Embed Size (px)
Citation preview
Annual reportand accounts 2016
The Directors’ report for 3i Infrastructure plc (“3i Infrastructure” or “the Company”) for the year to 31 March 2016 has been drawn up in reliance upon applicable English and Jersey law and the liabilities of the Company in connection with that report shall be subject to the limitations and restrictions provided by such law. This report may contain certain statements about the future outlook for 3i Infrastructure. Although the Directors believe their expectations are based on reasonable assumptions, any statements about the future outlook may be influenced by factors that could cause actual outcomes and results to be materially different.
Contents
Overview 1–9
Performance highlights 1
Chairman’s statement 2
Our portfolio 4
Our largest investments 5
New investment case studies 6
Strategic report 10–38
Our objectives and strategic priorities 10
The infrastructure asset class 11
Investment characteristics that we typically target 11
Market conditions 12
Our target markets for new investment 13
How we performed 14
Investment Adviser’s review 15
Financial review 25
Risk report 32
Principal risks and mitigation 36
Corporate responsibility 38
Review of investments 39–53
Elenia 40
Anglian Water Group (“AWG”) 42
Oystercatcher 44
ESVAGT 46
Cross London Trains (“XLT”) 48
Projects portfolio 50
3i India Infrastructure Fund 52
Governance 54–67
Introduction 54
Board of Directors 55
Directors’ report 56
Corporate governance statement 59
Report of the Audit and Risk Committee 65
Report of the Remuneration Committee 67
Financials and other information 68–96
Independent auditor’s report to the members of 3i Infrastructure plc 68
Consolidated statement of comprehensive income 72
Consolidated statement of changes in equity 73
Consolidated balance sheet 74
Consolidated cash flow statement 75
Significant accounting policies 76
Notes to the accounts 80
Investment policy 94
Portfolio valuation methodology 95
Information for shareholders 96
3i Infrastructure plc Annual report and accounts 2016 1
Overview
1
Performance highlights
25–31
See full performance details in the Financial review
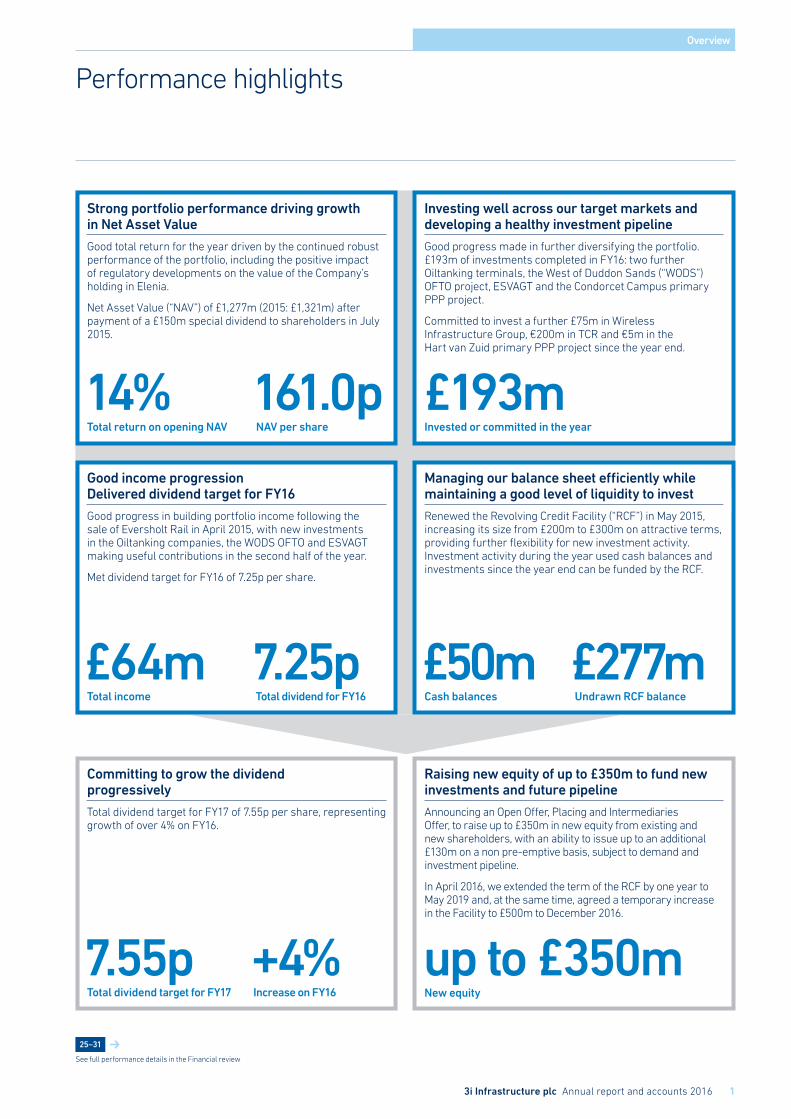
Strong portfolio performance driving growth in Net Asset Value
Good total return for the year driven by the continued robust performance of the portfolio, including the positive impact of regulatory developments on the value of the Company’s holding in Elenia.
Net Asset Value (“NAV”) of £1,277m (2015: £1,321m) after payment of a £150m special dividend to shareholders in July 2015.
14% 161.0pTotal return on opening NAV NAV per share
Good income progression Delivered dividend target for FY16
Good progress in building portfolio income following the sale of Eversholt Rail in April 2015, with new investments in the Oiltanking companies, the WODS OFTO and ESVAGT making useful contributions in the second half of the year.
Met dividend target for FY16 of 7.25p per share.
£64m 7.25pTotal income Total dividend for FY16
Committing to grow the dividend progressively
Total dividend target for FY17 of 7.55p per share, representing growth of over 4% on FY16.
7.55p +4%Total dividend target for FY17 Increase on FY16
Investing well across our target markets and developing a healthy investment pipeline
Good progress made in further diversifying the portfolio. £193m of investments completed in FY16: two further Oiltanking terminals, the West of Duddon Sands (“WODS”)OFTO project, ESVAGT and the Condorcet Campus primary PPP project.
Committed to invest a further £75m in Wireless Infrastructure Group, €200m in TCR and €5m in the Hart van Zuid primary PPP project since the year end.
£193mInvested or committed in the year
Managing our balance sheet efficiently while maintaining a good level of liquidity to invest
Renewed the Revolving Credit Facility (“RCF”) in May 2015, increasing its size from £200m to £300m on attractive terms, providing further flexibility for new investment activity. Investment activity during the year used cash balances and investments since the year end can be funded by the RCF.
£50m £277mCash balances Undrawn RCF balance
Raising new equity of up to £350m to fund new investments and future pipeline
Announcing an Open Offer, Placing and Intermediaries Offer, to raise up to £350m in new equity from existing and new shareholders, with an ability to issue up to an additional £130m on a non pre-emptive basis, subject to demand and investment pipeline.
In April 2016, we extended the term of the RCF by one year to May 2019 and, at the same time, agreed a temporary increase in the Facility to £500m to December 2016.
up to £350mNew equity
2 3i Infrastructure plc Annual report and accounts 2016
Overview
Chairman’s statement
3i Infrastructure provides its shareholders with a differentiated investment proposition. The infrastructure market continues to offer attractive investment opportunities, as demonstrated by the new investments completed by the Company.”Richard LaingChairman, 3i Infrastructure plc
11 May 2016
This is my first report to the shareholders of 3i Infrastructure since succeeding Peter Sedgwick as Chairman on 1 January 2016. Since my appointment, I have had an opportunity to get to know the Board and the investment advisory team and to understand the Company’s portfolio and the market in which it operates. I believe 3i Infrastructure is well positioned to continue to deliver its objectives and to provide its shareholders with a differentiated investment proposition, due to the quality of its portfolio and the advice it receives from the Investment Adviser.
The results we achieved in FY16, as well as over the longer term, confirm this. In FY16, we delivered a total return of 14%. This compares with the Company’s target of delivering a total return of 8% to 10% over the medium term. We redeployed a majority of the proceeds from the sale of the Company’s interest in Eversholt Rail across our target markets and met our dividend target for the year of 7.25 pence per share. Consistent with our progressive dividend policy, we are announcing a total dividend target for FY17 of 7.55 pence per share, implying a growth of over 4% compared to the total dividend we delivered in FY16.
Since the year end, we have committed to invest a further £75 million in Wireless Infrastructure Group (“WIG”), €200 million in TCR and a further €5 million in the Hart van Zuid primary PPP project. Our future investment pipeline is developing well and to ensure that we remain well funded to execute this future pipeline, we are launching an Open Offer, Placing and Intermediaries Offer with the intention of raising up to £350 million. We have increased our Revolving Credit Facility by £200 million to provide additional funding flexibility in the meantime.
PerformanceThe Company generated a total return of £166 million for the year to 31 March 2016, or 14% of opening Net Asset Value (“NAV”), adjusted for the payment of the special dividend on 31 July 2015. The NAV per share increased to 161.0 pence at 31 March 2016. This was a very good result in the context of the Company’s total return target of 8% to 10% per annum, to be achieved over the medium term, and was driven by the continued robust performance of the European portfolio, including the positive impact of regulatory developments for Elenia. In addition, the Company made good progress towards building portfolio income, with all new investments completed during the year yielding in line with our expectations.
We delivered a Total Shareholder Return (“TSR”) of 12.6% in the year to 31 March 2016, improving further our performance record since inception. The TSR from the Company’s IPO in March 2007 to 31 March 2016 was 164.3% or 11.3% on an annualised basis. This compares favourably with the returns in the broader market. Over the same period, the FTSE 250 generated a TSR of 93.4%, or 7.6% on an annualised basis. Importantly, the Company continues to achieve this outperformance with low share price volatility.
3i Infrastructure plc Annual report and accounts 2016 3
Overview
Dividend Last year, we announced a total dividend target for FY16 of 7.25 pence per share. Following the payment of the interim dividend of 3.625 pence per share in January 2016, the Board has declared a final dividend for the year of 3.625 pence per share, meeting our target for the year. We expect the final dividend to be paid on 11 July 2016. Consistent with our progressive dividend policy, we are announcing a total dividend target for FY17 of 7.55 pence per share, representing a year-on-year increase of 4%.
Strategy The increase in demand for infrastructure assets in the sustained low interest rate environment, combined with the availability of debt finance for infrastructure investment on attractive terms, has driven the price of some infrastructure assets higher. This trend has been most evident in the market for large Core infrastructure assets. Against this backdrop, the Company shaped its investment strategy to focus on mid-market economic infrastructure and greenfield projects, where prospective returns are more attractive. Our investment approach and execution are described on pages 10 to 13 and 16 to 17.
Investment and realisation activityIn competitive markets, we invested or committed to invest a total of £193 million in four new investments across mid-market economic infrastructure businesses and greenfield projects, redeploying a significant portion of the proceeds from the sale of the Company’s interest in Eversholt Rail. The new investments completed in the year are performing well and contributed to income generation in the second half of the year, in line with our expectations at the time of investment. In addition, since the year end, we have announced that we are to invest approximately £75 million in WIG and €200 million in TCR, in transactions expected to complete by the end of June and the end of August 2016 respectively, subject to regulatory clearance, and a further €5 million in the Hart van Zuid primary PPP project. These are complementary additions to the Company’s investment portfolio, providing further geographical and sector diversification.
The Investment Adviser continues to make progress with the realisation of the assets in the India Fund. Following the sale of approximately 54% of Adani Power in the last financial year, the India Fund sold its holding in Ind-Barath Energy (Utkal) Limited (“Ind-Barath Energy”) in FY16 and the proceeds from that sale are expected to be received in the first quarter of FY17.
Balance sheet and Open Offer, Placing and Intermediaries OfferThe efficient management of the Company’s liquidity continues to be a key area of focus for the Board. Following the sale of the Company’s investment in Eversholt Rail, the Company has continued to manage its liquidity position actively, ensuring that it maintains good liquidity to pursue new investment opportunities, while not diluting shareholder returns by holding excessive cash balances. Consistent with this objective, the Company announced in May 2015 that it would pay a special dividend of £150 million to shareholders and that it had negotiated a new RCF, increasing the Facility from £200 million to £300 million on attractive terms. Following the payment of the ordinary and special dividends, as well as investment and realisation flows, the Company ended the year with total liquidity of £327 million, including cash balances of £50 million and an undrawn RCF balance of £277 million. In April 2016, the RCF was increased by £200 million on a temporary basis to provide additional flexibility to make new investment commitments.
In order to ensure that the Company remains well funded to execute its new investments and future pipeline, we are launching an Open Offer, Placing and Intermediaries Offer with the intention of raising up to £350 million from existing and new shareholders. The proceeds from this offering will be used to fund completion of the investments in WIG and TCR, as well as to fund future investment opportunities. The Company may issue up to an additional £130 million of new shares, representing up to 10% of the existing issued share capital, on a non pre-emptive basis. This additional issue will be dependent on demand for the Offer and the Board’s assessment of the near-term pipeline.
Corporate governance At the end of December 2015, Peter Sedgwick retired after nine years as Chairman. On behalf of the Board, I would like to thank Peter for his contribution to a period of outstanding growth and success for 3i Infrastructure.
The Board aims to uphold the highest standard of corporate governance and, in the year under review, complied with all applicable provisions of the UK Corporate Governance Code. The Company’s Annual General Meeting and an Extraordinary General Meeting were held on 7 July 2015. All resolutions were approved by shareholders, including the election or re-election of all the Directors to the Board. The special resolutions relating to the share consolidation implemented in conjunction with the payment of the special dividend and the increase to the single investment concentration limit from 20% to 25% of gross assets were also approved with an overwhelming majority. This year’s AGM will be held on 7 July 2016.
OutlookThe infrastructure market continues to offer attractive investment opportunities, as demonstrated by the new investments the Company completed during the financial year and announced since then. These investments offer a stable return profile, sought after in a highly uncertain macroeconomic environment, which continues to be characterised by low interest rates and low growth. Looking ahead, we are confident in our business model and our ability to continue to deliver our objectives. We have a high quality portfolio which underpins future returns. We also have a healthy pipeline of investment opportunities across our target markets, and we have the funding and market access to continue to grow the Company over the years to come.
4 3i Infrastructure plc Annual report and accounts 2016
Overview
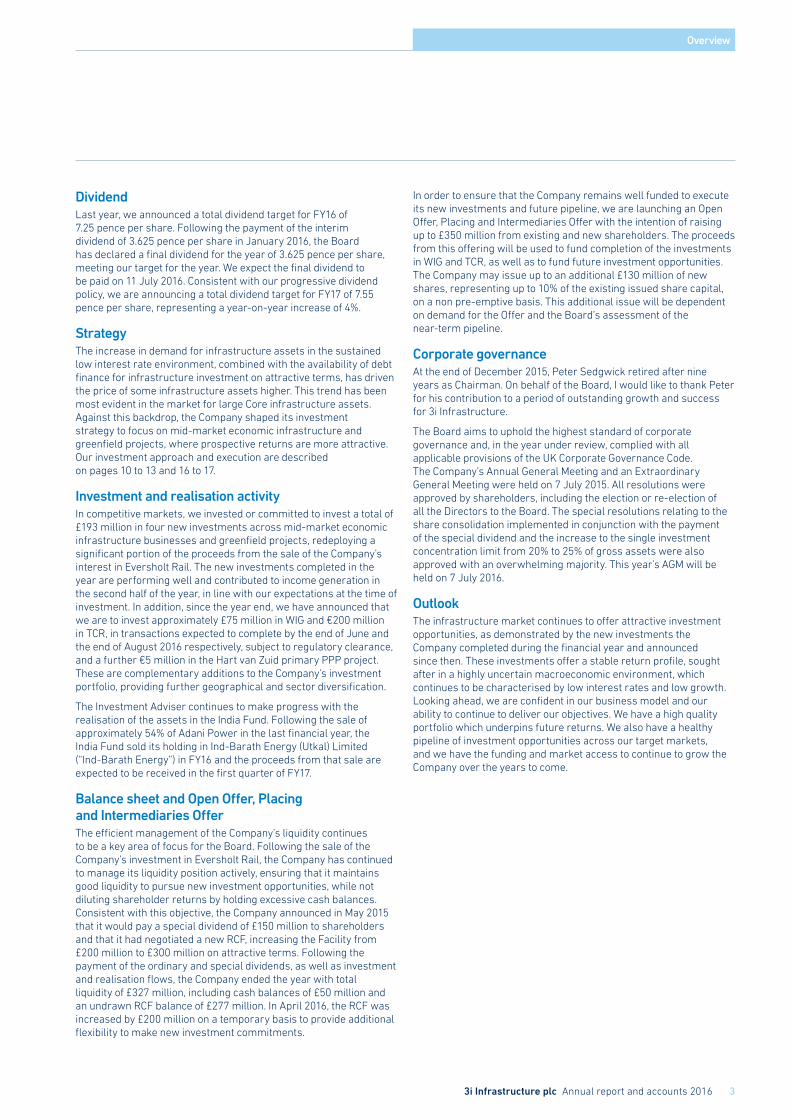
Breakdown by sector
Transportation
28%
12%
60%
UtilitiesEnergy
Breakdown by type1
12%
30%58%
OperationalPPP
PrimaryPPP
Low-risk energy
Our portfolioas at 31 March 2016
Economic infrastructure businessesDynamic businesses that own their asset base in perpetuity
− Elenia Finland: regulated electricity distribution
− Anglian Water Group UK: regulated water utility
− Oystercatcher Belgium, the Netherlands, Malta and Singapore: oil and oil product storage terminals (investment in two further terminals completed in the year)
− ESVAGT Denmark, Norway and UK: emergency rescue and response vessels (new investment in the year)
− Cross London Trains UK: rail rolling stock procurement and leasing
PPP projects Concession-based projects in construction (“primary”) or in operation Primary projects:− Two road projects in the Netherlands− Two educational facilities projects
in the UK and France− One bridge project in the UK− Two Government and social
accommodation projects in France and the Netherlands
Operational projects: Four investments, including 64 underlying projects: − Dalmore Capital Fund, an operational
PFI portfolio in the UK− Elgin, a school and community health
care facilities portfolio in the UK − NMM, a museum facilities project
in the Netherlands− Octagon, a healthcare facilities project
in the UK
Low-risk energy projects− West of Duddon Sands OFTO project
in the UK (new investment in the year)
Projects
31 March 2016 31 March 2015
Valuation1 £m % of portfolio
Valuation1 £m
% of portfolio
Economic infrastructure businesses 1,035 81% 1,051 83%Elenia 362 239
Anglian Water Group 255 242
Oystercatcher 187 110
ESVAGT 122 –
Cross London Trains 109 100
Eversholt Rail Sold 360
Projects 193 15% 159 12%Primary projects1 59 50
Operational projects 112 109
Low-risk energy projects 22 –
India Infrastructure Fund (six investments) 53 4% 63 5%Total investments and commitments 1,281 100% 1,273 100%Total cash balances 50 75
23 assets
£1,281m1
investment value
1 Includes investment commitments translated at year end exchange rate.
3i Infrastructure plc Annual report and accounts 2016 5
Overview
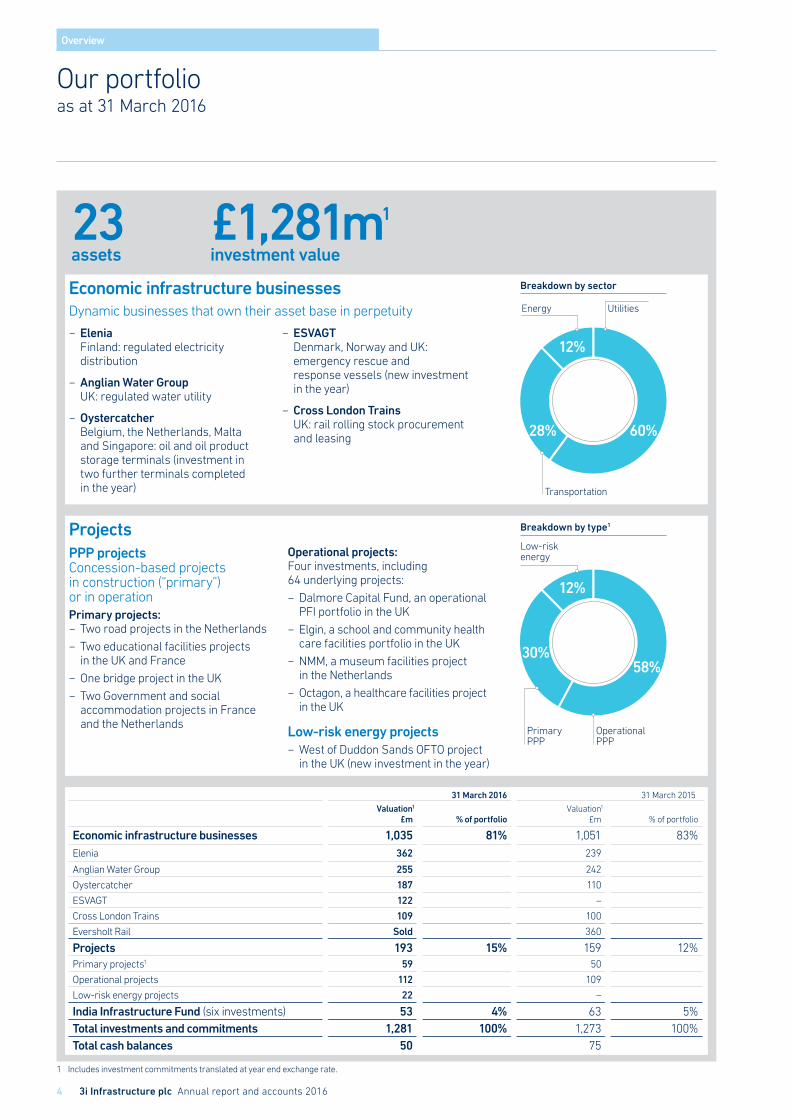
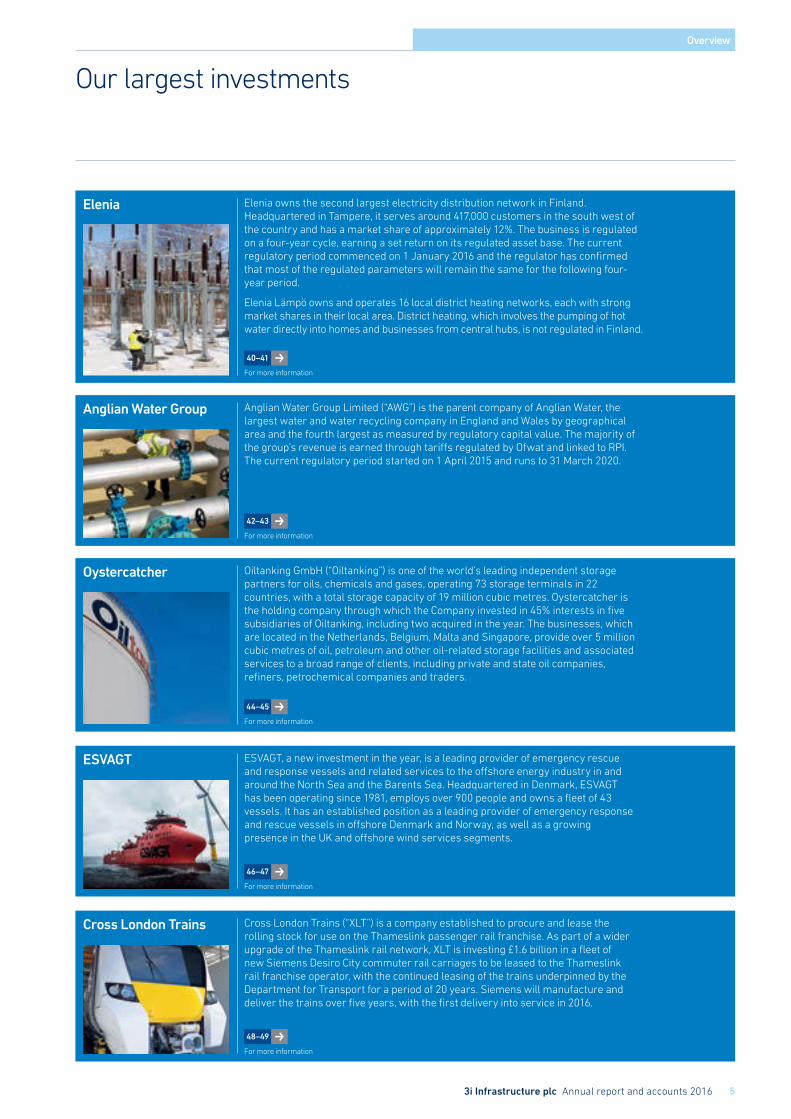
Our largest investments
Anglian Water Group Limited (“AWG”) is the parent company of Anglian Water, the largest water and water recycling company in England and Wales by geographical area and the fourth largest as measured by regulatory capital value. The majority of the group’s revenue is earned through tariffs regulated by Ofwat and linked to RPI. The current regulatory period started on 1 April 2015 and runs to 31 March 2020.
Oiltanking GmbH (“Oiltanking”) is one of the world’s leading independent storage partners for oils, chemicals and gases, operating 73 storage terminals in 22 countries, with a total storage capacity of 19 million cubic metres. Oystercatcher is the holding company through which the Company invested in 45% interests in five subsidiaries of Oiltanking, including two acquired in the year. The businesses, which are located in the Netherlands, Belgium, Malta and Singapore, provide over 5 million cubic metres of oil, petroleum and other oil-related storage facilities and associated services to a broad range of clients, including private and state oil companies, refiners, petrochemical companies and traders.
ESVAGT, a new investment in the year, is a leading provider of emergency rescue and response vessels and related services to the offshore energy industry in and around the North Sea and the Barents Sea. Headquartered in Denmark, ESVAGT has been operating since 1981, employs over 900 people and owns a fleet of 43 vessels. It has an established position as a leading provider of emergency response and rescue vessels in offshore Denmark and Norway, as well as a growing presence in the UK and offshore wind services segments.
Cross London Trains (“XLT”) is a company established to procure and lease the rolling stock for use on the Thameslink passenger rail franchise. As part of a wider upgrade of the Thameslink rail network, XLT is investing £1.6 billion in a fleet of new Siemens Desiro City commuter rail carriages to be leased to the Thameslink rail franchise operator, with the continued leasing of the trains underpinned by the Department for Transport for a period of 20 years. Siemens will manufacture and deliver the trains over five years, with the first delivery into service in 2016.
Elenia owns the second largest electricity distribution network in Finland. Headquartered in Tampere, it serves around 417,000 customers in the south west of the country and has a market share of approximately 12%. The business is regulated on a four-year cycle, earning a set return on its regulated asset base. The current regulatory period commenced on 1 January 2016 and the regulator has confirmed that most of the regulated parameters will remain the same for the following four-year period.
Elenia Lämpö owns and operates 16 local district heating networks, each with strong market shares in their local area. District heating, which involves the pumping of hot water directly into homes and businesses from central hubs, is not regulated in Finland.
40–41
For more information
42–43
For more information
44–45
For more information
46–47
For more information
48–49
For more information
Elenia
Anglian Water Group
Oystercatcher
ESVAGT
Cross London Trains
6 3i Infrastructure plc Annual report and accounts 2016
Overview
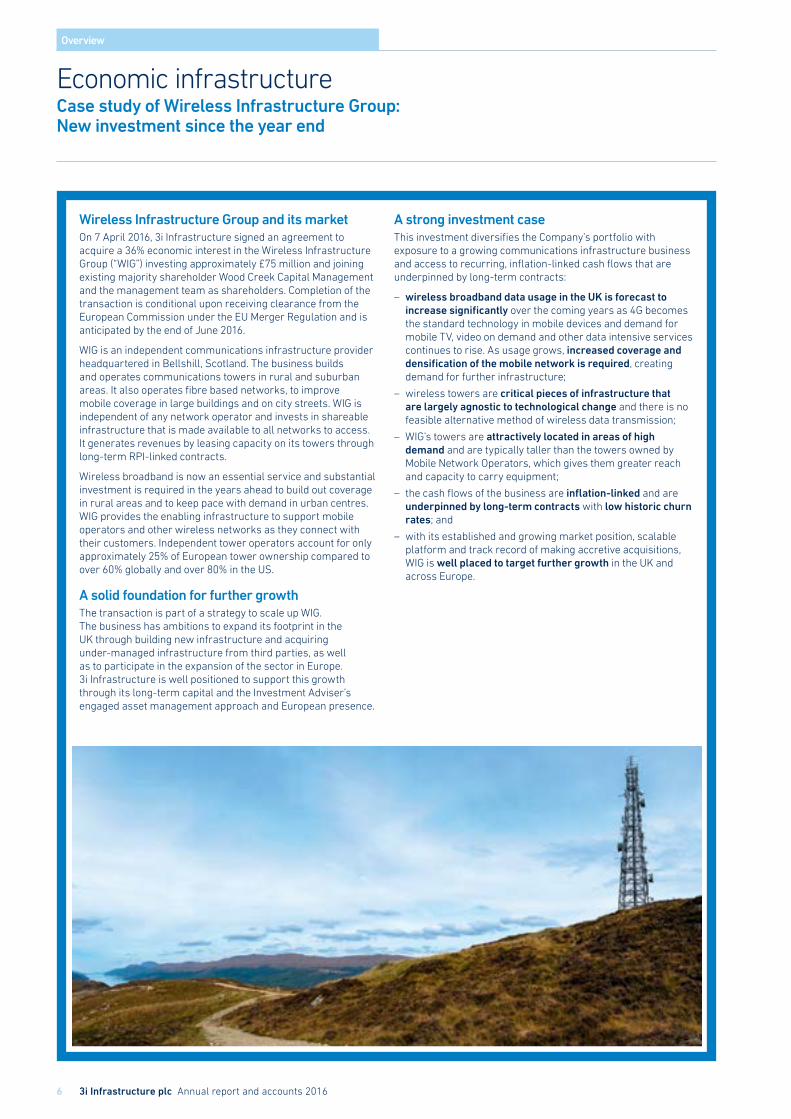
Economic infrastructureCase study of Wireless Infrastructure Group: New investment since the year end
Wireless Infrastructure Group and its marketOn 7 April 2016, 3i Infrastructure signed an agreement to acquire a 36% economic interest in the Wireless Infrastructure Group (“WIG”) investing approximately £75 million and joining existing majority shareholder Wood Creek Capital Management and the management team as shareholders. Completion of the transaction is conditional upon receiving clearance from the European Commission under the EU Merger Regulation and is anticipated by the end of June 2016.
WIG is an independent communications infrastructure provider headquartered in Bellshill, Scotland. The business builds and operates communications towers in rural and suburban areas. It also operates fibre based networks, to improve mobile coverage in large buildings and on city streets. WIG is independent of any network operator and invests in shareable infrastructure that is made available to all networks to access. It generates revenues by leasing capacity on its towers through long-term RPI-linked contracts.
Wireless broadband is now an essential service and substantial investment is required in the years ahead to build out coverage in rural areas and to keep pace with demand in urban centres. WIG provides the enabling infrastructure to support mobile operators and other wireless networks as they connect with their customers. Independent tower operators account for only approximately 25% of European tower ownership compared to over 60% globally and over 80% in the US.
A solid foundation for further growthThe transaction is part of a strategy to scale up WIG. The business has ambitions to expand its footprint in the UK through building new infrastructure and acquiring under-managed infrastructure from third parties, as well as to participate in the expansion of the sector in Europe. 3i Infrastructure is well positioned to support this growth through its long-term capital and the Investment Adviser’s engaged asset management approach and European presence.
A strong investment caseThis investment diversifies the Company’s portfolio with exposure to a growing communications infrastructure business and access to recurring, inflation-linked cash flows that are underpinned by long-term contracts:
– wireless broadband data usage in the UK is forecast to increase significantly over the coming years as 4G becomes the standard technology in mobile devices and demand for mobile TV, video on demand and other data intensive services continues to rise. As usage grows, increased coverage and densification of the mobile network is required, creating demand for further infrastructure;
– wireless towers are critical pieces of infrastructure that are largely agnostic to technological change and there is no feasible alternative method of wireless data transmission;
– WIG’s towers are attractively located in areas of high demand and are typically taller than the towers owned by Mobile Network Operators, which gives them greater reach and capacity to carry equipment;
– the cash flows of the business are inflation-linked and are underpinned by long-term contracts with low historic churn rates; and
– with its established and growing market position, scalable platform and track record of making accretive acquisitions, WIG is well placed to target further growth in the UK and across Europe.

3i Infrastructure plc Annual report and accounts 2016 7
Overview
Economic infrastructureCase study of TCR: New investment since the year end
TCR and its marketOn 29 April 2016, 3i Infrastructure announced it had agreed to invest approximately €200 million in TCR in a consortium with Deutsche Asset Management. 3i Infrastructure and Deutsche Asset Management will each acquire economic interests in TCR of up to 50% from current owners Chequers Capital and Florac. The remaining equity will be retained by the existing management team. Completion of the transaction is conditional upon receiving EU Merger Regulation clearance and is anticipated by the end of August 2016.
Headquartered in Brussels, Belgium, TCR is Europe’s largest independent asset manager of airport ground support equipment (“GSE”) and operates at over 100 airports. Since inception, TCR has defined the market for leased GSE, providing high quality assets and a full service leasing, maintenance and fleet management offering to its clients, which are predominantly independent ground handling companies, airlines and airports. This enables GSE operators to concentrate on their core business of ground handling. The GSE that TCR provides is critical infrastructure, without which some of Europe’s busiest airports could not operate.
Potential to grow the business furtherOperational leasing makes up a small, but growing, proportion of the overall market for GSE in Europe, since most equipment remains owned by airlines and ground handlers. However, leasing is becoming an increasingly attractive funding model, as it offers greater flexibility than ownership and provides ground handlers with an external source of capital for investment. As the largest lessor in Europe, we expect TCR to benefit from continued expansion of the overall market. 3i Infrastructure’s investment is also part of a strategy to support TCR not only in its growth in Europe, but also as it expands further internationally.
A strong investment caseTCR fits with the Company’s strategy of investing in companies with good asset backing, strong market positions and barriers to entry, yet with operational levers to achieve attractive returns for shareholders through active asset management:
– GSE is a scarce resource that is critical to the functioning of an airport; through first mover advantage, TCR has benefited from securing the largest independent GSE fleet in Europe. TCR has access to maintenance workshops in prime locations at airports, many of which are located airside. This means that a high quality maintenance and asset management service can be provided, resulting in high availability of TCR’s fleet;
– TCR is able to offer full-service rentals on a pan-European basis. This creates competitive advantages against competitors, which tend to offer either dry leases or only repair and maintenance services. TCR’s network means it can offer pan-European solutions at multiple locations, matching the footprints of its customers;
– outsourcing ownership of GSE equipment makes economic sense for independent ground handlers, as it allows them to manage the mismatch between short-term handling contracts and the typically 10-15 year useful life of equipment;
– TCR’s rental contracts are aligned with the ground handlers’ contracts with the airlines and are typically 3-5 years in duration. TCR has experienced a high level of contract renewal;
– the business has a diversified portfolio and is present at over 100 airports across 12 countries with a diverse contract and customer base meaning the revenues of the business are not materially reliant on a single client or geography; and
– the investment will provide exposure to the long-term growth in the aviation market, which is fundamentally GDP driven, yet it is expected to be insulated from short-term shocks to demand due to its exposure to aircraft movements rather than passenger numbers.
8 3i Infrastructure plc Annual report and accounts 2016
Overview
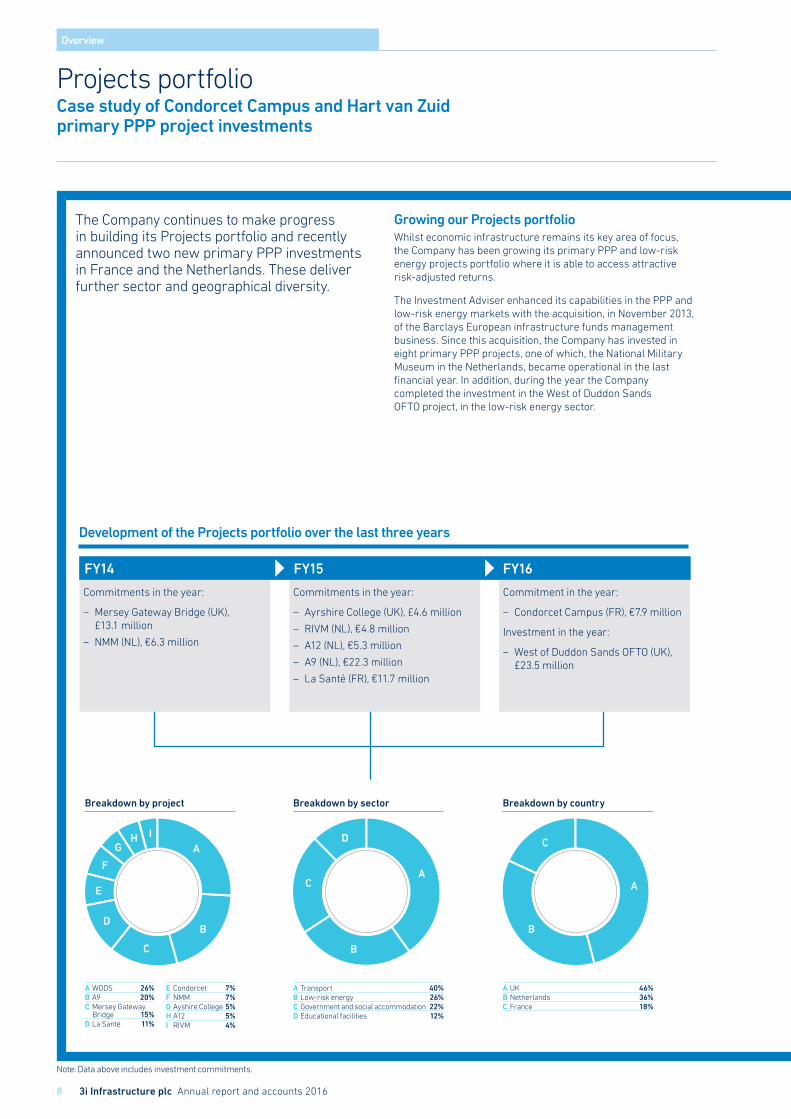
Breakdown by project
A
B
C
D
E
F
GH I
A WODS 26%B A9 20%C Mersey Gateway Bridge 15%D La Santé 11%
E Condorcet 7%F NMM 7%G Ayshire College 5%H A12 5%I RIVM 4%
Breakdown by sector
A
B
C
D
A Transport 40%B Low-risk energy 26%C Government and social accommodation 22%D Educational facilities 12%
Breakdown by country
A
B
C
A UK 46%B Netherlands 36%C France 18%
Note: Data above includes investment commitments.
Projects portfolioCase study of Condorcet Campus and Hart van Zuid primary PPP project investments
The Company continues to make progress in building its Projects portfolio and recently announced two new primary PPP investments in France and the Netherlands. These deliver further sector and geographical diversity.
Growing our Projects portfolioWhilst economic infrastructure remains its key area of focus, the Company has been growing its primary PPP and low-risk energy projects portfolio where it is able to access attractive risk-adjusted returns.
The Investment Adviser enhanced its capabilities in the PPP and low-risk energy markets with the acquisition, in November 2013, of the Barclays European infrastructure funds management business. Since this acquisition, the Company has invested in eight primary PPP projects, one of which, the National Military Museum in the Netherlands, became operational in the last financial year. In addition, during the year the Company completed the investment in the West of Duddon Sands OFTO project, in the low-risk energy sector.
Development of the Projects portfolio over the last three years
Commitments in the year:
– Mersey Gateway Bridge (UK), £13.1 million
– NMM (NL), €6.3 million
Commitments in the year:
– Ayrshire College (UK), £4.6 million
– RIVM (NL), €4.8 million
– A12 (NL), €5.3 million
– A9 (NL), €22.3 million
– La Santé (FR), €11.7 million
Commitment in the year:
– Condorcet Campus (FR), €7.9 million
Investment in the year:
– West of Duddon Sands OFTO (UK), £23.5 million
FY14 FY15 FY16

3i Infrastructure plc Annual report and accounts 2016 9
Overview
Condorcet Campus
On 15 March 2016, 3i Infrastructure announced that it had committed to invest €8 million to acquire an 80% interest in the Condorcet Campus primary PPP project in France. A consortium comprising 3i Infrastructure and entities of the VINCI Construction France and ENGIE groups was selected as preferred bidder following a tender run under the supervision of the Ministry of Higher Education and Research.
The €170 million project involves the design, build and finance of new buildings for a campus in Aubervilliers, north of Paris, as well as the provision of facilities management services.
Classrooms, student housing, a faculty club, cafeterias and other student living facilities will be built for the use of social sciences students, faculty and research staff. Construction is expected to be completed by the summer of 2019.
Hart van Zuid
On 29 April 2016, the Company announced it had committed €5 million to acquire a substantial majority interest in the Hart van Zuid primary PPP project in Rotterdam, the Netherlands in a partnership with Heijmans Capital and Ballast Nedam. The c.€200 million project involves the renewal and revitalisation of the area surrounding the Zuidplein and Ahoy centres. During the multi-year project, the Ahoy convention centre will be significantly expanded to include an international conference centre, a music hall, a cinema and a hotel. An art building with a library and theatre will be constructed on the new Plein op Zuid square.
In addition, the Zuidplein shopping centre will be renovated and expanded and the new Charlois swimming pool will be incorporated into the current city hall. Furthermore, the metro and bus transportation hubs will be renewed.
Construction work will commence in the second quarter of 2016.
© Saïda Dalmau, SBDA, Campus Condorcet, 2015
Strategic report
10 3i Infrastructure plc Annual report and accounts 2016
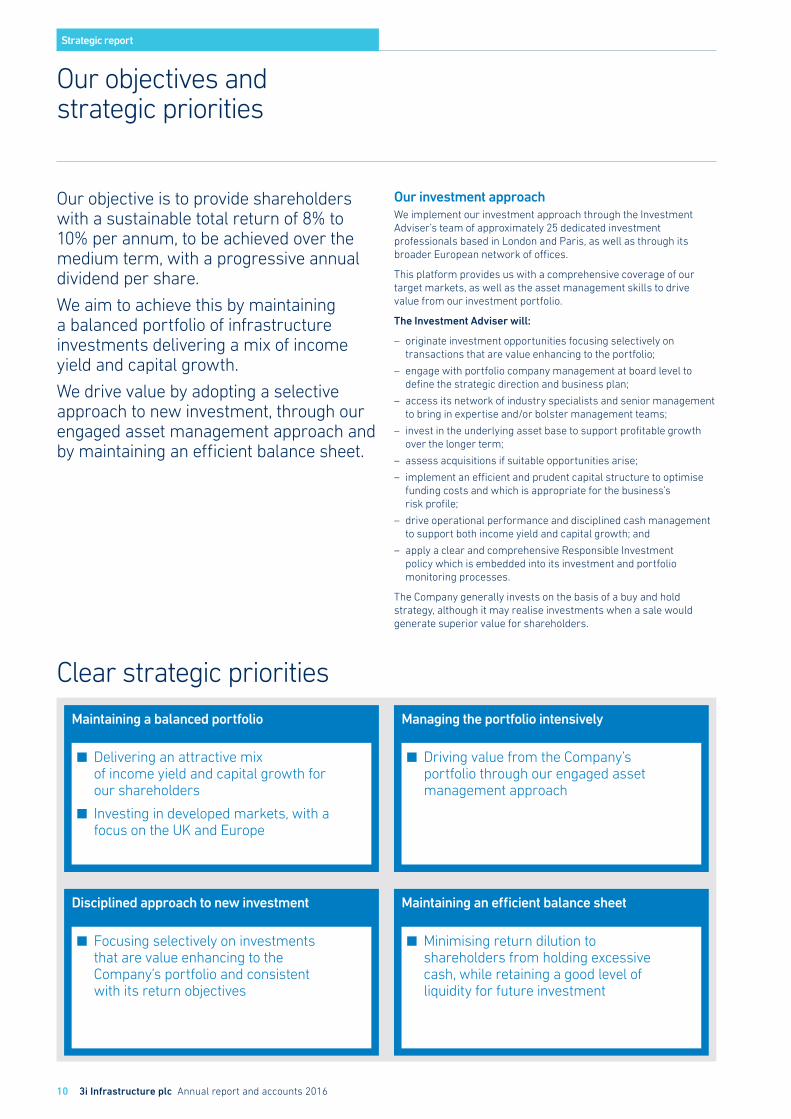
Our objectives and strategic priorities
Our investment approachWe implement our investment approach through the Investment Adviser’s team of approximately 25 dedicated investment professionals based in London and Paris, as well as through its broader European network of offices.
This platform provides us with a comprehensive coverage of our target markets, as well as the asset management skills to drive value from our investment portfolio.
The Investment Adviser will:
– originate investment opportunities focusing selectively on transactions that are value enhancing to the portfolio;
– engage with portfolio company management at board level to define the strategic direction and business plan;
– access its network of industry specialists and senior management to bring in expertise and/or bolster management teams;
– invest in the underlying asset base to support profitable growth over the longer term;
– assess acquisitions if suitable opportunities arise;
– implement an efficient and prudent capital structure to optimise funding costs and which is appropriate for the business’s risk profile;
– drive operational performance and disciplined cash management to support both income yield and capital growth; and
– apply a clear and comprehensive Responsible Investment policy which is embedded into its investment and portfolio monitoring processes.
The Company generally invests on the basis of a buy and hold strategy, although it may realise investments when a sale would generate superior value for shareholders.
Our objective is to provide shareholders with a sustainable total return of 8% to 10% per annum, to be achieved over the medium term, with a progressive annual dividend per share.
We aim to achieve this by maintaining a balanced portfolio of infrastructure investments delivering a mix of income yield and capital growth.
We drive value by adopting a selective approach to new investment, through our engaged asset management approach and by maintaining an efficient balance sheet.
Clear strategic priorities
Maintaining a balanced portfolio
Disciplined approach to new investment Maintaining an efficient balance sheet
Managing the portfolio intensively
Delivering an attractive mix of income yield and capital growth for our shareholders
Investing in developed markets, with a focus on the UK and Europe
Focusing selectively on investments that are value enhancing to the Company’s portfolio and consistent with its return objectives
Minimising return dilution to shareholders from holding excessive cash, while retaining a good level of liquidity for future investment
Driving value from the Company’s portfolio through our engaged asset management approach
Strategic report
3i Infrastructure plc Annual report and accounts 2016 11
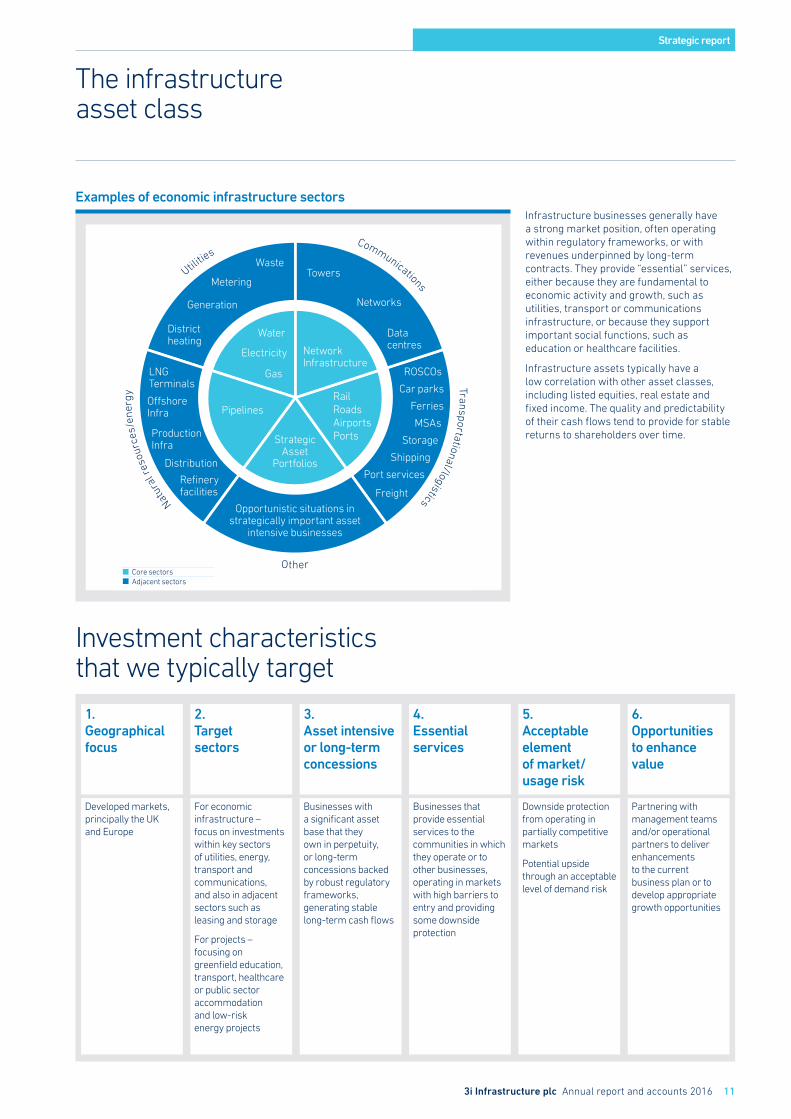
The infrastructure asset class
Infrastructure businesses generally have a strong market position, often operating within regulatory frameworks, or with revenues underpinned by long-term contracts. They provide “essential” services, either because they are fundamental to economic activity and growth, such as utilities, transport or communications infrastructure, or because they support important social functions, such as education or healthcare facilities.
Infrastructure assets typically have a low correlation with other asset classes, including listed equities, real estate and fixed income. The quality and predictability of their cash flows tend to provide for stable returns to shareholders over time.
Examples of economic infrastructure sectors
Communications
Transportational/logistics
Natur
al r
esou
rces
/ene
rgy
Utilitie
s
Other
TowersWaste
Metering
Generation
ROSCOs
Car parks
Ferries
MSAs
Storage
Shipping
Port services
Freight
District heating
LNGTerminals
O�shoreInfra
ProductionInfra
Distribution
Refineryfacilities
Gas
Electricity
Water
Networks
RailRoadsAirportsPorts
Pipelines
NetworkInfrastructure
Opportunistic situations instrategically important asset
intensive businesses
StrategicAsset
Portfolios
Data centres
Core sectorsAdjacent sectors
Investment characteristics that we typically target
1.Geographical focus
Developed markets, principally the UK and Europe
2.Target sectors
For economic infrastructure – focus on investments within key sectors of utilities, energy, transport and communications, and also in adjacent sectors such as leasing and storage
For projects – focusing on greenfield education, transport, healthcare or public sector accommodation and low-risk energy projects
3.Asset intensive or long-term concessions
Businesses with a significant asset base that they own in perpetuity, or long-term concessions backed by robust regulatory frameworks, generating stable long-term cash flows
4.Essential services
Businesses that provide essential services to the communities in which they operate or to other businesses, operating in markets with high barriers to entry and providing some downside protection
5.Acceptable element of market/usage risk
Downside protection from operating in partially competitive markets
Potential upside through an acceptable level of demand risk
6.Opportunities to enhance value
Partnering with management teams and/or operational partners to deliver enhancements to the current business plan or to develop appropriate growth opportunities
Strategic report
12 3i Infrastructure plc Annual report and accounts 2016
Market conditions
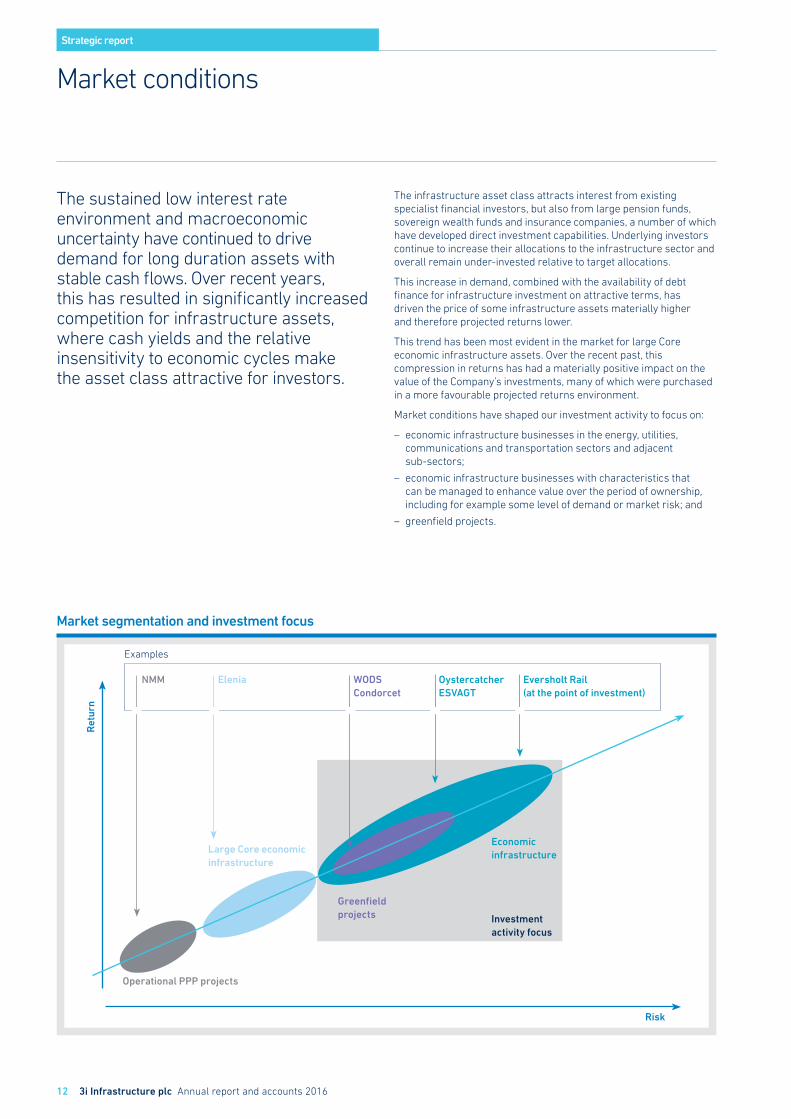
The sustained low interest rate environment and macroeconomic uncertainty have continued to drive demand for long duration assets with stable cash flows. Over recent years, this has resulted in significantly increased competition for infrastructure assets, where cash yields and the relative insensitivity to economic cycles make the asset class attractive for investors.
The infrastructure asset class attracts interest from existing specialist financial investors, but also from large pension funds, sovereign wealth funds and insurance companies, a number of which have developed direct investment capabilities. Underlying investors continue to increase their allocations to the infrastructure sector and overall remain under-invested relative to target allocations.
This increase in demand, combined with the availability of debt finance for infrastructure investment on attractive terms, has driven the price of some infrastructure assets materially higher and therefore projected returns lower.
This trend has been most evident in the market for large Core economic infrastructure assets. Over the recent past, this compression in returns has had a materially positive impact on the value of the Company’s investments, many of which were purchased in a more favourable projected returns environment.
Market conditions have shaped our investment activity to focus on:
– economic infrastructure businesses in the energy, utilities, communications and transportation sectors and adjacent sub-sectors;
– economic infrastructure businesses with characteristics that can be managed to enhance value over the period of ownership, including for example some level of demand or market risk; and
– greenfield projects.
Market segmentation and investment focus
Operational PPP projects
Investment activity focus
Large Core economic infrastructure
Greenfield projects
Economic infrastructure
Ret
urn
Risk
NMM Elenia WODSCondorcet
Oystercatcher ESVAGT
Eversholt Rail (at the point of investment)
Examples
Strategic report
3i Infrastructure plc Annual report and accounts 2016 13
Our target markets for new investment
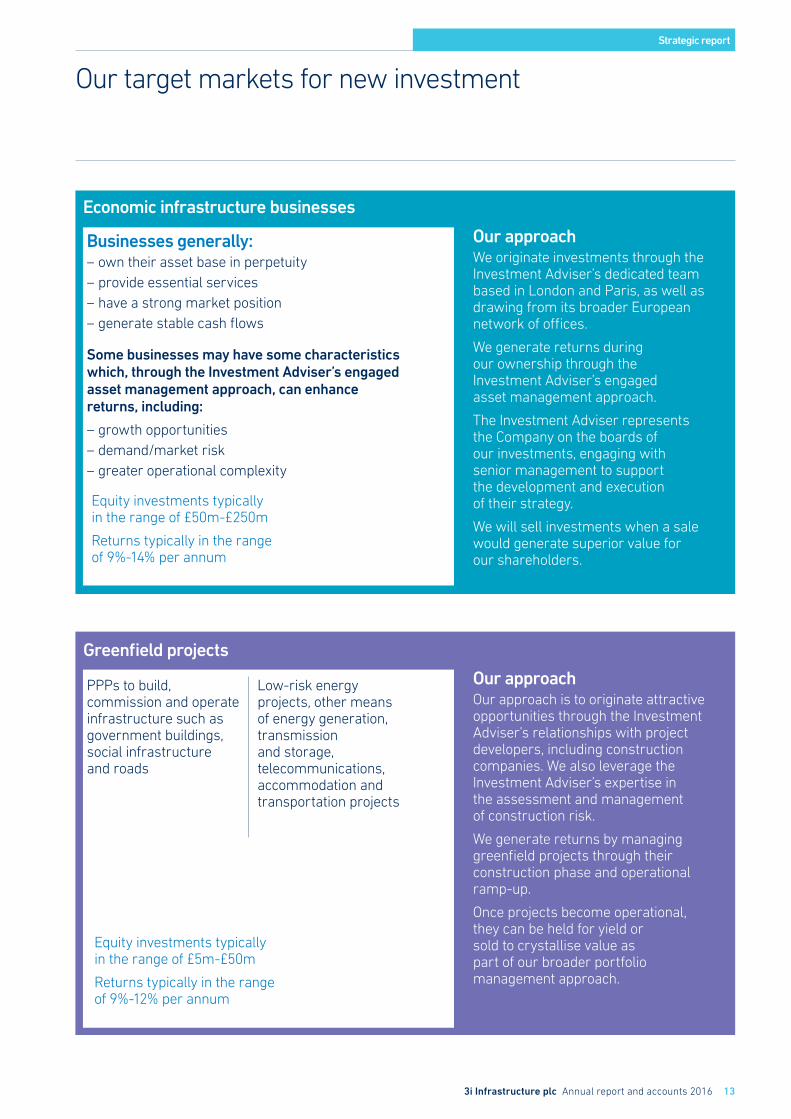
Businesses generally: – own their asset base in perpetuity – provide essential services – have a strong market position – generate stable cash flows
Some businesses may have some characteristics which, through the Investment Adviser’s engaged asset management approach, can enhance returns, including:
– growth opportunities – demand/market risk – greater operational complexity
PPPs to build, commission and operate infrastructure such as government buildings, social infrastructure and roads
Low-risk energy projects, other means of energy generation, transmission and storage, telecommunications, accommodation and transportation projects
Our approachWe originate investments through the Investment Adviser’s dedicated team based in London and Paris, as well as drawing from its broader European network of offices.
We generate returns during our ownership through the Investment Adviser’s engaged asset management approach.
The Investment Adviser represents the Company on the boards of our investments, engaging with senior management to support the development and execution of their strategy.
We will sell investments when a sale would generate superior value for our shareholders.
Our approachOur approach is to originate attractive opportunities through the Investment Adviser’s relationships with project developers, including construction companies. We also leverage the Investment Adviser’s expertise in the assessment and management of construction risk.
We generate returns by managing greenfield projects through their construction phase and operational ramp-up.
Once projects become operational, they can be held for yield or sold to crystallise value as part of our broader portfolio management approach.
Equity investments typically in the range of £50m-£250m
Returns typically in the range of 9%-14% per annum
Equity investments typically in the range of £5m-£50m
Returns typically in the range of 9%-12% per annum
Economic infrastructure businesses
Greenfield projects
Strategic report
14 3i Infrastructure plc Annual report and accounts 2016
How we performed
14.0%
24.6%
8–10% medium term return objective
2016
2015
7.25pps
7.00pps
2016
2015
11%
9%
4%
5%
85%
86%
2016
2015
Economic infrastructure businesses Projects portfolio India Fund
Key performance indicators
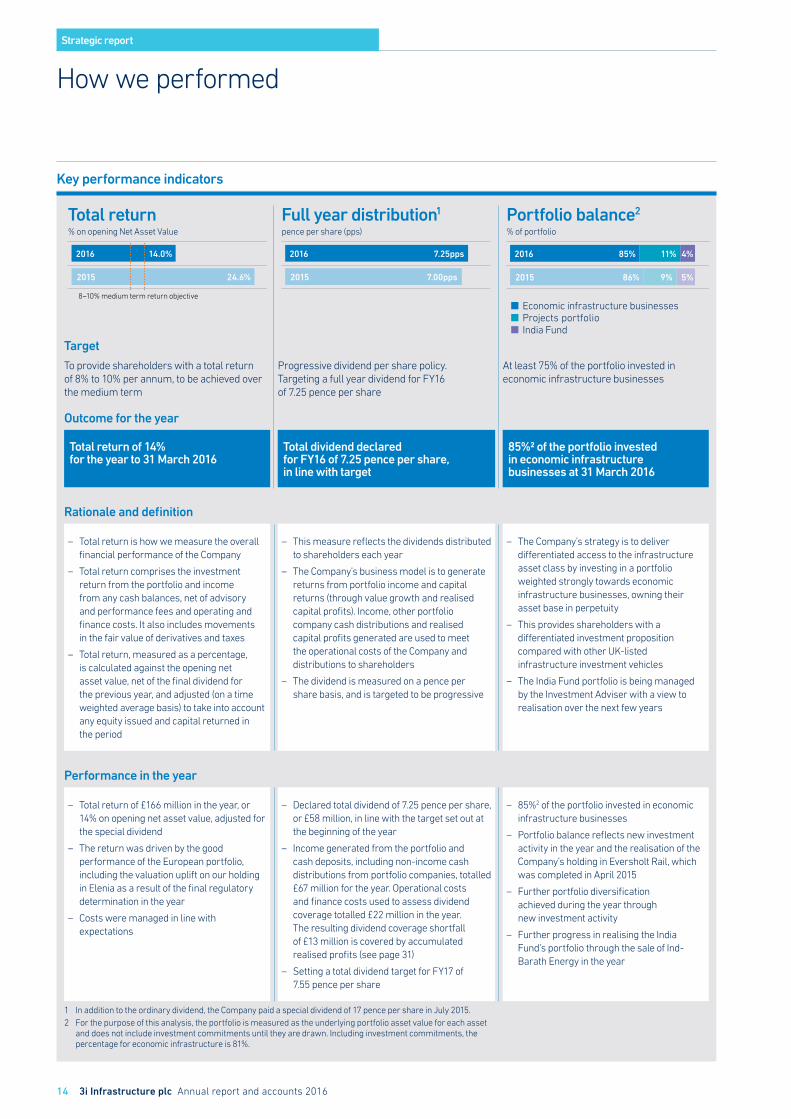
Total return% on opening Net Asset Value
Full year distribution1
pence per share (pps)
Portfolio balance2
% of portfolio
Target
To provide shareholders with a total return of 8% to 10% per annum, to be achieved over the medium term
Progressive dividend per share policy. Targeting a full year dividend for FY16 of 7.25 pence per share
At least 75% of the portfolio invested in economic infrastructure businesses
Outcome for the year
Total return of 14% for the year to 31 March 2016
Total dividend declared for FY16 of 7.25 pence per share, in line with target
85%2 of the portfolio invested in economic infrastructure businesses at 31 March 2016
Rationale and definition
– Total return is how we measure the overall financial performance of the Company
– Total return comprises the investment return from the portfolio and income from any cash balances, net of advisory and performance fees and operating and finance costs. It also includes movements in the fair value of derivatives and taxes
– Total return, measured as a percentage, is calculated against the opening net asset value, net of the final dividend for the previous year, and adjusted (on a time weighted average basis) to take into account any equity issued and capital returned in the period
– This measure reflects the dividends distributed to shareholders each year
– The Company’s business model is to generate returns from portfolio income and capital returns (through value growth and realised capital profits). Income, other portfolio company cash distributions and realised capital profits generated are used to meet the operational costs of the Company and distributions to shareholders
– The dividend is measured on a pence per share basis, and is targeted to be progressive
– The Company’s strategy is to deliver differentiated access to the infrastructure asset class by investing in a portfolio weighted strongly towards economic infrastructure businesses, owning their asset base in perpetuity
– This provides shareholders with a differentiated investment proposition compared with other UK-listed infrastructure investment vehicles
– The India Fund portfolio is being managed by the Investment Adviser with a view to realisation over the next few years
Performance in the year
– Total return of £166 million in the year, or 14% on opening net asset value, adjusted for the special dividend
– The return was driven by the good performance of the European portfolio, including the valuation uplift on our holding in Elenia as a result of the final regulatory determination in the year
– Costs were managed in line with expectations
– Declared total dividend of 7.25 pence per share, or £58 million, in line with the target set out at the beginning of the year
– Income generated from the portfolio and cash deposits, including non-income cash distributions from portfolio companies, totalled £67 million for the year. Operational costs and finance costs used to assess dividend coverage totalled £22 million in the year. The resulting dividend coverage shortfall of £13 million is covered by accumulated realised profits (see page 31)
– Setting a total dividend target for FY17 of 7.55 pence per share
– 85%2 of the portfolio invested in economic infrastructure businesses
– Portfolio balance reflects new investment activity in the year and the realisation of the Company’s holding in Eversholt Rail, which was completed in April 2015
– Further portfolio diversification achieved during the year through new investment activity
– Further progress in realising the India Fund’s portfolio through the sale of Ind-Barath Energy in the year
1 In addition to the ordinary dividend, the Company paid a special dividend of 17 pence per share in July 2015.2 For the purpose of this analysis, the portfolio is measured as the underlying portfolio asset value for each asset
and does not include investment commitments until they are drawn. Including investment commitments, the percentage for economic infrastructure is 81%.
Strategic report
3i Infrastructure plc Annual report and accounts 2016 15
Investment Adviser’s review
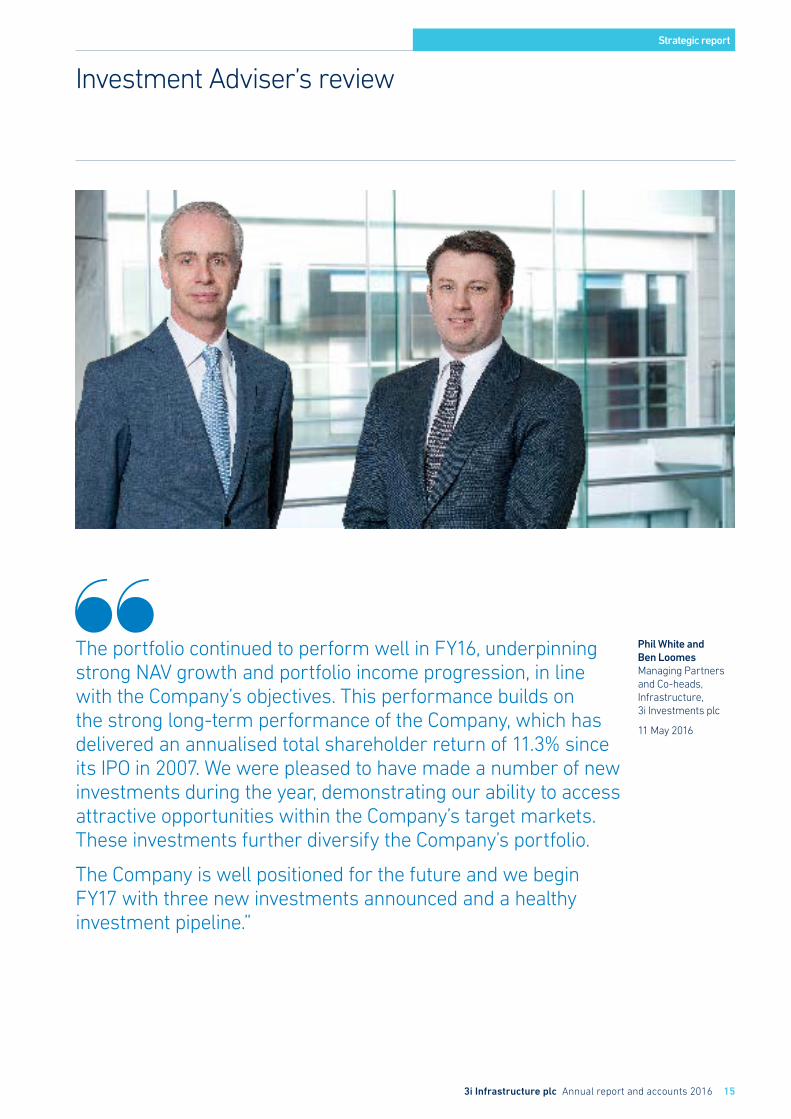
The portfolio continued to perform well in FY16, underpinning strong NAV growth and portfolio income progression, in line with the Company’s objectives. This performance builds on the strong long-term performance of the Company, which has delivered an annualised total shareholder return of 11.3% since its IPO in 2007. We were pleased to have made a number of new investments during the year, demonstrating our ability to access attractive opportunities within the Company’s target markets. These investments further diversify the Company’s portfolio.
The Company is well positioned for the future and we begin FY17 with three new investments announced and a healthy investment pipeline.”
Phil White and Ben Loomes Managing Partners and Co-heads, Infrastructure, 3i Investments plc
11 May 2016
Strategic report
16 3i Infrastructure plc Annual report and accounts 2016
About the Investment Adviser3i Investments plc (“3i Investments”), a wholly-owned subsidiary of 3i Group plc (“3i Group”), acts as the investment adviser (the “Investment Adviser”) to the Company through its infrastructure investment team (the “investment advisory team”). The investment advisory team provides advice to the Company on the origination and execution of new investments, on the management of the portfolio and on realisations, as well as on funding requirements. 3i Group was among the subscribers to the Company’s Initial Public Offering in 2007 and subsequent Placing and Open Offer in 2008, and owns approximately 34% of the equity in the Company. 3i Group has undertaken irrevocably to subscribe for its pro rata entitlement under the Open Offer announced on 12 May 2016 and will retain its 34% holding upon the completion of that Offer.
The investment advisory team is managed as a separate business line within 3i Group and operates from offices across 3i Group’s European network, focusing on origination, execution and portfolio management. The Investment Adviser also has a dedicated team in Mumbai to manage the assets in the India Fund. The team of investment professionals has significant experience of investing in, and managing, infrastructure assets. The investment advisory team can also draw on 3i Group’s broader network of investment professionals and relationships to originate infrastructure investment opportunities.
There have been a number of new appointments to the investment advisory team over the recent months. Bernardo Sottomayor joined the team as a Partner from Antin Infrastructure in October 2015, with a focus on the origination, execution and asset management of investments across Europe. In addition, James Dawes was appointed as Chief Financial Officer of 3i’s Infrastructure business, in succession to Stephen Halliwell from January 2016. A number of other appointments were also made, focused on the origination, execution and asset management of investments, as well as finance, operations and strategy.
The profiles of the senior members of the investment advisory team are on page 18.
Implementation of the Company’s strategy during the yearIn highly competitive markets, and in line with the Company’s strategic priorities, the Board and the Investment Adviser focused on:
Diversifying the Company’s portfolio with attractive investments in the Company’s target markets, while remaining disciplined in our approach to new investment Competition for large Core economic infrastructure businesses remains strong, as evidenced by a number of recent transactions in the sector. Against this backdrop, the Investment Adviser has remained disciplined in its approach to new investment, targeting more attractive risk-adjusted returns in areas of the infrastructure market, such as mid-market economic infrastructure businesses as well as greenfield projects, consistent with the Company’s investment focus (outlined on pages 10 to 13).
The team leveraged its partnerships, international network and local knowledge to invest or commit to invest a total of £193.4 million across the Company’s target markets during the year. Of this amount, £111.1 million was invested in ESVAGT, £52.6 million in two further oil storage terminals alongside Oiltanking and £23.5 million in the West of Duddon Sands (“WODS”) Offshore Transmission Owner (“OFTO”). These new investments have been performing well and contributed to portfolio income in the second half of the year. In addition, on 15 March 2016 the Company announced it had committed to invest £6.2 million in the Condorcet Campus primary PPP project in France and, as is usual with primary PPP investments, this commitment will be drawn at the end of the construction of the project, which is expected in 2019. These new investments are complementary additions to the Company’s existing portfolio, providing further geographical and sector diversification.
Since the year end, 3i Infrastructure announced that it had signed an agreement to acquire a 36% economic interest in Wireless Infrastructure Group, investing approximately £75 million and joining existing majority shareholder Wood Creek Capital Management and the management team as shareholders. It also announced it had agreed to invest approximately €200 million to acquire up to 50% in TCR, in a consortium with Deutsche Asset Management. Finally, it committed to invest €5 million in the Hart van Zuid primary PPP project in the Netherlands. These investments provide further sector and geographical diversification, adding exposure to high quality economic infrastructure businesses with attractive opportunities for growth and to a further Dutch primary PPP project.
The new investments in WIG, TCR, Condorcet Campus and Hart van Zuid are profiled on pages 6 to 9.
The Investment Adviser continues to develop the Company’s pipeline of future investment opportunities and is assessing a number of potential investments across the UK and Europe.
Driving value from the economic infrastructure portfolio The publication of the new regulatory settlement for Elenia was an important feature in the year. In December 2015, the Finnish Energy Authority, which regulates electricity distribution in Finland, issued the final determination for the sector covering the next two regulatory periods (from January 2016 to December 2023). This included several changes to address the low allowed return on capital experienced by all distribution companies over recent years, and was in line with our expectations following the publication of draft guidelines in June 2015. The Investment Adviser worked with Elenia’s management team throughout the year to assess the impact of the regulator’s draft proposals and to frame Elenia’s response to these proposals. The publication of the final determination formed part of the year-end valuation review of the Company’s holding in Elenia, including a reduction in the discount rate used to value the investment, reflecting the reduced regulatory risk over the next eight years.
Investment Adviser’s reviewContinued
Strategic report
3i Infrastructure plc Annual report and accounts 2016 17
The 2015–2020 regulatory period for AWG (“AMP6”) commenced on 1 April 2015. The AWG management team is now focusing on the implementation of the capital expenditure and efficiency programmes to drive value through AMP6. As part of the regulatory settlement for AMP6, AWG also has a set of Outcome Delivery Incentives. These are key operational performance parameters against which AWG will be judged and which carry material financial incentives and penalties. The business, with input from the Investment Adviser and other shareholders, is implementing initiatives to optimise performance against these parameters.
Market conditions in the oil and gas sector have been challenging, with a material decline in oil prices over the year. ESVAGT’s performance has remained resilient in this environment, given the medium-term nature of its contracts with producing platforms. We believe that these difficult market conditions could provide growth opportunities for ESVAGT, which has the advantages of a strong market position, scale, a younger fleet and better profitability compared to some of its competitors and we have been engaging actively with ESVAGT’s management to assess a number of development opportunities. We also believe that ESVAGT is well positioned to continue to grow in the offshore wind energy support market. The business made good progress against that objective in the last financial year, signing an agreement with MHI Vestas to provide a bespoke service operation vessel in support of two offshore wind power developments in Belgium for a period of 10 years from vessel delivery in mid-2017.
The Company’s investments in the Oiltanking terminals continued to perform well. Their performance is not directly correlated to the oil price, but more to the forward curve. Market conditions for Oiltanking’s trading customers improved during the year, with periods of contango in key product markets. This was offset in part by a reduction in demand for storage of certain products in parts of Europe and by additional storage capacity coming on line in the Singapore region. However, the strong market position of the five terminals continues to ensure that capacity at each terminal remains substantially let and that contract renewals are achieved on good terms. Following the completion of the investments in the Oiltanking Ghent and Oiltanking Terneuzen terminals in June 2015, the Investment Adviser has been working to embed these investments within the Oystercatcher vehicle and governance framework. As a result, the discount rate used to value Oystercatcher was reduced at the end of March 2016, reflecting the fact that the vehicle now owns a larger and more diverse set of terminals.
In the favourable debt market conditions over the recent years, the optimisation of portfolio companies’ capital structures has been a key driver of value creation by the Investment Adviser. Elenia was able to refinance the last tranche of its acquisition debt during the period, on attractive terms.
The Investment Adviser is heavily involved in strengthening the boards and management teams of its investee companies. In August 2015, Elenia appointed Tommi Valento as CFO, replacing Aapo Nikunen. Tommi was formerly Group Treasurer at Pohjolan Voima Oy, a Finnish power company, and has significant debt capital markets experience. Stephen Billingham, former CFO of British Energy and currently chairman of Punch Taverns, took over as chairman of AWG from Robert Napier in April 2015. On 2 November 2015, ESVAGT announced the appointment of Jesper Lok, formerly CEO of the Danish Railroads and of Falck’s Emergency Division, as chairman.
The Investment Adviser continues to work with the Company’s portfolio to assess new investment and capital expenditure programmes, as well as value accretive investments.
Continuing to manage the assets in the India FundThe Investment Adviser aims to realise value from the assets in the India Fund over the next few years and is making progress towards that objective. During the year, the India Fund sold its entire holding in Ind-Barath Energy. The Company expects to receive proceeds of approximately £7 million from that sale in the first quarter of FY17. This builds on the progress in FY15, when the India Fund achieved the sale of approximately 54% of its holding in Adani Power. The India Fund represented 4.1% of the Company’s portfolio at 31 March 2016, or 3.6% excluding the value of Ind-Barath Energy, which was valued at the sales proceeds at that date.
Managing the Company’s balance sheet efficientlyThe Investment Adviser ensured the implementation of the Company’s objective of managing its balance sheet efficiently, while maintaining liquidity to fund investment opportunities. The Company had low levels of cash throughout the year, following the payment of a special dividend of £150 million to shareholders and the redeployment of substantially all of the retained proceeds from the sale of Eversholt Rail in the new investments described above.
To ensure financial flexibility, the Company negotiated a new RCF in May 2015, increasing the size of the Facility from £200 million to £300 million on attractive terms. In April 2016, to accommodate further investment activity, the Company increased the size of the Facility from £300 million to £500 million on a temporary basis to December 2016. The maturity date of the Facility was extended by one year to May 2019.
OutlookThe Company delivered a strong total return during the last financial year, underpinned by the robust performance of the portfolio. Demand for large Core economic infrastructure investments in Europe continues to be strong, with recent transactions providing further evidence of low projected returns in this area. The Company has reinvested the proceeds from the sale of Eversholt Rail in a number of attractive investments across the Company’s target markets, which are performing well and contributed positively to the overall return for the year.
We continue to develop the Company’s investment pipeline and are assessing a number of investment opportunities across our target sectors and geographies. In this highly competitive market, we will remain disciplined in the assessment and pricing of these opportunities.
Strategic report
18 3i Infrastructure plc Annual report and accounts 2016
Investment Adviser’s reviewContinued
Profiles of senior members of the investment advisory team
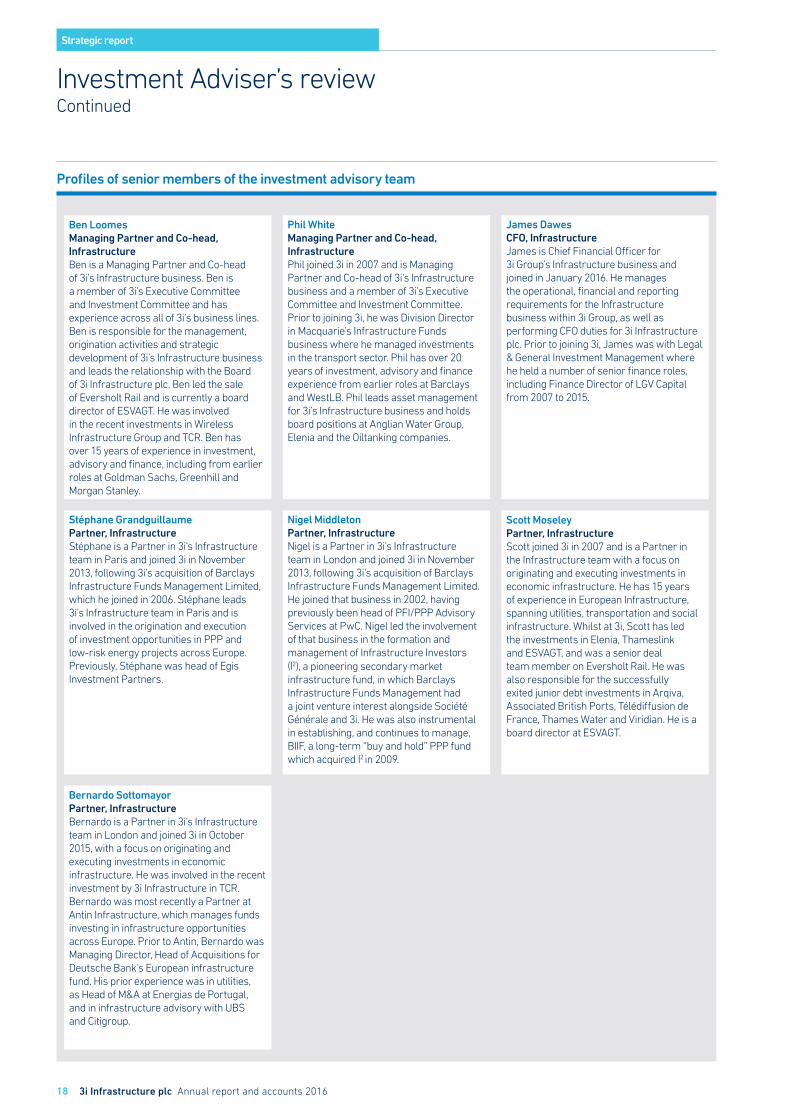
Ben Loomes Managing Partner and Co-head, InfrastructureBen is a Managing Partner and Co-head of 3i’s Infrastructure business. Ben is a member of 3i’s Executive Committee and Investment Committee and has experience across all of 3i’s business lines. Ben is responsible for the management, origination activities and strategic development of 3i’s Infrastructure business and leads the relationship with the Board of 3i Infrastructure plc. Ben led the sale of Eversholt Rail and is currently a board director of ESVAGT. He was involved in the recent investments in Wireless Infrastructure Group and TCR. Ben has over 15 years of experience in investment, advisory and finance, including from earlier roles at Goldman Sachs, Greenhill and Morgan Stanley.
Phil White Managing Partner and Co-head, InfrastructurePhil joined 3i in 2007 and is Managing Partner and Co-head of 3i’s Infrastructure business and a member of 3i’s Executive Committee and Investment Committee. Prior to joining 3i, he was Division Director in Macquarie’s Infrastructure Funds business where he managed investments in the transport sector. Phil has over 20 years of investment, advisory and finance experience from earlier roles at Barclays and WestLB. Phil leads asset management for 3i’s Infrastructure business and holds board positions at Anglian Water Group, Elenia and the Oiltanking companies.
James DawesCFO, InfrastructureJames is Chief Financial Officer for 3i Group’s Infrastructure business and joined in January 2016. He manages the operational, financial and reporting requirements for the Infrastructure business within 3i Group, as well as performing CFO duties for 3i Infrastructure plc. Prior to joining 3i, James was with Legal & General Investment Management where he held a number of senior finance roles, including Finance Director of LGV Capital from 2007 to 2015.
Stéphane GrandguillaumePartner, InfrastructureStéphane is a Partner in 3i’s Infrastructure team in Paris and joined 3i in November 2013, following 3i’s acquisition of Barclays Infrastructure Funds Management Limited, which he joined in 2006. Stéphane leads 3i’s Infrastructure team in Paris and is involved in the origination and execution of investment opportunities in PPP and low-risk energy projects across Europe. Previously, Stéphane was head of Egis Investment Partners.
Nigel MiddletonPartner, InfrastructureNigel is a Partner in 3i’s Infrastructure team in London and joined 3i in November 2013, following 3i’s acquisition of Barclays Infrastructure Funds Management Limited. He joined that business in 2002, having previously been head of PFI/PPP Advisory Services at PwC. Nigel led the involvement of that business in the formation and management of Infrastructure Investors (I2), a pioneering secondary market infrastructure fund, in which Barclays Infrastructure Funds Management had a joint venture interest alongside Société Générale and 3i. He was also instrumental in establishing, and continues to manage, BIIF, a long-term “buy and hold” PPP fund which acquired I2 in 2009.
Scott MoseleyPartner, InfrastructureScott joined 3i in 2007 and is a Partner in the Infrastructure team with a focus on originating and executing investments in economic infrastructure. He has 15 years of experience in European Infrastructure, spanning utilities, transportation and social infrastructure. Whilst at 3i, Scott has led the investments in Elenia, Thameslink and ESVAGT, and was a senior deal team member on Eversholt Rail. He was also responsible for the successfully exited junior debt investments in Arqiva, Associated British Ports, Télédiffusion de France, Thames Water and Viridian. He is a board director at ESVAGT.
Bernardo SottomayorPartner, InfrastructureBernardo is a Partner in 3i’s Infrastructure team in London and joined 3i in October 2015, with a focus on originating and executing investments in economic infrastructure. He was involved in the recent investment by 3i Infrastructure in TCR. Bernardo was most recently a Partner at Antin Infrastructure, which manages funds investing in infrastructure opportunities across Europe. Prior to Antin, Bernardo was Managing Director, Head of Acquisitions for Deutsche Bank’s European infrastructure fund. His prior experience was in utilities, as Head of M&A at Energias de Portugal, and in infrastructure advisory with UBS and Citigroup.
Strategic report
3i Infrastructure plc Annual report and accounts 2016 19
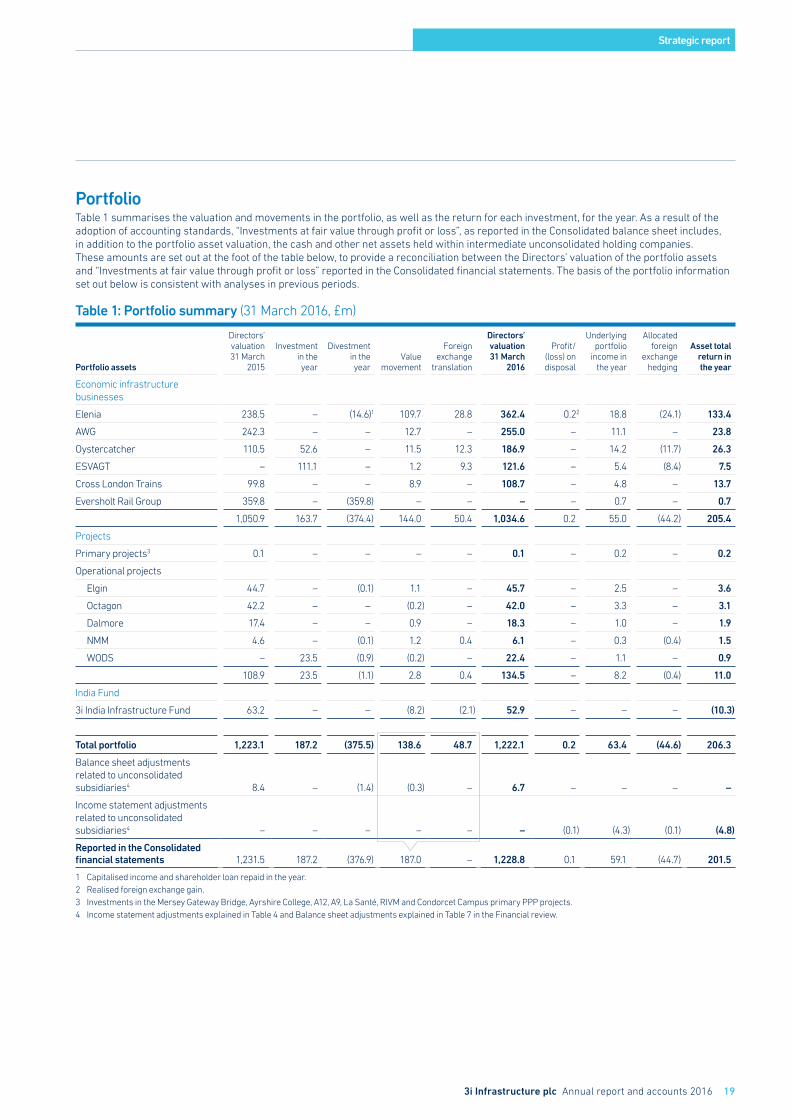
PortfolioTable 1 summarises the valuation and movements in the portfolio, as well as the return for each investment, for the year. As a result of the adoption of accounting standards, “Investments at fair value through profit or loss”, as reported in the Consolidated balance sheet includes, in addition to the portfolio asset valuation, the cash and other net assets held within intermediate unconsolidated holding companies. These amounts are set out at the foot of the table below, to provide a reconciliation between the Directors’ valuation of the portfolio assets and “Investments at fair value through profit or loss” reported in the Consolidated financial statements. The basis of the portfolio information set out below is consistent with analyses in previous periods.
Table 1: Portfolio summary (31 March 2016, £m)
Portfolio assets
Directors’valuation31 March
2015
Investmentin theyear
Divestmentin theyear
Valuemovement
Foreignexchange
translation
Directors’valuation31 March
2016
Profit/(loss) ondisposal
Underlyingportfolio
income inthe year
Allocatedforeign
exchangehedging
Asset totalreturn inthe year
Economic infrastructure businesses
Elenia 238.5 – (14.6)1 109.7 28.8 362.4 0.22 18.8 (24.1) 133.4
AWG 242.3 – – 12.7 – 255.0 – 11.1 – 23.8
Oystercatcher 110.5 52.6 – 11.5 12.3 186.9 – 14.2 (11.7) 26.3
ESVAGT – 111.1 – 1.2 9.3 121.6 – 5.4 (8.4) 7.5
Cross London Trains 99.8 – – 8.9 – 108.7 – 4.8 – 13.7
Eversholt Rail Group 359.8 – (359.8) – – – – 0.7 – 0.7
1,050.9 163.7 (374.4) 144.0 50.4 1,034.6 0.2 55.0 (44.2) 205.4
Projects
Primary projects3 0.1 – – – – 0.1 – 0.2 – 0.2
Operational projects
Elgin 44.7 – (0.1) 1.1 – 45.7 – 2.5 – 3.6
Octagon 42.2 – – (0.2) – 42.0 – 3.3 – 3.1
Dalmore 17.4 – – 0.9 – 18.3 – 1.0 – 1.9
NMM 4.6 – (0.1) 1.2 0.4 6.1 – 0.3 (0.4) 1.5
WODS – 23.5 (0.9) (0.2) – 22.4 – 1.1 – 0.9
108.9 23.5 (1.1) 2.8 0.4 134.5 – 8.2 (0.4) 11.0
India Fund
3i India Infrastructure Fund 63.2 – – (8.2) (2.1) 52.9 – – – (10.3)
Total portfolio 1,223.1 187.2 (375.5) 138.6 48.7 1,222.1 0.2 63.4 (44.6) 206.3
Balance sheet adjustments related to unconsolidated subsidiaries4 8.4 – (1.4) (0.3) – 6.7 – – – –
Income statement adjustments related to unconsolidated subsidiaries4 – – – – – – (0.1) (4.3) (0.1) (4.8)
Reported in the Consolidated financial statements 1,231.5 187.2 (376.9) 187.0 – 1,228.8 0.1 59.1 (44.7) 201.5
1 Capitalised income and shareholder loan repaid in the year.2 Realised foreign exchange gain.3 Investments in the Mersey Gateway Bridge, Ayrshire College, A12, A9, La Santé, RIVM and Condorcet Campus primary PPP projects.4 Income statement adjustments explained in Table 4 and Balance sheet adjustments explained in Table 7 in the Financial review.
Strategic report
20 3i Infrastructure plc Annual report and accounts 2016
1,500
1,400
1,300
1,200
1,100
1,000
900
800
700
1,222.1138.6
Total: £187.3m
(375.5)
187.2
1,223.1
Opening portfoliovalue at 1 April 2015
Investment Divestment/capital repayment
Unrealisedvaluemovement
Exchange movement
Closing portfolio value at 31 March 2016
48.71
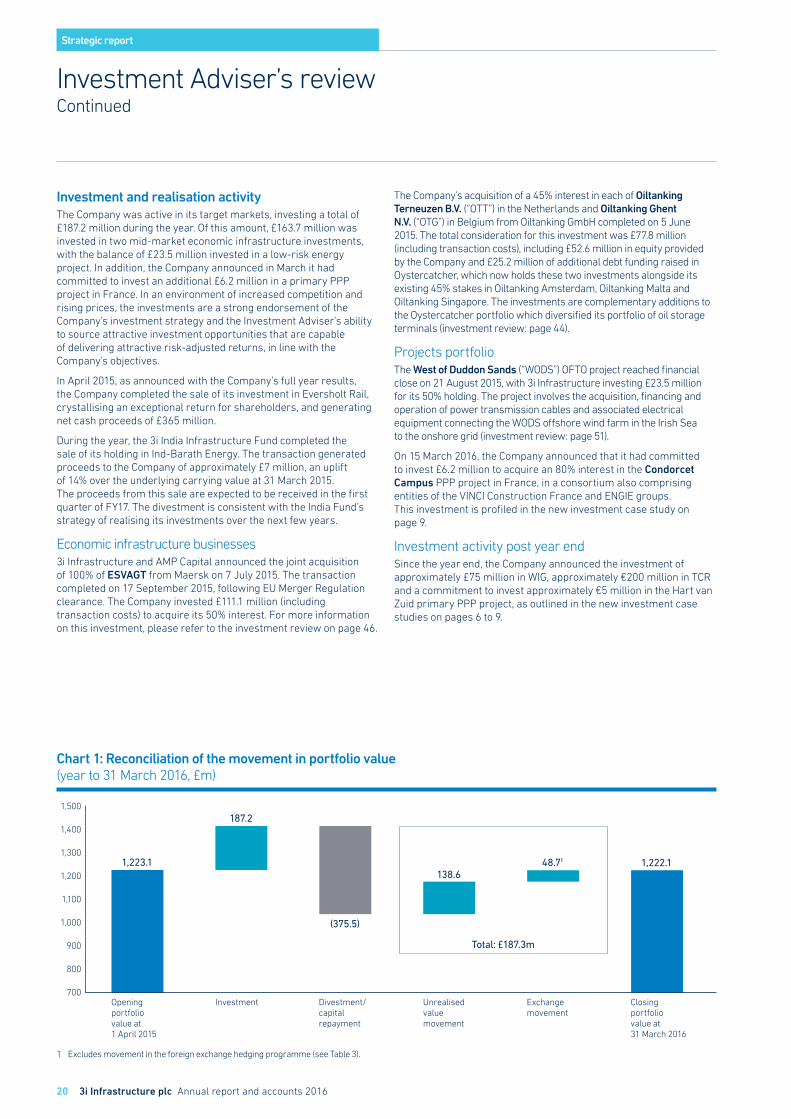
Investment and realisation activity The Company was active in its target markets, investing a total of £187.2 million during the year. Of this amount, £163.7 million was invested in two mid-market economic infrastructure investments, with the balance of £23.5 million invested in a low-risk energy project. In addition, the Company announced in March it had committed to invest an additional £6.2 million in a primary PPP project in France. In an environment of increased competition and rising prices, the investments are a strong endorsement of the Company’s investment strategy and the Investment Adviser’s ability to source attractive investment opportunities that are capable of delivering attractive risk-adjusted returns, in line with the Company’s objectives.
In April 2015, as announced with the Company’s full year results, the Company completed the sale of its investment in Eversholt Rail, crystallising an exceptional return for shareholders, and generating net cash proceeds of £365 million.
During the year, the 3i India Infrastructure Fund completed the sale of its holding in Ind-Barath Energy. The transaction generated proceeds to the Company of approximately £7 million, an uplift of 14% over the underlying carrying value at 31 March 2015. The proceeds from this sale are expected to be received in the first quarter of FY17. The divestment is consistent with the India Fund’s strategy of realising its investments over the next few years.
Economic infrastructure businesses3i Infrastructure and AMP Capital announced the joint acquisition of 100% of ESVAGT from Maersk on 7 July 2015. The transaction completed on 17 September 2015, following EU Merger Regulation clearance. The Company invested £111.1 million (including transaction costs) to acquire its 50% interest. For more information on this investment, please refer to the investment review on page 46.
The Company’s acquisition of a 45% interest in each of Oiltanking Terneuzen B.V. (“OTT”) in the Netherlands and Oiltanking Ghent N.V. (“OTG”) in Belgium from Oiltanking GmbH completed on 5 June 2015. The total consideration for this investment was £77.8 million (including transaction costs), including £52.6 million in equity provided by the Company and £25.2 million of additional debt funding raised in Oystercatcher, which now holds these two investments alongside its existing 45% stakes in Oiltanking Amsterdam, Oiltanking Malta and Oiltanking Singapore. The investments are complementary additions to the Oystercatcher portfolio which diversified its portfolio of oil storage terminals (investment review: page 44).
Projects portfolio The West of Duddon Sands (“WODS”) OFTO project reached financial close on 21 August 2015, with 3i Infrastructure investing £23.5 million for its 50% holding. The project involves the acquisition, financing and operation of power transmission cables and associated electrical equipment connecting the WODS offshore wind farm in the Irish Sea to the onshore grid (investment review: page 51).
On 15 March 2016, the Company announced that it had committed to invest £6.2 million to acquire an 80% interest in the Condorcet Campus PPP project in France, in a consortium also comprising entities of the VINCI Construction France and ENGIE groups. This investment is profiled in the new investment case study on page 9.
Investment activity post year endSince the year end, the Company announced the investment of approximately £75 million in WIG, approximately €200 million in TCR and a commitment to invest approximately €5 million in the Hart van Zuid primary PPP project, as outlined in the new investment case studies on pages 6 to 9.
Investment Adviser’s reviewContinued
Chart 1: Reconciliation of the movement in portfolio value (year to 31 March 2016, £m)
1 Excludes movement in the foreign exchange hedging programme (see Table 3).
Strategic report
3i Infrastructure plc Annual report and accounts 2016 21
Movements in portfolio valueAs set out in Chart 1, the portfolio assets were valued at £1,222.1 million at 31 March 2016, compared to £1,223.1 million at the beginning of the financial year. The movement in portfolio value was driven principally by investments and realisations during the period, as well as by good value growth for the European portfolio, offset in part by a decline in the value of the Company’s holding in the India Fund.
InvestmentThe Company invested a total of £187.2 million in the period in four new investments. These investments are described on page 20.
Divestment proceeds/capital repaymentsThe Company received total proceeds from investments of £381.1 million in the year (2015: £22.4 million), comprising principally proceeds of £365.2 million relating to the sale of its holding in Eversholt Rail, which completed on 16 April 2015. The asset was valued on a sales basis at 31 March 2015.
Other proceeds received by the Company during the year included:
– £14.8 million from Elenia relating to income capitalised in the previous financial year and to the partial repayment of a shareholder loan;
– £0.1 million from NMM relating to income capitalised in the previous financial year;
– £0.1 million in respect of a partial shareholder loan repayment from Elgin; and
– £0.9 million in respect of a partial shareholder loan repayment from the WODS OFTO project.
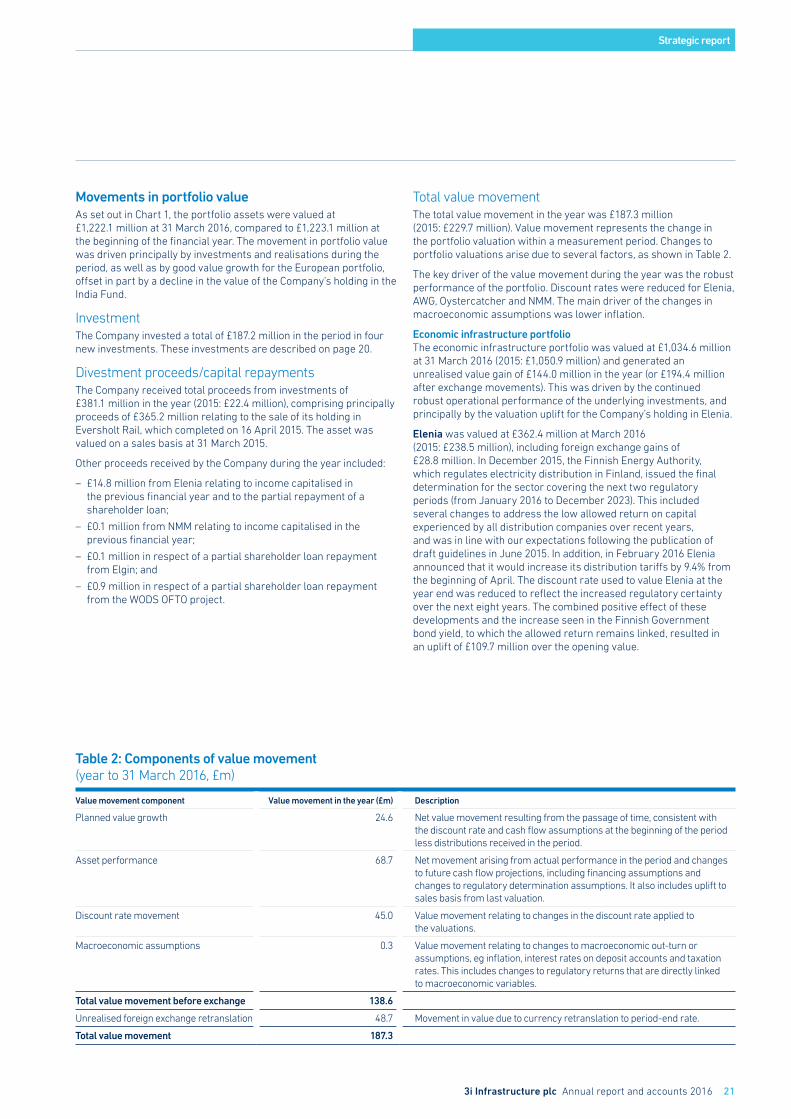
Total value movementThe total value movement in the year was £187.3 million (2015: £229.7 million). Value movement represents the change in the portfolio valuation within a measurement period. Changes to portfolio valuations arise due to several factors, as shown in Table 2.
The key driver of the value movement during the year was the robust performance of the portfolio. Discount rates were reduced for Elenia, AWG, Oystercatcher and NMM. The main driver of the changes in macroeconomic assumptions was lower inflation.
Economic infrastructure portfolioThe economic infrastructure portfolio was valued at £1,034.6 million at 31 March 2016 (2015: £1,050.9 million) and generated an unrealised value gain of £144.0 million in the year (or £194.4 million after exchange movements). This was driven by the continued robust operational performance of the underlying investments, and principally by the valuation uplift for the Company’s holding in Elenia.
Elenia was valued at £362.4 million at March 2016 (2015: £238.5 million), including foreign exchange gains of £28.8 million. In December 2015, the Finnish Energy Authority, which regulates electricity distribution in Finland, issued the final determination for the sector covering the next two regulatory periods (from January 2016 to December 2023). This included several changes to address the low allowed return on capital experienced by all distribution companies over recent years, and was in line with our expectations following the publication of draft guidelines in June 2015. In addition, in February 2016 Elenia announced that it would increase its distribution tariffs by 9.4% from the beginning of April. The discount rate used to value Elenia at the year end was reduced to reflect the increased regulatory certainty over the next eight years. The combined positive effect of these developments and the increase seen in the Finnish Government bond yield, to which the allowed return remains linked, resulted in an uplift of £109.7 million over the opening value.
Table 2: Components of value movement (year to 31 March 2016, £m)
Value movement component Value movement in the year (£m) Description
Planned value growth 24.6 Net value movement resulting from the passage of time, consistent with the discount rate and cash flow assumptions at the beginning of the period less distributions received in the period.
Asset performance 68.7 Net movement arising from actual performance in the period and changes to future cash flow projections, including financing assumptions and changes to regulatory determination assumptions. It also includes uplift to sales basis from last valuation.
Discount rate movement 45.0 Value movement relating to changes in the discount rate applied to the valuations.
Macroeconomic assumptions 0.3 Value movement relating to changes to macroeconomic out-turn or assumptions, eg inflation, interest rates on deposit accounts and taxation rates. This includes changes to regulatory returns that are directly linked to macroeconomic variables.
Total value movement before exchange 138.6
Unrealised foreign exchange retranslation 48.7 Movement in value due to currency retranslation to period-end rate.
Total value movement 187.3
Strategic report
22 3i Infrastructure plc Annual report and accounts 2016
AWG was valued at £255.0 million at March 2016 (2015: £242.3 million). The business performed well during the year, with operational performance and income levels in line with expectations. The business is currently focused on implementing its efficiency and capital spending programmes and has made a good start against the targets for the 2015–2020 regulatory period, or AMP6, which began on 1 April 2015. The valuation at the end of the year reflects the lower inflation assumptions for 2016 and a more prudent approach to gearing through the remainder of AMP6.
Oystercatcher was valued at £186.9 million at March 2016 (2015: £110.5 million), including foreign exchange gains of £12.3 million. Much of the value increase over the year was attributable to the new investments in the Oiltanking Terneuzen and Oiltanking Ghent terminals (£52.6 million cost), which are now held through the Oystercatcher vehicle, alongside the existing investments in Oiltanking Amsterdam, Oiltanking Malta and Oiltanking Singapore. The five terminals continue to perform well both operationally and financially, with capacity substantially let and a good level of throughput. The discount rate used to value Oystercatcher at the end of March was reduced, to reflect the fact that the vehicle now owns a larger and more diverse set of terminals. The valuation of Oystercatcher is affected by the euro and Singapore dollar exchange rate against sterling. The euro and Singapore dollar exposures are partially hedged, as described below.
ESVAGT was valued at £121.6 million at March 2016, against an acquisition cost of £111.1 million. The business has continued to perform robustly since acquisition. While the lower oil price environment is beginning to impact new oil and gas exploration activity, it has not yet impacted producing platforms, to which the majority of ESVAGT’s revenues are tied. Since investment, ESVAGT has progressed in diversifying its business away from its core oil and gas client base and secured a new, 10-year contract with MHI Vestas to provide a bespoke service operation vessel in support of the Belwind 1 and Nobelwind Belgian offshore wind farms. This contract had not been included in the original investment case.
XLT was valued at £108.7 million at March 2016 (2015: £99.8 million), reflecting continued progress in the manufacturing of the trains and offset in part by income receipts in the year. There are some initial delays in the acceptance programme and the Investment Adviser is working closely with XLT management, Siemens and GTR to address these. The conditional acceptance of the first unit by GTR took place in March 2016, with the delivery programme scheduled to complete in 2018.
Projects portfolioThe PPP and low-risk energy projects portfolio was valued at £134.6 million at March 2016 (2015: £109.0 million) reflecting the new investment in the WODS OFTO during the period, as well as the continued robust operational performance of the portfolio. This was offset in part by income receipts in the year and by the impact of lower than expected inflation. The discount rate used to value NMM was reduced during the year as the project became operational in the last financial year, contributing to a value uplift for this asset of £1.6 million, including foreign exchange gains, or 35%.
3i India Infrastructure FundThe India Fund was valued at £52.9 million at March 2016 (2015: £63.2 million), after exchange losses of £2.1 million as the Indian rupee declined against sterling in the period, as shown in Table 3. The negative value movement was due to a number of factors, including continued delays in project execution and funding constraints for the road projects, and the pricing and availability of fuel for the investments in the power sector. During the year, the share price of Adani Power fell by 28%, resulting in a reduction in the value of the Company’s holding of £2 million.
Foreign exchange impact There was significant volatility in exchange rates in the financial year, with foreign exchange translation losses incurred in the first half of the year more than reversed in the second half, as the euro, Danish krona and Singapore dollar all increased against sterling.
In March 2014, the Board extended the Company’s existing hedging policy to partially cover the Singapore dollar exchange rate risk that arises from the underlying investment in Oiltanking Singapore. More recently, the Board also extended the Company’s hedging policy to partially cover the Danish krona exchange rate risk that arises from the investment in ESVAGT, which completed in July 2015.
As shown in Table 3, the reported net foreign exchange gain on investments of £48.9 million related mainly to the Company’s euro and Danish krona portfolio, albeit those gains were largely offset through the respective hedging programmes.
The Indian rupee depreciated against sterling in the period, resulting in a small foreign exchange loss. The Indian rupee exposure is not hedged.
Table 3: Impact of foreign exchange movements on portfolio value (year to 31 March 2016, £m)
£/rupee£/€/SGD/
DKK Net impact
Translation of unhedged assets (£/rupee) (2.1) – (2.1)
Translation of partially hedged assets (£/€/SGD/DKK) – 51.0 51.0
Reported foreign exchange (losses)/gains on investments (2.1) 51.0 48.9
Movement in the fair value of derivative financial instruments (€/SGD/DKK hedging) – (44.6) (44.6)
Net foreign exchange (losses)/gains (2.1) 6.4 4.3
Investment Adviser’s reviewContinued
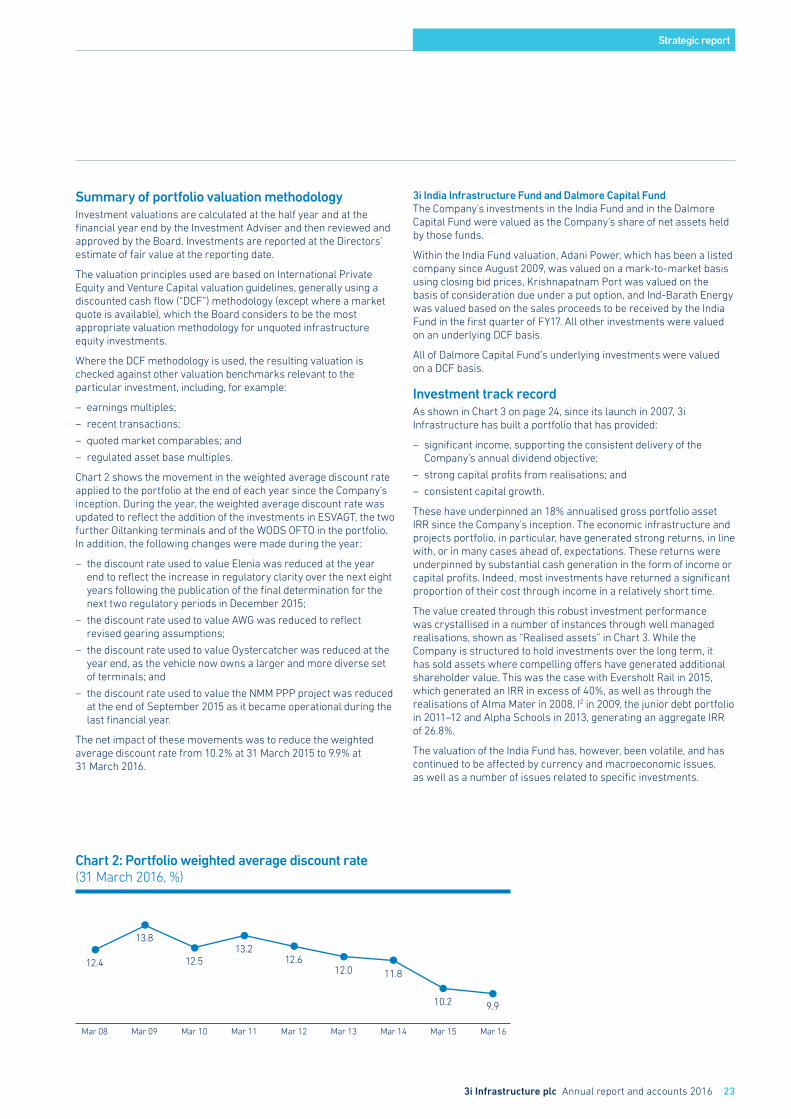
Strategic report
3i Infrastructure plc Annual report and accounts 2016 23
Mar 08 Mar 09 Mar 10 Mar 11 Mar 14 Mar 16Mar 15Mar 13Mar 12
12.4
13.8
12.513.2
12.612.0
10.2 9.9
11.8
Summary of portfolio valuation methodologyInvestment valuations are calculated at the half year and at the financial year end by the Investment Adviser and then reviewed and approved by the Board. Investments are reported at the Directors’ estimate of fair value at the reporting date.
The valuation principles used are based on International Private Equity and Venture Capital valuation guidelines, generally using a discounted cash flow (“DCF”) methodology (except where a market quote is available), which the Board considers to be the most appropriate valuation methodology for unquoted infrastructure equity investments.
Where the DCF methodology is used, the resulting valuation is checked against other valuation benchmarks relevant to the particular investment, including, for example:
– earnings multiples;
– recent transactions;
– quoted market comparables; and
– regulated asset base multiples.
Chart 2 shows the movement in the weighted average discount rate applied to the portfolio at the end of each year since the Company’s inception. During the year, the weighted average discount rate was updated to reflect the addition of the investments in ESVAGT, the two further Oiltanking terminals and of the WODS OFTO in the portfolio. In addition, the following changes were made during the year:
– the discount rate used to value Elenia was reduced at the year end to reflect the increase in regulatory clarity over the next eight years following the publication of the final determination for the next two regulatory periods in December 2015;
– the discount rate used to value AWG was reduced to reflect revised gearing assumptions;
– the discount rate used to value Oystercatcher was reduced at the year end, as the vehicle now owns a larger and more diverse set of terminals; and
– the discount rate used to value the NMM PPP project was reduced at the end of September 2015 as it became operational during the last financial year.
The net impact of these movements was to reduce the weighted average discount rate from 10.2% at 31 March 2015 to 9.9% at 31 March 2016.
3i India Infrastructure Fund and Dalmore Capital FundThe Company’s investments in the India Fund and in the Dalmore Capital Fund were valued as the Company’s share of net assets held by those funds.
Within the India Fund valuation, Adani Power, which has been a listed company since August 2009, was valued on a mark-to-market basis using closing bid prices, Krishnapatnam Port was valued on the basis of consideration due under a put option, and Ind-Barath Energy was valued based on the sales proceeds to be received by the India Fund in the first quarter of FY17. All other investments were valued on an underlying DCF basis.
All of Dalmore Capital Fund’s underlying investments were valued on a DCF basis.
Investment track recordAs shown in Chart 3 on page 24, since its launch in 2007, 3i Infrastructure has built a portfolio that has provided:
– significant income, supporting the consistent delivery of the Company’s annual dividend objective;
– strong capital profits from realisations; and
– consistent capital growth.
These have underpinned an 18% annualised gross portfolio asset IRR since the Company’s inception. The economic infrastructure and projects portfolio, in particular, have generated strong returns, in line with, or in many cases ahead of, expectations. These returns were underpinned by substantial cash generation in the form of income or capital profits. Indeed, most investments have returned a significant proportion of their cost through income in a relatively short time.
The value created through this robust investment performance was crystallised in a number of instances through well managed realisations, shown as “Realised assets” in Chart 3. While the Company is structured to hold investments over the long term, it has sold assets where compelling offers have generated additional shareholder value. This was the case with Eversholt Rail in 2015, which generated an IRR in excess of 40%, as well as through the realisations of Alma Mater in 2008, I2 in 2009, the junior debt portfolio in 2011–12 and Alpha Schools in 2013, generating an aggregate IRR of 26.8%.
The valuation of the India Fund has, however, been volatile, and has continued to be affected by currency and macroeconomic issues, as well as a number of issues related to specific investments.
Chart 2: Portfolio weighted average discount rate (31 March 2016, %)
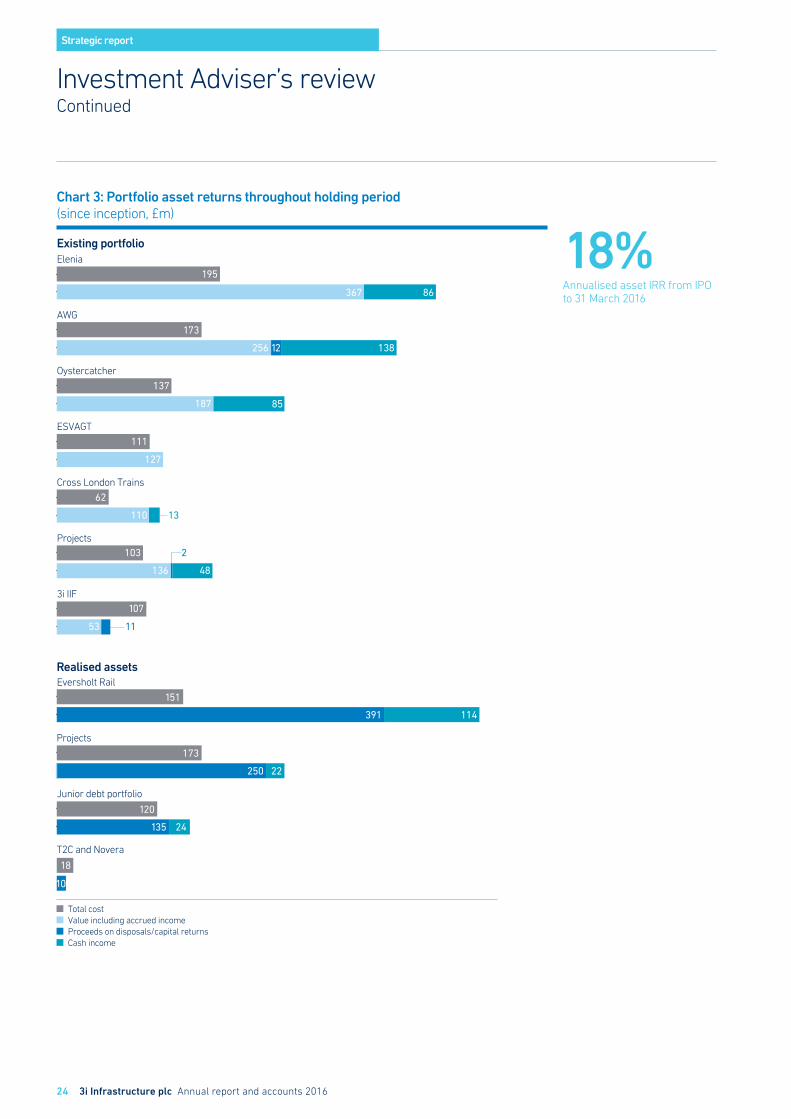
68
Existing portfolio
Value including accrued income
Proceeds on disposals/capital returnsCash income
Total cost
Projects
Junior debt portfolio
T2C and Novera
Eversholt Rail
22250
173
24135
120
10
18
114391
151
48136
3i IIF
53 11
Realised assets
Oystercatcher
85187
137
ESVAGT
127
111
Cross London Trains
110 13
62
Projects2103
107
Elenia
86367
195
13812
AWG
256
173
Strategic report
24 3i Infrastructure plc Annual report and accounts 2016
Chart 3: Portfolio asset returns throughout holding period (since inception, £m)
18%Annualised asset IRR from IPO to 31 March 2016
Investment Adviser’s reviewContinued
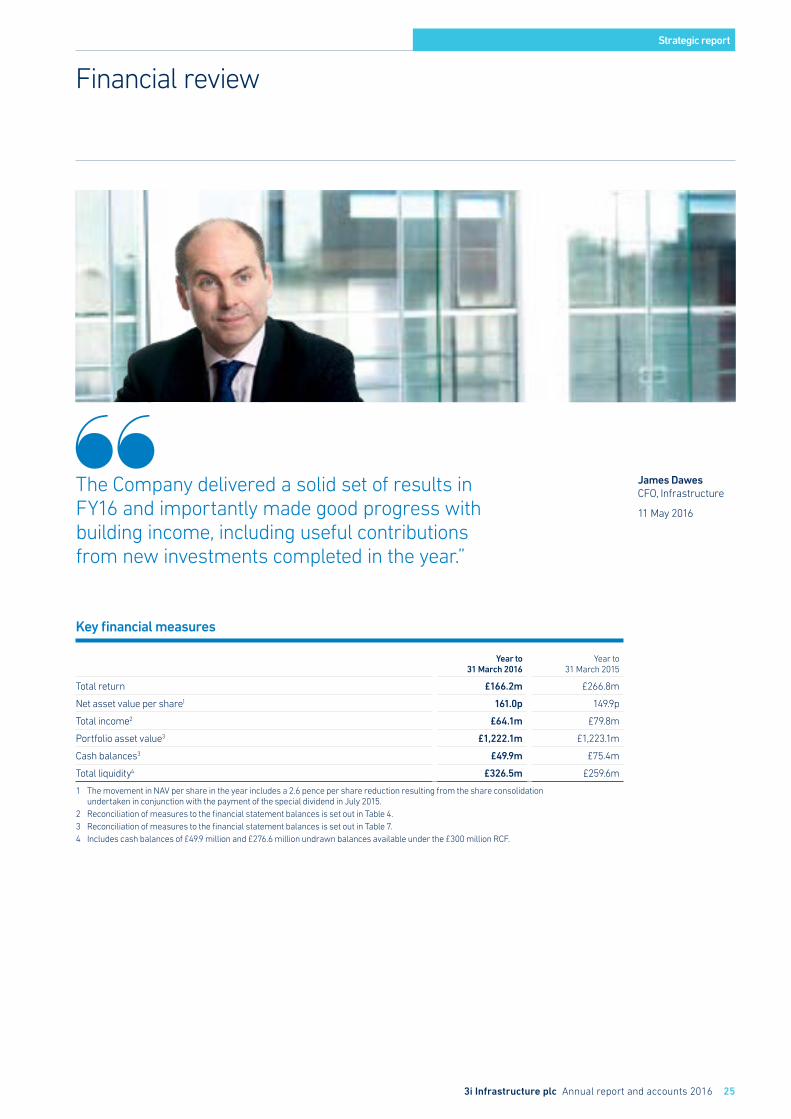
Strategic report
3i Infrastructure plc Annual report and accounts 2016 25
Financial review
The Company delivered a solid set of results in FY16 and importantly made good progress with building income, including useful contributions from new investments completed in the year.”
Key financial measures
Year to 31 March 2016
Year to 31 March 2015
Total return £166.2m £266.8m
Net asset value per share1 161.0p 149.9p
Total income2 £64.1m £79.8m
Portfolio asset value3 £1,222.1m £1,223.1m
Cash balances3 £49.9m £75.4m
Total liquidity4 £326.5m £259.6m
1 The movement in NAV per share in the year includes a 2.6 pence per share reduction resulting from the share consolidation undertaken in conjunction with the payment of the special dividend in July 2015.
2 Reconciliation of measures to the financial statement balances is set out in Table 4.3 Reconciliation of measures to the financial statement balances is set out in Table 7.4 Includes cash balances of £49.9 million and £276.6 million undrawn balances available under the £300 million RCF.
James DawesCFO, Infrastructure
11 May 2016
Strategic report
26 3i Infrastructure plc Annual report and accounts 2016
Financial reviewContinued
ReturnsThe Company’s performance is assessed by the Board based on the following measures:
– capital return: unrealised value movements due to changes to the carrying valuation of assets across the financial year (or since acquisition, if shorter) including the impact of foreign exchange movements relating to portfolio assets; or realised capital profits generated from the sale or partial sale of portfolio assets above their carrying valuation;
– movement in fair value of derivatives for foreign currency hedging;
– total income: interest and dividends from underlying portfolio assets, interest on cash holdings and transaction fees receivable;
– costs: advisory and performance fees, Board and other operating costs, transaction fees payable and finance costs relating to the Company’s RCF; and
– other net income/costs: includes other income and foreign exchange movements relating principally to euro balances held on deposit in relation to future commitments to fund investment.
Table 4 shows the underlying aggregate returns from portfolio assets for each of these elements of returns and costs. The Financial statements’ classification of these components of total return includes transactions within unconsolidated subsidiaries as the Company adopts Investment Entities (Amendments to IFRS 10, IFRS 12 and IAS 27) for its reporting.
Total return3i Infrastructure generated a total return for the year of £166.2 million, representing a 14.0% return on opening shareholders’ equity, adjusted on a time weighted average basis for the payment of the £150 million special dividend on 31 July 2015 (2015: £266.8 million, 24.6%).
The return was underpinned by the robust performance of the European portfolio and, in particular, by the valuation uplift in the Company’s holding in Elenia (see pages 21 to 22), as well as by positive foreign exchange movements during the second half of the year. This was offset partly by the weak performance of the India Fund (see page 22).
Table 4: Summary total return (year to 31 March 2016, £m)
Underlying portfolioasset aggregate
returns and costs
Adjustments for transactions inunconsolidated
subsidiariesFinancial
statements
Capital return 187.51 (0.4)2,3 187.1
Movement in fair value of derivatives (44.6) (0.1)2 (44.7)
Total income 64.1 (4.3)3 59.8
207.0 (4.8) 202.2
Costs (43.9) 5.03 (38.9)
Other net income/(costs) 3.1 (0.2) 2.9
Total return 166.2 – 166.2
1 Capital return includes a £48.9 million foreign exchange gain.2 Movement in fair value of derivatives relating to hedging specific to the Oystercatcher subsidiary, reclassified as capital return, as it is monitored by the Board as part of the
unrealised value movement in Oystercatcher.3 Costs of £5.0 million were incurred within unconsolidated subsidiaries, comprising predominantly fees paid directly to 3i Group (£4.2 million), operating expenses (£0.2 million)
and transaction fees (£0.6 million). These are reflected in capital returns or income as they have reduced either the carrying value, or the income distributed from these subsidiaries.
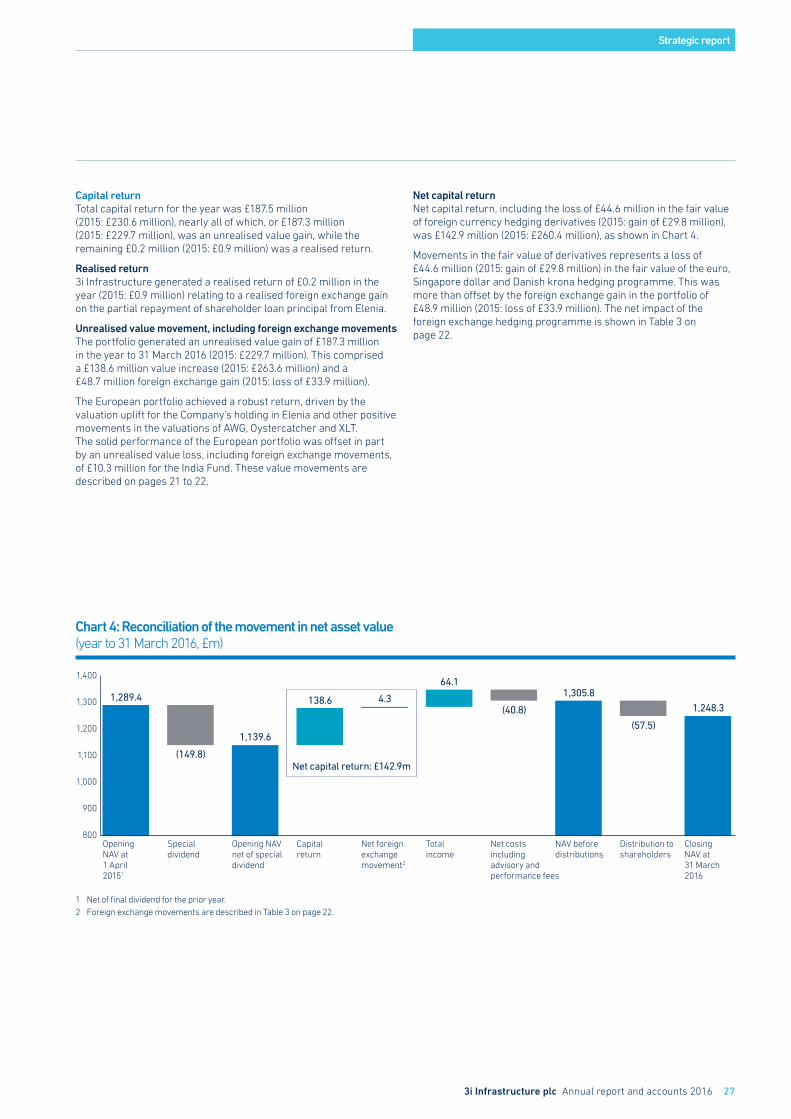
Strategic report
3i Infrastructure plc Annual report and accounts 2016 27
1,289.4
(149.8)
4.3
1,139.6
138.6
64.1
(40.8)
(57.5)
1,248.3
1,305.8
Opening NAV at 1 April 20151
Specialdividend
Opening NAVnet of specialdividend
Totalincome
Net foreignexchangemovement2
Net costs including advisory and performance fees
NAV before distributions
Distribution to shareholders
Closing NAV at 31 March2016
Capitalreturn
1,400
1,300
1,200
1,100
1,000
900
800
Net capital return: £142.9m
Capital returnTotal capital return for the year was £187.5 million (2015: £230.6 million), nearly all of which, or £187.3 million (2015: £229.7 million), was an unrealised value gain, while the remaining £0.2 million (2015: £0.9 million) was a realised return.
Realised return3i Infrastructure generated a realised return of £0.2 million in the year (2015: £0.9 million) relating to a realised foreign exchange gain on the partial repayment of shareholder loan principal from Elenia.
Unrealised value movement, including foreign exchange movementsThe portfolio generated an unrealised value gain of £187.3 million in the year to 31 March 2016 (2015: £229.7 million). This comprised a £138.6 million value increase (2015: £263.6 million) and a £48.7 million foreign exchange gain (2015: loss of £33.9 million).
The European portfolio achieved a robust return, driven by the valuation uplift for the Company’s holding in Elenia and other positive movements in the valuations of AWG, Oystercatcher and XLT. The solid performance of the European portfolio was offset in part by an unrealised value loss, including foreign exchange movements, of £10.3 million for the India Fund. These value movements are described on pages 21 to 22.
Net capital returnNet capital return, including the loss of £44.6 million in the fair value of foreign currency hedging derivatives (2015: gain of £29.8 million), was £142.9 million (2015: £260.4 million), as shown in Chart 4.
Movements in the fair value of derivatives represents a loss of £44.6 million (2015: gain of £29.8 million) in the fair value of the euro, Singapore dollar and Danish krona hedging programme. This was more than offset by the foreign exchange gain in the portfolio of £48.9 million (2015: loss of £33.9 million). The net impact of the foreign exchange hedging programme is shown in Table 3 on page 22.
1 Net of final dividend for the prior year.2 Foreign exchange movements are described in Table 3 on page 22.
Chart 4: Reconciliation of the movement in net asset value (year to 31 March 2016, £m)
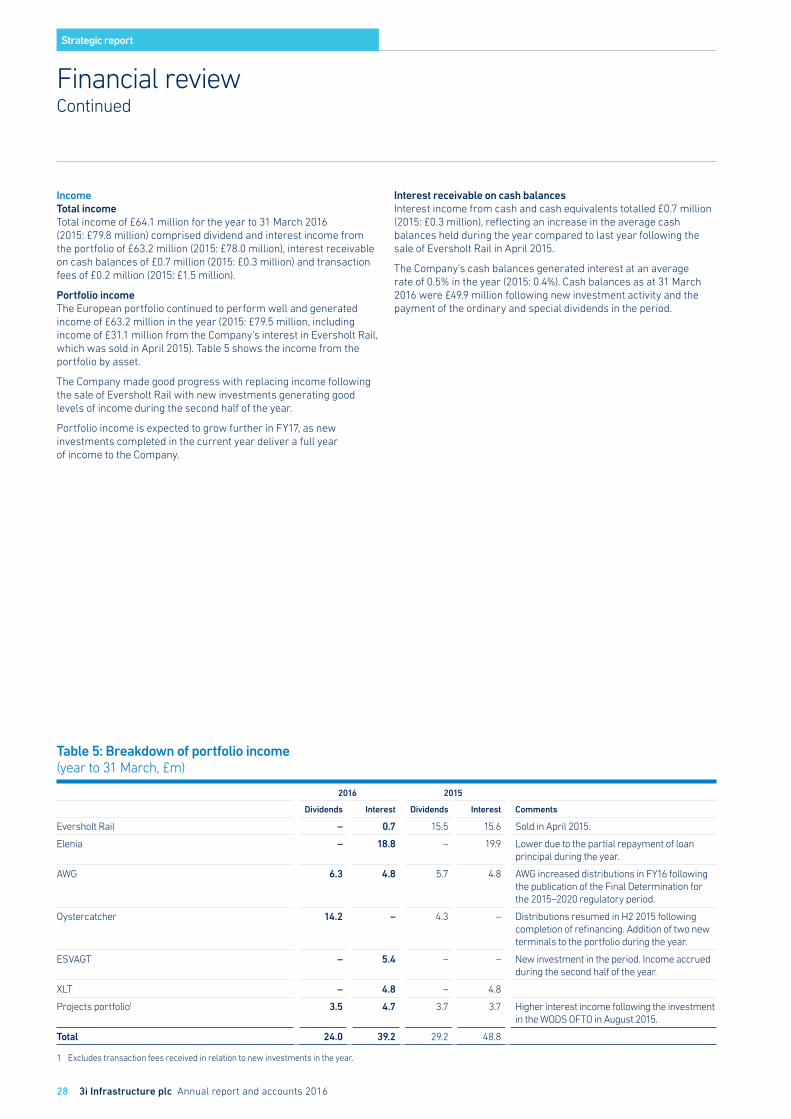
Strategic report
28 3i Infrastructure plc Annual report and accounts 2016
IncomeTotal incomeTotal income of £64.1 million for the year to 31 March 2016 (2015: £79.8 million) comprised dividend and interest income from the portfolio of £63.2 million (2015: £78.0 million), interest receivable on cash balances of £0.7 million (2015: £0.3 million) and transaction fees of £0.2 million (2015: £1.5 million).
Portfolio incomeThe European portfolio continued to perform well and generated income of £63.2 million in the year (2015: £79.5 million, including income of £31.1 million from the Company’s interest in Eversholt Rail, which was sold in April 2015). Table 5 shows the income from the portfolio by asset.
The Company made good progress with replacing income following the sale of Eversholt Rail with new investments generating good levels of income during the second half of the year.
Portfolio income is expected to grow further in FY17, as new investments completed in the current year deliver a full year of income to the Company.
Interest receivable on cash balancesInterest income from cash and cash equivalents totalled £0.7 million (2015: £0.3 million), reflecting an increase in the average cash balances held during the year compared to last year following the sale of Eversholt Rail in April 2015.
The Company’s cash balances generated interest at an average rate of 0.5% in the year (2015: 0.4%). Cash balances as at 31 March 2016 were £49.9 million following new investment activity and the payment of the ordinary and special dividends in the period.
Financial reviewContinued
Table 5: Breakdown of portfolio income (year to 31 March, £m)
2016 2015
Dividends Interest Dividends Interest Comments
Eversholt Rail – 0.7 15.5 15.6 Sold in April 2015.
Elenia – 18.8 – 19.9 Lower due to the partial repayment of loan principal during the year.
AWG 6.3 4.8 5.7 4.8 AWG increased distributions in FY16 following the publication of the Final Determination for the 2015–2020 regulatory period.
Oystercatcher 14.2 – 4.3 – Distributions resumed in H2 2015 following completion of refinancing. Addition of two new terminals to the portfolio during the year.
ESVAGT – 5.4 – – New investment in the period. Income accrued during the second half of the year.
XLT – 4.8 – 4.8
Projects portfolio1 3.5 4.7 3.7 3.7 Higher interest income following the investment in the WODS OFTO in August 2015.
Total 24.0 39.2 29.2 48.8
1 Excludes transaction fees received in relation to new investments in the year.
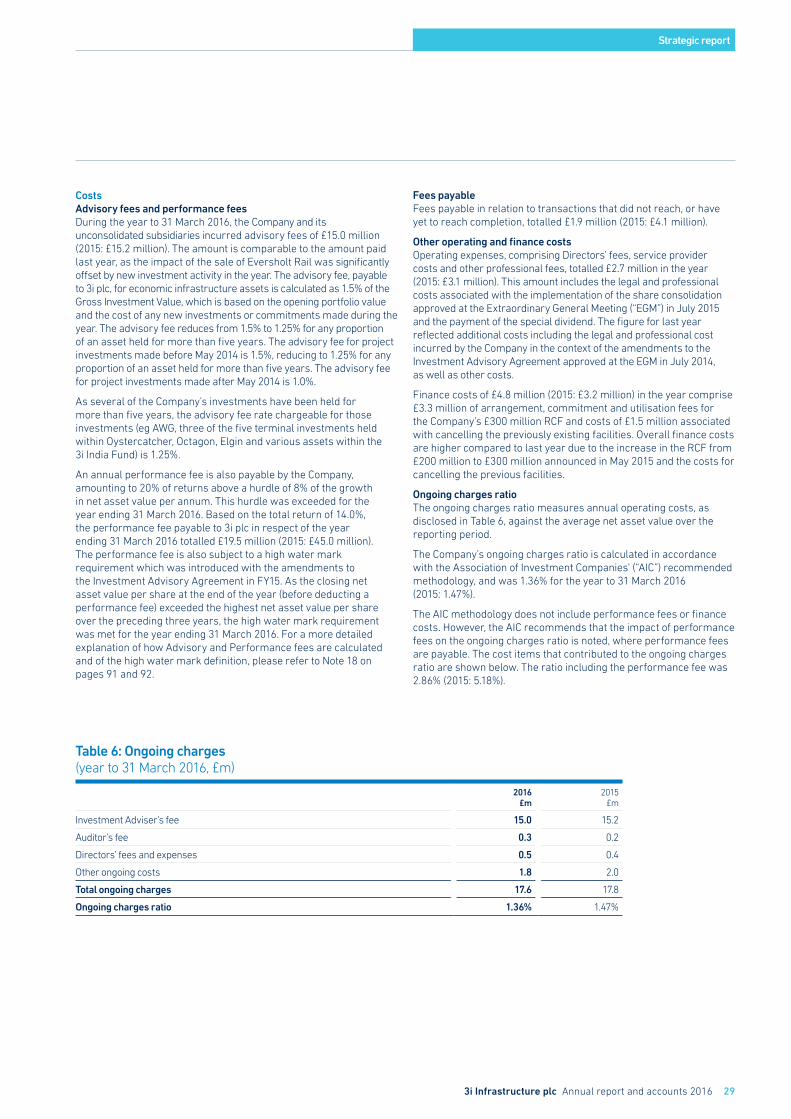
Strategic report
3i Infrastructure plc Annual report and accounts 2016 29
Table 6: Ongoing charges (year to 31 March 2016, £m)
2016£m
2015£m
Investment Adviser’s fee 15.0 15.2
Auditor’s fee 0.3 0.2
Directors’ fees and expenses 0.5 0.4
Other ongoing costs 1.8 2.0
Total ongoing charges 17.6 17.8
Ongoing charges ratio 1.36% 1.47%
CostsAdvisory fees and performance fees During the year to 31 March 2016, the Company and its unconsolidated subsidiaries incurred advisory fees of £15.0 million (2015: £15.2 million). The amount is comparable to the amount paid last year, as the impact of the sale of Eversholt Rail was significantly offset by new investment activity in the year. The advisory fee, payable to 3i plc, for economic infrastructure assets is calculated as 1.5% of the Gross Investment Value, which is based on the opening portfolio value and the cost of any new investments or commitments made during the year. The advisory fee reduces from 1.5% to 1.25% for any proportion of an asset held for more than five years. The advisory fee for project investments made before May 2014 is 1.5%, reducing to 1.25% for any proportion of an asset held for more than five years. The advisory fee for project investments made after May 2014 is 1.0%.
As several of the Company’s investments have been held for more than five years, the advisory fee rate chargeable for those investments (eg AWG, three of the five terminal investments held within Oystercatcher, Octagon, Elgin and various assets within the 3i India Fund) is 1.25%.
An annual performance fee is also payable by the Company, amounting to 20% of returns above a hurdle of 8% of the growth in net asset value per annum. This hurdle was exceeded for the year ending 31 March 2016. Based on the total return of 14.0%, the performance fee payable to 3i plc in respect of the year ending 31 March 2016 totalled £19.5 million (2015: £45.0 million). The performance fee is also subject to a high water mark requirement which was introduced with the amendments to the Investment Advisory Agreement in FY15. As the closing net asset value per share at the end of the year (before deducting a performance fee) exceeded the highest net asset value per share over the preceding three years, the high water mark requirement was met for the year ending 31 March 2016. For a more detailed explanation of how Advisory and Performance fees are calculated and of the high water mark definition, please refer to Note 18 on pages 91 and 92.
Fees payableFees payable in relation to transactions that did not reach, or have yet to reach completion, totalled £1.9 million (2015: £4.1 million).
Other operating and finance costsOperating expenses, comprising Directors’ fees, service provider costs and other professional fees, totalled £2.7 million in the year (2015: £3.1 million). This amount includes the legal and professional costs associated with the implementation of the share consolidation approved at the Extraordinary General Meeting (“EGM”) in July 2015 and the payment of the special dividend. The figure for last year reflected additional costs including the legal and professional cost incurred by the Company in the context of the amendments to the Investment Advisory Agreement approved at the EGM in July 2014, as well as other costs.
Finance costs of £4.8 million (2015: £3.2 million) in the year comprise £3.3 million of arrangement, commitment and utilisation fees for the Company’s £300 million RCF and costs of £1.5 million associated with cancelling the previously existing facilities. Overall finance costs are higher compared to last year due to the increase in the RCF from £200 million to £300 million announced in May 2015 and the costs for cancelling the previous facilities.
Ongoing charges ratioThe ongoing charges ratio measures annual operating costs, as disclosed in Table 6, against the average net asset value over the reporting period.
The Company’s ongoing charges ratio is calculated in accordance with the Association of Investment Companies’ (“AIC”) recommended methodology, and was 1.36% for the year to 31 March 2016 (2015: 1.47%).
The AIC methodology does not include performance fees or finance costs. However, the AIC recommends that the impact of performance fees on the ongoing charges ratio is noted, where performance fees are payable. The cost items that contributed to the ongoing charges ratio are shown below. The ratio including the performance fee was 2.86% (2015: 5.18%).
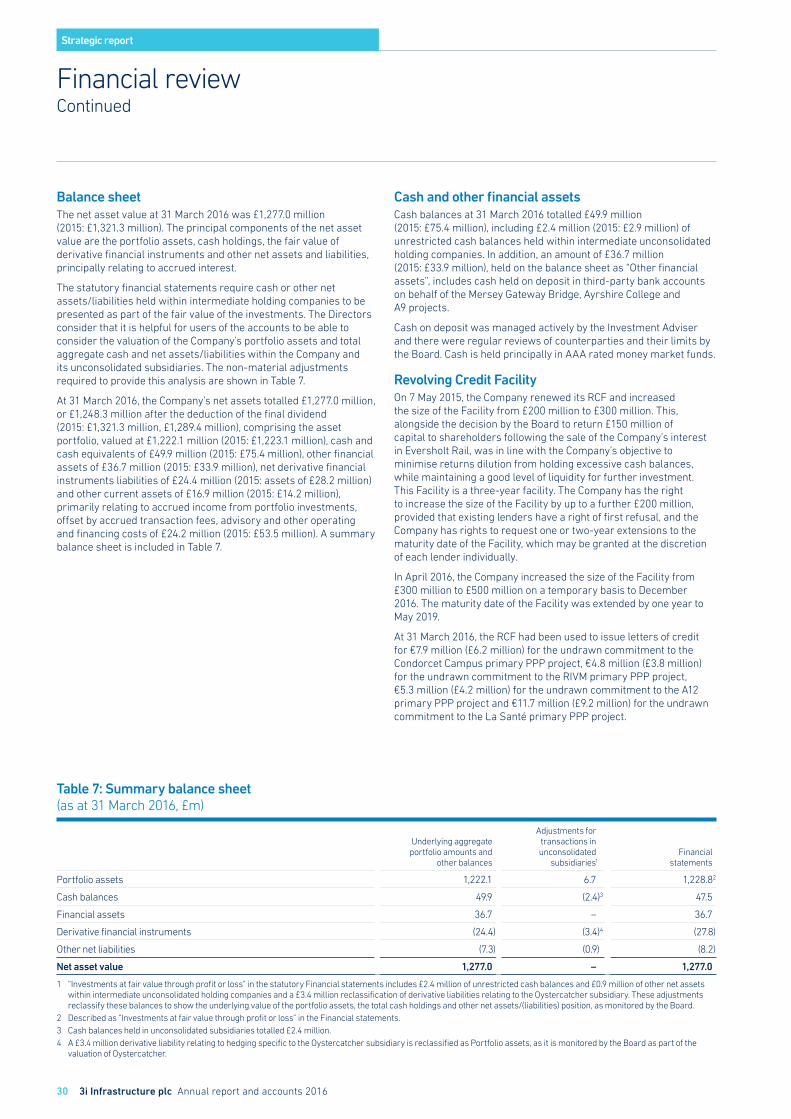
Strategic report
30 3i Infrastructure plc Annual report and accounts 2016
Financial reviewContinued
Balance sheetThe net asset value at 31 March 2016 was £1,277.0 million (2015: £1,321.3 million). The principal components of the net asset value are the portfolio assets, cash holdings, the fair value of derivative financial instruments and other net assets and liabilities, principally relating to accrued interest.
The statutory financial statements require cash or other net assets/liabilities held within intermediate holding companies to be presented as part of the fair value of the investments. The Directors consider that it is helpful for users of the accounts to be able to consider the valuation of the Company’s portfolio assets and total aggregate cash and net assets/liabilities within the Company and its unconsolidated subsidiaries. The non-material adjustments required to provide this analysis are shown in Table 7.
At 31 March 2016, the Company’s net assets totalled £1,277.0 million, or £1,248.3 million after the deduction of the final dividend (2015: £1,321.3 million, £1,289.4 million), comprising the asset portfolio, valued at £1,222.1 million (2015: £1,223.1 million), cash and cash equivalents of £49.9 million (2015: £75.4 million), other financial assets of £36.7 million (2015: £33.9 million), net derivative financial instruments liabilities of £24.4 million (2015: assets of £28.2 million) and other current assets of £16.9 million (2015: £14.2 million), primarily relating to accrued income from portfolio investments, offset by accrued transaction fees, advisory and other operating and financing costs of £24.2 million (2015: £53.5 million). A summary balance sheet is included in Table 7.
Cash and other financial assetsCash balances at 31 March 2016 totalled £49.9 million (2015: £75.4 million), including £2.4 million (2015: £2.9 million) of unrestricted cash balances held within intermediate unconsolidated holding companies. In addition, an amount of £36.7 million (2015: £33.9 million), held on the balance sheet as “Other financial assets”, includes cash held on deposit in third-party bank accounts on behalf of the Mersey Gateway Bridge, Ayrshire College and A9 projects.
Cash on deposit was managed actively by the Investment Adviser and there were regular reviews of counterparties and their limits by the Board. Cash is held principally in AAA rated money market funds.
Revolving Credit Facility On 7 May 2015, the Company renewed its RCF and increased the size of the Facility from £200 million to £300 million. This, alongside the decision by the Board to return £150 million of capital to shareholders following the sale of the Company’s interest in Eversholt Rail, was in line with the Company’s objective to minimise returns dilution from holding excessive cash balances, while maintaining a good level of liquidity for further investment. This Facility is a three-year facility. The Company has the right to increase the size of the Facility by up to a further £200 million, provided that existing lenders have a right of first refusal, and the Company has rights to request one or two-year extensions to the maturity date of the Facility, which may be granted at the discretion of each lender individually.
In April 2016, the Company increased the size of the Facility from £300 million to £500 million on a temporary basis to December 2016. The maturity date of the Facility was extended by one year to May 2019.
At 31 March 2016, the RCF had been used to issue letters of credit for €7.9 million (£6.2 million) for the undrawn commitment to the Condorcet Campus primary PPP project, €4.8 million (£3.8 million) for the undrawn commitment to the RIVM primary PPP project, €5.3 million (£4.2 million) for the undrawn commitment to the A12 primary PPP project and €11.7 million (£9.2 million) for the undrawn commitment to the La Santé primary PPP project.
Table 7: Summary balance sheet (as at 31 March 2016, £m)
Underlying aggregateportfolio amounts and
other balances
Adjustments fortransactions inunconsolidated
subsidiaries1Financial
statements
Portfolio assets 1,222.1 6.7 1,228.82
Cash balances 49.9 (2.4)3 47.5
Financial assets 36.7 – 36.7
Derivative financial instruments (24.4) (3.4)4 (27.8)
Other net liabilities (7.3) (0.9) (8.2)
Net asset value 1,277.0 – 1,277.0
1 “Investments at fair value through profit or loss” in the statutory Financial statements includes £2.4 million of unrestricted cash balances and £0.9 million of other net assets within intermediate unconsolidated holding companies and a £3.4 million reclassification of derivative liabilities relating to the Oystercatcher subsidiary. These adjustments reclassify these balances to show the underlying value of the portfolio assets, the total cash holdings and other net assets/(liabilities) position, as monitored by the Board.
2 Described as “Investments at fair value through profit or loss” in the Financial statements.3 Cash balances held in unconsolidated subsidiaries totalled £2.4 million.4 A £3.4 million derivative liability relating to hedging specific to the Oystercatcher subsidiary is reclassified as Portfolio assets, as it is monitored by the Board as part of the
valuation of Oystercatcher.
Strategic report
3i Infrastructure plc Annual report and accounts 2016 31
Return of capital and share consolidationFollowing the completion of the sale of Eversholt Rail in April 2015, on 12 May 2015 the Company announced that it would return £150 million to shareholders by way of a special dividend of 17.0 pence per share, to enable shareholders to participate in the sale of the asset. The Company also announced a 9 for 10 share consolidation, which was subject to shareholder approval at the EGM, to neutralise the impact of the payment of the special dividend on the share price. The share consolidation was approved by the shareholders at the EGM held on 7 July 2015 and the share consolidation was implemented shortly after, on 8 July 2015. The special dividend was paid to shareholders on 31 July 2015.
Net asset value per shareThe total net asset value per share at 31 March 2016 was 161.0 pence (2015: 149.9 pence). This reduces to 157.4 pence (2015: 146.3 pence) after the payment of the final dividend of 3.625 pence. There are no dilutive securities in issue.
The movement in NAV per share during the year includes a reduction of 2.6 pence per share resulting from the share consolidation and special dividend payment implemented in July. The share consolidation ratio was based on a share price of 168.8 pence per share (being the share price on 1 June 2015, the date of the publication of the EGM circular). In line with market practice, the share consolidation targeted share price consistency, rather than consistency in NAV per share. As the share price was at a premium to NAV per share at the time of the consolidation, a reduction of 2.6 pence to NAV per share resulted from the share consolidation and special dividend payment.
Dividend and dividend coverThe Board has proposed a total dividend for the year of 7.25 pence per share, or £57.5 million in aggregate (2015: 7.0 pence; £61.7 million). This is in line with the Company’s target announced in May last year.
When considering the coverage of the proposed dividend, the Board assesses the income earned from the portfolio, interest received on cash balances and any additional non-income cash distributions from portfolio assets which do not follow from a disposal of the underlying assets, as well as the level of ongoing operational costs incurred in the period. The Board also takes into account any surpluses retained from previous years, and net capital profits generated through asset realisations, which it considers available for distribution as dividend. For the year to 31 March 2016, total income and interest, including non-income cash distributions from portfolio companies, amounted to £66.9 million (2015: £85.0 million). For dividend cover, operational costs relating to advisory fees, operating expenses and financing costs, totalled £22.5 million for the year (2015: £21.5 million). The final dividend cover shortfall of £13.1 million which was expected following the sale of Eversholt Rail and accommodated in the Company’s cash flow planning, is covered from the amounts available for distribution as dividend as detailed above. The retained amount available for distribution, following the payment of the final dividend and performance fee, will be £55.0 million (March 2015: £33.1 million).
The Board is announcing a target dividend for FY17 of 7.55 pence per share.
Open Offer, Placing and Intermediaries OfferIn order to ensure that the Company remains well funded to execute its new investments and future pipeline, the Company is launching an Open Offer, Placing and Intermediaries Offer with the intention of raising up to £350 million from existing and new shareholders. The proceeds from this offering will be used to fund completion of the investments in WIG and TCR, as well as to fund future investment opportunities.
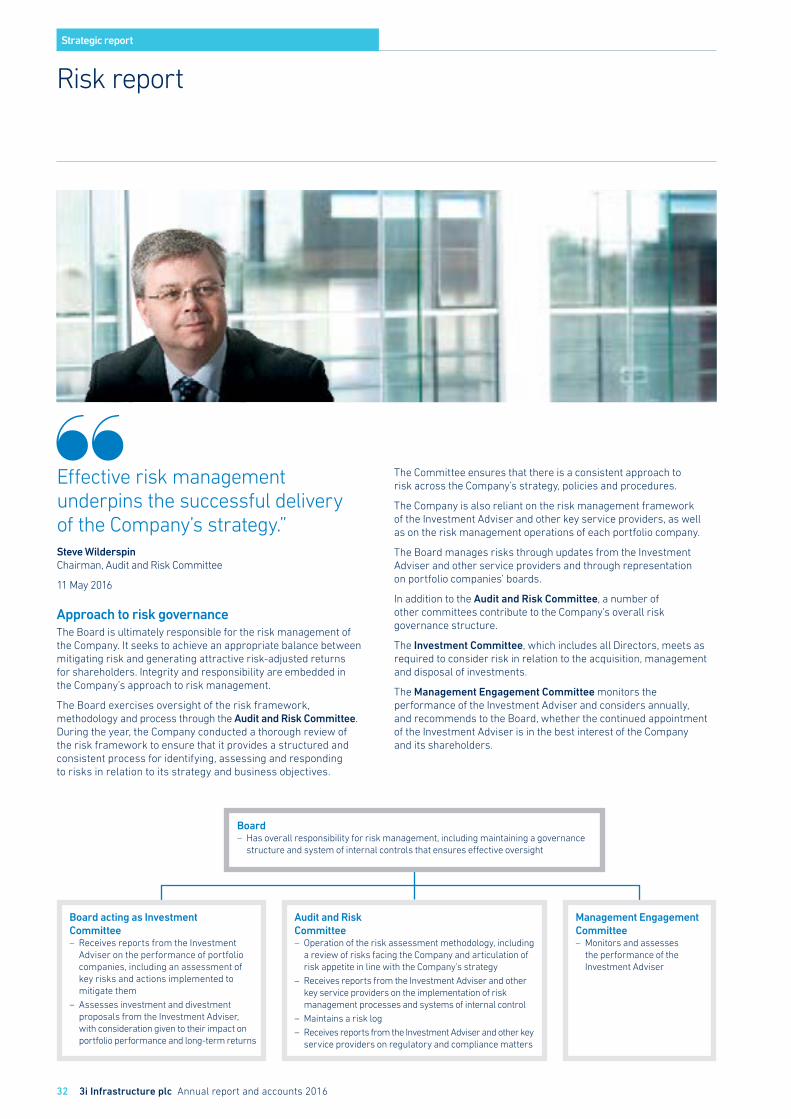
Strategic report
32 3i Infrastructure plc Annual report and accounts 2016
Risk report
Effective risk management underpins the successful delivery of the Company’s strategy.”Steve WilderspinChairman, Audit and Risk Committee
11 May 2016
Approach to risk governanceThe Board is ultimately responsible for the risk management of the Company. It seeks to achieve an appropriate balance between mitigating risk and generating attractive risk-adjusted returns for shareholders. Integrity and responsibility are embedded in the Company’s approach to risk management.
The Board exercises oversight of the risk framework, methodology and process through the Audit and Risk Committee. During the year, the Company conducted a thorough review of the risk framework to ensure that it provides a structured and consistent process for identifying, assessing and responding to risks in relation to its strategy and business objectives.
The Committee ensures that there is a consistent approach to risk across the Company’s strategy, policies and procedures.
The Company is also reliant on the risk management framework of the Investment Adviser and other key service providers, as well as on the risk management operations of each portfolio company.
The Board manages risks through updates from the Investment Adviser and other service providers and through representation on portfolio companies’ boards.
In addition to the Audit and Risk Committee, a number of other committees contribute to the Company’s overall risk governance structure.
The Investment Committee, which includes all Directors, meets as required to consider risk in relation to the acquisition, management and disposal of investments.
The Management Engagement Committee monitors the performance of the Investment Adviser and considers annually, and recommends to the Board, whether the continued appointment of the Investment Adviser is in the best interest of the Company and its shareholders.
Board – Has overall responsibility for risk management, including maintaining a governance structure and system of internal controls that ensures effective oversight
Board acting as Investment Committee – Receives reports from the Investment Adviser on the performance of portfolio companies, including an assessment of key risks and actions implemented to mitigate them
– Assesses investment and divestment proposals from the Investment Adviser, with consideration given to their impact on portfolio performance and long-term returns
Audit and Risk Committee – Operation of the risk assessment methodology, including a review of risks facing the Company and articulation of risk appetite in line with the Company’s strategy
– Receives reports from the Investment Adviser and other key service providers on the implementation of risk management processes and systems of internal control
– Maintains a risk log – Receives reports from the Investment Adviser and other key
service providers on regulatory and compliance matters
Management Engagement Committee – Monitors and assesses the performance of the Investment Adviser
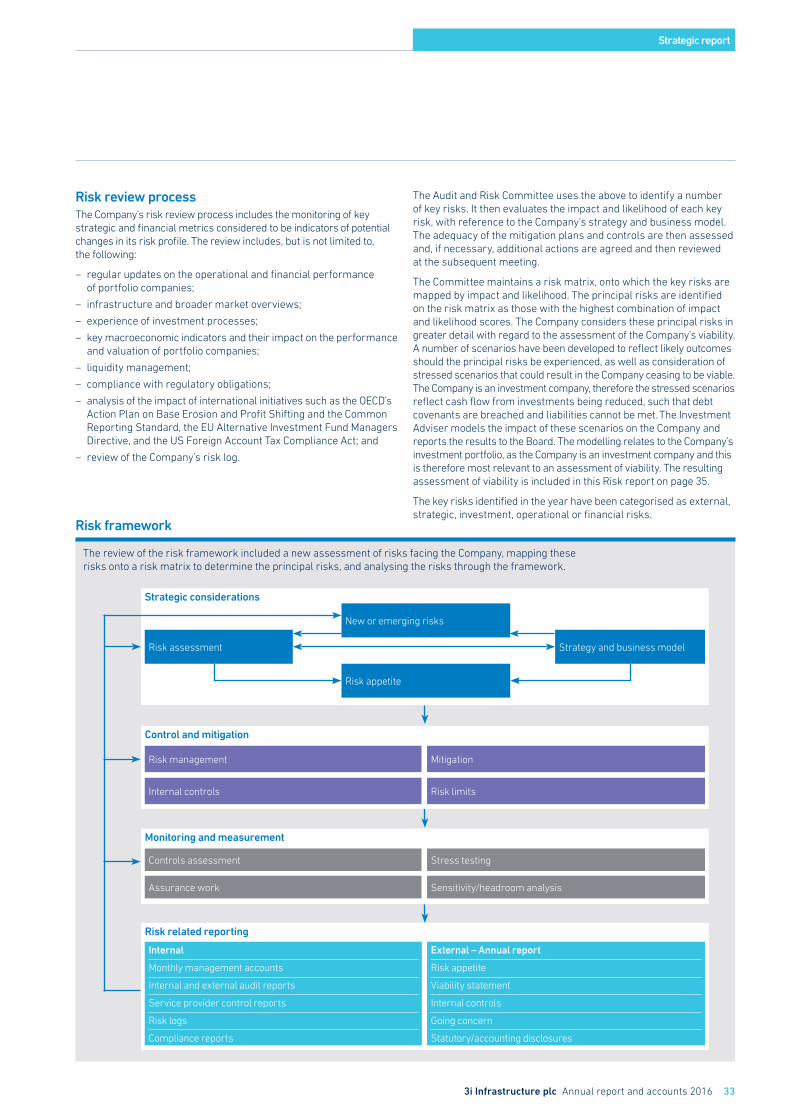
Strategic considerations
Strategic report
3i Infrastructure plc Annual report and accounts 2016 33
Risk framework
The review of the risk framework included a new assessment of risks facing the Company, mapping these risks onto a risk matrix to determine the principal risks, and analysing the risks through the framework.
New or emerging risks
Risk appetite
Risk assessment Strategy and business model
Risk related reporting
Internal
Monthly management accounts
Internal and external audit reports
Service provider control reports
Risk logs
Compliance reports
External – Annual report
Risk appetite
Viability statement
Internal controls
Going concern
Statutory/accounting disclosures
Control and mitigation
Risk management
Internal controls
Mitigation
Risk limits
Monitoring and measurement
Controls assessment
Assurance work
Stress testing
Sensitivity/headroom analysis
Risk review processThe Company’s risk review process includes the monitoring of key strategic and financial metrics considered to be indicators of potential changes in its risk profile. The review includes, but is not limited to, the following:
– regular updates on the operational and financial performance of portfolio companies;
– infrastructure and broader market overviews;
– experience of investment processes;
– key macroeconomic indicators and their impact on the performance and valuation of portfolio companies;
– liquidity management;
– compliance with regulatory obligations;
– analysis of the impact of international initiatives such as the OECD’s Action Plan on Base Erosion and Profit Shifting and the Common Reporting Standard, the EU Alternative Investment Fund Managers Directive, and the US Foreign Account Tax Compliance Act; and
– review of the Company’s risk log.
The Audit and Risk Committee uses the above to identify a number of key risks. It then evaluates the impact and likelihood of each key risk, with reference to the Company’s strategy and business model. The adequacy of the mitigation plans and controls are then assessed and, if necessary, additional actions are agreed and then reviewed at the subsequent meeting.
The Committee maintains a risk matrix, onto which the key risks are mapped by impact and likelihood. The principal risks are identified on the risk matrix as those with the highest combination of impact and likelihood scores. The Company considers these principal risks in greater detail with regard to the assessment of the Company’s viability. A number of scenarios have been developed to reflect likely outcomes should the principal risks be experienced, as well as consideration of stressed scenarios that could result in the Company ceasing to be viable. The Company is an investment company, therefore the stressed scenarios reflect cash flow from investments being reduced, such that debt covenants are breached and liabilities cannot be met. The Investment Adviser models the impact of these scenarios on the Company and reports the results to the Board. The modelling relates to the Company’s investment portfolio, as the Company is an investment company and this is therefore most relevant to an assessment of viability. The resulting assessment of viability is included in this Risk report on page 35.
The key risks identified in the year have been categorised as external, strategic, investment, operational or financial risks.
Strategic report
34 3i Infrastructure plc Annual report and accounts 2016
Risk reportContinued
Risk appetiteThe Committee has reviewed the risk matrix, and set out the Company’s appetite for each of the key risks. As an investment company, the Company seeks to take investment risk. The appetite for investment risk is described on page 12, with a risk/return graph which shows the investment focus of the Company, and in the investment policy on page 94. The Company seeks to limit or manage exposure to other risks to acceptable levels.
Review of significant key risksThe disclosures on the following pages are not an exhaustive list of risks and uncertainties faced by the Company, but rather a summary of significant key risks which are under active review by the Board. These significant key risks have the potential to affect materially the achievement of the Company’s strategic objectives and impact its financial performance. This disclosure shows developments in these significant key risks for the year. The risks that have been identified as principal risks are described in more detail in the table on pages 36 and 37.
The Company’s risk profile and appetite remains broadly stable.
External risks – market and competitionThe markets in which the Company seeks to invest, and in particular the European economic infrastructure market, are competitive, with strong demand for large Core assets. While this has supported value gains for existing assets in the portfolio, it has also made it challenging for the Company to secure new investments in large Core infrastructure businesses at total returns and yields consistent with the Company’s targets, posing a risk to the Company’s ability to source attractive investment opportunities. In this challenging environment, the Investment Adviser continues to leverage its network and skills to make investments that can continue to deliver attractive risk-adjusted returns to the Company’s shareholders.
Interest rates remained low throughout the year. This had positive implications for some of the portfolio assets, including Elenia and AWG, which have been able to continue to raise debt on attractive terms. Elenia’s regulatory allowed return was determined with reference to the 10-year Finnish government bond yield until December 2015. From January 2016, under the new regulatory settlement discussed below, the regulatory allowed return is determined with reference to the higher of the current or the 10-year rolling average 10-year Finnish government bond yield. This has had a positive impact on the valuation of the Company’s holding in Elenia.
Inflation remained below expectations in the period, continuing to impact the assets with inflation-linked revenues. However, cost inflation has also been low across the portfolio.
There was significant currency volatility in the year, with sterling depreciating by 9.1% against the euro in the run up to the UK referendum on continued membership of the European Union, and with the Indian rupee depreciating by 3.1% against sterling. The Company’s objective is to hedge partially its euro exposure and the Singapore dollar exposure (associated with the investment in Oiltanking Singapore within the Oystercatcher valuation). During the year, the hedging programme was extended to cover the Company’s exposure to the Danish krona, arising through the investment in ESVAGT, which completed in July 2015. The revaluation of the hedging programme for the euro, Singapore dollar and Danish krona is impacted by movements in forward exchange rates which are not necessarily matched exactly by an equivalent change in the spot exchange rate at which the assets are translated.
The exposure to the Indian rupee remains unhedged. In relation to this exposure, the Board’s assessment remains that the cost of hedging the exposure would considerably outweigh the potential benefits, given the lack of liquidity and resulting high execution costs and also due to the significant interest rate differential between sterling and rupee which impact the forward currency rates and hedging derivative valuation. The Board monitors the effectiveness of the Company’s hedging policy on a regular basis. Overall, 87% of the foreign exchange gains were offset by movements in the foreign exchange hedging derivatives.
External risks – regulatory and taxDuring the year the Finnish Energy Authority, which regulates electricity distribution in Finland, published the regulatory settlement for the next two four-year regulatory periods (beginning in January 2016). These change the calculation of the allowed return on capital for the industry, and certain other parameters, demonstrating the regulator’s intent to address the very low allowed return on capital experienced by all distribution companies over recent years.
In October 2015, the OECD’s Base Erosion and Profit Shifting (“BEPS”) action plan announced a set of proposals for changes designed to tighten international tax regimes and prevent tax planning strategies used by multinational businesses to artificially shift profits to low tax jurisdictions. The Company and the Investment Adviser have been monitoring the progress of the BEPS action plan since its inception in 2013 and this has included the Investment Adviser contributing to representations made by infrastructure bodies on certain of the proposals, notably those concerning the limiting of tax deductions for interest expenses of companies.
Although the October 2015 announcements mark a significant milestone for the BEPS action plan, the Company and the Investment Adviser need to, and will continue to, monitor further developments as different jurisdictions now consider the questions of which proposals they will implement when and to what extent. The OECD itself has noted that it needs to carry out further work and deliver further detail during 2016 on some of the proposals. In the 2016 Budget in March, the UK Government announced its intention to proceed with restrictions on interest deductibility. The proposals include the adoption of the fixed ratio rule under which deductible interest would be restricted to 30% of UK EBITDA, although the detailed design of the rules will follow further consultation. The BEPS proposals are extremely wide ranging and, subject to their adoption and implementation in different jurisdictions, are likely to impact all multinational businesses to some extent. At this stage it is not possible to determine the precise impact of proposals across Europe on the Company and its investments but the Company and the Investment Adviser will continue to monitor developments and consider the necessary actions.
Strategic report
3i Infrastructure plc Annual report and accounts 2016 35
Strategic risksDuring the year, the Company had to balance the funding requirements of its pipeline of investments with the objective of running its balance sheet efficiently. The Board assessed the Company’s liquidity requirements regularly. The Company announced in May 2015 that it had negotiated a new RCF, increasing the Facility from £200 million to £300 million for three years. The new Facility includes a temporary accordion feature, allowing for an increase in the Facility of a further £200 million. The Company took advantage of this feature in April 2016, and has aggregate short-term borrowing facilities of £500 million available for the remainder of the calendar year, positioning it to continue to make commitments for potential new investments.
Investment risksThe Company made four new investments during the year, in ESVAGT, two new Oiltanking terminals, the West of Duddon Sands OFTO project, and the Condorcet Campus primary PPP project.
The performance of the investments in the India Fund remained weak in the year. The Modi government, elected in May 2014, has made a number of important policy statements in support of investment in the infrastructure sector. However, these statements have yet to translate into concrete initiatives that can improve the performance of the portfolio materially. The India Fund sold its entire holding in Ind-Barath Energy during the year, realising an uplift to carrying value.
OperationalThe key areas of operational risk include the loss of key personnel at the Investment Adviser, and whether the Investment Adviser’s team can continue to support the delivery of the Company’s objectives. The Board monitors the performance of the Investment Adviser through the Management Engagement Committee. It also monitors the performance of key service providers, receiving reports of any significant control breaches.
Financial risks – valuationFollowing the compression in market returns and changes in asset pricing across the infrastructure sector, together with a new regulatory settlement for Elenia from the Finnish Energy Authority, there were several significant changes to asset valuations within the Company’s portfolio in this financial year.
Viability statement
The Directors have assessed the viability of the Company over a three-year period to March 2019. The Directors have taken account of the current position of the Company, and the principal risks it faces which are documented in this Risk report.
The Directors have considered the potential impact on the Company of a number of scenarios in addition to the Company’s business plan and recent forecasts, which quantify the financial impact of the principal risks occurring. These scenarios represent severe but plausible circumstances that the Company could experience, including a significant impairment in the value of the portfolio and a reduction in the cash flows available from portfolio companies from a variety of causes. The results of this stress testing showed that the Company would be able to withstand the impact of these scenarios occurring over the three-year period. The Directors also considered scenarios that would represent a serious threat to its liquidity in the time period. These scenarios were not considered to be plausible.
The Directors consider that a three-year period to March 2019 is an appropriate period to review for assessing the Company’s viability. This reflects greater predictability of the Company’s cash flows over that time period, the term of the Company’s Revolving Credit Facility, and increased uncertainty surrounding economic, political and regulatory changes over the longer term.
Based on this assessment, the Directors have a reasonable expectation that the Company will be able to continue in operation and meet its liabilities as they fall due over the three-year period to March 2019.
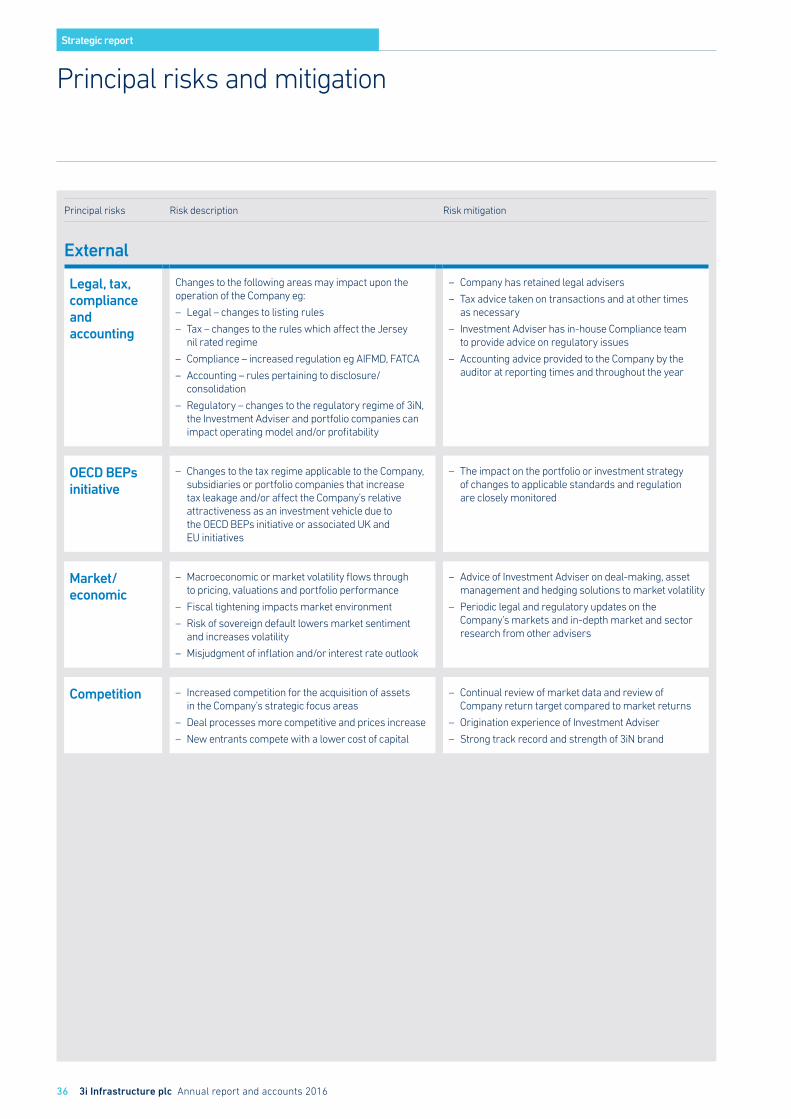
Strategic report
36 3i Infrastructure plc Annual report and accounts 2016
Principal risks Risk description Risk mitigation
External
Legal, tax, compliance and accounting
Changes to the following areas may impact upon the operation of the Company eg:
– Legal – changes to listing rules
– Tax – changes to the rules which affect the Jersey nil rated regime
– Compliance – increased regulation eg AIFMD, FATCA
– Accounting – rules pertaining to disclosure/consolidation
– Regulatory – changes to the regulatory regime of 3iN, the Investment Adviser and portfolio companies can impact operating model and/or profitability
– Company has retained legal advisers
– Tax advice taken on transactions and at other times as necessary
– Investment Adviser has in-house Compliance team to provide advice on regulatory issues
– Accounting advice provided to the Company by the auditor at reporting times and throughout the year
OECD BEPs initiative
– Changes to the tax regime applicable to the Company, subsidiaries or portfolio companies that increase tax leakage and/or affect the Company’s relative attractiveness as an investment vehicle due to the OECD BEPs initiative or associated UK and EU initiatives
– The impact on the portfolio or investment strategy of changes to applicable standards and regulation are closely monitored
Market/economic
– Macroeconomic or market volatility flows through to pricing, valuations and portfolio performance
– Fiscal tightening impacts market environment
– Risk of sovereign default lowers market sentiment and increases volatility
– Misjudgment of inflation and/or interest rate outlook
– Advice of Investment Adviser on deal-making, asset management and hedging solutions to market volatility
– Periodic legal and regulatory updates on the Company’s markets and in-depth market and sector research from other advisers
Competition – Increased competition for the acquisition of assets in the Company’s strategic focus areas
– Deal processes more competitive and prices increase
– New entrants compete with a lower cost of capital
– Continual review of market data and review of Company return target compared to market returns
– Origination experience of Investment Adviser
– Strong track record and strength of 3iN brand
Principal risks and mitigation
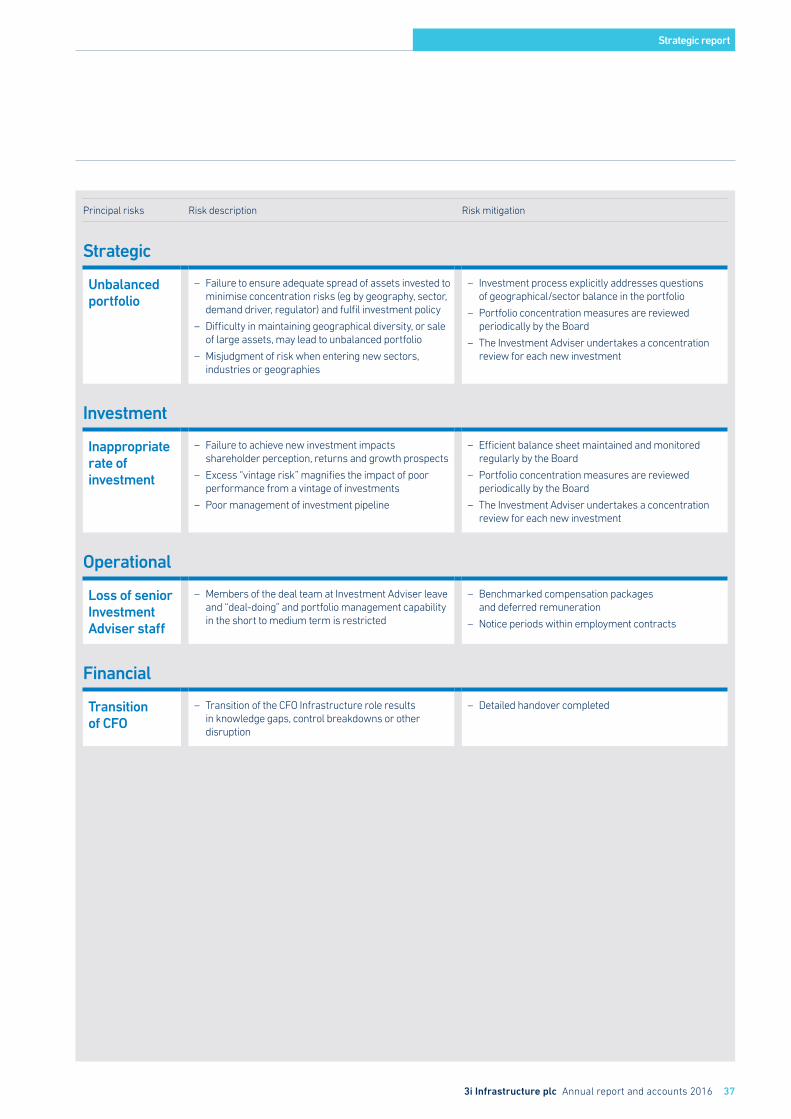
Strategic report
3i Infrastructure plc Annual report and accounts 2016 37
Principal risks Risk description Risk mitigation
Strategic
Unbalanced portfolio
– Failure to ensure adequate spread of assets invested to minimise concentration risks (eg by geography, sector, demand driver, regulator) and fulfil investment policy
– Difficulty in maintaining geographical diversity, or sale of large assets, may lead to unbalanced portfolio
– Misjudgment of risk when entering new sectors, industries or geographies
– Investment process explicitly addresses questions of geographical/sector balance in the portfolio
– Portfolio concentration measures are reviewed periodically by the Board
– The Investment Adviser undertakes a concentration review for each new investment
Investment
Inappropriate rate of investment
– Failure to achieve new investment impacts shareholder perception, returns and growth prospects
– Excess “vintage risk” magnifies the impact of poor performance from a vintage of investments
– Poor management of investment pipeline
– Efficient balance sheet maintained and monitored regularly by the Board
– Portfolio concentration measures are reviewed periodically by the Board
– The Investment Adviser undertakes a concentration review for each new investment
Operational
Loss of senior Investment Adviser staff
– Members of the deal team at Investment Adviser leave and “deal-doing” and portfolio management capability in the short to medium term is restricted
– Benchmarked compensation packages and deferred remuneration
– Notice periods within employment contracts
Financial
Transition of CFO
– Transition of the CFO Infrastructure role results in knowledge gaps, control breakdowns or other disruption
– Detailed handover completed
Strategic report
38 3i Infrastructure plc Annual report and accounts 2016
Corporate responsibility
The Board’s aim is to invest responsibly. The Board is responsible for the definition and implementation of the Company’s corporate responsibility policy, however in practice it relies heavily on the relevant policies and procedures put in place by 3i Group that apply to the Investment Adviser and, consequently, to the Company.For more information on 3i Group’s corporate responsibility policies, please refer to its website: www.3i.com/corporate-responsibility. The Board believes that these policies meet the Company’s objectives in this area.
Responsible Investment policy3i Group is a signatory to the UN Principles for Responsible Investment (“RI”) and has embedded RI policies in its investment and asset management processes.
The Investment Adviser’s philosophy on RI can be summarised as follows:
– the effective assessment and management of environmental, social, business integrity and corporate governance matters has a positive effect on the value of portfolio companies, and hence on 3i Infrastructure itself;
– compliance with local laws and regulations may not be enough to meet global expectations, deliver value and enhance reputation and licence to operate; and
– it is vital that the Investment Adviser seeks to identify all material environmental, social and governance (“ESG”) risks and opportunities through its due diligence and effectively manage them during the period of the Company’s investment.
The Investment Adviser’s RI policy makes clear that it aims to use its influence to promote a commitment in portfolio companies to:
– comply, as a minimum, with applicable local and international laws;
– mitigate adverse environmental and social impacts and enhance positive effects on the environment, workers and relevant stakeholders; and
– uphold high standards of business integrity and good corporate governance.
The main features of the policy include:
– clear statements of the commitment to mitigate adverse environmental and social impacts and uphold high standards of business integrity and good corporate governance;
– an exclusion list of businesses and activities in which investment is precluded;
– a referral list of businesses and activities which may be particularly sensitive and may require additional scrutiny; and
– a set of minimum ESG standards that portfolio companies should meet, either at the time of investment or within a reasonable period thereafter.
Details of the Investment Adviser’s RI policy are available on 3i Group’s website: www.3i.com/corporate-responsibility/responsible-investor.
GovernanceGood corporate governance is fundamental to 3i Infrastructure and its activities. For full details of the Company’s governance structure, please see the Governance section of this report and visit the Governance & CSR section of the Company’s website at www.3i-infrastructure.com.
Bribery ActThe Company does not offer, pay or accept bribes and is committed to working only with third parties whose standards of business integrity are substantively consistent with its own. The Company also expects the businesses it invests in to commit to avoiding corruption in all its forms and to comply with anti-bribery, anti-fraud and anti-money laundering laws applicable to them. The Company has an anti-bribery policy and is fully compliant with the provisions of the UK Bribery Act.
EnvironmentAs an investment company with no employees, governed by a non-executive Board of Directors, 3i Infrastructure has no material direct impact on the environment. Its carbon emissions are negligible, and limited to Board members’ travel to and from Jersey to attend Board meetings.
Procurement3i Infrastructure has developed policies and procedures in relation to the procurement of services received from third-party providers. As far as possible, the Company will work only with suppliers who support its aim to source products and services responsibly. 3i Infrastructure aims to have a collaborative relationship with its service providers and, wherever possible, will work with them when problems or issues arise to help them meet its requirements.
Prompt Payment Code3i Group performs most payment and treasury functions for the Company and is a signatory of the Prompt Payment Code. The Code encourages and promotes best practice between organisations and their suppliers. Signatories to the Code commit to paying their suppliers within clearly defined terms, and to ensuring there is a proper process for dealing with any issues that may arise.
This Strategic report is approved by order of the Board Authorised signatory
Capita Financial Administrators (Jersey) Limited
Company Secretary 11 May 2016
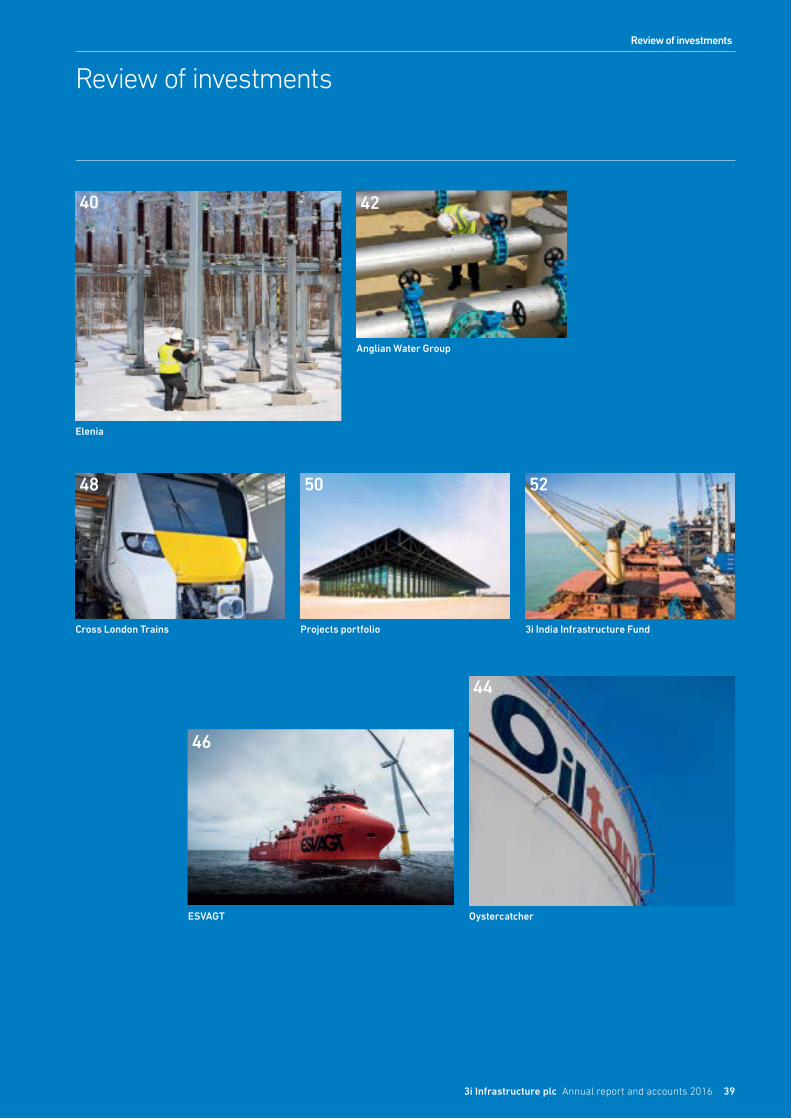
Review of investments
393i Infrastructure plc Annual report and accounts 2016
Review of investments
ESVAGT
Oystercatcher
Anglian Water Group
Elenia
3i India Infrastructure Fund
Projects portfolio Cross London Trains
46
44
50 52
4240
48
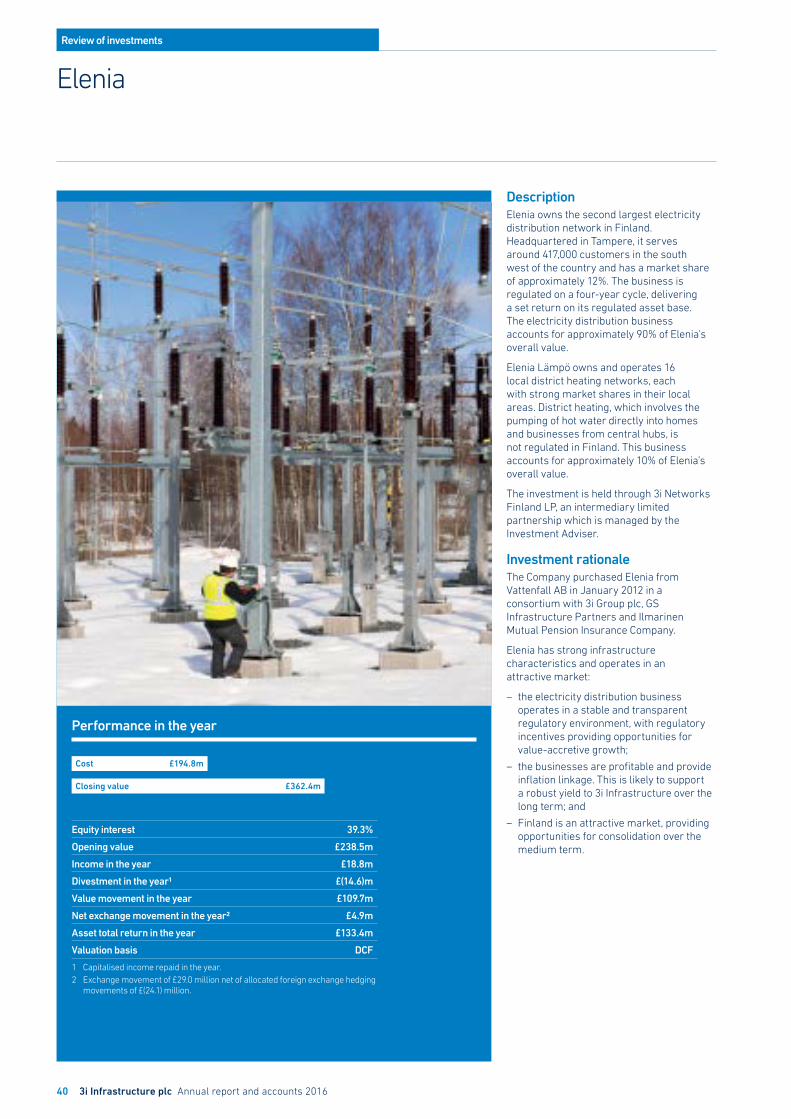
40 3i Infrastructure plc Annual report and accounts 2016
Review of investments
Cost £194.8m
Closing value £362.4m
Performance in the year
Elenia
DescriptionElenia owns the second largest electricity distribution network in Finland. Headquartered in Tampere, it serves around 417,000 customers in the south west of the country and has a market share of approximately 12%. The business is regulated on a four-year cycle, delivering a set return on its regulated asset base. The electricity distribution business accounts for approximately 90% of Elenia’s overall value.
Elenia Lämpö owns and operates 16 local district heating networks, each with strong market shares in their local areas. District heating, which involves the pumping of hot water directly into homes and businesses from central hubs, is not regulated in Finland. This business accounts for approximately 10% of Elenia’s overall value.
The investment is held through 3i Networks Finland LP, an intermediary limited partnership which is managed by the Investment Adviser.
Investment rationaleThe Company purchased Elenia from Vattenfall AB in January 2012 in a consortium with 3i Group plc, GS Infrastructure Partners and Ilmarinen Mutual Pension Insurance Company.
Elenia has strong infrastructure characteristics and operates in an attractive market:
– the electricity distribution business operates in a stable and transparent regulatory environment, with regulatory incentives providing opportunities for value-accretive growth;
– the businesses are profitable and provide inflation linkage. This is likely to support a robust yield to 3i Infrastructure over the long term; and
– Finland is an attractive market, providing opportunities for consolidation over the medium term.
Equity interest 39.3%
Opening value £238.5m
Income in the year £18.8m
Divestment in the year1 £(14.6)m
Value movement in the year £109.7m
Net exchange movement in the year2 £4.9m
Asset total return in the year £133.4m
Valuation basis DCF
1 Capitalised income repaid in the year.2 Exchange movement of £29.0 million net of allocated foreign exchange hedging
movements of £(24.1) million.
413i Infrastructure plc Annual report and accounts 2016
Review of investments
Achievements in the period of ownershipThe businesses were rebranded with the “Elenia” name in May 2012, reinforcing the separation from Vattenfall to domestic audiences.
The business successfully completed the post-acquisition corporate reorganisation in early January 2013. This allowed Elenia to begin distributing dividends to shareholders. In December 2013, Elenia’s original acquisition debt was fully refinanced through a Whole Business Securitisation, the first of its kind to be applied to a non-UK European utility. This was an important milestone for the business, with positive implications for value, as it provided a platform for access to the long-term capital markets and reduced the ongoing cost of debt. Elenia’s governance was enhanced through the appointment of new independent chairmen to the boards of each business, as well as through a number of management appointments to further strengthen the executive teams. In addition, management incentives were put in place to align management incentivisation to the objectives of the shareholders.
The consortium has engaged with the management team of Elenia to update and enhance its capital expenditure plans to improve network reliability. Since acquisition in January 2012, Elenia has invested more than €340 million in developing its electricity network, with a particular emphasis on improving service reliability and weather proofing. The rate of underground cabling has improved from 23% at acquisition to 34% as at 31 December 2015. A number of acquisitions have also been examined, with the first bolt-on acquisition of an adjacent network completed in August 2012.
Throughout the period of ownership, the consortium has supported the management team in its dialogue with the regulator. The regulator introduced a new security of supply incentive, aimed at improving the reliability of electricity supply in response to outages caused by severe weather conditions in 2011 and 2012, effective from January 2014, and more recently confirmed a revised approach to asset depreciation. During the year, the regulator published its final determination for the two regulatory periods beginning on 1 January 2016. As described below, this is favourable for the industry and for Elenia, and has had a positive impact on the value of the Company’s holding in the business.
In July 2014, Elenia became the first electricity distribution network in Europe and second in the world to receive ISO 55001 certification. ISO 55001 is a set of international standards establishing best practice for the systems and operations of companies in asset-intensive industries.
Developments in the yearOverall, both businesses continued to perform well operationally and financially, despite warmer than average weather conditions reducing demand and the impact of a number of severe storms throughout the year, which resulted in power disruptions and higher than average regulatory outage costs.
In December 2015, the Finnish Energy Authority, which regulates electricity distribution in Finland, published its final determination for the 2016–2019 and 2020–2023 regulatory periods. The new guidelines include several changes to address the issue of the low allowed return on capital experienced by all distribution companies over recent years, with the objective of incentivising distribution companies to improve the security of supply. The determination is broadly in line with the draft guidelines published earlier in the year.
In February 2016 Elenia announced that it would increase its distribution prices by an average of 9.4% with effect from 1 April 2016 in order to support further investment in the reliability of its network.
Following the proposed distribution price increases announced by certain other Finnish distribution companies, the Energy Authority issued a memorandum (at the request of the Finnish Ministry of Employment and the Economy) proposing that the Ministry consider legislative steps to: (i) define a limit on one-off increases in the electricity distribution tariff and minimum intervals between such increases; and (ii) ensure that a sufficient share of the income deriving from the electricity distribution tariffs is directed to network investments. The Ministry has confirmed that these proposals serve as the basis for the Government’s further assessment of the potential legislative changes and indicated that it anticipates that such potential changes could enter into force by the beginning of 2017. We do not expect this new legislation to impact materially the value of the Company’s holding in Elenia.
Elenia was able to continue to take advantage of the favourable credit market conditions during the year, issuing new bonds, with maturities to 2030 and 2031, on attractive terms, which it has used to repay bank debt and fund capex.
Elenia, supported by the consortium, continues to monitor potential acquisition opportunities in the fragmented electricity distribution market. Consolidation of the existing network would allow Elenia to leverage its operational expertise.
On 1 August 2015, Tommi Valento, formerly Group Treasurer at Pohjolan Voima Oy, was appointed as CFO of the business, replacing Aapo Nikunen.
Elenia revised its long-term business plan to reflect the impact of the new regulatory guidelines. Together with the reduction in the discount rate used to value the investment, this led to a value uplift in the Company’s holding in Elenia of £109.7 million over the year.
As announced on 15 January 2016, and further to the announcement by Elenia Finance Oyj on the same date, the shareholders in Elenia are undertaking a strategic review of their interests in the business. The shareholders continue to explore their options, and no decisions have been made.
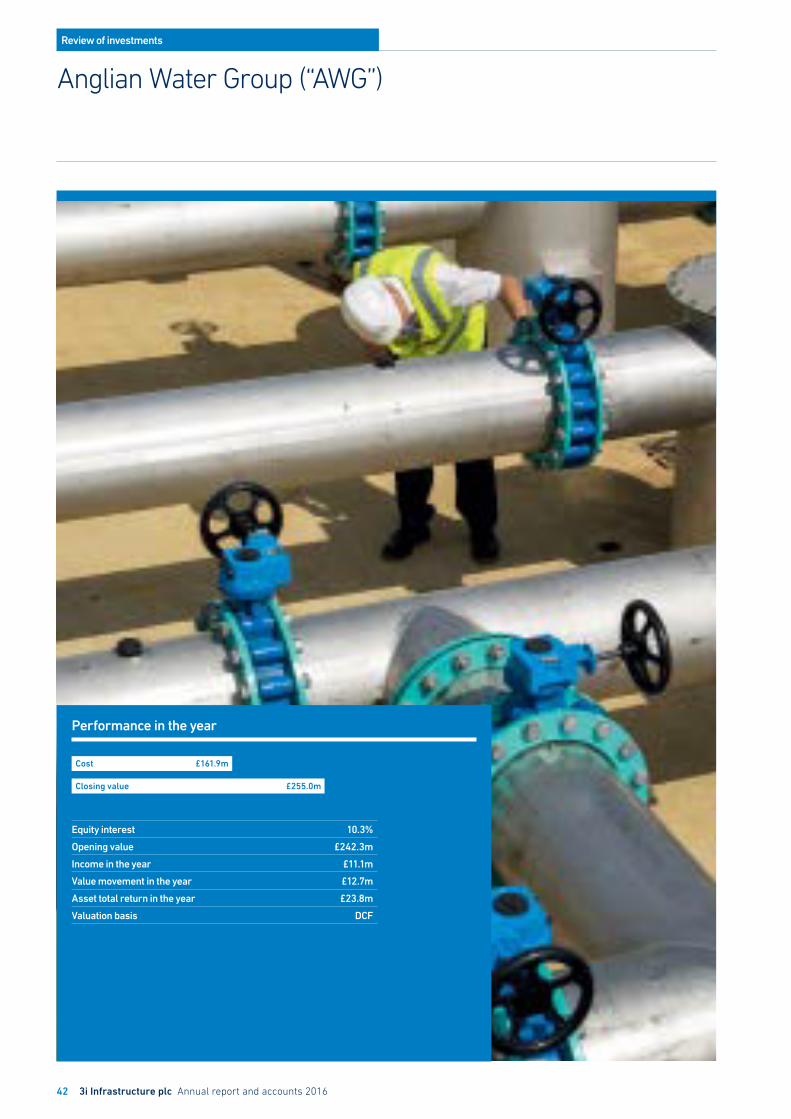
42 3i Infrastructure plc Annual report and accounts 2016
Review of investments
Equity interest 10.3%
Opening value £242.3m
Income in the year £11.1m
Value movement in the year £12.7m
Asset total return in the year £23.8m
Valuation basis DCF
Anglian Water Group (“AWG”)
Performance in the year
Cost £161.9m
Closing value £255.0m
433i Infrastructure plc Annual report and accounts 2016
Review of investments
DescriptionAnglian Water Group Limited is the parent company of Anglian Water, the largest water and water recycling company in England and Wales by geographical area and the fourth largest as measured by regulatory capital value. The majority of the group’s revenue is earned through tariffs regulated by Ofwat and linked to RPI.
The investment is held through 3i Osprey LP, an intermediary limited partnership whose partners comprise other third parties (including 3i Group, which has a small interest) and which is managed by the Investment Adviser.
Investment rationaleAWG was taken private in 2006 by a group of investors, including 3i Group, which “seeded” part of its AWG holding into 3i Infrastructure when the Company was set up in 2007. The business has strong infrastructure characteristics:
– a regulated near-monopoly position in its geographical area for the provision of water and water recycling services;
– stable and predictable earnings and cash flows through RPI-linked tariffs; and
– largely predictable operating costs.
In addition, AWG has attractive fundamentals:
– a strong and well-established management team;
– a well maintained asset base;
– operations in a geographic region with high population growth and relatively low industrial exposure, limiting cyclical correlation; and
– a track record of strong operational performance.
Achievements in the period of ownershipAWG has flourished under private ownership. It has refocused on its core business, selling Morrison Utilities Services, Morrison Facilities Services and much of its property portfolio. The company has been able to optimise its capital structure compared to listed peers and to distribute a higher proportion of cash flows to shareholders, resulting in a strong yield. The regulated capital value has grown steadily, underpinned by a comprehensive capital expenditure programme, which will be maintained for the 2015–2020 regulatory period (“AMP6”).
A new management incentive scheme was put in place post investment, aligning compensation with long-term value growth, asset quality and customer service rather than short-term earnings and share price performance. The management team now balances long-term planning, for example, to respond to the challenges of climate change, with a clear focus on operational efficiency and customer service.
Developments in the yearAWG performed well during the year, with operational performance and income levels in line with expectations. The business is currently focused on implementing its cost efficiency and capital spending programmes to drive value through the 2015–2020 regulatory period, which began on 1 April 2015. As part of the regulatory settlement for AMP6, AWG also has a set of Outcome Delivery Incentives. These are key operational performance parameters against which AWG will be judged and which carry material financial incentives and penalties. The business, with input from the Investment Adviser and other shareholders, is currently implementing initiatives to optimise performance against these parameters.
The core water business continues to perform well operationally. Ofwat did not produce its Service Incentive Mechanism survey for the year ending 31 March 2015 as the industry had just received its final settlement for AMP6. However, Anglian Water ranked third qualitatively in Ofwat’s survey for the financial year to March 2016, the first to be measured under the new regime, with the quantitative results still to come.
As expected, revenues were lower during the year due to the reduction in average bills following the regulatory settlement and a slight reduction in demand from residential customers. Also, as expected, operating costs were slightly higher as AWG implements measures in response to the new Outcome Delivery Incentive targets. There were no major operational incidents and water resource levels are normal for this point in the year.
During the second half of the year, Anglian Water completed its IRIS programme, which involved upgrading the telemetry system across its entire asset base. The new system will give Anglian Water a much greater level of oversight of its asset base and operations, which will assist it in planning and implementing its asset maintenance programme.
The Water Act became law in 2014, setting out a number of changes to the structure of the industry, including placing water
supply resilience at the heart of decision-making in the sector, extending competition for business customers and changing the abstraction regime to encourage more efficient use of water resources. Most of the changes in the Water Act had been well signalled and, as a top performing company AWG is well placed to accommodate the proposed changes. However, the structural nature of market liberalisation means that increasing amounts of management time will be consumed over the next year as AWG works towards the non-household retail market opening in April 2017. In December 2015, Ofwat published its Water 2020 consultation document, which sets out its proposals for the regulatory framework for wholesale markets and the 2019 price review, including opening up of the sludge and water resources markets and the introduction of CPI indexation. The proposals in Water 2020 had largely been well trailed and AWG is engaging proactively in this consultation along with the rest of the industry.
In the current environment of low inflation and in order to preserve greater financial flexibility, the board of AWG has decided to manage gearing downwards slightly through the end of this AMP. This will reduce dividends to the Company from those previously anticipated, and reduced the year end value accordingly.
Anglian Water has diverse sources of funding, and successfully refinanced its bank facilities and certain long dated bonds during the year on attractive terms.
On 1 April 2015, Stephen Billingham, former CFO of British Energy and currently chairman of Punch Taverns, took over as chairman of AWG from Robert Napier. In addition during April, John Hirst, formerly CEO of the Met Office, Steve Good, former CEO of Low & Bonar, and Polly Courtice, a Director of the University of Cambridge Institute for Sustainability Leadership, were appointed to the Board of the regulated water company as non-executive directors. Christopher Garnett and John Watkinson stepped down as non-executive directors of the regulated water company at the end of 2015.
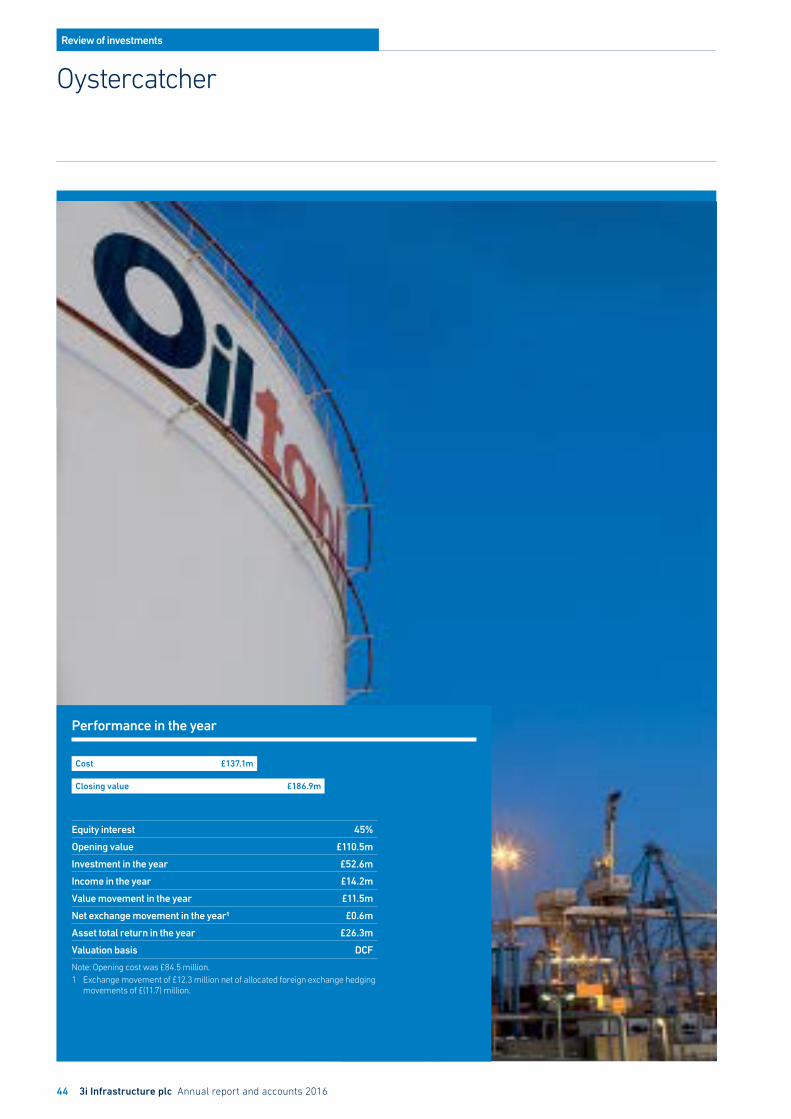
44 3i Infrastructure plc Annual report and accounts 2016
Review of investments
Oystercatcher
Performance in the year
Equity interest 45%
Opening value £110.5m
Investment in the year £52.6m
Income in the year £14.2m
Value movement in the year £11.5m
Net exchange movement in the year1 £0.6m
Asset total return in the year £26.3m
Valuation basis DCF
Note: Opening cost was £84.5 million.1 Exchange movement of £12.3 million net of allocated foreign exchange hedging
movements of £(11.7) million.
Cost £137.1m
Closing value £186.9m
453i Infrastructure plc Annual report and accounts 2016
Review of investments
DescriptionOystercatcher Luxco 2 S.à r.l. (“Oystercatcher”) is the holding company through which the Company holds 45% interests in five subsidiaries of Oiltanking GmbH (“Oiltanking”), located in Belgium, Malta, the Netherlands and Singapore.
These businesses provide over five million cubic metres of oil, petroleum and other oil-related storage facilities and associated services to a broad range of clients, including private and state oil companies, refiners, petrochemical companies and traders.
Oiltanking is one of the world’s leading independent storage partners for oils, chemicals and gases, operating 73 terminals in 22 countries with a total storage capacity of 19 million cubic metres.
Investment rationaleThe investment in the Amsterdam, Malta and Singapore terminals was completed in August 2007, while the investment in the Ghent (Belgium) and Terneuzen (Netherlands) terminals was completed in June 2015.
The key elements of the investment case for the terminals are:
– there is strong projected demand for oil and oil-related products;
– storage capacity remains scarce and is a key component of the oil and oil product supply chain, resulting in high occupancy;
– the businesses provide essential services and the terminals benefit from facilities and operational capabilities that make them attractive to existing and potential clients;
– the terminals are defensively located in key trading hubs and continue to benefit from high utilisation levels;
– contracts are let on a use-or-pay basis with fixed terms of up to 10 years, often with tariffs linked to local inflation rates, resulting in reliable cash flows; and
– the transactions allowed 3i Infrastructure to partner with a leading player in the oil storage market, with a strong operational reputation.
Achievements in the period of ownershipThe investment case has largely been confirmed, with the investments performing well. Storage capacity has been substantially let throughout the period of investment, and throughput levels have been high.
The Investment Adviser was actively involved in the assessment of a range of capital expenditure project proposals that have delivered long-term value accretion. In Singapore, a 160,000 cubic metre expansion project was approved in 2008 to accommodate increasing demand from adjacent refineries and petrochemical industries. This was completed in June 2009, with the capacity let on a use-or-pay basis under a long-term contract to an existing customer. In Amsterdam, a 42,000 cubic metre expansion project to provide dedicated storage for biodiesel products for a new production facility adjacent to the site was completed in June 2011. This capacity was pre-let on a use-or-pay basis. Several smaller investments were approved to upgrade throughput and customer service. In Malta, investment in a new 13,000 cubic metre tank was approved in 2011, completed in February 2012, and let on a use-or-pay basis to an existing customer. Since investment, total capacity at these three terminals has increased by 28%.
Oystercatcher’s portfolio of investments was diversified further in June 2015 through the acquisition of 45% stakes in the Oiltanking Ghent and Oiltanking Terneuzen terminals, located in the strategically important Amsterdam-Rotterdam-Antwerp region.
Oystercatcher completed a refinancing of its acquisition debt facilities in March 2013, and a further refinancing in October 2014. Both achieved good terms, extending the maturity date and lowering debt servicing costs.
Developments in the yearDuring the year, 3i Infrastructure completed its acquisition of 45% interests in two further Oiltanking terminals in Ghent in Belgium and Terneuzen in the Netherlands. Of the total £77.8 million consideration for these investments, £25.2 million was funded by additional debt in Oystercatcher, which holds the two investments alongside its existing 45% interest in Oiltanking Amsterdam, Oiltanking Malta and Oiltanking Singapore.
The market conditions for trading customers improved during the year, with periods of contango (when the spot or cash price of a commodity is lower than the forward price) in key product markets. This was offset by a reduction in demand for storage of certain products in parts of Europe, and by additional storage capacity coming on line in the Singapore region, which has led to some pressure on the storage rates at the point of contract renewal. The strong market position of the five terminals continues to ensure that capacity at each terminal remains substantially let and that contract renewals continue to be agreed on good terms. Overall, the terminals performed well during the year and faced no significant operational issues.
A number of capital investment projects, to expand capacity and/or to improve further the operational capabilities of the terminals, are currently being explored.
The discount rate used to value Oystercatcher was reduced at the end of March 2016, to reflect the fact that the vehicle now owns a larger and more diverse set of terminals, which also contributes to reducing the refinancing risk, as the debt is now serviced by cash flows from five businesses.
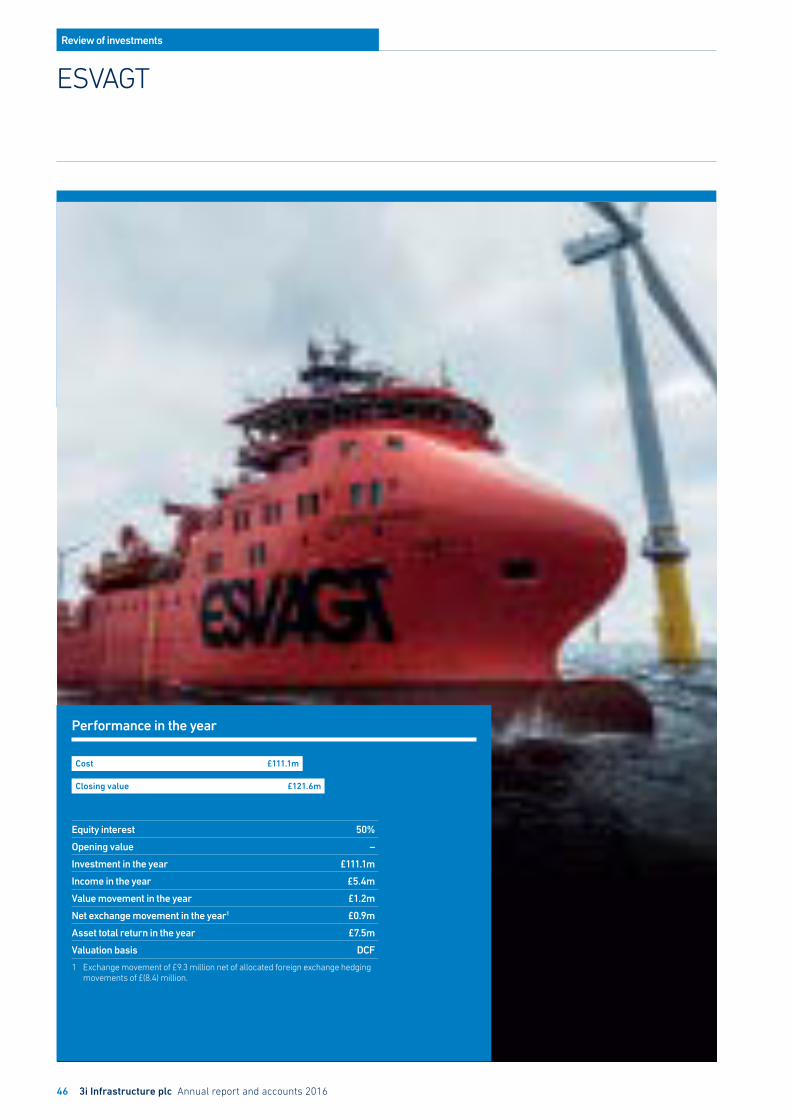
46 3i Infrastructure plc Annual report and accounts 2016
Review of investments
Cost £111.1m
Closing value £121.6m
Performance in the year
Equity interest 50%
Opening value –
Investment in the year £111.1m
Income in the year £5.4m
Value movement in the year £1.2m
Net exchange movement in the year1 £0.9m
Asset total return in the year £7.5m
Valuation basis DCF
1 Exchange movement of £9.3 million net of allocated foreign exchange hedging movements of £(8.4) million.
ESVAGT
473i Infrastructure plc Annual report and accounts 2016
Review of investments
DescriptionHeadquartered in Esbjerg, Denmark, ESVAGT is a leading provider of emergency rescue and response vessels (“ERRV”) and related services to the offshore energy industry in and around the North Sea and the Barents Sea. ESVAGT has been operating since 1981, employs over 900 people and owns a fleet of 43 vessels. Its services mainly involve the rescue and recovery of personnel, but also include the dispersion and recovery of oil spills, crew transfers, towing, and the warning of vessels that approach platforms too closely. It has an established position as a leading provider of emergency response and rescue services in offshore Denmark and Norway, with market shares of approximately 100% and 50% respectively, as well as a growing presence in the UK and high growth offshore wind services segments. Approximately 80% of ESVAGT’s ERRV revenues are associated with North Sea oil and gas production support, with the balance associated with North Sea oil and gas exploration expenditure and offshore wind services.
Investment rationale3i Infrastructure acquired ESVAGT from AP Møller-Maersk and other minority shareholders in September 2015, in a consortium with AMP Capital.
ESVAGT has strong infrastructure characteristics and operates in an attractive market:
– it is a market leader in Denmark and Norway, and has a small but growing presence in the UK offshore oil and gas market and in the expanding North Sea offshore wind sector;
– it is an asset intensive business, with a modern state-of-the-art fleet of purpose-built vessels;
– a high proportion of its revenues are contracted over the medium term with a diverse customer base featuring limited customer concentration, underpinning stable and predictable cash flows;
– it provides an essential service for the offshore energy industry in light of regulatory health and safety requirements, which constitutes a small component of the overall production cost, resulting in lower price sensitivity;
– it operates in a market with high barriers to entry, as customers require bespoke vessels, manned by experienced crews with a strong safety track record. The harsh weather conditions and language barriers also inhibit new market entrants based outside the region; and
– with its leading market position, strong safety track record and state-of-the-art fleet, ESVAGT is optimally positioned to exploit growth opportunities in the UK and potentially further afield, as well as in the offshore wind energy market.
Developments in the yearESVAGT performed in line with our investment case during the year.
The market conditions in which ESVAGT operates have been challenging, with oil prices declining since the Company invested, but ESVAGT’s performance has remained resilient against this backdrop. While lower oil prices may have affected oil majors’ short-term exploration plans, they have not affected producing platforms, which ESVAGT services through medium and long-term contracts, with high contract renewal rates. In addition, these challenging conditions could provide some growth opportunities for ESVAGT, which has the advantages of scale, a younger fleet and better profitability in comparison with some of its smaller competitors.
ESVAGT is well placed to leverage its strong market position to capitalise on growth opportunities in the UK market as well as the offshore wind energy support market, and made good progress towards that objective during the year. On 7 December 2015, it announced that it had signed an agreement with MHI Vestas to provide a bespoke service operation vessel in support of the Belwind 1 and Nobelwind Belgian offshore wind power developments. Under the terms of the agreement, ESVAGT will operate the vessel for the exclusive use of MHI Vestas’ on-site wind park engineering team for a period of 10 years from vessel delivery, which is expected in mid-2017.
The agreement builds on an existing five-year partnership with MHI Vestas and demonstrates the company’s strong customer relationships, its best in class operations and its partnership approach.
The Investment Adviser has developed a strong working relationship with members of the management team and is working closely with them to drive the business forward. As part of this process, the Investment Adviser assisted with the appointment of a new Chairman, Jesper Lok, who took office on 1 November 2015. Jesper is a strong addition to the Board and brings over 25 years of experience from the A.P. Moller-Maersk Group, having worked in Japan, Taiwan, Pakistan and Nigeria before heading SVITZER, the Maersk subsidiary that was formerly ESVAGT’s parent company, as CEO. In 2012, he joined DSB, the Danish railroads, as CEO and led the company’s turnaround. Most recently, he was CEO of Falck’s Emergency division.
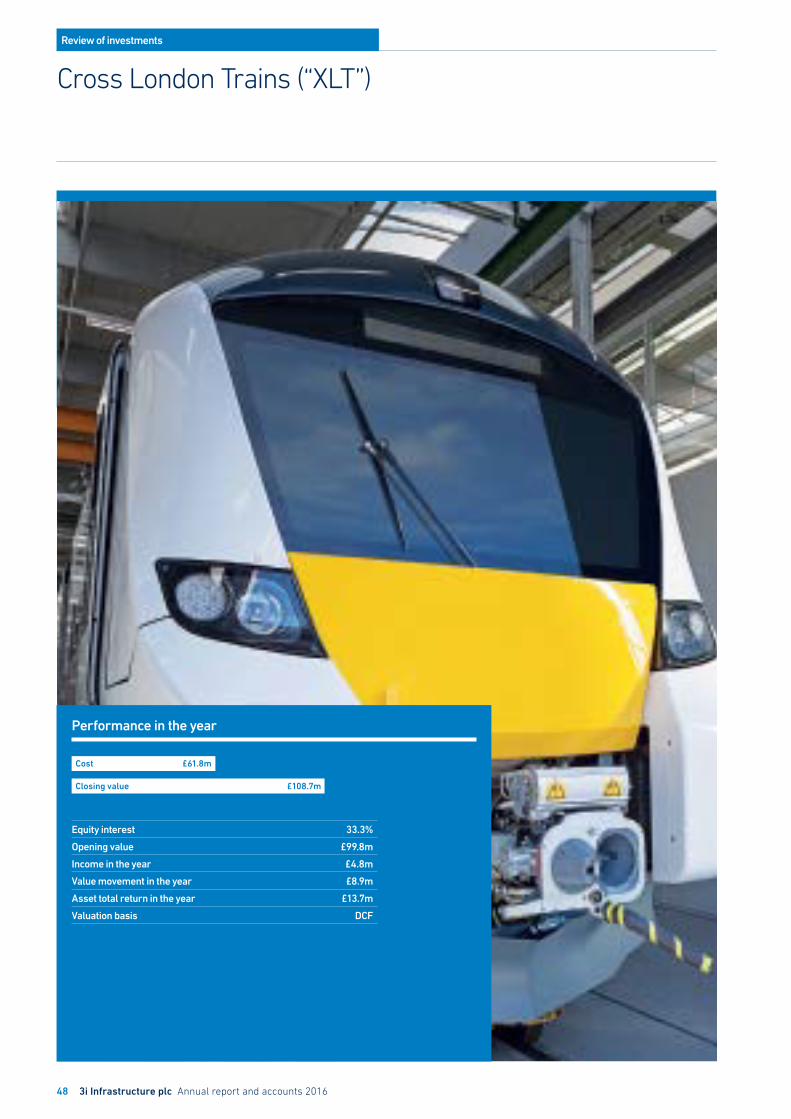
48 3i Infrastructure plc Annual report and accounts 2016
Review of investments
Equity interest 33.3%
Opening value £99.8m
Income in the year £4.8m
Value movement in the year £8.9m
Asset total return in the year £13.7m
Valuation basis DCF
Cross London Trains (“XLT”)
Performance in the year
Cost £61.8m
Closing value £108.7m
493i Infrastructure plc Annual report and accounts 2016
Review of investments
DescriptionCross London Trains is a company established to procure and lease the rolling stock for use on the Thameslink passenger rail franchise. As part of a wider upgrade of the Thameslink rail network, XLT is investing £1.6 billion in a fleet of new Siemens Desiro City commuter rail carriages to be leased to the Thameslink rail franchise operator, with the continued leasing of the trains underpinned by the Department for Transport (“DfT”) for a period of 20 years (the “s54 period”).
Siemens is manufacturing and will deliver the trains over a period of five years, with the first delivery into service expected in 2016. The fleet will comprise 1,140 Desiro City commuter rail carriages, capable of running on both overhead and third rail lines.
The fleet will be maintained by Siemens under a long-term service agreement. Following the initial 20-year s54 period, XLT will retain the ownership of the fleet and will be free to lease the trains for the remainder of their useful life. The Company owns 33.3% of the equity in XLT, in consortium with Siemens Project Ventures GmbH and Innisfree Limited.
Investment rationaleThe investment has strong infrastructure characteristics and fits well within 3i Infrastructure’s investment mandate as:
– it is a strategic asset, operating in the capacity-constrained London commuter market;
– it will generate high quality, low-risk cash flows, with rentals due on a “hell or high water” basis and lease revenues underpinned for 20 years by the DfT;
– it will retain ownership of the trains following this initial 20-year period, with their residual value supported by favourable market dynamics; and
– it allows the Company to partner with Siemens, a market leader in UK rolling stock manufacture and maintenance.
Achievements in the period of ownershipA senior management team was installed at XLT, comprising a new executive chairman and a managing director with relevant industry experience. Andy Pitt, executive chairman, was previously managing director of South West Trains. Charles Doyle, managing director, was previously a commercial principal at Transport for London. They have successfully set up all necessary business functions and built a strong working relationship with Eversholt Rail, which provides technical engineering and administrative services to the business under a long-term management services contract.
XLT, supported by its shareholders, has engaged proactively with a number of stakeholders, including Siemens, the DfT, Network Rail (“NR”) and the franchise holder, Govia Thameslink Railway (“GTR”). GTR has been the holder of the Thameslink franchise since September 2014 and XLT has built a good working relationship with its management team.
The Company and the Investment Adviser have built a strong working relationship with Siemens and Innisfree, the other shareholders in XLT.
The investment was immediately accretive to the Company through interest payments, and generates an attractive yield.
Developments in the yearDuring the year, Siemens made good progress with the manufacturing of the trains. In total, 23 trains were completed and delivered for testing in Germany, eight of which have been delivered for testing in the UK. The focus is now on the acceptance of units for passenger service in the UK, a complex process driven by GTR as franchise holder, which also involves multiple third-party stakeholders, as well as Siemens, XLT and Eversholt Rail. GTR is ultimately responsible for the safe operation of the trains, while NR has to deliver the underlying infrastructure. There are some initial delays in the acceptance programme and the Investment Adviser is working closely with XLT management, Siemens and GTR to resolve the issues. The provisional acceptance of the first unit by GTR took place in March 2016, with the delivery programme scheduled to complete in 2018.
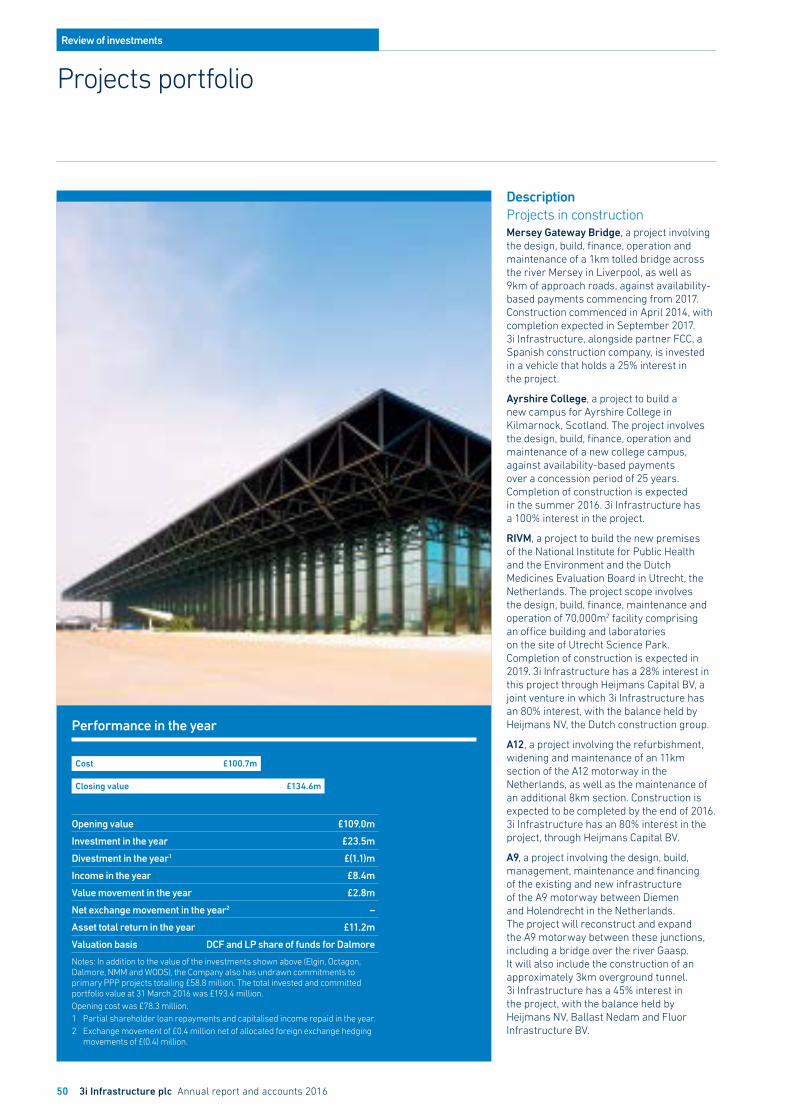
50 3i Infrastructure plc Annual report and accounts 2016
Review of investments
Performance in the year
Opening value £109.0m
Investment in the year £23.5m
Divestment in the year1 £(1.1)m
Income in the year £8.4m
Value movement in the year £2.8m
Net exchange movement in the year2 –
Asset total return in the year £11.2m
Valuation basis DCF and LP share of funds for Dalmore
Notes: In addition to the value of the investments shown above (Elgin, Octagon, Dalmore, NMM and WODS), the Company also has undrawn commitments to primary PPP projects totalling £58.8 million. The total invested and committed portfolio value at 31 March 2016 was £193.4 million. Opening cost was £78.3 million.1 Partial shareholder loan repayments and capitalised income repaid in the year. 2 Exchange movement of £0.4 million net of allocated foreign exchange hedging
movements of £(0.4) million.
Projects portfolio
DescriptionProjects in constructionMersey Gateway Bridge, a project involving the design, build, finance, operation and maintenance of a 1km tolled bridge across the river Mersey in Liverpool, as well as 9km of approach roads, against availability-based payments commencing from 2017. Construction commenced in April 2014, with completion expected in September 2017. 3i Infrastructure, alongside partner FCC, a Spanish construction company, is invested in a vehicle that holds a 25% interest in the project.
Ayrshire College, a project to build a new campus for Ayrshire College in Kilmarnock, Scotland. The project involves the design, build, finance, operation and maintenance of a new college campus, against availability-based payments over a concession period of 25 years. Completion of construction is expected in the summer 2016. 3i Infrastructure has a 100% interest in the project.
RIVM, a project to build the new premises of the National Institute for Public Health and the Environment and the Dutch Medicines Evaluation Board in Utrecht, the Netherlands. The project scope involves the design, build, finance, maintenance and operation of 70,000m2 facility comprising an office building and laboratories on the site of Utrecht Science Park. Completion of construction is expected in 2019. 3i Infrastructure has a 28% interest in this project through Heijmans Capital BV, a joint venture in which 3i Infrastructure has an 80% interest, with the balance held by Heijmans NV, the Dutch construction group.
A12, a project involving the refurbishment, widening and maintenance of an 11km section of the A12 motorway in the Netherlands, as well as the maintenance of an additional 8km section. Construction is expected to be completed by the end of 2016. 3i Infrastructure has an 80% interest in the project, through Heijmans Capital BV.
A9, a project involving the design, build, management, maintenance and financing of the existing and new infrastructure of the A9 motorway between Diemen and Holendrecht in the Netherlands. The project will reconstruct and expand the A9 motorway between these junctions, including a bridge over the river Gaasp. It will also include the construction of an approximately 3km overground tunnel. 3i Infrastructure has a 45% interest in the project, with the balance held by Heijmans NV, Ballast Nedam and Fluor Infrastructure BV.
Cost £100.7m
Closing value £134.6m
513i Infrastructure plc Annual report and accounts 2016
Review of investments
La Santé, a project involving the design, build, refurbishment, finance and maintenance of various buildings for La Santé prison in Paris. The project will also include the provision of facilities management services once construction is complete, which is expected to be by the end of 2018. 3i Infrastructure has an 80% interest in the project, with the balance held by subsidiaries of Vinci Construction France and GDF-Suez.
Condorcet Campus, a project involving the design, build and finance of new buildings for the Condorcet Campus, as well as the provision of facilities management services, in Aubervilliers, France. The project will also include classrooms, student housing, a faculty club, cafeterias and other student living facilities to be built for the use of social sciences students, faculty and research staff. Construction is expected to be completed by the summer of 2019. 3i Infrastructure has an 80% interest in the project, with the balance held by entities of the VINCI Construction France and ENGIE groups.
Operational projectsElgin is a portfolio of PFI project investments, comprising five schools projects and 11 community healthcare schemes, all of which are fully operational, under concessions of up to 32 years. The portfolio companies receive inflation-linked payments to cover services and buildings maintenance, which are subject to performance deductions for service failures and unavailability. Facilities services are sub-contracted to Robertson Facilities Management (in 15 projects) and Carillion Facilities Management (in one project).
Octagon is a concession company under a 35-year PFI contract to build, operate and maintain the Norfolk and Norwich University Hospital. Construction of the hospital was completed in August 2001. Octagon receives RPI-linked payments from the NHS Trust to cover services and buildings maintenance, which are subject to performance deductions for service failures and unavailability. Octagon sub-contracts the provision of facilities services to Serco.
Dalmore Capital Fund is a 25-year LP fund managed by Dalmore Capital Limited, investing in equity and subordinated debt in secondary PFI transactions which are operational and do not have volume-based payment regimes. The fund can invest across the social infrastructure sector and targets gross returns of 10% for its investors. The fund was fully drawn at 31 March 2015 with total commitments of £249 million.
National Military Museum is a project procured by the Dutch Ministry of Defence comprising the design, build, finance and maintenance of a museum facility on the site of the former Soesterberg Airbase, located approximately 60km south east of Amsterdam. The construction of the project was completed in September 2014, and the project became operational in the last financial year.
The facility exhibits military equipment and holds various related events including workshops and symposia on military research. The project is owned by Heijmans Capital BV, a joint venture between 3i and Heijmans.
Low-risk energy projectsWODS OFTO is a project jointly owned by 3i Infrastructure and PPP Equity PIP L.P., a fund managed by Dalmore Capital. The project involves the acquisition, financing and operation of power transmission cables and associated electrical equipment connecting the WODS offshore wind farm to the onshore grid in the Irish Sea. The OFTO assets include one offshore substation platform, two 40km long subsea cables, two 3km land cables and a new onshore substation. The project operates under a licence awarded by Ofgem, with a 20-year revenue entitlement period. The project was fully commissioned at acquisition and is generating good levels of income.
Investment rationaleExposure to PPP and low-risk energy projects provides the Company’s portfolio with low risk, index-linked cash flows. Investments in primary PPP projects tend to generate capital uplifts as the investments are managed from the construction phase through ramp-up.
Achievements in the period of ownershipAll operational assets in the PPP portfolio have performed well through their period of ownership, in line with, or ahead of, expectations, providing a good return to the Company since inception. This has been due principally to engaged portfolio management on the part of the Investment Adviser and other shareholders. The Investment Adviser has a strong track record in managing the development and construction risks for the primary PPP portfolio.
The Investment Adviser generated significant value through the sale of the Company’s holdings in Alma Mater, I2 and Alpha Schools at material uplifts over cost in 2008, 2009 and 2013 respectively, generating an aggregate IRR of 30%.
Developments in the yearAll assets in the operational PPP portfolio performed well operationally during the period, delivering good levels of income:
– Overall, the projects in the Elgin portfolio are performing in line with expectations. There is a construction defect in one of the schools which is being rectified by the original contractor.
– Octagon continues to perform in line with expectations.
– NMM is performing well and in line with expectations. The discount rate used to value NMM was reduced during the year to reflect it moving from a project in construction to an operational project, generating a value uplift of £1.6 million, or 35%.
– The Dalmore portfolio is performing to plan.
The Investment Adviser continues to be active in sourcing and making investments on behalf of the Company in greenfield projects. In March 2016, the Company committed to invest a total of £6.2 million in the Condorcet Campus in France.
In August 2015, the Company reached financial close on its £23.5 million investment in a 50% holding in the WODS OFTO project. This is the first OFTO to have been acquired by the Company. However, the Investment Adviser has extensive experience of managing OFTOs as a member of the Blue Transmission consortium, of which it has been a member since 3i Group’s acquisition of the Barclays Infrastructure platform in November 2013.
The Company’s greenfield projects portfolio is generally performing well, with construction proceeding broadly to plan and within budget. However, the commencement of construction of the RIVM project is significantly delayed and there is a risk of termination. The authority, SPV and contractor are working together to address the issues causing delay, which relate to the suitability of the building design to meet the specification. The Investment Adviser is closely involved in the negotiations.
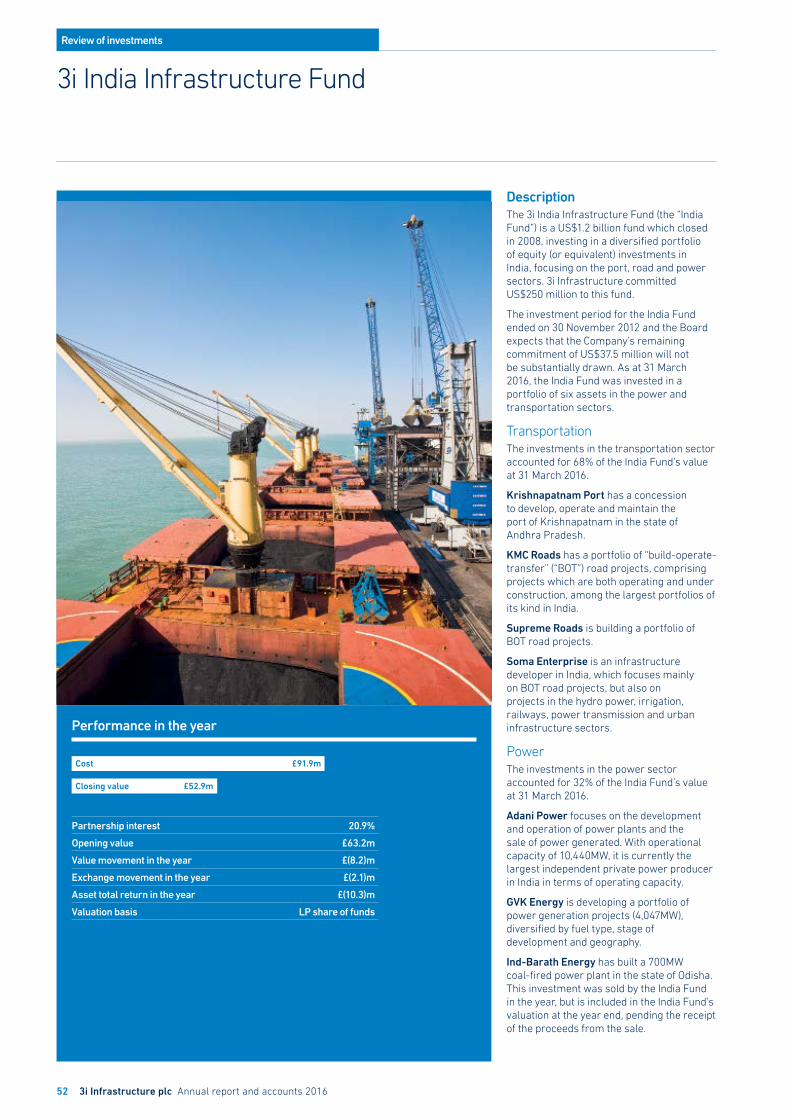
52 3i Infrastructure plc Annual report and accounts 2016
Review of investments
3i India Infrastructure Fund
DescriptionThe 3i India Infrastructure Fund (the “India Fund”) is a US$1.2 billion fund which closed in 2008, investing in a diversified portfolio of equity (or equivalent) investments in India, focusing on the port, road and power sectors. 3i Infrastructure committed US$250 million to this fund.
The investment period for the India Fund ended on 30 November 2012 and the Board expects that the Company’s remaining commitment of US$37.5 million will not be substantially drawn. As at 31 March 2016, the India Fund was invested in a portfolio of six assets in the power and transportation sectors.
TransportationThe investments in the transportation sector accounted for 68% of the India Fund’s value at 31 March 2016.
Krishnapatnam Port has a concession to develop, operate and maintain the port of Krishnapatnam in the state of Andhra Pradesh.
KMC Roads has a portfolio of “build-operate-transfer” (“BOT”) road projects, comprising projects which are both operating and under construction, among the largest portfolios of its kind in India.
Supreme Roads is building a portfolio of BOT road projects.
Soma Enterprise is an infrastructure developer in India, which focuses mainly on BOT road projects, but also on projects in the hydro power, irrigation, railways, power transmission and urban infrastructure sectors.
PowerThe investments in the power sector accounted for 32% of the India Fund’s value at 31 March 2016.
Adani Power focuses on the development and operation of power plants and the sale of power generated. With operational capacity of 10,440MW, it is currently the largest independent private power producer in India in terms of operating capacity.
GVK Energy is developing a portfolio of power generation projects (4,047MW), diversified by fuel type, stage of development and geography.
Ind-Barath Energy has built a 700MW coal-fired power plant in the state of Odisha. This investment was sold by the India Fund in the year, but is included in the India Fund’s valuation at the year end, pending the receipt of the proceeds from the sale.
Performance in the year
Partnership interest 20.9%
Opening value £63.2m
Value movement in the year £(8.2)m
Exchange movement in the year £(2.1)m
Asset total return in the year £(10.3)m
Valuation basis LP share of funds
Cost £91.9m
Closing value £52.9m
533i Infrastructure plc Annual report and accounts 2016
Review of investments
Investment rationaleThe investment case underpinning the Company’s commitment to the India Fund in 2007 can be summarised as follows:
– there was much need for infrastructure investment in India, with the infrastructure deficit in the country providing opportunity for private investment;
– the Indian Government was actively seeking and encouraging private investment in infrastructure development;
– the investment in the India Fund offered 3i Infrastructure exposure to a diversified pool of assets and larger investments than the Company could access on its own account, at no additional cost to the Company; and
– the India Fund was well positioned, with an established presence in its market through its investment manager.
Achievements in the period of ownershipThe India Fund reached the end of its investment period in November 2012 and now has a diversified portfolio of assets in the power, ports and roads sectors, in line with its mandate. 3i Investments, which manages the India Fund, is focused on monitoring the portfolio and on realising value from the portfolio over the next two to three years, as market conditions allow. To date, the Fund has sold approximately 54% of its holding in Adani Power, and during the year sold its entire holding in Ind-Barath Energy, the proceeds from which are expected to be received in the first quarter of FY17.
The valuation of the India Fund’s assets has been affected by a number of market and other external factors over its life, including the depreciation of the Indian rupee against sterling. At 31 March 2016, the India Fund’s net asset value was 0.75x its investment cost in rupee terms, and 0.59x in sterling terms. Overall, the Board is satisfied that appropriate action is being taken to manage the performance of the India Fund’s assets within the constraints of the macroeconomic and market challenges.
Developments in the yearOverall the performance of the investments in the India Fund remained weak in the year. The Modi government, elected in May 2014, has made a number of important policy statements in support of investment in the infrastructure sector. However, these statements have yet to translate into concrete initiatives that can improve the performance of the portfolio materially.
During the year, the Indian rupee depreciated against sterling, resulting in a foreign exchange loss of £2.1 million.
Transportation The India Fund’s transportation assets were valued in aggregate at £35.9 million at 31 March 2016 (2015: £42.9 million).
The road investments continue to be adversely impacted by slow project execution and cash flow constraints for many companies in the construction sector. A number of the construction companies have restructured their debt obligations. These pressures are affecting all three of the road assets. The Investment Adviser continues to work with Soma Enterprise, KMC Roads and Supreme Roads to address their ongoing issues.
Krishnapatnam Port is performing well. On 30 September 2013, the India Fund exercised a put option over its holding in the company. The consideration due under the put option has not been paid and the India Fund is seeking to enforce its rights through legal action, including arbitration proceedings. The first hearing of the arbitration panel took place during the year, the outcome of which was satisfactory for the Fund. There have been several subsequent hearings in the Indian Supreme Court, as a result of which the next hearing of the arbitration panel is now expected to re-hear the matters it previously considered. This is scheduled for May 2016.
Power The power sector investments were valued in aggregate at £17.0 million at 31 March 2016 (2015: £20.3 million). The factors affecting their performance have remained broadly unchanged, and include:
– the availability of domestic coal: Coal India continues to struggle to match supplies with the contracted demand from power producers and the resulting shortfall is being made up with expensive imports. In addition, in 2014, the Supreme Court cancelled over 200 coal licences awarded to private sector operators, which has exacerbated the problem in the short term; and
– the availability of gas: production from India’s main gas fields has declined dramatically in recent years and today little gas is available for power production.
The Indian government has been working to resolve some of these issues, increasing the regulated price of gas to encourage increased exploration and production and developing a mechanism to allow power producers to pass through increased fuel costs through higher tariffs under existing long-term power purchase agreements (“PPAs”). However, the Supreme Court has ruled against these proposed changes to PPA tariffs, and the matter has been referred to the Regulator.
In FY15, the India fund sold approximately 54% of its holding in Adani Power, at an average price of 54 rupees per share. During the year, shares in Adani Power declined from 47.3 rupees per share at 31 March 2015 to 34.2 rupees at 31 March 2016. This poor performance reflects the ongoing tariff renegotiation dispute, high fuel costs and the impact of the depreciating rupee.
GVK continues to face gas availability shortages, further delays and cost escalations affecting the completion of its construction projects and was one of the companies to have a coal mining licence withdrawn by the Supreme Court. These factors together have increased funding requirements. However, during the year the Alaknanda hydro power project was fully commissioned and is now operating well.
During the year, the India Fund sold its entire holding in Ind-Barath Energy.
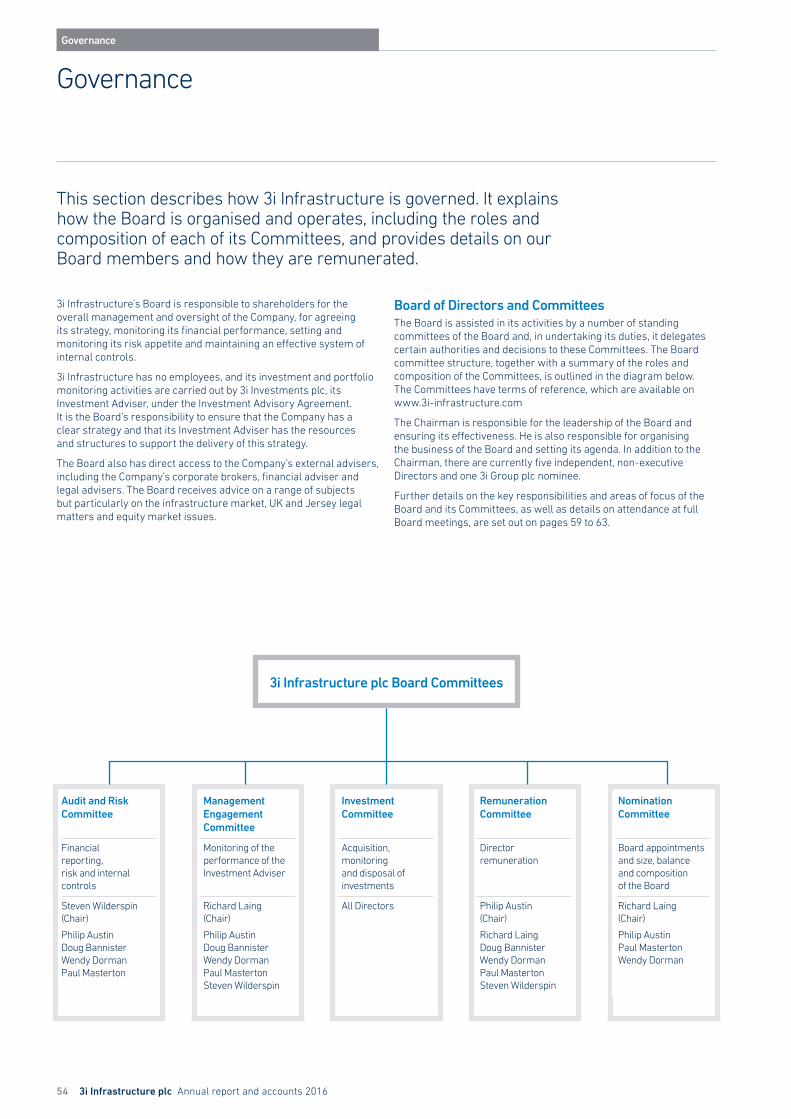
54 3i Infrastructure plc Annual report and accounts 2016
Governance
Governance
3i Infrastructure’s Board is responsible to shareholders for the overall management and oversight of the Company, for agreeing its strategy, monitoring its financial performance, setting and monitoring its risk appetite and maintaining an effective system of internal controls.
3i Infrastructure has no employees, and its investment and portfolio monitoring activities are carried out by 3i Investments plc, its Investment Adviser, under the Investment Advisory Agreement. It is the Board’s responsibility to ensure that the Company has a clear strategy and that its Investment Adviser has the resources and structures to support the delivery of this strategy.
The Board also has direct access to the Company’s external advisers, including the Company’s corporate brokers, financial adviser and legal advisers. The Board receives advice on a range of subjects but particularly on the infrastructure market, UK and Jersey legal matters and equity market issues.
Board of Directors and CommitteesThe Board is assisted in its activities by a number of standing committees of the Board and, in undertaking its duties, it delegates certain authorities and decisions to these Committees. The Board committee structure, together with a summary of the roles and composition of the Committees, is outlined in the diagram below. The Committees have terms of reference, which are available on www.3i-infrastructure.com
The Chairman is responsible for the leadership of the Board and ensuring its effectiveness. He is also responsible for organising the business of the Board and setting its agenda. In addition to the Chairman, there are currently five independent, non-executive Directors and one 3i Group plc nominee.
Further details on the key responsibilities and areas of focus of the Board and its Committees, as well as details on attendance at full Board meetings, are set out on pages 59 to 63.
Audit and Risk Committee
Management Engagement Committee
Investment Committee
Remuneration Committee
Nomination Committee
Financial reporting, risk and internal controls
Monitoring of the performance of the Investment Adviser
Acquisition, monitoring and disposal of investments
Director remuneration
Board appointments and size, balance and composition of the Board
Steven Wilderspin (Chair)
Philip AustinDoug BannisterWendy DormanPaul Masterton
Richard Laing (Chair)
Philip AustinDoug BannisterWendy DormanPaul MastertonSteven Wilderspin
All Directors Philip Austin (Chair)
Richard LaingDoug BannisterWendy DormanPaul MastertonSteven Wilderspin
Richard Laing (Chair)
Philip AustinPaul MastertonWendy Dorman
This section describes how 3i Infrastructure is governed. It explains how the Board is organised and operates, including the roles and composition of each of its Committees, and provides details on our Board members and how they are remunerated.
3i Infrastructure plc Board Committees

3i Infrastructure plc Annual report and accounts 2016 55
Governance
Board of Directors
Richard Laing Non-executive ChairmanRichard Laing was Chief Executive of CDC Group plc, from 2004 to 2011, having joined the organisation in 2000 as Finance Director. Prior to CDC, he spent 15 years at De La Rue, where he held a number of positions in the UK and internationally, latterly as the Group Finance Director. He was also a non-executive Director of Camelot. He previously worked in agribusiness and at PricewaterhouseCoopers and Marks & Spencer. His current non-executive appointments include JPMorgan Emerging Markets Investment Trust plc and Perpetual Income and Growth Investment Trust plc; Miro Forestry, which operates in Ghana and Sierra Leone and which he chairs; the Overseas Development Institute; and Plan UK, the international children’s charity. He is a Fellow of the Institute of Chartered Accountants in England and Wales (FCA). Board member since 1 January 2016, resident in the UK.
Philip Austin MBENon-executive Director, Senior Independent DirectorPhilip spent most of his career in banking with HSBC in the UK and Jersey and, from 1997 to 2001, was Deputy Chief Executive of the bank’s business in the Offshore Islands. In 2001, he became the founding CEO of Jersey Finance Ltd, the body set up as a joint venture between the government of Jersey and its Finance Industry, to represent and promote the Industry in Jersey and internationally. Between 2006 and 2009, he was at Equity Trust where he had direct responsibility for Jersey, Guernsey and Switzerland as well as being a member of the Group Executive Committee. He has since taken a number of directorships in companies in the financial services sector. He is a Fellow of the Chartered Institute of Bankers and a Fellow of the Institute of Management. Board member since 16 January 2007, resident in Jersey.
Doug BannisterNon-executive DirectorDoug has over 25 years of experience in the transportation sector, having led businesses trading around the world for P&O Nedlloyd and Maersk Line. He became Group CEO of the Ports of Jersey (Airport & Harbours) in 2011, with responsibility for the Island’s strategic aviation and maritime assets. Skilled in turnaround, restructuring and transformation of capital intense transportation businesses, he has been responsible for business improvements in a wide variety of transport and logistics activities in both the freight and passenger segments. Board member since 1 January 2015, resident in Jersey.
Wendy DormanNon-executive DirectorWendy is a chartered accountant who began her career as an auditor and went on to specialise in financial services taxation. In 2001, she moved from London to Jersey and she led the Channel Islands tax practice of PwC until June 2015. Wendy has over 25 years’ experience in taxation gained both in the UK and the offshore environment, working both in practice and in industry. Wendy is Chairman of the Jersey branch of the Institute of Directors and was awarded the 2011 IOD Jersey Female Director of the Year. She is also a non-executive director of Jersey Finance and CQS New City High Yield Fund Limited. She is a former President of the Jersey Society of Chartered and Certified Accountants. Board member since 1 March 2015, resident in Jersey.
Ian LobleyNon-executive DirectorIan joined 3i in 1987. He has been a Partner since 1994 and an active investor and board member across Europe, Asia and the USA. In his role as Partner – Asset Management, Ian has responsibility for investments in companies across a variety of sectors and is an experienced board member across multiple geographies. He is a member of the 3i Group Investment Committee and is a member of the BVCA UK and European Capital Committee. Board member since 6 May 2014, resident in the UK.
Paul MastertonNon-executive DirectorPaul spent most of his career in the printing and communications industry, holding various appointments in the UK, the US and Asia. From 2008 to 2013, Paul was the chief executive of the Durrell Wildlife Conservation Trust, an international wildlife charity. Paul has a number of directorships in banking, insurance and property development and, in 2012, was appointed as the founding chairman for Digital Jersey, a partnership between the Government of Jersey and the digital sector to represent and promote the industry. Board member since 4 April 2013, resident in Jersey.
Steven WilderspinNon-executive Director, Chairman of Audit and Risk CommitteeSteven has been the Principal of Wilderspin Independent Governance, which provides independent directorship services, since April 2007. He was previously a director of fund administrator at Maples Finance Jersey Limited. He has served on a number of private equity, property and hedge fund boards as well as the boards of special purpose companies engaged in structured finance transactions. Before that, from 1997, he acted as Head of Accounting at Perpetual Fund Management (Jersey) Limited. He also sits on the boards of two of 3i Infrastructure plc’s Luxembourg subsidiaries, 3i Infrastructure (Luxembourg) Holdings S.à r.l. and 3i Infrastructure (Luxembourg) S.à r.l. He is a qualified Chartered Accountant. Board member since 20 September 2007, resident in Jersey.
56 3i Infrastructure plc Annual report and accounts 2016
Governance
The Directors’ report contains statutory and corporate governance information for the year to 31 March 2016 (“the year”).
Principal activity3i Infrastructure is a closed-ended investment company that invests in infrastructure businesses and assets. The Directors do not anticipate any change in the principal activity of the Company in the foreseeable future. Its principal subsidiaries are shown on page 92.
Regulation3i Infrastructure is incorporated in Jersey and is regulated as a collective investment fund under the Collective Investment Funds (Jersey) Law 1988. It has a Premium Listing on the London Stock Exchange.
AIFMDThe Alternative Investment Fund Managers Directive (the “Directive”) entered into force on 22 July 2013. The Company is a non-EU Alternative Investment Fund (“AIF”) and is internally managed, which means that the Board of the Company also performs the functions of an Alternative Investment Fund Manager (“AIFM”) under the Directive and the AIF and the AIFM are the same entity. As a non-EU AIFM, the Company is currently outside the full scope of the Directive, but will be subject to a number of the Directive’s requirements should it wish to market the Company’s securities within the EU, depending on when and how such marketing of securities is performed.
NMPI On 31 January 2014, the Company issued a statement noting the changes to the UK Financial Conduct Authority (“FCA”) rules to the restrictions on the retail distribution of unregulated collective investment schemes and close substitutes (“non-mainstream pooled investments”, or “NMPIs”), which came into effect on 1 January 2014.
In this statement, the Company asserted that its shares are excluded from these rules and therefore the restrictions relating to NMPIs will not apply to its shares.
It is the Board’s intention that the Company will continue to conduct its affairs in such a manner that the Company’s shares will continue to be excluded from the FCA’s rules relating to NMPIs.
Results and dividendsThe Financial statements of the Company and its consolidated subsidiary (together referred to as the “Group”) for the year appear on pages 72 to 75. Total comprehensive income for the year was £166.2 million (2015: £266.8 million). An interim dividend of 3.625 pence per share (2015: 3.38 pence) in respect of the year to 31 March 2016 was paid on 7 January 2016. The Directors recommend that a final dividend of 3.625 pence per share (2015: 3.62 pence) be paid in respect of the year to 31 March 2016 to shareholders on the register at the close of business on 20 May 2016. The distribution of the dividend payments between interim and final dividends is evaluated by the Board each year, according to the Company’s performance, portfolio income generation and other factors, such as profits generated on the realisation of portfolio assets. The Company will be targeting a dividend for FY17 of 7.55 pence per share.
During the year, the Company paid a special dividend of 17 pence per share following the sale of Eversholt Rail, which completed in April 2016. The special dividend was paid on 31 July 2015.
Strategy, performance and principal risksThe Strategic report on pages 10 to 38 provides a review of the performance and position of the Company, together with a description of the principal risks and uncertainties that it faces.
OperationsThe Company has a non-executive Board of Directors and no employees. The Board acts as the Company’s Investment Committee and is responsible for the determination and supervision of the investment policy and for the approval of investment opportunities sourced by the Investment Adviser.
The Board also supervises the monitoring of existing investments and approves divestments and further financing of portfolio assets.
Advisory arrangements3i Investments plc (“3i Investments”), a wholly-owned subsidiary of 3i Group plc (“3i Group”), acts as Investment Adviser to the Company through its Infrastructure business. The investment advisory team provides advice to the Company on the origination and completion of new investments, on the realisation of investments, on funding requirements, as well as on the management of the investment portfolio. It provides its services under an Investment Advisory Agreement (the “IAA”), which includes an investment exclusivity arrangement in respect of investment opportunities within the Company’s investment policy.
Other significant service arrangementsIn addition to the arrangements described above, 3i plc and 3i Investments, in relation to certain regulatory services, have been appointed by the Company to provide support services to the Group, including treasury and accounting services, investor relations and other back office support services. The amounts payable under these arrangements are described in more detail in Note 18 on page 91.
Capita Financial Administrators (Jersey) Limited acts as the Administrator and Company Secretary to the Company.
Revolving Credit FacilityAt the start of the year, the Company was party to a £200 million multicurrency Revolving Credit Facility Agreement, which ran to 1 May 2016. This Facility was renewed on 7 May 2015 for a three-year term to 7 May 2018, with the size increased to £300 million to facilitate the management of the Company’s liquidity requirements. The Company has a right to request one- or two-year extensions to the maturity date of the Facility, which request(s) may be granted at the discretion of each lender individually. In April 2016, the term was extended by a further year to 7 May 2019. The Facility is secured by a fixed and floating charge over the directly held assets of the Company, and is subject to cancellation by the Company or termination by the banks in certain circumstances, which are market standard for such a facility, including if there is a change of investment adviser to the Company. Under the Facility agreement, the Company has the right to increase the size of the Facility by up to a further £200 million on the same interest margin and other terms and conditions, with the existing lenders having a right of first refusal. The Company exercised this right and on 25 April 2016 increased the Facility size to £500 million on a temporary basis until 31 December 2016, with the increase provided by existing lenders.
Directors’ report
3i Infrastructure plc Annual report and accounts 2016 57
Governance
Share capital and share consolidationThe issued share capital of the Company as at 31 March 2016 was 793,216,413 ordinary shares (2015: 881,351,570). In conjunction with the payment of the special dividend to shareholders described on page 31, during the year the Company implemented a share consolidation that was intended to maintain comparability, as far as possible, of the Company’s share price before and after the payment of the special dividend. The share consolidation replaced every 10 existing ordinary shares with nine new ordinary shares on 8 July 2015 following approval by a majority of the shareholders at the Extraordinary General Meeting (“EGM”) convened on 7 July 2015.
Major interests in ordinary sharesNotifications of the following voting interests in the Company’s ordinary share capital as at 31 March 2016 and 30 April 2016, which are disclosable in accordance with Chapter 5 of the FCA’s Disclosure and Transparency Rules, are as follows:
Interest in ordinary shares
Number of ordinary
shares1 as at 31 March
2016
% of issued share
capital
Number of ordinary
shares1 as at 30 April 2016
% of issued share
capital
3i Group plc (and subsidiaries) 269,375,960 34.0 269,375,960 34.0
Schroders plc 42,454,395 5.4 43,102,070 5.4
1 Each ordinary share carries the right to one vote.
Directors’ interestsIn accordance with FCA Listing Rule 9.8.6(R)(1), Directors’ interests in the shares of the Company (in respect of which transactions are notifiable to the Company under FCA Disclosure and Transparency Rule 3.1.2(R)) as at 31 March 2016 are shown below:
Directors’ interests and beneficial interests1Ordinary shares at 31 March 2016
Richard Laing2 20,000
Philip Austin 9,000
Doug Bannister –
Wendy Dorman –
Ian Lobley –
Paul Masterton 9,000
Steven Wilderspin 25,000
1 No options have ever been granted since the inception of the Company.2 Served from 1 January 2016.
In the period from 1 April 2016 to 30 April 2016, there were no changes in the interests of each serving Director.
Directors’ authority to buy back sharesThe Company did not purchase any of its own shares during the year. The current authority of the Company to make market purchases of up to 14.99% of the issued ordinary share capital expires at the next Annual General Meeting (“AGM”), to be held on 7 July 2016 (“the 2016 AGM”). The Company will seek to renew such authority until the end of the AGM in 2017, specifying the maximum and minimum price at which shares can be bought back. Any buyback of ordinary shares will be made subject to Jersey law and the making and timing of any buybacks will be at the absolute discretion of the Directors. Such purchases will also only be made in accordance with the Listing Rules of the FCA which provide that the price paid must not be more than the higher of: (i) 5% above the average middle market quotations for the ordinary shares for the five business days before the shares are purchased; and (ii) the higher of the last independent trade and the highest current independent bid on the London Stock Exchange at such time.
Directors’ conflicts of interestsDirectors have a statutory duty to avoid conflicts of interest with the Company. The Company’s Articles of Association enable Directors to approve conflicts of interest and include other conflict of interest provisions. The Company has implemented processes to identify potential and actual conflicts of interest. Such conflicts are then considered for approval by the Board, subject, if necessary, to appropriate conditions.
Directors’ indemnitiesThe Company’s Articles of Association provide that, subject to the provisions of the Statutes, every Director of the Company shall be indemnified out of the assets of the Company against all liabilities and expenses incurred by him or her in the actual or purported execution or discharge of his or her duties. “Statutes” here refers to the Companies (Jersey) Law 1991 and every other statute, regulation or order for the time being in force concerning companies registered under the Companies (Jersey) Law 1991. In addition, the Company has entered into indemnity agreements for the benefit of its Directors and these remain in force at the date of this report. The Company also had Directors’ and officers’ liability insurance in place in the year.
Statement of Directors’ responsibilitiesThe Directors are responsible for preparing the Annual report and accounts in accordance with applicable law and regulations and those International Financial Reporting Standards (“IFRSs”) which have been adopted by the European Union.
As a company listed on the London Stock Exchange, 3i Infrastructure is subject to the FCA’s Listing Rules and Disclosure and Transparency Rules, as well as to all applicable laws and regulations of Jersey, where it is incorporated.
Jersey company law requires the Directors to prepare financial statements for each financial period in accordance with generally accepted accounting principles. The Financial statements of the Company are required by law to give a true and fair view of the state of affairs of the Company at the period end and of the profit or loss of the Company for the period then ended.
58 3i Infrastructure plc Annual report and accounts 2016
Governance
In preparing these Financial statements, the Directors should:
– select suitable accounting policies and then apply them consistently;
– make judgments and estimates that are reasonable;
– specify which generally accepted accounting principles have been adopted in their preparation; and
– prepare the Financial statements on the going concern basis, unless it is inappropriate to presume that the Company will continue in business.
The Directors are responsible for keeping accounting records which are sufficient to show and explain the Company’s transactions and are such as to disclose with reasonable accuracy at any time the financial position of the Company and enable them to ensure that the Financial statements prepared by the Company comply with the requirements of the Companies (Jersey) Law 1991. They are also responsible for safeguarding the assets of the Group and hence for taking reasonable steps for the prevention and detection of fraud and other irregularities.
The Directors are also responsible for preparing the Annual report and accounts and the Directors confirm that they consider that, taken as a whole, the Annual report and accounts is fair, balanced and understandable and provides the information necessary for shareholders to assess the Company’s performance, business model and strategy.
In accordance with the FCA’s Disclosure and Transparency Rules, the Directors confirm to the best of their knowledge that:
(a) the Financial statements, prepared in accordance with applicable accounting standards, give a true and fair view of the assets, liabilities, financial position and profit or loss of the Group taken as a whole; and
(b) the Annual report and accounts include a fair review of the development and performance of the business and the position of the Group taken as a whole, together with a description of the principal risks and uncertainties faced by the Company.
The Directors of the Company and their functions are listed on pages 54 and 55.
The Directors have acknowledged their responsibilities in relation to the Financial statements for the year to 31 March 2016.
Going concernThe Company’s business activities, together with the factors likely to affect its future development, performance and position are set out in the Strategic report on pages 10 to 38 and in the Financial statements and related Notes on pages 72 to 93. The financial position of the Company, its cash flows, liquidity position and borrowing facilities are described in the Financial statements and related Notes on pages 72 to 93. In addition, Note 9 to the Financial statements includes the Company’s objectives, policies and processes for managing its capital, its financial risk management objectives, details of its financial instruments and hedging activities, and its exposures to credit risk and liquidity risk.
The Company has liquid financial resources and a strong investment portfolio providing a stable and robust income yield and an expectation of medium-term capital growth. As a consequence, the Directors believe that the Group is well placed to manage its business risks successfully. After making enquiries, the Directors have a reasonable expectation that the Company has adequate resources to continue in operational existence for the foreseeable future. Accordingly, they continue to adopt the going concern basis in preparing the Annual report and accounts.
By order of the Board Authorised signatory
Capita Financial Administrators (Jersey) LimitedCompany Secretary
11 May 2016
Registered Office: 12 Castle Street St. Helier Jersey JE2 3RT Channel Islands
Directors’ report Continued
3i Infrastructure plc Annual report and accounts 2016 59
Governance
Corporate governance statement
This section of the Directors’ report contains the corporate governance statement required by FCA Disclosure and Transparency Rule 7.2.
The Company’s approach to corporate governance The Company is committed to upholding the highest standards of corporate governance. It observes the requirements of the UK Corporate Governance Code (“the Code”), a copy of which is available from the Financial Reporting Council website (www.frc.org.uk), subject to the FCA’s Listing Rule 15.6.6(2), and to the extent applicable to the Company, given that it has no Executive Directors. The Code applies to all companies with a Premium Listing on the London Stock Exchange, irrespective of their country of incorporation.
The Company complied with all the applicable provisions of the Code for the financial year ending 31 March 2016.
The Board has adopted a code for Directors’ dealings in ordinary shares, which is based on the Model Code for Directors’ dealings contained in the Listing Rules (the “Model Code”). The Board is responsible for taking all proper and reasonable steps to ensure compliance with the Model Code by the Directors.
The Board’s responsibilities and processes The Board is responsible to shareholders for the overall management of the Company. It determines matters including financial strategy and planning and takes all investment and divestment decisions, taking into account the advice it receives from the Investment Adviser. The Board has put in place an organisational structure to ensure the efficient performance of its responsibilities. This is further described under the heading “Internal control” on page 64.
Matters reserved for the BoardThe Board has approved a formal schedule of matters reserved to it and the Audit and Risk Committee for decision. The matters reserved for the Board include:
– approval of the Company’s overall strategy, plans and annual operating budget;
– approval of the Company’s half-yearly and annual financial statements and changes in the Company’s accounting policies or practices;
– approval of changes relating to the capital structure of the Company or its regulated status;
– approval of the appointment and removal of the Investment Adviser and annual review and continued approval of key agreements with service providers, including the Investment Advisory Agreement with 3i Investments plc;
– approval of major changes in the nature of business operations or investment policy;
– approval of investments and divestments;
– approval of portfolio company valuations and review of the performance and plans for each portfolio company;
– review of the adequacy of internal control systems, including those operated by independent service providers; and
– appointments to the Board and determination of terms of appointment of Directors.
Meetings of the BoardA calendar of eight scheduled main Board meetings was agreed at the start of the year. Due to the nature of the Board’s close involvement in the operation of the Company and in making investment-related decisions, a number of further meetings are arranged from time to time at shorter notice. During the year, there were seven main meetings of the Board of Directors. The time allocated to the eighth scheduled Board meeting was instead utilised for a discussion of the Company’s strategy with the Investment Adviser. In addition to these meetings, there were six full Board meetings arranged at short notice and one meeting of a specifically formed committee to execute decisions arising from full Board meetings. The Directors’ attendance at main Board meetings is set out in the table below:
Directors’ attendance (year to 31 March 2016)
Number of meetings while a Director Attendance
Richard Laing1 2 2
Peter Sedgwick2 5 5
Philip Austin 7 7
Doug Bannister 7 7
Wendy Dorman 7 7
Ian Lobley 7 7
Paul Masterton 7 7
Steven Wilderspin 7 7
1 Served from 1 January 2016.2 Served until 31 December 2015.
The Board’s responsibilities are set out on page 54. The principal matters considered by the Board during the year in relation to those responsibilities included the following:
Strategy and returnsThe Board conducted a review of the Company’s strategy through a series of Board meetings, taking advice from the Investment Adviser, the Company’s Corporate Brokers and Financial Adviser. These meetings involved the following:
– review of the infrastructure market segments in which the Company operates, and of competitors’ activity and the returns available from investing in those markets;
– approval to revise the Company’s target total return to 8–10% over the medium term, as announced with the Company’s full-year results to 31 March 2015;
– approval to adopt a new dividend policy targeting a progressive annual dividend per share, as announced with the Company’s full-year results to 31 March 2015;
– approval of the dividend target for FY16 of 7.25 pence per share, as announced with the Company’s full-year results to 31 March 2015;
– approval to amend the Company’s investment policy and increase the single asset gross concentration limit from 20% to 25%, subject to shareholder approval. The amendment to the investment policy in respect of the single asset gross concentration limit was approved by a majority of shareholders at the EGM convened on 7 July 2015;
– regular reviews of portfolio asset performance, including the underlying performance of assets within the India Fund and review of the expected future returns from the portfolio;
60 3i Infrastructure plc Annual report and accounts 2016
Governance
– review of the recommendations of the Investment Adviser on the valuation of portfolio investments, including the benchmarking of those valuations in the context of prevailing market conditions and the timing of completion of regulatory review processes; and
– regular reviews of feedback from shareholders following key strategic and financial announcements.
Investment activity – approval of new investment decisions, including the decision
to invest in ESVAGT, two additional oil storage terminals with Oiltanking, the investment in the WODS OFTO project, the Condorcet Campus project, as well as Wireless Infrastructure Group, TCR and Hart van Zuid, which were announced after the year end;
– review of regular reports from the Investment Adviser relating to the infrastructure market and early stage work-in-progress investment opportunities;
– early stage strategic review of the Company’s holding in Elenia alongside the other shareholders in the Elenia group; and
– review of the market opportunity in a number of European geographies.
Financial management – management of the Company’s liquidity and review of the
Company’s liquidity policy;
– review of the Company’s existing RCF, and decision in May 2015 to renew and increase the size of the Facility to £300 million on improved terms. Approval and decision in April 2016 to increase the size of the RCF by a further £200 million to December 2016 and extend the maturity by an additional year;
– approval and decision to implement a £150 million return of capital to enable shareholders to participate in the exceptional sale of Eversholt Rail by way of a special dividend payment of 17 pence per share;
– approval to implement a 9 for 10 consolidation of the Company’s shares subject to shareholder approval in conjunction with the payment of the special dividend. The consolidation of the Company’s shares was approved by a majority of shareholders at the EGM convened on 7 July 2015;
– ongoing review of foreign exchange hedging;
– review and ongoing monitoring of the OECD’s Action Plan on Base Erosion and Profit Shifting;
– approval of the Company’s annual budget for the year to 31 March 2017;
– review and approval of the new risk framework; and
– following the year end, approval of the Company’s intention to raise up to £350 million in new equity through an Open Offer, Placing and Intermediaries Offer.
Manage relations with the Investment Adviser – a review with the Investment Adviser of its origination capabilities;
and
– formal evaluation of the performance of the Investment Adviser.
Other matters considered by the Board – succession planning, as well as comprehensive selection process
(in which Peter Sedgwick did not participate) and subsequent appointment of Richard Laing as Chairman with effect from 1 January 2016;
– the Board reviewed the impact of changes to the UK Corporate Governance Code including the requirement to incorporate a viability statement into the Annual report and accounts for 2016;
– the Board received updates to UK and Jersey law and regulations and considered their impact on the Company; and
– the Board considered the market practice for offering a scrip dividend alternative to shareholders.
InformationReports and papers are circulated to the Directors in a timely manner in preparation for Board and committee meetings. These papers are supplemented by information specifically requested by the Directors from time to time.
Performance evaluationBoardDuring the year, the Board conducted a formal evaluation of its own performance and that of its committees. This was an internal exercise following the full external review conducted by Dr Tracy Long of Boardroom Review, a specialist consultancy, in 2014. The evaluation this year considered, amongst other factors, the balance of skills, experience and knowledge of the Board members.
As part of the review:
– the Chairman led a review of the performance of the Board and its Committees, as well as of individual Directors; and
– the chairman of the Audit and Risk Committee led a review of the Audit and Risk Committee.
The review of the Chairman did not take place last year as he was appointed with effect from 1 January 2016, and had not served for a sufficient amount of time.
The results of the processes were formally reported to the Board and Audit and Risk Committee respectively. All Board members and members of the Investment Adviser gave personal views and feedback was presented to the Board.
Following the completion of the above process, the Board noted that the results of the exercise showed a high overall degree of satisfaction with the operation of the Board and interaction with the Investment Adviser.
The following recommendations were made as a result of the review:
– to continue to accelerate and deepen the level of Directors’ knowledge and understanding of the markets in which the Company operates, to allow them to provide constructive challenge to the Investment Adviser. In this context, it was agreed that priorities for both internal and external Board presentations, detailing aspects of the infrastructure sector, should be reviewed and agreed by the Board within the context of the broader corporate calendar; and
– to continue to address the future composition and succession requirements for the Board.
Corporate governance statement Continued
3i Infrastructure plc Annual report and accounts 2016 61
Governance
Investment AdviserThe Board has a Management Engagement Committee (comprising all Board members, with the exception of Ian Lobley, the 3i Group nominee Director who served throughout the year), which carries out the annual evaluation of the Investment Adviser required under the Listing Rules and which manages the relationship with the Investment Adviser on behalf of the Company. During the year, the Committee assessed the performance of the Investment Adviser. Following its assessment, and based on the good performance of the Investment Adviser, the Directors believe that the continued appointment of the Investment Adviser on the terms set out in Note 18 is in the interest of shareholders.
Appointment and re-election of DirectorsUnder the Code, all directors of FTSE 350 companies should be subject to annual election by shareholders. As a result, all Directors will voluntarily retire and stand for election or re-election at the 2016 AGM.
The ChairmanThe Chairman, Richard Laing, succeeded Peter Sedgwick with effect from 1 January 2016. The Chairman leads the Board in the determination and implementation of its strategy. The Chairman is responsible for organising the business of the Board, ensuring its effectiveness and setting its agenda. The Chairman also acts as the Company’s appointed member to the Advisory Board for the 3i India Infrastructure Fund. He receives no additional remuneration for this role. The Chairman facilitates the effective contribution of all the Directors and constructive relations between the Company’s advisers, including the Investment Adviser, and the Directors. The Chairman maintains direct links with the Company’s advisers and ensures that regular reports from them are circulated to the Directors to enable the Directors to remain aware of shareholders’ views. The Chairman ensures, with the co-operation of the Investment Adviser, that a programme of effective communications is available for shareholders, including with the Chairman and Senior Independent Director, when shareholders so wish.
Senior Independent DirectorPhilip Austin is the Senior Independent Director. In accordance with the Code, any shareholder concerns can be conveyed to the Senior Independent Director. The contact details of the Senior Independent Director are freely available on the Company’s website or through the Company Secretary.
DirectorsThe Board comprises the Chairman and six non-executive Directors. Biographical details for each of the Directors are set out on page 55. All Directors served throughout the year under review, with the exception of Peter Sedgwick, who served until 31 December 2015, and Richard Laing, who was appointed with effect from 1 January 2016.
No Director has a service contract with the Company, nor are any such contracts proposed. The Directors were appointed as non-executive Directors by the subscribers to the Memorandum of Association of the Company or at subsequent Board meetings. Each of the Directors has an appointment letter which reflects the best practice guidelines published in December 2011 by the Institute of Chartered Secretaries and Administrators.
Following the formal appraisal process of Directors, and in accordance with Section B.7.2 of the Code, the Chairman will propose the election or re-election of all Directors at the forthcoming AGM.
Copies of the appointment letters are available from the Company Secretary upon request.
The Directors’ appointments can be terminated, without compensation for loss of office, in accordance with the Articles. Under the Articles, their appointments can (inter alia) be terminated on notice from the other members of the Board, and also on ceasing to be a Director if they fail to be re-elected at any Annual General Meeting. In addition to fulfilling their legal responsibilities as Directors, the Directors are expected to bring an independent judgment to bear on issues of strategy, performance, investment appraisal and standards of conduct. They are also expected to ensure high standards of financial probity on the part of the Company. As well as papers for Board meetings, the Directors receive monthly management accounts, reports and information which enable them to scrutinise the Company’s performance against agreed objectives.
Changes to the Board of DirectorsOn 31 December 2015, Peter Sedgwick stepped down as Chairman and Director of the Company. Richard Laing was appointed Chairman of the Board in his stead, effective from 1 January 2016.
Directors’ independenceAll the Directors, with the exception of Ian Lobley, who was appointed as the 3i Group nominee to the Board with effect from 6 May 2014, are considered by the Board to be independent for the purposes of the Code. The Board assesses and reviews the independence of each of the Directors at least annually, having regard to the potential relevance and materiality of a Director’s interests and relationships. No Director was materially interested in any contract or arrangement subsisting during or at the end of the financial year in relation to the business of the Company.
As a non-independent Director who is not a member of the Management Engagement Committee, Ian Lobley did not participate in the Board’s evaluation of the performance of the Investment Adviser.
62 3i Infrastructure plc Annual report and accounts 2016
Governance
Training and developmentThe Company has developed a framework within which training for Directors is planned, with the objective of ensuring that the Directors understand the duties and responsibilities of being a director of a listed company and the business environment of the Company. All Directors are required continually to update their skills and maintain their familiarity with the Company and its business. Presentations on different aspects of the Company’s business are made regularly to the Board, usually by the Investment Adviser, but on occasion by other advisers, including the Company’s corporate brokers and financial adviser.
On appointment, all Directors have discussions with the Chairman and Company Secretary, following which appropriate briefings on the responsibilities of Directors, the Company’s business, the Company’s procedures and, where appropriate, briefings on the infrastructure market are arranged. The Company provides opportunities for Directors to obtain a thorough understanding of the Company’s business and the industry it operates in by meeting senior members of the investment advisory team who in turn can arrange, as required, visits to portfolio investments or support teams.
This year, the Directors also received presentations on aspects of the infrastructure market, including recent transactions and the returns available from investing in the economic infrastructure market, as well as the market opportunity in greenfield projects in Europe. The Board also received briefings on legal updates in relation to changes to laws and regulations in Jersey and the UK. The Company has procedures for Directors to take independent legal or other professional advice about the performance of their duties.
The Board’s committeesThe Board is assisted by various standing committees which report regularly to the Board and reviews the membership of these committees on a regular basis.
The Board’s committees all have clearly defined terms of reference which are available at www.3i-infrastructure.com. The terms of reference of the Audit and Risk Committee, of the Nominations Committee, of the Remuneration Committee and of the Management Engagement Committee provide that no one other than the particular committee chairman and members may attend meetings, unless invited to attend by the relevant committee.
Audit and Risk CommitteeThe Audit and Risk Committee, chaired by Steven Wilderspin, in the year under review also comprised Philip Austin, Doug Bannister, Paul Masterton and Wendy Dorman. All members served throughout the year, except for Wendy Dorman, who was appointed to this Committee on 1 July 2015. The qualifications of the members of the Audit and Risk Committee are set out in the biographical details of the Directors on page 55. All the members of the Audit and Risk Committee are independent non-executive Directors. The Board is satisfied that the Audit and Risk Committee chairman, Steven Wilderspin, has recent and relevant financial experience and is a qualified Chartered Accountant.
During the year to 31 March 2016, there were four meetings of the Audit and Risk Committee, attended by all members. A report from the Audit and Risk Committee is set out on page 65.
Remuneration CommitteeThe Remuneration Committee, chaired by Philip Austin, is charged with reviewing the scale and structure of the non-executive Directors’ remuneration, and for the year under review was constituted by all the independent non-executive Directors (Peter Sedgwick and subsequently Richard Laing, Philip Austin, Steven Wilderspin, Doug Bannister, Wendy Dorman and Paul Masterton). All members served throughout the year, except for Peter Sedgwick, who served until 31 December 2015, and Richard Laing, who was appointed to the Remuneration Committee on 28 January 2016.
The Remuneration Committee had one meeting in the year to 31 March 2016, attended by all members. A report from the Remuneration Committee is set out on page 67.
Nominations CommitteeThe Nominations Committee, chaired by Peter Sedgwick until 31 December 2015 and by Richard Laing with effect from 28 January 2016, in the year under review comprised Paul Masterton, who served throughout the year, Philip Austin and Wendy Dorman. Wendy Dorman was appointed to this Committee on 1 June 2015. The Committee held three scheduled meetings in the year to 31 March 2016, attended by all members, with the exception of Phil Austin, who was absent for one meeting. In addition, there were several informal discussions held between the members in relation to matters agreed at scheduled meetings.
The Committee is responsible for adopting a formal and transparent procedure for the appointment of new Directors, including interviewing potential candidates. Final decisions on nominations, however, are taken by the entire Board. The Nominations Committee can use the services of external search consultancies when new Directors are being recruited. During the year, the Nominations Committee approved the nomination of Richard Laing as Chairman of the Board, following a comprehensive selection process in which Peter Sedgwick did not take part. As part of the process to appoint new Directors to the Board, the Committee availed itself of the services of Odgers Berndtson, an external search consultancy which is independent of the Company.
As well as seeking an appropriate balance of expertise and experience, especially in finance and infrastructure, the nominations process has to take account of the residence of Directors, as the majority of Directors have to be non-resident in the UK. For practical reasons relating to the conduct of the Company’s affairs, most Directors are resident in the Channel Islands.
The Committee has been reviewing succession planning, to ensure that processes and plans are in place with regards to Board appointments dealing with succession and diversity. The Board’s policy on diversity is set out below.
Diversity The Company’s policy is to have a Board with a diverse range of skills, professional backgrounds and gender. To that end it will continue to ensure that in making appointments to the Board it, and any executive search firm that assists it, will consider a wide range of candidates from different backgrounds while making appointments solely on merit and which meet the objectives of its policy on diversity, including gender.
Corporate governance statement Continued
3i Infrastructure plc Annual report and accounts 2016 63
Governance
Investment CommitteeAs outlined on page 54, the Board as a whole acts as the Investment Committee.
Management Engagement CommitteeThe Management Engagement Committee has been chaired by Richard Laing from 28 January 2016, replacing Peter Sedgwick who chaired it until 31 December 2015. In the year under review, this Committee comprised Philip Austin, Doug Bannister, Wendy Dorman, Paul Masterton and Steven Wilderspin.
While the remit of the Committee is to manage all aspects of the relationship with the Investment Adviser, its principal function is to consider annually, and recommend to the Board, whether the continued appointment of the Investment Adviser is in the best interest of the Company and its shareholders and to give reasons for its recommendation. The Committee also reviews the terms of the Investment Advisory Agreement.
During the year, there were three meetings of the Management Engagement Committee, attended by all members. In those meetings, the Committee monitored the overall relationship and among specific topics it:
– reviewed reports from industry analysts, comparing the performance of listed infrastructure investment companies, including an analysis of the terms of their advisory agreements and fees charged;
– monitored and reviewed the Investment Adviser’s performance against the Company’s targets and general market conditions;
– reviewed the quality, timeliness, accuracy and relevance of the information provided to the Board, including reviews of portfolio company performance; and
– reviewed non-investment services provided by the Investment Adviser.
The Board concluded that the continued appointment of 3i Investments plc as Investment Adviser is in the interest of shareholders.
The Company SecretaryThe Company has appointed Capita Financial Administrators (Jersey) Limited as Company Secretary.
All Directors have access to the advice and services of the Company Secretary, who advise the Board, through the Chairman, on governance matters. The Company’s Articles of Association and the schedule of matters reserved for the Board or its duly authorised committees for decision provide that the appointment and removal of the Company Secretary would be a matter for the full Board.
The Board reviewed the Company Secretary’s performance during the year and approved its continued appointment.
Relations with shareholdersApproach to Investor RelationsThe Board recognises the importance of maintaining a purposeful relationship with shareholders and the Company has a comprehensive Investor Relations programme, devised and implemented by the Investment Adviser, to help existing and potential investors to understand its activities, strategy and financial performance. The Chairman maintains a dialogue with shareholders on strategy and corporate governance as required and shareholders are offered the opportunity to meet with the Chairman and with the Senior Independent Director. The Board receives reports from the Company’s brokers on shareholder issues and Directors are invited to attend the Company’s presentations to analysts and are offered the opportunity to meet shareholders at the AGM.
Board oversightThe Investment Adviser briefs the Board on a regular basis on the implementation of the Investor Relations programme and on feedback received from analysts and investors. Any significant concern raised by shareholders in relation to the Company is communicated to the Board. Research reports published by investment banks on the Company are circulated to the Board on a regular basis.
The Board also receives periodic feedback from existing shareholders and potential investors through the Company’s corporate brokers, JPMorgan Cazenove and RBC Capital Markets.
Institutional investor programmeMeetings with principal shareholders The Investment Adviser meets with the Company’s principal shareholders on a twice yearly basis, following the publication of annual and half-yearly results and as required during the year. The Chairman and Senior Independent Director are also available to meet with institutional shareholders as required.
Meetings with potential investors During the year, the Investment Adviser held regular meetings with potential investors in the UK and internationally to communicate the strategy and performance of the Company.
Annual and half-yearly results presentations The Chairman and Investment Adviser present the annual and half-yearly results to a broad group of analysts.
Individual investorsIndividual investors are encouraged to engage with the Company and provide feedback through the Company Secretary, whose contact details are available on the website.
WebsiteThe Company’s website provides a description of its strategy and portfolio, as well as a full archive of news and historical financial information and details of forthcoming events for shareholders and analysts.
64 3i Infrastructure plc Annual report and accounts 2016
Governance
Annual General MeetingThe Company uses its AGM as an opportunity to communicate with its shareholders. At the Meeting, business presentations are generally made by the Chairman and the Investment Adviser. The Senior Independent Director and chairman of the Audit and Risk Committee are also generally available to answer shareholders’ questions. Business to be discussed at the Meeting is notified to shareholders in advance through the Notice of Meeting and covers matters such as the annual election of directors, the appointment of the auditor and the dividend declaration. During the Meeting, shareholders are also asked to approve the Financial statements and report of the Directors and auditor. In addition, shareholders are asked to approve the Directors’ remuneration report and any proposed changes to non-executive Directors’ fees.
The 2015 Notice of AGM was dispatched to shareholders not less than 20 working days before the Meeting. At that Meeting, voting on each resolution was taken on a poll and the poll results were made available on the Company’s website.
Portfolio management and voting policyIn relation to unquoted investments, the Company’s approach is to seek to add value to the businesses in which it invests through the extensive experience, resources and contacts of the investment advisory team. In relation to quoted equity investments, the Company’s policy is to exercise voting rights on matters affecting the interests of the Company.
Internal controlThe Board is ultimately responsible for the Group’s system of internal control. The Audit and Risk Committee performed its annual review of the system’s effectiveness and reported its conclusions to the Board. The internal control system, which has been in place throughout the year and up to the date of approval of the Annual report, is designed to manage rather than eliminate the risk of failure to achieve business objectives and can provide only reasonable and not absolute assurance against material misstatement or loss.
The Board has contractually delegated investment advisory and support services to its key service providers and their contractual obligations encompass the implementation of systems of internal control, including financial, operational and compliance controls and risk management. The Audit and Risk Committee of the Company receives reports on the control systems and their operation from its main service providers, and is responsible for reviewing these reports for determining the effectiveness of internal controls.
In addition, the Board regularly reviews the principal risks faced by the Company and any entries in the Company’s risk log.
The Company’s control policies and procedures, which are in accordance with the Financial Reporting Council’s guidance on risk management, internal control and related financial and business reporting, have been in place throughout the financial year and up to the date this Report was approved. These include:
– the Investment Advisory and UK Support Services agreements specifically define the roles and responsibilities of the Investment Adviser and the service providers. These agreements set out information and reporting systems for monitoring the Company’s investments and their performance;
– the Board considers and approves the Company’s strategy and approves a budget on an annual basis;
– reports on the planning, forecasting and controlling of expenditure and the making of investments are regularly submitted to the Board and reviewed in detail;
– the Investment Adviser’s procedures for evaluating investments include detailed appraisals and due diligence that are reviewed by the Board as appropriate;
– the Investment Adviser and the service providers prepare valuations and management accounts which allow the Board to assess the Company’s activities and review its performance;
– the Investment Adviser’s compliance and internal audit departments continually review the Investment Adviser’s operations. The Audit and Risk Committee has access to relevant sections of their reports;
– the Investment Adviser and the service providers prepare the half-yearly and annual accounts of the Group and monitor all associated financial reporting processes that are reviewed by the Board as appropriate; and
– the Investment Adviser and the service providers notify the Board of any changes in accounting standards which may impact the Company’s significant accounting policies or any other statutory requirements which may subsequently impact the financial statements.
The Company does not have a separate internal audit function as it is not deemed appropriate given the structure of the Company, although this is reviewed annually by the Audit and Risk Committee.
Principles and processesThe Company adopts a set of core values and controls, which include:
– a planning framework which incorporates a Board-approved medium-term strategy;
– formal business and operating risk reviews which evaluate the potential financial impact and likelihood of identified risks and possible new risk areas;
– the setting of control, mitigation and monitoring procedures and the review of actual occurrences, identifying lessons to be learned;
– a comprehensive system of financial reporting to the Board, based on an annual budget with monthly reporting of actual results, analysis of variances, scrutiny of key performance measures and regular reforecasting;
– regular treasury reports to the Board, which analyse the funding requirements, track the generation and use of capital and the volume of liquidity and record the level of compliance with the Company’s funding objectives;
– well defined procedures governing the appraisal and approval of investments, including detailed investment and divestment approval procedures, incorporating appropriate levels of authority and regular post-investment reviews; and
– an Audit and Risk Committee which considers significant control matters and receives relevant reports from key service providers’ compliance, control or internal audit functions.
Corporate governance statement Continued
3i Infrastructure plc Annual report and accounts 2016 65
Governance
Report of the Audit and Risk Committee
Committee remitDuring the year, the Audit and Risk Committee undertook its responsibilities in accordance with its Terms of Reference, as detailed on the Company’s website.
Matters reviewed in the yearThe principal matters reviewed by the Audit and Risk Committee during the year are described below.
Financial reportingThe Committee reviewed and made recommendations to the Board regarding significant accounting matters and the accounting disclosures in the Half-yearly report and Annual report and accounts of the Company. The most significant matters of judgment considered by the Committee were:
– valuation of the Company’s infrastructure assets – this year, the areas examined included the level of discount rates applied in valuation models, with a particular focus on those used for all economic infrastructure assets, where changes were proposed. The Committee discussed these matters with the Investment Adviser and the auditor, including the auditor’s infrastructure valuation expert;
– investment income recognition – the Committee reviewed monthly management information for the portfolio and individual portfolio companies to identify where variances of income from expectations required further explanation; and
– calculation of the advisory and performance fees payable to the Investment Adviser – as well as the review of valuations, which drive advisory and performance fees, noted above, the Committee engaged the auditor to perform additional work to agree that the advisory and performance fees were calculated in accordance with the underlying Investment Advisory Agreement. The Committee also had access to a review of the calculation of the performance fee carried out by the internal audit function of the Investment Adviser.
The Committee considered the requirements of the UK Companies Act 2006 (Strategic Report and Directors’ Report) Regulation 2013 with which it is complying voluntarily, in line with best practice reporting. The Committee specifically reviewed the Annual report and accounts to conclude whether the financial reporting is fair, balanced, understandable, comprehensive and consistent with how the Board assesses the performance of the Company’s business during the financial year, as required for companies with a Premium Listing under the Code. As part of this review, the Committee considered if the Annual report and accounts provided the information necessary to shareholders to assess the Company’s performance, strategy and business model and reviewed the description of the Company’s Key Performance Indicators.
In addition to the above matters, the Committee reviewed the following areas:
– the Group structure and accounting treatment for the entities within the Group. This included the criteria assessed by the Directors to conclude that the Company continues to meet the definition of an Investment Entity as required for the adoption of the Investment Entities exception to IFRS 10, which defines how the Company presents its financial statements within the Half-yearly report and Annual report and accounts; and
– the implementation of the new “Viability Statement” required by the 2014 revision of the Code. This included overseeing the development of the risk management framework of the Company as detailed in the Risk section below.
The Committee presented its conclusions on the above areas to the Board and advised the Board that it considered the Annual report and accounts, taken as a whole, to be fair, balanced and understandable and provides the information necessary for the shareholders to assess the Company’s performance, business model and strategy.
External auditThe Audit and Risk Committee reviewed the effectiveness of the external audit process during the year, considering performance, objectivity, independence and relevant experience, and concluded that Ernst & Young LLP’s appointment as the Company’s auditor should be continued. In structuring its review, the Committee used a practical framework based on a guide issued by the Institute of Chartered Accountants of Scotland.
Ernst & Young LLP has been the Company’s auditor since inception in 2007 and the audit has not been re-tendered. The engagement audit partner was rotated last year. The Committee is aware of the provisions of the Code that state that an audit should be re-tendered every 10 years and the EU Audit Directive and Regulation which has introduced a requirement for applicable companies to undertake a tender of the external audit every 10 years, and change auditor at least every 20 years. The Committee has considered the provisions and transitional arrangements applicable to the Company and has decided that a full audit tender will be conducted in the year ending 31 March 2017 before a recommendation regarding future audit arrangements is brought to the Company’s AGM in July 2017.
The Audit and Risk Committee monitors the Company’s policy for non-audit services to ensure that the provision of such services by the external auditor does not impair the auditor’s independence or objectivity. In order to safeguard auditor objectivity and independence, the chairman of the Audit and Risk Committee is required to approve all non-audit work undertaken by the auditor, for the Company and its subsidiaries in advance and as a general rule the auditor will not be engaged on investment-related work. However, exceptions to this may be permitted if (i) the Company is acting in a consortium, (ii) the auditor is considered specialists in the sector, or (iii) the auditor is best placed to undertake the work through its knowledge of the Company’s financial systems, procedures and internal controls.
66 3i Infrastructure plc Annual report and accounts 2016
Governance
Ernst & Young LLP provided non-audit services to the consolidated Group for fees totalling £5,000 for the year to 31 March 2016 (2015: £221,000). This related to agreed-upon procedures on the advisory and performance fees. In this financial year and previous years, in line with the Company’s policy, Ernst & Young LLP provided non-audit services to support the transaction activity conducted by the Group during the year in relation to certain investee companies. The fees for these services are generally borne by the underlying investee companies or unconsolidated subsidiaries, and therefore are not included in the expenses of the Group. In assessing the auditor’s independence, the Committee reviews the total amount of fees paid to the auditor in accordance with the stated policy on non-audit services, regardless of whether they are borne by the Group or by the investee companies.
RiskDuring the year the Committee:
– recommended that a new Risk Framework be adopted by the Board as described on page 33;
– led the Board and senior executives of the Investment Adviser in an exercise to identify and rate risks in a risk matrix. This exercise collated individual perceptions of risk without reference back to previous risk assessments and brought the results together to arrive at a collective view. The resulting matrix helped identify the principal risks described on page 36 and the scenarios used for stress testing to support the conclusions of the Viability Statement; and
– considered the presentation of risk-related matters in the Annual report and accounts.
Other mattersOther matters reviewed by the Committee during the year were:
– the effectiveness of the internal control environment of the Company and the Company’s compliance with its regulatory requirements;
– the coverage of the proposed interim and final dividends, including a review of the Board’s assessment of the coverage of dividend payments through income generated by the Company, non-income cash distributions received from portfolio companies, net capital profits generated from the sale of portfolio assets and retained reserves;
– the debt levels in the underlying portfolio companies;
– the Company’s compliance with its regulatory obligations in Jersey, including a review of compliance with the Codes of Practice for Certified Funds; and
– the ongoing impact of international initiatives such as the EU Alternative Investment Fund Management Directive, including the timing of the Company’s registration under the Directive and the impact of marketing provisions under the Directive.
The Committee reported to the Board on how it has discharged its responsibilities and reported to the Board the key matters arising at each meeting. All recommendations were accepted by the Board.
Steven Wilderspin Chairman, Audit and Risk Committee
11 May 2016
Report of the Audit and Risk Committee Continued
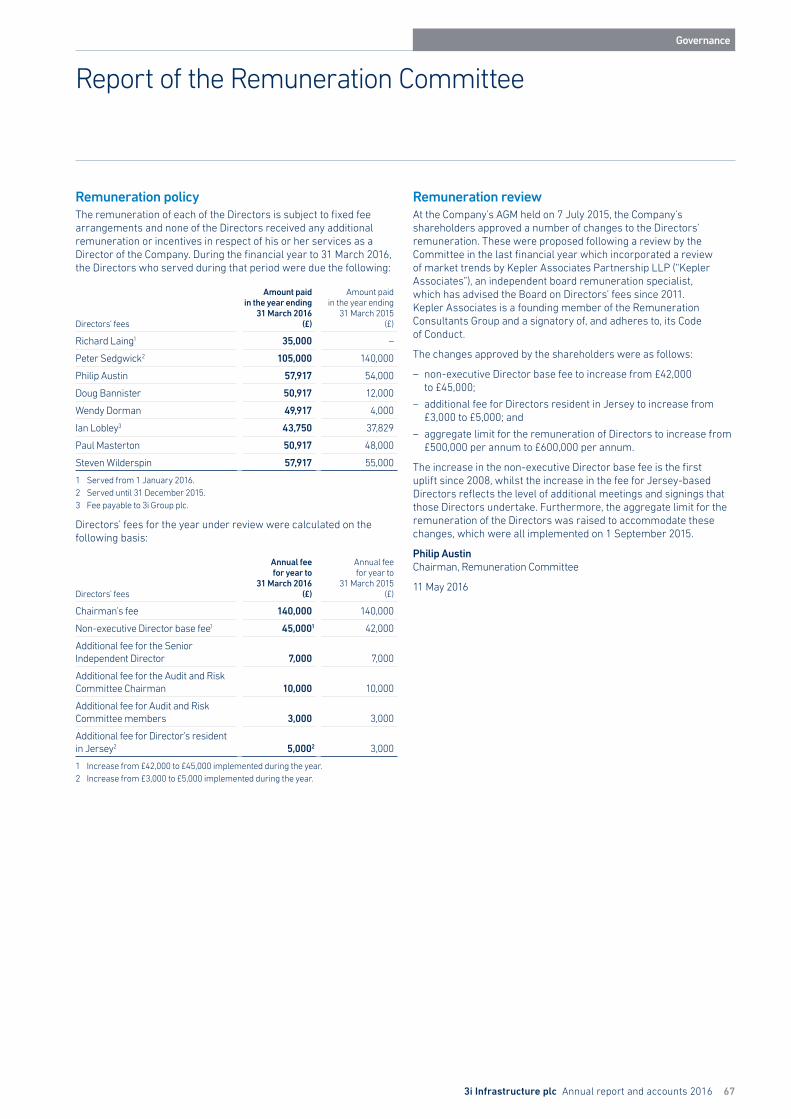
3i Infrastructure plc Annual report and accounts 2016 67
Governance
Report of the Remuneration Committee
Remuneration policyThe remuneration of each of the Directors is subject to fixed fee arrangements and none of the Directors received any additional remuneration or incentives in respect of his or her services as a Director of the Company. During the financial year to 31 March 2016, the Directors who served during that period were due the following:
Directors’ fees
Amount paid in the year ending
31 March 2016 (£)
Amount paid in the year ending
31 March 2015(£)
Richard Laing1 35,000 –
Peter Sedgwick2 105,000 140,000
Philip Austin 57,917 54,000
Doug Bannister 50,917 12,000
Wendy Dorman 49,917 4,000
Ian Lobley3 43,750 37,829
Paul Masterton 50,917 48,000
Steven Wilderspin 57,917 55,000
1 Served from 1 January 2016.2 Served until 31 December 2015.3 Fee payable to 3i Group plc.
Directors’ fees for the year under review were calculated on the following basis:
Directors’ fees
Annual fee for year to
31 March 2016(£)
Annual fee for year to
31 March 2015(£)
Chairman’s fee 140,000 140,000
Non-executive Director base fee1 45,0001 42,000
Additional fee for the Senior Independent Director 7,000 7,000
Additional fee for the Audit and Risk Committee Chairman 10,000 10,000
Additional fee for Audit and Risk Committee members 3,000 3,000
Additional fee for Director’s resident in Jersey2 5,0002 3,000
1 Increase from £42,000 to £45,000 implemented during the year.2 Increase from £3,000 to £5,000 implemented during the year.
Remuneration reviewAt the Company’s AGM held on 7 July 2015, the Company’s shareholders approved a number of changes to the Directors’ remuneration. These were proposed following a review by the Committee in the last financial year which incorporated a review of market trends by Kepler Associates Partnership LLP (“Kepler Associates”), an independent board remuneration specialist, which has advised the Board on Directors’ fees since 2011. Kepler Associates is a founding member of the Remuneration Consultants Group and a signatory of, and adheres to, its Code of Conduct.
The changes approved by the shareholders were as follows:
– non-executive Director base fee to increase from £42,000 to £45,000;
– additional fee for Directors resident in Jersey to increase from £3,000 to £5,000; and
– aggregate limit for the remuneration of Directors to increase from £500,000 per annum to £600,000 per annum.
The increase in the non-executive Director base fee is the first uplift since 2008, whilst the increase in the fee for Jersey-based Directors reflects the level of additional meetings and signings that those Directors undertake. Furthermore, the aggregate limit for the remuneration of the Directors was raised to accommodate these changes, which were all implemented on 1 September 2015.
Philip Austin Chairman, Remuneration Committee
11 May 2016
68 3i Infrastructure plc Annual report and accounts 2016
Financials and other information
Independent auditor’s report to the members of 3i Infrastructure plc
Our opinion on the consolidated financial statementsIn our opinion, the consolidated financial statements (the “financial statements”) of 3i Infrastructure plc (the “Company”) and its subsidiary (together the “Group”):
– give a true and fair view of the state of the Group’s affairs as at 31 March 2016 and its profit for the year then ended;
– have been properly prepared in accordance with International Financial Reporting Standards (“IFRS”) as adopted by the European Union (“EU”); and
– have been prepared in accordance with the requirements of the Companies (Jersey) Law 1991.
What we have auditedWe have audited the financial statements of the Group for the year ended 31 March 2016, which comprise the:
– Consolidated statement of comprehensive income for the year ended 31 March 2016;
– Consolidated statement of changes in equity for the year ended 31 March 2016;
– Consolidated balance sheet as at 31 March 2016;
– Consolidated cash flow statement for the year ended 31 March 2016; and
– Related notes 1 to 19 to the financial statements.
The financial reporting framework that has been applied in their preparation is applicable law and IFRS as adopted by the EU.
Overview of our audit approachRisks of material misstatement – Valuation of the investment portfolio
– Incomplete or inaccurate investment income recognition
– Calculation of performance fees (Prior Year: Calculation of advisory and performance fees)
Audit scope – We performed an audit of the financial statements of
3i Infrastructure plc, and its subsidiary, 3i Infrastructure Seed Assets GP Limited (together “the Group”) for the year ended 31 March 2016
Materiality – Materiality of £12.8m which represents 1% of net assets
(2015: £13.2m, 1% of net assets).
What has changed – Since there was no change in the Investment Advisory Agreement
in the current year, we have reassessed the associated risk of material misstatement in the calculation of advisory fees and have not considered it to be a risk of material misstatement.
Our assessment of risk of material misstatement We identified the risks of material misstatement described below as those that had the greatest effect on our overall audit strategy, the allocation of resources in the audit and the direction of the efforts of the audit team. In addressing these risks, we have performed the procedures below which were designed in the context of the financial statements as a whole and, consequently, we do not express any opinion on these individual areas.
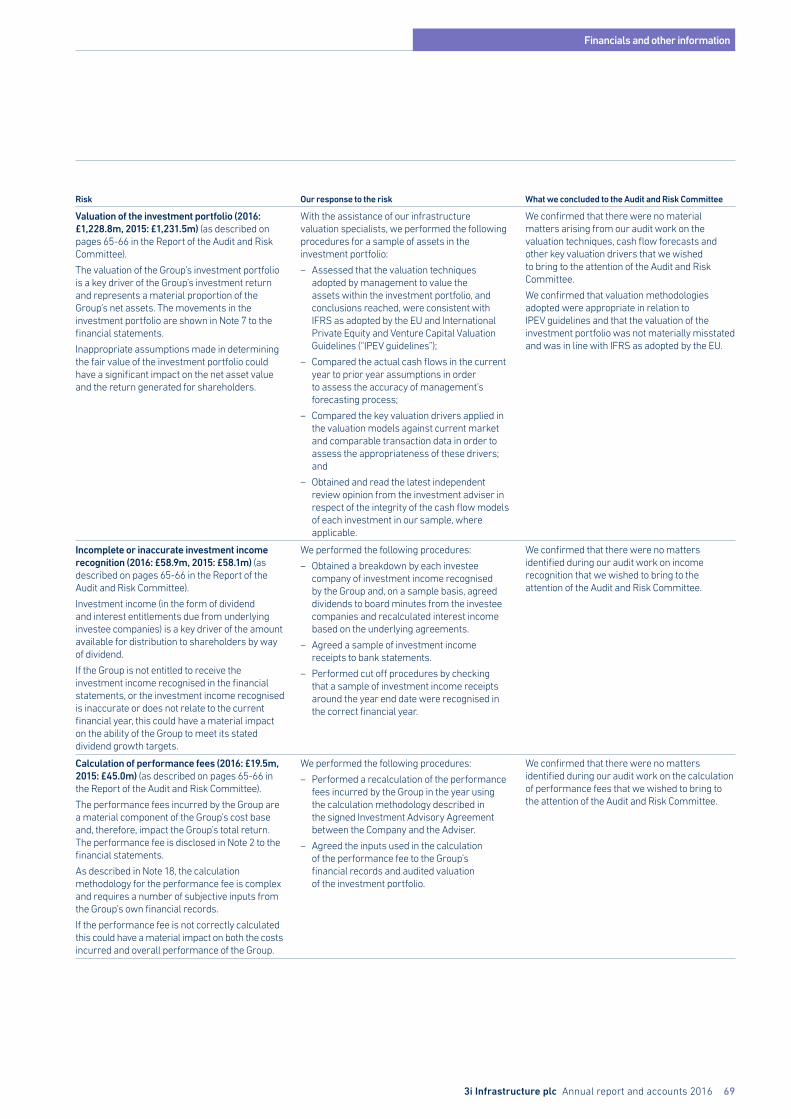
3i Infrastructure plc Annual report and accounts 2016 69
Financials and other information
Risk Our response to the risk What we concluded to the Audit and Risk Committee
Valuation of the investment portfolio (2016: £1,228.8m, 2015: £1,231.5m) (as described on pages 65-66 in the Report of the Audit and Risk Committee).
The valuation of the Group’s investment portfolio is a key driver of the Group’s investment return and represents a material proportion of the Group’s net assets. The movements in the investment portfolio are shown in Note 7 to the financial statements.
Inappropriate assumptions made in determining the fair value of the investment portfolio could have a significant impact on the net asset value and the return generated for shareholders.
With the assistance of our infrastructure valuation specialists, we performed the following procedures for a sample of assets in the investment portfolio:
– Assessed that the valuation techniques adopted by management to value the assets within the investment portfolio, and conclusions reached, were consistent with IFRS as adopted by the EU and International Private Equity and Venture Capital Valuation Guidelines (“IPEV guidelines”);
– Compared the actual cash flows in the current year to prior year assumptions in order to assess the accuracy of management’s forecasting process;
– Compared the key valuation drivers applied in the valuation models against current market and comparable transaction data in order to assess the appropriateness of these drivers; and
– Obtained and read the latest independent review opinion from the investment adviser in respect of the integrity of the cash flow models of each investment in our sample, where applicable.
We confirmed that there were no material matters arising from our audit work on the valuation techniques, cash flow forecasts and other key valuation drivers that we wished to bring to the attention of the Audit and Risk Committee.
We confirmed that valuation methodologies adopted were appropriate in relation to IPEV guidelines and that the valuation of the investment portfolio was not materially misstated and was in line with IFRS as adopted by the EU.
Incomplete or inaccurate investment income recognition (2016: £58.9m, 2015: £58.1m) (as described on pages 65-66 in the Report of the Audit and Risk Committee).
Investment income (in the form of dividend and interest entitlements due from underlying investee companies) is a key driver of the amount available for distribution to shareholders by way of dividend.
If the Group is not entitled to receive the investment income recognised in the financial statements, or the investment income recognised is inaccurate or does not relate to the current financial year, this could have a material impact on the ability of the Group to meet its stated dividend growth targets.
We performed the following procedures:
– Obtained a breakdown by each investee company of investment income recognised by the Group and, on a sample basis, agreed dividends to board minutes from the investee companies and recalculated interest income based on the underlying agreements.
– Agreed a sample of investment income receipts to bank statements.
– Performed cut off procedures by checking that a sample of investment income receipts around the year end date were recognised in the correct financial year.
We confirmed that there were no matters identified during our audit work on income recognition that we wished to bring to the attention of the Audit and Risk Committee.
Calculation of performance fees (2016: £19.5m, 2015: £45.0m) (as described on pages 65-66 in the Report of the Audit and Risk Committee).
The performance fees incurred by the Group are a material component of the Group’s cost base and, therefore, impact the Group’s total return. The performance fee is disclosed in Note 2 to the financial statements.
As described in Note 18, the calculation methodology for the performance fee is complex and requires a number of subjective inputs from the Group’s own financial records.
If the performance fee is not correctly calculated this could have a material impact on both the costs incurred and overall performance of the Group.
We performed the following procedures:
– Performed a recalculation of the performance fees incurred by the Group in the year using the calculation methodology described in the signed Investment Advisory Agreement between the Company and the Adviser.
– Agreed the inputs used in the calculation of the performance fee to the Group’s financial records and audited valuation of the investment portfolio.
We confirmed that there were no matters identified during our audit work on the calculation of performance fees that we wished to bring to the attention of the Audit and Risk Committee.
70 3i Infrastructure plc Annual report and accounts 2016
Financials and other information
The scope of our audit Our assessment of audit risk, our evaluation of materiality and our allocation of performance materiality determine our audit scope for the Group. This enables us to form an opinion on the financial statements. We take into account size, risk profile, the organisation of the Group and effectiveness of controls, including controls and changes in the business environment when assessing the level of work to be performed. The Group consists of the Company and its wholly owned subsidiary, 3i Infrastructure Seed Assets GP Limited.
Our application of materiality We apply the concept of materiality in planning and performing the audit, in evaluating the effect of identified misstatements on the audit and in forming our audit opinion.
Materiality – The magnitude of an omission or misstatement that, individually
or in the aggregate, could reasonably be expected to influence the economic decisions of the users of the financial statements. Materiality provides a basis for determining the nature and extent of our audit procedures.
– We determined planning materiality for the Group to be £12.8m which is 1% of net assets (2015: £13.2m, 1% of net assets). This provided a basis for determining the nature, timing and extent of our risk assessment procedures, identifying and assessing the risks of material misstatement and determining the nature, timing and extent of further audit procedures. We derived our materiality calculation as a proportion of net assets as we consider that to be the most important financial metric on which shareholders judge the performance of the Group.
Performance materiality – The application of materiality at the individual account or balance
level. It is set at an amount to reduce to an appropriately low level the probability that the aggregate of uncorrected and undetected misstatements exceeds materiality.
– On the basis of our risk assessments, together with our assessment of the Group’s overall control environment, our judgment was that overall performance materiality (i.e. our tolerance for misstatement in an individual account or balance) for the Group should be 75% of planning materiality, being £9.6m (2015: 75% of materiality, namely £9.9m). We have set performance materiality at this percentage due to our past experience of the audit that indicates a lower risk of misstatements, both corrected and uncorrected.
Reporting threshold – An amount below which identified misstatements are considered
as being clearly trivial.
– We agreed with the Audit and Risk Committee that we would report all audit differences in excess of £0.64m (2015: £0.70m) as well as differences below that threshold that, in our view, warranted reporting on qualitative grounds.
– We evaluate any uncorrected misstatements against both the quantitative measures of materiality discussed above and in the light of other relevant qualitative considerations in forming our opinion.
Scope of the audit of the financial statementsAn audit involves obtaining evidence about the amounts and disclosures in the financial statements sufficient to give reasonable assurance that the financial statements are free from material misstatement, whether caused by fraud or error. This includes an assessment of: whether the accounting policies are appropriate to the Group’s circumstances and have been consistently applied and adequately disclosed; the reasonableness of significant accounting estimates made by the Directors; and the overall presentation of the financial statements. In addition, we read all the financial and non-financial information in the Annual report to identify material inconsistencies with the audited financial statements and to identify any information that is apparently materially incorrect based on, or materially inconsistent with, the knowledge acquired by us in the course of performing the audit. If we become aware of any apparent material misstatements or inconsistencies we consider the implications for our report.
Respective responsibilities of directors and auditorAs explained more fully in the Statement of Directors’ Responsibilities set out on pages 57–58, the Directors are responsible for the preparation of the financial statements and for being satisfied that they give a true and fair view. Our responsibility is to audit and express an opinion on the financial statements in accordance with applicable law and International Standards on Auditing (UK and Ireland). Those standards require us to comply with the Auditing Practices Board’s Ethical Standards for Auditors.
This report is made solely to the Company’s members, as a body, in accordance with Article 113A of the Companies (Jersey) Law 1991. Our audit work has been undertaken so that we might state to the Company’s members those matters we are required to state to them in an auditor’s report and for no other purpose. To the fullest extent permitted by law, we do not accept or assume responsibility to anyone other than the Company and the Company’s members as a body, for our audit work, for this report, or for the opinions we have formed.
Independent auditor’s report to the members of 3i Infrastructure plc Continued
3i Infrastructure plc Annual report and accounts 2016 71
Financials and other information
1. The maintenance and integrity of the 3i Infrastructure plc website is the responsibility of the directors; the work carried out by the auditors does not involve consideration of these matters and, accordingly, the auditors accept no responsibility for any changes that may have occurred to the financial statements since they were initially presented on the web site.
2. Legislation in Jersey governing the preparation and dissemination of financial statements may differ from legislation in other jurisdictions.
Matters on which we are required to report by exception
ISAs (UK and Ireland) reporting We are required to report to you if, in our opinion, financial and non-financial information in the Annual report is:
– materially inconsistent with the information in the audited financial statements; or
– apparently materially incorrect based on, or materially inconsistent with, our knowledge of the Group acquired in the course of performing our audit; or
– otherwise misleading.
In particular, we are required to report whether we have identified any inconsistencies between our knowledge acquired in the course of performing the audit and the directors’ statement that they consider the Annual report and accounts taken as a whole is fair, balanced and understandable and provides the information necessary for shareholders to assess the entity’s performance, business model and strategy; and whether the Annual report appropriately addresses those matters that we communicated to the Audit and Risk Committee that we consider should have been disclosed.
We have no exceptions to report.
Companies (Jersey) Law 1991 reporting
We are required to report to you if, in our opinion:
– proper accounting records have not been kept, or proper returns adequate for our audit have not been received from branches not visited by us; or
– the financial statements are not in agreement with the accounting records and returns; or
– we have not received all the information and explanations we require for our audit.
We have no exceptions to report.
Listing Rules review requirements We are required to review:
– the directors’ statement in relation to going concern, set out on page 58 and longer-term viability, set out on page 35; and
– the part of the Corporate Governance Statement relating to the Company’s compliance with the provisions of the UK Corporate Governance Code specified for our review.
We have no exceptions to report.
Statement on the Directors’ assessment of the principal risks that would threaten the solvency or liquidity of the entity
ISAs (UK and Ireland) reporting We are required to give a statement as to whether we have anything material to add or to draw attention to in relation to:
– the directors’ confirmation in the Annual Report that they have carried out a robust assessment of the principal risks facing the entity, including those that would threaten its business model, future performance, solvency or liquidity;
– the disclosures in the Annual Report that describe those risks and explain how they are being managed or mitigated;
– the directors’ statement in the financial statements about whether they considered it appropriate to adopt the going concern basis of accounting in preparing them, and their identification of any material uncertainties to the entity’s ability to continue to do so over a period of at least 12 months from the date of approval of the financial statements; and
– the directors’ explanation in the Annual Report as to how they have assessed the prospects of the entity, over what period they have done so and why they consider that period to be appropriate, and their statement as to whether they have a reasonable expectation that the entity will be able to continue in operation and meet its liabilities as they fall due over the period of their assessment, including any related disclosures drawing attention to any necessary qualifications or assumptions.
We have nothing material to add or to draw your attention to.
David Robert John Moore, ACAfor and on behalf of Ernst & Young LLP Jersey, Channel Islands
11 May 2016
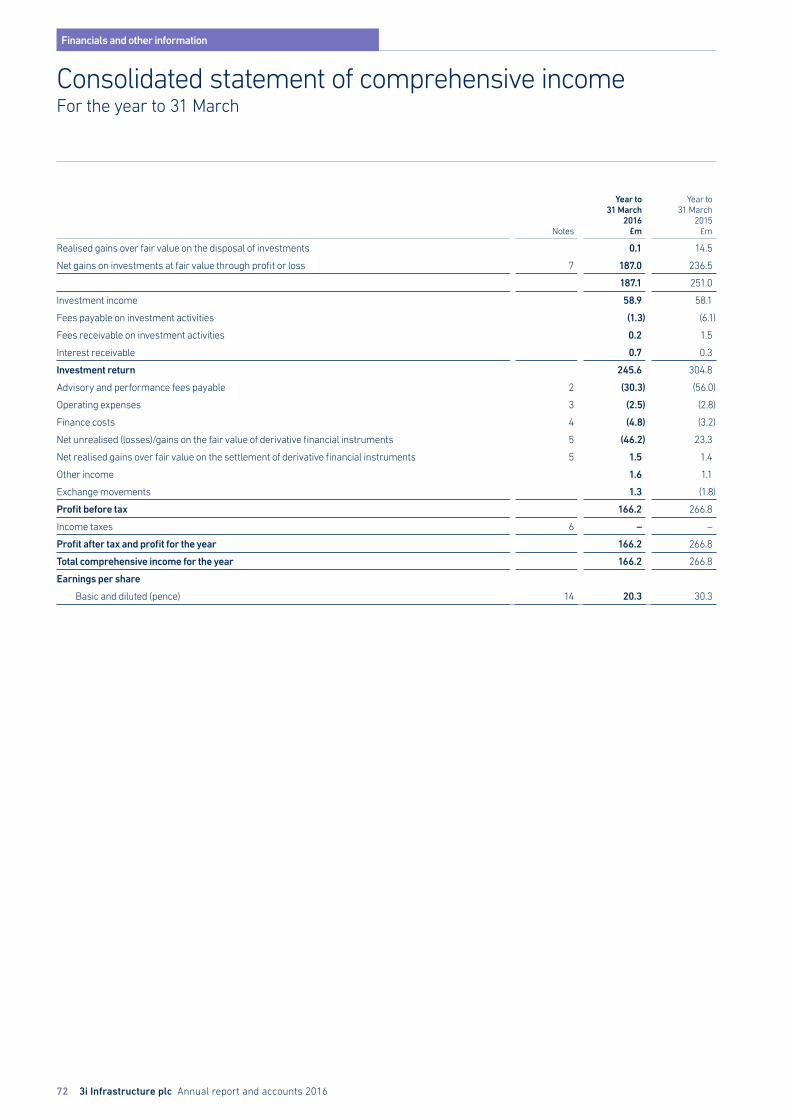
72 3i Infrastructure plc Annual report and accounts 2016
Financials and other information
Consolidated statement of comprehensive incomeFor the year to 31 March
Notes
Year to31 March
2016£m
Year to31 March
2015£m
Realised gains over fair value on the disposal of investments 0.1 14.5
Net gains on investments at fair value through profit or loss 7 187.0 236.5
187.1 251.0
Investment income 58.9 58.1
Fees payable on investment activities (1.3) (6.1)
Fees receivable on investment activities 0.2 1.5
Interest receivable 0.7 0.3
Investment return 245.6 304.8
Advisory and performance fees payable 2 (30.3) (56.0)
Operating expenses 3 (2.5) (2.8)
Finance costs 4 (4.8) (3.2)
Net unrealised (losses)/gains on the fair value of derivative financial instruments 5 (46.2) 23.3
Net realised gains over fair value on the settlement of derivative financial instruments 5 1.5 1.4
Other income 1.6 1.1
Exchange movements 1.3 (1.8)
Profit before tax 166.2 266.8
Income taxes 6 – –
Profit after tax and profit for the year 166.2 266.8
Total comprehensive income for the year 166.2 266.8
Earnings per share
Basic and diluted (pence) 14 20.3 30.3
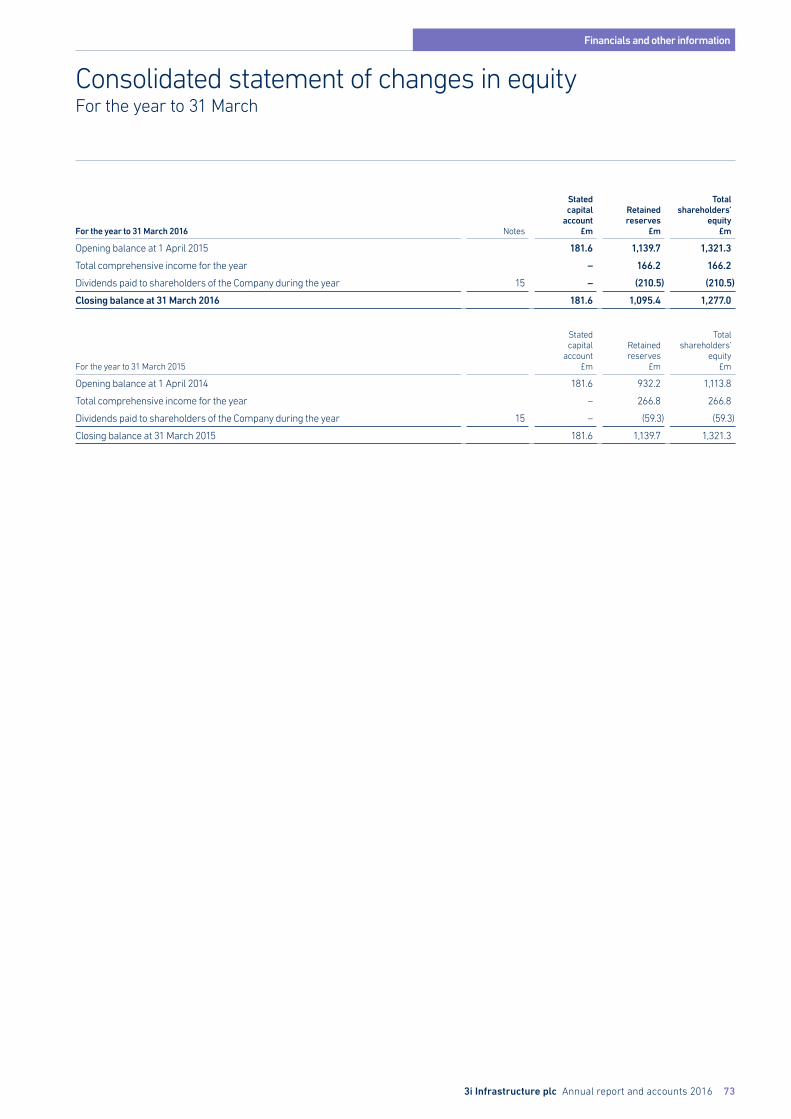
3i Infrastructure plc Annual report and accounts 2016 73
Financials and other information
Consolidated statement of changes in equityFor the year to 31 March
For the year to 31 March 2016 Notes
Statedcapital
account£m
Retainedreserves
£m
Totalshareholders’
equity£m
Opening balance at 1 April 2015 181.6 1,139.7 1,321.3
Total comprehensive income for the year – 166.2 166.2
Dividends paid to shareholders of the Company during the year 15 – (210.5) (210.5)
Closing balance at 31 March 2016 181.6 1,095.4 1,277.0
For the year to 31 March 2015
Statedcapital
account£m
Retainedreserves
£m
Totalshareholders’
equity£m
Opening balance at 1 April 2014 181.6 932.2 1,113.8
Total comprehensive income for the year – 266.8 266.8
Dividends paid to shareholders of the Company during the year 15 – (59.3) (59.3)
Closing balance at 31 March 2015 181.6 1,139.7 1,321.3
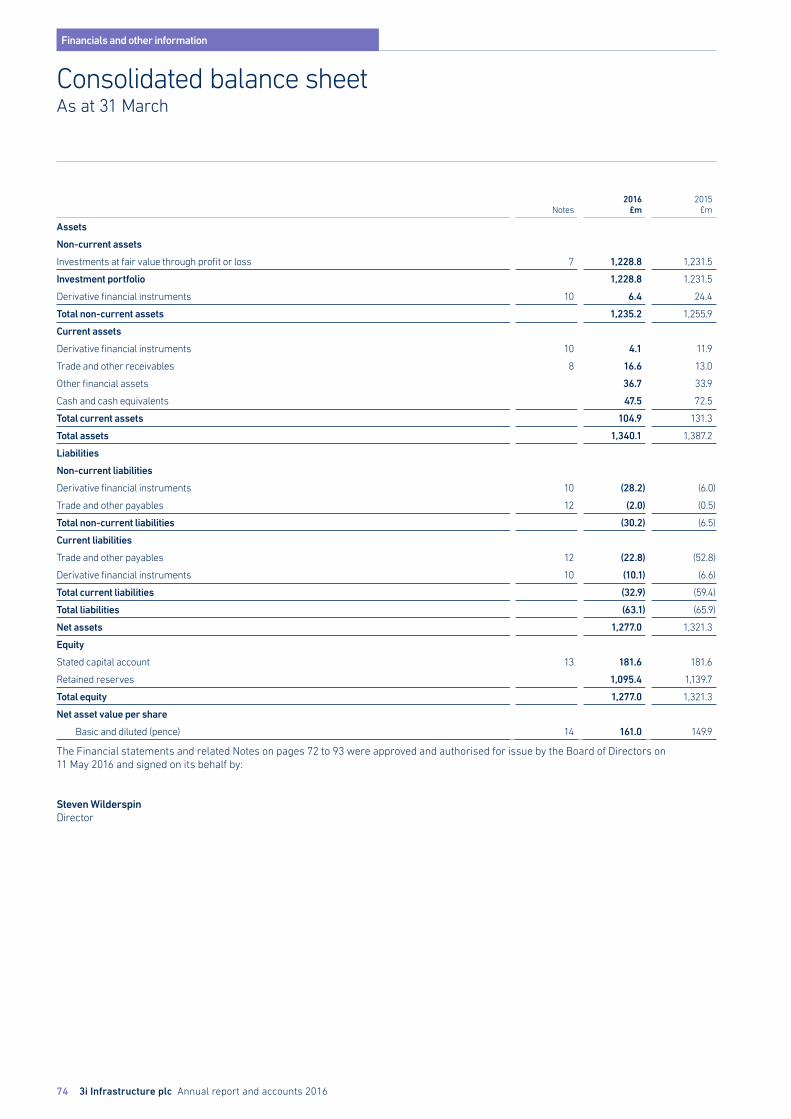
74 3i Infrastructure plc Annual report and accounts 2016
Financials and other information
Consolidated balance sheetAs at 31 March
Notes2016
£m2015
£m
Assets
Non-current assets
Investments at fair value through profit or loss 7 1,228.8 1,231.5
Investment portfolio 1,228.8 1,231.5
Derivative financial instruments 10 6.4 24.4
Total non-current assets 1,235.2 1,255.9
Current assets
Derivative financial instruments 10 4.1 11.9
Trade and other receivables 8 16.6 13.0
Other financial assets 36.7 33.9
Cash and cash equivalents 47.5 72.5
Total current assets 104.9 131.3
Total assets 1,340.1 1,387.2
Liabilities
Non-current liabilities
Derivative financial instruments 10 (28.2) (6.0)
Trade and other payables 12 (2.0) (0.5)
Total non-current liabilities (30.2) (6.5)
Current liabilities
Trade and other payables 12 (22.8) (52.8)
Derivative financial instruments 10 (10.1) (6.6)
Total current liabilities (32.9) (59.4)
Total liabilities (63.1) (65.9)
Net assets 1,277.0 1,321.3
Equity
Stated capital account 13 181.6 181.6
Retained reserves 1,095.4 1,139.7
Total equity 1,277.0 1,321.3
Net asset value per share
Basic and diluted (pence) 14 161.0 149.9
The Financial statements and related Notes on pages 72 to 93 were approved and authorised for issue by the Board of Directors on 11 May 2016 and signed on its behalf by:
Steven WilderspinDirector
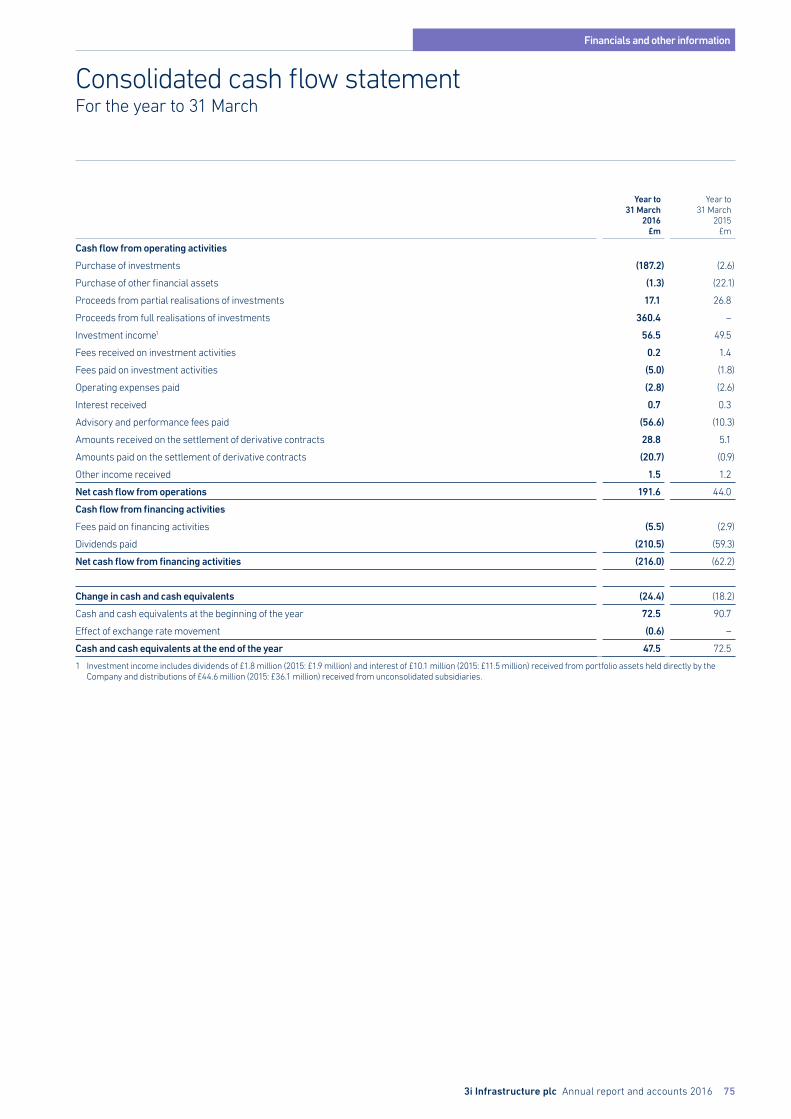
3i Infrastructure plc Annual report and accounts 2016 75
Financials and other information
Consolidated cash flow statementFor the year to 31 March
Year to31 March
2016£m
Year to31 March
2015£m
Cash flow from operating activities
Purchase of investments (187.2) (2.6)
Purchase of other financial assets (1.3) (22.1)
Proceeds from partial realisations of investments 17.1 26.8
Proceeds from full realisations of investments 360.4 –
Investment income1 56.5 49.5
Fees received on investment activities 0.2 1.4
Fees paid on investment activities (5.0) (1.8)
Operating expenses paid (2.8) (2.6)
Interest received 0.7 0.3
Advisory and performance fees paid (56.6) (10.3)
Amounts received on the settlement of derivative contracts 28.8 5.1
Amounts paid on the settlement of derivative contracts (20.7) (0.9)
Other income received 1.5 1.2
Net cash flow from operations 191.6 44.0
Cash flow from financing activities
Fees paid on financing activities (5.5) (2.9)
Dividends paid (210.5) (59.3)
Net cash flow from financing activities (216.0) (62.2)
Change in cash and cash equivalents (24.4) (18.2)
Cash and cash equivalents at the beginning of the year 72.5 90.7
Effect of exchange rate movement (0.6) –
Cash and cash equivalents at the end of the year 47.5 72.5
1 Investment income includes dividends of £1.8 million (2015: £1.9 million) and interest of £10.1 million (2015: £11.5 million) received from portfolio assets held directly by the Company and distributions of £44.6 million (2015: £36.1 million) received from unconsolidated subsidiaries.
76 3i Infrastructure plc Annual report and accounts 2016
Financials and other information
Significant accounting policies
Corporate information3i Infrastructure plc (the “Company”) is a company incorporated in Jersey, Channel Islands. The Consolidated financial statements for the year to 31 March 2016 comprise the financial statements of the Company and its consolidated subsidiary as defined in IFRS 10 Consolidated Financial Statements (together referred to as the “Group”). The Companies (Jersey) Law 1991 does not require the directors of a company to present separate financial statements where consolidated financial statements are presented and therefore the financial results and position of the Company are not presented alongside the consolidated financial statements of the Group.
The financial statements were authorised for issue by the Board of Directors on 11 May 2016.
Statement of complianceThese financial statements have been prepared in accordance with International Financial Reporting Standards, International Accounting Standards and their interpretations issued or adopted by the International Accounting Standards Board as adopted for use in the European Union (“IFRS”).
These financial statements have also been prepared in accordance with and in compliance with the Companies (Jersey) Law 1991.
Basis of preparationThe financial statements are prepared on a going concern basis as disclosed in the Directors’ report, as the Directors are satisfied that the Group has the resources to continue in business for the foreseeable future. In making this assessment, the Directors have considered a wide range of information relating to present and future conditions, including future projections of profitability and cash flows.
The financial statements of the Group are presented in sterling, the functional currency of the Company, rounded to the nearest hundred thousand pounds (£0.1 million) except where otherwise indicated.
The preparation of financial statements in conformity with IFRS requires the Board to make judgments, estimates and assumptions that affect the application of policies and reported amounts of assets and liabilities, income and expenses. The estimates and associated assumptions are based on experience and other factors that are believed to be reasonable under the circumstances, the results of which form the basis of determining the carrying values of assets and liabilities that are not readily apparent from other sources. Actual results may differ from these estimates.
Basis of consolidationIn accordance with IFRS 10 (as amended), entities that meet the definition of an investment entity are required to fair value certain subsidiaries through profit or loss in accordance with IAS 39 Financial Instruments: Recognition and Measurement, rather than consolidate their results. However, those subsidiaries that are not themselves investment entities and provide investment-related services to the Company are consolidated.
Key estimates and judgmentsThe preparation of financial statements in accordance with IFRS requires the Directors to exercise judgment in the process of applying the accounting policies defined below. The following policies are areas where a higher degree of judgment has been applied in the preparation of the financial statements.
(i) Assessment as investment entity – Entities that meet the definition of an investment entity within IFRS 10 are required to measure their subsidiaries at fair value through profit or loss rather than consolidate them unless they provided investment-related services to the Company. To determine that the Company continues to meet the definition of an investment entity, the Company is required to satisfy the following three essential criteria:
(a) the Company obtains funds from one or more investors for the purpose of providing those investor(s) with investment management services;
(b) the Company commits to its investor(s) that its business purpose is to invest funds solely for returns from capital appreciation, investment income, or both; and
(c) the Company measures and evaluates the performance of substantially all of its investments on a fair value basis.
The Company meets the criteria as follows:
– the stated strategy of the Company is to deliver stable returns to shareholders through a mix of income yield and capital appreciation;
– the Company provides investment management services and has several investors who pool their funds to gain access to infrastructure related investment opportunities that they might not have had access to individually; and
– the Company has elected to measure and evaluate the performance of all of its investments on a fair value basis. The fair value method is used to represent the Company’s performance in its communication to the market, including investor presentations. In addition, the Company reports fair value information internally to Directors, who use fair value as the primary measurement attribute to evaluate performance.
The Directors are of the opinion that the Company has all the typical characteristics of an investment entity and meets the definition in the standard. This conclusion will be reassessed on an annual basis.
(ii) Assessment of investments as structured entities – A structured entity is an entity that has been designed so that voting or similar rights are not the dominant factor in deciding who controls the entity. Additional disclosures are required by IFRS 12 for interests in structured entities, whether they are consolidated or not. The Directors have assessed whether the entities in which the Group invests should be classified as structured entities and have concluded that none of the entities should be classified as structured entities as voting rights are the dominant factor in deciding who controls these entities.
(iii) Assessment of consolidation requirements – The Group holds significant stakes in the majority of its investee companies and must exercise judgment in the level of control of the underlying investee company that is obtained in order to assess whether the company should be classified as a subsidiary.
3i Infrastructure plc Annual report and accounts 2016 77
Financials and other information
The Group must also exercise judgment in whether a subsidiary provides investment-related services or activities and therefore should be consolidated or held at fair value through profit or loss. Refer to significant accounting policy “A Classification” for further details.
During the year, the Company acquired two new principal subsidiary entities. The Directors have assessed whether these entities provide investment-related services and have concluded that they should not be consolidated and that they should be held at fair value through profit or loss.
The adoption of certain accounting policies by the Group also requires the use of certain critical accounting estimates in determining the information to be disclosed in the financial statements.
Valuation of the investment portfolioThe key area where estimates are significant to the consolidated financial statements and have a significant risk of causing a material adjustment to the carrying amounts of assets and liabilities within the next financial year is in the valuation of the investment portfolio.
The majority of assets in the investment portfolio are valued on a discounted cash flow basis which requires assumptions to be made regarding future cash flows and the discount rate to be applied to these cash flows. Refer to Note 7 for further details of the valuation techniques, significant inputs to those techniques and sensitivity of the fair value of these investments to the assumptions that have been made.
Standards and interpretations issued but not yet effectiveAs at 31 March 2016, the following new or amended standards and interpretations, which have not been applied in these financial statements, had been issued by the International Accounting Standards Board (IASB) but are yet to become effective.
IFRS Annual improvements 2012 to 2014 (effective for accounting periods commencing on or after 1 January 2016).
IFRS 9 Financial Instruments (effective for accounting periods commencing on or after 1 January 2018).
Amendments to IFRS 10, IFRS 12 and IAS 28 (effective for accounting periods commencing on or after 1 January 2016).
Amendments to IFRS 11 (effective for accounting periods commencing on or after 1 January 2016).
IFRS 15 Revenue from Contracts with Customers (effective for accounting periods commencing on or after 1 January 2018).
IFRS 16 Leases (effective for accounting periods commencing on or after 1 January 2019).
The Directors do not expect that the adoption of the Standards and Interpretations listed above will have a material impact on the financial statements of the Consolidated Group in future periods, although IFRS 9 may impact the disclosure of certain Financial Instruments.
IFRS 10 (Revised) – Consolidated Financial StatementsThe IASB issued a narrow scope amendment to IFRS 10 in December 2014 and subsequently the Group revisited its initial assessment of all of its subsidiaries and concluded that the initial assessment remained appropriate.
A Classification(i) Subsidiaries – Subsidiaries are entities controlled by the Company. Control exists when the Company is exposed, or has rights, to variable returns from its involvement with the subsidiary entity and has the ability to affect those returns through its power over the subsidiary entity. In accordance with the exception under IFRS 10 Consolidated Financial Statements, the Company only consolidates subsidiaries in the financial statements if they are deemed to perform independent investment-related services and do not meet the definition of an investment entity. Investments in subsidiaries that do not meet this definition are accounted for as Investments at fair value through profit or loss with changes in fair value recognised in the statement of comprehensive income in the year. The Directors have assessed all entities within the Group structure and concluded that 3i Infrastructure Seed Assets GP Limited is the only subsidiary of the Company that provides independent investment-related services or activities. This subsidiary has been consolidated with the Company to form “the Group”.
(ii) Associates – Associates are those entities in which the Group has significant influence, but not control, over the financial and operating policies. Investments that are held as part of the Group’s investment portfolio are carried in the balance sheet at fair value even though the Group may have significant influence over those companies. This treatment is permitted by IAS 28, Investment in Associates, which allows investments held by venture capital organisations to be excluded from its scope where those investments are designated, upon initial recognition, as at fair value through profit or loss and accounted for in accordance with IAS 39, with changes in fair value recognised in the statement of comprehensive income in the year.
(iii) Joint ventures – Interests in joint ventures that are held as part of the Group’s investment portfolio are carried in the balance sheet at fair value. This treatment is permitted by IFRS 11 and IAS 28, which allows interests held by venture capital organisations to be excluded from its scope where those investments are designated, upon initial recognition, as at fair value through profit or loss and accounted for in accordance with IAS 39, with changes in fair value recognised in the statement of comprehensive income in the year.
(iv) Transactions eliminated on consolidation – Intragroup balances between the Company and the consolidated subsidiary; 3i Infrastructure Seed Assets GP Limited, and any unrealised gains and losses or income and expenses arising from intragroup transactions, are eliminated in preparing the consolidated financial statements. There will be no elimination in relation to transactions between the Company and subsidiaries held at fair value.
78 3i Infrastructure plc Annual report and accounts 2016
Financials and other information
Significant accounting policiesContinued
B Exchange differencesForeign currency transactions – Transactions entered into by the Group in a currency other than its functional currency are recorded at the rates ruling when the transactions occur. Foreign currency monetary assets and liabilities are translated to the functional currency at the exchange rate ruling at the balance sheet date. Foreign exchange differences arising on translation to the functional currency are recognised in the statement of comprehensive income.
Non-monetary assets and liabilities that are measured in terms of historical cost in a foreign currency are translated using the exchange rate at the date of the transactions. Non-monetary assets and liabilities denominated in foreign currencies that are stated at fair value are translated to the functional currency using exchange rates ruling at the date the fair value was determined.
C Investment portfolioRecognition and measurement – Investments are recognised and de-recognised on a date where the purchase or sale of an investment is under a contract whose terms require the delivery or settlement of the investment. The Group manages its investments with a view to profiting from the receipt of investment income and obtaining capital appreciation from changes in the fair value of investments. Therefore, all quoted investments and unquoted investments are designated as at fair value through profit or loss upon initial recognition and subsequently carried in the balance sheet at fair value. All investments are initially recognised at the fair value of the consideration given and are subsequently measured at fair value, applying the Group’s valuation policy. Acquisition related costs are accounted for as expenses when incurred, unless directly related to the issue of debt or equity securities.
(i) Realised gains or losses on the disposal of investments are the difference between the fair value of the consideration receivable on disposal less any directly attributable costs and its fair value at the start of the accounting period, converted into sterling using the exchange rates in force at the date of disposal; and are recognised in the statement of comprehensive income.
(ii) Net gains or losses on the revaluation of investments are the movement in the fair value of investments between the start and end of the accounting period, or the investment acquisition date and the end of the accounting period, converted into sterling using the exchange rates in force at the end of the period; and are recognised in the statement of comprehensive income.
IncomePortfolio income is that portion of income that is directly related to the return from individual investments. It is recognised to the extent that it is probable that there will be an economic benefit and the income can be reliably measured.
Investment income relates to returns from investments in the portfolio, excluding fair value movement on the value of the portfolio.
The following specific recognition criteria must be met before the income is recognised:
– dividends from equity investments are recognised in the statement of comprehensive income when the Company’s rights to receive payment have been established with the exception of dividends paid out of pre-acquisition reserves that are recognised by adjusting the fair value of the equity investment upon acquisition;
– income from loans and receivables and debt held at fair value through profit or loss is recognised as it accrues by reference to the principal outstanding and the effective interest rate applicable, which is the rate that exactly discounts the estimated future cash flows through the expected life of the financial asset to the asset’s carrying value or principal amount;
– distributions from investments in Limited Partnerships are recognised in the statement of comprehensive income when the Company’s rights as a Limited Partner to receive payment have been established; and
– fees receivable represent amounts earned from investee companies on completion of underlying investment transactions and are recognised on an accruals basis once entitlement to the revenue has been established.
D Fees(i) Fees – Fees payable represent fees incurred in the process of acquiring an investment and are measured on the accruals basis.
(ii) Advisory fee – An annual advisory fee is payable to 3i plc based on the Gross Investment Value of the Group. The fee is payable quarterly in advance and is accrued in the period it is incurred. Further explanations are provided in Note 18.
(iii) Performance fee – 3i plc is entitled to a performance fee based on the Adjusted Total Return per ordinary share generated in the period in excess of a performance hurdle (subject to a high water mark requirement being exceeded). The fee is payable annually in arrears and is accrued in the period it is incurred. Further explanations are provided in Note 18.
(iv) Finance costs – Finance costs associated with loans and borrowings are recognised on an accruals basis using the effective interest method.
E Treasury assets and liabilitiesShort-term treasury assets and short and long-term treasury liabilities are used to manage cash flows and the overall costs of borrowing. Financial assets and liabilities are recognised in the balance sheet when the relevant Group entity becomes a party to the contractual provisions of the instrument.
(i) Cash and cash equivalents – Cash and cash equivalents in the balance sheet and cash flow statement comprise cash at bank, short-term deposits with an original maturity of three months or less and AAA rated money market funds. Interest receivable on cash and cash equivalents is recognised on an accruals basis.
3i Infrastructure plc Annual report and accounts 2016 79
Financials and other information
(ii) Bank loans, loan notes and borrowings – Loans and borrowings are initially recognised at the fair value of the consideration received, net of issue costs associated with the borrowings. Where issue costs are incurred in relation to arranging debt finance facilities these are capitalised and disclosed within Trade and other receivables and amortised over the life of the loan. After initial recognition, loans and borrowings are subsequently measured at amortised cost using the effective interest method, which is the rate that exactly discounts the estimated future cash flows through the expected life of the liabilities. Amortised cost is calculated by taking into account any issue costs and any discount or premium on settlement.
(iii) Other financial assets – Other financial assets in the balance sheet comprise principally cash held on deposit in third-party bank accounts on behalf of the Mersey Gateway Bridge, Ayrshire College and A9 primary PPP projects. The Company retains the right to replace these cash deposits for a letter of credit of the equivalent amount.
(iv) Derivative financial instruments – Derivative financial instruments are used to manage the risk associated with foreign currency fluctuations in the valuation of the investment portfolio and changes in interest rates on borrowings held by the Oystercatcher Luxco 2 S.à r.l. subsidiary. This is achieved by the use of forward foreign currency contracts and interest rate swaps. Such instruments are used for the sole purpose of efficient portfolio management. All derivative financial instruments are held at fair value through profit or loss. In the Consolidated cash flow statement the amounts received and paid on the settlement of the derivative financial instruments have been reclassified from financing to operating activities to more appropriately reflect the nature of the instruments as portfolio management tools.
Derivative financial instruments are recognised initially at fair value on the contract date and subsequently re-measured to the fair value at each reporting date. All changes in the fair value of derivative financial instruments are taken to the statement of comprehensive income. The maturity profile of derivative contracts is measured relative to the financial contract settlement date of each contract and the derivative contracts are disclosed in the financial statements as either current or non-current accordingly. Realised gains over fair value on the settlement of derivative financial instruments are the difference between the fair value of the consideration receivable on disposal and the fair value at the start of the accounting period, converted into sterling using the exchange rates in force at the date of disposal; and are recognised in the statement of comprehensive income.
F Other assetsAssets, other than those specifically accounted for under a separate policy, are stated at their consideration receivable less impairment losses. The carrying value of such assets or liabilities is considered to be approximate to their fair value. All assets are reviewed at each balance sheet date to determine whether there is any indication of impairment. If any such indication exists, the asset’s recoverable amount is estimated based on expected discounted future cash flows. Any change in levels of impairment is recognised directly in the statement of comprehensive income. An impairment loss is reversed at subsequent financial reporting dates to the extent that the asset’s carrying amount does not exceed its carrying value, had no impairment been recognised.
G Other liabilitiesLiabilities, other than those specifically accounted for under a separate policy, are stated based on the amounts which are considered to be payable in respect of goods or services received up to the financial reporting date. The carrying value of other liabilities is considered to be approximate to their fair value.
H Equity and reserves(i) Share capital – Share capital issued by the Company is recognised at the fair value of proceeds received and is credited to the stated capital account. Direct issue costs net of tax are deducted from the fair value of the proceeds received.
(ii) Equity and reserves – The stated capital account of the Company represents the cumulative proceeds recognised from share issues or new equity issued on the conversion of warrants made by the Company net of issue costs and reduced by any amount that has been transferred to retained reserves, in accordance with Jersey Company Law, in previous years. Share capital is treated as an equity instrument, on the basis that no contractual obligation exists for the Company to deliver cash or other financial assets to the holder of the instrument. The retained reserve incorporates the cumulative retained profits of the Company (after the payment of dividends) plus any amount that has been transferred from the stated capital account of the Company.
(iii) Dividends payable – Dividends on ordinary shares are recognised as a deduction from retained reserves in the period in which the Company’s obligation to make the dividend payment arises.
I Income taxesIncome taxes represent the sum of the tax currently payable, withholding taxes suffered and deferred tax. Tax is charged or credited in the statement of comprehensive income except to the extent that it relates to an amount recognised in the statement of changes in equity when it is recognised directly in this statement.
The tax currently payable is based on the taxable profit for the period. This may differ from the profit included in the consolidated statement of comprehensive income because it excludes items of income or expense that are taxable or deductible in other years and it further excludes items that are never taxable or deductible. The Group’s liability for current tax is calculated using tax rates and laws for each relevant tax jurisdiction in which the Company and its consolidated subsidiary operate that have been enacted or substantively enacted by the financial reporting date.
Deferred tax is the tax expected to be payable or recoverable on differences between the carrying amounts of assets and liabilities in the financial statements and the corresponding tax bases used in the computation of taxable profit and is accounted for using the balance sheet liability method.
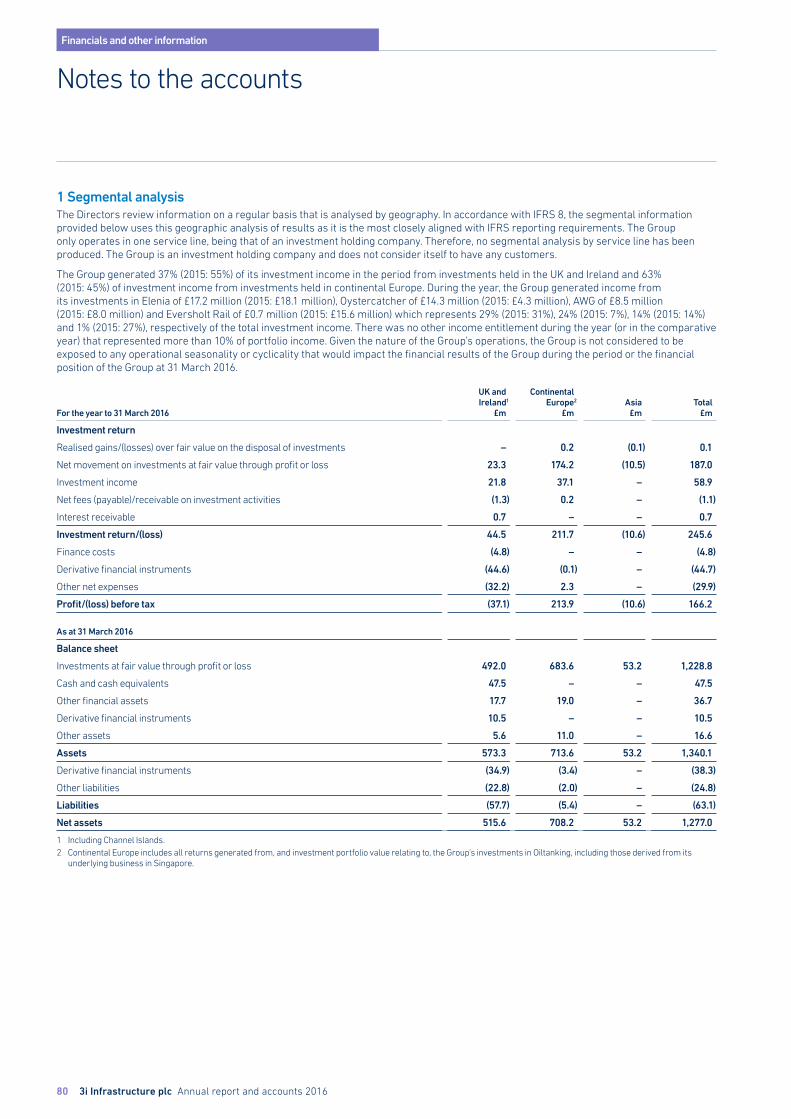
80 3i Infrastructure plc Annual report and accounts 2016
Financials and other information
Notes to the accounts
1 Segmental analysisThe Directors review information on a regular basis that is analysed by geography. In accordance with IFRS 8, the segmental information provided below uses this geographic analysis of results as it is the most closely aligned with IFRS reporting requirements. The Group only operates in one service line, being that of an investment holding company. Therefore, no segmental analysis by service line has been produced. The Group is an investment holding company and does not consider itself to have any customers.
The Group generated 37% (2015: 55%) of its investment income in the period from investments held in the UK and Ireland and 63% (2015: 45%) of investment income from investments held in continental Europe. During the year, the Group generated income from its investments in Elenia of £17.2 million (2015: £18.1 million), Oystercatcher of £14.3 million (2015: £4.3 million), AWG of £8.5 million (2015: £8.0 million) and Eversholt Rail of £0.7 million (2015: £15.6 million) which represents 29% (2015: 31%), 24% (2015: 7%), 14% (2015: 14%) and 1% (2015: 27%), respectively of the total investment income. There was no other income entitlement during the year (or in the comparative year) that represented more than 10% of portfolio income. Given the nature of the Group’s operations, the Group is not considered to be exposed to any operational seasonality or cyclicality that would impact the financial results of the Group during the period or the financial position of the Group at 31 March 2016.
For the year to 31 March 2016
UK andIreland1
£m
ContinentalEurope2
£mAsia
£mTotal
£m
Investment return
Realised gains/(losses) over fair value on the disposal of investments – 0.2 (0.1) 0.1
Net movement on investments at fair value through profit or loss 23.3 174.2 (10.5) 187.0
Investment income 21.8 37.1 – 58.9
Net fees (payable)/receivable on investment activities (1.3) 0.2 – (1.1)
Interest receivable 0.7 – – 0.7
Investment return/(loss) 44.5 211.7 (10.6) 245.6
Finance costs (4.8) – – (4.8)
Derivative financial instruments (44.6) (0.1) – (44.7)
Other net expenses (32.2) 2.3 – (29.9)
Profit/(loss) before tax (37.1) 213.9 (10.6) 166.2
As at 31 March 2016
Balance sheet
Investments at fair value through profit or loss 492.0 683.6 53.2 1,228.8
Cash and cash equivalents 47.5 – – 47.5
Other financial assets 17.7 19.0 – 36.7
Derivative financial instruments 10.5 – – 10.5
Other assets 5.6 11.0 – 16.6
Assets 573.3 713.6 53.2 1,340.1
Derivative financial instruments (34.9) (3.4) – (38.3)
Other liabilities (22.8) (2.0) – (24.8)
Liabilities (57.7) (5.4) – (63.1)
Net assets 515.6 708.2 53.2 1,277.0
1 Including Channel Islands.2 Continental Europe includes all returns generated from, and investment portfolio value relating to, the Group’s investments in Oiltanking, including those derived from its
underlying business in Singapore.
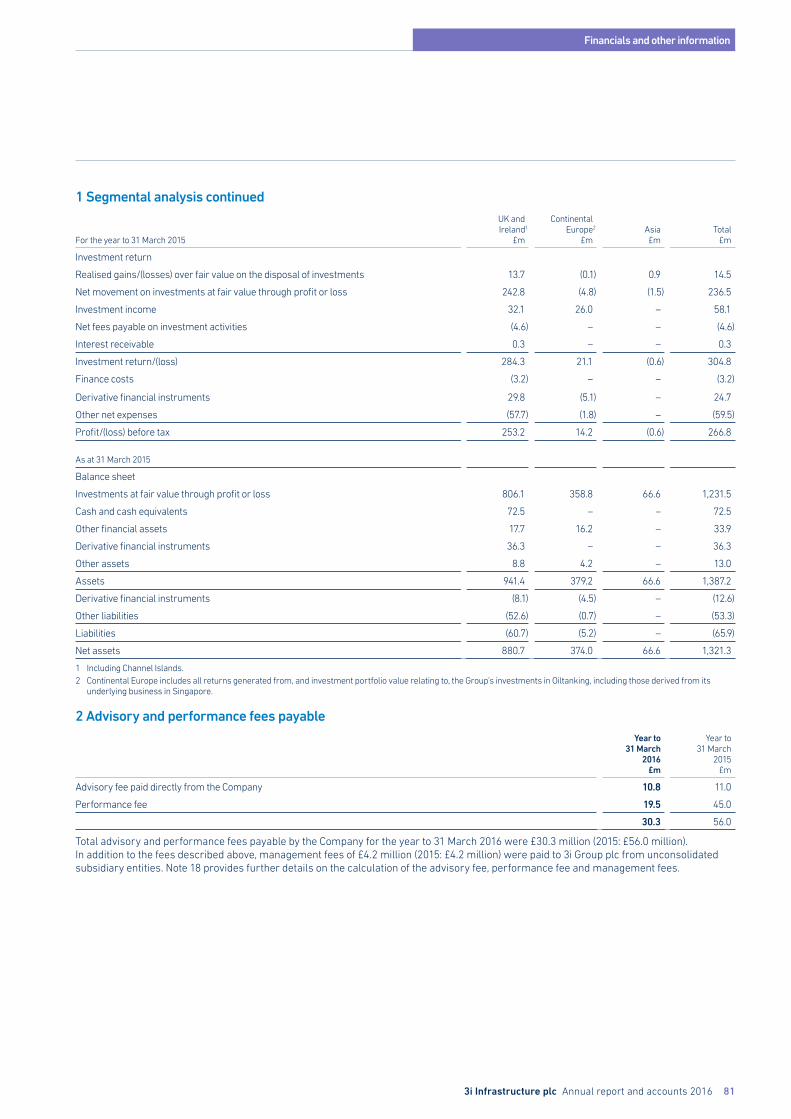
3i Infrastructure plc Annual report and accounts 2016 81
Financials and other information
1 Segmental analysis continued
For the year to 31 March 2015
UK andIreland1
£m
ContinentalEurope2
£mAsia£m
Total£m
Investment return
Realised gains/(losses) over fair value on the disposal of investments 13.7 (0.1) 0.9 14.5
Net movement on investments at fair value through profit or loss 242.8 (4.8) (1.5) 236.5
Investment income 32.1 26.0 – 58.1
Net fees payable on investment activities (4.6) – – (4.6)
Interest receivable 0.3 – – 0.3
Investment return/(loss) 284.3 21.1 (0.6) 304.8
Finance costs (3.2) – – (3.2)
Derivative financial instruments 29.8 (5.1) – 24.7
Other net expenses (57.7) (1.8) – (59.5)
Profit/(loss) before tax 253.2 14.2 (0.6) 266.8
As at 31 March 2015
Balance sheet
Investments at fair value through profit or loss 806.1 358.8 66.6 1,231.5
Cash and cash equivalents 72.5 – – 72.5
Other financial assets 17.7 16.2 – 33.9
Derivative financial instruments 36.3 – – 36.3
Other assets 8.8 4.2 – 13.0
Assets 941.4 379.2 66.6 1,387.2
Derivative financial instruments (8.1) (4.5) – (12.6)
Other liabilities (52.6) (0.7) – (53.3)
Liabilities (60.7) (5.2) – (65.9)
Net assets 880.7 374.0 66.6 1,321.3
1 Including Channel Islands.2 Continental Europe includes all returns generated from, and investment portfolio value relating to, the Group’s investments in Oiltanking, including those derived from its
underlying business in Singapore.
2 Advisory and performance fees payableYear to
31 March2016
£m
Year to31 March
2015£m
Advisory fee paid directly from the Company 10.8 11.0
Performance fee 19.5 45.0
30.3 56.0
Total advisory and performance fees payable by the Company for the year to 31 March 2016 were £30.3 million (2015: £56.0 million). In addition to the fees described above, management fees of £4.2 million (2015: £4.2 million) were paid to 3i Group plc from unconsolidated subsidiary entities. Note 18 provides further details on the calculation of the advisory fee, performance fee and management fees.
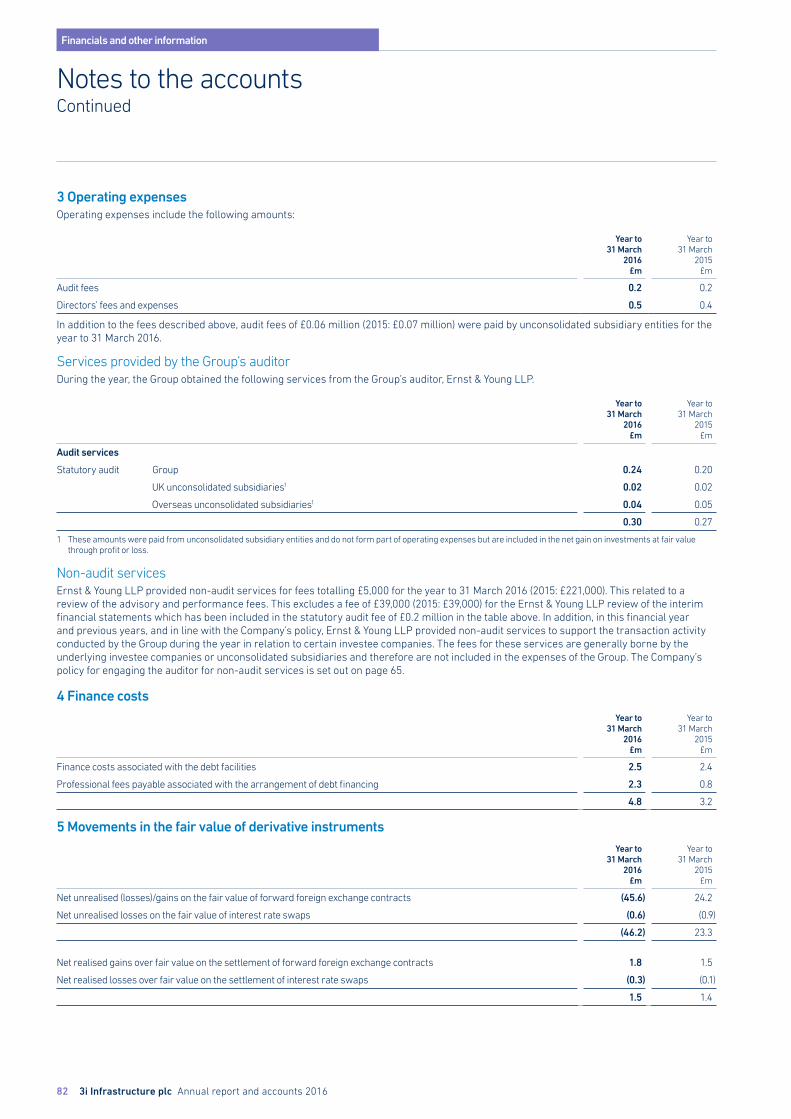
82 3i Infrastructure plc Annual report and accounts 2016
Financials and other information
Notes to the accountsContinued
3 Operating expensesOperating expenses include the following amounts:
Year to31 March
2016£m
Year to31 March
2015£m
Audit fees 0.2 0.2
Directors’ fees and expenses 0.5 0.4
In addition to the fees described above, audit fees of £0.06 million (2015: £0.07 million) were paid by unconsolidated subsidiary entities for the year to 31 March 2016.
Services provided by the Group’s auditorDuring the year, the Group obtained the following services from the Group’s auditor, Ernst & Young LLP.
Year to31 March
2016£m
Year to31 March
2015£m
Audit services
Statutory audit Group 0.24 0.20
UK unconsolidated subsidiaries1 0.02 0.02
Overseas unconsolidated subsidiaries1 0.04 0.05
0.30 0.27
1 These amounts were paid from unconsolidated subsidiary entities and do not form part of operating expenses but are included in the net gain on investments at fair value through profit or loss.
Non-audit servicesErnst & Young LLP provided non-audit services for fees totalling £5,000 for the year to 31 March 2016 (2015: £221,000). This related to a review of the advisory and performance fees. This excludes a fee of £39,000 (2015: £39,000) for the Ernst & Young LLP review of the interim financial statements which has been included in the statutory audit fee of £0.2 million in the table above. In addition, in this financial year and previous years, and in line with the Company’s policy, Ernst & Young LLP provided non-audit services to support the transaction activity conducted by the Group during the year in relation to certain investee companies. The fees for these services are generally borne by the underlying investee companies or unconsolidated subsidiaries and therefore are not included in the expenses of the Group. The Company’s policy for engaging the auditor for non-audit services is set out on page 65.
4 Finance costsYear to
31 March2016
£m
Year to31 March
2015£m
Finance costs associated with the debt facilities 2.5 2.4
Professional fees payable associated with the arrangement of debt financing 2.3 0.8
4.8 3.2
5 Movements in the fair value of derivative instrumentsYear to
31 March2016
£m
Year to31 March
2015£m
Net unrealised (losses)/gains on the fair value of forward foreign exchange contracts (45.6) 24.2
Net unrealised losses on the fair value of interest rate swaps (0.6) (0.9)
(46.2) 23.3
Net realised gains over fair value on the settlement of forward foreign exchange contracts 1.8
1.5
Net realised losses over fair value on the settlement of interest rate swaps (0.3) (0.1)
1.5 1.4
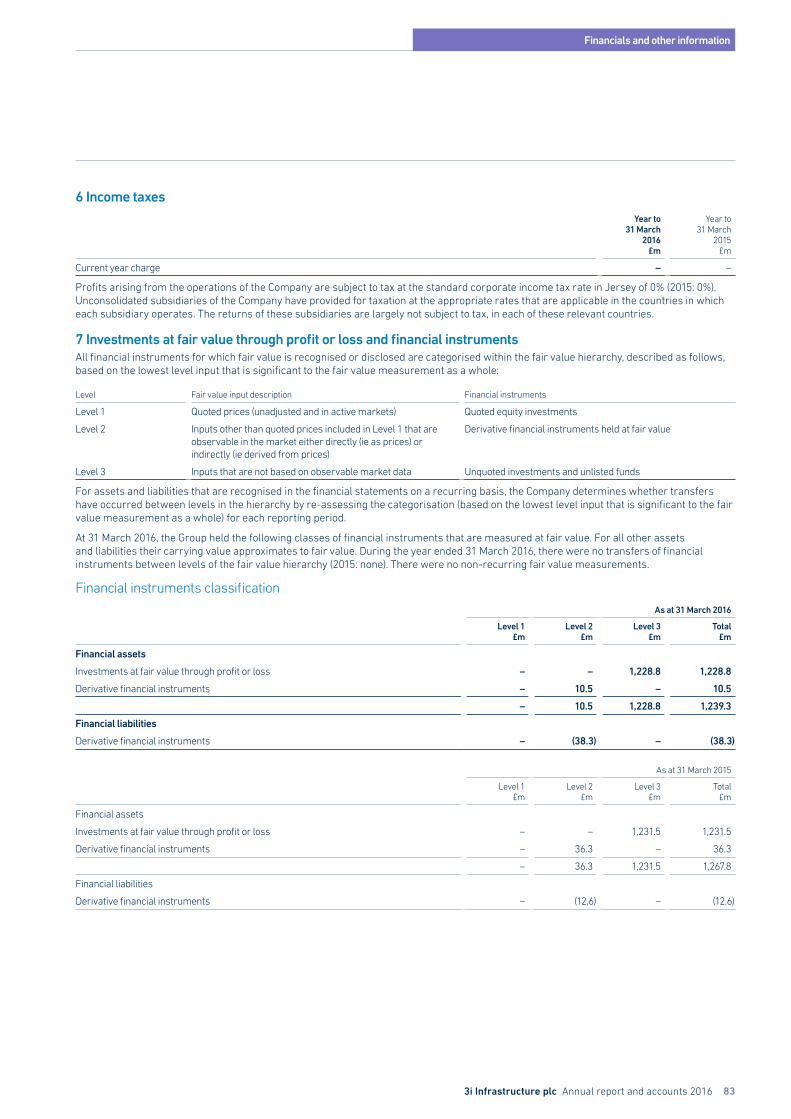
3i Infrastructure plc Annual report and accounts 2016 83
Financials and other information
6 Income taxesYear to
31 March2016
£m
Year to31 March
2015£m
Current year charge – –
Profits arising from the operations of the Company are subject to tax at the standard corporate income tax rate in Jersey of 0% (2015: 0%). Unconsolidated subsidiaries of the Company have provided for taxation at the appropriate rates that are applicable in the countries in which each subsidiary operates. The returns of these subsidiaries are largely not subject to tax, in each of these relevant countries.
7 Investments at fair value through profit or loss and financial instrumentsAll financial instruments for which fair value is recognised or disclosed are categorised within the fair value hierarchy, described as follows, based on the lowest level input that is significant to the fair value measurement as a whole:
Level Fair value input description Financial instruments
Level 1 Quoted prices (unadjusted and in active markets) Quoted equity investments
Level 2 Inputs other than quoted prices included in Level 1 that are observable in the market either directly (ie as prices) or indirectly (ie derived from prices)
Derivative financial instruments held at fair value
Level 3 Inputs that are not based on observable market data Unquoted investments and unlisted funds
For assets and liabilities that are recognised in the financial statements on a recurring basis, the Company determines whether transfers have occurred between levels in the hierarchy by re-assessing the categorisation (based on the lowest level input that is significant to the fair value measurement as a whole) for each reporting period.
At 31 March 2016, the Group held the following classes of financial instruments that are measured at fair value. For all other assets and liabilities their carrying value approximates to fair value. During the year ended 31 March 2016, there were no transfers of financial instruments between levels of the fair value hierarchy (2015: none). There were no non-recurring fair value measurements.
Financial instruments classificationAs at 31 March 2016
Level 1£m
Level 2£m
Level 3£m
Total£m
Financial assets
Investments at fair value through profit or loss – – 1,228.8 1,228.8
Derivative financial instruments – 10.5 – 10.5
– 10.5 1,228.8 1,239.3
Financial liabilities
Derivative financial instruments – (38.3) – (38.3)
As at 31 March 2015
Level 1£m
Level 2£m
Level 3£m
Total£m
Financial assets
Investments at fair value through profit or loss – – 1,231.5 1,231.5
Derivative financial instruments – 36.3 – 36.3
– 36.3 1,231.5 1,267.8
Financial liabilities
Derivative financial instruments – (12.6) – (12.6)
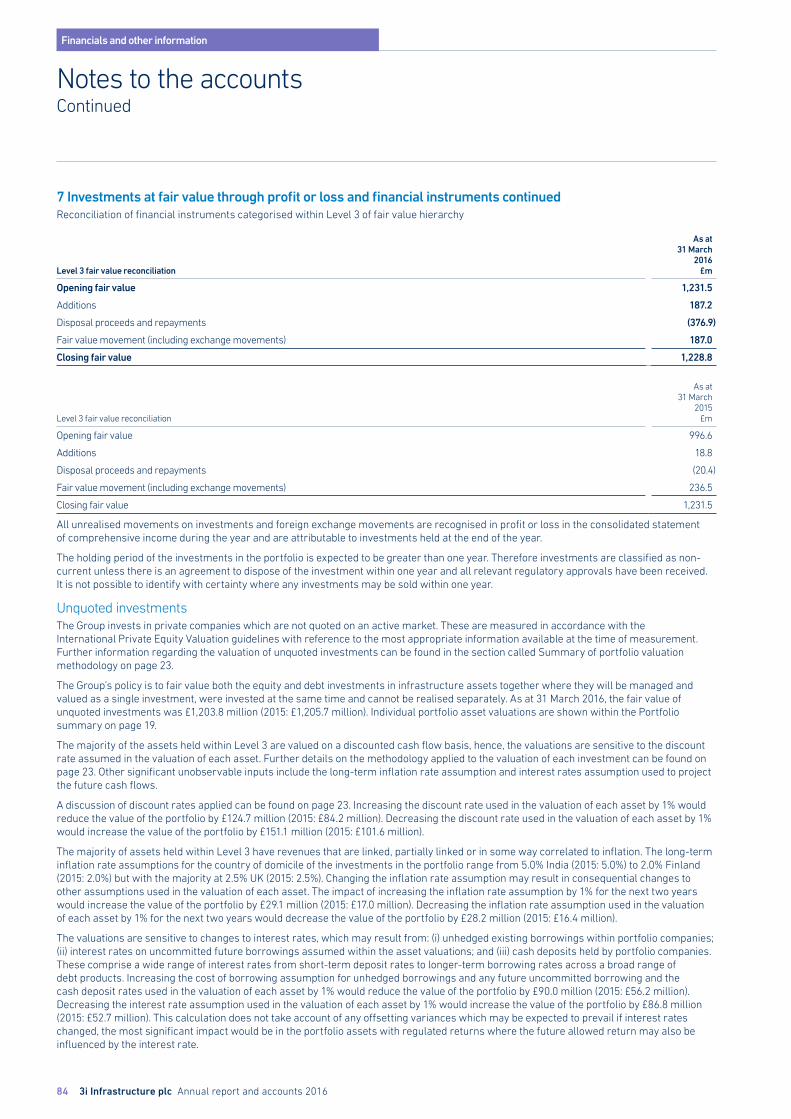
84 3i Infrastructure plc Annual report and accounts 2016
Financials and other information
Notes to the accountsContinued
7 Investments at fair value through profit or loss and financial instruments continuedReconciliation of financial instruments categorised within Level 3 of fair value hierarchy
Level 3 fair value reconciliation
As at31 March
2016£m
Opening fair value 1,231.5
Additions 187.2
Disposal proceeds and repayments (376.9)
Fair value movement (including exchange movements) 187.0
Closing fair value 1,228.8
Level 3 fair value reconciliation
As at31 March
2015£m
Opening fair value 996.6
Additions 18.8
Disposal proceeds and repayments (20.4)
Fair value movement (including exchange movements) 236.5
Closing fair value 1,231.5
All unrealised movements on investments and foreign exchange movements are recognised in profit or loss in the consolidated statement of comprehensive income during the year and are attributable to investments held at the end of the year.
The holding period of the investments in the portfolio is expected to be greater than one year. Therefore investments are classified as non-current unless there is an agreement to dispose of the investment within one year and all relevant regulatory approvals have been received. It is not possible to identify with certainty where any investments may be sold within one year.
Unquoted investmentsThe Group invests in private companies which are not quoted on an active market. These are measured in accordance with the International Private Equity Valuation guidelines with reference to the most appropriate information available at the time of measurement. Further information regarding the valuation of unquoted investments can be found in the section called Summary of portfolio valuation methodology on page 23.
The Group’s policy is to fair value both the equity and debt investments in infrastructure assets together where they will be managed and valued as a single investment, were invested at the same time and cannot be realised separately. As at 31 March 2016, the fair value of unquoted investments was £1,203.8 million (2015: £1,205.7 million). Individual portfolio asset valuations are shown within the Portfolio summary on page 19.
The majority of the assets held within Level 3 are valued on a discounted cash flow basis, hence, the valuations are sensitive to the discount rate assumed in the valuation of each asset. Further details on the methodology applied to the valuation of each investment can be found on page 23. Other significant unobservable inputs include the long-term inflation rate assumption and interest rates assumption used to project the future cash flows.
A discussion of discount rates applied can be found on page 23. Increasing the discount rate used in the valuation of each asset by 1% would reduce the value of the portfolio by £124.7 million (2015: £84.2 million). Decreasing the discount rate used in the valuation of each asset by 1% would increase the value of the portfolio by £151.1 million (2015: £101.6 million).
The majority of assets held within Level 3 have revenues that are linked, partially linked or in some way correlated to inflation. The long-term inflation rate assumptions for the country of domicile of the investments in the portfolio range from 5.0% India (2015: 5.0%) to 2.0% Finland (2015: 2.0%) but with the majority at 2.5% UK (2015: 2.5%). Changing the inflation rate assumption may result in consequential changes to other assumptions used in the valuation of each asset. The impact of increasing the inflation rate assumption by 1% for the next two years would increase the value of the portfolio by £29.1 million (2015: £17.0 million). Decreasing the inflation rate assumption used in the valuation of each asset by 1% for the next two years would decrease the value of the portfolio by £28.2 million (2015: £16.4 million).
The valuations are sensitive to changes to interest rates, which may result from: (i) unhedged existing borrowings within portfolio companies; (ii) interest rates on uncommitted future borrowings assumed within the asset valuations; and (iii) cash deposits held by portfolio companies. These comprise a wide range of interest rates from short-term deposit rates to longer-term borrowing rates across a broad range of debt products. Increasing the cost of borrowing assumption for unhedged borrowings and any future uncommitted borrowing and the cash deposit rates used in the valuation of each asset by 1% would reduce the value of the portfolio by £90.0 million (2015: £56.2 million). Decreasing the interest rate assumption used in the valuation of each asset by 1% would increase the value of the portfolio by £86.8 million (2015: £52.7 million). This calculation does not take account of any offsetting variances which may be expected to prevail if interest rates changed, the most significant impact would be in the portfolio assets with regulated returns where the future allowed return may also be influenced by the interest rate.
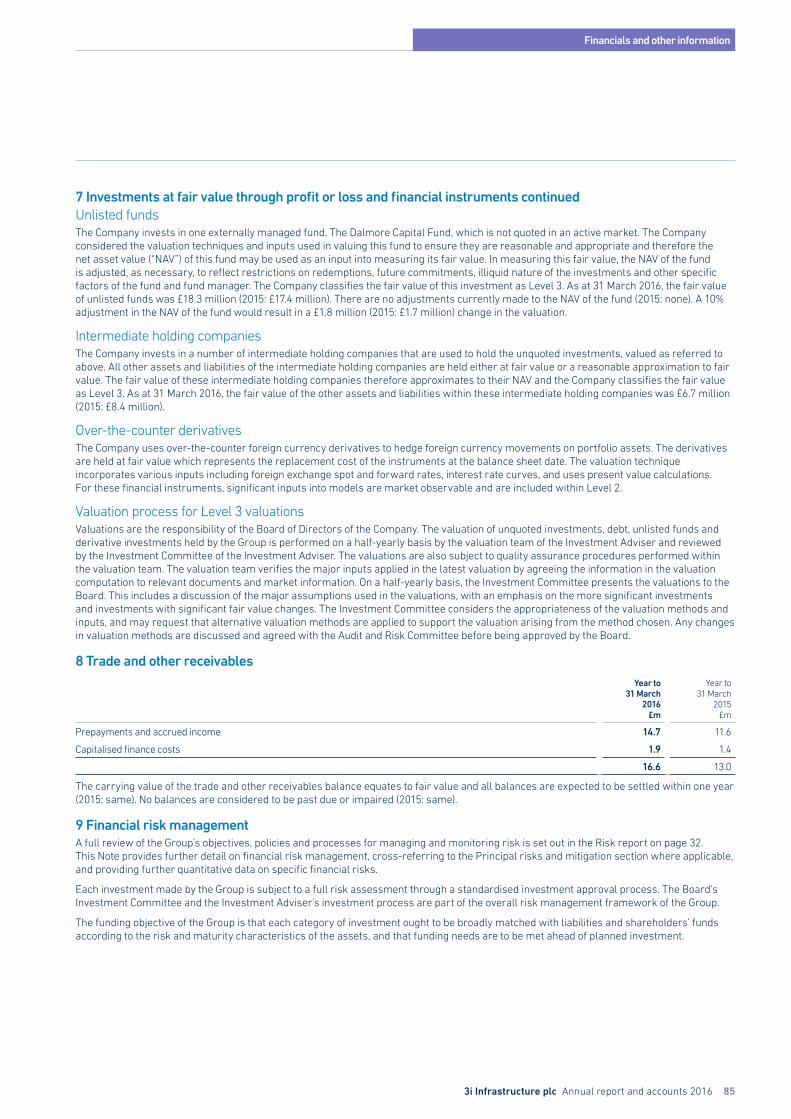
3i Infrastructure plc Annual report and accounts 2016 85
Financials and other information
7 Investments at fair value through profit or loss and financial instruments continuedUnlisted fundsThe Company invests in one externally managed fund, The Dalmore Capital Fund, which is not quoted in an active market. The Company considered the valuation techniques and inputs used in valuing this fund to ensure they are reasonable and appropriate and therefore the net asset value (“NAV”) of this fund may be used as an input into measuring its fair value. In measuring this fair value, the NAV of the fund is adjusted, as necessary, to reflect restrictions on redemptions, future commitments, illiquid nature of the investments and other specific factors of the fund and fund manager. The Company classifies the fair value of this investment as Level 3. As at 31 March 2016, the fair value of unlisted funds was £18.3 million (2015: £17.4 million). There are no adjustments currently made to the NAV of the fund (2015: none). A 10% adjustment in the NAV of the fund would result in a £1.8 million (2015: £1.7 million) change in the valuation.
Intermediate holding companiesThe Company invests in a number of intermediate holding companies that are used to hold the unquoted investments, valued as referred to above. All other assets and liabilities of the intermediate holding companies are held either at fair value or a reasonable approximation to fair value. The fair value of these intermediate holding companies therefore approximates to their NAV and the Company classifies the fair value as Level 3. As at 31 March 2016, the fair value of the other assets and liabilities within these intermediate holding companies was £6.7 million (2015: £8.4 million).
Over-the-counter derivativesThe Company uses over-the-counter foreign currency derivatives to hedge foreign currency movements on portfolio assets. The derivatives are held at fair value which represents the replacement cost of the instruments at the balance sheet date. The valuation technique incorporates various inputs including foreign exchange spot and forward rates, interest rate curves, and uses present value calculations. For these financial instruments, significant inputs into models are market observable and are included within Level 2.
Valuation process for Level 3 valuationsValuations are the responsibility of the Board of Directors of the Company. The valuation of unquoted investments, debt, unlisted funds and derivative investments held by the Group is performed on a half-yearly basis by the valuation team of the Investment Adviser and reviewed by the Investment Committee of the Investment Adviser. The valuations are also subject to quality assurance procedures performed within the valuation team. The valuation team verifies the major inputs applied in the latest valuation by agreeing the information in the valuation computation to relevant documents and market information. On a half-yearly basis, the Investment Committee presents the valuations to the Board. This includes a discussion of the major assumptions used in the valuations, with an emphasis on the more significant investments and investments with significant fair value changes. The Investment Committee considers the appropriateness of the valuation methods and inputs, and may request that alternative valuation methods are applied to support the valuation arising from the method chosen. Any changes in valuation methods are discussed and agreed with the Audit and Risk Committee before being approved by the Board.
8 Trade and other receivablesYear to
31 March2016
£m
Year to31 March
2015£m
Prepayments and accrued income 14.7 11.6
Capitalised finance costs 1.9 1.4
16.6 13.0
The carrying value of the trade and other receivables balance equates to fair value and all balances are expected to be settled within one year (2015: same). No balances are considered to be past due or impaired (2015: same).
9 Financial risk managementA full review of the Group’s objectives, policies and processes for managing and monitoring risk is set out in the Risk report on page 32. This Note provides further detail on financial risk management, cross-referring to the Principal risks and mitigation section where applicable, and providing further quantitative data on specific financial risks.
Each investment made by the Group is subject to a full risk assessment through a standardised investment approval process. The Board’s Investment Committee and the Investment Adviser’s investment process are part of the overall risk management framework of the Group.
The funding objective of the Group is that each category of investment ought to be broadly matched with liabilities and shareholders’ funds according to the risk and maturity characteristics of the assets, and that funding needs are to be met ahead of planned investment.
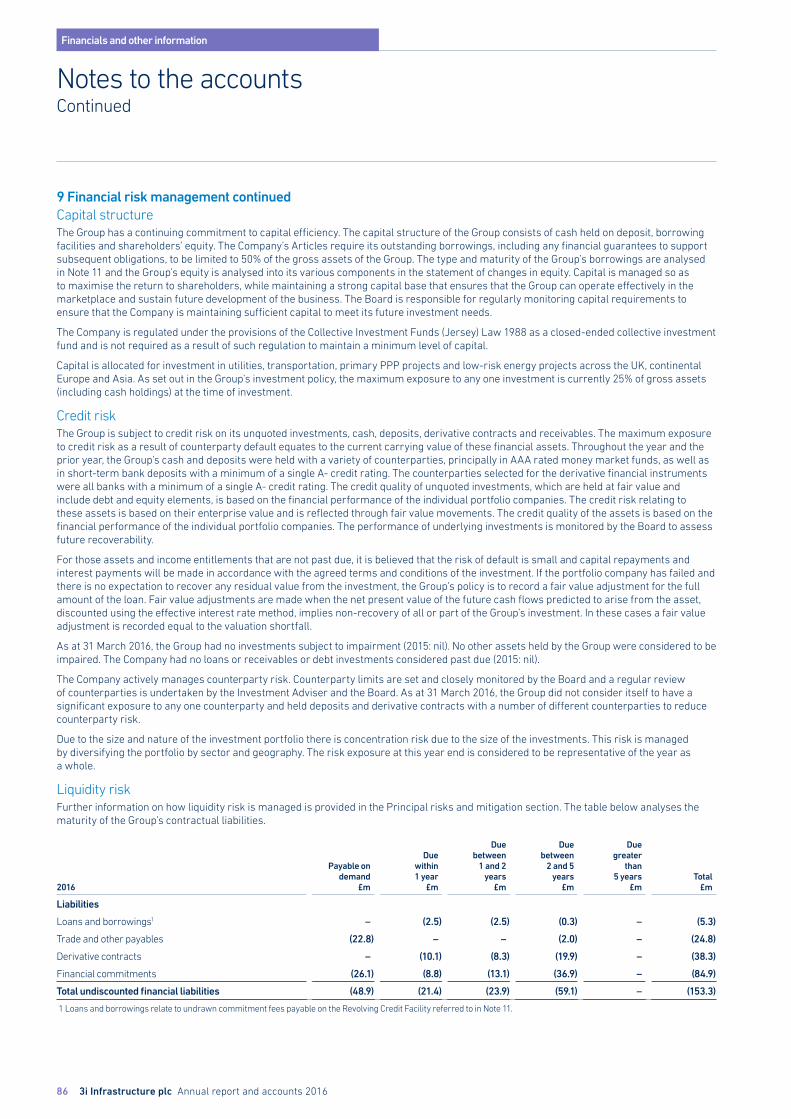
86 3i Infrastructure plc Annual report and accounts 2016
Financials and other information
Notes to the accountsContinued
9 Financial risk management continuedCapital structureThe Group has a continuing commitment to capital efficiency. The capital structure of the Group consists of cash held on deposit, borrowing facilities and shareholders’ equity. The Company’s Articles require its outstanding borrowings, including any financial guarantees to support subsequent obligations, to be limited to 50% of the gross assets of the Group. The type and maturity of the Group’s borrowings are analysed in Note 11 and the Group’s equity is analysed into its various components in the statement of changes in equity. Capital is managed so as to maximise the return to shareholders, while maintaining a strong capital base that ensures that the Group can operate effectively in the marketplace and sustain future development of the business. The Board is responsible for regularly monitoring capital requirements to ensure that the Company is maintaining sufficient capital to meet its future investment needs.
The Company is regulated under the provisions of the Collective Investment Funds (Jersey) Law 1988 as a closed-ended collective investment fund and is not required as a result of such regulation to maintain a minimum level of capital.
Capital is allocated for investment in utilities, transportation, primary PPP projects and low-risk energy projects across the UK, continental Europe and Asia. As set out in the Group’s investment policy, the maximum exposure to any one investment is currently 25% of gross assets (including cash holdings) at the time of investment.
Credit riskThe Group is subject to credit risk on its unquoted investments, cash, deposits, derivative contracts and receivables. The maximum exposure to credit risk as a result of counterparty default equates to the current carrying value of these financial assets. Throughout the year and the prior year, the Group’s cash and deposits were held with a variety of counterparties, principally in AAA rated money market funds, as well as in short-term bank deposits with a minimum of a single A- credit rating. The counterparties selected for the derivative financial instruments were all banks with a minimum of a single A- credit rating. The credit quality of unquoted investments, which are held at fair value and include debt and equity elements, is based on the financial performance of the individual portfolio companies. The credit risk relating to these assets is based on their enterprise value and is reflected through fair value movements. The credit quality of the assets is based on the financial performance of the individual portfolio companies. The performance of underlying investments is monitored by the Board to assess future recoverability.
For those assets and income entitlements that are not past due, it is believed that the risk of default is small and capital repayments and interest payments will be made in accordance with the agreed terms and conditions of the investment. If the portfolio company has failed and there is no expectation to recover any residual value from the investment, the Group’s policy is to record a fair value adjustment for the full amount of the loan. Fair value adjustments are made when the net present value of the future cash flows predicted to arise from the asset, discounted using the effective interest rate method, implies non-recovery of all or part of the Group’s investment. In these cases a fair value adjustment is recorded equal to the valuation shortfall.
As at 31 March 2016, the Group had no investments subject to impairment (2015: nil). No other assets held by the Group were considered to be impaired. The Company had no loans or receivables or debt investments considered past due (2015: nil).
The Company actively manages counterparty risk. Counterparty limits are set and closely monitored by the Board and a regular review of counterparties is undertaken by the Investment Adviser and the Board. As at 31 March 2016, the Group did not consider itself to have a significant exposure to any one counterparty and held deposits and derivative contracts with a number of different counterparties to reduce counterparty risk.
Due to the size and nature of the investment portfolio there is concentration risk due to the size of the investments. This risk is managed by diversifying the portfolio by sector and geography. The risk exposure at this year end is considered to be representative of the year as a whole.
Liquidity riskFurther information on how liquidity risk is managed is provided in the Principal risks and mitigation section. The table below analyses the maturity of the Group’s contractual liabilities.
2016
Payable ondemand
£m
Duewithin1 year
£m
Duebetween
1 and 2years
£m
Duebetween
2 and 5years
£m
Duegreater
than5 years
£mTotal
£m
Liabilities
Loans and borrowings1 – (2.5) (2.5) (0.3) – (5.3)
Trade and other payables (22.8) – – (2.0) – (24.8)
Derivative contracts – (10.1) (8.3) (19.9) – (38.3)
Financial commitments (26.1) (8.8) (13.1) (36.9) – (84.9)
Total undiscounted financial liabilities (48.9) (21.4) (23.9) (59.1) – (153.3)
1 Loans and borrowings relate to undrawn commitment fees payable on the Revolving Credit Facility referred to in Note 11.
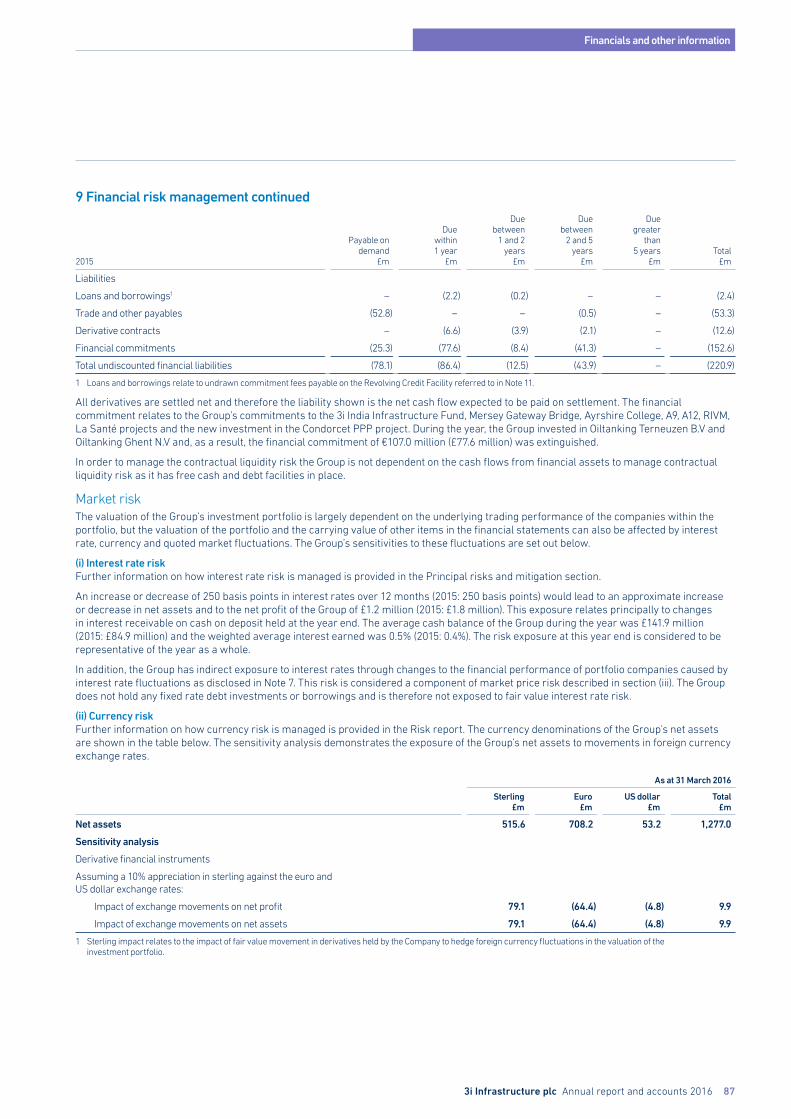
3i Infrastructure plc Annual report and accounts 2016 87
Financials and other information
9 Financial risk management continued
2015
Payable ondemand
£m
Duewithin1 year
£m
Duebetween
1 and 2years
£m
Duebetween
2 and 5years
£m
Duegreater
than5 years
£mTotal
£m
Liabilities
Loans and borrowings1 – (2.2) (0.2) – – (2.4)
Trade and other payables (52.8) – – (0.5) – (53.3)
Derivative contracts – (6.6) (3.9) (2.1) – (12.6)
Financial commitments (25.3) (77.6) (8.4) (41.3) – (152.6)
Total undiscounted financial liabilities (78.1) (86.4) (12.5) (43.9) – (220.9)
1 Loans and borrowings relate to undrawn commitment fees payable on the Revolving Credit Facility referred to in Note 11.
All derivatives are settled net and therefore the liability shown is the net cash flow expected to be paid on settlement. The financial commitment relates to the Group’s commitments to the 3i India Infrastructure Fund, Mersey Gateway Bridge, Ayrshire College, A9, A12, RIVM, La Santé projects and the new investment in the Condorcet PPP project. During the year, the Group invested in Oiltanking Terneuzen B.V and Oiltanking Ghent N.V and, as a result, the financial commitment of €107.0 million (£77.6 million) was extinguished.
In order to manage the contractual liquidity risk the Group is not dependent on the cash flows from financial assets to manage contractual liquidity risk as it has free cash and debt facilities in place.
Market riskThe valuation of the Group’s investment portfolio is largely dependent on the underlying trading performance of the companies within the portfolio, but the valuation of the portfolio and the carrying value of other items in the financial statements can also be affected by interest rate, currency and quoted market fluctuations. The Group’s sensitivities to these fluctuations are set out below.
(i) Interest rate riskFurther information on how interest rate risk is managed is provided in the Principal risks and mitigation section.
An increase or decrease of 250 basis points in interest rates over 12 months (2015: 250 basis points) would lead to an approximate increase or decrease in net assets and to the net profit of the Group of £1.2 million (2015: £1.8 million). This exposure relates principally to changes in interest receivable on cash on deposit held at the year end. The average cash balance of the Group during the year was £141.9 million (2015: £84.9 million) and the weighted average interest earned was 0.5% (2015: 0.4%). The risk exposure at this year end is considered to be representative of the year as a whole.
In addition, the Group has indirect exposure to interest rates through changes to the financial performance of portfolio companies caused by interest rate fluctuations as disclosed in Note 7. This risk is considered a component of market price risk described in section (iii). The Group does not hold any fixed rate debt investments or borrowings and is therefore not exposed to fair value interest rate risk.
(ii) Currency riskFurther information on how currency risk is managed is provided in the Risk report. The currency denominations of the Group’s net assets are shown in the table below. The sensitivity analysis demonstrates the exposure of the Group’s net assets to movements in foreign currency exchange rates.
As at 31 March 2016
Sterling £m
Euro £m
US dollar £m
Total £m
Net assets 515.6 708.2 53.2 1,277.0
Sensitivity analysis
Derivative financial instruments
Assuming a 10% appreciation in sterling against the euro and US dollar exchange rates:
Impact of exchange movements on net profit 79.1 (64.4) (4.8) 9.9
Impact of exchange movements on net assets 79.1 (64.4) (4.8) 9.9
1 Sterling impact relates to the impact of fair value movement in derivatives held by the Company to hedge foreign currency fluctuations in the valuation of the investment portfolio.
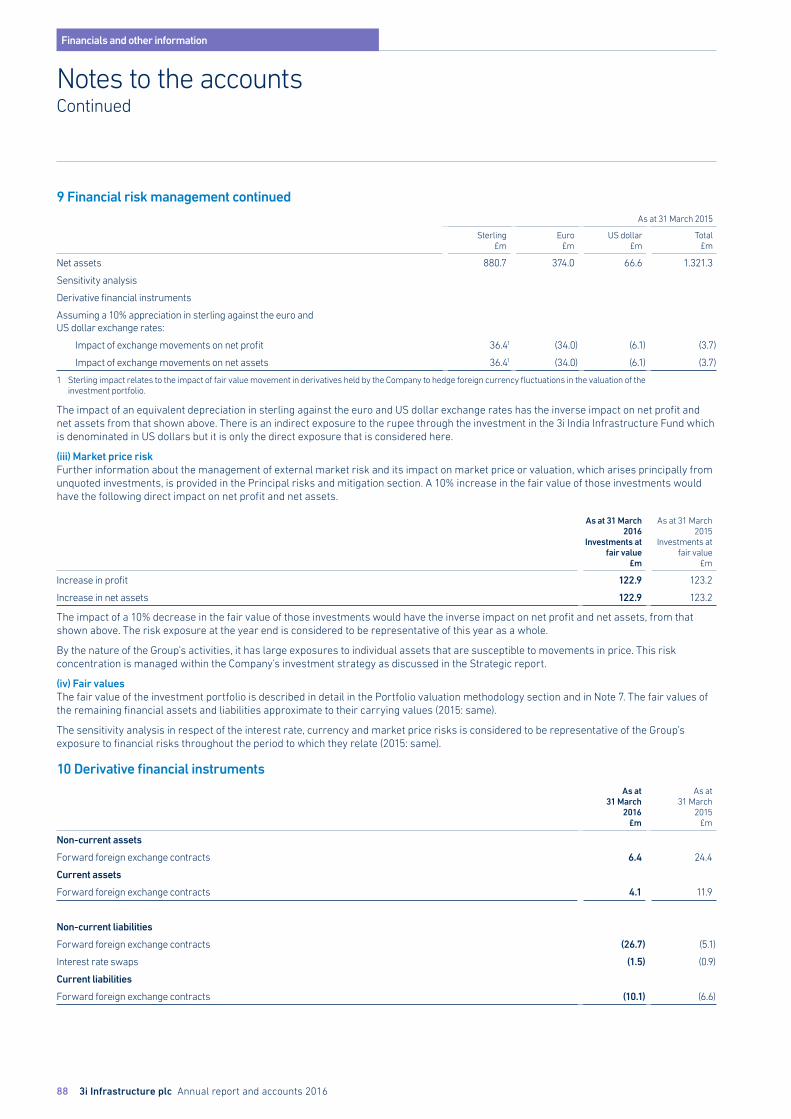
88 3i Infrastructure plc Annual report and accounts 2016
Financials and other information
Notes to the accountsContinued
9 Financial risk management continuedAs at 31 March 2015
Sterling£m
Euro£m
US dollar£m
Total £m
Net assets 880.7 374.0 66.6 1.321.3
Sensitivity analysis
Derivative financial instruments
Assuming a 10% appreciation in sterling against the euro and US dollar exchange rates:
Impact of exchange movements on net profit 36.41 (34.0) (6.1) (3.7)
Impact of exchange movements on net assets 36.41 (34.0) (6.1) (3.7)
1 Sterling impact relates to the impact of fair value movement in derivatives held by the Company to hedge foreign currency fluctuations in the valuation of the investment portfolio.
The impact of an equivalent depreciation in sterling against the euro and US dollar exchange rates has the inverse impact on net profit and net assets from that shown above. There is an indirect exposure to the rupee through the investment in the 3i India Infrastructure Fund which is denominated in US dollars but it is only the direct exposure that is considered here.
(iii) Market price riskFurther information about the management of external market risk and its impact on market price or valuation, which arises principally from unquoted investments, is provided in the Principal risks and mitigation section. A 10% increase in the fair value of those investments would have the following direct impact on net profit and net assets.
As at 31 March 2016
Investments at fair value
£m
As at 31 March 2015
Investments at fair value
£m
Increase in profit 122.9 123.2
Increase in net assets 122.9 123.2
The impact of a 10% decrease in the fair value of those investments would have the inverse impact on net profit and net assets, from that shown above. The risk exposure at the year end is considered to be representative of this year as a whole.
By the nature of the Group’s activities, it has large exposures to individual assets that are susceptible to movements in price. This risk concentration is managed within the Company’s investment strategy as discussed in the Strategic report.
(iv) Fair valuesThe fair value of the investment portfolio is described in detail in the Portfolio valuation methodology section and in Note 7. The fair values of the remaining financial assets and liabilities approximate to their carrying values (2015: same).
The sensitivity analysis in respect of the interest rate, currency and market price risks is considered to be representative of the Group’s exposure to financial risks throughout the period to which they relate (2015: same).
10 Derivative financial instrumentsAs at
31 March2016
£m
As at31 March
2015£m
Non-current assets
Forward foreign exchange contracts 6.4 24.4
Current assets
Forward foreign exchange contracts 4.1 11.9
Non-current liabilities
Forward foreign exchange contracts (26.7) (5.1)
Interest rate swaps (1.5) (0.9)
Current liabilities
Forward foreign exchange contracts (10.1) (6.6)
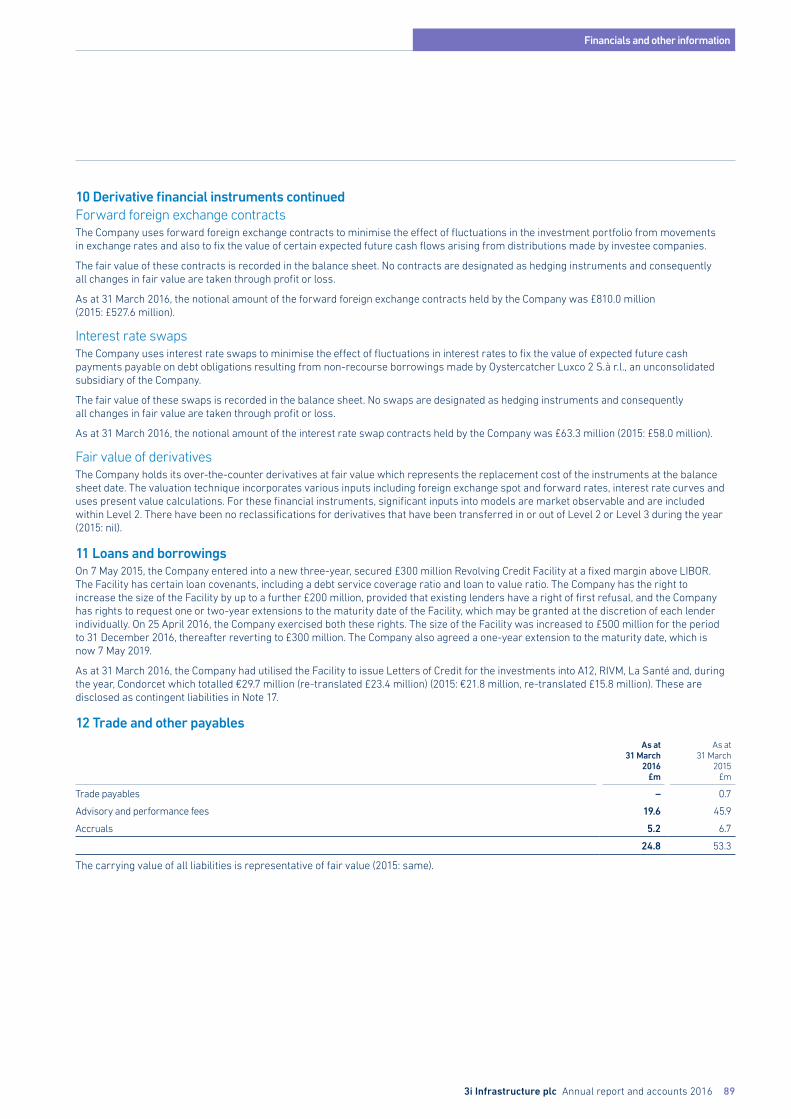
3i Infrastructure plc Annual report and accounts 2016 89
Financials and other information
10 Derivative financial instruments continuedForward foreign exchange contractsThe Company uses forward foreign exchange contracts to minimise the effect of fluctuations in the investment portfolio from movements in exchange rates and also to fix the value of certain expected future cash flows arising from distributions made by investee companies.
The fair value of these contracts is recorded in the balance sheet. No contracts are designated as hedging instruments and consequently all changes in fair value are taken through profit or loss.
As at 31 March 2016, the notional amount of the forward foreign exchange contracts held by the Company was £810.0 million (2015: £527.6 million).
Interest rate swapsThe Company uses interest rate swaps to minimise the effect of fluctuations in interest rates to fix the value of expected future cash payments payable on debt obligations resulting from non-recourse borrowings made by Oystercatcher Luxco 2 S.à r.l., an unconsolidated subsidiary of the Company.
The fair value of these swaps is recorded in the balance sheet. No swaps are designated as hedging instruments and consequently all changes in fair value are taken through profit or loss.
As at 31 March 2016, the notional amount of the interest rate swap contracts held by the Company was £63.3 million (2015: £58.0 million).
Fair value of derivativesThe Company holds its over-the-counter derivatives at fair value which represents the replacement cost of the instruments at the balance sheet date. The valuation technique incorporates various inputs including foreign exchange spot and forward rates, interest rate curves and uses present value calculations. For these financial instruments, significant inputs into models are market observable and are included within Level 2. There have been no reclassifications for derivatives that have been transferred in or out of Level 2 or Level 3 during the year (2015: nil).
11 Loans and borrowingsOn 7 May 2015, the Company entered into a new three-year, secured £300 million Revolving Credit Facility at a fixed margin above LIBOR. The Facility has certain loan covenants, including a debt service coverage ratio and loan to value ratio. The Company has the right to increase the size of the Facility by up to a further £200 million, provided that existing lenders have a right of first refusal, and the Company has rights to request one or two-year extensions to the maturity date of the Facility, which may be granted at the discretion of each lender individually. On 25 April 2016, the Company exercised both these rights. The size of the Facility was increased to £500 million for the period to 31 December 2016, thereafter reverting to £300 million. The Company also agreed a one-year extension to the maturity date, which is now 7 May 2019.
As at 31 March 2016, the Company had utilised the Facility to issue Letters of Credit for the investments into A12, RIVM, La Santé and, during the year, Condorcet which totalled €29.7 million (re-translated £23.4 million) (2015: €21.8 million, re-translated £15.8 million). These are disclosed as contingent liabilities in Note 17.
12 Trade and other payablesAs at
31 March2016
£m
As at31 March
2015£m
Trade payables – 0.7
Advisory and performance fees 19.6 45.9
Accruals 5.2 6.7
24.8 53.3
The carrying value of all liabilities is representative of fair value (2015: same).
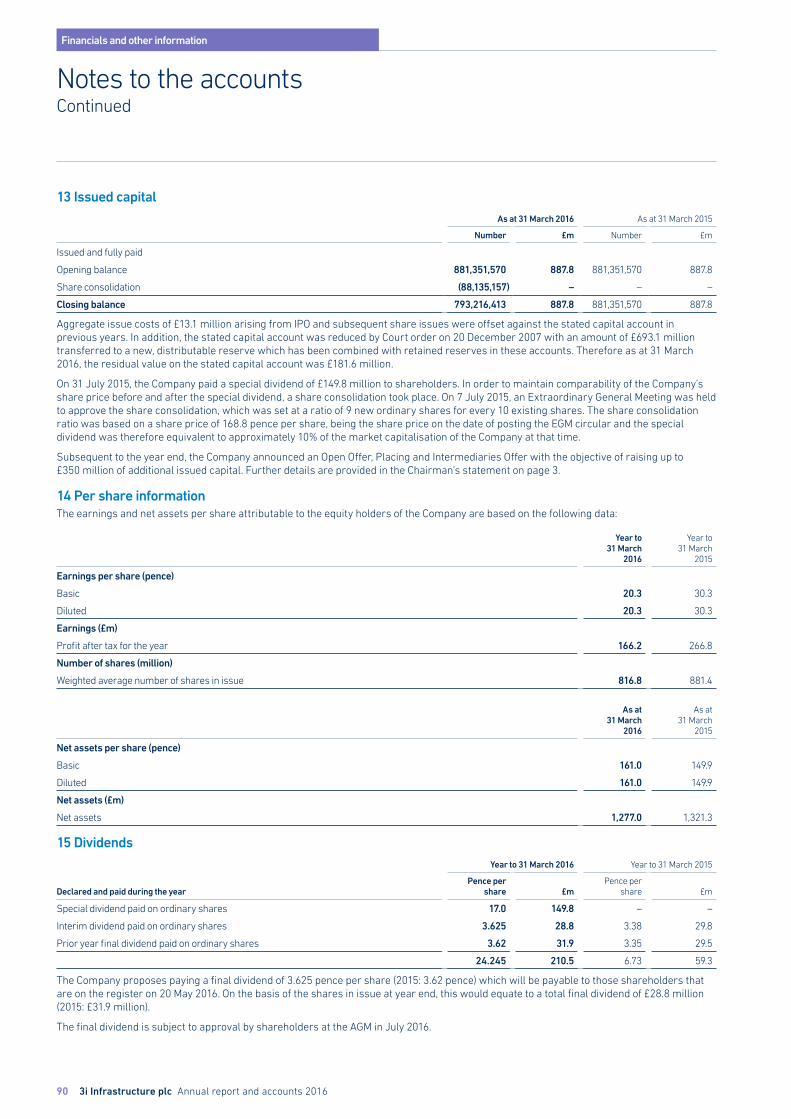
90 3i Infrastructure plc Annual report and accounts 2016
Financials and other information
Notes to the accountsContinued
13 Issued capitalAs at 31 March 2016 As at 31 March 2015
Number £m Number £m
Issued and fully paid
Opening balance 881,351,570 887.8 881,351,570 887.8
Share consolidation (88,135,157) – – –
Closing balance 793,216,413 887.8 881,351,570 887.8
Aggregate issue costs of £13.1 million arising from IPO and subsequent share issues were offset against the stated capital account in previous years. In addition, the stated capital account was reduced by Court order on 20 December 2007 with an amount of £693.1 million transferred to a new, distributable reserve which has been combined with retained reserves in these accounts. Therefore as at 31 March 2016, the residual value on the stated capital account was £181.6 million.
On 31 July 2015, the Company paid a special dividend of £149.8 million to shareholders. In order to maintain comparability of the Company’s share price before and after the special dividend, a share consolidation took place. On 7 July 2015, an Extraordinary General Meeting was held to approve the share consolidation, which was set at a ratio of 9 new ordinary shares for every 10 existing shares. The share consolidation ratio was based on a share price of 168.8 pence per share, being the share price on the date of posting the EGM circular and the special dividend was therefore equivalent to approximately 10% of the market capitalisation of the Company at that time.
Subsequent to the year end, the Company announced an Open Offer, Placing and Intermediaries Offer with the objective of raising up to £350 million of additional issued capital. Further details are provided in the Chairman’s statement on page 3.
14 Per share informationThe earnings and net assets per share attributable to the equity holders of the Company are based on the following data:
Year to31 March
2016
Year to31 March
2015
Earnings per share (pence)
Basic 20.3 30.3
Diluted 20.3 30.3
Earnings (£m)
Profit after tax for the year 166.2 266.8
Number of shares (million)
Weighted average number of shares in issue 816.8 881.4
As at31 March
2016
As at31 March
2015
Net assets per share (pence)
Basic 161.0 149.9
Diluted 161.0 149.9
Net assets (£m)
Net assets 1,277.0 1,321.3
15 Dividends
Declared and paid during the year
Year to 31 March 2016 Year to 31 March 2015
Pence per share £m
Pence per share £m
Special dividend paid on ordinary shares 17.0 149.8 – –
Interim dividend paid on ordinary shares 3.625 28.8 3.38 29.8
Prior year final dividend paid on ordinary shares 3.62 31.9 3.35 29.5
24.245 210.5 6.73 59.3
The Company proposes paying a final dividend of 3.625 pence per share (2015: 3.62 pence) which will be payable to those shareholders that are on the register on 20 May 2016. On the basis of the shares in issue at year end, this would equate to a total final dividend of £28.8 million (2015: £31.9 million).
The final dividend is subject to approval by shareholders at the AGM in July 2016.
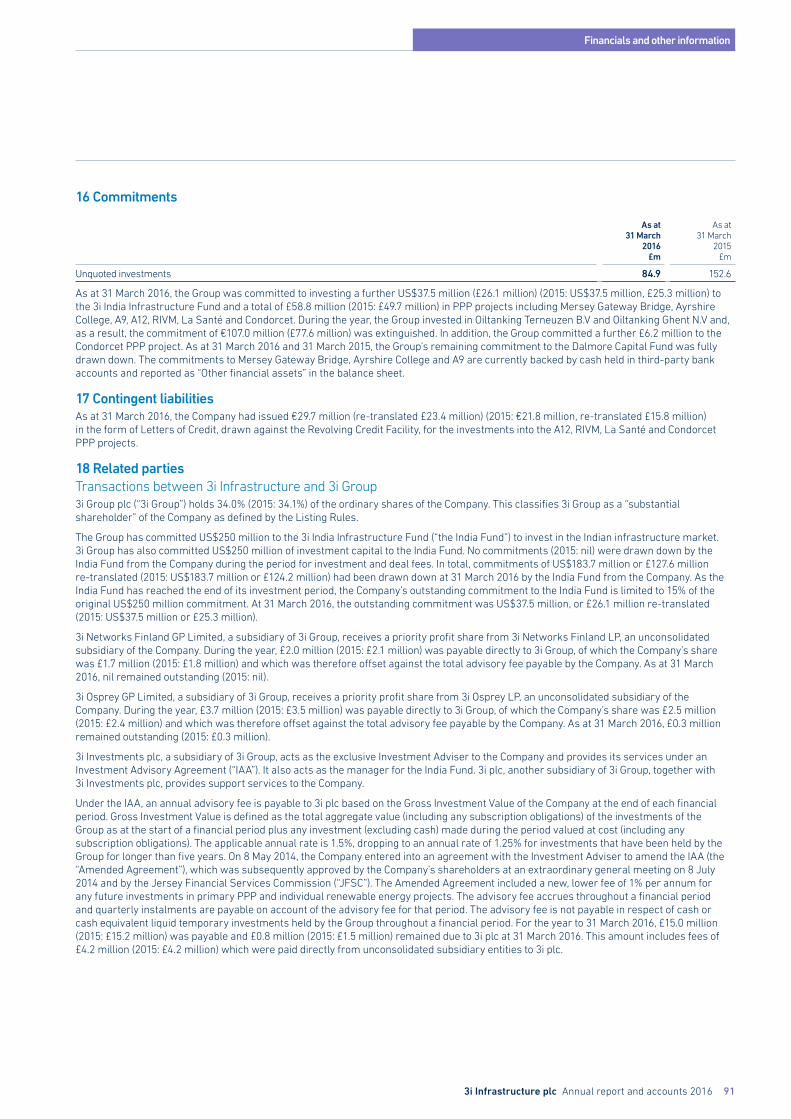
3i Infrastructure plc Annual report and accounts 2016 91
Financials and other information
16 Commitments
As at31 March
2016£m
As at31 March
2015£m
Unquoted investments 84.9 152.6
As at 31 March 2016, the Group was committed to investing a further US$37.5 million (£26.1 million) (2015: US$37.5 million, £25.3 million) to the 3i India Infrastructure Fund and a total of £58.8 million (2015: £49.7 million) in PPP projects including Mersey Gateway Bridge, Ayrshire College, A9, A12, RIVM, La Santé and Condorcet. During the year, the Group invested in Oiltanking Terneuzen B.V and Oiltanking Ghent N.V and, as a result, the commitment of €107.0 million (£77.6 million) was extinguished. In addition, the Group committed a further £6.2 million to the Condorcet PPP project. As at 31 March 2016 and 31 March 2015, the Group’s remaining commitment to the Dalmore Capital Fund was fully drawn down. The commitments to Mersey Gateway Bridge, Ayrshire College and A9 are currently backed by cash held in third-party bank accounts and reported as “Other financial assets” in the balance sheet.
17 Contingent liabilitiesAs at 31 March 2016, the Company had issued €29.7 million (re-translated £23.4 million) (2015: €21.8 million, re-translated £15.8 million) in the form of Letters of Credit, drawn against the Revolving Credit Facility, for the investments into the A12, RIVM, La Santé and Condorcet PPP projects.
18 Related partiesTransactions between 3i Infrastructure and 3i Group3i Group plc (“3i Group”) holds 34.0% (2015: 34.1%) of the ordinary shares of the Company. This classifies 3i Group as a “substantial shareholder” of the Company as defined by the Listing Rules.
The Group has committed US$250 million to the 3i India Infrastructure Fund (“the India Fund”) to invest in the Indian infrastructure market. 3i Group has also committed US$250 million of investment capital to the India Fund. No commitments (2015: nil) were drawn down by the India Fund from the Company during the period for investment and deal fees. In total, commitments of US$183.7 million or £127.6 million re-translated (2015: US$183.7 million or £124.2 million) had been drawn down at 31 March 2016 by the India Fund from the Company. As the India Fund has reached the end of its investment period, the Company’s outstanding commitment to the India Fund is limited to 15% of the original US$250 million commitment. At 31 March 2016, the outstanding commitment was US$37.5 million, or £26.1 million re-translated (2015: US$37.5 million or £25.3 million).
3i Networks Finland GP Limited, a subsidiary of 3i Group, receives a priority profit share from 3i Networks Finland LP, an unconsolidated subsidiary of the Company. During the year, £2.0 million (2015: £2.1 million) was payable directly to 3i Group, of which the Company’s share was £1.7 million (2015: £1.8 million) and which was therefore offset against the total advisory fee payable by the Company. As at 31 March 2016, nil remained outstanding (2015: nil).
3i Osprey GP Limited, a subsidiary of 3i Group, receives a priority profit share from 3i Osprey LP, an unconsolidated subsidiary of the Company. During the year, £3.7 million (2015: £3.5 million) was payable directly to 3i Group, of which the Company’s share was £2.5 million (2015: £2.4 million) and which was therefore offset against the total advisory fee payable by the Company. As at 31 March 2016, £0.3 million remained outstanding (2015: £0.3 million).
3i Investments plc, a subsidiary of 3i Group, acts as the exclusive Investment Adviser to the Company and provides its services under an Investment Advisory Agreement (“IAA”). It also acts as the manager for the India Fund. 3i plc, another subsidiary of 3i Group, together with 3i Investments plc, provides support services to the Company.
Under the IAA, an annual advisory fee is payable to 3i plc based on the Gross Investment Value of the Company at the end of each financial period. Gross Investment Value is defined as the total aggregate value (including any subscription obligations) of the investments of the Group as at the start of a financial period plus any investment (excluding cash) made during the period valued at cost (including any subscription obligations). The applicable annual rate is 1.5%, dropping to an annual rate of 1.25% for investments that have been held by the Group for longer than five years. On 8 May 2014, the Company entered into an agreement with the Investment Adviser to amend the IAA (the “Amended Agreement”), which was subsequently approved by the Company’s shareholders at an extraordinary general meeting on 8 July 2014 and by the Jersey Financial Services Commission (“JFSC”). The Amended Agreement included a new, lower fee of 1% per annum for any future investments in primary PPP and individual renewable energy projects. The advisory fee accrues throughout a financial period and quarterly instalments are payable on account of the advisory fee for that period. The advisory fee is not payable in respect of cash or cash equivalent liquid temporary investments held by the Group throughout a financial period. For the year to 31 March 2016, £15.0 million (2015: £15.2 million) was payable and £0.8 million (2015: £1.5 million) remained due to 3i plc at 31 March 2016. This amount includes fees of £4.2 million (2015: £4.2 million) which were paid directly from unconsolidated subsidiary entities to 3i plc.
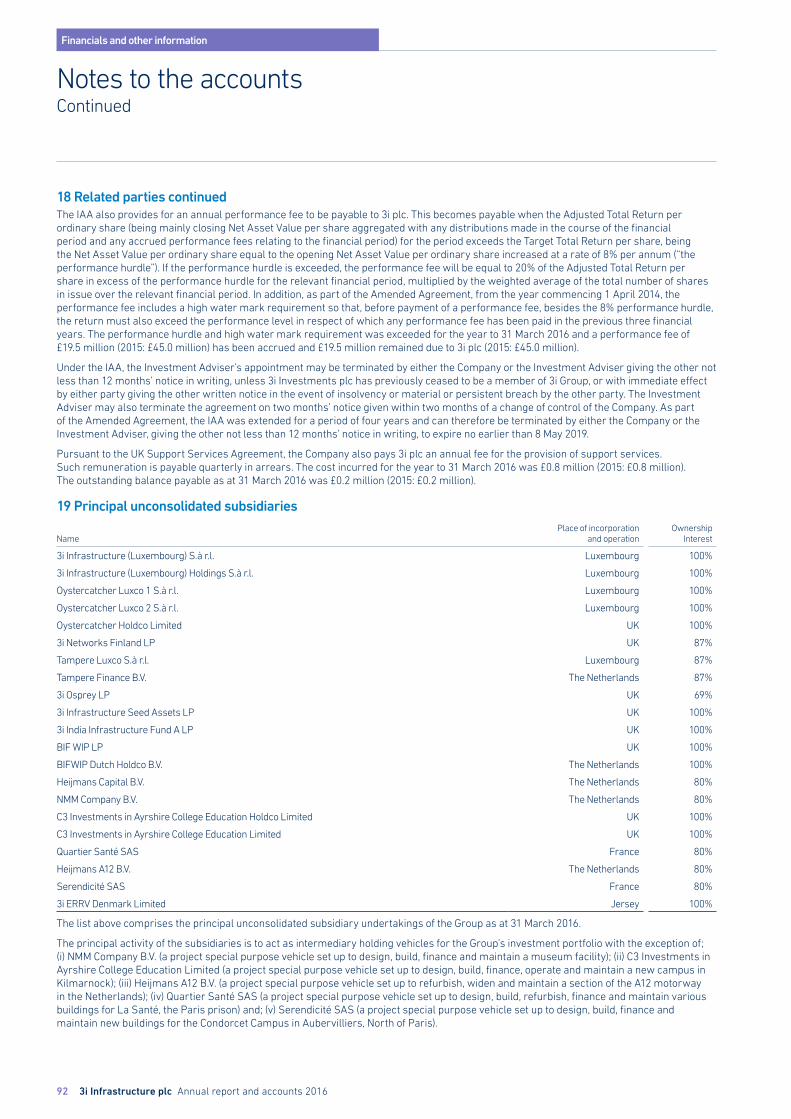
92 3i Infrastructure plc Annual report and accounts 2016
Financials and other information
Notes to the accountsContinued
18 Related parties continuedThe IAA also provides for an annual performance fee to be payable to 3i plc. This becomes payable when the Adjusted Total Return per ordinary share (being mainly closing Net Asset Value per share aggregated with any distributions made in the course of the financial period and any accrued performance fees relating to the financial period) for the period exceeds the Target Total Return per share, being the Net Asset Value per ordinary share equal to the opening Net Asset Value per ordinary share increased at a rate of 8% per annum (“the performance hurdle”). If the performance hurdle is exceeded, the performance fee will be equal to 20% of the Adjusted Total Return per share in excess of the performance hurdle for the relevant financial period, multiplied by the weighted average of the total number of shares in issue over the relevant financial period. In addition, as part of the Amended Agreement, from the year commencing 1 April 2014, the performance fee includes a high water mark requirement so that, before payment of a performance fee, besides the 8% performance hurdle, the return must also exceed the performance level in respect of which any performance fee has been paid in the previous three financial years. The performance hurdle and high water mark requirement was exceeded for the year to 31 March 2016 and a performance fee of £19.5 million (2015: £45.0 million) has been accrued and £19.5 million remained due to 3i plc (2015: £45.0 million).
Under the IAA, the Investment Adviser’s appointment may be terminated by either the Company or the Investment Adviser giving the other not less than 12 months’ notice in writing, unless 3i Investments plc has previously ceased to be a member of 3i Group, or with immediate effect by either party giving the other written notice in the event of insolvency or material or persistent breach by the other party. The Investment Adviser may also terminate the agreement on two months’ notice given within two months of a change of control of the Company. As part of the Amended Agreement, the IAA was extended for a period of four years and can therefore be terminated by either the Company or the Investment Adviser, giving the other not less than 12 months’ notice in writing, to expire no earlier than 8 May 2019.
Pursuant to the UK Support Services Agreement, the Company also pays 3i plc an annual fee for the provision of support services. Such remuneration is payable quarterly in arrears. The cost incurred for the year to 31 March 2016 was £0.8 million (2015: £0.8 million). The outstanding balance payable as at 31 March 2016 was £0.2 million (2015: £0.2 million).
19 Principal unconsolidated subsidiaries
NamePlace of incorporation
and operationOwnership
Interest
3i Infrastructure (Luxembourg) S.à r.l. Luxembourg 100%
3i Infrastructure (Luxembourg) Holdings S.à r.l. Luxembourg 100%
Oystercatcher Luxco 1 S.à r.l. Luxembourg 100%
Oystercatcher Luxco 2 S.à r.l. Luxembourg 100%
Oystercatcher Holdco Limited UK 100%
3i Networks Finland LP UK 87%
Tampere Luxco S.à r.l. Luxembourg 87%
Tampere Finance B.V. The Netherlands 87%
3i Osprey LP UK 69%
3i Infrastructure Seed Assets LP UK 100%
3i India Infrastructure Fund A LP UK 100%
BIF WIP LP UK 100%
BIFWIP Dutch Holdco B.V. The Netherlands 100%
Heijmans Capital B.V. The Netherlands 80%
NMM Company B.V. The Netherlands 80%
C3 Investments in Ayrshire College Education Holdco Limited UK 100%
C3 Investments in Ayrshire College Education Limited UK 100%
Quartier Santé SAS France 80%
Heijmans A12 B.V. The Netherlands 80%
Serendicité SAS France 80%
3i ERRV Denmark Limited Jersey 100%
The list above comprises the principal unconsolidated subsidiary undertakings of the Group as at 31 March 2016.
The principal activity of the subsidiaries is to act as intermediary holding vehicles for the Group’s investment portfolio with the exception of; (i) NMM Company B.V. (a project special purpose vehicle set up to design, build, finance and maintain a museum facility); (ii) C3 Investments in Ayrshire College Education Limited (a project special purpose vehicle set up to design, build, finance, operate and maintain a new campus in Kilmarnock); (iii) Heijmans A12 B.V. (a project special purpose vehicle set up to refurbish, widen and maintain a section of the A12 motorway in the Netherlands); (iv) Quartier Santé SAS (a project special purpose vehicle set up to design, build, refurbish, finance and maintain various buildings for La Santé, the Paris prison) and; (v) Serendicité SAS (a project special purpose vehicle set up to design, build, finance and maintain new buildings for the Condorcet Campus in Aubervilliers, North of Paris).
3i Infrastructure plc Annual report and accounts 2016 93
Financials and other information
19 Principal unconsolidated subsidiaries continuedThere are no current commitments or intentions to provide financial or other support to any of the unconsolidated subsidiaries, including commitments or intentions to assist the subsidiary in obtaining financial support except for those disclosed in Note 16 (2015: none). No such financial or other support was provided during the year (2015: none).
There are no significant restrictions on the ability of any of the unconsolidated subsidiaries to transfer funds to the Company in the form of cash dividends or to repay loans or advances made to the unconsolidated subsidiary by the Company except in the case of Oystercatcher Luxco 2 S.à r.l.
Oystercatcher Luxco 2 S.à r.l. has total borrowings of €225.0 million or £178.0 million (2015: €190.0 million, £137.8 million). These consist of two term loans (bank tranche) of €80.0 million or £63.3 million and €35.0 million or £27.7 million from a consortium of three banks and a further €110 million or £87.0 million term loan (PP tranche) with a financial institution. These facilities were agreed in October 2014 and amended in April 2015 and are repayable in full in October 2019 and October 2026 respectively. The facilities have certain loan covenants including interest cover ratios and a leverage ratio which may restrict the future payment of cash dividends from the subsidiary. RBC Europe Ltd as security agent, has security over the equity investments held by Oystercatcher Luxco 2 S.à r.l. The value of this security at 31 March 2016 was £365.7 million (2015: £251.7 million).
94 3i Infrastructure plc Annual report and accounts 2016
Financials and other information
Investment policy
The Company aims to build a diversified portfolio of equity investments in entities owning infrastructure businesses and assets. The Company seeks investment opportunities globally, but with a focus on Europe, North America and Asia.
The Company’s equity investments will often comprise share capital and related shareholder loans (or other financial instruments that are not shares but that, in combination with shares, are similar in substance). The Company may also invest in junior or mezzanine debt in infrastructure businesses or assets.
Most of the Company’s investments are in unquoted companies. However, the Company may also invest in entities owning infrastructure businesses and assets whose shares or other instruments are listed on any stock exchange, irrespective of whether they cease to be listed after completion of the investment, if the Directors judge that such an investment is consistent with the Company’s investment objectives. The Company will, in any case, invest no more than 15% of its total gross assets in other investment companies or investment trusts which are listed on the Official List.
The Company may also consider investing in other fund structures (in the event that it considers, on receipt of advice from the Investment Adviser, that that is the most appropriate and effective means of investing), which may be advised or managed either by the Investment Adviser or a third party. If the Company invests in another fund advised or managed by 3i Group, the relevant proportion of any advisory or management fees payable by the investee fund to 3i plc will be deducted from the annual advisory fee payable under the Investment Advisory Agreement and the relevant proportion of any performance fee will be deducted from the annual performance fee, if payable, under the Investment Advisory Agreement. For the avoidance of doubt, there will be no similar set‑off arrangement where any such fund is advised or managed by a third party.
For most investments, the Company seeks to obtain representation on the board of directors of the investee company (or equivalent governing body) and in cases where it acquires a majority equity interest in a business, that interest may also be a controlling interest.
No investment made by the Company will represent more than 25% of the Company’s gross assets, including cash holdings, at the time of the making of the investment. It is expected that most individual investments will exceed £50 million. In some cases, the total amount required for an individual transaction may exceed the maximum amount that the Company is permitted to commit to a single investment. In such circumstances, the Company may consider entering into co‑investment arrangements with 3i Group (or other investors who may also be significant shareholders), pursuant to which 3i Group and its subsidiaries (or such other investors) may co‑invest on the same financial and economic terms as the Company. The suitability of any such co‑investment arrangements will be assessed on a transaction‑by‑transaction basis and would be subject to Board approval. Depending on the size of the relevant investment and the identity of the relevant co‑investor, such a co‑investment arrangement may be subject to the related party transaction provisions contained in the Listing Rules and may therefore require shareholder consent.
The Company’s Articles require its outstanding borrowings, including any financial guarantees to support subsequent obligations, to be limited to 50% of the gross assets of the Group (valuing investments on the basis included in the Group’s accounts).
In accordance with Listing Rules requirements, the Company will only make a material change to its investment policy with the approval of shareholders.
3i Infrastructure plc Annual report and accounts 2016 95
Financials and other information
Portfolio valuation methodology
A description of the methodology used to value the investment portfolio of 3i Infrastructure and its consolidated subsidiary (“the Group”) is set out below in order to provide more detailed information than is included within the accounting policies and the Investment Adviser’s review for the valuation of the portfolio. The methodology complies in all material aspects with the “International Private Equity and Venture Capital valuation guidelines” which are endorsed by the British Private Equity and Venture Capital Association and the European Private Equity and Venture Capital Association.
Basis of valuationInvestments are reported at the Directors’ estimate of fair value at the reporting date in compliance with IFRS 13 Fair Value Measurement. Fair value is defined as “the price that would be received to sell an asset or paid to transfer a liability in an orderly transaction between market participants at the measurement date”.
GeneralIn estimating fair value, the Directors seek to use a methodology that is appropriate in light of the nature, facts and circumstances of the investment and its materiality in the context of the overall portfolio. The methodology that is the most appropriate may consequently include adjustments based on informed and experience‑based judgments, and will also consider the nature of the industry and market practice. Methodologies are applied consistently from period to period except where a change would result in a better estimation of fair value. Given the uncertainties inherent in estimating fair value, a degree of caution is applied in exercising judgments and making necessary estimates.
Investments may include portfolio assets and other net assets/liabilities balances. The methodology for valuing portfolio assets is set out below. Any net assets/liabilities within intermediate holding companies are valued in line with the Group accounting policy and held at fair value or approximate to fair value.
Quoted investmentsQuoted equity investments are valued at the closing bid price at the reporting date. In accordance with International Financial Reporting Standards, no discount is applied for liquidity of the stock or any dealing restrictions. Quoted debt investments will be valued using quoted prices provided by third‑party broker information where reliable or will be held at cost less fair value adjustments.
Unquoted investmentsUnquoted investments are valued using one of the following methodologies:
– Discounted Cash Flow (“DCF”)
– Proportionate share of net assets
– Sales basis
– Cost less any fair value adjustments required
DCFDCF is the primary basis for valuation. In using the DCF basis, fair value is estimated by deriving the present value of the investment using reasonable assumptions and estimation of expected future cash flows and the terminal value and date, and the appropriate risk‑adjusted discount rate that quantifies the risk inherent to the investment. The terminal value attributes a residual value to the investee company at the end of the projected discrete cash flow period. The discount rate will be estimated for each investment derived from the market risk‑free rate, a risk‑adjusted premium and information specific to the investment or market sector.
Proportionate share of net assetsWhere the Group has made investments into other infrastructure funds, the value of the investment will be derived from the Group’s share of net assets of the fund based on the most recent reliable financial information available from the fund. Where the underlying investments within a fund are valued on a DCF basis, the discount rate applied may be adjusted by the Company to reflect its assessment of the most appropriate discount rate for the nature of assets held in the fund. In measuring the fair value, the net asset value of the fund is adjusted, as necessary, to reflect restrictions on redemptions, future commitments, illiquid nature of the investments and other specific factors of the fund.
Sales basisThe expected sale proceeds will be used to assign a fair value to an asset in cases where offers have been received as part of an investment sales process. This may either support the value derived from another methodology or may be used as the primary valuation basis. A marketability discount is applied to the expected sale proceeds to derive the valuation where appropriate.
Cost less fair value adjustmentAny investment in a company that has failed or, in the view of the Board, is expected to fail within the next 12 months, has the equity shares valued at nil and the fixed income shares and loan instruments valued at the lower of cost and net recoverable amount.
96 3i Infrastructure plc Annual report and accounts 2016
Financials and other information
Financial calendar
Ex‑dividend date for final dividend 19 May 2016
Record date for final dividend 20 May 2016
Annual General Meeting 7 July 2016
Final dividend expected to be paid 11 July 2016
Half‑yearly results November 2016
RegistrarsFor shareholder services, including notifying changes of address, the registrar details are as follows:
Capita Registrars (Jersey) Limited 12 Castle Street St. Helier Jersey JE2 3RT Channel Islands
e‑mail: [email protected] Telephone: +44 (0)1534 847 000 Shareholder helpline: 0871 664 0300.
Calls cost 12p per minute plus your phone company’s access charge. If you are outside the United Kingdom, please call +44 371 664 0300. Calls outside the United Kingdom will be charged at the applicable international rate. Capita are open between 9.00am–5.30pm, Monday to Friday, excluding public holidays in England and Wales.
WebsiteFor full up‑to‑date investor relations information including the latest share price, recent reports, results presentations and financial news, please visit our investor relations website www.3i-infrastructure.com
If you would prefer to receive shareholder communications electronically, including your annual reports and notices of meetings, please go to www.3i-infrastructure.com/shareholder-services/registrar-e-communications for details of how to register.
Frequently used registrars’ forms may be found on our website at www.3i-infrastructure.com/shareholder-services/registrar-e-communications
Warning to shareholders – boiler room scamsShare fraud includes scams where investors are called out of the blue and offered shares that often turn out to be worthless or non‑existent, or are offered an inflated price for shares they own. These calls come from fraudsters operating in “boiler rooms” that are mostly based abroad.
While high profits are promised, those who buy or sell shares in this way usually lose their money.
Most share fraud victims are experienced investors who lose an average of £20,000, with around £200 million lost in the UK each year.
Protect yourselfIf you are offered unsolicited investment advice, discounted shares, a premium price for shares you own, or free company or research reports, you should take these steps before handing over any money:
1. Get the name of the person and organisation contacting you.
2. Check the Financial Services Register at www.fca.org.uk/register to ensure that they are authorised.
3. Use the details on the Financial Services Register to contact the firm.
4. Call the Financial Conduct Authority Consumer Helpline on 0800 111 6768 if there are no contact details on the Register or you are told they are out of date.
5. Search the Financial Conduct Authority’s list of unauthorised firms and individuals to avoid doing business with.
6. Remember: if it sounds too good to be true, it probably is. If you use an unauthorised firm to buy or sell shares or other investments, you will not have access to the Financial Ombudsman Service or Financial Services Compensation Scheme (FSCS) if things go wrong.
Report a scamIf you are approached about a share scam you should tell the Financial Conduct Authority using the share fraud reporting form at www.fca.org.uk, where you can find out about the latest investment scams. You can also call the Consumer Helpline on 0800 111 6768.
3i Infrastructure plcRegistered office: 12 Castle Street St. Helier Jersey JE2 3RT Channel Islands
Tel: +44 (0)1534 847 410
Registered in Jersey No. 95682
3i Infrastructure plc is regulated by the Jersey Financial Services Commission.
Information for shareholders

This report is printed on Cocoon Silk 50%, an environmentally‑friendly stock made with ECF (Elemental Chlorine Free) pure cellulose. This paper is FSC® certified and contains 50% recycled material.
Printed by Pureprint Group using environmental print technology and vegetable‑based inks throughout. 99% of the dry waste and 95% of the cleaning solvents associated with this production were recycled.
Designed and produced by Radley Yeldar www.ry.com

Annual report online
To receive shareholder communications electronically in future, including your annual and half‑yearly reports and notices of meetings, please go to:
3i Infrastructure plc Registered office: 12 Castle Street St. Helier Jersey JE2 3RT Channel Islands Tel: +44 (0)1534 847 410 www.3i‑infrastructure.com
For details of how to register, log on:www.3i-infrastructure.com