Embed Size (px)
Citation preview

Annual Report and Accounts 2016-17
HC 16


Annual Report and Accounts 2016-17
(For the year ended 31 March 2017)
Accounts presented to the House of Commons pursuant to Section 6 (4) of the Government Resources and Accounts Act 2000
Annual Report presented to the House of Commons by Command of Her Majesty
Ordered by the House of Commons to be printed on 29 June 2017
HC 16
The Government Actuary’s Department

© Crown copyright 2017
This publication is licensed under the terms of the Open Government Licence v3.0 except where otherwise stated. To view this licence, visit nationalarchives.gov.uk/doc/open-government-licence/version/3 or write to the Information Policy Team, The National Archives, Kew, London TW9 4DU, or email: [email protected].
Where we have identi�ed any third party copyright information you will need to obtain permission from the copyright holders concerned.This publication is available at www.gov.uk/government/publications
Any enquiries regarding this publication should be sent to us at [email protected]
Print ISBN 9781474145510 Web ISBN 9781474145527
ID 13061711 07/17
Printed on paper containing 75% recycled �bre content minimum
Printed in the UK by the Williams Lea Group on behalf of the Controller of Her Majesty’s Stationery Of�ce
This is part of a series of departmental publications which, along with the Main Estimates 2016-17 and the document Public Expenditure: Statistical Analyses 2016, present the government’s outturn for 2016-17 and planned expenditure for 2017-18.

ContentsThe Performance Report 4
Overview 4 Executive Statement 4 Purpose and activities of the Government Actuary’s Department 4 Principal Activities 5 Key organisational risks 6 Going concern assessment 6 Performance Summary 6
Performance Analysis 8 Departmental mission, vision and strategy 8 Performance and operating review 9 Sustainable development reporting 17
The Accountability Report 20
Corporate Governance Report 20 Executive’s Report 20 Statement of Accounting Of�cer’s Responsibilities 26 Governance Statement 27 Core Tables 35
Remuneration and Staff Report 38 Remuneration Report 38 Staff Report 45
Parliamentary Accountability and Audit Report 47 Statement of Parliamentary Supply 47 Notes to the Statement of Parliamentary Supply 49 Parliamentary Accountability Disclosures 52 Certi�cate and Report of the Comptroller and Auditor General to the House of Commons 53
The Financial Statements 55
Statement of Comprehensive Income 55 Statement of Financial Position 56 Statement of Cash Flows 57 Statement of Changes in Taxpayers’ Equity 58 Notes to the accounts 59

4 Government Actuary’s Department Annual Report and Accounts 2016-17
The Performance ReportOverview
This section contains a statement from the Government Actuary providing his perspective on the performance of the organisation over the period, details of the purpose and activities of the Government Actuary’s Department and a list of key risks that could affect the entity in delivering its objectives and a performance summary.
Executive StatementThis was the second year of the Government Actuary’s Department’s �ve year strategy, which seeks to steer the Department towards our shared vision for 2020.
During the year, we continued to focus on providing a high level of service to our clients, ensuring that we met their expectations whilst also delivering best value for money for the taxpayer. We achieved all our financial performance targets. Our vision is to be a single, high-performing team, and during the year we ensured that effective leadership promoted our values and objectives. We reviewed and updated many of our policies and processes, in particular with regard to �nance, HR and IT controls.
We fully established the Actuarial Services team during 2016-17 to ensure more consistent and cost effective actuarial support for our client-facing teams. During a period of change, we achieved a Civil Service staff engagement score of 65% compared to the overall average of 60% across the whole Civil Service. In particular, our scores for ‘organisational objectives’ and ‘my team’ were very strong.
We managed our performance through monitoring detailed targets, Key Performance Indicators (KPIs), and budgets. Through open and collaborative discussions at Board level,
we sought to ensure that we continually reviewed our performance and to ensure we meet the expectations of our clients.
The market for actuarial services continues to evolve. We won new work commissions during the year with a value of £6.1 million. These new commissions cover both traditional public sector pensions work and new insurance and investment projects. Because we wish to retain our strong client focus, we commissioned an independent review of our performance. This con�rmed that clients valued both our expertise and our partnership working approach.
Our performance during the year is explained in more detail in the Executive’s Report and the Performance and Operating Review.
Martin Clarke, Government Actuary
Purpose and activities of the Government Actuary’s DepartmentWe provide actuarial and specialist analysis, advice and assurance to clients in both the public sector (UK and overseas) and the private sector, where this is consistent with government policy and does not impair our ability to serve the UK government. We have unrivalled experience and expertise in advising the UK public service.
GAD is a non-Ministerial Department and its funding is budgeted to be entirely met from the fees charged to clients.
Most of our staff are based in of�ces in London, with a small operation in Edinburgh.

The Performance Report 5
Principal Activities
1. Pensions and Social Security
Public service pension schemesWe provide actuarial advice to all of the main UK public service schemes such as those for the civil service, armed forces, police, �re service, teachers, local government and National Health Service. Our advice impacts on a signi�cant proportion of the population, covering around 13 million members in total.
We advise and assist UK and overseas government departments on pension scheme policy and implementation. We also carry out regular actuarial valuations to measure scheme costs, provide �nancial information for pension scheme annual accounts, and maintain and update scheme actuarial factors.
The principal work relates to the four-yearly valuations for employer contributions, cost caps and associated factors. We assist with strategic and policy issues, bene�t design and how to recognise the cost of pensions in employer accounts.
Funded pension schemesWe advise funded occupational pension schemes (those which have a pool of assets backing the liabilities) in the wider public sector and the private sector. This work includes consultancy services for trustees of schemes; advice to sponsors; and strategic bene�t and investment reviews.
Pensions policy, regulation and supervisionWe provide actuarial analysis for government departments and public bodies requiring actuarial input to policy development. While the main focus is on the provision of actuarial support to of�cials in HM Treasury and the Department for Work and Pensions (DWP), we also provide support to a number of autonomous bodies such as the Pension Protection Fund and The Pensions Regulator.
Staff transfersWe provide advice on projects involving the transfer of staff between government departments and other public bodies. We also assist on projects where former public servants who transferred to a private sector scheme are able to rejoin a public service scheme under the revised ‘Fair Deal’ arrangements announced in October 2013.
Social securityWe provide regular reports to Parliament on the �nancial position of the UK National Insurance Fund (‘the Fund’) as required by legislation. These include an annual report concerning the impact on the Fund of the proposed up rating of bene�ts or changes in contributions, and a report every �ve years which summarises projections of the estimated balance in the fund over the longer term.
We also provide advice to social security organisations in other countries.
2. Insurance and Investment
Insurance and risk transferWe provide actuarial advice to government departments, public bodies and local authorities on life, general and health insurance related matters.
We value contingent liabilities and provide advice on the underlying risks, which might arise from self-insurance or risk transfer schemes.
We also assist in managing �nancial risks and, where our actuarial and insurance expertise is relevant, in developing government policy. Our analysis and advice apply to a wide range of challenges from climate change to social care funding.
Investment and riskWe provide advice on investment aspects of pensions and insurance as well as undertaking specialist projects on the management of risk within UK government departments and �nancial institutions.

6 Government Actuary’s Department Annual Report and Accounts 2016-17
We undertake a wide variety of assignments for public sector bodies on issues such as investment strategy, risk modelling, and project risk management.
We also produce monthly newsletters1 summarising the latest market and economic news and providing a brief article on a topic of interest.
3. Modelling and Quality AssuranceWe provide advice to governments and organisations in the UK and around the world on �nancial modelling, demographic modelling and other bespoke modelling services.
This includes:
> expert external assurance on a client’s model quality assurance approach, the models themselves, or on speci�c aspects of the modelling;
> advice and assistance on a model that a client wishes to develop internally; and
> providing a full modelling service, from initial consideration of model design right through to producing and interpreting results and making recommendations.
Key organisational risksStrategic risks identi�ed by the Management Board are as follows:
1. GAD’s services do not provide value for money;
2. GAD’s reputation for providing high quality advice to clients is damaged;
3. Failure to recruit, manage and allocate people resources appropriately; and
4. Failure to comply with �nancial targets set in parliamentary estimates.
1 https://www.gov.uk/government/publications/investment-and-risk-monthly-updates
Further details about how these could affect GAD in delivering its objectives can be found in the Governance Statement within the Accountability Report (pages 30-32).
Within the Governance Statement, we explain how we manage the strategic risks of the organisation, through a management process operating at three levels. The Risk Register is regularly reviewed at Board meetings.
The performance of the Department is measured through the production of Balanced Scorecard Key Performance Indicators (KPIs). The KPIs are produced on a monthly basis, and are presented at Board meeting for review, discussion and action.
Going concern assessmentIn common with other government departments, the future �nancing of the Department’s liabilities is to be met by the Supply process and the application of future income, both to be approved annually by Parliament. Accordingly, it is appropriate to adopt a going concern basis for the preparation of these �nancial statements.
Performance SummaryIn 2016-17, GAD successfully increased its level of new businesses by 8% from 2015-16. Surveys and interviews with various GAD stakeholders show that GAD is highly rated and achieved all of its parliamentary estimates targets.

The Performance Report 7
GAD’S WORK
Risk protection arrangement (RPA) for academiesThe risk protection arrangement (RPA) is an alternative to commercial insurance for academy trusts. Under the RPA, the UK government (Department for Education, DfE) covers the losses instead of commercial insurance.
An ongoing challenge for DfE is predicting the cost of claims, as well as estimating the total operating costs in the future. Due to the nature of the claims, there is often a delay between an event occurring and it being reported, and a further delay before it is fully resolved and settlement paid. This causes a considerable amount of uncertainty.
GAD has been working with DfE to assist with the understanding and quanti�cation of the risks accepted by the RPA. We provide advice and analysis on these problems by estimating the cost of claims for events that happened in the past and are expected in the future.
The results of our work are an integral component of DfE’s budgeting and �nancial reporting process. As well as assisting with these day-to-day activities, we have also helped to assess the future funding requirements for the RPA in its current form, and the feasibility of extending the scope of the services that are offered. Our partnership approach with DfE has helped to ensure the successful launch of the RPA, and this has recently been formally recognised by the arrangement winning a Government Finance Award for innovation.
Ian Rogers Chief Actuary, Insurance and Investment team

8 Government Actuary’s Department Annual Report and Accounts 2016-17
Performance Analysis
Departmental mission, vision and strategy
We aim to ensure that GAD becomes a single, high-performing team that:
> is recognised throughout government as a high quality source of innovative thinking and specialist advice across many sectors;
> has substantially enhanced its reputation for ef�ciency and value for money;
> achieves high levels of consistency and standardisation in its operations and business processes; and
> is widely recognised for its development of analytical, actuarial and business skills of its people.
MissionTo support effective decision-making and robust reporting within government as the �rst choice provider of actuarial and specialist analysis, advice and assurance.
Values
Leadership PledgeWe will be:
> INSPIRING: by expressing our pride and passion for GAD in an upbeat narrative that we will share with colleagues and contacts;
> CONFIDENT: to deal with issues promptly and clearly, sharing our ideas and experimenting; and
> EMPOWERING: by supporting and encouraging others to be innovative and change focussed.
Agile Dedicated Expert Partnering Trusted
through technical innovation and �exible working to meet evolving client needs
to delivering timely advice and �rst class and cost-effective customer service
and focused on quality of analysis to provide robust assurance on decision making
with our clients to understand their business needs and develop solutions that add value for them
to deliver a professional service with integrity
The Performance Report 9
Strategy2016-17 was the second year of our �ve-year strategy that seeks to steer the Department towards our vision for 2020. This strategy is centred on four strategic themes as set out below:t
External Environment
KPIs, Plans, Budgets and MI
Clients
Leadership
People
Processes
GAD2015
Where weare now
GAD2020
Where wewill be
The strategy document explores the relevant issues for each theme in more detail. You can read the complete document2 on our website. What follows is a summary of the key objectives by theme.
ClientsOur absolute priority is providing a high level of service to our clients – identifying their requirements and delivering them as effectively and ef�ciently as possible. This requires us to re�ect our values by partnering with our clients and being agile to innovate wherever necessary. We do not exist to make a pro�t or to grow business for its own sake, but to do the best we can for the taxpayer. We aim to be proactive in acting to secure our existing clients and diversifying our offering to both existing and new clients.
LeadershipPeople at all levels, across all teams, should have the opportunity to be leaders at GAD. Managers and leaders at all grades should be seen to embrace all elements of GAD values, strategy and objectives. This will help us achieve our vision of becoming a single,
2 https://www.gov.uk/government/publications/gad-department-strategy-2015-2020
high-performing team. Focus will be given to functional leadership, making change happen and leading by example.
PeopleTo be successful as a professional services organisation it is essential for GAD to effectively recruit, retain, manage, motivate and develop professional actuaries and those in roles supporting them. This requires strategies, policies and processes aligned to business needs, many of which are already in place. However others will be developed to continuously improve our ability to meet this objective.
ProcessesOur operational processes should be organised to maximise ef�ciency throughout the Department, re�ecting our dedication to carry out the highest quality work for the best value-for-money for our clients. We will focus on organisational structure, IT systems and software, work ef�ciencies and standardi-sation of procedures.
Performance and operating reviewIn 2016-17, we identi�ed the most important measures to help us understand how the Department was performing, and set ourselves some tough targets as part of a balanced scorecard. Whilst not all these aims were achieved in 2016-17, we made signi�cant progress and continued to learn important lessons as to where we can improve still further:
> We have continued to focus on developing our relationships with our clients, whilst maintaining our clients’ assessment of us as being ‘highly valued’. We have introduced client development plans in general and pioneered new Client Engagement Actuary roles within the Public Service Pensions Schemes teams, positioning us well to enhance our partnership with our clients. On-site actuaries working closely with client teams

10 Government Actuary’s Department Annual Report and Accounts 2016-17
have proved to be especially valuable to many of our clients. New business wins this year have signi�cantly exceeded our targets and helped us to continue to both diversify our business and strengthen our core pensions work. Although our range and versatility is becoming better known, we recognise that we can do more to illustrate the contribution that public service actuaries can make. There is scope, for example, to improve the communication of our capability in general and in competitive tenders in particular.
> Financial management of the Department has been further enhanced. We implemented a 3% fee rates reduction for clients and, by improving our resource usage and utilisation rates, remained within our Parliamentary �nancial control totals.
> On the people side the enhanced performance management system has been working well, as con�rmed by staff feedback, although line management will remain a focus for the coming year. The 2016 staff survey produced some pleasing improvements in scores which are testament to the work of leaders at all levels in the Department. Significant progress has been made with improving our HR processes and, in particular, enhancing the performance management system.
> The further development of ef�cient and consistent processes in our work for the public service pension schemes is bearing fruit, with many standard processes now built within the Actuarial Services function to deliver comprehensive and consistent actuarial analysis across all these schemes. Our risk management processes are becoming well-established and we are expecting a positive endorsement of our approach following the recent review carried out by Internal Audit. Some progress has been made in enhancing our approach to the project management of our work, but there is further to go before we can be con�dent that our teams and clients have ready access to the necessary information on progress and costs to ensure successful delivery of all our work.

The Performance Report 11
35%of this income classified
as ‘new business’(3% more than target)18%
Actuarial income from non-pensions business
(1% above target)
£17.5mActuarial income
in 2016-17(against £17.9m target)
22Insurance and investment projects completed, a 47%
increase from 2015-16
23GAD actuaries working onsite
alongside our clients
GAD is highly valued by
All bar 4requests were responded to within time period set
by statute96%of its ‘top 50’
clients(Target of 90%) 63%
actuarial utilisation(Target 60%)

12 Government Actuary’s Department Annual Report and Accounts 2016-17
To assess GAD’s performance in maintaining its reputation for providing high quality advice, GAD had actively sought feedback from its existing and potential clients via the use of:1. a client survey initiated by GAD. The full
GAD Client Survey 2016-17 report can be accessed via https://www.gov.uk/government/uploads/system/uploads/attachment_data/�le/614126/GAD_Client_Survey_Results_2016-17.pdf
2. an independent global leader for business intelligence to carry out Stakeholder Qualitative Research. Recommendations from this report includes:a) Build partnerships with clients via an
onsite presence and regular catch-ups and informal meetings. GAD already does so and will continue.
b) Offer tailored and innovative solutions by understanding clients’ needs, issues and challenges and how GAD can assist with these.
c) Proactively approach clients with suggestions of new and more ef�cient ways of doing things.
d) Offer solutions that take in the ‘bigger picture’ and apply GAD’s wider public sector knowledge.
e) Help clients and potential clients understand how GAD can help them, but avoid ‘hard selling’ by utilising more informal methods, such as the sharing of case studies through presentations, workshops, forums and learning events.
f) Promote GAD’s skills, quality and expertise, and include client endorsements.
g) Raise awareness, via presentations, workshops, master classes, learning events and forums. Publish articles in Civil Service publications/intranet to promote GAD’s image as a thought leader.
82%When I talk about
GAD, I say ‘we’ ratherthan ‘they’ compared
to 71% across theCivil Service
89% feel they are encouragedto come up with new and
better ways of doing things, a 17% increase from the
previous year73%
feel involved in thedecisions that affecttheir work, compared
to 57% across the Civil Service
63% feel their manager
actively role models thebehaviours set out in theCivil Service Leadership
Statement, 14% more thanthe previous year
94%feel they have the
skills required to dotheir job effectively,7% more than the
previous year
82%think that GAD respects
individual differences(e.g. cultures, working styles,
backgrounds, ideas, etc),9% more than the rest
of the Civil Service
76%manager motivates
me to be moreeffective in my job,
7% more than the restof the Civil Service
StaffSurvey2016

The Performance Report 13
GAD’S WORK
Isle of Man’s Social Security and National Insurance schemesIn July 2015 Tynwald, the parliament of the Isle of Man (IoM), approved a set of recommendations which resulted in the IoM and the United Kingdom (UK) having different State Pension provisions in respect of people reaching State Pension age on or after 6 April 2016. In the UK a new ‘single-tier’ State Pension was
introduced from 6 April 2016, whereas the IoM retained the existing State Pension provisions. However, the IoM was committed to introducing a new Manx Pension, designed for the IoM’s needs.
The Treasury’s Social Security Division commissioned GAD to assist in testing potential options they were considering for the reform of the IoM’s Social Security and National Insurance schemes, with particular reference to the National Insurance Fund.
Potential options for reform considered included:
> introducing a single tier, �at-rate State Pension approach similar to the UK; and
> linking future bene�ts increases, with the exception of the Pension Supplement, to the increase in average earnings
We analysed the options using different scenarios for the economic assumptions, in particular those for earnings and consumer price index increases. Our report provides estimates of the projection of contributions, bene�ts and fund balance to 2072 under the range of potential reform options.
At the July 2016 sitting Tynwald approved the Treasury’s proposals for reform, which were informed by the GAD analysis. These proposals will form the foundation of the new Manx State Pension due to be introduced from 6 April 2019.
Matt Gurden Chief Actuary, Advice to government team

14 Government Actuary’s Department Annual Report and Accounts 2016-17
Long-term expenditure trendsThe Government Actuary’s Department has agreed indicative baseline funding agreed until 2019-20. Further detail is provided within the Core Departmental Tables (see Corporate Governance Reporting section within the Accountability Report). However, in summary, the Department is expected to recover its costs, generating a small surplus. The capital budget for future years is £200,000.
Operating Review
Pensions and Social Security2016-17 saw the Public Service Pension Scheme teams starting work on the 2016 actuarial valuations. These valuations set the initial cost cap funds for the reformed schemes and for the �rst time will test the new cost management framework under which the schemes operate. The valuation work will continue into 2017-18.
Our newly created Actuarial Services team has undertaken the processing work for the valuations with the aim of improving consistency, ef�ciency and cost savings for our clients. In addition to this work, regular activities have continued including providing �gures for inclusion in the public service pension scheme accounts, for cash �ow forecasts and to feed into the Parliamentary supply estimates process.
During 2016-17 we completed a dry run rehearsal of how we will carry out a review of the actuarial valuations of the Local Government Pension Scheme as at 31 March 2016 in accordance with section 13 of the Public Service Pensions Act 2013. This involved extensive engagement with the various stakeholders.
A number of the Public Service Pension Scheme teams also provided support to sponsoring departments in defending legal
GAD’S WORK
High Speed 2 (HS2)HS2 is a high speed rail link project, which, in its �rst phase, will link London with the West Midlands. HS2 developed a risk �nancing strategy for its phase one programme and asked GAD to independently review the modelling and analysis work produced by their external advisors.
We supported on:
> the completeness of the risks identi�ed and assessed;
> the reasonableness, appropriateness and robustness of the assumptions and methodology employed to assess the risks;
> whether all risk mitigation strategies had been considered, and
> the determination of which risks were either included or excluded from the risk register.
We also identi�ed further possible risks and mitigation strategies that could be used. This support ensured HS2 could make an informed decision about the risks it faces and ways to control or mitigate certain risks within a large infrastructure project.
Andrew Jinks Deputy Chief Actuary, Insurance and Investment team

The Performance Report 15
challenges relating to the introduction, in 2015 following the review by Lord Hutton, of the reformed schemes.
The teams have also:
> advised other government departments and public bodies on pension issues specific to them, including advising economic regulators on their regulated companies’ pensions costs and advising the DWP on policy issues relating to private sector pension schemes; and
> provided advice on the pension aspects of outsourcing public sector services and of Machinery of Government changes. Major projects for our specialist staff transfer team included continuing to advise on the pensions aspects of the move of local government staff to the new Single Fraud Investigation Service under DWP and the setting up of Public Health England.
Actuarial ServicesThe Actuarial Services team has for the most part worked with the Public Service Pension Scheme teams on the 2016 actuarial valuations. The main focus has been on data processing, analysis of experience and initial calculations using a well-de�ned process for carrying out the updates. We also developed the tools and processes required for the later stages of the valuations. All of these are continuously improved to learn from our experiences.
The use of standardised approaches allows for a more consistent and streamlined approach to our work. This provides a more robust product to our clients at lower cost and allows for greater comparison across schemes.
Advice to governmentThe Advice to government team primarily support DWP, HM Treasury (HMT) and HM Revenue and Customs (HMRC) to formulate policy on private and public sector pensions, and to understand the implications of changes to the social security system.
During the year we have:
> delivered the Government Actuary’s annual report to the UK Parliament on the financial implications of changes to National Insurance contributions and bene�ts;
> prepared a report to the DWP Secretary of State on the future path of State Pension age required such that individuals are expected to spend a speci�ed proportion of their adult lives in retirement;
> provided policy advice to inform the DWP green paper on de�ned bene�t pension schemes ‘Security and Sustainability in De�ned Bene�t Pension Schemes’; and
> supported HMT to prepare for legal cases in relation to the transitional protection provisions in a number of public sector pension schemes.
Throughout the year we have worked with HMRC to identify ef�ciencies in the processes surrounding the operation of the National Insurance Fund, which should lead to lower running costs in future.
Additionally, we have also provided advice to a number of overseas governments on social security and pensions issues.
Insurance, Investment, Modelling and Quality AssuranceThe Insurance and Investment team had a very successful year, delivering advice, risk and modelling services to many central government departments and other public sector bodies. Increasing numbers of onsite actuaries and secondments have helped us continue to build deeper relationships with clients and contribute effectively to their priorities.
Noteworthy successes this year have been the ongoing work with UK Government Investments (formerly the Shareholder Executive) relating to the sale of student loans and a much closer engagement with DFID helping them with plans for a Global Insurance Development Facility.

16 Government Actuary’s Department Annual Report and Accounts 2016-17
We have continued to provide substantial support to the NHS Resolution and to develop our partnership on model QA with the Government Internal Audit Agency (GIAA). Our links with the National Audit Of�ce and the Of�ce for Budget Responsibility have also continued to develop on the back of OBR’s planned new Fiscal Risks report.
We continued to provide regular certi�cation of the randomness of the monthly premium bond draw (ERNIE) managed by National Savings and Investments (NS&I).
We have published online newsletters and technical bulletins throughout the year, all of which are available from our website (www.gov.uk/gad).
GAD’S WORK
National Health Service Resolution (NHS Resolution)NHS Resolution (previously known as the National Health Service Litigation Authority) is an important part of the National Health Service (NHS). Its remit includes providing indemnity cover for legal claims against the NHS and supporting NHS bodies in learning from claims.
GAD provides actuarial support to NHS Resolution, combining our technical skills in relation to insurance business with our public sector focus.
Our work for NHS Resolution focuses on the following areas in particular:
> calculation of member contributions for each of the indemnity schemes managed by NHS Resolution;
> calculation of accounting provisions for expected future payments arising from past events (including advising on appropriate assumptions to use for this purpose); and
> projection of the schemes’ future costs.
This work requires the application of actuarial technical skills appropriate to the different classes of business covered by the schemes. NHS Resolution differs from standard insurance business in a number of ways, including the scale of coverage, claim types, public sector �nancing arrangements and political considerations. We use our experience of being within and advising the public sector to focus our advice on NHS Resolution’s speci�c circumstances.
Aidan Smith Chief Actuary, Insurance and Investment team

The Performance Report 17
Sustainable development reporting
Commentary on Sustainability PerformanceWe are committed to integrating sustainability across our operations to support the UK Government Sustainable Development Strategy. As a small Department with less than 250 staff it is not mandatory for GAD to report in accordance with HM Treasury Public Sector Annual Reports: Sustainability Reporting. But, as a matter of good practice, we are reporting voluntarily, following the guidance where practical to do so.
Since 2009 we have met the international standard (ISO 14001:2004) for our Environmental Management System (EMS). The EMS is a management toolkit that enable us to document procedures and continuously monitor progress in environmental performance through regular measurements, reviews and audits. We intend on transitioning to the new ISO 14001:2015 standard before the 2018 renewal date.
Summary of PerformanceOur objectives and targets are based on the new Greening Government Commitments (GGCs) covering the period 2016 to 2020. These targets concentrate on reducing emissions and water use, improving waste management, buying ‘greener’ products and services, and being open and transparent. We set yearly targets for each GGC measure and these targets set out how we plan to achieve reductions in CO2 emissions from building energy use through efficient use of accommodation and IT, how waste will be diverted away from land�ll via methods based on the waste hierarchy principle and to manage the consumption of water.
A dashboard system is used which enables us to report sustainability information accurately and in a timely manner.
Greenhouse gas emissions
Baseline2009-10
2014-15 2015-16 2016-17
Non-�nancial Indicators (CO2e)
Scope 1 and 2 emissions1 248 199 226 177
Scope 3 emissions (indirect – of�cial business travel)
33 16 9 25
Total emissions 281 215 235 202
Other Non-�nancial Indicators
Number of domestic �ights 93 70 59 71
Related EnergyConsumption(KWh)2
Electricity 373,921 318,126 361,001 344,043
Gas 247,799 146,097 127,072 133,714
Financial Indicators (£)
Expenditure on energy 51,667 41,389 46,149 43,372
CRC License expenditure – 1,290 1,290 1,290
CRC emissions allowance – 6,396 5,797 5,349
CRC Phase 2 registration – – – –
Expenditure on of�cial business travel
66,135 33,590 30,813 31,121
1. CO2 emissions �gures are taken from the Cabinet Of�ce electronic Property Information Mapping Service (ePIMS) database.
2. The �gures for energy consumption are based on our occupied �oor space as a proportion of the total building space as the building is multi occupied and sub-metering is not available.

18 Government Actuary’s Department Annual Report and Accounts 2016-17
Waste
Baseline3
2010-112014-15 2015-16 2016-17
Non-�nancial Indicators (tonnes)
Non-Recycled 7 0 0 0
Total Reused/Recycled 15 17 21 8
Composted – 2 3 2
Energy recovery – 1 1 1
Total waste 22 20 25 11
Financial Indicators (£) Total disposal cost 8,162 6,716 8,000 7,208
3. The baseline year used is 2010-11 as �gures for 2009-10 are not available.
Targets and narrativeThe GGCs are that by 2020 the government will:
> Reduce greenhouse gas emissions by at least 32% from a 2009-10 baseline and all ministerial HQs to publish online real time energy use information; and
> Reduce the number of domestic business travel �ights by 30% from the 2009-10 baseline.
Gas consumption has increased slightly due to a cold winter.
Our electricity is generated from renewable sources as of 1 September 2016.
Total energy consumption has stabilised.
The number of domestic �ights is 25% lower than the 2009-10 baseline.
Finite resource consumption: PAPER
Baseline2009-10
2014-15 2015-16 2016-17
Non-�nancial Indicators (A4 Reams) 1,610 1,242 931 911
Targets and narrativeThe GGCs are that by 2020 the government will improve waste management by:
> Reducing the amount of waste going to land�ll to less than 10%;
> Continuing to improve waste management by reducing the overall amount of waste generated and increasing the proportion which is recycled.
Waste generation has reduced signi�cantly over the past year.
Our policy and practice, is to recycle all redundant ICT equipment that cannot be re-used using approved Waste Electrical and Electronic Equipment (WEEE) brokers.
Targets and narrativeThe GGC is that by 2020 the government will achieve a 50% cut in paper use from a 2009-10 baseline. Up to and including 2016-17 we have achieved a 43% reduction. Recycled paper is now fully implemented.
Paper �les are no longer our de�nitive form of record following the introduction of a new Electronic Records Management policy in 2014-15.

The Performance Report 19
Finite resource consumption: WATER
Baseline2009-10
2014-15 2015-16 2016-17
Non-�nancial Indicators (m3)
Water consumption 1,010 738 955 931
m3 per FTE 7.70 4.70 5.90 5.70
Financial Indicators (£)Water supply and disposal costs
2,030 1,885 2,383 2,184
Targets and narrativeThe GGC is to further reduce water consumption. GAD will continue to improve on our reductions by setting internal targets, and reporting on of�ce water use (m3 per FTE). Water consumption has stabilised.
ProcurementThe GGC is to ensure procurement of sustainable and ef�cient products whilst reducing the impact of the supply chain.
Our procurement policy includes using the framework contracts under the Crown Commercial Service (CCS) and we are subject to the Sustainability Policy which it operates. This year we have made increasing use of frameworks and centrally managed contracts where all suppliers have agreed to abide by the GPU sustainability policy.
We promote sustainability in procurement by:
> working closely with our suppliers – particularly in the areas of catering, cleaning and stationery to improve sustainable processes;
> using a Furniture Clearing House to acquire and donate second hand furniture between public sector departments;
> buying less environmentally damaging products and services;
> complying with environmental legislation and regulatory requirements;
> including relevant environmental conditions or criteria in speci�cation and tender documents, and evaluating supplier offers accordingly; and
> raising awareness of environmental issues within GAD, and amongst suppliers and contractors.
Biodiversity and adaptation plansWe are not required to have a biodiversity plan as our site is in a city centre and a street front building.
Climate Change adaptationWe are committed to limiting the extent to which we contribute to climate change. Reduction measures are designed to do this by reducing carbon dioxide emissions from energy use and transport. To support us in this we have engaged with the Facilities Management provider, Interserve to ensure that their use of facilities re�ects energy conservation and lighting reduction during off-peak hours.
Sustainability awarenessThe GAD sustainability lead is a registered member of the Institute of Environmental Management and Assessment. Sustainability is covered as part of induction for new recruits to the Department. For existing staff periodic updates or refresher training sessions are provided. There is intention to introduce a green week in the future.
Martin Clarke Government Actuary Accounting Of�cer 21 June 2017

20 Government Actuary’s Department Annual Report and Accounts 2016-17
The Accountability ReportCorporate Governance Report
Executive’s ReportDuring the year we generated an operating surplus of £0.78 million. Income for the year remained constant at £18.3 million. Fee income (income from actuarial services) increased by £86k from £17.381 million in 2015-16 to £17.467 million in 2016-17. Our fee rate had reduced by 3% in 2016-17 compared to 2015-16, in recognition of the financial pressures many of our clients are under.
Income generated from within the UK was £17.9 million (2015-16: £17.8 million).
Overseas income remains fairly constant at £468k (2015-16: £456k).
Miscellaneous income was £867k, declining from £900k in 2015-16. Miscellaneous income is largely generated by the sub-lease of two �oors of Finlaison House.
Administration costs in 2016-17 amounted to £17.5 million, a small increase from £17.1 million in 2015-16. Staff costs (£12.9 million) is the main component of administration costs. Staff costs in 2016-17 increased by nearly 4%. This was due to a general 1% pay increase for staff in post, and an increase in staff numbers. The cost of employing agency and some other temporary staff is classi�ed under other administration costs in our accounts. These additional staff costs have decreased from £517k in 2015-16 to £393k in 2016-17, in line with reduced numbers.
2,000
4,000
6,000
8,000
10,000
12,000
14,000
16,000
18,000
20,000
£000
's
2010-11 2011-12 2012-13 2013-14 2014-15 2015-16 2016-17
Income
–
Total income
UK Public Sector
Overseas & Private Sector
Miscellaneous (incl Rent)

The Accountability Report 21
Other administration expenditure remained consistent at around £4.7 million (2015-16: £4.7 million). Much expenditure was consistent with the previous year, although IT expenditure increased from £411k in 2015-16 to £602k in 2016-17, re�ecting our need to both updates systems and strengthen IT controls. We continue to keep expenditure under tight control and seek to achieve value for money by purchasing through Government Framework agreements and using shared service arrangements wherever appropriate. Details of expenditure are shown in Note 3.
Our capital budget (CDEL) for 2016-17 was £200k of which £185k was utilised. The majority of the capital spend was related to the replacement of IT hardware and software.
Our Supply Estimate had a net cash requirement of £423k and we achieved an outturn of (£357k) cash in 2016-17. All surplus cash at year end is returned to the Consolidated Fund. Running and capital costs were met through fee income generated from providing actuarial services and rental income.
The Statement of Financial Position shows total assets of £6.3 million (2015-16: £7.2 million), non-current and current assets plus current liabilities £4.6 million (2015-16: £4.3 million), and non-current liabilities of £1.2 million (2015-16: £1.4 million). Liabilities include provisions for an onerous lease and an injury bene�t claim.
GAD is a non-ministerial Department led by the Government Actuary. Details of the Chairman and the composition of the Management Board can be found in the Governance Statement. Board Members’ interests are disclosed in the Remuneration Report.
Payment of SuppliersOur aim is to pay suppliers in accordance with government policy, which is currently to pay 80% of undisputed invoices within 5 working days of the receipt of goods or services or the presentation of a valid invoice, whichever is the later. During 2016-17 91% of invoices by value
(84% by number) were paid within 5 working days. The equivalent �gures for 2015-16 were 89% of invoices by value (86% by number). No interest payments were made under the late Payment of Commercial Debts (Interest) Act 1998.
Expenditure on Consultancy, Professional Services, Publicity and AdvertisingDuring 2016-17 we spent £52k (2015-16: £47k) on consultancy and professional services.
We incurred costs of £393k (2015-16: £517k) on the employment of temporary staff. These were mainly specialist actuarial and IT staff required to meet additional demand from clients. We aim to have a small proportion of staff on temporary and �xed term contracts to provide �exibility to meet �uctuating demand.
£12k was incurred on publicity and advertising costs, all of which was for recruitment (2015-16: £13k).
Financial RiskWe have only very limited exposure to �nancial instruments which play a more limited role in creating and managing risk than would apply to a non-public sector body of a similar size. More detail is given in Note 9.
Political and Charitable donationsGAD made no political or charitable donations in 2016-17 (2015-16: £nil).
Financial OutturnOur �nancial outturn for 2016-17 is reported in different ways. The accounts show the net resource outturn as a surplus of (£780k) against an Estimate of (£87k) net surplus, resource Departmental Expenditure Limit (DEL) of (£670k) surplus against an Estimate of £3k and capital DEL of £185k against an Estimate of £200k. The tables in the Statement of Parliamentary Supply Notes 1 and 2 reconcile these �gures.

22 Government Actuary’s Department Annual Report and Accounts 2016-17
Recruitment and TurnoverGAD’s staff turnover has remained static this year at 13% but recruitment activity has increased with the introduction of the Actuarial Services team.
Permanent employees Contractors/agency/secondees/consultants
FTC employees
9%2%
89%
Staff in post as at 31 March 2017
Staff in Post
31/03/2017Male
31/03/2017Female
31/03/2017
Staff in Post
31/03/2016Male
31/03/2016Female
31/03/2016
Actuaries1 80 49 31 74 46 28
Trainee Actuaries1 35 22 13 44 29 15
Actuarial Technicians 29 19 10 14 10 4
Support Staff1 25 13 12 27 19 8
Secondees/Agency 4 3 1 9 7 2
Total 173 106 67 168 111 57
Of which:Leadership Group2 15 12 13 13 10 3
1. Permanent and Fixed Term Contract Employees
2. Although not formally constituted as a committee, the Leadership Group, which consists of the Management Board, Senior Chief Actuaries, Chief Actuaries and a number of other senior staff, is responsible for setting the tone and direction of the Department.
Given the cyclical nature of pension scheme valuation work and associated revenue, we utilise contingent labour, in the form of employees on fixed term contracts and secondees from the private sector when the need arises. This provides numerical and
functional � exibility and should enable us to better manage resources to meet the cyclical nature of client demands.
The following chart shows the workforce mix as at 31 March 2017.

The Accountability Report 23
Staff Engagement SurveyThe 2016 Staff Survey received an 86% completion rate which resulted in an overall Engagement Index of 65%. The headline scores in several key areas are very positive especially as GAD has initiated culture change initiatives and undertaken a structure change during the year. There were significant improvements made in �ve areas; Leadership and Managing change (+11%), Pay and Bene�ts (+9%), Resources and Workload (+8%), My Team (+7%) and My Work (+5%).
Four areas of improvement were identi�ed to focus on, pay and bene�ts, leadership and management, learning and development, people and performance management. A variety of actions have been identi�ed such as:
> review non-cash bene�ts that would be attractive to current employees and also assist with the attraction of new employees;
> ensure clearer communications about bene�ts, purpose and intentions of change and more direct communications with senior management;
> provide ‘on the job’ learning and development within the induction portfolio and create a Development Adviser role to support Trainee and Technician roles; and
> clarify the line management responsibilities and develop a training/coaching programme for line managers.
Equal Opportunities and DiversityWe are fully committed to providing equal opportunities for all staff, regardless of ethnicity, religion, gender, sexual orientation, age, marital status or trade union af�liation. Our aim is that the Department should re�ect a diverse, modern society at all levels both to bring in and bring on talent. For example, we advertised for graduate trainee actuaries and actuarial technicians in a range of media to attract a diverse range of applications. Throughout the year, the GAD management team entered into regular discussions with the
recognised trade union on matters affecting staff, informing and consulting them as required.
GAD demonstrates commitment to the recruitment and retention of people with disabilities. GAD provides assurance to disabled applicants that they are guaranteed an interview, providing they meet the minimum criteria of the job advertised and that they are given the opportunity to demonstrate their abilities at the interview stage. GAD will make reasonable adjustments to all stages of the recruitment process and to our jobs to make them more accessible to applicants who have a disability. This applies to both internally and externally advertised posts.
GAD encourages all employees to update their personal records and declare any disability; this helps to ensure that disabled people are given the support needed. The performance management system ensures that discussions regarding learning and development take place throughout the year and help employees to identify what they can do to make sure they can develop their skills and use their abilities to develop and progress within their job. GAD makes every effort to ensure disabled employees stay in employment and make adjustments to help people who become disabled stay in their current role, or �nd a suitable alternative.
Information for Staff and Communications PolicyWe keep all members of staff informed of changes affecting the Department. We operate an intranet site that is regularly updated with policy and guidance. Regular e-mails, Of�ce Notices and updates of other general departmental information are also used. There are a number of operating committees and working groups to encourage direct staff input into departmental decision making. A topical Blog from the Government Actuary is also sent to all staff each week.

24 Government Actuary’s Department Annual Report and Accounts 2016-17
Learning and DevelopmentThroughout the year many improvements have been put in place to strengthen the people related practices and the structures that underpin retention and performance strategies. The following interlinking aspects were focused on to support the organisation change agenda.
> Recruitment
Improvements have been made to recruitment processes and methods. In July a new recruitment brie�ng for the hiring panel was introduced to ensure staff understood the importance of fair and open competition for external recruitment campaigns, and to ensure the appointment of the best candidate on merit. This was accompanied with a mandatory requirement for all interview panel members to complete the Unconscious Bias training provided via the Civil Service Learning website.
In addition a new sift and interview scoring process was developed to simplify compliance; thereby providing assurance of consistency and fairness. This tool guides the panel through the recruitment principles and provides a detailed audit trail to evidence that appointments are made on merit. A Civil Service Commission audit in February confirmed the improvements made in 2016-17 with further actions required.
> Retention
Reward vouchers were introduced during the year to reward and recognise employee’s contribution with the aim to provide a more immediate motivational impact. £10,000 of the non-consolidated pay award was set aside for this reward initiative.
A survey of the people who had received reward vouchers was carried out in October to ascertain if the reward was delivered in a timely manner, in an appropriate way and with authenticity from the direct line manager. The results showed that 83% of
the respondents felt valued, pleased or rewarded when receiving the vouchers. 100% agreed that the vouchers were presented using a method they were generally comfortable with.
> Pay Structure Review
This project commenced at the beginning of October and will begin to address the issues associated with the removal of in-grade progression spine points, such as introducing a Job Family structure and an additional pay grade. The aims of the review are to create and implement a pay structure to suit GAD’s requirement to support talent management, career paths, and develop new pay principles so that all pay related matters are consistently applied across GAD. The review also considered wide pay bands, unequal gaps/overlaps in the pay structure, benchmarked professional salaries and attraction and retention strategies.
> Development
A new Learning and Development Portfolio was published in August to be used by employees to build their own development plans. The portfolio is an interactive map which shows what knowledge, skills and competences requirements are either essential, important, developmental, role/task related or optional for each of the current grades. An online training request facility has been developed which prompts employees to set out learning objectives that have been agreed with their manager and also incorporates immediate and longer term evaluation. A separate evaluation database has been designed to enable all people across GAD to see comments about training courses so they can make informed decisions about course suitability.
> Talent
Talent management reviews are carried out every quarter. Development opportunities have been identi�ed for

The Accountability Report 25
18 employees during the last 12 months; the majority have been promotions with one level move to a different team. Discussions have helped to identify opportunities for project work and other activities to develop experience, consider the potential career journey for Senior Trainees who are likely to qualify at the next exam session and have also focused on employees who need targeted support. A framework system for rotation of people between teams is currently being developed to provide the opportunity to experience different areas of work at GAD.
> Performance
A new performance management system was introduced in 2015 and several initiatives have been put in place to support managers such as Appraisal Training and Having Confident Conversations. To ensure continuous improvement in this area, and embed a high performance culture, several Engagement and Communications sessions have also focused on this topic. A half year review was conducted to ascertain how well performance management had been embedded in GAD. The survey sought employees’ views about their manager’s ability to have con�dent, meaningful and motivational conversations, clarify objectives and expectations, discuss development needs and aspirations and adhere to the process. It also asked managers for their views about their own abilities. A score of 79% was derived from the positive responses for successfully embedding performance management. Although this has progressed well there is still more to do to ensure performance management is fully embedded across GAD. The performance management system at GAD complies with the new Civil Service Performance Management Assurance Framework.
Effectiveness of staff whistleblowing proceduresWhistleblowing guidance is accessed via the intranet. Whistleblowing Policy awareness training was conducted during the companywide annual update in April 2016. In addition, a whistleblowing system is a professional requirement for quali�ed actuaries and is explained within the Institute and Faculty of Actuaries code of conduct. There have been no whistleblowing cases raised during the year.
Personal DataThere were no personal data incidents during the year which required disclosure.
Health and Safety ReportingWe are committed to providing a safe and healthy working environment and recognise the importance of our employees’ health.
Our staff are primarily of�ce based, so the main risks arise within the of�ce environment and staff working practices. We have procedures in place to ensure a safe working environment is maintained.
During 2016-17:
> no reportable accidents occurred;
> all new starters to the Department received an induction covering the Department’s Health and Safety policy and procedures and a Display Screen Equipment (DSE) Assessment of their workstation;
> risk assessments were carried out for expectant mothers and new mothers returning to work;
> discussions continued with the safety representative from Prospect (the recognised trade union in GAD) on all aspects of health and safety; and

26 Government Actuary’s Department Annual Report and Accounts 2016-17
> all statutory Health and Safety inspections and testing were carried out. These included �re evacuation drills, �re alarm and �re extinguisher testing, water systems monitoring and lift inspections.
Statement of Accounting Of�cer’s ResponsibilitiesUnder the Government Resources and Accounts Act 2000, HM Treasury has directed the Government Actuary’s Department to prepare for each �nancial year resource accounts detailing the resources acquired, held or disposed of during the year and the use of resources by the Department during the year.
The accounts are prepared on an accruals basis and must give a true and fair view of the state of affairs of the Government Actuary’s Department at the year end and of its net resource outturn, application of resources, changes in taxpayers’ equity and cash �ows for the �nancial year.
In preparing the accounts, the Accounting Officer is required to comply with the requirements of the Government Financial Reporting Manual and in particular to:
> observe the Accounts Direction issued by HM Treasury including the relevant accounting and disclosure requirements, and apply suitable accounting policies on a consistent basis;
> make judgements and estimates on a reasonable basis;
> state whether applicable accounting standards, as set out in the Government Financial Reporting Manual have been followed, and disclose and explain any material departures in the accounts; and
> prepare the accounts on a going concern basis.
HM Treasury has appointed the Permanent Head of the Department as Accounting Of�cer of the Government Actuary’s Department. The responsibilities of an Accounting Of�cer, including responsibility for the propriety and regularity of the public �nances for which the Accounting Of�cer is answerable, for keeping proper records and for safeguarding the Government Actuary’s Department’s assets, are set out in the Accounting Officers’ Memorandum issued by HM Treasury and published in Managing Public Money.
AuditorThe Comptroller and Auditor General is the statutorily appointed auditor for GAD’s accounts. The notional cost of audit services in 2016-17 was £60,000 (2015-16: £60,000). No fees, either actual or notional, were incurred for non-audit work (2015-16: £nil).
The Accounting Of�cer con�rms that:
> as far as he is aware, there is no relevant audit information of which our auditor is unaware;
> he has taken all the steps that he ought to have taken to make himself aware of any relevant audit information; and
> he has taken all the steps that he ought to establish that our auditor is aware of that information.
I con�rm that the Annual Report and Accounts as a whole is fair, balanced and understandable, and that I take personal responsibility for it and the judgements required for determining that it is fair, balanced and understandable.

The Accountability Report 27
Governance Statement
Governance FrameworkThe Government Actuary’s Department (GAD), which was established in 1919, is a non-Minis-terial Department responsible for providing actuarial services and advice to public sector clients (UK and overseas) and private sector clients, where this is consistent with government policy and does not impair our ability to serve the UK government. Ministerial responsibility lies with the Financial Secretary to the Treasury, Jane Ellison MP.
I, Martin Clarke, have been the Government Actuary since August 2014 and Accounting Of�cer since September 2014. I have a number of statutory duties in connection with public sector pensions and social security, and am also the Department Chief Executive and Accounting Of�cer of GAD in which capacity I am accountable to the Permanent Secretary of HM Treasury.
Governance Committees
Management BoardThe Management Board (MB) comprises six executive members, including me, and three non-executive members. It is the main decision-making body and supports me in providing leadership to GAD, framing the overall strategy for GAD and exercising oversight over the performance of the Department including its identi�cation and management of risks.
Membership of the Management Board as at 31 March 2017 was:
Martin Clarke Government Actuary
Wendy DabinettDirector of Human Resources
Stephen HumphreyHead of Specialist Actuarial
Robert Mackintosh Director of Finance
Angela Marshall Non-executive director, since September 2013, appointment extended to September 2019
Geoffrey Podger Non-executive director, Chair since November 2015 on a three year appointment
Louise Redmond Non-executive director, since September 2013, appointed until August 2019
Sue VivianHead of Public Sector Pensions
Colin Wilson Deputy Government Actuary
Robert Mackintosh joined the Management Board on 3 May 2016 as the Director of Finance, replacing Kevin Down.
Stephen Humphrey was appointed to the Board in the role of Head of Specialist Actuarial on 1 April 2016.
Tim Gardner, who had been Chief Operating Of�cer, left GAD on 11 May 2016.
28 Government Actuary’s Department Annual Report and Accounts 2016-17
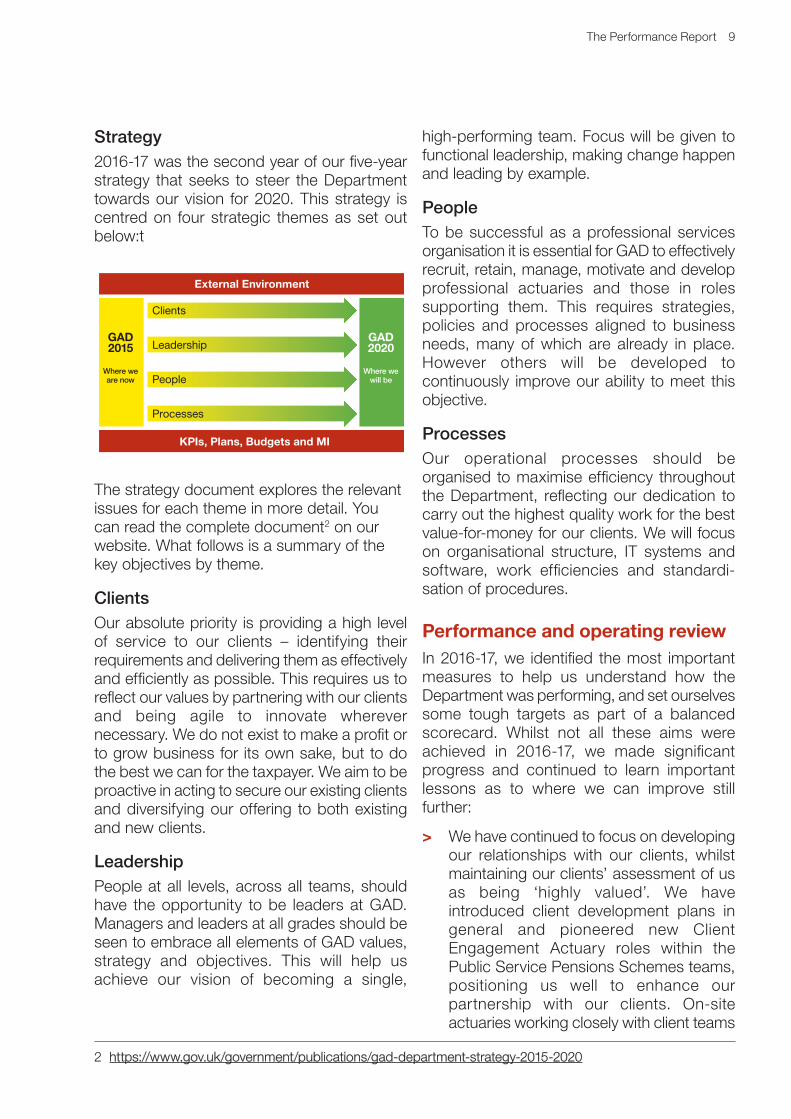
Non-Executive Board Members
Angela Marshall An accountant and a management consultant who has worked extensively in both the public and private sectors in both executive (including Chief Internal Auditor and Finance Director) and management consultancy roles. Since setting up her own company, has spent the last 20 years working across government and the public sector in senior advisory and non-executive roles. She currently holds non-executive positions at the Science and Technology Facilities Council and South Yorkshire Passenger Transport Executive, previous roles included the Valuation Of�ce Agency and the BIG Lottery.
Geoffrey Podger Currently Senior Visiting Research Fellow at the Centre for Risk Management, King’s College, London and also acts in a number of non-executive roles and undertakes consultancy work. In his previous public service career, he successively managed four regulatory agencies in the UK, the European Union and New Zealand. He has also worked in three UK Departments. Geoffrey was awarded the CB in 2003.
Louise Redmond A specialist in organisation development, culture and governance, she currently leads in these areas for Risk Culture Insights. Previous executive roles include Human Resources Director at the Bank of England and founder director of the governance services subsidiary of Law Debenture. She has worked with corporate boards in �nancial services, such as investment and asset management companies and insurers on many aspects of board governance, director effectiveness and managing risk culture.
During 2016-17, the Management Board met 10 times (including an Away Day to consider the Board’s effectiveness), with attendance as follows:
Martin Clarke 10 /10 Angela Marshall 9 / 10
Wendy Dabinett 7 / 10 Geoffrey Podger 10 / 10
Kevin Down 1 / 1 Louise Redmond 10 / 10
Stephen Humphrey 9 / 10 Sue Vivian 8 / 10
Robert Mackintosh 10 / 10 Colin Wilson 8 / 10
The Management Board carried out a regular evaluation of its effectiveness during 2016 which indicated that members felt that the nature, content and quality of information presented to the Board was relevant, timely and appropriate to the Department’s activities. Prior to the away day, all members had to
independently complete a ‘Board Evaluation Questionnaire’ adapted from the NAO’s ‘Unlocking your board’s full potential Board Evaluation Questionnaire’. The aggregate results were discussed on the day.

The Accountability Report 29
Audit and Risk Assurance CommitteeGAD has an Audit and Risk Assurance Committee (ARAC) comprising the three non-executive members of the Management Board. The Committee supports me in my responsibilities for issues of risk, governance, �nancial controls and associated assurance.
The Committee meets at least quarterly. As required, the Committee meets initially with the External and Internal Auditors, then joined by me and the Director of Finance.
During 2016-17, the Audit and Risk Assurance Committee met four times with attendance as follows:
During the year the Committee approved Internal Audit plans, reviewed the �ndings of the audits carried out and followed up on any actions recommended, considered External Audit plans and audit �ndings, reviewed the risk register and approved this Governance Statement. The monitoring of outstanding audit recommendations was strengthened through the production of a quarterly tracker report to con�rm implementation of agreed recommendations, or to highlight the outstanding actions required.
Other Committees
Executive CommitteeAn Executive Committee (ExCo), comprising the executive members of the Management Board and Functional Leads, meets weekly, principally on an informal basis with one formal meeting each month, to consider operational and management issues.
Support Operations CommitteeThe Support Operations Committee (SOC), chaired on a rotation basis by the Heads of the Support Teams, deals with operational and policy issues in the areas of accommodation, information technology, human resources, finance, environmental, security and information assurance. The Security Group reports to the SOC.
GAD Change Board
The GAD Change Board (GCB) was established in November 2014 to provide oversight to signi�cant projects and change activity. The GCB’s remit is to:
> ensure that change within the Department is managed well;
> challenge the robustness of plans for change and track progress;
> help arrange the resources necessary to complete and deliver projects;
> ensure a good standard of communication throughout the Department;
> assess risks to delivery and remedial action plans; and
> report progress to the Executive Committee and to the Management Board.
Technical CommitteeProfessional and technical matters are overseen by the Head of Technical and Professional who reports to the Deputy Government Actuary. In performing this role he is assisted by the Technical Committee (and sub-committees covering different technical areas) whose purpose is to develop and maintain appropriate technical and professional practices across GAD. The
Martin Clarke 4 / 4 Angela Marshall, Chair since January 2016, appointed until September 2019
4 / 4
Kevin Down 1 / 1 Geoffrey Podger 4 / 4
Robert Mackintosh 4 / 4 Louise Redmond 4 / 4
External Audit 4 / 4
Internal Audit 4 / 4

30 Government Actuary’s Department Annual Report and Accounts 2016-17
Technical Committee consists of the Head of Technical and Professional, me, the Deputy Government Actuary, the Head of Research, the Chief Actuaries and the chairs of the eight Technical sub-committees. It is chaired by the Head of Technical and Professional and reports to the Management Board.
Although not formally constituted as a committee, the Leadership Group, which consists of the Management Board, Senior Chief Actuaries, Chief Actuaries and a number of other senior staff, is responsible for setting the tone and direction of the Department.
IT Security Sub-CommitteeIn December 2016, the IT Security sub-committee was established. The sub-committee was established to provide oversight on IT performance, with a particular focus on the management of IT security policies and issues, and to ensure more formal monitoring and reporting of IT performance.
Board member’s interestsNo directorships or other signi�cant interests that may have caused a con�ict with their management responsibilities were held by Management Board members. Opportunity is provided to disclose con�icts at every meeting.
The Board’s governance and performanceThe Board undertook a facilitated full-day workshop in October 2016 at which the Board considered the effective governance of GAD, GAD’s attitude to risk and future workforce planning needs. These discussions:
> helped to clarify the respective roles, responsibilities, remits and decision making authority of GAD’s governance bodies (MB, ARAC and ExCo) and con�rmed that the MB itself should focus on both oversight and foresight and be both supportive and challenging;
> led to the development of a formal risk appetite statement which acts as a guide to decision making related to each of our four strategic themes (see below);
> con�rmed support for adopting a more future-focused / longer-term perspective, where appropriate introducing ‘foresight’ sessions to look at more strategic issues, direction of travel, how to future proof GAD; and
> identi�ed, from responses and comments to the MB evaluation questionnaire, a number of issues for further discussion, such as the level of detail provided for Board discussions, facilitating open and frank discussions, and getting the most from the different perspectives, challenge, mentoring and counsel that non-Executive members can provide.
Corporate Governance in Central Government Departments: Code of Good Practice (“The Code”)Government policy on departmental governance is outlined in Corporate Governance in Central Departments: Code of Good Practice (Cabinet Of�ce, July 2011). This Code operates on a ‘comply or explain’ basis, whereby departments are asked to disclose any element of the Code with which they are not fully compliant, explaining their rationale and any alternative measures which have been put in place to meet the objectives of the Code.
GAD meets the provisions outlined in the Code although as a non-ministerial Department, we have a mix of executives and non-executives, but no ministerial representation. The Chief Internal Auditor (CIA) does not receive an invitation to attend Management Board meetings, though does attend the Audit and Risk Assurance Committee on a quarterly basis. Further details on governance can be found in the Governance Statement.
Risk ManagementWe are a relatively small organisation, but the advice we provide impacts on decisions which can have signi�cant �nancial consequences and be relatively high risk given their political profile. Risk management is therefore integrated as far as possible into the normal

The Accountability Report 31
process of managing the business and the advice that we provide, but with clear responsibilities.
The strategic risks of the Department are considered as part of an enterprise risk management framework that is closely aligned to the 2015-20 strategy and annual business plans. The Management Board reviewed these risks at each meeting during the year. The strategic risks identi�ed by the Management Board are grouped into four strategic themes:
1. Advice is not value for money due to poor Processes in place, with speci�c risks arising from failure to: appropriately scope projects, communicate the scope to the team responsible, manage the project effectively, utilise resources ef�ciently, work consistently across teams, adopt adequate internal or technical guidance, or assess risks inherent in new business projects. We have a low appetite for risks to delivering our statutory obligations, and medium appetite for risks arising from seeking to enhance our consistency or ef�ciency.
2. GAD’s reputation for providing high quality advice to Clients effectively and ef�ciently is damaged such that future advice is not requested or acted upon, with speci�c risks arising from failure to: deliver high quality advice, provide client advice on time, develop innovative solutions and knowledge, work ef�ciently and to budget, use appropriate software, maintain strong client relationships or manage complaints appropriately. We have a low appetite for risks that are likely to undermine our reputation for quality or service, and medium appetite for risks arising from innovation to improve our offering.
3. GAD is unable to provide future advice effectively due to ineffective People policy, with speci�c risks arising from failure to: recruit an appropriate mix of staff, manage resource requirements and allocate them appropriately, attract and retain staff, or engage appropriately with staff. We have a low appetite for risks that are likely to
prevent us recruiting and retaining the quality of people we need, and medium appetite for risks associated with enhancing agile working.
4. GAD does not meet Financial targets or has poor �nancial control, with speci�c risks arising from failure to: meet expected budgets, capture revenue for work carried out and invoice on time, action revenue opportunities, or monitor and take action on debtors. We have a low appetite for major �nancial surprises or �nancial risks that are likely to undermine our sustainability as a service provider, and medium appetite for risks arising from seeking to improve the quality of our management information or reporting.
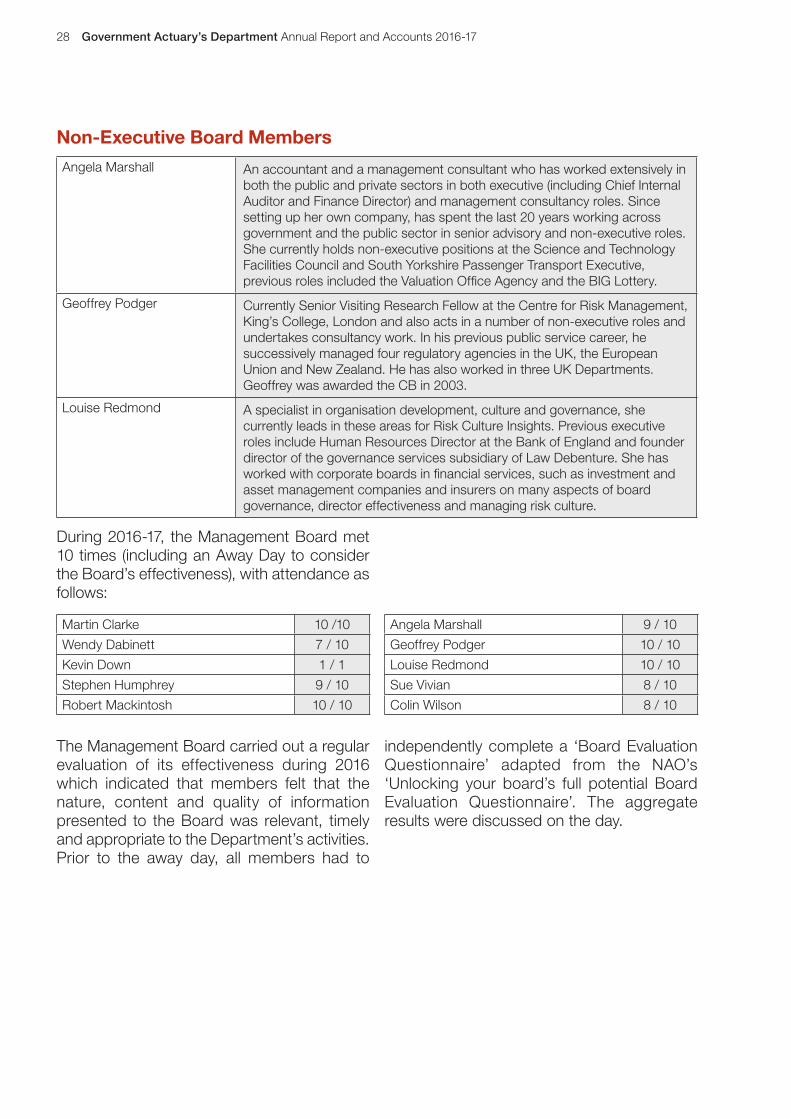
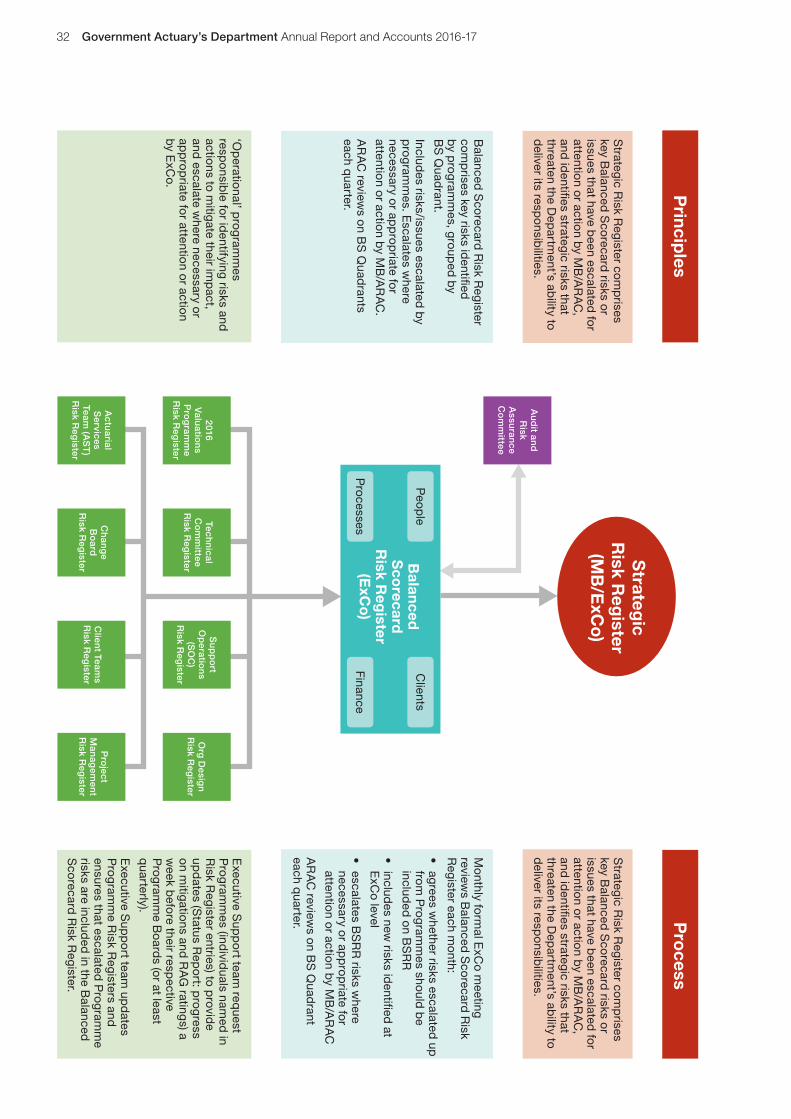
Our risk management processes operate at three levels, Strategic, Balanced Scorecard and Operational. Operational risks are managed within the relevant business areas, with a number of corresponding risk registers being used as management tools. Overall ratings and signi�cant individual risks are escalated to the Executive Committee where they are grouped into the relevant quadrant of the balanced scorecard alongside a number of key risk indicators which are produced as part of the regular management information. A member of the Executive has oversight responsibility for the risk management processes for each quadrant, alongside any other risks identi�ed by the Executive Committee in addition to the four themes above.
The most signi�cant risks are escalated to Management Board on the strategic risk register. In addition to consideration of this information, Management Board aims to perform a deep dive into each area in turn at successive meetings covering each area at least once during the �nancial year.
The ARAC is responsible for reviewing that the risk management processes are working effectively. It also agrees the three-year rolling Internal Audit plan and explores in more detail individual risks where necessary. Internal and External Audit reports are all received and reviewed by the ARAC.
32 Government Actuary’s Department Annual Report and Accounts 2016-17
Strateg
icR
isk Reg
ister(M
B/E
xCo)
Balan
cedS
corecard
Risk R
egister
(ExC
o)
Pro
cesses
Peop
le
Finance
Clients
2016 V
aluatio
ns
Pro
gram
me
Risk R
egister
Techn
ical C
om
mittee
Risk R
egister
Su
pp
ort
Op
eration
s (S
OC
)R
isk Reg
ister
Org
Desig
n R
isk Reg
ister
Actu
arial S
ervices Team
(AS
T)
Risk R
egister
Au
dit an
d
Risk
Assu
rance
Co
mm
ittee
Ch
ang
e B
oard
Risk R
egister
Clien
t Teams
Risk R
egister
Pro
ject M
anag
emen
t R
isk Reg
ister
Princip
lesP
rocess
Strategic R
isk Register co
mp
rises key B
alanced S
corecard
risks or
issues that have been escalated
for
attention o
r action b
y MB
/AR
AC
, and
identi�es strategic risks that
threaten the Dep
artment’s ab
ility to d
eliver its respo
nsibilities.
‘Op
erational’ p
rog
ramm
es resp
onsib
le for id
entifying risks and
actions to mitigate their im
pact,
and escalate w
here necessary or
app
ropriate fo
r attention or action
by E
xCo.
Executive S
upp
ort team
request
Pro
gram
mes (ind
ividuals nam
ed in
Risk R
egister entries) to provid
e up
dates (S
tatus Rep
ort: p
rog
ress on m
itigations and R
AG
ratings) a
week b
efore their resp
ective P
rog
ramm
e Board
s (or at least
quarterly).
Executive S
upp
ort team
upd
ates P
rog
ramm
e Risk R
egisters and
ensures that escalated P
rog
ramm
e risks are includ
ed in the B
alanced
Sco
recard R
isk Register.
Balanced
Sco
recard R
isk Register
com
prises key risks id
enti�ed
by p
rog
ramm
es, group
ed b
y B
S Q
uadrant.
Includes risks/issues escalated
by
pro
gram
mes. E
scalates where
necessary or ap
prop
riate for
attention o
r action b
y MB
/AR
AC
.
AR
AC
reviews o
n BS
Quad
rants each q
uarter.
Monthly fo
rmal E
xCo m
eeting review
s Balanced
Sco
recard R
isk R
egister each month:
• agrees w
hether risks escalated up
from
Pro
gram
mes should
be
included
on B
SR
R
• includes new
risks identi�ed
at E
xCo level
• escalates BS
RR
risks where
necessary or ap
prop
riate for
attention or action b
y MB
/AR
AC
AR
AC
reviews on B
S Q
uadrant
each quarter.
Strategic R
isk Register com
prises
key Balanced
Sco
recard risks o
r issues that have b
een escalated fo
r attention o
r action by M
B/A
RA
C,
and id
enti�es strategic risks that threaten the D
epartm
ent’s ability to
deliver its resp
onsibilities.

The Accountability Report 33
Internal Audit AssuranceThe assurance from Internal Audit is supplemented by a formal system of Assurance Statements produced by Executive Committee members. These statements, supported by other internal controls, require senior managers to give evidence to support their assurance that they and their teams comply with departmental policies and procedures, and, where appropriate, professional standards. The Assurance Statements cover governance arrangements, delivery and performance management, �nancial, people, information and project management. A review of assurance statements highlighted the need for:
> continued actuarial team training;
> review of completed assurances statements to ensure that they provide a template for future assurance mapping following the review by the Internal Audit team;
> changes in team structures to be allowed time to become embedded; and
> robust project management in the future.
In accordance with plans developed following the Macpherson review of quality assurance of government models, GAD maintains an up-to-date list of its business critical models, which is available on our website. For these purposes a model is de�ned as a set of calculations/assumptions/mathematical manipulations that supports a decision and is de�ned as business critical if it plays such a role in decision-making that an error could have a signi�cant reputational, economic or legal impact to GAD and its clients.
At the start of the �nancial year, improvements were made to the monthly Management Information pack. An updated balanced scorecard approach was adopted which aligned the key performance indicators with GAD’s 2016-17 business plan objectives.
During the year, additional IT security expertise was brought in to support the IT team to fully implement the recommendations of the IT Controls Report. Progress in implementing the outstanding recommendations was regularly reported at ARAC meetings, and the remaining work was prioritised on a risk based approach. The additional IT security support covered:
> the management of super-user accounts;
> the baselining of IT standards;
> consideration of the need for additional security protection;
> the updating and strengthening of IT policies and procedures; and
> the strengthening of IT Governance arrangements, and the production of key IT management information, including the establishment of the IT Security Sub-Committee as explained above.
As part of the strategy to improve overall IT resilience, we are looking to work with the IT team of the Government Legal Department for the future delivery of IT services. An outline roadmap has been produced, and a business proposal is being worked on.
In 2015-16, the Civil Service Commissioners rated the Department’s recruitment policies as ‘red’, re�ecting some incomplete recruitment process documentation and inconsistencies with sift criteria. Since this assessment was made, we have worked hard to ensure tangible improvements and greater transparency of the whole recruitment process. This was recognised by the Civil Service Commissioners during an audit towards the end of the �nancial year. They expect us to achieve an amber/green rating in 2017-18 if we maintain our current consistency. The improvements we have implemented include:
> a recruitment brie�ng process for line managers;
> enforcement of the need for recruiting line managers to complete ‘unconscious bias’ training;

34 Government Actuary’s Department Annual Report and Accounts 2016-17
> introduction of a new scoring system for the interview process; and
> formal recording of recruitment decisions.
On 1 February, the National Audit Of�ce published the report ‘Investigation into Police and Fire�ghters’ Pension Scheme commutation factors’. This followed the Pensions Ombudsman’s judgement of maladminis-tration against GAD in May 2015, caused by commutation factors not being updated in 2001. The report found that government failed to understand its obligations for the oversight of the key factors that translated annual pension payments to lump sums. It concluded that there was a lack of independent oversight of the schemes by parties outside government or representation from scheme members.
We have reviewed our internal controls to ensure that our statutory duties, such as the review of commutation factors, are clearly understood and discharged. Our revised controls, together with the updated approach to governance of government pension schemes, are designed to provide a more rigorous approach to ensuring that scheme regulations will be considered suf�ciently in future similar cases.
Other AssuranceThe Internal Audit team has undertaken a range of work during the year, in line with the agreed Audit Strategy by the ARAC:
> Key Financial Controls – moderate assurance con�rmed;
> Assurance Mapping – a Management Letter was issued following the production of a mapping template to assist in the management of �nancial and actuarial sources of assurance;
> Preparation of the Governance Statement - moderate assurance con�rmed, and the recommendations from the report were integrated into the preparation of this year’s statement;
> IT Controls: Follow up Report – an audit to monitor progress in implementing outstanding recommendations was undertaken. This report recognized the progress made to date, but also highlighted the outstanding work to be completed; and
> Risk Management – substantial assurance con�rmed with two recommendations related to risk review and escalation.
The Head of Internal Audit’s Annual Report gave a moderate assurance for the year as a whole. Where weaknesses in controls have been identi�ed we have agreed to implement the actions recommended by the Internal Audit team.
Quality Assurance SchemeSince October 2016, GAD has been accredited under the Institute and Faculty of Actuaries’ Quality Assurance Scheme (QAS).
QAS is a voluntary accreditation scheme which recognises organisations’ commitments to quality actuarial work. The organisation would need to employ more than one member of the Institute and Faculty of Actuaries (IFoA) and must demonstrate their commitment to assurance of the quality of actuarial work and comply with the standard ‘APS QA1 Quality Assurance Scheme for Organisations’.
The accreditation process included an independent assessment visit looking at GAD’s approach to quality assurance, con�icts of interest, training and development, speaking up and our relationship with the users of actuarial information. Based on this assessment, suitability is then determined by the QAS Sub Committee.

The Accountability Report 35
Core TablesThe Core Tables are required to be included by HM Treasury and are based on the outline guidance issued by HM Treasury. Outturn data is consistent with previous years’ published accounts and plan years’ information is consistent with the Spending Review settlement.
Table 1 is a summary of the public spending by the Department and this is supplemented by Table 2 which shows the administrative
cost budgets. The variances between the 2016-17 net resource outturn and budget are explained in the comparison of Estimate and Outturn within the Statement of Parliamentary Supply.
Approval for our spending plans for 2016-17 is set out in the Government Actuary’s Department Main Estimate 2016-17. The document is available at the HM Treasury website at www.gov.uk/hm-treasury.

36 Government Actuary’s Department Annual Report and Accounts 2016-17
Table 1: Public Spending £’000
2012-13Outturn
2013-14Outturn
2014-15Outturn
2015-16Outturn
2016-17Outturn
2017-18Plans
2018-19Plans
2019-20Plans
Resource DEL
Administration (778) (2,338) (1,352) (1,167) (788) (89) (199) (199)
Use of Provisions (DEL) 418 266 179 177 118 90 200 200
Total Resource DEL (360) (2,072) (1,173) (990) (670) 1 1 1
Of which:
Staff costs 12,101 12,018 12,220 12,391 12,883 14,568 13,029 12,658
Purchase of goods and services 3,884 4,491 4,336 4,522 4,407 5,198 4,694 4,790
Income from sales of goods and services (16,674) (18,970) (18,109) (18,279) (18,334) (20,166) (18,124) (17,850)
Depreciation 266 318 320 316 314 340 340 340
Other resource 63 71 60 60 60 61 62 63
Resource AME
Losses on revaluation – 23 1 – – – – –
Provisions (AME) (1,250) (1,431) (645) (291) (110) (90) (200) (200)
Total Resource AME (1,250) (1,408) (644) (291) (110) (90) (200) (200)
Of which:
Losses on revaluation – 23 1 – – – – –
Take up of provisions (832) (1,165) (466) (114) 8 – – –
Release of provision (418) (266) (179) (177) (118) (90) (200) (200)
Total Resource Budget (1,610) (3,480) (1,817) (1,281) (780) (89) (199) (199)
Of which:
Depreciation & Losses on revaluation 266 341 321 316 314 340 340 340
Capital DEL
Administration 154 473 203 133 185 200 200 200
Total Capital DEL 154 473 203 133 185 200 200 200
Of which:
Purchase of assets 154 473 203 133 185 200 200 200
Capital AME – – – – – – – –
Total Capital Budget 154 473 203 133 185 200 200 200
Total departmental spending1 (1,722) (3,348) (1,935) (1,464) (909) (229) (339) (339)
Of which:2
Total DEL (472) (1,917) (1,291) (1,173) (799) (139) (439) (439)
Total AME (1,250) (1,431) (645) (291) (110) (90) (200) (200)
1. Total departmental spending is the sum of the resource budget and the capital budget less depreciation. Similarly, total DEL is the sum of the resource budget DEL and capital budget DEL less depreciation in DEL, and total AME is the sum of resource budget AME and capital budget AME less losses on revaluation in AME.
2. The breakdown between DEL and AME of total departmental spending has been reclassi�ed to re�ect the exclusion of depreciation and losses on revaluation costs.

The Accountability Report 37
Table 2: Administration Budget £’000
2012-13Outturn
2013-14Outturn
2014-15Outturn
2015-16Outturn
2016-17Outturn
2017-18Plans
2018-19Plans
2019-20Plans
Resource DEL
Administration (778) (2,338) (1,352) (1,167) (788) (89) (199) (199)
Use of Provisions (DEL) 418 266 179 177 118 90 200 200
Total Resource DEL (360) (2,072) (1,173) (990) (670) 1 1 1
Of which:
Staff costs 12,101 12,018 12,220 12,391 12,883 14,568 13,029 12,658
Purchase of goods and services 3,884 4,491 4,336 4,522 4,407 5,198 4,694 4,790
Income from sales of goods and services (16,674) (18,970) (18,109) (18,279) (18,334) (20,166) (18,124) (17,850)
Depreciation 266 318 320 316 314 340 340 340
Other resource 63 71 60 60 60 61 62 63

38 Government Actuary’s Department Annual Report and Accounts 2016-17
Remuneration and Staff Report
The rest of this report is audited.
Remuneration Report
Service ContractsThe Constitutional Reform and Governance Act 2010 requires Civil Service appointments to be made on merit on the basis of fair and open competition. The Recruitment Principles published by the Civil Service Commission specify the circumstances when appointments may be made otherwise.
Unless otherwise stated, the of�cials covered by this report hold appointments which are open-ended. Early termination, other than for misconduct, would result in the individual receiving compensation as set out in the Civil Service Compensation Scheme.
Further information about the work of the Civil Service Commission can be found at www.civilservicecommission.org.uk.
Remuneration PolicyThe current head of the Department, Martin Clarke was appointed as Government Actuary on 1 August 2014 but did not formally take over the responsibility of Accounting Of�cer until 1 September 2014. The position is appointed through an open competition run by HM Treasury and the appointment is made following the general rules for Senior Civil Service Appointments initially for a period of �ve years. The appointment may only be terminated in accordance with the Civil Service Management Code.
The pay of the Government Actuary is determined on an annual basis, under agreed arrangements with the Permanent Secretary of HM Treasury. The determination of the pay of the remaining senior staff has been formally delegated to the Government Actuary, and is subject to the annual pay negotiation arrangements for GAD staff.
Due to the nature of the performance appraisal system for the Government Actuary, bonuses are paid in the year following the year for which performance has been assessed. Martin Clarke was awarded a bonus of £17,500 relating to the performance year to 31 March 2016 which was authorised by the Permanent Secretary for HM Treasury paid in �nancial year 2016-17.
Remuneration (including salary) and pension entitlementsThe following sections provide details of the remuneration and pension interests of the Management Board members of the Department. These details are shown in accordance with the 2016-17 Government Financial Reporting Manual (FReM) issued by HM Treasury and are subject to audit.

The Accountability Report 39
Remuneration (salary, bene�ts in kind and pensions)Included in the table is the remuneration of the Non-Executive Board Members (NEBMs) the Government Actuary’s Department has
appointed to the Management Board and the Audit Committee. The NEBMs receive no emoluments except for fees of £500 per seven hours of service plus their travelling expenses.
Single total �gure of remuneration
Salary(£’000)
Bonus payments(£’000)
Bene�ts in kind (to nearest £100)
Pension bene�ts(£’000)¹
Total(£’000)
2016-17 2015-16 2016-17 2015-16 2016-17 2015-16 2016-17 2015-16 2016-17 2015-16
Martin ClarkeGovernmentActuary
185–190 185–190 15–20 15–20 – – 71 71 275–280 270–275
Colin WilsonDeputy Government Actuary
145–150 140–145 0–5 0–5 – – 57 56 200–205 200–205
George RussellDeputy Government Actuary and Head of Actuarial Operations(until 31 May 2015)
–
20–25(145–150 full time
equivalent)
– – – – – 31 – 55–60
Sue VivianHead of Public Service Pensions (from 1 June 2015)
135–140
110–115(130–135 full time
equivalent)
0–5 0–5 – – 41 69 175–180 185–190
Stephen HumphreyHead of Specialist Actuarial(from 1 April 2016)
140–145 – 0–5 – – – 75 – 215–220 –
Robert MackintoshDirector of Finance(from 3 May 2016)
60–65(70–75 full year
equivalent)
– – – – – 32 – 90-95 –
Kevin Down2
Director of Finance(until 2 May 2016)
25–30(70–75 full time
equivalent)
60–65(65–70 full time
equivalent)
– 0–5 – – 28 30 50–55 90–95
Wendy DabinettDirector of Human Resources(from 9 March 2015)
75–80 70–75 0–5 0–5 – – 11 11 85–90 85–90
Tim GardnerChief Operating Of�cer(from 21 September 2015 until 11 May 2016)
10–15(120–125 full year
equivalent)
60–65(120–125 full year
equivalent)
– – – – 5 23 15–20 85–90
Geoffrey PodgerNon-executive Board Member (From 1 November 2015)
0–5 0–5 – – – – – – 0–5 0–5
Angela MarshallNon-executive Board Member
5–10 5–10 – – – – – – 5–10 5–10
Louise RedmondNon-executive Board Member
0–5 5–10 – – – – – – 0–5 5–10
Alex JablonowskiNon-executive Board Member (Until 31 December 2015)
– 0–5 – – – – – – – 0–5
1. The value of pension bene�ts accrued during the year is calculated as (the real increase in pension multiplied by 20) plus (the real increase in any lump sum) less (the contributions made by the individual). The real increase exclude increases due to in�ation or any increase or decreases due to a transfer of pension rights.
2. Kevin Down worked part-time until 29 February 2016.

40 Government Actuary’s Department Annual Report and Accounts 2016-17
Salary‘Salary’ includes gross salary, overtime, reserved rights to London weighting or London allowances, recruitment and retention allowances, private of�ce allowances and any other allowance to the extent that it is subject to UK taxation. This report is based on accrued payments made by the Department and thus recorded in these accounts.
Bene�ts in KindThe monetary value of bene�ts in kind covers any bene�ts provided by the Department and treated by HM Revenue and Customs as a taxable emolument.
BonusesBonuses are based on performance levels which are assessed as part of the appraisal process. Bonuses relate to the performance in the year in which they become payable to the individual. The bonus reported for the Government Actuary in 2016-17 relates to performance in 2015-16.
Pay MultiplesReporting bodies are required to disclose the relationship between the remuneration of the highest-paid director in their organisation and the median remuneration of the organisation’s workforce. This is based on the full-time equivalent staff at 31 March 2017 on an annualised basis.
The banded remuneration of the highest-paid director in GAD in the �nancial year 2016-17 was £200k-205k (2015-16: £200k-205k). This was 4.3 times (2015-16: 4.0 times) the median remuneration of the workforce, which was £47,501 (2015-16: £50,500).
The difference between 2015-16 and 2016-17 for median and ratio is due to more Junior Actuarial Technicians being employed in year, in line with GAD’s workforce plans.
No employees received remuneration in excess of the Government Actuary.
Remuneration ranged from £20k-£25k to £200k-£205k (2015-16: £20k-£25k to £200k-£205k).
Total remuneration includes salary, non-consol-idated performance-related pay and bene�ts-in-kind. It does not include severance payments, employer pension contributions and the cash equivalent transfer value of pensions.
The following table shows the median earnings of the Department’s workforce and the ratio between this and the earning of the highest paid director.
2016-17 2015-16
Band of highest paid director’s total remuneration (£000)
200-205 200-205
Median total (£) 47,501 50,500
Remuneration Ratio 4.3 4.0
Board Members’ interestsNo directorships or other signi�cant interests which may have caused a con�ict were held by Board Members.
Colin Wilson, Deputy Government Actuary of GAD was successfully appointed President of the IFoA on 23 June 2016 for the term of one year.

The Accountability Report 41
Pension Bene�ts
Accrued pension at
pension age as at
31/03/2017 and related lump sum
Real increase
in pension and related lump sum at pension age
CETV at 31/03/2017
CETV at 31/03/2016
Real increase in
CETV
£’000 £’000 £’000 £’000 £’000
Martin ClarkeGovernmentActuary
15–20 2.5–5.0 275 199 56
Colin WilsonDeputy Government Actuary
30–35 2.5–5.0 425 375 31
Kevin DownFormerly Director of Finance
20–25Plus
lump sumof 65–70
0–2.5Plus
lump sumof 0–2.5
415 394 17
Sue VivianHead of Public Service Pensions
25–30 2.5–5.0 482 423 33
Stephen HumphreyHead of Specialist Actuarial
40–45Plus
lump sumof 105–110
2.5–5.0Plus
lump sumof 2.5–5.0
738 660 43
Robert MackintoshDirector of Finance
25–30Plus
lump sumof 85–90
0–2.5Plus
lump sumof 2.5-5.0
581 530 27
Wendy DabinettDirector of Human Resources
Partnership Pension Scheme Bene�ts
Tim GardnerFormerly Chief Operating Of�cer
10–15 0–2.5 118 112 2
Some board members may incur annual allowance tax charges as a result of pension accrual during the accounting period. No allowance has been made for consequential bene�t reduction that may arise if these members elect to meet this tax liability, or similar ones from previous years, through a reduction to their pension bene�ts.
The �gures above, including the opening and closing CETVs re�ect these members’ periods of Management Board membership. Following GAD advice, the factors used to calculate CETVs were revised during the year. CETVs have been calculated in accordance with the factors effective at the relevant date.
42 Government Actuary’s Department Annual Report and Accounts 2016-17
Civil Service PensionsPension bene�ts are provided through the Civil Service pension arrangements. From 1 April 2015 a new pension scheme for civil servants was introduced – the Civil Servants and Others Pension Scheme or alpha, which provides bene�ts on a career average basis with a normal pension age equal to the member’s State Pension Age (or 65 if higher). From that date all newly appointed civil servants and the majority of those already in service joined alpha. Prior to that date, civil servants participated in the Principal Civil Service Pension Scheme (PCSPS). The PCSPS has four sections: 3 providing bene�ts on a �nal salary basis (classic, premium or classic plus) with a normal pension age of 60; and one providing bene�ts on a whole career basis (nuvos) with a normal pension age of 65.
These statutory arrangements are unfunded with the cost of bene�ts met by monies voted by Parliament each year. Pensions payable under classic, premium, classic plus, nuvos and alpha are increased annually in line with Pensions Increase legislation. Existing members of the PCSPS who were within 10 years of their normal pension age on 1 April 2012 remained in the PCSPS after 1 April 2015. Those who were between 10 years and 13 years and 5 months from their normal pension age on 1 April 2012 will switch into alpha sometime between 1 June 2015 and 1 February 2022. All members who switch to alpha have their PCSPS bene�ts ‘banked’, with those with earlier bene�ts in one of the �nal salary sections of the PCSPS having those bene�ts based on their �nal salary when they leave alpha. (The pension �gures quoted for of�cials show pension earned in PCSPS or alpha – as appropriate. Where the of�cial has bene�ts in both the PCSPS and alpha the �gure quoted is the combined value of their bene�ts in the two schemes.) Members joining from October 2002 may opt for either the appropriate de�ned bene�t arrangement or a ‘money purchase’ stakeholder pension with an employer contribution (partnership pension account).
Employee contributions are salary-related and range between 3% and 8.05% of pensionable earnings for members of classic (and members of alpha who were members of classic immediately before joining alpha) and between 4.6% and 8.05% for members of premium, classic plus, nuvos and all other members of alpha. Bene�ts in classic accrue at the rate of 1/80th of �nal pensionable earnings for each year of service. In addition, a lump sum equivalent to three years initial pension is payable on retirement. For premium, bene�ts accrue at the rate of 1/60th of �nal pensionable earnings for each year of service. Unlike classic, there is no automatic lump sum. classic plus is essentially a hybrid with bene�ts for service before 1 October 2002 calculated broadly as per classic and bene�ts for service from October 2002 worked out as in premium. In nuvos a member builds up a pension based on his pensionable earnings during their period of scheme membership. At the end of the scheme year (31 March) the member’s earned pension account is credited with 2.3% of their pensionable earnings in that scheme year and the accrued pension is uprated in line with Pensions Increase legislation. Bene�ts in alpha build up in a similar way to nuvos, except that the accrual rate in 2.32%. In all cases members may opt to give up (commute) pension for a lump sum up to the limits set by the Finance Act 2004.
The partnership pension account is a stakeholder pension arrangement. The employer makes a basic contribution of between 8% and 14.75% (depending on the age of the member) into a stakeholder pension product chosen by the employee from a panel of providers. The employee does not have to contribute, but where they do make contributions, the employer will match these up to a limit of 3% of pensionable salary (in addition to the employer’s basic contribution). Employers also contribute a further 0.5% of pensionable salary to cover the cost of centrally-provided risk bene�t cover (death in service and ill health retirement).

The Accountability Report 43
The accrued pension quoted is the pension the member is entitled to receive when they reach pension age, or immediately on ceasing to be an active member of the scheme if they are already at or over pension age. Pension age is 60 for members of classic, premium and classic plus, 65 for members of nuvos, and the higher of 65 or State Pension Age for members of alpha. (The pension �gures quoted for of�cials show pension earned in PCSPS or alpha – as appropriate. Where the of�cial has bene�ts in both the PCSPS and alpha the �gure quoted is the combined value of their bene�ts in the two schemes, but note that part of that pension may be payable from different ages.)
Further details about the Civil Service pension arrangements can be found at the website www.civilservicepensionscheme.org.uk
Cash Equivalent Transfer ValuesA Cash Equivalent Transfer Value (CETV) is the actuarially assessed capitalised value of the pension scheme benefits accrued by a member at a particular point in time. The bene�ts valued are the member’s accrued bene�ts and any contingent spouse’s pension payable from the scheme. A CETV is a payment made by a pension scheme or arrangement to secure pension bene�ts in another pension scheme or arrangement when the member leaves a scheme and chooses to transfer the bene�ts accrued in their former scheme. The pension �gures shown relate to the bene�ts that the individual has accrued as a consequence of their total membership of the pension scheme, not just their service in a senior capacity to which disclosure applies.
The �gures include the value of any pension bene�t in another scheme or arrangement which the member has transferred to the Civil Service pension arrangements. They also include any additional pension bene�t accrued to the member as a result of their buying additional pension bene�ts at their own cost. CETVs are worked out in accordance with The Occupational Pension Schemes (Transfer Values) (Amendment) Regulations 2008 and
do not take account of any actual or potential reduction to bene�ts resulting from Lifetime Allowance Tax which may be due when pension bene�ts are taken.
Real increase in CETVThis re�ects the increase in CETV that is funded by the employer. It does not include the increase in accrued pension due to in�ation, contributions paid by the employee (including the value of any bene�ts transferred from another pension scheme or arrangement) and uses common market valuation factors for the start and end of the period.
Compensation on early retirement or loss of of�ceNo compensation on early retirement or loss of of�ce was made in 2016-17 (£nil in 2015-16).
Payments to past directorsNo payments to past directors was made in 2016-17 (£nil in 2015-16).

44 Government Actuary’s Department Annual Report and Accounts 2016-17
Off-payroll engagementsFollowing the Review of Tax Arrangements of Public Sector Appointees published by the Chief Secretary to the Treasury on 23 May 2012, departments and their arm’s length bodies must publish information on their highly paid and/or senior off-payroll engagements.
Table 1. Off-payroll engagements as of 31 March 2017, for more than £220 per day and that last longer than six month
GAD
No. of existing engagements as of 31 March 2017
1
of which:
No. that have existed for < 1 year –
No. that have existed for between 1 and 2 years
1
No. that have existed for between 2 and 3 years
–
No. that have existed for between 3 and 4 years
–
No. that have existed for > 4 years –
All existing off-payroll engagement(s), outlined above, have at some point been subject to a risk based assessment as to whether assurance needs to be sought that the individual is paying the right amount of tax and, where necessary, that assurance has been sought.
Table 2. New off-payroll engagements, or those that reached six months in duration, between 1 April 2016 and 31 March 2017, for more than £220 per day and that last for longer than six months
GAD
No. of new engagements, or those that reached six months in duration, between 1 April 2016 and 31 March 2017
3
No. of the above which include contractual clauses giving the Department the right to request assurance in relation to income tax and National Insurance obligations
3
No. for whom assurance has been requested 3
of which:
No. for whom assurance has been received
3
No. for whom assurance has not been received
–
No. that have been terminated as a result of assurance not being received
–
Table 3. Engagements of board members, and/or, senior of�cials with signi�cant �nancial responsibility, between 1 April 2016 and 31 March 2017
GAD
No. of off-payroll engagements of board members, and/or, senior of�cials with signi�cant �nancial responsibility, during the �nancial year
–
Total no. of individuals on payroll and off-payroll that have been deemed ‘board members, and/or, senior of�cials with signi�cant �nancial responsibility’, during the �nancial year. This �gure should include both on payroll and off-payroll engagements
6

The Accountability Report 45
Staff Report
Staff Costs
Permanently employed
staff Others*
2016-17£000Total
2015-16£000Total
Wages and salaries 9,614 20 9,634 9,389
Social security costs 1,144 – 1,144 960
Other pension costs 2,105 – 2,105 2,042
Total costs 12,863 20 12,883 12,391
Less recoveries in respect of outward secondments
– – – –
Total costs 12,863 20 12,883 12,391
* Includes non-Executive Board members.
Of the total, £nil has been charged in capital (2015-16: £nil).
Of the total, £nil has been charged to the programme budget (2015-16: £nil).
The Principal Civil Service Pension Scheme (PCSPS) and the Civil Servant and Other Pension Scheme (CSOPS), known as alpha, are unfunded multi-employer de�ned bene�t schemes and generally government departments are unable to identify their share of the underlying assets and liabilities. Due to its role as Scheme Actuary, GAD would be able to identify its share but has not done so in line with normal practice. The Schemes were valued as at 31 March 2012. Details can be found at http://www.civilservicepension-scheme.org.uk/about-us/scheme-valuations.
For 2016-17, employers’ contributions of £2,111,620 were payable to the PCSPS (2015-16: £1,922,805) at one of four rates in the range 20.0% to 24.5% (2015-16: 20% to 24.5%) of pensionable pay, based on salary bands. The Scheme’s Actuary reviews employer contributions every four years
following a full scheme valuation. The contribution rates re�ect bene�ts as they are accrued, not when the costs are actually incurred, and re�ect past experience of the scheme.
Employees can opt to open a partnership pension account, a stakeholder pension with an employer contribution. Employers’ contributions of £43,245 (2015-16: £30,195) were paid to two appointed stakeholder pension providers. Employer contributions are age-related and range from 8% to 14% (2015-16: 3% to 12.5%) of pensionable pay. Employers also match employee contributions up to 3% of pensionable pay.
Employers’ contributions due to the partnership pension providers at the reporting date were £nil. Contributions prepaid at that date were £nil.

46 Government Actuary’s Department Annual Report and Accounts 2016-17
Average number of persons employedThe average number of whole-time equivalent persons employed during the year was as follows:
Permanently employed
staff Others
2016-17
Total
2015-16
Total
Total 140 16 156 146
Senior Civil Service (SCS) salaries (actual) as at 31 March 2017
Salary Bands Total31/03/2017
Male31/03/2017
Female31/03/2017
£135,000-£140,000 1 – 1
£140,000-£145,000 1 1 –
£145,000-£150,000 1 1 –
£185,000-£190,000 1 1 –
Total 4 3 1
Reporting of Civil Service and other compensation schemes – exit packagesNo exit packages were offered with GAD staff in 2016-17 (2015-16: Nil).
Sickness AbsenceThe Management Board monitored sickness absence on a monthly basis and in 2016-17 GAD lost an average of 4.2 working days per annum due to sickness absence in comparison to a Civil Service average of 7.2 days and a GAD average of 4.8 working days in 2015-16.

The Accountability Report 47
Parliamentary Accountability and Audit Report
The rest of this report is audited.
Statement of Parliamentary SupplyIn addition to the primary statements prepared under IFRS, the Government Financial Reporting Manual (FReM) requires the Government Actuary’s Department to prepare a Statement of Parliamentary Supply (SoPS) and supporting notes to show resource outturn against the Supply Estimate presented to Parliament, in respect of each budgetary control limit. The SoPs and related notes are subject to audit.
Summary of Resource and Capital Outturn 2016-17 2016-17
£0002015-16
£000
Estimate Outturn
Voted outturn compared with
Estimate: saving/ (excess)
Outturn
SoPS Note Voted
Non- Voted Total Voted
Non- Voted Total Total
Departmental Expenditure Limit
– Resource 1.1 3 – 3 (670) – (670) 673 (990)
– Capital 1.2 200 – 200 185 – 185 15 133
Annually Managed Expenditure
– Resource 1.1 (90) – (90) (110) – (110) 20 (291)
– Capital 1.2 – – – – – – – –
Total Budget 113 – 113 (595) – (595) 708 (1,148)
Non-Budget – – – – – – – –
Total 113 – 113 (595) – (595) 708 (1,148)
Total Resource (87) – (87) (780) – (780) 693 (1,281)
Total Capital 200 – 200 185 – 185 15 133
Total 113 – 113 (595) – (595) 708 (1,148)

48 Government Actuary’s Department Annual Report and Accounts 2016-17
Net Cash Requirement 2016-17
2016-17 £000
2016-17 £000
2015-16 £000
SoPS Note Estimate Outturn
Outturn compared
with Estimate:
saving/ (excess) Outturn
2 423 (357) 780 (720)
Administration Costs 2016-17 2016-17
£000 2016-17
£000 2015-16
£000
SoPS Note
Estimate Outturn
Outturn compared
with Estimate:
saving/ (excess)
Outturn
1.1 (87) (788) 701 (1,167)
Figures in the areas outlined in bold are voted totals subject to Parliamentary control. In addition, although not a separate voted limit, any breach of the administration budget will also result in an excess vote.
Expenditure for the year was in line with expectations and within all control totals. Management of cash has improved with our closing balance net cash requirement reduced approximately by 51% from £720,000 in 2015-16 to £357,000 in 2016-17.

The Accountability Report 49
Notes to the Statement of Parliamentary Supply
SoPS1. Net outturn
SoPS1.1. Analysis of net resource outturn by section 2016-17
£000 2015-16
£000
Outturn Estimate Outturn
Administration Programme Net total
compared to
Estimate saving/
(excess)
Net total compared
to Estimate,
adjusted for virements
Total
Gross Income Net Gross Income Net TotalNet
Total
Spending in Departmental Expenditure Limit
Voted:
Administration 17,546 (18,334) (788) – – – (788) (87) 701 673 (1,167)
Use of provision 118 – 118 – – – 118 90 (28) – 177
17,664 (18,334) (670) – – – (670) 3 673 673 (990)
Non-voted: – – – – – – – – – – –
Annually Managed Expenditure
Voted: Provisions (AME) – – – (110) – (110) (110) (90) 20 20 (291)
Non-voted: – – – – – – – – – – –
Total 17,664 (18,334) (670) (110) – (110) (780) (87) 693 693 (1,281)
SoPS1.2. Analysis of net capital outturn by section
2016-17 £000
2015-16 £000
Outturn Estimate Outturn
Gross Income Net Net
Net total compared
to Estimate
saving/ (excess)
Net total compared
to Estimate, adjusted
for virements Net
Spending in Departmental Expenditure Limit
Voted: 185 – 185 200 15 15 133
Non-voted: – – – – – – –
Annually Managed Expenditure
Voted: – – – – – – –
Non-voted: – – – – – – –
Total 185 – 185 200 15 15 133

50 Government Actuary’s Department Annual Report and Accounts 2016-17
SOPS2. Reconciliation of Net Resource Outturn to Net Cash Requirement
Estimate Outturn
Net total outturn
compared with
Estimate: saving/
(excess)
SoPS Note £000 £000 £000
Resource Outturn 1.1 (87) (780) 693
Capital Outturn 1.2 200 185 15
Accruals to cash adjustments:
Adjustments to remove non-cash items:
Depreciation and amortisation (320) (314) (6)
New provisions and adjustments to previous provisions – (8) 8
Departmental Unallocated Provision – – –
Other non-cash items (60) (60) –
Adjustments to re�ect movements in working balances:
Increase/(decrease) in work in progress – 1,821 (1,821)
Increase/(decrease) in receivables 600 (2,319) 2,919
(Increase)/decrease in payables – 1,000 (1,000)
Use of provisions 90 118 (28)
Net cash requirement 423 (357) 780

The Accountability Report 51
SOPS3. Income payable to the Consolidated Fund
Analysis of income payable to the Consolidated Fund
Outturn 2016-17
Outturn 2015-16
£000 £000 £000 £000
Income Receipts Income Receipts
Excess cash surrendered to the Consolidated Fund – – – –
Excess cash surrenderable to the Consolidated Fund – 357 – 720
Total amount payable to the Consolidated Fund – 357 – 720

52 Government Actuary’s Department Annual Report and Accounts 2016-17
Parliamentary Accountability Disclosures
Regularity of expenditure – Losses and special paymentsAs at 31 March 2017, GAD had no losses and special payments to report (2015-16: £26,000, £nil respectively).
Fees and chargesThe Government Actuary’s Department generates income (shown net of value added tax) through the provision of actuarial services provided, and also through income generated from the sub-letting of spare accommodation within our leasehold property.
Remote Contingent LiabilitiesAs at 31 March 2017, GAD had no remote contingent liabilities (2015-16: £nil).
Martin ClarkeGovernment ActuaryAccounting Of�cer
21 June 2017

The Accountability Report 53
The Certi�cate and Report of the Comptroller and Auditor General to the House of CommonsI certify that I have audited the �nancial statements of the Government Actuary’s Department for the year ended 31 March 2017 under the Government Resources and Accounts Act 2000. The �nancial statements comprise: the Department’s Statements of Comprehensive Income, Financial Position, Cash Flows, Changes in Taxpayers’ Equity; and the related notes. These �nancial statements have been prepared under the accounting policies set out within them. I have also audited the Statement of Parliamentary Supply and the related notes, and the information in the Remuneration and Staff Report and the Parliamentary Accountability Disclosures that is described in those reports and disclosures as having been audited.
Respective responsibilities of the Accounting Of�cer and auditorAs explained more fully in the Statement of Accounting Of�cer’s Responsibilities, the Accounting Of�cer is responsible for the preparation of the �nancial statements and for being satis�ed that they give a true and fair view. My responsibility is to audit, certify and report on the �nancial statements in accordance with the Government Resources and Accounts Act 2000. I conducted my audit in accordance with International Standards on Auditing (UK and Ireland). Those standards require me and my staff to comply with the Auditing Practices Board’s Ethical Standards for Auditors.
Scope of the audit of the �nancial statementsAn audit involves obtaining evidence about the amounts and disclosures in the �nancial statements suf�cient to give reasonable assurance that the �nancial statements are free from material misstatement, whether caused by fraud or error. This includes an assessment of: whether the accounting policies are appropriate to the Department’s circumstances and have been consistently applied and adequately disclosed; the reasonableness of signi�cant accounting estimates made by the Accounting Of�cer; and the overall presentation of the �nancial statements. In addition I read all the �nancial and non-�nancial information in the Performance Report and Accountability Report to identify material inconsistencies with the audited �nancial statements and to identify any information that is apparently materially incorrect based on, or materially inconsistent with, the knowledge acquired by me in the course of performing the audit. If I become aware of any apparent material misstatements or inconsis-tencies I consider the implications for my certi�cate/report.
I am required to obtain evidence suf�cient to give reasonable assurance that the Statement of Parliamentary Supply properly presents the outturn against voted Parliamentary control totals and that those totals have not been exceeded. The voted Parliamentary control totals are Departmental Expenditure Limits (Resource and Capital), Annually Managed Expenditure (Resource and Capital), Non-Budget (Resource) and Net Cash Requirement. I am also required to obtain evidence suf�cient to give reasonable assurance that the expenditure and income recorded in the �nancial statements have been applied to the purposes intended by Parliament and the �nancial transactions recorded in the �nancial statements conform to the authorities which govern them.
Opinion on regularityIn my opinion, in all material respects:
> the Statement of Parliamentary Supply properly presents the outturn against voted Parliamentary control totals for the year ended 31 March 2017 and shows that those totals have not been exceeded; and
54 Government Actuary’s Department Annual Report and Accounts 2016-17
> the expenditure and income recorded in the �nancial statements have been applied to the purposes intended by Parliament and the �nancial transactions recorded in the �nancial statements conform to the authorities which govern them.
Opinion on �nancial statementsIn my opinion:
> the �nancial statements give a true and fair view of the state of the Department’s affairs as at 31 March 2017 and of the Department’s net operating income for the year then ended; and
> the �nancial statements have been properly prepared in accordance with the Government Resources and Accounts Act 2000 and HM Treasury directions issued thereunder.
Opinion on other mattersIn my opinion:
> the parts of the Remuneration and Staff Report and the Parliamentary Accountability disclosures to be audited have been properly prepared in accordance with HM Treasury directions made under the Government Resources and Accounts Act 2000; and
> the information given in the Performance Report and Accountability Report for the �nancial year for which the �nancial statements are prepared is consistent with the �nancial statements.
Matters on which I report by exceptionI have nothing to report in respect of the following matters which I report to you if, in my opinion:
> adequate accounting records have not been kept or returns adequate for my audit have not been received from branches not visited by my staff; or
> the �nancial statements and the parts of the Remuneration and Staff Report and the Parliamentary Accountability disclosures to be audited are not in agreement with the accounting records and returns; or
> I have not received all of the information and explanations I require for my audit; or
> the Governance Statement does not re�ect compliance with HM Treasury’s guidance.
ReportI have no observations to make on these �nancial statements.
Sir Amyas C E Morse Date: 23 June 2017Comptroller and Auditor General
National Audit Of�ce 157-197 Buckingham Palace Road Victoria London SW1W 9SP

The Financial Statements 55
The Financial StatementsStatement of Comprehensive Income for the year ended 31 March 2017
This account summarises the expenditure and income generated and consumed on an accruals basis. It also includes other comprehensive income and expenditure, which include changes to the values of non-current assets and other �nancial instruments that cannot yet be recognised as income or expenditure.
Note 2016-17 £000
2015-16 £000
Income from sale of goods and services 4 (17,467) (17,381)
Other operating income 4 (867) (898)
Total operating income (18,334) (18,279)
Staff costs 2 12,883 12,391
Purchase of goods and services 3 2,391 2,530
Depreciation and impairment charges 3 314 316
Provision expense 3 8 (114)
Other operating expenditure 3 1,958 1,875
Total operating expenditure 17,554 16,998
Net operating income for the year (780) (1,281)
Other comprehensive income
Items which will not be reclassi�ed to net operating costs:
– Net (gain)/loss on revaluation of property, plant and equipment
5 (25) (136)
Total comprehensive net income for the year (805) (1,417)
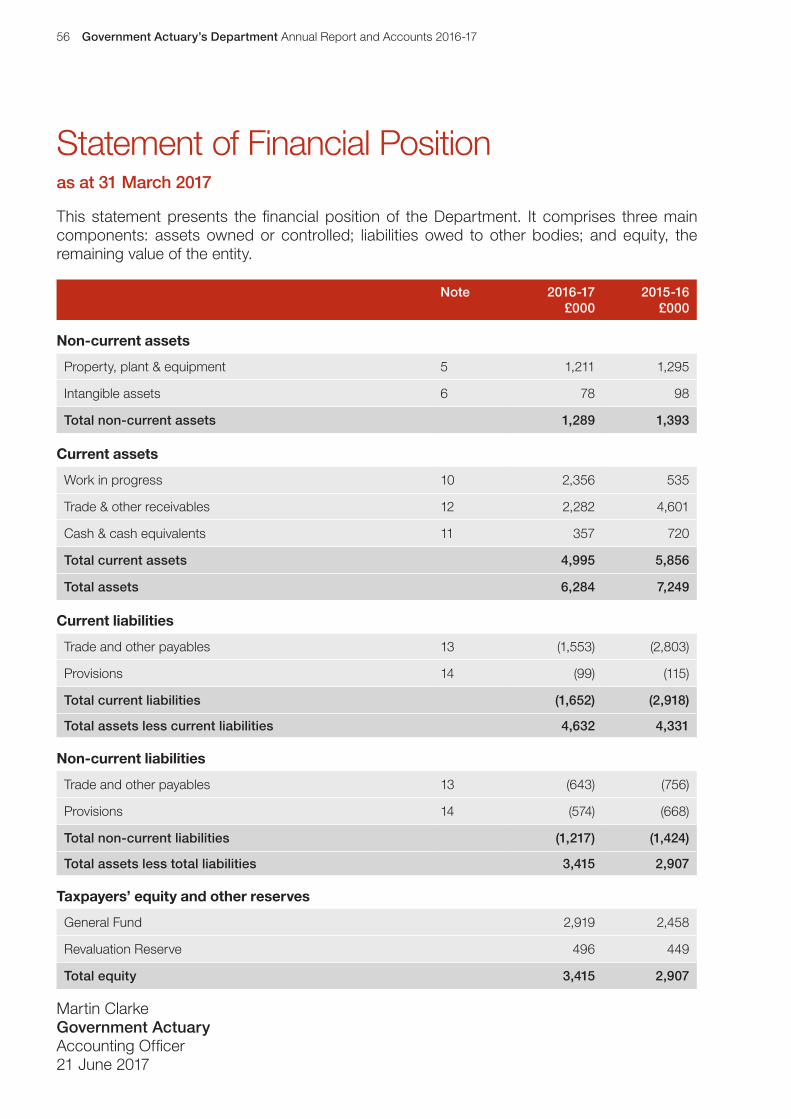
56 Government Actuary’s Department Annual Report and Accounts 2016-17
Statement of Financial Position as at 31 March 2017
This statement presents the �nancial position of the Department. It comprises three main components: assets owned or controlled; liabilities owed to other bodies; and equity, the remaining value of the entity.
Note 2016-17£000
2015-16£000
Non-current assets
Property, plant & equipment 5 1,211 1,295
Intangible assets 6 78 98
Total non-current assets 1,289 1,393
Current assets
Work in progress 10 2,356 535
Trade & other receivables 12 2,282 4,601
Cash & cash equivalents 11 357 720
Total current assets 4,995 5,856
Total assets 6,284 7,249
Current liabilities
Trade and other payables 13 (1,553) (2,803)
Provisions 14 (99) (115)
Total current liabilities (1,652) (2,918)
Total assets less current liabilities 4,632 4,331
Non-current liabilities
Trade and other payables 13 (643) (756)
Provisions 14 (574) (668)
Total non-current liabilities (1,217) (1,424)
Total assets less total liabilities 3,415 2,907
Taxpayers’ equity and other reserves
General Fund 2,919 2,458
Revaluation Reserve 496 449
Total equity 3,415 2,907
Martin Clarke Government Actuary Accounting Of�cer 21 June 2017

The Financial Statements 57
Statement of Cash Flows for the year ended 31 March 2017
The Statement of Cash Flows shows the changes in cash and cash equivalents of the Department during the reporting period. The statement shows how the Department generates and uses cash and cash equivalents by classifying cash �ows as operating, investing and �nancing activities. The amount of net cash �ows arising from operating activities is a key indicator of service costs and the extent to which these operations are funded by way of income from the recipients of services provided by the Department. Investing activities represent the extent to which cash in�ows and out�ows have been made for resources which are intended to contribute to the Departments’ future public service delivery.
Note 2016-17 £000
2015-16 £000
Cash �ows from operating activities
Net operating surplus 780 1,281
Adjustments for non-cash transactions 3 382 262
(Increase)/Decrease in trade and other receivables 12 2,319 (704)
(Increase)/Decrease in work in progress 10 (1,821) (95)
Increase/(Decrease) in trade and other payables 13 (1,000) 286
Use of provisions 14 (118) (177)
Net cash in�ow from operating activities 542 853
Cash �ows from investing activities
Purchase of property, plant and equipment 5 (145) (91)
Purchase of intangible assets 6 (40) (42)
Net cash out�ow from investing activities (185) (133)
Cash �ows from �nancing activities
From the Consolidated Fund (Supply) – current year – –
From the Consolidated Fund (Supply) – prior year – –
Net �nancing – –
Net increase/(decrease) in cash and cash equivalents in the period before adjustment for payments to the Consolidated Fund
357 720
Payments of amounts due to the Consolidated Fund (720) (2,091)
Net increase/(decrease) in cash and cash equivalents in the period after adjustment for receipts and payments to the Consolidated Fund
(363) (1,371)
Cash and cash equivalents at the beginning of the period 11 720 2,091
Cash and cash equivalents at the end of the period 11 357 720

58 Government Actuary’s Department Annual Report and Accounts 2016-17
Statement of Changes in Taxpayers’ Equity for the year ended 31 March 2017
This statement shows the movement in the year on the different reserves held by the Government Actuary’s Department, analysed into ‘general fund reserves’ (i.e. those reserves that re�ect a contribution from the Consolidated Fund). The Revaluation Reserve re�ects the change in asset values that have not been recognised as income or expenditure. The General Fund represents the total assets less liabilities of a Department, to the extent that the total is not represented by other reserves and �nancing items.
Note General Fund£000
Revaluation Reserve
£000
Taxpayers’ equity
£000
Balance at 1 April 2015 1,837 313 2,150
Net Parliamentary Funding – Drawn Down – – –
Net Parliamentary Funding – Deemed – – –
Supply (payable) adjustment (720) – (720)
Consolidated Fund Extra Receipts payable to the Consolidated Fund
– – –
Comprehensive net expenditure for the year 1,281 – 1,281
Notional charges
Auditors Remuneration 3 60 – 60
Revaluation gains and losses – PPE 5 – 136 136
Revaluation gains and losses – IA 6 – – –
Balance at 31 March 2016 2,458 449 2,907
Note General Fund£000
Revaluation Reserve
£000
Taxpayers’ equity
£000
Balance at 1 April 2016 2,458 449 2,907
Net Parliamentary Funding – Drawn Down – – –
Net Parliamentary Funding – Deemed – – –
Supply (payable) adjustment (357) – (357)
Consolidated Fund Extra Receipts payable to the Consolidated Fund
– – –
Comprehensive net expenditure for the year 780 – 780
Notional charges
Auditors Remuneration 3 60 – 60
Revaluation gains and losses – PPE 5 – 25 25
Transfers between reserves (22) 22 –
Balance at 31 March 2017 2,919 496 3,415

The Financial Statements 59
Notes to the accounts
1. Statement of accounting policiesThese �nancial statements have been prepared in accordance with the 2016-17 Government Financial Reporting Manual (FReM) issued by HM Treasury. The accounting policies contained in the FReM apply International Financial Reporting Standards (IFRS) as adapted or interpreted for the public sector context. Where the FReM permits a choice of accounting policy, the accounting policy which is judged to be most appropriate to the particular circumstances of the Government Actuary’s Department (GAD) for the purpose of giving a true and fair view has been selected. The particular policies adopted by GAD are described below. They have been applied consistently in dealing with items that are considered material to the accounts.
In addition to the primary statements prepared under the FReM, the Department is also required to prepare an additional primary statement. The Statement of Parliamentary Supply and supporting notes show outturn against Estimate in terms of the net resource requirement and the net cash requirement. These can be found in the Parliamentary Accountability and Audit Report section within the Accountability Report.
1.1 Accounting conventionThese accounts have been prepared under the historical cost convention modi�ed to account for the revaluation of property, plant and equipment and intangible assets. The accounts are prepared in £ Sterling to the nearest thousand.
1.2 Basis of preparationA description of the accounting policies for all material items are as follows:
1.2a Administration and Programme ExpenditureThe classi�cation of expenditure and income as administration or as programme follows the de�nition of administration costs set out in the FReM by HM Treasury.
1.2b PensionsThe Department recognises the expected cost of providing pensions on a systematic and rational basis over the period during which it bene�ts from employees’ services by payment to the relevant government pension provider of amounts calculated on an accruing basis.
1.2c Property, Plant and EquipmentProperty, plant and equipment are capitalised at a value of £1,000 and are depreciated according to 1.2e below.
1.2d Intangible AssetsGAD’s Intangible assets consists of computer software and are capitalised at a value of £1,000. The cost of such software is amortised according to 1.2e below.

60 Government Actuary’s Department Annual Report and Accounts 2016-17
1.2e Depreciation and AmortisationDepreciation and amortisation periods for property, plant and equipment and intangible assets adopted are as follows. These are accounted for on a straight line basis.
Leasehold improvements shorter of the useful economic life of improvements or end of lease
Information Technology useful economic life or 3 to 6 years where this is not clearFurniture and Fittings useful economic life or 10 years where this is not clearIntangible Assets useful economic life or 3 years where this is not clear
1.2f Revaluation and ImpairmentRevaluations applied are based on published indices. However, revaluation is only applied where the there is a material effect on the Statement of Financial Position (SoFP).
Any impairments incurred are expensed in the Statement of Comprehensive Income (SoCI).
1.2g Foreign Currency TransactionsTransactions in foreign currencies are recorded at the rate of exchange ruling at the time of the transaction. All currency gains or losses are taken into the SoCI. The Department’s functional currency and presentation currency is Sterling.
1.2h LeasesGAD has an operating lease in respect of its London Of�ce, Finlaison House.
Due to the length of the London Of�ce’s lease (20 years), the annual rent increases are effectively an attempt to account for in�ation (the rent increases by 2.47% per year), and thus in real terms are the same each year. Due to the amount of in�ation one can expect in 20 years, adding up all the nominal rents and dividing by 20 would overstate costs in real terms in earlier years of the lease, and understate it in later years. Therefore recognising simply the liability incurred each year is appropriate.
1.2i Work-in-ProgressWork in progress is actuarial income as incurred. This represents unbilled time charges which are valued at the lower of cost (including appropriate overheads, multiplied by the number of rechargeable hours booked through the time recording system and not already charged to clients) or recoverable value. Work is billed monthly in arrears, on completion or at agreed milestones. Variable rent cost charged from the facilities management company that needs to be recharged to sub-tenants will also be recognised in work in progress.
1.2j IncomeIncome is shown net of value added tax and comprises income from actuarial services provided, together with income from the sub-letting of spare accommodation in our leasehold property.
1.2k ProvisionsProvision are accounted for in accordance with IAS 37 Provisions, Contingent Liabilities and Contingent Assets. Discount rates used are obtained from HM Treasury Public Expenditure System papers each �nancial year. Discount rates are only applied to provisions where the effect would be material to the provision.
1.2l Value Added TaxIrrecoverable VAT is charged to the relevant expenditure category.

The Financial Statements 61
1.2m Losses and special paymentsLosses and special payments are charged to the relevant functional headings.
1.2n Employee bene�ts for annual leave carried forwardAnnual leave that has been earned by employees but not taken at the year-end is recognised in the �nancial statements within current liabilities.
1.2o Segmental ReportingUnder the de�nitions of IFRS 8 Operating Segments, GAD is an entity with a single reportable segment. GAD’s �nancial planning and internal reporting is based on GAD being one single entity. The function of ‘chief operating decision maker’, as de�ned by IFRS 8 is exercised by the Management Board. Financial information required by the Board to make decisions about planning, resource allocation and fee-setting as well as monitoring performance is reported on a GAD-wide basis. Accordingly, GAD complies with the entity-wide reporting requirements of IFRS 8, speci�cally income information about goods and services, geographical areas and major customers.
1.2p Cash and cash equivalentsCash in the Statement of Financial Position comprises cash at bank. For the purpose of the cash �ow statement, cash and cash equivalents consist of cash, less any outstanding bank overdrafts.
1.2q Impending application of newly issued accounting standards not yet effectiveFRS 9 Financial Instruments was issued in July 2014, effective for periods beginning on or after 1 January 2018. This was EU endorsed in November 2016. HM Treasury is working towards implementing the standard in the FReM from 2018-19.
IFRS 15 Revenue from Contracts with Customers was issued in May 2014, effective for periods beginning on or after 1 January 2018. It is not yet endorsed by the EU but is expected to be in 2017. HM Treasury is working towards implementing the standard in the FReM from 2018-19.
IFRS 16 Leases was issued in January 2016, effective for periods beginning on or after 1 January 2019. It is not yet endorsed by the EU but is expected to be in late 2017. The introduction of IFRS 16 is subject to analysis and review by HM Treasury and the other Relevant Authorities. HM Treasury will issue an Exposure Draft on IFRS 16 in advance of the effective date.
IAS 7 Statement of Cash Flows disclosure initiative issued in January 2016, effective for periods beginning on or after 1 January 2017. It is not yet endorsed by the EU but is expected to be in 2017. HM Treasury is working towards implementing the standard in the FReM from 2018-19.
1.3 Accounting estimates and judgementsThe preparation of �nancial statements requires management to make judgements, estimates and assumptions about the reported amounts of assets, liabilities, income and expenditure that are not readily apparent from other sources. The estimates and associated assumptions are based on historical experience and other factors that are considered to be relevant. Actual results may differ from these estimates. The estimates and underlying assumptions are reviewed on an ongoing basis. Revisions to accounting estimates are recognised in the period in which the estimate is revised and in any future periods affected.
This note sets out areas involving a higher degree of judgement, complexity, assumptions and estimation techniques, such as 1.2e Depreciation and Amortisation, 1.2f Revaluation and Impairment, 1.2i Work in progress and 1.2k Provisions above.

62 Government Actuary’s Department Annual Report and Accounts 2016-17
2. Staff costs
2016-17£000Total
2015-16£000Total
Wages and salaries 9,634 9,389
Social security costs 1,144 960
Other pension costs 2,105 2,042
Total costs 12,883 12,391
Less recoveries in respect of outward secondments – –
Total costs 12,883 12,391
For a detailed breakdown of the above staff costs and staff numbers, please refer to the Staff Report within the Accountability Report.

The Financial Statements 63
3. Expenditure
Notes 2016-17Total£000
2015-16Total£000
Purchase of goods and services
Facilities management 721 796
Agency and other temporary staff 393 517
Information Technology 602 411
Training 224 274
Recruitment 74 118
Subscriptions 102 94
Travel, subsistence and hospitality 61 148
Telecommunications 99 48
Consultancy 52 47
Auditor’s remuneration – internal audit 25 45
Photocopying 17 19
Stationery and publications 21 13
Other operating expenditure
Rentals under operating leases
Building 1,858 1,810
Equipment 2 1
Non-cash items
Depreciation and amortisation 5, 6 314 316
Provision movements 14 8 (114)
Loss on disposal of assets – –
Loss on revaluation – –
Auditor’s remuneration – external audit 60 60
Other expenditure 38 4
Total 4,671 4,607
In 2015-16, a balance of £123k was categorised as ‘other costs’. To improve transparency, where appropriate other costs have been reclassi�ed under the detailed expenditure headings. The prior year �gures for ‘Facilities Management’ and ‘Travel, subsistence and hospitality’ were £771k and £54k respectively.

64 Government Actuary’s Department Annual Report and Accounts 2016-17
4. Income
2016-17Total£000
2015-16Total£000
Government Departments 14,019 13,504
Of which receipts from:
Sub Tenants 867 898
National Insurance Fund 783 567
Wider public sector, private sector and overseas 4,315 4,775
Total 18,334 18,279
Income by geographical locations
UK 17,866 17,823
Overseas 468 456
Total 18,334 18,279
Income by types of work carried out
UK policy advice 2,410 5,065
Staff transfers 2,338 2,572
UK public service pensions 9,003 6,773
Other actuarial work 3,716 2,969
Rent and miscellaneous 867 900
Total 18,334 18,279
Income from one client was £1,008,000 (5.5% of total income), (2015-16: £1,562,000).

The Financial Statements 65
5. Property, plant and equipment
Leasehold Improvements
£000
Information Technology
£000
Furniture & Fittings
£000
2016-17
Total£000
Cost or valuation
At 1 April 2016 2,233 650 232 3,115
Additions – 144 1 145
Disposals – (154) (29) (183)
Revaluations 62 – – 62
Balance at 31 March 2017 2,295 640 204 3,139
Depreciation
At 1 April 2016 (1,212) (453) (155) (1,820)
Charged in year (139) (101) (14) (254)
Disposals – 154 29 183
Revaluations (37) – – (37)
Balance at 31 March 2017 (1,388) (400) (140) (1,928)
Carrying amount at 31 March 2016 1,021 197 77 1,295
Carrying amount at 31 March 2017 907 240 64 1,211
Leasehold Improvements
£000
Information Technology
£000
Furniture & Fittings
£000
2015-16
Total£000
Cost or valuation
At 1 April 2015 1,911 637 232 2,780
Additions 32 54 5 91
Disposals – (42) (7) (49)
Revaluations 290 1 2 293
Balance at 31 March 2016 2,233 650 232 3,115
Depreciation
At 1 April 2015 (934) (379) (147) (1,460)
Charged in year (121) (115) (14) (250)
Disposals – 42 7 49
Revaluations (157) (1) (1) (159)
Balance at 31 March 2016 (1,212) (453) (155) (1,820)
Carrying amount at 31 March 2015 977 258 85 1,320
Carrying amount at 31 March 2016 1,021 197 77 1,295
All assets are owned by GAD in both the current and prior year.

66 Government Actuary’s Department Annual Report and Accounts 2016-17
6. Intangible assets
2016-17Software Licenses
Total£000
Cost or valuation
At 1 April 2016 743
Additions 40
Disposals (597)
Balance at 31 March 2017 186
Depreciation
At 1 April 2016 (645)
Charged in year (60)
Disposals 597
Balance at 31 March 2017 (108)
Carrying amount at 31 March 2016 98
Carrying amount at 31 March 2017 78
2015-16Total£000
Cost or valuation
At 1 April 2015 699
Additions 42
Revaluations 2
Balance at 31 March 2016 743
Depreciation
At 1 April 2015 (578)
Charged in year (66)
Revaluations (1)
Balance at 31 March 2016 (645)
Carrying amount at 31 March 2015 121
Carrying amount at 31 March 2016 98
All assets are owned by GAD in both the current and prior year.

The Financial Statements 67
7. ImpairmentsGAD did not incur any impairment costs during 2016-17 (2015-16: £nil).
8. Capital and other commitments
8.1 Commitments under leases
8.1.1 Operating leasesTotal future minimum lease payments under operating leases are given in the table below for each of the following periods.
2016-17Total£000
2015-16Total£000
Buildings
Not later than one year 1,817 1,777
Later than one year and not later than �ve years 7,736 7,547
Later than �ve years 2,562 4,569
Total 12,115 13,893
Of�ce Equipment*
Not later than one year 1 1
Later than one year and not later than �ve years – 2
Later than �ve years – –
Total 1 3
Total commitments 12,116 13,896
Subtenants’ lease**
Not later than one year (640) (622)
* Of�ce equipment comprises franking machines only.
** Subtenants’ lease comprises rental income from Single Source Regulations Of�ce and the Higher Education Funding Council for England.
8.2 Capital commitmentsGAD had no capital commitments at 31 March 2017 (31 March 2016: £nil).
8.3 Other �nancial commitmentsGAD had no other �nancial commitments at 31 March 2017 (31 March 2016: £nil).

68 Government Actuary’s Department Annual Report and Accounts 2016-17
9. Financial InstrumentsFinancial instruments play a limited role in creating risk to GAD than would apply to a non-public sector body of a similar size.
All the �nancial assets and liabilities of GAD are held at fair value.
9.1 Credit RiskThe maximum credit risk the Department was exposed to at 31 March 2017 was £1,396,000 (trade receivables and accrued income).
An aged debtor analysis as at 31 March 2017 is as follows:
31 March 2017£000
Up to 30 days 873
31 – 180 days 522
181 – 365 days 1
Over 365 days –
9.2 Liquidity RiskApart from a small Parliamentary vote, GAD funds its payments with cash receipts from invoices issued.
GAD is required to surrender cash in its bank account at the end of each �nancial year to the Consolidated Fund. The Department has access to the Contingencies Fund to meet any cash shortfalls during a �nancial year, however this amount would need to be returned by the end of the �nancial year.
The Department manages its liquidity risk by continuously monitoring its cash �ow and management of outstanding debts.
Total amount owing analysed by when it falls due:
31 March 2017£000
Up to 1 year 1,183
1 to 5 years –
Over 5 years –
9.3 Market RiskGAD is exposed to foreign currency risk from overseas customers, which amounted to £nil debtor value as at 31 March 2017 (31 March 2016: £nil). As the amount of foreign currency debt is not considered to be material in terms of the total value of turnover, GAD does not employ any sensitivity analysis.

The Financial Statements 69
10. Work in progress
2016-17£000
2015-16£000
Value of time worked but not billed 2,356 535
Balance at 31 March 2,356 535
In 2016-17, Directors reviewed the amounts recoverable under contract and the relevant accounting policy and determined that due to the nature of the balance it was more accurate to present these balances within ‘Work in progress’. In 2015-16, £1,528k of amounts recoverable under contract were disclosed under ‘Prepayments and accrued income’ within note 12 ‘Trade receivables, �nancial and other assets’.
11. Cash and cash equivalents
2016-17£000
2015-16£000
Balance at 1 April 720 2,091
Net change in cash and cash equivalent balances (363) (1,371)
Balance at 31 March 357 720
The following balances at 31 March were held at:
Government Banking 357 720
Balance at 31 March 357 720
12. Trade receivables, �nancial and other assets
2016-17£000
2015-16£000
Amounts falling due within one year:
Trade receivables 1,396 2,705
Deposits and advances 39 38
Prepayments and accrued income 847 1,858
Balance at 31 March 2,282 4,601

70 Government Actuary’s Department Annual Report and Accounts 2016-17
13. Trade payables and other current liabilities
2016-17£000
2015-16£000
Amounts falling due within one year:
VAT 687 1,314
Other taxation and social security – 303
Trade payables – 1
Staff payables 259 228
Other payables – 1
Accruals and deferred income 139 127
Accommodation creditor 111 109
Consolidated Fund creditor for cash unspent – year end 357 720
Consolidated Fund creditor for cash unspent – prior year – –
Balance at 31 March 1,553 2,803
Amounts falling due after more than one year:
Accommodation creditor 643 756
Balance at 31 March 643 756
Total 2,196 3,559
14. Provisions for liabilities and charges
Onerous Lease£000
Pension Ombudsman
Case£000
Others£000
2016-17
Total£000
2015-16
Total£000
Balance at 1 April 454 20 309 783 1,074
Provided in the year – – – – 6
Provisions not required written back
– – – – (131)
Provisions utilised in the year
(80) (20) (18) (118) (177)
Borrowing costs (unwinding of discounts)
12 – (4) 8 11
Balance at 31 March 386 – 287 673 783

The Financial Statements 71
14.1 Analysis of expected timing of discounted �ows
Onerous Lease£000
Pension Ombudsman
Case£000
Others£000
2016-17
Total£000
2015-16
Total£000
Not later than one year 83 – 16 99 115
Later than one year and not later than �ve years
303 – 65 368 434
Later than �ve years – – 206 206 234
Balance at 31 March 386 – 287 673 783
Onerous LeaseA provision was made for the second �oor of Finlaison House which has been let at a rent level below the rent GAD is contractually required to pay. The provision is based on expected lease terms, length of lease, rent levels, rent reviews and rent free periods based on current market conditions for this type of rental property as advised by the Government Property Service (GPS) and independent property agents.
Discount rate applied was obtained from HM Treasury Public Service Expenditure paper 2016 (10).
Other ProvisionsA former GAD employee was awarded an injury bene�t allowance during 2009-10 under the Civil Service Injury Bene�ts Scheme. As a result GAD is responsible for making injury bene�t payments.
15. Contingent liabilitiesAs at 31 March 2017, GAD had no contingent liability (31 March 2016: £nil).
16. Related-party transactionsGAD’s major government clients for actuarial services includes the Department for Work and Pensions, the Cabinet Of�ce, the Department for Communities and Local Government, the Home Of�ce, HM Revenue and Customs, HM Treasury, the Department of Health, the Ministry of Defence and the Ministry of Justice.
GAD also receives rent and facilities management income from the Single Source Regulations Of�ce and the Higher Education Funding Council for England as sub-tenants in Finlaison House. In 2016-17 the total net income from these sub-tenants was £867,000 (2015-16: £898,000).
No Board member, key manager or other related parties has undertaken any material transactions with GAD during the year.
17. Third-party assetsDuring 2016-17, the Department did not hold any third party assets (2015-16: £nil).

72 Government Actuary’s Department Annual Report and Accounts 2016-17
18. Entities within the departmental boundaryNo entities, other than GAD itself, fall within the Departmental Boundary.
19. Events after the reporting period dateThere were no events recorded after the Statement of Financial Position date which affected the true and fair view of the accounts.
20. Date of Authorisation of AccountsThe accounts have been authorised for issue by the Accounting Of�cer on the same date as the C&AG’s Audit Certi�cate.