Embed Size (px)
Citation preview
Annual Report and Accounts 2010/11 National Grid Gas plc
Company number 2006000

National Grid Gas plc Annual Report and Accounts 2010/11
Contents
1 Operating and Financial Review
24 Directors’ Report 25 Statement of Directors’ responsibilities 26 Independent Auditors’ report to the members of National Grid Gas plc Consolidated financial statements under IFRS 27 Accounting policies 33 Adoption of new accounting standards 34 Consolidated income statement 35 Consolidated statement of comprehensive income 36 Consolidated balance sheet 37 Consolidated statement of changes in equity 38 Consolidated cash flow statement 39 Notes to the consolidated financial statements Company financial statements under UK GAAP 69 Company accounting policies 72 Company balance sheet 73 Notes to the Company financial statements 79 Glossary and definitions
National Grid Gas plc Annual Report and Accounts 2010/11 1
Operating and Financial Review contents Overview 1 Principal operations
2 How the UK gas industry works
2 Management structure
3 Review of the year
Operating environment 3 Operating environment
4 Regulatory environment – UK regulation
Delivering operational performance 6 Business drivers, risks and opportunities
7 Vision, strategy and objectives
8 Key performance indicators
9 Performance against objectives
Financial information 13 Financial performance
17 Financial position and financial management
21 Accounting policies This Operating and Financial Review describes the main trends and factors underlying the development, performance and position of National Grid Gas plc during the year ended 31 March 2011 as well as those likely to affect the Company in the future. It has been prepared in line with the guidance provided in the Reporting Statement on the Operating and Financial Review issued by the UK Accounting Standards Board and the Practice Statement on Management Commentary issued by the International Accounting Standards Board.
Principal operations Our principal operations are the ownership and operation of regulated gas infrastructure networks and the provision of gas metering services in Great Britain. We also have an interest in liquefied natural gas (LNG) storage facilities in Great Britain.
Gas Transmission Our Gas Transmission business comprises the following principal activities:
Gas Transmission owner We own the gas national transmission system in Great Britain, connecting to eight distribution networks and to third party independent systems for onward transportation of gas to end consumers.
Gas system operator We operate the gas national transmission system. Day-to-day operation includes balancing supply and demand.
LNG storage We own and operate three LNG storage facilities in Great Britain.
Gas Distribution We own and operate four of the eight regional gas distribution networks in Great Britain. Our networks comprise approximately 132,000 kilometres (82,000 miles) of gas distribution pipeline and we transport gas from the gas national transmission system to around 10.8 million consumers on behalf of 26 active gas shippers. Gas consumption in our UK networks was 304 TWh in 2010/11 compared with 299 TWh in 2009/10.
We manage the national gas emergency number (0800 111 999) for all the gas distribution networks and for other gas transporters in Great Britain. This service, along with the enquiries line, appliance repair helpline and meter number enquiry service, handled 2,816,403 calls during 2010/11.
Gas metering Our gas metering business, which is undertaken through our subsidiary company National Grid Metering Limited, provides installation and maintenance services to gas suppliers in the regulated gas market in Great Britain. Our metering business provides services for an asset base of about 16 million domestic, industrial and commercial meters.
Other activities Other activities include Xoserve which delivers transactional services on behalf of all the major gas network transportation companies in Great Britain, including ourselves. We jointly own Xoserve with the other gas distribution network companies, but we hold the controlling interest.
Operating and Financial Review

2 National Grid Gas plc Annual Report and Accounts 2010/11
How the UK gas industry works Within the UK gas industry there are four areas; production and importation (carried out by other companies), transmission (carried out by National Grid Gas plc), distribution (carried out by National Grid Gas plc and other companies) and supply (carried out by other companies).
Production and importation Gas producers, liquefied natural gas (LNG) importers and interconnector operators bring gas onshore. In the UK, there are seven gas reception terminals, three LNG importation terminals and three interconnectors, connecting Great Britain with Ireland, Belgium and the Netherlands.
We do not participate in either the production of gas for the UK market, or its importation.
Gas producers and importers sell the gas to licensed shippers, who then own the gas as it travels through the transmission and distribution networks. We are not a gas shipper; we do not buy or sell the gas we transport.
Transmission Gas from importation terminals is injected into the national transmission system (NTS) after the gas has been checked for quality. Gas previously extracted from the NTS and held in storage may be reintroduced into the system.
The NTS operates at pressures of up to 91 bar, transporting gas in high grade welded steel pipes of up to 1.2m diameter.
We are the sole owner and operator of gas transmission infrastructure in Great Britain.
Shippers pay us for the use of the NTS via entry and exit capacity charges.
Entry capacity allows shippers to put gas into the NTS at system entry points. Entry capacity is sold in a variety of auctions, ranging from daily to quarterly.
Exit capacity allows shippers to take gas off the NTS at NTS exit points into distribution networks and to other users who are supplied directly from the NTS.
For shippers who use the system, there is also a commodity charge based on the actual flows of gas into the NTS.
Distribution Gas exits the NTS at 53 offtake points where it is odourised. Gas is transported in the distribution networks at various pressures ranging from 75 bar down to 21 mbar for final delivery to end users.
Within the distribution networks, gas storage assets such as gas holders are used to help manage daily variation in demand.
In the UK, there are 13 local distribution zones grouped into eight regional distribution networks. We own four of the eight distribution networks and three other companies own the other four. As with the transmission system, the owners of the
distribution networks do not buy or sell gas; the commodity is transported on behalf of shippers.
Shippers pay us transportation charges for the use of our gas distribution networks. These charges are ultimately passed on to consumers.
The transportation charges reflect the costs of building and operating the networks, and also the costs of operating a 24 hour emergency telephone helpline.
Supply Although consumers in the UK have a choice of gas supply company, the gas is physically delivered to most consumers’ premises through a pipe belonging to the local distribution network. Our distribution networks deliver gas to approximately 10.8 million consumers.
Although we do not sell gas, and are not involved in billing consumers, we consider the consumers connected to our distribution network to be our customers because our activities directly affect them.
Consumers contract with gas supply companies for the supply of gas. The supply companies in turn contract with gas shippers who purchase the gas and arrange for it to be transported.
Suppliers also contract with metering companies, including National Grid Metering, which we own, for the provision of meters and metering services.
Of the average residential gas bill, transmission charges represent approximately 3% and distribution charges approximately 21%. The majority of the bill is the cost of the gas itself.
Management structure Management structure National Grid Gas is a subsidiary of National Grid plc (National Grid).
The performance of our principal businesses is reported by segment, reflecting the management responsibilities and economic characteristics of each activity. Throughout the year ended 31 March 2011, the management structure of National Grid was via global lines of business. The Gas Transmission and Gas Distribution businesses of National Grid Gas form part of the global Transmission and Gas Distribution businesses of National Grid respectively.
The overall management and governance of National Grid Gas is the responsibility of its Board of Directors. The Board of Directors has established a number of committees and sub-committees that assist it in its activities. These include the Transmission Executive Committee and the Distribution Executive Committee.
The day-to-day management of our Gas Transmission business is carried out by the Transmission Executive Committee. This committee is chaired by Nick Winser, who is a Director of National Grid Gas, and who also sits on the Board and Executive Committee of National Grid and is the National Grid

National Grid Gas plc Annual Report and Accounts 2010/11 3
Executive Director responsible for the global Transmission business.
The day-to-day management of National Grid Gas’s Gas Distribution business is carried out by the Distribution Executive Committee. This was chaired by Mark Fairbairn who was a Director of National Grid Gas, and also sat on the Board and Executive Committee of National Grid and was the National Grid Executive Director responsible for the global Gas Distribution business.
In addition to its own governance processes, National Grid Gas participates in the governance process of National Grid which is subject to the Combined Code on Corporate Governance.
New management structure from 4 April 2011 Four years ago National Grid introduced the common operating model, consisting of global lines of business, in order to promote common standards and ways of working. Following a strategic review this year, and in response to feedback received from customers, regulators and other stakeholders, National Grid announced on 31 January 2011 substantial changes to the way in which it is organised. With effect from 4 April 2011, National Grid has moved to a management structure more closely aligned with local responsibilities.
Certain functions will continue to have global responsibilities; these include finance, human resources, information systems and security, and procurement. There will also be regional functions, including regulation, safety and construction. There will be two UK businesses, UK Gas Distribution and UK Transmission. Our Gas Transmission business forms part of the UK Transmission business of National Grid and our Gas Distribution business forms part of the UK Gas Distribution business of National Grid.
In the new management structure, Nick Winser has been appointed to the role of Executive Director UK. Mark Fairbairn has stepped down from his directorships.
More information on the management structure of National Grid can be found in the National Grid Annual Report and Accounts 2010/11 and on National Grid’s website at www.nationalgrid.com.
Review of the year Gas Transmission In October 2010, we finished commissioning the Wormington to Sapperton gas pipeline. This pipeline, of approximately 44 km (27 miles), is required to provide additional exit capacity in the southwest of England to meet increases in distribution network and forecast power station demand.
On 13 December 2010, the Secretary of State gave consent for a pressure reduction installation at Tirley in Gloucestershire. Construction started on this installation in March 2011. Accordingly, we envisage that the full contracted capacity of 950 GWh in the Milford Haven gas pipeline will be available for winter 2012/13.
Gas Distribution In the UK, the first release of the new Gas Distribution front office system, a significant investment in the replacement of legacy IT applications, went live in October 2010 to over 1,000 employees. The full rollout of the programme is due to be completed by spring 2012.
A new campaign to reduce the number of electric cable strikes was introduced in the UK and has contributed to a 10% reduction during 2010/11.
Severe winter weather in the UK led to us failing several of our emergency standards of service. We met all but one of our other regulatory standards.
Ofgem imposed a fine of £8 million for inaccurate reporting of gas mains replacement data during 2005/06 to 2007/08.
A biomethane injection plant has been constructed to connect Adnams Bio Energy Ltd, the first production facility built for injecting biomethane into the UK gas network.
In our UK networks, actual gas consumption was 304 TWh in 2010/11 compared with 299 TWh in 2009/10.
Metering Our application to appeal against the £15 million fine imposed last year on our metering business for a breach of the Competition Act was unsuccessful.
Operating environment In common with all UK companies, we operate in a complex environment with a number of external factors affecting our operations.
UK and European energy policy In the UK, there is now a strong political focus on delivering a low carbon economy. The Climate Change Act requires the UK to cut greenhouse gas emissions by 80% from the 1990 levels by 2050 and by 34% by 2020. Dramatic changes in the way we produce and use our energy will be required. We must become less dependent on fossil fuels and use our energy more efficiently. Our forecasts for gas supply continue to be built on UK continental shelf decline and higher levels of importation. The changing sources of supply necessitate greater gas transmission network flexibility.
Economic environment Since the financial crisis in 2008/09, there has been a significant recovery. The UK, Europe and the US have emerged from recession and stock markets have risen during 2010/11.
In the UK, inflation has returned after a period of deflation, the retail price index having risen by 5.3% during 2010/11. Our UK regulated revenues are linked to inflation (see page 4 for an explanation of the UK regulatory regime), so higher inflation leads to higher revenue. We also have a significant quantity of index-linked debt, so our financing costs increase as inflation rises, providing an economic offset. However, revenues and financing costs are both based on lagged measures of inflation,
4 National Grid Gas plc Annual Report and Accounts 2010/11
and the time lags are not the same, so the economic offset is not perfect. Corporate responsibility Our reputation depends on our stakeholders being able to trust us and be confident in us. We can only retain our right to operate by working to the highest standards, by trusting our employees to do the right thing and by running our Company responsibly and sustainably.
National Grid’s Framework for Responsible Business, revised and relaunched in June 2010, provides a clear line of sight from our vision to how we manage our business and our day-to-day dealings with our stakeholders. National Grid’s company wide policies and position statements, available on its website, underpin the Framework.
More information on the corporate responsibility of National Grid can be found in the National Grid Annual Report and Accounts 2010/11 and on National Grid’s website at www.nationalgrid.com.
Business conduct This year, National Grid amended and reissued ‘Doing the Right Thing – Our Standards of Ethical Business Conduct’. Doing the Right Thing provides a common set of practical guidelines to help ensure our behaviours are lawful, comply with our policies and licences, and follow the values set out in the Framework and National Grid’s core values. We undertake face to face training of new starters and are making available online training for employees annually to ensure they understand the Standards.
We have taken steps to prepare for the implementation of the Bribery Act 2010 which comes into force in the UK in July 2011. This has included undertaking a risk assessment, review of Company policies (including Doing the Right Thing mentioned above) and an extensive training and awareness programme that will include eLearning for all employees.
More information on the business conduct of National Grid can be found in the National Grid Annual Report and Accounts 2010/11 and on National Grid’s website at www.nationalgrid.com.
Regulatory environment – UK regulation Regulatory framework In the UK, energy networks are regulated by the Office of Gas and Electricity Markets (Ofgem). Ofgem operates under the direction of governance of the Gas and Electricity Markets Authority (GEMA) and has established price control mechanisms that restrict the amount of revenue that can be earned by regulated businesses.
Ofgem’s main priority is to protect the interests of consumers. It does this by regulating monopoly activities such as the companies that run the gas networks and by promoting competitive gas markets.
The Gas Act 1986, as amended (the Act), provides the fundamental legal framework for gas companies. The Act establishes the licences for gas transmission and distribution.
Regulatory licences We hold two gas transporter licences: one for our gas transmission business, including LNG storage, and one for our gas distribution business, including our metering business.
Our licences established under the Act require each of these business activities to develop, maintain and operate an economic and efficient network and to facilitate competition in the supply of gas in Great Britain. The Act also provide the licensed businesses statutory powers such as the right to bury our pipes under public highways and the ability to purchase land compulsorily in order to facilitate the conduct of our businesses.
To ensure that our licensed businesses are operating efficiently, and that consumers are protected, we operate under six price controls in the UK, comprising: two for our gas transmission operations, one covering our role as transmission owner (TO) and the other for our roles as system operator (SO); and one for each of our four regional gas distribution networks. In addition to the six price controls, our LNG storage business has a price control covering some aspects of its operations. There is also a tariff cap price control applied to certain elements of domestic metering and daily meter reading activities undertaken by our Metering business.
Price control mechanism Because price control mechanisms restrict revenues, not profits, they encourage efficiencies within our regulated business. Savings that are made can be retained for the remainder of the price control period, but the higher level of efficiency that led to these savings is then used to inform a new baseline level for the next price control period.
Price control regulation is designed to ensure that, as a monopoly, we charge reasonable prices, and to provide us with a future level of revenue sufficient to enable us to meet our statutory duties and licence obligations. It also provides financial incentives to manage and operate our networks in an economic, efficient and coordinated manner in accordance with our legal and licence obligations, offer good quality of service to network users and invest in our networks in a timely and efficient manner to help ensure long-term security of supply is maintained.
During each price control review period, the amount of money that can be earned by our regulated business is restricted by what is referred to as an RPI-X price control, which is normally reviewed every five years by Ofgem. The RPI-X allowance is based upon Ofgem’s estimates of efficient operating expenditure (opex), capital expenditure (capex) and asset replacement, together with an allowance for depreciation and an allowed rate of return on capital invested in our businesses. These are used, together with the regulatory asset base value (RAV) to calculate the allowed revenue. The RAV, which represents the value ascribed by Ofgem to the capital employed

National Grid Gas plc Annual Report and Accounts 2010/11 5
in our regulated businesses, is adjusted to reflect asset additions, removals, depreciation and the rate of inflation.
The RPI-X price control takes the retail price index as its benchmark and subtracts X, an efficiency factor, from it. For example, at a time when annual inflation was 3%, a value for X of 2% would allow our regulatory businesses to raise prices by no more than 1%. Price controls also include incentive mechanisms to encourage us to improve our performance in particular areas.
The price control provides our regulated business with a level of revenue that is sufficient to finance the business if they are efficiently run. The revenue allowance is based on an estimate of the costs an efficient company would face in running its regulated businesses and includes operating expenditure, capital expenditure, financing costs including both debt and equity, and taxation.
Current price controls The key elements of the current price controls for gas transmission are that we are allowed to earn a 4.4% post-tax real return on our RAV, equivalent to a 5.05% vanilla return, with a £0.9 billion baseline five year capex allowance and a £0.3 billion five year controllable opex allowance.
In addition, we are subject to a number of incentives that can adjust our transmission network revenue, covering areas such as the cost of investment for additional capacity to facilitate new connections to the system.
The key elements of the current price controls for gas distribution are that we are allowed to earn a 4.3% post-tax real rate of return on our RAV, equivalent to a 4.94% vanilla return, with a £2.5 billion baseline five year capex allowance and a £1.6 billion five year controllable opex allowance.
Our gas transmission RAV currently stands at £4,889 million, our actual vanilla return is 7.2% and return on equity is 15.8%.
Our gas distribution RAV currently stands at £7,520 million, our actual vanilla return is 5.54% and return on equity is 12.1%.
Ofgem’s review of price controls: RPI-X@20 Since privatisation, the RPI-X mechanism has provided the industry with strong incentives to be more efficient. The level of opex costs has decreased over the years, transforming previously inefficient nationalised industries. However, over the past few years new challenges, such as Great Britain’s transition to lower carbon emissions and the requirement to renew ageing networks, have caused Ofgem to review the continuing appropriateness of the RPI-X approach.
In March 2008, Ofgem announced the RPI-X@20 review, which was a two year project to review the workings of the current approach to regulating Great Britain’s energy networks and develop future policy recommendations.
Ofgem’s RPI-X@20 review aims were to: drive improvements in quality of service and efficiency; ensure that the regulatory framework is flexible to adapt to structural changes in the
energy industry; and enable efficient network companies to finance themselves efficiently.
To allow the lessons of the review to be accommodated in full, Ofgem extended the current transmission price control from its scheduled end in March 2012 by one year to March 2013.
Following the RPI-X@20 review, Ofgem has identified a modified price control approach, designated as RIIO, to deliver and meet the changing future needs of the energy market.
The RIIO model Ofgem’s revised RIIO regulatory framework will be implemented in the next round of gas distribution and gas transmission price controls, which will start in April 2013.
RIIO refers to the formula:
Revenue = Incentives + Innovation + Outputs
To attract the efficient investment needed for the industry, Ofgem’s RIIO model is intended to incentivise network companies to deliver the outputs demanded by consumers and network users in an efficient and innovative way.
The key features of the RIIO model are:
a longer price control, lasting eight years, to provide stronger incentives for networks to manage costs;
encouraging network companies to work more closely with stakeholders to identify what they want from energy network companies. This should help networks to identify, and so better meet, the developing needs of the energy market;
rewarding network companies with higher returns where they meet the needs of the network users and consumers in innovative and efficient ways. However, network companies that perform poorly can expect to receive lower returns;
encouraging network companies to become actively involved in delivering a sustainable energy sector;
supporting the development and delivery of a network service that provides long-term value for money to existing and future consumers; and
providing clarity to future investors to ensure that network companies can raise the finance needed in a timely manner and at a reasonable cost to consumers.
Impact on National Grid Gas The RIIO model will not only reward us for increased efficiency, but also encourage us to engage more openly and effectively with our stakeholders. This will allow us to develop more robust commercial relationships with current and future network users to help us fulfil our vital role in the delivery of a sustainable future energy sector. It will also help us to respond and adapt our delivery plans to provide long-term value for money to network users.
Output measures in future price controls will give stakeholders a clear understanding of what we will deliver in return for the revenue that we receive from our customers. The proposed output categories are: customer satisfaction; reliability and

6 National Grid Gas plc Annual Report and Accounts 2010/11
availability; safe network services; connection terms; environmental impact; and social obligations. These outputs will cover both primary and secondary deliverables. We will be required to demonstrate in price controls that the primary outputs are material, controllable, measurable, comparable and legally compliant. The secondary deliverables will be evidenced through our business plans to demonstrate the costs required to deliver the primary outputs. Four years into the eight year price control, there will be an interim review of the outputs that we were required to deliver, to ensure that they remain relevant.
As the energy landscape evolves, Ofgem’s RIIO model should encourage us in our gas distribution and gas transmission roles to play a full part in the delivery of a sustainable energy sector and to deliver network services offering long-term value for money to existing and future consumers.
Business drivers, principal risks and opportunities Business drivers There are many factors that influence the success of our business and the financial returns we obtain. We consider the factors described here to be our principal business drivers.
Price controls The prices we charge for use of our gas transmission and distribution networks are determined in accordance with regulator approved price controls. These arrangements include incentives and/or penalty arrangements. The terms of these arrangements has a significant impact on our revenues.
People The skills and talents of our employees, along with succession planning and the development of future leaders, are critical to our success. We believe that business success will be delivered through the performance of all current and future employees, and enhanced by having a workforce that is diverse in its cultural, religious and community influences.
Capital investment Capital investment is a significant driver for organic growth. In our regulated gas networks, the prices we charge include an allowed return for capital investment determined in accordance with our price controls.
Safety, reliability and efficiency Our ability to operate safely and reliably is of paramount importance to us, our employees, our contractors, our customers, our regulators and the communities we serve. Operating efficiently allows us to minimise prices to our customers and improve our own financial performance.
Relationships and responsibility Our reputation is vitally important to us. We only earn the trust and confidence of our stakeholders by conducting business in a responsible manner. Our reputation depends on our behaviours being lawful and ethical, on complying with our policies and licences, and on living up to our core values.
Principal risks and opportunities There are a number of risks that might cause us to fail to contribute to National Grid’s vision or to deliver growth in its shareholder value. We can mitigate many of these risks by acting appropriately in response to the factors driving our business. The principal risks are described here.
Regulatory settlements and long-term contracts Our ability to obtain appropriate recovery of costs and rates of return on investment is of vital importance to the sustainability of our business. We have an opportunity to help shape the future of the regulatory environment. If we fail to take these opportunities, we risk failing to achieve satisfactory returns.
Financial performance Financial performance and operating cash flows are the basis for funding our future capital investment programmes, for servicing our borrowings and paying dividends. Failure to achieve satisfactory performance could affect our ability to deliver the returns we and our stakeholders expect.
Talent and skills Harnessing and developing the skills and talent of our existing employees, and recruiting, retaining and developing the best new talent, will enable us to improve our capabilities. Failure to engage and develop our existing employees or to attract and retain talented employees could hamper our ability to deliver in the future.
Investment in our networks Our future organic growth is dependent on the delivery of our capital investment plans. In order to deliver sustainable growth with superior financial performance we will need to finance our investment plans. Instability in the financial markets, loss of confidence by investors, or inadequate returns on our investment may restrict our ability to raise finance.
Safety, reliability and customer service The returns we generate are dependent on operating safely and reliably, and providing a quality service to customers. If we fail to meet our regulatory targets or the high standards we set ourselves, we risk loss of reputation as well as financial penalties imposed by regulators.
Efficiency Simplifying and standardising our systems and processes will drive efficiency and reduce costs. Transforming our operating model should enable us to deliver increased value to our shareholders. If we do not achieve the expected benefits in efficiency, then shareholder value will not grow as we hope or will diminish.
Sustainability and climate change Safeguarding our global environment for future generations is dependent on integrating sustainability and climate change considerations into our business decisions and influencing legislators, regulators, employees, customers and suppliers to address climate issues and become more environmentally responsible.
National Grid Gas plc Annual Report and Accounts 2010/11 7
Vision, strategy and objectives As a subsidiary company of National Grid, National Grid Gas participates in the National Grid vision and strategy, as described below:
Vision The vision is the long term aspiration for National Grid – what we want to be in the future. The vision statement has remained unchanged since it was first published in 2007:
We, at National Grid, will be the foremost international electricity and gas company, delivering unparalleled safety, reliability and efficiency, vital to the well-being of our customers and communities. We are committed to being an innovative leader in energy management and to safeguarding our global environment for future generations.
Strategy Our strategy is a medium term step in the journey to achieve the vision – what we will be doing over the next few years. It is also the over arching principle that provides commercial context to each of the objectives and actions.
Our strategy is designed to ensure that the objectives remain aligned with the factors that drive our business. For the last three years, our strategy has been expressed in these terms:
We will build on our core regulated business base and financial discipline to deliver sustainable growth and superior financial performance.
We will operate and grow our business to deliver consistently superior financial returns by:
Delivering excellent levels of safety, reliability, security, customer service and environmental performance
Using consistent and cost effective ways of working, putting into practice shared processes and systems
Driving an inclusive, high performance culture by engaging and developing our employees
Helping to shape UK energy policies through working with our external stakeholders and customers
Objectives To guide leaders, managers and individuals in our businesses and help deliver the strategy, we set out seven Company objectives:
Driving improvements in our safety, customer and operational performance
Delivering strong, sustainable regulatory and long-term contracts with good returns
Modernising and extending our transmission and distribution networks
Becoming more efficient through transforming our operating model and increasingly aligning our processes
Building trust, transparency and an inclusive and engaged workforce
Developing our talent, leadership skills and capabilities Positively shaping the energy and climate change agenda
with our external stakeholders These are the objectives against which our performance has been measured this year. A detailed discussion of our performance against each of the objectives can be found on pages 9 to 13.
Line of sight In a number of places in this report, we refer to the principle of line of sight. What we mean by this principle is that the individual objectives of every employee should be set by reference to the Company objectives, strategy and vision, ensuring that every individual is encouraged and incentivised to contribute to the same collective goals. Consequently, the actions required to deliver the strategy are allocated and aligned with employee responsibilities.
Performance for growth Our performance, talent and reward management process for managers is known as performance for growth (P4G). Formal annual P4G performance appraisals are carried out for every manager against their individual objectives and against the National Grid leadership qualities. The appraisal assesses both what the individual has achieved during the year and how those outcomes have been achieved. Our staff performance and reward framework for non-managerial grades, delivering performance, applies the same principles in aligning individual objectives with those of the Company.
Strategy for 2011/12 National Grid has updated its line of sight framework and this refreshed framework reflects the new organisational arrangement, namely moving from a line of business structure to a regional structure, as explained on page 3. In addition, we have increased the level of transparency of our strategic actions. This change will improve the connection between individual actions and the achievements the organisation needs to make in the year. National Grid’s 2011/12 strategic actions which are relevant to us are:
Improve our customer experience and advance performance by at least 1 quartile.
Deliver key employee and performance programmes that underpin 2011/12 objectives.
Deliver cost reductions by further leveraging support activity efficiencies, improve the buying experience and increase transparency of procurement savings.
Deliver common key processes and execute on best practice initiatives.
Work with Ofgem and other stakeholders to implement a successful rollover for TPCR4 and submit final proposals for RIIO-GD1 and RIIO-T1 plans (to start in April 2013).
Ensure successful delivery of the core investment programme.
Deliver the Gas Distribution transformation programme.
8 National Grid Gas plc Annual Report and Accounts 2010/11
Key performance indicators (KPIs)
Our performance and the progress we have made against our strategic aims and against the objectives we have set ourselves are described below and on the following pages.
We measure the achievement of our objectives both through the use of qualitative assessments and through the monitoring of quantitative indicators. To provide a full and rounded view of our business, we use non-financial as well as financial measures.
Although all these measures are important, some are considered to be of more significance than others, and these more significant measures are designated as KPIs. Our financial and non-financial KPIs are highlighted here. KPIs are used as our primary measures of whether we are achieving our principal strategic aims of sustainable growth and superior financial performance. We also use KPIs to measure our performance against our objectives; the relationships between the objectives and the KPIs are shown below.
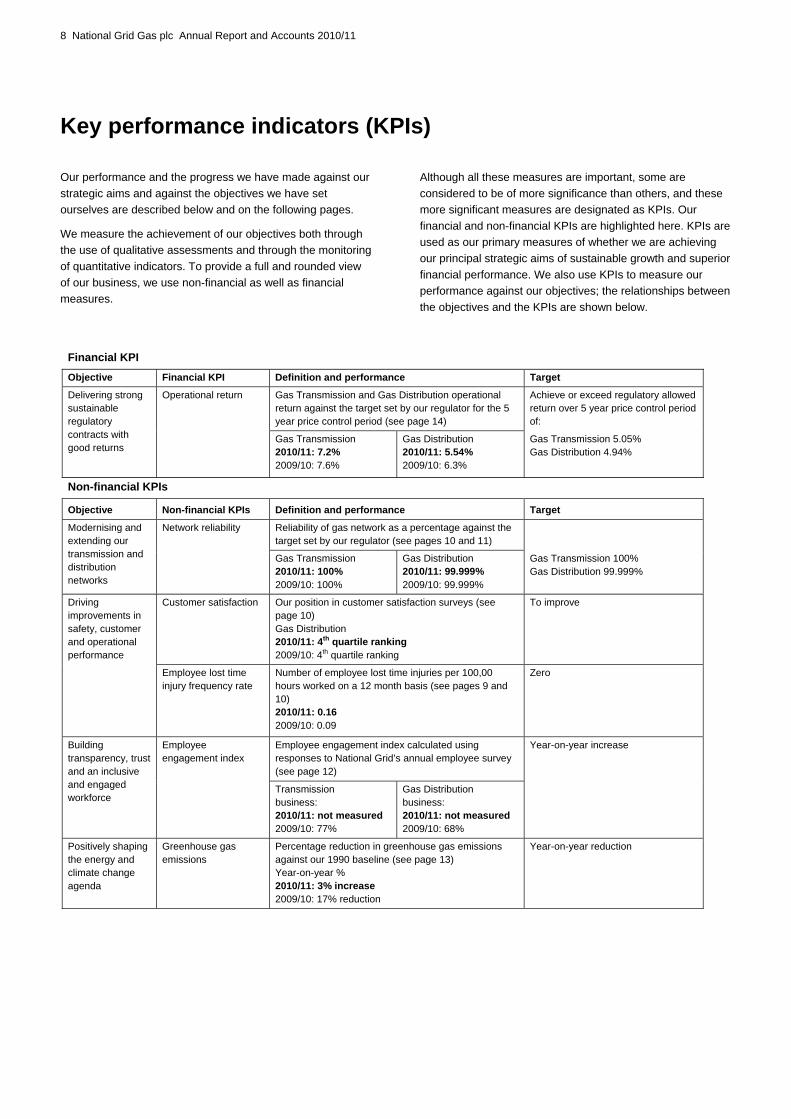
Financial KPI Objective Financial KPI Definition and performance Target
Gas Transmission and Gas Distribution operational return against the target set by our regulator for the 5 year price control period (see page 14)
Achieve or exceed regulatory allowed return over 5 year price control period of:
Delivering strong sustainable regulatory contracts with good returns
Operational return
Gas Transmission 2010/11: 7.2% 2009/10: 7.6%
Gas Distribution 2010/11: 5.54% 2009/10: 6.3%
Gas Transmission 5.05% Gas Distribution 4.94%
Non-financial KPIs
Objective Non-financial KPIs Definition and performance Target
Reliability of gas network as a percentage against the target set by our regulator (see pages 10 and 11)
Modernising and extending our transmission and distribution networks
Network reliability
Gas Transmission 2010/11: 100% 2009/10: 100%
Gas Distribution 2010/11: 99.999% 2009/10: 99.999%
Gas Transmission 100% Gas Distribution 99.999%
Customer satisfaction Our position in customer satisfaction surveys (see page 10) Gas Distribution 2010/11: 4th quartile ranking 2009/10: 4th quartile ranking
To improve Driving improvements in safety, customer and operational performance
Employee lost time injury frequency rate
Number of employee lost time injuries per 100,00 hours worked on a 12 month basis (see pages 9 and 10) 2010/11: 0.16 2009/10: 0.09
Zero
Employee engagement index calculated using responses to National Grid’s annual employee survey (see page 12)
Year-on-year increase Building transparency, trust and an inclusive and engaged workforce
Employee engagement index
Transmission business: 2010/11: not measured 2009/10: 77%
Gas Distribution business: 2010/11: not measured 2009/10: 68%
Positively shaping the energy and climate change agenda
Greenhouse gas emissions
Percentage reduction in greenhouse gas emissions against our 1990 baseline (see page 13) Year-on-year % 2010/11: 3% increase 2009/10: 17% reduction
Year-on-year reduction

National Grid Gas plc Annual Report and Accounts 2010/11 9
Performance against objectives We use a number of detailed performance measures in addition to the key performance indicators shown on the previous page, reflecting the scale and complexity of our operations. We use qualitative assessments to judge progress against our objectives in areas where numerical measures are less relevant.
Alignment of performance measures and strategy Our strategy is stated on page 7. Our performance in implementing the key elements of the strategy is measured in the following ways.
We will build on our core regulated business base... We invest in our existing business in order to improve efficiency and reliability.
Our KPI in this area is network reliability, as shown on the previous page, and other performance measures include capital investment (see page 11).
...and financial discipline... We seek to control operating costs and to invest capital only where we expect to be able to obtain an acceptable return. We are committed to maintaining a single A range credit rating.
Our KPI in this area is operational return as shown on the previous page.
...to deliver sustainable growth... There are a number of factors that determine the extent to which growth is sustainable. We believe that operational excellence will help us to build and maintain good relationships with our customers and regulators. Managing the skills and talents of our employees helps us to recruit, retain and develop the best possible talent, creating a diverse and motivated workforce and positioning ourselves to take advantage of present and future opportunities.
Our KPIs in this area, as shown on the previous page, are customer satisfaction, employee lost time injury frequency rate, employee engagement and greenhouse gas emissions. Other performance measures include measures of gender and ethnic mix.
...and superior financial performance We aim to deliver superior returns to National Grid.
Our performance measures include adjusted operating profit for the year (see pages 14 to 16) and operating cash flows (see page 17). A full disclosure of our financial performance can be found on pages 13 to 17.
Future changes to performance measures Following the adoption of new company objectives noted on page 7, we will be reviewing our KPIs and other performance measures and will report any changes in the 2011/12 Annual Report and Accounts.
Driving improvements in safety, customer and operational performance Safety Safety is critical both to business performance and to helping to define the culture of the Company for our employees. We recognise that our operations potentially give rise to risk and that some of our assets could have catastrophic consequences to surrounding communities if not properly controlled. We believe we can eliminate or minimise those risks to achieve zero injuries or harm and to safeguard members of the public. We further believe that everyone in the Company, collectively and individually, has a part to play in achieving this.
Process safety Process safety has been in the headlines in recent years as a result of incidents affecting other companies, such as the Deepwater Horizon incident in the Gulf of Mexico, the Buncefield explosion in the UK and the San Bruno pipeline explosion in California. While we have not had any significant incidents, operating major hazard sites and pipelines means managing process safety risks is always at the front of our thoughts in the way we run our business. As well as ensuring we have effective management systems in place, we look to incidents at other companies to learn any lessons.
National Grid has continued to report process safety KPIs up to Executive level throughout the year and we have focused on the effectiveness of the action plans to address any issues. This has been reinforced by getting our leadership team out into the field to discuss process safety. We see this as a critical element to demonstrating both leadership commitment and that we listen to the views of our employees.
In 2010/11, National Grid continued to converge its approach to process safety management across the Group with the development of a Group level major accident hazard framework. We have an effective safety management system in place which is the product of UK legislation and specific asset management policies. While this has delivered compliance, the implementation of a Group framework will ensure greater consistency and support the drive for continual improvement. With elements covering risk assessment, control standards and overarching management requirements, implementation throughout 2011/12 will require us to demonstrate that we have adequate controls in place. This will be supported by a cross group peer review process to provide assurance and facilitate the sharing of good practice.
Occupational safety We report our employee lost time injury frequency rate, expressed as lost time injuries per 100,000 hours worked, as a key measure that can be compared with other companies. This takes into account the number of employees and the hours worked. As well as reporting our lost time injury frequency rate, we also report the number of lost time injuries.
During 2010/11 the number of lost time injuries was 19 compared with 11 in 2009/10. 2010/11 saw a regrettable increase in our lost time injury frequency rate to 0.16 compared

10 National Grid Gas plc Annual Report and Accounts 2010/11
with 0.09 in 2009/10. Definitions for lost time injury and lost time injury frequency rate are included in the glossary on page 79.
At the same time, we have seen a significant improvement in the lost time injury performance of our contract partners’ workforce. In 2010/11, there were 9 contractor lost time injuries compared to 16 in 2009/10 and a target of zero.
The principal causes of lost time injuries were road traffic collisions, musculoskeletal injuries and slips, trips and falls. This year has seen a range of programmes implemented to improve performance in these areas.
However, lost time injury frequency rate only shows part of the picture and we measure a range of other performance indicators internally to ensure we control our safety risks. This year has seen particular emphasis on high potential incidents. These are typically the near misses that do not result in harm, but have the potential for serious injuries. Examples include: dropped loads, vehicles overturning and damaging underground cables. Distinguishing these incidents in terms of potential severity has allowed us to use novel ways to communicate learning to its workforce, such as publishing a ‘red top’ style newspaper featuring the stories of people involved in the incidents. It also provides the focus on developing campaigns to improve performance before people get hurt.
Public safety The safety of the public in the communities we serve is of prime importance to us. In 2010/11, 16 members of the public were injured as a result of our operations compared with 30 during 2009/10 and a target of zero. In 2009/10, a single incident, involving a gas explosion in a property in Shrewsbury, caused 12 of these injuries. Otherwise, the principal cause of injury was slips, trips and falls around our streetworks and road traffic collisions with our vehicles.
Enforcement action During 2010/11, we received two Improvement Notices in the UK from the Health and Safety Executive (HSE). The first was in relation to the maintenance of a short section of buried steel pipe running from an LPG vessel at one of our training centres. The notice was complied with and the pipe was subsequently found to be plastic. The second notice was in relation to our approach to collecting data on the condition of service pipes in blocks of flats. We have agreed a programme of work with the HSE to be completed by the end of September 2011.
Customer service Excellent customer service is not only consistent with our values and simply the right thing to do, it makes good business sense as good customer service means fewer complaints and decreased rework.
Gas Distribution Over the summer of 2010, work was completed on a new five year Gas Distribution customer strategy. While building on a number of existing initiatives to improve customer performance, we expect to benefit from continuous improvement to our current working practices and processes, and the
implementation of our new customer and user friendly systems (see Gas Distribution front office on page 11).
We recognise that system and process change alone is not enough to get us to our targets; we require more to deliver the standards of customer service to which we aspire. In 2011/12, we aim to change the look and feel of the interaction customers experience with us through the internet and printed media, including reviewing other companies’ methods to determine best practice. We will be able to use better management information to identify areas for closer focus for continuous improvement. We will develop and implement a stakeholder communication plan and implement training to support delivery of customer service. We will also improve our complaints handling processes to ensure we meet the Ofgem incentive and drive down complaints by understanding root causes and learning from them.
It is important to develop meaningful performance measurement tools, including performance targets for employees and contract partners to incentivise excellent performance.
Early indications are that our new strategy is driving improvements. All our networks are moving forward and we are scoring at or above our expectations for customer satisfaction.
Gas Transmission Gas Transmission is facing a period of unprecedented change within the energy sector. We will need to be a flexible organisation that is in tune with the market environment and with our customers.
Our growing list of customers includes gas storage and our more conventional gas customer connections. These new entrants will need our help in understanding our business and its complexity. We should not forget that we have a significant existing customer group who rightly expect us to deliver great customer service too. As customers ourselves, this is something we can and do expect.
Using information we have gathered from our customers and our employees, we are on our way to making the cultural shift in the way we behave and the way in which we do things. We are reviewing our internal interactions to assess their impact on our service provision, we are looking to ensure our website is a valued information resource, we will communicate the service level our customers can expect and are supporting our employees in developing their customer service skills.
We will continue to listen and respond to our customers and act upon their feedback. It is important to us that our customers recognise us as a company that is good to do business with and one that listens.
Reliability Gas Transmission We continue to maintain a world class standard of gas transmission network reliability in the UK, with reliability scores of 100%.
National Grid Gas plc Annual Report and Accounts 2010/11 11
Gas Distribution Despite the severe winter, we again achieved a high network reliability level of 99.999%, reflecting the low volume of customer interruptions during the year. We met our regulatory standards of service with the exception of one dealing with a category of connection quotations and several dealing with gas escapes. The coldest weather in December in over a century significantly increased emergency workload and hindered our engineers’ travel. As a result we fell short in six of our eight standards of service for gas escapes, where we are required to attend 97% of the escapes between one and two hours of the report.
Delivering strong, sustainable regulatory and long-term contracts with good returns Regulation For a full description of regulation including the key elements of current price control and developments in the year see pages 4 to 6.
Modernising and extending our networks The principal measure we use to monitor organic investment is capital expenditure, including investment in property, plant and equipment, and software.
We ensure, before any investment is undertaken, that we are clear how and when it will be remunerated and we only look to invest capital where we expect to be able to earn an acceptable return consistently with our licence and statutory obligations. Combined with procurement efficiencies this disciplined approach to capital investment has restricted the level of increase in capital expenditure to £46 million compared with last year.
Total capital expenditure during 2010/11 was £1,018 million compared with £972 million in 2009/10. More detail on capital expenditure by business is provided below.
Gas Transmission Capital investment in 2010/11 was £289 million, compared with £232 million in 2009/10. This mainly related to load related infrastructure on the gas transmission system. Capital investment included £9 million with respect to intangible assets, principally software applications (2009/10: £13 million).
Gas Distribution Capital investment of £669 million in 2010/11 (2009/10: £670 million) consisted of £476 million replacement expenditure (2009/10: £465 million) and £193 million other capital investment (2009/10: £205 million). Expenditure on software applications included within the above amounts was £75 million (2009/10: £54 million). The increase in software expenditure is primarily driven by the Gas Distribution front office system (see below).
Replacement expenditure increased by £11 million compared with 2009/10. Performance under the mains and services replacement incentive scheme has been adversely affected by the severe winter weather and we therefore expect to make a loss on this incentive in 2010/11.
In collaboration with our gas alliance and coalition partners, we have replaced 1,791 kilometres of metallic gas main this year and more than 15,000 kilometres since 2002/03. The vast majority of this relates to the long-term gas main replacement programme agreed with the Health and Safety Executive.
The reduction in other capital expenditure in 2010/11 compared with 2009/10 primarily reflects the completion of a major new pipeline in west London in 2009/10.
Gas Metering Capital expenditure invested in new and replacement meters in 2010/11 amounted to £54 million compared with £65 million in 2009/10.
Becoming more efficient by transforming our operating model and increasingly aligning our processes Gas Distribution front office (GDFO) GDFO is a significant investment for National Grid in the replacement of our legacy IT applications for asset and work management systems and is planned to be deployed in three stages. The core of the new system is SAP with three further satellite applications providing the specialist software we need to optimise our asset management capabilities and ensure our field staff are able to respond to customers quickly and effectively.
The first release of the new front office system went live in October 2010 to over 1,000 employees who operate the maintenance process. We were also able to implement an early release to emergency response teams in the West and East Midlands areas ahead of the winter. As with all major IT projects, there were teething problems to resolve in the first few weeks after going live and we were able to gain valuable experience through the winter of how the new system works.
The next two stages of GDFO implementation will take place in 2011/12. In the spring/summer, we will complete the full rollout to the remaining 1,000 emergency response staff, add additional data capture functionality to the maintenance teams’ application and introduce a new customer system into our call centres. The customer system will benefit from the integrated design. It will provide much greater information on job progress and any previous work at the customer’s premises, and enable rapid communication of issues to and from the field in response to customers’ needs. The final stage, following later in 2011/12, will be for our repair teams and to get all remaining new construction and mains replacement work flowing through the new system.
GDFO is not just a large IT replacement project. It forms the foundation of a wider transformation that is under way in Gas Distribution. The emphasis in our new operating model is to focus on improvements to all our processes. This focus will deliver big benefits for our customers and will enhance the efficiency and effectiveness of our operations. Coupled with the enhanced functionality from the investment in IT, we will be able
12 National Grid Gas plc Annual Report and Accounts 2010/11
to streamline our organisation and take advantage of our scale of operation.
Information services (IS) transformation The IS transformation programme establishes a global IS function for National Grid delivering services and new solutions to all parts of National Grid.
The transformation programme is underpinned by establishing a number of contracts for services that National Grid can leverage from the broader IT marketplace where such commodities (eg email and virtualisation services) can deliver excellence with economy of scale pricing. Some of the key contracts have been put in place this year with the remainder planned for next year. Sourcing decisions are taken with full consultation with the appropriate bodies and sympathetic consideration of the impact on employees.
An essential component of the transformation programme is to ensure that the structure of the IS department and its commercial arrangements are consistent with the overall National Grid strategy and specific line of business objectives, including National Grid Gas. The IS strategy and associated architecture plans are well developed to deliver efficiencies in the existing IT services through consolidation and rationalisation but also to invest in the new capabilities necessary to meet the challenges ahead.
The IS leadership team is well established and the overall organisational structure is evolving as the commercial contracts are put in place. Key functions that are critical to IS delivery are being developed to ensure we have the right internal capabilities in areas such as business relationships, security, architecture and strategy.
The next stages for the transformation are the completion of the contract placements, the transitioning activities necessary to establish the new arrangements and ensuring the delivery of the benefits.
Business process outsourcing The outsourcing to an external service provider in India, of some of National Grid’s UK shared services activities which we utilise, was undertaken during the year. This should deliver both financial and process benefits over the next five years.
Building trust, transparency and an inclusive and engaged workforce Employees We employ over 5,900 people. Communication is a key theme both at a corporate and business level. Multiple communication channels are used, including the use of intranets, which we continue to develop to ensure the timely passing of information to employees.
Employee engagement continues to be a key focus. 2010 saw an unprecedented employee survey response rate of 97% across National Grid. This response rate generated an extremely large amount of data and feedback to review.
As always, we have worked to engage teams throughout the business in creating action plans to address survey feedback. We also regularly seek feedback about the survey process, and teams have consistently expressed a desire to have more time to ensure their actions translate into meaningful results. Therefore, National Grid decided to postpone the 2011 survey to enable us to work more deeply on action planning and other key engagement activities.
We are working to ensure we create visible links between performance and engagement, as we feel the two are interconnected and vital to our success. Throughout 2011, we will be working on reinforcing the link between performance and engagement, and supporting our survey champions as we prepare to launch the 2012 employee survey.
Inclusion and diversity Measures such as the percentages of female and ethnic minority employees continue to be reviewed regularly at Executive Committee level. At 31 March 2011, 24.5% of National Grid Gas’s employees were female and 7.1% were from ethnic minority groups, compared to 22.6% and 6.7% respectively at 31 March 2010.
We aim to ensure equal opportunity in recruitment, career development, promotion, training and reward for all employees, including those with disabilities. Where existing employees become disabled, our policy is to provide continuing employment and training wherever practical.
Following the decision not to undertake a full employee survey in 2011, we are using an external partner to conduct a number of focus groups with a cross section of employees. These focus groups, in conjunction with interviews with senior management, will provide us with valuable insight into how inclusion and diversity are perceived within the Company.
Our employee resource groups, which cover areas including gender, ethnicity, disability, faith, sexual orientation and new employees, continue to deliver results in three areas: providing professional development opportunities for members through workshops and programmes; supporting the Company’s community relations activities through fundraising, volunteering, and providing support to organisations; and working to increase broader understanding of inclusion through workshops, presentations and other educational events.
Developing talent, leadership skills and capabilities Talent development continues to be a critical lever for successful business performance. During the past year, we completed the development of our leadership transitions strategy. In 2008, developing future leaders was created for senior leaders; in 2009, foundations of leadership was created for front line or first time leaders and in 2010, we launched two programmes targeted at middle level leaders focused on their leadership style and business acumen.
To support the development needs of the broader management population, a comprehensive portfolio of classroom based and

National Grid Gas plc Annual Report and Accounts 2010/11 13
eLearning solutions was introduced covering the areas of communication, performance management, business acumen and general management. More will be added as further business needs are identified.
The UK apprenticeship training programmes enjoy Ofsted outstanding ratings on all criteria and were awarded the East Midlands National Training Award for our advanced apprenticeship model.
To accommodate year on year growth in technical training needs in the UK, significant investments have been made in expanding the Eakring and Nottinghamshire learning centres.
Positively shaping the energy and climate change agenda with external stakeholders We aim to take the lead on the energy and climate change issues facing society. We will not simply react to the initiatives of other relevant bodies. Instead, we will be proactive in leading the agenda to make sure we help to safeguard the environment.
Climate change We have continued with our climate change strategy and energy efficiency programmes, focusing on initiatives that are cost effective and regulated. We remain committed to National Grid’s 45% by 2020 and 80% by 2050 greenhouse gas emissions reduction targets for Scope 1 and 2 emissions.
During 2010/11, we worked to deliver our targets under year one of National Grid’s first five year plan for greenhouse gas reduction. The plan established a trajectory to 2015 as the half-way point to our 2020 target. Performance against the plan is linked to the executive compensation scheme. A more detailed breakdown of emissions and performance against the plan can be found on National Grid’s website.
Our total scope 1 and 2 emissions for 2010/11 were 2.6 million tonnes carbon dioxide equivalent compared with 2.5 million tonnes in 2009/10.
We believe that a strong carbon price signal in the economy is essential to driving the right behaviours and to the delivery of a low carbon society. During 2010/11, we introduced a carbon price of £52 per tonne into our investment appraisals in order to challenge our designs and better understand where our opportunities for decarbonisation exist. As a regulated utility, we recognise that we will not always be funded to invest on this basis under existing price control agreements and, in such circumstances, the information that we gather will be used to inform future discussions.
It is equally important we understand the impact of past global emissions on future climate change. We have been working with the UK Met Office to understand how these changes might affect our UK infrastructure and future energy demand.
Financial performance Measurement of financial performance We report our financial results and position in accordance with International Financial Reporting Standards (IFRS).
Use of adjusted profit measures In considering the financial performance of our business and segments, we analyse each of our primary financial measures of operating profit, profit before tax and profit for the year into two components.
The first of these components is referred to as an adjusted profit measure, also known as a business performance measure. This is the principal measure used by management to assess the performance of the underlying business.
Adjusted results exclude exceptional items and remeasurements. These items are reported collectively as the second component of the financial measures.
The items comprising the second component are excluded from the adjusted profit measures used by management to monitor financial performance as they are considered to distort the comparability of our reported financial performance from year to year.
Accounting policy Q on page 31 explains in detail the items which are excluded from our adjusted profit measures.
Adjusted profit measures have limitations in their usefulness compared with the comparable total profit measures as they exclude important elements of our financial performance. However, we believe that by presenting our financial performance in two components it is easier to read and interpret financial performance between periods, as adjusted profit measures are made more comparable by removing the distorting effect of the excluded items, and those items are more clearly understood if separately identified and analysed. The presentation of these two components of financial performance is additional to, and not a substitute for, the comparable total profit measures presented.
Management uses adjusted profit measures as the basis for monitoring financial performance and in communicating financial performance to investors in external presentations and announcements of financial results. Internal financial reports, budgets and forecasts are primarily prepared on the basis of adjusted profit measures, although planned exceptional items, such as significant restructurings, and stranded cost recoveries are also reflected in budgets and forecasts. Management compensates for the limitations inherent in the use of adjusted profit measures through the separate monitoring and disclosure of the excluded items as a component of our overall financial performance.
Continuing and discontinued operations The financial results of our business and segments and of our other activities (as described on pages 13 to 17) are presented within continuing operations. There were no discontinued operations in 2010/11 or in 2009/10.
14 National Grid Gas plc Annual Report and Accounts 2010/11
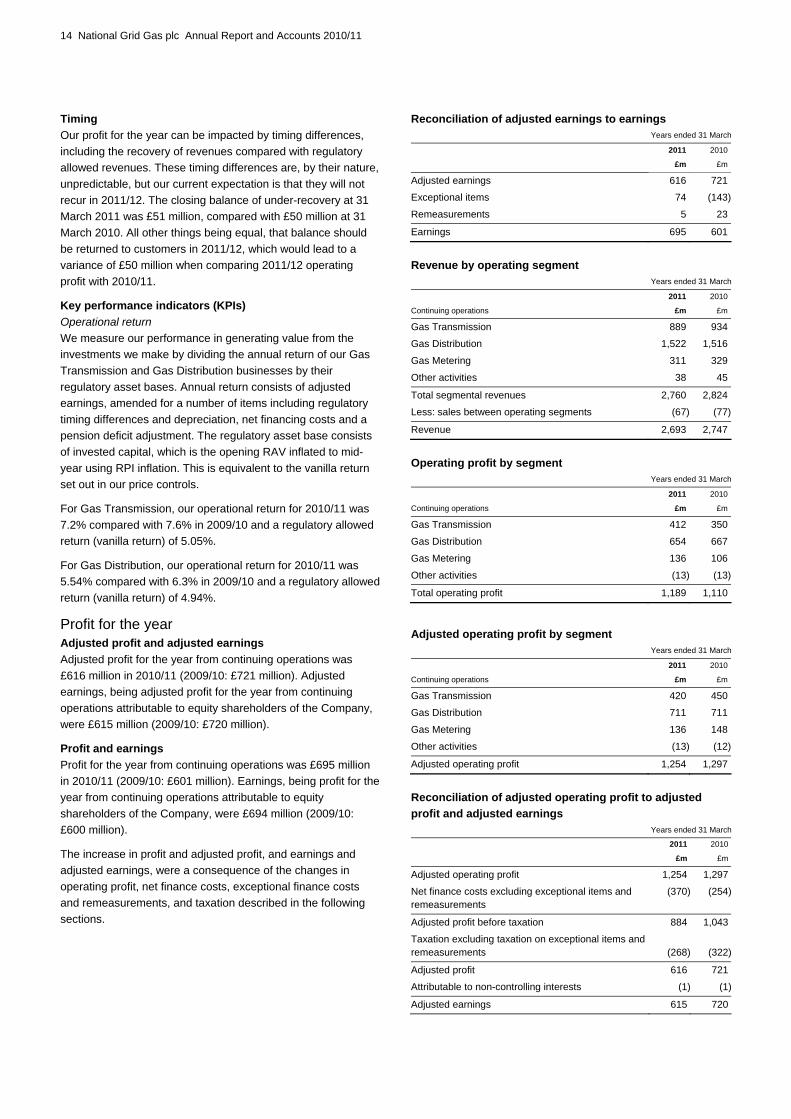
Timing Our profit for the year can be impacted by timing differences, including the recovery of revenues compared with regulatory allowed revenues. These timing differences are, by their nature, unpredictable, but our current expectation is that they will not recur in 2011/12. The closing balance of under-recovery at 31 March 2011 was £51 million, compared with £50 million at 31 March 2010. All other things being equal, that balance should be returned to customers in 2011/12, which would lead to a variance of £50 million when comparing 2011/12 operating profit with 2010/11.
Key performance indicators (KPIs) Operational return We measure our performance in generating value from the investments we make by dividing the annual return of our Gas Transmission and Gas Distribution businesses by their regulatory asset bases. Annual return consists of adjusted earnings, amended for a number of items including regulatory timing differences and depreciation, net financing costs and a pension deficit adjustment. The regulatory asset base consists of invested capital, which is the opening RAV inflated to mid-year using RPI inflation. This is equivalent to the vanilla return set out in our price controls.
For Gas Transmission, our operational return for 2010/11 was 7.2% compared with 7.6% in 2009/10 and a regulatory allowed return (vanilla return) of 5.05%.
For Gas Distribution, our operational return for 2010/11 was 5.54% compared with 6.3% in 2009/10 and a regulatory allowed return (vanilla return) of 4.94%.
Profit for the year Adjusted profit and adjusted earnings Adjusted profit for the year from continuing operations was £616 million in 2010/11 (2009/10: £721 million). Adjusted earnings, being adjusted profit for the year from continuing operations attributable to equity shareholders of the Company, were £615 million (2009/10: £720 million).
Profit and earnings Profit for the year from continuing operations was £695 million in 2010/11 (2009/10: £601 million). Earnings, being profit for the year from continuing operations attributable to equity shareholders of the Company, were £694 million (2009/10: £600 million).
The increase in profit and adjusted profit, and earnings and adjusted earnings, were a consequence of the changes in operating profit, net finance costs, exceptional finance costs and remeasurements, and taxation described in the following sections.
Reconciliation of adjusted earnings to earnings Years ended 31 March
2011 2010
£m £m
Adjusted earnings 616 721
Exceptional items 74 (143)
Remeasurements 5 23
Earnings 695 601
Revenue by operating segment
Years ended 31 March
2011 2010
Continuing operations £m £m
Gas Transmission 889 934
Gas Distribution 1,522 1,516
Gas Metering 311 329
Other activities 38 45
Total segmental revenues 2,760 2,824
Less: sales between operating segments (67) (77)
Revenue 2,693 2,747
Operating profit by segment
Years ended 31 March
2011 2010
Continuing operations £m £m
Gas Transmission 412 350
Gas Distribution 654 667
Gas Metering 136 106
Other activities (13) (13)
Total operating profit 1,189 1,110
Adjusted operating profit by segment Years ended 31 March
2011 2010
Continuing operations £m £m
Gas Transmission 420 450
Gas Distribution 711 711
Gas Metering 136 148
Other activities (13) (12)
Adjusted operating profit 1,254 1,297
Reconciliation of adjusted operating profit to adjusted profit and adjusted earnings
Years ended 31 March
2011 2010
£m £m
Adjusted operating profit 1,254 1,297
Net finance costs excluding exceptional items and remeasurements
(370) (254)
Adjusted profit before taxation 884 1,043
Taxation excluding taxation on exceptional items and remeasurements (268) (322)
Adjusted profit 616 721
Attributable to non-controlling interests (1) (1)
Adjusted earnings 615 720

National Grid Gas plc Annual Report and Accounts 2010/11 15
Reconciliation of operating profit to profit and earnings
Years ended 31 March
2011 2010
£m £m
Operating profit 1,189 1,110
Net finance costs (394) (221)
Total profit before taxation 795 889
Taxation (100) (288)
Profit 695 601
Attributable to non-controlling interests (1) (1)
Earnings 694 600
Reconciliation of adjusted operating profit to total operating profit
Years ended 31 March
2011 2010
Continuing operations £m £m
Adjusted operating profit 1,254 1,297
Exceptional items (65) (187)
Total operating profit 1,189 1,110
Reconciliation of adjusted profit before taxation to total profit before taxation
Years ended 31 March
2011 2010
Continuing operations £m £m
Adjusted profit before taxation 884 1,043
Exceptional items (96) (187)
Remeasurements 7 33
Total profit before taxation 795 889
Net finance costs Net finance costs excluding exceptional items and remeasurements were £370 million in 2010/11 compared with £254 million in 2009/10. The increase is due to higher accretions on index-linked debt following the return of UK inflation.
Exceptional items and remeasurements Exceptional charges of £65 million in 2010/11 consisted of restructuring costs of £57 million and other charges of £8 million.
Exceptional charges of £187 million in 2009/10 consisted of restructuring charges of £72 million, environmental charges of £14 million, pension deficit charges of £58 million and other charges of £43 million.
There were exceptional charges of £31 million during 2010/11 relating to the early redemption of debt following the rights issue by National Grid in June 2010 (2009/10: £nil).
Financial remeasurements relate to net gains on derivative financial instruments of £7 million (2009/10: £33 million gains).
Taxation The net tax charge of £100 million in 2010/11 comprised a £268 million charge on adjusted profit before tax and a £168 million
credit on exceptional items and remeasurements. This compares with a net charge of £288 million in 2009/10, comprising a £322 million charge on adjusted profit before tax and a £34 million credit on exceptional items and remeasurements.
The effective tax rate before and after exceptional items and remeasurements was 30% and 13% respectively (2009/10: 31% and 32%), compared with a standard UK corporation tax rate of 28% in both years.
Analysis of operating profit and adjusted operating profit 2010/11 compared with 2009/10 Changes in revenue and other operating income, operating costs and operating profit for 2010/11 compared with 2009/10 are analysed by operating segment as follows:
Revenue and other operating
income Operating
costsOperating
profit
Continuing operations £m £m £m
2009/10 results 2,761 (1,651) 1,110Add back 2009/10 exceptional items - 187 187
2009/10 adjusted results 2,761 (1,464) 1,297Gas Transmission (36) 6 (30)Gas Distribution 7 (7) -
Gas Metering (18) 6 (12)Other activities (7) 6 (1)Sales between businesses 10 (10) -
2010/11 adjusted results 2,717 (1,463) 1,2542010/11 exceptional items - (65) (65)
2010/11 results 2,717 (1,528) 1,189
The principal movements by operating segment are shown on the next page.

16 National Grid Gas plc Annual Report and Accounts 2010/11
Gas Transmission The results for the Gas Transmission segment for the years ended 31 March 2011 and 2010 were as follows:
Years ended 31 March
2011 2010
£m £m
Revenue and other operating income 912 948
Operating costs excluding exceptional items (492) (498)
Adjusted operating profit 420 450
Exceptional items (8) (100)
Operating profit 412 350
2010/11 compared with 2009/10:
Adjustedoperating
profit
£m
2009/10 adjusted operating profit 450
Allowed revenues (1) (3)
Timing of recoveries (2) (13)
LNG storage (3) (8)
Depreciation and amortisation (4) (4)
Other (2)
2010/11 adjusted operating profit 420
1 - Reduction in allowed revenues collectable under our price
controls. 2 - Repayment of allowed revenues over-recovered in the
previous year. 3 - Decrease in profitability because of lower shipper auction
revenues. A new price control is effective from 1 April 2011. 4 - Increase reflects the charges arising from our ongoing
capital investment programme.
Gas Distribution The results for the Gas Distribution segment for the years ended 31 March 2011 and 2010 were as follows:
Years ended 31 March
2011 2010
Continuing operations £m £m
Revenue and other operating income 1,523 1,516
Operating costs excluding exceptional items (812) (805)
Adjusted operating profit 711 711
Exceptional items (57) (44)
Total operating profit 654 667
2010/11 compared with 2009/10:
Adjustedoperating
profit
Continuing operations £m
2009/10 adjusted operating profit 711
Timing of recoveries (1) 27
Margin (2) (10)
Operating costs (3) (9)
Depreciation and amortisation (4) (17)
Other 9
2010/11 adjusted operating profit 711
1 - Some costs incurred in one period are only recovered
through revenue generated in a subsequent period. This gives rise to variations in profit from year to year.
2 - Price control revenue flat due to impact of negative RPI, offset by small positive allowed real increase in revenues. Reduction in margin largely due to loss on non-formula work offset by shrinkage margin and incentive income.
3 - Higher pension costs and the impact of severe weather, partly offset by efficiency savings and lower insurance premiums.
4 - Reflects increased investment (see page 11), including the Gas Distribution Front Office (see page 11) and completion of the Harefield to Southall pipeline in 2009/10.
Gas Metering The results for the Gas Metering segment for the years ended 31 March 2011 and 2010 were as follows:
Years ended 31 March
2011 2010
£m £m
Revenue 311 329
Operating costs excluding exceptional items (175) (181)
Adjusted operating profit 136 148
Exceptional items - (42)
Total operating profit 136 106
2010/11 compared with 2009/10:
Adjusted operating
profit
Continuing operations £m
2009/10 adjusted operating profit 148
Revenues (1) (17)
Other 5
2010/11adjusted operating profit 136
1 - Lower revenues due to reduced meter rental charges and a
decline in regulated meter population.
National Grid Gas plc Annual Report and Accounts 2010/11 17
Cash flows Cash flows from operating activities Cash generated from continuing operations was £1,706 million in 2010/11 compared with £1,872 million in 2009/10. This included cash outflows relating to exceptional items of £72 million and £123 million respectively.
The net cash inflow from operating activities after taxation was £1,588 million in 2010/11, compared with £1,563 million in 2009/10. This included a net corporate tax payment in 2010/11 of £118 million compared with £309 million in 2009/10.
Cash flows from investing activities Cash outflows from investing activities were £919 million in 2010/11 compared with £266 million in 2009/10. Cash outflows to purchase property, plant and equipment and intangible fixed assets, net of disposal proceeds, were £1,005 million in 2010/11 compared with £952 million in 2009/10. Interest received was £2 million in 2010/11 compared with £3 million in 2009/10. Net cash inflows from the disposal of financial investments were £84 million in 2010/11 compared with £683 million in 2009/10.
Cash flows from financing activities The net cash outflow from financing activities was £606 million in 2010/11 compared with a cash outflow of £1,301 million in 2009/10. This reflected net inflows from loans of £58 million (2009/10: £725 million outflow) and net payments to providers of finance, in the form of interest and dividends, of £664 million (2009/10: £576 million).
Net interest cash outflows decreased from £273 million in 2009/10 to £262 million in 2010/11.
Dividends paid to shareholders increased to £400 million in 2010/11 compared with £300 million in 2009/10.
Financial position and financial management Going concern Having made enquiries, the Directors consider that the Company and its subsidiaries have adequate resources to continue in business for the foreseeable future and that it is therefore appropriate to adopt the going concern basis in preparing the consolidated and individual financial statements of the Company. More details of our liquidity position are provided under the heading Liquidity and treasury management below and in note 28 to the consolidated financial statements.
Financial position Balance sheet Our balance sheet at 31 March 2011 can be summarised as follows:
Assets Liabilities
Net assets
£m £m £m
Property, plant and equipment
and non-current intangible assets 11,474 - 11,474
Current assets and liabilities 271 (849) (578)
Other non-current assets and liabilities 5,611 (1,222) 4,389
Deferred tax - (1,873) (1,873)
Total before net debt 17,356 (3,944) 13,412
Net debt 940 (8,010) (7,070)
Total as at 31 March 2011 18,296 (11,954) 6,342
Total as at 31 March 2010 17,845 (11,814) 6,031
The £311 million increase in net assets from £6,031 million at 31 March 2010 to £6,342 million at 31 March 2011 resulted from the profit for the year of £695 million and other items totalling £16 million, offset by dividends paid of £400 million.
Net debt Net debt increased by £211 million from £6,859 million at 31 March 2010 to £7,070 million at 31 March 2011. Cash flows from operations net of tax of £1,588 million were offset by capital expenditure, net of disposals, of £1,005 million, dividends paid of £400 million and net interest paid of £262 million, together with fair value and other movements of £132 million.
At 31 March 2011, net debt comprised borrowings of £7,902 million including bank overdrafts of £34 million, less derivative financial instruments with a net carrying value of £507 million, cash and cash equivalents of £83 million, and financial investments of £242 million (31 March 2010: borrowings of £7,672 million including bank overdrafts of £15 million less derivative financial instruments with a net carrying value of £486 million, cash and cash equivalents of £1 million, and financial investments of £326 million).
Capital structure We monitor the regulatory asset value (RAV) gearing of the Gas Transmission and Gas Distribution businesses. This is calculated as net debt expressed as a percentage of RAV, and indicates the level of debt employed to fund the regulated businesses. It is compared with the level of RAV gearing indicated by Ofgem as being appropriate for these businesses, at around 60%.
To calculate RAV gearing for the regulated Gas Transmission and Gas Distribution businesses we exclude an element of debt that is associated with the Gas Metering business. RAV gearing as at 31 March 2011 was 54% compared to 57% as at 31 March 2010.
18 National Grid Gas plc Annual Report and Accounts 2010/11
Liquidity and treasury management Treasury policy Funding and treasury risk management for National Grid Gas is carried out by the treasury function of National Grid under policies and guidelines approved by the Finance Committees of the Boards of National Grid and National Grid Gas. The Finance Committees have authority delegated from the relevant Boards and are responsible for regular review and monitoring of treasury activity and for the approval of specific transactions, the authority for which may be further delegated.
The primary objective of the treasury function is to manage the funding and liquidity requirements of National Grid. A secondary objective is to manage the associated financial risks, in the form of interest rate risk and foreign exchange risk, to within acceptable boundaries. Further details of the management of funding and liquidity and the main risks arising from our financing activities are set out below, as are the policies for managing these risks, including the use of financial derivatives, which are agreed and reviewed by the Boards and the Finance Committees.
The treasury function is not operated as a profit centre. Debt and treasury positions are managed in a non-speculative manner, such that all transactions in financial instruments or products are matched to an underlying current or anticipated business requirement.
Commodity derivatives entered into in respect of gas commodities are used in support of the business’s operational requirements and their use is explained on page 20.
Current condition of the financial markets The financial markets have essentially returned to normal for National Grid following the turmoil in the capital markets in 2008 and 2009. Following National Grid’s rights issue, which completed in June 2010, our funding requirements were modest. Nevertheless, we issued approximately £350 million of new long-term debt and also repurchased £368 million. We remain confident of our ability to access the public debt markets in the future.
Cash flow and cash flow forecasting Cash flows from operations are largely stable annually and over a period of years. Our gas transmission and distribution operations are subject to multi-year price control agreements with our regulator, Ofgem.
Both short and long-term cash flow forecasts are produced regularly to assist the treasury function in identifying short-term liquidity and long-term funding requirements, and we seek to enhance our cash flow forecasting processes on an ongoing basis. Cash flow forecasts, supplemented by a financial headroom analysis, are monitored regularly to assess funding adequacy for at least a 12 month period.
As part of our regulatory arrangements, our operations are subject to a number of restrictions on the way we can operate. These include regulatory ‘ring-fences’ that requires us to maintain adequate financial resources and restricts our ability to undertake transactions with other National Grid subsidiary
companies including paying dividends, lending cash or levying charges.
Funding and liquidity management We maintain medium-term note and commercial paper programmes to facilitate long and short-term debt issuance into capital and money markets.
At 31 March 2011, we had a $2.5 billion US commercial paper programme (unutilised), a $1.25 billion Euro commercial paper programme (unutilised) and a €10.0 billion Euro medium-term note programme (€5.2 billion issued).
In addition we have both committed and uncommitted bank borrowing facilities that are available for general corporate purposes to support our liquidity requirements. At 31 March 2011, the Company had £425 million of long-term committed facilities (undrawn), expiring in April 2014.
To facilitate debt issuance into the capital and money markets, we maintain credit ratings. Details of our long-term senior unsecured debt and short-term debt credit ratings are provided below within ‘credit ratings’.
We invest surplus funds on the money markets, usually in the form of short-term fixed deposits and placements with money market funds that are invested in highly liquid instruments of high credit quality. Investment of surplus funds is subject to our counterparty risk management policy, and we continue to believe that our cash management and counterparty risk management policies provide appropriate liquidity and credit risk management. Details relating to cash, short-term investments and other financial assets at 31 March 2011 are shown in notes 15 and 16 to the consolidated financial statements.
We believe that maturing amounts in respect of our contractual obligations can be met from existing cash and investments, operating cash flows and other financings that we reasonably expect to be able to secure in the future, together with the use of committed facilities if required.
In line with our normal treasury practice we expect to continue to access the markets in order to manage actively our debt portfolio, optimise our finance costs and manage our refinancing risk.
Credit ratings It is a condition of the regulatory ring-fence around the Company that it uses reasonable endeavours to maintain an investment grade credit rating. As of 31 March 2011, the long-term senior unsecured debt and short-term debt credit ratings respectively provided by Moody’s Investor Services, Standard & Poor’s and Fitch were as follows (all with outlooks of stable):
Moody’s Investor Services A3/P2
Standard & Poor’s A-/A2
Fitch A/F2
Use of derivative financial instruments As part of our business operations, including our treasury activities, we are exposed to risks arising from fluctuations in

National Grid Gas plc Annual Report and Accounts 2010/11 19
interest rates and exchange rates. We use financial instruments, including financial derivatives, to manage exposures of this type. Our policy is not to use financial derivatives for trading purposes. More details on derivative financial instruments are provided in note 12 to the consolidated financial statements.
Refinancing risk management Refinancing risk is controlled mainly by limiting the amount of debt maturities arising on borrowings in any financial year.
Note 17 to the consolidated financial statements sets out the contractual maturities of our borrowings over the next five years, with total contracted borrowings maturing over 41 years. We expect to be able to refinance this debt through the capital and money markets as we have done during the year to 31 March 2011.
Interest rate risk management Our interest rate exposure arising from borrowings and deposits is managed by the use of fixed and floating rate debt and derivative financial instruments, including interest rate swaps, swaptions and forward rate agreements. The interest rate risk management policy is to seek to minimise total financing costs (being interest costs and changes in the market value of debt) subject to constraints so that, even with an extreme movement in interest rates, neither the interest cost nor the total financing cost is expected to exceed preset limits with a high degree of certainty.
Some of our bonds in issue are inflation-linked, that is their cost is linked to changes in the UK Retail Prices Index (RPI). We believe that these bonds provide an appropriate hedge for revenues and our regulatory asset values that are also RPI linked under our price control formulas.
The performance of the treasury function in interest rate risk management is measured by comparing the actual total financing costs of the National Grid debt with those of a passively managed benchmark portfolio with set ratios of fixed rate to floating-rate debt, to identify the impact of actively managing National Grid’s interest rate risk. This is monitored regularly by the Finance Committee of National Grid.
Within the constraints of our interest rate risk management policy, and as approved by the Finance Committee, we actively manage our interest rate exposure and therefore the interest rate profile will change over time.
In 2011/12, we expect our financing costs to continue to benefit from low short-term interest rates, some of which have already been locked in using short-term interest rate derivatives.
More information on the interest rate profile of our debt is included in note 28(a) to the consolidated financial statements.
Foreign exchange risk management We have a policy of managing our foreign exchange transaction risk by hedging contractually committed foreign exchange transactions over a prescribed minimum size. This covers a minimum of 75% of such transactions occurring in the next six months and a minimum of 50% of transactions occurring six to
twelve months in the future. Cover generally takes the form of forward sale or purchase of foreign currencies and must always relate to forecast underlying operational cash flows.
The result of this hedging activity is that our cash flow has limited exposure to foreign currencies.
Our capital expenditure programme over the next few years will result in material foreign currency exposures as we purchase raw materials and components from overseas suppliers. The treasury function will seek to manage these exposures through a range of hedging strategies and instruments.
In addition, we are exposed to currency exposures on borrowings in currencies other than sterling, principally the euro. This currency exposure is managed through the use of cross-currency swaps, so that post derivatives the currency profile is almost entirely sterling.
More details can be found in note 28(a) to the consolidated financial statements.
Counterparty risk management Counterparty risk arises from the investment of surplus funds, from the use of derivative instruments, and from commercial contracts entered into by the businesses, including commodity contracts. The National Grid Finance Committee has agreed a policy for managing such risk on a portfolio basis across National Grid. This policy sets limits as to the exposure that National Grid can have with any one counterparty, based on that counterparty’s credit rating from independent credit rating agencies. National Grid’s exposure to individual counterparties is monitored daily and counterparty limits are regularly updated for changes in credit ratings. The treasury function is responsible for managing the policy. Where contracts carrying credit risk are entered into outside the treasury function, part of the relevant counterparty limit can be allocated to the business area involved. This ensures that National Grid’s overall exposure is managed within the appropriate limit.
Where multiple transactions are entered into with a single counterparty, a netting arrangement is usually put in place to reduce our exposure to credit risk of that counterparty. When transacting interest rate and exchange rate derivatives, we use market standard documentation, which provides for netting in respect of all transactions governed by a specific ISDA agreement with a counterparty.
Further information on the management of counterparty risk is provided in note 28(c) to the consolidated financial statements.
Valuation and sensitivity analysis We calculate the fair value of debt and financial derivatives by discounting all future cash flows by the market yield curve at the balance sheet date, including the credit spread for debt, and in the case of financial derivatives taking into account the credit quality of both parties. The market yield curve for each currency is obtained from external sources for interest and foreign exchange rates. In the case of instruments that include options, the Black’s variation of the Black-Scholes model is used to calculate fair value.
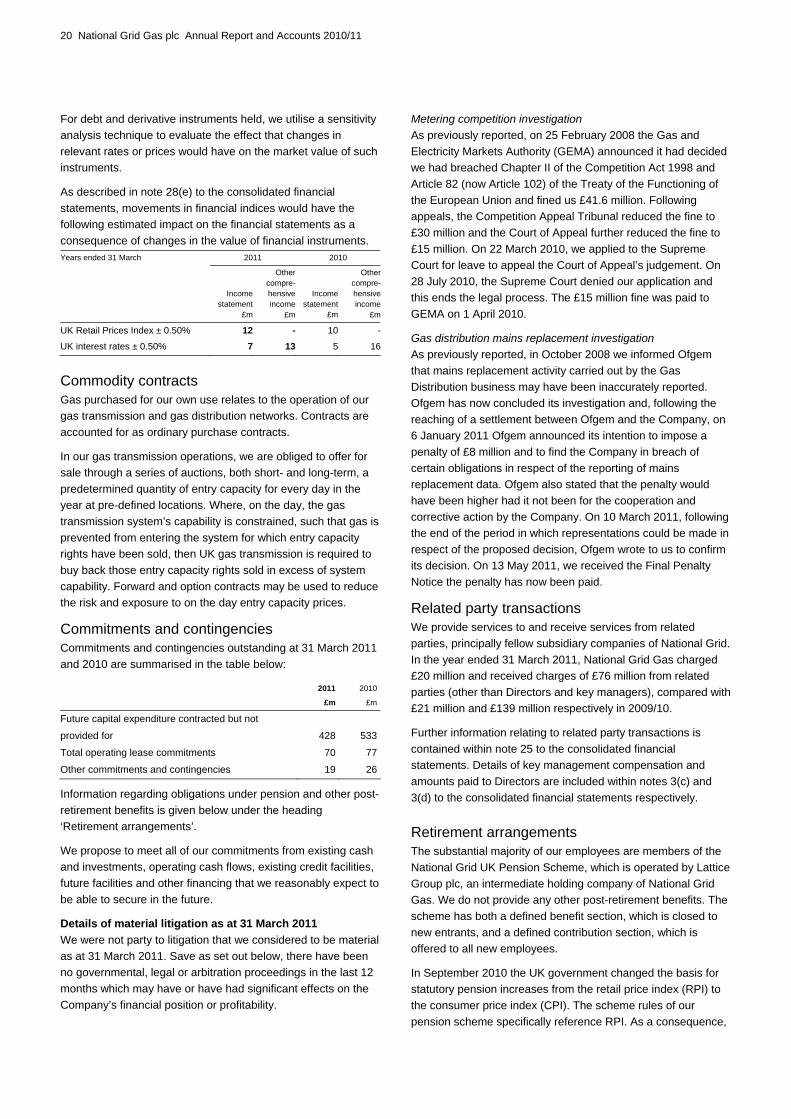
20 National Grid Gas plc Annual Report and Accounts 2010/11
For debt and derivative instruments held, we utilise a sensitivity analysis technique to evaluate the effect that changes in relevant rates or prices would have on the market value of such instruments.
As described in note 28(e) to the consolidated financial statements, movements in financial indices would have the following estimated impact on the financial statements as a consequence of changes in the value of financial instruments. Years ended 31 March 2011 2010
Incomestatement
£m
Other compre-hensive income
£m
Incomestatement
£m
Other compre-hensive income
£m
UK Retail Prices Index ± 0.50% 12 - 10 -
UK interest rates ± 0.50% 7 13 5 16
Commodity contracts Gas purchased for our own use relates to the operation of our gas transmission and gas distribution networks. Contracts are accounted for as ordinary purchase contracts.
In our gas transmission operations, we are obliged to offer for sale through a series of auctions, both short- and long-term, a predetermined quantity of entry capacity for every day in the year at pre-defined locations. Where, on the day, the gas transmission system’s capability is constrained, such that gas is prevented from entering the system for which entry capacity rights have been sold, then UK gas transmission is required to buy back those entry capacity rights sold in excess of system capability. Forward and option contracts may be used to reduce the risk and exposure to on the day entry capacity prices.
Commitments and contingencies Commitments and contingencies outstanding at 31 March 2011 and 2010 are summarised in the table below:
2011 2010
£m £m
Future capital expenditure contracted but not
provided for 428 533
Total operating lease commitments 70 77
Other commitments and contingencies 19 26
Information regarding obligations under pension and other post-retirement benefits is given below under the heading ‘Retirement arrangements’.
We propose to meet all of our commitments from existing cash and investments, operating cash flows, existing credit facilities, future facilities and other financing that we reasonably expect to be able to secure in the future.
Details of material litigation as at 31 March 2011 We were not party to litigation that we considered to be material as at 31 March 2011. Save as set out below, there have been no governmental, legal or arbitration proceedings in the last 12 months which may have or have had significant effects on the Company’s financial position or profitability.
Metering competition investigation As previously reported, on 25 February 2008 the Gas and Electricity Markets Authority (GEMA) announced it had decided we had breached Chapter II of the Competition Act 1998 and Article 82 (now Article 102) of the Treaty of the Functioning of the European Union and fined us £41.6 million. Following appeals, the Competition Appeal Tribunal reduced the fine to £30 million and the Court of Appeal further reduced the fine to £15 million. On 22 March 2010, we applied to the Supreme Court for leave to appeal the Court of Appeal’s judgement. On 28 July 2010, the Supreme Court denied our application and this ends the legal process. The £15 million fine was paid to GEMA on 1 April 2010.
Gas distribution mains replacement investigation As previously reported, in October 2008 we informed Ofgem that mains replacement activity carried out by the Gas Distribution business may have been inaccurately reported. Ofgem has now concluded its investigation and, following the reaching of a settlement between Ofgem and the Company, on 6 January 2011 Ofgem announced its intention to impose a penalty of £8 million and to find the Company in breach of certain obligations in respect of the reporting of mains replacement data. Ofgem also stated that the penalty would have been higher had it not been for the cooperation and corrective action by the Company. On 10 March 2011, following the end of the period in which representations could be made in respect of the proposed decision, Ofgem wrote to us to confirm its decision. On 13 May 2011, we received the Final Penalty Notice the penalty has now been paid.
Related party transactions We provide services to and receive services from related parties, principally fellow subsidiary companies of National Grid. In the year ended 31 March 2011, National Grid Gas charged £20 million and received charges of £76 million from related parties (other than Directors and key managers), compared with £21 million and £139 million respectively in 2009/10.
Further information relating to related party transactions is contained within note 25 to the consolidated financial statements. Details of key management compensation and amounts paid to Directors are included within notes 3(c) and 3(d) to the consolidated financial statements respectively.
Retirement arrangements The substantial majority of our employees are members of the National Grid UK Pension Scheme, which is operated by Lattice Group plc, an intermediate holding company of National Grid Gas. We do not provide any other post-retirement benefits. The scheme has both a defined benefit section, which is closed to new entrants, and a defined contribution section, which is offered to all new employees.
In September 2010 the UK government changed the basis for statutory pension increases from the retail price index (RPI) to the consumer price index (CPI). The scheme rules of our pension scheme specifically reference RPI. As a consequence,

National Grid Gas plc Annual Report and Accounts 2010/11 21
the impact of the Government’s move to CPI was predominantly limited to our guaranteed minimum pensions and the financial consequence was an approximate £50 million reduction in plan liabilities.
As there is no contractual arrangement or stated policy for charging the net defined benefit cost of the scheme to National Grid Gas, we account for the scheme as if it were a defined contribution scheme and do not recognise any share of the assets and liabilities of the scheme.
Actuarial position A triennial valuation is carried out for the independent trustees of the scheme by professionally qualified actuaries, using the projected unit method. The purpose of the valuation is to design a funding plan to ensure that present and future contributions should be sufficient to meet future liabilities.
The 2010 valuation is nearing completion and we have reached an agreement in principle with the Trustees and are in the later stages of finalising documentation.
The last completed full actuarial valuation of the National Grid UK Pension Scheme was as at 31 March 2007. This concluded that the pre-tax funding deficit was £442 million in the defined benefit section on the basis of the funding assumptions. Employer cash contributions for the ongoing cost of this plan are currently being made at a rate of 29.4% of pensionable payroll.
The next valuation of the scheme is due as at 31 March 2013.
Accounting policies Basis of accounting The consolidated financial statements present the results of National Grid Gas for the years ended 31 March 2011 and 2010 and financial position as at 31 March 2011 and 2010. They have been prepared using the accounting policies shown, in accordance with International Financial Reporting Standards (IFRS).
In complying with IFRS, we are also complying with the version of IFRS that has been endorsed by the European Union for use by listed companies.
Choices permitted under IFRS IFRS provide certain options available within accounting standards. Material choices we have made, and continue to make include the following:
Presentation formats We use the nature of expense method for our income statement and total our balance sheet to net assets and total equity.
In the income statement, we present subtotals of total operating profit, profit before tax and profit from continuing operations, together with additional subtotals excluding exceptional items and remeasurements. Exceptional items and remeasurements are presented on the face of the income statement.
Financial instruments We normally opt to apply hedge accounting in most circumstances where this is permitted.
Critical accounting policies The application of accounting principles requires us to make estimates, judgments and assumptions that may affect the reported amounts of assets, liabilities, revenue and expenses and the disclosure of contingent assets and liabilities in the accounts. On an ongoing basis, we evaluate our estimates using historical experience, consultation with experts and other methods that we consider reasonable in the particular circumstances to ensure compliance with IFRS. Actual results may differ significantly from our estimates, the effect of which will be recognised in the period in which the facts that give rise to the revision become known.
Certain accounting policies, described below, have been identified as critical accounting policies, as these policies involve particularly complex or subjective decisions or assessments. The discussion of critical accounting policies below should be read in conjunction with the description of our accounting policies set out in our consolidated financial statements.
Revenue Revenue includes an assessment of gas transportation services supplied to customers between the date of the last invoice and the year end. Changes to the estimate of the gas transportation services supplied during this period would have an impact on the reported results.
Estimates of unbilled revenues amounted to £165 million at 31 March 2011 compared with £184 million at 31 March 2010.
Estimated economic lives of property, plant and equipment The reported amounts for depreciation of property, plant and equipment and amortisation of non-current intangible assets can be materially affected by the judgments exercised in determining their estimated economic lives.
Hedge accounting Derivative financial instruments are used to hedge certain economic exposures arising from movements in exchange and interest rates or other factors that could affect either the value of the Company’s assets or liabilities or affect future cash flows.
Movements in the fair values of derivative financial instruments may be accounted for using hedge accounting where the relevant eligibility, documentation and effectiveness testing requirements are met. If a hedge does not meet the strict criteria for hedge accounting, or where there is ineffectiveness or partial ineffectiveness, then the movements will be recorded in the income statement immediately instead of being recognised in the statement of comprehensive income or by being offset by adjustments to the carrying value of debt.
Exceptional items and remeasurements Exceptional items and remeasurements are items of income and expenditure that, in the judgement of management, should be disclosed separately on the basis that they are material,

22 National Grid Gas plc Annual Report and Accounts 2010/11
either by their nature or their size, to an understanding of the company’s financial performance and distort the comparability of financial performance between periods.
Items of income or expense that are considered by management for designation as exceptional items include such items as significant restructurings, write-downs or impairments of non-current assets, material changes in environmental provisions, gains or losses on disposals of businesses or investments and debt redemption costs.
Remeasurements comprise gains or losses recorded in the income statement arising from changes in the fair value of derivative financial instruments. These fair values increase or decrease as a consequence of changes in financial indices and prices over which the Company has no control.
Tax estimates The tax charge is based on the profit for the year and tax rates in effect. The determination of appropriate provisions for taxation requires us to take into account anticipated decisions of tax authorities and estimate its ability to utilise tax benefits through future earnings and tax planning.
Carrying value of assets and potential for impairments The carrying value of assets recorded in the consolidated balance sheet could be materially reduced if an impairment were to be assessed as being required. Impairment reviews are carried out when a change in circumstance is identified that indicates an asset might be impaired. An impairment review involves calculating either or both of the fair value or the value-in-use of an asset or group of assets and comparing with the carrying value in the balance sheet.
These calculations involve the use of assumptions as to the price that could be obtained for, or the future cash flows that will be generated by, an asset or group of assets, together with an appropriate discount rate to apply to those cash flows.
Assets and liabilities carried at fair value Certain financial investments and derivative financial instruments are carried in the balance sheet at their fair value rather than historical cost.
The fair value of financial investments is based on market prices, as are those of derivative financial instruments where market prices exist. Other derivative financial instruments are valued using financial models, which include judgements on, in particular, future movements in exchange and interest rates.
Provisions Provisions are made for liabilities, the timing and amount of which is uncertain. These include provisions for the cost of environmental restoration and remediation, restructuring and employer and public liability claims.
Calculations of these provisions are based on estimated cash flows relating to these costs, discounted at an appropriate rate where the impact of discounting is material. The amounts and timing of cash flows relating to environmental liabilities are based on management estimates supported by the use of external consultants.
Pension obligations Defined benefit pension obligations are accounted for as if the National Grid UK Pension Scheme were a defined contribution scheme as there is neither a contractual arrangement, nor a stated policy under which the Company is charged for the costs of providing pensions.
A change in these arrangements may lead to the Company recognising the cost of providing pensions on a different basis, together with a proportion of the actuarial gains and losses and of the assets and liabilities of the pension scheme.
Sensitivities In order to illustrate the impact that changes in assumptions could have on our results and financial position, the following sensitivities are presented:
Revenue accruals A 10% change in our estimate of unbilled revenues at 31 March 2011 would result in an increase or decrease in our recorded net assets and profit for the year by approximately £12 million net of tax.
Asset useful lives An increase in the useful economic lives of assets of one year on average would reduce our annual depreciation charge on property, plant and equipment by £11 million (pre-tax) and our annual amortisation charge on intangible assets by £3 million (pre-tax).
Hedge accounting If using our derivative financial instruments, hedge accounting had not been achieved during the year ended 31 March 2011 then the profit for the year would have been £38 million higher than that reported net of tax, and net assets would have been £29 million higher.
Assets carried at fair value A 10% change in assets and liabilities carried at fair value would result in an increase or decrease in the carrying value of derivative financial instruments of £51 million.
Provisions A 10% change in the estimates of future cash flows estimated in respect of provisions for liabilities would result in an increase or decrease in our provisions of approximately £20 million.
Accounting developments Accounting standards, amendments to standards and interpretations adopted in 2010/11 In preparing our consolidated financial statements we have complied with International Financial Reporting Standards, International Accounting Standards and interpretations applicable for 2010/11. The standards, amendments to standards and interpretations adopted during 2010/11 are discussed in the financial statements on page 33. None of these resulted in a material change to our consolidated results, assets or liabilities in 2010/11 or in those of previous periods.

National Grid Gas plc Annual Report and Accounts 2010/11 23
Accounting standards, amendments to standards and interpretations not yet adopted New accounting standards, amendments to standards and interpretations which have been issued but not yet adopted by National Grid are discussed in the financial statements on page 33.
24 National Grid Gas plc Annual Report and Accounts 2010/11
Directors’ Report for the year ended 31 March 2011
In accordance with the requirements of the Companies Act 2006 and UK Listing Authority’s Listing, Disclosure and Transparency Rules, the following sections describe the matters that are required for inclusion in the Directors’ Report and were approved by the Board. Further details of matters required to be included in the Directors’ Report are incorporated by reference into this report, as detailed below.
Directors The Directors serving during the year or subsequently were:
Malcolm Cooper Appointed June 2007 Mark Fairbairn Resigned March 2011 Stuart Humphreys Appointed July 2008 John Pettigrew Appointed April 2011 Paul Whittaker Appointed June 2007 Adam Wiltshire Appointed June 2006 Nick Winser Appointed July 2003 Directors’ and Officers’ liability insurance cover is arranged and qualifying third party indemnities are in place for each Director.
Principal activities and business review A full description of the Company’s principal activities, businesses and principal risks and uncertainties is contained in the Operating and Financial Review on pages 1 to 23, which are incorporated by reference into this report.
Material interests in shares National Grid Gas plc is a wholly owned subsidiary undertaking of National Grid Gas Holdings Limited. The ultimate parent company of National Grid Gas plc is National Grid plc.
Dividends During the year, interim dividends totalling £400 million were paid (2009/10: £300 million interim dividend). The Directors have not proposed a final dividend.
Donations During 2010/11, some £0.1million (2009/10: £2.6 million) was invested in support of community initiatives and relationships in the UK. There were no direct charitable donations for 2010/11 (2009/10: £nil).
No political donations were made in the UK and EU, including donations as defined for the purposes of the Political Parties, Elections and Referendums Act 2000.
Research and development Expenditure on research and development was £9 million during the year (2009/10: £10 million).
Financial instruments Details on the use of financial instruments and financial risk management are included on pages 18 to 20 in the Operating and Financial Review.
Future developments Details of future developments are contained in the Operating and Financial Review.
Employee involvement As a part of National Grid, we have well established and effective arrangements through electronic mail, intranet and in-house publications and briefing meetings, at each business location and company wide, for communication and consultation with both employees and trade union representatives, and for communication of performance, strategy and operating model, together with significant business issues. We recognise the importance of aligning employee and shareholder interests, and are committed to employee share ownership through the National Grid plc Share Incentive Plan and Sharesave scheme, which are open to all employees.
Policy and practice on payment of creditors It is our policy to include in contracts or other agreements, terms of payment with suppliers. Once agreed, we aim to abide by these terms of payment. The average creditor payment period at 31 March 2011 was 20 days (17 days at 31 March 2010).
Audit information Having made the requisite enquiries, so far as the Directors in office at the date of the signing of this report are aware, there is no relevant audit information of which the auditors are unaware and each Director has taken all reasonable steps to make themselves aware of any relevant audit information and to establish that the auditors are aware of that information.
Annual General Meeting Notice of the National Grid Gas’s Annual General Meeting for 2011 will be issued separately to shareholders.
On behalf of the Board Jonathan Munsey Company Secretary 20 July 2011 National Grid Gas plc, 1-3 Strand, London WC2N 5EH Registered in England and Wales Number 2006000

National Grid Gas plc Annual Report and Accounts 2010/11 25
Statement of Directors’ responsibilities The Directors are responsible for preparing the Annual Report and Accounts, including the consolidated financial statements and the Company financial statements and the Directors’ Report, in accordance with applicable law and regulations.
Company law requires the Directors to prepare financial statements for each financial year. Under that law the Directors have prepared the consolidated financial statements in accordance with International Financial Reporting Standards (IFRS) as adopted by the European Union, and the Company financial statements in accordance with applicable law and United Kingdom Accounting Standards (United Kingdom Generally Accepted Accounting Practice, UK GAAP). In preparing the consolidated financial statements, the Directors have also elected to comply with IFRS, issued by the International Accounting Standards Board (IASB). Under company law the Directors must not approve the financial statements unless they are satisfied that they give a true and fair view of the state of affairs of the Company on a consolidated and individual basis and of the consolidated profit of the Company for that period.
In preparing those financial statements, the Directors are required to:
select suitable accounting policies and then apply them consistently;
make judgements and estimates that are reasonable and prudent;
state that the consolidated financial statements comply with IFRS as adopted by the European Union, and with regard to the Company financial statements that applicable UK Accounting Standards have been followed, subject to any material departures disclosed and explained in the financial statements; and
prepare the consolidated financial statements and Company financial statements on a going concern basis unless it is inappropriate to presume that the Company, on a consolidated and individual basis, will continue in business, in which case there should be supporting assumptions or qualifications as necessary.
The Directors are responsible for keeping adequate accounting records that are sufficient to show and explain the company’s transactions and disclose with reasonable accuracy at any time the financial position of the Company on a consolidated and individual basis and to enable them to ensure that the consolidated financial statements comply with the Companies Act 2006 and Article 4 of the IAS Regulation and the Company financial statements comply with the Companies Act 2006. They are also responsible for safeguarding the assets of the Company and its subsidiaries and hence for taking reasonable steps for the prevention and detection of fraud and other irregularities.
Each of the Directors, whose names are listed in the Directors report on page 24 and who were in office at the date of signing of this statement, confirms that, to the best of their knowledge:
The consolidated financial statements and the Company financial statements, which have been prepared in accordance with IFRS as adopted by the European Union and UK GAAP respectively, give a true and fair view of the assets, liabilities, financial position and profit of the Company on a consolidated and individual basis; and
The Annual Report includes a fair review of the development and performance of the business and the position of the Company on a consolidated and individual basis, together with a description of the principal risks and uncertainties that it faces.
On behalf of the Board Jonathan Munsey Company Secretary 20 July 2011
26 National Grid Gas plc Annual Report and Accounts 2010/11
Independent Auditors’ report to the Members of National Grid Gas plc We have audited the consolidated and Company financial statements (the ‘‘financial statements’’) of National Grid Gas plc for the year ended 31 March 2011 which comprise the consolidated income statement, the consolidated statement of comprehensive income, the consolidated and Company balance sheets, the consolidated statement of changes in equity, the consolidated cash flow statement, the accounting policies and Company accounting policies, the adoption of new accounting standards, the notes to the consolidated financial statements and the notes to the Company financial statements. The financial reporting framework that has been applied in the preparation of the financial statements is applicable law and International Financial Reporting Standards (IFRS) as adopted by the European Union. The financial reporting framework that has been applied in the preparation of the parent Company financial statements is applicable law and United Kingdom Accounting Standards (United Kingdom Generally Accepted Accounting Practice).
Respective responsibilities of directors and auditors As explained more fully in the Statement of Directors’ Responsibilities set out on page 25, the Directors are responsible for the preparation of the financial statements and for being satisfied that they give a true and fair view. Our responsibility is to audit the financial statements in accordance with applicable law and International Standards on Auditing (UK and Ireland). Those standards require us to comply with the Auditing Practices Board’s Ethical Standards for Auditors.
This report, including the opinions, has been prepared for and only for the Company’s members as a body in accordance with Chapter 3 of Part 16 of the Companies Act 2006 and for no other purpose. We do not, in giving these opinions, accept or assume responsibility for any other purpose or to any other person to whom this report is shown or into whose hands it may come save where expressly agreed by our prior consent in writing.
Scope of the audit of the financial statements An audit involves obtaining evidence about the amounts and disclosures in the financial statements sufficient to give reasonable assurance that the financial statements are free from material misstatement, whether caused by fraud or error. This includes an assessment of: whether the accounting policies are appropriate to the Group’s and Company’s circumstances and have been consistently applied and adequately disclosed; the reasonableness of significant accounting estimates made by the Directors; and the overall presentation of the financial statements. In addition, we read all the financial and non-financial information in the annual report to identify material inconsistencies with the audited financial statements. If we become aware of any apparent material
misstatements or inconsistencies we consider the implications for our report.
Opinion on financial statements In our opinion:
the financial statements give a true and fair view of the state of the group’s and of the Company’s affairs as at 31 March 2011 and of the group’s profit and cash flows for the year then ended;
the consolidated financial statements have been properly prepared in accordance with IFRS as adopted by the European Union;
the Company financial statements have been properly prepared in accordance with United Kingdom Generally Accepted Accounting Practice (UK GAAP); and
the financial statements have been prepared in accordance with the requirements of the Companies Act 2006.
Opinion on other matters prescribed by the Companies Act 2006 In our opinion the information given in the Directors’ Report for the financial year for which the financial statements are prepared is consistent with the financial statements.
Matters of which we are required to report by exception We have nothing to report in respect of the following: Under the Companies Act 2006, we are required to report to you if, in our opinion:
adequate accounting records have not been kept by the parent Company, or returns adequate for our audit have not been received from branches not visited by us; or
the Company financial statements are not in agreement with the accounting records and returns; or
certain disclosures of Directors’ remuneration specified by law are not made; or
we have not received all the information and explanations we require for our audit.
Phil Harrold (Senior Statutory Auditor) for and on behalf of PricewaterhouseCoopers LLP Chartered Accountants and Statutory Auditors Birmingham 20 July 2011

National Grid Gas plc Annual Report and Accounts 2010/11 27
Accounting policies for the year ended 31 March 2011
A. Basis of preparation of consolidated financial statements under IFRS National Grid Gas’s principal activities involve the transmission and distribution of gas and the provision of gas metering services within Great Britain. The Company is a public limited company incorporated and domiciled in England with its registered office at 1-3 Strand, London WC2N 5EH.
These consolidated financial statements were approved for issue by the Board of Directors on 20 July 2011.
These consolidated financial statements have been prepared in accordance with International Financial Reporting Standards (IFRS) as issued by the International Accounting Standards Board and as adopted by the European Union. They are prepared on the basis of all IFRS accounting standards and interpretations that are mandatory for periods ending 31 March 2010 and in accordance with the Companies Act 2006 applicable to companies reporting under IFRS and Article 4 of the European Union IAS regulation. The 2010 comparative financial information has also been prepared on this basis.
The consolidated financial statements have been prepared on a historical cost basis, except for the revaluation of derivative financial instruments and investments classified as available for sale.
These consolidated financial statements are presented in pounds sterling, which is the functional currency of the Company.
The preparation of financial statements requires management to make estimates and assumptions that affect the reported amounts of assets and liabilities, disclosures of contingent assets and liabilities and the reported amounts of revenue and expenses during the reporting period. Actual results could differ from these estimates.
B. Basis of consolidation The consolidated financial statements incorporate the financial statements of the Company and its subsidiaries.
.A subsidiary is defined as an entity controlled by the Company. Control is achieved where the Company has the power to govern the financial and operating policies of an entity so as to obtain benefits from its activities.
Where necessary, adjustments are made to bring the accounting policies used under UK generally accepted accounting principles (UK GAAP) used in the individual financial statements of the Company and its subsidiaries and joint ventures into line with those used by the Company in its consolidated financial statements under IFRS. Inter-company transactions are eliminated.
C. Foreign currencies Transactions in currencies other than the functional currency of the Company or subsidiary concerned are recorded at the rates of exchange prevailing on the dates of the transactions. At each balance sheet date, monetary assets and liabilities that are denominated in foreign currencies are retranslated at closing exchange rates. Other non-monetary assets are not retranslated unless they are carried at fair value.
Gains and losses arising on retranslation of monetary assets and liabilities are included in the income statement.
On consolidation, the assets and liabilities of overseas financing operations that have a functional currency different from the Company’s functional currency of sterling are translated at exchange rates prevailing at the balance sheet date. Income and expense items are translated at the weighted average exchange rates for the period. Exchange differences arising are classified as equity and transferred to the consolidated translation reserve.
D. Intangible assets Identifiable intangible assets are recorded at cost less accumulated amortisation and any provision for impairment.
Internally generated intangible fixed assets, such as software, are recognised only if an asset is created that can be identified; it is probable that the asset created will generate future economic benefits; and that the development cost of the asset can be measured reliably. Where no internally generated intangible asset can be recognised, development expenditure is recorded as an expense in the period in which it is incurred.
Intangible assets under development are not amortised. Other non-current intangible assets are amortised on a straight-line basis over their estimated useful economic lives. The principal amortisation periods for categories of intangible assets are:
Amortisation periods Years
Software 3 to 5
Intangible emission allowances are accounted for in accordance with accounting policy R.
E. Property, plant and equipment Property, plant and equipment are recorded at cost less accumulated depreciation and any impairment losses.
Cost includes payroll and finance costs incurred which are directly attributable to the construction of property, plant and equipment as well as the cost of any associated asset retirement obligations.
28 National Grid Gas plc Annual Report and Accounts 2010/11
Property, plant and equipment include assets in which the Company’s interest comprises legally protected statutory or contractual rights of use.
Additions represent the purchase or construction of new assets, including capital expenditure for safety and environmental assets, and extensions to, enhancements to, or replacement of existing assets.
Contributions from customers towards the cost of property, plant and equipment received prior to 1 July 2009, together with contributions towards the cost of relocating plant and equipment, are included in trade and other payables as deferred income and credited on a straight-line basis to the income statement over the estimated economic useful lives of the assets to which they relate.
Contributions from customers received post 1 July 2009 are recognised in revenue immediately, except where the contributions are consideration for a future service, in which case they are recognised initially as deferred income and revenue is subsequently recognised over the period in which the service is provided.
Depreciation is not provided on freehold land or assets in the course of construction. Other property, plant and equipment are depreciated, principally on a straight-line basis, at rates estimated to write off their book values over their estimated useful economic lives. In assessing estimated useful economic lives, which are reviewed on a regular basis, consideration is given to any contractual arrangements and operational requirements relating to particular assets. Unless otherwise determined by operational requirements, the depreciation periods for the principal categories of property, plant and equipment are, in general, as shown in the table below:
Depreciation periods Years
Freehold and leasehold buildings up to 50
Plant and machinery
– mains, services and regulating equipment 30 to 100
– meters and metering equipment 5 to 18
Motor vehicles and office equipment 3 to 10
F. Impairment of assets Impairments of assets are calculated as the difference between the carrying value of the asset and its recoverable amount, if lower. Where such an asset does not generate cash flows that are independent from other assets, the recoverable amount of the cash-generating unit to which that asset belongs is estimated. Recoverable amount is defined as the higher of fair value less costs to sell and estimated value in use at the date the impairment review is undertaken.
Value in use represents the present value of expected future cash flows, discounted using a pre-tax discount rate that reflects current market assessments of the time value of money and the risks specific to the asset for which the estimates of future cash flows have not been adjusted.
Tests for impairment are carried out only if there is some indication that the carrying value of the assets may have been impaired.
Material impairments are recognised in the income statement and are disclosed separately.
G. Taxation Current tax Current tax assets and liabilities are measured at the amount expected to be recovered from or paid to the taxation authorities. The tax rates and tax laws used to compute the amount are those that are enacted or substantively enacted by the balance sheet date. Current tax is charged or credited to the income statement, except to the extent that it relates to items recognised in other comprehensive income or directly in equity. In these cases the tax is also recognised in other comprehensive income or directly in equity, respectively. Management periodically evaluates positions taken in tax returns with respect to situations in which applicable tax regulation is subject to interpretation and establishes provisions where appropriate on the basis of amounts expected to be paid to the tax authorities.
Deferred tax Deferred tax is provided using the balance sheet liability method and is recognised on temporary differences between the carrying amounts of assets and liabilities in the financial statements and the corresponding tax bases used in the computation of taxable profit.
Deferred tax liabilities are generally recognised on all taxable temporary differences and deferred tax assets are recognised to the extent that is probable that taxable profits will be available against which deductible temporary differences can be utilised. Such assets and liabilities are not recognised if the temporary difference arises from the initial recognition (other than a business combination) of assets and liabilities in a transaction that affects neither the accounting profits nor the taxable profits.
Deferred tax is calculated at the tax rates that are expected to apply in the period when the liability is settled or the asset is realised, based on the tax rates (and tax laws) that have been enacted or substantively enacted by the balance sheet date. Deferred tax is charged or credited to the income statement, except where it relates to items charged or credited directly to equity, in which case the deferred tax is also dealt with in equity. In these cases the tax is also recognised in other comprehensive income or directly in equity, respectively.
The carrying amount of deferred tax assets is reviewed at each balance sheet date and reduced to the extent that it is no longer probable that sufficient taxable profits will be available to allow all or part of the deferred income tax asset to be recovered. Unrecognised deferred tax assets are reassessed at each balance sheet date and are recognised to the extent that it has become probable that future taxable profit will allow the deferred tax asset to be recovered.

National Grid Gas plc Annual Report and Accounts 2010/11 29
Deferred tax assets and liabilities are offset when there is a legally enforceable right to set off current tax assets against current tax liabilities, and when they relate to income taxes levied by the same taxation authority and it is intended to settle current tax assets and liabilities on a net basis.
H. Inventories Inventories, which comprise raw materials and consumables, are stated at cost less provision for damage and obsolescence. Cost comprises cost of direct materials and those costs that have been incurred in bringing the inventories to their present location and condition.
I. Environmental costs Provision is made for environmental costs arising from past operations, based on future estimated expenditures, discounted to present values. Changes in the provision arising from revised estimates or discount rates or changes in the expected timing of expenditures are recognised in the income statement. The unwinding of the discount is included within the income statement as a financing charge.
J. Revenue Revenue represents the sales value derived from the transmission and distribution of gas and the provision of gas metering services during the year including assessment of the value of services provided, but not invoiced at the year end. It excludes value added tax and intra-group sales.
The sales value for the transmission and distribution of gas is largely determined from the amount of system capacity sold for the year and the amount of gas transported in the year, evaluated at contractual prices on a monthly basis. Where revenue for the year exceeds the maximum amount permitted by regulatory agreement and adjustments will be made to future prices to reflect this over-recovery, a liability for the over-recovery is not recognised as such an adjustment to future prices relates to the provision of future services. Similarly, an asset is not recognised where a regulatory agreement permits adjustments to be made to future prices in respect of an under-recovery.
The sales value for the provision of gas metering services is largely derived from monthly charges for the provision of individual meters under contractual arrangements.
Income arising from the sale of properties as a result of property management activities, from the sale of emission allowances and from the recovery of pension deficit from other gas transporters under regulatory arrangements is reported under other operating income
K. Segmental information Segmental information is based on the information the Board of Directors uses internally for the purposes of evaluating the performance of operating segments and determining resource allocation between operating segments. The Board of Directors is deemed to be the chief operating decision-maker and assesses the performance of operations principally on the basis of operating items before exceptionals and remeasurements.
L. Pensions The substantial majority of the Company’s employees are members of the defined benefit section of the National Grid UK Pension Scheme. There is no contractual arrangement or stated policy for charging the net defined benefit cost of the Scheme to the Company. Accordingly, the Scheme is recognised as if it were a defined contribution scheme. The pension charge for the year represents the contributions payable to the Scheme for the period. A share of the assets and liabilities, or the actuarial gains and losses of the Scheme are not recognised in these financial statements.
M. Leases Rentals under operating leases are charged to income on a straight-line basis over the term of the relevant lease.
N. Financial instruments Financial assets, liabilities and equity instruments are classified according to the substance of the contractual arrangements entered into, and recognised on trade date. Available-for-sale financial assets are non-derivatives that are either designated in this category or not classified in any other categories.
Trade receivables are initially recognised at fair value and subsequently measured at amortised cost, less any appropriate allowances for estimated irrecoverable amounts. A provision is established for irrecoverable amounts when there is objective evidence that amounts due under the original payment terms will not be collected. Indications that the trade receivable may become irrecoverable would include financial difficulties of the debtor, likelihood of the debtor’s insolvency, and default or significant failure of payment. Trade payables are initially recognised at fair value and subsequently measured at amortised cost.
Loans receivable and other receivables are carried at amortised cost using the effective interest rate method. Interest income, together with gains and losses when the loans and receivables are derecognised or impaired, are recognised in the income statement.
Other financial investments are recognised at fair value plus, in the case of available-for-sale financial investments, directly related incremental transaction costs and are subsequently carried at fair value on the balance sheet. Changes in the fair value of investments classified as fair value through profit and loss are included in the income statement, while changes in the fair value of investments classified as available-for-sale are recognised directly in equity, until the investment is disposed of or is determined to be impaired. At this time, the cumulative

30 National Grid Gas plc Annual Report and Accounts 2010/11
gain or loss previously recognised in equity is included in the income statement for the period. Investment income on available-for-sale investments is recognised using the effective interest rate method and taken through interest income in the income statement.
Borrowings, which include interest-bearing loans, UK Retail Prices Index (RPI) linked debt and overdrafts, are recorded at their initial fair value which normally reflects the proceeds received, net of direct issue costs less any repayments. Subsequently they are stated at amortised cost, using the effective interest rate method. Any difference between the proceeds after direct issue costs and the redemption value is recognised over the term of the borrowing in the income statement using the effective interest rate method.
Borrowing costs directly attributable to the acquisition, or construction of assets that necessarily take a substantial period of time to prepare for their intended use, are added to their cost. Such additions cease when the assets are substantially ready for their intended use.
Derivative financial instruments are recorded at fair value, and where the fair value of a derivative is positive, it is carried as a derivative asset and where negative, as a derivative liability. Assets and liabilities on different transactions are only netted if the transactions are with the same counterparty, a legal right to set-off exists and the cash flows are intended to be settled on a net basis. Gains and losses arising from changes in the fair value are included in the income statement in the period they arise.
No adjustment is made with respect to derivative clauses embedded in financial instruments or other contracts that are closely related to those instruments or contracts. In particular, interest payments on UK RPI debt are linked to movements in the UK retail price index. The link to RPI is considered to be an embedded derivative, which is closely related to the underlying debt instrument based on the view that there is a strong relationship between interest rates and inflation in the UK economy. Consequently these embedded derivatives are not accounted for separately from the debt instrument. Where there are embedded derivatives in host contracts not closely related, the embedded derivative is separately accounted for as a derivative financial instrument and recorded at fair value.
An equity instrument is any contract that evidences a residual interest in the consolidated assets of the Company after deducting all of its liabilities and is recorded at the proceeds received, net of direct issue costs with an amount equal to the nominal amount of the shares issued included in the share capital account and the balance recorded in the share premium account.
Subsequent to initial recognition, the fair values of financial instruments measured at fair value that are quoted in active markets are based on bid prices for assets held and offer prices for issued liabilities. When independent prices are not available, fair values are determined using valuation techniques which are
consistent with techniques commonly used by the relevant market. The techniques use observable market data.
O. Hedge accounting The Company and its subsidiaries enter into both derivative financial instruments (derivatives) and non-derivative financial instruments in order to manage interest rate and foreign currency exposures, and commodity price risks associated with underlying business activities and the financing of those activities.
Hedge accounting allows derivatives to be designated as a hedge of another (non-derivative) financial instrument, to mitigate the impact of potential volatility in the income statement of changes in fair value of the derivative instruments. To qualify for hedge accounting documentation is prepared specifying the hedging strategy, the component transactions and methodology used for effectiveness measurement. The Company uses two hedge accounting methods.
Firstly, changes in the carrying value of financial instruments that are designated and effective as hedges of future cash flows (cash flow hedges) are recognised directly in equity and any ineffective portion is recognised immediately in the income statement. Amounts deferred in equity in respect of cash flow hedges are subsequently recognised in the income statement in the same period in which the hedged item affects net profit or loss. Where a non-financial asset or a non-financial liability results from a forecasted transaction or firm commitment being hedged, the amounts deferred in equity are included in the initial measurement of that non-monetary asset or liability.
Secondly, fair value hedge accounting offsets the changes in the fair value of the hedging instrument against the change in the fair value of the hedged item in respect to the risk being hedged. These changes are recognised in the income statement to the extent the fair value hedge is effective. Adjustments made to the carrying amount of the hedged item for fair value hedges will be amortised over the remaining life, in line with the hedged item.
Changes in the fair value of derivatives that do not qualify for hedge accounting are recognised in the income statement as they arise, within finance costs.
Hedge accounting is discontinued when the hedging instrument expires or is sold, terminated, or exercised, or no longer qualifies for hedge accounting. At that time, any cumulative gains or losses relating to cash flow hedges recognised in equity are initially retained in equity and subsequently recognised in the income statement, in the same periods in which the previously hedged item affects net profit or loss. For fair value hedges, the cumulative adjustment recorded to the carrying value of the hedged item at the date hedge accounting is discontinued, is amortised to the income statement using the effective interest rate method.
If a hedged forecast transaction is no longer expected to occur, the net cumulative gain or loss recognised in equity is transferred to the income statement immediately.
National Grid Gas plc Annual Report and Accounts 2010/11 31
P. Share-based payments National Grid issues equity-settled share-based payments to certain employees of the Company and its subsidiaries.
Equity-settled, share-based payments are measured at fair value at the date of grant. The fair value determined at the grant date of the equity-settled, share-based payments is expensed on a straight-line basis over the vesting period, based on an estimate of the number of shares that will eventually vest. Payments made by the Company to National Grid in respect of share-based payments are recognised as a reduction in equity.
Q. Business performance and exceptional items and remeasurements Our financial performance is analysed into two components: business performance, which excludes exceptional items and remeasurements; and exceptional items and remeasurements. Business performance is used by management to monitor financial performance, as it is considered to increase the comparability of our reported financial performance from year to year. Business performance subtotals, which exclude exceptional items and remeasurements, are presented on the face of the income statement or in the notes to the financial statements.
Exceptional items and remeasurements are items of income and expenditure that, in the judgment of management, should be disclosed separately on the basis that they are material, either by their nature or their size, to an understanding of our financial performance and significantly distort the comparability of financial performance between periods.
Items of income or expense that are considered by management for designation as exceptional items include such items as significant restructurings, write-downs, pension deficit payments or impairments of non-current assets, significant changes in environmental provisions, and gains or losses on disposals of businesses or investments.
Costs arising from restructuring programmes primarily relate to redundancy costs. Redundancy costs are charged to the income statement in the year in which an irrevocable commitment is made to incur the costs and the main features of the restructuring plan have been announced to affected employees.
Remeasurements comprise gains or losses recorded in the income statement arising from changes in the fair value of derivative financial instruments to the extent that hedge accounting is not achieved or is not effective.
R. Emission allowances Emission allowances, which relate to the emissions of carbon dioxide, are recorded as an intangible asset within current assets and are initially recorded at cost, and subsequently at the lower of cost and net realisable value. For allocations of emission allowances granted by the UK Government, cost is deemed to be equal to fair value at the date of allocation. Receipts of such grants are treated as deferred income and are recognised in the income statement in the period in which carbon dioxide emissions are made. A provision is recorded in respect of the obligation to deliver emission allowances and charges are recognised in the income statement in the period in which carbon dioxide emissions are made.
Income from emission allowances which are sold is reported as part of other operating income.
S. Cash and cash equivalents Cash and cash equivalents include cash held at bank and in hand, together with short-term highly liquid investments with an original maturity of less than three months that are readily convertible to known amounts of cash and subject to an insignificant change in value. Net cash and cash equivalents reflected in the cash flow statement are net of bank overdrafts, which are reported in borrowings.
T. Other reserves Other reserves comprise the capital redemption reserve arising from the refinancing and restructuring of the Lattice Group in 1999. It represents the amount of the reduction in the share capital of the Company as a consequence of that restructuring. As the amounts included in other reserves are not attributable to any of the other classes of equity presented, they have been disclosed as a separate classification of equity.
U. Dividends Interim dividends are recognised when they become payable to the Company’s shareholders. Final dividends are recognised in the financial year in which they are approved.
32 National Grid Gas plc Annual Report and Accounts 2010/11
V. Areas of judgement and key sources of estimation uncertainty The preparation of financial statements requires management to make estimates and assumptions that affect the reported amounts of assets and liabilities, disclosures of contingent assets and liabilities and the reported amounts of revenue and expenses during the reporting period. Actual results could differ from these estimates. Information about such judgements and estimation is contained in the accounting policies or the notes to the financial statements, and the key areas are summarised below.
Areas of judgement that have the most significant effect on the amounts recognised in the financial statements:
The categorisation of certain items as exceptional items and remeasurements and the definition of adjusted earnings – note 4.
The exemptions adopted on transition to IFRS on 1 April 2004.
The recognition of defined benefit pension costs as if the National Grid UK Pension Scheme was a defined contribution scheme – accounting policy L.
Hedge accounting – accounting policy O.
Key sources of estimation uncertainty that have a significant risk of causing a material adjustment to the carrying amounts of assets and liabilities within the next financial year:
Review of residual lives, carrying values and impairment charges for intangible assets and property, plant and equipment – accounting policies D, E and F.
Valuation of financial instruments and derivatives – notes 12, 15 and 27.
Revenue recognition and assessment of unbilled revenue – accounting policy J.
Environmental provisions – note 21.

National Grid Gas plc Annual Report and Accounts 2010/11 33
Adoption of new accounting standards
New IFRS accounting standards and interpretations adopted in 2010/11 During the year ended 31 March 2011, the Company adopted the following International Financial Reporting Standards (IFRS), International Accounting Standards (IAS) or amendments and interpretations by the IFRS Interpretations Committee. None of the pronouncements had a material impact on the Company’s consolidated results or assets and liabilities.
IFRS 3R on business combinations IAS 27R on consolidated and individual financial
statements Amendment to IAS 39 Financial Instruments:
Recognition and measurement on eligible hedged items Revised IFRS 1 on first time adoption of IFRS IFRIC 17 on distribution of non-cash assets to owners -
Improvements to IFRS 2009 Amendment to IFRS 2 on group cash-settled share-
based payments Amendment to IFRS 1 on first time adoption of IFRS Amendment to IAS 32 on classification of rights issues
New IFRS accounting standards and interpretations not yet adopted The standards and interpretations listed below were not effective for the year ended 31 March 2011.
The Company enters into a significant number of transactions which fall within the scope of IFRS 9 on financial instruments. The International Accounting Standards Board is completing IFRS 9 on financial instruments in phases and the Company is evaluating the impact of the standard as it develops.
IFRS 10, 11, 12 and 13 and the consequent amendments to IAS 27 and IAS 28 were issued on 12 May 2011. The Company is evaluating the impact of these standards on the financial statements.
None of the other standards and interpretations listed below are expected to have a material impact on the Company’s consolidated results or assets and liabilities.
IFRS 9 on financial instruments Revised IAS 24 on related party disclosures IFRIC 19 on extinguishing financial liabilities with equity
instruments Amendment to IFRIC 14 on prepayments of a minimum
funding requirement Amendment to IFRS 1 on comparative IFRS 7
disclosures Improvements to IFRS 2010 Amendment to IFRS 7 on disclosures for transfers of
financial assets Amendment to IFRS 1 on severe hyperinflation and
removal of fixed dates for first-time adoption Amendment to IAS 12 on deferred tax on recovery of
underlying assets IFRS 10 on consolidated financial statements IFRS 11 on joint arrangements IFRS 12 on disclosures of interests in other entities IFRS 13 on fair value measurements IAS 27 on separate financial statements IAS 28 on investment in associates and joint ventures

34 National Grid Gas plc Annual Report and Accounts 2010/11
Consolidated income statementfor the years ended 31 March
2011 2011 2010 2010 Notes £m £m £m £m
Revenue 1(a) 2,693 2,747Other operating income 2 24 14Operating costs 3 (1,528) (1,651)
Operating profitBefore exceptional items 1(b) 1,254 1,297Exceptional items 4 (65) (187)
Total operating profit 1(b) 1,189 1,110Interest income and similar income 6 2 3Interest expense and other finance costs
Before exceptional items and remeasurements 6 (372) (257)Exceptional items and remeasurements 4, 6 (24) 33
6 (396) (224)
Profit before taxationBefore exceptional items and remeasurements 884 1,043Exceptional items and remeasurements 4 (89) (154)
Total profit before taxation 795 889Taxation
Before exceptional items and remeasurements 7 (268) (322)Exceptional items and remeasurements 4, 7 168 34
Total taxation 7 (100) (288)
Profit after taxationBefore exceptional items and remeasurements 616 721Exceptional items and remeasurements 4 79 (120)
Profit for the year 695 601
Attributable to:Equity shareholders of the parent 694 600Non-controlling interests 1 1
695 601
The results reported above relate to continuing operations.
The notes on pages 39 to 68 form part of the consolidated financial statements.
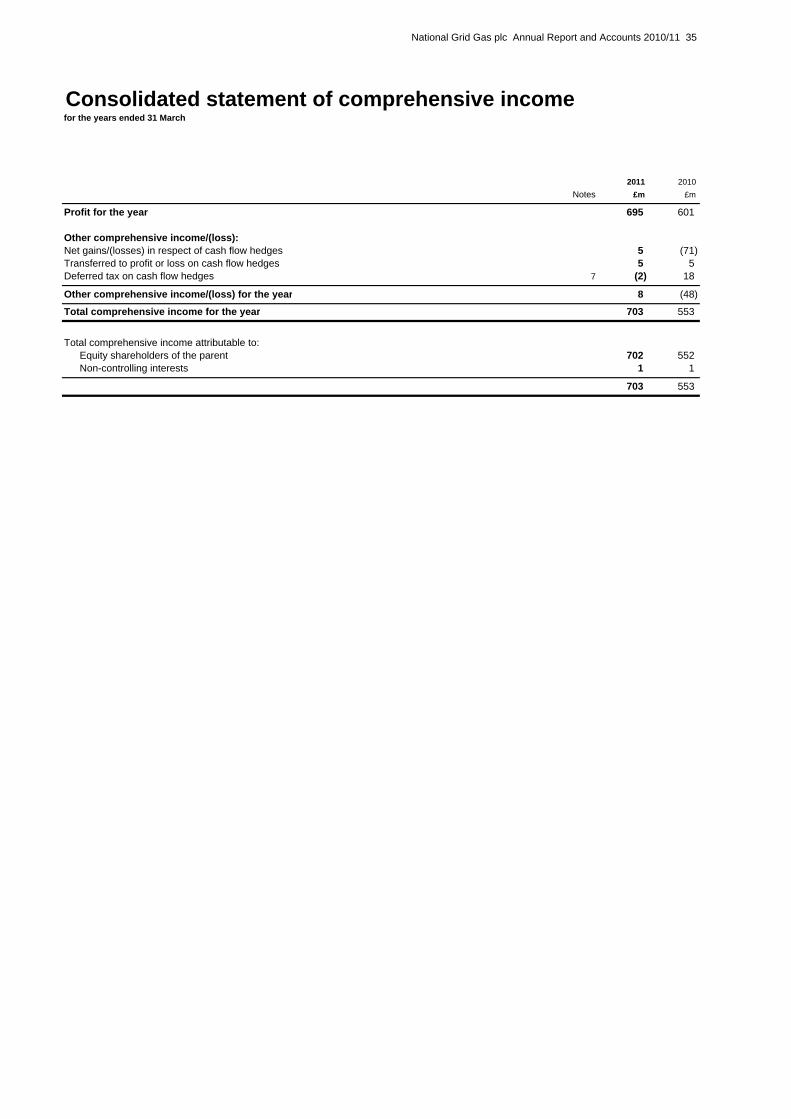
National Grid Gas plc Annual Report and Accounts 2010/11 35
Consolidated statement of comprehensive incomefor the years ended 31 March
2011 2010 Notes £m £m
Profit for the year 695 601
Other comprehensive income/(loss):Net gains/(losses) in respect of cash flow hedges 5 (71)Transferred to profit or loss on cash flow hedges 5 5Deferred tax on cash flow hedges 7 (2) 18
Other comprehensive income/(loss) for the year 8 (48)
Total comprehensive income for the year 703 553
Total comprehensive income attributable to:Equity shareholders of the parent 702 552Non-controlling interests 1 1
703 553
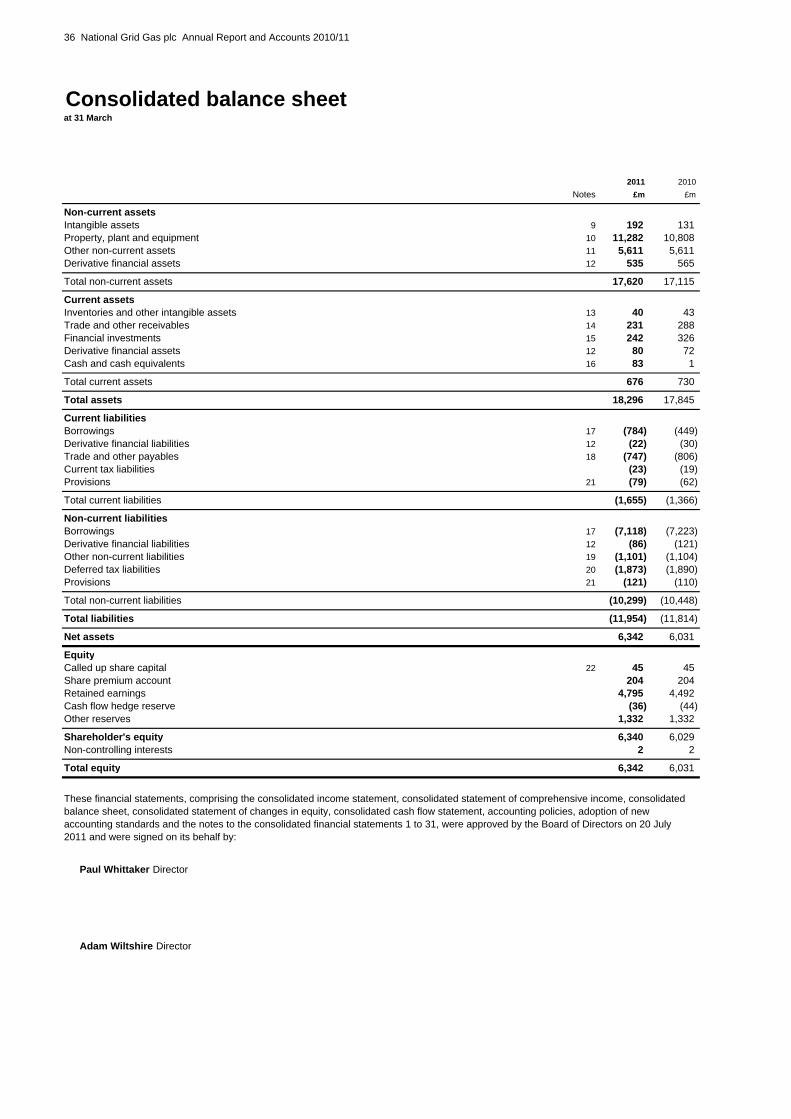
36 National Grid Gas plc Annual Report and Accounts 2010/11
Consolidated balance sheetat 31 March
2011 2010 Notes £m £m
Non-current assetsIntangible assets 9 192 131Property, plant and equipment 10 11,282 10,808Other non-current assets 11 5,611 5,611Derivative financial assets 12 535 565
Total non-current assets 17,620 17,115
Current assetsInventories and other intangible assets 13 40 43Trade and other receivables 14 231 288Financial investments 15 242 326Derivative financial assets 12 80 72Cash and cash equivalents 16 83 1
Total current assets 676 730
Total assets 18,296 17,845
Current liabilitiesBorrowings 17 (784) (449)Derivative financial liabilities 12 (22) (30)Trade and other payables 18 (747) (806)Current tax liabilities (23) (19)Provisions 21 (79) (62)
Total current liabilities (1,655) (1,366)
Non-current liabilitiesBorrowings 17 (7,118) (7,223)Derivative financial liabilities 12 (86) (121)Other non-current liabilities 19 (1,101) (1,104)Deferred tax liabilities 20 (1,873) (1,890)Provisions 21 (121) (110)
Total non-current liabilities (10,299) (10,448)
Total liabilities (11,954) (11,814)
Net assets 6,342 6,031
EquityCalled up share capital 22 45 45Share premium account 204 204Retained earnings 4,795 4,492Cash flow hedge reserve (36) (44)Other reserves 1,332 1,332
Shareholder's equity 6,340 6,029Non-controlling interests 2 2
Total equity 6,342 6,031
Paul Whittaker Director
Adam Wiltshire Director
These financial statements, comprising the consolidated income statement, consolidated statement of comprehensive income, consolidated balance sheet, consolidated statement of changes in equity, consolidated cash flow statement, accounting policies, adoption of new accounting standards and the notes to the consolidated financial statements 1 to 31, were approved by the Board of Directors on 20 July 2011 and were signed on its behalf by:

National Grid Gas plc Annual Report and Accounts 2010/11 37
Consolidated statement of changes in equity
Called up Share Cash flow Total Non-share premium Retained hedge Other shareholders' controlling Total
capital account earnings reserve reserves equity interests equity £m £m £m £m £m £m £m £m
As at 1 April 2009 45 204 4,184 4 1,332 5,769 1 5,770Total comprehensive income/(loss) for the year - - 600 (48) - 552 1 553Equity dividends - - (300) - - (300) - (300)Share-based payments - - 8 - - 8 - 8
As at 31 March 2010 45 204 4,492 (44) 1,332 6,029 2 6,031Total comprehensive income for the year - - 694 8 - 702 1 703Equity dividends - - (400) - - (400) - (400)Other movements in non-controlling interests - - - - - - (1) (1)Share-based payments - - 9 - - 9 - 9
At 31 March 2011 45 204 4,795 (36) 1,332 6,340 2 6,342
The Company is prohibited from declaring a dividend or other distribution unless it has certified that it is in compliance in all material respects with certain regulatory obligations, including a requirement to ensure it has sufficient financial resources and facilities to enable it to carry on its business and a requirement to use all reasonable endeavours to maintain an investment grade credit rating.
Gains and losses recognised in the cash flow hedge reserve as of 31 March 2011 will be continuously transferred to the income statement until the borrowings are repaid (note 17).
The amount of the cash flow hedge reserve due to be released from reserves to the income statement within the next year is £5m, with the remaining amount due to be released with the same maturity profile as borrowings in note 17.
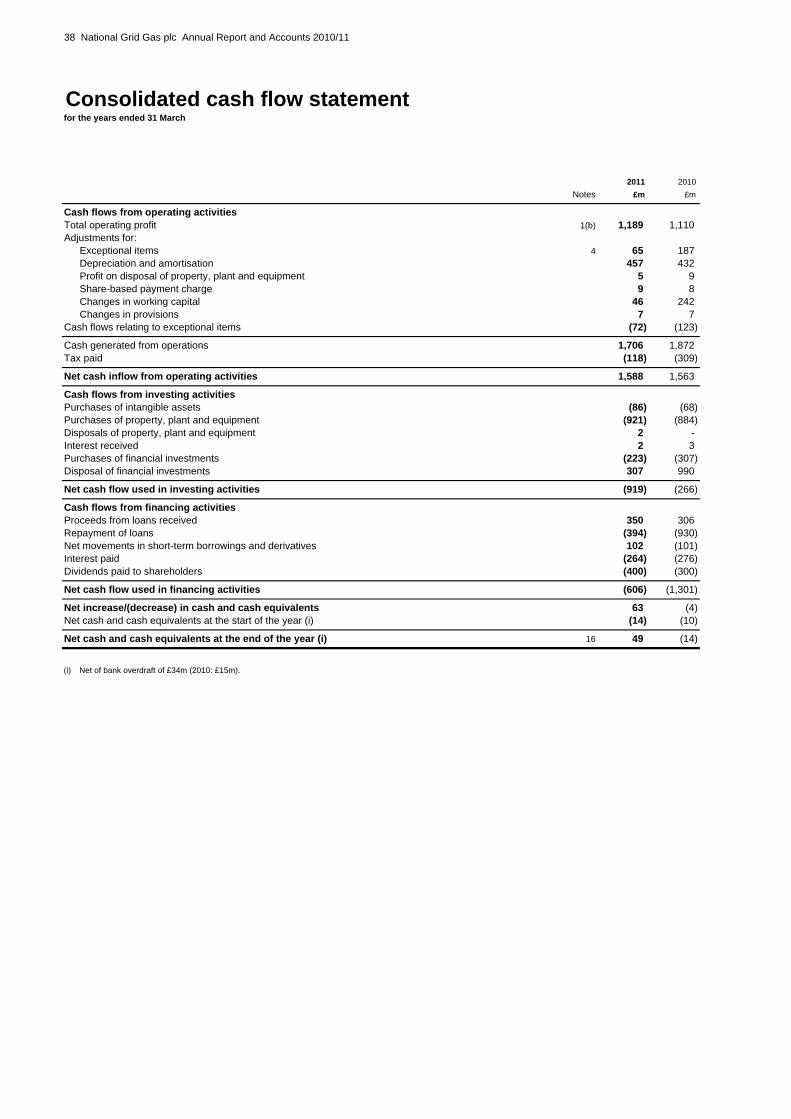
38 National Grid Gas plc Annual Report and Accounts 2010/11
Consolidated cash flow statementfor the years ended 31 March
2011 2010 Notes £m £m
Cash flows from operating activitiesTotal operating profit 1(b) 1,189 1,110Adjustments for:
Exceptional items 4 65 187Depreciation and amortisation 457 432Profit on disposal of property, plant and equipment 5 9Share-based payment charge 9 8Changes in working capital 46 242Changes in provisions 7 7
Cash flows relating to exceptional items (72) (123)
Cash generated from operations 1,706 1,872Tax paid (118) (309)
Net cash inflow from operating activities 1,588 1,563
Cash flows from investing activitiesPurchases of intangible assets (86) (68)Purchases of property, plant and equipment (921) (884)Disposals of property, plant and equipment 2 -Interest received 2 3Purchases of financial investments (223) (307)Disposal of financial investments 307 990
Net cash flow used in investing activities (919) (266)
Cash flows from financing activitiesProceeds from loans received 350 306Repayment of loans (394) (930)Net movements in short-term borrowings and derivatives 102 (101)Interest paid (264) (276)Dividends paid to shareholders (400) (300)
Net cash flow used in financing activities (606) (1,301)
Net increase/(decrease) in cash and cash equivalents 63 (4)Net cash and cash equivalents at the start of the year (i) (14) (10)
Net cash and cash equivalents at the end of the year (i) 16 49 (14)
(i) Net of bank overdraft of £34m (2010: £15m).

National Grid Gas plc Annual Report and Accounts 2010/11 39
Notes to the consolidated financial statements -analysis of items in the primary statements
1. Segmental analysis
Gas Transmission - the gas transmission network in the UK and the associated UK liquefied natural gas (LNG) storage activitiesGas Distribution - four of the eight regional networks of Great Britain's gas distribution systemGas Metering - regulated gas metering activities in the UK
a) RevenueSales Sales Sales Sales
Total between to third Total between to third sales businesses parties sales businesses parties 2011 2011 2011 2010 2010 2010
£m £m £m £m £m £m
Operating segments - continuing operationsGas Transmission 889 1 888 934 - 934Gas Distribution 1,522 44 1,478 1,516 55 1,461Gas Metering 311 - 311 329 - 329
Other activities 38 22 16 45 22 23
2,760 67 2,693 2,824 77 2,747
b) Operating profit/(loss)
Before exceptional items After exceptional items
2011 2010 2011 2010 £m £m £m £m
Operating segments - continuing operationsGas Transmission 420 450 412 350Gas Distribution 711 711 654 667Gas Metering 136 148 136 106
Other activities (13) (12) (13) (13)
1,254 1,297 1,189 1,110
Where revenue received or receivable exceeds the maximum amount permitted by regulatory agreement and adjustments will be made to future prices to reflect the over-recovery, no liablity is recognised. Similarly, no asset is recognised where a regulatory agreement permits adjustments to be made to future prices in respect of an under-recovery. There was an under-recovery of £51m at 31 March 2011 (2010: £50m).
Sales between businesses are priced having regard to the regulatory and legal requirements that the businesses are subject to, which include requirements to avoid cross-subsidies.
Our segments are unchanged from those reported in the financial statements for the year ended 31 March 2010. All of the Company's sales and operations take place within the UK.
Further details of the exceptional items and remeasurements are provided in note 4.
Other activities relate to the xoserve business which provides transportation transaction services on behalf of all the major gas network transportation companies, including ourselves, together with corporate activities.
The Board of Directors is National Grid Gas plc's chief operating decision making body (as defined by IFRS 8 on operating segments). The segmental analysis is based on the information the Board of Directors uses internally for the purposes of evaluating the performance of operating segments and determining resource allocation between segments. The performance of operating segments is assessed principally on the basis of operating profit before exceptional items. The following table describes the main activities for each operating segment:
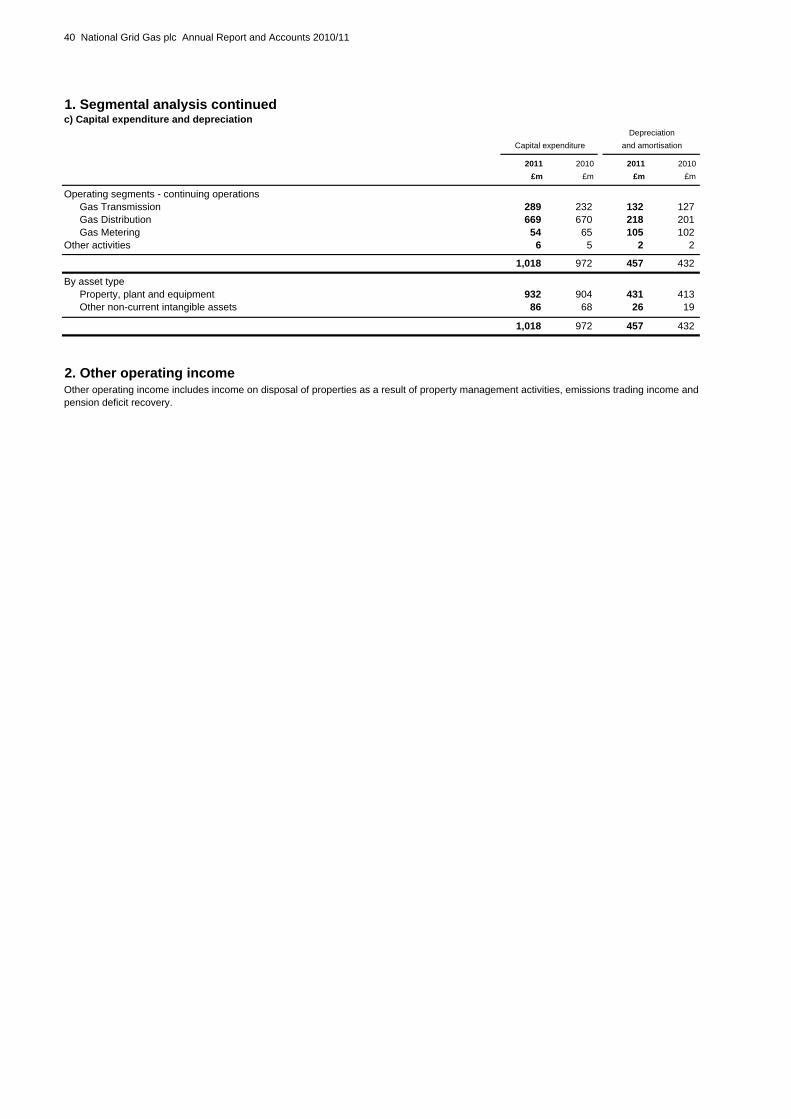
40 National Grid Gas plc Annual Report and Accounts 2010/11
1. Segmental analysis continuedc) Capital expenditure and depreciation
DepreciationCapital expenditure and amortisation
2011 2010 2011 2010 £m £m £m £m
Operating segments - continuing operationsGas Transmission 289 232 132 127Gas Distribution 669 670 218 201Gas Metering 54 65 105 102
Other activities 6 5 2 2
1,018 972 457 432
By asset typeProperty, plant and equipment 932 904 431 413Other non-current intangible assets 86 68 26 19
1,018 972 457 432
2. Other operating incomeOther operating income includes income on disposal of properties as a result of property management activities, emissions trading income and pension deficit recovery.

National Grid Gas plc Annual Report and Accounts 2010/11 41
3. Operating costsBefore exceptional items Exceptional items Total
2011 2010 2011 2010 2011 2010 £m £m £m £m £m £m
Depreciation and amortisation 457 432 - - 457 432Payroll costs 264 255 17 16 281 271Other operating charges:
Purchases of gas 142 156 - - 142 156Rates 239 247 - - 239 247Other 361 374 48 171 409 545
1,463 1,464 65 187 1,528 1,651
Operating costs include:Consumption of inventories 3 3Research expenditure 9 10Operating leases 16 16
(a) Payroll costs2011 2010
£m £m
Wages and salaries 254 267Social security costs 22 24Other pension costs 73 45Share-based payments (note 29) 8 8Severance costs (excluding pension costs) 10 13
367 357Less: payroll costs capitalised (86) (86)
281 271
(b) Number of employees, including Directors31 March Average Average
2011 2011 2010 Number Number Number
UKContinuing operations 5,931 6,045 6,311
(c) Key management compensation2011 2010
£m £m
Salaries and short-term employee benefits 3 3Post employment benefits 2 2Share-based payments 2 2
7 7
Key management comprises the Board of Directors of the Company together with those Executive Directors of National Grid plc who have managerial responsibility for any of the businesses of National Grid Gas plc and who are not also Directors of the Company.
The vast majority of employees are either directly or indirectly employed in the transmission and distribution of gas.
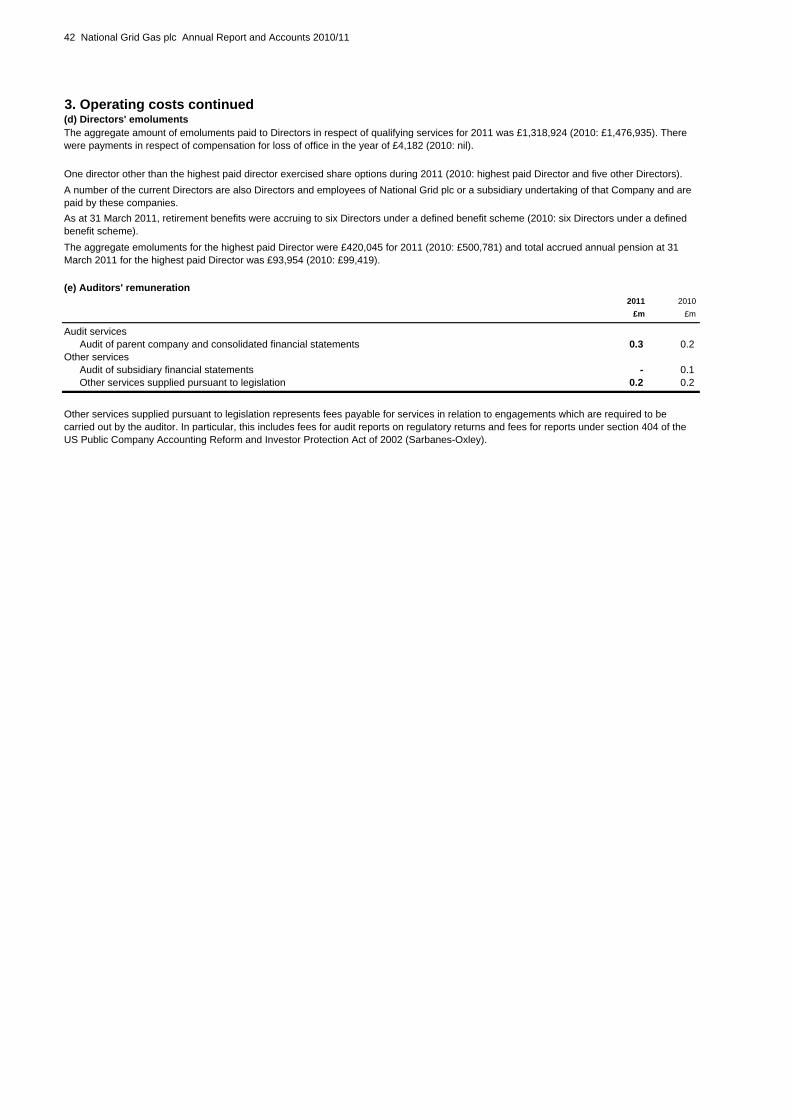
42 National Grid Gas plc Annual Report and Accounts 2010/11
3. Operating costs continued(d) Directors' emoluments
(e) Auditors' remuneration2011 2010
£m £m
Audit servicesAudit of parent company and consolidated financial statements 0.3 0.2
Other servicesAudit of subsidiary financial statements - 0.1Other services supplied pursuant to legislation 0.2 0.2
One director other than the highest paid director exercised share options during 2011 (2010: highest paid Director and five other Directors).
The aggregate emoluments for the highest paid Director were £420,045 for 2011 (2010: £500,781) and total accrued annual pension at 31 March 2011 for the highest paid Director was £93,954 (2010: £99,419).
Other services supplied pursuant to legislation represents fees payable for services in relation to engagements which are required to be carried out by the auditor. In particular, this includes fees for audit reports on regulatory returns and fees for reports under section 404 of the US Public Company Accounting Reform and Investor Protection Act of 2002 (Sarbanes-Oxley).
A number of the current Directors are also Directors and employees of National Grid plc or a subsidiary undertaking of that Company and are paid by these companies.As at 31 March 2011, retirement benefits were accruing to six Directors under a defined benefit scheme (2010: six Directors under a defined benefit scheme).
The aggregate amount of emoluments paid to Directors in respect of qualifying services for 2011 was £1,318,924 (2010: £1,476,935). There were payments in respect of compensation for loss of office in the year of £4,182 (2010: nil).

National Grid Gas plc Annual Report and Accounts 2010/11 43
4. Exceptional items and remeasurements2011 2010
£m £m
Included within operating profit:Exceptional items:
Restructuring costs (i) (57) (72)Environmental charges (ii) - (14)Pension deficit charges (iii) - (58)Other (iv) (8) (43)
(65) (187)
Included within finance costs:Exceptional items:
Debt redemption costs (v) (31) -Remeasurements:
Net gains on derivative financial instruments (vi) 7 33( )(24) 33
Total included within profit before tax (89) (154)Included within taxation:Exceptional credits arising on items not included in profit before tax:
Deferred tax credit arising on the reduction in the UK tax rate (vii) 144 -Tax on exceptional items 26 44Tax on remeasurements (2) (10)
168 34
Total exceptional items and remeasurements after tax 79 (120)
Total exceptional items after tax 74 (143)Total remeasurements after tax 5 23
Total exceptional items and remeasurements after tax 79 (120)
(i)
(ii)
(iii)
(iv)
(v)
(vi)
(vii)
Pension deficit charges in 2010 arise from recovery plan contributions to the National Grid UK Pension Scheme.
Remeasurements - net gains on derivative financial instruments comprise gains and losses arising on derivative financial instruments reported in the income statement. These exclude gains and losses for which hedge accounting has been effective, which have been recognised directly in other comprehensive income or which are offset by adjustments to the carrying value of debt.
The exceptional tax credit arises from a reduction in the UK corporation tax rate from 28% to 26% included and enacted in the Finance (No. 2) Act 2010 and the Provisional Collection of Taxes Act 1968 and applicable from 1 April 2011. This results in a reduction in deferred tax liabilities.
Restructuring costs include transformation related initiatives of £47m (2010: £23m), pension curtailment costs as a result of redundancies of £10m (2010: £10m) and the further restructuring of our Liquefied Natural Gas (LNG) storage facilities in 2010 of £39m.
Other costs for the year ended 31 March 2011 include an £8m penalty levied by Ofgem on our Gas Distribution business. Other costs for the year ended 31 March 2010 include £41m related to a fine of £15m levied by the Gas and Electricity Markets Authority (GEMA) together with associated costs, provisions against receivables and other balance sheet items. For further details of the fine levied on us by GEMA see note 24.
Environmental charges include £14m arising from changes in landfill tax legislation in the UK in 2010.
Debt redemption costs represent costs arising from our debt repurchase programme, undertaken primarily in the first half of the year, to manage our cash resources efficiently following the rights issue by National Grid.
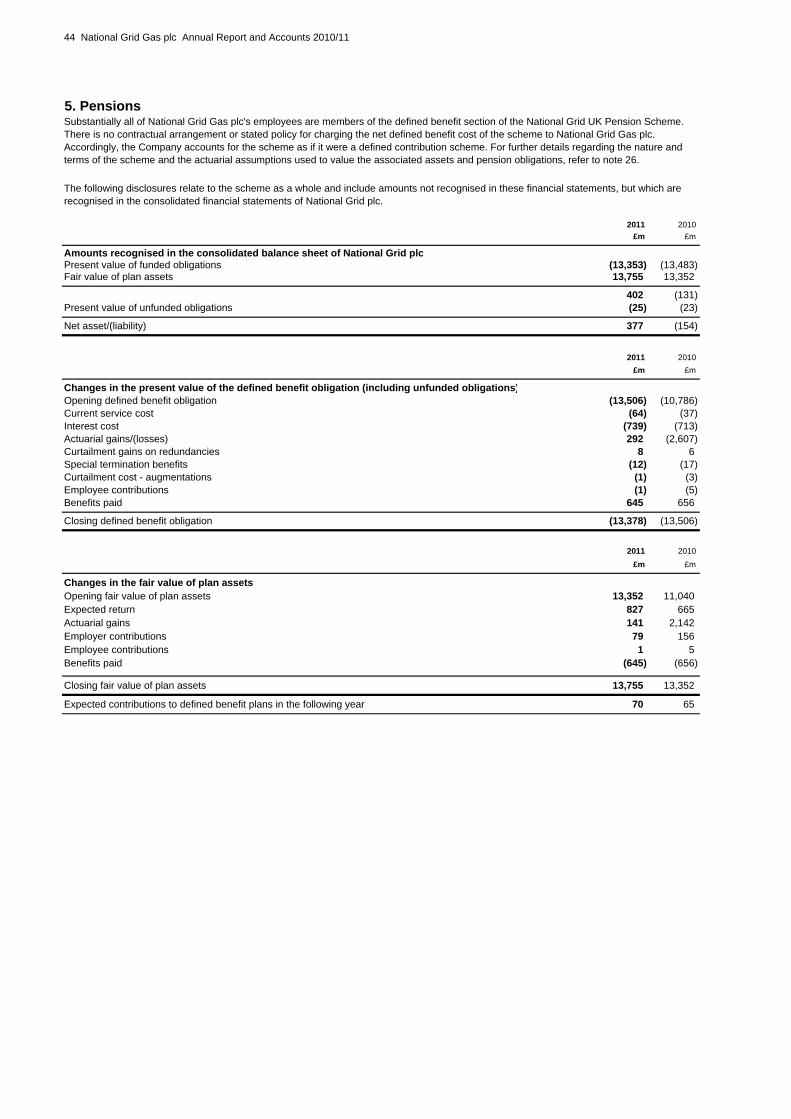
44 National Grid Gas plc Annual Report and Accounts 2010/11
5. Pensions
2011 2010 £m £m
Amounts recognised in the consolidated balance sheet of National Grid plcPresent value of funded obligations (13,353) (13,483)Fair value of plan assets 13,755 13,352
402 (131)Present value of unfunded obligations (25) (23)
Net asset/(liability) 377 (154)
2011 2010 £m £m
Changes in the present value of the defined benefit obligation (including unfunded obligations)Opening defined benefit obligation (13,506) (10,786)Current service cost (64) (37)Interest cost (739) (713)Actuarial gains/(losses) 292 (2,607)Curtailment gains on redundancies 8 6Special termination benefits (12) (17)Curtailment cost - augmentations (1) (3)Employee contributions (1) (5)Benefits paid 645 656
Closing defined benefit obligation (13,378) (13,506)
2011 2010 £m £m
Changes in the fair value of plan assetsOpening fair value of plan assets 13,352 11,040Expected return 827 665Actuarial gains 141 2,142Employer contributions 79 156Employee contributions 1 5Benefits paid (645) (656)
Closing fair value of plan assets 13,755 13,352
Expected contributions to defined benefit plans in the following year 70 65
Substantially all of National Grid Gas plc's employees are members of the defined benefit section of the National Grid UK Pension Scheme. There is no contractual arrangement or stated policy for charging the net defined benefit cost of the scheme to National Grid Gas plc. Accordingly, the Company accounts for the scheme as if it were a defined contribution scheme. For further details regarding the nature and terms of the scheme and the actuarial assumptions used to value the associated assets and pension obligations, refer to note 26.
The following disclosures relate to the scheme as a whole and include amounts not recognised in these financial statements, but which are recognised in the consolidated financial statements of National Grid plc.
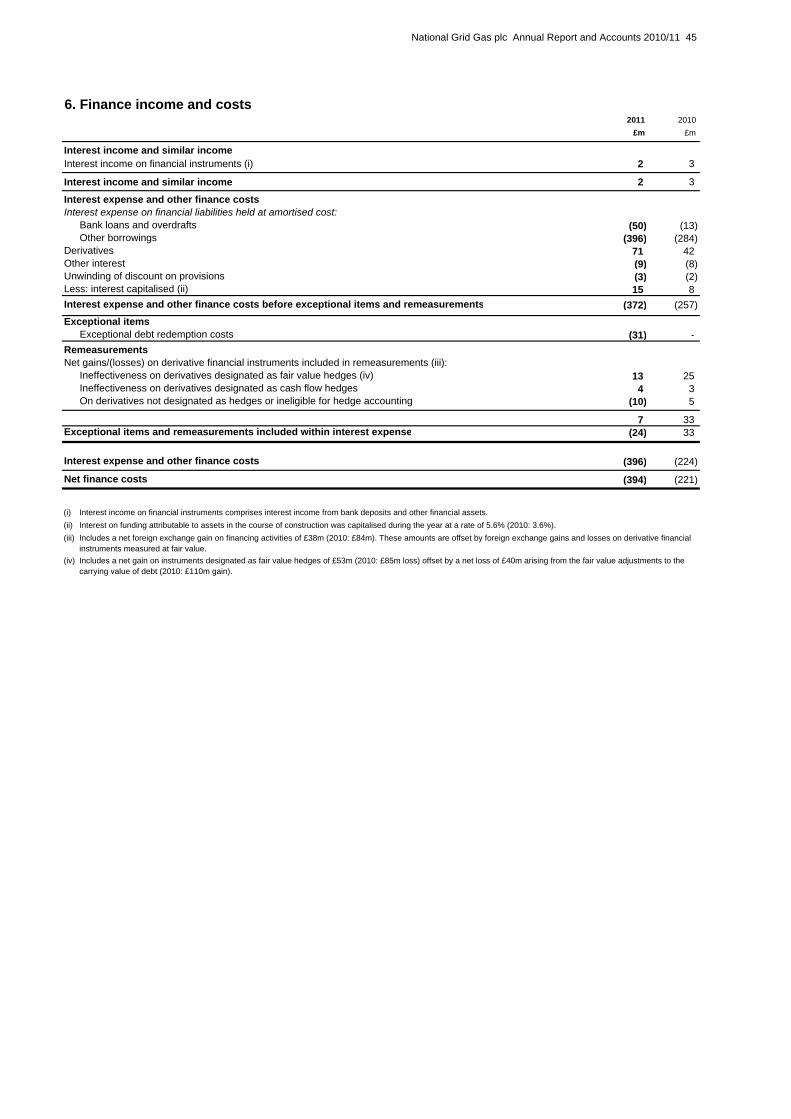
National Grid Gas plc Annual Report and Accounts 2010/11 45
6. Finance income and costs2011 2010
£m £m
Interest income and similar incomeInterest income on financial instruments (i) 2 3
Interest income and similar income 2 3
Interest expense and other finance costsInterest expense on financial liabilities held at amortised cost:
Bank loans and overdrafts (50) (13)Other borrowings (396) (284)
Derivatives 71 42Other interest (9) (8)Unwinding of discount on provisions (3) (2)Less: interest capitalised (ii) 15 8Interest expense and other finance costs before exceptional items and remeasurements (372) (257)Exceptional items
Exceptional debt redemption costs (31) -RemeasurementsNet gains/(losses) on derivative financial instruments included in remeasurements (iii):
Ineffectiveness on derivatives designated as fair value hedges (iv) 13 25Ineffectiveness on derivatives designated as cash flow hedges 4 3On derivatives not designated as hedges or ineligible for hedge accounting (10) 5
7 33Exceptional items and remeasurements included within interest expense (24) 33
Interest expense and other finance costs (396) (224)
Net finance costs (394) (221)
(i)(ii)(iii)
(iv)
Interest on funding attributable to assets in the course of construction was capitalised during the year at a rate of 5.6% (2010: 3.6%).Includes a net foreign exchange gain on financing activities of £38m (2010: £84m). These amounts are offset by foreign exchange gains and losses on derivative financial instruments measured at fair value.
Interest income on financial instruments comprises interest income from bank deposits and other financial assets.
Includes a net gain on instruments designated as fair value hedges of £53m (2010: £85m loss) offset by a net loss of £40m arising from the fair value adjustments to the carrying value of debt (2010: £110m gain).

46 National Grid Gas plc Annual Report and Accounts 2010/11
7. TaxationTaxation on items charged/(credited) to the income statement
Before exceptional items Exceptional itemsand remeasurements and remeasurements Total
2011 2010 2011 2010 2011 2010 £m £m £m £m £m £m
United KingdomCorporation tax at 28% 141 196 (23) (34) 118 162Corporation tax adjustment in respect of prior years 1 (5) - - 1 (5)
142 191 (23) (34) 119 157
Deferred tax 131 129 (144) - (13) 129Deferred tax adjustment in respect of prior years (5) 2 (1) - (6) 2
126 131 (145) - (19) 131
Total tax charge/(credit) 268 322 (168) (34) 100 288
Taxation on items charged/(credited) to other comprehensive income and equity2011 2010
£m £m
Deferred tax charge/(credit) on revaluation of cash flow hedges 2 (18)
Tax charge/(credit) recognised in consolidated statement of comprehensive income 2 (18)
Before After Before After exceptional exceptional exceptional exceptionalitems and items and items and items and
remeasure- remeasure- remeasure- remeasure- ments ments ments ments
2011 2011 2010 2010 £m £m £m £m
Profit before taxationBefore exceptional items and remeasurements 884 884 1,043 1,043Exceptional items and remeasurements - (89) - (154)
Profit before taxation from continuing operations 884 795 1,043 889
Profit on continuing operations multiplied by the rate of corporationtax in the UK of 28% 248 223 292 249Effects of:Adjustments in respect of prior years (4) (5) (3) (3)Expenses not deductible for tax purposes 3 3 3 4Impact of change in UK tax rate - (144) - -Other 21 23 30 38
Total taxation from continuing operations 268 100 322 288
% % % %
Effective tax rate 30.3 12.6 30.9 32.4
The tax charge for the year after exceptional items and remeasurements is lower (2010: higher) than the standard rate of corporation tax in the UK of 28% (2010: 28%). The differences are explained below:
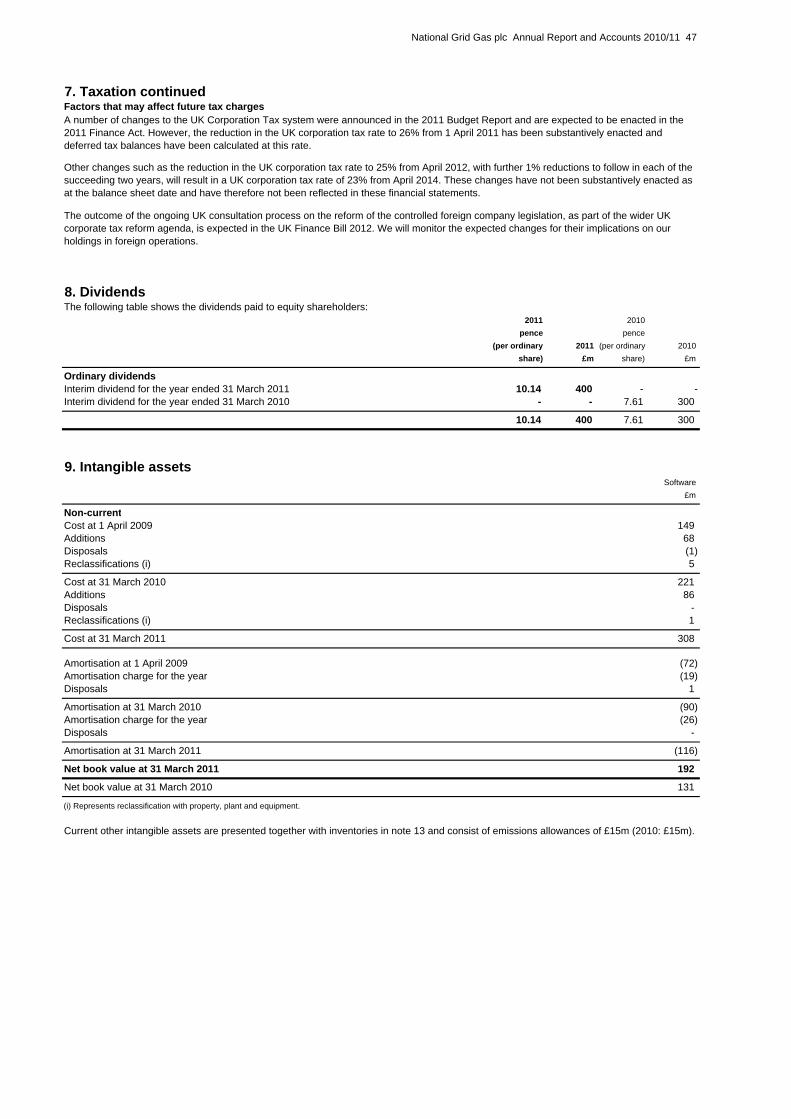
National Grid Gas plc Annual Report and Accounts 2010/11 47
7. Taxation continuedFactors that may affect future tax charges
8. DividendsThe following table shows the dividends paid to equity shareholders:
2011 2010 pence pence
(per ordinary 2011 (per ordinary 2010 share) £m share) £m
Ordinary dividendsInterim dividend for the year ended 31 March 2011 10.14 400 - -Interim dividend for the year ended 31 March 2010 - - 7.61 300
10.14 400 7.61 300
9. Intangible assetsSoftware
£m
Non-currentCost at 1 April 2009 149Additions 68Disposals (1)Reclassifications (i) 5
Cost at 31 March 2010 221Additions 86Disposals -Reclassifications (i) 1
Cost at 31 March 2011 308
Amortisation at 1 April 2009 (72)Amortisation charge for the year (19)Disposals 1
Amortisation at 31 March 2010 (90)Amortisation charge for the year (26)Disposals -
Amortisation at 31 March 2011 (116)
Net book value at 31 March 2011 192
Net book value at 31 March 2010 131
The outcome of the ongoing UK consultation process on the reform of the controlled foreign company legislation, as part of the wider UK corporate tax reform agenda, is expected in the UK Finance Bill 2012. We will monitor the expected changes for their implications on our holdings in foreign operations.
(i) Represents reclassification with property, plant and equipment.
Current other intangible assets are presented together with inventories in note 13 and consist of emissions allowances of £15m (2010: £15m).
Other changes such as the reduction in the UK corporation tax rate to 25% from April 2012, with further 1% reductions to follow in each of the succeeding two years, will result in a UK corporation tax rate of 23% from April 2014. These changes have not been substantively enacted as at the balance sheet date and have therefore not been reflected in these financial statements.
A number of changes to the UK Corporation Tax system were announced in the 2011 Budget Report and are expected to be enacted in the 2011 Finance Act. However, the reduction in the UK corporation tax rate to 26% from 1 April 2011 has been substantively enacted and deferred tax balances have been calculated at this rate.
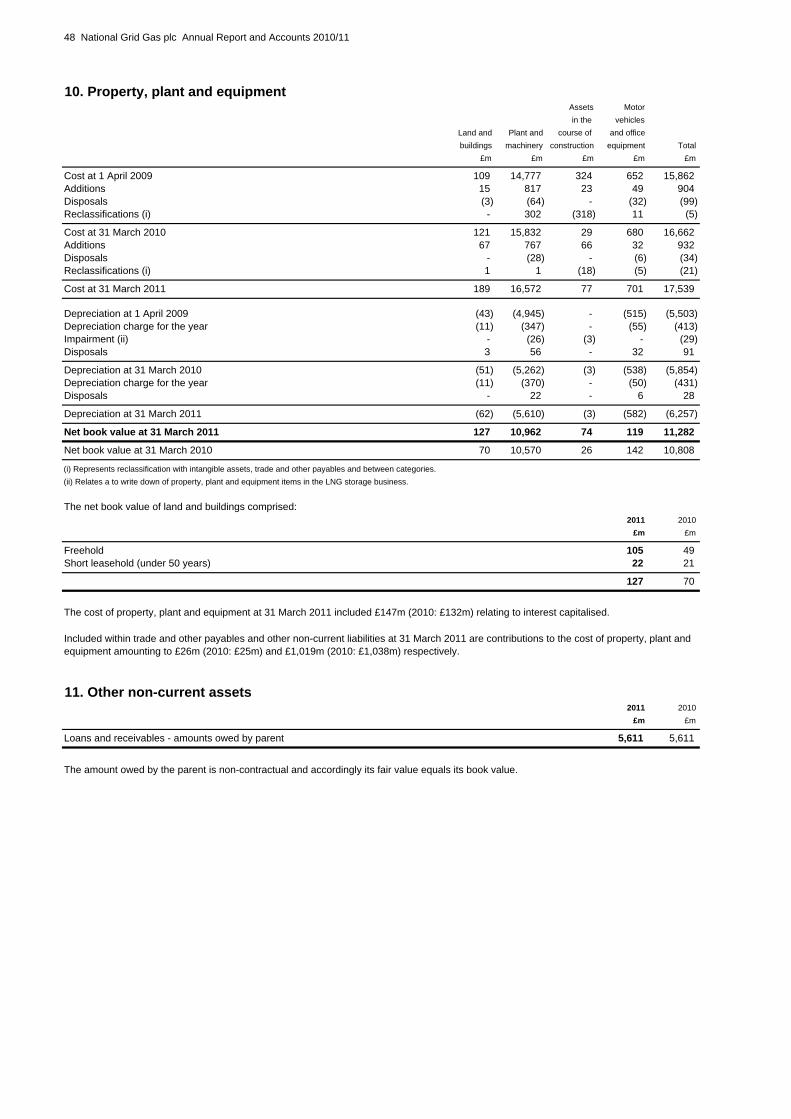
48 National Grid Gas plc Annual Report and Accounts 2010/11
10. Property, plant and equipmentAssets Motor in the vehicles
Land and Plant and course of and office buildings machinery construction equipment Total
£m £m £m £m £m
Cost at 1 April 2009 109 14,777 324 652 15,862Additions 15 817 23 49 904Disposals (3) (64) - (32) (99)Reclassifications (i) - 302 (318) 11 (5)
Cost at 31 March 2010 121 15,832 29 680 16,662Additions 67 767 66 32 932Disposals - (28) - (6) (34)Reclassifications (i) 1 1 (18) (5) (21)
Cost at 31 March 2011 189 16,572 77 701 17,539
Depreciation at 1 April 2009 (43) (4,945) - (515) (5,503)Depreciation charge for the year (11) (347) - (55) (413)Impairment (ii) - (26) (3) - (29)Disposals 3 56 - 32 91
Depreciation at 31 March 2010 (51) (5,262) (3) (538) (5,854)Depreciation charge for the year (11) (370) - (50) (431)Disposals - 22 - 6 28
Depreciation at 31 March 2011 (62) (5,610) (3) (582) (6,257)
Net book value at 31 March 2011 127 10,962 74 119 11,282
Net book value at 31 March 2010 70 10,570 26 142 10,808
The net book value of land and buildings comprised:2011 2010
£m £m
Freehold 105 49Short leasehold (under 50 years) 22 21
127 70
11. Other non-current assets2011 2010
£m £m
Loans and receivables - amounts owed by parent 5,611 5,611
The amount owed by the parent is non-contractual and accordingly its fair value equals its book value.
Included within trade and other payables and other non-current liabilities at 31 March 2011 are contributions to the cost of property, plant and equipment amounting to £26m (2010: £25m) and £1,019m (2010: £1,038m) respectively.
The cost of property, plant and equipment at 31 March 2011 included £147m (2010: £132m) relating to interest capitalised.
(i) Represents reclassification with intangible assets, trade and other payables and between categories.(ii) Relates a to write down of property, plant and equipment items in the LNG storage business.
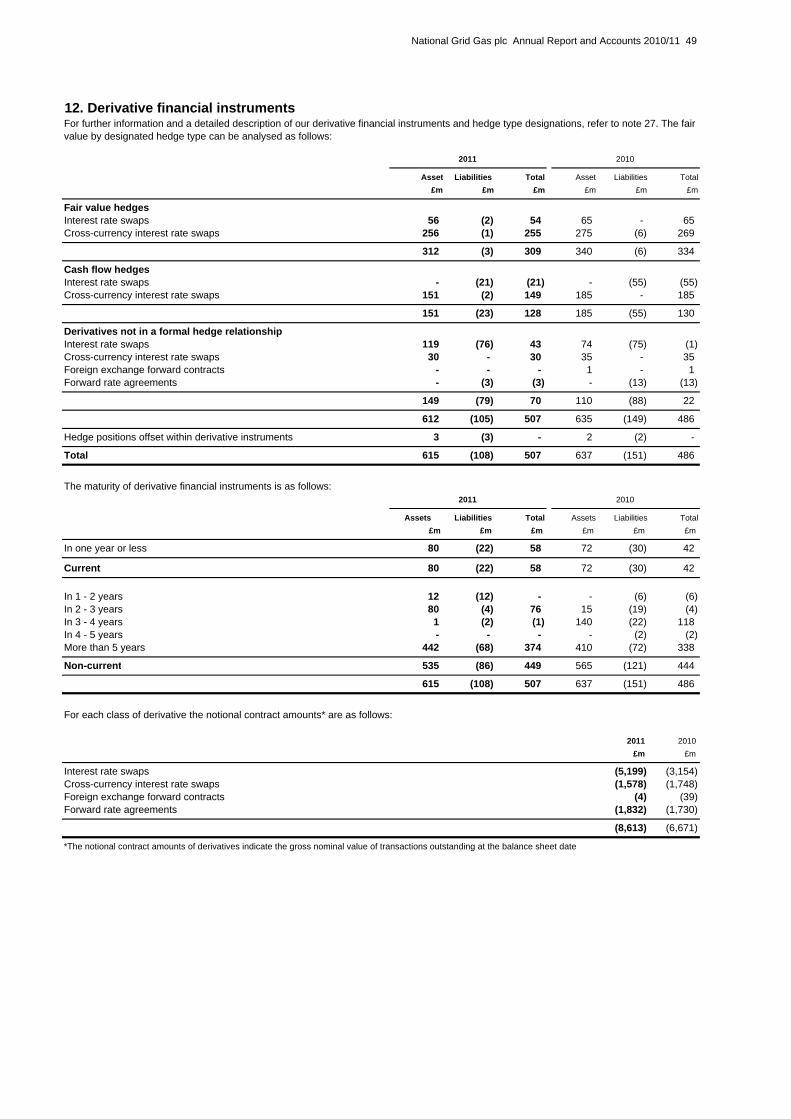
National Grid Gas plc Annual Report and Accounts 2010/11 49
12. Derivative financial instruments
2011 2010
Asset Liabilities Total Asset Liabilities Total£m £m £m £m £m £m
Fair value hedgesInterest rate swaps 56 (2) 54 65 - 65Cross-currency interest rate swaps 256 (1) 255 275 (6) 269
312 (3) 309 340 (6) 334
Cash flow hedgesInterest rate swaps - (21) (21) - (55) (55)Cross-currency interest rate swaps 151 (2) 149 185 - 185
151 (23) 128 185 (55) 130
Derivatives not in a formal hedge relationshipInterest rate swaps 119 (76) 43 74 (75) (1)Cross-currency interest rate swaps 30 - 30 35 - 35Foreign exchange forward contracts - - - 1 - 1Forward rate agreements - (3) (3) - (13) (13)
149 (79) 70 110 (88) 22
612 (105) 507 635 (149) 486
Hedge positions offset within derivative instruments 3 (3) - 2 (2) -
Total 615 (108) 507 637 (151) 486
The maturity of derivative financial instruments is as follows:2011 2010
Assets Liabilities Total Assets Liabilities Total£m £m £m £m £m £m
In one year or less 80 (22) 58 72 (30) 42
Current 80 (22) 58 72 (30) 42
In 1 - 2 years 12 (12) - - (6) (6)In 2 - 3 years 80 (4) 76 15 (19) (4)In 3 - 4 years 1 (2) (1) 140 (22) 118In 4 - 5 years - - - - (2) (2)More than 5 years 442 (68) 374 410 (72) 338
Non-current 535 (86) 449 565 (121) 444
615 (108) 507 637 (151) 486
2011 2010 £m £m
Interest rate swaps (5,199) (3,154)Cross-currency interest rate swaps (1,578) (1,748)Foreign exchange forward contracts (4) (39)Forward rate agreements (1,832) (1,730)
(8,613) (6,671)
*The notional contract amounts of derivatives indicate the gross nominal value of transactions outstanding at the balance sheet date
For further information and a detailed description of our derivative financial instruments and hedge type designations, refer to note 27. The fair value by designated hedge type can be analysed as follows:
For each class of derivative the notional contract amounts* are as follows:
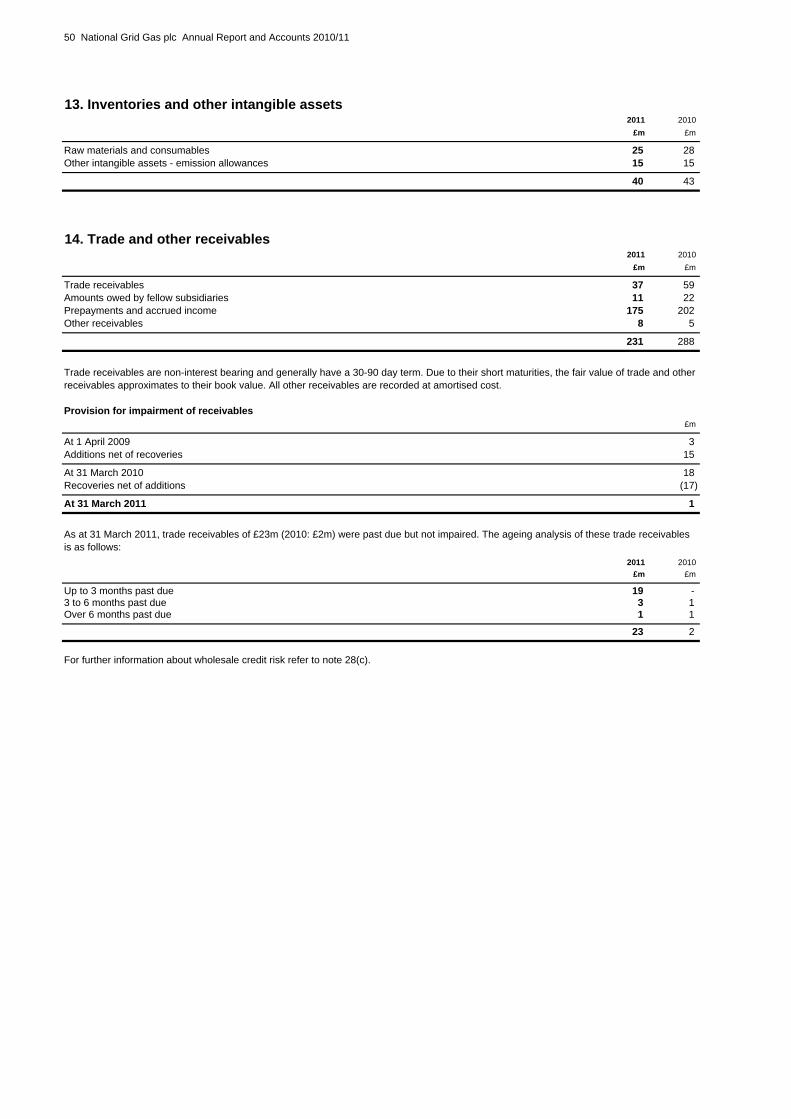
50 National Grid Gas plc Annual Report and Accounts 2010/11
13. Inventories and other intangible assets2011 2010
£m £m
Raw materials and consumables 25 28Other intangible assets - emission allowances 15 15
40 43
14. Trade and other receivables2011 2010
£m £m
Trade receivables 37 59Amounts owed by fellow subsidiaries 11 22Prepayments and accrued income 175 202Other receivables 8 5
231 288
Provision for impairment of receivables£m
At 1 April 2009 3Additions net of recoveries 15
At 31 March 2010 18Recoveries net of additions (17)
At 31 March 2011 1
2011 2010 £m £m
Up to 3 months past due 19 -3 to 6 months past due 3 1Over 6 months past due 1 1
23 2
For further information about wholesale credit risk refer to note 28(c).
As at 31 March 2011, trade receivables of £23m (2010: £2m) were past due but not impaired. The ageing analysis of these trade receivables is as follows:
Trade receivables are non-interest bearing and generally have a 30-90 day term. Due to their short maturities, the fair value of trade and other receivables approximates to their book value. All other receivables are recorded at amortised cost.
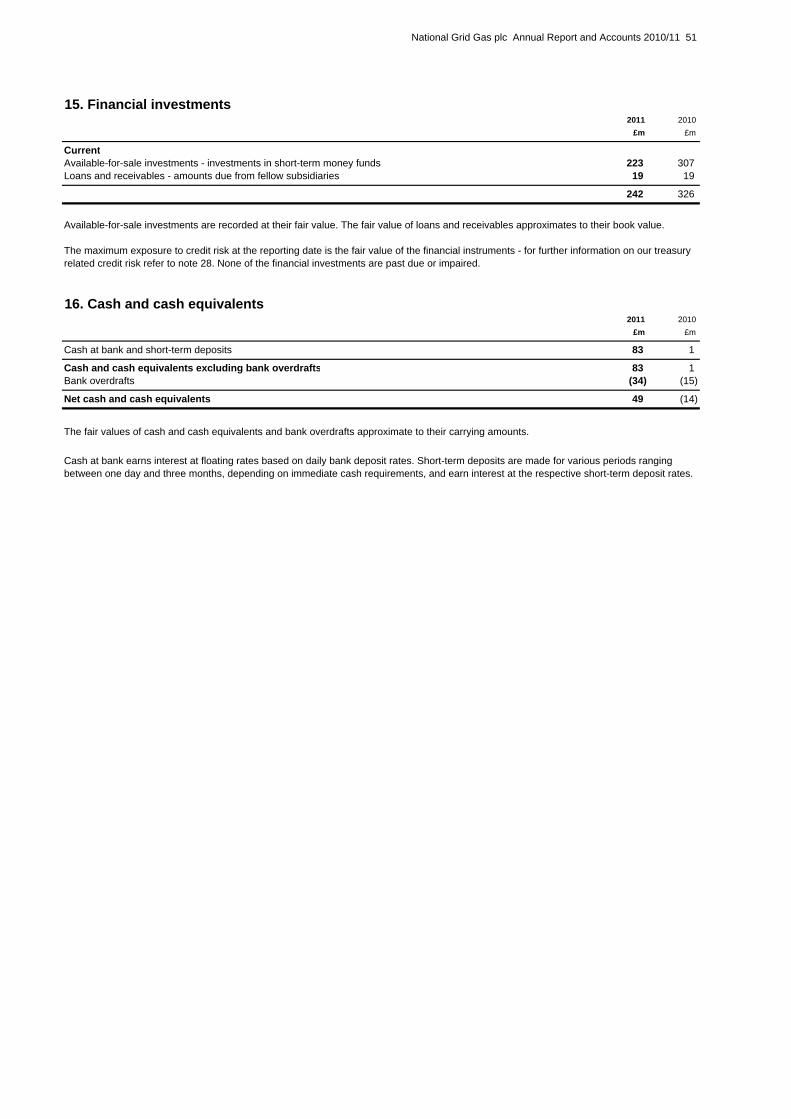
National Grid Gas plc Annual Report and Accounts 2010/11 51
15. Financial investments2011 2010
£m £m
CurrentAvailable-for-sale investments - investments in short-term money funds 223 307Loans and receivables - amounts due from fellow subsidiaries 19 19
242 326
Available-for-sale investments are recorded at their fair value. The fair value of loans and receivables approximates to their book value.
16. Cash and cash equivalents2011 2010
£m £m
Cash at bank and short-term deposits 83 1
Cash and cash equivalents excluding bank overdrafts 83 1Bank overdrafts (34) (15)
Net cash and cash equivalents 49 (14)
The fair values of cash and cash equivalents and bank overdrafts approximate to their carrying amounts.
The maximum exposure to credit risk at the reporting date is the fair value of the financial instruments - for further information on our treasury related credit risk refer to note 28. None of the financial investments are past due or impaired.
Cash at bank earns interest at floating rates based on daily bank deposit rates. Short-term deposits are made for various periods ranging between one day and three months, depending on immediate cash requirements, and earn interest at the respective short-term deposit rates.

52 National Grid Gas plc Annual Report and Accounts 2010/11
17. Borrowings
2011 2010 £m £m
CurrentBank loans 278 243Bonds 101 115Other loans 2 2Borrowings from fellow subsidiaries 369 74Bank overdrafts (note 16) 34 15
784 449
Non-currentBank loans 994 659Bonds 5,964 6,165Other loans 160 149Borrowings from fellow subsidiaries - 250
7,118 7,223
Total borrowings 7,902 7,672
Total borrowings are repayable as follows: 2011 2010 £m £m
Less than 1 year 784 449In 1 - 2 years 224 251In 2 - 3 years 501 222In 3 - 4 years 133 730In 4 - 5 years - 134In more than 5 years by instalments 51 -In more than 5 years other than by instalments 6,209 5,886
7,902 7,672
The notional amount outstanding of the debt portfolio as at 31 March 2011 was £8,048m (2010: £7,819m).
All of the unused facilities at 31 March 2011 and at 31 March 2010 were held as back-up to commercial paper and similar borrowings.
18. Trade and other payables2011 2010
£m £m
Trade payables 411 439Amounts owed to fellow subsidiaries 78 125Deferred income 147 136Social security and other taxes 67 72Other payables 44 34
747 806
The fair value of borrowings at 31 March 2011 was £8,081m (2010: £7,765m). Market values, where available, have been used to determine fair values. Where market values are not available, fair values have been calculated by discounting cash flows at prevailing interest rates.
Due to their short maturities, the fair value of trade and other payables (excluding deferred income) approximates to their book value. All trade and other payables are recorded at amortised cost.
Collateral is placed with or received from any counterparty where we have entered into a credit support annex to the ISDA Master Agreement once the current mark-to-market valuation of the trades between the parties exceeds an agreed threshold. Included in current bank loans is £275m (2010: £240m) in respect of cash received under collateral agreements. No cash has been placed under collateral agreements.
None of the Company's borrowings are secured by charges over assets of the Company.
As at 31 March 2011, the Company had committed credit facilities of £425m (2010: £700m) of which £425m was undrawn (2010: £700m undrawn). These undrawn facilities expire within three to four years.

National Grid Gas plc Annual Report and Accounts 2010/11 53
19. Other non-current liabilities2011 2010
£m £m
Trade payables 22 -Other payables - 4Deferred income 1,079 1,100
1,101 1,104
20. Deferred tax assets and liabilities
Deferred tax (assets)/liabilities Accelerated Share- Other net tax based Financial temporary
depreciation payments instruments differences Total £m £m £m £m £m
Deferred tax assets at 31 March 2009 - (3) - (14) (17)Deferred tax liabilities at 31 March 2009 1,736 - 26 32 1,794
At 1 April 2009 1,736 (3) 26 18 1,777Charged/(credited) to income statement 141 - (5) (5) 131Credited to equity - - (18) - (18)
At 31 March 2010 1,877 (3) 3 13 1,890
Deferred tax assets at 31 March 2010 - (3) - (19) (22)Deferred tax liabilities at 31 March 2010 1,877 - 3 32 1,912
At 1 April 2010 1,877 (3) 3 13 1,890Credited to income statement (7) (1) (2) (9) (19)Charged to equity - - 2 - 2
At 31 March 2011 1,870 (4) 3 4 1,873
Deferred tax assets at 31 March 2011 - (4) - (26) (30)Deferred tax liabilities at 31 March 2011 1,870 - 3 30 1,903
At 31 March 2011 1,870 (4) 3 4 1,873
Deferred tax assets are all offset against deferred tax liabilities.
At the balance sheet date there were no material current deferred tax assets or liabilities (2010: £nil).
The fair value of trade and other payables approximates to their book value. All other non-current liabilities are recorded at amortised cost.
The following are the major deferred tax assets and liabilities recognised, and the movements thereon, during the current and prior years:
Deferred tax assets in respect of capital losses of £15m (2010: £15m) have not been recognised as their future recovery is uncertain or not currently anticipated. The capital losses are available to carry forward indefinitely. The capital losses can be offset against specific types of future capital gains.
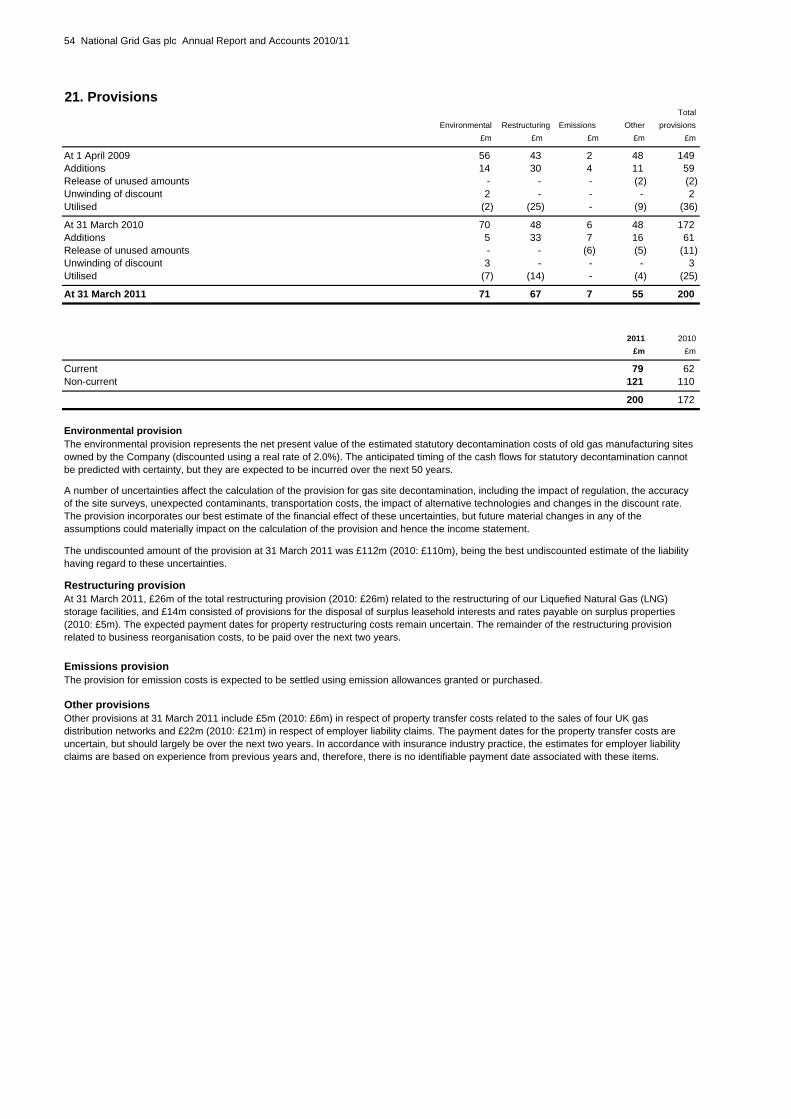
54 National Grid Gas plc Annual Report and Accounts 2010/11
21. ProvisionsTotal
Environmental Restructuring Emissions Other provisions £m £m £m £m £m
At 1 April 2009 56 43 2 48 149Additions 14 30 4 11 59Release of unused amounts - - - (2) (2)Unwinding of discount 2 - - - 2Utilised (2) (25) - (9) (36)
At 31 March 2010 70 48 6 48 172Additions 5 33 7 16 61Release of unused amounts - - (6) (5) (11)Unwinding of discount 3 - - - 3Utilised (7) (14) - (4) (25)
At 31 March 2011 71 67 7 55 200
2011 2010 £m £m
Current 79 62Non-current 121 110
200 172
Environmental provision
Restructuring provision
Emissions provision
Other provisionsOther provisions at 31 March 2011 include £5m (2010: £6m) in respect of property transfer costs related to the sales of four UK gas distribution networks and £22m (2010: £21m) in respect of employer liability claims. The payment dates for the property transfer costs are uncertain, but should largely be over the next two years. In accordance with insurance industry practice, the estimates for employer liability claims are based on experience from previous years and, therefore, there is no identifiable payment date associated with these items.
The environmental provision represents the net present value of the estimated statutory decontamination costs of old gas manufacturing sites owned by the Company (discounted using a real rate of 2.0%). The anticipated timing of the cash flows for statutory decontamination cannot be predicted with certainty, but they are expected to be incurred over the next 50 years.
A number of uncertainties affect the calculation of the provision for gas site decontamination, including the impact of regulation, the accuracy of the site surveys, unexpected contaminants, transportation costs, the impact of alternative technologies and changes in the discount rate. The provision incorporates our best estimate of the financial effect of these uncertainties, but future material changes in any of the assumptions could materially impact on the calculation of the provision and hence the income statement.
The undiscounted amount of the provision at 31 March 2011 was £112m (2010: £110m), being the best undiscounted estimate of the liability having regard to these uncertainties.
The provision for emission costs is expected to be settled using emission allowances granted or purchased.
At 31 March 2011, £26m of the total restructuring provision (2010: £26m) related to the restructuring of our Liquefied Natural Gas (LNG) storage facilities, and £14m consisted of provisions for the disposal of surplus leasehold interests and rates payable on surplus properties (2010: £5m). The expected payment dates for property restructuring costs remain uncertain. The remainder of the restructuring provision related to business reorganisation costs, to be paid over the next two years.

National Grid Gas plc Annual Report and Accounts 2010/11 55
22. Share capitalNumber Number
of shares of shares
2011 2010 2011 2010
millions millions £m £m
At 31 March 2010 and 2011 - ordinary shares of 12/15p each3,944 3,944 45 45
23. Consolidated cash flow statementa) Reconciliation of net cash flow to movement in net debt
2011 2010 £m £m
Movement in cash and cash equivalents 63 (4)Decrease in financial investments (84) (683)(Increase)/decrease in borrowings and derivatives (58) 725Net interest paid on the components of net debt 262 268
Change in net debt resulting from cash flows 183 306Changes in fair value of financial assets and liabilities 10 (33)Net interest charge on the components of net debt (404) (252)
Movement in net debt (net of related derivative financial instruments) in the year (211) 21Net debt (net of related derivative financial instruments) at the start of the year (6,859) (6,880)
Net debt (net of related derivative financial instruments) at the end of the year (7,070) (6,859)
b) Analysis of changes in net debt
Cash andcash Bank Net Financial Total
equivalents overdrafts cash investments Borrowings Derivatives debt£m £m £m £m £m £m £m
At 1 April 2009 - (10) (10) 1,009 (8,662) 783 (6,880)Cash flow 1 (5) (4) (686) 1,100 (104) 306Fair value gains and losses - - - - 202 (235) (33)Interest charges - - - 3 (297) 42 (252)
At 31 March 2010 1 (15) (14) 326 (7,657) 486 (6,859)Cash flow 82 (19) 63 (86) 275 (69) 183Fair value gains and losses - - - - (9) 19 10Interest charges - - - 2 (477) 71 (404)
At 31 March 2011 83 (34) 49 242 (7,868) 507 (7,070)
Balances at 31 March 2011 comprise:Non-current assets - - - - - 535 535Current assets 83 - 83 242 - 80 405Current liabilities - (34) (34) - (750) (22) (806)Non-current liabilities - - - - (7,118) (86) (7,204)
83 (34) 49 242 (7,868) 507 (7,070)
Allotted, called up and fully paid

56 National Grid Gas plc Annual Report and Accounts 2010/11
Notes to the consolidated financial statements -supplementary information
24. Commitments and contingenciesa) Future capital expenditure
2011 2010 £m £m
Contracted for but not provided 428 533
b) Operating lease commitmentsTotal commitments under non-cancellable operating leases were as follows:
2011 2010 £m £m
Amounts due:Less than 1 year 16 16In 1 - 2 years 11 11In 2 - 3 years 9 9In 3 - 4 years 7 8In 4 - 5 years 5 7More than 5 years 22 26
70 77
c) Amounts receivable under sublease arrangementsThe total of future minimum sublease payments expected to be received under non-cancellable subleases is £5m (2010: £5m).
d) Other commitments, contingencies and guarantees
e) Parent Company loan guarantees on behalf of subsidiaries
f) Litigation and claimsMetering competition investigation
Gas Distribution mains replacement investigationAs previously reported, in October 2008 we informed Ofgem that mains replacement activity carried out by our Gas Distribution business may have been inaccurately reported. Ofgem has now concluded its investigation and, following the reaching of a settlement between Ofgem and the Company, on 6 January 2011, Ofgem announced its proposed decision to impose a penalty of £8m and to find the Company in breach of certain obligations in respect of the reporting of mains replacement data. Ofgem also stated that the penalty would have been higher had it not been for the cooperation and corrective action by National Grid. On 10 March 2011, following the end of the period in which representations could be made, Ofgem wrote to the Company to confirm its decision. On 13 May 2011, we received the Final Penalty Notice and the penalty has now been paid.
The Company has guaranteed the repayment of principal sums, any associated premium and interest on specific loans due from its financial subsidiaries to third parties. At 31 March 2011, the sterling equivalent amounted to £1,104m (2010: £1,168m).
The value of other commitments, contingencies and guarantees at 31 March 2011 amounted to £121m (2010: £209m), including gas purchase commitments amounting to £102m (2010: £43m).
As previously reported, on 25 February 2008 the Gas and Electricity Markets Authority (GEMA) announced it had decided we had breached Chapter 11 of the Competition Act 1998 and Article 82 (now Article 102) of the Treaty of the Functioning of the European Union and fined us £41.6m. Following appeals, the Competition Appeal Tribunal reduced the fine to £30m and the Court of Appeal further reduced the fine to £15m. On 22 March 2010, we applied to the Supreme Court for leave to appeal the Court of Appeal's judgement. On 28 July 2010, the Supreme Court denied our application and this ends the legal process. The £15m fine was paid to GEMA on 1 April 2010.
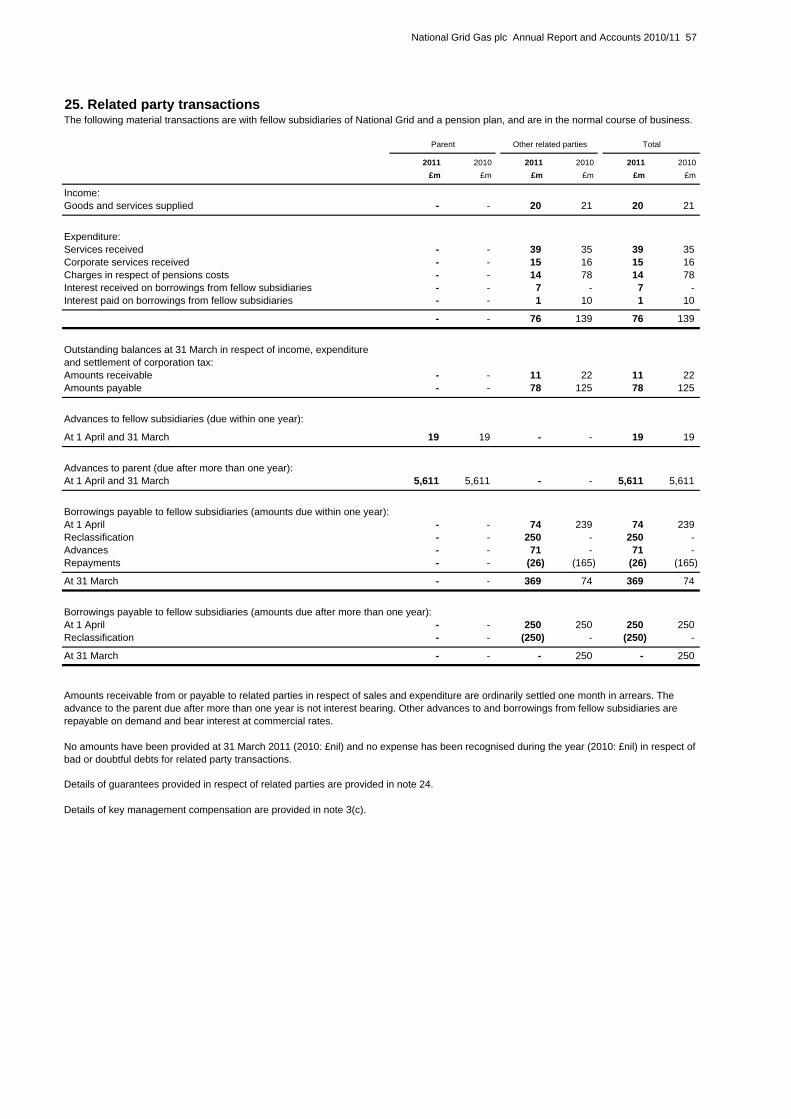
National Grid Gas plc Annual Report and Accounts 2010/11 57
25. Related party transactions
Parent Other related parties Total
2011 2010 2011 2010 2011 2010 £m £m £m £m £m £m
Income:Goods and services supplied - - 20 21 20 21
Expenditure:Services received - - 39 35 39 35Corporate services received - - 15 16 15 16Charges in respect of pensions costs - - 14 78 14 78Interest received on borrowings from fellow subsidiaries - - 7 - 7 -Interest paid on borrowings from fellow subsidiaries - - 1 10 1 10
- - 76 139 76 139
Outstanding balances at 31 March in respect of income, expenditureand settlement of corporation tax:Amounts receivable - - 11 22 11 22Amounts payable - - 78 125 78 125
Advances to fellow subsidiaries (due within one year):
At 1 April and 31 March 19 19 - - 19 19
Advances to parent (due after more than one year):At 1 April and 31 March 5,611 5,611 - - 5,611 5,611
Borrowings payable to fellow subsidiaries (amounts due within one year):At 1 April - - 74 239 74 239Reclassification - - 250 - 250 -Advances - - 71 - 71 -Repayments - - (26) (165) (26) (165)
At 31 March - - 369 74 369 74
Borrowings payable to fellow subsidiaries (amounts due after more than one year):At 1 April - - 250 250 250 250Reclassification - - (250) - (250) -
At 31 March - - - 250 - 250
Amounts receivable from or payable to related parties in respect of sales and expenditure are ordinarily settled one month in arrears. The advance to the parent due after more than one year is not interest bearing. Other advances to and borrowings from fellow subsidiaries are repayable on demand and bear interest at commercial rates.
The following material transactions are with fellow subsidiaries of National Grid and a pension plan, and are in the normal course of business.
No amounts have been provided at 31 March 2011 (2010: £nil) and no expense has been recognised during the year (2010: £nil) in respect of bad or doubtful debts for related party transactions.
Details of guarantees provided in respect of related parties are provided in note 24.
Details of key management compensation are provided in note 3(c).
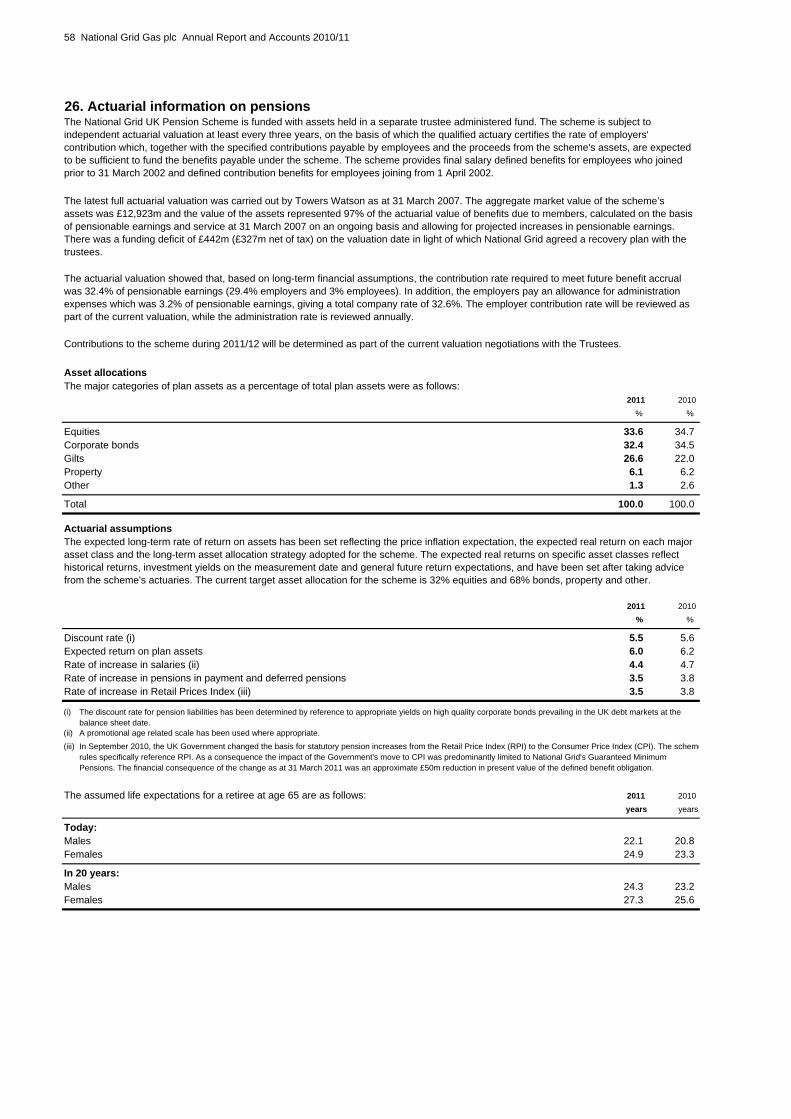
58 National Grid Gas plc Annual Report and Accounts 2010/11
26. Actuarial information on pensions
Asset allocationsThe major categories of plan assets as a percentage of total plan assets were as follows:
2011 2010 % %
Equities 33.6 34.7Corporate bonds 32.4 34.5Gilts 26.6 22.0Property 6.1 6.2Other 1.3 2.6
Total 100.0 100.0
Actuarial assumptions
2011 2010 % %
Discount rate (i) 5.5 5.6Expected return on plan assets 6.0 6.2Rate of increase in salaries (ii) 4.4 4.7Rate of increase in pensions in payment and deferred pensions 3.5 3.8Rate of increase in Retail Prices Index (iii) 3.5 3.8
(i)
(ii) A promotional age related scale has been used where appropriate.(iii)
The assumed life expectations for a retiree at age 65 are as follows: 2011 2010 years years
Today:Males 22.1 20.8Females 24.9 23.3
In 20 years:Males 24.3 23.2Females 27.3 25.6
The National Grid UK Pension Scheme is funded with assets held in a separate trustee administered fund. The scheme is subject to independent actuarial valuation at least every three years, on the basis of which the qualified actuary certifies the rate of employers' contribution which, together with the specified contributions payable by employees and the proceeds from the scheme's assets, are expected to be sufficient to fund the benefits payable under the scheme. The scheme provides final salary defined benefits for employees who joined prior to 31 March 2002 and defined contribution benefits for employees joining from 1 April 2002.
The latest full actuarial valuation was carried out by Towers Watson as at 31 March 2007. The aggregate market value of the scheme’s assets was £12,923m and the value of the assets represented 97% of the actuarial value of benefits due to members, calculated on the basis of pensionable earnings and service at 31 March 2007 on an ongoing basis and allowing for projected increases in pensionable earnings. There was a funding deficit of £442m (£327m net of tax) on the valuation date in light of which National Grid agreed a recovery plan with the trustees.
The actuarial valuation showed that, based on long-term financial assumptions, the contribution rate required to meet future benefit accrual was 32.4% of pensionable earnings (29.4% employers and 3% employees). In addition, the employers pay an allowance for administration expenses which was 3.2% of pensionable earnings, giving a total company rate of 32.6%. The employer contribution rate will be reviewed as part of the current valuation, while the administration rate is reviewed annually.
The expected long-term rate of return on assets has been set reflecting the price inflation expectation, the expected real return on each major asset class and the long-term asset allocation strategy adopted for the scheme. The expected real returns on specific asset classes reflect historical returns, investment yields on the measurement date and general future return expectations, and have been set after taking advice from the scheme's actuaries. The current target asset allocation for the scheme is 32% equities and 68% bonds, property and other.
The discount rate for pension liabilities has been determined by reference to appropriate yields on high quality corporate bonds prevailing in the UK debt markets at the balance sheet date.
In September 2010, the UK Government changed the basis for statutory pension increases from the Retail Price Index (RPI) to the Consumer Price Index (CPI). The schemerules specifically reference RPI. As a consequence the impact of the Government's move to CPI was predominantly limited to National Grid's Guaranteed Minimum Pensions. The financial consequence of the change as at 31 March 2011 was an approximate £50m reduction in present value of the defined benefit obligation.
Contributions to the scheme during 2011/12 will be determined as part of the current valuation negotiations with the Trustees.
National Grid Gas plc Annual Report and Accounts 2010/11 59
26. Actuarial information on pensions continued
Sensitivities to actuarial assumptionsChange in Change in
pension obligations annual pension cost2011 2010 2011 2010
£m £m £m £m
Sensitivities (all other assumptions held constant)0.1% change in discount rate 190 210 1 20.5% change in long term rate of increase in salaries 80 85 3 4Increase of one year in life expectations at age 60 420 430 2 2
27. Supplementary information on derivative financial instruments
Treasury financial instruments
Fair value hedges
Cash flow hedges
Derivatives not in a formal hedge relationship
Forward foreign currency contracts are used to hedge anticipated and committed future currency cash flows. Where these contracts qualify for hedge accounting, they are designated as cash flow hedges. On recognition of the underlying transaction in the financial statements, the associated hedge gains and losses deferred in equity are transferred and included with the recognition of the underlying transaction.
Derivatives are used for hedging purposes in the management of exposure to market risks. This enables the optimisation of the overall cost of accessing debt capital markets, and mitigates the market risk which would otherwise arise from the Company assets and liabilities.
Hedging policies using derivative financial instruments are further explained in note 28. Derivatives held as hedging instruments are formally designated as hedges as defined in IAS 39. Derivatives may qualify as hedges for accounting purposes if they are fair value hedges or cash flow hedges. These are described as follows:
When a hedging instrument expires or is sold, or when a hedge no longer meets the criteria for hedge accounting, any cumulative gain or loss existing in equity at that time remains in equity and is recognised when the forecast transaction is ultimately recognised in the income statement or on the balance sheet. When a forecast transaction is no longer expected to occur, the cumulative gain or loss that was reported in equity is immediately transferred to remeasurements within the income statement.
Exposure arises from the variability in future interest and currency cash flows on assets and liabilities which bear interest at variable rates or are in a foreign currency. Interest rate and cross-currency swaps are maintained, and designated as cash flow hedges where they qualify, to manage this exposure. Fair value changes on designated cash flow hedges are initially recognised directly in the cash flow hedge reserve, as gains or losses recognised in equity. Amounts are transferred from equity and recognised in the income statement as the income or expense is recognised on the hedged asset or liability.
Fair value hedges principally consist of interest rate and cross-currency swaps that are used to protect against changes in the fair value of fixed-rate, long-term financial instruments due to movements in market interest rates. For qualifying fair value hedges, all changes in the fair value of the derivative and changes in the fair value of the item in relation to the risk being hedged are recognised in the income statement. If the hedge relationship is terminated, the fair value adjustment to the hedged item continues to be reported as part of the basis of the item and is amortised to the income statement as a yield adjustment over the remainder of the life of the hedged item.
Derivatives are financial instruments that derive their value from the price of an underlying item such as interest rates, foreign exchange, credit spreads, or other indices. Derivatives enable their users to alter exposure to market or credit risks. We use derivatives to manage our treasury risks.
The gains and losses on ineffective portions of such derivatives are recognised immediately in remeasurements within the income statement.
Our policy is not to use derivatives for trading purposes. However, due to the complex nature of hedge accounting under IAS 39, some derivatives may not qualify for hedge accounting, or are specifically not designated as a hedge where natural offset is more appropriate. Changes in the fair value of any derivative instruments that do not qualify for hedge accounting are recognised immediately in remeasurements within the income statement.

60 National Grid Gas plc Annual Report and Accounts 2010/11
28. Financial risk
(a) Market risk(i) Foreign exchange risk
2011
Sterling Euro Dollar Other Total£m £m £m £m £m
Cash and cash equivalents 82 1 - - 83Financial investments 242 - - - 242Borrowings (i) (5,962) (876) (719) (345) (7,902)
Pre-derivative position (5,638) (875) (719) (345) (7,577)Derivative effect (1,406) 848 720 345 507
Net debt position (7,044) (27) 1 - (7,070)
2010
Sterling Euro Dollar Other Total£m £m £m £m £m
Cash and cash equivalents 1 - - - 1Financial investments 326 - - - 326Borrowings (i) (5,510) (1,119) (713) (330) (7,672)
Pre-derivative position (5,183) (1,119) (713) (330) (7,345)Derivative effect (1,687) 1,129 714 330 486
Net debt position (6,870) 10 1 - (6,859)
(i) Includes bank overdrafts
Risk management related to financial activities is carried out by a central treasury department under policies approved by the Boards of Directors of National Grid plc and the Company. This department identifies, evaluates and hedges financial risks in close co-operation with the operating units. The Boards provide written principles for overall risk management, as well as written policies covering specific areas, such as foreign exchange risk, interest rate risk, credit risk, use of derivative financial instruments and non-derivative financial instruments, and investment of excess liquidity as discussed further in our treasury policy, described on page 18 of the Operating and Financial Review.
With respect to near term foreign exchange risk, we use foreign exchange forwards to manage foreign exchange transaction exposure. Our policy is to hedge a minimum percentage of known contracted foreign currency flows in order to mitigate foreign currency movements in the intervening period. Where cash forecasts are less certain, we generally cover a percentage of the foreign currency flows depending on the level of agreed probability for those future cash flows.
We are exposed to foreign exchange risk arising from non-sterling future commercial transactions and non-sterling recognised assets and liabilities.
There was no significant currency exposure on other financial instruments, including trade receivables and payables and other receivables and payables.
Our activities expose us to a variety of financial risks: market risk, including foreign exchange risk; fair value interest rate risk and cash flow interest rate risk; credit risk; and liquidity risk. The overall risk management programme focuses on the unpredictability of financial markets and seeks to minimise potential adverse effects on financial performance. Derivative financial instruments are used to hedge certain risk exposures.
During the years ended 31 March 2011 and 2010, derivative financial instruments were used to manage foreign exchange risk as follows:
National Grid Gas plc Annual Report and Accounts 2010/11 61
28. Financial risk continued(a) Market risk continued(ii) Cash flow and fair value interest rate risk
Interest rate risk arising from our financial investments is primarily variable being mainly composed of short-dated money funds.
2011 2010 £m £m
Fixed interest rate borrowingsLess than 1 year (83) (98)In 1 - 2 years (24) (1)In 2 - 3 years (501) (22)In 3 - 4 years - (730)In 4 - 5 years - -More than 5 years (2,658) (2,777)
(3,266) (3,628)Floating interest rate borrowings (including RPI linked) (4,583) (4,044)Non-interest bearing borrowings (53) -
Total borrowings (7,902) (7,672)
2011
Fixed Floatingrate rate RPI (i) Other (ii) Total£m £m £m £m £m
Cash and cash equivalents 83 - - - 83Financial investments - 242 - - 242Borrowings (iii) (3,266) (958) (3,625) (53) (7,902)
Pre-derivative position (3,183) (716) (3,625) (53) (7,577)Derivative effect 1,413 (1,135) 229 - 507
Net debt position (iv) (1,770) (1,851) (3,396) (53) (7,070)
2010
Fixed Floatingrate rate RPI(i) Other (ii) Total£m £m £m £m £m
Cash and cash equivalents 1 - - - 1Financial investments - 326 - - 326Borrowings (iii) (3,628) (914) (3,130) - (7,672)
Pre-derivative position (3,627) (588) (3,130) - (7,345)Derivative effect 756 (387) 117 - 486
(2,871) (975) (3,013) - (6,859)
(i) The post-derivative impact represents financial instruments linked to UK RPI.(ii)(iii) Includes bank overdrafts
(iv) The post derivative impact includes short-dated derivative contracts maturing within 12 months of the balance sheet date.
Represents financial instruments which are not directly affected by interest rate risk, including investments in equity or other non-interest bearing instruments.
During the years ended 31 March 2011 and 2010, net debt was managed using derivative instruments to hedge interest rate risk as follows:
Interest rate risk arises on our borrowings. Borrowings issued at variable rates expose us to cash flow interest rate risk. Borrowings issued at fixed rates expose us to fair value interest rate risk. Our interest rate risk management policy as further explained on page 19 is to minimise the finance costs (being interest costs and changes in the market value of debt) subject to certain constraints. Some of our borrowings issued are index-linked, that is their cost is linked to changes in the UK Retail Prices Index (RPI). We believe that these borrowings provide a hedge for revenues and regulatory asset values that are also RPI-linked.
The following table sets out the carrying amount, by contractual maturity, of borrowings that are exposed to interest rate risk before taking into account interest rate swaps:

62 National Grid Gas plc Annual Report and Accounts 2010/11
28. Financial risk continued(b) Fair value analysis
Level 1 Level 2 Level 3 Total Level 1 Level 2 Level 3 Total£m £m £m £m £m £m £m £m
AssetsAvailable-for-sale investments 223 - - 223 307 - - 307Derivative financial instruments - 614 1 615 - 635 2 637
223 614 1 838 307 635 2 944
LiabilitiesDerivative financial instruments - (108) - (108) - (151) - (151)
Total 223 506 1 730 307 484 2 793
During the year no transfers have been made between the hierarchy levels.
2011 2010 Level 3 Level 3
Valuation Valuation£m £m
At 1 April 2 (1)Net gains for the year (i) - 3Settlements (1) -At 31 March 1 2(i)
2010
The financial instruments classified as level 3 are currency swaps where the currency forward curve is illiquid. The changes in the value of our level 3 derivative financial instruments are as follows:
Level 1: Financial instruments with quoted prices for identical instruments in active markets.
Level 2: Financial instruments with quoted prices for similar instruments in active markets or quoted prices for identical or similar instruments in inactive markets and financial instruments valued using models where all significant inputs are based directly or indirectly on observable market data. Level 3: Financial instruments valued using techniques where one or more significant inputs are based on unobservable market data.
A reasonably possible change in assumptions is unlikely to result in a material change in the fair value of the level 3 instruments.
Gains are attributable to assets or liabilities held at the end of the reporting period and have been recognised in finance costs in the income statement
2011
The following is an analysis of our financial instruments measured at fair value. They are reported in a tiered hierarchy based on the valuation methodology described on page 19, and reflecting the significance of market observable inputs. The best evidence of fair value is a quoted price in an actively traded market. In the event that the market for a financial instrument is not active, a valuation technique is used.
National Grid Gas plc Annual Report and Accounts 2010/11 63
28. Financial risk continued(c) Credit risk
Treasury related credit risk
Wholesale and retail credit risk
(d) Liquidity analysis
Due Due DueDue between between 3 years
within 1 and 2 2 and 3 and1 year years years beyond Total
At 31 March 2011 £m £m £m £m £m
Non-derivative financial liabilitiesBorrowings (679) (223) (501) (6,645) (8,048)Interest payments on borrowings (i) (237) (237) (219) (3,494) (4,187)Other non-interest bearing liabilities (455) (22) - - (477)
Derivative financial liabilitiesDerivative contracts - receipts 95 119 132 726 1,072Derivative contract - payments (23) (32) (23) (549) (627)
Total at 31 March 2011 (1,299) (395) (611) (9,962) (12,267)
Due Due DueDue between between 3 years
within 1 and 2 2 and 3 and1 year years years beyond Total
At 31 March 2010 £m £m £m £m £m
Non-derivative financial liabilitiesBorrowings (330) (252) (221) (7,091) (7,894)Interest payments on borrowings (i) (248) (253) (256) (3,819) (4,576)Other non-interest bearing liabilities (473) (4) - - (477)
Derivative financial liabilitiesDerivative contract - receipts 135 77 91 893 1,196Derivative contract - payments (60) (41) (48) (637) (786)
Total at 31 March 2010 (976) (473) (434) (10,654) (12,537)
(i)
The counterparty exposure under derivative financial contracts as shown in note 12 was £615m (2010: £637m); after netting agreements it was £576m (2010: £550m). This exposure is further reduced by collateral received as shown in note 17.
We determine our liquidity requirements by the use of both short and long-term cash flow forecasts. These forecasts are supplemented by a financial headroom analysis which is used to assess funding adequacy for at least a 12 month period.
The interest on borrowings is calculated based on borrowings held at 31 March without taking account of future issues. Floating rate interest is estimated using a forward interest rate curve as at 31 March. Payments are included on the basis of the earliest date on which the Company can be required to settle.
Our principal commercial exposure is governed by the credit rules within the Uniform Network Code. These lay down the level of credit relative to the regulatory asset value for each credit rating. Sales to retail customers, such as those requiring connections, are usually settled in cash or using major credit cards. Management does not expect any significant losses of receivables that have not been provided for as shown in note 14.
Counterparty risk arises from the investment of surplus funds and from the use of derivative instruments. Our limits are managed by the central treasury department of National Grid, as explained in our treasury policy on page 18 to 20.
The following is an analysis of the contractual undiscounted cash flows payable under financial liabilities, and derivative assets and liabilities as at the balance sheet date:
As at 31 March 2011 and 2010, we had a number of exposures to individual counterparties. In accordance with our treasury policies and exposure management practices, counterparty credit exposure limits are continually monitored and no individual exposure is considered significant in the ordinary course of treasury management activity. We do not expect any significant losses from non-performance by these counterparties.
Credit risk is the risk of loss resulting from counterparties' default on their commitments including failure to pay or make a delivery on a contract. Credit risk is managed on a portfolio basis for National Grid as a whole. Credit risk arises from cash and cash equivalents, derivative financial instruments, and deposits with banks and financial institutions, as well as credit exposures to wholesale and retail customers, including outstanding receivables and committed transactions.
64 National Grid Gas plc Annual Report and Accounts 2010/11
28. Financial risk continued(e) Sensitivity analysis
The following assumptions were made in calculating the sensitivity analysis:•
•
•
••
••
•
2011 2010
Other OtherIncome Equity Income Equity
statement Reserves statement Reserves-/+ £m -/+ £m -/+ £m -/+ £m
UK Retail Prices Index +/- 0.50% 12 - 10 -UK interest rates +/- 0.50% 7 13 5 16
The income statement sensitivities impact interest expense and financial instrument remeasurements.
(f) Capital and risk management
Our licence and some of our bank loan agreements impose lower limits for the long-term credit ratings that the Company must hold. These requirements are monitored on a regular basis in order to ensure compliance.
sensitivity to the Retail Prices Index does not take into account any changes to revenue or operating costs that are affected by the Retail Prices Index or inflation generally.
the floating leg of any swap or any floating rate debt is treated as not having any interest rate already set, therefore a change in interest rates affects a full 12 month period for the accrued interest portion of the sensitivity calculations; and
The sensitivity analysis has been prepared on the basis that the amount of net debt, the ratio of fixed to floating interest rates of the debt and derivatives portfolio, and the proportion of financial instruments in foreign currencies are all constant, and on the basis of the hedge designations in place at 31 March 2011 and 31 March 2010, respectively. As a consequence, this sensitivity analysis relates to the positions at those dates and is not representative of the years then ended, as all of these varied.
the sensitivity of accrued interest to movements in interest rates is calculated on net floating rate exposures on debt, deposits and derivative instruments;
The analysis excludes the impact of movements in market variables on the carrying value of provisions.
Financial instruments affected by market risk include borrowings, deposits and derivative financial instruments. The following analysis illustrates the sensitivity to changes in market variables, being UK interest rates and the UK Retail Prices Index.
debt with a maturity below one year is floating rate for the accrued interest part of the calculation;
the balance sheet sensitivity to interest rates relates only to derivative financial instruments and available-for-sale investments, as debt and other deposits are carried at amortised cost and so their carrying value does not change as interest rates move;
changes in the carrying value of derivative financial instruments not in hedging relationships only affect the income statement;
Our objective when managing capital is to safeguard the Company's ability to continue as a going concern and to remain within regulatory constraints. The principal measure of balance sheet efficiency is gearing calculated as net debt expressed as a percentage of regulatory asset value. The gearing ratio at 31 March 2011 was 54% compared with 57% at 31 March 2010. We regularly review and maintain or adjust the capital structure as appropriate in order to manage the level of gearing.
all other changes in the carrying value of derivative financial instruments designated as hedges are fully effective with no impact on the income statement;
changes in the carrying value of derivatives from movements in interest rates designated as cash flow hedges are assumed to be recorded fully within equity;
Using the above assumptions, the following table shows the illustrative impact on the income statement and items that are recognised directly in equity that would result from reasonably possible movements in changes in the UK Retail Prices Index and UK interest rates, after the effects of tax.

National Grid Gas plc Annual Report and Accounts 2010/11 65
29. Share options and reward plans
Active share plans
Additional information in respect of active share plans (excluding Sharesave scheme)2011 2010
millions millions
Awards of ordinary shares at 1 April 1.3 1.4Impact of rights issue 0.2 -Awards made 0.6 0.5Lapses/forfeits (0.2) -Awards vested - (0.6)
Awards of ordinary shares at 31 March 1.9 1.3
Conditional awards available for release at 31 March 0.2 -
Non-active share plans
Deferred Share Plan - 50% of any Annual Performance Plan awarded to Executive Directors of National Grid and a fixed percentage awarded to senior employees is automatically deferred into National Grid shares which are held in trust for three years before release.
PSP - awards delivered in National Grid shares are made to Executive Directors of National Grid and senior employees. The criteria are based on National Grid's total shareholder return (50%) when compared to FTSE 100 and annualised growth of National Grid's EPS (50%) when compared to growth in RPI.
National Grid operates three principal forms of share option and award plans in which our employees and Directors participate. These plans include an employee Sharesave scheme, a Performance Share Plan (PSP) and the Deferred Share Plan.
Sharesave scheme - share options are offered to employees at 80% of the market price at the time of invitation. The share options are exercisable on completion of a three and/or five year Save As You Earn contract.
We also have historical plans where awards are still outstanding but no further awards will be granted. These include the Executive Share Option Plan for which details of movements are provided below.
On 14 June 2010, National Grid completed a rights issue. The number of shares allocated to employees under share plans has been adjusted to reflect the bonus element of the rights issue. The terms of National Grid's share plans were adjusted such that participants of the various plans were no better or worse off as a result of the rights issue.

66 National Grid Gas plc Annual Report and Accounts 2010/11
29. Share options and reward plans continuedShare options - Sharesave scheme and Executive Share Option Plan
Sharesave Executive Plan Totalscheme options options options
Weighted Weighted average average
price price £ millions £ millions millions
At 31 March 2009 4.86 12.0 4.57 0.1 12.1Granted 5.20 2.4 - - 2.4Lapsed - expired 5.41 (0.6) - - (0.6)Exercised 3.96 (2.4) - - (2.4)
At 31 March 2010 5.10 11.4 4.59 0.1 11.5Impact of rights issue - 1.4 - - 1.4Granted 4.45 2.7 - - 2.7Lapsed - expired 4.63 (0.8) - - (0.8)Exercised 5.11 (2.1) - - (2.1)
At 31 March 2011 4.43 12.6 3.80 0.1 12.7
ExercisableAt 31 March 2011 4.84 0.9 3.80 0.1 1.0
At 31 March 2010 5.15 0.5 4.41 0.1 0.6
Weighted average share price at exercise date
Year ended 31 March 2011 5.53 2.1 - - 2.1
Year ended 31 March 2010 5.74 2.4 - - 2.4
The weighted average remaining contractual life of options in the employee Sharesave scheme at 31 March 2011 was 2 years and 1 month. These options have exercise prices between £3.80 and £5.73 per ordinary share. The aggregate intrinsic value of all options outstanding and exercisable at 31 March 2011 amounted to £54m and £1m respectively.
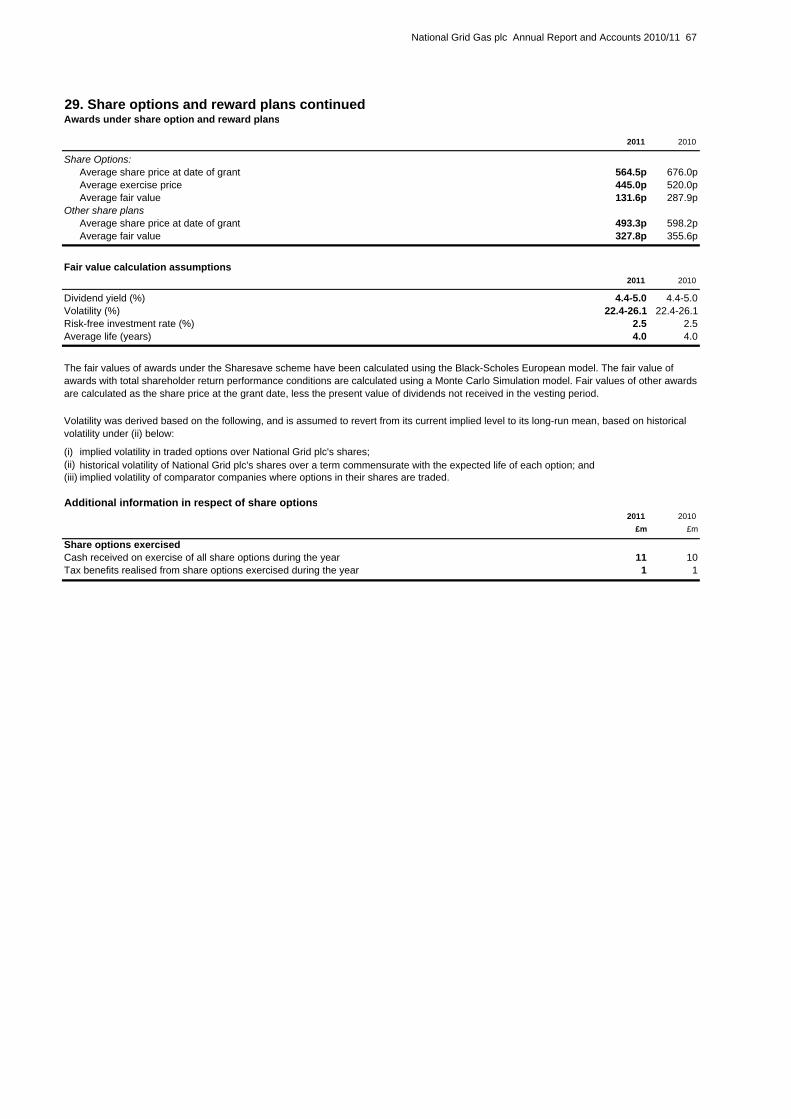
National Grid Gas plc Annual Report and Accounts 2010/11 67
29. Share options and reward plans continuedAwards under share option and reward plans
2011 2010
Share Options:Average share price at date of grant 564.5p 676.0pAverage exercise price 445.0p 520.0pAverage fair value 131.6p 287.9p
Other share plansAverage share price at date of grant 493.3p 598.2pAverage fair value 327.8p 355.6p
2011 2010
Dividend yield (%) 4.4-5.0 4.4-5.0Volatility (%) 22.4-26.1 22.4-26.1 Risk-free investment rate (%) 2.5 2.5Average life (years) 4.0 4.0
(i) implied volatility in traded options over National Grid plc's shares;(ii)(iii) implied volatility of comparator companies where options in their shares are traded.
Additional information in respect of share options2011 2010
£m £m
Share options exercised Cash received on exercise of all share options during the year 11 10Tax benefits realised from share options exercised during the year 1 1
Volatility was derived based on the following, and is assumed to revert from its current implied level to its long-run mean, based on historical volatility under (ii) below:
The fair values of awards under the Sharesave scheme have been calculated using the Black-Scholes European model. The fair value of awards with total shareholder return performance conditions are calculated using a Monte Carlo Simulation model. Fair values of other awards are calculated as the share price at the grant date, less the present value of dividends not received in the vesting period.
historical volatility of National Grid plc's shares over a term commensurate with the expected life of each option; and
Fair value calculation assumptions

68 National Grid Gas plc Annual Report and Accounts 2010/11
30. Ultimate parent company
31. Principal subsidiary undertakingsPrincipal activity Holding
British Transco Capital Inc. (incorporated in the US) Financing 100%British Transco Finance Inc. (incorporated in the US) Financing 100%British Transco Finance (No. 1) Limited Financing 100%British Transco Finance (No. 2) Limited Financing 100%British Transco Finance (No. 3) Limited Financing 100%British Transco Finance (No. 5) Limited Financing 100%British Transco International Finance BV (incorporated in the Netherlands) Financing 100%National Grid Gas Finance (No 1) plc Financing 100%National Grid Metering Limited Gas metering services 100%Xoserve Limited Gas transportation transaction services 56.57%
A full list of all subsidiaries and associated undertakings is available from the Company Secretary of the Company.
National Grid Gas plc’s immediate parent company is National Grid Gas Holdings Limited. The ultimate parent company and controlling party is National Grid plc. Both of these companies are incorporated in Great Britain and are registered in England and Wales. National Grid plc consolidates the accounts of National Grid Gas plc. Copies of the consolidated accounts of National Grid plc may be obtained from the Company Secretary, 1-3 Strand, London WC2N 5EH.

National Grid Gas plc Annual Report and Accounts 2010/11 69
Company accounting policies for the year ended 31 March 2011
A. Basis of preparation of individual financial statements under UK GAAP These individual financial statements of the Company have been prepared in accordance with applicable UK accounting and financial reporting standards and the Companies Act 2006.
The individual financial statements of the Company have been prepared on a historical cost basis, except for the revaluation of financial instruments.
These financial statements are presented in pounds sterling because that is the currency of the primary economic environment in which the Company operates.
The Company has not presented its own profit and loss account as permitted by section 408 of the Companies Act 2006. The Company has taken the exemption from preparing a cash flow statement under the terms of FRS 1 (revised 1996) ‘Cash Flow Statements’.
In accordance with exemptions under FRS 8 ‘Related party disclosures’, as the Company is a wholly owned subsidiary of National Grid plc whose consolidated financial statements are publicly available, it has only disclosed related party transactions with companies which are not wholly owned by National Grid plc.
Furthermore, in accordance with exemptions under FRS 29 ‘Financial Instruments: Disclosures’, the Company has not presented the financial instruments disclosures required by the standard, as disclosures which comply with the standard are included in the consolidated financial statements.
The preparation of financial statements requires management to make estimates and assumptions that affect the reported amounts of assets and liabilities, disclosures of contingent assets and liabilities and the reported amounts of revenue and expenses during the reporting period. Actual results could differ from these estimates.
B. Foreign currencies Transactions in currencies other than the functional currency of the Company are recorded at the rates of exchange prevailing on the dates of the transactions. At each balance sheet date, monetary assets and liabilities that are denominated in foreign currencies are retranslated at closing exchange rates. Gains and losses arising on retranslation of monetary assets and liabilities are included in the profit and loss account.
C. Tangible fixed assets Tangible fixed assets are included in the balance sheet at their cost less accumulated depreciation. Costs include payroll costs and finance costs incurred which are directly attributable to the construction of tangible fixed assets.
Tangible fixed assets include assets in which the Company’s interest comprises legally protected statutory or contractual rights of use.
Additions represent the purchase or construction of new assets, extensions to, or significant increases in, the capacity of tangible fixed assets.
Contributions received towards the cost of tangible fixed assets are included in creditors as deferred income and credited on a straight-line basis to the profit and loss account over the life of the assets.
Depreciation is not provided on freehold land or assets in the course of construction. Other tangible fixed assets are depreciated principally on a straight-line basis, at rates estimated to write off their book values over their estimated useful economic lives. In assessing estimated useful economic lives, which are reviewed on a regular basis, consideration is given to any contractual arrangements and operational requirements relating to particular assets. Unless otherwise determined by operational requirements, the depreciation periods for the principal categories of tangible fixed assets are, in general, as shown in the table below:
Depreciation periods Years
Freehold and leasehold properties up to 50
Plant and machinery:
– Mains, services and regulating equipment 30 to 100
– Meters and metering equipment 5 to 18
Motor vehicles and office equipment 3 to 10
D. Fixed asset investments Investments held as fixed assets are stated at cost less any provisions for impairment. Impairments are calculated such that the carrying value of the fixed asset investment is the lower of its cost or recoverable amount.
E. Impairment of fixed assets Impairments of fixed assets are calculated as the difference between the carrying values of the net assets of income generating units, including where appropriate, investments, and their recoverable amounts. Recoverable amount is defined as the higher of net realisable value or estimated value in use at the date the impairment review is undertaken. Net realisable value represents the amount that can be generated through the sale of assets. Value in use represents the present value of expected future cash flows discounted on a pre-tax basis, using the estimated cost of capital of the income generating unit.
Impairment reviews are carried out if there is some indication that impairment may have occurred, or where otherwise required to ensure that fixed assets are not carried above their

70 National Grid Gas plc Annual Report and Accounts 2010/11
estimated recoverable amounts. Impairments are recognised in the profit and loss account, and, where material, are disclosed as exceptional. Impairment reversals are recognised when, in management’s opinion, the reversal is permanent.
F. Taxation Current tax for the current and prior periods is provided at the amount expected to be paid (or recovered) using the tax rates and tax laws that have been enacted or substantively enacted by the balance sheet date.
Deferred tax is provided in full on timing differences which result in an obligation at the balance sheet date to pay more tax, or the right to pay less tax, at a future date, at tax rates expected to apply when the timing differences reverse, based on tax rates and tax laws that have been enacted or substantively enacted by the balance sheet date. Timing differences arise from the inclusion of items of income and expenditure in taxation computations in periods different from those in which they are included in the financial statements. Deferred tax assets are recognised to the extent that it is regarded as more likely than not that they will be recovered. Deferred tax assets and liabilities are not discounted.
G. Stocks Stocks are stated at cost less provision for deterioration and obsolescence.
H. Environmental costs Environmental costs, based on discounted future estimated expenditures expected to be incurred, are provided for in full. The unwinding of the discount is included within the profit and loss account as a financing charge.
I. Revenue Revenue represents the sales value derived from the transmission and distribution of gas and the provision of gas metering services during the year, including an assessment of services provided, but not invoiced as at the year end. It excludes value added tax and intra-group sales.
Where revenue for the year exceeds the maximum amount permitted by regulatory agreement and adjustments will be made to future prices to reflect this over-recovery, a liability for the over-recovery is not recognised as such an adjustment to future prices relates to the provision of future services. Similarly, an asset is not recognised where a regulatory agreement permits adjustments to be made to future prices in respect of an under-recovery.
J. Replacement expenditure Replacement expenditure is recognised within operating costs and represents the cost of planned maintenance of mains and services assets by replacing or lining sections of pipe. This expenditure is principally undertaken to repair and maintain the safety of the network and is written off as incurred. Expenditure that enhances the performance of mains and services assets is treated as an addition to tangible fixed assets.
K. Pensions The substantial majority of the Company’s employees are members of the defined benefit section of the National Grid UK Pension Scheme. There is no contractual arrangement or stated policy for charging the net defined benefit cost of the scheme to the Company. Accordingly, the Scheme is recognised in these Company financial statements as if it were a defined contribution scheme. The pension charge for the year represents the contributions payable to the Scheme for the period. A share of the assets and liabilities or the actuarial gains and losses of the Scheme are not recognised in these Company financial statements.
L. Leases Operating lease payments are charged to the profit and loss account on a straight-line basis over the term of the lease.
M. Financial instruments Financial assets, liabilities and equity instruments are classified according to the substance of the contractual arrangements entered into. An equity instrument is any contract that evidences a residual interest in the assets of the Company after deducting all of its liabilities and is recorded at the proceeds received, net of direct issue costs.
Loans receivable are carried at amortised cost using the effective interest rate method less any allowance for estimated impairments. A provision is established for impairments when there is objective evidence that the Company will not be able to collect all amounts due under the original terms of the loan. Interest income, together with losses when the loans are impaired, is recognised on an effective interest rate basis in the profit and loss account.
Current asset financial investments are recognised at fair value plus directly related incremental transaction costs and are subsequently carried at fair value on the balance sheet. Changes in the fair value of investments classified as available-for-sale are recognised directly in equity, until the investment is disposed of or is determined to be impaired. At this time the cumulative gain or loss previously recognised in equity is included in net profit or loss for the period. Investment income on investments classified as available-for-sale is recognised in the profit and loss account as it accrues.
Borrowings, which include interest-bearing loans, UK Retail Prices Index (RPI) linked debt and overdrafts are recorded at their initial fair value which normally reflects the proceeds received, net of direct issue costs less any repayments. Subsequently, these are stated at amortised cost, using the effective interest rate method. Any difference between proceeds and the redemption value is recognised over the term of the borrowing in the profit and loss account using the effective interest rate method.
Derivative financial instruments (derivatives) are recorded at fair value, and where the fair value of a derivative is positive, it is carried as a derivative asset and where negative, as a liability. Assets and liabilities on different transactions are only netted if
National Grid Gas plc Annual Report and Accounts 2010/11 71
the transactions are with the same counterparty, a legal right of set-off exists and the cash flows are intended to be settled on a net basis. Gains and losses arising from changes in fair value are included in the profit and loss account in the period they arise.
Where derivatives are embedded in other financial instruments that are closely related to those instruments, no adjustment is made with respect to such derivative clauses. Otherwise the derivative is recorded separately at fair value on the balance sheet.
The fair values of financial instruments measured at fair value that are quoted in active markets are based on bid prices for assets held and offer prices for issued liabilities. When independent prices are not available, fair values are determined by using valuation techniques which are consistent with techniques commonly used by the relevant market. The techniques use observable market data.
N. Hedge accounting The Company enters into derivative financial instruments (derivatives) and non-derivative financial instruments in order to manage interest rate and foreign currency exposures, with a view to managing these risks associated with the Company’s underlying business activities and the financing of those activities. The principal derivatives used include interest rate swaps, forward rate agreements, currency swaps and forward foreign currency contracts.
Hedge accounting allows derivatives to be designated as a hedge of another (non-derivative) financial instrument, to mitigate the impact of potential volatility in the profit and loss account. The Company uses two hedge accounting methods.
Firstly, changes in the carrying value of financial instruments that are designated and effective as hedges of future cash flows (cash flow hedges) are recognised directly in equity and any ineffective portion is recognised immediately in the profit and loss account. Amounts deferred in equity in respect of cash flow hedges are subsequently recognised in the profit and loss account in the same period in which the hedged item affects net profit or loss.
Secondly, changes in the carrying value of financial instruments that are designated as hedges of the changes in the fair value of assets or liabilities (fair value hedges) are recognised in the profit and loss account. An offsetting amount is recorded as an adjustment to the carrying value of hedged items, with a corresponding entry in the profit and loss account, to the extent that the change is attributable to the risk being hedged and that the fair value hedge is effective.
Changes in the fair value of derivatives that do not qualify for hedge accounting are recognised in the profit and loss account as they arise.
Hedge accounting is discontinued when the hedging instrument expires or is sold, terminated, exercised, or no longer qualifies for hedge accounting. At that time, any cumulative gains or losses relating to cash flow hedges recognised in equity are
initially retained in equity and subsequently recognised in the profit and loss account in the same periods in which the previously hedged item affects net profit or loss. For fair value hedges the cumulative adjustment recorded to its carrying value at the date hedge accounting is discontinued is amortised to the profit and loss account using the effective interest rate method.
If a hedged transaction is no longer expected to occur, the net cumulative gain or loss recognised in equity is transferred to the profit and loss account immediately.
O. Parent Company guarantees The Company has guaranteed the repayment of the principal and any associated premium and interest on specific loans due from certain subsidiary undertakings to third parties. In the event of default or non-performance by the subsidiary, the Company recognises such guarantees as insurance contracts, at fair value with a corresponding increase in the carrying value of the investment.
P. Share-based payments National Grid issues equity-settled share-based payments to certain employees of the Company. Equity-settled share-based payments are measured at fair value at the date of grant based on an estimate of the number of shares that will eventually vest. This fair value is recognised on a straight-line basis over the vesting period, as an operating cost and an increase in equity. Payments made by the Company to National Grid in respect of share-based payments are recognised as a reduction in equity.
Q. Restructuring costs Costs arising from the Company’s restructuring programmes primarily relate to redundancy costs. Redundancy costs are charged to the profit and loss account in the period in which the Company becomes irrevocably committed to incurring the costs and the main features of the restructuring plan have been announced to affected employees.
R. Emission allowances Emission allowances, which relate to the emissions of carbon dioxide, are recorded as an intangible asset within current assets and are initially recorded at cost, and subsequently at the lower of cost and net realisable value. For allocations of emission allowances granted by the UK Government, cost is deemed to be equal to fair value at the date of allocation. Receipts of such grants are treated as deferred income and are recognised in the income statement in the period in which carbon dioxide emissions are made. A provision is recorded in respect of the obligation to deliver emission allowances and charges are recognised in the income statement in the period in which carbon dioxide emissions are made.
S. Dividends Interim dividends are recognised when they become payable to the Company’s shareholders. Final dividends are recognised in the financial year in which they are approved.
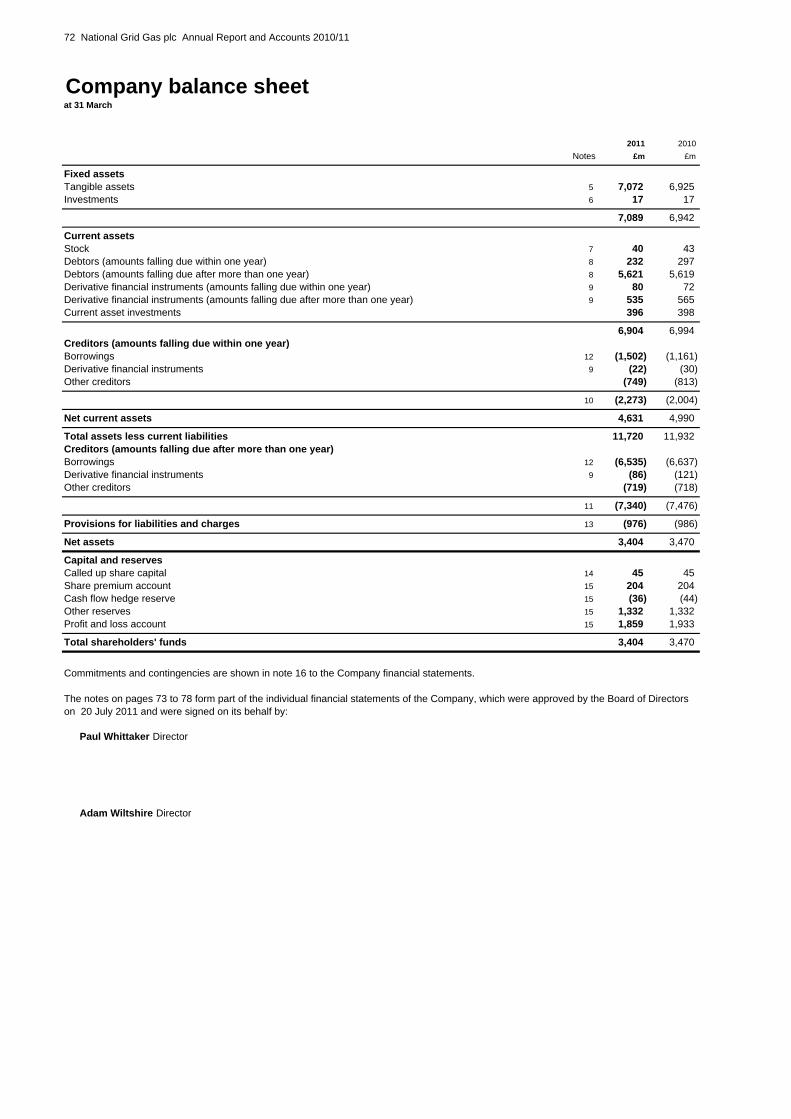
72 National Grid Gas plc Annual Report and Accounts 2010/11
Company balance sheetat 31 March
2011 2010 Notes £m £m
Fixed assetsTangible assets 5 7,072 6,925Investments 6 17 17
7,089 6,942
Current assetsStock 7 40 43Debtors (amounts falling due within one year) 8 232 297Debtors (amounts falling due after more than one year) 8 5,621 5,619Derivative financial instruments (amounts falling due within one year) 9 80 72Derivative financial instruments (amounts falling due after more than one year) 9 535 565Current asset investments 396 398
6,904 6,994Creditors (amounts falling due within one year)Borrowings 12 (1,502) (1,161)Derivative financial instruments 9 (22) (30)Other creditors (749) (813)
10 (2,273) (2,004)
Net current assets 4,631 4,990
Total assets less current liabilities 11,720 11,932Creditors (amounts falling due after more than one year)Borrowings 12 (6,535) (6,637)Derivative financial instruments 9 (86) (121)Other creditors (719) (718)
11 (7,340) (7,476)
Provisions for liabilities and charges 13 (976) (986)
Net assets 3,404 3,470
Capital and reservesCalled up share capital 14 45 45Share premium account 15 204 204Cash flow hedge reserve 15 (36) (44)Other reserves 15 1,332 1,332Profit and loss account 15 1,859 1,933
Total shareholders' funds 3,404 3,470
Commitments and contingencies are shown in note 16 to the Company financial statements.
Paul Whittaker Director
Adam Wiltshire Director
The notes on pages 73 to 78 form part of the individual financial statements of the Company, which were approved by the Board of Directors on 20 July 2011 and were signed on its behalf by:
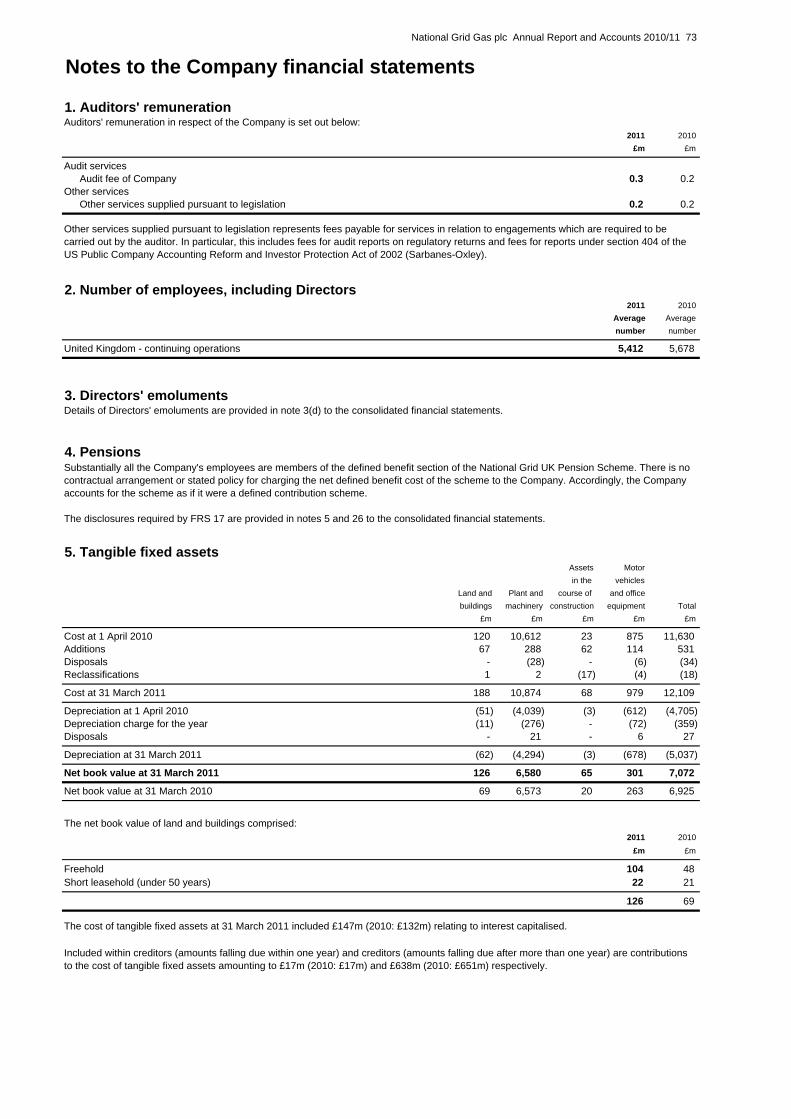
National Grid Gas plc Annual Report and Accounts 2010/11 73
Notes to the Company financial statements
1. Auditors' remunerationAuditors' remuneration in respect of the Company is set out below:
2011 2010 £m £m
Audit servicesAudit fee of Company 0.3 0.2
Other servicesOther services supplied pursuant to legislation 0.2 0.2
2. Number of employees, including Directors2011 2010
Average Average number number
United Kingdom - continuing operations 5,412 5,678
3. Directors' emolumentsDetails of Directors' emoluments are provided in note 3(d) to the consolidated financial statements.
4. Pensions
5. Tangible fixed assetsAssets Motor in the vehicles
Land and Plant and course of and office buildings machinery construction equipment Total
£m £m £m £m £m
Cost at 1 April 2010 120 10,612 23 875 11,630Additions 67 288 62 114 531Disposals - (28) - (6) (34)Reclassifications 1 2 (17) (4) (18)
Cost at 31 March 2011 188 10,874 68 979 12,109
Depreciation at 1 April 2010 (51) (4,039) (3) (612) (4,705)Depreciation charge for the year (11) (276) - (72) (359)Disposals - 21 - 6 27
Depreciation at 31 March 2011 (62) (4,294) (3) (678) (5,037)
Net book value at 31 March 2011 126 6,580 65 301 7,072
Net book value at 31 March 2010 69 6,573 20 263 6,925
The net book value of land and buildings comprised:2011 2010
£m £m
Freehold 104 48Short leasehold (under 50 years) 22 21
126 69
Other services supplied pursuant to legislation represents fees payable for services in relation to engagements which are required to be carried out by the auditor. In particular, this includes fees for audit reports on regulatory returns and fees for reports under section 404 of the US Public Company Accounting Reform and Investor Protection Act of 2002 (Sarbanes-Oxley).
Included within creditors (amounts falling due within one year) and creditors (amounts falling due after more than one year) are contributions to the cost of tangible fixed assets amounting to £17m (2010: £17m) and £638m (2010: £651m) respectively.
The cost of tangible fixed assets at 31 March 2011 included £147m (2010: £132m) relating to interest capitalised.
Substantially all the Company's employees are members of the defined benefit section of the National Grid UK Pension Scheme. There is no contractual arrangement or stated policy for charging the net defined benefit cost of the scheme to the Company. Accordingly, the Company accounts for the scheme as if it were a defined contribution scheme.
The disclosures required by FRS 17 are provided in notes 5 and 26 to the consolidated financial statements.

74 National Grid Gas plc Annual Report and Accounts 2010/11
6. InvestmentsShares in subsidiary
undertakings £m
Cost and net book value at 31 March 2010 and 31 March 2011 17
The names of the principal subsidiary undertakings are included in note 31 to the consolidated financial statements.
The directors believe that the carrying value of the investments is supported by their underlying net assets.
7. Stock2011 2010
£m £m
Raw materials and consumables 40 43
8. Debtors2011 2010
£m £m
Amounts falling due within one year:Trade debtors 36 58Amounts owed by fellow subsidiary undertakings 15 24Corporation tax - 10Other debtors 8 5Prepayments and accrued income 173 200
232 297
Amounts falling due after more than one year:Other debtors 10 8Amounts owed by immediate parent undertaking 5,611 5,611
5,621 5,619
Total debtors 5,853 5,916
9. Derivative financial instrumentsThe fair value of derivative financial instruments shown on the balance sheet is as follows:
Assets Liabilities Total Assets Liabilities Total£m £m £m £m £m £m
Amounts falling due in one year 80 (22) 58 72 (30) 42Amounts falling due after more than one year 535 (86) 449 565 (121) 444
615 (108) 507 637 (151) 486
2011 2010 £m £m
Interest rate swaps (5,199) (3,154)Cross-currency interest rate swaps (1,578) (1,748)Foreign exchange forward contracts (4) (39)Forward rate agreements (1,832) (1,730)
(8,613) (6,671)
*The notional contract amounts of derivatives indicate the gross nominal value of transactions outstanding at the balance sheet date
For each class of derivative the notional contract amounts* are as follows:
2011 2010
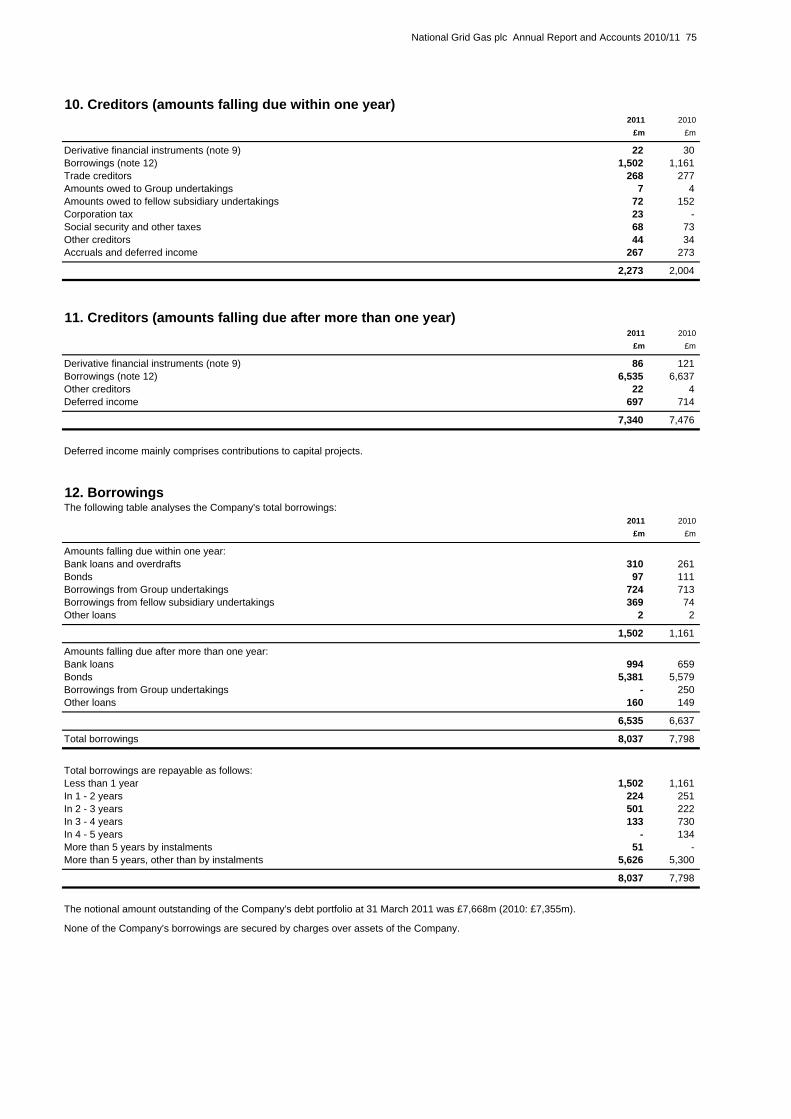
National Grid Gas plc Annual Report and Accounts 2010/11 75
10. Creditors (amounts falling due within one year)2011 2010
£m £m
Derivative financial instruments (note 9) 22 30Borrowings (note 12) 1,502 1,161Trade creditors 268 277Amounts owed to Group undertakings 7 4Amounts owed to fellow subsidiary undertakings 72 152Corporation tax 23 -Social security and other taxes 68 73Other creditors 44 34Accruals and deferred income 267 273
2,273 2,004
11. Creditors (amounts falling due after more than one year)2011 2010
£m £m
Derivative financial instruments (note 9) 86 121Borrowings (note 12) 6,535 6,637Other creditors 22 4Deferred income 697 714
7,340 7,476
Deferred income mainly comprises contributions to capital projects.
12. BorrowingsThe following table analyses the Company's total borrowings:
2011 2010 £m £m
Amounts falling due within one year:Bank loans and overdrafts 310 261Bonds 97 111Borrowings from Group undertakings 724 713Borrowings from fellow subsidiary undertakings 369 74Other loans 2 2
1,502 1,161
Amounts falling due after more than one year:Bank loans 994 659Bonds 5,381 5,579Borrowings from Group undertakings - 250Other loans 160 149
6,535 6,637
Total borrowings 8,037 7,798
Total borrowings are repayable as follows:Less than 1 year 1,502 1,161In 1 - 2 years 224 251In 2 - 3 years 501 222In 3 - 4 years 133 730In 4 - 5 years - 134More than 5 years by instalments 51 -More than 5 years, other than by instalments 5,626 5,300
8,037 7,798
The notional amount outstanding of the Company's debt portfolio at 31 March 2011 was £7,668m (2010: £7,355m).
None of the Company's borrowings are secured by charges over assets of the Company.
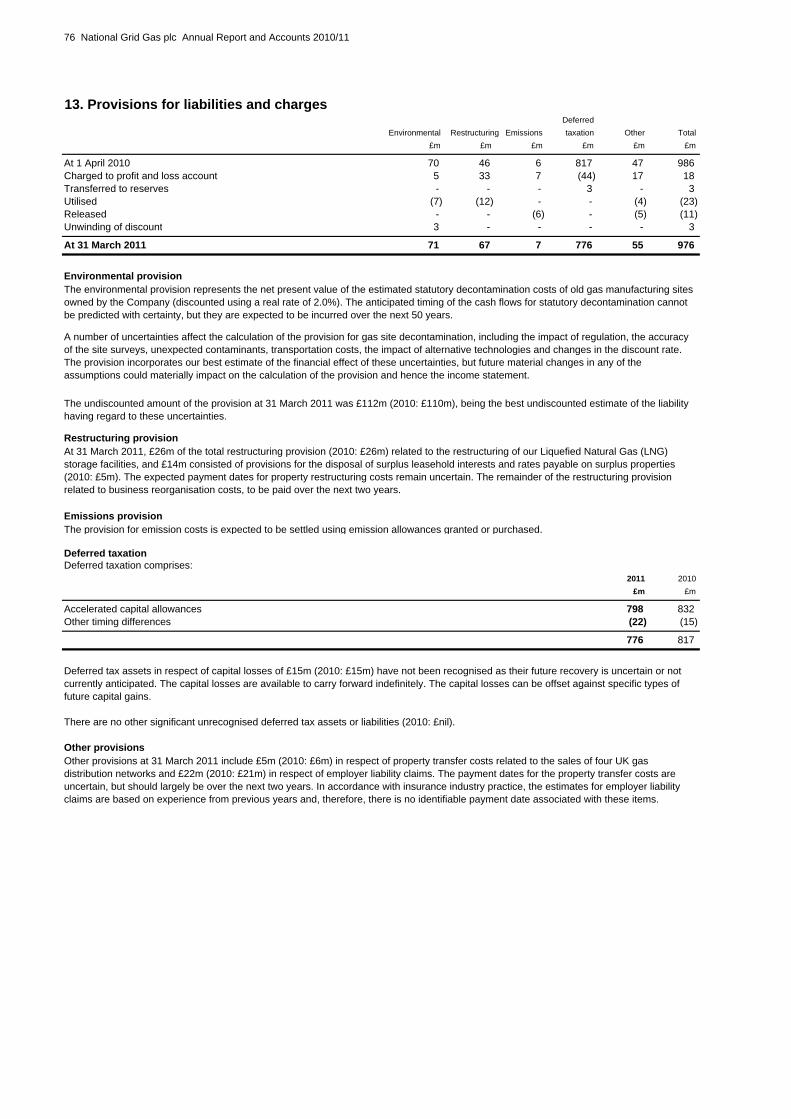
76 National Grid Gas plc Annual Report and Accounts 2010/11
13. Provisions for liabilities and chargesDeferred
Environmental Restructuring Emissions taxation Other Total £m £m £m £m £m £m
At 1 April 2010 70 46 6 817 47 986Charged to profit and loss account 5 33 7 (44) 17 18Transferred to reserves - - - 3 - 3Utilised (7) (12) - - (4) (23)Released - - (6) - (5) (11)Unwinding of discount 3 - - - - 3
At 31 March 2011 71 67 7 776 55 976
Environmental provision
Restructuring provision
Emissions provision
Deferred taxationDeferred taxation comprises:
2011 2010 £m £m
Accelerated capital allowances 798 832Other timing differences (22) (15)
776 817
There are no other significant unrecognised deferred tax assets or liabilities (2010: £nil).
Other provisions
The provision for emission costs is expected to be settled using emission allowances granted or purchased.
The environmental provision represents the net present value of the estimated statutory decontamination costs of old gas manufacturing sites owned by the Company (discounted using a real rate of 2.0%). The anticipated timing of the cash flows for statutory decontamination cannot be predicted with certainty, but they are expected to be incurred over the next 50 years.
At 31 March 2011, £26m of the total restructuring provision (2010: £26m) related to the restructuring of our Liquefied Natural Gas (LNG) storage facilities, and £14m consisted of provisions for the disposal of surplus leasehold interests and rates payable on surplus properties (2010: £5m). The expected payment dates for property restructuring costs remain uncertain. The remainder of the restructuring provision related to business reorganisation costs, to be paid over the next two years.
A number of uncertainties affect the calculation of the provision for gas site decontamination, including the impact of regulation, the accuracy of the site surveys, unexpected contaminants, transportation costs, the impact of alternative technologies and changes in the discount rate. The provision incorporates our best estimate of the financial effect of these uncertainties, but future material changes in any of the assumptions could materially impact on the calculation of the provision and hence the income statement.
The undiscounted amount of the provision at 31 March 2011 was £112m (2010: £110m), being the best undiscounted estimate of the liability having regard to these uncertainties.
Other provisions at 31 March 2011 include £5m (2010: £6m) in respect of property transfer costs related to the sales of four UK gas distribution networks and £22m (2010: £21m) in respect of employer liability claims. The payment dates for the property transfer costs are uncertain, but should largely be over the next two years. In accordance with insurance industry practice, the estimates for employer liability claims are based on experience from previous years and, therefore, there is no identifiable payment date associated with these items.
Deferred tax assets in respect of capital losses of £15m (2010: £15m) have not been recognised as their future recovery is uncertain or not currently anticipated. The capital losses are available to carry forward indefinitely. The capital losses can be offset against specific types of future capital gains.

National Grid Gas plc Annual Report and Accounts 2010/11 77
14. Called up share capitalNumber Number
of shares of shares 2011 2010 2011 2010
millions millions £m £m
At 31 March 2010 and 2011 - ordinary shares of 12/15p eachAllotted, called up and fully paid 3,944 3,944 45 45
National Grid Gas plc is a wholly owned subsidiary undertaking of National Grid Gas Holdings Limited.
15. ReservesShare Cash flow Capital Profit
Premium hedge redemption and loss Account reserve reserve account
£m £m £m £m
At 1 April 2010 204 (44) 1,332 1,933Profit for the year - - - 318Dividends - - - (400)Net gain recognised directly in reserves - 8 - -Share-based payments - - - 8
At 31 March 2011 204 (36) 1,332 1,859
The Company is prohibited from declaring a dividend or other distribution unless it has certified that it is in compliance in all material respects with certain regulatory obligations, including a requirement to ensure it has sufficient financial resources and facilities to enable it to carry on its business and a requirement to use all reasonable endeavours to maintain an investment grade credit rating.
The Company has not presented its own profit and loss account as permitted by section 408 of the Companies Act 2006. The Company’s profit after taxation was £318m (2010: £322m).

78 National Grid Gas plc Annual Report and Accounts 2010/11
16. Commitments and contingenciesa) Future capital expenditure
b) Lease commitments
Land and buildings Other Total
2011 2010 2011 2010 2011 2010 £m £m £m £m £m £m
Expiring:In one year or less - 1 1 1 1 2In more than one year, but not more than five years 5 5 4 4 9 9In more than five years 5 4 - - 5 4
10 10 5 5 15 15
c) Other commitments and contingencies
d) Parent Company loan guarantees on behalf of subsidiary undertakings
e) Litigation and claimsMetering competition investigation
Gas Distribution mains replacement investigation
17. Related parties
2011 2010 £m £m
Goods and services supplied 9 8Services received 22 22Amounts receivable at 31 March 6 3Amounts payable at 31 March 2 1
Amounts payable or receivable are ordinarily settled one month in arrears. No amounts have been provided at 31 March 2011 (2010: nil) and no expense has been recognised during the year (2010: nil) in respect of bad or doubtful debts from the above related party transactions.
As previously reported, in October 2008 we informed Ofgem that mains replacement activity carried out by our Gas Distribution business may have been inaccurately reported. Ofgem has now concluded its investigation and, following the reaching of a settlement between Ofgem and the Company, on 6 January 2011, Ofgem announced its proposed decision to impose a penalty of £8m and to find the Company in breach of certain obligations in respect of the reporting of mains replacement data. Ofgem also stated that the penalty would have been higher had it not been for the cooperation and corrective action by National Grid. On 10 March 2011, following the end of the period in which representations could be made, Ofgem wrote to the Company to confirm its decision. On 13 May 2011, we received the Final Penalty Notice and the penalty has now been paid.
As previously reported, on 25 February 2008 the Gas and Electricity Markets Authority (GEMA) announced it had decided we had breached Chapter 11 of the Competition Act 1998 and Article 82 (now Article 102) of the Treaty of the Functioning of the European Union and fined us £41.6m. Following appeals, the Competition Appeal Tribunal reduced the fine to £30m and the Court of Appeal further reduced the fine to £15m. On 22 March 2010, we applied to the Supreme Court for leave to appeal the Court of Appeal's judgement. On 28 July 2010, the Supreme Court denied our application and this ends the legal process. The £15m fine was paid to GEMA on 1 April 2010.
The Company has guaranteed the repayment of principal sums, any associated premium and interest on specific loans due from its financial subsidiaries to third parties. At 31 March 2011, the sterling equivalent amounted to £1,104m (2010: £1,168m).
At 31 March 2011, the Company’s total operating lease commitments for the financial year ending 31 March 2012 amounted to £15m (2010 commitments for 2011: £15m) and are analysed by lease expiry date as follows:
As at 31 March 2011, the Company had placed contracts for capital expenditure (tangible fixed assets) amounting to £427m (2010: £532m).
The following material transactions are with a subsidiary of the Company which is not wholly owned by National Grid plc and are in the normal course of business. Other related party transactions are not disclosed in accordance with the exemptions available under FRS 8.
The value of other commitments, contingencies and guarantees at 31 March 2011 amounted to £121m (2010: £209m), including gas purchase commitments amounting to £102m (2010: £43m).

National Grid Gas plc Annual Report and Accounts 2010/11 79
Glossary and definitions
References to the 'Company', 'we', 'our',and 'us', refer to National Grid Gas plc itself or to National Grid Gas plc and its subsidiaries collectively, depending on context.
FRS OfgemUK Financial Reporting Standard The Office of Gas and Electricity Markets
GAAP tonnes CO2 equivalentGenerally accepted accounting principles Measure of greenhouse gas emissions in relation
to the impact of carbon dioxideGWGigawatt, 109 watts RAV
Regulatory asset valueGWhGigawatt hours TW
Terawatt, 1012 wattsHSEHealth and Safety Executive TWh
Terawatt hoursIASInternational Accounting Standard
IFRICInternational Financial Reporting Standards Interpretations Committee
IFRSInternational Financial Reporting Standard
KPIKey Performance Indicator
LNGLiquefied natural gas
Lost time injuryA work-related injury which causes a person to be away from work for at least one normal shift after the shift on which the injury occurs, because the person isunfit to perform his or her duties
National GridNational Grid plc, the ultimate parent Company of National Grid Gas plc and its controlling party

National Grid Gas plc1-3 Strand, London WC2N 5EH, United KingdomRegistered in England and Wales Company number 2006000