Embed Size (px)
Citation preview

Annual Report and Accounts
2010-11
Annual Report and Accounts
2010-11 Presented to Parliament pursuant to Schedule 15, Section 6 of the National
Health Service Act 2006
Ordered by the House of Commons to be printed on 23 June 2011
HC 1196 LONDON: The Stationery Office £20.50

© NHS Business Services Authority (2011)
The text of this document (this excludes, where present, the Royal Arms and all departmental and agency logos) may be reproduced free of charge in any format or medium providing that it is reproduced accurately and not in a misleading context
The material must be acknowledged as NHS Business Services Authority copyright
and the document title specified. Where third party material has been identified, permission from the respective copyright holder must be sought.
Any enquiries regarding this publication should be sent to: Corporate Secretary,
Bridge House, 152 Pilgrim Street, Newcastle upon Tyne, NE1 6SN.
This document is also available from our website at www.nhsbsa.nhs.uk
ISBN: 9780102973501
Printed in the UK by The Stationery Office Limited on behalf of the Controller of Her Majesty’s Stationery Office
ID 2437597 06/11
Printed on paper containing 75% recycled fibre content minimum

Annual Report and Accounts 2010-11
Contents
Page
1. Chairman’s Introduction 5 2. Our year at a glance 7 3. Our Organisation 8 4. Our Performance 11 5. Delivering Services for Clients and Customers 15 6. Our people 23 7. Property, Asset Management and Sustainability 26 8. Complaints 29 9. Looking after Information 30 10. Financial review 32 11. NHSBSA Board and Remuneration report 36 12. Statement of the Chief Executive’s responsibilities 43 13. Statement on Internal Control 44 14. Certificate and Report of the Comptroller and Auditor General 49 15. Financial Statements 51 16. Notes to the Accounts 55

SECTION 1: CHAIRMAN’S INTRODUCTION
I am delighted to introduce our report and accounts for 2010-11. It has been another challenging year during which the NHS Business Services Authority (NHSBSA) has continued to deliver a wide range of quality services for our clients and customers within an increasingly difficult and demanding environment. Each year we face increased demand for our services and 2010-11 has been no different. A notable area of growth is the volume of payments we make to pharmacists in England. We now process around 800 million prescription items each year which totals over £8 billion in payments and these volumes are set to continue to increase in the coming years.
It is very important that we deliver such services to a high standard. It is also a priority of the NHSBSA to ensure a continual focus on driving down our costs and making our services more efficient for the benefit of the taxpayer and the wider NHS. This has never been more important than within the current financial and economic environment. I am proud of our record in reducing our costs because allowing for inflation and the increased volumes referred to above, our running costs are now almost £60million lower than our equivalent costs when we were established in 2005-06. This is a reduction in running costs of nearly 40% and cumulative savings of over £160million which have been available to the Department of Health for re-investment in frontline services. We have continued to do more for less. We aim to do even more in the years ahead. I would urge you to read our strategy and business plan which is available on our website. These documents outline how we intend to reduce our operating costs by a further 30% by 2015 without compromising on service or quality. Alongside which we will continue to regularly review the quality of our services through our comprehensive and balanced scorecard which includes detailed key performance indicators, customer satisfaction reports and benchmarking data. The ALB Review, which was published in July 2010, recommended the NHSBSA was retained in short term and subjected to a commercial review which would aim to “identify potential for increased commercial opportunities, including the potential to remove functions from the ALB sector”. These conclusions have had significant impact during 2010-11 as the NHSBSA has supported colleagues in the Department of Health to undertake this review. At the time of writing the recommendations of the review are unknown but they are likely to have a significant impact on the future of the NHSBSA. Against this uncertainty, three non-executive members of the Board were re-appointed for a third and final term to enable the organisation to maintain a degree of stability at the most senior level. I am very pleased to continue to work with Jeremy Strachan, David Teale and Mike Harling and the rest of my colleagues on the Board without whom much of our success would not be possible. I also would like to take
5

this opportunity to publically thank John Smith, who retired as Director of Finance on 31 December 2010, for his hard work and commitment to the NHSBSA since we were established. We welcome to the Board Michael Brodie who has been promoted to Acting Director of Finance pending a substantive appointment. Ultimately, it is our people and those of our private sector partners who ensure the delivery of our services to the high standards we all expect and I would like to express my sincere gratitude and appreciation for all of their efforts during the last year. Looking ahead to 2011-12, we will see significant change across the NHS as the Health and Social Care Bill is implemented. This will significantly affect our customer base. We will also need to implement the agreed changes following the Government’s consideration of the report of the Independent Public Service Pensions Commission published in March 2010. Depending upon the changes required, there is expected to be a significant impact upon the NHS Pension Scheme. I remain confident that the NHSBSA will meet these challenges alongside the outcomes of the commercial review and the important targets we have set out in our strategy and business plan.
Paul Rich Chair NHS Business Services Authority
Paul Rich
6
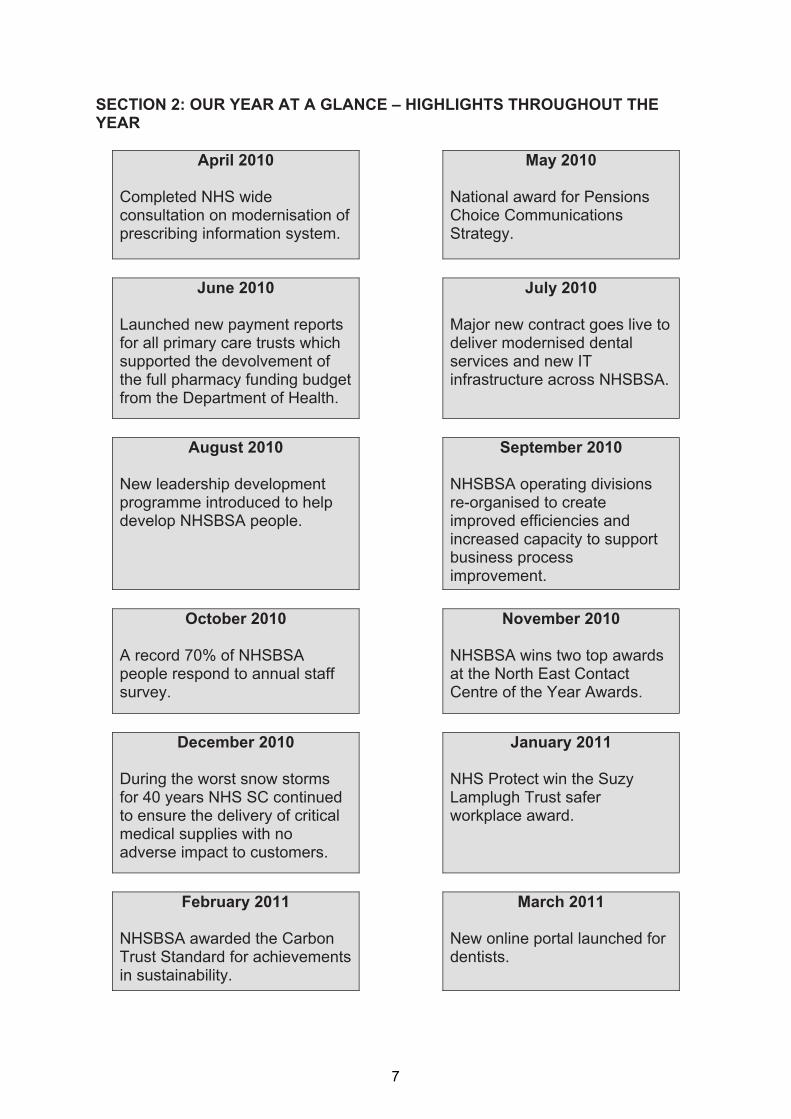
SECTION 2: OUR YEAR AT A GLANCE – HIGHLIGHTS THROUGHOUT THE YEAR
April 2010 Completed NHS wide consultation on modernisation of prescribing information system.
May 2010 National award for Pensions Choice Communications Strategy.
June 2010
Launched new payment reports for all primary care trusts which supported the devolvement of the full pharmacy funding budget from the Department of Health.
July 2010 Major new contract goes live to deliver modernised dental services and new IT infrastructure across NHSBSA.
August 2010
New leadership development programme introduced to help develop NHSBSA people.
September 2010 NHSBSA operating divisions re-organised to create improved efficiencies and increased capacity to support business process improvement.
October 2010
A record 70% of NHSBSA people respond to annual staff survey.
November 2010 NHSBSA wins two top awards at the North East Contact Centre of the Year Awards.
December 2010
During the worst snow storms for 40 years NHS SC continued to ensure the delivery of critical medical supplies with no adverse impact to customers.
January 2011 NHS Protect win the Suzy Lamplugh Trust safer workplace award.
February 2011
NHSBSA awarded the Carbon Trust Standard for achievements in sustainability.
March 2011 New online portal launched for dentists.
7

SECTION 3: OUR ORGANISATION
Our Services
The NHS Business Services Authority (NHSBSA) is a Special Health Authority, which is an Arms Length Body of the Department of Health. We manage a range of key services which directly support the front line of the NHS including:
• Management of the NHS Pension Scheme in England and Wales which has over 2 million members and receives contributions of over £8 billion per annum.
• Payments to pharmacists (in England) for prescriptions dispensed in primary care settings (circa 800 million for prescription items with payments over £8 billion per annum).
• Payments to dentists for work undertaken on NHS contracts (40 million dental forms with payments totalling over £2.5 billion) in England and Wales.
• Provision of management information to over 25,000 registered NHS and DH users on costs and trends in prescribing and dental care in England and Wales.
• Administration of the European Health Insurance Card (EHIC) scheme (in the UK) processing over 5 million EHIC cards this year.
• Provision of NHS Protect which provides counter fraud services for the NHS in England and Wales and security management services in England. This service has resulted in 616 successful fraud prosecutions and the recovery of more than £65 million over the last 10 years.
• Management of a 10-year outsourced agreement for the delivery of supply chain services to the NHS (in England and Wales), supporting the planned delivery of around £1 billion of procurement savings to the NHS over the life of the contract.
• Provision of advice and contract management to DH departments on supply chain strategic contracts and programmes, eg Flu Pandemic Preparedness, Childhood Vaccines and Emergency Preparedness.
• Administering a range of health benefit schemes across the UK, including a low income scheme, medical and maternity exemption schemes, tax credit NHS exemption cards (in the UK) and prescription pre-payment certificates (in England). In total we process over 9 million claims per annum.
• Management of schemes for NHS Student Bursaries and NHS Social Work Bursaries (in England) making payments of over £530 million in respect of over 100,000 registered healthcare and social work professionals.
• Management of the NHS Injury Benefit Scheme (in England and Wales) processing over 30,000 applications since the inception of the Scheme.
• Provision of a range of hosted employment, human resources and financial services.
8

Our Locations
We provide this range of services from centres based across the country as described below.
Newcastle • Headquarter Functions • Shared Services • Prescription Pricing • EHIC • Help with Health Costs • NHS Protect
Fleetwood • NHS Pensions • Student Bursaries • Injury Benefits
Wakefield • Prescription Processing &
Scanning
Middlebrook • Prescription Processing &
Scanning
Alfreton • Supply Chain Management
London NHS Protect
Eastbourne • Dental Services
9

Our Management
The NHSBSA is run by its Board of Directors which comprises a non executive chair, a chief executive, five non executive directors and four executive directors. Operational management responsibilities are as follows:
NHS BSA Board
Chief Executive
Chief Operating Officer
Director of Finance
Commercial Director
Director of People and
Organisational Development
Responsible for the management of: • Dental Services • NHS Pensions • NHS Injury Benefits
Scheme • Prescription
Services • Customer Contact
Services • NHS Social Work
Bursaries • NHS Student
Bursaries • Patient and Public
Services • NHS Protect • Information
Technology
Responsible for the management of: • Strategic Finance • Risk Management • Property and Asset
Management • Sustainability
Responsible for the management of: • Supply Chain
Management • Commercial Services
Responsible for the management of: • Human Resources • Learning &
Development • Staff Engagement • Organisational
Development • Health & Safety
10
SECTION 4: OUR PERFORMANCE
Key Performance Indicators
We have developed a comprehensive balanced scorecard which assists in driving continuous improvements in our performance. The scorecard can be interrogated at various levels and provides data on: • Financial performance; • Specific service level operating performance; • Project performance; • Key performance indicators; • Customer satisfaction; • Benchmarking of operational processes and industry standard services; • Employee engagement and satisfaction.
Performance Management Reporting
Performance reports are reviewed regularly within the NHSBSA. Board members meet regularly with Department of Health sponsors to discuss performance and to ensure our business continues to deliver against policy requirements. We understand the importance of working closely with our clients and during the last year we have reviewed and significantly improved the way in which we do this. We have introduced a new framework which provides a more structured approach to ensuring our clients have regular opportunities to discuss their priorities and requirements with us. We also gain valuable feedback as to their satisfaction with service delivery. This process will remain under regular review. An Executive Information Service provides key performance information to the desktops of relevant managers across the NHSBSA. This information is up to date and accurate to support discussions with clients and management decisions.
Key Performance Indicators for Service Delivery
Key performance indicators (KPIs) consolidate over 80 service delivery performance indicators. We measure our performance across the processes within each of our services, including: • Payments to customers: We measure the accuracy of our payments and their timeliness. • Case administration: We measure the accuracy of our administration in each case and the timeliness
with which we deal with them. • Information: We measure the timeliness of our information products to customers.
11

• Supply chain: We manage the contract with NHS Supply Chain and at a high level monitor the
standard industry measurements in the areas of “on time in full”, product delivery and orders received on time.
• Contact centre: Within our contact centres we monitor the standard industry measurements in the areas of wait times and abandoned call rates. The key performance indicators for service delivery are shown on the following table. The results are reported on a RAG (red-amber-green) basis and demonstrate average performance throughout 2010-11. Overall performance during 2010-11 has been good with most targets either achieved or improved. There has also been a significant improvement within the ‘turn around’ times of case administration within Pensions with the majority of cases being cleared within target. However, the overall status in this area remains amber mainly due to issues beyond the control of the service, where information supplied by employers is missing and so our customers experienced delays whilst the information is sought.
Payments Case Admin Information Contact Centre Supply Chain
Tim
elin
ess
(targ
et =
100
%)
Accu
racy
Tim
elin
ess
Accu
racy
Tim
elin
ess
(targ
et =
100
%)
Wai
t Tim
es
(targ
et =
80%
an
swer
ed
with
in 2
0 se
cs)
Aba
ndon
ed
Cal
l Rat
e
(ta
rget
= ra
te
does
not
ex
ceed
3%
)
Pro
duct
Av
aila
bilit
y (ta
rget
=
98.2
%)
good
s/or
ders
re
ceiv
ed o
n tim
e (ta
rget
=
98.7
5%)
OTI
F
Con
tract
or
Ser
vice
s Dental Services this periodforecast
Prescription Services
this periodforecast
Patient & Public Services this periodforecast
Pensions this periodforecast
Contract Management Supply Chain
this periodforecast
Cen
tral
Serv
ices Finance this period
forecast
HR this periodforecast
12

Customer Satisfaction
We undertake annual structured customer satisfaction surveys using an independent specialist (with a variety of our stakeholders). The results provide valuable feedback to enable action plans to be created to improve our customers’ experiences. We consider our customers to be those who use our services, which is not always the same as our clients, who pay for the services we provide. The areas surveyed mirror our key performance indicators but also include an overall customer satisfaction result based on customers being asked to consider all aspects of the service they currently receive. The results are reported on a RAG (red-amber-green) basis and demonstrate current performance levels in our service areas. Our overall results are shown in the table below:
Payments Case Admin
Information Contact Centre
Supply Chain Overall
Tim
elin
ess
Accu
racy
Tim
elin
ess
Accu
racy
Del
iver
ies
on ti
me
Del
iver
ies
accu
rate
an
d co
mpl
ete
Con
tract
or
Serv
ices
Dental Services
Prescription Services
Patient & Public Services
Pensions Division
Contract Management Supply Chain
Overall score is based upon asking customers the following question. "Thinking of all aspects of the service that you currently receive from __, how would you rate them overall on a scale of 1 to 10?"
13
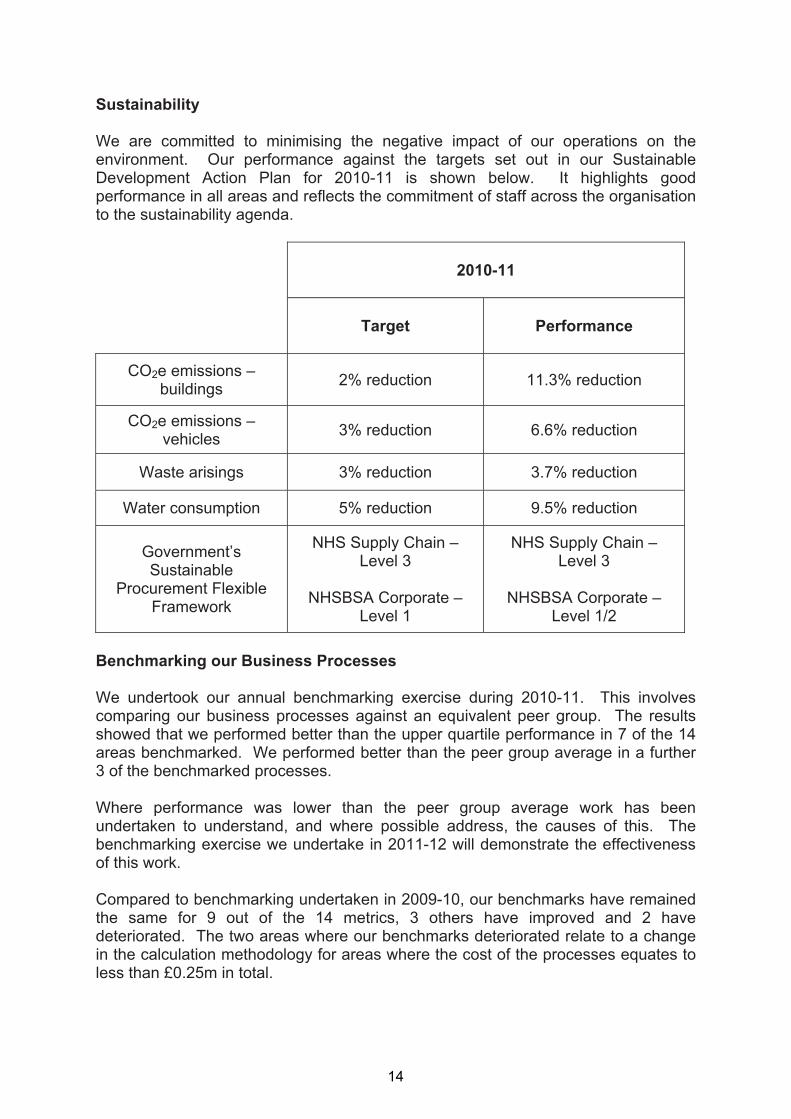
Sustainability
We are committed to minimising the negative impact of our operations on the environment. Our performance against the targets set out in our Sustainable Development Action Plan for 2010-11 is shown below. It highlights good performance in all areas and reflects the commitment of staff across the organisation to the sustainability agenda.
2010-11
Target Performance
CO2e emissions – buildings 2% reduction 11.3% reduction
CO2e emissions – vehicles 3% reduction 6.6% reduction
Waste arisings 3% reduction 3.7% reduction
Water consumption 5% reduction 9.5% reduction
Government’s Sustainable
Procurement Flexible Framework
NHS Supply Chain – Level 3
NHSBSA Corporate – Level 1
NHS Supply Chain – Level 3
NHSBSA Corporate – Level 1/2
Benchmarking our Business Processes
We undertook our annual benchmarking exercise during 2010-11. This involves comparing our business processes against an equivalent peer group. The results showed that we performed better than the upper quartile performance in 7 of the 14 areas benchmarked. We performed better than the peer group average in a further 3 of the benchmarked processes. Where performance was lower than the peer group average work has been undertaken to understand, and where possible address, the causes of this. The benchmarking exercise we undertake in 2011-12 will demonstrate the effectiveness of this work. Compared to benchmarking undertaken in 2009-10, our benchmarks have remained the same for 9 out of the 14 metrics, 3 others have improved and 2 have deteriorated. The two areas where our benchmarks deteriorated relate to a change in the calculation methodology for areas where the cost of the processes equates to less than £0.25m in total.
14
SECTION 5: DELIVERING SERVICES FOR CLIENTS AND CUSTOMERS
1. Dental Services
NHS Dental Services ensure dentists are paid promptly and accurately, making payments totalling over £2.5 billion in the last year. We also produce statistics and other information relating to dentistry for use across the NHS. In addition, we provide expert support and advice to assist the Government in setting dental policy.
Introduction of a New Business Partner
During 2010-11, following a lengthy tendering and procurement process, we partnered with Capita to deliver dental support services including the processing of dental forms and making payments to dentists. This new contract worth over £100m was awarded to Capita in December 2009 and following a period of transition the service commenced on 1 July 2010. The transition was completed successfully and the full programme of service transformation is underway. This change programme, which is expected to continue until the end of 2011, involves the development of new systems which will: • Improve the overall efficiency of the processing systems; • Improve the information services available to users; • Provide a superior platform from which to launch new products and services to
NHS customers. One important initiative for users is a new web based dental portal which provides online services for all dental providers including instant access to up to date information about contracts, progress regarding claims processing and superannuation information.
NHS Dental Contract Pilots
Following the findings of the Steele Review in 2009, the Department of Health has undertaken a consultation on proposals for contract models to be piloted during 2011-12. We have been working closely with the Department of Health during this time and with suppliers of dental practice management systems to support the development of dental pilots, the outcomes of which will significantly inform future dental contract reforms. This work will continue into 2011-12 and is focussed on: • Developing an appropriate system to receive required information from the pilot
contracts, enabling the provision of relevant data to clients and customers;
15

• Developing a new ‘rules engine’ within the above systems to enable appropriate payments to the pilot schemes;
• Providing the suppliers of dental practice management systems with the technical
specifications to assist the development of supporting systems.
Dental Access programme
In 2010-11 a new type of dental contract was introduced to help address the problem of access to NHS dentistry and to support the NHS commitment that, by March 2011, access to high quality NHS dentistry would be available to all who wanted it. Payments to dentists in line with this contract are linked to both access and quality targets, as well as payments for service and activity. We are now introducing systems which enable the collection and reporting on the additional data required to generate the key performance indicators linked to the quality payments.
Private Regulation in Wales
Following changes to registration requirements in Wales, private dentists are required to register with Health Inspectorate Wales. As part of this change, we are now undertaking clinical inspection visits to practice facilities to examine clinical records and provide reports to the Health Inspectorate. Also as part of the services provided to Wales, we are currently amending systems to provide management information to the seven Welsh Local Health Boards following a merger of the previous twenty two Boards.
2. NHS Pensions
The NHS Pension Scheme provides retirement benefits to NHS employees, GPs, dentists and employees of other approved organisations in England and Wales. During 2010-11, the NHS Pension Scheme had over 2 million members and received contributions in excess of £8 billion.
NHS Pension Choice
A significant ongoing area of activity during 2010-11 was related to delivery of NHS Pension Choice. This is an exercise which aims to provide all eligible members of the NHS Pension Scheme with an opportunity to choose to transfer their membership from the original 1995 section of the Pension Scheme to the 2008 section. This is a large exercise and as such is scheduled to last until the end of 2011-12 Delivery of Choice continued successfully during last year with NHS Pensions issuing members with comparative statements via their employers in line with the agreed timetable. A range of information has also been provided to members via our website, roadshows, factsheets etc. We remain on target to complete the overall programme by March 2012.
16
New Pensions Legislation
We have responded to a number of legislative changes and directions from Government during the year. These have included: • Providing a range of information to support the Independent Public Service
Pensions Commission review of public sector pensions; • Changing the pension indexation measure from the Retail Prices Index to the
Consumer Prices Index; • Implementing a project to meet the requirements of the changes in legislation
regarding reduced annual allowance and tax relief restrictions.
Business Blueprint Programme
The 2008 section of the Pension Scheme introduced further complexities to an already complex pension system. The Independent Public Service Pensions Commission review of public sector pensions is likely to introduce additional changes. To assist us with current and future change, a business blueprint programme was initiated during 2010-11. The programme will result in the updating and development of detailed documentation relating to all pension business processes. This output will support a future re-let of the contract, improve business effectiveness, strengthen our disclosure obligations and improve checks of administrative compliance against scheme regulations. This project will continue into 2011-12.
Members’ Services
Initiatives to improve member satisfaction have been implemented during 2010-11. These have primarily focussed on the following areas: • Improving the efficiency of case handling; • Improving our contact centre provision; • Using our resources more effectively across all our services; • Managing our members’ service expectations more effectively.
3. NHS Injury Benefits Scheme
The NHS Injury Benefits Scheme provides an annual allowance for staff who have suffered a permanent loss of earning ability as the result of an illness or injury which is wholly or mainly attributable to their NHS employment. The service has processed over 30,000 applications since the scheme began. During 2010-11 we started work with the Department of Health to review the rules and structure of the scheme, the outcome of which is expected in 2011-12.
17
4. Prescription Services
NHS Prescription Services makes payments to pharmacists in England for the prescriptions they dispense in primary care. During 2010-11, we processed around 800 million prescription items and made payments of more than £8 billion.
Pricing System
During the last year, we completed the rollout of the automation of our prescription pricing system so that all appliance contractor accounts were being processed through the new system, along with all community pharmacy, dispensing doctors and personal administration accounts.
Accuracy of Pricing
Due to very high volumes of prescriptions handled each year, we have continued to make significant efforts to measure and monitor the accuracy of our processing systems. Recent improvements introduced to help improve accuracy include: • A new process for pricing expensive prescription items; • Changes in the way in which we manage our operator performance which has
improved accuracy; • Improvements in the accuracy of systems that automatically read prescription
forms; • Improvements in the efficiency of populating drug databases and thereby
reducing opportunities for error; • The completion of a detailed retrospective exercise on payment accuracy. The programme of investment and performance measures implemented in the NHS Prescription Service over the last two years has resulted in a sustained improvement in overall prescription pricing accuracy. Accuracy was within the 12 month rolling Net Cash Variance target range (of +/- 0.2%) for the financial year ending March 2011. The NHSBSA will work towards further improvements in its pricing system and business processes in 2011-12.
Pricing Transparency
From April 2010, we improved the transparency of payments made to dispensing contractors with items valued greater than £100 being individually listed on contractors’ payment schedules. This additional information has enabled pharmacists to check their payments more closely.
Prescribing Information
As part of the prescription processing process we capture and provide a wide range of information relating to prescribing. During 2010-11, we have introduced new
18
systems to support primary care trusts in monitoring and managing remuneration payments for pharmaceutical services supplied by pharmacy and appliance contractors. In early 2010, we consulted with key users and stakeholders regarding primary care prescribing information systems and reports. During 2010-11, we have continued to work with stakeholders to explore the information improvements that need to be made to support national Department of Health programmes such as Quality, Innovation, Productivity and Prevention (QIPP) and also changes associated with the new Health Bill. A business case was submitted to DH at the end of 2010-11 to seek the necessary investment and we hope this will progress successfully during 2011-12. We have also worked closely with the NHS Health and Social Care Information Centre to publish the first QIPP prescribing comparators. These comparators will support national work to review the use and procurement of medicine and ultimately support wider savings for the NHS.
5. Customer Contact Service
The majority of our services share a single contact centre service. This service handles nearly three million calls a year, nearly half a million of which are successfully dealt with by our automated service. The service has also been used to support the national flu helpline and fundraising events such as Red Nose Day in March 2011. The service deals with a wide range of issues on a daily basis including:
• Assisting in the completion of application forms for help under the low income scheme;
• Confirming when student bursary payments are ready to be released;
• Setting up direct debit payments for customers applying for prescription prepayment certificates;
• Advising customers on EHIC card applications including instances where customers are already abroad;
• Providing advice to customers regarding refunds for dental treatment following the issue of a maternity exemption form;
• Confirming to dispensing contractors that payments will be made on time;
• Providing customers with information following unsuccessful tax credit NHS exemption card applications;
• Advising members and employers on a range of issues regarding the NHS pension scheme;
• Helping NHS dentists understand their monthly payment schedule.
19
During 2010-11 the contact centre gained recognition for its quality of service when it won two awards in the North East Contact Centre Awards for 2010. The service gained top place for both Public Sector Contact Centre Adviser of the Year and Contact Centre Dream Team of the Year.
6. NHS Bursaries
Our management of the schemes for NHS Student Bursaries and NHS Social Work Bursaries makes payments of over £530 million in respect of over 100,000 registered healthcare and social work professionals. During 2010-11 we reviewed the way in which applications are made for an NHS Student Bursary to help improve the customer’s experience. A new bursary application system has been developed over the last 12 months which will ‘go-live’ during 2011. The new system will provide students with a self-service web interface that will enable them to make their bursary application online and track its progress.
7. European Health Insurance Card
The European Health Insurance Card (EHIC) allows UK residents access to state provided healthcare in all countries across Europe. We administer the EHIC application and card distribution system on behalf of the Department of Health. Customers are able to apply via post, telephone or online with over 99% of web and telephone applications dispatched to customers within 3 days. During 2010-11, we were pleased to maintain rolling accuracy consistently above our 97% target.
8. Help with Health Costs
On behalf of the Department of Health, we administer a range of health benefit schemes across the UK, including a low income scheme, medical and maternity exemption schemes, tax credit NHS exemption cards and prescription pre-payment certificates. In 2010-11, we processed over 9 million claims. For customers who applied for assistance under the Low Income Scheme, we continued to process their applications in excess of the 97% accuracy target and within 15 days. For our pre-payment certificates and exemption customers, during 2010-11, we continued to deliver more than 99% of applications within 3 days.
9. NHS Protect (formerly NHS Counter Fraud and Security Management Services)
We provide NHS counter fraud services for England and Wales and security management services for England. From 1 April 2011, these services became known as NHS Protect. Over the last 10 years we have had 616 successful fraud prosecutions and recovered more than £65 million.
20

Tackling Fraud
2010-11 witnessed an increase of over 20% in referrals to the Fraud and Corruption Reporting line. By the end of January 2011, there had been 83 successful prosecutions for fraud since the beginning of the financial year. A fraud risk assessment tool was also piloted by Local Counter Fraud Specialists during the year. The tool is designed to assist in testing the control measures within health bodies where there is a high risk of fraud.
Quality and Training
Following a full analysis and consultation exercise, we have developed and introduced a revised university accredited Foundation Level training programme for Security Management specialists operating across the NHS. We have also expanded the developmental training material supplied to Local Counter Fraud Specialists across the NHS, developing and enhancing skills beyond the foundation level of training. During 2010-11 and following consultation, our quality assurance team established an effective quality assurance process for the management of security within the NHS. A framework for qualitative assessment within the security management discipline, endorsed by the Care Quality Commission, has now been established.
Risk Measurement
The role of our risk measurement team is to identify the nature and scale of fraud and corruption in the NHS. One exercise undertaken during 2010-11, reviewed medical locum agency invoicing for staff supplied by employment agencies to five NHS Trusts. Following analysis of around 6,500 documents, the evidence revealed that overcharging had occurred at all five Trusts and a high error rate in invoices received.
Security Management
Work continued during 2010-11 to ensure over 30,000 NHS staff who work alone were provided with, and fully trained in the use of, lone worker protection services. The service allows the member of NHS staff to discretely send an alert when they are concerned for their safety and where necessary be attended by the emergency services for their security.
10. NHS Supply Chain
We manage a 10 year outsourced contract for the delivery of supply chain services to the NHS in England and Wales. Working together with DHL, who provide the service as NHS Supply Chain, we support the planned delivery of around £1 billion of procurement savings to the NHS over the life of the contract.
21

We have a team, comprising experts in logistics, procurement, finance and audit, dedicated to working with NHS Supply Chain to support the achievement of these planned benefits and throughout 2010-11 savings remained on target. We also provided advice and contract management to the Department of Health on a number of supply chain strategic contracts and programmes such as Flu Pandemic Preparedness, Childhood Vaccines, Emergency Preparedness and Medical and Pharmaceutical Resilience. We provide both operational and contractual advice and support and successfully negotiated a reduction of circa £17m out of a contract between the DH and DHL during 2010. We identified further cost out opportunities against the same contract, and are working with the DH to convert these opportunities. Under the innovative technology adoption procurement programme (iTAPP) we are currently leading two initiatives aimed at realising benefits from two ‘missed opportunities’ which have the potential to deliver in excess of £30m of NHS savings.
11. Back Office Services
In 2010-11, we continued to provide hosted employment and back office services including human resources and financial services to a range of NHS bodies. We employ around 2,000 staff and administer payments of over £100 million on behalf of various DH teams and programmes. We also manage all the records previously held by the Healthcare Commission on behalf of the Parliamentary and Health Service Ombudsman.
22
SECTION 6: OUR PEOPLE
Staff Survey
Our annual staff survey was carried out in October 2010 and achieved a very encouraging response rate of 70%, which was a significant improvement on the 55% response rate in 2009. The survey provided our people with an opportunity to offer their views on the organisation and what it is like working for the NHSBSA. The survey results highlighted a number of areas in which our people scored the organisation highly including:
• A belief that we deliver a good quality service to our customers and clients;
• Being kept informed about important and relevant issues;
• A clear understanding of what staff were expected to achieve in their roles. The results also focussed on four key themes which staff believe could be improved across the organisation, which were:
• Communications;
• The way in which we manage and develop our talent;
• Our approach to learning and development;
• Working together as one team. The results of the survey have been shared widely across the organisation. Detailed reports have been issued to managers who have discussed the results with their teams to review and act upon suggested areas for improvement. A further survey will be undertaken in 2011.
Performance and Talent Management
During 2010-11, we have piloted a new approach to performance and talent management which will be further implemented during 2011-12. This changed approach is intended to improve performance and develop our staff in a consistent way. It will also address one of the key issues raised in the 2010 staff survey.
Communications and Engagement
In 2010-11 we integrated internal communications and staff engagement within the People and Organisational Development team. We have also been busy developing a NHSBSA wide intranet to replace our existing intranets which were still based on the locations of our offices. This will provide us with a NHSBSA wide platform to improve communications which was another issue raised in the staff survey.
23

Equality and Diversity
We are committed to equality of opportunity for all employees and potential employees and are aware of our obligations under the Equality Act 2010. Our aim is to create an environment in which individual differences and the contributions of all employees are recognised and valued and where everyone, irrespective of race, gender, disability, sexual orientation or religion and belief is treated with equity, dignity and respect. As an Authority we collate and monitor information looking across all equality strands with regard to current staff, leavers, disciplinary and grievance issues as well as for those applying to work for us. Additionally, we have updated our online Equality and Diversity training package in line with new legislation and this is to be rolled out to all employees.
Sickness Absence
We have an absence management policy covering the whole of the organisation which provides a consistent framework approach. The policy is underpinned by an externally provided occupational health service and employee assistance programme which is available 24 hours a day. Our overall level of short term sickness absence (seven days or less) for the year 2010-11 was 1.16% and long term was 2.48%. This compares with an overall total of just less than 4% during 2009-10.
Health and Safety
We improved our accident and incident reporting protocols during 2010-11. This was predominantly achieved through the full implementation of a NHSBSA-wide on-line electronic reporting system. This system has enabled any accidents and incidents to be reported in a timely manner and the relevant data captured quickly and accurately. This has been supported by an extensive training programme with over 200 staff now trained to use the system. Within the RIDDOR (Reporting of Injuries, Diseases and Dangerous Occurrences Regulations) requirements, we reported three RIDDOR injuries and nil incidents during 2010-11. Our reportable Accident Incidence Rate (AIR) for 2010-11 is calculated to be 1157, which compares favourably with the national benchmark for public service and local government of 1368. Also during 2010-11, our health and safety function has delivered:
• In-house training to cover display screen equipment, workstation competency and fire awareness;
• A series of proactive premises inspections;
24

• A new health and safety management system;
• Specialist risk assessments;
• Premises inspections and development of appropriate action plans;
• Accident / incident investigations.
25

SECTION 7: PROPERTY, ASSET MANAGEMENT AND SUSTAINABILITY
Property
We have a Property and Facilities Team which supports our Property Asset Management Group to oversee the ongoing development of our estates strategy. This estates strategy aims to support the business by ensuring that our property portfolio is fit for purpose and that suitable buildings are available in the most appropriate locations to help us achieve service excellence and value for money in our operations. In support of this, the strategy includes the following key principles:
• Compliance with the Government Property Unit policy and the property control environment;
• Rationalisation of the number of properties in the portfolio, involving the disposal of unwanted accommodation;
• Improving space utilisation and a drive towards full occupancy of all properties;
• Improving quality of office stock in line with best government practice. Space utilisation has continued to improve as the occupancy of our remaining properties increases. Across all our buildings, we occupied 10.8m² per whole time equivalent (WTE) during 2010-11. This compares with 12.2 m² per WTE during 2009-10. We reduced our total occupied net internal area from 29,360m² in 2009-10 to 28,741m² in 2010-11. We also undertook work on several of these buildings during 2010-11 to improve the quality of the work environment.
Sustainability
In the two years since the launch of the first NHSBSA Sustainable Development Action Plan (SDAP), we have made good progress in improving performance. We have been held up as an example of best practice within the Department of Health Climate Change Plan during early 2010 and were awarded the Carbon Trust Standard during early 2011. We are mindful of guidance published by HM Treasury in June 2010 regarding the publication of sustainability data in public sector annual reports. Whilst this guidance is not yet mandatory, the information we have included is in line with the guidance. In addition to the high level performance, reported at Section 4, the following section sets out our sustainability report for the year.
Greenhouse Gas (GHG) Emissions
We have installed energy efficient equipment, such as point-of-use water heaters, LED lighting and motion sensors, and this coupled with improved control of our buildings using Building Management Systems and targeted behavioural campaigns
26

has resulted in significant reductions in GHG emissions. Our transport emissions have also been targeted via operational policies and training.
Absolute
GREENHOUSE GAS EMISSIONS 2009-10 2010-11
Non-Financial Information - (tCO2e)
Scope 1 (Gas combustion)
1,103 805
Scope 1 (Owned and finance leased cars) Scope 3 (Business travel/non-owned/non-finance leased vehicles/private vehicles)
323 272
Scope 1 (Owned and finance leased trucks/ vans)
7 6
Scope 2 (Electricity purchased)
5,128 4,722
Scope 3 (Business Travel - non-owned/ non-finance leased vehicles - Air)
26 26
Scope 3 (Business Travel - non-owned/ non-finance leased vehicles - Rail)
77 77
Scope 3 (Business Travel - non-owned/ non-finance leased vehicles – Hire vehicles)
106 104
Non-Financial Information – Related Energy Consumption (kWh)
Scope 1 (Gas combustion)
5,366,561 3,915,531
Scope 2 (Electricity purchased)
9,405,940 8,660,757
Waste
We have continued to improve facilities, guidance and training for building users on how to reuse and recycle waste materials. Procedures relating to procurement activity, business case development and project management have also been rolled out to ensure waste elimination, reduction and recovery is taken into account at the earliest possible point. It should be noted that the NHSBSA’s waste recycling figures are significantly affected each year by the timing of the disposal of prescription forms. These forms are released in large volumes throughout the year.
27
Absolute
WASTE MINIMISATION AND MANAGEMENT 2009-10 2010-11
Non-Financial Information – (tonnes)
Total Waste Arising 1,662 1,431 Waste sent to Landfill (residual) 666 480 Waste recycled/ reused (recycled, composted, internal or external reused)
893 780
Waste incinerated/ energy from 103 171 waste
Water
Installation of efficient equipment, such as push-taps and the trial of waterless urinals, has been undertaken during 2010-11.
Absolute
FINITE RESOURCE CONSUMPTION - WATER 2009-10 2010-11 Non-Financial Information - (m3)
Water Consumption - Supplied 14,470 13,097
Sustainable Procurement
Our key actions undertaken during 2010-11, to achieve more sustainable procurement methods, have been to roll-out a corporate Sustainable Procurement Policy and procedures alongside targeted training. Category and supplier analysis, including spend and sustainability risk assessment has also been completed and a sustainability-focussed supplier engagement programme has commenced.
28

SECTION 8: COMPLAINTS
We take complaints seriously and believe in the value of learning from the complaints which are made about our staff and services to make improvements for our customers. During 2010-11, we made further improvements to our complaints handling processes. We handled an increased number of issues through our customer contact centre which helped our customers to have their concerns dealt with quickly and effectively. The total number of complaints received during 2010–11 was 1,392 of which 575 (41.3%) were found to be justified. (This compares with a total of 2,261 during 2009-10 of which 48% were found to be justified.) The total number of complaints received during 2010-11 represented 0.003% of the total number of transactions we handled during the year. It should be noted that NHS Pensions is subject to pension legislation which also governs complaints handling which is reflected in our complaints procedure. The above figures do not include any formal stage 1 or 2 pension disputes.
29

SECTION 9: LOOKING AFTER INFORMATION
During 2010-11 we have continued to improve our approach to handling information efficiently and securely. Each year, we undertake a detailed self assessment using the NHS-wide Information Governance toolkit. Using this toolkit, our rating for 2010-11 was an overall satisfactory rating with a total compliance level of 79%. We did not have any security incidents classified as serious untoward incidents by the Department of Health. However, there were 35 minor incidents throughout the year which are summarised below according to Department of Health categorisation. Whilst each incident is investigated thoroughly, it should be noted that these incidents represent a very small percentage (<0.001%) of the large number of transactions undertaken by the NHSBSA each year.
Category Nature of Incident Total
I Loss of inadequately protected electronic equipment, devices or paper documents from secured NHS premises
13
II Loss of inadequately protected electronic equipment, devices or paper documents from outside secured NHS premises
2
III Insecure disposal of inadequately protected electronic equipment, devices or paper documents 1
IV Unauthorised Disclosure 18
V Other 1
Total Number of Incidents 35
In the course of our business, we hold and use information about members of the public and NHS colleagues. Some of this information is of a personal and sensitive nature and as a consequence we have stringent controls in place to ensure the security of this information. Issues relating to information governance within the NHSBSA are co-ordinated by the Information Governance and Security Group which is chaired by the Commercial Director who holds the position of both our Caldicott Guardian and Senior Information Risk Owner (SIRO). The remit of the Caldicott Guardian is to ensure that any person identifiable information we hold is held and used properly. The remit of the SIRO is to take ownership of our information risk policy, act as advocate for information risk to the Board and provide written advice to the accounting officer on the content of their Statement on Internal Control with regard to information risk.
30

Data Protection & Freedom of Information
As a Special Health Authority, we are subject to the requirements of the Data Protection Act (DPA) 1998 and we have filed the appropriate notification with the Information Commissioner’s Office. This means that all subject access requests are responded to within the provisions of the Act, typically within 40 calendar days. During 2010-11, we dealt with 242 DPA requests, all except 3 were responded to within the required timeframe. The number of requests has decreased by 35 (13%) when compared to last year. We are also subject to the requirements of the Freedom of Information Act (FoI) 2000. This means that all requests for information are responded to within the provisions of the act, typically within 20 working days. During 2010-11, we dealt with 983 FOI requests, all except 4 were responded to within the required timeframe. The number of requests has increased by 174 (22%) compared to last year. As a public sector information holder, we comply with the cost allocation and charging requirements set out in HM Treasury and Office of Public Sector Information guidance. We can confirm that no charges were made for access to information during 2010-11.
31

SECTION 10: FINANCIAL REVIEW
Background
The financial statements contained within this report have been prepared in accordance with the direction given by the Secretary of State for Health under the NHS Act 2006 and in a format instructed by the DH with the approval of HM Treasury. Our accounts for 2010-11 have been prepared under International Financial Reporting Standards (IFRS) and comprise a Statement of Financial Position, Statement of Comprehensive Net Expenditure, a Statement of Cash Flows and a Statement of Changes in Taxpayers Equity, all with related notes. We differ from most other Special Health Authorities in that our accounts are based upon three distinct segments. The first of these segments is a summary of the trading activity of NHS Supply Chain which is also supported by full disclosure notes reflecting the different nature of supply chain trading to the administration of the rest of the NHSBSA. Secondly, the bursary payments we make on behalf of Strategic Health Authorities to NHS students and the DH for Social Work students are disclosed separately. The third segment of our accounts relates to our operating expenditure, which are our running costs. The NHSBSA is currently the subject of a commercial review by the Department of Health, although the results of the review have not been reported yet. When the review concludes it is not expected to have any immediate significant impact on the Authority or its funding arrangements and consequently no financial considerations are reported this year. We have received confirmation that funding from the DH for the next 12 months has been agreed.
Financial Performance
We have been set stringent financial targets by the Department of Health against which we are expected to deliver. For 2010-11 we were required to maintain our expenditure within certain key funding limits:
• Revenue expenditure within a limit of £141.353m;
• Capital expenditure within a limit of £23.441m. We are able to report that for 2010-11 we successfully achieved these statutory targets. In addition to the above, we are required to comply with the Better Payments Practice Code, which requires non NHS trade creditors to be paid within 30 days or agreed terms. Our performance against this target for 2010-11 is as follows:
32

Non-NHS Number Value £000 Total non-NHS Trade Invoices paid 2010-11 1,772,615 81,202,112 Total non-NHS Trade Invoices paid within target 599,526 68,837,615 Percentage of non-NHS bills paid within target 33.82% 84.77%
This overall performance is split as follows:
Supply Chain Performance Total non-NHS Trade Invoices paid 2010-11 Total non-NHS Trade Invoices paid within target Percentage of non-NHS Trade Invoices paid within target
Number1,754,135 582,498 33.21%
Value £000 1,175,606 457,580
38.92% Other Divisions Performance Total NHS Trade Invoices paid 2010-11 Total NHS Trade Invoices paid within target Percentage of NHS Trade Invoices paid within target
18,480 17,028 92.14%
80,026,506 68,380,035
85.45%
NHS Supply Chain performance is disclosed with reference to this 30 day target. This is consistent with the rest of the Authority however NHS Supply Chain is entitled to agree extended payment terms with suppliers. NHS Supply Chain compliance with contractually agreed payment terms is higher than against this 30 day target and is within the creditor day performance criteria defined in the Master Services Agreement.
Financial Standing
Delivering Value for Money
Delivering value for money is an integral part of our vision and some of the achievements outlined in this report demonstrate our success in doing so. After adjusting for the impact of the increased volumes of transactions we have processed, and inflationary pressures, our running costs are estimated to be up to 40% lower than they were when the NHSBSA was created in 2006.
33
We have total non current assets of £63.9m. Of this, £21.2m relates to property, plant and equipment that we own, the balance primarily relates to IT software, licenses and developments. We have net current assets on our balance sheet of £127.9m, this includes £65.2m relating to the working capital balances of the NHS Supply Chain which is operated by DHL. There were no post balance sheet events to report.
We have achieved these savings by:
• Automating our systems and leveraging technology to reduce manual involvement in business processes to a minimum e.g. scanning and intelligent character recognition in our prescription processing system and voice automation in our customer contact centre;
• Re-engineering our business processes through the application of six-sigma and lean methodologies to some of our key functions;
• Providing and promoting internet access to our services to replace both paper and telephone based access;
• Centralising services common to all business streams e.g. HR, finance, commercial, property and facilities, imaging, IT infrastructure and call centre functions and reorganising our operational capability to maximise synergy savings;
• Putting in place professional contract and service management of key private sector suppliers to improve efficiency and value;
• Reviewing and re-shaping services such as NHS Protect and Dental Reference Services;
• Negotiating and awarding a contract with a private sector provider to transform dental services and a managed IT infrastructure which delivers major savings over the contract term.
Future Financial Targets
Like all public services, we are facing significant financial challenges in the short term. Our strategy for 2011-16 and our business plan for 2011-12 set out our strategy and plans for the organisation to ensure we continue to deliver against our financial targets. This will be achieved through a range of initiatives including:
• Outsourced service delivery;
• Management de-layering;
• Review of service levels;
• Identification of non value added activities;
• Further income generation;
• Opportunities for further sharing of services;
• Opportunities to recharge functions;
• Renegotiating existing contracts with third party providers;
• Service specific efficiencies.
34

Pension Costs for Current Staff
The treatment of pension liabilities and relevant pension scheme details are set out in the accounting policies note 3.6 to the financial statements and in the remuneration report on page 37.
Hosted Services
We provide a range of hosted financial and HR services to other NHS organisations and Department of Health teams. The costs that we incur in providing these services, primarily staff costs have been included within our operating expenditure, as has the total income contributions received from these organisations to cover costs. For 2010-11 the income received from hosted and managed services was £1.1m. The income and expenditure of the organisations to which we provide hosted services, although disbursed by us, is not included in our income and expenditure accounts and is charged to the relevant organisation's accounts.
Auditor
The Comptroller and Auditor General is appointed by statute to audit the NHSBSA. The audit fee for the year ended 31 March 2011 of £150k is for the audit of these accounts. An additional £64k relates to the audit of our Pharmaceutical Payments and the provision of assurances to other bodies over our various payment systems. An additional notional fee of £85k relates to the audit of the Pension Scheme Accounts.
Accounting Officer’s Disclosure to the Auditors
As far as the Accounting Officer is aware, there is no relevant audit information of which our auditors are unaware and the Accounting Officer has taken all steps he ought to have taken to make himself aware of any relevant audit information and to establish that our auditors are aware of that information.
Principal Risks and Uncertainty
Effective risk management is a cornerstone of good governance and our framework of procedures and internal controls contribute to mitigating and controlling the risks we face. Our risk management system is embedded throughout the organisation and was in place throughout 2010-11. Our Statement on Internal Control, included at page 44, provides further details of our risk management strategy and procedures.
Nick Scholte Chief Executive NHS Business Services Authority 16 June 2011
35

SECTION 11: NHSBSA BOARD AND REMUNERATION REPORT Board Members Declared Interests
The members of the NHSBSA Board are listed below alongside their declared interests for 2010-11.
Chair
Paul Rich Nothing Declared
Non- Executive Directors
David Hulf Non-Executive Director & Chair of Audit Committee at National Savings and Investments
Jeremy Strachan Trustee of Drugscope (National Charitable Trust) Company Secretary for Forensic Science Service Ltd (Government Owned Private Company)
Anne Galbraith Member of Puffin Appeal (Charity Raising Funds for Cystic Fibrosis) Chair of Valuation Tribunal Service Chair of Council for University of Durham Health Consultant (Self Employed) – Chaired Mental Health Inquiries
David Teale Chair of Solutions SK (Company wholly owned by Stockport MBC) Chair of Individual Solutions SK Member and Chair of Audit Committee for Parkway Green Housing Trust (Charitable Trust) Chief Executive of North of England Excellence
Michael Harling Shareholder in Deutsche Post Partner is also declared as being a shareholder in Deutsche Post Receives a pension from the Steria Pension Plan (part of Groupe Steria SCA & known as Xansa Pension Plan until March 2011) Board Member, Guinness South Ltd - a Housing Association (previously known as Guinness Trust, Guinness Midsummer Ltd, Guinness Midsummer Homes Ltd, Clapton Community Housing Trust Ltd - all charitable social housing providers)
36

Executive Directors
Nick Scholte Nothing Declared Chief Executive Roberta Barker Trustee of Richmondshire Leisure Trust Director of People & Organisational Development John Smith Nothing Declared Director of Finance (until 31 December 2010) Michael Brodie Member of Durham University Audit Committee Acting Director of Finance Vice-Chair of the Executive Committee of CIPFA in the (from 1 January 2011) North East Jim Orr Nothing Declared Commercial Director Alistair McDonald Nothing Declared Chief Operating Officer
Remuneration Report
The remuneration of the NHSBSA Executive Directors is set by the Remuneration and Terms of Service Committee on behalf of the NHSBSA Board in conjunction with the Department of Health. The Committee is chaired by a Non-Executive Director of the Board together with two other Non-Executive Members, one of whom is the Chair of the Authority. This report for the year ended 31 March 2011 is produced by the Board. The Remuneration and Terms of Service Committee has met on five occasions during the period 1 April 2010 to 31 March 2011. The Remuneration and Terms of Service Committee operates within a framework laid down by the Department of Health. Its remit is to determine, on behalf of the Authority the Terms of Service, remuneration and other benefits of the Chief Executive, Executive Directors and such other posts as are specifically designated by the Board to be within their purview, ensuring that relevant employees are fairly rewarded for their individual contributions to the organisation. The Committee also ensures that an effective system is in place and being properly administered to monitor and evaluate the performance of relevant employees, including such assessments as may be required to determine their level of remuneration. The remuneration of Executive Directors is reviewed annually by the Remuneration and Terms of Service Committee, taking account of national awards, central
37

guidance and other relevant factors. The remuneration of Non-Executive Directors is determined by the Secretary of State for Health. The NHSBSA, with the approval of the Department of Health Pay and Performance Oversight Committee operates the NHS VSM Pay Framework. This framework also provides access to an approved scheme for performance related payments which are paid in line with Department of Health instructions. During 2010-11 each of the Executive Directors, of the NHSBSA, received 5% performance payment, on a collegiate basis, for achieving specified organisational objectives during 2009-10. This payment was agreed with the Department of Health. The performance arrangements for the 2010-11 performance year are yet to be agreed.
Appointments
Non-Executive Directors are appointed by the Secretary of State for a term of either three or four years. Executive Directors have standard NHS very senior manager contracts of employment. There are no contractual clauses or other agreements for compensation in the event of early termination of office other than those provided by statutory requirements.
Emoluments of Board Members
The remuneration relating to all directors in post during 2010-11 is detailed in the tables below which identify the salary, other payments and allowances and pension benefits applicable to both executives and non executives. This information is subject to audit.
38
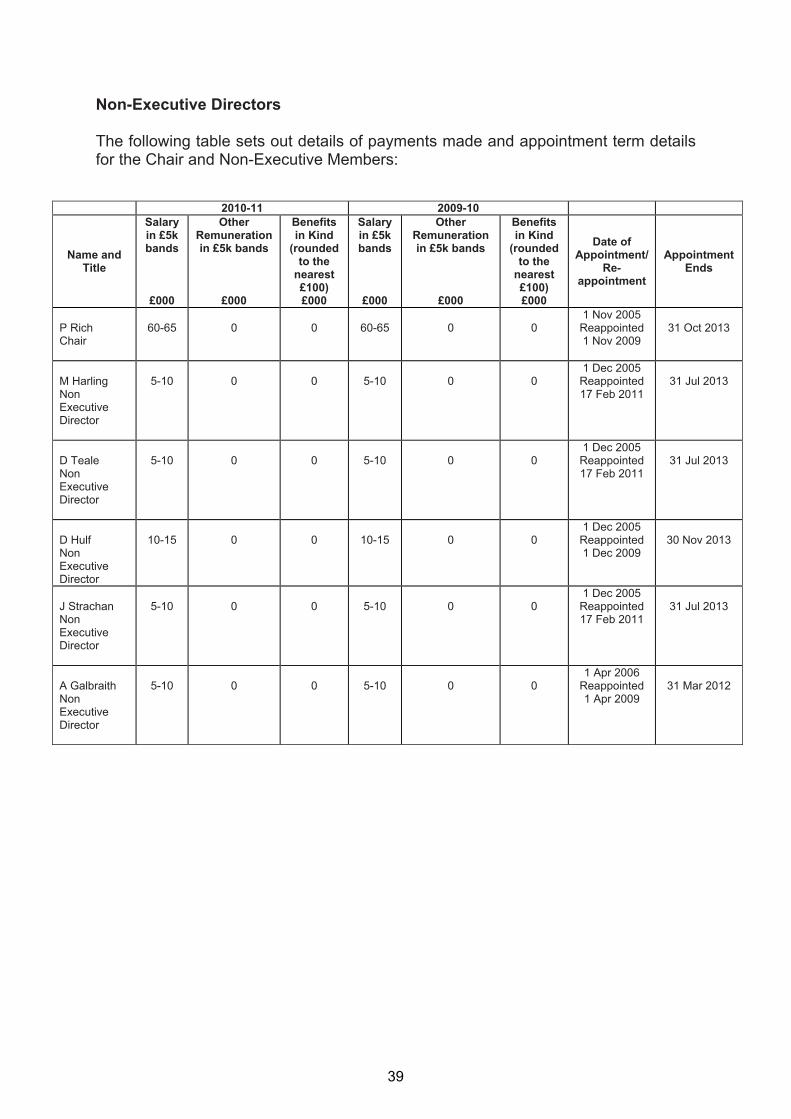
Non-Executive Directors
The following table sets out details of payments made and appointment term details for the Chair and Non-Executive Members:
2010-11 2009-10
Name and Title
Salary in £5k bands
£000
Other Remuneration in £5k bands
£000
Benefits in Kind
(rounded to the
nearest £100) £000
Salary in £5k bands
£000
Other Remuneration in £5k bands
£000
Benefits in Kind
(rounded to the
nearest £100) £000
Date of Appointment/
Re-appointment
Appointment Ends
1 Nov 2005 P Rich 60-65 0 0 60-65 0 0 Reappointed 31 Oct 2013 Chair 1 Nov 2009 1 Dec 2005 M Harling 5-10 0 0 5-10 0 0 Reappointed 31 Jul 2013 Non 17 Feb 2011 Executive Director 1 Dec 2005 D Teale 5-10 0 0 5-10 0 0 Reappointed 31 Jul 2013 Non 17 Feb 2011 Executive Director 1 Dec 2005 D Hulf 10-15 0 0 10-15 0 0 Reappointed 30 Nov 2013 Non 1 Dec 2009 Executive Director 1 Dec 2005 J Strachan 5-10 0 0 5-10 0 0 Reappointed 31 Jul 2013 Non 17 Feb 2011 Executive Director 1 Apr 2006 A Galbraith 5-10 0 0 5-10 0 0 Reappointed 31 Mar 2012 Non 1 Apr 2009 Executive Director
39
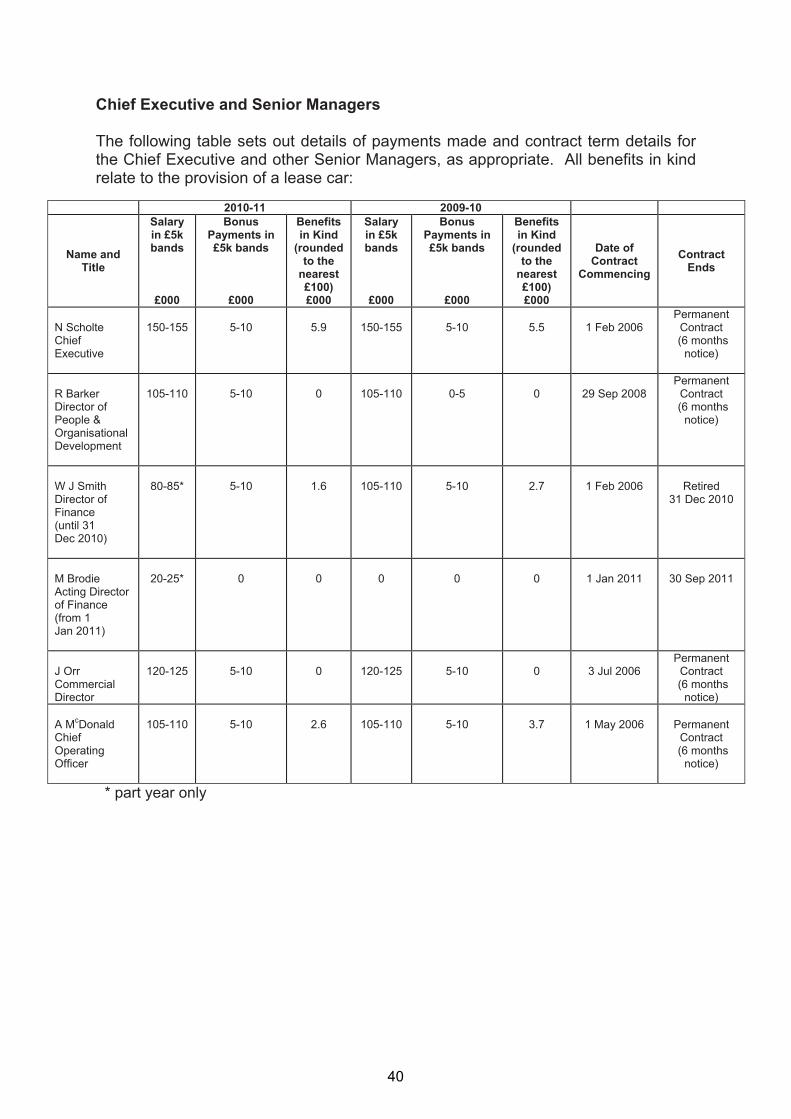
Chief Executive and Senior Managers
The following table sets out details of payments made and contract term details for the Chief Executive and other Senior Managers, as appropriate. All benefits in kind relate to the provision of a lease car:
2010-11 2009-10
Name and Title
Salary in £5k bands
£000
Bonus Payments in £5k bands
£000
Benefits in Kind
(rounded to the
nearest £100) £000
Salary in £5k bands
£000
Bonus Payments in £5k bands
£000
Benefits in Kind
(rounded to the
nearest £100) £000
Date of Contract
Commencing Contract
Ends
Permanent N Scholte 150-155 5-10 5.9 150-155 5-10 5.5 1 Feb 2006 Contract Chief (6 months Executive notice) R Barker Director of People & Organisational Development
105-110
5-10
0
105-110
0-5
0
29 Sep 2008
Permanent Contract
(6 months notice)
W J Smith 80-85* 5-10 1.6 105-110 5-10 2.7 1 Feb 2006 Retired Director of 31 Dec 2010 Finance (until 31 Dec 2010) M Brodie Acting Director of Finance (from 1 Jan 2011)
20-25*
0
0
0
0
0
1 Jan 2011
30 Sep 2011
Permanent J Orr 120-125 5-10 0 120-125 5-10 0 3 Jul 2006 Contract Commercial (6 months Director notice) A McDonald 105-110 5-10 2.6 105-110 5-10 3.7 1 May 2006 Permanent Chief Contract Operating (6 months Officer notice)
* part year only
40

Pension Benefits
The table below sets out the pension benefits of the Chief Executive and Senior Managers of the NHSBSA:
* This figure has been restated following receipt of a revised calculation.
As Non-Executive Directors do not receive pensionable remuneration, there are no entries in respect of pensions for Non-Executive Directors.
Cash Equivalent Transfer Value
A Cash Equivalent Transfer Value (CETV) is the actuarially assessed capital value of the pension scheme benefits accrued by a member at a particular point in time. The benefits valued are the members’ accrued benefits and any contingent spouse’s pension payable from the scheme.
Name and Title
Real
Increase in
pension at age
60 (bands
of £2,500)
£000
Real
Increase in
pension lump sum
at aged 60 (bands of £2,500)
£000
Total
accrued pension at age 60
at 31 March 2011
(bands of £5,000)
£000
Lump sum at age 60 related to accrued
pension at 31 March
2011 (bands of £5,000)
£000
Cash Equivalent Transfer
Value at 31 March 2011
£000
Cash Equivalent Transfer
Value at 31 March 2010
£000
Real
Increase in Cash
Equivalent Transfer
Value
£000
Employer’s contribution
to stakeholder pension
£000 N Scholte Chief Executive
0 – 2.5
5 – 7.5
50 – 55
155 – 160
918
971*
(37)
0
R Barker Director of People & Organisational Development
0 – 2.5
0
0 – 5
0
39
28
8
0
W J Smith Director of Finance (until 31 Dec 2010)
0 – 2.5
2.5 – 5
45 – 50
140 – 145
n/a
1,116
n/a
0
M Brodie Acting Director of Finance (from 1 Jan 2011)
0 – 2.5
5 – 7.5
20 – 25
60 – 65
250
268
(12)
0
J Orr Commercial Director
0 – 2.5
5 – 7.5
25 – 30
85 – 90
680
664
11
0
A McDonald Chief Operating Officer
0 – 2.5
2.5 – 5
40 – 45
125 – 130
683
734
(35)
0
41

A CETV is a payment made by a pension scheme or arrangement to secure pension benefits in another pension scheme or arrangement when the member leaves a scheme and chooses to transfer the benefit accrued in the former scheme. The pension figures shown relate to the benefits that the individual has accrued as a consequence of their total membership of the pension scheme, not just their service in a senior capacity to which disclosure applies. The CETV figure and the other pension details, include the value of any pension benefits in another scheme or arrangement which the individual has transferred to the NHS pension scheme. They also include any additional pension benefit accrued to the member as a result of their purchasing additional years of pension service in the scheme at their own cost. CETV are calculated within the guidelines and framework prescribed by the Institute and Faculty of Actuaries.
Real Increase in CETV
This reflects the increase in CETV effectively funded by the employer. It takes account of the increase in accrued pension due to inflation, contributions paid by the employee (including the value of any benefits transferred from another scheme or arrangement) and uses common market valuation factors for the start and end of period.
Nick Scholte Chief Executive NHS Business Services Authority 16 June 2011
42
SECTION 12: STATEMENT OF THE CHIEF EXECUTIVE’S RESPONSIBILITIES
Under the National Health Service Act 2006 and directions made there under by the Secretary of State with the approval of Treasury, we are required to prepare a statement of accounts for each financial year in the form, and on the basis, determined by the Secretary of State, with the approval of Treasury. The accounts are prepared on an accruals basis and must give a true and fair view of our state of affairs at the year end and of its net resource outturn, recognised gains and losses and cash flows for the financial year. The Accounting Officer for the DH has appointed the Chief Executive of the NHSBSA as the Accounting Officer, with responsibility for preparing our accounts and for transmitting them to the Comptroller and Auditor General. In preparing the accounts, the Accounting Officer is required to:
• observe the accounts direction issued by the Secretary of State, including the relevant accounting and disclosure requirements, and apply suitable accounting policies on a consistent basis;
• make judgements and estimates on a reasonable basis;
• state whether applicable accounting standards have been followed and disclosed and explain any material departures in the financial statements; and
• prepare the financial statements on a going concern basis, unless inappropriate to presume that the NHSBSA will continue in operation.
The Chief Executive's relevant responsibilities as Accounting Officer, including responsibility for the propriety and regularity of the public funds and assets vested in the NHSBSA, and for the keeping of proper records, are set out in Managing Public Money issued by the Treasury.
43
SECTION 13: STATEMENT ON INTERNAL CONTROL
Scope of Responsibility
The NHSBSA Board is accountable for internal control. As Accounting Officer, and Chief Executive of this Board, I have responsibility for maintaining a sound system of internal control that supports the achievement of the organisation’s policies, aims and objectives. I also have responsibility for safeguarding the public funds and the organisation’s assets for which I am personally responsible, in accordance with the responsibilities set out in HM Treasury’s Managing Public Money and as assigned to me in the Accounting Officer Memorandum. The NHSBSA manages a range of business activities on behalf of the Department of Health. Accountability arrangements with the Department comprise an overall Senior Departmental Sponsor, with individual sponsors providing policy direction for each core service stream. A clear ongoing accountability framework is in place, which includes formal quarterly reviews with all sponsors, where amongst strategic, policy and operational issues, the NHSBSA’s corporate risk register and latest financial position are reviewed. Additionally, regular scheduled meetings are held with individual service sponsors.
The Purpose of the System of Internal Control
The system of internal control is designed to manage risk to a reasonable level rather than to eliminate all risk of failure to achieve policies, aims and objectives; it can therefore only provide reasonable and not absolute assurance of effectiveness. The system of internal control is based on an ongoing process designed to:
• identify and prioritise the risks to the achievement of the organisation’s policies, aims and objectives,
• evaluate the likelihood of those risks being realised and the impact should they be realised, and to manage them efficiently, effectively and economically.
The system of internal control has been in place in the NHS Business Services Authority for the year ended 31 March 2011 and up to the date of approval of the annual report and accounts.
Capacity to Handle Risk
The NHSBSA is committed to ensuring that risk management is an integral part of the leadership and management of the organisation. The Board has overall responsibility for approving the Authority’s Risk Management Strategy and assurance relating to the implementation and monitoring of this strategy is provided by the Audit and Risk Management Committee. As Accounting Officer, I have overall responsibility for establishing the organisation’s internal controls and I have delegated certain risk management responsibilities to other Directors and their senior managers.
44

We have established a team with responsibility for coordinating the risk management activities within each business stream and supporting all staff with the effective identification and management of risks. The Authority aims to empower all staff to assume responsibility for contributing to effective risk management. This is achieved by robust governance systems and processes which enable the identification, assessment, analysis and management of risk at appropriate levels for all operational and project related risks. During 2010-11 we have further developed our capability and capacity to manage risk. We have refreshed our Risk Management Policy, setting out our risk appetite and risk tolerance and providing greater clarity around assessing and responding to risks. A new Risk Management Process Guide and supporting training, tools and techniques are in the process of development. Additionally, we have improved the way we report and review our corporate risk register, ensuring that its format is aligned with our Business Plan.
The Risk and Control Framework
In working towards its five year Strategy, the NHSBSA Board approves an annual Business Plan which sets out the key service delivery priorities, objectives and developments which it aims to deliver against during the year. The plan also identifies the key risks to delivery. Responsibility for approving the Authority’s policy and procedures for the management of risk is a Board responsibility and as Accounting Officer, responsibility for ensuring the NHSBSA has a programme of risk management in place has been delegated to me. The Audit and Risk Management Committee provide the Authority’s Board with an independent and objective review of the adequacy and effectiveness of the Authority’s overall assurance framework and in particular the organisation’s risk management approach. The Committee has responsibility for reviewing:
• All risk and control related disclosure statements including the annual Head of Internal Audit statement and external audit opinion
• The underlying assurance process that governs the management of principal risks and the achievement of corporate objectives
• The appropriateness of policies and procedures for ensuring compliance with law, guidance and codes of conduct, and their effectiveness
• Policies and procedures related to the detection and prevention of fraud and corruption.
The Committee meets these responsibilities by receiving regular reports on a range of audit and assurance topics and in particular through the receipt and review of:
• Quarterly risk management reports setting out and assessing the major risks facing the organisation, stratified into the key areas of focus set out in our
45

Business Plan. Such reports set out the key movements in risks between reporting periods and identify emerging risks and the mitigating actions which have been taken or are planned to mitigate them.
• A half yearly corporate assurance schedule which sets out the key elements of the Authority’s overarching assurance framework and identifies the extent to which robust arrangements are in place and operating effectively in each area.
• An annual risk management report outlining how the Authority’s risk management arrangements have continued to operate effectively during the year and how they have been reviewed and strengthened.
• An annual local counter fraud specialist report, supported by regular reports identifying the Authority’s fraud risks by way of fraud risk matrices.
• The outcome of auditors’ assignments to review the control environment covering Pharmaceutical, Dental and Student Bursary Payments so that third party assurance can be provided to Primary Care Trusts and Strategic Health Authorities, as appropriate, for the payments made by the NHSBSA on their behalf.
Supporting the role of the Board and the Audit and Risk Management Committee, the NHSBSA’s risk and control framework also includes the following elements:
• Regular quarterly reviews of the Corporate Risk Register by the Leadership Team, as a precursor to the Audit and Risk Management Committee Review.
• The maintenance and quarterly review of Risk Registers for each service area covering their operational and project risks.
• A Risk Management Group led by the Director of Finance with representation from all of the NHSBSA’s services, which reviews risk issues and provides a platform for shared learning and a harmonised approach.
• Annual letters of management representation from each Managing Director providing confirmation that an appropriate control environment has been in place throughout the financial year for their area, thus informing this Statement on Internal Control.
• Regular reviews of all information risks by an Information Governance and Security Group (IGSG) which monitors the Authority’s compliance with information governance and security best practice and self assesses against a nationally developed toolkit.
• A performance management framework which highlights performance against key performance indicators for each service stream.
• Control measures are in place to ensure that all the organisation's obligations under equality, diversity and human rights legislation are complied with.
• As an employer with staff entitled to membership of the NHS Pension scheme, control measures are in place to ensure all employer obligations contained within the Scheme regulations are complied with. This includes ensuring that deductions from salary, employer’s contributions and payments in to the Scheme are in accordance with the Scheme rules, and that member Pension Scheme
46

records are accurately updated in accordance with the timescales detailed in the Regulations
• Regular reviews of the Sustainable Development Action Plan and Carbon Reduction Strategy to ensure that the Authority’s sustainability targets are being met.
Towards the end of 2010-11 the NHSBSA has undertaken an assurance mapping process utilising the widely recognised three lines of defence model to identify the assurance in place over each of its core business processes and also its governance responsibilities and legislative requirements. This model highlights where assurance can be taken from management control and reporting; functional oversight and governance systems, and independent review and regulatory oversight. It provides a basis on which the leadership of the NHSBSA can determine the focus of its assurance effort; assesses the outcome of assurance activity and determine its assurance appetite. This integrated approach to assurance will be further developed during 2011-12. As set out above, the Authority has strong governance arrangements to manage and minimise the risks it faces. However, like any organisation, the NHSBSA faces some major risks. In particular, the Authority faces key risks regarding external factors which impact upon the organisation. As an organisation we have identified a risk that, due to the complexity of our activities, we may be unable to respond to changes in policy where these are required at short notice. This is particularly pertinent at a time of major change both in the wider NHS and the potential implications of the Health and Social Care Bill and also the ongoing Commercial Review of the NHSBSA. We are looking to mitigate, manage and control this risk through our client relationship management process, regular engagement with stakeholders and organisational and service redesign.
Review of Effectiveness
As Accounting Officer, I have responsibility for reviewing the effectiveness of the system of internal control. My review is informed in a number of ways. The Head of Internal Audit provides me with an opinion on the overall arrangements for gaining assurance through the Assurance Framework and on the controls reviewed as part of the risk based internal audit work. For 2010-11 the Head of Internal Audit Opinion concluded that based on the work completed to date significant assurance can be given that there is a generally sound system of internal control, designed to meet the Authority’s objectives, and that controls are generally being applied consistently. Some control issues were brought to the attention of management. The significant areas are outlined later in this statement. Executive Directors and Managing Directors within the organisation who have responsibility for the development and maintenance of the system of internal control within their service area provide me with assurance via annual letters of management representation which confirm that internal controls have remained in place during the year; financial information for their service is to the best of their knowledge correct and there is no material information of which they are aware that I have not also been made aware of.
47

The Assurance Framework itself provides me with evidence that the effectiveness of controls that manage the risks to the organisation achieving its principal objectives has been reviewed. My review is also informed by:
• The work of the Audit and Risk Management Committee which informs the Board about the outcome of its activities through submission of its minutes and its annual report to the Board
• The findings of both the National Audit Office and our internal audit reviews. The Audit and Risk Management Committee oversees progress towards the implementation of all such recommendations.
• The work of our Local Counter Fraud Specialist to prevent, deter, investigate and report on fraud activity.
A plan to address weaknesses and ensure continuous improvement of the assurance system is in place and the Audit and Risk Management Committee will continue to monitor improvements in the overall corporate assurance framework.
Significant Internal Control Issues
One of the elements of the NHSBSA’s service portfolio is the administration and payment of student bursaries on behalf of Strategic Health Authorities. The NHSBSA has in place a control environment designed to minimise the risk of fraud or error in the calculation of bursary payments. This environment involves the identification and operation of a number of key control objectives and supporting controls. One such key control is that a random sample of elements of 340 payments are checked for accuracy every month by the Student Bursaries Quality Assurance Team. However, during testing this control was found to have not operated effectively. Additionally, weaknesses were identified in the design of this and other bursary controls and the subsequent reporting of performance. An agreed action plan has been developed to address these control issues, progress against which will be monitored by senior management and the Audit and Risk Management Committee.
Conclusion
With the exception of the internal control issue that I have outlined in this statement, my review confirms that the NHSBSA has a generally sound system of internal control that supports the achievement of its policies, aims and objectives and that those control issues have been and are being addressed.
Nick Scholte Chief Executive NHS Business Services Authority 16 June 2011
48

CERTIFICATE AND REPORT OF THE COMPTROLLER AND AUDITOR GENERAL TO THE HOUSE OF COMMONS
I certify that I have audited the financial statements of the NHS Business Services Authority for the year ended 31 March 2011 under the National Health Service Act 2006. These comprise the Statement of Comprehensive Net Expenditure, the Statement of Changes in Taxpayers’ Equity, the Statement of Financial Position, the Statement of Cash Flows and the related notes. These financial statements have been prepared under the accounting policies set out within them. I have also audited the information in the Remuneration Report that is described in that report as having been audited.
Respective Responsibilities of the Chief Executive and Auditor As explained more fully in the Statement of the Chief Executive Responsibilities, the Chief Executive is responsible for the preparation of the financial statements and for being satisfied that they give a true and fair view. My responsibility is to audit, certify and report on the financial statements in accordance with the National Health Service Act 2006. I conducted my audit in accordance with International Standards on Auditing (UK and Ireland). Those standards require me and my staff to comply with the Auditing Practices Board’s Ethical Standards for Auditors.
Scope of the Audit of the Financial Statements An audit involves obtaining evidence about the amounts and disclosures in the financial statements sufficient to give reasonable assurance that the financial statements are free from material misstatement, whether caused by fraud or error. This includes an assessment of: whether the accounting policies are appropriate to the NHS Business Services Authority’s circumstances and have been consistently applied and adequately disclosed; the reasonableness of significant accounting estimates made by the NHS Business Services Authority; and the overall presentation of the financial statements. In addition, I read all the financial and non-financial information in the Annual Report to identify material inconsistencies with the audited financial statements. If I become aware of any apparent material misstatements or inconsistencies I consider the implications for my certificate. In addition, I am required to obtain evidence sufficient to give reasonable assurance that the expenditure and income reported in the financial statements have been applied to the purposes intended by Parliament and the financial transactions conform to the authorities which govern them.
Opinion on Regularity In my opinion, in all material respects, the expenditure and income have been applied to the purposes intended by Parliament and the financial transactions conform to the authorities which govern them.
Opinion on the financial statements In my opinion:
• the financial statements give a true and fair view, of the state of the NHS Business Services Authority’s affairs as at 31 March 2011, and of its net operating costs for the year then ended; and
49

• the financial statements have been properly prepared in accordance with the National Health Service Act 2006 and directions issued thereunder.
Opinion on Other Matters In my opinion:
• the part of the Remuneration Report to be audited has been properly prepared in accordance with directions made under the National Health Service Act 2006; and
• the information given in the Financial Review for the financial year for which the financial statements are prepared is consistent with the financial statements.
Matters on which I report by exception I have nothing to report in respect of the following matters which I report to you if, in my opinion:
• adequate accounting records have not been kept; or
• the financial statements and the part of the Remuneration Report to be audited are not in agreement with the accounting records or returns; or
• I have not received all of the information and explanations I require for my audit; or
• the Statement on Internal Control does not reflect compliance with HM Treasury’s guidance.
Report
I have no observations to make on these financial statements.
Amyas C E Morse Comptroller and Auditor General National Audit Office 157-197 Buckingham Palace Road Victoria London SW1W 9SP 20 June 2011
50
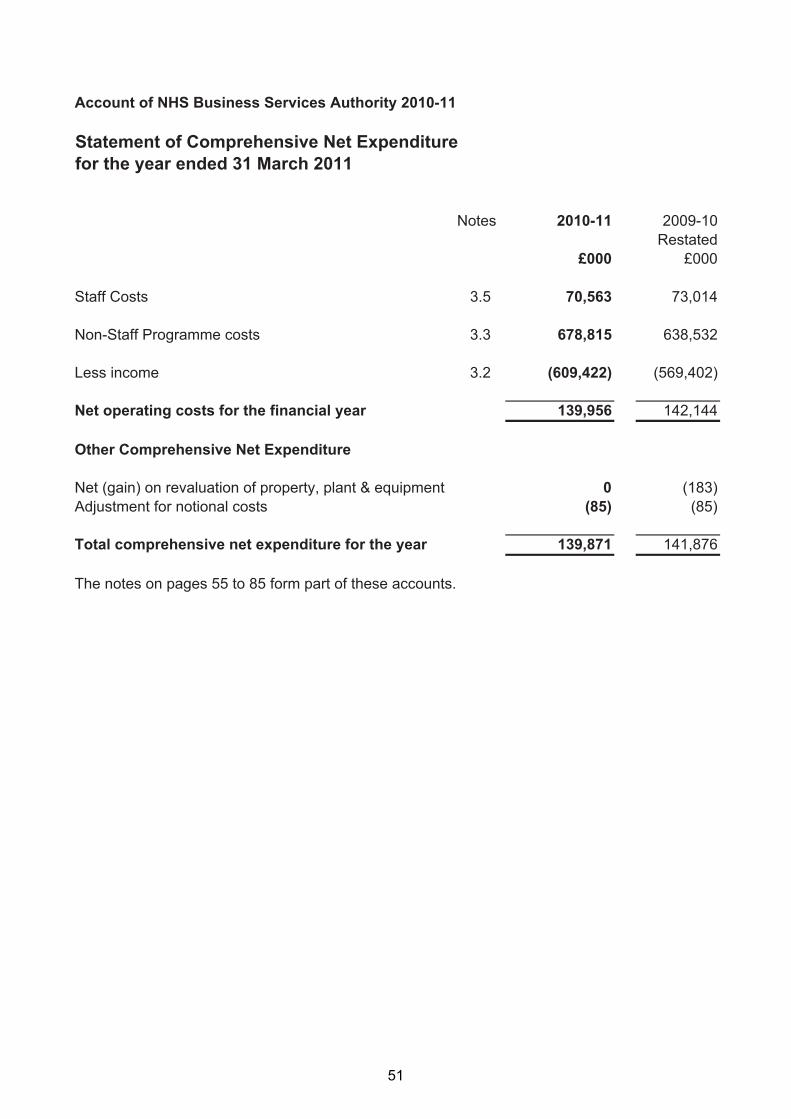
Account of NHS Business Services Authority 2010-11
Statement of Comprehensive Net Expenditurefor the year ended 31 March 2011
Notes 2010-11 2009-10Restated
£000 £000
Staff Costs 3.5 70,563 73,014
Non-Staff Programme costs 3.3 678,815 638,532
Less income 3.2 (609,422) (569,402)
142,144Net operating costs for the financial year
Other Comprehensive Net Expenditure
139,956
Net (gain) on revaluation of property, plant & equipment 0 (183)Adjustment for notional costs
Total comprehensive net expenditure for the year
(85)
139,871
(85)
141,876
The notes on pages 55 to 85 form part of these accounts.
51

Account of NHS Business Services Authority 2010-11
Statement of Financial Position at 31 March 2011
Notes 31 March 2011 31 March 2010£000 £000
Non Current AssetsProperty, Plant & Equipment 4.2 21,218 19,330Intangible Assets 4.1 40,403 37,328Trade and other receivables 4.4 2,284 2,161Total non-current assets 63,905 58,819
Current AssetsInventories 4.3 61,680 66,114Trade and other receivables 4.4 157,461 149,958Cash and cash equivalentsTotal current assets
4.6 35,025 21,676254,166 237,748
Current LiabilitiesTrade and other payables 4.5 189,032 171,089Borrowings 4.5.1 17 0Provisions for liabilities and chargesTotal current liabilities
4.7 1,077 272190,126 171,361
Non-current assets plus/less net current assets/liabilities
Non-current liabilities
127,945 125,206
Provisions for liabilities and chargesTotal non-current liabilities
4.7 3,898 2,0903,898 2,090
Assets Less Liabilities: 124,047 123,116
Taxpayers' Equity
General Fund 4.9 121,214 120,283Revaluation Reserve
Total Taxpayers' Equity:
4.8 2,833 2,833
124,047 123,116
The notes on pages 55 to 85 form part of these accounts.
Nick ScholteChief Executive and Accounting Officer16 June 2011
52

Account of NHS Business Services Authority 2010-11
Statement of Changes in Taxpayers’ EquityFor the year ended 31 March 2011
General Revaluation Total Fund Reserve Reserves£000 £000 £000
Balance at 31 March 2010 120,283 2,833 123,116
Changes in taxpayers’ equity for 2010-11Net operating cost for the year (139,956) 0 (139,956)Non-cash charges – notional costsTotal recognised income and expense for 2010-11
85 0 85(139,871) 0 (139,871)
Net Parliamentary funding
Balance at 31 March 2011
140,802 0 140,802
121,214 2,833 124,047
General Revaluation Total Fund Reserve Reserves
Restated Restated£000 £000 £000
Balance at 31 March 2009 110,401 2,650 113,051
Changes in taxpayers’ equity for 2009-10Net operating cost for the year (142,144) 0 (142,144)Net gain/(loss) on revaluation of Property, Plant and Equipment 0 183 183Non-cash charges – notional costsTotal recognised income and expense for 2009-10
85 0 85(142,059) 183 (141,876)
Net Parliamentary funding
Balance at 31 March 2010
151,941 0 151,941
120,283 2,833 123,116
The notes on pages 55 to 85 form part of these accounts.
53
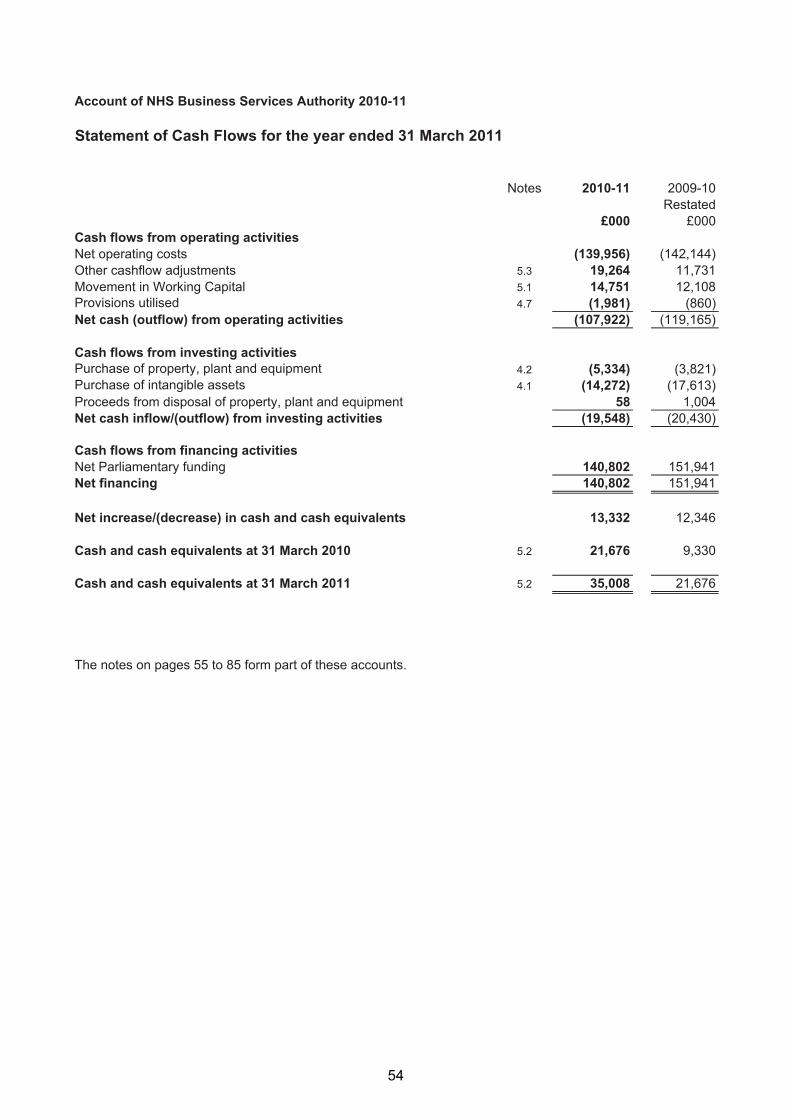
Account of NHS Business Services Authority 2010-11
Statement of Cash Flows for the year ended 31 March 2011
Notes 2010-11 2009-10Restated
£000 £000Cash flows from operating activitiesNet operating costs (139,956) (142,144)Other cashflow adjustments 5.3 19,264 11,731Movement in Working Capital 5.1 14,751 12,108Provisions utilisedNet cash (outflow) from operating activities
4.7 (1,981)(107,922)
(860)(119,165)
Cash flows from investing activitiesPurchase of property, plant and equipment 4.2 (5,334) (3,821)Purchase of intangible assets 4.1 (14,272) (17,613)Proceeds from disposal of property, plant and equipmentNet cash inflow/(outflow) from investing activities
58(19,548)
1,004(20,430)
Cash flows from financing activitiesNet Parliamentary fundingNet financing
Net increase/(decrease) in cash and cash equivalents
140,802140,802
13,332
151,941151,941
12,346
Cash and cash equivalents at 31 March 2010
Cash and cash equivalents at 31 March 2011
5.2
5.2
21,676
35,008
9,330
21,676
The notes on pages 55 to 85 form part of these accounts.
54

Account of NHS Business Services Authority 2010-11
Notes to the Accounts1. Accounting PoliciesThe financial statements have been prepared in accordance with the Government Financial Reporting Manual (FReM) issued by HM Treasury. The accounting policies contained in the FReM apply International Financial Reporting Standards as adapted or interpreted for the public sector context. Where the FReM permits a choice of accounting policy, the accounting policy which is judged to be most appropriate to the particular circumstances of the NHSBSA for the purpose of giving a true and fair view has been selected. The particular policies adopted are described below. They have been applied consistently in dealing with items that are considered material to the accounts.
1.1 Accounting ConventionsThis account is prepared under the historical cost convention, modified to account for the revaluation of fixed assets at their value to the business by reference to current costs. This is in accordance with directions issued by the Secretary of State for Health and approved by Treasury. Special Health Authorities are not required to provide a reconciliation between current cost and historical cost surplus and deficits.
Acquisitions and Discontinued OperationsActivities are considered to be ‘acquired’ only if they are acquired from outside the public sector. Activities are considered to be ‘discontinued’ only if they cease entirely. They are not considered to be ‘discontinued’ if they transfer from one NHS body to another.
Critical accounting judgements and key sources of estimation uncertaintyIn the application of the Authority’s accounting policies, management is required to make judgements, estimates and assumptions about the carrying amounts of assets and liabilities that are not readily apparent from other sources. The estimates and associated assumptions are based on historical experience and other factors, that are considered to be relevant. Actual results may differ from those estimates. The estimates and underlying assumptions are continually reviewed. Revisions to accounting estimates are recognised in the period in which the estimate is revised if the revision affects only that period, or in the period of the revision and future periods if the revision affects both current and future periods.
1.2 IncomeIncome is accounted for applying the accruals convention. Income is recognised to the extent that it is probable that the economic benefits will flow to the Authority and the income can be reliably measured.
The main source of funding for the non-trading divisions of the Special Health Authority is Parliamentary grant from the Department of Health from Request for Resources 1 and 2 within an approved cash limit, which is credited to the general fund. Parliamentary funding is recognised in the financial period in which it is received.
Operating income within the non-trading divisions is income which relates directly to the operating activities of these divisions of the authority. It principally comprises fees and charges for services provided on a full-cost basis to external customers, as well as public repayment work. It includes both income appropriated-in-aid and income to the Consolidated Fund which HM Treasury has agreed should be treated as operating income. Where income is received for a specific activity which is to be delivered in the following financial year, that income is deferred.
55

Account of NHS Business Services Authority 2010-11
1. Accounting Policies (continued)
The main source of funding for the Supply Chain trading division of the Authority is income from sales to NHS customers. Additional income comes from similar sales to non-NHS customers.
The funding of Bursary payments comes from two sources: Student Bursaries from the Strategic Health Authorities and Social Work Bursaries from the DH Policy Team. This income is treated as operating income.
1.3 TaxationThe Authority is not liable to pay corporation tax. Expenditure is shown net of recoverable VAT. Irrecoverable VAT is charged to the most appropriate expenditure heading or capitalised if it relates to an asset.
1.4 Capital charge interestFrom 2010-11 capital charge interest is no longer applied, in line with the Treasury Financial Reporting Manual (FReM). Prior year comparative figures have been adjusted to reflect this change in accounting policy. In previous years a charge, reflecting the cost of capital utilised by the Authority was included in operating costs.
1.5 Property, Plant & Equipment
(a) CapitalisationAll assets falling into the following categories are capitalised:Property, Plant & Equipment which is capable of being used for more than one year and they:
• individually have a cost equal to or greater than £5,000; or
• collectively have a cost of at least £5,000 and an individual cost of more than £250, where the assets are functionally interdependent, they have broadly simultaneous purchase dates, are anticipated to have simultaneous disposal dates and are under single managerial control; or
• form part of the initial setting-up cost of a new building, irrespective of their individual or cost.
(b) ValuationLand and buildings used for the Authority’s services or for administrative purposes are stated in the Statement of Financial Position at their revalued amounts, being the fair value at the date of revaluation less any subsequent accumulated depreciation and impairment losses. Revaluations are performed with sufficient regularity to ensure that carrying amounts are not materially different from those that would be determined at the Statement of Financial Position date. The latest revaluation was carried out by an independent RICS qualified valuer from the DVS Valuation Office Agency as at 31 March 2010. Fair values are determined as follows:
Land and non-specialised buildings – market value for existing use
Specialised buildings – depreciated replacement cost
56

Account of NHS Business Services Authority 2010-11
1. Accounting Policies (continued)
Properties in the course of construction for service or administration purposes are carried at cost, less any impairment loss. Cost includes professional fees but not borrowing costs, which are recognised as expenses immediately, as allowed by IAS 23 for assets held at fair value. Assets are revalued and depreciation commences when they are brought into use.
Until 31 March 2008, fixtures and equipment were carried at replacement cost, as assessed by indexation and depreciation of historic cost. From 1 April 2008 indexation has ceased. The carrying value of existing assets at that date will be written off over their remaining useful lives and new fixtures and equipment are carried at depreciated historic cost as this is not considered to be materially different from fair value.
Increases arising on revaluation are taken to the Revaluation Reserve except when it reverses a revaluation decrease for the same asset previously recognised in the Operating Cost Statement, in which case it is credited to the Operating Cost Statement to the extent of the decrease previously charged there. A revaluation decrease is charged to the revaluation reserve to the extent that there is a balance on the reserve for the asset and, thereafter, to the Operating Cost Statement.
1.6 Intangible AssetsExpenditure on research activities is recognised as an expense in the period in which it is incurred.
Intangible assets are capitalised when they have a cost of at least £5,000. Intangible assets acquired separately are initially recognised at fair value. Internally-generated assets are recognised if, and only if, all of the following have been demonstrated:
• the technical feasibility of completing the intangible asset so that it will be available for use
• the intention to complete the intangible asset and use it
• the ability to use the intangible asset
• how the intangible asset will generate probable future economic benefits
• the availability of adequate technical, financial and other resources to complete the intangible asset and use it
• the ability to measure reliably the expenditure attributable to the intangible asset during its development
The amount initially recognised for internally-generated intangible assets is the sum of the expenditure incurred from the date when the criteria above are initially met. Where no internally-generated intangible asset can be recognised, the expenditure is charged to the Operating Cost Statement in the period in which it is incurred.
Following initial recognition, intangible assets are carried at fair value by reference to an active market, or, where no active market exists, at amortised replacement cost (modern equivalent assets basis), indexed for relevant price increases, as a proxy for fair value. Internally-developed software is held at amortised historic cost to reflect the opposite effects of development costs and technological advances.
57

Account of NHS Business Services Authority 2010-11
1. Accounting Policies (continued)
1.7 Depreciation, amortisation and impairmentsLand and properties under construction are not depreciated.
Otherwise, depreciation and amortisation are charged on a straight line basis to write off the costs or valuation of tangible and intangible non-current assets, less any residual value, over their estimated useful lives. The estimated useful lives and residual values are reviewed each year end, with the effect of any changes recognised on a prospective basis. Assets held under finance leases are depreciated over their estimated useful lives or, where shorter, the lease term.
At each Statement of Financial Position date, the Authority checks whether there is any indication that any of its tangible or intangible non-current assets have suffered an impairment loss. If there is indication of an impairment loss, the recoverable amount of the asset is estimated to determine whether there has been a loss and, if so, its amount. Intangible assets not yet available for use are tested for impairment annually.
If there has been an impairment loss, the asset is written down to its recoverable amount, with the loss charged to the revaluation reserve to the extent that there is a balance on the reserve for the asset and, thereafter, to the Operating Cost Statement. Where an impairment loss subsequently reverses, the carrying amount of the asset is increased to the revised estimate of the recoverable amount but capped at the amount that would have been determined had there been no initial impairment loss. The reversal of the impairment loss is credited to the Operating Cost Statement to the extent to the extent of the decrease previously charged there and thereafter to the revaluation reserve.
1.8 InventoriesInventories are valued at the lower of cost and net realisable value after allowance for redundant and slow moving items. This is considered to be a reasonable approximation to current cost due to the high turnover of stocks.
1.9 Cash and cash equivalentsCash is cash in hand and deposits with any financial institution repayable without penalty on notice of not more than 24 hours. Cash equivalents are investments that mature in 3 months or less from the date of acquisition and that are readily convertible to known amounts of cash with insignificant risk of change in value.
1.10 Losses and Special PaymentsLosses and special payments are items that Parliament would not have contemplated when it agreed funds for the health service or passed legislation. By their nature they are items that ideally should not arise. They are therefore subject to special control procedures compared with the generality of payments. They are divided into different categories, which govern the way each individual case is handled.
Losses and special payments are charged to the relevant functional headings including losses which would have been made good through insurance cover had the Authority not been bearing its own risks (with insurance premiums then being included as normal revenue expenditure).
58

Account of NHS Business Services Authority 2010-11
1. Accounting Policies (continued)
1.11 Employee benefits
Short-term employee benefitsSalaries, wages and employment-related payments are recognised in the period in which the service is received from employees. The cost of leave earned but not taken by employees at the end of the period is recognised in the financial statements to the extent that employees are permitted to carry forward leave into the following period.
Retirement benefit costsPast and present employees are covered by the provisions of the NHS Pensions Scheme. The scheme is an unfunded, defined benefit scheme that covers NHS employers, General Practices and other bodies, allowed under the direction of the Secretary of State, in England and Wales. The scheme is not designed to be run in a way that would enable NHS bodies to identify their share of the underlying scheme assets and liabilities. Therefore, the scheme is accounted for as if it were a defined contribution scheme: the cost to the NHS body of participating in the scheme is taken as equal to the contributions payable to the scheme for the accounting period.
For early retirements other than those due to ill health the additional pension liabilities are not funded by the scheme. The full amount of the liability for the additional costs is charged to expenditure at the time the Trust commits itself to the retirement, regardless of the method of payment.
1.12 Research and DevelopmentResearch and development expenditure is charged against income in the year in which it is incurred, except insofar as development expenditure relates to a clearly defined project and the benefits of it can reasonably be regarded as assured. Expenditure so deferred is limited to the value of future benefits expected and is amortised through the Operating Cost Statement on a systematic basis over the period expected to benefit from the project. It should be revalued on the basis of current cost. The amortisation is calculated on the same basis as depreciation, on a quarterly basis.
1.13 LeasesLeases are classified as finance leases when substantially all the risks and rewards of ownership are transferred to the lessee. All other leases are classified as operating leases.
The Authority as lesseeProperty, plant and equipment held under finance leases are initially recognised, at the inception of the lease, at fair value or, if lower, at the present value of the minimum lease payments, with a matching liability for the lease obligation to the lessor. Lease payments are apportioned between finance charges and reduction of the lease obligation so as to achieve a constant rate on interest on the remaining balance of the liability. Finance charges are recognised in calculating the Authority’s net operating cost.
Operating lease payments are recognised as an expense on a straight-line basis over the lease term. Lease incentives are recognised initially as a liability and subsequently as a reduction of rentals on a straight-line basis over the lease term.
59
Account of NHS Business Services Authority 2010-11
1. Accounting Policies (continued)
Contingent rentals are recognised as an expense in the period in which they are incurred.
Where a lease is for land and buildings, the land and building components are separated. Leased land is treated as an operating lease. Leased buildings are assessed as to whether they are operating or finance leases.
The Authority as lessorAmounts due from lessees under finance leases are recorded as receivables at the amount of the Authority’s net investment in the leases. Finance lease income is allocated to accounting periods so as to reflect a constant periodic rate of return on the Authority’s net investment outstanding in respect of the leases.
Rental income from operating leases is recognised on a straight-line basis over the term of the lease. Initial direct costs incurred in negotiating and arranging an operating lease are added to the carrying amount of the leased asset and recognised on a straight-line basis over the lease term.
1.14 ProvisionsThe Authority provides for legal or constructive obligations that are of uncertain timing or amount at the Statement of Financial Position date on the basis of the best estimate of the expenditure required to settle the obligation. Where the effect of the time value of money is significant, the estimated risk-adjusted cash flows are discounted using the Treasury’s discount rate of 2.2% in real terms.
1.15 Financial Instruments
Financial assetsFinancial assets are recognised on the Statement of Financial Position when the Authority becomes party to the financial instrument contract or, in the case of trade receivables, when the goods or services have been delivered. Financial assets are derecognised when the contractual rights have expired or the asset has been transferred.
Financial assets are initially recognised at fair value.
Financial assets are classified into the following categories: financial assets ‘at fair value through profit and loss’; ‘held to maturity investments’; ‘available for sale’ financial assets, and ‘loans and receivables’. The classification depends on the nature and purpose of the financial assets and is determined at the time of initial recognition.
Financial assets at fair value through profit and lossEmbedded derivatives that have different risks and characteristics to their host contracts, and contracts with embedded derivatives whose separate value cannot be ascertained, are treated as financial assets at fair value through profit and loss. They are held at fair value, with any resultant gain or loss recognised in the operating cost statement. The net gain or loss incorporates any interest earned on the financial asset.
60

Account of NHS Business Services Authority 2010-11
1. Accounting Policies (continued)
Held to maturity investmentsHeld to maturity investments are non-derivative financial assets with fixed or determinable payments and fixed maturity, and there is a positive intention and ability to hold to maturity. After initial recognition, they are held at amortised cost using the effective interest method, less any impairment. Interest is recognised using the effective interest method.
Available for sale financial assetsAvailable for sale financial assets are non-derivative financial assets that are designated as available for sale or that do not fall within any of the other three financial asset classifications. They are measured at fair value with changes in value taken to the revaluation reserve, with the exception of impairment losses. Accumulated gains or losses are recycled to the operating cost statement on de-recognition.
Loans and receivablesLoans and receivables are non-derivative financial assets with fixed or determinable payments which are not quoted in an active market. After initial recognition, they are measured at amortised cost using the effective interest method, less any impairment. Interest is recognised using the effective interest method.
Fair value is determined by reference to quoted market prices where possible, otherwise by valuation techniques.
The effective interest rate is the rate that exactly discounts estimated future cash receipts through the expected life of the financial asset, to the net carrying amount of the financial asset.
At the Statement of Financial Position date, the Authority assesses whether any financial assets, other than those held at ‘fair value through profit and loss’ are impaired. Financial assets are impaired and impairment losses recognised if there is objective evidence of impairment as a result of one or more events which occurred after the initial recognition of the asset and which has an impact on the estimated future cash flows of the asset.
For financial assets carried at amortised cost, the amount of the impairment loss is measured as the difference between the asset’s carrying amount and the present value of the revised future cash flows discounted at the asset’s original effective interest rate. The loss is recognised in the Operating Cost Statement and the carrying amount of the asset is reduced directly, or through a provision for impairment of receivables.
If, in a subsequent period, the amount of the impairment loss decreases and the decrease can be related objectively to an event occurring after the impairment was recognised, the previously recognised impairment loss is reversed through the Operating Cost Statement to the extent that the carrying amount of the receivable at the date of the impairment is reversed does not exceed what the amortised cost would have been had the impairment not been recognised.
61
Account of NHS Business Services Authority 2010-11
1. Accounting Policies (continued)
Financial liabilitiesFinancial liabilities are recognised on the Statement of Financial Position when the Authority becomes party to the contractual provisions of the financial instrument or, in the case of trade payables, when the goods or services have been received. Financial liabilities are derecognised when the liability has been discharged, that is, the liability has been paid or has expired.
Financial liabilities are initially recognised at fair value.
Financial liabilities are classified as either financial liabilities ‘at fair value through profit and loss’ or other financial liabilities.
Financial liabilities at fair value through profit and lossEmbedded derivatives that have different risks and characteristics to their host contracts, and contracts with embedded derivatives whose separate value cannot be ascertained, are treated as financial liabilities at fair value through profit and loss. They are held at fair value, with any resultant gain or loss recognised in the Operating Cost Statement. The net gain or loss incorporates any interest earned on the financial asset.
Other financial liabilitiesAfter initial recognition, all other financial liabilities are measured at amortised cost using the effective interest method. The effective interest rate is the rate that exactly discounts estimated future cash payments through the life of the asset, to the net carrying amount of the financial liability. Interest is recognised using the effective interest method.
1.16 Accounting standards that have been issued but have not yet been adoptedA new IFRS, a number of IFRS amendments, a new IFRIC Interpretation and an IFRIC Amendment have been issued but are not yet effective and have not been adopted early by the Authority. Those that are expected to be applicable to the Authority are listed below along with major FReM changes for 2011-12, none are anticipated to have a future material impact on the Authority’s financial statements:
IFRS 9 Financial Instruments
IAS 1 (Revised) Presentation of Financial Statements
FReM Chapter 4 – Accounting Boundaries
FReM Chapter 11 – Income and Expenditure
62

Account of NHS Business Services Authority 2010-11
2.1 Operating segments
The Authority's activities are considered to fall within three segments: trading through Supply Chain, the payment of Student and SocialWork Bursaries and our operating expenditure relating to the provision of services to the wider NHS.
Details of the income and expenditure and assets and liabilities of the segments are shown below. The segments' shares of assets andliabilities are disclosed in more detail within the relevant notes to the accounts.
Supply Chain Bursaries Service Provision Total
2010/11 2009/10 2010/11 2009/10 2010/11 2009/10 2010/11 2009/10£000 £000 £000 £000 £000 £000 £000 £000
Trading AccountIncome 1,269,230 1,198,041 0 0 0 0 1,269,230 1,198,041
Expenditure (1,269,230) (1,198,041) 0 0 0 0 (1,269,230) (1,198,041)
0Surplus/(deficit) 0 0
Statement of Comprehensive Net Expenditure
0 0 0 0 0
Income 0 0 (592,920) (557,576) (16,502) (11,826) (609,422) (569,402)
Expenditure 0 0 592,920 557,576 156,458 157,562 749,378 715,138
145,736Net Operating Costs 0 0
Statement of Financial Position
0 0 139,956 145,736 139,956
Assets 213,325 205,081 14,772 14,141 89,974 77,345 318,071 296,567
Liabilities (148,098) (139,854)
Assets less Liabilities 65,227 65,227
(10,984) (9,354)
3,788 4,787
(34,942) (24,243)
55,032 53,102
(194,024)
124,047
(173,451)
123,116
2.2 Supply Chain Trading2010-11 2009-10
£000 £000
Gross incomeSales to NHS Customers 1,216,426 1,147,209Sales to Non-NHS Customers 35,309 28,996Fees and other income 17,495 21,836
1,198,0411,269,230Cost of sales and administrationCost of Sales 1,113,841 1,039,688Main service provider contract 155,389 158,353
Net trading surplus for the year
1,269,230
0
1,198,041
0
The trading nature of NHS Supply Chain activity is such that it cannot be disclosed in full in the Authority's Operating Cost Statement and itsstandard associated notes. This note provides the equivalent level of detail relating to Supply Chain only.
From 1 October 2006 the previously in-house service was outsourced to an external provider. Under the outsourcing arrangement, all tradingrelated administration expenditure is met by the service provider and is funded from the trading surplus. All non-trading income andexpenditure relating to the Supply Chain Management Division is now included in the Authority's Operating Cost Statement.
Supply Chain staff numbers and related costs
Under the outsourcing arrangement that began on 1 October 2006, all trading related staff transferred to the service provider.
63

Account of NHS Business Services Authority 2010-11
3.1.1 Revenue Resource Limit2010-11 2009-10
Restated£000 £000
Net operating costs for the financial year 139,956 142,144Revenue Resource LimitUnder/(over) spend against Revenue Resource Limit
141,3531,397
155,05612,912 *
* See Note 9: Prior Period Adjustments
3.1.2 Capital Resource Limit2010-11 2009-10
£000 £000Gross Capital Expenditure 19,606 21,434Less: Net Book Value of assets disposed ofCharge against the Capital Resource Limit
(44)19,562
(1,016)20,418
Capital Resource LimitUnder/(Over) spend Against Capital Resource Limit
23,4413,879
23,7003,282
64
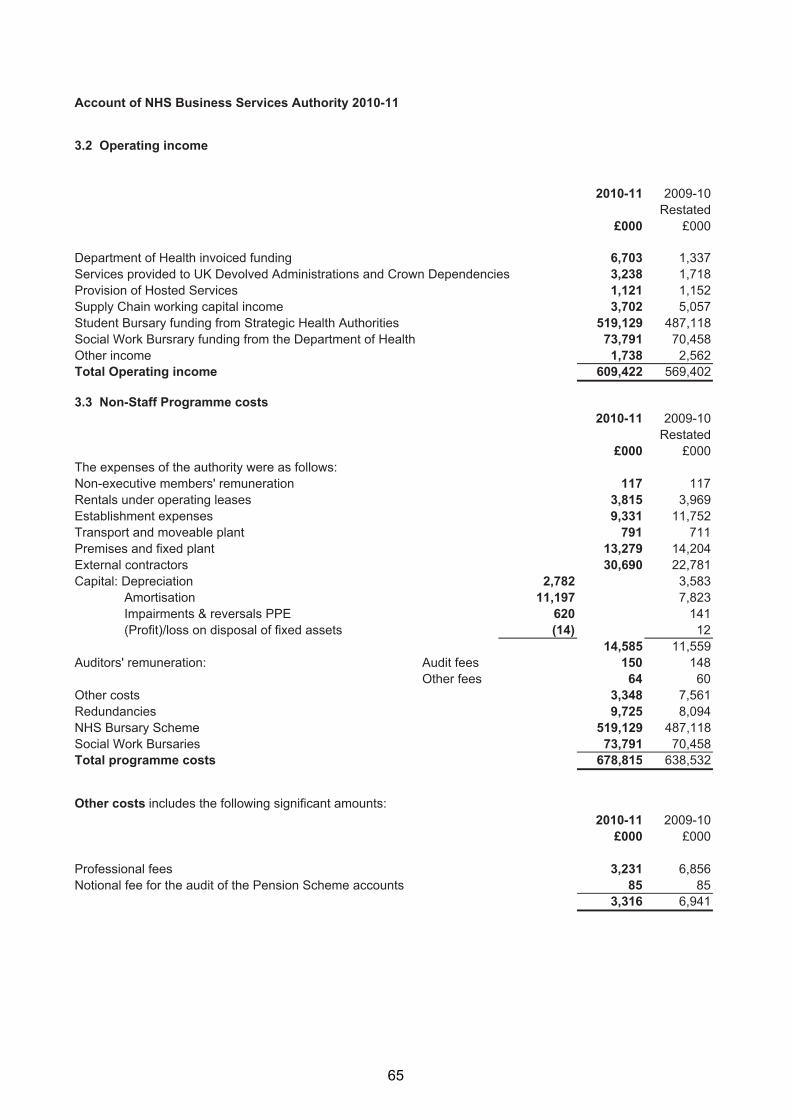
Account of NHS Business Services Authority 2010-11
3.2 Operating income
2010-11 2009-10Restated
£000 £000
Department of Health invoiced funding 6,703 1,337Services provided to UK Devolved Administrations and Crown Dependencies 3,238 1,718Provision of Hosted Services 1,121 1,152Supply Chain working capital income 3,702 5,057Student Bursary funding from Strategic Health Authorities 519,129 487,118Social Work Bursrary funding from the Department of Health 73,791 70,458Other incomeTotal Operating income
1,738 2,562609,422 569,402
3.3 Non-Staff Programme costs2010-11 2009-10
Restated£000 £000
The expenses of the authority were as follows:Non-executive members' remuneration 117 117Rentals under operating leases 3,815 3,969Establishment expenses 9,331 11,752Transport and moveable plant 791 711Premises and fixed plant 13,279 14,204External contractors 30,690 22,781Capital: Depreciation 2,782 3,583 Amortisation 11,197 7,823 Impairments & reversals PPE 620 141 (Profit)/loss on disposal of fixed assets (14)
14,58512
11,559Auditors' remuneration: Audit fees 150 148
Other fees 64 60Other costs 3,348 7,561Redundancies 9,725 8,094NHS Bursary Scheme 519,129 487,118Social Work BursariesTotal programme costs
73,791 70,458678,815 638,532
Other costs includes the following significant amounts:2010-11 2009-10
£000 £000
Professional fees 3,231 6,856Notional fee for the audit of the Pension Scheme accounts 85
3,31685
6,941
65
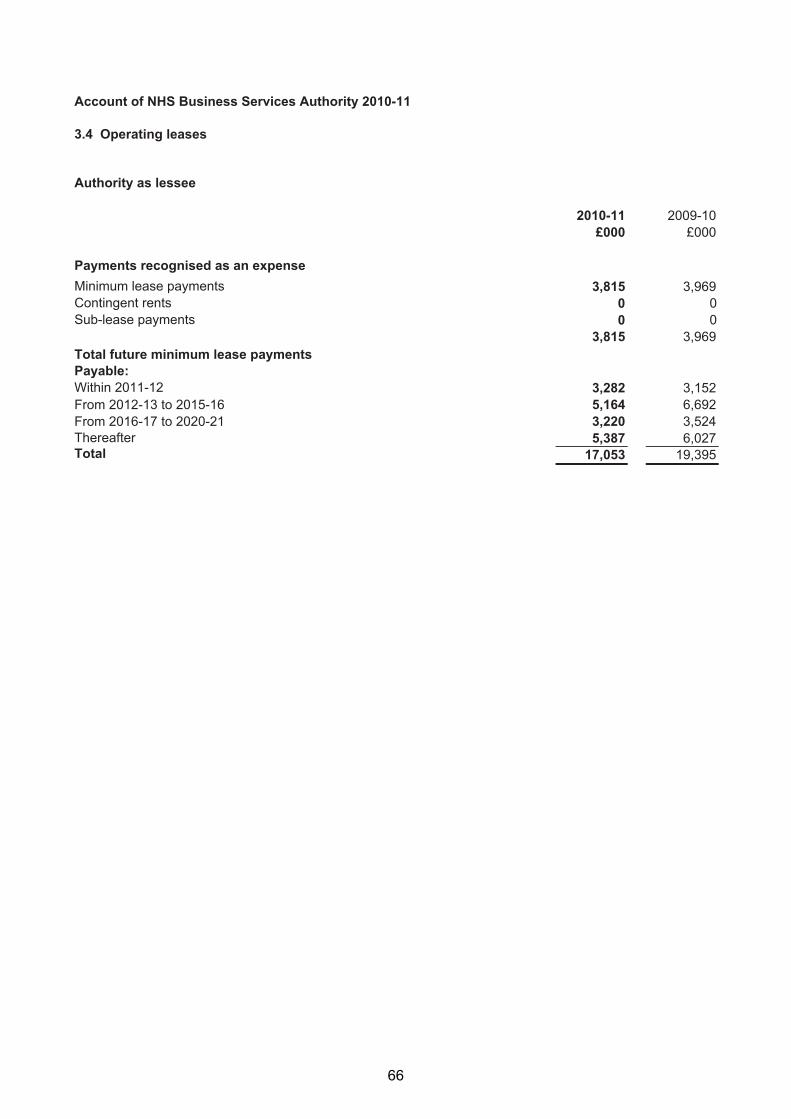
Account of NHS Business Services Authority 2010-11
3.4 Operating leases
Authority as lessee
2010-11 2009-10£000 £000
Payments recognised as an expenseMinimum lease payments 3,815 3,969Contingent rents 0 0Sub-lease payments 0 0
3,815 3,969Total future minimum lease paymentsPayable:Within 2011-12 3,282 3,152From 2012-13 to 2015-16 5,164 6,692From 2016 17- to 2020 21- 3,220 3,524ThereafterTotal
5,38717,053
6,02719,395
66

Account of NHS Business Services Authority 2010-11
3.5 Staff numbers and related costs
Executive members and staff costs:Total Permanently Other Total
2010-11 employed 2009-10£000 £000 £000 £000
Salaries and wages 61,359 59,781 1,578 65,808Social security costs 4,477 4,477 0 4,586Employer contributions to NHS Pensions 6,081 6,081 0 6,269Other pension costs 897 897 0 905
Total 72,814 71,236 1,578 77,568
Capitalised staff costs (2,251) (4,554)
70,563 73,014
The average number of persons employed during the year was :
Total Permanently Other 2009-10employed
Total
Number
2,524
Number
2,469
Number
55
Number
2,676
Note on expenditure of staff benefitsThe amount spent on staff benefits during the year totalled £Nil (2009-10 £Nil).
Exit Costs
Number of Total number Number of other of exit
compulsory departures packages by 2010-11 redundancies agreed cost band
<£10,000 38 27 65£10,000 - £25,000 11 20 31£25,000 - £50,000 12 51 63£50,000 - £100,000 11 28 39£100,000 - £150,000 9 9 18£150,000 - £200,000Total number of exit packages by type
485
2137
6222
8,687
Total number
Total Resource Cost (£'000) 3,281 5,406
Number of Number of other of exit
compulsory departures packages by 2009-10 redundancies agreed cost band
<£10,000 18 167 185£10,000 - £25,000 7 9 16£25,000 - £50,000 8 19 27£50,000 - £100,000 0 19 19£100,000 - £150,000 0 6 6£150,000 - £200,000Total number of exit packages by type
Total Resource Cost (£'000)
033
462
2222
2,986
2255
3,448
The whole time equivalent number of staff whose cost was capitalised was 50 (2009-10: 101)
67

Account of NHS Business Services Authority 2010-11
3.6 Pension costsPast and present employees are covered by the provisions of the NHS Pensions Scheme. Details of the benefits payable under these provisions can be found on the NHS Pensions website at www.nhsbsa.nhs.uk/pensions. The scheme is an unfunded, defined benefit scheme that covers NHS employers, General Practices and other bodies, allowed under the direction of the Secretary of State, in England and Wales. The scheme is not designed to be run in a way that would enable NHS bodies to identify their share of the underlying scheme assets and liabilities. Therefore, the scheme is accounted for as if it were a defined contribution scheme: the cost to the NHS Body of participating in the scheme is taken as equal to the contributions payable to the scheme for the accounting period.
The scheme is subject to a full actuarial valuation every four years (until 2004, every five years) and an accounting valuation every year. An outline of these follows:
a) Full actuarial (funding) valuationThe purpose of this valuation is to assess the level of liability in respect of the benefits due under the scheme (taking into account its recent demographic experience), and to recommend the contribution rates to be paid by employers and scheme members. The last such valuation, which determined current contribution rates was undertaken as at 31 March 2004 and covered the period from 1 April 1999 to that date. The conclusion from the 2004 valuation was that the scheme had accumulated a notional deficit of £3.3billion against the notional assets as at 31 March 2004.
In order to defray the costs of benefits, employers pay contributions at 14% of pensionable pay and most employees had up to April 2008 paid 6%, with manual staff paying 5%. Following the full actuarial review by the Government Actuary undertaken as at 31 March 2004, and after consideration of changes to the NHS Pension Scheme taking effect from 1 April 2008, his Valuation report recommended that employer contributions could continue at the existing rate of 14% of pensionable pay, from 1 April 2008, following the introduction of employee contributions on a tiered scale from 5% up to 8.5% of their pensionable pay depending on total earnings. On advice from the scheme actuary, scheme contributions may be varied from time to time to reflect changes in the scheme’s liability.
b) Accounting valuationA valuation of the scheme liability is carried out annually by the scheme actuary as at the end of the reporting period by updating the results of the full actuarial valuation.
Between the full actuarial valuations at a two-year midpoint, a full and detailed member data-set is provided to the scheme actuary. At this point the assumptions regarding the composition of the scheme membership are updated to allow the scheme liability to be valued.
The valuation of the scheme liability as at 31 March 2011, is based on detailed membership data as at 31 March 2008 (the latest midpoint) updated to 31 March 2011 with summary global member and accounting data. The latest assessment of the liabilities of the scheme is contained in the scheme actuary report, which forms part of the annual NHS Pensions Scheme (England and Wales) Resource Account, published annually. These accounts can be viewed on the NHS Pensions website. Copies can also be obtained from the Stationery Office.
68

Account of NHS Business Services Authority 2010-11
c) Scheme provisions In 2010-11 the NHS Pension Scheme provided defined benefits, which are summarised below. This list is an illustrative guide only, and is not intended to detail all the benefits provided by the Scheme or the specific conditions that must be met before these benefits can be obtained:
Annual PensionsThe scheme is a “final salary” scheme. Annual pensions are normally based on 1/80th for the 1995 section and of the best of the last 3 years pensionable pay for each year of service, and 1/60th for the 2008 section of reckonable pay per year of membership. Members who are practioners as defined by the Scheme Regulations have their annual pensions based upon total pensionable earnings over the relevant pensionable service. With effect from 1 April 2008 members can choose to give up some of their annual pension for an additional tax free lump sum, up to a maximum amount permitted under HMRC rules. This new provision is known as “pension commutation”.
Pensions IndexationAnnual increases are applied to pension payments at rates defined by the Pensions (Increase) Act 1971, and are based on changes in retail prices in the twelve months ending 30 September in the previous calendar year.
Ill Health RetirementEarly payment of a pension, with enhancement in certain circumstances, is available to members of the Scheme who are permanently incapable of fulfilling their duties or regular employment effectively through illness or infirmity.
Death BenefitsA death gratuity of twice their final year’s pensionable pay for death in service, and five times their annual pension for death after retirement is payable.
Additional Voluntary Contributions (AVCs)Members can purchase additional service in the NHS Scheme and contribute to money purchase AVCs run by the Scheme’s approved providers or by other Free Standing Additional Voluntary Contributions (FSAVC) providers.
Transfer between FundsScheme members have the option to transfer their pension between the NHS Pension Scheme and another scheme when they move into or out of NHS employment.
Preserved BenefitsWhere a scheme member ceases NHS employment with more than two years service they can preserve their accrued NHS pension for payment when they reach retirement age.
Compensation for Early RetirementWhere a member of the Scheme is made redundant they may be entitled to early receipt of their pensions plus enhancement, at the employer’s cost.
69

Account of NHS Business Services Authority 2010-11
d) Principal Civil Service Pension SchemeSome past and present employees are covered by the provisions of the Principal Civil Service Pension Scheme (PCSPS). The defined benefit elements of the scheme are unfunded and non-contributory except in respect of dependents’ benefits. The Authority recognises the expected costs of these elements on a systematic and rational basis over the period during which it benefits from employees’ services by payment to the PCSPS of amounts calculated on an accruing basis. Liability for payment of future benefits is a charge on the PCSPS. In respect of the defined contribution elements of the scheme, the Authority recognises the contributions payable for the year.
3.7 The Late Payment of Commercial Debts (Interest) Act 1998No payments were made under the legislation during the year.
3.8 Other gains and losses2010-11 2009-10
£000 £000Profit on disposal of land and buildings 0 10(Loss) on disposal of land and buildings 0 0Profit on disposal of plant and equipment 22 12(Loss) on disposal of plant and equipmentTotal
(8)14
(34)(12)
70

Account of NHS Business Services Authority 2010-11
4.1 Intangible assets
4.1.1 Intangible assets 2010-11Software Information Development licences Technology Expenditure Total
£000 £000 £000 £000
Gross cost at 1 April 2010 4,788 51,009 421 56,218Additions - purchased 0 14,272 0 14,272Reclassifications 0 421 (421) 0DisposalsGross cost at 31 March 2011
(3,924) 0 0 (3,924)864 65,702 0 66,566
AmortisationAccumulated amortisation at 1 April 2010 4,262 14,400 228 18,890Charged during the year 401 10,796 0 11,197Reclassifications 0 228 (228) 0DisposalsAccumulated amortisation at 31 March 2011
(3,924) 0 0 (3,924)739 25,424 0 26,163
Net book value at 31 March 2010
Net book value at 31 March 2011
526 36,609 193 37,328
125 40,278 0 40,403
4.1.2 Intangible assets 2009-10
Software Information Development licences Technology Expenditure Total
£000 £000 £000 £000
Gross cost at 1 April 2009 4,659 33,525 421 38,605Additions - purchased 129 17,484 0 17,613Reclassifications 0 0 0 0Gross cost at 31 March 2010 4,788 51,009 421 56,218
Amortisation:Accumulated amortisation at 1 April 2009 3,803 7,098 166 11,067Charged during the year 459 7,302 62 7,823Reclassifications 0 0 0 0Accumulated amortisation at 31 March 2010 4,262 14,400 228 18,890
Net book value at 31 March 2009
Net book value at 31 March 2010
856 26,427 255 27,538
526 36,609 193 37,328
Supply Chain and Bursaries had no Intangible assets during the accounting period (2009-10 - £Nil)
71
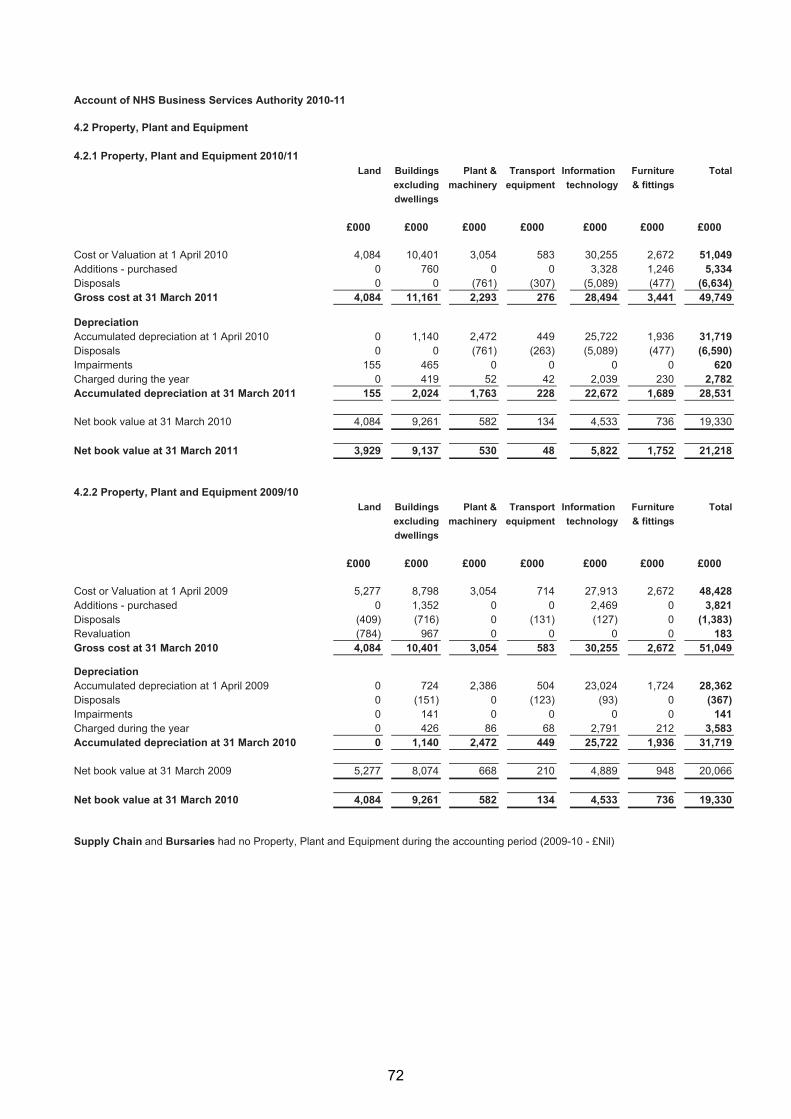
Account of NHS Business Services Authority 2010-11
4.2 Property, Plant and Equipment
4.2.1 Property, Plant and Equipment 2010/11Land Buildings Plant & Transport Information Furniture Total
excluding machinery equipment technology & fittingsdwellings
£000 £000 £000 £000 £000 £000 £000
Cost or Valuation at 1 April 2010 4,084 10,401 3,054 583 30,255 2,672 51,049Additions - purchased 0 760 0 0 3,328 1,246 5,334DisposalsGross cost at 31 March 2011
04,084
011,161
(761)2,293
(307)276
(5,089)28,494
(477)3,441
(6,634)49,749
DepreciationAccumulated depreciation at 1 April 2010 0 1,140 2,472 449 25,722 1,936 31,719Disposals 0 0 (761) (263) (5,089) (477) (6,590)Impairments 155 465 0 0 0 0 620Charged during the yearAccumulated depreciation at 31 March 2011
0155
4192,024
521,763
42228
2,03922,672
2301,689
2,78228,531
19,330
21,218
Net book value at 31 March 2010
Net book value at 31 March 2011
4,084
3,929
9,261
9,137
582
530
134
48
4,533
5,822
736
1,752
4.2.2 Property, Plant and Equipment 2009/10Land Buildings Plant & Transport Information Furniture Total
excluding machinery equipment technology & fittingsdwellings
£000 £000 £000 £000 £000 £000 £000
Cost or Valuation at 1 April 2009 5,277 8,798 3,054 714 27,913 2,672 48,428Additions - purchased 0 1,352 0 0 2,469 0 3,821Disposals (409) (716) 0 (131) (127) 0 (1,383)RevaluationGross cost at 31 March 2010
(784)4,084
96710,401
03,054
0583
030,255
02,672
18351,049
DepreciationAccumulated depreciation at 1 April 2009 0 724 2,386 504 23,024 1,724 28,362Disposals 0 (151) 0 (123) (93) 0 (367)Impairments 0 141 0 0 0 0 141Charged during the yearAccumulated depreciation at 31 March 2010
00
4261,140
862,472
68449
2,79125,722
2121,936
3,58331,719
20,066
19,330
Net book value at 31 March 2009
Net book value at 31 March 2010
5,277
4,084
8,074
9,261
668
582
210
134
4,889
4,533
948
736
Supply Chain and Bursaries had no Property, Plant and Equipment during the accounting period (2009-10 - £Nil)
72

Account of NHS Business Services Authority 2010-11
4.2 Property, Plant and Equipment (continued)
4.2.3 Land and BuildingsThe net book value of land and buildings comprises:
31 March 2011 31 March 2010£000 £000
Freehold 11,004 11,495Long leasehold 2,062 1,705Short leaseholdTotal
013,066
14513,345
4.2.4 Economic Lives of Non-current Assets
Min Life Max LifeIntangible assets Years YearsSoftware licences 3 5Information technology 5 5Property, Plant and EquipmentBuildings excl. dwellings 3 65Plant & machinery 5 10Transport equipment 5 7Information technology 5 7Furniture & fittings 5 10
4.2.5 Impairments
a) Impairments charged in the year to the Statement of Comprehensive Net Expenditure2010-11 2009-10
Property, plant and Intangible Property, plant Intangible
equipment assets and equipment assets£000 £000 £000 £000
Impairments arose from:Loss or damage from normal operations 70 0 0 0Changes in market priceTotal
550 0 141 0620 0 141 0
b) Impairments charged in the year to the revaluation reserve2010-11 2009-10
Property, plant and Intangible Property, plant & Intangible
equipment assets equipment assets£000 £000 £000 £000
Charged to the revaluation reserve: 0 0 0 0
73
Account of NHS Business Services Authority 2010-11
4.2 Property, Plant and Equipment (continued)
4.2.6 Non-current assets held for sale
Year ended Land Buildingsexcludingdwellings
Total
£000 £000 £000
31 March 201131 March 2010
345500
8351,300
1,1801,800
Two of the Authority's buildings previously used for prescription processingwere rendered surplus to requirements by the successful implementation ofthe Capacity Improvement Programme and vacated during 2009-10. Thesebuildings were held for sale at the year end.
These buildings fall within the Service Provision segment assets.
74

Account of NHS Business Services Authority 2010-11
4.3 Inventories
31 March 2011 31 March 2010£000 £000
Supply Chain trading stocksTotal
61,68061,680
66,11466,114
All inventories relate to Supply Chain
4.4 Receivables Current31 March 2011 31 March 2010
£000 £000Trade receivables - revenue 129,138 105,102Provision for impairment of receivables (8,433) (5,392)Prepayments and accrued income 14,625 12,379Other receivables 22,131 37,869Trade and other receivables 157,461 149,958
Segmental splitSupply Chain 140,626 135,020Service Provision 8,241 6,078Bursaries 8,594 8,860
157,461 149,958
Non-current31 March 2011 31 March 2010
£000 £000Other receivables 2,284 2,161Trade and other receivables 2,284 2,161
Segmental splitSupply Chain 0 0Service Provision 0 0Bursaries 2,284 2,161
2,284 2,161
75
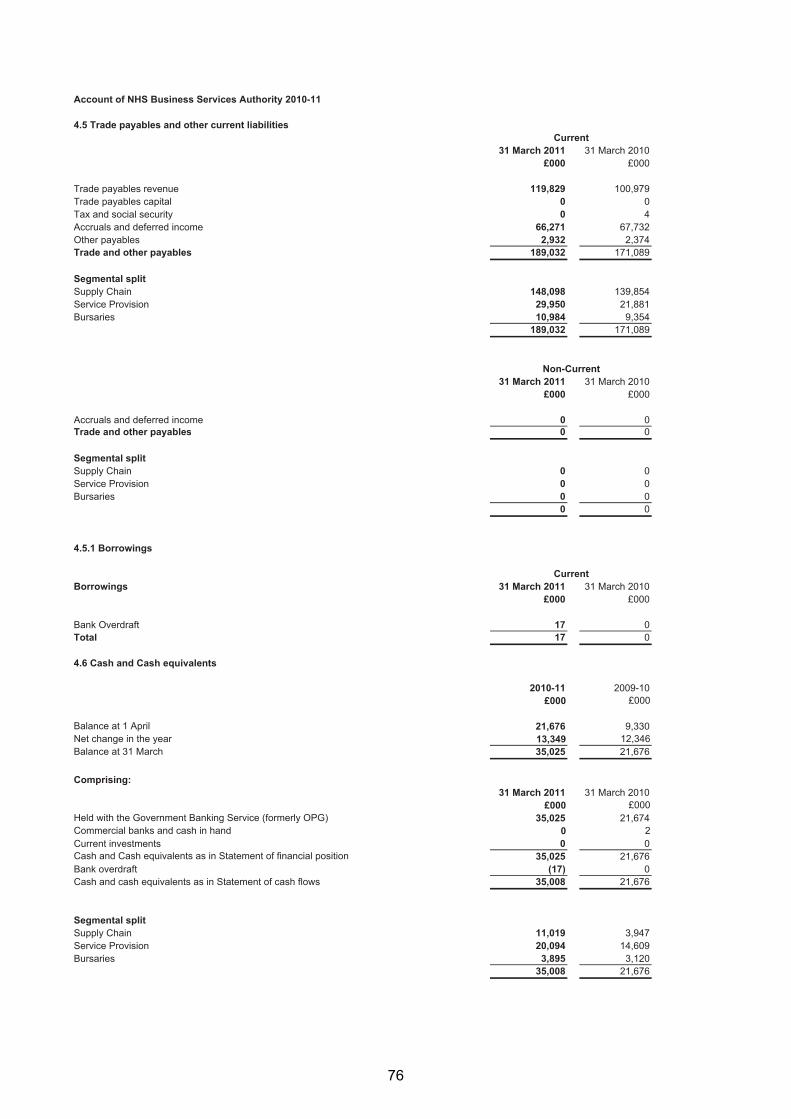
Account of NHS Business Services Authority 2010-11
4.5 Trade payables and other current liabilitiesCurrent
31 March 2011 31 March 2010£000 £000
Trade payables revenue 119,829 100,979Trade payables capital 0 0Tax and social security 0 4Accruals and deferred income 66,271 67,732Other payablesTrade and other payables
Segmental split
2,932 2,374189,032 171,089
Supply Chain 148,098 139,854Service Provision 29,950 21,881Bursaries 10,984 9,354
189,032 171,089
Non-Current31 March 2011 31 March 2010
£000 £000
Accruals and deferred income 0 0Trade and other payables
Segmental split
0 0
Supply Chain 0 0Service Provision 0 0Bursaries 0 0
0 0
4.5.1 Borrowings
CurrentBorrowings 31 March 2011 31 March 2010
£000 £000
Bank Overdraft 17 0Total 17 0
4.6 Cash and Cash equivalents
2010-11 2009-10£000 £000
Balance at 1 April 21,676 9,330Net change in the yearBalance at 31 March
13,34935,025
12,34621,676
Comprising:31 March 2011 31 March 2010
£000 £000Held with the Government Banking Service (formerly OPG) 35,025 21,674Commercial banks and cash in hand 0 2Current investments 0 0
21,676Cash and Cash equivalents as in Statement of financial position 35,025Bank overdraftCash and cash equivalents as in Statement of cash flows
Segmental split
(17)35,008
021,676
Supply Chain 11,019 3,947Service Provision 20,094 14,609Bursaries 3,895
35,0083,120
21,676
76

Account of NHS Business Services Authority 2010-11
4.7 Provisions for liabilities and chargesCurrent
31 March 2011 31 March 2010£000 £000
Pensions relating to other staff 24 142Legal claims 251 130Other 802 0
1,077 272
Non-current
Total
31 March 2011 31 March 2010£000 £000
Pensions relating to other staff 75 1,761Legal claims 0 0OtherTotal
3,823 3293,898 2,090
All provisions relate to the Service Provision segment.
Pensions Legal Other Totalrelating to claims
otherstaff£000 £000 £000 £000
At 1 April 2009 1,993 175 967 3,135Arising during the year 67 20 0 87Utilised during the year (157) (65) (638) (860)Reversed unused 0 0 0 0Unwinding of discount 0 0 0 0Change in discount rateAt 1 April 2010
0 0 0 01,903 130 329 2,362
Arising during the year 58 240 4,296 4,594Utilised during the year (1,862) (119) 0 (1,981)Reversed unused 0 0 0 0Unwinding of discount 0 0 0 0Change in discount rate 0 0 0 0
At 31 March 2011 99 251 4,625 4,975
Expected timing of cash-flows:In the remainder of the spending review period to 31 March 2012 24 251 802 1,077
Between 1 April 2012 and 31 March 2016 69 0 3,823 3,892
Between 1 April 2016 and 31 March 2021 6 0 0 6Thereafter 0 0 0 0
Other provisions at 31 March 2011 relate to Leasehold Property Decommissioning £3,823k andRedundancies £802k.
Contingencies at 31 March 2011
At 31 March 2011, there were no known contingent assets or liabilities (2009-10: £nil).
77

Account of NHS Business Services Authority 2010-11
4.8 Revaluation Reserve2010-11 2009-10
£000 £000
At 1 April 2,833 2,650Impairments 0 0Revaluations
At 31 March
0
2,833
183
2,833
4.9 General Fund2010-11 2009-10
£000 £000
At 1 April 120,283 110,401Net operating cost for the year (139,956) (142,144)Net Parliamentary funding 140,802 151,941Notional costsAt 31 March
85121,214
85120,283
78

Account of NHS Business Services Authority 2010-11
4.10 Events after the reporting period
There have been no adjusting or non-adjusting events after the reporting period.
The Accounts were authorised for issue on 21 June 2011 by the NHS BSA Chief Executive andAccounting Officer.
4.11 Capital commitments
31 March 2011 31 March 2010£000 £000
Property, plant and equipment 0 5,370Intangible assetsTotal
6,0346,034
10,44015,810
The Authority had contracted capital commitments as at 31 March for which no provision has been made
79

Account of NHS Business Services Authority 2010-11
5.1 Movements in working capital2010-11 2009-10
£000 £000
(Increase)/decrease in receivables within 1 year (7,503) (44,881)(Increase)/decrease in receivables after 1 year (123) (552)(Increase)/decrease in inventories 4,434 (4,127)Increase/(decrease) in payables within 1 year 17,943 61,668Increase/(decrease) in payables after 1 yearTotal
014,751
012,108
5.2 Analysis of changes in net debtAs at 1 Cash As at 31
April 2010£000
flows£000
March 2011£000
GBS (formerly OPG) cash at bank 21,674 13,351 35,025Commercial cash at bank and in hand 2 (2) 0Bank overdraftTotal
021,676
(17) (17)13,332 35,008
5.3 Other cashflow adjustments 2010-11 2009-10Depreciation 2,782 3,583Amortisation 11,197 7,823Impairments and reversals 620 141(Profit)/Loss on disposal of assets (14) 12Notional Costs 85 85Provisions - Arising in YearTotal
4,59419,264
8711,731
80
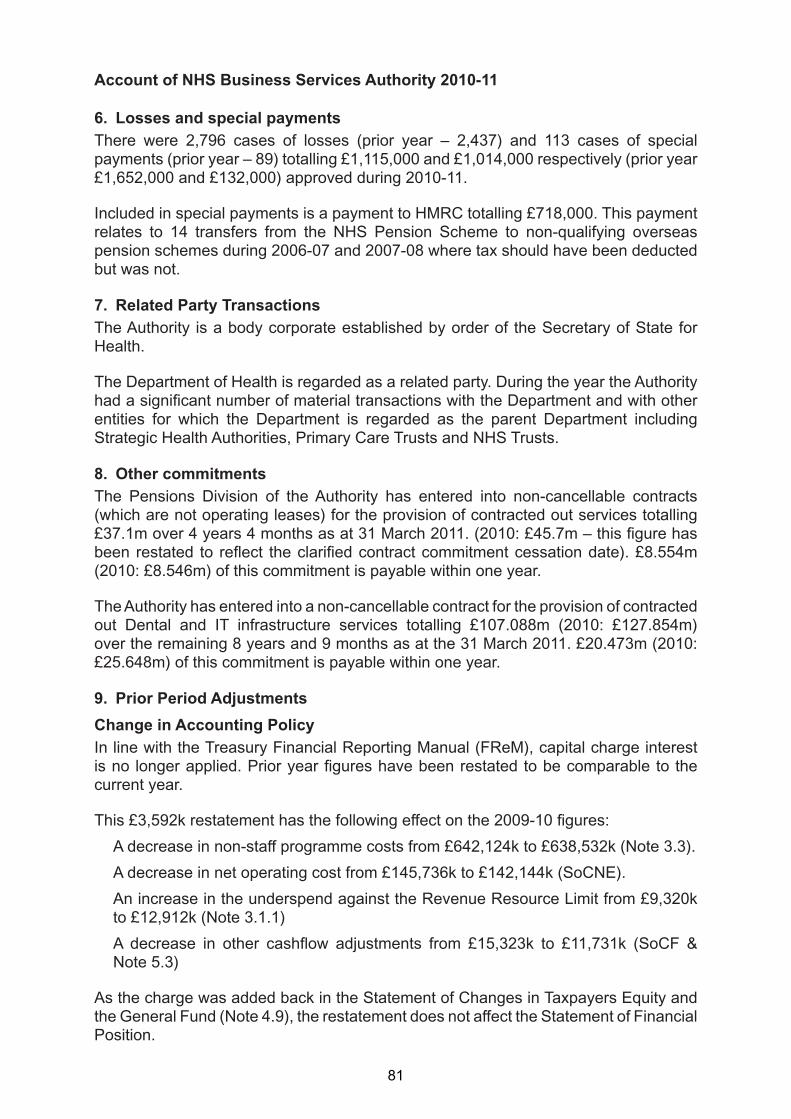
Account of NHS Business Services Authority 2010-11
6. Losses and special paymentsThere were 2,796 cases of losses (prior year – 2,437) and 113 cases of special payments (prior year – 89) totalling £1,115,000 and £1,014,000 respectively (prior year £1,652,000 and £132,000) approved during 2010-11.
Included in special payments is a payment to HMRC totalling £718,000. This payment relates to 14 transfers from the NHS Pension Scheme to non-qualifying overseas pension schemes during 2006-07 and 2007-08 where tax should have been deducted but was not.
7. Related Party TransactionsThe Authority is a body corporate established by order of the Secretary of State for Health.
The Department of Health is regarded as a related party. During the year the Authority had a significant number of material transactions with the Department and with other entities for which the Department is regarded as the parent Department including Strategic Health Authorities, Primary Care Trusts and NHS Trusts.
8. Other commitmentsThe Pensions Division of the Authority has entered into non-cancellable contracts (which are not operating leases) for the provision of contracted out services totalling £37.1m over 4 years 4 months as at 31 March 2011. (2010: £45.7m – this figure has been restated to reflect the clarified contract commitment cessation date). £8.554m (2010: £8.546m) of this commitment is payable within one year.
The Authority has entered into a non-cancellable contract for the provision of contracted out Dental and IT infrastructure services totalling £107.088m (2010: £127.854m) over the remaining 8 years and 9 months as at the 31 March 2011. £20.473m (2010: £25.648m) of this commitment is payable within one year.
9. Prior Period Adjustments
Change in Accounting PolicyIn line with the Treasury Financial Reporting Manual (FReM), capital charge interest is no longer applied. Prior year figures have been restated to be comparable to the current year.
This £3,592k restatement has the following effect on the 2009-10 figures:
A decrease in non-staff programme costs from £642,124k to £638,532k (Note 3.3).
A decrease in net operating cost from £145,736k to £142,144k (SoCNE).
An increase in the underspend against the Revenue Resource Limit from £9,320k to £12,912k (Note 3.1.1)
A decrease in other cashflow adjustments from £15,323k to £11,731k (SoCF & Note 5.3)
As the charge was added back in the Statement of Changes in Taxpayers Equity and the General Fund (Note 4.9), the restatement does not affect the Statement of Financial Position.
81

Account of NHS Business Services Authority 2010-11
10. Financial Instruments
Financial risk managementFinancial reporting standard IFRS 7 requires disclosure of the role that financial instruments have had during the period in creating or changing the risks a body faces in undertaking its activities. As the cash requirements of the Authority are met primarily through Parliamentary Funding, financial instruments play a more limited role in creating risk that would apply to a non-public sector body of a similar size. The majority of financial instruments relate to contracts for non-financial items in line with the Authority’s expected purchase and usage requirements and the Authority is therefore exposed to little credit, liquidity or market risk.
Currency riskThe Authority is principally a domestic organisation with the great majority of transactions, assets and liabilities being in the UK and Sterling based. The Authority has no overseas operations. The Authority therefore has low exposure to currency rate fluctuations.
Interest rate riskAll of the Authority’s financial assets and financial liabilities carry nil or fixed rates of interest. The Authority is not, therefore, exposed to significant interest-rate risk.
Credit RiskBecause the majority of the Authority’s income comes from funds voted by Parliament and from other NHS bodies the Authority has low exposure to credit risk. The only potential exposure relates to the recovery of overpaid bursaries however any defaults would be recoverable from Strategic Health Authorities who fund the payments.
Liquidity RiskThe Authority’s net operating costs are financed from resources voted annually by Parliament. The Authority largely finances its capital expenditure from funds made available from Government under an agreed capital resource limit. The Authority is not, therefore, exposed to significant liquidity risks.
82
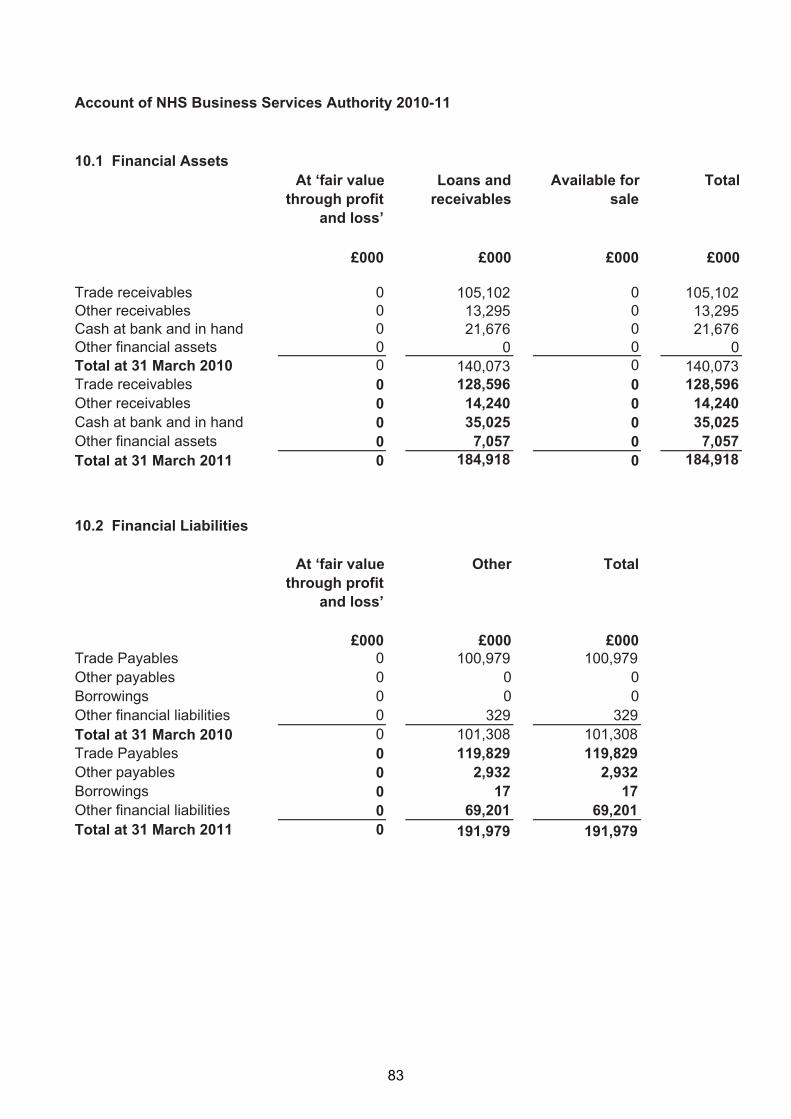
Account of NHS Business Services Authority 2010-11
10.1 Financial AssetsAt ‘fair value Loans and Available for Total
through profit receivables saleand loss’
£000 £000 £000 £000
Trade receivables 0 105,102 0 105,102Other receivables 0 13,295 0 13,295Cash at bank and in hand 0 21,676 0 21,676Other financial assets 0 0 0 0
140,073Total at 31 March 2010 0 140,073 0Trade receivables 0 128,596 0 128,596Other receivables 0 14,240 0 14,240Cash at bank and in hand 0 35,025 0 35,025Other financial assetsTotal at 31 March 2011
00
7,057184,918
00
7,057184,918
10.2 Financial Liabilities
At ‘fair value Other Total through profit
and loss’
£000 £000 £000Trade Payables 0 100,979 100,979Other payables 0 0 0Borrowings 0 0 0Other financial liabilities 0 329 329Total at 31 March 2010 0 101,308 101,308Trade Payables 0 119,829 119,829Other payables 0 2,932 2,932Borrowings 0 17 17Other financial liabilitiesTotal at 31 March 2011
00
69,201 69,201191,979 191,979
83

Account of NHS Business Services Authority 2010-11
10 Financial Instruments (continued)
10.3 Maturity of financial liabilities
31 March 2011 31 March 2010£000 £000
In one year or less 188,156 100,979In more than one year but not more than five years 3,823 329In more than five yearsTotal
0191,979
0101,308
10.4 Fair valuesFair values of financial assets and liabilities do not differ from the carrying amounts.
84
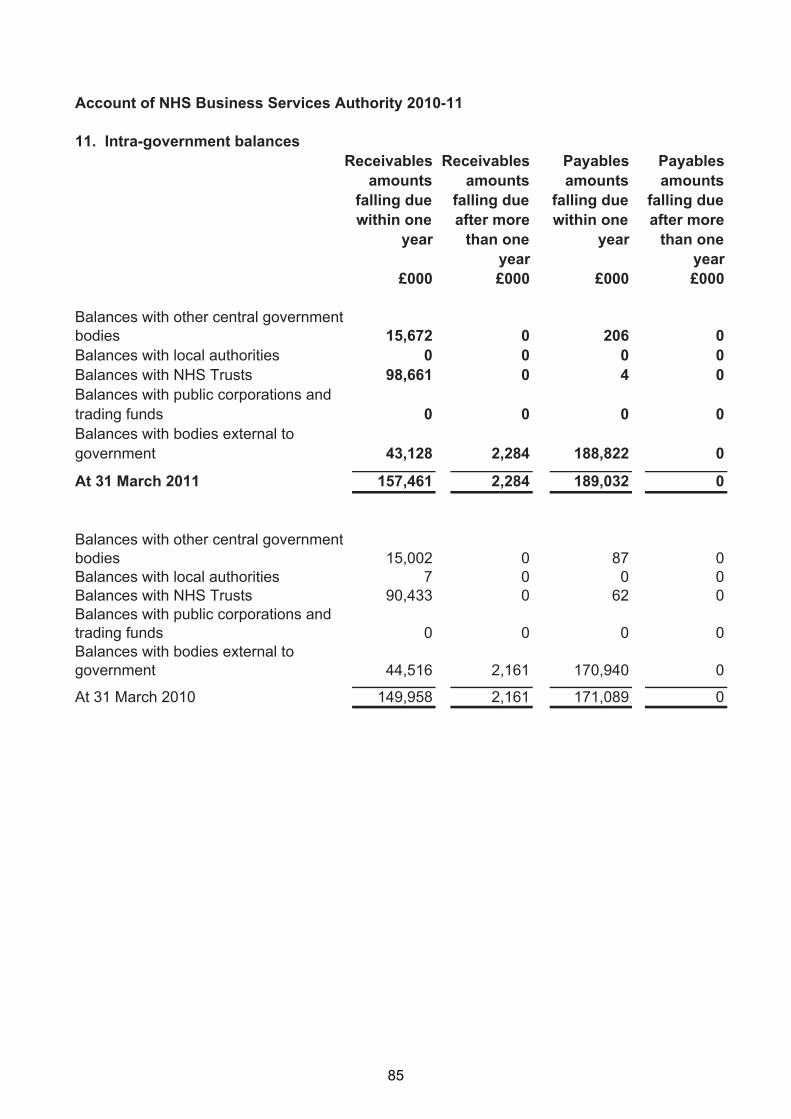
Account of NHS Business Services Authority 2010-11
11. Intra-government balancesReceivables Receivables Payables Payables
amounts amounts amounts amountsfalling due falling due falling due falling duewithin one after more within one after more
year than one year than oneyear year
£000 £000 £000 £000
Balances with other central governmentbodies 15,672 0 206 0Balances with local authorities 0 0 0 0Balances with NHS Trusts 98,661 0 4 0Balances with public corporations andtrading funds 0 0 0 0Balances with bodies external to government 43,128 2,284 188,822 0
0At 31 March 2011 157,461 2,284 189,032
Balances with other central governmentbodies 15,002 0 87 0Balances with local authorities 7 0 0 0Balances with NHS Trusts 90,433 0 62 0Balances with public corporations andtrading funds 0 0 0 0Balances with bodies external to government
At 31 March 2010
44,516 2,161
149,958 2,161
170,940
171,089
0
0
85

Published by TSO (The Stationery Office) and available from:
Onlinewww.tsoshop.co.uk
Mail, Telephone, Fax & E-mailTSOPO Box 29, Norwich, NR3 1GNTelephone orders/General enquiries: 0870 600 5522Order through the Parliamentary Hotline Lo-Call 0845 7 023474Fax orders: 0870 600 5533E-mail: [email protected]: 0870 240 3701
The Parliamentary Bookshop12 Bridge Street, Parliament SquareLondon SW1A 2JXTelephone orders/General enquiries: 020 7219 3890Fax orders: 020 7219 3866Email: [email protected]: http://www.bookshop.parliament.uk
TSO@Blackwell and other Accredited Agents
Customers can also order publications from:TSO Ireland16 Arthur Street, Belfast BT1 4GDTel 028 9023 8451 Fax 028 9023 5401