Embed Size (px)
Citation preview
ANNUAL REPORT ANALYSIS PROJECT Starbucks, Dunkin' Brands and Panera Bread
Intermediate Financial Accoun1ng 1 University of Dallas, Spring 2015 By: A. Alsakran, F. Masoudy, M. Almohammed and F. Alharbi
1
ACCT 5325 – ANNUAL REPORT ANALYSIS PROJECT
1. Introduction:
Purpose of The Analysis:
Financial analysis is the most common method and technique used to evaluate the financial performance and financial condi1on of a company. Different types or ra1os provide financial informa1on from different aspects. It involves selec1on, evalua1on and interpreta1on of financial informa1on to provide meaningful informa1on. Recommenda7on:
On the basis of the given ra1o analysis it is recommended that one should invest in Starbuck’s Corpora1on as it is more secure and offers a fair return to its investors. Overview of The Presenta7on Structure:
In this presenta1on we will analyze the financial ra1os of the 3 most pres1gious companies in the food industry namely: Panera Bread, Dunkin’s Brands and Starbuck’s Corpora1on. Then on the basis of this analysis we will present a recommenda1on about which company is more worthy of investment. Finally the presenta1on will end up with the summary and conclusion.
2
ACCT 5325 – ANNUAL REPORT ANALYSIS PROJECT
2. Overview:
2-‐1. INDUSTRY: Largest Companies Within The Industry:
Panera Bread, McDonald's, Subway, Starbucks, Dunkin’s Brands and Starbuck’s are the largest companies in the food industry. Starbuck’s Corpora1on holds 36.7% of the market share, Dunkin’s Brands holds 24.6% and the remaining 38.7% is shared by other companies. Geographical Presence in The Industry:
Panera Bread holds a strong posi1on in the industry with opera1ons in more than 36 countries in the world. Dunkin’s Brands is currently opera1ng in more than 30 countries with about 40 years of experience. Starbuck’s Corpora1on is opera1ng in more than 65 countries. Economic Factor:
The companies have global existence and their opera1ons in different countries are affected by the poli1cal and economic situa1on of these countries. The increased compe11on in the industry has saturated the market and offered variety of products to the customers. Yet from the financial analysis this can be viewed that overall the industry is growing and each company’s profit is increasing each year.
3
ACCT 5325 – ANNUAL REPORT ANALYSIS PROJECT
2. Overview:
2-‐1. BUSINESS STRATEGY FOR EACH COMPANY: Panera Bread: • Panera Bread was established in 1981 as Au Bon Pain. The company spread out along the
east cost and interna1onally through 1990’s. Later on, the name was changed to Panera Bread in 1997. Today, Panera is a specialized bakery-‐café that caters baked goods, sandwiches, soups and salads. Panera has been steadily growing throughout the years with a strong financial and opera1ng performance.
• According to Shaich, CEO and founder of Panera, in his interview with Business Insider, “Panera in its core comes from a view that compe11ve advantage is everything.” Panera believes in fresh and healthy ingredients that are delivered to stores on a daily basis. Also, they provide a home style atmosphere to ensure that their customers are comfortable whether they dine-‐in or taking their orders to-‐go.
• The company focuses on a long term marking strategy; therefore, it is expected for Panera to con1nue delivering its goods consistently.
4
Panera Bread Company. (2014, April 22). 2013 Annual Report to Stockholders. Retrieved 16 April 2015
ACCT 5325 – ANNUAL REPORT ANALYSIS PROJECT
2. Overview:
2-‐1. BUSINESS STRATEGY FOR EACH COMPANY: Dunkin' Brands: • Dunkin' Brands is the one of the largest coffee and donuts chain opera1ng in almost all big countries
of the world. The annual sales revenue of the company has been flourished tremendously over the past five years making it a leading coffee and donuts seller in the interna1onal market.
• The company has repot a annual revenue of 748.71 million in 2014 which is almost 5% greater than the reported sales revenue of 2013.
• Dunkin donuts was also one of the akrac1ve company from investment point of view having income available for common share holders of $176.36 million which provides an basic earning per share of 1.67 which is greater than the past year EPS of 1.38.
• Dunkin donuts has been using product differen1a1on strategy providing high quality donuts through processing from hi-‐tech machines.
• There has also been product differen1a1on strategy used by the company by making the best donuts in market.
• The overall company perspec1ve for next 5 years looks quiet favorable because there has been an increase in overall sales and profits from last 5 years. The EPS is also rising which is makes the Dunkin Donut a good company that investors can invest in.
5
Business Strategy. (n.d.). Starbucks and Dunkin Donuts. Retrieved 16 April 2015
ACCT 5325 – ANNUAL REPORT ANALYSIS PROJECT
2. Overview:
2-‐1. BUSINESS STRATEGY FOR EACH COMPANY: Starbucks Corpora7on: • Starbucks Corpora1on is an interna1onal coffee and coffeehouse chain based in Seakle,
Washington. It was founded in 1971 by Jerry Baldwin, Zev Siegl and Gordon Bowker. • Starbucks is the largest coffeehouse company in the world, with 17,009 stores in 50
countries, including over 11,000 in the United. Their product mix includes roasted and handcraoed high quality and premium premium priced coffees, tea, a variety of fresh food items and other beverages.
• Starbucks is to effec1vely leverage their cornerstone product differen1a1on and also offering a premium product mix of high quality. Starbuck’s brand is built on selling the finest quality coffee.
• Starbucks employs a broad differen1a1on strategy. This strategy is concentrated on a broader segment of the total market. Starbucks serves a market that is defined by coffee drinkers.
6
Starbucks Corpora1on. (2014, December 4). Starbucks Details Five-‐Year Plan to Accelerate Profitable Growth at Investor Conference | Starbucks Newsroom. Retrieved 16 April 2015
ACCT 5325 – ANNUAL REPORT ANALYSIS PROJECT
3. Financial Ratio Calculations and Analysis:
Ra1o Result
Compared to Industry Defini1on Interpreta1on Area Interpreta1on Dec. 30, 2014 Dec. 31,
2013 Stock' adjusted
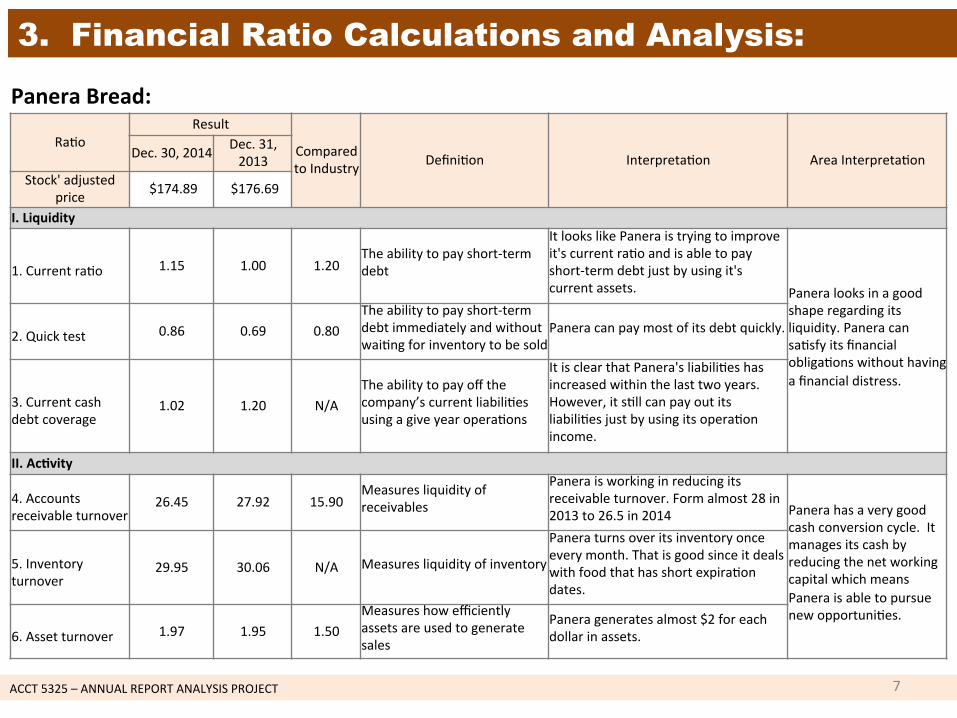
price $174.89 $176.69
I. Liquidity
1. Current ra1o 1.15 1.00 1.20
The ability to pay short-‐term debt
It looks like Panera is trying to improve it's current ra1o and is able to pay short-‐term debt just by using it's current assets. Panera looks in a good
shape regarding its liquidity. Panera can sa1sfy its financial obliga1ons without having a financial distress.
2. Quick test 0.86 0.69 0.80
The ability to pay short-‐term debt immediately and without wai1ng for inventory to be sold
Panera can pay most of its debt quickly.
3. Current cash debt coverage
1.02 1.20 N/A The ability to pay off the company’s current liabili1es using a give year opera1ons
It is clear that Panera's liabili1es has increased within the last two years. However, it s1ll can pay out its liabili1es just by using its opera1on income.
II. Ac7vity 4. Accounts receivable turnover
26.45 27.92 15.90 Measures liquidity of receivables
Panera is working in reducing its receivable turnover. Form almost 28 in 2013 to 26.5 in 2014 Panera has a very good
cash conversion cycle. It manages its cash by reducing the net working capital which means Panera is able to pursue new opportuni1es.
5. Inventory turnover
29.95 30.06 N/A Measures liquidity of inventory
Panera turns over its inventory once every month. That is good since it deals with food that has short expira1on dates.
6. Asset turnover 1.97 1.95 1.50
Measures how efficiently assets are used to generate sales
Panera generates almost $2 for each dollar in assets.
Panera Bread:
7
ACCT 5325 – ANNUAL REPORT ANALYSIS PROJECT
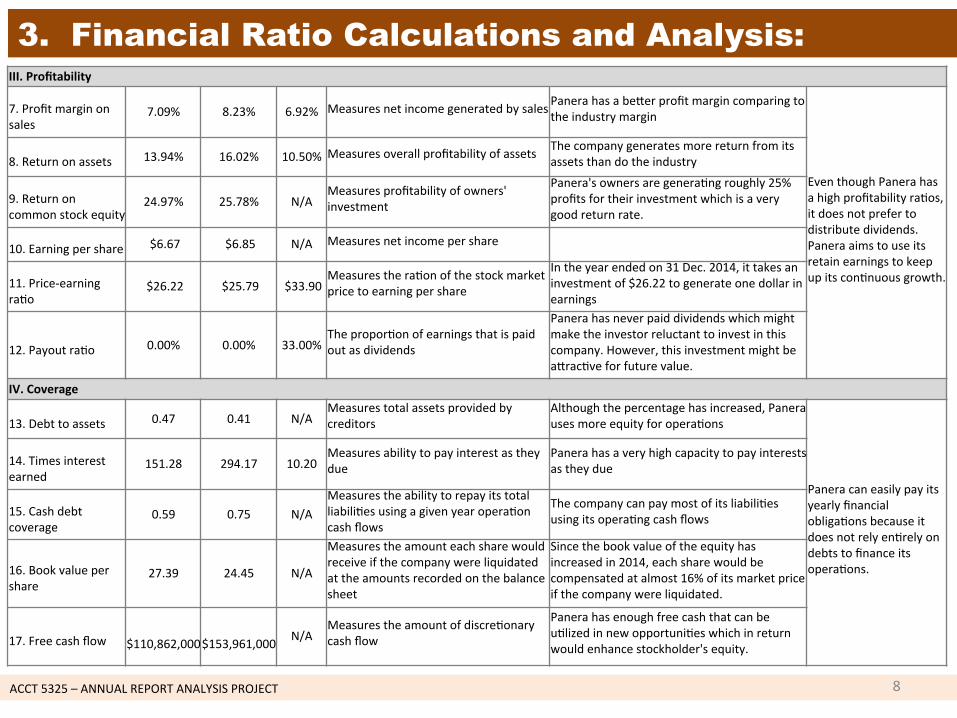
3. Financial Ratio Calculations and Analysis: III. Profitability 7. Profit margin on sales
7.09% 8.23% 6.92% Measures net income generated by sales Panera has a beker profit margin comparing to the industry margin
Even though Panera has a high profitability ra1os, it does not prefer to distribute dividends. Panera aims to use its retain earnings to keep up its con1nuous growth.
8. Return on assets 13.94% 16.02% 10.50% Measures overall profitability of assets The company generates more return from its
assets than do the industry
9. Return on common stock equity
24.97% 25.78% N/A Measures profitability of owners' investment
Panera's owners are genera1ng roughly 25% profits for their investment which is a very good return rate.
10. Earning per share $6.67 $6.85 N/A Measures net income per share
11. Price-‐earning ra1o
$26.22 $25.79 $33.90 Measures the ra1on of the stock market price to earning per share
In the year ended on 31 Dec. 2014, it takes an investment of $26.22 to generate one dollar in earnings
12. Payout ra1o 0.00% 0.00% 33.00%
The propor1on of earnings that is paid out as dividends
Panera has never paid dividends which might make the investor reluctant to invest in this company. However, this investment might be akrac1ve for future value.
IV. Coverage 13. Debt to assets 0.47 0.41 N/A
Measures total assets provided by creditors
Although the percentage has increased, Panera uses more equity for opera1ons
Panera can easily pay its yearly financial obliga1ons because it does not rely en1rely on debts to finance its opera1ons.
14. Times interest earned
151.28 294.17 10.20 Measures ability to pay interest as they due
Panera has a very high capacity to pay interests as they due
15. Cash debt coverage
0.59 0.75 N/A Measures the ability to repay its total liabili1es using a given year opera1on cash flows
The company can pay most of its liabili1es using its opera1ng cash flows
16. Book value per share
27.39 24.45 N/A
Measures the amount each share would receive if the company were liquidated at the amounts recorded on the balance sheet
Since the book value of the equity has increased in 2014, each share would be compensated at almost 16% of its market price if the company were liquidated.
17. Free cash flow
$110,862,000
$153,961,000 N/A
Measures the amount of discre1onary cash flow
Panera has enough free cash that can be u1lized in new opportuni1es which in return would enhance stockholder's equity.
8
ACCT 5325 – ANNUAL REPORT ANALYSIS PROJECT
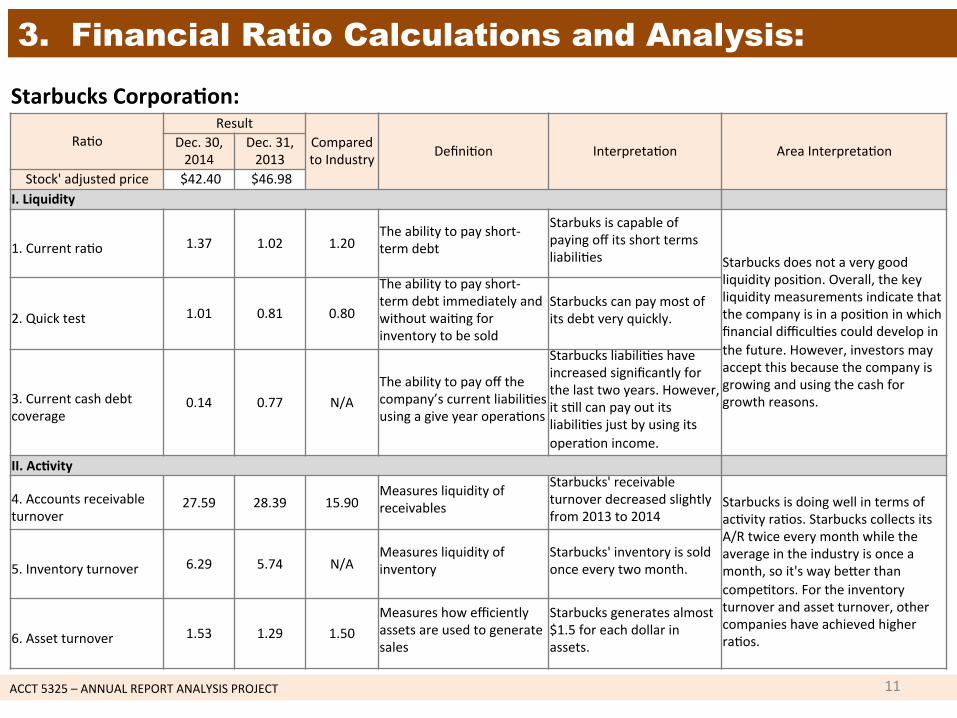
3. Financial Ratio Calculations and Analysis:
Ra1o Result
Compared to Industry Defini1on Interpreta1on Area Interpreta1on Dec. 30,
2014 Dec. 31, 2013
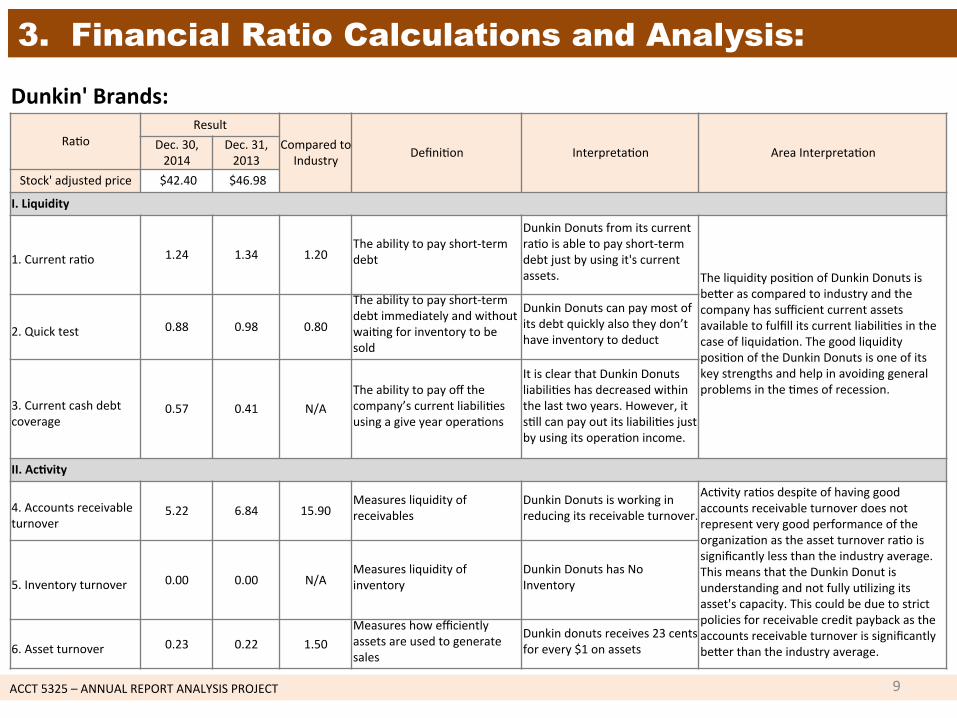
Stock' adjusted price $42.40 $46.98
I. Liquidity
1. Current ra1o 1.24 1.34 1.20
The ability to pay short-‐term debt
Dunkin Donuts from its current ra1o is able to pay short-‐term debt just by using it's current assets. The liquidity posi1on of Dunkin Donuts is
beker as compared to industry and the company has sufficient current assets available to fulfill its current liabili1es in the case of liquida1on. The good liquidity posi1on of the Dunkin Donuts is one of its key strengths and help in avoiding general problems in the 1mes of recession.
2. Quick test 0.88 0.98 0.80
The ability to pay short-‐term debt immediately and without wai1ng for inventory to be sold
Dunkin Donuts can pay most of its debt quickly also they don’t have inventory to deduct
3. Current cash debt coverage
0.57 0.41 N/A The ability to pay off the company’s current liabili1es using a give year opera1ons
It is clear that Dunkin Donuts liabili1es has decreased within the last two years. However, it s1ll can pay out its liabili1es just by using its opera1on income.
II. Ac7vity
4. Accounts receivable turnover
5.22 6.84 15.90 Measures liquidity of receivables
Dunkin Donuts is working in reducing its receivable turnover.
Ac1vity ra1os despite of having good accounts receivable turnover does not represent very good performance of the organiza1on as the asset turnover ra1o is significantly less than the industry average. This means that the Dunkin Donut is understanding and not fully u1lizing its asset's capacity. This could be due to strict policies for receivable credit payback as the accounts receivable turnover is significantly beker than the industry average.
5. Inventory turnover 0.00 0.00 N/A
Measures liquidity of inventory
Dunkin Donuts has No Inventory
6. Asset turnover 0.23 0.22 1.50
Measures how efficiently assets are used to generate sales
Dunkin donuts receives 23 cents for every $1 on assets
Dunkin' Brands:
9
ACCT 5325 – ANNUAL REPORT ANALYSIS PROJECT
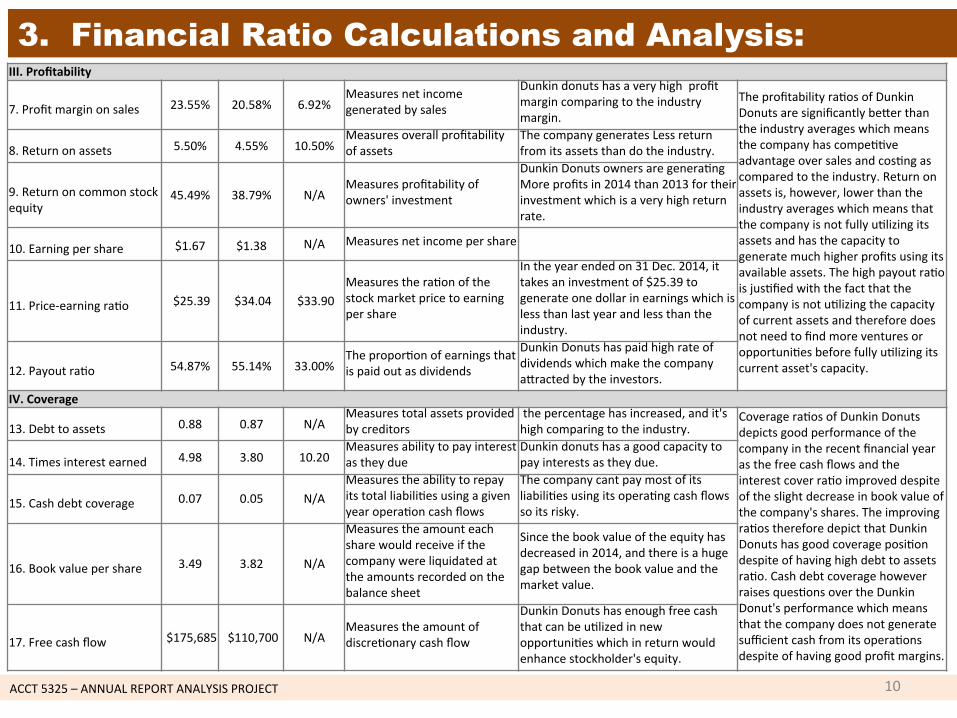
3. Financial Ratio Calculations and Analysis: III. Profitability
7. Profit margin on sales 23.55% 20.58% 6.92%
Measures net income generated by sales
Dunkin donuts has a very high profit margin comparing to the industry margin.
The profitability ra1os of Dunkin Donuts are significantly beker than the industry averages which means the company has compe11ve advantage over sales and cos1ng as compared to the industry. Return on assets is, however, lower than the industry averages which means that the company is not fully u1lizing its assets and has the capacity to generate much higher profits using its available assets. The high payout ra1o is jus1fied with the fact that the company is not u1lizing the capacity of current assets and therefore does not need to find more ventures or opportuni1es before fully u1lizing its current asset's capacity.
8. Return on assets 5.50% 4.55% 10.50%
Measures overall profitability of assets
The company generates Less return from its assets than do the industry.
9. Return on common stock equity
45.49% 38.79% N/A Measures profitability of owners' investment
Dunkin Donuts owners are genera1ng More profits in 2014 than 2013 for their investment which is a very high return rate.
10. Earning per share $1.67 $1.38 N/A Measures net income per share
11. Price-‐earning ra1o $25.39 $34.04 $33.90
Measures the ra1on of the stock market price to earning per share
In the year ended on 31 Dec. 2014, it takes an investment of $25.39 to generate one dollar in earnings which is less than last year and less than the industry.
12. Payout ra1o 54.87% 55.14% 33.00%
The propor1on of earnings that is paid out as dividends
Dunkin Donuts has paid high rate of dividends which make the company akracted by the investors.
IV. Coverage 13. Debt to assets 0.88 0.87 N/A
Measures total assets provided by creditors
the percentage has increased, and it's high comparing to the industry.
Coverage ra1os of Dunkin Donuts depicts good performance of the company in the recent financial year as the free cash flows and the interest cover ra1o improved despite of the slight decrease in book value of the company's shares. The improving ra1os therefore depict that Dunkin Donuts has good coverage posi1on despite of having high debt to assets ra1o. Cash debt coverage however raises ques1ons over the Dunkin Donut's performance which means that the company does not generate sufficient cash from its opera1ons despite of having good profit margins.
14. Times interest earned 4.98 3.80 10.20
Measures ability to pay interest as they due
Dunkin donuts has a good capacity to pay interests as they due.
15. Cash debt coverage 0.07 0.05 N/A
Measures the ability to repay its total liabili1es using a given year opera1on cash flows
The company cant pay most of its liabili1es using its opera1ng cash flows so its risky.
16. Book value per share 3.49 3.82 N/A
Measures the amount each share would receive if the company were liquidated at the amounts recorded on the balance sheet
Since the book value of the equity has decreased in 2014, and there is a huge gap between the book value and the market value.
17. Free cash flow $175,685 $110,700 N/A
Measures the amount of discre1onary cash flow
Dunkin Donuts has enough free cash that can be u1lized in new opportuni1es which in return would enhance stockholder's equity.
10
ACCT 5325 – ANNUAL REPORT ANALYSIS PROJECT
3. Financial Ratio Calculations and Analysis:
Ra1o Result
Compared to Industry Defini1on Interpreta1on Area Interpreta1on Dec. 30,
2014 Dec. 31, 2013
Stock' adjusted price $42.40 $46.98 I. Liquidity
1. Current ra1o 1.37 1.02 1.20
The ability to pay short-‐term debt
Starbuks is capable of paying off its short terms liabili1es Starbucks does not a very good
liquidity posi1on. Overall, the key liquidity measurements indicate that the company is in a posi1on in which financial difficul1es could develop in the future. However, investors may accept this because the company is growing and using the cash for growth reasons.
2. Quick test 1.01 0.81 0.80
The ability to pay short-‐term debt immediately and without wai1ng for inventory to be sold
Starbucks can pay most of its debt very quickly.
3. Current cash debt coverage
0.14 0.77 N/A The ability to pay off the company’s current liabili1es using a give year opera1ons
Starbucks liabili1es have increased significantly for the last two years. However, it s1ll can pay out its liabili1es just by using its opera1on income.
II. Ac7vity 4. Accounts receivable turnover
27.59 28.39 15.90 Measures liquidity of receivables
Starbucks' receivable turnover decreased slightly from 2013 to 2014
Starbucks is doing well in terms of ac1vity ra1os. Starbucks collects its A/R twice every month while the average in the industry is once a month, so it's way beker than compe1tors. For the inventory turnover and asset turnover, other companies have achieved higher ra1os.
5. Inventory turnover 6.29 5.74 N/A
Measures liquidity of inventory
Starbucks' inventory is sold once every two month.
6. Asset turnover 1.53 1.29 1.50
Measures how efficiently assets are used to generate sales
Starbucks generates almost $1.5 for each dollar in assets.
Starbucks Corpora7on:
11
ACCT 5325 – ANNUAL REPORT ANALYSIS PROJECT
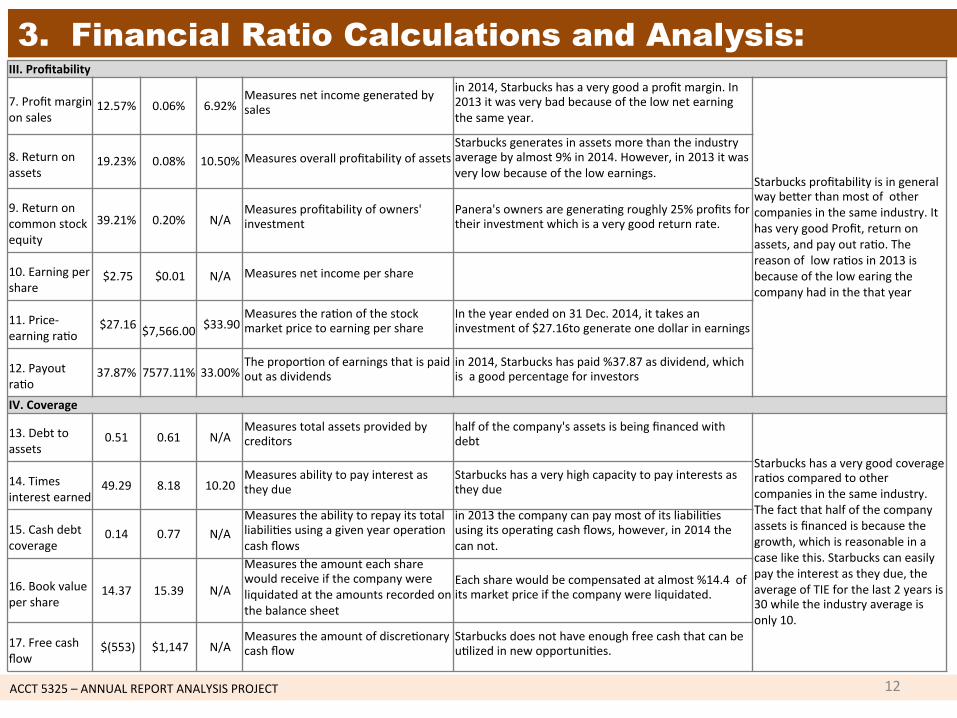
3. Financial Ratio Calculations and Analysis: III. Profitability 7. Profit margin on sales
12.57% 0.06% 6.92% Measures net income generated by sales
in 2014, Starbucks has a very good a profit margin. In 2013 it was very bad because of the low net earning the same year.
Starbucks profitability is in general way beker than most of other companies in the same industry. It has very good Profit, return on assets, and pay out ra1o. The reason of low ra1os in 2013 is because of the low earing the company had in the that year
8. Return on assets
19.23% 0.08% 10.50% Measures overall profitability of assets Starbucks generates in assets more than the industry average by almost 9% in 2014. However, in 2013 it was very low because of the low earnings.
9. Return on common stock equity
39.21% 0.20% N/A Measures profitability of owners' investment
Panera's owners are genera1ng roughly 25% profits for their investment which is a very good return rate.
10. Earning per share
$2.75 $0.01 N/A Measures net income per share
11. Price-‐earning ra1o
$27.16 $7,566.00 $33.90
Measures the ra1on of the stock market price to earning per share
In the year ended on 31 Dec. 2014, it takes an investment of $27.16to generate one dollar in earnings
12. Payout ra1o
37.87% 7577.11% 33.00% The propor1on of earnings that is paid out as dividends
in 2014, Starbucks has paid %37.87 as dividend, which is a good percentage for investors
IV. Coverage 13. Debt to assets
0.51 0.61 N/A Measures total assets provided by creditors
half of the company's assets is being financed with debt
Starbucks has a very good coverage ra1os compared to other companies in the same industry. The fact that half of the company assets is financed is because the growth, which is reasonable in a case like this. Starbucks can easily pay the interest as they due, the average of TIE for the last 2 years is 30 while the industry average is only 10.
14. Times interest earned
49.29 8.18 10.20 Measures ability to pay interest as they due
Starbucks has a very high capacity to pay interests as they due
15. Cash debt coverage
0.14 0.77 N/A Measures the ability to repay its total liabili1es using a given year opera1on cash flows
in 2013 the company can pay most of its liabili1es using its opera1ng cash flows, however, in 2014 the can not.
16. Book value per share
14.37 15.39 N/A
Measures the amount each share would receive if the company were liquidated at the amounts recorded on the balance sheet
Each share would be compensated at almost %14.4 of its market price if the company were liquidated.
17. Free cash flow
$(553) $1,147 N/A Measures the amount of discre1onary cash flow
Starbucks does not have enough free cash that can be u1lized in new opportuni1es.
12
ACCT 5325 – ANNUAL REPORT ANALYSIS PROJECT
4. A Comparison of The Companies By Area:
1. Liquidity: Aoer comparing the three companies, we can conclude that Panera has the best liquidity ra1os,
then Starbucks and the last is Dunkin Donuts. The the reason that Starbucks is does not have a high liquidity is because of their expanding and using cash for growth. 2. Ac7vity:
Based on all the three companies ac1vi1es, it seems that Panera has a good ability to get new chances as long as they are working on the franchise ideas to expand their business. Comparing to Starbucks, which assembles its account receivables twice monthly and its compe1tors collect them every month. 3. Profitability:
Comparing the profitability to these three company, we see that Starbucks has beker profitability than Panera and Dunkin donuts that’s because Panera does not distribute dividends and there profitability is lower than Starbucks. Also, Dunkin Donuts has lower profitability ra1o even though they distribute dividends but on the other hand, they are not fully u1lizing its assets. 4. Coverage:
Aoer comparing all companies coverage ra1os, it seems that all companies can meet their financial obliga1ons without having financial distress. Even though Starbucks doesn't have free cash flow, it fulfilled its obliga1ons toward lenders. Although Panera keeps a high book value among the other companies and a high TIE, it s1ll does not pay dividends which might discourage investors from inves1ng in it.
13

ACCT 5325 – ANNUAL REPORT ANALYSIS PROJECT
5. Investment Recommendation:
Recommenda7ons: Based on the given ra1o analysis, we will prefer to invest our money in Starbuck’s Corpora1on for the following reasons: • It possesses a high market share. • Although the company doesn’t have the best current cash debt coverage ra1o yet Its
liquidity ra1os are sa1sfactory. • The ac1vi1es ra1os are also improving each year. • It has the highest return on asset and price earnings ra1o. • Panera Bread has the highest earning per share, book value per share and free cash
flows but its payout ra1o is zero for 2 years while the payout ra1o of Starbuck’s Corpora1on is very good.
• Its free cash flows are nega1ve this year because in the previous year it paid a huge amount of dividend to its shareholders. The company possesses a great poten1al for improvement in the future.
• The company has a low debt to asset ra1o which means low risk. • The profitability ra1os are also favorable for investors.
14
ACCT 5325 – ANNUAL REPORT ANALYSIS PROJECT
6. Summary and Conclusion:
Summary:
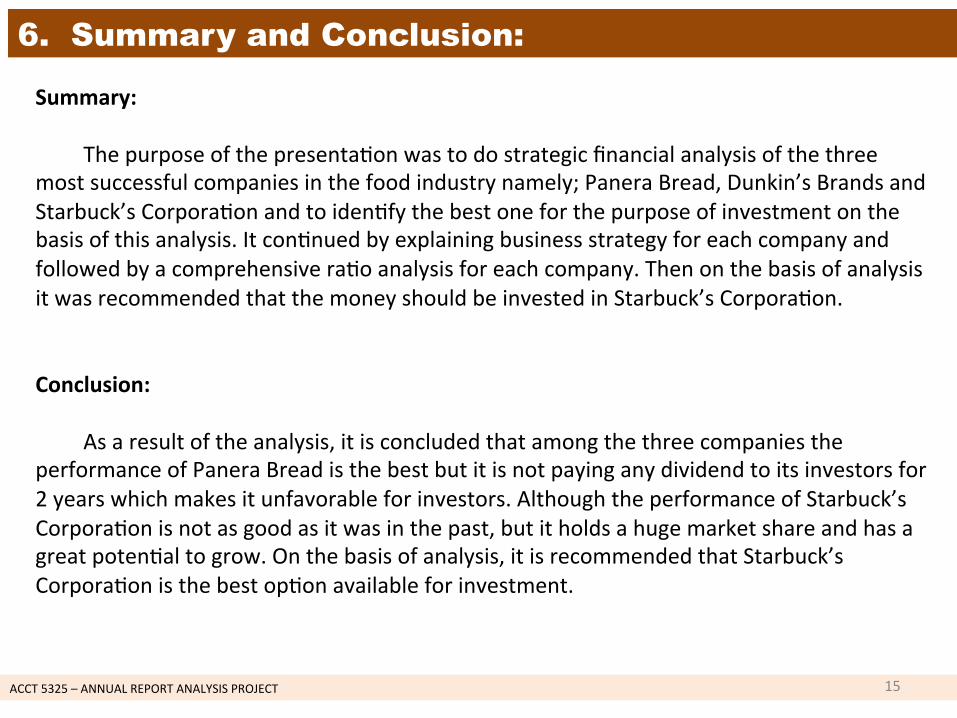
The purpose of the presenta1on was to do strategic financial analysis of the three most successful companies in the food industry namely; Panera Bread, Dunkin’s Brands and Starbuck’s Corpora1on and to iden1fy the best one for the purpose of investment on the basis of this analysis. It con1nued by explaining business strategy for each company and followed by a comprehensive ra1o analysis for each company. Then on the basis of analysis it was recommended that the money should be invested in Starbuck’s Corpora1on. Conclusion:
As a result of the analysis, it is concluded that among the three companies the performance of Panera Bread is the best but it is not paying any dividend to its investors for 2 years which makes it unfavorable for investors. Although the performance of Starbuck’s Corpora1on is not as good as it was in the past, but it holds a huge market share and has a great poten1al to grow. On the basis of analysis, it is recommended that Starbuck’s Corpora1on is the best op1on available for investment.
15
ACCT 5325 – ANNUAL REPORT ANALYSIS PROJECT
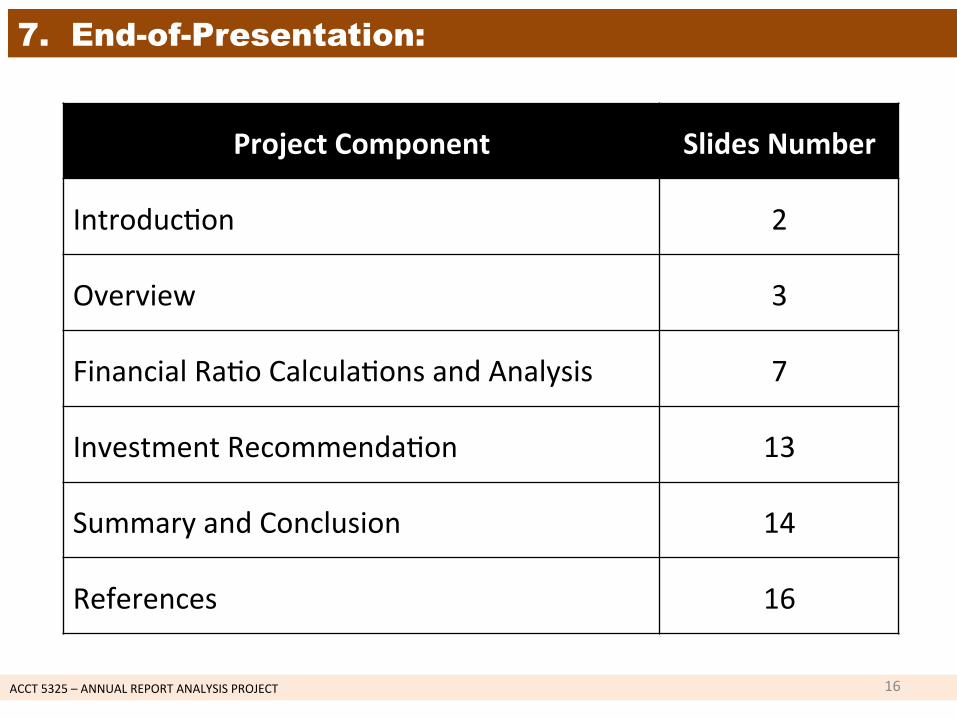
7. End-of-Presentation:
Project Component Slides Number
Introduc1on 2
Overview 3
Financial Ra1o Calcula1ons and Analysis 7
Investment Recommenda1on 13
Summary and Conclusion 14
References 16
16
ACCT 5325 – ANNUAL REPORT ANALYSIS PROJECT
References (1):
Berman, K., & Joe Knight ; with John Case. (2013). Financial Intelligence, Revised Edi2on: A Manager’s Guide to Knowing What the
Numbers Really Mean.
Business Strategy. (n.d.). Starbucks and Dunkin Donuts. Retrieved 16 April 2015, from hkps://sites.google.com/site/
starbucksanddunkindonuts/business-‐strategy
Carlberg, C. G. (2010). Business analysis: MicrosoD Excel 2010. Indianapolis, IN: Que Corpora1on,U.S.
Carlberg, C. G. (2011). Sta2s2cal analysis: MicrosoD Excel 2010. Indianapolis, IN: Que Corpora1on,U.S.
DNKN Income Statement | Dunkin’ Brands Group, Inc. Stock -‐ Yahoo! Finance. (n.d.). Retrieved 6 April 2015, from hkp://
finance.yahoo.com/q/is?s=DNKN Income Statement
Dunkin’ Brands | Financials. (n.d.). Retrieved 6 April 2015, from hkp://investor.dunkinbrands.com/financials.cfm
Dunkin’ Brands Group Inc. (n.d.). Retrieved 6 April 2015, from hkp://www.marketwatch.com/inves1ng/stock/dnkn/financials
Goudreau, J. (2014). Here Are The Epiphanies That Made Panera A $4.5 Billion Restaurant Chain. Business Insider. Retrieved from hkp://
www.businessinsider.com/panera-‐bread-‐founder-‐ron-‐shaich-‐on-‐growth-‐strategies-‐2014-‐11
Kieso, D. E., Weygandt, J. J., & Warfield, T. D. (2014). Intermediate Accoun2ng, 2014 FASB Update. United States: John Wiley & Sons.
NASDAQ’s Homepage for Retail Investors. (2015, April 6). Retrieved 6 April 2015, from hkp://www.nasdaq.com
News and Advice for a Life1me of Financial Decisions. (n.d.). Retrieved 6 April 2015, from hkp://www.dailyfinance.com
17
ACCT 5325 – ANNUAL REPORT ANALYSIS PROJECT
References (2):
Our History. (n.d.). Retrieved 6 April 2015, from hkps://www.panerabread.com/en-‐us/company/about-‐panera/our-‐history.html
Panera Bread Company. (2014a, April 22). 2013 Annual Report to Stockholders. Retrieved 16 April 2015, from hkps://
www.panerabread.com/content/dam/panerabread/documents/financial/2013/ar-‐2013.pdf
Panera Bread Is On The Right Track To Future Growth. (n.d.). Retrieved 6 April 2015, from hkp://www.gurufocus.com/news/267651/
panera-‐bread-‐is-‐on-‐the-‐right-‐track-‐to-‐future-‐growth
Ross, S. A., Westerfield, R. W., & Jordan, B. D. (2012). Fundamentals of Corporate Finance Standard Edi2on (10th ed.). New York, NY:
McGraw Hill Higher Educa1on.
Starbucks Corpora1on. (2014b, December 4). Starbucks Details Five-‐Year Plan to Accelerate Profitable Growth at Investor Conference |
Starbucks Newsroom. Retrieved 16 April 2015, from hkps://news.starbucks.com/news/live-‐blog-‐starbucks-‐path-‐for-‐growth-‐outlined-‐
at-‐2014-‐biennial-‐investor-‐day
U.S. Securi1es and Exchange Commission. (2013). Panera Bread. Retrieved 16 April 2015, from hkp://www.sec.gov/cgi-‐bin/viewer?
ac1on=view
U.S. Securi1es and Exchange Commission. (2014c). Dunkin’ Brands. Retrieved 16 April 2015, from hkp://www.sec.gov/cgi-‐bin/browse-‐
edgar?ac1on=getcompany
U.S. Securi1es and Exchange Commission. (2014d). Panera Bread. Retrieved 16 April 2015, from hkp://www.sec.gov/cgi-‐bin/viewer?
ac1on=view
U.S. Securi1es and Exchange Commission. (2014e). STARBUCKS. Retrieved 16 April 2015, from hkp://www.sec.gov/cgi-‐bin/viewer?
ac1on=view
Yahoo Finance -‐ Business Finance, Stock Market, Quotes, News. (n.d.). Retrieved 6 April 2015, from hkp://finance.yahoo.com/
18