Embed Size (px)
Citation preview

Findel plc Registered Office: 2 Gregory Street, Hyde, Cheshire SK14 4TH
Find
el plc
ww
w.fin
del.co
.uk
AN
NU
AL
RE
PO
RT
& A
CC
OU
NT
S 2
016
Findel plc
www.findel.co.uk
ANNUAL REPORT & ACCOUNTS
2016
www.findel.co.uk 1
ST
RA
TE
GIC
RE
PO
RT
2—24
GO
VE
RN
AN
CE
25
—6
7C
ON
SO
LID
AT
ED
FIN
AN
CIA
L S
TA
TE
ME
NT
S 6
8—
11
7C
OM
PA
NY
FIN
AN
CIA
L S
TA
TE
ME
NT
S 1
18
—1
41
1. Strategic Report
2. Financial Highlights
4. Chairman’s Statement
8. Our businesses and strategic objectives
10. Express Gifts
14. Findel Education
20. Finance Director’s Review
22. Principal risks and uncertainties
24. Our people, our products, community and the environment
2. Governance
25. Directors & Officers
26. Directors’ Report
31. Corporate Governance Report
35. Board Report on Directors’ Remuneration
55. Nomination Committee Report
56. Audit & Risk Committee Report
60. Corporate Social Responsibility Report
63. Statement of Directors’ Responsibilities
64. Independent Auditor’s Report
3. Financial Statements
68. Consolidated Income Statement
70. Consolidated Statement of Comprehensive Income
71. Consolidated Balance Sheet
72. Consolidated Cash Flow Statement
73. Consolidated Statement of Changes in Equity
74. Notes to the Consolidated Financial Statements
118. Company Balance Sheet
119. Company Cash Flow Statement
120. Company Statement of Changes in Equity
121. Notes to the Company Financial Statements
Contents
A year of progress to improve long-term prospects
The Findel group contains market leading businesses in the UK home shopping and education supplies markets
Strategic Report
2 Findel plc Annual report and accounts 2016
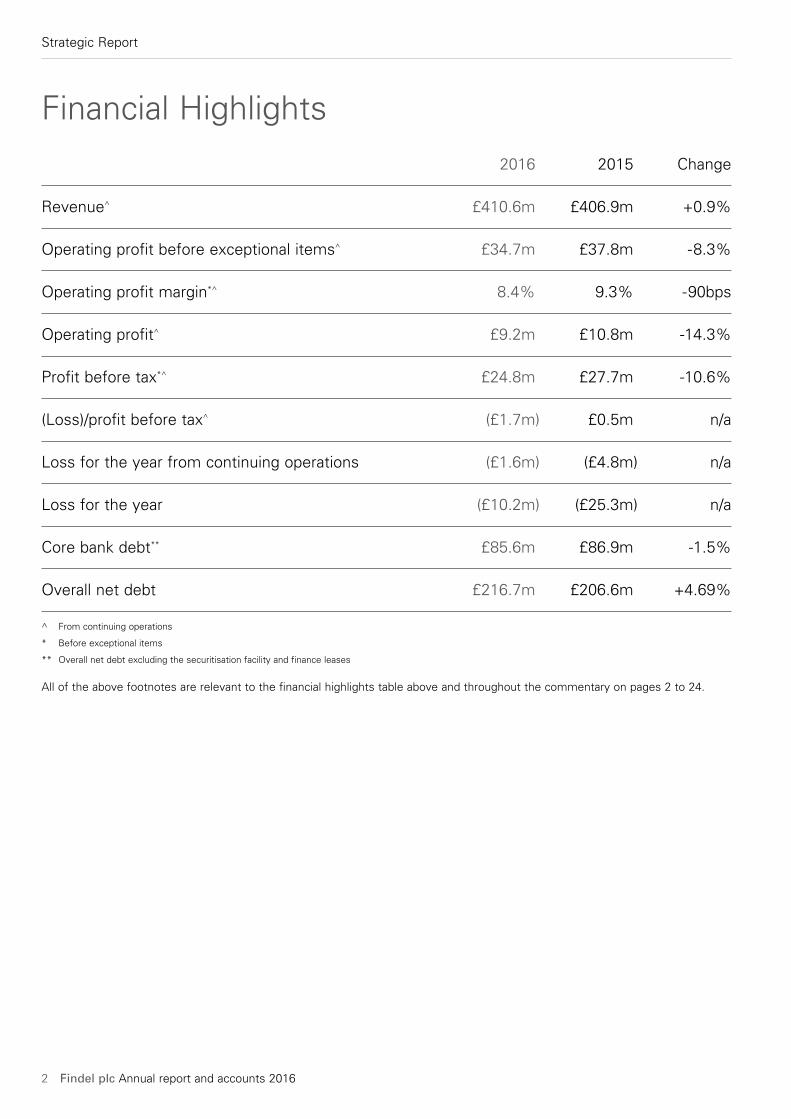
Financial Highlights
2016 2015 Change
Revenue^ £410.6m £406.9m +0.9%
Operating profit before exceptional items^ £34.7m £37.8m -8.3%
Operating profit margin*^ 8.4% 9.3% -90bps
Operating profit^ £9.2m £10.8m -14.3%
Profit before tax*^ £24.8m £27.7m -10.6%
(Loss)/profit before tax^ (£1.7m) £0.5m n/a
Loss for the year from continuing operations (£1.6m) (£4.8m) n/a
Loss for the year (£10.2m) (£25.3m) n/a
Core bank debt** £85.6m £86.9m -1.5%
Overall net debt £216.7m £206.6m +4.69%
^ From continuing operations
* Before exceptional items
** Overall net debt excluding the securitisation facility and finance leases
All of the above footnotes are relevant to the financial highlights table above and throughout the commentary on pages 2 to 24.
Strategic Report
www.findel.co.uk 3
ST
RA
TE
GIC
RE
PO
RT
2—24
GO
VE
RN
AN
CE
25
—6
7C
ON
SO
LID
AT
ED
FIN
AN
CIA
L S
TA
TE
ME
NT
S 6
8—
11
7C
OM
PA
NY
FIN
AN
CIA
L S
TA
TE
ME
NT
S 1
18
—1
41
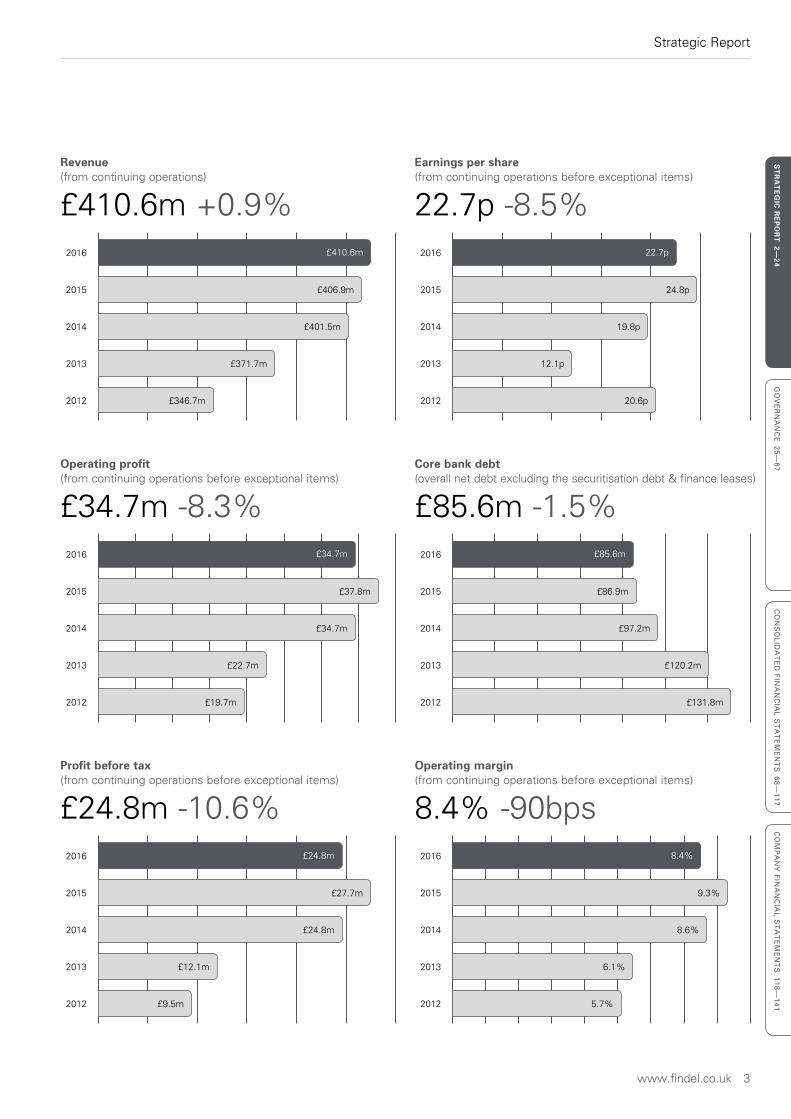
Revenue (from continuing operations)
£410.6m +0.9%
Earnings per share (from continuing operations before exceptional items)
22.7p -8.5%
Operating profit (from continuing operations before exceptional items)
£34.7m -8.3%
Core bank debt (overall net debt excluding the securitisation debt & finance leases)
£85.6m -1.5%
Profit before tax (from continuing operations before exceptional items)
£24.8m -10.6%
Operating margin (from continuing operations before exceptional items)
8.4% -90bps
2012
2013
2014
2015
2016
£401.5m
£406.9m
£410.6m
£346.7m
£371.7m
2012
2013
2014
2015
2016
£34.7m
£37.8m
£34.7m
£19.7m
£22.7m
2012
2013
2014
2015
2016
£97.2m
£86.9m
£85.6m
£131.8m
£120.2m
2012
2013
2014
2015
2016
£24.8m
£27.7m
£24.8m
£9.5m
£12.1m
2012
2013
2014
2015
2016
8.6%
9.3%
8.4%
5.7%
6.1%
2012
2013
2014
2015
2016
19.8p
24.8p
22.7p
20.6p
12.1p
Strategic Report
4 Findel plc Annual report and accounts 2016
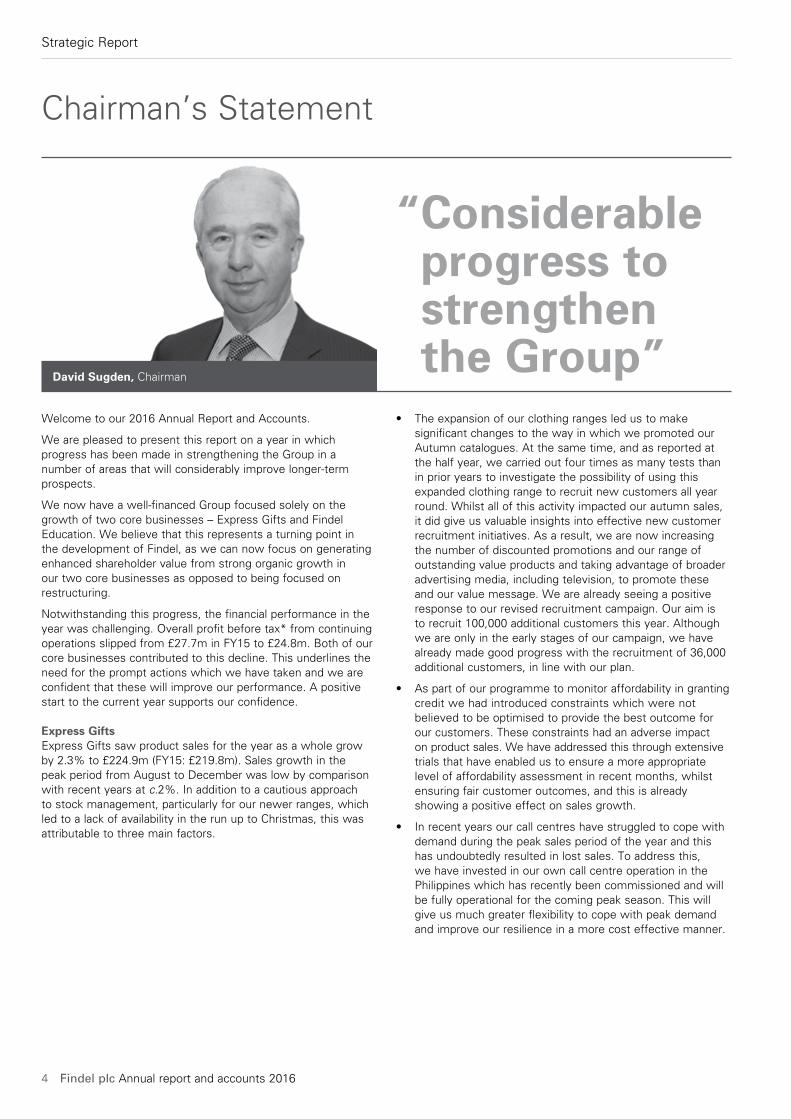
Chairman’s Statement
Welcome to our 2016 Annual Report and Accounts.
We are pleased to present this report on a year in which progress has been made in strengthening the Group in a number of areas that will considerably improve longer-term prospects.
We now have a well-financed Group focused solely on the growth of two core businesses – Express Gifts and Findel Education. We believe that this represents a turning point in the development of Findel, as we can now focus on generating enhanced shareholder value from strong organic growth in our two core businesses as opposed to being focused on restructuring.
Notwithstanding this progress, the financial performance in the year was challenging. Overall profit before tax* from continuing operations slipped from £27.7m in FY15 to £24.8m. Both of our core businesses contributed to this decline. This underlines the need for the prompt actions which we have taken and we are confident that these will improve our performance. A positive start to the current year supports our confidence.
Express GiftsExpress Gifts saw product sales for the year as a whole grow by 2.3% to £224.9m (FY15: £219.8m). Sales growth in the peak period from August to December was low by comparison with recent years at c.2%. In addition to a cautious approach to stock management, particularly for our newer ranges, which led to a lack of availability in the run up to Christmas, this was attributable to three main factors.
• The expansion of our clothing ranges led us to make significant changes to the way in which we promoted our Autumn catalogues. At the same time, and as reported at the half year, we carried out four times as many tests than in prior years to investigate the possibility of using this expanded clothing range to recruit new customers all year round. Whilst all of this activity impacted our autumn sales, it did give us valuable insights into effective new customer recruitment initiatives. As a result, we are now increasing the number of discounted promotions and our range of outstanding value products and taking advantage of broader advertising media, including television, to promote these and our value message. We are already seeing a positive response to our revised recruitment campaign. Our aim is to recruit 100,000 additional customers this year. Although we are only in the early stages of our campaign, we have already made good progress with the recruitment of 36,000 additional customers, in line with our plan.
• As part of our programme to monitor affordability in granting credit we had introduced constraints which were not believed to be optimised to provide the best outcome for our customers. These constraints had an adverse impact on product sales. We have addressed this through extensive trials that have enabled us to ensure a more appropriate level of affordability assessment in recent months, whilst ensuring fair customer outcomes, and this is already showing a positive effect on sales growth.
• In recent years our call centres have struggled to cope with demand during the peak sales period of the year and this has undoubtedly resulted in lost sales. To address this, we have invested in our own call centre operation in the Philippines which has recently been commissioned and will be fully operational for the coming peak season. This will give us much greater flexibility to cope with peak demand and improve our resilience in a more cost effective manner.
David Sugden, Chairman
“ Considerable progress to strengthen the Group”
Strategic Report
www.findel.co.uk 5
ST
RA
TE
GIC
RE
PO
RT
2—24
GO
VE
RN
AN
CE
25
—6
7C
ON
SO
LID
AT
ED
FIN
AN
CIA
L S
TA
TE
ME
NT
S 6
8—
11
7C
OM
PA
NY
FIN
AN
CIA
L S
TA
TE
ME
NT
S 1
18
—1
41
The management team in Express Gifts has been further strengthened during the year with the appointment of a Deputy Managing Director, who will focus initially on marketing, and a new IT Director with a digital focus. The ongoing process of management development has now seen significant strengthening of our capability in financial services, buying, marketing and IT.
Our application to the FCA for full authorisation of our consumer credit business was submitted in October 2015.
Findel EducationThe past year has seen the new management team in Findel Education begin to tackle the root causes of the decline in sales and customer numbers which has resulted from an ongoing loss of market share.
The changes to the operating structure of the business, which have involved the integration of the teams responsible for each sales channel (our “Go To Market” strategy) have been implemented. These teams are reviewing every aspect of our offer to ensure that the products and the way that they are presented in our catalogues and online are relevant and attractive to their respective target customers. Our catalogue production processes are also being modernised to reduce costs but more importantly to make the process more flexible and enable our buyers to focus on improved buying processes. The best timing for each channel’s main catalogue launch is also under review having undertaken tests on the main Classroom brand in recent months which have shown encouraging results. The objective is to achieve a stabilisation of sales in FY17.
The business has successfully managed product margins and operating costs during the year, which has mitigated the impact of the £8.4m sales decline to produce an operating profit* of £3.2m, only £1.0m below the £4.2m reported in FY15.
The merger of Findel Education’s two warehouses is progressing very well and is on track to be completed by the end of the calendar year. This is expected to produce significant savings for the business of between £2-3m from FY18 onwards, which will represent a step-change in the profitability of this business and its ambition to achieve peer-comparable returns.
These actions have contributed to product sales in the new financial year to date that are strongly ahead of last year. The impact of a fall in Sterling on the price of imports of product from the Far East was around £2m and a significant contributor to the reduction in the operating profit* for Express Gifts in the year.
The financial services activities performed strongly throughout the year, with improvements in the credit quality of the receivables book driving lower bad debt charges, lower default fees, higher interest income and a greater level of customer retention. Total revenue from financial services increased by 7.6% during the year to £88.1m. We continue to monitor the balance between maintaining tight underwriting standards and growing product sales closely to ensure the right outcome for customers. The business initiated a programme of risk-based pricing for its credit offer in November 2015, focused initially on those established customers who present a higher than average level of risk. This programme will be rolled out to new customers in the coming months which should generate additional sustainable financial services revenue in FY17.
There continues to be a wide-ranging programme of development and investment within Express Gifts, aimed at improving the customers’ experience and meeting their evolving expectations. This has included the recent launch of an updated website, which has improved the customer experience through enhanced navigation and search facilities, a fully responsive mobile platform as well as cross-sell and up-sell opportunities. The benefits of the updated website are already starting to be seen. Further upgrades to our core IT systems will follow in the next year to provide the flexibility for future technology improvements to be deployed more quickly and the move to a more digital future.
Our new financial services platform will also be available in summer 2017 to provide the basis for more tailored financial products for our customers. All of this investment is expected to increase order frequency and produce greater levels of customer retention in the coming years.
Strategic Report
6 Findel plc Annual report and accounts 2016
Chairman’s Statement continued
The changes introduced to receivables collection processes by Express Gifts over the last two years including the introduction of a strategy to pursue the sale of significantly overdue receivables to third-parties, have enabled and required management to refine the estimation models used for receivables provisioning. In some areas, in particular in relation to customers with whom forbearance arrangements, both with and without interest, have been entered into, better information is now available to allow an improved, more accurate, assessment of the level of provision required. Based on this improved information, an additional provision of £4.3m has been recognised at March 2016, of which c.£3m relates to an adjustment to correct an area of previous non-compliance with IAS 39. We have concluded that the changes made would not, if they had been made during the prior year, have had a material impact on the comparative period income statement, as the level of provision at the beginning of 2014 would also have been similarly impacted. As a result, we consider it appropriate to recognise the additional £4.3m provision during 2016, although, since the increase in the provision of £4.3m does not relate to current year performance, this additional charge to the income statement has been classified as an exceptional item.
Exceptional charges totalling £5.6m were made in relation to the Findel Education warehouse merger, most of which represents the cash rental shortfall over the remaining 12 years of the warehouse lease in Enfield which will be vacated and is recorded as an onerous lease provision.
DividendsThe Board is continuing the work to restructure the Company balance sheet in order to create distributable reserves and enable the progress made in strengthening the financial position of the Group to be translated into the reinstatement of dividend payments. Further updates on progress in this area will be provided during the year.
The business has also reviewed its digital offering recognising that currently online orders are less than half the level enjoyed by our competitors. To address this, a new fully integrated website is being developed which will be launched during 2017 supported by enhanced online marketing tools.
Findel Education has continued to see challenging market conditions in the new financial year, with spending levels from schools remaining constrained. This is not expected to change in the near term. In response, the business is focused on increasing market share as well as seeking to exploit additional demand opportunities in such areas as furniture supplies.
Corporate activityDuring the year we have agreed new banking facilities providing a four year revolving credit facility and securitisation facilities on much improved normal commercial terms. This represents a significant milestone in the development of Findel.
Also during the year we achieved a successful sale of Kitbag to Fanatics, which completed in February. In addition to the total cash proceeds received of c.£14m this has enabled us to exit a business that has required considerable cash and management resources over many years.
Exceptional itemsExceptional items for the continuing operations totalling £26.5m (FY15: £27.2m) were incurred during the year. The largest item related to customer redress and refunds for flawed financial services products estimated at £14.4m some of which has already been paid. The new financial services management team has been carrying out reviews of all products sold. This process is now complete. The number of products identified as requiring redress or refund is testimony to the work that was needed to improve standards in this business. Whilst the provisions for redress are estimates and therefore subject to change in the light of actual costs incurred, we believe the work that has been undertaken is at a point where all past sales of products requiring redress or refund have now been identified.
We have taken prompt actions to improve our performance. A positive start to the current year supports our confidence.
Strategic Report
www.findel.co.uk 7
ST
RA
TE
GIC
RE
PO
RT
2—24
GO
VE
RN
AN
CE
25
—6
7C
ON
SO
LID
AT
ED
FIN
AN
CIA
L S
TA
TE
ME
NT
S 6
8—
11
7C
OM
PA
NY
FIN
AN
CIA
L S
TA
TE
ME
NT
S 1
18
—1
41
OutlookIn terms of financial performance, last year was more challenging than we expected. It has however been a year of considerable progress in addressing the business fundamentals that will drive growth in sales and profits going forward. Whilst there is still more to do we are already seeing the benefits of these actions which gives us confidence that we will return to profitable growth in the current and future years.
David SugdenChairman
13 June 2016
* before exceptional items
** overall net debt excluding the securitisation facility and finance leases
Management and BoardIn line with previous announcements it is my intention to step down as Chairman and leave the Board at the conclusion of the forthcoming Annual General Meeting. The search for a replacement is well advanced and we expect to make a further announcement in the near future. My six years on the Findel Board have seen the Company move from the brink of insolvency to a well-focused Company with sound financing and excellent prospects. This has been particularly rewarding and I would like to personally pay tribute to and thank everyone, inside and outside of the Company, whose considerable efforts have made this possible.
Sandy Kinney Pritchard stepped down from the Board as a Non-Executive Director in July 2015 and was replaced by Greg Ball who joined the Board in February 2016. Greg has significant experience of working in retail and regulated financial services from across his executive and non-executive career which will be of great value to the Group in the years ahead.
EmployeesOn behalf of the Board and the shareholders I would like to thank all of our employees for their substantial efforts in the last year. We continue to benefit from a workforce who show exceptional commitment to the development of the Group and the ongoing progress of the Group is substantially due to their efforts. I would also like to wish the employees of Kitbag well for the future under their new ownership.
Current tradingThe early weeks of our financial year are relatively quiet trading periods for our businesses, but the Group has made a solid start to the year. Express Gifts has had a particularly encouraging start with the underlying rate of product sales well ahead of last year and comfortably in line with our expectations. The challenging market conditions for Findel Education noted above have led to a disappointing start to the year within its Schools brands, which has been partially offset by an encouraging performance from classroom brands and international sales.
A fuller update on trading will be given at our AGM.
Strategic Report
8 Findel plc Annual report and accounts 2016
Our businesses and strategic objectives
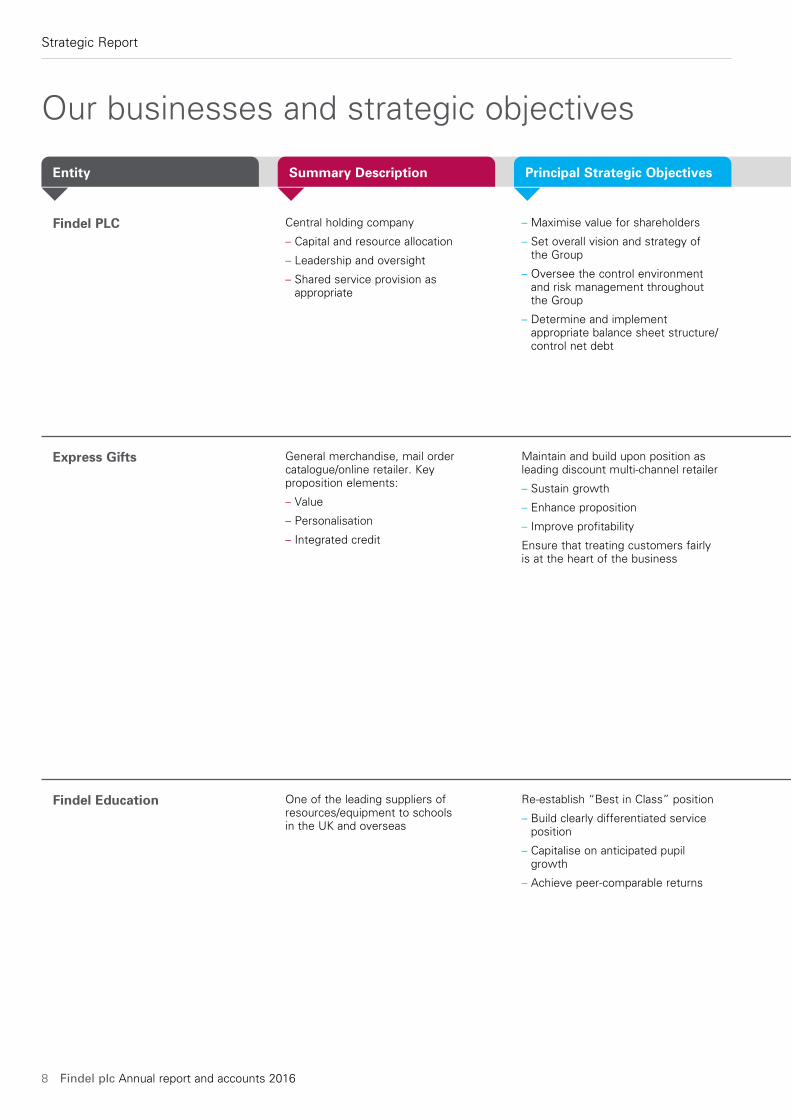
Central holding company
– Capital and resource allocation
– Leadership and oversight
– Shared service provision as appropriate
Entity Summary Description Principal Strategic Objectives
Findel PLC – Maximise value for shareholders
– Set overall vision and strategy of the Group
– Oversee the control environment and risk management throughout the Group
– Determine and implement appropriate balance sheet structure/control net debt
General merchandise, mail order catalogue/online retailer. Key proposition elements:
– Value
– Personalisation
– Integrated credit
Express Gifts Maintain and build upon position as leading discount multi-channel retailer
– Sustain growth
– Enhance proposition
– Improve profitability
Ensure that treating customers fairly is at the heart of the business
One of the leading suppliers of resources/equipment to schools in the UK and overseas
Findel Education Re-establish “Best in Class” position
– Build clearly differentiated service position
– Capitalise on anticipated pupil growth
– Achieve peer-comparable returns
Strategic Report
www.findel.co.uk 9
ST
RA
TE
GIC
RE
PO
RT
2—24
GO
VE
RN
AN
CE
25
—6
7C
ON
SO
LID
AT
ED
FIN
AN
CIA
L S
TA
TE
ME
NT
S 6
8—
11
7C
OM
PA
NY
FIN
AN
CIA
L S
TA
TE
ME
NT
S 1
18
—1
41
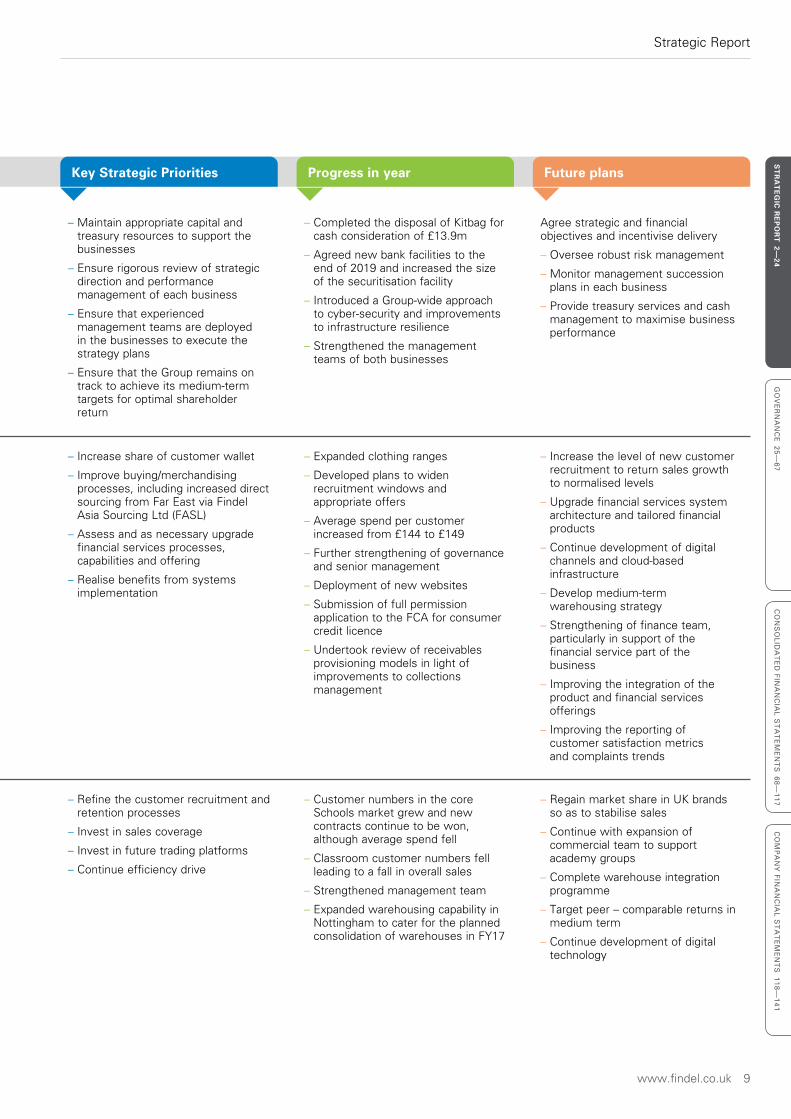
Key Strategic Priorities Progress in year Future plans
– Maintain appropriate capital and treasury resources to support the businesses
– Ensure rigorous review of strategic direction and performance management of each business
– Ensure that experienced management teams are deployed in the businesses to execute the strategy plans
– Ensure that the Group remains on track to achieve its medium-term targets for optimal shareholder return
– Completed the disposal of Kitbag for cash consideration of £13.9m
– Agreed new bank facilities to the end of 2019 and increased the size of the securitisation facility
– Introduced a Group-wide approach to cyber-security and improvements to infrastructure resilience
– Strengthened the management teams of both businesses
Agree strategic and financial objectives and incentivise delivery
– Oversee robust risk management
– Monitor management succession plans in each business
– Provide treasury services and cash management to maximise business performance
– Increase share of customer wallet
– Improve buying/merchandising processes, including increased direct sourcing from Far East via Findel Asia Sourcing Ltd (FASL)
– Assess and as necessary upgrade financial services processes, capabilities and offering
– Realise benefits from systems implementation
– Expanded clothing ranges
– Developed plans to widen recruitment windows and appropriate offers
– Average spend per customer increased from £144 to £149
– Further strengthening of governance and senior management
– Deployment of new websites
– Submission of full permission application to the FCA for consumer credit licence
– Undertook review of receivables provisioning models in light of improvements to collections management
– Increase the level of new customer recruitment to return sales growth to normalised levels
– Upgrade financial services system architecture and tailored financial products
– Continue development of digital channels and cloud-based infrastructure
– Develop medium-term warehousing strategy
– Strengthening of finance team, particularly in support of the financial service part of the business
– Improving the integration of the product and financial services offerings
– Improving the reporting of customer satisfaction metrics and complaints trends
– Refine the customer recruitment and retention processes
– Invest in sales coverage
– Invest in future trading platforms
– Continue efficiency drive
– Customer numbers in the core Schools market grew and new contracts continue to be won, although average spend fell
– Classroom customer numbers fell leading to a fall in overall sales
– Strengthened management team
– Expanded warehousing capability in Nottingham to cater for the planned consolidation of warehouses in FY17
– Regain market share in UK brands so as to stabilise sales
– Continue with expansion of commercial team to support academy groups
– Complete warehouse integration programme
– Target peer – comparable returns in medium term
– Continue development of digital technology
Strategic Report
10 Findel plc Annual report and accounts 2016
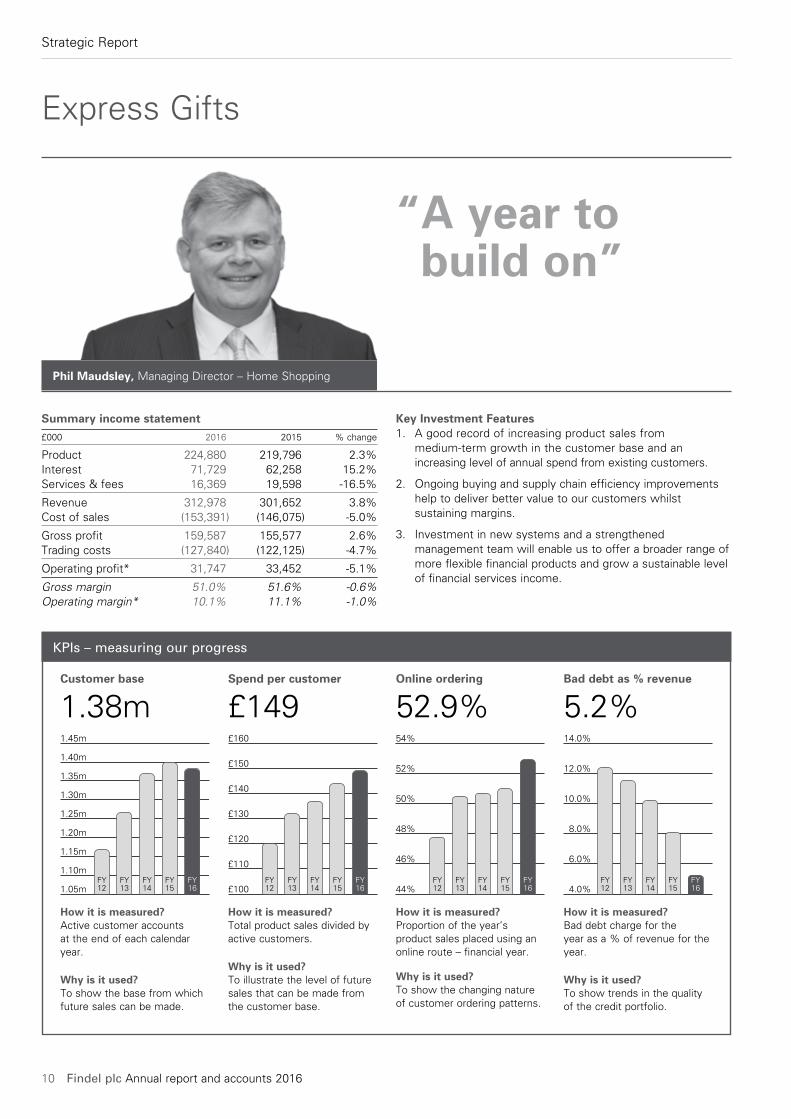
“ A year to build on”
Express Gifts
Phil Maudsley, Managing Director – Home Shopping
Key Investment Features1. A good record of increasing product sales from
medium-term growth in the customer base and an increasing level of annual spend from existing customers.
2. Ongoing buying and supply chain efficiency improvements help to deliver better value to our customers whilst sustaining margins.
3. Investment in new systems and a strengthened management team will enable us to offer a broader range of more flexible financial products and grow a sustainable level of financial services income.
Summary income statement
£000 2016 2015 % change
Product 224,880 219,796 2.3%Interest 71,729 62,258 15.2%Services & fees 16,369 19,598 -16.5%
Revenue 312,978 301,652 3.8%Cost of sales (153,391) (146,075) -5.0%
Gross profit 159,587 155,577 2.6%Trading costs (127,840) (122,125) -4.7%
Operating profit* 31,747 33,452 -5.1%
Gross margin 51.0% 51.6% -0.6%Operating margin* 10.1% 11.1% -1.0%
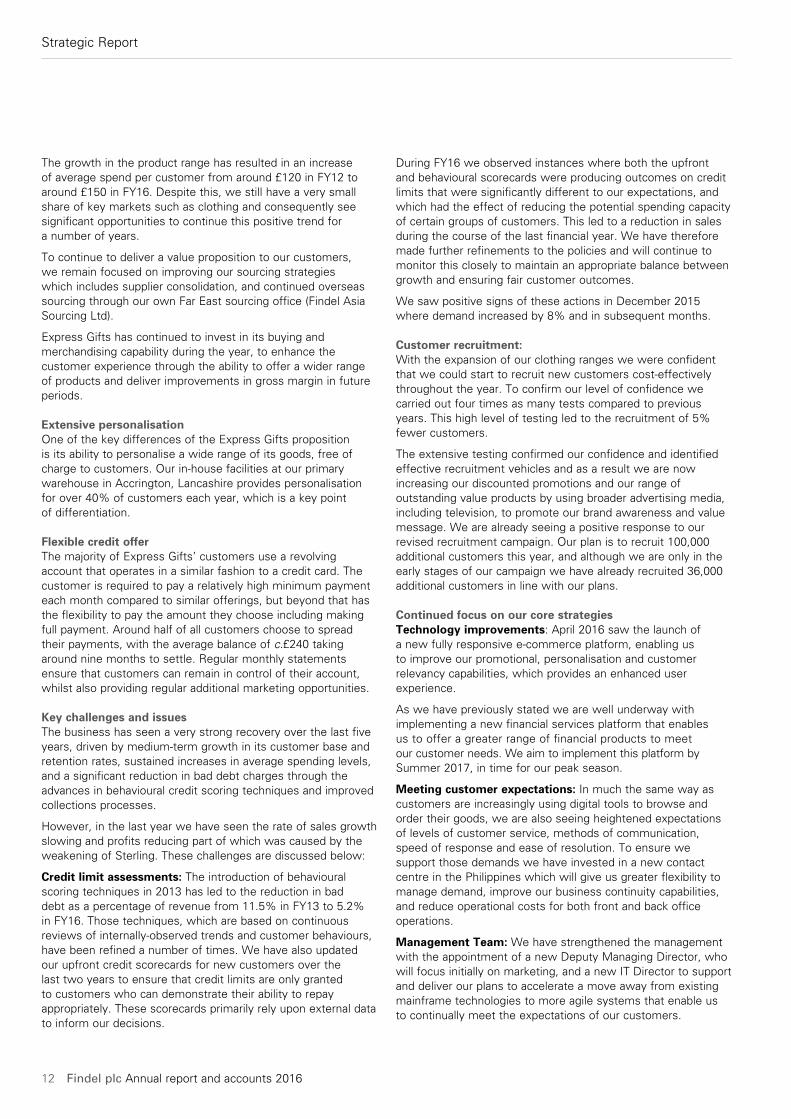
KPIs – measuring our progress
How it is measured?Active customer accounts at the end of each calendar year.
Why is it used?To show the base from which future sales can be made.
Customer base
1.38m
1.05m
1.20m
1.30m
1.25m
1.15m
1.10m
1.35m
1.40m
1.45m
FY12
FY13
FY14
FY15
FY16
How it is measured?Total product sales divided by active customers.
Why is it used?To illustrate the level of future sales that can be made from the customer base.
Spend per customer
£149
How it is measured?Proportion of the year’s product sales placed using an online route – financial year.
Why is it used?To show the changing nature of customer ordering patterns.
How it is measured?Bad debt charge for the year as a % of revenue for the year.
Why is it used?To show trends in the quality of the credit portfolio.
Online ordering
52.9%Bad debt as % revenue
5.2%
£100
£130
£140
£120
£110
£160
£150
FY12
FY13
FY14
FY15
FY16 44%
50%
52%
48%
46%
54%
FY12
FY13
FY14
FY15
FY16 4.0%
8.0%
10.0%
6.0%
12.0%
14.0%
FY12
FY13
FY14
FY15
FY16
Strategic Report
www.findel.co.uk 11
ST
RA
TE
GIC
RE
PO
RT
2—24
GO
VE
RN
AN
CE
25
—6
7C
ON
SO
LID
AT
ED
FIN
AN
CIA
L S
TA
TE
ME
NT
S 6
8—
11
7C
OM
PA
NY
FIN
AN
CIA
L S
TA
TE
ME
NT
S 1
18
—1
41
We have seen a mixed performance from our largest business in the last year, which has illustrated the strengths of its model, but has also highlighted the need to improve a number of areas to maximise its longer-term prospects.
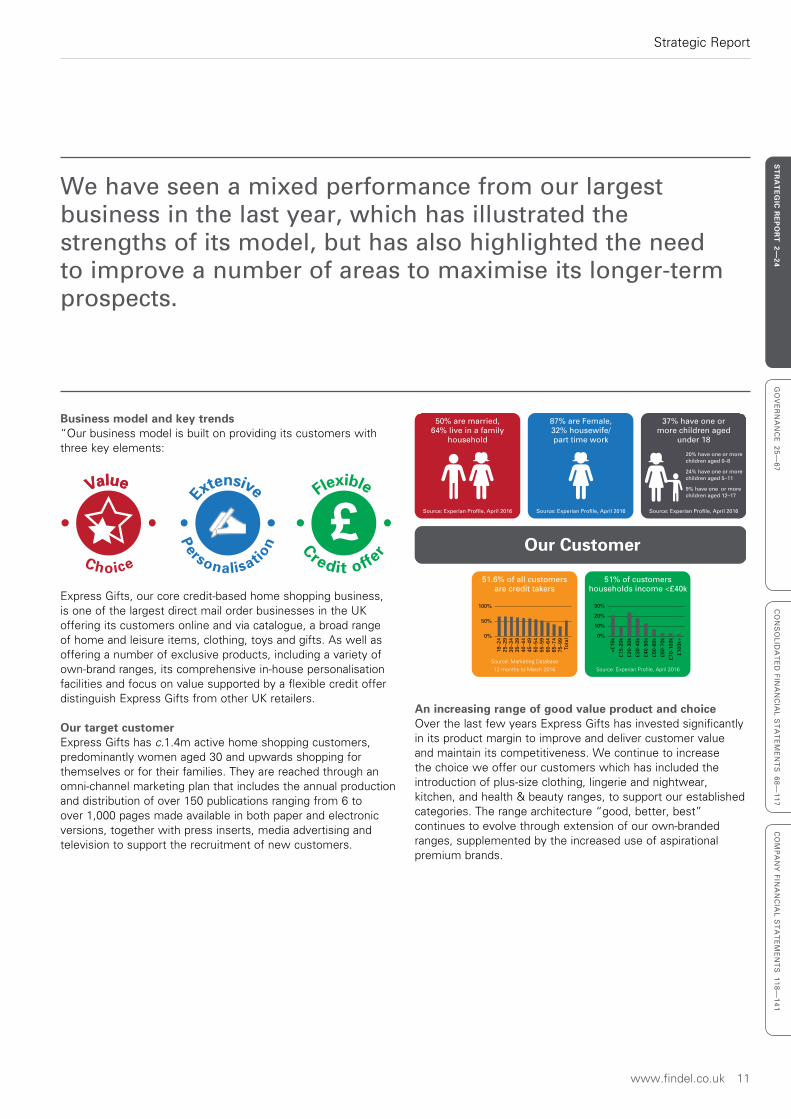
Business model and key trends“Our business model is built on providing its customers with three key elements:
£ValueValue
Choice
Personalisatio
n Credit offe
r
Extensive Flexible
Express Gifts, our core credit-based home shopping business, is one of the largest direct mail order businesses in the UK offering its customers online and via catalogue, a broad range of home and leisure items, clothing, toys and gifts. As well as offering a number of exclusive products, including a variety of own-brand ranges, its comprehensive in-house personalisation facilities and focus on value supported by a flexible credit offer distinguish Express Gifts from other UK retailers.
Our target customerExpress Gifts has c.1.4m active home shopping customers, predominantly women aged 30 and upwards shopping for themselves or for their families. They are reached through an omni-channel marketing plan that includes the annual production and distribution of over 150 publications ranging from 6 to over 1,000 pages made available in both paper and electronic versions, together with press inserts, media advertising and television to support the recruitment of new customers.
Our Customer
Source: Experian Profile, April 2016
50% are married,64% live in a family
household
Source: Experian Profile, April 2016
87% are Female,32% housewife/part time work
Source: Marketing Database
12 months to March 2016
51.6% of all customersare credit takers
Source: Experian Profile, April 2016
51% of customershouseholds income <£40k
Source: Experian Profile, April 2016
37% have one ormore children aged
under 18
20% have one or morechildren aged 0–8
24% have one or morechildren aged 5–11
9% have one or morechildren aged 12–17
0%
50%
100%
0%
<£15
k
£15-
20k
£20-
30k
£30-
40k
£40-
50k
£50-
60k
£60-
70k
£70-
100k
£100
k+
18–2
425
–29
30–3
435
–39
40–4
445
–49
50–5
455
–59
60–6
465
–74
75–9
9To
tal
10%
20%
30%
An increasing range of good value product and choiceOver the last few years Express Gifts has invested significantly in its product margin to improve and deliver customer value and maintain its competitiveness. We continue to increase the choice we offer our customers which has included the introduction of plus-size clothing, lingerie and nightwear, kitchen, and health & beauty ranges, to support our established categories. The range architecture “good, better, best” continues to evolve through extension of our own-branded ranges, supplemented by the increased use of aspirational premium brands.
Strategic Report
12 Findel plc Annual report and accounts 2016
During FY16 we observed instances where both the upfront and behavioural scorecards were producing outcomes on credit limits that were significantly different to our expectations, and which had the effect of reducing the potential spending capacity of certain groups of customers. This led to a reduction in sales during the course of the last financial year. We have therefore made further refinements to the policies and will continue to monitor this closely to maintain an appropriate balance between growth and ensuring fair customer outcomes.
We saw positive signs of these actions in December 2015 where demand increased by 8% and in subsequent months.
Customer recruitment:With the expansion of our clothing ranges we were confident that we could start to recruit new customers cost-effectively throughout the year. To confirm our level of confidence we carried out four times as many tests compared to previous years. This high level of testing led to the recruitment of 5% fewer customers.
The extensive testing confirmed our confidence and identified effective recruitment vehicles and as a result we are now increasing our discounted promotions and our range of outstanding value products by using broader advertising media, including television, to promote our brand awareness and value message. We are already seeing a positive response to our revised recruitment campaign. Our plan is to recruit 100,000 additional customers this year, and although we are only in the early stages of our campaign we have already recruited 36,000 additional customers in line with our plans.
Continued focus on our core strategiesTechnology improvements: April 2016 saw the launch of a new fully responsive e-commerce platform, enabling us to improve our promotional, personalisation and customer relevancy capabilities, which provides an enhanced user experience.
As we have previously stated we are well underway with implementing a new financial services platform that enables us to offer a greater range of financial products to meet our customer needs. We aim to implement this platform by Summer 2017, in time for our peak season.
Meeting customer expectations: In much the same way as customers are increasingly using digital tools to browse and order their goods, we are also seeing heightened expectations of levels of customer service, methods of communication, speed of response and ease of resolution. To ensure we support those demands we have invested in a new contact centre in the Philippines which will give us greater flexibility to manage demand, improve our business continuity capabilities, and reduce operational costs for both front and back office operations.
Management Team: We have strengthened the management with the appointment of a new Deputy Managing Director, who will focus initially on marketing, and a new IT Director to support and deliver our plans to accelerate a move away from existing mainframe technologies to more agile systems that enable us to continually meet the expectations of our customers.
The growth in the product range has resulted in an increase of average spend per customer from around £120 in FY12 to around £150 in FY16. Despite this, we still have a very small share of key markets such as clothing and consequently see significant opportunities to continue this positive trend for a number of years.
To continue to deliver a value proposition to our customers, we remain focused on improving our sourcing strategies which includes supplier consolidation, and continued overseas sourcing through our own Far East sourcing office (Findel Asia Sourcing Ltd).
Express Gifts has continued to invest in its buying and merchandising capability during the year, to enhance the customer experience through the ability to offer a wider range of products and deliver improvements in gross margin in future periods.
Extensive personalisationOne of the key differences of the Express Gifts proposition is its ability to personalise a wide range of its goods, free of charge to customers. Our in-house facilities at our primary warehouse in Accrington, Lancashire provides personalisation for over 40% of customers each year, which is a key point of differentiation.
Flexible credit offerThe majority of Express Gifts’ customers use a revolving account that operates in a similar fashion to a credit card. The customer is required to pay a relatively high minimum payment each month compared to similar offerings, but beyond that has the flexibility to pay the amount they choose including making full payment. Around half of all customers choose to spread their payments, with the average balance of c.£240 taking around nine months to settle. Regular monthly statements ensure that customers can remain in control of their account, whilst also providing regular additional marketing opportunities.
Key challenges and issuesThe business has seen a very strong recovery over the last five years, driven by medium-term growth in its customer base and retention rates, sustained increases in average spending levels, and a significant reduction in bad debt charges through the advances in behavioural credit scoring techniques and improved collections processes.
However, in the last year we have seen the rate of sales growth slowing and profits reducing part of which was caused by the weakening of Sterling. These challenges are discussed below:
Credit limit assessments: The introduction of behavioural scoring techniques in 2013 has led to the reduction in bad debt as a percentage of revenue from 11.5% in FY13 to 5.2% in FY16. Those techniques, which are based on continuous reviews of internally-observed trends and customer behaviours, have been refined a number of times. We have also updated our upfront credit scorecards for new customers over the last two years to ensure that credit limits are only granted to customers who can demonstrate their ability to repay appropriately. These scorecards primarily rely upon external data to inform our decisions.
Strategic Report
www.findel.co.uk 13
ST
RA
TE
GIC
RE
PO
RT
2—24
GO
VE
RN
AN
CE
25
—6
7C
ON
SO
LID
AT
ED
FIN
AN
CIA
L S
TA
TE
ME
NT
S 6
8—
11
7C
OM
PA
NY
FIN
AN
CIA
L S
TA
TE
ME
NT
S 1
18
—1
41
We have continued to invest in our infrastructure and systems, and in the skills and capability of our teams to enable us to continually meet our customer expectations and ensure long-term growth of the business
The proportion of goods imported from the Far East increased once again, with the Group’s own sourcing office playing an increased role in procuring products. However, the impact of a fall in Sterling on these imports during the year reduced operating profits by around £2m. The further reductions in Sterling seen since the start of the EU-Referendum campaign will cause a further deterioration in FY17.
As reported during the year, as part of its enhanced oversight work, the business has identified flaws in legacy products that require customers to be refunded. A provision of £14.4m has been taken within exceptional costs to cover this activity and the customer contact programmes are underway.
Overall, Express Gifts reported an operating profit* of £31.7m (FY15: £33.5m). After taking account of exceptional items, it reported an operating profit of £11.9m (FY15: £30.1m).
2016 PerformanceProduct revenues for FY16 increased by 2.3% to £224.9m (FY15: £219.8m) as noted above. Since January, the level of underlying product sales growth has recovered to the levels we expect Express Gifts to be able to deliver over the medium term.
The financial services part of the business performed strongly throughout the year. The scorecard and operational changes made in the business delivered a further improvement in the credit quality of the receivables book, driving lower bad debt charges, higher service charge income and a greater level of customer retention. Revenue from financial services increased by 7.6% during the year to £88.1m. The business initiated a programme of risk-based pricing for its credit offer in November 2015, focused initially on those established customers who present a higher than average level of risk. This programme will be rolled out to new customers in the coming months which should generate additional sustainable financial services revenue in FY17.
Bad debt as a percentage of revenue reduced to 5.2% (FY15: 8.1%). The changes to receivables collection processes introduced over the last two years by Express Gifts, including the sale of significantly overdue receivables to third-parties, have led to a need to refine the estimation models used for receivables provisioning. An exceptional impairment charge of £4.3m has been recorded in the current year relating to the impact of these changes set out in the Finance Director’s Report.
The business submitted its application for a full consumer credit licence from the Financial Conduct Authority in October 2015 on schedule. A substantial amount of work has been undertaken to improve the governance and effectiveness of controls and risk management within the business over the last year. Exceptional costs of some £0.8m were incurred in relation to this project during the current year.
Strategic Report
14 Findel plc Annual report and accounts 2016
Findel Education
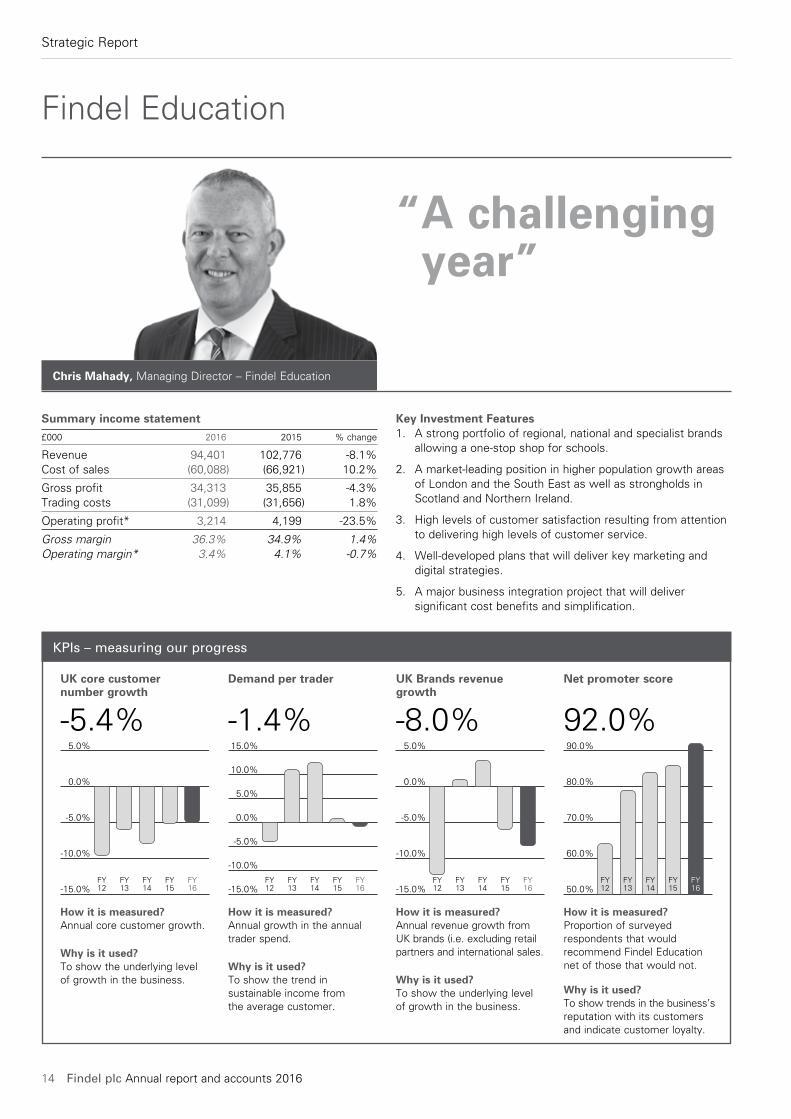
Chris Mahady, Managing Director – Findel Education
Key Investment Features1. A strong portfolio of regional, national and specialist brands
allowing a one-stop shop for schools.
2. A market-leading position in higher population growth areas of London and the South East as well as strongholds in Scotland and Northern Ireland.
3. High levels of customer satisfaction resulting from attention to delivering high levels of customer service.
4. Well-developed plans that will deliver key marketing and digital strategies.
5. A major business integration project that will deliver significant cost benefits and simplification.
Summary income statement
£000 2016 2015 % change
Revenue 94,401 102,776 -8.1%Cost of sales (60,088) (66,921) 10.2%
Gross profit 34,313 35,855 -4.3%Trading costs (31,099) (31,656) 1.8%
Operating profit* 3,214 4,199 -23.5%
Gross margin 36.3% 34.9% 1.4%Operating margin* 3.4% 4.1% -0.7%
“ A challenging year”
KPIs – measuring our progress
How it is measured?Annual core customer growth.
Why is it used?To show the underlying level of growth in the business.
UK core customer number growth
-5.4%
-15.0%
-10.0%
-5.0%
0.0%
5.0%
FY12
FY13
FY14
FY15
FY16
How it is measured?Annual growth in the annual trader spend.
Why is it used?To show the trend in sustainable income from the average customer.
Demand per trader
-1.4%
How it is measured?Annual revenue growth from UK brands (i.e. excluding retail partners and international sales.
Why is it used?To show the underlying level of growth in the business.
How it is measured?Proportion of surveyed respondents that would recommend Findel Education net of those that would not.
Why is it used?To show trends in the business’s reputation with its customers and indicate customer loyalty.
UK Brands revenue growth
-8.0%
Net promoter score
92.0%
-15.0%
-10.0%
-5.0%
0.0%
5.0%
10.0%
15.0%
FY12
FY13
FY14
FY15
FY16 -15.0%
-10.0%
-5.0%
0.0%
5.0%
FY12
FY13
FY14
FY15
FY16 50.0%
60.0%
70.0%
80.0%
90.0%
FY12
FY13
FY14
FY15
FY16
Strategic Report
www.findel.co.uk 15
ST
RA
TE
GIC
RE
PO
RT
2—24
GO
VE
RN
AN
CE
25
—6
7C
ON
SO
LID
AT
ED
FIN
AN
CIA
L S
TA
TE
ME
NT
S 6
8—
11
7C
OM
PA
NY
FIN
AN
CIA
L S
TA
TE
ME
NT
S 1
18
—1
41
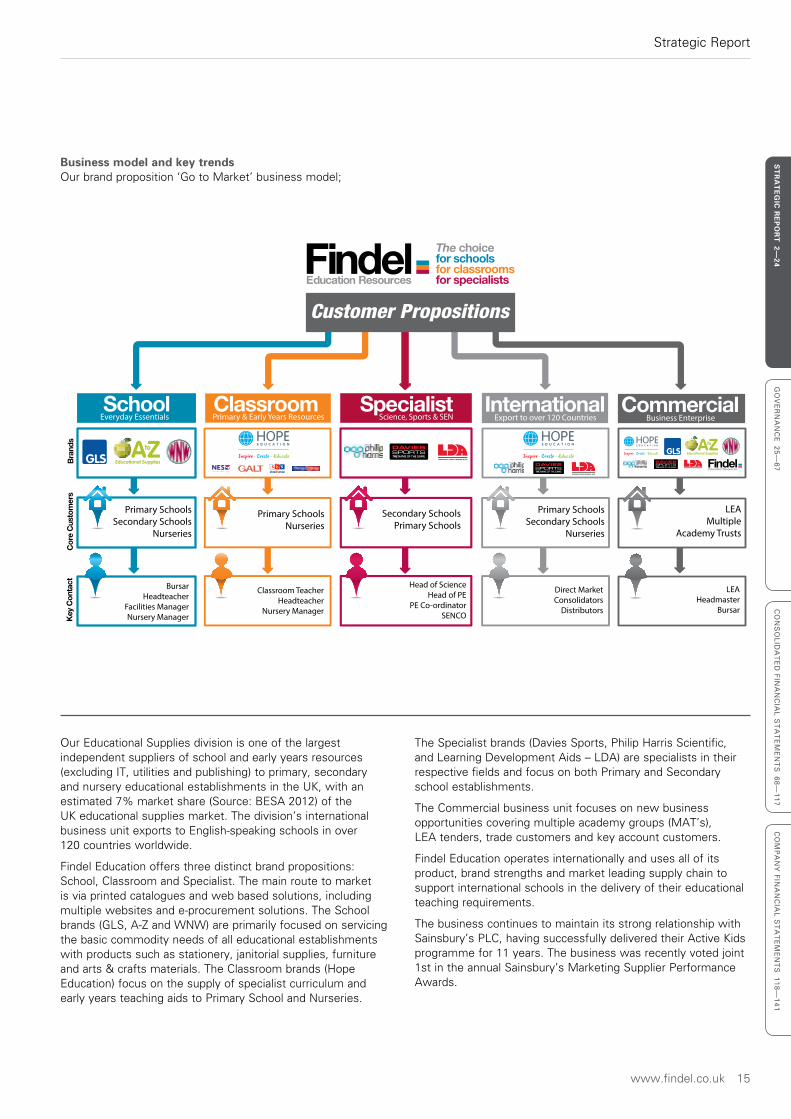
The Specialist brands (Davies Sports, Philip Harris Scientific, and Learning Development Aids – LDA) are specialists in their respective fields and focus on both Primary and Secondary school establishments.
The Commercial business unit focuses on new business opportunities covering multiple academy groups (MAT’s), LEA tenders, trade customers and key account customers.
Findel Education operates internationally and uses all of its product, brand strengths and market leading supply chain to support international schools in the delivery of their educational teaching requirements.
The business continues to maintain its strong relationship with Sainsbury’s PLC, having successfully delivered their Active Kids programme for 11 years. The business was recently voted joint 1st in the annual Sainsbury’s Marketing Supplier Performance Awards.
Our Educational Supplies division is one of the largest independent suppliers of school and early years resources (excluding IT, utilities and publishing) to primary, secondary and nursery educational establishments in the UK, with an estimated 7% market share (Source: BESA 2012) of the UK educational supplies market. The division’s international business unit exports to English-speaking schools in over 120 countries worldwide.
Findel Education offers three distinct brand propositions: School, Classroom and Specialist. The main route to market is via printed catalogues and web based solutions, including multiple websites and e-procurement solutions. The School brands (GLS, A-Z and WNW) are primarily focused on servicing the basic commodity needs of all educational establishments with products such as stationery, janitorial supplies, furniture and arts & crafts materials. The Classroom brands (Hope Education) focus on the supply of specialist curriculum and early years teaching aids to Primary School and Nurseries.
Business model and key trendsOur brand proposition ‘Go to Market’ business model;
School
Classroom
Specialist
International
THE NAME OF THE GAME.
THE NAME OF THE GAME.
Primary SchoolsSecondary Schools
Nurseries
Primary SchoolsSecondary Schools
Nurseries
Secondary SchoolsPrimary Schools
Primary SchoolsNurseries
BursarHeadteacher
Facilities ManagerNursery Manager
Classroom TeacherHeadteacher
Nursery Manager
Head of ScienceHead of PE
PE Co-ordinatorSENCO
Direct MarketConsolidators
Distributors
Bran
dsCo
re C
usto
mer
sKe
y Co
ntac
t
Everyday Essentials Primary & Early Years Resources Science, Sports & SEN Export to over 120 CountriesCommercial
THE NAME OF THE GAME.
LEAMultiple
Academy Trusts
LEAHeadmaster
Bursar
Business Enterprise
Customer Propositions
Strategic Report
16 Findel plc Annual report and accounts 2016
Our International business has had a steady year with continued focus on developing a strategic platform that will drive growth in the future.
Our Business Transformation Plans are on plan for deliveryA new Leadership team has been put in place with the appointment of a new Chief Marketing Officer, Chief Information Officer and Operations Director. This team are delivering the key management qualities to successfully lead and transform the organisation. The team are fully focused on the delivery of the strategic plans for demand growth, digital capability and simplified low cost IT system and distribution model.
We have invested over £6m in our major business IT systems and warehouse integration programme which is running well and is on plan. This investment will simplify the way we operate by moving onto just one core operating system and deliver c.£2-3m of cash and cost saving benefit to the business in FY18. The project has delivered an automated picking and packing system in Nottingham that will be a market-leading distribution solution, bringing significant customer experience enhancements and a substantially increased order processing capacity.
The final brand will move after peak season with the Enfield distribution centre closing in December 2016.
The development and deployment of new technologies represents a key change programme for the business and during the year we have recruited a new Head of Digital and a new team who are fully focused on driving our web and e-procurement capabilities. We have successfully upgraded our existing websites during the year and have plans to significantly further enhance them over the next 12 months. We have also implemented our key e-procurement sites for the Scotland Excel contract. Recently we have launched our low level entry point procurement system to the market. This has been well received. Our overall digital revenues represent 16% of total sales which is well below our major competitors. It is clear that the education marketplace whilst slower to adopt digital technology than consumer markets is making increasing use of this channel. It is therefore a key priority for us to upgrade our capability in this area.
Key challenges and issuesThe business has seen a decline in both sales and customer numbers which has resulted from a loss in market share over a number of years. Under the guidance of a new Chief Marketing Officer we have been working hard to rebuild and reorganise our key Marketing, Buying and Sales functions into brand business units, each of which is fully focused on the specific needs of the customers and the brands that they are purchasing from. There has been a significant investment of c.£1m in resourcing this area.. The new teams are settling in well and starting to deliver a real step change in the way that we drive the business units and their key growth objectives.
The School brands (GLS/A-Z/WNW) have had a more positive year from a rolling customer number perspective, coming from decline of 7.2% in FY15 to a net gain of 1.0% by the year end. However, this stabilisation of market share has been more than offset by reductions in the average spend per customer, particularly on larger value items such as furniture which provides a good insight into the budget challenges schools are facing.
The Classroom brand (Hope) has experienced a more difficult year with a continued reduction in customer numbers. However, there are now signs of stabilisation to customer numbers and the overall demand position following the launch of a new 500 page test catalogue in January 2016. During the year we have rebuilt the Specialist teams and are starting to see good early signs of improvement in 2016.
Scotland Excel has had a very strong year with 5.5% growth year on year.
We continue to perform well in the Academy sector with ten commercial wins during the last 12 months. This has been achieved by our Commercial Business Unit, a team who are fully focused on new business opportunities in LEA tenders, Academy Groups and new business ventures. The general trend for state schools to move to Academy status is a good way for the business to gain market share and gives us a pipeline of opportunities that can be won on the back of building a strong Academy proposition.
Market conditions continue to be challenging but the business has stabilised market share in its UK brands. The business is on plan to deliver its transformational programme

www.findel.co.uk 17
ST
RA
TE
GIC
RE
PO
RT
2—24
GO
VE
RN
AN
CE
25
—6
7C
ON
SO
LID
AT
ED
FIN
AN
CIA
L S
TA
TE
ME
NT
S 6
8—
11
7C
OM
PA
NY
FIN
AN
CIA
L S
TA
TE
ME
NT
S 1
18
—1
41
Strategic Report
18 Findel plc Annual report and accounts 2016
The completion of our system and warehouse integration project in the next few months is expected to deliver cash and net profit benefits of c.£2-3m to the business from FY18. The business has recognised exceptional charges totalling £5.6m relating to this project, as discussed in note 6. After taking account of this, Findel Education reported an operating loss of £2.4m (FY15: loss of £19.5m).
In the short-term market conditions are expected to continue to present funding challenges for LEA state driven schools. A greater proportion of school budgets is expected to be allocated to areas such as staff costs and building costs, which in turn reduces the proportion available to be spent on consumables and resources. This has been felt across the educational resource supplier base during early 2016. The School Fair Funding formula which is due to be implemented during 2016 is a concern for our key London heartland with LEA’s starting to plan for the reduction in budgets. Our ambition is to offset these pressures by regaining market share and growing customer numbers so as to achieve a stabilisation of revenue in the next 12 months. The business will also look to exploit opportunities in areas such as furniture supplies.
The long-term fundamentals for the education consumables and resources market remain attractive with the demographic trends showing increases in pupil numbers, this is particularly pronounced in GLS’s stronghold of London and South-East, and in nursery and primary school aged children.
We are pleased with the progress being made and the Board is confident that this will deliver improved business performance and, despite continuing difficult market conditions, we still expect results in line with our expectations.
Customer experience continues to excel with a record net promoter score of 92%Findel Education continues to deliver a ‘Best in Class Customer Experience’ across all areas and this is seen as a key attribute of the brands. The business has continued to build on the strong success delivered with a Net Promoter Score of 92% (FY15: 86%). We are now using external websites such as Feefo to gauge customer feedback on service and products, so far results have been very positive at between 96-97%.
2016 Performance and ProgressFY16 was a challenging year with overall sales down by 8.1% against the prior year. This was driven by a reduction in overall spend levels of School brand customers despite a stabilisation of its customer base and a continued reduction in the Classroom and Specialist brand customer base. As a business we have been realistic about the timescales to turn around the reducing customer and demand base and are encouraged by the key customer metric changes that we have seen in recent months. We have maintained a strong market share in London and the South-East by increasing our salesforce and marketing activities. Scotland had a very strong year with growth of +5.5%. Our Commercial sales team continued to grow key academy group relationships with 10 tender wins during the year and have a strong pipeline for the next 12 months.
The business has successfully managed product margins delivering a 140bps improvement in the gross profit margin and strong operating cost controls during the year which has mitigated the impact of the £8.4m sales decline to produce an operating profit* of £3.2m (FY15: £4.2m).
Our major business IT systems and warehouse integration programme is running well and is on plan

www.findel.co.uk 19
ST
RA
TE
GIC
RE
PO
RT
2—24
GO
VE
RN
AN
CE
25
—6
7C
ON
SO
LID
AT
ED
FIN
AN
CIA
L S
TA
TE
ME
NT
S 6
8—
11
7C
OM
PA
NY
FIN
AN
CIA
L S
TA
TE
ME
NT
S 1
18
—1
41
Strategic Report
20 Findel plc Annual report and accounts 2016
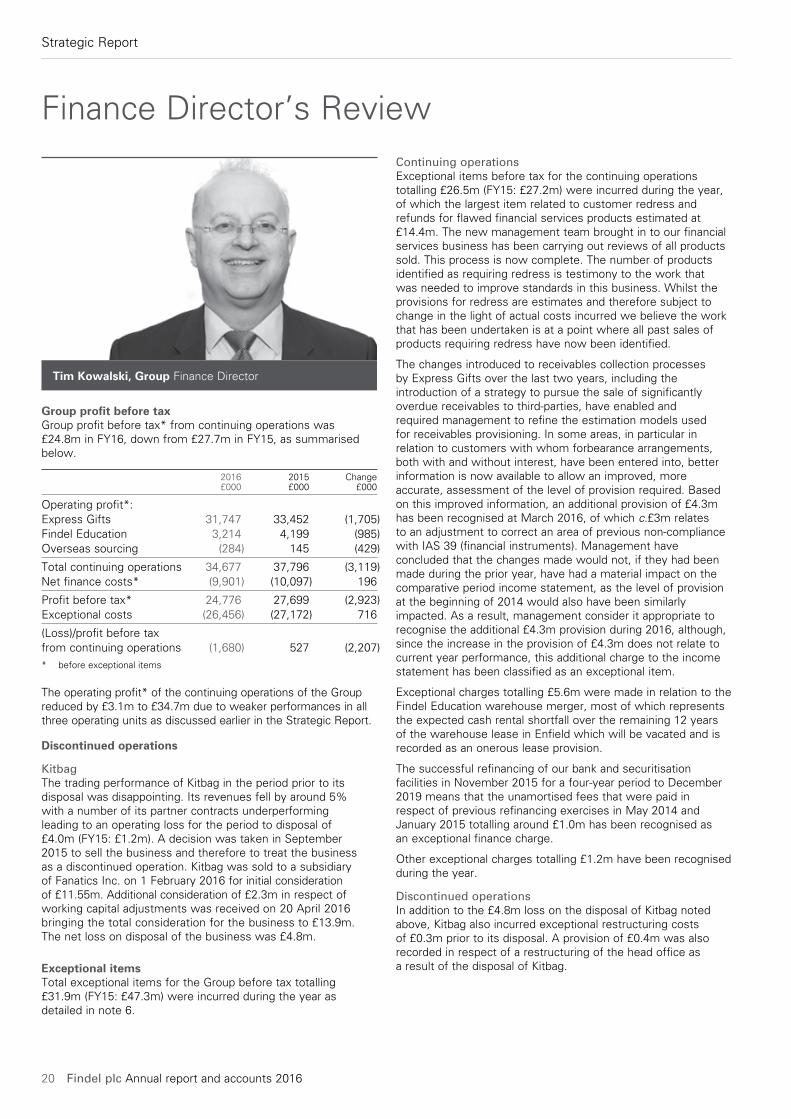
Finance Director’s Review
Group profit before taxGroup profit before tax* from continuing operations was £24.8m in FY16, down from £27.7m in FY15, as summarised below.
2016 2015 Change £000 £000 £000
Operating profit*:Express Gifts 31,747 33,452 (1,705)Findel Education 3,214 4,199 (985)Overseas sourcing (284) 145 (429)
Total continuing operations 34,677 37,796 (3,119)Net finance costs* (9,901) (10,097) 196
Profit before tax* 24,776 27,699 (2,923)Exceptional costs (26,456) (27,172) 716
(Loss)/profit before tax from continuing operations (1,680) 527 (2,207)* before exceptional items
The operating profit* of the continuing operations of the Group reduced by £3.1m to £34.7m due to weaker performances in all three operating units as discussed earlier in the Strategic Report.
Discontinued operations
KitbagThe trading performance of Kitbag in the period prior to its disposal was disappointing. Its revenues fell by around 5% with a number of its partner contracts underperforming leading to an operating loss for the period to disposal of £4.0m (FY15: £1.2m). A decision was taken in September 2015 to sell the business and therefore to treat the business as a discontinued operation. Kitbag was sold to a subsidiary of Fanatics Inc. on 1 February 2016 for initial consideration of £11.55m. Additional consideration of £2.3m in respect of working capital adjustments was received on 20 April 2016 bringing the total consideration for the business to £13.9m. The net loss on disposal of the business was £4.8m.
Exceptional itemsTotal exceptional items for the Group before tax totalling £31.9m (FY15: £47.3m) were incurred during the year as detailed in note 6.
Continuing operationsExceptional items before tax for the continuing operations totalling £26.5m (FY15: £27.2m) were incurred during the year, of which the largest item related to customer redress and refunds for flawed financial services products estimated at £14.4m. The new management team brought in to our financial services business has been carrying out reviews of all products sold. This process is now complete. The number of products identified as requiring redress is testimony to the work that was needed to improve standards in this business. Whilst the provisions for redress are estimates and therefore subject to change in the light of actual costs incurred we believe the work that has been undertaken is at a point where all past sales of products requiring redress have now been identified.
The changes introduced to receivables collection processes by Express Gifts over the last two years, including the introduction of a strategy to pursue the sale of significantly overdue receivables to third-parties, have enabled and required management to refine the estimation models used for receivables provisioning. In some areas, in particular in relation to customers with whom forbearance arrangements, both with and without interest, have been entered into, better information is now available to allow an improved, more accurate, assessment of the level of provision required. Based on this improved information, an additional provision of £4.3m has been recognised at March 2016, of which c.£3m relates to an adjustment to correct an area of previous non-compliance with IAS 39 (financial instruments). Management have concluded that the changes made would not, if they had been made during the prior year, have had a material impact on the comparative period income statement, as the level of provision at the beginning of 2014 would also have been similarly impacted. As a result, management consider it appropriate to recognise the additional £4.3m provision during 2016, although, since the increase in the provision of £4.3m does not relate to current year performance, this additional charge to the income statement has been classified as an exceptional item.
Exceptional charges totalling £5.6m were made in relation to the Findel Education warehouse merger, most of which represents the expected cash rental shortfall over the remaining 12 years of the warehouse lease in Enfield which will be vacated and is recorded as an onerous lease provision.
The successful refinancing of our bank and securitisation facilities in November 2015 for a four-year period to December 2019 means that the unamortised fees that were paid in respect of previous refinancing exercises in May 2014 and January 2015 totalling around £1.0m has been recognised as an exceptional finance charge.
Other exceptional charges totalling £1.2m have been recognised during the year.
Discontinued operationsIn addition to the £4.8m loss on the disposal of Kitbag noted above, Kitbag also incurred exceptional restructuring costs of £0.3m prior to its disposal. A provision of £0.4m was also recorded in respect of a restructuring of the head office as a result of the disposal of Kitbag.
Tim Kowalski, Group Finance Director
Strategic Report
www.findel.co.uk 21
ST
RA
TE
GIC
RE
PO
RT
2—24
GO
VE
RN
AN
CE
25
—6
7C
ON
SO
LID
AT
ED
FIN
AN
CIA
L S
TA
TE
ME
NT
S 6
8—
11
7C
OM
PA
NY
FIN
AN
CIA
L S
TA
TE
ME
NT
S 1
18
—1
41
Dividends and capital structureThe directors have determined that no interim dividend will be paid (FY15: nil) and are not recommending the payment of a final dividend (FY15: nil).
The action taken during the period under review to cancel non-distributable reserves and reduce the nominal value of ordinary shares means that the Company has made good progress in reducing the deficit on its profit and loss account. The Company has not received any dividends from its subsidiaries and its balance sheet as at the end of March 2016 shows a deficiency of £33.2m on its retained reserves (FY15: deficiency of £156.4m). It is therefore not yet in a position to declare a dividend. The directors will provide further updates on dividend policy during the year.
Treasury and risk managementThe Group’s central treasury function seeks to reduce or eliminate exposure to foreign exchange, interest rate and other financial risks, to ensure sufficient liquidity is available to meet foreseeable needs and to invest cash assets safely and profitably. It does not engage in speculative transactions and transacts only in relation to underlying business requirements in accordance with approved policies.
Interest rate risk managementThe Group’s interest rate exposure is managed by the use of derivative arrangements as appropriate, details of which are set out in note 20 to the financial statements. The Group has purchased interest rate caps since the year end covering the period from May 2016 to October 2017 to protect against the risk of unforeseen increases to LIBOR rates.
Net interest costs* for the year were £9.9m, slightly lower than the £10.1m from FY15, reflecting lower pension scheme interest and the lower borrowing margin achieved in Q4. This charge was covered 3.5 times by operating profit* (FY15: 3.7 times). As noted above, the successful refinancing of our bank and securitisation facilities in November 2015 for a four-year period to December 2019 means that the unamortised fees that were paid in respect of previous refinancing exercises in May 2014 and January 2015 totalling around £1.0m has been recognised as an exceptional finance charge.
Currency risk managementA significant proportion of the products sold principally through the Group’s Express Gifts division are procured through the Group’s Far East buying office and beyond. The currency of purchase for these goods is principally the US dollar, with a proportion being denominated in Hong Kong dollars.
At the balance sheet date, the Group had no outstanding forward contracts in place. However, the Group has recently amended its policy which, until now has been to only cover exposures occurring within the current financial year. In keeping with sector peers, currency hedging will now be undertaken on a rolling 12-month basis, which will lead to period-end valuation gains/losses on future hedges being reported separately in the Group’s Income Statement.
Borrowing riskThe Group’s exposure to borrowing and cash investment risk is managed by dealing only with banks and financial institutions with strong credit ratings.* before exceptional items
PensionsThe Group has continued to make additional voluntary contributions to its defined benefit schemes totalling £2.5m in the current financial period (FY15: £4.1m) to improve the funding levels of these closed schemes. In accordance with the schedule of contributions agreed with the trustees in early 2014, £2.5m of contributions will be made in FY17, rising to £5.0m from FY18. The net deficit at the end of FY16 measured in accordance with IAS19 reduced to £2.3m (FY15: £11.5m) mainly as a result of gains in the year, reflecting an increase to the discount rate and a change to the mortality tables used to value the scheme’s liabilities.
TaxationThe Group posted a credit of £0.1m in the year in respect of taxation for the continuing operations (FY15: £5.3m). The equivalent effective pre-exceptional tax rate for the year was 21.1% (FY15: 23.7%).
Earnings per shareThe adjusted earnings per share for the year reduced from 24.81p in FY15 to 22.70p in FY16. The basic loss per share from continuing operations was 1.85p per share (FY15: loss per share of 5.63p).
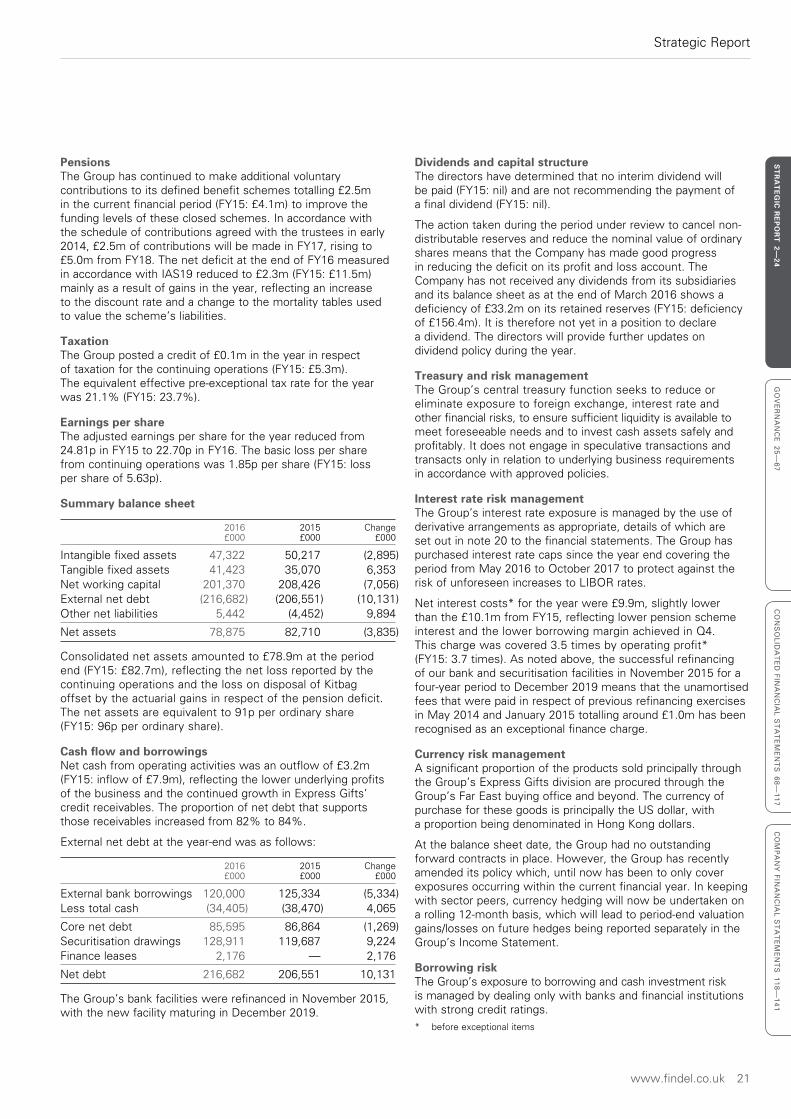
Summary balance sheet
2016 2015 Change £000 £000 £000
Intangible fixed assets 47,322 50,217 (2,895)Tangible fixed assets 41,423 35,070 6,353Net working capital 201,370 208,426 (7,056)External net debt (216,682) (206,551) (10,131)Other net liabilities 5,442 (4,452) 9,894
Net assets 78,875 82,710 (3,835)
Consolidated net assets amounted to £78.9m at the period end (FY15: £82.7m), reflecting the net loss reported by the continuing operations and the loss on disposal of Kitbag offset by the actuarial gains in respect of the pension deficit. The net assets are equivalent to 91p per ordinary share (FY15: 96p per ordinary share).
Cash flow and borrowingsNet cash from operating activities was an outflow of £3.2m (FY15: inflow of £7.9m), reflecting the lower underlying profits of the business and the continued growth in Express Gifts’ credit receivables. The proportion of net debt that supports those receivables increased from 82% to 84%.
External net debt at the year-end was as follows:
2016 2015 Change £000 £000 £000
External bank borrowings 120,000 125,334 (5,334)Less total cash (34,405) (38,470) 4,065
Core net debt 85,595 86,864 (1,269)Securitisation drawings 128,911 119,687 9,224Finance leases 2,176 — 2,176
Net debt 216,682 206,551 10,131
The Group’s bank facilities were refinanced in November 2015, with the new facility maturing in December 2019.
Strategic Report
22 Findel plc Annual report and accounts 2016
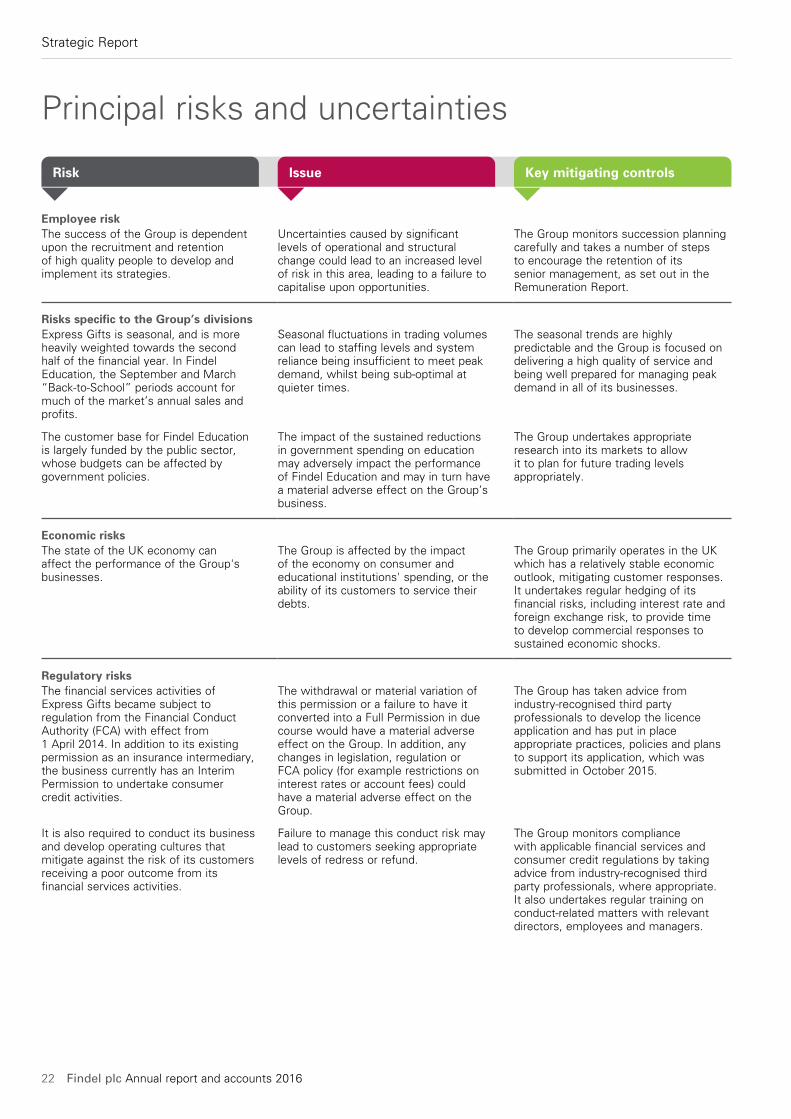
Principal risks and uncertainties
Risk Issue Key mitigating controls
Employee riskThe success of the Group is dependent upon the recruitment and retention of high quality people to develop and implement its strategies.
Uncertainties caused by significant levels of operational and structural change could lead to an increased level of risk in this area, leading to a failure to capitalise upon opportunities.
The Group monitors succession planning carefully and takes a number of steps to encourage the retention of its senior management, as set out in the Remuneration Report.
Risks specific to the Group’s divisionsExpress Gifts is seasonal, and is more heavily weighted towards the second half of the financial year. In Findel Education, the September and March “Back-to-School” periods account for much of the market’s annual sales and profits.
Seasonal fluctuations in trading volumes can lead to staffing levels and system reliance being insufficient to meet peak demand, whilst being sub-optimal at quieter times.
The seasonal trends are highly predictable and the Group is focused on delivering a high quality of service and being well prepared for managing peak demand in all of its businesses.
The customer base for Findel Education is largely funded by the public sector, whose budgets can be affected by government policies.
The impact of the sustained reductions in government spending on education may adversely impact the performance of Findel Education and may in turn have a material adverse effect on the Group’s business.
The Group undertakes appropriate research into its markets to allow it to plan for future trading levels appropriately.
Economic risksThe state of the UK economy can affect the performance of the Group's businesses.
The Group is affected by the impact of the economy on consumer and educational institutions' spending, or the ability of its customers to service their debts.
The Group primarily operates in the UK which has a relatively stable economic outlook, mitigating customer responses. It undertakes regular hedging of its financial risks, including interest rate and foreign exchange risk, to provide time to develop commercial responses to sustained economic shocks.
Regulatory risksThe financial services activities of Express Gifts became subject to regulation from the Financial Conduct Authority (FCA) with effect from 1 April 2014. In addition to its existing permission as an insurance intermediary, the business currently has an Interim Permission to undertake consumer credit activities.
The withdrawal or material variation of this permission or a failure to have it converted into a Full Permission in due course would have a material adverse effect on the Group. In addition, any changes in legislation, regulation or FCA policy (for example restrictions on interest rates or account fees) could have a material adverse effect on the Group.
The Group has taken advice from industry-recognised third party professionals to develop the licence application and has put in place appropriate practices, policies and plans to support its application, which was submitted in October 2015.
It is also required to conduct its business and develop operating cultures that mitigate against the risk of its customers receiving a poor outcome from its financial services activities.
Failure to manage this conduct risk may lead to customers seeking appropriate levels of redress or refund.
The Group monitors compliance with applicable financial services and consumer credit regulations by taking advice from industry-recognised third party professionals, where appropriate. It also undertakes regular training on conduct-related matters with relevant directors, employees and managers.
Strategic Report
www.findel.co.uk 23
ST
RA
TE
GIC
RE
PO
RT
2—24
GO
VE
RN
AN
CE
25
—6
7C
ON
SO
LID
AT
ED
FIN
AN
CIA
L S
TA
TE
ME
NT
S 6
8—
11
7C
OM
PA
NY
FIN
AN
CIA
L S
TA
TE
ME
NT
S 1
18
—1
41
Risk Issue Key mitigating controls
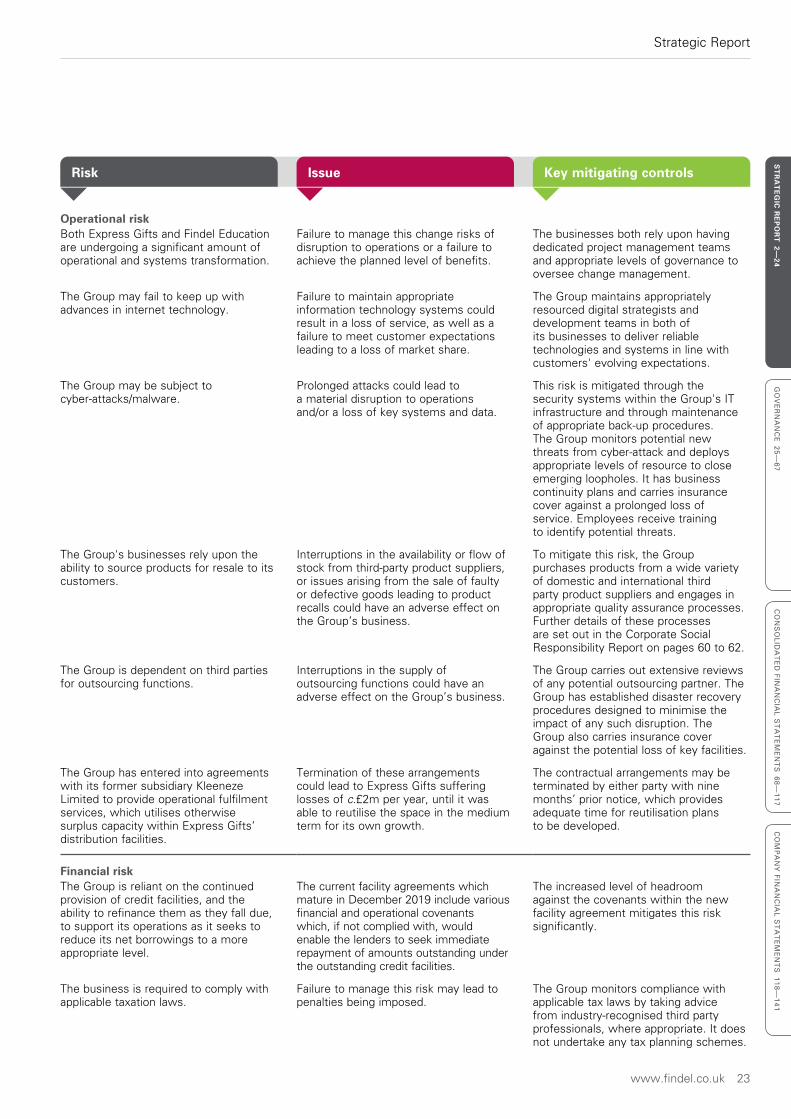
Operational riskBoth Express Gifts and Findel Education are undergoing a significant amount of operational and systems transformation.
Failure to manage this change risks of disruption to operations or a failure to achieve the planned level of benefits.
The businesses both rely upon having dedicated project management teams and appropriate levels of governance to oversee change management.
The Group may fail to keep up with advances in internet technology.
Failure to maintain appropriate information technology systems could result in a loss of service, as well as a failure to meet customer expectations leading to a loss of market share.
The Group maintains appropriately resourced digital strategists and development teams in both of its businesses to deliver reliable technologies and systems in line with customers' evolving expectations.
The Group may be subject to cyber-attacks/malware.
Prolonged attacks could lead to a material disruption to operations and/or a loss of key systems and data.
This risk is mitigated through the security systems within the Group's IT infrastructure and through maintenance of appropriate back-up procedures. The Group monitors potential new threats from cyber-attack and deploys appropriate levels of resource to close emerging loopholes. It has business continuity plans and carries insurance cover against a prolonged loss of service. Employees receive training to identify potential threats.
The Group's businesses rely upon the ability to source products for resale to its customers.
Interruptions in the availability or flow of stock from third-party product suppliers, or issues arising from the sale of faulty or defective goods leading to product recalls could have an adverse effect on the Group’s business.
To mitigate this risk, the Group purchases products from a wide variety of domestic and international third party product suppliers and engages in appropriate quality assurance processes. Further details of these processes are set out in the Corporate Social Responsibility Report on pages 60 to 62.
The Group is dependent on third parties for outsourcing functions.
Interruptions in the supply of outsourcing functions could have an adverse effect on the Group’s business.
The Group carries out extensive reviews of any potential outsourcing partner. The Group has established disaster recovery procedures designed to minimise the impact of any such disruption. The Group also carries insurance cover against the potential loss of key facilities.
The Group has entered into agreements with its former subsidiary Kleeneze Limited to provide operational fulfilment services, which utilises otherwise surplus capacity within Express Gifts’ distribution facilities.
Termination of these arrangements could lead to Express Gifts suffering losses of c.£2m per year, until it was able to reutilise the space in the medium term for its own growth.
The contractual arrangements may be terminated by either party with nine months’ prior notice, which provides adequate time for reutilisation plans to be developed.
Financial riskThe Group is reliant on the continued provision of credit facilities, and the ability to refinance them as they fall due, to support its operations as it seeks to reduce its net borrowings to a more appropriate level.
The current facility agreements which mature in December 2019 include various financial and operational covenants which, if not complied with, would enable the lenders to seek immediate repayment of amounts outstanding under the outstanding credit facilities.
The increased level of headroom against the covenants within the new facility agreement mitigates this risk significantly.
The business is required to comply with applicable taxation laws.
Failure to manage this risk may lead to penalties being imposed.
The Group monitors compliance with applicable tax laws by taking advice from industry-recognised third party professionals, where appropriate. It does not undertake any tax planning schemes.
Strategic Report
24 Findel plc Annual report and accounts 2016
Our people, our products, community and the environment
Our Corporate Social Responsibility Report is set out on pages 60 to 62 and covers the following principal areas:
• examples of initiatives in place within the Group’s businesses to support and develop our employees;
• an outline of the structures in place and examples of activities during the period to manage the health and safety risks inherent in the Group’s activities;
• the Group’s approach to product safety and sourcing;
• the impact of the Group’s activities on the environment, measures we take to mitigate those impacts and our environmental performance over the period; and
• examples of the social and community related activities around the Group.
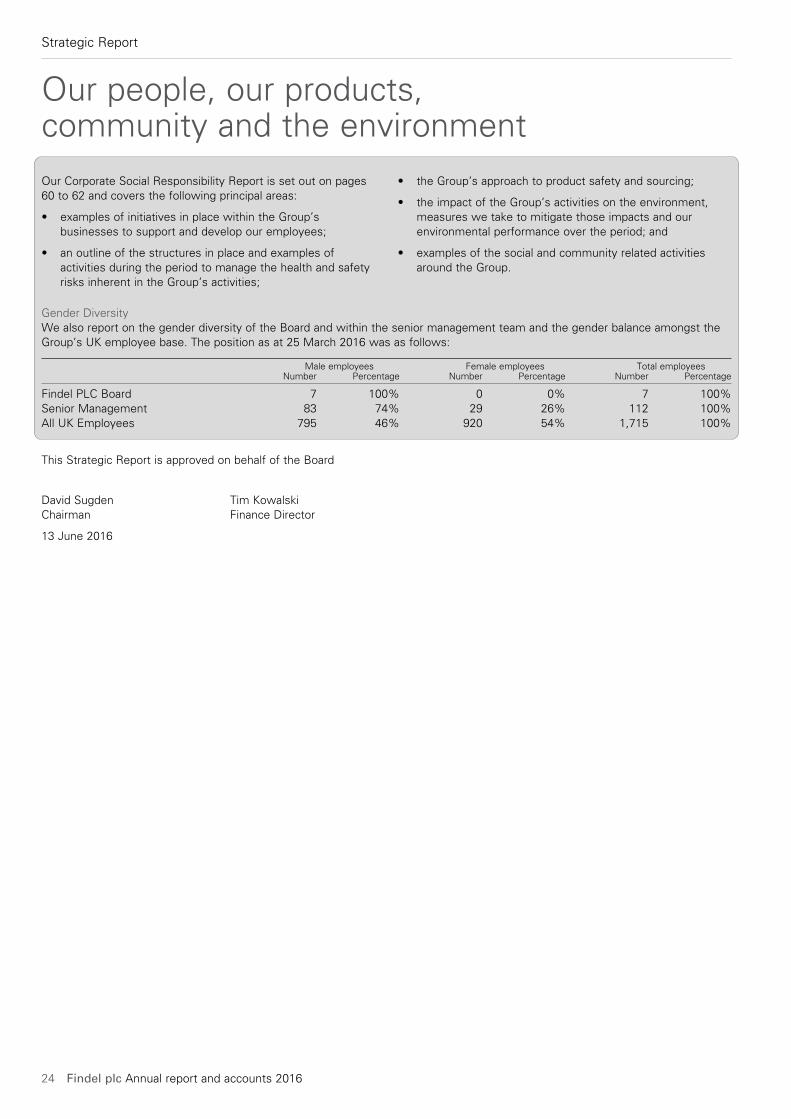
Gender DiversityWe also report on the gender diversity of the Board and within the senior management team and the gender balance amongst the Group’s UK employee base. The position as at 25 March 2016 was as follows:
Male employees Female employees Total employees Number Percentage Number Percentage Number Percentage
Findel PLC Board 7 100% 0 0% 7 100%Senior Management 83 74% 29 26% 112 100%All UK Employees 795 46% 920 54% 1,715 100%
This Strategic Report is approved on behalf of the Board
David Sugden Tim KowalskiChairman Finance Director
13 June 2016
www.findel.co.uk 25
CO
NS
OL
IDA
TE
D F
INA
NC
IAL
ST
AT
EM
EN
TS
68
—1
17
CO
MP
AN
Y F
INA
NC
IAL
ST
AT
EM
EN
TS
11
8—
14
1G
OV
ER
NA
NC
E 25—
67S
TR
AT
EG
IC R
EP
OR
T 2
—2
4
Governance
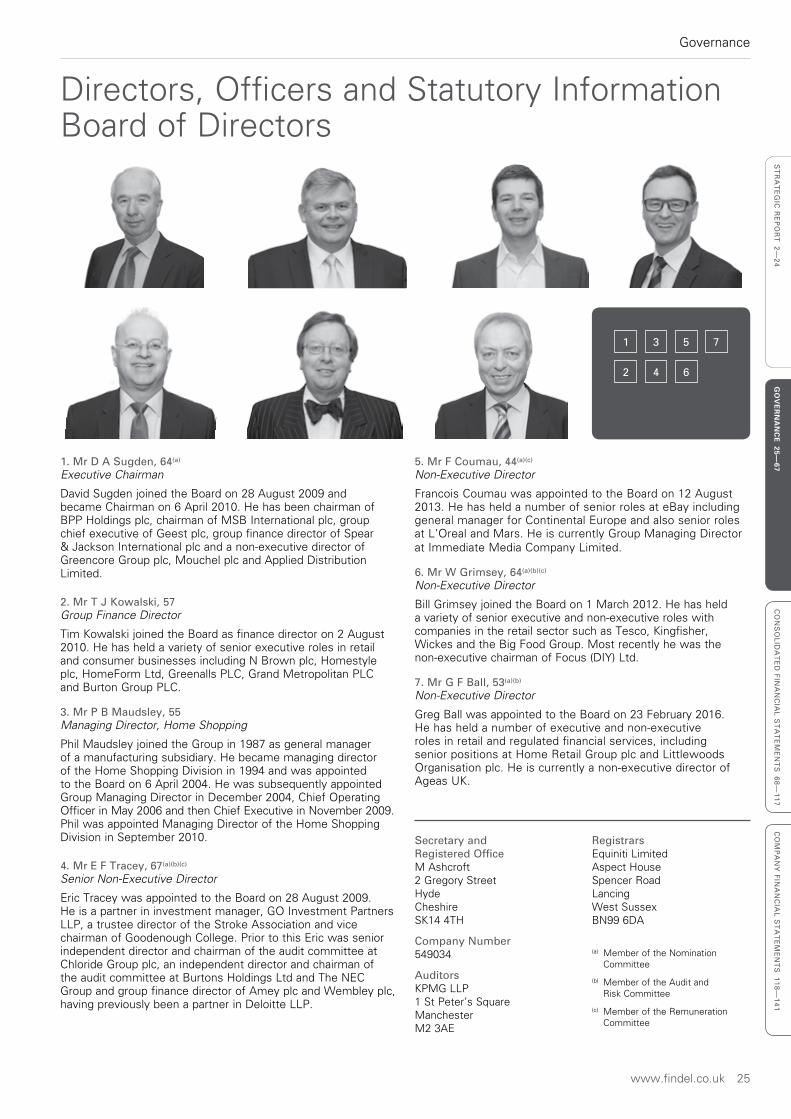
Directors, Officers and Statutory InformationBoard of Directors
Secretary and Registered OfficeM Ashcroft2 Gregory StreetHydeCheshireSK14 4TH
Company Number 549034
Auditors KPMG LLP1 St Peter’s SquareManchesterM2 3AE
Registrars Equiniti LimitedAspect HouseSpencer RoadLancingWest SussexBN99 6DA
(a) Member of the Nomination Committee
(b) Member of the Audit and Risk Committee
(c) Member of the Remuneration Committee
5. Mr F Coumau, 44(a)(c)
Non -Executive Director
Francois Coumau was appointed to the Board on 12 August 2013. He has held a number of senior roles at eBay including general manager for Continental Europe and also senior roles at L’Oreal and Mars. He is currently Group Managing Director at Immediate Media Company Limited.
6. Mr W Grimsey, 64(a)(b)(c)
Non -Executive Director
Bill Grimsey joined the Board on 1 March 2012. He has held a variety of senior executive and non-executive roles with companies in the retail sector such as Tesco, Kingfisher, Wickes and the Big Food Group. Most recently he was the non-executive chairman of Focus (DIY) Ltd.
7. Mr G F Ball, 53(a)(b)
Non -Executive Director
Greg Ball was appointed to the Board on 23 February 2016. He has held a number of executive and non-executive roles in retail and regulated financial services, including senior positions at Home Retail Group plc and Littlewoods Organisation plc. He is currently a non-executive director of Ageas UK.
1. Mr D A Sugden, 64(a)
Executive Chairman
David Sugden joined the Board on 28 August 2009 and became Chairman on 6 April 2010. He has been chairman of BPP Holdings plc, chairman of MSB International plc, group chief executive of Geest plc, group finance director of Spear & Jackson International plc and a non-executive director of Greencore Group plc, Mouchel plc and Applied Distribution Limited.
2. Mr T J Kowalski, 57Group Finance Director
Tim Kowalski joined the Board as finance director on 2 August 2010. He has held a variety of senior executive roles in retail and consumer businesses including N Brown plc, Homestyle plc, HomeForm Ltd, Greenalls PLC, Grand Metropolitan PLC and Burton Group PLC.
3. Mr P B Maudsley, 55Managing Director, Home Shopping
Phil Maudsley joined the Group in 1987 as general manager of a manufacturing subsidiary. He became managing director of the Home Shopping Division in 1994 and was appointed to the Board on 6 April 2004. He was subsequently appointed Group Managing Director in December 2004, Chief Operating Officer in May 2006 and then Chief Executive in November 2009. Phil was appointed Managing Director of the Home Shopping Division in September 2010.
4. Mr E F Tracey, 67(a)(b)(c)
Senior Non -Executive Director
Eric Tracey was appointed to the Board on 28 August 2009. He is a partner in investment manager, GO Investment Partners LLP, a trustee director of the Stroke Association and vice chairman of Goodenough College. Prior to this Eric was senior independent director and chairman of the audit committee at Chloride Group plc, an independent director and chairman of the audit committee at Burtons Holdings Ltd and The NEC Group and group finance director of Amey plc and Wembley plc, having previously been a partner in Deloitte LLP.
1
2
3
4
5
6
7
26 Findel plc Annual report and accounts 2016
Governance
Directors’ Report
The directors present their annual report and accounts on the affairs of the Group, together with the financial statements and Auditors’ report for the 52 week period ended 25 March 2016. The Corporate Governance Report set out on pages 31 to 34 forms part of this report.
Strategic ReportPursuant to sections 414A-D Companies Act 2006, the Strategic Report can be found on pages 2 to 24. This includes a review of the Group’s activities; the principal risks and uncertainties facing the Group; the main trends and factors likely to affect the future development, performance or position of the Group’s business; and the key performance indicators identified by management. The Directors’ Report and the Strategic Report also comprises the management report for the purposes of the FCA Disclosure and Transparency Rules (DTR 4.1.8R). All such information as is required to be contained in this report by s.417 of the Companies Act 2006 is incorporated by reference into this report.
Going concernIn determining whether the Group’s financial statements for the period ended 25 March 2016 can be prepared on a going concern basis, the directors considered all factors likely to affect its future development, performance and its financial position, including cash flows, liquidity position and borrowing facilities and the risks and uncertainties relating to its business activities in the current economic climate. The financial position of the Group, its cash flows, liquidity position and borrowing facilities and the key risks and uncertainties are set out in further detail in the Finance Director’s Review on pages 20 to 24.
The directors have reviewed the trading and cash flow forecasts as part of their going concern assessment, including reasonable downside sensitivities which take into account the uncertainties in the current operating environment including amongst other matters demand for the Group’s products, its available financing facilities, and regulatory licensing and compliance. Although at certain times the level of headroom reduces to a level which is less than the directors would regard as desirable in the long term, the directors believe it to be sufficient and have identified controllable mitigating actions that could be implemented if required. The Group’s banking facilities were extended during the year and now mature in December 2019.
Taking into account the above uncertainties and circumstances, the directors formed a judgement that there is a reasonable expectation that the Company and the Group have adequate resources to continue in operational existence for a period of at least 12 months from the date of this report.
Accordingly, they continue to adopt the going concern basis in preparing the Group’s annual consolidated financial statements.
Viability StatementWhile the financial statements have been prepared on a going concern basis, the provisions of the UK Corporate Governance Code requires the directors to make a statement in the annual report with regard to the viability of the Group, including explaining how they have assessed the prospects of the Group, the period of time for which they have made the assessment and why they consider that period to be appropriate. The Board has reviewed the viability of the Group for the three year period up to March 2019.
The Board selected this period of review as it aligns with the Group’s normal strategic planning process which results in the development and approval by the Board of medium-term business plans each year. These plans consider the Group’s future projections of sales growth, profitability, cash flows, capital requirements and resources for each of its divisions, together with covenant compliance and other relevant financial and regulatory ratios over the forecast period.
The plans were then subjected to sensitivity analyses that considered the Group’s resilience to the occurrence of reasonable downside scenarios. Consideration was also given to the likely impact of the Group’s principal risks over that planning horizon after taking account of the mitigation actions that could be taken to reduce the impact or occurrence of those risks, which are set out in the principal risks and uncertainties section on pages 22 to 23.
On the basis of this review, the Board confirms that it has a reasonable expectation that the Group will be able to continue in operation and meet its liabilities as they fall due over the three year period up to March 2019.
DividendsThe directors have determined that no interim dividend will be paid (FY15: nil) and are not recommending the payment of a final dividend (FY15: nil).
The action taken during the period under review to cancel non-distributable reserves and reduce the nominal value of ordinary shares means that the Company has made good progress in reducing the deficit on its profit and loss account. The Company has not received any dividends from its subsidiaries in respect of the period under review and its balance sheet as at the end of March 2016 shows a deficiency of £33.2m on its retained reserves (FY15: deficiency of £156.4m). It is therefore not yet in a position to declare a dividend. The directors will provide further updates on dividend policy in due course.
The rights of the holders of convertible shares to restrict dividends are set out below.
www.findel.co.uk 27
Governance
ST
RA
TE
GIC
RE
PO
RT
2—
24
GO
VE
RN
AN
CE
25—67
CO
NS
OL
IDA
TE
D F
INA
NC
IAL
ST
AT
EM
EN
TS
68
—1
17
CO
MP
AN
Y F
INA
NC
IAL
ST
AT
EM
EN
TS
11
8—
14
1
Financial Risk ManagementPolicies on financial risk management are set out in note 32, on page 56 of the Report of the Audit & Risk Committee and on pages 22 and 23 of the Strategic Report.
Capital StructureDetails of the issued share capital, together with details of the movements in the Company’s issued share capital during the year are shown in note 24 and such information is incorporated into this report. In particular, during the period under review the Company reduced the nominal value of its ordinary share capital from £1 per share to 10 pence per share (further details are set out below under the heading “Capital Reduction”).
The Company has two classes of share, neither of which carries rights to fixed income. The rights and obligations attaching to both classes of share are contained in the Articles of Association, a copy of which is available for inspection at the registered office of the Company. The ordinary shares carry the right to attend and speak at general meetings of the Company, to one vote on each resolution at such meetings, to appoint proxies to exercise full voting rights and to participate in any distribution of income or capital. The holders of convertible shares have a right to attend meetings but no voting rights (save in respect of any resolution relating to the rights of the convertible shares). The following rights and restrictions attach to the convertible shares:
• rights attaching to the convertible shares may only be varied by resolution passed by the holders of 85% or more of the nominal value of the convertible shares then in issue;
• consent of 85% of the holders of convertible shares is required before the Company declares any dividend or distribution in excess of 50% of the Group’s net income in respect of any accounting reference period, and the convertible shares have the right to participate in any dividend to the extent that it exceeds 50% of the Group’s net income in respect of any accounting reference period;
• the right to elect to participate in any return of capital on a voluntary winding-up of the Company as if the convertible shares had been converted into ordinary shares;
• the right to convert the convertible shares into ordinary shares between 28 February 2013 and 28 February 2021 (Conversion Period) if the volume weighted average ordinary share price is greater than 479.4p;
• the convertible shares will automatically be converted into ordinary shares in the event of a takeover offer;
• on conversion into new ordinary shares the convertible shares will rank pari passu with existing ordinary shares;
• until expiry of the Conversion Period, or earlier conversion, the Company is subject to certain restrictions including that it shall not, without the consent of 85% of the holders of convertible shares:
– vary the rights attached to the ordinary shares;
– create a new class of shares ranking ahead of the ordinary shares;
– convert the Company from a public company to a private company (other than pursuant to a takeover offer);
– issue loan stock or debt instruments or enter into any borrowing save on arm’s length terms.
If the convertible shares have not converted into ordinary shares within the Conversion Period they will automatically convert into non-voting deferred shares with no voting or profit participation rights.
There are no specific restrictions on the size of a holding or on the transfer of ordinary shares or convertible shares and there are no requirements for prior approval of any transfers; all such matters are governed by the general provisions of the Articles of Association and prevailing legislation. The directors are not aware of any agreements between holders of the Company’s shares that may result in restrictions on the transfer of securities or on voting rights. The Articles of Association may only be changed with agreement of shareholders.
Details of employee share schemes are set out in note 23. Shares held by the Company’s Employee Benefit Trust rank pari passu with the ordinary shares in issue and have no special rights, but abstain from voting.
The Company did not obtain authority from shareholders at the AGM held in July 2015 to purchase its own shares. The Company made no purchases of its own shares during the financial year and no shares were acquired by forfeiture or surrender or made subject to a lien or charge.
No person has any special rights of control over the Company’s share capital and all issued shares are fully paid.
There are a number of agreements that take effect, alter or terminate upon a change of control of the Company such as commercial contracts, bank loan agreements, property lease arrangements and employees’ share plans. Any such situation would be carefully managed to ensure that any effect on the business was minimised. Furthermore, the directors are not aware of any agreements between the Company and its directors or employees that provide for compensation for loss of office or employment that occurs as a consequence of a takeover bid, other than as disclosed in the Board Report on Directors’ Remuneration.
28 Findel plc Annual report and accounts 2016
Governance
Directors’ Report
Capital ReductionDuring the period under review and following shareholder approval at the 2015 Annual General Meeting, the Company completed the Court and regulatory processes to cancel the share premium account and capital redemption reserve and cancel and extinguish 90 pence of the £1 paid up or credited as paid up on each of its ordinary shares. The reserve arising is subject to the undertaking given to the Court for the protection of the Company’s creditors (referred to below). This process reduced dificiency on the profit and loss account of the Company as described above and as set out in Note 24 to the Financial Statements for the period under review.
In accordance with the Company’s undertaking to the Court, an amount equal to the sum arising on the capital reduction, cancellation of share premium account and capital redemption reserve of the Company (the “Capital Reduction”) has been transferred to a special reserve in the books of the Company (the “Special Reserve”). Subject to both the terms of the undertaking and certain waivers granted by the Court, the Special Reserve shall not be treated as representing realised profits of the Company until such time as all amounts owing to creditors of the Company as at the effective date of the Capital Reduction have either been satisfied or the relevant creditors have provided their consent. As part of the Capital Reduction, the Company obtained the consent of, inter alia, its bank funders and certain of its landlords.
The Capital Reduction has not changed the number of ordinary shares in issue or any rights attaching to the ordinary shares.
Shareholders who hold their shares in certificated form should note that replacement certificates have not been issued to reflect this change in nominal value; they should simply retain their existing share certificates.
Acquisition of own sharesThe Company did not obtain authority from shareholders at the AGM held in July 2015 to purchase its own shares. The Company made no purchases of its own shares during the financial year and no shares were acquired by forfeiture or surrender or made subject to a lien or charge.
DirectorsThe directors of the Company at the date of this report are shown on page 25. Information concerning their interests in the share capital of the Company as at 25 March 2016 and as at 10 June 2016 is included in the Board Report on Directors’ Remuneration on page 52. All the directors served throughout the year save that Mrs Kinney Pritchard stepped down from the Board in August 2015 and Mr Greg Ball was appointed to the Board on 22 February 2016. Mr Siddle retired from the Board after the previous year-end on 31 March 2015. A summary of the rules relating to the appointment and removal of directors and details regarding the powers of the directors are set out in the Corporate Governance Report on pages 31 and 34.
At the conclusion of the 2016 Annual General Meeting Mr Sugden will step down from the Board. A further announcement regarding his successor will be issued in the near future. At the Annual General Meeting Mr Kowalski and Mr Coumau will retire by rotation and, being eligible, will offer themselves for reappointment. Mr Ball, having been appointed during the year will retire in accordance with the Articles of Association and, being eligible, offers himself for appointment at the Annual General Meeting.
Following the annual performance evaluation, the Board confirms that the performance of the Non-Executive Directors subject to appointment or re-appointment has been effective throughout the period, or throughout the period since their appointment, and that they have continued to demonstrate commitment to their roles. The Nomination Committee endorses their proposed reappointment at the forthcoming Annual General Meeting. Mr Kowalski has a rolling service contract with the Company which provides a 12 month rolling notice period. Mr Ball and Mr Coumau are Non-Executive Directors and do not have service contracts with the Company. The appointment of Non-Executive Directors is for an initial period of three years, subject to review and re-election in General Meeting. Further details of the service contracts and letters of appointment of directors can be found on pages 43 and 44 of the Board’s Report on Directors’ Remuneration.
Directors’ and Officers’ Insurance and IndemnityThe Group maintained insurance for directors and officers of the Group during the financial year, indemnifying them (to the extent permitted by law and the Company’s Articles of Association) against certain liabilities incurred by them when acting on behalf of the Group. The Company has executed deeds of indemnity for the benefit of each director in respect of liabilities which may attach to them in their capacity as directors of the Company. Neither the insurance nor the deeds of indemnity provide cover where the relevant director or officer has acted fraudulently or dishonestly.
EmployeesThe Company recognises its social and statutory duty to employ disabled persons and pursues a policy of providing, wherever possible, the same employment opportunities to disabled persons as to others, and training for employees who have become disabled during the period when they were employed by the Group. Information to employees regarding the Company and factors affecting its performance and that of its subsidiaries is provided through normal management channels and regular consultation.
www.findel.co.uk 29
Governance
ST
RA
TE
GIC
RE
PO
RT
2—
24
GO
VE
RN
AN
CE
25—67
CO
NS
OL
IDA
TE
D F
INA
NC
IAL
ST
AT
EM
EN
TS
68
—1
17
CO
MP
AN
Y F
INA
NC
IAL
ST
AT
EM
EN
TS
11
8—
14
1
Environmental mattersInformation on environmental matters, including our greenhouse gas emissions is disclosed in the Corporate Social Responsibility Report on pages 60 to 62.
Overseas BranchesThe Group does not have any branches outside the UK.
UK Corporate Governance CodeThe Company’s statement on corporate governance can be found in the Corporate Governance Report on pages 31 to 34. The Corporate Governance Report forms part of this Directors’ Report and is incorporated into it by its cross reference.
Political donations, expenditure and contributionsNo political donations, expenditure or contributions were made during the financial year (2015: £nil).
Substantial ShareholdingsAs at 25 March 2016 the Company had been notified pursuant to the Disclosure and Transparency Rules of the following material interests of 3% or more in its share capital:
Proportion Proportion Number of Share Number of voting rights of voting of Shares Capital Direct Indirect rights
Sports Direct International plc 14,885,983 17.22% 15,125,065 — 17.50%Schroders plc 17,286,983 20.00% — 15,118,175 17.49%Toscafund Asset Management LLP 17,331,727 20.05% — 17,331,727 20.05%River & Mercantile Asset Management LLP 5,126,767 5.93% 5,126,767 — 5.93%FIL Ltd 4,848,694 5.60% — 4,848,694 5.60%Aberforth Partners Ltd 4,705,300 5.44% — 4,705,300 5.44%Henderson Global Investors Limited 4,253,193 4.94% — 4,253,193 4.94%Standard Life Investments Ltd 3,629,708 4.22% 2,616,853 1,012,855 4.22%
On 29 March 2016 Sports Direct International plc notified the Company that it had acquired a contract for difference in respect of 10,868,367 shares, representing 12.57% of the Company’s share capital. The total interest of Sports Direct International plc in the Company was increased to 25,754,350 shares, representing 29.79% of the Company’s share capital.
On 30 March 2016 Morgan Stanley notified the Company that it had acquired an interest in 5,890,930 shares, representing 6.81% of the Company’s share capital. Further notifications were received from Morgan Stanley on 5 April 2016 in respect of an increase in its interest to 8,734,426 shares (10.10% of the Company’s share capital); on 7 April 2016 in respect of a decrease in its interest to 6,855,077 shares (7.93% of the Company’s share capital); on 8 April 2016 in respect of a further decrease in its interest to 4,471,479 shares (5.17% of the Company’s share capital); and finally on 11 April 2016 when its interest fell below 3% of the Company’s share capital.
On 8 April 2016 Toscafund Asset Management LLP notified the Company that its interest had decreased to 8,557,809 shares, representing 9.90% of the Company’s share capital.
On 25 May 2016, FIL Limited notified the Company that its interest had increased to 6,114,830 shares, representing 7.07% of the Company’s share capital.
There had been no further notifications between 25 March 2016 and 10 June 2016.
AuditorKPMG LLP has notified its willingness to continue as auditor to the Company and a resolution concerning their re-appointment will be proposed at the Annual General Meeting together with a resolution to authorise the directors to set the remuneration of the auditor. An analysis of audit and non-audit fees earned by the auditors during the year is set out in note 10 to the accounts.
Disclosure of information to the auditorIn the case of each of the persons who are directors of the Company at the date when this report was approved:
• so far as each of the directors is aware, there is no relevant audit information (as defined in the Companies Act 2006) of which the Company’s auditor is unaware; and
• each of the directors has taken all the steps that he ought to have taken as a director to make himself aware of any relevant audit information and to establish that the Company’s auditors are aware of that information.
This confirmation is given and should be interpreted in accordance with the provisions of s418 of the Companies Act 2006.
30 Findel plc Annual report and accounts 2016
Governance
Directors’ Report
Annual General MeetingA separate circular comprising the notice of Annual General Meeting to be held on 29 July 2016 will be issued to shareholders in the near future and will include details of the business to be transacted at the meeting and an explanation of all resolutions to be considered at the Annual General Meeting. In addition to the ordinary business of the meeting, there will be one item of special business, namely to adopt a replacement Performance Share Plan following the expiry of the current Plan.
Approval of the Findel Performance Share Plan 2016The Company’s existing long-term incentive arrangement for the Company’s executive directors and other selected senior management is the Findel Performance Share Plan 2006 (the “2006 Plan”). Approved by shareholders in July 2006 for ten years, the 2006 Plan has provided for annual share-based awards ordinarily vesting three years from grant, subject to the grantee’s continued service and to the extent to which objective performance criteria are met over a three year measurement period.
The Remuneration Committee of the Board has recently undertaken a review of the 2006 Plan and concluded that shareholder authority should be sought for a replacement arrangement, the Findel Performance Share Plan 2016 (the “2016 Plan”). The terms of the 2016 Plan have been designed to materially continue with the existing policy under the 2006 Plan but with appropriate changes to take account of prevailing best practice expectations. Following a final round of awards under the 2006 Plan on the normal timetable, the 2016 Plan would be implemented to govern future award policy.
A summary of the principal terms of the 2016 Plan will be included in the Notice of AGM to be issued in the near future.
VotingFull details as to how to vote will be contained in the Notice of AGM and associated Form of Proxy to be issued in the near future.
RecommendationThe Board considers that the item of special business to be proposed at the 2016 AGM is in the best interests of the Company and its shareholders as a whole and unanimously recommends that shareholders vote in favour of that resolution at the AGM. The full recommendation of the Board will be included in the Notice of AGM to be issued in the near future.
By order of the Board
Mark AshcroftSecretary
13 June 2016
www.findel.co.uk 31
Governance
ST
RA
TE
GIC
RE
PO
RT
2—
24
GO
VE
RN
AN
CE
25—67
CO
NS
OL
IDA
TE
D F
INA
NC
IAL
ST
AT
EM
EN
TS
68
—1
17
CO
MP
AN
Y F
INA
NC
IAL
ST
AT
EM
EN
TS
11
8—
14
1
Corporate Governance Report
ComplianceThe Board considers that throughout the year under review the Company has complied with the relevant provisions of the 2014 issue of the UK Corporate Governance Code (the “Code”), and with the rules of the UK Listing Authority, save that the Board operated with an Executive Chairman throughout the year. A copy of the Code can be located at https://www.frc.org.uk.
Application of the principles of the CodeThis report explains how the Company has applied the main principles of the Code to its activities. The section of the Code entitled “Main Principles of the Code” sets out the main and supporting principles of good governance for companies, which are split into the following topics: leadership; effectiveness; accountability; remuneration and relations with shareholders.
The BoardAt 25 March 2016, the Board was made up of seven members comprising the Chairman, Mr Sugden; the finance director, Mr Kowalski; a further executive director, Mr Maudsley and four Non-Executive Directors. The Non-Executive Directors are considered by the Board to be independent of management and free of any relationship which could materially interfere with the exercise of their independent judgement. Biographical details of each of the directors, which illustrate their range of experience, are set out on page 25.
The current Chairman, Mr Sugden, became a member of the Board in 2009 and was an independent Non-Executive Director of the Company prior to his appointment as Chairman on 6 April 2010. He has no other significant commitments that the Board considers are a constraint on his agreed time commitment to the Company.
Mr Siddle stepped down as Chief Executive on 31 March 2015. Mr Sugden became Executive Chairman with effect from the beginning of March 2015 whilst the Board considered the medium-term shape of the Group and the appropriate longer-term leadership structure. Following the sale of Kitbag in February 2016 the Board determined to continue to operate with an Executive Chairman for the medium term. As Mr Sugden has indicated that he does not wish to continue in this role for an extended period the Board is seeking to appoint a successor to Mr Sugden who will step down from the Board at the conclusion of the forthcoming Annual General Meeting. A further announcement regarding his successor will be issued shortly.
The Senior Independent Director is Mr Tracey and he is the director whom shareholders may contact if they feel their concerns are not being addressed through the normal channels. For the period during which the Company is operating with an Executive Chairman the role of the Senior Independent Director has been enhanced in the following ways to ensure continued independent oversight by the Board:
• Chairing the Nomination Committee
• Agreeing Board agenda and minutes with the Executive Chairman
• An enhanced role in shareholder meetings
• Carrying out the annual appraisal of Board performance
• Reporting to shareholders via a Nomination Committee Report in the annual report.
The Non-Executive Directors met during the year without the executive directors present.
Directors are subject to election at the Annual General Meeting immediately following their appointment and are subject to reappointment at least every three years. The Board has determined that in the normal course Non-Executive Directors will be asked to serve two terms of three years. The Board assesses annually whether each Non-Executive Director is independent against the criteria set out in the Code.
The appointment and replacement of directors of the Company is governed by the Company’s Articles of Association, the Code, the Companies Act 2006 and related legislation. The Articles themselves may be amended by special resolution of the shareholders. The powers of directors are described in the Articles and the Main Board Terms of Reference, copies of which are available on request, and are summarised in the Corporate Governance Report on page 33.
During the period ended 25 March 2016, no director had any material interest in any significant contract to which the Company or any subsidiary was a party.
Conflicts of InterestThe Company has a procedure for the disclosure, review, authorisation and management of directors’ conflicts of interest and potential conflicts of interest, in accordance with the provisions of the Companies Act 2006. The procedure is included in the Articles of Association and has been adhered to by the Board since its introduction. In deciding whether to authorise a conflict or potential conflict of interest, the directors must have regard to their general duties under the Companies Act 2006. The authorisation of any conflict matter, and the terms of authorisation are reviewed by the Board as appropriate and, as a minimum, on an annual basis.
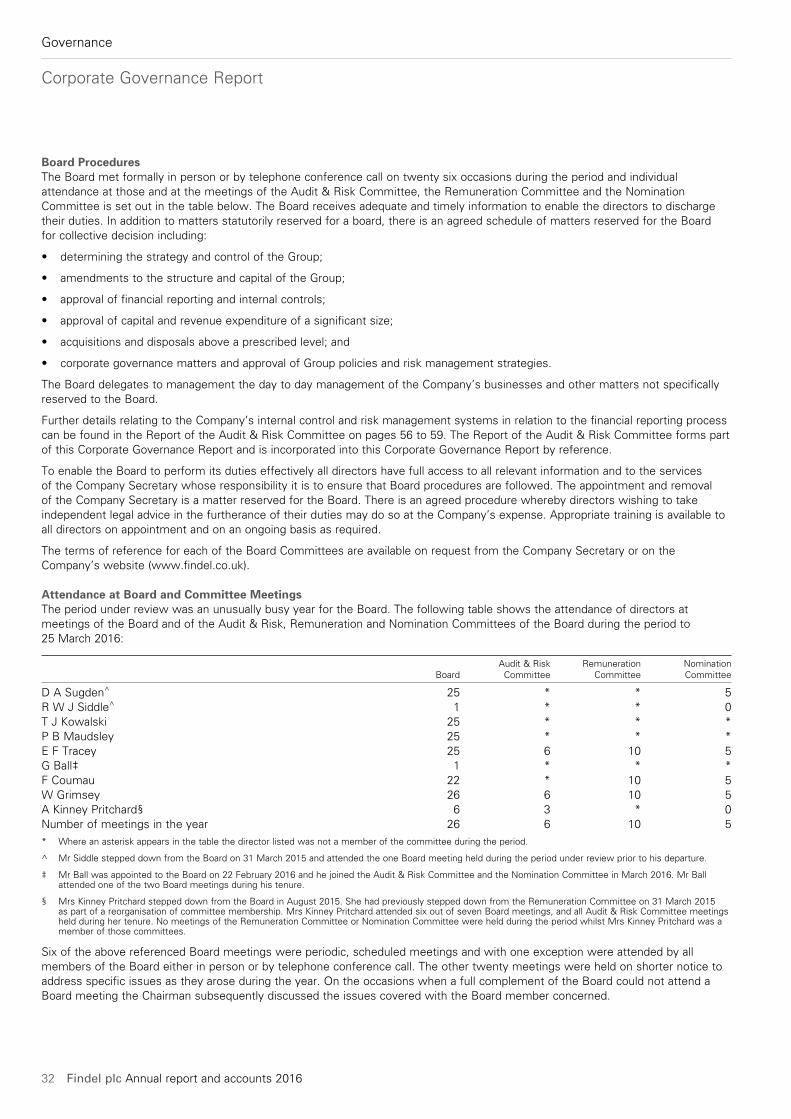
32 Findel plc Annual report and accounts 2016
Governance
Corporate Governance Report
Board ProceduresThe Board met formally in person or by telephone conference call on twenty six occasions during the period and individual attendance at those and at the meetings of the Audit & Risk Committee, the Remuneration Committee and the Nomination Committee is set out in the table below. The Board receives adequate and timely information to enable the directors to discharge their duties. In addition to matters statutorily reserved for a board, there is an agreed schedule of matters reserved for the Board for collective decision including:
• determining the strategy and control of the Group;
• amendments to the structure and capital of the Group;
• approval of financial reporting and internal controls;
• approval of capital and revenue expenditure of a significant size;
• acquisitions and disposals above a prescribed level; and
• corporate governance matters and approval of Group policies and risk management strategies.
The Board delegates to management the day to day management of the Company’s businesses and other matters not specifically reserved to the Board.
Further details relating to the Company’s internal control and risk management systems in relation to the financial reporting process can be found in the Report of the Audit & Risk Committee on pages 56 to 59. The Report of the Audit & Risk Committee forms part of this Corporate Governance Report and is incorporated into this Corporate Governance Report by reference.
To enable the Board to perform its duties effectively all directors have full access to all relevant information and to the services of the Company Secretary whose responsibility it is to ensure that Board procedures are followed. The appointment and removal of the Company Secretary is a matter reserved for the Board. There is an agreed procedure whereby directors wishing to take independent legal advice in the furtherance of their duties may do so at the Company’s expense. Appropriate training is available to all directors on appointment and on an ongoing basis as required.
The terms of reference for each of the Board Committees are available on request from the Company Secretary or on the Company’s website (www.findel.co.uk).
Attendance at Board and Committee MeetingsThe period under review was an unusually busy year for the Board. The following table shows the attendance of directors at meetings of the Board and of the Audit & Risk, Remuneration and Nomination Committees of the Board during the period to 25 March 2016:
Audit & Risk Remuneration Nomination Board Committee Committee Committee
D A Sugden^ 25 * * 5R W J Siddle^ 1 * * 0T J Kowalski 25 * * *P B Maudsley 25 * * *E F Tracey 25 6 10 5G Ball‡ 1 * * *F Coumau 22 * 10 5W Grimsey 26 6 10 5A Kinney Pritchard§ 6 3 * 0Number of meetings in the year 26 6 10 5* Where an asterisk appears in the table the director listed was not a member of the committee during the period.
^ Mr Siddle stepped down from the Board on 31 March 2015 and attended the one Board meeting held during the period under review prior to his departure.
‡ Mr Ball was appointed to the Board on 22 February 2016 and he joined the Audit & Risk Committee and the Nomination Committee in March 2016. Mr Ball attended one of the two Board meetings during his tenure.
§ Mrs Kinney Pritchard stepped down from the Board in August 2015. She had previously stepped down from the Remuneration Committee on 31 March 2015 as part of a reorganisation of committee membership. Mrs Kinney Pritchard attended six out of seven Board meetings, and all Audit & Risk Committee meetings held during her tenure. No meetings of the Remuneration Committee or Nomination Committee were held during the period whilst Mrs Kinney Pritchard was a member of those committees.
Six of the above referenced Board meetings were periodic, scheduled meetings and with one exception were attended by all members of the Board either in person or by telephone conference call. The other twenty meetings were held on shorter notice to address specific issues as they arose during the year. On the occasions when a full complement of the Board could not attend a Board meeting the Chairman subsequently discussed the issues covered with the Board member concerned.
www.findel.co.uk 33
Governance
ST
RA
TE
GIC
RE
PO
RT
2—
24
GO
VE
RN
AN
CE
25—67
CO
NS
OL
IDA
TE
D F
INA
NC
IAL
ST
AT
EM
EN
TS
68
—1
17
CO
MP
AN
Y F
INA
NC
IAL
ST
AT
EM
EN
TS
11
8—
14
1
Board EffectivenessThe Board’s annual internal self-assessment exercise was completed during the first half of the financial year and the outcomes from that exercise were reviewed by the Senior Independent Director including one-to-one discussions between each director and the Senior Independent Director followed by a discussion by the Board as a whole following a presentation of a findings and his conclusion by the Senior Independent Director. The Board has engaged its first independently facilitated review of its effectiveness which will take place later in the year.
The performance of each director has been assessed by the Senior Independent Director and, in some cases, by peer review and has been discussed in a one-to-one meeting between the Senior Independent Director and the individual director.
The Senior Independent Director met during the financial year with each of the Non-Executive Directors to discuss the performance of the Chairman. The Senior Independent Director has discussed the results of that assessment with the Chairman.
Relations with ShareholdersThe Company recognises the importance of communicating with its shareholders, to ensure that its strategy and performance are understood. This is achieved principally through the Interim Report, periodic trading statements, the Annual Report and the Annual General Meeting. In addition, a range of corporate information is available to investors on the Company’s website (www.findel.co.uk).
The Chairman and Finance Director are primarily responsible for investor relations. Feedback from major shareholders is reported to the Board and discussed at its meetings and from time to time the Chairman also discusses the views of the Company’s major shareholders with the Non-Executive Directors. Formal presentations are made to institutional shareholders following the announcement of the Company’s full year and half year results. During the year the Senior Independent Director and the Chairman of the Remuneration Committee meet with institutional shareholders as required. The Board recognises that the Annual General Meeting is the principal forum for dialogue with private shareholders. All directors normally attend the Annual General Meeting and are available to answer any questions that shareholders may wish to raise. The Notice of Meeting is sent to shareholders at least 20 working days before the meeting. Shareholders vote on a show of hands, unless a poll is validly called and after each such vote the number of proxy votes received for and against the resolution is announced.
Powers of the BoardThe directors manage the business of the Company subject to the Companies Act 2006 and the Articles of Association of the Company and subject to such directions as are prescribed by the Company by special resolution.
The Board may exercise all the powers of the Company to borrow money and to mortgage or charge its undertaking, property, assets and uncalled capital and to issue debentures and other securities whether outright or as collateral security, for any debt, liability or obligation of the Company or of any third party. The Board must restrict the borrowings of the Company and exercise all powers of control exercisable over its subsidiaries (if any) so that the total amount of the Findel Group’s borrowings (exclusive of inter-group borrowings) do not exceed £450,000,000. However, the Company may pass an ordinary resolution allowing borrowings to exceed such limit.
The Board may, subject to the provisions of the Companies Act and shareholder approval where required, exercise its authority to allot shares, grant rights to subscribe for shares or to convert any security into shares. Shares may be issued with such rights or restrictions as may be approved by resolution of the shareholders and shares may be issued on terms that they are, or at the option of the Company may be liable to be, redeemed. The Board may, prior to allotment, determine the terms, conditions and manner in which shares can be redeemed by the Company.
Committee MembershipIn contemplation of the retirement of Mr Siddle from the Board and the Nomination Committee on 31 March 2015, the Board reviewed the membership of its principal committees, so that with effect from 27 March 2015, Mr Coumau retired from the Audit & Risk Committee and Mrs Kinney Pritchard retired from the Remuneration Committee.
Subsequently, Mrs Kinney Pritchard stepped down from the Board in August 2015 and Mr Tracey took over from her the chairmanship of the Audit & Risk Committee. In November 2015 Mr Grimsey took over the chairmanship of the Remuneration Committee from Mr Tracey. In March 2016, following his appointment to the Board, Mr Ball joined the Audit & Risk Committee and the Nomination Committee. The Audit & Risk Committee Report on pages 58 to 59 explains further Committee changes that are intended to take effect shortly.
Details of the membership of the committees as at the end of the period under review are included on page 25.
34 Findel plc Annual report and accounts 2016
Governance
Corporate Governance Report
Audit & Risk CommitteeThe Audit & Risk Committee operates under written terms of reference which are available on the Company’s website (www.findel.co.uk) and is comprised of only independent Non-Executive Directors. It is chaired by Mr Tracey, having previously been chaired by Mrs Kinney Pritchard until August 2015. The Committee’s report is set out on pages 56 to 59.
Remuneration CommitteeThe Remuneration Committee operates under written terms of reference which are available on the Company’s website (www.findel.co.uk). It is comprised of only independent Non-Executive Directors and Mr Grimsey is the chairman, having previously been chaired by Mr Tracey until November 2015. The Committee’s report is set out on pages 35 to 54.
Nomination CommitteeThe Nomination Committee operates under written terms of reference which are available on the Company’s website (www.findel.co.uk) and is comprised of the Chairman, the Chief Executive (until he left the Board on 31 March 2015) and the independent Non-Executive Directors. The Committee Chairman is Mr Tracey, the Senior Independent Director. This reflected the enhanced role for the Senior Independent Director agreed by the Board during the period in which the Company operates with an Executive Chairman. The Committee’s report is set out on page 55.
On behalf of the Board
Mark AshcroftCompany Secretary
13 June 2016
www.findel.co.uk 35
Governance
ST
RA
TE
GIC
RE
PO
RT
2—
24
GO
VE
RN
AN
CE
25—67
CO
NS
OL
IDA
TE
D F
INA
NC
IAL
ST
AT
EM
EN
TS
68
—1
17
CO
MP
AN
Y F
INA
NC
IAL
ST
AT
EM
EN
TS
11
8—
14
1
Board Report on Directors’ Remuneration
Dear ShareholderOn behalf of the Board, I am pleased to present the Directors’ Remuneration Report for the year ended 25 March 2016.
The Remuneration Committee (the “Committee”) has presented this report in compliance with the reporting regulations, and included an abridged Remuneration Policy Report which sets out the policy on the remuneration of the Executive and Non-Executive Directors and an Annual Report on Remuneration which discloses how the current remuneration policy has been implemented in the year ended 25 March 2016. The Annual Report on Remuneration which describes the implementation of the policy during the year will again be subject to an advisory vote at the forthcoming AGM in 2016.
Performance and Remuneration for 2015/2016As detailed in the Strategic Report, FY2015/16 has seen further development of the Group structure including the disposal of the Kitbag business in February 2016. Proceeds were reinvested in capital expenditure and working capital to support further growth in the core Express Gifts and Findel Education businesses. We achieved year-on-year growth in sales of 0.9% and an operating margin of 8.4%. Despite these efforts, and reflecting the level of stretch in our target setting process, the threshold level of profit was not met. Whilst a number of key strategic objectives and the establishment of a framework to support successful customer outcomes were completed successfully, the Committee determined that no bonus would be payable to Executive Directors.
With regards to our longer-term performance, the 2013 Performance Share Plan (“PSP”) awards which were granted to the Finance Director and the MD, Home Shopping were eligible to vest in 2016. These awards were subject to an equal blend of EPS growth and share price appreciation targets. In summary the absolute share price targets ranged from 270p to 475p, and EPS targets ranged from 25.8p to 33.8p. The share price achieved for the purposes of testing against the condition was 193p and so this element of the award lapsed in full as a result of the threshold share price target not being met. The adjusted EPS for the year ended 25 March 2016 was 22.7p and as the threshold target was not met this element of the award also lapsed in full.* Before exceptional items
Key remuneration issues for 2015/16During 2015/16 the Committee met ten times. The key matters which were discussed are as follows:
• The salary levels of the Executive Directors;
• The bonus out-turn for the 2014/15 annual bonuses;
• The terms of the 2015/16 annual bonus plan;
• The quantum and performance targets for the 2015/16 Performance Share Plan awards;
• Testing of the 2012 Performance Share Plan award’s performance targets;
• Treatment under the Performance Share Plan rules for those in Kitbag who were transferred with the business to new external ownership;
• Approval of remuneration changes and the remuneration of new appointments of any employee within the remit of the Committee;
• Review of current remuneration structures;
• Consideration of Performance Share Plan awards to Executive Directors, including the exceptional award to the MD, Home Shopping;
• Review of long-term incentive structures, including the proposed renewal of the Performance Share Plan;
• Approval of 2014/15 Directors’ Remuneration Report;
• The annual self-evaluation of the effectiveness of the Committee; and
• Consideration of developments in best practice.
During year the Committee granted an exceptional PSP award to the MD, Home Shopping. This award was made after a comprehensive review by the Committee and following consultation with our largest shareholders. The rationale for the award was to retain the services of a key member of the Executive team at a time of perceived instability due to corporate activity and to refocus on key initiatives to deliver significant improvements for the period through to FY2017/18. In light of the increased quantum the Committee determined that no further award will be granted in FY2016/17 to the MD, Home Shopping. Further details of this award are set out in the Annual Report on Remuneration (pages 49 to 50).
36 Findel plc Annual report and accounts 2016
Governance
Board Report on Directors’ Remuneration
Application of Remuneration Policy for 2016/17The Committee’s policy remains to set remuneration at an appropriate level to retain and motivate executives of the appropriate calibre to deliver the Company’s strategy. Supporting the Company’s current phase of development and strategy, remuneration is clearly biased towards performance-related elements that are aligned with continued delivery of improved levels of profitable growth and thus returns to our shareholders.
During the year, the Committee reviewed its current remuneration policy and concluded that the broad framework continues to support the Company’s strategy. In terms of the key decisions taken with regard to the implementation of the current remuneration policy for FY2016/17 these included:
• Retaining the same broad annual bonus structure but with refined weightings to apply to the performance measures. Reflecting current strategic priorities profit remains the primary metric (applying to 60% of the bonus opportunity) with business transformation (15%), treatment of customers (15%) and personal targets (10%) completing a balanced scorecard of performance objectives for the year under review.
• Granting a final set of awards under the 2006 Performance Share Plan prior to its expiry at the end of its 10 year life and seeking shareholder approval for a replacement plan (on broadly similar terms) at the 2016 AGM which will then serve as the principal long-term incentive vehicle thereafter. The new PSP is to be operated in the same manner as the current plan, albeit updated to reflect developments in best practice.
• Setting an equal blend of challenging absolute total shareholder return and earnings per share growth targets for the FY2016/17 PSP awards.
• In response to developments in best practice:
– stronger recovery and withholding (clawback and malus) provisions will apply to the FY2016/17 annual bonus and long-term incentive awards as well as these provisions also applying in the annual bonus in future years and the new PSP; and
– a two year holding period on vested shares will apply to the final award to be granted under the existing PSP in FY2016/17 to the Finance Director and the same provision will also apply to future awards granted to Executive Directors under the replacement PSP.
The Committee remains comfortable, particularly in light of the changes noted above, that the overall policy to be implemented for FY2016/17 will not inadvertently encourage undue risk taking through rigorous review of the annual bonus determination and the substantial proportion of total remuneration to be weighted towards long-term performance.
The above changes are within the Company’s shareholder approved remuneration policy and so the Committee is not seeking shareholder approval for a revised Remuneration Policy Report. However, to assist shareholders in reviewing the Company’s implementation of its policy during FY2015/16, an abridged Remuneration Policy Report has been included for completeness in the Remuneration Report that follows.
Should it be considered appropriate to further materially amend the current overall remuneration policy in future, the Committee would look to engage in an appropriate form of consultation with the Company’s major shareholders at that time.
On behalf of the Board, I would like to thank shareholders for their continued support and look forward to your support of our remuneration policy at the 2016 AGM.
William GrimseyChair of the Remuneration Committee
13 June 2016
www.findel.co.uk 37
Governance
ST
RA
TE
GIC
RE
PO
RT
2—
24
GO
VE
RN
AN
CE
25—67
CO
NS
OL
IDA
TE
D F
INA
NC
IAL
ST
AT
EM
EN
TS
68
—1
17
CO
MP
AN
Y F
INA
NC
IAL
ST
AT
EM
EN
TS
11
8—
14
1
Remuneration Policy Report
IntroductionThis report has been prepared in accordance with provisions of the Companies Act 2006 and Schedule 8 of the Large and Medium sized Companies and Groups (Accounts and Reports) (Amendment) Regulations 2013. The report also meets the relevant requirements of the Listing Rules of the Financial Conduct Authority and describes how the Board has applied the principles of good governance relating to directors’ remuneration.
The Directors’ Remuneration Policy was approved by a binding resolution at the 2014 AGM and is operational from that date (the ‘Effective Date’ for the purposes of the legislation), until the 2017 AGM. For ease of reference, a copy of the report is re-presented below, with minor amendments for page and year references, the inclusion of service contract details for new appointments and with the removal of the scenario charts. Details of the Executive Chairman’s arrangements have been noted where relevant. The original report can be accessed from our website at www.findel.co.uk. The Annual Report on Remuneration, along with the Annual Statement from the Committee Chairman, will be put to an advisory vote at the 2016 AGM. A new PSP will also be put to a shareholder vote at the 2016 AGM, with the intention that this will replace the current PSP when it expires during 2016.
The regulations require the auditors to report to the Company’s members on the ‘auditable parts’ of the directors’ remuneration report and to state whether, in their opinion, the parts of the report that have been subject to audit have been properly prepared in accordance with the relevant legislation. The parts of this report which have been audited have been highlighted accordingly.
Policy on Remuneration of Executive DirectorsThe key objectives of the remuneration policy for Executive Directors are:
• To provide a competitive remuneration package which will attract and retain the highest calibre of executive;
• To ensure that individual rewards and incentives are properly aligned with personal performance, the performance of the Group, and the interests of shareholders;
• To structure remuneration packages so a significant proportion is performance related;
• To operate simple, transparent incentive structures with a clear aim to reward for long-term shareholder value creation; and
• To set executive pay packages having had due regard to pay and employment conditions in the wider workforce.
In line with the Association of British Insurers’ (ABI) Guidelines on Responsible Investment Disclosure, the Committee endeavours to structure incentives for Executive Directors and senior executive management so that they will not raise environmental, social or governance (ESG) risks by inadvertently motivating irresponsible behaviour. More generally, with regard to the overall remuneration structure, there is no restriction on the Committee which prevents it from taking into account corporate governance on ESG matters.
Remuneration policy is reviewed regularly and the Committee is satisfied that the current policy does not encourage undue risk taking (e.g. due to the range of performance metrics used in incentive plans and the substantial weighting towards long-term performance) and that it is not in conflict with the Company’s policies on internal controls that are used to manage risk more generally.
The Committee takes due account of remuneration structures elsewhere in the Group when setting pay for the Executive Directors (for example, consideration is given to the overall salary increase budget).
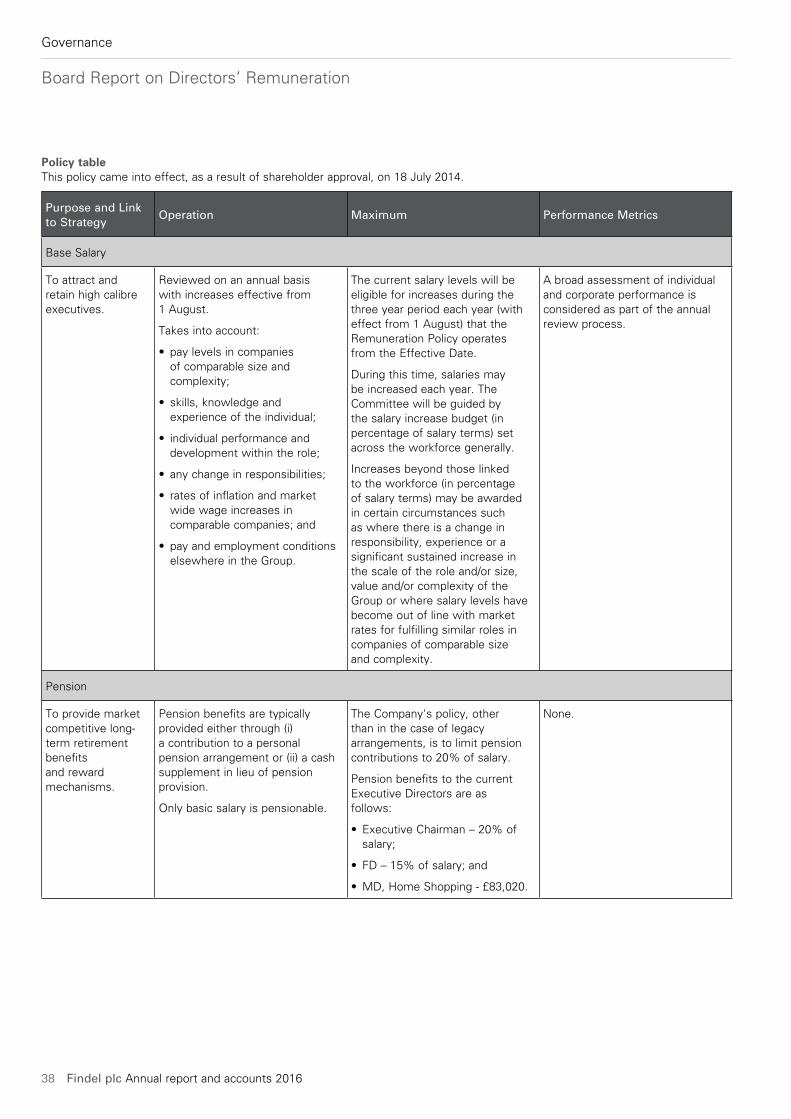
38 Findel plc Annual report and accounts 2016
Governance
Board Report on Directors’ Remuneration
Policy tableThis policy came into effect, as a result of shareholder approval, on 18 July 2014.
Purpose and Link to Strategy
Operation Maximum Performance Metrics
Base Salary
To attract and retain high calibre executives.
Reviewed on an annual basis with increases effective from 1 August.
Takes into account:
• pay levels in companies of comparable size and complexity;
• skills, knowledge and experience of the individual;
• individual performance and development within the role;
• any change in responsibilities;
• rates of inflation and market wide wage increases in comparable companies; and
• pay and employment conditions elsewhere in the Group.
The current salary levels will be eligible for increases during the three year period each year (with effect from 1 August) that the Remuneration Policy operates from the Effective Date.
During this time, salaries may be increased each year. The Committee will be guided by the salary increase budget (in percentage of salary terms) set across the workforce generally.
Increases beyond those linked to the workforce (in percentage of salary terms) may be awarded in certain circumstances such as where there is a change in responsibility, experience or a significant sustained increase in the scale of the role and/or size, value and/or complexity of the Group or where salary levels have become out of line with market rates for fulfilling similar roles in companies of comparable size and complexity.
A broad assessment of individual and corporate performance is considered as part of the annual review process.
Pension
To provide market competitive long-term retirement benefits and reward mechanisms.
Pension benefits are typically provided either through (i) a contribution to a personal pension arrangement or (ii) a cash supplement in lieu of pension provision.
Only basic salary is pensionable.
The Company's policy, other than in the case of legacy arrangements, is to limit pension contributions to 20% of salary.
Pension benefits to the current Executive Directors are as follows:
• Executive Chairman – 20% of salary;
• FD – 15% of salary; and
• MD, Home Shopping - £83,020.
None.
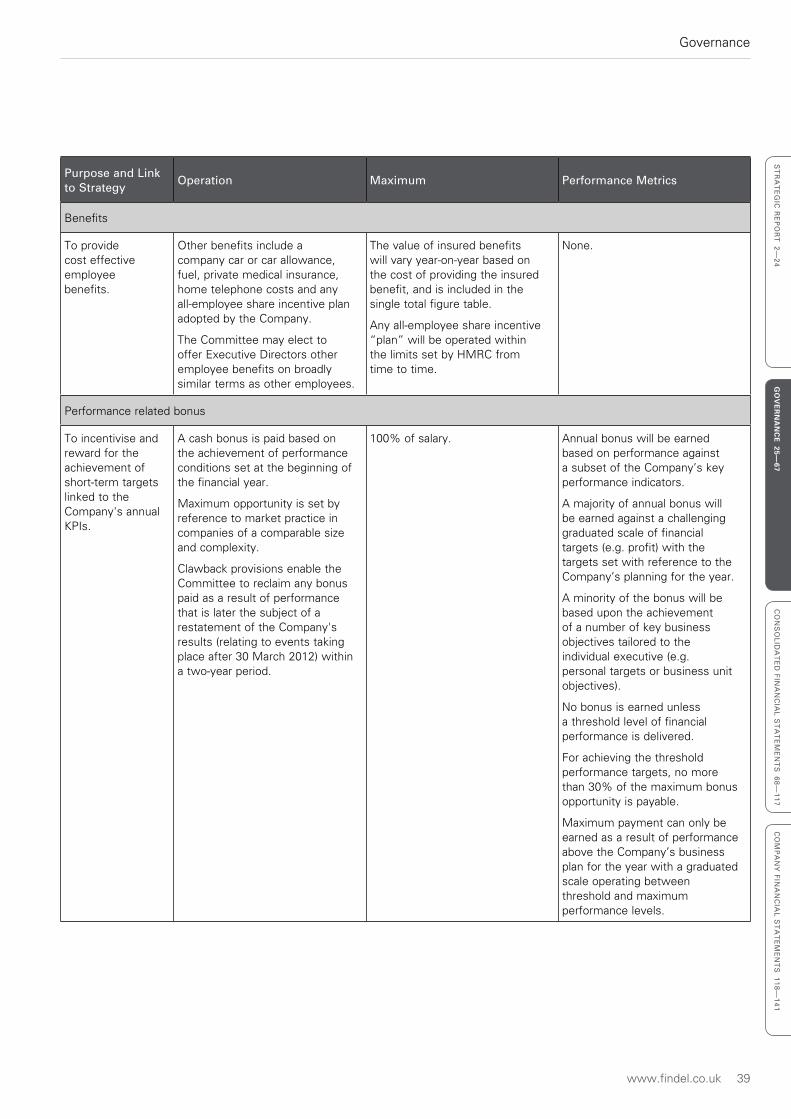
www.findel.co.uk 39
Governance
ST
RA
TE
GIC
RE
PO
RT
2—
24
GO
VE
RN
AN
CE
25—67
CO
NS
OL
IDA
TE
D F
INA
NC
IAL
ST
AT
EM
EN
TS
68
—1
17
CO
MP
AN
Y F
INA
NC
IAL
ST
AT
EM
EN
TS
11
8—
14
1
Purpose and Link to Strategy
Operation Maximum Performance Metrics
Benefits
To provide cost effective employee benefits.
Other benefits include a company car or car allowance, fuel, private medical insurance, home telephone costs and any all-employee share incentive plan adopted by the Company.
The Committee may elect to offer Executive Directors other employee benefits on broadly similar terms as other employees.
The value of insured benefits will vary year-on-year based on the cost of providing the insured benefit, and is included in the single total figure table.
Any all-employee share incentive “plan” will be operated within the limits set by HMRC from time to time.
None.
Performance related bonus
To incentivise and reward for the achievement of short-term targets linked to the Company's annual KPIs.
A cash bonus is paid based on the achievement of performance conditions set at the beginning of the financial year.
Maximum opportunity is set by reference to market practice in companies of a comparable size and complexity.
Clawback provisions enable the Committee to reclaim any bonus paid as a result of performance that is later the subject of a restatement of the Company's results (relating to events taking place after 30 March 2012) within a two-year period.
100% of salary. Annual bonus will be earned based on performance against a subset of the Company’s key performance indicators.
A majority of annual bonus will be earned against a challenging graduated scale of financial targets (e.g. profit) with the targets set with reference to the Company’s planning for the year.
A minority of the bonus will be based upon the achievement of a number of key business objectives tailored to the individual executive (e.g. personal targets or business unit objectives).
No bonus is earned unless a threshold level of financial performance is delivered.
For achieving the threshold performance targets, no more than 30% of the maximum bonus opportunity is payable.
Maximum payment can only be earned as a result of performance above the Company’s business plan for the year with a graduated scale operating between threshold and maximum performance levels.
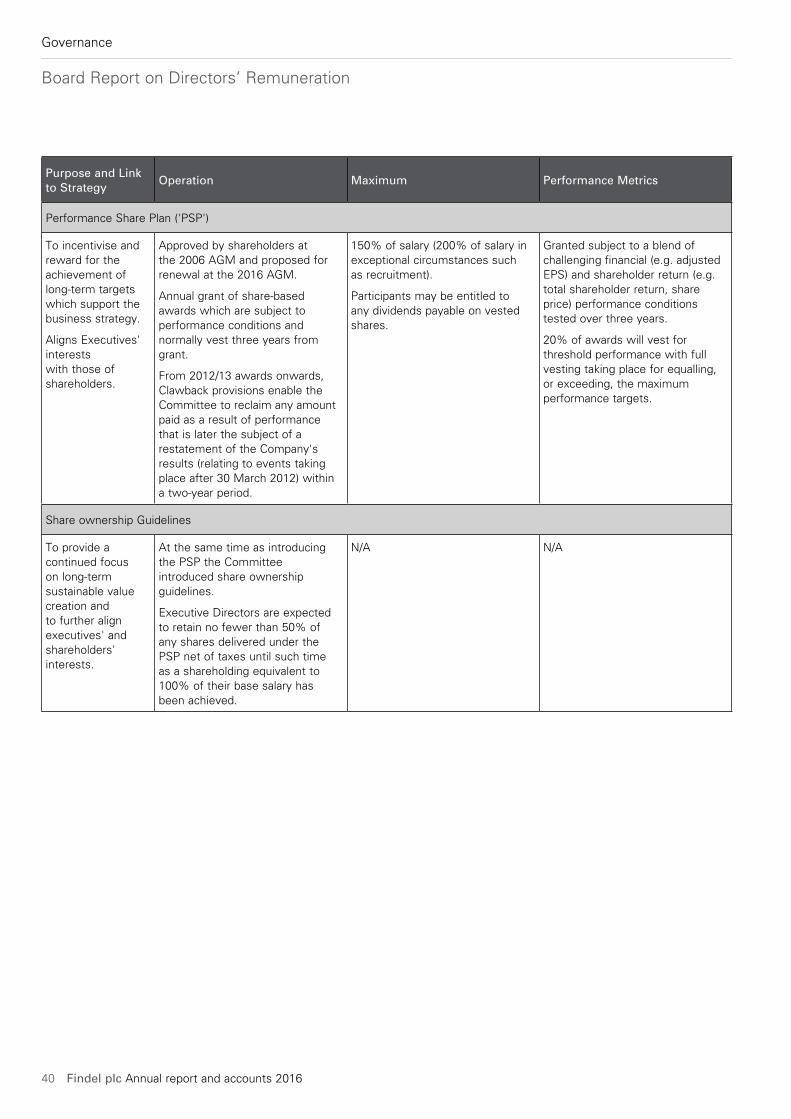
40 Findel plc Annual report and accounts 2016
Governance
Board Report on Directors’ Remuneration
Purpose and Link to Strategy
Operation Maximum Performance Metrics
Performance Share Plan ('PSP')
To incentivise and reward for the achievement of long-term targets which support the business strategy.
Aligns Executives' interests with those of shareholders.
Approved by shareholders at the 2006 AGM and proposed for renewal at the 2016 AGM.
Annual grant of share-based awards which are subject to performance conditions and normally vest three years from grant.
From 2012/13 awards onwards, Clawback provisions enable the Committee to reclaim any amount paid as a result of performance that is later the subject of a restatement of the Company's results (relating to events taking place after 30 March 2012) within a two-year period.
150% of salary (200% of salary in exceptional circumstances such as recruitment).
Participants may be entitled to any dividends payable on vested shares.
Granted subject to a blend of challenging financial (e.g. adjusted EPS) and shareholder return (e.g. total shareholder return, share price) performance conditions tested over three years.
20% of awards will vest for threshold performance with full vesting taking place for equalling, or exceeding, the maximum performance targets.
Share ownership Guidelines
To provide a continued focus on long-term sustainable value creation and to further align executives' and shareholders' interests.
At the same time as introducing the PSP the Committee introduced share ownership guidelines.
Executive Directors are expected to retain no fewer than 50% of any shares delivered under the PSP net of taxes until such time as a shareholding equivalent to 100% of their base salary has been achieved.
N/A N/A
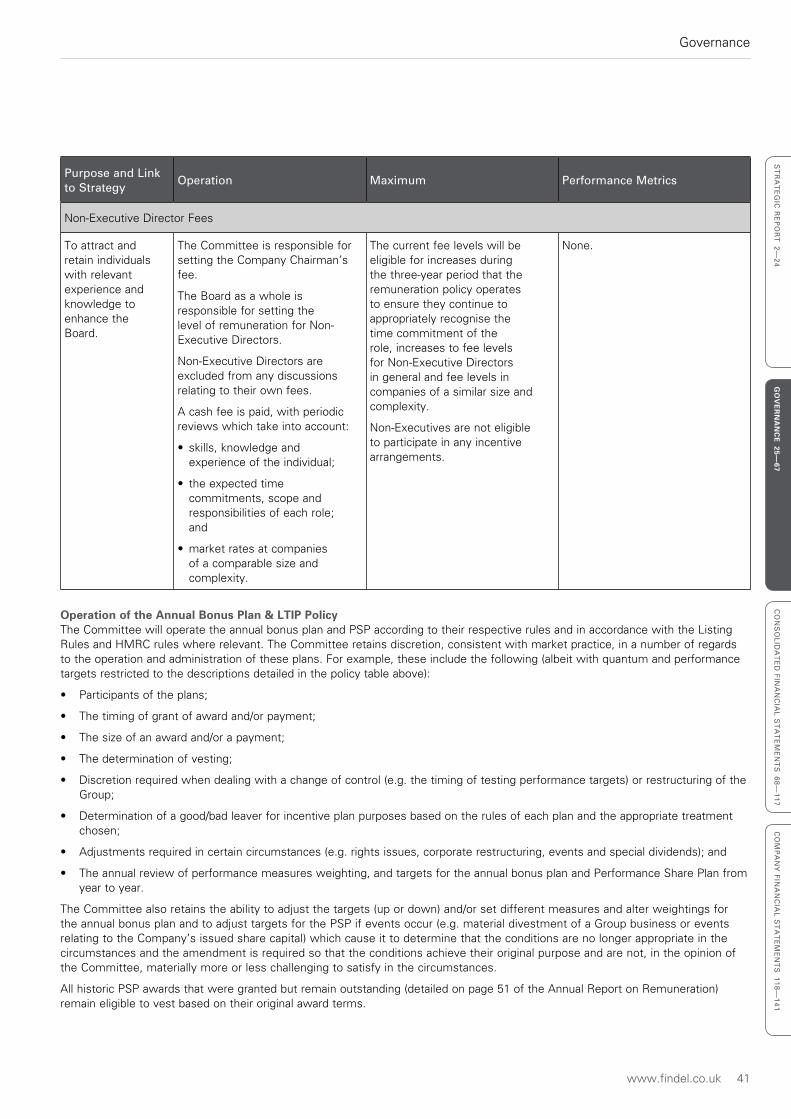
www.findel.co.uk 41
Governance
ST
RA
TE
GIC
RE
PO
RT
2—
24
GO
VE
RN
AN
CE
25—67
CO
NS
OL
IDA
TE
D F
INA
NC
IAL
ST
AT
EM
EN
TS
68
—1
17
CO
MP
AN
Y F
INA
NC
IAL
ST
AT
EM
EN
TS
11
8—
14
1
Purpose and Link to Strategy
Operation Maximum Performance Metrics
Non-Executive Director Fees
To attract and retain individuals with relevant experience and knowledge to enhance the Board.
The Committee is responsible for setting the Company Chairman’s fee.
The Board as a whole is responsible for setting the level of remuneration for Non-Executive Directors.
Non-Executive Directors are excluded from any discussions relating to their own fees.
A cash fee is paid, with periodic reviews which take into account:
• skills, knowledge and experience of the individual;
• the expected time commitments, scope and responsibilities of each role; and
• market rates at companies of a comparable size and complexity.
The current fee levels will be eligible for increases during the three-year period that the remuneration policy operates to ensure they continue to appropriately recognise the time commitment of the role, increases to fee levels for Non-Executive Directors in general and fee levels in companies of a similar size and complexity.
Non-Executives are not eligible to participate in any incentive arrangements.
None.
Operation of the Annual Bonus Plan & LTIP PolicyThe Committee will operate the annual bonus plan and PSP according to their respective rules and in accordance with the Listing Rules and HMRC rules where relevant. The Committee retains discretion, consistent with market practice, in a number of regards to the operation and administration of these plans. For example, these include the following (albeit with quantum and performance targets restricted to the descriptions detailed in the policy table above):
• Participants of the plans;
• The timing of grant of award and/or payment;
• The size of an award and/or a payment;
• The determination of vesting;
• Discretion required when dealing with a change of control (e.g. the timing of testing performance targets) or restructuring of the Group;
• Determination of a good/bad leaver for incentive plan purposes based on the rules of each plan and the appropriate treatment chosen;
• Adjustments required in certain circumstances (e.g. rights issues, corporate restructuring, events and special dividends); and
• The annual review of performance measures weighting, and targets for the annual bonus plan and Performance Share Plan from year to year.
The Committee also retains the ability to adjust the targets (up or down) and/or set different measures and alter weightings for the annual bonus plan and to adjust targets for the PSP if events occur (e.g. material divestment of a Group business or events relating to the Company’s issued share capital) which cause it to determine that the conditions are no longer appropriate in the circumstances and the amendment is required so that the conditions achieve their original purpose and are not, in the opinion of the Committee, materially more or less challenging to satisfy in the circumstances.
All historic PSP awards that were granted but remain outstanding (detailed on page 51 of the Annual Report on Remuneration) remain eligible to vest based on their original award terms.
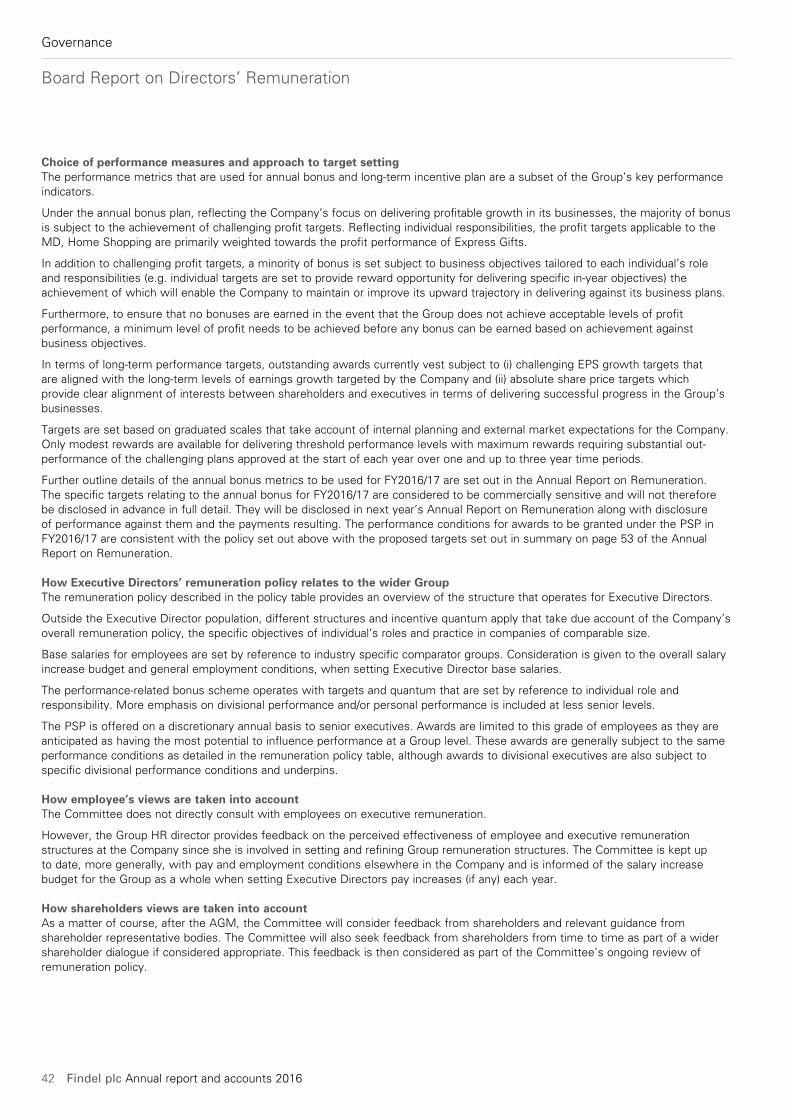
42 Findel plc Annual report and accounts 2016
Governance
Board Report on Directors’ Remuneration
Choice of performance measures and approach to target settingThe performance metrics that are used for annual bonus and long-term incentive plan are a subset of the Group’s key performance indicators.
Under the annual bonus plan, reflecting the Company’s focus on delivering profitable growth in its businesses, the majority of bonus is subject to the achievement of challenging profit targets. Reflecting individual responsibilities, the profit targets applicable to the MD, Home Shopping are primarily weighted towards the profit performance of Express Gifts.
In addition to challenging profit targets, a minority of bonus is set subject to business objectives tailored to each individual’s role and responsibilities (e.g. individual targets are set to provide reward opportunity for delivering specific in-year objectives) the achievement of which will enable the Company to maintain or improve its upward trajectory in delivering against its business plans.
Furthermore, to ensure that no bonuses are earned in the event that the Group does not achieve acceptable levels of profit performance, a minimum level of profit needs to be achieved before any bonus can be earned based on achievement against business objectives.
In terms of long-term performance targets, outstanding awards currently vest subject to (i) challenging EPS growth targets that are aligned with the long-term levels of earnings growth targeted by the Company and (ii) absolute share price targets which provide clear alignment of interests between shareholders and executives in terms of delivering successful progress in the Group’s businesses.
Targets are set based on graduated scales that take account of internal planning and external market expectations for the Company. Only modest rewards are available for delivering threshold performance levels with maximum rewards requiring substantial out-performance of the challenging plans approved at the start of each year over one and up to three year time periods.
Further outline details of the annual bonus metrics to be used for FY2016/17 are set out in the Annual Report on Remuneration. The specific targets relating to the annual bonus for FY2016/17 are considered to be commercially sensitive and will not therefore be disclosed in advance in full detail. They will be disclosed in next year’s Annual Report on Remuneration along with disclosure of performance against them and the payments resulting. The performance conditions for awards to be granted under the PSP in FY2016/17 are consistent with the policy set out above with the proposed targets set out in summary on page 53 of the Annual Report on Remuneration.
How Executive Directors’ remuneration policy relates to the wider GroupThe remuneration policy described in the policy table provides an overview of the structure that operates for Executive Directors.
Outside the Executive Director population, different structures and incentive quantum apply that take due account of the Company’s overall remuneration policy, the specific objectives of individual’s roles and practice in companies of comparable size.
Base salaries for employees are set by reference to industry specific comparator groups. Consideration is given to the overall salary increase budget and general employment conditions, when setting Executive Director base salaries.
The performance-related bonus scheme operates with targets and quantum that are set by reference to individual role and responsibility. More emphasis on divisional performance and/or personal performance is included at less senior levels.
The PSP is offered on a discretionary annual basis to senior executives. Awards are limited to this grade of employees as they are anticipated as having the most potential to influence performance at a Group level. These awards are generally subject to the same performance conditions as detailed in the remuneration policy table, although awards to divisional executives are also subject to specific divisional performance conditions and underpins.
How employee’s views are taken into accountThe Committee does not directly consult with employees on executive remuneration.
However, the Group HR director provides feedback on the perceived effectiveness of employee and executive remuneration structures at the Company since she is involved in setting and refining Group remuneration structures. The Committee is kept up to date, more generally, with pay and employment conditions elsewhere in the Company and is informed of the salary increase budget for the Group as a whole when setting Executive Directors pay increases (if any) each year.
How shareholders views are taken into accountAs a matter of course, after the AGM, the Committee will consider feedback from shareholders and relevant guidance from shareholder representative bodies. The Committee will also seek feedback from shareholders from time to time as part of a wider shareholder dialogue if considered appropriate. This feedback is then considered as part of the Committee’s ongoing review of remuneration policy.
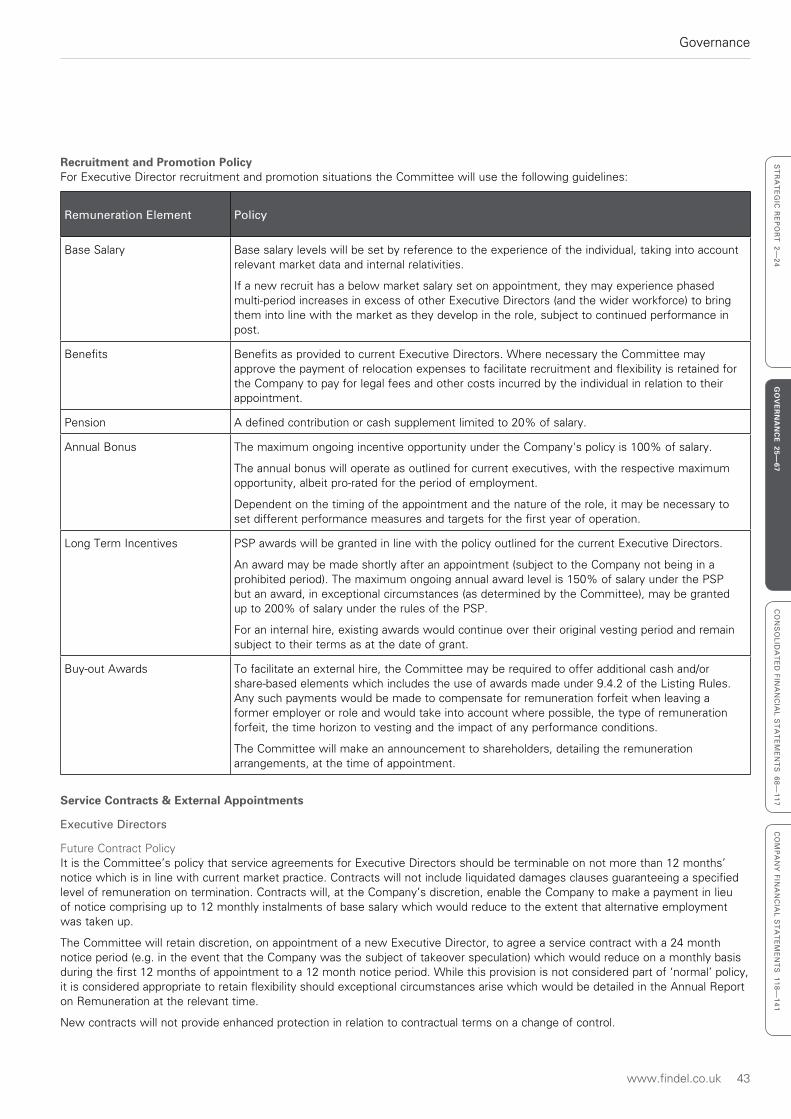
www.findel.co.uk 43
Governance
ST
RA
TE
GIC
RE
PO
RT
2—
24
GO
VE
RN
AN
CE
25—67
CO
NS
OL
IDA
TE
D F
INA
NC
IAL
ST
AT
EM
EN
TS
68
—1
17
CO
MP
AN
Y F
INA
NC
IAL
ST
AT
EM
EN
TS
11
8—
14
1
Recruitment and Promotion PolicyFor Executive Director recruitment and promotion situations the Committee will use the following guidelines:
Remuneration Element Policy
Base Salary Base salary levels will be set by reference to the experience of the individual, taking into account relevant market data and internal relativities.
If a new recruit has a below market salary set on appointment, they may experience phased multi-period increases in excess of other Executive Directors (and the wider workforce) to bring them into line with the market as they develop in the role, subject to continued performance in post.
Benefits Benefits as provided to current Executive Directors. Where necessary the Committee may approve the payment of relocation expenses to facilitate recruitment and flexibility is retained for the Company to pay for legal fees and other costs incurred by the individual in relation to their appointment.
Pension A defined contribution or cash supplement limited to 20% of salary.
Annual Bonus The maximum ongoing incentive opportunity under the Company's policy is 100% of salary.
The annual bonus will operate as outlined for current executives, with the respective maximum opportunity, albeit pro-rated for the period of employment.
Dependent on the timing of the appointment and the nature of the role, it may be necessary to set different performance measures and targets for the first year of operation.
Long Term Incentives PSP awards will be granted in line with the policy outlined for the current Executive Directors.
An award may be made shortly after an appointment (subject to the Company not being in a prohibited period). The maximum ongoing annual award level is 150% of salary under the PSP but an award, in exceptional circumstances (as determined by the Committee), may be granted up to 200% of salary under the rules of the PSP.
For an internal hire, existing awards would continue over their original vesting period and remain subject to their terms as at the date of grant.
Buy-out Awards To facilitate an external hire, the Committee may be required to offer additional cash and/or share-based elements which includes the use of awards made under 9.4.2 of the Listing Rules. Any such payments would be made to compensate for remuneration forfeit when leaving a former employer or role and would take into account where possible, the type of remuneration forfeit, the time horizon to vesting and the impact of any performance conditions.
The Committee will make an announcement to shareholders, detailing the remuneration arrangements, at the time of appointment.
Service Contracts & External Appointments
Executive Directors
Future Contract PolicyIt is the Committee’s policy that service agreements for Executive Directors should be terminable on not more than 12 months’ notice which is in line with current market practice. Contracts will not include liquidated damages clauses guaranteeing a specified level of remuneration on termination. Contracts will, at the Company’s discretion, enable the Company to make a payment in lieu of notice comprising up to 12 monthly instalments of base salary which would reduce to the extent that alternative employment was taken up.
The Committee will retain discretion, on appointment of a new Executive Director, to agree a service contract with a 24 month notice period (e.g. in the event that the Company was the subject of takeover speculation) which would reduce on a monthly basis during the first 12 months of appointment to a 12 month notice period. While this provision is not considered part of ‘normal’ policy, it is considered appropriate to retain flexibility should exceptional circumstances arise which would be detailed in the Annual Report on Remuneration at the relevant time.
New contracts will not provide enhanced protection in relation to contractual terms on a change of control.
44 Findel plc Annual report and accounts 2016
Governance
Board Report on Directors’ Remuneration
Service Contracts of Executive DirectorsThe service contract of Mr Kowalski, dated 2 October 2010, is subject to one year’s rolling notice by either party. In the event of termination of employment, the Company may elect to make up to 12 monthly payments to the value of base salary and benefits that may cease, at the discretion of the Company, to the extent that alternative employment is taken up.
The service contract of Mr Maudsley dated 6 October 1997, is subject to one year’s rolling notice. There are no express provisions included in the contract on termination other than the Company may require the employee to remain away from work during his notice period during which time he would continue to be remunerated.
David Sugden’s letter of appointment as Executive Chairman, dated 27 January 2015 is subject to six month’s rolling notice by either party.
General provisionsIn certain circumstances such as gross misconduct, the Company may terminate employment immediately without notice or payment for each of the current or future Executive Directors. In the event of early termination of a service agreement, the Committee would consider appropriate use of mitigation and phased compensation payments where possible. In addition, any statutory entitlements or payments to settle or compromise claims in connection with a termination of any existing or future Executive Director would be made as necessary. The Committee also retains the discretion to meet any outplacement costs if deemed necessary.
Unless the Committee determines otherwise, annual bonuses are not normally payable if an Executive Director has left or is under notice at the payment date. Any annual bonus payments would normally only be made to an Executive Director who has left or is under notice if the Committee determines him a ‘good leaver’ (e.g. death, injury or disability, redundancy, serious long-term illness, transfer or sale of the employing company, retirement with the Company’s agreement or other circumstances at the discretion of the Committee), in which case a bonus entitlement would be calculated based on the period up to the date of cessation of employment and performance.
The treatment for share-based incentives previously granted to an Executive Director will be determined based on the relevant plan rules. The default treatment will be for outstanding awards to lapse on cessation of employment.
However, in relation to awards granted under the PSP (approved by shareholders at the 2006 AGM), in certain prescribed ‘good leaver’ circumstances (e.g. death, injury or disability, redundancy, serious long-term illness, transfer or sale of the employing company, retirement with the Company’s agreement or other circumstances at the discretion of the Committee) awards may remain eligible to vest subject to performance conditions, which will be measured over the original performance period or up to the date of cessation, with time pro-rating applied unless the Committee considers it inappropriate to do so.
Outside appointmentsThe Company currently allows the Executive Directors to undertake outside interests and appointments, subject to the prior approval of the Board, in which instances they are allowed to retain any fees that they receive in respect of such activities. Mr Sugden is a director of Zenatron Limited and there were no other such arrangements in place during the period under review.
Non-Executive DirectorsThe appointment of non-Executive Directors is for an initial period of three years, subject to review and re-election in General Meeting. They do not have service agreements.
The Letter of Appointment for Mr Tracey is dated 11 November 2009; for Mr Grimsey, 30 January 2012; for Mr Coumau, 2 August 2013; for Mrs Kinney Pritchard (who stepped down from the Board on 28 August 2015), 8 October 2014 and for Mr Greg Ball, 16 February 2016.
Mr Tracey’s letter of appointment entitles him to three months’ notice of termination. The letters of appointment of the other Non-Executive Directors are terminable at will. Save for any payment of fees in lieu of notice to Mr Tracey there is no entitlement to compensation for loss of office in connection with the termination of the services of the Non-Executive Directors.
The service contracts for Group FD and MD Home Shopping and letters of appointment for the Executive Chairman and the Non-Executive Directors are available for inspection at the Company’s registered office during normal business hours and at the AGM (for 15 minutes prior to the meeting and during the meeting).
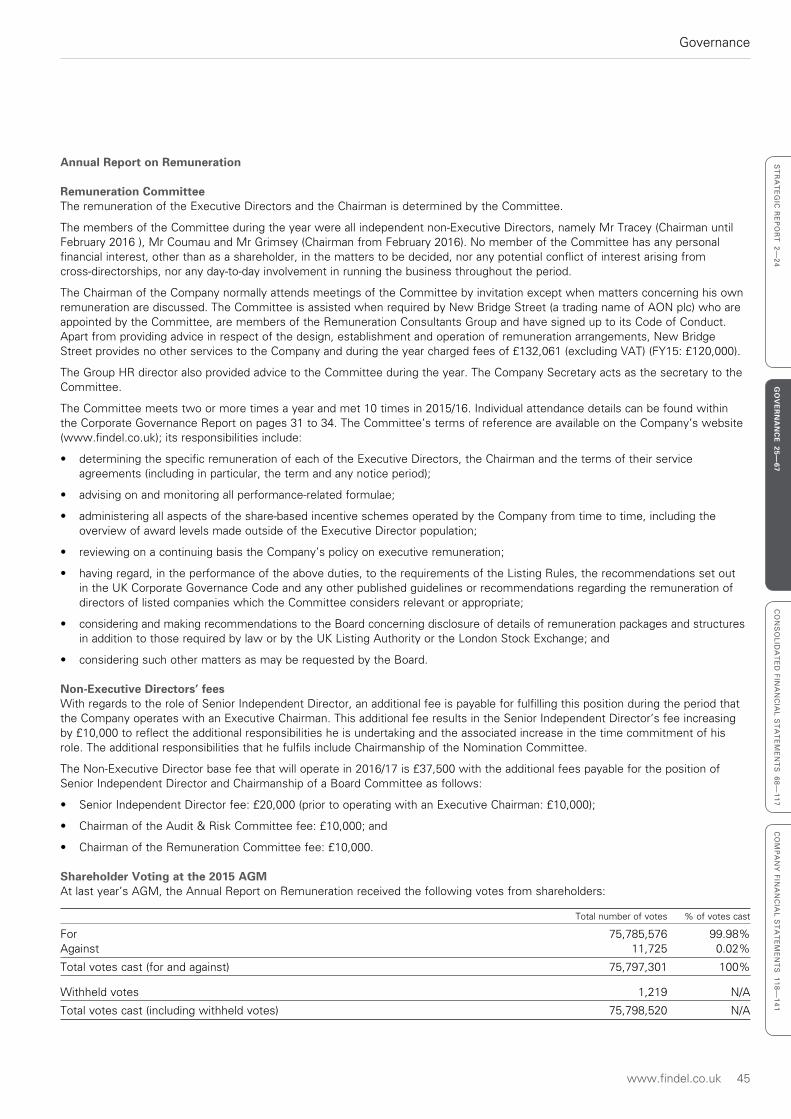
www.findel.co.uk 45
Governance
ST
RA
TE
GIC
RE
PO
RT
2—
24
GO
VE
RN
AN
CE
25—67
CO
NS
OL
IDA
TE
D F
INA
NC
IAL
ST
AT
EM
EN
TS
68
—1
17
CO
MP
AN
Y F
INA
NC
IAL
ST
AT
EM
EN
TS
11
8—
14
1
Annual Report on Remuneration
Remuneration CommitteeThe remuneration of the Executive Directors and the Chairman is determined by the Committee.
The members of the Committee during the year were all independent non-Executive Directors, namely Mr Tracey (Chairman until February 2016 ), Mr Coumau and Mr Grimsey (Chairman from February 2016). No member of the Committee has any personal financial interest, other than as a shareholder, in the matters to be decided, nor any potential conflict of interest arising from cross-directorships, nor any day-to-day involvement in running the business throughout the period.
The Chairman of the Company normally attends meetings of the Committee by invitation except when matters concerning his own remuneration are discussed. The Committee is assisted when required by New Bridge Street (a trading name of AON plc) who are appointed by the Committee, are members of the Remuneration Consultants Group and have signed up to its Code of Conduct. Apart from providing advice in respect of the design, establishment and operation of remuneration arrangements, New Bridge Street provides no other services to the Company and during the year charged fees of £132,061 (excluding VAT) (FY15: £120,000).
The Group HR director also provided advice to the Committee during the year. The Company Secretary acts as the secretary to the Committee.
The Committee meets two or more times a year and met 10 times in 2015/16. Individual attendance details can be found within the Corporate Governance Report on pages 31 to 34. The Committee’s terms of reference are available on the Company’s website (www.findel.co.uk); its responsibilities include:
• determining the specific remuneration of each of the Executive Directors, the Chairman and the terms of their service agreements (including in particular, the term and any notice period);
• advising on and monitoring all performance-related formulae;
• administering all aspects of the share-based incentive schemes operated by the Company from time to time, including the overview of award levels made outside of the Executive Director population;
• reviewing on a continuing basis the Company’s policy on executive remuneration;
• having regard, in the performance of the above duties, to the requirements of the Listing Rules, the recommendations set out in the UK Corporate Governance Code and any other published guidelines or recommendations regarding the remuneration of directors of listed companies which the Committee considers relevant or appropriate;
• considering and making recommendations to the Board concerning disclosure of details of remuneration packages and structures in addition to those required by law or by the UK Listing Authority or the London Stock Exchange; and
• considering such other matters as may be requested by the Board.
Non-Executive Directors’ feesWith regards to the role of Senior Independent Director, an additional fee is payable for fulfilling this position during the period that the Company operates with an Executive Chairman. This additional fee results in the Senior Independent Director’s fee increasing by £10,000 to reflect the additional responsibilities he is undertaking and the associated increase in the time commitment of his role. The additional responsibilities that he fulfils include Chairmanship of the Nomination Committee.
The Non-Executive Director base fee that will operate in 2016/17 is £37,500 with the additional fees payable for the position of Senior Independent Director and Chairmanship of a Board Committee as follows:
• Senior Independent Director fee: £20,000 (prior to operating with an Executive Chairman: £10,000);
• Chairman of the Audit & Risk Committee fee: £10,000; and
• Chairman of the Remuneration Committee fee: £10,000.
Shareholder Voting at the 2015 AGMAt last year’s AGM, the Annual Report on Remuneration received the following votes from shareholders:
Total number of votes % of votes cast
For 75,785,576 99.98%Against 11,725 0.02%
Total votes cast (for and against) 75,797,301 100%
Withheld votes 1,219 N/A
Total votes cast (including withheld votes) 75,798,520 N/A
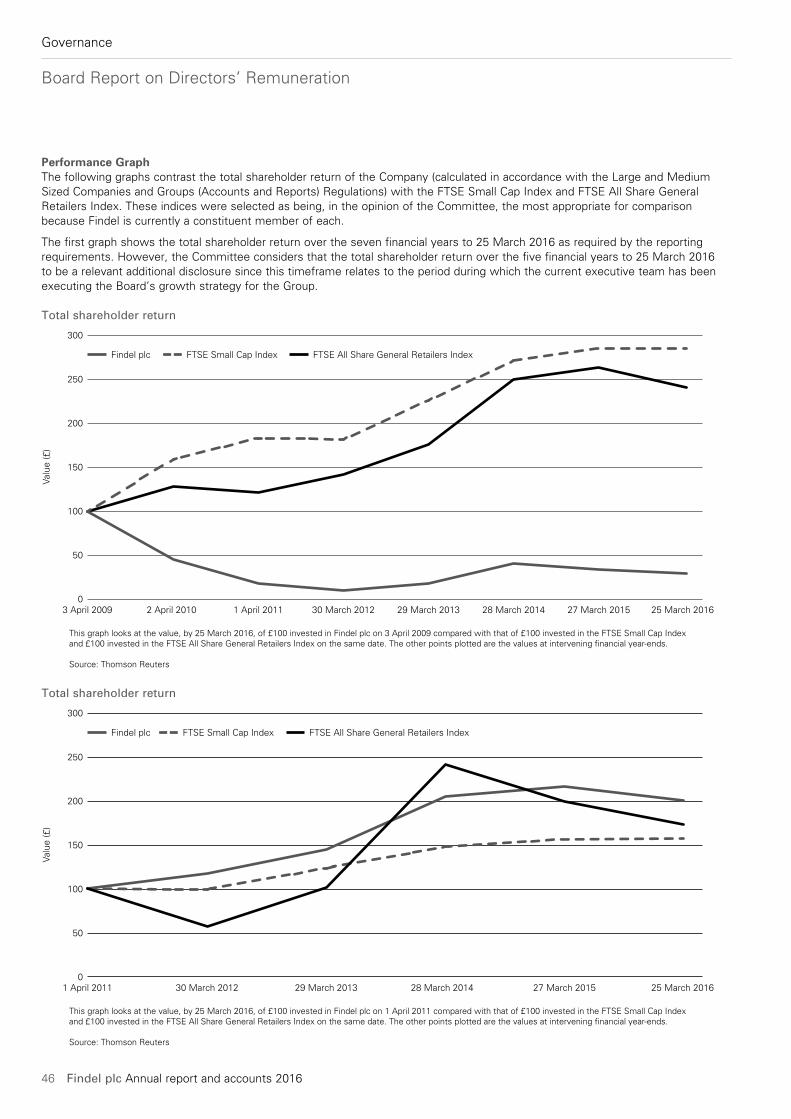
46 Findel plc Annual report and accounts 2016
Governance
Board Report on Directors’ Remuneration
Performance GraphThe following graphs contrast the total shareholder return of the Company (calculated in accordance with the Large and Medium Sized Companies and Groups (Accounts and Reports) Regulations) with the FTSE Small Cap Index and FTSE All Share General Retailers Index. These indices were selected as being, in the opinion of the Committee, the most appropriate for comparison because Findel is currently a constituent member of each.
The first graph shows the total shareholder return over the seven financial years to 25 March 2016 as required by the reporting requirements. However, the Committee considers that the total shareholder return over the five financial years to 25 March 2016 to be a relevant additional disclosure since this timeframe relates to the period during which the current executive team has been executing the Board’s growth strategy for the Group.
Total shareholder return
0
50
100
150
200
250
300
3 April 2009 2 April 2010 1 April 2011 30 March 2012 29 March 2013 25 March 201627 March 201528 March 2014
Valu
e (£
)
Findel plc FTSE Small Cap Index FTSE All Share General Retailers Index
This graph looks at the value, by 25 March 2016, of £100 invested in Findel plc on 3 April 2009 compared with that of £100 invested in the FTSE Small Cap Indexand £100 invested in the FTSE All Share General Retailers Index on the same date. The other points plotted are the values at intervening financial year-ends.
Source: Thomson Reuters
Total shareholder return
0
50
100
150
200
250
300
1 April 2011 30 March 2012 29 March 2013 25 March 201627 March 201528 March 2014
Valu
e (£
)
Findel plc FTSE Small Cap Index FTSE All Share General Retailers Index
This graph looks at the value, by 25 March 2016, of £100 invested in Findel plc on 1 April 2011 compared with that of £100 invested in the FTSE Small Cap Indexand £100 invested in the FTSE All Share General Retailers Index on the same date. The other points plotted are the values at intervening financial year-ends.
Source: Thomson Reuters
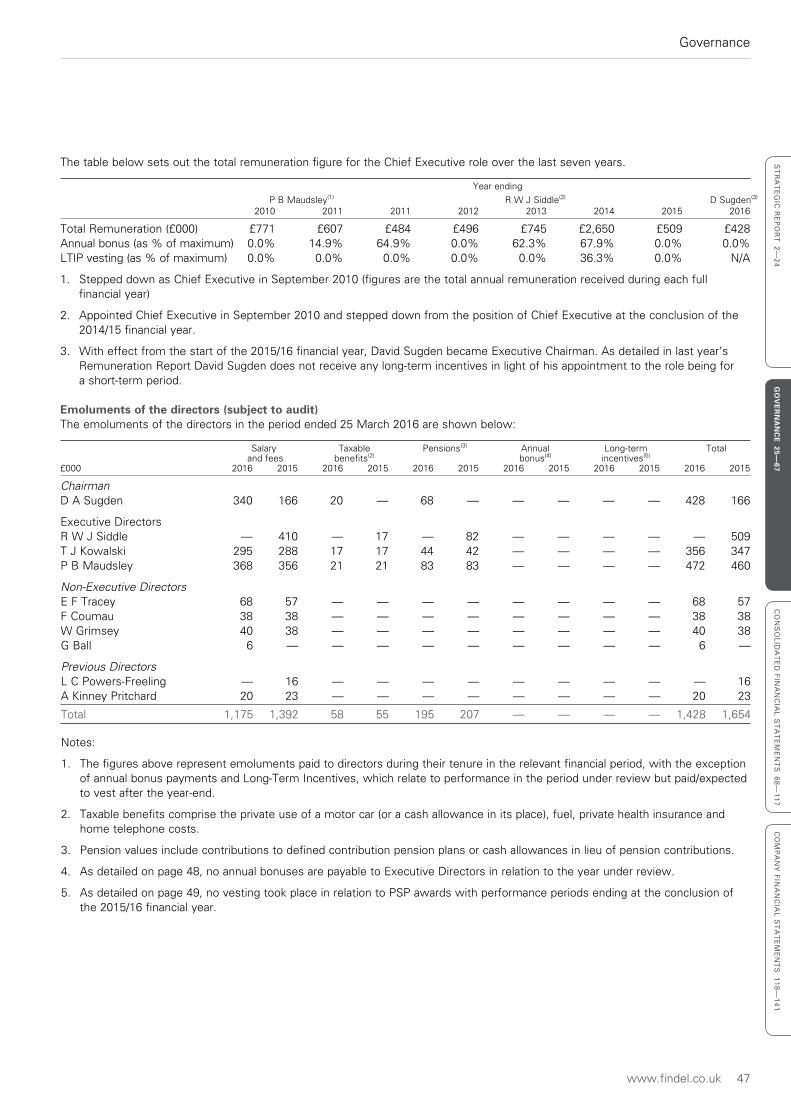
www.findel.co.uk 47
Governance
ST
RA
TE
GIC
RE
PO
RT
2—
24
GO
VE
RN
AN
CE
25—67
CO
NS
OL
IDA
TE
D F
INA
NC
IAL
ST
AT
EM
EN
TS
68
—1
17
CO
MP
AN
Y F
INA
NC
IAL
ST
AT
EM
EN
TS
11
8—
14
1
The table below sets out the total remuneration figure for the Chief Executive role over the last seven years.
Year ending
P B Maudsley(1) R W J Siddle(2) D Sugden(3)
2010 2011 2011 2012 2013 2014 2015 2016
Total Remuneration (£000) £771 £607 £484 £496 £745 £2,650 £509 £428Annual bonus (as % of maximum) 0.0% 14.9% 64.9% 0.0% 62.3% 67.9% 0.0% 0.0%LTIP vesting (as % of maximum) 0.0% 0.0% 0.0% 0.0% 0.0% 36.3% 0.0% N/A
1. Stepped down as Chief Executive in September 2010 (figures are the total annual remuneration received during each full financial year)
2. Appointed Chief Executive in September 2010 and stepped down from the position of Chief Executive at the conclusion of the 2014/15 financial year.
3. With effect from the start of the 2015/16 financial year, David Sugden became Executive Chairman. As detailed in last year’s Remuneration Report David Sugden does not receive any long-term incentives in light of his appointment to the role being for a short-term period.
Emoluments of the directors (subject to audit)The emoluments of the directors in the period ended 25 March 2016 are shown below:
Salary Taxable Pensions(3) Annual Long-term Total and fees benefits(2) bonus(4) incentives(5)
£000 2016 2015 2016 2015 2016 2015 2016 2015 2016 2015 2016 2015
ChairmanD A Sugden 340 166 20 — 68 — — — — — 428 166
Executive DirectorsR W J Siddle — 410 — 17 — 82 — — — — — 509T J Kowalski 295 288 17 17 44 42 — — — — 356 347P B Maudsley 368 356 21 21 83 83 — — — — 472 460
Non-Executive DirectorsE F Tracey 68 57 — — — — — — — — 68 57F Coumau 38 38 — — — — — — — — 38 38W Grimsey 40 38 — — — — — — — — 40 38G Ball 6 — — — — — — — — — 6 —
Previous DirectorsL C Powers-Freeling — 16 — — — — — — — — — 16A Kinney Pritchard 20 23 — — — — — — — — 20 23
Total 1,175 1,392 58 55 195 207 — — — — 1,428 1,654
Notes:
1. The figures above represent emoluments paid to directors during their tenure in the relevant financial period, with the exception of annual bonus payments and Long-Term Incentives, which relate to performance in the period under review but paid/expected to vest after the year-end.
2. Taxable benefits comprise the private use of a motor car (or a cash allowance in its place), fuel, private health insurance and home telephone costs.
3. Pension values include contributions to defined contribution pension plans or cash allowances in lieu of pension contributions.
4. As detailed on page 48, no annual bonuses are payable to Executive Directors in relation to the year under review.
5. As detailed on page 49, no vesting took place in relation to PSP awards with performance periods ending at the conclusion of the 2015/16 financial year.
48 Findel plc Annual report and accounts 2016
Governance
Board Report on Directors’ Remuneration
2015/16 Annual bonus (subject to audit)The 2015/16 performance related bonus plan maximum is 100% of salary for the Finance Director and MD, Home Shopping and was set at a full-year equivalent of £300,000 for the Executive Chairman.
With regards to the proportion of the total bonus that could be earned against each element, 60% of the maximum opportunity was based on profit performance (split as 40% based on Express Gifts operating profit and 20% on Group profit before tax in the case of the MD, Home Shopping), with 20% based on individually tailored strategic targets and 20% against business transformation targets set to be aligned with the implementation of policies and practice around treating customers fairly.
The non-financial targets were subject to achieving a threshold level of profitability before any payments could be made for non-financial performance. In addition, the entire bonus was also subject to a further underpin that enables the Committee to scale the bonus back to zero if there were any material instances of inappropriate outcomes for customers.
The annual profit targets were set on a sliding scale and for the purposes of the 2015/16 annual bonus were as shown in the table below:
Profit Performance Threshold Max
Group profit before tax* £27.0m £31.3mExpress Gifts operating profit** £36.3m £42.7m* Group profit before tax is stated before exceptional items and was adjusted to remove the impact of Kitbag which was divested towards the end of the
financial year
** The Express Gifts annual operating profit figures used in the plan exclude the allocation of central PLC costs and are stated before exceptional items
Based on actual figures of £24.8m for Group profit before tax (before exceptional items) and £31.7m for Express Gifts operating profit (before exceptional items), the threshold targets were not met.
With regards to performance against non-financial targets, the Executive Directors in part shared common objectives in relation to key Group strategic priorities but were also subject to tailored individual targets.
In terms of the common objectives, these included achieving net debt, cash management and execution of business transformation targets. The cash management targets were achieved following compliance with the Group’s relevant covenants. The year-end net debt target was narrowly missed (with year-end net debt being £216.7m which was above the target of £205.7m).With regards to individually tailored targets, these included (i) ensuring an effective and stable top level management structure and (ii) developing a Board approved strategy for Kitbag and Findel Education (Executive Chairman), (iii) achieving a successful medium term refinancing of bank debt (Executive Chairman and Finance Director) and (iv) developing and implementing planned elements of the EGL management development and succession plan (Executive Chairman and MD, Home Shopping).
When assessing performance against these specific measures the Committee considered a broad range of reference points, both qualitative and quantitative where possible and concluded that targets had been partially met. There were some significant successes (e.g. the sale of Kitbag), the appointment of the Marketing Director and IT Directors to strengthen EGL’s succession plan. However, in light of the financial performance noted above (i.e. failure to meet the threshold profit target), no bonuses against the above targets, (either financial or non-financial) were payable. Disclosure in relation to personal performance against targets set is limited to that described above. This is on the basis that full disclosure would include commercially sensitive information (e.g. specific details relating to the sale of Kitbag) and, as a result, it is not expected that further details will be disclosed. Should the disclosure of further details no longer be considered commercially sensitive in a year’s time, relevant details would be included in next year’s Directors’ Remuneration Report.
When testing performance against the business transformation targets the Committee considered the processes and controls which have been embedded into the business over the last year against the targets set, and the execution of the action plan developed to support the FCA application process. Progress has been made against a number of milestones which included implementing a Voice of the Customer platform, improving customer communications across all channels of the sales process, documenting all sales policies and procedures in line with FCA requirements, implementing improved real time credit scoring of customers, improving the customer supply chain and broadening the range of products offered to customers. However, as above for the other non-financial targets set, since the threshold profit target was not met, no bonus was payable in relation to this part of the bonus.
In summary, as a result of not meeting the threshold profit target, no bonuses were payable notwithstanding the progress achieved against the non-financial targets noted above.
www.findel.co.uk 49
Governance
ST
RA
TE
GIC
RE
PO
RT
2—
24
GO
VE
RN
AN
CE
25—67
CO
NS
OL
IDA
TE
D F
INA
NC
IAL
ST
AT
EM
EN
TS
68
—1
17
CO
MP
AN
Y F
INA
NC
IAL
ST
AT
EM
EN
TS
11
8—
14
1
Directors’ pension entitlements (subject to audit)In addition to the pension contributions set out in the table above, Mr Maudsley was a deferred member of the Findel Group Pension Fund, a defined benefit scheme, during the year. He is the only director who had accrued entitlements under the Fund as follows:
Increase Transfer Accrued Accrued Increase Transfer Transfer Increase in value of pension pension in value of value of in accrued increase 25 March 27 March accrued accrued accrued transfer pension 2016 2015 pension pension pension value excluding including 25 March 27 March over the inflation inflation 2016 2015 period £000 £000 £000 £000 £000 £000 £000 £000
— — N/A 134 — N/A 2,184 —
As a deferred member, Mr Maudsley no longer accrued benefits under the defined benefit scheme. However, in line with the preservation requirements his pension was eligible to be increased in line with inflation with his normal retirement age for the defined benefit scheme being 65. His defined pension benefits had Enhanced Protection. Contributions are made by the Group on an ongoing basis in relation to meeting the funding requirements of the benefits accrued on behalf of all pension plan members.
The pension entitlements shown above are those which would have been paid annually on retirement based on service to the end of the period, but exclude any future statutory entitlement to increases, up to retirement. The transfer value was calculated on the basis of actuarial advice in accordance with the relevant regulations.
The transfer values disclosed above did not represent a sum paid or payable to the individual director. Instead they represent a potential liability of the pension scheme. Mr Maudsley elected to transfer his benefits out of the Findel Group Pension Fund on 18 December 2015. There was no increase in his pension entitlements between 27 March 2015 and his transfer out on 18 December 2015. The transfer value in lieu of his benefits on 18 December 2015 totalled £2,209,962.
The Non-Executive Directors do not receive pension benefits.
Directors’ Share Options and Long-Term Incentive Plans (subject to audit)
Awards vesting in relation to FY2015/16The performance conditions for the awards granted in July 2013 are an equal blend of EPS* growth and share price appreciation targets. In summary the absolute share price targets range from 270p to 475p, and EPS* targets range from 25.8p to 33.8p.
The average share price for the three months to 31 March 2016 was 193p. This was below the threshold target so this element of the awards lapsed in full. The Company’s adjusted EPS* of 22.7p resulted in this element of the awards also lapsing in full. These awards would otherwise have been eligible for vesting in July 2016, subject to continued service requirements.* Before exceptional items
PSP Awards in FY2015/16Due to a prolonged closed period as the result of corporate activity, the Committee was unable to grant PSP awards to Executive Directors until March 2016. At this time an award of 100% of salary was made to the Finance Director. Following a comprehensive review of his arrangements, the Committee determined it appropriate to make an exceptional award of 200% of salary to the MD, Home Shopping. When making this decision the Committee considered a number of factors including:
• The streamlining of the Group that had taken place over the past few years which further increased the importance of the performance of Express Gifts to that of the overall Group;
• The transition to a new Group Executive Chairman, which will become a permanent role once a successor to David Sugden is identified, allied to the increased risk of corporate activity following the simplification of the Group as a result of the successful disposal of Kitbag, creating a period of instability and potential distraction at a time when continued focus is needed on key initiatives to reinvigorate sales growth in order to deliver the significant improvement in results planned for FY2017/18; and
• Ensuring EGL has a leadership team with the appropriate personnel and skills to work with the Group Board to deliver against its long-term strategy in a period of rapid change in both on-line retailing and the regulation and marketing of retail financial services.
50 Findel plc Annual report and accounts 2016
Governance
Board Report on Directors’ Remuneration
However, mindful of the fact that the approach does provide a higher potential reward if the challenging performance targets are met, no further long-term incentive award will be granted in FY2016/17 to the MD, Home Shopping in light of the quantum of the FY2015/16 exceptional award.
With regards to the performance targets applicable to the awards granted in FY2015/16, they were set on the basis of challenging absolute Total Shareholder Return (“TSR”) targets. The use of an absolute TSR metric was considered preferable at the start of the current year given our expected streamlining of the Group during the year and the desire to set stretching targets mindful of the size of the awards being granted (e.g. maximum vesting under the targets was set to require annualised growth well above that historically required to achieve upper quartile performance where a relative TSR condition was used against a relevant general FTSE Index such as the FTSE Small Cap). Using financial targets (such as EPS) would have required the Committee to consider adjusting the impact of disposals out of the condition when it was tested. Use of TSR does not require such adjustments to be made and therefore was considered a cleaner measure of our success. Furthermore, absolute growth in TSR provides clear alignment between shareholders’ returns and the reward of the Executive team.
The absolute share price targets are as follows:
Three month average share price to 31 March 2018 Percentage of Shares subject to (prior to any dividend adjustment) the share price performance condition that vest
Below 310p 0%310p 20%410p or higher 100%
Straight line vesting between each performance point
While the Committee continues to believe that absolute TSR is the best measure of success through to 31 March 2018, a number of underpins will apply to ensure that share price growth is underpinned by the achievement of both our financial plans and our key strategic objectives. The underpins that will also apply (enabling the Committee to scale back vesting, including to zero if these are not met) are as follows:
• EPS (before exceptional items) for the FY2017/18 must be at least 32.2p; and/or
• There have been no material incidences of bad behaviour of any employee within the Company’s group in relation to “treating customers fairly” during the Performance Period.
• For Phil Maudsley only – the work to date on ensuring that the EGL leadership team has the appropriate skills and calibre to take the business forward is completed (i.e. ensuring we have the appropriate balance of skills in the team to meet heightened regulatory requirements and the necessary talent pipeline in place).
The details of the awards granted, which are measured over performance to 31 March 2018, are included in the table below:
Type of Basis of Share price Number of Face value % of face award award at date of shares of award value which granted grant(1) awarded vests at threshold
Finance Director Nil cost option 100% of salary 197.35p 145,946 £288,025 20%MD, Home Shopping Nil cost option 200% of salary 188.60p 389,978 £733,500 20%
1. The Committee had previously agreed that awards to the Finance Director (and other senior executives) should be based on the share price at the notional date of grant which was in July 2015 (when awards to other participants were made). The share price used in respect of MD, Home Shopping awards was the five day average prior to the date of grant on 1 March 2016.
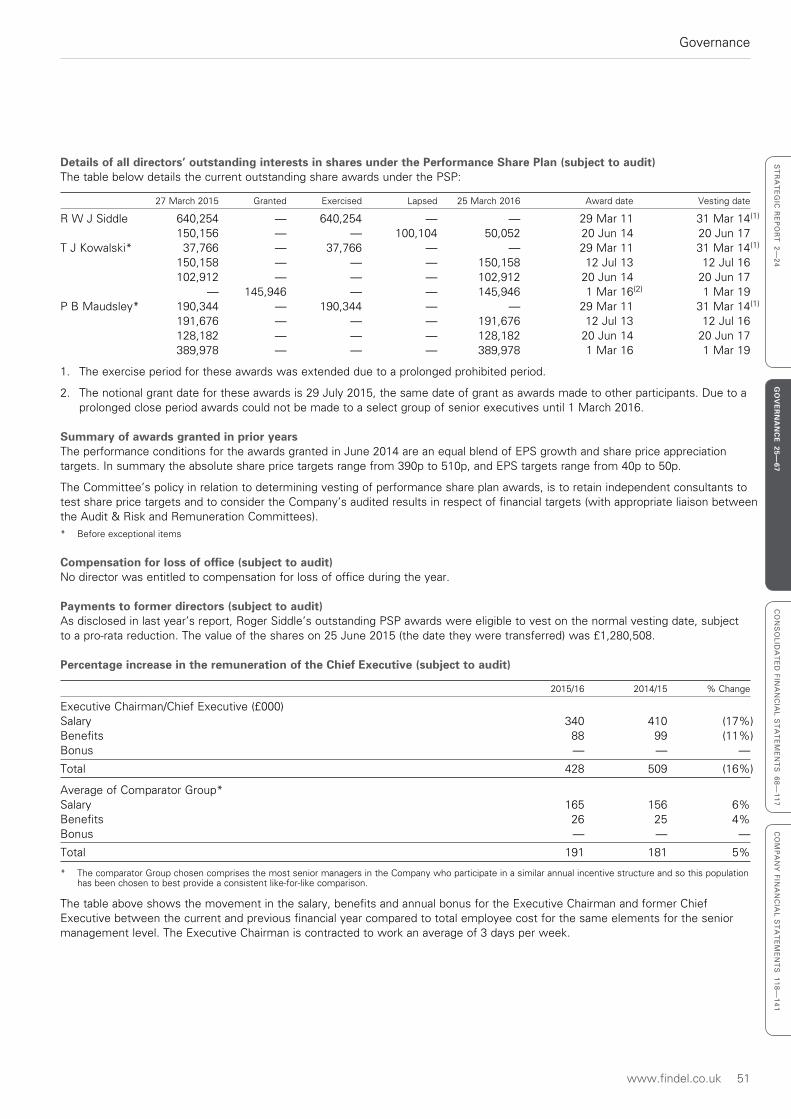
www.findel.co.uk 51
Governance
ST
RA
TE
GIC
RE
PO
RT
2—
24
GO
VE
RN
AN
CE
25—67
CO
NS
OL
IDA
TE
D F
INA
NC
IAL
ST
AT
EM
EN
TS
68
—1
17
CO
MP
AN
Y F
INA
NC
IAL
ST
AT
EM
EN
TS
11
8—
14
1
Details of all directors’ outstanding interests in shares under the Performance Share Plan (subject to audit)The table below details the current outstanding share awards under the PSP:
27 March 2015 Granted Exercised Lapsed 25 March 2016 Award date Vesting date
R W J Siddle 640,254 — 640,254 — — 29 Mar 11 31 Mar 14(1)
150,156 — — 100,104 50,052 20 Jun 14 20 Jun 17T J Kowalski* 37,766 — 37,766 — — 29 Mar 11 31 Mar 14(1)
150,158 — — — 150,158 12 Jul 13 12 Jul 16 102,912 — — — 102,912 20 Jun 14 20 Jun 17 — 145,946 — — 145,946 1 Mar 16(2) 1 Mar 19P B Maudsley* 190,344 — 190,344 — — 29 Mar 11 31 Mar 14(1)
191,676 — — — 191,676 12 Jul 13 12 Jul 16 128,182 — — — 128,182 20 Jun 14 20 Jun 17 389,978 — — — 389,978 1 Mar 16 1 Mar 19
1. The exercise period for these awards was extended due to a prolonged prohibited period.
2. The notional grant date for these awards is 29 July 2015, the same date of grant as awards made to other participants. Due to a prolonged close period awards could not be made to a select group of senior executives until 1 March 2016.
Summary of awards granted in prior yearsThe performance conditions for the awards granted in June 2014 are an equal blend of EPS growth and share price appreciation targets. In summary the absolute share price targets range from 390p to 510p, and EPS targets range from 40p to 50p.
The Committee’s policy in relation to determining vesting of performance share plan awards, is to retain independent consultants to test share price targets and to consider the Company’s audited results in respect of financial targets (with appropriate liaison between the Audit & Risk and Remuneration Committees).* Before exceptional items
Compensation for loss of office (subject to audit)No director was entitled to compensation for loss of office during the year.
Payments to former directors (subject to audit)As disclosed in last year’s report, Roger Siddle’s outstanding PSP awards were eligible to vest on the normal vesting date, subject to a pro-rata reduction. The value of the shares on 25 June 2015 (the date they were transferred) was £1,280,508.
Percentage increase in the remuneration of the Chief Executive (subject to audit)
2015/16 2014/15 % Change
Executive Chairman/Chief Executive (£000)Salary 340 410 (17%)Benefits 88 99 (11%)Bonus — — —
Total 428 509 (16%)
Average of Comparator Group*Salary 165 156 6%Benefits 26 25 4%Bonus — — —
Total 191 181 5%
* The comparator Group chosen comprises the most senior managers in the Company who participate in a similar annual incentive structure and so this population has been chosen to best provide a consistent like-for-like comparison.
The table above shows the movement in the salary, benefits and annual bonus for the Executive Chairman and former Chief Executive between the current and previous financial year compared to total employee cost for the same elements for the senior management level. The Executive Chairman is contracted to work an average of 3 days per week.
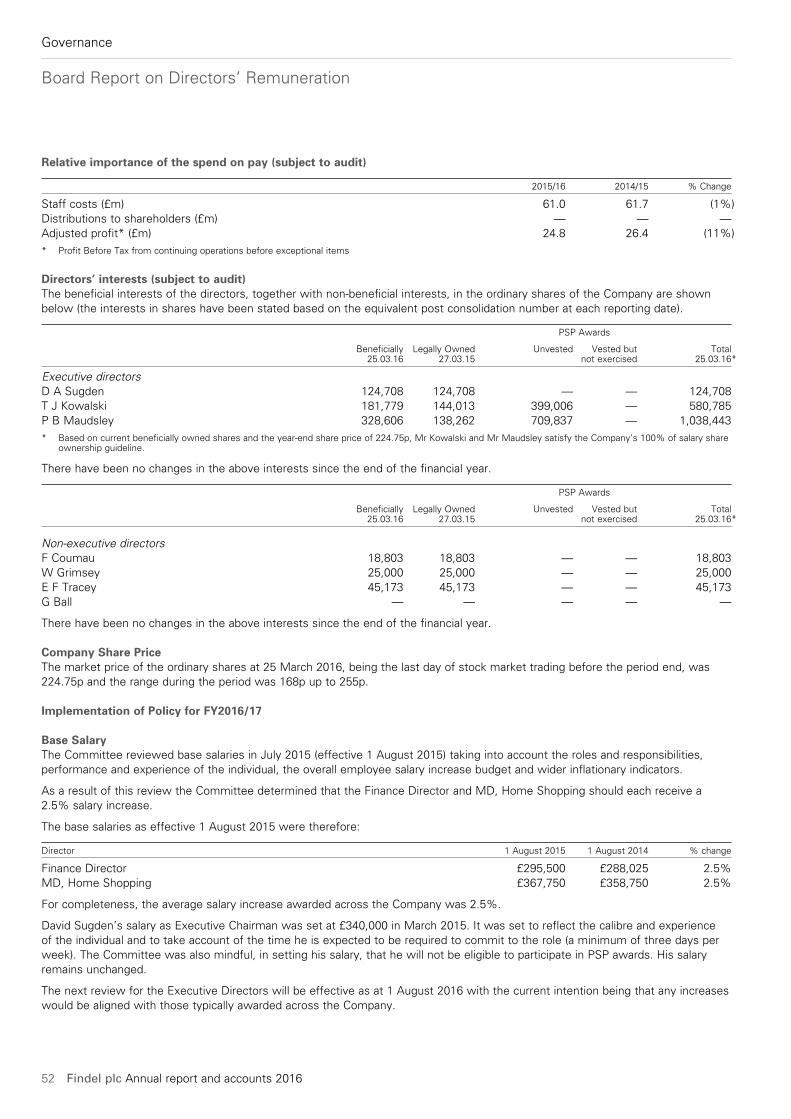
52 Findel plc Annual report and accounts 2016
Governance
Board Report on Directors’ Remuneration
Relative importance of the spend on pay (subject to audit)
2015/16 2014/15 % Change
Staff costs (£m) 61.0 61.7 (1%)Distributions to shareholders (£m) — — —Adjusted profit* (£m) 24.8 26.4 (11%)* Profit Before Tax from continuing operations before exceptional items
Directors’ interests (subject to audit)The beneficial interests of the directors, together with non-beneficial interests, in the ordinary shares of the Company are shown below (the interests in shares have been stated based on the equivalent post consolidation number at each reporting date).
PSP Awards
Beneficially Legally Owned Unvested Vested but Total 25.03.16 27.03.15 not exercised 25.03.16*
Executive directorsD A Sugden 124,708 124,708 — — 124,708T J Kowalski 181,779 144,013 399,006 — 580,785P B Maudsley 328,606 138,262 709,837 — 1,038,443* Based on current beneficially owned shares and the year-end share price of 224.75p, Mr Kowalski and Mr Maudsley satisfy the Company’s 100% of salary share
ownership guideline.
There have been no changes in the above interests since the end of the financial year.
PSP Awards
Beneficially Legally Owned Unvested Vested but Total 25.03.16 27.03.15 not exercised 25.03.16*
Non-executive directorsF Coumau 18,803 18,803 — — 18,803W Grimsey 25,000 25,000 — — 25,000E F Tracey 45,173 45,173 — — 45,173G Ball — — — — —
There have been no changes in the above interests since the end of the financial year.
Company Share PriceThe market price of the ordinary shares at 25 March 2016, being the last day of stock market trading before the period end, was 224.75p and the range during the period was 168p up to 255p.
Implementation of Policy for FY2016/17
Base SalaryThe Committee reviewed base salaries in July 2015 (effective 1 August 2015) taking into account the roles and responsibilities, performance and experience of the individual, the overall employee salary increase budget and wider inflationary indicators.
As a result of this review the Committee determined that the Finance Director and MD, Home Shopping should each receive a 2.5% salary increase.
The base salaries as effective 1 August 2015 were therefore:
Director 1 August 2015 1 August 2014 % change
Finance Director £295,500 £288,025 2.5%MD, Home Shopping £367,750 £358,750 2.5%
For completeness, the average salary increase awarded across the Company was 2.5%.
David Sugden’s salary as Executive Chairman was set at £340,000 in March 2015. It was set to reflect the calibre and experience of the individual and to take account of the time he is expected to be required to commit to the role (a minimum of three days per week). The Committee was also mindful, in setting his salary, that he will not be eligible to participate in PSP awards. His salary remains unchanged.
The next review for the Executive Directors will be effective as at 1 August 2016 with the current intention being that any increases would be aligned with those typically awarded across the Company.
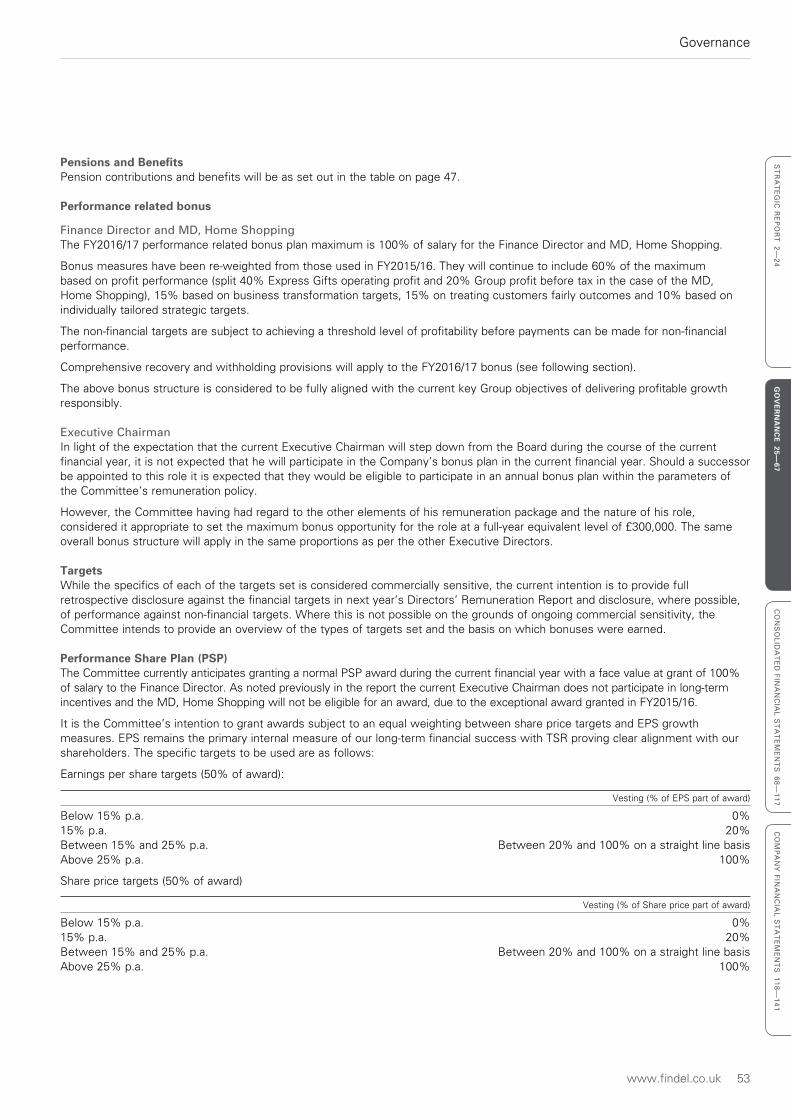
www.findel.co.uk 53
Governance
ST
RA
TE
GIC
RE
PO
RT
2—
24
GO
VE
RN
AN
CE
25—67
CO
NS
OL
IDA
TE
D F
INA
NC
IAL
ST
AT
EM
EN
TS
68
—1
17
CO
MP
AN
Y F
INA
NC
IAL
ST
AT
EM
EN
TS
11
8—
14
1
Pensions and BenefitsPension contributions and benefits will be as set out in the table on page 47.
Performance related bonus
Finance Director and MD, Home ShoppingThe FY2016/17 performance related bonus plan maximum is 100% of salary for the Finance Director and MD, Home Shopping.
Bonus measures have been re-weighted from those used in FY2015/16. They will continue to include 60% of the maximum based on profit performance (split 40% Express Gifts operating profit and 20% Group profit before tax in the case of the MD, Home Shopping), 15% based on business transformation targets, 15% on treating customers fairly outcomes and 10% based on individually tailored strategic targets.
The non-financial targets are subject to achieving a threshold level of profitability before payments can be made for non-financial performance.
Comprehensive recovery and withholding provisions will apply to the FY2016/17 bonus (see following section).
The above bonus structure is considered to be fully aligned with the current key Group objectives of delivering profitable growth responsibly.
Executive ChairmanIn light of the expectation that the current Executive Chairman will step down from the Board during the course of the current financial year, it is not expected that he will participate in the Company’s bonus plan in the current financial year. Should a successor be appointed to this role it is expected that they would be eligible to participate in an annual bonus plan within the parameters of the Committee’s remuneration policy.
However, the Committee having had regard to the other elements of his remuneration package and the nature of his role, considered it appropriate to set the maximum bonus opportunity for the role at a full-year equivalent level of £300,000. The same overall bonus structure will apply in the same proportions as per the other Executive Directors.
TargetsWhile the specifics of each of the targets set is considered commercially sensitive, the current intention is to provide full retrospective disclosure against the financial targets in next year’s Directors’ Remuneration Report and disclosure, where possible, of performance against non-financial targets. Where this is not possible on the grounds of ongoing commercial sensitivity, the Committee intends to provide an overview of the types of targets set and the basis on which bonuses were earned.
Performance Share Plan (PSP)The Committee currently anticipates granting a normal PSP award during the current financial year with a face value at grant of 100% of salary to the Finance Director. As noted previously in the report the current Executive Chairman does not participate in long-term incentives and the MD, Home Shopping will not be eligible for an award, due to the exceptional award granted in FY2015/16.
It is the Committee’s intention to grant awards subject to an equal weighting between share price targets and EPS growth measures. EPS remains the primary internal measure of our long-term financial success with TSR proving clear alignment with our shareholders. The specific targets to be used are as follows:
Earnings per share targets (50% of award):
Vesting (% of EPS part of award)
Below 15% p.a. 0%15% p.a. 20%Between 15% and 25% p.a. Between 20% and 100% on a straight line basisAbove 25% p.a. 100%
Share price targets (50% of award)
Vesting (% of Share price part of award)
Below 15% p.a. 0%15% p.a. 20%Between 15% and 25% p.a. Between 20% and 100% on a straight line basisAbove 25% p.a. 100%
54 Findel plc Annual report and accounts 2016
Governance
Board Report on Directors’ Remuneration
The above ranges of targets were calibrated after taking into account both internal and external growth expectations such that they are felt to provide a balance between being realistic at the bottom end of the range and very demanding at the top end of the range (e.g. the absolute TSR targets maximum performance requirement at 25% p.a. growth remains above the typical upper quartile performance level required to achieve full vesting in a relative TSR condition against a general Index such as the FTSE Small Cap).
Awards will be subject to a two year holding period on any vested shares and enhanced recovery and withholding provisions.
Recovery and withholdingWhile Findel is not subject to the FCA/PRA Remuneration Code, as an FCA regulated firm in relation to providing credit to customers, it is considered appropriate to broaden the circumstances under which recovery and withholding may apply and the time period over which recovery and withholding can take place. These provisions apply equally to the current year annual bonus and PSP awards to be granted and will apply to future year incentives (including in the new PSP) for Executive Directors.
In future, recovery and withholding may take place for up to three years (from two) following the payment/vesting of incentives and this period may be extended by up to two further years if a potential claim comes to light prior to the end of the three year period. In terms of the recovery and withholding events, these have been broadened to include circumstances where there has been a significant failure of risk management or insufficient provisions made in connection with a customer redress issue (e.g. payment protection). The full list of recovery and withholding events also includes (i) misstatement of results (ii) error in assessing calculations and (iii) gross misconduct.
On behalf of the Board
William GrimseyChairman of the Remuneration Committee
13 June 2016
www.findel.co.uk 55
Governance
ST
RA
TE
GIC
RE
PO
RT
2—
24
GO
VE
RN
AN
CE
25—67
CO
NS
OL
IDA
TE
D F
INA
NC
IAL
ST
AT
EM
EN
TS
68
—1
17
CO
MP
AN
Y F
INA
NC
IAL
ST
AT
EM
EN
TS
11
8—
14
1
Nomination Committee Report
The Nomination Committee operates under written terms of reference which are available on the Company’s website (www.findel.co.uk). Its principal duties are to periodically review the composition of the Board and to recommend suitable candidates for approval by the Board to fill executive and non-executive vacancies.
During the year the Nomination Committee comprised the Chairman, the Chief Executive (until he left the Board on 31 March 2015) and the independent Non-Executive Directors. The Committee Chairman was Mr Tracey, the Senior Independent Director. This reflected the enhanced role for the Senior Independent Director agreed by the Board during the period in which the Company operates with an Executive Chairman.
The general approach of the Committee in relation to Board appointments is to engage external recruitment specialists to carry out a search for appropriate candidates. Committee members meet a short list of candidates before discussing and agreeing a recommended candidate to the Board. Where there are appropriate internal candidates they are included in the external assessment process.
The Board has adopted a policy on Board diversity which recognises that diversity (including but not restricted to gender) is an important factor in ensuring that the profile of Board members provides the necessary range of perspectives and skill-sets to ensure effective stewardship.
The Committee appointed The Zygos Partnership to assist in the selection of a new Non-Executive Director to replace Mrs Kinney-Pritchard who left the Board in August 2015. A specification for the appointment was agreed and a search carried out by Zygos. The exercise produced a shortlist of candidates who were interviewed by members of the Committee and from which the eventual preferred candidate, Mr Ball, was selected and recommended to the Board. Mr Ball was appointed to the Board on 22 February 2016.
In January 2015 Mr Siddle, the Group Chief Executive, informed the Board of his intention to step down from his position at the end of that financial year. In light of the potential for change in the shape of the Group at that time (with the potential sale of Kleeneze and the strategic review of Kitbag both ongoing at that time), the Board decided not to seek a replacement Group Chief Executive immediately. Mr Sugden became Executive Chairman with effect from the start of March 2015. The Committee subsequently appointed Zygos to seek candidates for the role of Chief Executive but following the sale of Kitbag in February 2016 the Committee revised its approach and recommended that the Board should seek a permanent Executive Chairman, Mr Sugden having indicated that he did not wish to continue in that role on a permanent basis. Since then Mr Sugden has indicated that he will retire from the Board at the conclusion of the 2016 Annual General Meeting. A further announcement regarding his successor will be issued shortly.
Zygos provided its services directly to the Nomination Committee and, save as follows, has not otherwise provided its services to the Company or other members of its Group. As part of its (subsequently aborted) brief to seek out a Chief Executive, Zygos identified a candidate for the position of Marketing Director and Deputy Managing Director of Express Gifts Ltd and that candidate has now taken up that post.
During the period the work of the Nomination Committee also included a review of the composition and balance of the Board; a more detailed approach to succession planning for the executive directors; an evaluation of the effectiveness of the Committee (via a self-assessment questionnaire based process); and consideration of the directors to be proposed for election/re-election at the 2016 Annual General Meeting.
The Nomination Committee reviewed the performances and commitment of the Non-Executive Directors proposed for election/re-election and reported to the Board that it should recommend those elections/re-elections to shareholders.
By order of the Board
Eric TraceyChairman of the Nomination Committee
13 June 2016
56 Findel plc Annual report and accounts 2016
Governance
Audit & Risk Committee Report
On behalf of the Committee, I am pleased to present this year’s Audit & Risk Committee Report, which provides an overview of how we, as a Committee, have discharged our responsibilities, setting out the significant issues we have reviewed and concluded on in the year.
This report focuses mainly on:
• Committee governance;
• The key risks facing the business;
• Our focus since the last annual report, including the impact of changes in the UK corporate governance regime;
• Internal controls; and
• The operation of the internal and external audit functions.
Committee GovernanceThe Audit & Risk Committee operates under written terms of reference, which were reviewed during the year and are available on the Company’s website (www.findel.co.uk).
The Committee is comprised of three independent Non-Executive Directors. Brief biographical details of the Committee members, including their expertise and experience, are set out on page 25 and the number of meetings and attendance are set out on page 32. The executive directors, the Chairman of the Board and the Head of Internal Audit attended each meeting by invitation. Divisional executives were also invited to meetings during the year in relation to some of the specific matters under review listed below. The external auditors also attended all meetings.
The Committee has not used its powers to engage external advisers other than those appointed in conjunction with management in the year under review. Private meetings are held at least twice a year with the external auditor and with the Head of Internal Audit. In these meetings the Committee probed the efficiency and effectiveness of the internal and external audit, including the co-operation received by the auditors, recommendations for improvements to processes and timeliness of addressing control and process recommendations.
There have been a number of changes to the composition of the Committee during the year. Francois Coumau resigned from the Committee on 31 March 2015 as part of a review of Board Committee membership. Sandy Kinney Pritchard resigned as Chairman and as a member of the Committee in August 2015, following her stepping down from the Board, and Eric Tracey took over as Chairman of the Committee. Mr Ball joined the Committee in March 2016 following his appointment to the Board.
The Committee’s agenda is linked to events in the Company’s financial calendar and its assessment of key business risks as well as other matters for review recommended by the Board and the Remuneration Committee in their meetings. The effectiveness of the Committee is assessed as part of the annual Board and Committee effectiveness review, further detail on which is contained in the report on corporate governance on pages 31 to 34.
The Board has decided to accept the Audit & Risk Committee’s recommendation to split the Committee into two separate Committees, the Audit Committee to be chaired by Eric Tracey and the Risk Committee to be chaired by Greg Ball. This will be implemented in the near future and the Committee’s respective terms of reference will then be posted on the Company’s website (www.findel.co.uk). Further background regarding this development is set out on pages 58 and 59.
The Key Business RisksThe Board has carried out a robust assessment of the principal risks facing the Company, including those that would threaten its business model, future performance, solvency or liquidity. The principal risks and uncertainties that could impact the performance of the Group are set out on pages 22 to 23.
Our focus since the last annual report – accounting and auditThe most significant matters relating to the annual accounts considered were:
(a) Recoverability of trade receivables in Express Gifts Limited;
(b) Financial services redress provisions;
(c) Recoverability of goodwill and unamortised intangible assets;
(d) Exceptional items; and
(e) Carrying amount of inventories.
The Committee received a paper from the Finance Director supporting his judgements in each of these areas and another report from the external auditors setting out their opinions and subjective assessments of the level of prudence involved in the key judgements. The Committee challenged the robustness of these proposals. In all cases, the Committee was guided by the overriding mantras of “fair, balanced and understandable” and “true and fair view”.
www.findel.co.uk 57
Governance
ST
RA
TE
GIC
RE
PO
RT
2—
24
GO
VE
RN
AN
CE
25—67
CO
NS
OL
IDA
TE
D F
INA
NC
IAL
ST
AT
EM
EN
TS
68
—1
17
CO
MP
AN
Y F
INA
NC
IAL
ST
AT
EM
EN
TS
11
8—
14
1
The particular challenges by the Committee in relation to the matters listed above were:
(a) Receivables provisioning – were the outcomes consistent with what the Board’s monitoring of monthly results had led us to expect? What were the reasons for changes in the levels of provisioning in particular categories of the receivables balances? Were changes in Express Gifts’ approach to the management of debt sales and customers with whom forbearance arrangements have been agreed appropriately reflected in the provision for doubtful debts? Has any information come to light from the building of a new bad debt provisioning model ahead of the introduction of IFRS 9 in 2018 that casts doubt on the overall validity of the existing approach? As a high level of post-model adjustments to reflect changes in operating practices was again required, in part as a result of challenges from the auditor, the Committee enquired and was satisfied with the responses to its challenges as to why these were required, to why changes had been made by management to its initial estimates and to the disclosure of an element of the year’s charge as an exceptional item. Nevertheless, the Committee has highlighted that further work is required in this area (see below).
(b) Financial Services redress provisioning – had the review of processes within Express Gifts been robust in identifying the areas of system or operation flaws which may have resulted in customer detriment? Where detriment had been established, and especially where changes in earlier estimates has been made, were the forecast assumptions underpinning the calculation of provisions appropriate, in the light of both the Company’s data collection and the interactions of the Company with the FCA? The Committee received satisfactory responses to these challenges.
(c) Goodwill and Intangible asset recoverability – with the sale of Kitbag in February 2016 the risk of overstatement of intangible asset values declined significantly. The Committee received satisfactory responses to its challenges to whether the resulting carrying values for other goodwill and intangible assets were credible in the light of our current assessment of each business’ prospects.
(d) Exceptional items – were the items truly exceptional in nature? Had all exceptional charges and credits been disclosed? Were the disclosures sufficient? The Committee concluded that all exceptional items were appropriate and consistent with the financial statement showing a true and fair view of the financial performance for the year.
(e) Stock provisioning – were the stock provisions adequate given the Company’s plans for sales of slow moving items and the healthy Christmas season demand outstripping the Company’s ability to respond at short notice, as described in the Chairman’s Statement? The Committee was satisfied with the responses to its auditors’ challenges.
The Committee also considered:
(f) at the planning stage of the audit, how the auditors defined and applied materiality in their audit. The Committee was satisfied with the responses.
(g) towards the conclusion of the audit, the materiality of adjusted and unadjusted errors as reported by the external auditors to the Committee – what caused them? What did they imply for levels of control and how did they impact our view on the annual report as a whole? The Committee concluded that appropriate adjustments and disclosures had been made;
(h) the going concern assessment – having monitored going concern against the borrowing facilities in place throughout the year the Board’s assessment was considerably eased by the revision of the Group’s banking facilities in November 2015 as described in note 19 to the accounts. The Committee was satisfied with the responses to its questions about how the Group could manage various sensitivities to the central estimates;
(i) the viability statement – the Committee approved the choice of three years as the period over which to assess viability and examined the extent of contingency built into the second and third years of the forward projections, the key risks or threats to the Group’s viability and the amount of disclosure proposed around the key risks. The Committee was satisfied with the responses received; and
(j) the overall level of prudence in the accounts – how consistent were the judgements and assessments with the equivalent judgements and assessments of the previous year? Were the key judgements and assessments consistent with the Board discussions of the businesses’ performance throughout the year and with the conclusions of the Board’s annual strategic review? The Committee was satisfied on each of these points.
In reviewing the annual report on behalf of the Board and making recommendations that were adopted by the Board in relation to the overall “fair, balanced and understandable” test, the Committee considered the report in the light of the tone and content of papers presented to the Board over the year by the Executive Chairman, business heads and the Finance Director, assessed the balance of positive and negative comments on each business in the light of the business’s performance for the year.
The Committee also considered and accepted management’s review of Group accounting policies.
Our focus since the last annual report – risk management and internal controlThe Committee has responsibility for the regular review of the Group’s system of internal control and its effectiveness and reports its findings to the Board. It is the role of management to implement the Board’s policies on risk and control through the design and operation of appropriate internal control systems. Operating management is charged with the ongoing responsibility for identifying risks facing each of the operating units and for putting in place procedures to mitigate, manage and monitor risks. The system of internal control is designed to manage rather than eliminate the risk of failing to achieve business objectives and can provide only reasonable and not absolute assurance against material misstatement or loss.
58 Findel plc Annual report and accounts 2016
Governance
Audit & Risk Committee Report
Management uses a “three lines of defence” approach, where the first line of defence is in the management of the business units, who are responsible for ensuring that a robust risk and control environment is established as part of their daily operations. The second line of defence is provided by the oversight functions within the business and at Group level, setting policies, procedures, and compliance and governance frameworks. The third line of defence is the internal and external auditors who offer independent challenge to the levels of assurance provided by the business operations and oversight functions.
During the previous year, the structure of internal control within the Group’s largest business, Express Gifts, was further strengthened by the establishment of its own Audit and Risk Committees. During the year the output from those committees has provided valuable insights to complement that of the Group’s own assessments of the key risks within the business. Senior members of the Express Gifts management team have also undergone extensive training during the year on the ongoing requirements of the FCA in respect of risk management and conduct.
In the year since the last annual report, the Committee has also monitored and challenged:
(a) how the Group’s businesses were dealing with the challenges of the digitalisation of aspects of their interfaces with suppliers and customers, the changes in customer buying behaviour and the adequacy of the businesses’ defences against cyber-attack;
(b) the preparations by Express Gifts for their application for a full FCA licence in late 2015;
(c) the continuing compliance journey at Express Gifts as new systems are brought on stream and change programmes are developed to further improve processes and behaviours, including performance measurement and staff appraisal systems, all to underpin appropriate customer outcomes;
(d) the risk of customer fraud at both our businesses and the tools required to identify and mitigate against this;
(e) a review of systems access in relation to data protection requirements and the actions required to mitigate the risks in this area;
(f) a review of authorisation levels across the Group to update the existing approved authority listings for changing business circumstances; and
(g) a review of project management to give assurance to the Board on project delivery, timescales and budgets.
The Committee used the experience and expertise of its members to meet with management outside of Committee meetings to ensure that their experience was available to management. In relation to matters listed at (a), (b) and (c) above the Committee also received presentations from the Express Gifts management team, at which plans were reviewed and challenged, noting that a significant amount of work was still required to achieve the level of behavioural change, understanding of the interaction between product and financial services policies and efficiency desired by the Board. The Committee reviewed the significant changes in organisation and personnel within Express Gifts as key elements of the plan to achieve greater regulatory resilience. The Committee noted that Express Gifts had continuously improved its IT security over the last year to further mitigate the risk of cyber-attacks and were extending training to its staff on recognising cyber threats as they develop.
Internal Audit reports were also received and discussed relating to each of the matters set out at (d) to (g) above.
The Committee oversees the adequacy of Findel’s whistleblowing arrangements, ensuring that they are proportionate for the Group and enable staff and contractors to raise concerns, in confidence, about possible wrongdoing in financial reporting or other matters. The Committee considered a report on the whistleblowing arrangements within the Group and an overview of instances of whistleblowing. The chairman of the Committee also reviewed the service provided by the external provider of the whistleblowing service with the head of that company. The report concluded that there is awareness of whistleblowing processes and procedures within the Group and that there were no matters that would suggest these are not operating effectively.
The Committee has conducted its annual review of the effectiveness of the Group’s system of internal control. The Committee is satisfied with the progress made during the year, save for three areas of exception. First, until it was sold, Kitbag, as reported last year, was reliant upon interim compensating manual controls to compensate for shortcomings in its not fully automated IT systems. Secondly, in respect of the customer receivables impairment provision at Express Gifts, two key assumptions have been revised in response to changes in business practices during the year (principally relating to debt sales and arrangements with customers on forbearance) which has necessitated changes to the model’s output at the year-end, in part due to challenges raised by the auditors, in order to maintain an appropriate level of provision and resulted in an exceptional charge to the profit and loss account. An improved suite of KPIs in this area is being introduced in the first quarter of the current financial year and an upgraded model is being developed and is planned to be in place during the second half of the current financial year. Finally, the KPIs relating to the monitoring and control of conduct risk and fair customer outcomes with Express Gifts and related financial services income streams continue to be developed.
During the period, it was recognised that with the level of change in the regulatory environment which the business is currently experiencing and with the addition of Greg Ball as a Non-Executive Director, it was an appropriate opportunity to increase the Board level focus on risk management even further. To that end, proposals to separate the Audit and Risk Committee into two separate Committees of the Board were put to and accepted by the Board and will be implemented in the near future. The newly constituted Audit Committee will continue to monitor, challenge and guide the traditional areas involving assurance through internal and external audit of the financial activities. The separate Risk Committee will allow greater scrutiny of the risk management framework being
www.findel.co.uk 59
Governance
ST
RA
TE
GIC
RE
PO
RT
2—
24
GO
VE
RN
AN
CE
25—67
CO
NS
OL
IDA
TE
D F
INA
NC
IAL
ST
AT
EM
EN
TS
68
—1
17
CO
MP
AN
Y F
INA
NC
IAL
ST
AT
EM
EN
TS
11
8—
14
1
operated across the Group including assuring the content and scrutinising management’s planning against core risk areas. Both will be operated in such a way as to ensure any dependencies will be identified and managed jointly to optimise each Committee’s effectiveness. It is envisaged they will mirror the current Audit and Risk Committee in terms of frequency of meetings.
External auditorsThe Committee reviewed the independence of the external auditor and the safeguards that they have in place, including partner and staff rotation and extent of non-audit services, to avoid such independence and objectivity being compromised.
The Company’s policy is that the Company should tender the audit at least once every ten years and would not expect to retain the same audit firm for a period of longer than twenty years. John Costello, the senior statutory auditor from KPMG LLP for the Company for the last five years since their first appointment as auditors for FY11, retired by rotation after the 2015 audit. The Committee considered that a full audit re-tendering process was not required at the current time. The senior statutory auditor from KPMG LLP for the Company is now Nicola Quayle.
The Group policy on the provision by the external auditor of audit and non-audit services is based on the principle that the external auditor should only undertake non-audit services where they are the best provider unless that was considered by the Committee to compromise their independence. The Committee reviewed an analysis of all services provided by the external auditors and other accounting firms. The policy is reviewed annually by the Audit & Risk Committee and approved by the Board.
The detailed disclosure of the fees payable to KPMG LLP for both audit and non-audit services performed during the year is set out in note 10 to the consolidated financial statements and reflects the Committee’s recommendation that greater explanation be provided than is required by law. Non-audit work awarded to the auditors related to corporate VAT and taxation advice, including in relation to the disposal of Kitbag and advice on the earlier Strategic Review of Kitbag.
Much of this VAT work related to the resolution of the legacy issues at Kitbag and the periodic review of specialist aspects of VAT compliance for retail groups for which KPMG have developed expertise within the niche home shopping sector.
KPMG have also developed expertise in the sports retail industry and, as such, were considered appropriate candidates to advise on the Strategic Review of Kitbag.
The Committee also considered the level of non-audit fees paid to KPMG LLP in the context of similar fees paid during the year to other major accounting firms by the Group and noted that their proportion amounted to around 37% of all such fees. The Committee was satisfied with the level of fees, independence, objectivity and effectiveness of KPMG LLP but agreed to review this further in the current year once new European Regulations regarding the provision of tax advice from the statutory auditor has been finalised.
The Committee reviewed the effectiveness of the external audit of the FY15 financial statements by discussing the audit separately with the executive directors and senior finance officers, the Company Secretary and the external auditors. Accordingly, in the light of the above, the Board accepted the Committee’s recommendation that a resolution for the appointment of KPMG LLP as auditors of the Company will be proposed at the forthcoming Annual General Meeting. A review of the effectiveness of the FY16 audit will be carried out following the issue of this Annual Report.
Internal auditThe role of internal audit combines an in-house internal audit department together with an appropriate level of co-sourcing of specialised internal audit services in the areas of financial services and IT. During the year, a new Head of Internal Audit was appointed and the staffing has been further enhanced and expanded, see below. The Head of Internal Audit holds discussions with the chairman of the Committee at least four times each year and has direct access to him at any time.
The team has delivered improvements in four areas:
• Capacity – the team delivered a 200% uplift in reviews completed in the second half of the year;
• Capability – the team’s technical and geographical base has been strengthened to match the business in terms of retail, financial services and core finance skills;
• Focus – clearer, shorter reporting has been introduced together with regular communication with key customers aligned against a visible, rolling assurance plan;
• Risk – conversations with review sponsors have focused on controls, risk management and the appropriate toleration of exposure.
The Committee approved the internal audit programme for the FY17 financial year, including the use of independent third parties.
Eric TraceyChair of the Audit & Risk Committee
13 June 2016
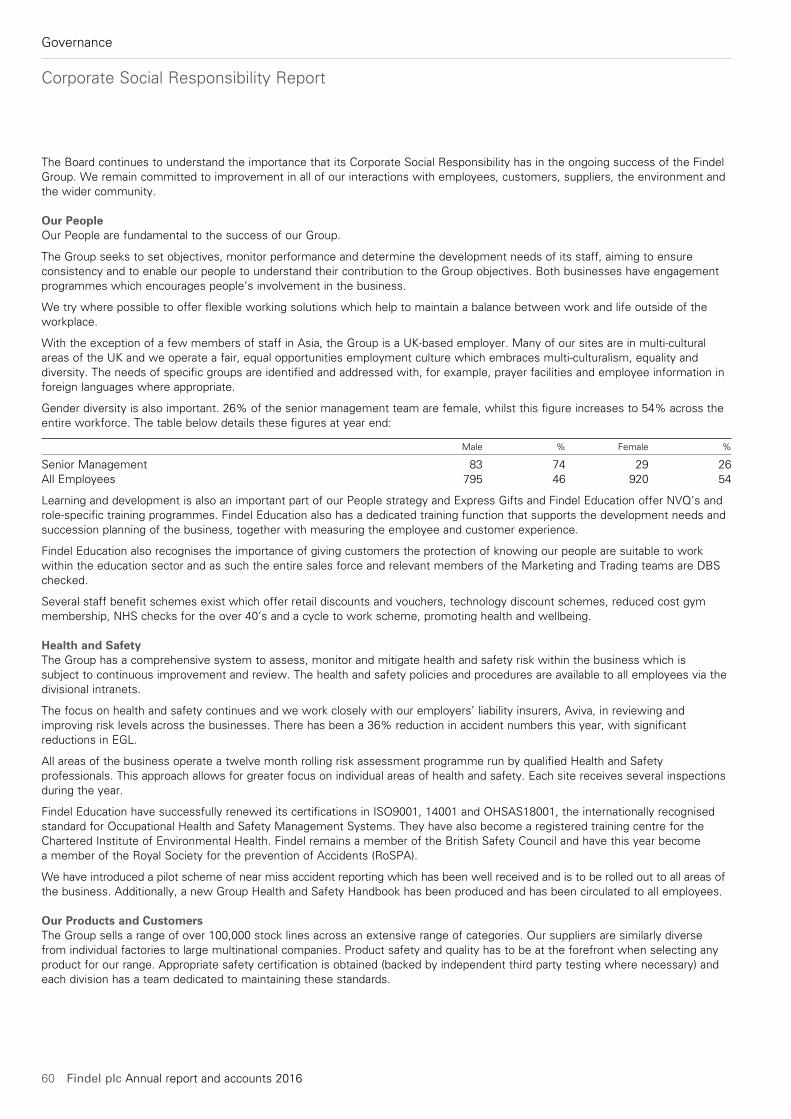
60 Findel plc Annual report and accounts 2016
Governance
Corporate Social Responsibility Report
The Board continues to understand the importance that its Corporate Social Responsibility has in the ongoing success of the Findel Group. We remain committed to improvement in all of our interactions with employees, customers, suppliers, the environment and the wider community.
Our PeopleOur People are fundamental to the success of our Group.
The Group seeks to set objectives, monitor performance and determine the development needs of its staff, aiming to ensure consistency and to enable our people to understand their contribution to the Group objectives. Both businesses have engagement programmes which encourages people’s involvement in the business.
We try where possible to offer flexible working solutions which help to maintain a balance between work and life outside of the workplace.
With the exception of a few members of staff in Asia, the Group is a UK-based employer. Many of our sites are in multi-cultural areas of the UK and we operate a fair, equal opportunities employment culture which embraces multi-culturalism, equality and diversity. The needs of specific groups are identified and addressed with, for example, prayer facilities and employee information in foreign languages where appropriate.
Gender diversity is also important. 26% of the senior management team are female, whilst this figure increases to 54% across the entire workforce. The table below details these figures at year end:
Male % Female %
Senior Management 83 74 29 26All Employees 795 46 920 54
Learning and development is also an important part of our People strategy and Express Gifts and Findel Education offer NVQ’s and role-specific training programmes. Findel Education also has a dedicated training function that supports the development needs and succession planning of the business, together with measuring the employee and customer experience.
Findel Education also recognises the importance of giving customers the protection of knowing our people are suitable to work within the education sector and as such the entire sales force and relevant members of the Marketing and Trading teams are DBS checked.
Several staff benefit schemes exist which offer retail discounts and vouchers, technology discount schemes, reduced cost gym membership, NHS checks for the over 40’s and a cycle to work scheme, promoting health and wellbeing.
Health and SafetyThe Group has a comprehensive system to assess, monitor and mitigate health and safety risk within the business which is subject to continuous improvement and review. The health and safety policies and procedures are available to all employees via the divisional intranets.
The focus on health and safety continues and we work closely with our employers’ liability insurers, Aviva, in reviewing and improving risk levels across the businesses. There has been a 36% reduction in accident numbers this year, with significant reductions in EGL.
All areas of the business operate a twelve month rolling risk assessment programme run by qualified Health and Safety professionals. This approach allows for greater focus on individual areas of health and safety. Each site receives several inspections during the year.
Findel Education have successfully renewed its certifications in ISO9001, 14001 and OHSAS18001, the internationally recognised standard for Occupational Health and Safety Management Systems. They have also become a registered training centre for the Chartered Institute of Environmental Health. Findel remains a member of the British Safety Council and have this year become a member of the Royal Society for the prevention of Accidents (RoSPA).
We have introduced a pilot scheme of near miss accident reporting which has been well received and is to be rolled out to all areas of the business. Additionally, a new Group Health and Safety Handbook has been produced and has been circulated to all employees.
Our Products and CustomersThe Group sells a range of over 100,000 stock lines across an extensive range of categories. Our suppliers are similarly diverse from individual factories to large multinational companies. Product safety and quality has to be at the forefront when selecting any product for our range. Appropriate safety certification is obtained (backed by independent third party testing where necessary) and each division has a team dedicated to maintaining these standards.
www.findel.co.uk 61
Governance
ST
RA
TE
GIC
RE
PO
RT
2—
24
GO
VE
RN
AN
CE
25—67
CO
NS
OL
IDA
TE
D F
INA
NC
IAL
ST
AT
EM
EN
TS
68
—1
17
CO
MP
AN
Y F
INA
NC
IAL
ST
AT
EM
EN
TS
11
8—
14
1
Express Gifts now require new suppliers to produce an Ethical Trading statement as part of the set-up process from a recognised third party auditor. They have also set up, with the help of Veriso, a grading scheme for suppliers which allows continuous improvement of conditions and standards within the Express Gifts supply chain.
Our own Hong Kong office has been sourcing products for Group companies and third parties for over 30 years and requires that each of the 230 factories they deal with has a valid, reputable audit certificate in place with at least six months’ validity and there is a programme for monitoring the renewal of these. A further level of scrutiny has been introduced this year to require evidence that factories with improvement works required under the audits provide photographic evidence of compliance.
Within Express Gifts, various products in our household and children’s furniture ranges are procured from FSC and sustainable sources, whilst within Findel Education all products are assessed for quality including REACH, ROHS, FSC and EU timber regulations compliance.
Express Gifts has seen the importance it places on safety and quality of products translated into a reduction in its returns rate by 0.1%. This is in spite of further diversification into clothing ranges which by their nature have a higher rate of return.
Findel Education’s Customer Voice programme has once again shown strong positive trends in customer feedback. Customer queries have reduced by 47% showing that Findel Education are fulfilling their mission of being ‘easy to do business with’. In March 2016, they recorded their highest ever net promoter score of 92% against a base established in 2010 of 50%. Feefo has also been introduced across the brand websites producing rating of between 92% and 100%. Every poor or bad rating is followed up individually with the customer.
Express Gifts have worked even harder this year to place their customers at the heart of what they do and the services they deliver and this can be seen by improvements in a number of customer metrics.
The EnvironmentAs a business mainly operating within mail order and e-commerce, the Group environmental impact is predominantly through utility consumption and our use and disposal of paper and packaging, although as a non-manufacturing company, our emissions remain relatively low.
The Group’s Scope 1 emissions from its vehicle fleet in 2015/16 were 244 tonnes of CO2 compared to 326 tonnes in 2014/15, a reduction of 25% due to a combination of a significantly reduced fleet size and a switch to lower emission vehicles on renewal of the remaining fleet. The Scope 2 emissions from its energy usage were 5,310 tonnes of CO2 which is a reduction of 5.3% from 5,605 tonnes in 2014/15.
The high number of relatively low value despatches in our businesses continues to make it economically and environmentally efficient to use third party carriers to transport product to our customers. Prior to appointment and on a regular basis thereafter, we ask our third party carriers to demonstrate their environmental credentials.
Each of our businesses continues to supply its customers with the information necessary to make informed environmental choices. This includes the identification in our catalogues of products made from renewable or recycled materials and the energy ratings of our white goods. Our Education division continues to increase its range of eco-friendly products which includes products made from recycled paper, Fairtrade, energy efficiency A rated appliances, environmentally friendly products and lower carbon footprint UK-sourced products.
All sites within Findel Education have ISO14001 accreditation, an internationally recognised standard for environmental management which ensures each location has a fully compliant Environmental Management System.
EnergyThe Group’s major use of energy continues to be the heating and lighting of buildings, powered conveyor equipment and in our vehicle fleet. The more efficient use of space combined with energy management initiatives have seen a reduction of total energy consumption in our buildings as reported above.
Energy efficiency is a material consideration when procuring vehicles, equipment or services. Our major sites all benefit from centralised control of heating and ventilation systems and are subject to regular monitoring to ensure they are operating as efficiently as possible. Findel Education have installed energy saving lighting in its two major sites.
The Group Company Car Policy focuses on low carbon emission vehicles with a reduction in the CO2 limit for all new vehicles from a maximum permitted CO2 of 160 g/km to 130 g/km. This has seen a reduction in the current fleet of an average from 122 g/km to 115g/km and should reduce further on full renewal of the fleet during 2016/17.
PaperThe tonnage of paper used in our catalogues and brochures has shown a reduction from 12,974 tonnes in 2014/15 to 11,744 in 2015/16, a reduction of 9.5%.
All paper used for printing by all of our divisions is now manufactured at mills which have Programme for the Endorsement of Forest Certification (PEFC) chain of custody certification.
62 Findel plc Annual report and accounts 2016
Governance
Corporate Social Responsibility Report
PackagingThe Group is constantly seeking innovative ways to minimise the level of packaging used, whilst ensuring that products are received by our customers undamaged. We also actively seek out opportunities with suppliers to reduce packaging.
In the current year, we have once again seen a rise in the overall packaging levels consistent with the increased turnover and reflect the already low levels of packaging achieved by previous initiatives.
WasteAll EGL sites continue to be Zero to Landfill sites and have been since May 2012. In the last 12 months, 2,410 tonnes of waste was collected, of which 65% was recycled and 35% was recovered via an Energy From Waste (EFW) plant. This is an increase in line with turnover against last year’s figure.
Findel Education have achieved a Zero to Landfill standard at its two largest sites in Nottingham and Enfield and have reduced the landfill element of its total waste to less than 2.67%.
Community SupportOnce again, the Company and its employees continue to support a number of local and national charities, together with local communities and organisations close to our various bases of operation.
Both Express Gifts and Findel Education are partnering local schools in the Business in The Community initiative, providing support and guidance to staff and students. Findel Education are also involved with the Greggs Breakfast Club at St. Patrick’s Primary School in Manchester which helps the children get a great start to their day and promotes health, well-being and development.
www.findel.co.uk 63
Governance
ST
RA
TE
GIC
RE
PO
RT
2—
24
GO
VE
RN
AN
CE
25—67
CO
NS
OL
IDA
TE
D F
INA
NC
IAL
ST
AT
EM
EN
TS
68
—1
17
CO
MP
AN
Y F
INA
NC
IAL
ST
AT
EM
EN
TS
11
8—
14
1
Statement of Directors’ Responsibilities in Respect of the Annual Report and the Financial Statements
Responsibility statement of the directors in respect of the Annual Report
The directors are responsible for preparing the Annual Report and the Group and parent company financial statements in accordance with applicable law and regulations.
Company law requires the directors to prepare Group and parent company financial statements for each financial year. Under that law they are required to prepare the Group financial statements in accordance with IFRSs as adopted by the EU and applicable law and have elected to prepare the parent company financial statements in accordance with UK Accounting Standards, including FRS 101 Reduced Disclosure Framework.
Under company law the directors must not approve the financial statements unless they are satisfied that they give a true and fair view of the state of affairs of the Group and parent company and of their profit or loss for that period. In preparing each of the Group and parent company financial statements, the directors are required to:
• select suitable accounting policies and then apply them consistently;
• make judgements and estimates that are reasonable and prudent;
• for the Group financial statements, state whether they have been prepared in accordance with IFRSs as adopted by the EU;
• for the parent company financial statements, state whether applicable UK Accounting Standards have been followed, subject to any material departures disclosed and explained in the parent company financial statements; and
• prepare the financial statements on the going concern basis unless it is inappropriate to presume that the Group and the parent company will continue in business.
The directors are responsible for keeping adequate accounting records that are sufficient to show and explain the parent company’s transactions and disclose with reasonable accuracy at any time the financial position of the parent company and enable them to ensure that its financial statements comply with the Companies Act 2006. They have general responsibility for taking such steps as are reasonably open to them to safeguard the assets of the Group and to prevent and detect fraud and other irregularities.
Under applicable law and regulations, the directors are also responsible for preparing a Strategic Report, Directors’ Report, Directors’ Remuneration Report and Corporate Governance Statement that complies with that law and those regulations.
The directors are responsible for the maintenance and integrity of the corporate and financial information included on the Company’s website (www.findel.co.uk). Legislation in the UK governing the preparation and dissemination of financial statements may differ from legislation in other jurisdictions.
We confirm that to the best of our knowledge:
i) the financial statements, prepared in accordance with the applicable set of accounting standards, give a true and fair view of the assets, liabilities, financial position and profit or loss of the Company and the undertakings included in the consolidation taken as a whole; and
ii) the Strategic Report includes a fair review of the development and performance of the business and the position of the issuer and the undertakings included in the consolidation taken as a whole, together with a description of the principal risks and uncertainties that they face.
We consider the annual report and accounts, taken as a whole, is fair, balanced and understandable and provides the information necessary for shareholders to assess the Group’s position and performance, business model and strategy.
The Directors of Findel plc are detailed on page 25.
By order of the Board
David Sugden Tim KowalskiChairman Finance Director
13 June 2016
64 Findel plc Annual report and accounts 2016
Governance
Independent Auditor’s Report to the Members of Findel plc only
Opinions and conclusions arising from our audit
1 Our opinion on the financial statements is unmodified We have audited the financial statements of Findel plc for the period ended 25 March 2016 set out on pages 68 to 141. In our opinion:
• the financial statements give a true and fair view of the state of the Group’s and of the parent company’s affairs as at 25 March 2016 and of the Group’s loss for the period then ended;
• the Group financial statements have been properly prepared in accordance with International Financial Reporting Standards as adopted by the European Union;
• the parent company financial statements have been properly prepared in accordance with UK Accounting Standards, including FRS 101 Reduced Disclosure Framework; and
• the financial statements have been prepared in accordance with the requirements of the Companies Act 2006; and, as regards the Group financial statements, Article 4 of the IAS Regulation.
2 Our assessment of risks of material misstatementIn arriving at our audit opinion above on the financial statements the risks of material misstatement that had the greatest effect on our audit, in decreasing order of audit significance, were as follows. With the exception of the new risk identified this year in relation to financial services redress provisions, the order of significance is unchanged from the prior year.
Recoverability of trade receivables in Express Gifts Limited £244.3m, allowance for doubtful debts £43.1m (2015: £316.1m, allowance for doubtful debts £123.4m) Risk versus 2015:34
Refer to page 57 (Audit & Risk Committee Report), page 78 (accounting policy), page 81 note 2 (critical accounting judgements and key sources of estimation uncertainty) and pages 99 to 100, note 16 (financial disclosures)
• The risk – The Group has a significant level of trade receivables which are due to be recovered by instalments as a result of extended credit terms offered to customers by the Express Gifts Limited business. The balance of receivables in the Express Gifts Limited business comprises a significant number of individually small balances. The Group uses a provisioning model to determine the appropriate level of provision against balances which may not ultimately be recovered. The basis of the provisioning model has remained consistent with that used in the prior period, although there have been a number of refinements in assumptions and estimates during the year, including to reflect changes in business practices, some of which have resulted in an additional charge in respect of previous periods. Small changes in assumptions and estimates used in the provisioning model to value the allowance for doubtful debts can have a significant effect on the results and financial position of the Group. As a consequence, adequate disclosure of assumptions and areas of estimation uncertainty is also important.
• Our response – Our audit procedures included testing the Group’s controls over credit-checking customers and setting/extending credit limits and over the receivables collection processes, including the allocation of receipts to customer accounts, all of which drive the gross balances to be considered for provisioning. We critically assess the assumptions and estimates used in the model to value the allowance for doubtful debts by comparing the collection rates and roll rates to actual experience. We benchmarked key metrics, such as emergence periods and provision coverage, to industry data, with particular focus on similar lending.
We also considered whether the Group’s policies have appropriately been consistently applied between periods and we consider the likelihood of management bias in determining the provision. Where the policies have not been consistently applied we considered the changes in the light of changes in business practices during the period to assess the reasonableness of the changes in assumptions, and the resulting impact on the charge to the income statement for doubtful debt for the year.
In addition we assessed the adequacy of the Group’s disclosures regarding the degree of judgement and estimation involved in arriving at the allowance for doubtful debts, including the element of the doubtful debt charge for the year classified as exceptional in the Group’s income statement.
www.findel.co.uk 65
Governance
ST
RA
TE
GIC
RE
PO
RT
2—
24
GO
VE
RN
AN
CE
25—67
CO
NS
OL
IDA
TE
D F
INA
NC
IAL
ST
AT
EM
EN
TS
68
—1
17
CO
MP
AN
Y F
INA
NC
IAL
ST
AT
EM
EN
TS
11
8—
14
1
Financial services redress provisions £15.3m (2015: £3.5m) Risk versus 2015: 5(new risk)
Refer to page 57 (Audit & Risk Committee Report), page 81 (accounting policy) and page 103 (financial disclosures)
• The risk – The Group’s provision of credit services to customers means that it operates within a regulated environment which requires the Group to comply with the principles of the Financial Conduct Authority (FCA). There is a risk that any non-compliance with these principles could trigger the need for significant customer redress programmes. During the year, the Group completed a review of financial services products sold in previous periods, during which products were identified which are likely to require customer redress. As a result, and given the value of the provision recorded, this area was identified as one of the risks of material misstatement having the greatest effect on this year’s audit.
Where a need for customer redress has been identified, a significant level of judgement is required in assessing the level of the Group’s expected cash outflow, and hence the provision required. These judgements are based on consultations with the FCA but also involve management assessment.
• Our response – In this area our audit procedures included reviewing correspondence with regulators and the Group’s external advisors, and assessing customer complaints, to assess that the provision has been appropriately made for all known redress issues and that the provisions have been calculated in line with appropriate directives, as well as in line with market practice. We also assessed whether these provisions have been made based on management’s best estimate taking into account the information available.
Where redress programmes have commenced, we considered the incidence of claims received following the Group’s mailing to the population of potential claimants to see if there were indications that the initial assessment of the liability was significantly mis-stated. Further we compared the response rates, uphold rates and settlement levels of the claims received to date to empirical claim data and we assessed the impact of sensitivity analysis in relation to the key assumptions on the level of provision recorded.
We also assessed the adequacy of the Group’s disclosures regarding the degree of judgement and estimation involved in arriving at the provision for redress claims, and the sensitivity of the provision to changes in those estimates.
Recoverability of goodwill £16.7m (2015: £16.7m) and unamortised intangible assets £21.2m (2015: £21.2m) Risk versus 2015: 6Refer to page 57 (Audit & Risk Committee Report), page 77 (accounting policy) and pages 95 to 97 (financial disclosures)
• The risk – Goodwill and unamortised intangible assets are tested for impairment annually. The current trading environment has been increasingly challenging for certain of the Group’s businesses, in particular Findel Education in which revenue has decreased during the year and profitability has not improved. Due to the inherent uncertainty involved in forecasting and discounting future cash flows, which are the basis of the assessment of recoverability, this is one of the key judgemental areas that our audit is concentrated on.
• Our response – In this area our audit procedures included testing of the Group’s budgeting procedures, upon which the forecasts are based, and the workings and integrity of the Group’s discounted cash flow model. We critically evaluated the discount rates used to discount forecast cash flows by comparing the specific rates used to market data relevant to those cash flows.
We compared the Group’s assumptions to independent third party data as well as our own assessments in relation to key inputs such as projected economic growth and cost inflation, as well as performing break-even analysis on the assumptions. We compared the sum of the discounted cash flows to the value derived from the Group’s market capitalisation to assess the reasonableness of the value in use calculations.
We also assessed whether the Group’s disclosures about the sensitivity of the outcome of the impairment assessment to changes in key assumptions reflected the risks inherent in the valuation of goodwill and unamortised intangibles.
66 Findel plc Annual report and accounts 2016
Governance
Independent Auditor’s Report to the Members of Findel plc only
Exceptional items £26.5m (2015: £45.7m) Risk versus 2015: 34
Refer to page 57 (Audit & Risk Committee Report), page 74 (accounting policy) and pages 87 to 88 (financial disclosures)
• The risk – The Group presents alternative income statement measures before “exceptional items” within the consolidated income statement and throughout the Annual Report. The directors believe that this information better reflects a fair presentation of the normal trading performance of the Group during the period as exceptional items are the effects of transactions that necessitate separate presentation in order for the financial performance of the Group to be more fully understood. Judgement and estimates are required in arriving at the categorisation and quantity of items as exceptional.
• Our response – In this area our audit procedures included assessing the appropriateness of classification of items as exceptional by considering whether they fulfilled the criteria, as set out by the Group as their accounting policy, to require separate disclosure and whether that criteria was consistently applied between periods and between similar transactions. This included detailed discussions with the management of the relevant Group businesses to understand the nature of the respective items.
When provisions were made in the prior period for exceptional items we assessed by examining the expenditure charged against the provision whether the utilisation of the provision in the current period was appropriate and that any release of the provision is appropriately classified as an exceptional item.
We also considered, with reference to the criteria per the accounting policy, whether there are any transactions included within the results before exceptional items which we consider should have been classified as exceptional in accordance with the Group’s policy.
We also assessed the adequacy of the disclosure of the exceptional items and of the basis for their selection as exceptional.
Carrying amount of inventories £53.5m (2015: £65.4m) Risk versus 2015:34
Refer to page 57 (Audit & Risk Committee Report), page 79 (accounting policy) and page 98 (financial disclosures)
• The risk – The Group has significant levels of inventory and judgements are taken with regard to the categorisation of stock as obsolete and/or slow moving and which should therefore be considered for provision; estimates are then involved in arriving at provisions against cost in respect of slow moving and obsolete inventories to arrive at a valuation based on the lower of cost and net realisable value.
• Our response – Our audit procedures included testing the Group’s controls designed to identify slow moving and/or obsolete inventories. We compared inventory levels to sales data to corroborate whether slow moving and obsolete inventories had been appropriately identified and we challenged the Group’s categorisation as obsolete or slow moving. We considered realisations of inventories during the period and after the period end, in particular of clearance categories, and compared these to the Group’s expected recoveries for inventory categorised as obsolete and/or slow moving at the period end date to assess whether the provision for obsolete and slow moving stock is appropriate.
We also considered whether the Group’s policies had been consistently applied and we considered the adequacy of the Group’s disclosures in respect of the judgement and estimation made in respect of inventory provisioning.
3 Our application of materiality and an overview of the scope of our auditThe materiality for the group financial statements as a whole was set at £2m (2015: £2m), determined with reference to a benchmark of group revenue of £474.6m (2015: £518.0m), of which it represents 0.4% (2015: 0.4%) when considering revenue from continuing and discontinued operations. We consider revenue to be more appropriate than a profit-based benchmark given the Group’s low level of profitability after exceptional items in recent years.
We report to the Audit & Risk Committee any corrected or uncorrected identified misstatements exceeding £0.1m (2015: £0.1m), in addition to other identified misstatements that warranted reporting on qualitative grounds.
All of the Group’s five (2015: six) reporting components were subjected to audits for group reporting purposes. Our work covered 100% (2015: 100%) of group revenue; 100% (2015: 99%) of group profit before taxation; and 99% (2015: 99%) of total group assets.
The group team instructed component auditors as to the significant areas to be covered, including the relevant risks detailed above and the information to be reported back. The group team approved the component materialities, which ranged from £1.5m to £0.3m (2015: £1.5m to £0.1m), having regard to the mix of size and risk profile of the Group across the components. The work on one of the five components (2015: one of the six components) was performed by component auditors and the rest by the group team.
www.findel.co.uk 67
Governance
ST
RA
TE
GIC
RE
PO
RT
2—
24
GO
VE
RN
AN
CE
25—67
CO
NS
OL
IDA
TE
D F
INA
NC
IAL
ST
AT
EM
EN
TS
68
—1
17
CO
MP
AN
Y F
INA
NC
IAL
ST
AT
EM
EN
TS
11
8—
14
1
4 Our opinion on other matters prescribed by the Companies Act 2006 is unmodifiedIn our opinion:
• the part of the Directors’ Remuneration Report to be audited has been properly prepared in accordance with the Companies Act 2006; and
• the information given in the Strategic Report and the Directors’ Report for the financial period for which the financial statements are prepared is consistent with the financial statements.
5 We have nothing to report on the disclosures of principal risks Based on the knowledge we acquired during our audit, we have nothing material to add or draw attention to in relation to:
• the directors’ statement on viability included in the Directors’ Report on page 26, concerning the principal risks, their management, and, based on that, the directors’ assessment and expectations of the Group’s continuing in operation over the three years to March 2019; or
• the disclosures in note 1 of the financial statements concerning the use of the going concern basis of accounting.
6 We have nothing to report in respect of the matters on which we are required to report by exception Under ISAs (UK and Ireland) we are required to report to you if, based on the knowledge we acquired during our audit, we have identified other information in the annual report that contains a material inconsistency with either that knowledge or the financial statements, a material misstatement of fact, or that is otherwise misleading.
In particular, we are required to report to you if:
• we have identified material inconsistencies between the knowledge we acquired during our audit and the directors’ statement that they consider that the annual report and financial statements taken as a whole is fair, balanced and understandable and provides the information necessary for shareholders to assess the Group’s position and performance, business model and strategy; or
• the Audit & Risk Committee Report does not appropriately address matters communicated by us to the Audit & Risk Committee.
Under the Companies Act 2006 we are required to report to you if, in our opinion:
• adequate accounting records have not been kept by the parent company, or returns adequate for our audit have not been received from branches not visited by us; or
• the parent company financial statements and the part of the Directors’ Remuneration Report to be audited are not in agreement with the accounting records and returns; or
• certain disclosures of directors’ remuneration specified by law are not made; or
• we have not received all the information and explanations we require for our audit.
Under the Listing Rules we are required to review:
• the directors’ statements, set out on page 26, in relation to going concern and longer-term viability; and
• the part of the Corporate Governance Statement on pages 31 to 34 in the Annual Report & Accounts relating to the Company’s compliance with the eleven provisions of the 2014 UK Corporate Governance Code specified for our review.
We have nothing to report in respect of the above responsibilities.
Scope and responsibilitiesAs explained more fully in the Directors’ Responsibilities Statement set out on page 63, the directors are responsible for the preparation of the financial statements and for being satisfied that they give a true and fair view. A description of the scope of an audit of financial statements is provided on the Financial Reporting Council’s website at www.frc.org.uk/auditscopeukprivate. This report is made solely to the Company’s members as a body and is subject to important explanations and disclaimers regarding our responsibilities, published on our website at www.kpmg.com/uk/auditscopeukco2014a, which are incorporated into this report as if set out in full and should be read to provide an understanding of the purpose of this report, the work we have undertaken and the basis of our opinions.
Nicola Quayle (Senior Statutory Auditor) for and on behalf of KPMG LLP, Statutory AuditorChartered Accountants 1 St Peter’s SquareManchester M2 3AE 13 June 2016
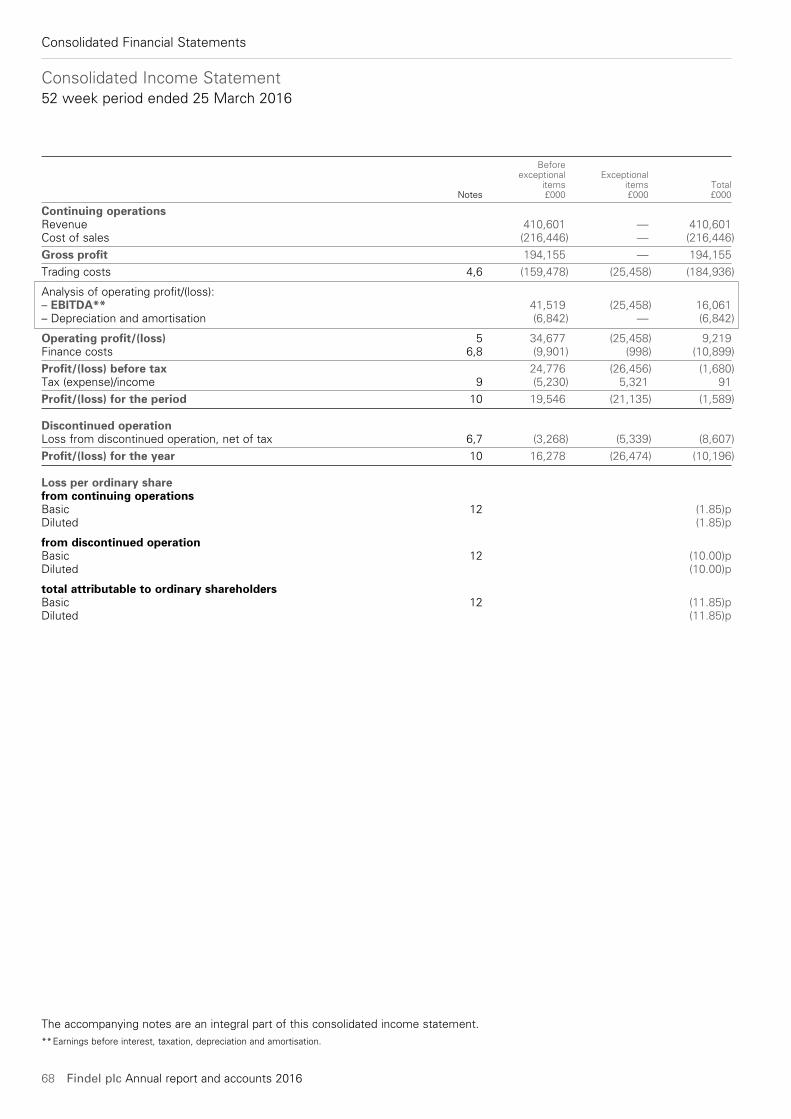
68 Findel plc Annual report and accounts 2016
Consolidated Financial Statements
Before exceptional Exceptional items items Total Notes £000 £000 £000
Continuing operationsRevenue 410,601 — 410,601Cost of sales (216,446) — (216,446)
Gross profit 194,155 — 194,155
Trading costs 4,6 (159,478) (25,458) (184,936)
Analysis of operating profit/(loss):– EBITDA** 41,519 (25,458) 16,061– Depreciation and amortisation (6,842) — (6,842)
Operating profit/(loss) 5 34,677 (25,458) 9,219Finance costs 6,8 (9,901) (998) (10,899)
Profit/(loss) before tax 24,776 (26,456) (1,680)Tax (expense)/income 9 (5,230) 5,321 91
Profit/(loss) for the period 10 19,546 (21,135) (1,589)
Discontinued operationLoss from discontinued operation, net of tax 6,7 (3,268) (5,339) (8,607)
Profit/(loss) for the year 10 16,278 (26,474) (10,196)
Loss per ordinary sharefrom continuing operationsBasic 12 (1.85)pDiluted (1.85)p
from discontinued operationBasic 12 (10.00)pDiluted (10.00)p
total attributable to ordinary shareholdersBasic 12 (11.85)pDiluted (11.85)p
Consolidated Income Statement52 week period ended 25 March 2016
The accompanying notes are an integral part of this consolidated income statement.** Earnings before interest, taxation, depreciation and amortisation.
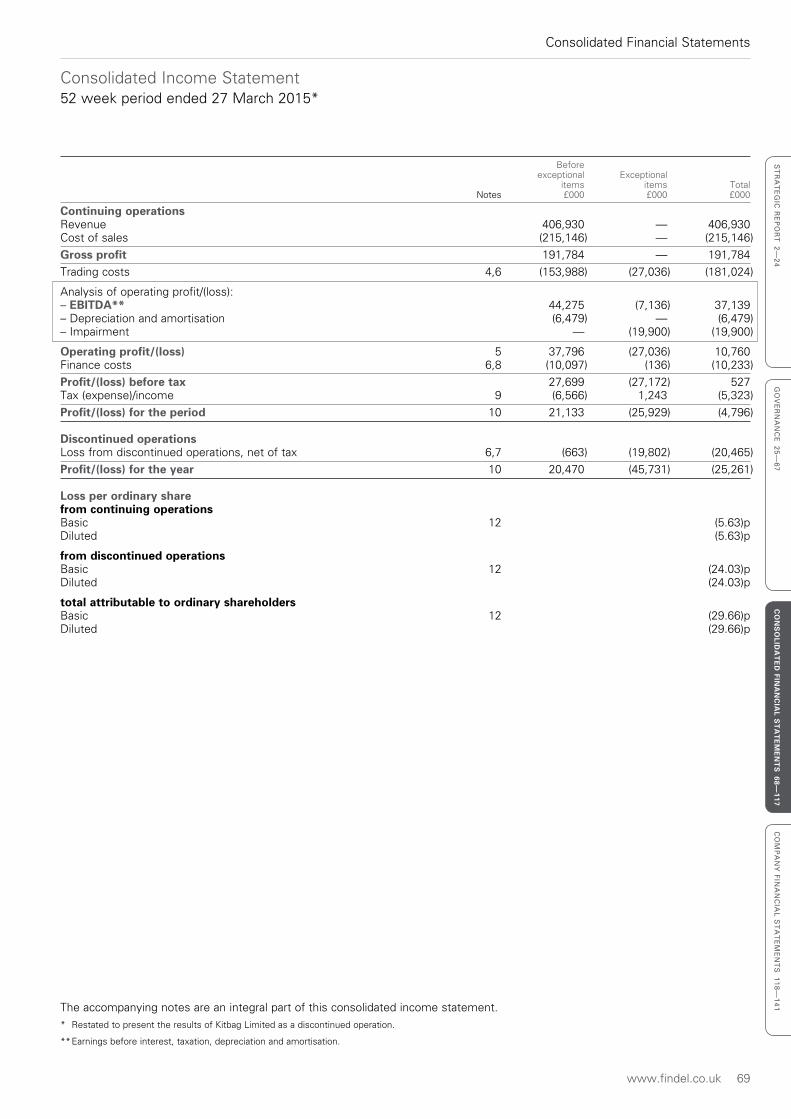
www.findel.co.uk 69
Consolidated Financial Statements
ST
RA
TE
GIC
RE
PO
RT
2—
24
GO
VE
RN
AN
CE
25
—6
7C
ON
SO
LIDA
TE
D FIN
AN
CIA
L ST
AT
EM
EN
TS
68—117
CO
MP
AN
Y F
INA
NC
IAL
ST
AT
EM
EN
TS
11
8—
14
1
Consolidated Income Statement52 week period ended 27 March 2015*
Before exceptional Exceptional items items Total Notes £000 £000 £000
Continuing operationsRevenue 406,930 — 406,930Cost of sales (215,146) — (215,146)
Gross profit 191,784 — 191,784
Trading costs 4,6 (153,988) (27,036) (181,024)
Analysis of operating profit/(loss): – EBITDA** 44,275 (7,136) 37,139– Depreciation and amortisation (6,479) — (6,479)– Impairment — (19,900) (19,900)
Operating profit/(loss) 5 37,796 (27,036) 10,760Finance costs 6,8 (10,097) (136) (10,233)
Profit/(loss) before tax 27,699 (27,172) 527Tax (expense)/income 9 (6,566) 1,243 (5,323)
Profit/(loss) for the period 10 21,133 (25,929) (4,796)
Discontinued operationsLoss from discontinued operations, net of tax 6,7 (663) (19,802) (20,465)
Profit/(loss) for the year 10 20,470 (45,731) (25,261)
Loss per ordinary sharefrom continuing operationsBasic 12 (5.63)pDiluted (5.63)p
from discontinued operationsBasic 12 (24.03)pDiluted (24.03)p
total attributable to ordinary shareholdersBasic 12 (29.66)pDiluted (29.66)p
The accompanying notes are an integral part of this consolidated income statement.* Restated to present the results of Kitbag Limited as a discontinued operation.
** Earnings before interest, taxation, depreciation and amortisation.
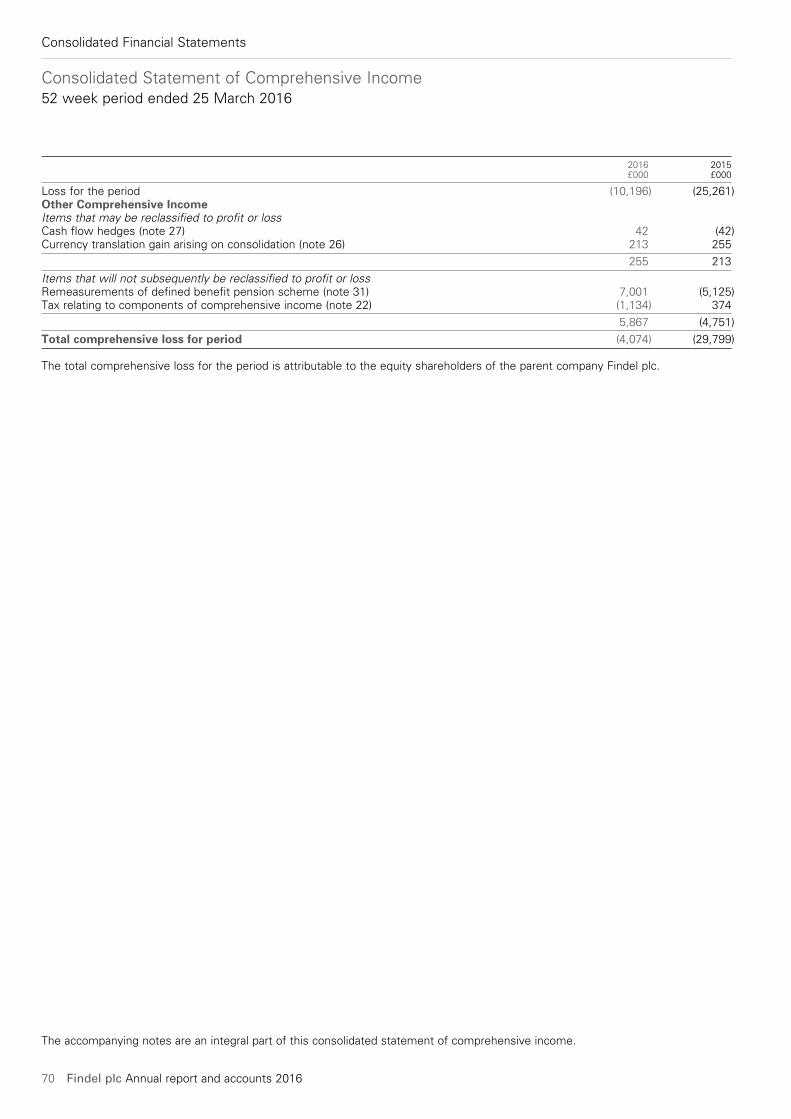
70 Findel plc Annual report and accounts 2016
Consolidated Financial Statements
Consolidated Statement of Comprehensive Income52 week period ended 25 March 2016
2016 2015 £000 £000
Loss for the period (10,196) (25,261)Other Comprehensive IncomeItems that may be reclassified to profit or lossCash flow hedges (note 27) 42 (42)Currency translation gain arising on consolidation (note 26) 213 255
255 213
Items that will not subsequently be reclassified to profit or lossRemeasurements of defined benefit pension scheme (note 31) 7,001 (5,125)Tax relating to components of comprehensive income (note 22) (1,134) 374
5,867 (4,751)
Total comprehensive loss for period (4,074) (29,799)
The total comprehensive loss for the period is attributable to the equity shareholders of the parent company Findel plc.
The accompanying notes are an integral part of this consolidated statement of comprehensive income.
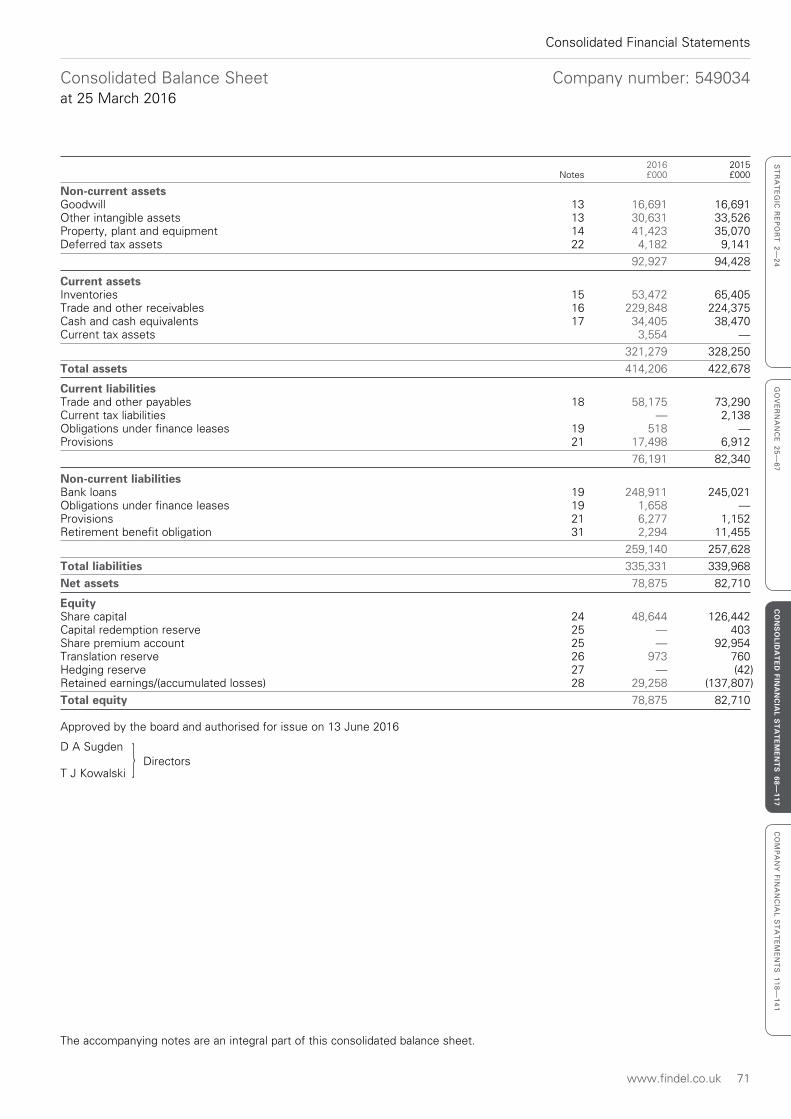
www.findel.co.uk 71
Consolidated Financial Statements
ST
RA
TE
GIC
RE
PO
RT
2—
24
GO
VE
RN
AN
CE
25
—6
7C
ON
SO
LIDA
TE
D FIN
AN
CIA
L ST
AT
EM
EN
TS
68—117
CO
MP
AN
Y F
INA
NC
IAL
ST
AT
EM
EN
TS
11
8—
14
1
Consolidated Balance Sheet Company number: 549034at 25 March 2016
2016 2015 Notes £000 £000
Non-current assetsGoodwill 13 16,691 16,691Other intangible assets 13 30,631 33,526Property, plant and equipment 14 41,423 35,070Deferred tax assets 22 4,182 9,141
92,927 94,428
Current assetsInventories 15 53,472 65,405Trade and other receivables 16 229,848 224,375Cash and cash equivalents 17 34,405 38,470Current tax assets 3,554 —
321,279 328,250
Total assets 414,206 422,678
Current liabilitiesTrade and other payables 18 58,175 73,290Current tax liabilities — 2,138Obligations under finance leases 19 518 —Provisions 21 17,498 6,912
76,191 82,340
Non-current liabilitiesBank loans 19 248,911 245,021Obligations under finance leases 19 1,658 —Provisions 21 6,277 1,152Retirement benefit obligation 31 2,294 11,455
259,140 257,628
Total liabilities 335,331 339,968
Net assets 78,875 82,710
EquityShare capital 24 48,644 126,442Capital redemption reserve 25 — 403Share premium account 25 — 92,954Translation reserve 26 973 760Hedging reserve 27 — (42)Retained earnings/(accumulated losses) 28 29,258 (137,807)
Total equity 78,875 82,710
Approved by the board and authorised for issue on 13 June 2016
D A Sugden DirectorsT J Kowalski }
The accompanying notes are an integral part of this consolidated balance sheet.
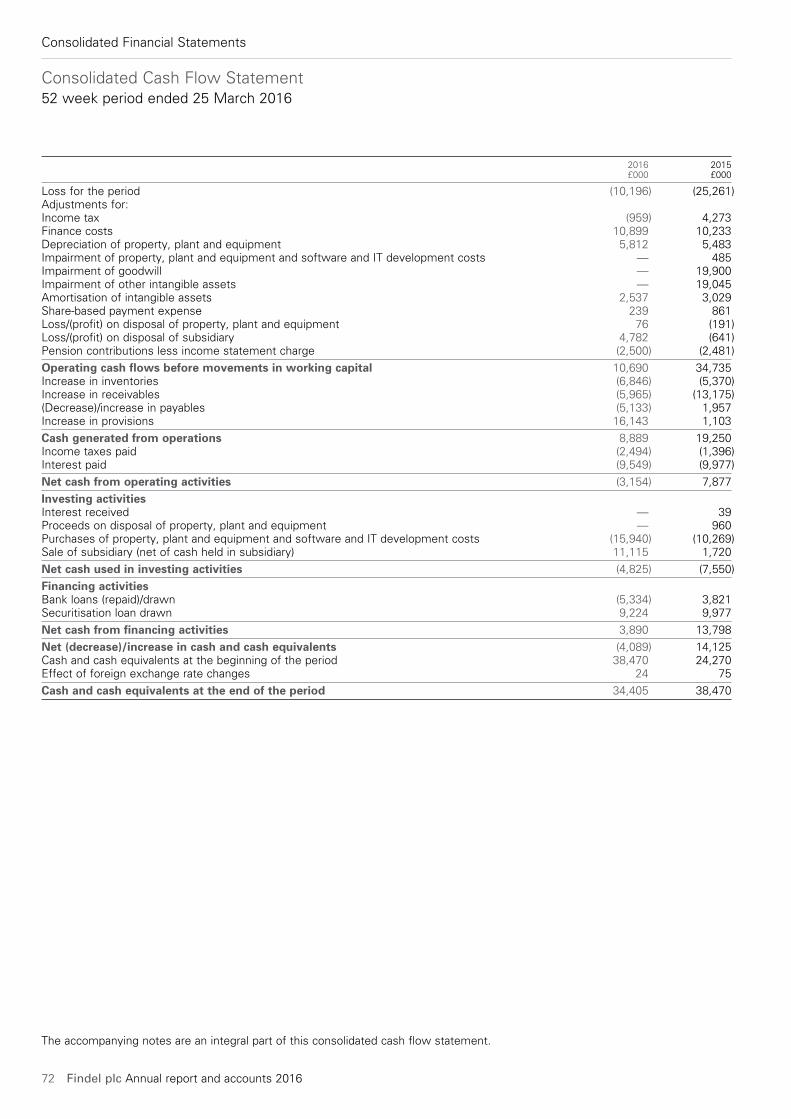
72 Findel plc Annual report and accounts 2016
Consolidated Financial Statements
Consolidated Cash Flow Statement52 week period ended 25 March 2016
2016 2015 £000 £000
Loss for the period (10,196) (25,261)Adjustments for:Income tax (959) 4,273Finance costs 10,899 10,233Depreciation of property, plant and equipment 5,812 5,483Impairment of property, plant and equipment and software and IT development costs — 485Impairment of goodwill — 19,900Impairment of other intangible assets — 19,045Amortisation of intangible assets 2,537 3,029Share-based payment expense 239 861Loss/(profit) on disposal of property, plant and equipment 76 (191)Loss/(profit) on disposal of subsidiary 4,782 (641)Pension contributions less income statement charge (2,500) (2,481)
Operating cash flows before movements in working capital 10,690 34,735Increase in inventories (6,846) (5,370)Increase in receivables (5,965) (13,175)(Decrease)/increase in payables (5,133) 1,957Increase in provisions 16,143 1,103
Cash generated from operations 8,889 19,250Income taxes paid (2,494) (1,396)Interest paid (9,549) (9,977)
Net cash from operating activities (3,154) 7,877
Investing activitiesInterest received — 39Proceeds on disposal of property, plant and equipment — 960Purchases of property, plant and equipment and software and IT development costs (15,940) (10,269)Sale of subsidiary (net of cash held in subsidiary) 11,115 1,720
Net cash used in investing activities (4,825) (7,550)
Financing activitiesBank loans (repaid)/drawn (5,334) 3,821Securitisation loan drawn 9,224 9,977
Net cash from financing activities 3,890 13,798
Net (decrease)/increase in cash and cash equivalents (4,089) 14,125Cash and cash equivalents at the beginning of the period 38,470 24,270Effect of foreign exchange rate changes 24 75
Cash and cash equivalents at the end of the period 34,405 38,470
The accompanying notes are an integral part of this consolidated cash flow statement.
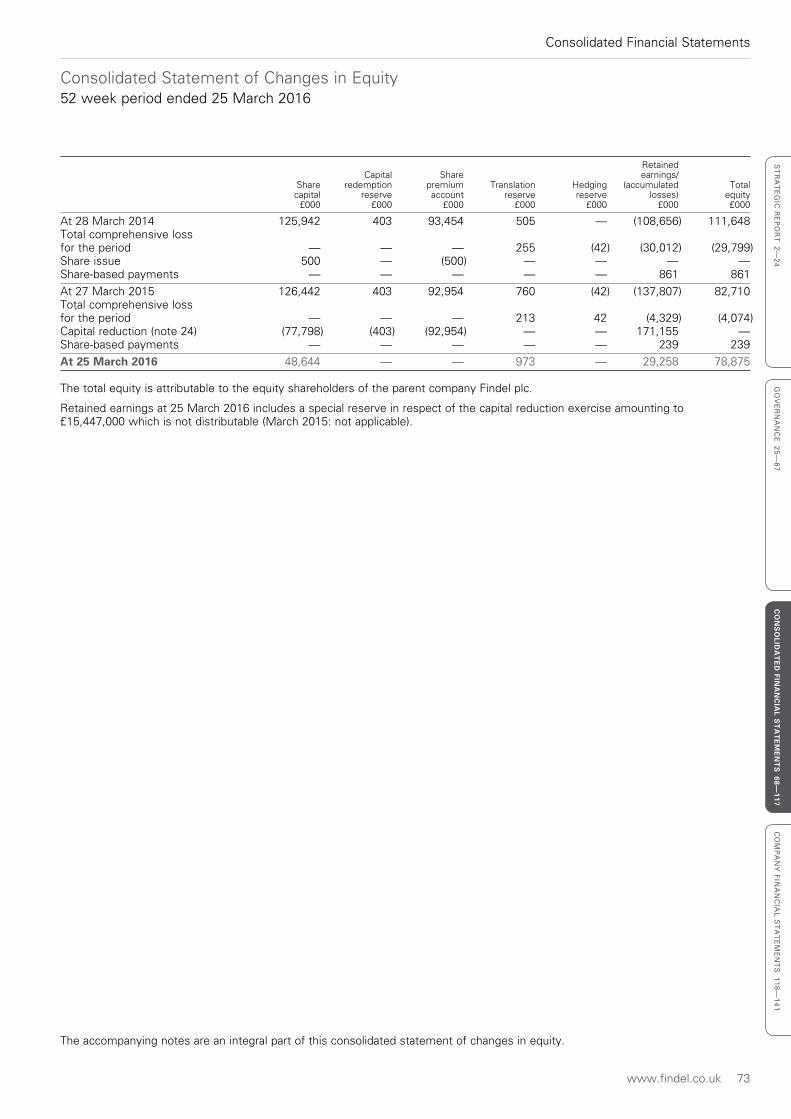
www.findel.co.uk 73
Consolidated Financial Statements
ST
RA
TE
GIC
RE
PO
RT
2—
24
GO
VE
RN
AN
CE
25
—6
7C
ON
SO
LIDA
TE
D FIN
AN
CIA
L ST
AT
EM
EN
TS
68—117
CO
MP
AN
Y F
INA
NC
IAL
ST
AT
EM
EN
TS
11
8—
14
1
Consolidated Statement of Changes in Equity52 week period ended 25 March 2016
Retained Capital Share earnings/ Share redemption premium Translation Hedging (accumulated Total capital reserve account reserve reserve losses) equity £000 £000 £000 £000 £000 £000 £000
At 28 March 2014 125,942 403 93,454 505 — (108,656) 111,648Total comprehensive loss for the period — — — 255 (42) (30,012) (29,799)Share issue 500 — (500) — — — —Share-based payments — — — — — 861 861
At 27 March 2015 126,442 403 92,954 760 (42) (137,807) 82,710Total comprehensive loss for the period — — — 213 42 (4,329) (4,074)Capital reduction (note 24) (77,798) (403) (92,954) — — 171,155 —Share-based payments — — — — — 239 239
At 25 March 2016 48,644 — — 973 — 29,258 78,875
The total equity is attributable to the equity shareholders of the parent company Findel plc.
Retained earnings at 25 March 2016 includes a special reserve in respect of the capital reduction exercise amounting to £15,447,000 which is not distributable (March 2015: not applicable).
The accompanying notes are an integral part of this consolidated statement of changes in equity.
Notes to the Consolidated Financial Statements
74 Findel plc Annual report and accounts 2016
Consolidated Financial Statements
1 General information and accounting policiesFindel plc is a company incorporated in the United Kingdom under the Companies Act 2006. The address of the registered office is given on page 25. The nature of the Group’s operations and its principal activities are set out in the Strategic Report on pages 2 to 24.
These financial statements are presented in sterling because that is the currency of the primary economic environment in which the Group operates. Foreign operations are included in accordance with the accounting policies set out below.
Impact of accounting standards not yet effectiveThe following Adopted IFRSs have been issued but have not been applied by the Group in these financial statements. Their adoption is not expected to have a material effect on the financial statements unless otherwise indicated:
• Recognition of Deferred Tax Assets for Unrealised Losses – Amendments to IAS 12 (effective date 31 December 2017) – Management is still considering the impact of this new standard.
• IFRS 15 Revenue from Contracts with Customers (effective date 31 December 2018) – Management is still considering the impact of this new standard.
• IFRS 9 Financial Instruments recognition and measurement – Replacing IAS 39 (effective date 31 December 2018) – Management is still considering the impact of this new standard and is as yet unable to quantify its likely impact.
• IFRS 16 Leases (effective date 31 December 2019) – Management is still considering the impact of this new standard and is as yet unable to quantify its likely impact.
Impact of accounting standards adoptedA number of amendments to IAS 19 Employee Benefits, IAS 16 Property, Plant and Equipment and IAS 38 Intangible Assets became effective during the current period. These have therefore been adopted in the Group’s consolidated financial statements in the current period. There is no impact on the consolidated financial statements in either the current or prior periods as a result of this adoption, other than certain disclosure requirements.
Income statement presentation
Exceptional itemsAs permitted by IAS1 “Presentation of financial statements”, an item is disclosed separately if it is considered unusual by its nature and scale, and is of such significance that separate disclosure is required in the financial statements in order to fairly present the financial performance of the Group. Such items are referred to as exceptional items and are described in note 6.
Discontinued operationsKitbag LimitedThe Group completed the disposal of its sports retail company, Kitbag Limited, on 1 February 2016. The business met the criteria to be accounted for as a discontinued operation as defined in IFRS 5, “Non-current assets held for sale and discontinued operations”. Results from this discontinued operation have therefore been separated out in the consolidated income statement in both the current and prior periods to enhance the comparability of the ongoing businesses. Further details are given in note 7.
Kleeneze LimitedThe Group completed the disposal of its network marketing company, Kleeneze Limited, in the prior period. Results from this discontinued operation until the point of completion have been separated out in the consolidated income statement to enhance the comparability of the ongoing businesses. Further details are given in note 7.
Basis of accountingThe financial statements have been prepared in accordance with International Financial Reporting Standards (IFRSs) adopted for use in the European Union and therefore comply with Article 4 of the EU IAS Regulation. The financial statements have been prepared on the going concern basis as set out below. The financial statements have been prepared on the historical cost basis except for the revaluation of certain financial instruments.
The principal accounting policies adopted are set out below and have been applied consistently in the current and prior period.
www.findel.co.uk 75
Consolidated Financial Statements
ST
RA
TE
GIC
RE
PO
RT
2—
24
GO
VE
RN
AN
CE
25
—6
7C
ON
SO
LIDA
TE
D FIN
AN
CIA
L ST
AT
EM
EN
TS
68—117
CO
MP
AN
Y F
INA
NC
IAL
ST
AT
EM
EN
TS
11
8—
14
1
1 General information and accounting policies – continued
Going concernIn determining whether the Group’s financial statements for the period ended 25 March 2016 can be prepared on a going concern basis, the directors considered all factors likely to affect its future development, performance and its financial position, including cash flows, liquidity position and borrowing facilities and the risks and uncertainties relating to its business activities in the current economic climate. The financial position of the Group, its cash flows, liquidity position and borrowing facilities and the key risks and uncertainties are set out in further detail above in the Finance Director’s Review on pages 20 to 24.
The directors have reviewed the trading and cash flow forecasts as part of their going concern assessment, including reasonable downside sensitivities which take into account the uncertainties in the current operating environment including amongst other matters demand for the Group’s products, its available financing facilities, and regulatory licensing and compliance. Although at certain times the level of headroom reduces to a level which is less than the directors would regard as desirable in the long term, the directors believe it to be sufficient and have identified controllable mitigating actions that could be implemented if required. The Group’s banking facilities were extended during the year and now mature in December 2019.
Taking into account the above uncertainties and circumstances, the directors formed a judgement that there is a reasonable expectation that the Company and the Group have adequate resources to continue in operational existence for a period of at least 12 months.
Accordingly, they continue to adopt the going concern basis in preparing the Group’s annual consolidated financial statements.
Basis of consolidation
SubsidiariesSubsidiaries are consolidated from the date on which control is transferred to the Group. They cease to be consolidated from the date that the Group no longer has control.
Inter-company transactions, balances and unrealised gains on transactions between group companies are eliminated on consolidation. Unrealised losses are also eliminated unless the transaction provides evidence of an impairment of the asset transferred.
The financial statements of all subsidiaries are prepared to the same reporting date as the parent company.
Segmental reportingIFRS 8 requires operating segments to be identified on the basis of the internal financial information reported to the Chief Operating Decision Maker (CODM) who is primarily responsible for the allocation of resources to segments and the assessment of performance of the segments. The CODM is the Board of the Company.
The CODM assesses profit performance using operating profit measured on a basis consistent with the disclosure in the Group financial information.
Prior to the disposal of Kitbag Limited on 1 February 2016, the Group was organised into four operating segments:
• Express Gifts;
• Findel Education;
• Overseas sourcing; and
• Kitbag.
Following the disposal of Kitbag Limited on 1 February 2016, the Group is now organised into three operating segments.
Revenue recognitionRevenue comprises the fair value of the sale of goods and services to external customers, net of value added tax, rebates, discounts and returns. Revenue is recognised as follows:
Sale of goodsRevenue is recognised when the significant risks and rewards of ownership of the goods have passed to the buyer, which is considered to be upon despatch, and the amount of revenue can be measured reliably. In Kleeneze Limited, the buyer was considered to be the customer who purchases goods from the distributor; paragraph 8 of IAS 18 ‘Revenue’ would regard Kleeneze Limited as the principal and the distributor as the agent.
A provision for estimated returns is made based upon past experience and trends, representing the profit on goods sold during the period which will be returned and refunded after the period end.
Notes to the Consolidated Financial Statements
76 Findel plc Annual report and accounts 2016
Consolidated Financial Statements
1 General information and accounting policies – continued
Interest incomeInterest income on customer credit accounts is recognised on a time-proportion basis, using the effective interest method.
Rendering of servicesRevenue is recognised in respect of non-interest related financial income and delivery charges at the point at which the service is deemed to have been rendered. In all cases income is recognised when the relevant service has been provided to the customer.
Volume based discounts and other arrangements with suppliersBoth Express Gifts and Findel Education entered into volume based discount agreements with suppliers in both the current and prior period. Discounts are calculated annually based upon an agreed percentage of purchases made from suppliers with which an agreement is in place. Discounts are agreed with suppliers prior to being recorded in the income statement. In most cases, the discount is set off against outstanding invoices.
Both Express Gifts and Findel Education also receive contributions from suppliers in exchange for their products being listed in publications. These contributions are agreed with suppliers on a case by case basis.
The value of volume based discounts and contributions received in the period ended 25 March 2016 was approximately £5.7m (2015: £7.3m) which represents approximately 2.6% (2015: 3.4%) of cost of sales relating to continuing operations.
Foreign currency translation
Functional and presentational currencyThe consolidated financial statements are presented in sterling, which is the Company’s and Group’s functional and presentational currency. Items included in the financial statements of each of the Group’s entities are measured using the currency of the primary economic environment in which the entity operates (the functional currency).
Transactions and balancesTransactions in foreign currencies are recorded at the exchange rate prevailing on the date of the transaction. At each balance sheet date, monetary assets and liabilities denominated in foreign currencies are retranslated at the exchange rate prevailing at the balance sheet date. Translation differences on monetary items are taken to the income statement with the exception of differences on translations that are subject to effective cash flow hedges.
Translation differences on non-monetary items are reported as part of the fair value gain or loss and are included in either equity or the income statement as appropriate.
Group companiesThe results and financial position of overseas Group entities are translated into sterling as follows:
• Assets and liabilities are translated at the closing rate at the date of that balance sheet;
• Income and expenses are translated at the average exchange rate for the period; and
• All resulting exchange differences are recognised as a separate component of equity.
On consolidation, exchange differences arising from the translation of the net investment in foreign entities are taken to equity. Tax charges and credits attributable to those exchange differences are taken directly to equity.
Share-based paymentsThe Group operates a number of equity-settled, share-based compensation plans.
The Group has applied the requirements of IFRS 2 “Share-based payments”.
The Group principally issues equity-settled share-based payments to certain employees. Equity-settled share-based payments are measured at fair value (excluding the effect of non market-based vesting conditions) at the date of grant. The fair value determined at the grant date of the equity-settled share-based payments is expensed on a straight-line basis over the vesting period, based on the Group’s estimate of shares that will eventually vest and adjusted for the effect of non market-based vesting conditions.
Fair value is usually measured by use of the Stochastic Valuation (aka “Monte-Carlo”) model. The expected life used in the model has been adjusted, based on management’s best estimate, for the effects of non-transferability, exercise restrictions, and behavioural considerations.
www.findel.co.uk 77
Consolidated Financial Statements
ST
RA
TE
GIC
RE
PO
RT
2—
24
GO
VE
RN
AN
CE
25
—6
7C
ON
SO
LIDA
TE
D FIN
AN
CIA
L ST
AT
EM
EN
TS
68—117
CO
MP
AN
Y F
INA
NC
IAL
ST
AT
EM
EN
TS
11
8—
14
1
1 General information and accounting policies – continued
Property, plant and equipmentProperty, plant and equipment are held at cost less accumulated depreciation and any impairment in value.
Depreciation is charged on a straight-line basis as follows:
• Freehold properties are depreciated over 50 years;
• Leasehold premises with lease terms of 50 years or less are depreciated over the remaining period of the lease;
• Plant and equipment are depreciated over 3 to 20 years according to the estimated life of the asset;
• Equipment on hire or lease is depreciated over the period of the lease;
• Land is not depreciated.
Assets held in the course of construction are not depreciated until they are brought into use.
Software and IT development costsExpenditure on IT software development is recognised as an internally-generated intangible asset up to the point where the main projects cease to involve external contractors, and only if all of the following conditions are met:
• an asset is created that can be identified (such as software and new processes);
• it is probable that the asset created will generate future economic benefits; and
• the development cost of the asset can be measured reliably.
Internally-generated intangible assets are amortised on a straight-line basis over their useful lives of three to seven years. Where no internally-generated intangible asset can be recognised, expenditure is recognised as an expense in the period in which it is incurred.
GoodwillThere have been no acquisitions in the current period which would be accounted for under IFRS 3 Revised. For acquisitions between 1 April 2004 and 2 April 2010, goodwill is the excess of the fair value of the consideration payable for an acquisition over the fair value of the Group’s share of identifiable net assets of a subsidiary, associate or joint venture acquired at the date of acquisition. Fair values are attributed to the identifiable assets, liabilities and contingent liabilities that existed at the date of acquisition, reflecting their condition at that date. Adjustments are made where necessary to bring the accounting policies of acquired businesses into alignment with those of the Group.
Goodwill on acquisitions of subsidiaries is included in intangible assets. Goodwill on acquisitions of associates and joint ventures is included in the carrying amount of the investment. Goodwill is stated at cost less any impairment. Goodwill is not amortised but is tested annually for impairment. An impairment charge is recognised for any amount by which the carrying value of goodwill exceeds its recoverable value.
Gains and losses on the disposal of an entity include the carrying amount of goodwill relating to the entity sold, allocated where necessary on a pro rata basis.
Other intangible assetsIntangible assets acquired as part of an acquisition of a business are capitalised separately from goodwill, if those assets are separable and their fair value can be measured reliably.
The cost of intangible assets with finite useful economic lives is amortised on a straight-line basis over that period. The carrying values of intangible assets are reviewed for impairment when events or changes in circumstances indicate that the carrying values may not be recoverable.
Brand namesLegally protected or otherwise separable trade names acquired as part of a business combination are capitalised at fair value on acquisition. Brand names are assumed to have an indefinite life and are not amortised, but are subject to annual impairment tests.
Customer relationshipsContractual and non-contractual customer relationships acquired as part of a business combination are capitalised at fair value on acquisition and amortised on a straight-line basis over a period of between 2 and 20 years, representing the directors’ best estimate of their useful economic lives.
Notes to the Consolidated Financial Statements
78 Findel plc Annual report and accounts 2016
Consolidated Financial Statements
1 General information and accounting policies – continued
Financial instrumentsFinancial assets and financial liabilities are recognised in the Group’s balance sheet when the Group becomes a party to the contractual provisions of the instrument.
Financial assetsThe Group’s financial assets are classified as either derivatives or “loans and receivables”. The classification depends on the nature and purpose of the financial assets and is determined at the time of initial recognition.
Effective interest methodThe effective interest method is a method of calculating the amortised cost of a financial asset and of allocating interest income over the relevant period. The effective interest rate is the rate that exactly discounts estimated future cash receipts (including all fees paid or received that form an integral part of the effective interest rate, transaction costs and other premiums or discounts) through the expected life of the financial asset, or, where appropriate, a shorter period, to the principal amount.
Income is recognised on an effective interest basis for loans and receivables.
Loans and receivablesTrade receivables, loans, and other receivables that have fixed or determinable payments are classified as loans and receivables. Loans and receivables are measured at amortised cost using the effective interest method, less any impairment. Interest income is recognised by applying the effective interest rate, except for short-term receivables when the recognition of interest would be immaterial.
Impairment of financial assetsLoans and receivables are assessed for indicators of impairment at each balance sheet date. Financial assets are impaired where there is objective evidence that, as a result of one or more events that occurred after the initial recognition of the financial asset, the estimated future cash flows of the investment have been impacted.
• Objective evidence of impairment could include:
• significant financial difficulty of the issuer or counterparty; or
• default or delinquency in interest or principal payments; or
• it becoming probable that the borrower will enter bankruptcy or financial reorganisation.
For trade receivables in Express Gifts, assets that are not individually significant are assessed for impairment on a collective basis. For the purpose of a collective evaluation of impairment, financial assets are grouped on the basis of common credit risk characteristics such as past-due status and other relevant factors. Specific consumer credit receivables are removed from the portfolio when they suffer a bankruptcy event or when management judges that the debt is irrecoverable. Other non-payment events are considered as part of the collective assessment for impairment in line with the characteristics of the portfolio. The rest of the Group tests for impairment of receivables on an individual basis.
Objective evidence of impairment for a portfolio of receivables includes the Group’s past experience of collecting payments, an increase in the number of delayed payments in the portfolio past the average credit period, as well as observable changes in national or local economic conditions that correlate with default on receivables.
The carrying amount of the financial asset is reduced by the impairment loss directly for all financial assets with the exception of trade receivables, where the carrying amount is reduced through the use of an allowance account. When a trade receivable is considered uncollectible, it is written off against the allowance account. Subsequent recoveries of amounts previously written off are credited against the allowance account. Changes in the carrying amount of the allowance account are recognised in profit or loss.
If, in a subsequent period, the amount of the impairment loss decreases and the decrease can be related objectively to an event occurring after the impairment was recognised, the previously recognised impairment loss is reversed through profit or loss to the extent that the carrying amount of the asset at the date the impairment is reversed does not exceed what the amortised cost would have been had the impairment not been recognised.
Cash and cash equivalentsCash and cash equivalents comprise cash on hand and demand deposits, and other short-term highly liquid investments that are readily convertible to a known amount of cash and are subject to an insignificant risk of changes in value.
Derecognition of financial assetsThe Group derecognises a financial asset only when the contractual rights to the cash flows from the asset expire; or it transfers the financial asset and substantially all the risks and rewards of ownership of the asset to another entity. If the Group neither transfers nor retains substantially all the risks and rewards of ownership and continues to control the transferred asset, the Group recognises its retained interest in the asset and an associated liability for amounts it may have to pay. If the Group retains substantially all the risks and rewards of ownership of a transferred financial asset, the Group continues to recognise the financial asset and also recognises a collateralised borrowing for the proceeds received.
www.findel.co.uk 79
Consolidated Financial Statements
ST
RA
TE
GIC
RE
PO
RT
2—
24
GO
VE
RN
AN
CE
25
—6
7C
ON
SO
LIDA
TE
D FIN
AN
CIA
L ST
AT
EM
EN
TS
68—117
CO
MP
AN
Y F
INA
NC
IAL
ST
AT
EM
EN
TS
11
8—
14
1
1 General information and accounting policies – continued
Financial liabilities and equityFinancial liabilities and equity instruments are classified according to the substance of the contractual arrangements entered into.
Equity instrumentsAn equity instrument is any contract that evidences a residual interest in the assets of the Group after deducting all of its liabilities. Equity instruments issued by the Group are recorded at the proceeds received, net of direct issue costs.
Where financial liabilities are extinguished by equity instruments issued the difference between the carrying value of the debt extinguished and the fair value of the equity instrument issued is recorded in the income statement.
Financial liabilitiesThe Group’s financial liabilities are classified as either “fair value through profit and loss” or “other financial liabilities”.
Other financial liabilitiesOther financial liabilities, including borrowings, are initially measured at fair value, net of transaction costs. Other financial liabilities are subsequently measured at amortised cost using the effective interest method, with interest expense recognised on an effective yield basis. The effective interest method is a method of calculating the amortised cost of a financial liability and of allocating interest expense over the relevant period. The effective interest rate is the rate that exactly discounts estimated future cash payments through the expected life of the financial liability, or, where appropriate, a shorter period.
The Group derecognises financial liabilities when, and only when, the Group’s obligations are discharged, cancelled or they expire.
Derivative financial instrumentsOn initial designation of the derivative as the hedging instrument, the Group formally documents the relationship between the hedging instrument and hedged item, including the risk management objectives and strategy in undertaking the hedge transaction and the hedged risk, together with the methods that will be used to assess the effectiveness of the hedging relationship. The Group makes an assessment, both at the inception of the hedge relationship as well as on an ongoing basis, of whether the hedging instruments are expected to be “highly effective” in offsetting the changes in the fair value or cash flows of the respective hedged items attributable to the hedged risk, and whether the actual results of each hedge are within a range of 80 – 125%. For a cash flow hedge of a forecast transaction, the transaction should be highly probable to occur and should present an exposure to variations in cash flows that could ultimately affect reported profit or loss.
Derivatives are recognised initially at fair value; attributable transaction costs are recognised in profit or loss as incurred. Subsequent to initial recognition, derivatives are measured at fair value, and changes therein are accounted for as described below.
Cash flow hedgesWhen a derivative is designated as the hedging instrument in a hedge of the variability in cash flows attributable to a particular risk associated with a recognised asset or liability or a highly probable forecast transaction that could affect profit or loss, the effective portion of changes in the fair value of the derivative is recognised in other comprehensive income and presented in the hedging reserve in equity. Any ineffective portion of changes in the fair value of the derivative is recognised immediately in profit or loss. When the hedged item is a non-financial asset, the amount accumulated in equity is included in the carrying amount of the asset when the asset is recognised. In other cases the amount accumulated in equity is reclassified to profit or loss in the same period that the hedged item affects profit or loss. If the hedging instrument no longer meets the criteria for hedge accounting, expires or is sold, terminated or exercised, or the designation is revoked, then hedge accounting is discontinued prospectively. If the forecast transaction is no longer expected to occur, then the balance in equity is reclassified in profit or loss.
The Group enters into a variety of derivative financial instruments to manage its exposure to interest rate and foreign exchange rate risk, including foreign exchange forward contracts, interest rate caps and swaps and foreign currency options. Further details of derivative financial instruments are disclosed in note 20 to the financial statements.
Derivatives are initially recognised at fair value at the date a derivative contract is entered into and are subsequently remeasured to their fair value at each balance sheet date. The resulting gain or loss is recognised in profit or loss immediately.
A derivative is presented as a non-current asset or a non-current liability if the remaining maturity of the instrument is more than 12 months and it is not expected to be realised or settled within 12 months. Other derivatives are presented as current assets or current liabilities.
InventoriesInventories are stated at the lower of cost and net realisable value.
Cost is calculated on a weighted average cost basis, and where applicable includes those costs that have been incurred in bringing the inventories to their present location and condition.
Net realisable value is the estimated selling price in the ordinary course of business, less applicable variable selling expenses.
Notes to the Consolidated Financial Statements
80 Findel plc Annual report and accounts 2016
Consolidated Financial Statements
1 General information and accounting policies – continued
Impairment of non-financial assetsAssets that have an indefinite useful life are not subject to amortisation but are tested annually for impairment. Assets that are subject to amortisation are reviewed for impairment whenever events or changes in circumstances indicate that the carrying amount may not be recoverable. An impairment loss is recognised for the amount by which the asset’s carrying amount exceeds its recoverable amount. The recoverable amount is the higher of an asset’s fair value less costs to sell and value in use. For the purposes of assessing impairment, assets are grouped at the lowest levels for which there are separately identifiable cash flows (cash-generating units).
TaxationThe tax currently payable or receivable is based on taxable profit or loss for the period. Taxable profit differs from net profit as reported in the income statement because it excludes items of income or expense that are taxable or deductible in other years and it further excludes items that are never taxable or deductible. The Group’s liability for current tax is calculated using tax rates that have been enacted or substantively enacted by the balance sheet date.
Deferred taxation is provided in full on temporary differences arising between the tax bases of assets and liabilities and their carrying amounts in the consolidated financial statements. However, if the deferred taxation arises from initial recognition of an asset or liability in a transaction other than a business combination that at the time of the transaction affects neither accounting nor taxable profit or loss, it is not accounted for. Deferred taxation is calculated using tax rates that are expected to apply when the related deferred taxation asset is realised or the deferred taxation liability is settled.
Deferred taxation assets are recognised to the extent that it is probable that future taxable profit will be available against which the temporary differences can be utilised.
Deferred tax assets and liabilities are offset if there is a legally enforceable right to offset current tax liabilities and assets, and they relate to income taxes levied by the same tax authority on the same taxable entity, or on different tax entities, but they intend to settle current tax liabilities and assets on a net basis or their tax assets and liabilities will be realised simultaneously.
Leases
Finance leasesLeases of property, plant and equipment where the Group has substantially all the risks and rewards of ownership are classified as finance leases. Finance leases are capitalised at the lease’s inception at the lower of the fair value of the leased property and the present value of the minimum lease payments. Each lease payment is allocated between the liability and finance charges so as to achieve a constant rate on the finance balance outstanding. The corresponding rental obligations, net of finance charges, are included in other long-term payables. The interest element of the finance cost is charged to the income statement over the lease period so as to produce a constant periodic rate of interest on the remaining balance of the liability for each period. Property, plant and equipment acquired under finance leases is depreciated over the shorter of the anticipated useful life of the asset and its lease term.
Operating leasesLeases in which a significant proportion of the risks and rewards of ownership are retained by the lessor are classified as operating leases. Payments made under operating leases are charged to the income statement on a straight-line basis over the period of the lease. Incentives from lessors are recognised as a systematic reduction of the charge over the lease term.
Retirement benefit costsThe Group has both defined benefit and defined contribution plans. A defined benefit plan is a pension plan that defines an amount of pension benefit that an employee will receive on retirement, usually dependent on one or more factors such as age, years of service and compensation. A defined contribution plan is a pension plan under which the Group pays fixed contributions into an independently administered fund. The Group has no legal or constructive obligations to pay further contributions if the fund does not hold sufficient assets to pay all employees the benefits relating to employee service in the current and prior periods. The cost of providing these benefits, recognised in the income statement, comprises the amount of contributions payable to the schemes in respect of the year.
For defined benefit retirement plans, the cost of providing benefits is determined using the Projected Unit Credit method, with actuarial valuations being carried out at each balance sheet date.
www.findel.co.uk 81
Consolidated Financial Statements
ST
RA
TE
GIC
RE
PO
RT
2—
24
GO
VE
RN
AN
CE
25
—6
7C
ON
SO
LIDA
TE
D FIN
AN
CIA
L ST
AT
EM
EN
TS
68—117
CO
MP
AN
Y F
INA
NC
IAL
ST
AT
EM
EN
TS
11
8—
14
1
2 Critical accounting judgements and key sources of estimation uncertaintyThe preparation of consolidated financial statements in conformity with IFRS requires management to make judgements, estimates and assumptions that affect the application of accounting policies and the reported amounts of assets, liabilities, income and expenses. Actual results may differ from these estimates.
Critical judgements in applying the Group’s accounting policiesIn the process of applying the Group’s accounting policies, which are described in note 1, management has made the following judgements that have the most significant effect on the amounts recognised in the financial statements (apart from those involving estimates, which are dealt with below).
Classification of exceptional items – judgement is applied in determining whether or not it is considered appropriate to present items separately in the income statement in order to fairly present the financial performance of the Group.
Treatment of leases – judgement is applied to assess whether the risks and rewards of ownership of the asset have transferred to determine whether a lease is accounted for as a finance lease or an operating lease.
Key sources of estimation uncertaintyThe key assumptions concerning the future, and other key sources of estimation uncertainty at the balance sheet date, that have a significant risk of causing a material adjustment to the carrying amounts of assets and liabilities within the next financial year are as follows:
Valuation of indefinite lived intangibles and goodwill (note 13)The Group has significant investments in goodwill and indefinite lived intangible assets at 25 March 2016 as a result of acquisitions of businesses and purchases of such assets. The carrying value of goodwill at 25 March 2016 is £16.7m. The carrying value of indefinite lived intangible assets is £21.2m. These assets are held at cost less provisions for impairment and tested annually for impairment. Tests for impairment are primarily based on the calculation of a value in use for each cash generating unit. This involves the preparation of discounted cash flow projections, which require an estimate of both future operating cash flows and an appropriate discount rate. Such estimates are inherently subjective and can have a material impact on the result of the impairment test.
Inventory provisioning (note 15)The Group carries significant amounts of inventory against which there are provisions for slow moving and delisted products. At 25 March 2016 a provision of £1.7m is held against a gross inventory value of £55.2m. The provisioning policies require a high degree of judgement and the use of estimates around future sales and demand for products. In addition management make use of estimates regarding the selling price of items in order to ensure that inventories are valued at the lower of cost and net realisable value.
Express Gifts’ trade receivables (note 16)Express Gifts’ trade receivables are recognised on the balance sheet at original invoice amount less provision for impairment. At 25 March 2016 trade receivables with a gross value of £244.3m were recorded on the balance sheet less a provision for impairment of £43.1m. Provisions for impairment of receivables within Express Gifts are established when there is objective evidence that the Group will not be able to collect all amounts due and are based on estimated roll rates and collection rates at each year-end, as well as assumptions around the sale of significantly overdue receivables to third-parties. The roll rates, collection rates and assumptions around the sale of significantly overdue receivables are estimated based on historical and current trends and are inherently subjective.
The changes introduced to receivables collection processes by Express Gifts over the last two years, including the introduction of a strategy to pursue the sale of significantly overdue receivables to third-parties, have enabled and required management to refine the estimation models used for receivables provisioning. In some areas, in particular in relation to customers with whom forbearance arrangements, both with and without interest, have been entered into, better information is now available to allow an improved, more accurate, assessment of the level of provision required. Based on this improved information, an additional provision of £4.3m has been recognised at March 2016, of which c.£3m relates to an adjustment to correct an area of previous non-compliance with IAS 39. Management have concluded that the changes made would not, if they had been made during the prior year, have had a material impact on the comparative period income statement, as the level of provision at the beginning of 2014 would also have been similarly impacted. As a result, management consider it appropriate to recognise the additional £4.3m provision during 2016, although, since the increase in the provision of £4.3m does not relate to current year performance, this additional charge to the income statement has been classified as an exceptional item.
Provisions for Financial Services redress (note 21)In both the current and prior period, the Group made provisions in respect of redress and refunds for mis-sold financial services products. At 25 March 2016 a provision of £15.3m was recorded in the balance sheet. The provision amount is calculated based upon estimated volumes of customers affected and the level of redress required following discussions with the FCA and the underwriters concerned.
The carrying amounts of the assets and liabilities detailed above are sensitive to the underlying assumptions used by management in their calculation. It is reasonably possible that the outcomes within the next financial year could differ from the assumptions made, which would impact upon the carrying values assumed.
Estimates and underlying assumptions are reviewed on an ongoing basis. Revisions to accounting estimates are recognised in the period in which the estimates are revised and in any of the future periods affected.
Notes to the Consolidated Financial Statements
82 Findel plc Annual report and accounts 2016
Consolidated Financial Statements
3 SubsidiariesThe subsidiaries of Findel plc, the Group’s ultimate parent company, at 25 March 2016 were as follows:
Name Holding type Status/Activity Jurisdiction of incorporation
Express Gifts Limited Direct Retailer England and WalesFindel Education Limited Direct Retailer England and WalesFindel Asia Sourcing Limited Direct Procurement services Hong KongExpress Gifts Philippines Inc. Indirect Outsourced service provider PhilippinesFindel Education Group Limited Indirect Holding company England and WalesFindel Wholesale Limited Direct Property holding company England and WalesTCC1 Limited Direct Retailer England and Wales2Care4 Limited Direct Property holding company England and WalesAce of Clubs Limited Direct Dormant England and WalesAlternative Choice Limited Direct Dormant England and WalesBurley House Weddings Limited Direct Dormant England and WalesC. & S. (Sutton) Limited Direct Dormant England and WalesCare 4 Schools Limited Direct Dormant England and WalesCare Cards Limited Direct Dormant England and WalesCare4Free Limited Direct Dormant England and WalesCascade Party Toys Limited Direct Dormant England and WalesChristmas-E Limited Direct Dormant England and WalesDean’s Childsplay Toys Limited Direct Dormant England and WalesDee Textiles Limited Indirect Dormant England and WalesDesigned For Giving Limited Direct Dormant England and WalesDesigned For You Limited Direct Dormant England and WalesDurban Mills Limited Direct Dormant England and WalesEB2C Limited Indirect Dormant England and WalesEstore Fulfilment Limited Direct Dormant England and WalesExpress Home Shopping Limited Direct Dormant England and WalesFD1 Limited Indirect Dormant England and WalesFindel (Toys) Limited Direct Dormant England and WalesFindel 2010 Limited Direct Dormant England and WalesFindel Educational Supplies Limited Direct Dormant England and WalesFindel Europe B.V. Direct Dormant NetherlandsFindel Fundraising Limited Direct Dormant England and WalesFindel Gifts Limited Direct Dormant England and WalesFindel Healthcare Limited Direct Dormant England and WalesFindel Home Shopping Limited Direct Dormant England and WalesFindel Interactive Limited Direct Dormant England and WalesFindel Properties Limited Direct Dormant England and WalesFindel Services Limited Direct Dormant England and WalesFindel Stationery Limited Direct Dormant England and WalesFine Art Designs Limited Direct Dormant England and WalesFine Art Developments (Marketing) Limited Direct Dormant England and WalesFine Art Developments (Supplies) Limited Direct Dormant England and WalesFine Art Developments Employee Trust Limited Direct Dormant England and WalesFine Art Developments Limited Direct Dormant England and WalesFriends of Nature Limited Direct Dormant England and WalesFundraising Direct Limited Direct Dormant England and WalesGalt Education Limited Direct Dormant England and WalesE.J. Arnold & Son Limited Direct Dormant England and WalesHeron Educational Limited Direct Dormant England and WalesE.J. Arnold Limited Direct Dormant England and WalesGLS Educational Supplies Limited Indirect Dormant England and Wales
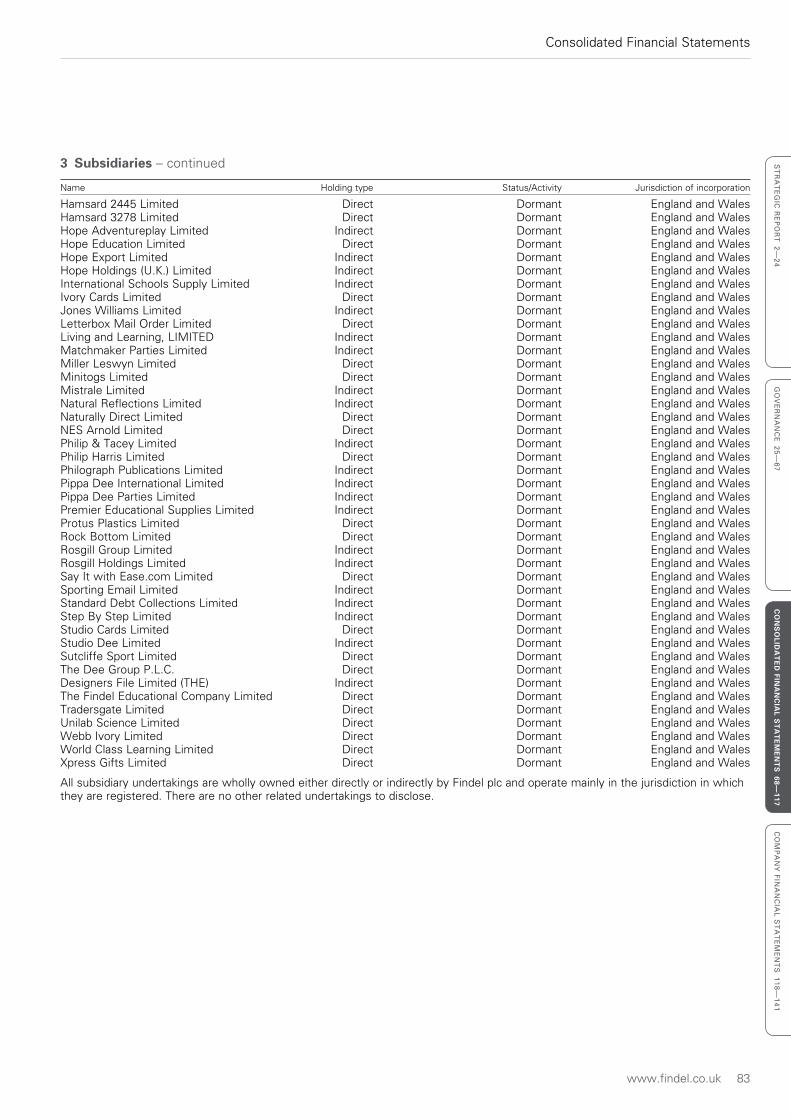
www.findel.co.uk 83
Consolidated Financial Statements
ST
RA
TE
GIC
RE
PO
RT
2—
24
GO
VE
RN
AN
CE
25
—6
7C
ON
SO
LIDA
TE
D FIN
AN
CIA
L ST
AT
EM
EN
TS
68—117
CO
MP
AN
Y F
INA
NC
IAL
ST
AT
EM
EN
TS
11
8—
14
1
3 Subsidiaries – continued
Name Holding type Status/Activity Jurisdiction of incorporation
Hamsard 2445 Limited Direct Dormant England and WalesHamsard 3278 Limited Direct Dormant England and WalesHope Adventureplay Limited Indirect Dormant England and WalesHope Education Limited Direct Dormant England and WalesHope Export Limited Indirect Dormant England and WalesHope Holdings (U.K.) Limited Indirect Dormant England and WalesInternational Schools Supply Limited Indirect Dormant England and WalesIvory Cards Limited Direct Dormant England and WalesJones Williams Limited Indirect Dormant England and WalesLetterbox Mail Order Limited Direct Dormant England and WalesLiving and Learning, LIMITED Indirect Dormant England and WalesMatchmaker Parties Limited Indirect Dormant England and WalesMiller Leswyn Limited Direct Dormant England and WalesMinitogs Limited Direct Dormant England and WalesMistrale Limited Indirect Dormant England and WalesNatural Reflections Limited Indirect Dormant England and WalesNaturally Direct Limited Direct Dormant England and WalesNES Arnold Limited Direct Dormant England and WalesPhilip & Tacey Limited Indirect Dormant England and WalesPhilip Harris Limited Direct Dormant England and WalesPhilograph Publications Limited Indirect Dormant England and WalesPippa Dee International Limited Indirect Dormant England and WalesPippa Dee Parties Limited Indirect Dormant England and WalesPremier Educational Supplies Limited Indirect Dormant England and WalesProtus Plastics Limited Direct Dormant England and WalesRock Bottom Limited Direct Dormant England and WalesRosgill Group Limited Indirect Dormant England and WalesRosgill Holdings Limited Indirect Dormant England and WalesSay It with Ease.com Limited Direct Dormant England and WalesSporting Email Limited Indirect Dormant England and WalesStandard Debt Collections Limited Indirect Dormant England and WalesStep By Step Limited Indirect Dormant England and WalesStudio Cards Limited Direct Dormant England and WalesStudio Dee Limited Indirect Dormant England and WalesSutcliffe Sport Limited Direct Dormant England and WalesThe Dee Group P.L.C. Direct Dormant England and WalesDesigners File Limited (THE) Indirect Dormant England and WalesThe Findel Educational Company Limited Direct Dormant England and WalesTradersgate Limited Direct Dormant England and WalesUnilab Science Limited Direct Dormant England and WalesWebb Ivory Limited Direct Dormant England and WalesWorld Class Learning Limited Direct Dormant England and WalesXpress Gifts Limited Direct Dormant England and Wales
All subsidiary undertakings are wholly owned either directly or indirectly by Findel plc and operate mainly in the jurisdiction in which they are registered. There are no other related undertakings to disclose.
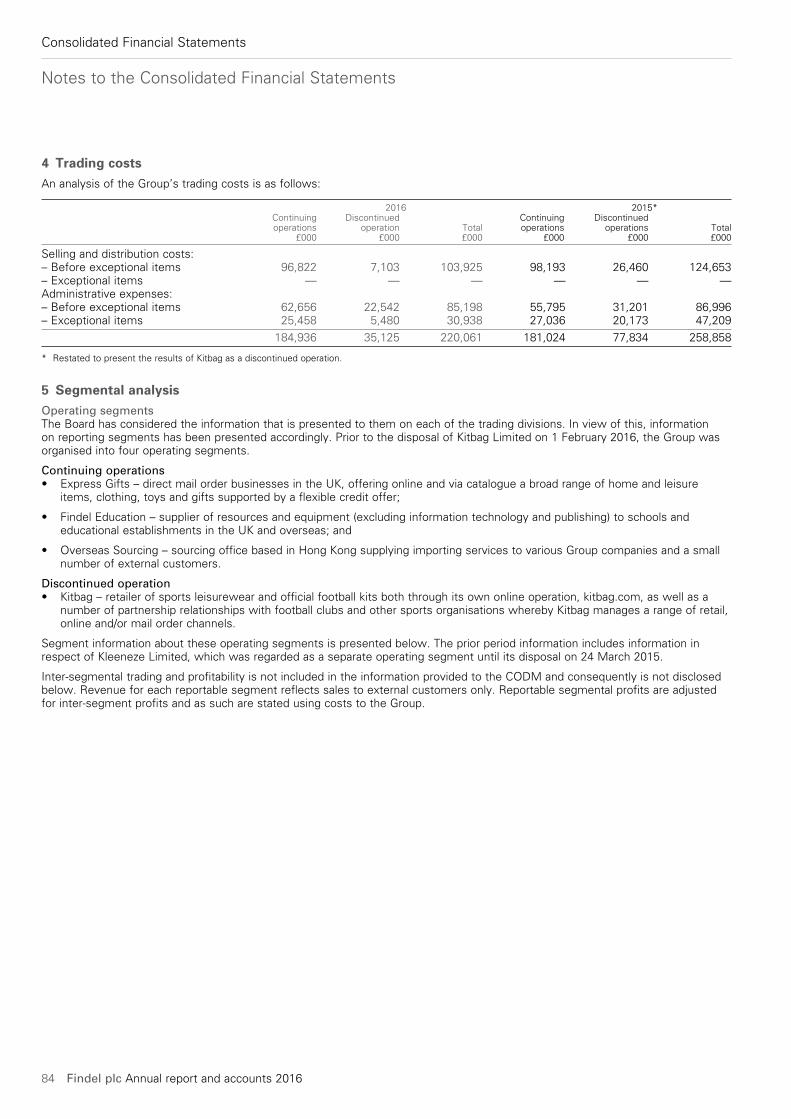
Notes to the Consolidated Financial Statements
84 Findel plc Annual report and accounts 2016
Consolidated Financial Statements
4 Trading costsAn analysis of the Group’s trading costs is as follows:
2016 2015* Continuing Discontinued Continuing Discontinued operations operation Total operations operations Total £000 £000 £000 £000 £000 £000
Selling and distribution costs:– Before exceptional items 96,822 7,103 103,925 98,193 26,460 124,653– Exceptional items — — — — — —Administrative expenses:– Before exceptional items 62,656 22,542 85,198 55,795 31,201 86,996– Exceptional items 25,458 5,480 30,938 27,036 20,173 47,209
184,936 35,125 220,061 181,024 77,834 258,858
* Restated to present the results of Kitbag as a discontinued operation.
5 Segmental analysisOperating segmentsThe Board has considered the information that is presented to them on each of the trading divisions. In view of this, information on reporting segments has been presented accordingly. Prior to the disposal of Kitbag Limited on 1 February 2016, the Group was organised into four operating segments.
Continuing operations• Express Gifts – direct mail order businesses in the UK, offering online and via catalogue a broad range of home and leisure
items, clothing, toys and gifts supported by a flexible credit offer;
• Findel Education – supplier of resources and equipment (excluding information technology and publishing) to schools and educational establishments in the UK and overseas; and
• Overseas Sourcing – sourcing office based in Hong Kong supplying importing services to various Group companies and a small number of external customers.
Discontinued operation• Kitbag – retailer of sports leisurewear and official football kits both through its own online operation, kitbag.com, as well as a
number of partnership relationships with football clubs and other sports organisations whereby Kitbag manages a range of retail, online and/or mail order channels.
Segment information about these operating segments is presented below. The prior period information includes information in respect of Kleeneze Limited, which was regarded as a separate operating segment until its disposal on 24 March 2015.
Inter-segmental trading and profitability is not included in the information provided to the CODM and consequently is not disclosed below. Revenue for each reportable segment reflects sales to external customers only. Reportable segmental profits are adjusted for inter-segment profits and as such are stated using costs to the Group.
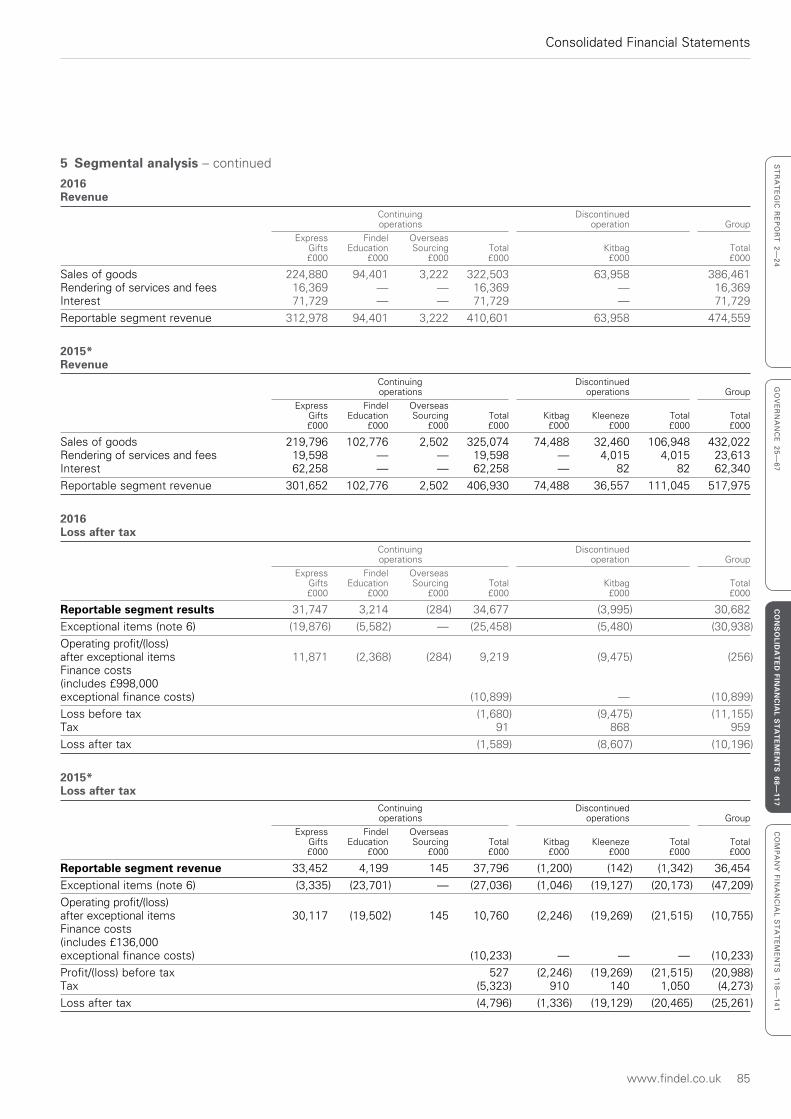
www.findel.co.uk 85
Consolidated Financial Statements
ST
RA
TE
GIC
RE
PO
RT
2—
24
GO
VE
RN
AN
CE
25
—6
7C
ON
SO
LIDA
TE
D FIN
AN
CIA
L ST
AT
EM
EN
TS
68—117
CO
MP
AN
Y F
INA
NC
IAL
ST
AT
EM
EN
TS
11
8—
14
1
5 Segmental analysis – continued
2016Revenue Continuing Discontinued operations operation Group
Express Findel Overseas Gifts Education Sourcing Total Kitbag Total £000 £000 £000 £000 £000 £000
Sales of goods 224,880 94,401 3,222 322,503 63,958 386,461Rendering of services and fees 16,369 — — 16,369 — 16,369Interest 71,729 — — 71,729 — 71,729
Reportable segment revenue 312,978 94,401 3,222 410,601 63,958 474,559
2015*Revenue Continuing Discontinued operations operations Group
Express Findel Overseas Gifts Education Sourcing Total Kitbag Kleeneze Total Total £000 £000 £000 £000 £000 £000 £000 £000
Sales of goods 219,796 102,776 2,502 325,074 74,488 32,460 106,948 432,022Rendering of services and fees 19,598 — — 19,598 — 4,015 4,015 23,613Interest 62,258 — — 62,258 — 82 82 62,340
Reportable segment revenue 301,652 102,776 2,502 406,930 74,488 36,557 111,045 517,975
2016Loss after tax Continuing Discontinued operations operation Group
Express Findel Overseas Gifts Education Sourcing Total Kitbag Total £000 £000 £000 £000 £000 £000
Reportable segment results 31,747 3,214 (284) 34,677 (3,995) 30,682
Exceptional items (note 6) (19,876) (5,582) — (25,458) (5,480) (30,938)
Operating profit/(loss) after exceptional items 11,871 (2,368) (284) 9,219 (9,475) (256)Finance costs (includes £998,000 exceptional finance costs) (10,899) — (10,899)
Loss before tax (1,680) (9,475) (11,155)Tax 91 868 959
Loss after tax (1,589) (8,607) (10,196)
2015*Loss after tax Continuing Discontinued operations operations Group
Express Findel Overseas Gifts Education Sourcing Total Kitbag Kleeneze Total Total £000 £000 £000 £000 £000 £000 £000 £000
Reportable segment revenue 33,452 4,199 145 37,796 (1,200) (142) (1,342) 36,454
Exceptional items (note 6) (3,335) (23,701) — (27,036) (1,046) (19,127) (20,173) (47,209)
Operating profit/(loss) after exceptional items 30,117 (19,502) 145 10,760 (2,246) (19,269) (21,515) (10,755)Finance costs (includes £136,000 exceptional finance costs) (10,233) — — — (10,233)
Profit/(loss) before tax 527 (2,246) (19,269) (21,515) (20,988)Tax (5,323) 910 140 1,050 (4,273)
Loss after tax (4,796) (1,336) (19,129) (20,465) (25,261)
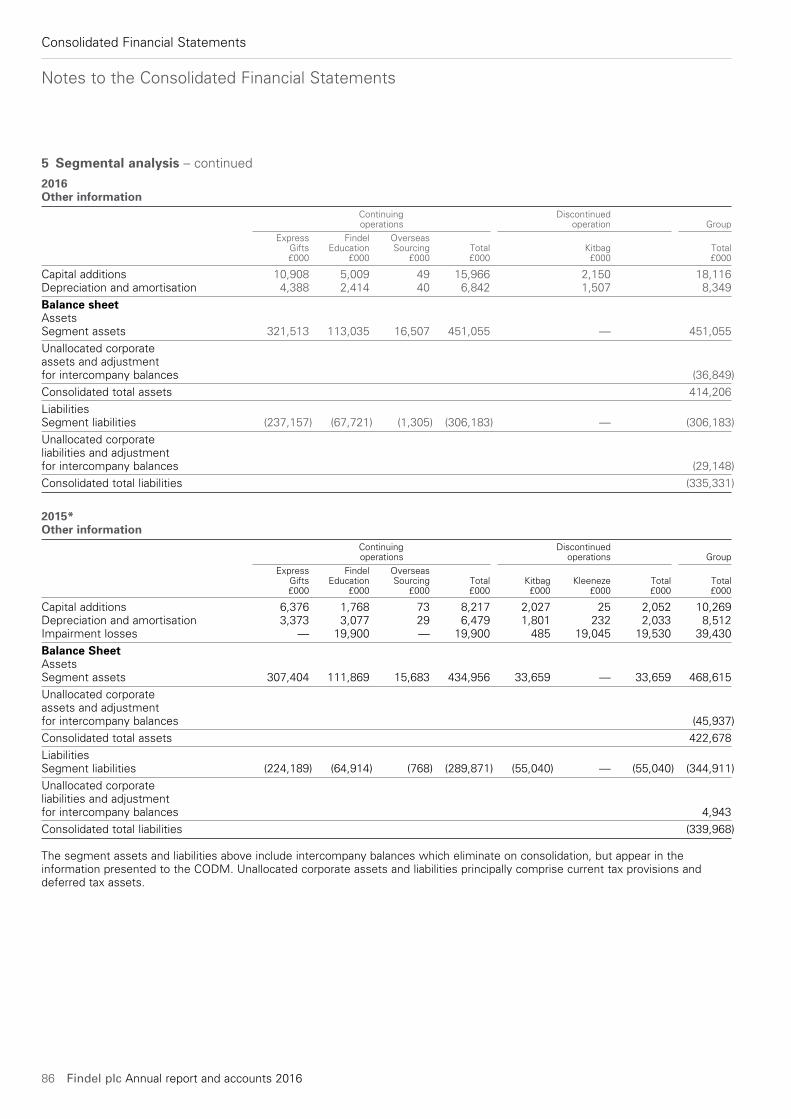
Notes to the Consolidated Financial Statements
86 Findel plc Annual report and accounts 2016
Consolidated Financial Statements
5 Segmental analysis – continued
2016Other information Continuing Discontinued operations operation Group
Express Findel Overseas Gifts Education Sourcing Total Kitbag Total £000 £000 £000 £000 £000 £000
Capital additions 10,908 5,009 49 15,966 2,150 18,116Depreciation and amortisation 4,388 2,414 40 6,842 1,507 8,349
Balance sheetAssetsSegment assets 321,513 113,035 16,507 451,055 — 451,055
Unallocated corporate assets and adjustment for intercompany balances (36,849)
Consolidated total assets 414,206
LiabilitiesSegment liabilities (237,157) (67,721) (1,305) (306,183) — (306,183)
Unallocated corporate liabilities and adjustment for intercompany balances (29,148)
Consolidated total liabilities (335,331)
2015*Other information Continuing Discontinued operations operations Group
Express Findel Overseas Gifts Education Sourcing Total Kitbag Kleeneze Total Total £000 £000 £000 £000 £000 £000 £000 £000
Capital additions 6,376 1,768 73 8,217 2,027 25 2,052 10,269Depreciation and amortisation 3,373 3,077 29 6,479 1,801 232 2,033 8,512Impairment losses — 19,900 — 19,900 485 19,045 19,530 39,430
Balance SheetAssetsSegment assets 307,404 111,869 15,683 434,956 33,659 — 33,659 468,615
Unallocated corporate assets and adjustment for intercompany balances (45,937)
Consolidated total assets 422,678
LiabilitiesSegment liabilities (224,189) (64,914) (768) (289,871) (55,040) — (55,040) (344,911)
Unallocated corporate liabilities and adjustment for intercompany balances 4,943
Consolidated total liabilities (339,968)
The segment assets and liabilities above include intercompany balances which eliminate on consolidation, but appear in the information presented to the CODM. Unallocated corporate assets and liabilities principally comprise current tax provisions and deferred tax assets.
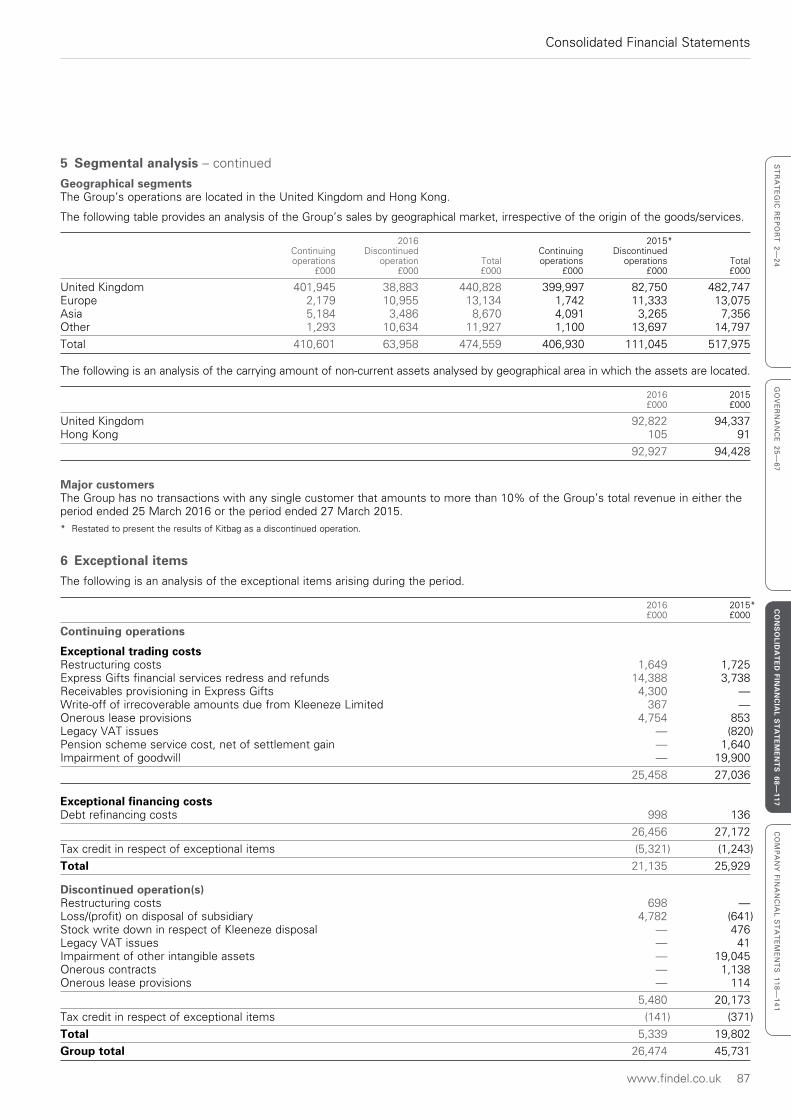
www.findel.co.uk 87
Consolidated Financial Statements
ST
RA
TE
GIC
RE
PO
RT
2—
24
GO
VE
RN
AN
CE
25
—6
7C
ON
SO
LIDA
TE
D FIN
AN
CIA
L ST
AT
EM
EN
TS
68—117
CO
MP
AN
Y F
INA
NC
IAL
ST
AT
EM
EN
TS
11
8—
14
1
5 Segmental analysis – continued
Geographical segmentsThe Group’s operations are located in the United Kingdom and Hong Kong.
The following table provides an analysis of the Group’s sales by geographical market, irrespective of the origin of the goods/services.
2016 2015* Continuing Discontinued Continuing Discontinued operations operation Total operations operations Total £000 £000 £000 £000 £000 £000
United Kingdom 401,945 38,883 440,828 399,997 82,750 482,747Europe 2,179 10,955 13,134 1,742 11,333 13,075Asia 5,184 3,486 8,670 4,091 3,265 7,356Other 1,293 10,634 11,927 1,100 13,697 14,797
Total 410,601 63,958 474,559 406,930 111,045 517,975
The following is an analysis of the carrying amount of non-current assets analysed by geographical area in which the assets are located.
2016 2015 £000 £000
United Kingdom 92,822 94,337Hong Kong 105 91
92,927 94,428
Major customersThe Group has no transactions with any single customer that amounts to more than 10% of the Group’s total revenue in either the period ended 25 March 2016 or the period ended 27 March 2015.* Restated to present the results of Kitbag as a discontinued operation.
6 Exceptional itemsThe following is an analysis of the exceptional items arising during the period.
2016 2015* £000 £000
Continuing operations
Exceptional trading costsRestructuring costs 1,649 1,725Express Gifts financial services redress and refunds 14,388 3,738Receivables provisioning in Express Gifts 4,300 —Write-off of irrecoverable amounts due from Kleeneze Limited 367 —Onerous lease provisions 4,754 853Legacy VAT issues — (820)Pension scheme service cost, net of settlement gain — 1,640Impairment of goodwill — 19,900
25,458 27,036
Exceptional financing costsDebt refinancing costs 998 136
26,456 27,172
Tax credit in respect of exceptional items (5,321) (1,243)
Total 21,135 25,929
Discontinued operation(s)Restructuring costs 698 —Loss/(profit) on disposal of subsidiary 4,782 (641)Stock write down in respect of Kleeneze disposal — 476Legacy VAT issues — 41Impairment of other intangible assets — 19,045Onerous contracts — 1,138Onerous lease provisions — 114
5,480 20,173
Tax credit in respect of exceptional items (141) (371)
Total 5,339 19,802
Group total 26,474 45,731
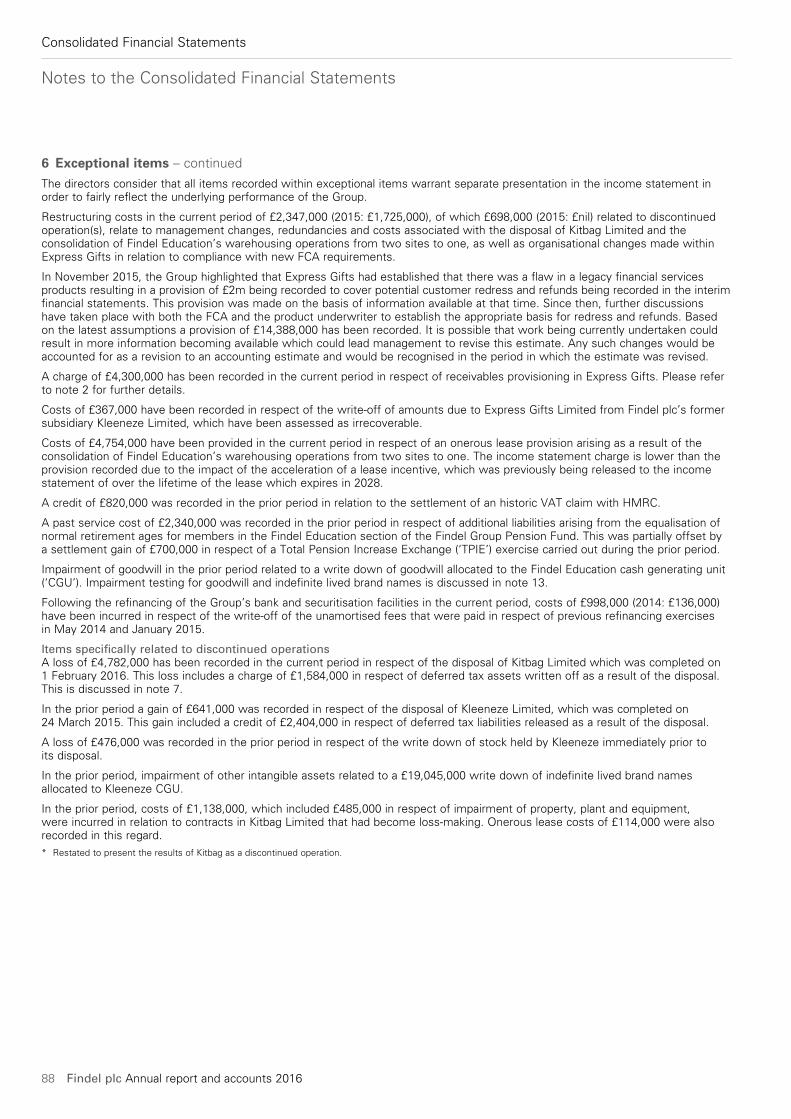
Notes to the Consolidated Financial Statements
88 Findel plc Annual report and accounts 2016
Consolidated Financial Statements
6 Exceptional items – continued
The directors consider that all items recorded within exceptional items warrant separate presentation in the income statement in order to fairly reflect the underlying performance of the Group.
Restructuring costs in the current period of £2,347,000 (2015: £1,725,000), of which £698,000 (2015: £nil) related to discontinued operation(s), relate to management changes, redundancies and costs associated with the disposal of Kitbag Limited and the consolidation of Findel Education’s warehousing operations from two sites to one, as well as organisational changes made within Express Gifts in relation to compliance with new FCA requirements.
In November 2015, the Group highlighted that Express Gifts had established that there was a flaw in a legacy financial services products resulting in a provision of £2m being recorded to cover potential customer redress and refunds being recorded in the interim financial statements. This provision was made on the basis of information available at that time. Since then, further discussions have taken place with both the FCA and the product underwriter to establish the appropriate basis for redress and refunds. Based on the latest assumptions a provision of £14,388,000 has been recorded. It is possible that work being currently undertaken could result in more information becoming available which could lead management to revise this estimate. Any such changes would be accounted for as a revision to an accounting estimate and would be recognised in the period in which the estimate was revised.
A charge of £4,300,000 has been recorded in the current period in respect of receivables provisioning in Express Gifts. Please refer to note 2 for further details.
Costs of £367,000 have been recorded in respect of the write-off of amounts due to Express Gifts Limited from Findel plc’s former subsidiary Kleeneze Limited, which have been assessed as irrecoverable.
Costs of £4,754,000 have been provided in the current period in respect of an onerous lease provision arising as a result of the consolidation of Findel Education’s warehousing operations from two sites to one. The income statement charge is lower than the provision recorded due to the impact of the acceleration of a lease incentive, which was previously being released to the income statement of over the lifetime of the lease which expires in 2028.
A credit of £820,000 was recorded in the prior period in relation to the settlement of an historic VAT claim with HMRC.
A past service cost of £2,340,000 was recorded in the prior period in respect of additional liabilities arising from the equalisation of normal retirement ages for members in the Findel Education section of the Findel Group Pension Fund. This was partially offset by a settlement gain of £700,000 in respect of a Total Pension Increase Exchange (‘TPIE’) exercise carried out during the prior period.
Impairment of goodwill in the prior period related to a write down of goodwill allocated to the Findel Education cash generating unit (‘CGU’). Impairment testing for goodwill and indefinite lived brand names is discussed in note 13.
Following the refinancing of the Group’s bank and securitisation facilities in the current period, costs of £998,000 (2014: £136,000) have been incurred in respect of the write-off of the unamortised fees that were paid in respect of previous refinancing exercises in May 2014 and January 2015.
Items specifically related to discontinued operationsA loss of £4,782,000 has been recorded in the current period in respect of the disposal of Kitbag Limited which was completed on 1 February 2016. This loss includes a charge of £1,584,000 in respect of deferred tax assets written off as a result of the disposal. This is discussed in note 7.
In the prior period a gain of £641,000 was recorded in respect of the disposal of Kleeneze Limited, which was completed on 24 March 2015. This gain included a credit of £2,404,000 in respect of deferred tax liabilities released as a result of the disposal.
A loss of £476,000 was recorded in the prior period in respect of the write down of stock held by Kleeneze immediately prior to its disposal.
In the prior period, impairment of other intangible assets related to a £19,045,000 write down of indefinite lived brand names allocated to Kleeneze CGU.
In the prior period, costs of £1,138,000, which included £485,000 in respect of impairment of property, plant and equipment, were incurred in relation to contracts in Kitbag Limited that had become loss-making. Onerous lease costs of £114,000 were also recorded in this regard.* Restated to present the results of Kitbag as a discontinued operation.
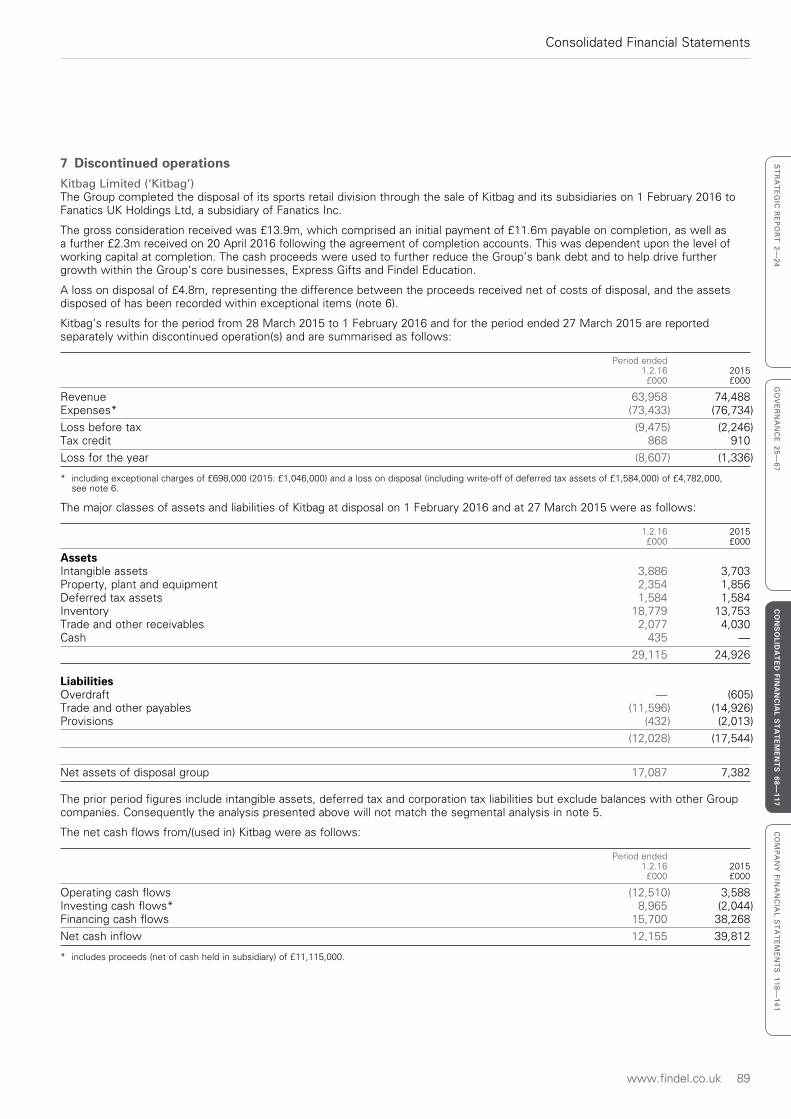
www.findel.co.uk 89
Consolidated Financial Statements
ST
RA
TE
GIC
RE
PO
RT
2—
24
GO
VE
RN
AN
CE
25
—6
7C
ON
SO
LIDA
TE
D FIN
AN
CIA
L ST
AT
EM
EN
TS
68—117
CO
MP
AN
Y F
INA
NC
IAL
ST
AT
EM
EN
TS
11
8—
14
1
7 Discontinued operationsKitbag Limited (‘Kitbag’)The Group completed the disposal of its sports retail division through the sale of Kitbag and its subsidiaries on 1 February 2016 to Fanatics UK Holdings Ltd, a subsidiary of Fanatics Inc.
The gross consideration received was £13.9m, which comprised an initial payment of £11.6m payable on completion, as well as a further £2.3m received on 20 April 2016 following the agreement of completion accounts. This was dependent upon the level of working capital at completion. The cash proceeds were used to further reduce the Group’s bank debt and to help drive further growth within the Group’s core businesses, Express Gifts and Findel Education.
A loss on disposal of £4.8m, representing the difference between the proceeds received net of costs of disposal, and the assets disposed of has been recorded within exceptional items (note 6).
Kitbag’s results for the period from 28 March 2015 to 1 February 2016 and for the period ended 27 March 2015 are reported separately within discontinued operation(s) and are summarised as follows:
Period ended 1.2.16 2015 £000 £000
Revenue 63,958 74,488Expenses* (73,433) (76,734)
Loss before tax (9,475) (2,246)Tax credit 868 910
Loss for the year (8,607) (1,336)
* including exceptional charges of £698,000 (2015: £1,046,000) and a loss on disposal (including write-off of deferred tax assets of £1,584,000) of £4,782,000, see note 6.
The major classes of assets and liabilities of Kitbag at disposal on 1 February 2016 and at 27 March 2015 were as follows:
1.2.16 2015 £000 £000
AssetsIntangible assets 3,886 3,703Property, plant and equipment 2,354 1,856Deferred tax assets 1,584 1,584Inventory 18,779 13,753Trade and other receivables 2,077 4,030Cash 435 —
29,115 24,926
LiabilitiesOverdraft — (605)Trade and other payables (11,596) (14,926)Provisions (432) (2,013)
(12,028) (17,544)
Net assets of disposal group 17,087 7,382
The prior period figures include intangible assets, deferred tax and corporation tax liabilities but exclude balances with other Group companies. Consequently the analysis presented above will not match the segmental analysis in note 5.
The net cash flows from/(used in) Kitbag were as follows:
Period ended 1.2.16 2015 £000 £000
Operating cash flows (12,510) 3,588Investing cash flows* 8,965 (2,044)Financing cash flows 15,700 38,268
Net cash inflow 12,155 39,812
* includes proceeds (net of cash held in subsidiary) of £11,115,000.
Notes to the Consolidated Financial Statements
90 Findel plc Annual report and accounts 2016
Consolidated Financial Statements
7 Discontinued operations – continued
Kleeneze Limited (‘Kleeneze’)The Group completed the disposal of its network marketing company, Kleeneze, to Trillium Pond A.G. (a subsidiary of CVSL Inc.) on 24 March 2015 for gross consideration of £3.4m.
Period ended 24.3.15 £000
Revenue 36,557Expenses* (55,826)
Loss before tax (19,269)Tax credit 140
Loss for the year (19,129)
* including exceptional charges of £19,768,000 and a profit on disposal (including release of deferred tax liabilities of £2,404,000) of £641,000.
The major classes of assets and liabilities of Kleeneze at disposal on 24 March 2015 were as follows:
24.3.15 £000
AssetsProperty, plant and equipment 414Inventory 4,371Trade and other receivables 2,793Cash 1,316
8,894
LiabilitiesDeferred tax liability (2,404)Trade and other payables (4,097)
(6,501)
Net assets of disposal group 2,393
The net cash flows from/(used in) Kleeneze were as follows:
Period ended 24.3.15 £000
Operating cash flows 2,115Investing cash flows* 3,433Financing cash flow (10,005)
Net cash outflow (4,457)
* includes proceeds (net of cash held in subsidiary) of £1,720,000.
8 Finance expense
2016 2015 £000 £000
Interest on bank loans 9,561 9,836Net interest cost on defined benefit pension obligations (note 31) 340 261Exceptional financing costs (note 6) 998 136
10,899 10,233
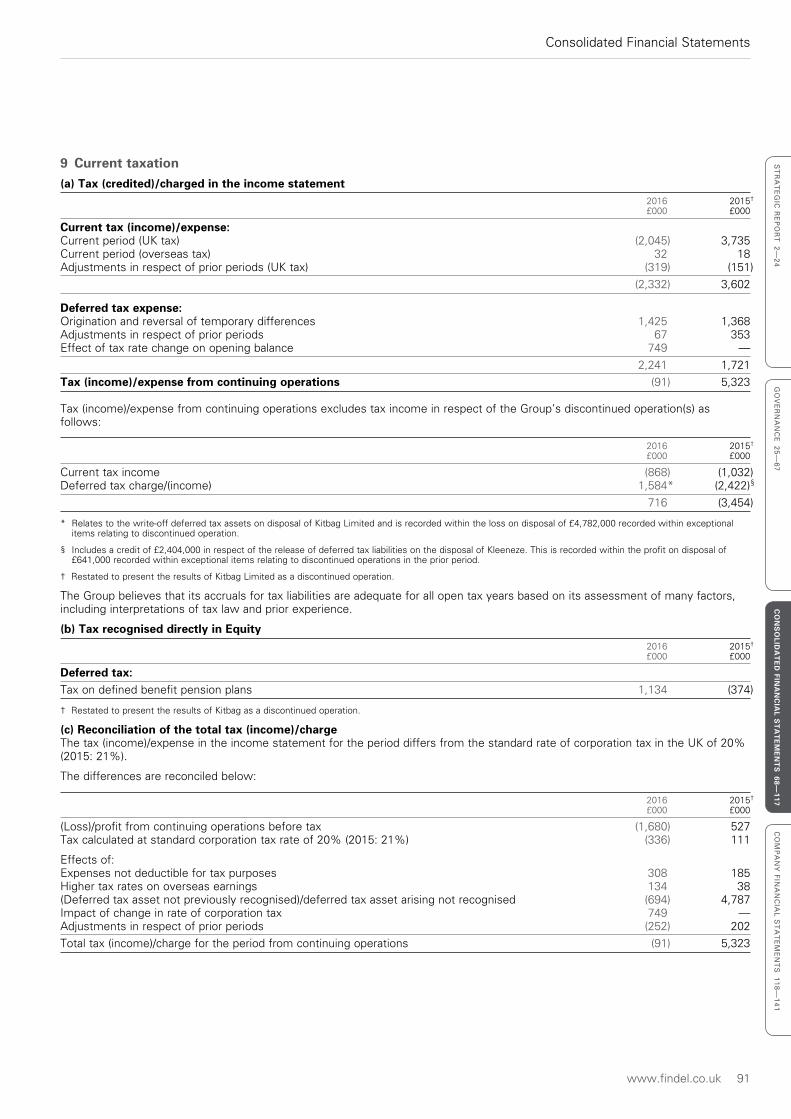
www.findel.co.uk 91
Consolidated Financial Statements
ST
RA
TE
GIC
RE
PO
RT
2—
24
GO
VE
RN
AN
CE
25
—6
7C
ON
SO
LIDA
TE
D FIN
AN
CIA
L ST
AT
EM
EN
TS
68—117
CO
MP
AN
Y F
INA
NC
IAL
ST
AT
EM
EN
TS
11
8—
14
1
9 Current taxation(a) Tax (credited)/charged in the income statement 2016 2015† £000 £000
Current tax (income)/expense:Current period (UK tax) (2,045) 3,735Current period (overseas tax) 32 18Adjustments in respect of prior periods (UK tax) (319) (151)
(2,332) 3,602
Deferred tax expense:Origination and reversal of temporary differences 1,425 1,368Adjustments in respect of prior periods 67 353Effect of tax rate change on opening balance 749 —
2,241 1,721
Tax (income)/expense from continuing operations (91) 5,323
Tax (income)/expense from continuing operations excludes tax income in respect of the Group’s discontinued operation(s) as follows:
2016 2015† £000 £000
Current tax income (868) (1,032)Deferred tax charge/(income) 1,584* (2,422)§
716 (3,454)
* Relates to the write-off deferred tax assets on disposal of Kitbag Limited and is recorded within the loss on disposal of £4,782,000 recorded within exceptional items relating to discontinued operation.
§ Includes a credit of £2,404,000 in respect of the release of deferred tax liabilities on the disposal of Kleeneze. This is recorded within the profit on disposal of £641,000 recorded within exceptional items relating to discontinued operations in the prior period.
† Restated to present the results of Kitbag Limited as a discontinued operation.
The Group believes that its accruals for tax liabilities are adequate for all open tax years based on its assessment of many factors, including interpretations of tax law and prior experience.
(b) Tax recognised directly in Equity 2016 2015† £000 £000
Deferred tax:Tax on defined benefit pension plans 1,134 (374)
† Restated to present the results of Kitbag as a discontinued operation.
(c) Reconciliation of the total tax (income)/chargeThe tax (income)/expense in the income statement for the period differs from the standard rate of corporation tax in the UK of 20% (2015: 21%).
The differences are reconciled below:
2016 2015† £000 £000
(Loss)/profit from continuing operations before tax (1,680) 527Tax calculated at standard corporation tax rate of 20% (2015: 21%) (336) 111
Effects of: Expenses not deductible for tax purposes 308 185Higher tax rates on overseas earnings 134 38(Deferred tax asset not previously recognised)/deferred tax asset arising not recognised (694) 4,787Impact of change in rate of corporation tax 749 —Adjustments in respect of prior periods (252) 202
Total tax (income)/charge for the period from continuing operations (91) 5,323
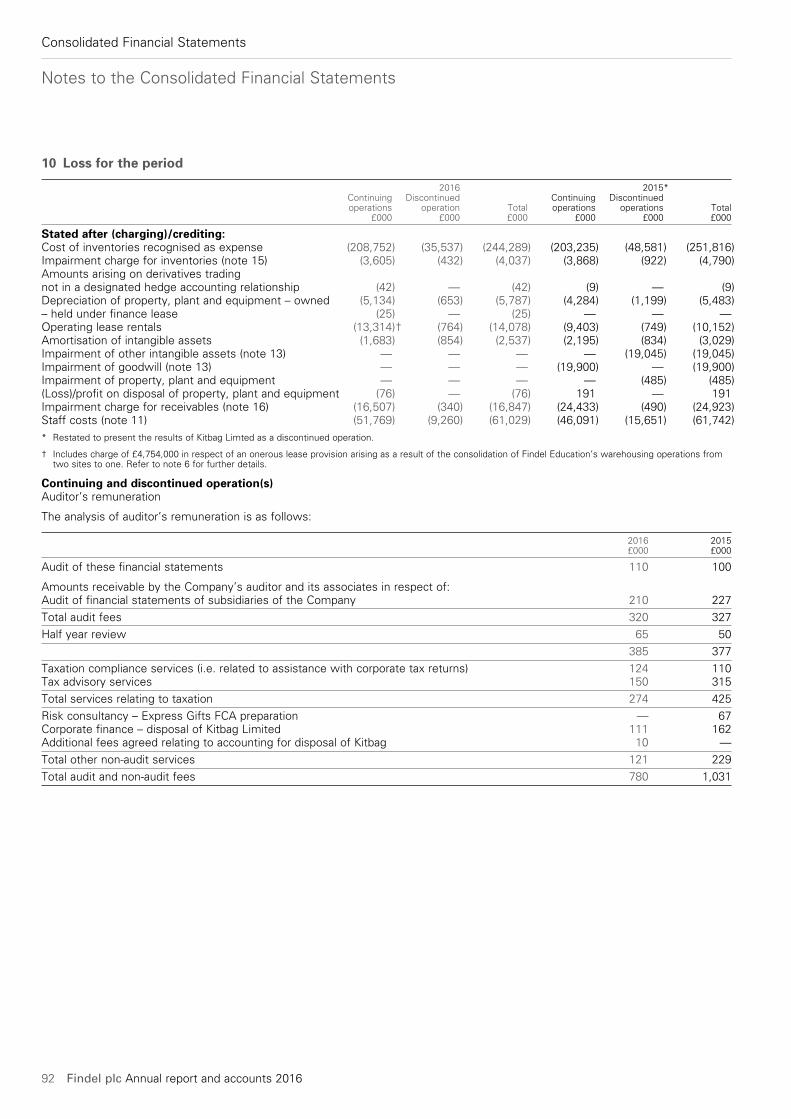
Notes to the Consolidated Financial Statements
92 Findel plc Annual report and accounts 2016
Consolidated Financial Statements
10 Loss for the period
2016 2015* Continuing Discontinued Continuing Discontinued operations operation Total operations operations Total £000 £000 £000 £000 £000 £000
Stated after (charging)/crediting:Cost of inventories recognised as expense (208,752) (35,537) (244,289) (203,235) (48,581) (251,816)Impairment charge for inventories (note 15) (3,605) (432) (4,037) (3,868) (922) (4,790)Amounts arising on derivatives tradingnot in a designated hedge accounting relationship (42) — (42) (9) — (9)Depreciation of property, plant and equipment – owned (5,134) (653) (5,787) (4,284) (1,199) (5,483)– held under finance lease (25) — (25) — — —Operating lease rentals (13,314)† (764) (14,078) (9,403) (749) (10,152)Amortisation of intangible assets (1,683) (854) (2,537) (2,195) (834) (3,029)Impairment of other intangible assets (note 13) — — — — (19,045) (19,045)Impairment of goodwill (note 13) — — — (19,900) — (19,900)Impairment of property, plant and equipment — — — — (485) (485)(Loss)/profit on disposal of property, plant and equipment (76) — (76) 191 — 191Impairment charge for receivables (note 16) (16,507) (340) (16,847) (24,433) (490) (24,923)Staff costs (note 11) (51,769) (9,260) (61,029) (46,091) (15,651) (61,742)* Restated to present the results of Kitbag Limted as a discontinued operation.
† Includes charge of £4,754,000 in respect of an onerous lease provision arising as a result of the consolidation of Findel Education’s warehousing operations from two sites to one. Refer to note 6 for further details.
Continuing and discontinued operation(s)Auditor’s remuneration
The analysis of auditor’s remuneration is as follows:
2016 2015 £000 £000
Audit of these financial statements 110 100
Amounts receivable by the Company’s auditor and its associates in respect of:Audit of financial statements of subsidiaries of the Company 210 227
Total audit fees 320 327
Half year review 65 50
385 377
Taxation compliance services (i.e. related to assistance with corporate tax returns) 124 110Tax advisory services 150 315
Total services relating to taxation 274 425
Risk consultancy – Express Gifts FCA preparation — 67Corporate finance – disposal of Kitbag Limited 111 162Additional fees agreed relating to accounting for disposal of Kitbag 10 —
Total other non-audit services 121 229
Total audit and non-audit fees 780 1,031
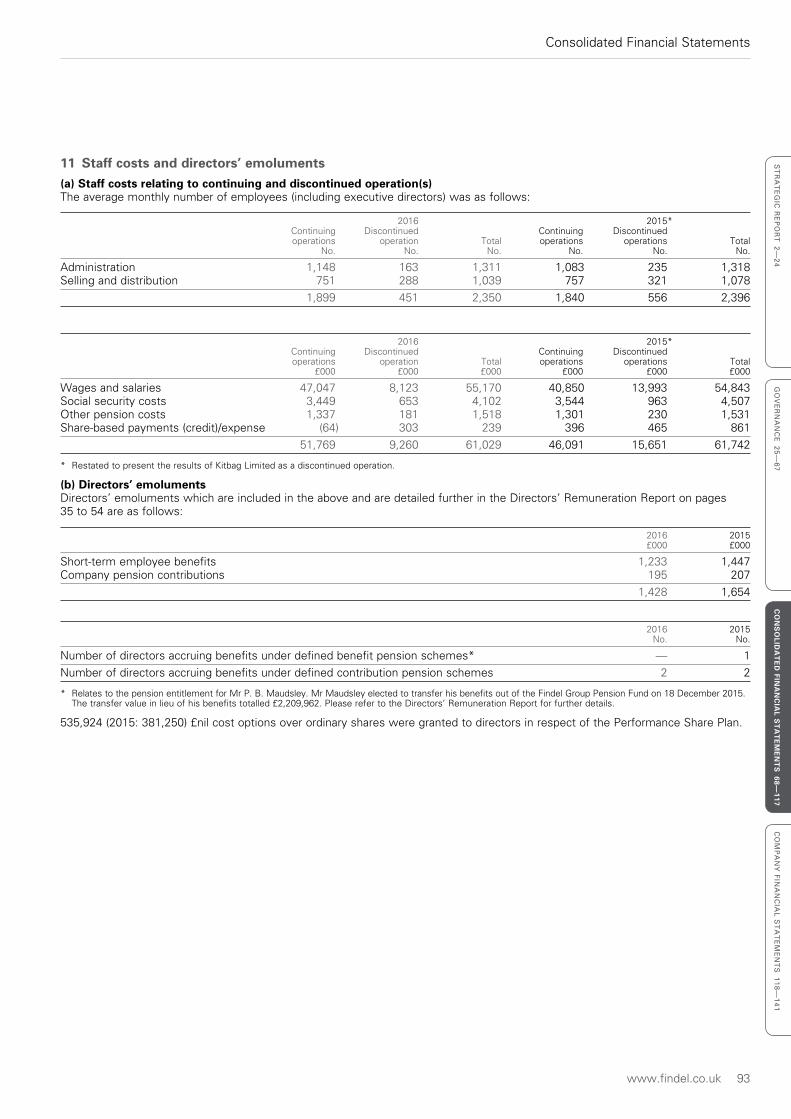
www.findel.co.uk 93
Consolidated Financial Statements
ST
RA
TE
GIC
RE
PO
RT
2—
24
GO
VE
RN
AN
CE
25
—6
7C
ON
SO
LIDA
TE
D FIN
AN
CIA
L ST
AT
EM
EN
TS
68—117
CO
MP
AN
Y F
INA
NC
IAL
ST
AT
EM
EN
TS
11
8—
14
1
11 Staff costs and directors’ emoluments(a) Staff costs relating to continuing and discontinued operation(s)The average monthly number of employees (including executive directors) was as follows:
2016 2015* Continuing Discontinued Continuing Discontinued operations operation Total operations operations Total No. No. No. No. No. No.
Administration 1,148 163 1,311 1,083 235 1,318Selling and distribution 751 288 1,039 757 321 1,078
1,899 451 2,350 1,840 556 2,396
2016 2015* Continuing Discontinued Continuing Discontinued operations operation Total operations operations Total £000 £000 £000 £000 £000 £000
Wages and salaries 47,047 8,123 55,170 40,850 13,993 54,843Social security costs 3,449 653 4,102 3,544 963 4,507Other pension costs 1,337 181 1,518 1,301 230 1,531Share-based payments (credit)/expense (64) 303 239 396 465 861
51,769 9,260 61,029 46,091 15,651 61,742
* Restated to present the results of Kitbag Limited as a discontinued operation.
(b) Directors’ emolumentsDirectors’ emoluments which are included in the above and are detailed further in the Directors’ Remuneration Report on pages 35 to 54 are as follows:
2016 2015 £000 £000
Short-term employee benefits 1,233 1,447Company pension contributions 195 207
1,428 1,654
2016 2015 No. No.
Number of directors accruing benefits under defined benefit pension schemes* — 1
Number of directors accruing benefits under defined contribution pension schemes 2 2
* Relates to the pension entitlement for Mr P. B. Maudsley. Mr Maudsley elected to transfer his benefits out of the Findel Group Pension Fund on 18 December 2015. The transfer value in lieu of his benefits totalled £2,209,962. Please refer to the Directors’ Remuneration Report for further details.
535,924 (2015: 381,250) £nil cost options over ordinary shares were granted to directors in respect of the Performance Share Plan.
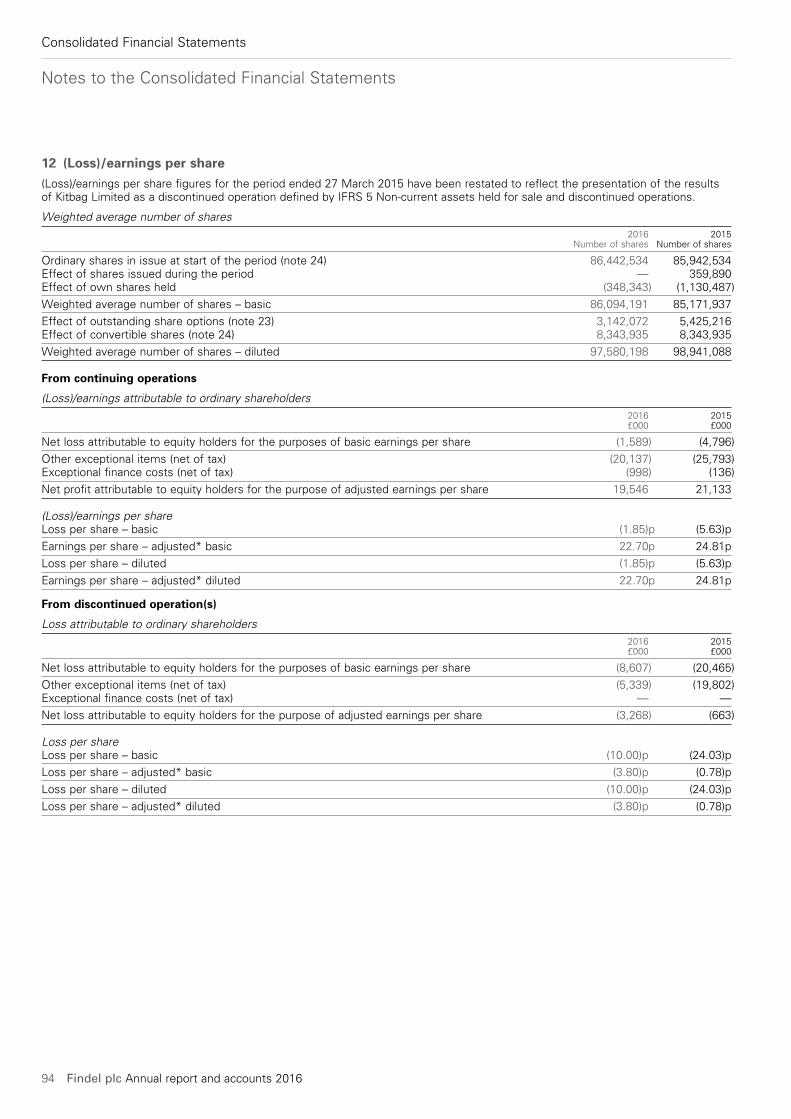
Notes to the Consolidated Financial Statements
94 Findel plc Annual report and accounts 2016
Consolidated Financial Statements
12 (Loss)/earnings per share(Loss)/earnings per share figures for the period ended 27 March 2015 have been restated to reflect the presentation of the results of Kitbag Limited as a discontinued operation defined by IFRS 5 Non-current assets held for sale and discontinued operations.
Weighted average number of shares 2016 2015 Number of shares Number of shares
Ordinary shares in issue at start of the period (note 24) 86,442,534 85,942,534Effect of shares issued during the period — 359,890Effect of own shares held (348,343) (1,130,487)
Weighted average number of shares – basic 86,094,191 85,171,937
Effect of outstanding share options (note 23) 3,142,072 5,425,216Effect of convertible shares (note 24) 8,343,935 8,343,935
Weighted average number of shares – diluted 97,580,198 98,941,088
From continuing operations
(Loss)/earnings attributable to ordinary shareholders 2016 2015 £000 £000
Net loss attributable to equity holders for the purposes of basic earnings per share (1,589) (4,796)
Other exceptional items (net of tax) (20,137) (25,793)Exceptional finance costs (net of tax) (998) (136)
Net profit attributable to equity holders for the purpose of adjusted earnings per share 19,546 21,133
(Loss)/earnings per shareLoss per share – basic (1.85)p (5.63)p
Earnings per share – adjusted* basic 22.70p 24.81p
Loss per share – diluted (1.85)p (5.63)p
Earnings per share – adjusted* diluted 22.70p 24.81p
From discontinued operation(s)
Loss attributable to ordinary shareholders 2016 2015 £000 £000
Net loss attributable to equity holders for the purposes of basic earnings per share (8,607) (20,465)
Other exceptional items (net of tax) (5,339) (19,802)Exceptional finance costs (net of tax) — —
Net loss attributable to equity holders for the purpose of adjusted earnings per share (3,268) (663)
Loss per shareLoss per share – basic (10.00)p (24.03)p
Loss per share – adjusted* basic (3.80)p (0.78)p
Loss per share – diluted (10.00)p (24.03)p
Loss per share – adjusted* diluted (3.80)p (0.78)p
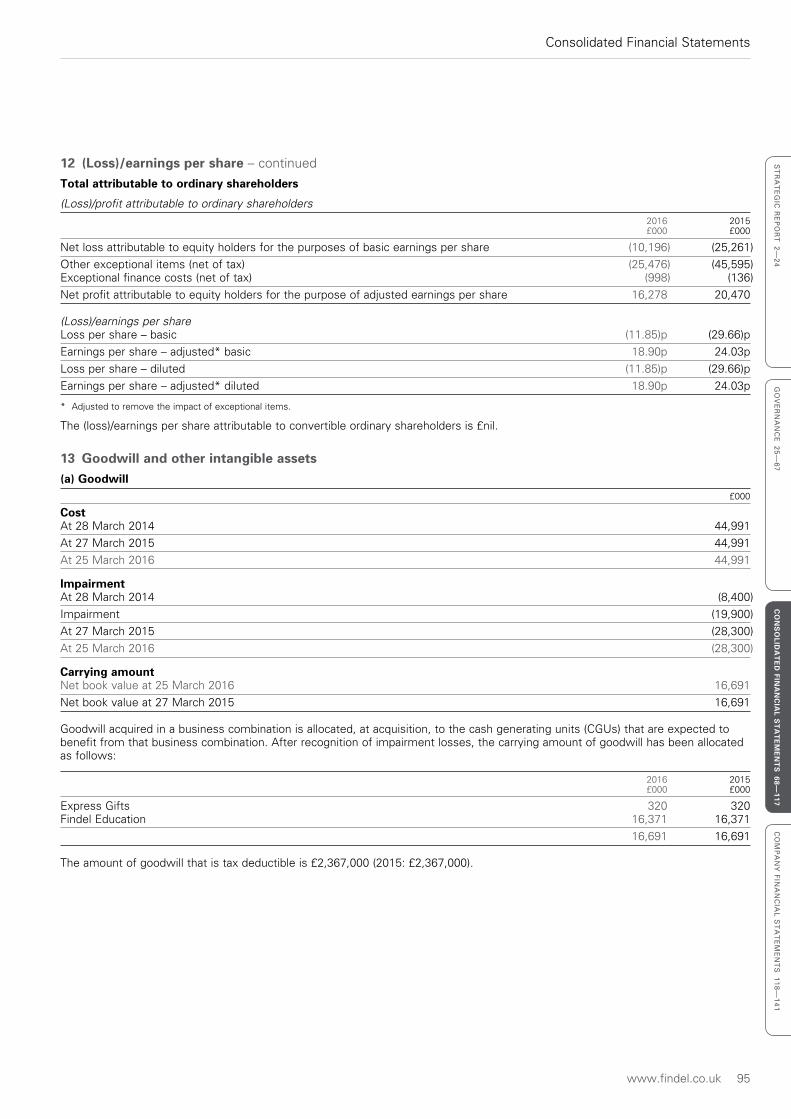
www.findel.co.uk 95
Consolidated Financial Statements
ST
RA
TE
GIC
RE
PO
RT
2—
24
GO
VE
RN
AN
CE
25
—6
7C
ON
SO
LIDA
TE
D FIN
AN
CIA
L ST
AT
EM
EN
TS
68—117
CO
MP
AN
Y F
INA
NC
IAL
ST
AT
EM
EN
TS
11
8—
14
1
12 (Loss)/earnings per share – continued
Total attributable to ordinary shareholders
(Loss)/profit attributable to ordinary shareholders 2016 2015 £000 £000
Net loss attributable to equity holders for the purposes of basic earnings per share (10,196) (25,261)
Other exceptional items (net of tax) (25,476) (45,595)Exceptional finance costs (net of tax) (998) (136)
Net profit attributable to equity holders for the purpose of adjusted earnings per share 16,278 20,470
(Loss)/earnings per shareLoss per share – basic (11.85)p (29.66)p
Earnings per share – adjusted* basic 18.90p 24.03p
Loss per share – diluted (11.85)p (29.66)p
Earnings per share – adjusted* diluted 18.90p 24.03p
* Adjusted to remove the impact of exceptional items.
The (loss)/earnings per share attributable to convertible ordinary shareholders is £nil.
13 Goodwill and other intangible assets(a) Goodwill £000
CostAt 28 March 2014 44,991
At 27 March 2015 44,991
At 25 March 2016 44,991
ImpairmentAt 28 March 2014 (8,400)
Impairment (19,900)
At 27 March 2015 (28,300)
At 25 March 2016 (28,300)
Carrying amountNet book value at 25 March 2016 16,691
Net book value at 27 March 2015 16,691
Goodwill acquired in a business combination is allocated, at acquisition, to the cash generating units (CGUs) that are expected to benefit from that business combination. After recognition of impairment losses, the carrying amount of goodwill has been allocated as follows:
2016 2015 £000 £000
Express Gifts 320 320Findel Education 16,371 16,371
16,691 16,691
The amount of goodwill that is tax deductible is £2,367,000 (2015: £2,367,000).
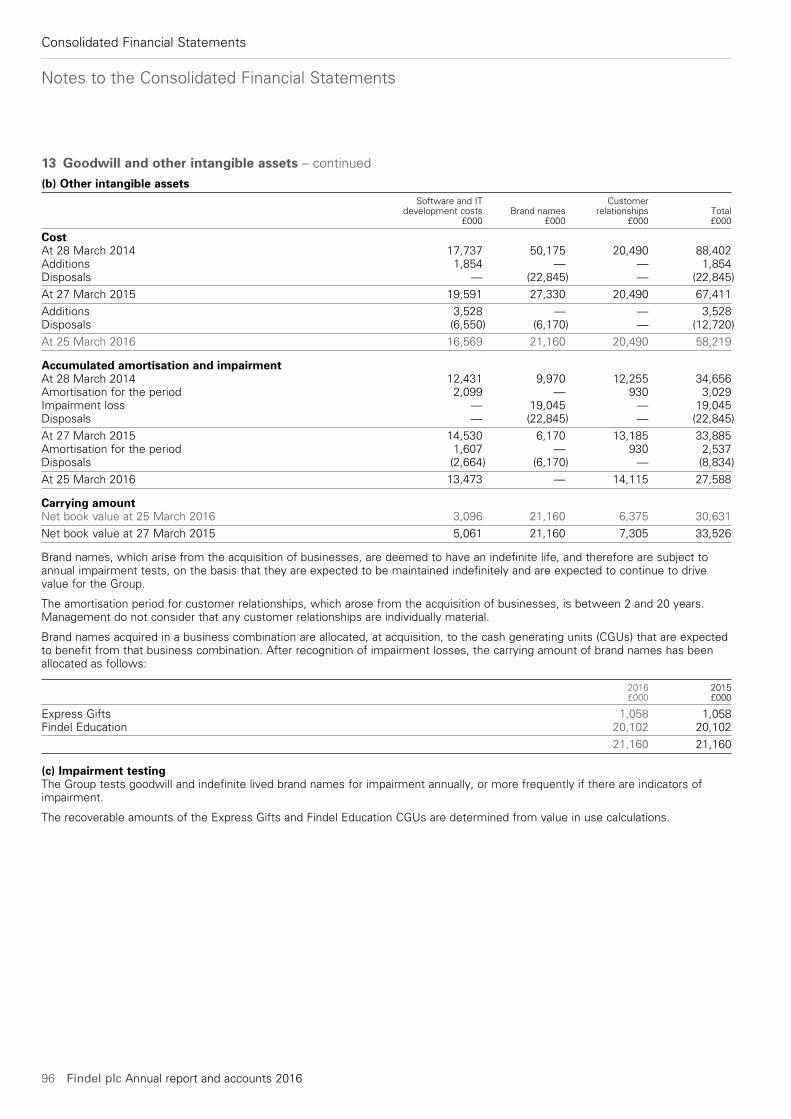
Notes to the Consolidated Financial Statements
96 Findel plc Annual report and accounts 2016
Consolidated Financial Statements
13 Goodwill and other intangible assets – continued
(b) Other intangible assets Software and IT Customer development costs Brand names relationships Total £000 £000 £000 £000
CostAt 28 March 2014 17,737 50,175 20,490 88,402Additions 1,854 — — 1,854Disposals — (22,845) — (22,845)
At 27 March 2015 19,591 27,330 20,490 67,411
Additions 3,528 — — 3,528Disposals (6,550) (6,170) — (12,720)
At 25 March 2016 16,569 21,160 20,490 58,219
Accumulated amortisation and impairmentAt 28 March 2014 12,431 9,970 12,255 34,656Amortisation for the period 2,099 — 930 3,029Impairment loss — 19,045 — 19,045Disposals — (22,845) — (22,845)
At 27 March 2015 14,530 6,170 13,185 33,885Amortisation for the period 1,607 — 930 2,537Disposals (2,664) (6,170) — (8,834)
At 25 March 2016 13,473 — 14,115 27,588
Carrying amountNet book value at 25 March 2016 3,096 21,160 6,375 30,631
Net book value at 27 March 2015 5,061 21,160 7,305 33,526
Brand names, which arise from the acquisition of businesses, are deemed to have an indefinite life, and therefore are subject to annual impairment tests, on the basis that they are expected to be maintained indefinitely and are expected to continue to drive value for the Group.
The amortisation period for customer relationships, which arose from the acquisition of businesses, is between 2 and 20 years. Management do not consider that any customer relationships are individually material.
Brand names acquired in a business combination are allocated, at acquisition, to the cash generating units (CGUs) that are expected to benefit from that business combination. After recognition of impairment losses, the carrying amount of brand names has been allocated as follows:
2016 2015 £000 £000
Express Gifts 1,058 1,058Findel Education 20,102 20,102
21,160 21,160
(c) Impairment testingThe Group tests goodwill and indefinite lived brand names for impairment annually, or more frequently if there are indicators of impairment.
The recoverable amounts of the Express Gifts and Findel Education CGUs are determined from value in use calculations.
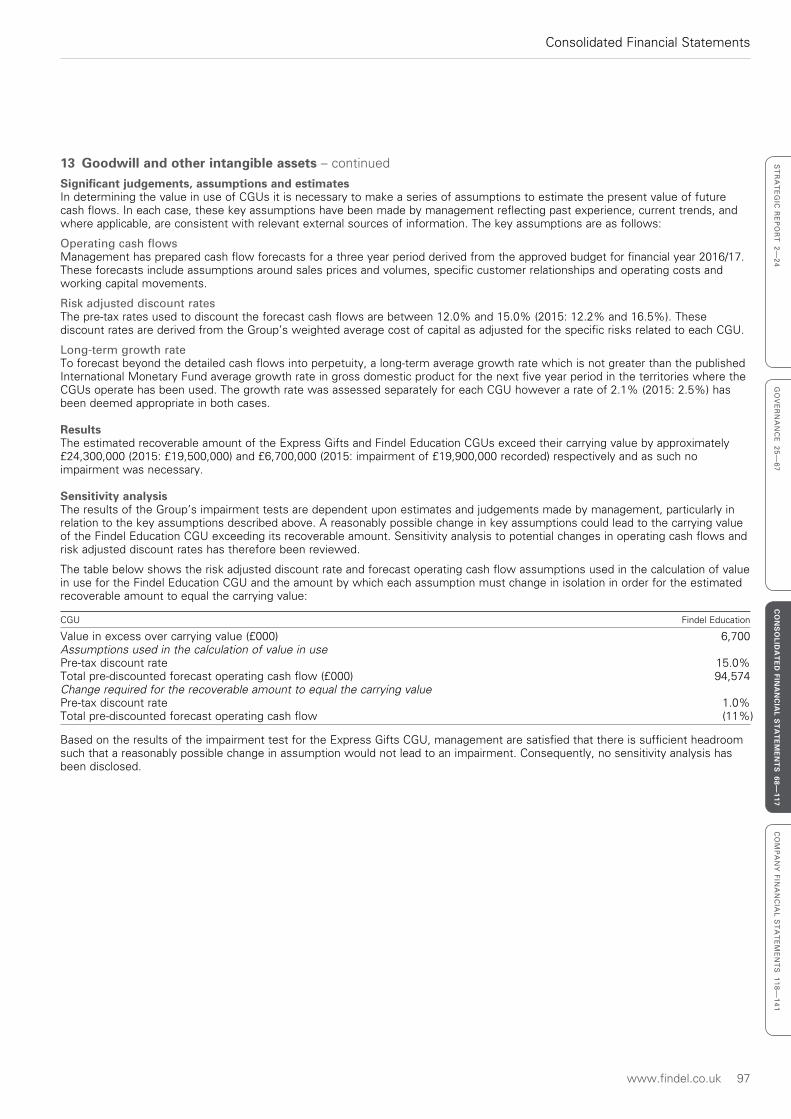
www.findel.co.uk 97
Consolidated Financial Statements
ST
RA
TE
GIC
RE
PO
RT
2—
24
GO
VE
RN
AN
CE
25
—6
7C
ON
SO
LIDA
TE
D FIN
AN
CIA
L ST
AT
EM
EN
TS
68—117
CO
MP
AN
Y F
INA
NC
IAL
ST
AT
EM
EN
TS
11
8—
14
1
13 Goodwill and other intangible assets – continued
Significant judgements, assumptions and estimatesIn determining the value in use of CGUs it is necessary to make a series of assumptions to estimate the present value of future cash flows. In each case, these key assumptions have been made by management reflecting past experience, current trends, and where applicable, are consistent with relevant external sources of information. The key assumptions are as follows:
Operating cash flowsManagement has prepared cash flow forecasts for a three year period derived from the approved budget for financial year 2016/17. These forecasts include assumptions around sales prices and volumes, specific customer relationships and operating costs and working capital movements.
Risk adjusted discount ratesThe pre-tax rates used to discount the forecast cash flows are between 12.0% and 15.0% (2015: 12.2% and 16.5%). These discount rates are derived from the Group’s weighted average cost of capital as adjusted for the specific risks related to each CGU.
Long-term growth rateTo forecast beyond the detailed cash flows into perpetuity, a long-term average growth rate which is not greater than the published International Monetary Fund average growth rate in gross domestic product for the next five year period in the territories where the CGUs operate has been used. The growth rate was assessed separately for each CGU however a rate of 2.1% (2015: 2.5%) has been deemed appropriate in both cases.
ResultsThe estimated recoverable amount of the Express Gifts and Findel Education CGUs exceed their carrying value by approximately £24,300,000 (2015: £19,500,000) and £6,700,000 (2015: impairment of £19,900,000 recorded) respectively and as such no impairment was necessary.
Sensitivity analysisThe results of the Group’s impairment tests are dependent upon estimates and judgements made by management, particularly in relation to the key assumptions described above. A reasonably possible change in key assumptions could lead to the carrying value of the Findel Education CGU exceeding its recoverable amount. Sensitivity analysis to potential changes in operating cash flows and risk adjusted discount rates has therefore been reviewed.
The table below shows the risk adjusted discount rate and forecast operating cash flow assumptions used in the calculation of value in use for the Findel Education CGU and the amount by which each assumption must change in isolation in order for the estimated recoverable amount to equal the carrying value:
CGU Findel Education
Value in excess over carrying value (£000) 6,700Assumptions used in the calculation of value in usePre-tax discount rate 15.0%Total pre-discounted forecast operating cash flow (£000) 94,574Change required for the recoverable amount to equal the carrying valuePre-tax discount rate 1.0%Total pre-discounted forecast operating cash flow (11%)
Based on the results of the impairment test for the Express Gifts CGU, management are satisfied that there is sufficient headroom such that a reasonably possible change in assumption would not lead to an impairment. Consequently, no sensitivity analysis has been disclosed.
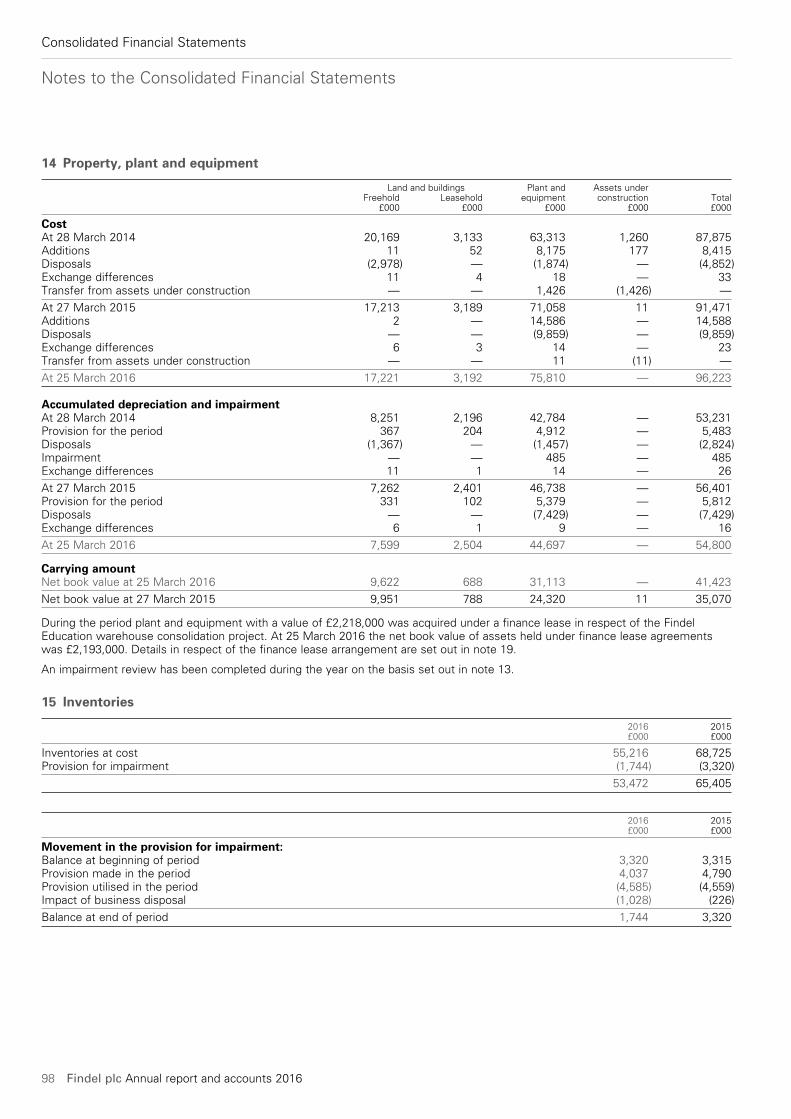
Notes to the Consolidated Financial Statements
98 Findel plc Annual report and accounts 2016
Consolidated Financial Statements
14 Property, plant and equipment
Land and buildings Plant and Assets under Freehold Leasehold equipment construction Total £000 £000 £000 £000 £000
CostAt 28 March 2014 20,169 3,133 63,313 1,260 87,875Additions 11 52 8,175 177 8,415Disposals (2,978) — (1,874) — (4,852)Exchange differences 11 4 18 — 33Transfer from assets under construction — — 1,426 (1,426) —
At 27 March 2015 17,213 3,189 71,058 11 91,471Additions 2 — 14,586 — 14,588Disposals — — (9,859) — (9,859)Exchange differences 6 3 14 — 23Transfer from assets under construction — — 11 (11) —
At 25 March 2016 17,221 3,192 75,810 — 96,223
Accumulated depreciation and impairmentAt 28 March 2014 8,251 2,196 42,784 — 53,231Provision for the period 367 204 4,912 — 5,483Disposals (1,367) — (1,457) — (2,824)Impairment — — 485 — 485Exchange differences 11 1 14 — 26
At 27 March 2015 7,262 2,401 46,738 — 56,401Provision for the period 331 102 5,379 — 5,812Disposals — — (7,429) — (7,429)Exchange differences 6 1 9 — 16
At 25 March 2016 7,599 2,504 44,697 — 54,800
Carrying amountNet book value at 25 March 2016 9,622 688 31,113 — 41,423
Net book value at 27 March 2015 9,951 788 24,320 11 35,070
During the period plant and equipment with a value of £2,218,000 was acquired under a finance lease in respect of the Findel Education warehouse consolidation project. At 25 March 2016 the net book value of assets held under finance lease agreements was £2,193,000. Details in respect of the finance lease arrangement are set out in note 19.
An impairment review has been completed during the year on the basis set out in note 13.
15 Inventories
2016 2015 £000 £000
Inventories at cost 55,216 68,725Provision for impairment (1,744) (3,320)
53,472 65,405
2016 2015 £000 £000
Movement in the provision for impairment:Balance at beginning of period 3,320 3,315Provision made in the period 4,037 4,790Provision utilised in the period (4,585) (4,559)Impact of business disposal (1,028) (226)
Balance at end of period 1,744 3,320
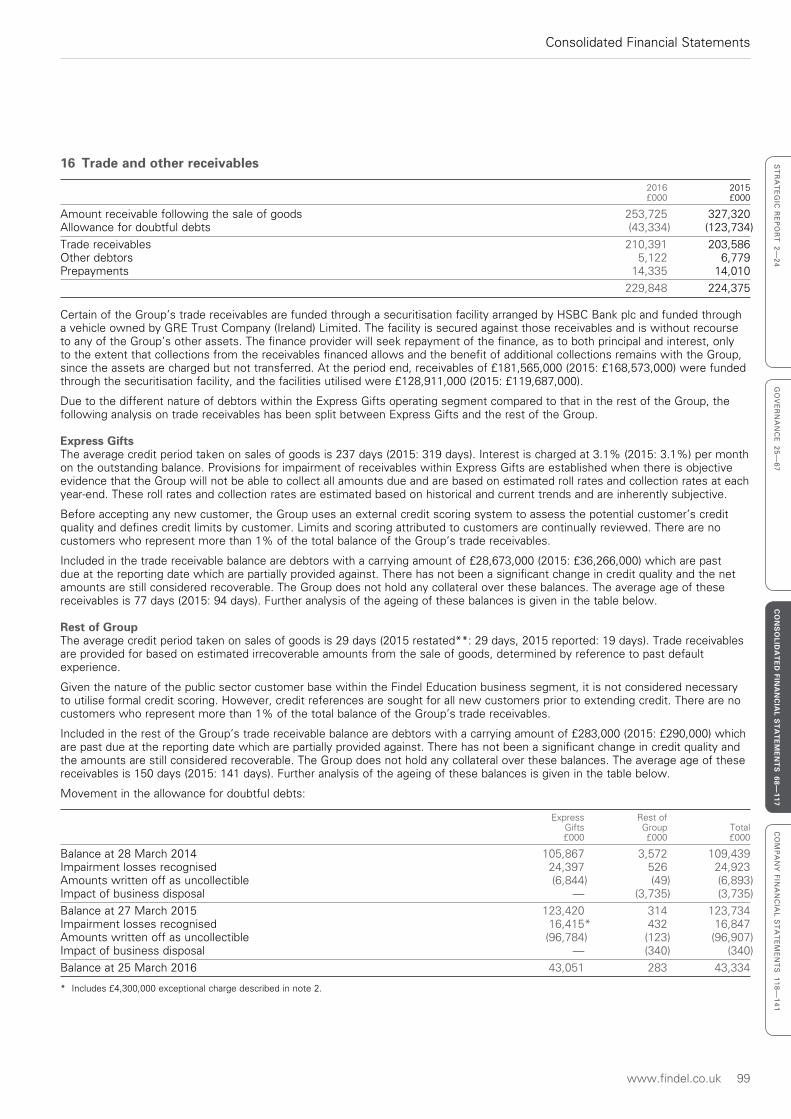
www.findel.co.uk 99
Consolidated Financial Statements
ST
RA
TE
GIC
RE
PO
RT
2—
24
GO
VE
RN
AN
CE
25
—6
7C
ON
SO
LIDA
TE
D FIN
AN
CIA
L ST
AT
EM
EN
TS
68—117
CO
MP
AN
Y F
INA
NC
IAL
ST
AT
EM
EN
TS
11
8—
14
1
16 Trade and other receivables
2016 2015 £000 £000
Amount receivable following the sale of goods 253,725 327,320Allowance for doubtful debts (43,334) (123,734)
Trade receivables 210,391 203,586Other debtors 5,122 6,779Prepayments 14,335 14,010
229,848 224,375
Certain of the Group’s trade receivables are funded through a securitisation facility arranged by HSBC Bank plc and funded through a vehicle owned by GRE Trust Company (Ireland) Limited. The facility is secured against those receivables and is without recourse to any of the Group’s other assets. The finance provider will seek repayment of the finance, as to both principal and interest, only to the extent that collections from the receivables financed allows and the benefit of additional collections remains with the Group, since the assets are charged but not transferred. At the period end, receivables of £181,565,000 (2015: £168,573,000) were funded through the securitisation facility, and the facilities utilised were £128,911,000 (2015: £119,687,000).
Due to the different nature of debtors within the Express Gifts operating segment compared to that in the rest of the Group, the following analysis on trade receivables has been split between Express Gifts and the rest of the Group.
Express GiftsThe average credit period taken on sales of goods is 237 days (2015: 319 days). Interest is charged at 3.1% (2015: 3.1%) per month on the outstanding balance. Provisions for impairment of receivables within Express Gifts are established when there is objective evidence that the Group will not be able to collect all amounts due and are based on estimated roll rates and collection rates at each year-end. These roll rates and collection rates are estimated based on historical and current trends and are inherently subjective.
Before accepting any new customer, the Group uses an external credit scoring system to assess the potential customer’s credit quality and defines credit limits by customer. Limits and scoring attributed to customers are continually reviewed. There are no customers who represent more than 1% of the total balance of the Group’s trade receivables.
Included in the trade receivable balance are debtors with a carrying amount of £28,673,000 (2015: £36,266,000) which are past due at the reporting date which are partially provided against. There has not been a significant change in credit quality and the net amounts are still considered recoverable. The Group does not hold any collateral over these balances. The average age of these receivables is 77 days (2015: 94 days). Further analysis of the ageing of these balances is given in the table below.
Rest of GroupThe average credit period taken on sales of goods is 29 days (2015 restated**: 29 days, 2015 reported: 19 days). Trade receivables are provided for based on estimated irrecoverable amounts from the sale of goods, determined by reference to past default experience.
Given the nature of the public sector customer base within the Findel Education business segment, it is not considered necessary to utilise formal credit scoring. However, credit references are sought for all new customers prior to extending credit. There are no customers who represent more than 1% of the total balance of the Group’s trade receivables.
Included in the rest of the Group’s trade receivable balance are debtors with a carrying amount of £283,000 (2015: £290,000) which are past due at the reporting date which are partially provided against. There has not been a significant change in credit quality and the amounts are still considered recoverable. The Group does not hold any collateral over these balances. The average age of these receivables is 150 days (2015: 141 days). Further analysis of the ageing of these balances is given in the table below.
Movement in the allowance for doubtful debts:
Express Rest of Gifts Group Total £000 £000 £000
Balance at 28 March 2014 105,867 3,572 109,439Impairment losses recognised 24,397 526 24,923Amounts written off as uncollectible (6,844) (49) (6,893)Impact of business disposal — (3,735) (3,735)
Balance at 27 March 2015 123,420 314 123,734Impairment losses recognised 16,415* 432 16,847Amounts written off as uncollectible (96,784) (123) (96,907)Impact of business disposal — (340) (340)
Balance at 25 March 2016 43,051 283 43,334
* Includes £4,300,000 exceptional charge described in note 2.
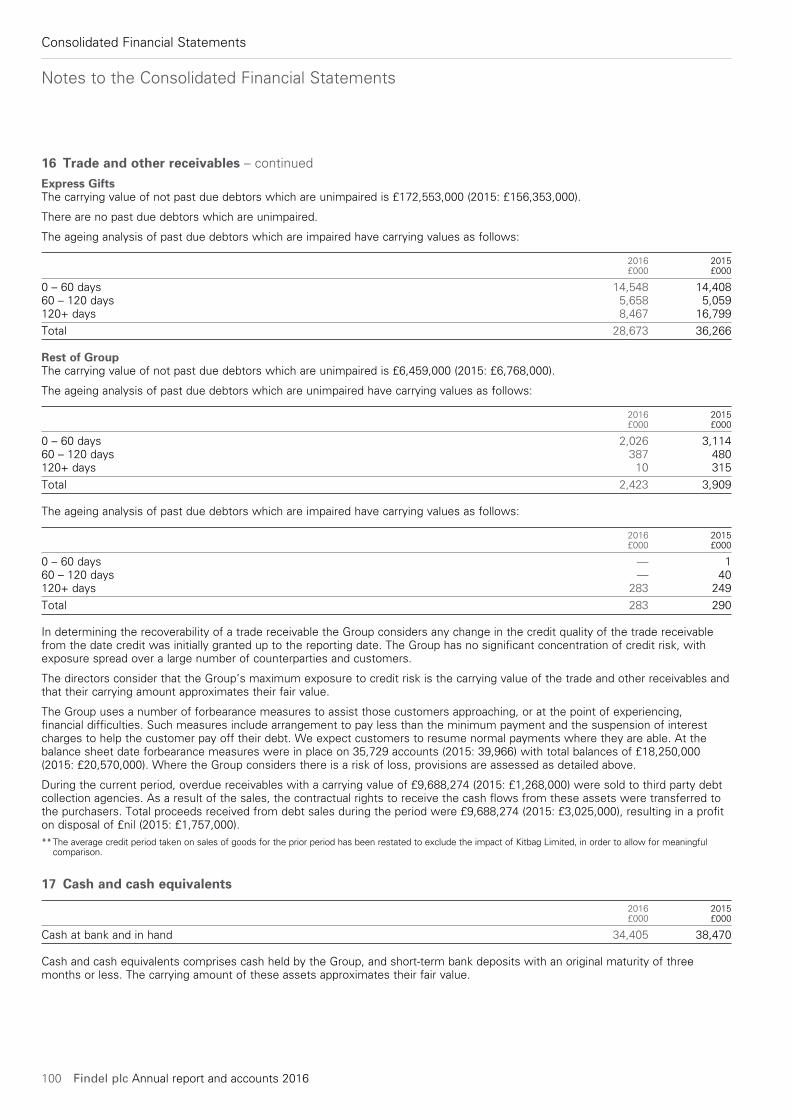
Notes to the Consolidated Financial Statements
100 Findel plc Annual report and accounts 2016
Consolidated Financial Statements
16 Trade and other receivables – continued
Express GiftsThe carrying value of not past due debtors which are unimpaired is £172,553,000 (2015: £156,353,000).
There are no past due debtors which are unimpaired.
The ageing analysis of past due debtors which are impaired have carrying values as follows:
2016 2015 £000 £000
0 – 60 days 14,548 14,40860 – 120 days 5,658 5,059120+ days 8,467 16,799
Total 28,673 36,266
Rest of GroupThe carrying value of not past due debtors which are unimpaired is £6,459,000 (2015: £6,768,000).
The ageing analysis of past due debtors which are unimpaired have carrying values as follows:
2016 2015 £000 £000
0 – 60 days 2,026 3,11460 – 120 days 387 480120+ days 10 315
Total 2,423 3,909
The ageing analysis of past due debtors which are impaired have carrying values as follows:
2016 2015 £000 £000
0 – 60 days — 160 – 120 days — 40120+ days 283 249
Total 283 290
In determining the recoverability of a trade receivable the Group considers any change in the credit quality of the trade receivable from the date credit was initially granted up to the reporting date. The Group has no significant concentration of credit risk, with exposure spread over a large number of counterparties and customers.
The directors consider that the Group’s maximum exposure to credit risk is the carrying value of the trade and other receivables and that their carrying amount approximates their fair value.
The Group uses a number of forbearance measures to assist those customers approaching, or at the point of experiencing, financial difficulties. Such measures include arrangement to pay less than the minimum payment and the suspension of interest charges to help the customer pay off their debt. We expect customers to resume normal payments where they are able. At the balance sheet date forbearance measures were in place on 35,729 accounts (2015: 39,966) with total balances of £18,250,000 (2015: £20,570,000). Where the Group considers there is a risk of loss, provisions are assessed as detailed above.
During the current period, overdue receivables with a carrying value of £9,688,274 (2015: £1,268,000) were sold to third party debt collection agencies. As a result of the sales, the contractual rights to receive the cash flows from these assets were transferred to the purchasers. Total proceeds received from debt sales during the period were £9,688,274 (2015: £3,025,000), resulting in a profit on disposal of £nil (2015: £1,757,000).** The average credit period taken on sales of goods for the prior period has been restated to exclude the impact of Kitbag Limited, in order to allow for meaningful
comparison.
17 Cash and cash equivalents
2016 2015 £000 £000
Cash at bank and in hand 34,405 38,470
Cash and cash equivalents comprises cash held by the Group, and short-term bank deposits with an original maturity of three months or less. The carrying amount of these assets approximates their fair value.
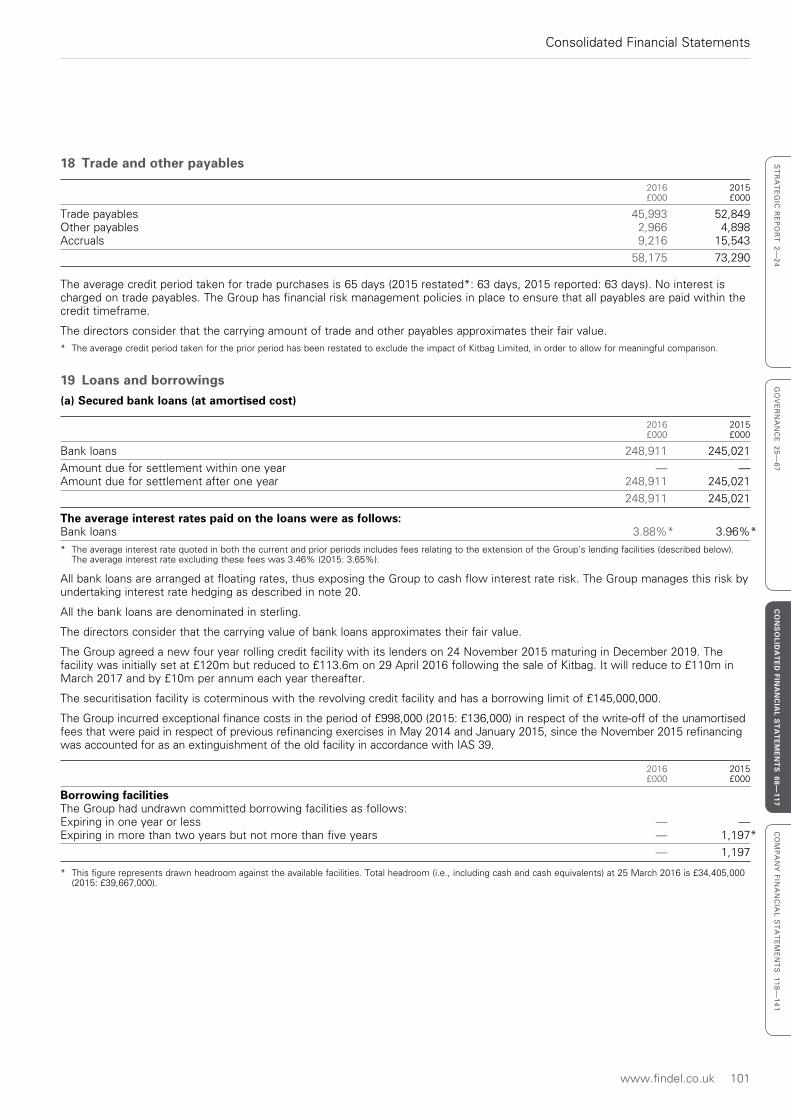
www.findel.co.uk 101
Consolidated Financial Statements
ST
RA
TE
GIC
RE
PO
RT
2—
24
GO
VE
RN
AN
CE
25
—6
7C
ON
SO
LIDA
TE
D FIN
AN
CIA
L ST
AT
EM
EN
TS
68—117
CO
MP
AN
Y F
INA
NC
IAL
ST
AT
EM
EN
TS
11
8—
14
1
18 Trade and other payables
2016 2015 £000 £000
Trade payables 45,993 52,849Other payables 2,966 4,898Accruals 9,216 15,543
58,175 73,290
The average credit period taken for trade purchases is 65 days (2015 restated*: 63 days, 2015 reported: 63 days). No interest is charged on trade payables. The Group has financial risk management policies in place to ensure that all payables are paid within the credit timeframe.
The directors consider that the carrying amount of trade and other payables approximates their fair value.* The average credit period taken for the prior period has been restated to exclude the impact of Kitbag Limited, in order to allow for meaningful comparison.
19 Loans and borrowings(a) Secured bank loans (at amortised cost)
2016 2015 £000 £000
Bank loans 248,911 245,021
Amount due for settlement within one year — —Amount due for settlement after one year 248,911 245,021
248,911 245,021
The average interest rates paid on the loans were as follows:Bank loans 3.88%* 3.96%*
* The average interest rate quoted in both the current and prior periods includes fees relating to the extension of the Group’s lending facilities (described below). The average interest rate excluding these fees was 3.46% (2015: 3.65%).
All bank loans are arranged at floating rates, thus exposing the Group to cash flow interest rate risk. The Group manages this risk by undertaking interest rate hedging as described in note 20.
All the bank loans are denominated in sterling.
The directors consider that the carrying value of bank loans approximates their fair value.
The Group agreed a new four year rolling credit facility with its lenders on 24 November 2015 maturing in December 2019. The facility was initially set at £120m but reduced to £113.6m on 29 April 2016 following the sale of Kitbag. It will reduce to £110m in March 2017 and by £10m per annum each year thereafter.
The securitisation facility is coterminous with the revolving credit facility and has a borrowing limit of £145,000,000.
The Group incurred exceptional finance costs in the period of £998,000 (2015: £136,000) in respect of the write-off of the unamortised fees that were paid in respect of previous refinancing exercises in May 2014 and January 2015, since the November 2015 refinancing was accounted for as an extinguishment of the old facility in accordance with IAS 39.
2016 2015 £000 £000
Borrowing facilitiesThe Group had undrawn committed borrowing facilities as follows:Expiring in one year or less — —Expiring in more than two years but not more than five years — 1,197*
— 1,197
* This figure represents drawn headroom against the available facilities. Total headroom (i.e., including cash and cash equivalents) at 25 March 2016 is £34,405,000 (2015: £39,667,000).
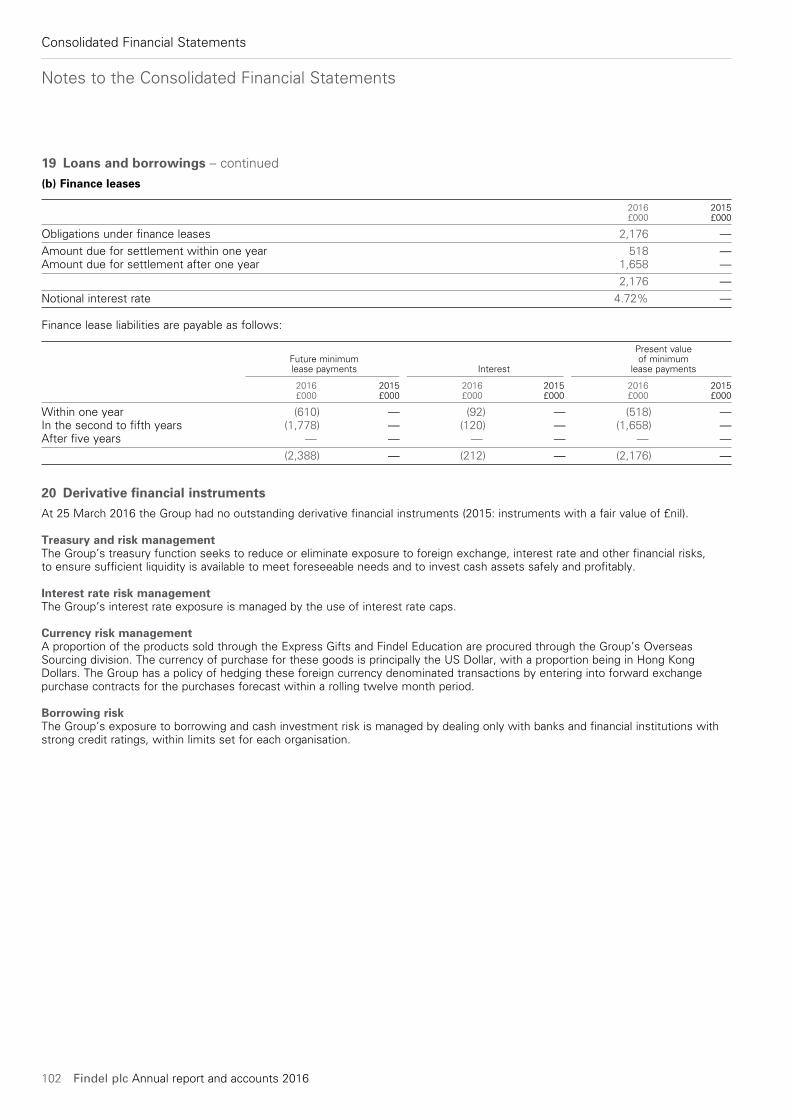
Notes to the Consolidated Financial Statements
102 Findel plc Annual report and accounts 2016
Consolidated Financial Statements
19 Loans and borrowings – continued
(b) Finance leases
2016 2015 £000 £000
Obligations under finance leases 2,176 —
Amount due for settlement within one year 518 —Amount due for settlement after one year 1,658 —
2,176 —
Notional interest rate 4.72% —
Finance lease liabilities are payable as follows:
Present value Future minimum of minimum lease payments Interest lease payments 2016 2015 2016 2015 2016 2015 £000 £000 £000 £000 £000 £000
Within one year (610) — (92) — (518) —In the second to fifth years (1,778) — (120) — (1,658) —After five years — — — — — —
(2,388) — (212) — (2,176) —
20 Derivative financial instrumentsAt 25 March 2016 the Group had no outstanding derivative financial instruments (2015: instruments with a fair value of £nil).
Treasury and risk managementThe Group’s treasury function seeks to reduce or eliminate exposure to foreign exchange, interest rate and other financial risks, to ensure sufficient liquidity is available to meet foreseeable needs and to invest cash assets safely and profitably.
Interest rate risk managementThe Group’s interest rate exposure is managed by the use of interest rate caps.
Currency risk managementA proportion of the products sold through the Express Gifts and Findel Education are procured through the Group’s Overseas Sourcing division. The currency of purchase for these goods is principally the US Dollar, with a proportion being in Hong Kong Dollars. The Group has a policy of hedging these foreign currency denominated transactions by entering into forward exchange purchase contracts for the purchases forecast within a rolling twelve month period.
Borrowing riskThe Group’s exposure to borrowing and cash investment risk is managed by dealing only with banks and financial institutions with strong credit ratings, within limits set for each organisation.
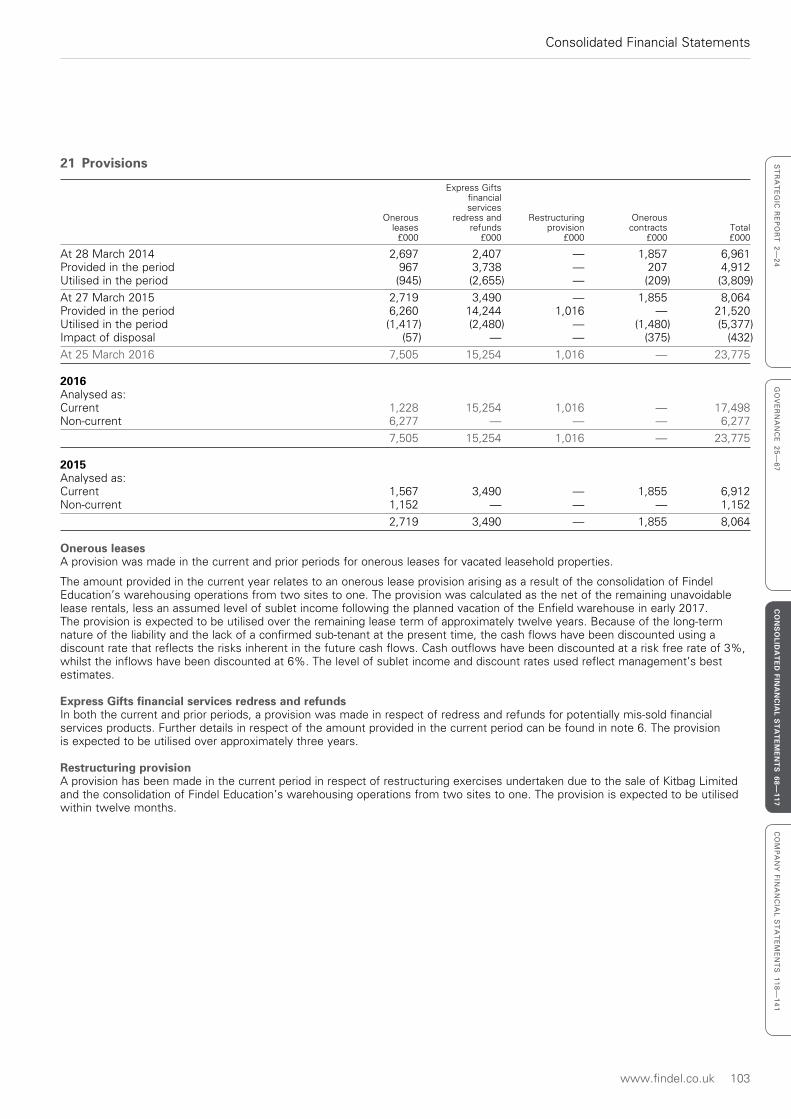
www.findel.co.uk 103
Consolidated Financial Statements
ST
RA
TE
GIC
RE
PO
RT
2—
24
GO
VE
RN
AN
CE
25
—6
7C
ON
SO
LIDA
TE
D FIN
AN
CIA
L ST
AT
EM
EN
TS
68—117
CO
MP
AN
Y F
INA
NC
IAL
ST
AT
EM
EN
TS
11
8—
14
1
21 Provisions
Express Gifts financial services Onerous redress and Restructuring Onerous leases refunds provision contracts Total £000 £000 £000 £000 £000
At 28 March 2014 2,697 2,407 — 1,857 6,961Provided in the period 967 3,738 — 207 4,912Utilised in the period (945) (2,655) — (209) (3,809)
At 27 March 2015 2,719 3,490 — 1,855 8,064Provided in the period 6,260 14,244 1,016 — 21,520Utilised in the period (1,417) (2,480) — (1,480) (5,377)Impact of disposal (57) — — (375) (432)
At 25 March 2016 7,505 15,254 1,016 — 23,775
2016Analysed as:Current 1,228 15,254 1,016 — 17,498Non-current 6,277 — — — 6,277
7,505 15,254 1,016 — 23,775
2015Analysed as:Current 1,567 3,490 — 1,855 6,912Non-current 1,152 — — — 1,152
2,719 3,490 — 1,855 8,064
Onerous leasesA provision was made in the current and prior periods for onerous leases for vacated leasehold properties.
The amount provided in the current year relates to an onerous lease provision arising as a result of the consolidation of Findel Education’s warehousing operations from two sites to one. The provision was calculated as the net of the remaining unavoidable lease rentals, less an assumed level of sublet income following the planned vacation of the Enfield warehouse in early 2017. The provision is expected to be utilised over the remaining lease term of approximately twelve years. Because of the long-term nature of the liability and the lack of a confirmed sub-tenant at the present time, the cash flows have been discounted using a discount rate that reflects the risks inherent in the future cash flows. Cash outflows have been discounted at a risk free rate of 3%, whilst the inflows have been discounted at 6%. The level of sublet income and discount rates used reflect management’s best estimates.
Express Gifts financial services redress and refundsIn both the current and prior periods, a provision was made in respect of redress and refunds for potentially mis-sold financial services products. Further details in respect of the amount provided in the current period can be found in note 6. The provision is expected to be utilised over approximately three years.
Restructuring provisionA provision has been made in the current period in respect of restructuring exercises undertaken due to the sale of Kitbag Limited and the consolidation of Findel Education’s warehousing operations from two sites to one. The provision is expected to be utilised within twelve months.
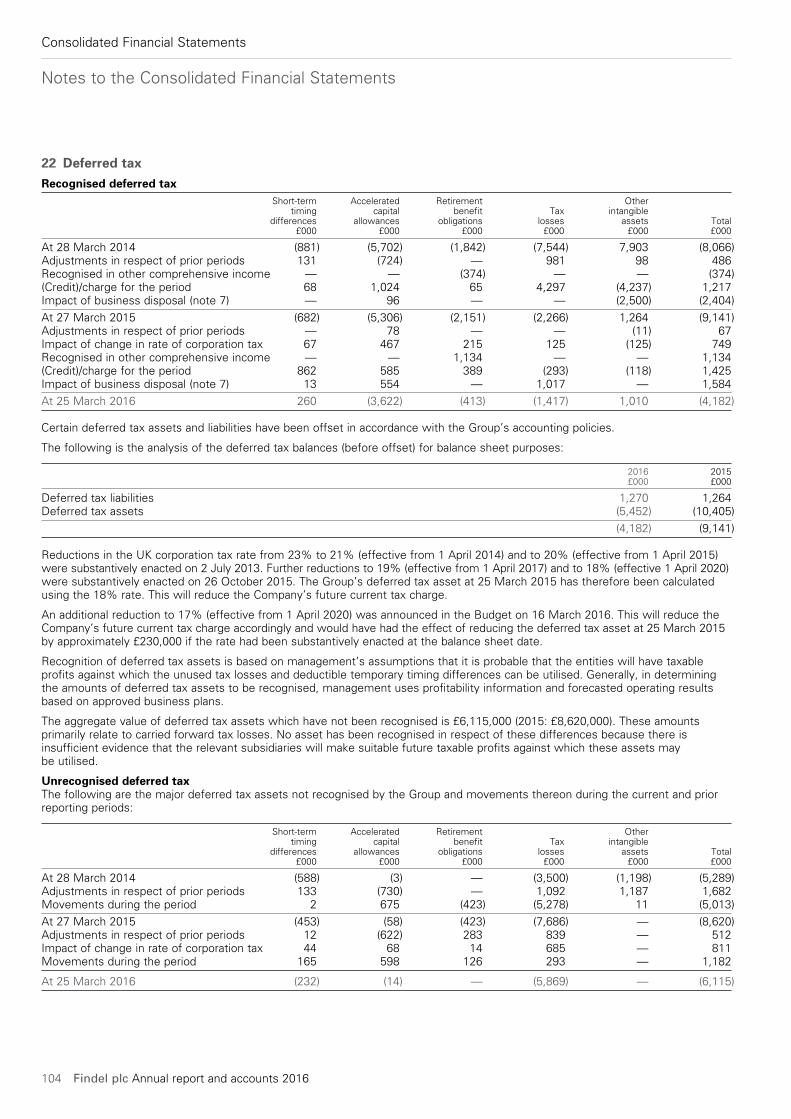
Notes to the Consolidated Financial Statements
104 Findel plc Annual report and accounts 2016
Consolidated Financial Statements
22 Deferred taxRecognised deferred tax Short-term Accelerated Retirement Other timing capital benefit Tax intangible differences allowances obligations losses assets Total £000 £000 £000 £000 £000 £000
At 28 March 2014 (881) (5,702) (1,842) (7,544) 7,903 (8,066)Adjustments in respect of prior periods 131 (724) — 981 98 486Recognised in other comprehensive income — — (374) — — (374)(Credit)/charge for the period 68 1,024 65 4,297 (4,237) 1,217Impact of business disposal (note 7) — 96 — — (2,500) (2,404)
At 27 March 2015 (682) (5,306) (2,151) (2,266) 1,264 (9,141)Adjustments in respect of prior periods — 78 — — (11) 67Impact of change in rate of corporation tax 67 467 215 125 (125) 749Recognised in other comprehensive income — — 1,134 — — 1,134(Credit)/charge for the period 862 585 389 (293) (118) 1,425Impact of business disposal (note 7) 13 554 — 1,017 — 1,584
At 25 March 2016 260 (3,622) (413) (1,417) 1,010 (4,182)
Certain deferred tax assets and liabilities have been offset in accordance with the Group’s accounting policies.
The following is the analysis of the deferred tax balances (before offset) for balance sheet purposes:
2016 2015 £000 £000
Deferred tax liabilities 1,270 1,264Deferred tax assets (5,452) (10,405)
(4,182) (9,141)
Reductions in the UK corporation tax rate from 23% to 21% (effective from 1 April 2014) and to 20% (effective from 1 April 2015) were substantively enacted on 2 July 2013. Further reductions to 19% (effective from 1 April 2017) and to 18% (effective 1 April 2020) were substantively enacted on 26 October 2015. The Group’s deferred tax asset at 25 March 2015 has therefore been calculated using the 18% rate. This will reduce the Company’s future current tax charge.
An additional reduction to 17% (effective from 1 April 2020) was announced in the Budget on 16 March 2016. This will reduce the Company’s future current tax charge accordingly and would have had the effect of reducing the deferred tax asset at 25 March 2015 by approximately £230,000 if the rate had been substantively enacted at the balance sheet date.
Recognition of deferred tax assets is based on management’s assumptions that it is probable that the entities will have taxable profits against which the unused tax losses and deductible temporary timing differences can be utilised. Generally, in determining the amounts of deferred tax assets to be recognised, management uses profitability information and forecasted operating results based on approved business plans.
The aggregate value of deferred tax assets which have not been recognised is £6,115,000 (2015: £8,620,000). These amounts primarily relate to carried forward tax losses. No asset has been recognised in respect of these differences because there is insufficient evidence that the relevant subsidiaries will make suitable future taxable profits against which these assets may be utilised.
Unrecognised deferred taxThe following are the major deferred tax assets not recognised by the Group and movements thereon during the current and prior reporting periods:
Short-term Accelerated Retirement Other timing capital benefit Tax intangible differences allowances obligations losses assets Total £000 £000 £000 £000 £000 £000
At 28 March 2014 (588) (3) — (3,500) (1,198) (5,289)Adjustments in respect of prior periods 133 (730) — 1,092 1,187 1,682Movements during the period 2 675 (423) (5,278) 11 (5,013)
At 27 March 2015 (453) (58) (423) (7,686) — (8,620)Adjustments in respect of prior periods 12 (622) 283 839 — 512Impact of change in rate of corporation tax 44 68 14 685 — 811Movements during the period 165 598 126 293 — 1,182
At 25 March 2016 (232) (14) — (5,869) — (6,115)
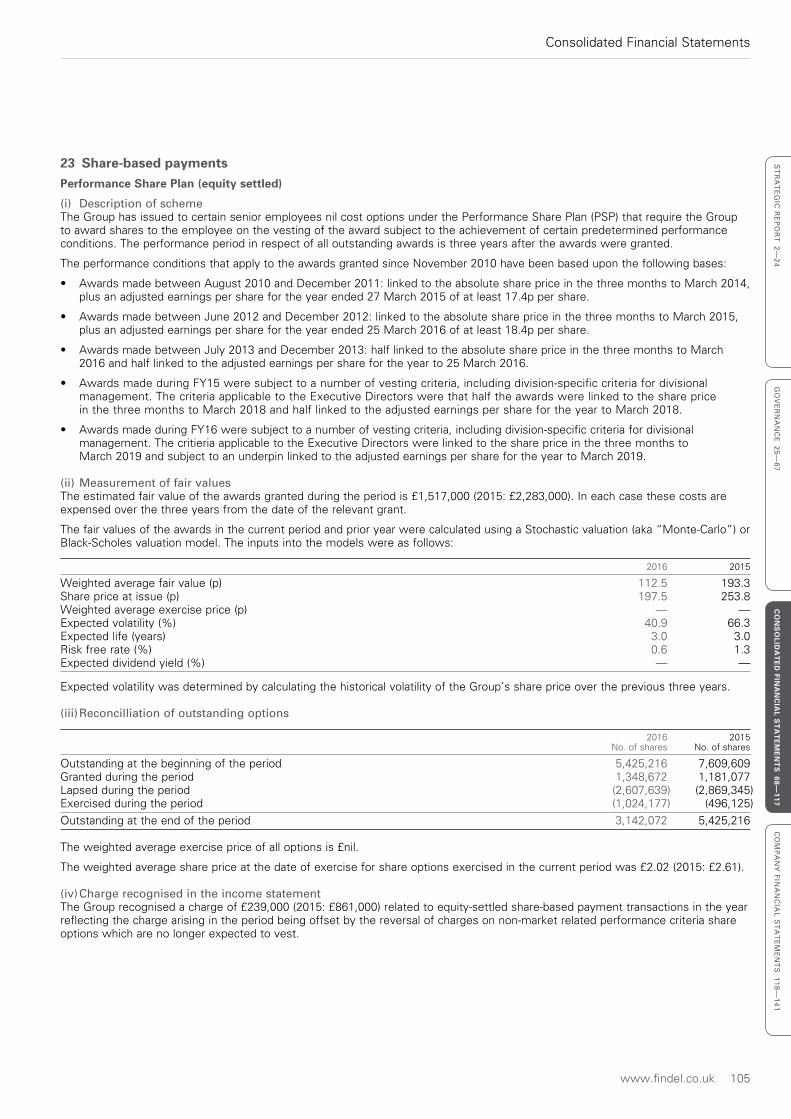
www.findel.co.uk 105
Consolidated Financial Statements
ST
RA
TE
GIC
RE
PO
RT
2—
24
GO
VE
RN
AN
CE
25
—6
7C
ON
SO
LIDA
TE
D FIN
AN
CIA
L ST
AT
EM
EN
TS
68—117
CO
MP
AN
Y F
INA
NC
IAL
ST
AT
EM
EN
TS
11
8—
14
1
23 Share-based paymentsPerformance Share Plan (equity settled)
(i) Description of schemeThe Group has issued to certain senior employees nil cost options under the Performance Share Plan (PSP) that require the Group to award shares to the employee on the vesting of the award subject to the achievement of certain predetermined performance conditions. The performance period in respect of all outstanding awards is three years after the awards were granted.
The performance conditions that apply to the awards granted since November 2010 have been based upon the following bases:
• Awards made between August 2010 and December 2011: linked to the absolute share price in the three months to March 2014, plus an adjusted earnings per share for the year ended 27 March 2015 of at least 17.4p per share.
• Awards made between June 2012 and December 2012: linked to the absolute share price in the three months to March 2015, plus an adjusted earnings per share for the year ended 25 March 2016 of at least 18.4p per share.
• Awards made between July 2013 and December 2013: half linked to the absolute share price in the three months to March 2016 and half linked to the adjusted earnings per share for the year to 25 March 2016.
• Awards made during FY15 were subject to a number of vesting criteria, including division-specific criteria for divisional management. The criteria applicable to the Executive Directors were that half the awards were linked to the share price in the three months to March 2018 and half linked to the adjusted earnings per share for the year to March 2018.
• Awards made during FY16 were subject to a number of vesting criteria, including division-specific criteria for divisional management. The critieria applicable to the Executive Directors were linked to the share price in the three months to March 2019 and subject to an underpin linked to the adjusted earnings per share for the year to March 2019.
(ii) Measurement of fair valuesThe estimated fair value of the awards granted during the period is £1,517,000 (2015: £2,283,000). In each case these costs are expensed over the three years from the date of the relevant grant.
The fair values of the awards in the current period and prior year were calculated using a Stochastic valuation (aka “Monte-Carlo”) or Black-Scholes valuation model. The inputs into the models were as follows:
2016 2015
Weighted average fair value (p) 112.5 193.3Share price at issue (p) 197.5 253.8Weighted average exercise price (p) — —Expected volatility (%) 40.9 66.3Expected life (years) 3.0 3.0Risk free rate (%) 0.6 1.3Expected dividend yield (%) — —
Expected volatility was determined by calculating the historical volatility of the Group’s share price over the previous three years.
(iii) Reconcilliation of outstanding options
2016 2015 No. of shares No. of shares
Outstanding at the beginning of the period 5,425,216 7,609,609Granted during the period 1,348,672 1,181,077Lapsed during the period (2,607,639) (2,869,345)Exercised during the period (1,024,177) (496,125)
Outstanding at the end of the period 3,142,072 5,425,216
The weighted average exercise price of all options is £nil.
The weighted average share price at the date of exercise for share options exercised in the current period was £2.02 (2015: £2.61).
(iv) Charge recognised in the income statementThe Group recognised a charge of £239,000 (2015: £861,000) related to equity-settled share-based payment transactions in the year reflecting the charge arising in the period being offset by the reversal of charges on non-market related performance criteria share options which are no longer expected to vest.
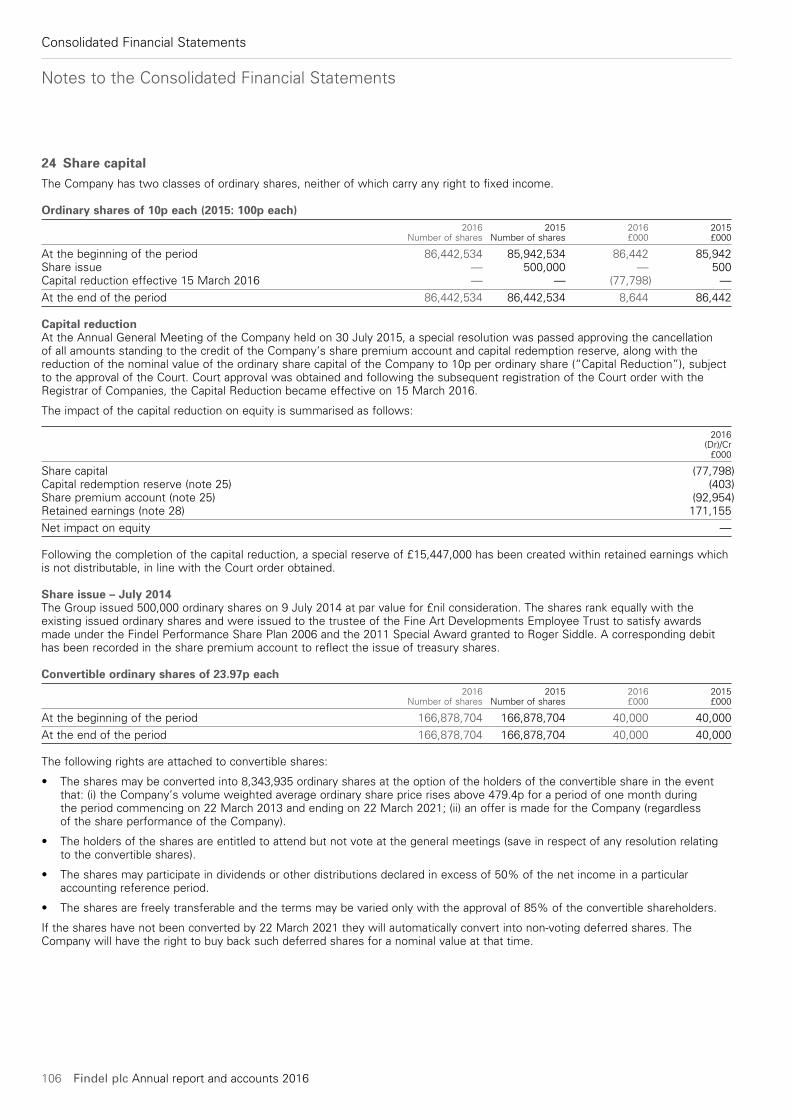
Notes to the Consolidated Financial Statements
106 Findel plc Annual report and accounts 2016
Consolidated Financial Statements
24 Share capitalThe Company has two classes of ordinary shares, neither of which carry any right to fixed income.
Ordinary shares of 10p each (2015: 100p each) 2016 2015 2016 2015 Number of shares Number of shares £000 £000
At the beginning of the period 86,442,534 85,942,534 86,442 85,942Share issue — 500,000 — 500Capital reduction effective 15 March 2016 — — (77,798) —
At the end of the period 86,442,534 86,442,534 8,644 86,442
Capital reductionAt the Annual General Meeting of the Company held on 30 July 2015, a special resolution was passed approving the cancellation of all amounts standing to the credit of the Company’s share premium account and capital redemption reserve, along with the reduction of the nominal value of the ordinary share capital of the Company to 10p per ordinary share (“Capital Reduction”), subject to the approval of the Court. Court approval was obtained and following the subsequent registration of the Court order with the Registrar of Companies, the Capital Reduction became effective on 15 March 2016.
The impact of the capital reduction on equity is summarised as follows:
2016 (Dr)/Cr £000
Share capital (77,798)Capital redemption reserve (note 25) (403)Share premium account (note 25) (92,954)Retained earnings (note 28) 171,155
Net impact on equity —
Following the completion of the capital reduction, a special reserve of £15,447,000 has been created within retained earnings which is not distributable, in line with the Court order obtained.
Share issue – July 2014The Group issued 500,000 ordinary shares on 9 July 2014 at par value for £nil consideration. The shares rank equally with the existing issued ordinary shares and were issued to the trustee of the Fine Art Developments Employee Trust to satisfy awards made under the Findel Performance Share Plan 2006 and the 2011 Special Award granted to Roger Siddle. A corresponding debit has been recorded in the share premium account to reflect the issue of treasury shares.
Convertible ordinary shares of 23.97p each 2016 2015 2016 2015 Number of shares Number of shares £000 £000
At the beginning of the period 166,878,704 166,878,704 40,000 40,000
At the end of the period 166,878,704 166,878,704 40,000 40,000
The following rights are attached to convertible shares:
• The shares may be converted into 8,343,935 ordinary shares at the option of the holders of the convertible share in the event that: (i) the Company’s volume weighted average ordinary share price rises above 479.4p for a period of one month during the period commencing on 22 March 2013 and ending on 22 March 2021; (ii) an offer is made for the Company (regardless of the share performance of the Company).
• The holders of the shares are entitled to attend but not vote at the general meetings (save in respect of any resolution relating to the convertible shares).
• The shares may participate in dividends or other distributions declared in excess of 50% of the net income in a particular accounting reference period.
• The shares are freely transferable and the terms may be varied only with the approval of 85% of the convertible shareholders.
If the shares have not been converted by 22 March 2021 they will automatically convert into non-voting deferred shares. The Company will have the right to buy back such deferred shares for a nominal value at that time.
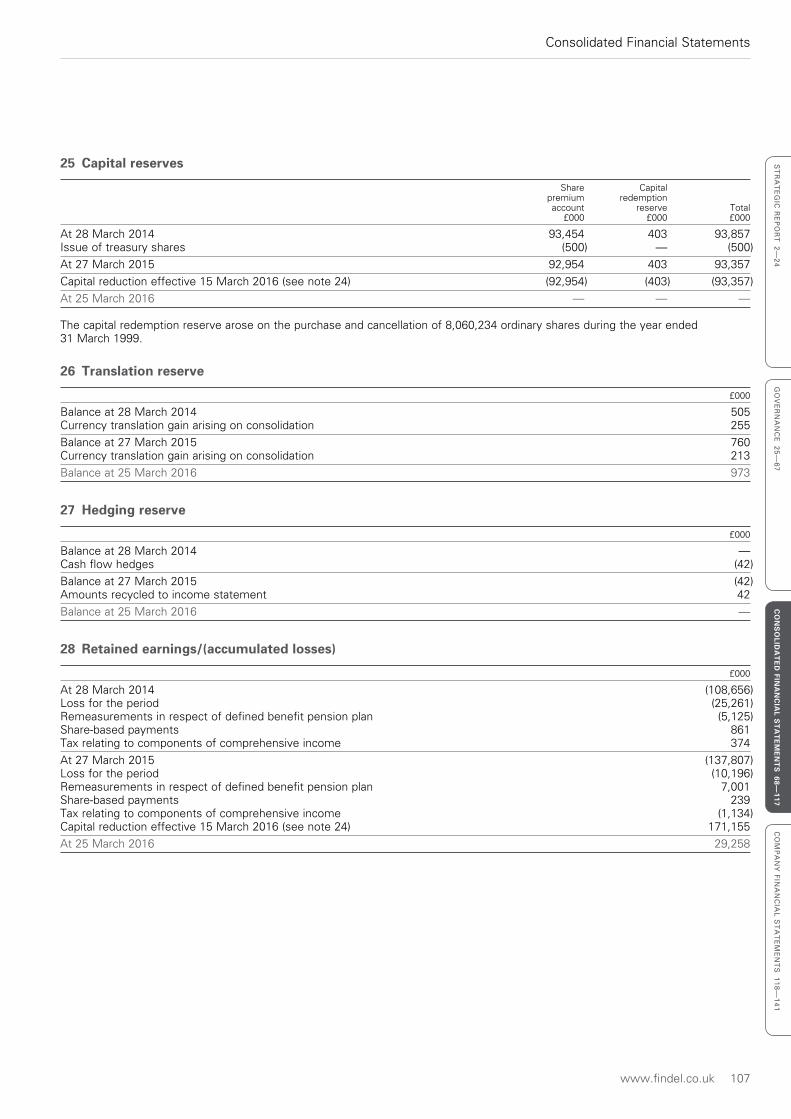
www.findel.co.uk 107
Consolidated Financial Statements
ST
RA
TE
GIC
RE
PO
RT
2—
24
GO
VE
RN
AN
CE
25
—6
7C
ON
SO
LIDA
TE
D FIN
AN
CIA
L ST
AT
EM
EN
TS
68—117
CO
MP
AN
Y F
INA
NC
IAL
ST
AT
EM
EN
TS
11
8—
14
1
25 Capital reserves
Share Capital premium redemption account reserve Total £000 £000 £000
At 28 March 2014 93,454 403 93,857Issue of treasury shares (500) — (500)
At 27 March 2015 92,954 403 93,357
Capital reduction effective 15 March 2016 (see note 24) (92,954) (403) (93,357)
At 25 March 2016 — — —
The capital redemption reserve arose on the purchase and cancellation of 8,060,234 ordinary shares during the year ended 31 March 1999.
26 Translation reserve
£000
Balance at 28 March 2014 505Currency translation gain arising on consolidation 255
Balance at 27 March 2015 760Currency translation gain arising on consolidation 213
Balance at 25 March 2016 973
27 Hedging reserve
£000
Balance at 28 March 2014 —Cash flow hedges (42)
Balance at 27 March 2015 (42)Amounts recycled to income statement 42
Balance at 25 March 2016 —
28 Retained earnings/(accumulated losses)
£000
At 28 March 2014 (108,656)Loss for the period (25,261)Remeasurements in respect of defined benefit pension plan (5,125)Share-based payments 861Tax relating to components of comprehensive income 374
At 27 March 2015 (137,807)Loss for the period (10,196)Remeasurements in respect of defined benefit pension plan 7,001Share-based payments 239Tax relating to components of comprehensive income (1,134)Capital reduction effective 15 March 2016 (see note 24) 171,155
At 25 March 2016 29,258
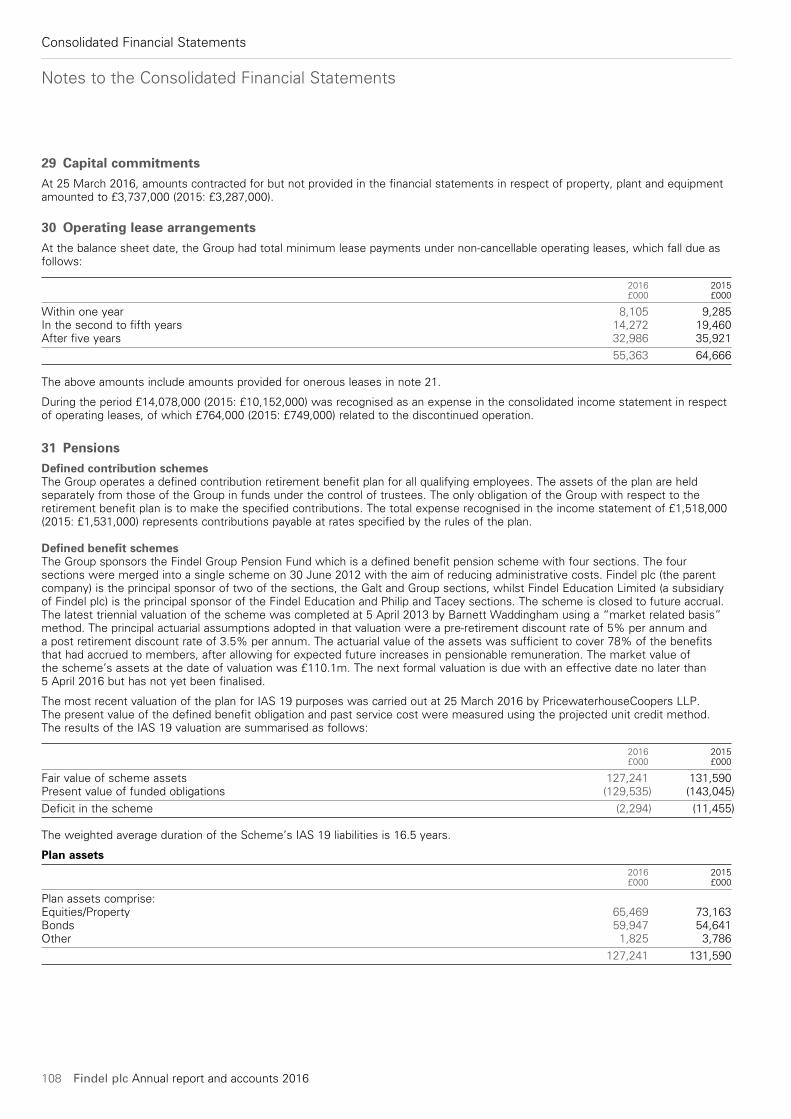
Notes to the Consolidated Financial Statements
108 Findel plc Annual report and accounts 2016
Consolidated Financial Statements
29 Capital commitmentsAt 25 March 2016, amounts contracted for but not provided in the financial statements in respect of property, plant and equipment amounted to £3,737,000 (2015: £3,287,000).
30 Operating lease arrangementsAt the balance sheet date, the Group had total minimum lease payments under non-cancellable operating leases, which fall due as follows:
2016 2015 £000 £000
Within one year 8,105 9,285In the second to fifth years 14,272 19,460After five years 32,986 35,921
55,363 64,666
The above amounts include amounts provided for onerous leases in note 21.
During the period £14,078,000 (2015: £10,152,000) was recognised as an expense in the consolidated income statement in respect of operating leases, of which £764,000 (2015: £749,000) related to the discontinued operation.
31 PensionsDefined contribution schemesThe Group operates a defined contribution retirement benefit plan for all qualifying employees. The assets of the plan are held separately from those of the Group in funds under the control of trustees. The only obligation of the Group with respect to the retirement benefit plan is to make the specified contributions. The total expense recognised in the income statement of £1,518,000 (2015: £1,531,000) represents contributions payable at rates specified by the rules of the plan.
Defined benefit schemesThe Group sponsors the Findel Group Pension Fund which is a defined benefit pension scheme with four sections. The four sections were merged into a single scheme on 30 June 2012 with the aim of reducing administrative costs. Findel plc (the parent company) is the principal sponsor of two of the sections, the Galt and Group sections, whilst Findel Education Limited (a subsidiary of Findel plc) is the principal sponsor of the Findel Education and Philip and Tacey sections. The scheme is closed to future accrual. The latest triennial valuation of the scheme was completed at 5 April 2013 by Barnett Waddingham using a “market related basis” method. The principal actuarial assumptions adopted in that valuation were a pre-retirement discount rate of 5% per annum and a post retirement discount rate of 3.5% per annum. The actuarial value of the assets was sufficient to cover 78% of the benefits that had accrued to members, after allowing for expected future increases in pensionable remuneration. The market value of the scheme’s assets at the date of valuation was £110.1m. The next formal valuation is due with an effective date no later than 5 April 2016 but has not yet been finalised.
The most recent valuation of the plan for IAS 19 purposes was carried out at 25 March 2016 by PricewaterhouseCoopers LLP. The present value of the defined benefit obligation and past service cost were measured using the projected unit credit method. The results of the IAS 19 valuation are summarised as follows:
2016 2015 £000 £000
Fair value of scheme assets 127,241 131,590Present value of funded obligations (129,535) (143,045)
Deficit in the scheme (2,294) (11,455)
The weighted average duration of the Scheme’s IAS 19 liabilities is 16.5 years.
Plan assets 2016 2015 £000 £000
Plan assets comprise:Equities/Property 65,469 73,163Bonds 59,947 54,641Other 1,825 3,786
127,241 131,590
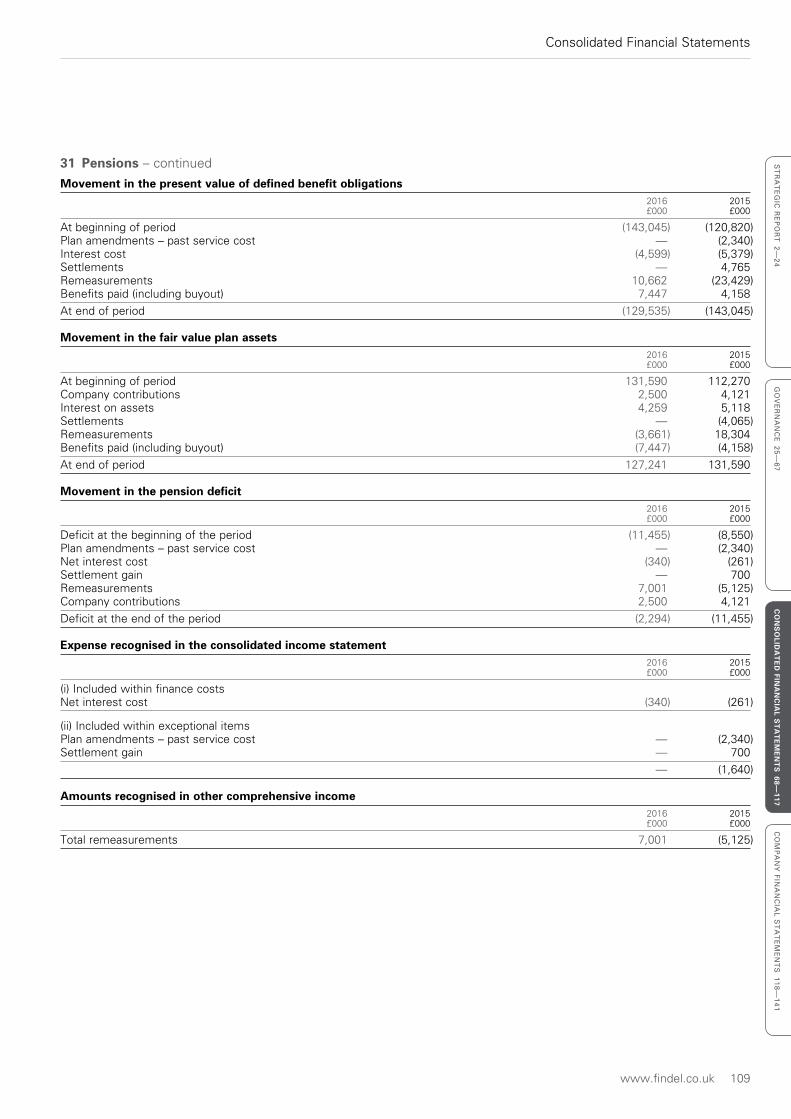
www.findel.co.uk 109
Consolidated Financial Statements
ST
RA
TE
GIC
RE
PO
RT
2—
24
GO
VE
RN
AN
CE
25
—6
7C
ON
SO
LIDA
TE
D FIN
AN
CIA
L ST
AT
EM
EN
TS
68—117
CO
MP
AN
Y F
INA
NC
IAL
ST
AT
EM
EN
TS
11
8—
14
1
31 Pensions – continued
Movement in the present value of defined benefit obligations 2016 2015 £000 £000
At beginning of period (143,045) (120,820)Plan amendments – past service cost — (2,340)Interest cost (4,599) (5,379)Settlements — 4,765Remeasurements 10,662 (23,429)Benefits paid (including buyout) 7,447 4,158
At end of period (129,535) (143,045)
Movement in the fair value plan assets 2016 2015 £000 £000
At beginning of period 131,590 112,270Company contributions 2,500 4,121Interest on assets 4,259 5,118Settlements — (4,065)Remeasurements (3,661) 18,304Benefits paid (including buyout) (7,447) (4,158)
At end of period 127,241 131,590
Movement in the pension deficit 2016 2015 £000 £000
Deficit at the beginning of the period (11,455) (8,550)Plan amendments – past service cost — (2,340)Net interest cost (340) (261)Settlement gain — 700Remeasurements 7,001 (5,125)Company contributions 2,500 4,121
Deficit at the end of the period (2,294) (11,455)
Expense recognised in the consolidated income statement 2016 2015 £000 £000
(i) Included within finance costsNet interest cost (340) (261)
(ii) Included within exceptional itemsPlan amendments – past service cost — (2,340)Settlement gain — 700
— (1,640)
Amounts recognised in other comprehensive income 2016 2015 £000 £000
Total remeasurements 7,001 (5,125)
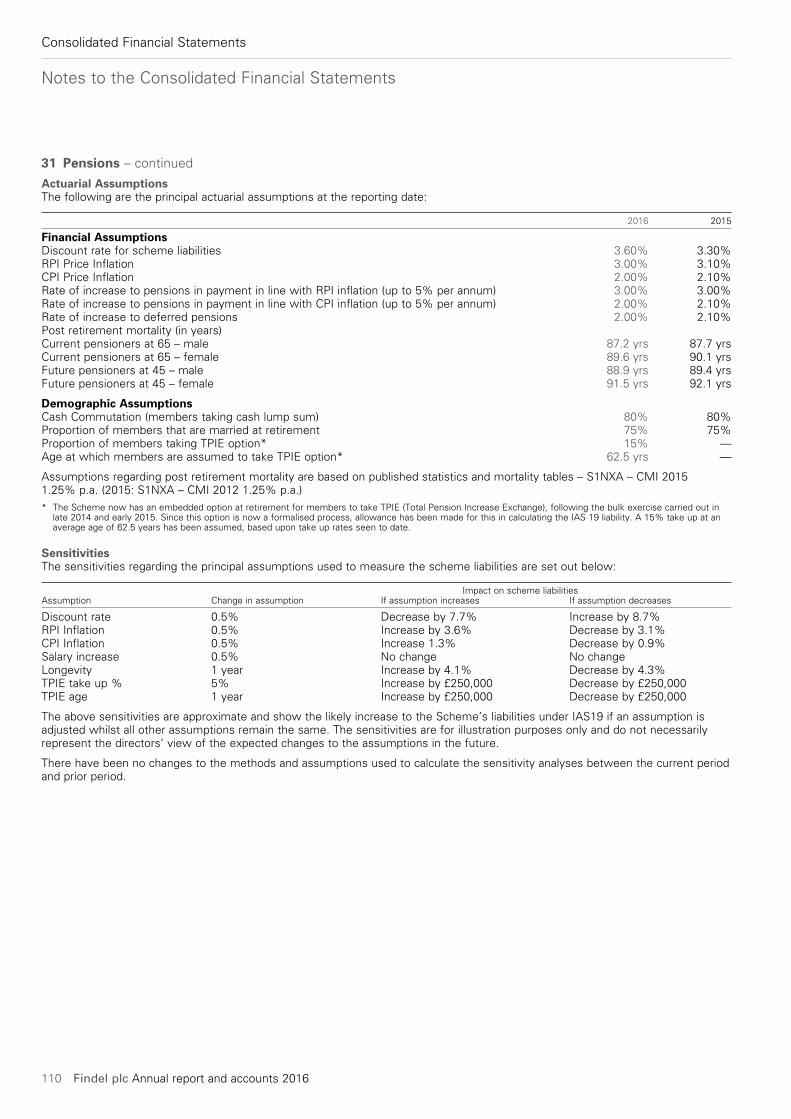
Notes to the Consolidated Financial Statements
110 Findel plc Annual report and accounts 2016
Consolidated Financial Statements
31 Pensions – continued
Actuarial AssumptionsThe following are the principal actuarial assumptions at the reporting date:
2016 2015
Financial AssumptionsDiscount rate for scheme liabilities 3.60% 3.30%RPI Price Inflation 3.00% 3.10%CPI Price Inflation 2.00% 2.10%Rate of increase to pensions in payment in line with RPI inflation (up to 5% per annum) 3.00% 3.00%Rate of increase to pensions in payment in line with CPI inflation (up to 5% per annum) 2.00% 2.10%Rate of increase to deferred pensions 2.00% 2.10%Post retirement mortality (in years)Current pensioners at 65 – male 87.2 yrs 87.7 yrsCurrent pensioners at 65 – female 89.6 yrs 90.1 yrsFuture pensioners at 45 – male 88.9 yrs 89.4 yrsFuture pensioners at 45 – female 91.5 yrs 92.1 yrs
Demographic AssumptionsCash Commutation (members taking cash lump sum) 80% 80%Proportion of members that are married at retirement 75% 75%Proportion of members taking TPIE option* 15% —Age at which members are assumed to take TPIE option* 62.5 yrs —
Assumptions regarding post retirement mortality are based on published statistics and mortality tables – S1NXA – CMI 2015 1.25% p.a. (2015: S1NXA – CMI 2012 1.25% p.a.)* The Scheme now has an embedded option at retirement for members to take TPIE (Total Pension Increase Exchange), following the bulk exercise carried out in
late 2014 and early 2015. Since this option is now a formalised process, allowance has been made for this in calculating the IAS 19 liability. A 15% take up at an average age of 62.5 years has been assumed, based upon take up rates seen to date.
SensitivitiesThe sensitivities regarding the principal assumptions used to measure the scheme liabilities are set out below:
Impact on scheme liabilitiesAssumption Change in assumption If assumption increases If assumption decreases
Discount rate 0.5% Decrease by 7.7% Increase by 8.7%RPI Inflation 0.5% Increase by 3.6% Decrease by 3.1%CPI Inflation 0.5% Increase 1.3% Decrease by 0.9%Salary increase 0.5% No change No changeLongevity 1 year Increase by 4.1% Decrease by 4.3%TPIE take up % 5% Increase by £250,000 Decrease by £250,000TPIE age 1 year Increase by £250,000 Decrease by £250,000
The above sensitivities are approximate and show the likely increase to the Scheme’s liabilities under IAS19 if an assumption is adjusted whilst all other assumptions remain the same. The sensitivities are for illustration purposes only and do not necessarily represent the directors’ view of the expected changes to the assumptions in the future.
There have been no changes to the methods and assumptions used to calculate the sensitivity analyses between the current period and prior period.
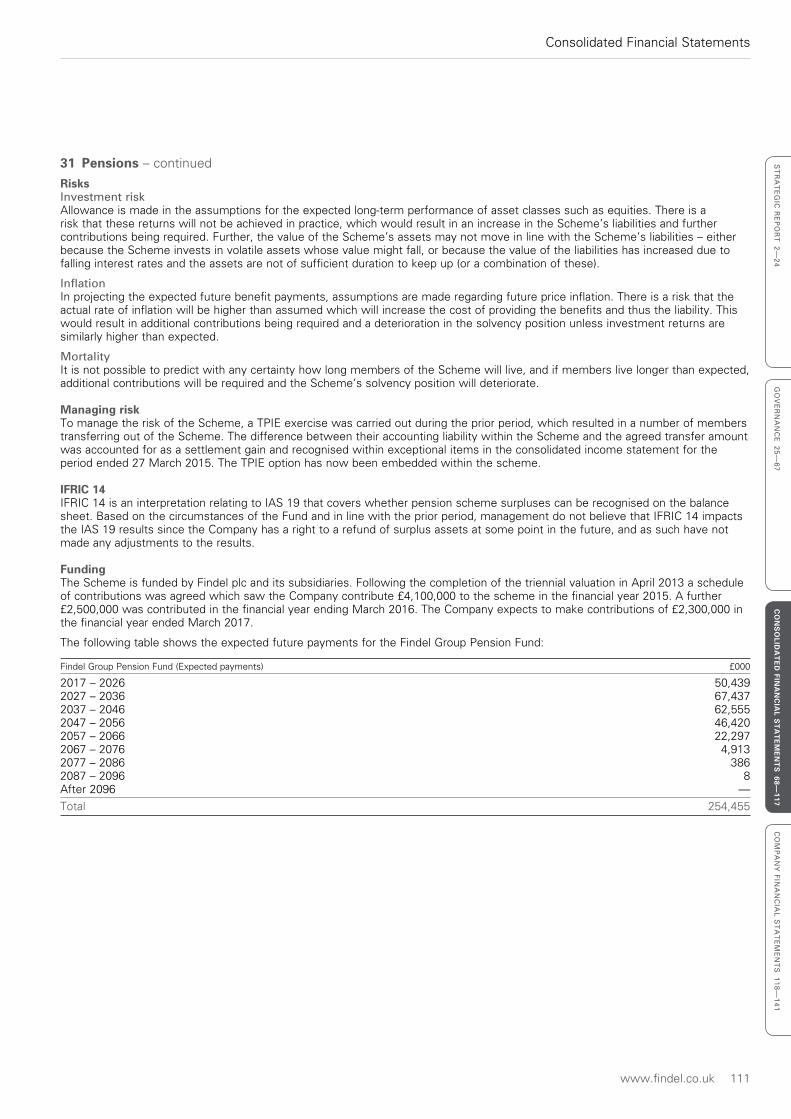
www.findel.co.uk 111
Consolidated Financial Statements
ST
RA
TE
GIC
RE
PO
RT
2—
24
GO
VE
RN
AN
CE
25
—6
7C
ON
SO
LIDA
TE
D FIN
AN
CIA
L ST
AT
EM
EN
TS
68—117
CO
MP
AN
Y F
INA
NC
IAL
ST
AT
EM
EN
TS
11
8—
14
1
31 Pensions – continued
RisksInvestment riskAllowance is made in the assumptions for the expected long-term performance of asset classes such as equities. There is a risk that these returns will not be achieved in practice, which would result in an increase in the Scheme’s liabilities and further contributions being required. Further, the value of the Scheme’s assets may not move in line with the Scheme’s liabilities – either because the Scheme invests in volatile assets whose value might fall, or because the value of the liabilities has increased due to falling interest rates and the assets are not of sufficient duration to keep up (or a combination of these).
InflationIn projecting the expected future benefit payments, assumptions are made regarding future price inflation. There is a risk that the actual rate of inflation will be higher than assumed which will increase the cost of providing the benefits and thus the liability. This would result in additional contributions being required and a deterioration in the solvency position unless investment returns are similarly higher than expected.
MortalityIt is not possible to predict with any certainty how long members of the Scheme will live, and if members live longer than expected, additional contributions will be required and the Scheme’s solvency position will deteriorate.
Managing riskTo manage the risk of the Scheme, a TPIE exercise was carried out during the prior period, which resulted in a number of members transferring out of the Scheme. The difference between their accounting liability within the Scheme and the agreed transfer amount was accounted for as a settlement gain and recognised within exceptional items in the consolidated income statement for the period ended 27 March 2015. The TPIE option has now been embedded within the scheme.
IFRIC 14IFRIC 14 is an interpretation relating to IAS 19 that covers whether pension scheme surpluses can be recognised on the balance sheet. Based on the circumstances of the Fund and in line with the prior period, management do not believe that IFRIC 14 impacts the IAS 19 results since the Company has a right to a refund of surplus assets at some point in the future, and as such have not made any adjustments to the results.
FundingThe Scheme is funded by Findel plc and its subsidiaries. Following the completion of the triennial valuation in April 2013 a schedule of contributions was agreed which saw the Company contribute £4,100,000 to the scheme in the financial year 2015. A further £2,500,000 was contributed in the financial year ending March 2016. The Company expects to make contributions of £2,300,000 in the financial year ended March 2017.
The following table shows the expected future payments for the Findel Group Pension Fund:
Findel Group Pension Fund (Expected payments) £000
2017 – 2026 50,4392027 – 2036 67,4372037 – 2046 62,5552047 – 2056 46,4202057 – 2066 22,2972067 – 2076 4,9132077 – 2086 3862087 – 2096 8After 2096 —
Total 254,455
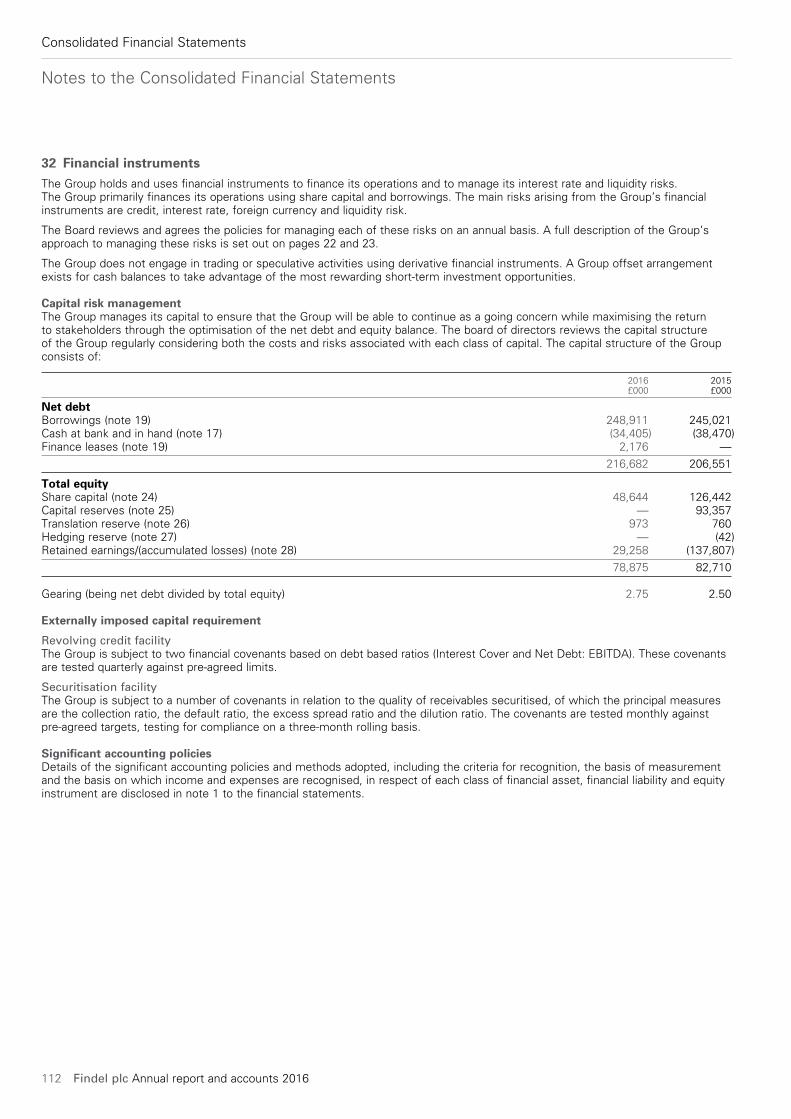
Notes to the Consolidated Financial Statements
112 Findel plc Annual report and accounts 2016
Consolidated Financial Statements
32 Financial instrumentsThe Group holds and uses financial instruments to finance its operations and to manage its interest rate and liquidity risks. The Group primarily finances its operations using share capital and borrowings. The main risks arising from the Group’s financial instruments are credit, interest rate, foreign currency and liquidity risk.
The Board reviews and agrees the policies for managing each of these risks on an annual basis. A full description of the Group’s approach to managing these risks is set out on pages 22 and 23.
The Group does not engage in trading or speculative activities using derivative financial instruments. A Group offset arrangement exists for cash balances to take advantage of the most rewarding short-term investment opportunities.
Capital risk managementThe Group manages its capital to ensure that the Group will be able to continue as a going concern while maximising the return to stakeholders through the optimisation of the net debt and equity balance. The board of directors reviews the capital structure of the Group regularly considering both the costs and risks associated with each class of capital. The capital structure of the Group consists of:
2016 2015 £000 £000
Net debtBorrowings (note 19) 248,911 245,021Cash at bank and in hand (note 17) (34,405) (38,470)Finance leases (note 19) 2,176 —
216,682 206,551
Total equityShare capital (note 24) 48,644 126,442Capital reserves (note 25) — 93,357Translation reserve (note 26) 973 760Hedging reserve (note 27) — (42)Retained earnings/(accumulated losses) (note 28) 29,258 (137,807)
78,875 82,710
Gearing (being net debt divided by total equity) 2.75 2.50
Externally imposed capital requirement
Revolving credit facilityThe Group is subject to two financial covenants based on debt based ratios (Interest Cover and Net Debt: EBITDA). These covenants are tested quarterly against pre-agreed limits.
Securitisation facilityThe Group is subject to a number of covenants in relation to the quality of receivables securitised, of which the principal measures are the collection ratio, the default ratio, the excess spread ratio and the dilution ratio. The covenants are tested monthly against pre-agreed targets, testing for compliance on a three-month rolling basis.
Significant accounting policiesDetails of the significant accounting policies and methods adopted, including the criteria for recognition, the basis of measurement and the basis on which income and expenses are recognised, in respect of each class of financial asset, financial liability and equity instrument are disclosed in note 1 to the financial statements.
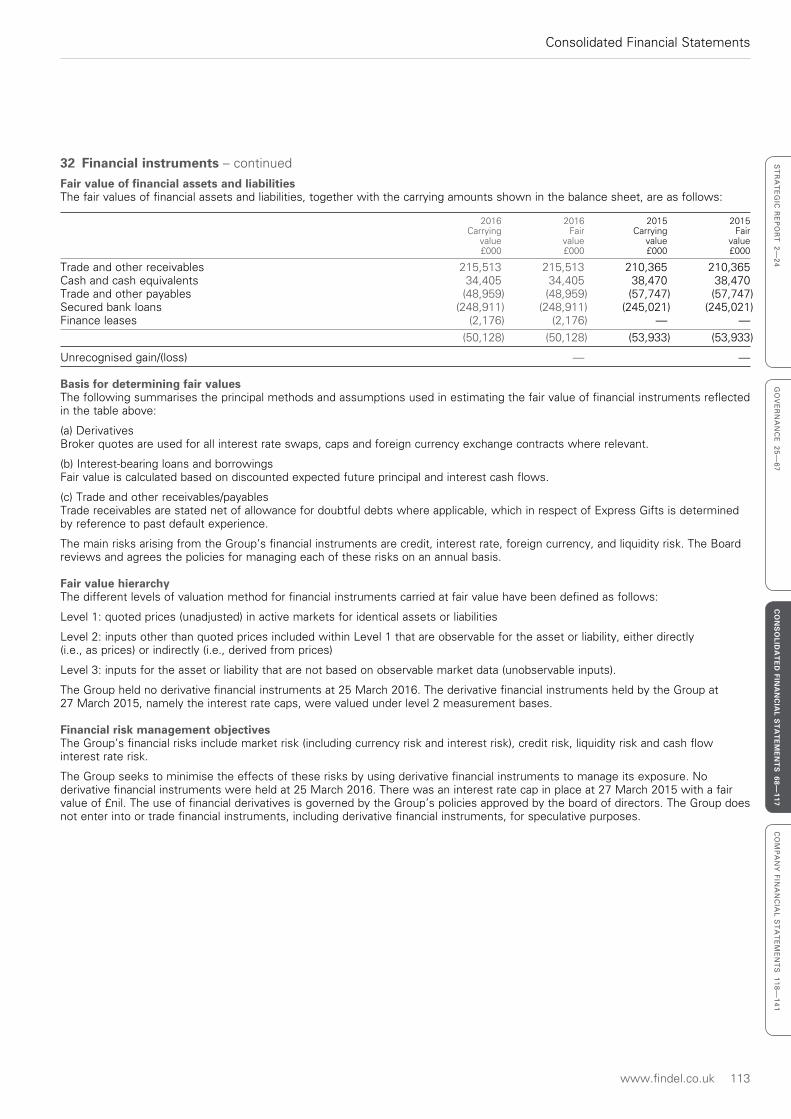
www.findel.co.uk 113
Consolidated Financial Statements
ST
RA
TE
GIC
RE
PO
RT
2—
24
GO
VE
RN
AN
CE
25
—6
7C
ON
SO
LIDA
TE
D FIN
AN
CIA
L ST
AT
EM
EN
TS
68—117
CO
MP
AN
Y F
INA
NC
IAL
ST
AT
EM
EN
TS
11
8—
14
1
32 Financial instruments – continued
Fair value of financial assets and liabilitiesThe fair values of financial assets and liabilities, together with the carrying amounts shown in the balance sheet, are as follows:
2016 2016 2015 2015 Carrying Fair Carrying Fair value value value value £000 £000 £000 £000
Trade and other receivables 215,513 215,513 210,365 210,365Cash and cash equivalents 34,405 34,405 38,470 38,470Trade and other payables (48,959) (48,959) (57,747) (57,747)Secured bank loans (248,911) (248,911) (245,021) (245,021)Finance leases (2,176) (2,176) — —
(50,128) (50,128) (53,933) (53,933)
Unrecognised gain/(loss) — —
Basis for determining fair valuesThe following summarises the principal methods and assumptions used in estimating the fair value of financial instruments reflected in the table above:
(a) DerivativesBroker quotes are used for all interest rate swaps, caps and foreign currency exchange contracts where relevant.
(b) Interest-bearing loans and borrowingsFair value is calculated based on discounted expected future principal and interest cash flows.
(c) Trade and other receivables/payablesTrade receivables are stated net of allowance for doubtful debts where applicable, which in respect of Express Gifts is determined by reference to past default experience.
The main risks arising from the Group’s financial instruments are credit, interest rate, foreign currency, and liquidity risk. The Board reviews and agrees the policies for managing each of these risks on an annual basis.
Fair value hierarchyThe different levels of valuation method for financial instruments carried at fair value have been defined as follows:
Level 1: quoted prices (unadjusted) in active markets for identical assets or liabilities
Level 2: inputs other than quoted prices included within Level 1 that are observable for the asset or liability, either directly (i.e., as prices) or indirectly (i.e., derived from prices)
Level 3: inputs for the asset or liability that are not based on observable market data (unobservable inputs).
The Group held no derivative financial instruments at 25 March 2016. The derivative financial instruments held by the Group at 27 March 2015, namely the interest rate caps, were valued under level 2 measurement bases.
Financial risk management objectivesThe Group’s financial risks include market risk (including currency risk and interest risk), credit risk, liquidity risk and cash flow interest rate risk.
The Group seeks to minimise the effects of these risks by using derivative financial instruments to manage its exposure. No derivative financial instruments were held at 25 March 2016. There was an interest rate cap in place at 27 March 2015 with a fair value of £nil. The use of financial derivatives is governed by the Group’s policies approved by the board of directors. The Group does not enter into or trade financial instruments, including derivative financial instruments, for speculative purposes.
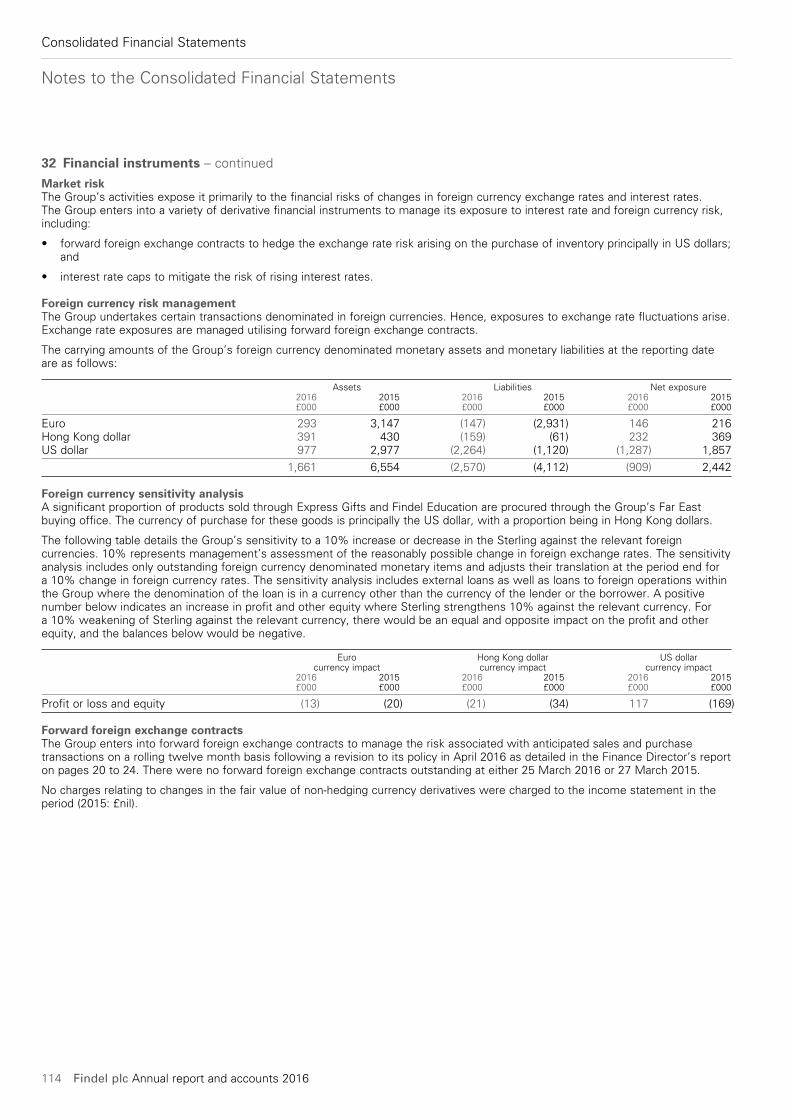
Notes to the Consolidated Financial Statements
114 Findel plc Annual report and accounts 2016
Consolidated Financial Statements
32 Financial instruments – continued
Market riskThe Group’s activities expose it primarily to the financial risks of changes in foreign currency exchange rates and interest rates. The Group enters into a variety of derivative financial instruments to manage its exposure to interest rate and foreign currency risk, including:
• forward foreign exchange contracts to hedge the exchange rate risk arising on the purchase of inventory principally in US dollars; and
• interest rate caps to mitigate the risk of rising interest rates.
Foreign currency risk managementThe Group undertakes certain transactions denominated in foreign currencies. Hence, exposures to exchange rate fluctuations arise. Exchange rate exposures are managed utilising forward foreign exchange contracts.
The carrying amounts of the Group’s foreign currency denominated monetary assets and monetary liabilities at the reporting date are as follows:
Assets Liabilities Net exposure 2016 2015 2016 2015 2016 2015 £000 £000 £000 £000 £000 £000
Euro 293 3,147 (147) (2,931) 146 216Hong Kong dollar 391 430 (159) (61) 232 369US dollar 977 2,977 (2,264) (1,120) (1,287) 1,857
1,661 6,554 (2,570) (4,112) (909) 2,442
Foreign currency sensitivity analysisA significant proportion of products sold through Express Gifts and Findel Education are procured through the Group’s Far East buying office. The currency of purchase for these goods is principally the US dollar, with a proportion being in Hong Kong dollars.
The following table details the Group’s sensitivity to a 10% increase or decrease in the Sterling against the relevant foreign currencies. 10% represents management’s assessment of the reasonably possible change in foreign exchange rates. The sensitivity analysis includes only outstanding foreign currency denominated monetary items and adjusts their translation at the period end for a 10% change in foreign currency rates. The sensitivity analysis includes external loans as well as loans to foreign operations within the Group where the denomination of the loan is in a currency other than the currency of the lender or the borrower. A positive number below indicates an increase in profit and other equity where Sterling strengthens 10% against the relevant currency. For a 10% weakening of Sterling against the relevant currency, there would be an equal and opposite impact on the profit and other equity, and the balances below would be negative.
Euro Hong Kong dollar US dollar currency impact currency impact currency impact 2016 2015 2016 2015 2016 2015 £000 £000 £000 £000 £000 £000
Profit or loss and equity (13) (20) (21) (34) 117 (169)
Forward foreign exchange contractsThe Group enters into forward foreign exchange contracts to manage the risk associated with anticipated sales and purchase transactions on a rolling twelve month basis following a revision to its policy in April 2016 as detailed in the Finance Director’s report on pages 20 to 24. There were no forward foreign exchange contracts outstanding at either 25 March 2016 or 27 March 2015.
No charges relating to changes in the fair value of non-hedging currency derivatives were charged to the income statement in the period (2015: £nil).
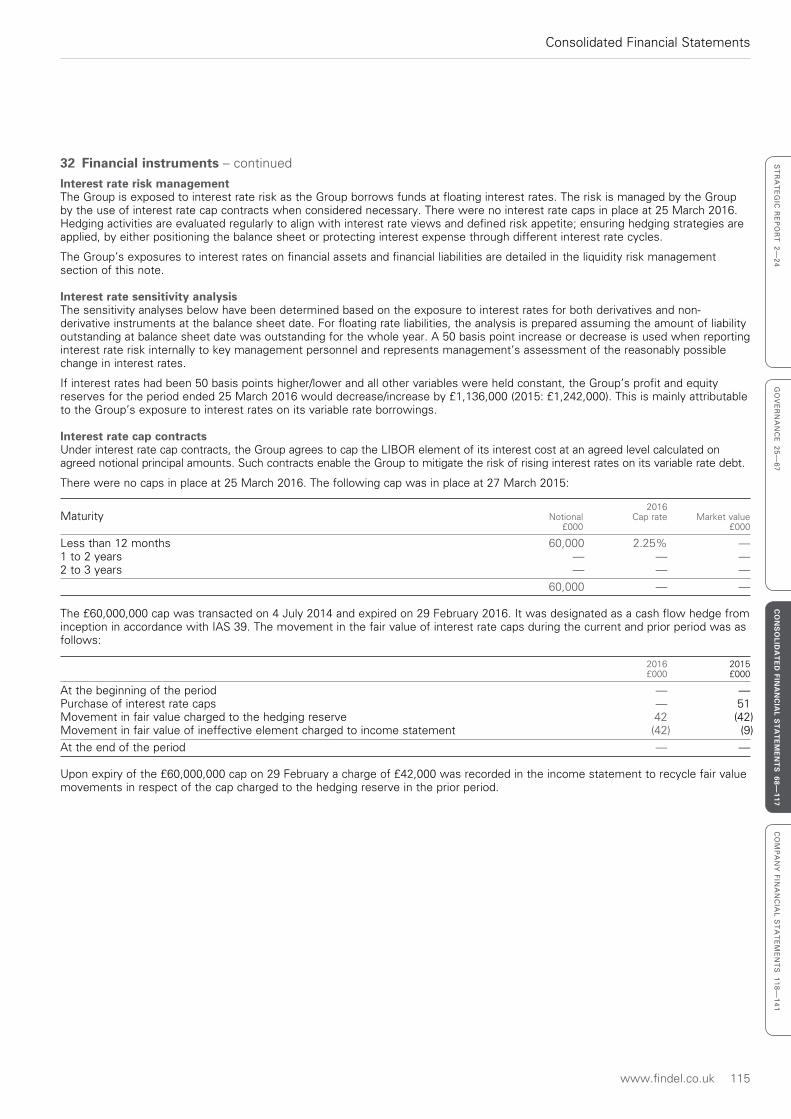
www.findel.co.uk 115
Consolidated Financial Statements
ST
RA
TE
GIC
RE
PO
RT
2—
24
GO
VE
RN
AN
CE
25
—6
7C
ON
SO
LIDA
TE
D FIN
AN
CIA
L ST
AT
EM
EN
TS
68—117
CO
MP
AN
Y F
INA
NC
IAL
ST
AT
EM
EN
TS
11
8—
14
1
32 Financial instruments – continued
Interest rate risk managementThe Group is exposed to interest rate risk as the Group borrows funds at floating interest rates. The risk is managed by the Group by the use of interest rate cap contracts when considered necessary. There were no interest rate caps in place at 25 March 2016. Hedging activities are evaluated regularly to align with interest rate views and defined risk appetite; ensuring hedging strategies are applied, by either positioning the balance sheet or protecting interest expense through different interest rate cycles.
The Group’s exposures to interest rates on financial assets and financial liabilities are detailed in the liquidity risk management section of this note.
Interest rate sensitivity analysisThe sensitivity analyses below have been determined based on the exposure to interest rates for both derivatives and non-derivative instruments at the balance sheet date. For floating rate liabilities, the analysis is prepared assuming the amount of liability outstanding at balance sheet date was outstanding for the whole year. A 50 basis point increase or decrease is used when reporting interest rate risk internally to key management personnel and represents management’s assessment of the reasonably possible change in interest rates.
If interest rates had been 50 basis points higher/lower and all other variables were held constant, the Group’s profit and equity reserves for the period ended 25 March 2016 would decrease/increase by £1,136,000 (2015: £1,242,000). This is mainly attributable to the Group’s exposure to interest rates on its variable rate borrowings.
Interest rate cap contractsUnder interest rate cap contracts, the Group agrees to cap the LIBOR element of its interest cost at an agreed level calculated on agreed notional principal amounts. Such contracts enable the Group to mitigate the risk of rising interest rates on its variable rate debt.
There were no caps in place at 25 March 2016. The following cap was in place at 27 March 2015:
2016 Maturity Notional Cap rate Market value £000 £000
Less than 12 months 60,000 2.25% —1 to 2 years — — —2 to 3 years — — —
60,000 — —
The £60,000,000 cap was transacted on 4 July 2014 and expired on 29 February 2016. It was designated as a cash flow hedge from inception in accordance with IAS 39. The movement in the fair value of interest rate caps during the current and prior period was as follows:
2016 2015 £000 £000
At the beginning of the period — —Purchase of interest rate caps — 51Movement in fair value charged to the hedging reserve 42 (42)Movement in fair value of ineffective element charged to income statement (42) (9)
At the end of the period — —
Upon expiry of the £60,000,000 cap on 29 February a charge of £42,000 was recorded in the income statement to recycle fair value movements in respect of the cap charged to the hedging reserve in the prior period.
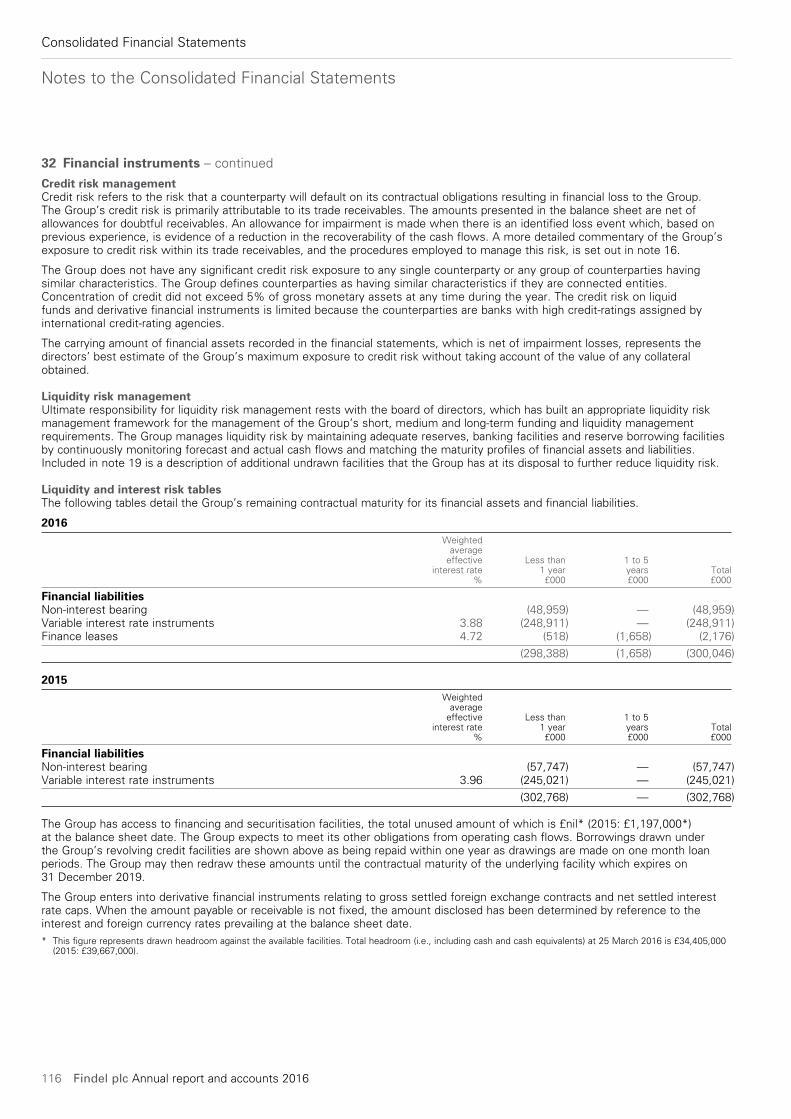
Notes to the Consolidated Financial Statements
116 Findel plc Annual report and accounts 2016
Consolidated Financial Statements
32 Financial instruments – continued
Credit risk managementCredit risk refers to the risk that a counterparty will default on its contractual obligations resulting in financial loss to the Group. The Group’s credit risk is primarily attributable to its trade receivables. The amounts presented in the balance sheet are net of allowances for doubtful receivables. An allowance for impairment is made when there is an identified loss event which, based on previous experience, is evidence of a reduction in the recoverability of the cash flows. A more detailed commentary of the Group’s exposure to credit risk within its trade receivables, and the procedures employed to manage this risk, is set out in note 16.
The Group does not have any significant credit risk exposure to any single counterparty or any group of counterparties having similar characteristics. The Group defines counterparties as having similar characteristics if they are connected entities. Concentration of credit did not exceed 5% of gross monetary assets at any time during the year. The credit risk on liquid funds and derivative financial instruments is limited because the counterparties are banks with high credit-ratings assigned by international credit-rating agencies.
The carrying amount of financial assets recorded in the financial statements, which is net of impairment losses, represents the directors’ best estimate of the Group’s maximum exposure to credit risk without taking account of the value of any collateral obtained.
Liquidity risk managementUltimate responsibility for liquidity risk management rests with the board of directors, which has built an appropriate liquidity risk management framework for the management of the Group’s short, medium and long-term funding and liquidity management requirements. The Group manages liquidity risk by maintaining adequate reserves, banking facilities and reserve borrowing facilities by continuously monitoring forecast and actual cash flows and matching the maturity profiles of financial assets and liabilities. Included in note 19 is a description of additional undrawn facilities that the Group has at its disposal to further reduce liquidity risk.
Liquidity and interest risk tablesThe following tables detail the Group’s remaining contractual maturity for its financial assets and financial liabilities.
2016 Weighted average effective Less than 1 to 5 interest rate 1 year years Total % £000 £000 £000
Financial liabilitiesNon-interest bearing (48,959) — (48,959)Variable interest rate instruments 3.88 (248,911) — (248,911)Finance leases 4.72 (518) (1,658) (2,176)
(298,388) (1,658) (300,046)
2015 Weighted average effective Less than 1 to 5 interest rate 1 year years Total % £000 £000 £000
Financial liabilitiesNon-interest bearing (57,747) — (57,747)Variable interest rate instruments 3.96 (245,021) — (245,021)
(302,768) — (302,768)
The Group has access to financing and securitisation facilities, the total unused amount of which is £nil* (2015: £1,197,000*) at the balance sheet date. The Group expects to meet its other obligations from operating cash flows. Borrowings drawn under the Group’s revolving credit facilities are shown above as being repaid within one year as drawings are made on one month loan periods. The Group may then redraw these amounts until the contractual maturity of the underlying facility which expires on 31 December 2019.
The Group enters into derivative financial instruments relating to gross settled foreign exchange contracts and net settled interest rate caps. When the amount payable or receivable is not fixed, the amount disclosed has been determined by reference to the interest and foreign currency rates prevailing at the balance sheet date.* This figure represents drawn headroom against the available facilities. Total headroom (i.e., including cash and cash equivalents) at 25 March 2016 is £34,405,000
(2015: £39,667,000).
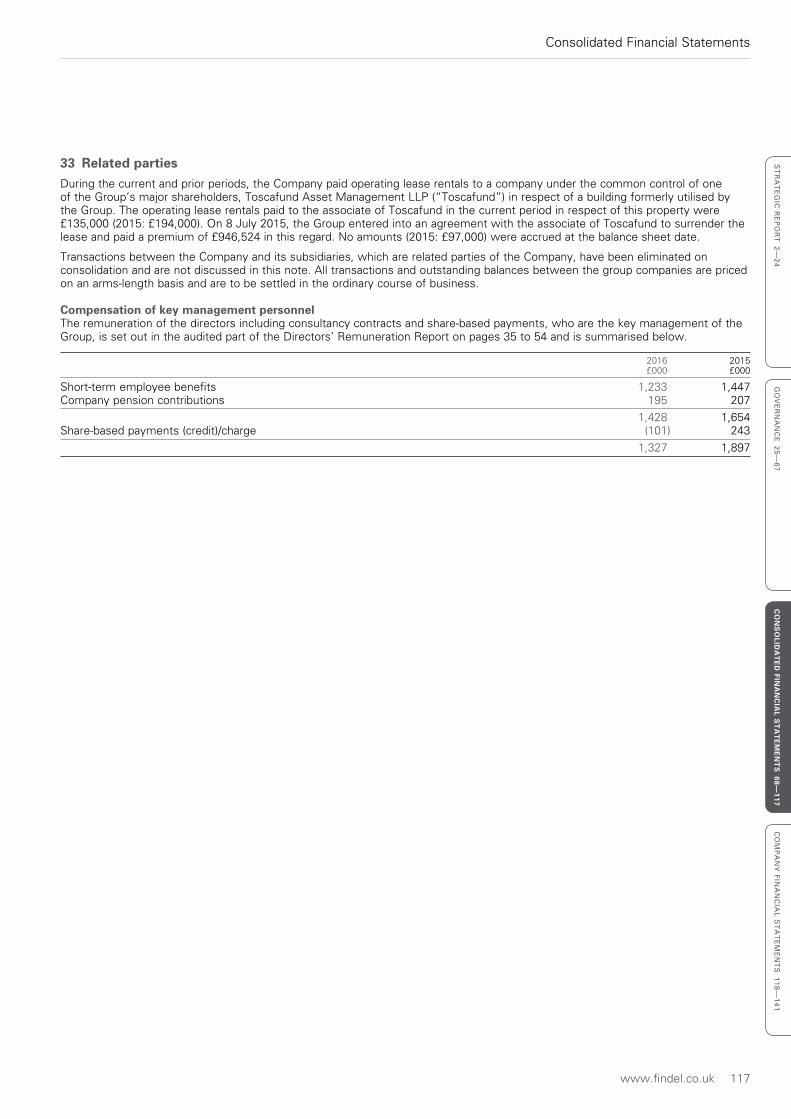
www.findel.co.uk 117
Consolidated Financial Statements
ST
RA
TE
GIC
RE
PO
RT
2—
24
GO
VE
RN
AN
CE
25
—6
7C
ON
SO
LIDA
TE
D FIN
AN
CIA
L ST
AT
EM
EN
TS
68—117
CO
MP
AN
Y F
INA
NC
IAL
ST
AT
EM
EN
TS
11
8—
14
1
33 Related partiesDuring the current and prior periods, the Company paid operating lease rentals to a company under the common control of one of the Group’s major shareholders, Toscafund Asset Management LLP (“Toscafund”) in respect of a building formerly utilised by the Group. The operating lease rentals paid to the associate of Toscafund in the current period in respect of this property were £135,000 (2015: £194,000). On 8 July 2015, the Group entered into an agreement with the associate of Toscafund to surrender the lease and paid a premium of £946,524 in this regard. No amounts (2015: £97,000) were accrued at the balance sheet date.
Transactions between the Company and its subsidiaries, which are related parties of the Company, have been eliminated on consolidation and are not discussed in this note. All transactions and outstanding balances between the group companies are priced on an arms-length basis and are to be settled in the ordinary course of business.
Compensation of key management personnelThe remuneration of the directors including consultancy contracts and share-based payments, who are the key management of the Group, is set out in the audited part of the Directors’ Remuneration Report on pages 35 to 54 and is summarised below.
2016 2015 £000 £000
Short-term employee benefits 1,233 1,447Company pension contributions 195 207
1,428 1,654Share-based payments (credit)/charge (101) 243
1,327 1,897
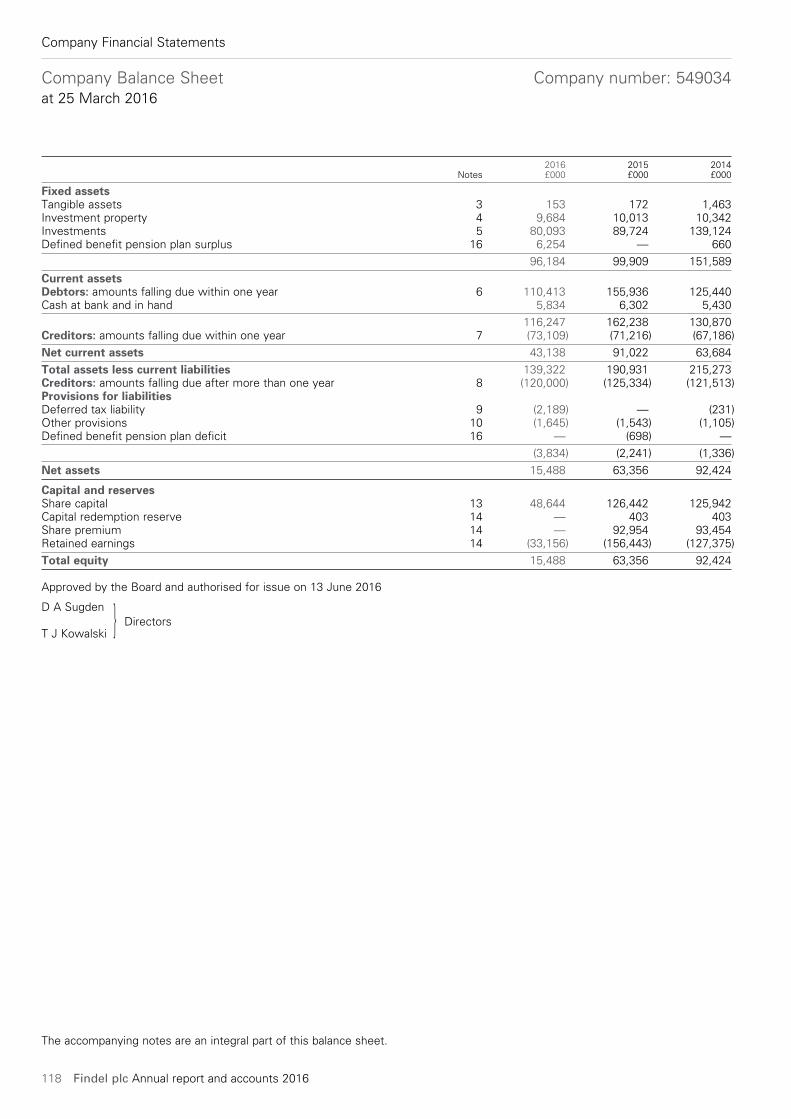
118 Findel plc Annual report and accounts 2016
Company Financial Statements
2016 2015 2014 Notes £000 £000 £000
Fixed assetsTangible assets 3 153 172 1,463Investment property 4 9,684 10,013 10,342Investments 5 80,093 89,724 139,124Defined benefit pension plan surplus 16 6,254 — 660
96,184 99,909 151,589
Current assetsDebtors: amounts falling due within one year 6 110,413 155,936 125,440Cash at bank and in hand 5,834 6,302 5,430
116,247 162,238 130,870Creditors: amounts falling due within one year 7 (73,109) (71,216) (67,186)
Net current assets 43,138 91,022 63,684
Total assets less current liabilities 139,322 190,931 215,273Creditors: amounts falling due after more than one year 8 (120,000) (125,334) (121,513)Provisions for liabilitiesDeferred tax liability 9 (2,189) — (231)Other provisions 10 (1,645) (1,543) (1,105)Defined benefit pension plan deficit 16 — (698) —
(3,834) (2,241) (1,336)
Net assets 15,488 63,356 92,424
Capital and reservesShare capital 13 48,644 126,442 125,942Capital redemption reserve 14 — 403 403Share premium 14 — 92,954 93,454Retained earnings 14 (33,156) (156,443) (127,375)
Total equity 15,488 63,356 92,424
Approved by the Board and authorised for issue on 13 June 2016
D A Sugden DirectorsT J Kowalski }
Company Balance Sheet Company number: 549034at 25 March 2016
The accompanying notes are an integral part of this balance sheet.
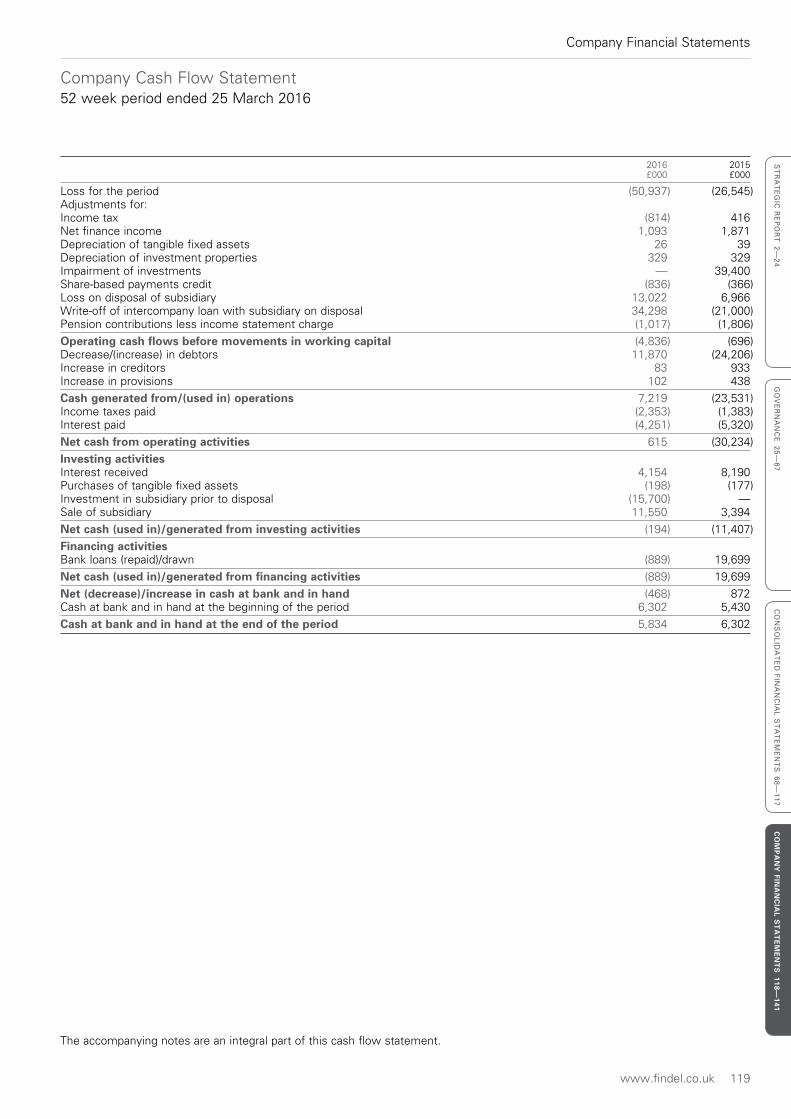
www.findel.co.uk 119
Company Financial Statements
ST
RA
TE
GIC
RE
PO
RT
2—
24
GO
VE
RN
AN
CE
25
—6
7C
ON
SO
LID
AT
ED
FIN
AN
CIA
L S
TA
TE
ME
NT
S 6
8—
11
7C
OM
PA
NY
FINA
NC
IAL S
TA
TE
ME
NT
S 118—
141
Company Cash Flow Statement52 week period ended 25 March 2016
2016 2015 £000 £000
Loss for the period (50,937) (26,545)Adjustments for:Income tax (814) 416Net finance income 1,093 1,871Depreciation of tangible fixed assets 26 39Depreciation of investment properties 329 329Impairment of investments — 39,400Share-based payments credit (836) (366)Loss on disposal of subsidiary 13,022 6,966Write-off of intercompany loan with subsidiary on disposal 34,298 (21,000)Pension contributions less income statement charge (1,017) (1,806)
Operating cash flows before movements in working capital (4,836) (696)Decrease/(increase) in debtors 11,870 (24,206)Increase in creditors 83 933Increase in provisions 102 438
Cash generated from/(used in) operations 7,219 (23,531)Income taxes paid (2,353) (1,383)Interest paid (4,251) (5,320)
Net cash from operating activities 615 (30,234)
Investing activitiesInterest received 4,154 8,190Purchases of tangible fixed assets (198) (177)Investment in subsidiary prior to disposal (15,700) —Sale of subsidiary 11,550 3,394
Net cash (used in)/generated from investing activities (194) (11,407)
Financing activitiesBank loans (repaid)/drawn (889) 19,699
Net cash (used in)/generated from financing activities (889) 19,699
Net (decrease)/increase in cash at bank and in hand (468) 872Cash at bank and in hand at the beginning of the period 6,302 5,430
Cash at bank and in hand at the end of the period 5,834 6,302
The accompanying notes are an integral part of this cash flow statement.
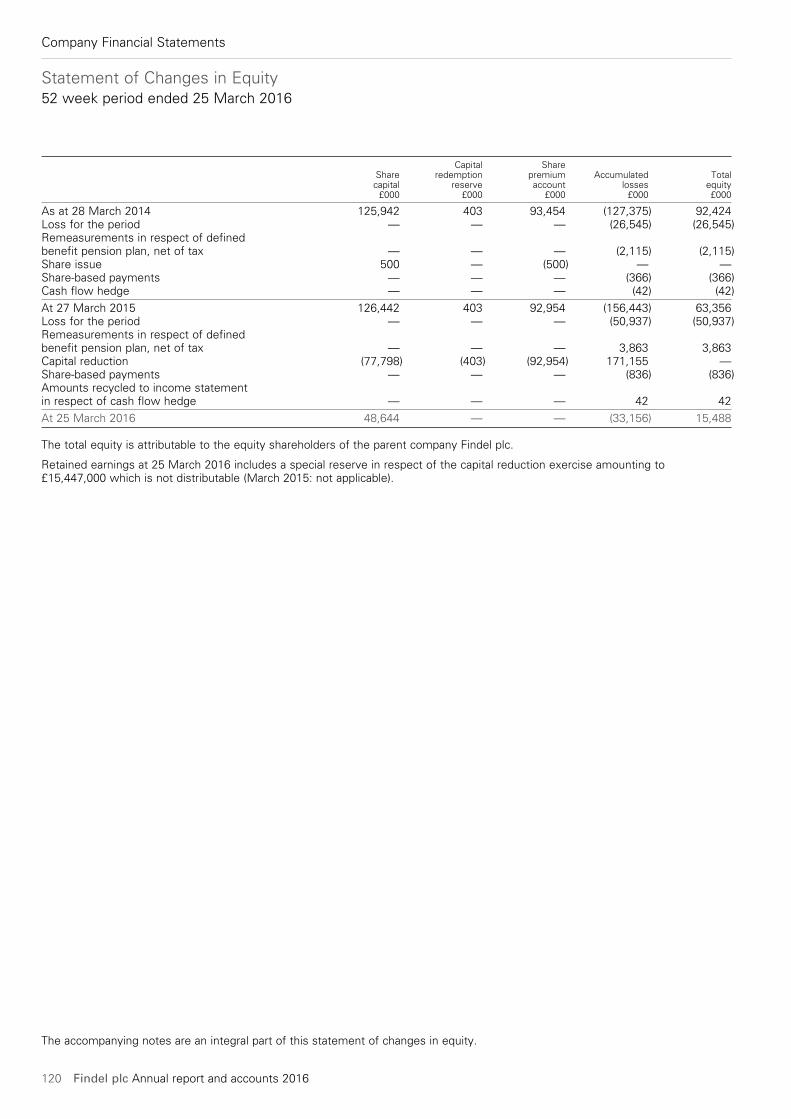
120 Findel plc Annual report and accounts 2016
Company Financial Statements
Statement of Changes in Equity52 week period ended 25 March 2016
Capital Share Share redemption premium Accumulated Total capital reserve account losses equity £000 £000 £000 £000 £000
As at 28 March 2014 125,942 403 93,454 (127,375) 92,424Loss for the period — — — (26,545) (26,545)Remeasurements in respect of defined benefit pension plan, net of tax — — — (2,115) (2,115)Share issue 500 — (500) — —Share-based payments — — — (366) (366)Cash flow hedge — — — (42) (42)
At 27 March 2015 126,442 403 92,954 (156,443) 63,356Loss for the period — — — (50,937) (50,937)Remeasurements in respect of defined benefit pension plan, net of tax — — — 3,863 3,863Capital reduction (77,798) (403) (92,954) 171,155 —Share-based payments — — — (836) (836)Amounts recycled to income statement in respect of cash flow hedge — — — 42 42
At 25 March 2016 48,644 — — (33,156) 15,488
The total equity is attributable to the equity shareholders of the parent company Findel plc.
Retained earnings at 25 March 2016 includes a special reserve in respect of the capital reduction exercise amounting to £15,447,000 which is not distributable (March 2015: not applicable).
The accompanying notes are an integral part of this statement of changes in equity.
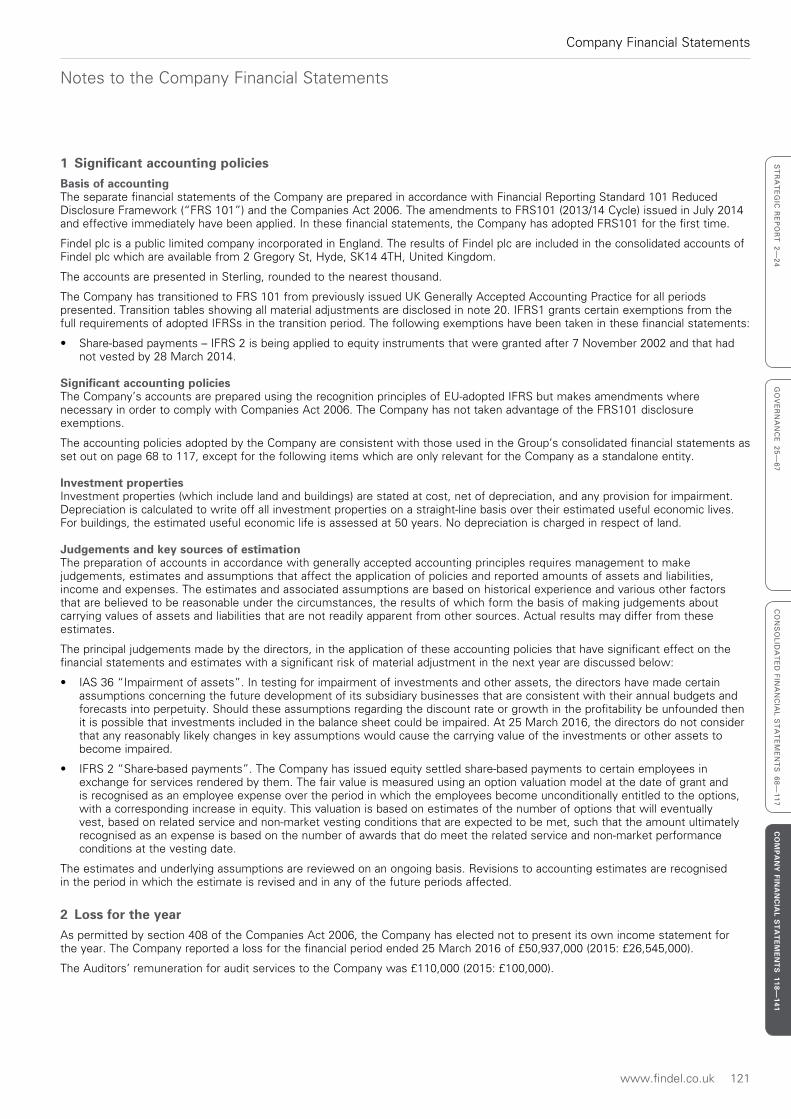
www.findel.co.uk 121
Company Financial Statements
ST
RA
TE
GIC
RE
PO
RT
2—
24
GO
VE
RN
AN
CE
25
—6
7C
ON
SO
LID
AT
ED
FIN
AN
CIA
L S
TA
TE
ME
NT
S 6
8—
11
7C
OM
PA
NY
FINA
NC
IAL S
TA
TE
ME
NT
S 118—
141
Notes to the Company Financial Statements
1 Significant accounting policiesBasis of accountingThe separate financial statements of the Company are prepared in accordance with Financial Reporting Standard 101 Reduced Disclosure Framework (“FRS 101”) and the Companies Act 2006. The amendments to FRS101 (2013/14 Cycle) issued in July 2014 and effective immediately have been applied. In these financial statements, the Company has adopted FRS101 for the first time.
Findel plc is a public limited company incorporated in England. The results of Findel plc are included in the consolidated accounts of Findel plc which are available from 2 Gregory St, Hyde, SK14 4TH, United Kingdom.
The accounts are presented in Sterling, rounded to the nearest thousand.
The Company has transitioned to FRS 101 from previously issued UK Generally Accepted Accounting Practice for all periods presented. Transition tables showing all material adjustments are disclosed in note 20. IFRS1 grants certain exemptions from the full requirements of adopted IFRSs in the transition period. The following exemptions have been taken in these financial statements:
• Share-based payments – IFRS 2 is being applied to equity instruments that were granted after 7 November 2002 and that had not vested by 28 March 2014.
Significant accounting policiesThe Company’s accounts are prepared using the recognition principles of EU-adopted IFRS but makes amendments where necessary in order to comply with Companies Act 2006. The Company has not taken advantage of the FRS101 disclosure exemptions.
The accounting policies adopted by the Company are consistent with those used in the Group’s consolidated financial statements as set out on page 68 to 117, except for the following items which are only relevant for the Company as a standalone entity.
Investment propertiesInvestment properties (which include land and buildings) are stated at cost, net of depreciation, and any provision for impairment. Depreciation is calculated to write off all investment properties on a straight-line basis over their estimated useful economic lives. For buildings, the estimated useful economic life is assessed at 50 years. No depreciation is charged in respect of land.
Judgements and key sources of estimationThe preparation of accounts in accordance with generally accepted accounting principles requires management to make judgements, estimates and assumptions that affect the application of policies and reported amounts of assets and liabilities, income and expenses. The estimates and associated assumptions are based on historical experience and various other factors that are believed to be reasonable under the circumstances, the results of which form the basis of making judgements about carrying values of assets and liabilities that are not readily apparent from other sources. Actual results may differ from these estimates.
The principal judgements made by the directors, in the application of these accounting policies that have significant effect on the financial statements and estimates with a significant risk of material adjustment in the next year are discussed below:
• IAS 36 “Impairment of assets”. In testing for impairment of investments and other assets, the directors have made certain assumptions concerning the future development of its subsidiary businesses that are consistent with their annual budgets and forecasts into perpetuity. Should these assumptions regarding the discount rate or growth in the profitability be unfounded then it is possible that investments included in the balance sheet could be impaired. At 25 March 2016, the directors do not consider that any reasonably likely changes in key assumptions would cause the carrying value of the investments or other assets to become impaired.
• IFRS 2 “Share-based payments”. The Company has issued equity settled share-based payments to certain employees in exchange for services rendered by them. The fair value is measured using an option valuation model at the date of grant and is recognised as an employee expense over the period in which the employees become unconditionally entitled to the options, with a corresponding increase in equity. This valuation is based on estimates of the number of options that will eventually vest, based on related service and non-market vesting conditions that are expected to be met, such that the amount ultimately recognised as an expense is based on the number of awards that do meet the related service and non-market performance conditions at the vesting date.
The estimates and underlying assumptions are reviewed on an ongoing basis. Revisions to accounting estimates are recognised in the period in which the estimate is revised and in any of the future periods affected.
2 Loss for the yearAs permitted by section 408 of the Companies Act 2006, the Company has elected not to present its own income statement for the year. The Company reported a loss for the financial period ended 25 March 2016 of £50,937,000 (2015: £26,545,000).
The Auditors’ remuneration for audit services to the Company was £110,000 (2015: £100,000).
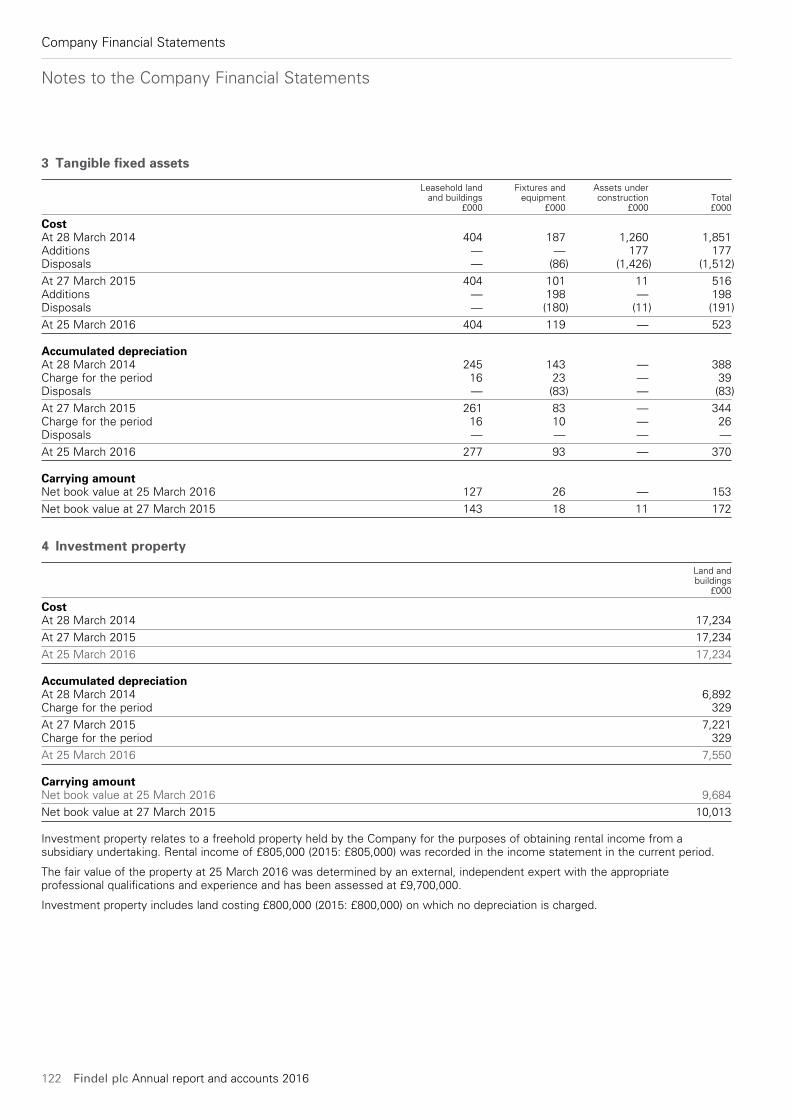
Notes to the Company Financial Statements
122 Findel plc Annual report and accounts 2016
Company Financial Statements
3 Tangible fixed assets
Leasehold land Fixtures and Assets under and buildings equipment construction Total £000 £000 £000 £000
CostAt 28 March 2014 404 187 1,260 1,851Additions — — 177 177Disposals — (86) (1,426) (1,512)
At 27 March 2015 404 101 11 516Additions — 198 — 198Disposals — (180) (11) (191)
At 25 March 2016 404 119 — 523
Accumulated depreciationAt 28 March 2014 245 143 — 388Charge for the period 16 23 — 39Disposals — (83) — (83)
At 27 March 2015 261 83 — 344Charge for the period 16 10 — 26Disposals — — — —
At 25 March 2016 277 93 — 370
Carrying amountNet book value at 25 March 2016 127 26 — 153
Net book value at 27 March 2015 143 18 11 172
4 Investment property
Land and buildings £000
CostAt 28 March 2014 17,234
At 27 March 2015 17,234
At 25 March 2016 17,234
Accumulated depreciationAt 28 March 2014 6,892Charge for the period 329
At 27 March 2015 7,221Charge for the period 329
At 25 March 2016 7,550
Carrying amountNet book value at 25 March 2016 9,684
Net book value at 27 March 2015 10,013
Investment property relates to a freehold property held by the Company for the purposes of obtaining rental income from a subsidiary undertaking. Rental income of £805,000 (2015: £805,000) was recorded in the income statement in the current period.
The fair value of the property at 25 March 2016 was determined by an external, independent expert with the appropriate professional qualifications and experience and has been assessed at £9,700,000.
Investment property includes land costing £800,000 (2015: £800,000) on which no depreciation is charged.
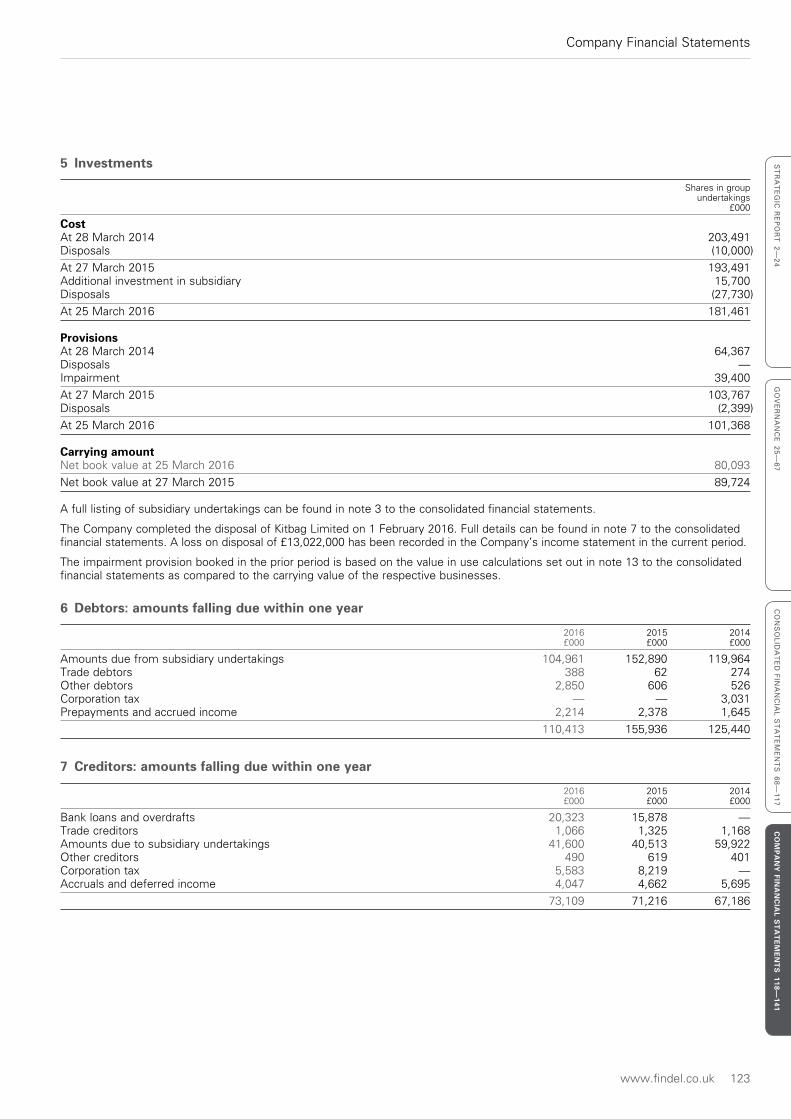
www.findel.co.uk 123
Company Financial Statements
ST
RA
TE
GIC
RE
PO
RT
2—
24
GO
VE
RN
AN
CE
25
—6
7C
ON
SO
LID
AT
ED
FIN
AN
CIA
L S
TA
TE
ME
NT
S 6
8—
11
7C
OM
PA
NY
FINA
NC
IAL S
TA
TE
ME
NT
S 118—
141
5 Investments
Shares in group undertakings £000
CostAt 28 March 2014 203,491Disposals (10,000)
At 27 March 2015 193,491Additional investment in subsidiary 15,700Disposals (27,730)
At 25 March 2016 181,461
ProvisionsAt 28 March 2014 64,367Disposals —Impairment 39,400
At 27 March 2015 103,767Disposals (2,399)
At 25 March 2016 101,368
Carrying amountNet book value at 25 March 2016 80,093
Net book value at 27 March 2015 89,724
A full listing of subsidiary undertakings can be found in note 3 to the consolidated financial statements.
The Company completed the disposal of Kitbag Limited on 1 February 2016. Full details can be found in note 7 to the consolidated financial statements. A loss on disposal of £13,022,000 has been recorded in the Company’s income statement in the current period.
The impairment provision booked in the prior period is based on the value in use calculations set out in note 13 to the consolidated financial statements as compared to the carrying value of the respective businesses.
6 Debtors: amounts falling due within one year
2016 2015 2014 £000 £000 £000
Amounts due from subsidiary undertakings 104,961 152,890 119,964Trade debtors 388 62 274Other debtors 2,850 606 526Corporation tax — — 3,031Prepayments and accrued income 2,214 2,378 1,645
110,413 155,936 125,440
7 Creditors: amounts falling due within one year
2016 2015 2014 £000 £000 £000
Bank loans and overdrafts 20,323 15,878 —Trade creditors 1,066 1,325 1,168Amounts due to subsidiary undertakings 41,600 40,513 59,922Other creditors 490 619 401Corporation tax 5,583 8,219 —Accruals and deferred income 4,047 4,662 5,695
73,109 71,216 67,186
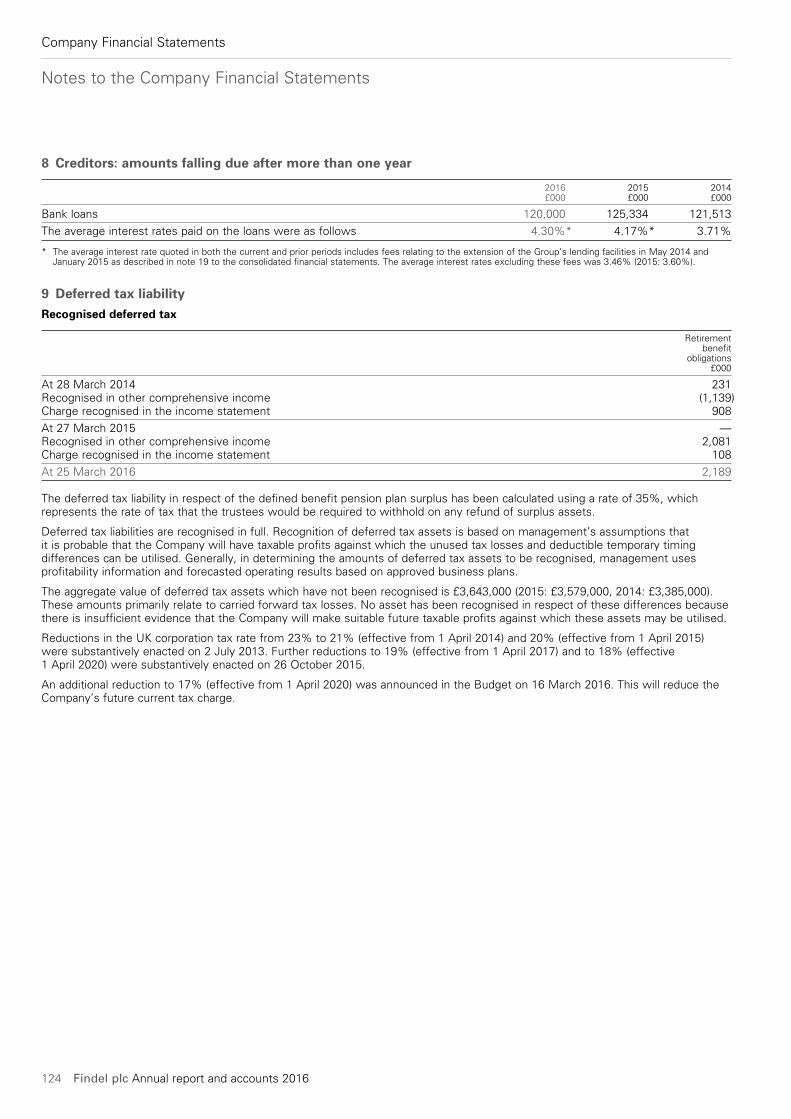
Notes to the Company Financial Statements
124 Findel plc Annual report and accounts 2016
Company Financial Statements
8 Creditors: amounts falling due after more than one year
2016 2015 2014 £000 £000 £000
Bank loans 120,000 125,334 121,513
The average interest rates paid on the loans were as follows 4.30%* 4.17%* 3.71%
* The average interest rate quoted in both the current and prior periods includes fees relating to the extension of the Group’s lending facilities in May 2014 and January 2015 as described in note 19 to the consolidated financial statements. The average interest rates excluding these fees was 3.46% (2015: 3.60%).
9 Deferred tax liabilityRecognised deferred tax
Retirement benefit obligations £000
At 28 March 2014 231Recognised in other comprehensive income (1,139)Charge recognised in the income statement 908
At 27 March 2015 —Recognised in other comprehensive income 2,081Charge recognised in the income statement 108
At 25 March 2016 2,189
The deferred tax liability in respect of the defined benefit pension plan surplus has been calculated using a rate of 35%, which represents the rate of tax that the trustees would be required to withhold on any refund of surplus assets.
Deferred tax liabilities are recognised in full. Recognition of deferred tax assets is based on management’s assumptions that it is probable that the Company will have taxable profits against which the unused tax losses and deductible temporary timing differences can be utilised. Generally, in determining the amounts of deferred tax assets to be recognised, management uses profitability information and forecasted operating results based on approved business plans.
The aggregate value of deferred tax assets which have not been recognised is £3,643,000 (2015: £3,579,000, 2014: £3,385,000). These amounts primarily relate to carried forward tax losses. No asset has been recognised in respect of these differences because there is insufficient evidence that the Company will make suitable future taxable profits against which these assets may be utilised.
Reductions in the UK corporation tax rate from 23% to 21% (effective from 1 April 2014) and 20% (effective from 1 April 2015) were substantively enacted on 2 July 2013. Further reductions to 19% (effective from 1 April 2017) and to 18% (effective 1 April 2020) were substantively enacted on 26 October 2015.
An additional reduction to 17% (effective from 1 April 2020) was announced in the Budget on 16 March 2016. This will reduce the Company’s future current tax charge.
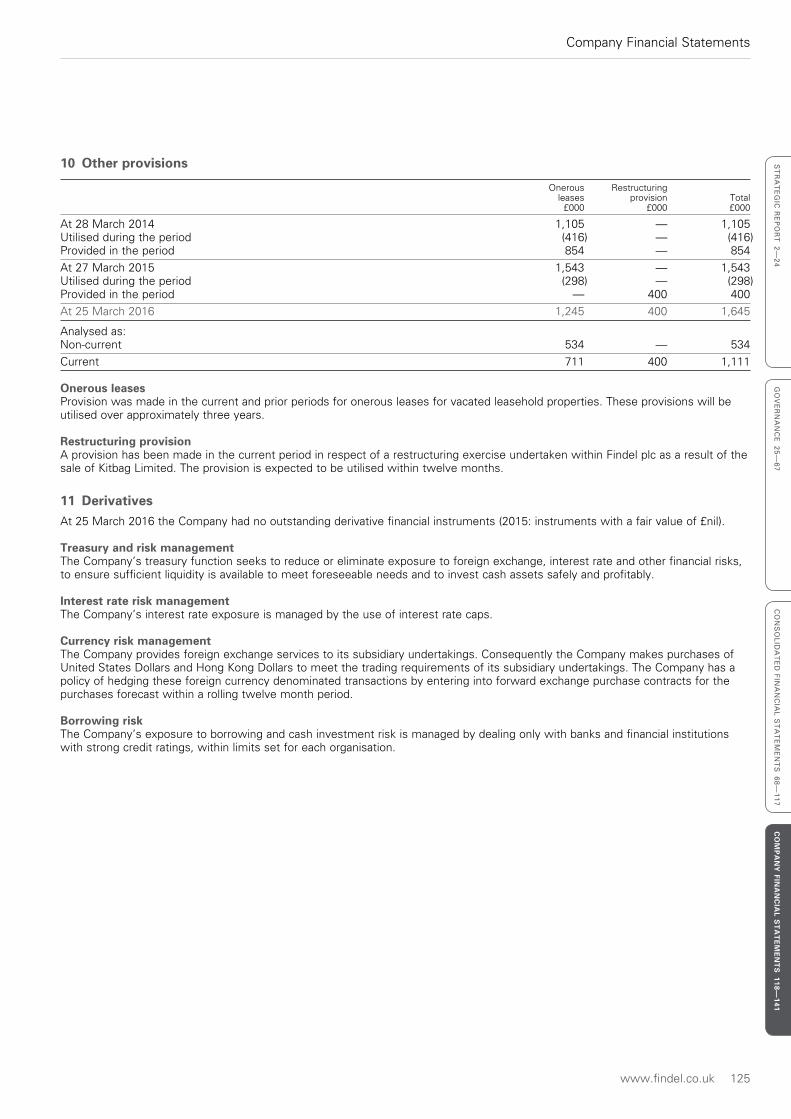
www.findel.co.uk 125
Company Financial Statements
ST
RA
TE
GIC
RE
PO
RT
2—
24
GO
VE
RN
AN
CE
25
—6
7C
ON
SO
LID
AT
ED
FIN
AN
CIA
L S
TA
TE
ME
NT
S 6
8—
11
7C
OM
PA
NY
FINA
NC
IAL S
TA
TE
ME
NT
S 118—
141
10 Other provisions
Onerous Restructuring leases provision Total £000 £000 £000
At 28 March 2014 1,105 — 1,105Utilised during the period (416) — (416)Provided in the period 854 — 854
At 27 March 2015 1,543 — 1,543Utilised during the period (298) — (298)Provided in the period — 400 400
At 25 March 2016 1,245 400 1,645
Analysed as:Non-current 534 — 534
Current 711 400 1,111
Onerous leasesProvision was made in the current and prior periods for onerous leases for vacated leasehold properties. These provisions will be utilised over approximately three years.
Restructuring provisionA provision has been made in the current period in respect of a restructuring exercise undertaken within Findel plc as a result of the sale of Kitbag Limited. The provision is expected to be utilised within twelve months.
11 DerivativesAt 25 March 2016 the Company had no outstanding derivative financial instruments (2015: instruments with a fair value of £nil).
Treasury and risk managementThe Company’s treasury function seeks to reduce or eliminate exposure to foreign exchange, interest rate and other financial risks, to ensure sufficient liquidity is available to meet foreseeable needs and to invest cash assets safely and profitably.
Interest rate risk managementThe Company’s interest rate exposure is managed by the use of interest rate caps.
Currency risk managementThe Company provides foreign exchange services to its subsidiary undertakings. Consequently the Company makes purchases of United States Dollars and Hong Kong Dollars to meet the trading requirements of its subsidiary undertakings. The Company has a policy of hedging these foreign currency denominated transactions by entering into forward exchange purchase contracts for the purchases forecast within a rolling twelve month period.
Borrowing riskThe Company’s exposure to borrowing and cash investment risk is managed by dealing only with banks and financial institutions with strong credit ratings, within limits set for each organisation.
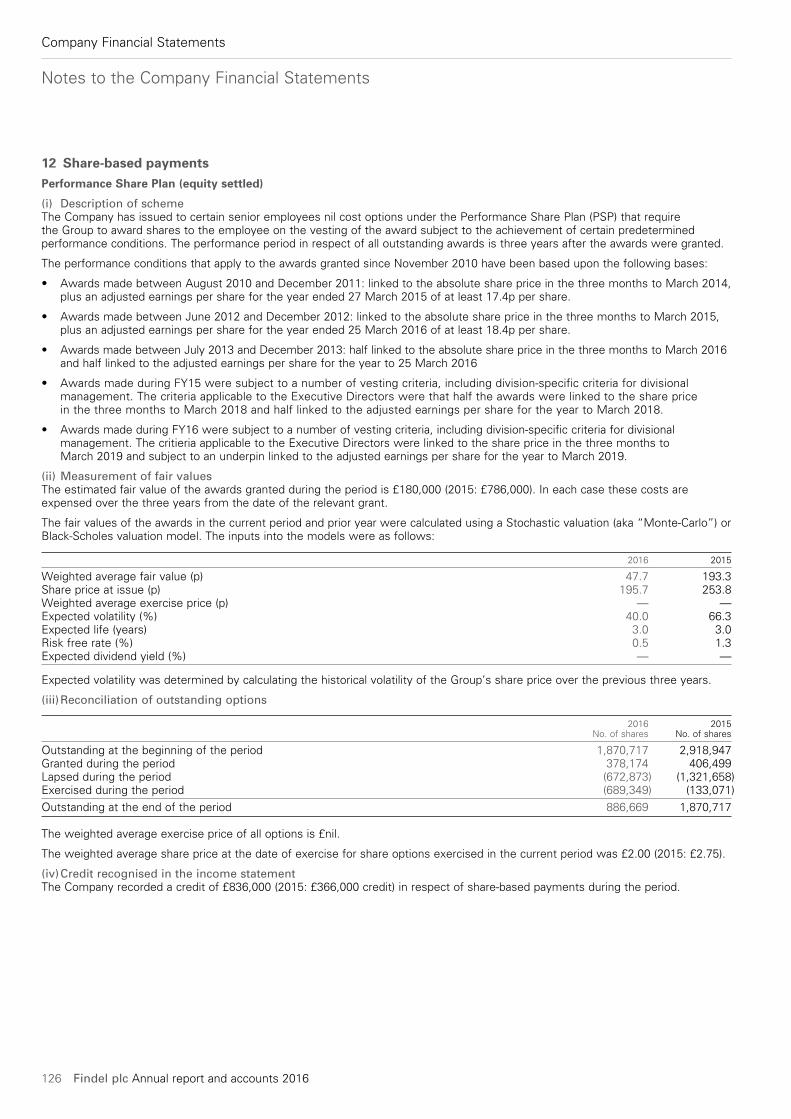
Notes to the Company Financial Statements
126 Findel plc Annual report and accounts 2016
Company Financial Statements
12 Share-based paymentsPerformance Share Plan (equity settled)
(i) Description of schemeThe Company has issued to certain senior employees nil cost options under the Performance Share Plan (PSP) that require the Group to award shares to the employee on the vesting of the award subject to the achievement of certain predetermined performance conditions. The performance period in respect of all outstanding awards is three years after the awards were granted.
The performance conditions that apply to the awards granted since November 2010 have been based upon the following bases:
• Awards made between August 2010 and December 2011: linked to the absolute share price in the three months to March 2014, plus an adjusted earnings per share for the year ended 27 March 2015 of at least 17.4p per share.
• Awards made between June 2012 and December 2012: linked to the absolute share price in the three months to March 2015, plus an adjusted earnings per share for the year ended 25 March 2016 of at least 18.4p per share.
• Awards made between July 2013 and December 2013: half linked to the absolute share price in the three months to March 2016 and half linked to the adjusted earnings per share for the year to 25 March 2016
• Awards made during FY15 were subject to a number of vesting criteria, including division-specific criteria for divisional management. The criteria applicable to the Executive Directors were that half the awards were linked to the share price in the three months to March 2018 and half linked to the adjusted earnings per share for the year to March 2018.
• Awards made during FY16 were subject to a number of vesting criteria, including division-specific criteria for divisional management. The critieria applicable to the Executive Directors were linked to the share price in the three months to March 2019 and subject to an underpin linked to the adjusted earnings per share for the year to March 2019.
(ii) Measurement of fair valuesThe estimated fair value of the awards granted during the period is £180,000 (2015: £786,000). In each case these costs are expensed over the three years from the date of the relevant grant.
The fair values of the awards in the current period and prior year were calculated using a Stochastic valuation (aka “Monte-Carlo”) or Black-Scholes valuation model. The inputs into the models were as follows:
2016 2015
Weighted average fair value (p) 47.7 193.3Share price at issue (p) 195.7 253.8Weighted average exercise price (p) — —Expected volatility (%) 40.0 66.3Expected life (years) 3.0 3.0Risk free rate (%) 0.5 1.3Expected dividend yield (%) — —
Expected volatility was determined by calculating the historical volatility of the Group’s share price over the previous three years.
(iii) Reconciliation of outstanding options
2016 2015 No. of shares No. of shares
Outstanding at the beginning of the period 1,870,717 2,918,947Granted during the period 378,174 406,499Lapsed during the period (672,873) (1,321,658)Exercised during the period (689,349) (133,071)
Outstanding at the end of the period 886,669 1,870,717
The weighted average exercise price of all options is £nil.
The weighted average share price at the date of exercise for share options exercised in the current period was £2.00 (2015: £2.75).
(iv) Credit recognised in the income statementThe Company recorded a credit of £836,000 (2015: £366,000 credit) in respect of share-based payments during the period.
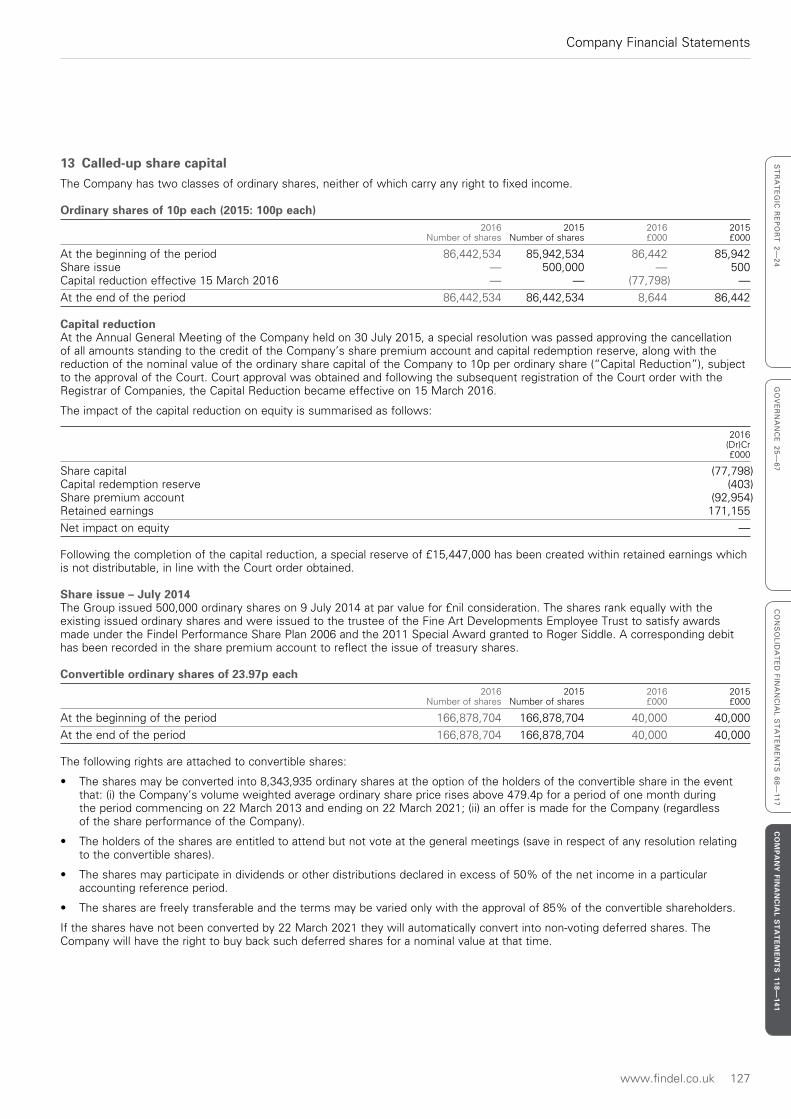
www.findel.co.uk 127
Company Financial Statements
ST
RA
TE
GIC
RE
PO
RT
2—
24
GO
VE
RN
AN
CE
25
—6
7C
ON
SO
LID
AT
ED
FIN
AN
CIA
L S
TA
TE
ME
NT
S 6
8—
11
7C
OM
PA
NY
FINA
NC
IAL S
TA
TE
ME
NT
S 118—
141
13 Called-up share capitalThe Company has two classes of ordinary shares, neither of which carry any right to fixed income.
Ordinary shares of 10p each (2015: 100p each) 2016 2015 2016 2015 Number of shares Number of shares £000 £000
At the beginning of the period 86,442,534 85,942,534 86,442 85,942Share issue — 500,000 — 500Capital reduction effective 15 March 2016 — — (77,798) —
At the end of the period 86,442,534 86,442,534 8,644 86,442
Capital reductionAt the Annual General Meeting of the Company held on 30 July 2015, a special resolution was passed approving the cancellation of all amounts standing to the credit of the Company’s share premium account and capital redemption reserve, along with the reduction of the nominal value of the ordinary share capital of the Company to 10p per ordinary share (“Capital Reduction”), subject to the approval of the Court. Court approval was obtained and following the subsequent registration of the Court order with the Registrar of Companies, the Capital Reduction became effective on 15 March 2016.
The impact of the capital reduction on equity is summarised as follows:
2016 (Dr)Cr £000
Share capital (77,798)Capital redemption reserve (403)Share premium account (92,954)Retained earnings 171,155
Net impact on equity —
Following the completion of the capital reduction, a special reserve of £15,447,000 has been created within retained earnings which is not distributable, in line with the Court order obtained.
Share issue – July 2014The Group issued 500,000 ordinary shares on 9 July 2014 at par value for £nil consideration. The shares rank equally with the existing issued ordinary shares and were issued to the trustee of the Fine Art Developments Employee Trust to satisfy awards made under the Findel Performance Share Plan 2006 and the 2011 Special Award granted to Roger Siddle. A corresponding debit has been recorded in the share premium account to reflect the issue of treasury shares.
Convertible ordinary shares of 23.97p each 2016 2015 2016 2015 Number of shares Number of shares £000 £000
At the beginning of the period 166,878,704 166,878,704 40,000 40,000
At the end of the period 166,878,704 166,878,704 40,000 40,000
The following rights are attached to convertible shares:
• The shares may be converted into 8,343,935 ordinary shares at the option of the holders of the convertible share in the event that: (i) the Company’s volume weighted average ordinary share price rises above 479.4p for a period of one month during the period commencing on 22 March 2013 and ending on 22 March 2021; (ii) an offer is made for the Company (regardless of the share performance of the Company).
• The holders of the shares are entitled to attend but not vote at the general meetings (save in respect of any resolution relating to the convertible shares).
• The shares may participate in dividends or other distributions declared in excess of 50% of the net income in a particular accounting reference period.
• The shares are freely transferable and the terms may be varied only with the approval of 85% of the convertible shareholders.
If the shares have not been converted by 22 March 2021 they will automatically convert into non-voting deferred shares. The Company will have the right to buy back such deferred shares for a nominal value at that time.
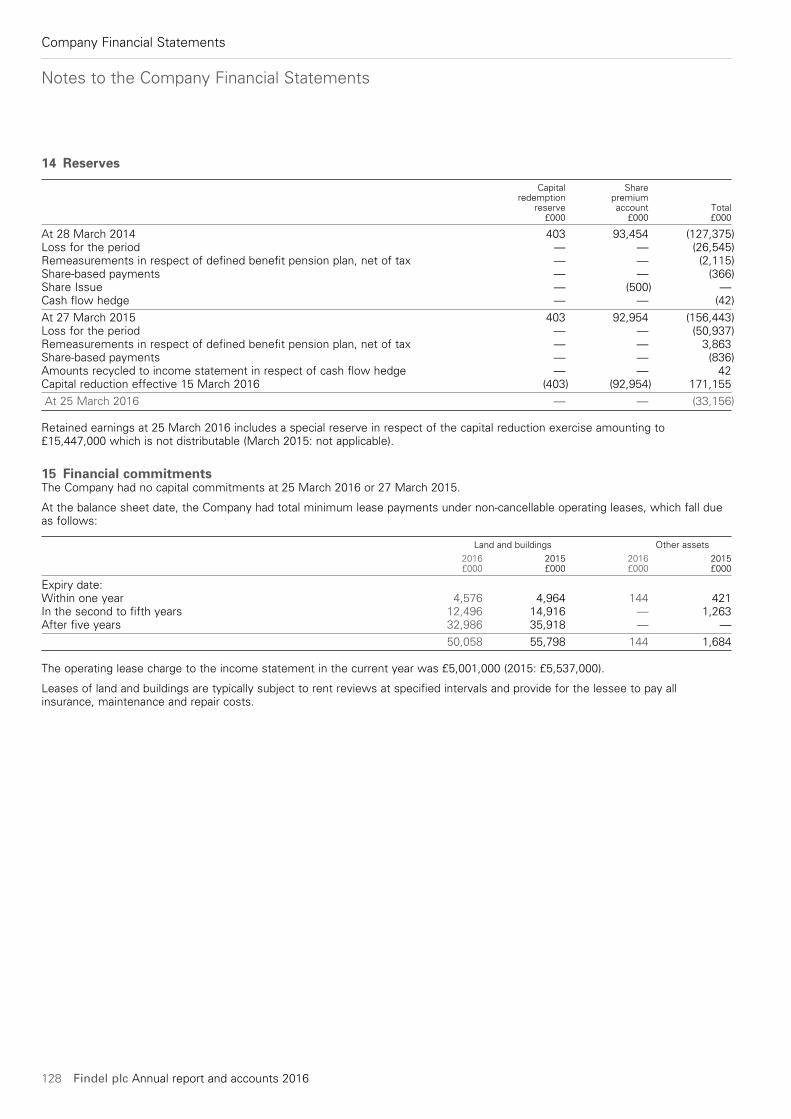
Notes to the Company Financial Statements
128 Findel plc Annual report and accounts 2016
Company Financial Statements
14 Reserves
Capital Share redemption premium reserve account Total £000 £000 £000
At 28 March 2014 403 93,454 (127,375)Loss for the period — — (26,545)Remeasurements in respect of defined benefit pension plan, net of tax — — (2,115)Share-based payments — — (366)Share Issue — (500) —Cash flow hedge — — (42)
At 27 March 2015 403 92,954 (156,443)Loss for the period — — (50,937)Remeasurements in respect of defined benefit pension plan, net of tax — — 3,863Share-based payments — — (836)Amounts recycled to income statement in respect of cash flow hedge — — 42Capital reduction effective 15 March 2016 (403) (92,954) 171,155
At 25 March 2016 — — (33,156)
Retained earnings at 25 March 2016 includes a special reserve in respect of the capital reduction exercise amounting to £15,447,000 which is not distributable (March 2015: not applicable).
15 Financial commitmentsThe Company had no capital commitments at 25 March 2016 or 27 March 2015.
At the balance sheet date, the Company had total minimum lease payments under non-cancellable operating leases, which fall due as follows:
Land and buildings Other assets
2016 2015 2016 2015 £000 £000 £000 £000
Expiry date:Within one year 4,576 4,964 144 421In the second to fifth years 12,496 14,916 — 1,263After five years 32,986 35,918 — —
50,058 55,798 144 1,684
The operating lease charge to the income statement in the current year was £5,001,000 (2015: £5,537,000).
Leases of land and buildings are typically subject to rent reviews at specified intervals and provide for the lessee to pay all insurance, maintenance and repair costs.
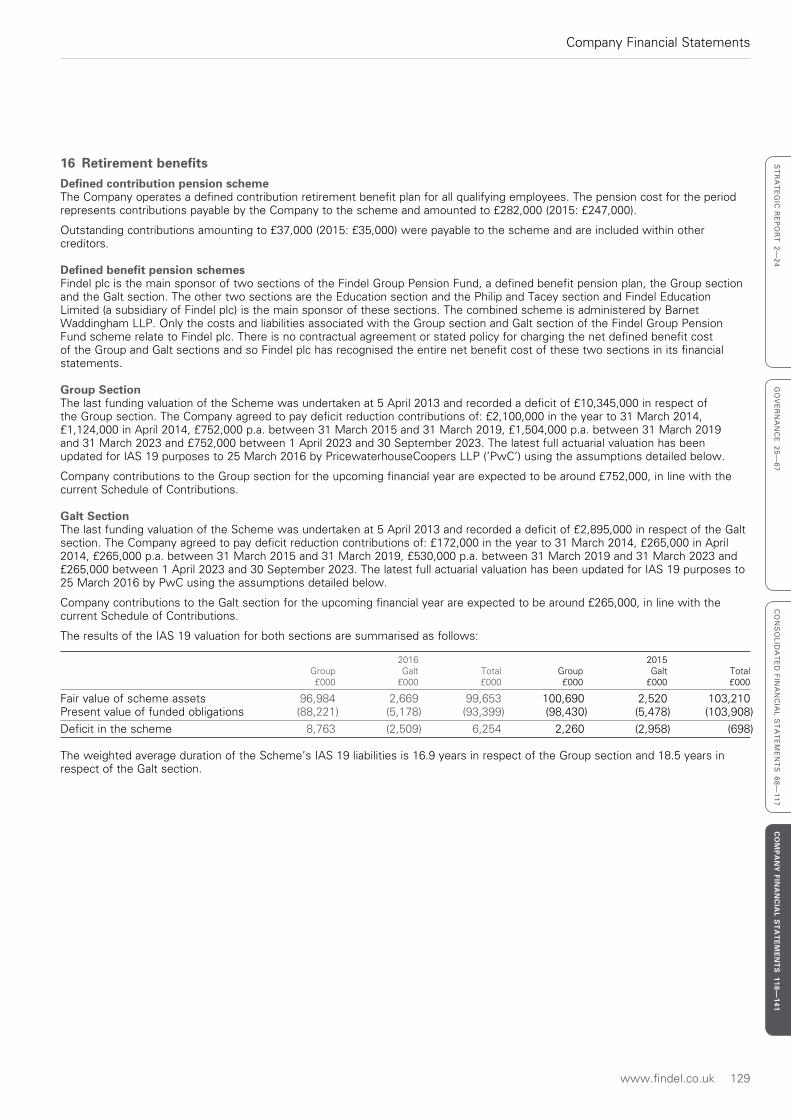
www.findel.co.uk 129
Company Financial Statements
ST
RA
TE
GIC
RE
PO
RT
2—
24
GO
VE
RN
AN
CE
25
—6
7C
ON
SO
LID
AT
ED
FIN
AN
CIA
L S
TA
TE
ME
NT
S 6
8—
11
7C
OM
PA
NY
FINA
NC
IAL S
TA
TE
ME
NT
S 118—
141
16 Retirement benefitsDefined contribution pension schemeThe Company operates a defined contribution retirement benefit plan for all qualifying employees. The pension cost for the period represents contributions payable by the Company to the scheme and amounted to £282,000 (2015: £247,000).
Outstanding contributions amounting to £37,000 (2015: £35,000) were payable to the scheme and are included within other creditors.
Defined benefit pension schemesFindel plc is the main sponsor of two sections of the Findel Group Pension Fund, a defined benefit pension plan, the Group section and the Galt section. The other two sections are the Education section and the Philip and Tacey section and Findel Education Limited (a subsidiary of Findel plc) is the main sponsor of these sections. The combined scheme is administered by Barnet Waddingham LLP. Only the costs and liabilities associated with the Group section and Galt section of the Findel Group Pension Fund scheme relate to Findel plc. There is no contractual agreement or stated policy for charging the net defined benefit cost of the Group and Galt sections and so Findel plc has recognised the entire net benefit cost of these two sections in its financial statements.
Group SectionThe last funding valuation of the Scheme was undertaken at 5 April 2013 and recorded a deficit of £10,345,000 in respect of the Group section. The Company agreed to pay deficit reduction contributions of: £2,100,000 in the year to 31 March 2014, £1,124,000 in April 2014, £752,000 p.a. between 31 March 2015 and 31 March 2019, £1,504,000 p.a. between 31 March 2019 and 31 March 2023 and £752,000 between 1 April 2023 and 30 September 2023. The latest full actuarial valuation has been updated for IAS 19 purposes to 25 March 2016 by PricewaterhouseCoopers LLP (‘PwC’) using the assumptions detailed below.
Company contributions to the Group section for the upcoming financial year are expected to be around £752,000, in line with the current Schedule of Contributions.
Galt SectionThe last funding valuation of the Scheme was undertaken at 5 April 2013 and recorded a deficit of £2,895,000 in respect of the Galt section. The Company agreed to pay deficit reduction contributions of: £172,000 in the year to 31 March 2014, £265,000 in April 2014, £265,000 p.a. between 31 March 2015 and 31 March 2019, £530,000 p.a. between 31 March 2019 and 31 March 2023 and £265,000 between 1 April 2023 and 30 September 2023. The latest full actuarial valuation has been updated for IAS 19 purposes to 25 March 2016 by PwC using the assumptions detailed below.
Company contributions to the Galt section for the upcoming financial year are expected to be around £265,000, in line with the current Schedule of Contributions.
The results of the IAS 19 valuation for both sections are summarised as follows:
2016 2015 Group Galt Total Group Galt Total £000 £000 £000 £000 £000 £000
Fair value of scheme assets 96,984 2,669 99,653 100,690 2,520 103,210Present value of funded obligations (88,221) (5,178) (93,399) (98,430) (5,478) (103,908)
Deficit in the scheme 8,763 (2,509) 6,254 2,260 (2,958) (698)
The weighted average duration of the Scheme’s IAS 19 liabilities is 16.9 years in respect of the Group section and 18.5 years in respect of the Galt section.
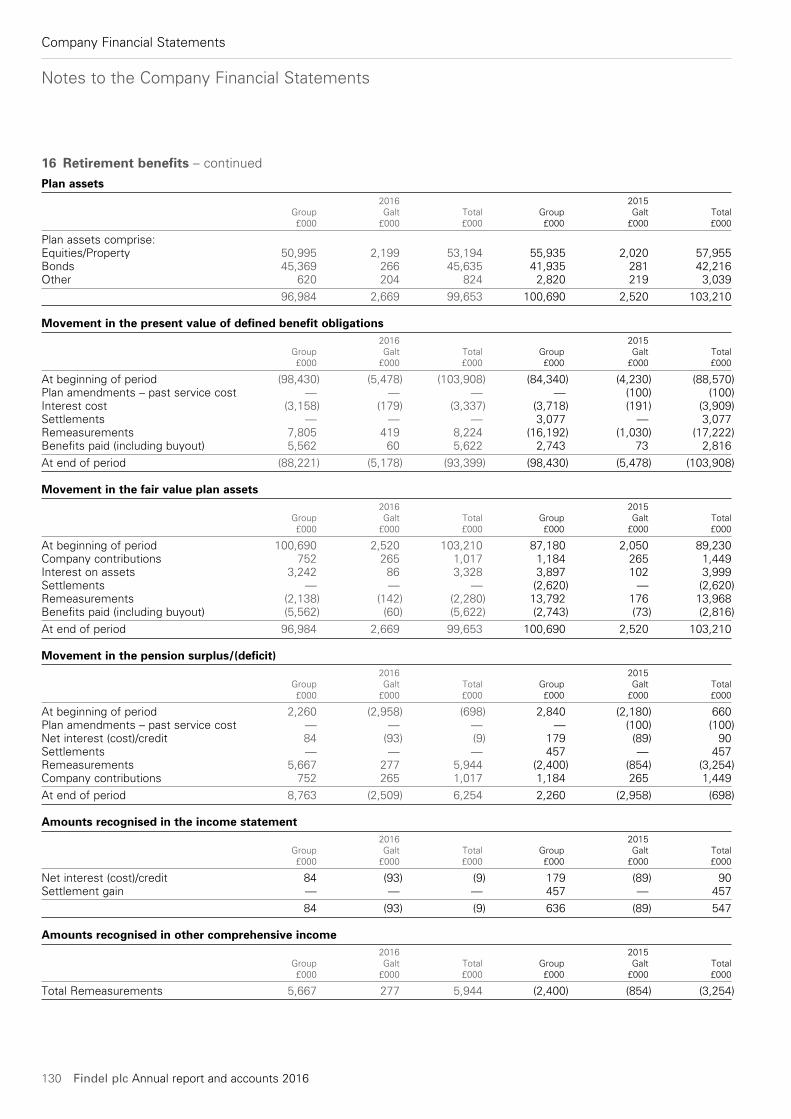
Notes to the Company Financial Statements
130 Findel plc Annual report and accounts 2016
Company Financial Statements
16 Retirement benefits – continued
Plan assets 2016 2015 Group Galt Total Group Galt Total £000 £000 £000 £000 £000 £000
Plan assets comprise:Equities/Property 50,995 2,199 53,194 55,935 2,020 57,955Bonds 45,369 266 45,635 41,935 281 42,216Other 620 204 824 2,820 219 3,039
96,984 2,669 99,653 100,690 2,520 103,210
Movement in the present value of defined benefit obligations 2016 2015 Group Galt Total Group Galt Total £000 £000 £000 £000 £000 £000
At beginning of period (98,430) (5,478) (103,908) (84,340) (4,230) (88,570)Plan amendments – past service cost — — — — (100) (100)Interest cost (3,158) (179) (3,337) (3,718) (191) (3,909)Settlements — — — 3,077 — 3,077Remeasurements 7,805 419 8,224 (16,192) (1,030) (17,222)Benefits paid (including buyout) 5,562 60 5,622 2,743 73 2,816
At end of period (88,221) (5,178) (93,399) (98,430) (5,478) (103,908)
Movement in the fair value plan assets 2016 2015 Group Galt Total Group Galt Total £000 £000 £000 £000 £000 £000
At beginning of period 100,690 2,520 103,210 87,180 2,050 89,230Company contributions 752 265 1,017 1,184 265 1,449Interest on assets 3,242 86 3,328 3,897 102 3,999Settlements — — — (2,620) — (2,620)Remeasurements (2,138) (142) (2,280) 13,792 176 13,968Benefits paid (including buyout) (5,562) (60) (5,622) (2,743) (73) (2,816)
At end of period 96,984 2,669 99,653 100,690 2,520 103,210
Movement in the pension surplus/(deficit) 2016 2015 Group Galt Total Group Galt Total £000 £000 £000 £000 £000 £000
At beginning of period 2,260 (2,958) (698) 2,840 (2,180) 660Plan amendments – past service cost — — — — (100) (100)Net interest (cost)/credit 84 (93) (9) 179 (89) 90Settlements — — — 457 — 457Remeasurements 5,667 277 5,944 (2,400) (854) (3,254)Company contributions 752 265 1,017 1,184 265 1,449
At end of period 8,763 (2,509) 6,254 2,260 (2,958) (698)
Amounts recognised in the income statement 2016 2015 Group Galt Total Group Galt Total £000 £000 £000 £000 £000 £000
Net interest (cost)/credit 84 (93) (9) 179 (89) 90Settlement gain — — — 457 — 457
84 (93) (9) 636 (89) 547
Amounts recognised in other comprehensive income 2016 2015 Group Galt Total Group Galt Total £000 £000 £000 £000 £000 £000
Total Remeasurements 5,667 277 5,944 (2,400) (854) (3,254)
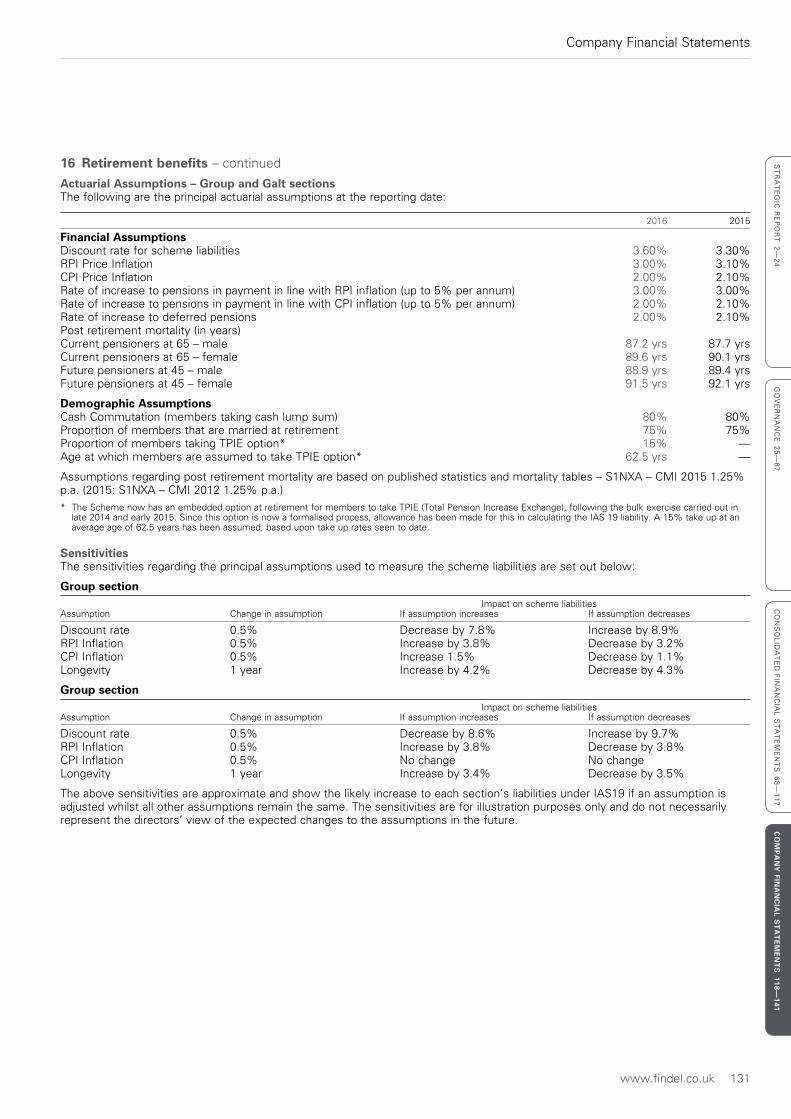
www.findel.co.uk 131
Company Financial Statements
ST
RA
TE
GIC
RE
PO
RT
2—
24
GO
VE
RN
AN
CE
25
—6
7C
ON
SO
LID
AT
ED
FIN
AN
CIA
L S
TA
TE
ME
NT
S 6
8—
11
7C
OM
PA
NY
FINA
NC
IAL S
TA
TE
ME
NT
S 118—
141
16 Retirement benefits – continued
Actuarial Assumptions – Group and Galt sectionsThe following are the principal actuarial assumptions at the reporting date:
2016 2015
Financial AssumptionsDiscount rate for scheme liabilities 3.60% 3.30%RPI Price Inflation 3.00% 3.10%CPI Price Inflation 2.00% 2.10%Rate of increase to pensions in payment in line with RPI inflation (up to 5% per annum) 3.00% 3.00%Rate of increase to pensions in payment in line with CPI inflation (up to 5% per annum) 2.00% 2.10%Rate of increase to deferred pensions 2.00% 2.10%Post retirement mortality (in years)Current pensioners at 65 – male 87.2 yrs 87.7 yrsCurrent pensioners at 65 – female 89.6 yrs 90.1 yrsFuture pensioners at 45 – male 88.9 yrs 89.4 yrsFuture pensioners at 45 – female 91.5 yrs 92.1 yrs
Demographic AssumptionsCash Commutation (members taking cash lump sum) 80% 80%Proportion of members that are married at retirement 75% 75%Proportion of members taking TPIE option* 15% —Age at which members are assumed to take TPIE option* 62.5 yrs —
Assumptions regarding post retirement mortality are based on published statistics and mortality tables – S1NXA – CMI 2015 1.25% p.a. (2015: S1NXA – CMI 2012 1.25% p.a.)* The Scheme now has an embedded option at retirement for members to take TPIE (Total Pension Increase Exchange), following the bulk exercise carried out in
late 2014 and early 2015. Since this option is now a formalised process, allowance has been made for this in calculating the IAS 19 liability. A 15% take up at an average age of 62.5 years has been assumed, based upon take up rates seen to date.
SensitivitiesThe sensitivities regarding the principal assumptions used to measure the scheme liabilities are set out below:
Group section Impact on scheme liabilitiesAssumption Change in assumption If assumption increases If assumption decreases
Discount rate 0.5% Decrease by 7.8% Increase by 8.9%RPI Inflation 0.5% Increase by 3.8% Decrease by 3.2%CPI Inflation 0.5% Increase 1.5% Decrease by 1.1%Longevity 1 year Increase by 4.2% Decrease by 4.3%
Group section Impact on scheme liabilitiesAssumption Change in assumption If assumption increases If assumption decreases
Discount rate 0.5% Decrease by 8.6% Increase by 9.7%RPI Inflation 0.5% Increase by 3.8% Decrease by 3.8%CPI Inflation 0.5% No change No changeLongevity 1 year Increase by 3.4% Decrease by 3.5%
The above sensitivities are approximate and show the likely increase to each section’s liabilities under IAS19 if an assumption is adjusted whilst all other assumptions remain the same. The sensitivities are for illustration purposes only and do not necessarily represent the directors’ view of the expected changes to the assumptions in the future.
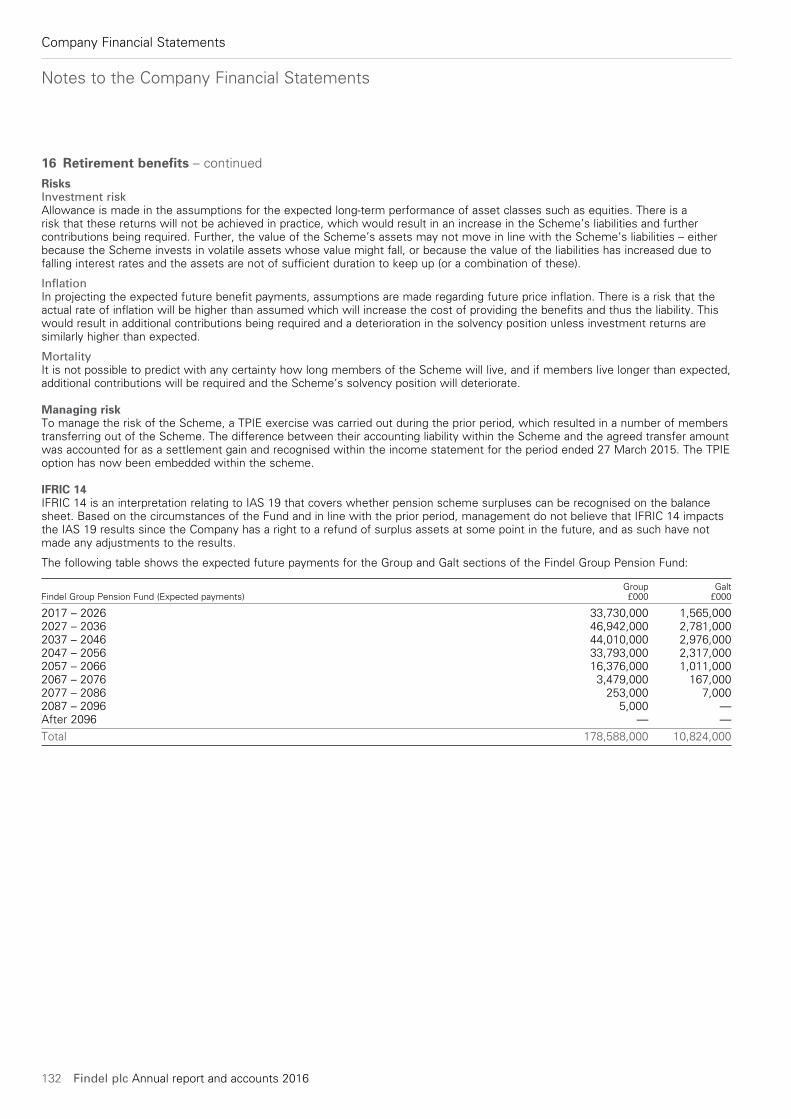
Notes to the Company Financial Statements
132 Findel plc Annual report and accounts 2016
Company Financial Statements
16 Retirement benefits – continued
RisksInvestment riskAllowance is made in the assumptions for the expected long-term performance of asset classes such as equities. There is a risk that these returns will not be achieved in practice, which would result in an increase in the Scheme’s liabilities and further contributions being required. Further, the value of the Scheme’s assets may not move in line with the Scheme’s liabilities – either because the Scheme invests in volatile assets whose value might fall, or because the value of the liabilities has increased due to falling interest rates and the assets are not of sufficient duration to keep up (or a combination of these).
InflationIn projecting the expected future benefit payments, assumptions are made regarding future price inflation. There is a risk that the actual rate of inflation will be higher than assumed which will increase the cost of providing the benefits and thus the liability. This would result in additional contributions being required and a deterioration in the solvency position unless investment returns are similarly higher than expected.
MortalityIt is not possible to predict with any certainty how long members of the Scheme will live, and if members live longer than expected, additional contributions will be required and the Scheme’s solvency position will deteriorate.
Managing riskTo manage the risk of the Scheme, a TPIE exercise was carried out during the prior period, which resulted in a number of members transferring out of the Scheme. The difference between their accounting liability within the Scheme and the agreed transfer amount was accounted for as a settlement gain and recognised within the income statement for the period ended 27 March 2015. The TPIE option has now been embedded within the scheme.
IFRIC 14IFRIC 14 is an interpretation relating to IAS 19 that covers whether pension scheme surpluses can be recognised on the balance sheet. Based on the circumstances of the Fund and in line with the prior period, management do not believe that IFRIC 14 impacts the IAS 19 results since the Company has a right to a refund of surplus assets at some point in the future, and as such have not made any adjustments to the results.
The following table shows the expected future payments for the Group and Galt sections of the Findel Group Pension Fund:
Group Galt Findel Group Pension Fund (Expected payments) £000 £000
2017 – 2026 33,730,000 1,565,0002027 – 2036 46,942,000 2,781,0002037 – 2046 44,010,000 2,976,0002047 – 2056 33,793,000 2,317,0002057 – 2066 16,376,000 1,011,0002067 – 2076 3,479,000 167,0002077 – 2086 253,000 7,0002087 – 2096 5,000 —After 2096 — —
Total 178,588,000 10,824,000
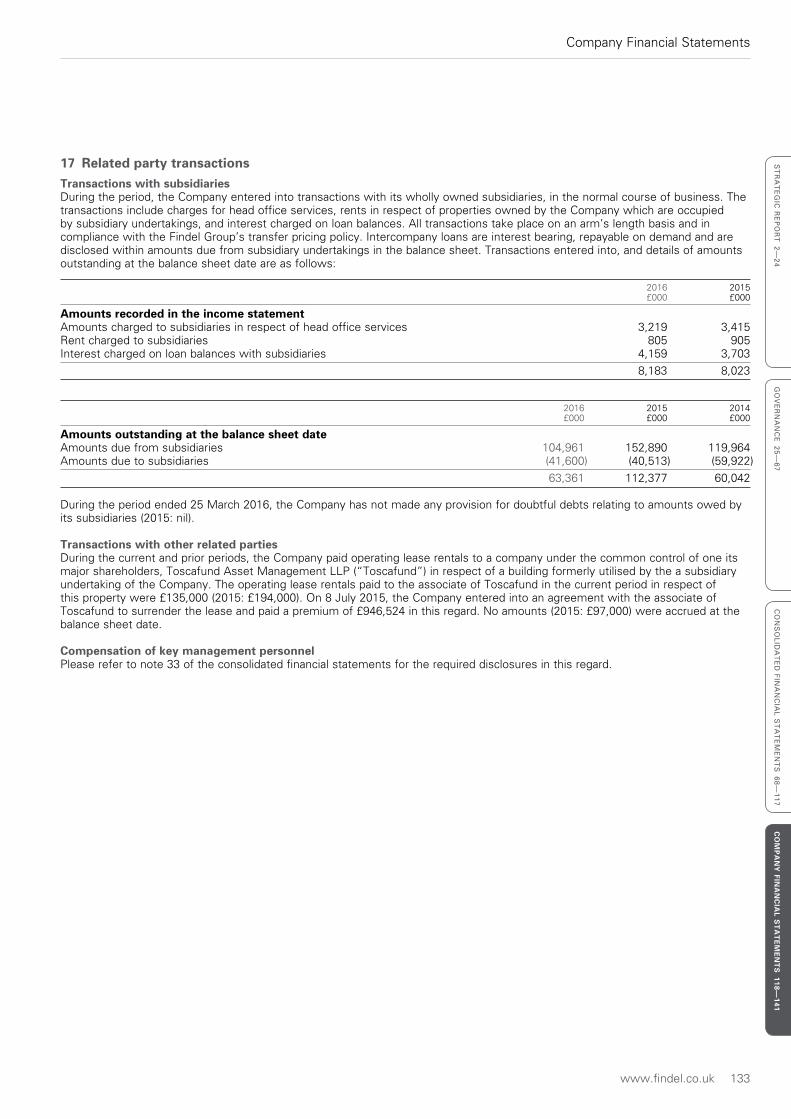
www.findel.co.uk 133
Company Financial Statements
ST
RA
TE
GIC
RE
PO
RT
2—
24
GO
VE
RN
AN
CE
25
—6
7C
ON
SO
LID
AT
ED
FIN
AN
CIA
L S
TA
TE
ME
NT
S 6
8—
11
7C
OM
PA
NY
FINA
NC
IAL S
TA
TE
ME
NT
S 118—
141
17 Related party transactionsTransactions with subsidiariesDuring the period, the Company entered into transactions with its wholly owned subsidiaries, in the normal course of business. The transactions include charges for head office services, rents in respect of properties owned by the Company which are occupied by subsidiary undertakings, and interest charged on loan balances. All transactions take place on an arm’s length basis and in compliance with the Findel Group’s transfer pricing policy. Intercompany loans are interest bearing, repayable on demand and are disclosed within amounts due from subsidiary undertakings in the balance sheet. Transactions entered into, and details of amounts outstanding at the balance sheet date are as follows:
2016 2015 £000 £000
Amounts recorded in the income statementAmounts charged to subsidiaries in respect of head office services 3,219 3,415Rent charged to subsidiaries 805 905Interest charged on loan balances with subsidiaries 4,159 3,703
8,183 8,023
2016 2015 2014 £000 £000 £000
Amounts outstanding at the balance sheet dateAmounts due from subsidiaries 104,961 152,890 119,964Amounts due to subsidiaries (41,600) (40,513) (59,922)
63,361 112,377 60,042
During the period ended 25 March 2016, the Company has not made any provision for doubtful debts relating to amounts owed by its subsidiaries (2015: nil).
Transactions with other related partiesDuring the current and prior periods, the Company paid operating lease rentals to a company under the common control of one its major shareholders, Toscafund Asset Management LLP (“Toscafund”) in respect of a building formerly utilised by the a subsidiary undertaking of the Company. The operating lease rentals paid to the associate of Toscafund in the current period in respect of this property were £135,000 (2015: £194,000). On 8 July 2015, the Company entered into an agreement with the associate of Toscafund to surrender the lease and paid a premium of £946,524 in this regard. No amounts (2015: £97,000) were accrued at the balance sheet date.
Compensation of key management personnelPlease refer to note 33 of the consolidated financial statements for the required disclosures in this regard.
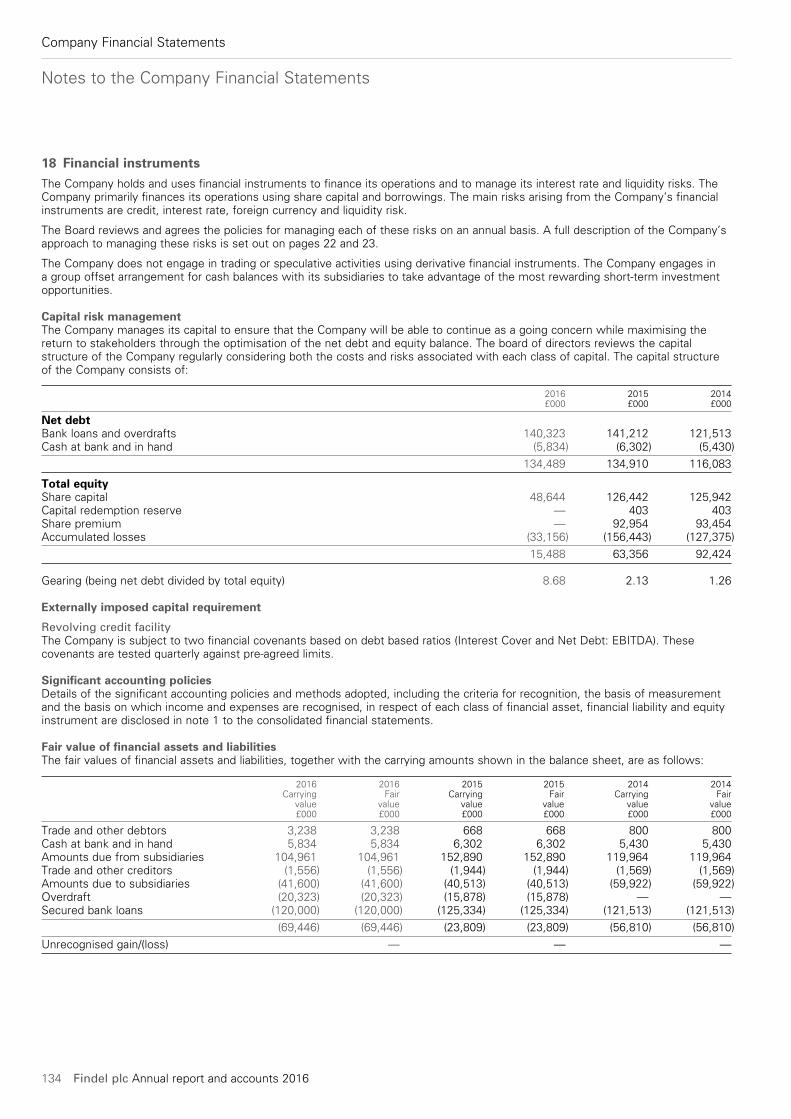
Notes to the Company Financial Statements
134 Findel plc Annual report and accounts 2016
Company Financial Statements
18 Financial instrumentsThe Company holds and uses financial instruments to finance its operations and to manage its interest rate and liquidity risks. The Company primarily finances its operations using share capital and borrowings. The main risks arising from the Company’s financial instruments are credit, interest rate, foreign currency and liquidity risk.
The Board reviews and agrees the policies for managing each of these risks on an annual basis. A full description of the Company’s approach to managing these risks is set out on pages 22 and 23.
The Company does not engage in trading or speculative activities using derivative financial instruments. The Company engages in a group offset arrangement for cash balances with its subsidiaries to take advantage of the most rewarding short-term investment opportunities.
Capital risk managementThe Company manages its capital to ensure that the Company will be able to continue as a going concern while maximising the return to stakeholders through the optimisation of the net debt and equity balance. The board of directors reviews the capital structure of the Company regularly considering both the costs and risks associated with each class of capital. The capital structure of the Company consists of:
2016 2015 2014 £000 £000 £000
Net debtBank loans and overdrafts 140,323 141,212 121,513Cash at bank and in hand (5,834) (6,302) (5,430)
134,489 134,910 116,083
Total equityShare capital 48,644 126,442 125,942Capital redemption reserve — 403 403Share premium — 92,954 93,454Accumulated losses (33,156) (156,443) (127,375)
15,488 63,356 92,424
Gearing (being net debt divided by total equity) 8.68 2.13 1.26
Externally imposed capital requirement
Revolving credit facilityThe Company is subject to two financial covenants based on debt based ratios (Interest Cover and Net Debt: EBITDA). These covenants are tested quarterly against pre-agreed limits.
Significant accounting policiesDetails of the significant accounting policies and methods adopted, including the criteria for recognition, the basis of measurement and the basis on which income and expenses are recognised, in respect of each class of financial asset, financial liability and equity instrument are disclosed in note 1 to the consolidated financial statements.
Fair value of financial assets and liabilitiesThe fair values of financial assets and liabilities, together with the carrying amounts shown in the balance sheet, are as follows:
2016 2016 2015 2015 2014 2014 Carrying Fair Carrying Fair Carrying Fair value value value value value value £000 £000 £000 £000 £000 £000
Trade and other debtors 3,238 3,238 668 668 800 800Cash at bank and in hand 5,834 5,834 6,302 6,302 5,430 5,430Amounts due from subsidiaries 104,961 104,961 152,890 152,890 119,964 119,964Trade and other creditors (1,556) (1,556) (1,944) (1,944) (1,569) (1,569)Amounts due to subsidiaries (41,600) (41,600) (40,513) (40,513) (59,922) (59,922)Overdraft (20,323) (20,323) (15,878) (15,878) — —Secured bank loans (120,000) (120,000) (125,334) (125,334) (121,513) (121,513)
(69,446) (69,446) (23,809) (23,809) (56,810) (56,810)
Unrecognised gain/(loss) — — —
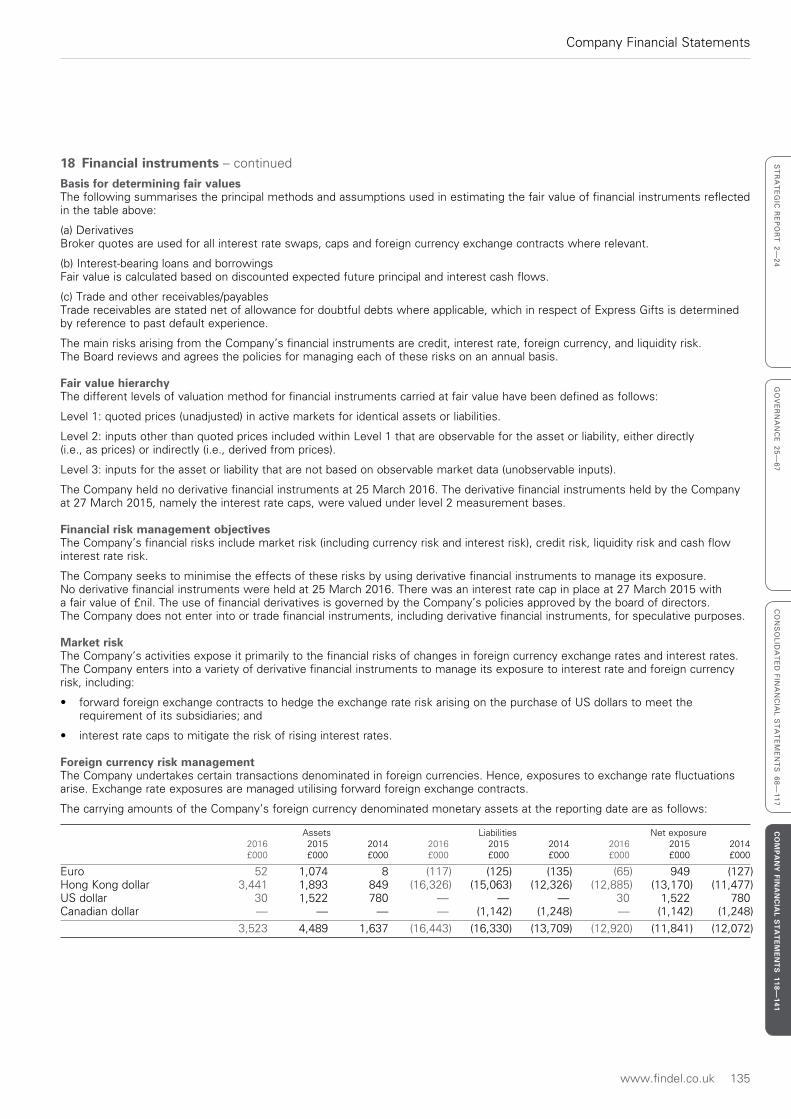
www.findel.co.uk 135
Company Financial Statements
ST
RA
TE
GIC
RE
PO
RT
2—
24
GO
VE
RN
AN
CE
25
—6
7C
ON
SO
LID
AT
ED
FIN
AN
CIA
L S
TA
TE
ME
NT
S 6
8—
11
7C
OM
PA
NY
FINA
NC
IAL S
TA
TE
ME
NT
S 118—
141
18 Financial instruments – continued
Basis for determining fair valuesThe following summarises the principal methods and assumptions used in estimating the fair value of financial instruments reflected in the table above:
(a) DerivativesBroker quotes are used for all interest rate swaps, caps and foreign currency exchange contracts where relevant.
(b) Interest-bearing loans and borrowingsFair value is calculated based on discounted expected future principal and interest cash flows.
(c) Trade and other receivables/payablesTrade receivables are stated net of allowance for doubtful debts where applicable, which in respect of Express Gifts is determined by reference to past default experience.
The main risks arising from the Company’s financial instruments are credit, interest rate, foreign currency, and liquidity risk. The Board reviews and agrees the policies for managing each of these risks on an annual basis.
Fair value hierarchyThe different levels of valuation method for financial instruments carried at fair value have been defined as follows:
Level 1: quoted prices (unadjusted) in active markets for identical assets or liabilities.
Level 2: inputs other than quoted prices included within Level 1 that are observable for the asset or liability, either directly (i.e., as prices) or indirectly (i.e., derived from prices).
Level 3: inputs for the asset or liability that are not based on observable market data (unobservable inputs).
The Company held no derivative financial instruments at 25 March 2016. The derivative financial instruments held by the Company at 27 March 2015, namely the interest rate caps, were valued under level 2 measurement bases.
Financial risk management objectivesThe Company’s financial risks include market risk (including currency risk and interest risk), credit risk, liquidity risk and cash flow interest rate risk.
The Company seeks to minimise the effects of these risks by using derivative financial instruments to manage its exposure. No derivative financial instruments were held at 25 March 2016. There was an interest rate cap in place at 27 March 2015 with a fair value of £nil. The use of financial derivatives is governed by the Company’s policies approved by the board of directors. The Company does not enter into or trade financial instruments, including derivative financial instruments, for speculative purposes.
Market riskThe Company’s activities expose it primarily to the financial risks of changes in foreign currency exchange rates and interest rates. The Company enters into a variety of derivative financial instruments to manage its exposure to interest rate and foreign currency risk, including:
• forward foreign exchange contracts to hedge the exchange rate risk arising on the purchase of US dollars to meet the requirement of its subsidiaries; and
• interest rate caps to mitigate the risk of rising interest rates.
Foreign currency risk managementThe Company undertakes certain transactions denominated in foreign currencies. Hence, exposures to exchange rate fluctuations arise. Exchange rate exposures are managed utilising forward foreign exchange contracts.
The carrying amounts of the Company’s foreign currency denominated monetary assets at the reporting date are as follows:
Assets Liabilities Net exposure 2016 2015 2014 2016 2015 2014 2016 2015 2014 £000 £000 £000 £000 £000 £000 £000 £000 £000
Euro 52 1,074 8 (117) (125) (135) (65) 949 (127)Hong Kong dollar 3,441 1,893 849 (16,326) (15,063) (12,326) (12,885) (13,170) (11,477)US dollar 30 1,522 780 — — — 30 1,522 780Canadian dollar — — — — (1,142) (1,248) — (1,142) (1,248)
3,523 4,489 1,637 (16,443) (16,330) (13,709) (12,920) (11,841) (12,072)
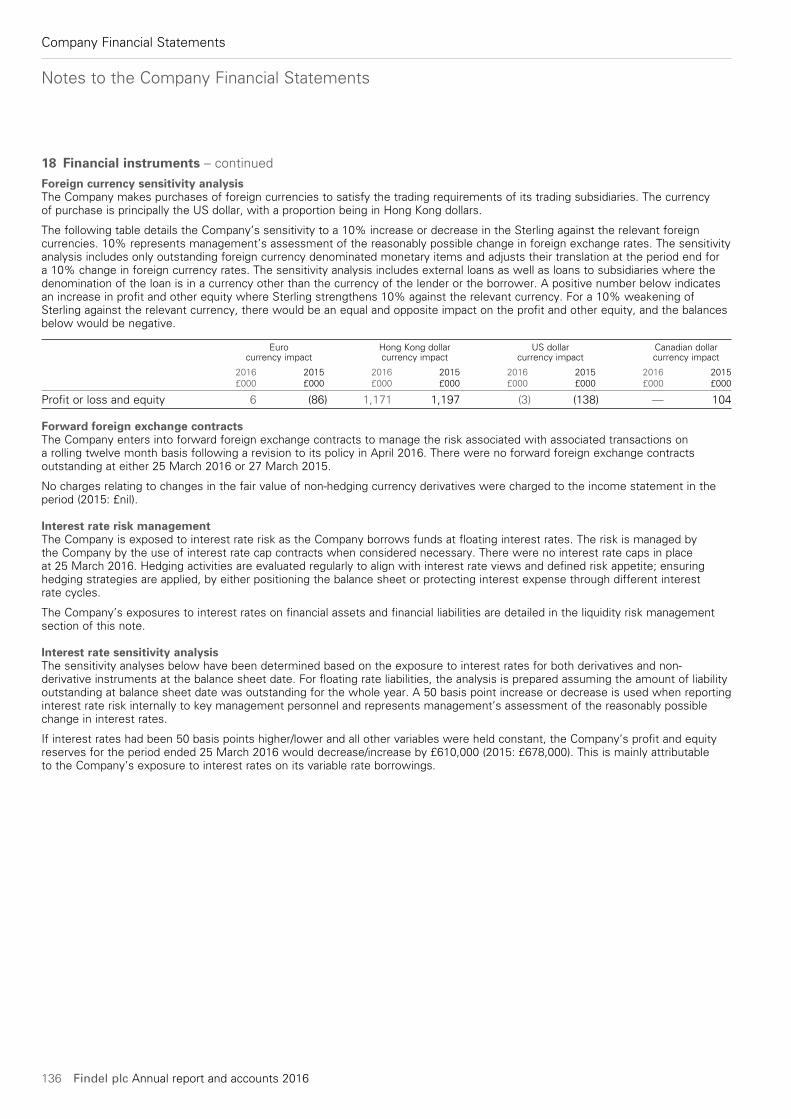
Notes to the Company Financial Statements
136 Findel plc Annual report and accounts 2016
Company Financial Statements
18 Financial instruments – continued
Foreign currency sensitivity analysisThe Company makes purchases of foreign currencies to satisfy the trading requirements of its trading subsidiaries. The currency of purchase is principally the US dollar, with a proportion being in Hong Kong dollars.
The following table details the Company’s sensitivity to a 10% increase or decrease in the Sterling against the relevant foreign currencies. 10% represents management’s assessment of the reasonably possible change in foreign exchange rates. The sensitivity analysis includes only outstanding foreign currency denominated monetary items and adjusts their translation at the period end for a 10% change in foreign currency rates. The sensitivity analysis includes external loans as well as loans to subsidiaries where the denomination of the loan is in a currency other than the currency of the lender or the borrower. A positive number below indicates an increase in profit and other equity where Sterling strengthens 10% against the relevant currency. For a 10% weakening of Sterling against the relevant currency, there would be an equal and opposite impact on the profit and other equity, and the balances below would be negative.
Euro Hong Kong dollar US dollar Canadian dollar currency impact currency impact currency impact currency impact
2016 2015 2016 2015 2016 2015 2016 2015 £000 £000 £000 £000 £000 £000 £000 £000
Profit or loss and equity 6 (86) 1,171 1,197 (3) (138) — 104
Forward foreign exchange contractsThe Company enters into forward foreign exchange contracts to manage the risk associated with associated transactions on a rolling twelve month basis following a revision to its policy in April 2016. There were no forward foreign exchange contracts outstanding at either 25 March 2016 or 27 March 2015.
No charges relating to changes in the fair value of non-hedging currency derivatives were charged to the income statement in the period (2015: £nil).
Interest rate risk managementThe Company is exposed to interest rate risk as the Company borrows funds at floating interest rates. The risk is managed by the Company by the use of interest rate cap contracts when considered necessary. There were no interest rate caps in place at 25 March 2016. Hedging activities are evaluated regularly to align with interest rate views and defined risk appetite; ensuring hedging strategies are applied, by either positioning the balance sheet or protecting interest expense through different interest rate cycles.
The Company’s exposures to interest rates on financial assets and financial liabilities are detailed in the liquidity risk management section of this note.
Interest rate sensitivity analysisThe sensitivity analyses below have been determined based on the exposure to interest rates for both derivatives and non-derivative instruments at the balance sheet date. For floating rate liabilities, the analysis is prepared assuming the amount of liability outstanding at balance sheet date was outstanding for the whole year. A 50 basis point increase or decrease is used when reporting interest rate risk internally to key management personnel and represents management’s assessment of the reasonably possible change in interest rates.
If interest rates had been 50 basis points higher/lower and all other variables were held constant, the Company’s profit and equity reserves for the period ended 25 March 2016 would decrease/increase by £610,000 (2015: £678,000). This is mainly attributable to the Company’s exposure to interest rates on its variable rate borrowings.
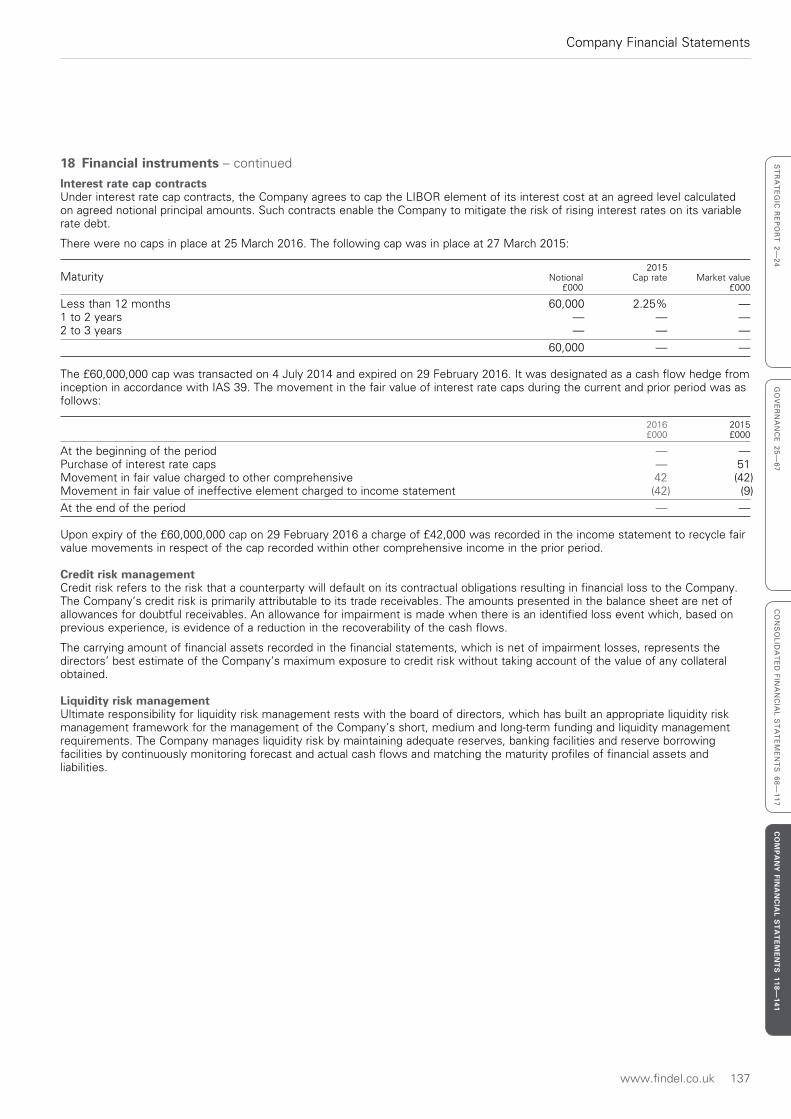
www.findel.co.uk 137
Company Financial Statements
ST
RA
TE
GIC
RE
PO
RT
2—
24
GO
VE
RN
AN
CE
25
—6
7C
ON
SO
LID
AT
ED
FIN
AN
CIA
L S
TA
TE
ME
NT
S 6
8—
11
7C
OM
PA
NY
FINA
NC
IAL S
TA
TE
ME
NT
S 118—
141
18 Financial instruments – continued
Interest rate cap contractsUnder interest rate cap contracts, the Company agrees to cap the LIBOR element of its interest cost at an agreed level calculated on agreed notional principal amounts. Such contracts enable the Company to mitigate the risk of rising interest rates on its variable rate debt.
There were no caps in place at 25 March 2016. The following cap was in place at 27 March 2015:
2015 Maturity Notional Cap rate Market value £000 £000
Less than 12 months 60,000 2.25% —1 to 2 years — — —2 to 3 years — — —
60,000 — —
The £60,000,000 cap was transacted on 4 July 2014 and expired on 29 February 2016. It was designated as a cash flow hedge from inception in accordance with IAS 39. The movement in the fair value of interest rate caps during the current and prior period was as follows:
2016 2015 £000 £000
At the beginning of the period — —Purchase of interest rate caps — 51Movement in fair value charged to other comprehensive 42 (42)Movement in fair value of ineffective element charged to income statement (42) (9)
At the end of the period — —
Upon expiry of the £60,000,000 cap on 29 February 2016 a charge of £42,000 was recorded in the income statement to recycle fair value movements in respect of the cap recorded within other comprehensive income in the prior period.
Credit risk managementCredit risk refers to the risk that a counterparty will default on its contractual obligations resulting in financial loss to the Company. The Company’s credit risk is primarily attributable to its trade receivables. The amounts presented in the balance sheet are net of allowances for doubtful receivables. An allowance for impairment is made when there is an identified loss event which, based on previous experience, is evidence of a reduction in the recoverability of the cash flows.
The carrying amount of financial assets recorded in the financial statements, which is net of impairment losses, represents the directors’ best estimate of the Company’s maximum exposure to credit risk without taking account of the value of any collateral obtained.
Liquidity risk managementUltimate responsibility for liquidity risk management rests with the board of directors, which has built an appropriate liquidity risk management framework for the management of the Company’s short, medium and long-term funding and liquidity management requirements. The Company manages liquidity risk by maintaining adequate reserves, banking facilities and reserve borrowing facilities by continuously monitoring forecast and actual cash flows and matching the maturity profiles of financial assets and liabilities.
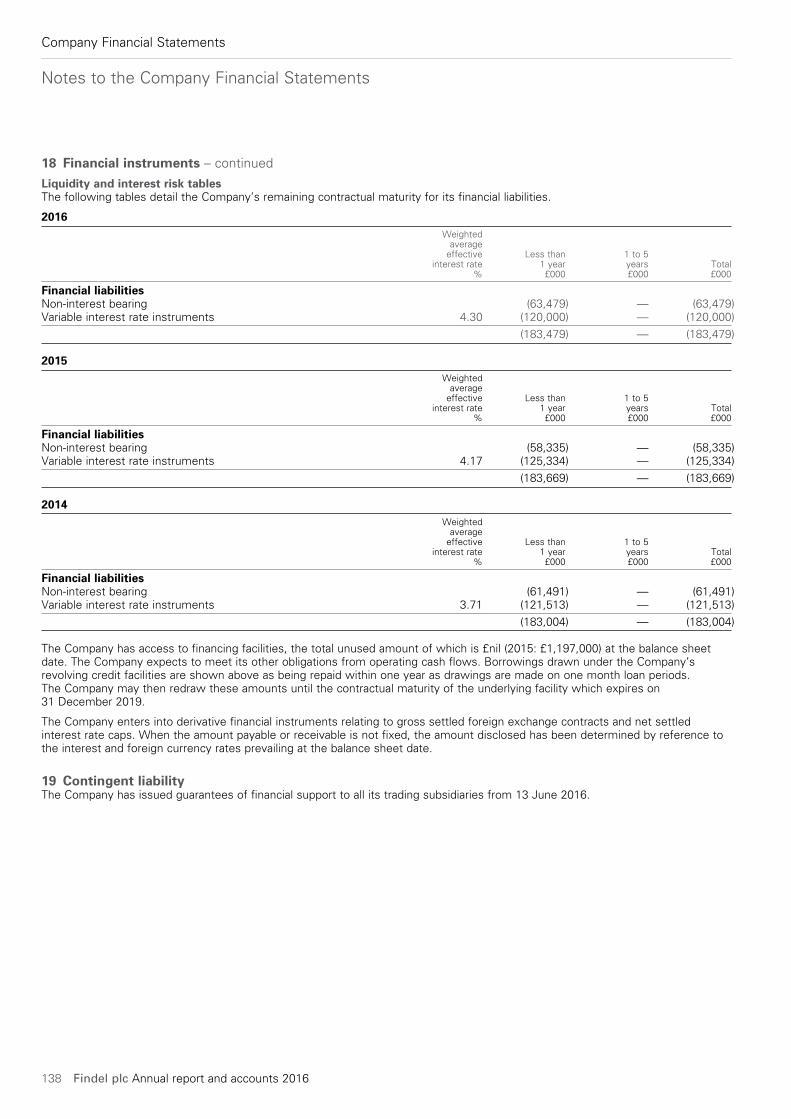
Notes to the Company Financial Statements
138 Findel plc Annual report and accounts 2016
Company Financial Statements
18 Financial instruments – continued
Liquidity and interest risk tablesThe following tables detail the Company’s remaining contractual maturity for its financial liabilities.
2016 Weighted average effective Less than 1 to 5 interest rate 1 year years Total % £000 £000 £000
Financial liabilitiesNon-interest bearing (63,479) — (63,479)Variable interest rate instruments 4.30 (120,000) — (120,000)
(183,479) — (183,479)
2015 Weighted average effective Less than 1 to 5 interest rate 1 year years Total % £000 £000 £000
Financial liabilitiesNon-interest bearing (58,335) — (58,335)Variable interest rate instruments 4.17 (125,334) — (125,334)
(183,669) — (183,669)
2014 Weighted average effective Less than 1 to 5 interest rate 1 year years Total % £000 £000 £000
Financial liabilitiesNon-interest bearing (61,491) — (61,491)Variable interest rate instruments 3.71 (121,513) — (121,513)
(183,004) — (183,004)
The Company has access to financing facilities, the total unused amount of which is £nil (2015: £1,197,000) at the balance sheet date. The Company expects to meet its other obligations from operating cash flows. Borrowings drawn under the Company’s revolving credit facilities are shown above as being repaid within one year as drawings are made on one month loan periods. The Company may then redraw these amounts until the contractual maturity of the underlying facility which expires on 31 December 2019.
The Company enters into derivative financial instruments relating to gross settled foreign exchange contracts and net settled interest rate caps. When the amount payable or receivable is not fixed, the amount disclosed has been determined by reference to the interest and foreign currency rates prevailing at the balance sheet date.
19 Contingent liabilityThe Company has issued guarantees of financial support to all its trading subsidiaries from 13 June 2016.
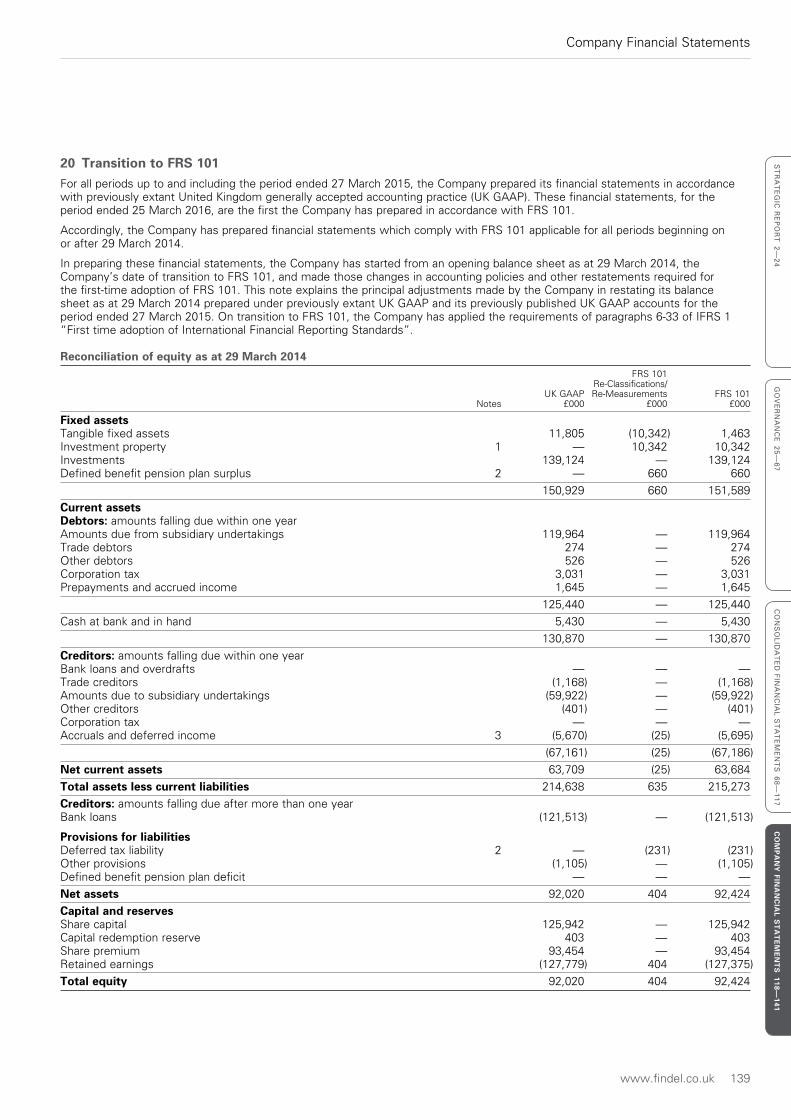
www.findel.co.uk 139
Company Financial Statements
ST
RA
TE
GIC
RE
PO
RT
2—
24
GO
VE
RN
AN
CE
25
—6
7C
ON
SO
LID
AT
ED
FIN
AN
CIA
L S
TA
TE
ME
NT
S 6
8—
11
7C
OM
PA
NY
FINA
NC
IAL S
TA
TE
ME
NT
S 118—
141
20 Transition to FRS 101For all periods up to and including the period ended 27 March 2015, the Company prepared its financial statements in accordance with previously extant United Kingdom generally accepted accounting practice (UK GAAP). These financial statements, for the period ended 25 March 2016, are the first the Company has prepared in accordance with FRS 101.
Accordingly, the Company has prepared financial statements which comply with FRS 101 applicable for all periods beginning on or after 29 March 2014.
In preparing these financial statements, the Company has started from an opening balance sheet as at 29 March 2014, the Company’s date of transition to FRS 101, and made those changes in accounting policies and other restatements required for the first-time adoption of FRS 101. This note explains the principal adjustments made by the Company in restating its balance sheet as at 29 March 2014 prepared under previously extant UK GAAP and its previously published UK GAAP accounts for the period ended 27 March 2015. On transition to FRS 101, the Company has applied the requirements of paragraphs 6-33 of IFRS 1 “First time adoption of International Financial Reporting Standards”.
Reconciliation of equity as at 29 March 2014 FRS 101 Re-Classifications/ UK GAAP Re-Measurements FRS 101 Notes £000 £000 £000
Fixed assetsTangible fixed assets 11,805 (10,342) 1,463Investment property 1 — 10,342 10,342Investments 139,124 — 139,124Defined benefit pension plan surplus 2 — 660 660
150,929 660 151,589
Current assetsDebtors: amounts falling due within one yearAmounts due from subsidiary undertakings 119,964 — 119,964Trade debtors 274 — 274Other debtors 526 — 526Corporation tax 3,031 — 3,031Prepayments and accrued income 1,645 — 1,645
125,440 — 125,440
Cash at bank and in hand 5,430 — 5,430
130,870 — 130,870
Creditors: amounts falling due within one yearBank loans and overdrafts — — —Trade creditors (1,168) — (1,168)Amounts due to subsidiary undertakings (59,922) — (59,922)Other creditors (401) — (401)Corporation tax — — —Accruals and deferred income 3 (5,670) (25) (5,695)
(67,161) (25) (67,186)
Net current assets 63,709 (25) 63,684
Total assets less current liabilities 214,638 635 215,273
Creditors: amounts falling due after more than one yearBank loans (121,513) — (121,513)
Provisions for liabilitiesDeferred tax liability 2 — (231) (231)Other provisions (1,105) — (1,105)Defined benefit pension plan deficit — — —
Net assets 92,020 404 92,424
Capital and reservesShare capital 125,942 — 125,942Capital redemption reserve 403 — 403Share premium 93,454 — 93,454Retained earnings (127,779) 404 (127,375)
Total equity 92,020 404 92,424
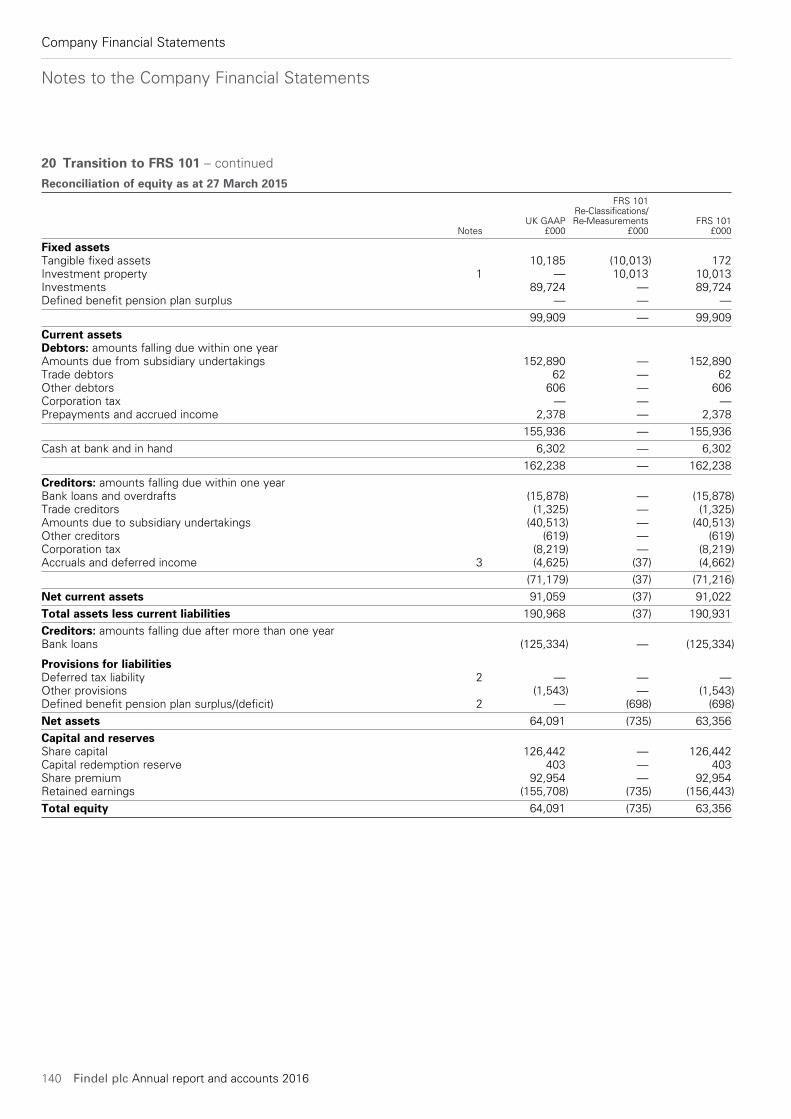
Notes to the Company Financial Statements
140 Findel plc Annual report and accounts 2016
Company Financial Statements
20 Transition to FRS 101 – continued
Reconciliation of equity as at 27 March 2015 FRS 101 Re-Classifications/ UK GAAP Re-Measurements FRS 101 Notes £000 £000 £000
Fixed assetsTangible fixed assets 10,185 (10,013) 172Investment property 1 — 10,013 10,013Investments 89,724 — 89,724Defined benefit pension plan surplus — — —
99,909 — 99,909
Current assetsDebtors: amounts falling due within one yearAmounts due from subsidiary undertakings 152,890 — 152,890Trade debtors 62 — 62Other debtors 606 — 606Corporation tax — — —Prepayments and accrued income 2,378 — 2,378
155,936 — 155,936
Cash at bank and in hand 6,302 — 6,302
162,238 — 162,238
Creditors: amounts falling due within one yearBank loans and overdrafts (15,878) — (15,878)Trade creditors (1,325) — (1,325)Amounts due to subsidiary undertakings (40,513) — (40,513)Other creditors (619) — (619)Corporation tax (8,219) — (8,219)Accruals and deferred income 3 (4,625) (37) (4,662)
(71,179) (37) (71,216)
Net current assets 91,059 (37) 91,022
Total assets less current liabilities 190,968 (37) 190,931
Creditors: amounts falling due after more than one yearBank loans (125,334) — (125,334)
Provisions for liabilitiesDeferred tax liability 2 — — —Other provisions (1,543) — (1,543)Defined benefit pension plan surplus/(deficit) 2 — (698) (698)
Net assets 64,091 (735) 63,356
Capital and reservesShare capital 126,442 — 126,442Capital redemption reserve 403 — 403Share premium 92,954 — 92,954Retained earnings (155,708) (735) (156,443)
Total equity 64,091 (735) 63,356
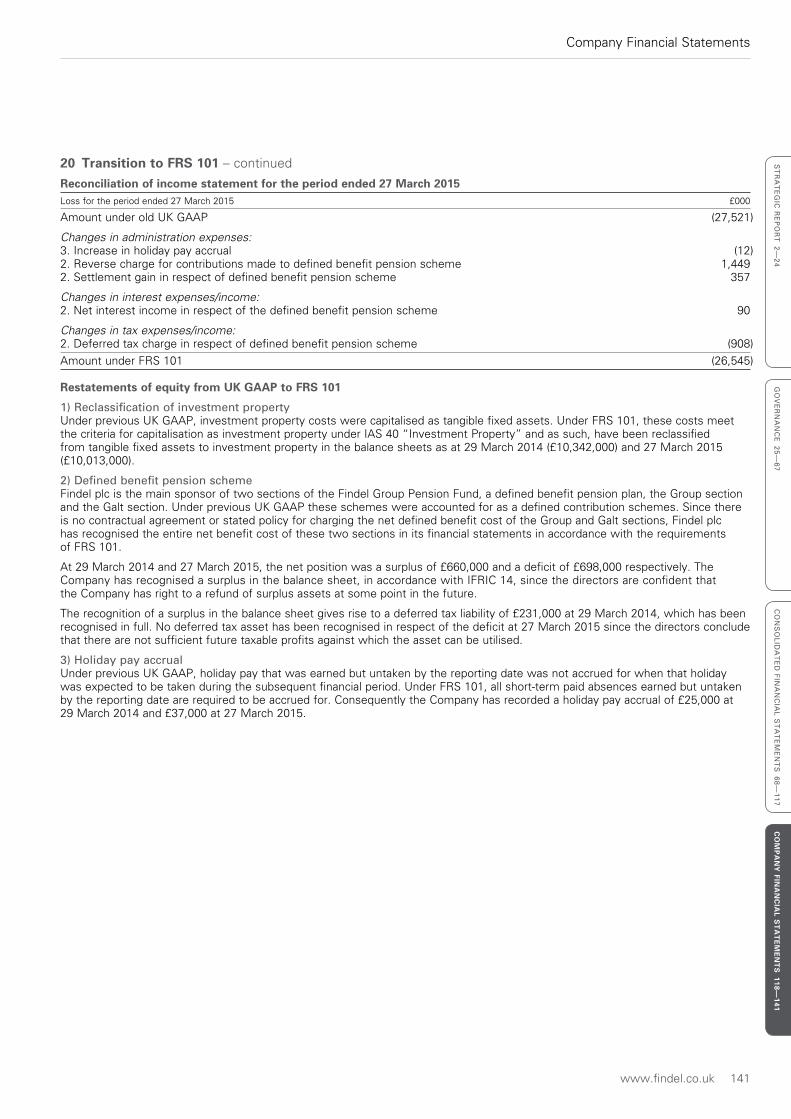
www.findel.co.uk 141
Company Financial Statements
ST
RA
TE
GIC
RE
PO
RT
2—
24
GO
VE
RN
AN
CE
25
—6
7C
ON
SO
LID
AT
ED
FIN
AN
CIA
L S
TA
TE
ME
NT
S 6
8—
11
7C
OM
PA
NY
FINA
NC
IAL S
TA
TE
ME
NT
S 118—
141
20 Transition to FRS 101 – continued
Reconciliation of income statement for the period ended 27 March 2015Loss for the period ended 27 March 2015 £000
Amount under old UK GAAP (27,521)
Changes in administration expenses:3. Increase in holiday pay accrual (12)2. Reverse charge for contributions made to defined benefit pension scheme 1,4492. Settlement gain in respect of defined benefit pension scheme 357
Changes in interest expenses/income:2. Net interest income in respect of the defined benefit pension scheme 90
Changes in tax expenses/income:2. Deferred tax charge in respect of defined benefit pension scheme (908)
Amount under FRS 101 (26,545)
Restatements of equity from UK GAAP to FRS 101
1) Reclassification of investment propertyUnder previous UK GAAP, investment property costs were capitalised as tangible fixed assets. Under FRS 101, these costs meet the criteria for capitalisation as investment property under IAS 40 “Investment Property” and as such, have been reclassified from tangible fixed assets to investment property in the balance sheets as at 29 March 2014 (£10,342,000) and 27 March 2015 (£10,013,000).
2) Defined benefit pension schemeFindel plc is the main sponsor of two sections of the Findel Group Pension Fund, a defined benefit pension plan, the Group section and the Galt section. Under previous UK GAAP these schemes were accounted for as a defined contribution schemes. Since there is no contractual agreement or stated policy for charging the net defined benefit cost of the Group and Galt sections, Findel plc has recognised the entire net benefit cost of these two sections in its financial statements in accordance with the requirements of FRS 101.
At 29 March 2014 and 27 March 2015, the net position was a surplus of £660,000 and a deficit of £698,000 respectively. The Company has recognised a surplus in the balance sheet, in accordance with IFRIC 14, since the directors are confident that the Company has right to a refund of surplus assets at some point in the future.
The recognition of a surplus in the balance sheet gives rise to a deferred tax liability of £231,000 at 29 March 2014, which has been recognised in full. No deferred tax asset has been recognised in respect of the deficit at 27 March 2015 since the directors conclude that there are not sufficient future taxable profits against which the asset can be utilised.
3) Holiday pay accrualUnder previous UK GAAP, holiday pay that was earned but untaken by the reporting date was not accrued for when that holiday was expected to be taken during the subsequent financial period. Under FRS 101, all short-term paid absences earned but untaken by the reporting date are required to be accrued for. Consequently the Company has recorded a holiday pay accrual of £25,000 at 29 March 2014 and £37,000 at 27 March 2015.

142 Findel plc Annual report and accounts 2016
Notes

www.findel.co.uk 143
Notes

144 Findel plc Annual report and accounts 2016
Notes

Findel plc Registered Office: 2 Gregory Street, Hyde, Cheshire SK14 4TH
Find
el plc
ww
w.fin
del.co
.uk
AN
NU
AL
RE
PO
RT
& A
CC
OU
NT
S 2
016
Findel plc
www.findel.co.uk
ANNUAL REPORT & ACCOUNTS
2016