Embed Size (px)
Citation preview

Credit Suisse Group AG
Annual Report2020

Key metrics in / end of % change
2020 2019 2018 20 / 19 19 / 18
Credit Suisse (CHF million)
Net revenues 22,389 22,484 20,920 0 7
Provision for credit losses 1,096 324 245 238 32
Total operating expenses 17,826 17,440 17,303 2 1
Income before taxes 3,467 4,720 3,372 (27) 40
Net income attributable to shareholders 2,669 3,419 2,024 (22) 69
Cost/income ratio (%) 79.6 77.6 82.7 – –
Effective tax rate (%) 23.1 27.4 40.4 – –
Basic earnings per share (CHF) 1.09 1.35 0.79 (19) 71
Diluted earnings per share (CHF) 1.06 1.32 0.77 (20) 71
Return on equity (%) 5.9 7.7 4.7 – –
Return on tangible equity (%) 6.6 8.7 5.4 – –
Assets under management and net new assets (CHF billion)
Assets under management 1,511.9 1,507.2 1,344.9 0.3 12.1
Net new assets 42.0 79.3 53.7 (47.0) 47.7
Balance sheet statistics (CHF million)
Total assets 805,822 787,295 768,916 2 2
Net loans 291,908 296,779 287,581 (2) 3
Total shareholders’ equity 42,677 43,644 43,922 (2) (1)
Tangible shareholders’ equity 38,014 38,690 38,937 (2) (1)
Basel III regulatory capital and leverage statistics (%)
CET1 ratio 12.9 12.7 12.6 – –
CET1 leverage ratio 4.4 4.0 4.1 – –
Tier 1 leverage ratio 6.4 5.5 5.2 – –
Share information
Shares outstanding (million) 2,406.1 2,436.2 2,550.6 (1) (4)
of which common shares issued 2,447.7 2,556.0 2,556.0 (4) 0
of which treasury shares (41.6) (119.8) (5.4) (65) –
Book value per share (CHF) 17.74 17.91 17.22 (1) 4
Tangible book value per share (CHF) 15.80 15.88 15.27 (1) 4
Market capitalization (CHF million) 27,904 32,451 27,605 (14) 18
Dividend per share (CHF) 0.2926 0.2776 0.2625 5 6
Number of employees (full-time equivalents)
Number of employees 48,770 47,860 45,680 2 5
See relevant tables for additional information on these metrics.

Annual Report 2020
Credit Suisse Group AG

For the purposes of this report, unless the context otherwise requires, the terms “Credit Suisse Group”, “Credit Suisse”, the “Group”, “we”, “us” and “our”
mean Credit Suisse Group AG and its consolidated subsidiaries. The business of Credit Suisse AG, the direct bank subsidiary of the Group, is substantially
similar to the Group, and we use these terms to refer to both when the subject is the same or substantially similar. We use the term the “Bank” when we
are referring only to Credit Suisse AG and its consolidated subsidiaries. Abbreviations and selected terms are explained in the List of abbreviations and the
Glossary in the back of this report. Publications referenced in this report, whether via website links or otherwise, are not incorporated into this report. The
English language version of this report is the controlling version. In various tables, use of “–” indicates not meaningful or not applicable.
Credit Suisse DirectWith the Credit Suisse Direct app for smartphones and tablets you have all the advantages of mobile banking at your fingertips – anytime, anywhere. Whether you want to pay bills, transfer account, trade securities, check your credit card details or follow your safe-keeping account in real time or catch up on financial information.
Investor Relationsallows investors, analysts, media and other interested parties to remain up to date with relevant online and offline financial information on Credit Suisse.
Credit Suisse Apps – Available in the App Store and Google Play Store
Credit Suisse – Annual Reporting Suite
Annual ReportThe Annual Report is a detailed pres-entation of Credit Suisse Group’s com-pany structure, corporate govern ance, compensa tion practices and treasury and risk management framework, and it includes a review of Credit Suisse Group’s oper ating and fi nancial results accompanied by its annual fi nancial statements.credit-suisse.com/ar
Sustainability ReportThe Sustainability Report explains how Credit Suisse’s commitments and aspi-rations in this area are put into practice as a key component of its operations.credit-suisse.com/sustainabilityreport
Credit Suisse Group AG Credit Suisse AG
Annual Report2020
Pre-Proof 3, Feb 24, 2021
Sustainability Report 2020
Investor Relations
4 Message from the Chairman and the Chief Executive Officer
8 Interview with the Chairman and the Chief Executive Officer
11 I – Information on the company
12 Credit Suisse at a glance13 Strategy19 Divisions26 Regulation and supervision45 Risk factors
59 II–Operatingandfinancialreview
60 Operating environment63 Credit Suisse76 Swiss Universal Bank83 International Wealth
Management91 Asia Pacific95 Investment Bank99 Corporate Center103 Assets under management106 Critical accounting estimates
113 III – Treasury, Risk, Balance sheet and Off-balance sheet
114 Liquidity and funding management
122 Capital management139 Risk management179 Balance sheet and off-balance
sheet
183 IV – Corporate Governance
233 V – Compensation
269VI–Consolidatedfinancialstatements – Credit Suisse Group
427 VII – Parent company financialstatements–CreditSuisse Group
Appendix
A-2 Selected five-year informationA-4 List of abbreviationsA-6 GlossaryA-10 Investor informationA-12 Financial calendar and
contacts

4 Message from the Chairman and the Chief Executive Officer
Message from the Chairman and the Chief Executive OfficerIn 2020, we recorded strong operating performance in Wealth Management-related and Investment Bank divisions. We confirmed our strategy of being a leading Wealth Manager with strong global Investment Banking capabilities by launching a number of strategic initiatives to support our growth ambitions. In a year dominated by the global COVID-19 pandemic, we generated net income attrib-utable to shareholders of CHF 2.7 billion. Group net new assets were CHF 42 billion.
Dear shareholders, clients and colleagues
In our previous Annual Report, we noted that the COVID-19 pan-demic, still in its early stages at the time, would have a significant impact on the global economy. Like others, we are devastated by the enormous human and economic toll that this crisis inflicted, and continues to inflict. Even as we work hard to achieve our business goals, we cannot lose sight of what is happening around us in our communities and societies. We must keep events in their proper perspective. Nonetheless, we are proud of what our roughly 49,000 employees in all markets have achieved for our clients, the bank and its shareholders over the last 12 months.
Solid result in a difficult operating environmentThe outstanding commitment and loyalty of our employees made it possible for us to deliver a solid result even in the difficult year of 2020. After equity markets – and not least financial stocks – came under great pressure in March and April, the global economy contracted with extraordinary severity at the start of the second quarter of 2020 as a result of the measures taken to combat the pandemic. Central banks and governments reacted with monetary and fiscal stimulus of an unprecedented magni-tude. The period from May to August was then characterized by a sharp recovery as volatility declined and stock markets bounced back impressively. The resurgence of new case numbers in the US, Europe and a number of Asian countries from the fall onward then led to new restrictions on public life, together with commer-cial restrictions in certain sectors. While expectations of a return to normality have risen against a backdrop of vaccine program rollouts since December, the situation remains challenging in view of the emergence of new virus mutations.
In this environment, net revenues in the Wealth Management-related businesses across our divisions declined by 8% in total to CHF 13.6 billion in 2020. Global investment banking revenues of USD 10.2 billion in 2020, increased 19% year on year. With overall net revenues for the Group remaining stable at CHF 22.4 billion and a 2% increase in total operating expenses to CHF 17.8 billion, the Group recorded income before taxes of CHF 3.5 bil-lion, 27% lower than in the previous year. Net income attributable to shareholders amounted to CHF 2.7 billion for 2020. This was a decline of 22% year on year including primarily the effects of higher provision for credit losses and major litigation provisions, as
well as the impairment to the valuation of our minority sharehold-ing in York Capital Management. Across the Group, we attracted net new assets of CHF 42 billion in 2020, and recorded assets under management in excess of CHF 1.5 trillion at year end.
Operating performance supporting our growth agendaThe repercussions of the COVID-19 pandemic brought macro-economic challenges in their wake, along with very unfavorable exchange rate movements. As only around a quarter of our busi-ness is generated in our reporting currency, the Swiss franc, a depreciation of the dollar – precisely the scenario that unfolded in the reporting year – feeds through into the final numbers. However, our strategy of being a leading wealth manager with strong global investment banking capabilities proved robust in this environment. We recorded a strong underlying performance that would have seen adjusted income before taxes, excluding signifi-cant items* rise by 6% and adjusted pre-provision profit, excluding significant items* rise by 22%.
In keeping with our strategy, we launched four key strategic initia-tives in the reporting year. First, we created a global Investment Bank (IB), including our Global Trading Solutions (GTS) business and a globally integrated equities platform. Second, we affirmed our commitment to play a leading role as a provider of sustainable financial services with the establishment of a new Sustainability, Research & Investment Solutions (SRI) function at the Executive Board level. Third, we are on track in integrating Neue Aargauer Bank into the Swiss Universal Bank (SUB) and have successfully launched a digital banking offering – CSX – for Swiss retail cli-ents. Fourth, we are ensuring alignment across our control func-tions in respect of risk and compliance business practices through the new, integrated Chief Risk and Compliance Officer (CRCO) function, which will be retained at Executive Board level. We anticipate gross savings of approximately CHF 400 to 450 million annually from these initiatives, which should feed through into our results fully from 2022 onward. Assuming favorable commercial market and economic conditions, we will be able to reinvest this entire amount in our business.
Divisional resultsThe SUB division recorded income before taxes of CHF 2.1 billion for the full year 2020, a decline of 18% compared to 2019. Net revenues declined 5% year on year to CHF 5.6 billion, or on

5Message from the Chairman and the Chief Executive Officer
an adjusted* basis were almost precisely the amount that we were able to generate the previous year. Net new assets for the division as a whole amounted to CHF 7.8 billion. Total operating expenses remained stable compared to the previous year at CHF 3.2 billion, despite litigation expenses of CHF 45 million and restructuring costs of CHF 44 million, primarily incurred in connection with the integra-tion of Neue Aargauer Bank. The Private Clients area recorded a 16% decline in income before taxes to CHF 1.1 billion year on year. Net revenues amounted to CHF 3.1 billion, or 4% lower than in the previous year. Corporate & Institutional Clients generated income before taxes of CHF 1.0 billion, down 21% on the prior year due to a 6% decline in net revenues to CHF 2.6 billion.
The International Wealth Management (IWM) division recorded income before taxes of CHF 1.1 billion in 2020, 49% lower than in the previous year, with net revenues recording a decline of 17% year on year to CHF 4.8 billion. The result was impacted by significant items that resulted in a net negative effect of CHF 84 million – compared to a positive effect of CHF 323 million in 2019 – and by restructuring costs of CHF 55 million. The division
attracted high net new assets of CHF 32.2 billion in 2020. In Private Banking, income before taxes for 2020 totaled CHF 1.1 billion, a decline of 31% year on year. Net revenues for 2020 declined by 10% to CHF 3.7 billion. Private Banking recorded record-high net new assets of CHF 16.7 billion, a rise of 5% year on year, with notable inflows from emerging markets and West-ern Europe. Asset Management generated a loss before taxes of CHF 39 million for 2020, which mainly reflected the impairment loss from York in the final quarter. At CHF 1.1 billion, net rev-enues were down 33% compared to 2019.
The Asia Pacific (APAC) division increased net revenues to CHF 3.2 billion in 2020, 4% up from the previous year. Income before taxes for 2020 totaled CHF 828 million, a decline of 10% year on year. The rise in transaction-based revenues only partially compensated for higher provision for credit losses. Total operat-ing expenses rose by 2% to CHF 2.1 billion compared to 2019. The division attracted net new assets of CHF 8.6 billion in 2020, an impressive result. APAC had assets under management of CHF 221.3 billion at the end of the year.
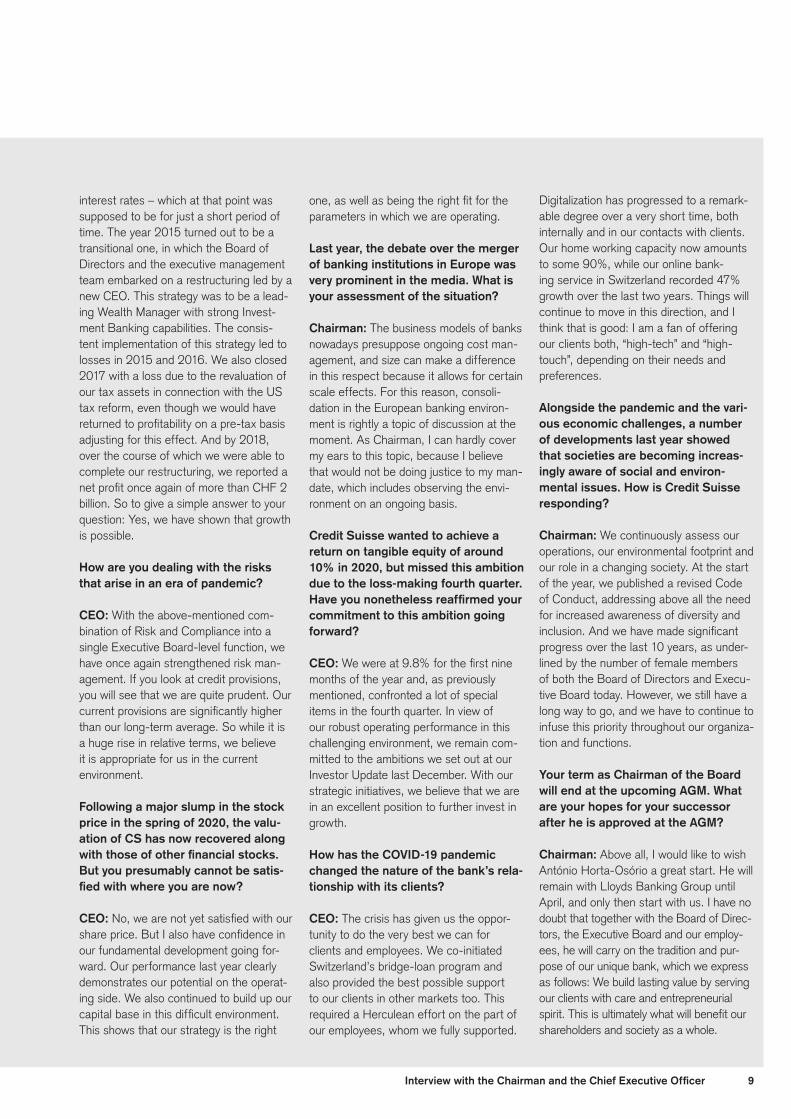
Urs Rohner, Chairman of the Board of Directors (left) and Thomas Gottstein, Chief Executive Officer.

6 Message from the Chairman and the Chief Executive Officer
The IB division recorded income before taxes of CHF 1.7 billion in 2020, an increase of 61% year on year. Net revenues rose by 11% to CHF 9.1 billion compared to the previous year, with all busi-ness lines contributing to this result. Total operating expenses for 2020 declined by 1% year on year. Return on regulatory capital** was 12.2% for 2020, compared to just 7.1% for the prior year. The IB achieved this outstanding result in an environment character-ized by the repercussions of the COVID-19 pandemic and high volatility, which was also impacted by geopolitical and macroeco-nomic uncertainties such as the UK’s exit from the EU and the US presidential elections. The weakening of the US dollar impacted our reported result in Swiss francs as it had a negative effect on rev-enues while at the same time reducing operating expenses.
Creating value for shareholders In keeping with our intention to increase the ordinary dividend per share by at least 5% per annum, the Board of Directors will pro-pose a cash distribution of CHF 0.2926 per share for the 2020 financial year to shareholders at the Annual General Meeting on April 30, 2021. Half of the distribution will be paid out of capital contribution reserves, free of withholding tax and not subject to income tax for Swiss resident individuals who hold the shares as a private investment; the remaining half will be paid out of retained earnings, net of 35% Swiss withholding tax.
In December, we completed our share buyback program for 2020 that we had started on January 6, 2020 and then had to sus-pend in March as a result of the COVID-19 pandemic. As part of this program, we bought back approximately 28.5 million shares for a total of CHF 325 million, which were then cancelled in line with the capital reduction approved by shareholders at the 2020 Annual General Meeting.
Our share buyback program for 2021, through which we intend to buy back shares amounting to at least CHF 1.0 billion with an upper limit of CHF 1.5 billion, subject to market and economic con-ditions, kicked off in January. The shares bought back in 2021 are expected to be cancelled via a capital reduction, in line with a reso-lution expected to be passed at a later Annual General Meeting.
Resilient business model generates capitalOur resilient diversified business model allows us to continue to generate capital. Already at the end of 2019, our capital and leverage ratios met the Swiss regulatory requirements that took effect in 2020. We strengthened our capital base once again last year. This is reflected in our common equity tier 1 (CET1) ratio, which rose from 12.7% at the end of 2019 to 12.9% at the end of 2020.
Reflecting the fourth quarter results, the Group’s Return on Tan-gible Equity (RoTE)** declined to 6.6% for the full year 2020. For the first nine months of 2020, this figure stood at 9.8%, higher than the 8.7% reported for the full year 2019. We are maintaining our medium-term RoTE** target of 10-12%, in a normalized envi-ronment and subject to market and economic conditions. Diluted earnings per share for 2020 amounted to CHF 1.06, compared to CHF 1.32 for 2019, while the tangible book value per share**
remained stable at CHF 15.80 at the end of 2020, compared to CHF 15.88 at the end of 2019.
Cooperative dialogue with regulatorsAs reported in last year’s Annual Report, the Swiss Financial Market Supervisory Authority FINMA (FINMA) regarded our emergency plan for Credit Suisse (Schweiz) AG in February 2020 as effective. In September 2020, FINMA announced that it was opening enforcement proceedings against Credit Suisse in the context of the “observation activities.” We are cooperating fully in these proceedings, and working with our Swiss regulator to ensure a comprehensive and brisk resolution of this matter.
Changes to the Board of Directors and Executive BoardAfter serving on the Board of Directors for 12 years and chair-ing this body for 10 of them, Urs Rohner will step down from the Board at this year’s Annual General Meeting, in keeping with the maximum term of 12 years introduced during his time in office. The Board of Directors is pleased to be able to propose António Horta-Osório for election as the new Chairman of the Board of Directors at the Annual General Meeting on April 30, 2021. António Horta-Osório has been Group Chief Executive Officer of Lloyds Banking Group, the largest retail and commercial bank in the UK, since 2011. With this proposed appointment, the Board of Directors is looking forward to gaining as its new Chairman a profoundly experienced figure in the international banking industry with a proven track record.
In addition to Urs Rohner, two other current members of the Board of Directors will not be standing for re-election at the 2021 Annual General Meeting: Joaquin J. Ribeiro and John Tiner. As already communicated at the end of October last year, the Board of Directors of Credit Suisse Group AG will be proposing the election of two new, non-executive members of the Board of Directors at the Annual General Meeting on April 30, 2021, namely Clare Brady and Blythe Masters. Clare Brady, a British citizen, was previously director of Internal Audit at the Interna-tional Monetary Fund. She is currently a member of the Audit and Risk Commission of the International Federation of Red Cross and Red Crescent Societies in Switzerland, and a non-executive member of the Board of Directors of Fidelity Asian Values, PLC in the UK. Blythe Masters, likewise a British citizen, held a num-ber of leading functions at J.P. Morgan Chase over a period of 27 years. She then moved to Digital Asset Holdings, an enterprise blockchain company for which she acted as CEO until 2018. She is currently a member of the Board of Directors of A.P. Møller-Maersk, as well as Chair of the Board of Directors and Audit Committee of Phunware, an enterprise mobile platform.
In keeping with the launch of the above-mentioned strategic ini-tiatives, there have also been changes to the Executive Board. We transferred management responsibility for the global Invest-ment Bank to Brian Chin, who previously headed up our former Global Markets division. David Miller, previously CEO of the for-mer Investment Banking & Capital Markets division, has stepped down from the Executive Board and taken over management of the capital markets and advisory business within IB. With the aim

7Message from the Chairman and the Chief Executive Officer
of bringing greater effectiveness and efficiency to our control-ling environment given changing regulatory parameters, we have now combined Risk and Compliance into the single function of Chief Risk and Compliance Officer (CRCO), which is held by Lara Warner. The new Sustainability, Research & Investment Solutions (SRI) function is headed by Lydie Hudson as CEO.
Ongoing commitment to sustainabilityThe new Executive Board-level function for sustainability under-scores our commitment to this topic, which formed an important aspect of Group strategy in 2020. While the challenge of climate change received rather less public attention last year due to the pandemic, we are in no doubt that the Earth’s climate and other sustainability questions will rightfully remain in the spotlight over the coming decade. We want to be a leading provider of sus-tainability solutions in the financial industry, across our Wealth Management and the Investment Bank. We are underlining this ambition by assigning the mandate of a Board of Directors Sus-tainability Leader to our board member Iris Bohnet.
In 2020, we made significant progress in this area. Specifically, we introduced the Client Energy Transition Frameworks for the key industries of oil and gas, mining, and utilities/power genera-tion, which we believe will form an important part of our strategic program of evaluating the energy transition readiness of corpo-rate clients in these sectors. Our progress in this area is attract-ing recognition. For example, as part of the annual review of the S&P Dow Jones Indices in November 2020, we were once again selected as an index component of both the Dow Jones Sus-tainability World Index and the Dow Jones Sustainability Europe Index. Meanwhile, Credit Suisse’s rating by the Carbon Disclosure Project in respect of climate-related disclosure improved to “A-,” while the MSCI ESG rating improved to “A.”
Outlook and recent eventsAt our 4Q20 results announcement on February 18, 2021, we noted in our outlook statement that Credit Suisse has seen a strong start to 2021. This has continued over the last month, with the Group achieving the highest level of income before taxes in both January and February in a decade. Our Investment Bank division is benefitting from a particularly strong performance in capital markets issuance activity and from a continued good per-formance across sales & trading, with overall Investment Bank year-to-date revenues up over 50% compared to the same period last year. Increased YoY client activity is also benefitting all three of our Wealth Management-related businesses, led by growth in GTS, and with particular strength in the Asia Pacific division, while sequentially net interest income is stabilizing and recur-ring commissions and fees continue to trend up. Notwithstand-ing the continued COVID-19 pandemic, our credit loss experience remains benign, with signs of improvement in the global economy beginning to benefit allowance for credit losses under the current expected credit loss (CECL) accounting methodology.
With regard to the suspension and liquidation of the supply chain finance funds (with an aggregate net asset value of approximately USD 10 billion as published in late February 2021) managed by
Credit Suisse Asset Management (CSAM) with assets origi-nated and structured by Greensill Capital, Credit Suisse’s prior-ity remains the recovery of funds for CSAM’s investors. CSAM is working closely with the administrators of Greensill Capital, Grant Thornton, and with other parties to facilitate this process. Initial redemption repayments totalling USD 3.1 billion across the four funds have been made beginning on March 8, 2021. The funds’ management companies intend to announce further cash distributions over the coming months, and we will update fund investors accordingly. With respect to the collateralized USD 140 million bridge loan made by Credit Suisse to Greensill Capital last year, USD 50 million has been recently repaid by the administra-tors of Greensill Capital, reducing the outstanding loan to USD 90 million. While these issues are still at an early stage, we would note that it is reasonably possible that Credit Suisse will incur a charge in respect of these matters.
On March 17, 2021, and subsequent to the recent reports and announcements regarding the CSAM managed supply chain finance funds, the Board of Directors of the Group decided to appoint Ulrich Körner as CEO of Asset Management and a mem-ber of the Group Executive Board, effective April 1, 2021. From that date, the Asset Management business will be separated from the International Wealth Management division and managed as a new separate division. As a member of the Executive Board, Ulrich Körner will report directly to the Group CEO, Thomas Gottstein.
As a final point, we would like to thank our roughly 49,000 employees around the world for their terrific work and dedica-tion in 2020. The repercussions of the coronavirus pandemic have posed major challenges to our clients, our company and the everyday working lives of our employees. What we achieved in 2020 for our clients under difficult circumstances makes us proud, and strengthens confidence that our bank will prove suc-cessful in tackling the challenges that lie ahead – whether that be tackling the ongoing pandemic, the demands posed by the ongo-ing digitalization of financial services or the greatest social and macroeconomic challenge of our era – climate change.
Best regards
Urs Rohner Thomas GottsteinChairman of the Chief Executive OfficerBoard of Directors
March 2021
> Refer to “Important Information” on page 10 for a reconciliation of adjusted results and further information.

8 Interview with the Chairman and the Chief Executive Officer
Interview with the Chairman and the Chief Executive Officer
objectives set out in the Paris Agreement. The strategy is the right one, and we are making it future-oriented by aligning it with the key themes of the coming years.
Urs Rohner, after 10 years as Chair-man, 12 years on the Board of Directors, and a full 17 years at Credit Suisse, you are not standing for re-election at this year’s AGM. Is now the right time?
Chairman: Well, I suppose I’m at fault myself when it comes to the timing, as the term restriction of 12 years for a board member was after all introduced during my tenure as Chairman. I am convinced that in these kinds of functions, change is nec-essary at appropriate intervals. So in that sense, it’s time for a change in my case too. The outstanding qualities my desig-nated successor, António Horta-Osório, brings to the table only strengthen me in that belief.
You have joined the Executive Board in 2004. How does the Credit Suisse of 2021 differ from the Credit Suisse of 2004?
Chairman: To be honest, a comprehen-sive answer to that question would go beyond the scope of this interview. On the one hand, the DNA of Credit Suisse is very much the same: an entrepreneur’s bank that shapes its business in accor-dance with the social and economic chal-lenges of the era. But when you compare operating and strategic business models, no stone has been left unturned. And don’t forget that as an industry we are operating in a very different environment compared to 17 years ago.
By that you mean what specifically?
Chairman: It took years to repair the damage of the financial crisis of 2007-2008 and the subsequent eurozone debt crisis. Also, for a global, systemically important big bank operating from Swit-zerland, the introduction of the automatic
After three very good quarters despite a difficult operating environment, you closed the fourth quarter of 2020 with a loss due to several items, which had an adverse impact on your results. Does that frustrate you?
CEO: The write-downs and costs from litigation issues we booked in the fourth quarter – with the underlying matters dat-ing back several years – do frustrate me, yes. This is natural. On the other hand, it was important for us to find a resolution as rapidly as possible and keep these matters from holding us back in the future.
In connection with the presentation of the results for the full year 2020, you talked about a basis for growth. What do you mean by that?
CEO: Not only did we have to absorb the repercussions of the pandemic in 2020, we also had to confront other macroeco-nomic challenges, along with highly unfa-vorable exchange rate movements. In my view, we did a good job in rising to those challenges. It became clear last year that our strategy of being a leading wealth manager with strong global investment banking capabilities could withstand the kind of pandemic not seen for generations.
So aren’t any corrections to the strat-egy needed?
CEO: We launched a number of strategic initiatives last year to position ourselves for growth. We created a global Invest-ment Bank and aligned our Risk and Compliance control functions in a newly integrated Risk and Compliance area at the Executive Board level. In addition, we established an entirely new function at the Executive Board level – Sustainability, Research & Investment Solutions – with the ambition to put sustainability at the core of our offering to private, corporate and institutional clients. We want to lead the way with our research-based advisory activity. At the same time, we are under-scoring our commitment to achieving the
exchange of information fundamentally redefined the rules of the cross-border wealth management business.
And how did these changes impact Credit Suisse?
Chairman: Looking back at my time as Chairman, the years from 2011 to 2015 were challenging, as we still had to deal with the repercussions of 2008. In addi-tion to legal disputes and regulatory inves-tigations, we were above all grappling with a need for reform that was apparent throughout the financial industry. And all this came against the backdrop of a euro-zone debt crisis, the new Basel III frame-work, and the “Too Big to Fail” legislation in Switzerland. Specifically, we needed to be more resilient, build up more capital, ensure more stable financing and adjust the bank’s business model, as well as exit certain business areas. With regard to the build-up of capital and the reduction of risks, we had met our planned objec-tives by the end of 2013. In 2014, we resolved significant legacy issues relating to the cross-border business with the US authorities, while in the very same year the G20 confirmed the automatic exchange of information as a global standard. These – combined with the so-called “Swiss finish” – were the key parameters for the world of banking following the great financial crisis, together with the Financial Stability Board’s proposal in respect of the loss-absorbing capacity of global systemically important banks, of which Credit Suisse is one.
Did you ever ask yourselves whether growth was even possible against such a backdrop?
Chairman: The strategic question of how a company or indeed an industry can grow sustainably will always arise, irrespective of the prevailing environment. For instance, in mid-January 2015, we saw the decision by the Swiss National Bank to abandon the minimum level it had set for the euro-Swiss franc exchange rate, along with the introduction of negative
Interview with the Chairman and the Chief Executive Officer
9Interview with the Chairman and the Chief Executive Officer
one, as well as being the right fit for the parameters in which we are operating.
Last year, the debate over the merger of banking institutions in Europe was very prominent in the media. What is your assessment of the situation?
Chairman: The business models of banks nowadays presuppose ongoing cost man-agement, and size can make a difference in this respect because it allows for certain scale effects. For this reason, consoli-dation in the European banking environ-ment is rightly a topic of discussion at the moment. As Chairman, I can hardly cover my ears to this topic, because I believe that would not be doing justice to my man-date, which includes observing the envi-ronment on an ongoing basis.
Credit Suisse wanted to achieve a return on tangible equity of around 10% in 2020, but missed this ambition due to the loss-making fourth quarter. Have you nonetheless reaffirmed your commitment to this ambition going forward?
CEO: We were at 9.8% for the first nine months of the year and, as previously mentioned, confronted a lot of special items in the fourth quarter. In view of our robust operating performance in this challenging environment, we remain com-mitted to the ambitions we set out at our Investor Update last December. With our strategic initiatives, we believe that we are in an excellent position to further invest in growth.
How has the COVID-19 pandemic changed the nature of the bank’s rela-tionship with its clients?
CEO: The crisis has given us the oppor-tunity to do the very best we can for clients and employees. We co-initiated Switzerland’s bridge-loan program and also provided the best possible support to our clients in other markets too. This required a Herculean effort on the part of our employees, whom we fully supported.
interest rates – which at that point was supposed to be for just a short period of time. The year 2015 turned out to be a transitional one, in which the Board of Directors and the executive management team embarked on a restructuring led by a new CEO. This strategy was to be a lead-ing Wealth Manager with strong Invest-ment Banking capabilities. The consis-tent implementation of this strategy led to losses in 2015 and 2016. We also closed 2017 with a loss due to the revaluation of our tax assets in connection with the US tax reform, even though we would have returned to profitability on a pre-tax basis adjusting for this effect. And by 2018, over the course of which we were able to complete our restructuring, we reported a net profit once again of more than CHF 2 billion. So to give a simple answer to your question: Yes, we have shown that growth is possible.
How are you dealing with the risks that arise in an era of pandemic?
CEO: With the above-mentioned com-bination of Risk and Compliance into a single Executive Board-level function, we have once again strengthened risk man-agement. If you look at credit provisions, you will see that we are quite prudent. Our current provisions are significantly higher than our long-term average. So while it is a huge rise in relative terms, we believe it is appropriate for us in the current environment.
Following a major slump in the stock price in the spring of 2020, the valu-ation of CS has now recovered along with those of other financial stocks. But you presumably cannot be satis-fied with where you are now?
CEO: No, we are not yet satisfied with our share price. But I also have confidence in our fundamental development going for-ward. Our performance last year clearly demonstrates our potential on the operat-ing side. We also continued to build up our capital base in this difficult environment. This shows that our strategy is the right
Digitalization has progressed to a remark-able degree over a very short time, both internally and in our contacts with clients. Our home working capacity now amounts to some 90%, while our online bank-ing service in Switzerland recorded 47% growth over the last two years. Things will continue to move in this direction, and I think that is good: I am a fan of offering our clients both, “high-tech” and “high-touch”, depending on their needs and preferences.
Alongside the pandemic and the vari-ous economic challenges, a number of developments last year showed that societies are becoming increas-ingly aware of social and environ-mental issues. How is Credit Suisse responding?
Chairman: We continuously assess our operations, our environmental footprint and our role in a changing society. At the start of the year, we published a revised Code of Conduct, addressing above all the need for increased awareness of diversity and inclusion. And we have made significant progress over the last 10 years, as under-lined by the number of female members of both the Board of Directors and Execu-tive Board today. However, we still have a long way to go, and we have to continue to infuse this priority throughout our organiza-tion and functions.
Your term as Chairman of the Board will end at the upcoming AGM. What are your hopes for your successor after he is approved at the AGM?
Chairman: Above all, I would like to wish António Horta-Osório a great start. He will remain with Lloyds Banking Group until April, and only then start with us. I have no doubt that together with the Board of Direc-tors, the Executive Board and our employ-ees, he will carry on the tradition and pur-pose of our unique bank, which we express as follows: We build lasting value by serving our clients with care and entrepreneurial spirit. This is ultimately what will benefit our shareholders and society as a whole.

10 Message from the Chairman and the Chief Executive Officer
Important Information
* Refers to adjusted results or adjusted results excluding significant items as applicable. Results excluding items included in our reported results are non-GAAP financial measures.
in 2020 2019 % change
Results (CHF million)
Income/(loss) before taxes 3,467 4,720 (27)
Total adjustments 1,181 248 376
Adjusted income before taxes 4,648 4,968 (6)
Significant items
gain related to InvestLab transfer 268 327 (18)
gain on equity investment in Allfunds Group 127 0 –
gain on equity investment in SIX Group AG 158 498 (68)
gain on equity investment in Pfandbriefbank 134 0 –
impairment on York Capital Management (414) 0 –
Adjusted income before taxes
excluding significant items 4,375 4,143 6
Adjusted results are non-GAAP financial measures which exclude certain items included in our reported results. Refer to “Reconciliation of adjusted results” in II – Operating and finan-cial review – Credit Suisse for further information.
** Return on tangible equity, return on regulatory capital and tangible book value per share are non-GAAP financial measures. Refer to II – Operat-ing and financial review – Credit Suisse for information on how these measures are calculated and to “Financial goals” in I- Information on the company – Strategy for further information on ambitions that are non-GAAP financial measures. For further details on capital-related information, see “Capital Manage-ment-Regulatory Capital Framework” in III-Treasury, Risk, Balance sheet and Offbalance sheet.
References to Wealth Management mean SUB Private Clients, IWM Private Banking and APAC or their combined results. References to Wealth Management-related mean SUB, IWM and APAC or their combined results. References to global investment banking mean the Investment Bank, APAC advisory and underwriting as well as M&A, DCM and ECM in SUB Corporate & Institutional Clients. References to pre-provision profit mean pre-tax income excluding provision for credit losses.
We may not achieve all of the expected benefits of our strategic initia-tives. Factors beyond our control, including but not limited to the market and economic conditions (including macroeconomic and other challenges and uncertainties, for example, resulting from the COVID-19 pandemic), changes in laws, rules or regulations and other challenges discussed in our public filings, could limit our ability to achieve some or all of the expected benefits of these initiatives.
This document contains forward-looking statements that involve inherent risks and uncertainties, and we might not be able to achieve the predic-tions, forecasts, projections and other outcomes we describe or imply in forward-looking statements. A number of important factors could cause results to differ materially from the plans, objectives, expectations, esti-mates and intentions we express in these forward-looking statements, including those we identify in I – Information on the company – Risk factors and in the “Cautionary statement regarding forward-looking information” in our Annual Report 2020 on Form 20-F for the fiscal year ended December 31, 2020 and other public filings and press releases. We do not intend to update these forward-looking statements.
This document contains certain unaudited interim financial information for the first quarter of 2021. This information has been derived from man-agement accounts, is preliminary in nature, does not reflect the complete results of the first quarter of 2021 and is subject to change, including as a result of any normal quarterly adjustments in relation to the financial state-ments for the first quarter of 2021. This information has not been subject to any review by our independent registered public accounting firm. There can be no assurance that the final results for these periods will not differ from these preliminary results, and any such differences could be material. Quarterly financial results for the first quarter of 2021 will be included in our 1Q21 Financial Report. These interim results of operations are not nec-essarily indicative of the results to be achieved for the remainder of the full first quarter of 2021.
In preparing this document, management has made estimates and assump-tions that affect the numbers presented. Actual results may differ. Annu-alized numbers do not take into account variations in operating results, seasonality and other factors and may not be indicative of actual, full-year results. Figures throughout this document may also be subject to rounding adjustments. All opinions and views constitute judgments as of the date of writing without regard to the date on which the reader may receive or access the information. This information is subject to change at any time without notice and we do not intend to update this information.
11
Credit Suisse at a glance 12
Strategy 13
Divisions 19
Regulation and supervision 26
Risk factors 45
I – Information on the company

12 Credit Suisse at a glance
Credit Suisse at a glance
Swiss Universal BankThe Swiss Universal Bank division offers comprehensive advice and a wide range of financial solutions to private, corporate and institutional clients primarily domiciled in our home market of Switzerland, which offers attractive growth opportunities and where we can build on a strong market position across our key businesses. Our Private Clients business has a leading franchise in our Swiss home market and serves ultra-high-net-worth indi-vidual, high-net-worth individual, affluent and retail clients. Our Corporate & Institutional Clients business serves large corporate clients, small and medium-sized enterprises, institutional clients, external asset managers, financial institutions and commodity traders.
Investment BankThe Investment Bank division delivers client-centric sales and trading products, services and solutions across all asset classes and regions as well as advisory, underwriting and financing ser-vices. Our range of products and services includes global securi-ties sales, trading and execution, prime brokerage, capital raising and comprehensive corporate advisory services. Additionally, our Global Trading Solutions platform provides centralized trading and sales services to the Group’s other business divisions. Our clients include financial institutions and sponsors, corporations, govern-ments, ultra-high-net-worth individuals, sovereigns and institutional investors.
International Wealth ManagementThe International Wealth Management division through its Private Banking business offers comprehensive advisory services and tai-lored investment and financing solutions to wealthy private clients and external asset managers in Europe, the Middle East, Africa and Latin America, utilizing comprehensive access to the broad spectrum of Credit Suisse’s global resources and capabilities as well as a wide range of proprietary and third-party products and services. Our Asset Management business offers investment solutions and services globally to a broad range of clients, includ-ing pension funds, governments, foundations and endowments, corporations and individuals.
Asia PacificThe Asia Pacific division delivers an integrated wealth manage-ment, financing, underwriting and advisory offering to our target ultra-high-net-worth, entrepreneur and corporate clients. We provide a comprehensive suite of wealth management products and services to our clients in Asia Pacific and provide a broad range of advisory services related to debt and equity underwrit-ing of public offerings and private placements as well as merg-ers and acquisitions. Our close collaboration with the Investment Bank supports and enables our wealth management activities in the region through the delivery of holistic, innovative products and tailored advice.
Credit Suisse Our strategy builds on Credit Suisse’s core strengths: its position as a leading global wealth manager, its specialist investment banking capabilities and its strong presence in our home market of Switzerland. We seek to follow a balanced approach with our wealth management activities, aiming to capitalize on both the large pool of wealth within mature markets as well as the signifi-cant growth in wealth in Asia Pacific and other emerging markets. Founded in 1856, we today have a global reach with operations in about 50 countries and 48,770 employees from over 150 different nations. Our broad footprint helps us to generate a more geographically balanced stream of revenues and net new assets and allows us to capture growth opportunities around the world. We serve our clients through three regionally focused divisions: Swiss Universal Bank, International Wealth Management and Asia Pacific. These regional businesses are supported by our Investment Bank division. Our business divisions cooperate closely to pro-vide holistic financial solutions, including innovative products and specially tailored advice.

13Strategy
Strategy
Credit Suisse strategyOur strategy is to be a leading Wealth Manager with strong global Investment Banking capabilities.Our strategy has driven our operational success as we have transformed Credit Suisse since 2015. During our restructur-ing phase between 2015 and 2018, we lowered our break-even point through a significant reduction in our cost base, success-fully de-risked our investment banking activities and strengthened our capital base. Since then, we have implemented a series of structural refinements intended to improve effectiveness, drive efficiencies and capture future growth opportunities.
Our organizational structure now consists of three regionally focused Wealth Management-related divisions: Swiss Universal Bank, Inter-national Wealth Management and Asia Pacific, supported by the global Investment Bank. We launched a new Sustainability, Research & Investment Solutions (SRI) function at the Executive Board level, underlining the sharpened focus on sustainability. We combined our former Risk Management and Compliance functions into a single integrated Chief Risk and Compliance Officer function to unlock potential global synergies. Our operating businesses are supported by focused corporate functions at the Group Executive Board level, consisting of: Chief Financial Officer, Chief Operating Officer, Chief Risk and Compliance Officer, Sustainability, Research & Investment Solutions, General Counsel and Human Resources.
We are now focused on the growth phase of our strategic journey, proactively investing to capture growth opportunities across all our businesses, and our ambition to be a leader in sustainability.
Accelerate Wealth Management growth
We believe wealth management is one of the most attractive seg-ments in banking. Global wealth has grown significantly in recent years and is projected to continue to outgrow GDP over the com-ing years. We seek to follow a balanced approach with our wealth management activities, aiming to capitalize on both the large pool of wealth within mature markets as well as the significant growth in wealth in Asia Pacific and other emerging markets.
The entrepreneurs and ultra-high-net-worth individuals (UHNWI) segment is expected to be the fastest growing wealth segment especially in the higher growth emerging markets. We believe that our positioning as the “Bank for Entrepreneurs” by leverag-ing our strengths in Wealth Management and Investment Banking provides us with differentiated capabilities to protect and grow our clients’ wealth and offer an integrated approach across their pri-vate and corporate financial needs.
Through our regionalized model, across our three Wealth Man-agement-related divisions Swiss Universal Bank, International Wealth Management and Asia Pacific, we have enhanced our cli-ent proximity and react to changing client needs.
Since 2015, we have built on our leading regional wealth man-agement positions to significantly grow our Wealth Management business. We have attracted CHF 250.9 billion of net new assets since the beginning of 2016, leading to record Assets under Management of CHF 1,511.9 billion at the end of 2020. We will seek to accelerate our growth by investing into our Wealth Man-agement-related businesses with the ambition to deliver positive operating leverage and a return on regulatory capital of 20-25% in the medium-term. We also aim to grow our Wealth Manage-ment-related income before taxes to between CHF 5.0-5.5 bil-lion in 2023.
> References to our Wealth Management-related businesses mean our Swiss Universal Bank division, our International Wealth Management division and our Asia Pacific division or their combined results.
> References to our Wealth Management businesses mean the Private Clients business within Swiss Universal Bank, the Private Banking business within International Wealth Management and the Asia Pacific division or their com-bined results.
We are implementing the following initiatives with clear medium-term ambition growth rates for the Swiss Universal Bank, Interna-tional Wealth Management and Asia Pacific to deliver our financial ambitions in our Wealth Management business:p Grow client business volume by building on our Bank for
Entrepreneurs;p Enhance our financing solutions;p Grow mandates leveraging our “House View”;p Capture opportunities in private markets;p Develop sustainable investing and financing solutions;p Accelerate digital transformation; andp Extend collaboration with Asset Management, Global Trading
Solutions (GTS) and the Investment Bank.
Generate sustainable Investment Bank returns
A strong investment banking business is key to our ability to pro-vide institutional-style solutions as well as capital markets and advisory services to our wealth management clients.
Effective August 1, 2020, we created a single, globally-integrated Investment Bank division through the combination of our former Global Markets, Investment Banking & Capital Markets and Asia Pacific Markets businesses to achieve critical scale. Our newly integrated global division is intended to be more diversified, more balanced, less volatile and more connected to our Wealth Man-agement clients.
In addition, GTS was created within the Investment Bank through the combination of the successful businesses of International Trading Solutions (ITS) and Asia Pacific Solutions. GTS is a joint venture between the Investment Bank and our International Wealth Management, Swiss Universal Bank and Asia Pacific divi-sions to provide institutional-style solutions to our wealth man-agement clients.
14 Strategy
Since 2016, we have transformed the Investment Bank, growing our revenues by 13% to USD 9.7 billion and more than tripling our income before taxes to USD 1.8 billion in 2020 while significantly reducing the risk profile of the business. We are focused on driving sustainable returns across the Investment Bank and delivering on our medium-term return on regulatory capital ambition of 10-15%.
We believe we are well-positioned for the post COVID-19 market environment, and will benefit from the expected recovery in merg-ers and acquisitions (M&A) and asset finance, increased capi-tal markets activity driven by leveraged finance and anticipated normalization of credit loss provisions. We intend to continue to strengthen the connectivity to our Wealth Management-related businesses, particularly through GTS, delivering institutional-style solutions to Wealth Management clients and the newly established mid-market M&A and advisory team in International Wealth Management. We are focused on disciplined investment in people, capital and technology in our market-leading businesses across equities, fixed income and capital markets and advisory.
Be a leader in sustainability
Credit Suisse’s commitment to integrating sustainability across our businesses and operations led to the creation of Sustainabil-ity, Research & Investment Solutions at the Executive Board level. We aim to deliver industry-leading sustainable insights and solu-tions across wealth management, investment banking, corporate and institutional clients and provide a single “House View” with a focus on supertrends and sustainability. We are also committed to driving our own transition, including our commitment to achieve net zero emissions from our operations, supply chain and financ-ing activities no later than 2050, with intermediate emissions goals for 2030, as well as our commitment to develop science-based targets.
Our ambition is to provide sustainable investment solutions at the core of our offering to wealth management clients. We are extending the breadth and depth of our offering by integrating Environmental, Social and Governance (ESG) into our investment processes through our proprietary Credit Suisse Sustainability Framework. In 2020, we announced the goal to provide at least CHF 300 billion of sustain-able financing over the next 10 years, supported by our proprietary Client Energy Transition Framework. In addition, we aim to partner with industry leaders and NGOs to drive best-in-class ESG standard setting.
We have established a Board-level Sustainability Advisory Com-mittee to oversee our sustainability strategy and its execution and have established a Sustainability Leadership Committee with senior representatives from each division and control function to drive and execute our sustainability strategy across the bank.
COVID-19 pandemic
The spread of COVID-19 has had a significant impact on the global economy. In response to the COVID-19 outbreak in
countries and regions in which the Group operates, the Executive Board invoked our formal crisis management process and put in place various response measures, including travel restrictions, a quarantine protocol, guidelines for client meetings and employee gatherings and certain changes to the daily operations of critical processes, in order to ensure continuity of our business opera-tions and protect the health and safety of employees.
Through the COVID-19 pandemic, Credit Suisse has supported its employees, clients and the communities in which we oper-ate. We have provided free antibody testing to employees and extended paid family leave in locations with closed schools. An internal survey in June 2020 showed that more than 90% of our employees felt well-supported and informed by management’s response to the COVID-19 pandemic.
Credit Suisse has played an active role in the design and execu-tion of the COVID-19 SME financing program sponsored by the Swiss government that provided CHF 17 billion of financing and we have conducted a bank-wide donation matching program rais-ing approximately CHF 25 million for charities focused on allevi-ating the impact of COVID-19 and supporting those affected by inequality.
Credit Suisse was able to process a loan volume of approximately CHF 3 billion in 2020 as part of the COVID-19 bridge loan pro-gram to help support the Swiss economy. As a supplement to this program, in January 2021 we also made available to our corpo-rate clients an additional credit facility of CHF 500 million.
Our COVID-19 crisis management efforts were recognized by Euromoney with an award for “Global Excellence in Leadership” – Euromoney Awards for Excellence 2020.
We are closely monitoring the spread of COVID-19 and the potential effects on our operations, business and financial per-formance, including credit loss estimates, trading revenues, net interest income and potential goodwill assessments.
> Refer to “COVID-19 pandemic and related regulatory measures” in II – Operat-ing and financial review – Credit Suisse for further information regarding other developments pertaining to COVID-19.
Financial ambitionsOur financial ambitions are:p Intend to deliver a medium-term Group return on tangible
equity (RoTE) of 10-12%, in a normalized environment, subject to market and economic conditions;
p Aim to increase Wealth Management-related income before taxes to between CHF 5.0-5.5 billion in 2023;
p Intend to deliver on our medium-term return on regulatory cap-ital ambition of 20-25% in our Wealth Management-related businesses and 10-15% for our global Investment Bank;
p Drive positive operating leverage, including with continued innovation in digitalization and automation;
15Strategy
p Continue to accrue for at least 5% dividend growth per annum, including with respect to the planned 2020 dividend compared to the total 2019 dividend of CHF 0.2776 per share; and
p Intend to buy back at least CHF 1.0 billion of shares in 2021, and up to a maximum of CHF 1.5 billion for the full year, sub-ject to market and economic conditions.
We aim to operate with a common equity tier 1 (CET1) ratio of at least 12.5% and a Tier 1 ratio in excess of 17.5% for at least the first half of 2021 given the ongoing COVID-19 pandemic.
We expect to record total restructuring expenses over the course of our current restructuring program of approximately CHF 300-350 million which we believe will allow us to generate approxi-mately CHF 250-300 million of gross savings in 2021 and approximately CHF 400-450 million gross savings from 2022 onwards. Together with ongoing productivity measures, this will allow for reinvestment, subject to market and economic condi-tions, of approximately CHF 300-600 million across Wealth Man-agement and the Investment Bank, as well as in technology and SRI.
Our ambitions often include metrics that are non-GAAP financial measures and are unaudited. A reconciliation of these ambitions to the nearest generally accepted accounting principles (GAAP) mea-sures is unavailable without unreasonable efforts. Adjusted results exclude goodwill impairment, major litigation provisions, real estate gains and other revenue and expense items included in our reported results, all of which are unavailable on a prospective basis. Return on Tangible Equity is based on tangible shareholders’ equity, a non-GAAP financial measure also known as tangible book value, which is calculated by deducting goodwill and other intangible assets from total shareholders’ equity as presented in our balance sheet, both of which are unavailable on a prospective basis. Return on regulatory capital, a non-GAAP financial measure, is calculated using income/(loss) after tax and assumes a tax rate of 25% and capital allocated based on the average of 10% of risk-weighted assets (RWA) and 3.5% of leverage exposure; the essential components of this cal-culation are unavailable on a prospective basis. Such ambitions are calculated in a manner that is consistent with the accounting policies applied by us in preparing our financial statements.
Withdrawal of the UK from the EU and our legal entity structureFollowing extensive negotiations with the EU on the terms of its withdrawal, the UK ceased to be a member of the EU on Janu-ary 31, 2020. Under the terms of the withdrawal agreement, the UK continued to be bound by EU laws for a transitional period, through December 31, 2020.
Our UK investment banking entities, Credit Suisse International and Credit Suisse Securities Europe Limited, have in the past provided a comprehensive range of investment banking services to clients through both the London operations and a number of different branches across the European Union and, following the UK’s withdrawal, subject to certain exceptions, we completed the transfer of their EU clients and EU venue-facing businesses to entities in the EU. In order to provide continued services to EU clients and access to EU markets, we leveraged our exist-ing legal entity network and, where necessary, transferred our EU clients and EU venue-facing broker-dealer business to Group entities incorporated in Spain, Credit Suisse Securities, Sociedad de Valores, S.A., and Germany, Credit Suisse (Deutschland) AG. We transferred our EU client lending business activities, where required, to Credit Suisse (Deutschland) AG. Businesses in the UK entities’ EU branches were transferred to branches of Credit Suisse Securities, Sociedad de Valores, S.A.
In July 2020, an application for authorization as a credit institution was filed with the Bank of Spain to convert the existing broker-dealer entity, Credit Suisse Securities, Sociedad de Valores, S.A., into a fully licensed banking entity, Credit Suisse Bank (Europe) SA. The application is currently under consideration by the Bank of Spain and the European Central Bank, and subject to their authorization, the conversion is anticipated to take place by mid-year 2021. The new bank will be able to provide the full suite of investment banking business EU-wide, including capital markets advice, loan origination, arranging, underwriting, distribution and securities and derivatives sales, trading and execution services.
Our UK wealth management entity, Credit Suisse (UK) Limited, has in the past provided a comprehensive range of wealth man-agement services to clients through its London operations and, following the UK’s withdrawal, ceased such services to its EU cli-ents. In order to provide continued services to such clients, where necessary, we transferred clients to other existing entities in our wealth management entity network in the EU.
Following the UK’s withdrawal from the EU and in the context of an overarching global legal entity simplification program, the Group has furthermore developed a comprehensive EU entity strategy during 2020, which is in the process of implementa-tion. The global legal entity simplification program is also defin-ing a strategy to optimize the legal entity structure across other regions, including expediting the closure of redundant entities and an optimization of the legal entity structure of our asset manage-ment businesses within International Wealth Management. Over the medium term, the Group anticipates achieving a leaner global legal entity structure, which is aligned to the business strategy and requires maintaining fewer legal entities with the respective capital benefits for the parent entity, Credit Suisse AG.

16 Strategy
Products and services Private banking offerings and Wealth Management solutions
We offer a wide range of private banking and Wealth Manage-ment solutions tailored for our clients in our Swiss Universal Bank, International Wealth Management and Asia Pacific divisions.
Client segment specific value propositionsOur wide range of Wealth Management solutions is tailored to specific client segments. Close collaboration with our Invest-ment Banking businesses enables us to offer customized and innovative solutions to our clients, especially in the UHNWI seg-ment, and we have specialized teams offering bespoke and com-plex solutions predominantly for our sophisticated clients. This distinct value proposition of our integrated bank remains a key strength in our client offerings.
Structured advisory processWe apply a structured approach in our advisory process based on a thorough understanding of our clients’ needs, personal circum-stances, product knowledge, investment objectives and a com-prehensive analysis of their financial situation to define individual client risk profiles. On this basis, we define an individual investment strategy in collaboration with our clients. This strategy is imple-mented to help ensure adherence to portfolio quality standards and compliance with suitability and appropriateness standards for all investment instruments. Responsible for the implementation are either the portfolio managers or our relationship managers working together with their advisory clients. Our UHNWI relationship man-agers are supported by dedicated portfolio managers.
Comprehensive investment servicesWe offer a comprehensive range of investment advice and dis-cretionary asset management services based on the outcome of our structured advisory process and the global “House View” of our Credit Suisse Investment Committee. We base our advice and services on the analysis and recommendations of our research and investment strategy teams, which provide a wide range of invest-ment expertise, including macroeconomic, equity, bond, commodity and foreign-exchange analysis, as well as research on the econ-omy. Our investment advice covers a range of services, from port-folio consulting to advising on individual investments. We offer our clients portfolio and risk management solutions, including managed investment products. These are products actively managed and structured by our specialists or third parties, providing private inves-tors with access to investment opportunities that otherwise would not be available to them. For clients with more complex require-ments, we offer investment portfolio structuring and the implemen-tation of individual strategies, including a wide range of structured products and alternative investments. Discretionary asset manage-ment services are available to clients who wish to delegate the responsibility for investment decisions to Credit Suisse. We are an
industry leader in alternative investments and, in close collabora-tion with our asset management business and Investment Banking businesses, we offer innovative products with limited correlation to equities and bonds, such as hedge funds, private equity, commodi-ties and real estate investments.
In addition, we offer solutions for a range of private and corporate Wealth Management needs, which include financial planning, succession planning and trust services.
Financing and lending We offer a broad range of financing and lending solutions across all of our private client segments, including consumer credit and real estate mortgage lending, real asset lending relating to ship and avi-ation financing for UHNWI, standard and structured hedging and lombard lending solutions as well as collateral trading services.
Multi-shore platform With global operations comprising 13 international booking cen-ters in addition to our operations in Switzerland, we are able to offer our clients booking capabilities locally as well as through our international hubs. Our multi-shore offering is designed to serve clients who are focused on geographical risk diversification, have multiple domiciles, seek access to global execution services or are interested in a wider range of products than is available to them locally.
Corporate client and institutional client offerings
In accordance with our ambition to position ourselves as the “Bank for Entrepreneurs”, we provide corporate and institu-tional clients, predominantly in Switzerland, with a broad range of financial solutions. To meet our clients’ evolving needs, we deliver our offering through an integrated franchise and interna-tional presence. Based on this model, we are able to assist our clients in virtually every stage of their business life cycle to cover their banking needs. For corporate clients, we provide a wide spectrum of banking products such as traditional and structured lending, payment services, foreign exchange, capital goods leas-ing and investment solutions. In addition, we apply our Investment Banking capabilities to supply customized services in the areas of M&A, syndications and structured finance. For corporations with specific needs for global finance and transaction banking, we provide services in commodity trade finance, trade finance, structured trade finance, export finance and factoring. For our Swiss institutional clients, including pension funds, insurance companies, public sector and UHNWI clients, we offer a wide range of fund solutions and fund-linked services, including fund management and administration, fund design and comprehen-sive global custody solutions. Our offering also includes ship and aviation finance and a competitive range of services and products for financial institutions such as securities, cash and treasury services.
17Strategy
Asset management offerings
Our traditional investment products provide strategies and com-prehensive management across equities, fixed income, and multi-asset products in both fund formation and customized solutions. Stressing investment principles, such as risk management and asset allocation, we take an active and disciplined approach to investing. Alongside our actively managed offerings, we have a suite of passively managed solutions, which provide clients access to a wide variety of investment options for different asset classes in a cost-effective manner.
We also offer institutional and individual clients a range of alterna-tive investment products, including credit investments, hedge fund strategies, real estate and commodities. We are also able to offer access to various asset classes and markets through strategic alliances and key joint ventures with external managers.
Investment Banking financial solutions
Capital markets and advisoryEquity capital markets originates, syndicates and underwrites equity in initial public offerings (IPOs), common and convertible stock issues, acquisition financing and other equity issues.
Debt capital markets originates, syndicates and underwrites corporate and sovereign debt, including investment grade and leveraged loans, investment grade and high yield bonds and unit transactions. We are also a leading provider of committed acquisi-tion financing, including leveraged loan, bridge finance and mez-zanine finance and collateralized loan obligation formation.
Advisory services advises clients on all aspects of M&A, cor-porate sales, restructurings, divestitures, spin-offs and takeover defense strategies.
EquitiesCash equities provides a comprehensive suite of offerings, including: (i) sales trading, responsible for managing the order flow between our clients and the marketplace and providing clients with trading ideas and capital commitments, identify-ing trends and delivering the most effective trade execution; (ii) high touch and program trading, exchange-traded funds (ETFs) and advanced execution services (AES) platform under our global execution services group, which executes client orders and makes markets in listed and over-the-counter (OTC) cash securities, ETFs and programs, providing liquidity to the mar-ket through both capital commitments and risk management. AES is a sophisticated suite of algorithmic trading strategies, tools and analytics that facilitates global trading across equities, options, futures and foreign exchange. By employing algorithms to execute client orders and limit volatility, AES helps institutions and hedge funds reduce market impact. Credit Suisse provides access to over 100 trading destinations in over 40 countries and six continents. In addition, we also provide specific research and analytics through the Group’s SRI function and other content-driven products and services.
Prime services, through our globally integrated platform, offers hedge funds and institutional clients execution, financing, cus-tody, clearing and risk advisory services across various asset classes through prime brokerage, synthetic financing and listed and OTC derivatives. In addition, we partner with the most estab-lished fund managers, fast-growing funds and select startups, blending traditional prime brokerage services with innovative financing solutions and comprehensive capital and consulting advisory services, to help funds build durable organizations across their lifecycle.
Equity derivatives provides a full range of equity-related and cross-asset products globally, including investment options, sys-tematic strategies and financing solutions, as well as sophisti-cated hedging and risk management expertise and comprehen-sive execution capabilities to private banking clients, financial institutions, hedge funds, asset managers and corporations.
Convertibles: The convertibles team provides secondary trading and market making of convertible bonds as well as pricing and distribution of Credit Suisse-originated convertible issuances.
Fixed incomeGlobal credit products is an industry-leading, client-focused credit franchise that provides expert coverage in credit trading, sales and financing. Our strong history of credentials, includ-ing a strong record in leveraged finance, reflect our unique ability to provide value-added products and solutions to our investors. We are a leading sales and trading market-maker in private and public debt across the credit spectrum, including leveraged loans, high yield and investment grade cash, as well as systematic trad-ing. We are also a market-maker in the credit derivatives market, including the credit default swap index (CDX) suite, liquid single-name credit default swaps (CDS), sovereign CDS, credit default swaptions and iBoxx total return swaps. We offer clients a com-prehensive range of financing options for credit products includ-ing, but not limited to, repurchase agreements, short covering, total return swaps and portfolio lending.
Securitized products is a market-leading franchise provid-ing asset based liquidity and financing solutions and products to institutional and Wealth Management clients. We have experience in a broad range of asset categories including consumer, com-mercial, residential, commercial real estate, transportation and alternatives. Our finance business focuses on providing asset and portfolio advisory services and financing solutions (warehouse, bridge and acquisition) and originates, structures and executes capital markets transactions for our clients. Our trading platform provides market liquidity across a broad range of loans and secu-rities, including residential mortgage-backed securities (RMBS), asset-backed securities (ABS) and commercial mortgage-backed securities (CMBS). CMBS and RMBS include government- and agency-backed as well as private-label loans. We have a sea-soned and dedicated securitized product sales force that distrib-utes our primary and secondary product offerings to our client base. We also offer residential mortgage servicing capabilities through our mortgage servicer Select Portfolio Services.

18 Strategy
Macro products includes our global foreign exchange and rates businesses and investment grade capital markets team in Swit-zerland. Our rates business offers market-making capabilities in US cash and derivatives, European cleared swaps and select bilateral and structured solutions. Our investor products busi-ness manufactures credit rates, foreign exchange and commod-ity based structured products for institutional and private banking clients.
Emerging markets, financing and structured credit includes a range of financing products including cash flow lending, share-backed lending and secured financing transactions and onshore trading in Brazil, Mexico, Russia, Turkey, China, India and South Korea. In addition, we offer financing solutions and tailored investment products for Latin American, Central and Eastern European, Middle Eastern and African financial institutions and corporate and sovereign clients.
OtherOther products and activities include lending and certain real estate investments. Lending includes senior bank debt in the form of syndicated loans and commitments to extend credit to invest-ment grade and non-investment grade borrowers.
Research and HOLTOur equity and fixed income businesses are enhanced by the research and HOLT functions. HOLT offers a framework for objectively assessing the performance of over 20,000 companies worldwide, with interactive tools and consulting services that cli-ents use to make informed investment decisions.
Equity and fixed income research uses in-depth analytical frame-works, proprietary methodologies and data sources to analyze approximately 3,000 companies worldwide and provide macro-economic insights into this constantly changing environment.

19Divisions
Divisions
Swiss Universal BankBusiness profile
Within Swiss Universal Bank, we offer comprehensive advice and a broad range of financial solutions to private, corporate and institu-tional clients primarily domiciled in Switzerland. We serve our clients through the following six dedicated business areas in order to cater to our Swiss client base: Digital Banking, Private Bank-ing and Premium Clients within the Private Clients business, and Corporate Banking, Investment Banking and Institutional Clients within the Corporate & Institutional Clients business.
Our Private Clients business has a leading client franchise in Swit-zerland, serving approximately 1.5 million clients, including UHNWI, high-net-worth individual (HNWI), affluent and retail clients. Our service offering is based on our structured advisory process, distinct client-segment-specific value propositions and coverage mod-els as well as access to a broad range of comprehensive products and services. Our network includes 1,290 relationship managers in 109 branches. Additionally, our clients benefit from the advice of more than 300 specialists in areas such as investing, wealth and real estate planning, and lending. Our consumer finance business BANK-now has 17 branches. Also, we offer our clients the world’s leading credit card brands through Swisscard AECS GmbH, an equity method investment jointly owned with American Express.
Our Corporate & Institutional Clients business offers expert advice and high-quality services to a wide range of clients, serving the needs of over 100,000 corporations and institutions, including large corporate clients, small and medium-size enterprises (SMEs), institutional clients, external asset managers, financial institutions and commodity traders. This business also includes our Swiss investment banking business, serving corporate clients and finan-cial institutions in connection with financing transactions in debt and equity capital markets and advising on M&A transactions. Our business includes 480 relationship managers who serve our clients out of 58 locations.
Key data – Swiss Universal Bank in / end of
2020 2019 2018
Key data
Net revenues (CHF million) 5,615 5,905 5,443
Income before taxes (CHF million) 2,104 2,573 1,991
Assets under management (CHF billion)
– Private Clients 208.6 217.6 198.0
– Corporate & Institutional Clients 462.6 436.4 348.7
Number of employees 13,220 12,560 12,150
Business environment
The Swiss private banking and wealth management industry remains very attractive and continues to have positive growth prospects. Switzerland has one of the highest millionaire densities worldwide and is expected to continue to have one of the highest
average levels of wealth per adult. We remain well-positioned in the Swiss market with strong market shares across our cli-ent segments, although the rise of financial technology (Fintech) companies in Europe and Switzerland with aggressive market entry strategies might increase the competition in the retail seg-ment going forward.
The corporate and institutional clients business continues to offer attractive opportunities, supported by the resilience of the Swiss economy. We are a leading provider of banking services to corpo-rate and institutional clients in Switzerland, utilizing our market-leading investment banking capabilities in Switzerland for local execution while leveraging the international reach and placing power of our global Investment Bank.
Structurally, the industry continues to undergo significant change. Regulatory requirements for investment advisory services continue to increase, including in the areas of suitability and appropriateness of advice, client information and documentation. This is expected to drive further consolidation of smaller banks due to the higher critical size necessary to fulfill business and regulatory requirements. We continue to believe that we are well-positioned to opportunistically take advantage of this potential market consolidation. We have made additional progress in adapting to the changing regulatory environment and are continuing to dedicate significant resources to ensure our business is compliant with regulatory standards. Furthermore, interest rates are expected to remain negative for a longer period of time. In 2020, we continued to pursue mitigat-ing actions and charged negative interest rates on Swiss franc deposits above a certain threshold.
The COVID-19 pandemic negatively affected our business per-formance in 2020, including higher provision for credit losses, adverse foreign exchange-related movements and a sharp reduc-tion in US dollar interest rates. We believe that the pandemic can be expected to have continued negative effects on major econo-mies globally and could keep adversely affecting our business performance going forward, including lower interest rates impact-ing our margins and an adverse impact on credit losses.
Business strategy
Switzerland, our home market, has always been and is expected to remain a key market for our Group and is core to our over-all strategy. Within Swiss Universal Bank, we combine all the strengths and critical mass of our Swiss retail, wealth manage-ment, corporate, institutional and investment banking activities. The division is well-positioned to meet the needs of our clients, both individual and corporate, with a broad suite of customized products and services.
In order to further cement our standing as a leading Swiss bank, we focus on our four key priorities:
Bank for Switzerland with Global ExpertiseWe are committed to our Swiss home market and to all our clients in Switzerland – we are a universal bank that serves private, corporate
20 Divisions
and institutional client segments. We intend to expand our market share and continue to be a responsible partner in Swiss society.
In 2020, we decided to accelerate our innovation and digi-tal delivery process and combined our Direct Banking business area with our Digitalization & Products business area to create an integrated Digital Banking business area. The aim of this new business area is to focus on digital solutions for our high-tech clients, predominantly our retail/affluent and smaller corporate clients. Furthermore, we decided to adapt our branch network in response to changing client behavior. We further announced the integration of our subsidiary Neue Aargauer Bank into Credit Suisse (Schweiz) AG in order to establish a consistent and effi-cient offering in the canton of Aargau. We continue to see poten-tial in developing the HNWI and the UHNWI business through selective relationship manager hiring. Both of these wealth market segments are growing significantly and remain highly attractive. Our holistic offering and the collaboration across the division and across the bank are the basis for our efforts to capture further growth in both market segments. Furthermore, we continue to create value for our clients by leveraging our expertise in investment banking and asset management. Our efforts and commitment to Switzerland remain a priority and we were recognized again as “Switzerland’s Best Bank” – Euromoney Awards for Excellence 2020 as well as “Switzerland’s Bank of the Year 2020” – The Banker Award 2020.
Bank for EntrepreneursEntrepreneurship has always been important for Credit Suisse, and entrepreneurial thinking is one of our core principles. We have grown and will seek to continue to significantly grow our business with entrepreneurs and their companies across all businesses within Swiss Universal Bank, including by leveraging our international con-nectivity in investment banking and asset management. It is our ambition to be recognized as the “Bank for Entrepreneurs”.
We strengthened our focus on being recognized as the “Bank for Entrepreneurs” by launching joint client coverage for private and corporate clients in 2015. In this context, we increased the num-ber of Entrepreneurs & Executives relationship managers and now cover the Swiss market with 26 locations. We actively contributed to further develop Switzerland as a center for entrepreneurship and innovation through our private equity vehicle Credit Suisse Entre-preneur Capital Ltd. With more than ten investments in new as well as existing portfolio companies in 2020, we not only helped young entrepreneurs to grow their businesses but also supported them in successfully navigating a challenging operating environment. Our broad range of expertise and capabilities enabled us to execute a large number of investment banking transactions in 2020 and we were again recognized as “Switzerland’s Best Investment Bank” – Euromoney Awards for Excellence 2020 as well as “Best Private Bank for Entrepreneurs” – Global Private Banking Awards 2020 – PWM / The Banker.
Bank for Holistic SolutionsWe seek to work as partners, understand clients’ complex needs and find compelling solutions that solve problems holistically, giv-ing clients practical experiences, services and products.
Our comprehensive offering for the various needs and stages in the lives of our clients underpins our ambition to provide holistic solutions. In 2020, we played an active role, from the outset, in the development of the bridging loan solution for Swiss SMEs in response to the COVID-19 pandemic which was sponsored by the Swiss government. The program was very well received in Switzerland and had a significant impact for Swiss SMEs in miti-gating the adverse effects of the pandemic. In total, Credit Suisse was able to process a loan volume of approximately CHF 3 billion in 2020 as part of the COVID-19 bridge loan program to help support the Swiss economy. As a supplement to this program, in January 2021 we also made available to our corporate clients an additional credit facility of CHF 500 million. Through the Credit Suisse Collective Foundation 1e, we provide companies and self-employed persons in Switzerland with the opportunity to structure their extra-mandatory retirement plans on an attractive, autono-mous basis. In 2020, we were able to significantly grow the num-ber of enrolled companies as well as corresponding assets under management. In line with increasing demand for sustainable investment opportunities, our clients will now also benefit from our collaboration with the Group’s newly developed SRI function.
Bank for the Digital GenerationWe are transforming the way we serve and advise our clients in an increasingly digital society and economy. We expect new technologies and business models to emerge and must adapt our efforts to be successful. To this end, we are investing in digital capabilities with a focus on client engagement, self-service capa-bilities and frontline productivity. Digitalization, automation and data management will be key drivers to continuously improve our cost position and drive our competitiveness with the possibility to fundamentally change the way we work.
In 2020, we continued the strengthening of digital solutions and capabilities for private, corporate and institutional clients as well as relationship managers. We developed and launched our new CSX offering, including a mobile-optimized onboarding process, a debit card and a redesigned mobile banking application targeted at clients with primarily digital banking needs. The CSX offering suite is being continuously expanded with new features such as the CSX Financial Plan, a comprehensive financial planning solution, and CSX Invest, a mobile-optimized, simple solution for first time investors. Moreover, we have rolled out our new relationship manager application tool for our business areas covering corporate clients and institutional clients to drive productivity of client-facing employees.
Selected awards and market share momentum
Credit Suisse received a number of key industry awards in 2020, including: p “Global Excellence in Leadership” – Euromoney Awards for
Excellence 2020p “Excellence in Leadership in Western Europe” – Euromoney
Awards for Excellence 2020p “Switzerland’s Best Bank” – Euromoney Awards for Excellence
2020

21Divisions
p “Switzerland’s Best Investment Bank” – Euromoney Awards for Excellence 2020
p “Switzerland’s Bank of the Year 2020” – The Banker Award 2020
p “Best Private Bank for Entrepreneurs” – Global Private Bank-ing Awards 2020 – PWM / The Banker
International Wealth Management
Business profile
International Wealth Management is an integrated wealth man-ager catering to the needs of our private, corporate and institu-tional clients by offering expert advice and a broad range of finan-cial solutions.
Our Private Banking business provides comprehensive advi-sory services and tailored investment and financing solutions to wealthy private clients and external asset managers in Europe, the Middle East, Africa and Latin America. We serve our clients through 1,140 relationship managers in 42 cities in 25 countries, utilizing comprehensive access to the broad spectrum of Credit Suisse’s global resources and capabilities as well as a wide range of proprietary and third-party products and services.
Our Asset Management business offers investment solutions and services globally to a broad range of clients, including pen-sion funds, governments, foundations and endowments, corpora-tions and individuals, along with our private banking businesses. Our asset management capabilities span across a diversified range of asset classes, with a focus on select traditional and alternative strategies.
Key data – International Wealth Management in / end of
2020 2019 2018
Key data
Net revenues (CHF million) 4,837 5,816 5,320
Income before taxes (CHF million) 1,052 2,065 1,610
Assets under management (CHF billion)
– Private Banking 365.4 370.0 357.5
– Asset Management 440.3 437.9 388.7
Number of employees 9,850 10,230 9,930
Business environment
The private banking and asset management industries entered 2020 following a long-term period of fundamentally supportive business and investment conditions driven by a strong economic cycle. With the outbreak of the COVID-19 pandemic, however, wealth growth and clients’ investment sentiment deteriorated, reflecting increased financial market volatility and a reduced
economic growth outlook. Despite a gradual recovery in financial markets since the second quarter, client activity and related reve-nues remained subdued and credit losses increased during 2020, which led many industry participants to activate contingency cost reduction plans to safeguard profitability.
If the adverse impact of the pandemic on economic growth can be mitigated in 2021, the private banking industry is expected to benefit from attractive medium to long-term growth prospects in the emerging and Western European markets covered by Interna-tional Wealth Management. Private banking assets are expected to grow by approximately 7% annually through 2024 from their 2020 base under this scenario. Regionally, private banking assets are expected to grow by approximately 8% in Russia and Central & Eastern Europe, by approximately 9% in the Middle East & Africa and by approximately 12% in Latin America. This growth expectation is in part based on an anticipated increase in popula-tion, entrepreneurial wealth creation and technological advance-ments. Although wealth is expected to grow at a slower pace in Western Europe (by approximately 4% annually), this region continues to be of crucial importance, holding approximately 20% of the world’s private banking assets. In addition, demographic developments relating to an aging population, such as funding pressure in the public pension systems and a transfer of wealth to the next generation, are expected to present important opportuni-ties in the European private banking markets.
The asset management industry is also expected to resume its growth trend assuming an effective containment of the COVID-19 pandemic, with positive support from increasing global wealth. At the same time, asset managers face a number of challenges, including regulatory complexities and revenue and margin com-pression. The continued rise of passive and low-fee products reflects ongoing fee sensitivity from investors. Although fees for alternative strategies have been more resilient, market trends have led to a need for more innovative products and solutions. In this environment, managers must demonstrate differentiating capabilities including not only strong investment performance, but also other value-add capabilities such as risk management and controls, compliance, client reporting and data security.
Several trends are expected to shape the wealth management industry and provide opportunities for International Wealth Man-agement in the years to come, such as the need by clients for increasingly sophisticated financial solutions, the ongoing tran-sition towards sustainable investing and sustainable financing and the rise in importance of private markets within the financial ecosystem.
The COVID-19 pandemic negatively affected our business per-formance in 2020, including higher provision for credit losses, adverse foreign exchange-related movements and a sharp reduc-tion in US dollar interest rates. The outlook of our business is uncertain due to the continued pandemic and its related eco-nomic impacts, including lower interest rates and potential credit losses. Potentially lower average assets under management due to the volatility in financial markets, lower performance fees and
22 Divisions
investment-related revenues and a shift towards lower risk asset classes may continue to impact results in our Asset Management business.
Business strategy
Our business is among the industry’s leaders by size and reputa-tion in our target markets and regions. International Wealth Man-agement continues to contribute significantly to Credit Suisse’s strategic and financial ambitions. We evolved our business strat-egy in 2020 to better capture our growth potential, aspiring to be the preferred banking partner to our clients. The following strate-gic priorities guide our decisions:
Focus on clients’ needsWe have tailored our organization and client coverage model with the aim of systematically serving the specific needs of each cli-ent segment and promoting long-term growth across emerging and Western European markets. We serve our clients through five regional coverage areas addressing the geographies of Western Europe, Emerging Europe, Middle East/Turkey/Africa, Bra-zil and Latin America. We serve our clients through a combina-tion of offshore centers and local offices to deliver our integrated banking services to UHNWI and entrepreneurial HNWI clients. Within these regional coverage areas we have embedded a small number of senior bankers, who we refer to as Strategic Client Partners, that provide services dedicated to strategic clients, giv-ing them streamlined access to our firm-wide solutions. In paral-lel, our Private Banking International coverage area serves clients with less complex needs. These clients are domiciled across all International Wealth Management regions and are served out of Switzerland through an analytics-driven, multi-channel advisory model.
To support this model, we are strengthening and adapting our footprint with technology investments in our key hubs, while selectively investing in onshore locations and markets with attrac-tive growth prospects. We have hired relationship managers, solu-tion experts, risk management and compliance specialists locally as part of our efforts to better identify and address client needs and business opportunities.
Expand our capabilitiesWe focus on systematically offering solutions and products that are tailored to our clients’ needs, holistically advising them on their assets and liabilities. We believe that broadened collabora-tion and partnership across our firm provides the basis for creat-ing a differentiated and needs-based value proposition and for gaining a larger share of our client’s business. We are leveraging our investment strategy and research capabilities, including the Credit Suisse House View, as part of our approach to further opti-mize the risk/return profiles of our clients’ investment portfolios.
In 2020, we significantly expanded our capabilities to systemati-cally address three areas of high client demand by:p Creating a dedicated Investment Banking Advisory business
area in International Wealth Management to address the needs
of our entrepreneurial clients in mid-market M&A and corpo-rate advisory, in close collaboration with Credit Suisse’s Invest-ment Bank division.
p Launching a Sustainable Client Solutions business area to address the fast-growing client demand for sustainable invest-ments and sustainable financing.
p Consolidating all our lending capabilities into the International Financing Group business area as a single, efficient hub in International Wealth Management for all our lending solutions.
Cross-divisional collaboration and product innovation, including the centralized trading and sales services sourced from our GTS joint venture within the Investment Bank, enable us to offer inte-grated solutions to institutional and private clients.
Invest in our operating modelWe are further investing in our infrastructure, improving processes front-to-back and driving our digital transformation to ensure scalability and support our growth plans. In that regard, we are simplifying our operating model, making important investments in the redesign and automation of processes, while enhancing and harmonizing our onshore platforms. These measures aim at short-ening the time-to-market of products and solutions and reducing our relationship managers’ administrative tasks. They are also expected to help us to systematically embed risk management and compliance oversight into our processes, enhancing our abil-ity to protect our franchise and reputation, thus facilitating sus-tainable growth.
Position Asset Management for long-term growthIn our Asset Management business, we seek to grow our recur-ring management fees, especially in our wholly owned operating businesses, by scaling-up our existing strong franchises while focusing product launches on areas adjacent to core strengths, with an additional emphasis on differentiating alternative invest-ment solutions and private market offerings. We aim to do this while maintaining a disciplined approach to cost management.
Furthermore, we are making significant investments into our plat-form and resources to accelerate the integration of ESG criteria into our offering, address the growing client demand for sustain-able investments and become a leader for sustainable investment solutions. Finally, we support the growth efforts of our Asset Management franchise through strong collaboration and connec-tivity with Credit Suisse’s wealth management businesses glob-ally, to better align our offering to client needs and shorten the delivery time for new investment opportunities.
Selected awards and market share momentum
Credit Suisse received a number of key industry awards in 2020, including:p “Central and Eastern Europe’s Best Bank for Wealth Manage-
ment” – Euromoney Awards for Excellence 2020p “Latin America’s Best Bank for Wealth Management” – Euro-
money Awards for Excellence 2020

23Divisions
p “Excellence in Leadership in Western Europe” – Euromoney Awards for Excellence 2020
p “Best Private Bank in Russia” (eighth consecutive year), “Best Private Bank in the Middle East” and “Best Private Bank for Entrepreneurs” – Global Private Banking Awards 2020 – PWM / The Banker
p “Best Private Bank in the Middle East” – Euromoney Private Banking and Wealth Management Survey 2020
Asia PacificBusiness profile
The Asia Pacific division delivers an integrated wealth manage-ment offering, spanning private banking, financing, underwriting and advisory, to our target ultra-high-net-worth, entrepreneur and corporate clients. Our comprehensive suite of wealth manage-ment capabilities includes investment funds, discretionary man-dates, wealth planning services such as family office and philan-thropy advisory, lending solutions, debt and equity underwriting of public offerings and private placements, and advisory related to M&A. Our close collaboration with the other divisions of the bank globally supports and enables our wealth management activities in the region by providing global connectivity, innovative products and holistic solutions to our Asia Pacific clients.
Key data – Asia Pacific in / end of
2020 2019 2018
Key data
Net revenues (CHF million) 3,155 3,029 2,759
Income before taxes (CHF million) 828 922 632
Assets under management (CHF billion) 221.3 220.0 199.3
Number of employees 6,890 6,530 6,200
Business environment
Wealth creation in Asia has largely been driven by first and sec-ond generation entrepreneurs. The fundamentals underpinning long-term, entrepreneur-led wealth creation and growth in busi-ness activities for the Asia Pacific region remained positive and are expected to continue. Asia Pacific continues to be a fast growing region, with gross domestic product and the UHNWI wealth segment estimated to increase significantly in the com-ing years. An increase in wealth held by UHNWI and HNWI is expected to result in larger capital pools for investment and enhanced opportunities for entrepreneur-led activity, notwith-standing short-term market cyclicality and pressures.
Asia Pacific was the first region to be affected by COVID-19, with local governments generally responding early to the pandemic in the first half of 2020. The pandemic and ongoing geopoliti-cal tensions, particularly between China and the US, have led to greater market volatility and also uncertainty. There was higher
client activity in 2020, particularly across equity underwriting and structured products, while corporate M&A advisory activity was lower. There was also significant client deleveraging in the first half of the year. The US dollar depreciated in the second half of 2020 against a basket of major world currencies, with the US Dollar Index declining 13% since its peak in March 2020.
Our operating environment and results in 2020 were significantly influenced by the global impact of the COVID-19 pandemic. Reactions of investors and central banks and a sharp reduc-tion in US dollar interest rates significantly increased volatility in financial markets and led to higher credit losses. These effects could have an impact on our results, including potentially adverse impacts on credit losses and mark-to-market losses in our financ-ing business.
Business strategy
Our business strategy remains steadfast, despite short-term market cyclicality and pressures, and is centered on the growth of our franchise in large wealth and financial markets in Asia, as well as on our ambition to be “The Bank for Entrepreneurs in Asia Pacific”. Our divisional model and integrated delivery are key differentiators that support our client-centric strategy to provide holistic advice, structured solutions and tailored investment and lending services that cater to our clients’ private and corporate financial needs. Our consistent focus on maintaining a diversified regional footprint and leading market positions in private banking and investment banking has been critical to meeting our clients’ needs, attracting strong talent and fostering a partnership culture that can deliver attractive returns and growth with disciplined risk management.
Our wealth management-focused businesses in Asia Pacific demonstrated resilient performance in 2020, driven by higher transaction-based revenues, supported by increased revenues from strong client activity, structured equity origination and equity underwriting, and GTS. We established the business unit, Asia Pacific Strategic Products (ASP), comprised of Asia Pacific Financing Group (AFG), Asia Pacific Asset Finance and Loan Syndication, to enable our strategy to deliver differentiated capa-bilities across financing, capital solutions and structuring to our entrepreneur and corporate client segments across the region. Our diversified platform across clients, countries and products continues to be essential to effectively and sustainably compete in a region as dynamic and varied as Asia Pacific. A key milestone achieved during the year was the increase of our sharehold-ing in our China securities joint venture, Credit Suisse Founder Securities Limited (CSFS), from 33.3% to 51%, paving the way for Credit Suisse to build out our onshore capabilities in China to capture opportunities for the further growth of our Greater China business.
Looking ahead, our strategic priorities are to leverage our dif-ferentiated integrated model to selectively broaden our cover-age base of UHNW and entrepreneur clients through strategic hires across the region and deepen tailored product offerings,

24 Divisions
especially in financing and managed solutions. We intend to drive diversified growth by investing in our leading country franchises, continuing our long-term build out of China onshore capabilities and growing wealth-linked strategic solutions and distribution in collaboration with the bank’s businesses globally, including GTS, SRI and Asset Management. We will seek operational excellence by leveraging digitalization, data management and automation to improve the overall client experience and continue to enhance our risk management and controls.
Selected 2020 awards and market share momentum
p “Asia’s Best Bank for Wealth Management” – Euromoney Asia Awards for Excellence 2020
p “Best Private Bank, Asia Pacific” – Asian Private Banker Awards for Distinction 2020
p “Asia’s Best Investment Bank” – GlobalCapital Asia Awards 2020
p “Equity Derivatives House of the Year, Asia ex-Japan” – Asia Risk Awards 2020
p “Credit Derivatives House of the Year, Asia ex-Japan” – Asia Risk Awards 2020
p “Best House, Asian Equities” – Structured Retail Products Asia Awards 2020
Investment BankBusiness profile
The Investment Bank offers a broad range of financial products and services focused on client-driven businesses and also sup-ports Credit Suisse’s global wealth management businesses and their clients. Our suite of products and services includes global securities sales, trading and execution, prime brokerage and capital raising and advisory services. Our clients include financial institu-tions, corporations, governments, sovereigns, ultra-high-net-worth and institutional investors, such as pension funds and hedge funds, financial sponsors and private individuals around the world. We deliver our investment banking capabilities globally through regional and local teams based in both major developed and emerging mar-ket centers. Our integrated business model enables us to deliver high value, customized solutions that leverage the expertise offered across Credit Suisse and that help our clients unlock capital and value in order to achieve their strategic goals.
Key data – Investment Bank in / end of
2020 2019 2018
Key data
Net revenues (CHF million) 9,098 8,161 8,004
Income before taxes (CHF million) 1,655 1,026 818
Number of employees 17,560 17,050 15,590
Business environment
In 2020, operating conditions were impacted by unprecedented events, primarily driven by the global COVID-19 pandemic as well as geopolitical and macroeconomic uncertainties related to the UK’s withdrawal from the EU and the US elections. Uncertainty due to the spread of COVID-19 led to severe market dislocations including record levels of volatility, widening credit spreads and a collapse in energy prices. Major central banks and governments around the world responded by implementing unprecedented monetary and fiscal policy stimulus measures, which resulted in strong investor demand for yield with record debt and equity issuance levels and resulted in significantly higher volumes and client activity in our trading businesses, in particular our GTS business. However, the economic impact of the pandemic has had a negative impact on our credit exposures and may have an adverse impact on client sentiment and risk appetite going for-ward, which is likely to impact our results. The industry-wide fee pool increased 19% compared to 2019. These events nega-tively impacted M&A fee pools with completed fee pools down 10% compared to 2019. Despite this slowdown in M&A activity, announced M&A volumes increased in the second half of the year.
Business strategy
Effective August 1, 2020, we integrated our investment banking capabilities across the former Global Markets, Investment Bank-ing and Capital Markets and Asia Pacific Markets businesses into one division, the Investment Bank. This globally-integrated, client-centric platform consolidates our sales and trading, under-writing and advisory capabilities, enabling us to achieve critical scale, maximize global connectivity and reduce earnings volatility. As part of our structural initiatives, we created GTS, combining our successful ITS and Asia Pacific Solutions franchises to glo-balize institutional products for our wealth management clients. The methodology applied to allocate GTS results across the four divisions reflects the economic contribution from the client base that each division provides to GTS, as well as the historical per-formance of the constituting businesses, and combines a fixed allocation and an additional split to each division of any GTS out-performance above the fixed allocation. In addition, we increased scale in our equities business by integrating our APAC cash and prime services businesses to better serve our institutional clients. We also simplified our capital markets businesses by combining our origination and execution platforms.
We believe these strategic actions make us well-positioned to grow revenues and deliver sustainable returns while maintain-ing cost and capital discipline. We remain focused on maintaining our leading market shares as well as investing in growth areas. Specifically, our strategy includes increasing our M&A footprint in the high growth technology and healthcare sectors, developing tailored products and solutions across ESG and private markets, expanding our onshore China footprint and investing in electronic trading. In addition, we expect to further increase collabora-tion across Credit Suisse, focusing on our International Wealth

25Divisions
Management clients, particularly with UHNW clients in collabora-tion with GTS, and EMEA capital markets and advisory groups.
We expect that the integration will also enable us to generate efficiencies from consolidating our risk, technology and execution platforms. Specifically, we expect to deliver more than USD 100 million in gross cost savings, as part of the Group’s 2022 gross
cost savings target. We expect to be able to optimize capital allocation by investing in our most profitable opportunities, while aligning with a Group target of allocating approximately one third of capital to the Investment Bank. We believe these strategic actions will enable us to achieve a return on regulatory capital of 10-15% in the medium term.

26 Regulation and supervision
Regulation and supervision
Overview Our operations are regulated by authorities in each of the jurisdic-tions in which we have offices, branches and subsidiaries.
Central banks and other bank regulators, financial services agen-cies, securities agencies and exchanges and self-regulatory orga-nizations are among the regulatory authorities that oversee our businesses. There is coordination among many of our regulators, in particular among our primary regulators in Switzerland, the US, the EU and the UK as well as in the Asia Pacific region.
The supervisory and regulatory regimes of the countries in which we operate determine to some degree our ability to expand into new markets, the services and products that we are able to offer in those markets and how we structure specific operations.
Governments and regulatory authorities around the world have responded to the challenging market conditions beginning in 2007 by proposing and enacting numerous reforms of the regula-tory framework for financial services firms such as the Group. In particular, a number of reforms have been proposed and enacted by regulators, including our primary regulators, which could poten-tially have a material effect on our business. These regulatory developments could result in additional costs or limit or restrict the way we conduct our business. Although we expect regula-tory-related costs and capital requirements for all major financial services firms (including the Group) to continue to be high, we cannot predict the likely impact of proposed regulations on our businesses or results. We believe, however, that overall we are well positioned for regulatory reform, as we have reduced risk and maintained strong capital, funding and liquidity.
> Refer to “Risk factors” for further information on risks that may arise relating to regulation.
Recent regulatory developments and proposalsSome of the most significant regulations proposed or enacted during 2020 and early 2021 are discussed below.
Global initiatives
Certain regulatory developments and standards are being coordi-nated on a global basis and implemented under local law, such as those discussed below.
COVID-19 outbreakSince December 2019, COVID-19 has spread rapidly across the world, and on March 3, 2020, it was characterized as a pandemic by the World Health Organization. Financial services regulators and authorities around the world, such as the European Cen-tral Bank (ECB), the UK Financial Conduct Authority (FCA), the Board of Governors of the Federal Reserve System (Fed), the New York State Department of Financial Services (DFS) and the
Swiss Financial Market Supervisory Authority FINMA (FINMA) have focused on and are closely monitoring the evolution of the COVID-19 outbreak and its impact on the financial services sec-tor. These regulators have adopted measures to provide tempo-rary relief to supervised entities in respect of certain regulatory requirements. These regulatory initiatives have accompanied a range of measures by national governments and central banks in a number of jurisdictions to support the economy and, in particu-lar, incentivize lending to businesses and consumers. Such mea-sures include interest-rate cuts and introducing or extending asset purchase schemes and liquidity and credit facilities for financial sector institutions. Authorities will continue to monitor the spread of COVID-19 closely and are expected to adapt their guidance to firms as the situation develops.
> Refer to “COVID-19 pandemic and related regulatory measures” in II – Operat-ing and financial review – Credit Suisse for a discussion of regulatory develop-ments pertaining to COVID-19.
Interbank Offered Rate TransitionCredit Suisse has identified a significant number of its liabili-ties and assets linked to interbank offered rate (IBOR) indices across businesses that require transition to alternative refer-ence rates and is participating in national working groups and industry forums that are working to address this transition. In this regard, on October 23, 2020, the International Swap and Derivatives Association (ISDA) launched (i) Supplement number 70 to the 2006 ISDA Definitions (IBOR Supplement) and (ii) the ISDA 2020 IBOR Fallbacks Protocol (IBOR Protocol). The IBOR Supplement is intended to enhance the robustness of deriva-tives contracts traded on or after January 25, 2021 by address-ing the risk that some IBORs are permanently discontinued or, in the case of the London interbank offered rate (LIBOR), cease to be representative, by applying fallbacks to specified alternative references rates upon such a trigger. The IBOR Protocol permits adhering parties to amend in-scope transactions entered into prior to January 25, 2021 on similar terms. These documents are a critical element to industry efforts to facilitate the derivatives markets’ transition away from LIBOR and other IBORs. The Bank and certain other subsidiaries adhered to the IBOR Protocol on October 22, 2020.
On October 16, 2020, FINMA published FINMA Guidance 08/2020 specifically addressing LIBOR replacement under deriv-ative contracts. According to FINMA, in Switzerland, the largest remaining exposure to LIBOR is located in the over-the-counter (OTC) derivatives market, and FINMA has therefore advised the affected supervised entities to adhere to the IBOR Protocol.
On December 4, 2020, FINMA published FINMA Guidance 10/2020, in which FINMA again emphasized the importance of the implementation of an adequate LIBOR transition strategy across all LIBOR based agreements, in view of the operational risks inherent to the impending LIBOR discontinuation. FINMA namely recommended that by late January 2021, the relevant financial institutions no longer enter into transactions referencing LIBOR that do not include robust fallback clauses governing the replacement of the relevant LIBOR upon LIBOR discontinuation.
27Regulation and supervision
Further, FINMA recommended that by March 31, 2021, financial institutions define and implement a strategy to reduce LIBOR exposure by year-end 2021. This strategy should, in FINMA’s view, also envisage a reach-out to counterparties by late March 2021.
On March 5, 2021, ICE Benchmark Administration Limited (IBA), the LIBOR Administrator, announced that it would cease the pub-lication of representative settings for all CHF, EUR, GBP, JPY LIBORs and for the one-week and two-month USD LIBORs immediately following the LIBOR publication on December 31, 2021 and for the remaining USD LIBORs immediately follow-ing the LIBOR publication on June 30, 2023. Concurrently, the FCA confirmed that all LIBOR settings will either cease to be provided by any administrator or be available only in synthetic, non-representative form after such dates with respect to such LIBOR settings, to be used in certain instances. The extent of the FCA’s power to require publication of synthetic rates is sub-ject to the enactment of the Financial Services Bill by the UK Parliament. Further, ISDA issued a statement noting that the FCA’s announcement constitutes an “index cessation event” for purposes of the IBOR Supplement and the IBOR Protocol. When IBA had first announced that it would consult on its intention to cease the publication of such LIBOR settings on November 30, 2020, the Fed, the Office of the Comptroller of the Currency (OCC) and the Federal Deposit Insurance Corporation (FDIC) released a statement that encouraged banks to cease entering into new contracts that use USD LIBOR as a reference rate as soon as practicable and in any event by December 31, 2021 in order to facilitate an orderly LIBOR transition. The FCA expressed support for the statement made by the Fed, OCC and FDIC.
> Refer to “Replacement of interbank offered rates” in II – Operating and finan-cial review – Credit Suisse – Other information for further information pertain-ing to IBOR transition.
Switzerland
Credit Suisse is subject to the Basel III framework, as imple-mented in Switzerland, as well as Swiss legislation and regula-tions for systemically important banks, which include capital, liquidity, leverage and large exposure requirements and rules for emergency plans designed to maintain systemically relevant func-tions in the event of impending insolvency.
> Refer to “Liquidity and funding management” and “Capital management” in III – Treasury, Risk, Balance sheet and Off-balance sheet for information regard-ing our current regulatory framework and expected changes to this framework affecting capital and liquidity standards.
Prospectus regimeThe Financial Services Act (FinSA) which came into effect on January 1, 2020 introduced a new prospectus regime for the offering of securities in Switzerland. FINMA granted both BX Swiss AG and the SIX Exchange Regulation AG a license as reviewing bodies for prospectuses with effect from June 1, 2020. The reviewing bodies are regulated under the FinSA and are tasked with reviewing and approving the prospectuses published in connection with a public offer of securities or the admission of
securities to trading on a trading venue in Switzerland. Subject to certain exemptions, the publication of approved prospectuses will be mandatory from December 1, 2020 onwards for issuers of securities, provided a public offer or admission to trading is intended in Switzerland.
Regime for providing financial servicesThe FinSA also introduced duties for Swiss financial service pro-viders or foreign financial service providers providing financial ser-vices to clients in Switzerland, including on a mere cross-border basis. The duties include the registration of persons who perform financial services on behalf of a financial service provider or in their own capacity as financial service providers (so-called client advisers). With effect from July 20, 2020 FINMA authorized BX Swiss AG as the first registration body for client advisors under FinSA. The registration bodies maintain a register of client advis-ers as provided for under FinSA. Client advisers of Swiss financial service providers that are not subject to prudential supervision and advisers of foreign financial service providers that provide their services in Switzerland or to clients in Switzerland must reg-ister with a registration body (subject to certain exemptions). The registration bodies are tasked with ensuring that the client advis-ers have completed the necessary training and further education measures required under FinSA for the provision of financial advi-sory services in Switzerland.
Resolution regimeOn February 25, 2020, FINMA published a report providing a detailed assessment of the recovery and resolution plans of the systemically important Swiss institutions. FINMA approved the recovery plans of all five systemically important Swiss banks. In addition, FINMA regarded the Swiss emergency plan submitted by Credit Suisse as effective. With respect to the global resolv-ability, FINMA concluded that Credit Suisse has already taken important preparatory steps and has thus made considerable progress.
Investment services regulationIn response to the European Commission’s decision not to extend the recognition of the Swiss legal and supervisory framework for trading venues with that of the EU beyond June 30, 2019, the Swiss Federal Department of Finance (FDF) activated certain protective measures in Switzerland to ensure the functioning of Swiss trading venues. Since July 1, 2019, trading venues require a recognition by FINMA if they offer or facilitate trading in certain equity securities of Swiss companies, and the FDF placed the EU on a list of jurisdictions for which no such recognition would be granted. As the UK formally left the EU on January 31, 2020, the FDF subsequently updated its list of jurisdictions with effect from February 1, 2020 to include the UK as a separate entity. On January 13, 2021 the UK government enacted legislation, setting out its decision that the Swiss legal and supervisory framework in respect of Swiss trading venues BX Swiss AG and SIX Swiss Exchange AG meets equivalent outcomes to the UK’s corre-sponding regime. With effect from February 3, 2021, UK invest-ment firms may meet the UK share trading obligation by trading on these exchanges. As a consequence, Switzerland reciprocated

28 Regulation and supervision
by deactivating the stock exchange protective measure in rela-tion to the UK and removing the UK from the relevant list. On February 3, 2021, FINMA also updated its list of recognized trad-ing venues to again include the London Stock Exchange plc and other UK trading venues.
DLT-LawOn September 25, 2020, the Swiss Parliament approved the Law on Distributed Ledger Technology (DLT-Law). The DLT-Law introduces a new concept of so-called “DLT-Rights,” allowing for the tokenization of rights, claims and financial instruments, such as bonds, shares or derivatives. In addition, the DLT-Law provides for an introduction of a new licensing category as a DLT-Trading Venue under the Financial Market Infrastructure Act and certain clarifications relating to the treatment of cryptocurrencies in Swiss insolvency proceedings. The amendments to the Swiss Code of Obligations and the Federal Act on Intermediated Securities set-out under the DLT-Law, which enable the creation of ledger based DLT-Rights, entered into force on February 1, 2021. The remaining provisions of the DLT-Law will likely enter into force on August 1, 2021.
Corporate Law ReformOn June 19, 2020, the Swiss Parliament adopted a number of substantial amendments to the Swiss corporate law set out under the Swiss Code of Obligations. The amendments include changes relating to share capital, corporate governance, shareholder rights, obligations of a company in case of financial distress, a transfer of the regulations of the Swiss Ordinance Against Exces-sive Compensation with respect to Listed Corporations (Compen-sation Ordinance) into general Swiss corporate law, and “comply or explain” disclosure obligations regarding gender diversity at the board and executive board level of large Swiss listed companies, including Credit Suisse Group AG. While the general effective date of the new law will be announced at a later point in time, the Swiss Federal Council resolved in September 2020 to make the “comply or explain” disclosure obligations on gender diversity effective as of January 1, 2021. This “comply or explain” rule will become applicable five years after the effective date with regard to the board of directors, and ten years after the effective date with regard to the executive management. Therefore, the relevant companies, including Credit Suisse Group AG, will be required to adhere to the respective disclosure obligations as of 2026 and 2031, respectively.
Data Protection ActOn September 25, 2020, the Swiss Parliament approved the revision of the Swiss Federal Act on Data Protection (FADP), which will provide for a number of changes. Thereunder namely, data relating to legal entities will no longer be protected. As under the General Data Protection Regulation (GDPR), only data relat-ing to individuals will fall within the scope of the revised FADP. Similar to the GDPR, the revised FADP will have an extraterrito-rial effect and foreign data controllers must appoint a representa-tive in Switzerland if they perform specific processing activities on data relating to individuals in Switzerland. The revised FADP will impose increased governance and documentation requirements
on controllers, such as managing inventories of processing activi-ties, notifying data breaches and performing data processing impact assessments. Further, the revised FADP will grant more extensive powers to the Swiss Federal Data Protection and Infor-mation Commissioner and significantly broaden sanctions affect-ing individuals for non-compliance with predetermined provisions. The public consultation on the ordinance to the revised FADP is expected to start in the second quarter of 2021, and the revised FADP is expected to enter into force in the second half of 2022.
Responsible Business Initiative / CounterproposalOn November 29, 2020, the popular initiative “The Responsible Business Initiative – Protecting human rights and the environ-ment” was rejected by a majority of the Swiss cantons in a public vote. As a result, the indirect counterproposal of the Swiss Parlia-ment will enter into effect. Under the counterproposal, companies of public interest (i.e., listed companies, banks, insurance com-panies and other supervised companies in the financial sector) must report annually on certain non-financial matters. The report must contain information necessary to understand the company’s business development, performance and position, as well as the impact the company’s activity has on environmental (including CO2 targets), social, employee, human rights and anti-corrup-tion matters. The counterproposal also lays down additional due diligence duties with regard to conflict minerals and child labor. The counterproposal is yet to be published in the Swiss Federal Gazette. As of such publication, the referendum period will begin and if no optional referendum is requested, the new transpar-ency and due diligence obligations will enter into effect once the implementing ordinance has been finalized. The reporting and due diligence obligations will need to be observed for the first time with respect to the financial year commencing one year after the entry into effect of the counterproposal. For financial years that correspond to the calendar year, this would likely be the financial year 2023.
Tax Reform of the Swiss withholding tax systemAfter publishing a first draft legislation and conducting a consulta-tion procedure in 2020 regarding the reform of the Swiss with-holding tax system applicable to interest payments, the Swiss Federal Council has decided to pursue the reform with a reduced scope only. In particular, under the current proposal, Swiss with-holding tax on interest payments on customer deposits from banks to individuals resident in Switzerland would be maintained, while Swiss withholding tax on all other interest payments to all investors alike would be abolished. In addition, the securities turnover stamp duty on Swiss bonds would be abandoned. A first draft of the amended draft legislation is expected to be submit-ted to the Swiss Federal Council in the first half of 2021. For the moment, the actual implementation parameters and timing of the Swiss withholding tax reform are open.
Automatic exchange of information in tax mattersIn June 2020, the Swiss Parliament adopted a reform of the Federal Act on the International Automatic Exchange of Infor-mation in Tax Matters. The aim of the reform was to implement

29Regulation and supervision
certain recommendations of the Global Forum on Transparency and Exchange of Information for Tax Purposes (Global Forum) after the Global Forum’s review of the Swiss automatic exchange of information (AEI) legal framework. The amendments include modifications to a bank’s diligence obligations, including with respect to the opening of bank accounts and document retention. The law entered into effect on January 1, 2021.
Tax treatment of financial sanctionsIn June 2020, the Swiss Parliament implemented the current practice of the Swiss tax authorities and the Swiss Supreme Court with respect to the tax-deductibility of financial sanctions in the Federal Act on Tax Treatment of Financial Sanctions. Namely, as far as a financial sanction has a profit-absorbing element that can be proven, the relevant part of the sanction may be tax-deductible, but as far as a sanction has a penal character, such amount cannot be deducted for tax purposes. However, the law further adds the possibility of deducting a foreign penal sanction if it can be proven that such sanction violates the Swiss public order or if the company demonstrates that it has taken all reason-able steps to comply with the law. The law is expected to enter into effect on January 1, 2022.
US
In July 2010, the US enacted the Dodd-Frank Wall Street Reform and Consumer Protection Act (Dodd-Frank Act), which provides a broad framework for regulatory changes. Although rulemaking in respect of many of the provisions of the Dodd-Frank Act has taken place by different regulators, including the US Department of the Treasury (US Treasury), the Fed, the US Securities and Exchange Commission (SEC), the OCC, the FDIC, the Commod-ity Futures Trading Commission (CFTC) and the Financial Stability Oversight Council (FSOC), those rules are subject to update and revision and uncertainty remains about the ultimate scope of the US regulatory framework.
SanctionsAs a result of allegations concerning Russian acts related to Ukraine, Syria, cybersecurity and electoral interference, in 2018 and 2019, the US Treasury’s Office of Foreign Assets Control (OFAC) designated a number of Russian government officials, business people and certain related companies as specially des-ignated nationals (SDNs). Such designation blocks their assets and prohibits dealings within US jurisdiction by both the newly designated SDNs and entities owned 50% or more by one or more blocked persons. US law also authorizes the imposition of other restrictions against non-US entities that, among other activities, engage in significant transactions with or provide mate-rial support to such blocked persons. In 2019, the US imposed additional sanctions on the Russian Federation prohibiting US financial institutions from participating directly in future primary issues of non-ruble denominated Russian sovereign debt and lending non-ruble denominated funds to the Russian Federation (but not from providing related services such as US dollar clearing to third parties). Further sanctions related to Russia or additional Russian persons or entities are possible, particularly as a result of
changes to US foreign policy arising from the transition between presidential administrations, and the potential effects of related disruptions may include an adverse impact on our businesses.
Since 2017, the US has imposed sanctions related to Venezuela that, among other restrictions, block the assets of and prohibit transactions with the Government of Venezuela and state-owned entities, as well as certain government officials, and prohibit fur-ther dealings with them within US jurisdiction. A number of gen-eral licenses provide exceptions to these prohibitions, most nota-bly with respect to holdings of and certain dealings in pre-2017 debt of the Government of Venezuela and PdVSA, the state-owned oil company. Additionally, throughout 2019 and 2020 OFAC designated additional persons and entities, including mari-time shipping companies and trade facilitators outside of Venezu-ela, for assisting the Government of Venezuela. Further sanctions related to Venezuela or Venezuelan entities are possible, and the potential effects of related disruptions may include an adverse impact on our businesses.
Political and trade tensions between the US and China led to a series of sanctions and countermeasures in 2020 through the end of the Trump administration in early 2021, some of which are particularly relevant to financial institutions. These measures are new and not yet well-defined, and their ultimate impact on Chi-nese financial markets and financial institutions operating in China remains unclear. There are also a range of other sanctions and export control developments from both China and the US that could affect the integration of Chinese and US markets and have an impact on our customers or economic circumstances. Further sanctions and other restrictive measures arising from tensions in China-US relations are also possible. These developments may give rise to conflicts of law, compliance risks, and market disrup-tions that may have an adverse impact on our business.
Banking regulation and supervision On January 30, 2020, the Fed finalized a rule to amend its regu-lations governing when one company will be deemed to control another, which define, among other things, the scope of entities deemed to be our affiliates and subsidiaries subject to regula-tion and supervision under US federal banking laws. The new rule went into effect on September 30, 2020. There may be further regulatory interpretation and guidance, but we do not expect the rule to have a material impact on our operations.
On June 25, 2020, the five federal agencies responsible for administration of the so called “Volcker Rule” finalized amend-ments to provide new exclusions from the definition of a covered fund and offer certainty, clarity and flexibility for foreign banking organizations to engage in funds-related activities. The revised rule became effective October 1, 2020. We have implemented policies and procedures designed to address compliance with the Volcker Rule. The Volcker Rule is highly complex and may be sub-ject to further rulemaking, regulatory interpretation and guidance.
On June 25, 2020, the Fed released the results of its annual supervisory stress test, as implemented pursuant to the

30 Regulation and supervision
Dodd-Frank Act. Our US intermediate holding company (IHC) was projected to maintain capital ratios above minimum regulatory requirements under all scenarios in all quarters. On August 10, 2020, the Fed announced new, individualized risk-based capital requirements for large banking organizations, including our US IHC, determined by performance in the annual supervisory stress tests. Under the new requirements, our US IHC is now subject to risk-based capital requirements inclusive of a 6.9% stress capi-tal buffer, designed to absorb losses in periods of financial and economic stress. The size of the stress capital buffer requirement is subject to update depending on future Comprehensive Capi-tal Analysis and Review (CCAR) results. If our US IHC does not maintain this buffer above minimum risk-based capital require-ments, it will be limited in its ability to pay dividends and make discretionary bonus payments and other earnings distributions. The stress capital buffer became effective on October 1, 2020. Finally, the Fed did not object to the capital planning practices at our US IHC, meaning our US IHC will no longer be subject to a possible qualitative objection for the 2021 CCAR cycle onwards.
Also, on June 25, 2020, in addition to the results of its normal stress test, the Fed announced results of a sensitivity analy-sis to assess the resiliency of CCAR firms under COVID-19-re-lated downside scenarios. As a result of that analysis, the Fed announced that it would be requiring all CCAR firms to update and resubmit their capital plans based on hypothetical scenarios for a second round of bank stress tests. On December 18, 2020, the Fed released the results of these additional supervisory stress tests. Our US IHC was projected to maintain capital ratios above minimum regulatory requirements under all scenarios in all quar-ters, and the additional supervisory stress tests did not result in a modification to the risk-based capital requirements or the stress capital buffer applicable to our US IHC (although the Fed has extended the time period in which it may notify a firm that its stress capital buffer requirement will be recalculated to March 31, 2021). On December 18, 2020, the Fed also announced the extension of capital distribution limitations in place for the third quarter of 2020 through the first quarter of 2021 for 34 large banking organizations, including our US IHC. The limitations apply to cash dividends on common equity and stock repurchases based on recent income.
On July 24, 2020, the FDIC and the SEC finalized rules that would clarify the application of the Securities Investor Protection Act (SIPA) in a receivership for a systemically significant broker-dealer under the Dodd-Frank Act’s Orderly Liquidation Authority, which could potentially apply to our US broker-dealer. The final rules are substantively identical to the 2016 proposals. The rules clarify how relevant provisions of SIPA would be incorporated into a proceeding under the Orderly Liquidation Authority, that the Securities Investor Protection Corporation would be appointed as trustee for the broker-dealer, the claims process and the FDIC’s powers as receiver with respect to the transfer of assets of the broker-dealer.
On October 20, 2020, the Fed published a final rule on the net stable funding ratio (NSFR), effective July 1, 2021, that will
require CS’s US IHC to maintain a minimum level of stable fund-ing based on the liquidity characteristics of its assets, commit-ments and derivative exposures over a one-year time horizon. The final rules are largely consistent with the Basel III framework pub-lished by the Basel Committee on Banking Supervision (BCBS). There may be further regulatory interpretation and guidance, and the full impact of the rule will not be known with certainty for some time.
On December 6, 2020, the Fed and the FDIC announced mul-tiple resolution planning actions applicable to certain foreign banks, including Credit Suisse. The Fed and FDIC announced that the weaknesses previously identified in the resolution plans of four foreign banks, including our resolution plan, were success-fully remediated. In addition, the Fed and FDIC provided the tar-geted information request for our targeted resolution plan, which is now due on December 17, 2021. This request focuses on our response to COVID-19 and its impact on our resolution-related capabilities. Finally, the Fed and FDIC finalized guidance appli-cable to our future resolution plan filings, beginning with the tar-geted plan we must file on December 17, 2021. The guidance is similar to current guidance applicable to our resolution plans and in some instances has reduced expectations, but it does include new expectations that we will need to address in our 2021 plan.
On December 18, 2020, the Fed announced that, beginning in 2021, the Large Institution Supervision Coordinating Committee (LISCC) supervisory portfolio will consist only of US global sys-temically important banks (G-SIBs). This announcement should result in the supervisory expectations for CS’s US operations being comparable to the expectations applicable to institutions of similar size and complexity for the areas of capital, liquidity, corporate governance and resolution planning. Although CS has been removed from the LISCC supervisory portfolio, this will not result in any changes to the regulatory requirements applicable to CS’ combined US operations. The Fed has indicated that in 2021 it will publish criteria for the potential inclusion of a non-US bank’s US operations in the LISCC supervisory portfolio.
On December 22, 2020, Credit Suisse entered into an agree-ment with the Federal Reserve Bank of New York (FRBNY) and the NY Department of Financial Services (DFS) regarding the Bank Secrecy Act (BSA) and Anti-Money Laundering (AML) pro-gram of its New York Branch, after the FRBNY’s 2019 examina-tion of Credit Suisse’s New York Branch identified deficiencies in the compliance risk management program framework related to BSA/AML. The terms of the agreement include no monetary penalty and no restriction to normal business operations. The agreement does, however establish clear objectives that Credit Suisse must meet in connection with its New York Branch, including with respect to improving the BSA/AML compliance framework, revising the customer due diligence program, ensur-ing accurate identification and reporting of known or suspected violations of law or transactions and planning for independent testing of compliance with BSA/AML requirements. Credit Suisse expects to comply with the agreement in a timely manner.

31Regulation and supervision
Broker-dealer regulation and supervision On September 16, 2020, the SEC adopted amendments to SEC Rule 15c2-11, which sets out a broker-dealer’s information review obligations concerning the issuer of an over-the-counter security, prior to publication or submission of a quotation in that security. The SEC has amended the rule to (a) expand review require-ments to apply to qualified inter-dealer quotation systems (and permit the broker-dealer’s reliance on those systems in certain circumstances); (b) limit certain existing exceptions to the infor-mation review requirements; and (c) add additional exceptions for certain securities that the SEC has deemed are less susceptible to fraud. The amendments to SEC Rule 15c2-11 became effec-tive on December 28, 2020, and the SEC has set Septem-ber 28, 2021 as the compliance date for the amended rule. In addition, on December 22, 2020, the SEC proposed a related, conditional exemption to the information review and recordkeep-ing requirements of SEC Rule 15c2-11 for proprietary quotations for certain categories of securities, so long as the distribution of those quotations is restricted to a market of only sophisticated or professional investors. The proposal was subject to a 30-day comment period from the publication date in the Federal Register and comments were due on February 11, 2021.
Derivative regulation and supervision On July 22, 2020, the CFTC adopted capital and financial report-ing rules for non-bank swap dealers and major swap participants (Swap Entities) and financial reporting rules for bank Swap Enti-ties. The new capital rules will apply to our non-bank deriva-tives dealer entities, Credit Suisse Capital LLC (CSC) and Credit Suisse Securities Europe Limited (CSSEL). CSC, as an over-the-counter derivatives dealer registered with the SEC, is already subject to capital and financial reporting rules administered by the SEC, and we do not expect the new CFTC rules to have a mate-rial impact on CSC because they will for the most part incorporate those SEC rules by reference. CSSEL may, with further approval by the CFTC, be able to satisfy the new CFTC rules through substituted compliance with comparable UK requirements. If, however, CSSEL is unable to rely on substituted compliance, it will face conflicts between CFTC and UK requirements that could prevent it from continuing to trade swaps with US persons. In addition, Credit Suisse International (CSI), which is a UK bank provisionally registered with the CFTC as a swap dealer, will be subject to new CFTC financial reporting requirements that, absent clarification, will diverge from its UK financial reporting obligations (for example by requiring it to report under US generally accepted accounting principles). If the CFTC does not clarify that CSI and other non-US bank Swap Entities can instead provide financial reports in accordance with home country accounting and other standards, CSI will bear significant increased cost to comply with the CFTC’s requirements. These new CFTC rules will take effect on October 6, 2021.
On July 23, 2020, the CFTC adopted rules that codify several elements of the CFTC’s current policy and no-action letters with respect to the cross-border application of certain swaps regula-tions applicable to Swap Entities, but with changes to certain definitions to align with the SEC, and that expand the application
of rules to swaps entered into by certain foreign subsidiaries of US parent companies and US branches of non-US banks. These new rules will take effect on September 14, 2021. However, the new rules leave existing CFTC guidance in place with respect to mandatory clearing, mandatory trade execution, real-time public reporting, swap data repository reporting and large trader report-ing requirements. The application of these two different cross-border regimes may increase our compliance costs and could disrupt some of our trading relationships.
On September 17, 2020, the CFTC adopted rules that will sub-stantially revise its real-time public reporting and regulatory reporting requirements for swaps. Among other changes, the new rules will significantly increase the block size above which swap transactions are subject to delayed public reporting, clarify report-ing requirements for certain types of swaps such as prime bro-kerage swaps, clarify and expand the data elements required to be reported in order to harmonize more closely with international standards, extend the deadline for making regulatory reports and introduce new data verification and correction requirements. The increase in block sizes could potentially reduce liquidity in the swaps markets or increase our hedging costs by subjecting more of our swap transactions to real-time public reporting. In addition, we are likely to incur significant operational and other costs to implement the new requirements. The new requirements will take effect on May 25, 2022, except that the changes to block sizes will take effect one year after that date.
Certain of our subsidiaries are subject to the margin rules for uncleared swaps of the CFTC and/or the margin rules for uncleared swaps and security-based swaps of the OCC, the Fed, the FDIC, the Farm Credit Administration and the Federal Hous-ing Finance Agency (together, the Prudential Regulators). Both the CFTC margin rules and the margin rules of the Prudential Regulators are following a phased implementation schedule. On April 3, 2020, the BCBS and the International Organization of Securities Commissions (IOSCO) provided an additional one-year extension to the fifth and sixth phases of the implementa-tion schedule of the rules requiring initial margin for non-centrally cleared derivatives, meaning the final implementation date for the application of initial margin requirements for market partici-pants with group-wide notional derivatives exposure during the preceding March, April and May of at least EUR 8 billion would be September 1, 2022 while the implementation date for those with group-wide notional derivatives exposure of at least EUR 50 billion would be September 1, 2021. Consistent with the revised implementation schedule adopted by the BCBS-IOSCO and in light of implementation issues posed by the COVID-19 pandemic, the CFTC and Prudential Regulators adopted interim final rules on May 28, 2020 and June 25, 2020, respectively, to delay the compliance date until September 1, 2021 for market participants with group-wide notional derivatives exposure during the preced-ing March, April and May exceeding USD 50 billion. On June 25, 2020 and October 15, 2020, the Prudential Regulators and the CFTC, respectively, adopted rules that delay the compliance date for initial margin requirements for market participants with group-wide notional derivatives exposure during the preceding March,
32 Regulation and supervision
April and May of at least USD 8 billion from September 1, 2021 until September 1, 2022. These delays were intended to avoid a market disruption in September 2020, but the broad expansion of initial margin requirements on September 1, 2021 and Septem-ber 1, 2022 could have a significant adverse impact on our OTC derivatives business because of the large number of affected counterparties that might need to enter into new documentation and upgrade their systems in order to comply.
The Prudential Regulators’ June 25, 2020 final rule also clarifies that certain amendments to uncleared swaps and security-based swaps entered into prior to the relevant compliance dates (i.e., legacy swaps), including amendments to address the upcoming discontinuation of LIBOR, generally will not trigger margin rules for those swaps. The final rule will therefore facilitate the transi-tion to new risk-free rates. Further, the final rule exempts most non-US swap dealers subject to the Prudential Regulators’ mar-gin rules, including CSI, from collecting initial margin on uncleared swaps with affiliates. Thus, our US subsidiaries trading swaps with CSI will be alleviated of the burden of initial margin require-ments, thereby increasing the efficient use of their assets.
On October 15, 2020, the CFTC adopted final rules expanding and revising position limits for certain physical commodity deriva-tives. The new rules will expand the CFTC’s position limit regime, which currently covers only a subset of agricultural futures con-tracts, to cover additional specified agricultural, energy and met-als futures contracts. The new rules will also cover futures con-tracts and options on futures contracts that are linked to these specified contracts, as well as economically equivalent swaps. The new rules further restrict the availability of exemptions from position limits for certain hedging activity and impose new requirements on US futures exchanges and swap execution facili-ties to administer position limits and related exemptions. Overall, the new rules may restrict the ability of our asset management businesses to trade in physical commodity derivatives covered by position limits, restrict the ability of our market making businesses to provide liquidity in these derivatives to certain types of clients, and generally increase the compliance costs and burdens of our businesses that transact in physical commodity derivatives. The new rules initially took effect March 15, 2021, but with delayed compliance dates of January 1, 2022 for the expansion of posi-tion limits to cover additional futures contracts and January 1, 2023 for the expansion of position limits to cover swaps.
EU
The EU has also proposed and enacted a wide range of pruden-tial, securities and governance regulations to address systemic risk and to further regulate financial institutions, products and markets. These proposals are at various stages of the EU pre-legislative, legislative rule-making and implementation processes, and their final form and cumulative impact remain uncertain.
UK-EU relationshipOn June 23, 2016, voters in the UK voted to leave the EU. Fol-lowing extensive negotiations with the EU on the terms of its
withdrawal, the UK ceased to be a member of the EU on Janu-ary 31, 2020 but under the terms of the concluded withdrawal agreement, the UK continued to be bound by EU laws, with full financial services passporting, for a transitional period ending on December 31, 2020. Following the end of the transitional period, EU law, including financial services passporting, no lon-ger applies in the UK. On December 24, 2020, the UK and the EU announced that they had agreed on a Trade and Cooperation Agreement (TCA), an Agreement between the UK and the Euro-pean Atomic Energy Community for Cooperation on the Safe and Peaceful Uses of Nuclear Energy and an Agreement concern-ing Security Procedures for Exchanging and Protecting Classi-fied Information. The UK and the EU have agreed to provisionally apply these agreements until April 30, 2021 to allow for comple-tion of their respective ratification processes. The TCA generally did not seek to cover financial services. The EU and the UK have committed to setting out a “non-binding memorandum of under-standing governing the regulatory dialogue” for regulatory coop-eration in financial services by March 2021. Although equivalence may be one of the topics discussed in the regulatory dialogue, the decision to grant equivalence is unilateral and not subject to bilateral negotiation. There can be no assurance that the EU will grant equivalence to the UK financial services regime and (even if equivalence is granted) any such decision may be revoked at any time.
The body of EU law, as it stood at the end of the transition period, has largely been retained in UK law in the immediate term, with Her Majesty’s Treasury (HM Treasury) exercising certain statu-tory powers to remedy deficiencies in retained EU law relating to financial services, through statutory instruments. The statutory instruments are not intended to make policy changes, other than to reflect the UK’s new position outside the EU. HM Treasury has also delegated powers to the UK’s financial services regulators to address deficiencies in the regulators’ rulebooks arising as a result of the exit, and to the EU Binding Technical Standards that are part of retained EU law. However, the intended fate of many EU laws that will apply in 2021 or later is not yet known.
However, the UK government has begun a broad program of review of the UK’s future regulatory framework. On October 19, 2020, HM Treasury issued a consultation marking the launch of the second phase of the review which seeks to examine, among other things, how the regulatory framework for financial services needs to adapt to be fit for the future, in particular to reflect the UK’s new position outside of the EU. Further, on October 21, 2020, the UK government introduced the Financial Services Bill in the UK Parliament. Among other things, the Financial Services Bill amends existing UK laws on financial services in relation to the prudential regimes for banks and investment firms (including the implementation in the UK of Basel III reforms). The UK gov-ernment is also undertaking a broader review of the UK’s future regulatory framework.
On November 16, 2020, in a joint statement, HM Treasury and the UK regulators announced that they would target an imple-mentation date of January 1, 2022 for implementing those Basel

33Regulation and supervision
III reforms which make up the UK equivalent to the outstanding elements of the amendments to the Capital Requirements Regu-lation (CRR) (made by the amending Regulation CRR II) as well as introducing a new prudential regime for investment firms.
Credit Suisse is working to address the implications of the con-sequences of these changes and to minimize disruption for our clients. Adverse changes to any of these arrangements, and even uncertainty over potential changes during any period of negotia-tion, could potentially impact our results in the UK or other mar-kets we serve.
> Refer to “Withdrawal of the UK from the EU and our legal entity structure” in Strategy and “Key risk developments” in III – Treasury, Risk, Balance sheet and Off-balance sheet – Risk management for further information.
Regulatory frameworkThe principal regulatory structures that apply to our operations are discussed below.
Global initiatives
Total Loss-Absorbing CapacityOn January 1, 2019, the final Financial Stability Board’s (FSB) Total Loss Absorbing Capacity (TLAC) standard for G-SIBs became effective, subject to a phase-in until January 1, 2022. The purpose of the standard is to enhance the ability of regula-tors to recapitalize a G-SIB at the point of non-viability in a man-ner that minimizes systemic disruption, preserves critical functions and limits the exposure of public sector funds. TLAC-eligible instruments include instruments that count towards satisfying minimum regulatory capital requirements, as well as long-term unsecured debt instruments that have remaining maturities of no less than one year, are subordinated by statute, corporate struc-ture or contract to certain excluded liabilities, including depos-its, are held by unaffiliated third parties and meet certain other requirements. Excluding any applicable regulatory capital buffers that are otherwise required, the minimum TLAC requirement was at least 16% of a G-SIB’s risk-weighted assets as of January 1, 2019, and will increase to at least 18% as of January 1, 2022. In addition, the minimum TLAC requirement was at least 6% of the Basel III leverage ratio denominator as of January 1, 2019, and must be at least 6.75% as of January 1, 2022. National regula-tors may implement or interpret the requirements more strictly within their own jurisdictions.
In Switzerland, the FSB’s TLAC standard was implemented on July 1, 2016 under the Capital Adequacy Ordinance.
> Refer to “Liquidity and funding management” and “Capital management” in III – Treasury, Risk, Balance sheet and Off-balance sheet for information regard-ing our current regulatory framework and expected changes to this framework affecting capital and liquidity standards.
In the US, the Fed has adopted a final rule that implements the FSB’s TLAC standard. The final rule requires, among other things, the US IHCs of non-US G-SIBs, such as Credit Suisse’s
US IHC, to maintain minimum amounts of “internal” TLAC, a TLAC buffer and long-term debt satisfying certain eligibility cri-teria, commencing January 1, 2019. The entity designated as Credit Suisse’s US IHC is required to issue all TLAC debt instru-ments to a foreign parent entity (a non-US entity that controls the IHC) or another foreign affiliate that is wholly owned by its foreign parent. The final rules also impose limitations on the types of financial transactions in which the entity designated as Credit Suisse’s US IHC can engage.
In the UK, the Bank of England published its statement of policy on its approach to establishing the requirement under the EU Bank Recovery and Resolution Directive (BRRD) for certain UK entities, including CSI and CSSEL, to maintain the minimum requirements for own funds and eligible liabilities (MREL) as well as its approach on setting internal MREL. Similar to the FSB’s TLAC standard, the MREL requirement obliges firms within the scope of the BRRD to maintain a minimum level of own funds and liabilities that can be bailed in. The statement of policy provides that internal MREL requirements for UK material subsidiaries of non-UK G-SIBs, such as Credit Suisse would be scaled between 75% and 90% of external MREL based on factors including the resolution strategy of the group and the home country’s approach to internal total loss-absorbing capacity calibration. Interim inter-nal MREL requirements came into effect beginning January 1, 2019, and their full implementation will be phased in through January 1, 2022. In addition, the CRR II introduced a require-ment, as of June 27, 2019, for material subsidiaries of non-EU G-SIBs, which are not resolution entities, to maintain internal MREL scaled at 90% of the external MREL requirement that would apply if the material subsidiary were a resolution entity. The Bank of England has stated that its statement of policy should be read in compliance with the new CRR II requirements. The Bank of England is undertaking a review of the calibration of MREL requirements.
ISDA Resolution Stay ProtocolsCredit Suisse voluntarily adhered to the ISDA 2015 Universal Resolution Stay Protocol (ISDA 2015 Universal Protocol) at the time of its launch in November 2015. By adhering to the ISDA 2015 Universal Protocol, parties agree to be bound by certain existing and forthcoming special resolution regimes to ensure that cross-border derivatives and securities financing transac-tions are subject to statutory stays on direct and affiliate-linked default rights in the event a bank counterparty enters into resolu-tion, regardless of its governing law. These stays are intended to facilitate an orderly resolution of a troubled bank. The ISDA 2015 Universal Protocol also introduces similar stays and overrides on affiliate-linked default rights in the event that an affiliate of an adhering party becomes subject to proceedings under the US Bankruptcy Code, under which no such stays or overrides cur-rently exist.
In order to expand the scope of parties and transactions cov-ered by the ISDA 2015 Universal Protocol or similar contractual arrangements, the G20 committed to introducing regulations
34 Regulation and supervision
requiring large banking groups to include ISDA 2015 Universal Protocol-like provisions in certain financial contracts when facing counterparties under foreign laws.
In Switzerland, the Federal Ordinance on Banks and Savings Institutions (Banking Ordinance) and the Federal Ordinance of FINMA on the Insolvency of Banks and Securities Dealers (FINMA Banking Insolvency Ordinance) require Swiss banks, including Credit Suisse, to include a clause under which the counterparty recognizes FINMA’s stay powers under the Fed-eral Act on Banks and Savings Banks of November 8, 1934, as amended, in certain of their contracts and in certain contracts entered into by their subsidiaries or affiliates. The requirement to include such a clause applies to the financial contracts exhaus-tively listed under the FINMA Banking Insolvency Ordinance and that are not governed by Swiss law or that provide for jurisdiction outside of Switzerland.
In the UK, the Prudential Regulation Authority (PRA) published final rules requiring UK entities, including CSI and CSSEL, to ensure that their counterparties under a broad range of financial arrangements are subject to the stays on early termination rights under the UK Banking Act that would be applicable upon their resolution.
ISDA has developed another protocol, the ISDA Resolution Stay Jurisdictional Modular Protocol, which is intended to be a mecha-nism to facilitate market-wide compliance with these requirements by both dealers, such as Credit Suisse, and their counterparties.
In the EU, amendments to BRRD (through amending Direc-tive BRRD II) (BRRD II) introduced harmonized requirements for relevant EU entities to include a contractual term within certain financial contracts governed by the laws of a non-EU jurisdic-tion, recognizing that the contract may be subject to the exercise of resolution powers by the resolution authority to suspend the entity’s payment or delivery obligations, or to suspend a counter-party’s termination or security enforcement rights.
In the US, the Fed, the FDIC and the OCC each issued final rules designed to improve the resolvability of US headquartered G-SIBs and the US operations of non-US G-SIBs, such as our US operations. These final rules require covered entities to modify certain qualified financial contracts to obtain agreement of coun-terparties that (1) their qualified financial contracts are subject to the stays on default rights under the Orderly Liquidation Authority and the Federal Deposit Insurance Act, which is similar to require-ments introduced in other jurisdictions to which we are already subject, and (2) certain affiliate-linked default rights would be lim-ited or overridden if an affiliate of the G-SIB entered proceedings under the US Bankruptcy Code or other insolvency or resolution regimes. ISDA has developed the ISDA 2018 US Resolution Stay Protocol (ISDA US Protocol) to facilitate compliance with the final rules. All the relevant Credit Suisse’s entities have adhered to the ISDA US Protocol to amend their qualified financial contracts with adhering counterparties to comply with the final rules.
Foreign Exchange In 2017, public and private sector representatives from the foreign exchange committees of 16 international foreign exchange (FX) trading centers agreed to form a Global Foreign Exchange Com-mittee and publish the FX Global Code, which sets out global principles of good practice, including ethics, governance, execu-tion, information sharing, risk management and compliance, and confirmation and settlement processes. Credit Suisse signed the FX Global Code’s Statement of Commitment on a global basis on May 21, 2018 and supports the adoption of the FX Global Code by FX market participants.
Switzerland
Banking regulation and supervisionAlthough Credit Suisse Group is not a bank according to the Bank Law and the Banking Ordinance, the Group is required, pursuant to the provisions on consolidated supervision of financial groups and conglomerates of the Bank Law, to comply with cer-tain requirements for banks. Such requirements include capital adequacy, loss-absorbing capacity, solvency and risk concentra-tion on a consolidated basis, and certain reporting obligations. Our banks in Switzerland are regulated by FINMA on a legal entity basis and, if applicable, on a consolidated basis.
Our banks in Switzerland operate under banking licenses granted by FINMA pursuant to the Bank Law and the Banking Ordinance. In addition, certain of these banks hold securities dealer licenses granted by FINMA pursuant to the Swiss Federal Act on Stock Exchanges and Securities Trading, which was in effect at the time the license was granted. As of January 1, 2020, the applica-ble ongoing licensing requirements for securities dealers are set out under the Financial Institutions Act (FinIA) and the Financial Institutions Ordinance (FinIO).
FINMA is the sole bank supervisory authority in Switzerland and is independent, including from the Swiss National Bank (SNB). Under the Bank Law, FINMA is responsible for the supervision of the Swiss banking system. The SNB is responsible for imple-menting the government’s monetary policy relating to banks and securities dealers and for ensuring the stability of the financial system. Under the “Too Big to Fail” legislation, the SNB is also responsible for determining which banks in Switzerland are sys-temically relevant banks and which functions are systemically rel-evant in Switzerland. The SNB has identified the Group on a con-solidated basis as a systemically relevant bank for the purposes of Swiss law.
Our banks in Switzerland are subject to close and continuous prudential supervision and direct audits by FINMA. Under the Bank Law, our banks are subject to inspection and supervision by an independent regulatory auditing firm recognized by FINMA, which is appointed by the bank’s board of directors and required to assess whether the bank is in compliance with laws and regu-lations, including the Bank Law, the Banking Ordinance and FINMA regulations.

35Regulation and supervision
Credit Suisse is subject to the Basel III framework, as imple-mented in Switzerland, as well as Swiss legislation and regula-tions for systemically important banks, which include capital, liquidity, leverage and large exposure requirements, and rules for emergency plans designed to maintain systemically relevant func-tions in the event of impending insolvency.
Our regulatory capital is calculated on the basis of accounting principles generally accepted in the US, with certain adjustments required by, or agreed with, FINMA.
> Refer to “Liquidity and funding management” and “Capital management” in III – Treasury, Risk, Balance sheet and Off-balance sheet for further informa-tion regarding our current regulatory framework and expected changes to this framework affecting capital and liquidity standards.
Under Swiss banking law, banks and securities dealers are required to manage risk concentration within specific limits. Aggregated credit exposure to any single counterparty or a group of related counterparties must bear an adequate relationship to the bank’s adjusted eligible capital (for systemically relevant banks like us, to their core Tier 1 capital) taking into account counterparty risks and risk mitigation instruments.
Subject to certain transitional periods, the FinSA and the FinIA as well as the implementing ordinances, the Financial Services Ordinance (FinSO) and the FinIO entered into effect on Janu-ary 1, 2020. With the enactment of FinSA and FinSO a new statutory regime, governing the provision of financial services in Switzerland, including to Swiss clients from abroad on a cross-border basis, as well as the offering of financial instruments, and the admission to trading of financial instruments, was introduced in Switzerland. FinIA and FinIO govern the licensing requirements and provide for a differentiated supervisory regime for securities dealers, asset managers, trustees, managers of collective assets, fund management companies and investment firms.
Under the Bank Law and FinIA, Swiss banks and securities dealers are obligated to keep confidential the existence and all aspects of their relationships with customers. These cus-tomer confidentiality laws do not, however, provide protection with respect to criminal offenses such as insider trading, money laundering, terrorist financing activities, tax fraud or evasion or prevent the disclosure of information to courts and administrative authorities.
Swiss rules and regulations to combat money laundering and ter-rorist financing are comprehensive and require banks and other financial intermediaries to thoroughly verify and document cus-tomer identity before commencing business. In addition, these rules and regulations, aimed at preventing money laundering, include obligations to maintain appropriate policies for dealings with politically exposed persons and procedures and controls to detect money laundering and terrorist financing activities, includ-ing reporting suspicious activities to authorities.
In addition, the Swiss Criminal Code provides for stringent anti-corruption and anti-bribery laws prohibiting illegitimate bribery
payments (and the receipt thereof) to Swiss and foreign public officials as well as persons in the private sector.
Compensation design and its implementation and disclosure have been required to comply with standards promulgated by FINMA under its Circular on Remuneration Schemes and the Compensa-tion Ordinance, as updated from time to time.
Securities dealer and asset management regulation and supervision Our securities dealer activities in Switzerland are conducted pri-marily through the Bank, under the supervision of FINMA, and are subject to regulation under FinIA and FinIO, which entered into effect on January 1, 2020 and regulate all aspects of the securities dealer business in Switzerland, including regulatory capital, risk concentration, sales and trading practices, record-keeping requirements and procedures and periodic reporting procedures.
Our asset management activities in Switzerland, which include the establishment and administration of mutual funds registered for public distribution, are conducted under the supervision of FINMA. Effective January 1, 2020, our activities as asset man-ager of collective assets are also governed by FinIA, subject to phase-in provisions.
Resolution regime Following the financial crisis of 2007/2008, the Swiss legislator promulgated special rules for the stabilization and restructuring of systemically important financial institutions. Among other aspects, these rules require plans for recovery and resolution. Each sys-temically important bank is required to submit a recovery plan to FINMA once a year, in which it sets out how it would stabilize itself in a crisis without government intervention, also taking the requirements of foreign regulators into account; this plan requires FINMA’s approval. In addition, each Swiss systemically important bank must submit an emergency plan, in which it details how it would ensure uninterrupted continuity of its systemically impor-tant functions in Switzerland, particularly access to deposits and payments, in a crisis; FINMA must review this plan and evalu-ate whether it is ready to be implemented if necessary. Credit Suisse was required to submit an effective Swiss emergency plan to FINMA for review by the end of 2019, and on February 25, 2020, FINMA published a report noting that it regarded the Swiss emergency plan submitted by Credit Suisse as effective. A third element is the resolution plan, which FINMA produces for sys-temically important banks, indicating how the entire global group would be recapitalized, restructured and/or liquidated in a crisis; FINMA assesses the resolvability of an institution on the basis of whether the preparations are sufficient to successfully implement the plan if necessary. If internationally active Swiss systemically important banks increase their global resolvability, FINMA can grant rebates on the respective institution’s gone concern capital requirements.
The FINMA Banking Insolvency Ordinance governs resolution (i.e., restructuring or liquidation) proceedings applicable to Swiss

36 Regulation and supervision
banks and securities dealers, such as Credit Suisse AG and Credit Suisse (Schweiz) AG, and Swiss-domiciled parent com-panies of financial groups, such as Credit Suisse Group AG, and certain other unregulated Swiss-domiciled companies belonging to financial groups. Instead of prescribing a particular resolu-tion concept, the FINMA Banking Insolvency Ordinance provides FINMA with a significant amount of authority and discretion in the case of resolution, as well as various restructuring tools from which FINMA may choose.
FINMA may open resolution proceedings if there is an impend-ing insolvency because there is justified concern that the relevant Swiss bank (or Swiss-domiciled parent companies of financial groups and certain other unregulated Swiss-domiciled companies belonging to financial groups) is over-indebted, has serious liquid-ity problems or no longer fulfills capital adequacy requirements. Resolution proceedings may only take the form of restructuring (rather than liquidation) proceedings if (i) the recovery of, or the continued provision of individual banking services by, the relevant bank appears likely and (ii) the creditors of the relevant bank are likely better off in restructuring proceedings than in liquidation proceedings. All realizable assets in the relevant entity’s posses-sion will be subject to such proceedings, regardless of where they are located.
If FINMA were to open restructuring proceedings with respect to Credit Suisse AG, Credit Suisse (Schweiz) AG or Credit Suisse Group AG, it would have discretion to take decisive actions, including (i) transferring the assets of the banks or Credit Suisse Group AG, as applicable, or a portion thereof, together with its debt and other liabilities, or a portion thereof, and contracts, to another entity, (ii) staying (for a maximum of two working days) the termination of, and the exercise of rights to terminate net-ting rights, rights to enforce or dispose of certain types of col-lateral or rights to transfer claims, liabilities or certain collateral, under contracts to which the banks or Credit Suisse Group AG, as applicable, is a party, (iii) converting the debt of the banks or Credit Suisse Group AG, as applicable, into equity (debt-to-equity swap), and/or (iv) partially or fully writing off the obligations of the banks or Credit Suisse Group AG, as applicable (haircut).
Prior to any debt-to equity swap or haircut, outstanding equity capital and debt instruments issued by Credit Suisse AG, Credit Suisse (Schweiz) AG or Credit Suisse Group AG that are part of its regulatory capital (including outstanding high trigger capital instruments and low trigger capital instruments) must be con-verted or written off (as applicable) and cancelled. Any debt-to-equity swap (but not any haircut) would have to follow the hierarchy of claims to the extent such debt is not excluded from such conversion by the FINMA Banking Insolvency Ordinance. Contingent liabilities of Credit Suisse AG, Credit Suisse (Schweiz) AG or Credit Suisse Group AG such as guarantees could also be subjected to a debt-to-equity swap or a haircut, to the extent amounts are due and payable thereunder at any time during restructuring proceedings.
For systemically relevant institutions, such as Credit Suisse AG, Credit Suisse (Schweiz) AG and Credit Suisse Group AG, credi-tors have no right to reject the restructuring plan approved by FINMA.
SupervisionThe Federal Act on Financial Market Infrastructure and Market Conduct in Securities and Derivatives Trading (FMIA) governs the organization and operation of financial market infrastructures and the conduct of financial market participants in securities and derivatives trading. FMIA, along with the Financial Market Infra-structure Ordinance (FMIO) came into effect on January 1, 2016. However, financial market infrastructures and the operators of organized trading facilities were granted different transitional peri-ods to comply with various new duties, including those associated with the publication of pre- and post-trade transparency informa-tion and with high-frequency trading. Under the FMIA, FINMA was designated to determine the timing of the introduction of a clearing obligation and to specify the categories of derivatives covered. Accordingly, on September 1, 2018, the revised Ordi-nance of the Swiss Financial Market Supervisory Authority on Financial Market Infrastructures and Market Conduct in Securities and Derivatives Trading (FMIO-FINMA) entered into force, intro-ducing a mandatory clearing obligation for standardized interest-rate and credit derivatives traded OTC and making effective, as of such date, the deadlines for the first clearing obligations laid down in the FMIO, i.e., six months, twelve months or eighteen months, depending on the categories of derivatives and the type of counterparty.
TaxAutomatic exchange of information and administrative assistance in tax mattersIn Switzerland, the Multilateral Convention on Mutual Administra-tive Assistance in Tax Matters (MAC) and the Multilateral Com-petent Authority Agreement (MCAA), together with the Federal Act on the International Automatic Exchange of Information in Tax Matters and its implementing ordinance, form the legal basis for the automatic exchange of information. Based on the MCAA, the multilateral agreement with the EU on the international automatic exchange of information in tax matters and a number of bilateral AEI agreements, Switzerland collects and exchanges informa-tion with more than 100 jurisdictions in respect of financial assets held in, and income derived thereon and credited to, accounts or deposits maintained in Switzerland.
Further to the MAC, Switzerland is required to spontaneously exchange certain information on advanced tax rulings in accor-dance with the OECD and G20 project to combat base erosion and profit shifting (BEPS). Additionally in 2009, Switzerland adopted the OECD standard on administrative assistance in tax matters in accordance with Art. 26 of the OECD Model Agree-ment which has subsequently been included in 60 Double Tax Agreements (DTAs), 51 of which are in force and applicable. The 2009 protocol (Protocol, ratified in 2019) amending the tax treaty
37Regulation and supervision
regarding income tax between Switzerland and the US, a mecha-nism for the exchange of information upon request in tax matters between Switzerland and the US is now in place. This mecha-nism allows the US to make group requests under the US Foreign Account Tax Compliance Act (FATCA) concerning non-consent-ing US accounts and non-consenting non-participating foreign financial institutions. The Protocol further erases the distinction between tax evasion and tax fraud in the context of administrative assistance to permit any exchanges of information as may be rel-evant to the administration or enforcement of the domestic laws concerning taxes.
Finally, in accordance with the Multilateral Competent Authority Agreement on the Exchange of Country-by-Country Reports as well as the implementing Swiss federal legislation, multinational groups of companies in Switzerland have to prepare country-by-country reports since the 2018 tax year with the exchange of the reports by Switzerland having started in 2020.
Tax exemptions on TLAC and similar instrumentsBased on the revised Withholding Tax Act, which entered into force on January 1, 2017, the exemption from withholding tax of interest paid on contingent convertible bonds and write-down bonds of banks or group companies of finance groups which were approved by FINMA and issued between January 1, 2013 and December 31, 2016, has been extended to issuances between January 1, 2017 and December 31, 2021. It also exempts inter-est paid on TLAC instruments approved by FINMA for purposes of meeting regulatory requirements which have been or will be issued between January 1, 2017 and December 31, 2021, or have been issued prior to January 1, 2017 where the foreign issuer thereof will be substituted for a Swiss issuer between Jan-uary 1, 2017 and December 31, 2021. It is currently planned to further extend said exemptions until December 31, 2026.
Furthermore, since 2017, equity securities in banks or group companies of a financial group issued in connection with the con-version of TLAC instruments into equity are exempt from the 1% issuance stamp tax, in addition to the exemption for equity securi-ties in banks issued from conversion capital.
Participation Exemption for “Too Big to Fail” InstrumentsCurrent legislation requires systemically relevant banks to issue contingent convertible bonds, write-off bonds and bail-in bonds through their top holding company, which may then on-lend the funds to direct or indirect subsidiaries. The Federal Act on Calcu-lation of the Participation Deduction for “Too Big to Fail” Instru-ments, which became effective as of January 1, 2019, permits such top holding companies (Konzernobergesellschaften) of systemically relevant banks to carve-out interest expenses on these “Too Big to Fail” instruments for purposes of calculating their tax-exempt net participation income. To level the effect of the carve-out, the respective assets and liabilities positions are also eliminated in the calculation. This allows for a calculation of the participation exemption with a complete carve-out of “Too Big to Fail” instruments to the extent the proceeds thereof are downstreamed.
Federal Act on Tax Reform and AHV Financing (TRAF)The main provisions of the Federal Act on Tax Reform and AHV Financing (TRAF) entered into force on January 1, 2020, together with further implementing legislation on federal and can-tonal level. Under the new withholding tax law introduced under TRAF, effective since January 1, 2020, companies listed on a Swiss stock exchange who are paying a dividend out of legal cap-ital contribution reserves are required to simultaneously pay a divi-dend out of taxable reserves of at least the same amount. Also, under these new rules, when a company listed on a Swiss stock exchange repurchases shares to cancel them, the company must charge at least fifty percent of the liquidation amount to capital contribution reserves, the liquidation amount being the amount equal to the repurchase price less the nominal amount. Prior to the new law, these companies were not limited in using the one or other type of reserves.
Swiss courts’ practice on withholding tax refunds The Swiss Federal Tax Authority (FTA) and the Swiss courts con-tinue to apply a strict beneficial ownership test for the application of any double taxation agreement based refund of Swiss with-holding tax on dividend payments and the like. The focus is on the beneficial ownership of the securities and/or the dividends at the time of payment, which is assessed from a factual and eco-nomic point of view, without regard to the parties’ intentions or motivation, and must be proven by the party requesting a refund in the form of detailed documentation at the request of the FTA. In the context of derivative transactions, it has become increas-ingly more difficult to obtain a refund of Swiss withholding tax as in most cases the FTA will not consider the recipient of a payment subject to withholding tax under a derivative transaction to be the beneficial owner of that payment for purposes of a refund of such withholding tax. However, the Swiss Supreme Court has also held that this strict application of the beneficial ownership test, as well as the proof requirements, do not mean that a financial institution involved in a derivative transaction is not entitled to a refund; if beneficial ownership can be established, a refund will be granted.
US
Banking regulation and supervisionOur banking operations are subject to extensive federal and state regulation and supervision in the US. Our direct US offices are composed of our New York Branch and representative offices in California. Each of these offices is licensed with, and subject to examination and regulation by, the state banking authority in the state in which it is located.
Our New York Branch is licensed by the New York Superinten-dent of Financial Services (Superintendent), examined by the DFS, and subject to laws and regulations applicable to a foreign bank operating a New York branch. Under the New York Bank-ing Law, our New York Branch must maintain eligible assets with banks in the state of New York. The amount of eligible assets required, which is expressed as a percentage of third-party liabili-ties, could increase if our New York Branch is no longer desig-nated well rated by the Superintendent.

38 Regulation and supervision
The New York Banking Law authorizes the Superintendent to seize our New York Branch and all of Credit Suisse AG’s business and property in New York State (which includes property of our New York Branch, wherever it may be located, and all of Credit Suisse AG’s property situated in New York State) under circum-stances generally including violations of law, unsafe or unsound practices or insolvency. In liquidating or dealing with our New York Branch’s business after taking possession, the Superintendent would only accept for payment the claims of depositors and other creditors (unaffiliated with us) that arose out of transactions with our New York Branch. After the claims of those creditors were paid out of the business and property of the Bank in New York, the Superintendent would turn over the remaining assets, if any, to us or our liquidator or receiver.
Under New York Banking Law and US federal banking laws, our New York Branch is generally subject to single borrower lending limits expressed as a percentage of the worldwide capital of the Bank. Under the Dodd-Frank Act, lending limits take into account credit exposure arising from derivative transactions, securities borrowing and lending transactions and repurchase and reverse repurchase agreements with counterparties.
Our operations are also subject to reporting and examination requirements under US federal banking laws. Our US non-banking operations are subject to examination by the Fed in its capacity as our US umbrella supervisor. The New York Branch is also subject to examination by the Fed and is subject to federal banking law requirements and limitations on the acceptance and maintenance of deposits. The New York Branch is not a member of, and its deposits are not insured by, the FDIC, and it does not engage in retail deposit taking.
US federal banking laws provide that a state-licensed branch (such as the New York Branch) or agency of a foreign bank may not, as a general matter, engage as principal in any type of activ-ity that is not permissible for a federally licensed branch or agency of a foreign bank unless the Fed has determined that such activity is consistent with sound banking practice. In addition, regulations which the Fed may adopt (including at the recommendation of the FSOC) could affect the nature of the activities which the Bank (including the New York Branch) may conduct, and may impose restrictions and limitations on the conduct of such activities.
The Fed may terminate the activities of a US branch or agency of a foreign bank if it finds that the foreign bank: (i) is not subject to comprehensive supervision in its home country; (ii) has violated the law or engaged in an unsafe or unsound banking practice in the US; or (iii) for a foreign bank that presents a risk to the stabil-ity of the US financial system, the home country of the foreign bank has not adopted, or made demonstrable progress toward adopting, an appropriate system of financial regulation to mitigate such risk.
Credit Suisse Group and the Bank became financial holding com-panies for purposes of US federal banking law in 2000 and, as a result, may engage in a broad range of non-banking activities in
the US, including insurance, securities, private equity and other financial activities, in each case subject to regulatory require-ments and limitations. Credit Suisse Group is still required to obtain the prior approval of the Fed (and potentially other US banking regulators) before acquiring, directly or indirectly, the ownership or control of more than 5% of any class of voting shares of (or otherwise controlling) any US bank, bank holding company or many other US depositary institutions and their hold-ing companies, and as a result of the Dodd-Frank Act, before making certain acquisitions involving large non-bank companies. The New York Branch is also restricted from engaging in cer-tain tying arrangements involving products and services, and in certain transactions with certain of its affiliates. If Credit Suisse Group or the Bank ceases to be well-capitalized or well-man-aged under applicable Fed rules, or otherwise fails to meet any of the requirements for financial holding company status, it may be required to discontinue certain financial activities or terminate its New York Branch. Credit Suisse Group’s ability to undertake acquisitions permitted for financial holding companies could also be adversely affected.
As mentioned above, Credit Suisse is also subject to the so-called “Volcker Rule,” which limits the ability of banking entities to sponsor or invest in certain private equity or hedge funds, broadly defined, and to engage in certain types of proprietary trading for their own account. These restrictions are subject to certain exclusions and exemptions, including with respect to underwrit-ing, market-making, risk-mitigating hedging and certain asset and fund management activities, and with respect to certain transac-tions and investments occurring solely outside of the US. The Volcker Rule requires banking entities to establish an extensive array of compliance policies, procedures and quantitative metrics reporting designed to ensure and monitor compliance with restric-tions under the Volcker Rule. It also requires an annual attesta-tion either by the Chief Executive Officer of the top-tier foreign banking organization (FBO) or the senior management officer in the US as to the implementation of a compliance program rea-sonably designed to achieve compliance with the Volcker Rule. In April 2017, the Fed granted Credit Suisse an extended transition period to conform investments in certain illiquid funds under the Volcker Rule for an additional five years (i.e., until July 21, 2022). Credit Suisse has implemented a Volcker Rule compliance pro-gram reasonably designed to satisfy the requirements of the Vol-cker Rule. The Volcker Rule’s implementing regulations are highly complex and may be subject to further rulemaking and regulatory interpretation and guidance.
Fed regulations implementing the Dodd-Frank Act required Credit Suisse to create a single US IHC to hold all of its US subsidiar-ies with limited exceptions. The IHC requirement does not apply to the New York Branch. Credit Suisse’s US IHC is subject to US risk-based capital and leverage requirements that are largely consistent with the Basel III framework published by the BCBS, though they diverge in several important respects due to the requirements of the Dodd-Frank Act, and is subject to capital planning and capital stress testing requirements under the Dodd-Frank Act and the Fed’s annual CCAR.

39Regulation and supervision
Credit Suisse’s US IHC is also subject to additional requirements under the Fed’s final TLAC framework for IHCs, described above. In addition, both Credit Suisse’s US IHC itself and the combined US operations of Credit Suisse (including Credit Suisse’s US IHC and the New York Branch) are subject to other prudential require-ments, including with respect to liquidity risk management, liquid-ity stress testing and separate liquidity buffers for each of Credit Suisse’s US IHC and the New York Branch. Our US IHC is also subject to the Fed’s applicable rules on liquidity coverage ratio (LCR), single counterparty credit limits (SCCL) and, once effec-tive on July 1, 2021, NSFR. The SCCL limits our aggregate net credit exposures to any single unaffiliated counterparty based on Tier 1 capital. Our combined US operations (including our US IHC and New York Branch) may qualify for a regime of substituted compliance with comparable home country rules, but our US IHC is ineligible for the substituted compliance regime and remains subject to a separate SCCL requirement. Under proposals that remain under consideration, the combined US operations of Credit Suisse may become subject to an early remediation regime which could be triggered by risk-based capital, leverage, stress tests, liquidity, risk management and market indicators.
> Refer to “Liquidity and funding management” in III – Treasury, Risk, Balance sheet and Off-balance sheet for further information on Basel III LCR and NSFR.
A major focus of US policy and regulation relating to financial institutions has been to combat money laundering and terrorist financing and to enforce compliance with US economic sanc-tions. These laws and regulations impose obligations to maintain appropriate policies, procedures and controls to detect and report money laundering and terrorist financing, verify the identity of customers and comply with economic sanctions. Any failure to maintain and implement adequate programs to combat money laundering and terrorist financing, and violations of such economic sanctions, laws and regulations, could have serious legal and reputational consequences. We take our obligations to prevent money laundering and terrorist financing in the US and glob-ally and to comply with US economic sanctions very seriously, while appropriately respecting and protecting the confidential-ity of clients. We have policies, procedures and training intended to ensure that our employees comply with “know your customer” regulations and understand when a client relationship or business should be evaluated as higher risk for us. We are also subject to both the anti-bribery and accounting provisions of the US Foreign Corrupt Practices Act. The anti-bribery provisions prohibit the bribery of non-US government officials. The accounting provisions require us to keep accurate books and records and to maintain a system of internal accounting controls.
The Dodd-Frank Act requires issuers with listed securities to establish a claw-back policy to recoup erroneously awarded com-pensation in the event of an accounting restatement but no final rules have been adopted.
Broker-dealer and asset management regulation and supervision Our US broker-dealers are subject to extensive regulation by US regulatory authorities. The SEC is the federal agency primarily
responsible for the regulation of broker-dealers, investment advis-ers and investment companies. In addition, the US Treasury has the authority to promulgate rules relating to US Treasury and gov-ernment agency securities, the Municipal Securities Rulemaking Board (MSRB) has the authority to promulgate rules relating to municipal securities, and the MSRB also promulgates regulations applicable to certain securities credit transactions. In addition, broker-dealers are subject to regulation by securities industry self-regulatory organizations, including the Financial Industry Reg-ulatory Authority (FINRA), and by state securities authorities.
Our US broker-dealers are registered with the SEC and our pri-mary US broker-dealer is registered in all 50 states, the District of Columbia, Puerto Rico and the US Virgin Islands. Our US reg-istered entities are subject to extensive regulatory requirements that apply to all aspects of their business activity, including, where applicable: capital requirements; the use and safekeeping of customer funds and securities; the suitability of customer invest-ments and best interest obligations for certain retail customers; record-keeping and reporting requirements; employee-related matters; limitations on extensions of credit in securities transac-tions; prevention and detection of money laundering and terrorist financing; procedures relating to research analyst independence; procedures for the clearance and settlement of trades; and com-munications with the public.
Our US broker-dealers are also subject to the SEC’s net capital rule, which requires broker-dealers to maintain a specified level of minimum net capital in relatively liquid form. Compliance with the net capital rule could limit operations that require intensive use of capital, such as underwriting and trading activities and the financing of customer account balances and also could restrict our ability to withdraw capital from our broker-dealers. Most of our US broker-dealers are also subject to additional net capital requirements of FINRA and, in some cases, other self-regulatory organizations.
Our securities and asset management businesses include legal entities registered and regulated as a broker-dealer and invest-ment adviser by the SEC. The SEC-registered mutual funds that we advise are subject to the Investment Company Act of 1940. For pension fund customers, we are subject to the Employee Retirement Income Security Act of 1974 and similar state statutes.
The Dodd-Frank Act also requires broader regulation of hedge funds and private equity funds, as well as credit rating agencies.
Derivative regulation and supervision The CFTC is the federal agency primarily responsible for the reg-ulation of futures commission merchants, commodity pool opera-tors, commodity trading advisors and introducing brokers, among other regulatory categories. With the effectiveness of the Dodd-Frank Act, CFTC oversight was expanded to include persons engaging in a relevant activity with respect to swaps, and regis-tration categories were added for swap dealers and major swap participants. For derivatives activities, these CFTC registrants

40 Regulation and supervision
are subject to industry self-regulatory organizations, such as the National Futures Association (NFA), which has been designated by the CFTC as a registered futures association.Each of CSI, CSSEL and CSC is registered with the CFTC as a swap dealer as a result of its applicable swap activities and is therefore subject to requirements relating to reporting, record-keeping, swap confirmation, swap portfolio reconciliation and compression, mandatory clearing, mandatory on-facility trad-ing, swap trading relationship documentation, external business conduct, risk management, chief compliance officer duties and reports and internal controls. However, where permitted by com-parability determinations by the CFTC or in reliance on no-action letters issued by the CFTC, non-US swap dealers, including CSI and CSSEL, can comply with certain requirements through substituted compliance with EU regulations. The CFTC has also granted no-action letters that have applied since the UK’s with-drawal from the EU, which permit CSI and CSSEL to satisfy such requirements by complying with relevant UK regulations.
As registered swap dealers that are not banks, CSSEL and CSC are also subject to the CFTC’s margin rules for uncleared swaps. As a non-US swap dealer, CSSEL is only subject to these rules in connection with its uncleared swaps with US persons, non-US persons guaranteed by US persons, and certain non-US swap dealer subsidiaries of US persons. As a registered swap dealer that is a foreign bank, CSI is subject to the margin rules for uncleared swaps and security-based swaps of the Fed, and CSI likewise is only subject to these rules in connection with its uncleared swaps and security-based swaps with US persons, non-US persons guaranteed by US persons, and certain non-US swap dealer subsidiaries of US persons. Both the CFTC’s margin rules and the Fed’s margin rules are following a phased imple-mentation schedule. Since March 1, 2017, CSI, CSSEL and CSC have been required to comply with variation margin requirements with covered entities under these rules, requiring the exchange of daily mark-to-market margin with all such covered entities. Ini-tial margin requirements began phasing in annually for different counterparties from September 1, 2016, with remaining phases relating to the application of initial margin requirements to market participants with group-wide notional derivatives exposure dur-ing the preceding March, April and May of at least USD 50 bil-lion or at least USD 8 billion on September 1, 2021 or Septem-ber 1, 2022, respectively. The broad expansion of initial margin requirements on September 1, 2021 or September 1, 2022 could have a significant adverse impact on our OTC derivatives busi-ness because of the large number of affected counterparties that might need to enter into new documentation and upgrade their systems in order to comply.
As noted above, as non-bank swap dealers, CSSEL and CSC are subject to the CFTC’s capital and financial reporting rules that were adopted in July 2020 and will take effect on October 6, 2021.
One of our US broker-dealers, Credit Suisse Securities (USA) LLC, is also registered as a futures commission merchant and
subject to the capital, segregation and other requirements of the CFTC and the NFA.
Our asset management businesses include legal entities regis-tered and regulated as commodity pool operators and commod-ity trading advisors by the CFTC and the NFA and therefore are subject to disclosure, recordkeeping, reporting and other require-ments of the CFTC and the NFA.
The Dodd-Frank Act mandates that the CFTC establish aggre-gate position limits for certain physical commodity futures con-tracts and economically equivalent swaps, and as noted above, on October 15, 2020, the CFTC adopted final rules expand-ing and revising position limits for certain physical commodity derivatives.
Additionally, the SEC has finalized rules implementing most of the key derivatives provisions of the Dodd-Frank Act, including secu-rity-based swap dealer registration, capital, margin, segregation, internal and external business conduct, recordkeeping and finan-cial reporting, risk mitigation techniques, and transaction report-ing rules. These rules are scheduled to take effect on November 1, 2021. Unlike the CFTC, the SEC has not yet finalized rules relating to mandatory clearing or mandatory on-facility trading. While the SEC’s rules have largely paralleled many of the CFTC’s rules, significant differences between the final CFTC and SEC rules could materially increase the compliance costs associated with, and hinder the efficiency of, our equity and credit derivatives businesses with US persons. For example, significant differences between the cross-border application of SEC and CFTC rules could have such effects. In particular, SEC rules applying public transaction reporting and external business conduct requirements to security-based swaps between non-US persons that are arranged, negotiated or executed by US personnel (ANE transac-tions) could discourage non-US counterparties from entering into such transactions, unless the SEC permits substituted compli-ance with non-US reporting or business conduct requirements. While the SEC has issued time-limited relief from its reporting requirements which will last until the earlier of four years fol-lowing the first compliance date in each security-based swaps asset class or 12 months after the SEC provides notice that its no-action position will expire, the portion of the relief related to assignment of reporting duties does not extend to certain ANE transactions. Our non-bank derivatives dealer entities, CSC and CSSEL, are expected to be subject to the SEC’s finalized capital, margin and segregation requirements for security-based swap dealers. We do not expect a significant impact to CSC because it is already subject to SEC capital requirements as an over-the-counter derivatives dealer registered with the SEC, the SEC’s new margin requirements are aligned in key respects with CFTC margin requirements that already apply to CSC as a CFTC-regis-tered swap dealer, and CSC should be eligible for exemption from certain SEC segregation requirements. CSSEL may, with further approval by the SEC, be able to satisfy SEC capital and margin requirements through substituted compliance with comparable UK requirements and may also be eligible for exemption from

41Regulation and supervision
certain SEC segregation requirements. If, however, CSSEL is unable to rely on substituted compliance in connection with SEC capital and margin requirements, it will face conflicts between SEC and UK requirements that could prevent it from continuing to trade security-based swaps with US persons.
FATCA Pursuant to an agreement with the US Internal Revenue Ser-vice (IRS) entered into in compliance with FATCA, Credit Suisse is required to identify and provide the IRS with information on accounts held by US persons and certain US-owned foreign entities, as well as to withhold tax on payments made to foreign financial institutions that are not in compliance with FATCA and account holders who fail to provide sufficient information to clas-sify an account as a US or non-US account. Switzerland and the US have entered into a “Model 2” intergovernmental agreement to implement FATCA, which requires Credit Suisse to disclose account details directly to the US tax authority with the consent of the US clients concerned. Where US clients do not provide Credit Suisse consent to disclose to the IRS, the US authorities must make a group request for this data through normal administrative assistance channels. Group requests are effective for information applying to cases dating from June 30, 2014.
Resolution regime The Dodd-Frank Act also established an “Orderly Liquidation Authority,” a regime for the orderly liquidation of systemically significant non-bank financial companies, which could poten-tially apply to certain of our US entities. The Secretary of the US Treasury may under certain circumstances appoint the FDIC as receiver for a failing financial company in order to prevent risks to US financial stability. The FDIC would then have the author-ity to charter a “bridge” company to which it can transfer assets and liabilities of the financial company, including swaps and other QFCs, in order to preserve the continuity of critical functions of the financial company. The FDIC has indicated that it prefers a single-point-of-entry strategy, although it retains the ability to resolve individual financial companies. As noted above, on July 24, 2020, the FDIC and SEC finalized rules that would clarify the application of SIPA in a receivership for a systemically significant broker-dealer under the Dodd-Frank Act’s Orderly Liquidation Authority.
In addition, the Dodd-Frank Act and related rules promulgated by the Fed and the FDIC require bank holding companies and com-panies treated as bank holding companies with total consolidated assets above specified thresholds, such as us, and certain desig-nated non-bank financial firms, to submit periodically to the Fed and the FDIC resolution plans describing the strategy for rapid and orderly resolution under the US Bankruptcy Code or other applicable insolvency regimes, though such plans may not rely on the Orderly Liquidation Authority. Our combined US operations are required to file a resolution plan every three years, alternating between a full resolution plan and a less extensive targeted reso-lution plan that will focus on certain core elements, responding to the targeted information request described above, and certain changes from the previous full plan. We must file a targeted plan
by December 17, 2021. The deadline for our next full plan is July 1, 2024.
CybersecurityFederal and state regulators, including the DFS, FINRA and the SEC, have increasingly focused on cybersecurity risks and responses for regulated entities. For example, the DFS cyberse-curity regulation applies to any licensed person, including DFS-licensed branches of non-US banks, and requires each company to assess its specific risk profile periodically and design a program that addresses its risks in a robust fashion. Each covered entity must monitor its systems and networks and notify the superin-tendent of the DFS within 72 hours after it is determined that a material cybersecurity event has occurred. Similarly, FINRA has identified cybersecurity as a significant risk and will assess firms’ programs to mitigate those risks. In addition, the SEC has issued expanded interpretative guidance that highlights requirements under US federal securities laws that public operating companies must pay particular attention to with respect to cybersecurity risks and incidents.
EU
Financial services regulation and supervisionOur EU banks, investment firms and fund managers are subject to extensive regulation by EU and national regulatory authorities, whose requirements are increasingly imposed under EU directives and regulations aimed at increasing integration and harmonization in the European market for financial services. While regulations have immediate and direct effect in EU member states, directives must be implemented through national legislation. As a result, the terms of implementation of directives are not always consis-tent from country to country. In response to the financial crisis and in order to strengthen European supervisory arrangements, the EU established the European Systemic Risk Board, which has macro-prudential oversight of the financial system. The EU has also established three supervisory authorities responsible for promoting greater harmonization and consistent application of EU legislation by national regulators: EBA, the European Securities and Markets Authority and the European Insurance and Occupa-tional Pensions Authority.
The Basel III capital framework is implemented in the EU by the amendments to the Capital Requirements Directive (CRD) (through the amending directive CRD V) and the CRR II ( jointly known as the CRD V package). The CRD V package comprises a single prudential rule book for banks and investment firms. CRR II contains, among other things, amendments to the previous CRR relating to, among other things, leverage ratio, market risk, counterparty credit risk and large exposures and implementing the FSB’s TLAC standard. CRD V includes among other things, corporate governance and remuneration requirements, including a cap on variable remuneration. The CRD V amendments also include a new requirement for non-EU banking groups with two or more institutions and at least EUR 40 billion of assets in the EU to establish an EU intermediate financial holding company that would be subject to consolidated prudential supervision in the EU.

42 Regulation and supervision
While the majority of the CRR II measures will apply from June 28, 2021, certain requirements, such as the new TLAC require-ments, applied immediately on entry into force on June 27, 2019. EU member states were required to adopt national legislative measures necessary to comply with CRD V by December 28, 2020. The requirement for an intermediate holding company will apply in practice from December 30, 2023.
Within the eurozone, banks are supervised within the Single Supervisory Mechanism. This empowers the ECB to act as a single direct supervisor for significant banks in the 17 eurozone countries and for certain non-eurozone countries which may choose to participate in the Single Supervisory Mechanism.
The revised Markets in Financial Instruments Directive (MiFID II) and the Markets in Financial Instruments Regulation (MiFIR) have introduced a number of significant changes to the regulatory framework established by the Markets in Financial Instruments Directive (MiFID I), and the European Commission has adopted a number of delegated and implementing measures, which supple-ment their requirements. In particular, MiFID II and MiFIR have introduced enhanced organizational and business conduct stan-dards that apply to investment firms, including a number of Credit Suisse EU entities advising clients within the European Economic Area. These provisions include standards for managing conflicts of interest, best execution and enhanced investor protection. MiFID II has also enforced specific safeguards for algorithmic and high-frequency trading and introduced a ban on the receipt of investment research by portfolio managers and providers of inde-pendent investment advice unless paid for by clients. On February 26, 2021, the EU enacted a series of “quick-fix” amendments to MiFID II, which aim to alleviate the administrative burdens on investment firms in order to facilitate the EU’s economic recovery from the COVID-19 pandemic. The changes include amend-ments to client information and product governance requirements and the regime for research on small and mid-cap issuers and on fixed income instruments. The amendments entered into force on February 27, 2021 and will apply from February 28, 2022. EU member states are required to transpose the amendments into national law by November 28, 2021. Furthermore, the European Commission is expected to produce a comprehensive MiFID II review proposal in the fourth quarter of 2021 or the first quarter of 2022.
The Benchmarks Regulation (BMR) introduces new rules aimed at ensuring greater accuracy and integrity of benchmarks in financial instruments. The BMR sets out various requirements which will govern the activities of benchmark administrators and submitters. Certain requirements have applied to Credit Suisse in its capacity as a contributor to several critical benchmarks since June 30, 2016. The majority of the other provisions of the BMR have applied since January 1, 2018, although a two-year transi-tion period permitting usage of the EU non-critical benchmark, not yet compliant with the BMR, by EU-supervised entities came to an end on December 31, 2019 and “critical” and third country benchmark providers, including CSI as a UK benchmark admin-istrator, have been given until December 31, 2023 to comply. A
number of European Commission Delegated Regulations supple-menting the BMR also entered into force in 2018. The regulations specify, among other things, the criteria for assessing whether certain events would result in significant and adverse impacts on matters including the market integrity and financial stabil-ity of one or more member states and the conditions to assess the impact resulting from the cessation of, or change to, existing benchmarks.
On January 4, 2017, the European Commission Delegated Regulation supplementing the European Market Infrastructure Regulation (EMIR) with regard to regulatory technical standards for risk mitigation techniques for OTC derivatives not cleared by a central counterparty (CCP) entered into force. The Delegated Regulation imposes a requirement on financial counterparties and non-financial counterparties above the clearing threshold to col-lect initial margin and variation margin in respect of non-centrally cleared OTC derivative transactions. The requirements relating to initial margin and variation margin have applied since February 4, 2017 in relation to the largest market participants. Other market participants have become or in the future will become subject to the requirements relating to initial margin through a series of phase-in dates, starting September 1, 2017. Requirements relat-ing to variation margin have applied to all financial and non-finan-cial counterparties above the clearing threshold since March 1, 2017. On June 17, 2019, a broad range of amendments to EMIR (through the “EMIR Refit” Regulation) entered into force, includ-ing in relation to counterparty classification, clearing, margin and reporting requirements. In particular, the amendments include an obligation for clearing members and clients which provide clearing services to provide services under fair, reasonable, non-discrim-inatory and transparent commercial terms, which will apply from June 18, 2021. Further amendments to EMIR (known as “EMIR 2.2”) entered into force in January 2020. EMIR 2.2 focuses on the authorization and supervision of CCPs. Amongst other things, EMIR 2.2 creates new supervisory mechanisms for ensuring more coherent and consistent supervision of EU CCPs as well as a more robust regime for recognizing non-EU CCPs, including through the newly established CCP Supervisory Committee and a tiering system for non-EU CCPs according to their systemic importance to the EU or member states. Further, on February 18, 2021, certain amendments to the EMIR regulatory technical standards entered into force. Among other things, amendments to the regulatory technical standards for risk mitigation techniques for OTC derivatives not cleared by a CCP extend the deadline for the implementation of initial margin requirements for firms in the final implementation phases, extend the temporary exemption for single-stock equity options or index options (equity options) to January 4, 2024 and allow UK counterparties to be replaced with EU counterparties without triggering the bilateral margin and clearing obligation requirements under certain conditions until January 1, 2022.
Resolution regime The BRRD establishes a framework for the recovery and resolu-tion of credit institutions and investment firms and applies to all Credit Suisse EU entities, including branches of the Bank. The
43Regulation and supervision
BRRD introduces requirements for recovery and resolution plans, provides for bank resolution tools, including bail-in for failing banks, and establishes country-specific bank resolution financ-ing arrangements. In addition, as part of their powers over banks in resolution, resolution authorities are empowered to replace a bank’s senior management, transfer a bank’s rights, assets and liabilities to another person, take a bank into public ownership, and close out and terminate a bank’s financial contracts or deriva-tives contracts. Banks are required to produce recovery plans, describing proposed arrangements to permit them to restore their viability, while resolution authorities are empowered to produce resolution plans which describe how a bank may be resolved in an orderly manner, were it to fail.
Under the BRRD, the resolution authority can increase the capi-tal of a failing or failed bank through bail-in: i.e., the write-down, reduction or cancellation of liabilities held by unsecured creditors, or their conversion to equity or other securities. All of a bank’s liabilities are subject to bail-in, unless explicitly excluded by the BRRD because they are, for example, covered deposits, secured liabilities, or liabilities arising from holding client assets or client money.
The BRRD also requires banks to hold a certain amount of bail-inable loss-absorbing capacity at both individual and consolidated levels. This requirement is known as the MREL, and is conceptu-ally similar to the TLAC framework.
In June 2019, amendments to BRRD (through BRRD II) entered into force. EU member states were required to adopt national leg-islative measures necessary to comply with BRRD II by Decem-ber 28, 2020. BRRD II contains amendments to the existing EU regime relating to MREL to align it with the TLAC standard and to introduce, among other things, changes to the contractual recognition of bail-in and a new moratorium power for competent authorities.
The Single Resolution Mechanism Regulation, which came into force on August 19, 2014, established the Single Resolution Board as the resolution authority in charge of Banks in the euro-zone. Since January 1, 2016, the Single Resolution Board has had full resolution powers, including bail-in.
Data protection regulationThe GDPR is now fully applicable and applies to the processing of personal data in the context of our EU establishments as well as on an extraterritorial basis. The GDPR also forms the basis of our Global Data Protection standard ensuring that policies and pro-cesses of the highest standard apply to all Credit Suisse entities globally, subject to local laws and regulations. The GDPR requires us to take various measures to ensure compliance with the regu-lation, including processing personal data in accordance with the data protection principles, maintaining records of data process-ing, ensuring adequate security for personal data, complying with data breach notification requirements, and giving effect to data
subjects’ rights. Furthermore, in accordance with the GDPR, we have appointed a Data Protection Officer who is responsible for monitoring our compliance with and providing advice in connec-tion with global data protection laws and regulations. The GDPR grants broad enforcement powers to data protection authorities, including the potential to levy significant administrative fines for non-compliance.
In addition to the GDPR, other jurisdictions in which we oper-ate have adopted or are proposing data privacy standards, for example the FADP in Switzerland, applicable US data privacy laws including the California Consumer Privacy Act of 2018 and the California Privacy Rights Act, the Thailand Personal Data Protection Act and the Data Protection Law DIFC No. 5 2020 in Dubai, some of which are similar to the GDPR or contain their own requirements more robust than the GDPR. As additional data privacy laws come into effect in the coming years, we continue to monitor changes and ensure compliance with our data privacy obligations.
Anti-money laundering regulationThe Fifth Money Laundering Directive (MLD5) entered into force on July 9, 2018 and EU member states were required to comply with the requirements of MLD5 by January 10, 2020. Among other things, MLD5 clarifies the requirements for enhanced due diligence measures and countermeasures relating to high-risk third countries and introduced a new obligation for EU member states to establish centralized mechanisms to identify holders and controllers of bank and payment accounts.
Investment services regulationSince July 1, 2019, following a decision by the European Com-mission not to extend the recognition of the equivalence of the Swiss legal and supervisory framework for trading venues with that of the EU, EU investment firms are, in principle, prohibited from trading in certain equity securities of companies domiciled in Switzerland on Swiss trading venues. Likewise, since July 1, 2019, under measures taken by the Swiss FDF, trading venues domiciled in the EU are effectively prohibited from offering or facilitating trading in certain equity securities of Swiss companies.
UK
Banking regulation and supervision The principal statutory regulators of financial services activ-ity in the UK are the PRA, a part of the Bank of England, which is responsible for the micro-prudential regulation of banks and larger investment firms, and the FCA, which regulates markets, the conduct of business of all financial firms, and the pruden-tial regulation of firms not regulated by the PRA. In addition, the Financial Policy Committee of the Bank of England is responsible for macro-prudential regulation.
The UK was required to implement EU directives into national law until the end of the transitional period following its exit from the

44 Regulation and supervision
EU in January 2020. Following the end of the transitional period on December 31, 2020, EU laws which were in effect and appli-cable as at December 31, 2020 were “on-shored” (retained) in UK law with amendments that remedy, mitigate, or prevent “defi-ciencies” in the on-shored EU law arising from the withdrawal of the UK from the EU but do not otherwise make general policy changes. Accordingly, at present, the regulatory regime for banks operating in the UK largely conforms to required EU standards, including compliance with capital adequacy standards, customer protection requirements, conduct of business rules and anti-money laundering rules. These standards, requirements and rules are similarly implemented, under the same directives, throughout the member states of the EU in which we operate.
CSI, Credit Suisse (UK) Limited and Credit Suisse AG, London Branch are authorized to take deposits. We also have a number of entities authorized to conduct investment business and asset management activities. In deciding whether to grant authoriza-tion, the PRA must first determine whether a firm satisfies the threshold conditions for authorization, which include suitability and the requirement for the firm to be fit and proper. The PRA is also responsible for approval of certain models with respect to regula-tory capital requirements of our UK subsidiaries.
Our London Branch is required to comply principally with Swiss home country regulation. However, as a response to the global financial crisis, the PRA made changes to its prudential super-vision rules in its rulebook, applying a principle of “self-suffi-ciency,” such that CSI, CSSEL and Credit Suisse (UK) Limited are required to maintain adequate liquidity resources, under the day-to-day supervision of the entity’s senior management, held in a custodian account in the name of the entity, unencumbered and attributed to the entity balance sheet. In addition, the PRA requires CSI, CSSEL and Credit Suisse (UK) Limited to maintain a minimum capital ratio and to monitor and report large exposures in accordance with the CRR.
The PRA has implemented the requirements of CRD relating to staff remuneration and imposed a 1:1 cap on variable remunera-tion which can rise to 1:2 with explicit shareholder approval.
The UK Financial Services (Banking Reform) Act 2013, enacted in December 2013, establishes a more stringent regulatory regime for senior managers and specified risk takers in a bank or PRA authorized investment firm; it also makes reckless miscon-duct in the management of a bank a criminal offense. These rules impact our UK entities, such as CSI and CSSEL.
Broker-dealer and asset management regulation and supervisionOur London bank and broker-dealer subsidiaries are authorized under the Financial Services and Markets Act 2000 (FSMA) and are subject to regulation by the PRA and FCA. In addition, our asset management companies are authorized under the FSMA and are subject to regulation by the FCA. In deciding whether to authorize an investment firm in the UK, the PRA and FCA will consider the threshold conditions, which include suitability and the general requirement for a firm to be fit and proper. The PRA and FCA are responsible for regulating most aspects of an investment firm’s business, including its regulatory capital, sales and trading practices, use and safekeeping of customer funds and securi-ties, record-keeping, margin practices and procedures, registra-tion standards for individuals carrying on certain functions, anti-money laundering systems and periodic reporting and settlement procedures.
Resolution regime The UK legislation related to the recovery and resolution of credit institutions such as Credit Suisse consists of the special reso-lution regime (SRR), the PRA recovery and resolution frame-work and the FCA recovery and resolution requirements, which implemented the BRRD in the UK. The UK Banking Act and the related secondary legislation govern the application of the SRR, which grants the UK authorities powers to handle systemically important firms, such as banks, in case of highly likely failure. The UK resolution authority is the Bank of England which is empow-ered, among other things, to direct firms and their parent under-takings to address or remove barriers to resolvability, to enforce resolution actions and to carry out resolvability assessments of credit institutions. Separately, the PRA and the FCA have the power to require parent undertakings of firms subject to this regime to take actions such as the preparation and submission of group recovery plans or the facilitation of the use of resolution powers.
Financial crimeWe are also subject, as a result of our operations in the UK, to UK financial crime legislation including the Bribery Act 2010, the Money Laundering, Terrorist Financing and Transfer of Funds (Information on the Payer) Regulations 2017 and financial sanc-tions imposed by the UK government. In addition, as part of the FCA’s responsibility to ensure the integrity of the UK financial markets, it requires all authorized firms in the UK, including CS entities, to have systems and controls in place to mitigate the risk that they might be used to commit financial crime.
45Risk factors
Risk factors
Our businesses are exposed to a variety of risks that could adversely affect our results of operations and financial condition, including, among others, those described below.
Liquidity risk Liquidity, or ready access to funds, is essential to our business, particularly our investment banking businesses. We seek to main-tain available liquidity to meet our obligations in a stressed liquidity environment.
> Refer to “Liquidity and funding management” in III – Treasury, Risk, Balance sheet and Off-balance sheet for information on our liquidity management.
Our liquidity could be impaired if we were unable to access the capital markets, sell our assets or if our liquidity costs increase Our ability to borrow on a secured or unsecured basis and the cost of doing so can be affected by increases in interest rates or credit spreads, the availability of credit, regulatory requirements relating to liquidity or the market perceptions of risk relating to us, certain of our counterparties or the banking sector as a whole, including our perceived or actual creditworthiness. An inabil-ity to obtain financing in the unsecured long-term or short-term debt capital markets, or to access the secured lending markets, could have a substantial adverse effect on our liquidity. In chal-lenging credit markets our funding costs may increase or we may be unable to raise funds to support or expand our businesses, adversely affecting our results of operations. Following the finan-cial crisis in 2008 and 2009, our costs of liquidity have been significant and we expect to incur ongoing costs as a result of regulatory requirements for increased liquidity.
If we are unable to raise needed funds in the capital markets (including through offerings of equity, regulatory capital securities and other debt), we may need to liquidate unencumbered assets to meet our liabilities. In a time of reduced liquidity, we may be unable to sell some of our assets, or we may need to sell assets at depressed prices, which in either case could adversely affect our results of operations and financial condition.
Our businesses rely significantly on our deposit base for fundingOur businesses benefit from short-term funding sources, includ-ing primarily demand deposits, inter-bank loans, time deposits and cash bonds. Although deposits have been, over time, a stable source of funding, this may not continue. In that case, our liquidity position could be adversely affected and we might be unable to meet deposit withdrawals on demand or at their contractual matu-rity, to repay borrowings as they mature or to fund new loans, investments and businesses.
Changes in our ratings may adversely affect our business Ratings are assigned by rating agencies. Rating agencies may lower, indicate their intention to lower or withdraw their ratings
at any time. The major rating agencies remain focused on the financial services industry, particularly regarding potential declines in profitability, asset quality deterioration, asset price volatility, the impact from any potential easing or enhancement of regula-tory requirements and challenges from increased costs related to compliance and litigation. Any downgrades in our ratings could increase our borrowing costs, limit our access to capital markets, increase our cost of capital and adversely affect the ability of our businesses to sell or market their products, engage in business transactions – particularly financing and derivatives transactions – and retain our clients.
Market and credit risksThe ongoing global COVID-19 pandemic has adversely affected, and may continue to adversely affect, our business, operations and financial performanceSince December 2019, the COVID-19 pandemic has spread rapidly and globally, with a high concentration of cases in cer-tain countries in which we conduct business. The ongoing global COVID-19 pandemic has adversely affected, and may con-tinue to adversely affect, our business, operations and financial performance.
The spread of COVID-19 and resulting tight government con-trols and containment measures implemented around the world have caused severe disruption to global supply chains and eco-nomic activity, and the market has entered a period of signifi-cantly increased volatility. The spread of COVID-19 is continuing to have an adverse impact on the global economy, the sever-ity and duration of which is difficult to predict, and has adversely affected our business, operations and financial performance. Modeling for current expected credit losses (CECL) has been made more difficult by the effects of the COVID-19 pandemic on market volatility and macroeconomic factors, and has required ongoing monitoring and more frequent testing across the Group, particularly for credit models. There can be no assurance that, even after adjustments are made to model outputs, the Group will not recognize unexpected losses arising from the model uncertainty that has resulted from the COVID-19 pandemic. The COVID-19 pandemic has significantly impacted, and is likely to continue to adversely affect, our credit loss estimates, mark-to-market losses, trading revenues, net interest income and potential goodwill assessments and may also adversely affect our ability to successfully realize our strategic objectives and goals. Should current economic conditions persist or deteriorate, the macro-economic environment could have a continued adverse effect on these outlined and other aspects of our business, operations and financial performance, including decreased client activity or
46 Risk factors
demand for our products, disruptions to our workforce or operat-ing systems, possible constraints on capital and liquidity or a pos-sible downgrade of our credit ratings. Additionally, legislative and regulatory changes in response to the COVID-19 pandemic, such as consumer and corporate relief measures, could further affect our business. As such measures are often rapidly introduced and varying in their nature, we are also exposed to heightened risks as we may be required to implement large-scale changes quickly. Furthermore, once such measures expire, are withdrawn or are no longer supported by governments, economic growth may be negatively impacted, which in turn may adversely affect our busi-ness, operations and financial performance.
The extent of the adverse impact of the pandemic on the global economy and markets will depend, in part, on the duration and severity of the measures taken to limit the spread of the virus and counter its impact, including further emergence of new strains of COVID-19 and the safety, efficacy and availability of vaccines and treatments, and, in part, on the size and effectiveness of the compensating measures taken by governments, including addi-tional stimulus legislation, and how quickly and to what extent normal economic and operating conditions can resume. To the extent the COVID-19 pandemic continues to adversely affect the global economy and/or our business, operations or financial per-formance, it may also have the effect of increasing the likelihood and/or magnitude of other risks described herein, or may give rise to other risks not presently known to us or not currently expected to be significant to our business, operations or financial perfor-mance. We are closely monitoring the potential adverse effects and impact on our operations, businesses and financial perfor-mance, including liquidity and capital usage, though the extent of the impact is difficult to fully and accurately predict at this time due to the continuing evolution of this uncertain situation.
We may incur significant losses on our trading and investment activities due to market fluctuations and volatilityAlthough we continue to strive to reduce our balance sheet and have made significant progress in implementing our strategy over the past few years, we also continue to maintain large trading and investment positions and hedges in the debt, currency and equity markets, and in private equity, hedge funds, real estate and other assets. These positions could be adversely affected by volatility in financial and other markets, that is, the degree to which prices fluctuate over a particular period in a particular market, regard-less of market levels. To the extent that we own assets, or have net long positions, in any of those markets, a downturn in those markets could result in losses from a decline in the value of our net long positions. Conversely, to the extent that we have sold assets that we do not own, or have net short positions, in any of those markets, an upturn in those markets could expose us to potentially significant losses as we attempt to cover our net short positions by acquiring assets in a rising market. Market fluctua-tions, downturns and volatility can adversely affect the fair value of our positions and our results of operations. Adverse market or economic conditions or trends have caused, and in the future may cause, a significant decline in our net revenues and profitability.
Our businesses and organization are subject to the risk of loss from adverse market conditions and unfavorable economic, monetary, political, legal, regulatory and other developments in the countries in which we operateAs a global financial services company, our businesses could be materially adversely affected by unfavorable global and local economic and market conditions, as well as geopolitical events and other developments in Europe, the US, Asia and elsewhere around the world (even in countries in which we do not currently conduct business). Further, numerous countries have experi-enced severe economic disruptions particular to that country or region, including extreme currency fluctuations, high inflation, or low or negative growth, among other negative conditions, which could have an adverse effect on our operations and investments. Volatility also increased at the beginning of 2020 and equity market indices declined amid concerns surrounding the spread of COVID-19, and the economic environment may experience further volatility depending on the longevity and severity of the COVID-19 pandemic.
Although the severity of the European sovereign debt crisis appears to have abated somewhat over recent years, political uncertainty, including in relation to the UK’s withdrawal from the EU, remains elevated and could cause disruptions in market con-ditions in Europe and around the world and could further have an adverse impact on financial institutions, including us. The eco-nomic and political impact of the UK leaving the EU, including on investments and market confidence in the UK and the remainder of the EU, may adversely affect our future results of operations and financial condition.
Following the UK’s withdrawal from the EU, our legal entities that are organized or operate in the UK face limitations on provid-ing services or otherwise conducting business in the EU, which require us to implement significant changes to our legal entity structure. In addition, as part of an overarching global legal entity simplification program, the Group has developed a comprehen-sive EU entity strategy and is also defining a strategy to optimize the legal entity structure across other regions, including expedit-ing the closure of redundant entities and an optimization of the legal entity structure of our asset management businesses within International Wealth Management. There are a number of uncer-tainties that may affect the feasibility, scope and timing of the intended results, including the outcome of the ongoing negotia-tions between the EU and the UK for a framework for regula-tory cooperation on financial services and the operation of their unilateral and autonomous processes for recognizing each other’s regulatory framework as equivalent. Finally, future significant legal and regulatory changes, including possible regulatory divergence between the EU and the UK, affecting us and our operations may require us to make further changes to our legal structure. The implementation of these changes has required, and may further require, the investment of significant time and resources and has increased, and may potentially further increase, operational, regu-latory, compliance, capital, funding and tax costs as well as our counterparties’ credit risk.
47Risk factors
> Refer to “Withdrawal of the UK from the EU and our legal entity structure” in Strategy, “UK-EU relationship” in Regulation and supervision – Recent regulatory developments and proposals – EU, “Key risk developments” in III – Treasury, Risk, Balance sheet and Off-balance sheet – Risk management and “Corporate Governance framework” in IV – Corporate Governance for further information.
The environment of political uncertainty in countries and regions in which we conduct business may also affect our business. The increased popularity of nationalist and protectionist sentiments, including implementation of trade barriers and restrictions on market access, may result in significant shifts in national policy and a decelerated path to further European integration. Similar uncertainties exist regarding the impact of recent and proposed changes in US policies on trade, immigration and foreign rela-tions. Growing global trade tensions, including between key trad-ing partners such as China, the US and the EU and the continu-ing COVID-19 pandemic may be disruptive to global economic growth and may also negatively affect our business.
In the past, the low interest rate environment has adversely affected our net interest income and the value of our trading and non-trading fixed income portfolios, and resulted in a loss of customer deposits as well as an increase in the liabilities relat-ing to our existing pension plans. Furthermore, interest rates are expected to remain low for a longer period of time. Future changes in interest rates, including increasing interest rates or changes in the current negative short-term interest rates in our home market, could adversely affect our businesses and results. Interest rate cuts by national governments and central banks in response to the COVID-19 outbreak, including in the US, could also adversely impact our net interest income, including in our International Wealth Management and Asia Pacific divisions due to their larger share of US dollar-denominated deposits. In addi-tion, movements in equity markets have affected the value of our trading and non-trading equity portfolios, while the historical strength of the Swiss franc has adversely affected our revenues and net income and exposed us to currency exchange rate risk. Further, diverging monetary policies among the major economies in which we operate, in particular among the Fed, ECB and SNB, may adversely affect our results.
Such adverse market or economic conditions may negatively impact our investment banking and wealth management busi-nesses and adversely affect net revenues we receive from com-missions and spreads. These conditions may result in lower investment banking client activity, adversely impacting our finan-cial advisory and underwriting fees. Such conditions may also adversely affect the types and volumes of securities trades that we execute for customers. Cautious investor behavior in response to adverse conditions could result in generally decreased cli-ent demand for our products, which could negatively impact our results of operations and opportunities for growth. Unfavorable market and economic conditions have affected our businesses in the past, including the low interest rate environment, contin-ued cautious investor behavior and changes in market structure.
These negative factors could be reflected, for example, in lower commissions and fees from our client-flow sales and trading and asset management activities, including commissions and fees that are based on the value of our clients’ portfolios.
Our response to adverse market or economic conditions may dif-fer from that of our competitors and an investment performance that is below that of competitors or asset management bench-marks could also result in a decline in assets under management and related fees, making it harder to attract new clients. There could be a shift in client demand away from more complex prod-ucts, which may result in significant client deleveraging, and our results of operations related to private banking and asset man-agement activities could be adversely affected. Adverse market or economic conditions, including as a result of the COVID-19 pan-demic, could exacerbate such effects.
In addition, several of our businesses engage in transactions with, or trade in obligations of, governmental entities, including supra-national, national, state, provincial, municipal and local authori-ties. These activities can expose us to enhanced sovereign, credit-related, operational and reputational risks, which may also increase as a result of adverse market or economic conditions. Risks related to these transactions include the risks that a gov-ernmental entity may default on or restructure its obligations or may claim that actions taken by government officials were beyond the legal authority of those officials, which could adversely affect our financial condition and results of operations.
Adverse market or economic conditions could also affect our pri-vate equity investments. If a private equity investment substan-tially declines in value, we may not receive any increased share of the income and gains from such investment (to which we are enti-tled in certain cases when the return on such investment exceeds certain threshold returns), may be obligated to return to inves-tors previously received excess carried interest payments and may lose our pro rata share of the capital invested. In addition, it could become more difficult to dispose of the investment, as even investments that are performing well may prove difficult to exit.
In addition to the macroeconomic factors discussed above, other political, social and environmental developments beyond our con-trol, including terrorist attacks, cyber attacks, military conflicts, economic or political sanctions, disease pandemics, political or civil unrest and widespread demonstrations, natural disasters, or infrastructure issues, such as transportation or power failures, could have a material adverse effect on economic and market conditions, market volatility and financial activity, with a potential related effect on our businesses and results. In addition, as geo-political tensions rise, compliance with legal or regulatory obliga-tions in one jurisdiction may be seen as supporting the law or pol-icy objectives of that jurisdiction over another jurisdiction, creating additional risks for our business.
> Refer to “Non-financial risk” in III – Treasury, Risk, Balance sheet and Off-bal-ance sheet – Risk management – Risk coverage and management for further information.
48 Risk factors
Uncertainties regarding the expected discontinuation of benchmark rates may adversely affect our business, financial condition and results of operations and are requiring adjustments to our agreements with clients and other market participants, as well as to our systems and processesIn July 2017, the FCA, which regulates LIBOR, announced that it will no longer compel banks to submit rates for the calcula-tion of the LIBOR benchmark after year-end 2021. Other IBORs may also be permanently discontinued or cease to be represen-tative. In March 2021, the FCA announced that, consistent with its prior announcement, all CHF, EUR, GBP, JPY LIBOR set-tings and the one-week and two-month USD LIBOR settings will permanently cease to be provided by any administrator or will no longer be representative immediately after December 31, 2021. The remaining USD LIBOR settings will permanently cease to be provided by any administrator or will no longer be representa-tive immediately after June 30, 2023, providing additional time to address the legacy contracts that reference such USD LIBOR settings. However, there is no certainty that the extended period of time to transition to alternative reference rates is sufficient given how widely USD LIBOR is referenced. Further, a number of initiatives have been developed to support the transition, such as the publication by ISDA of Supplement number 70 to the 2006 ISDA Definitions (IBOR Supplement) and the accompanying IBOR Protocol. Although these measures may help facilitate the derivatives markets’ transition away from IBORs, our clients and other market participants may not adhere to the IBOR Protocol or may not be otherwise willing to apply the provisions of the IBOR Supplement to relevant documentation. Furthermore, no similar multilateral mechanism exists to amend legacy loans or bonds, many of which must instead be amended individually, which may require the consent of multiple lenders or bondholders. As a con-sequence, there can be no assurance that market participants, including Credit Suisse, will be able to successfully modify all out-standing IBOR referencing contracts or otherwise be sufficiently prepared for the uncertainties resulting from cessation, potentially leading to disputes. Although legislation to address so-called “tough legacy” contracts has been proposed in multiple jurisdic-tions, it is uncertain whether, when and how such legislation will be enacted. In addition, the terms and scope of the proposed leg-islative solutions are inconsistent and potentially overlapping.
Credit Suisse has identified a significant number of its liabilities and assets, including credit instruments such as credit agree-ments, loans and bonds, linked to IBORs across its businesses that require transition to alternative reference rates. The discon-tinuation of IBORs or future changes in the administration of benchmarks could result in adverse consequences to the return on, value of and market for securities, credit instruments and other instruments whose returns or contractual mechanics are linked to any such benchmark, including those issued and traded by the Group. For example, alternative reference rate-linked prod-ucts may not provide a term structure and may calculate inter-est payments differently than benchmark-linked products, which could lead to greater uncertainty with respect to corresponding
payment obligations. The transition to alternative reference rates also raises concerns of liquidity risk, which may arise due to slow acceptance, take-up and development of liquidity in products that use alternative reference rates, leading to market dislocation or fragmentation. It is also possible that such products will perform differently to IBOR products during times of economic stress, adverse or volatile market conditions and across the credit and economic cycle, which may impact the value, return on and profit-ability of our alternative reference rates-based assets. The tran-sition to alternative reference rates will also require a change in contractual terms of existing products currently linked to IBORs.
Further, the replacement of IBORs with an alternative reference rate in existing securities and other contracts, or in internal dis-counting models, could negatively impact the value of and return on such existing securities, credit instruments and other contracts and result in mispricing and additional legal, financial, tax, opera-tional, market, compliance, reputational, competitive or other risks to us, our clients and other market participants. For example, we may face a risk of litigation, disputes or other actions from clients, counterparties, customers, investors or others regarding the interpretation or enforcement of related contractual provi-sions or if we fail to appropriately communicate the effect that the transition to alternative reference rates will have on existing and future products. Further, litigation, disputes or other action may occur as a result of the interpretation or application of legislation, in particular, if there is an overlap between legislation introduced in different jurisdictions. In addition, the transition to alternative reference rates requires changes to our documentation, method-ologies, processes, controls, systems and operations, which has resulted and may continue to result in increased effort and cost. There may also be related risks that arise in connection with the transition. For example, our hedging strategy may be negatively impacted or market risk may increase in the event of different alternative reference rates applying to our assets compared to our liabilities. In particular, our swaps and similar instruments that reference an IBOR and that are used to manage long-term inter-est rate risk related to our credit instruments could adopt different alternative reference rates than the related credit instruments, resulting in potential basis risk and potentially making hedging our credit instruments more costly or less effective.
> Refer to “Replacement of interbank offered rates” in II – Operating and finan-cial review – Credit Suisse – Other information for further information.
We may incur significant losses in the real estate sectorWe finance and acquire principal positions in a number of real estate and real estate-related products, primarily for clients, and originate loans secured by commercial and residential properties. As of December 31, 2020, our real estate loans as reported to the SNB totaled approximately CHF 149 billion. We also securi-tize and trade in commercial and residential real estate and real estate-related whole loans, mortgages and other real estate and commercial assets and products, including CMBS and RMBS. Our real estate-related businesses and risk exposures could be adversely affected by any downturn in real estate markets, other sectors and the economy as a whole. In particular, we have

49Risk factors
exposure to commercial real estate, which has been impacted by the COVID-19 pandemic and resulting tight government controls and containment measures. Should these conditions persist or deteriorate, they could create additional risk for our commercial real estate-related businesses. In addition, the risk of poten-tial price corrections in the real estate market in certain areas of Switzerland could have a material adverse effect on our real estate-related businesses.
Holding large and concentrated positions may expose us to large lossesConcentrations of risk could increase losses, given that we have provided or may in the future provide sizeable loans to, conduct sizeable transactions with, and own securities holdings in, certain customers, clients, counterparties, industries, countries or any pool of exposures with a common risk characteristic. Decreas-ing economic growth in any sector in which we make significant commitments, for example, through underwriting, lending or advisory services, could also negatively affect our net revenues. In addition, a significant deterioration in the credit quality of one of our borrowers or counterparties could lead to concerns about the creditworthiness of other borrowers or counterparties in simi-lar, related or dependent industries. This type of interrelationship could exacerbate our credit, liquidity and market risk exposure and potentially cause us to incur losses.
We have significant risk concentration in the financial services industry as a result of the large volume of transactions we rou-tinely conduct with broker-dealers, banks, funds and other finan-cial institutions, and in the ordinary conduct of our business, we may be subject to risk concentration with a particular counter-party. In addition, we, and other financial institutions, may pose systemic risk in a financial or credit crisis, and may be vulnerable to market sentiment and confidence, particularly during periods of severe economic stress. We, like other financial institutions, con-tinue to adapt our practices and operations in consultation with our regulators to better address an evolving understanding of our exposure to, and management of, systemic risk and risk concen-tration to financial institutions. Regulators continue to focus on these risks, and there are numerous new regulations and govern-ment proposals, and significant ongoing regulatory uncertainty, about how best to address them. There can be no assurance that the changes in our industry, operations, practices and regulation will be effective in managing these risks.
> Refer to “Regulation and supervision” for further information.
Risk concentration may cause us to suffer losses even when eco-nomic and market conditions are generally favorable for others in our industry.
Our hedging strategies may not prevent lossesIf any of the variety of instruments and strategies we use to hedge our exposure to various types of risk in our businesses is not effective, we may incur losses. We may be unable to pur-chase hedges or be only partially hedged, or our hedging strate-gies may not be fully effective in mitigating our risk exposure in all market environments or against all types of risk.
Market risk may increase the other risks that we faceIn addition to the potentially adverse effects on our businesses described above, market risk could exacerbate the other risks that we face. For example, if we were to incur substantial trading losses, our need for liquidity could rise sharply while our access to liquidity could be impaired. In conjunction with another mar-ket downturn, our customers and counterparties could also incur substantial losses of their own, thereby weakening their financial condition and increasing our credit and counterparty risk exposure to them.
We may suffer significant losses from our credit exposuresOur businesses are subject to the fundamental risk that bor-rowers and other counterparties will be unable to perform their obligations. Our credit exposures exist across a wide range of transactions that we engage in with a large number of clients and counterparties, including lending relationships, commitments and letters of credit, as well as derivative, currency exchange and other transactions. Our exposure to credit risk can be exacer-bated by adverse economic or market trends, as well as increased volatility in relevant markets or instruments. For example, adverse economic effects arising from the COVID-19 outbreak, such as disruptions to economic activity and global supply chains, will likely continue to negatively impact the creditworthiness of certain counterparties and result in increased credit losses for our busi-nesses. In addition, disruptions in the liquidity or transparency of the financial markets may result in our inability to sell, syndicate or realize the value of our positions, thereby leading to increased concentrations. Any inability to reduce these positions may not only increase the market and credit risks associated with such positions, but also increase the level of risk-weighted assets on our balance sheet, thereby increasing our capital requirements, all of which could adversely affect our businesses.
> Refer to “Credit risk” in III – Treasury, Risk, Balance sheet and Off-balance sheet – Risk management – Risk coverage and management for information on management of credit risk.
Our regular review of the creditworthiness of clients and counter-parties for credit losses does not depend on the accounting treat-ment of the asset or commitment. Changes in creditworthiness of loans and loan commitments that are fair valued are reflected in trading revenues.
Management’s determination of the provision for credit losses is subject to significant judgment. Our banking businesses may need to increase their provisions for credit losses or may record losses in excess of the previously determined provisions if our original estimates of loss prove inadequate, which could have a material adverse effect on our results of operations. Credit Suisse adopted the “Measurement of Credit Losses on Financial Instru-ments” (ASU 2016-13) accounting standard and its subsequent amendments on January 1, 2020 and incorporates forward-looking information and macroeconomic factors into its credit loss estimates applying the modified retrospective approach. The new accounting standard generally requires management to estimate lifetime CECL on Credit Suisse’s credit exposure held at amortized cost; under the previous standard, such estimates were made under the incurred loss model. Such adoption of
50 Risk factors
ASU 2016-13 and its subsequent amendments could result in greater volatility in earnings and capital levels due to economic developments or occurrence of an extreme and statistically rare event that cannot be adequately reflected in the CECL model. For example, the effects surrounding the outbreak of COVID-19 could continue to have an adverse effect on the Group’s credit loss estimates and goodwill assessments in the future, which could have a significant impact on our results of operations and regulatory capital. In addition, model overlays may become nec-essary in these circumstances as the CECL model outputs are overly sensitive to the effect of economic inputs that lie signifi-cantly outside of their historical range. We may suffer unexpected losses if the models and assumptions that are used to estimate our allowance for credit losses are not sufficient to address our credit losses.
> Refer to “Accounting developments” in II – Operating and financial review – Credit Suisse – Other information, “Credit risk” in III – Treasury, Risk, Balance sheet and Off-balance sheet – Risk management – Risk coverage and man-agement and “Note 1 – Summary of significant accounting policies”, “Note 9 – Provision for credit losses”, “Note 19 – Loans” and “Note 20 – Financial instruments measured at amortized cost and credit losses” in VI – Consolidated financial statements – Credit Suisse Group for further information.
Under certain circumstances, we may assume long-term credit risk, extend credit against illiquid collateral and price derivative instruments aggressively based on the credit risks that we take. As a result of these risks, our capital and liquidity requirements may continue to increase.
Defaults by one or more large financial institutions could adversely affect financial markets generally and us specificallyConcerns, rumors about or an actual default by one institution could lead to significant liquidity problems, losses or defaults by other institutions because the commercial soundness of many financial institutions may be closely related as a result of credit, trading, clearing or other relationships between institu-tions. This risk is typically referred to as systemic risk. Concerns about defaults by and failures of many financial institutions could lead to losses or defaults by financial institutions and financial intermediaries with which we interact on a daily basis, such as clearing agencies, clearing houses, banks, securities firms and exchanges. Our credit risk exposure will also increase if the collat-eral we hold cannot be realized or can only be liquidated at prices insufficient to cover the full amount of the exposure.
The information that we use to manage our credit risk may be inaccurate or incompleteAlthough we regularly review our credit exposure to specific cli-ents and counterparties and to specific industries, countries and regions that we believe may present credit concerns, default risk may arise from events or circumstances that are difficult to foresee or detect, such as fraud. We may also lack correct and complete information with respect to the credit or trading risks of a counterparty or risk associated with specific industries, coun-tries and regions or misinterpret such information that is received or otherwise incorrectly assess a given risk situation. Additionally, there can be no assurance that measures instituted to manage such risk will be effective in all instances.
Strategy riskWe may not achieve all of the expected benefits of our strategic initiatives On July 30, 2020, we announced certain changes to the struc-ture and organization of the Group and a new restructuring pro-gram, which is expected to be completed within a year from the announcement. This program is intended to continue our efforts to achieve our strategic objectives, which are based on a number of key assumptions regarding the future economic environment, the economic growth of certain geographic regions, the regula-tory landscape, our ability to meet certain financial goals, antici-pated interest rates and central bank action, among other things. If any of these assumptions (including but not limited to our ability to meet certain financial goals) prove inaccurate in whole or in part, our ability to achieve some or all of the expected benefits of our strategy could be limited, including our ability to retain key employees, distribute capital to shareholders through dividends and share buyback programs or achieve our other goals, such as those in relation to return on tangible equity. In addition, the Group depends on dividends, distributions and other payments from its subsidiaries to fund external dividend payments and share buybacks. Factors beyond our control, including but not limited to market and economic conditions, changes in laws, rules or regu-lations, execution risk related to the implementation of our strat-egy and other challenges and risk factors discussed in this report, could limit our ability to achieve some or all of the expected ben-efits of this strategy. Capital payments from subsidiaries might be restricted as a result of regulatory, tax or other constraints. If we are unable to implement our strategy successfully in whole or in part or should the components of the strategy that are imple-mented fail to produce the expected benefits, our financial results and our share price may be materially and adversely affected.
> Refer to “Strategy” for further information on our strategic direction.
Additionally, part of our strategy has involved a change in focus within certain areas of our business, which may have unantici-pated negative effects in other areas of the business and may result in an adverse effect on our business as a whole.
The implementation of our strategy may increase our exposure to certain risks, including but not limited to credit risks, mar-ket risks, operational risks and regulatory risks. We also seek to achieve certain financial goals, for example in relation to return on tangible equity, which may or may not be successful. There is no guarantee that we will be able to achieve these goals in the form described or at all. Finally, changes to the organizational structure of our business, as well as changes in personnel and manage-ment, may lead to temporary instability of our operations.
In addition, acquisitions and other similar transactions we under-take subject us to certain risks. Even though we review the records of companies we plan to acquire, it is generally not fea-sible for us to review all such records in detail. Even an in-depth review of records may not reveal existing or potential problems or permit us to become familiar enough with a business to fully assess its capabilities and deficiencies. As a result, we may

51Risk factors
assume unanticipated liabilities (including legal and compli-ance issues), or an acquired business may not perform as well as expected. We also face the risk that we will not be able to integrate acquisitions into our existing operations effectively as a result of, among other things, differing procedures, business practices and technology systems, as well as difficulties in adapt-ing an acquired company into our organizational structure. We face the risk that the returns on acquisitions will not support the expenditures or indebtedness incurred to acquire such businesses or the capital expenditures needed to develop such businesses. We also face the risk that unsuccessful acquisitions will ultimately result in us being required to write down or write off any goodwill associated with such transactions. We continue to have a signifi-cant amount of goodwill relating to our acquisition of Donaldson, Lufkin & Jenrette Inc. and other transactions recorded on our balance sheet that could result in additional goodwill impairment charges.
We may also seek to engage in new joint ventures (within the Group and with external parties) and strategic alliances. Although we endeavor to identify appropriate partners, our joint venture efforts may prove unsuccessful or may not justify our investment and other commitments.
Country and currency exchange risk Country risks may increase market and credit risks we faceCountry, regional and political risks are components of market and credit risk. Financial markets and economic conditions gen-erally have been and may in the future be materially affected by such risks. Economic or political pressures in a country or region, including those arising from local market disruptions, currency cri-ses, monetary controls or other factors, may adversely affect the ability of clients or counterparties located in that country or region to obtain foreign currency or credit and, therefore, to perform their obligations to us, which in turn may have an adverse impact on our results of operations.
We may face significant losses in emerging marketsAn element of our strategy is to increase our private banking busi-nesses in emerging market countries. Our implementation of this strategy will increase our existing exposure to economic instability in those countries. We monitor these risks, seek diversity in the sectors in which we invest and emphasize client-driven business. Our efforts at limiting emerging market risk, however, may not always succeed. In addition, various emerging market coun-tries have experienced and may continue to experience severe economic, financial and political disruptions or slower economic growth than in previous years, including significant devaluations of their currencies, defaults or threatened defaults on sovereign debt and capital and currency exchange controls. In addition, sanctions have been imposed on certain individuals and companies in these markets that prohibit or restrict dealings with them and certain related entities and further sanctions are possible. The possible effects of any such disruptions may include an adverse impact
on our businesses and increased volatility in financial markets generally.
Currency fluctuations may adversely affect our results of operationsWe are exposed to risk from fluctuations in exchange rates for currencies, particularly the US dollar. In particular, a substantial portion of our assets and liabilities are denominated in curren-cies other than the Swiss franc, which is the primary currency of our financial reporting. Our capital is also stated in Swiss francs, and we do not fully hedge our capital position against changes in currency exchange rates. The Swiss franc was strong against the US dollar and the euro in 2020.
As we incur a significant part of our expenses in Swiss francs while we generate a large proportion of our revenues in other cur-rencies, our earnings are sensitive to changes in the exchange rates between the Swiss franc and other major currencies. Although we have implemented a number of measures designed to offset the impact of exchange rate fluctuations on our results of operations, the appreciation of the Swiss franc in particular and exchange rate volatility in general have had an adverse impact on our results of operations and capital position in recent years and may continue to have an adverse effect in the future.
Operational, risk management and estimation risksWe are exposed to a wide variety of operational risks, including cybersecurity and other information technology risksOperational risk is the risk of financial loss arising from inad-equate or failed internal processes, people or systems or from external events. In general, although we have business conti-nuity plans, our businesses face a wide variety of operational risks, including technology risk that stems from dependencies on information technology, third-party suppliers and the telecom-munications infrastructure as well as from the interconnectivity of multiple financial institutions with central agents, exchanges and clearing houses. As a global financial services company, we rely heavily on our financial, accounting and other data processing systems, which are varied and complex, and we may face addi-tional technology risks due to the global nature of our operations. Our business depends on our ability to process a large volume of diverse and complex transactions within a short space of time, including derivatives transactions, which have increased in volume and complexity. We may rely on automation, robotic processing, machine learning and artificial intelligence for certain operations, and this reliance may increase in the future with corresponding advancements in technology, which could expose us to additional cybersecurity risks. We are exposed to operational risk arising from errors made in the execution, confirmation or settlement of transactions or from transactions not being properly recorded or accounted for. Cybersecurity and other information technol-ogy risks for financial institutions have significantly increased in recent years and we may face an increased risk of cyber attacks or heightened risks associated with a lesser degree of data and

52 Risk factors
intellectual property protection in certain foreign jurisdictions in which we operate. Regulatory requirements in these areas have increased and are expected to increase further.
Information security, data confidentiality and integrity are of criti-cal importance to our businesses, and there has been recent regulatory scrutiny on the ability of companies to safeguard per-sonal information of individuals in accordance with data protection regulation, including the European General Data Protection Regu-lation and the Swiss Federal Act on Data Protection. Governmen-tal authorities, employees, individual customers or business part-ners may initiate proceedings against us as a result of security breaches affecting the confidentiality or integrity of personal data, as well as the failure, or perceived failure, to comply with data protection regulations. The adequate monitoring of operational risks and adherence to data protection regulations have also come under increased regulatory scrutiny. Any failure of Credit Suisse to adequately ensure the security of data and to address the increased technology-related operational risks could also lead to regulatory sanctions or investigations and a loss of trust in our systems, which may adversely affect our reputation, business and operations.
> Refer to “Recent regulatory developments and proposals – Switzerland – Data Protection Act” and “Regulatory Framework – EU – Data protection regulation” in Regulation and supervision for further information.
Threats to our cybersecurity and data protection systems require us to dedicate significant financial and human resources to pro-tect the confidentiality, integrity and availability of our systems and information. Despite our wide range of security measures, it is not always possible to anticipate the evolving threat landscape and mitigate all risks to our systems and information. These threats may derive from human error, fraud or malice, or may result from accidental technological failure. There may also be attempts to fraudulently induce employees, clients, third parties or other users of our systems to disclose sensitive information in order to gain access to our data or that of our clients. We could also be affected by risks to the systems and information of clients, vendors, service providers, counterparties and other third par-ties. Security breaches may involve substantial remediation costs, affect our ability to carry out our businesses or impair the trust of our clients or potential clients, any of which could have a material adverse effect on our business and financial results. In addition, we may introduce new products or services or change processes, resulting in new operational risks that we may not fully appreciate or identify.
The ongoing global COVID-19 pandemic has led to a wide-scale and prolonged shift to remote working for our employees, which increases the vulnerability of our information technology systems and the likelihood of damage as a result of a cybersecurity inci-dent. For example, the use of remote devices to access the firm’s networks could impact our ability to quickly detect and mitigate security threats and human errors as they arise. Remote work-ing may also require our employees to use third party technology, which may not provide the same level of information security as
our own information systems. Additionally, it is more challenging to ensure the comprehensive roll-out of system security updates and we also have less visibility over the physical security of our devices and systems. Our customers have also increasingly relied on remote (digital) banking services during the COVID-19 pan-demic. This has resulted in a greater demand for our information technology infrastructure and increases the potential significance of any outage or cybersecurity incident that may occur. Due to the evolving nature of cybersecurity risks and our reduced vis-ibility and control in light of remote working in the context of the global COVID-19 pandemic, our efforts to provide appropriate policies and security measures may prove insufficient to mitigate all cybersecurity and data protection threats. The rise in remote access, by both our employees and customers, has increased the burden on our information technology systems and may cause our systems (and our ability to deliver our services) to become slow or fail entirely. Any slowdown in our service delivery or any system outage due to overutilization will have a negative impact on our business and reputation.
We and other financial institutions have been subject to cyber attacks, information or security breaches and other forms of attacks. We expect to continue to be the target of such attacks in the future. In the event of a cyber attack, information or secu-rity breach or technology failure, we may experience operational issues, the infiltration of payment systems or the unauthorized release, gathering, monitoring, misuse, loss or destruction of confidential, proprietary and other information relating to Credit Suisse, our clients, vendors, service providers, counterparties or other third parties. Given our global footprint and the high volume of transactions we process, the large number of clients, partners and counterparties with which we do business, our growing use of digital, mobile and internet-based services, and the increasing frequency, sophistication and evolving nature of cyber attacks, a cyber attack, information or security breach or technology fail-ure may occur without detection for an extended period of time. In addition, we expect that any investigation of a cyber attack, information or security breach or technology failure will be inher-ently unpredictable and it may take time before any investigation is complete. During such time, we may not know the extent of the harm or how best to remediate it and certain errors or actions may be repeated or compounded before they are discovered and rectified, all or any of which would further increase the costs and consequences of a cyber attack, information or security breach or technology failure.
If any of our systems do not operate properly or are compromised as a result of cyber attacks, information or security breaches, technology failures, unauthorized access, loss or destruction of data, unavailability of service, computer viruses or other events that could have an adverse security impact, we could be subject to litigation or suffer financial loss not covered by insurance, a disruption of our businesses, liability to our clients, damage to relationships with our vendors, regulatory intervention or reputa-tional damage. Any such event could also require us to expend

53Risk factors
significant additional resources to modify our protective measures or to investigate and remediate vulnerabilities or other exposures. We may also be required to expend resources to comply with new and increasingly expansive regulatory requirements related to cybersecurity.
We may suffer losses due to employee misconductOur businesses are exposed to risk from potential non-compli-ance with policies or regulations, employee misconduct or negli-gence and fraud, which could result in civil, regulatory or criminal investigations and charges, regulatory sanctions and serious reputational or financial harm. In recent years, a number of multi-national financial institutions have suffered material losses due to, for example, the actions of traders executing unauthorized trades or other employee misconduct. It is not always possible to deter or fully prevent employee misconduct and the precautions we take to prevent and detect this activity may not always be effective.
Our risk management procedures and policies may not always be effectiveWe have risk management procedures and policies designed to manage our risk. These techniques and policies, however, may not always be effective, particularly in highly volatile markets. We continue to adapt our risk management techniques, in particu-lar value-at-risk and economic capital, which rely on historical data, to reflect changes in the financial and credit markets. No risk management procedures can anticipate every market devel-opment or event, and our risk management procedures and hedg-ing strategies, and the judgments behind them, may not fully miti-gate our risk exposure in all markets or against all types of risk.
> Refer to “Risk management” in III – Treasury, Risk, Balance sheet and Off-balance sheet for information on our risk management.
Our actual results may differ from our estimates and valuationsWe make estimates and valuations that affect our reported results, including determining the fair value of certain assets and liabilities, establishing provisions for contingencies and losses for loans, litigation and regulatory proceedings, accounting for goodwill and intangible asset impairments, evaluating our ability to realize deferred tax assets, valuing equity-based compensa-tion awards, modeling our risk exposure and calculating expenses and liabilities associated with our pension plans. These estimates are based on judgment and available information, and our actual results may differ materially from these estimates.
> Refer to “Critical accounting estimates” in II – Operating and financial review and “Note 1 – Summary of significant accounting policies” in VI – Consolidated financial statements – Credit Suisse Group for information on these estimates and valuations.
Our estimates and valuations rely on models and processes to predict economic conditions and market or other events that might affect the ability of counterparties to perform their obliga-tions to us or impact the value of assets. To the extent our models and processes become less predictive due to unforeseen market conditions, illiquidity or volatility, our ability to make accurate esti-mates and valuations could be adversely affected.
Our accounting treatment of off-balance sheet entities may changeWe enter into transactions with special purpose entities (SPEs) in our normal course of business, and certain SPEs with which we transact and conduct business are not consolidated and their assets and liabilities are off-balance sheet. We may have to exercise significant management judgment in applying relevant accounting consolidation standards, either initially or after the occurrence of certain events that may require us to reassess whether consolidation is required. Accounting standards relating to consolidation, and their interpretation, have changed and may continue to change. If we are required to consolidate an SPE, its assets and liabilities would be recorded on our consolidated bal-ance sheets and we would recognize related gains and losses in our consolidated statements of operations, and this could have an adverse impact on our results of operations and capital and lever-age ratios.
> Refer to “Off-balance sheet” in III – Treasury, Risk, Balance sheet and Off-balance sheet – Balance sheet and off-balance sheet for information on our transactions with and commitments to SPEs.
We are exposed to climate change risks, which could adversely affect our reputation, business operations, clients and customers, as well as the creditworthiness of our counterpartiesWe operate in many regions, countries and communities around the world where our businesses, and the activities of our clients, could be impacted by climate change. Climate change could expose us to financial risk either through its physical (e.g., climate or weather-related events) or transitional (e.g., changes in climate policy or in the regulation of financial institutions with respect to climate change risks) effects. Transition risks could be further accelerated by the occurrence of changes in the physical climate.
Physical and transition climate risks could have a financial impact on us either directly, through our physical assets, costs and operations, or indirectly, through our financial relationships with our clients. These risks are varied and include, but are not limited to, the risk of declines in asset values, including in connection with our real estate investments, credit risk associated with loans and other credit exposures to our clients, business risk, including loss of revenues associated with reducing exposure to traditional business with clients that do not have a credible transition plan, decrease in assets under management if such clients decide to move assets away and increased defaults and reallocation of capital as a result of changes in global policies, and regulatory risk, including ongoing legislative and regulatory uncertainties and changes regarding climate risk management and best practices. Additionally, the risk of reduced availability of insurance, opera-tional risk related to Credit Suisse-owned buildings and infra-structure, the risk of significant interruptions to business opera-tions, as well as the need to make changes in response to those consequences are further examples of climate-related risks. Our reputation and client relationships may be damaged by our or our clients’ involvement in certain business activities associated with climate change or as a result of negative public sentiment,
54 Risk factors
regulatory scrutiny or reduced investor and stakeholder confi-dence due to our response to climate change and our climate change strategy. If we fail to appropriately measure and manage the various risks we face as a result of climate change, or fail to adapt our strategy and business model to the changing regula-tory requirements and market expectations, our business, results of operations and financial condition could be materially adversely affected.
> Refer to “Climate-related risks” in III – Treasury, Risk, Balance sheet and Off-balance sheet – Risk management for further information on our risk manage-ment procedures relating to climate change.
Legal, regulatory and reputational risks Our exposure to legal liability is significantWe face significant legal risks in our businesses, and the volume and amount of damages claimed in litigation, regulatory proceed-ings and other adversarial proceedings against financial services firms continue to increase in many of the principal markets in which we operate.
We and our subsidiaries are subject to a number of material legal proceedings, regulatory actions and investigations, and an adverse result in one or more of these proceedings could have a material adverse effect on our operating results for any particular period, depending, in part, on our results for such period.
> Refer to “Note 40 – Litigation” in VI – Consolidated financial statements – Credit Suisse Group for information relating to these and other legal and regu-latory proceedings involving our investment banking and other businesses.
It is inherently difficult to predict the outcome of many of the legal, regulatory and other adversarial proceedings involving our businesses, particularly those cases in which the matters are brought on behalf of various classes of claimants, seek damages of unspecified or indeterminate amounts or involve novel legal claims. Management is required to establish, increase or release reserves for losses that are probable and reasonably estimable in connection with these matters, all of which requires the applica-tion of significant judgment and discretion.
> Refer to “Critical accounting estimates” in II – Operating and financial review and “Note 1 – Summary of significant accounting policies” in VI – Consolidated financial statements – Credit Suisse Group for further information.
Regulatory changes may adversely affect our business and ability to execute our strategic plansIn many areas of our business, we are subject to extensive regu-lation by governmental agencies, supervisory authorities and self-regulatory organizations in Switzerland, the EU, the UK, the US and other jurisdictions in which we operate. We expect to face increasingly extensive and complex regulation and regula-tory scrutiny and possible enforcement actions. In recent years, costs related to our compliance with these requirements and the penalties and fines sought and imposed on the financial services industry by regulatory authorities have increased significantly. We expect such increased regulation and enforcement to continue to increase our costs, including, but not limited to, costs related
to compliance, systems and operations, and to negatively affect our ability to conduct certain types of business. These increased costs and negative impacts on our business could adversely affect our profitability and competitive position. These regulations often serve to limit our activities, including through the application of increased or enhanced capital, leverage and liquidity require-ments, the implementation of additional capital surcharges for risks related to operational, litigation, regulatory and similar mat-ters, customer protection and market conduct regulations and direct or indirect restrictions on the businesses in which we may operate or invest. Such limitations can have a negative effect on our business and our ability to implement strategic initiatives. To the extent we are required to divest certain businesses, we could incur losses, as we may be forced to sell such businesses at a discount, which in certain instances could be substantial, as a result of both the constrained timing of such sales and the pos-sibility that other financial institutions are liquidating similar invest-ments at the same time.
Since 2008, regulators and governments have focused on the reform of the financial services industry, including enhanced capi-tal, leverage and liquidity requirements, changes in compensation practices (including tax levies) and measures to address systemic risk, including ring-fencing certain activities and operations within specific legal entities. These regulations and requirements could require us to reduce assets held in certain subsidiaries or inject capital or other funds into or otherwise change our operations or the structure of our subsidiaries and the Group. Differences in the details and implementation of such regulations may further negatively affect us, as certain requirements are currently not expected to apply equally to all of our competitors or to be imple-mented uniformly across jurisdictions.
Moreover, as a number of these requirements are currently being finalized and implemented, their regulatory impact may further increase in the future and their ultimate impact cannot be pre-dicted at this time. For example, the Basel III reforms are still being finalized and implemented and/or phased in, as applicable. The additional requirements related to minimum regulatory capi-tal, leverage ratios and liquidity measures imposed by Basel III, as implemented in Switzerland, together with more stringent require-ments imposed by the Swiss legislation and their application by FINMA, and the related implementing ordinances and actions by our regulators, have contributed to our decision to reduce risk-weighted assets and the size of our balance sheet, and could potentially impact our access to capital markets and increase our funding costs. In addition, various reforms in the US, includ-ing the “Volcker Rule” and derivatives regulation, have imposed, and will continue to impose, new regulatory duties on certain of our operations. These requirements have contributed to our deci-sion to exit certain businesses (including a number of our private equity businesses) and may lead us to exit other businesses. Recent CFTC, SEC and Fed rules and proposals have materially increased, or could in the future materially increase, the operat-ing costs, including margin requirements, compliance, informa-tion technology and related costs, associated with our deriva-tives businesses with US persons, while at the same time making

55Risk factors
it more difficult for us to operate a derivatives business outside the US. Further, in 2014, the Fed adopted a final rule under the Dodd-Frank Act that introduced a new framework for regulation of the US operations of foreign banking organizations such as ours. Implementation is expected to continue to result in us incur-ring additional costs and to affect the way we conduct our busi-ness in the US, including through our US IHC. Further, current and possible future cross-border tax regulation with extraterritorial effect, such as FATCA, and other bilateral or multilateral tax trea-ties and agreements on the automatic exchange of information in tax matters, impose detailed reporting obligations and increased compliance and systems-related costs on our businesses. In addition, the US tax reform enacted on December 22, 2017 introduced substantial changes to the US tax system, including the lowering of the corporate tax rate and the introduction of the US base erosion and anti-abuse tax. Additionally, implementa-tion of regulations such as the Capital Requirements Directive V (CRD V) in the EU, FinSA in Switzerland, and other reforms may negatively affect our business activities. Whether or not the FinSA, together with supporting or implementing ordinances and regulations, will be deemed equivalent to MiFID II, currently remains uncertain. Swiss banks, including us, may accordingly be limited from participating in certain businesses regulated by MiFID II. Finally, we expect that TLAC requirements, which took effect on January 1, 2019 in Switzerland, the US and in the UK, as well as in the EU with respect to EU G-SIBs from June 27, 2019 and are being finalized in many other jurisdictions, as well as new requirements and rules with respect to the internal total loss-absorbing capacity (iTLAC) of G-SIBs and their operating entities, may increase our cost of funding and restrict our ability to deploy capital and liquidity on a global basis as needed once the TLAC and iTLAC requirements are implemented across all relevant jurisdictions.
We are subject to economic sanctions laws and regulatory requirements of various countries. These laws and regulatory requirements generally prohibit or restrict transactions involving certain countries/territories and parties. Our costs of monitoring and complying with frequent and complex changes to applica-ble economic sanctions laws and regulatory requirements have increased and there is an increased risk that we may not identify and stop prohibited activities before they occur or that we may otherwise fail to comply with economic sanctions laws and regu-latory requirements. Any violation of a sanctions program could subject us to significant civil and potentially criminal penalties.
> Refer to “Sanctions” in Regulation and supervision – Recent regulatory devel-opments and proposals – US for further information.
We expect the financial services industry and its members, including us, to continue to be affected by the significant uncer-tainty over the scope and content of regulatory reform in 2021 and beyond, in particular, uncertainty in relation to the future US regulatory agenda of the new presidential administration, which includes a variety of proposals to change existing regulations or the approach to regulation of the financial industry as well as potential new tax policy, and potential changes in regulation
following the UK’s withdrawal from the EU and the results of European national elections. Changes in laws, rules or regula-tions, or in their interpretation or enforcement, or the implemen-tation of new laws, rules or regulations, may adversely affect our results of operations.
Despite our best efforts to comply with applicable regulations, a number of risks remain, particularly in areas where applicable regulations may be unclear or inconsistent across jurisdictions or where regulators or international bodies, organizations or unions revise their previous guidance or courts overturn previous rul-ings. Additionally, authorities in many jurisdictions have the power to bring administrative or judicial proceedings against us, which could result in, among other things, suspension or revocation of our licenses, cease and desist orders, fines, civil penalties, criminal penalties or other disciplinary action that could materially adversely affect our results of operations and seriously harm our reputation.
> Refer to “Regulation and supervision” for a description of our regulatory regime and a summary of some of the significant regulatory and government reform proposals affecting the financial services industry as well as to “Liquidity and funding management” and “Capital management” in III – Treasury, Risk, Bal-ance sheet and Off-balance sheet for information regarding our current regula-tory framework and expected changes to this framework affecting capital and liquidity standards.
Damage to our reputation could significantly harm our businesses, including our competitive position and business prospectsOur ability to attract and retain customers, clients, investors and employees, and conduct business transactions with our counter-parties, could be adversely affected to the extent our reputa-tion is damaged. Harm to our reputation can arise from various sources, including if our comprehensive procedures and controls fail, or appear to fail, to prevent employee misconduct, negligence and fraud, to address conflicts of interest and breach of fiduciary obligations, to produce materially accurate and complete financial and other information, to identify credit, liquidity, operational and market risks inherent in our business or to prevent adverse legal or regulatory actions or investigations. Additionally, our reputation may be harmed by compliance failures, privacy and data security intrusions, cyber incidents, technology failures, challenges to the suitability or reasonableness of our particular trading or invest-ment recommendations or strategies and the activities of our customers, clients, counterparties and third parties. Actions by the financial services industry generally or by certain members or individuals in the industry also can adversely affect our reputa-tion. In addition, our reputation may be negatively impacted by our Environmental, Social and Governance (ESG) practices and dis-closures, including those related to climate change and how we address ESG concerns in our business activities, or by our clients’ involvement in certain business activities associated with climate change. Adverse publicity or negative information in the media, posted on social media by employees, or otherwise, whether or not factually correct, may also adversely impact our business prospects or financial results, which risk can be magnified by the speed and pervasiveness with which information is disseminated through those channels.

56 Risk factors
A reputation for financial strength and integrity is critical to our performance in the highly competitive environment arising from globalization and convergence in the financial services indus-try, and our failure to address, or the appearance of our failing to address, these and other issues gives rise to reputational risk that could harm our business, results of operations and financial con-dition. Failure to appropriately address any of these issues could also give rise to additional regulatory restrictions and legal risks, which may further lead to reputational harm.
> Refer to “Reputational risk” in III – Treasury, Risk, Balance sheet and Off-bal-ance sheet – Risk management – Risk coverage and management for further information.
Swiss resolution proceedings and resolution planning requirements may affect our shareholders and creditorsPursuant to Swiss banking laws, FINMA has broad powers and discretion in the case of resolution proceedings with respect to a Swiss bank, such as Credit Suisse AG or Credit Suisse (Schweiz) AG, and to a Swiss parent company of a financial group, such as Credit Suisse Group AG. These broad powers include the power to initiate restructuring proceedings with respect to Credit Suisse AG, Credit Suisse (Schweiz) AG or Credit Suisse Group AG and, in connection therewith, cancel the outstanding equity of the entity subject to such proceedings, convert such entity’s debt instruments and other liabilities into equity and/or cancel such debt instruments and other liabilities, in each case, in whole or in part, and stay (for a maximum of two business days) certain ter-mination and netting rights under contracts to which such entity is a party, as well as the power to order protective measures, includ-ing the deferment of payments, and institute liquidation proceed-ings with respect to Credit Suisse AG, Credit Suisse (Schweiz) AG or Credit Suisse Group AG. The scope of such powers and discretion and the legal mechanisms that would be applied are subject to development and interpretation.
We are currently subject to resolution planning requirements in Switzerland, the US and the UK and may face similar require-ments in other jurisdictions. If a resolution plan is determined by the relevant authority to be inadequate, relevant regulations may allow the authority to place limitations on the scope or size of our business in that jurisdiction, require us to hold higher amounts of capital or liquidity, require us to divest assets or subsidiaries or to change our legal structure or business to remove the relevant impediments to resolution.
> Refer to “Recent regulatory developments and proposals – Switzerland” and “Regulatory framework – Switzerland – Resolution regime” in Regulation and supervision for a description of the current resolution regime under Swiss banking laws as it applies to Credit Suisse AG, Credit Suisse (Schweiz) AG and Credit Suisse Group AG.
Any conversion of our convertible capital instruments would dilute the ownership interests of existing shareholdersUnder Swiss regulatory capital rules, we are required to issue a significant amount of contingent capital instruments, certain of which would convert into common equity upon the occurrence of
specified triggering events, including our common equity tier 1 ratio falling below prescribed thresholds (7% in the case of high-trigger instruments), or a determination by FINMA that conversion is necessary, or that we require extraordinary public sector sup-port, to prevent us from becoming insolvent. As of December 31, 2020, we had 2,406.1 million common shares outstanding and we had issued in the aggregate an equivalent of CHF 1.3 billion in principal amount of such contingent convertible capital instru-ments, and we may issue more such contingent convertible capi-tal instruments in the future. The conversion of some or all of our contingent convertible capital instruments due to the occurrence of any of such triggering events would result in the dilution of the ownership interests of our then existing shareholders, which dilution could be substantial. Additionally, any conversion, or the anticipation of the possibility of a conversion, could negatively impact the market price of our ordinary shares.
> Refer to “Contingent convertible capital instruments” in III – Treasury, Risk, Balance sheet and Off-balance sheet – Capital management – Capital instru-ments for further information on the triggering events related to our contingent convertible capital instruments.
Changes in monetary policy are beyond our control and difficult to predictWe are affected by the monetary policies adopted by the cen-tral banks and regulatory authorities of Switzerland, the US and other countries. The actions of the SNB and other central bank-ing authorities directly impact our cost of funds for lending, capi-tal raising and investment activities and may impact the value of financial instruments we hold and the competitive and operat-ing environment for the financial services industry. Many central banks, including the Fed, have implemented significant changes to their monetary policy or have experienced significant changes in their management and may implement or experience further changes. We cannot predict whether these changes will have a material adverse effect on us or our operations. In addition, changes in monetary policy may affect the credit quality of our customers. Any changes in monetary policy are beyond our con-trol and difficult to predict.
Legal restrictions on our clients may reduce the demand for our servicesWe may be materially affected not only by regulations applicable to us as a financial services company, but also by regulations and changes in enforcement practices applicable to our clients. Our business could be affected by, among other things, existing and proposed tax legislation, antitrust and competition policies, cor-porate governance initiatives and other governmental regulations and policies, and changes in the interpretation or enforcement of existing laws and rules that affect business and the financial markets. For example, focus on tax compliance and changes in enforcement practices could lead to further asset outflows from our private banking businesses.

57Risk factors
Competition We face intense competitionWe face intense competition in all sectors of the financial services markets and for the products and services we offer. Consolida-tion through mergers, acquisitions, alliances and cooperation, including as a result of financial distress, has increased competi-tive pressures. Competition is based on many factors, including the products and services offered, pricing, distribution systems, customer service, brand recognition, perceived financial strength and the willingness to use capital to serve client needs. Consoli-dation has created a number of firms that, like us, have the ability to offer a wide range of products and services, from loans and deposit taking to brokerage, investment banking and asset man-agement services. Some of these firms may be able to offer a broader range of products than we do, or offer such products at more competitive prices. Current market conditions have resulted in significant changes in the competitive landscape in our indus-try as many institutions have merged, altered the scope of their business, declared bankruptcy, received government assistance or changed their regulatory status, which will affect how they conduct their business. In addition, current market conditions have had a fundamental impact on client demand for products and services. Some new competitors in the financial technol-ogy sector have sought to target existing segments of our busi-nesses that could be susceptible to disruption by innovative or less regulated business models. Emerging technology may also result in further competition in the markets in which we operate, for example, by allowing e-commerce firms or other companies to provide products and services similar to ours at a lower price or in a more competitive manner in terms of customer convenience. We can give no assurance that our results of operations will not be adversely affected.
We must recruit and retain highly skilled employeesOur performance is largely dependent on the talents and efforts of highly skilled individuals. Competition for qualified employees is intense. We have devoted considerable resources to recruit-ing, training and compensating employees. Our continued ability to compete effectively in our businesses depends on our ability to attract new employees and to retain and motivate our exist-ing employees. The continued public focus on compensation practices in the financial services industry, and related regula-tory changes, may have an adverse impact on our ability to attract and retain highly skilled employees. In particular, limits on the amount and form of executive compensation imposed by regula-tory initiatives, including the Swiss Compensation Ordinance, or any successor legislation thereof in Switzerland and the Capital Requirements Directive IV (as amended by CRD V) in the EU and the UK, could potentially have an adverse impact on our ability to retain certain of our most highly skilled employees and hire new qualified employees in certain businesses.
We face competition from new trading technologiesOur businesses face competitive challenges from new trading technologies, including trends towards direct access to automated and electronic markets with low or no fees and commissions, and the move to more automated trading platforms. Such technolo-gies and trends may adversely affect our commission and trading revenues, exclude our businesses from certain transaction flows, reduce our participation in the trading markets and the associ-ated access to market information and lead to the establishment of new and stronger competitors. We have made, and may con-tinue to be required to make, significant additional expenditures to develop and support new trading systems or otherwise invest in technology to maintain our competitive position.

58 Risk factors
[this page intentionally left blank]

59
Operating environment 60
Credit Suisse 63
Swiss Universal Bank 76
International Wealth Management 83
Asia Pacific 91
Investment Bank 95
Corporate Center 99
Assets under management 103
Critical accounting estimates 106
II – Operating and financial review
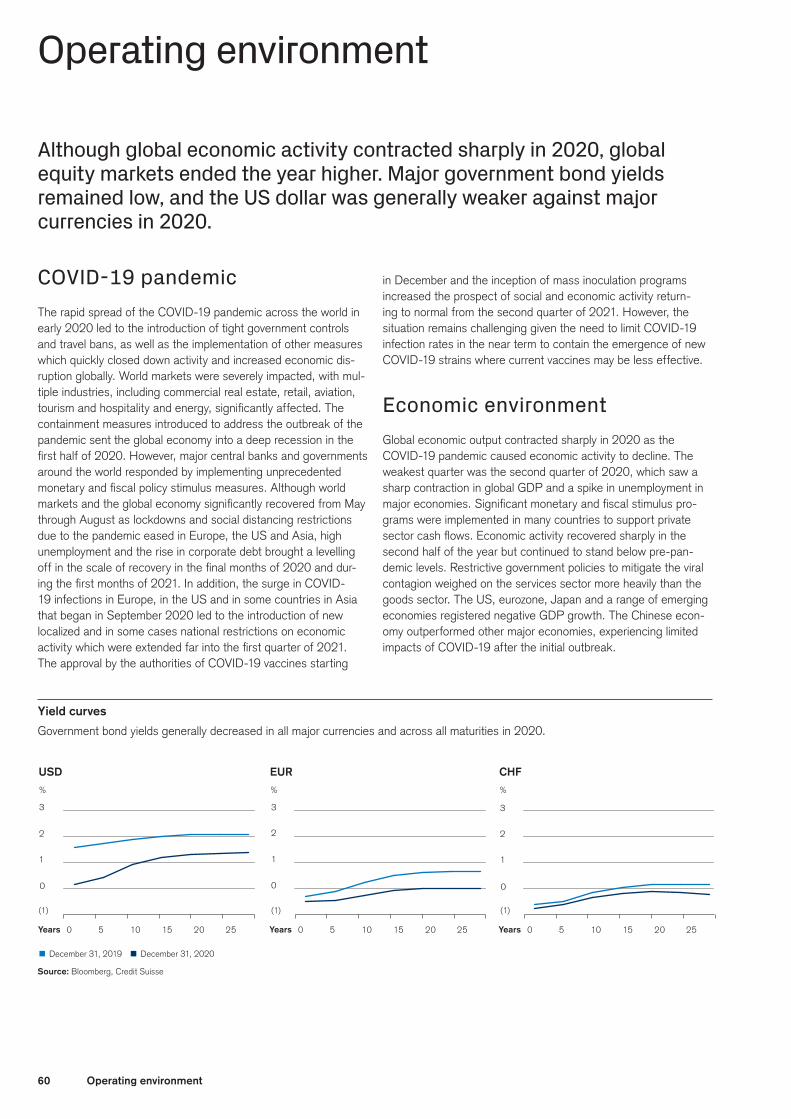
60 Operating environment
Yield curves
Government bond yields generally decreased in all major currencies and across all maturities in 2020.
%
USD
0 5 10 15 20 25
0
1
2
3
Years
(1)
%
EUR
0 5 10 15 20 25Years
%
CHF
0 5 10 15 20 25
0
1
2
3
Years
0
1
2
3
(1) (1)
p December 31, 2019 p December 31, 2020
Source: Bloomberg, Credit Suisse
Operating environment
Although global economic activity contracted sharply in 2020, global equity markets ended the year higher. Major government bond yields remained low, and the US dollar was generally weaker against major currencies in 2020.
COVID-19 pandemicThe rapid spread of the COVID-19 pandemic across the world in early 2020 led to the introduction of tight government controls and travel bans, as well as the implementation of other measures which quickly closed down activity and increased economic dis-ruption globally. World markets were severely impacted, with mul-tiple industries, including commercial real estate, retail, aviation, tourism and hospitality and energy, significantly affected. The containment measures introduced to address the outbreak of the pandemic sent the global economy into a deep recession in the first half of 2020. However, major central banks and governments around the world responded by implementing unprecedented monetary and fiscal policy stimulus measures. Although world markets and the global economy significantly recovered from May through August as lockdowns and social distancing restrictions due to the pandemic eased in Europe, the US and Asia, high unemployment and the rise in corporate debt brought a levelling off in the scale of recovery in the final months of 2020 and dur-ing the first months of 2021. In addition, the surge in COVID-19 infections in Europe, in the US and in some countries in Asia that began in September 2020 led to the introduction of new localized and in some cases national restrictions on economic activity which were extended far into the first quarter of 2021. The approval by the authorities of COVID-19 vaccines starting
in December and the inception of mass inoculation programs increased the prospect of social and economic activity return-ing to normal from the second quarter of 2021. However, the situation remains challenging given the need to limit COVID-19 infection rates in the near term to contain the emergence of new COVID-19 strains where current vaccines may be less effective.
Economic environment Global economic output contracted sharply in 2020 as the COVID-19 pandemic caused economic activity to decline. The weakest quarter was the second quarter of 2020, which saw a sharp contraction in global GDP and a spike in unemployment in major economies. Significant monetary and fiscal stimulus pro-grams were implemented in many countries to support private sector cash flows. Economic activity recovered sharply in the second half of the year but continued to stand below pre-pan-demic levels. Restrictive government policies to mitigate the viral contagion weighed on the services sector more heavily than the goods sector. The US, eurozone, Japan and a range of emerging economies registered negative GDP growth. The Chinese econ-omy outperformed other major economies, experiencing limited impacts of COVID-19 after the initial outbreak.

61Operating environment
Equity markets
Global equity markets ended the year higher after a significant drop in the first quarter of 2020. World bank stocks underperformed.
p Emerging markets Asia p Europe p MSCI World banks p MSCI European banks p VDAX p Emerging markets Latin America p North America p MSCI World p VIX Index
Source: Datastream, MSCI, Credit Suisse Source: Bloomberg, MSCI, Credit Suisse Source: Bloomberg, Credit Suisse
Index (December 31, 2019 = 100)
Performance by region
1Q 2Q 4Q3Q 1Q 2Q 4Q3Q 1Q 2Q 4Q3Q
40
60
80
100
120
140
2020
Index (December 31, 2019 = 100)
Performance world banks
40
60
80
100
120
140
2020 2020
%
Volatility
0
20
40
60
80
100
Credit spreads
After a strong widening in the first quarter of 2020, credit spreads tightened again towards the end of the year.
p European CDS (iTraxx) p North American CDS (CDX) bp: basis points
Source: Bloomberg, Credit Suisse
1Q 2Q 3Q 4Q
bp
40
60
80
100
120
140
160
2020
Global monetary policy eased significantly in 2020. The US Fed-eral Reserve lowered the target range for its federal funds rate sharply to 0-0.25%, restarted asset purchases, implemented a range of measures to encourage bank lending and announced a shift to average inflation targeting. The European Central Bank increased asset purchase commitments and eased the terms of long-term lending operations, while leaving the deposit rate at negative 0.5%. The Swiss National Bank kept policy rates unchanged. Elsewhere in developed markets, the Bank of Can-ada, the Bank of England and the Bank of Japan expanded asset purchases and finished the year with policy rates close to zero. In emerging markets, a range of central banks lowered interest rates.
Global equities moved higher in 2020, despite the sharp drop in economic activity caused by the global COVID-19 pandemic. Global equities appreciated more than 14%, driven by measures introduced by governments and central banks globally to address the economic impact of the COVID-19 pandemic, including accommodative monetary policy conditions and substantial asset purchase programs. US and emerging market equities outper-formed global equities, while European and Japanese markets underperformed. Among industry sectors, information technol-ogy was the top performer with a 42.7% increase, followed by consumer discretionary and communication services. The energy sector was the worst performer, followed by real estate, financials and utilities. Equity market volatility, as measured by the Chicago Board Options Exchange Market Volatility Index (VIX), spiked in March 2020 during the market selloff, before returning to more normalized, yet still elevated, levels towards the end of the year. The Credit Suisse Hedge Fund Index increased 6.4% in 2020. World bank stocks underperformed against global equity mar-kets in 2020. European bank stocks underperformed world bank stocks in 2020, particularly in the third quarter of 2020. At the end of 2020, world bank stocks traded 14% lower compared to 2019 (refer to the charts under “Equity markets”).
In fixed income, bonds delivered strong returns reflecting accom-modative central bank policies in both developed and emerg-ing markets following the COVID-19 pandemic outbreak. In US dollar rates, the spread between the 10-year and 2-year US treasury yields steepened gradually in the second half of 2020. In contrast, the yield curve remained flat across all maturities in Europe and Switzerland, similar to 2019 year-end (refer to the charts under “Yield curves”). In credit, both global developed and emerging market corporate bonds showed positive returns, as did emerging market sovereign bonds. Credit spreads decreased significantly after peaking in March of 2020 (refer to the chart “Credit spreads”).

62 Operating environment
After a modest appreciation in the first quarter of the year, the US dollar trended lower against most other major currencies for the remainder of 2020. The euro advanced, in particular after Euro-pean Union member states managed to agree on the EU Recov-ery Fund. The Swiss franc also appreciated against the US dollar. After initial losses in the first quarter of 2020, most emerging market currencies gained against the US dollar. The Chinese ren-minbi was the best performing major emerging market currency, while the Argentine peso and the Brazilian real were the worst performers against the US dollar.
After a sharp decline at the beginning of the year, the Credit Suisse Commodity Benchmark rebounded, but ended the year 9% lower compared to 2019. The energy market was the worst underperformer and declined more than 31%. Industrial metals increased 14%, driven by strong Chinese demand. Precious met-als benefitted from the extraordinary monetary and fiscal policies seen in 2020. Growing Chinese import demand also contributed to an increase in the price of agricultural commodities in addi-tion to weather-related supply downgrades in key crop growing countries.
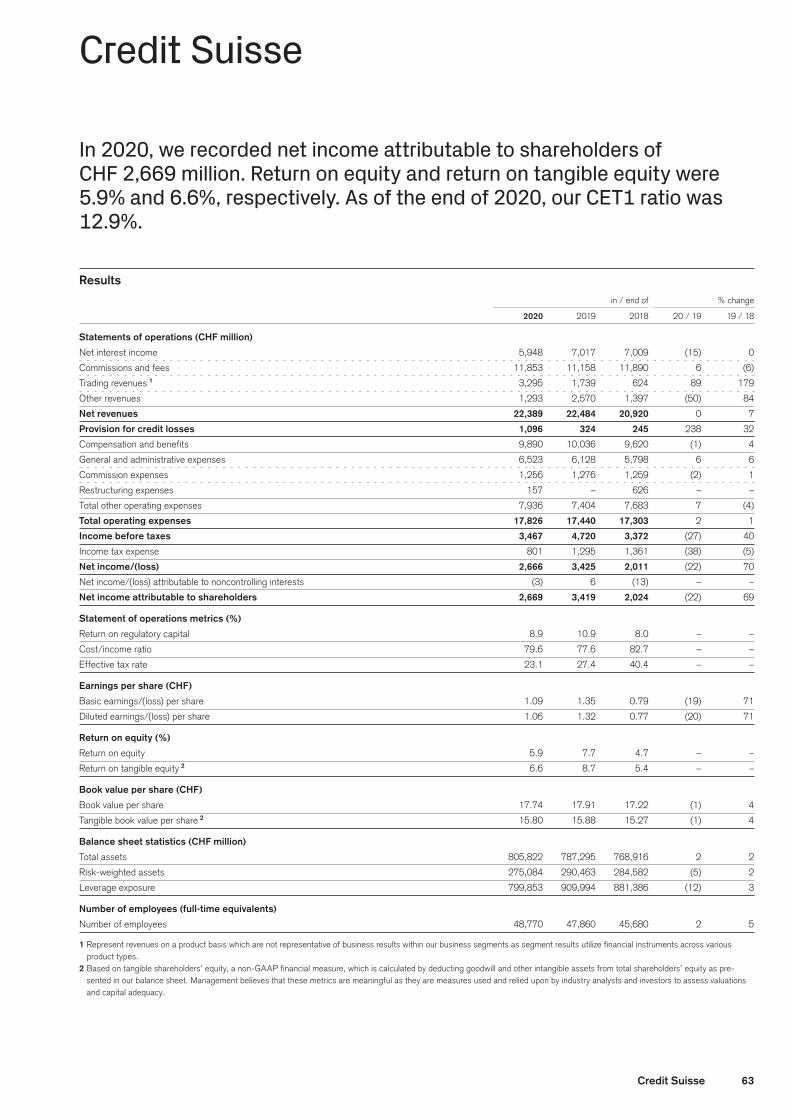
63Credit Suisse
Credit Suisse
In 2020, we recorded net income attributable to shareholders of CHF 2,669 million. Return on equity and return on tangible equity were 5.9% and 6.6%, respectively. As of the end of 2020, our CET1 ratio was 12.9%.
Results in / end of % change
2020 2019 2018 20 / 19 19 / 18
Statements of operations (CHF million)
Net interest income 5,948 7,017 7,009 (15) 0
Commissions and fees 11,853 11,158 11,890 6 (6)
Trading revenues 1 3,295 1,739 624 89 179
Other revenues 1,293 2,570 1,397 (50) 84
Net revenues 22,389 22,484 20,920 0 7
Provision for credit losses 1,096 324 245 238 32
Compensation and benefits 9,890 10,036 9,620 (1) 4
General and administrative expenses 6,523 6,128 5,798 6 6
Commission expenses 1,256 1,276 1,259 (2) 1
Restructuring expenses 157 – 626 – –
Total other operating expenses 7,936 7,404 7,683 7 (4)
Total operating expenses 17,826 17,440 17,303 2 1
Income before taxes 3,467 4,720 3,372 (27) 40
Income tax expense 801 1,295 1,361 (38) (5)
Net income/(loss) 2,666 3,425 2,011 (22) 70
Net income/(loss) attributable to noncontrolling interests (3) 6 (13) – –
Net income attributable to shareholders 2,669 3,419 2,024 (22) 69
Statement of operations metrics (%)
Return on regulatory capital 8.9 10.9 8.0 – –
Cost/income ratio 79.6 77.6 82.7 – –
Effective tax rate 23.1 27.4 40.4 – –
Earnings per share (CHF)
Basic earnings/(loss) per share 1.09 1.35 0.79 (19) 71
Diluted earnings/(loss) per share 1.06 1.32 0.77 (20) 71
Return on equity (%)
Return on equity 5.9 7.7 4.7 – –
Return on tangible equity 2 6.6 8.7 5.4 – –
Book value per share (CHF)
Book value per share 17.74 17.91 17.22 (1) 4
Tangible book value per share 2 15.80 15.88 15.27 (1) 4
Balance sheet statistics (CHF million)
Total assets 805,822 787,295 768,916 2 2
Risk-weighted assets 275,084 290,463 284,582 (5) 2
Leverage exposure 799,853 909,994 881,386 (12) 3
Number of employees (full-time equivalents)
Number of employees 48,770 47,860 45,680 2 5
1 Represent revenues on a product basis which are not representative of business results within our business segments as segment results utilize financial instruments across various product types.
2 Based on tangible shareholders’ equity, a non-GAAP financial measure, which is calculated by deducting goodwill and other intangible assets from total shareholders’ equity as pre-sented in our balance sheet. Management believes that these metrics are meaningful as they are measures used and relied upon by industry analysts and investors to assess valuations and capital adequacy.

64 Credit Suisse
Credit Suisse
Credit Suisse reporting structure
Credit Suisse includes the results of the four reporting segments and the Corporate Center.
Swiss Universal Bank
International Wealth Management
Asia Pacific
Investment Bank
Corporate Center
Private Clients
Private Banking
Corporate & Institutional Clients
Asset Management
Organizational structure and restatementEffective August 1, 2020, we created a single, globally-integrated Investment Bank division through the combination of our former Global Markets, Investment Banking & Capital Markets and Asia Pacific – Markets businesses to achieve critical scale. We also launched a new Sustainability, Research & Investment Solutions function at the Executive Board level, underlining the sharpened focus on sustainability. We also combined our former Risk Man-agement and Compliance functions into a single integrated Chief Risk and Compliance Officer function to unlock potential global synergies. We also revised our allocations for corporate functions and funding costs to align to the new organizational structure.
Reflecting these updates, our financial reporting is now presented as four reporting segments plus the Corporate Center. Prior peri-ods have been restated to conform to the current presentation. These restatements had no impact on the net income/(loss) or the total shareholders’ equity of the Group.
> Refer to “Strategy” in I – Information on the company for further information.
Results summary2020 resultsIn 2020, Credit Suisse reported net income attributable to share-holders of CHF 2,669 million compared to CHF 3,419 million in 2019. Income before taxes was CHF 3,467 million, compared to CHF 4,720 million in 2019. The 2020 results reflected stable net revenues and a 2% increase in total operating expenses. Provision for credit losses was CHF 1,096 million compared to CHF 324 million in 2019, driven by negative developments in our corporate lending portfolio and the application of the cur-rent expected credit loss (CECL) methodology. Total operating expenses in 2020 included net litigation provisions of CHF 1,227 million, mainly in connection with mortgage-related matters, and restructuring expenses of CHF 157 million. Total operating expenses in 2019 included net litigation provisions of CHF 623 million, mainly in connection with mortgage-related matters.
Results in 2020 were impacted by the weakening of the average rate of the US dollar against the Swiss franc, which adversely impacted revenues, but favorably impacted expenses.
The 2020 results included a gain of CHF 268 million relat-ing to the completed transfer of the Credit Suisse InvestLab AG (InvestLab) fund platform to Allfunds Group, which was recog-nized in the divisional results of Swiss Universal Bank, Interna-tional Wealth Management and Asia Pacific (as described below). In 2020, we revalued our equity investment in the SIX Swiss Exchange (SIX) Group AG, resulting in a gain before taxes of CHF 158 million, which was recognized in the divisional results of Swiss Universal Bank and International Wealth Management, we revalued our equity investment in Pfandbriefbank, resulting in a gain of CHF 134 million, which was recognized in the divisional results of Swiss Universal Bank, and we revalued our equity investment in Allfunds Group, resulting in a gain before taxes of CHF 127 million, which was recognized in the divisional results of Swiss Universal Bank, International Wealth Management and Asia Pacific. Results also included an impairment of CHF 414 million relating to York Capital Management (York), which was recognized in International Wealth Management (as described below).
The COVID-19 pandemic and the consequences for markets and the global economy affected the Group’s financial performance in 2020, including significant impacts on our provision for credit losses and trading revenues as well as on net interest income as a result of foreign exchange movements and a sharp reduc-tion in US dollar interest rates. We continue to closely monitor the COVID-19 pandemic and its effects on our operations and businesses. Should current economic conditions persist or con-tinue to deteriorate, the macroeconomic environment could have an adverse effect on these and other aspects of our business, operations and financial performance, including decreased client activity or demand for our products.
2019 resultsIn 2019, Credit Suisse reported net income attributable to share-holders of CHF 3,419 million compared to CHF 2,024 million

65Credit Suisse
in 2018. In 2019, Credit Suisse reported income before taxes of CHF 4,720 million compared to CHF 3,372 million in 2018. The 2019 results reflected a 7% increase in net revenues and stable total operating expenses. Total operating expenses in 2019 included net litigation provisions of CHF 623 million, mainly in connection with mortgage-related matters. The 2018 results reflected CHF 626 million of restructuring expenses.
The 2019 results included a gain of CHF 327 million relating to the completed first closing of the transfer of the InvestLab fund platform, which was recognized in the divisional results of Swiss Universal Bank, International Wealth Management and Asia Pacific. In 2019, we elected fair value accounting of our investment in SIX Group AG, resulting in a gain before taxes of CHF 498 million, which was recognized in the divisional results of Swiss Universal Bank and International Wealth Management.
2020 results detailsNet revenuesCompared to 2019, net revenues of CHF 22,389 million were stable, primarily reflecting higher net revenues in the Investment Bank, offset by lower net revenues in International Wealth Man-agement. The increase in net revenues in the Investment Bank was driven by broad-based growth across all businesses. The decrease in net revenues in International Wealth Management was primarily driven by the impairment loss from York, reflected in other revenues, lower transaction-based and performance-based revenue and lower net interest income.
Provision for credit lossesIn 2020, we recorded provision for credit losses of CHF 1,096 mil-lion, primarily reflecting provisions of CHF 471 million in the Invest-ment Bank, CHF 270 million in Swiss Universal Bank, CHF 236 million in Asia Pacific and CHF 110 million in International Wealth Management. Provision for credit losses reflected CHF 685 mil-lion of specific provisions and CHF 411 million related to the appli-cation of the CECL methodology.
Total operating expensesWe reported total operating expenses of CHF 17,826 million in 2020, a 2% increase compared to 2019. General and admin-istrative expenses increased 6%, primarily driven by higher net litigation provisions of CHF 1,227 million, mainly in connection with mortgage-related matters, partially offset by lower travel and entertainment expenses and lower professional services fees. Total operating expenses in 2020 included restructuring expenses of CHF 157 million.
Income tax expenseIn 2020, we recorded income tax expense of CHF 801 mil-lion compared to CHF 1,295 million in 2019. The Credit Suisse effective tax rate was 23.1% in 2020, compared to 27.4% in 2019. The effective tax rate for 2020 mainly reflected the impact of the geographical mix of results, non-deductible funding costs and other tax adjustments of a recurring nature. Additionally, the effective tax rate was positively impacted by the re-assessment of the US base erosion and anti-abuse tax (BEAT) provision for 2019 of CHF 180 million, the impact of previously unrecognized tax benefits of CHF 157 million relating to the resolution of inter-est cost deductibility with and between international tax authori-ties and the impact of a change in US tax rules, which resulted in a benefit of CHF 141 million. The impact of these benefits was partially offset by the annual reassessment of deferred taxes of CHF 252 million. Overall, net deferred tax assets decreased CHF 739 million to CHF 3,137 million during 2020, mainly driven by foreign exchange impacts, the annual re-assessment of deferred taxes and earnings.
The US tax reform enacted in December 2017 introduced the BEAT tax regime, effective as of January 1, 2018, for which final regulations were issued by the US Department of Treasury on December 2, 2019. Following the publication of the 2019 finan-cial statements, Credit Suisse continued its analysis of the final regulations, resulting in a revision to the technical application of the prior BEAT estimate. This new information was not available or reasonably knowable at the time of the publication of the 2019 financial statements and resulted in a change of accounting esti-mate reflected in 2020.
> Refer to “Note 29 – Tax” in VI – Consolidated financial statements – Credit Suisse Group for further information.

66 Credit Suisse
Results overview
Swiss International Strategic
Universal Wealth Asia Investment Corporate Resolution Credit
in / end of Bank Management Pacific Bank Center 1 Unit 1 Suisse
2020 (CHF million)
Net revenues 5,615 4,837 3,155 9,098 (316) – 22,389
Provision for credit losses 270 110 236 471 9 – 1,096
Compensation and benefits 1,975 2,310 1,319 3,934 352 – 9,890
Total other operating expenses 1,266 1,365 772 3,038 1,495 – 7,936
of which general and administrative expenses 1,013 1,080 614 2,409 1,407 – 6,523
of which restructuring expenses 44 55 4 47 7 – 157
Total operating expenses 3,241 3,675 2,091 6,972 1,847 – 17,826
Income/(loss) before taxes 2,104 1,052 828 1,655 (2,172) – 3,467
Return on regulatory capital 17.1 19.6 22.0 12.2 – – 8.9
Cost/income ratio 57.7 76.0 66.3 76.6 – – 79.6
Total assets 261,465 95,206 67,356 270,488 111,307 – 805,822
Goodwill 575 1,352 1,021 1,478 0 – 4,426
Risk-weighted assets 81,288 43,000 26,589 77,872 46,335 – 275,084
Leverage exposure 295,507 104,014 74,307 319,339 6,686 – 799,853
2019 (CHF million)
Net revenues 5,905 5,816 3,029 8,161 (427) – 22,484
Provision for credit losses 109 49 55 104 7 – 324
Compensation and benefits 1,945 2,377 1,285 3,940 489 – 10,036
Total other operating expenses 1,278 1,325 767 3,091 943 – 7,404
of which general and administrative expenses 1,060 1,103 620 2,470 875 – 6,128
Total operating expenses 3,223 3,702 2,052 7,031 1,432 – 17,440
Income/(loss) before taxes 2,573 2,065 922 1,026 (1,866) – 4,720
Return on regulatory capital 20.2 37.3 21.3 7.1 – – 10.9
Cost/income ratio 54.6 63.7 67.7 86.2 – – 77.6
Total assets 249,829 91,277 73,719 266,257 106,213 – 787,295
Goodwill 607 1,494 995 1,567 0 – 4,663
Risk-weighted assets 80,489 43,529 31,857 82,218 52,370 – 290,463
Leverage exposure 284,798 99,085 81,090 332,019 113,002 – 909,994
2018 (CHF million)
Net revenues 5,443 5,320 2,759 8,004 102 (708) 20,920
Provision for credit losses 127 37 28 51 1 1 245
Compensation and benefits 1,903 2,311 1,244 3,761 147 254 9,620
Total other operating expenses 1,422 1,362 855 3,374 252 418 7,683
of which general and administrative expenses 1,091 1,020 670 2,430 202 385 5,798
of which restructuring expenses 101 115 37 353 (1) 21 626
Total operating expenses 3,325 3,673 2,099 7,135 399 672 17,303
Income/(loss) before taxes 1,991 1,610 632 818 (298) (1,381) 3,372
Return on regulatory capital 16.3 30.4 16.4 5.9 – – 8.0
Cost/income ratio 61.1 69.0 76.1 89.1 – – 82.7
Total assets 241,366 90,354 69,643 257,998 93,369 20,874 768,916
Goodwill 615 1,544 1,018 1,589 0 0 4,766
Risk-weighted assets 79,133 40,359 31,585 84,862 30,239 17,926 284,582
Leverage exposure 275,229 97,099 77,417 312,655 94,094 29,579 881,386
1 Beginning in 2019, the Strategic Resolution Unit ceased to exist as a separate division of the Group. The residual portfolio remaining as of December 31, 2018 is now managed in an Asset Resolution Unit and is separately disclosed within the Corporate Center.
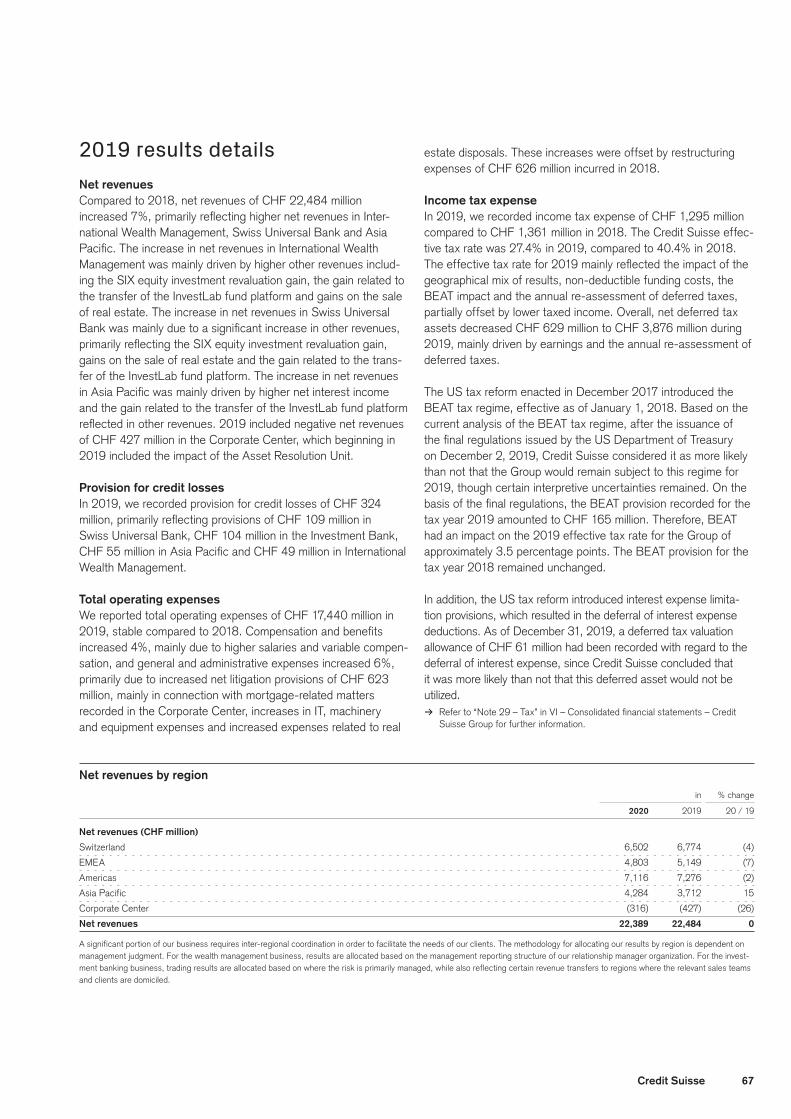
67Credit Suisse
2019 results detailsNet revenuesCompared to 2018, net revenues of CHF 22,484 million increased 7%, primarily reflecting higher net revenues in Inter-national Wealth Management, Swiss Universal Bank and Asia Pacific. The increase in net revenues in International Wealth Management was mainly driven by higher other revenues includ-ing the SIX equity investment revaluation gain, the gain related to the transfer of the InvestLab fund platform and gains on the sale of real estate. The increase in net revenues in Swiss Universal Bank was mainly due to a significant increase in other revenues, primarily reflecting the SIX equity investment revaluation gain, gains on the sale of real estate and the gain related to the trans-fer of the InvestLab fund platform. The increase in net revenues in Asia Pacific was mainly driven by higher net interest income and the gain related to the transfer of the InvestLab fund platform reflected in other revenues. 2019 included negative net revenues of CHF 427 million in the Corporate Center, which beginning in 2019 included the impact of the Asset Resolution Unit.
Provision for credit lossesIn 2019, we recorded provision for credit losses of CHF 324 million, primarily reflecting provisions of CHF 109 million in Swiss Universal Bank, CHF 104 million in the Investment Bank, CHF 55 million in Asia Pacific and CHF 49 million in International Wealth Management.
Total operating expensesWe reported total operating expenses of CHF 17,440 million in 2019, stable compared to 2018. Compensation and benefits increased 4%, mainly due to higher salaries and variable compen-sation, and general and administrative expenses increased 6%, primarily due to increased net litigation provisions of CHF 623 million, mainly in connection with mortgage-related matters recorded in the Corporate Center, increases in IT, machinery and equipment expenses and increased expenses related to real
estate disposals. These increases were offset by restructuring expenses of CHF 626 million incurred in 2018.
Income tax expenseIn 2019, we recorded income tax expense of CHF 1,295 million compared to CHF 1,361 million in 2018. The Credit Suisse effec-tive tax rate was 27.4% in 2019, compared to 40.4% in 2018. The effective tax rate for 2019 mainly reflected the impact of the geographical mix of results, non-deductible funding costs, the BEAT impact and the annual re-assessment of deferred taxes, partially offset by lower taxed income. Overall, net deferred tax assets decreased CHF 629 million to CHF 3,876 million during 2019, mainly driven by earnings and the annual re-assessment of deferred taxes.
The US tax reform enacted in December 2017 introduced the BEAT tax regime, effective as of January 1, 2018. Based on the current analysis of the BEAT tax regime, after the issuance of the final regulations issued by the US Department of Treasury on December 2, 2019, Credit Suisse considered it as more likely than not that the Group would remain subject to this regime for 2019, though certain interpretive uncertainties remained. On the basis of the final regulations, the BEAT provision recorded for the tax year 2019 amounted to CHF 165 million. Therefore, BEAT had an impact on the 2019 effective tax rate for the Group of approximately 3.5 percentage points. The BEAT provision for the tax year 2018 remained unchanged.
In addition, the US tax reform introduced interest expense limita-tion provisions, which resulted in the deferral of interest expense deductions. As of December 31, 2019, a deferred tax valuation allowance of CHF 61 million had been recorded with regard to the deferral of interest expense, since Credit Suisse concluded that it was more likely than not that this deferred asset would not be utilized.
> Refer to “Note 29 – Tax” in VI – Consolidated financial statements – Credit Suisse Group for further information.
Net revenues by region in % change
2020 2019 20 / 19
Net revenues (CHF million)
Switzerland 6,502 6,774 (4)
EMEA 4,803 5,149 (7)
Americas 7,116 7,276 (2)
Asia Pacific 4,284 3,712 15
Corporate Center (316) (427) (26)
Net revenues 22,389 22,484 0
A significant portion of our business requires inter-regional coordination in order to facilitate the needs of our clients. The methodology for allocating our results by region is dependent on management judgment. For the wealth management business, results are allocated based on the management reporting structure of our relationship manager organization. For the invest-ment banking business, trading results are allocated based on where the risk is primarily managed, while also reflecting certain revenue transfers to regions where the relevant sales teams and clients are domiciled.

68 Credit Suisse
Regulatory capitalAs of the end of 2020, our Bank for International Settlements (BIS) common equity tier 1 (CET1) ratio was 12.9% and our risk-weighted assets (RWA) were CHF 275.1 billion.
> Refer to “Capital management” in III – Treasury, Risk, Balance sheet and Off-balance sheet for further information.
Employees and other headcountIn the first quarter of 2020, as part of a review of headcount allo-cation keys, we recalibrated the divisional allocations for corpo-rate function services, mainly relating to changes in the utilization of corporate function services by the divisions. Prior period head-count allocations have not been restated.
As of December 31, 2020, we had 48,770 employees worldwide, of which 16,040 were in Switzerland and 32,730 were abroad.
The number of employees increased by 910 compared to the end of 2019. The increase reflected increases in Swiss Universal Bank, the Investment Bank and Asia Pacific, offset by decreases in International Wealth Management and the Corporate Center. The number of outsourced roles, contractors and consultants decreased by 110 compared to the end of 2019.
Employees and other headcount
end of 2020 2019
Employees
Swiss Universal Bank 13,220 12,560
International Wealth Management 9,850 10,230
Asia Pacific 6,890 6,530
Investment Bank 17,560 17,050
Corporate Center 1,250 1,490
Total employees 48,770 47,860
of which Switzerland 16,040 16,140
of which all other regions 32,730 31,720
Other headcount
Outsourced roles, contractors and consultants 1 13,210 13,320
Total employees and other headcount 61,980 61,180
Based on full-time equivalents.1 Excludes the headcount of certain managed service resources which are related to fixed
fee projects.
COVID-19 pandemic and related regulatory measuresThe rapid spread of the COVID-19 pandemic across the world in early 2020 led to the introduction of tight government controls and travel bans, as well as the implementation of other measures, which quickly closed down activity and increased economic dis-ruption globally. World markets were severely impacted, with mul-tiple industries, including commercial real estate, retail, aviation, tourism and hospitality and energy, significantly affected. The
containment measures introduced to address the outbreak of the pandemic sent the global economy into a deep recession in the first half of 2020. However, major central banks and governments around the world responded by implementing unprecedented monetary and fiscal policy stimulus measures. Although world markets and the global economy significantly recovered from May through August as lockdowns and social distancing restrictions due to the pandemic eased in Europe, the US and Asia, high unemployment and the rise in corporate debt brought a levelling off in the scale of recovery in the final months of 2020 and dur-ing the first months of 2021. In addition, the surge in COVID-19 infections in Europe, in the US and in some countries in Asia that began in September 2020 led to the introduction of new localized and in some cases national restrictions on economic activity, which were extended far into the first quarter of 2021. The approval by the authorities of COVID-19 vaccines start-ing in December and the inception of mass inoculation programs increased the prospect of social and economic activity return-ing to normal from the second quarter of 2021. However, the situation remains challenging given the need to limit COVID-19 infection rates in the near term to contain the emergence of new COVID-19 strains where current vaccines may be less effective.
The pandemic and the consequences for markets and the global economy affected the Group’s financial performance in 2020, including significant impacts on credit loss estimates, as well as on trading revenues, net interest income and goodwill assess-ments. We continue to closely monitor the COVID-19 pandemic and its effects on our operations and businesses, including through the re-assessment of financial plans and the develop-ment of several stress scenarios to take into account potential additional negative impacts.
The Swiss government, the Swiss National Bank and the Swiss Financial Market Supervisory Authority FINMA (FINMA) have taken various measures to mitigate the consequences for the economy and the financial system. Governments and regulators in other jurisdictions where we have operations have taken and con-tinue to take a number of emergency and temporary measures to address the financial and economic pressures arising from the COVID-19 pandemic.
In March 2020, the Swiss Federal Council enacted an emer-gency ordinance on the granting of loans with joint and several guarantees provided by the Swiss Confederation. Thereunder, Swiss companies affected by the COVID-19 pandemic could apply to their banks for bridge credit facilities amounting to a maximum of 10% of their annual revenues and up to a maxi-mum of CHF 20 million. Loans granted under this ordinance of up to CHF 500,000 are fully secured by the Swiss Confedera-tion and no interest will be due on these loans. Loans that exceed CHF 500,000 are secured by the Swiss Confederation up to 85% of the aggregate amount of the loan with the lending bank remaining subject to the credit risk on the remaining 15%. The interest rate on loans exceeding CHF 500,000 is currently 0.5% on the portion of the loan secured by the Swiss Confederation. Swiss companies with revenues of more than CHF 500 million
69Credit Suisse
are not covered by this program. For loans granted to companies under this program the Swiss National Bank has implemented refinancing facilities. Credit Suisse was significantly involved in this program from its inception. On December 18, 2020, effec-tive as of December 19, 2020, the emergency ordinance, with certain clarifications, was transferred into ordinary legislation by the COVID-19 Joint and Several Guarantee Act.
In March 2020, FINMA announced the temporary exclusion of central bank reserves from leverage ratio calculations. This tem-porary measure took immediate effect and was originally applied until July 1, 2020. In May 2020, FINMA announced the exten-sion of the temporary exclusion until January 1, 2021. The exclu-sion applied to deposits with all central banks globally, and thus not only to deposits held with the Swiss National Bank. For banks whose shareholders approved dividends or other similar distribu-tions relating to 2019 after March 25, 2020, or who had planned to seek such shareholder approval, the capital relief relating to the leverage ratio was reduced. Accordingly, the capital relief appli-cable to Credit Suisse in 2020 was adjusted to account for the dividend paid in 2020.
In March 2020, the Swiss Federal Council approved the proposal of the Swiss National Bank to deactivate the Swiss countercycli-cal capital buffer. The Swiss Federal Council to date has never activated the BIS countercyclical buffer, but instead required banks to hold CET1 capital equal to 2% of RWA pertaining to mortgage loans that finance residential property in Switzerland. This Swiss countercyclical capital buffer has served to strengthen banking sector resilience in the event of over-heating in the domestic mortgage and real estate markets. Given the circum-stances, in an effort to provide banks with greater flexibility to provide loans designed to address the economic impact of the COVID-19 pandemic, the Federal Council decided to deacti-vate the Swiss countercyclical capital buffer requirement as of March 27, 2020 until further notice.
In March 2020, the Group of Central Bank Governors and Heads of Supervision announced changes to the implementation timeline of the outstanding Basel III standards. The implementation date of the Basel III standards finalized in December 2017 has been deferred by one year to January 2023. The accompanying transi-tional arrangements for the output floor have also been extended by one year to January 2028. The implementation date of the revised market risk framework finalized in January 2019 has been deferred by one year to January 2023. These measures have been taken to provide additional management capacity for banks and supervisors to respond to the COVID-19 outbreak.
As a result of the abrupt increase in market volatility due to the COVID-19 pandemic, financial institutions that apply the model approach to market risk began recording an increased number of backtesting exceptions in March and April 2020. Such an excep-tion occurs if the loss incurred on a single day is greater than the loss indicated by the model. Backtesting exceptions exceeding a certain number in a rolling 12-month period lead to an immedi-ate increase of the minimum capital requirements for market risk.
In April 2020, FINMA allowed a temporary freeze on backtest-ing exceptions impacting the capital multiplier, expiring on July 1, 2020. In June 2020, FINMA confirmed that (i) all recent excep-tions that are proven by the institution as not attributable to a lack of precision of the risk aggregation model can be disregarded; and (ii) the exemption will be fundamentally incorporated into future supervisory practice. As a result, we had one backtesting exception in our regulatory value-at-risk (VaR) model in the rolling 12-month period through the end of 2020, which is considered for the calculation of the capital multiplier.
Effective January 1, 2020, certain Basel III revisions to the capi-tal requirements for credit risk became effective. The revisions relate to a new standardized approach for counterparty credit risk (SA-CCR) for derivatives, equity investments in funds and cen-tral counterparty default fund contributions. In response to the COVID-19 pandemic, FINMA advised us that we could phase in CHF 12 billion of risk-weighted-assets inflation that arose from these new capital requirements equally throughout 2020 rather than immediately in the first quarter of 2020.
Other informationSupply chain finance fundsOn March 1, 2021, the boards of the supply chain finance funds managed by certain Group subsidiaries decided to suspend redemptions and subscriptions of those funds to protect the interests of the funds’ investors. On March 4, 2021, the boards decided to terminate those funds and proceed to their liquidation. Those decisions were based on concerns that a substantial part of the funds’ assets was subject to considerable valuation uncer-tainty. Credit Suisse Asset Management (Schweiz) AG (CSAM) acts as the portfolio manager of these supply chain finance funds. Redemptions and subscriptions of certain other funds managed by CSAM or CSAM subsidiaries that invest in part in these supply chain finance funds have also been suspended.
The assets held by the supply chain finance funds, largely con-sisting of notes backed by existing and future receivables, were originated and structured by Greensill Capital (UK) Limited or one of its affiliates (Greensill Capital). The last published net asset value of the supply chain finance funds in late February was approximately USD 10 billion in the aggregate. Initial redemp-tion payments totaling USD 3.1 billion across the supply chain finance funds were made to their investors beginning on March 8, 2021. The portfolio manager continues to work to liquidate the remaining assets in the four funds as the receivables comprising the funds’ assets mature. Greensill Capital filed for insolvency in the UK on March 8, 2021, and the portfolio manager is working closely with the administrators of Greensill Capital, Grant Thorn-ton, and with other parties to facilitate this process. However, there remains considerable uncertainty regarding the valuation of a significant part of the remaining assets, including the fact that the portfolio manager has been informed that certain of the notes underlying the funds will not be repaid when they fall due, and the

70 Credit Suisse
amounts that ultimately will be distributed to investors in respect of the funds.
Group subsidiaries also have collateralized bridge lending and other direct and indirect exposures to Greensill Capital, including exposures relating to certain fund-linked products. With regard to the outstanding collateralized bridge loan of USD 140 mil-lion, USD 50 million was recently repaid by the administrators of Greensill Capital, reducing the outstanding amount of the loan to USD 90 million.
We continue to analyze these matters, including with the assis-tance of external counsel and other experts. The Board of Direc-tors has also initiated an investigation of these matters.
It has been decided that as of March 10, 2021, three senior CSAM employees will not be performing their roles for the time being. The payout and vesting of variable compensation of a number of senior employees involved in these matters, up to and including Executive Board members, has been suspended as a measure to ensure that we can reconsider the variable com-pensation for 2020 and are able to apply malus or clawback, if appropriate.
A number of regulatory investigations and actions have been initiated or are being considered in respect of these matters, including by FINMA, one of which is the agreement to a Pillar 2 buffer with Credit Suisse. Furthermore, certain investors have already threatened litigation and, as this matter develops, we may become subject to litigation, disputes or other actions. The prior-ity for Credit Suisse remains the recovery of funds for CSAM’s investors, and the portfolio manager is working closely with the administrators to facilitate this process. We would note that it is reasonably possible that Credit Suisse will incur a loss in respect of these matters, albeit that given the early stage of this process, it is not yet possible to estimate the size of such a reasonably possible loss. However, the ultimate cost to the Group of resolv-ing these matters may be material to its operating results. We might also suffer reputational harm associated with these mat-ters that might cause client departures or loss of assets under management.
New Asset Management divisionOn March 17, 2021, and subsequent to the recent reports and announcements regarding the CSAM managed supply chain finance funds, the Board of Directors of the Group decided to appoint Ulrich Körner as CEO of Asset Management and a mem-ber of the Group Executive Board, effective April 1, 2021. From that date, the Asset Management business will be separated from the International Wealth Management division and managed as a new separate division of the Group.
Credit Suisse InvestLab AG transfer to Allfunds GroupFollowing the completion of the first step of the combination of our open architecture investment fund platform InvestLab and Allfunds Group in September 2019, we successfully completed the second and final step of the combination in March 2020 with
the transfer of related distribution agreements to Allfunds Group. Upon completion of this final step, Credit Suisse became an 18% shareholder in the combined business and is represented on the board of directors. Net revenues in 2020 included CHF 268 mil-lion from this second closing, reflected in the International Wealth Management, Swiss Universal Bank and Asia Pacific divisions. Credit Suisse’s shareholding in Allfunds Group has subsequently decreased to 14%.
Credit Suisse Founder Securities LimitedIn 2020, we received approval from the China Securities Regula-tory Commission and increased our shareholding in the securities joint venture, Credit Suisse Founder Securities Limited, to 51% from the previous 33.3% by way of a capital injection and related procedures.
York Capital ManagementIn the fourth quarter of 2020, York informed its investors of a significant change in strategy. As a result, York will focus on longer duration assets such as private equity, private debt and collateralized loan obligations, while winding down its European hedge funds business and primarily managing internal capital in its multi-strategy fund. York’s Asia Pacific business is expected to be spun off as a new and separate hedge fund in 2021, in which the Group intends to have a continuing interest. As a result of this announcement, the Group recorded an impairment of CHF 414 million (USD 458 million) to the valuation of its non-controlling interest that it has owned since 2010.
DividendsIn light of the COVID-19 pandemic and in response to a request by FINMA, on April 9, 2020, the Board of Directors made a revised dividend proposal to our shareholders for approval at the 2020 Annual General Meeting (AGM). Instead of a total divi-dend of CHF 0.2776 per share for the financial year 2019, the Board of Directors proposed a cash distribution of CHF 0.1388 per share. At the 2020 AGM on April 30, 2020, our sharehold-ers approved the proposal. In order to distribute the full dividend amount of CHF 0.2776 as originally proposed to shareholders, the Board of Directors proposed a second dividend distribution equal to the first distribution of CHF 0.1388 gross per share, which was approved by shareholders at an Extraordinary General Meeting held on November 27, 2020. For each distribution, 50% of the distribution was paid out of capital contribution reserves, free of Swiss withholding tax and not subject to income tax for Swiss resident individuals holding the shares as a private invest-ment, and 50% percent was paid out of retained earnings, net of 35% Swiss withholding tax.
Our Board of Directors will propose to the shareholders at the AGM on April 30, 2021 a cash distribution of CHF 0.2926 per share for the financial year 2020. 50% of the distribution will be paid out of capital contribution reserves, free of Swiss withhold-ing tax and will not be subject to income tax for Swiss resident individuals holding the shares as a private investment, and 50% will be paid out of retained earnings, net of 35% Swiss withhold-ing tax.

71Credit Suisse
Replacement of interbank offered ratesA major structural change in global financial markets is in prog-ress with respect to the replacement of interbank offered rate (IBOR) benchmarks. There is significant international and regula-tory pressure to replace certain IBOR benchmarks with alterna-tive reference rates (ARRs). There are significant risks associated with the transition, including financial, legal, tax, operational and conduct risks and the risk of an untimely transition due to a lack of client or market readiness. However, we believe certain oppor-tunities related to the transition also exist in the areas of product innovation and development, business growth and strategy and client communication and engagement.
Although the transition has progressed significantly, certain aspects of the transition remain uncertain, including widely accepted conventions for new products based on ARRs, the engagement of end users, certain aspects of regulatory relief for remediation amendments and the form of legislative support avail-able for contracts that cannot be moved away from IBOR rates by the end of 2021 or 2023, as applicable. In March 2021, the Financial Conduct Authority announced that all CHF, EUR, GBP, JPY LIBOR settings and the one-week and two-month USD LIBOR settings will permanently cease to be provided by any administrator or will no longer be representative immediately after December 31, 2021, but that the remaining USD LIBOR settings will permanently cease to be provided by any administrator or will no longer be representative immediately after June 30, 2023. While the depth of ARR-markets differs significantly across cur-rencies, regulatory guidance urges for the cessation of new busi-ness referencing IBOR rates in 2021 in some markets or curren-cies sooner than in others.
Credit Suisse has a significant level of liabilities and assets linked to IBOR indices across businesses that require transition to ARRs. Despite the negative impact of the COVID-19 pandemic on the global economy and the financial sector, building on the foundation laid in 2019, the Group continued to execute its IBOR transition strategy. Our work remained focused on the five key areas identified in 2019:p Operational readiness and resiliency: by the end of 2020, the
bank was operationally ready to support new products in most markets in which it was active. We engaged with our third party vendors and/or developed in-house solutions to prepare for the demand from our clients.
p Legal contract assessment and repapering: we increased our capacity to review contracts on a large scale throughout the Group and have conducted an initial assessment of a signifi-cant portion of our legacy portfolio. While client interest in active remediation of legacy contracts remains at low levels, we are well prepared to increase this activity and continue with legacy contract remediation in 2021.
p Product development and industry engagement: we have con-tinued to participate in national working groups in all of our main markets and actively support the initiatives developed in these forums. We supported and were among the initial sig-natories of the International Swap and Derivatives Association (ISDA) IBOR Protocol, a solution developed to address the
large number of bilateral derivatives in a cost-effective manner. In our Swiss home market, we successfully launched a Swiss Average Rate Overnight (SARON)-based mortgage product, and in our main markets, we remained active as an issuer of ARR-based debt and continued to actively trade derivatives.
p Risk management and mitigation: to manage transition risk, we implemented a group-wide policy to limit new IBOR-referenc-ing business and control the wind-down of legacy exposures in advance of the cessation dates. Accordingly, divisional plans are being developed to ensure timely compliance with the policy and limits therein. Our modelling and risk management systems have mostly been revised to accommodate the transi-tion and were successfully tested when the central clearing houses conducted their transition to alternative USD and EUR discounting models in 2020. The majority of our pricing mod-els have been reviewed and where needed updated, preparing to meet the demand for new ARR-products. As our clients continue to sign up to the ISDA IBOR Protocol, over 80% of the legacy portfolio effectively has robust, integrated fallbacks, significantly reducing the transition risk in our derivatives portfolio.
p Strategic Transition Planning and Communication: aligned with regulatory guidance on the transition, our businesses have developed and ratified their own transition plans. While certain product details and conventions remain to be agreed upon across the markets, we believe that these plans position us to be prepared and to optimally service our clients during and after the transition. Over forty thousand of our employees have been trained for taking our counterparts on this journey and we have informed and initiated an early discussion with many of our clients.
Coordinating the Group’s transition activities across its divi-sions and businesses, the IBOR Transition Program remains fully engaged in overseeing the efforts under the leadership of mem-bers of the Group Executive Board, business leaders and func-tional leaders across the entire Group.
Format of presentationIn managing our business, revenues are evaluated in the aggre-gate, including an assessment of trading gains and losses and the related interest income and expense from financing and hedging positions. For this reason, specific individual revenue categories in isolation may not be indicative of performance. Certain reclassifi-cations have been made to prior periods to conform to the current presentation.
Accounting developmentsThe Group adopted Financial Accounting Standards Board Accounting Standards Update (ASU) 2016-13, “Measurement of Credit Losses on Financial Instruments” (ASU 2016-13) and its subsequent amendments on January 1, 2020, incorporating forward-looking information and macro-economic factors into its credit loss estimates. The modified retrospective approach was applied in adopting ASU 2016-13, which resulted in a decrease in retained earnings of CHF 132 million, net of tax, with no signifi-cant impact on regulatory capital.
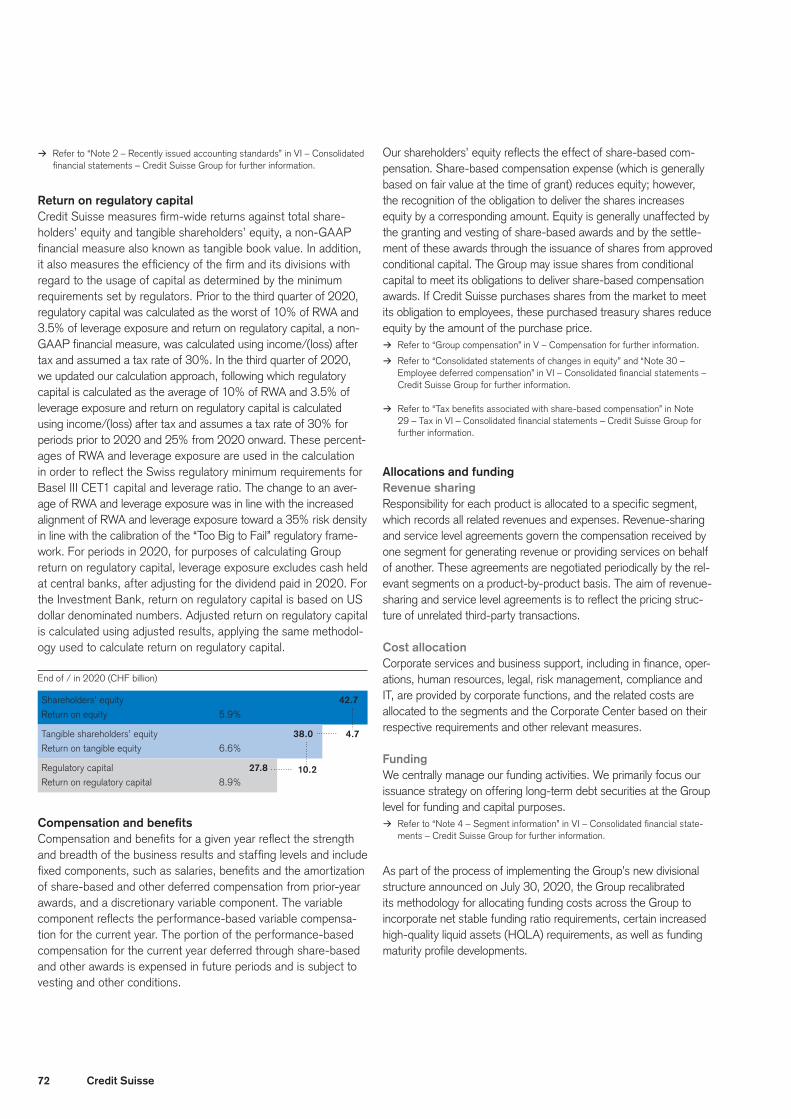
72 Credit Suisse
End of / in 2020 (CHF billion)
Shareholders’ equity 42.7
Return on equity 5.9%
Tangible shareholders’ equity 38.0
Return on tangible equity 6.6%
Regulatory capital 27.8
Return on regulatory capital 8.9%10.2
4.7
> Refer to “Note 2 – Recently issued accounting standards” in VI – Consolidated financial statements – Credit Suisse Group for further information.
Return on regulatory capitalCredit Suisse measures firm-wide returns against total share-holders’ equity and tangible shareholders’ equity, a non-GAAP financial measure also known as tangible book value. In addition, it also measures the efficiency of the firm and its divisions with regard to the usage of capital as determined by the minimum requirements set by regulators. Prior to the third quarter of 2020, regulatory capital was calculated as the worst of 10% of RWA and 3.5% of leverage exposure and return on regulatory capital, a non-GAAP financial measure, was calculated using income/(loss) after tax and assumed a tax rate of 30%. In the third quarter of 2020, we updated our calculation approach, following which regulatory capital is calculated as the average of 10% of RWA and 3.5% of leverage exposure and return on regulatory capital is calculated using income/(loss) after tax and assumes a tax rate of 30% for periods prior to 2020 and 25% from 2020 onward. These percent-ages of RWA and leverage exposure are used in the calculation in order to reflect the Swiss regulatory minimum requirements for Basel III CET1 capital and leverage ratio. The change to an aver-age of RWA and leverage exposure was in line with the increased alignment of RWA and leverage exposure toward a 35% risk density in line with the calibration of the “Too Big to Fail” regulatory frame-work. For periods in 2020, for purposes of calculating Group return on regulatory capital, leverage exposure excludes cash held at central banks, after adjusting for the dividend paid in 2020. For the Investment Bank, return on regulatory capital is based on US dollar denominated numbers. Adjusted return on regulatory capital is calculated using adjusted results, applying the same methodol-ogy used to calculate return on regulatory capital.
Compensation and benefitsCompensation and benefits for a given year reflect the strength and breadth of the business results and staffing levels and include fixed components, such as salaries, benefits and the amortization of share-based and other deferred compensation from prior-year awards, and a discretionary variable component. The variable component reflects the performance-based variable compensa-tion for the current year. The portion of the performance-based compensation for the current year deferred through share-based and other awards is expensed in future periods and is subject to vesting and other conditions.
Our shareholders’ equity reflects the effect of share-based com-pensation. Share-based compensation expense (which is generally based on fair value at the time of grant) reduces equity; however, the recognition of the obligation to deliver the shares increases equity by a corresponding amount. Equity is generally unaffected by the granting and vesting of share-based awards and by the settle-ment of these awards through the issuance of shares from approved conditional capital. The Group may issue shares from conditional capital to meet its obligations to deliver share-based compensation awards. If Credit Suisse purchases shares from the market to meet its obligation to employees, these purchased treasury shares reduce equity by the amount of the purchase price.
> Refer to “Group compensation” in V – Compensation for further information.
> Refer to “Consolidated statements of changes in equity” and “Note 30 – Employee deferred compensation” in VI – Consolidated financial statements – Credit Suisse Group for further information.
> Refer to “Tax benefits associated with share-based compensation” in Note 29 – Tax in VI – Consolidated financial statements – Credit Suisse Group for further information.
Allocations and fundingRevenue sharingResponsibility for each product is allocated to a specific segment, which records all related revenues and expenses. Revenue-sharing and service level agreements govern the compensation received by one segment for generating revenue or providing services on behalf of another. These agreements are negotiated periodically by the rel-evant segments on a product-by-product basis. The aim of revenue-sharing and service level agreements is to reflect the pricing struc-ture of unrelated third-party transactions.
Cost allocationCorporate services and business support, including in finance, oper-ations, human resources, legal, risk management, compliance and IT, are provided by corporate functions, and the related costs are allocated to the segments and the Corporate Center based on their respective requirements and other relevant measures.
FundingWe centrally manage our funding activities. We primarily focus our issuance strategy on offering long-term debt securities at the Group level for funding and capital purposes.
> Refer to “Note 4 – Segment information” in VI – Consolidated financial state-ments – Credit Suisse Group for further information.
As part of the process of implementing the Group’s new divisional structure announced on July 30, 2020, the Group recalibrated its methodology for allocating funding costs across the Group to incorporate net stable funding ratio requirements, certain increased high-quality liquid assets (HQLA) requirements, as well as funding maturity profile developments.

73Credit Suisse
Fair valuationsFair value can be a relevant measurement for financial instru-ments when it aligns the accounting for these instruments with how we manage our business. The levels of the fair value hier-archy as defined by the relevant accounting guidance are not a measurement of economic risk, but rather an indication of the observability of prices or valuation inputs.
> Refer to “Note 1 – Summary of significant accounting policies” and “Note 36 – Financial instruments” in VI – Consolidated financial statements – Credit Suisse Group for further information.
The fair value of the majority of the Group’s financial instruments is based on quoted prices in active markets (level 1) or observ-able inputs (level 2). These instruments include government and agency securities, certain short-term borrowings, most invest-ment grade corporate debt, certain high yield debt securities, exchange-traded and certain over-the-counter (OTC) derivative instruments and most listed equity securities.
In addition, the Group holds financial instruments for which no prices are available and for which have few or no observable inputs (level 3). For these instruments, the determination of fair value requires subjective assessment and judgment depending on liquidity, pricing assumptions, the current economic and competi-tive environment and the risks affecting the specific instrument. In such circumstances, valuation is determined based on man-agement’s own judgments about the assumptions that market participants would use in pricing the asset or liability (including assumptions about risk). These instruments include certain OTC derivatives, including interest rate, foreign exchange, equity and credit derivatives, certain corporate equity-linked securities, mort-gage-related securities, private equity investments, certain loans and credit products, including leveraged finance, certain syndi-cated loans and certain high yield bonds.
Models were used to value financial instruments for which no prices are available and which have little or no observable inputs (level 3). Models are developed internally and are reviewed by functions independent of the front office to ensure they are appropriate for current market conditions. The models require subjective assessment and varying degrees of judgment depend-ing on liquidity, concentration, pricing assumptions and risks affecting the specific instrument. The models consider observable and unobservable parameters in calculating the value of these products, including certain indices relating to these products. Consideration of these indices is more significant in periods of lower market activity.
As of the end of 2020, 36% and 27% of our total assets and total liabilities, respectively, were measured at fair value.
The majority of our level 3 assets are recorded in our investment banking businesses. Total assets at fair value recorded as level 3 instruments increased CHF 0.1 billion to CHF 16.4 billion as of the end of 2020, primarily reflecting net realized/unrealized gains, mainly in trading assets, and net transfers in, mainly in loans and loans held-for-sale. These increases were mostly offset by net settlements, mainly in trading assets and loans held-for-sale.
As of the end of 2020, our level 3 assets comprised 2% of total assets and 6% of total assets measured at fair value, compared to 2% and 5%, respectively, as of the end of 2019.
We believe that the range of any valuation uncertainty, in the aggregate, would not be material to our financial condition; how-ever, it may be material to our operating results for any particular period, depending, in part, upon the operating results for such period.

74 Credit Suisse
Reconciliation of adjusted results
Adjusted results referred to in this document are non-GAAP financial measures that exclude certain items included in our reported results. Management believes that adjusted results provide a useful presentation of our operating results for purposes of assessing our Group and divisional performance consistently over time, on a basis that excludes items that management does not consider rep-resentative of our underlying performance. Provided below is a reconciliation of our adjusted results to the most directly comparable US GAAP measures. The Group announced a new restructuring plan beginning in the third quarter of 2020 and the related restructur-ing charges are excluded for purposes of adjusted results. Swiss International Strategic
Universal Wealth Asia Investment Corporate Resolution Credit
in Bank Management Pacific Bank Center 1 Unit 1 Suisse
2020 (CHF million)
Net revenues 5,615 4,837 3,155 9,098 (316) – 22,389
Real estate (gains)/losses (15) 0 0 0 0 – (15)
Adjusted net revenues 5,600 4,837 3,155 9,098 (316) – 22,374
Provision for credit losses 270 110 236 471 9 – 1,096
Total operating expenses 3,241 3,675 2,091 6,972 1,847 – 17,826
Restructuring expenses (44) (55) (4) (47) (7) – (157)
Major litigation provisions (45) 11 0 (24) (930) – (988)
Expenses related to real estate disposals 2 (3) (7) 0 (41) 0 – (51)
Adjusted total operating expenses 3,149 3,624 2,087 6,860 910 – 16,630
Income/(loss) before taxes 2,104 1,052 828 1,655 (2,172) – 3,467
Total adjustments 77 51 4 112 937 – 1,181
Adjusted income/(loss) before taxes 2,181 1,103 832 1,767 (1,235) – 4,648
Adjusted return on regulatory capital (%) 17.7 20.6 22.1 13.1 – – 11.9
2019 (CHF million)
Net revenues 5,905 5,816 3,029 8,161 (427) – 22,484
Real estate (gains)/losses (223) (45) 0 (7) 24 – (251)
(Gains)/losses on business sales 0 0 0 0 2 – 2
Adjusted net revenues 5,682 5,771 3,029 8,154 (401) – 22,235
Provision for credit losses 109 49 55 104 7 – 324
Total operating expenses 3,223 3,702 2,052 7,031 1,432 – 17,440
Major litigation provisions (3) 30 0 0 (416) – (389)
Expenses related to real estate disposals 2 (12) (21) 0 (76) 1 – (108)
Adjusted total operating expenses 3,208 3,711 2,052 6,955 1,017 – 16,943
Income/(loss) before taxes 2,573 2,065 922 1,026 (1,866) – 4,720
Total adjustments (208) (54) 0 69 441 – 248
Adjusted income/(loss) before taxes 2,365 2,011 922 1,095 (1,425) – 4,968
Adjusted return on regulatory capital (%) 18.6 36.3 21.3 7.6 – – 11.4
2018 (CHF million)
Net revenues 5,443 5,320 2,759 8,004 102 (708) 20,920
Real estate (gains)/losses (21) (2) 0 0 (4) (1) (28)
(Gains)/losses on business sales (37) (55) 0 0 21 0 (71)
Adjusted net revenues 5,385 5,263 2,759 8,004 119 (709) 20,821
Provision for credit losses 127 37 28 51 1 1 245
Total operating expenses 3,325 3,673 2,099 7,135 399 672 17,303
Restructuring expenses (101) (115) (37) (353) 1 (21) (626)
Major litigation provisions (37) 0 (79) (10) (1) (117) (244)
Expenses related to business sales – (47) – – – (4) (51)
Adjusted total operating expenses 3,187 3,511 1,983 6,772 399 530 16,382
Income/(loss) before taxes 1,991 1,610 632 818 (298) (1,381) 3,372
Total adjustments 80 105 116 363 17 141 822
Adjusted income/(loss) before taxes 2,071 1,715 748 1,181 (281) (1,240) 4,194
Adjusted return on regulatory capital (%) 17.0 32.4 19.4 8.5 – – 9.9
1 Beginning in 2019, the Strategic Resolution Unit ceased to exist as a separate division of the Group. The residual portfolio remaining as of December 31, 2018 is now managed in an Asset Resolution Unit and is separately disclosed within the Corporate Center.
2 Relates to the termination of real estate contracts initiated before the completion of the previous three-year restructuring program at the end of 2018.

75Credit Suisse
Group and Bank differencesThe business of the Bank is substantially the same as the business of Credit Suisse Group, and substantially all of the Bank’s opera-tions are conducted through the Swiss Universal Bank, Interna-tional Wealth Management, Asia Pacific and the Investment Bank segments. Certain Corporate Center activities of the Group, such as hedging activities relating to share-based compensation awards,
are not applicable to the Bank. Certain other assets, liabilities and results of operations, primarily relating to Credit Suisse Services AG, our Swiss service company, with branches in the UK, Singa-pore and India, and its subsidiary in Poland, are managed as part of the activities of the Group’s segments. However, they are legally owned by the Group and are not part of the Bank’s consolidated financial statements.
> Refer to “Note 42 – Subsidiary guarantee information” in VI – Consolidated financial statements – Credit Suisse Group for further information on the Bank.
Comparison of consolidated statements of operations Group Bank
in 2020 2019 2018 2020 2019 2018
Statements of operations (CHF million)
Net revenues 22,389 22,484 20,920 22,503 22,686 20,820
Provision for credit losses 1,096 324 245 1,092 324 245
Total operating expenses 17,826 17,440 17,303 18,200 17,969 17,719
Income before taxes 3,467 4,720 3,372 3,211 4,393 2,856
Income tax expense 801 1,295 1,361 697 1,298 1,134
Net income 2,666 3,425 2,011 2,514 3,095 1,722
Net income/(loss) attributable to noncontrolling interests (3) 6 (13) 3 14 (7)
Net income attributable to shareholders 2,669 3,419 2,024 2,511 3,081 1,729
Comparison of consolidated balance sheets Group Bank
end of 2020 2019 2020 2019
Balance sheet statistics (CHF million)
Total assets 805,822 787,295 809,688 790,459
Total liabilities 762,881 743,581 762,629 743,696
Capitalization and indebtedness Group Bank
end of 2020 2019 2020 2019
Capitalization and indebtedness (CHF million)
Due to banks 16,423 16,744 16,420 16,742
Customer deposits 390,921 383,783 392,039 384,950
Central bank funds purchased,
securities sold under repurchase
agreements and securities
lending transactions 23,851 27,533 23,944 27,641
Long-term debt 161,087 152,005 160,279 151,000
Other liabilities 170,599 163,516 169,947 163,363
Total liabilities 762,881 743,581 762,629 743,696
Total equity 42,941 43,714 47,059 46,763
Total capitalization and
indebtedness 805,822 787,295 809,688 790,459
Dividends from the Bank to the Group
for the financial year 2020 2019 2018 2017 2016
Dividends (CHF million)
Dividends 10 1 10 10 10 10
1 The Bank’s total share capital is fully paid and consisted of 4,399,680,200 registered shares as of December 31, 2020. Dividends are determined in accordance with Swiss law and the Bank’s articles of incorporation. Proposal of the Board of Directors to the annual general meeting of the Bank.
BIS capital metrics Group Bank
end of 2020 2019 2020 2019
Capital and risk-weighted assets (CHF million)
CET1 capital 35,361 36,774 40,701 41,933
Tier 1 capital 51,202 49,791 55,659 54,024
Total eligible capital 52,163 1 52,725 1 56,620 2 56,958 2
Risk-weighted assets 275,084 290,463 275,676 290,843
Capital ratios (%)
CET1 ratio 12.9 12.7 14.8 14.4
Tier 1 ratio 18.6 17.1 20.2 18.6
Total capital ratio 19.0 1 18.2 1 20.5 2 19.6 2
1 Amounts are shown on a look-through basis. Certain tier 2 instruments are subject to phase out through 2022. As of 2020 and 2019, total eligible capital was CHF 52,437 million and CHF 53,038 million, including CHF 273 million and CHF 313 million of such instruments and the total capital ratio was 19.1% and 18.3%, respectively.
2 Amounts are shown on a look-through basis. Certain tier 2 instruments are subject to phase out through 2022. As of 2020 and 2019, total eligible capital was CHF 56,893 million and CHF 57,271 million, including CHF 273 million and CHF 314 million of such instruments and the total capital ratio was 20.6% and 19.7%, respectively.
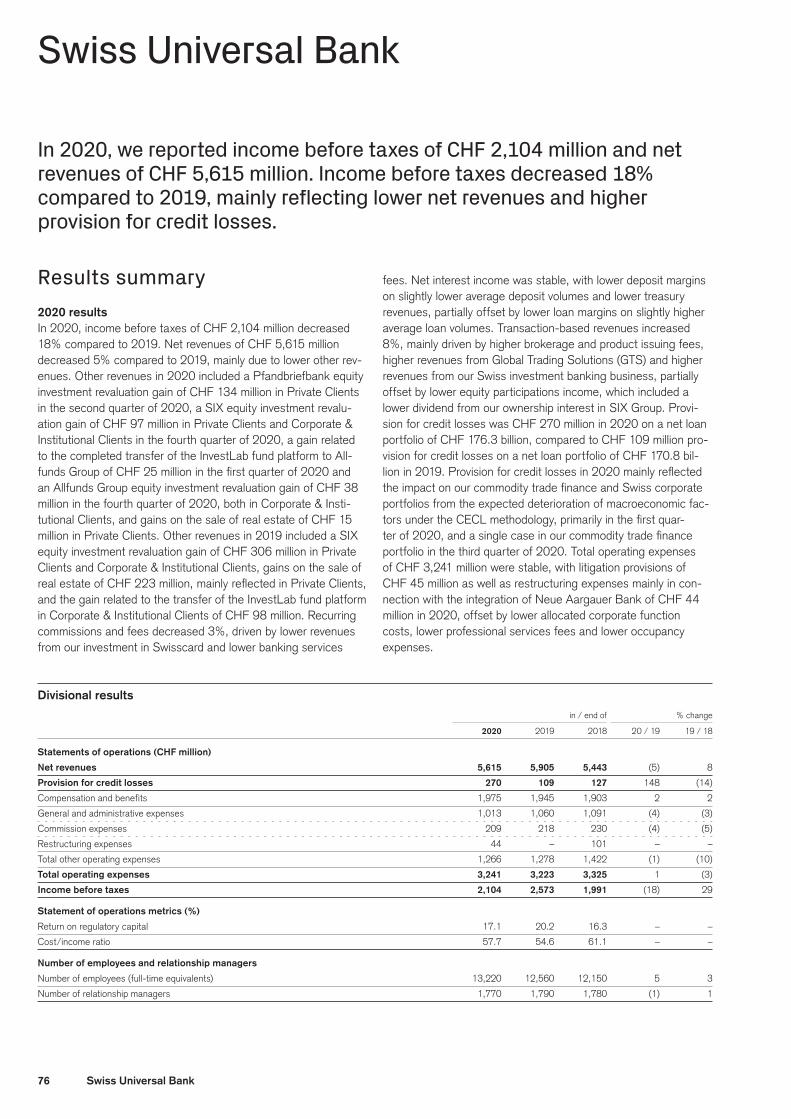
76 Swiss Universal Bank
Swiss Universal Bank
In 2020, we reported income before taxes of CHF 2,104 million and net revenues of CHF 5,615 million. Income before taxes decreased 18% compared to 2019, mainly reflecting lower net revenues and higher provision for credit losses.
Results summary2020 resultsIn 2020, income before taxes of CHF 2,104 million decreased 18% compared to 2019. Net revenues of CHF 5,615 million decreased 5% compared to 2019, mainly due to lower other rev-enues. Other revenues in 2020 included a Pfandbriefbank equity investment revaluation gain of CHF 134 million in Private Clients in the second quarter of 2020, a SIX equity investment revalu-ation gain of CHF 97 million in Private Clients and Corporate & Institutional Clients in the fourth quarter of 2020, a gain related to the completed transfer of the InvestLab fund platform to All-funds Group of CHF 25 million in the first quarter of 2020 and an Allfunds Group equity investment revaluation gain of CHF 38 million in the fourth quarter of 2020, both in Corporate & Insti-tutional Clients, and gains on the sale of real estate of CHF 15 million in Private Clients. Other revenues in 2019 included a SIX equity investment revaluation gain of CHF 306 million in Private Clients and Corporate & Institutional Clients, gains on the sale of real estate of CHF 223 million, mainly reflected in Private Clients, and the gain related to the transfer of the InvestLab fund platform in Corporate & Institutional Clients of CHF 98 million. Recurring commissions and fees decreased 3%, driven by lower revenues from our investment in Swisscard and lower banking services
fees. Net interest income was stable, with lower deposit margins on slightly lower average deposit volumes and lower treasury revenues, partially offset by lower loan margins on slightly higher average loan volumes. Transaction-based revenues increased 8%, mainly driven by higher brokerage and product issuing fees, higher revenues from Global Trading Solutions (GTS) and higher revenues from our Swiss investment banking business, partially offset by lower equity participations income, which included a lower dividend from our ownership interest in SIX Group. Provi-sion for credit losses was CHF 270 million in 2020 on a net loan portfolio of CHF 176.3 billion, compared to CHF 109 million pro-vision for credit losses on a net loan portfolio of CHF 170.8 bil-lion in 2019. Provision for credit losses in 2020 mainly reflected the impact on our commodity trade finance and Swiss corporate portfolios from the expected deterioration of macroeconomic fac-tors under the CECL methodology, primarily in the first quar-ter of 2020, and a single case in our commodity trade finance portfolio in the third quarter of 2020. Total operating expenses of CHF 3,241 million were stable, with litigation provisions of CHF 45 million as well as restructuring expenses mainly in con-nection with the integration of Neue Aargauer Bank of CHF 44 million in 2020, offset by lower allocated corporate function costs, lower professional services fees and lower occupancy expenses.
Divisional results in / end of % change
2020 2019 2018 20 / 19 19 / 18
Statements of operations (CHF million)
Net revenues 5,615 5,905 5,443 (5) 8
Provision for credit losses 270 109 127 148 (14)
Compensation and benefits 1,975 1,945 1,903 2 2
General and administrative expenses 1,013 1,060 1,091 (4) (3)
Commission expenses 209 218 230 (4) (5)
Restructuring expenses 44 – 101 – –
Total other operating expenses 1,266 1,278 1,422 (1) (10)
Total operating expenses 3,241 3,223 3,325 1 (3)
Income before taxes 2,104 2,573 1,991 (18) 29
Statement of operations metrics (%)
Return on regulatory capital 17.1 20.2 16.3 – –
Cost/income ratio 57.7 54.6 61.1 – –
Number of employees and relationship managers
Number of employees (full-time equivalents) 13,220 12,560 12,150 5 3
Number of relationship managers 1,770 1,790 1,780 (1) 1
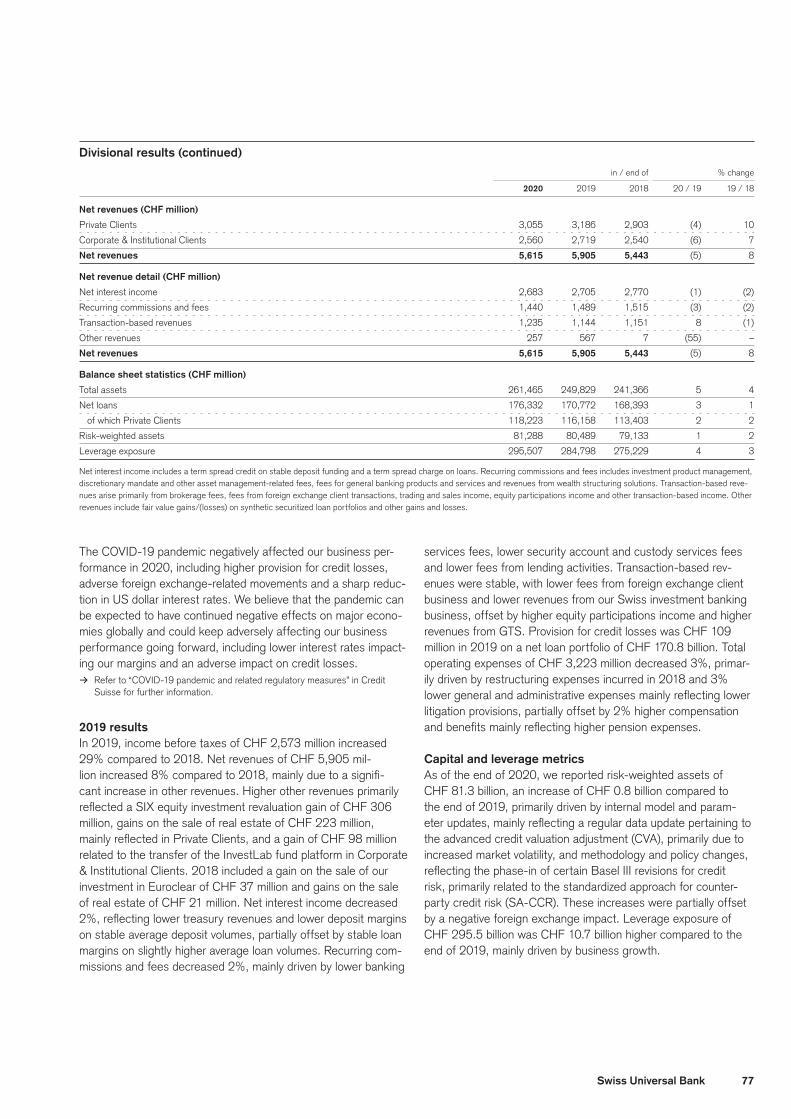
77Swiss Universal Bank
Divisional results (continued) in / end of % change
2020 2019 2018 20 / 19 19 / 18
Net revenues (CHF million)
Private Clients 3,055 3,186 2,903 (4) 10
Corporate & Institutional Clients 2,560 2,719 2,540 (6) 7
Net revenues 5,615 5,905 5,443 (5) 8
Net revenue detail (CHF million)
Net interest income 2,683 2,705 2,770 (1) (2)
Recurring commissions and fees 1,440 1,489 1,515 (3) (2)
Transaction-based revenues 1,235 1,144 1,151 8 (1)
Other revenues 257 567 7 (55) –
Net revenues 5,615 5,905 5,443 (5) 8
Balance sheet statistics (CHF million)
Total assets 261,465 249,829 241,366 5 4
Net loans 176,332 170,772 168,393 3 1
of which Private Clients 118,223 116,158 113,403 2 2
Risk-weighted assets 81,288 80,489 79,133 1 2
Leverage exposure 295,507 284,798 275,229 4 3
Net interest income includes a term spread credit on stable deposit funding and a term spread charge on loans. Recurring commissions and fees includes investment product management, discretionary mandate and other asset management-related fees, fees for general banking products and services and revenues from wealth structuring solutions. Transaction-based reve-nues arise primarily from brokerage fees, fees from foreign exchange client transactions, trading and sales income, equity participations income and other transaction-based income. Other revenues include fair value gains/(losses) on synthetic securitized loan portfolios and other gains and losses.
The COVID-19 pandemic negatively affected our business per-formance in 2020, including higher provision for credit losses, adverse foreign exchange-related movements and a sharp reduc-tion in US dollar interest rates. We believe that the pandemic can be expected to have continued negative effects on major econo-mies globally and could keep adversely affecting our business performance going forward, including lower interest rates impact-ing our margins and an adverse impact on credit losses.
> Refer to “COVID-19 pandemic and related regulatory measures” in Credit Suisse for further information.
2019 resultsIn 2019, income before taxes of CHF 2,573 million increased 29% compared to 2018. Net revenues of CHF 5,905 mil-lion increased 8% compared to 2018, mainly due to a signifi-cant increase in other revenues. Higher other revenues primarily reflected a SIX equity investment revaluation gain of CHF 306 million, gains on the sale of real estate of CHF 223 million, mainly reflected in Private Clients, and a gain of CHF 98 million related to the transfer of the InvestLab fund platform in Corporate & Institutional Clients. 2018 included a gain on the sale of our investment in Euroclear of CHF 37 million and gains on the sale of real estate of CHF 21 million. Net interest income decreased 2%, reflecting lower treasury revenues and lower deposit margins on stable average deposit volumes, partially offset by stable loan margins on slightly higher average loan volumes. Recurring com-missions and fees decreased 2%, mainly driven by lower banking
services fees, lower security account and custody services fees and lower fees from lending activities. Transaction-based rev-enues were stable, with lower fees from foreign exchange client business and lower revenues from our Swiss investment banking business, offset by higher equity participations income and higher revenues from GTS. Provision for credit losses was CHF 109 million in 2019 on a net loan portfolio of CHF 170.8 billion. Total operating expenses of CHF 3,223 million decreased 3%, primar-ily driven by restructuring expenses incurred in 2018 and 3% lower general and administrative expenses mainly reflecting lower litigation provisions, partially offset by 2% higher compensation and benefits mainly reflecting higher pension expenses.
Capital and leverage metricsAs of the end of 2020, we reported risk-weighted assets of CHF 81.3 billion, an increase of CHF 0.8 billion compared to the end of 2019, primarily driven by internal model and param-eter updates, mainly reflecting a regular data update pertaining to the advanced credit valuation adjustment (CVA), primarily due to increased market volatility, and methodology and policy changes, reflecting the phase-in of certain Basel III revisions for credit risk, primarily related to the standardized approach for counter-party credit risk (SA-CCR). These increases were partially offset by a negative foreign exchange impact. Leverage exposure of CHF 295.5 billion was CHF 10.7 billion higher compared to the end of 2019, mainly driven by business growth.

78 Swiss Universal Bank
Reconciliation of adjusted results Private Clients Corporate & Institutional Clients Swiss Universal Bank
in 2020 2019 2018 2020 2019 2018 2020 2019 2018
Adjusted results (CHF million)
Net revenues 3,055 3,186 2,903 2,560 2,719 2,540 5,615 5,905 5,443
Real estate (gains)/losses (15) (221) (21) 0 (2) 0 (15) (223) (21)
(Gains)/losses on business sales 0 0 (19) 0 0 (18) 0 0 (37)
Adjusted net revenues 3,040 2,965 2,863 2,560 2,717 2,522 5,600 5,682 5,385
Provision for credit losses 62 46 30 208 63 97 270 109 127
Total operating expenses 1,913 1,858 1,906 1,328 1,365 1,419 3,241 3,223 3,325
Restructuring expenses (35) – (66) (9) – (35) (44) – (101)
Major litigation provisions 0 0 0 (45) (3) (37) (45) (3) (37)
Expenses related to real estate disposals (3) (8) – 0 (4) – (3) (12) –
Adjusted total operating expenses 1,875 1,850 1,840 1,274 1,358 1,347 3,149 3,208 3,187
Income before taxes 1,080 1,282 967 1,024 1,291 1,024 2,104 2,573 1,991
Total adjustments 23 (213) 26 54 5 54 77 (208) 80
Adjusted income before taxes 1,103 1,069 993 1,078 1,296 1,078 2,181 2,365 2,071
Adjusted return on regulatory capital (%) – – – – – – 17.7 18.6 17.0
Adjusted results are non-GAAP financial measures. Refer to “Reconciliation of adjusted results” in Credit Suisse for further information.
Private Clients
2020 results detailsIncome before taxes of CHF 1,080 million decreased 16% com-pared to 2019, mainly driven by lower net revenues and higher total operating expenses.
Net revenuesIn 2020, net revenues of CHF 3,055 million decreased 4%, mainly reflecting lower other revenues. Other revenues in 2020 included the Pfandbriefbank equity investment revaluation gain of CHF 134 million, the SIX equity investment revaluation gain of CHF 47 million and gains on the sale of real estate of CHF 15 million. Other revenues in 2019 included gains on the sale of real estate of CHF 221 million and the SIX equity investment revalu-ation gain of CHF 149 million. Recurring commissions and fees of CHF 775 million decreased 6%, primarily reflecting lower revenues from our investment in Swisscard. Transaction-based revenues of CHF 480 million increased 17%, primarily driven by higher client activity and higher revenues from GTS, partially offset by lower equity participations income, which included the lower dividend from our ownership interest in SIX Group. Net interest income of CHF 1,614 million increased 2%, with lower loan margins on slightly higher average loan volumes, partially off-set by lower deposit margins on stable average deposit volumes and lower treasury revenues.
Provision for credit lossesThe Private Clients loan portfolio is substantially comprised of residential mortgages in Switzerland and loans collateralized by securities and, to a lesser extent, consumer finance loans.
In 2020, Private Clients recorded provision for credit losses of CHF 62 million compared to CHF 46 million in 2019. The pro-vision was primarily related to our consumer finance business including the application of the CECL methodology.
Total operating expensesCompared to 2019, total operating expenses of CHF 1,913 mil-lion increased 3%, mainly reflecting higher compensation and benefits and restructuring expenses of CHF 35 million in 2020, partially offset by lower general and administrative expenses. Compensation and benefits of CHF 1,166 million increased 6%, primarily driven by higher allocated corporate function costs, higher pension expenses and increased salary expenses, partially offset by lower discretionary compensation expenses. General and administrative expenses of CHF 617 million decreased 6%, primarily reflecting lower allocated corporate function costs.
MarginsOur gross margin was 149 basis points in 2020, one basis point lower compared to 2019, mainly reflecting lower other revenues and lower recurring commissions and fees, partially offset by a 3.7% decrease in average assets under management, higher transaction-based revenues and higher net interest income.
> Refer to “Assets under management” for further information.
Our net margin was 53 basis points in 2020, seven basis points lower compared to 2019, mainly reflecting lower net revenues and higher total operating expenses, partially offset by the lower aver-age assets under management.

79Swiss Universal Bank
Results – Private Clients in / end of % change
2020 2019 2018 20 / 19 19 / 18
Statements of operations (CHF million)
Net revenues 3,055 3,186 2,903 (4) 10
Provision for credit losses 62 46 30 35 53
Compensation and benefits 1,166 1,099 1,077 6 2
General and administrative expenses 617 656 659 (6) 0
Commission expenses 95 103 104 (8) (1)
Restructuring expenses 35 – 66 – –
Total other operating expenses 747 759 829 (2) (8)
Total operating expenses 1,913 1,858 1,906 3 (3)
Income before taxes 1,080 1,282 967 (16) 33
Statement of operations metrics (%)
Cost/income ratio 62.6 58.3 65.7 – –
Net revenue detail (CHF million)
Net interest income 1,614 1,580 1,615 2 (2)
Recurring commissions and fees 775 826 835 (6) (1)
Transaction-based revenues 480 412 413 17 0
Other revenues 186 368 40 (49) –
Net revenues 3,055 3,186 2,903 (4) 10
Margins on assets under management (bp)
Gross margin 1 149 150 140 – –
Net margin 2 53 60 47 – –
Number of relationship managers
Number of relationship managers 1,290 1,280 1,260 1 2
1 Net revenues divided by average assets under management.2 Income before taxes divided by average assets under management.
2019 results detailsIncome before taxes of CHF 1,282 million increased 33% com-pared to 2018, driven by higher net revenues and 3% lower total operating expenses.
Net revenuesIn 2019, net revenues of CHF 3,186 million increased 10%, mainly reflecting higher other revenues due to gains on the sale of real estate of CHF 221 million and the SIX equity invest-ment revaluation gain of CHF 149 million. Net interest income of CHF 1,580 million decreased 2%, with lower treasury revenues and lower deposit margins on slightly higher average deposit vol-umes, partially offset by slightly higher loan margins on slightly higher average loan volumes. Recurring commissions and fees of CHF 826 million were stable, with lower revenues from our investment in Swisscard and lower security account and custody services fees, offset by higher investment product management fees, higher investment advisory fees and higher fees from lend-ing activities. Transaction-based revenues of CHF 412 million were stable, mainly reflecting lower fees from foreign exchange client business offset by higher equity participations income.
Provision for credit lossesThe Private Clients loan portfolio is substantially comprised of residential mortgages in Switzerland and loans collateralized by securities and, to a lesser extent, consumer finance loans.
In 2019, Private Clients recorded provision for credit losses of CHF 46 million compared to CHF 30 million in 2018. The provi-sion was primarily related to our consumer finance business.
Total operating expensesCompared to 2018, total operating expenses of CHF 1,858 mil-lion decreased 3%, mainly reflecting restructuring expenses incurred in 2018, partially offset by 2% higher compensation and benefits. General and administrative expenses of CHF 656 million were stable, primarily reflecting lower professional services fees, offset by higher occupancy expenses. Compensation and benefits of CHF 1,099 million increased 2%, primarily driven by higher pension expenses.

80 Swiss Universal Bank
Assets under managementAs of the end of 2020, assets under management of CHF 208.6 billion were CHF 9.0 billion lower compared to the end of 2019, mainly due to net asset outflows and unfavorable foreign exchange-related movements, partially offset by favorable mar-ket movements. Net asset outflows of CHF 5.9 billion mainly reflected outflows in the UHNW client segment, driven by a single outflow in the first quarter of 2020.
As of the end of 2019, assets under management of CHF 217.6 billion were CHF 19.6 billion higher compared to the end of 2018, mainly due to favorable market movements and net new assets. Net new assets of CHF 3.4 billion reflected positive contributions from all businesses.
Assets under management – Private Clients in / end of % change
2020 2019 2018 20 / 19 19 / 18
Assets under management (CHF billion)
Assets under management 208.6 217.6 198.0 (4.1) 9.9
Average assets under management 205.0 212.8 207.7 (3.7) 2.5
Assets under management by currency (CHF billion)
USD 34.8 36.0 28.9 (3.3) 24.6
EUR 19.3 20.2 20.1 (4.5) 0.5
CHF 145.7 151.9 140.0 (4.1) 8.5
Other 8.8 9.5 9.0 (7.4) 5.6
Assets under management 208.6 217.6 198.0 (4.1) 9.9
Growth in assets under management (CHF billion)
Net new assets (5.9) 3.4 3.0 – –
Other effects (3.1) 16.2 (13.3) – –
of which market movements 1.9 18.7 (10.6) – –
of which foreign exchange (3.8) (1.5) (0.8) – –
of which other (1.2) (1.0) (1.9) – –
Growth in assets under management (9.0) 19.6 (10.3) – –
Growth in assets under management (%)
Net new assets (2.7) 1.7 1.4 – –
Other effects (1.4) 8.2 (6.3) – –
Growth in assets under management (4.1) 9.9 (4.9) – –

81Swiss Universal Bank
Corporate & Institutional Clients
2020 results detailsIncome before taxes of CHF 1,024 million decreased 21% com-pared to 2019, reflecting lower net revenues and higher provi-sion for credit losses, partially offset by lower total operating expenses.
Net revenuesCompared to 2019, net revenues of CHF 2,560 million decreased 6%, mainly driven by lower other revenues. Other revenues in 2020 included the SIX equity investment revaluation gain of CHF 50 million, the gain related to the completed transfer of the InvestLab fund platform of CHF 25 million and the Allfunds Group equity investment revaluation gain of CHF 38 million. Other revenues in 2019 included the SIX equity investment reval-uation gain of CHF 157 million and the gain of CHF 98 million related to the transfer of the InvestLab fund platform. Net interest income of CHF 1,069 million decreased 5%, with lower deposit margins on lower average deposit volumes and lower loan mar-gins on stable average loan volumes. Recurring commissions and fees of CHF 665 million were stable, with higher fund and invest-ment advisory fees and higher fees from lending activities, offset
by lower banking services fees. Transaction-based revenues of CHF 755 million increased 3%, mainly reflecting higher revenues from GTS, higher revenues from our Swiss investment banking business and increased brokerage and product issuing fees, par-tially offset by lower fees from foreign exchange client business and lower equity participations income, which included the lower dividend from our ownership interest in SIX Group.
Provision for credit lossesThe Corporate & Institutional Clients loan portfolio has relatively low concentrations and is mainly secured by real estate, securi-ties and other financial collateral.
In 2020, Corporate & Institutional Clients recorded provision for credit losses of CHF 208 million compared to CHF 63 million in 2019. The provision for credit losses in 2020 reflected the impact on our commodity trade finance and Swiss corporate portfolios from the expected deterioration of macroeconomic factors under the CECL methodology, primarily in the first quarter of 2020, and a single case in our commodity trade finance portfolio in the third quarter of 2020.
Results – Corporate & Institutional Clients in / end of % change
2020 2019 2018 20 / 19 19 / 18
Statements of operations (CHF million)
Net revenues 2,560 2,719 2,540 (6) 7
Provision for credit losses 208 63 97 230 (35)
Compensation and benefits 809 846 826 (4) 2
General and administrative expenses 396 404 432 (2) (6)
Commission expenses 114 115 126 (1) (9)
Restructuring expenses 9 – 35 – –
Total other operating expenses 519 519 593 0 (12)
Total operating expenses 1,328 1,365 1,419 (3) (4)
Income before taxes 1,024 1,291 1,024 (21) 26
Statement of operations metrics (%)
Cost/income ratio 51.9 50.2 55.9 – –
Net revenue detail (CHF million)
Net interest income 1,069 1,125 1,155 (5) (3)
Recurring commissions and fees 665 663 680 0 (3)
Transaction-based revenues 755 732 738 3 (1)
Other revenues 71 199 (33) (64) –
Net revenues 2,560 2,719 2,540 (6) 7
Number of relationship managers
Number of relationship managers 480 510 520 (6) (2)

82 Swiss Universal Bank
Total operating expensesCompared to 2019, total operating expenses of CHF 1,328 million decreased 3%, primarily reflecting lower compensation and benefits. Compensation and benefits of CHF 809 million decreased 4%, driven by lower allocated corporate function costs and lower salary expenses. General and administrative expenses of CHF 396 million decreased 2%, primarily reflecting lower allocated corporate function costs, lower occupancy expenses, decreased professional services fees and lower travel and enter-tainment expenses, partially offset by higher litigation provisions.
2019 results detailsIncome before taxes of CHF 1,291 million increased 26% com-pared to 2018, reflecting higher net revenues, lower total operat-ing expenses and lower provision for credit losses.
Net revenuesCompared to 2018, net revenues of CHF 2,719 million increased 7%, driven by the SIX equity investment revaluation gain of CHF 157 million and the gain of CHF 98 million related to the transfer of the InvestLab fund platform, both reflected in other revenues. Net interest income of CHF 1,125 million decreased 3%, reflecting lower loan margins on slightly higher average loan volumes, partially offset by higher deposit margins on stable average deposit volumes. Recurring commissions and fees of CHF 663 million decreased 3%, mainly driven by lower fees banking services fees. Transaction-based revenues of CHF 732 million were stable, mainly reflecting lower client activity and lower revenues from our Swiss investment banking business, offset by higher revenues from GTS and higher equity participations income.
Provision for credit lossesThe Corporate & Institutional Clients loan portfolio has relatively low concentrations and is mainly secured by real estate, securi-ties and other financial collateral.
In 2019, Corporate & Institutional Clients recorded provision for credit losses of CHF 63 million compared to CHF 97 million in 2018. The decrease reflected lower new provisions and higher releases of provision for credit losses.
Total operating expensesCompared to 2018, total operating expenses of CHF 1,365 mil-lion decreased 4%, primarily reflecting restructuring expenses incurred in 2018 and lower general and administrative expenses, partially offset by 2% higher compensation and benefits. General and administrative expenses of CHF 404 million decreased 6%, primarily reflecting lower litigation provisions. Compensation and benefits of CHF 846 million increased 2%, driven by higher pen-sion expenses and higher deferred compensation expenses from prior-year awards.
Assets under managementAs of the end of 2020, assets under management of CHF 462.6 billion were CHF 26.2 billion higher compared to the end of 2019, mainly driven by favorable market movements and net new assets, partially offset by unfavorable foreign exchange-related movements. Net new assets of CHF 13.7 billion mainly reflected inflows from our pension business.
As of the end of 2019, assets under management of CHF 436.4 billion were CHF 87.7 billion higher compared to the end of 2018, mainly driven by net new assets and favorable market move-ments. Net new assets of CHF 45.3 billion reflected strong inflows from our pension business.
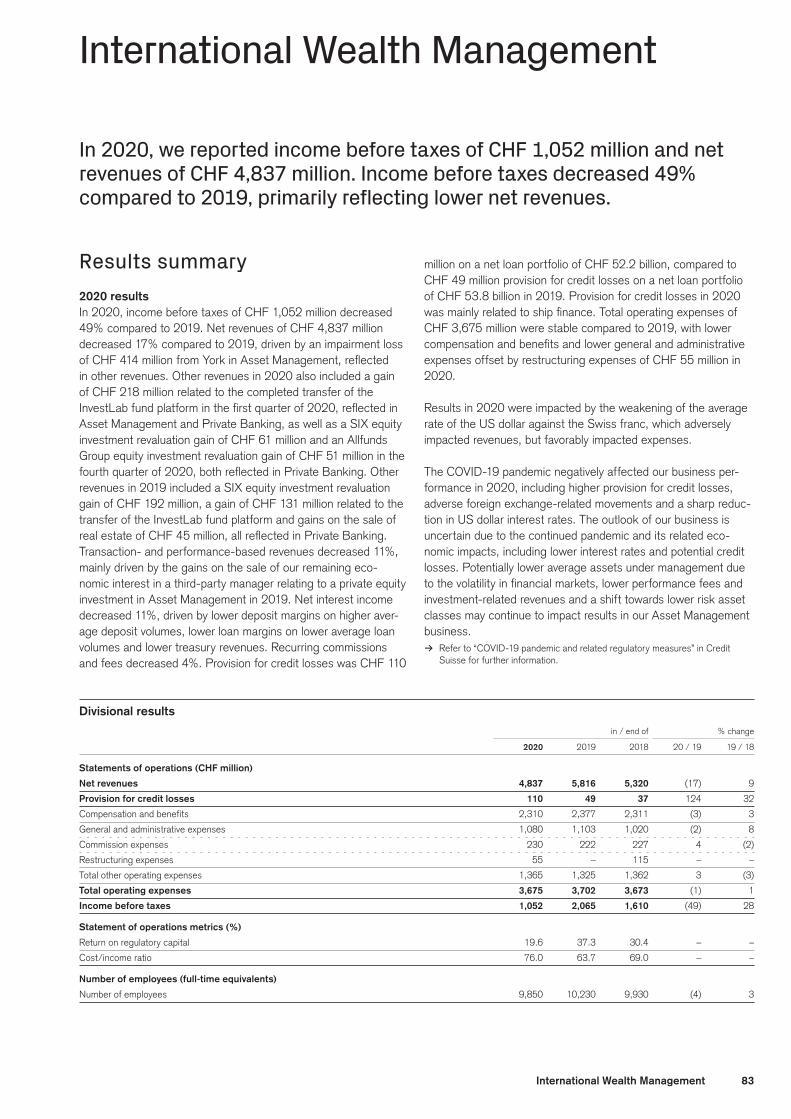
83International Wealth Management
International Wealth Management
In 2020, we reported income before taxes of CHF 1,052 million and net revenues of CHF 4,837 million. Income before taxes decreased 49% compared to 2019, primarily reflecting lower net revenues.
Results summary2020 resultsIn 2020, income before taxes of CHF 1,052 million decreased 49% compared to 2019. Net revenues of CHF 4,837 million decreased 17% compared to 2019, driven by an impairment loss of CHF 414 million from York in Asset Management, reflected in other revenues. Other revenues in 2020 also included a gain of CHF 218 million related to the completed transfer of the InvestLab fund platform in the first quarter of 2020, reflected in Asset Management and Private Banking, as well as a SIX equity investment revaluation gain of CHF 61 million and an Allfunds Group equity investment revaluation gain of CHF 51 million in the fourth quarter of 2020, both reflected in Private Banking. Other revenues in 2019 included a SIX equity investment revaluation gain of CHF 192 million, a gain of CHF 131 million related to the transfer of the InvestLab fund platform and gains on the sale of real estate of CHF 45 million, all reflected in Private Banking. Transaction- and performance-based revenues decreased 11%, mainly driven by the gains on the sale of our remaining eco-nomic interest in a third-party manager relating to a private equity investment in Asset Management in 2019. Net interest income decreased 11%, driven by lower deposit margins on higher aver-age deposit volumes, lower loan margins on lower average loan volumes and lower treasury revenues. Recurring commissions and fees decreased 4%. Provision for credit losses was CHF 110
million on a net loan portfolio of CHF 52.2 billion, compared to CHF 49 million provision for credit losses on a net loan portfolio of CHF 53.8 billion in 2019. Provision for credit losses in 2020 was mainly related to ship finance. Total operating expenses of CHF 3,675 million were stable compared to 2019, with lower compensation and benefits and lower general and administrative expenses offset by restructuring expenses of CHF 55 million in 2020.
Results in 2020 were impacted by the weakening of the average rate of the US dollar against the Swiss franc, which adversely impacted revenues, but favorably impacted expenses.
The COVID-19 pandemic negatively affected our business per-formance in 2020, including higher provision for credit losses, adverse foreign exchange-related movements and a sharp reduc-tion in US dollar interest rates. The outlook of our business is uncertain due to the continued pandemic and its related eco-nomic impacts, including lower interest rates and potential credit losses. Potentially lower average assets under management due to the volatility in financial markets, lower performance fees and investment-related revenues and a shift towards lower risk asset classes may continue to impact results in our Asset Management business.
> Refer to “COVID-19 pandemic and related regulatory measures” in Credit Suisse for further information.
Divisional results in / end of % change
2020 2019 2018 20 / 19 19 / 18
Statements of operations (CHF million)
Net revenues 4,837 5,816 5,320 (17) 9
Provision for credit losses 110 49 37 124 32
Compensation and benefits 2,310 2,377 2,311 (3) 3
General and administrative expenses 1,080 1,103 1,020 (2) 8
Commission expenses 230 222 227 4 (2)
Restructuring expenses 55 – 115 – –
Total other operating expenses 1,365 1,325 1,362 3 (3)
Total operating expenses 3,675 3,702 3,673 (1) 1
Income before taxes 1,052 2,065 1,610 (49) 28
Statement of operations metrics (%)
Return on regulatory capital 19.6 37.3 30.4 – –
Cost/income ratio 76.0 63.7 69.0 – –
Number of employees (full-time equivalents)
Number of employees 9,850 10,230 9,930 (4) 3
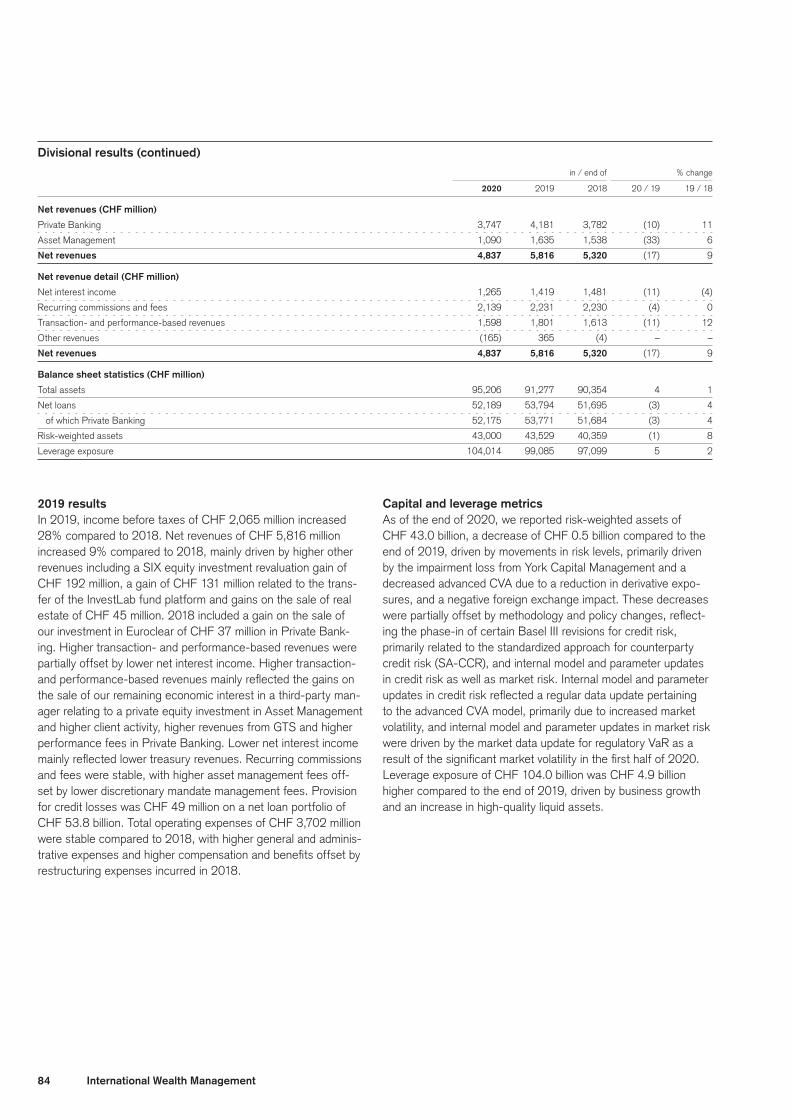
84 International Wealth Management
Divisional results (continued) in / end of % change
2020 2019 2018 20 / 19 19 / 18
Net revenues (CHF million)
Private Banking 3,747 4,181 3,782 (10) 11
Asset Management 1,090 1,635 1,538 (33) 6
Net revenues 4,837 5,816 5,320 (17) 9
Net revenue detail (CHF million)
Net interest income 1,265 1,419 1,481 (11) (4)
Recurring commissions and fees 2,139 2,231 2,230 (4) 0
Transaction- and performance-based revenues 1,598 1,801 1,613 (11) 12
Other revenues (165) 365 (4) – –
Net revenues 4,837 5,816 5,320 (17) 9
Balance sheet statistics (CHF million)
Total assets 95,206 91,277 90,354 4 1
Net loans 52,189 53,794 51,695 (3) 4
of which Private Banking 52,175 53,771 51,684 (3) 4
Risk-weighted assets 43,000 43,529 40,359 (1) 8
Leverage exposure 104,014 99,085 97,099 5 2
2019 resultsIn 2019, income before taxes of CHF 2,065 million increased 28% compared to 2018. Net revenues of CHF 5,816 million increased 9% compared to 2018, mainly driven by higher other revenues including a SIX equity investment revaluation gain of CHF 192 million, a gain of CHF 131 million related to the trans-fer of the InvestLab fund platform and gains on the sale of real estate of CHF 45 million. 2018 included a gain on the sale of our investment in Euroclear of CHF 37 million in Private Bank-ing. Higher transaction- and performance-based revenues were partially offset by lower net interest income. Higher transaction- and performance-based revenues mainly reflected the gains on the sale of our remaining economic interest in a third-party man-ager relating to a private equity investment in Asset Management and higher client activity, higher revenues from GTS and higher performance fees in Private Banking. Lower net interest income mainly reflected lower treasury revenues. Recurring commissions and fees were stable, with higher asset management fees off-set by lower discretionary mandate management fees. Provision for credit losses was CHF 49 million on a net loan portfolio of CHF 53.8 billion. Total operating expenses of CHF 3,702 million were stable compared to 2018, with higher general and adminis-trative expenses and higher compensation and benefits offset by restructuring expenses incurred in 2018.
Capital and leverage metricsAs of the end of 2020, we reported risk-weighted assets of CHF 43.0 billion, a decrease of CHF 0.5 billion compared to the end of 2019, driven by movements in risk levels, primarily driven by the impairment loss from York Capital Management and a decreased advanced CVA due to a reduction in derivative expo-sures, and a negative foreign exchange impact. These decreases were partially offset by methodology and policy changes, reflect-ing the phase-in of certain Basel III revisions for credit risk, primarily related to the standardized approach for counterparty credit risk (SA-CCR), and internal model and parameter updates in credit risk as well as market risk. Internal model and parameter updates in credit risk reflected a regular data update pertaining to the advanced CVA model, primarily due to increased market volatility, and internal model and parameter updates in market risk were driven by the market data update for regulatory VaR as a result of the significant market volatility in the first half of 2020. Leverage exposure of CHF 104.0 billion was CHF 4.9 billion higher compared to the end of 2019, driven by business growth and an increase in high-quality liquid assets.
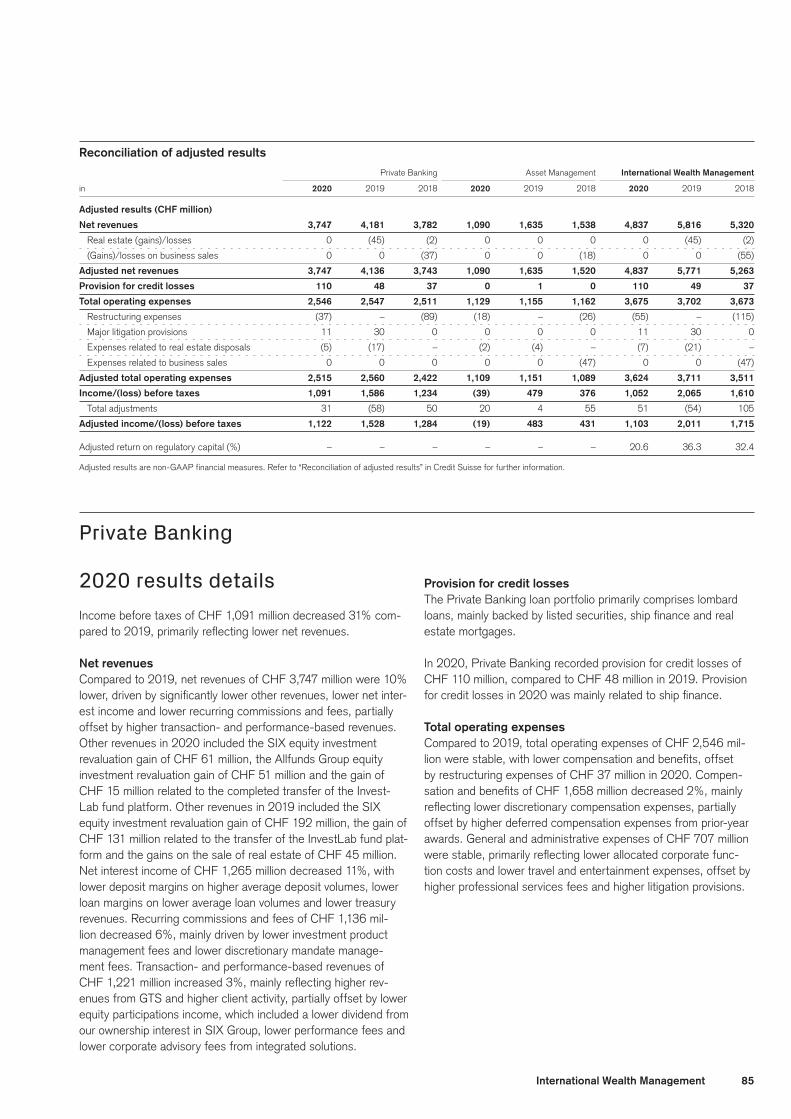
85International Wealth Management
Reconciliation of adjusted results Private Banking Asset Management International Wealth Management
in 2020 2019 2018 2020 2019 2018 2020 2019 2018
Adjusted results (CHF million)
Net revenues 3,747 4,181 3,782 1,090 1,635 1,538 4,837 5,816 5,320
Real estate (gains)/losses 0 (45) (2) 0 0 0 0 (45) (2)
(Gains)/losses on business sales 0 0 (37) 0 0 (18) 0 0 (55)
Adjusted net revenues 3,747 4,136 3,743 1,090 1,635 1,520 4,837 5,771 5,263
Provision for credit losses 110 48 37 0 1 0 110 49 37
Total operating expenses 2,546 2,547 2,511 1,129 1,155 1,162 3,675 3,702 3,673
Restructuring expenses (37) – (89) (18) – (26) (55) – (115)
Major litigation provisions 11 30 0 0 0 0 11 30 0
Expenses related to real estate disposals (5) (17) – (2) (4) – (7) (21) –
Expenses related to business sales 0 0 0 0 0 (47) 0 0 (47)
Adjusted total operating expenses 2,515 2,560 2,422 1,109 1,151 1,089 3,624 3,711 3,511
Income/(loss) before taxes 1,091 1,586 1,234 (39) 479 376 1,052 2,065 1,610
Total adjustments 31 (58) 50 20 4 55 51 (54) 105
Adjusted income/(loss) before taxes 1,122 1,528 1,284 (19) 483 431 1,103 2,011 1,715
Adjusted return on regulatory capital (%) – – – – – – 20.6 36.3 32.4
Adjusted results are non-GAAP financial measures. Refer to “Reconciliation of adjusted results” in Credit Suisse for further information.
Private Banking
2020 results detailsIncome before taxes of CHF 1,091 million decreased 31% com-pared to 2019, primarily reflecting lower net revenues.
Net revenuesCompared to 2019, net revenues of CHF 3,747 million were 10% lower, driven by significantly lower other revenues, lower net inter-est income and lower recurring commissions and fees, partially offset by higher transaction- and performance-based revenues. Other revenues in 2020 included the SIX equity investment revaluation gain of CHF 61 million, the Allfunds Group equity investment revaluation gain of CHF 51 million and the gain of CHF 15 million related to the completed transfer of the Invest-Lab fund platform. Other revenues in 2019 included the SIX equity investment revaluation gain of CHF 192 million, the gain of CHF 131 million related to the transfer of the InvestLab fund plat-form and the gains on the sale of real estate of CHF 45 million. Net interest income of CHF 1,265 million decreased 11%, with lower deposit margins on higher average deposit volumes, lower loan margins on lower average loan volumes and lower treasury revenues. Recurring commissions and fees of CHF 1,136 mil-lion decreased 6%, mainly driven by lower investment product management fees and lower discretionary mandate manage-ment fees. Transaction- and performance-based revenues of CHF 1,221 million increased 3%, mainly reflecting higher rev-enues from GTS and higher client activity, partially offset by lower equity participations income, which included a lower dividend from our ownership interest in SIX Group, lower performance fees and lower corporate advisory fees from integrated solutions.
Provision for credit lossesThe Private Banking loan portfolio primarily comprises lombard loans, mainly backed by listed securities, ship finance and real estate mortgages.
In 2020, Private Banking recorded provision for credit losses of CHF 110 million, compared to CHF 48 million in 2019. Provision for credit losses in 2020 was mainly related to ship finance.
Total operating expensesCompared to 2019, total operating expenses of CHF 2,546 mil-lion were stable, with lower compensation and benefits, offset by restructuring expenses of CHF 37 million in 2020. Compen-sation and benefits of CHF 1,658 million decreased 2%, mainly reflecting lower discretionary compensation expenses, partially offset by higher deferred compensation expenses from prior-year awards. General and administrative expenses of CHF 707 million were stable, primarily reflecting lower allocated corporate func-tion costs and lower travel and entertainment expenses, offset by higher professional services fees and higher litigation provisions.

86 International Wealth Management
Results – Private Banking in / end of % change
2020 2019 2018 20 / 19 19 / 18
Statements of operations (CHF million)
Net revenues 3,747 4,181 3,782 (10) 11
Provision for credit losses 110 48 37 129 30
Compensation and benefits 1,658 1,688 1,601 (2) 5
General and administrative expenses 707 710 667 0 6
Commission expenses 144 149 154 (3) (3)
Restructuring expenses 37 – 89 – –
Total other operating expenses 888 859 910 3 (6)
Total operating expenses 2,546 2,547 2,511 0 1
Income before taxes 1,091 1,586 1,234 (31) 29
Statement of operations metrics (%)
Cost/income ratio 67.9 60.9 66.4 – –
Net revenue detail (CHF million)
Net interest income 1,265 1,419 1,481 (11) (4)
Recurring commissions and fees 1,136 1,205 1,224 (6) (2)
Transaction- and performance-based revenues 1,221 1,186 1,036 3 14
Other revenues 125 371 41 (66) –
Net revenues 3,747 4,181 3,782 (10) 11
Margins on assets under management (bp)
Gross margin 1 107 115 103 – –
Net margin 2 31 44 34 – –
Number of relationship managers
Number of relationship managers 1,140 1,150 1,110 (1) 4
Net interest income includes a term spread credit on stable deposit funding and a term spread charge on loans. Recurring commissions and fees includes investment product management, discretionary mandate and other asset management-related fees, fees for general banking products and services and revenues from wealth structuring solutions. Transaction- and perfor-mance-based revenues arise primarily from brokerage and product issuing fees, fees from foreign exchange client transactions, trading and sales income, equity participations income and other transaction- and performance-based income.1 Net revenues divided by average assets under management.2 Income before taxes divided by average assets under management.
MarginsOur gross margin was 107 basis points in 2020, eight basis points lower compared to 2019, driven by lower other revenues and lower net interest income, partially offset by a 4.0% decrease in average assets under management.
> Refer to “Assets under management” for further information.
Our net margin was 31 basis points in 2020, 13 basis points lower compared to 2019, mainly reflecting lower net revenues, partially offset by the lower average assets under management.
2019 results detailsIncome before taxes of CHF 1,586 million increased 29% com-pared to 2018, primarily reflecting higher net revenues.
Net revenuesCompared to 2018, net revenues of CHF 4,181 million were 11% higher, mainly driven by higher other revenues. Other revenues included the SIX equity investment revaluation gain of CHF 192 million, the gain of CHF 131 million related to the transfer of the InvestLab fund platform and the gains on the sale of real estate of CHF 45 million. 2018 included the gain on the sale of our investment in Euroclear of CHF 37 million. Transaction- and per-formance-based revenues of CHF 1,186 million increased 14%, mainly reflecting higher client activity, higher revenues from GTS, increased performance fees and higher corporate advisory fees related to integrated solutions. Net interest income of CHF 1,419 million decreased 4%, mainly reflecting lower treasury revenues. Recurring commissions and fees of CHF 1,205 million decreased 2%, mainly reflecting lower discretionary mandate management fees and lower investment product management fees, partially offset by higher fees from lending activities.
Provision for credit lossesIn 2019, Private Banking recorded provision for credit losses of CHF 48 million, compared to CHF 37 million in 2018, driven by various individual cases.

87International Wealth Management
Total operating expensesCompared to 2018, total operating expenses of CHF 2,547 mil-lion were stable, with higher compensation and benefits and higher general and administrative expenses, offset by restruc-turing expenses incurred in 2018. Compensation and benefits of CHF 1,688 million increased 5%, mainly reflecting higher deferred compensation expenses from prior-year awards, higher salary expenses and higher social security and pension expenses. General and administrative expenses of CHF 710 mil-lion increased 6%, primarily reflecting higher allocated corporate function costs.
Assets under managementAs of the end of 2020, assets under management of CHF 365.4 billion were CHF 4.6 billion lower compared to the end of 2019, driven by unfavorable foreign exchange-related movements, par-tially offset by net new assets and favorable market movements. Net new assets of CHF 16.7 billion mainly reflected inflows from both emerging markets and Western Europe.
As of the end of 2019, assets under management of CHF 370.0 billion were CHF 12.5 billion higher compared to the end of 2018, driven by favorable market movements and net new assets, partially offset by structural effects and unfavorable foreign exchange-related movements. Net new assets of CHF 11.0 billion mainly reflected inflows from emerging markets.
Assets under management – Private Banking in / end of % change
2020 2019 2018 20 / 19 19 / 18
Assets under management (CHF billion)
Assets under management 365.4 370.0 357.5 (1.2) 3.5
Average assets under management 349.8 364.5 368.1 (4.0) (1.0)
Assets under management by currency (CHF billion)
USD 180.5 179.2 170.3 0.7 5.2
EUR 110.4 101.4 106.7 8.9 (5.0)
CHF 17.9 18.7 17.5 (4.3) 6.9
Other 56.6 70.7 63.0 (19.9) 12.2
Assets under management 365.4 370.0 357.5 (1.2) 3.5
Growth in assets under management (CHF billion)
Net new assets 16.7 11.0 14.2 – –
Other effects (21.3) 1.5 (23.6) – –
of which market movements 11.6 31.1 (12.0) – –
of which foreign exchange (28.8) (8.2) (7.8) – –
of which other (4.1) (21.4) (3.8) – –
Growth in assets under management (4.6) 12.5 (9.4) – –
Growth in assets under management (%)
Net new assets 4.5 3.1 3.9 – –
Other effects (5.7) 0.4 (6.5) – –
Growth in assets under management (1.2) 3.5 (2.6) – –
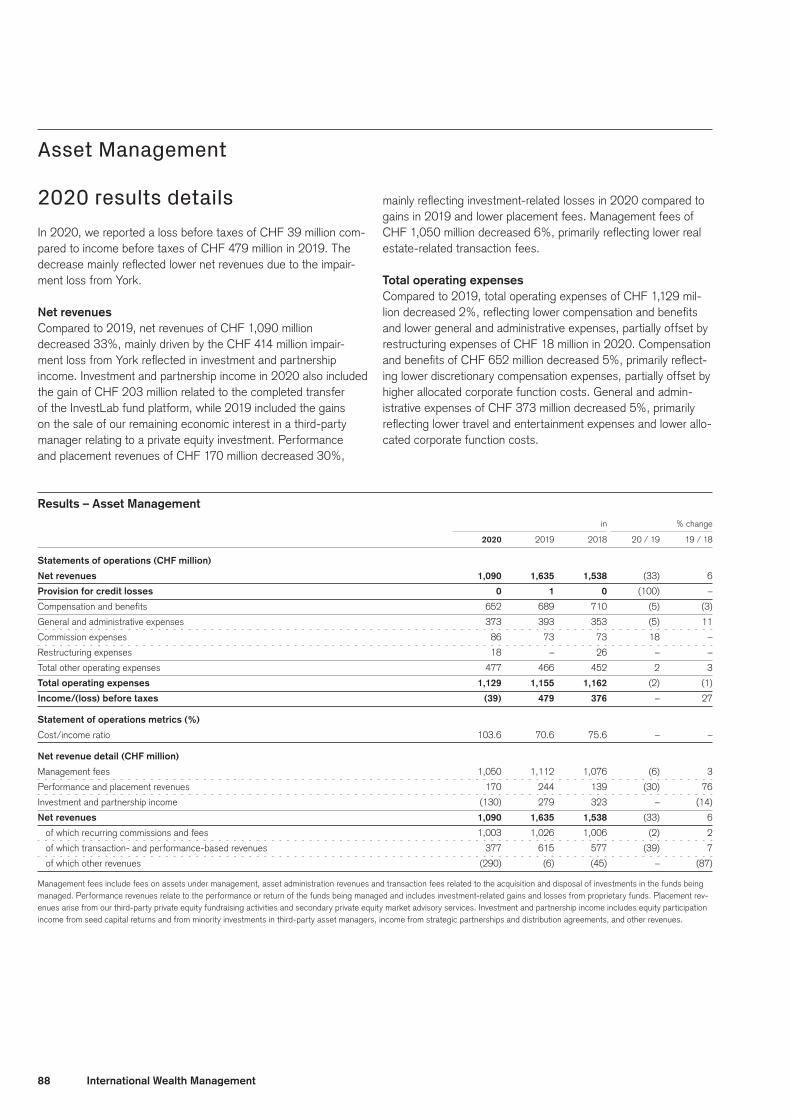
88 International Wealth Management
Asset Management
2020 results detailsIn 2020, we reported a loss before taxes of CHF 39 million com-pared to income before taxes of CHF 479 million in 2019. The decrease mainly reflected lower net revenues due to the impair-ment loss from York.
Net revenuesCompared to 2019, net revenues of CHF 1,090 million decreased 33%, mainly driven by the CHF 414 million impair-ment loss from York reflected in investment and partnership income. Investment and partnership income in 2020 also included the gain of CHF 203 million related to the completed transfer of the InvestLab fund platform, while 2019 included the gains on the sale of our remaining economic interest in a third-party manager relating to a private equity investment. Performance and placement revenues of CHF 170 million decreased 30%,
mainly reflecting investment-related losses in 2020 compared to gains in 2019 and lower placement fees. Management fees of CHF 1,050 million decreased 6%, primarily reflecting lower real estate-related transaction fees.
Total operating expensesCompared to 2019, total operating expenses of CHF 1,129 mil-lion decreased 2%, reflecting lower compensation and benefits and lower general and administrative expenses, partially offset by restructuring expenses of CHF 18 million in 2020. Compensation and benefits of CHF 652 million decreased 5%, primarily reflect-ing lower discretionary compensation expenses, partially offset by higher allocated corporate function costs. General and admin-istrative expenses of CHF 373 million decreased 5%, primarily reflecting lower travel and entertainment expenses and lower allo-cated corporate function costs.
Results – Asset Management in % change
2020 2019 2018 20 / 19 19 / 18
Statements of operations (CHF million)
Net revenues 1,090 1,635 1,538 (33) 6
Provision for credit losses 0 1 0 (100) –
Compensation and benefits 652 689 710 (5) (3)
General and administrative expenses 373 393 353 (5) 11
Commission expenses 86 73 73 18 –
Restructuring expenses 18 – 26 – –
Total other operating expenses 477 466 452 2 3
Total operating expenses 1,129 1,155 1,162 (2) (1)
Income/(loss) before taxes (39) 479 376 – 27
Statement of operations metrics (%)
Cost/income ratio 103.6 70.6 75.6 – –
Net revenue detail (CHF million)
Management fees 1,050 1,112 1,076 (6) 3
Performance and placement revenues 170 244 139 (30) 76
Investment and partnership income (130) 279 323 – (14)
Net revenues 1,090 1,635 1,538 (33) 6
of which recurring commissions and fees 1,003 1,026 1,006 (2) 2
of which transaction- and performance-based revenues 377 615 577 (39) 7
of which other revenues (290) (6) (45) – (87)
Management fees include fees on assets under management, asset administration revenues and transaction fees related to the acquisition and disposal of investments in the funds being managed. Performance revenues relate to the performance or return of the funds being managed and includes investment-related gains and losses from proprietary funds. Placement rev-enues arise from our third-party private equity fundraising activities and secondary private equity market advisory services. Investment and partnership income includes equity participation income from seed capital returns and from minority investments in third-party asset managers, income from strategic partnerships and distribution agreements, and other revenues.

89International Wealth Management
2019 results detailsIncome before taxes of CHF 479 million increased 27% com-pared to 2018, primarily reflecting higher net revenues.
In the fourth quarter of 2018, we completed a business disposal involving a spin-off relating to our securitized products fund, while retaining an economic interest in the new management company and the fund. Beginning in the first quarter of 2019, revenues from this interest are recognized as investment and partner-ship income rather than management fees and performance and placement revenues as previously reported. Prior periods have been reclassified to conform to the current presentation.
Net revenuesCompared to 2018, net revenues of CHF 1,635 million increased 6%, reflecting higher performance and placement revenues and higher management fees, partially offset by lower investment and partnership income. Performance and placement revenues of CHF 244 million increased significantly, reflecting higher place-ment fees, higher performance fees including the sale of a private equity investment of a fund and investment-related gains in 2019 compared to losses in 2018. Management fees of CHF 1,112 mil-lion increased 3%, mainly reflecting higher average assets under management. Investment and partnership income of CHF 279 million decreased 14% mainly as 2018 included revenues from a business disposal and due to lower revenues from a single manager hedge fund, partially offset by gains on the sale of our remaining economic interest in a third-party manager relating to a private equity investment and higher revenues from our system-atic market making business.
Total operating expensesCompared to 2018, total operating expenses of CHF 1,155 mil-lion were stable, reflecting restructuring expenses incurred in 2018 and lower compensation and benefits, offset by higher gen-eral and administrative expenses. Compensation and benefits of CHF 689 million decreased 3%, primarily reflecting lower salary expenses and deferred compensation expenses from prior-year awards, mainly related to the 2018 business disposal. General and administrative expenses of CHF 393 million increased 11%, primarily reflecting higher professional services fees and higher allocated corporate function costs.
Assets under managementAs of the end of 2020, assets under management of CHF 440.3 billion were CHF 2.4 billion higher compared to the end of 2019, mainly reflecting favorable market movements and net new assets, partially offset by structural effects and unfavorable for-eign exchange-related movements. Net new assets of CHF 15.5 billion mainly reflected inflows from traditional investments. Struc-tural effects included CHF 14.8 billion relating to the sale of Win-casa AG in 2012 following the conclusion in 2020 of a transition period regarding the related assets under management.
As of the end of 2019, assets under management of CHF 437.9 billion were CHF 49.2 billion higher compared to the end of 2018, mainly reflecting favorable market movements and net new assets. Net new assets of CHF 21.5 billion mainly reflected inflows from traditional and alternative investments.

90 International Wealth Management
Assets under management – Asset Management in / end of % change
2020 2019 2018 20 / 19 19 / 18
Assets under management (CHF billion)
Traditional investments 285.8 262.8 218.9 8.8 20.1
Alternative investments 109.5 130.6 124.6 (16.2) 4.8
Investments and partnerships 45.0 44.5 45.2 1.1 (1.5)
Assets under management 440.3 437.9 388.7 0.5 12.7
Average assets under management 428.7 416.3 397.8 3.0 4.7
Assets under management by currency (CHF billion)
USD 120.8 119.8 107.2 0.8 11.8
EUR 57.5 54.8 49.0 4.9 11.8
CHF 213.5 215.3 184.9 (0.8) 16.4
Other 48.5 48.0 47.6 1.0 0.8
Assets under management 440.3 437.9 388.7 0.5 12.7
Growth in assets under management (CHF billion)
Net new assets 1 15.5 21.5 22.2 – –
Other effects (13.1) 27.7 (19.1) – –
of which market movements 18.4 33.7 (9.1) – –
of which foreign exchange (14.2) (5.3) (3.4) – –
of which other (17.3) 2 (0.7) (6.6) – –
Growth in assets under management 2.4 49.2 3.1 – –
Growth in assets under management (%)
Net new assets 3.5 5.5 5.8 – –
Other effects (3.0) 7.2 (5.0) – –
Growth in assets under management 0.5 12.7 0.8 – –
1 Includes outflows for private equity assets reflecting realizations at cost and unfunded commitments on which a fee is no longer earned.2 Includes CHF 14.8 billion relating to the sale of Wincasa AG in 2012 following the conclusion in 2020 of a transition period regarding the related assets under management.
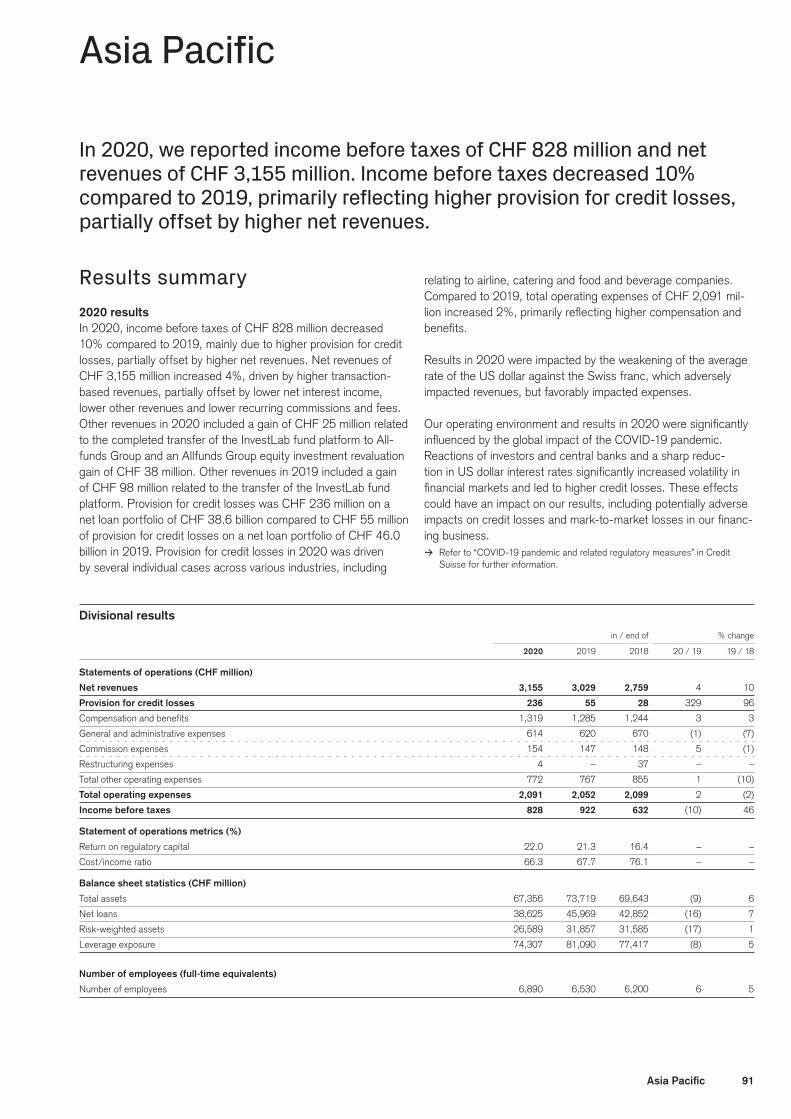
91Asia Pacific
Asia Pacific
In 2020, we reported income before taxes of CHF 828 million and net revenues of CHF 3,155 million. Income before taxes decreased 10% compared to 2019, primarily reflecting higher provision for credit losses, partially offset by higher net revenues.
Results summary2020 results In 2020, income before taxes of CHF 828 million decreased 10% compared to 2019, mainly due to higher provision for credit losses, partially offset by higher net revenues. Net revenues of CHF 3,155 million increased 4%, driven by higher transaction-based revenues, partially offset by lower net interest income, lower other revenues and lower recurring commissions and fees. Other revenues in 2020 included a gain of CHF 25 million related to the completed transfer of the InvestLab fund platform to All-funds Group and an Allfunds Group equity investment revaluation gain of CHF 38 million. Other revenues in 2019 included a gain of CHF 98 million related to the transfer of the InvestLab fund platform. Provision for credit losses was CHF 236 million on a net loan portfolio of CHF 38.6 billion compared to CHF 55 million of provision for credit losses on a net loan portfolio of CHF 46.0 billion in 2019. Provision for credit losses in 2020 was driven by several individual cases across various industries, including
relating to airline, catering and food and beverage companies. Compared to 2019, total operating expenses of CHF 2,091 mil-lion increased 2%, primarily reflecting higher compensation and benefits.
Results in 2020 were impacted by the weakening of the average rate of the US dollar against the Swiss franc, which adversely impacted revenues, but favorably impacted expenses.
Our operating environment and results in 2020 were significantly influenced by the global impact of the COVID-19 pandemic. Reactions of investors and central banks and a sharp reduc-tion in US dollar interest rates significantly increased volatility in financial markets and led to higher credit losses. These effects could have an impact on our results, including potentially adverse impacts on credit losses and mark-to-market losses in our financ-ing business.
> Refer to “COVID-19 pandemic and related regulatory measures” in Credit Suisse for further information.
Divisional results in / end of % change
2020 2019 2018 20 / 19 19 / 18
Statements of operations (CHF million)
Net revenues 3,155 3,029 2,759 4 10
Provision for credit losses 236 55 28 329 96
Compensation and benefits 1,319 1,285 1,244 3 3
General and administrative expenses 614 620 670 (1) (7)
Commission expenses 154 147 148 5 (1)
Restructuring expenses 4 – 37 – –
Total other operating expenses 772 767 855 1 (10)
Total operating expenses 2,091 2,052 2,099 2 (2)
Income before taxes 828 922 632 (10) 46
Statement of operations metrics (%)
Return on regulatory capital 22.0 21.3 16.4 – –
Cost/income ratio 66.3 67.7 76.1 – –
Balance sheet statistics (CHF million)
Total assets 67,356 73,719 69,643 (9) 6
Net loans 38,625 45,969 42,852 (16) 7
Risk-weighted assets 26,589 31,857 31,585 (17) 1
Leverage exposure 74,307 81,090 77,417 (8) 5
Number of employees (full-time equivalents)
Number of employees 6,890 6,530 6,200 6 5

92 Asia Pacific
Divisional results (continued) in / end of % change
2020 2019 2018 20 / 19 19 / 18
Net revenue detail (CHF million)
Net interest income 1,071 1,118 964 (4) 16
Recurring commissions and fees 348 378 378 (8) 0
Transaction-based revenues 1,670 1,433 1,416 17 1
Other revenues 66 100 1 (34) –
Net revenues 3,155 3,029 2,759 4 10
Margins on assets under management (annualized) (bp)
Gross margin 1 147 141 137 – –
Net margin 2 39 43 31 – –
Number of relationship managers
Number of relationship managers 600 600 580 0 3
Net interest income includes a term spread credit on stable deposit funding and a term spread charge on loans. Recurring commissions and fees includes investment product management, discretionary mandate and other asset management-related fees, fees for general banking products and services and revenues from wealth structuring solutions. Transaction-based rev-enues arise primarily from brokerage and product issuing fees, fees from foreign exchange client transactions, trading and sales income including revenues from GTS, financing, underwrit-ing and advisory fees, equity participations income and other transaction-based income. Financing revenues include unrealized mark-to-market movements on our fair valued portfolio.1 Net revenues divided by average assets under management.2 Income before taxes divided by average assets under management.
Reconciliation of adjusted results Asia Pacific
in 2020 2019 2018
Adjusted results (CHF million)
Net revenues 3,155 3,029 2,759
Provision for credit losses 236 55 28
Total operating expenses 2,091 2,052 2,099
Restructuring expenses (4) – (37)
Major litigation provisions 0 0 (79)
Adjusted total operating expenses 2,087 2,052 1,983
Income before taxes 828 922 632
Total adjustments 4 0 116
Adjusted income before taxes 832 922 748
Adjusted return on regulatory capital (%) 22.1 21.3 19.4
Adjusted results are non-GAAP financial measures. Refer to “Reconciliation of adjusted results” in Credit Suisse for further information.
2019 resultsIn 2019, income before taxes of CHF 922 million increased 46% compared to 2018, mainly due to higher net revenues and lower total operating expenses. Net revenues of CHF 3,029 million increased 10%, mainly driven by higher net interest income and a gain of CHF 98 million related to the transfer of the InvestLab fund platform to Allfunds Group reflected in other revenues. Pro-vision for credit losses was CHF 55 million on a net loan portfolio of CHF 46.0 billion. Compared to 2018, total operating expenses of CHF 2,052 million decreased 2%, mainly reflecting lower gen-eral and administrative expenses, partially offset by higher com-pensation and benefits. 2018 included litigation provisions related to the US Department of Justice (DoJ) and US Securities and Exchange Commission (SEC) investigations regarding our hir-ing practices in the Asia Pacific region between 2007 and 2013, which were resolved, as well as restructuring expenses of CHF 37 million.
Capital and leverage metrics As of the end of 2020, we reported risk-weighted assets of CHF 26.6 billion, a decrease of CHF 5.3 billion compared to the end of 2019, primarily reflecting a negative foreign exchange impact and lower business usage. Leverage exposure was CHF 74.3 billion, a decrease of CHF 6.8 billion compared to the end of 2019, mainly driven by a negative foreign exchange impact.
2020 results detailsIncome before taxes of CHF 828 million decreased 10% com-pared to 2019, reflecting higher provision for credit losses and higher total operating expenses, partially offset by higher net revenues.
93Asia Pacific
Net revenuesNet revenues of CHF 3,155 million increased 4% compared to 2019, reflecting higher transaction-based revenues, partially off-set by lower net interest income, lower other revenues and lower recurring commissions and fees. Transaction-based revenues increased 17% to CHF 1,670 million, primarily reflecting higher revenues from GTS, higher client activity, higher structured equity origination and equity underwriting revenues, partially offset by lower financing revenues and lower fees from mergers and acquisitions (M&A) transactions. Financing revenues reflected unrealized mark-to-market losses on our fair valued portfolio. Net interest income decreased 4% to CHF 1,071 million, mainly reflecting significantly lower deposit margins on lower average deposit volumes and lower average loan volumes despite higher loan margins, partially offset by higher treasury revenues. Other revenues in 2020 included a gain of CHF 25 million related to the completed transfer of the InvestLab fund platform to Allfunds Group and the Allfunds Group equity investment revaluation gain of CHF 38 million compared to a gain of CHF 98 million related to the transfer of the InvestLab fund platform in 2019. Recurring commissions and fees of CHF 348 million decreased 8%, mainly reflecting lower investment product management fees, security account and custody services fees and fees from lending activi-ties, partially offset by higher discretionary mandate management fees.
Provision for credit lossesThe loan portfolio primarily comprises lombard loans, which are mainly backed by listed securities, share-backed loans and secured and unsecured loans to corporates.
In 2020, we recorded provision for credit losses of CHF 236 mil-lion compared to provision for credit losses of CHF 55 million in 2019. Provision for credit losses in 2020 was driven by several individual cases across various industries, including relating to air-line, catering and food and beverage companies.
Total operating expensesTotal operating expenses of CHF 2,091 million increased 2% compared to 2019, mainly reflecting higher compensation and benefits. Compensation and benefits increased 3% to CHF 1,319 million, mainly reflecting higher discretionary compensation expenses and higher deferred compensation expenses from prior-year awards, largely offset by lower salary expenses. General and administrative expenses of CHF 614 million were stable, mainly due to lower travel and entertainment expenses and lower allo-cated corporate function costs, offset by higher IT machinery and equipment costs and higher professional services fees.
MarginsOur gross margin was 147 basis points in 2020, six basis points higher compared to 2019, mainly reflecting higher transaction-based revenues, partially offset by lower net interest income and lower other revenues.
> Refer to “Assets under management” for further information.
Our net margin was 39 basis points in 2020, four basis points lower compared to 2019, mainly reflecting higher provision for credit losses, partially offset by higher net revenues.
2019 results detailsIncome before taxes of CHF 922 million increased 46% com-pared to 2018 reflecting higher net revenues and lower total operating expenses, partially offset by higher provision for credit losses.
Net revenuesNet revenues of CHF 3,029 million increased 10% compared to 2018, mainly reflecting higher net interest income and the gain of CHF 98 million related to the transfer of the InvestLab fund platform to Allfunds Group reflected in other revenues. Net inter-est income increased 16% to CHF 1,118 million, mainly reflect-ing higher treasury revenues and higher average loan volumes despite slightly lower loan margins. Transaction-based revenues of CHF 1,433 million were stable, primarily reflecting higher reve-nues from GTS, higher client activity and higher debt underwriting revenues, offset by lower fees from M&A transactions and lower equity underwriting revenues. Recurring commissions and fees of CHF 378 million were stable, mainly reflecting lower fees from lending activities, offset by higher investment product manage-ment fees, discretionary mandate management fees and invest-ment advisory fees.
Provision for credit lossesThe loan portfolio primarily comprises lombard loans, which are mainly backed by listed securities, share-backed loans and secured and unsecured loans to corporates.
In 2019, we recorded provision for credit losses of CHF 55 million relating to several individual cases, including provisions relating to an Indian infrastructure development company and an Indonesian healthcare company, compared to provision for credit losses of CHF 28 million in 2018.
Total operating expensesTotal operating expenses of CHF 2,052 million decreased 2% compared to 2018, mainly reflecting lower general and admin-istrative expenses, partially offset by higher compensation and benefits. 2018 included litigation provisions related to the DoJ and SEC investigations regarding our hiring practices in the Asia Pacific region between 2007 and 2013, which were resolved, as well as restructuring expenses of CHF 37 million. General and administrative expenses decreased 7% to CHF 620 million, mainly due to the litigation provisions incurred in 2018, par-tially offset by higher allocated corporate function costs in 2019. Compensation and benefits increased 3% to CHF 1,285 million, primarily reflecting higher allocated corporate function costs and higher deferred compensation expenses from prior-year awards, largely offset by lower salary expenses and lower discretionary compensation expenses.

94 Asia Pacific
Assets under managementAs of the end of 2020, assets under management of CHF 221.3 billion were CHF 1.3 billion higher compared to the end of 2019, mainly reflecting favorable market movements and net new assets, largely offset by unfavorable foreign exchange-related movements. Net new assets of CHF 8.6 billion mainly reflected inflows from Southeast Asia, Australia, Japan and Greater China.
As of the end of 2019, assets under management of CHF 220.0 billion were CHF 20.7 billion higher compared to the end of 2018, mainly reflecting favorable market movements and net new assets, partially offset by unfavorable foreign exchange-related movements. Net new assets of CHF 8.7 billion mainly reflected inflows from Greater China, Southeast Asia and Japan.
Assets under management in / end of % change
2020 2019 2018 20 / 19 19 / 18
Assets under management (CHF billion)
Assets under management 221.3 220.0 199.3 0.6 10.4
Average assets under management 214.9 215.2 201.5 (0.1) 6.8
Assets under management by currency (CHF billion)
USD 122.5 122.7 104.0 (0.2) 18.0
EUR 6.0 7.0 5.8 (14.3) 20.7
CHF 1.7 1.8 1.8 (5.6) –
Other 91.1 88.5 87.7 2.9 0.9
Assets under management 221.3 220.0 199.3 0.6 10.4
Growth in assets under management (CHF billion)
Net new assets 8.6 8.7 14.4 – –
Other effects (7.3) 12.0 (11.9) – –
of which market movements 10.3 17.0 (12.7) – –
of which foreign exchange (17.2) (3.2) (0.5) – –
of which other (0.4) (1.8) 1.3 – –
Growth in assets under management 1.3 20.7 2.5 – –
Growth in assets under management (%)
Net new assets 3.9 4.4 7.3 – –
Other effects (3.3) 6.0 (6.0) – –
Growth in assets under management 0.6 10.4 1.3 – –

95Investment Bank
Investment Bank
In 2020, we reported income before taxes of CHF 1,655 million and net revenues of CHF 9,098 million, reflecting revenue growth and significantly improved profitability.
Results summary2020 resultsIn 2020, we reported income before taxes of CHF 1,655 mil-lion and net revenues of CHF 9,098 million. Market condi-tions were impacted by the global COVID-19 pandemic as well as geopolitical and macroeconomic uncertainties related to the UK’s withdrawal from the EU and the US elections, resulting in record levels of volatility. Results in 2020 were impacted by the weakening of the average rate of the US dollar against the Swiss franc, which adversely impacted revenues, but favorably impacted expenses. Net revenues increased 11%, driven by broad-based growth across all businesses. Fixed income sales and trading rev-enues increased 20%, reflecting strong macro, credit and emerg-ing markets trading activity. Equity sales and trading revenues increased 6%, reflecting higher equity derivatives and cash equi-ties trading activity due to significantly increased trading volumes
and volatility. Capital markets revenues increased 27%, reflecting significantly higher equity capital markets revenues and increased share of wallet. Advisory and other fees increased 1%, reflect-ing higher revenues from completed M&A transactions despite a decline in industry-wide issuance activity. Provision for credit losses was CHF 471 million in 2020 compared to CHF 104 mil-lion in 2019, driven by the application of the CECL methodology, as well as negative developments in our corporate lending port-folio across various industries. Negative other revenues in 2020 mainly reflected higher funding costs related to COVID-19 and a loss from a single name counterparty. Total operating expenses of CHF 6,972 million were stable in Swiss francs, but increased 6% in US dollars, reflecting increased compensation and benefits and higher general and administrative and restructuring expenses. In 2020, we incurred restructuring expenses of CHF 47 million.
Divisional results in / end of % change
2020 2019 2018 20 / 19 19 / 18
Statements of operations (CHF million)
Net revenues 9,098 8,161 8,004 11 2
Provision for credit losses 471 104 51 353 104
Compensation and benefits 3,934 3,940 3,761 – 5
General and administrative expenses 2,409 2,470 2,430 (2) 2
Commission expenses 582 621 591 (6) 5
Restructuring expenses 47 – 353 – –
Total other operating expenses 3,038 3,091 3,374 (2) (8)
Total operating expenses 6,972 7,031 7,135 (1) (1)
Income before taxes 1,655 1,026 818 61 25
Statement of operations metrics (%)
Return on regulatory capital 12.2 7.1 5.9 – –
Cost/income ratio 76.6 86.2 89.1 – –
Balance sheet statistics (CHF million)
Total assets 270,488 266,257 257,998 2 3
Net loans 23,359 24,657 22,909 (5) 8
Risk-weighted assets 77,872 82,218 84,862 (5) (3)
Risk-weighted assets (USD) 88,423 84,842 86,041 4 (1)
Leverage exposure 319,339 332,019 312,655 (4) 6
Leverage exposure (USD) 362,607 342,614 316,998 6 8
Number of employees (full-time equivalents)
Number of employees 17,560 17,050 15,590 3 9

96 Investment Bank
Divisional results (continued) in % change
2020 2019 2018 20 / 19 19 / 18
Net revenue detail (CHF million)
Fixed income sales and trading 4,016 3,352 2,626 20 28
Equity sales and trading 2,410 2,278 2,141 6 6
Capital markets 2,353 1,860 2,244 27 (17)
Advisory and other fees 603 596 937 1 (36)
Other revenues 1 (284) 75 56 – 34
Net revenues 9,098 8,161 8,004 11 2
1 Other revenues include treasury funding costs and changes in the carrying value of certain investments.
Reconciliation of adjusted results Investment Bank
in 2020 2019 2018
Adjusted results (CHF million)
Net revenues 9,098 8,161 8,004
Real estate (gains)/losses 0 (7) 0
Adjusted net revenues 9,098 8,154 8,004
Provision for credit losses 471 104 51
Total operating expenses 6,972 7,031 7,135
Restructuring expenses (47) – (353)
Major litigation provisions (24) 0 (10)
Expenses related to real estate disposals (41) (76) –
Adjusted total operating expenses 6,860 6,955 6,772
Income before taxes 1,655 1,026 818
Total adjustments 112 69 363
Adjusted income before taxes 1,767 1,095 1,181
Adjusted return on regulatory capital (%) 13.1 7.6 8.5
Adjusted results are non-GAAP financial measures. Refer to “Reconciliation of adjusted results” in Credit Suisse for further information.
In 2020, operating conditions were impacted by unprecedented events, primarily driven by the global COVID-19 pandemic as well as geopolitical and macroeconomic uncertainties related to the UK’s withdrawal from the EU and the US elections. Uncertainty due to the spread of COVID-19 led to severe market dislocations including record levels of volatility, widening credit spreads and a collapse in energy prices. Major central banks and governments around the world responded by implementing unprecedented monetary and fiscal policy stimulus measures, which resulted in strong investor demand for yield with record debt and equity issu-ance levels and resulted in significantly higher volumes and client activity in our trading businesses, in particular our GTS business. However, the economic impact of the pandemic has had a nega-tive impact on our credit exposures and may have an adverse impact on client sentiment and risk appetite going forward, which is likely to impact our results.
> Refer to “COVID-19 pandemic and related regulatory measures” in Credit Suisse for further information.
2019 resultsIn 2019, we reported income before taxes of CHF 1,026 mil-lion and net revenues of CHF 8,161 million. Revenue increased 2%, reflecting higher trading revenues, with particular strength in our GTS franchise, as we continued to focus on our institu-tional and wealth management clients, partially offset by lower revenues from capital markets and advisory and other fees. Fixed income sales and trading revenues increased 28%, driven by broad-based growth across all businesses, reflecting improved operating conditions. Equity sales and trading revenues increased 6%, reflecting higher prime services and stable equity derivatives revenues, partially offset by lower cash equities revenues due to lower trading volumes across regions. Capital markets revenues decreased 17%, reflecting a slowdown in leveraged finance activ-ity across the market due to increased market volatility. Advi-sory revenues decreased 36%, mainly reflecting lower revenues from completed M&A transactions. Total operating expenses of CHF 7,031 million were stable compared to 2018, as higher compensation and benefits in 2019 were offset by restructuring expenses incurred in 2018.

97Investment Bank
Capital and leverage metrics As of the end of 2020, risk-weighted assets were USD 88.4 bil-lion, an increase of USD 3.6 billion compared to 2019. The increase was driven by methodology and policy changes, reflecting the phase-in of certain Basel III revisions in credit risk and movements in risk levels primarily in market and credit risk. Leverage exposure was USD 363 billion, an increase of USD 20.0 billion compared to 2019, reflecting increases in COVID-19 related buffers and HQLA.
2020 results details Fixed income sales and tradingFixed income sales and trading revenues of CHF 4,016 million increased 20% compared to 2019, reflecting higher revenues across most businesses, driven by increased trading volumes and client activity. Macro products revenues increased, due to signifi-cantly improved performance in our rates and foreign exchange businesses. Global credit products revenues increased signifi-cantly, driven by higher investment grade and leveraged finance trading activity across regions. In addition, emerging markets revenues increased, reflecting higher structured credit and trad-ing client activity, particularly in Asia. In Swiss francs, securitized products revenues decreased slightly, while revenues in US dol-lars increased, reflecting higher agency trading revenues partially offset by lower non-agency trading activity.
Equity sales and tradingEquity sales and trading revenues of CHF 2,410 million increased 6% compared to 2019, reflecting higher equity derivatives and cash equities revenues. Equity derivatives revenues increased, driven by higher client activity in corporate and flow equity deriva-tives. Cash equities revenues increased due to higher trading and client activity across regions. In Swiss francs, prime services revenues decreased, while revenues in US dollars were stable, as higher client financing activity across regions was offset by lower commissions in listed derivatives.
Capital marketsCapital markets revenues of CHF 2,353 million increased 27% compared to 2019, reflecting strong client activity across equity and debt capital markets, driven by increased issuance activity. Equity capital markets revenues increased significantly, driven by higher initial public offering (IPO) issuances and follow-on activ-ity. In addition, debt capital markets revenues increased, driven by higher investment grade issuance activity reflecting favorable market conditions including a continued low interest rate environ-ment partially offset by lower leveraged finance activity.
Advisory and other feesRevenues from advisory and other fees of CHF 603 million were stable compared to 2019, while revenues in US dollars increased 7%, driven by higher revenues from completed M&A transactions.
Provision for credit lossesThe Investment Bank recorded provision for credit losses of CHF 471 million in 2020 compared to CHF 104 million in 2019, driven by the application of the CECL methodology, primarily due to sectors highly vulnerable to the COVID-19 pandemic, as well as negative developments in our corporate lending portfolio across various industries, mainly in the mining, real estate and oil and gas sectors.
Total operating expensesCompared to 2019, total operating expenses of CHF 6,972 mil-lion were stable in Swiss francs, but increased 6% in US dollars, reflecting increased compensation and benefits and higher gen-eral and administrative and restructuring expenses. General and administrative expenses of CHF 2,409 million decreased 2%, mainly reflecting reduced travel and entertainment costs, lower allocated corporate function costs, and lower expenses related to real estate disposals, partially offset by increased revenue-related costs from capital markets transactions and higher UK bank levy expenses. Compensation and benefits of CHF 3,934 million were stable, as increased discretionary compensation expenses were offset by reduced salary expenses. In 2020, we incurred restruc-turing expenses of CHF 47 million.
2019 results details
Fixed income sales and tradingFixed income sales and trading revenues of CHF 3,352 million increased 28% compared to 2018, reflecting higher revenue growth across all businesses due to improved operating condi-tions. Securitized products revenues increased, despite a signifi-cant gain in 2018 from the sale of an investment acquired in the normal course of business. Securitized products results reflected higher client activity across agency trading and our asset finance business, partially offset by reduced non-agency trading rev-enues. Global credit products revenues increased significantly, driven by higher investment grade trading activity, due to our investments in the franchise, and higher leveraged finance trading activity across regions. Emerging markets revenues increased, reflecting higher financing and trading activity across regions. In addition, macro products revenues increased, reflecting improved rates trading activity, partially offset by lower foreign exchange revenues.
Equity sales and tradingEquity sales and trading revenues of CHF 2,278 million increased 6% compared to 2018, reflecting higher prime services and higher equity derivatives revenues, partially offset by lower cash equities revenues. Prime services revenues increased, reflecting higher client financing activity and improved commissions in listed derivatives across regions. Equity derivatives revenues increased, reflecting higher client activity in structured equity derivatives, partially offset by reduced flow derivatives revenues. These
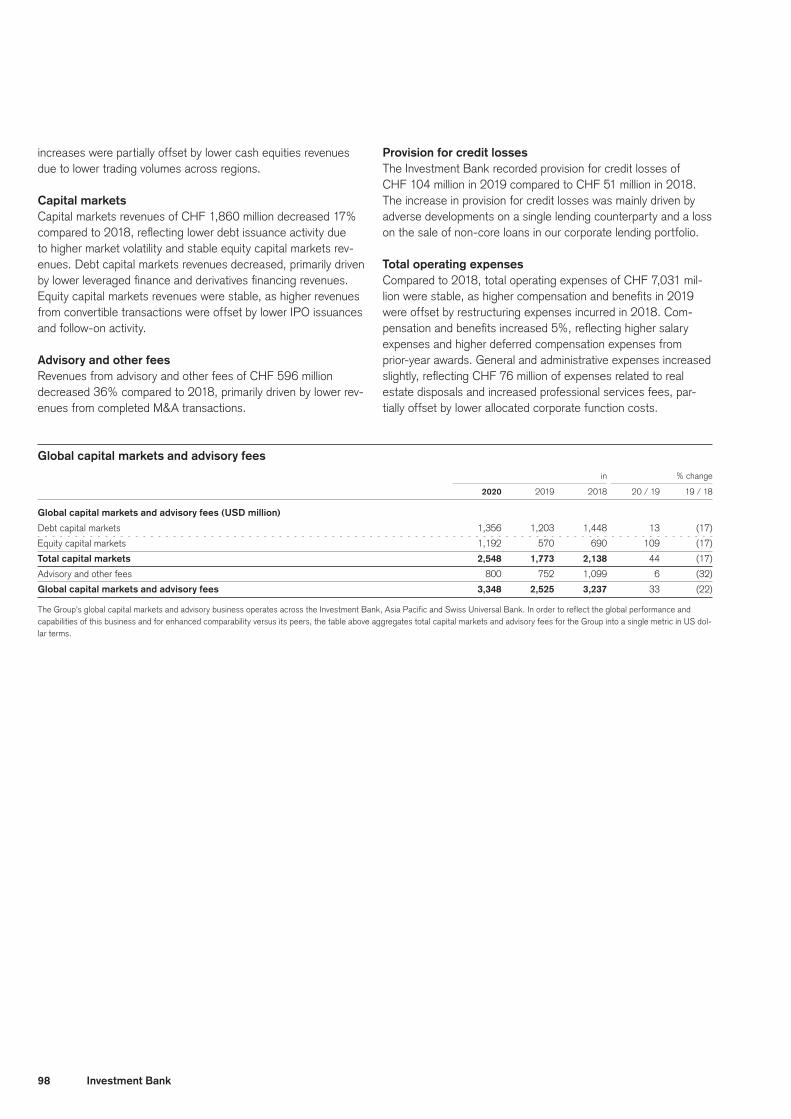
98 Investment Bank
increases were partially offset by lower cash equities revenues due to lower trading volumes across regions.
Capital marketsCapital markets revenues of CHF 1,860 million decreased 17% compared to 2018, reflecting lower debt issuance activity due to higher market volatility and stable equity capital markets rev-enues. Debt capital markets revenues decreased, primarily driven by lower leveraged finance and derivatives financing revenues. Equity capital markets revenues were stable, as higher revenues from convertible transactions were offset by lower IPO issuances and follow-on activity.
Advisory and other feesRevenues from advisory and other fees of CHF 596 million decreased 36% compared to 2018, primarily driven by lower rev-enues from completed M&A transactions.
Provision for credit lossesThe Investment Bank recorded provision for credit losses of CHF 104 million in 2019 compared to CHF 51 million in 2018. The increase in provision for credit losses was mainly driven by adverse developments on a single lending counterparty and a loss on the sale of non-core loans in our corporate lending portfolio.
Total operating expensesCompared to 2018, total operating expenses of CHF 7,031 mil-lion were stable, as higher compensation and benefits in 2019 were offset by restructuring expenses incurred in 2018. Com-pensation and benefits increased 5%, reflecting higher salary expenses and higher deferred compensation expenses from prior-year awards. General and administrative expenses increased slightly, reflecting CHF 76 million of expenses related to real estate disposals and increased professional services fees, par-tially offset by lower allocated corporate function costs.
Global capital markets and advisory fees in % change
2020 2019 2018 20 / 19 19 / 18
Global capital markets and advisory fees (USD million)
Debt capital markets 1,356 1,203 1,448 13 (17)
Equity capital markets 1,192 570 690 109 (17)
Total capital markets 2,548 1,773 2,138 44 (17)
Advisory and other fees 800 752 1,099 6 (32)
Global capital markets and advisory fees 3,348 2,525 3,237 33 (22)
The Group’s global capital markets and advisory business operates across the Investment Bank, Asia Pacific and Swiss Universal Bank. In order to reflect the global performance and capabilities of this business and for enhanced comparability versus its peers, the table above aggregates total capital markets and advisory fees for the Group into a single metric in US dol-lar terms.

99Corporate Center
Corporate Center
In 2020, we reported a loss before taxes of CHF 2,172 million compared to a loss of CHF 1,866 million in 2019.
Corporate Center compositionCorporate Center includes parent company operations such as Group financing, expenses for projects sponsored by the Group, including costs associated with the evolution of our legal entity structure to meet developing and future regulatory requirements, and certain other expenses and revenues that have not been allocated to the segments. Corporate Center further includes consolidation and elimination adjustments required to eliminate intercompany revenues and expenses.
Treasury results include the impact of volatility in the valuations of certain central funding transactions such as structured notes issuances and swap transactions. Treasury results also include additional interest charges from transfer pricing to align funding costs to assets held in the Corporate Center and legacy funding costs.
The Asset Resolution Unit includes the residual portfolio of the Strategic Resolution Unit, which ceased to exist as a separate division of the Group at the beginning of 2019. The Asset Resolu-tion Unit is separately presented within our Corporate Center dis-closures, including related asset funding costs. Certain activities
not linked to the underlying portfolio, such as legacy funding costs, legacy litigation provisions, a specific client compliance function and noncontrolling interests without significant economic interest, which were previously part of the Strategic Resolution Unit, are recorded in the Corporate Center and are not reflected in the Asset Resolution Unit. Prior periods have not been restated. Information about the Strategic Resolution Unit can be found in our previous Annual Reports.
> Refer to credit-suisse.com/annualreporting for prior year annual reports.
Other revenues primarily include required elimination adjust-ments associated with trading in own shares, treasury commis-sions charged to divisions, the cost of certain hedging transac-tions executed in connection with the Group’s RWA and valuation hedging impacts from long-dated legacy deferred compensation and retirement programs mainly relating to former employees.
Compensation and benefits include fair value adjustments on cer-tain deferred compensation plans not allocated to the segments and fair value adjustments on certain other long-dated legacy deferred compensation and retirement programs mainly relating to former employees.
Corporate Center results in / end of % change
2020 2019 2018 20 / 19 19 / 18
Statements of operations (CHF million)
Treasury results (356) (501) 25 (29) –
Asset Resolution Unit (178) (144) – 24 –
Other 218 218 77 0 183
Net revenues (316) (427) 102 (26) –
Provision for credit losses 9 7 1 29 –
Compensation and benefits 352 489 147 (28) 233
General and administrative expenses 1,407 875 202 61 333
Commission expenses 81 68 51 19 33
Restructuring expenses 7 – (1) – –
Total other operating expenses 1,495 943 252 59 274
Total operating expenses 1,847 1,432 399 29 259
Income/(loss) before taxes (2,172) (1,866) (298) 16 –
of which Asset Resolution Unit (337) (383) – (12) –
Balance sheet statistics (CHF million)
Total assets 111,307 106,213 93,369 5 14
Risk-weighted assets 46,335 52,370 30,239 (12) 73
Leverage exposure 6,686 1 113,002 94,094 (94) 20
The Asset Resolution Unit includes the residual portfolio of the Strategic Resolution Unit, which ceased to exist as a separate division of the Group at the beginning of 2019. The Asset Resolution Unit is separately presented within our Corporate Center disclosures, including related asset funding costs.1 As of the end of 2020 leverage exposure excludes CHF 110,677 million of central bank reserves, after adjusting for the dividend paid in 2020.

100 Corporate Center
Reconciliation of adjusted results Corporate Center
in 2020 2019 2018
Adjusted results (CHF million)
Net revenues (316) (427) 102
Real estate (gains)/losses 0 24 (4)
(Gains)/losses on business sales 0 2 21
Adjusted net revenues (316) (401) 119
Provision for credit losses 9 7 1
Total operating expenses 1,847 1,432 399
Restructuring expenses (7) – 1
Major litigation provisions (930) (416) (1)
Expenses related to real estate disposals 0 1 –
Adjusted total operating expenses 910 1,017 399
Loss before taxes (2,172) (1,866) (298)
Total adjustments 937 441 17
Adjusted income/(loss) before taxes (1,235) (1,425) (281)
Adjusted results are non-GAAP financial measures. Refer to “Reconciliation of adjusted results” in Credit Suisse for further information.
Results summary2020 results In 2020, we reported a loss before taxes of CHF 2,172 million compared to a loss of CHF 1,866 million in 2019. We reported negative net revenues of CHF 316 million in 2020, primarily driven by negative treasury results and the Asset Resolution Unit. Total operating expenses of CHF 1,847 million increased 29% com-pared to 2019, mainly reflecting higher general and administrative expenses, primarily driven by increased legacy litigation provisions of CHF 996 million in 2020, mainly in connection with mort-gage-related matters, partially offset by lower compensation and benefits.
2019 results In 2019, we reported a loss before taxes of CHF 1,866 million compared to a loss of CHF 298 million in 2018. We reported nega-tive net revenues of CHF 427 million in 2019, driven by negative treasury results and negative net revenues related to the Asset Resolution Unit, partially offset by other revenues. Total operat-ing expenses of CHF 1,432 million increased 259% compared to 2018, primarily reflecting higher general and administra-tive expenses, driven by increased legacy litigation provisions of CHF 465 million in 2019, mainly in connection with mortgage-related matters, partially offset by lower compensation and benefits.
Capital and leverage metricsAs of the end of 2020, we reported RWA of CHF 46.3 billion, a decrease of CHF 6.0 billion compared to the end of 2019, pri-marily driven by movements in risk levels, mainly in credit risk, primarily due to decreased advanced CVA and decreased deriva-tives exposures, and a negative foreign exchange impact. This was partially offset by internal model and parameter updates in credit risk, driven by a regular data update pertaining to the advanced CVA model, primarily due to increased market volatility. Leverage exposure was CHF 6.7 billion as of the end of 2019, a
decrease of CHF 106.3 billion compared to the end of 2019, pri-marily reflecting the temporary exclusion of central bank reserves from the leverage exposure in 2020, as permitted by FINMA.
> Refer to “COVID-19 pandemic and related regulatory measures” in Credit Suisse for further information on the temporary exclusion in 2020.
2020 Results detailsNet revenuesIn 2020, we reported negative net revenues of CHF 316 million compared to CHF 427 million in 2019.
Negative treasury results of CHF 356 million in 2020 reflected losses of CHF 234 million with respect to structured notes volatil-ity, negative revenues of CHF 147 million relating to funding activi-ties, excluding Asset Resolution Unit-related asset funding costs, losses of CHF 50 million relating to hedging volatility and losses of CHF 34 million on fair-valued money market instruments. Negative revenues and losses were partially offset by gains of CHF 107 million relating to fair value option volatility on own debt.
In the Asset Resolution Unit, we reported negative net revenues of CHF 178 million in 2020 compared to CHF 144 million in 2019. The movement was primarily driven by lower revenues from portfo-lio assets.
Other revenues of CHF 218 million were stable compared to 2019, as the elimination of losses from trading in own shares compared to the elimination of gains in 2019 and a loss in 2019 related to a real estate sale were offset by the negative valuation impact from long-dated legacy deferred compensation and retirement pro-grams and the valuation adjustment on a legacy exposure.
Provision for credit losses In 2020, we recorded provision for credit losses of CHF 9 million compared to provision for credit losses of CHF 7 million in 2019.
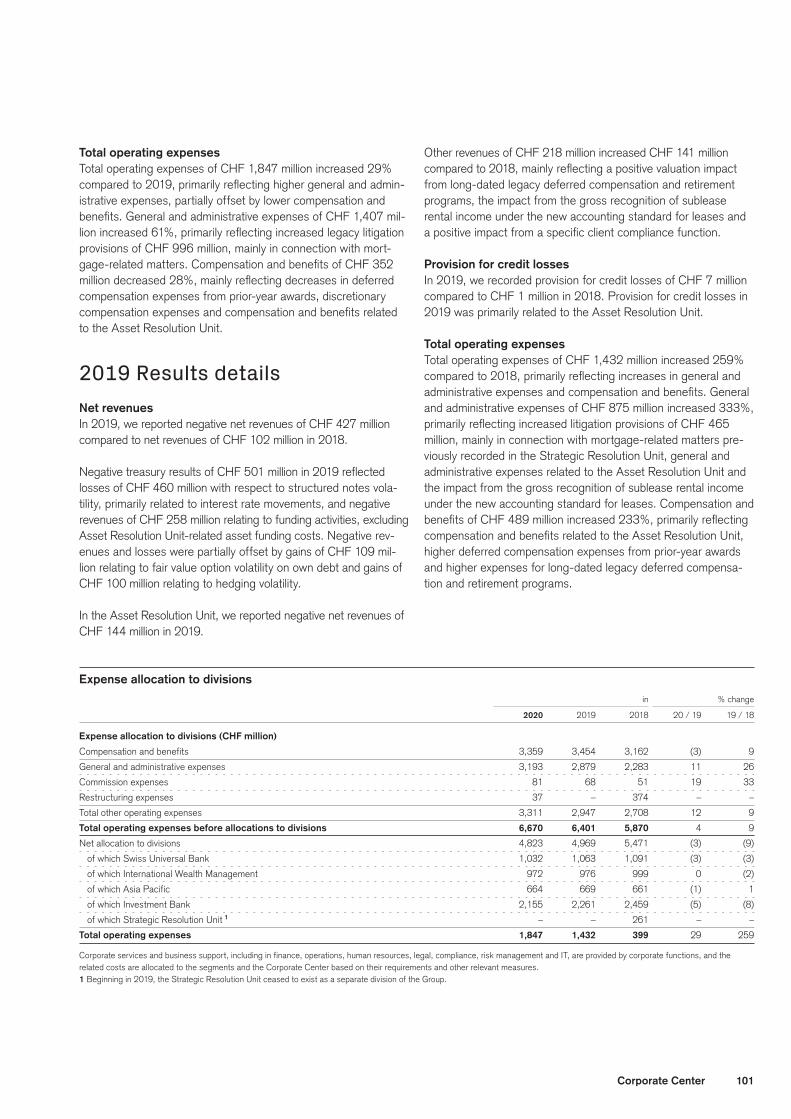
101Corporate Center
Total operating expensesTotal operating expenses of CHF 1,847 million increased 29% compared to 2019, primarily reflecting higher general and admin-istrative expenses, partially offset by lower compensation and benefits. General and administrative expenses of CHF 1,407 mil-lion increased 61%, primarily reflecting increased legacy litigation provisions of CHF 996 million, mainly in connection with mort-gage-related matters. Compensation and benefits of CHF 352 million decreased 28%, mainly reflecting decreases in deferred compensation expenses from prior-year awards, discretionary compensation expenses and compensation and benefits related to the Asset Resolution Unit.
2019 Results details Net revenuesIn 2019, we reported negative net revenues of CHF 427 million compared to net revenues of CHF 102 million in 2018.
Negative treasury results of CHF 501 million in 2019 reflected losses of CHF 460 million with respect to structured notes vola-tility, primarily related to interest rate movements, and negative revenues of CHF 258 million relating to funding activities, excluding Asset Resolution Unit-related asset funding costs. Negative rev-enues and losses were partially offset by gains of CHF 109 mil-lion relating to fair value option volatility on own debt and gains of CHF 100 million relating to hedging volatility.
In the Asset Resolution Unit, we reported negative net revenues of CHF 144 million in 2019.
Other revenues of CHF 218 million increased CHF 141 million compared to 2018, mainly reflecting a positive valuation impact from long-dated legacy deferred compensation and retirement programs, the impact from the gross recognition of sublease rental income under the new accounting standard for leases and a positive impact from a specific client compliance function.
Provision for credit lossesIn 2019, we recorded provision for credit losses of CHF 7 million compared to CHF 1 million in 2018. Provision for credit losses in 2019 was primarily related to the Asset Resolution Unit.
Total operating expensesTotal operating expenses of CHF 1,432 million increased 259% compared to 2018, primarily reflecting increases in general and administrative expenses and compensation and benefits. General and administrative expenses of CHF 875 million increased 333%, primarily reflecting increased litigation provisions of CHF 465 million, mainly in connection with mortgage-related matters pre-viously recorded in the Strategic Resolution Unit, general and administrative expenses related to the Asset Resolution Unit and the impact from the gross recognition of sublease rental income under the new accounting standard for leases. Compensation and benefits of CHF 489 million increased 233%, primarily reflecting compensation and benefits related to the Asset Resolution Unit, higher deferred compensation expenses from prior-year awards and higher expenses for long-dated legacy deferred compensa-tion and retirement programs.
Expense allocation to divisions in % change
2020 2019 2018 20 / 19 19 / 18
Expense allocation to divisions (CHF million)
Compensation and benefits 3,359 3,454 3,162 (3) 9
General and administrative expenses 3,193 2,879 2,283 11 26
Commission expenses 81 68 51 19 33
Restructuring expenses 37 – 374 – –
Total other operating expenses 3,311 2,947 2,708 12 9
Total operating expenses before allocations to divisions 6,670 6,401 5,870 4 9
Net allocation to divisions 4,823 4,969 5,471 (3) (9)
of which Swiss Universal Bank 1,032 1,063 1,091 (3) (3)
of which International Wealth Management 972 976 999 0 (2)
of which Asia Pacific 664 669 661 (1) 1
of which Investment Bank 2,155 2,261 2,459 (5) (8)
of which Strategic Resolution Unit 1 – – 261 – –
Total operating expenses 1,847 1,432 399 29 259
Corporate services and business support, including in finance, operations, human resources, legal, compliance, risk management and IT, are provided by corporate functions, and the related costs are allocated to the segments and the Corporate Center based on their requirements and other relevant measures.1 Beginning in 2019, the Strategic Resolution Unit ceased to exist as a separate division of the Group.

102 Corporate Center
Asset Resolution Unit in / end of % change
2020 2019 20 / 19
Statements of operations (CHF million)
Revenues from portfolio assets 39 84 (54)
Asset funding costs (217) (228) (5)
Net revenues (178) (144) 24
Provision for credit losses (4) 5 –
Compensation and benefits 90 131 (31)
General and administrative expenses 68 95 (28)
Commission expenses 5 8 (38)
Total other operating expenses 73 103 (29)
Total operating expenses 163 234 (30)
Income/(loss) before taxes (337) (383) (12)
Balance sheet statistics (CHF million)
Total assets 12,560 12,668 (1)
Risk-weighted assets (USD) 1 9,930 10,750 (8)
Leverage exposure (USD) 20,532 20,719 (1)
1 Risk-weighted assets excluding operational risk were USD 8,963 million and USD 9,043 million as of the end of 2020 and 2019, respectively.

103Assets under management
Assets under management
As of the end of 2020, assets under management were CHF 1,511.9 billion, stable compared to the end of 2019, with net new assets of CHF 42.0 billion.
Assets under managementAssets under management comprise assets that are placed with us for investment purposes and include discretionary and advi-sory counterparty assets. Discretionary assets are assets for which the client fully transfers the discretionary power to a Credit Suisse entity with a management mandate. Discretionary assets are reported in the business in which the advice is provided as well as in the business in which the investment decisions take place. Assets managed by the Asset Management business
of International Wealth Management for other businesses are reported in each applicable business and eliminated at the Group level. Advisory assets include assets placed with us where the cli-ent is provided access to investment advice but retains discretion over investment decisions.
Assets under management and net new assets include assets managed by consolidated entities, joint ventures and strategic participations. Assets from joint ventures and participations are counted in proportion to our share in the respective entity.
Assets under management and client assets end of % change
2020 2019 2018 20 / 19 19 / 18
Assets under management (CHF billion)
Swiss Universal Bank – Private Clients 208.6 217.6 198.0 (4.1) 9.9
Swiss Universal Bank – Corporate & Institutional Clients 462.6 436.4 348.7 6.0 25.2
International Wealth Management – Private Banking 365.4 370.0 357.5 (1.2) 3.5
International Wealth Management – Asset Management 440.3 437.9 388.7 0.5 12.7
Asia Pacific 221.3 220.0 199.3 0.6 10.4
Strategic Resolution Unit 1 – – 0.5 – –
Assets managed across businesses 2 (186.3) (174.7) (147.8) 6.6 18.2
Assets under management 1,511.9 1,507.2 1,344.9 0.3 12.1
of which discretionary assets 483.0 489.7 442.9 (1.4) 10.6
of which advisory assets 1,028.9 1,017.5 902.0 1.1 12.8
Client assets (CHF billion) 3
Swiss Universal Bank – Private Clients 262.5 260.4 231.2 0.8 12.6
Swiss Universal Bank – Corporate & Institutional Clients 562.2 534.4 454.5 5.2 17.6
International Wealth Management – Private Banking 465.5 474.0 430.5 (1.8) 10.1
International Wealth Management – Asset Management 440.3 437.9 388.7 0.5 12.7
Asia Pacific 315.4 275.0 243.0 14.7 13.2
Strategic Resolution Unit 1 – – 2.4 – –
Assets managed across businesses 2 (186.3) (174.7) (147.7) 6.6 18.3
Client assets 1,859.6 1,807.0 1,602.6 2.9 12.8
1 Beginning in 2019, the Strategic Resolution Unit ceased to exist as a separate division of the Group. The residual assets under management were either transferred to other divisions or no longer qualify as assets under management.
2 Represents assets managed by Asset Management within International Wealth Management for the other businesses.3 Client assets is a broader measure than assets under management as it includes transactional accounts and assets under custody (assets held solely for transaction-related or safekeep-
ing/custody purposes) and assets of corporate clients and public institutions used primarily for cash management or transaction-related purposes.

104 Assets under management
Net new assetsNet new assets include individual cash payments, delivery of securities and cash flows resulting from loan increases or repayments.
Interest and dividend income credited to clients and commis-sions, interest and fees charged for banking services as well as changes in assets under management due to currency and market volatility are not taken into account when calculating net new assets. Any such changes are not directly related to the Group’s success in acquiring assets under management. Similarly structural effects mainly relate to asset inflows and outflows due to acquisition or divestiture, exit from businesses or markets or exits due to new regulatory requirements and are not taken into account when calculating net new assets. The Group reviews rel-evant policies regarding client assets on a regular basis.
Results summary2020 results As of the end of 2020, assets under management were CHF 1,511.9 billion, an increase of CHF 4.7 billion compared to the end of 2019. The increase was driven by favorable mar-ket movements and net new assets of CHF 42.0 billion, partially offset by unfavorable foreign exchange-related movements and structural effects. Structural effects included CHF 14.8 billion in the Asset Management business of International Wealth Manage-ment relating to the sale of Wincasa AG in 2012 following the conclusion in 2020 of a transition period regarding the related assets under management.
Net new assets of CHF 42.0 billion mainly reflected inflows across the following businesses. Net new assets of CHF 16.7 billion in the Private Banking business of International Wealth
Management mainly reflected inflows from both emerging mar-kets and Western Europe. Net new assets of CHF 15.5 billion in the Asset Management business of International Wealth Manage-ment mainly reflected inflows from traditional investments. Net new assets of CHF 13.7 billion in the Corporate & Institutional Clients business of Swiss Universal Bank mainly reflected inflows from the pension business. Net new assets of CHF 8.6 billion in Asia Pacific mainly reflected inflows from Southeast Asia, Austra-lia, Japan and Greater China. These inflows were partially offset by net asset outflows of CHF 5.9 billion in the Private Clients business of Swiss Universal Bank, mainly reflecting outflows in the UHNW client segment, driven by a single outflow in the first quarter of 2020.
2019 resultsAs of the end of 2019, assets under management were CHF 1,507.2 billion, an increase of CHF 162.3 billion compared to the end of 2018. The increase was driven by favorable market movements and net new assets of CHF 79.3 billion, partially off-set by structural effects and unfavorable foreign exchange-related movements.
Net new assets of CHF 79.3 billion mainly reflected inflows across the following businesses. Net new assets of CHF 45.3 billion in the Corporate & Institutional Clients business of Swiss Universal Bank reflected strong inflows from the pension busi-ness. Net new assets of CHF 21.5 billion in the Asset Man-agement business of International Wealth Management mainly reflected inflows from traditional and alternative investments. Net new assets of CHF 11.0 billion in the Private Banking business of International Wealth Management mainly reflected inflows from emerging markets. Net new assets of CHF 8.7 billion in Asia Pacific reflected inflows across most of the markets in this region.
> Refer to “Swiss Universal Bank”, “International Wealth Management” and “Asia Pacific” and “Note 39 – Assets under management” in VI – Consolidated finan-cial statements – Credit Suisse Group for further information.
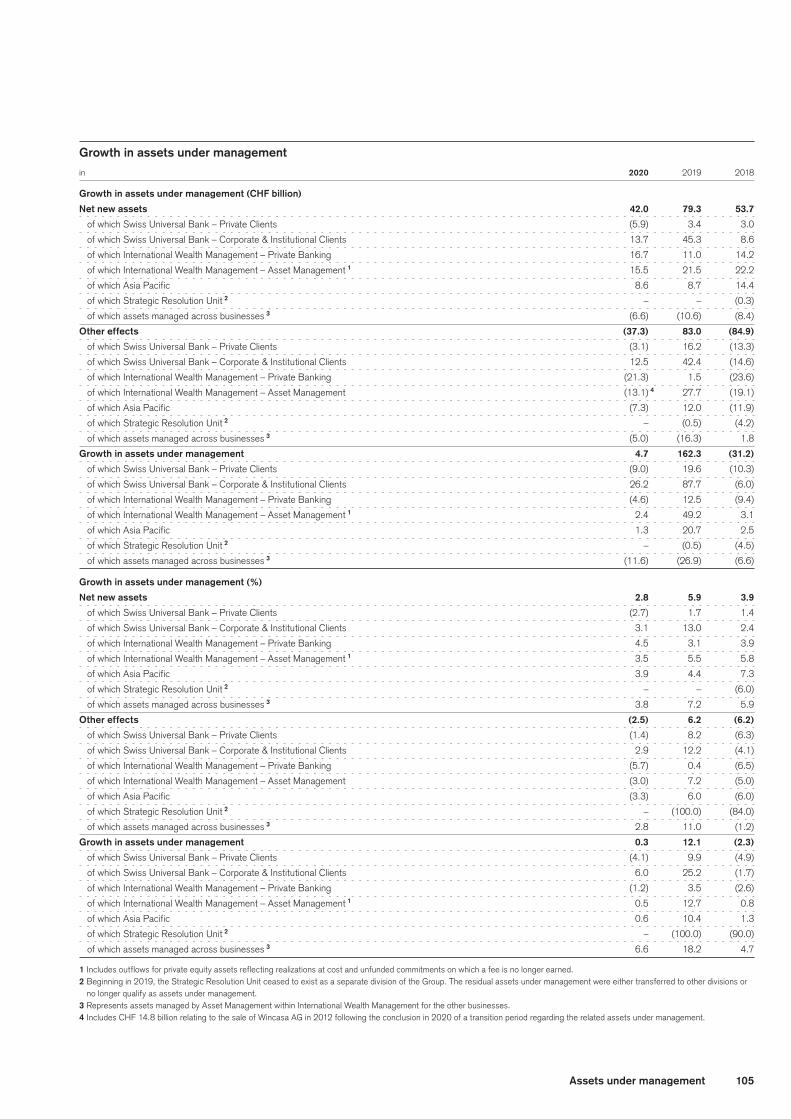
105Assets under management
Growth in assets under management
in 2020 2019 2018
Growth in assets under management (CHF billion)
Net new assets 42.0 79.3 53.7
of which Swiss Universal Bank – Private Clients (5.9) 3.4 3.0
of which Swiss Universal Bank – Corporate & Institutional Clients 13.7 45.3 8.6
of which International Wealth Management – Private Banking 16.7 11.0 14.2
of which International Wealth Management – Asset Management 1 15.5 21.5 22.2
of which Asia Pacific 8.6 8.7 14.4
of which Strategic Resolution Unit 2 – – (0.3)
of which assets managed across businesses 3 (6.6) (10.6) (8.4)
Other effects (37.3) 83.0 (84.9)
of which Swiss Universal Bank – Private Clients (3.1) 16.2 (13.3)
of which Swiss Universal Bank – Corporate & Institutional Clients 12.5 42.4 (14.6)
of which International Wealth Management – Private Banking (21.3) 1.5 (23.6)
of which International Wealth Management – Asset Management (13.1) 4 27.7 (19.1)
of which Asia Pacific (7.3) 12.0 (11.9)
of which Strategic Resolution Unit 2 – (0.5) (4.2)
of which assets managed across businesses 3 (5.0) (16.3) 1.8
Growth in assets under management 4.7 162.3 (31.2)
of which Swiss Universal Bank – Private Clients (9.0) 19.6 (10.3)
of which Swiss Universal Bank – Corporate & Institutional Clients 26.2 87.7 (6.0)
of which International Wealth Management – Private Banking (4.6) 12.5 (9.4)
of which International Wealth Management – Asset Management 1 2.4 49.2 3.1
of which Asia Pacific 1.3 20.7 2.5
of which Strategic Resolution Unit 2 – (0.5) (4.5)
of which assets managed across businesses 3 (11.6) (26.9) (6.6)
Growth in assets under management (%)
Net new assets 2.8 5.9 3.9
of which Swiss Universal Bank – Private Clients (2.7) 1.7 1.4
of which Swiss Universal Bank – Corporate & Institutional Clients 3.1 13.0 2.4
of which International Wealth Management – Private Banking 4.5 3.1 3.9
of which International Wealth Management – Asset Management 1 3.5 5.5 5.8
of which Asia Pacific 3.9 4.4 7.3
of which Strategic Resolution Unit 2 – – (6.0)
of which assets managed across businesses 3 3.8 7.2 5.9
Other effects (2.5) 6.2 (6.2)
of which Swiss Universal Bank – Private Clients (1.4) 8.2 (6.3)
of which Swiss Universal Bank – Corporate & Institutional Clients 2.9 12.2 (4.1)
of which International Wealth Management – Private Banking (5.7) 0.4 (6.5)
of which International Wealth Management – Asset Management (3.0) 7.2 (5.0)
of which Asia Pacific (3.3) 6.0 (6.0)
of which Strategic Resolution Unit 2 – (100.0) (84.0)
of which assets managed across businesses 3 2.8 11.0 (1.2)
Growth in assets under management 0.3 12.1 (2.3)
of which Swiss Universal Bank – Private Clients (4.1) 9.9 (4.9)
of which Swiss Universal Bank – Corporate & Institutional Clients 6.0 25.2 (1.7)
of which International Wealth Management – Private Banking (1.2) 3.5 (2.6)
of which International Wealth Management – Asset Management 1 0.5 12.7 0.8
of which Asia Pacific 0.6 10.4 1.3
of which Strategic Resolution Unit 2 – (100.0) (90.0)
of which assets managed across businesses 3 6.6 18.2 4.7
1 Includes outflows for private equity assets reflecting realizations at cost and unfunded commitments on which a fee is no longer earned.2 Beginning in 2019, the Strategic Resolution Unit ceased to exist as a separate division of the Group. The residual assets under management were either transferred to other divisions or
no longer qualify as assets under management.3 Represents assets managed by Asset Management within International Wealth Management for the other businesses.4 Includes CHF 14.8 billion relating to the sale of Wincasa AG in 2012 following the conclusion in 2020 of a transition period regarding the related assets under management.

106 Critical accounting estimates
Critical accounting estimates
In order to prepare the consolidated financial statements in accor-dance with US GAAP, management is required to make certain accounting estimates to ascertain the value of assets and liabili-ties. These estimates are based upon judgment and the informa-tion available at the time, and actual results may differ materially from these estimates. Management believes that the estimates and assumptions used in the preparation of the consolidated financial statements are reasonable and consistently applied.
We believe that the critical accounting estimates discussed below involve the most complex judgments and assessments.
> Refer to “Note 1 – Summary of significant accounting policies” and “Note 2 – Recently issued accounting standards” in VI – Consolidated financial state-ments – Credit Suisse Group for further information on significant accounting policies and new accounting pronouncements. For financial information relat-ing to the Bank, refer to the corresponding notes in the consolidated financial statements of the Bank.
Fair valueA significant portion of our financial instruments is carried at fair value. The fair value of the majority of these financial instruments is based on quoted prices in active markets or observable inputs.
In addition, we hold financial instruments for which no prices are available and which have few or no observable inputs. For these instruments, the determination of fair value requires subjec-tive assessment and judgment, depending on liquidity, pricing assumptions, the current economic and competitive environment and the risks affecting the specific instrument. In such circum-stances, valuation is determined based on management’s own judgments about the assumptions that market participants would use in pricing the asset or liability, including assumptions about risk. These instruments include certain OTC derivatives includ-ing interest rate, foreign exchange, equity and credit derivatives, certain corporate equity-linked securities, mortgage-related securities, private equity investments and certain loans and credit products, including leveraged finance, certain syndicated loans, certain high yield bonds and life finance instruments.
Control processes are applied to ensure that the fair values of the financial instruments reported in the consolidated financial state-ments, including those derived from pricing models, are appropri-ate and determined on a reasonable basis.
> Refer to “Note 36 – Financial instruments” in VI – Consolidated financial state-ments – Credit Suisse Group for further information.
Variable interest entitiesAs a normal part of our business, we engage in various transac-tions, which include entities that are considered variable interest entities (VIEs). VIEs are special purpose entities that typically either lack sufficient equity to finance their activities without addi-tional subordinated financial support or are structured such that the holders of the voting rights do not substantively participate in the gains and losses of the entity. Such entities are required to
be assessed for consolidation, compelling the primary beneficiary to consolidate the VIE. The primary beneficiary is the party that has the power to direct the activities that most significantly affect the economics of the VIE and has the right to receive benefits or the obligation to absorb losses of the entity that could be poten-tially significant to the VIE. We consolidate all VIEs for which we are the primary beneficiary. Application of the requirements for consolidation of VIEs may require the exercise of significant judgment.
> Refer to “Note 1 – Summary of significant accounting policies” and “Note 35 – Transfers of financial assets and variable interest entities” in VI – Consolidated financial statements – Credit Suisse Group for further information on VIEs.
Contingencies and loss provisionsA contingency is an existing condition that involves a degree of uncertainty that will ultimately be resolved upon the occurrence or non-occurrence of future events.
Litigation contingenciesWe are involved in a number of judicial, regulatory and arbitra-tion proceedings concerning matters arising in connection with the conduct of our businesses. Some of these proceedings have been brought on behalf of various classes of claimants and seek damages of material and/or indeterminate amounts. We accrue loss contingency litigation provisions and take a charge to income in connection with certain proceedings when losses, additional losses or ranges of loss are probable and reasonably estimable. We also accrue litigation provisions for the estimated fees and expenses of external lawyers and other service providers in rela-tion to such proceedings, including in cases for which we have not accrued a loss contingency provision. We accrue these fee and expense litigation provisions and take a charge to income in connection therewith when such fees and expenses are probable and reasonably estimable. We review our legal proceedings each quarter to determine the adequacy of our litigation provisions and may increase or release provisions based on management’s judg-ment and the advice of counsel. The establishment of additional provisions or releases of litigation provisions may be necessary in the future as developments in such proceedings warrant.
It is inherently difficult to determine whether a loss is probable or even reasonably possible or to estimate the amount of any loss or loss range for many of our legal proceedings. Estimates, by their nature, are based on judgment and currently available informa-tion and involve a variety of factors, including, but not limited to, the type and nature of the proceeding, the progress of the matter, the advice of counsel, our defenses and our experience in similar matters, as well as our assessment of matters, including settle-ments, involving other defendants in similar or related cases or proceedings. Factual and legal determinations, many of which are complex, must be made before a loss, additional losses or ranges of loss can be reasonably estimated for any proceeding. We do not believe that we can estimate an aggregate range of reason-ably possible losses for certain of our proceedings because of
107Critical accounting estimates
their complexity, the novelty of some of the claims, the early stage of the proceedings, the limited amount of discovery that has occurred and/or other factors. Most matters pending against us seek damages of an indeterminate amount. While certain mat-ters specify the damages claimed, such claimed amount may not represent our reasonably possible losses.
> Refer to “Note 40 – Litigation” in VI – Consolidated financial statements – Credit Suisse Group for further information on legal proceedings.
Allowance and provision for credit lossesOn January 1, 2020, the Group adopted the new account-ing standard ASU 2016-13 “Measurement of Credit Losses on Financial Instruments” and its subsequent amendments, applying a modified retrospective approach, which replaced the incurred credit loss model for recognizing credit losses. The new standard requires the measurement of CECL for financial assets held at amortized cost as of the reporting date over the remaining con-tractual life (considering the effect of prepayments) based on historical experience, current conditions and reasonable and sup-portable forward-looking information, including macroeconomic scenarios. To address circumstances where in management’s judgment the CECL model outputs are overly sensitive to the effect of economic inputs that lie significantly outside of their his-torical range, model overlays are applied.
> Refer to “Note 1 – Summary of significant accounting policies” and “Note 20 – Financial instruments measured at amortized cost and credit losses” in VI – Consolidated financial statements – Credit Suisse Group for further information.
Current expected credit lossThe measurement of expected credit losses across all catego-ries of financial assets held at amortized cost requires judgment, the estimation of the amount, timing of future cash flows and collateral values when determining credit losses. The Group’s CECL calculations are outputs of complex statistical mod-els and expert judgment overlays with a number of underlying assumptions regarding the choice of variable inputs and their interdependencies.
For performing credit exposures, the model parameters are based on internally and externally compiled data comprising both quanti-tative and qualitative factors and are tailored to various categories and exposures. The CECL measurement has three main inputs: probability of default, loss given default and exposure at default. The estimation of these parameters include the expected macro-economic environment, the contractual maturities of exposures, historical data considering portfolio-specific factors, differences in product structure, collateral types, seniority of the claim, counter-party industry and recovery costs of any collateral that is integral to the financial asset.
There is significant judgment involved in the estimation and appli-cation of forward-looking information, including macroeconomic scenarios. The Group’s estimation of expected credit losses is based on a discounted estimate that considers future macro-economic scenarios that are probability-weighted according to the best estimate of their relative likelihood. This estimate is based on historical frequency, current trends and conditions and
macroeconomic factors such as regional gross domestic product, unemployment rates and interest rates.
For credit-impaired financial assets, the expected credit losses are measured using the present value of estimated future cash flows (unless a practical expedient for collateral-dependent finan-cial assets is applied), and the impaired credit exposures and related allowances are revalued to reflect the passage of time.
Expected credit losses for individually impaired credit exposures are measured by performing an in-depth review and analysis, considering factors such as recovery and exit options as well as collateral and the risk profile of the borrower. The individual mea-surement of expected credit losses for impaired financial assets also considers reasonable and supportable forward-looking infor-mation that is relevant to the individual counterparty (idiosyncratic information) and reflective of the macroeconomic environment that the borrower is exposed to, apart from any historical loss information and current conditions. If there are different scenarios relevant for the individual expected credit loss measurement, they are considered on a probability-weighted basis.
The COVID-19 pandemic has had a significant impact on the global economy and has affected the Group’s business perfor-mance and credit loss estimates for the year 2020. We continue to closely monitor the COVID-19 pandemic and its effects on our operations and businesses.
> Refer to “Risk Management” in III – Treasury, Risk, Balance sheet and Off-balance sheet and “Note 20 – Financial instruments measured at amortized cost and credit losses” in VI – Consolidated financial statements – Credit Suisse Group for loan portfolio disclosures, valuation adjustment disclosures and certain other information relevant to the evaluation of credit risk and credit risk management.
Goodwill impairmentUnder US GAAP, goodwill is not amortized, but is reviewed for potential impairment on an annual basis as of December 31 and at any other time that events or circumstances indicate that the carrying value of goodwill may not be recoverable.
For the purpose of testing goodwill for impairment, each reporting unit is assessed individually. A reporting unit is an operating seg-ment or one level below an operating segment, also referred to as a component. A component of an operating segment is deemed to be a reporting unit if the component constitutes a business for which discrete financial information is available and management regularly reviews the operating results of that component.
On July 30, 2020, the Group announced an updated strategy and related organizational changes, which included the intro-duction of a new segment structure with an effective date of August 1, 2020. Under the prior structure, the reporting units were Swiss Universal Bank – Private Clients, Swiss Universal Bank – Corporate & Institutional Banking, International Wealth Management – Private Banking, International Wealth Manage-ment – Asset Management, Asia Pacific – Wealth Management

108 Critical accounting estimates
& Connected, Asia Pacific – Markets, Global Markets and Invest-ment Banking & Capital Markets. As a result of the organiza-tional changes, the Asia Pacific – Markets, Global Markets and Investment Banking & Capital Markets reporting units were com-bined into one new reporting unit named the Investment Bank. The announcement of the strategy and organizational changes represented a triggering event for goodwill impairment testing purposes.
The Group’s reporting units under the new structure are defined as follows: Swiss Universal Bank – Private Clients, Swiss Univer-sal Bank – Corporate & Institutional Clients, International Wealth Management – Private Banking, International Wealth Manage-ment – Asset Management, Asia Pacific and the Investment Bank.
In accordance with US GAAP, the Group continually assesses whether or not there has been a triggering event requiring a review of goodwill.
Under ASU 2011-08, “Testing Goodwill for Impairment”, a quali-tative assessment is permitted to evaluate whether a report-ing unit’s fair value is less than its carrying value. If on the basis of the qualitative assessment it is more likely than not that the reporting unit’s fair value is higher than its carrying value, no quantitative goodwill impairment test is required. If on the basis of the qualitative assessment it is more likely than not that the reporting unit’s fair value is lower than its carrying value, a quanti-tative goodwill impairment test must be performed, by calculat-ing the fair value of the reporting unit and comparing that amount to its carrying value. If the fair value of a reporting unit exceeds its carrying value, there is no goodwill impairment. If the carrying value exceeds the fair value, there is a goodwill impairment. The goodwill impairment is calculated as the difference between the carrying value and the fair value of the reporting unit up to a max-imum of the goodwill amount recorded in that reporting unit.
The qualitative assessment is intended to be a simplification of the annual impairment test and can be bypassed for any reporting unit and any period to proceed directly to performing the quan-titative goodwill impairment test. When bypassing the qualitative assessment in any period in accordance with the current practice of the Group, the preparation of a qualitative assessment can be resumed in any subsequent period.
Circumstances that could trigger an initial qualitative assessment of the goodwill impairment test include, but are not limited to: (i) macroeconomic conditions such as a deterioration in general eco-nomic conditions or other developments in equity and credit mar-kets; (ii) industry and market considerations such as a deteriora-tion in the environment in which the entity operates, an increased competitive environment, a decline in market-dependent multiples or metrics (considered in both absolute terms and relative to peers), and regulatory or political developments; (iii) other rel-evant entity-specific events such as changes in management, key personnel or strategy; (iv) a more-likely-than-not expecta-tion of selling or disposing of all, or a portion, of a reporting unit;
(v) results of testing for recoverability of a significant asset group within a reporting unit; (vi) recognition of a goodwill impairment in the financial statements of a subsidiary that is a component of a reporting unit; and (vii) a sustained decrease in share price (con-sidered in both absolute terms and relative to peers).
The carrying value of each reporting unit for the purpose of the goodwill impairment test is determined by considering the report-ing units’ risk-weighted assets usage, leverage ratio exposure, deferred tax assets, goodwill, intangible assets and other CET1 capital relevant adjustments. The residual value between the total of these elements and the Group’s shareholders’ equity is allo-cated to the reporting units on a pro-rata basis. As of Decem-ber 31, 2020, this residual value was a credit of CHF 6,279 million.
In estimating the fair value of its reporting units, the Group applied a combination of the market approach and the income approach. Under the market approach, consideration was given to price to projected earnings multiples or price to book value multiples for similarly traded companies and prices paid in recent transactions that have occurred in its industry or in related indus-tries. Under the income approach, a discount rate was applied that reflects the risk and uncertainty related to the reporting unit’s projected cash flows, which were determined from the Group’s financial plan.
In determining the estimated fair value, the Group relied upon its latest five-year financial plan, which included significant manage-ment assumptions and estimates based on its view of current and future economic conditions and regulatory changes.
Estimates of the Group’s future earnings potential, and that of the reporting units, involve considerable judgment, including manage-ment’s view on future changes in market cycles, the regulatory environment and the anti cipated result of the implementation of business strategies, competitive factors and assumptions con-cerning the retention of key employees. Adverse changes in the estimates and assumptions used to determine the fair value of the Group’s reporting units may result in a goodwill impairment in the future.
A goodwill impairment is defined as the amount by which a report-ing unit’s carrying value exceeds its fair value. An impairment loss shall be recognized in an amount equal to the excess, limited to the total amount of goodwill allocated to the reporting unit.
The Group determined in the first quarter of 2020 that a good-will triggering event occurred for its former Investment Banking & Capital Markets reporting unit. Based on its goodwill impairment analyses performed as of March 31, 2020, the Group concluded that the estimated fair value for all of the reporting units with good-will exceeded their related carrying values and no impairments were necessary as of March 31, 2020.
The Group also determined in the second quarter of 2020 that a goodwill triggering event occurred for its former Asia Pacific
109Critical accounting estimates
– Markets, Global Markets and Investment Banking & Capital Markets reporting units. Goodwill has to be tested for impairment before and immediately after a reorganization of reporting units. Based on this goodwill impairment analysis, the Group concluded that there would be no impairment necessary for its Global Mar-kets, Investment Banking & Capital Markets and Asia Pacific – Markets reporting units under the prior reporting structure as the estimated fair value of these reporting units exceeded their related carrying values by 11%, 13% and 6%, respectively. The good-will allocated to these reporting units became more sensitive to an impairment because of higher implied costs of equity due to the greater economic uncertainty resulting from the COVID-19 pan-demic. The Group concluded that no impairment was necessary for its new Investment Bank reporting unit as the estimated fair value significantly exceeded its carrying value.
Based on its goodwill impairment analysis performed as of December 31, 2020, the Group concluded that there was no impairment necessary for any of its reporting units as the esti-mated fair value of the reporting units significantly exceeded their carrying values.
The Group engaged the services of an independent valuation specialist to assist in the valuation of the International Wealth Management – Asset Management, Asia Pacific and the Invest-ment Bank reporting units as of December 31, 2020. The valua-tions were performed using a combination of the market approach and income approach.
The results of the impairment evaluation of each reporting unit’s goodwill would be significantly impacted by adverse changes in the underlying parameters used in the valuation process. If actual outcomes or the future outlook adversely differ from manage-ment’s best estimates of the key economic assumptions and associated cash flows applied in the valuation of the reporting unit, we could potentially incur material impairment charges in the future.
The COVID-19 pandemic is still having a significant impact on the global economy and is likely to continue to affect the Group’s business performance, including goodwill assessments, going forward.
> Refer to “Note 21 – Goodwill” in VI – Consolidated financial statements – Credit Suisse Group for further information on goodwill.
TaxesUncertainty of income tax positionsWe follow the income tax guidance under US GAAP, which sets out a consistent framework to determine the appropriate level of tax reserves to maintain for uncertain income tax positions.
Significant judgment is required in determining whether it is more likely than not that an income tax position will be sustained upon examination, including resolution of any related appeals or litiga-tion processes, based on the technical merits of the position.
Further judgment is required to determine the amount of benefit eligible for recognition in the consolidated financial statements.
> Refer to “Note 29 – Tax” in VI – Consolidated financial statements – Credit Suisse Group for further information on income tax positions.
Deferred tax valuation allowancesDeferred tax assets and liabilities are recognized for the esti-mated future tax effects of net operating loss (NOL) carry-for-wards and temporary differences between the carrying values of existing assets and liabilities and their respective tax bases at the dates of the consolidated balance sheets.
The realization of deferred tax assets on temporary differences is dependent upon the generation of taxable income during the periods in which those temporary differences become deduct-ible. The realization of deferred tax assets on NOLs is dependent upon the generation of taxable income during the periods prior to their expiration, if applicable. Management regularly evalu-ates whether deferred tax assets will be realized. If management considers it more likely than not that all or a portion of a deferred tax asset will not be realized, a corresponding valuation allowance is established. In evaluating whether deferred tax assets will be realized, management considers both positive and negative evi-dence, including projected future taxable income, the reversal of deferred tax liabilities, which can be scheduled, and tax planning strategies.
This evaluation requires significant management judgment, pri-marily with respect to projected taxable income. Future taxable income can never be predicted with certainty. It is derived from budgets and strategic business plans but is dependent on numer-ous factors, some of which are beyond management’s control. Substantial variance of actual results from estimated future tax-able profits, or changes in our estimate of future taxable profits and potential restructurings, could lead to changes in deferred tax assets being realizable, or considered realizable, and would require a corresponding adjustment to the valuation allowance.
As part of its normal practice, management has conducted a detailed evaluation of its expected future results and has also considered stress scenarios, the impact of the COVID-19 pan-demic and the withdrawal of the UK from the EU. This evalua-tion has indicated the expected future results that are likely to be earned in jurisdictions where the Group has significant gross deferred tax assets, such as Switzerland, the UK and the US. Management then compared those expected future results with the applicable law governing utilization of deferred tax assets. Based on the expected future results in the Bank parent com-pany and given that the Swiss tax law allows for a seven-year carry-forward period for NOLs, a valuation allowance was recorded on the deferred tax assets of this entity. UK tax law allows for an unlimited carry-forward period for NOLs, and even though there are restrictions on the use of tax losses carried for-ward, these are not expected to have a material impact on the recoverability of the net deferred tax assets. US tax law allows for a 20-year carry-forward period for NOLs arising prior to 2017, federal NOLs generated in the tax years 2018, 2019 or 2020

110 Critical accounting estimates
can be carried back for five years and with no expiry limitations for NOLs arising in 2018 and subsequent years.
> Refer to “Note 29 – Tax” in VI – Consolidated financial statements – Credit Suisse Group for further information on deferred tax assets.
Pension plansThe GroupThe Group covers pension requirements, in both Swiss and non-Swiss locations, through various defined benefit pension plans and defined contribution pension plans.
Our funding policy with respect to these pension plans is consis-tent with local government and tax requirements.
The Group accounts for the Group plan as a single-employer defined benefit pension plan and uses the projected unit credit actuarial method to determine the net periodic benefit costs, projected benefit obligation (PBO), accumulated benefit obliga-tion (ABO) and the related amounts recognized in the consoli-dated balance sheets. The calculation of the expense and liability associated with the defined benefit pension plans requires an extensive use of assumptions, which include the discount rate, expected return on plan assets and rate of future compensation increases. Management determines these assumptions based upon currently available market and industry data and historical experience of the plans. Management also consults with an inde-pendent actuarial firm to assist in selecting appropriate assump-tions and valuing its related liabilities. Management regularly reviews the actuarial assumptions used to value and measure the defined benefit obligation on a periodic basis as required by US GAAP. The actuarial assumptions that we use may differ materi-ally from actual results due to changing market and economic conditions and specific experience of the plans (such as invest-ment management over or underperformance, higher or lower withdrawal rates and longer or shorter life spans of the partici-pants). Any such differences could have a significant impact on the amount of pension expense recorded in future years.
The funded status of our defined benefit pension and other post-retirement defined benefit plans is recorded in the consolidated balance sheets. The impacts from re-measuring the funded status (reflected in actuarial gains or losses) and from amending the plan (reflected in prior service cost or credits) are recognized in equity as a component of accumulated other comprehensive income/(loss) (AOCI).
The PBO of our total defined benefit pension plans included CHF 498 million and CHF 551 million related to our assump-tion for future salary increases as of December 31, 2020 and 2019. The ABO is defined as the PBO less the amount related to estimated future salary increases. The difference between the fair value of plan assets and the ABO was an overfunding of CHF 3,126 million for 2020, compared to CHF 3,148 million for 2019.
We are required to estimate the expected long-term rate of return on plan assets, which is then used to compute benefit costs recorded in the consolidated statements of operations. Estimating future returns on plan assets is particularly subjective, as the esti-mate requires an assessment of possible future market returns based on the plan asset mix. In calculating pension expense and in determining the expected long-term rate of return, we use the market-related value of assets. The assumptions used to deter-mine the benefit obligation as of the measurement date are also used to calculate the net periodic benefit costs for the 12-month period following this date.
The expected weighted-average long-term rate of return used to determine the expected return on plan assets as a component of the net periodic benefit costs in 2020 and 2019 was 2.10% and 2.40%, respectively, for the Swiss plan and 2.37% and 3.00%, respectively, for the international plans. In 2020, if the expected long-term rate of return had been increased/decreased one per-centage point, net pension expense for the Swiss plan would have decreased/increased CHF 168 million and net pension expense for the international plans would have decreased/increased CHF 35 million.
The discount rates used in determining the benefit obligation and the pension expense are based on yield curves, constructed from high-quality corporate bonds currently available and observable in the market and are expected to be available during the period to maturity of the pension benefits. In countries where there is no deep market in high-quality corporate bonds with longer dura-tions, the best available market information, including government bond yields and risk premiums, is used to construct the yield curve. Credit Suisse uses the spot rate approach for determining the benefit obligation and for service and interest cost compo-nents of the pension expense for future years. Under the spot rate approach, individual spot rates along the yield curve are applied to each expected future benefit payment, whereas under the previous methodology a single weighted-average discount rate derived from the yield curve was applied.
For the Swiss plan, the weighted average discount rate for the PBO decreased 0.05 percentage points, from 0.45% as of December 31, 2019 to 0.40% as of December 31, 2020, mainly due to a decrease in Swiss bond market rates. The average discount rate for the PBO for the international plans decreased 0.71 percentage points, from 2.38% as of December 31, 2019 to 1.67% as of December 31, 2020, mainly due to a decrease in bond market rates. For the year ended December 31, 2020, a one percentage point decline in the discount rates for the Swiss plan would have resulted in an increase in the PBO of CHF 2,499 million and an increase in pension expense of CHF 81 million, and a one percentage point increase in discount rates would have resulted in a decrease in the PBO of CHF 1,976 million and a decrease in the pension expense of CHF 46 million. A one per-centage point decline in discount rates for the international plans as of December 31, 2020 would have resulted in an increase in the PBO of CHF 755 million and a decrease in pension expense of CHF 4 million, and a one percentage point increase in discount

111Critical accounting estimates
rates would have resulted in a decrease in the PBO of CHF 575 million and an increase in the pension expense of CHF 6 million.
The interest rate on savings balances assumption for the Swiss pension plan has been updated. In prior years, the interest rate on savings balances was set to follow the discount rate. Due to the higher actual interest rate on savings balances payments over prior years, the interest rate on savings balances increased 0.80 percentage points, from 0.45% as of December 31, 2019 to 1.25% as of December 31, 2020. This resulted in an increase to the PBO of approximately CHF 450 million. For the year ended December 31, 2020, a one percentage point decline in the interest rate on savings balances for the Swiss plan would have resulted in a decrease in the PBO of CHF 482 million and a one percentage point increase in interest rate on savings bal-ances would have resulted in an increase in the PBO of CHF 535 million.
Actuarial gains and losses recognized in AOCI are amortized over the average remaining service period of active employees expected to receive benefits under the plan, which, as of Decem-ber 31, 2020, was approximately 10 years for the Swiss plan and 3 to 20 years for the international plans. For plans where there are very few active members, actuarial gains and losses are amortized over the average remaining life expectancy of the inactive participants. Prior service cost recognized in AOCI are amortized over the remaining service period of the employees affected by the plan amendment. The pre-tax expense associated with the amortization of net actuarial losses and prior service cost for defined benefit pension plans for the years ended Decem-ber 31, 2020, 2019 and 2018 was CHF 181 million, CHF 158 million and CHF 227 million, respectively. The impact from devia-tions between our actuarial assumptions and the actual develop-ments of such parameters observed for our pension plans further impacts the amount of net actuarial losses or gains recognized in equity, resulting in a higher or lower amount of amortization expense in periods after 2021.
> Refer to “Note 32 – Pension and other post-retirement benefits” in VI – Con-solidated financial statements – Credit Suisse Group for further information.
The BankThe Bank covers pension requirements for its employees in Swit-zerland through participation in a defined benefit pension plan sponsored by the Group (Group plan). Various legal entities within the Group participate in the Group plan, which is set up as an independent trust domiciled in Zurich. The Group accounts for the Group plan as a single-employer defined benefit pension plan and uses the projected unit credit actuarial method to determine the net periodic pension expense, PBO, ABO and the related amounts recognized in the consolidated balance sheets. The funded status of the Group plan is recorded in the consolidated
balance sheets. The actuarial gains and losses and prior service costs or credits are recognized in equity as a component of AOCI.
The Bank accounts for the Group plan on a defined contribution basis whereby it only recognizes the amounts required to be con-tributed to the Group plan during the period as net periodic pen-sion expense and only recognizes a liability for any contributions due and unpaid. No other expense or balance sheet amounts related to the Group plan are recognized by the Bank.
The Bank covers pension requirements for its employees in inter-national locations through participation in various pension plans, which are accounted for as single-employer defined benefit pen-sion plans or defined contribution pension plans.
In 2020 and 2019, the weighted-average expected long-term rate of return used to calculate the expected return on plan assets as a component of the net periodic benefit costs for the international single-employer defined benefit pension plans was 2.37% and 3.00%, respectively. In 2020, if the expected long-term rate of return had been increased/decreased one percent-age point, net pension expense would have decreased/increased CHF 35 million.
The discount rate used in determining the benefit obligation is based either on high-quality corporate bond rates or government bond rates plus a premium in order to approximate high-quality corporate bond rates. The average discount rate for the PBO for the international plans decreased 0.72 percentage points, from 2.38% as of December 31, 2019 to 1.66% as of December 31, 2020. A one percentage point decline in the discount rate for the international single-employer plans as of December 31, 2020 would have resulted in an increase in PBO of CHF 754 million and a decrease in pension expense of CHF 4 million, and a one percentage point increase in discount rates would have resulted in a decrease in PBO of CHF 574 million and an increase in pen-sion expense of CHF 6 million.
Actuarial gains and losses recognized in AOCI are amortized over the average remaining service period of active employees expected to receive benefits under the plan. For plans where there are very few active members, actuarial gains and losses are amortized over the average remaining life expectancy of the inactive participants. Prior service cost recognized in AOCI are amortized over the remaining service period of the employees affected by the plan amendment. The pre-tax expense associated with the amortization of recognized net actuarial losses and prior service cost for the years ended December 31, 2020, 2019 and 2018 was CHF 14 million, CHF 20 million and CHF 47 million, respectively.

112 Critical accounting estimates
[this page intentionally left blank]

113
Liquidity and funding management 114
Capital management 122
Risk management 139
Balance sheet and off-balance sheet 179
III – Treasury, Risk, Balance sheet and Off-balance sheet

114 Liquidity and funding management
Liquidity and funding management
During 2020, we maintained a strong liquidity and funding position. The majority of our unsecured funding was generated from core customer deposits and long-term debt.
Liquidity managementIn response to regulatory reform, since 2015 we have primarily focused our issuance strategy on offering long-term debt securi-ties at the Group level for funding and capital purposes. Prior to that, securities for funding and capital purposes were primarily issued by the Bank, our principal operating subsidiary and a US registrant, and recently we have begun to issue short duration securities at the Bank level for funding diversification. Our primary source of liquidity is funding through consolidated entities. Pro-ceeds from issuances are lent to operating subsidiaries and affili-ates on both a senior and subordinated basis, as needed; the lat-ter typically to meet going and gone concern capital requirements and the former as desired by management to support business initiatives and liquidity needs.
Our liquidity and funding strategy is approved by the Capital Allo-cation & Risk Management Committee (CARMC) and overseen by the Board of Directors (Board). The implementation and exe-cution of the liquidity and funding strategy is managed within the division of the Chief Financial Officer (CFO) by Treasury and our global liquidity group. The global liquidity group was established in 2018 to centralize control of liability and collateral management with the aim of optimizing our liquidity sourcing, funding costs and high-quality liquid assets (HQLA) portfolio on behalf of Treasury. Treasury ensures adherence to our funding policy and the global liquidity group is focused on the efficient coordination of the short-term unsecured and secured funding desks. This approach enhances our ability to manage potential liquidity and funding risks and to promptly adjust our liquidity and funding levels to meet stress situations. Our liquidity and funding profile is regularly reported to CARMC and the Board, who define our risk tolerance, including liquidity risk, and set parameters for the balance sheet and funding usage of our businesses. The Board is responsible for defining our overall risk tolerance in the form of a risk appetite statement.
Our liquidity and funding profile reflects our strategy and risk appetite and is driven by business activity levels and the overall operating environment. We have adapted our liquidity and fund-ing profile to reflect lessons learned from the financial crisis, the subsequent changes in our business strategy and regulatory developments. We have been an active participant in regulatory and industry forums to promote best practice standards on quan-titative and qualitative liquidity management. Our internal liquidity risk management framework is subject to review and monitor-ing by the Swiss Financial Market Supervisory Authority FINMA (FINMA), other regulators and rating agencies.
Regulatory framework
BIS liquidity frameworkThe Basel Committee on Banking Supervision (BCBS) estab-lished the Basel III international framework for liquidity risk mea-surement, standards and monitoring. The Basel III framework includes a liquidity coverage ratio (LCR) and a net stable funding ratio (NSFR). Credit Suisse is subject to the Basel III frame-work, as implemented in Switzerland, as well as Swiss legisla-tion and regulations for systemically important banks (Swiss Requirements).
The LCR addresses liquidity risk over a 30-day period. The LCR aims to ensure that banks have unencumbered HQLA available to meet short-term liquidity needs under a severe stress scenario. The LCR is comprised of two components, the value of HQLA in stressed conditions and the total net cash outflows calculated according to specified scenario parameters. Under the BCBS framework, the minimum required ratio of liquid assets over net cash outflows is 100%.
The NSFR establishes criteria for a minimum amount of stable funding based on the liquidity of a bank’s on- and off-balance sheet activities over a one-year horizon. The NSFR is a comple-mentary measure to the LCR and is structured to ensure that illiquid assets are funded with an appropriate amount of stable long-term funds. The NSFR is defined as the ratio of available stable funding over the amount of required stable funding and, once implemented by national regulators, should always be at least 100%.
Swiss liquidity requirementsThe Swiss Federal Council adopted a liquidity ordinance (Liquid-ity Ordinance) that implements Basel III liquidity requirements into Swiss law. Under the Liquidity Ordinance, systemically rel-evant banks like Credit Suisse are subject to a minimum LCR requirement of 100% at all times and the associated disclosure requirements.
> Refer to credit-suisse.com/regulatorydisclosures for additional information.
FINMA requires us to report the NSFR to FINMA on a monthly basis during an observation period that began in 2012. The reporting instructions are generally aligned with the final BCBS NSFR requirements. Although originally planned for January 1, 2018, the Federal Council had decided to postpone the introduc-tion of the NSFR as a minimum standard in Switzerland. On Sep-tember 11, 2020, the Federal Council adopted an amendment to the Liquidity Ordinance, implementing NSFR as a minimum

115Liquidity and funding management
standard beginning July 1, 2021, including the associated disclo-sure requirements. On November 12, 2020, FINMA published a partially revised “Liquidity risks – banks” Circular, which sets out FINMA’s technical requirements and will also come into force on July 1, 2021.
Our liquidity principles and our liquidity risk management frame-work as agreed with FINMA are in line with the Basel III liquidity framework.
Liquidity risk management
Our approach to liquidity risk management Our liquidity and funding policy is designed to ensure that fund-ing is available to meet all obligations in times of stress, whether caused by market events or issues specific to Credit Suisse. We achieve this through a conservative asset/liability management strategy aimed at maintaining long-term funding, including stable deposits, in excess of illiquid assets. To address short-term liquid-ity stress, we maintain a liquidity pool, as described below, that covers unexpected outflows in the event of severe market and idiosyncratic stress. Our liquidity risk parameters reflect various liquidity stress assumptions that we believe are conservative. We manage our liquidity profile at a sufficient level such that, in the event we are unable to access unsecured funding, we expect to have sufficient liquidity to sustain operations for a period of time in excess of our minimum limit. This includes potential currency mismatches, which are not deemed to be a major risk but are monitored and subject to limits, particularly in the significant cur-rencies of euro, Japanese yen, pound sterling, Swiss franc and US dollar.
Although compliance with a minimum NSFR is not yet required, we began using the NSFR in 2012 as one of our primary tools, in parallel with the internal liquidity barometer, and in 2014 the LCR, to monitor our structural liquidity position and plan funding.
We use our internal liquidity barometer to manage liquidity to internal targets and as a basis to model both Credit Suisse-spe-cific and market-wide stress scenarios and their impact on liquid-ity and funding. Our internal barometer framework supports the management of our funding structure. It allows us to manage the time horizon over which the stressed market value of unencum-bered assets (including cash) exceeds the aggregate value of contractual outflows of unsecured liabilities plus a conservative forecast of anticipated contingent commitments. This internal barometer framework enables us to manage liquidity to a desired profile under a Credit Suisse-specific or market-wide stress that permits us to continue business activities for a period of time (also known as a liquidity horizon) without changing business plans. Under this framework, we also have short-term targets based on additional stress scenarios to ensure uninterrupted liquidity for short time frames. At the beginning of 2017, we introduced a new version of our internal liquidity barometer, which includes enhanced functionalities to manage entity-specific liquidity under newly defined and more conservative stress scenarios for rede-fined short and long-term time horizons.
In the second quarter of 2014, we began allocating the major-ity of the balance sheet usage related to our Treasury-managed HQLA portfolio to the business divisions to allow for a more efficient management of their business activities from an over-all Group perspective with respect to LCR and Swiss leverage requirements.
Our overall liquidity management framework allows us to run stress analyses on our balance sheet and off-balance sheet posi-tions, which include, but are not limited to, the following:p A multiple-notch downgrade in the Bank’s long-term debt
credit ratings, which would require additional funding as a result of certain contingent off-balance sheet obligations;
p Significant withdrawals from private banking client deposits;p Potential cash outflows associated with the prime brokerage
business;p Over-collateralization of available secured funding;p Limited availability of capital markets, certificates of deposit
and commercial paper; p Other money market access will be significantly reduced;p A reduction in funding value of unencumbered assets;p The inaccessibility of assets held by subsidiaries due to regula-
tory, operational and other constraints;p The possibility of providing non-contractual liquidity support in
times of market stress, including purchasing our unsecured debt;p Monitoring the concentration in sources of wholesale funding
and thus encourage funding diversification;p Monitoring the composition and analysis of the unencumbered
assets;p Restricted availability of foreign currency swap markets; andp Other scenarios as deemed necessary from time to time.
Governance Funding, liquidity, capital and our foreign exchange exposures are managed centrally by Treasury. Oversight of these activities is provided by CARMC, a committee that includes the chief execu-tive officers (CEOs) of the Group and the divisions, the CFO, the Chief Risk and Compliance Officer (CRCO) and the Treasurer.
It is CARMC’s responsibility to review the capital position, balance sheet development, current and prospective funding, interest rate risk and foreign exchange exposure and to define and monitor adherence to internal risk limits. CARMC regularly reviews the methodology and assumptions of our liquidity risk management framework and determines the liquidity horizon to be maintained.
All liquidity stress tests are coordinated and overseen by the CRCO to ensure a consistent and coordinated approach across all risk disciplines.
Contingency funding planningIn the event of a liquidity crisis, our Contingency Funding Plan provides for specific actions to be taken depending on the nature of the crisis. Our plan is designed to address ever-increasing liquidity and funding stresses and has pre-defined escalation lev-els aimed at maximizing the likelihood that we can take certain

116 Liquidity and funding management
measures to address liquidity or funding shortfalls. In order to identify a deteriorating liquidity situation, we monitor a set of regulatory and economic liquidity metrics while also seeking the views of our subject matter experts as well as Group and entity senior management, who retain at all times the authority to take remedial actions promptly. In all cases, the plan’s primary objec-tives are to strengthen liquidity (immediate), reduce funding needs (medium term) and assess recovery options (longer term).
Liquidity metrics
Liquidity pool Treasury manages a sizeable portfolio of HQLA comprised of cash held at central banks and securities. A portion of the liquid-ity pool is generated through reverse repurchase agreements with top-rated counterparties. We are mindful of potential credit risk and therefore focus our liquidity holdings strategy on cash held at central banks and highly rated government bonds and on short-term reverse repurchase agreements. These government bonds are eligible as collateral for liquidity facilities with various central banks including the Swiss National Bank (SNB), the US Fed-eral Reserve (Fed), the European Central Bank (ECB) and the Bank of England. Our direct exposure on these bonds is limited to highly liquid, top-rated sovereign entities or fully guaranteed agencies of sovereign entities. The liquidity pool may be used to meet the liquidity requirements of our operating companies. All securities, including those obtained from reverse repurchase agreements, are subject to a stress level haircut in our barometer to reflect the risk that emergency funding may not be available at market value in a stress scenario.
We centrally manage this liquidity pool and hold it at our main operating entities. Holding securities in these entities ensures that we can make liquidity and funding available to local entities in need without delay.
As of December 31, 2020, our liquidity pool managed by Trea-sury and the global liquidity group had an average HQLA value of CHF 201.3 billion. The liquidity pool consisted of CHF 114.4 bil-lion of cash held at major central banks, primarily the SNB, the ECB and the Fed, and CHF 86.9 billion market value of securities issued by governments and government agencies, primarily from the US and the UK.
In addition to the above-mentioned liquidity pool, there is also a portfolio of unencumbered liquid assets managed by the busi-nesses, primarily in the Investment Bank division, in coopera-tion with the global liquidity group. These assets generally include high-grade bonds and highly liquid equity securities that form part of major indices. In coordination with the businesses and the global liquidity group, Treasury can access these assets to gener-ate liquidity if required. As of December 31, 2020, this portfolio of liquid assets had a market value of CHF 25.9 billion, consisting of CHF 10.6 billion of high-grade bonds and CHF 15.3 billion of highly liquid equity securities. Under our internal model, an aver-age stress-level haircut of 13% is applied to these assets. The haircuts applied to this portfolio reflect our assessment of overall market risk at the time of measurement, potential monetization capacity taking into account increased haircuts, market volatility and the quality of the relevant securities.
Liquidity pool – Group 2020 2019
Swiss US Other
end of franc dollar Euro currencies Total Total
Liquid assets (CHF million)
Cash held at central banks 77,061 11,800 23,016 2,552 114,429 82,209
Securities 13,083 48,781 7,037 17,966 86,867 82,641
Liquid assets 1 90,144 60,581 30,053 20,518 201,296 164,850
1 Reflects a pre-cancellation view.
Liquidity Coverage Ratio Our calculation methodology for the LCR is prescribed by FINMA and uses a three-month average that is measured using daily calculations during the quarter. The FINMA calculation of HQLA takes into account a cancellation mechanism (post-cancellation view) and is therefore not directly comparable to the assets pre-sented in the financial statements that could potentially be mon-etized under a severe stress scenario. The cancellation mecha-nism effectively excludes the impact of certain secured financing transactions from available HQLA and simultaneously adjusts the level of net cash outflows calculated. Application of the cancella-tion mechanism adjusts both the numerator and denominator of the LCR calculation, meaning that the impact is mostly neutral on the LCR itself.
Our HQLA measurement methodology excludes potentially eligible HQLA available for use by entities of the Group in cer-tain jurisdictions that may not be readily accessible for use by the Group as a whole. These HQLA eligible amounts may be restricted for reasons such as local regulatory requirements, including large exposure requirements, or other binding con-straints that could limit the transferability to other Group entities in other jurisdictions.
On this basis, the level of our LCR was 190% as of the end of 2020, a decrease from 198% as of the end of 2019, represent-ing an average HQLA of CHF 204 billion and average net cash outflows of CHF 107 billion. The ratio reflects a conservative liquidity position, including ensuring that the Group’s branches and subsidiaries meet applicable local liquidity requirements and

117Liquidity and funding management
taking a prudent approach to liquidity management during the COVID-19 pandemic.
The decrease in the LCR compared to 2019 reflected an increase in net cash outflows, which was partially offset by a higher level of average HQLA. The increase in net cash outflows primar-ily resulted from a decrease in net cash inflows associated with secured wholesale funding and secured lending activities, a decrease in cash inflows from fully performing exposures, as well
as higher cash outflows from additional requirements primarily related to derivative exposures and other collateral requirements. These increases in net cash outflows were partially offset by lower cash outflows from unsecured wholesale funding, primarily driven by decreases in unsecured debt. The higher level of HQLA reflected an increase in the amount of cash held with central banks, as well as an increase in the amount of securities held during the period.
Liquidity coverage ratio – Group 2020 2019
Unweighted Weighted Weighted
end of value 1 value 2 value 2
High-quality liquid assets (CHF million)
High-quality liquid assets 3 – 203,536 164,503
Cash outflows
Retail deposits and deposits from small business customers 161,262 19,825 20,519
Unsecured wholesale funding 235,302 89,758 92,801
Secured wholesale funding – 44,979 49,456
Additional requirements 175,292 35,989 33,761
Other contractual funding obligations 56,751 56,751 58,909
Other contingent funding obligations 214,181 5,574 5,792
Total cash outflows – 252,876 261,238
Cash inflows
Secured lending 124,593 59,090 84,353
Inflows from fully performing exposures 62,541 28,081 32,567
Other cash inflows 58,329 58,329 61,063
Total cash inflows 245,463 145,500 177,983
Liquidity coverage ratio
High-quality liquid assets (CHF million) – 203,536 164,503
Net cash outflows (CHF million) – 107,376 83,255
Liquidity coverage ratio (%) – 190 198
Calculated using a three-month average, which is calculated on a daily basis.1 Calculated as outstanding balances maturing or callable within 30 days.2 Calculated after the application of haircuts for high-quality liquid assets or inflow and outflow rates.3 Consists of cash and eligible securities as prescribed by FINMA and reflects a post-cancellation view.
Funding managementTreasury is responsible for the development, execution and regu-lar updating of our funding plan. The plan reflects projected busi-ness growth, development of the balance sheet, future funding needs and maturity profiles as well as the effects of changing market and regulatory conditions.
Interest expense on long-term debt is monitored and managed relative to certain indices, which historically included interbank offered rate (IBOR) benchmarks, but is now transitioning to alter-native reference rates (ARRs) in place of IBORs. This follows from our own internal IBOR transition program to coordinate tran-sition readiness on a firm-wide basis and is aligned with interna-tional and regulatory expectations. This approach to term funding best reflects the sensitivity of both our liabilities and our assets to changes in interest rates.

118 Liquidity and funding management
Match funded
Balance sheet funding structure
as of December 31, 2020 (CHF billion)
Reverse repurchase agreements 59 Repurchase
75 agreements
28 Short positions
Funding-neutral assets1 64
Cash & due from banks 140
7 Other short-term liabilities2
51 Due to banks
161 Long-term debt
43 Total equity
356 Deposits5
time 79
demand 178
savings 72
fiduciary 27
Unencumbered liquid assets3 105
Loans4 291
Other illiquid assets 103
Assets 806 806 Liabilities and Equity
Funding-neutral 64 liabilities1
122% coverage
1 Primarily includes brokerage receivables/payables, positive/negative replacement values and cash collateral.
2 Primarily includes excess of funding neutral liabilities (brokerage payables) over cor-responding assets.
3 Primarily includes unencumbered trading assets, unencumbered investment securities and excess reverse repurchase agreements, after haircuts.
4 Excludes loans with banks.5 Excludes due to banks and certificates of deposit.
21 Short-term borrowings
Encumbered trading assets 44
We continually manage the impact of funding spreads through careful management of our liability mix and opportunistic issu-ance of debt. The effect of funding spreads on interest expense depends on many factors, including market conditions, product type and the absolute level of the indices on which our funding is based.
We diversify our long-term funding sources by issuing structured notes, which are debt securities on which the return is linked to commodities, stocks, indices or currencies or other assets. We generally hedge structured notes with positions in the underlying assets or derivatives.
We also use other collateralized financings, including repurchase agreements and securities lending agreements. The level of our repurchase agreements fluctuates, reflecting market opportuni-ties, client needs for highly liquid collateral, such as US treasuries and agency securities, and the impact of balance sheet and risk-weighted asset limits. In addition, matched book trades, under which securities are purchased under agreements to resell and are simultaneously sold under agreements to repurchase with comparable maturities, earn spreads, are relatively risk free and are generally related to client activity.
Funding sourcesWe fund our balance sheet primarily through core customer deposits, long-term debt, including structured notes, and share-holders’ equity. We monitor the funding sources, including their concentrations against certain limits, according to their counter-party, currency, tenor, geography and maturity, and whether they are secured or unsecured. A substantial portion of our balance sheet is match funded and requires no unsecured funding. Match funded balance sheet items consist of assets and liabilities with close to equal liquidity durations and values so that the liquidity and funding generated or required by the positions are substan-tially equivalent.
Cash and due from banks and reverse repurchase agreements are highly liquid. A significant part of our assets, principally unen-cumbered trading assets that support the securities business, is comprised of securities inventories and collateralized receivables that fluctuate and are generally liquid. These liquid assets are available to settle short-term liabilities.
Loans, which comprise the largest component of our illiquid assets, are funded by our core customer deposits, with an excess coverage of 22% as of the end of 2020, compared to 9% as of the end of 2019, reflecting a small decrease in loans and an increase in deposits. We fund other illiquid assets, including real estate, private equity and other long-term investments as well as the haircut for the illiquid portion of securities, with long-term debt and equity, in which we try to maintain a substantial funding buffer.
Our core customer deposits totaled CHF 356 billion as of the end of 2020, an increase compared to CHF 324 billion as of the end of 2019, reflecting an increase in the customer deposit base in the private banking and corporate & institutional banking busi-nesses in 2020. Core customer deposits are from clients with whom we have a broad and long-standing relationship. Core cus-tomer deposits exclude deposits from banks and certificates of deposit. We place a priority on maintaining and growing customer deposits, as they have proven to be a stable and resilient source of funding even in difficult market conditions. Our core customer deposit funding is supplemented by the issuance of long-term debt.
> Refer to the chart “Balance sheet funding structure” and “Balance sheet” in Balance sheet and off-balance sheet for further information.

119Liquidity and funding management
Funds transfer pricing We maintain an internal funds transfer pricing system based on market rates. Our funds transfer pricing system is designed to allocate to our businesses all funding costs in a way that incen-tivizes their efficient use of funding. Our funds transfer pricing system is an essential tool that allocates to the businesses the short-term and long-term costs of funding their balance sheet usages and off-balance sheet contingencies. The funds trans-fer pricing framework ensures full funding costs allocation under normal business conditions, but it is of even greater importance in a stressed capital markets environment where raising funds is more challenging and expensive. Under this framework, our businesses are also credited to the extent they provide long-term stable funding.
Contractual maturity of assets and liabilitiesThe following table provides contractual maturities of the assets and liabilities specified as of the end of 2020. The contractual maturities are an important source of information for liquidity risk management. However, liquidity risk is also managed based on an expected maturity that considers counterparty behavior and in addition takes into account certain off-balance sheet items such as derivatives. Liquidity risk management performs extensive anal-yses of counterparty behavioral assumptions under various stress scenarios.
> Refer to “Contractual obligations and other commercial commitments” in Bal-ance sheet and off-balance sheet and “Note 34 – Guarantees and commit-ments” in VI – Consolidated financial statements – Credit Suisse Group for further information on contractual maturities of guarantees and commitments.
Contractual maturity of assets and liabilities Between Between Between Greater
Less than 1 to 3 3 to 12 1 to 5 than
end of 2020 On demand 1 month months months years 5 years Total
Assets (CHF million)
Cash and due from banks 134,720 617 621 141 0 3,013 139,112
Interest-bearing deposits with banks 0 219 384 633 22 40 1,298
Central bank funds sold, securities purchased under
resale agreements and securities borrowing transactions 20,495 28,234 10,552 17,567 2,239 46 79,133
Securities received as collateral, at fair value 50,170 268 292 43 0 0 50,773
Trading assets, at fair value 157,338 0 0 0 0 0 157,338
Investment securities 0 0 1 148 2 456 607
Other investments 0 13 3 0 0 5,396 5,412
Net loans 8,109 53,717 25,881 55,827 97,361 51,013 291,908
Goodwill 0 0 0 0 0 4,426 4,426
Other intangible assets 0 0 0 0 0 237 237
Brokerage receivables 35,941 0 0 0 0 0 35,941
Other assets 13,350 1,733 5,457 1,682 4,062 13,353 39,637
Total assets 420,123 84,801 43,191 76,041 103,686 77,980 805,822
Liabilities
Due to banks 6,321 1,984 6,011 2,097 10 0 16,423
Customer deposits 266,725 29,231 45,687 47,763 972 543 390,921
Central bank funds purchased, securities sold under
repurchase agreements and securities lending transactions 9,833 5,807 5,763 901 1,547 0 23,851
Obligation to return securities received as collateral, at fair value 50,170 268 292 43 0 0 50,773
Trading liabilities, at fair value 45,871 0 0 0 0 0 45,871
Short-term borrowings 0 2,168 6,721 11,979 0 0 20,868
Long-term debt 0 2,226 2,069 20,688 79,450 56,654 161,087
Brokerage payables 21,653 0 0 0 0 0 21,653
Other liabilities 19,817 6,640 135 845 2,101 1,896 31,434
Total liabilities 420,390 48,324 66,678 84,316 84,080 59,093 762,881
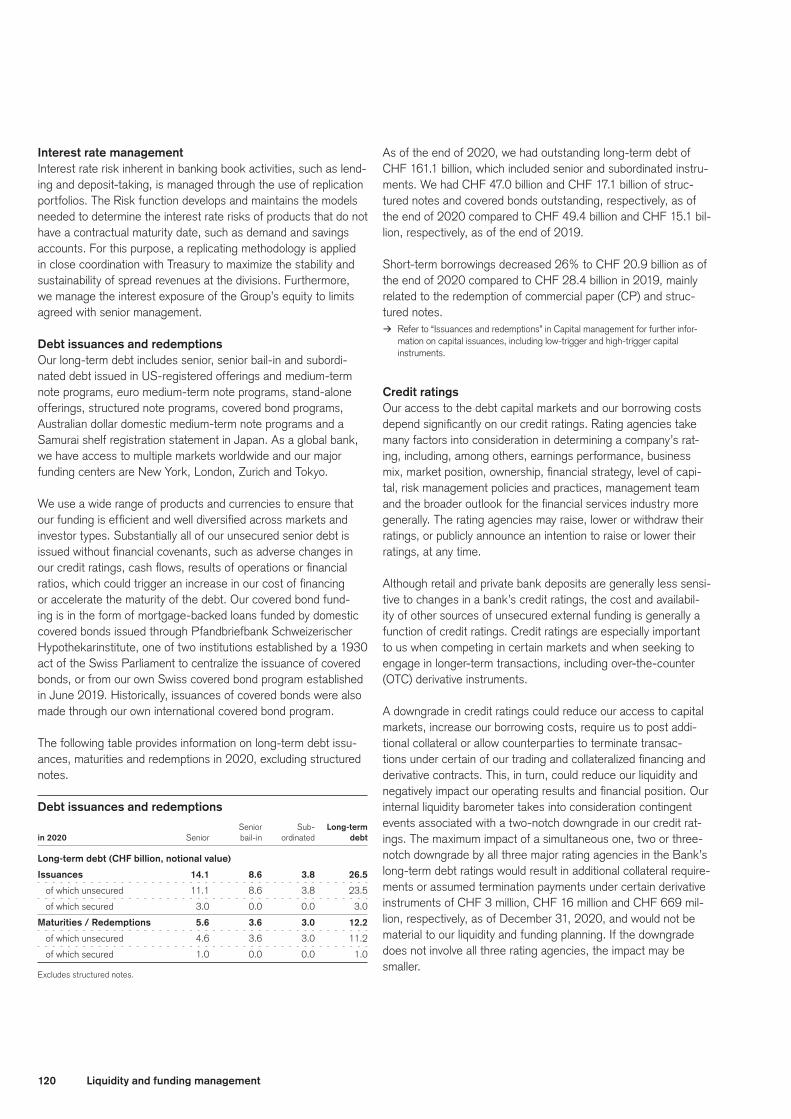
120 Liquidity and funding management
Interest rate management Interest rate risk inherent in banking book activities, such as lend-ing and deposit-taking, is managed through the use of replication portfolios. The Risk function develops and maintains the models needed to determine the interest rate risks of products that do not have a contractual maturity date, such as demand and savings accounts. For this purpose, a replicating methodology is applied in close coordination with Treasury to maximize the stability and sustainability of spread revenues at the divisions. Furthermore, we manage the interest exposure of the Group’s equity to limits agreed with senior management.
Debt issuances and redemptions Our long-term debt includes senior, senior bail-in and subordi-nated debt issued in US-registered offerings and medium-term note programs, euro medium-term note programs, stand-alone offerings, structured note programs, covered bond programs, Australian dollar domestic medium-term note programs and a Samurai shelf registration statement in Japan. As a global bank, we have access to multiple markets worldwide and our major funding centers are New York, London, Zurich and Tokyo.
We use a wide range of products and currencies to ensure that our funding is efficient and well diversified across markets and investor types. Substantially all of our unsecured senior debt is issued without financial covenants, such as adverse changes in our credit ratings, cash flows, results of operations or financial ratios, which could trigger an increase in our cost of financing or accelerate the maturity of the debt. Our covered bond fund-ing is in the form of mortgage-backed loans funded by domestic covered bonds issued through Pfandbriefbank Schweizerischer Hypothekarinstitute, one of two institutions established by a 1930 act of the Swiss Parliament to centralize the issuance of covered bonds, or from our own Swiss covered bond program established in June 2019. Historically, issuances of covered bonds were also made through our own international covered bond program.
The following table provides information on long-term debt issu-ances, maturities and redemptions in 2020, excluding structured notes.
Debt issuances and redemptions Senior Sub- Long-term
in 2020 Senior bail-in ordinated debt
Long-term debt (CHF billion, notional value)
Issuances 14.1 8.6 3.8 26.5
of which unsecured 11.1 8.6 3.8 23.5
of which secured 3.0 0.0 0.0 3.0
Maturities / Redemptions 5.6 3.6 3.0 12.2
of which unsecured 4.6 3.6 3.0 11.2
of which secured 1.0 0.0 0.0 1.0
Excludes structured notes.
As of the end of 2020, we had outstanding long-term debt of CHF 161.1 billion, which included senior and subordinated instru-ments. We had CHF 47.0 billion and CHF 17.1 billion of struc-tured notes and covered bonds outstanding, respectively, as of the end of 2020 compared to CHF 49.4 billion and CHF 15.1 bil-lion, respectively, as of the end of 2019.
Short-term borrowings decreased 26% to CHF 20.9 billion as of the end of 2020 compared to CHF 28.4 billion in 2019, mainly related to the redemption of commercial paper (CP) and struc-tured notes.
> Refer to “Issuances and redemptions” in Capital management for further infor-mation on capital issuances, including low-trigger and high-trigger capital instruments.
Credit ratings Our access to the debt capital markets and our borrowing costs depend significantly on our credit ratings. Rating agencies take many factors into consideration in determining a company’s rat-ing, including, among others, earnings performance, business mix, market position, ownership, financial strategy, level of capi-tal, risk management policies and practices, management team and the broader outlook for the financial services industry more generally. The rating agencies may raise, lower or withdraw their ratings, or publicly announce an intention to raise or lower their ratings, at any time.
Although retail and private bank deposits are generally less sensi-tive to changes in a bank’s credit ratings, the cost and availabil-ity of other sources of unsecured external funding is generally a function of credit ratings. Credit ratings are especially important to us when competing in certain markets and when seeking to engage in longer-term transactions, including over-the-counter (OTC) derivative instruments.
A downgrade in credit ratings could reduce our access to capital markets, increase our borrowing costs, require us to post addi-tional collateral or allow counterparties to terminate transac-tions under certain of our trading and collateralized financing and derivative contracts. This, in turn, could reduce our liquidity and negatively impact our operating results and financial position. Our internal liquidity barometer takes into consideration contingent events associated with a two-notch downgrade in our credit rat-ings. The maximum impact of a simultaneous one, two or three-notch downgrade by all three major rating agencies in the Bank’s long-term debt ratings would result in additional collateral require-ments or assumed termination payments under certain derivative instruments of CHF 3 million, CHF 16 million and CHF 669 mil-lion, respectively, as of December 31, 2020, and would not be material to our liquidity and funding planning. If the downgrade does not involve all three rating agencies, the impact may be smaller.

121Liquidity and funding management
Potential cash outflows on these derivative contracts associated with a downgrade of our long-term debt credit ratings, such as the requirement to post additional collateral to the counterparty, the loss of re-hypothecation rights on any collateral received and impacts arising from additional termination events, are monitored and taken into account in the calculation of our liquidity require-ments. There are additional derivative related risks that do not relate to the downgrade of our long-term debt credit ratings and which may impact our liquidity position, including risks relating to holdings of derivatives collateral or potential movements in the valuation of derivatives positions. The potential outflows resulting across all derivative product types are monitored as part of the LCR scenario parameters and the internal liquidity reporting.
> Refer to “Investor information” in the Appendix for further information on Group and Bank credit ratings.
Cash flows from operating, investing and financing activities As a global financial institution, our cash flows are complex and interrelated and bear little relation to our net earnings and net assets. Consequently, we believe that traditional cash flow analy-sis is less meaningful in evaluating our liquidity position than the liquidity and funding policies described above. Cash flow analysis may, however, be helpful in highlighting certain macro trends in our business.
For the year ended December 31, 2020, net cash used in oper-ating activities of continuing operations was CHF 6.5 billion, primarily reflecting an increase in other assets and an increase in valuation adjustments relating to long-term debt, partially offset by a decrease in net trading assets and liabilities. Our operat-ing assets and liabilities vary significantly in the normal course of business due to the amount and timing of cash flows. Manage-ment believes cash flows from operations, available cash bal-ances and short-term and long-term borrowings will be sufficient to fund our operating liquidity needs.
Our investing activities primarily include originating loans to be held to maturity, other receivables and the investment secu-rities portfolio. For the year ended December 31, 2020, net cash used in investing activities from continuing operations was CHF 16.7 billion, primarily due to a decrease in central bank funds sold, securities purchased under resale agreements and securities borrowing transactions and by the proceeds from sales of loans, partially offset by an increase in loans.
Our financing activities primarily include the issuance of debt and receipt of customer deposits. We pay annual dividends on our common shares. In 2020, net cash provided by financing activities of continuing operations was CHF 29.7 billion, mainly reflecting the issuance of long-term debt, the increase in due to banks and customer deposits, the sale of treasury shares, par-tially offset by the repayment of long-term debt, the repurchase of treasury shares, the decrease in short-term borrowings and the decrease in central bank funds purchased, securities sold under repurchase agreements and securities lending transactions.

122 Capital management
Capital management
As of the end of 2020, our BIS CET1 ratio was 12.9% and our BIS tier 1 leverage ratio was 6.4%.
Capital strategyCredit Suisse considers a strong and efficient capital posi-tion to be a priority. Through our capital strategy, our goal is to strengthen our capital position and optimize the use of risk-weighted assets (RWA), particularly in light of emerging regula-tory capital requirements.
The overall capital needs of Credit Suisse reflect management’s regulatory and credit rating objectives as well as our underly-ing risks. Our framework considers the capital needed to absorb losses, both realized and unrealized, while remaining a strongly capitalized institution. Multi-year projections and capital plans are prepared for the Group and its major subsidiaries and reviewed throughout the year with their regulators. These plans are subject to various stress tests, reflecting both macroeconomic and spe-cific risk scenarios. Capital contingency plans are developed in connection with these stress tests to ensure that possible mitigat-ing actions are consistent with both the amount of capital at risk and the market conditions for accessing additional capital.
Regulatory frameworkCredit Suisse is subject to the Basel III framework, as imple-mented in Switzerland, as well as Swiss legislation and regula-tions for systemically important banks (Swiss Requirements), which include capital, liquidity, leverage and large exposure requirements and rules for emergency plans designed to main-tain systemically relevant functions in the event of threatened insolvency.
The Basel framework describes a range of options for determin-ing capital requirements in order to provide banks and supervisors the ability to select approaches that are most appropriate for their operations and their financial market infrastructure. In general, Credit Suisse has adopted the most advanced approaches, which align with the way that risk is internally managed and provide the greatest risk sensitivity.
Our capital metrics fluctuate during any reporting period in the ordinary course of business.
BIS Requirements
The BCBS, the standard setting committee within the Bank for International Settlements (BIS), issued the Basel III framework, with higher minimum capital requirements and conservation and countercyclical buffers, revised risk-based capital measures, a leverage ratio and liquidity standards. The framework was designed to strengthen the resilience of the banking sector and requires banks to hold more capital, mainly in the form of com-mon equity. The new capital standards became fully effective on January 1, 2019 for those countries that have adopted Basel III.
Under Basel III, the minimum common equity tier 1 (CET1) requirement is 4.5% of RWA. In addition, a 2.5% CET1 capital conservation buffer is required to absorb losses in periods of financial and economic stress.
A progressive buffer between 1% and 2.5% (with a possible additional 1% surcharge) of CET1, depending on a bank’s sys-temic importance, is an additional capital requirement for global systemically important banks (G-SIBs). The Financial Stability Board (FSB) identified Credit Suisse as a G-SIB. A progressive buffer of 1% was applied to Credit Suisse in 2020 and will remain unchanged for 2021.
CET1 capital is subject to certain regulatory deductions and other adjustments to common equity, including the deduction of deferred tax assets for tax-loss carry-forwards, goodwill and other intangible assets.
In addition to the CET1 requirements, there is also a require-ment for 1.5% of additional tier 1 capital and 2% of tier 2 capital. These requirements may also be met with CET1 capital. To qual-ify as additional tier 1 under Basel III, capital instruments must provide for principal loss absorption through a conversion into common equity or a write-down of principal feature. The trigger for such conversion or write-down must include a CET1 ratio of at least 5.125% as well as a trigger at the point of non-viability.

123Capital management
Capital frameworks for Credit Suisse
BIS Requirements Swiss Requirements
Countercyclical buffer up to 2.5% CET1
Countercyclical buffer up to 2.5% CET1
1 Does not include any rebates for resolvability and for certain tier 2 low-trigger instruments recognized in gone concern capital.
4.5% CET14.5% CET1
Minimum component
2.5% Capital conservation buffer
1% Progressive buffer
1.5% Additional tier 1
2% Tier 2
11.5%
9.5% 10%
14.3%
28.6%
8%
Goi
ng c
once
rn
4.3% Additional tier 1
Gon
e co
ncer
n
14.3%1 Bail-in debt instruments
5.5% CET1 Buffer component
Basel III further provides for a countercyclical buffer that could require banks to hold up to 2.5% of CET1. This requirement is imposed by national regulators where credit growth is deemed to be excessive and leading to the build-up of system-wide risk.
Banks are required to maintain a tier 1 leverage ratio of 3%.
Swiss Requirements
The legislation implementing the Basel III framework in Switzer-land in respect of capital requirements for systemically relevant banks, including Credit Suisse, goes beyond the Basel III mini-mum standards for systemically relevant banks.
Under the Capital Adequacy Ordinance, Swiss banks classified as systemically important banks operating internationally, such as Credit Suisse, are subject to two different minimum requirements for loss-absorbing capacity: such banks must hold sufficient capital that absorbs losses to ensure continuity of service (going concern requirement), and they must issue sufficient debt instru-ments to fund an orderly resolution without recourse to public resources (gone concern requirement).
Going concern capital and gone concern capital together form our total loss-absorbing capacity (TLAC). The going concern and gone concern requirements are generally aligned with the FSB’s total loss-absorbing capacity standard.
Both the going concern and the gone concern requirements were subject to phase-in, with gradually increasing requirements as well as grandfathering provisions for certain outstanding instru-ments, and became fully effective on January 1, 2020. Under the Capital Adequacy Ordinance’s grandfathering provisions, addi-tional tier 1 capital instruments with a low trigger qualify as going concern capital until their first call date; additional tier 1 capital instruments and tier 2 capital instruments that no longer qualify as going concern capital, qualify as gone concern capital until ter-mination or one year before their final maturity, respectively.
Additionally, there are FINMA decrees that apply to Credit Suisse as a systemically important bank operating internationally, includ-ing capital adequacy requirements as well as liquidity and risk diversification requirements.
Banks that do not maintain the minimum requirements may be limited in their ability to pay dividends and make discretionary bonus payments and other earnings distributions.

124 Capital management
Going concern requirementThe going concern requirement applicable in 2020 for a G-SIB consists of (i) a base requirement of 12.86% of RWA and 4.5% of leverage exposure; and (ii) a surcharge, which reflects the G-SIB’s systemic importance. For Credit Suisse, this translates into a going concern requirement in 2020 of 14.3% of RWA, of which the minimum CET1 component is 10%, with the remainder to be met with a maximum of 4.3% additional tier 1 capital, which includes high-trigger capital instruments that would be converted into common equity or written down if the CET1 ratio falls below 7%. Under the going concern requirement, the Swiss leverage ratio must be 5%, of which the minimum CET1 component is 3.5%, with the remainder to be met with a maximum of 1.5% additional tier 1 capital, which includes high-trigger capital instruments.
Gone concern requirementThe gone concern requirement of a G-SIB is equal to its total going concern requirement, which in 2020 consists of a base requirement of 12.86% of RWA and 4.5% of leverage exposure, plus any sur-charges applicable to the relevant G-SIB. The gone concern require-ment does not include any countercyclical buffers. Credit Suisse is subject to a gone concern requirement in 2020 of 14.3% of RWA and a 5% Swiss leverage ratio and is subject to potential capital rebates for resolvability and for certain tier 2 low-trigger instruments recognized as gone concern capital.
The gone concern requirement should primarily be fulfilled with bail-in instruments that are designed to absorb losses after the write-down or conversion into equity of regulatory capital of a G-SIB in a restructuring scenario, but before the write-down or conversion into equity of other senior obligations of the G-SIB. Bail-in instruments do not feature capital triggers that may lead to a write-down and/or a conversion into equity outside of restructuring, but only begin to bear losses once the G-SIB is formally in restructuring proceedings and FINMA orders capital measures (i.e., a write-down and/or a conver-sion into equity) in the restructuring plan.
Bail-in instruments must fulfill certain criteria in order to qualify under the gone concern requirement, including FINMA approval. In addition to bail-in instruments, the gone concern requirement may further be fulfilled with other capital instruments, including CET1, additional tier 1 capital instruments or tier 2 capital instruments.
FINMA decreesThe SNB designated the Group as a financial group of systemic importance under applicable Swiss law. FINMA requires the Group to fully comply with the special requirements for systemi-cally important banks operating internationally, which include capital adequacy requirements and also specify liquidity and risk diversification requirements.
In December 2013, FINMA issued a decree (2013 FINMA Decree), specifying capital adequacy requirements for the Bank on a stand-alone basis (Bank parent company), and for the Bank and the Group, each on a consolidated basis, as systemically relevant institutions.
In October 2017, FINMA issued an additional decree with respect to the regulatory capital requirements of the Bank parent com-pany (2017 FINMA Decree), specifying the treatment of invest-ments in subsidiaries for capital adequacy purposes. This decree partially replaced certain aspects of the 2013 FINMA Decree, but all other aspects of that decree remain in force. The changes aim to create a capital adequacy framework for the Bank parent com-pany that is more comparable to relevant international frameworks and does not rely on exemptions from, or corrections of, the basic framework applicable to all Swiss banks. The changes only apply to the going concern capital requirements for the Bank parent company.
The 2017 FINMA Decree requires the Bank parent company to risk-weight both direct and indirect investments in subsidiaries, with the initial risk-weight set at 200%. Beginning in 2019, these risk-weights have gradually begun to increase over 10 years to 250% for participations in subsidiaries in Switzerland and to 400% for participations in subsidiaries abroad. In 2020, partici-pations in subsidiaries in Switzerland were risk-weighted at 210% and participations in subsidiaries abroad at 240%.
The 2017 FINMA Decree also applies an adjustment (referred to as a regulatory filter) to any impact on CET1 capital arising from the accounting change under applicable Swiss banking rules for the Bank parent company’s investments in subsidiaries from the portfolio valuation method to the individual valuation method, which was implemented as of December 31, 2019. In contrast to the accounting treatment, the regulatory filter allows Credit Suisse to measure the regulatory capital position as if the Bank parent com-pany had maintained the portfolio valuation method. As a result, the methodology valuation losses under the individual valuation method are reversed and the Bank parent company’s CET1 capital as well as the Bank parent company’s participation values, which are subject to risk weighting, are higher, since the regulatory filter allows the reversal of the methodology valuation losses under the individual valuation method, in comparison to the portfolio valuation method applied for regulatory capital.
> Refer to credit-suisse.com/regulatorydisclosures for the Bank parent com-pany’s regulatory disclosures.

125Capital management
Swiss capital and leverage requirements for Credit Suisse Capital Leverage
Effective as of January 1, 2020 ratio ratio
Capital components (%)
CET1 – minimum 4.5 1.5
Additional tier 1 – maximum 3.5 1.5
Minimum component 8.0 3.0
CET1 – minimum 5.5 2.0
Additional tier 1 – maximum 0.8 0.0
Buffer component 6.3 2.0
Going concern 14.3 5.0
of which base requirement 12.86 4.5
of which surcharge 1.44 0.5
Gone concern 14.3 5.0
of which base requirement 12.86 4.5
of which surcharge 1.44 0.5
Total loss-absorbing capacity 28.6 10.0
Does not include the effects of the countercyclical buffers and any rebates for resolvability and for certain tier 2 low-trigger instruments recognized in gone concern capital. As of the end of 2020, for the Group, the rebates for resolvability and for certain tier 2 low-trigger instruments for the capital ratios were 2.565% and 0.436%, respectively, and for the Bank, they were 2.565% and 0.435%, respectively. For the Group, the rebates for resolvability and for certain tier 2 low-trigger instruments for leverage ratios were 0.9% and 0.132%, respectively, and for the Bank, they were 0.9% and 0.131%, respectively. Net of these rebates, the gone concern ratio for capital and leverage for the Group were 11.299% and 3.968%, respectively, and for the Bank they were 11.3% and 3.969%, respectively.
Other requirementsRequirements in Switzerland include an extended countercyclical buffer, which is based on the BIS countercyclical buffer that could require banks to hold up to 2.5% of RWA in the form of CET1 cap-ital. The extended countercyclical buffer relates to a requirement that can be imposed by national regulators when credit growth is deemed to be excessive and leading to the build-up of system-wide risk. The Swiss Federal Council has not activated the BIS coun-tercyclical buffer for Switzerland.
FINMA requirements include capital charges for mortgages that finance owner-occupied residential property in Switzerland (mort-gage multiplier). The mortgage multiplier applies for purposes of both BIS and FINMA requirements.
Other regulatory disclosures
In connection with the implementation of Basel III, certain regula-tory disclosures for the Group and certain of its subsidiaries are required. The Group’s Pillar 3 disclosure, regulatory disclosures, additional information on capital instruments, including the main features and terms and conditions of regulatory capital instru-ments and total loss-absorbing capacity-eligible instruments that form part of the eligible capital base and total loss-absorb-ing capacity resources, G-SIB financial indicators, reconciliation requirements, leverage ratios and certain liquidity disclosures as well as regulatory disclosures for subsidiaries can be found on our website.
> Refer to credit-suisse.com/regulatorydisclosures for additional information.
Regulatory developmentsIn response to the COVID-19 pandemic, the Swiss government, the SNB and FINMA have taken various measures to mitigate the consequences for the economy and the financial system, includ-ing the temporary exclusion of central bank reserves from lever-age ratio calculations, deactivation of the Swiss countercyclical capital buffer and modifications to the phase-in of RWA inflation related to certain Basel III revisions to the capital requirements for credit risk. In addition, the BCBS announced changes to the implementation timeline of the outstanding Basel III standards.
> Refer to “COVID-19 pandemic and related regulatory measures” in II – Operat-ing and financial review – Credit Suisse for a discussion of regulatory develop-ments pertaining to COVID-19.
In January 2020, FINMA and Credit Suisse agreed that a substantial part of the net exposure of Credit Suisse AG (Bank parent) toward Credit Suisse Group AG (Group parent) originating from unsecured loans shall be covered by an additional gone concern capacity at the Bank parent. The Group parent, in support of its single point-of-entry bail-in strategy, is obliged to make the additional funds available. These additional funds constitute eligible gone concern capacity. However, to the extent that the aforementioned net exposure of the Bank parent is covered by such funds, they do not qualify for the gone concern capital ratio calculation at the Bank or the Group level.
Since January 1, 2020, the Bank parent company has been sub-ject to new quantitative gone concern requirements for additional loss-absorbing capacity comprising three elements: (i) require-ments for its third-party risk exposure; (ii) a buffer requirement equal to 30% of the consolidated requirement of the Bank; and (iii) the sum of gone concern capital provided to its subsidiar-ies, currently Credit Suisse (Schweiz) AG, Credit Suisse Holdings (USA) Inc., Credit Suisse International and Credit Suisse Secu-rities (Europe) Limited. In accordance with the Capital Ade-quacy Ordinance transitional provision, a second element (buffer requirement) is being phased in from January 1, 2021 to Janu-ary 1, 2024.
Effective January 1, 2020, certain revisions to the capital require-ments of credit risk became effective. The revisions relate to equity investments in funds and central counterparty positions and a new standardized approach for counterparty credit risk (SA-CCR) for derivatives.
In July 2020, the Basel Committee published an updated stan-dard for the regulatory capital treatment of credit valuation adjust-ment (CVA) risk for derivatives and securities financing transac-tions. The revisions for the regulatory capital treatment of CVA risk mainly include recalibrated risk weights and an overall recali-bration of the standardized and basic approach. The implementa-tion date for the revised CVA framework has been set for Janu-ary 1, 2023.

126 Capital management
Capital instrumentsContingent capital instrumentsWe have issued high-trigger and low-trigger capital instruments to meet our capital requirements. Our high-trigger instruments either mandatorily convert into our ordinary shares or their princi-pal amount is written down to zero upon the occurrence of certain specified triggering events. These events include our CET1 ratio falling below 7% (or any lower applicable minimum threshold), or a determination by FINMA that conversion or write down is nec-essary, or that we require public sector capital support, to prevent us from becoming insolvent, bankrupt or unable to pay a material amount of our debts, or other similar circumstances. Conversion or write down can only be prevented if FINMA, at our request, is satisfied that certain conditions exist and conversion or write down is not required. High-trigger instruments are designed to absorb losses before our other capital instruments, including the low-trigger capital instruments. The features of low-trigger capi-tal instruments are described below. Contingent Capital Awards would not convert into common equity, but would be written down to zero upon a trigger event.
Higher Trigger Capital AmountThe capital ratio write-down triggers for certain of our outstand-ing capital instruments take into account the fact that other out-standing capital instruments that contain relatively higher capital ratios as part of their trigger feature are expected to convert into equity or be written down prior to the write-down of such capital instruments. The amount of additional capital that is expected to be contributed by such conversion into equity or write-down is referred to as the Higher Trigger Capital Amount.
The following tier 1 capital notes (collectively, Tier 1 Capital Notes), which have a trigger amount of 5.125% and qualify as low trigger capital instruments, were outstanding as of December 31, 2020:p USD 2.5 billion 6.25% tier 1 capital notes; andp USD 2.25 billion 7.5% tier 1 capital notes.
The following tier 2 capital notes (collectively, Tier 2 Capital Notes), which have a trigger amount of 5% and qualify as low trigger capital instruments, were outstanding as of December 31, 2020:p USD 2.5 billion 6.5% tier 2 capital notes.
Issuances and redemptions Par value
at issuance Year of Currency (million) Coupon rate (%) Description maturity
Issuances – callable bail-in instruments
First quarter of 2020 EUR 1,250 0.65 Senior notes 2028
USD 280 – Zero coupon accreting senior notes 2060
Second quarter of 2020 USD 3,000 4.194 Senior notes 2031
EUR 2,000 3.25 Senior notes 2026
USD 1,500 2.193 Senior notes 2026
GBP 750 2.25 Senior notes 2028
January 2021 to date EUR 1,500 floating rate Senior notes 2026
EUR 1,500 0.625 Senior notes 2033 1
USD 2,000 1.305 Senior notes 2027
Issuances – high-trigger capital instruments
First quarter of 2020 USD 1,000 5.1 Perpetual tier 1 contingent capital notes –
Third quarter of 2020 USD 1,500 5.25 Perpetual tier 1 contingent capital notes –
Fourth quarter of 2020 USD 1,500 4.5 Perpetual tier 1 contingent capital notes –
Redemptions
First quarter of 2020 USD 2,500 5.4 Tier 2 subordinated notes –
CHF 200 3.375 Tier 2 subordinated notes –
USD 1,500 2.75 Senior notes –
Third quarter of 2020 EUR 1,250 5.75 Tier 2 capital notes –
CHF 435 0.63 Senior notes –
Fourth quarter of 2020 GBP 250 7.00 Tier 2 subordinated notes –
USD 2,000 3.125 Senior notes –
USD 45 – Zero coupon tier 2 subordinated notes –
EUR 50 floating rate Senior notes –
1 Matures in 2033 with no call option.

127Capital management
Each of the series of Tier 1 Capital Notes and Tier 2 Capital Notes qualify as low-trigger capital instruments and have a write-down fea-ture, which means that the full principal amount of the notes will be permanently written down to zero upon the occurrence of specified triggering events. These events occur when the amount of our CET1 ratio, together with an additional ratio described below that takes into account other outstanding capital instruments, falls below 5.125% for the Tier 1 Capital Notes and 5% for the Tier 2 Capital Notes. The write-down can only be prevented if FINMA, at our request, is satis-fied that certain conditions exist and determines a write-down is not required. The capital notes will also be written down upon a non-via-bility event, which occurs when FINMA determines that a write-down is necessary, or that we require extraordinary public sector capital support, to prevent us from becoming insolvent, bankrupt or unable to pay a material amount of our debts, or other similar circumstances.
With respect to the capital instruments that specify a trigger event if the CET1 ratio were to fall below 5.125%, the Higher Trigger Capital Amount was CHF 11.4 billion and the Higher Trigger Capital Ratio (i.e., the ratio of the Higher Trigger Capital Amount to the aggregate of all RWA of the Group) was 4.1%, both as of the end of 2020.
With respect to the capital instruments that specify a trigger event if the CET1 ratio were to fall below 5%, the Higher Trig-ger Capital Amount was CHF 15.8 billion and the Higher Trigger Capital Ratio was 5.8%, both as of the end of 2020.
> Refer to the table “BIS capital metrics – Group” for further information on the BIS metrics used to calculate such measures.
BIS capital metrics
BIS capital metrics – Group
end of 2020 2019 % change
Capital and risk-weighted assets (CHF million)
CET1 capital 35,361 36,774 (4)
Tier 1 capital 51,202 49,791 3
Total eligible capital 52,163 52,725 (1)
Risk-weighted assets 275,084 290,463 (5)
Capital ratios (%)
CET1 ratio 12.9 12.7 –
Tier 1 ratio 18.6 17.1 –
Total capital ratio 19.0 18.2 –
Eligible capital – Group
end of 2020 2019 % change
Eligible capital (CHF million)
Total shareholders’ equity 42,677 43,644 (2)
Adjustments
Regulatory adjustments 1 (342) (247) 38
Goodwill 2 (4,681) (4,848) (3)
Other intangible assets 2 (271) (38) –
Deferred tax assets that rely on
future profitability (1,070) (1,465) (27)
Shortfall of provisions to expected losses (176) (458) (62)
Gains/(losses) due to changes in
own credit on fair-valued liabilities 3 2,466 2,911 (15)
Defined benefit pension assets 2 (2,249) (2,263) (1)
Investments in own shares (397) (426) (7)
Other adjustments 4 (596) (36) –
Total adjustments (7,316) (6,870) 6
CET1 capital 35,361 36,774 (4)
High-trigger capital instruments
(7% trigger) 11,410 8,310 37
Low-trigger capital instruments
(5.125% trigger) 4,431 4,707 (6)
Additional tier 1 capital 15,841 13,017 22
Tier 1 capital 51,202 49,791 3
Tier 2 low-trigger capital instruments
(5% trigger) 961 2,934 (67)
Tier 2 capital 5 961 2,934 (67)
Total eligible capital 5 52,163 52,725 (1)
1 Includes certain adjustments, such as a cumulative dividend accrual.2 Net of deferred tax liability.3 Since the first quarter of 2020, net of tax.4 Includes reversals of cash flow hedge reserves and, in 2020, of unrealized gains on cer-
tain investments that are not eligible for CET1 recognition.5 Amounts are shown on a look-through basis. Certain tier 2 instruments are subject to
phase out through 2022. As of 2020 and 2019, total eligible capital was CHF 52,437 million and CHF 53,038 million, including CHF 273 million and CHF 313 million of such instruments and the total capital ratio was 19.1% and 18.3%, respectively.

128 Capital management
2020 Capital movement – Group 2020 2019
CET1 capital (CHF million)
Balance at beginning of period 36,774 35,824
Net income attributable to shareholders 2,669 3,419
Foreign exchange impact 1 (2,664) (985)
Dividends (755) (720)
Reversal of unrealized gains on certain equity investments
not eligible for CET1 recognition (427) 0
Regulatory adjustment of goodwill and intangible assets,
net of deferred tax liability (389) (137)
Repurchase of shares under the share buyback program (325) (1,000)
Other 2 478 373
Balance at end of period 35,361 36,774
Additional tier 1 capital (CHF million)
Balance at beginning of period 13,017 10,216
Foreign exchange impact (1,214) (204)
Issuances 3,633 2,796
Other 3 405 209
Balance at end of period 15,841 13,017
Tier 2 capital (CHF million)
Balance at beginning of period 2,934 3,508
Foreign exchange impact (161) (83)
Redemptions (1,341) 0
Other 4 (471) (491)
Balance at end of period 961 2,934
Eligible capital (CHF million)
Balance at end of period 52,163 52,725
1 Includes US GAAP cumulative translation adjustments and the foreign exchange impact on regulatory CET1 adjustments.
2 Includes the net effect of share-based compensation and a regulatory adjustment of defined benefit pension plan assets.
3 Primarily reflects valuation impacts.4 Includes the impact of the prescribed amortization requirement as instruments move
closer to their maturity date.
Our CET1 ratio was 12.9% as of the end of 2020 compared to 12.7% as of the end of 2019. Our tier 1 ratio was 18.6% as of the end of 2020 compared to 17.1% as of the end of 2019. Our total capital ratio was 19.0% as of the end of 2020 compared to 18.2% as of the end of 2019.
CET1 capital was CHF 35.4 billion as of the end of 2020, a decrease of 4% compared to CHF 36.8 billion as of the end of 2019. CET1 was mainly impacted by a negative foreign exchange impact, a dividend accrual and the reversal of unrealized gains on certain equity investments not eligible for CET1 recognition, par-tially offset by net income attributable to shareholders.
Additional tier 1 capital was CHF 15.8 billion as of the end of 2020 compared to CHF 13.0 billion as of the end of 2019, mainly reflecting the issuance of high-trigger additional tier 1 cap-ital notes, partially offset by a negative foreign exchange impact.
Tier 2 capital was CHF 1.0 billion as of the end of 2020 com-pared to CHF 2.9 billion as of the end of 2019, mainly due to the redemption of tier 2 low-trigger capital instruments.
Total eligible capital as of the end of 2020 was CHF 52.2 billion compared to CHF 52.7 billion as of the end of 2019, reflect-ing decreases in tier 2 capital and CET1 capital, offset by an increase in additional tier 1 capital.
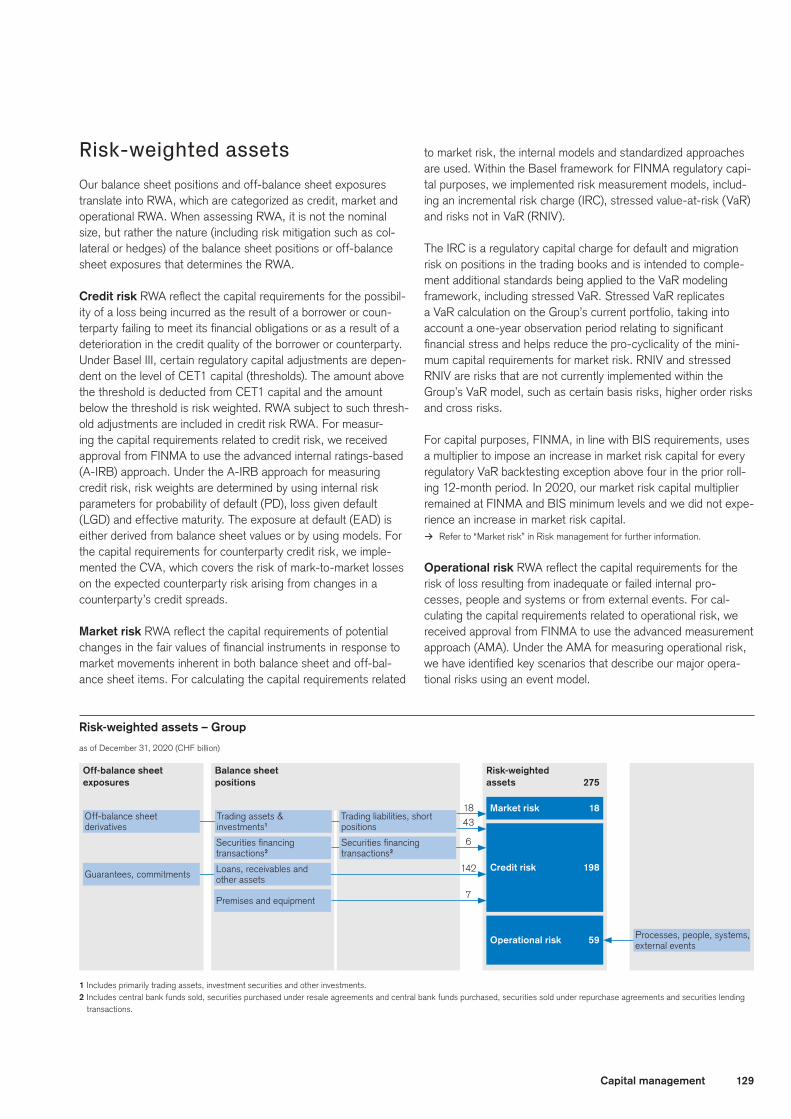
129Capital management
Balance sheet positions
18
43
6
142
7
Off-balance sheet exposures
Risk-weighted assets 275
Risk-weighted assets – Group
as of December 31, 2020 (CHF billion)
Market risk 18
Operational risk 59
Credit risk 198
Processes, people, systems, external events
1 Includes primarily trading assets, investment securities and other investments. 2 Includes central bank funds sold, securities purchased under resale agreements and central bank funds purchased, securities sold under repurchase agreements and securities lending
transactions.
Off-balance sheet derivatives
Guarantees, commitments
Trading assets & investments1
Loans, receivables and other assets
Premises and equipment
Securities financing transactions2
Trading liabilities, short positions
Securities financing transactions2
Risk-weighted assetsOur balance sheet positions and off-balance sheet exposures translate into RWA, which are categorized as credit, market and operational RWA. When assessing RWA, it is not the nominal size, but rather the nature (including risk mitigation such as col-lateral or hedges) of the balance sheet positions or off-balance sheet exposures that determines the RWA.
Credit risk RWA reflect the capital requirements for the possibil-ity of a loss being incurred as the result of a borrower or coun-terparty failing to meet its financial obligations or as a result of a deterioration in the credit quality of the borrower or counterparty. Under Basel III, certain regulatory capital adjustments are depen-dent on the level of CET1 capital (thresholds). The amount above the threshold is deducted from CET1 capital and the amount below the threshold is risk weighted. RWA subject to such thresh-old adjustments are included in credit risk RWA. For measur-ing the capital requirements related to credit risk, we received approval from FINMA to use the advanced internal ratings-based (A-IRB) approach. Under the A-IRB approach for measuring credit risk, risk weights are determined by using internal risk parameters for probability of default (PD), loss given default (LGD) and effective maturity. The exposure at default (EAD) is either derived from balance sheet values or by using models. For the capital requirements for counterparty credit risk, we imple-mented the CVA, which covers the risk of mark-to-market losses on the expected counterparty risk arising from changes in a counterparty’s credit spreads.
Market risk RWA reflect the capital requirements of potential changes in the fair values of financial instruments in response to market movements inherent in both balance sheet and off-bal-ance sheet items. For calculating the capital requirements related
to market risk, the internal models and standardized approaches are used. Within the Basel framework for FINMA regulatory capi-tal purposes, we implemented risk measurement models, includ-ing an incremental risk charge (IRC), stressed value-at-risk (VaR) and risks not in VaR (RNIV).
The IRC is a regulatory capital charge for default and migration risk on positions in the trading books and is intended to comple-ment additional standards being applied to the VaR modeling framework, including stressed VaR. Stressed VaR replicates a VaR calculation on the Group’s current portfolio, taking into account a one-year observation period relating to significant financial stress and helps reduce the pro-cyclicality of the mini-mum capital requirements for market risk. RNIV and stressed RNIV are risks that are not currently implemented within the Group’s VaR model, such as certain basis risks, higher order risks and cross risks.
For capital purposes, FINMA, in line with BIS requirements, uses a multiplier to impose an increase in market risk capital for every regulatory VaR backtesting exception above four in the prior roll-ing 12-month period. In 2020, our market risk capital multiplier remained at FINMA and BIS minimum levels and we did not expe-rience an increase in market risk capital.
> Refer to “Market risk” in Risk management for further information.
Operational risk RWA reflect the capital requirements for the risk of loss resulting from inadequate or failed internal pro-cesses, people and systems or from external events. For cal-culating the capital requirements related to operational risk, we received approval from FINMA to use the advanced measurement approach (AMA). Under the AMA for measuring operational risk, we have identified key scenarios that describe our major opera-tional risks using an event model.

130 Capital management
Risk-weighted assets – Group Swiss International
Universal Wealth Asia Investment Corporate
end of Bank Management Pacific Bank Center Group
2020 (CHF million)
Credit risk 69,428 29,920 20,133 53,475 25,156 198,112
Market risk 1,598 1,962 1,645 10,749 2,363 18,317
Operational risk 10,262 11,118 4,811 13,648 18,816 58,655
Risk-weighted assets 81,288 43,000 26,589 77,872 46,335 275,084
2019 (CHF million)
Credit risk 66,878 28,866 24,981 57,832 28,396 206,953
Market risk 2,144 2,328 1,424 6,689 2,607 15,192
Operational risk 11,467 12,335 5,452 17,697 21,367 68,318
Risk-weighted assets 80,489 43,529 31,857 82,218 52,370 290,463
Risk-weighted assets movements
RWA decreased 5% to CHF 275.1 billion as of the end of 2020 from CHF 290.5 billion as of the end of 2019, mainly reflecting a negative foreign exchange impact and movements in risk lev-els, mainly in credit risk. These decreases were partially offset by increases related to methodology and policy changes in credit risk and internal model and parameter updates in credit and market risk.
Excluding the foreign exchange impact, the movement in credit risk was primarily driven by increases related to methodology and policy changes and internal model and parameter updates, largely offset by movements in risk levels attributable to book size. The increase in methodology and policy changes reflected the phase-in of certain Basel III revisions for credit risk, including SA-CCR for derivatives, mainly in International Wealth Management, equity investments in funds and central counterparty default fund con-tributions. The increase related to internal model and parameter updates was mainly driven by a regular data update pertaining to the advanced CVA model, primarily due to increased market volatility, mainly in Swiss Universal Bank, the Corporate Center and International Wealth Management. This was partially off-set by the implementation of a new model for corporate clients, accompanied by the phase out of a multiplier on certain corporate
exposures, mainly in the Investment Bank. The movements in risk levels attributable to book size was primarily driven by decreased advanced CVA in International Wealth Management, the Cor-porate Center and Swiss Universal Bank, decreased derivatives exposures in the Corporate Center and Asia Pacific, an equity impairment loss in International Wealth Management and equity exposures in the Investment Bank.
Excluding the foreign exchange impact, the decrease in market risk was primarily driven by internal model and parameter updates, mainly in the Investment Bank, primarily reflecting the market data update for regulatory VaR, as a result of the signifi-cant market volatility in first half of 2020.
Excluding the foreign exchange impact, the decrease in operational risk was mainly driven by internal model and param-eter updates. In addition to decreases related to the annual recalibration of the advanced measurement approach, we have updated our operational risk RWA advanced measurement approach in respect of historical mortgage-related settlements, which was reflected in the Corporate Center. Internal model and parameter updates also reflected updated operational risk alloca-tion keys, resulting in lower operational risk RWA in the Invest-ment Bank, offset by higher operational risk RWA in the Corpo-rate Center and International Wealth Management.
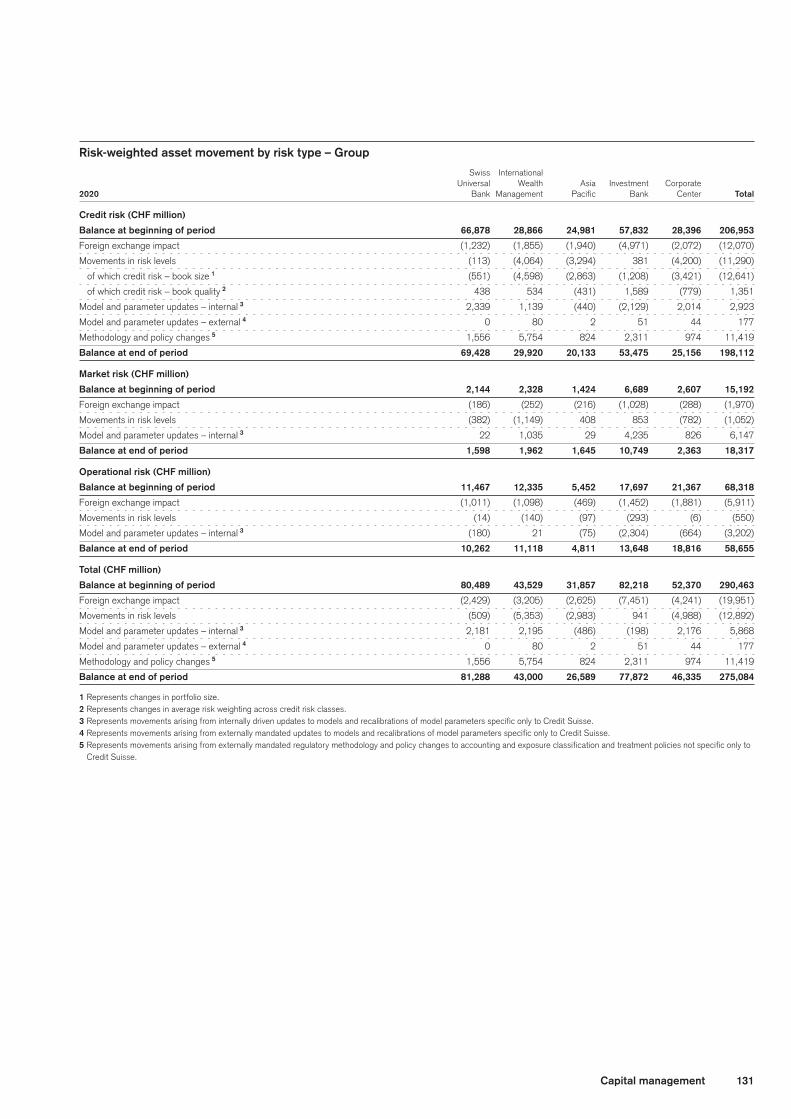
131Capital management
Risk-weighted asset movement by risk type – Group Swiss International
Universal Wealth Asia Investment Corporate
2020 Bank Management Pacific Bank Center Total
Credit risk (CHF million)
Balance at beginning of period 66,878 28,866 24,981 57,832 28,396 206,953
Foreign exchange impact (1,232) (1,855) (1,940) (4,971) (2,072) (12,070)
Movements in risk levels (113) (4,064) (3,294) 381 (4,200) (11,290)
of which credit risk – book size 1 (551) (4,598) (2,863) (1,208) (3,421) (12,641)
of which credit risk – book quality 2 438 534 (431) 1,589 (779) 1,351
Model and parameter updates – internal 3 2,339 1,139 (440) (2,129) 2,014 2,923
Model and parameter updates – external 4 0 80 2 51 44 177
Methodology and policy changes 5 1,556 5,754 824 2,311 974 11,419
Balance at end of period 69,428 29,920 20,133 53,475 25,156 198,112
Market risk (CHF million)
Balance at beginning of period 2,144 2,328 1,424 6,689 2,607 15,192
Foreign exchange impact (186) (252) (216) (1,028) (288) (1,970)
Movements in risk levels (382) (1,149) 408 853 (782) (1,052)
Model and parameter updates – internal 3 22 1,035 29 4,235 826 6,147
Balance at end of period 1,598 1,962 1,645 10,749 2,363 18,317
Operational risk (CHF million)
Balance at beginning of period 11,467 12,335 5,452 17,697 21,367 68,318
Foreign exchange impact (1,011) (1,098) (469) (1,452) (1,881) (5,911)
Movements in risk levels (14) (140) (97) (293) (6) (550)
Model and parameter updates – internal 3 (180) 21 (75) (2,304) (664) (3,202)
Balance at end of period 10,262 11,118 4,811 13,648 18,816 58,655
Total (CHF million)
Balance at beginning of period 80,489 43,529 31,857 82,218 52,370 290,463
Foreign exchange impact (2,429) (3,205) (2,625) (7,451) (4,241) (19,951)
Movements in risk levels (509) (5,353) (2,983) 941 (4,988) (12,892)
Model and parameter updates – internal 3 2,181 2,195 (486) (198) 2,176 5,868
Model and parameter updates – external 4 0 80 2 51 44 177
Methodology and policy changes 5 1,556 5,754 824 2,311 974 11,419
Balance at end of period 81,288 43,000 26,589 77,872 46,335 275,084
1 Represents changes in portfolio size.2 Represents changes in average risk weighting across credit risk classes.3 Represents movements arising from internally driven updates to models and recalibrations of model parameters specific only to Credit Suisse.4 Represents movements arising from externally mandated updates to models and recalibrations of model parameters specific only to Credit Suisse.5 Represents movements arising from externally mandated regulatory methodology and policy changes to accounting and exposure classification and treatment policies not specific only to
Credit Suisse.

132 Capital management
Leverage metricsCredit Suisse has adopted the BIS leverage ratio framework, as issued by the BCBS and implemented in Switzerland by FINMA. Under the BIS framework, the leverage ratio measures tier 1 cap-ital against the end-of-period exposure. As used herein, leverage exposure consists of period-end total assets and prescribed regu-latory adjustments, such as derivative financial instruments, secu-rities financing transactions and off-balance sheet exposures.
Leverage exposure – Group
end of 2020 2019
Leverage exposure (CHF million)
Swiss Universal Bank 295,507 284,798
International Wealth Management 104,014 99,085
Asia Pacific 74,307 81,090
Investment Bank 319,339 332,019
Corporate Center 6,686 113,002
Leverage exposure 799,853 909,994
The leverage exposure was CHF 799.9 billion as of the end of 2020, which decreased 12% compared to CHF 910.0 billion as of the end of 2019. The decrease mainly reflects the temporary exclusion of central bank reserves from the leverage exposure in 2020, as permitted by FINMA. This temporary exclusion termi-nated as of January 1, 2021.
> Refer to “Balance sheet and off-balance sheet” for further information on the movement in the Group’s consolidated balance sheet.
Leverage exposure components – Group
end of 2020 2019 % change
Leverage exposure (CHF million)
Total assets 805,822 787,295 2
Adjustments
Difference in scope of consolidation
and tier 1 capital deductions 1 (16,680) (14,146) 18
Derivative financial instruments 68,577 75,856 (10)
Securities financing transactions (39,009) (29,580) 32
Off-balance sheet exposures 88,944 90,569 (2)
Other (107,801) 2 – –
Total adjustments (5,969) 122,699 –
Leverage exposure 799,853 909,994 (12)
1 Includes adjustments for investments in banking, financial, insurance or commercial enti-ties that are consolidated for accounting purposes but outside the scope of regulatory consolidation and tier 1 capital deductions related to balance sheet assets.
2 Includes cash held at central banks of CHF 110,677 million, after adjusting for the divi-dend paid in 2020.
BIS leverage metrics – Group
end of 2020 2019 % change
Capital and leverage exposure (CHF million)
CET1 capital 35,361 36,774 (4)
Tier 1 capital 51,202 49,791 3
Leverage exposure 799,853 1 909,994 (12)
Leverage ratios (%)
CET1 leverage ratio 4.4 4.0 –
Tier 1 leverage ratio 6.4 5.5 –
1 Leverage exposure as of the end of 2020 excludes CHF 110,677 million of cash held at central banks, after adjusting for the dividend paid in 2020.
BIS leverage ratios – Group
The CET1 leverage ratio was 4.4% as of the end of 2020, com-pared to 4.0% as of the end of 2019, mainly reflecting lower leverage exposure. The tier 1 leverage ratio was 6.4% as of the end of 2020, compared to 5.5% as of the end of 2019, mainly reflecting lower leverage exposure.
Swiss metricsSwiss capital metricsAs of the end of 2020, our Swiss CET1 capital was CHF 35.4 billion and our Swiss CET1 ratio was 12.8%. Our going concern capital was CHF 51.2 billion and our going concern capital ratio was 18.6%. Our gone concern capital was CHF 41.9 billion and our gone concern capital ratio was 15.2%. Our total loss-absorbing capacity was CHF 93.0 billion and our TLAC ratio was 33.8%.
Swiss capital metrics – Group
end of 2020 2019 % change
Swiss capital and risk-weighted assets (CHF million)
Swiss CET1 capital 35,351 36,740 (4)
Going concern capital 51,192 49,757 3
Gone concern capital 41,852 41,138 2
Total loss-absorbing capacity 93,044 90,895 2
Swiss risk-weighted assets 275,576 291,282 (5)
Swiss capital ratios (%)
Swiss CET1 ratio 12.8 12.6 –
Going concern capital ratio 18.6 17.1 –
Gone concern capital ratio 15.2 14.1 –
TLAC ratio 33.8 31.2 –
The Swiss capital requirements have been fully phased-in as of January 1, 2020 and the 2019 balances are presented on a comparative basis as previously reported. Rounding differences may occur.
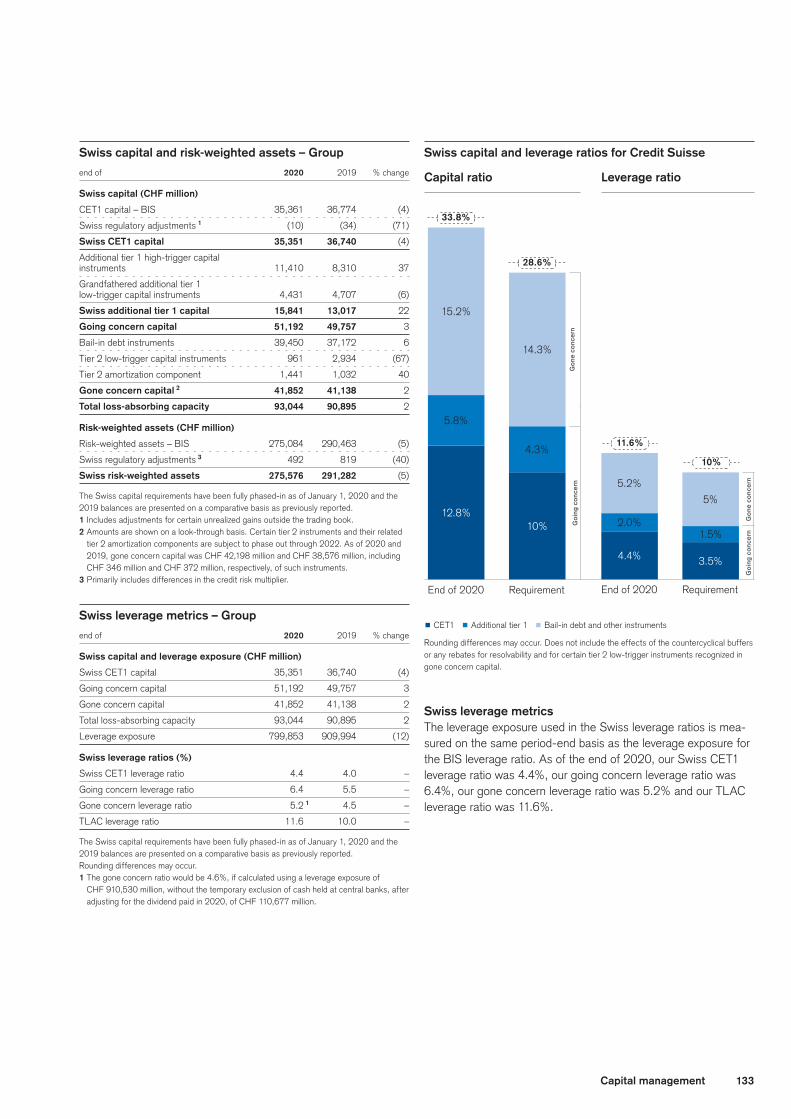
133Capital management
Swiss capital and leverage ratios for Credit Suisse
End of 2020 End of 2020Requirement Requirement
p CET1 p Additional tier 1 p Bail-in debt and other instruments
Rounding differences may occur. Does not include the effects of the countercyclical buffers or any rebates for resolvability and for certain tier 2 low-trigger instruments recognized in gone concern capital.
Goi
ng c
once
rnG
one
conc
ern
3.5%4.4%
5%
5.2%
1.5%2.0%
10%
11.6%
10%12.8%
15.2%
4.3%
5.8%
28.6%
33.8%
Capital ratio Leverage ratio
14.3%
Goi
ng c
once
rnG
one
conc
ern
Swiss capital and risk-weighted assets – Group
end of 2020 2019 % change
Swiss capital (CHF million)
CET1 capital – BIS 35,361 36,774 (4)
Swiss regulatory adjustments 1 (10) (34) (71)
Swiss CET1 capital 35,351 36,740 (4)
Additional tier 1 high-trigger capital
instruments 11,410 8,310 37
Grandfathered additional tier 1
low-trigger capital instruments 4,431 4,707 (6)
Swiss additional tier 1 capital 15,841 13,017 22
Going concern capital 51,192 49,757 3
Bail-in debt instruments 39,450 37,172 6
Tier 2 low-trigger capital instruments 961 2,934 (67)
Tier 2 amortization component 1,441 1,032 40
Gone concern capital 2 41,852 41,138 2
Total loss-absorbing capacity 93,044 90,895 2
Risk-weighted assets (CHF million)
Risk-weighted assets – BIS 275,084 290,463 (5)
Swiss regulatory adjustments 3 492 819 (40)
Swiss risk-weighted assets 275,576 291,282 (5)
The Swiss capital requirements have been fully phased-in as of January 1, 2020 and the 2019 balances are presented on a comparative basis as previously reported.1 Includes adjustments for certain unrealized gains outside the trading book.2 Amounts are shown on a look-through basis. Certain tier 2 instruments and their related
tier 2 amortization components are subject to phase out through 2022. As of 2020 and 2019, gone concern capital was CHF 42,198 million and CHF 38,576 million, including CHF 346 million and CHF 372 million, respectively, of such instruments.
3 Primarily includes differences in the credit risk multiplier.
Swiss leverage metrics – Group
end of 2020 2019 % change
Swiss capital and leverage exposure (CHF million)
Swiss CET1 capital 35,351 36,740 (4)
Going concern capital 51,192 49,757 3
Gone concern capital 41,852 41,138 2
Total loss-absorbing capacity 93,044 90,895 2
Leverage exposure 799,853 909,994 (12)
Swiss leverage ratios (%)
Swiss CET1 leverage ratio 4.4 4.0 –
Going concern leverage ratio 6.4 5.5 –
Gone concern leverage ratio 5.2 1 4.5 –
TLAC leverage ratio 11.6 10.0 –
The Swiss capital requirements have been fully phased-in as of January 1, 2020 and the 2019 balances are presented on a comparative basis as previously reported. Rounding differences may occur.1 The gone concern ratio would be 4.6%, if calculated using a leverage exposure of
CHF 910,530 million, without the temporary exclusion of cash held at central banks, after adjusting for the dividend paid in 2020, of CHF 110,677 million.
Swiss leverage metricsThe leverage exposure used in the Swiss leverage ratios is mea-sured on the same period-end basis as the leverage exposure for the BIS leverage ratio. As of the end of 2020, our Swiss CET1 leverage ratio was 4.4%, our going concern leverage ratio was 6.4%, our gone concern leverage ratio was 5.2% and our TLAC leverage ratio was 11.6%.
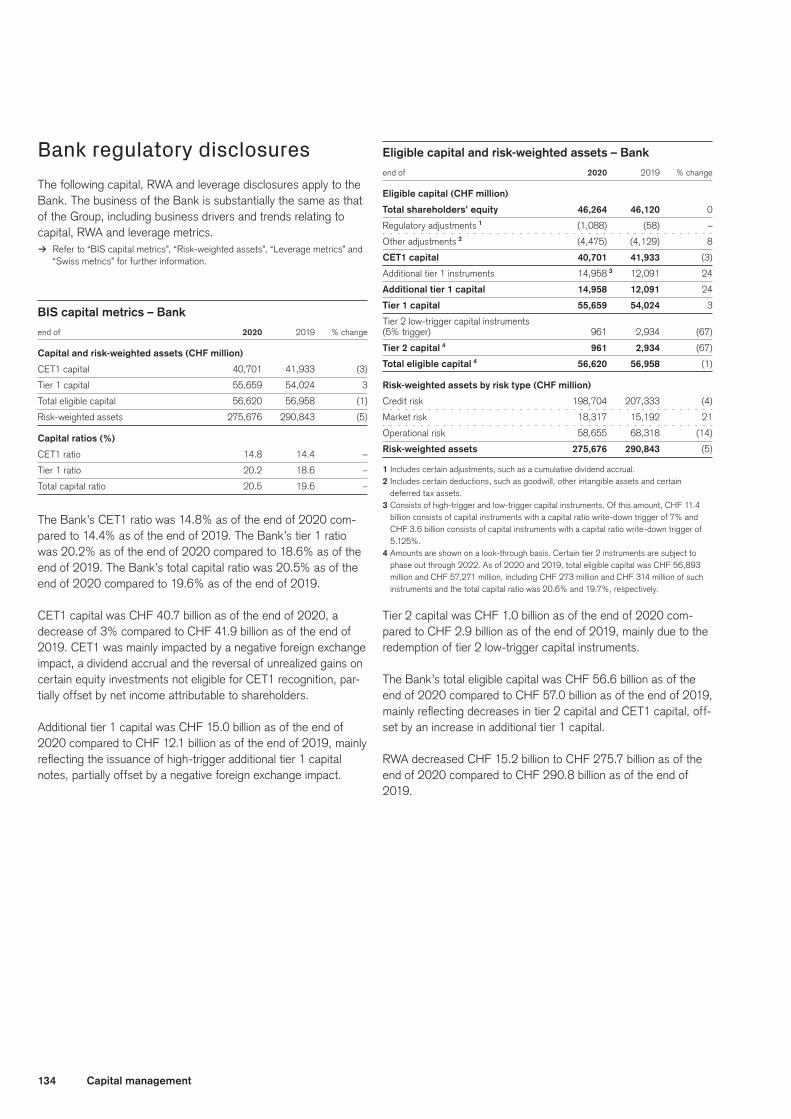
134 Capital management
Bank regulatory disclosuresThe following capital, RWA and leverage disclosures apply to the Bank. The business of the Bank is substantially the same as that of the Group, including business drivers and trends relating to capital, RWA and leverage metrics.
> Refer to “BIS capital metrics”, “Risk-weighted assets”, “Leverage metrics” and “Swiss metrics” for further information.
BIS capital metrics – Bank
end of 2020 2019 % change
Capital and risk-weighted assets (CHF million)
CET1 capital 40,701 41,933 (3)
Tier 1 capital 55,659 54,024 3
Total eligible capital 56,620 56,958 (1)
Risk-weighted assets 275,676 290,843 (5)
Capital ratios (%)
CET1 ratio 14.8 14.4 –
Tier 1 ratio 20.2 18.6 –
Total capital ratio 20.5 19.6 –
The Bank’s CET1 ratio was 14.8% as of the end of 2020 com-pared to 14.4% as of the end of 2019. The Bank’s tier 1 ratio was 20.2% as of the end of 2020 compared to 18.6% as of the end of 2019. The Bank’s total capital ratio was 20.5% as of the end of 2020 compared to 19.6% as of the end of 2019.
CET1 capital was CHF 40.7 billion as of the end of 2020, a decrease of 3% compared to CHF 41.9 billion as of the end of 2019. CET1 was mainly impacted by a negative foreign exchange impact, a dividend accrual and the reversal of unrealized gains on certain equity investments not eligible for CET1 recognition, par-tially offset by net income attributable to shareholders.
Additional tier 1 capital was CHF 15.0 billion as of the end of 2020 compared to CHF 12.1 billion as of the end of 2019, mainly reflecting the issuance of high-trigger additional tier 1 capital notes, partially offset by a negative foreign exchange impact.
Eligible capital and risk-weighted assets – Bank
end of 2020 2019 % change
Eligible capital (CHF million)
Total shareholders’ equity 46,264 46,120 0
Regulatory adjustments 1 (1,088) (58) –
Other adjustments 2 (4,475) (4,129) 8
CET1 capital 40,701 41,933 (3)
Additional tier 1 instruments 14,958 3 12,091 24
Additional tier 1 capital 14,958 12,091 24
Tier 1 capital 55,659 54,024 3
Tier 2 low-trigger capital instruments
(5% trigger) 961 2,934 (67)
Tier 2 capital 4 961 2,934 (67)
Total eligible capital 4 56,620 56,958 (1)
Risk-weighted assets by risk type (CHF million)
Credit risk 198,704 207,333 (4)
Market risk 18,317 15,192 21
Operational risk 58,655 68,318 (14)
Risk-weighted assets 275,676 290,843 (5)
1 Includes certain adjustments, such as a cumulative dividend accrual.2 Includes certain deductions, such as goodwill, other intangible assets and certain
deferred tax assets.3 Consists of high-trigger and low-trigger capital instruments. Of this amount, CHF 11.4
billion consists of capital instruments with a capital ratio write-down trigger of 7% and CHF 3.6 billion consists of capital instruments with a capital ratio write-down trigger of 5.125%.
4 Amounts are shown on a look-through basis. Certain tier 2 instruments are subject to phase out through 2022. As of 2020 and 2019, total eligible capital was CHF 56,893 million and CHF 57,271 million, including CHF 273 million and CHF 314 million of such instruments and the total capital ratio was 20.6% and 19.7%, respectively.
Tier 2 capital was CHF 1.0 billion as of the end of 2020 com-pared to CHF 2.9 billion as of the end of 2019, mainly due to the redemption of tier 2 low-trigger capital instruments.
The Bank’s total eligible capital was CHF 56.6 billion as of the end of 2020 compared to CHF 57.0 billion as of the end of 2019, mainly reflecting decreases in tier 2 capital and CET1 capital, off-set by an increase in additional tier 1 capital.
RWA decreased CHF 15.2 billion to CHF 275.7 billion as of the end of 2020 compared to CHF 290.8 billion as of the end of 2019.

135Capital management
Leverage exposure components – Bank
end of 2020 2019 % change
Leverage exposure (CHF million)
Total assets 809,688 790,459 2
Adjustments
Difference in scope of consolidation
and tier 1 capital deductions 1 (14,079) (11,545) 22
Derivative financial instruments 68,651 75,906 (10)
Securities financing transactions (39,004) (29,580) 32
Off-balance sheet exposures 88,948 90,574 (2)
Other (121,342) 2 – –
Total adjustments (16,826) 125,355 –
Leverage exposure 792,862 915,814 (13)
1 Includes adjustments for investments in banking, financial, insurance or commercial enti-ties that are consolidated for accounting purposes but outside the scope of regulatory consolidation and tier 1 capital deductions related to balance sheet assets.
2 Includes cash held at central banks of CHF 124,218 million, after adjusting for the divi-dend paid in 2020.
BIS leverage metrics – Bank
end of 2020 2019 % change
Capital and leverage exposure (CHF million)
CET1 capital 40,701 41,933 (3)
Tier 1 capital 55,659 54,024 3
Leverage exposure 792,862 1 915,814 (13)
Leverage ratios (%)
CET1 leverage ratio 5.1 4.6 –
Tier 1 leverage ratio 7.0 5.9 –
1 Leverage exposure as of the end of 2020 excludes CHF 124,218 million of cash held at central banks, after adjusting for the dividend paid in 2020.
Swiss capital metrics – Bank
end of 2020 2019 % change
Swiss capital and risk-weighted assets (CHF million)
Swiss CET1 capital 40,691 41,899 (3)
Going concern capital 55,648 53,990 3
Gone concern capital 41,857 41,136 2
Total loss-absorbing capacity 97,505 95,126 3
Swiss risk-weighted assets 276,157 291,651 (5)
Swiss capital ratios (%)
Swiss CET1 ratio 14.7 14.4 –
Going concern capital ratio 20.2 18.5 –
Gone concern capital ratio 15.2 14.1 –
TLAC ratio 35.3 32.6 –
The Swiss capital requirements have been fully phased-in as of January 1, 2020 and the 2019 balances are presented on a comparative basis. Rounding differences may occur.
Swiss capital and risk-weighted assets – Bank
end of 2020 2019 % change
Swiss capital (CHF million)
CET1 capital – BIS 40,701 41,933 (3)
Swiss regulatory adjustments 1 (10) (34) (71)
Swiss CET1 capital 40,691 41,899 (3)
Additional tier 1 high-trigger capital
instruments 11,408 8,315 37
Grandfathered additional tier 1
low-trigger capital instruments 3,549 3,776 (6)
Swiss additional tier 1 capital 14,957 12,091 24
Going concern capital 55,648 53,990 3
Bail-in debt instruments 39,455 37,170 6
Tier 2 low-trigger capital instruments 961 2,934 (67)
Tier 2 amortization component 1,441 1,032 40
Gone concern capital 2 41,857 41,136 2
Total loss-absorbing capacity 97,505 95,126 3
Risk-weighted assets (CHF million)
Risk-weighted assets – BIS 275,676 290,843 (5)
Swiss regulatory adjustments 3 481 808 (40)
Swiss risk-weighted assets 276,157 291,651 (5)
The Swiss capital requirements have been fully phased-in as of January 1, 2020 and the 2019 balances are presented on a comparative basis.1 Includes adjustments for certain unrealized gains outside the trading book.2 Amounts are shown on a look-through basis. Certain tier 2 instruments and their related
tier 2 amortization components are subject to phase out through 2022. As of 2020 and 2019, gone concern capital was CHF 42,203 million and CHF 38,574 million, including CHF 346 million and CHF 372 million, respectively, of such instruments.
3 Primarily includes differences in the credit risk multiplier.
Swiss leverage metrics – Bank
end of 2020 2019 % change
Swiss capital and leverage exposure (CHF million)
Swiss CET1 capital 40,691 41,899 (3)
Going concern capital 55,648 53,990 3
Gone concern capital 41,857 41,136 2
Total loss-absorbing capacity 97,505 95,126 3
Leverage exposure 792,862 915,814 (13)
Swiss leverage ratios (%)
Swiss CET1 leverage ratio 5.1 4.6 –
Going concern leverage ratio 7.0 5.9 –
Gone concern leverage ratio 5.3 1 4.5 –
TLAC leverage ratio 12.3 10.4 –
The Swiss capital requirements have been fully phased-in as of January 1, 2020 and the 2019 balances are presented on a comparative basis. Rounding differences may occur.1 The gone concern ratio would be 4.6%, if calculated using a leverage exposure of
CHF 917,080 million, without the temporary exclusion of cash held at central banks, after adjusting for the dividend paid in 2020, of CHF 124,218 million.
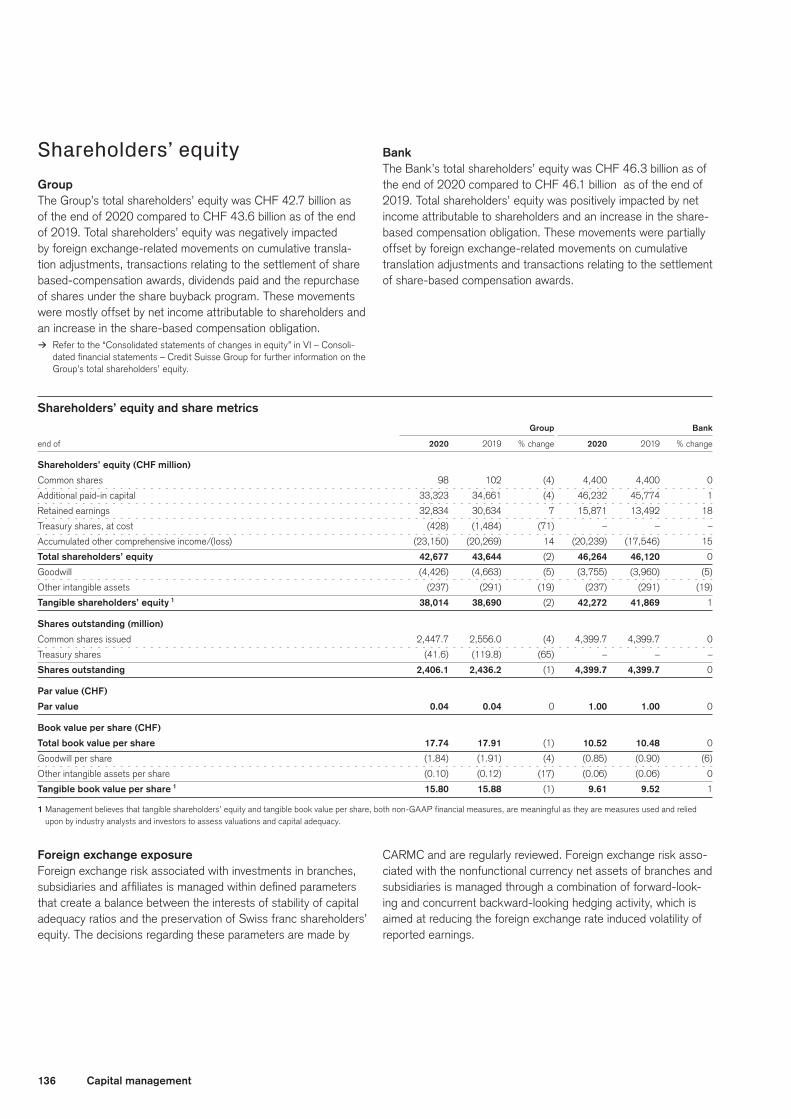
136 Capital management
Shareholders’ equityGroupThe Group’s total shareholders’ equity was CHF 42.7 billion as of the end of 2020 compared to CHF 43.6 billion as of the end of 2019. Total shareholders’ equity was negatively impacted by foreign exchange-related movements on cumulative transla-tion adjustments, transactions relating to the settlement of share based-compensation awards, dividends paid and the repurchase of shares under the share buyback program. These movements were mostly offset by net income attributable to shareholders and an increase in the share-based compensation obligation.
> Refer to the “Consolidated statements of changes in equity” in VI – Consoli-dated financial statements – Credit Suisse Group for further information on the Group’s total shareholders’ equity.
BankThe Bank’s total shareholders’ equity was CHF 46.3 billion as of the end of 2020 compared to CHF 46.1 billion as of the end of 2019. Total shareholders’ equity was positively impacted by net income attributable to shareholders and an increase in the share-based compensation obligation. These movements were partially offset by foreign exchange-related movements on cumulative translation adjustments and transactions relating to the settlement of share-based compensation awards.
Shareholders’ equity and share metrics Group Bank
end of 2020 2019 % change 2020 2019 % change
Shareholders’ equity (CHF million)
Common shares 98 102 (4) 4,400 4,400 0
Additional paid-in capital 33,323 34,661 (4) 46,232 45,774 1
Retained earnings 32,834 30,634 7 15,871 13,492 18
Treasury shares, at cost (428) (1,484) (71) – – –
Accumulated other comprehensive income/(loss) (23,150) (20,269) 14 (20,239) (17,546) 15
Total shareholders’ equity 42,677 43,644 (2) 46,264 46,120 0
Goodwill (4,426) (4,663) (5) (3,755) (3,960) (5)
Other intangible assets (237) (291) (19) (237) (291) (19)
Tangible shareholders’ equity 1 38,014 38,690 (2) 42,272 41,869 1
Shares outstanding (million)
Common shares issued 2,447.7 2,556.0 (4) 4,399.7 4,399.7 0
Treasury shares (41.6) (119.8) (65) – – –
Shares outstanding 2,406.1 2,436.2 (1) 4,399.7 4,399.7 0
Par value (CHF)
Par value 0.04 0.04 0 1.00 1.00 0
Book value per share (CHF)
Total book value per share 17.74 17.91 (1) 10.52 10.48 0
Goodwill per share (1.84) (1.91) (4) (0.85) (0.90) (6)
Other intangible assets per share (0.10) (0.12) (17) (0.06) (0.06) 0
Tangible book value per share 1 15.80 15.88 (1) 9.61 9.52 1
1 Management believes that tangible shareholders’ equity and tangible book value per share, both non-GAAP financial measures, are meaningful as they are measures used and relied upon by industry analysts and investors to assess valuations and capital adequacy.
Foreign exchange exposureForeign exchange risk associated with investments in branches, subsidiaries and affiliates is managed within defined parameters that create a balance between the interests of stability of capital adequacy ratios and the preservation of Swiss franc shareholders’ equity. The decisions regarding these parameters are made by
CARMC and are regularly reviewed. Foreign exchange risk asso-ciated with the nonfunctional currency net assets of branches and subsidiaries is managed through a combination of forward-look-ing and concurrent backward-looking hedging activity, which is aimed at reducing the foreign exchange rate induced volatility of reported earnings.
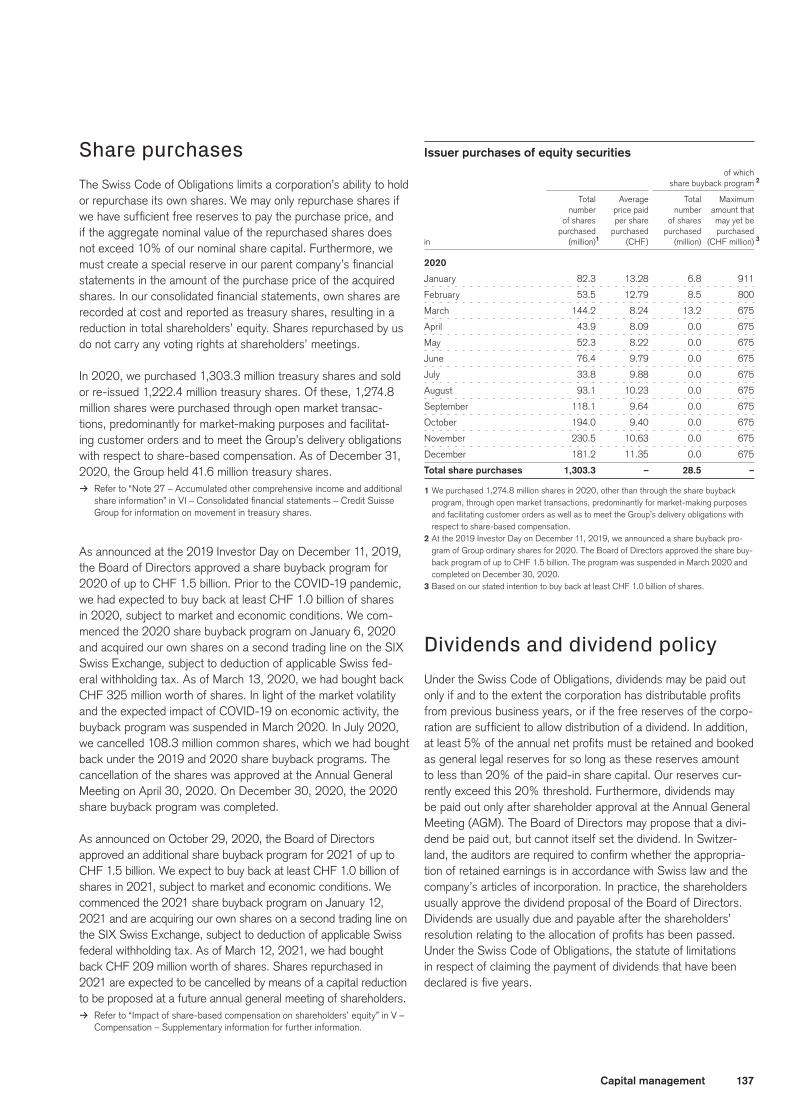
137Capital management
Share purchasesThe Swiss Code of Obligations limits a corporation’s ability to hold or repurchase its own shares. We may only repurchase shares if we have sufficient free reserves to pay the purchase price, and if the aggregate nominal value of the repurchased shares does not exceed 10% of our nominal share capital. Furthermore, we must create a special reserve in our parent company’s financial statements in the amount of the purchase price of the acquired shares. In our consolidated financial statements, own shares are recorded at cost and reported as treasury shares, resulting in a reduction in total shareholders’ equity. Shares repurchased by us do not carry any voting rights at shareholders’ meetings.
In 2020, we purchased 1,303.3 million treasury shares and sold or re-issued 1,222.4 million treasury shares. Of these, 1,274.8 million shares were purchased through open market transac-tions, predominantly for market-making purposes and facilitat-ing customer orders and to meet the Group’s delivery obligations with respect to share-based compensation. As of December 31, 2020, the Group held 41.6 million treasury shares.
> Refer to “Note 27 – Accumulated other comprehensive income and additional share information” in VI – Consolidated financial statements – Credit Suisse Group for information on movement in treasury shares.
As announced at the 2019 Investor Day on December 11, 2019, the Board of Directors approved a share buyback program for 2020 of up to CHF 1.5 billion. Prior to the COVID-19 pandemic, we had expected to buy back at least CHF 1.0 billion of shares in 2020, subject to market and economic conditions. We com-menced the 2020 share buyback program on January 6, 2020 and acquired our own shares on a second trading line on the SIX Swiss Exchange, subject to deduction of applicable Swiss fed-eral withholding tax. As of March 13, 2020, we had bought back CHF 325 million worth of shares. In light of the market volatility and the expected impact of COVID-19 on economic activity, the buyback program was suspended in March 2020. In July 2020, we cancelled 108.3 million common shares, which we had bought back under the 2019 and 2020 share buyback programs. The cancellation of the shares was approved at the Annual General Meeting on April 30, 2020. On December 30, 2020, the 2020 share buyback program was completed.
As announced on October 29, 2020, the Board of Directors approved an additional share buyback program for 2021 of up to CHF 1.5 billion. We expect to buy back at least CHF 1.0 billion of shares in 2021, subject to market and economic conditions. We commenced the 2021 share buyback program on January 12, 2021 and are acquiring our own shares on a second trading line on the SIX Swiss Exchange, subject to deduction of applicable Swiss federal withholding tax. As of March 12, 2021, we had bought back CHF 209 million worth of shares. Shares repurchased in 2021 are expected to be cancelled by means of a capital reduction to be proposed at a future annual general meeting of shareholders.
> Refer to “Impact of share-based compensation on shareholders’ equity” in V – Compensation – Supplementary information for further information.
Issuer purchases of equity securities of which
share buyback program 2
Total Average Total Maximum
number price paid number amount that of shares per share of shares may yet be
purchased purchased purchased purchased
in (million) 1 (CHF) (million) (CHF million) 3
2020
January 82.3 13.28 6.8 911
February 53.5 12.79 8.5 800
March 144.2 8.24 13.2 675
April 43.9 8.09 0.0 675
May 52.3 8.22 0.0 675
June 76.4 9.79 0.0 675
July 33.8 9.88 0.0 675
August 93.1 10.23 0.0 675
September 118.1 9.64 0.0 675
October 194.0 9.40 0.0 675
November 230.5 10.63 0.0 675
December 181.2 11.35 0.0 675
Total share purchases 1,303.3 – 28.5 –
1 We purchased 1,274.8 million shares in 2020, other than through the share buyback program, through open market transactions, predominantly for market-making purposes and facilitating customer orders as well as to meet the Group’s delivery obligations with respect to share-based compensation.
2 At the 2019 Investor Day on December 11, 2019, we announced a share buyback pro-gram of Group ordinary shares for 2020. The Board of Directors approved the share buy-back program of up to CHF 1.5 billion. The program was suspended in March 2020 and completed on December 30, 2020.
3 Based on our stated intention to buy back at least CHF 1.0 billion of shares.
Dividends and dividend policyUnder the Swiss Code of Obligations, dividends may be paid out only if and to the extent the corporation has distributable profits from previous business years, or if the free reserves of the corpo-ration are sufficient to allow distribution of a dividend. In addition, at least 5% of the annual net profits must be retained and booked as general legal reserves for so long as these reserves amount to less than 20% of the paid-in share capital. Our reserves cur-rently exceed this 20% threshold. Furthermore, dividends may be paid out only after shareholder approval at the Annual General Meeting (AGM). The Board of Directors may propose that a divi-dend be paid out, but cannot itself set the dividend. In Switzer-land, the auditors are required to confirm whether the appropria-tion of retained earnings is in accordance with Swiss law and the company’s articles of incorporation. In practice, the shareholders usually approve the dividend proposal of the Board of Directors. Dividends are usually due and payable after the shareholders’ resolution relating to the allocation of profits has been passed. Under the Swiss Code of Obligations, the statute of limitations in respect of claiming the payment of dividends that have been declared is five years.

138 Capital management
In light of the COVID-19 pandemic and in response to a request by FINMA, on April 9, 2020, the Board of Directors made a revised dividend proposal to our shareholders at the 2020 AGM. Instead of a total dividend of CHF 0.2776 per share, the Board of Directors proposed a cash distribution of CHF 0.1388 per share. At the 2020 AGM on April 30, 2020, our shareholders approved the proposal. On October 29, 2020, the Board of Directors proposed a second cash distribution of CHF 0.1388 per share, which was approved by our shareholders at an Extraordinary General Meeting on November 27, 2020.
For each distribution, 50% of the distributions was paid out of capital contribution reserves, free of Swiss withholding tax and not subject to income tax for Swiss resident individuals hold-ing the shares as a private investment, and 50% was paid out of retained earnings, net of 35% Swiss withholding tax.
Our dividend payment policy seeks to provide investors with an efficient form of capital distribution relative to earnings. Our divi-dend payment policy is to pay a cash dividend per share, subject to performance and the decision of the Board of Directors and approval of our shareholders in due course. We expect to gen-erate a sustainable ordinary dividend for shareholders and to increase the ordinary dividend by at least 5% per annum.
Our Board of Directors will propose to the shareholders at the AGM on April 30, 2021 a cash distribution of CHF 0.2926 per share for the financial year 2020. 50% of the distribution will be paid out of capital contribution reserves, free of Swiss withhold-ing tax and will not be subject to income tax for Swiss resident
individuals holding the shares as a private investment, and 50% will be paid out of retained earnings, net of 35% Swiss withhold-ing tax. The ex-dividend date has been set to May 4, 2021.
Reflecting our holding company structure, the Group is not an operating company and holds investments in subsidiaries. It is therefore reliant on the dividends of its subsidiaries to pay share-holder dividends and service its long-term debt. The subsidiar-ies of the Group are generally subject to legal restrictions on the amount of dividends they can pay. The amount of dividends paid by operating subsidiaries is determined after consideration of the expectations for future results and growth of the operating businesses.
> Refer to “Proposed distribution out of capital contribution reserves” in VII – Parent company financial statements – Credit Suisse Group – Proposed appropriation of retained earnings and capital distribution for further informa-tion on dividends.
Dividend per ordinary share USD 1 CHF
Dividend per ordinary share for the financial year
2019 0.2761 0.2776
2018 0.257126 0.2625
2017 0.249 0.25
2016 0.7161 0.70
2015 0.7194 0.70
1 Represents the distribution on each American Depositary Share. For further information, refer to credit-suisse.com/dividend.
139Risk management
Risk management
As of the end of 2020, the Group had a gross loan portfolio of CHF 293.5 billion, gross impaired loans of CHF 3.2 billion and, in 2020, an average risk management VaR of USD 76 million.
In 2020, we decisively navigated the COVID-19 pandemic due to prudent risk management, structurally well-contained credit risk across our portfolio and our strong capital position. Despite the challenges resulting from the COVID-19 pandemic, on August 1, 2020 we unified the risk management (Risk) and compliance (Compliance) organizations into one Chief Risk and Compliance Officer function (Risk & Compliance) to further enhance the effectiveness and the efficiency of our control environment and improve coordination within the function.
Our Risk function’s key achievements in 2020 included the enhancement of our crisis reporting capabilities and the support of the swift delivery of COVID-19 loans to small and medium-sized enterprises in Switzerland.
Our Compliance function continued to provide second line of defense management of compliance risks in alignment with the Group’s risk appetite, enabling compliant business growth. In 2020, the Group made significant progress on its compliance strategy, with a continued focus on capability enhancements and standardization of its compliance program framework Group-wide.
Risk & Compliance is focused on delivering on its core purpose – to partner with the business to seek to ensure our actions are strategic, sustainable and compliant with the risk appetite of the Group.
Key risk developmentsWe are closely monitoring the following key risk and global eco-nomic developments as well as the potential effects on our opera-tions and businesses, including through the reassessment of financial plans and the development of stress scenarios that take into account potential additional negative impacts. 2020 was sig-nificantly shaped by the COVID-19 pandemic.
COVID-19 pandemicThe rapid spread of the COVID-19 pandemic across the world in early 2020 led to the introduction of tight government controls and travel bans, as well as the implementation of other measures, which quickly closed down activity and increased economic dis-ruption globally. World markets were severely impacted, with mul-tiple industries, including commercial real estate, retail, aviation, tourism and hospitality and energy, significantly affected. The containment measures introduced to address the outbreak of the pandemic sent the global economy into a deep recession in the first half of 2020. However, major central banks and governments around the world responded by implementing unprecedented monetary and fiscal policy stimulus measures. Although world
markets and the global economy significantly recovered from May through August as lockdowns and social distancing restrictions due to the pandemic eased in Europe, the US and Asia, high unemployment and the rise in corporate debt brought a levelling off in the scale of recovery in the final months of 2020 and dur-ing the first months of 2021. In addition, the surge in COVID-19 infections in Europe, in the US and in some countries in Asia that began in September 2020 led to the introduction of new localized and in some cases national restrictions on economic activity, which were extended far into the first quarter of 2021. The approval by the authorities of COVID-19 vaccines start-ing in December and the inception of mass inoculation programs increased the prospect of social and economic activity return-ing to normal from the second quarter of 2021. However, the situation remains challenging given the need to limit COVID-19 infection rates in the near term to contain the emergence of new COVID-19 strains where current vaccines may be less effective.
The pandemic and the consequences for markets and the global economy affected the Group’s financial performance in 2020, including significant impacts on our provision for credit losses and trading revenues, as well as on net interest income as a result of foreign exchange movements and a sharp reduction in US dollar interest rates. We continue to closely monitor the COVID-19 pan-demic and its effects on our operations and businesses.
Credit and equity marketsPrivate sector corporate debt growth was rapid in 2020. The COVID-19 pandemic has negatively impacted specific sectors, such as commercial real estate, retail, aviation, tourism and hos-pitality and energy. The Fed and other central banks supported corporates under the difficult conditions of 2020 and early 2021 but the extension of their asset purchase programs into the higher risk segments of the debt markets could have the unintended consequence of encouraging excessive risk-taking among global investors, fueling the threat of future financial market instabil-ity. Credit markets suffered a substantial number of corporate defaults during the course of 2020 and a slower-than expected or delayed economic recovery in 2021 could further increase default rates.
The volume of trading by retail investors in January and February of 2021 challenging large short positions held by hedge funds also raised questions over market collusion, investor protection and potentially excessive risk-taking. The need for trading plat-forms favored by retail investors to raise significant amounts of additional capital shows that such activities have grown to poten-tially become systemic threats to future financial market stability. Risk has been monitoring potential short squeeze target positions.
140 Risk management
China relationsThe economic recession related to the COVID-19 pandemic threatened to lead to a renewed trade tariff escalation between the US and China, a further increase of tensions on technology-related issues and a potential acceleration in a trend to a more protectionist environment for financial flows and for longer-term investments. In addition, changes to national security laws in Hong Kong in 2020 increased tensions between China and the US, as well as with European countries and Australia. Further, relations with India may be impacted by rising geopolitical com-petition and as India increasingly positions itself as an alternative manufacturing sector hub to China. Under the new US admin-istration, relations between the US and China are expected to become less confrontational, but challenges over technology transfers and intellectual property rights are expected to continue. We closely monitor the risk management implications of a poten-tial expansion of sanctions on Chinese companies, disruptions to global supply chains and the increased scrutiny regarding listing requirements for Chinese companies on stock exchanges.
Emerging markets and geopolitical risksThere are many emerging market countries which are highly rated by the credit rating agencies and which are well-placed to deal with the impacts from the COVID-19 pandemic. However, some countries faced prolonged challenges in controlling infec-tion rates. In addition, many sovereigns with weak balance sheets have seen negative impacts from the pandemic and suffered some adverse financial impacts, such as significant and disorderly currency depreciations. The pandemic brought deep recessions to the major emerging market countries, with the exception of China, in the first half of 2020. Economic recovery occurred in most countries in the second half of 2020 as well as a return of foreign capital inflows, but further economic improvement in 2021 is expected to be slow and uneven. Government responses to the COVID-19 crisis will leave a legacy of significantly higher sovereign debt levels, which may weigh on the ability of econo-mies to grow rapidly over the medium-to-long term. In addi-tion, low-income groups have suffered significantly as a result of the COVID-19 recessions. This is expected to worsen income inequalities, complicate economic policy-making and keep the risk of political instability and social unrest in certain regions in which we operate relatively high. Portfolio reviews into vulnerabili-ties and exposures are conducted on a regular basis for select emerging markets.
Monetary policyIn the new policy framework introduced at the end of August 2020, the Fed moved to a flexible average inflation target of 2% per annum. Fed guidance, reiterated in January at the Fed-eral Open Market Committee, pointed to the funds rate staying close to zero until late 2023, which indicated that the targeted inflation rate would be challenging to achieve and that the Fed’s 2021 priority will be to support economic activity and to help lift employment. Other major central banks also reviewed their mon-etary policy framework and in the near term will focus on sup-porting activity and employment, rather than being concerned about a surge in inflation. We closely monitor the potential impact
on global investor behavior and across the financial markets of central bank policy rates staying at current very low levels for an extended period of time. We also run stress scenarios which model the potential impact of surprise events, such as sharply higher inflation, on the financial markets and on the economy.
US electionsThere was a period of high volatility in the financial markets lead-ing up to the November 2020 US elections, reflecting fears that confirmation of the election outcomes could be delayed or that outcomes could be disputed. Government initiatives to contain the further spread of the pandemic also intensified while an addi-tional fiscal support program for businesses and households was agreed in December 2020. In addition, the new administration proposed another budget stimulus package in the beginning of 2021 and the vaccination program against the pandemic acceler-ated sharply.
Withdrawal of the UK from the EUThe transition period for the UK’s withdrawal from the EU ended on December 31, 2020. Ahead of that time there was a risk that there would be no final agreement between the UK and the EU by that date on detailed trade arrangements. That uncertainty, in particular against the backdrop of the COVID-19 pandemic, created disruptions in the UK in December, with some spill-over on EU countries such as Ireland. A detailed trade arrange-ment for the shipment of goods was eventually reached between the UK and the EU by December 31, 2020. However, agree-ment on equivalence regimes for financial market transactions are only expected to be finalized in the first half of 2021. We are continuing to closely monitor the potential operational implica-tions on transactions and on the functioning of financial markets caused by changes to equivalence regimes or future regulatory divergence.
Climate changeClimate risk has continued to gain momentum as a significant issue for banks and financial institutions due to increasing regula-tory initiatives, industry developments, client and investor expec-tations and public pressure. There is also increasing demand for comprehensive disclosure. We have made significant progress to address this demand and our Board of Directors (Board) and management remain highly focused on the topic. We further intensified our efforts to reinforce climate risk management by creating a dedicated Climate Risk function. We have created a model for a client energy transition framework that would guide our engagements and impose restrictions against lending to cli-ents with no credible transition plans in place. We continue to develop our related risk taxonomy, scenario and other related frameworks.
Cyber riskThe financial industry continues to be increasingly reliant on technology and faces dynamic cyber threats from a variety of actors. We continue to invest significantly in our information and cybersecurity program in order to strengthen our ability to antici-pate, detect, defend against and recover from cyber attacks. We

141Risk management
regularly assess the effectiveness of our key controls and con-duct ongoing employee training and awareness activities, includ-ing for key management personnel, in order to embed resilience and a strong cyber risk culture. In response to the COVID-19 pandemic, the Group has increased the usage of remote working technology and has adapted controls to address the increased cyber risk exposure.
Replacement of interbank offered ratesA major structural change in global financial markets is in prog-ress with respect to the replacement of IBOR benchmarks. There is significant international and regulatory pressure to replace certain IBOR benchmarks with alternative reference rates. There are significant risks associated with the transition, including financial, legal, tax, operational and conduct risks and the risk of an untimely transition due to a lack of client or market readi-ness. Credit Suisse has a significant level of liabilities and assets linked to IBOR indices across businesses that require transition to alternative reference rates and has mobilized an IBOR transition program to coordinate transition readiness on a firm-wide basis. To manage transition risk, the Group implemented a global policy to limit new IBOR-referencing business and control the wind-down of legacy exposures in advance of the cessation dates. Accordingly, the divisions are developing plans to ensure timely compliance with the policy and limits therein. During the course of 2020, we incorporated alternative reference rates into our stress testing framework.
Risk management oversightPrudent risk-taking in line with the Group’s strategic priorities is fundamental to our business and success. The primary objec-tives of risk management are to protect our financial strength and reputation, while ensuring that capital is well deployed to support business activities and growth. The Group’s risk management framework is based on transparency, management accountability and independent oversight. Risk management is an integral part of the business planning process with strong senior management and Board involvement.
We continuously work to strengthen risk management across the Group in an effort to meet the challenges resulting from a volatile market environment and increasing complexity driven by the changing regulatory landscape. Utilizing comprehensive risk management processes and sophisticated control systems, we continuously work to minimize the negative impact that may arise from risk concentrations.
The Group’s business operations are based on conscious and disciplined risk-taking. We believe that independent risk manage-ment, compliance and audit processes with proper management accountability are critical to the interests and concerns of stake-holders. The Group’s approach to risk management is supported by the following principles:
p Establish a clear risk appetite that sets out the types and lev-els of risk we are prepared to take;
p Have in place risk management and compliance policies that set out authorities and responsibilities for taking and managing risks;
p Seek to establish resilient risk constraints that promote mul-tiple perspectives on risk and reduce the reliance on single risk measures;
p Actively monitor risks and take mitigating actions where they fall outside accepted levels; and
p Breaches of risk limits or tolerances are identified, analyzed and escalated, and large, repeated or unauthorized exceptions may lead to terminations, adverse adjustments to compensa-tion or other disciplinary action.
Culture
Risk culture encompasses a shared set of values across the Group that fosters the importance, understanding and control of risk.
The Group promotes a strong risk culture where employees are empowered to take accountability for identifying and escalating risks and for challenging inappropriate actions. The businesses are held accountable for managing all of the risks they generate, including those relating to employee behavior and conduct, in line with our risk appetite. Expectations on risk culture are regularly communicated by senior management, reinforced through policies and training, and considered in the performance assessment and compensation processes and, with respect to employee conduct, assessed by formal disciplinary review committees.
We seek to promote responsible behavior through the Group’s Code of Conduct, which provides a clear statement on the behav-ioral expectations of our employees and members of the Board, in order to maintain and strengthen our reputation for integrity, fair dealing and measured risk-taking. In addition, through 2020 our Conduct and Ethics Standards were an important part of embedding our desired behaviors into our business strategy and the organizational fabric.
In January 2021, we announced the evolution of our Code of Conduct to include a refreshed set of cultural values (inclusion, meritocracy, partnership, accountability, client focus and trust) which continue to focus on the important components origi-nally outlined in our previous Conduct and Ethics Standards, but present them in a modernized and updated framework. In 2021, the Code of Conduct was updated to align with the new cultural values.
> Refer to “Conduct risk” in Risk coverage and management – Non-financial risk for further information.
> Refer to “credit-suisse.com/sustainabilityreport” for our Sustainability Report.

142 Risk management
Key management bodies and committees covering risk management matters
Group / Bank
Divisional risk management committees1 Legal entities
p Risk boards and management committees for certain significant legal entities with independent governance and oversight
p Responsible for assuring local regulatory compliance as well as defining local risk appetite
Board of Directors
Risk Committee Audit CommitteeConduct and Financial Crime
Control CommitteeCompensation Committee
Swiss Universal Bank
International Wealth Management
Asia Pacific
Investment Bank
Executive Board Executive Board Risk Forum
Capital Allocation & Risk Management Committee (CARMC)Valuation Risk Management
Committee (VARMC)
1 Divisional risks may be covered by the respective legal entity risk management committees.
Position & Client Risk (PCR) Asset & Liability Management (ALM) Internal Control System (ICS)
Governance
Effective governance sets a solid foundation for comprehensive risk management discipline. The Group’s risk governance frame-work is based on a “three lines of defense” governance model, where each line has a specific role with defined responsibilities and works in close collaboration to identify, assess and mitigate risks.
The first line of defense is the front office, which is responsible for pursuing suitable business opportunities within the strategic risk objectives and compliance requirements of the Group. Its pri-mary responsibility is to ensure compliance with relevant legal and regulatory requirements, maintain effective internal controls and ensure that the Group operates within its risk appetite.
The second line of defense includes functions across the Group such as Risk & Compliance, General Counsel (including Regula-tory Affairs) and Product Control. The functions within the second line articulate standards and expectations for the effective man-agement of risk and controls, including advising on, publishing related policies on and assessing compliance with applicable legal and regulatory requirements. They are responsible for reviewing, measuring and challenging front office activities and for produc-ing independent assessments and risk reporting for senior man-agement and regulatory authorities. Risk & Compliance is also responsible for articulating and designing the risk appetite frame-work across the Group.
The third line of defense is the Internal Audit function, which monitors the effectiveness of controls across various functions and operations, including risk management, compliance and gov-ernance practices.
The Group’s operations are regulated by authorities in each of the jurisdictions in which we conduct business. Central banks and other bank regulators, financial services agencies, securi-ties agencies and exchanges and self-regulatory organizations are among the regulatory authorities that oversee our businesses. FINMA is our primary regulator.
> Refer to “Regulation and supervision” in I – Information on the company for further information.
The Group’s governance includes a committee structure and a comprehensive set of corporate policies which are developed, reviewed and approved by the Board, the Executive Board, their respective committees, the Chief Risk and Compliance Officer (CRCO) and the board of directors of significant subsidiaries, in accordance with their respective responsibilities and levels of authority.
> Refer to “Board of Directors” and “Executive Board” in IV – Corporate Gover-nance for further information.
Board of DirectorsThe Board is responsible for our strategic direction, supervision and control, and for defining our overall tolerance for risk. In par-ticular, the Board approves the risk management framework and sets overall risk appetite in consultation with its Risk Committee (Risk Committee) among other responsibilities and authorities defined in the Organizational Guidelines and Regulations (OGR).
The Risk Committee is responsible for assisting the Board in fulfilling its oversight responsibilities by periodically reviewing the Risk function, its resources and key risks.

143Risk management
The Audit Committee is responsible for assisting the Board in fulfilling its oversight responsibilities by monitoring management’s approach with respect to financial reporting, internal controls, accounting and legal and regulatory compliance. Additionally, the Audit Committee is responsible for monitoring the independence and performance of internal and external auditors.
The Conduct and Financial Crime Control Committee is responsible for assisting the Board in fulfilling its oversight duties with respect to the Group’s exposure to financial crime risk. It is tasked with monitoring and assessing the effectiveness of financial crime compliance programs and initiatives focused on improving conduct and vigilance within the context of combatting financial crime.
The Compensation Committee is responsible for determin-ing, reviewing and proposing compensation principles for the Group. Under the compensation risk framework, various corpo-rate functions including Risk & Compliance, General Counsel, Human Resources, Internal Audit and Product Control provide input for the assessment of the divisions’ and certain individuals’ overall risk and conduct performance and determine an overall risk rating, which is presented to the chairs of the Compensa-tion Committee, Risk Committee and Audit Committee, and is contemplated as part of the divisions’ and certain individuals’ performance.
Executive BoardThe Executive Board is responsible for establishing our strategic business plans, subject to approval by the Board, and imple-menting such plans. It further reviews and coordinates significant initiatives within the Risk & Compliance function and approves Group-wide risk policies. The CRCO represents the Risk & Com-pliance function and provides regular information and reports to the Executive Board and the Board.
Executive Board Risk ForumThe Executive Board Risk Forum, chaired by the CRCO, was established in 2020. The forum is responsible for determining the management strategy for critical risk and compliance issues at the Group and/or cross-divisional level, reviewing and resolv-ing issues pertaining to risk escalated by the Capital Allocation & Risk Management Committee (CARMC) or any Executive Board member, reviewing and overseeing critical approvals including, but not limited to, risk appetite and the risk framework and monitoring of key risk and compliance trends and relevant metrics.
Executive Board committees
The Capital Allocation & Risk Management Committee (CARMC) is responsible for overseeing and directing our risk profile, recommending risk limits at the Group level to the Risk Committee and the Board, establishing and allocating risk appe-tite among the various businesses, reviewing new significant business strategies or changes in business strategies including business migrations, making risk-related decisions on escalations, and for applying measures, methodologies and tools to monitor
and manage the risk portfolio. CARMC will furthermore escalate items requiring additional oversight to the Executive Board Risk Forum. There are three cycles of CARMC, which each meet at least quarterly. p The Position & Client Risk (PCR) cycle determines the risk
management strategy and approves risk appetite and other appropriate measures relating to the market, credit, liquidity, reputational, sustainability, environmental and social risks of clients or industries across the various businesses within the Group.
p The Asset & Liability Management (ALM) cycle reviews the funding and balance sheet trends and activities, plans and monitors regulatory and business liquidity requirements and internal and regulatory capital adequacy, provides governance and oversight over all material business migrations and ensures that legal entity strategic initiatives are within the Group’s risk appetite and appropriately supported and controlled.
p The Internal Control System (ICS) cycle monitors and analyzes significant non-financial risks (including operational, legal and compliance risks), reviews and approves the business conti-nuity program’s alignment with the corporate strategy on an annual basis, sets risk constraints on specific businesses and functions to control significant non-financial risks (including operational risk exposure) and reviews and assesses the ade-quacy and effectiveness of the internal control system.
The Valuation Risk Management Committee (VARMC) is responsible for establishing policies regarding the valuation of certain material assets and the policies and calculation meth-odologies applied in the valuation process. Further, VARMC is responsible for monitoring and assessing valuation risks, review-ing inventory valuation conclusions and directing the resolution of significant inventory valuation issues.
Divisional and legal entity risk management committeesDivisional and legal entity risk management committees review risk, legal, compliance and internal control matters specific to the divisions and individual legal entities, respectively.
Risk & Compliance organization
The risk management functions (Risk) within Risk & Compli-ance are responsible for providing risk management oversight and establishing an organizational basis to manage risk matters. Risk challenges and engages with the business divisions in shaping the divisions’ and the Group’s risk profiles.
The key organizational elements include a structure consisting of divisional/legal entity coverage and global risk type functions. The structure reflects the Group’s business strategy and legal entity considerations and is supported by strategy-enabling functions.
The organization has continued to evolve, including the modi-fication and formation of certain global risk type and strategy-enabling functions, in order to support our efforts to drive strate-gic and sustainable returns on risk that reflect the risk appetite of the Group.
144 Risk management
Compliance is an independent global function within Risk & Com-pliance that works with the businesses to manage risks arising from the potential failure to comply with applicable laws, regula-tions, rules or market standards. As a second line of defense function, responsibilities include independently assessing compli-ance risk, executing monitoring and testing activities and report-ing on adherence to our compliance risk appetite and other mate-rial matters to the Board and senior management. Compliance creates, implements and monitors compliance policies and pro-cedures to prevent or detect compliance breaches of employees and clients. Compliance is mandated to ensure that regulatory and compliance risks are adequately overseen and managed in the organization and is also responsible for the identification and remediation of significant breaches of the Group’s compliance processes and controls. Compliance runs global risk oversight programs, for example cross border and client tax compliance, and establishes and monitors policies, guidelines, procedures and controls related to potential risks such as money laundering, brib-ery and corruption and sanctions.
Global risk and compliance functionsThe global risk type functions design our risk appetite framework and ensure globally harmonized models and methodologies. They comprise Credit Risk (including reputational risk), Market Risk, Non-Financial Risk, Independent Validation & Review, Treasury & Liquidity Risk, Enterprise Risk Management and Quantitative Analysis & Technology and are accountable for functional risk oversight and the risk constraint framework at the global and local legal entity level. They are also responsible for functional mod-els, methodologies and policies and function-related regulatory change.
Credit Risk Review is a review function independent from the Credit Risk function with a direct reporting line to the Chair of the Risk Committee, administratively reporting to the CRCO. Credit Risk Review assesses the Group’s credit exposures and credit risk management processes and practices.
The Deputy Chief Compliance Officer (DCCO) leads the global Compliance function, with responsibility for financial crime com-pliance, core compliance and compliance investigations, and compliance operations, reporting to the CRCO. The DCCO is responsible for setting global compliance standards, frameworks and policies, and for overseeing global compliance programs. The DCCO provides input to divisional chief compliance officers, who report to the DCCO on a secondary basis, and acts as the del-egate of the CRCO for compliance matters within parameters set out by the CRCO.
Divisional/legal entity coverageOur governance framework includes dedicated risk management committees for each division. The divisional chief risk officers for Swiss Universal Bank, International Wealth Management, Asia Pacific and the Investment Bank have established granular risk appetite frameworks and reporting capabilities to cover the specific needs of their business divisions and are responsible for
ensuring alignment of the risk management activities within our divisions.
Legal entity chief risk officers provide risk oversight for certain significant legal entities in the locations of our main operations. They are responsible for ensuring that Group risk appetite frame-works and related policies are applied consistently and according to local requirements.
Divisional chief compliance officers, who also provide compliance oversight for the most significant legal entities in their respective regions, are responsible for providing independent oversight and control over the compliance risks and regulatory risks relating to their respective divisions and legal entities.
Strategy-enabling functionsData & Technology (including Digital Transformation & Products Labs), a shared function within Risk & Compliance, drives the transformation of key front to back processes and the delivery of advanced analytics, case management, self-service digital assis-tance and robotics capabilities on a common platform.
Regulatory Affairs
On September 1, 2020, Regulatory Affairs was combined with the Group’s Public Policy and Regulatory Foresight and Intel-ligence teams, forming the new Public Policy and Regulatory Affairs department within the General Counsel function. By com-bining these three teams, the Group brings the key Regulatory Affairs functions, which include regulatory change detection and assessment, advocacy and supervisory engagement, under uni-fied leadership directly reporting to the General Counsel, which is intended to further enhance consistency and strengthen the Group’s capabilities in these key areas. Regulatory Affairs is a global function that assists the Group’s efforts to mitigate regu-latory risk by advising, managing and providing transparency on regulatory interactions, such as exams, ad hoc requests, meet-ings and notifications, and tracking regulatory commitments.
Risk appetite frameworkOverview
We maintain a comprehensive Group-wide risk appetite frame-work, which is governed by a global policy and provides a robust foundation for risk appetite setting and management across the Group. A key element of the framework is a detailed statement of the Board-approved risk appetite which is aligned to our financial and capital plans. The framework also encompasses the pro-cesses and systems for assessing the appropriate level of risk appetite required to constrain our overall risk profile.
Risk capacity is the maximum level of risk that we can assume given our current level of resources before breaching any con-straints determined by liquidity and capital requirements, the

145Risk management
Risk appetite framework – key definitions
Risk capacity Maximum level of risk that we can assume given our current level of resources before breaching any constraints determined by capital and liquidity require-ments, the operational environment and our responsibilities to depositors, shareholders, investors and other stakeholders.
Risk appetite Aggregate level and types of risk we are willing to assume within our risk capacity to achieve our strategic objectives and business plan.
Risk profile Point-in-time assessment of our net risk exposures aggregated within and across each relevant risk category and expressed in a variety of different quantitative risk metrics and qualitative risk observations.
Risk constraints Quantitative and qualitative measures based on forward-looking assumptions that allocate our aggregate risk appetite to businesses, legal entities, risk categories, concentrations and, as appropriate, other levels.
Risk constraints (qualitative constraint statements, limits, guidelines, tolerances, targets and flags)
Risk capacity
Risk appetite
Risk profile
operational environment and our responsibilities to depositors, shareholders, investors and other stakeholders. Risk appetite expresses the aggregate level and types of risk we are willing to assume within our risk capacity to achieve our strategic objectives and business plan. Risk profile is a point-in-time assessment of our net risk exposures aggregated within and across each rele-vant risk category and is expressed in a variety of different quan-titative risk metrics and qualitative risk observations. The size of our risk profile is restricted to the planned level of our risk appe-tite through the use of risk constraints, such as limits, guidelines, tolerances and targets.
Key aspects and process
The Group risk appetite framework is governed by an overarching global policy that encompasses the suite of specific policies, pro-cesses and systems with which the risk constraints are calibrated and the risk profile is managed. Strategic risk objectives (SROs) are effectively embedded across our organization at the Group, business division and legal entity level through a suite of differ-ent types of risk measures (quantitative and qualitative) as part of our efforts to ensure we operate within the thresholds defined by the Board. The SROs are regularly assessed as part of our continuing enhancements to our risk management processes. In December 2020, the Board reviewed and confirmed the SROs, which consist of:p promoting stability of earnings to support performance in line
with financial objectives;
p ensuring sound management of funding and liquidity in normal and stressed conditions;
p maintaining capital adequacy under both normal and stressed conditions; and
p maintaining the integrity of our business and operations.
Group-wide risk appetite is determined in partnership with the financial and capital planning process on an annual basis, based on bottom-up forecasts that reflect planned risk usage by the businesses and top-down, Board-driven strategic risk objec-tives and risk appetite. Scenario stress testing of financial and capital plans is an essential element in the risk appetite calibra-tion process, through which our strategic risk objectives, financial resources and business plans are aligned. The capital plans are also analyzed using our economic capital coverage ratio, which provides a further means of assessing bottom-up risk plans with respect to available capital resources. The risk appetite is approved through a number of internal governance forums, including joint approval by the CRCO and the CFO, CARMC, the Risk Committee and, subsequently, by the Board.
The risk appetite statement is the formal plan, approved by the Board, for our Group-wide risk appetite. Divisional allocations are cascaded from the Group and approved in divisional risk manage-ment committees. Legal entity risk appetites are set by the local legal entity board of directors within the limits established by the Group. The top-down and bottom-up risk appetite calibration pro-cess includes the following key steps:
146 Risk management
Top-down:p Group-level strategic risk objectives are agreed by the Board
in line with our financial and capital objectives.p Top-down risk capacities and risk appetites are determined
with reference to available resources and key thresholds, such as minimum regulatory requirements.
p A risk appetite statement is determined and approved annu-ally by the Board, and is based on the strategic risk objectives, the comprehensive scenario stress testing of our forecasted financial results and capital requirements, and our economic capital framework. A semi-annual review of the risk appetite and capacity levels is performed. The risk appetite statement comprises quantitative and qualitative risk measures necessary for adequate control of the risk appetite across the organiza-tion. The review of the top-down and bottom-up risk appetite levels and their allocation between divisions and legal entities is performed by CARMC.
p Separate legal entity risk appetite frameworks aligned to local regulatory requirements are in place for material subsidiaries. An integrated year-end planning process ensures that individ-ual legal entity risk appetites are consistent with Group levels.
p Divisional risk committees are responsible for allocating risk appetite within the respective divisions based on individual business line reviews and requirements.
Bottom-up:p Planned risk levels and related risk appetite requests are
provided by front office business experts in conjunction with financial and capital plans in order to ensure consistency with the business strategy. Risk plans are reviewed by the relevant risk management committees.
p Bottom-up risk forecasts are aggregated across businesses to assess divisional and Group-wide risk plans and to support management decisions on variations to existing risk appetite levels or the possible need for new risk appetite measures.
p The effectiveness of risk appetite in support of business strategy execution and delivery against financial objectives is assessed via a risk appetite effectiveness framework. This framework assists senior management and the Board in ensur-ing that appropriate levels of risk appetite are set and that the subsequent risk constraints are appropriately calibrated.
p Risk, financial and capital plans are jointly reviewed and approved by the Executive Board and the Board.
The Group-wide risk appetite framework encompasses multiple quantitative and qualitative aspects. The quantitative risk appe-tite aspects are measured using various metrics, including stress scenario metrics related to capital, earnings and liquidity, risk-weighted assets and economic risk capital. The qualitative risk appetite aspects are used to monitor adherence to international and local laws and regulations, industry guidelines and internal policies, and are designed to manage and mitigate the Group’s conduct and reputational risk. The division-specific risk appetite statements leverage the Group-wide quantitative and qualitative aspects by including constraints across credit risk, market risk
and non-financial risk and are designed to ensure that risk-taking activity by our businesses remains within the Group-wide risk appetite.
Risk constraints
A core aspect of our risk appetite framework is a sound system of integrated risk constraints. These allow us to maintain our risk profile within our overall risk appetite, and encourage meaningful discussion between the relevant businesses, Risk functions and members of senior management around the evolution of our risk profile and risk appetite. Considerations include changing exter-nal factors (such as market developments, geopolitical conditions and client demand) as well as internal factors (such as financial resources, business needs and strategic views). Our risk appetite framework utilizes a suite of different types of risk constraints to reflect the aggregate risk appetite of the Group and to further cascade risk appetite across our organization, including among business divisions and legal entities. The risk constraints restrict our maximum balance sheet and off-balance sheet exposure given the market environment, business strategy and financial resources available to absorb losses. Different levels of seniority are mapped to each type of risk constraint, which require specific permanent or temporary modification, enforcement and breach response protocols. Risk constraints are monitored on a regular basis as part of our efforts to ensure they continue to fulfill their purposes.
We define the following risk constraint categories:p Qualitative constraints represent constraints that are used
to manage identified but unquantifiable or subjective risks, with adherence assessed by the appropriate level of constraint authority.
p Quantitative constraints represent constraints that are used to manage identified quantifiable risks and exist in the form of limits, guidelines, tolerances, targets and flags.
Constraint authority for the risk constraints is determined by the relevant approving body and constraints are currently in effect for all key risk governance bodies and committees including the Board, its Risk Committee, the Executive Board Risk Forum and CARMC. The appropriateness of the constraint types for the vari-ous risk classes within our risk appetite, including market, credit, non-financial and liquidity risk, is determined considering the respective characteristics of the various risk constraint types.
In general, risk constraints will be set in different ways depending on their respective functions and objectives. For example, certain risk constraints will reflect a maximum risk appetite, whereas oth-ers will be set closer to the current usage in order to ensure timely escalation and feedback among the relevant businesses, Risk functions and members of senior management. These consider-ations also influence the extent to which certain risk constraints may be introduced, modified or retired in response to changing external and internal factors.

147Risk management
We define the following types of risk constraints:p Qualitative constraint statements are required for all quali-
tative constraints. Qualitative constraint statements need to be specific and to clearly define the respective risk to ensure that the risk profile for unquantifiable or subjective risks is readily assessable.
p Limits, guidelines and tolerances are specific threshold levels for a given risk metric. Limits are binding thresholds that require discussion to avoid a breach and trigger imme-diate remediating action if a breach occurs. Guidelines are thresholds which, if breached, require an action plan to reduce risk below the guideline or to propose, justify and agree to adjust the guideline. Tolerances are designed as management thresholds to initiate discussion, and breach of a tolerance level triggers review by the relevant constraint authority.
p Targets represent the level of risk that the Group intends to accept in pursuit of business objectives at a specific point in time in the future.
p Flags are early warning indicators, which serve primarily as a business risk management and supervisory control tool for our front offices, Treasury and Risk. Flags can be set for any quantifiable risk and may be complementary to other types of constraints.
With respect to limits, guidelines and tolerances, established cri-teria are applied in the selection of the appropriate risk constraint, including the assessment of (i) the materiality of the respective risk metric with regard to its contribution to the overall Group risk appetite; (ii) the importance of the risk constraint to the organiza-tion from a qualitative perspective; (iii) the characteristic of the respective risk, e.g., risk concentrations or high priority risk for the Group; and (iv) the availability of mitigating actions to manage the risk profile of the Group in relation to the respective risk.
We have established a constraint structure which manages the Group’s risk profile using multiple metrics, including VaR, scenario analysis, economic risk capital and various exposure limits at the Group level. The overall risk limits for the Group are set by the Board in consultation with its Risk Committee and are binding. In 2020 and 2019, no Board limits were exceeded. The CRCO may approve temporary excesses of certain CARMC limits up to a predefined level until the next CARMC meeting. The CRCO also approves a corresponding remediation plan, with immediate notice of the temporary excess and remediation plan to the Group CEO, and subsequent notice to CARMC and the Board at their next meetings.
Dedicated constraints are also in place to cover the specific risk profiles of individual businesses and legal entities. In the context of the overall risk appetite of the Group, as defined by the limits set by the Board in consultation with its Risk Committee, CARMC is responsible for allocating key limits to divisions as deemed necessary to manage risk within individual lines of business. The divisional risk management committees and the divisional and legal entity chief risk officers are responsible for allocating risk appetite further within the organization. For this purpose, they use
a detailed framework of individual risk limits designed to control risk-taking at a granular level by individual businesses and in the aggregate. The risk constraints are intended to:p limit overall risk-taking to the Group’s risk appetite;p trigger senior management discussions with the businesses
involved, risk management and governance committees in case of substantial change in the overall risk profile;
p ensure consistent risk measurement across businesses;p provide a common framework for the allocation of resources to
businesses; andp provide a basis for protecting the Group’s capital base and
meeting strategic risk objectives.
The limit owners are responsible for reviewing warning triggers for risk limits. They may set warning triggers for potential limit excesses at any level lower than the approved limits as deemed appropriate after taking into account the nature of the underly-ing business. A comprehensive risk appetite constraint framework is in place which defines roles and responsibilities, including risk constraint setting and escalation authorities. Strict escalation pro-cedures apply to any breach in risk constraints.
Risk coverage and managementWe use a wide range of risk management practices to address the variety of risks that arise from our business activities. Poli-cies, processes, standards, risk assessment and measurement methodologies, risk appetite constraints, and risk monitoring and reporting are key components of our risk management practices. Our risk management practices complement each other in our analysis of potential loss, support the identification of interde-pendencies and interactions of risks across the organization and provide a comprehensive view of our exposures. We regularly review and update our risk management practices to ensure con-sistency with our business activities and relevance to our business and financial strategies. Risk management practices have evolved over time without a standardized approach within the industry, therefore comparisons across firms may not be meaningful. Our key risk types are aligned to our global risk taxonomy and include the following:p Capital riskp Credit riskp Market riskp Non-financial riskp Model riskp Reputational riskp Business riskp Climate-related risksp Fiduciary riskp Pension risk
For purposes of categorizing key risk types, non-traded market risk and funding liquidity are together an individual risk type in our global risk taxonomy. While non-traded market risk is described further below as part of market risk, funding liquidity is managed
148 Risk management
by Treasury. Funding liquidity is the risk that the Group, although solvent, either does not have sufficient financial resources to enable it to meet its obligations as they fall due, or can secure such resources only at excessive cost.
> Refer to “Liquidity and funding management” for further information on liquidity and funding risks.
Capital risk
DefinitionCapital risk is the risk that we do not have adequate capital to support our activities and maintain the minimum capital require-ments. Under the Basel framework, we are required to maintain a robust and comprehensive framework for assessing capital adequacy, defining internal capital targets and ensuring that these capital targets are consistent with our overall risk profile and the current operating environment.
Sources of capital riskCapital risk results from the Group’s risk exposures, avail-able capital resources, regulatory requirements and accounting standards.
Evaluation and management of capital riskThe stress testing framework and economic risk capital are tools used by the Group to evaluate and manage capital risk. Our capi-tal management framework is designed to ensure that we meet all regulatory capital requirements for the Group and its regulated subsidiaries.
> Refer to “Capital strategy” and “Regulatory framework” in Capital management for further information on the management of capital and risk-weighted assets and regulatory capital requirements.
Overview of stress testing frameworkStress testing or scenario analysis represents a risk management approach that formulates hypothetical questions, including what would happen to our portfolio if, for example, historic or adverse forward-looking events were to occur. A well-developed stress testing framework provides a powerful tool for senior manage-ment to identify these risks and also take corrective actions to protect the earnings and capital from undesired impacts.
Stress testing is a fundamental element of our Group-wide risk appetite framework included in overall risk management to ensure that our financial position and risk profile provide sufficient resilience to withstand the impact of severe economic condi-tions. Stress testing results are monitored against limits, and are used in risk appetite discussions and strategic business planning and to support our internal capital adequacy assessment pro-cess (ICAAP). Within the risk appetite framework, CARMC sets Group-wide and divisional stressed position loss limits to corre-spond to minimum post-stress capital ratios. Currently, limits are set on the basis of look-through BIS CET1 capital ratios. Stress tests also form an integral part of the Group’s capital planning and the recovery and resolution plan (RRP) process. Within the RRP, stress tests provide the indicative scenario severity required to reach recovery and resolution capital levels.
Stress testing provides key inputs for managing the following objectives of the risk appetite framework:p Ensuring Group-wide capital adequacy on both a regulatory
basis and under stressed conditions: We run a suite of scenar-ios on forecasted financial metrics such as net revenues, total operating expenses, income before taxes and risk-weighted assets. The post-stress capital ratios are assessed against the risk appetite of the Group.
p Maintaining stable earnings: We mainly use stress testing to quantitatively assess earnings stability risk. Earnings-loss-trig-gers are established and monitored to contain excessive risk-taking which could compromise our earnings stability.
We also conduct externally defined stress tests that meet the specific requirements of regulators. For example, as part of vari-ous regular stress tests and analysis, FINMA requires a semi-annual loss potential analysis that includes two stress tests. For 2020, the FINMA stress test included an extreme scenario that sees the world economy experience a severe recession mainly as a result of a worsening of a European debt crisis and a COVID-19 pandemic scenario that sees the world economy suffer several severe infection waves, which force governments to implement extreme lockdowns on social and economic activity in the fourth quarter of 2020 and the first half of 2021. Credit Suisse also developed its own version of a COVID-19 pandemic scenario (severe W-shaped recovery) to stress capital adequacy as part of its ICAAP.
Methodology and scope of Group-wide stress testingStress tests are carried out to determine stressed position losses, earnings volatility and stressed capital ratios using historical, forward-looking and reverse stress testing scenarios. The scope of stress testing includes market, credit, operational, business and pension risk. Stress tests also include the scenario impact on risk-weighted assets through changes to market, credit and operational components.
We use historical stress testing scenarios to consider the impact of market shocks from relevant periods of extreme market distur-bance. Standardized severity levels allow comparability of severity across differing risk types. The calibration of bad day, bad week, severe event and extreme event scenarios involves the identifi-cation of the worst moves that have occurred in recent history. Severe flight to quality (SFTQ) is a key scenario used for Group-wide stress testing and risk appetite setting. It is a combination of market shocks and defaults that reflects conditions similar to what followed the 2008/2009 financial crisis. The SFTQ scenario assumes a severe crash across financial markets, along with stressed default rates.
We use forward-looking stress testing scenarios to complement historical scenarios. The forward-looking scenarios are cen-tered on potential macroeconomic, geopolitical or policy threats. The Scenario Management Oversight Committee, comprised of internal economists and representatives of the front office, Risk & Compliance and the CFO function (Finance), discusses the backdrop to several forward-looking scenarios. The Scenario

149Risk management
Management Oversight Committee reviews a wide range of sce-narios and selects those that are most relevant to the analysis of key macroeconomic shocks. Some examples of forward-looking scenarios include US and European country recessions, a so-called emerging markets economic “hard landing” and the impact of monetary policy changes by central banks. Various scenarios are also used to mitigate concentration risks across the entire Group, such as the credit concentration scenario. During 2020, the Group focused on the following forward-looking scenarios:p Financial sector problems in the eurozone: the markets chal-
lenge the solvency of a systemically-important bank, which puts the overall European financial sector and selected euro-zone countries under acute pressure with a potential break-down in relations between Switzerland and the EU. As a result, the eurozone and the Swiss economy are forced into reces-sion. Contagion from a European recession to the US and emerging market economies is assumed to be substantial.
p A China and emerging markets “hard landing” scenario: there is a severe economic slowdown in China driven by a wave of defaults in the private non-financial and financial sectors. The problems in China negatively impact all large emerging mar-kets through lower commodity prices, increased capital flight and reduced intra-regional foreign trade. The Hong Kong dol-lar comes under significant pressure and de-pegs from the US dollar. There is also significant contagion to the economy in the US and in Europe.
p Stress scenarios for the UK and for the US: the scenarios take into account the large increase in economic policy out-look uncertainties and the higher risk that inflation significantly accelerates, bringing about a disorderly rise in government bond yields. The UK stress scenario focuses on the risks which may materialize from leaving the EU. The US stress sce-nario focuses on the credit, market and business risks which may materialize from excessive risk taking, investors’ search for yield, more expansionary fiscal policies and a shift toward more protectionist foreign trade practices.
We also use a flight to quality lite scenario (FTQ Lite), which is a one-in-three years likelihood scenario with a lower severity of impact than SFTQ but with a higher likelihood of occurrence. FTQ Lite is used to test the earnings robustness of the Group.
The scenarios are reviewed and updated regularly as markets and business strategies evolve. In April 2020, an ad hoc internal COVID-19 severe W-shaped recovery scenario was developed to assess how the Group would be affected by a further spread of the pandemic and a prolonged recovery path. We also utilize ad hoc scenario analyses, for example in respect of the escalation in geopolitical tensions in the Middle East, in connection with cur-rent events as a proactive risk management tool.
We use reverse stress testing scenarios to complement traditional stress testing and enhance our understanding of business model vulnerabilities. Reverse stress testing scenarios define a range of severe adverse outcomes and identify what could lead to these outcomes. The more severe scenarios include large counterparty
failures, sudden shifts in market conditions, operational risk events, credit rating downgrades and the shutdown of wholesale funding markets.
Overview of economic risk capitalEconomic risk capital measures risks in terms of economic reali-ties rather than regulatory or accounting rules and estimates the amount of capital needed to remain solvent and in business under extreme market, business and operating conditions over the period of one year, given a target financial strength (our long-term credit rating). This framework allows us to assess, monitor and manage capital adequacy and solvency risk in both “going concern” and “gone concern” scenarios. In a “going concern” scenario, we hold sufficient capital to absorb losses to ensure continuity of service. In a “gone concern” scenario, we hold sufficient capital to absorb unexpected losses at a confidence level of 99.97% and fund an orderly resolution without recourse to public resources. Economic risk capital supplements the Group’s RRP process.
Economic risk capital as a metric for Group-wide and divisional risk management, including limit setting and monitoring, has been significantly de-emphasized and, since January 2020, is primar-ily used for certain specific businesses only. At the level of the Group, economic risk capital is now used primarily as a tool for capital management in a “gone concern” scenario, measuring the combined impact from quantifiable risks such as market, credit, operational, pension and expense risk. Return on economic risk capital as a metric for performance management has been replaced by other metrics such as return on regulatory capital. Due to the limited use of economic risk capital, the Group no lon-ger reports economic risk capital metrics.
> Refer to “Capital strategy” and “Regulatory framework” in Capital management for further information on our capital management framework.
Methodology and scope of economic risk capitalEconomic risk capital is set to a level needed to absorb unexpected losses at a confidence level of 99.97%. Our economic risk capital model is a set of methodologies used for measuring quantifiable risks associated with our business activities on a consistent basis. It is calculated separately for position risk (reflecting our exposure to market and credit risks), operational risk and other risks, using appropriate methodologies for each risk category. Economic risk capital is calculated by aggregating position, operational and other risks.
Position risk is the level of unexpected loss from our portfolio of balance sheet and off-balance sheet positions over a one-year holding period and includes market and credit risks. It is calculated at a 99% confidence level for risk management purposes reflecting a “going concern” scenario and at a 99.97% confidence level for capital management purposes reflecting a “gone concern” resolu-tion scenario. Our position risks categories are described in the table “Position risk categories”. To determine our overall position risk, we consider the diversification benefit across risk types. When analyzing position risk for risk management purposes, we look at individual risk types before and after the diversification benefit.
150 Risk management
Position risk categories
Risks captured
Credit risk Risk of counterparty defaults relating to investment and private banking credit exposures directly held in the form of lending products (including loans and credit guarantees) or derivatives and shorter-term exposures such as underwriting commitments and trading book inventory, as well as credit exposures indirectly held in the form of collateral in derivatives, reverse repurchase and securities lending transactions; settlement risk is not captured in the economic risk capital framework
Potential changes in creditworthiness relating to private banking corporate and retail credit exposures
Non-traded credit spread risk Potential changes in creditworthiness relating to investment banking credit exposures
Securitized products Commercial and residential real estate activities, including mortgage-backed securities, mortgage loans and real estate acquired at auction, and other securitized products, including asset-backed securities
Benefits from certain market risk hedges
Traded risk Interest rates, credit spreads, foreign exchange rates, equity and commodity prices and volatilities, equity risk arbitrage, life finance and litigation activities, and illiquid hedge fund exposures
Risks currently not implemented in our economic risk capital models for traded risks, primarily for fixed income and equity trading, such as certain basis risks, higher order risks and cross risks between asset classes
Equity investments Private equity and other illiquid equity investment exposures
Operational risk is the risk of financial loss arising from inad-equate or failed internal processes, people and systems or from external events. We use an internal model to calculate the eco-nomic capital requirement for operational risk at a 99.97% confi-dence level and a one-year holding period.
Other risks covered include expense risk, pension risk, owned real estate risk, foreign exchange risk between available economic capital and economic risk capital, interest rate risk on client interest rate margin positions and the benefit from deferred share-based compensation awards.
Available economic capital is our internal view of the capital avail-able to absorb losses based on the reported BIS CET1 capital under Basel III, with economic adjustments applied to provide con-sistency with our economic risk capital.
The economic risk capital coverage ratio operates with a number of distinct bands that serve as key controls for monitoring and man-aging our operational solvency. An economic risk capital coverage ratio lower than 125% requires senior management review. Imme-diate actions such as risk reductions or capital measures would be triggered at a coverage ratio lower than 100%. The Board has set the minimum level for this coverage ratio at 80%.
Governance of capital riskFor capital risk, the Scenario Management Oversight Commit-tee has received responsibility from CARMC for the Group-wide scenario calibration and analysis process, including the design of scenarios and the assessment and approval of scenario results. Stress tests are conducted on a regular basis and the results, trend information and supporting analysis are reported to the Board, senior management and regulators. We have a com-prehensive set of stress testing models that is governed by the Model Approval and Control Committee (MACC) and the NFRM
Capital Data Committee, both of which are functional approval committees under the Risk Processes & Standards Committee (RPSC) governance and approve new and changed models and methodologies. Members of the functional approval committees include relevant risk function experts, such as for market, liquidity, credit and operational risk, and representatives from the Group’s divisions, major legal entities and control functions.
Our economic risk capital models are similarly governed by the MACC, which approves the economic risk capital models and methodologies.
Credit risk
DefinitionCredit risk is the risk of financial loss arising as a result of a bor-rower or counterparty failing to meet its financial obligations or as a result of deterioration in the credit quality of the borrower or counterparty. In the event of a default, a bank generally incurs a loss equal to the amount owed by the debtor, less any recover-ies from foreclosure, liquidation of collateral, the restructuring of the debtor company or other recovery proceeds from the debtor. A change in the credit quality of a counterparty has an impact on the valuation of assets measured at fair value, with valuation changes recorded in the consolidated statements of operations.
Sources of credit riskCredit risk arises from the execution of our business strategy in the divisions and reflects exposures directly held in the form of lending products (including loans and credit guarantees) or deriva-tives, shorter-term exposures such as underwriting commitments, and settlement risk related to the exchange of cash or securities outside of typical delivery versus payment structures. For the divi-sions, the main sources of credit risk are presented in the table “Main sources of credit risk by division”.

151Risk management
Main sources of credit risk by division
Swiss Universal Bank Real estate financing, lending to corporate clients and lending against financial collateral
International Wealth Management Lending against financial collateral and real assets (e.g., real estate, ships, aircraft) and corporate lending
Asia Pacific Lending to ultra-high-net-worth and entrepreneur clients, mainly backed by listed financial collateral; secured and unsecured loans to corporates in the Asia Pacific region
Investment Bank Loan underwriting and lending commitments to corporate clients, markets and trading activities including securities financing and derivatives products with global institutional clients
Corporate Center Money market exposure through balance sheet management, credit exposure with central counterparties and legacy positions
Evaluation and management of credit riskWe use a credit risk management framework which provides for the consistent evaluation, measurement and management of credit risk across the Group. Assessments of credit risk expo-sures for internal risk estimates and risk-weighted assets are calculated based on PD, LGD and EAD models. The credit risk framework incorporates the following core elements:p counterparty and transaction assessments: application of
internal credit ratings (PD), assignment of LGD and EAD val-ues in relation to counterparties and transactions;
p credit limits: establishment of credit limits, subject to approval by delegated authority holders, to serve as primary risk con-trols on exposures and to prevent undue risk concentrations;
p credit monitoring, impairments and provisions: processes to support the ongoing monitoring and management of credit exposures, supporting the early identification of deterioration and any subsequent impact; and
p risk mitigation: active management of credit exposures through the use of cash sales, participations, collateral, guarantees, insurance or hedging instruments.
Counterparty and transaction assessmentsWe evaluate and assess counterparties and clients to whom we have credit exposures. For the majority of counterparties and clients, we use internally developed statistical rating models to determine internal credit ratings which are intended to reflect the PD of each counterparty. These rating models are backtested against internal experience, validated by a function independent of model development and approved by our main regulators for application in the regulatory capital calculation under the A-IRB approach of the Basel framework. Findings from backtesting serve as a key input for any future rating model developments.
Internal statistical rating models are based on a combination of quantitative factors (e.g., financial fundamentals and market data) and qualitative factors (e.g., credit history and economic trends).
For the remaining counterparties where statistical rating models are not used, internal credit ratings are assigned on the basis of a
structured expert approach using a variety of inputs such as peer analyses, industry comparisons, external ratings and research as well as the judgment of expert credit officers.
In addition to counterparty ratings, Credit Risk also assesses the risk profile of individual transactions and assigns transaction rat-ings which reflect specific contractual terms such as seniority, security and collateral.
Internal credit ratings may differ from external credit ratings, where available, and are subject to periodic review. Our internal ratings are mapped to a PD band associated with each rating which is calibrated to historical default experience using inter-nal data and external data sources. Our internal masterscale for credit ratings is shown in the table “Credit Suisse counterparty ratings”.
LGD estimates the size of loss that may arise on a credit expo-sure in the event of a default. We assign LGD on credit exposures based on the structure of the transaction and credit mitigation such as collateral or guarantees. The LGD values are calibrated to reflect a downturn macroeconomic environment and include recovery costs.
EAD represents the expected amount of credit exposure in the event of a default and reflects the current drawn exposure and an expectation regarding the future evolution of the credit exposure. For loan exposures, a credit conversion factor is applied to project the additional drawn amount between current utilization and the approved facility amount. The credit exposure related to traded products such as derivatives is based on a simulation using statis-tical models.
We use internal rating methodologies consistently for the pur-poses of approval, establishment and monitoring of credit limits and credit portfolio management, credit policy, management reporting, risk-adjusted performance measurement, economic risk capital measurement and allocation and financial accounting.

152 Risk management
Credit Suisse counterparty ratings
Ratings PD bands (%) Definition S&P Fitch Moody’s Details
AAA 0.000 – 0.021 Substantially AAA AAA Aaa Extremely low risk, very high long-term
risk free stability, still solvent under extreme conditions
AA+ 0.021 – 0.027 Minimal risk AA+ AA+ Aa1 Very low risk, long-term stability, repayment
AA 0.027 – 0.034 AA AA Aa2 sources sufficient under lasting adverse
AA- 0.034 – 0.044 AA- AA- Aa3 conditions, extremely high medium-term stability
A+ 0.044 – 0.056 Modest risk A+ A+ A1 Low risk, short- and medium-term stability, small adverse
A 0.056 – 0.068 A A A2 developments can be absorbed long term, short- and
A- 0.068 – 0.097 A- A- A3 medium-term solvency preserved in the event of serious difficulties
BBB+ 0.097 – 0.167 Average risk BBB+ BBB+ Baa1 Medium to low risk, high short-term stability, adequate
BBB 0.167 – 0.285 BBB BBB Baa2 substance for medium-term survival, very stable short
BBB- 0.285 – 0.487 BBB- BBB- Baa3 term
BB+ 0.487 – 0.839 Acceptable risk BB+ BB+ Ba1 Medium risk, only short-term stability, only capable of
BB 0.839 – 1.442 BB BB Ba2 absorbing minor adverse developments in the medium term,
BB- 1.442 – 2.478 BB- BB- Ba3 stable in the short term, no increased credit risks expected within the year
B+ 2.478 – 4.259 High risk B+ B+ B1 Increasing risk, limited capability to absorb
B 4.259 – 7.311 B B B2 further unexpected negative developments
B- 7.311 – 12.550 B- B- B3
CCC+ 12.550 – 21.543 Very high CCC+ CCC+ Caa1 High risk, very limited capability to absorb
CCC 21.543 – 100.00 risk CCC CCC Caa2 further unexpected negative developments
CCC- 21.543 – 100.00 CCC- CCC- Caa3
CC 21.543 – 100.00 CC CC Ca
C 100 Imminent or C C C Substantial credit risk has materialized, i.e., counterparty
D1 Risk of default actual loss D D is distressed and/or non-performing. Adequate specific
D2 has materialized provisions must be made as further adverse developments will result directly in credit losses.
Transactions rated C are potential problem loans; those rated D1 are non-performing assets and those rated D2 are non-interest earning.
Credit limitsOur credit exposures are managed at the counterparty and ulti-mate parent level in accordance with credit limits which apply in relation to current and potential future exposures. Credit limits to counterparties and groups of connected companies are subject to formal approval under delegated authority within the divisions where the credit exposures are generated, and where significant in terms of size or risk profile, are subject to further escalation to the Group chief credit officer or CRCO.
In addition to counterparty and ultimate parent exposures, credit limits and tolerances are also applied at the portfolio level to mon-itor and manage risk concentrations such as to specific industries, countries or products. In addition, credit risk concentration is reg-ularly supervised by credit and risk management committees.
Credit monitoring, impairments and provisionsA rigorous credit quality monitoring process is performed to pro-vide for early identification of possible changes in the creditwor-thiness of clients, and includes regular asset and collateral quality reviews, business and financial statement analysis, and relevant economic and industry studies. Credit Risk maintains regularly updated watch lists and holds review meetings to re-assess coun-terparties that could be subject to adverse changes in creditwor-thiness. The review of the credit quality of clients and counterpar-ties does not depend on the accounting treatment of the asset or commitment.
In the event that a deterioration in creditworthiness results in a default, credit exposures are transferred to recovery management functions within Credit Risk and are subject to formal reporting to a monthly recovery review meeting. The determination of any
allowance for credit losses in relation to such exposures is based on an assessment of the exposure profile and expectations for recovery, which are discussed with the Group chief credit officer whose approval is required for any full or partial write-offs.
We have an impairment process for loans valued at amortized cost which are specifically classified as potential problem exposure, non-performing exposure, non-interest-earning exposure or restruc-tured exposure. The Group maintains specific valuation allowances, which we consider a reasonable estimate of losses identified in the existing credit portfolio, and provides for loan losses based on a regular and detailed analysis of all counterparties, taking collateral value into consideration, where applicable. If uncertainty exists as to the repayment of either principal or interest, a specific valuation allowance is either created or adjusted accordingly. The specific allowance for credit losses is revalued by Credit Risk at least annu-ally or more frequently depending on the risk profile of the borrower or credit-relevant events. A credit portfolio & provisions review committee regularly reviews the appropriateness of allowances for credit losses.
An inherent (or general) allowance for credit losses is estimated for all loans and other financial assets held at amortized cost and related off-balance sheet credit exposures not specifically identified as impaired. With effect from January 1, 2020, the Group changed the methodology for the calculation of credit loss provisions due to the adoption of a new accounting standard under US GAAP. The new methodology is a forward-looking expected loss approach referred to as a current expected credit losses (CECL) methodol-ogy. Under the former approach, provisions for credit losses were based on incurred losses only. Under the new methodology, the method for determining the inherent credit loss in certain lending
153Risk management
portfolios is derived from calculating the expected lifetime credit loss via bespoke models and requires significant management judgment by means of a qualitative overlay process. The forward-looking component of the new models is reflected through fore-casts of portfolio- and region-specific macroeconomic factors. In addition to these factors for systematic risk, the models contain idiosyncratic risk drivers. Qualitative adjustments reflect remaining idiosyncratic and portfolio-specific risks, which are not captured in the models. The calibration of these models is based on internal and/or external data. PD estimates contain a time-dependent, for-ward-looking component. LGD estimates can contain loan-specific attributes. In addition, selected LGD models contain a forward-looking component. Similar to LGD models, EAD models can contain loan-specific and/or forward-looking information. All model outputs are subject to a monthly review process, and the related expected credit loss assessments require approval by the Senior Management Approval Committee (SMAC) which is jointly chaired by the CRCO and CFO. The SMAC is the ultimate approval body of the CECL provisions for the Group, and it also approves the sce-nario weighting probabilities and baseline macroeconomic factors.
> Refer to “Note 20 – Financial instruments held at amortized cost and credit losses” in VI – Consolidated financial statements – Credit Suisse Group for fur-ther information on our CECL methodology.
Changes in the credit quality of loans held at fair value are reflected in valuation changes recorded directly in revenues, and therefore are not part of the impaired loans balance which only includes loans valued on an amortized cost basis.
Risk mitigationDrawn and undrawn credit exposures are managed by taking financial and non-financial collateral supported by enforceable legal documentation, as well as by utilizing credit hedging tech-niques. Financial collateral in the form of cash, marketable securi-ties (e.g., equities, bonds or funds) and guarantees serves to miti-gate the inherent risk of credit loss and to improve recoveries in the event of a default. Financial collateral is subject to controls on eligibility and is supported by frequent market valuation depending on the asset class to ensure exposures remain adequately col-lateralized. Depending on the quality of the collateral, appropriate haircuts are applied for risk management purposes.
Non-financial collateral such as residential and commercial real estate, tangible assets (e.g., ships or aircraft), inventories and com-modities are valued at the time of credit approval and periodically thereafter depending on the type of credit exposure and collateral coverage ratio.
In addition to collateral, we also utilize credit hedging in the form of protection provided by single-name and index credit default swaps as well as structured hedging and insurance products. Credit hedg-ing is used to mitigate risks arising from the loan portfolio, loan underwriting exposures and counterparty credit risk. Hedging is intended to reduce the risk of loss from a specific counterparty default or broader downturn in markets that impact the overall credit risk portfolio. Credit hedging contracts are typically bilateral or centrally cleared derivative transactions and are subject to collat-eralized trading arrangements. Hedging risk mitigation is evaluated
to ensure that basis or tenor risk is appropriately identified and managed.
In addition to collateral and hedging strategies, we also actively manage our loan portfolio and may sell or sub-participate positions in the loan portfolio as a further form of risk mitigation.
Governance of credit riskCredit risk is managed and controlled by the Credit Risk function and divisional chief risk officers and governed by a comprehen-sive framework of policies and committees. Key processes are reviewed through supervisory checks on a regular basis by Credit Risk, including the Group chief credit officer.
The Group chief credit officer has established an executive gover-nance and change committee to support overall management and oversight of the Credit Risk function. The committee is comprised of senior personnel of key functions within Credit Risk and divi-sional chief credit officers. The governance framework is based on a committee structure covering key areas of the credit risk framework including the credit risk appetite committee, credit risk policy committee, credit risk controls committee and various proj-ect and change related governance committees. The governance framework ensures appropriate oversight of the global Credit Risk function and the maintenance of required global standards for the management of the Group’s credit exposure.
Credit risk reviewGovernance and supervisory checks within Credit Risk are sup-plemented by the Credit Risk Review function. The Credit Risk Review function is independent from Credit Risk with a direct functional reporting line to the Risk Committee Chair, adminis-tratively reporting to the CRCO. Credit Risk Review’s primary responsibility is to provide timely and independent assessments of the Group’s credit exposures and credit risk management processes and practices. Any findings and agreed actions are reported to senior management and, as necessary, to the Risk Committee.
Market risk
This market risk section has been updated to focus on the con-cepts of traded market risk and non-traded market risk in order to more closely align the descriptions to the internal risk framework and control processes.
DefinitionMarket risk is the risk of financial loss arising from movements in market risk factors. The movements in market risk factors that generate financial losses are considered to be adverse changes in interest rates, credit spreads, foreign exchange rates, equity and commodity prices and other factors, such as market volatility and the correlation of market prices across asset classes. A typical transaction or position in financial instruments may be exposed to a number of different market risk factors. Market risks arise from both our trading and non-trading activities.

154 Risk management
Although market risk includes funding liquidity for purposes of categorizing our key risk types, the descriptions in this section pri-marily relate to traded market risk and non-traded market risk.
Traded market riskSources of traded market riskMarket risks arise from our trading activities, primarily in the Investment Bank (which includes Global Trading Solutions). Our trading activities typically include fair-valued positions and risks arising from our involvement in primary and secondary mar-ket activities, for client facilitation and market-making purposes, including derivatives markets.
The Group is active globally in the principal trading markets, using a wide range of trading and hedging products, including deriva-tives and structured products. Structured products are custom-ized transactions often using combinations of financial instru-ments and are executed to meet specific client or internal needs. As a result of our broad participation in products and markets, the Group’s trading strategies are correspondingly diverse and expo-sures are generally spread across a range of risks and locations.
The market risks associated with the portfolio, including the embedded derivative elements of our structured products, are actively monitored and managed as part of our overall risk man-agement framework and are reflected in our VaR measures.
Evaluation and management of traded market riskWe use market risk measurement and management methods capable of calculating comparable exposures across our many activities and employ focused tools that can model specific char-acteristics of certain instruments or portfolios. The tools are used for internal market risk management, internal market risk report-ing and external disclosure purposes. Our principal market risk measures for traded market risk are VaR, scenario analysis, as included in our stress testing framework, position risk, as included in our economic risk capital, and sensitivity analysis. These mea-sures complement each other in our market risk assessment and are used to measure traded market risk at the Group level. Our risk management practices are regularly reviewed to ensure they remain appropriate.
Measurement of traded market risk using value-at-riskVaR is a risk measure that quantifies the potential loss on a given portfolio of financial instruments over a certain holding period that is expected not to be exceeded at a certain confidence level. Positions are aggregated by risk factors rather than by prod-uct. For example, interest rate risk VaR captures potential losses driven by fluctuations of interest rates affecting a wide variety of interest rate products (such as interest rate swaps and swaptions) as well as other products (such as foreign exchange derivatives and equity derivatives) for which interest rate risk is not the pri-mary market risk driver. The use of VaR allows the comparison of risk across different businesses. It also provides a means of aggregating and netting a variety of positions within a portfolio to reflect historical correlations between different assets, allowing for a portfolio diversification benefit. Our VaR model is designed
to take into account a comprehensive set of risk factors across all asset classes.
VaR is an important tool in risk management and is used for mea-suring quantifiable risks from our activities exposed to market risk on a daily basis. In addition, VaR is one of the main risk measures for limit monitoring, financial reporting, calculation of regulatory capital and regulatory backtesting.
Our VaR model is based on historic data moves that derive plau-sible future trading losses. The model is responsive to changes in market conditions through the use of exponential weighting that applies a greater weight to more recent events, and the use of expected shortfall equivalent measures to ensure all extreme adverse events are considered in the model. We use the same VaR model for risk management (including limit monitoring and financial reporting), regulatory capital calculation and regulatory backtesting purposes, although confidence level, holding period, historical look-back period and the scope of financial instruments considered can be different.
For our risk management VaR, we use a rolling two-year historical dataset, a one-day holding period and a 98% confidence level. This means that we would expect daily mark-to-market trading losses to exceed the reported VaR not more than twice on aver-age in 100 trading days over a multi-year observation period. The 98% confidence level VaR is calculated using an equivalent expected shortfall approach. The expected shortfall represents the average of the potential worst losses beyond the confidence level. This measure captures risks from trading activities and it is closely aligned to the model we use to measure regulatory VaR for capital purposes. Compared to regulatory VaR, however, it has a wider scope and generally includes trading book securitiza-tions risk, banking book positions held at fair value and foreign exchange and commodity risk from banking book positions. The scope of our risk management VaR is periodically reviewed to ensure it remains aligned with the internal risk framework and control processes.
For regulatory capital purposes, we operate under the Basel III market risk framework which includes the following components for the calculation of regulatory capital: regulatory VaR, stressed VaR, IRC, RNIV, stressed RNIV and a regulatory prescribed standardized approach for securitizations. The regulatory VaR for capital purposes uses a two-year historical dataset, a ten-day holding period and a 99% confidence level calculated using an expected shortfall approach. This measure captures all risks in the trading book and foreign exchange and commodity risks in the banking book and excludes securitization positions, as these are treated under the securitization approach for regulatory pur-poses. Stressed VaR replicates the regulatory VaR calculation on the Group’s current portfolio over a continuous one-year observa-tion period that reflects a period of significant financial stress for the Group. The historical dataset starting in 2006 allows for the capturing of a longer history of potential loss events and helps reduce the pro-cyclicality of the minimum capital requirements for market risk. IRC is a regulatory capital charge for default and
155Risk management
migration risk on positions in the trading books that may not be captured adequately under a ten-day holding period. RNIV cap-tures a variety of risks, such as certain basis risks, higher order risks and cross risks between asset classes, not adequately cap-tured by the VaR model for example due to lack of sufficient or accurate risk or historical market data.
Backtesting VaR uses a two-year historical dataset, a one-day holding period and a 99% confidence level calculated using an expected shortfall approach. This measure captures risks in the trading book and includes securitization positions. Backtest-ing VaR is not a component used for the calculation of regula-tory capital but may have an impact through the regulatory capital multiplier if the number of backtesting exceptions exceeds regula-tory thresholds.
Assumptions used in our market risk measurement methods for regulatory capital purposes are compliant with the standards pub-lished by the BCBS and other international standards for market risk management. We have approval from FINMA, as well as from other regulators for our subsidiaries, to use our regulatory VaR model in the calculation of market risk capital requirements. Ongoing enhancements to our VaR methodology are subject to regulatory approval or notification depending on their materiality, and the model is subject to regular reviews by regulators and the Group’s independent Model Risk Management function.
Information required under Pillar 3 of the Basel framework related to market risk is available on our website.
> Refer to “credit-suisse.com/regulatorydisclosures” for further information.
> Refer to “Risk-weighted assets” in Capital management for further information on the use of our regulatory VaR model in the calculation of market risk capital requirements.
VaR assumptions and limitationsThe VaR model uses assumptions and estimates that we believe are reasonable, but VaR only quantifies the potential loss on a portfolio based on historical market conditions. The main assump-tions and limitations of VaR as a risk measure are:p VaR relies on historical data to estimate future changes in
market conditions. Historical scenarios may not capture all potential future outcomes, particularly where there are signifi-cant changes in market conditions, such as increases in vola-tilities and changes in the correlation of market prices across asset classes;
p VaR provides an estimate of losses at a specified confidence level; the use of an expected shortfall equivalent measure allows all extreme adverse events to be considered in the model;
p VaR is based on either a one-day (for internal risk manage-ment, backtesting and disclosure purposes) or a ten-day (for regulatory capital purposes) holding period. This assumes that risks can be either sold or hedged over the holding period, which may not be possible for all types of exposure, particu-larly during periods of market illiquidity or turbulence; it also
assumes that risks will remain in existence over the entire holding period; and
p VaR is calculated using positions held at the end of each busi-ness day and does not include intra-day changes in exposures.
To mitigate some of the VaR limitations and estimate losses asso-ciated with market movements that are unusually severe or not reflected in the historical observation period, we use other metrics designed for risk management purposes and described above, including stressed VaR, scenario analysis, as included in our stress testing framework, position risk, as included in our eco-nomic risk capital, and sensitivity analysis.
For some risk types there can be insufficient historical data for a calculation within the Group’s VaR model. This often happens because underlying instruments may have traded only for a lim-ited time. Where we do not have sufficient market data, the VaR calculation relies on market data proxies or extreme parameter moves. Market data proxies are selected to be as close to the underlying instrument as possible. Where neither a suitable mar-ket dataset nor a close proxy is available, extreme market moves are used.
We use a risk factor identification process to ensure that risks are identified for capture. There are two parts to this process. First, the market data dependency approach systematically determines the risk requirements based on data inputs used by front-office pricing models and compares this with the risk types that are captured by the Group’s VaR model and the RNIV framework. Second, the product-based approach is a qualitative analysis of product types undertaken in order to identify the risk types that those product types would be exposed to. A comparison is again made with the risk types that are captured in the VaR and RNIV frameworks. This process identifies risks that are not yet captured in the VaR model or the RNIV framework. A plan for including these risks in one or the other framework can then be devised. RNIV is captured in our economic risk capital framework.
VaR backtestingBacktesting is one of the techniques used to assess the accu-racy and performance of our VaR model used by the Group for risk management and regulatory capital purposes and serves to highlight areas of potential enhancements. Backtesting is used by regulators to assess the adequacy of regulatory capital held by the Group, the calculation of which includes regulatory VaR and stressed VaR.
Backtesting involves comparing the results produced by the VaR model with the hypothetical trading revenues on the trading book. Hypothetical trading revenues are defined in compliance with regulatory requirements and aligned with the VaR model output by excluding (i) non-market elements (such as fees, commissions, cancellations and terminations, net cost of funding and credit-related valuation adjustments) and (ii) gains and losses from intra-day trading. A backtesting exception occurs when a hypothetical trading loss exceeds the daily VaR estimate.
156 Risk management
For capital purposes and in line with BIS requirements, FINMA increases the capital multiplier for every regulatory VaR back-testing exception above four in the prior rolling 12-month period, resulting in an incremental market risk capital requirement for the Group. VaR models with less than five backtesting exceptions are considered by regulators to be classified in a defined “green zone”. The “green zone” corresponds to backtesting results that do not themselves suggest a problem with the quality or accuracy of a bank’s model.
Scenario analysisMarket risk stress testing and scenarios quantify portfolio impacts under stressed market conditions, expressed as a potential loss number, which can be used in conjunction with other metrics such as market risk sensitivities and VaR to manage the Group’s expo-sure to traded market risk. The analysis performed by the market risk scenarios team supports the daily risk management of spe-cific businesses, as well as their understanding of the impact of scenarios run across the Group, either for internal assessments or for regulatory requests. Stress testing is essential for understand-ing the impact of large market moves and is particularly important for portfolios that hold complex and exotic instruments, where the risk profile is non-linear or where the value of the positions may be contingent on several factors (known as cross-risks), or to less liquid risk factors such as correlation. Market Risk imple-ments thresholds and tolerances to help manage the portfolio during stressed market conditions and advises the trading desks on potential hedging strategies.
Market risk stress testing is also used to model potential out-comes and capture vulnerabilities of the trading portfolios around specific macroeconomic or geopolitical events such as the UK’s withdrawal from the EU, the COVID-19 pandemic and the US elections. These outcomes are used to guide business activi-ties and develop risk management strategies during such events and are often supported with risk tolerances, which limit potential loss given the likelihood of the event, in line with the Group’s risk appetite.
Credit, debit and funding valuation adjustmentsCredit valuation adjustments (CVA) are modifications to the mea-surement of the value of derivative assets used to reflect the credit risk of counterparties.
Debit valuation adjustments (DVA) are modifications to the mea-surement of the value of derivative liabilities used to reflect an entity’s own credit risk.
Funding valuation adjustments (FVA) reflect the fair value costs and benefits of funding associated with (i) any under-collateralized portions of a derivative and (ii) the funding of equivalent transfer-able collateral where the proceeds of any derivative collateraliza-tion cannot be sold or repledged.
These adjustments and their impact on revenues are not captured by the VaR framework.
Traded market risk constraintsOur market risk constraints framework encompasses specific constraints on various market risk measures, including VaR and results of scenario analysis and sensitivity analysis at the Group, divisional, legal entity and business line levels. For example, we have controls over consolidated traded market risk exposures as well as concentrations in the portfolio. Risk constraints are cas-caded to lower organizational levels within the businesses. Risk limits are binding and any significant increase in risk exposures is escalated in a timely manner. The Group’s OGR and internal policies determine limit-setting authority, temporary modification of such limits in certain situations and required approval author-ity at the Group, Bank, divisional, business and legal entity levels for any instances that could cause such limits to be exceeded. Market risk limit excesses are subject to a formal escalation pro-cedure and the incremental risk associated with the excess must be approved by the responsible risk manager within the Market Risk function, with escalation to senior management if certain thresholds are exceeded. The majority of the market risk limits are monitored on a daily basis. Limits for which the inherent cal-culation time is longer or for which the risk profile changes less often are monitored less frequently depending on the nature of the limit (weekly, monthly or quarterly). The business is mandated to remediate market risk limit excesses within three business days upon notification. Remediation actions that take longer than three days are subject to an out-of-policy remediation process with senior management escalation.
Mitigation of traded market riskOnce a transaction has been executed, it is captured as part of our risk monitoring processes and subject to the market risk constraints framework. Specific policies ensure that for any new material and/or unusual transactions, the Market Risk function has been engaged and appropriate approvals are sought. These transactions are reviewed and approved by the Market Risk func-tion so that the risk profile of the portfolio is in line with the risk appetite after execution.
Traded market risk is mitigated using financial securities, deriva-tives, insurance contracts or other appropriate means.
Governance of traded market riskTraded market risk is managed and controlled by the Market Risk function and divisional chief risk officers and governed by a com-prehensive framework of policies and committees.
Oversight of the Market Risk function is provided by various com-mittees and supervisory reviews at the Group, legal entity and divisional level, covering the related framework, risk appetite, quantitative approaches, evolving risk profile, material new trades and new business activity. The committees are comprised of senior Market Risk personnel. Relevant topics are escalated to senior management.
The governance framework ensures appropriate oversight of the Group’s traded market risk exposures.
157Risk management
Like other models, our VaR model is subject to internal gover-nance including validation by a team of modeling experts that are independent from the model developers. Validation includes identifying and testing the model’s assumptions and limitations, investigating its performance through historical and potential future stress events, and testing that the live implementation of the model behaves as intended. We employ a range of different control processes to help ensure that the models used for traded market risk remain appropriate over time. As part of these control processes, the MACC meets regularly to review model perfor-mance and approve any new or amended models.
Non-traded market riskSources of non-traded market riskNon-traded market risk primarily relates to asset and liability mis-match exposures in our banking book. Our businesses and Trea-sury have non-traded portfolios that carry market risks, mainly related to changes in interest rates but also to changes in foreign exchange rates.
We assume interest rate risks through lending and deposit-tak-ing, money market and funding activities, and the deployment of our consolidated equity as well as other activities at the divisional level. Non-maturing products, such as savings accounts, have no contractual maturity date or direct market-linked interest rate and are risk-managed on a pooled basis using replication portfolios on behalf of the business divisions. Replication portfolios transform non-maturing products into a series of fixed-term products that approximate the re-pricing and volume behavior of the pooled cli-ent transactions.
Information required under Pillar 3 of the Basel framework related to interest rate risk in the banking book (IRRBB) is available on our website.
> Refer to “credit-suisse.com/regulatorydisclosures” for further information.
The majority of non-traded foreign exchange risk is associated with our investments in foreign branches, subsidiaries and affili-ates denominated in currencies other than the reporting currency of the Group (i.e., Swiss francs).
Evaluation and management of non-traded market riskWe monitor IRRBB through established systems, processes and controls. Risk measures are provided to estimate the impact of changes in interest rates both in terms of risk to earnings as well as risk to the economic value of the Group’s asset and liability position. For the purpose of this disclosure, IRRBB is measured using sensitivity analysis, which measures the potential change in economic value resulting from specified hypothetical shocks to interest rates. It is not a measure of the potential impact on reported earnings in the current period, since it takes into account accrual accounted positions as well as certain positions that are carried at fair value.
Structural foreign exchange risk is a market risk stemming from our investments in foreign operations denominated in currencies other than the reporting currency of the Group, net of hedges,
and is subject to fluctuations in exchange rates. Non-structural foreign exchange risk relates to our foreign currency risk from banking book positions other than from our net investment in for-eign operations. It is managed under our market risk constraints framework and is covered by VaR.
Structural foreign exchange risk is specified and measured in terms of sensitivity to hypothetical foreign currency shocks. The sensitivity to hypothetical foreign currency shocks is also used to define our risk appetite constraints. Along with the management of the Group’s CET1 ratio sensitivity to moves in foreign exchange rates, we measure and monitor sensitivities for several other key metrics, such as tier 1 leverage ratio, where the currency compo-sition can be different from that of the CET1 ratio.
Mitigation of non-traded market riskThe Group’s IRRBB risk appetite level is primarily driven by the available capital and is allocated to the Group’s material legal entities. The Group does not have a regulatory requirement to hold capital against IRRBB. The economic impacts of adverse shifts in interest rates from FINMA-defined scenarios are signifi-cantly below 15% of tier 1 capital, which is the threshold used by FINMA to identify banks that potentially run excessive levels of interest rate risk at group and legal entity levels.
The Group aims to keep a limited risk profile for the economic value of the Group’s asset and liability position while maintain-ing high earnings stability. This is achieved mainly by systematic hedging of issued debt and interest rate risk arising from loans and deposit maturity mismatches in the private banking business. The main instruments used for hedging are interest rate swaps.
Structural foreign exchange risk is actively managed by Treasury through the execution of currency hedges with the aim of mitigat-ing the sensitivity of the Group’s CET1 ratio to adverse move-ments in foreign exchange rates within parameters set out in the risk appetite framework.
Governance of non-traded market riskThe PCR cycle of CARMC is responsible for the Group’s IRRBB and structural foreign exchange risk control framework and escalation of risk constraint breaches. The Group’s RPSC and associated sub-committees are responsible for the oversight and approval of related risk models, global policies, manuals, guide-lines and procedures. Divisional and legal entity risk manage-ment committees review IRRBB and structural foreign exchange-related matters specific to their local entities and jurisdictions.
Non-financial risk
Definition and sources of non-financial riskNon-financial risk is the risk of an adverse direct or indirect impact originating from sources outside the financial markets, including but not limited to operational risk, technology risk, cyber risk, compliance risk, regulatory risk, legal risk and conduct risk. Non-financial risk is inherent in most aspects of our business, including the systems and processes that support our activities. It
158 Risk management
comprises a large number of disparate risks that can manifest in a variety of ways. Examples include the risk of damage to physical assets, business disruption, failures relating to data integrity and trade processing, cyber attacks, internal or external fraudulent or unauthorized transactions, inappropriate cross-border activities, money laundering, improper handling of confidential information, conflicts of interest, improper gifts and entertainment and failure in duties to clients.
Non-financial risk can arise from a wide variety of internal and external forces, including human error, inappropriate conduct, failures in systems, processes and controls, pandemic, deliber-ate attack or natural and man-made disasters. Outsourcing and external third parties may also create risks around maintaining business processes, system stability, data loss, data manage-ment, reputation and regulatory compliance. The main categories and sources of non-financial risk are described below.
Operational riskOperational risk is the risk of an adverse impact arising from inad-equate or failed internal processes, people or systems, or from external events. Operational risk does not include business and reputational risks; however, some operational risks can lead to reputational issues and as such these risks may be closely linked.
Technology riskTechnology risk deserves particular attention given the complex technological landscape that covers our business model. Ensuring that confidentiality, integrity and availability of information assets are protected is critical to our operations. Technology risk is the risk that system-related failures, such as service outages or infor-mation security incidents, may disrupt business. Technology risk is inherent not only in our IT assets, but also in the people and processes that interact with them including through dependency on third-party suppliers and the worldwide telecommunications infrastructure. We seek to ensure that the data used to support key business processes and reporting is secure, complete, accu-rate, available, timely and meets appropriate quality and integrity standards. We require our critical IT systems to be identified, secure, resilient and available to support our ongoing operations, decision-making, communications and reporting. Our systems must also have the capabilities, capacity, scalability and adapt-ability to meet current and future business objectives, the needs of our customers and regulatory and legal expectations. Failure to meet these standards and requirements may result in adverse events that could subject us to reputational damage, fines, liti-gation, regulatory sanctions, financial losses or loss of market share. Technology risks are managed through our technology risk management program, business continuity management plan and business contingency and resiliency plans. Technology risks are included as part of our overall enterprise risk and control assess-ment based upon a forward-looking approach focusing on the most significant risks in terms of potential impact and likelihood.
Cyber riskCyber risk, which is part of technology risk, is the risk that the Group will be compromised as a result of cyber attacks, security
breaches, unauthorized access, loss or destruction of data, unavailability of service, computer viruses or other events that could have an adverse security impact. Any such event could sub-ject us to litigation or cause us to suffer a financial loss, a disrup-tion of our businesses, liability to our clients, regulatory interven-tion or reputational damage. We could also be required to expend significant additional resources to modify our protective measures or to investigate and remediate vulnerabilities or other exposures.
We recognize that cyber risk represents a rapidly evolving exter-nal risk landscape. The financial industry continues to face cyber threats from a variety of actors who are driven by monetary, politi-cal and other motivations. We actively monitor external incidents and threats and assess and respond accordingly to any potential vulnerabilities that this may reveal. We are also an active partici-pant in industry forums and information exchange initiatives and engage in regulatory consultation on this subject.
We have an enterprise-wide cybersecurity strategy to provide strategic guidance as part of our efforts to achieve an optimized end-to-end security and risk competence that enables a secure and innovative business environment, aligned with the Group’s risk appetite. A technology security team leverages a wide array of leading technology solutions and industry best practices to support our ability to maintain a secure perimeter and detect and respond to threats in real time.
We regularly assess the effectiveness of key controls and con-duct ongoing employee training and awareness activities, includ-ing for key management personnel, in order to embed a strong cyber risk culture. As part of the enterprise risk and control framework (ERCF), the Executive Board as well as divisional and legal entity risk management committees are given updates on the broader technology risk exposure.
Significant incidents are escalated to the Risk Committee together with key findings and mitigating actions. Related busi-ness continuity and response plans are tested and simulations are conducted up to the Executive Board and Board level.
Legal riskLegal risk is the risk of loss or imposition of damages, fines, pen-alties or other liability or any other material adverse impact aris-ing from circumstances including the failure to comply with legal obligations, whether contractual, statutory or otherwise, changes in enforcement practices, the making of a legal challenge or claim against us, our inability to enforce legal rights or the failure to take measures to protect our rights.
Compliance riskCompliance risk is the risk of legal or regulatory sanctions or financial loss that may result from the failure to comply with appli-cable laws, regulations, rules or market standards.
Regulatory riskRegulatory risk is the risk that changes in laws, regulations, rules or market standards may limit our activities and have a negative

159Risk management
effect on our business or our ability to implement strategic ini-tiatives, or can result in an increase in operating costs for the business or make our products and services more expensive for clients.
Conduct riskThe Group considers conduct risk to be the risk that improper behavior or judgment by our employees may result in a nega-tive financial, non-financial or reputational impact to our clients, employees or the Group, or negatively impact the integrity of the financial markets. Conduct risk may arise from a wide variety of activities and types of behaviors. A Group-wide definition of con-duct risk supports the efforts of our employees to have a com-mon understanding of and consistently manage and mitigate our conduct risk. Further, it promotes standards of responsible con-duct and ethics in our employees. Managing conduct risk includes consideration of the risks generated by each business and the strength of the associated mitigating controls. Conduct risk is also assessed by reviewing and learning from past incidents within the Group and at other firms in the financial services sector.
The ongoing focus and investment in a strong risk culture is fun-damental to the management of conduct risk. The Group’s Code of Conduct provides a clear statement on the behavioral expecta-tions, supported by our cultural values.
> Refer to “Culture” in Risk management oversight and to “Corporate governance framework” in IV – Corporate Governance – Overview for further information on our Code of Conduct.
Evaluation and management of non-financial risksWe aim to maintain the integrity of our business, operations and reputation as a core principle guiding the management and over-sight of non-financial risks by ensuring that our day-to-day opera-tions are sustainable and resilient, do not expose us to significant losses and enable our employees to make decisions and conduct business in line with our values and desired reputation as a firm.
Each business area and function is responsible for its risks and the provision of adequate resources and procedures for the man-agement of those risks. They are supported by the designated second line of defense functions responsible for independent risk and compliance oversight, methodologies, tools and report-ing within their areas as well as working with management on non-financial risk issues that arise. Businesses and relevant con-trol functions meet regularly to discuss risk issues and identify required actions to mitigate risks.
The Non-Financial Risk function oversees the Group’s estab-lished ERCF, providing a consistent and unified approach to evaluating and monitoring the Group’s non-financial risks. The ERCF sets common minimum standards across the Group for non-financial risk and control processes and review and challenge activities. Risk and control assessments are in place across all divisions and functions, consisting of the risk and control self-assessment, compliance risk assessment and legal risk assess-ment. Key non-financial risks are identified annually and represent the most significant risks requiring senior management attention.
Where appropriate, remediation plans are put in place with own-ership by senior management and ongoing Executive Board level oversight through CARMC.
Non-financial risk capital managementOur activities to manage non-financial risk capital include sce-nario analysis and operational risk regulatory capital measure-ment, as further described below. In addition, we transfer the risk of potential losses from certain non-financial risks to third-party insurance companies in certain instances.
Non-financial risk scenario analysisNon-financial risk scenario analysis is forward-looking and is used to identify and measure exposure to a range of potential adverse events, such as unauthorized trading, transaction processing errors and compliance issues. These scenarios help businesses and functions assess the suitability of controls in light of exist-ing risks and estimate hypothetical but plausible risk exposures. Scenarios are developed as qualitative estimation approaches to support stressed loss projections and capital calculations (both economic and regulatory capital) as part of regulatory require-ments set by regulatory agencies in the jurisdictions in which we operate.
Non-financial risk regulatory capital measurementWe use a set of internally validated and approved models to cal-culate our regulatory capital requirements for non-financial risk (also referred to as “operational risk capital”) across the Group and for legal entities. For Group regulatory capital requirements, we use a model under the AMA. The model is based on a loss distribution approach that uses relevant historical internal and external loss data to estimate frequency and severity distribu-tions for different types of potential non-financial risk losses, such as an unauthorized trading incident, execution delivery errors, fraud, litigation events or a material business disruption. Business experts and senior management review and challenge model parameters in light of changes of business environment and internal control factors to ensure that the capital projection is reasonable and forward-looking. Deductions are taken from the regulatory capital requirement for non-financial risk to account for the mitigating values of insurance policies held by the Group. The regulatory capital requirement represents the 99.9th percentile of the estimated distribution of total operational losses for the Group over a one-year time horizon. A risk-sensitive approach is applied to allocate capital to the businesses.
Governance of non-financial risksEffective governance processes establish clear roles and respon-sibilities for managing non-financial risks and define appropri-ate escalation processes for outcomes that are outside expected levels. We utilize a comprehensive set of policies and procedures that set out how employees are expected to conduct their activi-ties, including clearly defined roles for each of the three lines of defense to achieve appropriate segregation of duties.
Risk & Compliance is responsible for setting minimum standards for managing non-financial risks at the Group level. This includes
160 Risk management
ensuring the cohesiveness of policies and procedures, tools and practices throughout the Group, particularly with regard to the identification, evaluation, mitigation, monitoring and reporting of these risks. Other second line of defense non-financial risk over-sight functions are responsible for setting supplemental policies and procedures where applicable.
Non-financial risk exposures, metrics, issues and remediation efforts are discussed in quarterly CARMC internal control system meetings and in divisional operational risk and compliance man-agement committee meetings, which have senior representatives from relevant functions.
For conduct risk, periodic monitoring of metrics is based on thresholds set by severity level, with material trends identified and escalated as appropriate to senior management.
Model risk
Like most other financial firms, we rely on advanced quantita-tive models across all business lines and legal entities to support a broad range of applications, including estimating various forms of financial risk, valuation of securities, stress testing, assessing capital adequacy, providing wealth management services to cli-ents and to meet various reporting requirements.
Definition and sources of model riskModel risk is the risk of adverse consequences from decisions made based on model results that may be incorrect, misin-terpreted or used inappropriately. All quantitative models are imperfect approximations that are subject to varying degrees of uncertainty in their output depending on, among other factors, the model’s complexity and its intended application. As a result, modeling errors are unavoidable and can result in inappropriate business decisions, financial loss, regulatory and reputational risk and incorrect or inadequate capital reporting. Model errors, intrin-sic uncertainty and inappropriate use are the primary contributors to aggregate, Group-wide model risk.
Evaluation and management of model riskThrough our global model risk management and governance framework we seek to identify, measure and mitigate all sig-nificant risks arising from the use of models embedded within our global model ecosystem. Model risks can then be mitigated through a well-designed and robust model risk management framework, encompassing both model governance policies and procedures in combination with model validation best practices.
Robust model risk management is crucial to ensuring that the Group’s model risk is assessed and managed using a central inventory that includes all models of the Group in order to remain within a defined model risk appetite by focusing on identifica-tion, measurement and resolution of model limitations. Under the Group’s model governance policies, the Model Risk Manage-ment function validates and approves all new models and mate-rial changes to existing models before their implementation, in compliance with standards established by regulators. Developers,
owners and model supervisors are responsible for identifying, developing, implementing and testing their models. Model super-visors are responsible for ensuring that models are submitted to the Model Risk Management function for validation and approval and entered into the Group’s model inventory. The Model Risk Management function is structured to be independent from model users, developers and supervisors.
A rigorous validation practice should ensure that models are conceptually sound, correctly implemented by the model own-ers and developers and functioning as intended. To accomplish this, model risk management deploys a team of objective, well-informed subject matter experts (the model validators) who have the necessary skills and knowledge to pose effective challenge to all classes of models as a guiding principle for mitigating model risk.
Under the Group model governance policies, all models are risk-tiered according to an internal scoring method that combines complexity and materiality to assign models into one of four risk tiers. These rating tiers are used to prioritize models and allo-cate resources for initial validations, annual reviews and ongoing monitoring.
Governance of model riskGovernance is an important part of model risk management. Vari-ous model review committees within the Model Risk Management function prepare aggregate model risk reports that serve to iden-tify concentrations of model risk and to make recommendations for remediation. These reports are submitted regularly to a dedi-cated model risk governance committee which escalates issues as necessary to the Group’s Model Risk Steering Committee and the Board’s Risk Committee.
The Model Risk Management function reviews models, reports model limitations to key stakeholders, tracks remediation plans for validation findings and reports on model risk tolerance and met-rics to senior management. The Model Risk Management func-tion oversees controls to support a complete and accurate Group-wide model inventory and performs semi-annual attestations affirming the completeness and accuracy of its model inventory.
Reputational risk
Definition and sources of reputational riskReputational risk is the risk that negative perception by our stake-holders, including clients, counterparties, employees, sharehold-ers, regulators and the general public, may adversely impact client acquisition and damage our business relationships with clients and counterparties, affecting staff morale and reducing access to funding sources.
Reputational risk may arise from a variety of sources, including, but not limited to, the nature or purpose of a proposed transaction or service, the identity or activity of a potential client, the regulatory or political climate in which the business will be transacted, significant public attention surrounding the transaction itself or the potential
161Risk management
sustainability risks of a transaction. Sustainability risks are poten-tially adverse impacts on the environment, on people or society, which may be caused by, contributed to or directly linked to finan-cial service providers through the activities of their clients. These may manifest themselves as reputational risks, but potentially also as credit, operational or other risks. Reputational risk may also arise from reputational damage in the aftermath of a non-financial risk incident, such as cyber crime or the failure by employees to meet expected conduct and ethical standards.
Evaluation and management of reputational riskReputational risk is included in the Group’s risk appetite frame-work to ensure that risk-taking is aligned with the approved risk appetite. We highly value our reputation and are fully committed to protecting it through a prudent approach to risk-taking and a responsible approach to business. This is achieved through the use of dedicated processes, resources and policies focused on identifying, evaluating, managing and reporting potential reputa-tional risks. This is also achieved by applying the highest stan-dards of personal accountability and ethical conduct as set out in the Group’s Code of Conduct and the Group’s approach to cultural values and behaviors. Reputational risk potentially aris-ing from proposed business transactions and client activity is assessed in the reputational risk review process. The Group’s global policy on reputational risk requires employees to be con-servative when assessing potential reputational impact and, where certain indicators give rise to potential reputational risk, the relevant business proposal or service must be submitted through the reputational risk review process. This involves a submis-sion by an originator (any employee), approval by a business area head or designee, and its subsequent referral for evaluation by a reputational risk approver or by the respective divisional client risk committee. Reputational risk approvers are experienced and high-ranking senior managers, independent of the business divisions with the authority to approve, reject or impose conditions (also in relation to environmental or social matters) on a transaction or the establishment of a client relationship. In cases of particularly com-plex or cross-divisional transactions, the decision may be referred to the Global Client Risk Committee (GCRC), which includes representatives of the Executive Board, including the CRCO and General Counsel, and has authority to approve, reject or impose conditions on our participation in the transaction or service.
For transactions with potential sustainability risks, the internal specialist unit Sustainability Risk evaluates the nature of the trans-action and Credit Suisse’s role, the identity and activities of the client and the regulatory context of its operations, and assesses the environmental and social aspects of the client’s operations, products or services. The team determines whether the client’s activities are consistent with the relevant industry standards and whether the potential transaction is compatible with Credit Suisse’s policies and guidelines for sensitive sectors. The out-come of this analysis is submitted to the responsible business unit and/or entered into the reputational risk review process for evalu-ation by a reputational risk approver.
Governance of reputational riskThe PCR cycle within CARMC and the newly formed Global Cli-ent Risk Committee, which reports to and receives its delegated authority from the PCR cycle, on a global level, and the divisional client risk committees, on a divisional or legal entity level, are the governing bodies responsible for the oversight and active discus-sion of reputational and sustainability risks. At the Board level, the Risk Committee and Audit Committee jointly assist the Board in fulfilling its reputational risk oversight responsibilities by review-ing and approving the Group’s risk appetite framework as well as assessing the adequacy of the management of reputational and sustainability risks.
In order to inform our stakeholders about how we manage some of the environmental and social risks inherent to the banking business, we publish our Sustainability Report, in which we also describe our efforts to conduct our operations in a manner that is environmentally and socially responsible and broadly contributes to society.
> Refer to “credit-suisse.com/sustainabilityreport” for our Sustainability Report.
Business risk
Definition and sources of business riskBusiness risk is the risk of not achieving our financial goals and ambitions in connection with the Group’s strategy and how the business is managed in response to the external operating envi-ronment. External factors include both market and economic conditions, as well as shifts in the regulatory environment. Inter-nally, we face risks arising from inappropriate strategic decisions, ineffective implementation of business strategies or an inability to adapt business strategies in response to changes in the oper-ating environment, including in relation to client and competitor behavior.
The Group depends on dividends, distributions and other pay-ments from its subsidiaries and the capital payouts in these sub-sidiaries might be restricted as a result of regulatory, tax or other constraints. Our businesses are also exposed to a variety of risks that could adversely impact the Group’s dividend payments or share buyback programs.
Business risk also includes risks associated with the Group’s illiq-uid investments. These investments are not subject to CARMC-approved processes for trading activities due to their character-istics and risk profile. Illiquid investments include private equity, hedge fund and mutual fund seed and co-investments as well as other investments, such as collateralized loan obligations (CLO) mandated by regulatory risk retention requirements. Banking book loans and strategic investments are not covered under the illiquid investment risk.
Evaluation and management of business riskThe Group financial plan serves as the basis for the financial goals and ambitions against which the businesses and legal

162 Risk management
entities are assessed regularly throughout the year. These regular reviews include evaluations of financial performance, capitalization and capital usage, key business risks, overall operating environ-ment and business strategy. This enables management to iden-tify and execute changes to the Group’s operations and strategy where needed.
Governance of business riskStrategic and related financial plans are developed by each divi-sion annually and aggregated into a Group financial plan, which is reviewed by the CRCO, CFO and CEO before presentation to the full Executive Board and the Board. On a regular basis, the Board and the Executive Board conduct more fundamental in-depth reviews of the Group’s strategy and reassess our performance objectives.
> Refer to “Strategy” in I – Information on the company for further information.
Illiquid investment risk is separately governed by the Risk Com-mittee and the PCR cycle of CARMC. The divisional risk manage-ment committees and associated sub-committees are responsible for the day-to-day oversight and approval of related risk models, guidelines and procedures.
Climate-related risks
Definition of climate-related risksClimate-related risks are the potentially adverse direct and indirect impacts on the Group’s financial metrics, operations or reputation due to transitional or physical effects of climate change. Climate-related risks could manifest themselves through existing risk types such as credit risk, market risk, non-financial risk, business risk or reputational risk.
Sources of climate-related risksWe have identified several key risks and opportunities originat-ing from either the physical or the transitional effects of climate change. Physical risks can arise from climate and weather-related events (e.g., heatwaves, droughts, floods, storms and sea-level rise) and can potentially result in material financial losses, impair-ing asset values and the creditworthiness of borrowers. Transi-tion risks can arise from the process of adjustment toward a low carbon economy through changes in climate policy, technological developments and disruptive business models, and shifting inves-tor and consumer sentiment. Physical and transition climate risks can affect us as an organization either directly, through our physi-cal assets, costs and operations, or indirectly, through our finan-cial relationships with our clients.
Evaluation and management of climate-related risksClimate risk is one of the environmental aspects considered as part of the broader sustainability risk agenda of Credit Suisse. In 2018, we established a climate change program to address the recommendations of the FSB’s Taskforce on Climate-related Financial Disclosures (TCFD) with respect to external disclo-sures on climate-related risks and opportunities. In 2019, we integrated our TCFD adoption program into our Group-wide cli-mate risk strategy program, sponsored by the CRCO, that has
senior management representation from our business divisions as well as from General Counsel, Risk & Compliance and the new Sustainability, Research & Investment Solutions function. The mandate of the program is to develop comprehensive strate-gies to address climate risk. This includes supporting our clients’ energy transition toward low-carbon operations, technologies and services, continuing the ongoing implementation of the TCFD recommendations as well as working toward the implementa-tion of various industry recommendations and compliance with upcoming regulatory expectations. In 2020, we further intensified our efforts on climate risk management by creating a dedicated climate risk team within Credit Risk.
Overall, Credit Suisse is pursuing a three-pronged approach as part of our efforts to address climate change and climate-related risks. First, we are working with our clients to support their tran-sition to low-carbon and climate-resilient business models, and we are working to further integrate climate change into our risk management models as part of our climate risk strategy program. Second, we are focusing on delivering sustainable finance solu-tions that help our clients achieve their goals and contribute to the realization of the UN Sustainable Development Goals; and third, we are working on further reducing the carbon footprint of our own operations.
Our efforts to implement the TCFD recommendations continued in 2020. Detailed disclosures in accordance with TCFD recom-mendations are available in our Sustainability Report.
> Refer to “credit-suisse.com/sustainabilityreport” for our Sustainability Report.
StrategyCredit Suisse recognizes its share of responsibilities in combat-ing climate change by supporting the transition to a low-carbon and climate-resilient economy. As a financial institution, we are committed to playing our part in addressing this global challenge through our role as a financial intermediary between the econ-omy, the environment and society.
We aim to leverage existing risk management processes and capabilities for the management of climate risk exposures by mapping the underlying climate risks to our existing risk types. As methodologies for assessing climate risk evolve, we are develop-ing consistent climate-related metrics that we believe are use-ful for risk management purposes. The Group has enhanced its internal reports and is developing further climate risk-related sce-nario analysis. We have also continued exploring scenario models through the range of pilots that include the participation in the UN Environment Programme Finance Initiative and the engagement in the Paris Agreement Capital Transition Assessment (PACTA) pilot that covered implications from both physical and transition risks.
Credit Suisse is engaged in a range of activities which aim to support the transition to a lower carbon and more climate-resil-ient economy. As part of our strategy that demonstrates Credit Suisse’s commitment to climate change goals, while also acting as a proactive partner to our clients who are working to transi-tion their businesses, we have developed sector-specific client
163Risk management
energy transition frameworks (CETFs). CETFs consist of the identification of priority sectors/industries and a methodology to categorize clients that operate in these sectors according to their energy transition readiness. With this approach we aim to actively encourage clients to transition along the CETF scale over time and support them through financing and advisory services. At the same time we aim to manage Credit Suisse’s business and repu-tational risk exposure by assessing clients against the relevant CETFs before transacting with them. Financing of clients with the lowest categorization in terms of transition readiness, i.e., of “unaware” clients, will be phased out over time. To date, we have rolled out CETFs for the highest priority sectors, such as oil and gas, coal mining and utilities/power generation (fossil fuel-based). Other sectors for which we are developing or planning to develop CETFs include shipping, aviation, commodities trade finance as well as manufacturing, construction/real estate, agriculture and forestry. Additionally, we introduced further restrictions in 2020 to certain business activities related to thermal coal extraction, coal power and offshore and onshore oil and gas projects in the Arctic region.
Strategic alignment of our business with the objectives of the Sustainable Development Goals set by the United Nations and the Paris Agreement on Climate Change (Paris Agreement) is another important objective for us and we have signed the Prin-ciples for Responsible Banking as well as the Poseidon Principles to further these objectives.
In December 2020, we announced that we would develop science-based targets within the next 24 months, including to achieve net zero emissions from our operations, supply chain and financing activities no later than 2050, with intermediate emission goals for 2030. In addition, we announced aligning our financing with the Paris Agreement objective of limiting global warming to 1.5°C.
Risk managementClimate-related risks are embedded in our Group-wide risk taxon-omy. These risks – alongside other environmental and social risks – are considered within the Group-wide, standardized reputa-tional risk review process. In 2020, we also continued our work to identify risks stemming from climate change and to integrate the management of these risks within the front-to-back processes of the Group because these risks manifest themselves through reputational, credit, operational and other risks.
We have identified sensitive sectors which pose greater envi-ronmental and social risks (including impacts to the climate) and have policies and guidelines in place to govern the responsible provision of financial services to clients within these sectors. Con-sequently, within the reputational risk review process, we evalu-ate factors such as a company’s greenhouse gas footprint or its energy efficiency targets while some of our policies and guide-lines require clients to have a plan in place to deal with climate change risks. In 2019, our sector policies and guidelines, which had previously excluded any form of financing for new greenfield thermal coal mines, were updated to also exclude any form of
financing specifically related to the development of new coal-fired power plants. Additionally, as announced in July 2020, we will generally not be directly lending or be involved in capital mar-kets underwriting to any company deriving more than 25% of its revenues from thermal coal extraction or from coal power. Such transactions will only be allowed if it will help the company specifi-cally to transition in accordance with the Paris Agreement and the use of proceeds are tied to such transition strategies or, for companies deriving more than 25% of revenues from coal power, if the company can demonstrate a decreasing share of coal in its generation portfolio consistent with our CETFs. These restrictions do not apply to companies that are involved in metallurgical coal extraction. We also announced that we would not provide financ-ing related to offshore and onshore oil and gas projects in the Arctic region.
Direct physical risks of climate change are identified and assessed through the business continuity management process alongside other physical risks such as natural disasters.
We actively engage in industry forums to foster the development of industry standards. We have contributed to the development of transition risk and physical risk assessment models as part of the UN Environment Programme Finance Initiative Phase II bank-ing pilot. Together with other banks we participated in the PACTA pilot project to test methodologies for measuring the alignment of credit portfolios with the objectives of the Paris Agreement. In Switzerland, Credit Suisse participated in the voluntary climate alignment test of investment portfolios and Swiss mortgages for Swiss banks, asset managers, pension funds and insurance com-panies coordinated by the Swiss Federal Office for the Environ-ment. We published a summary of our individual results, as one of the few participating banks to do so.
Metrics and targetsWe have developed a range of internal analytics on Credit Suisse’s exposures to clients in climate-impacted sectors. We are now accelerating the development of our capabilities to measure and manage climate and sustainability-related risks and thereby adhere to our commitments to align our financing with the Paris Agreement objectives. More detail on Credit Suisse’s exposures to climate-related risks is available in our Sustainability Report.
> Refer to “credit-suisse.com/sustainabilityreport” for our Sustainability Report.
Our green finance solutions are designed to achieve a positive impact on the environment while also creating financial value for our clients, drawing upon the expertise of various specialist departments across our divisions.
From 2013 to the end of 2020, we supported the issuance of over USD 49 billion of sustainable debt capital markets products such as green, social, sustainability, sustainability-linked and transition bonds as well as green certificates of deposits and commercial paper. We are also active in the sustainability lend-ing market and during 2020 we participated in a total of over USD 34 billion worth of sustainability-linked loans, including loan renewals and extensions. Additionally, we actively support clean

164 Risk management
and renewable energy businesses. From 2010 through the end of 2020, we were involved in over 150 transactions in this field with a value of over USD 130 billion.
In 2020, we announced the goal to provide at least CHF 300 billion of sustainable financing to support transition strategies (renewables, green/blue/transition bonds, low-carbon energy solutions and financings aligned to the UN Sustainable Develop-ment Goals) over the next 10 years.
We are part of the global RE100 (100% renewable electricity) ini-tiative through which we intend to source 100% renewable elec-tricity across our entire global operations by 2025. In 2020, 94% of the Group’s electricity consumed globally was generated using renewable resources. Furthermore, we manage and disclose greenhouse gas emissions from our own operations on the basis of an ISO 14001-certified environmental management system. At an operational level, we have been working on a greenhouse gas neutral basis globally since 2010.
Governance of climate-related risksClimate change-related responsibilities are included in the Board’s Risk Committee charter. At the Executive Board level, the PCR cycle of CARMC assumes responsibility for the overall climate change strategy and is mandated to ensure that the capabilities for the management of relevant long-term risk trends, including climate change, are put in place. Furthermore, key internal poli-cies incorporate important elements of climate risk management.
In 2020, we established the GCRC on a global level, reporting to and receiving its delegated authority from the PCR cycle of CARMC, on a global level, and the divisional client risk commit-tees, on a divisional or legal entity level. The establishment of the GCRC enables a comprehensive assessment of risks related to transactions and client relationships, including reputational risk, sustainability risk and climate risk.
The newly established Climate Risk function within Credit Risk provides dedicated capabilities to assess and manage the multi-faceted aspects of climate-related risks. Additionally, at the level of the Board, we have established the Sustainability Advisory Committee.
Fiduciary risk
Definition and sources of fiduciary riskFiduciary risk is the risk of financial loss arising when the Group or its employees, acting in a fiduciary capacity as trustee, invest-ment manager or as mandated by law, do not act in the best interest of the client in connection with the provision of advice and/or management of our client’s assets including from a prod-uct-related market, credit, liquidity, counterparty and non-financial risk perspective.
Evaluation and management of fiduciary riskWith regard to fiduciary risk that relates to discretionary invest-ment-related activities, assessing investment performance and
reviewing forward-looking investment risks in our client portfolios and investment funds is central to our investment oversight pro-gram. Areas of focus include:p Measuring and monitoring investment performance of discre-
tionary client portfolios and investment funds and comparing the returns against benchmarks and peer groups to under-stand level, sources and drivers of the returns.
p Assessing risk measures such as exposure, sensitivities, stress scenarios, expected volatility and liquidity across our portfolios to ensure that we are managing the assets in line with the clients’ expectations and risk tolerance.
p Treating clients with a prudent standard of care, which includes information disclosure, subscriptions and redemptions processes, trade execution and requiring the highest ethical conduct.
p Ensuring discretionary portfolio managers’ investment approach is in accordance with prospectus, regulations and cli-ent guidelines.
p Monitoring client investment guidelines or investment fund lim-its. In certain cases, internal limits or guidelines are also estab-lished and monitored.
Fiduciary risks from activities other than discretionary investment management, such as the advised portfolios, are managed and monitored in a similar oversight program. This program is actively managed in cooperation with the Compliance function and is based on the suitability framework.
Governance of fiduciary riskSound governance is essential for all discretionary management activities including trade execution and the investment process. Our program targets daily, monthly or quarterly monitoring of all portfolio management activities with independent analysis pro-vided to senior management. Formal review meetings are in place to ensure that investment performance and risks are in line with expectations and adequately supervised.
Pension risk
Definition and sources of pension riskPension risk is the financial risk from contractual or other liabili-ties to which we are exposed as a sponsor of and/or participant in pension plans. It is the risk that we may be required to make unexpected payments or other contributions to a pension plan because of a potential obligation (i.e., underfunding).
We sponsor three types of pension plans:p defined benefit plans;p defined contribution plans; and p our Swiss savings plan.
Pension risk arises from defined benefit plans and the Swiss sav-ings plan, which has elements of a defined benefit plan. Under these plans, we, as the plan sponsor, bear the potential risk of having to provide additional funding in the event of a plan shortfall whereby the plan liabilities exceed the plan assets. Under defined contribution plans there is no defined benefit at retirement and

165Risk management
the employee bears the investment risk; as a result, the plan sponsor is not responsible for a shortfall. The majority of our pen-sion risk derives from the defined benefit plans in Switzerland, the UK and the US.
Sources of risks can be broadly categorized into asset investment risks (e.g., underperformance of bonds, equities and alternative investments) and liability risks, primarily from changes in interest rates, inflation and longevity.
Evaluation and management of pension riskPension plan structureThe Group’s major pension plans are established as separate entities from the sponsor firm and are governed by trustees who are charged with safeguarding the interests of the plan members pursuant to statutory and regulatory requirements. Risk-taking activity within the Group’s pension funds is not typically within the direct control of the sponsor firm. There is however a risk that we, as the plan sponsor, may have a potential obligation to contribute due to underfunding which could have a negative impact on the Group’s capital and income before taxes.
Metrics and targetsPensions risk forms an integral part of the Group’s risk appe-tite assessment with internal macro-economic stress scenarios used for Group-wide stress testing. These are incremental to the assessment performed by the trustees and their external advisers.
Within Risk, pension risk is measured and quantified through both our stress testing framework and internal capital metrics used to assess the Group’s capital requirements. These measures are intended to assess the potential impact from the revaluation of pension assets and liabilities on the Group’s capital metrics and income before taxes.
Governance of pension riskThe overall pension risk framework and governance structure of our pension plans consists of three components:p Trustees have overall responsibility of the pension plan and
act on behalf of the beneficiaries of the plan with additional oversight by actuaries and external consultants. Trustees are responsible for ensuring that the pension plan is run properly and the member benefits are secure.
p Depending on the jurisdiction there is oversight provided by senior management, trustees, actuaries and/or advisors in relation to local funding, investment strategy, plan changes or other actions of the pension fund.
p Risk & Compliance monitors and reports various metrics and analytics to senior management and regulators (e.g., economic risk capital, severe flight to quality and loss potential analysis).
Risk portfolio analysisCredit risk
Credit risk overviewAll transactions that are exposed to potential losses arising as a result of a borrower or counterparty failing to meet its financial obligations or as a result of deterioration in the credit quality of the borrower or counterparty are subject to credit risk exposure measurement and management.
> Refer to “Note 20 – Financial instruments measured at amortized cost and credit losses” in VI – Consolidated financial statements – Credit Suisse Group for information on credit quality and aging analysis of loans.
For regulatory capital purposes, credit risk comprises sev-eral regulatory categories where credit risk measurement and related regulatory capital requirements are subject to different measurement approaches under the Basel framework. Details on regulatory credit risk categories, credit quality indicators and credit risk concentration are available in our disclosures required under Pillar 3 of the Basel framework related to risk, which will be available on our website.
> Refer to “credit-suisse.com/regulatorydisclosures” for further information.
Loans and irrevocable loan commitmentsThe following table provides an overview of loans and irrevocable loan commitments by division in accordance with accounting prin-ciples generally accepted in the US and are not comparable with the regulatory credit risk exposures presented in our disclosures required under Pillar 3 of the Basel framework.
Loans and irrevocable loan commitments
end of 2020 2019
CHF million
Gross loans 293,539 297,841
Irrevocable loan commitments 119,022 125,127
Total loans and irrevocable loan commitments 412,561 422,968
of which Swiss Universal Bank 190,872 183,604
of which International Wealth Management 59,667 58,774
of which Asia Pacific 42,287 49,489
of which Investment Bank 118,167 129,059
of which Corporate Center 1,568 2,042
Loans held-for-sale and traded loansAs of December 31, 2020 and 2019, loans held-for-sale included CHF 102 million and CHF 25 million, respectively, of seasoned US subprime residential mortgages from consolidated variable interest entities (VIE). Traded loans included US subprime resi-dential mortgages of CHF 233 million and CHF 173 million as of December 31, 2020 and 2019, respectively.

166 Risk management
LoansThe table “Loans” provides an overview of our loans by loan classes, impaired loans, the related allowance for credit losses and selected loan metrics by business division. The carrying val-ues of loans and related allowance for credit losses are presented
in accordance with generally accepted accounting standards in the US and are not comparable with the regulatory credit risk exposures presented in our disclosures required under Pillar 3 of the Basel framework.
Loans Swiss International
Universal Wealth Asia Investment Corporate Credit
end of Bank Management Pacific Bank Center Suisse
2020 (CHF million)
Mortgages 106,071 3,653 1,520 0 26 111,270
Loans collateralized by securities 6,960 19,900 23,324 1,574 31 51,789
Consumer finance 4,336 414 4 62 72 4,888
Consumer 117,367 23,967 24,848 1,636 129 167,947
Real estate 24,122 1,983 2,374 557 9 29,045
Commercial and industrial loans 31,458 24,848 8,629 8,292 870 74,097
Financial institutions 3,176 1,776 2,528 11,320 272 19,072
Governments and public institutions 768 64 472 1,923 151 3,378
Corporate & institutional 59,524 28,671 14,003 22,092 1,302 125,592
Gross loans 176,891 52,638 38,851 23,728 1,431 293,539
of which held at fair value 25 62 2,446 8,316 559 11,408
Net (unearned income) / deferred expenses 104 (104) (27) (69) 1 (95)
Allowance for credit losses 1 (663) (345) (199) (300) (29) (1,536)
Net loans 176,332 52,189 38,625 23,359 1,403 291,908
2019 (CHF million)
Mortgages 2 104,257 3,883 1,492 0 39 109,671
Loans collateralized by securities 2 6,757 20,828 26,809 2,000 31 56,425
Consumer finance 3,791 504 21 7 78 4,401
Consumer 114,805 25,215 28,322 2,007 148 170,497
Real estate 23,569 2,076 3,095 465 15 29,220
Commercial and industrial loans 2 29,395 24,932 9,883 8,406 879 73,495
Financial institutions 2,650 1,619 3,910 11,747 441 20,367
Governments and public institutions 744 237 878 2,237 166 4,262
Corporate & institutional 56,358 28,864 17,766 22,855 1,501 127,344
Gross loans 171,163 54,079 46,088 24,862 1,649 297,841
of which held at fair value 190 31 3,922 8,021 498 12,662
Net (unearned income) / deferred expenses 96 (106) (45) (62) 1 (116)
Allowance for credit losses 1 (487) (179) (74) (143) (63) (946)
Net loans 170,772 53,794 45,969 24,657 1,587 296,779
1 Allowance for credit losses is only based on loans that are not carried at fair value.2 Certain corporate & institutional loans have been reclassified to consumer loans following the application of a look-through approach with regard to beneficial owners. Prior periods have
been reclassified to conform to the current presentation.
Compared to December 31, 2019, gross loans decreased CHF 4.3 billion to CHF 293.5 billion as of December 31, 2020, mainly due to the translation impact from the US dollar, lower loans collateralized by securities, lower loans to financial institu-tions and lower loans to governments and public institutions, partially offset by higher consumer mortgages and higher com-mercial and industrial loans. The net decrease of CHF 4.6 billion in loans collateralized by securities mainly reflected decreases in Asia Pacific and International Wealth Management. Loans to financial institutions decreased CHF 1.3 billion, mainly reflecting
decreases in Asia Pacific and the Investment Bank, partially off-set by an increase in Swiss Universal Bank. The net decrease of CHF 0.9 billion in loans to governments and public institutions mainly reflected decreases in Asia Pacific and the Investment Bank. Consumer mortgages increased CHF 1.6 billion, mainly driven by an increase in Swiss Universal Bank. Commercial and industrial loans increased CHF 0.6 billion, mainly driven by an increase in Swiss Universal Bank, partially offset by a decrease in Asia Pacific.

167Risk management
On a divisional level, decreases in gross loans of CHF 7.2 billion in Asia Pacific, CHF 1.4 billion in International Wealth Manage-ment, CHF 1.1 billion in the Investment Bank and CHF 0.2 billion in the Corporate Center were partially offset by an increase of CHF 5.7 billion in Swiss Universal Bank.
> Refer to “Note 19 – Loans” and “Note 20 – Financial instruments measured at amortized cost and credit losses” in VI – Consolidated financial statements – Credit Suisse Group for further information.
Collateralized loansThe table “Collateralized loans” provides an overview of collateral-ized loans by division. For consumer loans, the balances reflect the gross carrying value of the loan classes “Mortgages” and “Loans collateralized by securities”, of which substantially all are fully collateralized. Consumer finance loans are not included as the majority of these loans are unsecured. For corporate & insti-tutional loans, the balances reflect the value of mortgages and financial and other collateral related to secured loans, considered up to the amount of the related loans.
Collateralized loans Swiss International
Universal Wealth Asia Investment Corporate Credit
end of Bank Management Pacific Bank Center Suisse
2020 (CHF million)
Gross loans 176,891 52,638 38,851 23,728 1,431 293,539
Collateralized loans 161,405 50,024 33,183 9,653 115 254,380
of which consumer 1 113,031 23,553 24,844 1,574 57 163,059
of which mortgages 106,071 3,653 1,520 0 26 111,270
of which loans collateralized by securities 6,960 19,900 23,324 1,574 31 51,789
of which corporate & institutional 2 48,374 26,471 8,339 8,079 58 91,321
of which secured by mortgages 33,756 2,780 159 249 0 36,944
of which secured by financial and other collateral 14,618 23,691 8,180 7,830 58 54,377
2019 (CHF million)
Gross loans 171,163 54,079 46,088 24,862 1,649 297,841
Collateralized loans 157,485 52,295 38,380 11,041 388 259,589
of which consumer 1 111,014 24,711 28,301 2,000 70 166,096
of which mortgages 104,257 3,883 1,492 0 39 109,671
of which loans collateralized by securities 6,757 20,828 26,809 2,000 31 56,425
of which corporate & institutional 2 46,471 27,584 10,079 9,041 318 93,493
of which secured by mortgages 33,920 2,826 730 152 0 37,628
of which secured by financial and other collateral 12,551 24,758 9,349 8,889 318 55,865
1 Reflects the gross carrying value of the consumer loan classes “Mortgages” and “Loans collateralized by securities”, before allowance for credit losses.2 Reflects the value of mortgages and financial and other collateral related to secured corporate & institutional loans, considered up to the amount of the related loans.
Within consumer loans, mortgages primarily include mortgages on residential real estate such as single family homes, apartments and holiday homes as well as building loans. Mortgages may also include certain loans that are secured by a combination of mort-gages or other real estate titles and other collateral including, e.g., securities, cash deposits or life insurance policies. Loans collateralized by securities primarily include lombard loans secured by well-diversified portfolios of securities and share-backed loans.
Within corporate & institutional loans, mortgage collateral primar-ily includes income-producing commercial and residential real estate held by corporate & institutional clients. Financial and other collateral includes various types of eligible collateral, e.g., secu-rities, cash deposits, financial receivables related to factoring, certain real assets such as ownership titles in ship and aircraft, inventories and commodities, and certain guarantees.
Financial collateral is subject to frequent market valuation depending on the asset class. In the Group’s private banking, cor-porate and institutional businesses, all collateral values for loans
are regularly reviewed according to the Group’s risk management policies and directives, with maximum review periods determined by collateral type, market liquidity and market transparency. For example, traded securities are revalued on a daily basis and prop-erty values are appraised over a medium-term horizon gener-ally exceeding one year considering the characteristics of the property, current developments in the relevant real estate market and the current level of credit exposure to the borrower. If the credit exposure to a borrower has changed significantly, in volatile markets or in times of increasing general market risk, collateral values may be appraised more frequently. Management judgment is applied in assessing whether markets are volatile or general market risk has increased to a degree that warrants a more fre-quent update of collateral values. Movements in monitored risk metrics that are statistically different compared to historical expe-rience are considered in addition to analysis of externally-provided forecasts, scenario techniques and macroeconomic research. For impaired loans, the fair value of collateral is determined within 90 days of the date the impairment was identified and thereaf-ter regularly revalued by Credit Risk within the impairment review

168 Risk management
process. In the Group’s investment banking businesses, collat-eral-dependent loans are appraised on at least an annual basis, or when a loan-relevant event occurs.
As of December 31, 2020, 97% of the aggregate Swiss residential mortgage loan portfolio of CHF 112.4 billion had a loan-to-value (LTV) ratio equal to or lower than 80%. As of
December 31, 2019, 97% of the aggregate Swiss residential mortgage loan portfolio of CHF 110.5 billion had an LTV ratio equal to or lower than 80%. For substantially all Swiss residen-tial mortgage loans originated in 2020 and 2019, the average LTV ratio was equal to or lower than 80% at origination. Our LTV ratios are based on the most recent appraised value of the collateral.
Impaired loans Swiss International
Universal Wealth Asia Investment Corporate Credit
end of Bank Management Pacific Bank Center Suisse
2020 (CHF million)
Non-performing loans 406 692 312 210 46 1,666
Non-interest-earning loans 258 81 0 0 36 375
Non-accrual loans 664 773 312 210 82 2,041
Restructured loans 39 60 150 56 8 313
Potential problem loans 324 101 219 199 0 843
Other impaired loans 363 161 369 255 8 1,156
Gross impaired loans 1 1,027 934 2 681 465 90 3,197
of which loans with a specific allowance 908 576 681 465 80 2,710
of which loans without a specific allowance 119 358 0 0 10 487
2019 (CHF million)
Non-performing loans 453 482 166 87 62 1,250
Non-interest-earning loans 204 43 0 0 13 260
Non-accrual loans 657 525 166 87 75 1,510
Restructured loans 66 203 0 13 68 350
Potential problem loans 155 47 0 61 3 266
Other impaired loans 221 250 0 74 71 616
Gross impaired loans 1 878 775 2 166 161 146 2,126
of which loans with a specific allowance 799 468 166 148 133 1,714
of which loans without a specific allowance 79 307 0 13 13 412
1 Impaired loans are only based on loans that are not carried at fair value.2 Includes gross impaired loans of CHF 76 million and CHF 39 million as of December 31, 2020 and 2019, respectively, which are mostly secured by guarantees provided by investment-
grade export credit agencies.
Impaired loansCompared to December 31, 2019, gross impaired loans increased CHF 1.1 billion to CHF 3.2 billion as of December 31, 2020, mainly driven by higher potential problem loans across all divisions and higher non-performing loans in International Wealth Manage-ment, Asia Pacific and the Investment Bank.
In Asia Pacific, gross impaired loans increased CHF 515 million, mainly driven by the impairment of several share-backed loans and a newly impaired position in the catering sector, partially offset by the write-off of a share-backed loan in the healthcare sector. In the Investment Bank, gross impaired loans increased CHF 304 million, mainly driven by new impairments in the oil and gas, aviation and retail sectors. In International Wealth Manage-ment, gross impaired loans increased CHF 159 million, primarily driven by increases in European mortgages, aviation finance and export finance, partially offset by reductions in ship finance. In Swiss Universal Bank, gross impaired loans increased CHF 149 million, mainly reflecting new impairments of large Swiss corpo-rates that experienced a significant decline in revenues due to the
COVID-19 pandemic and a newly impaired position in commod-ity trade finance. These increases in Swiss Universal Bank were partially offset by repayments and write-offs in several client seg-ments. Gross impaired loans in the Corporate Center decreased CHF 56 million, mainly driven by the fair value option election for an impaired exposure under the CECL guidance.
In March 2020, US federal banking regulators issued the “Inter-agency Statement on Loan Modifications and Reporting for Financial Institutions Working with Customers Affected by the Coronavirus (Revised)” (Interagency Statement). According to the Interagency Statement, short-term modifications made on a good faith basis in response to the COVID-19 crisis to borrow-ers that were otherwise current prior to the relief being granted would not be considered to be troubled debt restructurings. This includes short-term modifications such as payment deferrals, fee waivers, repayment term extensions or payment delays that are insignificant. The Interagency Statement was developed in con-sultation with the Financial Accounting Standards Board (FASB) and the Group has applied this guidance. The Group has granted

169Risk management
short-term modifications to certain borrowers due to the COVID-19 crisis in the form of deferrals of capital and interest payments that are within the scope of this guidance and the loans sub-ject to those deferrals have not been reported as troubled debt
restructurings in restructured loans. As of December 31, 2020, the Group had CHF 4.3 billion of loans held at amortized cost that were modified and not reported as troubled debt restructurings as a result of this relief and interpretative guidance.
Allowance for credit losses on loans Swiss International
Universal Wealth Asia Investment Corporate Credit
end of Bank Management Pacific Bank Center Suisse
2020 (CHF million)
Balance at beginning of period 1, 2 534 344 42 99 30 1,049
Current-period provision for expected credit losses 240 100 235 323 2 900
of which methodology changes (19) 0 0 0 0 (19)
of which provisions for interest 11 4 12 8 2 37
Gross write-offs (107) (71) (44) (100) (3) (325)
Recoveries 8 1 0 2 2 13
Net write-offs (99) (70) (44) (98) (1) (312)
Foreign currency translation impact and other adjustments, net (12) (29) (34) (24) (2) (101)
Balance at end of period 1 663 345 199 300 29 1,536
of which individually evaluated 440 141 153 106 26 866
of which collectively evaluated 223 204 46 194 3 670
1 Allowance for credit losses is only based on loans that are not carried at fair value.2 Includes a net impact of CHF 103 million from the adoption of the new CECL guidance and the related election of the fair value option for certain loans on January 1, 2020, of which
CHF 47 million is reflected in Swiss Universal Bank, CHF 165 million in International Wealth Management, CHF (32) million in Asia Pacific, CHF (44) million in the Investment Bank and CHF (33) million in the Corporate Center.
The following tables provide an overview of changes in impaired loans and related allowance for credit losses by loan portfolio segment.
Gross impaired loans by loan portfolio segment Corporate &
Consumer institutional Total
2020 (CHF million)
Balance at beginning of period 683 1,443 2,126
New impaired loans 843 2,187 3,030
Increase in existing impaired loans 187 69 256
Reclassifications to non-impaired status (227) (321) (548)
Repayments 1 (390) (510) (900)
Liquidation of collateral, insurance or guarantee payments (57) (181) (238)
Sales 2 (18) (54) (72)
Write-offs (82) (237) (319)
Foreign currency translation impact and other adjustments, net (34) (104) (138)
Balance at end of period 905 2,292 3,197
1 Full or partial principal repayments.2 Includes transfers to loans held-for-sale for intended sales of held-to-maturity loans.
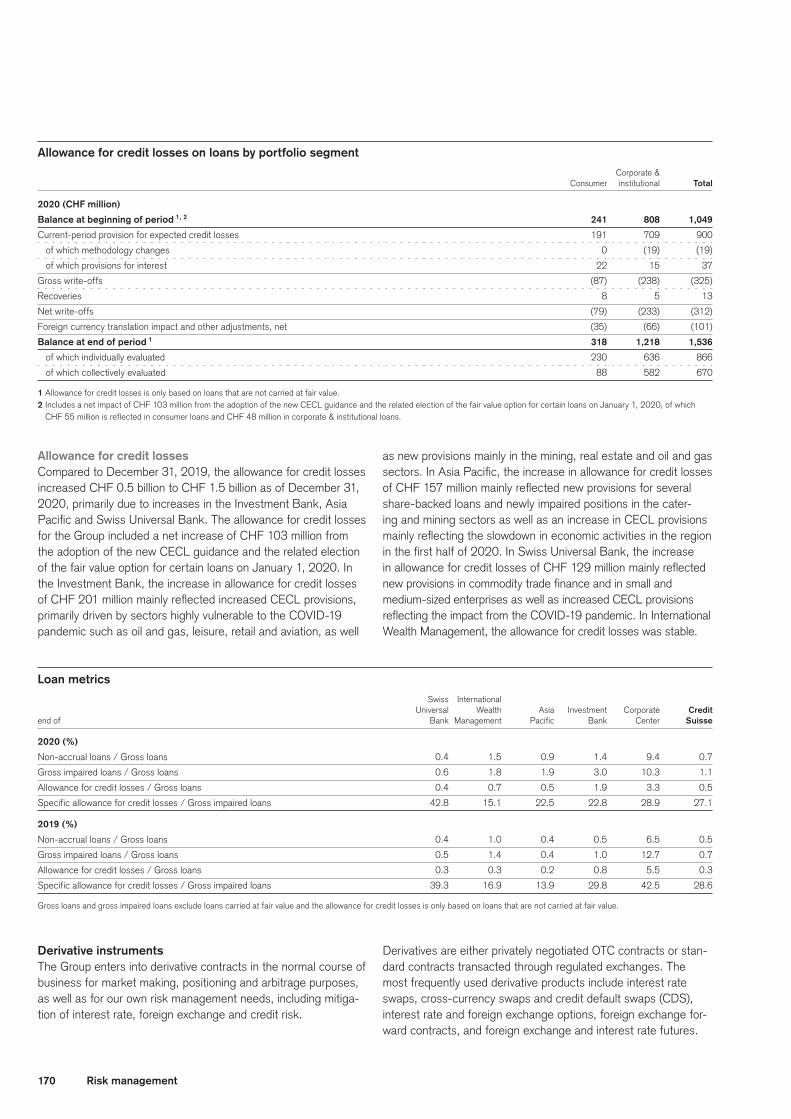
170 Risk management
Allowance for credit losses on loans by portfolio segment Corporate &
Consumer institutional Total
2020 (CHF million)
Balance at beginning of period 1, 2 241 808 1,049
Current-period provision for expected credit losses 191 709 900
of which methodology changes 0 (19) (19)
of which provisions for interest 22 15 37
Gross write-offs (87) (238) (325)
Recoveries 8 5 13
Net write-offs (79) (233) (312)
Foreign currency translation impact and other adjustments, net (35) (66) (101)
Balance at end of period 1 318 1,218 1,536
of which individually evaluated 230 636 866
of which collectively evaluated 88 582 670
1 Allowance for credit losses is only based on loans that are not carried at fair value.2 Includes a net impact of CHF 103 million from the adoption of the new CECL guidance and the related election of the fair value option for certain loans on January 1, 2020, of which
CHF 55 million is reflected in consumer loans and CHF 48 million in corporate & institutional loans.
Allowance for credit lossesCompared to December 31, 2019, the allowance for credit losses increased CHF 0.5 billion to CHF 1.5 billion as of December 31, 2020, primarily due to increases in the Investment Bank, Asia Pacific and Swiss Universal Bank. The allowance for credit losses for the Group included a net increase of CHF 103 million from the adoption of the new CECL guidance and the related election of the fair value option for certain loans on January 1, 2020. In the Investment Bank, the increase in allowance for credit losses of CHF 201 million mainly reflected increased CECL provisions, primarily driven by sectors highly vulnerable to the COVID-19 pandemic such as oil and gas, leisure, retail and aviation, as well
as new provisions mainly in the mining, real estate and oil and gas sectors. In Asia Pacific, the increase in allowance for credit losses of CHF 157 million mainly reflected new provisions for several share-backed loans and newly impaired positions in the cater-ing and mining sectors as well as an increase in CECL provisions mainly reflecting the slowdown in economic activities in the region in the first half of 2020. In Swiss Universal Bank, the increase in allowance for credit losses of CHF 129 million mainly reflected new provisions in commodity trade finance and in small and medium-sized enterprises as well as increased CECL provisions reflecting the impact from the COVID-19 pandemic. In International Wealth Management, the allowance for credit losses was stable.
Loan metrics Swiss International
Universal Wealth Asia Investment Corporate Credit
end of Bank Management Pacific Bank Center Suisse
2020 (%)
Non-accrual loans / Gross loans 0.4 1.5 0.9 1.4 9.4 0.7
Gross impaired loans / Gross loans 0.6 1.8 1.9 3.0 10.3 1.1
Allowance for credit losses / Gross loans 0.4 0.7 0.5 1.9 3.3 0.5
Specific allowance for credit losses / Gross impaired loans 42.8 15.1 22.5 22.8 28.9 27.1
2019 (%)
Non-accrual loans / Gross loans 0.4 1.0 0.4 0.5 6.5 0.5
Gross impaired loans / Gross loans 0.5 1.4 0.4 1.0 12.7 0.7
Allowance for credit losses / Gross loans 0.3 0.3 0.2 0.8 5.5 0.3
Specific allowance for credit losses / Gross impaired loans 39.3 16.9 13.9 29.8 42.5 28.6
Gross loans and gross impaired loans exclude loans carried at fair value and the allowance for credit losses is only based on loans that are not carried at fair value.
Derivative instrumentsThe Group enters into derivative contracts in the normal course of business for market making, positioning and arbitrage purposes, as well as for our own risk management needs, including mitiga-tion of interest rate, foreign exchange and credit risk.
Derivatives are either privately negotiated OTC contracts or stan-dard contracts transacted through regulated exchanges. The most frequently used derivative products include interest rate swaps, cross-currency swaps and credit default swaps (CDS), interest rate and foreign exchange options, foreign exchange for-ward contracts, and foreign exchange and interest rate futures.

171Risk management
The replacement values of derivative instruments correspond to their fair values at the dates of the consolidated balance sheets and arise from transactions for the account of individual customers and for our own account. Positive replacement values (PRV) constitute an asset, while negative replacement values (NRV) constitute a liability. Fair value does not indicate future gains or losses, but rather premiums paid or received for a derivative instrument at inception, if applicable, and unrealized gains and losses from marking to market all deriva-tives at a particular point in time. The fair values of derivatives are determined using various methodologies, primarily observable mar-ket prices where available and, in their absence, observable market parameters for instruments with similar characteristics and maturities, net present value analysis or other pricing models as appropriate.
The following table illustrates how credit risk on derivatives receiv-ables is reduced by the use of legally enforceable netting agree-ments and collateral agreements. Netting agreements allow us to net balances from derivative assets and liabilities transacted with the same counterparty when the netting agreements are legally enforceable. Replacement values are disclosed net of such agree-ments in the consolidated balance sheets. Collateral agreements are entered into with certain counterparties based upon the nature of the counterparty and/or the transaction and require the place-ment of cash or securities with us as collateral for the underlying transaction. The carrying values of derivatives are presented in accordance with generally accepted accounting standards in the US and are not comparable with the derivatives metrics presented in our disclosures required under Pillar 3 of the Basel framework.
Derivative instruments by maturity 2020 2019
Positive Positive
Less More replace- Less More replace-
than 1 to 5 than ment than 1 to 5 than ment
end of / due within 1 year years 5 years value 1 year years 5 years value
CHF billion
Interest rate products 8.7 19.7 46.9 75.3 6.1 18.1 44.3 68.5
Foreign exchange products 14.0 5.7 4.8 24.5 11.7 5.6 4.7 22.0
Equity/index-related products 7.9 10.8 0.5 19.2 6.4 5.3 0.3 12.0
Credit derivatives 0.5 2.6 1.8 4.9 0.5 4.7 1.0 6.2
Other products 1 0.7 0.0 1.0 1.7 0.4 0.0 1.0 1.4
OTC derivative instruments 31.8 38.8 55.0 125.6 25.1 33.7 51.3 110.1
Exchange-traded derivative instruments 20.6 5.7
Netting agreements 2 (120.6) (97.9)
Total derivative instruments 25.6 17.9
of which recorded in trading assets 25.5 17.7
of which recorded in other assets 0.1 0.2
1 Primarily precious metals, commodity and energy products.2 Taking into account legally enforceable netting agreements.
Derivative transactions exposed to credit risk are subject to a credit request and approval process, ongoing credit and counterparty monitoring and a credit quality review process. The following table represents the rating split of our credit exposure from derivative instruments.
Derivative instruments by counterparty credit rating
end of 2020 2019
CHF billion
AAA 1.6 1.2
AA 5.8 6.5
A 2.5 2.4
BBB 4.4 4.8
BB or lower 10.7 2.2
OTC derivative instruments 25.0 17.1
Exchange-traded derivative instruments 1 0.6 0.8
Total derivative instruments 1 25.6 17.9
Credit ratings do not reflect the benefit of collateral received.1 Taking into account legally enforceable netting agreements.
Derivative instruments are categorized as exposures from trad-ing activities (trading) and those qualifying for hedge accounting (hedging). Trading includes activities relating to market mak-ing, positioning and arbitrage. It also includes economic hedges where the Group enters into derivative contracts for its own risk management purposes, but where the contracts do not qualify for hedge accounting under US GAAP. Hedging includes contracts that qualify for hedge accounting under US GAAP, such as fair value hedges, cash flow hedges and net investment hedges.
> Refer to “Note 28 – Offsetting of financial assets and financial liabilities” in VI – Consolidated financial statements – Credit Suisse Group for further information on offsetting of derivatives.
> Refer to “Note 33 – Derivatives and hedging activities” in VI – Consolidated financial statements – Credit Suisse Group for further information on deriva-tives, including an overview of derivatives by products categorized for trading and hedging purposes.

172 Risk management
Forwards and futuresThe Group enters into forward purchase and sale contracts for mortgage-backed securities, foreign currencies and commitments to buy or sell commercial and residential mortgages. In addition, we enter into futures contracts on equity-based indices and other financial instruments, as well as options on futures contracts. These contracts are typically entered into to meet the needs of customers, for trading and for hedging purposes.
On forward contracts, the Group is exposed to counterparty credit risk. To mitigate this credit risk, we limit transactions by counterparty, regularly review credit limits and adhere to internally established credit extension policies.
For futures contracts and options on futures contracts, the change in the market value is settled with a clearing broker in cash each day. As a result, our credit risk with the clearing bro-ker is limited to the net positive change in the market value for a single day.
SwapsSwap agreements consist primarily of interest rate swaps, CDS, currency and equity swaps. The Group enters into swap agree-ments for trading and risk management purposes. Interest rate swaps are contractual agreements to exchange interest rate pay-ments based on agreed upon notional amounts and maturities. CDS are contractual agreements in which the buyer of the swap pays a periodic fee in return for a contingent payment by the seller of the swap following a credit event of a reference entity. A credit event is commonly defined as bankruptcy, insolvency, receivership, material adverse restructuring of debt, or failure to meet payment obligations when due. Currency swaps are con-tractual agreements to exchange payments in different curren-cies based on agreed notional amounts and currency pairs. Equity swaps are contractual agreements to receive the appreciation or depreciation in value based on a specific strike price on an equity instrument in exchange for paying another rate, which is usually based on an index or interest rate movements.
OptionsWe write options specifically designed to meet the needs of cus-tomers and for trading purposes. These written options do not expose us to the credit risk of the customer because, if exer-cised, we and not our counterparty are obligated to perform. At the beginning of the contract period, we receive a cash pre-mium. During the contract period, we bear the risk of unfavorable changes in the value of the financial instruments underlying the options. To manage this market risk, we purchase or sell cash or derivative financial instruments. Such purchases and sales may include debt and equity securities, forward and futures contracts, swaps and options.
We also purchase options to meet customer needs, for trading purposes and for hedging purposes. For purchased options, we obtain the right to buy or sell the underlying instrument at a fixed price on or before a specified date. During the contract period, our risk is limited to the premium paid. The underlying instruments
for these options typically include fixed income and equity securi-ties, foreign currencies and interest rate instruments or indices. Counterparties to these option contracts are regularly reviewed in order to assess creditworthiness.
Selected European credit risk exposuresThe scope of our disclosure of European credit risk exposure includes all countries of the EU which are rated below AA or its equivalent by at least one of the three major rating agencies and where our gross exposure exceeds our quantitative threshold of EUR 0.5 billion. We believe this external rating is a useful mea-sure in determining the financial ability of countries to meet their financial obligations, including giving an indication of vulnerability to adverse business, financial and economic conditions.
Monitoring of selected European credit risk exposuresThe Group’s credit risk exposure to these European countries is managed as part of our overall risk management process. The Group makes use of country limits and performs scenario analy-ses on a regular basis, which include analyses of our indirect sovereign credit risk exposures from our exposures to selected European financial institutions. This assessment of indirect sov-ereign credit risk exposures includes analysis of publicly available disclosures of counterparties’ exposures to the European coun-tries within the defined scope of our disclosure. We monitor the concentration of collateral underpinning our OTC derivative and reverse repurchase agreement exposures through monthly report-ing, and also monitor the impact of sovereign rating downgrades on collateral eligibility. Strict limits on sovereign collateral from G7 and non-G7 countries are monitored monthly. Similar disclosure is part of our regular risk reporting to regulators.
As part of our global scenario framework, the counterparty credit risk stress testing framework measures counterparty exposure under scenarios calibrated to the 99th percentile for the worst one month and one year moves observed in the available his-tory, as well as the absolutely worst weekly move observed in the same dataset. The scenario results are aggregated at the coun-terparty level for all our counterparties, including all European countries to which we have exposure. Furthermore, counterparty default scenarios are run where specific entities are set to default. In one of these scenarios, a European sovereign default is inves-tigated. This scenario determines the maximum exposure that we have to this country in the event of its default and serves to iden-tify those counterparties where exposure will rise substantially as a result of the modeled country defaulting.
The scenario framework also considers a range of other severe scenarios, including a specific eurozone crisis scenario which assumes the default of selected European countries, currently modeled to include Greece, Ireland, Italy, Portugal and Spain. It is assumed that the sovereigns, financial institutions and corporates within these countries default, with a 100% loss of sovereign and financial institutions exposures and a 0% to 100% loss of corporates depending on their credit ratings. As part of this sce-nario, we additionally assume a severe market sell-off involving an equity market crash, widening credit spreads, a rally in the price

173Risk management
of gold and a devaluation of the euro. In addition, the eurozone crisis scenario assumes the default of a small number of our mar-ket counterparties that we believe would be severely affected by a default across the selected European countries. These counter-parties are assumed to default as we believe that they would be the most affected institutions because of their direct presence in the relevant countries and their direct exposures. Through these processes, revaluation and redenomination risks on our exposures are considered on a regular basis by our Risk function.
Presentation of selected European credit risk exposuresThe basis for the presentation of the country exposure is our internal risk domicile view. The risk domicile view is based on the domicile of the legal counterparty, i.e., it may include exposure to a legal entity domiciled in the reported country even if its parent is located outside of the country.
The credit risk exposure in the table is presented on a risk-based view before deduction of any related allowance for credit losses. We present our credit risk exposure and related risk mitigation for the following distinct categories:p Gross credit risk exposure includes the principal amount of
loans drawn, letters of credit issued and undrawn portions of committed facilities, the PRV of derivative instruments after consideration of legally enforceable netting agreements, the notional value of investments in money market funds and the market values of securities financing transactions and the debt cash trading portfolio (short-term securities) netted at the issuer level.
p Risk mitigation includes CDS and other hedges, at their net notional amount, guarantees, insurance and collateral (primar-ily cash, securities and, to a lesser extent, real estate, mainly for exposures of our private banking, corporate and institu-tional businesses to corporates & other). Collateral values applied for the calculation of the net exposure are determined in accordance with our risk management policies and reflect applicable margining considerations.
p Net credit risk exposure represents gross credit risk exposure net of risk mitigation.
p Inventory represents the long inventory positions in trading and non-trading physical debt and synthetic positions, each at mar-ket value, all netted at the issuer level. Physical debt is non-derivative debt positions (e.g., bonds), and synthetic positions are created through OTC contracts (e.g., CDS purchased and/or sold and total return swaps).
CDS presented in the risk mitigation column are purchased as a direct hedge to our OTC exposure and the risk mitigation impact is considered to be the notional amount of the contract for risk purposes, with the mark-to-market fair value of CDS risk-man-aged against the protection provider. Net notional amounts of
CDS reflect the notional amount of CDS protection purchased less the notional amount of CDS protection sold and are based on the origin of the CDS reference credit, rather than that of the CDS counterparty. CDS included in the inventory column repre-sent contracts recorded in our trading books that are hedging the credit risk of the instruments included in the inventory column and are disclosed on the same basis as the value of the fixed income instrument they are hedging.
The Group does not have any tranched CDS positions on these European countries and only an insignificant amount of indexed credit derivatives is included in inventory.
The credit risk of CDS contracts themselves, i.e., the risk that the CDS counterparty will not perform in the event of a default, is managed separately from the credit risk of the reference credit. To mitigate such credit risk, generally all CDS contracts are col-lateralized. In addition, they are executed with counterparties with whom we have an enforceable International Swaps and Deriva-tives Association (ISDA) master agreement that provides for daily margining.
Development of selected European credit risk exposuresOn a gross basis, before taking into account risk mitigation, our risk-based sovereign credit risk exposure to Cyprus, Greece, Ireland, Italy, Malta, Portugal and Spain decreased 10% to EUR 2,265 million as of December 31, 2020, compared to EUR 2,514 million as of December 31, 2019. Our net exposure to these sovereigns was EUR 1,943 million, 16% lower compared to EUR 2,306 million as of December 31, 2019. Our non-sovereign risk-based credit risk exposure in these countries as of Decem-ber 31, 2020 included net exposures to financial institutions of EUR 2,304 million, 12% lower compared to December 31, 2019, and net exposures to corporates and other counterparties of EUR 2,649 million, 11% higher compared to December 31, 2019.
A significant majority of the purchased credit protection is trans-acted with central counterparties or banks outside of the dis-closed countries. For credit protection purchased from central counterparties or banks in the disclosed countries, such credit risk is reflected in the gross and net exposure to each respective country.
Sovereign debt rating developmentsFrom year-end 2019 through February 28, 2021, the long-term sovereign debt ratings of the countries listed in the table changed as follows: Fitch increased Greece’s rating from BB- to BB and decreased Italy’s rating from BBB to BBB-. Moody’s increased Greece’s rating from B1 to BA3. These rating changes did not have a significant impact on the Group’s financial position, result of operations, liquidity or capital resources.

174 Risk management
Selected European credit risk exposures Gross Net Total credit risk credit risk credit risk exposure Risk mitigation exposure Inventory 2 exposure
Net
synthetic
December 31, 2020 CDS Other 1 inventory 3 Gross Net
Cyprus (EUR million)
Financial institutions 7 0 2 5 0 0 7 5
Corporates & other 1,242 0 1,046 196 0 0 1,242 196
Total 1,249 0 1,048 201 0 0 1,249 201
Greece
Sovereign 102 84 0 18 6 2 108 24
Financial institutions 280 0 277 3 1 0 281 4
Corporates & other 321 0 283 38 3 (3) 324 41
Total 703 84 560 59 10 (1) 713 69
Ireland
Sovereign 1,022 0 0 1,022 1 1 1,023 1,023
Financial institutions 1,473 0 236 1,237 27 (67) 1,500 1,264
Corporates & other 948 0 355 593 39 (26) 987 632
Total 3,443 0 591 2,852 67 (92) 3,510 2,919
Italy
Sovereign 568 49 189 330 0 (12) 568 330
Financial institutions 855 0 441 414 81 (16) 936 495
Corporates & other 3,929 50 2,931 948 143 33 4,072 1,091
Total 5,352 99 3,561 1,692 224 5 5,576 1,916
Malta
Financial institutions 97 0 24 73 0 0 97 73
Corporates & other 520 0 490 30 4 0 524 34
Total 617 0 514 103 4 0 621 107
Portugal
Sovereign 0 0 0 0 25 25 25 25
Financial institutions 370 0 296 74 14 1 384 88
Corporates & other 285 3 237 45 28 23 313 73
Total 655 3 533 119 67 49 722 186
Spain
Sovereign 541 0 0 541 0 (65) 541 541
Financial institutions 968 0 657 311 64 (5) 1,032 375
Corporates & other 2,643 110 2,015 518 64 (121) 2,707 582
Total 4,152 110 2,672 1,370 128 (191) 4,280 1,498
Total
Sovereign 2,233 133 189 1,911 32 (49) 2,265 1,943
Financial institutions 4,050 0 1,933 2,117 187 (87) 4,237 2,304
Corporates & other 9,888 163 7,357 2,368 281 (94) 10,169 2,649
Total 16,171 296 9,479 6,396 500 (230) 16,671 6,896
1 Includes other hedges (derivative instruments), guarantees, insurance and collateral.2 Represents long inventory positions netted at issuer level.3 Substantially all of which results from CDS; represents long positions net of short positions.

175Risk management
Market risk
Traded market riskDevelopment of traded market risksThe tables entitled “One-day, 98% risk management VaR” and “Average one-day, 98% risk management VaR by division” show our traded market risk exposure, as measured by one-day, 98% risk management VaR in Swiss francs and US dollars. As we measure VaR for internal risk management purposes using the US dollar as the base currency, the VaR figures were translated into Swiss francs using daily foreign exchange translation rates. VaR estimates are computed separately for each risk type and for the whole portfolio. The different risk types are grouped into five categories including interest rate, credit spread, foreign exchange, commodity and equity risks.
In connection with the update of the market risk section to focus on the concepts of traded market risk and non-traded market risk in order to more closely align the descriptions to the Group’s internal risk framework and control processes, we also reflected corresponding updates in the information presented in the risk management VaR tables beginning in the fourth quarter of 2020.
Risk management VaR now measures the Group’s traded market risk exposure, which generally includes trading book positions, banking book positions held at fair value and foreign exchange and commodity risk from banking book positions. Before the update, risk management VaR measured the Group’s trading book exposure. Prior periods have been reclassified to conform to the current presentation.
We regularly review our VaR model to ensure that it remains appropriate given evolving market conditions and the composition of our trading portfolio. In the third quarter of 2020, a VaR model enhancement was implemented to use full revaluation of certain exotic equity products to capture the risk of co-movements of for-eign exchange spot and at-the-money volatility as well as equity spot and at-the-money volatility in a unified equity model. The risk of these co-movements was previously captured through a com-bination of our equity and foreign exchange VaR models comple-mented by the RNIV charge. This model enhancement affected the scope of the foreign exchange and the equity models, how-ever, it did not have a material impact on total risk management VaR.
One-day, 98% risk management VaR Diversi-
Interest Credit Foreign fication
in / end of rate spread exchange Commodity Equity benefit 1 Total
CHF million
2020
Average 22 82 12 2 19 (65) 72
Minimum 10 27 3 1 10 – 2 28
Maximum 43 176 38 3 32 – 2 185
End of period 13 70 36 2 32 (93) 60
2019
Average 16 29 4 2 11 (27) 35
Minimum 9 25 2 1 8 – 2 30
Maximum 29 39 9 3 17 – 2 46
End of period 13 28 3 1 11 (26) 30
USD million
2020
Average 24 88 14 2 20 (72) 76
Minimum 11 28 3 1 10 – 2 29
Maximum 44 181 43 3 36 – 2 189
End of period 14 79 41 2 36 (104) 68
2019
Average 16 29 4 2 11 (27) 35
Minimum 9 25 2 1 8 – 2 30
Maximum 29 39 9 3 17 – 2 47
End of period 14 29 3 1 11 (27) 31
Excludes risks associated with counterparty and own credit exposures. Risk management VaR measures traded market risk and generally includes the trading book positions, banking book positions held at fair value and foreign exchange and commodity risk from banking book positions; prior periods have been reclassified to conform to the current presentation.1 Diversification benefit represents the reduction in risk that occurs when combining different, not perfectly correlated risk types in the same portfolio and is measured as the difference
between the sum of the individual risk types and the risk calculated on the combined portfolio.2 As the maximum and minimum occur on different days for different risk types, it is not meaningful to calculate a portfolio diversification benefit.

176 Risk management
Daily risk management VaR
j One-day risk management VaR (98%) Excludes risks associated with counterparty and own credit exposures.
CHF million
0
40
80
120
160
200
1Q20 2Q20 3Q20 4Q20
Daily total backtesting revenues
p 2020 p 2019
0
30
60
90
120
150
< (1
00
)
Days
(10
0)–
(75
)
(75
)–(5
0)
(50
)–(2
5)
(25
)–0
0–
25
25
–5
0
50
–7
5
75
–1
00
10
0–
12
5
12
5–
15
0
> 1
50
CHFmillion
121
64
120
123
2 121 434 59
3814 12
Average one-day, 98% risk management VaR by division Swiss International Diversi-
Universal Wealth Asia Investment Corporate fication Credit
in Bank Management Pacific Bank Center benefit 1 Suisse
CHF million
2020 9 6 19 64 5 (31) 72
2019 2 10 3 12 30 4 (24) 35
USD million
2020 10 7 20 68 5 (34) 76
2019 2 10 3 12 30 4 (24) 35
Excludes risks associated with counterparty and own credit exposures. Risk management VaR measures traded market risk and generally includes the trading book positions, banking book positions held at fair value and foreign exchange and commodity risk from banking book positions; prior periods have been reclassified to conform to the current presentation.1 Difference between the sum of the standalone VaR for each division and the VaR for the Group.2 The restatement of divisional historical average risk management VaR under the new organization required certain additional assumptions, which will not be required for future periods.
We measure VaR in US dollars, as the majority of our trading activities are conducted in US dollars.
Period-end risk management VaR of USD 68 million as of December 31, 2020 increased 119% compared to Decem-ber 31, 2019, and average risk management VaR of USD 76 mil-lion in 2020 increased 117% compared to 2019. The increases observed for average interest rate, credit spread and equity risk management VaR in 2020 primarily reflect the significantly increased volatility in financial markets globally at the end of the first quarter of 2020. The increase in foreign exchange risk man-agement VaR reflected the model enhancement implemented in the third quarter of 2020.
On a divisional level, the Investment Bank was the main contribu-tor to the Group’s increased risk management VaR. Average risk management VaR of Swiss Universal Bank in 2020 was stable as a scope adjustment for accrual accounted positions in mid-2020 was largely offset by the significantly increased volatility in finan-cial markets at the end of the first quarter of 2020.
The chart entitled “Daily risk management VaR” shows the aggre-gated traded market risk on a consolidated basis.
The histogram entitled “Daily total backtesting revenues” com-pares the daily total backtesting revenues for 2020 with those for 2019. Total backtesting revenues is an internally used metric,
limited to the trading book only, and excludes the cost of carry, credit provisions and internal revenue transfers. The cost of carry is the change in value of the portfolio from one day to the next, assuming all other factors such as market levels and trade popula-tion remain constant, and can be negative or positive. In 2020, we had seven trading loss days compared to three trading loss days in 2019.
For capital purposes and in line with BIS requirements, FINMA increases the capital multiplier for every regulatory VaR back-testing exception above four in the prior rolling 12-month period, resulting in an incremental market risk capital requirement for the Group.
In April 2020, FINMA announced that it believed most backtest-ing exceptions experienced by regulated institutions in March and April 2020 were not due to shortcomings of the model, but due to the increase in volatility related to the COVID-19 pandemic. To mitigate this volatility-related pro-cyclicality, FINMA allowed a temporary freeze on backtesting exceptions impacting the capital multiplier, expiring on July 1, 2020. In June 2020, FINMA con-firmed that (i) all recent exceptions that are proven by the institu-tion as not attributable to a lack of precision of the risk aggre-gation model can be disregarded; and (ii) the exemption will be

177Risk management
fundamentally incorporated into future supervisory practice. As a result, we had one backtesting exception in our regulatory VaR model in the rolling 12-month period through the end of 2020, which is considered for the calculation of the capital multiplier.
> Refer to “Risk-weighted assets” in Capital management for further information on the use of our regulatory VaR model in the calculation of trading book mar-ket risk capital requirements.
Credit, debit and funding valuation adjustmentsVaR excludes the impact of changes in both counterparty and our own credit spreads on derivative products. As of December 31, 2020, the estimated sensitivity implies that a one basis point increase in credit spreads, both counterparty and our own, would have resulted in a CHF 1.2 million gain on the overall deriva-tives position in our trading businesses. In addition, a one basis point increase in our own credit spread on our fair valued struc-tured notes portfolio (including the impact of hedges) would have resulted in a CHF 14.4 million gain as of December 31, 2020. As of December 31, 2020, the estimated FVA sensitivity implies that a one basis point increase in the fair value funding spread would have resulted in a CHF 0.3 million gain on the overall derivatives position in the investment banking businesses.
Non-traded market riskDevelopment of interest rate risks in the banking bookInterest rate risk on banking book positions is measured by estimating the impact resulting from a one basis point parallel increase in yield curves on the present value of interest rate-sensitive banking book positions. This is measured on the Group’s entire banking book. Interest rate risk sensitivities disclosed below are in line with our internal risk management view.
> Refer to credit-suisse.com/regulatorydisclosures for the Group’s publication “Pillar 3 and regulatory disclosures 4Q20 – Credit Suisse Group AG” which includes additional information on regulatory interest rate risk in the banking book in accordance with FINMA guidance.
As of December 31, 2020, the interest rate sensitivity of a one basis point parallel increase in yield curves was negative CHF 5.3 million, compared to negative CHF 4.0 million as of Decem-ber 31, 2019. The change was mainly driven by our regular man-agement of banking book and net interest income hedging activi-ties, partially offset by the appreciation of the Swiss franc against the US dollar.
One basis point parallel increase in yield curves by currency – banking book positions
end of CHF USD EUR Other Total
2020 (CHF million)
Impact on present value (2.0) (3.4) 0.2 (0.1) (5.3)
2019 (CHF million)
Impact on present value (1.8) (2.1) 0.0 (0.1) (4.0)
Interest rate risk on banking book positions is also assessed using other measures, including the potential value change resulting from a significant change in yield curves. The interest rate scenarios disclosed below have been aligned to the FINMA guidance for Pillar 3 disclosures. The table “Interest rate sce-nario results – banking book positions” shows the impact of the FINMA-defined interest rate scenarios on the net present value of our banking book positions excluding additional tier 1 capital instruments (as per Pillar 3 requirements) and including additional tier 1 capital instruments.
As of December 31, 2020, the most adverse economic impact from these scenarios (including additional tier 1 capital instru-ments) was a loss of CHF 655 million, compared to a loss of CHF 551 million as of December 31, 2019. The change was mainly driven by our regular management of banking book and net interest income hedging activities, partially offset by the appreciation of the Swiss franc against the US dollar.

178 Risk management
Interest rate scenario results – banking book positions Total – Total – Pillar 3 Internal
end of CHF USD EUR Other view 1 view 2
2020 (CHF million)
Parallel up (317) (1,735) 56 41 (1,955) (655)
Parallel down 393 2,064 (16) 144 2,585 1,286
Steepener shock 3 (248) (177) (12) 9 (428) (227)
Flattener shock 4 202 (206) 21 73 90 178
Rise in short-term interest rates 39 (931) 30 107 (755) (149)
Fall in short-term interest rates (48) 1,036 (30) 117 1,075 469
2019 (CHF million)
Parallel up (332) (1,308) 58 (47) (1,629) (551)
Parallel down 368 1,452 65 54 1,939 862
Steepener shock 3 (182) 67 7 (21) (129) (43)
Flattener shock 4 127 (386) (11) 10 (260) (107)
Rise in short-term interest rates (17) (917) (11) (8) (953) (380)
Fall in short-term interest rates 11 895 6 6 918 345
All scenarios are in line with FINMA guidance (FINMA circular 2019/2).1 Excludes additional tier 1 capital instruments in accordance with Pillar 3 requirements.2 Includes additional tier 1 capital instruments in accordance with the Group’s risk management view.3 Reflects a fall in short-term interest rates combined with a rise in long-term interest rates.4 Reflects a rise in short-term interest rates combined with a fall in long-term interest rates.
Illiquid investments
The Group’s illiquid investment positions, which may not be strongly correlated with general equity markets, are measured using sensitivity analysis that estimates the potential change in value resulting from a 10% decline in the equity markets of
developed nations and a 20% decline in the equity markets of emerging market nations. The estimated impact of this scenario would have been a decrease of CHF 271 million in the value of the illiquid investment portfolio as of December 31, 2020, com-pared to a decrease of CHF 262 million as of December 31, 2019.

179Balance sheet and off-balance sheet
Balance sheet and off-balance sheet
As of the end of 2020, total assets of CHF 805.8 billion increased 2% and total liabilities of CHF 762.9 billion increased 3% compared to the end of 2019, primarily reflecting higher operating activities, partially offset by a negative foreign exchange translation impact.
The majority of our transactions are recorded on our balance sheet. However, we also enter into transactions that give rise to both on and off-balance sheet exposure.
Balance sheet Total assets were CHF 805.8 billion as of the end of 2020, an increase of CHF 18.5 billion, or 2%, compared to the end of 2019. Excluding the foreign exchange translation impact, total assets increased CHF 68.7 billion. Cash and due from banks increased CHF 37.2 billion, or 37%, mainly driven by higher cash positions at the ECB, the SNB and the Fed. Trading assets increased CHF 3.5 billion, or 2%, primarily reflecting an increase in derivative instruments, partially offset by the foreign exchange
translation impact and decreases in debt and equity securities. Brokerage receivables were stable. Central bank funds sold, securities purchased under resale agreements and securities borrowing transactions decreased CHF 27.9 billion, or 26%, pri-marily due to a decrease in reverse repurchase transactions from customers and banks, a decrease in cash collateral and the for-eign exchange translation impact. Net loans decreased CHF 4.9 billion, or 2%, mainly due to the foreign exchange translation impact, lower loans collateralized by securities, lower loans to financial institutions and lower loans to governments and public institutions, partially offset by higher consumer mortgages and higher commercial and industrial loans. All other assets increased CHF 10.2 billion, or 11%, primarily including an increase of CHF 10.6 billion, or 26%, in securities received as collateral.
Balance sheet summary end of % change
2020 2019 2018 20 / 19 19 / 18
Assets (CHF million)
Cash and due from banks 139,112 101,879 100,047 37 2
Central bank funds sold, securities purchased under
resale agreements and securities borrowing transactions 79,133 106,997 117,095 (26) (9)
Trading assets 157,338 153,797 133,635 2 15
Net loans 291,908 296,779 287,581 (2) 3
Brokerage receivables 35,941 35,648 38,907 1 (8)
All other assets 102,390 92,195 91,651 11 1
Total assets 805,822 787,295 768,916 2 2
Liabilities and equity (CHF million)
Due to banks 16,423 16,744 15,220 (2) 10
Customer deposits 390,921 383,783 363,925 2 5
Central bank funds purchased, securities sold under
repurchase agreements and securities lending transactions 23,851 27,533 24,623 (13) 12
Trading liabilities 45,871 38,186 42,169 20 (9)
Long-term debt 161,087 152,005 154,308 6 (1)
Brokerage payables 21,653 25,683 30,923 (16) (17)
All other liabilities 103,075 99,647 93,729 3 6
Total liabilities 762,881 743,581 724,897 3 3
Total shareholders’ equity 42,677 43,644 43,922 (2) (1)
Noncontrolling interests 264 70 97 277 (28)
Total equity 42,941 43,714 44,019 (2) (1)
Total liabilities and equity 805,822 787,295 768,916 2 2

180 Balance sheet and off-balance sheet
Total liabilities were CHF 762.9 billion as of the end of 2020, an increase of CHF 19.3 billion, or 3%, compared to the end of 2019. Excluding the foreign exchange translation impact, total liabilities increased CHF 70.2 billion. Long-term debt increased CHF 9.1 billion, or 6%, primarily reflecting issuances of senior debt, partially offset by maturities of senior debt and the foreign exchange translation impact. Trading liabilities increased CHF 7.7 billion, or 20%, primarily reflecting increases in derivative instru-ments and short positions, partially offset by the foreign exchange translation impact. Customer deposits increased CHF 7.1 bil-lion, or 2%, mainly due to an increase in demand and savings deposits, partially offset by decreases in certificates of deposits and time deposits and the foreign exchange translation impact. Brokerage payables decreased CHF 4.0 billion, or 16%, primar-ily due to the foreign exchange translation impact, a decrease in margin lending and lower futures balances. Central bank funds purchased, securities sold under repurchase agreements and securities lending transactions decreased CHF 3.7 billion, or 13%, mainly reflecting the foreign exchange translation impact, decreases in federal funds purchased, repurchase transactions with banks and cash collateral, partially offset by an increase in repurchase transactions with customers. Due to banks decreased CHF 0.3 billion, or 2%, primarily reflecting the foreign exchange translation impact. All other liabilities increased CHF 3.4 billion, or 3%, primarily including an increase of CHF 10.6 billion, or 26%, in obligation to return securities received as collateral, partially offset by a decrease of CHF 7.5 billion, or 26%, in short-term borrowings.
> Refer to “Liquidity and funding management” and “Capital management” for more information, including our funding of the balance sheet and the leverage ratio.
Off-balance sheet We enter into off-balance sheet arrangements in the normal course of business. Off-balance sheet arrangements are transac-tions or other contractual arrangements with, or for the benefit of, an entity that is not consolidated. These transactions include derivative instruments, guarantees and similar arrangements, retained or contingent interests in assets transferred to an uncon-solidated entity in connection with our involvement with special purpose entities (SPEs), and obligations and liabilities (including contingent obligations and liabilities) under variable interests in unconsolidated entities that provide financing, liquidity, credit and other support.
Derivative instrumentsWe enter into derivative contracts in the normal course of busi-ness for market making, positioning and arbitrage purposes, as well as for our own risk management needs, including mitigation of interest rate, foreign exchange and credit risk.
> Refer to “Derivative instruments” in Risk management – Risk portfolio analy-sis – Credit risk and “Note 33 – Derivatives and hedging activities” and “Note 36 – Financial instruments” in VI – Consolidated financial statements – Credit Suisse Group for further information.
Guarantees and similar arrangementsIn the ordinary course of business, guarantees and indemnifica-tions are provided that contingently obligate us to make payments to a guaranteed or indemnified party based on changes in an asset, liability or equity security of the guaranteed or indemnified party. We may be contingently obligated to make payments to a guaranteed party based on another entity’s failure to perform, or we may have an indirect guarantee of the indebtedness of oth-ers. Guarantees provided include, but are not limited to, custom-ary indemnifications to purchasers in connection with the sale of assets or businesses; to investors in private equity funds spon-sored by us regarding potential obligations of their employees to return amounts previously paid as carried interest; and to inves-tors in our securities and other arrangements to provide gross-up payments if there is a withholding or deduction because of a tax assessment or other governmental charge.
In connection with the sale of assets or businesses, we some-times provide the acquirer with certain indemnification provisions. These indemnification provisions vary by counterparty in scope and duration and depend upon the type of assets or businesses sold. They are designed to transfer the potential risk of certain unquantifiable and unknowable loss contingencies, such as litiga-tion, tax and intellectual property matters, from the acquirer to the seller. We closely monitor all such contractual agreements in order to ensure that indemnification provisions are adequately provided for in our consolidated financial statements.
US GAAP requires disclosure of our maximum potential payment obligations under certain guarantees to the extent that it is pos-sible to estimate them and requires recognition of a liability for the fair value of obligations undertaken for guarantees issued or amended after December 31, 2002.
> Refer to “Note 34 – Guarantees and commitments” in VI – Consolidated finan-cial statements – Credit Suisse Group for disclosure of our estimated maximum payment obligations under certain guarantees and related information.
Representations and warranties on residential mortgage loans soldIn connection with the Investment Bank division’s sale of US resi-dential mortgage loans, we have provided certain representations and warranties relating to the loans sold. We have provided these representations and warranties relating to sales of loans to institu-tional investors, primarily banks, and non-agency, or private label, securitizations. The loans sold are primarily loans that we have purchased from other parties. The scope of representations and warranties, if any, depends on the transaction, but can include: ownership of the mortgage loans and legal capacity to sell the loans; loan-to-value ratios and other characteristics of the prop-erty, the borrower and the loan; validity of the liens securing the loans and absence of delinquent taxes or related liens; conformity to underwriting standards and completeness of documentation; and origination in compliance with law. If it is determined that rep-resentations and warranties were breached, we may be required to repurchase the related loans or indemnify the investors to make them whole for losses. Whether we will incur a loss in con-nection with repurchases and make whole payments depends on:
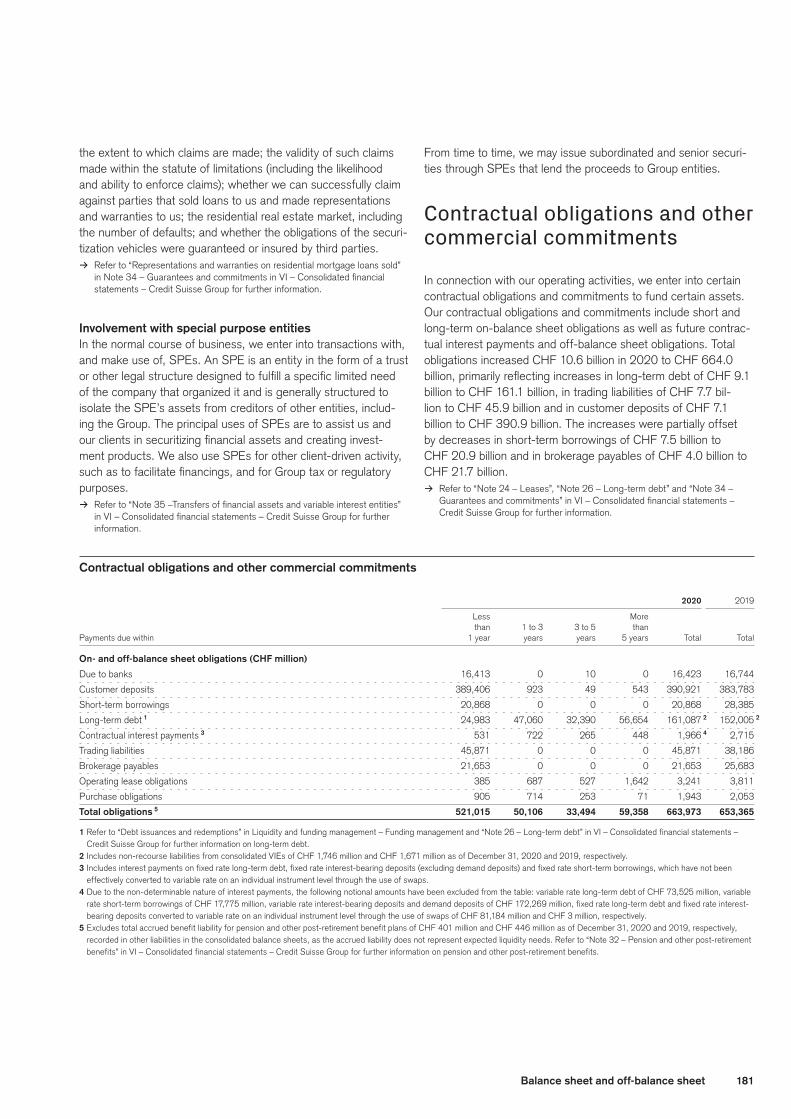
181Balance sheet and off-balance sheet
the extent to which claims are made; the validity of such claims made within the statute of limitations (including the likelihood and ability to enforce claims); whether we can successfully claim against parties that sold loans to us and made representations and warranties to us; the residential real estate market, including the number of defaults; and whether the obligations of the securi-tization vehicles were guaranteed or insured by third parties.
> Refer to “Representations and warranties on residential mortgage loans sold” in Note 34 – Guarantees and commitments in VI – Consolidated financial statements – Credit Suisse Group for further information.
Involvement with special purpose entitiesIn the normal course of business, we enter into transactions with, and make use of, SPEs. An SPE is an entity in the form of a trust or other legal structure designed to fulfill a specific limited need of the company that organized it and is generally structured to isolate the SPE’s assets from creditors of other entities, includ-ing the Group. The principal uses of SPEs are to assist us and our clients in securitizing financial assets and creating invest-ment products. We also use SPEs for other client-driven activity, such as to facilitate financings, and for Group tax or regulatory purposes.
> Refer to “Note 35 –Transfers of financial assets and variable interest entities” in VI – Consolidated financial statements – Credit Suisse Group for further information.
From time to time, we may issue subordinated and senior securi-ties through SPEs that lend the proceeds to Group entities.
Contractual obligations and other commercial commitments
In connection with our operating activities, we enter into certain contractual obligations and commitments to fund certain assets. Our contractual obligations and commitments include short and long-term on-balance sheet obligations as well as future contrac-tual interest payments and off-balance sheet obligations. Total obligations increased CHF 10.6 billion in 2020 to CHF 664.0 billion, primarily reflecting increases in long-term debt of CHF 9.1 billion to CHF 161.1 billion, in trading liabilities of CHF 7.7 bil-lion to CHF 45.9 billion and in customer deposits of CHF 7.1 billion to CHF 390.9 billion. The increases were partially offset by decreases in short-term borrowings of CHF 7.5 billion to CHF 20.9 billion and in brokerage payables of CHF 4.0 billion to CHF 21.7 billion.
> Refer to “Note 24 – Leases”, “Note 26 – Long-term debt” and “Note 34 – Guarantees and commitments” in VI – Consolidated financial statements – Credit Suisse Group for further information.
Contractual obligations and other commercial commitments
2020 2019
Less More
than 1 to 3 3 to 5 than
Payments due within 1 year years years 5 years Total Total
On- and off-balance sheet obligations (CHF million)
Due to banks 16,413 0 10 0 16,423 16,744
Customer deposits 389,406 923 49 543 390,921 383,783
Short-term borrowings 20,868 0 0 0 20,868 28,385
Long-term debt 1 24,983 47,060 32,390 56,654 161,087 2 152,005 2
Contractual interest payments 3 531 722 265 448 1,966 4 2,715
Trading liabilities 45,871 0 0 0 45,871 38,186
Brokerage payables 21,653 0 0 0 21,653 25,683
Operating lease obligations 385 687 527 1,642 3,241 3,811
Purchase obligations 905 714 253 71 1,943 2,053
Total obligations 5 521,015 50,106 33,494 59,358 663,973 653,365
1 Refer to “Debt issuances and redemptions” in Liquidity and funding management – Funding management and “Note 26 – Long-term debt” in VI – Consolidated financial statements – Credit Suisse Group for further information on long-term debt.
2 Includes non-recourse liabilities from consolidated VIEs of CHF 1,746 million and CHF 1,671 million as of December 31, 2020 and 2019, respectively.3 Includes interest payments on fixed rate long-term debt, fixed rate interest-bearing deposits (excluding demand deposits) and fixed rate short-term borrowings, which have not been
effectively converted to variable rate on an individual instrument level through the use of swaps.4 Due to the non-determinable nature of interest payments, the following notional amounts have been excluded from the table: variable rate long-term debt of CHF 73,525 million, variable
rate short-term borrowings of CHF 17,775 million, variable rate interest-bearing deposits and demand deposits of CHF 172,269 million, fixed rate long-term debt and fixed rate interest-bearing deposits converted to variable rate on an individual instrument level through the use of swaps of CHF 81,184 million and CHF 3 million, respectively.
5 Excludes total accrued benefit liability for pension and other post-retirement benefit plans of CHF 401 million and CHF 446 million as of December 31, 2020 and 2019, respectively, recorded in other liabilities in the consolidated balance sheets, as the accrued liability does not represent expected liquidity needs. Refer to “Note 32 – Pension and other post-retirement benefits” in VI – Consolidated financial statements – Credit Suisse Group for further information on pension and other post-retirement benefits.

182 Balance sheet and off-balance sheet
[this page intentionally left blank]
183
Overview 184
Shareholders 190
Board of Directors 196
Executive Board 221
Additional information 229
IV – Corporate Governance
184 Corporate Governance
Corporate Governance
2020 marked a year of change for the Group’s corporate governance with the announcement of a new Chairman, the transition to a new CEO and the implementation of several important organizational changes.
OverviewThe Group’s corporate governance reflects our commitment to safeguarding the interests of our stakeholders. Our corporate governance complies with internationally accepted standards, and we recognize the importance of good corporate governance. We know that transparent disclosure of our governance helps stake-holders assess the quality of the Group’s corporate governance and assists investors in their investment decisions.
Corporate Governance developments
The key corporate governance developments for the Group in 2020 and in early 2021 included:
Board of Directors (Board)p The Board’s nomination of António Horta-Osório, Group Chief
Executive of Lloyds Banking Group (until end April 2021), as the new Chairman of the Board for election at the 2021 Annual General Meeting (AGM) and successor to Urs Rohner, who will not stand for re-election at the AGM, after having reached the 12-year tenure limit;
p Further nominations of Board member candidates Clare Brady, former director of internal audit at the International Monetary Fund and auditor general of the World Bank Group, and Blythe Masters, former CEO of the financial technology firm Digital Asset Holdings and long-time executive at JPMorgan Chase, for election as new Board members at the 2021 AGM;
p Subject to shareholder approval at the 2021 AGM of Clare Brady and Blythe Masters, five of thirteen, or 38%, of Board members will be female;
p The election of Board member Richard Meddings, a financial expert with over 30 years of experience in the financial ser-vices sector, at the 2020 AGM and his subsequent appoint-ment as Chair of the Audit Committee, succeeding John Tiner, who will not stand for re-election at the 2021 AGM after hav-ing reached the 12-year tenure limit;
p The appointment of Christian Gellerstad as Chair of the Con-duct and Financial Crime Control Committee, succeeding Urs Rohner, who will remain a member of the committee until the 2021 AGM;
p The announcement that Board and Audit Committee member Joaquin J. Ribeiro will not stand for re-election at the 2021 AGM, and the announcement last year that Board and Audit Committee member Alexander Gut would not stand for re-election at the 2020 AGM; and
p The Board’s decision to establish a new Sustainability Advisory Committee, chaired by the current Board member and Board-appointed Sustainability Leader Iris Bohnet and consisting of
members of the Board and Executive Board, as well as exter-nal advisors; the Sustainability Advisory Committee will provide guidance and expertise with respect to the firm-wide sustain-ability strategy and its execution.
Executive Boardp The announcement in early 2020 of the Board’s appointments
of Thomas Gottstein as the new CEO, succeeding Tidjane Thiam, and André Helfenstein as CEO of Swiss Universal Bank (both effective February 14, 2020);
p A number of changes to the roles of existing Executive Board members in light of organizational changes described below, covering the appointments of Brian Chin as CEO of the Investment Bank, Lara Warner as Chief Risk and Compli-ance Officer (CRCO) and Lydie Hudson as CEO of Sustain-ability, Research & Investment Solutions (SRI), all with effect from August 1, 2020. As a consequence of the creation of a single Investment Bank division, David Miller, former CEO of the Investment Banking & Capital Markets division, stepped down from the Executive Board, also with effect from August 1, 2020; and
p As of the date of this report, the Executive Board consists of three female and eight male members, or 27% and 73%, respectively, in line with the minimum 20% representation of each gender as stipulated by the respective provision in the new Swiss corporate law.
Organizational structurep Creation of a single, globally-integrated Investment Bank divi-
sion through the combination of the former Global Markets, Investment Banking & Capital Markets and Asia Pacific – Mar-kets businesses to achieve critical scale;
p Combination of the former Risk Management and Compliance functions into a single, integrated CRCO function (Risk and Compliance), to further enhance the effectiveness and effi-ciency of the Group’s control environment amid stricter regula-tory frameworks;
p Launch of the new SRI function at the Executive Board level, underlying the sharpened focus on sustainability, and the establishment of a firm-wide Sustainability Leadership Com-mittee comprising members of senior management and co-chaired by the CEO of SRI and the Chief Sustainability Officer (CSO); and
p The merger of the business of Neue Aargauer Bank AG with that of Credit Suisse (Schweiz) AG, in the context of steps announced in August 2020 with regard to the positioning of the Group’s retail banking business in Switzerland and in order to create a uniform presence and single brand in the Canton of Aargau, Switzerland.
185Corporate Governance
New Asset Management divisionp The decision of the Board on March 17, 2021, subsequent to
the recent reports and announcements regarding the Credit Suisse Asset Management managed supply chain finance funds, to appoint Ulrich Körner as CEO of Asset Management and a member of the Group Executive Board, effective April 1, 2021. From that date, the Asset Management business will be separated from the International Wealth Management division and managed as a new separate division of the Group.
Annual General Meetingp Following a request by the Swiss Financial Market Supervisory
Authority FINMA (FINMA) and in light of the economic chal-lenges due to the COVID-19 pandemic, the Board revised its original proposal to shareholders in March 2020 regarding the appropriation of retained earnings and distribution of dividends and proposed a distribution of dividends in two equal tranches during 2020. The dividend proposals were subsequently approved by shareholders at the AGM on April 30, 2020 and at an Extraordinary General Meeting (EGM) on November 27, 2020;
p Also due to the COVID-19 pandemic, and pursuant to the related Federal Council’s COVID-19 ordinance, the 2020 AGM and EGM were held without the personal attendance of shareholders. Shareholders were represented at the AGM and EGM exclusively by the independent proxy; and
p The Board decided to hold the 2021 AGM without the per-sonal attendance of shareholders, given the ongoing COVID-19 pandemic and related restrictions and to ensure the health and safety of shareholders and employees.
External auditor rotationp The election of PricewaterhouseCoopers AG (PwC) as the
Group’s new statutory auditor at the 2020 AGM and the suc-cessful completion of the Group’s external auditor rotation from KPMG AG (KPMG) to PwC, effective for the fiscal year ending December 31, 2020.
Regulatory developmentsWe regularly monitor developments in corporate governance guidelines, regulations and best practice standards in all jurisdic-tions relevant to our business operations. On June 19, 2020, the Swiss Parliament adopted a number of substantial amend-ments to the Swiss corporate law set out under the Swiss Code of Obligations. The revisions include changes to executive com-pensation of listed companies, transferring the regulations of the Swiss Ordinance Against Excessive Compensation with respect to Listed Corporations (Compensation Ordinance) into the Code of Obligations, and provide for a more flexible process on share-holder meetings and the strengthening of shareholder rights. The new law further stipulates gender diversity guidelines at the board and executive board levels, which include “comply or explain” disclosure obligations for representation of each gender on the board of directors and executive board of listed companies of at least 30% and 20%, respectively. While the general effective date of the new law will be announced at a later point in time, the Swiss Federal Council resolved in September 2020 to make
the “comply or explain” disclosure obligations on gender diver-sity effective as of January 1, 2021. Listed companies will have a transitional period of five years to comply with the “comply or explain” gender guidelines for the board of directors and ten years for the implementation at the level of the executive board. As of December 31, 2020, Credit Suisse complies with the gender requirements for our Executive Board and, subject to shareholder approval, expects to comply with the requirements for our Board following the 2021 AGM.
Governance of crisis managementThe Group has a crisis management framework and robust gover-nance processes in place to enable the effective management of crises. The crisis management framework includes the implemen-tation of global and regional Crisis Assessment Teams (CAT) and Crisis Management Teams (CMT) consisting of representatives from senior management and specialist functions from across the firm. The Global CAT assesses the impact of a specific crisis event to the firm on a global level and provides recommendations for final deci-sions to the Global CMT, whose members include all members of the Executive Board. In the case of a specific crisis event, firm-wide business continuity management response measures are triggered and overseen by the Executive Board. At the Board level, oversight of business continuity management is within the responsibility of the Risk Committee. In any given crisis event, the Board may delegate certain responsibilities to a sub-committee of its members that is authorized to take actions that exceed the mandate of the Execu-tive Board, in particular when decisions are needed in too short a time frame to convene the full Board. Such a crisis could include, for example, a sovereign crisis, large single name default, cyber or other operational incident and global macroeconomic or market event or public health crisis, such as the COVID-19 pandemic. Once the crisis management process is invoked, multiple response measures are triggered, including Group crisis specific risk reporting, if neces-sary, and other potential steps, such as notification of regulators.
In February 2020, in response to the COVID-19 pandemic in coun-tries and regions in which the Group operates, the Executive Board invoked our crisis management process, which remains in place as of the date of this report, given that the COVID-19 pandemic has not yet subsided and that renewed lockdowns and other restrictions have occurred across different countries in the latter part of 2020 and early 2021. Invoking the crisis management process meant that various response measures were put in place, including travel restric-tions, a quarantine protocol, guidelines for client meetings, employee gatherings and working from home, and certain changes to the daily operations of critical processes, in order to ensure continuity of our business operations and to protect the health and safety of our employees. The crisis management process and related measures were continuously monitored and adapted throughout 2020 and early 2021, in light of changing circumstances, with daily Execu-tive Board calls held following the initial outbreak of the COVID-19 pandemic in the first part of 2020. Specific crisis reporting was also developed, with regular updates provided to regulators and the Board. The Board has remained actively involved in the ongoing monitoring of the Group’s response to market developments and operational challenges, including business continuity management
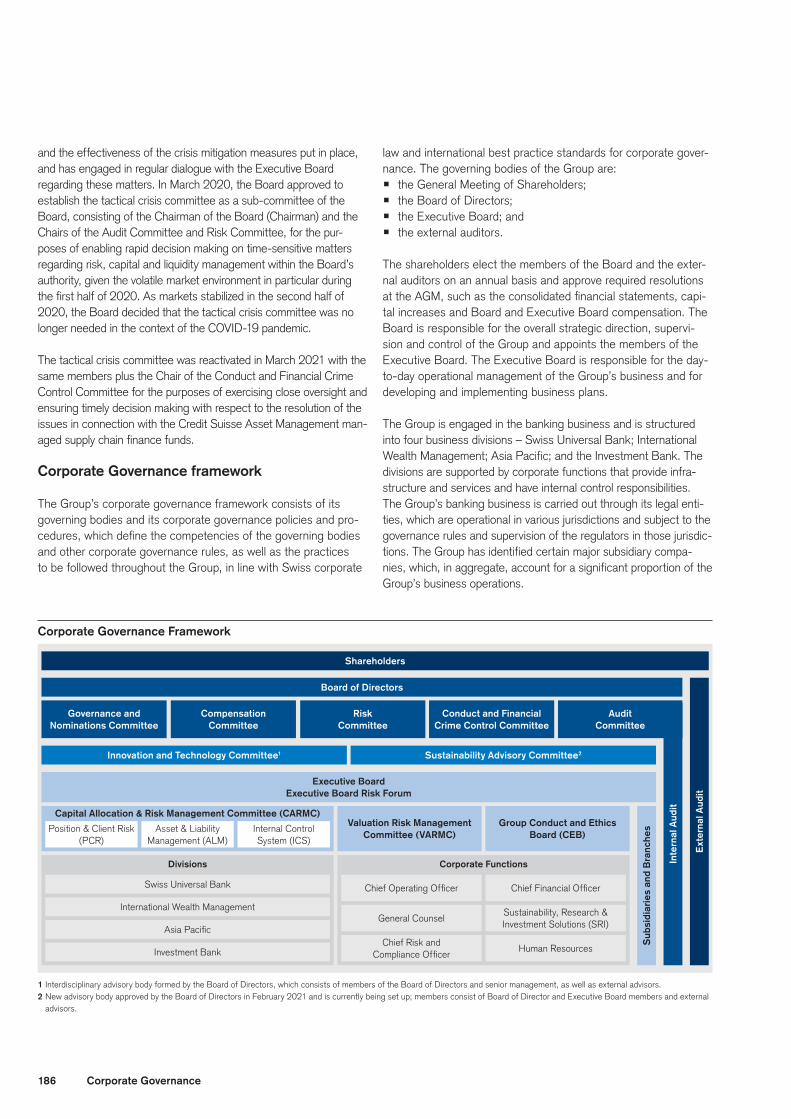
186 Corporate Governance
Corporate Governance Framework
Divisions Corporate Functions
Board of Directors
Innovation and Technology Committee1 Sustainability Advisory Committee2
Shareholders
Executive Board Executive Board Risk Forum
Capital Allocation & Risk Management Committee (CARMC)
Governance and Nominations Committee
Compensation Committee
Risk Committee
Conduct and Financial Crime Control Committee
Audit Committee
Valuation Risk Management Committee (VARMC)
Group Conduct and Ethics Board (CEB)
Inte
rnal
Aud
it
Sub
sidi
arie
s an
d B
ranc
hes
Ext
erna
l Aud
it
Swiss Universal Bank Chief Operating Officer
International Wealth Management
Chief Financial Officer
Asia PacificGeneral Counsel
Investment Bank
Sustainability, Research & Investment Solutions (SRI)
Chief Risk and Compliance Officer
Human Resources
1 Interdisciplinary advisory body formed by the Board of Directors, which consists of members of the Board of Directors and senior management, as well as external advisors.2 New advisory body approved by the Board of Directors in February 2021 and is currently being set up; members consist of Board of Director and Executive Board members and external
advisors.
Position & Client Risk (PCR)
Asset & Liability Management (ALM)
Internal Control System (ICS)
and the effectiveness of the crisis mitigation measures put in place, and has engaged in regular dialogue with the Executive Board regarding these matters. In March 2020, the Board approved to establish the tactical crisis committee as a sub-committee of the Board, consisting of the Chairman of the Board (Chairman) and the Chairs of the Audit Committee and Risk Committee, for the pur-poses of enabling rapid decision making on time-sensitive matters regarding risk, capital and liquidity management within the Board’s authority, given the volatile market environment in particular during the first half of 2020. As markets stabilized in the second half of 2020, the Board decided that the tactical crisis committee was no longer needed in the context of the COVID-19 pandemic.
The tactical crisis committee was reactivated in March 2021 with the same members plus the Chair of the Conduct and Financial Crime Control Committee for the purposes of exercising close oversight and ensuring timely decision making with respect to the resolution of the issues in connection with the Credit Suisse Asset Management man-aged supply chain finance funds.
Corporate Governance framework
The Group’s corporate governance framework consists of its governing bodies and its corporate governance policies and pro-cedures, which define the competencies of the governing bodies and other corporate governance rules, as well as the practices to be followed throughout the Group, in line with Swiss corporate
law and international best practice standards for corporate gover-nance. The governing bodies of the Group are:p the General Meeting of Shareholders;p the Board of Directors;p the Executive Board; andp the external auditors.
The shareholders elect the members of the Board and the exter-nal auditors on an annual basis and approve required resolutions at the AGM, such as the consolidated financial statements, capi-tal increases and Board and Executive Board compensation. The Board is responsible for the overall strategic direction, supervi-sion and control of the Group and appoints the members of the Executive Board. The Executive Board is responsible for the day-to-day operational management of the Group’s business and for developing and implementing business plans.
The Group is engaged in the banking business and is structured into four business divisions – Swiss Universal Bank; International Wealth Management; Asia Pacific; and the Investment Bank. The divisions are supported by corporate functions that provide infra-structure and services and have internal control responsibilities. The Group’s banking business is carried out through its legal enti-ties, which are operational in various jurisdictions and subject to the governance rules and supervision of the regulators in those jurisdic-tions. The Group has identified certain major subsidiary compa-nies, which, in aggregate, account for a significant proportion of the Group’s business operations.
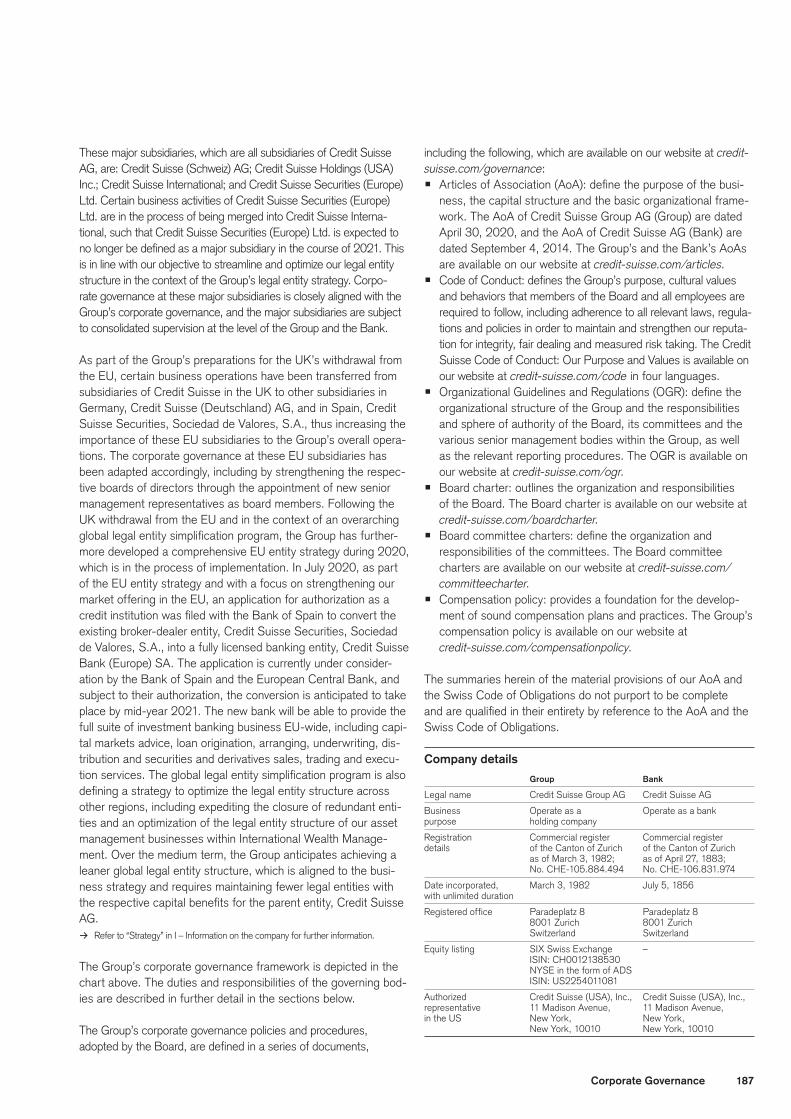
187Corporate Governance
These major subsidiaries, which are all subsidiaries of Credit Suisse AG, are: Credit Suisse (Schweiz) AG; Credit Suisse Holdings (USA) Inc.; Credit Suisse International; and Credit Suisse Securities (Europe) Ltd. Certain business activities of Credit Suisse Securities (Europe) Ltd. are in the process of being merged into Credit Suisse Interna-tional, such that Credit Suisse Securities (Europe) Ltd. is expected to no longer be defined as a major subsidiary in the course of 2021. This is in line with our objective to streamline and optimize our legal entity structure in the context of the Group’s legal entity strategy. Corpo-rate governance at these major subsidiaries is closely aligned with the Group’s corporate governance, and the major subsidiaries are subject to consolidated supervision at the level of the Group and the Bank.
As part of the Group’s preparations for the UK’s withdrawal from the EU, certain business operations have been transferred from subsidiaries of Credit Suisse in the UK to other subsidiaries in Germany, Credit Suisse (Deutschland) AG, and in Spain, Credit Suisse Securities, Sociedad de Valores, S.A., thus increasing the importance of these EU subsidiaries to the Group’s overall opera-tions. The corporate governance at these EU subsidiaries has been adapted accordingly, including by strengthening the respec-tive boards of directors through the appointment of new senior management representatives as board members. Following the UK withdrawal from the EU and in the context of an overarching global legal entity simplification program, the Group has further-more developed a comprehensive EU entity strategy during 2020, which is in the process of implementation. In July 2020, as part of the EU entity strategy and with a focus on strengthening our market offering in the EU, an application for authorization as a credit institution was filed with the Bank of Spain to convert the existing broker-dealer entity, Credit Suisse Securities, Sociedad de Valores, S.A., into a fully licensed banking entity, Credit Suisse Bank (Europe) SA. The application is currently under consider-ation by the Bank of Spain and the European Central Bank, and subject to their authorization, the conversion is anticipated to take place by mid-year 2021. The new bank will be able to provide the full suite of investment banking business EU-wide, including capi-tal markets advice, loan origination, arranging, underwriting, dis-tribution and securities and derivatives sales, trading and execu-tion services. The global legal entity simplification program is also defining a strategy to optimize the legal entity structure across other regions, including expediting the closure of redundant enti-ties and an optimization of the legal entity structure of our asset management businesses within International Wealth Manage-ment. Over the medium term, the Group anticipates achieving a leaner global legal entity structure, which is aligned to the busi-ness strategy and requires maintaining fewer legal entities with the respective capital benefits for the parent entity, Credit Suisse AG.
> Refer to “Strategy” in I – Information on the company for further information.
The Group’s corporate governance framework is depicted in the chart above. The duties and responsibilities of the governing bod-ies are described in further detail in the sections below.
The Group’s corporate governance policies and procedures, adopted by the Board, are defined in a series of documents,
including the following, which are available on our website at credit-suisse.com/governance:p Articles of Association (AoA): define the purpose of the busi-
ness, the capital structure and the basic organizational frame-work. The AoA of Credit Suisse Group AG (Group) are dated April 30, 2020, and the AoA of Credit Suisse AG (Bank) are dated September 4, 2014. The Group’s and the Bank’s AoAs are available on our website at credit-suisse.com/articles.
p Code of Conduct: defines the Group’s purpose, cultural values and behaviors that members of the Board and all employees are required to follow, including adherence to all relevant laws, regula-tions and policies in order to maintain and strengthen our reputa-tion for integrity, fair dealing and measured risk taking. The Credit Suisse Code of Conduct: Our Purpose and Values is available on our website at credit-suisse.com/code in four languages.
p Organizational Guidelines and Regulations (OGR): define the organizational structure of the Group and the responsibilities and sphere of authority of the Board, its committees and the various senior management bodies within the Group, as well as the relevant reporting procedures. The OGR is available on our website at credit-suisse.com/ogr.
p Board charter: outlines the organization and responsibilities of the Board. The Board charter is available on our website at credit-suisse.com/boardcharter.
p Board committee charters: define the organization and responsibilities of the committees. The Board committee charters are available on our website at credit-suisse.com/committeecharter.
p Compensation policy: provides a foundation for the develop-ment of sound compensation plans and practices. The Group’s compensation policy is available on our website at credit-suisse.com/compensationpolicy.
The summaries herein of the material provisions of our AoA and the Swiss Code of Obligations do not purport to be complete and are qualified in their entirety by reference to the AoA and the Swiss Code of Obligations.
Company details Group Bank
Legal name Credit Suisse Group AG Credit Suisse AG
Business Operate as a Operate as a bank
purpose holding company
Registration Commercial register Commercial register details of the Canton of Zurich of the Canton of Zurich as of March 3, 1982; as of April 27, 1883; No. CHE-105.884.494 No. CHE-106.831.974
Date incorporated, March 3, 1982 July 5, 1856
with unlimited duration
Registered office Paradeplatz 8 Paradeplatz 8
8001 Zurich 8001 Zurich
Switzerland Switzerland
Equity listing SIX Swiss Exchange –
ISIN: CH0012138530
NYSE in the form of ADS
ISIN: US2254011081
Authorized Credit Suisse (USA), Inc., Credit Suisse (USA), Inc., representative 11 Madison Avenue, 11 Madison Avenue, in the US New York, New York, New York, 10010 New York, 10010

188 Corporate Governance
Credit Suisse Purpose and Values
Brand
Values
Strategy
Purpose
Code of Conduct
I M P A C T
Why we exist
What we do
Who we are
How we act
Credit Suisse Group AG and Credit Suisse AG are registered companies in Switzerland. The Group’s shares are listed on the SIX Swiss Exchange and – in the form of American Depositary Shares (ADS), as evidenced by American Depositary Receipts – on the New York Stock Exchange (NYSE). The business purpose of the Group, as set forth in Article 2 of its AoA, is to hold direct or indirect interests in all types of businesses in Switzerland and abroad, in particular in the areas of banking, fi nance, asset man-agement and insurance. The business purpose of the Bank, as set forth in Article 2 of its AoA, is to operate as a bank, with all related banking, fi nance, consultancy, service and trading activi-ties in Switzerland and abroad. The AoA of the Group and the Bank set forth their powers to establish new businesses, acquire a majority or minority interest in existing businesses and provide related fi nancing as well as acquire, mortgage and sell real estate properties both in Switzerland and abroad.
> Refer to “II – Operating and fi nancial review” for a detailed review of our oper-ating results.
> Refer to “Note 41 – Signifi cant subsidiaries and equity method investments” in VI – Consolidated fi nancial statements – Credit Suisse Group for a list of sig-nifi cant subsidiaries and associated entities.
Purpose and valuesAt Credit Suisse, we believe that we have an important role to play in society and in supporting our communities. As a bank, we provide capital, manage and protect wealth, participate in markets and facilitate infrastructure development. This allows us to contribute to sustainable economic growth. In this context, we launched the Credit Suisse purpose statement in December 2020. The purpose statement was developed over the course of 2020 by a diverse team of senior talents, involved the participa-tion of over 500 Credit Suisse employees and was approved by the Executive Board and the Board. In addition to the purpose statement, a full revision of the Group’s Code of Conduct was completed in 2020. The refreshed document “The Credit Suisse Code of Conduct: Our Purpose and Values” refl ects the new pur-pose statement and emphasizes our six cultural values of inclu-sion, meritocracy, partnership, accountability, client focus and trust (“IMPACT”) and the underlying behaviors that we expect all of our employees and members of the Board to observe. The revised Code of Conduct continues to reinforce our commitment to complying with all applicable laws, regulations and policies in order to safeguard our reputation for integrity, fair dealing and measured risk-taking and includes clear guidelines for the escala-tion of concerns by employees, including concerns regarding the CEO, members of the Executive Board and senior fi nancial offi -cers. The purpose and values framework is shown in the illustra-tion below.
> Refer to credit-suisse.com/code for our Code of Conduct.
Sustainability and Environmental Social and Governance (ESG) considerationsFor Credit Suisse, sustainability is about creating sustainable value for clients, shareholders, employees and other stakehold-ers. We strive to comply with the cultural values set out in our Code of Conduct in every aspect of our work, including in our relationships with diverse stakeholders. We do so based on a broad understanding of our duties as a fi nancial services provider and employer and as an integral part of the economy, society and the environment. With the establishment of the new SRI function at the Executive Board level in 2020, Credit Suisse has set out its ambition to become a leader in sustainability in the fi nancial industry and drive a cohesive, fi rm-wide sustainability strategy, through which we aspire to meet the evolving needs and expec-tations of clients, investors, employees and society in general. For a number of years, we have published an annual Corporate Responsibility Report, reporting on topics that are relevant to our business and our stakeholders. For 2020, we have enhanced the scope of the reporting included in the former Corporate Respon-sibility Report and are publishing this for the fi rst time as the Credit Suisse Sustainability Report (Sustainability Report). The Sustainability Report covers the majority of the content from the prior Corporate Responsibility Report in a refreshed format and structure and, in addition, includes new and enhanced disclo-sures, in particular our disclosure pursuant to the Sustainability Accounting Standards Board (SASB) Standards for the fi rst time, as well as enhanced Task Force on Climate-related Financial Dis-closures (TCFD) disclosures.
The Group’s Sustainability Report continues to refl ect the Global Reporting Initiative Standards for sustainability reporting (Core option) while also providing information on the progress we have made in implementing the Ten Principles of the UN Global Com-pact as well as examples of how we can contribute to the realiza-tion of the UN Sustainable Development Goals. Our Sustainability Report 2020 is reported to the SIX Swiss Exchange in accor-dance with the opting-in regulation for companies issuing sustain-ability reports.
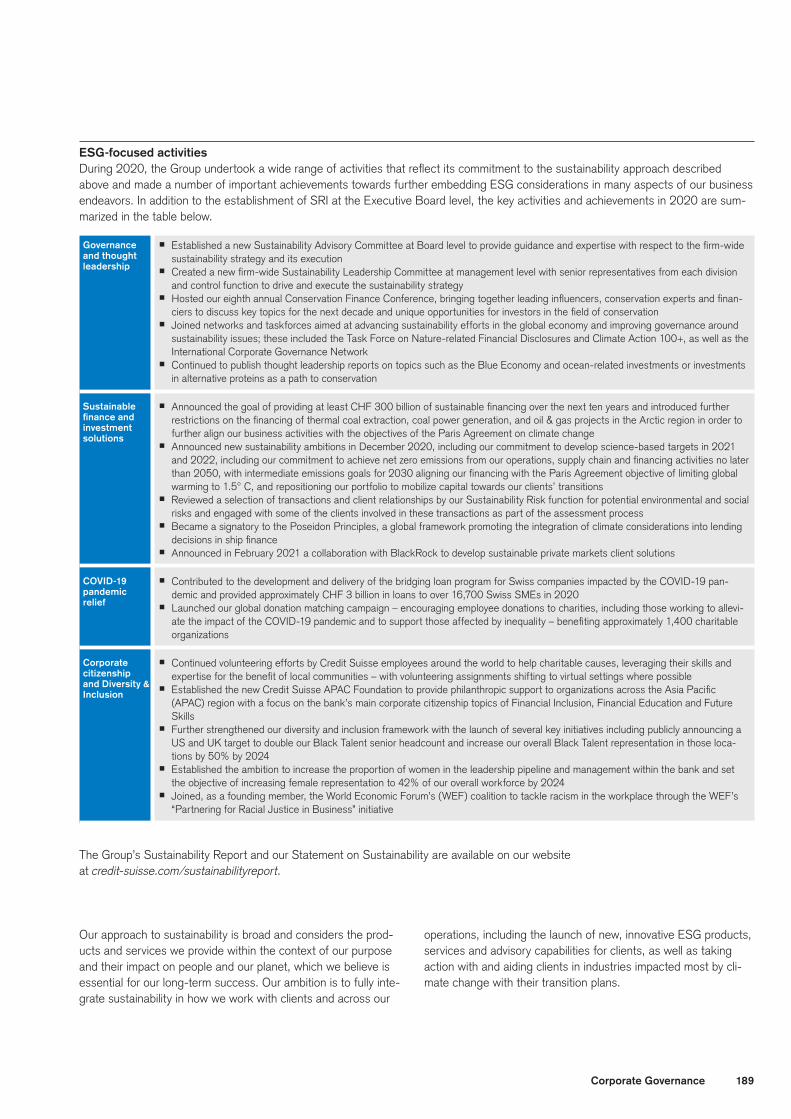
189Corporate Governance
ESG-focused activitiesDuring 2020, the Group undertook a wide range of activities that reflect its commitment to the sustainability approach described above and made a number of important achievements towards further embedding ESG considerations in many aspects of our business endeavors. In addition to the establishment of SRI at the Executive Board level, the key activities and achievements in 2020 are sum-marized in the table below.
Governance and thought leadership
p Established a new Sustainability Advisory Committee at Board level to provide guidance and expertise with respect to the firm-wide sustainability strategy and its execution
p Created a new firm-wide Sustainability Leadership Committee at management level with senior representatives from each division and control function to drive and execute the sustainability strategy
p Hosted our eighth annual Conservation Finance Conference, bringing together leading influencers, conservation experts and finan-ciers to discuss key topics for the next decade and unique opportunities for investors in the field of conservation
p Joined networks and taskforces aimed at advancing sustainability efforts in the global economy and improving governance around sustainability issues; these included the Task Force on Nature-related Financial Disclosures and Climate Action 100+, as well as the International Corporate Governance Network
p Continued to publish thought leadership reports on topics such as the Blue Economy and ocean-related investments or investments in alternative proteins as a path to conservation
Sustainable finance and investment solutions
p Announced the goal of providing at least CHF 300 billion of sustainable financing over the next ten years and introduced further restrictions on the financing of thermal coal extraction, coal power generation, and oil & gas projects in the Arctic region in order to further align our business activities with the objectives of the Paris Agreement on climate change
p Announced new sustainability ambitions in December 2020, including our commitment to develop science-based targets in 2021 and 2022, including our commitment to achieve net zero emissions from our operations, supply chain and financing activities no later than 2050, with intermediate emissions goals for 2030 aligning our financing with the Paris Agreement objective of limiting global warming to 1.5° C, and repositioning our portfolio to mobilize capital towards our clients’ transitions
p Reviewed a selection of transactions and client relationships by our Sustainability Risk function for potential environmental and social risks and engaged with some of the clients involved in these transactions as part of the assessment process
p Became a signatory to the Poseidon Principles, a global framework promoting the integration of climate considerations into lending decisions in ship finance
p Announced in February 2021 a collaboration with BlackRock to develop sustainable private markets client solutions
COVID-19 pandemic relief
p Contributed to the development and delivery of the bridging loan program for Swiss companies impacted by the COVID-19 pan-demic and provided approximately CHF 3 billion in loans to over 16,700 Swiss SMEs in 2020
p Launched our global donation matching campaign – encouraging employee donations to charities, including those working to allevi-ate the impact of the COVID-19 pandemic and to support those affected by inequality – benefiting approximately 1,400 charitable organizations
Corporate citizenship and Diversity & Inclusion
p Continued volunteering efforts by Credit Suisse employees around the world to help charitable causes, leveraging their skills and expertise for the benefit of local communities – with volunteering assignments shifting to virtual settings where possible
p Established the new Credit Suisse APAC Foundation to provide philanthropic support to organizations across the Asia Pacific (APAC) region with a focus on the bank’s main corporate citizenship topics of Financial Inclusion, Financial Education and Future Skills
p Further strengthened our diversity and inclusion framework with the launch of several key initiatives including publicly announcing a US and UK target to double our Black Talent senior headcount and increase our overall Black Talent representation in those loca-tions by 50% by 2024
p Established the ambition to increase the proportion of women in the leadership pipeline and management within the bank and set the objective of increasing female representation to 42% of our overall workforce by 2024
p Joined, as a founding member, the World Economic Forum’s (WEF) coalition to tackle racism in the workplace through the WEF’s “Partnering for Racial Justice in Business” initiative
The Group’s Sustainability Report and our Statement on Sustainability are available on our website at credit-suisse.com/sustainabilityreport.
Our approach to sustainability is broad and considers the prod-ucts and services we provide within the context of our purpose and their impact on people and our planet, which we believe is essential for our long-term success. Our ambition is to fully inte-grate sustainability in how we work with clients and across our
operations, including the launch of new, innovative ESG products, services and advisory capabilities for clients, as well as taking action with and aiding clients in industries impacted most by cli-mate change with their transition plans.
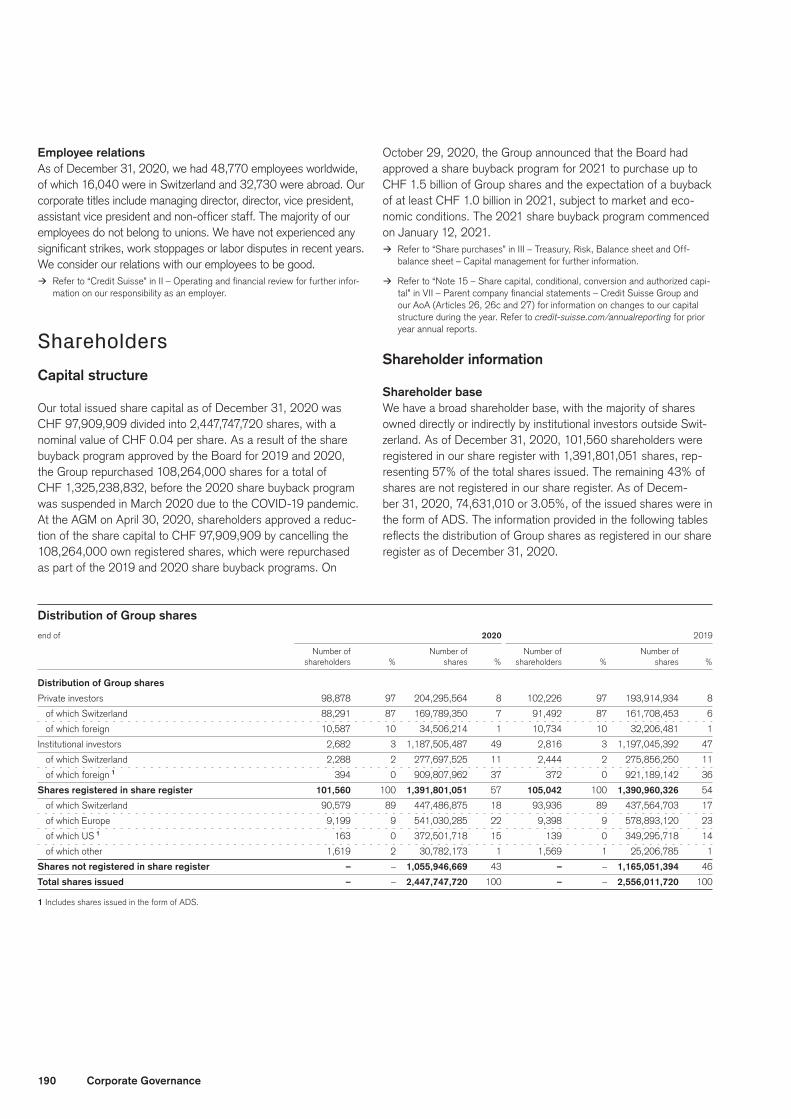
190 Corporate Governance
Employee relationsAs of December 31, 2020, we had 48,770 employees worldwide, of which 16,040 were in Switzerland and 32,730 were abroad. Our corporate titles include managing director, director, vice president, assistant vice president and non-officer staff. The majority of our employees do not belong to unions. We have not experienced any significant strikes, work stoppages or labor disputes in recent years. We consider our relations with our employees to be good.
> Refer to “Credit Suisse” in II – Operating and financial review for further infor-mation on our responsibility as an employer.
ShareholdersCapital structure
Our total issued share capital as of December 31, 2020 was CHF 97,909,909 divided into 2,447,747,720 shares, with a nominal value of CHF 0.04 per share. As a result of the share buyback program approved by the Board for 2019 and 2020, the Group repurchased 108,264,000 shares for a total of CHF 1,325,238,832, before the 2020 share buyback program was suspended in March 2020 due to the COVID-19 pandemic. At the AGM on April 30, 2020, shareholders approved a reduc-tion of the share capital to CHF 97,909,909 by cancelling the 108,264,000 own registered shares, which were repurchased as part of the 2019 and 2020 share buyback programs. On
October 29, 2020, the Group announced that the Board had approved a share buyback program for 2021 to purchase up to CHF 1.5 billion of Group shares and the expectation of a buyback of at least CHF 1.0 billion in 2021, subject to market and eco-nomic conditions. The 2021 share buyback program commenced on January 12, 2021.
> Refer to “Share purchases” in III – Treasury, Risk, Balance sheet and Off-balance sheet – Capital management for further information.
> Refer to “Note 15 – Share capital, conditional, conversion and authorized capi-tal” in VII – Parent company financial statements – Credit Suisse Group and our AoA (Articles 26, 26c and 27) for information on changes to our capital structure during the year. Refer to credit-suisse.com/annualreporting for prior year annual reports.
Shareholder information
Shareholder baseWe have a broad shareholder base, with the majority of shares owned directly or indirectly by institutional investors outside Swit-zerland. As of December 31, 2020, 101,560 shareholders were registered in our share register with 1,391,801,051 shares, rep-resenting 57% of the total shares issued. The remaining 43% of shares are not registered in our share register. As of Decem-ber 31, 2020, 74,631,010 or 3.05%, of the issued shares were in the form of ADS. The information provided in the following tables reflects the distribution of Group shares as registered in our share register as of December 31, 2020.
Distribution of Group shares
end of 2020 2019
Number of Number of Number of Number of
shareholders % shares % shareholders % shares %
Distribution of Group shares
Private investors 98,878 97 204,295,564 8 102,226 97 193,914,934 8
of which Switzerland 88,291 87 169,789,350 7 91,492 87 161,708,453 6
of which foreign 10,587 10 34,506,214 1 10,734 10 32,206,481 1
Institutional investors 2,682 3 1,187,505,487 49 2,816 3 1,197,045,392 47
of which Switzerland 2,288 2 277,697,525 11 2,444 2 275,856,250 11
of which foreign 1 394 0 909,807,962 37 372 0 921,189,142 36
Shares registered in share register 101,560 100 1,391,801,051 57 105,042 100 1,390,960,326 54
of which Switzerland 90,579 89 447,486,875 18 93,936 89 437,564,703 17
of which Europe 9,199 9 541,030,285 22 9,398 9 578,893,120 23
of which US 1 163 0 372,501,718 15 139 0 349,295,718 14
of which other 1,619 2 30,782,173 1 1,569 1 25,206,785 1
Shares not registered in share register – – 1,055,946,669 43 – – 1,165,051,394 46
Total shares issued – – 2,447,747,720 100 – – 2,556,011,720 100
1 Includes shares issued in the form of ADS.
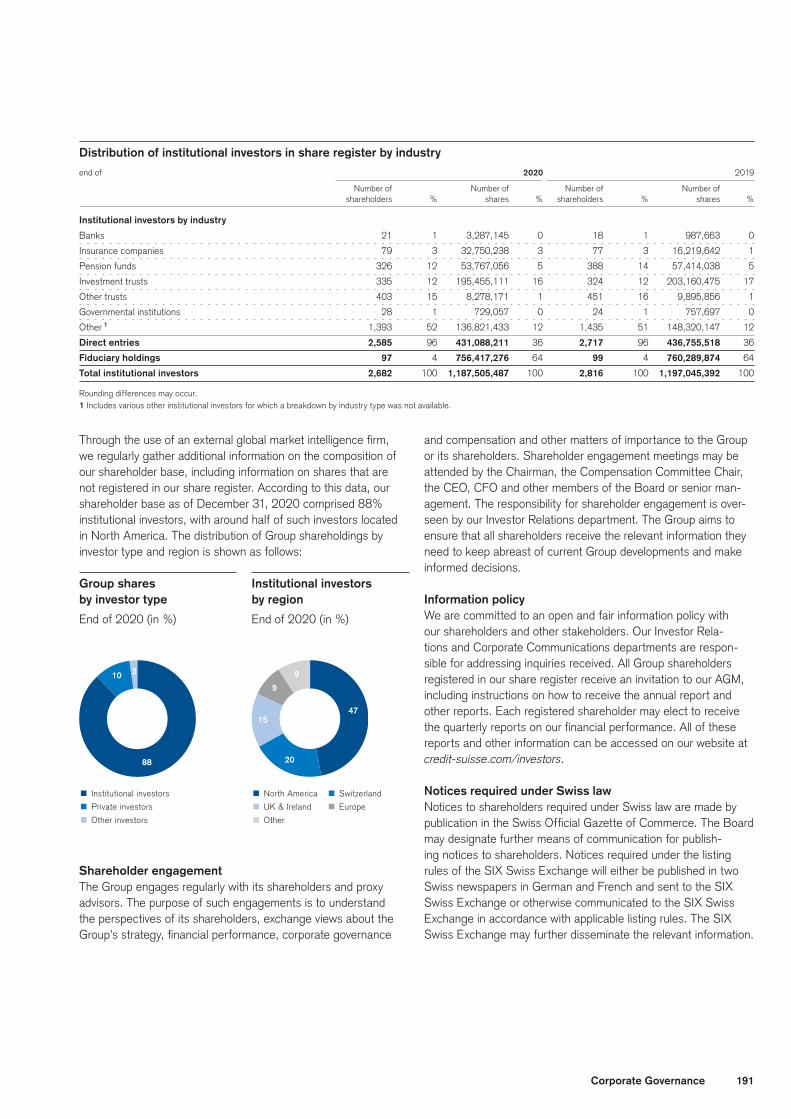
191Corporate Governance
10 2
88
Group shares by investor type
End of 2020 (in %)
Institutional investors by region
End of 2020 (in %)
p Institutional investors
p Private investors
p Other investors
p North America p Switzerland
p UK & Ireland p Europe
p Other
9
15
20
9
47
Distribution of institutional investors in share register by industry
end of 2020 2019
Number of Number of Number of Number of
shareholders % shares % shareholders % shares %
Institutional investors by industry
Banks 21 1 3,287,145 0 18 1 987,663 0
Insurance companies 79 3 32,750,238 3 77 3 16,219,642 1
Pension funds 326 12 53,767,056 5 388 14 57,414,038 5
Investment trusts 335 12 195,455,111 16 324 12 203,160,475 17
Other trusts 403 15 8,278,171 1 451 16 9,895,856 1
Governmental institutions 28 1 729,057 0 24 1 757,697 0
Other 1 1,393 52 136,821,433 12 1,435 51 148,320,147 12
Direct entries 2,585 96 431,088,211 36 2,717 96 436,755,518 36
Fiduciary holdings 97 4 756,417,276 64 99 4 760,289,874 64
Total institutional investors 2,682 100 1,187,505,487 100 2,816 100 1,197,045,392 100
Rounding differences may occur.1 Includes various other institutional investors for which a breakdown by industry type was not available.
Through the use of an external global market intelligence firm, we regularly gather additional information on the composition of our shareholder base, including information on shares that are not registered in our share register. According to this data, our shareholder base as of December 31, 2020 comprised 88% institutional investors, with around half of such investors located in North America. The distribution of Group shareholdings by investor type and region is shown as follows:
Shareholder engagementThe Group engages regularly with its shareholders and proxy advisors. The purpose of such engagements is to understand the perspectives of its shareholders, exchange views about the Group’s strategy, financial performance, corporate governance
and compensation and other matters of importance to the Group or its shareholders. Shareholder engagement meetings may be attended by the Chairman, the Compensation Committee Chair, the CEO, CFO and other members of the Board or senior man-agement. The responsibility for shareholder engagement is over-seen by our Investor Relations department. The Group aims to ensure that all shareholders receive the relevant information they need to keep abreast of current Group developments and make informed decisions.
Information policyWe are committed to an open and fair information policy with our shareholders and other stakeholders. Our Investor Rela-tions and Corporate Communications departments are respon-sible for addressing inquiries received. All Group shareholders registered in our share register receive an invitation to our AGM, including instructions on how to receive the annual report and other reports. Each registered shareholder may elect to receive the quarterly reports on our financial performance. All of these reports and other information can be accessed on our website at credit-suisse.com/investors.
Notices required under Swiss lawNotices to shareholders required under Swiss law are made by publication in the Swiss Official Gazette of Commerce. The Board may designate further means of communication for publish-ing notices to shareholders. Notices required under the listing rules of the SIX Swiss Exchange will either be published in two Swiss newspapers in German and French and sent to the SIX Swiss Exchange or otherwise communicated to the SIX Swiss Exchange in accordance with applicable listing rules. The SIX Swiss Exchange may further disseminate the relevant information.

192 Corporate Governance
Significant shareholdersUnder the Swiss Federal Act on Financial Market Infrastructure and Market Conduct in Securities and Derivative Trading (FMIA), anyone holding shares in a company listed on the SIX Swiss Exchange is required to notify the company and the SIX Swiss Exchange if their holding reaches, falls below or exceeds the following thresholds: 3%, 5%, 10%, 15%, 20%, 25%, 331/3%, 50% or 662/3% of the voting rights entered into the commercial register, whether or not the voting rights can be exercised (that is, notifications must also include certain derivative holdings such as options or similar instruments). Following receipt of such notifica-tion, the company has an obligation to inform the public. In addi-tion, pursuant to the Swiss Code of Obligations, a company must disclose in the notes to its annual consolidated financial state-ments the identity of any shareholders who own in excess of 5% of its shares. The following provides an overview of the holdings of our significant shareholders, including any rights to purchase or dispose of shares, based on the most recent disclosure noti-fications. In line with the FMIA requirements, the percentages indicated below were calculated in relation to the share capital reflected in the AoA at the time of the disclosure notification. As shareholders are only required to notify the company and the SIX Swiss Exchange if their holding reaches, falls below or exceeds the thresholds listed above, the percentage holdings of our sig-nificant shareholders may vary at any given time compared to the date of submission of the most recent notification for these respective shareholders. The full text of all notifications can be found on our website at credit-suisse.com/shareholders. Each share entitles the holder to one vote, except as described below.
> Refer to “Note 3 – Business developments, significant shareholders and sub-sequent events” in VI – Consolidated financial statements – Credit Suisse Group for further information on significant shareholders.
The Group also holds positions in its own shares, including shares acquired through the share buyback program described above, which are subject to the same disclosure requirements as sig-nificant external shareholders. These positions fluctuate and, in addition to the activity from our share buyback program, primarily reflect activities related to market making, facilitating client orders and satisfying the obligations under our employee compensa-tion plans. Shares held by the Group have no voting rights. As of December 31, 2020, our holdings amounted to 1.99% purchase positions (1.67% registered shares and 0.32% share acquisition rights) and 4.62% sales positions (disposal rights), mainly related to the Group’s outstanding tier 1 capital instruments, which would be converted into Group ordinary shares upon the occurrence of certain specified triggering events. As a result of the share buy-back program for 2020, the Group’s purchase positions in its own shares increased steadily during early 2020, before the 2020 share buyback program was suspended in March 2020 due to the COVID-19 pandemic. The 108,264,000 shares that were repurchased as part of the 2019 and 2020 share buyback pro-grams were subsequently cancelled after shareholders approved a capital reduction through cancellation of shares that were repur-chased under the share buyback programs in 2019 and 2020 at the 2020 AGM. The Group resumed share repurchases in Janu-ary 2021 under the 2021 share buyback program, subject to market and economic conditions. The Group intends to propose a cancellation of the shares repurchased as part of the 2021 share buyback program at the 2022 AGM.
> Refer to “Issuances and redemptions” in III – Treasury, Risk, Balance sheet and Off-balance sheet – Capital management for further information.
Cross shareholdingsThe Group has no cross shareholdings in excess of 5% of capital or voting rights with any other company.
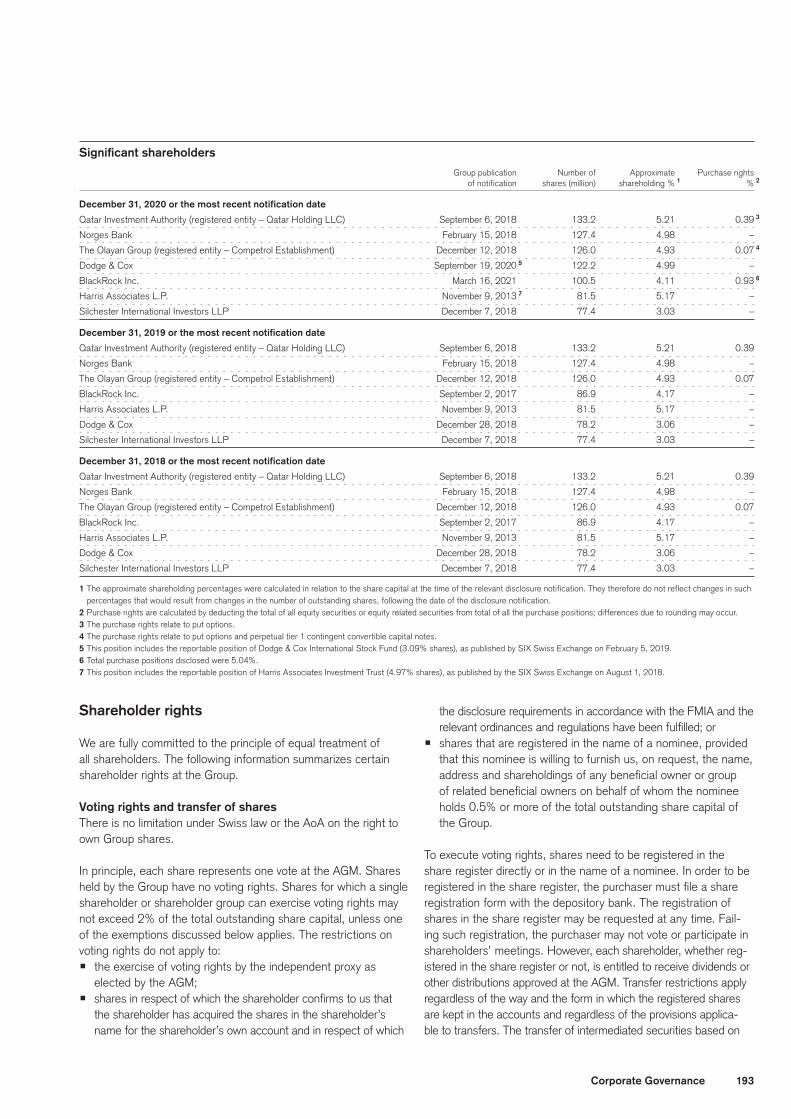
193Corporate Governance
Significant shareholders Group publication Number of Approximate Purchase rights
of notification shares (million) shareholding % 1 % 2
December 31, 2020 or the most recent notification date
Qatar Investment Authority (registered entity – Qatar Holding LLC) September 6, 2018 133.2 5.21 0.39 3
Norges Bank February 15, 2018 127.4 4.98 –
The Olayan Group (registered entity – Competrol Establishment) December 12, 2018 126.0 4.93 0.07 4
Dodge & Cox September 19, 2020 5 122.2 4.99 –
BlackRock Inc. March 16, 2021 100.5 4.11 0.93 6
Harris Associates L.P. November 9, 2013 7 81.5 5.17 –
Silchester International Investors LLP December 7, 2018 77.4 3.03 –
December 31, 2019 or the most recent notification date
Qatar Investment Authority (registered entity – Qatar Holding LLC) September 6, 2018 133.2 5.21 0.39
Norges Bank February 15, 2018 127.4 4.98 –
The Olayan Group (registered entity – Competrol Establishment) December 12, 2018 126.0 4.93 0.07
BlackRock Inc. September 2, 2017 86.9 4.17 –
Harris Associates L.P. November 9, 2013 81.5 5.17 –
Dodge & Cox December 28, 2018 78.2 3.06 –
Silchester International Investors LLP December 7, 2018 77.4 3.03 –
December 31, 2018 or the most recent notification date
Qatar Investment Authority (registered entity – Qatar Holding LLC) September 6, 2018 133.2 5.21 0.39
Norges Bank February 15, 2018 127.4 4.98 –
The Olayan Group (registered entity – Competrol Establishment) December 12, 2018 126.0 4.93 0.07
BlackRock Inc. September 2, 2017 86.9 4.17 –
Harris Associates L.P. November 9, 2013 81.5 5.17 –
Dodge & Cox December 28, 2018 78.2 3.06 –
Silchester International Investors LLP December 7, 2018 77.4 3.03 –
1 The approximate shareholding percentages were calculated in relation to the share capital at the time of the relevant disclosure notification. They therefore do not reflect changes in such percentages that would result from changes in the number of outstanding shares, following the date of the disclosure notification.
2 Purchase rights are calculated by deducting the total of all equity securities or equity related securities from total of all the purchase positions; differences due to rounding may occur.3 The purchase rights relate to put options.4 The purchase rights relate to put options and perpetual tier 1 contingent convertible capital notes.5 This position includes the reportable position of Dodge & Cox International Stock Fund (3.09% shares), as published by SIX Swiss Exchange on February 5, 2019.6 Total purchase positions disclosed were 5.04%.7 This position includes the reportable position of Harris Associates Investment Trust (4.97% shares), as published by the SIX Swiss Exchange on August 1, 2018.
Shareholder rights
We are fully committed to the principle of equal treatment of all shareholders. The following information summarizes certain shareholder rights at the Group.
Voting rights and transfer of sharesThere is no limitation under Swiss law or the AoA on the right to own Group shares.
In principle, each share represents one vote at the AGM. Shares held by the Group have no voting rights. Shares for which a single shareholder or shareholder group can exercise voting rights may not exceed 2% of the total outstanding share capital, unless one of the exemptions discussed below applies. The restrictions on voting rights do not apply to:p the exercise of voting rights by the independent proxy as
elected by the AGM;p shares in respect of which the shareholder confirms to us that
the shareholder has acquired the shares in the shareholder’s name for the shareholder’s own account and in respect of which
the disclosure requirements in accordance with the FMIA and the relevant ordinances and regulations have been fulfilled; or
p shares that are registered in the name of a nominee, provided that this nominee is willing to furnish us, on request, the name, address and shareholdings of any beneficial owner or group of related beneficial owners on behalf of whom the nominee holds 0.5% or more of the total outstanding share capital of the Group.
To execute voting rights, shares need to be registered in the share register directly or in the name of a nominee. In order to be registered in the share register, the purchaser must file a share registration form with the depository bank. The registration of shares in the share register may be requested at any time. Fail-ing such registration, the purchaser may not vote or participate in shareholders’ meetings. However, each shareholder, whether reg-istered in the share register or not, is entitled to receive dividends or other distributions approved at the AGM. Transfer restrictions apply regardless of the way and the form in which the registered shares are kept in the accounts and regardless of the provisions applica-ble to transfers. The transfer of intermediated securities based on

194 Corporate Governance
Group shares, and the pledging of these intermediated securities as collateral, is based on the provisions of the Swiss Federal Intermedi-ated Securities Act. The transfer or pledging of shares as collateral by means of written assignment is not permitted.
> Refer to credit-suisse.com/articles for information in our AoA (Art. 10 and 14a) on share register and transfer of shares, voting rights and the independent proxy.
Annual General MeetingUnder Swiss law, the AGM must be held within six months of the end of the fiscal year. Notice of an AGM, including agenda items and proposals submitted by the Board and by shareholders, must be published in the Swiss Official Gazette of Commerce at least 20 days prior to the AGM.
Shares only qualify for voting at an AGM if they are registered in the share register with voting rights no later than three days prior to the AGM.
Convocation of shareholder meetingsThe AGM is convened by the Board or, if necessary, by the statu-tory auditors, with 20 days’ prior notice. The Board is further required to convene an EGM if so resolved at a shareholders’ meeting or if so requested by shareholders holding in aggregate at least 10% of the nominal share capital. The request to call an EGM must be submitted in writing to the Board, and, at the same time, Group shares representing at least 10% of the nomi-nal share capital must be deposited for safekeeping. The shares remain in safekeeping until the day after the EGM.
Request to place an item on the agendaShareholders holding shares with an aggregate nominal value of at least CHF 40,000 have the right to request that a specific item be placed on the agenda and voted upon at the AGM. The request to include a particular item on the agenda, together with a relevant proposal, must be submitted in writing to the Board no later than 45 days before the meeting and, at the same time, Group shares with an aggregate nominal value of at least CHF 40,000 must be deposited for safekeeping. The shares remain in safekeeping until the day after the AGM.
Quorum requirementsThe AGM may, in principle, pass resolutions without regard to the number of shareholders present at the meeting or represented by proxy, except as discussed below. Resolutions and elections gen-erally require the approval of a majority of the votes represented at the meeting, except as otherwise provided by mandatory provi-sions of law or by the AoA.
Shareholders’ resolutions that require a vote by a majority of the votes represented include:p amendments to the AoA, unless a supermajority is required;p election of members of the Board, the Chairman, the mem-
bers of the Compensation Committee, the independent proxy and statutory auditors;
p approval of the compensation of the members of the Board and the Executive Board;
p approval of the annual report and the statutory and consoli-dated accounts;
p discharge of the acts of the members of the Board and Execu-tive Board; and
p determination of the appropriation of retained earnings.
A quorum of at least two-thirds of the votes represented is required for resolutions on:p change of the purpose of the company;p creation of shares with increased voting powers;p implementation of transfer restrictions on shares;p increase in conditional and authorized capital;p increase of capital by way of conversion of capital surplus or by
contribution in kind;p restriction or suspension of pre-emptive subscription rights;p change of location of the principal office; andp dissolution of the company without liquidation.
A quorum of at least half of the total share capital and approval by at least three-quarters of the votes represented is required for resolutions on:p the conversion of registered shares into bearer shares;p amendments to the AoA relating to registration and voting
rights of nominee holders; andp the dissolution of the company.
A quorum of at least half of the total share capital and the approval of at least seven-eighths of the votes cast is required for amendments to provisions of the AoA relating to voting rights.
Say-on-PayIn accordance with the Swiss Code of Best Practice for Corpo-rate Governance, the Group will submit the compensation report (contained in the Compensation section of the 2020 Annual Report) for a consultative, non-binding vote by shareholders at the 2021 AGM. In accordance with the Compensation Ordinance, the Group will submit the following Board and Executive Board compensation recommendations for binding votes by sharehold-ers at the 2021 AGM: p For the Board: a maximum amount of compensation for the
Board for the period from the 2021 AGM to the 2022 AGM;p For the Executive Board: an aggregate amount of variable
compensation comprising the variable short-term incentive (STI) compensation for Executive Board members for the 2020 financial year;
p For the Executive Board: a maximum amount of fixed compen-sation for the Executive Board for the period from the 2021 AGM to the 2022 AGM; and
p For the Executive Board: an aggregate amount of variable compensation comprising the variable long-term incentive (LTI) compensation for Executive Board members for the 2021 financial year (based on fair value at grant).
In line with our established practice, the Group will continue to submit the compensation report for a consultative vote by shareholders.
> Refer to “V – Compensation” for further information on the binding vote.

195Corporate Governance
Discharge of the acts of the Board and the Executive BoardAccording to Swiss law, the AGM has the power to discharge the actions of the members of the Board and the Executive Board. The 2020 AGM granted discharge to the members of the Board and the Executive Board for the 2019 financial year.
Pre-emptive subscription rights and preferential subscription rightsUnder Swiss law, any share issue, whether for cash or non-cash consideration or no consideration, is subject to the prior approval of the shareholders. Shareholders of a Swiss corporation have certain pre-emptive subscription rights to subscribe for new issues of shares and certain preferential rights to subscribe for option bonds, convertible bonds or similar debt instruments with option or convertible rights in proportion to the nominal amount of shares held. A resolution adopted at a shareholders’ meeting with a supermajority may, however, limit or suspend pre-emptive sub-scription rights in certain limited circumstances.
Duty to make an offerSwiss law provides that anyone who, directly or indirectly or acting in concert with third parties, acquires 331/3% or more of the vot-ing rights of a listed Swiss company, whether or not such rights are exercisable, must make an offer to acquire all of the listed equity securities of such company, unless the AoA of the com-pany provides otherwise. Our AoA does not include a contrary provision. This mandatory offer obligation may be waived under certain circumstances by the Swiss Takeover Board or FINMA. If no waiver is granted, the mandatory offer must be made pursu-ant to procedural rules set forth in the FMIA and implementing ordinances.
Clauses on changes in controlTo the best of our knowledge, there are no agreements in place that could lead to a change in control of the Group. Subject to
certain provisions in the Group’s employee compensation plans, which allow for the Compensation Committee or Board to deter-mine the treatment of outstanding awards for all employees, including the Executive Board members, in the case of a change in control, there are no provisions that require the payment of extraordinary benefits in the agreements and plans benefiting members of the Board and the Executive Board or any other members of senior management. Specifically, there are no con-tractually agreed severance payments in the case of a change in control of the Group.
> Refer to “Contract lengths, termination and change in control provisions” in V – Compensation – Executive Board compensation for further information on the clauses on changes in control.
Borrowing and raising fundsNeither Swiss law nor our AoA restrict our power to borrow and raise funds in any way. The decision to borrow funds is passed by or under the direction of our Board, with no shareholders’ resolu-tion required.
LiquidationUnder Swiss law and our AoA, the Group may be dissolved at any time by a shareholders’ resolution, which must be passed by:p a supermajority of at least three-quarters of the votes cast at
the meeting in the event the Group were to be dissolved by way of liquidation; and
p a supermajority of at least two-thirds of the votes represented and an absolute majority of the par value of the shares repre-sented at the meeting in other cases.
Dissolution by order of FINMA is possible if we become bankrupt. Under Swiss law, any surplus arising out of liquidation (after the settlement of all claims of all creditors) is distributed to sharehold-ers in proportion to the paid-up par value of shares held.

196 Corporate Governance
Board of DirectorsGeneral information
Membership and qualificationsThe AoA (Chapter IV, Section 2, The Board of Directors, Art. 15.1 of the Group’s AoA and Chapter III, Section 6. Board of Directors, Art. 6.1 of the Bank’s AoA) provide that the Board shall consist of a minimum of seven members. The Board currently consists of 13 members. We believe that the size of the Board must be such that the committees can be staffed with qualified members. At the same time, the Board must be small enough to ensure an effective and rapid decision-making process. Board members are elected at the AGM by our shareholders individually for a period of one year and are eligible for re-election. Shareholders will also elect a member of the Board as the Chairman and each of the members of the Com-pensation Committee for a period of one year. One year of office is understood to be the period of time from one AGM to the close of the next AGM. Members of the Board shall generally retire after having served on the Board for 12 years. Under certain circum-stances, the Board may extend the limit of terms of office for a par-ticular Board member for a maximum of three additional years.
An overview of the Board and the committee membership is shown in the following table. The composition of the Boards of the Group and the Bank is identical.
Board composition and succession planningThe Governance and Nominations Committee regularly considers the composition of the Board as a whole and in light of staffing requirements for the committees. The Governance and Nomina-tions Committee recruits and evaluates candidates for Board membership based on criteria as set forth by the OGR (Chapter II Board of Directors, Item 8.2.3). The Governance and Nomina-tions Committee may also retain outside consultants with respect to the identification and recruitment of potential new Board mem-bers. In assessing candidates, the Governance and Nominations Committee considers the requisite skills and characteristics of Board members as well as the composition of the Board as a whole. Among other considerations, the Governance and Nomi-nations Committee takes into account skills, management expe-rience, independence and diversity in the context of the needs of the Board to fulfill its responsibilities. The Governance and Nominations Committee also considers other activities and com-mitments of an individual in order to be satisfied that a proposed member of the Board can devote enough time to a Board position at the Group.
> Refer to “Mandates” for further information.
Members of the Board of Directors Conduct and
Board Governance and Financial Crime
member Nominations Audit Compensation Control Risk
since Independence Committee Committee Committee Committee Committee
Elected at 2020 AGM
Urs Rohner, Chairman 1,3 2009 Independent Chair – – Member –
Iris Bohnet 1,2 2012 Independent – – Member – –
Christian Gellerstad 2019 Independent Member – Member Chair –
Andreas Gottschling 2017 Independent Member Member – – Chair
Michael Klein 2018 Independent – – Member – Member
Shan Li 2019 Independent – – – – Member
Seraina Macia 2015 Independent – – – – Member
Richard Meddings 3 2020 Independent Member Chair – Member Member
Kai S. Nargolwala 1 2013 Independent Member – Chair Member –
Ana Paula Pessoa 1 2018 Independent – Member – Member –
Joaquin J. Ribeiro 2016 Independent – Member – – –
Severin Schwan, Vice-Chair and
Lead Independent Director 2014 Independent Member – – – Member
John Tiner 2009 Independent – Member – – –
1 Member of the Innovation and Technology Committee.2 Board Sustainability Leader and Chair of the new Sustainability Advisory Committee.3 Member of the new Sustainability Advisory Committee.

197Corporate Governance
Board composition
Industry experience Geographical focus1 Length of tenure Gender diversity
2
3
3
5
4
3
6
3
10
pFinancial services (banking, insurance)
p Law, government & academia
pPharma, manufacturing & technology
pAdvertising, marketing & media
pAmericas
pSwitzerland
pEMEA
pAsia Pacific
p4 years and less
pBetween 5 and 8 years
pBetween 9 and 12 years
pMale
pFemale
1 Geographical focus represents the region in which the Board member has mostly focused his or her professional activities and may differ from the nationality of that individual.
Board member experience and expertise
(Number and percentage of Board members)
Leadership development experience 100%
Experience in international business / organization 100%
Finance / financial management expertise 77%
Executive-level role in financial industry (>10 years) 62%
Non-executive listed company Board member 54%
Risk, audit and/or compliance expertise 54%
Executive-level role in non- financial industry (>10 years)
Innovation, technology and/or media expertise
HR and incentive structures
31%
31%
23%
The background, skills and experience of our Board members are diverse and broad and include holding or having held top manage-ment positions at financial services and other companies in Swit-zerland and abroad, as well as leading positions in government, academia and international organizations. The Board is composed of individuals with wide-ranging professional expertise in key areas including finance and financial management, risk manage-ment, audit, innovation and technology, legal, compliance and regulatory affairs, advertising, marketing and media, and human resources and incentive structures. Diversity of culture, experi-ence and opinion are important aspects of Board composition, as well as gender diversity. While the ratio of female-to-male Board members may vary in any given year, the Board is committed to complying with the gender diversity guidelines as stipulated in the new Swiss corporate law. The collective experience and expertise of our Board members as of the end of 2020 across those key areas considered particularly relevant for the Group is illustrated in the following chart.
In areas where the Board’s collective experience and expertise may require strengthening, the Board may either decide to nomi-nate a new Board member candidate with specialist expertise, engage outside experts or take other measures. For example, at the 2020 AGM, Richard Meddings was elected as a new Board member and subsequently appointed Audit Committee chair, succeeding former Audit Committee chair John Tiner, who is not standing for election at the 2021 AGM after having reached the 12-year tenure limit. Two further changes to the Audit Committee were also announced in 2020, which required the Board to iden-tify new Board members capable of serving on the Audit Commit-tee: former Board and Audit Committee member Alexander Gut announced that he would not stand for reelection at the 2020 AGM and current Board and Audit Committee Joaquin J. Ribeiro indicated that he would not stand for reelection at the 2021 AGM. Given this situation and in order to maintain an adequately staffed, strong and independent Audit Committee, the Board consequently nominated Clare Brady and Blythe Masters as new Board members, two recognized financial experts, both of whom the Board intends to appoint as Audit Committee members, sub-ject to their election at the 2021 AGM.

198 Corporate Governance
To maintain a high degree of expertise, diversity and indepen-dence in the future, the Board has a succession planning pro-cess in place to identify potential candidates for the Board at an early stage. With this process, we are well prepared when Board members rotate off the Board. The objectives of the succession planning process are to ensure adequate representation of key Board competencies and a Board composition that is well suited to address future challenges, while maintaining the stability and professionalism of the Board. Potential candidates are evaluated according to criteria defined to assess the candidates’ expertise and experience, which include the following:p proven track record as an executive with relevant leadership
credentials gained in an international business environment in financial services or another industry;
p relevant functional skills and credentials in the key areas listed above;
p understanding of global banking, financial markets and finan-cial regulation;
p broad international experience and global business perspective, with a track record of having operated in multiple geographies;
p ability to bring insight and clarity to complex situations and to both challenge and constructively support management;
p high level of integrity and affinity with the Group’s values and corporate culture; and
p willingness to commit sufficient time to prepare for and attend Board and committee meetings.
The evaluation of candidates also considers formal indepen-dence and other criteria for Board membership, consistent with legal and regulatory requirements and the Swiss Code of Best Practice for Corporate Governance. Furthermore, we believe that other aspects, including team dynamics and personal reputation of Board members, play a critical role in ensuring the effective functioning of the Board. This is why the Group places the utmost importance on the right mix of personalities who are also fully committed to making their blend of specific skills and experience available to the Board.
While the Board is continually engaged in considering poten-tial candidates throughout the year, succession planning for the next year is typically kicked off at the Board’s annual strategy offsite, which is held mid-year. In addition to its discussions of the Group’s strategy, the Board holds a dedicated session on corporate governance, at which, among other topics, current Board composition and future needs are discussed, including the needs for suitable Board committee composition. Based on the outcome of these discussions, the interest and availability of cer-tain candidates will be explored further. The Board’s discussions will continue at its annual self-assessment session, which usually takes place at year-end, and it will consider specific changes in Board composition to be proposed at the next AGM. The Board
will generally approve candidates to be nominated as new Board members for election at the AGM at its February or March meet-ings, shortly before the publication of this report.
Chairman successionAt the AGM 2021, Urs Rohner will have served on the Board for the maximum standard term limit of 12 years and will therefore not stand for re-election at the 2021 AGM. In order to find a successor to Urs Rohner, the Board established a dedicated search committee early in 2020, consisting primarily of the members of the Governance and Nominations Committee. Following a structured and thorough search process with an international focus, the search committee reviewed numerous well-qualified candidates and ultimately recommended to the Board to propose António Horta-Osório as the new Chairman and successor to Urs Rohner for election at the 2021 AGM. António Horta-Osório is currently the Group Chief Executive of Lloyds Bank-ing Group, the largest retail and commercial bank in the UK, until the end of April 2021. Mr. Horta-Osório is a recognized financial services industry leader and has had a long and successful career in interna-tional banking that spans over thirty years. In addition to his role with Lloyds Banking Group, António Horta-Osório currently serves as a non-executive director at Exor in the Netherlands, Fundação Cham-palimaud in Portugal, Sociedade Francisco Manuel dos Santos in Portugal, and Stichting/Enable INPAR in the Netherlands, as well as Chairman of the Board of Trustees of the Wallace Collection in Lon-don. Mr. Horta-Osório is a citizen of Portugal and the UK.
New members and continuing trainingAny newly appointed member is required to participate in an orien-tation program to become familiar with our organizational structure, strategic plans, significant financial, accounting and risk issues and other important matters relating to the governance of the Group. The orientation program is designed to take into account the new Board member’s individual background and level of experience in each specific area. Moreover, the program’s focus is aligned with any committee memberships of the person concerned. Board members are encouraged to engage in continuing training. The Board and the committees of the Board regularly ask specialists within the Group to speak about specific topics in order to enhance the Board members’ understanding of issues that already are, or may become, of particular importance to our business.
MeetingsIn 2020, the Board held 19 meetings, the majority of which were held as video or telephone conferences in light of the travel and other restrictions on holding in-person meetings due to the COVID-19 pandemic. In addition, the Board held their annual two-day strategy session. The members of the Board are encour-aged to attend all meetings of the Board and the committees on which they serve.

199Corporate Governance
Meeting attendance – Board and Board committees Conduct and
Governance and Financial Crime
Board of Nominations Audit Compensation Control Risk
Directors 1 Committee 2 Committee 3 Committee 4 Committee 5 Committee 6
in 2020
Total number of meetings held 20 19 18 11 6 9
of which in-person meetings 4 0 1 1 1 1
of which video or telephone conference meetings 16 19 17 10 5 8
Meeting attendance, in % 98 96 100 98 100 95
Number of members who missed no meetings 11 5 6 3 5 5
Number of members who missed one meeting 1 0 0 1 0 2
Number of members who missed two or more meetings 1 2 0 0 0 0
Approximate meeting duration, in hours 7 8.0 – 9.0 1.0 – 2.0 5.0 – 6.0 2.0 – 3.0 2.0 – 3.0 5.0 – 6.0
Meeting attendance is shown for the calendar year 2020, which spans two Board periods.1 The Board consisted of 13 members at the beginning and the end of the year, with 1 member joining the Board (Robert Meddings) and 1 member leaving the Board (Alexander Gut).2 The Governance and Nominations Committee consisted of 5 members at the beginning of the year and 6 at the end of the year, with 2 members joining the committee (Christian Geller-
stad, Richard Meddings) and 1 member leaving the committee (John Tiner).3 The Audit Committee consisted of 5 members at the beginning and the end of the year, with 1 member joining the committee (Richard Meddings) and 1 member leaving the committee
(Alexander Gut).4 The Compensation Committee consisted of the same 4 members at the beginning and at the end of the year.5 The Conduct and Financial Crime Control Committee consisted of 5 members at the beginning and the end of the year, with 1 member joining the committee (Richard Meddings) and
1 member leaving the committee (John Tiner).6 The Risk Committee consisted of 6 members at the beginning and the end of the year, with 1 member joining the committee (Richard Meddings) and 1 member leaving the committee
(John Tiner). Two of the nine meetings were non-mandatory workshops and not counted for attendance.7 The approximate meeting duration in hours refers only to those meetings, which were originally scheduled as in-person meetings, but due to the COVID-19 pandemic, had to be con-
verted to video conference meetings (e.g. meetings held in April, June, August, October and December of 2020). This excluded the Governance and Nominations Committee, which held the majority of its meetings per telephone conference. The meetings of the Compensation Committee were on average 2 – 3 hours, with the exception of the meeting at the beginning of the year for the purposes of proposing variable compensation for the Group and the Executive Board; the approximate duration of this meeting was 4 – 5 hours.
All members of the Board are expected to spend the necessary time outside of these meetings needed to discharge their respon-sibilities appropriately. The Chairman calls the meeting with suffi-cient notice and prepares an agenda for each meeting. However, any other Board member has the right to call an extraordinary meeting, if deemed necessary. The Chairman has the discretion to invite members of management or others to attend the meet-ings. Generally, the members of the Executive Board attend part of the meetings to ensure effective interaction with the Board. The Board also holds separate private sessions without manage-ment present. Minutes are kept of the proceedings and resolu-tions of the Board.
From time to time, the Board may make certain decisions via circular resolution, unless a member asks that the matter be discussed in a meeting and not decided upon by way of written consent. During 2020, the Board resolved on four matters via circular resolution. As of the date of the publication of this report, in 2021, the Board has held six meetings via video or telephone conference and resolved on two matters via circular resolution.
Meeting attendance – individual Board members
Attendance (%) < 75 75 – 84 85 – 94 95 – 100
Board member
Urs Rohner, Chairman pIris Bohnet pChristian Gellerstad pAndreas Gottschling pMichael Klein p Shan Li pSeraina Macia pRichard Meddings 1 pKai S. Nargolwala pAna Paula Pessoa pJoaquin J. Ribeiro pSeverin Schwan p John Tiner p
Includes Board and Committee meeting attendance.1 Board member as of the 2020 AGM.
200 Corporate Governance
MandatesOur Board members may assume board or executive level or other roles in companies and organizations outside of the Group, which are collectively referred to as mandates. The Compensa-tion Ordinance sets out that companies must include provisions in their articles of association to define the activities that fall within the scope of a mandate and set limits on the number of man-dates that board members and executive management may hold. According to the Group’s AoA (Chapter IV, Section 2, The Board of Directors, Art. 20b), mandates include activities in the most senior executive and management bodies of listed companies and all other legal entities that are obliged to obtain an entry in the Swiss commercial register or a corresponding foreign reg-ister. Board members are obligated to disclose all mandates to the Group and changes thereto, which occur during their board tenure. Board members wishing to assume a new mandate with a company or organization must first consult with the Chairman before accepting such mandate, in order to ensure there are no conflicts of interest or other issues.
The limitations on mandates assumed by Board members outside of the Group are summarized in the table below.
Type of mandate and limitation – Board
Type of mandate Limitation
Listed companies No more than four other mandates
Other legal entities 1 No more than five mandates
Legal entities on behalf of the Group 2 No more than ten mandates
Charitable legal entities 3 No more than ten mandates
1 Includes private non-listed companies.2 Includes memberships in business and industry associations.3 Also includes honorary mandates in cultural or educational organizations.
No Board member holds mandates in excess of these restric-tions. The restrictions shown above do not apply to mandates of Board members in legal entities controlled by the Group such as subsidiary boards.
> Refer to “Audit Committee” in Board committees for further information on lim-its on Audit Committee service.
Independence
The Board consists solely of non-executive directors within the Group, of which at least the majority must be determined to be independent. In its independence determination, the Board takes into account the factors set forth in the OGR (Chapter II Board of Directors, Item 3.2), the committee charters and applicable laws, regulations and listing standards. Our independence standards are also periodically measured against other emerging best prac-tice standards.
The Governance and Nominations Committee performs an annual assessment of the independence of each Board member and
reports its findings to the Board for the final determination of inde-pendence of each individual member. The Board has applied the independence criteria of the SIX Swiss Exchange Directive on Information relating to Corporate Governance, FINMA, the Swiss Code of Best Practice for Corporate Governance and the rules of the NYSE and the Nasdaq Stock Market (Nasdaq) in determining the definition of independence.
Independence criteria applicable to all Board membersIn general, a director is considered independent if the director:p is not, and has not been for the past three years, employed as
an Executive Board member at the Group or any of its subsid-iaries or in another significant function at the Group;
p is not, and has not been for the past three years, an employee or affiliate of the Group’s external auditor;
p does not, according to the Board’s assessment, maintain a material direct or indirect business relationship with the Group or any of its subsidiaries which causes a conflict of interest due to its nature or extent; and
p is not, or has not been for the past three years, part of an interlocking directorate in which an Executive Board member serves on the compensation committee of another company that employs the Board member.
Whether or not a relationship between the Group or any of its subsidiaries and a member of the Board is considered material depends in particular on the following factors:p the volume and size of any transactions concluded in relation
to the financial status and credit standing of the Board mem-ber concerned or the organization in which he or she is a part-ner, significant shareholder or executive officer;
p the terms and conditions applied to such transactions in com-parison to those applied to transactions with counterparties of a similar credit standing;
p whether the transactions are subject to the same internal approval processes and procedures as transactions that are concluded with other counterparties;
p whether the transactions are performed in the ordinary course of business; and
p whether the transactions are structured in such a way and on such terms and conditions that the transaction could be con-cluded with a third party on comparable terms and conditions.
Moreover, Board members with immediate family members who would not qualify as independent according to the above listed crite-ria shall be subject to a three-year cooling-off period for purposes of determining their independence after fulfilment of the independence criteria by the immediate family member. Significant shareholder status is generally not considered a criterion for independence unless the shareholding exceeds 10% of the Group’s share capital or in instances where the shareholder may otherwise influence the Group in a significant manner.

201Corporate Governance
Specific independence considerations Board members serving on the Audit Committee are subject to independence requirements in addition to those required of other Board members. None of the Audit Committee members may be an affiliated person of the Group or may, directly or indirectly, accept any consulting, advisory or other compensatory fees from us other than their regular compensation as members of the Board and its committees.
For Board members serving on the Compensation Committee, the independence determination considers all factors relevant to determining whether a director has a relationship with the Group that is material to that director’s ability to be independent from management in connection with the duties of a Compensation Committee member, including, but not limited to:p the source of any compensation of the Compensation Com-
mittee member, including any consulting, advisory or other compensatory fees paid by the Group to such director; and
p whether the Compensation Committee member is affiliated with the Group, any of its subsidiaries or any affiliates of any of its subsidiaries.
Other independence standardsWhile the Group is not subject to such standards, the Board acknowledges that some proxy advisors apply different standards for assessing the independence of our Board members, including the length of tenure a Board member has served, the full-time status of a Board Member, annual compensation levels of Board members within a comparable range to executive pay or a Board member’s former executive status for periods further back than the preceding three years.
Independence determinationAs of December 31, 2020, all members of the Board were deter-mined by the Board to be independent.
Board leadership
Chairman of the BoardThe Chairman is a non-executive member of the Board, in accor-dance with Swiss banking law, and performs his role on a full-time basis, in line with the practice expected by FINMA, our main regulator. The Chairman:p coordinates the work within the Board;p works with the committee chairmen to coordinate the tasks of
the committees;
p ensures that the Board members are provided with the infor-mation relevant for performing their duties;
p drives the Board agenda;p drives key Board topics, especially regarding the strategic
development of the Group, succession planning, the structure and organization of the Group, corporate governance, as well as compensation and compensation structure, including the performance evaluation and compensation of the CEO and the Executive Board;
p chairs the Board, the Governance and Nominations Commit-tee and the Shareholder Meetings;
p takes an active role in representing the Group to key share-holders, investors, regulators and supervisors, industry asso-ciations and other external stakeholders;
p has no executive function within the Group;p with the exception of the Governance and Nominations Com-
mittee and the Conduct and Financial Crime Control Commit-tee, is not a member of any of the other Board standing com-mittees; and
p may attend all or parts of selected committee meetings as a guest without voting power.
Vice-Chair and Lead Independent DirectorThere may be one or more Vice-Chairs. The Vice-Chair:p is a member of the Board;p is a designated deputy to the Chairman; andp assists the Chairman by providing support and advice to the
Chairman, assuming the Chairman’s role in the event of the Chairman’s absence or indisposition and leading the Board accordingly.
According to the Group’s OGR (Chapter II Board of Directors, Item 3.4), the Board may appoint a Lead Independent Director. If the Chairman is determined not to be independent by the Board, the Board must appoint a Lead Independent Director. The Lead Independent Director:p may convene meetings without the Chairman being present;p takes a leading role among the Board members, particularly
when issues between a non-independent Chairman and the independent Board members arise (for example, when a non-independent Chairman has a conflict of interest);
p leads the Board’s annual assessment of the Chairman; andp ensures that the work of the Board and Board-related pro-
cesses continue to run smoothly.
Severin Schwan currently serves as the Vice-Chair and the Lead Independent Director.
202 Corporate Governance
Segregation of dutiesIn accordance with Swiss banking law, the Group operates under a dual board structure, which strictly segregates the duties of supervision, which are the responsibility of the Board, from the duties of management, which are the responsibility of the Execu-tive Board. The roles of the Chairman (non-executive) and the CEO (executive) are separate and carried out by two different people.
Board responsibilities In accordance with the OGR (Chapter II Board of Directors, Item 5.1), the Board delegates certain tasks to Board committees and delegates the management of the company and the preparation and implementation of Board resolutions to certain management bodies or executive officers to the extent permitted by law, in par-ticular Article 716a and 716b of the Swiss Code of Obligations, and the AoA (Chapter IV, Section 2, The Board of Directors, Art. 17 of the Group’s AoA and Chapter III, Section 6. Board of Direc-tors, Art. 6.3 of the Bank’s AoA).
With responsibility for the overall direction, supervision and control of the company, the Board:p regularly assesses our competitive position and approves our
strategic and financial plans and risk appetite statement and overall risk limits;
p appoints or dismisses the CEO and the members of the Exec-utive Board and appoints or dismisses the head of Internal Audit as well as the regulatory auditor;
p receives a status report at each ordinary meeting on our finan-cial results, capital, funding and liquidity situation;
p receives, on a monthly basis, management information pack-ages, which provide detailed information on our performance and financial status, as well as quarterly risk reports outlining recent developments and outlook scenarios;
p is provided by management, with regular updates on key issues and significant events, as deemed appropriate or requested;
p has access to all information concerning the Group in order to appropriately discharge its responsibilities;
p reviews and approves significant changes to our structure and organization;
p approves the annual variable compensation for the Group and the divisions and recommends compensation of the Board and Executive Board for shareholder approval at the AGM;
p provides oversight on significant projects including acquisitions, divestitures, investments and other major projects;
p approves the recovery and resolution plans of the Group and its major subsidiaries; and
p along with its committees, is entitled, without consulting with management and at the Group’s expense, to engage external legal, financial or other advisors, as it deems appropriate, with respect to any matters within its authority.
Management information systemThe Group has a comprehensive management information sys-tem (MIS) in place as part of our efforts to ensure the Board and senior management are provided with the necessary informa-tion and reports to carry out their respective oversight and man-agement responsibilities. The Chairman may request additional reports as deemed appropriate.
Governance of Group subsidiariesThe Board assumes oversight responsibility for establishing appropriate governance for Group subsidiaries. The governance of the Group is based on the principles of an integrated oversight and management structure with global scope, which enables management of the Group as one economic unit. The Group sets corporate governance standards to ensure the efficient and harmonized steering of the Group. In accordance with the OGR (Chapter II Board of Directors, Item 5.1.12), the Board appoints or dismisses the chairperson and the members of the board of directors of the major subsidiaries of the Group and approves their compensation. A policy naming the subsidiaries in scope and providing guidelines for the nomination and compensation process is periodically reviewed by the Board. The governance of the major subsidiaries, subject to compliance with all applicable local laws and regulations, should be consistent with the corpo-rate governance principles of the Group, as reflected in the OGR and other corporate governance documents. In order to facilitate consistency and alignment of Group and subsidiary governance, it is the Group’s policy for the Board to appoint at least one Group director to each of the boards of its major subsidiaries. Directors and officers of the Group and its major subsidiaries are commit-ted to ensuring transparency and collaboration throughout the Group.
203Corporate Governance
Board evaluationThe Board conducts a self-assessment once a year, where it reviews its own performance against the responsibilities listed in its charter and the Board’s objectives and determines future objectives, including any special focus objectives for the coming year. The performance assessment of the Chairman is led by the Vice-Chairman; the Chairman does not participate in the discus-sion of his own performance. As part of the self-assessment, the Board evaluates its effectiveness with respect to a number of different aspects, including board structure and composition, communication and reporting, agenda setting and continuous improvement. From time to time, the Board may also mandate an external advisor to facilitate the evaluation process. In 2020, the Board mandated an external firm, Boardroom Review Ltd., to perform a board effectiveness evaluation. Similar to the previous evaluation concluded in 2017, the 2020 effectiveness evaluation included a comprehensive review of Board processes and docu-mentation, interviews by the external assessor with the Chair-man, the individual Board members, the CEO and certain other Executive Board members, and the participation of the external assessor as an observer in Board and Board committee meet-ings. The results from the external board effectiveness evaluation were presented and discussed at a Board meeting in early 2021 and addressed the Board’s leadership and contribution and the work of the Board. Specific topics reviewed included the Board’s culture and current and future composition, priorities for the new Chairman of the Board, the Board’s shared strategic perspec-tive, developing a longer-term agenda, visibility and understanding of the rapidly changing global landscape of the financial services industry and the ESG agenda. The Board is targeting performing an external board effectiveness evaluation every three years.
Board changes At the 2020 AGM, Richard Meddings was elected as a new member of the Board and appointed by the Board as Chair of the Audit Committee and Board and Audit Committee member Alexander Gut did not stand for reelection. At the 2021 AGM on April 30, 2021, the Board proposes António Horta-Osório, Clare Brady and Blythe Masters for election as new non-executive Board members and António Horta-Osório for election as the new Chairman of the Board. The Board furthermore proposes Blythe Masters as a new Compensation Committee member
and intends to appoint both Clare Brady and Blythe Masters to the Audit Committee, subject to their election at the AGM. Clare Brady is the former director of internal audit at the International Monetary Fund and vice president and auditor general of the World Bank Group. She is currently a member of the Audit and Risk Commission of the International Federation of Red Cross and Red Crescent Societies, Switzerland, as well as a non-exec-utive member of the board of Fidelity Asian Values, PLC in the UK. Her long experience in audit, compliance and risk manage-ment at various banks and international financial institutions will be an asset to the Board and her extensive expertise in the area of internal audit will be of particular benefit to the Audit Commit-tee. Blythe Masters is a former executive at JPMorgan Chase, where she held various key roles over 27 years, including Chief Financial Officer of the Investment Bank, and Head of Global Commodities, before joining Digital Asset Holdings, an enter-prise blockchain company, where she was CEO until 2018. She is currently an industry partner at Motive Partners, where she also serves as CEO and board member of Motive Capital Corporation. Motive Capital Corporation is a special purpose acquisition com-pany (SPAC), a non-operating entity with the purpose of acquir-ing an existing, operational business. Once the acquisition has been completed, Blythe Masters will not serve as the CEO of the acquired business. She holds several other board memberships, including board and audit committee chair at Phunware, an enter-prise mobile platform, board member and audit committee chair at GCM Grosvenor and board member at A.P. Møller-Maersk. Her experience as a financial services and technology executive, in particular, her expertise in corporate and investment banking and her more recent experience within innovative financial technolo-gies, will strengthen the Board’s expertise in the areas of innova-tion and technology, as well as complement the Board’s collective financial services industry experience. Of the current Board mem-bers, Urs Rohner, Joaquin Ribeiro and John Tiner will not stand for re-election at the AGM. The Board proposes that all other current members of the Board be re-elected to the Board and proposes Iris Bohnet, Christian Gellerstad, Michael Klein, Blythe Masters and Kai S. Nargolwala as members of the Compensation Committee. Subject to their election at the AGM, the Board has determined António Horta-Osório, Clare Brady and Blythe Mas-ters to be independent Board members, according to the Group’s independence standards.
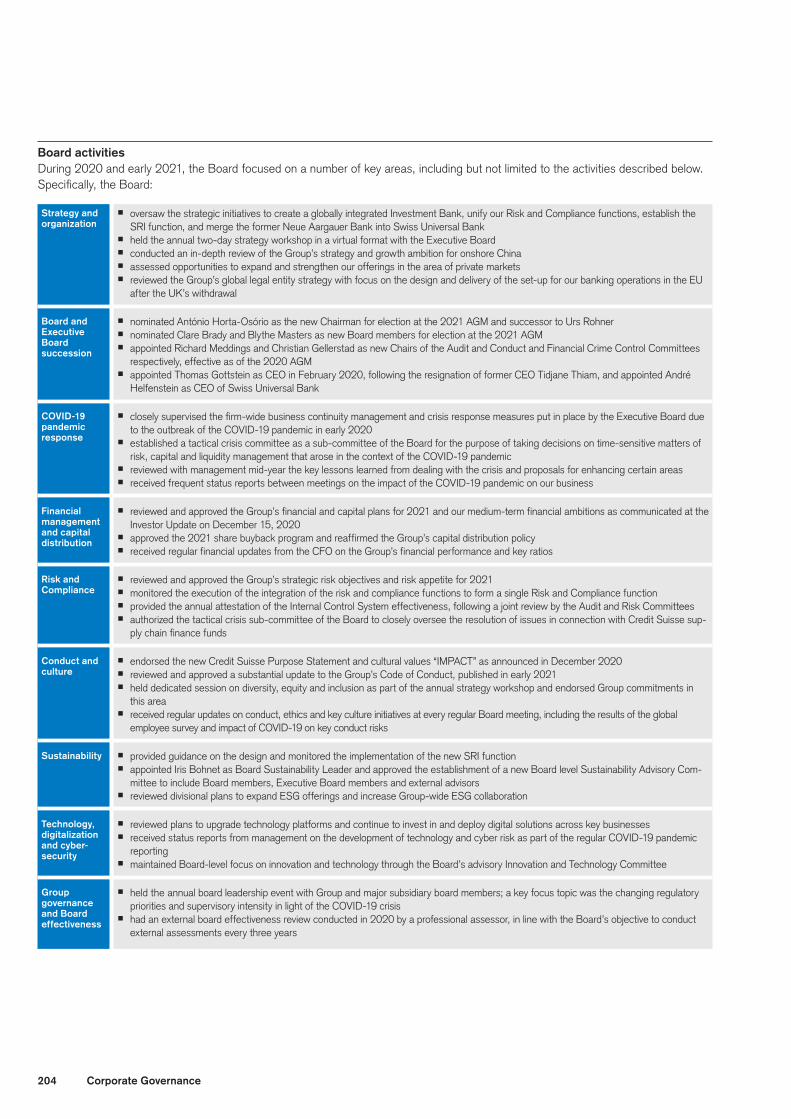
204 Corporate Governance
Board activitiesDuring 2020 and early 2021, the Board focused on a number of key areas, including but not limited to the activities described below. Specifically, the Board:
Strategy and organization
p oversaw the strategic initiatives to create a globally integrated Investment Bank, unify our Risk and Compliance functions, establish the SRI function, and merge the former Neue Aargauer Bank into Swiss Universal Bank
p held the annual two-day strategy workshop in a virtual format with the Executive Boardp conducted an in-depth review of the Group’s strategy and growth ambition for onshore Chinap assessed opportunities to expand and strengthen our offerings in the area of private marketsp reviewed the Group’s global legal entity strategy with focus on the design and delivery of the set-up for our banking operations in the EU
after the UK’s withdrawal
Board and Executive Board succession
p nominated António Horta-Osório as the new Chairman for election at the 2021 AGM and successor to Urs Rohnerp nominated Clare Brady and Blythe Masters as new Board members for election at the 2021 AGMp appointed Richard Meddings and Christian Gellerstad as new Chairs of the Audit and Conduct and Financial Crime Control Committees
respectively, effective as of the 2020 AGMp appointed Thomas Gottstein as CEO in February 2020, following the resignation of former CEO Tidjane Thiam, and appointed André
Helfenstein as CEO of Swiss Universal Bank
COVID-19 pandemic response
p closely supervised the firm-wide business continuity management and crisis response measures put in place by the Executive Board due to the outbreak of the COVID-19 pandemic in early 2020
p established a tactical crisis committee as a sub-committee of the Board for the purpose of taking decisions on time-sensitive matters of risk, capital and liquidity management that arose in the context of the COVID-19 pandemic
p reviewed with management mid-year the key lessons learned from dealing with the crisis and proposals for enhancing certain areasp received frequent status reports between meetings on the impact of the COVID-19 pandemic on our business
Financial management and capital distribution
p reviewed and approved the Group’s financial and capital plans for 2021 and our medium-term financial ambitions as communicated at the Investor Update on December 15, 2020
p approved the 2021 share buyback program and reaffirmed the Group’s capital distribution policyp received regular financial updates from the CFO on the Group’s financial performance and key ratios
Risk and Compliance
p reviewed and approved the Group’s strategic risk objectives and risk appetite for 2021p monitored the execution of the integration of the risk and compliance functions to form a single Risk and Compliance functionp provided the annual attestation of the Internal Control System effectiveness, following a joint review by the Audit and Risk Committeesp authorized the tactical crisis sub-committee of the Board to closely oversee the resolution of issues in connection with Credit Suisse sup-
ply chain finance funds
Conduct and culture
p endorsed the new Credit Suisse Purpose Statement and cultural values “IMPACT” as announced in December 2020p reviewed and approved a substantial update to the Group’s Code of Conduct, published in early 2021p held dedicated session on diversity, equity and inclusion as part of the annual strategy workshop and endorsed Group commitments in
this areap received regular updates on conduct, ethics and key culture initiatives at every regular Board meeting, including the results of the global
employee survey and impact of COVID-19 on key conduct risks
Sustainability p provided guidance on the design and monitored the implementation of the new SRI functionp appointed Iris Bohnet as Board Sustainability Leader and approved the establishment of a new Board level Sustainability Advisory Com-
mittee to include Board members, Executive Board members and external advisorsp reviewed divisional plans to expand ESG offerings and increase Group-wide ESG collaboration
Technology, digitalization and cyber-security
p reviewed plans to upgrade technology platforms and continue to invest in and deploy digital solutions across key businessesp received status reports from management on the development of technology and cyber risk as part of the regular COVID-19 pandemic
reportingp maintained Board-level focus on innovation and technology through the Board’s advisory Innovation and Technology Committee
Group governance and Board effectiveness
p held the annual board leadership event with Group and major subsidiary board members; a key focus topic was the changing regulatory priorities and supervisory intensity in light of the COVID-19 crisis
p had an external board effectiveness review conducted in 2020 by a professional assessor, in line with the Board’s objective to conduct external assessments every three years

205Corporate Governance
Board committees
The Board has five standing committees: the Governance and Nominations Committee, the Audit Committee, the Compensation Committee, the Conduct and Financial Crime Control Committee and the Risk Committee. In addition, the Board has two advisory committees, the Innovation and Technology Committee and the new Sustainability Advisory Committee. Except for the Compen-sation Committee members, who are elected by the shareholders on an annual basis, the committee members are appointed by the Board for a term of one year.
At each Board meeting, the Chairs of the committees report to the Board about the activities of the respective committees. In addition, the minutes and documentation of the committee meet-ings are accessible to all Board members.
Each committee has its own charter, which has been approved by the Board. Each standing committee performs a self-assessment once a year, where it reviews its own performance against the responsibilities listed in its charter and the committee’s objectives and determines any special focus objectives for the coming year.
In light of the COVID-19 pandemic, the Board furthermore estab-lished a sub-committee of the Board in 2020, the tactical crisis committee, consisting of the Chairman and the Chairs of the Audit and Risk Committees, for the purpose of taking decisions on behalf of the full Board on time-sensitive matters of risk, capital and liquidity management within the Board’s authority. The tactical crisis committee was reactivated in 2021 with the same members plus the Chair of the Conduct and Financial Crime Control Com-mittee for the purposes of exercising close oversight and timely decision making with respect to the issues that arose in connec-tion with Credit Suisse supply chain finance funds.
Given the Group’s ambition to becoming a leader in sustainability in the financial industry and the establishment of SRI in 2020, the Board also decided to form the new Sustainability Advisory Com-mittee in order to provide guidance and expertise with respect to the firm-wide ESG strategy and its execution.
Governance and Nominations Committee The Governance and Nominations Committee consists of the Chairman, the Vice-Chair and the Chairs of the committees of the Board and other members appointed by the Board. It may include non-independent Board members; however, the majority of members must qualify as independent. Our Governance and Nominations Committee currently consists of six members. All of our Governance and Nominations Committee members are independent.
The Governance and Nominations Committee generally meets on a monthly basis and the meetings are usually attended by the CEO. It may also ask other members of management or special-ists to attend a meeting.
As part of its main duties and responsibilities, the Governance and Nominations Committee:p acts as counselor to the Chairman and supports him in the
preparation of the Board meetings;p addresses the corporate governance issues affecting the
Group and develops and recommends to the Board corporate governance principles and such other corporate governance-related documents as it deems appropriate for the Group;
p reviews the independence of the Board members annu-ally and recommends its assessment to the Board for final determination;
p is responsible for setting selection criteria for Board member-ship, which shall reflect the requirements of applicable laws and regulations, and identifying, evaluating and nominating candidates for Board membership;
p guides the Board’s annual performance assessment of the Chairman, the CEO and the members of the Executive Board;
p proposes to the Board the appointment, replacement or dis-missal of members of the Executive Board as well as other appointments requiring endorsement by the Board; and
p reviews succession plans with the Chairman and the CEO relating to Executive Board positions and keeps informed on other top management succession plans.
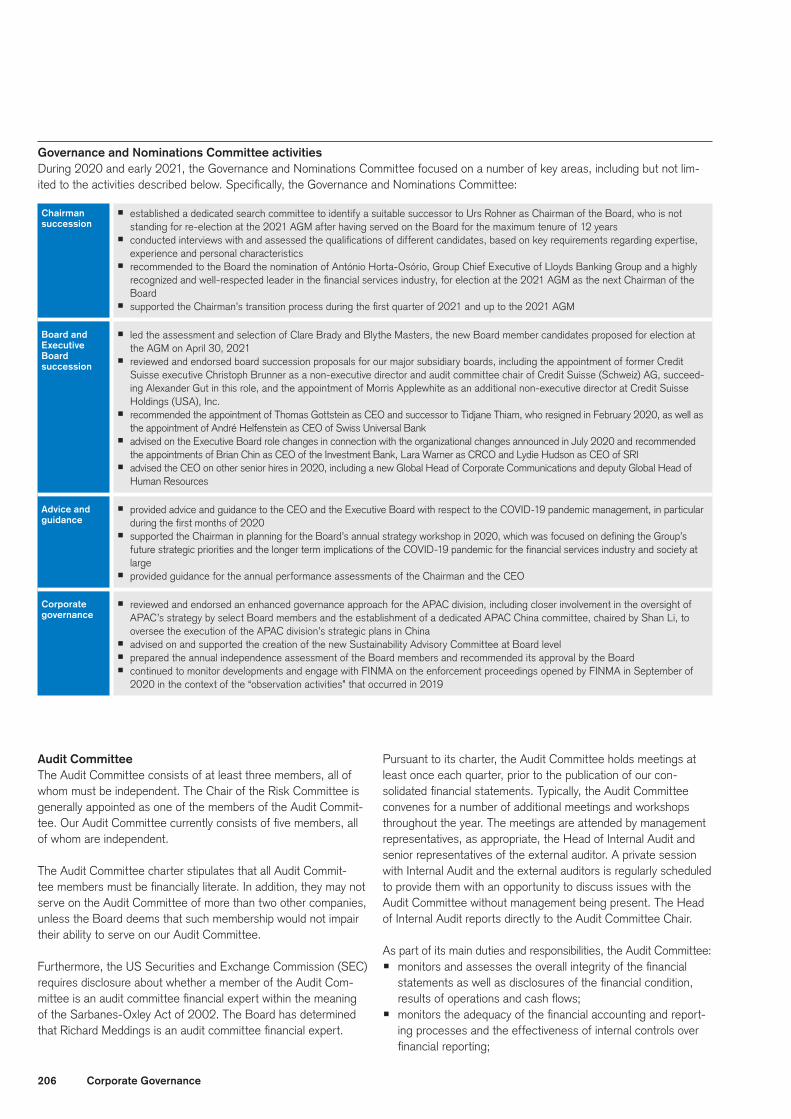
206 Corporate Governance
Governance and Nominations Committee activities During 2020 and early 2021, the Governance and Nominations Committee focused on a number of key areas, including but not lim-ited to the activities described below. Specifically, the Governance and Nominations Committee:
Chairman succession
p established a dedicated search committee to identify a suitable successor to Urs Rohner as Chairman of the Board, who is not standing for re-election at the 2021 AGM after having served on the Board for the maximum tenure of 12 years
p conducted interviews with and assessed the qualifications of different candidates, based on key requirements regarding expertise, experience and personal characteristics
p recommended to the Board the nomination of António Horta-Osório, Group Chief Executive of Lloyds Banking Group and a highly recognized and well-respected leader in the financial services industry, for election at the 2021 AGM as the next Chairman of the Board
p supported the Chairman’s transition process during the first quarter of 2021 and up to the 2021 AGM
Board and Executive Board succession
p led the assessment and selection of Clare Brady and Blythe Masters, the new Board member candidates proposed for election at the AGM on April 30, 2021
p reviewed and endorsed board succession proposals for our major subsidiary boards, including the appointment of former Credit Suisse executive Christoph Brunner as a non-executive director and audit committee chair of Credit Suisse (Schweiz) AG, succeed-ing Alexander Gut in this role, and the appointment of Morris Applewhite as an additional non-executive director at Credit Suisse Holdings (USA), Inc.
p recommended the appointment of Thomas Gottstein as CEO and successor to Tidjane Thiam, who resigned in February 2020, as well as the appointment of André Helfenstein as CEO of Swiss Universal Bank
p advised on the Executive Board role changes in connection with the organizational changes announced in July 2020 and recommended the appointments of Brian Chin as CEO of the Investment Bank, Lara Warner as CRCO and Lydie Hudson as CEO of SRI
p advised the CEO on other senior hires in 2020, including a new Global Head of Corporate Communications and deputy Global Head of Human Resources
Advice and guidance
p provided advice and guidance to the CEO and the Executive Board with respect to the COVID-19 pandemic management, in particular during the first months of 2020
p supported the Chairman in planning for the Board’s annual strategy workshop in 2020, which was focused on defining the Group’s future strategic priorities and the longer term implications of the COVID-19 pandemic for the financial services industry and society at large
p provided guidance for the annual performance assessments of the Chairman and the CEO
Corporate governance
p reviewed and endorsed an enhanced governance approach for the APAC division, including closer involvement in the oversight of APAC’s strategy by select Board members and the establishment of a dedicated APAC China committee, chaired by Shan Li, to oversee the execution of the APAC division’s strategic plans in China
p advised on and supported the creation of the new Sustainability Advisory Committee at Board levelp prepared the annual independence assessment of the Board members and recommended its approval by the Boardp continued to monitor developments and engage with FINMA on the enforcement proceedings opened by FINMA in September of
2020 in the context of the “observation activities” that occurred in 2019
Audit CommitteeThe Audit Committee consists of at least three members, all of whom must be independent. The Chair of the Risk Committee is generally appointed as one of the members of the Audit Commit-tee. Our Audit Committee currently consists of five members, all of whom are independent.
The Audit Committee charter stipulates that all Audit Commit-tee members must be financially literate. In addition, they may not serve on the Audit Committee of more than two other companies, unless the Board deems that such membership would not impair their ability to serve on our Audit Committee.
Furthermore, the US Securities and Exchange Commission (SEC) requires disclosure about whether a member of the Audit Com-mittee is an audit committee financial expert within the meaning of the Sarbanes-Oxley Act of 2002. The Board has determined that Richard Meddings is an audit committee financial expert.
Pursuant to its charter, the Audit Committee holds meetings at least once each quarter, prior to the publication of our con-solidated financial statements. Typically, the Audit Committee convenes for a number of additional meetings and workshops throughout the year. The meetings are attended by management representatives, as appropriate, the Head of Internal Audit and senior representatives of the external auditor. A private session with Internal Audit and the external auditors is regularly scheduled to provide them with an opportunity to discuss issues with the Audit Committee without management being present. The Head of Internal Audit reports directly to the Audit Committee Chair.
As part of its main duties and responsibilities, the Audit Committee:p monitors and assesses the overall integrity of the financial
statements as well as disclosures of the financial condition, results of operations and cash flows;
p monitors the adequacy of the financial accounting and report-ing processes and the effectiveness of internal controls over financial reporting;

207Corporate Governance
p monitors processes designed to ensure compliance by the Group in all significant respects with legal and regulatory requirements, including disclosure controls and procedures;
p monitors the adequacy of the management of non-financial risks jointly with the Risk Committee, including the assessment of the effectiveness of internal controls that go beyond the area of financial reporting;
p reviews jointly with the Conduct and Financial Crime Control Committee any significant matters related to compliance and con-duct for which a joint review is determined to be appropriate; and
p monitors the qualifications, independence and performance of the external auditors and of Internal Audit.
The Audit Committee is regularly informed about significant proj-ects and initiatives aimed at further improving processes and receives regular updates on significant legal, compliance, disciplin-ary, tax and regulatory matters. Furthermore, the Audit Committee has established procedures for the receipt, retention and treatment of complaints of a significant nature regarding accounting, internal accounting controls, auditing or other matters alleging potential misconduct, including a whistleblower hotline to provide the option to report complaints on a confidential, anonymous basis.
Audit Committee activitiesDuring 2020 and early 2021, the Audit Committee focused on a number of key areas, including but not limited to the activities described below. Specifically, the Audit Committee:
Quarterly and annual financial reporting
p performed its regular review of the quarterly and annual financial results and related accounting, reporting and internal control and disclosure matters, as well as matters of significant judgment
p held specific reviews on certain accounting and reporting matters of particular relevance in 2020 and early 2021, such as the Group’s restructuring and the related goodwill assessment, the reporting and disclosure following the new organizational structure and the respective restatement of prior periods, the impairment to the valuation of the Group’s non-controlling interest in York Capi-tal Management and, as announced on January 8, 2021, the increase of litigation provisions mainly in connection with mortgage-related matters
p held regular reviews of the Bank parent company financial statements, with a particular focus on capital, the financial performance and legal entity governance, including the review of capital distribution and the net funding position
p assumed, jointly with the Risk Committee, oversight on the newly implemented US GAAP accounting standard for current expected credit losses (CECL), which became effective on January 1, 2020. Due to the COVID-19 pandemic and the related market volatility, heightened oversight was required, with a particular focus on the quarterly credit provisioning, as well as the related governance and quality assurance processes
p held various educational sessions (some jointly with the Risk Committee) on selected topics, such as the Fundamental Review of Trading Book (FRTB), structured notes, securitized products, pension risk and hedging
Internal and external audit
p received regular updates from the Head of Internal Audit on key audit findings and held a dedicated workshop with the Internal Audit senior leadership team about their risk assessments for the organization, emerging risk and control themes, and audit planning and methodology, as well as on organizational matters of the Internal Audit function, such as talent and succession planning
p closely monitored the transition from KPMG to PwC and provided guidance to PwC in their first year as the Group’s new external auditor, including holding various private sessions and frequent dialogue with the senior audit partners
Legal, regulatory compliance and conduct matters
p received updates from the General Counsel at every meeting on significant litigation, regulatory enforcement and tax matters, as well as regular reports on key regulatory developments and interactions with our main regulators
p maintained a focus on compliance topics through briefings at every regular meeting by the Deputy Chief Compliance Officer on key compliance risks and associated internal controls as well as through the quarterly Compliance Risk Report
p reviewed the Group’s whistleblowing processes and governance, as well as select cases and their resolutionp received, jointly with the Conduct and Financial Crime Control Committee, updates on significant matters related to compliance and
conduct, with a particular focus on the oversight of key programs enhancing the Group’s financial crime compliance framework to meet US and Swiss regulatory expectations
p reviewed, jointly with the Risk Committee, the annual assessment of the effectiveness of the internal control system and recom-mended approval by the Board of the adequacy of the internal control system, according to the requirements of FINMA
Infrastructure and key change programs
p conducted in-depth reviews of the payments processes and systems landscape, including the application simplification program, the application of robotics, as well as the governance framework and checks and balances
p held a comprehensive session on IT system architecture, focusing on the complexity of the IT environment, the associated risk pro-file, end-of-life management, architecture simplification and platform strategy, and the maintenance of the overall stability and secu-rity levels of the IT environment
p received updates on the Group’s global legal entity strategy and strategy to optimize the legal entity structure following agreed design principles, the global booking model, and both global and local legal and regulatory requirements
p reviewed, jointly with the Risk Committee, the Group’s key change programs, the Group’s data management framework and the related regulatory interactions and feedback, as well as the Group’s third-party risk management framework, including an over-view of external third-party relationships, the respective risk profile and regulatory requirements and the related risk assessment processes
208 Corporate Governance
Internal AuditOur Internal Audit function comprises a team of around 400 professionals, substantially all of whom are directly involved in auditing activities. The Head of Internal Audit reports directly to the Audit Committee Chair and the Audit Committee directs and oversees the activities of the Internal Audit function.
Internal Audit performs an independent and objective assurance function that is designed to add value to our operations. Using a systematic and disciplined approach, the Internal Audit team eval-uates and enhances the effectiveness of our risk management, control and governance processes.
Internal Audit is responsible for carrying out periodic audits in line with the Internal Audit Charter, which is approved by the Audit Committee and available publicly. It regularly and independently assesses the risk exposure of our various business activities, taking into account industry trends, strategic and organizational decisions, best practice and regulatory matters. Based on the results of its assessment, Internal Audit develops detailed annual audit objectives, defining key risk themes and specifying resource requirements for approval by the Audit Committee.
As part of its efforts to achieve best practice, Internal Audit regu-larly benchmarks its methods and tools against those of its peers. In addition, it submits periodic internal reports and summaries thereof to the management teams as well as the Chairman and the Audit Committee Chair. The Head of Internal Audit reports to the Audit Committee at least quarterly and more frequently as appropriate. Internal Audit coordinates its operations with the activities of the external auditor for maximum effect.
The Audit Committee annually assesses the performance and effectiveness of the Internal Audit function. For 2020, the Audit Committee concluded that the Internal Audit function was effec-tive and independent, with the appropriate resources to deliver against the Internal Audit Charter.
External AuditThe Audit Committee is responsible for the oversight of the external auditor. The external auditor reports directly to the Audit Committee and the Board with respect to its audit of the Group’s financial statements and is ultimately accountable to the share-holders. The Audit Committee pre-approves the retention of, and fees paid to, the external auditor for all audit and non-audit services.
> Refer to “External audit” in Additional information for further information.
Compensation CommitteeThe Compensation Committee consists of at least three members of the Board, all of whom must be independent. Our Compen-sation Committee currently consists of four members. All of our Compensation Committee members are independent.
Pursuant to its charter, the Compensation Committee holds at least four meetings per year. Additional meetings may be sched-uled at any time. The meetings are attended by management rep-resentatives, as appropriate.
As part of its main duties and responsibilities, the Compensation Committee:p reviews the Group’s compensation policy;p establishes new compensation plans or amending existing
plans and recommends them to the Board for approval;p reviews the performance of the Group and the divisions and
recommends the variable compensation pools for the Group and the divisions to the Board for approval;
p proposes individual compensation for the Board members to the Board;
p discusses and recommends to the Board a proposal for the CEO’s compensation;
p discusses and recommends to the Board the Executive Board members’ compensation based on proposals by the CEO;
p reviews and recommends to the Board the compensation for individuals being considered for an Executive Board position; and
p reviews and endorses the annual compensation report submit-ted for a consultative vote by shareholders at the AGM.
In accordance with the Compensation Ordinance, all compensa-tion proposals for members of the Board and the Executive Board are subject to AGM approval.
The Compensation Committee is authorized to retain outside advisors, at the Group’s expense, for the purpose of providing guidance to the Compensation Committee as it carries out its responsibilities. Prior to their appointment, the Compensation Committee conducts an independence assessment of the advi-sors pursuant to the rules of the SEC and the listing standards of the NYSE and Nasdaq.
> Refer to “The Compensation Committee” in V – Compensation – Compensa-tion governance for information on our compensation approach, principles and objectives and outside advisors.

209Corporate Governance
Compensation Committee activities During 2020 and early 2021, the Compensation Committee focused on a number of key areas, including but not limited to the activi-ties described below. Specifically, the Compensation Committee:
Executive Board and Board compen sation
p reviewed and recommended approval by the Board for the Executive Board variable compensation for 2020, including an assess-ment of the non-financial performance of the CEO and individual Executive Board members according to the pre-defined non-finan-cial categories of strategy/client focus, risk and compliance, conduct and ethics, and people
p conducted a comprehensive review and partial redesign of the Executive Board compensation structure for 2021, following the CEO change in the first quarter of 2020, including holding two dedicated workshops with senior management and the independent com-pensation advisor, and approved several changes with respect to the STI and LTI award plans
p reviewed and recommended the performance metrics and targets for the 2021 STI and LTI awards, reflecting the Group’s strategy and financial goals for 2021, as well as non-financial metrics
p reviewed and recommended approval by the Board of the compensation arrangements for the incoming and outgoing Executive Board members during 2020, including for the Group CEO
p reviewed and recommended approval by the Board of the compensation arrangements for the designated Chairman
Shareholder engagement and Say-on-Pay
p continued to engage extensively with shareholders and proxy advisors on compensation, including holding numerous meetings with shareholders involving the Compensation Committee Chair, the Global Head of Human Resources and, in part, the Chairman; feed-back and key issues resulting from these meetings were addressed regularly by the full committee
p acknowledged the solid shareholder support of 85% or above for the binding compensation proposals for the Board and the Execu-tive Board at the 2020 AGM and 79% for the non-binding proposal on the Compensation Report and reviewed and discussed inves-tor comments and proxy advisor analysis and recommendations in the lead up to the Say-on-Pay votes at the AGM
Group compen sation
p assessed the Group’s performance and determined the variable compensation pools for 2020, taking into account the Group’s financial performance, in terms of both the reported and underlying financial results for 2020, input from the Group’s risk and control functions, including the Conduct and Ethics boards, as well as the economic environment in light of the COVID-19 pandemic
p conducted the annual review of the Group’s compensation framework and determined that it remains fit for purpose and aligned with our compensation objectives overall
p reviewed the proposed variable compensation amounts for specific groups of employees, in line with regulatory guidance and the Group’s Compensation Policy, including any disciplinary issues and points of positive recognition
p conducted the annual review of the disciplinary process, including the number and type of disciplinary cases and their impact on compensation, and constructively challenged management on the rationale for select cases
p approved the application of malus for certain employees upon the recommendation of the Group Conduct and Ethics Boardp reviewed and approved the 2021 edition of the Group’s Compensation Policy and Implementation Standards and continued to focus
on ensuring comprehensive and transparent disclosure in the Group’s compensation reportp reviewed equal pay and gender pay practices at Credit Suisse
Regulatory and industry developments
p received and assessed periodic reports on industry and regulatory developments, including executive pay trends, competitor prac-tices, key corporate governance developments and regulatory themes with implications for compensation
p closely monitored compensation-related impacts of the COVID-19 pandemic, including peer company actions with respect to execu-tive compensation and the wider workforce, and endorsed the Group’s employee charitable donation program, including the donation commitments of the Executive Board members and the Chairman
Conduct and Financial Crime Control CommitteeThe Conduct and Financial Crime Control Committee reflects the Group’s priority to rigorously address financial crime risk and ensure that the highest standards of conduct and vigilance are maintained throughout the Group. The Conduct and Financial Crime Control Committee consists of at least three members. It may include non-independent members; however, the majority of members must qualify as independent. The Audit Commit-tee Chair is generally appointed as one of the members of the Conduct and Financial Crime Control Committee. The Conduct and Financial Crime Control Committee currently consists of five members, all of whom are independent.
Pursuant to its charter, the Conduct and Financial Crime Control Committee holds at least four meetings a year. The Conduct and Financial Crime Control Committee may convene for additional meetings throughout the year in order to appropriately discharge its responsibilities. The meetings are attended by management
representatives and representatives of Internal Audit and the Group’s external auditors, as appropriate.
The Conduct and Financial Crime Control Committee assists the Board in fulfilling its oversight duties with respect to the Group’s exposure to financial crime risk. It is tasked with monitoring and assessing the effectiveness of financial crime compliance pro-grams and initiatives focused on improving conduct and vigilance within the context of combatting financial crime.
As part of its main duties and responsibilities, the Conduct and Financial Crime Control Committee:p reviews and assesses the Group’s overall compliance frame-
work for addressing financial crime risk, including policies, pro-cedures and organizational set-up;
p monitors and assesses the effectiveness of financial crime compliance programs, including those with respect to the fol-lowing areas: anti-money laundering, client identification and
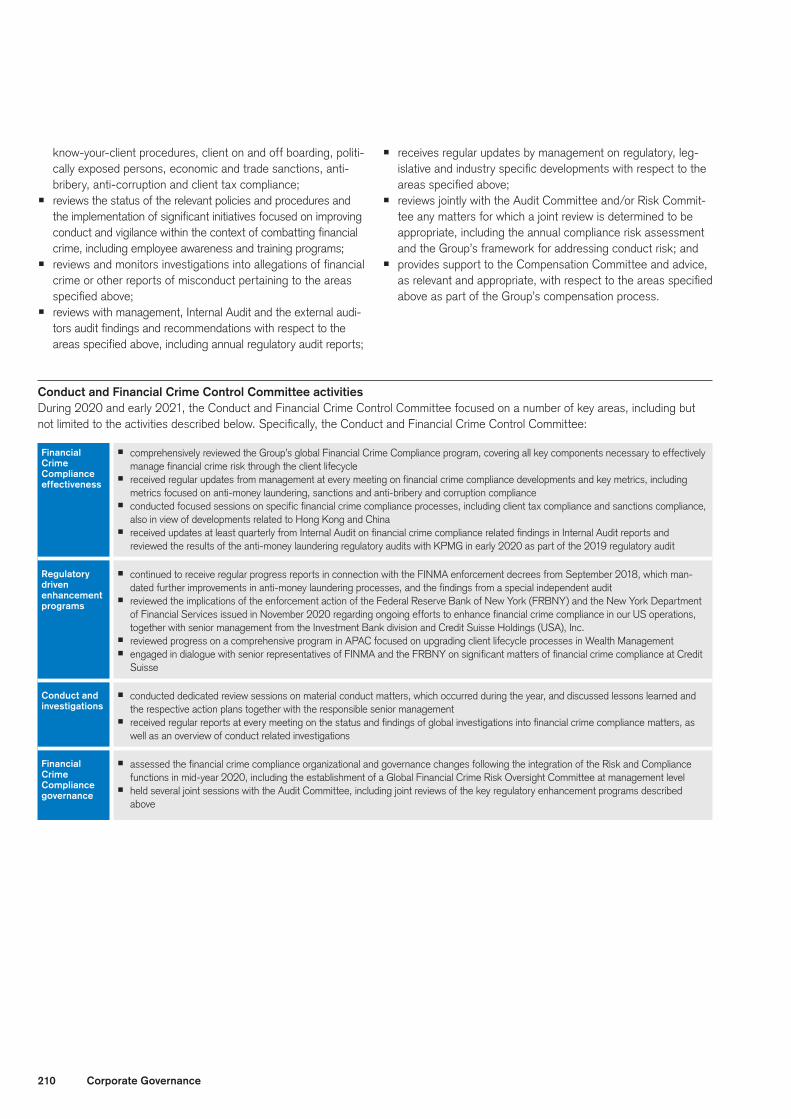
210 Corporate Governance
know-your-client procedures, client on and off boarding, politi-cally exposed persons, economic and trade sanctions, anti-bribery, anti-corruption and client tax compliance;
p reviews the status of the relevant policies and procedures and the implementation of significant initiatives focused on improving conduct and vigilance within the context of combatting financial crime, including employee awareness and training programs;
p reviews and monitors investigations into allegations of financial crime or other reports of misconduct pertaining to the areas specified above;
p reviews with management, Internal Audit and the external audi-tors audit findings and recommendations with respect to the areas specified above, including annual regulatory audit reports;
p receives regular updates by management on regulatory, leg-islative and industry specific developments with respect to the areas specified above;
p reviews jointly with the Audit Committee and/or Risk Commit-tee any matters for which a joint review is determined to be appropriate, including the annual compliance risk assessment and the Group’s framework for addressing conduct risk; and
p provides support to the Compensation Committee and advice, as relevant and appropriate, with respect to the areas specified above as part of the Group’s compensation process.
Conduct and Financial Crime Control Committee activitiesDuring 2020 and early 2021, the Conduct and Financial Crime Control Committee focused on a number of key areas, including but not limited to the activities described below. Specifically, the Conduct and Financial Crime Control Committee:
Financial Crime Compliance effectiveness
p comprehensively reviewed the Group’s global Financial Crime Compliance program, covering all key components necessary to effectively manage financial crime risk through the client lifecycle
p received regular updates from management at every meeting on financial crime compliance developments and key metrics, including metrics focused on anti-money laundering, sanctions and anti-bribery and corruption compliance
p conducted focused sessions on specific financial crime compliance processes, including client tax compliance and sanctions compliance, also in view of developments related to Hong Kong and China
p received updates at least quarterly from Internal Audit on financial crime compliance related findings in Internal Audit reports and reviewed the results of the anti-money laundering regulatory audits with KPMG in early 2020 as part of the 2019 regulatory audit
Regulatory driven enhancement programs
p continued to receive regular progress reports in connection with the FINMA enforcement decrees from September 2018, which man-dated further improvements in anti-money laundering processes, and the findings from a special independent audit
p reviewed the implications of the enforcement action of the Federal Reserve Bank of New York (FRBNY) and the New York Department of Financial Services issued in November 2020 regarding ongoing efforts to enhance financial crime compliance in our US operations, together with senior management from the Investment Bank division and Credit Suisse Holdings (USA), Inc.
p reviewed progress on a comprehensive program in APAC focused on upgrading client lifecycle processes in Wealth Managementp engaged in dialogue with senior representatives of FINMA and the FRBNY on significant matters of financial crime compliance at Credit
Suisse
Conduct and investigations
p conducted dedicated review sessions on material conduct matters, which occurred during the year, and discussed lessons learned and the respective action plans together with the responsible senior management
p received regular reports at every meeting on the status and findings of global investigations into financial crime compliance matters, as well as an overview of conduct related investigations
Financial Crime Compliance governance
p assessed the financial crime compliance organizational and governance changes following the integration of the Risk and Compliance functions in mid-year 2020, including the establishment of a Global Financial Crime Risk Oversight Committee at management level
p held several joint sessions with the Audit Committee, including joint reviews of the key regulatory enhancement programs described above
211Corporate Governance
Risk CommitteeThe Risk Committee consists of at least three members. It may include non-independent members. The Chair of the Audit Com-mittee is generally appointed as one of the members of the Risk Committee. Our Risk Committee currently consists of six mem-bers, all of whom are independent.
Pursuant to its charter, the Risk Committee holds at least four meetings a year. In addition, the Risk Committee usually con-venes for additional meetings throughout the year in order to appropriately discharge its responsibilities. The meetings are attended by management representatives, as appropriate.
The Risk Committee is responsible for assisting the Board in fulfilling its oversight responsibilities by periodically reviewing the Group’s risk management function, its resources and key risks.
As part of its main duties and responsibilities, the Risk Committee:p reviews and assesses the integrity and adequacy of the risk
management function of the Group including risk measure-ment approaches;
p reviews and calibrates risk appetite at the Group level and at the level of key businesses, considering capital, liquidity, fund-ing, credit, market, model, and climate risks, illiquid investment activities, and jointly with the Audit Committee, significant mat-ters of non-financial risk as appropriate;
p reviews and calibrates major risk concentrations;p approves the list of countries to be monitored with internal
country limits and proposes the country limits allocated to such countries to the Board;
p reviews and assesses the business continuity management, risk measurement and management with respect to the inter-nal control system, and annually the firm-wide risk manage-ment framework; and
p reviews, jointly with the Audit Committee, the annual assess-ment of the adequacy and effectiveness of the internal con-trol system, the status of major infrastructure and committed change programs, as well as the control functions’ input into remuneration.
The Risk Committee is regularly informed about the risk profile of the Group, including major risk topics and key initiatives aimed at responding to regulatory change and further improving risk management across the Group. In addition, the Risk Commit-tee mandates the Credit Risk Review function to independently assess Credit Suisse’s credit risk management practices, identify issues impacting the quality of credit risk management and report its findings to the Risk Committee.
The Risk Committee furthermore looks to ensure that key risk developments are addressed appropriately, such as the evolv-ing cyber risk landscape. Senior management, the Board and the Risk Committee are actively engaged and regularly informed on the extent of the threats and mitigations in place to manage cyber incidents. Related business continuity and response plans are tested and simulations are conducted up to the Executive Board and Board level. Significant incidents are escalated to the Risk Committee together with key findings and mitigating actions. The close monitoring of and quick response to cyber threats have been of particular importance during the COVID-19 crisis, which has generally seen an elevated level of cyber threats in the industry.

212 Corporate Governance
Risk Committee activities During 2020 and early 2021, the Risk Committee focused on a number of key areas, including but not limited to the activities described below. Specifically, the Risk Committee:
COVID-19 pandemic management
p actively engaged with management throughout the year to closely monitor and address the changing risk landscape due to the COVID-19 pandemic and the resulting market volatility observed in the first half of 2020, including the review and approval of risk appetite adjustments and monitoring of the implementation of lessons learned from the crisis
p focused, together with management, on actions taken to address liquidity management issues that arose in March 2020 in connec-tion with the initial market reactions to the COVID-19 pandemic
p reviewed regular crisis management reporting from management with particular focus on the development of the lending portfolio, as well as an assessment of the COVID-19 impact on regulatory activities
Risk appetite and risk management frameworks
p reviewed and endorsed the revised risk appetite framework, the Group’s strategic risk objectives and the risk appetite statements for 2021
p reviewed and endorsed a revised and enhanced country risk framework, which moves Credit Suisse toward industry best practice based on feedback from consulting firms; the holistic framework spans across both developed and emerging markets and is based on risk-sensitive stress metrics that cover market and credit risk position taking
p maintained its focus on supporting the Board in reviewing strategically important topics, including adequacy of capital, liquidity and funding and the allocation of capital to Group businesses and major subsidiaries
Infrastructure and key change programs
p reviewed progress on the integration of the Risk and Compliance functions, including the new organizational structure, regulatory interaction during the transition to a unified Risk and Compliance function, and key risks and dependencies
p received regular updates on key change programs in line with regulatory expectations, some jointly with the Audit Committee, includ-ing the global booking model and the legal entity strategy, addressing also the EU target setup and programs focused on enhancing data management and governance
p monitored progress on the Group’s interbank offered rate (IBOR) transition program, an effort to coordinate transition readiness on a group-wide basis for the expected replacement of certain IBOR benchmarks, which included updates on key transition risks and transition scenario analysis
p reviewed, jointly with the Audit Committee, risks related to data management, IT and outsourcingp reviewed, jointly with the Innovation and Technology Committee, risks related to IT security, data protection and cyber risk
Risk monitoring
p monitored the implementation of risk governance enhancements that improved the review, approval and escalation of risk mattersp monitored aspects of the Group’s risk management framework, for example, with respect to model risk, share backed lending,
liquidity risk, stress testing and the internal control frameworkp reviewed implications of Basel III reforms as part of the Group Internal Capital Adequacy Assessment Process review and the
update of the FRTBp conducted focused credit risk reviews for a number of risk concentrations, addressing collateral, emerging market countries or single
name concentrationsp regularly monitored the risk profile and risk appetite for various businesses, including the corporate bank, hedge funds, financial
sponsors, leveraged finance, capital markets, International Wealth Management ship finance, Global Trading Solutions, various Swiss Universal Bank businesses and the Corporate Center, with focus on the Asset Resolution Unit
p reviewed, jointly with the Audit Committee, risks related to pension, hedging, CECL and conduct risk
Climate and sustainability risk
p reviewed the Group’s policy and position with respect to reputational risk and sustainability, with particular focus on existing reputa-tional risk process challenges and key developments related to sustainability, such as the TCFD recommendations
p received a comprehensive briefing on the progress of our climate risk strategy, which, among other aspects, covered key external developments with respect to the management of climate risk at banks, as well as internal progress on the development of energy transition frameworks for the Group’s corporate clients in industries impacted most by climate change, and on our existing commit-ments, such as the restriction of certain business activities in climate-polluting sectors

213Corporate Governance
Innovation and Technology Committee The Board established an Innovation and Technology Committee as an interdisciplinary advisory group in 2015. The group acts as a senior platform to discuss internal progress in relation to innova-tion and technology initiatives, as well as relevant industry-wide technology trends. The Innovation and Technology Committee is chaired by Claude Honegger, senior technology manager at Credit Suisse and Head of Innovation and Technology Transfor-mation. Mr. Honegger assumed the role of committee Chair in 2020 from former Group Board member and senior technology advisor Sebastian Thrun, who chaired the committee since its inception and remains a committee member. Participants in the Innovation and Technology Committee include Board members, the Group Chief Operating Officer (COO), other members of management, internal technology experts and a senior cyberse-curity advisor. The Innovation and Technology Committee typi-cally holds three to four meetings a year. In 2020, the Innova-tion and Technology Committee held three meetings. Committee activities included a review of the COO organization’s response to the COVID-19 pandemic, digitalization opportunities in Wealth Management in general and progress on digital offerings in the Swiss Universal Bank division and a comprehensive update on the digital transformation of the Risk and Compliance function and a review and assessment of the Group’s IT security, data protection and cyber risk management capabilities, which was conducted jointly with the Risk Committee.
Sustainability Advisory CommitteeAt the Investor Update on December 15, 2020, the Group announced its intention to establish a Sustainability Advisory Committee at the Board level. In February 2021, the Board approved the set-up and constitution of the new committee, which will be chaired by Board Sustainability Leader Iris Bohnet and consist of at least two other Board members, three Execu-tive Board members and external advisors. From the Board and Executive Board, the committee members are Urs Rohner, Rich-ard Meddings, Thomas Gottstein, Lydie Hudson and Lara War-ner. Subject to his election at the 2021 AGM, the new Chairman, António Horta-Osório, will become a member of the Sustainability Advisory Committee. The process to select and appoint suitable external advisors is in progress. The Sustainability Advisory Com-mittee will assist the Board, in an advisory capacity, in fulfilling its oversight duties in respect of the development and execution of the Group’s sustainability strategy and targets, and monitor-ing and assessing the effectiveness of the respective sustain-ability programs and initiatives. Responsibilities include endorsing the sustainability strategy and ambitions and ensuring actions are being taken to accomplish them, advising on sustainability metrics and tracking and monitoring progress, and bringing in external expertise, so as to provide a critical outside view across a variety of sustainability topics.

214 Corporate Governance
Biographies of the Board
Urs RohnerBorn 1959Swiss CitizenBoard member since 2009
Chairman of the Board
Professional history
2004–present Credit Suisse
Chairman of the Board and the Governance and Nominations Committee (2011–present)
Member of the Conduct and Financial Crime Control Committee (2020–present), Chair (2019 – 2020)
Member of the Innovation and Technology Committee (2015–present)
Member of the board of Credit Suisse (Schweiz) AG (Swiss subsidiary) (2015–present)
Vice-Chair of the Board and member of the Governance and Nominations Committee (2009 – 2011)
Member of the Risk Committee (2009 – 2011)
Chief Operating Officer (2006 – 2009)
General Counsel (2004 – 2009)
Member of the Executive Board (2004 – 2009)
2000 – 2004 ProSiebenSat.1 Media AG, Chairman of the Executive Board and CEO
1983 – 1999 Lenz & Staehelin
Partner (1992 – 1999)
Attorney (1983 – 1988; 1990 – 1992)
1988 – 1989 Sullivan & Cromwell LLP, New York, attorney
Education
1990 Admission to the bar of the State of New York
1986 Admission to the bar of the Canton of Zurich
1983 Master in Law (lic.iur.), University of Zurich, Switzerland
Other activities and functions
GlaxoSmithKline plc, board member
Swiss Bankers Association, vice-chairman1
Swiss Finance Council, board member1
Institute of International Finance, board member1
European Banking Group, member1
European Financial Services Round Table, member1
University of Zurich Department of Economics, advisory board member
Lucerne Festival, board of trustees member
1 Mr. Rohner performs functions in these organizations in his capacity as Chairman of the Group.
Iris BohnetBorn 1966Swiss CitizenBoard member since 2012
Professional history
2012–present Credit Suisse
Member of the Compensation Committee (2012–present)
Chair of the Sustainability Advisory Committee (2021–present)
Member of the Innovation and Technology Committee (2015–present)
1998–present Harvard Kennedy School
Academic Dean (2018–present, 2010 – 2014)
Albert Pratt Professor of Business and Government (2018–present)
Director of the Women and Public Policy Program (2008–present)
Professor of public policy (2006 – 2018)
Associate professor of public policy (2003 – 2006)
Assistant professor of public policy (1998 – 2003)
1997 – 1998 Haas School of Business, University of California at Berkeley, visiting scholar
Education
1997 Doctorate in Economics, University of Zurich, Switzerland
1992 Master’s degree in Economic History, Economics and Political Science, University of Zurich, Switzerland
Other activities and functions
Publicis Groupe Diversity Progress Council, member
Economic Dividends for Gender Equality (EDGE), advisory board member
We shape tech, advisory board member
Women in Banking and Finance, patron
UK Government Equalities Office/BIT, advisor
Take The Lead Women, advisor

215Corporate Governance
Christian GellerstadBorn 1968Swiss and Swedish CitizenBoard member since 2019
Professional history
2019–present Credit Suisse
Chair of the Conduct and Financial Crime Control Committee (2020–present)
Member of the Governance and Nominations Committee (2020–present)
Member of the Compensation Committee (2019–present)
Member of the Conduct and Financial Crime Control Committee (2019–present)
1994 – 2018 Pictet Group
CEO, Pictet Wealth Management (2007 – 2018)
Executive Committee Member, Banque Pictet & Cie SA, Geneva (2013 – 2018)
Equity Partner, Pictet Group (2006 – 2018)
CEO and Managing Director Banque Pictet & Cie (Europe) S.A., Luxembourg (2000 – 2007)
Deputy CEO and Senior Vice President, Pictet Bank & Trust Ltd., Bahamas (1996 – 2000)
Financial Analyst & Portfolio Manager, Pictet & Cie, Geneva (1994 – 1996)
Before 1994 Cargill International, Emerging Markets Trader
Education
2019 Board Director Diploma, International Institute for Management Development (IMD), Switzerland
1996 Certified International Investment Analyst (CIIA) and Certified Portfolio Manager and Financial Analyst (AZEK)
1993 Master in Business Administration and Economics, University of St. Gallen (HSG), Switzerland
Other activities and functions
Elatior SA, chairman
Nubica SA, board member
Taurus Group SA, board member
FAVI SA, board member
AFICA SA, board member
Tsampéhro SA, board member
Andreas GottschlingBorn 1967German CitizenBoard member since 2017
Professional history
2017–present Credit Suisse
Chair of the Risk Committee (2018–present)
Member of the Governance and Nominations Committee (2018–present)
Member of the Audit Committee (2018–present)
Member of the Risk Committee (2017–present)
Member of the board of Credit Suisse International and Credit Suisse Securities (Europe) Limited (UK subsidiaries) (2018–present)
2013 – 2016 Erste Group Bank, Vienna, Chief Risk Officer and Member of the Management Board
2012 – 2013 McKinsey and Company, Zurich, Senior Advisor Risk Practice
2005 – 2012 Deutsche Bank, London, Frankfurt and Zurich
Member of the Risk Executive Committee & Divisional Board (2005 – 2012)
Global Head Operational Risk (2006 – 2010)
Global Head of Risk Analytics and Instruments (2005 – 2011)
2003 – 2005 LGT Capital Management, Switzerland, Head of Quant Research
2000 – 2003 Euroquants, Germany, Consultant
1997 – 2000 Deutsche Bank, Frankfurt, Head of Quantitative Analysis
Education
1997 Doctorate in Economics, University of California, San Diego, USA
1991 Postgraduate Studies in Physics, Mathematics and Economics, Harvard University, Cambridge, US
1990 Degrees in Mathematics and Economics, University of Freiburg, Germany
Other activities and functions
Deutsche Börse AG, supervisory board member
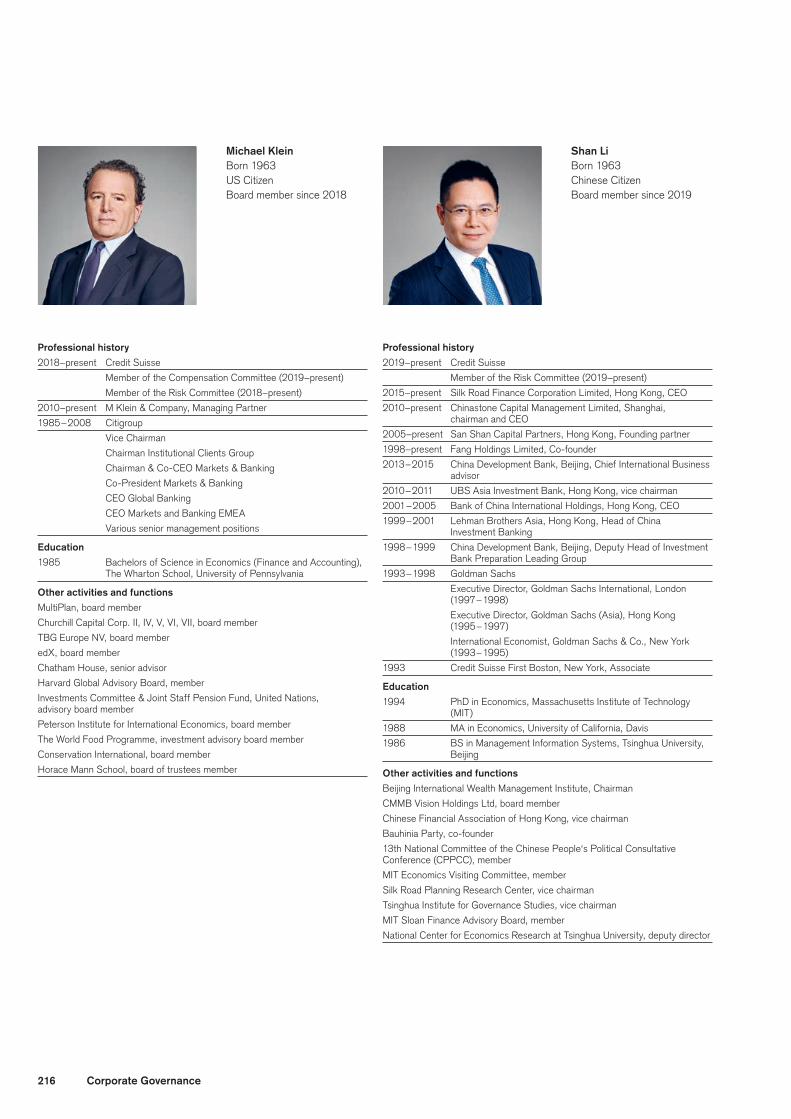
216 Corporate Governance
Michael KleinBorn 1963US CitizenBoard member since 2018
Professional history
2018–present Credit Suisse
Member of the Compensation Committee (2019–present)
Member of the Risk Committee (2018–present)
2010–present M Klein & Company, Managing Partner
1985 – 2008 Citigroup
Vice Chairman
Chairman Institutional Clients Group
Chairman & Co-CEO Markets & Banking
Co-President Markets & Banking
CEO Global Banking
CEO Markets and Banking EMEA
Various senior management positions
Education
1985 Bachelors of Science in Economics (Finance and Accounting), The Wharton School, University of Pennsylvania
Other activities and functions
MultiPlan, board member
Churchill Capital Corp. II, IV, V, VI, VII, board member
TBG Europe NV, board member
edX, board member
Chatham House, senior advisor
Harvard Global Advisory Board, member
Investments Committee & Joint Staff Pension Fund, United Nations, advisory board member
Peterson Institute for International Economics, board member
The World Food Programme, investment advisory board member
Conservation International, board member
Horace Mann School, board of trustees member
Shan LiBorn 1963Chinese CitizenBoard member since 2019
Professional history
2019–present Credit Suisse
Member of the Risk Committee (2019–present)
2015–present Silk Road Finance Corporation Limited, Hong Kong, CEO
2010–present Chinastone Capital Management Limited, Shanghai, chairman and CEO
2005–present San Shan Capital Partners, Hong Kong, Founding partner
1998–present Fang Holdings Limited, Co-founder
2013 – 2015 China Development Bank, Beijing, Chief International Business advisor
2010 – 2011 UBS Asia Investment Bank, Hong Kong, vice chairman
2001 – 2005 Bank of China International Holdings, Hong Kong, CEO
1999 – 2001 Lehman Brothers Asia, Hong Kong, Head of China Investment Banking
1998 – 1999 China Development Bank, Beijing, Deputy Head of Investment Bank Preparation Leading Group
1993 – 1998 Goldman Sachs
Executive Director, Goldman Sachs International, London (1997 – 1998)
Executive Director, Goldman Sachs (Asia), Hong Kong (1995 – 1997)
International Economist, Goldman Sachs & Co., New York (1993 – 1995)
1993 Credit Suisse First Boston, New York, Associate
Education
1994 PhD in Economics, Massachusetts Institute of Technology (MIT)
1988 MA in Economics, University of California, Davis
1986 BS in Management Information Systems, Tsinghua University, Beijing
Other activities and functions
Beijing International Wealth Management Institute, Chairman
CMMB Vision Holdings Ltd, board member
Chinese Financial Association of Hong Kong, vice chairman
Bauhinia Party, co-founder
13th National Committee of the Chinese People‘s Political Consultative Conference (CPPCC), member
MIT Economics Visiting Committee, member
Silk Road Planning Research Center, vice chairman
Tsinghua Institute for Governance Studies, vice chairman
MIT Sloan Finance Advisory Board, member
National Center for Economics Research at Tsinghua University, deputy director

217Corporate Governance
Seraina MaciaBorn 1968Swiss, Australian and US CitizenBoard member since 2015
Professional history
2015–present Credit Suisse
Member of the Risk Committee (2018–present)
Member of the Audit Committee (2015 – 2018)
2020–present Joyn Insurance Services LLC
CEO and co-founder
2017 – 2020 Blackboard U.S. Holdings, Inc. (AIG Corporation)
Executive vice president & CEO of Blackboard (AIG technology-focused subsidiary; formerly Hamilton USA)
2016 – 2017 Hamilton Insurance Group
CEO Hamilton USA
2013 – 2016 AIG Corporation
Executive vice-president and CEO Regional Management & Operations of AIG, New York (2015 – 2016)
CEO and President of AIG EMEA, London (2013 – 2016)
2010 – 2013 XL Insurance North America, chief executive
2002 – 2010 Zurich Financial Services
President Specialties Business Unit, Zurich North America Commercial, New York (2007 – 2010)
CFO Zurich North America Commercial, New York (2006 – 2007)
Various positions, among others: head of the joint investor relations and rating agencies management departments; head of rating agencies management; senior investor relations officer (2002 – 2008)
2000 – 2002 NZB Neue Zuercher Bank, founding partner and financial analyst
1990 – 2000 Swiss Re
Rating agency coordinator, Swiss Re Group (2000)
Senior underwriter and deputy head of financial products, Melbourne (1996 – 1999)
Various senior underwriting and finance positions, Zurich (1990 – 1996)
Education
2001 Chartered Financial Analyst (CFA), CFA Institute, US
1999 MBA, Monash Mt Eliza Business School, Australia
1997 Post-graduate certificate in Management, Deakin University, Australia
Other activities and functions
BanQu, chair
CFA Institute, member
Food Bank for New York City, chair
Richard MeddingsBorn 1958British CitizenBoard member since 2020
Professional history
2020–present Credit Suisse
Chair of the Audit Committee (2020–present)
Member of the Governance and Nominations Committee (2020–present)
Member of the Conduct and Financial Crime Control Committee (2020–present)
Member of the Risk Committee (2020–present)
2018–present TSB Bank plc
Chairman
Interim executive chairman (2018-2019)
2017 – 2019 Jardine Lloyd Thompson Group Plc
Non-executive director
Chair of the Remuneration Committee
Member of the Audit and Risk Committee
2015 – 2019 Deutsche Bank AG
Member of the Supervisory Board
Chair of the Audit Committee, member of the Risk Committee and member of the Strategy Committee
2014 – 2017 Legal & General Group Plc
Non-executive director
Chair of the Risk Committee
Member of the Audit and Remuneration Committee
2008 – 2014 3i Group Plc
Non-executive director and senior independent director
Chair of the Audit and Risk Committee
2002 – 2014 Standard Chartered Group plc
Group executive director
Finance director (2006-2014)
2000 – 2002 Barclays Plc
Group financial controller
COO of Wealth Management Division
1999 – 2000 Woolwich Plc, Group Finance Director
Prior to 1999 BZW (CSFB) (1996-1999)
Hill Samuel Bank (1984-1996)
Price Waterhouse (1980-1984)
Education
1983 UK Chartered Accountant, Institute of Chartered Accountants in England and Wales
1980 MA Modern History, Exeter College, Oxford
Other activities and functions
HM Treasury Board, non-executive director
Teach First, Director and member of the board of trustees
Hastings Educational Opportunity Area, chair

218 Corporate Governance
Kai S. NargolwalaBorn 1950Singaporean CitizenBoard member since 2013
Professional history
2008–present Credit Suisse
Member of the Conduct and Financial Crime Control Committee (2019–present)
Chair of the Compensation Committee (2017–present)
Member of the Governance and Nominations Committee (2017-present)
Member of the Innovation and Technology Committee (2015–present)
Member of the Compensation Committee (2014–present)
Member of the Risk Committee (2013 – 2017)
Non-executive chairman of Credit Suisse’s Asia-Pacific region (2010 – 2011)
Member of the Executive Board (2008 – 2010)
CEO of Credit Suisse Asia Pacific region (2008 – 2010)
1998 – 2007 Standard Chartered plc, main board executive director
Prior to 1998 Bank of America
Group executive vice president and head of Asia Wholesale Banking group in Hong Kong (1990 – 1995)
Head of High Technology Industry group in San Francisco and New York (1984 – 1990)
Various management and other positions in the UK (1976 – 1984)
Peat Marwick Mitchell & Co., London, accountant (1970 – 1976)
Education
1974 Fellow of the Institute of Chartered Accountants (FCA), England and Wales
1969 BA in Economics, University of Delhi
Other activities and functions
Prudential plc. / Prudential Corporation Asia Limited, non-executive director
PSA International Pte. Ltd. Singapore, non-executive director
Temasek International Pte. Ltd, Sustainable Finance Steering Committee, co-chair
Singapore Pools (Private) Limited, Deputy Chairman
Singapore Institute of Directors, Fellow
Ana Paula PessoaBorn 1967Brazilian CitizenBoard member since 2018
Professional history
2018–present Credit Suisse
Member of the Conduct and Financial Crime Control Committee (2019–present)
Member of the Audit Committee (2018–present)
Member of the Innovation and Technology Committee (2018–present)
2017–present Kunumi AI, Partner, investor and chair
2015 – 2017 Olympic & Paralympic Games 2016, CFO of Organising Committee
2012 – 2015 Brunswick Group, Managing partner of Brazilian branch
2001 – 2011 Infoglobo Newspaper Group, CFO and innovation director
1993 – 2001 Globo Organizations, senior management positions in several media divisions
Education
1991 MA, FRI (Development Economics), Stanford University, California
1988 BA, Economics and International Relations, Stanford University, California
Other activities and functions
Cosan, board member
Suzano Pulp and Paper, board member
Vinci Group, board member
News Corporation, board member
Global Advisory Council for Stanford University, member
Instituto Atlántico de Gobierno, advisory board member
Fundação Roberto Marinho, member of the audit committee

219Corporate Governance
Joaquin J. RibeiroBorn 1956US CitizenBoard member since 2016
Professional history
2016–present Credit Suisse
Member of the Audit Committee (2016–present)
1997 – 2016 Deloitte LLP (USA)
Vice chairman (2010 – 2016)
Chairman of Global Financial Services Industry practice (2010 – 2016)
Head of US Financial Services Industry practice (2003 – 2010)
Head of Global Financial Services Industry practice in Asia (1997 – 2003)
Head of South East Asian Corporate Restructuring practice (1997 – 2000)
2005 – 2010 World Economic Forum, senior advisor to Finance Governor’s Committee
Education
1996 Executive Business Certificate, Columbia Business School, New York
1988 MBA in Finance, New York University, New York
1980 Certified Public Accountant, New York
1978 Bachelor’s degree in Accounting, Pace University, New York
Other activities and functions
Mr. Riberio currently does not hold directorships in other organizations.
Severin SchwanBorn 1967Austrian, German and Swiss CitizenBoard member since 2014
Vice-Chair of the Board Lead Independent Director
Professional history
2014–present Credit Suisse
Vice-Chair and Lead Independent Director (2017–present)
Member of the Governance and Nominations Committee (2017–present)
Member of the Risk Committee (2014–present)
Member of the board of Credit Suisse (Schweiz) AG (Swiss subsidiary) (2015 – 2017)
1993–present Roche Group
CEO (2008–present)
Member of the board of Roche Holding Ltd. (2013–present)
CEO Division Roche Diagnostics (2006 – 2008)
Head Asia Pacific Region, Roche Diagnostics Singapore (2004 – 2006)
Head Global Finance & Services, Roche Diagnostics Basel (2000 – 2004)
Various management and other positions with Roche Germany, Belgium and Switzerland (1993 – 2000)
Education
1993 Doctor of Law, University of Innsbruck, Austria
1991 Master’s degrees in Economics and Law, University of Innsbruck, Austria
Other activities and functions
International Business Leaders Advisory Council for the Mayor of Shanghai, member
220 Corporate Governance
John TinerBorn 1957British CitizenBoard member since 2009
Professional history
2009–present Credit Suisse
Member of the Audit Committee (2009–present)
Member of the Conduct and Financial Crime Control Committee (2019 – 2020)
Chair of the Audit Committee (2011 – 2020)
Member of the Governance and Nominations Committee (2011 – 2020)
Member of the Risk Committee (2011 – 2020)
Member of the board of Credit Suisse Holdings (USA), Inc., Credit Suisse (USA), Inc. and Credit Suisse Securities (USA), LLC (US subsidiaries) (2015–present)
2008 – 2013 Resolution Operations LLP, CEO
2001 – 2007 Financial Services Authority (FSA)
CEO (2003 – 2007)
Managing director of the investment, insurance and consumer directorate (2001 – 2003)
Prior to 2001 Arthur Andersen, UK
Managing partner, UK Business Consulting (1998 – 2001)
Managing partner, Worldwide Financial Services practice (1997 – 2001)
Head of UK Financial Services practice (1993 – 1997)
Partner in banking and capital markets (1988 – 1997)
Auditor and consultant, Tansley Witt (later Arthur Andersen UK) (1976 – 1988)
Education
2010 Honorary Doctor of Letters, Kingston University, London
1980 UK Chartered Accountant, Institute of Chartered Accountants in England and Wales
Other activities and functions
Ardonagh Group Limited, chairman
Salcombe Brewery Limited, chairman
Former members of the BoardInformation about former members of the Board is available on our website at credit-suisse.com/annualreporting. Honorary Chairman of Credit Suisse Group AGRainer E. Gut, born 1932, Swiss Citizen, was appointed Honorary Chairman of the Group in 2000 after he retired as Chairman, a position he had held from 1986 to 2000. Mr. Gut was a member of the board of Nestlé SA, Vevey, from 1981 to 2005, where he was vice-chairman from 1991 to 2000 and chairman from 2000 to 2005. As Honorary Chairman, Mr. Gut does not have any function in the governance of the Group and does not attend the meetings of the Board. Secretaries of the BoardJoan E. BelzerRoman Schaerer

221Corporate Governance
Executive BoardMembership
The Executive Board is the most senior management body of the Group. Its members are appointed by the Board. Prior to the appointment of an Executive Board member, the terms and con-ditions of the individual’s employment contract with the Group are reviewed by the Compensation Committee. The Executive Board currently consists of eleven members. The composition of the Executive Board of the Group and the Bank is identical, with the exception of André Helfenstein, who is a member of the Execu-tive Board of the Group, but not the Bank.
Executive Board changesThe Group announced a number of changes to the Executive Board in 2020, as well as changes to the roles of several existing Executive Board members. With effect from February 14, 2020, Thomas Gottstein was appointed Group CEO, succeeding Tidjane Thiam, and André Helfenstein was appointed the new CEO of Swiss Universal Bank and Executive Board member of the Group, as well as the new CEO of Credit Suisse (Schweiz) AG, succeed-ing Thomas Gottstein. With effect from August 1, 2020, Executive Board members Brian Chin, Lara Warner and Lydie Hudson were appointed to the new and/or expanded roles of CEO of the Invest-ment Bank, CRCO and CEO of SRI, respectively. Additionally, with effect from August 1, 2020, David Miller stepped down from the Executive Board and assumed a new senior management role within the Investment Bank.
Members of the Executive Board Executive Board
member since Role
Thomas P. Gottstein, Chief Executive Officer 2015 Group CEO
Romeo Cerutti, General Counsel 2009 Corporate Function Head
Brian Chin, CEO Investment Bank 2016 Divisional Head
André Helfenstein, CEO Swiss Universal Bank 2020 Divisional Head
Lydie Hudson, CEO Sustainability, Research & Investment Solutions 2019 Corporate Function Head
David R. Mathers, Chief Financial Officer 2010 Corporate Function Head
Antoinette Poschung, Global Head of Human Resources 2019 Corporate Function Head
Helman Sitohang, CEO Asia Pacific 2015 Divisional Head
James B. Walker, Chief Operating Officer 2019 Corporate Function Head
Lara J. Warner, Chief Risk and Compliance Officer 2015 Corporate Function Head
Philipp Wehle, CEO International Wealth Management 2019 Divisional Head
Responsibilities
The Executive Board is responsible for the day-to-day operational management of the Group under the leadership of the CEO.
As part of its main duties and responsibilities, the Executive Board:p establishes the strategic business plans for the Group overall
as well as for the principal businesses, subject to approval by the Board;
p regularly reviews and coordinates significant initiatives, projects and business developments in the divisions and the corporate functions, including important risk management matters;
p regularly reviews the consolidated and divisional financial per-formance, including progress on key performance indicators, as well as the Group’s capital and liquidity positions and those of its major subsidiaries;
p appoints and dismisses senior managers, with the exception of managers from Internal Audit, and periodically reviews senior management talent across the Group and talent development programs;
p reviews and approves business transactions, including merg-ers, acquisitions, establishment of joint ventures and establish-ment of subsidiary companies; and
p approves key policies for the Group.
Executive Board committees
The Executive Board has several standing committees, which are chaired by an Executive Board member and meet periodically throughout the year and/or as required. These committees are:p The Executive Board Risk Forum: the Executive Board Risk
Forum, chaired by the CRCO, was established in 2020. The forum is responsible for determining the management strat-egy for critical risk and compliance issues at the Group and/or cross-divisional level, reviewing and resolving issues pertaining to risk escalated by the Capital Allocation & Risk Management Committee (CARMC) or any Executive Board member, review-ing and overseeing critical approvals including, but not limited to, risk appetite and the risk framework and monitoring of key risk and compliance trends and relevant metrics.
p Capital Allocation & Risk Management Committee (CARMC): CARMC is responsible for overseeing and directing our risk profile, recommending risk limits at the Group level to the Risk Committee and the Board, establishing and allocating risk appetite among the various businesses, reviewing new sig-nificant business strategies or changes in business strategies including business migrations, making risk-related decisions on escalations and for applying measures, methodologies and tools to monitor and manage the risk portfolio. CARMC will furthermore escalate items requiring additional oversight

222 Corporate Governance
to the Executive Board Risk Forum. There are three cycles of CARMC which each meet quarterly: the Position & Client Risk cycle (chaired by the CRCO), the Asset & Liability Man-agement cycle (chaired by the CFO) and the Internal Control System cycle (chaired by the Head of Non-Financial Risk, who reports to the CRCO).
p Valuation Risk Management Committee (VARMC): VARMC (chaired by the CFO) is responsible for establishing policies regarding the valuation of certain material assets and the poli-cies and calculation methodologies applied in the valuation process. Further, VARMC is responsible for monitoring and assessing valuation risks, reviewing inventory valuation con-clusions and directing the resolution of significant valuation issues.
p Group Conduct and Ethics Board: the Group CEB (co-chaired by the Global Head of Human Resources and the CEO of SRI since August 1, 2020) is responsible for overseeing how conduct and ethics matters are handled within the divisions and corporate functions and ensuring consistency and align-ment of practices across the Group. The Group CEB conducts reviews of employee sanctions and may perform subsequent evaluations for specific matters that have been escalated by the CEBs established for each division and the corporate func-tions. The Group CEB also oversees the activities of the con-duct and ethics ombudsperson.
The role of the conduct and ethics ombudsperson was created in 2018 as a result of a review of the Group’s global approach to handling claims of sexual harassment. The ombudsperson is accountable directly to the Chief Executive Officer and the Group Conduct and Ethics Board. The ombudsperson’s role is to serve as a point of immediate escalation when sexual harassment claims arise and to ensure there is appropriate awareness of and attention to such claims. The ombudsperson works with our Com-pliance, General Counsel and Human Resources functions as well as our business divisions to review our relevant global train-ing programs, policies and protocols, so that they can be further
enhanced as part of our efforts to prevent sexual harassment at work and to make sure all cases are managed in a fair, accurate and consistent way within our global framework.
> Refer to “Risk management” in III – Treasury, Risk, Balance sheet and Off-balance sheet for information on our risk management oversight.
Executive Board mandates
Our Executive Board members may, similar to our Board mem-bers, assume board or executive level or other roles in compa-nies and organizations outside of the Group, which are collectively referred to as mandates. According to the Group’s AoA (Chap-ter IV, Section 3, The Executive Board, Art. 20f), the number of mandates Executive Board members may hold in listed compa-nies and other organizations outside of the Group is subject to certain restrictions, in order to comply with the Compensation Ordinance and to ensure that our Executive Board members dedi-cate sufficient time to fulfil their executive roles.
The limitations on mandates assumed by Executive Board mem-bers outside of the Group are summarized in the table below.
Type of mandate and limitation – Executive Board
Type of mandate Limitation
Listed companies No more than one other mandate
Other legal entities 1 No more than two mandates
Legal entities on behalf of the Group 2 No more than ten mandates
Charitable legal entities 3 No more than ten mandates
1 Includes private non-listed companies.2 Includes memberships in business and industry associations.3 Also includes honorary mandates in cultural or educational organizations.
No Executive Board member holds mandates in excess of these restrictions. The restrictions shown above do not apply to man-dates of Executive Board members in legal entities controlled by the Group, such as subsidiary boards.
> Refer to “Mandates” in Board of Directors for further information.

223Corporate Governance
Biographies of the Executive Board members
Thomas P. GottsteinBorn 1964Swiss CitizenMember since 2015
Chief Executive Officer
Professional history
1999–present Credit Suisse
Chief Executive Officer of the Group (2020–present)
Member of the board of Credit Suisse (Schweiz) AG (Swiss subsidiary) (2020–present)
CEO Credit Suisse (Schweiz) AG (2016 – 2020)
CEO Swiss Universal Bank (2015 – 2020)
Head of Premium Clients Switzerland & Global External Asset Managers (2014 – 2015)
Head of Investment Banking Coverage Switzerland (2010 – 2013)
Co-Head of Equity Capital Markets EMEA (2007 – 2009)
Head of Equity Capital Markets Switzerland, Austria and Scandinavia, London (2005 – 2007)
Head of Equity Capital Markets Switzerland, Zurich (2002 – 2005)
Investment Banking Department Switzerland (1999 – 2002)
Prior to 1999 UBS
Telecoms Investment Banking and Equity Capital Markets, London
Group Controlling, Zurich
Education
1995 PhD in Finance and Accounting, University of Zurich
1989 Degree in Business Administration and Economics, University of Zurich
Other activities and functions
Credit Suisse Foundation, board member
Swiss Entrepreneurs Foundation, foundation board member
Opernhaus Zurich, board and audit committee member
Romeo CeruttiBorn 1962Swiss and Italian CitizenMember since 2009
General Counsel
Professional history
2006–present Credit Suisse
General Counsel (2009–present)
Global Co-Head of Compliance (2008 – 2009)
General Counsel, Private Banking (2006 – 2009)
1999 – 2006 Lombard Odier Darier Hentsch & Cie
Partner of the Group Holding (2004 – 2006)
Head of Corporate Finance (1999 – 2004)
1995 – 1999 Homburger Rechtsanwälte, Zurich, attorney-at-law
Prior to 1995 Latham and Watkins, Los Angeles, attorney-at-law
Education
1998 Post-doctorate degree in Law (Habilitation), University of Fribourg
1992 Admission to the bar of the State of California
1992 Master of Law (LLM), University of California, Los Angeles
1990 Doctorate in Law, University of Fribourg
1989 Admission to the bar of the Canton of Zurich
1986 Master in Law (lic.iur.), University of Fribourg
Other activities and functions
Vifor Pharma Ltd., vice-chairman
Swiss Finance Institute (SFI), chairman
American-Swiss Chamber of Commerce, legal group member
Ulrico Hoepli Foundation, board of trustees member
224 Corporate Governance
Brian ChinBorn 1977US CitizenMember since 2016
CEO Investment Bank
Professional history
2003–present Credit Suisse
CEO Investment Bank (2020–present)
CEO Global Markets (2016 – 2020)
Member of the board of Credit Suisse Holdings (USA), Inc., Credit Suisse (USA), Inc. and Credit Suisse Securities (USA) LLC (US subsidiaries) (2016–present)
Co-Head of Credit Pillar within Global Markets (2015 – 2016)
Global Head of Securitized Products and Co-Head of Fixed Income, Americas (2012 – 2016)
Other senior positions within Investment Banking (2003 – 2012)
2000 – 2003 Deloitte & Touche LLP, senior analyst, Securitization Transaction Team
Prior to 2000 PriceWaterhouseCoopers LLP, Capital Markets Advisory Services
The United States Attorney’s Office, Frauds division
Education
2000 BS in Accounting, Rutgers University
Other activities and functions
Credit Suisse Americas Foundation, board member
André HelfensteinBorn 1967Swiss and British CitizenMember since 2020
CEO Swiss Universal Bank
Professional history
2007–present Credit Suisse
CEO Swiss Universal Bank (2020–present)
CEO Credit Suisse (Schweiz) AG (2020–present)
Head of Institutional Clients, Swiss Universal Bank (2017 – 2020)
Credit Suisse (Schweiz) AG, member of the executive board (2016-present)
Swiss Universal Bank, member of the executive board (2015-present)
Head of Corporate & Institutional Clients, Swiss Universal Bank (2015 – 2017)
Private & Wealth Management organization in Switzerland: Head of Private Banking Clients, Region Zurich and Region Head Zurich (2013 – 2015)
Private & Wealth Management organization in Switzerland: Head of Private Clients Region Zurich (2010 – 2013)
Head of Products, Sales & Pricing, Credit Suisse Private Banking (2007 – 2010)
1996 – 2007 The Boston Consulting Group (BCG)
Partner & Managing Director (2005 – 2007)
Director BCG CH Recruiting and Member of the BCG CH and US Career Development Committees (2000 – 2007)
Various management and other positions (1996 – 2000)
1993 – 1995 STB Unternehmensentwicklungen AG (VZ VermögensZentrum AG), Associate
Education
1992 Master’s Degree in Business, University of St. Gallen
1990 Certificate in Psychology/Sociology, Université de la Sorbonne
Other activities and functions
Pension Fund CS Group (Schweiz), foundation board and investment committee member
Pension Fund 2 CS Group (Schweiz), foundation board member
Credit Suisse Foundation, foundation board member
FINMA Private Banking Panel, member
SIX Group AG, board and risk committee member
Swiss Entrepreneurs Foundation, foundation board member
Europa Forum Luzern, steering committee member
Venture Incubator AG, board vice chairman
Foundation Bessamin, foundation board member

225Corporate Governance
Lydie HudsonBorn 1979US CitizenMember since 2019
CEO Sustainability, Research & Investment Solutions
Professional history
2008–present Credit Suisse
CEO Sustainability, Research & Investment Solutions (2020–present)
Chief Compliance and Regulatory Affairs Officer (2020)
Chief Compliance Officer (2019 – 2020)
Chief Operating Officer, Global Markets (2015 – 2019)
Chief Operating Officer, Global Equities (2014 – 2015)
Various management and strategy roles in Equities, Fixed Income and Asset Management (2008 – 2014)
2006 – 2008 The Boston Consulting Group, consultant
2001 – 2004 Lehman Brothers, associate, analyst, Global Real Estate Group
Education
2006 Master in Business Administration (MBA), Harvard Business School
2001 Bachelor of Arts, International Politics and Economics, Middlebury College
Other activities and functions
Women‘s Leadership Board, Harvard, board member
Good Shepherd Services, board member
World Economic Forum, Young Global Leader
David R. MathersBorn 1965British CitizenMember since 2010
Chief Financial Officer
Professional history
1998–present Credit Suisse
Chief Financial Officer (2010–present)
CEO of Credit Suisse International and Credit Suisse Securities (Europe) Limited (UK subsidiaries) (2016–present)
Chairman of Asset Resolution Unit (2019–present)
Head of Strategic Resolution Unit (2015 – 2018)
Head of IT and Operations (2012 – 2015)
Head of Finance and COO of Investment Banking (2007 – 2010)
Senior positions in Credit Suisse’s Equity business, including Director of European Research and Co-Head of European Equities (1998 – 2007)
Prior to 1998 HSBC
Global head of equity research (1997 – 1998)
Research analyst, HSBC James Capel (1987 – 1997)
Education
1991 Associate Certification, Society of Investment Analysis
1991 MA in Natural Sciences, University of Cambridge, England
1987 BA in Natural Sciences, University of Cambridge, England
Other activities and functions
European CFO Network, member
Women in Science & Engineering (WISE) program and academic awards and grants at Robinson College, Cambridge, sponsor
TheCityUK, leadership council member
Various other charitable and conservation commitments

226 Corporate Governance
Antoinette PoschungBorn 1956Swiss CitizenMember since 2019
Global Head of Human Resources
Professional history
2008–present Credit Suisse
Global Head of Human Resources (2019–present)
Conduct and Ethics Ombudsperson (2018–present)
Head of Human Resources for Corporate Functions (2018 – 2019)
Head of Talent Development & Organizational Effectiveness (2015 – 2017)
Head of Compensation, Benefits & Payroll (2012 – 2014)
Head of Human Resources Shared Services (2008 – 2012)
2007 – 2008 AXA-Winterthur, member of the Executive Board and Head of Human Resources
2003 – 2007 “Winterthur” Swiss Insurance Group, Head of Human Resources
2001 – 2003 Canton Zurich, Head of Human Resources for the Cantonal Administration
1998 – 2001 Baloise Group, Head of Human Resources Basler Insurance
Education
2016 Certificate of Organizational and Executive Coaching, Columbia University
1989 Master in Education, Psychology and Philosophy, University of Zurich
Other activities and functions
Ms. Poschung currently does not hold directorships in other organizations.
Helman SitohangBorn 1965Singaporean CitizenMember since 2015
CEO Asia Pacific
Professional history
1999–present Credit Suisse
CEO Asia Pacific (2015–present)
Regional CEO APAC (2014 – 2015)
Head of Investment Banking Asia Pacific (2012 – 2015)
Co-Head of the Emerging Markets Council (2012 – 2015)
CEO of South East Asia (2010 – 2015)
Co-Head of the Investment Banking Department – Asia Pacific (2009 – 2012)
Co-Head of the Global Markets Solutions Group – Asia Pacific (2009 – 2012)
Country CEO, Indonesia (1999 – 2010)
Prior to 1999 Bankers Trust, derivatives group
Citibank, corporate bank
Schlumberger Overseas, field engineer
Education
1989 BS degree in Engineering, Bandung Institute of Technology
Other activities and functions
Credit Suisse Foundation, board member
Room to Read Singapore Ltd., regional board member, SEA board chairman

227Corporate Governance
James B. WalkerBorn 1965British and US CitizenMember since 2019
Chief Operating Officer
Professional history
2009–present Credit Suisse
Chief Operating Officer (2019–present)
Chief Financial Officer of Credit Suisse Holdings (USA), Inc. and Regional Americas Finance lead (2018 – 2019)
Finance Chief Operating Officer (2016 – 2019)
Head of Finance Change (2014 – 2019)
Global Head of Product Control (2011 – 2019)
Head of Americas Investment Banking Operations and Global Head of OTC Operations (2009 – 2011)
2007 – 2009 Barclays Capital, New York, CFO, Americas
1994 – 2007 Merrill Lynch
CFO, Global Markets & Investment Banking, New York (2005 – 2007)
CFO, Global Equities and Fixed Income, New York (2003 – 2005)
CFO, Global Fixed Income, New York (2002 – 2003)
CFO, Securities Services Division, New York (2000 – 2002)
Various senior management positions (1994 – 2000)
1986 – 1994 Morgan Stanley, various finance and derivative finance roles
Education
1986 Postgraduate Diploma Finance, University of Stirling
1985 Bachelor of Science Mathematics, University of Glasgow
Other activities and functions
Mr. Walker currently does not hold directorships in other organizations.
Lara J. WarnerBorn 1967Australian and US CitizenMember since 2015
Chief Risk and Compliance Officer
Professional history
2002–present Credit Suisse
Chief Risk and Compliance Officer (2020–present)
Chief Risk Officer (2019 – 2020)
Member of the board of Credit Suisse Holdings (USA), Inc., Credit Suisse (USA), Inc. and Credit Suisse Securities (USA) LLC (US subsidiaries) (2019–present)
Chief Compliance and Regulatory Affairs Officer (2015 – 2019)
Chief Operating Officer, Investment Banking (2013 – 2015)
Chief Financial Officer, Investment Banking (2010 – 2015)
Head of Global Fixed Income Research (2009 – 2010)
Head of US Equity Research (2004 – 2009)
Senior Equity Research Analyst (2002 – 2004)
1999 – 2001 Lehman Brothers, equity research analyst
Prior to 1999 AT&T
Director of Investor Relations (1997 – 1999)
Chief Financial Officer, Competitive Local Exchange Business (1995 – 1997)
Various finance and operating roles (1988 – 1995)
Education
1988 Bachelor of Science – Finance, Pennsylvania State University
Other activities and functions
Women’s Leadership Board of Harvard University’s John F. Kennedy School of Government, member/Chair Emeritus
Harvard Kennedy School – Dean‘s Executive Committee, board member
Pennsylvania State University Board of Visitors, member

228 Corporate Governance
Philipp WehleBorn 1974German CitizenMember since 2019
CEO International Wealth Management
Professional history
2005–present Credit Suisse
CEO International Wealth Management (2019–present)
CFO International Wealth Management (2015 – 2019)
Head of Finance Private Banking Coverage (2015)
Head of Financial Management Region & Wealth Management Switzerland (2013 – 2014)
Head of Financial Management Private Banking Asia Pacific (2011 – 2012)
Head of Controlling Private Banking Switzerland (2007 – 2011)
Senior Project Manager, Business Development Private Banking Switzerland (2005 – 2007)
2001 – 2005 Consart Management Consultants, Consultant / Project Manager
Education
2001 Master’s Degree in Economics, University of Bonn, Germany
Other activities and functions
Credit Suisse Asset Management & Investor Services (Schweiz) Holding AG, board member
Credit Suisse Foundation, board member
Akademischer Hilfsfond, Bonn, member
Former members of the Executive BoardInformation about former members of the Executive Board is available on our website at credit-suisse.com/annualreporting.

229Corporate Governance
Additional informationBanking relationships with Board and Executive Board members and related party transactions
The Group is a global financial services provider. Many of the members of the Board and the Executive Board, their close family members or companies associated with them maintain banking relationships with us. The Group or any of its banking subsidiar-ies may from time to time enter into financing and other bank-ing agreements with companies in which current members of the Board or the Executive Board have a significant influence as defined by the SEC, such as holding executive and/or board level roles in these companies. With the exception of the transac-tions described below, relationships with members of the Board or the Executive Board and such companies are in the ordinary course of business and are entered into on an arm’s length basis. Also, unless otherwise noted, all loans to members of the Board, members of the Executive Board, their close family members or companies associated with them were made in the ordinary course of business, were made on substantially the same terms, including interest rates and collateral, as those prevailing at the time for comparable transactions with other persons and did not involve more than the normal risk of collectability or present other unfavorable features. As of December 31, 2020, 2019 and 2018, there were no loan exposures to such related parties that were not made in the ordinary course of business and at prevailing market conditions.
> Refer to “Board loans” and “Executive Board loans (audited)” in V – Compen-sation – Board of Directors compensation and – Executive Board compensa-tion, respectively, for the outstanding loans to members of the Board and the Executive Board.
Related party transactions
In December 2018, a subsidiary of the Group executed a transac-tion with an affiliate to sell a minority interest in a trading platform for a gain of approximately USD 80 million.
External Audit
External Audit forms an integral part of the Group’s corporate governance framework and plays a key role by providing an inde-pendent assessment of our operations and internal controls.
> Refer to “Audit Committee” in Board of Directors – Board committees for fur-ther information on the responsibilities of the audit committee.
External auditor rotationAs of the AGM in April 2020, PwC was approved by sharehold-ers as the Group’s new statutory auditor for the fiscal year ending December 31, 2020 and PwC’s appointment by the Board as FINMA regulatory auditor was formally confirmed.
Over the course of 2020, corresponding measures were under-taken by the Audit Committee to ensure an orderly and effective transition of external auditor responsibilities. The Audit Committee
reviewed the processes followed to ensure PwC’s independence, according to applicable external auditor independence standards, and extended the scope of its policy on non-audit service restric-tions to PwC.
Principal external auditorThe Group retains a single global audit firm as its principal exter-nal auditor to perform both the statutory (financial) audit and the regulatory audit work mandated by FINMA. The AGM elects the statutory auditor annually, while the Board is responsible for the appointment of the regulatory auditor.
Our principal external auditor is PwC, Birchstrasse 160, 8050 Zurich, Switzerland. The mandate was first given to PwC for the fiscal year ending December 31, 2020, following share-holder approval for the appointment of PwC at the 2020 AGM. The Group is not subject to mandatory external audit firm rota-tion requirements; however, the lead audit partners are subject to periodic rotation requirements. Audit partner rotation is key to ensuring the highest level of audit quality. In general, audit part-ners with key roles or signing obligations for the Group or material Group entities are subject to a maximum of five years of service. Audit partners with roles overseeing non-material Group entities or serving a supplemental role are subject to a maximum of seven years of service. Specialist partners, including (but not limited to) IT, valuation, tax and forensic areas are not subject to mandated rotation. The lead Group engagement partners are Matthew Fal-coner, Global Lead Partner, Matthew Goldman, Group Engage-ment Partner and Andrin Bernet, Lead Regulatory Audit Partner.
> Refer to “Audit Committee” in Board of Directors – Board committees for fur-ther information on audit rotation.
GovernanceThe Audit Committee monitors and pre-approves the fees to be paid to the principal external auditor for its services. It has developed and approved a policy on the engagement of public accounting firms that is designed to help ensure that the indepen-dence of the external auditor is maintained at all times.
The policy limits the scope of services that the principal external auditor may provide to us or any of our subsidiaries in connection with its audit and stipulates certain permissible types of non-audit services, including audit-related services and tax services that have been pre-approved by the Audit Committee. The princi-pal external auditor is required to report periodically to the Audit Committee about the scope of the services it has provided and the fees for the services it has performed to date. The principal external auditor also provides a report as to its independence to the Audit Committee at least once a year. In accordance with our pre-approval policy and as in prior years, all non-audit services provided in 2020 were pre-approved.
The fees paid to PwC as the Group’s principal external auditors for the financial year 2020 and to KPMG for the financial year 2019 are provided in the following table.

230 Corporate Governance
Fees paid to the principal external auditor
for financial year 2020 2019 % change
Fees (CHF million)
Audit services 1 58.1 56.0 4
Audit-related services 2 2.5 5.5 (55)
Tax services 3 0.2 2.4 (92)
1 Audit services include the integrated audit of the Group’s consolidated and statutory financial statements, interim reviews and comfort and consent letters. Additionally, they include all assurance and attestation services related to the regulatory filings of the Group and its subsidiaries. Audit fees exclude value-added taxes.
2 Audit-related services are primarily in respect of: (i) reports related to the Group’s compli-ance with provisions of agreements or calculations required by agreements; (ii) account-ing advice; (iii) audits of private equity funds and employee benefit plans; and (iv) regula-tory advisory services.
3 Tax services are in respect of tax compliance and consultation services, including: (i) preparation and/or review of tax returns of the Group and its subsidiaries; (ii) assistance with tax audits and appeals; and (iii) confirmations relating to the Qualified Intermediary status of Group entities.
The principal external auditor attends all meetings of the Audit Committee and reports on the findings of its audit and/or interim review work. The Audit Committee reviews the principal external auditor’s audit plan on an annual basis and evaluates the perfor-mance of the principal external auditor and its senior representa-tives in fulfilling their responsibilities. Moreover, the Audit Commit-tee recommends to the Board the appointment or replacement of the principal external auditor, subject to shareholder approval as required by Swiss law.
Special auditorIn addition, the 2020 AGM elected, pursuant to Art. 21 of our AoA, the firm BDO AG, Fabrikstrasse 50, 8031 Zurich, Swit-zerland, as special auditor for the purposes of issuing the legally required report for capital increases in accordance with Article 652f of the Swiss Code of Obligations, mainly relating to the valuation of companies in consideration of the qualified capital increases involving contributions in kind. BDO AG did not provide any such services in 2020 and 2019.
Other information
Complying with rules and regulations We fully adhere to Swiss corporate law and the principles set out in the Swiss Code of Best Practice for Corporate Governance, dated August 28, 2014, including its appendix stipulating recommenda-tions on the process for setting compensation for the Board and the Executive Board.
In connection with our primary listing on the SIX Swiss Exchange, we are subject to the Directive on Information relating to Cor-porate Governance, dated June 20, 2019 (in effect since Janu-ary 2, 2020). Our shares are also listed on the NYSE in the form of ADS and certain of the Bank’s exchange traded notes are listed on Nasdaq. As a result, we are subject to certain US rules and regulations. We adhere to the NYSE’s and Nasdaq’s corpo-rate governance listing standards (NYSE and Nasdaq standards), with a few exceptions where the rules are not applicable to for-eign private issuers.
The following are the significant differences between our corporate governance standards and the corporate governance standards applicable to US domestic issuers listed on the NYSE and Nasdaq:p Approval of employee benefit plans: NYSE and Nasdaq stan-
dards require shareholder approval of the establishment of, and material revisions to, certain equity compensation plans. We comply with Swiss law, which requires that shareholders approve the creation of conditional capital used for the issu-ance of shares for employee benefit plans and other equity compensation plans, as well as approve the remuneration of executives, but does not require shareholders to approve the terms of such plans.
p Risk assessment and risk management: NYSE standards allocate the responsibility for the discussion of guidelines and policies governing the process by which risk assessment and risk management is undertaken to the Audit Committee, while at the Group these duties are assumed by the Risk Commit-tee, in line with Swiss regulatory standards and expectations. Whereas our Audit Committee members satisfy the NYSE as well as Nasdaq independence requirements, our Risk Commit-tee may include a minority of non-independent members.
p Independence of nominating and corporate governance commit-tee: NYSE and Nasdaq standards require that all members of the nominating and corporate governance committee be inde-pendent. The Group’s Governance and Nominations Commit-tee is currently composed entirely of independent members, but according to its charter, may include non-independent members.
p Reporting: NYSE standards require that certain board com-mittees report specified information directly to shareholders, while under Swiss law only the Board reports directly to the shareholders and the committees submit their reports to the full Board.
p Appointment of the external auditor: NYSE and Nasdaq stan-dards require that an Audit Committee of a listed company comply with and have the authority necessary to comply with the requirements of Rule 10A-3 of the Securities Exchange Act of 1934. Rule 10A-3 requires the Audit Committee to be directly responsible for the appointment, compensation, reten-tion and oversight of the external auditor unless there is a conflicting requirement under home country law. Under Swiss law, the appointment of the external auditor must be approved by the shareholders at the AGM based on the proposal of the Board, upon the recommendation of the Audit Committee.
p Audit Committee charter: Nasdaq standards require the Audit Committee to review and assess the adequacy of its charter on an annual basis, while our Audit Committee’s charter only requires review and assessment from time to time in accor-dance with applicable Swiss laws.
p Executive sessions: NYSE and Nasdaq standards require the board of directors to meet regularly in executive sessions com-posed solely of independent directors. Our Board meets regularly in executive sessions comprising all directors, including any direc-tors determined not to be independent. However, if any item dis-cussed at the meeting raises a conflict of interest for any of our directors, such director may not participate in the related decision making. In line with Swiss law, the Board does not include any directors who are also members of management.

231Corporate Governance
p Quorums: Nasdaq standards require that the company’s by-laws provide for a quorum of at least 331/3% of the outstand-ing shares of the company’s common stock for any meeting of the holders of common stock. Consistent with Swiss corporate law, the Group’s AoA (Chapter IV, Section 1, The General Meeting of Shareholders, Art. 12), call for a quorum in certain instances, but do not require a quorum of 331/3% or greater of the holders of the outstanding shares of common stock for any meeting of shareholders.
p Independence: NYSE and Nasdaq independence standards specify thresholds for the maximum permissible amount of (i) direct compensation that can be paid by the company to a director or an immediate family member thereof, outside of such director’s directorship fees and other permitted payments; and (ii) payments between the company and another com-pany at which such director or an immediate family member thereof is an executive officer, controlling shareholder, partner or employee. Our independence standards do not specify thresh-olds for direct compensation or cross-company payments or rev-enues, but consider these facts in the overall materiality of the business relationship determination for independence purposes.
Fiduciary duties and indemnificationThe Swiss Code of Obligations requires directors and members of senior management to safeguard the interests of the corpora-tion and, in connection with this requirement, imposes the duties of care and loyalty on directors and members of senior management. While Swiss law does not have a specific provision on conflicts of interest, the duties of care and loyalty are generally understood to disqualify directors and members of senior management from par-ticipating in decisions that could directly affect them. Directors and members of senior management are personally liable to the corpo-ration for any breach of these provisions.
The Group’s AoA and the Bank’s AoA do not contain provisions regarding the indemnification of directors and officers. According to Swiss statutory law, an employee has a right to be indemnified by the employer against losses and expenses incurred by such person in the execution of such person’s duties under an employ-ment agreement, unless the losses and expenses arise from the employee’s gross negligence or willful misconduct. It is our policy to indemnify current and former directors and/or employ-ees against certain losses and expenses in respect of service as a director or employee of the Group, one of the Group’s affiliates or another entity that we have approved, subject to specific condi-tions or exclusions. We maintain directors’ and officers’ insurance for our directors and officers.
Fees and charges for holders of ADSIn November 2016, the Group entered into a deposit agreement with The Bank of New York Mellon as depositary for the ADS (Depositary). In accordance with the deposit agreement, the Depositary may charge holders of our ADS, either directly or indi-rectly, fees or charges up to the amounts described below.
The Depositary collects its fees and related expenses for the delivery and surrender of ADS directly from investors deposit-ing or surrendering ADS for the purpose of withdrawal or from intermediaries acting for them. The Depositary collects fees and expenses for making distributions to holders by deducting those fees and expenses from the amounts distributed or by selling a portion of distributable property to pay the fees and expenses. The Depositary may generally refuse to provide any services until its fees for those services are paid.
Fees and charges for holders of ADS
Fees
USD 5 (or less) per 100 ADS For the issuance of ADS, including issuances resulting from a distribution of shares, share dividends, share splits (or portion thereof) and other property; for ADS issued upon the exercise of rights; and for the surrender of ADS for cancellation and withdrawal of shares.
USD 0.05 (or less) per ADS For any distribution of cash to ADS registered holders, including upon the sale of rights or other entitlements.
Registration or transfer fees For the transfer and registration of shares on our share register to or from the name of the Depositary or its agent when the holder deposits or withdraws shares.
Charges
Expenses of the Depositary For cable and facsimile transmissions (when expressly provided in the deposit agreement); and for converting foreign currency to US dollars.
Taxes and other governmental Paid, as necessary, to the Depositary or the custodian who pays certain charges on any ADS or share underlying charges an ADS, for example, stock transfer taxes, stamp duty or applicable interest or penalty thereon.
Other charges Paid, as necessary, to the Depositary or its agents for servicing the deposited shares.
Amounts paid by the Depositary to the GroupIn 2020, in accordance with the deposit agreement, the Deposi-tary made payments to the Group in an aggregated amount of USD 0.4 million, including for the reimbursement of expenses relating to its ADS program. The Depositary has also contractu-ally agreed to provide certain ADS program-related services free of charge.
Under certain circumstances, including removal of the Depositary or termination of the ADS program by the Group, the Group is required to repay certain amounts paid to the Group and to com-pensate the Depositary for payments made or services provided on behalf of the Group.

232 Corporate Governance
[this page intentionally left blank]

233
Letter from the Chair of the Compensation Committee 234
Executive Board compensation 238
Groupcompensation 246
Board of Directors compensation 255
Compensationdesign 260
Compensationgovernance 265
ReportoftheStatutoryAuditor 267
V – Compensation
234 Compensation
Compensation
Letter from the Chair of the Compensation Committee
Kai S. NargolwalaChair of the Compensation Committee
Dear shareholders
As Chair of the Compensation Committee of the Board of Direc-tors (Compensation Committee), I am pleased to present to you the 2020 Compensation Report.
We have all experienced an unprecedented period during 2020 on various levels, with extreme market volatility, global economic disruption, restricted mobility and social distancing driven by the COVID-19 pandemic, all factors which the Compensation Com-mittee has had to consider and balance during the year.
As a global company operating in more than 50 countries, Credit Suisse had an important role to play in mitigating the effects of the crisis on our employees and the broader community. Several measures and initiatives were successfully implemented during the year, including: p Highly effective global crisis management framework and busi-
ness continuity management enabling approximately 90% of our employees to work from home;
p Free COVID-19 antibody tests to employees; p Extended paid family leave to employees in locations where
schools remain closed; p Support for small-medium enterprises (SME) and the Swiss
economy with ~CHF 3.0 billion of COVID-19 bridging loans, on which we did not generate any profits;
p A bank-wide matching donation program that raised CHF 25 million in support of relief efforts to mitigate the hard-ship caused by COVID-19 and to support those affected by inequality. This included donations committed by the Executive Board of at least 20% of their annual base salary during six months in 2020, with the Chairman of the Board of Directors (Board) making a similar commitment; and
p Various well-being initiatives for employees. 92% of employ-ees felt well-supported and informed by management’s response to the COVID-19 pandemic, based on an internal pulse survey in June 2020.
The above measures were achieved without the use of govern-mental support, and there were no reductions in the workforce directly attributed to the COVID-19 pandemic.
As an organization, Credit Suisse welcomed Thomas Gottstein as Group CEO in February 2020. Mr. Gottstein refined our strat-egy during the year to focus on growth and operational synergies with several key initiatives. These included creating one global Investment Bank; integrating our Risk and Compliance functions; establishing the Sustainability, Research & Investment Solutions (SRI) function; continuing the integration of Neue Aargauer Bank (NAB) in SUB; and launching our digital banking offering CSX to position Credit Suisse as a digital leader in banking in Switzer-land. As a result of these structural changes, several of the Exec-utive Board members have taken on expanded roles, continuing the strong ethic of talent development at Credit Suisse.
COVID-19 and impact on compensation
During the year, the Compensation Committee monitored closely the evolving regulatory guidance, proxy advisor commentary and peer compensation decisions concerning the COVID-19 pan-demic. The Compensation Committee assessed the impact of the COVID-19 pandemic on our existing Group and Executive Board compensation framework and design, including pay for performance, alignment with the interests of our shareholders, and motivation and retention of talent. After careful consider-ation, the Compensation Committee decided not to modify any of the performance conditions or features of “in-flight” awards. With respect to the overall Group variable compensation pool, the Compensation Committee noted that the 2020 financial results reflect a substantial increase in the provision for credit losses to take into account the impact of the pandemic, contributing to a significant year-on-year decrease in reported income before taxes. With respect to Executive Board compensation, in addi-tion to the above, the short-term incentive (STI) and long-term incentive (LTI) variable compensation awards are both deter-mined based on financial metrics that include the full effects of significant items and major litigation provisions. Therefore, the Compensation Committee decided not to exercise any discre-tion (positive or negative) to modify the Group or Executive Board variable compensation outcomes.
Underlyingperformancehighlightsin2020
Against a backdrop of challenging market conditions, reported net revenues were stable year on year. Reflecting the uncertain economic environment triggered by the COVID-19 pandemic, the Group reported a provision for credit losses of CHF 1.1 billion, an increase of CHF 772 million year on year, resulting in reported income before taxes of CHF 3.5 billion, 27% lower than the previ-ous year. Reported results were also negatively impacted by major litigation provisions of CHF 988 million, primarily in connection with legacy mortgage-related cases, and by restructuring expenses. Excluding these as well as real estate gains and expenses related to real estate disposals, adjusted income before taxes was 6% lower than the prior year. In assessing the Group’s financial perfor-mance, the Compensation Committee adopted the same approach as in the previous year towards the treatment of significant items that did not reflect underlying performance. For example, in 2019 the gain related to the transfer of the Credit Suisse InvestLab AG

235Compensation
-27% -2.1pps
Income before taxes (CHF billion)
Assets under management (CHF billion)
Return on tangible equity (%)
Group performance highlights
4.7 8.7
3.5 6.6
2019 20192020
+6%
4.14.4
2019 2020
Adjusted income before taxes excludingsignificantitems (CHF billion)
+0.3%
1,507 1,512
2019 2020 2020
Return on tangible equity, a non-GAAP financial measure, is based on tangible shareholders’ equity, a non-GAAP financial measure, which is calculated by deducting goodwill and other intangible assets from total shareholders’ equity as presented in our balance sheet. Results excluding items included in our reported results are non-GAAP financial measures. Refer to “Reconciliation of adjusted results” in II – Operating and financial review – Credit Suisse for further information.
fund platform (InvestLab) to Allfunds Group and the revaluation gain related to our equity investment in SIX Swiss Exchange Group AG (SIX) were not considered part of underlying performance in determining the 2019 variable incentive compensation pool. Simi-larly, in 2020, the gain related to the completed transfer of Invest-Lab to Allfunds Group, the respective revaluation gains related to our equity investments in SIX, Pfandbriefbank and Allfunds Group, and the impairment related to the investment in York Capital Man-agement (York) were not considered reflective of underlying Group performance. Taking all of the above into consideration, the Com-pensation Committee noted that the underlying performance of the Group, as measured by adjusted income before taxes excluding significant items, increased 6% compared with the prior year. It is important to note, however, that the full impact of these items was taken into account in determining the Executive Board’s 2020 STI awards, which in aggregate, were 30% lower year on year.
in 2020 2019 % change
Results (CHF million)
Income/(loss) before taxes 3,467 4,720 (27)
Total adjustments 1,181 248 376
Adjusted income before taxes 4,648 4,968 (6)
Significant items
gain related to InvestLab transfer 268 327 (18)
gain on equity investment in Allfunds Group 127 0 –
gain on equity investment in SIX Group AG 158 498 (68)
gain on equity investment in Pfandbriefbank 134 0 –
impairment on York Capital Management (414) 0 –
Adjusted income before taxes
excluding significant items 4,375 4,143 6
Adjusted results are non-GAAP financial measures which exclude certain items included in our reported results. Refer to “Reconciliation of adjusted results” in II – Operating and finan-cial review – Credit Suisse for further information.
In terms of business performance, Wealth Management-related businesses delivered resilient performance, driven by stronger transaction-based revenues. Net new assets (NNA) in our Wealth Management businesses were CHF 19.4 billion and our assets under management (AuM) increased slightly at CHF 1.5 trillion with positive market movements and NNA offsetting significant negative foreign exchange-related effects. In global investment banking, Capital Markets & Advisory revenues increased 31% compared with the prior year, with IPO activity resulting in a num-ber 1 ranking by volume for global IPOs. Our investment banking and capital markets business within APAC was ranked number 3 in 2020 with increased share of wallet for the fifth consecu-tive year, among international banks in APAC excluding Japan and China onshore. Global Trading Solutions (GTS), our internal collaboration among our four divisions delivering institutional-style solutions to our Wealth Management clients, recorded strong rev-enue growth, with revenues up 31% year on year.
> References to our Wealth Management-related businesses mean our Swiss Universal Bank division, our International Wealth Management division and our Asia Pacific division or their combined results.
> References to our Wealth Management businesses mean the Private Clients business within Swiss Universal Bank, the Private Banking business within International Wealth Management and the Asia Pacific division or their com-bined results.
> References to Capital Markets & Advisory mean capital markets revenues and advisory and other fees within global investment banking.
After considering the underlying Group and divisional financial performance, relative performance versus peers, market position and market trends, as well as the current social and economic conditions and risk, control, compliance and conduct and eth-ics considerations, the Compensation Committee proposed an overall Group variable incentive compensation pool of CHF 2,949 million, which was approved by the Board. This amount is 7% lower than the prior year, and reflects a balance between lower reported results impacted by significant items and a 6% increase in adjusted income before taxes excluding significant items, as well as a response to the COVID-19 pandemic and resulting eco-nomic environment.
Compensationoutcomesfor2020
Executive Board compensationTotal aggregate Executive Board compensation for 2020 of CHF 68.4 million, 12% lower than the prior year, is comprised of: p CHF 29.0 million fixed compensation, a portion of which has
been paid from the approved pool for fixed compensation for new and promoted Executive Board members;

236 Compensation
–12% –7%–20% –1%
Executive Board compensation (CHF million)
Group variable incentive compen-sation awarded (CHF million)
CEO compensation2 (CHF million)
Board of Directors compensation (CHF million)
31.5
22.4
23.5
3,1682,949
11.3 11.177.4 10.7
8.568.4
3.5
3.3
3.9
10.8
29.0
15.7
23.7
2.9
2.0
3.610.8
2019 20192019 20192020 20202020 2020
Figures above may contain rounding differences.1 Fixed compensation includes base salary, role-based allowances, dividend equivalents, pension and other benefits.2 Compensation for former Credit Suisse Group CEO Tidjane Thiam in 2019 and Mr. Gottstein in 2020.3 Compensation related to subsidiary board membership.
LTI
Group Board
LTI
STISTI
Fixed1Fixed1
0.330.53
p CHF 15.7 million short-term incentive (STI) award, subject to shareholder approval at the 2021 Annual General Meeting (AGM); and
p CHF 23.7 million long-term incentive (LTI) opportunity at fair value at the time of grant.
> Refer to “Executive Board compensation” for further information.
The decrease in Executive Board compensation was mainly due to the 30% decrease in the amount of STI variable compensation awarded. The average payout on the 2020 STI awards was 48% of the maximum opportunity compared with 68% for the prior year, primarily driven by the higher provision for credit losses, increased major litigation provisions and the York impairment.
ChiefExecutiveOfficer(CEO)compensationMr. Gottstein’s total compensation granted for 2020 of CHF 8.5 mil-lion was 20% lower than the previous CEO’s compensation for the prior year. This decrease was mainly driven by a lower achievement on the 2020 STI financial performance targets, and also reflects a lower overall maximum compensation opportunity compared with the previous CEO.
Including deferred compensation that settled in 2020 relating to his role prior to being appointed CEO, Mr. Gottstein’s realized compensation for 2020 was CHF 4.2 million (excluding dividend equivalents, pension and other benefits), compared with CHF 6.9 million for the prior year for the previous CEO.
> Refer to “Compensation of the CEO and highest paid Executive Board mem-ber” in Executive Board compensation for further information.
Vestingofthe2018LTI(2018-2020performancecycle)To align the interests of the Executive Board to those of long-term shareholders, more than half of the Executive Board variable incentive compensation is in the form of LTI opportunities, subject to challenging performance conditions over a three-year perfor-mance period, and further subject to share price performance until settlement of the award. For the 2018-2020 performance period, the average return on tangible equity (RoTE), the average adjusted tangible book value per share (TBVPS) and the relative total shareholder return (RTSR) resulted in achievement of 54% of the maximum opportunity after step-downs and departures. Based on the share price at the end of 2020, the estimated value of the 2018 LTI was 35% of the maximum opportunity after step-downs and departures. The final value of the awards at delivery may differ from the value at the end of 2020 due to subsequent share price movement.
> Refer to “Executive Board compensation” for further information, including a description of RoTE and adjusted TBVPS.
Group compensationAs discussed earlier, the Compensation Committee noted the Group’s solid underlying performance, as reflected by the 6% increase in adjusted income before taxes excluding significant items, and proposed a Group variable incentive pool of CHF 2,949 million, 7% lower compared with the previous year. Differentiation continues to be a focus, with the highest-performing employees rewarded for their contribution to the Group’s financial performance.
With respect to recent reports and announcements regarding the Credit Suisse Asset Management managed supply chain finance funds, the Compensation Committee is monitoring developments closely and will determine, based on investigation results, any appropriate actions to be applied, including the application of the Group’s existing malus and clawback provisions on variable com-pensation awards. The payout and vesting of variable compensa-tion of a number of senior employees involved in these matters, up to and including Executive Board members, has been suspended as a measure to ensure that we can reconsider the variable com-pensation for 2020 and are able to apply malus or clawback, if appropriate.
Board of Directors (Board) compensationAggregate compensation to the Board for the Group and subsid-iary boards was CHF 11.1 million, compared with the amount of CHF 12.0 million that was approved prospectively by sharehold-ers at the 2020 AGM.
> Refer to “Board of Directors compensation” for further information.

237Compensation
At the 2021 AGM, the Board will propose to shareholders the election of António Horta-Osório as the new Chairman of the Board. The current compensation structure will remain unchanged, including fee levels for the Chairman.
Annual review of our compensation framework and shareholder engagement
As part of the annual review, the Compensation Committee assessed whether current practices remain appropriately competi-tive, in light of regulatory and market developments. During the year, I also met with many of our key shareholders to discuss our compensation design, and I appreciate the open discussions and feedback that we received. The Compensation Committee decided that the current compensation framework for both the Executive Board and Group employees continues to be broadly fit for pur-pose, with some refinements for 2021. The STI structure will be further enhanced by introducing division-specific financial metrics for the heads of the business divisions, in addition to the current RoTE, adjusted income before taxes and non-financial assess-ment. For the 2021 LTI, with respect to the relative total share-holder return (RTSR), we will retain the zero payout for a rank within the lowest five and maximum payout for a rank within the top five, with smoother payout levels for rankings in between to avoid large movements, positive or negative, based on small differences in TSR compared with peers. In the ever-changing operating environment, going forward the Compensation Committee will continue to assess whether the current design can be further improved to better reflect pay for performance and alignment to the shareholder experience.
Environmental, social and governance (ESG) considerations in the compensation process
In 2020, the Group reviewed its sustainability strategy and announced its ambition to become a sustainability leader in the financial services industry. In order to have a meaningful impact, our goal is to fully integrate sustainability in the strategy for the Group. This includes striving to be a leader in our core competencies, pro-viding bespoke advisory services to private and corporate clients, developing proprietary sustainable investment solutions, producing thematic industry research and partnering with industry groups and non-governmental organizations on sustainability topics.
The Board has recognized that in order to achieve our aspirations, sustainability must be integrated at all levels of the Group, as reflected by the following announcements in 2020: p Establishment of SRI as a separate corporate function at the
Executive Board level, elevating the importance of sustainabil-ity topics with Executive Board level representation;
p Establishment of the Sustainability Advisory Committee at the Board level, which will complement the Conduct & Financial Crime Control Committee (CFCCC) in supervising all material ESG related topics across the Group; and
p Nomination of designated sustainability leaders in each divi-sion/function across the Group.
As part of the Group’s strategy, sustainability is also considered in various stages of the compensation process. For example, in determining the Group variable incentive pool, the Compensa-tion Committee takes into account audit, compliance, disciplinary, risk and regulatory-related issues, among other considerations. In addition, one of the key drivers of bonus pool development at the divisional level is economic contribution, which factors in the level of risk taken to achieve profitability. For the Executive Board’s annual STI awards, ESG factors such as compliance, risk management, conduct and ethics, talent management, diversity and inclusion, and client satisfaction, are included and individually assessed as part of the overall non-financial performance assess-ment, which contributes to one-third of the STI award.
> Refer to “Environmental, Social and Governance (ESG) considerations at Credit Suisse” for further information.
“Say-on-Pay” compensation proposals at the 2021AGM
At the 2021 AGM, we will be seeking shareholder support for the following say-on-pay proposals:p Maximum aggregate amount of fixed compensation for the
Executive Board for the 2021 AGM to 2022 AGM period (CHF 31.0 million, unchanged from the prior period);
p Aggregate 2020 STI award to be granted to the Executive Board (CHF 15.7 million, 30% lower than the CHF 22.4 mil-lion for 2019);
p Aggregate 2021 LTI opportunity at fair value at the time of grant (CHF 25.1 million), based on a maximum opportunity of CHF 47.6 million, compared to the 2020 LTI fair value of CHF 28.6 million, based on a maximum opportunity of CHF 53.75 million); and
p Maximum aggregate amount of compensation for the Board for the 2021 AGM to 2022 AGM period of CHF 12.0 million, unchanged from the prior period.
Further information on each of these proposals is contained in the “Say-on-Pay” brochure that accompanies the AGM invitation and is also available at credit-suisse.com/agm.
On behalf of the Compensation Committee, I would like to thank you for your support and feedback, which we will continue to seek as we review and refine our compensation practices to ensure that they remain aligned with the interests of our shareholders and fully compliant with all legal and regulatory requirements.
Kai S. NargolwalaChair of the Compensation CommitteeMember of the Board March 2021
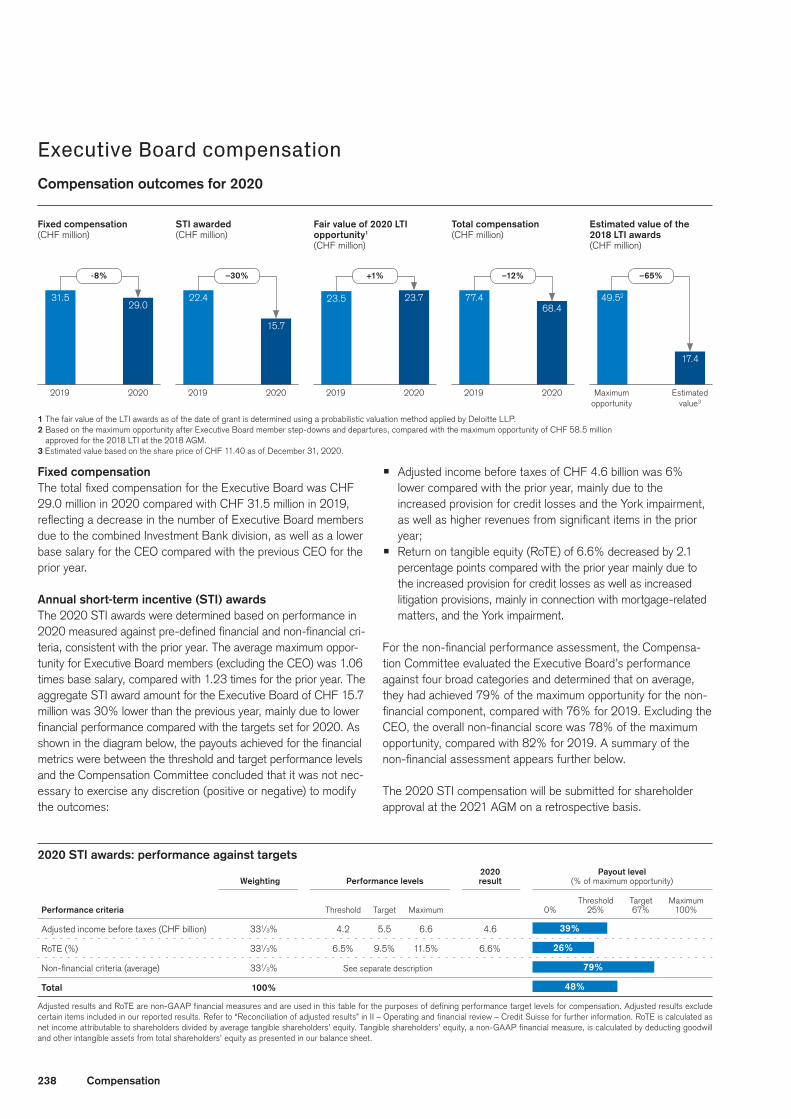
238 Compensation
Fixed compensation (CHF million)
STIawarded (CHF million)
Fairvalueof2020LTI opportunity1 (CHF million)
Totalcompensation (CHF million)
Estimated value of the 2018LTIawards (CHF million)
-8% –30% +1% –12% –65%
31.5 22.4 23.5 77.4 49.52
29.0
15.7
23.768.4
17.4
1 The fair value of the LTI awards as of the date of grant is determined using a probabilistic valuation method applied by Deloitte LLP.2 Based on the maximum opportunity after Executive Board member step-downs and departures, compared with the maximum opportunity of CHF 58.5 million
approved for the 2018 LTI at the 2018 AGM.3 Estimated value based on the share price of CHF 11.40 as of December 31, 2020.
2019 2019 2019 2019 Maximum opportunity
2020 2020 2020 2020 Estimated value3
2020STIawards:performanceagainsttargets 2020 Payoutlevel Weighting
Performance levels
result
(% of maximum opportunity)
Threshold Target Maximum Performance criteria Threshold Target Maximum 0% 25% 67% 100%
Adjusted income before taxes (CHF billion) 331/3% 4.2 5.5 6.6 4.6
RoTE (%) 331/3% 6.5% 9.5% 11.5% 6.6%
Non-financial criteria (average) 331/3% See separate description
Total 100%
Adjusted results and RoTE are non-GAAP financial measures and are used in this table for the purposes of defining performance target levels for compensation. Adjusted results exclude certain items included in our reported results. Refer to “Reconciliation of adjusted results” in II – Operating and financial review – Credit Suisse for further information. RoTE is calculated as net income attributable to shareholders divided by average tangible shareholders’ equity. Tangible shareholders’ equity, a non-GAAP financial measure, is calculated by deducting goodwill and other intangible assets from total shareholders’ equity as presented in our balance sheet.
39%
26%
48%
79%
Executive Board compensationCompensationoutcomesfor2020
Fixed compensation The total fixed compensation for the Executive Board was CHF 29.0 million in 2020 compared with CHF 31.5 million in 2019, reflecting a decrease in the number of Executive Board members due to the combined Investment Bank division, as well as a lower base salary for the CEO compared with the previous CEO for the prior year.
Annualshort-termincentive(STI)awardsThe 2020 STI awards were determined based on performance in 2020 measured against pre-defined financial and non-financial cri-teria, consistent with the prior year. The average maximum oppor-tunity for Executive Board members (excluding the CEO) was 1.06 times base salary, compared with 1.23 times for the prior year. The aggregate STI award amount for the Executive Board of CHF 15.7 million was 30% lower than the previous year, mainly due to lower financial performance compared with the targets set for 2020. As shown in the diagram below, the payouts achieved for the financial metrics were between the threshold and target performance levels and the Compensation Committee concluded that it was not nec-essary to exercise any discretion (positive or negative) to modify the outcomes:
p Adjusted income before taxes of CHF 4.6 billion was 6% lower compared with the prior year, mainly due to the increased provision for credit losses and the York impairment, as well as higher revenues from significant items in the prior year;
p Return on tangible equity (RoTE) of 6.6% decreased by 2.1 percentage points compared with the prior year mainly due to the increased provision for credit losses as well as increased litigation provisions, mainly in connection with mortgage-related matters, and the York impairment.
For the non-financial performance assessment, the Compensa-tion Committee evaluated the Executive Board’s performance against four broad categories and determined that on average, they had achieved 79% of the maximum opportunity for the non-financial component, compared with 76% for 2019. Excluding the CEO, the overall non-financial score was 78% of the maximum opportunity, compared with 82% for 2019. A summary of the non-financial assessment appears further below.
The 2020 STI compensation will be submitted for shareholder approval at the 2021 AGM on a retrospective basis.

239Compensation
Strategy/ Client Focus
Strategy/ Client Focus
Risk and Compliance
Conduct and Ethics
People
Conduct and Ethics
People
Risk and Compliance
Executive Board assessment
CEO assessment
Category
Category
p Various industry awards acknowledging excellence in client service, including Euromoney Awards for “Global Excellence in Leadership”, “Switzerland’s Best Bank”, “Switzerland’s Best Investment Bank”, “Asia’s Best Bank for Wealth Management”; The Banker “Bank of the Year 2020 in Switzerland”, “Investment Bank of the Year”
p Capital Markets & Advisory: ranked by Dealogic as #1 Global IPOs; #1 Sponsors Leveraged Finance; Top 6 announced M&A based on volumes and increased share of wallet based on fees
p Fixed Income Sales & Trading: ranked #1 Structured Credit (Bloomberg) and #1 Asset Finance (Thomson Reuters)p Successful implementation of strategic connectivity between Investment Bank and Wealth Management businesses evidenced by 31%
growth in GTS revenues compared with the prior yearp Development of comprehensive ESG strategy, and recognition for the Group’s engagement, including being upgraded to an A rating by
MSCI p Executed 37 Green, Social and Sustainability Bond transactions in 2020 totaling USD 19 billion, an increase of 42% year on yearp Integration of NAB on track with unified coverage, harmonized processes and offering and successful client retentionp Established significant CSX client base with half of clients below 35 years of age
p Mr. Gottstein managed a smooth transition into new role at a time of severe disruption due to the COVID-19 pandemic and led the design and successful implementation of several key initiatives, including: creation of one global Investment Bank; launch of the new Sustainability, Research & Investment Solutions function; integration of NAB; launch of CSX and combination of the Risk and Compliance functions
p He put forth a strategy to raise pre-tax profitability in Wealth Management-related businesses, a key part of our growth strategyp He interacted personally with many key clients, often leading to specific businessp He enhanced our sustainability strategy through the creation of SRI, which has announced a goal to provide at least CHF 300
billion of sustainable financing to support transition strategies (e.g. renewables, Green/Blue/Transition bonds, low-carbon energy solutions and UN Sustainable Development Goals (SDG) aligned financings) over the next 10 years
p He played a key role with respect to the creation and execution of the Swiss government backed COVID-19 lending facilities, strengthening the Bank’s standing in its home market
p Mr. Gottstein strengthened the control environment through the combination of the Risk and Compliance functionsp He continued to drive the focus on climate risk management, announcing our ambition to align our activities with the Paris
Agreement objective of limiting global warming to 1.5° C and committing to develop science-based targets in 2021 and 2022, including achieving net zero emissions from our operations, supply chain and financing activities by no later than 2050 (with interme-diate emissions targets to be set for 2030)
p He played a key role in resolving and mitigating a number of historic and other issues, including mortgage-related litigation and the York investment impairment
p Mr. Gottstein led the evolution of the Conduct and Ethics standards into a set of cultural values (IMPACT) and launched the Group’s purpose statement
p He actively communicated and engaged with employees on a regular basis, for example via quarterly townhalls during the year, including the first townhall dedicated to Diversity & Inclusion
p Mr. Gottstein successfully shifted operations to a mostly digital footprint in a short time period, maintaining employee engagement and morale
p He was actively involved in recruitment of key roles and talent developmentp He has supported a renewed focus on Diversity & Inclusion, including setting targets for Black Talent representation in the UK and
the US, and fostering a more LGBT+ inclusive culture
p Greater focus on leadership and culture for more accountability, transparency and opennessp The ratio of severe disciplinary cases remained stable compared with the prior year
p Strong employee survey results across the board and generally very positive recognition for leadership / support during COVID-19p Continued progress in addressing the gender pay gaps in the UK, with a ~2% decrease in the average hourly pay rate and bonus
pay gaps as published in March 2020p Launched anti-bias and inclusion leadership training for senior leaders, including Executive Board members p Renewed strong commitment to Diversity & Inclusion with targets for Black Talent in the UK and US and gender representation set p Ensured key talent retention as reflected by lower top performers attrition rates, with voluntary turnover of 7.1% in 2020 compared
with 9.8% in 2019p Continued to actively focus on Diversity & Inclusion measures and programs; the proportion of women in senior management positions
(Managing Director, Directors and Vice Presidents) in 2020 increased to 28% from 27% in the prior year
p Successfully navigated the COVID-19 pandemic during 2020, managing its impact across risk typesp Ensured consistent, tight lending standards, supporting risk-controlled lending growth with an objective to maintain rigorous credit
standards, consistent with our <10 bps provision for credit losses ratio through the cycle (for the periods 2010-2020)p Simpler and scalable technology shared by Risk and Compliance, delivering solutions to deploy rapid cross-risk and cross-bank
modelling and reportingp Established new global and divisional client risk committees embedding relevant risk types and compliance disciplines for a holistic
client viewp Introduced environmental objectives to be achieved by 2025, focusing on reducing total greenhouse gas emissions, procuring
renewable electricity, increasing green office space and reducing paper and water consumptionp Continued investment in climate risk management, establishing a dedicated team with a mandate to set risk appetite and strategic
trajectories in order to protect the Bank’s portfolio from climate-related risks. This included the appointment of a Chief Sustainability Officer and a Group Head of Reputational Risk, Sustainability and Climate Risk
2020STIawards:non-financialperformanceassessment
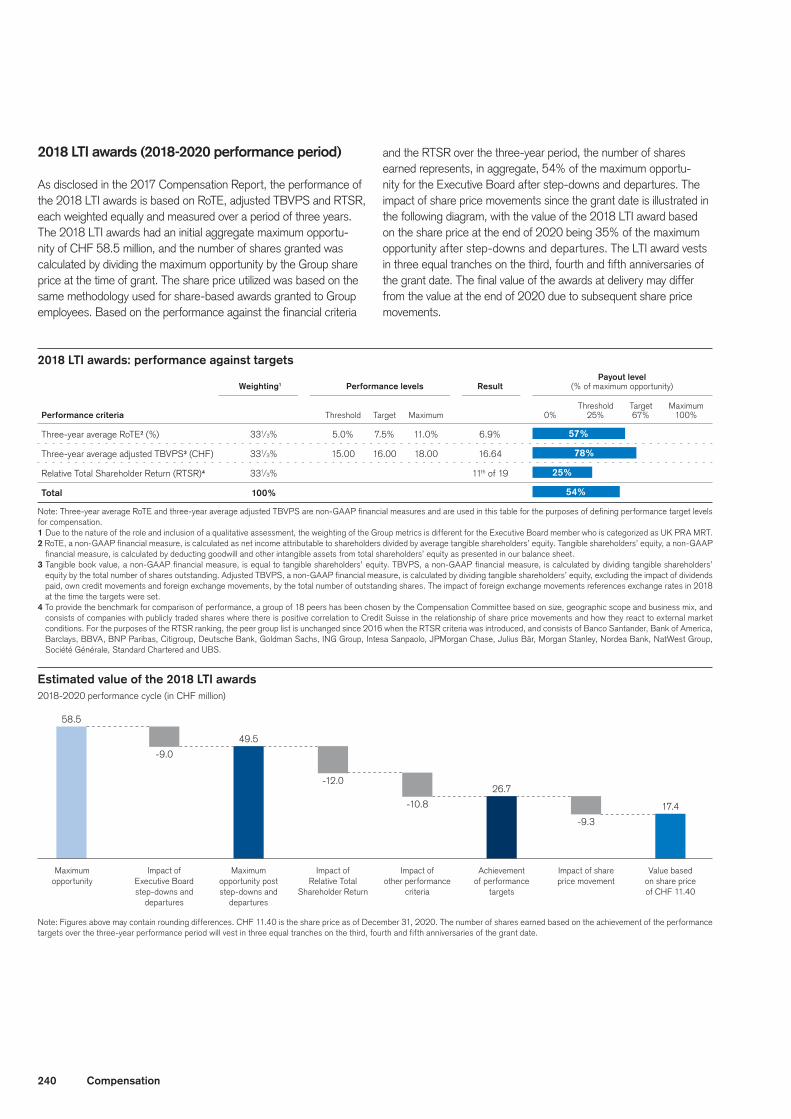
240 Compensation
2018LTIawards:performanceagainsttargets Payout level Weighting1
Performance levels
Result
(% of maximum opportunity)
Threshold Target Maximum Performance criteria Threshold Target Maximum 0% 25% 67% 100%
Three-year average RoTE2 (%) 331/3% 5.0% 7.5% 11.0% 6.9%
Three-year average adjusted TBVPS3 (CHF) 331/3% 15.00 16.00 18.00 16.64
Relative Total Shareholder Return (RTSR)4 331/3% 11th of 19
Total 100%
Note: Three-year average RoTE and three-year average adjusted TBVPS are non-GAAP financial measures and are used in this table for the purposes of defining performance target levels for compensation.1 Due to the nature of the role and inclusion of a qualitative assessment, the weighting of the Group metrics is different for the Executive Board member who is categorized as UK PRA MRT.2 RoTE, a non-GAAP financial measure, is calculated as net income attributable to shareholders divided by average tangible shareholders’ equity. Tangible shareholders’ equity, a non-GAAP
financial measure, is calculated by deducting goodwill and other intangible assets from total shareholders’ equity as presented in our balance sheet.3 Tangible book value, a non-GAAP financial measure, is equal to tangible shareholders’ equity. TBVPS, a non-GAAP financial measure, is calculated by dividing tangible shareholders’
equity by the total number of shares outstanding. Adjusted TBVPS, a non-GAAP financial measure, is calculated by dividing tangible shareholders’ equity, excluding the impact of dividends paid, own credit movements and foreign exchange movements, by the total number of outstanding shares. The impact of foreign exchange movements references exchange rates in 2018 at the time the targets were set.
4To provide the benchmark for comparison of performance, a group of 18 peers has been chosen by the Compensation Committee based on size, geographic scope and business mix, and consists of companies with publicly traded shares where there is positive correlation to Credit Suisse in the relationship of share price movements and how they react to external market conditions. For the purposes of the RTSR ranking, the peer group list is unchanged since 2016 when the RTSR criteria was introduced, and consists of Banco Santander, Bank of America, Barclays, BBVA, BNP Paribas, Citigroup, Deutsche Bank, Goldman Sachs, ING Group, Intesa Sanpaolo, JPMorgan Chase, Julius Bär, Morgan Stanley, Nordea Bank, NatWest Group, Société Générale, Standard Chartered and UBS.
57%
78%
54%
25%
2018-2020 performance cycle (in CHF million)
Estimatedvalueofthe2018LTIawards
Maximum opportunity
Impact of Executive Board step-downs and
departures
Maximum opportunity post step-downs and
departures
Impact of Relative Total
Shareholder Return
Impact of other performance
criteria
Achievement of performance
targets
Impact of share price movement
Value based on share price of CHF 11.40
58.5
-9.0
49.5
-12.0
-10.8
26.7
17.4
Note: Figures above may contain rounding differences. CHF 11.40 is the share price as of December 31, 2020. The number of shares earned based on the achievement of the performance targets over the three-year performance period will vest in three equal tranches on the third, fourth and fifth anniversaries of the grant date.
-9.3
2018LTIawards(2018-2020performanceperiod)
As disclosed in the 2017 Compensation Report, the performance of the 2018 LTI awards is based on RoTE, adjusted TBVPS and RTSR, each weighted equally and measured over a period of three years. The 2018 LTI awards had an initial aggregate maximum opportu-nity of CHF 58.5 million, and the number of shares granted was calculated by dividing the maximum opportunity by the Group share price at the time of grant. The share price utilized was based on the same methodology used for share-based awards granted to Group employees. Based on the performance against the financial criteria
and the RTSR over the three-year period, the number of shares earned represents, in aggregate, 54% of the maximum opportu-nity for the Executive Board after step-downs and departures. The impact of share price movements since the grant date is illustrated in the following diagram, with the value of the 2018 LTI award based on the share price at the end of 2020 being 35% of the maximum opportunity after step-downs and departures. The LTI award vests in three equal tranches on the third, fourth and fifth anniversaries of the grant date. The final value of the awards at delivery may differ from the value at the end of 2020 due to subsequent share price movements.

241Compensation
19th 18th 17th 16th 15th 14th 13th 12th 11th 10th 9th 8th 7th 6th 5th 4th 3rd 2nd 1st
Achievement Level – Ranking vs Peers
Bottom 5 0% payout
Top5 100% payout
10%
20%
30%
40%
50%
60%
70%
80%
90%
2021LTIRTSRpayoutlevels
2020LTIopportunities(2020-2022performanceperiod)
The fair value of the 2020 LTI at the time of grant was CHF 28.6 million, as determined by Deloitte LLP (Deloitte) and as approved by shareholders at the 2020 AGM. The team within Deloitte that conducts this valuation is in a department separate from the Deloitte advisor to the Compensation Committee. The initial number of shares was calculated by dividing the maximum opportunity of CHF 53.75 million by the share price at the time of grant, whereby the share price for this purpose is calculated using the same methodology used for share-based awards granted to Group employees. The amount achieved at the end of the perfor-mance cycle may differ from the fair value at grant, and therefore the actual performance will be measured and disclosed at the end of the three-year performance period. The average maximum opportunity for Executive Board members (excluding the CEO) was 1.94 times base salary, compared with 2.20 times base sal-ary for the prior year.
> Refer to “Compensation design” and the 2019 Annual Report for further information.
Compensation of the Group CEO and highest paid Executive Board memberThe annual performance assessment of the Group CEO and the highest paid Executive Board member, Thomas Gottstein, takes into account the same financial and non-financial criteria applied to other Executive Board members. Based on the STI perfor-mance assessment described previously and the fair value of the 2020 LTI, Mr. Gottstein’s total variable incentive compensation for 2020 was CHF 5.6 million. Mr. Gottstein’s total compensation for 2020 was CHF 8.5 million, compared with total compensation of CHF 10.7 million awarded to the previous CEO in 2019.
Mr. Gottstein’s realized compensation for 2020 comprises: p CHF 2.6 million base salary, of which CHF 270,000 was
committed for donation to COVID-19 related relief efforts; p CHF 1.0 million non-deferred cash component of the 2020
STI award (paid out in 2021, subject to shareholder approval at the 2021 AGM);
p Group shares with a value at delivery of CHF 0.2 million in relation to the second vested installment of the 2016 LTI and Group shares with a value at delivery of CHF 0.2 million in relation to the first vested installment of the 2017 LTI; and
p CHF 0.2 million deferred cash portion of the 2016 STI award.
In addition, Mr. Gottstein received CHF 0.1 million as compensa-tion for dividend equivalents on vested awards and CHF 0.2 mil-lion in pension and other benefits.
2021LTIopportunities(2021-2023performanceperiod)
The 2021 LTI opportunities will continue to be based on RoTE, adjusted TBVPS and RTSR, each weighted equally and
measured over a period of three years. The LTI opportunities will continue to vest in three equal tranches on the third, fourth and fifth anniversaries of the grant date, and the grant price will continue to be based on the same methodology used for share-based awards granted to Group employees. In relation to the RTSR component, for 2021 and prospective LTIs, there will con-tinue to be zero payout for a ranking within the lowest five and maximum payout for a ranking within the top five, with smoother payout levels for rankings in between to avoid large movements, positive or negative, based on small differences in TSR com-pared with peers. After taking into consideration the Group’s internal financial plan, prior-year performance, analyst expecta-tions and the Group’s publicly stated ambitions, as well as market developments, the Compensation Committee decided to set the threshold, target and maximum performance levels for the RoTE component to 6.0%, 10.0% and 12.0%, respectively. The cor-responding adjusted TBVPS performance levels for the threshold, target and maximum have been set at CHF 17.90, CHF 19.30 and CHF 20.10, respectively, as shown in the table below. The fair value at grant of the 2021 LTI is 53% of the maximum oppor-tunity, similar to the 2020 LTI fair valuation. At the 2021 AGM, shareholders will be asked to approve an aggregate 2021 LTI amount of CHF 25.1 million, based on the fair value at grant. This amount will form part of the 2021 Executive Board compensation disclosure.
Performancetargetlevelsforthe2021LTI Performance targets
Performance criteria Threshold Target Maximum
Three-year average RoTE 1 6.0% 10.0% 12.0%
Three-year average adjusted TBVPS (CHF) 2 17.90 19.30 20.10
1 RoTE, a non-GAAP financial measure, is calculated as net income attributable to share-holders divided by average tangible shareholders’ equity. Tangible shareholders’ equity, a non-GAAP financial measure, is calculated by deducting goodwill and other intangible assets from total shareholders’ equity as presented in our balance sheet.
2 Adjusted TBVPS is a non-GAAP financial measure. For purposes of the 2021 LTI, it is calculated by dividing tangible shareholders’ equity by the total number of outstanding shares, after excluding the cumulative impact of dividends paid, own credit movements, any future corporate developments impacting equity and FX rate movements during the performance period.
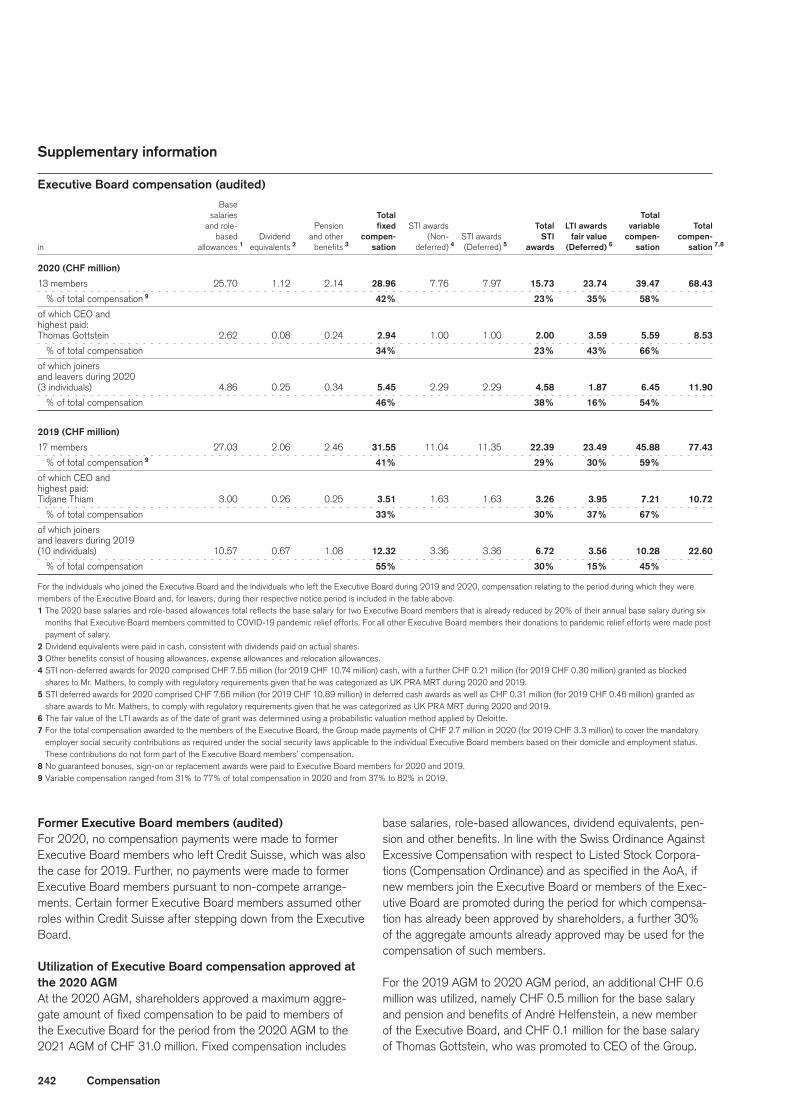
242 Compensation
Supplementary information
Executive Board compensation (audited) Base
salaries Total Total
and role- Pension fixed STI awards Total LTIawards variable Total based Dividend and other compen- (Non- STI awards STI fair value compen- compen-
in allowances 1 equivalents 2 benefits 3 sation deferred) 4 (Deferred) 5 awards (Deferred) 6 sation sation 7,8
2020(CHFmillion)
13 members 25.70 1.12 2.14 28.96 7.76 7.97 15.73 23.74 39.47 68.43
% of total compensation 9 42% 23% 35% 58%
of which CEO and
highest paid:
Thomas Gottstein 2.62 0.08 0.24 2.94 1.00 1.00 2.00 3.59 5.59 8.53
% of total compensation 34% 23% 43% 66%
of which joiners
and leavers during 2020
(3 individuals) 4.86 0.25 0.34 5.45 2.29 2.29 4.58 1.87 6.45 11.90
% of total compensation 46% 38% 16% 54%
2019(CHFmillion)
17 members 27.03 2.06 2.46 31.55 11.04 11.35 22.39 23.49 45.88 77.43
% of total compensation 9 41% 29% 30% 59%
of which CEO and
highest paid:
Tidjane Thiam 3.00 0.26 0.25 3.51 1.63 1.63 3.26 3.95 7.21 10.72
% of total compensation 33% 30% 37% 67%
of which joiners
and leavers during 2019
(10 individuals) 10.57 0.67 1.08 12.32 3.36 3.36 6.72 3.56 10.28 22.60
% of total compensation 55% 30% 15% 45%
For the individuals who joined the Executive Board and the individuals who left the Executive Board during 2019 and 2020, compensation relating to the period during which they were members of the Executive Board and, for leavers, during their respective notice period is included in the table above.1 The 2020 base salaries and role-based allowances total reflects the base salary for two Executive Board members that is already reduced by 20% of their annual base salary during six
months that Executive Board members committed to COVID-19 pandemic relief efforts. For all other Executive Board members their donations to pandemic relief efforts were made post payment of salary.
2 Dividend equivalents were paid in cash, consistent with dividends paid on actual shares.3 Other benefits consist of housing allowances, expense allowances and relocation allowances.4 STI non-deferred awards for 2020 comprised CHF 7.55 million (for 2019 CHF 10.74 million) cash, with a further CHF 0.21 million (for 2019 CHF 0.30 million) granted as blocked
shares to Mr. Mathers, to comply with regulatory requirements given that he was categorized as UK PRA MRT during 2020 and 2019.5 STI deferred awards for 2020 comprised CHF 7.66 million (for 2019 CHF 10.89 million) in deferred cash awards as well as CHF 0.31 million (for 2019 CHF 0.46 million) granted as
share awards to Mr. Mathers, to comply with regulatory requirements given that he was categorized as UK PRA MRT during 2020 and 2019.6 The fair value of the LTI awards as of the date of grant was determined using a probabilistic valuation method applied by Deloitte.7 For the total compensation awarded to the members of the Executive Board, the Group made payments of CHF 2.7 million in 2020 (for 2019 CHF 3.3 million) to cover the mandatory
employer social security contributions as required under the social security laws applicable to the individual Executive Board members based on their domicile and employment status. These contributions do not form part of the Executive Board members’ compensation.
8 No guaranteed bonuses, sign-on or replacement awards were paid to Executive Board members for 2020 and 2019.9 Variable compensation ranged from 31% to 77% of total compensation in 2020 and from 37% to 82% in 2019.
Former Executive Board members (audited) For 2020, no compensation payments were made to former Executive Board members who left Credit Suisse, which was also the case for 2019. Further, no payments were made to former Executive Board members pursuant to non-compete arrange-ments. Certain former Executive Board members assumed other roles within Credit Suisse after stepping down from the Executive Board.
Utilization of Executive Board compensation approved at the2020AGMAt the 2020 AGM, shareholders approved a maximum aggre-gate amount of fixed compensation to be paid to members of the Executive Board for the period from the 2020 AGM to the 2021 AGM of CHF 31.0 million. Fixed compensation includes
base salaries, role-based allowances, dividend equivalents, pen-sion and other benefits. In line with the Swiss Ordinance Against Excessive Compensation with respect to Listed Stock Corpora-tions (Compensation Ordinance) and as specified in the AoA, if new members join the Executive Board or members of the Exec-utive Board are promoted during the period for which compensa-tion has already been approved by shareholders, a further 30% of the aggregate amounts already approved may be used for the compensation of such members.
For the 2019 AGM to 2020 AGM period, an additional CHF 0.6 million was utilized, namely CHF 0.5 million for the base salary and pension and benefits of André Helfenstein, a new member of the Executive Board, and CHF 0.1 million for the base salary of Thomas Gottstein, who was promoted to CEO of the Group.
243Compensation
By the time of the 2021 AGM, a total of approximately CHF 27.6 million will have been paid to Executive Board members, of which CHF 26.4 million relates to the individuals who were members of the Executive Board at the time of the 2020 AGM.
At the 2020 AGM, shareholders also approved LTI compensation to be granted to members of the Executive Board for the 2020 financial year with a fair value at grant of CHF 28.6 million and a corresponding maximum opportunity of CHF 53.75 million, which was subsequently awarded to the Executive Board members. The amount of the 2020 LTI award earned by each of the Executive Board members can only be determined after the completion of the three-year performance period.
Cash settlement of share awardsThe Executive Board members are permitted to elect, subject to minimum shareholding requirements, at a predefined date in advance of settlement, to receive their vested share-based awards in the form of shares, cash or 50% in the form of shares and 50% in cash, in each case based on the Group share price at the time of settlement. An election to receive cash is subject to reversal if at the time of settlement the Group share price is less than 75% of the share price at the time of election. The timing and pricing of settlement will be the same as under the previous award plan and as under the plans of the non-Executive Board population.
Contract lengths, termination and change in control provisions All members of the Executive Board have employment contracts with the Group that are valid until terminated. The standard notice period for termination of employment by either the Group or the respective Executive Board member is six months. Execu-tive Board members may be held to a non-compete period of up to one year and may be compensated for this period of time by mutual agreement. In the event of termination, there are no contractual provisions that allow for the payment of severance awards to Executive Board members beyond the regular compen-sation awarded during the notice period. Pre-defined conditions for all employees, including Executive Board members, apply for the payment of outstanding deferred compensation awards, depending on whether the termination of employment was vol-untary, involuntary, by mutual agreement or as the result of a change in control. In case of a termination for cause, any deferred
compensation and outstanding awards will be forfeited. There are no other contracts, agreements or arrangements with the mem-bers of the Executive Board that provide for other types of pay-ments or benefits in connection with termination of employment that are not generally available to other employees of the Group.
In the case of a change in control, the treatment of outstanding awards for all employees, including Executive Board members, will be determined by the Board upon recommendation of the Compensation Committee with the aim of maximizing shareholder value, subject to circumstances and prevailing market conditions. There are no provisions in the employment contracts of Executive Board members or any other pre-determined arrangements that require the payment of any type of extraordinary benefits, includ-ing special severance awards or transaction premia, in the case of a change in control.
Other outstanding awards As of December 31, 2020, the outstanding cash-based deferred compensation awards granted to certain Executive Board mem-bers in prior years comprised of the Capital Opportunity Facility (COF), contingent capital awards (CCA), Deferred Cash Allow-ance Plan (DCAP) and deferred STI cash awards. The cumula-tive value of such cash-based awards at their grant dates was CHF 29.3 million compared with CHF 29.9 million as of Decem-ber 31, 2020. These amounts also include the cash value of dividend equivalents related to unvested share awards at their respective grant dates and at December 31, 2020.
MinimumshareholdingrequirementsAs of December 31, 2020, the CEO and all Executive Board members fulfilled the minimum shareholding requirements of 500,000 shares and 300,000 shares, respectively, as mea-sured against the number of shares owned plus the number of unvested awards calculated on the basis of actual achievement level (for awards that have reached the end of their three-year performance period) or maximum opportunity (for awards that have not reached the end of their three-year performance period). The CEO and Executive Board members are not permitted to sell shares until they have met the minimum shareholding require-ments, except as necessary to fulfill taxation obligations on the respective shares awarded.

244 Compensation
Executive Board holdings and values of deferred share-based awards by individual Value (CHF) of Number of Value (CHF) of unvested awards Number of Number of owned shares and unvested awards at year end
end of owned shares 1 unvested awards 2 unvested awards at grant date 3 (at fair value) 4
2020
Thomas P. Gottstein 329,945 1,175,386 1,505,331 14,059,196 7,982,209
Romeo Cerutti 360,449 569,438 929,887 7,134,274 4,108,232
Brian Chin 568,030 1,790,864 2,358,894 21,951,346 12,474,970
André Helfenstein 74,229 671,329 745,558 7,523,347 5,899,796
Lydie Hudson 57,115 421,216 478,331 4,864,351 2,895,168
David R. Mathers 110,958 1,313,581 1,424,539 14,661,244 10,505,639
Antoinette Poschung 141,405 207,515 348,920 2,360,009 1,412,321
Helman Sitohang 365,186 1,344,933 1,710,119 16,773,304 9,612,195
James B. Walker 143,444 577,046 720,490 6,552,588 5,092,395
Lara J. Warner – 1,089,006 1,089,006 13,461,484 7,647,962
Philipp Wehle 74,542 670,246 744,788 7,652,671 5,095,777
Total 2,225,303 9,830,560 12,055,863 116,993,815 72,726,662
2019
Tidjane Thiam 66,422 1,303,823 1,370,245 19,084,599 10,833,091
Romeo Cerutti 323,165 458,513 781,678 6,750,770 3,820,259
Brian Chin 494,030 1,430,886 1,924,916 20,368,149 11,843,258
Thomas P. Gottstein 150,214 672,361 822,575 9,574,478 5,530,279
Lydie Hudson 26,175 295,386 321,561 3,739,373 2,832,024
David R. Mathers 84,360 1,029,891 1,114,251 13,509,668 9,392,954
David Miller – 734,280 734,280 10,240,437 8,888,164
Antoinette Poschung 123,318 139,024 262,342 1,693,270 1,302,361
Helman Sitohang 264,737 1,007,352 1,272,089 14,683,925 8,198,365
James B. Walker 100,153 317,330 417,483 4,181,205 3,834,492
Lara J. Warner – 786,568 786,568 11,361,535 6,138,554
Philipp Wehle 21,540 364,059 385,599 4,735,987 3,862,390
Total 1,654,114 8,539,473 10,193,587 119,923,396 76,476,192
1 Includes shares that were initially granted as deferred compensation and have vested.2 Includes unvested shares originating from LTI opportunities calculated on the basis of maximum opportunity for awards that have not reached the end of their three-year performance
period, given that the actual achievement level and associated number of unvested shares cannot be determined until the end of the performance period. For LTI awards that have reached the end of their three-year performance period, the number of unvested shares reflects the actual number of shares earned based on achievement of the performance target levels.
3 Determined based on the number of unvested awards multiplied by the share price at grant.4 Includes the value of unvested LTI opportunities. For LTI awards that have reached the end of their three-year performance period, the value is based on the actual number of shares
eligible to vest. For LTI opportunities that have not reached the end of their three-year performance period, this is determined based on the number of shares at fair value at the time of grant, multiplied by the share price at the end of the year.

245Compensation
Executive Board outstanding deferred compensation awards % of which
exposed to
Total Ex post Ex post Total ex post outstanding Granted Paid out in explicit implicit outstanding explicit
in / end end of 2019 in 2020 1 2020 adjustments adjustments endof2020 adjustments
Executive Board (CHF million)
CCAs Cash-based 6 1 (3) – 0 4 100%
Deferred cash awards 2 Cash-based 13 7 (1) – (1) 18 100%
Share awards 3 Share-based 86 48 (5) (8) (7) 114 100%
Performance share awards Share-based 9 3 (3) – (2) 7 100%
Total 114 59 (12) (8) (10) 143 –
1 Includes awards granted to Executive Board members with respect to their previous roles prior to joining the Executive Board.2 Includes the deferred cash portion of STI awards.3 Includes the outstanding 2020, 2019 and 2018 LTI opportunities at maximum opportunity.
Executive Board loans (audited)The majority of loans outstanding to Executive Board members are mortgages or loans against securities. Such loans are made on the same terms available to employees under the Group’s employee benefit plans. Pursuant to the AoA, each Executive Board member may be granted individual credit facilities or loans up to a maximum of CHF 20 million. As of December 31, 2020, 2019 and 2018, outstanding loans to Executive Board mem-bers amounted to CHF 13 million, CHF 32 million and CHF 33 million, respectively. The number of individuals with outstanding loans at the beginning and the end of 2020 was 5 and 4, respec-tively, and the highest loan outstanding was CHF 6 million to Mr. Gottstein.
All mortgage loans to Executive Board members are granted either with variable or fixed interest rates over a certain period. Typically,
mortgages are granted for periods of up to ten years. Interest rates applied are based on refinancing costs plus a margin, and interest rates and other terms are consistent with those applicable to other employees. Loans against securities are granted at interest rates and on terms applicable to such loans granted to other employees. The same credit approval and risk assessment procedures apply to Executive Board members as for other employees. Unless oth-erwise noted, all loans to Executive Board members were made in the ordinary course of business and substantially on the same terms, including interest rates and collateral, as those prevailing at the time for comparable transactions with other persons and in consideration of the terms which apply to all Group employees. These loans did not involve more than the normal risk of collectabil-ity or present other unfavorable features.
> Refer to “Banking relationships with Board and Executive Board members and related party transactions” in IV – Corporate Governance – Additional informa-tion for further information.

246 Compensation
-3% -12%-7%
Totalcompensationawarded (CHF million)
TotalcompensationawardedtoMRTCs (CHF million)
Variable incentive compensation awarded (CHF million)
10,155 1,8213,1689,8401,6072,949
2019 201920192020 20202020
Group compensationCompensationoutcomesfor2020
Variable incentive compensation awardedAgainst the backdrop of challenging market and economic con-ditions prompted by the COVID-19 pandemic, underlying busi-ness performance was solid, with adjusted income before taxes excluding significant items increasing 6% compared with the prior year. The Compensation Committee also considered a range of other factors such as relative performance versus peers and mar-ket position and market trends, as well as risk, control, compli-ance and conduct and ethics considerations. Overall, the Com-pensation Committee proposed a Group variable incentive pool of CHF 2,949 million, 7% lower compared with the previous year, in the context of lower reported results and to take into account the COVID-19 pandemic and resulting economic environment.
Approximately 51% of variable incentive compensation awarded is deferred and expensed in future periods, and subject to future service, performance and malus criteria and other restrictive covenants.
CompensationawardedtoMaterialRiskTakersandControllers(MRTCs)Total compensation awarded to MRTCs for 2020 was CHF 1,607 million, compared with CHF 1,821 million for 2019. Of the CHF 1,607 million total compensation awarded, 58% was in the form of variable compensation, with 75% of the variable compensation subject to malus.

247Compensation
Totalcompensationawarded
2020 2019
For Unrestricted Deferred Total Unrestricted Deferred Total
Fixed compensation (CHF million)
Salaries 5,158 120 5,278 5,241 108 5,349
Social security 653 – 653 642 – 642
Other 1 836 – 836 786 – 786
Totalfixedcompensation 6,647 120 6,767 6,669 108 6,777
Variable incentive compensation (CHF million)
Cash 1,417 – 1,417 1,433 – 1,433
Share awards 35 592 627 37 626 663
Performance share awards – 493 493 – 553 553
Contingent Capital Awards – 253 253 – 268 268
Deferred cash awards – 159 159 – 251 251
Totalvariableincentivecompensation 1,452 1,497 2,949 1,470 1,698 3,168
Other variable compensation (CHF million)
Cash severance 47 – 47 98 – 98
Retention awards 0 40 40 – 40 40
Other 2 16 21 37 19 53 72
Totalothervariablecompensation 63 61 124 117 93 210
Totalcompensationawarded(CHFmillion)
Totalcompensationawarded 8,162 1,678 9,840 8,256 1,899 10,155
of which guaranteed bonuses 10 9 19 26 34 60
Salaries include role-based allowances.1 Includes pension and other post-retirement expense of CHF 517 million and CHF 437 million in 2020 and 2019, respectively.2 Includes replacement awards to compensate employees for the equivalent fair value of deferred awards cancelled by previous employers as well as sign-on payments.
Number of employees awarded variable incentive and other compensation
2020 2019
Other Other
MRTCs 1 employees Total MRTCs 1 employees Total
Number of employees awarded variable incentive compensation
Variable incentive compensation 1,413 43,531 44,944 1,398 41,827 43,225
of which Cash 1,254 43,469 44,723 1,211 41,232 42,443
of which Share awards 1,282 5,492 6,774 1,277 5,796 7,073
of which Performance share awards 1,297 853 2,150 1,297 823 2,120
of which Contingent Capital Awards 1,268 4,509 5,777 1,262 4,644 5,906
of which Deferred cash awards 247 412 659 245 796 1,041
Number of employees awarded other variable compensation
Cash severance 10 599 609 27 764 791
Retention awards 42 104 146 17 35 52
Guaranteed bonuses 1 66 67 7 123 130
Other 2 24 3 573 597 34 3 556 590
Excluding Executive Board members who were in office on December 31, 2020 or 2019, respectively.1 Excludes individuals who may have been classified as MRTCs according to regulatory requirements of jurisdictions outside of Switzerland, particularly US-based revenue producers in the
Investment Bank, who were classified as Covered Employees by the US Federal Reserve.2 Includes replacement awards to compensate employees for the equivalent fair value of deferred awards cancelled by previous employers as well as sign-on payments.3 For 2020 and 2019, sign-on payments were paid to 0 and 1 MRTC, respectively.

248 Compensation
CompensationawardedtoMaterialRiskTakersandControllers
2020 2019
For Unrestricted Deferred Total Unrestricted Deferred Total
Fixed compensation (CHF million)
Totalfixedcompensation 1 598 74 672 640 57 697
Variable incentive compensation (CHF million)
Cash 193 – 193 228 – 228
Share awards 35 178 213 37 205 242
Performance share awards – 299 299 – 357 357
Contingent Capital Awards – 119 119 – 136 136
Deferred cash awards – 78 78 – 90 90
Totalvariableincentivecompensation 228 674 902 265 788 1,053
Other variable compensation (CHF million)
Cash severance 4 – 4 9 – 9
Retention awards 0 17 17 – 37 37
Other 2 3 3 9 12 2 3 23 25
Totalothervariablecompensation 7 26 33 11 60 71
Totalcompensation(CHFmillion)
Totalcompensation 833 774 1,607 916 905 1,821
of which guaranteed bonuses 0 0 0 1 5 6
Excluding Executive Board members who were in office on December 31, 2020 or 2019, respectively. Of the total compensation awarded to MRTCs for 2020 and 2019, 48% and 50%, respectively, was deferred. Of the total variable incentive compensation awarded to MRTCs for 2020 and 2019, 75% and 75%, respectively, was deferred.1 The number of MRTCs receiving fixed compensation for 2020 and 2019 was 1,438 and 1,444, respectively.2 Includes replacement awards to compensate employees for the equivalent fair value of deferred awards cancelled by previous employers as well as sign-on payments.3 For 2020 and 2019, sign-on payments paid to MRTCs amounted to CHF 0 million and CHF 3 million, respectively.
GroupcompensationandbenefitsexpenseCompensation and benefits expenses recognized in the cur-rent year income statement include salaries, role-based allow-ances, variable compensation, benefits and employer taxes on
compensation. Variable compensation expense reflects the vari-able cash compensation for the current year and amortization of deferred compensation awards granted in prior years.

249Compensation
Groupcompensationandbenefitsexpense
2020 2019
Current Deferred Current Deferred
compen- compen- compen- compen-
in sation sation Total sation sation Total
Fixed compensation expense (CHF million)
Salaries 5,158 112 1 5,270 5,241 102 1 5,343
Social security 2 653 – 653 642 – 642
Other 3 836 – 836 786 – 786
Totalfixedcompensationexpense 6,647 112 6,759 6,669 102 6,771
Variable incentive compensation expense (CHF million)
Cash 1,417 – 1,417 1,433 – 1,433
Share awards 35 573 4,5 608 37 589 4,5 626
Performance share awards – 448 448 – 438 438
Contingent Capital Awards – 255 255 – 308 308
Deferred cash awards 6 – 286 5 286 – 318 5 318
Totalvariableincentivecompensationexpense 1,452 1,562 3,014 1,470 1,653 3,123
Other variable compensation expense (CHF million)
Cash severance 47 – 47 98 – 98
Retention Awards – 43 43 – 22 22
Other 7 27 – 27 22 – 22
Totalothervariablecompensationexpense 74 43 117 120 22 142
Totalcompensationexpense(CHFmillion)
Totalcompensationexpense 8,173 1,717 9,890 8,259 1,777 10,036
Salaries include role-based allowances. Restructuring expenses in connection with the strategic review of the Group were disclosed separately and were not part of the total compensation expenses. In 2020, restructuring expenses included cash severance expenses of CHF 69 million relating to 793 employees.1 Includes deferred fixed cash compensation expense of CHF 112 million and CHF 102 million related to cash awards for 2020 and 2019, respectively.2 Represents the Group’s portion of employees’ mandatory social security.3 Includes pension and other post-retirement expense of CHF 517 million and CHF 437 million in 2020 and 2019, respectively.4 Includes CHF 6 million and CHF 10 million of compensation expense associated with replacement share awards granted in 2020 and 2019, respectively.5 In 2020, Contingent Capital share awards are included in the category share awards, and Capital Opportunity Facility awards are included in the category deferred cash awards. Prior
periods have been reclassified to conform to the current presentation.6 Includes CHF 2 million and CHF 4 million of compensation expense associated with replacement cash awards granted in 2020 and 2019, respectively.7 Includes sign-on payments.
Group estimated unrecognized compensation expenseThe following table shows the estimated compensation expense that has not yet been recognized through the income statement for deferred compensation awards granted for 2020 and prior years that were outstanding as of December 31, 2020, with
comparative information for 2019. These estimates are based on the fair value of each award on the grant date, taking into account the current estimated outcome of relevant performance criteria and estimated future forfeitures. No estimate has been included for future mark-to-market adjustments.
Group estimated unrecognized compensation expense
Deferred compensation 2020 Deferred compensation 2019
For For
For prior-year For prior-year
end of 2020 awards Total 2019 awards Total
Estimated unrecognized compensation expense (CHF million)
Share awards 538 449 1 987 596 477 1 1,073
Performance share awards 453 194 647 519 193 712
Contingent Capital Awards 241 151 392 257 165 422
Deferred cash awards 159 201 2 360 251 181 2 432
Retention awards – 40 40 – 48 48
Totalestimatedunrecognizedcompensationexpense 1,391 1,035 2,426 1,623 1,064 2,687
1 Includes CHF 10 million and CHF 28 million of estimated unrecognized compensation expense associated with replacement share awards granted to new employees in 2020 and 2019, respectively, not related to prior years.
2 Includes CHF 3 million and CHF 11 million of estimated unrecognized compensation expense associated with replacement cash awards granted to new employees in 2020 and 2019, respectively, not related to prior years.

250 Compensation
Changes to the value of outstanding deferred awardsEmployees experience changes to the value of their deferred compensation awards during the vesting period due to both implicit and explicit value changes. Implicit value changes primarily reflect market-driven effects, such as changes in the Group share price, changes in the value of the CCA and foreign exchange rate movements. Explicit value changes reflect risk adjustments triggered by conditions related to negative performance in the performance-based awards, forfeiture, or the malus provisions in all deferred awards. The final value of an award will only be deter-mined at settlement.
> Refer to “Note 30 – Employee deferred compensation” in VI – Consolidated financial statements – Credit Suisse Group for further information.
The following table provides a comparison of the outstanding deferred compensation awards at the end of 2019 and 2020, indicating the value of changes due to ex post implicit and ex post explicit adjustments. For 2020, the change in value for the outstanding deferred compensation awards was mainly due to implicit adjustments driven primarily by changes in the Group share price, foreign exchange rate movements and changes in the value of CCA.
Outstanding deferred compensation awards % of which
exposed to
Total Ex post Ex post Total ex post outstanding Granted Paid out in explicit implicit outstanding explicit
in / end end of 2019 in 2020 2020 adjustments adjustments endof2020 adjustments
Group (CHF million) 1
CCAs Cash-based 747 269 (183) (20) (122) 691 100%
Deferred cash awards 2 Cash-based 241 104 (123) (5) (24) 193 100%
Share awards 2 Share-based 1,449 3 735 (402) (74) (280) 1,428 100%
Performance share awards Share-based 948 540 (244) (25) (174) 1,045 100%
Total 3,385 1,648 (952) (124) (600) 3,357 –
MaterialRiskTakersandControllers(CHFmillion) 4
CCAs Cash-based 330 137 (82) (2) (29) 354 100%
Deferred cash awards 2 Cash-based 98 46 (55) – (9) 80 100%
Share awards 2 Share-based 496 3 259 (147) (10) (94) 504 100%
Performance share awards Share-based 560 338 (134) (4) (95) 665 100%
Total 1,484 780 (418) (16) (227) 1,603 –
1 Includes MRTCs and Executive Board members who were in office on December 31, 2020.2 Includes retention awards.3 Contingent Capital share awards are included in the category share awards. Prior periods have been reclassified to conform to the current presentation.4 Excludes Executive Board members who were in office on December 31, 2020.
Supplementary information
Impact of share-based compensation on shareholders’ equityIn general, the income statement expense recognition of share-based awards on a pre-tax basis has a neutral impact
on shareholders’ equity because the reduction to shareholders’ equity from the expense recognition is offset by the obligation to deliver shares, which is recognized as an increase to equity by a corresponding amount. Shareholders’ equity includes, as addi-tional paid-in capital, the tax benefits associated with the expens-ing and subsequent settlement of share-based awards.

251Compensation
Since 2017, the Group has been fulfilling its share delivery obliga-tions by purchasing shares in the market. The Group maintained this practice during 2020 and will continue covering future share delivery obligations through market purchases.
Share-based awards outstandingAt the end of 2020, there were 218.0 million share-based awards outstanding, of which 126.3 million were share awards and 91.7 million performance share awards.
> Refer to “Note 30 – Employee deferred compensation” in VI – Consolidated financial statements – Credit Suisse Group for further information.
Subsequent activityIn early 2021, the Group granted approximately 44.6 million new share awards and 37.8 million new performance share awards with respect to performance in 2020. Further, the Group awarded CHF 253 million of deferred variable incentive compensation in the form of CCA pursuant to the Group’s compensation policy.
In the first half of 2021, the Group plans to settle 86.8 million deferred awards from prior years, including 52.2 million share awards and 34.6 million performance share awards. The Group will continue to meet this delivery obligation through market purchases.
> Refer to “Capital management” in III – Treasury, Risk, Balance sheet and Off-balance sheet for more information.
Group compensation framework
The key elements of our current Group employees’ compensation framework and how they applied to various employee categories are described below.
Base salariesAll employees are paid a base salary. Salary levels are based on the skills, qualifications and relevant experience of the individ-ual, the responsibilities required by the role and external market factors.
Role-based allowancesRole-based allowances are a component of fixed compensation awarded to certain employees identified as Prudential Regulation Authority (PRA) Material Risk Takers (MRTs) under UK regula-tory requirements or material risk takers under other EU regula-tory requirements. These role-based allowances are determined based on the role and organizational responsibility of the individu-als. Role-based allowances are deemed to be fixed compensation for the purposes of calculating the cap of variable incentive com-pensation as required by the Capital Requirements Directive IV (CRD IV) and Capital Requirements Regulation. DCAP is a form of role-based allowance that is used primarily in the Americas.
Variable incentive compensation For 2020, variable incentive compensation was paid in cash unless the total compensation awarded to an employee for 2020 was greater than or equal to CHF 250,000 or the local currency equivalent or USD 250,000 for employees whose total compen-sation is denominated in US dollars. In these cases a portion was paid in cash and the balance was deferred, vesting at a later date.
Generally, employees receive the cash portion of their variable incentive compensation at a regular payroll settlement date close to the grant date. To comply with CRD IV requirements, employ-ees who hold material risk taker roles in respect of certain Group subsidiaries in the EU receive shares for 50% of the non-deferred portion of variable incentive compensation that would have been paid to them in cash. These shares are vested at the time of grant but remain blocked, that is, subject to transfer restrictions, for a period of time, generally 12 months.
For 2020 there was one global deferral table with deferral rates that range from 17.5% to 85%. The amount of variable incentive compensation paid in cash for 2020 was capped at CHF 2 million or the local currency equivalent (or USD 2 million for employ-ees whose total compensation is denominated in US dollars) per employee.
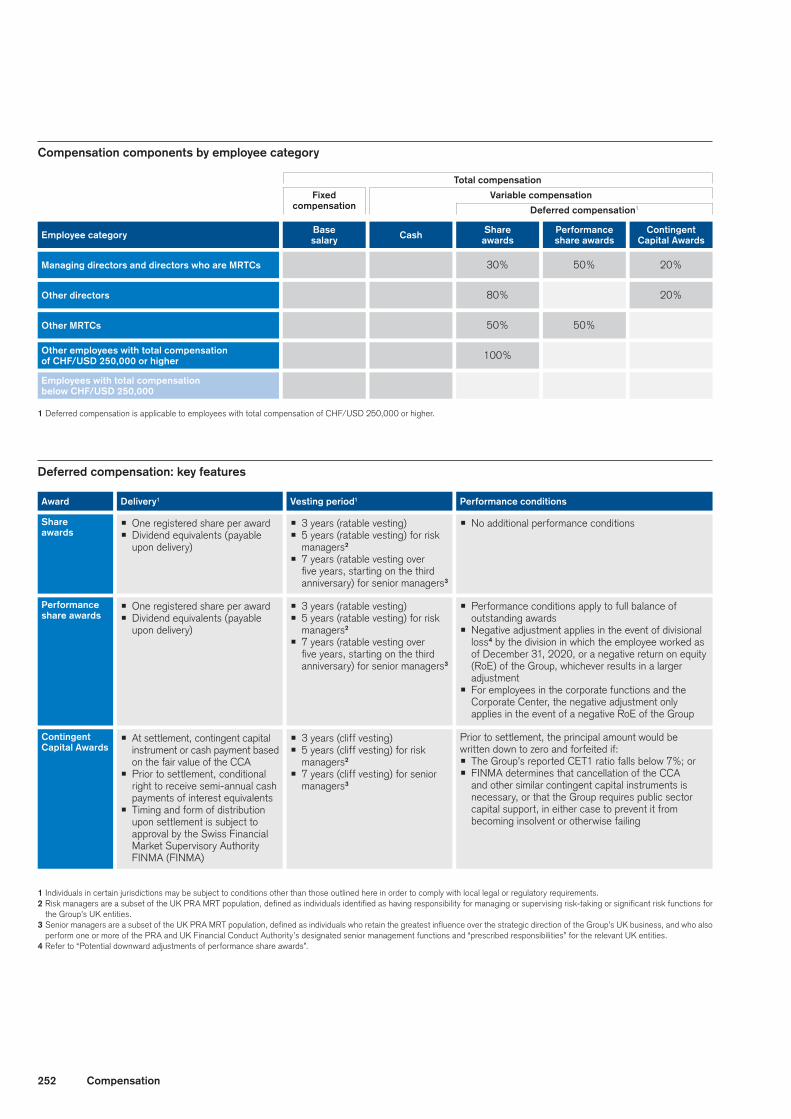
252 Compensation
1 Deferred compensation is applicable to employees with total compensation of CHF/USD 250,000 or higher.
Employee category
ManagingdirectorsanddirectorswhoareMRTCs
Other directors
OtherMRTCs
Base salary Cash Share
awards
30%
80%
50%
100%
Performance share awards
50%
50%
Contingent Capital Awards
20%
20%
Deferred compensation1
Variable compensation
Totalcompensation
Fixed compensation
Employees with total compensation belowCHF/USD250,000
Other employees with total compen sation ofCHF/USD250,000orhigher
Award
Share awards
Performance share awards
Contingent Capital Awards
Delivery1 Vesting period1
p One registered share per awardp Dividend equivalents (payable
upon delivery)
p One registered share per awardp Dividend equivalents (payable
upon delivery)
p At settlement, contingent capital instrument or cash payment based on the fair value of the CCA
p Prior to settlement, conditional right to receive semi-annual cash payments of interest equivalents
p Timing and form of distribution upon settlement is subject to approval by the Swiss Financial Market Supervisory Authority FINMA (FINMA)
p 3 years (ratable vesting)p 5 years (ratable vesting) for risk
managers2
p 7 years (ratable vesting over five years, starting on the third anniversary) for senior managers3
p 3 years (ratable vesting)p 5 years (ratable vesting) for risk
managers2
p 7 years (ratable vesting over five years, starting on the third anniversary) for senior managers3
p 3 years (cliff vesting)p 5 years (cliff vesting) for risk
managers2
p 7 years (cliff vesting) for senior managers3
Performance conditions
p No additional performance conditions
p Performance conditions apply to full balance of outstanding awards
p Negative adjustment applies in the event of divisional loss4 by the division in which the employee worked as of December 31, 2020, or a negative return on equity (RoE) of the Group, whichever results in a larger adjustment
p For employees in the corporate functions and the Corporate Center, the negative adjustment only applies in the event of a negative RoE of the Group
Prior to settlement, the principal amount would be written down to zero and forfeited if:p The Group’s reported CET1 ratio falls below 7%; or p FINMA determines that cancellation of the CCA
and other similar contingent capital instruments is necessary, or that the Group requires public sector capital support, in either case to prevent it from becoming insolvent or otherwise failing
1 Individuals in certain jurisdictions may be subject to conditions other than those outlined here in order to comply with local legal or regulatory requirements.2 Risk managers are a subset of the UK PRA MRT population, defined as individuals identified as having responsibility for managing or supervising risk-taking or significant risk functions for
the Group’s UK entities. 3 Senior managers are a subset of the UK PRA MRT population, defined as individuals who retain the greatest influence over the strategic direction of the Group’s UK business, and who also
perform one or more of the PRA and UK Financial Conduct Authority’s designated senior management functions and “prescribed responsibilities” for the relevant UK entities. 4 Refer to “Potential downward adjustments of performance share awards”.
Compensation components by employee category
Deferredcompensation:keyfeatures

253Compensation
Potential downward adjustments of performance share awards As described in the following table, performance share awards may be subject to negative adjustments in the event of a divisional loss. The amount of potential negative adjustment is shown in the table below.
Downward adjustment if division incurs a loss
Division loss before taxes Downward adjustment on
(in CHF billion) award balance (in %)
1.00 15
2.00 30
3.00 45
4.00 60
5.00 75
6.00 90
6.67 100
Competitive benchmarkingThe assessment of the economic and competitive environment is an important element of the compensation process as the Group strives for market-informed, competitive compensation levels. Internal expertise and the services of compensation consulting firms are used to benchmark compensation levels against relevant peers, taking into account geographical variations. The Com-pensation Committee is provided with regular reports from an independent compensation adviser on industry and market trends, including competitor performance and pay trends. The core group considered for the purposes of Group peer benchmarking are Bank of America, Barclays, Citigroup, Deutsche Bank, Goldman Sachs, JPMorgan Chase, Morgan Stanley and UBS. Specific benchmarking may include other peers, depending on the busi-ness area or geographic location, as appropriate.
For consideration of European and local practices, the Compen-sation Committee also references a cross-industry peer group of multinational companies headquartered in Europe selected on the basis of comparability to Credit Suisse in size, scale, global scope of operations and economic influence. In addition to the companies already listed previously and those included as part of the Executive Board LTI RTSR peer group, peers considered for Executive Board compensation include: ABN AMRO Bank, AstraZeneca, Bayer, Commerzbank, Credit Agricole, Danske Bank, GlaxoSmithKline, HSBC, Lloyds Banking Group, Merck KGaA, Natixis, Novartis, Roche, Sanofi and UniCredit.
Focus on risk and controlRisk and control considerations are an integral part of the perfor-mance assessment and compensation processes. This ensures that the Group’s approach to compensation includes a focus on risk and internal control matters and discourages excessive risk taking. Senior management from the Group’s corporate func-tions, including Risk & Compliance, General Counsel, Human Resources, Internal Audit and Product Control, provide the Com-pensation Committee with comprehensive feedback on regula-tory, audit, disciplinary and risk-related issues or trends across the Group, relevant to the assessment of the Group’s risk and control culture. Divisions are assessed against risk and conduct mea-sures for the year, and the consolidated findings are presented to the Compensation Committee and the CEO. Based on these assessments, the Compensation Committee may approve adjust-ments to the divisional pool levels as proposed by the CEO.
Aside from risk considerations, disciplinary events may also impact compensation decisions. Conduct and Ethics Boards (CEBs) review all disciplinary events and decide on disciplinary sanctions proposed by the recommendation teams, which include represen-tatives from the control functions. CEBs have been established at the Group-wide level, as well as for each business division and the corporate functions overall. The Group CEB meets on a quarterly basis to ensure that sanctions applied are in line with the Group’s risk appetite, market practice and regulatory requirements.

254 Compensation
Malus
Clawback
Application Scope/Criteria
p Reduction or cancellation of outstanding deferred awards prior to settlement
p Applies to all outstanding deferred awards granted
p Claim back of deferred and non-deferred variable compensation after vesting and settlement
p For UK PRA MRTs, clawback may be applied up to seven years from grant date (or such longer period as may be required)
p The Group will apply clawback provisions to the extent permitted under local laws, as required
p Impermissible disclosure or misuse of Group information, or willful engagement in conduct that is materially detrimental to an interest of the Group;
p Conduct that evidences serious misbehavior or serious error; p Conduct that causes, could cause or could have caused the Group or any division or region
to suffer a significant downturn in financial performance or regulatory capital base;p Significant failure of risk management; or p Conduct that is reviewed by the Group’s disciplinary conduct, ethics or similar committee
For UK PRA MRTs, clawback may be applied in certain situations, including:p Conduct which resulted in significant losses to the Group; p Failure to meet appropriate standards of fitness and propriety;p Reasonable evidence of misconduct or misbehavior or a material or serious error;p The Group or relevant business unit suffers a material failure of risk management; p A regulator mandates a significant increase in regulatory capital for the Group or any division
or region; orp The individual has contributed to any regulatory sanctions imposed on the Group or division
or region
Similar clawback provisions apply for employees regulated by the Bank of Italy and other EU-regulated employees who are subject to a clawback requirement.
Covered Employees
MRTCs
Employee categories Compensation process
p MRTCsp US-based revenue producers in the Investment Bank division
p Members of the Executive Boardp Employees who report directly to a member of the Executive Boardp Employees, individually or as part of a group, with the ability to put material amounts of the
Group’s capital at riskp Top 150 paid employees across the Group based on total compensation p Any employee identified as taking or controlling material risks on behalf of the Group, as
prescribed by EU/UK regulatorsp Senior relationship managers in the Wealth Management-related businessesp Other individuals whose roles have been identified as having a potential impact on the
market, reputational and operational risk of the Group
Focus on risk assessment p Covered employees and their
managers are required to define role- specific risk objectives and to incorporate risk considerations in their performance evaluations and when setting variable incentive compensation
p Types of risks considered vary by role (e.g., reputational, credit, market, operational, liquidity, legal and compliance)
p Both realized and potential risk outcomes are assessed
MalusandclawbackprovisionsAll deferred compensation awards granted contain malus provi-sions that enable the Group to reduce or cancel the awards prior to settlement if the participant engages in certain detrimental conduct. Malus provisions were enforced during the course of
2020, impacting 44 employees. All variable incentive compen-sation granted to UK PRA MRTs and employees regulated by the Bank of Italy are subject to clawback. Other EU-regulated employees are also subject to clawback provisions as required by applicable legal or regulatory requirements.
CoveredEmployees(includingMaterialRiskTakersandControllers)Covered employees are subject to a heightened level of scrutiny over the alignment of their compensation with performance and risk considerations.
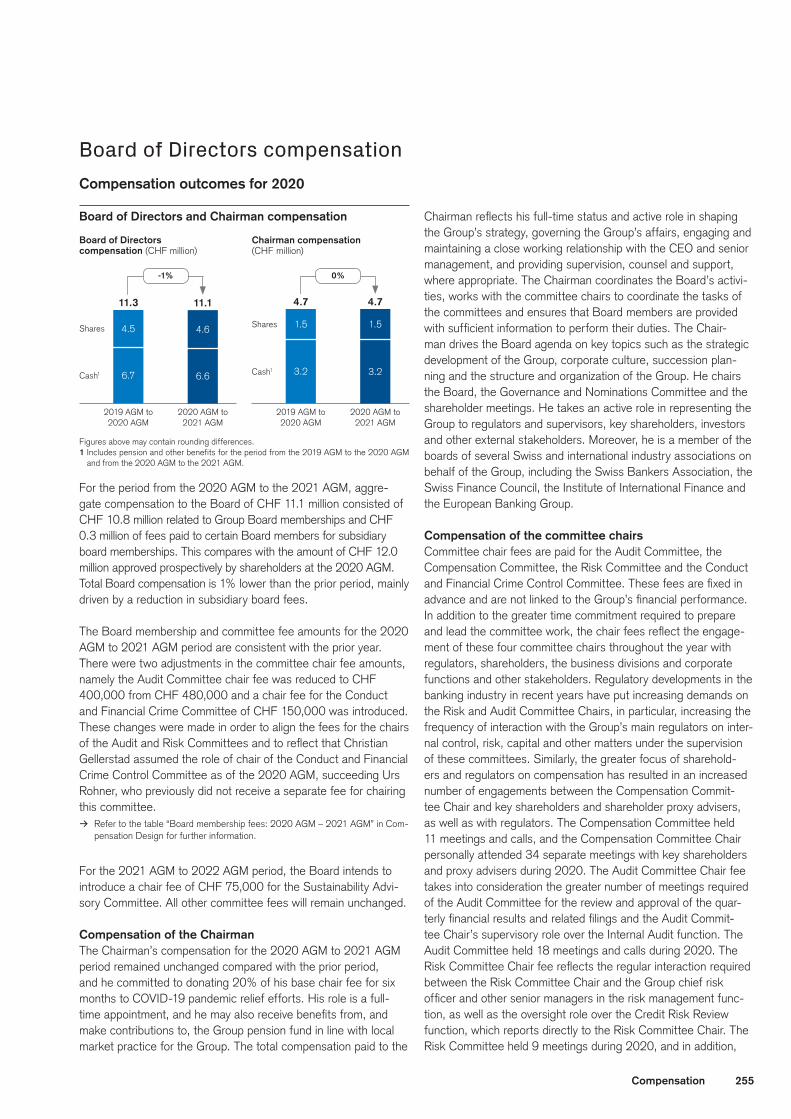
255Compensation
-1% 0%
Board of Directors compensation (CHF million)
Chairman compensation (CHF million)
Board of Directors and Chairman compensation
6.7
4.5
11.3 4.7 4.711.1
3.2
1.5
6.6
4.6
3.2
1.5
2019 AGM to 2020 AGM
2019 AGM to 2020 AGM
2020 AGM to 2021 AGM
2020 AGM to 2021 AGM
Figures above may contain rounding differences.1 Includes pension and other benefits for the period from the 2019 AGM to the 2020 AGM
and from the 2020 AGM to the 2021 AGM.
Shares Shares
Cash1 Cash1
Board of Directors compensationCompensationoutcomesfor2020
For the period from the 2020 AGM to the 2021 AGM, aggre-gate compensation to the Board of CHF 11.1 million consisted of CHF 10.8 million related to Group Board memberships and CHF 0.3 million of fees paid to certain Board members for subsidiary board memberships. This compares with the amount of CHF 12.0 million approved prospectively by shareholders at the 2020 AGM. Total Board compensation is 1% lower than the prior period, mainly driven by a reduction in subsidiary board fees.
The Board membership and committee fee amounts for the 2020 AGM to 2021 AGM period are consistent with the prior year. There were two adjustments in the committee chair fee amounts, namely the Audit Committee chair fee was reduced to CHF 400,000 from CHF 480,000 and a chair fee for the Conduct and Financial Crime Committee of CHF 150,000 was introduced. These changes were made in order to align the fees for the chairs of the Audit and Risk Committees and to reflect that Christian Gellerstad assumed the role of chair of the Conduct and Financial Crime Control Committee as of the 2020 AGM, succeeding Urs Rohner, who previously did not receive a separate fee for chairing this committee.
> Refer to the table “Board membership fees: 2020 AGM – 2021 AGM” in Com-pensation Design for further information.
For the 2021 AGM to 2022 AGM period, the Board intends to introduce a chair fee of CHF 75,000 for the Sustainability Advi-sory Committee. All other committee fees will remain unchanged.
Compensation of the ChairmanThe Chairman’s compensation for the 2020 AGM to 2021 AGM period remained unchanged compared with the prior period, and he committed to donating 20% of his base chair fee for six months to COVID-19 pandemic relief efforts. His role is a full-time appointment, and he may also receive benefits from, and make contributions to, the Group pension fund in line with local market practice for the Group. The total compensation paid to the
Chairman reflects his full-time status and active role in shaping the Group’s strategy, governing the Group’s affairs, engaging and maintaining a close working relationship with the CEO and senior management, and providing supervision, counsel and support, where appropriate. The Chairman coordinates the Board’s activi-ties, works with the committee chairs to coordinate the tasks of the committees and ensures that Board members are provided with sufficient information to perform their duties. The Chair-man drives the Board agenda on key topics such as the strategic development of the Group, corporate culture, succession plan-ning and the structure and organization of the Group. He chairs the Board, the Governance and Nominations Committee and the shareholder meetings. He takes an active role in representing the Group to regulators and supervisors, key shareholders, investors and other external stakeholders. Moreover, he is a member of the boards of several Swiss and international industry associations on behalf of the Group, including the Swiss Bankers Association, the Swiss Finance Council, the Institute of International Finance and the European Banking Group.
Compensation of the committee chairs Committee chair fees are paid for the Audit Committee, the Compensation Committee, the Risk Committee and the Conduct and Financial Crime Control Committee. These fees are fixed in advance and are not linked to the Group’s financial performance. In addition to the greater time commitment required to prepare and lead the committee work, the chair fees reflect the engage-ment of these four committee chairs throughout the year with regulators, shareholders, the business divisions and corporate functions and other stakeholders. Regulatory developments in the banking industry in recent years have put increasing demands on the Risk and Audit Committee Chairs, in particular, increasing the frequency of interaction with the Group’s main regulators on inter-nal control, risk, capital and other matters under the supervision of these committees. Similarly, the greater focus of sharehold-ers and regulators on compensation has resulted in an increased number of engagements between the Compensation Commit-tee Chair and key shareholders and shareholder proxy advisers, as well as with regulators. The Compensation Committee held 11 meetings and calls, and the Compensation Committee Chair personally attended 34 separate meetings with key shareholders and proxy advisers during 2020. The Audit Committee Chair fee takes into consideration the greater number of meetings required of the Audit Committee for the review and approval of the quar-terly financial results and related filings and the Audit Commit-tee Chair’s supervisory role over the Internal Audit function. The Audit Committee held 18 meetings and calls during 2020. The Risk Committee Chair fee reflects the regular interaction required between the Risk Committee Chair and the Group chief risk officer and other senior managers in the risk management func-tion, as well as the oversight role over the Credit Risk Review function, which reports directly to the Risk Committee Chair. The Risk Committee held 9 meetings during 2020, and in addition,
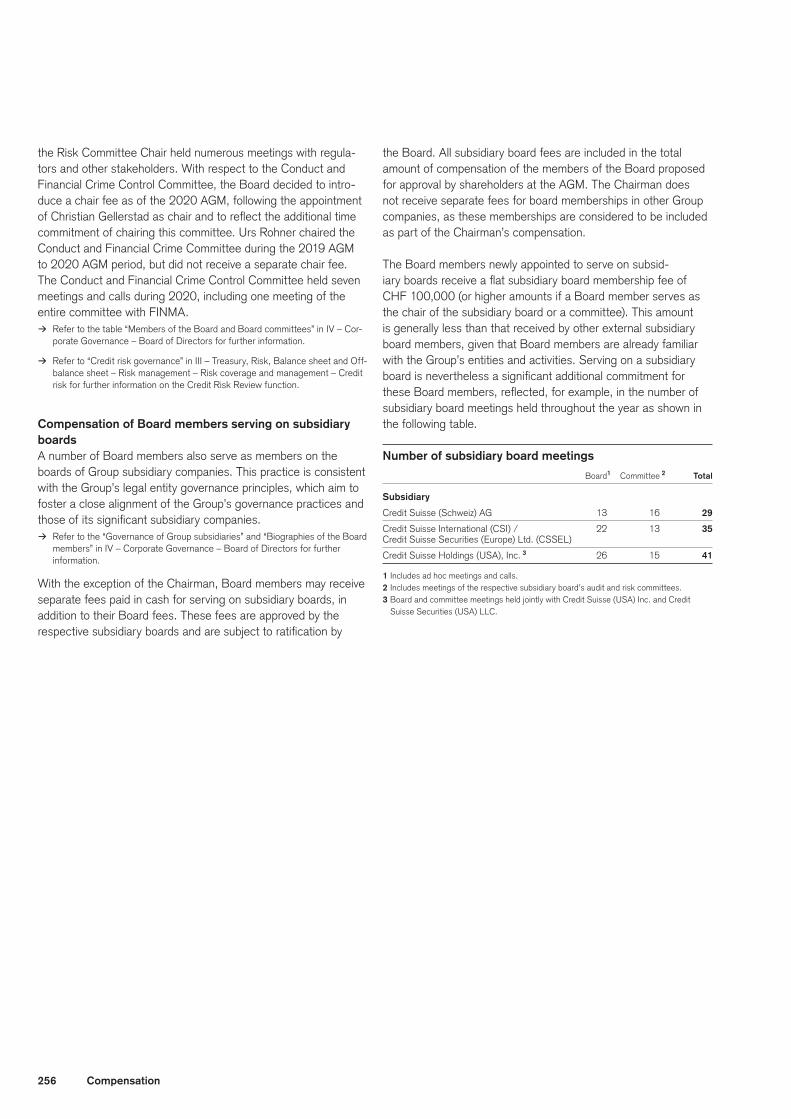
256 Compensation
the Risk Committee Chair held numerous meetings with regula-tors and other stakeholders. With respect to the Conduct and Financial Crime Control Committee, the Board decided to intro-duce a chair fee as of the 2020 AGM, following the appointment of Christian Gellerstad as chair and to reflect the additional time commitment of chairing this committee. Urs Rohner chaired the Conduct and Financial Crime Committee during the 2019 AGM to 2020 AGM period, but did not receive a separate chair fee. The Conduct and Financial Crime Control Committee held seven meetings and calls during 2020, including one meeting of the entire committee with FINMA.
> Refer to the table “Members of the Board and Board committees” in IV – Cor-porate Governance – Board of Directors for further information.
> Refer to “Credit risk governance” in III – Treasury, Risk, Balance sheet and Off-balance sheet – Risk management – Risk coverage and management – Credit risk for further information on the Credit Risk Review function.
Compensation of Board members serving on subsidiary boardsA number of Board members also serve as members on the boards of Group subsidiary companies. This practice is consistent with the Group’s legal entity governance principles, which aim to foster a close alignment of the Group’s governance practices and those of its significant subsidiary companies.
> Refer to the “Governance of Group subsidiaries” and “Biographies of the Board members” in IV – Corporate Governance – Board of Directors for further information.
With the exception of the Chairman, Board members may receive separate fees paid in cash for serving on subsidiary boards, in addition to their Board fees. These fees are approved by the respective subsidiary boards and are subject to ratification by
the Board. All subsidiary board fees are included in the total amount of compensation of the members of the Board proposed for approval by shareholders at the AGM. The Chairman does not receive separate fees for board memberships in other Group companies, as these memberships are considered to be included as part of the Chairman’s compensation.
The Board members newly appointed to serve on subsid-iary boards receive a flat subsidiary board membership fee of CHF 100,000 (or higher amounts if a Board member serves as the chair of the subsidiary board or a committee). This amount is generally less than that received by other external subsidiary board members, given that Board members are already familiar with the Group’s entities and activities. Serving on a subsidiary board is nevertheless a significant additional commitment for these Board members, reflected, for example, in the number of subsidiary board meetings held throughout the year as shown in the following table.
Number of subsidiary board meetings Board 1 Committee 2 Total
Subsidiary
Credit Suisse (Schweiz) AG 13 16 29
Credit Suisse International (CSI) / 22 13 35
Credit Suisse Securities (Europe) Ltd. (CSSEL)
Credit Suisse Holdings (USA), Inc. 3 26 15 41
1 Includes ad hoc meetings and calls.2 Includes meetings of the respective subsidiary board’s audit and risk committees.3 Board and committee meetings held jointly with Credit Suisse (USA) Inc. and Credit
Suisse Securities (USA) LLC.

257Compensation
Supplementary information
Boardcompensationfromthe2020AGMtothe2021AGM(audited) Group
Of which Total, Pension awarded including
CF Base board Committee Chair and other in Group Subsidiary subsidiary
GNC AC CC CCC RC fee fee fee benefits Total shares 1 board fee 2 boards 3
CHF
Urs Rohner, Chairman 4 C M 3,000,000 – 1,500,000 218,665 4,718,665 1,500,000 4,718,665
Iris Bohnet M 250,000 100,000 – 350,000 175,000 350,000
Christian Gellerstad M M C 250,000 150,000 150,000 550,000 275,000 550,000
Andreas Gottschling M M C 250,000 200,000 400,000 850,000 425,000 100,000 950,000
Michael Klein M M 250,000 200,000 – 450,000 225,000 450,000
Shan Li M 250,000 100,000 – 350,000 175,000 350,000
Seraina Macia M 250,000 100,000 – 350,000 175,000 350,000
Richard Meddings M C M M 250,000 225,000 400,000 875,000 437,500 875,000
Kai S. Nargolwala M C M 250,000 125,000 300,000 675,000 337,500 675,000
Ana Paula Pessoa M M 250,000 225,000 – 475,000 237,500 475,000
Joaquin J. Ribeiro M 250,000 150,000 – 400,000 200,000 400,000
Severin Schwan M M 250,000 150,000 – 400,000 200,000 400,000
John Tiner M 250,000 150,000 – 400,000 200,000 198,000 598,000
Total 6,000,000 1,875,000 2,750,000 218,665 10,843,665 4,562,500 298,000 11,141,665
GNC = Governance and Nominations Committee; AC = Audit Committee; CC = Compensation Committee; CFCCC = Conduct and Financial Crime Control Committee; RC = Risk Com-mittee; C = Chair; M = Member1 As of December 31, 2020, one-half of the Board member fees to be awarded in Group shares have been delivered to Board members. The applicable Group share price was CHF 8.62.
The remaining shares will be delivered to Board members at or around the date of the 2021 AGM, and the share price for this second share delivery will be determined at that time. Group shares are subject to a four-year blocking period.
2 Subsidiary board fees were awarded for the following subsidiary board roles: i) Mr. Gottschling serves as non-executive director, member of the risk committee and chair of the advisory remuneration committee of the UK subsidiaries Credit Suisse International and Credit Suisse Securities (Europe) Limited and receives annual fees of CHF 100,000 for these roles; ii) Mr. Tiner serves as non-executive board member of the US subsidiaries Credit Suisse Holdings (USA), Inc., Credit Suisse (USA) Inc. and Credit Suisse Securities (USA) LLC and receives annual fees of USD 225,000 for these roles; in the case of Mr. Tiner, these fees were agreed prior to the cap of CHF 100,000 being adopted for Group Board members serving on sub-sidiary boards.
3 At the 2020 AGM, shareholders approved a maximum amount of total compensation to be awarded to Board members until the 2021 AGM of CHF 12 million. For the total compensation awarded to members of the Board, the Group will make estimated payments of CHF 0.7 million for the 2020 / 2021 Board period to cover the mandatory employer social security contri-butions as required under the social security laws applicable to the individual Board members based on their domicile and employment status. These contributions do not form part of the Board members’ compensation.
4 The Chair fee of the Chairman is set at CHF 1.5 million to be awarded as 100% Group shares. The total compensation of the Chairman includes benefits for the period from the 2020 AGM to the 2021 AGM of CHF 218,665, including pension and health insurance benefits.

258 Compensation
Boardcompensationfromthe2019AGMtothe2020AGM(audited) Group
Of which Total, Pension awarded including
CF Base board Committee Chair and other in Group Subsidiary subsidiary
GNC AC CC CCC RC fee fee fee benefits Total shares 1 board fee 2 boards 3
CHF
Urs Rohner, Chairman 4 C C 3,000,000 1,500,000 218,665 4,718,665 1,500,000 4,718,665
Iris Bohnet M 250,000 100,000 350,000 175,000 350,000
Christian Gellerstad M M 250,000 175,000 425,000 212,500 425,000
Andreas Gottschling M M C 250,000 200,000 400,000 850,000 425,000 100,000 950,000
Alexander Gut M 250,000 150,000 400,000 200,000 150,000 550,000
Michael Klein M M 250,000 200,000 450,000 225,000 450,000
Shan Li M 250,000 100,000 350,000 175,000 350,000
Seraina Macia M 250,000 100,000 350,000 175,000 350,000
Kai S. Nargolwala M C M 250,000 125,000 300,000 675,000 337,500 675,000
Ana Paula Pessoa M M 250,000 225,000 475,000 237,500 475,000
Joaquin J. Ribeiro M 250,000 150,000 400,000 200,000 400,000
Severin Schwan M M 250,000 150,000 400,000 200,000 400,000
John Tiner M C M M 250,000 225,000 480,000 955,000 477,500 225,000 1,180,000
Total 6,000,000 1,900,000 2,680,000 218,665 10,798,665 4,540,000 475,000 11,273,665
GNC = Governance and Nominations Committee; AC = Audit Committee; CC = Compensation Committee; RC = Risk Committee; C = Chair; M = Member1 As of December 31, 2019, one-half of the Board member fees to be awarded in Group shares have been delivered to Board members. The applicable Group share price was CHF 12.19.
The remaining shares were delivered to Board members at or around the date of the 2020 AGM and the share price for this second share delivery was determined at that time. Group shares are subject to a four-year blocking period.
2 Subsidiary board fees were awarded for the following subsidiary board roles: i) Mr. Gottschling served as non-executive director, member of the risk committee and chair of the advisory remuneration committee of the UK subsidiaries Credit Suisse International and Credit Suisse Securities (Europe) Limited and received annual fees of CHF 100,000 for these roles; ii) Mr. Gut served as non-executive director and audit committee chair of the Swiss subsidiary Credit Suisse (Schweiz) AG and received annual fees of CHF 100,000 and CHF 50,000 for these roles, respectively; iii) Mr. Tiner served as non-executive board member of the US subsidiaries Credit Suisse Holdings (USA), Inc., Credit Suisse (USA) Inc. and Credit Suisse Securities (USA) LLC; and in the case of Mr. Tiner, these fees were agreed prior to the cap of CHF 100,000 being adopted for Group Board members serving on subsidiary boards.
3 At the 2019 AGM, shareholders approved a maximum amount of total compensation to be awarded to Board members until the 2020 AGM of CHF 12 million. For the total compensa-tion awarded to members of the Board, the Group made payments of CHF 0.5 million for the 2019 / 2020 Board period to cover the mandatory employer social security contributions as required under the social security laws applicable to the individual Board members based on their domicile and employment status. These contributions do not form part of the Board members’ compensation.
4 The Chair fee of the Chairman is set at CHF 1.5 million to be awarded as 100% Group shares. The total compensation of the Chairman includes benefits for the period from the 2019 AGM to the 2020 AGM of CHF 218,665, including pension and health insurance benefits.
259Compensation
Board shareholdingsThe following table discloses the shareholdings of the Board members, their immediate family and companies in which they have a controlling interest. As of December 31, 2020 and 2019, there were no Board members with outstanding options.
Board shareholdings by individual
end of 2020 2019
December 31 (shares) 1
Urs Rohner 425,783 298,416
Iris Bohnet 96,328 74,916
Christian Gellerstad 103,991 51,716
Andreas Gottschling 104,659 51,391
Michael Klein 49,897 22,369
Shan Li 28,590 7,178
Seraina Macia 84,844 63,432
Richard Meddings 2 13,774 –
Kai S. Nargolwala 366,334 324,088
Ana Paula Pessoa 53,816 24,758
Joaquin J. Ribeiro 77,724 53,253
Severin Schwan 169,976 145,505
John Tiner 335,960 278,188
Total 1,911,676 1,395,210 3
1 Includes Group shares that are subject to a blocking period of up to four years; includes shareholdings of immediate family members.
2 Richard Meddings was newly elected at the 2020 AGM.3 Excludes 51,455 shares held by Alexander Gut, who did not stand for re-election to the
Board as of April 30, 2020.
Board loansThe majority of loans outstanding to members of the Board are mortgages or loans against securities. Such loans are made to Board members on the same terms available to third-party cli-ents. Pursuant to the AoA, each member of the Board may be granted individual credit facilities or loans up to a maximum of CHF 20 million at market conditions. As of December 31, 2020, 2019 and 2018, outstanding loans to Board members amounted to CHF 9 million, CHF 9 million and CHF 6 million, respectively.
Board members with loans, including the Chairman, do not bene-fit from employee conditions, but are subject to conditions applied to clients with a comparable credit standing. Unless otherwise noted, all loans to Board members are made in the ordinary course of business and substantially on the same terms, includ-ing interest rates and collateral, as those prevailing at the time for comparable transactions with other persons. Such loans do not involve more than the normal risk of collectability or present other unfavorable features. In addition to the loans listed below, the Group or any of its banking subsidiaries may enter into financing and other banking agreements with companies in which current Board members have a significant influence as defined by the US Securities and Exchange Commission (SEC). Examples include holding executive and/or board level roles in these companies. Unless otherwise noted, loans extended by the Group to such companies are also made in the ordinary course of business and at prevailing market conditions. As of December 31, 2020, 2019 and 2018, there was no loan exposure to such related party com-panies that was not made in the ordinary course of business and at prevailing market conditions.
> Refer to “Banking relationships with Board and Executive Board members and related party transactions” in IV – Corporate Governance – Additional informa-tion for further information.
Board loans by individual (audited)
end of 2020 2019
December 31 (CHF)
Urs Rohner 4,490,000 4,575,000
Christian Gellerstad 3,495,150 3,533,550
Seraina Macia 944,000 952,000
Total 8,929,150 9,060,550 1
Includes loans to immediate family members and companies, in which the respective Board member has an ownership stake of 50% or higher.1 Excludes a loan of CHF 30,000 held by Alexander Gut, who did not stand for re-election
to the Board as of April 30, 2020.
Former members of the BoardOne former member of the Board is eligible to receive office infrastructure and secretarial support. These services are based on existing resources and are not used on a regular basis. No additional fees, severance payments or other forms of compensa-tion were paid to former members of the Board or related parties during 2020 and 2019.

260 Compensation
What we do
What we don’t do
p Pay for performance alignment with a significant portion of Executive Board and employee compensation “at risk” and determined by the achievement of performance targets linked to Group financial results and shareholder value creation
p Majorityofvariablepayindeferredshare-basedawardswith vesting periods of at least three yearsp Risk, compliance and conduct and ethics considerations are factored into the compensation decision-making processp Minimumshareholdingrequirements, with Executive Board members restricted from selling shares, or from receiving
share-based awards in the form of cash, until they fulfill the requirementsp Strong malus provisions that enable the cancellation or reduction of unsettled awards in the event of certain detrimental
conductp Competitive benchmarking against our peer groups to make informed decisions on pay levels and pay practices p Mitigationofequitydilution of existing shareholders by fulfilling the Group’s share delivery obligations through purchasing
shares in the marketp Shareholder engagement throughout the year to gather feedback on compensation programs and practices and reflect it in our
decision-making
p No “golden parachute” agreements or any other pre-determined termination agreements including special severance awards for employees
p No special severance provisions to Executive Board members beyond the regular compensation awarded during the notice period
p No hedging of outstanding unvested share-based awards and no pledging of unvested, or vested and undistributed share-based awards
p No multi-year guaranteed incentive awards
Compensation designCompensation strategy and objectives
Consistent with prior years, our key compensation objectives are to maintain compensation practices that:
p foster a performance culture based on merit that differenti-ates and rewards excellent performance;
p attract and retain employees, and motivate them to achieve results with integrity and fairness;
p balance the mix of fixed and variable compensation to appropriately reflect the value and responsibility of the role per-formed, and to influence appropriate behaviors and actions;
p promote effective risk management practices that are aligned with the Group’s compliance and control cultures;
p create a culture that adheres to high standards of conduct and behavior aligned to values, through a system of apply-ing both malus and rewards;
p encourage teamwork and collaboration across the Group; p achieve a balanceddistributionofprofitabilitybetween
shareholders and employees over the long term, subject to Group performance and market conditions; and
p take into account the long-term performance of the Group, in order to create sustainable value for shareholders.

261Compensation
Governance and leadership
Social
Ratings and indices
Environment and sustain-able business practice
Ourachievementsin2020
p Creation of our Sustainability, Research & Investment Solutions function (SRI) at Executive Board levelp Establishment of a new group entitled Sustainability Strategy, Advisory & Finance (SSAF), to support the creation of a cohesive and
dedicated bank-wide sustainability offering within SRIp Creation of a firm-wide Sustainability Leadership Committee responsible for driving the development and implementation of the
sustainability strategy, and for assessing progress against the Bank’s strategic sustainability objectives and commitments including the Principles for Responsible Banking (PRB)
p Launched Credit Suisse purpose statement and refreshed values, all embedded in an updated Code of Conductp Trained over 2,300 participants on our sustainability solution in 2020, including on our Credit Suisse Sustainable Investment
Frameworkp Successfully completed globally certified Environmental Management System audit carried out by SGS (according to ISO14001)
p Strong commitment to Diversity & Inclusion, with a refreshed D&I strategy, and new US and UK targets for Black Talent representation in the company
p Published research on gender and LGBT+ topics, including the CS Gender 3000 report (linking gender diversity with company perfor-mance) and the LGBT 350 report (a study of 350 companies and their approach to LGBT+ equality in the workforce, and relationship with earnings and share price outperformance)
p Strengthened targeted recruitment campaigns that focus on diverse groups, e.g., Credit Suisse’s Real Returns program and Diversity Internship program
p Credit Suisse was recognized with over 50 awards, across recruitment, virtual recruitment, employer attractiveness, employer branding and diversity and inclusion categories, from institutions such as Forbes, Universum and eFinancial Careers
p Active engagement in the G20 and International Monetary Fund initiative on debt forgiveness and relief p Proactive support to all tenants that were impacted by the decision of the Federal Government to close all non-essential businesses in
Switzerland, by waiving the rent of their businesses for one month without any conditions
p Ongoing inclusion in leading sustainability indices, such as Dow Jones Sustainability Index (DJSI)p Upgraded to an A rating in the MSCI ESG Rating
p Played a critical role in the bridging loan solution for Swiss companies, providing approximately CHF 3 billion in loans to over 16,700 Swiss SMEs in 2020
p Enabling Client Transitions – announced goal to provide at least CHF 300 billion of sustainable financing to support transition strategies over the next 10 years
p Intensified ESG integration for all CS Asset Management real estate funds capturing over CHF 30 billion AuM and 14 fundsp Joined global RE100 initiative, with a public commitment to source 100% renewable electricity across our entire global operations
by 2025p Commitment to develop science-based targets in 2021 and 2022, including goal of net zero emissions from our operations, supply
chain and financing activities no later than 2050, and alignment of our financing with the Paris Agreement objective of limiting global warming to 1.5°C
p Reduced our greenhouse gas emissions by 88% from our 2010 baseline yearp Improved CDP climate change score from B to A-
Environmental, social and governance (ESG) considerations at Credit Suisse
Sustainability in compensationFinancial institutions have a crucial role to play in society, and Credit Suisse is committed to conducting its business in the most sustain-able manner possible. As a reflection of this commitment, we have established a Sustainability Advisory Committee at the Board level and a new Sustainability, Research & Investment Solutions (SRI) function at the Executive Board level. We strengthened our commitments to Diversity & Inclusion and launched our first-ever purpose statement to infuse our values into our daily working lives. As part of this commitment, ESG aspects are considered in various stages of the compensation process:
p Groupvariableincentivepool: the Compensation Commit-tee considers audit, disciplinary, risk and regulatory-related issues, among other factors, in order to determine appropriate adjustments to the Group, divisional and corporate functions pools. In addition, one of the key drivers of bonus pool devel-opment at the divisional level is economic contribution, which factors in the level of risk taken to achieve profitability;
p ExecutiveBoardannualSTIawards: the non-financial component of Executive Board annual STI awards includes the consideration of ESG factors, particularly the integration of ESG into investment processes, client satisfaction, corpo-rate responsibility, talent management, diversity and inclusion, compliance, risk management, and conduct and ethics; and
p Equalpaypolicy: Credit Suisse does not tolerate any form of discrimination, in particular discrimination based on ethnicity,
nationality, gender, sexual orientation, gender identity, religion, age, marital or family status, pregnancy, disability, or any other status that is protected by local law. We recognize and value diversity and inclusion as a driver of success. Our policies and practices support a culture of fairness, where employ-ment-related decisions, including decisions on compensation, are based on an individual’s qualifications, performance and behavior, or other legitimate business considerations, such as the profitability of the Group or the division and department of the individual, and the strategic needs of the Group. Consis-tent with our long-term commitment to fair pay, the Compen-sation Committee reviews our pay practices on a regular basis to identify potential areas requiring more attention.
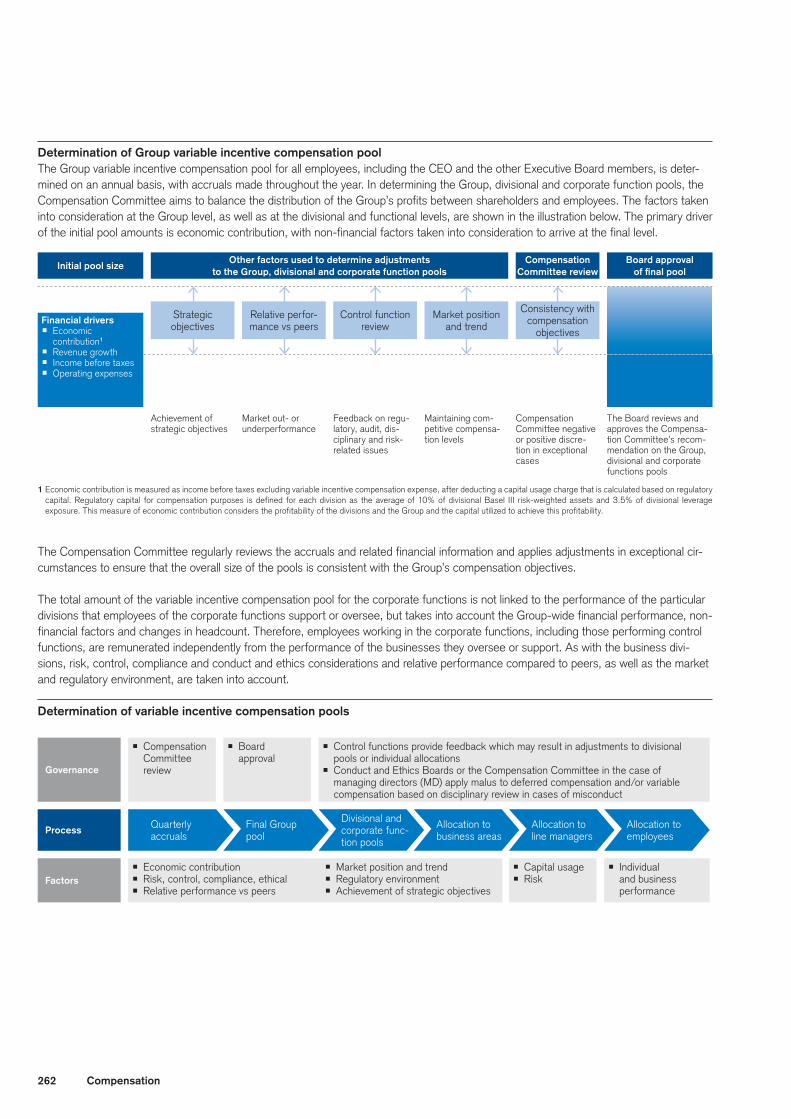
262 Compensation
Financial driversp Economic
contribution1
p Revenue growth p Income before taxesp Operating expenses
Initial pool size
Achievement of strategic objectives
Market out- or underperformance
Feedback on regu-latory, audit, dis-ciplinary and risk-related issues
Maintaining com-petitive compensa-tion levels
Compensation Committee negative or positive discre-tion in exceptional cases
The Board reviews and approves the Compensa-tion Committee’s recom-mendation on the Group, divisional and corporate functions pools
Board approval offinalpool
Other factors used to determine adjustments to the Group, divisional and corporate function pools
Compensation Committee review
Relative perfor-mance vs peers
Control function review
Market position and trend
Consistency with compensation
objectives
Strategic objectives
1 Economic contribution is measured as income before taxes excluding variable incentive compensation expense, after deducting a capital usage charge that is calculated based on regulatory capital. Regulatory capital for compensation purposes is defined for each division as the average of 10% of divisional Basel III risk-weighted assets and 3.5% of divisional leverage exposure. This measure of economic contribution considers the profitability of the divisions and the Group and the capital utilized to achieve this profitability.
Determination of variable incentive compensation pools
Process
Factors
Governance
p Compensation Committee review
p Economic contributionp Risk, control, compliance, ethicalp Relative performance vs peers
p Market position and trendp Regulatory environmentp Achievement of strategic objectives
p Board approval
p Capital usagep Risk
p Individual and business performance
p Control functions provide feedback which may result in adjustments to divisional pools or individual allocations
p Conduct and Ethics Boards or the Compensation Committee in the case of managing directors (MD) apply malus to deferred compensation and/or variable compensation based on disciplinary review in cases of misconduct
Quarterly accruals
Final Group pool
Divisional and corporate func-tion pools
Allocation to business areas
Allocation to line managers
Allocation to employees
Determination of Group variable incentive compensation poolThe Group variable incentive compensation pool for all employees, including the CEO and the other Executive Board members, is deter-mined on an annual basis, with accruals made throughout the year. In determining the Group, divisional and corporate function pools, the Compensation Committee aims to balance the distribution of the Group’s profits between shareholders and employees. The factors taken into consideration at the Group level, as well as at the divisional and functional levels, are shown in the illustration below. The primary driver of the initial pool amounts is economic contribution, with non-financial factors taken into consideration to arrive at the final level.
The Compensation Committee regularly reviews the accruals and related financial information and applies adjustments in exceptional cir-cumstances to ensure that the overall size of the pools is consistent with the Group’s compensation objectives.
The total amount of the variable incentive compensation pool for the corporate functions is not linked to the performance of the particular divisions that employees of the corporate functions support or oversee, but takes into account the Group-wide financial performance, non-financial factors and changes in headcount. Therefore, employees working in the corporate functions, including those performing control functions, are remunerated independently from the performance of the businesses they oversee or support. As with the business divi-sions, risk, control, compliance and conduct and ethics considerations and relative performance compared to peers, as well as the market and regulatory environment, are taken into account.
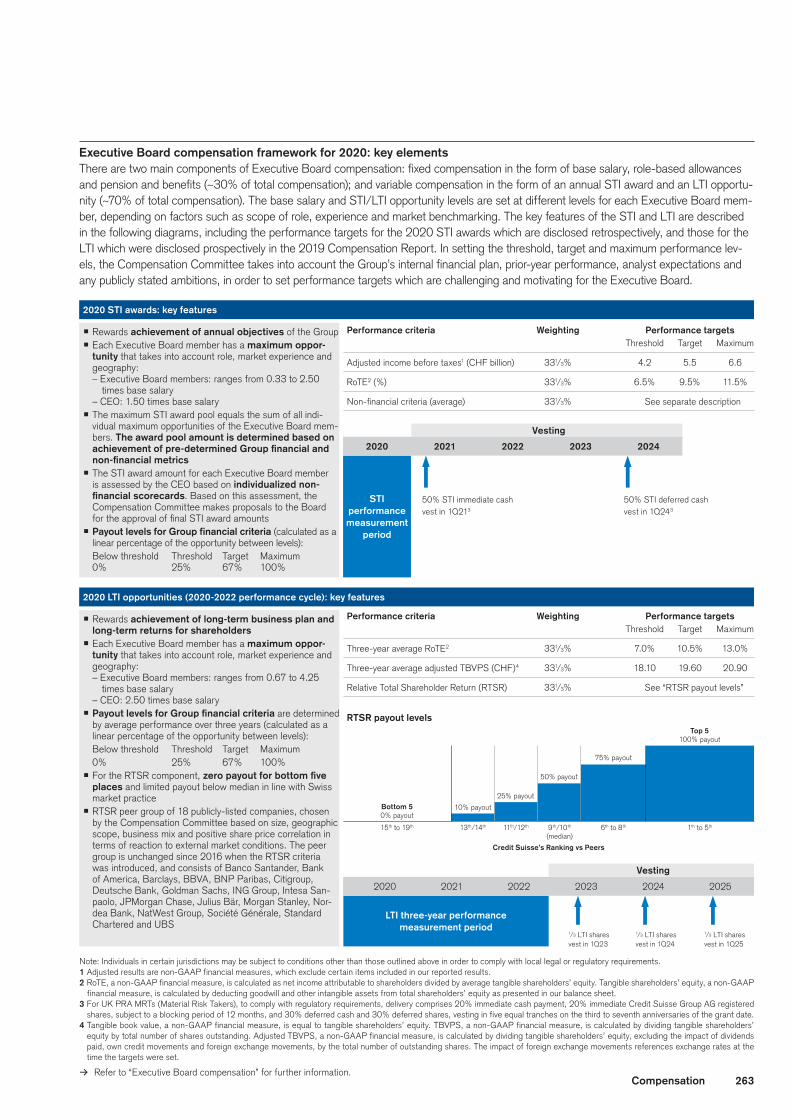
263Compensation
p Rewards achievement of annual objectives of the Groupp Each Executive Board member has a maximum oppor-
tunity that takes into account role, market experience and geography:– Executive Board members: ranges from 0.33 to 2.50
times base salary– CEO: 1.50 times base salary
p The maximum STI award pool equals the sum of all indi-vidual maximum opportunities of the Executive Board mem-bers. Theawardpoolamountisdeterminedbasedonachievementofpre-determinedGroupfinancialandnon-financialmetrics
p The STI award amount for each Executive Board member is assessed by the CEO based on individualized non-financialscorecards. Based on this assessment, the Compensation Committee makes proposals to the Board for the approval of final STI award amounts
p Payout levels for Group financial criteria (calculated as a linear percentage of the opportunity between levels):Below threshold Threshold Target Maximum 0% 25% 67% 100%
2020STIawards:keyfeatures
Vesting
STI performance measurement
period
50% STI immediate cash vest in 1Q213
50% STI deferred cash vest in 1Q243
Performance criteria Weighting Performance targets Threshold Target Maximum
Adjusted income before taxes1 (CHF billion) 331/3% 4.2 5.5 6.6
RoTE2 (%) 331/3% 6.5% 9.5% 11.5%
Non-financial criteria (average) 331/3% See separate description
2020 2021 2022 2023 2024
p Rewards achievement of long-term business plan and long-term returns for shareholders
p Each Executive Board member has a maximum oppor-tunity that takes into account role, market experience and geography:– Executive Board members: ranges from 0.67 to 4.25
times base salary– CEO: 2.50 times base salary
p PayoutlevelsforGroupfinancialcriteria are determined by average performance over three years ( calculated as a linear percentage of the opportunity between levels):Below threshold Threshold Target Maximum0% 25% 67% 100%
p For the RTSR component, zeropayoutforbottomfiveplaces and limited payout below median in line with Swiss market practice
p RTSR peer group of 18 publicly-listed companies, chosen by the Compensation Committee based on size, geographic scope, business mix and positive share price correlation in terms of reaction to external market conditions. The peer group is unchanged since 2016 when the RTSR criteria was introduced, and consists of Banco Santander, Bank of America, Barclays, BBVA, BNP Paribas, Citigroup, Deutsche Bank, Goldman Sachs, ING Group, Intesa San-paolo, JPMorgan Chase, Julius Bär, Morgan Stanley, Nor-dea Bank, NatWest Group, Société Générale, Standard Chartered and UBS
2020LTIopportunities(2020-2022performancecycle):keyfeatures
Note: Individuals in certain jurisdictions may be subject to conditions other than those outlined above in order to comply with local legal or regulatory requirements.1 Adjusted results are non-GAAP financial measures, which exclude certain items included in our reported results.2 RoTE, a non-GAAP financial measure, is calculated as net income attributable to shareholders divided by average tangible shareholders’ equity. Tangible shareholders’ equity, a non-GAAP
financial measure, is calculated by deducting goodwill and other intangible assets from total shareholders’ equity as presented in our balance sheet.3 For UK PRA MRTs (Material Risk Takers), to comply with regulatory requirements, delivery comprises 20% immediate cash payment, 20% immediate Credit Suisse Group AG registered
shares, subject to a blocking period of 12 months, and 30% deferred cash and 30% deferred shares, vesting in five equal tranches on the third to seventh anniversaries of the grant date.4 Tangible book value, a non-GAAP financial measure, is equal to tangible shareholders’ equity. TBVPS, a non-GAAP financial measure, is calculated by dividing tangible shareholders’
equity by total number of shares outstanding. Adjusted TBVPS, a non-GAAP financial measure, is calculated by dividing tangible shareholders’ equity, excluding the impact of dividends paid, own credit movements and foreign exchange movements, by the total number of outstanding shares. The impact of foreign exchange movements references exchange rates at the time the targets were set.
RTSRpayoutlevels
Performance criteria Weighting Performance targets Threshold Target Maximum
Three-year average RoTE2 331/3% 7.0% 10.5% 13.0%
Three-year average adjusted TBVPS (CHF)4 331/3% 18.10 19.60 20.90
Relative Total Shareholder Return (RTSR) 331/3% See “RTSR payout levels”
Vesting
LTIthree-yearperformance measurement period
1/3 LTI shares vest in 1Q23
1/3 LTI shares vest in 1Q24
1/3 LTI shares vest in 1Q25
2020 2021 2022 2023 2024 2025
Bottom 5 0% payout
10% payout
25% payout
50% payout
75% payout
Top5 100% payout
15th to 19th 13th/14th 11th/12th 9th/10th (median)
6th to 8th 1th to 5th
Credit Suisse’s Ranking vs Peers
ExecutiveBoardcompensationframeworkfor2020:keyelementsThere are two main components of Executive Board compensation: fixed compensation in the form of base salary, role-based allowances and pension and benefits (~30% of total compensation); and variable compensation in the form of an annual STI award and an LTI opportu-nity (~70% of total compensation). The base salary and STI/LTI opportunity levels are set at different levels for each Executive Board mem-ber, depending on factors such as scope of role, experience and market benchmarking. The key features of the STI and LTI are described in the following diagrams, including the performance targets for the 2020 STI awards which are disclosed retrospectively, and those for the LTI which were disclosed prospectively in the 2019 Compensation Report. In setting the threshold, target and maximum performance lev-els, the Compensation Committee takes into account the Group’s internal financial plan, prior-year performance, analyst expectations and any publicly stated ambitions, in order to set performance targets which are challenging and motivating for the Executive Board.
> Refer to “Executive Board compensation” for further information.

264 Compensation
Features DesignVesting (year)
2020 2021 2022 2023 2024
Base Salary
Pension andBenefits
Cash Award
Share Awards
Performance Share Awards
CCA
1⁄3
1⁄3
1⁄3
1⁄3
1⁄3
1⁄3
p Based on skills, qualifications, relevant experience, responsibilities and external market factors
p Role-based allowances apply to certain MRTCs
p Pension and benefits consistent with local market practice
p Employees with total compensation below CHF/USD 250,000 receive their full amount of variable compensation in the form of an immediate cash award
p Deferred share awards with no additional performance conditions
p Managing Directors (MD) and MRTCs receive deferred share awards with performance conditions as part of their deferred compensation
p MD and Directors receive loss-absorbing contingent capital awards
Fixe
dVa
riab
le
For t
otal
com
pens
atio
n of
C
HF/
US
D 2
50,0
00
or h
ighe
r:
Note: Individuals in certain jurisdictions may be subject to conditions other than those outlined above in order to comply with local legal or regulatory requirements.
Note: The Vice-Chair and Lead Independent Director does not receive additional compensation for these roles.1 Committee chairs do not receive committee fees in addition to their chair fees.2 The Chairman does not receive any additional fees for chairing the GNC.
Boardmembershipfees:2020AGM–2021AGM(inCHF)
Role Board
Governance and Nominations Committee (GNC)
Audit Committee (AC)
Compensation Committee (CC)
Conduct and Financial Crime Control Committee (CFCCC)
Risk Committee (RC)
Form of payment
Timingofpayment
Base fee/Committee fee (excluding the Chairman)
250,000 50,000
– 2
150,000
400,000
100,000
300,000
75,000
150,000
100,000
400,000
3,000,000
1,500,000
Committee Chair fee1
Chairman’s base fee
Chairman’s Chair fee
50% cash; 50% Group shares blocked and non-transferable for four years
Group shares blocked and nontransferable for four years
Cash 12 monthly payments
One installment at end of current board period
One installment at end of current board period
Two equal installments in arrears
Groupemployeescompensationframeworkfor2020:keyelementsThe compensation structure for employees not on the Executive Board consists of fixed compensation in the form of base salary, role-based allowances and pension and benefits, and variable compensation in the form of cash, share awards, performance share awards and contingent capital awards, as shown in the diagram below.
> Refer to “Group compensation” for further information.
BoardofDirectorscompensationframeworkfor2020:keyelementsThe Board compensation framework for 2020 continues to be based on a fixed fee structure for the period from one AGM to the next with pre-defined fees for Board membership, committee membership and chairing a committee. In line with industry practice, Board fees are not linked to the financial performance of the Group. Fees for specific Board leadership roles are reviewed periodically and adjusted as required. Base Board fees have not changed for over 10 years.
> Refer to “Board of Directors compensation” for further information.

265Compensation
Compensation governance TheCompensationCommittee
The Compensation Committee is the supervisory and governing body for compensation policies, practices and plans. In designing and setting compensation, the Compensation Committee aims to make decisions in the best interests of the Group and to align the interests of the Group’s employees to those of shareholders. The Compensation Committee reviews proposals regarding Group, Executive Board and Board compensation, and makes recom-mendations to the Board for approval. Total Executive Board compensation and Board compensation are also subject to share-holder approval pursuant to the Compensation Ordinance and the AoA.
The Compensation Committee consists of at least three members of the Board, all of whom must be independent. The members during the 2020 AGM to 2021 AGM term were Kai S. Nargol-wala (Chair), Iris Bohnet, Christian Gellerstad and Michael Klein. The Board has applied the independence criteria of the SIX Swiss Exchange Directive on Information relating to Corporate Governance, the FINMA, the Swiss Code of Best Practice for
Corporate Governance, and the listing standards of the New York Stock Exchange (NYSE) and the Nasdaq Stock Market (Nas-daq), in determining that all of these individuals are independent.
> Refer to “Independence” in IV – Corporate Governance – Board of Directors for more information on how the Group determines the independence of its Board members.
Compensation Committee activities
The Chairman and the CEO may attend the Compensation Com-mittee meetings, and the Compensation Committee Chair deter-mines the attendance of other Board members, Executive Board members, senior management, compensation advisers and exter-nal legal counsel, as appropriate. The Chairman, CEO, Executive Board members and senior management do not participate in dis-cussions which relate to their own compensation outcomes.
In addition to the 34 investor and proxy adviser meetings held by the Compensation Committee Chair, during 2020, the Compen-sation Committee held 11 internal meetings and calls, with an overall attendance rate of 100%. The Compensation Committee’s focus areas in 2020 are summarized in the following table:
CompensationCommitteeactivitiesin2020 Jan Feb Mar Apr Jun Jul Aug Oct Dec
Compensation governance, design and disclosure
Review of compensation policy and charter updates p p pReview of Compensation Report p p p Review and refinement of Executive Board compensation design p p p p p pReview of Group compensation structure and award plans p p p p p p pCompensation Committee self-assessment and focus areas p
Risk and regulatory
Review of input from control functions p p p p Review of any disciplinary events/potential application of malus p p p p p pReview of regulatory developments p p p
Annual compensation review
Accruals and full year forecast of variable incentive compensation pools p p p p p pPerformance assessment and overall Group pool recommendation p p pCEO and Executive Board performance objectives and target setting p p p p CEO and Executive Board performance assessment and awards p p p p p p pReview of Board fees p p
External
Review of shareholder engagement and feedback p p p pReview of market trends p p p p pReview of benchmarking data p p p

266 Compensation
Advisers to the Compensation Committee
The Compensation Committee is authorized to retain external advisers to provide support as it carries out its responsibilities. Deloitte LLP (Deloitte) has been retained to assist the Compen-sation Committee in ensuring that the Group’s compensation pro-grams remain competitive, responsive to regulatory developments and in line with the compensation policy. Deloitte has appointed a senior consultant to advise the Compensation Committee. Apart from assisting the Compensation Committee, this senior consultant does not provide any other services to the Group. The Compensation Committee also obtained external legal advice during 2020 on various matters relating to compensation policy and design. Prior to appointment, the Compensation Committee conducted an independence assessment of its advisers pursuant to the rules of the SEC and the listing standards of the NYSE and the Nasdaq.
Other aspects of compensation governance
Compensation policy The compensation policy applies to all employees and compensa-tion plans of the Group. It contains a detailed description of the Group’s compensation principles and objectives as well as the compensation programs. It also sets out the standards and pro-cesses relating to the development, management, implementa-tion and governance of compensation. The compensation policy is available at credit-suisse.com/compensationpolicy.
Approval authorityThe approval authorities for setting the compensation policy and compensation for different groups of employees are defined in the Group’s Organizational Guidelines and Regulations and the Compensation Committee charter available at credit-suisse.com/governance. Compensation
Action Committee Board
Establish or change the Group’s compensation policy R A
Establish or change compensation plans R A
Set variable incentive compensation pools for the
Group and the divisions R A
Determine Executive Board compensation,
including for the CEO R A 1
Determine Board compensation,
including for the Chairman R A 1
Determine compensation for the Head of Internal Audit A 2 n/a
Determine compensation for MRTCs and
other selected members of management A n/a
R = recommendation; A = approval1 Subject to shareholder approval requirement pursuant to the Compensation Ordinance
and the AoA.2 In consultation with the Audit Committee Chair.
Risk and control considerationsDuring its annual review of the Group’s performance, the Com-pensation Committee considers input from the Risk Committee Chair with respect to risk considerations, and the Audit Commit-tee Chair with respect to internal control considerations as well as the CFCCC Chair with respect to matters concerning financial crime compliance. The Compensation Committee also considers input from various corporate functions including Risk & Compli-ance, General Counsel, Human Resources, Internal Audit and Product Control, regarding control and compliance issues and any breaches of relevant rules and regulations or the Group’s Code of Conduct.
To meet regulatory guidelines regarding employees engaged in risk-taking activities, the Compensation Committee reviews and approves the compensation for employees identified as MRTCs. The Risk Committee is involved in the review process for the compensation of MRTCs.
> Refer to “Focus on risk and control” in Group compensation for further information.

267Compensation
PricewaterhouseCoopers AG, Birchstrasse 160, Postfach, CH-8050 Zürich, Switzerland Telefon: +41 58 792 44 00, Telefax: +41 58 792 44 10, www.pwc.ch
PricewaterhouseCoopers AG is a member of the global PricewaterhouseCoopers network of firms, each of which is a separate and independent legal entity.
Report of the statutory auditor To the General Meeting of Shareholders of Credit Suisse Group AG, Zurich
We have audited the accompanying compensation report of Credit Suisse Group AG for the year ended December 31, 2020. The audit was limited to the information disclosed according to articles 14-16 of the Ordinance against Excessive Compensation in Stock Exchange Listed Companies (the “Ordinance”) contained in the sections marked as “(audited)” on pages 242 to 259 of the compensation report.
Board of Directors’ responsibility The Board of Directors is responsible for the preparation and overall fair presentation of the compensation report in accordance with Swiss law and the Ordinance. The Board of Directors is also responsible for designing the compensation system and defining individual compensation packages.
Auditor’s responsibility Our responsibility is to express an opinion on the accompanying compensation report. We conducted our audit in accordance with Swiss Auditing Standards. Those standards require that we comply with ethical requirements and plan and perform the audit to obtain reasonable assurance about whether the compensation report complies with Swiss law and articles 14–16 of the Ordinance.
An audit involves performing procedures to obtain audit evidence on the disclosures made in the compensation report with regard to compensation, loans and credits in accordance with articles 14–16 of the Ordinance. The procedures selected depend on the auditor’s judgment, including the assessment of the risks of material misstatements in the compensation report, whether due to fraud or error. This audit also includes evaluating the reasonableness of the methods applied to value components of compensation, as well as assessing the overall presentation of the compensation report.
We believe that the audit evidence we have obtained is sufficient and appropriate to provide a basis for our opinion.
Opinion In our opinion, the compensation report of Credit Suisse Group AG for the year ended December 31, 2020 complies with Swiss law and articles 14–16 of the Ordinance.
PricewaterhouseCoopers AG Matthew Falconer Beresford Caloia
Audit expert Audit expert Auditor in charge Zurich, Switzerland March 18, 2021

268 Compensation
[this page intentionally left blank]

269
VI – Consolidated financial statements – Credit Suisse GroupReport of the Statutory Auditor 271
Report of the Independent Registered Public Accounting Firm 271-IV
Consolidated financial statements 273
Notes to the consolidated financial statements 280
Controls and procedures 426

270 Consolidated financial statements – Credit Suisse Group
Notes to the consolidated financial statements
1 Summary of significant accounting policies ...........................................................................2802 Recently issued accounting standards...................................................................................2893 Business developments, significant shareholders and subsequent events ................................2904 Segment information ...........................................................................................................2935 Net interest income .............................................................................................................2956 Commissions and fees.........................................................................................................2957 Trading revenues .................................................................................................................2958 Other revenues ...................................................................................................................2969 Provision for credit losses ....................................................................................................296
10 Compensation and benefits .................................................................................................29611 General and administrative expenses ....................................................................................29612 Restructuring expenses .......................................................................................................29713 Earnings per share ..............................................................................................................29714 Revenue from contracts with customers ...............................................................................29815 Securities borrowed, lent and subject to repurchase agreements ............................................30016 Trading assets and liabilities .................................................................................................30017 Investment securities ...........................................................................................................30118 Other investments ...............................................................................................................30219 Loans.................................................................................................................................30320 Financial instruments measured at amortized cost and credit losses .......................................30421 Goodwill .............................................................................................................................31622 Other intangible assets ........................................................................................................31823 Other assets and other liabilities ...........................................................................................31924 Leases ...............................................................................................................................32025 Deposits .............................................................................................................................32226 Long-term debt ..................................................................................................................32227 Accumulated other comprehensive income and additional share information ............................32428 Offsetting of financial assets and financial liabilities ...............................................................32629 Tax ....................................................................................................................................33030 Employee deferred compensation .........................................................................................33531 Related parties....................................................................................................................33932 Pension and other post-retirement benefits ...........................................................................34133 Derivatives and hedging activities .........................................................................................35134 Guarantees and commitments .............................................................................................35735 Transfers of financial assets and variable interest entities .......................................................36136 Financial instruments ...........................................................................................................37037 Assets pledged and collateral ...............................................................................................39738 Capital adequacy ................................................................................................................39739 Assets under management ..................................................................................................39940 Litigation ............................................................................................................................40041 Significant subsidiaries and equity method investments .........................................................41142 Subsidiary guarantee information .........................................................................................41443 Credit Suisse Group parent company ....................................................................................42244 Significant valuation and income recognition differences between
US GAAP and Swiss GAAP banking law (true and fair view) ..................................................423

271Consolidated fi nancial statements – Credit Suisse Group
PricewaterhouseCoopers AG, Birchstrasse 160, Postfach, CH-8050 Zürich, Switzerland Telefon: +41 58 792 44 00, Telefax: +41 58 792 44 10, www.pwc.ch
PricewaterhouseCoopers AG is a member of the global PricewaterhouseCoopers network of firms, each of which is a separate and independent legal entity.
Report of the Statutory Auditor To the General Meeting of Credit Suisse Group AG, Zurich
Report on the audit of the consolidated financial statements
Opinion on the Consolidated Financial Statements We have audited the accompanying consolidated balance sheet of Credit Suisse Group AG and its subsidiaries (the "Group") as of December 31, 2020, and the related consolidated statements of operations, comprehensive income, changes in equity and cash flows for the year then ended, including the related notes (collectively referred to as the “consolidated financial statements”). In our opinion, the consolidated financial statements present fairly, in all material respects, the financial position of the Group as of December 31, 2020, and the results of its operations and its cash flows for the year then ended, in conformity with the U.S. Generally Accepted Accounting Principles, and comply with Swiss law.
We also have audited the adjustments to reflect the change in the composition of reportable segments as presented in Note 4 and described in Note 3. In our opinion, such adjustments are appropriate and have been properly applied. We were not engaged to audit, review or apply any procedures to the 2018 and 2019 financial statements of the Group other than with respect to the adjustments and, accordingly, we do not express an opinion or any other form of assurance on the 2018 and 2019 financial statements taken as a whole.
Change in Accounting Principle
As discussed in Note 2 and Note 20 to the consolidated financial statements, the Group changed the manner in which it accounts for credit losses on certain financial instruments in 2020.
Basis for Opinions These consolidated financial statements are the responsibility of the Board of Directors. Our responsibility is to express an opinion on the Group's consolidated financial statements based on our audits. We are a public accounting firm registered with the Swiss Federal Audit Oversight Authority and the Public Company Accounting Oversight Board (United States) ("PCAOB") and are required to be independent with respect to the Group in accordance with Swiss law and the U.S. federal securities laws and the applicable rules and regulations of the Swiss audit profession, the Securities and Exchange Commission and the PCAOB.
We conducted our audits in accordance with Swiss law, Swiss Auditing Standards and the standards of the PCAOB. Those standards require that we plan and perform the audit to obtain reasonable assurance about whether the consolidated financial statements are free of material misstatement, whether due to error or fraud. Our audits included performing procedures to assess the risks of material misstatement of the consolidated financial statements, whether due to error or fraud, and performing procedures that respond to those risks. Such procedures included examining, on a test basis, evidence regarding the amounts and disclosures in the consolidated financial statements. Our audits also included evaluating the accounting principles used and significant estimates made, as well as evaluating the overall presentation of the consolidated financial statements. We believe that our audits provide a reasonable basis for our opinion.
Critical Audit Matters The critical audit matters communicated below are matters arising from the current period audit of the consolidated financial statements that were communicated or required to be communicated to the audit committee and that (i) relate to accounts or disclosures that are material to the consolidated financial statements and (ii) involved our especially challenging, subjective, or complex judgments. The communication of critical audit matters does not alter in any way our

271-I Consolidated fi nancial statements – Credit Suisse Group
2 Credit Suisse Group AG | Report of the Statutory Auditor
opinion on the consolidated financial statements, taken as a whole, and we are not, by communicating the critical audit matters below, providing separate opinions on the critical audit matters or on the accounts or disclosures to which they relate.
Fair Value of Certain Level 3 Financial Instruments
As described in Note 36 to the consolidated financial statements, the Group carries CHF 16.4 billion of its assets and CHF 14.0 billion of its liabilities at fair value on a recurring basis that are classified in level 3 of the fair value hierarchy as of December 31, 2020. For these financial instruments, for which no prices are available and which have few or no observable inputs, the determination of fair value may require the use of either industry standard models or internally developed proprietary models as well as require subjective assessment and judgment, depending on liquidity, pricing assumptions, the current economic and competitive environment and the risks affecting the specific instrument. Unobservable inputs used by management to value certain of these level 3 financial instruments included adjusted Net Asset Value (“NAV”), discount rate, terminal growth rate, credit spread, correlation, volatility, market implied life expectancy, mortality rate and market comparable price.
The principal considerations for our determination that performing procedures relating to the fair value of certain level 3 financial instruments is a critical audit matter are the significant judgment by management to determine the fair value of these financial instruments due to the use of either industry standard models or internally developed proprietary models, which included unobservable inputs related to adjusted NAV, discount rate, terminal growth rate, credit spread, correlation, volatility, market implied life expectancy, mortality rate and market comparable price. This in turn led to a high degree of auditor subjectivity, judgment and effort to evaluate the audit evidence obtained related to the valuation, and the audit effort involved the use of professionals with specialized skill and knowledge.
Addressing the matter involved performing procedures and evaluating audit evidence in connection with forming our overall opinion on the consolidated financial statements. These procedures included testing the effectiveness of controls relating to the fair value of certain level 3 financial instruments, including controls over the Group’s models, significant unobservable inputs, and data. These procedures also included, among others (i) the involvement of professionals with specialized skill and knowledge to assist in developing an independent range of prices for a sample of financial instruments and (ii) comparing the independent estimate to management’s estimate to evaluate the reasonableness of management’s estimate. Developing the independent estimate involved (i) testing the completeness and accuracy of data provided by management, and as appropriate, (ii) evaluating management’s unobservable inputs and (iii) independently developing unobservable inputs related to adjusted NAV, discount rate, terminal growth rate, credit spread, correlation, volatility, market implied life expectancy, mortality rate and market comparable price.
Allowance for Credit Losses - Collectively Evaluated Corporate and Institutional Loans - Investment Bank
As described in Note 20 to the consolidated financial statements, the Group’s allowance for credit losses represents management’s estimate of expected credit losses on loans held at amortized cost. As of December 31, 2020, the collectively evaluated expected credit losses in the Investment Bank of CHF 194 million primarily consist of Corporate and Institutional loans with a gross loan balance, excluding those which are held at fair value, of CHF 13,776 million. The Group’s credit loss requirements are based on a forward-looking, lifetime current expected credit loss (“CECL”) model by incorporating reasonable and supportable forecasts of future economic conditions available at the reporting date. Management’s estimation of expected credit losses is based on a discounted probability-weighted estimate that considers three future macroeconomic scenarios: a baseline scenario, an upside scenario and a downside scenario. For extreme and statistically rare events which cannot be adequately reflected in CECL models, such as the current effects of the COVID-19 pandemic on the global economy, the event becomes the baseline scenario. In the current environment, to address circumstances where in management’s judgment the CECL model outputs are overly sensitive to the effect of economic inputs that lie significantly outside of their historical range, model overlays are applied. These overlays are based on expert judgment and are applied in response to these exceptional circumstances to consider historical stressed losses and industry and counterparty credit level reviews.
The principal consideration for our determination that performing procedures relating to the allowance for credit losses on collectively evaluated corporate and institutional loans within the Investment Bank is a critical audit matter are (i) the significant judgement by management in evaluating model results and assessing the need for overlays to the CECL model output in the current environment, (ii) the significant judgment and estimation by management in determining an appropriate methodology for the overlays applied, which both in turn led to a high degree of auditor judgement, subjectivity and effort in performing procedures and in evaluating audit evidence obtained relating to the appropriateness of overlays to the CECL model output, and (iii) the audit effort involved professionals with specialized skill and knowledge.
Addressing the matter involved performing procedures and evaluating audit evidence in connection with forming our overall opinion on the consolidated financial statements. These procedures included testing the effectiveness of controls relating to management’s expected credit loss process. The procedures also included, among others, testing management’s process for estimating expected credit losses, which included (i) evaluating the appropriateness of the methodologies used to determine the allowance for credit losses, (ii) testing the completeness and accuracy of data used in the estimate, and (iii) evaluating the reasonableness of management’s model overlays. The procedures included
271-IIConsolidated fi nancial statements – Credit Suisse Group
3 Credit Suisse Group AG | Report of the Statutory Auditor
the use of professionals with specialized skill and knowledge to assist in evaluating the appropriateness of model methodologies and assist in evaluating the audit evidence.
Goodwill Impairment Assessment - Investment Bank Reporting Unit
As described in Note 21 to the consolidated financial statements, the Group’s goodwill balance was CHF 4.4 billion as of December 31, 2020 of which CHF 1.5 billion was allocated to the Investment Bank reporting unit. Goodwill is reviewed for impairment on an annual basis as of December 31 and at any other time that events or circumstances indicate that the carrying value of goodwill may not be recoverable. Goodwill is allocated to the Group’s reporting units for the purposes of the impairment test. In estimating the fair value of its reporting units, the Group applied a combination of the market approach and the income approach. In determining the estimated fair value, the Group relied upon its latest five-year financial plan which included significant management assumptions and estimates based on its view of current and future economic conditions and assumptions regarding the discount rate under the income approach as well as price to projected earnings and price to book value multiples (“multiples”) under the market approach.
The principal considerations for our determination that performing procedures relating to the goodwill impairment assessment of the Investment Bank reporting unit is a critical audit matter are (i) the significant judgment by management when developing the fair value measurement of the Investment Bank reporting unit, (ii) a high degree of auditor judgment, subjectivity, and effort in performing procedures and evaluating management’s significant assumptions related to the combination of the market approach and income approach, five-year financial plan, discount rate and multiples, and (iii) the audit effort involved the use of professionals with specialized skill and knowledge.
Addressing the matter involved performing procedures and evaluating audit evidence in connection with forming our overall opinion on the consolidated financial statements. These procedures included testing the effectiveness of controls relating to management’s goodwill impairment assessment. These procedures also included, among others (i) testing management’s process for developing the fair value estimate of the Investment Bank reporting unit; (ii) evaluating the appropriateness of the combination of the market approach and income approach; (iii) testing the completeness and accuracy of underlying data used in the model; and (iv) evaluating the reasonableness of the significant assumptions used by management related to the five-year financial plan, discount rate and the multiples. Evaluating management’s assumptions related to the five-year financial plan involved evaluating whether the assumptions used by management were reasonable considering the current and past performance of the reporting unit. Professionals with specialized skill and knowledge were used to assist in the evaluation of the Group’s market approach and income approach as well as the discount rate and multiples assumptions.
Litigation provisions
As described in Note 40 to the consolidated financial statements, the Group is involved in a number of judicial, regulatory and arbitration proceedings concerning matters arising in connection with the conduct of its businesses. The Group’s aggregate litigation provisions include estimates of losses, additional losses or ranges of loss for proceedings for which such losses are probable and can be reasonably estimated. As of December 31, 2020, the Group has recorded litigation provisions of CHF 1.7 billion. Management’s estimate of the aggregate range of reasonably possible losses that are not covered by existing provisions for which the Group believes an estimate is possible is zero to CHF 0.9 billion.
The principal considerations for our determination that performing procedures relating to the litigation provision is a critical audit matter are the significant judgment by management when assessing the likelihood of a loss being incurred and when determining a reasonable estimate of the loss, which in turn led to a high degree of auditor judgment, subjectivity, and effort in evaluating management’s assessment of the provision for losses and related disclosures.
Addressing the matter involved performing procedures and evaluating audit evidence in connection with forming our overall opinion on the consolidated financial statements. These procedures included testing the effectiveness of controls relating to management’s estimation of the litigation provisions, including controls over determining whether a loss is probable and whether the amount of loss can be reasonably estimated, as well as controls over the related financial statement disclosures. These procedures also included, among others, obtaining and evaluating the letters of audit inquiry with external legal counsel, evaluating the reasonableness of management’s assessment regarding whether an unfavorable outcome is reasonably possible or probable and reasonably estimable, and evaluating the sufficiency of the Group’s litigation disclosures.
271-III Consolidated fi nancial statements – Credit Suisse Group
4 Credit Suisse Group AG | Report of the Statutory Auditor
Report on other legal and regulatory requirements In accordance with article 728a para. 1 item 3 CO and Swiss Auditing Standard 890, we confirm that an internal control system exists, which has been designed for the preparation of consolidated financial statements according to the instructions of the Board of Directors.
We recommend that the consolidated financial statements submitted to you be approved.
We have also audited, in accordance with the standards of the PCAOB, the Group’s internal control over financial reporting as of December 31, 2020, based on criteria established in Internal Control – Integrated Framework (2013) issued by the Committee of Sponsoring Organizations of the Treadway Commission (COSO), and our report dated March 18, 2021 expressed an unqualified opinion on the effectiveness of the Group’s internal control over financial reporting.
PricewaterhouseCoopers AG
Matthew Falconer Matthew Goldman
Audit expert Auditor in charge
Group audit partner
Zurich, Switzerland March 18, 2021
We have served as the Group’s auditor since 2020.

271-IVConsolidated fi nancial statements – Credit Suisse Group
PricewaterhouseCoopers AG, Birchstrasse 160, Postfach, CH-8050 Zürich, Switzerland Telefon: +41 58 792 44 00, Telefax: +41 58 792 44 10, www.pwc.ch
PricewaterhouseCoopers AG is a member of the global PricewaterhouseCoopers network of firms, each of which is a separate and independent legal entity.
Report of Independent Registered Public Accounting Firm To the Board of Directors and shareholders of Credit Suisse Group AG
Opinion on Internal Control over Financial Reporting We have audited the internal control over financial reporting of Credit Suisse Group AG and its subsidiaries (the “Group”) as of as of December 31, 2020, based on criteria established in Internal Control - Integrated Framework (2013) issued by the Committee of Sponsoring Organizations of the Treadway Commission (COSO). In our opinion, the Group maintained, in all material respects, effective internal control over financial reporting as of December 31, 2020, based on criteria established in Internal Control - Integrated Framework (2013) issued by the COSO.
We also have audited, in accordance with the standards of the Public Company Accounting Oversight Board (United States) ("PCAOB"), the consolidated balance sheet of the Group as of December 31, 2020, and the related consolidated statements of operations, comprehensive income, changes in equity and cash flows for the year then ended, including the related notes (collectively referred to as the “consolidated financial statements”), and our report dated March 18, 2021 expressed an unqualified opinion on those consolidated financial statements.
Basis for Opinion The Group's management is responsible for maintaining effective internal control over financial reporting, and for its assessment of the effectiveness of internal control over financial reporting, included in Management report on Internal Control over Financial Reporting. Our responsibility is to express an opinion on the Group's internal control over financial reporting based on our audit. We are a public accounting firm registered with the PCAOB and are required to be independent with respect to the Group in accordance with the U.S. federal securities laws and the applicable rules and regulations of the Securities and Exchange Commission and the PCAOB.
We conducted our audit in accordance with the standards of the PCAOB. Those standards require that we plan and perform the audit to obtain reasonable assurance about whether effective internal control over financial reporting was maintained in all material respects. Our audit included obtaining an understanding of internal control over financial reporting, assessing the risk that a material weakness exists, and testing and evaluating the design and operating effectiveness of internal control based on the assessed risk. Our audit also included performing such other procedures as we considered necessary in the circumstances. We believe that our audit provides a reasonable basis for our opinion.
Definition and Limitations of Internal Control over Financial Reporting A company’s internal control over financial reporting is a process designed to provide reasonable assurance regarding the reliability of financial reporting and the preparation of financial statements for external purposes in accordance with generally accepted accounting principles. A company’s internal control over financial reporting includes those policies and procedures that (i) pertain to the maintenance of records that, in reasonable detail, accurately and fairly reflect the transactions and dispositions of the assets of the company; (ii) provide reasonable assurance that transactions are recorded as necessary to permit preparation of financial statements in accordance with generally accepted accounting principles, and that receipts and expenditures of the company are being made only in accordance with authorizations of management and directors of the company; and (iii) provide reasonable assurance regarding prevention or timely detection of unauthorized acquisition, use, or disposition of the company’s assets that could have a material effect on the financial statements.
272 Consolidated fi nancial statements – Credit Suisse Group
2 Credit Suisse Group AG | Report of Independent Registered Public Accounting Firm
Because of its inherent limitations, internal control over financial reporting may not prevent or detect misstatements. Also, projections of any evaluation of effectiveness to future periods are subject to the risk that controls may become inadequate because of changes in conditions, or that the degree of compliance with the policies or procedures may deteriorate.
PricewaterhouseCoopers AG
Matthew Falconer Matthew Goldman
Audit expert Auditor in charge
Group audit partner
Zurich, Switzerland March 18, 2021

273Consolidated financial statements – Credit Suisse Group
Consolidated financial statements
Consolidated statements of operationsin Note 2020 2019 2018
Consolidated statements of operations (CHF million)
Interest and dividend income 5 13,919 20,184 19,613
Interest expense 5 (7,971) (13,167) (12,604)
Net interest income 5 5,948 7,017 7,009
Commissions and fees 6 11,853 11,158 11,890
Trading revenues 7 3,295 1,739 624
Other revenues 8 1,293 2,570 1,397
Net revenues 22,389 22,484 20,920
Provision for credit losses 9 1,096 324 245
Compensation and benefits 10 9,890 10,036 9,620
General and administrative expenses 11 6,523 6,128 5,798
Commission expenses 1,256 1,276 1,259
Restructuring expenses 12 157 – 626
Total other operating expenses 7,936 7,404 7,683
Total operating expenses 17,826 17,440 17,303
Income before taxes 3,467 4,720 3,372
Income tax expense 29 801 1,295 1,361
Net income 2,666 3,425 2,011
Net income/(loss) attributable to noncontrolling interests (3) 6 (13)
Net income attributable to shareholders 2,669 3,419 2,024
Earnings/(loss) per share (CHF)
Basic earnings per share 13 1.09 1.35 0.79
Diluted earnings per share 13 1.06 1.32 0.77
Consolidated statements of comprehensive incomein 2020 2019 2018
Comprehensive income/(loss) (CHF million)
Net income 2,666 3,425 2,011
Gains/(losses) on cash flow hedges 178 100 (10)
Foreign currency translation (3,065) (1,025) (325)
Unrealized gains/(losses) on securities (17) 20 (17)
Actuarial gains/(losses) (37) 326 (391)
Net prior service credit/(cost) (148) 217 (135)
Gains/(losses) on liabilities related to credit risk 202 (1,860) 1,654
Other comprehensive income/(loss), net of tax (2,887) (2,222) 776
Comprehensive income/(loss) (221) 1,203 2,787
Comprehensive income/(loss) attributable to noncontrolling interests (9) 8 (15)
Comprehensive income/(loss) attributable to shareholders (212) 1,195 2,802
The accompanying notes to the consolidated financial statements are an integral part of these statements.

274 Consolidated financial statements – Credit Suisse Group
Consolidated balance sheetsend of Note 2020 2019
Assets (CHF million)
Cash and due from banks 139,112 101,879
of which reported at fair value 525 356
of which reported from consolidated VIEs 90 138
Interest-bearing deposits with banks 1,298 741
Central bank funds sold, securities purchased under
resale agreements and securities borrowing transactions 15 79,133 106,997
of which reported at fair value 57,994 85,556
Securities received as collateral, at fair value 50,773 40,219
of which encumbered 27,614 20,234
Trading assets, at fair value 16 157,338 153,797
of which encumbered 43,511 38,269
of which reported from consolidated VIEs 2,164 2,788
Investment securities 17 607 1,006
of which reported at fair value 607 1,006
Other investments 18 5,412 5,666
of which reported at fair value 3,794 3,550
of which reported from consolidated VIEs 1,251 1,412
Net loans 19 291,908 296,779
of which reported at fair value 11,408 12,662
of which encumbered 179 293
of which reported from consolidated VIEs 900 649
allowance for credit losses (1,536) (946)
Goodwill 21 4,426 4,663
Other intangible assets 22 237 291
of which reported at fair value 180 244
Brokerage receivables 35,941 35,648
Other assets 23 39,637 39,609
of which reported at fair value 8,373 10,402
of which encumbered 167 217
of which reported from consolidated VIEs 1,876 1,694
of which loans held-for-sale (amortized cost base) 650 –
Total assets 805,822 787,295
The accompanying notes to the consolidated financial statements are an integral part of these statements.

275Consolidated financial statements – Credit Suisse Group
Consolidated balance sheets (continued)end of Note 2020 2019
Liabilities and equity (CHF million)
Due to banks 25 16,423 16,744
of which reported at fair value 413 322
Customer deposits 25 390,921 383,783
of which reported at fair value 4,343 3,339
of which reported from consolidated VIEs 1 0
Central bank funds purchased, securities sold under
repurchase agreements and securities lending transactions 15 23,851 27,533
of which reported at fair value 13,594 10,715
Obligation to return securities received as collateral, at fair value 50,773 40,219
Trading liabilities, at fair value 16 45,871 38,186
of which reported from consolidated VIEs 10 8
Short-term borrowings 20,868 28,385
of which reported at fair value 10,740 11,333
of which reported from consolidated VIEs 4,178 4,885
Long-term debt 26 161,087 152,005
of which reported at fair value 70,976 70,331
of which reported from consolidated VIEs 1,746 1,671
Brokerage payables 21,653 25,683
Other liabilities 23 31,434 31,043
of which reported at fair value 7,780 7,891
of which reported from consolidated VIEs 208 297
Total liabilities 762,881 743,581
Common shares 98 102
Additional paid-in capital 33,323 34,661
Retained earnings 32,834 30,634
Treasury shares, at cost (428) (1,484)
Accumulated other comprehensive income/(loss) 27 (23,150) (20,269)
Total shareholders’ equity 42,677 43,644
Noncontrolling interests 264 70
Total equity 42,941 43,714
Total liabilities and equity 805,822 787,295
end of Note 2020 2019
Additional share information
Par value (CHF) 0.04 0.04
Authorized shares 1 3,100,747,720 3,209,011,720
Common shares issued 27 2,447,747,720 2,556,011,720
Treasury shares 27 (41,602,841) (119,761,811)
Shares outstanding 27 2,406,144,879 2,436,249,909
1 Includes issued shares and unissued shares (conditional, conversion and authorized capital).
The accompanying notes to the consolidated financial statements are an integral part of these statements.
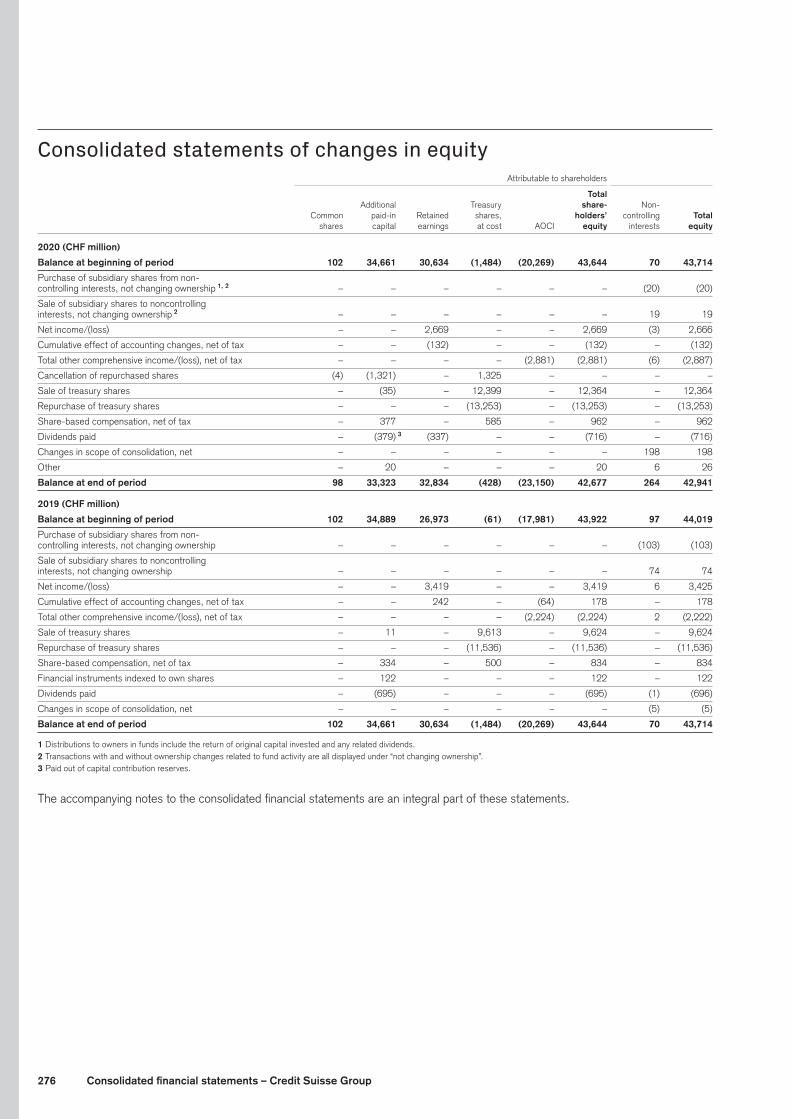
276 Consolidated financial statements – Credit Suisse Group
Consolidated statements of changes in equity Attributable to shareholders
Total
Additional Treasury share- Non-
Common paid-in Retained shares, holders’ controlling Total shares capital earnings at cost AOCI equity interests equity
2020 (CHF million)
Balance at beginning of period 102 34,661 30,634 (1,484) (20,269) 43,644 70 43,714
Purchase of subsidiary shares from non-
controlling interests, not changing ownership 1, 2 – – – – – – (20) (20)
Sale of subsidiary shares to noncontrolling
interests, not changing ownership 2 – – – – – – 19 19
Net income/(loss) – – 2,669 – – 2,669 (3) 2,666
Cumulative effect of accounting changes, net of tax – – (132) – – (132) – (132)
Total other comprehensive income/(loss), net of tax – – – – (2,881) (2,881) (6) (2,887)
Cancellation of repurchased shares (4) (1,321) – 1,325 – – – –
Sale of treasury shares – (35) – 12,399 – 12,364 – 12,364
Repurchase of treasury shares – – – (13,253) – (13,253) – (13,253)
Share-based compensation, net of tax – 377 – 585 – 962 – 962
Dividends paid – (379) 3 (337) – – (716) – (716)
Changes in scope of consolidation, net – – – – – – 198 198
Other – 20 – – – 20 6 26
Balance at end of period 98 33,323 32,834 (428) (23,150) 42,677 264 42,941
2019 (CHF million)
Balance at beginning of period 102 34,889 26,973 (61) (17,981) 43,922 97 44,019
Purchase of subsidiary shares from non-
controlling interests, not changing ownership – – – – – – (103) (103)
Sale of subsidiary shares to noncontrolling
interests, not changing ownership – – – – – – 74 74
Net income/(loss) – – 3,419 – – 3,419 6 3,425
Cumulative effect of accounting changes, net of tax – – 242 – (64) 178 – 178
Total other comprehensive income/(loss), net of tax – – – – (2,224) (2,224) 2 (2,222)
Sale of treasury shares – 11 – 9,613 – 9,624 – 9,624
Repurchase of treasury shares – – – (11,536) – (11,536) – (11,536)
Share-based compensation, net of tax – 334 – 500 – 834 – 834
Financial instruments indexed to own shares – 122 – – – 122 – 122
Dividends paid – (695) – – – (695) (1) (696)
Changes in scope of consolidation, net – – – – – – (5) (5)
Balance at end of period 102 34,661 30,634 (1,484) (20,269) 43,644 70 43,714
1 Distributions to owners in funds include the return of original capital invested and any related dividends.2 Transactions with and without ownership changes related to fund activity are all displayed under “not changing ownership”.3 Paid out of capital contribution reserves.
The accompanying notes to the consolidated financial statements are an integral part of these statements.

277Consolidated financial statements – Credit Suisse Group
Consolidated statements of changes in equity (continued) Attributable to shareholders Total Additional Treasury share- Non- Common paid-in Retained shares, holders’ controlling Total shares capital earnings at cost AOCI equity interests equity
2018 (CHF million)
Balance at beginning of period 102 35,668 24,973 (103) (18,738) 41,902 287 42,189
Purchase of subsidiary shares from non-
controlling interests, not changing ownership – – – – – – (69) (69)
Sale of subsidiary shares to noncontrolling
interests, changing ownership – 2 – – – 2 (2) –
Sale of subsidiary shares to noncontrolling
interests, not changing ownership – – – – – – 30 30
Net income/(loss) – – 2,024 – – 2,024 (13) 2,011
Cumulative effect of accounting changes, net of tax – – (24) – (21) (45) – (45)
Total other comprehensive income/(loss), net of tax – – – – 778 778 (2) 776
Sale of treasury shares – (28) – 11,721 – 11,693 – 11,693
Repurchase of treasury shares – – – (12,441) – (12,441) – (12,441)
Share-based compensation, net of tax – (120) – 762 – 642 – 642
Financial instruments indexed to own shares – 28 – – – 28 – 28
Dividends paid – (661) – – – (661) (5) (666)
Changes in scope of consolidation – – – – – – (129) (129)
Balance at end of period 102 34,889 26,973 (61) (17,981) 43,922 97 44,019
The accompanying notes to the consolidated financial statements are an integral part of these statements.

278 Consolidated financial statements – Credit Suisse Group
Consolidated statements of cash flowsin 2020 2019 2018
Operating activities (CHF million)
Net income 2,666 3,425 2,011
Adjustments to reconcile net income/(loss) to net cash provided by/(used in)
operating activities (CHF million)
Impairment, depreciation and amortization 1,356 1,275 936
Provision for credit losses 1,096 324 245
Deferred tax provision/(benefit) 434 589 800
Valuation adjustments relating to long-term debt 2,364 10,221 (4,743)
Share of net income/(loss) from equity method investments (121) (79) (111)
Trading assets and liabilities, net (7,130) (27,892) 25,536
(Increase)/decrease in other assets (7,923) 2,808 3,453
Increase/(decrease) in other liabilities 902 (6,615) (14,294)
Other, net (158) (2,480) (950)
Total adjustments (9,180) (21,849) 10,872
Net cash provided by/(used in) operating activities (6,514) (18,424) 12,883
Investing activities (CHF million)
(Increase)/decrease in interest-bearing deposits with banks (519) 411 (427)
(Increase)/decrease in central bank funds sold, securities purchased under
resale agreements and securities borrowing transactions 19,219 8,386 (1,372)
Purchase of investment securities (402) (557) (683)
Proceeds from sale of investment securities 629 6 255
Maturities of investment securities 184 1,007 567
Investments in subsidiaries and other investments (210) (285) (547)
Proceeds from sale of other investments 678 1,158 1,772
(Increase)/decrease in loans (5,735) (15,344) (12,500)
Proceeds from sales of loans 3,860 4,612 5,980
Capital expenditures for premises and equipment and other intangible assets (1,188) (1,293) (1,095)
Proceeds from sale of premises and equipment and other intangible assets 45 30 30
Other, net 113 543 342
Net cash provided by/(used in) investing activities 16,674 (1,326) (7,678)
The accompanying notes to the consolidated financial statements are an integral part of these statements.
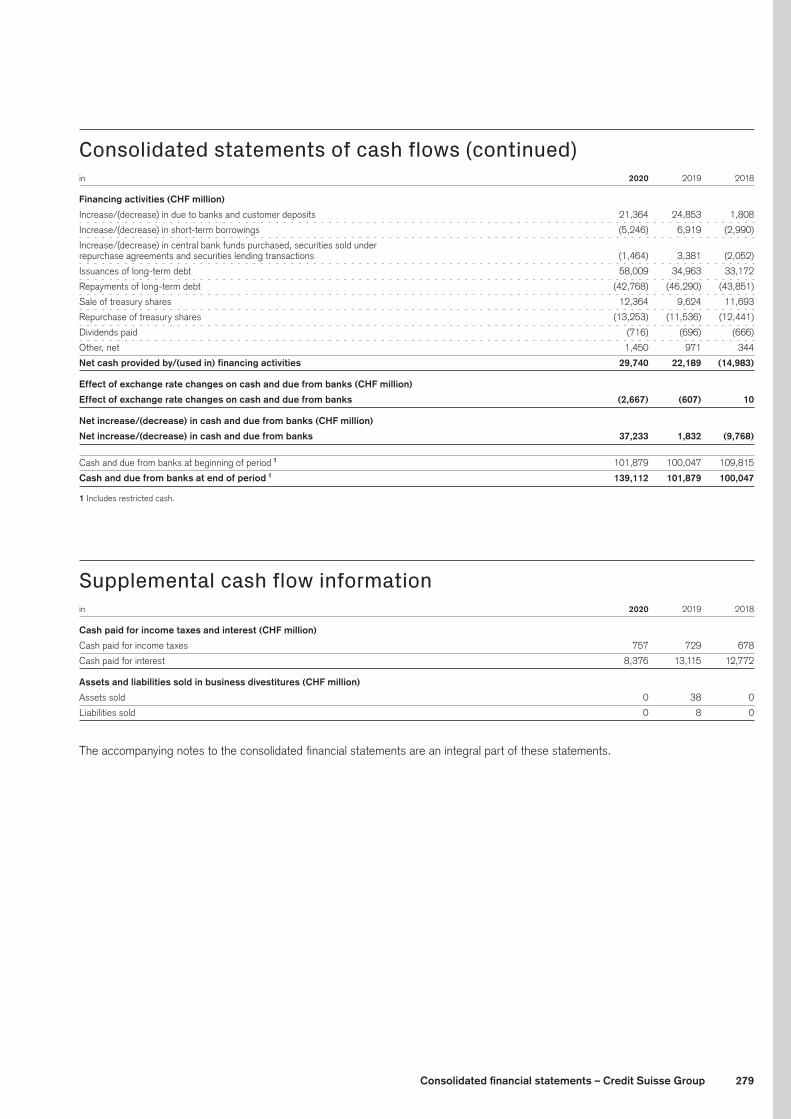
279Consolidated financial statements – Credit Suisse Group
Consolidated statements of cash flows (continued)in 2020 2019 2018
Financing activities (CHF million)
Increase/(decrease) in due to banks and customer deposits 21,364 24,853 1,808
Increase/(decrease) in short-term borrowings (5,246) 6,919 (2,990)
Increase/(decrease) in central bank funds purchased, securities sold under
repurchase agreements and securities lending transactions (1,464) 3,381 (2,052)
Issuances of long-term debt 58,009 34,963 33,172
Repayments of long-term debt (42,768) (46,290) (43,851)
Sale of treasury shares 12,364 9,624 11,693
Repurchase of treasury shares (13,253) (11,536) (12,441)
Dividends paid (716) (696) (666)
Other, net 1,450 971 344
Net cash provided by/(used in) financing activities 29,740 22,189 (14,983)
Effect of exchange rate changes on cash and due from banks (CHF million)
Effect of exchange rate changes on cash and due from banks (2,667) (607) 10
Net increase/(decrease) in cash and due from banks (CHF million)
Net increase/(decrease) in cash and due from banks 37,233 1,832 (9,768)
Cash and due from banks at beginning of period 1 101,879 100,047 109,815
Cash and due from banks at end of period 1 139,112 101,879 100,047
1 Includes restricted cash.
Supplemental cash flow informationin 2020 2019 2018
Cash paid for income taxes and interest (CHF million)
Cash paid for income taxes 757 729 678
Cash paid for interest 8,376 13,115 12,772
Assets and liabilities sold in business divestitures (CHF million)
Assets sold 0 38 0
Liabilities sold 0 8 0
The accompanying notes to the consolidated financial statements are an integral part of these statements.

280 Consolidated financial statements – Credit Suisse Group
Notes to the consolidated financial statements1 Summary of significant accounting policiesThe accompanying consolidated financial statements of Credit Suisse Group AG (the Group) are prepared in accordance with accounting principles generally accepted in the US (US GAAP) and are stated in Swiss francs (CHF). The financial year for the Group ends on December 31. Certain reclassifications have been made to the prior year’s consolidated financial statements to conform to the current presentation which had no impact on net income/(loss) or total shareholders’ equity.
In preparing the consolidated financial statements, management is required to make estimates and assumptions including, but not limited to, the fair value measurements of certain financial assets and liabilities, the allowance for loan losses, the evaluation of vari-able interest entities (VIEs), the impairment of assets other than loans, recognition of deferred tax assets, tax uncertainties, pen-sion liabilities and various contingencies. These estimates and assumptions affect the reported amounts of assets and liabili-ties and the disclosure of contingent assets and liabilities as of the dates of the consolidated balance sheets and the reported amounts of revenues and expenses during the reporting period. While management evaluates its estimates and assumptions on an ongoing basis, actual results could differ materially from man-agement’s estimates. Market conditions may increase the risk and complexity of the judgments applied in these estimates.
Principles of consolidation
The consolidated financial statements include the financial state-ments of the Group and its subsidiaries. The Group’s subsidiar-ies are entities in which it holds, directly or indirectly, more than 50% of the voting rights or where it exercises control. The Group consolidates limited partnerships in cases where it is the general partner and the limited partners do not have either substantive kick out rights and/or substantive participating rights or is a lim-ited partner with substantive rights to kick out the general partner or dissolve the partnership and participate in significant decisions made in the ordinary course of business. The Group also consoli-dates VIEs if the Group is the primary beneficiary in accordance with Accounting Standards Codification (ASC) Topic 810 – Con-solidation. The effects of material intercompany transactions and balances have been eliminated.
Where a Group subsidiary is determined to be an investment company as defined by ASC Topic 946 – Financial Services – Investment Companies, interests in other entities held by this Group subsidiary are not consolidated and are carried at fair value.
Group entities that qualify as broker-dealer entities as defined by ASC Topic 940 – Financial Services – Brokers and Dealers do not consolidate investments in voting interest entities that would otherwise qualify for consolidation when the investment is held on a temporary basis for trading purposes. In addition, subsidiaries that are strategic components of a broker-dealer’s operations are consolidated regardless of holding intent.
Foreign currency translation
Transactions denominated in currencies other than the functional currency of the related entity are recorded by remeasuring them in the functional currency of the related entity using the foreign exchange rate on the date of the transaction. As of the dates of the consolidated balance sheets, monetary assets and liabilities are reported using the year-end spot foreign exchange rates. For-eign exchange rate differences are recorded in the consolidated statements of operations. Non-monetary assets and liabilities are recorded using the historic exchange rate.
For the purpose of consolidation, the assets and liabilities of Group companies with functional currencies other than the Swiss franc are translated into Swiss franc equivalents using year-end spot foreign exchange rates, whereas revenues and expenses are translated at weighted average foreign exchange rates for the period. Translation adjustments arising from consolidation are included in accumulated other comprehensive income/(loss) (AOCI) within total shareholders’ equity. Cumulative translation adjustments are released from AOCI and recorded in the con-solidated statements of operations when the Group disposes and loses control of a consolidated foreign subsidiary.
Fair value measurement and option
The fair value measurement guidance establishes a single authoritative definition of fair value and sets out a framework for measuring fair value. The fair value option creates an alternative measurement treatment for certain financial assets and financial liabilities. The fair value option can be elected at initial recogni-tion of the eligible item or at the date when the Group enters into an agreement which gives rise to an eligible item (e.g., a firm commitment or a written loan commitment). If not elected at ini-tial recognition, the fair value option can be applied to an item upon certain triggering events that give rise to a new basis of accounting for that item. The application of the fair value option to a financial asset or a financial liability does not change its clas-sification on the balance sheet and the election is irrevocable. Changes in fair value resulting from the election are recorded in trading revenues.
> Refer to “Fair value option” in Note 36 – Financial instruments for further information.
Cash and due from banks
Cash and due from banks consists of currency on hand, demand deposits with banks or other financial institutions and cash equiv-alents. Cash equivalents are defined as short-term, highly liquid instruments with original maturities of three months or less, which are held for cash management purposes. Restricted cash is any cash or cash equivalent recorded in cash and due from banks subject to restrictions imposed by a governmental or other regula-tory agency that require the Group to set aside specified amounts of cash as reserves against transactions and time deposits.

281Consolidated financial statements – Credit Suisse Group
Reverse repurchase and repurchase agreements
Purchases of securities under agreements to resell (reverse repur-chase agreements) and securities sold under agreements to repur-chase (repurchase agreements) do not constitute economic sales; therefore, they are treated as collateralized financing transactions, which are carried in the consolidated balance sheet at the amount of cash disbursed or received, respectively. Reverse repurchase agreements are recorded as collateralized assets while repurchase agreements are recorded as liabilities. The underlying securities sold continuing to be recognized in trading assets or investment securities. The fair value of securities to be repurchased and resold is monitored on a daily basis, and additional collateral is obtained as needed to protect against credit exposure.
Assets and liabilities recorded under these agreements are accounted for on one of two bases, the accrual basis or the fair value basis. Under the accrual basis, interest earned on reverse repurchase agreements and interest incurred on repurchase agreements are reported in interest and dividend income and interest expense, respectively. The Group elects to apply the fair value option to selected agreements pursuant to ASC Topic 825 – Financial Instruments. Under such circumstances, the change in fair value is reported in trading revenues. Accrued interest income and expense are recorded in the same manner as under the accrual method.
Reverse repurchase and repurchase agreements may be netted if they are with the same counterparty; have the same maturity date; settle through the same qualifying clearing institution and subject to a right of offset allowed by a legally enforceable master netting agreement or a central counterparty’s clearing rules.
Securities lending and borrowing transactions
Securities borrowed and securities loaned that are cash-collater-alized are included in the consolidated balance sheets at amounts equal to the cash advanced or received. If securities received as collateral in a securities lending and borrowing transaction may be sold or repledged, they are recorded as securities received as collateral in the consolidated balance sheet and a corresponding liability to return the security is recorded. Securities lending trans-actions against non-cash collateral in which the Group has the right to resell or repledge the collateral received are recorded at the fair value of the collateral initially received. For securities lend-ing transactions, the Group receives cash or securities collateral in an amount generally in excess of the market value of securi-ties lent. The Group monitors the fair value of securities borrowed and loaned on a daily basis with additional collateral obtained as necessary.
Fees and interest received or paid are recorded in interest and dividend income and interest expense, respectively, on an accrual basis. If the fair value basis of accounting is elected, any result-ing change in fair value is reported in trading revenues. Accrued interest income and expense are recorded in the same manner as under the accrual method.
Transfers of financial assets
Transfers of financial assets may involve the sale of these assets to special purpose entities (SPEs), which in turn issue securi-ties to investors. The Group values its beneficial interests in such SPEs at fair value using quoted market prices, if such positions are traded on an active exchange or financial models that incor-porate observable and unobservable inputs.
> Refer to “Note 35 – Transfers of financial assets and variable interest entities” for further information on the Group’s transfer activities.
Trading assets and liabilities
Trading assets and liabilities include debt securities, marketable equity instruments, derivative instruments, certain loans held in broker-dealer entities, commodities and precious metals. Items included in the trading portfolio are carried at fair value and clas-sified as held for trading purposes based on management’s intent. Regular-way security transactions are recorded on a trade-date basis. Unrealized and realized gains and losses on trading positions are recorded in trading revenues.
Derivatives
Freestanding derivative contracts are carried at fair value in the consolidated balance sheets regardless of whether these instru-ments are held for trading or risk management purposes. Com-mitments to originate mortgage loans that will be held for sale are considered derivatives for accounting purposes. When derivative features embedded in certain contracts that meet the definition of a derivative are not considered clearly and closely related to the host contract, either the embedded feature is accounted for sep-arately at fair value or the entire contract, including the embedded feature, is accounted for at fair value. In both cases, changes in fair value are recorded in the consolidated statements of opera-tions. If separated for measurement purposes, the derivative is recorded in the same line item in the consolidated balance sheets as the host contract.
Derivatives classified as trading assets and liabilities include those held for trading purposes and those used for risk management purposes that do not qualify for hedge accounting. Derivatives held for trading purposes arise from proprietary trading activ-ity and from customer-based activity. Realized gains and losses, changes in unrealized gains and losses and interest flows are included in trading revenues. Derivative contracts designated and qualifying as fair value hedges, cash flow hedges or net invest-ment hedges are reported as other assets or other liabilities.
The fair value of exchange-traded derivatives is typically derived from observable market prices and/or observable market param-eters. Fair values for over-the-counter (OTC) derivatives are determined on the basis of proprietary models using various input parameters. Derivative contracts are recorded on a net basis per counterparty where a right to offset exists under an enforceable master netting agreement or a central counterparty’s clearing rules.
282 Consolidated financial statements – Credit Suisse Group
Where no such rights exist, fair values are recorded on a gross basis.
Where hedge accounting is applied, the Group formally docu-ments all relationships between hedging instruments and hedged items, including the risk management objectives and strategy for undertaking hedge transactions. At inception of a hedge and on an ongoing basis, the hedge relationship is formally assessed to determine whether the derivatives that are used in hedging trans-actions are highly effective in offsetting changes in fair values or cash flows of hedged items attributable to the hedged risk. The Group discontinues hedge accounting prospectively in the follow-ing circumstances:(i) the derivative is no longer effective in offsetting changes in the
fair value or cash flows of a hedged item (including forecasted transactions);
(ii) the derivative expires or is sold, terminated or exercised;(iii) the derivative is no longer designated as a hedging instrument
because it is unlikely that the forecasted transaction will occur; or
(iv) the designation of the derivative as a hedging instrument is otherwise no longer appropriate.
For derivatives that are designated and qualify as fair value hedges, the carrying values of the underlying hedged items are adjusted to fair value for the risk being hedged. Changes in the fair value of these derivatives are recorded in the same line item of the consolidated statements of operations used to present the changes in the fair value of the hedged item.
When the Group discontinues fair value hedge accounting because it determines that the derivative no longer qualifies as an effective hedge, the derivative will continue to be carried in the consolidated balance sheets at its fair value, and the hedged asset or liability will no longer be adjusted for changes in fair value attributable to the hedged risk. Interest-related fair value adjustments made to the underlying hedged items will be amortized to the consolidated statements of operations over the remaining life of the hedged item. Any unamortized interest-related fair value adjustment is recorded in the consolidated statements of operations upon sale or extinguishment of the hedged asset or liability, respectively. Any other fair value hedge adjustments remain part of the carry-ing amount of the hedged asset or liability and are recognized in the consolidated statements of operations upon disposition of the hedged item as part of the gain or loss on disposition.
For hedges of the variability of cash flows from forecasted trans-actions and floating rate assets or liabilities, the change in the fair value of a designated derivative is recorded in AOCI. These amounts are reclassified into the line item in the consolidated statements of operations in which the hedged item is recorded when the variable cash flow from the hedged item impacts earn-ings (for example, when periodic settlements on a variable rate asset or liability are recorded in the consolidated statements of operations or when the hedged item is disposed of).
When hedge accounting is discontinued on a cash flow hedge, the net gain or loss will remain in AOCI and be reclassified into the consolidated statements of operations in the same period or periods during which the formerly hedged transaction is reported in the consolidated statements of operations. When the Group discontinues hedge accounting because it is probable that a forecasted transaction will not occur within the specified date or period plus two months, the derivative will continue to be carried in the consolidated balance sheets at its fair value, and gains and losses that were previously recorded in AOCI will be recognized immediately in the consolidated statements of operations.
For hedges of a net investment in a foreign operation, the change in the fair value of the hedging derivative is recorded in AOCI. The Group uses the forward method of determining effectiveness for net investment hedges, which results in the time value portion of a foreign currency forward being reported in AOCI.
Investment securities
Investment securities include debt securities classified as held-to-maturity and debt securities classified as available-for-sale. Regu-lar-way security transactions are recorded on a trade-date basis.
Debt securities where the Group has the positive intent and abil-ity to hold such securities to maturity are classified as such and are carried at amortized cost, net of any unamortized premium or discount. Debt securities classified as held-to-maturity require an assessment of the current expected credit loss (CECL) at the reporting date.
Debt securities classified as available-for-sale are carried at fair value. Unrealized gains and losses, which represent the differ-ence between fair value and amortized cost, are recorded in AOCI. Amounts reported in AOCI are net of income taxes.
Debt securities classified as available-for-sale are impaired if there is a decline in fair value below amortized cost basis. If the Group intends to sell an impaired security or more likely than not will be required to sell such a security before recovering its amor-tized cost basis, the entire difference between the amortized cost basis and fair value is recognized as a credit loss. However, if the Group does not intend to sell and is not likely to be required to sell, an assessment is made if a decline in fair value of the secu-rity is due to credit-related factors or non-credit related factors. Credit-related impairment is recognized in earnings by recording an allowance for credit losses. Any portion of the unrealized loss that relates to non-credit related factors is recognized in AOCI, net of income taxes.
Amortization of premiums or discounts for debt securities is recorded in interest and dividend income using the effective yield method through the maturity date of the security.

283Consolidated financial statements – Credit Suisse Group
Other investments
Other investments include equity method investments, equity securities without a readily determinable fair value, such as hedge funds, private equity securities and certain investments in non-marketable mutual funds for which the Group has neither sig-nificant influence nor control over the investee, and real estate held-for-investment.
Equity method investments are investments for which the Group has the ability to significantly influence the operating and financial policies. Significant influence is typically characterized by owner-ship of 20% to 50% of the voting stock or in-substance common stock of a corporation or 3% to 5% or more of limited partner-ship interests. Equity method investments are accounted for under the equity method of accounting or the fair value option, which the Group has elected to apply for selected equity method investments. Under the equity method of accounting, the Group’s proportionate share of the profit or loss, and any impairment on the investee, if applicable, is reported in other revenues. Under the fair value option, changes in fair value are reported in other revenues.
Equity securities without a readily determinable fair value are car-ried at fair value, net asset value practical expedient to estimate fair value or at cost less impairment, adjusted for observable price changes (measurement alternative). Memberships in exchanges are reported at cost, less impairment. Equity securities without a read-ily determinable fair value held by the Group’s subsidiaries that are determined to be investment companies as defined by ASC Topic 946 – Financial Services – Investment Companies are carried at fair value, with changes in fair value recorded in other revenues.
Equity method investments and equity securities without a read-ily determinable fair value held by subsidiaries that are within the scope of ASC Topic 940 – Financial Services – Brokers and Dealers are measured at fair value and reported in trading assets when the intent of the broker-dealer entity is to hold the asset temporarily for trading purposes. Changes in fair value are reported in trading revenues. Equity securities without a readily determinable fair value include investments in entities that regu-larly calculate net asset value per share or its equivalent, with changes in fair value recorded in other revenue.
Real estate held-for-investment purposes is carried at cost less accumulated depreciation and is depreciated over its estimated useful life, generally 40 to 67 years. Land that is classified as real estate held-for-investment purposes is carried at historical cost and is not depreciated. Real estate held-for-investment purposes is tested for impairment annually, or more frequently, if events or changes in circumstances indicate that the carrying amount may not be recoverable. For real estate held-for-investment purposes, the fair values were measured based on either discounted cash flow analyses or external market appraisals. Recognition of an impairment on such assets establishes a new cost base, which is not adjusted for subsequent recoveries in value.
Loans
Loans held-to-maturityLoans which the Group intends to hold until maturity are carried at outstanding principal balances plus accrued interest, net of the following items: unamortized premiums, discounts on purchased loans, deferred loan origination fees and direct loan origina-tion costs on originated loans. Interest income is accrued on the unpaid principal balance and net deferred premiums/discounts and fees/costs are amortized as an adjustment to the loan yield over the term of the related loans.
A loan is classified as non-performing and thus considered credit impaired no later than when the contractual payments of principal and/or interest are more than 90 days past due except for sub-prime residential loans which are classified as non-performing no later than when the contractual payments of principal and/or interest are more than 120 days past due. The additional 30 days ensure that these loans are not incorrectly assessed as non-performing during the time when servicing of them typically is being transferred. However, management may determine that a loan should be classified as non-performing notwithstanding that contractual payments of principal and/or interest are less than 90 days past due or, in the case of subprime residential loans, 120 days past due. In addition, the Group continues to add accrued interest receivable to the loan’s balance for collection purposes; however, a credit provision is recorded, resulting in no interest income recognition.
A loan can be further downgraded to non-interest-earning when the collection of interest is considered so doubtful that further accrual of interest is deemed inappropriate.
Generally, non-performing loans and non-interest-earning loans may be restored to performing status only when delinquent prin-cipal and interest are brought up to date in accordance with the terms of the loan agreement and when certain performance crite-ria are met.
Interest collected on non-performing loans and non-interest-earn-ing loans is accounted for using the cash basis or the cost recov-ery method or a combination of both.
Amortization of deferred fees and premiums and discounts ceases while a loan is deemed to be non-performing or non-interest-earning.
Loans that are modified in a troubled debt restructuring are reported as restructured loans. Generally, a restructured loan would have been considered credit-impaired prior to the restructur-ing. Loans modified in a troubled debt restructuring are no longer considered credit-impaired in the years following the restructuring if the restructured loan carries an interest rate that is equal to or greater than the rate the Group was willing to accept at the time of the restructuring for a loan with comparable risk and the loan is

284 Consolidated financial statements – Credit Suisse Group
not credit-impaired based on the terms specified by the restructur-ing agreement. Loans that have been restructured in a troubled debt restructuring and are performing according to the new terms continue to accrue interest. Loan restructurings may include the receipt of assets in satisfaction of the loan, the modification of loan terms (e.g., reduction of interest rates, extension of maturity dates at a stated interest rate lower than the current market rate for new loans with similar risk, or reduction in principal amounts and/or accrued interest balances) or a combination of both.
Potential problem loans are credit-impaired loans where contrac-tual payments have been received according to schedule, but where doubt exists as to the collection of future contractual pay-ments. Potential problem loans continue to accrue interest.
> Refer to “Note 19 – Loans” for further information.
Credit losses on financial instruments measured at amortized costThe credit loss requirements apply to financial assets measured at amortized cost including loans held-to-maturity, net invest-ments in leases as a lessor as well as off-balance sheet credit exposures, such as irrevocable loan commitments, and credit guarantees. The credit loss requirements are based on a forward-looking, lifetime CECL model by incorporating reasonable and supportable forecasts of future economic conditions available at the reporting date. The CECL amounts are estimated over the contractual term of the financial assets taking into account the effect of prepayments. This requires considerable judgment over how changes in macroeconomic factors as well as changes in forward-looking borrower-specific characteristics will affect the CECL amounts.
The Group measures expected credit losses of financial assets on a collective (pool) basis when similar risk characteristics exist. For financial assets that do not share similar risk characteristics, expected credit losses are evaluated on an individual basis. CECL amounts are probability-weighted estimates of potential credit losses based on historical frequency, current trends and condi-tions as well as forecasted macroeconomic factors, such as gross domestic product, unemployment rates and interest rates.
For financial assets that are performing at the reporting date, the allowance for credit losses is generally measured using a probability of default/loss given default approach under which both probability of default (PD), loss given default (LGD) and exposure at default (EAD) are estimated. For financial assets that are credit-impaired at the reporting date, the Group generally applies a discounted cash flow approach to determine the difference between the gross carrying amount and the present value of estimated future cash flows.
An allowance for credit losses is deducted from the amortized cost basis of the financial asset. Changes in the allowance for credit losses are recorded in the consolidated statement of opera-tions in provision for credit losses or, if related to provisions on past due interest, in net interest income.
For undrawn irrevocable loan commitments, the present value is calculated based on the difference between the contractual cash flows that are due to the Group if the commitment is drawn and the cash flows that the Group expects to receive, in order to estimate the provision for expected credit losses. For credit guar-antees, expected credit losses are recognized for the contingency of the credit guarantee. Provisions for off-balance sheet credit exposures are recognized as a provision in other liabilities in the consolidated balance sheets.
Write-off of a financial asset occurs when it is considered certain that there is no possibility of recovering the outstanding principal. If the amount of loss on write-off is greater than the accumulated allowance for credit losses, the difference results in an additional credit loss. The additional credit loss is first recognized as an addition to the allowance; the allowance is then applied against the gross carrying amount. Any repossessed collateral is initially measured at fair value. The subsequent measurement depends on the nature of the collateral. Any uncollectible accrued interest receivable is written off by reversing the related interest income.
Expected recoveries on financial assets previously written off or assessed/planned to be written off have to be reflected in the allowance for credit losses; for this purpose, the amount of expected recoveries cannot exceed the aggregate amounts previ-ously written off or assessed/planned to be written off. Accord-ingly, expected recoveries from financial assets previously writ-ten off may result in an overall negative allowance for credit loss balance. Prior to January 2020, the allowance for credit losses reflected probable incurred credit losses.
> Refer to “Note 20 – Financial instruments measured at amortized cost and credit losses” for further information.
Loans held-for-saleLoans, which the Group intends to sell in the foreseeable future, are considered held-for-sale and are carried at the lower of amortized cost or market value determined on either an individual method basis, or in the aggregate for pools of similar loans if sold or securitized as a pool. Loans held-for-sale are included in other assets. Adjustments to the lower of amortized cost basis or fair value are presented as a valuation allowance and recorded in other revenue.
Purchased impaired loansPurchased loans for which it is probable at acquisition that all contractually required payments will not be received are recorded at their net purchase price and no allowances are carried over. The excess of the estimated cash flows to be collected over the amount paid is accreted into interest income over the estimated recovery period when reasonable estimates can be made about the timing and amount of recovery. The Group does not consider such loans to be impaired at the time of acquisition. Such loans are deemed impaired only if the Group’s estimate of cash to be received decreases below the estimate at the time of acquisition. Increases in the estimated expected recovery are recorded as a reversal of allowances, if any, and then recognized as an adjust-ment of the effective yield of the loan.

285Consolidated financial statements – Credit Suisse Group
Loans held at fair value under the fair value optionLoans and loan commitments for which the fair value option is elected are reported at fair value with changes in fair value reported in trading revenues. The application of the fair value option does not change the loan’s classification. Loan commit-ments carried at fair value are recorded in other assets or other liabilities, respectively.
Goodwill and other intangible assets
Goodwill arises on the acquisition of subsidiaries and equity method investments. It is measured as the excess of the fair value of the consideration transferred, the fair value of any non-controlling interest in the acquiree and the fair value of any pre-viously held equity interest in the acquired subsidiary, over the net of the acquisition-date fair values of the identifiable assets acquired and the liabilities assumed. Goodwill is not amortized; instead it is tested for impairment annually, or more frequently if events or changes in circumstances indicate that goodwill may be impaired. Goodwill is allocated to the Group’s reporting units for the purposes of the impairment test.
Other intangible assets may be acquired individually or as part of a group of assets assumed in a business combination. Other intangible assets include but are not limited to: patents, licenses, copyrights, trademarks, branch networks, mortgage servicing rights, customer base and deposit relationships. Acquired intangible assets are initially measured at the amount of cash disbursed or the fair value of other assets distributed. Other intangible assets that have a finite useful life are amortized over that period. Other intangible assets acquired after January 1, 2002 that are deter-mined to have an indefinite useful life are not amortized; instead they are tested for impairment annually, or more frequently if events or changes in circumstances indicate that the indefinite intangible asset may be impaired. Mortgage servicing rights are included in non-amortizing other intangible assets and are carried at fair value, with changes in fair value recognized through earnings in the period in which they occur. Mortgage servicing rights represent the right to perform specified mortgage servicing activities on behalf of third parties. Mortgage servicing rights are either purchased from third parties or retained upon sale of acquired or originated loans.
Income taxes
Deferred tax assets and liabilities are recorded for the expected future tax consequences of temporary differences between the carrying amounts of assets and liabilities at the dates of the con-solidated balance sheets and their respective tax bases. Deferred tax assets and liabilities are computed using currently enacted tax rates and are recorded in other assets and other liabilities, respectively. Income tax expense or benefit is recorded in income tax expense/(benefit), except to the extent the tax effect relates to transactions recorded directly in total shareholders’ equity. Deferred tax assets are reduced by a valuation allowance, if necessary, to the amount that management believes will more likely than not be realized. Deferred tax assets and liabilities are adjusted for the effect of changes in tax laws and rates in the
period in which changes are approved by the relevant authority. Deferred tax assets and liabilities are presented on a net basis for the same tax-paying component within the same tax jurisdiction.
The Group follows the guidance in ASC Topic 740 – Income Taxes, which sets out a consistent framework to determine the appropriate level of tax reserves to maintain for uncertain tax positions. The Group determines whether it is more likely than not that an income tax position will be sustained upon examination based on the technical merits of the position. Sustainable income tax positions are then measured to determine the amount of benefit eligible for recognition in the consolidated financial state-ments. Each such sustainable income tax position is measured at the largest amount of benefit that is more likely than not to be realized upon ultimate settlement.
Brokerage receivables and brokerage payables
The Group recognizes receivables and payables from transactions in financial instruments purchased from and sold to customers, banks and broker-dealers. The Group is exposed to risk of loss resulting from the inability of counterparties to pay for or deliver financial instruments purchased or sold, in which case the Group would have to sell or purchase, respectively, these financial instru-ments at prevailing market prices. To the extent an exchange or clearing organization acts as counterparty to a transaction, credit risk is generally considered to be limited. The Group establishes credit limits for each customer and requires them to maintain mar-gin collateral in compliance with applicable regulatory and inter-nal guidelines. In order to conduct trades with an exchange or a third-party bank, the Group is required to maintain a margin. This is usually in the form of cash and deposited in a separate margin account with the exchange or broker. If available information indi-cates that it is probable that a brokerage receivable is impaired, an allowance is established. Write-offs of brokerage receivables occur if the outstanding amounts are considered uncollectible.
Premises and equipment
Premises and equipment (including equipment under operating leases where the Group is the lessor), with the exception of land, are carried at cost less accumulated depreciation.
Buildings are depreciated on a straight-line basis over their estimated useful lives, generally 40 to 67 years, and building improvements are depreciated on a straight-line basis over their estimated useful lives, generally not exceeding five to ten years. Land is carried at historical cost and is not depreciated. Lease-hold improvements, such as alterations and improvements to rented premises, are depreciated on a straight-line basis over the shorter of the lease term or estimated useful life, which generally does not exceed ten years. Equipment, such as computers, machinery, fur-nishings, vehicles and other tangible non-financial assets, is depre-ciated using the straight-line method over its estimated useful lives, generally three to ten years. Certain leasehold improvements and equipment, such as data center power generators, may have esti-mated useful lives greater than ten years.

286 Consolidated financial statements – Credit Suisse Group
The Group capitalizes costs relating to the acquisition, installa-tion and development of software with a measurable economic benefit, but only if such costs are identifiable and can be reliably measured. The Group depreciates capitalized software costs on a straight-line basis over the estimated useful life of the software, generally not exceeding seven years, taking into consideration the effects of obsolescence, technology, competition and other eco-nomic factors.
Leases
For lessee arrangements, the Group recognizes lease liabilities, which are reported as other liabilities or long-term debt, and right-of-use assets, which are reported as other assets. Lease liabili-ties are recognized at the lease commencement date based on the present value of lease payments over the lease term. Right-of-use assets are initially measured based on the lease liability, adjusted for any initial direct costs, any lease payments made prior to lease commencement and for any lease incentives.
> Refer to “Note 23 – Other assets and other liabilities”, “Note 24 – Leases” and “Note 26 – Long-term debt” for further information.
Options that permit the Group to extend or terminate a lease are only included in the measurement of right-of-use assets and lease liabilities when it is reasonably certain that the Group would exer-cise the extension option or would not exercise the termination option. Lease payments, which depend on an index or a referenced rate, are considered unavoidable and are included in the lease lia-bilities using the index or rate as of the lease commencement date. Other variable lease payments, as well as subsequent changes in an index or referenced rate, are excluded from the lease liabilities. The Group’s incremental borrowing rate, which is used in determin-ing the present value of lease payments, is derived from information available at the lease commencement date.
Operating lease costs, which include amortization and an interest component, are recognized over the remaining lease term on a straight-line basis. Operating and variable lease costs are recog-nized in general and administrative expenses.
For sales-type and direct financing leases under lessor arrange-ments, which are classified as loans, the Group de-recognizes the underlying assets and recognizes a net investment in the lease. The net investment in the lease is calculated as the lease receiv-able plus the unguaranteed portion of the estimated residual value. The lease receivable is initially measured at the present value of the sum of the future lease payments receivable over the lease term and any portion of the estimated residual value at the end of the lease term that is guaranteed by either the lessee or an unrelated third party. Lease terms may include options that permit the lessee to extend or renew these leases. Such options are only included in the measurement of lease receivables for sales-type and direct financing leases when it is reasonably cer-tain that the lessee would exercise these options. Subsequently, unearned income is amortized to interest income over the lease term using the effective interest method.
> Refer to “Note 19 – Loans”, “Note 20 – Financial instruments measured at amortized cost and credit losses” and “Note 24 – Leases” for further information.
For operating leases under lessor arrangements, the Group continues to recognize the underlying asset and depreciates the asset over its estimated useful life. Lease income is recognized in other income on a straight-line basis over the lease term.
Recognition of an impairment on non-financial assets
The Group evaluates premises, equipment, right-of-use assets and finite intangible assets for impairment at least annually and whenever events or changes in circumstances indicate that the carrying amount may not be recoverable. The impairment assess-ment is performed for a group of assets for which largely sepa-rate cash flows can be identified. Where the carrying amount for the group of assets exceeds the recoverable amount, the group of assets is considered impaired and an impairment is recorded in general and administrative expenses. Recognition of an impair-ment on such assets establishes a new cost base, which is not adjusted for subsequent recoveries in value.
Customer deposits
Customer deposits represent funds held from customers (both retail and commercial) and banks and consist of interest-bearing demand deposits, savings deposits and time deposits. Inter-est is accrued based on the contractual provisions of the deposit contract.
Long-term debt
Total long-term debt is composed of debt issuances that do not contain derivative features as well as hybrid debt. Hybrid debt includes capital instruments as well as those issued as part of the Group’s structured product activities. Long-term debt includes both Swiss franc and foreign currency denominated fixed and variable rate bonds.
The Group actively manages interest rate risk and foreign cur-rency risk on vanilla debt through the use of derivative contracts, primarily interest rate and currency swaps. In particular, fixed rate debt is hedged with receive-fixed, pay-floating interest rate swaps, and the Group applies hedge accounting per the guidance of ASC Topic 815 – Derivatives and Hedging.
For capital management purposes, the Group has outstanding hybrid capital instruments in the form of low- and high-trigger tier 1 and tier 2 capital notes, with a write-off or contingent share conversion feature. Typically, these instruments have an embed-ded derivative that is bifurcated for accounting purposes. The embedded derivative is measured separately and changes in fair value are recorded in trading revenue. The host contract is gener-ally accounted for under the amortized cost method unless the fair value option has been elected and the entire instrument is carried at fair value.
287Consolidated financial statements – Credit Suisse Group
The Group’s long-term debt also includes various equity-linked and other indexed instruments with embedded derivative features, for which payments and redemption values are linked to commodities, stocks, indices, currencies or other assets. The Group elected to account for substantially all of these instruments at fair value.
Changes in the fair value of fair-value option elected instruments are recognized as a component of trading revenues, except for changes in fair value attributed to own credit risk, which is recorded in other comprehensive income (OCI), net of tax, and recycled to trading revenue when the debt is de-recognized.
GuaranteesIn cases where the Group acts as a guarantor, the Group recog-nizes in other liabilities, at the inception of a guarantee, a liability for the fair value of the obligations undertaken in issuing such a guarantee, including its ongoing obligation to perform over the term of the guarantee in the event that certain events or conditions occur. Contingent obligations under issued guarantees not related to a financial obligation such as performance guarantees and non-financial standby letters of credit are assessed for the probability of loss on an ongoing basis. Contingent obligations under issued guarantees related to a financial obligation such as credit guaran-tees and financial standby letters of credit are assessed for CECL at reporting date.
Pension and other post-retirement benefitsCredit Suisse sponsors a number of post-employment benefit plans for its employees worldwide, which include defined benefit pension plans and other post-employment benefits. The major plans are located in Switzerland, the UK and the US.
The Group uses the projected unit credit actuarial method to deter-mine the present value of its projected benefit obligations (PBO) and the current and past service costs or credits related to its defined benefit and other post-retirement benefit plans. The mea-surement date used to perform the actuarial valuation is Decem-ber 31 and is performed by independent qualified actuaries.
Certain key assumptions are used in performing the actuarial val-uations. These assumptions must be made concerning the future events that will determine the amount and timing of the benefit payments and thus require significant judgment and estimates by Group management. This includes making assumptions with regard to discount rates, salary increases, interest rate on savings balances, expected long-term rate of return on plan assets and mortality (future life expectancy).
The assumed discount rates reflect the rates at which the pension benefits could be effectively settled. These rates are determined based on yield curves, constructed from high-quality corporate bonds currently available and observable in the market and are expected to be available during the period to maturity of the pen-sion benefits. In countries where there is no deep market in high-quality corporate bonds with longer durations, the best available market information, including governmental bond yields and risk premiums, is used to construct the yield curve.
Salary increases are determined by reviewing historical practice and external market data as well as considering internal projections.
The interest rate on savings balances is applicable only to the Credit Suisse Swiss pension plan (Swiss pension plan). The Board of Trustees of the Swiss pension plan sets the interest rate to be applied on the accumulated savings balance on an annual basis. Credit Suisse estimates the future interest rate on savings balances, taking into consideration actions and rates approved by the Board of Trustees of the Swiss pension plan and expected future changes in the interest rate environment based on the yield curve used for the discount rate.
The expected long-term rate of return on plan assets is deter-mined on a plan-by-plan basis, taking into account asset alloca-tion, historical rate of return, benchmark indices for similar-type pension plan assets, long-term expectations of future returns and investment strategy.
Mortality assumptions are based on standard mortality tables and standard models and methodologies for projecting future improvements to mortality as developed and published by external independent actuarial societies and actuarial organizations.
Health care cost trend rates are determined by reviewing external data and the Group’s own historical trends for health care costs.
The funded status of the Group’s defined benefit post-retirement and pension plans is recognized in the consolidated balance sheets.
Actuarial gains and losses in excess of 10% of the greater of the PBO or the market value of plan assets are amortized to net periodic pension and other post-retirement benefit costs on a straight-line basis over the average remaining service life of active employees expected to receive benefits. If all or almost all of the participants are inactive, the amortization period is based on the average remaining life expectancy of the inactive participants. Unrecognized prior service costs or credits are amortized over the remaining service period of employees affected by a plan amendment.
The Group records pension expense for defined contribution plans when the employee renders service to the company, essen-tially coinciding with the cash contributions to the plans.
Share-based compensation
For all share-based awards granted to employees, compensation expense is measured at grant date or modification date based on the fair value of the number of awards for which the requisite ser-vice is expected to be rendered and is recognized in the consoli-dated statements of operations over the required service period.
The incremental tax effects of the difference between the com-pensation expense recorded in the US GAAP accounts and the tax deduction received, are recorded in the income statement at the point in time the deduction for tax purposes is recorded.

288 Consolidated financial statements – Credit Suisse Group
Compensation expense for share-based awards that vest in their entirety at the end of the vesting period (cliff vesting) and awards that vest in annual installments (graded vesting), which only con-tain a service condition that affects vesting, is recognized on a straight-line basis over the service period for the entire award. However, if awards with graded vesting contain a performance condition, then each installment is expensed as if it were a sepa-rate award (“front-loaded” expense recognition). Furthermore, recognition of compensation expense is accelerated to the date an employee becomes eligible for retirement.
Performance share awards contain a performance condition. In the event of either a negative return on equity (ROE) of the Group or a divisional loss, any outstanding performance share awards will be subject to a reduction. The amount of compensation expense recorded includes an estimate of any expected reductions. For each reporting period after the grant date, the expected number of shares to be ultimately delivered upon vesting is reassessed and reflected as an adjustment to the cumulative compensation expense recorded in the income statement. The basis for the ROE calculation may vary from year to year, depending on the Compen-sation Committee’s determination for the year in which the perfor-mance shares are granted.
Certain employees own equity interests in the form of carried interests in certain funds managed by the Group. Expenses rec-ognized under these ownership interests are reflected in the con-solidated statements of operations in compensation and benefits.
Own shares, own bonds and financial instruments on own shares
The Group may buy and sell own shares, own bonds and financial instruments on own shares within its normal trading and market-making activities. In addition, the Group may hold its own shares to satisfy commitments arising from employee share-based com-pensation awards. Own shares are recorded at cost and reported as treasury shares, resulting in a reduction to total sharehold-ers’ equity. Financial instruments on own shares are recorded as assets or liabilities or as equity when the criteria for equity classification are met. Dividends received by subsidiaries on own shares and unrealized and realized gains and losses on own shares classified in total shareholders’ equity are excluded from the consolidated statements of operations.
Any holdings of bonds issued by any Group entity are eliminated in the consolidated financial statements.
Net interest income
Interest income and interest expense arising from interest-bearing assets and liabilities other than those carried at fair value or the
lower of cost or market are accrued, and any related net deferred premiums, discounts, origination fees or costs are amortized as an adjustment to the yield over the life of the related asset and lia-bility. Interest from debt securities and dividends on equity securi-ties carried as trading assets and trading liabilities are recorded in interest and dividend income.
> Refer to “Loans” for further information on interest on loans.
Commissions and fees
Commissions and fees include revenue from contracts with cus-tomers. The Group recognizes revenue when it satisfies a con-tractual performance obligation. The Group satisfies a perfor-mance obligation when control of the underlying good or services related to the performance obligation is transferred to the cus-tomer. Control is the ability to direct the use of, and obtain sub-stantially all of the remaining benefits from, the good or service. The Group must determine whether control of a good or service is transferred over time. If so, the related revenue is recognized over time as the good or service is transferred to the customer. If not, control of the good or service is transferred at a point in time. The performance obligations are typically satisfied as the ser-vices in the contract are rendered. Revenue is measured based on the consideration specified in a contract with a customer, and excludes any amounts collected on behalf of third parties. The transaction price can be a fixed amount or can vary because of performance bonuses or other similar items. Variable consider-ation is only included in the transaction price once it is probable that a significant reversal in the amount of cumulative revenue recognized will not occur when the uncertainty associated with the amount of variable consideration is subsequently resolved. Generally, no significant judgement is required with respect to recording variable consideration.
When another party is involved in providing goods or services to a customer, the Group must determine whether the nature of its promise is a performance obligation to provide the specified goods or services itself (that is, the Group is a principal) or to arrange for those goods or services to be provided by the other party (that is, the Group is an agent). The Group determines whether it is a principal or an agent for each specified good or service promised to the customer. Gross presentation (revenue on the revenue line and expense on the expense line) is appropriate when the Group acts as principal in a transaction. Conversely, net presentation (revenue and expenses reported net) is appropriate when the Group acts as an agent in the transaction.
Transaction-related expenses are expensed as incurred. Under-writing expenses are deferred and recognized along with the underwriting revenue.
> Refer to “Note 14 – Revenue from contracts with customers” for further information.

289Consolidated financial statements – Credit Suisse Group
2 Recently issued accounting standardsRecently adopted accounting standards
ASC Topic 326 – Financial Instruments – Credit LossesIn June 2016, the Financial Accounting Standards Board (FASB) issued Accounting Standards Update (ASU) 2016-13, “Measure-ment of Credit Losses on Financial Instruments” (ASU 2016-13), creating ASC Topic 326 – Financial Instruments – Credit Losses. ASU 2016-13 is intended to improve financial reporting by requir-ing timelier recording of credit losses on financial assets mea-sured at amortized cost basis including, but not limited to loans, net investments in leases and off-balance sheet credit exposures. ASU 2016-13 eliminated the probable initial recognition thresh-old under the previous incurred loss methodology for recognizing credit losses. Instead, ASU 2016-13 requires the measurement of all expected credit losses for financial assets held at the report-ing date over the remaining contractual life (considering the effect of prepayments) based on historical experience, current conditions and reasonable and supportable forecasts. The Group has incor-porated forward-looking information and macroeconomic factors into its credit loss estimates. ASU 2016-13 requires enhanced
disclosures to help investors and other financial statement users to better understand significant estimates and judgments used in esti-mating credit losses, as well as the credit quality and underwriting standards of an organization’s portfolio.
In May 2019, the FASB issued ASU 2019-05, “Financial Instru-ments – Credit Losses” (ASU 2019-05), to provide targeted tran-sition relief upon the adoption of ASU 2016-13. The amendment provided the option to irrevocably elect the fair value option on cer-tain financial assets on transition.
As the Group is a US Securities and Exchange Commission (SEC) filer, ASU 2016-13 and its subsequent amendments were effective for annual reporting periods beginning after December 15, 2019, including interim periods within those annual reporting periods. The Group adopted ASU 2016-13 and its subsequent amendments on January 1, 2020, applying the modified retrospective approach, which resulted in a decrease in retained earnings of CHF 132 mil-lion, net of tax, with no significant impact on regulatory capital.
Impact from the adoption of ASC Topic 326 – Financial Instruments – Credit Losses Carrying Carrying
value as of value as of December 31, January 1, 2019 (before Reclass- Remeasure- 2020 (after
adoption) ifications ments adoption)
Assets (CHF million)
Cash and due from banks, net 101,879 – (1) 101,878
allowance for credit losses – – (1) (1)
Interest-bearing deposits with banks, net 741 – (3) 738
allowance for credit losses – – (3) (3)
Net loans 296,779 – (187) 296,592
of which reported at fair value 12,662 248 2 (84) 12,826
of which reported at amortized cost (amortized cost base) 285,179 (248) 2 – 284,931
allowance for credit losses (946) – (103) (1,049)
Other assets, net 39,609 – (8) 39,632 3
allowance for credit losses – other assets held at amortized cost (33) 1 – (8) (41)
Liabilities
Other liabilities 31,043 – (36) 31,007
of which reported at fair value 7,891 – 7 7,898
of which provisions for expected credit losses on
off-balance sheet credit exposures 172 – (43) 129
Adoption impact before taxes – – (163) –
Income taxes 31
Adoption impact on retained earnings (132)
1 In the Annual Report 2019, the allowance for credit losses was reflected in the carrying value of the respective balance sheet position and was not separately disclosed.2 Reflects the irrevocable election of the fair value option for selected positions, as applicable, in accordance with ASU 2019-05. Reclassifications are made at amortized cost before
allowance of credit loss. The related release of the allowance for credit loss as well as the fair value adjustment between the amortized cost basis and the fair value are reflected in the remeasurement column.
3 Includes the adoption impact on deferred tax assets of CHF 31 million, in addition to the CECL pre-tax remeasurements.

290 Consolidated financial statements – Credit Suisse Group
ASC Topic 820 – Fair Value MeasurementIn August 2018, the FASB issued ASU 2018-13, “Disclo-sure Framework – Changes to the Disclosure Requirements for Fair Value Measurement” (ASU 2018-13), an update to ASC Topic 820 – Fair Value Measurement. The amendments in ASU 2018-13 removed, modified and added certain disclo-sure requirements in ASC Topic 820, Fair Value Measurement. ASU 2018-13 is effective for annual reporting periods begin-ning after December 15, 2019 and for the interim periods within those annual reporting periods. Early adoption was permitted, including in an interim period, for any eliminated or modified disclosure requirements. The Group early adopted the amend-ments for removing disclosures and the amendments for certain modifying disclosures upon the issuance of ASU 2018-13. The Group adopted the remaining amendments on January 1, 2020. As these amendments related only to disclosures, there was no impact from the adoption of ASU 2018-13 on the Group’s finan-cial position, results of operations or cash flows.
ASC Topic 848 – Reference Rate ReformIn March 2020, the FASB issued ASU 2020-04, “Facilitation of the Effects of Reference Rate Reform on Financial Report-ing” (ASU 2020-04), creating ASC Topic 848 – Reference Rate Reform. The amendments in ASU 2020-04 provide optional guidance for a limited period of time to ease the potential burden in accounting for (or recognizing the effects of) reference rate reform on financial reporting. The amendments are elective and apply to contracts, hedging relationships and other transactions that reference the London Interbank Offered Rate (LIBOR) or another reference rate expected to be discontinued because of reference rate reform.
In January 2021, the FASB issued ASU 2021-01, “Reference Rate Reform, Scope” (ASU 2021-01), which expands the scope
of ASC Topic 848 to apply certain optional expedients for contract modifications and hedge accounting provided in ASU 2020-04 to derivative instruments that use an interest rate for margining, dis-counting, or contract price alignment that is modified for reference rate reform. The guidance also applies to derivatives that do not reference LIBOR or other reference rates that are expected to be discontinued.
The amendments may be applied as of March 12, 2020 through December 31, 2022. The Group elected to apply ASU 2020-04 and retrospectively apply ASU 2021-01 during 2020. These elec-tions did not have a material impact on the Group’s financial posi-tion, results of operations and cash flows.
Standards to be adopted in future periods
ASC Topic 740 – Income TaxesIn December 2019, the FASB issued ASU 2019-12, “Simplifying the Accounting for Income Taxes” (ASU 2019-12), an update to ASC Topic 740 – Income Taxes. The amendments in ASU 2019-12 eliminate certain exceptions related to the approach for intrape-riod tax allocation, the methodology for calculating income taxes in an interim period and the accounting for basis differences when there are changes in foreign ownership. In addition, ASU 2019-12 includes clarification and simplification of other aspects of the accounting for income taxes. The amendments are effective for annual reporting periods beginning after December 15, 2020 and for the interim periods within those annual reporting periods. Early adoption is permitted, including in an interim period. The adop-tion of ASU 2019-12 on January 1, 2021 did not have a material impact on the Group’s financial position, results of operations or cash flows.
3 Business developments, significant shareholders and subsequent events
Business developments
Organizational structure and restatementEffective August 1, 2020 the Group created a single, globally integrated Investment Bank division through the combination of its former Global Markets, Investment Banking & Capital Markets and Asia Pacific – Markets businesses to achieve critical scale. The Group also launched a new Sustainability, Research & Investment Solutions (SRI) function at the Executive Board level, underlining the sharpened focus on sustainability. The Group also combined its former Risk Management and Compliance functions into a single integrated Chief Risk and Compliance Officer function to unlock potential global synergies. The Group also revised its allocations for corporate functions and funding costs to align to the new organiza-tional structure.
In addition, Global Trading Solutions (GTS) was created within the Investment Bank through the combination of the businesses of International Trading Solutions (ITS) and Asia Pacific Solutions. GTS is a joint venture among the Investment Bank, International Wealth Management, Swiss Universal Bank and Asia Pacific divi-sions and provides centralized trading and sales services to insti-tutional and private clients. The methodology applied to allocate GTS results across the four divisions reflects the economic contri-bution from the client base that each division provides to GTS, as well as the historical performance of the constituting businesses, and combines a fixed allocation and an additional split to each division of any GTS outperformance above the fixed allocation.
The Group centrally manages its funding activities. As part of the process of implementing the Group’s new divisional structure

291Consolidated financial statements – Credit Suisse Group
announced on July 30, 2020, the Group recalibrated its method-ology for allocating funding costs across the Group to incorporate net stable funding ratio requirements, certain increased HQLA requirements, as well as funding maturity profile developments.
Reflecting these updates, the Group’s financial reporting is now presented as four reporting segments plus the Corporate Center. Prior periods have been restated to conform to the current pre-sentation. These restatements had no impact on the net income/(loss) or the total shareholders’ equity of the Group.
Neue Aargauer Bank integrationIn the fourth quarter of 2020, the Group merged the business of its wholly owned subsidiary, Neue Aargauer Bank AG, with Credit Suisse (Schweiz) AG, in order to establish a single brand in the Canton of Aargau. The merger was effected on November 27, 2020 under simplified requirements of the Swiss Merger Act with retroactive effect as of July 1, 2020.
Credit Suisse InvestLab AGFollowing the completion of the first step of the combination of the Group’s open architecture investment fund platform Credit Suisse InvestLab AG (InvestLab) and Allfunds Group in Sep-tember 2019, the Group successfully completed the second and final step of the combination in March 2020 with the transfer of related distribution agreements to Allfunds Group. Other revenues in 2020 included CHF 268 million from this second closing, reflected in net revenues of the Swiss Universal Bank, Interna-tional Wealth Management and Asia Pacific divisions.
Credit Suisse Founder Securities LimitedIn 2020, the Group received approval from the China Securi-ties Regulatory Commission and increased its shareholding in the securities joint venture Credit Suisse Founder Securities Limited to 51% from the previous 33.3% by way of a capital injection and related procedures.
York Capital ManagementIn the fourth quarter of 2020, York Capital Management (York) informed its investors of a significant change in strategy. As a result, York will focus on longer duration assets such as private equity, private debt and collateralized loan obligations, while winding down its European hedge funds business and primarily managing internal capital in its multi-strategy fund. York’s Asia Pacific busi-ness is expected to be spun off as a new and separate hedge fund in 2021, in which the Group intends to have a continuing interest. As a result of this announcement, the Group recorded an impair-ment of CHF 414 million to the valuation of its noncontrolling inter-est that it has owned since 2010, recognized in other revenues.
COVID-19 pandemicThe COVID-19 pandemic and the consequences for markets and the global economy affected the Group’s financial performance in 2020, including significant impacts on provision for credit losses, as well as on trading revenues and net interest income as a result of foreign exchange movements and a sharp reduction in US dollar interest rates. The Group continues to closely monitor the COVID-19 pandemic and its effects on its operations and busi-nesses. Should current economic conditions persist or continue to deteriorate, the macroeconomic environment may have an adverse effect on these and other aspects of the Group’s busi-ness, operations and financial performance, including decreased client activity or demand for its products.
Significant shareholders
Significant shareholders registered in the share registerThe following table includes significant shareholders (including nominees) with holdings in Group shares of at least 5% of the voting rights, which were registered in the share register as of December 31, 2020 and 2019, respectively.
Significant shareholders registered in the share register 2020 2019
Number Total nominal Share- Number Total nominal Share-
of shares value holding of shares value holding
end of (million) (CHF million) (%) (million) (CHF million) (%)
Direct shareholders 1
Chase Nominees Ltd. 2 323 13 13.21 343 14 13.43
Nortrust Nominees Ltd. 2 184 7 7.53 163 7 6.37
1 As registered in the share register of the Group on December 31 of the reporting period; includes shareholders registered as nominees.2 Nominee holdings exceeding 2% are registered with a right to vote only if the nominee confirms that no individual shareholder holds more than 0.5% of the outstanding share capital or if
the nominee discloses the identity of any beneficial owner holding more than 0.5% of the outstanding capital.
Information received from shareholders not registered in the share registerIn addition to the shareholdings registered in the share register of the Group, the Group has obtained and reported to the SIX Swiss Exchange information from its shareholders in accordance with the notification requirements of the Swiss Federal Act on Financial Market Infrastructures and Market Conduct in Securities
and Derivatives Trading. These shareholders may hold their shareholdings in Group shares through a nominee. The following shareholder notifications relate to registered voting rights exceed-ing 5% of all voting rights, which are subject to disclosure in the notes to the financial statements in accordance with the Swiss Code of Obligations.
292 Consolidated financial statements – Credit Suisse Group
In a disclosure notification that the Group published on Novem-ber 9, 2013, the Group was notified that as of November 4, 2013, Harris Associates L.P. held 81.5 million shares, or 5.17% of the voting rights, of the registered Group shares issued as of the date of the notified transaction. No further disclosure noti-fication has been received from Harris Associates L.P. relating to holdings of registered Group shares since 2013. This position includes the reportable position of Harris Associates Investment Trust (4.97% of the voting rights), as published by the SIX Swiss Exchange on August 1, 2018.
In a disclosure notification that the Group published on Septem-ber 6, 2018, the Group was notified that as of August 24, 2018, Qatar Holding LLC held 133.2 million shares, or 5.21% of the voting rights, of the registered Group shares issued as of the date of the notified transaction. No further disclosure notification has been received from Qatar Holding LLC relating to holdings of registered Group shares since 2018.
Subsequent event
On March 1, 2021, the boards of the supply chain finance funds managed by certain Group subsidiaries decided to suspend redemptions and subscriptions of those funds to protect the interests of the funds’ investors. On March 4, 2021, the boards decided to terminate those funds and proceed to their liquidation. Those decisions were based on concerns that a substantial part of the funds’ assets was subject to considerable valuation uncer-tainty. Credit Suisse Asset Management (Schweiz) AG (CSAM) acts as the portfolio manager of these supply chain finance funds. Redemptions and subscriptions of certain other funds managed by CSAM or CSAM subsidiaries that invest in part in these supply chain finance funds have also been suspended.
The assets held by the supply chain finance funds, largely con-sisting of notes backed by existing and future receivables, were originated and structured by Greensill Capital (UK) Limited or one of its affiliates (Greensill Capital). The last published net asset value of the supply chain finance funds in late February was approximately USD 10 billion in the aggregate. Initial redemp-tion payments totaling USD 3.1 billion across the supply chain finance funds were made to their investors beginning on March 8, 2021. The portfolio manager continues to work to liquidate the remaining assets in the four funds as the receivables compris-ing the funds’ assets mature. Greensill Capital filed for insol-vency in the UK on March 8, 2021, and the portfolio manager is working closely with the administrators of Greensill Capital,
Grant Thornton, and with other parties to facilitate this process. However, there remains considerable uncertainty regarding the valuation of a significant part of the remaining assets, including the fact that the portfolio manager has been informed that certain of the notes underlying the funds will not be repaid when they fall due, and the amounts that ultimately will be distributed to inves-tors in respect of the funds.
Group subsidiaries also have collateralized bridge lending and other direct and indirect exposures to Greensill Capital, including exposures relating to certain fund-linked products. With regard to the outstanding collateralized bridge loan of USD 140 mil-lion, USD 50 million was recently repaid by the administrators of Greensill Capital, reducing the outstanding amount of the loan to USD 90 million.
The Group continues to analyze these matters, including with the assistance of external counsel and other experts. The Board of Directors has also initiated an investigation of these matters.
It has been decided that as of March 10, 2021, three senior CSAM employees will not be performing their roles for the time being. The payout and vesting of variable compensation of a number of senior employees involved in these matters, up to and including Executive Board members, has been suspended as a measure to ensure that the Group can reconsider the variable compensation for 2020 and are able to apply malus or clawback, if appropriate.
A number of regulatory investigations and actions have been initi-ated or are being considered in respect of these matters, includ-ing by FINMA, one of which is the agreement to a Pillar 2 buffer with Credit Suisse. Furthermore, certain investors have already threatened litigation and, as this matter develops, Credit Suisse may become subject to litigation, disputes or other actions. The priority for Credit Suisse remains the recovery of funds for CSAM’s investors, and the portfolio manager is working closely with the administrators to facilitate this process. Credit Suisse notes that it is reasonably possible that Credit Suisse will incur a loss in respect of these matters, albeit that given the early stage of this process, it is not yet possible to estimate the size of such a reasonably possible loss. However, the ultimate cost to the Group of resolving these matters may be material to its operating results. Credit Suisse might also suffer reputational harm associ-ated with these matters that might cause client departures or loss of assets under management.

293Consolidated financial statements – Credit Suisse Group
4 Segment informationThe Group is a global financial services company domiciled in Switzerland and serves its clients through three regionally focused divisions: Swiss Universal Bank, International Wealth Manage-ment and Asia Pacific. These regional businesses are supported by the Investment Bank division. Beginning in 2019, the Strate-gic Resolution Unit ceased to exist as a separate division of the Group. The residual portfolio remaining as of December 31, 2018 is now managed in an Asset Resolution Unit and is separately dis-closed within our Corporate Center.
Effective August 1, 2020 the Group created a single, globally-integrated Investment Bank division through the combination of its former Global Markets, Investment Banking & Capital Markets and Asia Pacific – Markets businesses to achieve critical scale. The Group also revised its allocations for corporate functions and funding costs to align to the new organizational structure.
> Refer to “Organizational structure and restatement” in Note 3 – Business developments, significant shareholders and subsequent events – Business developments for further information.
The segment information reflects the Group’s reportable seg-ments and the Corporate Center, which are managed and reported on a pre-tax basis, as follows:p The Swiss Universal Bank division offers comprehen-
sive advice and a wide range of financial solutions to private, corporate and institutional clients primarily domiciled in the Group’s home market Switzerland. The Private Clients busi-ness has a leading franchise in the Group’s home market and serves ultra-high-net-worth individual, high-net-worth indi-vidual, affluent and retail clients. The Corporate & Institutional Clients business serves large corporate clients, small and medium-sized enterprises, institutional clients, external asset managers, financial institutions and commodity traders.
p The International Wealth Management division through its Private Banking business offers comprehensive advisory services and tailored investment and financing solutions to wealthy private clients and external asset managers in Europe, the Middle East, Africa and Latin America. The Asset Man-agement business offers investment solutions and services globally to a broad range of clients, including pension funds, governments, foundations and endowments, corporations and individuals.
p In the Asia Pacific division delivers an integrated wealth man-agement, financing, underwriting and advisory offering to our tar-get ultra-high-net-worth, entrepreneur and corporate clients. We provide a comprehensive suite of wealth management products and services to our clients in Asia Pacific and provide a broad range of advisory services related to debt and equity underwrit-ing of public offerings and private placements as well as merg-ers and acquisitions (M&A). Our close collaboration with the Investment Bank supports and enables our wealth management activities in the region through the delivery of holistic, innovative products and tailored advice.
p The Investment Bank division delivers client-centric sales and trading products, services and solutions across all asset classes
and regions as well as advisory, underwriting and financing ser-vices. Our range of products and services includes global securi-ties sales, trading and execution, prime brokerage, capital raising and comprehensive corporate advisory services. Additionally, our GTS platform provides centralized trading and sales services to the Group’s other business divisions. Our clients include financial institutions and sponsors, corporations, governments, ultra-high-net-worth individuals, sovereigns and institutional investors.
Corporate Center includes parent company operations such as Group financing, expenses for projects sponsored by the Group and certain expenses and revenues that have not been allocated to the segments. In addition, the Corporate Center includes con-solidation and elimination adjustments required to eliminate inter-company revenues and expenses.
Revenue sharing and cost allocation
Responsibility for each product is allocated to a specific segment, which records all related revenues and expenses. Revenue-sharing and service level agreements govern the compensation received by one segment for generating revenue or providing services on behalf of another. These agreements are negotiated periodically by the relevant segments on a product-by-product basis. The aim of revenue-sharing and service level agree-ments is to reflect the pricing structure of unrelated third-party transactions.
Corporate services and business support in finance, operations, human resources, legal, compliance, risk management and IT are provided by corporate functions, and the related costs are allocated to the segments and Corporate Center based on their requirements and other relevant measures.
Funding
The Group centrally manages its funding activities. New instru-ments for funding and capital purposes are primarily issued by Credit Suisse Group AG and are passed on to Credit Suisse AG, the direct bank subsidiary of the Group (the Bank). The Bank lends funds to its operating subsidiaries and affiliates on both a senior and subordinated basis, as needed, the latter typically to meet capital requirements, or as desired by management to capitalize on opportunities. Capital is distributed to the segments considering factors such as regulatory capital requirements, uti-lized economic capital and the historic and future potential return on capital.
Transfer pricing, using market rates, is used to record net rev-enues and expenses in each of the segments for this capital and funding. The Group’s funds transfer pricing system is designed to allocate funding costs to its businesses in a way that incentivizes their efficient use of funding. The Group’s funds transfer pricing system is an essential tool that allocates to the businesses the short-term and long-term costs of funding their balance sheet

294 Consolidated financial statements – Credit Suisse Group
usages and off-balance sheet contingencies. The funds transfer pricing framework ensures the full funding costs allocation under normal business conditions, but it is of even greater importance in a stressed capital markets environment where raising funds is more challenging and expensive. Under this framework, the Group’s businesses are also credited to the extent they provide long-term stable funding.
Net revenues and income/(loss) before taxes
in 2020 2019 2018
Net revenues (CHF million)
Swiss Universal Bank 5,615 5,905 5,443
International Wealth Management 4,837 5,816 5,320
Asia Pacific 3,155 3,029 2,759
Investment Bank 9,098 8,161 8,004
Strategic Resolution Unit 1 – – (708)
Corporate Center (316) (427) 102
Net revenues 22,389 22,484 20,920
Income/(loss) before taxes (CHF million)
Swiss Universal Bank 2,104 2,573 1,991
International Wealth Management 1,052 2,065 1,610
Asia Pacific 828 922 632
Investment Bank 1,655 1,026 818
Strategic Resolution Unit 1 – – (1,381)
Corporate Center (2,172) (1,866) (298)
Income before taxes 3,467 4,720 3,372
1 Beginning in 2019, the Strategic Resolution Unit ceased to exist as a separate division of the Group. The residual portfolio remaining as of December 31, 2018 is now managed in an Asset Resolution Unit and is separately disclosed within the Corporate Center.
Total assets
end of 2020 2019
Total assets (CHF million)
Swiss Universal Bank 261,465 249,829
International Wealth Management 95,206 91,277
Asia Pacific 67,356 73,719
Investment Bank 270,488 266,257
Corporate Center 111,307 106,213
Total assets 805,822 787,295
Net revenues and income/(loss) before taxes by geographical location
in 2020 2019 2018
Net revenues (CHF million)
Switzerland 7,719 8,434 7,646
EMEA 3,885 1,962 1,686
Americas 7,614 9,103 8,731
Asia Pacific 3,171 2,985 2,857
Net revenues 22,389 22,484 20,920
Income/(loss) before taxes (CHF million)
Switzerland 1,770 2,985 1,924
EMEA (124) (1,786) (2,082)
Americas 1,577 3,409 3,452
Asia Pacific 244 112 78
Income before taxes 3,467 4,720 3,372
The designation of net revenues and income/(loss) before taxes is based on the location of the office recording the transactions. This presentation does not reflect the way the Group is managed.
Total assets by geographical location
end of 2020 2019
Total assets (CHF million)
Switzerland 262,034 242,991
EMEA 159,661 144,888
Americas 287,619 305,328
Asia Pacific 96,508 94,088
Total assets 805,822 787,295
The designation of total assets by region is based upon customer domicile.

295Consolidated financial statements – Credit Suisse Group
5 Net interest incomein 2020 2019 2018
Net interest income (CHF million)
Loans 5,733 7,179 6,770
Investment securities 3 9 80
Trading assets 5,816 7,340 7,131
Central bank funds sold, securities
purchased under resale agreements
and securities borrowing transactions 1,596 2,926 2,856
Other 771 2,730 2,776
Interest and dividend income 13,919 20,184 19,613
Deposits (1,113) (3,055) (2,287)
Short-term borrowings (166) (409) (359)
Trading liabilities (2,658) (3,513) (3,453)
Central bank funds purchased, securities
sold under repurchase agreements and
securities lending transactions (907) (1,668) (1,877)
Long-term debt (2,753) (3,412) (3,816)
Other (374) (1,110) (812)
Interest expense (7,971) (13,167) (12,604)
Net interest income 5,948 7,017 7,009
6 Commissions and feesin 2020 2019 2018
Commissions and fees (CHF million)
Lending business 1,631 1,687 1,931
Investment and portfolio management 3,187 3,438 3,582
Other securities business 66 63 48
Fiduciary business 3,253 3,501 3,630
Underwriting 2,255 1,564 1,718
Brokerage 3,244 2,893 2,813
Underwriting and brokerage 5,499 4,457 4,531
Other services 1,470 1,513 1,798
Commissions and fees 11,853 11,158 11,890
7 Trading revenuesin 2020 2019 2018
Trading revenues (CHF million)
Interest rate products (1) 96 757
Foreign exchange products 2,473 668 367
Equity/index-related products 422 1,071 (307)
Credit products 192 (513) (97)
Commodity and energy products 132 144 102
Other products 77 273 (198)
Trading revenues 3,295 1,739 624
Represents revenues on a product basis which are not representative of business results within segments, as segment results utilize financial instruments across various product types. Trading revenues include revenues from trading financial assets and liabilities as follows:p Equities;p Commodities;p Listed and OTC derivatives;p Derivatives linked to funds of hedge funds and providing
financing facilities to funds of hedge funds;p Market making in the government bond and associated OTC
derivative swap markets;p Domestic, corporate and sovereign debt, convertible and non-
convertible preferred stock and short-term securities such as floating rate notes and commercial paper (CP);
p Market making and positioning in foreign exchange products;p Credit derivatives on investment grade and high yield credits;p Trading and securitizing all forms of securities that are based
on underlying pools of assets; andp Life settlement contracts.
Trading revenues also include changes in the fair value of finan-cial assets and liabilities elected to fair value under US GAAP. The main components include certain instruments from the following categories:p Central bank funds purchased/sold;p Securities purchased/sold under resale/repurchase
agreements;p Securities borrowing/lending transactions;p Loans and loan commitments; andp Customer deposits, short-term borrowings and long-term debt.
Managing the risks
As a result of the Group’s broad involvement in financial products and markets, its trading strategies are correspondingly diverse and exposures are generally spread across a diversified range of risk factors and locations. The Group uses an economic capital limit structure to limit overall risk taking. The level of risk incurred by its divisions is further managed by a variety of factors and specific risk constraints, including consolidated controls over trading expo-sures. Also, as part of its overall risk management, the Group holds a portfolio of economic hedges. Hedges are impacted by market movements, similar to trading securities, and may result in gains or losses on the hedges which offset losses or gains on the portfolios they were designed to economically hedge. The Group manages its trading risk with regard to both market and credit risk. The Group uses market risk measurement and management methods capable of calculating comparable exposures across its many activities and

296 Consolidated financial statements – Credit Suisse Group
employs focused tools that can model unique characteristics of certain instruments or portfolios.
The principal risk measurement methodology for trading book expo-sures is value-at-risk. Macroeconomic and specific hedging strate-gies are in place to manage and mitigate the market and credit risk in the trading book.
8 Other revenuesin 2020 2019 2018
Other revenues (CHF million)
Noncontrolling interests without SEI 0 0 (2)
Loans held-for-sale (34) (14) (4)
Long-lived assets held-for-sale 26 252 39
Equity method investments (254) 232 228
Other investments 769 1,141 337
Other 786 959 799
Other revenues 1,293 2,570 1,397
Negative other revenues from equity method investments of CHF 254 million primarily reflected an impairment of CHF 414 million relating to the Group’s equity investment in York. It also included a gain of CHF 268 million from the second and final step of the combination of InvestLab and Allfunds Group in the first quarter of 2020 as well as a revaluation gain of CHF 127 million from the Group’s equity investment in Allfunds Group in the fourth quarter of 2020.
Other revenues from other investments in 2020 of CHF 769 million included a revaluation gain of CHF 158 million from the Group’s equity investment in SIX Swiss Exchange (SIX) Group AG as well as a revaluation gain of CHF 134 million from the Group’s equity investment in Pfandbriefbank. In 2019 other investments of CHF 1,141 million included a revaluation gain of CHF 498 million from the Group’s equity investment in SIX Group AG as well as CHF 327 million from the first closing of the trans-fer of InvestLab to Allfunds Group.
> Refer to “Note 18 – Other investments” for further information.
9 Provision for credit lossesin 2020 2019 2018
Provision for credit losses (CHF million)
Loans held at amortized cost 863 284 201
Other financial assets held at amortized cost 24 11 0
Off-balance sheet credit exposures 209 29 44
Provision for credit losses 1,096 324 245
10 Compensation and benefitsin 2020 2019 2018
Compensation and benefits (CHF million)
Salaries and variable compensation 8,401 8,608 8,220
Social security 653 642 652
Other 1 836 786 748
Compensation and benefits 9,890 10,036 9,620
1 Includes pension-related expenses of CHF 517 million, CHF 437 million and CHF 411 million in 2020, 2019 and 2018, respectively, relating to service costs for defined benefit pension plans and employer contributions for defined contribution plans.
11 General and administrative expenses
in 2020 2019 2018
General and administrative expenses (CHF million)
Occupancy expenses 982 1,090 964
IT, machinery and equipment 1,428 1,343 1,174
Provisions and losses 1,261 640 425
Travel and entertainment 152 337 338
Professional services 1,546 1,712 1,803
Amortization and impairment of
other intangible assets 8 10 9
Other 1 1,146 996 1,085
General and administrative expenses 6,523 6,128 5,798
1 Includes pension-related expenses/(credits) of CHF (159) million, CHF (204) million and CHF (208) million in 2020, 2019 and 2018, respectively, relating to certain components of net periodic benefit costs for defined benefit plans.

297Consolidated financial statements – Credit Suisse Group
12 Restructuring expensesIn connection with the key strategic growth initiatives announced in July 2020, restructuring expenses of CHF 157 million were recognized in 2020. Restructuring expenses may include sever-ance expenses, expenses in connection with the acceleration of certain deferred compensation awards, pension expenses and real estate contract termination costs.
Restructuring expenses by type
in 2020 2019 2018
Restructuring expenses by type (CHF million)
Compensation and benefits-related expenses 107 – 246
of which severance expenses 69 – 169
of which accelerated deferred compensation 38 – 77
General and administrative-related expenses 50 – 380
of which pension expenses 38 – 74
Total restructuring expenses 157 – 626
Restructuring liabilities 2020 2019 2018
Compen- General and Compen- General and Compen- General and
sation and administrative sation and administrative sation and administrative
in benefits expenses Total benefits expenses Total benefits expenses Total
Restructuring liabilities (CHF million)
Balance at beginning of period – – – 156 190 346 196 110 306
Net additional charges 1 69 6 75 – – – 169 219 388
Reclassifications – – – (156) 2 (190) 3 (346) – – –
Utilization (19) (4) (23) – – – (209) (139) (348)
Balance at end of period 50 2 52 – – – 156 190 346
1 The following items for which expense accretion was accelerated in 2020 and 2018 due to the restructuring of the Group are not included in the restructuring liabilities: unsettled share-based compensation of CHF 27 million and CHF 56 million, respectively; unsettled pension obligations of CHF 38 million and CHF 74 million, respectively, which remain classified as pension provisions; unsettled cash-based deferred compensation of CHF 11 million and CHF 21 million, respectively, which remain classified as compensation liabilities; and accelerated accumulated depreciation and impairment of CHF 6 million and CHF 87 million, respectively, which remain classified as premises and equipment. The settlement date for the unsettled share-based compensation remains unchanged at three years.
2 In 2019, CHF 97 million was transferred to litigation provisions and CHF 59 million was transferred to other liabilities.3 In 2019, CHF 167 million was transferred to right-of-use assets in accordance with ASU 2016-02 and CHF 23 million to other liabilities.
13 Earnings per sharein 2020 2019 2018
Basic net income/(loss) attributable to shareholders (CHF million)
Net income attributable to shareholders for basic earnings per share 2,669 3,419 2,024
Net income attributable to shareholders for diluted earnings per share 2,669 3,419 2,024
Weighted-average shares outstanding (million)
For basic earnings per share available for common shares 2,457.0 2,524.2 2,574.2
Dilutive share options and warrants 1.8 2.7 3.0
Dilutive share awards 67.6 59.9 53.8
For diluted earnings per share available for common shares 1 2,526.4 2,586.8 2,631.0
Earnings/(loss) per share available for common shares (CHF)
Basic earnings per share available for common shares 1.09 1.35 0.79
Diluted earnings per share available for common shares 1.06 1.32 0.77
1 Weighted-average potential common shares relating to instruments that were not dilutive for the respective periods (and therefore not included in the diluted earnings per share calcula-tion above) but could potentially dilute earnings per share in the future were 6.2 million, 7.9 million and 8.7 million for 2020, 2019 and 2018, respectively.

298 Consolidated financial statements – Credit Suisse Group
14 Revenue from contracts with customersRevenue is measured based on the consideration specified in a contract with a customer, and excludes any amounts collected on behalf of third parties. Taxes assessed by a governmental author-ity that are collected by the Group from a customer and both imposed on and concurrent with a specific revenue-producing transaction are excluded from revenue. The Group recognizes revenue when it satisfies a contractual performance obligation. Variable consideration is only included in the transaction price once it is probable that a significant reversal in the amount of cumulative revenue recognized will not occur when the uncer-tainty associated with the amount of variable consideration is sub-sequently resolved. Generally no significant judgement is required with respect to recording variable consideration.
If a fee is a fixed percentage of a variable account value at con-tract inception, recognition of the fee revenue is constrained as the contractual consideration is highly susceptible to change due to factors outside of the Group’s influence. However, at each performance measurement period end (e.g., end-of-day, end-of-month, end-of-quarter), recognition of the cumulative amount of the consideration to which the Group is entitled is no longer con-strained because it is calculated based on a known account value and the fee revenue is no longer variable.
Nature of services
The following is a description of the principal activities from which the Group generates its revenues from contracts with customers.
The performance obligations are typically satisfied as the services in the contract are rendered. The contract terms are generally such that they do not result in any contract assets. The contracts gener-ally do not include a significant financing component or obligations for refunds or other similar obligations. Any variable consideration included in the transaction price is only recognized when the uncer-tainty of the amount is resolved and it is probable that a significant reversal of cumulative revenue recognized will not occur.
Credit Suisse’s wealth management businesses provide invest-ment services and solutions for clients, including asset man-agement, investment advisory and investment management, wealth planning, and origination and structuring of sophisticated financing transactions. The Group receives for these services investment advisory and investment management fees which are generally reflected in the line item “Investment and portfolio man-agement” in the table “Contracts with customers and disaggre-gation of revenues” below. Generally, the fee for the service pro-vided is recognized over the period of time the service is provided.
The wealth management businesses also provide comprehensive advisory services and tailored investment and financing solutions to private, corporate and institutional clients. The nature of the services range from investment and wealth management activi-ties, which are services rendered over a period of time according to the contract with the customer, to more transaction-specific
services such as brokerage and sales and trading services and the offer of client-tailored financing products. The services are provided as requested by Credit Suisse’s clients, and the fee for the service requested is recognized once the service is provided.
The Group’s asset management businesses offer investment solu-tions and services globally to a broad range of clients, including pension funds, governments, foundations and endowments, corpo-rations and individuals. Fund managers typically enter into a variety of contracts to provide investment management and other services. A fund manager may satisfy its performance obligation indepen-dently or may engage a third party to satisfy some or all of a perfor-mance obligation on the fund manager’s behalf. Although the fund manager may have engaged a third party to provide inputs to the overall investment management services, the contractual obligation to provide investment management services to a customer remains the primary responsibility of the fund manager. As such, the fund manager is acting as a principal in the transaction. As a fund man-ager, the Group typically receives base management fees and may additionally receive performance-based management fees which are both recognized as “Investment and portfolio management” rev-enues in the table “Contracts with customers and disaggregation of revenues” below. Base management fees are generally calculated based on the net asset value (NAV) of the customer’s investment, which can change during the performance period. Performance-based management fees are variable consideration received by the Group depending on the financial performance of the underly-ing fund. As both the base management fees and performance-based management fees are variable, the Group recognizes the fees once it is probable that a significant reversal of the revenue recognized will not occur and when the uncertainty of the amount is resolved. The estimate of these variable fees is constrained until the end of the performance measurement period. Generally, the uncertainty is resolved at the end of the performance measure-ment period and therefore no significant judgement is necessary when recording variable consideration. Under a clawback obligation provision, a fund manager may be required to return certain distri-butions received from a fund if a specific performance threshold, i.e., benchmark, is not achieved at the end of the lifetime of the fund. The contractual clawback obligation is an additional factor of uncertainty which is considered in the constraint assessment. If the performance-based management fee is earned but the clawback provision has not lapsed, the clawback obligation is accounted for as a refund liability.
The Group’s capital markets businesses underwrite and sell secu-rities on behalf of customers. Typically, the fees in these busi-nesses are recognized at a single point in time once the transac-tion is complete, i.e., when the securities have been placed with investors, and recognized as underwriting revenue. All expenses incurred in satisfying the performance obligation are deferred and recognized once the transaction is complete. Generally Credit Suisse and other banks form a syndicate group to underwrite and place the securities for a customer. The Group may act as the lead or a participating member in the syndicate group. Each

299Consolidated financial statements – Credit Suisse Group
member of the syndicate group, including the lead and partici-pating underwriters, is acting as principal for their proportionate share of the syndication. As a result, the individual underwrit-ers reflect their proportionate share of underwriting revenue and underwriting costs on a gross basis.
The Group also offers brokerage services in its investment banking businesses, including global securities sales, trading and execution, prime brokerage and investment research. For the services pro-vided, such as the execution of client trades in securities or deriva-tives, the Group typically earns a brokerage commission when the trade is executed. The Group generally acts as an agent when buy-ing or selling exchange-traded cash securities, exchange-traded derivatives or centrally cleared OTC derivatives on behalf of clients.
Credit Suisse’s investment banking businesses provide services that include advisory services to clients in connection with corpo-rate finance activities. The term “advisory” includes any type of service the Group provides in an advisory capacity. For these types of services, the Group typically receives a non-refundable retainer fee and/or a success fee which usually represents a percentage of the transaction proceeds if and when the corporate finance activ-ity is completed. Additionally, the contract may contain a milestone fee such as an “announcement fee” that is payable upon the public announcement of the corporate finance activity. Typically the fees in the investment banking business are recognized at a specific point in time once it is determined that the performance obligation related to the transaction has been completed. A contract liability will be recorded if the Group receives a payment such as a retainer fee or announcement fee for an advisory service prior to satisfying the performance obligation. Advisory fees are recognized ratably over time in scenarios where the contracted service of the Group is to act as an advisor over a specified period not related to or depen-dent on the successful completion of a transaction. Revenues recognized from these services are reflected in the line item “Other Services” in the table below.
Contracts with customers and disaggregation of revenues
in 2020 2019 2018
Contracts with customers (CHF million)
Investment and portfolio management 3,187 3,438 3,582
Other securities business 66 63 48
Underwriting 2,255 1,564 1,718
Brokerage 3,242 2,891 2,829
Other services 1,475 1,521 1,902
Total revenues from
contracts with customers 10,225 9,477 10,079
The table above differs from “Note 6 – Commissions and fees” as it includes only those contracts with customers that are in scope of ASC Topic 606 – Revenue from Contracts with Customers.
Contract balances
end of 2020 2019
Contract balances (CHF million)
Contract receivables 1,001 880
Contract liabilities 48 53
Contract balances
in 4Q20 3Q20 2Q20 1Q20
Revenue recognized (CHF million)
Revenue recognized in the
reporting period included
in the contract liabilities balance
at the beginning of period 7 12 12 11
The Group did not recognize any revenues in the reporting period from performance obligations satisfied in previous periods.
There were no material net impairment losses on contract receiv-ables in 2020, 2019 or 2018. The Group did not recognize any contract assets during 2020, 2019 or 2018.
Capitalized costs
The Group has not incurred costs to obtain a contract nor costs to fulfill a contract that are eligible for capitalization.
Remaining performance obligations
ASC Topic 606’s practical expedient allows the Group to exclude from its remaining performance obligations disclosure any per-formance obligations which are part of a contract with an original expected duration of one year or less. Additionally any variable consideration, for which it is probable that a significant reversal in the amount of cumulative revenue recognized will occur when the uncertainty associated with the variable consideration is sub-sequently resolved, is not subject to the remaining performance obligations disclosure because such variable consideration is not included in the transaction price (e.g., investment manage-ment fees). Upon review, the Group determined that no material remaining performance obligations are in scope of the remaining performance obligations disclosure.
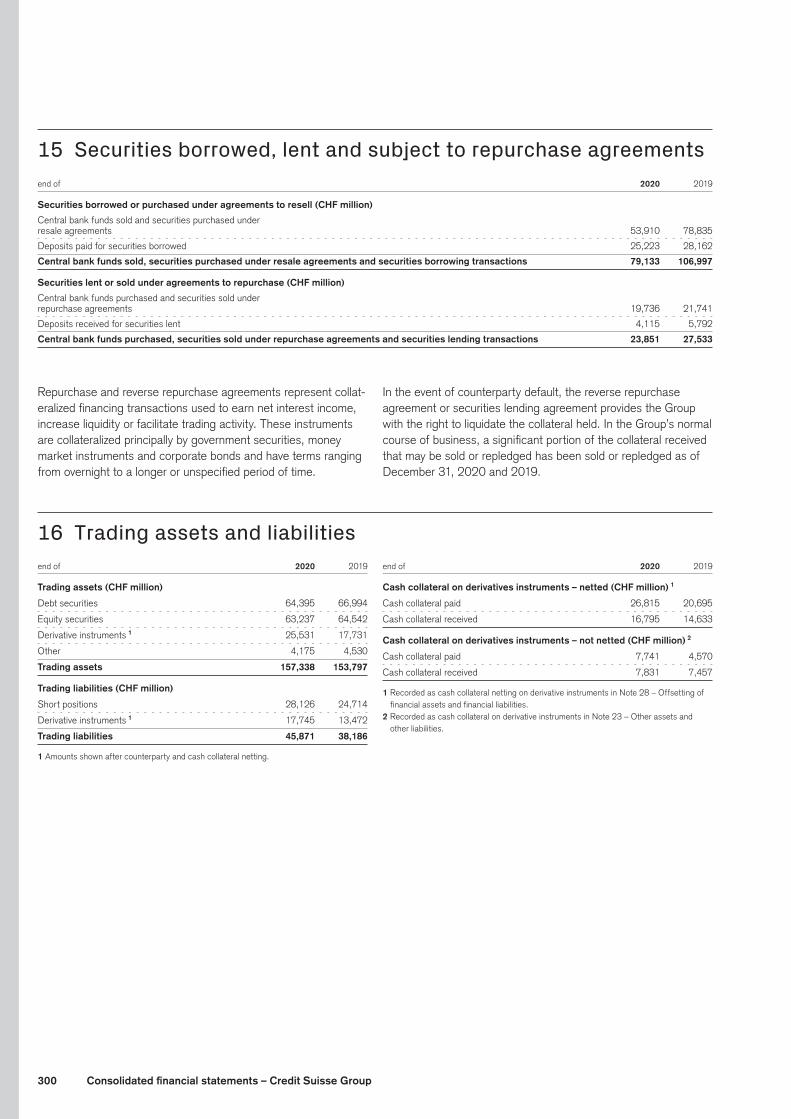
300 Consolidated financial statements – Credit Suisse Group
15 Securities borrowed, lent and subject to repurchase agreementsend of 2020 2019
Securities borrowed or purchased under agreements to resell (CHF million)
Central bank funds sold and securities purchased under
resale agreements 53,910 78,835
Deposits paid for securities borrowed 25,223 28,162
Central bank funds sold, securities purchased under resale agreements and securities borrowing transactions 79,133 106,997
Securities lent or sold under agreements to repurchase (CHF million)
Central bank funds purchased and securities sold under
repurchase agreements 19,736 21,741
Deposits received for securities lent 4,115 5,792
Central bank funds purchased, securities sold under repurchase agreements and securities lending transactions 23,851 27,533
Repurchase and reverse repurchase agreements represent collat-eralized financing transactions used to earn net interest income, increase liquidity or facilitate trading activity. These instruments are collateralized principally by government securities, money market instruments and corporate bonds and have terms ranging from overnight to a longer or unspecified period of time.
In the event of counterparty default, the reverse repurchase agreement or securities lending agreement provides the Group with the right to liquidate the collateral held. In the Group’s normal course of business, a significant portion of the collateral received that may be sold or repledged has been sold or repledged as of December 31, 2020 and 2019.
16 Trading assets and liabilitiesend of 2020 2019
Trading assets (CHF million)
Debt securities 64,395 66,994
Equity securities 63,237 64,542
Derivative instruments 1 25,531 17,731
Other 4,175 4,530
Trading assets 157,338 153,797
Trading liabilities (CHF million)
Short positions 28,126 24,714
Derivative instruments 1 17,745 13,472
Trading liabilities 45,871 38,186
1 Amounts shown after counterparty and cash collateral netting.
end of 2020 2019
Cash collateral on derivatives instruments – netted (CHF million) 1
Cash collateral paid 26,815 20,695
Cash collateral received 16,795 14,633
Cash collateral on derivatives instruments – not netted (CHF million) 2
Cash collateral paid 7,741 4,570
Cash collateral received 7,831 7,457
1 Recorded as cash collateral netting on derivative instruments in Note 28 – Offsetting of financial assets and financial liabilities.
2 Recorded as cash collateral on derivative instruments in Note 23 – Other assets and other liabilities.

301Consolidated financial statements – Credit Suisse Group
17 Investment securitiesend of 2020 2019
Investment securities (CHF million)
Debt securities available-for-sale 607 1,006
Total investment securities 607 1,006
Investment securities by type 2020 2019
Gross Gross Gross Gross
Amortized unrealized unrealized Fair Amortized unrealized unrealized Fair
end of cost gains losses value cost gains losses value
Investment securities by type (CHF million)
Swiss federal, cantonal or local government entities 3 0 0 3 2 0 0 2
Foreign governments 0 0 0 0 163 8 0 171
Corporate debt securities 593 11 0 604 807 28 2 833
Debt securities available-for-sale 596 11 0 607 972 36 2 1,006
Gross unrealized losses on debt securities and the related fair value Less than 12 months 12 months or more Total
Gross Gross Gross
Fair unrealized Fair unrealized Fair unrealized
end of value losses value losses value losses
2019 (CHF million)
Corporate debt securities 204 2 0 0 204 2
Debt securities available-for-sale 204 2 0 0 204 2
Proceeds from sales, realized gains and realized losses from debt securities available-for-sale
in 2020 2019 2018
Sales of debt securities available-for-sale (CHF million)
Proceeds from sales 629 6 255
Realized gains 42 0 8
Amortized cost, fair value and average yield of debt securities Average
Amortized Fair yield
end of cost value (in %)
2020 (CHF million, except where indicated)
Due within 1 year 149 149 0.26
Due from 1 to 5 years 2 2 3.75
Due from 5 to 10 years 445 456 (0.01)
Debt securities available-for-sale 596 607 0.07
Allowance for credit losses on debt securities available-for-sale
A credit loss exists if there is a decline in fair value of the security below the amortized cost as a result of the non-collectability of the amounts due in accordance with the contractual terms.
An allowance for expected credit losses is recorded in the con-solidated statement of operations in provision for credit losses and the non-credit-related losses are recorded in AOCI. Subse-quent improvements in the estimated credit losses are immedi-ately recorded in the consolidated statement of operations as a reduction in allowance and credit loss expense. A security is written off if it is considered certain that there is no possibility of recovering the outstanding principal. As of the end of 2020, the Group had no allowance for credit losses on debt securities available-for-sale.

302 Consolidated financial statements – Credit Suisse Group
18 Other investmentsend of 2020 2019
Other investments (CHF million)
Equity method investments 2,631 2,367
Equity securities (without a readily determinable fair value) 1 1,779 2,148
of which at net asset value 113 409
of which at measurement alternative 359 274
of which at fair value 1,278 1,434
of which at cost less impairment 29 31
Real estate held-for-investment 2 82 99
Life finance instruments 3 920 1,052
Total other investments 5,412 5,666
1 Includes private equity, hedge funds and restricted stock investments as well as certain investments in non-marketable mutual funds for which the Group has neither significant influence nor control over the investee.
2 As of the end of 2020 and 2019, real estate held for investment included foreclosed or repossessed real estate of CHF 16 million and CHF 24 million, respectively, of which CHF 13 million and CHF 10 million, respectively, were related to residential real estate.
3 Includes single premium immediate annuity contracts.
Accumulated depreciation related to real estate held-for-invest-ment amounted to CHF 35 million, CHF 34 million and CHF 31 million for 2020, 2019 and 2018, respectively.
An impairment of CHF 1 million was recorded on real estate held-for-investments in 2020. No impairments were recorded on real estate held-for-investments in 2019 and 2018, respectively.
Equity securities at measurement alternative
in / end of 2020 Cumulative 2019
Impairments and adjustments (CHF million)
Impairments and downward adjustments (17) (25) (1)
Upward adjustments 137 147 11
> Refer to “Note 36 – Financial instruments” for further information on such
investments.
In the second quarter of 2020, as a result of a corporate action by Pfandbriefbank, the Group has revalued the shares it holds in Pfandbriefbank under the measurement alternative principle in accordance with US GAAP in respect of this equity investment.
Following the completion of the first step of the combination of our open architecture investment fund platform InvestLab and Allfunds Group in September 2019, the Group success-fully completed the second and final step of the combination in March 2020 with the transfer of related distribution agreements to Allfunds Group. The investment is accounted for as an equity method investment.
In December 2019, Credit Suisse completed a review of the accounting treatment of the shares that it holds in SIX Group AG and elected fair value accounting under US GAAP in respect of this equity investment.
In the fourth quarter of 2020, York informed its investors of a significant change in strategy. As a result, York will focus on longer duration assets such as private equity, private debt and collateralized loan obligations, while winding down its European hedge funds business and primarily managing internal capital in its multi-strategy fund. York’s Asia Pacific business is expected to be spun off as a new and separate hedge fund in 2021, in which the Group intends to have a continuing interest. As a result of this announcement, the Group recorded an impairment of CHF 414 million to the valuation of its equity method investment.

303Consolidated financial statements – Credit Suisse Group
19 LoansThe Group’s loan portfolio is classified into two portfolio seg-ments, consumer loans and corporate & institutional loans. Con-sumer loans are disaggregated into the classes of mortgages, loans collateralized by securities and consumer finance. Corporate & institutional loans are disaggregated into the classes of real estate, commercial and industrial loans, financial institutions, and governments and public institutions.
For financial reporting purposes, the carrying values of loans and related allowance for loan losses are presented in accordance with US GAAP and are not comparable with the regulatory credit risk exposures presented in our disclosures required under Pillar 3 of the Basel framework.
Loans
end of 2020 2019
Loans (CHF million)
Mortgages 1 111,270 109,671
Loans collateralized by securities 1 51,789 56,425
Consumer finance 4,888 4,401
Consumer 167,947 170,497
Real estate 29,045 29,220
Commercial and industrial loans 1 74,097 73,495
Financial institutions 19,072 20,367
Governments and public institutions 3,378 4,262
Corporate & institutional 125,592 127,344
Gross loans 293,539 297,841
of which held at amortized cost 282,131 285,179
of which held at fair value 11,408 12,662
Net (unearned income)/deferred expenses (95) (116)
Allowance for credit losses (1,536) (946)
Net loans 291,908 296,779
Gross loans by location
Switzerland 168,589 163,133
Foreign 124,950 134,708
Gross loans 293,539 297,841
Impaired loans
Non-performing loans 1,666 1,250
Non-interest-earning loans 375 260
Non-accrual loans 2,041 1,510
Restructured loans 313 350
Potential problem loans 843 266
Other impaired loans 1,156 616
Gross impaired loans 2 3,197 2,126
1 Certain corporate & institutional loans have been reclassified to consumer loans following the application of a look-through approach with regard to beneficial owners. The prior period has been reclassified to conform to the current presentation.
2 As of December 31, 2020 and 2019, CHF 180 million and CHF 208 million, respectively, were related to consumer mortgages secured by residential real estate for which formal fore-closure proceedings according to local requirements of the applicable jurisdiction were in process.
In accordance with Group policies, impaired loans include non-accrual loans, comprised of non-performing loans and non-inter-est-earning loans, as well as restructured loans and potential problem loans.
> Refer to “Loans” in Note 1 – Summary of significant accounting policies for further information on loans and categories of impaired loans.
> Refer to “Note 20 – Financial instruments measured at amortized cost and credit losses” for further information on loans held at amortized cost.

304 Consolidated financial statements – Credit Suisse Group
20 Financial instruments measured at amortized cost and credit losses
This disclosure provides an overview of the Group’s balance sheet positions that include financial assets carried at amortized cost that are subject to the CECL accounting guidance, effective since January 1, 2020. It includes the following sections:p Allowance for credit losses (including the methodology for esti-
mating expected credit losses in non-impaired and impaired financial assets and current-period estimates);
p Credit quality information (including monitoring of credit quality and internal ratings);
p Past due financial assets;
p Non-accrual financial assets;p Collateral-dependent financial assets;p Off-balance sheet credit exposure; andp Troubled debt restructurings and modifications.
As of December 31, 2020, the Group had no notable balances of purchased financial assets with more than insignificant credit deterioration since origination.
> Refer to “Note 1 – Summary of significant accounting policies” for further information on the accounting of financial assets and off-balance sheet credit exposure subject to the CECL accounting guidance.
Overview of financial instruments measured at amortized cost – by balance sheet position Allowance Net Amortized for credit carrying
end of cost basis 1 losses value
2020 (CHF million)
Cash and due from banks 138,593 (6) 138,587
Interest-bearing deposits with banks 1,303 2 (5) 1,298
Securities purchased under resale agreements and securities borrowing transactions 21,139 0 21,139
Loans 282,036 2,3 (1,536) 280,500
Brokerage receivables 35,942 2 (1) 35,941
Other assets 15,394 (43) 15,351
Total 494,407 (1,591) 492,816
1 Net of unearned income/deferred expenses, as applicable.2 Excludes accrued interest in the total amount of CHF 351 million, with no related allowance for credit losses. Of the accrued interest balance, CHF 1 million relates to interest-bearing
deposits with banks, CHF 334 million to loans and CHF 16 million to brokerage receivables. These accrued interest balances are reported in other assets.3 Includes endangered interest of CHF 88 million on non-accrual loans which are reported as part of the loans’ amortized cost balance.
Allowance for credit losses
Estimating expected credit losses – overviewThe following key elements and processes of estimating expected credit losses apply to the Group’s major classes of financial assets held at amortized cost.
Expected credit losses on non-impaired credit exposuresExpected credit loss models for non-impaired credit exposures have three main inputs: (i) probability of default (PD), (ii) loss given default (LGD) and (iii) exposure at default (EAD). These parameters are derived from internally developed statistical models which are based on historical data and leverage regula-tory models under the advanced internal rating-based approach. Expected credit loss models use forward-looking information to derive point-in-time estimates of forward-looking term structures.
PD estimates are based on statistical rating models and tailored to various categories of counterparties and exposures. These statistical rating models are based on internally and externally compiled data comprising both quantitative and qualitative factors. A migration of a counterparty or exposure between rating classes generally leads to a change in the estimate of the associated PD.
Lifetime PDs are estimated considering the expected macroeco-nomic environment and the contractual maturities of exposures, adjusted for estimated prepayment rates where applicable.
LGD estimates the size of the expected loss that may arise on a credit exposure in the event of a default. The Group estimates LGD based on the history of recovery rates of claims against defaulted counterparties, considering, as appropriate, factors such as differences in product structure, collateral type, senior-ity of the claim, counterparty industry and recovery costs of any collateral that is integral to the financial asset. Certain LGD val-ues are also calibrated to reflect the expected macroeconomic environment.
EAD represents the expected amount of credit exposure in the event of a default. It reflects the current drawn exposure with a counterparty and an expectation regarding the future evolution of the credit exposure under the contract or facility, including amorti-zation and prepayments. The EAD of a financial asset is the gross carrying amount at default, which is modeled based on historical data by applying a term structure and considering portfolio-spe-cific factors such as the drawn amount as of the reporting date, the facility limit, amortization schedules, financial collateral and
305Consolidated financial statements – Credit Suisse Group
product type. For certain financial assets, the Group determines EAD by modeling the range of possible exposure outcomes at various points in time using scenario and statistical techniques.
Where a relationship to macroeconomic indicators is statistically sound and in line with economic expectations, the parameters are modeled accordingly, incorporating the Group’s forward looking forecasts and applying regional segmentations where appropriate.
The Group’s macroeconomic and market variable forecasts for the CECL scenarios cover a five-year time horizon. For periods beyond that reasonable and supportable forecast period, the Group immediately reverts to average economic environment vari-ables as model input factors.
Alternative qualitative estimation approaches are used for certain products. For lombard loans (including share-backed loans), the PD/LGD approach used does not consider the Group’s forward looking forecasts as these are not meaningful for the estimate of expected credit losses in light of the short time-frame considered for closing out positions under daily margining arrangements. For international private residential mortgages and securitizations, the Group applies qualitative approaches where credit specialists fol-low a structured process and use their expertise and judgment to determine the CECL amounts.
The Group measures expected credit losses considering the risk of default over the maximum contractual period (including any borrower’s extension options) during which it is exposed to credit risk, even if the Group considers a longer period for risk manage-ment purposes. The maximum contractual period extends to the date at which the Group has the right to require repayment of an advance or terminate an irrevocable loan commitment or a credit guarantee.
Expected credit losses on impaired credit exposuresExpected credit losses for individually impaired credit exposures are measured by performing an in-depth review and analysis of these exposures, considering factors such as recovery and exit options as well as collateral and the risk profile of the bor-rower. The individual measurement of expected credit losses for impaired financial assets also considers reasonable and support-able forward-looking information that is relevant to the individual counterparty (idiosyncratic information) and reflective of the mac-roeconomic environment that the borrower is exposed to, apart from any historical loss information and current conditions. If there are different scenarios relevant for the individual expected credit loss measurement, they are considered on a probability-weighted basis. The related allowance for credit losses is revalued by Credit Risk, at least annually or more frequently, depending on the risk profile of the borrower or credit-relevant events.
For credit-impaired financial assets, the expected credit losses are measured using the present value of estimated future cash flows (unless a practical expedient for collateral-dependent finan-cial assets is applied) and the impaired credit exposures and related allowance are revalued to reflect the passage of time.
For all classes of financial assets, the trigger to detect an impaired credit exposure is non-payment of interest, principal amounts or other contractual payment obligations, or when, for example, the Group may become aware of specific adverse infor-mation relating to a counterparty’s ability to meet its contractual obligations, despite the current repayment status of its particular credit facility. For credit exposures where repayment is dependent on collateral, a decrease in collateral values can be an additional trigger to detect an impairment. Additional procedures may apply to specific classes of financial assets as described further below.
Troubled debt restructurings, also referred to as restructured loans, are considered impaired credit exposures in line with the Group’s policies and subject to individual assessment and provi-sioning for expected credit losses by the Group’s recovery func-tions. Restructured loans that defaulted again within 12 months from the last restructuring remain impaired or are impaired if they were considered non-impaired at the time of the subsequent default.
Macroeconomic scenariosThe estimation and application of forward-looking information requires quantitative analysis and significant expert judgment. The Group’s estimation of expected credit losses is based on a discounted probability-weighted estimate that considers three future macroeconomic scenarios: a baseline scenario, an upside scenario and a downside scenario. The baseline scenario repre-sents the most likely outcome. The two other scenarios represent more optimistic and more pessimistic outcomes with the down-side scenario being more severe than the upside scenario. The scenarios are probability-weighted according to the Group’s best estimate of their relative likelihood based on historical frequency, an assessment of the current business and credit cycles as well as the macroeconomic factor (MEF) trends.
The scenario design team within the Group’s Enterprise Risk Management (ERM) function determines the MEFs and mar-ket projections that are relevant for the Group’s three scenarios across the global credit portfolio. The scenario design team for-mulates the baseline scenario projections used for the CECL cal-culation from the Group’s global chief investment office in-house economic research forecasts and, where deemed appropriate, from external sources such as the Bloomberg consensus of econ-omist forecasts (covering the views of other investment banks and external economic consultancies), forecasts from nonparti-san think tanks, major central banks and multilateral institutions, such as the International Monetary Fund (IMF), the Organisation for Economic Co-operation and Development (OECD) and the World Bank. For factors where no in-house or credible external forecasts are available, an internal model is used to calibrate the baseline scenario projections. The downside and upside scenarios are derived from these baseline scenario projections. These three scenario projections are subject to a review and challenge process and any feedback from this process is incorporated into the scenario projections by the ERM scenario design team. The CECL scenario design working group is the governance forum. The working group performs an additional review and challenge

306 Consolidated financial statements – Credit Suisse Group
and subsequently recommends approval of the MEFs and related market projections as well as the occurrence probability weights that are allocated to the baseline, downside and upside scenarios. MEFs and related market projections as well as the scenario occurrence probability weights used for the calculation of CECL are approved by the Senior Management Approval Committee.
Current-period estimate of expected credit lossesThe key MEFs used in each of the macroeconomic scenarios for the calculation of the expected credit losses include, but are not limited to, GDP and unemployment rates. These MEFs have been selected based on the portfolios that are most material to the estimation of CECL from a longer term perspective.
As of December 31, 2020, the forecast macroeconomic sce-narios were weighted 50% for the baseline, 40% for the down-side and 10% for the upside scenario. The forecast range for the increase in Swiss real GDP was 0.1% to 5.4% for 2021 and 0.8% to 4.5% for 2022. The forecast in the baseline scenario for the timing of the recovery of quarterly Swiss real GDP to return to pre-pandemic levels (i.e., the fourth quarter of 2019) was the third quarter of 2021. The forecast range of the increase in the eurozone real GDP was 0.3% to 7.8% for 2021 and 2.8% to 3.9% for 2022. The forecast in the baseline scenario for the tim-ing of the recovery of the quarterly eurozone real GDP to return to pre-pandemic levels was the first quarter of 2023. The fore-cast range for the increase in US real GDP was 0.5% to 5.2% for 2021 and 2.0% to 5.1% for 2022. The forecast in the base-line scenario for the timing of the recovery of the quarterly US real GDP to return to pre-pandemic levels was the fourth quarter of 2021. The forecast range for the increase in world industrial production was 2.4% to 8.6% for 2021 and 2.9% to 5.9% for 2022. The MEF projections incorporate adjustments to reflect the impact of the COVID-19 pandemic related economic support programs provided by national governments and by central banks. While GDP and industrial production are significant inputs to the forecast models, a range of other inputs are also incorporated for all three scenarios to provide projections for future economic and market conditions. Given the complex nature of the forecast-ing process, no single economic variable is viewed in isolation or independently of other inputs.
For extreme and statistically rare events which cannot be ade-quately reflected in CECL models, such as the effects of the COVID-19 pandemic on the global economy, the event becomes the baseline scenario. In the current environment, to address cir-cumstances where in management’s judgment the CECL model outputs are overly sensitive to the effect of economic inputs that lie significantly outside of their historical range, model overlays are applied. These overlays are based on expert judgment and are applied in response to these exceptional circumstances to consider historical stressed losses and industry and counterparty credit level reviews. Overlays have also been used to capture judgment on the economic uncertainty from the lockdowns and other actions directed towards managing the pandemic. As a result of these overlays, provisions for credit losses are not pri-marily derived from MEF projections.
Interest income attributable to passage of timeFor financial assets held at amortized cost for which the Group measures expected credit losses based on the discounted cash flow methodology the entire change in present value is reported in provision for credit losses.
Methodology changesThe probability of default model for commodity trade finance exposures was adjusted during the reporting period to reflect the latest model development analysis and expert feedback. This change has been supported by backtesting results. The impact from this model change has been reflected in the table “Allow-ance for credit losses – loans held at amortized cost”.
Loans held at amortized costThe Group’s loan portfolio is classified into two portfolio seg-ments, consumer loans and corporate & institutional loans. The main risk characteristics are described by individual class of financing receivable for each of these portfolio segments:
Consumer loans:p Mortgages: includes lending instruments secured by residen-
tial real estate; such credit exposure is sensitive to the level of interest rates and unemployment as well as real estate valuation.
p Loans collateralized by securities: includes lending secured by marketable financial collateral (e.g., equities, bonds, invest-ment funds and precious metals); such credit exposure is sen-sitive to market prices for securities which impact the value of financial collateral.
p Consumer finance: includes lending to private individuals such as credit cards, personal loans and leases; such credit expo-sure is sensitive to MEFs including economic growth, unem-ployment and interest rates.
Corporate & institutional loans:p Real estate: includes lending backed by commercial or
income-producing real estate; such credit exposure is sensitive to MEFs including economic growth, unemployment, interest rates and industrial production as well as real estate valuation.
p Commercial and industrial loans: includes lending to corporate clients including small and medium-sized enterprises, large corporates and multinational clients; such credit exposure is sensitive to MEFs including economic growth, unemployment and industrial production.
p Financial institutions: includes lending to financial institutions such as banks and insurance companies; such credit exposure is sensitive to MEFs including economic growth and interest rates.
p Governments and public institutions: includes lending to central government and state-owned enterprises; such credit expo-sure is sensitive to MEFs including economic growth.
Expected credit losses on impaired loansIn addition to the triggers described further above, loans man-aged on the Swiss platform are reviewed depending on event-driven developments. All corporate and institutional loans are

307Consolidated financial statements – Credit Suisse Group
reviewed at least annually based on the borrower’s financial state-ments and any indications of difficulties they may experience. Loans that are not impaired, but which are of special concern due to changes in covenants, downgrades, negative financial news and other adverse developments, are either transferred to recovery management or included on a watch list. All loans on the watch list are reviewed at least quarterly to determine whether
they should be released, remain on the watch list or be moved to recovery management. For loans in recovery management from the Swiss platform, larger positions are reviewed on a quarterly basis for any event-driven changes. Otherwise, these loans are reviewed at least annually. All loans in recovery management on international platforms are reviewed on at least a monthly basis.
Allowance for credit losses – loans held at amortized cost 2020 2019 1 2018 1
Corporate & Corporate & Corporate &
Consumer institutional Total Consumer institutional Total Consumer institutional Total
Allowance for credit losses (CHF million)
Balance at beginning of period 241 808 1,049 2 187 715 902 220 662 882
Current-period provision for expected credit losses 191 709 900 63 221 284 19 182 201
of which methodology changes 0 (19) (19) – – – – – –
of which provisions for interest 3 22 15 37 – – – – – –
Gross write-offs (87) (238) (325) (86) (213) (299) (85) (184) (269)
Recoveries 8 5 13 9 16 25 21 37 58
Net write-offs (79) (233) (312) (77) (197) (274) (64) (147) (211)
Provisions for interest – – – 14 28 42 11 19 30
Foreign currency translation impact
and other adjustments, net (35) (66) (101) (1) (7) (8) 1 (1) 0
Balance at end of period 318 1,218 1,536 186 760 946 187 715 902
of which individually evaluated 230 636 866 145 464 609 146 462 608
of which collectively evaluated 88 582 670 41 296 337 41 253 294
1 Measured under the previous accounting guidance (incurred loss model).2 Includes a net impact of CHF 103 million from the adoption of the new CECL guidance and the related election of the fair value option for certain loans on January 1, 2020, of which
CHF 55 million is reflected in consumer loans and CHF 48 million in corporate & institutional loans.3 Represents the current-period net provision for accrued interest on non-accrual loans and lease financing transactions which is recognized as a reversal of interest income.
Gross write-offs of CHF 325 million in 2020 compared to gross write-offs of CHF 299 million in 2019 and were primarily related to corporate & institutional loans in both years. In 2020, gross write-offs in corporate & institutional loans were mainly related to the oil and gas, ship finance, lombard lending, small and medium-sized enterprises, health care and commodity trade finance sectors. Write-offs in consumer loans were mainly related
to consumer finance and a share-backed loan. In 2019, gross write-offs in corporate & institutional loans were mainly related to the commodity trade finance, the large Swiss corporates and the small and medium-sized enterprises business areas, the super-market sector in Europe, lombard loans and an infrastructure development company. Write-offs in consumer loans were mainly related to consumer finance and lombard loans.
Purchases, reclassifications and sales – loans held at amortized cost 2020 2019 2018
Corporate & Corporate & Corporate &
in Consumer institutional Total Consumer institutional Total Consumer institutional Total
CHF million
Purchases 1 45 2,756 2,801 18 2,478 2,496 0 2,163 2,163
Reclassifications from loans held-for-sale 2 0 6 6 0 11 11 0 1 1
Reclassifications to loans held-for-sale 3 18 2,007 2,025 0 3,138 3,138 1 2,351 2,352
Sales 3 18 1,626 1,644 0 3,001 3,001 1 2,267 2,268
1 Includes drawdowns under purchased loan commitments.2 Includes loans previously reclassified to held-for-sale that were not sold and were reclassified back to loans held-to-maturity.3 All loans held at amortized cost which are sold are reclassified to loans held-for-sale on or prior to the date of the sale.

308 Consolidated financial statements – Credit Suisse Group
Other financial assetsThe Group’s other financial assets include certain balance sheet positions held at amortized cost, each representing its own port-folio segment; they have the following risk characteristics:p Cash and due from banks and interest-bearing deposits with
banks: includes balances held with banks, primarily cash bal-ances with central banks and nostro accounts; such credit exposure is sensitive to the credit rating and profile of the bank or central bank.
p Reverse repurchase agreements and securities borrowing transactions: includes lending and borrowing of securities against cash or other financial collateral; such credit exposure is sensitive to the credit rating and profile of the counterparty and relative changes in the valuation of securities and financial collateral.
p Brokerage receivables: includes mainly settlement accounts with brokers and margin accounts; such credit exposure is sensitive to the credit rating and profile of the counterparty.
p Other assets: includes mainly cash collateral, accrued inter-est, fees receivable, mortgage servicing advances and failed purchases; such credit exposure is sensitive to the credit rating and profile of the related counterparty.
Allowance for credit losses – other financial assets held at amortized cost 2020
CHF million
Balance at beginning of period 45
Current-period provision for expected credit losses 24
Gross write-offs (12)
Recoveries 2
Net write-offs (10)
Foreign currency translation impact
and other adjustments, net (4)
Balance at end of period 55
of which individually evaluated 17
of which collectively evaluated 38
Credit quality information
Monitoring of credit quality and internal ratings – OverviewThe Group monitors the credit quality of financial assets held at amortized cost through its credit risk management framework, which provides for the consistent evaluation, measurement and management of credit risk across the Group. Assessments of credit risk exposures for internal risk estimates and risk-weighted assets are calculated based on PD, LGD and EAD models.
> Refer to “Expected credit losses on non-impaired credit exposures” for further information on PD, LGD and EAD.
The credit risk management framework incorporates the following core elements:p Counterparty and transaction assessments: application of
internal credit ratings (using PD), assignment of LGD and EAD values in relation to counterparties and transactions;
p Credit limits: establishment of credit limits, subject to approval by delegated authority holders, to serve as primary risk con-trols on exposures and to prevent undue risk concentrations;
p Credit monitoring, impairments and provisions: processes to support the ongoing monitoring and management of credit exposures, supporting the early identification of deterioration and any subsequent impact; and
p Risk mitigation: active management of risk mitigation provided in relation to credit exposures, including through the use of cash sales, participations, collateral or guarantees or hedging instruments.
The Group evaluates and assesses counterparties and clients to whom it has credit exposures, primarily using internal rating mod-els. The Group uses these models to determine internal credit rat-ings which are intended to reflect the PD of each counterparty.
For a majority of counterparties and clients, internal ratings are based on internally developed statistical models that have been backtested against internal experience and validated by a func-tion independent of model development. Findings from back-testing serve as a key input for any future rating model develop-ments. The Group’s internally developed statistical rating models are based on a combination of quantitative factors (e.g., financial fundamentals, such as balance sheet information for corporates and loan-to-value (LTV) ratio and the borrower’s income level for mortgage lending, and market data) and qualitative factors (e.g., credit histories from credit reporting bureaus and economic trends).
For the remaining counterparties where statistical rating models are not used, internal credit ratings are assigned on the basis of a structured expert approach using a variety of inputs, such as peer analyses, industry comparisons, external ratings and research as well as the judgment of senior credit officers.
In addition to counterparty ratings, Credit Risk also assesses the risk profile of individual transactions and assigns transaction rat-ings which reflect specific contractual terms such as seniority, security and collateral.
Internal credit ratings may differ from external credit ratings, where available, and are subject to periodic review depend-ing on exposure type, client segment, collateral or event-driven developments. The Group’s internal ratings are mapped to a PD band associated with each rating which is calibrated to historical default experience using internal data and external data sources. The Group’s internal rating bands are reviewed on an annual basis with reference to extended historical default data and are therefore based on stable long-run averages. Adjustments to PD bands are only made where significant deviations to existing val-ues are detected. The last update was made in 2012 and since then no significant changes to the robust long-run averages have been detected.
For the purpose of the credit quality disclosures included in these financial statements, an equivalent rating based on the Standard

309Consolidated financial statements – Credit Suisse Group
& Poor’s rating scale is assigned to the Group’s internal ratings based on the PD band associated with each rating. These inter-nal ratings are used consistently across all classes of financial assets and are aggregated to the credit quality indicators “invest-ment grade” and “non-investment grade”.
The Group uses internal rating methodologies consistently for the purposes of approval, establishment and monitoring of credit lim-its and credit portfolio management, credit policy, management reporting, risk-adjusted performance measurement, economic risk capital measurement and allocation and financial accounting.
A rigorous credit quality monitoring process is performed to pro-vide for early identification of possible changes in the creditwor-thiness of clients and includes regular asset and collateral quality reviews, business and financial statement analysis and relevant
economic and industry studies. Credit Risk maintains regularly updated watch lists and holds review meetings to re-assess coun-terparties that could be subject to adverse changes in creditwor-thiness. The review of the credit quality of clients and counterpar-ties does not depend on the accounting treatment of the asset or commitment.
> Refer to “Expected credit losses on impaired loans” for further information on credit monitoring.
Credit quality of loans held at amortized costThe following table presents the Group’s carrying value of loans held at amortized cost by aggregated internal counterparty credit ratings “investment grade” and “non-investment grade” that are used as credit quality indicators for the purpose of this disclosure, by year of origination.
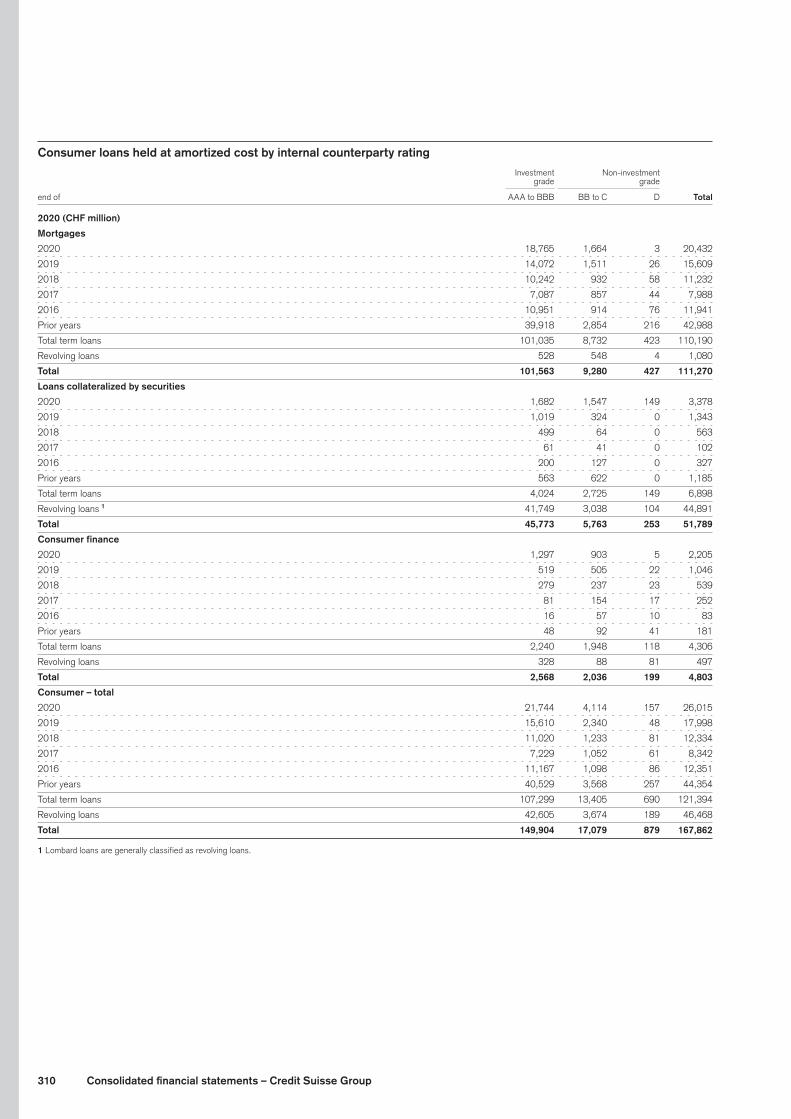
310 Consolidated financial statements – Credit Suisse Group
Consumer loans held at amortized cost by internal counterparty rating Investment Non-investment grade grade
end of AAA to BBB BB to C D Total
2020 (CHF million)
Mortgages
2020 18,765 1,664 3 20,432
2019 14,072 1,511 26 15,609
2018 10,242 932 58 11,232
2017 7,087 857 44 7,988
2016 10,951 914 76 11,941
Prior years 39,918 2,854 216 42,988
Total term loans 101,035 8,732 423 110,190
Revolving loans 528 548 4 1,080
Total 101,563 9,280 427 111,270
Loans collateralized by securities
2020 1,682 1,547 149 3,378
2019 1,019 324 0 1,343
2018 499 64 0 563
2017 61 41 0 102
2016 200 127 0 327
Prior years 563 622 0 1,185
Total term loans 4,024 2,725 149 6,898
Revolving loans 1 41,749 3,038 104 44,891
Total 45,773 5,763 253 51,789
Consumer finance
2020 1,297 903 5 2,205
2019 519 505 22 1,046
2018 279 237 23 539
2017 81 154 17 252
2016 16 57 10 83
Prior years 48 92 41 181
Total term loans 2,240 1,948 118 4,306
Revolving loans 328 88 81 497
Total 2,568 2,036 199 4,803
Consumer – total
2020 21,744 4,114 157 26,015
2019 15,610 2,340 48 17,998
2018 11,020 1,233 81 12,334
2017 7,229 1,052 61 8,342
2016 11,167 1,098 86 12,351
Prior years 40,529 3,568 257 44,354
Total term loans 107,299 13,405 690 121,394
Revolving loans 42,605 3,674 189 46,468
Total 149,904 17,079 879 167,862
1 Lombard loans are generally classified as revolving loans.
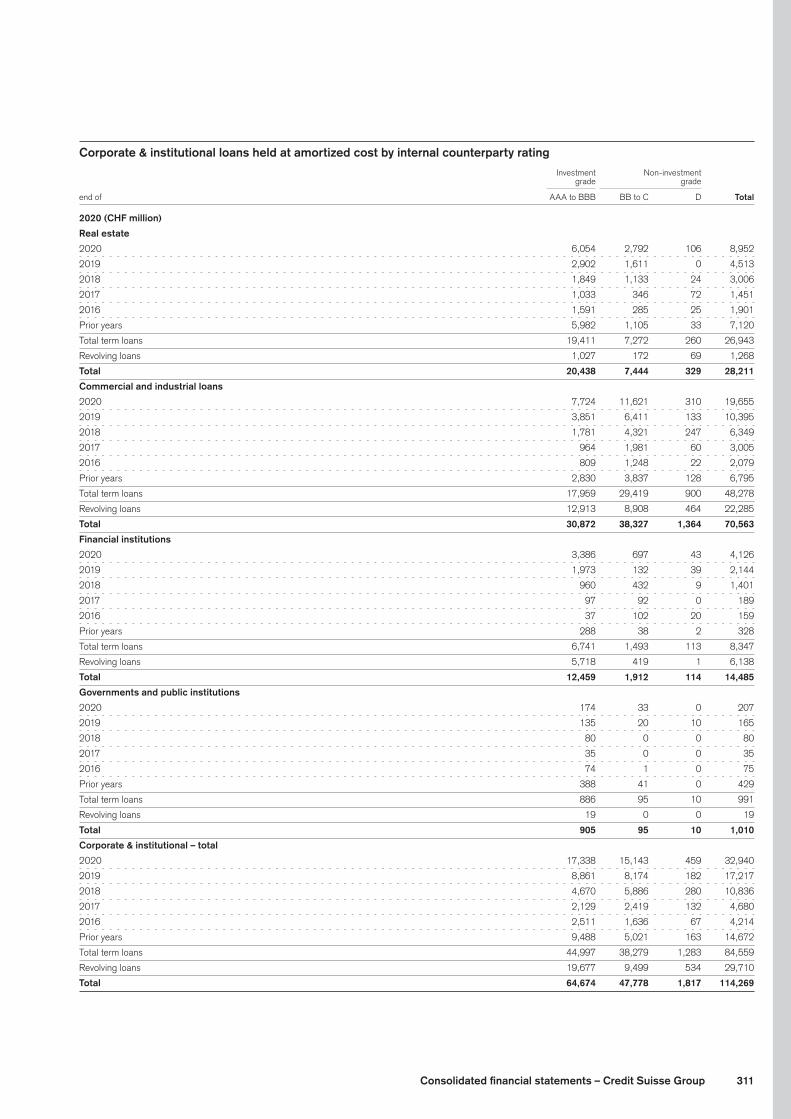
311Consolidated financial statements – Credit Suisse Group
Corporate & institutional loans held at amortized cost by internal counterparty rating Investment Non-investment grade grade
end of AAA to BBB BB to C D Total
2020 (CHF million)
Real estate
2020 6,054 2,792 106 8,952
2019 2,902 1,611 0 4,513
2018 1,849 1,133 24 3,006
2017 1,033 346 72 1,451
2016 1,591 285 25 1,901
Prior years 5,982 1,105 33 7,120
Total term loans 19,411 7,272 260 26,943
Revolving loans 1,027 172 69 1,268
Total 20,438 7,444 329 28,211
Commercial and industrial loans
2020 7,724 11,621 310 19,655
2019 3,851 6,411 133 10,395
2018 1,781 4,321 247 6,349
2017 964 1,981 60 3,005
2016 809 1,248 22 2,079
Prior years 2,830 3,837 128 6,795
Total term loans 17,959 29,419 900 48,278
Revolving loans 12,913 8,908 464 22,285
Total 30,872 38,327 1,364 70,563
Financial institutions
2020 3,386 697 43 4,126
2019 1,973 132 39 2,144
2018 960 432 9 1,401
2017 97 92 0 189
2016 37 102 20 159
Prior years 288 38 2 328
Total term loans 6,741 1,493 113 8,347
Revolving loans 5,718 419 1 6,138
Total 12,459 1,912 114 14,485
Governments and public institutions
2020 174 33 0 207
2019 135 20 10 165
2018 80 0 0 80
2017 35 0 0 35
2016 74 1 0 75
Prior years 388 41 0 429
Total term loans 886 95 10 991
Revolving loans 19 0 0 19
Total 905 95 10 1,010
Corporate & institutional – total
2020 17,338 15,143 459 32,940
2019 8,861 8,174 182 17,217
2018 4,670 5,886 280 10,836
2017 2,129 2,419 132 4,680
2016 2,511 1,636 67 4,214
Prior years 9,488 5,021 163 14,672
Total term loans 44,997 38,279 1,283 84,559
Revolving loans 19,677 9,499 534 29,710
Total 64,674 47,778 1,817 114,269

312 Consolidated financial statements – Credit Suisse Group
Total loans held at amortized cost by internal counterparty rating Investment Non-investment grade grade
end of AAA to BBB BB to C D Total
2020 (CHF million)
Loans held at amortized cost – total
2020 39,082 19,257 616 58,955
2019 24,471 10,514 230 35,215
2018 15,690 7,119 361 23,170
2017 9,358 3,471 193 13,022
2016 13,678 2,734 153 16,565
Prior years 50,017 8,589 420 59,026
Total term loans 152,296 51,684 1,973 205,953
Revolving loans 62,282 13,173 723 76,178
Total 214,578 64,857 2,696 282,131 1
1 Excludes accrued interest on loans held at amortized cost of CHF 334 million.
2019 Gross loans held at amortized cost by internal counterparty rating Investment Non-investment grade grade
end of AAA to BBB BB to C D Total
2019 (CHF million)
Mortgages 1 99,677 9,629 365 109,671
Loans collateralized by securities 1 50,766 5,531 128 56,425
Consumer finance 1,527 2,677 167 4,371
Consumer 151,970 17,837 660 170,467
Real estate 20,524 7,674 125 28,323
Commercial and industrial loans 1 30,090 38,522 1,108 69,720
Financial institutions 13,267 2,122 47 15,436
Governments and public institutions 1,166 67 0 1,233
Corporate & institutional 65,047 48,385 1,280 114,712
Gross loans held at amortized cost 217,017 66,222 1,940 285,179
1 Certain corporate & institutional loans have been reclassified to consumer loans following the application of a look-through approach with regard to beneficial owners. The prior period has been reclassified to conform to the current presentation.
Credit quality of other financial assets held at amortized costThe following table presents the Group’s carrying value of other financial assets held at amortized cost by aggregated internal
counterparty credit ratings investment grade and non-investment grade, by year of origination.
Other financial assets held at amortized cost by internal counterparty rating Investment Non-investment grade grade
end of AAA to BBB BB to C D Total
2020 (CHF million)
Other financial assets held at amortized cost
2018 0 70 0 70
2017 0 2 0 2
2016 0 4 0 4
Total term positions 0 76 0 76
Revolving positions 0 934 0 934
Total 0 1,010 0 1,010
Includes primarily mortgage servicing advances and failed purchases.
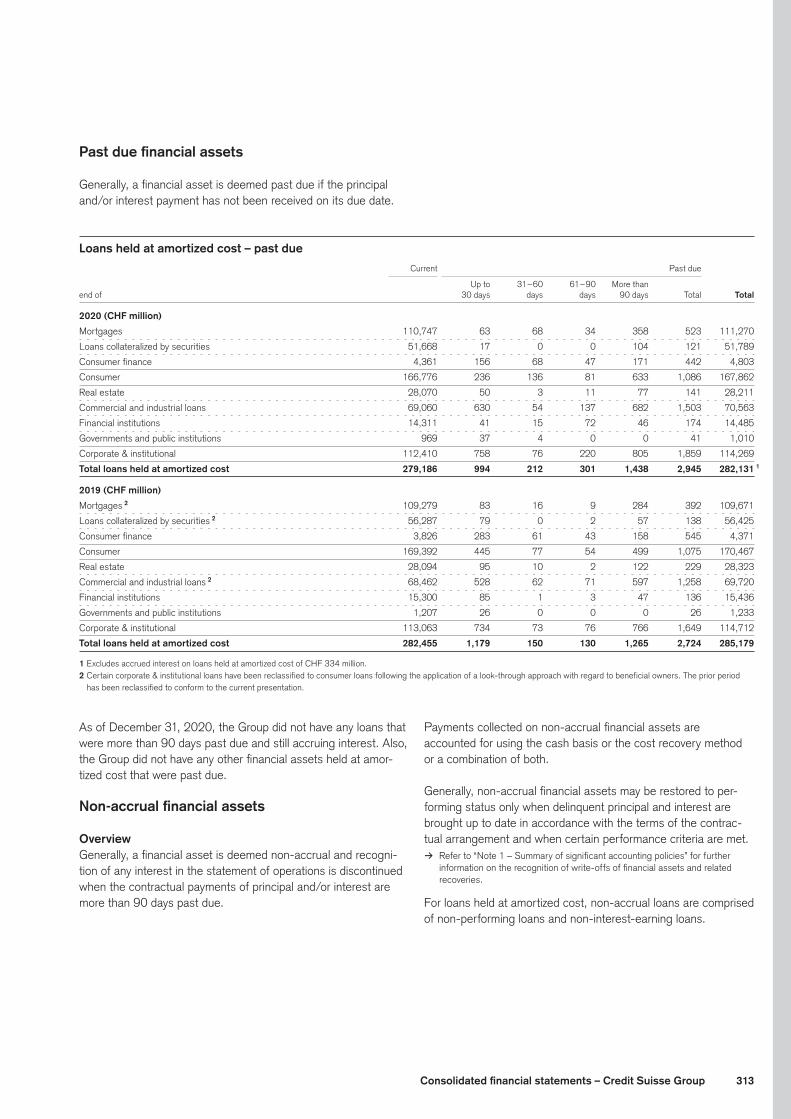
313Consolidated financial statements – Credit Suisse Group
Past due financial assets
Generally, a financial asset is deemed past due if the principal and/or interest payment has not been received on its due date.
Loans held at amortized cost – past due Current Past due
Up to 31 – 60 61 – 90 More than
end of 30 days days days 90 days Total Total
2020 (CHF million)
Mortgages 110,747 63 68 34 358 523 111,270
Loans collateralized by securities 51,668 17 0 0 104 121 51,789
Consumer finance 4,361 156 68 47 171 442 4,803
Consumer 166,776 236 136 81 633 1,086 167,862
Real estate 28,070 50 3 11 77 141 28,211
Commercial and industrial loans 69,060 630 54 137 682 1,503 70,563
Financial institutions 14,311 41 15 72 46 174 14,485
Governments and public institutions 969 37 4 0 0 41 1,010
Corporate & institutional 112,410 758 76 220 805 1,859 114,269
Total loans held at amortized cost 279,186 994 212 301 1,438 2,945 282,131 1
2019 (CHF million)
Mortgages 2 109,279 83 16 9 284 392 109,671
Loans collateralized by securities 2 56,287 79 0 2 57 138 56,425
Consumer finance 3,826 283 61 43 158 545 4,371
Consumer 169,392 445 77 54 499 1,075 170,467
Real estate 28,094 95 10 2 122 229 28,323
Commercial and industrial loans 2 68,462 528 62 71 597 1,258 69,720
Financial institutions 15,300 85 1 3 47 136 15,436
Governments and public institutions 1,207 26 0 0 0 26 1,233
Corporate & institutional 113,063 734 73 76 766 1,649 114,712
Total loans held at amortized cost 282,455 1,179 150 130 1,265 2,724 285,179
1 Excludes accrued interest on loans held at amortized cost of CHF 334 million.2 Certain corporate & institutional loans have been reclassified to consumer loans following the application of a look-through approach with regard to beneficial owners. The prior period
has been reclassified to conform to the current presentation.
As of December 31, 2020, the Group did not have any loans that were more than 90 days past due and still accruing interest. Also, the Group did not have any other financial assets held at amor-tized cost that were past due.
Non-accrual financial assets
OverviewGenerally, a financial asset is deemed non-accrual and recogni-tion of any interest in the statement of operations is discontinued when the contractual payments of principal and/or interest are more than 90 days past due.
Payments collected on non-accrual financial assets are accounted for using the cash basis or the cost recovery method or a combination of both.
Generally, non-accrual financial assets may be restored to per-forming status only when delinquent principal and interest are brought up to date in accordance with the terms of the contrac-tual arrangement and when certain performance criteria are met.
> Refer to “Note 1 – Summary of significant accounting policies” for further information on the recognition of write-offs of financial assets and related recoveries.
For loans held at amortized cost, non-accrual loans are comprised of non-performing loans and non-interest-earning loans.
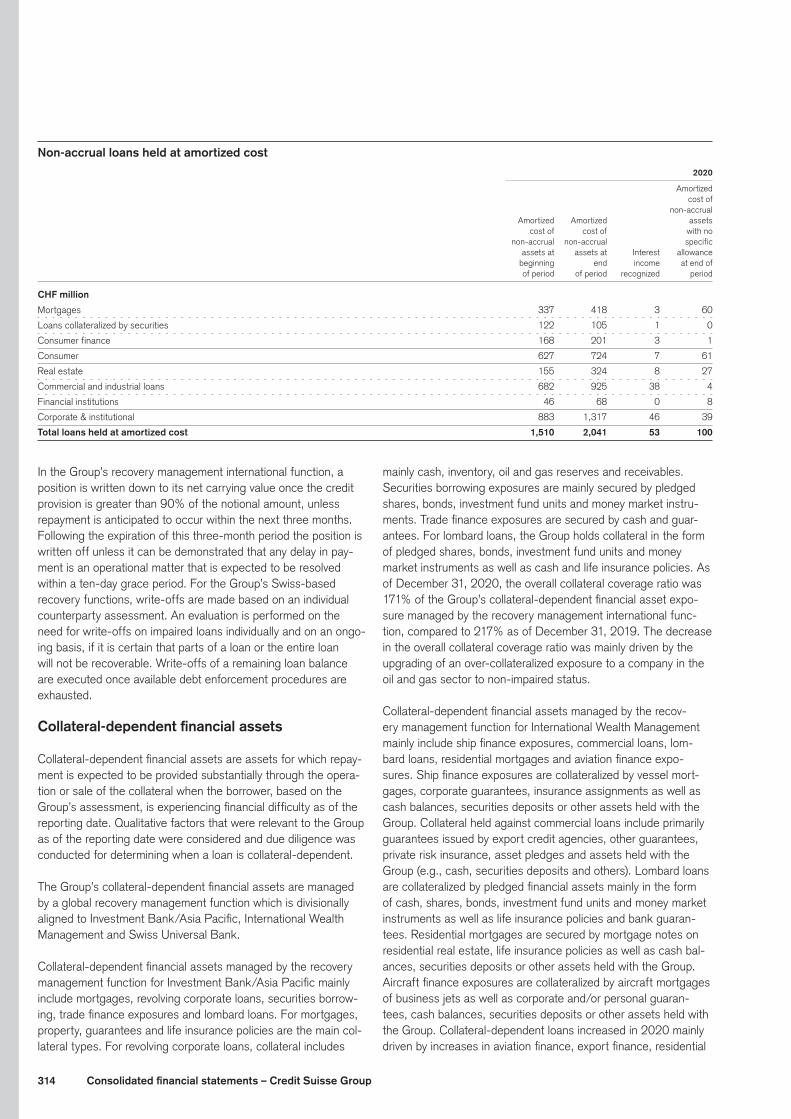
314 Consolidated financial statements – Credit Suisse Group
Non-accrual loans held at amortized cost 2020
Amortized cost of non-accrual Amortized Amortized assets cost of cost of with no non-accrual non-accrual specific
assets at assets at Interest allowance
beginning end income at end of of period of period recognized period
CHF million
Mortgages 337 418 3 60
Loans collateralized by securities 122 105 1 0
Consumer finance 168 201 3 1
Consumer 627 724 7 61
Real estate 155 324 8 27
Commercial and industrial loans 682 925 38 4
Financial institutions 46 68 0 8
Corporate & institutional 883 1,317 46 39
Total loans held at amortized cost 1,510 2,041 53 100
In the Group’s recovery management international function, a position is written down to its net carrying value once the credit provision is greater than 90% of the notional amount, unless repayment is anticipated to occur within the next three months. Following the expiration of this three-month period the position is written off unless it can be demonstrated that any delay in pay-ment is an operational matter that is expected to be resolved within a ten-day grace period. For the Group’s Swiss-based recovery functions, write-offs are made based on an individual counterparty assessment. An evaluation is performed on the need for write-offs on impaired loans individually and on an ongo-ing basis, if it is certain that parts of a loan or the entire loan will not be recoverable. Write-offs of a remaining loan balance are executed once available debt enforcement procedures are exhausted.
Collateral-dependent financial assets
Collateral-dependent financial assets are assets for which repay-ment is expected to be provided substantially through the opera-tion or sale of the collateral when the borrower, based on the Group’s assessment, is experiencing financial difficulty as of the reporting date. Qualitative factors that were relevant to the Group as of the reporting date were considered and due diligence was conducted for determining when a loan is collateral-dependent.
The Group’s collateral-dependent financial assets are managed by a global recovery management function which is divisionally aligned to Investment Bank/Asia Pacific, International Wealth Management and Swiss Universal Bank.
Collateral-dependent financial assets managed by the recovery management function for Investment Bank/Asia Pacific mainly include mortgages, revolving corporate loans, securities borrow-ing, trade finance exposures and lombard loans. For mortgages, property, guarantees and life insurance policies are the main col-lateral types. For revolving corporate loans, collateral includes
mainly cash, inventory, oil and gas reserves and receivables. Securities borrowing exposures are mainly secured by pledged shares, bonds, investment fund units and money market instru-ments. Trade finance exposures are secured by cash and guar-antees. For lombard loans, the Group holds collateral in the form of pledged shares, bonds, investment fund units and money market instruments as well as cash and life insurance policies. As of December 31, 2020, the overall collateral coverage ratio was 171% of the Group’s collateral-dependent financial asset expo-sure managed by the recovery management international func-tion, compared to 217% as of December 31, 2019. The decrease in the overall collateral coverage ratio was mainly driven by the upgrading of an over-collateralized exposure to a company in the oil and gas sector to non-impaired status.
Collateral-dependent financial assets managed by the recov-ery management function for International Wealth Management mainly include ship finance exposures, commercial loans, lom-bard loans, residential mortgages and aviation finance expo-sures. Ship finance exposures are collateralized by vessel mort-gages, corporate guarantees, insurance assignments as well as cash balances, securities deposits or other assets held with the Group. Collateral held against commercial loans include primarily guarantees issued by export credit agencies, other guarantees, private risk insurance, asset pledges and assets held with the Group (e.g., cash, securities deposits and others). Lombard loans are collateralized by pledged financial assets mainly in the form of cash, shares, bonds, investment fund units and money market instruments as well as life insurance policies and bank guaran-tees. Residential mortgages are secured by mortgage notes on residential real estate, life insurance policies as well as cash bal-ances, securities deposits or other assets held with the Group. Aircraft finance exposures are collateralized by aircraft mortgages of business jets as well as corporate and/or personal guaran-tees, cash balances, securities deposits or other assets held with the Group. Collateral-dependent loans increased in 2020 mainly driven by increases in aviation finance, export finance, residential

315Consolidated financial statements – Credit Suisse Group
mortgages and lombard loans, partially offset by reductions in ship finance. The overall collateral coverage decreased from 92% as of December 31, 2019 to 89% as of December 31, 2020, mainly due to decreased collateral coverage ratios in ship finance and mortgages, partially offset by an improved ratio in lombard loans.
Collateral-dependent financial assets managed by the recovery management function for Swiss Universal Bank mainly include residential mortgages and commercial mortgages. Collateral held against residential mortgages includes mainly mortgage notes on residential real estate, pledged capital awards in retirement plans and life insurance policies. For commercial mortgages, collateral held includes primarily mortgage notes on commercial real estate and cash balances, securities deposits or other assets held with the Group. The overall collateral coverage ratio in relation to the collateral-dependent financial assets decreased from 90% as of December 31, 2019 to 88% as of December 31, 2020 both for residential and commercial mortgages, reflecting repayments of mortgages with higher collateral coverage ratios and decreases in collateral values on the remaining portfolio.
Off-balance sheet credit exposures
The Group portfolio comprises off-balance sheet exposures with credit risk in the form of irrevocable commitments, guarantees and similar instruments which are in the scope of CECL measure-ment. The main risk characteristics are as follows:
p Irrevocable commitments are primarily commitments made to corporate and institutional borrowers to provide loans under approved, but undrawn, credit facilities. In addition, the Group has irrevocable commitments under documentary credits for corporate and institutional clients that facilitate international trade. The related credit risk exposure is to corporate clients, including small and medium-sized enterprises, large corporates and multinational clients who are impacted by macroeconomic and industry-specific factors such as economic growth, unem-ployment and industrial production.
p Guarantees are provided to third parties which contingently obligate the Group to make payments in the event that the underlying counterparty fails to fulfill its obligation under a borrowing or other contractual arrangement. The credit risk associated with guarantees is primarily to corporate and insti-tutional clients and financial institutions, which are sensitive to MEFs including economic growth and interest rates.
For off-balance sheet credit exposures, methodology, scenar-ios and MEFs used to estimate the provision for expected credit losses are the same as those used to estimate the allowance for credit losses for financial assets held at amortized cost. For the EAD models, a credit conversion factor or similar methodology is applied to off-balance sheet credit exposures in order to project the additional drawn amount between current utilization and the committed facility amount.
> Refer to “Allowance for credit losses” for further information on methodology, scenarios and MEFs used to estimate expected credit losses.
Troubled debt restructurings and modifications
Restructured financing receivables held at amortized cost 2020 2019 2018
Recorded Recorded Recorded Recorded Recorded Recorded investment – investment – investment – investment – investment – investment – Number of pre- post- Number of pre- post- Number of pre- post-
in contracts modification modification contracts modification modification contracts modification modification
CHF million, except where indicated
Mortgages 0 0 0 1 7 7 5 29 29
Loans collateralized by securities 3 165 165 0 0 0 0 0 0
Commercial and industrial loans 17 127 95 25 172 161 13 182 160
Total loans 20 292 260 26 179 168 18 211 189
Restructured financing receivables held at amortized cost that defaulted within 12 months from restructuring 2020 2019 2018
Number of Recorded Number of Recorded Number of Recorded
in contracts investment contracts investment contracts investment
CHF million, except where indicated
Mortgages 0 0 1 13 1 8
Commercial and industrial loans 4 13 1 2 8 76
Total loans 4 13 2 15 9 84

316 Consolidated financial statements – Credit Suisse Group
In 2020, the loan modifications of the Group included waivers of interest, principal or other claims, extended loan repayment terms, including postponed or reduced loan amortizations, extended pay-back period or maturity date, partly in combination with changes in covenants.
As of December 31, 2020 and 2019, the Group did not have any commitments to lend additional funds to debtors whose loan terms had been modified in troubled debt restructurings.
In March 2020, US federal banking regulators issued the “Inter-agency Statement on Loan Modifications and Reporting for Financial Institutions Working with Customers Affected by the Coronavirus (Revised)” (Interagency Statement). According to the
Interagency Statement, short-term modifications made on a good faith basis in response to the COVID-19 crisis to borrowers that were otherwise current prior to the relief being granted would not be considered to be troubled debt restructurings. This includes short-term modifications such as payment deferrals, fee waivers, repayment term extensions or payment delays that are insignifi-cant. The Interagency Statement was developed in consultation with the FASB and the Group has applied this guidance. The Group has granted short-term modifications to certain borrowers due to the COVID-19 crisis in the form of deferrals of capital and interest payments that are within the scope of this guidance and the loans subject to those deferrals have not been reported as troubled debt restructurings in restructured loans.
21 Goodwill Swiss International Credit Universal Wealth Asia Investment Suisse
2020 Bank Management Pacific Bank Group 1
Gross amount of goodwill (CHF million)
Balance at beginning of period 607 1,494 995 5,446 8,554
Goodwill acquired during the year 0 9 98 24 131
Foreign currency translation impact (29) (112) (62) (113) (316)
Other (3) (39) (10) 0 (52)
Balance at end of period 575 1,352 1,021 5,357 8,317
Accumulated impairment (CHF million)
Balance at beginning of period 0 0 0 3,879 3,891
Balance at end of period 0 0 0 3,879 3,891
Net book value (CHF million)
Net book value 575 1,352 1,021 1,478 4,426
2019
Gross amount of goodwill (CHF million)
Balance at beginning of period 615 1,544 1,018 5,468 8,657
Foreign currency translation impact (5) (22) (13) (22) (62)
Other (3) (28) (10) 0 (41)
Balance at end of period 607 1,494 995 5,446 8,554
Accumulated impairment (CHF million)
Balance at beginning of period 0 0 0 3,879 3,891
Balance at end of period 0 0 0 3,879 3,891
Net book value (CHF million)
Net book value 607 1,494 995 1,567 4,663
1 Gross amount of goodwill and accumulated impairment include CHF 12 million related to legacy business transferred to the former Strategic Resolution Unit in 4Q15 and fully written off at the time of transfer, in addition to the divisions disclosed.
317Consolidated financial statements – Credit Suisse Group
In accordance with US GAAP, the Group continually assesses whether or not there has been a triggering event requiring a review of goodwill.
The Group determined in the first quarter of 2020 that a goodwill triggering event occurred for its former Investment Banking & Capital Markets reporting unit. Based on its goodwill impairment analysis performed, the Group concluded that the estimated fair value for all of the reporting units with goodwill exceeded their related carrying values and no impairments were necessary as of March 31, 2020.
The Group also determined in the second quarter of 2020 that a goodwill triggering event occurred for its former Asia Pacific – Markets, Global Markets and Investment Banking & Capital Markets reporting units. Goodwill has to be tested for impairment before and immediately after a reorganization of reporting units. Based on this goodwill impairment analysis, the Group concluded that there would be no impairment necessary for its Global Mar-kets, Investment Banking & Capital Markets and Asia Pacific – Markets reporting units under the prior reporting structure as the estimated fair value of these reporting units exceeded their related carrying values by 11%, 13% and 6%, respectively. The goodwill allocated to these reporting units became more sensitive to an impairment due to the higher implied costs of equity due to the greater economic uncertainty resulting from the COVID-19 pandemic. The Group concluded that no impairment was neces-sary for its new reporting unit named Investment Bank as the estimated fair value substantially exceeded its related carrying value.
The approach for determining the carrying value and estimating the fair values of the reporting units was applied consistently for both the prior reporting structure and the new reporting structure.
The carrying value of each reporting unit for the purpose of the goodwill impairment test is determined by considering the reporting units’ risk-weighted assets usage, leverage ratio expo-sure, deferred tax assets, goodwill, intangible assets and other
common equity tier 1 (CET1) capital relevant adjustments. Any residual equity, after considering the total of these elements, is allocated to the reporting units on a pro-rata basis.
In estimating the fair value of its reporting units, the Group applied a combination of the market approach and the income approach. Under the market approach, consideration was given to price to pro-jected earnings multiples or price to book value multiples for similarly traded companies and prices paid in recent transactions that have occurred in its industry or in related industries. Under the income approach, a discount rate was applied that reflects the risk and uncertainty related to the reporting unit’s projected cash flows, which were determined from the Group’s financial plan.
In determining the estimated fair value, the Group relied upon its latest five-year financial plan which included significant manage-ment assumptions and estimates based on its view of current and future economic conditions and regulatory changes.
The Group engaged the services of an independent valuation specialist to assist in the valuation of the International Wealth Management – Asset Management, Asia Pacific and the Invest-ment Bank reporting units as of December 31, 2020. The valua-tions were performed using a combination of the market approach and income approach.
The results of the impairment evaluation of each reporting unit’s goodwill would be significantly impacted by adverse changes in the underlying parameters used in the valuation process. If actual outcomes or the future outlook adversely differ from manage-ment’s best estimates of the key economic assumptions and associated cash flows applied in the valuation of the report-ing unit, the Group could potentially incur material impairment charges in the future.
As a result of acquisitions, the Group has recorded goodwill as an asset in its consolidated balance sheets, the most significant component of which arose from the acquisition of Donaldson, Lufkin & Jenrette Inc. in 2000.

318 Consolidated financial statements – Credit Suisse Group
22 Other intangible assets 2020 2019
Accumu- Accumu-
Gross lated Net Gross lated Net carrying amorti- carrying carrying amorti- carrying
end of amount zation amount amount zation amount
Other intangible assets (CHF million)
Trade names/trademarks 24 (24) 0 27 (26) 1
Client relationships 30 0 30 20 (2) 18
Other (3) 4 1 (3) 4 1
Total amortizing other intangible assets 51 (20) 31 44 (24) 20
Non-amortizing other intangible assets 206 – 206 271 – 271
of which mortgage servicing rights, at fair value 180 – 180 244 – 244
Total other intangible assets 257 (20) 237 315 (24) 291
Additional information
in 2020 2019 2018
Aggregate amortization and impairment (CHF million)
Aggregate amortization 6 5 8
Impairment 2 5 1
Estimated amortization
Estimated amortization (CHF million)
2021 2
2022 2
2023 2
2024 1
2025 1

319Consolidated financial statements – Credit Suisse Group
23 Other assets and other liabilitiesend of 2020 2019
Other assets (CHF million)
Cash collateral on derivative instruments 7,741 4,570
Cash collateral on non-derivative transactions 635 428
Derivative instruments used for hedging 131 183
Assets held-for-sale 7,077 8,971
of which loans 1 7,046 8,886
allowance for loans held-for-sale (48) 0
of which real estate 2 27 38
of which long-lived assets 4 47
Premises and equipment and right-of-use assets 7,376 7,832
Assets held for separate accounts 102 111
Interest and fees receivable 4,255 4,688
Deferred tax assets 3,667 4,399
Prepaid expenses 448 431
of which cloud computing arrangement
implementation costs 38 27
Failed purchases 1,451 1,643
Defined benefit pension and post-retirement plan assets 2,872 2,878
Other 3,882 3,475
Other assets 39,637 39,609
1 Included as of December 31, 2020 and 2019 were CHF 262 million and CHF 800 mil-lion, respectively, in restricted loans, which represented collateral on secured borrowings.
2 As of December 31, 2020 and 2019, real estate held-for-sale included foreclosed or repossessed real estate of CHF 8 million and CHF 9 million, respectively, of which CHF 8 million and CHF 9 million, respectively, were related to residential real estate.
end of 2020 2019
Other liabilities (CHF million)
Cash collateral on derivative instruments 7,831 7,457
Cash collateral on non-derivative transactions 174 516
Derivative instruments used for hedging 45 48
Operating leases liabilities 2,759 3,213
Provisions 2,080 1,179
of which expected credit losses on
off-balance sheet credit exposure 311 172
Restructuring liabilities 52 –
Liabilities held for separate accounts 102 111
Interest and fees payable 4,297 5,101
Current tax liabilities 555 678
Deferred tax liabilities 530 523
Failed sales 1,120 936
Defined benefit pension and post-retirement
plan liabilities 410 455
Other 11,479 10,826
Other liabilities 31,434 31,043
Premises, equipment and right-of-use assets
end of 2020 2019
Premises and equipment (CHF million)
Buildings and improvements 1,425 1,436
Land 291 294
Leasehold improvements 1,775 1,855
Software 7,038 6,478
Equipment 1,874 1,887
Premises and equipment 12,403 11,950
Accumulated depreciation (7,627) (7,153)
Total premises and equipment, net 4,776 4,797
Right-of-use assets (CHF million)
Right-of-use assets-operating leases 2,600 3,035
Total premises and equipment and right-of-use assets 7,376 7,832
Depreciation, amortization and impairment
end of 2020 2019 2018
CHF million
Depreciation on premises and equipment 964 939 830
Impairment on premises and equipment 10 3 8
Amortization and impairment on right-of-use assets 331 324 –
> Refer to “Note 24 – Leases” for further information on right-of-use assets.

320 Consolidated financial statements – Credit Suisse Group
24 LeasesThe Group enters into both lessee and lessor arrangements.
> Refer to “Note 1 – Summary of significant accounting policies” and “Note 23 – Other assets and other liabilities” for further information.
Lessee arrangements
The Group primarily enters into operating leases. When a real estate lease has both lease and non-lease components, the Group allocates the consideration in the contract based on the relative standalone selling price. For all leases other than real estate leases, the Group does not separate lease and non-lease components. The Group’s finance leases are not material.
The Group has entered into leases for real estate, equipment and vehicles.
Certain equipment and real estate have subsequently been sub-leased. Sublease income is recognized in other revenues.
Lease costs
end of 2020 2019
Lease costs (CHF million)
Operating lease costs 369 388
Variable lease costs 50 40
Sublease income (71) (78)
Net lease costs 348 350
From time to time, the Group enters into sale-leaseback transac-tions in which an asset is sold and immediately leased back. If specific criteria are met, the asset is derecognized from the bal-ance sheet and an operating lease is recognized.
During 2020, the Group entered into one sale-leaseback trans-action, with a lease term of one year. During 2019, the Group entered into 4 sale-leaseback transactions, with lease terms ranging from 5 to 10 years. During 2018, the Group entered into one sale-leaseback transaction with a lease term of ten years.
Other information
end of 2020 2019
Other information (CHF million)
Gains/(losses) on sale and leaseback transactions 15 274
Cash paid for amounts included in the measurement
of operating lease liabilities recorded in operating cash flows (403) (464)
Right-of-use assets obtained in exchange of new
operating lease liabilities 1 32 102
Changes to right-of-use assets due to lease
modifications for operating leases 32 221
1 Includes right-of-use assets relating to changes in classification of scope of variable inter-est entities.
The weighted average remaining lease terms and discount rates are based on all outstanding operating leases as well as their respective lease terms and remaining lease obligations.
Weighted average remaining lease term and discount rate
end of 2020 2019
Operating leases
Remaining lease term (years) 11.9 12.2
Discount rate (%) 2.6 2.8
The following table reflects the undiscounted cash flows from leases for the next five years and thereafter, based on the expected lease term.
Maturities relating to operating lease arrangements
end of 2020 2019
Maturity (CHF million)
Due within 1 year 385 468
Due between 1 and 2 years 364 387
Due between 2 and 3 years 323 371
Due between 3 and 4 years 278 336
Due between 4 and 5 years 249 286
Thereafter 1,642 1,963
Operating lease obligations 3,241 3,811
Future interest payable (482) (598)
Operating lease liabilities 2,759 3,213
Lessor arrangements
The Group enters into sales-type, direct financing and operat-ing leases for real estate, equipment and vehicles. When a real estate lease has both lease and non-lease components, the Group allocates the consideration in the contract based on the relative standalone selling price. For all leases other than real estate leases, the Group does not separate lease and non-lease components.
As of December 31, 2020 and 2019, the Group had approxi-mately CHF 0.9 billion and CHF 0.8 billion, respectively, of resid-ual value guarantees associated with lessor arrangements.
The Group’s risk of loss relating to the residual value of leased assets is mitigated through contractual arrangements with manu-factures or suppliers. Leased assets are also monitored through projections of the residual values at lease origination and periodic reviews of residual values.
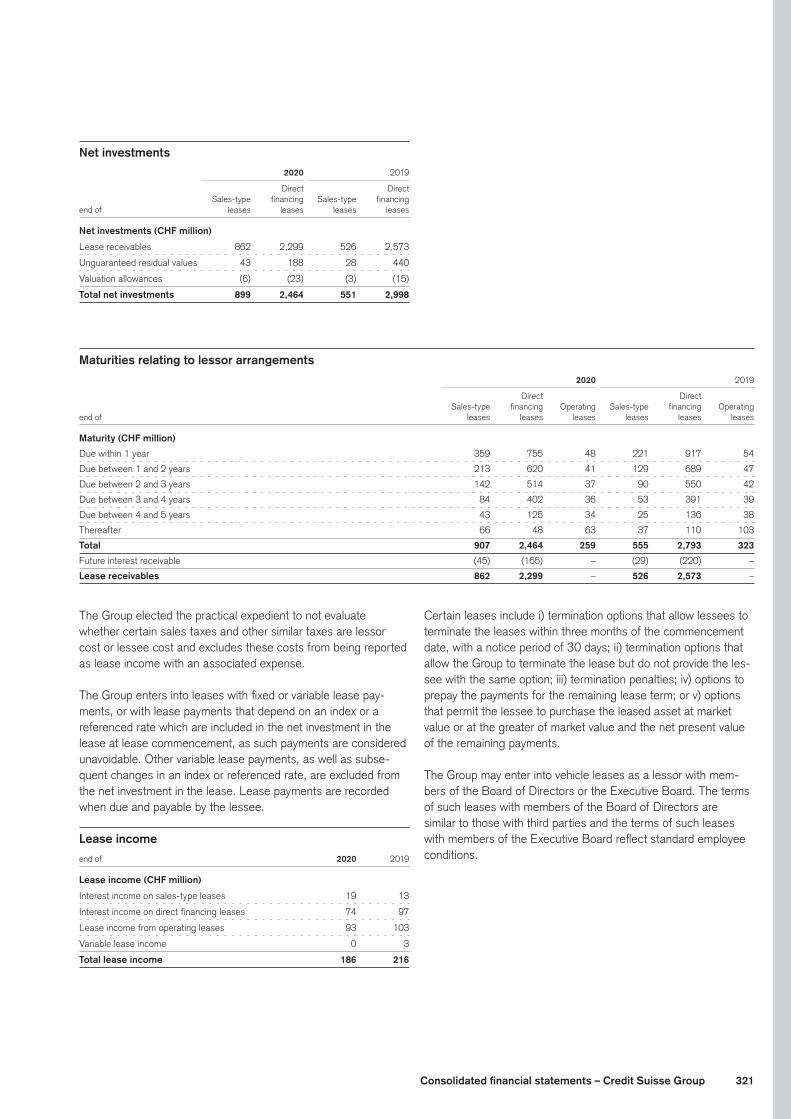
321Consolidated financial statements – Credit Suisse Group
Net investments 2020 2019
Direct Direct Sales-type financing Sales-type financing
end of leases leases leases leases
Net investments (CHF million)
Lease receivables 862 2,299 526 2,573
Unguaranteed residual values 43 188 28 440
Valuation allowances (6) (23) (3) (15)
Total net investments 899 2,464 551 2,998
Maturities relating to lessor arrangements 2020 2019
Direct Direct
Sales-type financing Operating Sales-type financing Operating
end of leases leases leases leases leases leases
Maturity (CHF million)
Due within 1 year 359 755 48 221 917 54
Due between 1 and 2 years 213 620 41 129 689 47
Due between 2 and 3 years 142 514 37 90 550 42
Due between 3 and 4 years 84 402 36 53 391 39
Due between 4 and 5 years 43 125 34 25 136 38
Thereafter 66 48 63 37 110 103
Total 907 2,464 259 555 2,793 323
Future interest receivable (45) (165) – (29) (220) –
Lease receivables 862 2,299 – 526 2,573 –
The Group elected the practical expedient to not evaluate whether certain sales taxes and other similar taxes are lessor cost or lessee cost and excludes these costs from being reported as lease income with an associated expense.
The Group enters into leases with fixed or variable lease pay-ments, or with lease payments that depend on an index or a referenced rate which are included in the net investment in the lease at lease commencement, as such payments are considered unavoidable. Other variable lease payments, as well as subse-quent changes in an index or referenced rate, are excluded from the net investment in the lease. Lease payments are recorded when due and payable by the lessee.
Lease income
end of 2020 2019
Lease income (CHF million)
Interest income on sales-type leases 19 13
Interest income on direct financing leases 74 97
Lease income from operating leases 93 103
Variable lease income 0 3
Total lease income 186 216
Certain leases include i) termination options that allow lessees to terminate the leases within three months of the commencement date, with a notice period of 30 days; ii) termination options that allow the Group to terminate the lease but do not provide the les-see with the same option; iii) termination penalties; iv) options to prepay the payments for the remaining lease term; or v) options that permit the lessee to purchase the leased asset at market value or at the greater of market value and the net present value of the remaining payments.
The Group may enter into vehicle leases as a lessor with mem-bers of the Board of Directors or the Executive Board. The terms of such leases with members of the Board of Directors are similar to those with third parties and the terms of such leases with members of the Executive Board reflect standard employee conditions.

322 Consolidated financial statements – Credit Suisse Group
25 Deposits 2020 2019
Switzer- Switzer-
end of land Foreign Total land Foreign Total
Deposits (CHF million)
Non-interest-bearing demand deposits 3,231 3,085 6,316 2,665 1,744 4,409
Interest-bearing demand deposits 144,709 41,995 186,704 118,566 30,552 149,118
Savings deposits 62,769 8,764 71,533 64,304 46 64,350
Time deposits 26,864 115,927 142,791 1 27,539 155,111 182,650 1
Total deposits 237,573 169,771 407,344 2 213,074 187,453 400,527 2
of which due to banks – – 16,423 – – 16,744
of which customer deposits – – 390,921 – – 383,783
The designation of deposits in Switzerland versus foreign deposits is based upon the location of the office where the deposit is recorded.1 Included CHF 142,698 million and CHF 182,036 million as of December 31, 2020 and 2019, respectively, of the Swiss franc equivalent of individual time deposits greater than
USD 100,000 in Switzerland and foreign offices.2 Not included as of December 31, 2020 and 2019 were CHF 106 million and CHF 116 million, respectively, of overdrawn deposits reclassified as loans.
26 Long-term debt end of 2020 2019
Long-term debt (CHF million)
Senior 133,056 108,667
Subordinated 26,285 41,667
Non-recourse liabilities from consolidated VIEs 1,746 1,671
Long-term debt 161,087 152,005
of which reported at fair value 70,976 70,331
of which structured notes 47,039 49,435
end of 2020 2019
Structured notes by product (CHF million)
Equity 29,907 31,666
Fixed income 13,882 13,558
Credit 2,881 3,734
Other 369 477
Total structured notes 47,039 49,435
Total long-term debt includes debt issuances managed by Trea-sury that do not contain derivative features (vanilla debt), as well as hybrid debt instruments with embedded derivatives, which are issued as part of the Group’s structured product activities. Long-term debt includes both Swiss franc and foreign exchange denominated fixed and variable rate bonds.
The interest rate ranges presented in the table below are based on the contractual terms of the Group’s vanilla debt. Interest rate ranges for future coupon payments on structured products for which fair value has been elected are not included in the table
below as these coupons are dependent upon the embedded deriv-ative and prevailing market conditions at the time each coupon is paid. In addition, the effects of derivatives used for hedging are not included in the interest rate ranges on the associated debt.
Group-internal funding related to loss-absorbing instruments has been aligned to international standards for internal total loss-absorbing capacity (TLAC) instruments and to the new article 126b of the Swiss Capital Adequacy Ordinance, effective January 1, 2020. Due to this alignment, the bail-in debt instruments issued by Credit Suisse AG to Credit Suisse Group Funding (Guernsey) Limited, a non-consolidated funding entity, have been permanently subordinated in 2019.
Effective November 3, 2020, Credit Suisse Group AG and Credit Suisse Group Funding (Guernsey) Limited exercised the voluntary issuer substitution clause included in the terms of senior unse-cured notes issued by Credit Suisse Group Funding (Guernsey) Limited with a maturity date post December 31, 2022. As a result of the substitution, Credit Suisse Group AG succeeded to, and was substituted for, and became bound by every obligation of, Credit Suisse Group Funding (Guernsey) Limited as principal obli-gor under these notes, which qualify as TLAC debt instruments. In addition, the related subordinated internal TLAC notes issued by Credit Suisse AG and held by Credit Suisse Group Funding (Guern-sey) Limited have been transferred to Credit Suisse Group AG. This resulted in a decrease in subordinated long-term debt and a respective increase in senior long-term debt.

323Consolidated financial statements – Credit Suisse Group
Long-term debt by maturities
end of 2021 2022 2023 2024 2025 Thereafter Total
Group parent company (CHF million)
Senior debt
Fixed rate 0 0 5,608 1,258 7,431 21,707 36,004
Variable rate 0 53 528 1,708 0 0 2,289
Interest rate (range in %) 1 – 0.8 0.6–3.8 1.0–4.2 1.3–3.8 0.7–5.4 –
Subordinated debt
Fixed rate 0 1,394 4,309 3,208 2,000 5,322 16,233
Interest rates (range in %) 1 – 7.1 3.9–7.5 3.5–6.3 3.0–7.3 4.5–6.4 –
Subtotal – Group parent company 0 1,447 10,445 6,174 9,431 27,029 54,526
Subsidiaries (CHF million)
Senior debt
Fixed rate 9,364 4,581 1,873 3,856 2,398 13,931 36,003
Variable rate 13,380 12,615 8,274 4,131 6,117 14,243 58,760
Interest rates (range in %) 1 0.1–4.0 0.1–8.2 0.1–2.2 0.1–3.6 0.1–3.5 0.1–7.1 –
Subordinated debt
Fixed rate 1,342 5,069 2,394 23 9 131 8,968
Variable rate 881 195 0 0 4 4 1,084
Interest rates (range in %) 1 2.5–4.7 0.1–3.8 0.6–6.5 3.5–5.7 0.4–5.9 0.9–7.2 –
Non-recourse liabilities from consolidated VIEs
Fixed rate 7 128 0 0 208 0 343
Variable rate 9 22 17 2 25 2 14 1,316 1,403
Interest rates (range in %) 1 6.7–10.3 1.3–2.9 – – 1.9 0.0–10.7 –
Subtotal – Subsidiaries 24,983 22,610 12,558 8,035 8,750 29,625 106,561
Total long-term debt 24,983 24,057 23,003 14,209 18,181 56,654 161,087
of which structured notes 12,299 8,788 5,132 3,508 3,956 13,356 47,039
The maturity of perpetual debt is based on the earliest callable date. The maturity of all other debt is based on contractual maturity and includes certain structured notes that have manda-tory early redemption features based on stipulated movements in markets or the occurrence of a market event. Within this population there are approximately CHF 3.4 billion of such notes with a contractual maturity of greater than one year that have an observable likelihood of redemption occurring within one year based on a modelling assessment. 1 Excludes structured notes for which fair value has been elected as the related coupons are dependent upon the embedded derivatives and prevailing market conditions at the time each
coupon is paid.2 Reflects equity linked notes, where the payout is not fixed.
The Group and the Bank maintain a shelf registration statement with the SEC, which allows each entity to issue, from time to time, senior and subordinated debt securities, warrants and guarantees.
> Refer to “Note 42 – Subsidiary guarantee information” for further information on subsidiary guarantees.
The Group maintains a euro medium-term note program that allows the Bank to issue senior debt securities.
The Group maintains three senior debt programs that allow the Group to issue senior debt securities with certain features that are designed to allow for statutory bail-in by the Swiss Financial Market Supervisory Authority FINMA (FINMA) under the Swiss banking laws and regulations.
The Bank maintains a JPY 500 billion Samurai shelf registration statement that allows it to issue, from time to time, senior and subordinated debt securities.

324 Consolidated financial statements – Credit Suisse Group
27 Accumulated other comprehensive income and additional share information
Accumulated other comprehensive income Gains/
Gains/ Unrealized Net prior (losses) on
(losses) Cumulative gains/ Actuarial service liabilities
on cash translation (losses) on gains/ credit/ relating to
flow hedges adjustments securities 1 (losses) (cost) credit risk AOCI
2020 (CHF million)
Balance at beginning of period 28 (14,469) 30 (3,690) 604 (2,772) (20,269)
Increase/(decrease) 91 (3,076) (49) (327) (5) 45 (3,321)
Reclassification adjustments, included in net income/(loss) 87 17 32 290 (143) 157 440
Total increase/(decrease) 178 (3,059) (17) (37) (148) 202 (2,881)
Balance at end of period 206 (17,528) 13 (3,727) 456 (2,570) (23,150)
2019 (CHF million)
Balance at beginning of period (72) (13,442) 10 (3,974) 387 (890) (17,981)
Increase/(decrease) 65 (1,015) 20 44 338 (2,053) (2,601)
Increase/(decrease) due to equity method investments 10 (18) 0 0 0 0 (8)
Reclassification adjustments, included in net income/(loss) 25 6 0 282 (121) 193 385
Cumulative effect of accounting changes, net of tax 0 0 0 (42) 0 (22) (64)
Total increase/(decrease) 100 (1,027) 20 284 217 (1,882) (2,288)
Balance at end of period 28 (14,469) 30 (3,690) 604 (2,772) (20,269)
2018 (CHF million)
Balance at beginning of period (62) (13,119) 48 (3,583) 522 (2,544) (18,738)
Increase/(decrease) (114) (342) (10) (710) (26) 1,605 403
Increase/(decrease) due to equity method investments (10) 0 0 0 0 0 (10)
Reclassification adjustments, included in net income/(loss) 114 19 (7) 319 (109) 49 385
Cumulative effect of accounting changes, net of tax 0 0 (21) 0 0 0 (21)
Total increase/(decrease) (10) (323) (38) (391) (135) 1,654 757
Balance at end of period (72) (13,442) 10 (3,974) 387 (890) (17,981)
1 No impairments on available-for-sale debt securities were recognized in net income/(loss) in 2020, 2019 and 2018.
> Refer to “Note 29 – Tax” and “Note 32 – Pension and other post-retirement benefits” for income tax expense/(benefit) on the movements of accumulated other comprehensive income/(loss).

325Consolidated financial statements – Credit Suisse Group
Details of significant reclassification adjustments
in 2020 2019 2018
Reclassification adjustments, included in net income/(loss) (CHF million)
Cumulative translation adjustments
Reclassification adjustments 1 17 6 19
Actuarial gains/(losses)
Amortization of recognized actuarial losses 2 355 355 396
Tax expense/(benefit) (65) (73) (77)
Net of tax 290 282 319
Net prior service credit/(cost)
Amortization of recognized prior service credit/(cost) 2 (176) (153) (138)
Tax expense/(benefit) 33 32 29
Net of tax (143) (121) (109)
1 Includes net releases of CHF 21 million on the liquidation of Credit Suisse Securities (Johannesburg) Proprietary Limited in 2018. These were reclassified from cumulative translation adjustments and included in net income in other revenues.
2 These components are included in the computation of total benefit costs. Refer to “Note 32 – Pension and other post-retirement benefits” for further information.
Additional share information 2020 2019 2018
Common shares issued
Balance at beginning of period 2,556,011,720 2,556,011,720 2,556,011,720
Cancellation of repurchased shares (108,264,000) 0 0
Balance at end of period 2,447,747,720 2,556,011,720 2,556,011,720
Treasury shares
Balance at beginning of period (119,761,811) (5,427,691) (5,757,666)
Sale of treasury shares 1,222,417,138 795,576,688 770,559,108
Repurchase of treasury shares (1,303,331,434) (951,743,509) (816,841,331)
Cancellation of repurchased shares 108,264,000 0 0
Share-based compensation 50,809,266 41,832,701 46,612,198
Balance at end of period (41,602,841) (119,761,811) (5,427,691)
Common shares outstanding
Balance at end of period 2,406,144,879 1 2,436,249,909 1 2,550,584,029
1 At par value CHF 0.04 each, fully paid. In addition to the treasury shares, a maximum of 653,000,000 unissued shares (conditional, conversion and authorized capital) were available for issuance without further approval of the shareholders. 111,193,477 of these shares were reserved for capital instruments.

326 Consolidated financial statements – Credit Suisse Group
28 Offsetting of financial assets and financial liabilitiesThe disclosures set out in the tables below include derivatives, reverse repurchase and repurchase agreements, and securities lending and borrowing transactions that:p are offset in the Group’s consolidated balance sheets; orp are subject to an enforceable master netting agreement or
similar agreement (enforceable master netting agreements), irrespective of whether they are offset in the Group’s consoli-dated balance sheets.
Similar agreements include derivative clearing agreements, global master repurchase agreements and global master securities lend-ing agreements.
Derivatives
The Group transacts bilateral OTC derivatives (OTC derivatives) mainly under International Swaps and Derivatives Association (ISDA) Master Agreements and Swiss Master Agreements for OTC derivative instruments. These agreements provide for the net settlement of all transactions under the agreement through a single payment in the event of default or termination under the agreement. They allow the Group to offset balances from deriva-tive assets and liabilities as well as the receivables and payables to related cash collateral transacted with the same counterparty. Collateral for OTC derivatives is received and provided in the form of cash and marketable securities. Such collateral may be subject to the standard industry terms of an ISDA Credit Support Annex. The terms of an ISDA Credit Support Annex provide that securi-ties received or provided as collateral may be pledged or sold during the term of the transactions and must be returned upon maturity of the transaction. These terms also give each coun-terparty the right to terminate the related transactions upon the other counterparty’s failure to post collateral. Financial collateral received or pledged for OTC derivatives may also be subject to collateral agreements which restrict the use of financial collateral.
For derivatives transacted with exchanges (exchange-traded derivatives) and central clearing counterparties (OTC-cleared
derivatives), positive and negative replacement values (PRV/NRV) and related cash collateral may be offset if the terms of the rules and regulations governing these exchanges and central clearing counterparties permit such netting and offset.
Where no such agreements or terms exist, fair values are recorded on a gross basis.
Exchange-traded derivatives or OTC-cleared derivatives, which are fully margined and for which the daily margin payments con-stitute settlement of the outstanding exposure, are not included in the offsetting disclosures because they are not subject to off-setting due to the daily settlement. The daily margin payments, which are not settled until the next settlement cycle is conducted, are presented in brokerage receivables or brokerage payables. The notional amount for these daily settled derivatives is included in the fair value of derivative instruments table in “Note 33 – Derivatives and hedging activities”.
Under US GAAP, the Group elected to account for substantially all financial instruments with an embedded derivative that is not considered clearly and closely related to the host contract at fair value. There is an exception for certain bifurcatable hybrid debt instruments which the Group did not elect to account for at fair value. However, these bifurcated embedded derivatives are gen-erally not subject to enforceable master netting agreements and are not recorded as derivative instruments under trading assets and liabilities or other assets and other liabilities. Information on bifurcated embedded derivatives has therefore not been included in the offsetting disclosures.
The following table presents the gross amount of derivatives sub-ject to enforceable master netting agreements by contract and transaction type, the amount of offsetting, the amount of deriva-tives not subject to enforceable master netting agreements and the net amount presented in the consolidated balance sheets.

327Consolidated financial statements – Credit Suisse Group
Offsetting of derivatives 2020 2019
Derivative Derivative Derivative Derivative
end of assets liabilities assets liabilities
Gross derivatives subject to enforceable master netting agreements (CHF billion)
OTC-cleared 6.1 4.6 3.8 3.0
OTC 68.2 65.7 63.7 61.9
Exchange-traded 0.5 0.6 0.3 0.2
Interest rate products 74.8 70.9 67.8 65.1
OTC-cleared 0.2 0.2 0.1 0.2
OTC 23.1 27.7 21.0 25.4
Foreign exchange products 23.3 27.9 21.1 25.6
OTC 10.7 15.1 10.1 10.4
Exchange-traded 19.9 20.4 5.3 5.0
Equity/index-related products 30.6 35.5 15.4 15.4
OTC-cleared 0.7 0.7 2.8 3.0
OTC 3.9 4.9 3.1 4.0
Credit derivatives 4.6 5.6 5.9 7.0
OTC 1.6 0.7 1.2 0.5
Exchange-traded 0.1 0.1 0.0 0.0
Other products 1 1.7 0.8 1.2 0.5
OTC-cleared 7.0 5.5 6.7 6.2
OTC 107.5 114.1 99.1 102.2
Exchange-traded 20.5 21.1 5.6 5.2
Total gross derivatives subject to enforceable master netting agreements 135.0 140.7 111.4 113.6
Offsetting (CHF billion)
OTC-cleared (6.2) (5.4) (6.0) (5.3)
OTC (94.4) (104.3) (87.0) (93.6)
Exchange-traded (20.0) (20.3) (4.9) (4.9)
Offsetting (120.6) (130.0) (97.9) (103.8)
of which counterparty netting (103.2) (103.2) (83.2) (83.2)
of which cash collateral netting (17.4) (26.8) (14.7) (20.6)
Net derivatives presented in the consolidated balance sheets (CHF billion)
OTC-cleared 0.8 0.1 0.7 0.9
OTC 13.1 9.8 12.1 8.6
Exchange-traded 0.5 0.8 0.7 0.3
Total net derivatives subject to enforceable master netting agreements 14.4 10.7 13.5 9.8
Total derivatives not subject to enforceable master netting agreements 2 11.2 6.8 4.4 3.7
Total net derivatives presented in the consolidated balance sheets 25.6 17.5 17.9 13.5
of which recorded in trading assets and trading liabilities 25.5 17.5 17.7 13.5
of which recorded in other assets and other liabilities 0.1 0.0 0.2 0.0
1 Primarily precious metals, commodity and energy products.2 Represents derivatives where a legal opinion supporting the enforceability of netting in the event of default or termination under the agreement is not in place.
Reverse repurchase and repurchase agreements and securities lending and borrowing transactions
Reverse repurchase and repurchase agreements are generally covered by master repurchase agreements. In certain situations, for example, in the event of default, all contracts under the agree-ments are terminated and are settled net in one single payment. Master repurchase agreements also include payment or settle-ment netting provisions in the normal course of business that state that all amounts in the same currency payable by each party to the other under any transaction or otherwise under the master repurchase agreement on the same date shall be set off.
As permitted by US GAAP the Group has elected to net transac-tions under such agreements in the consolidated balance sheet when specific conditions are met. Transactions are netted if, among other conditions, they are executed with the same coun-terparty, have the same explicit settlement date specified at the inception of the transactions, are settled through the same secu-rities transfer system and are subject to the same enforceable master netting agreement. The amounts offset are measured on the same basis as the underlying transaction (i.e., on an accrual basis or fair value basis).
Securities lending and borrowing transactions are generally exe-cuted under master securities lending agreements with netting
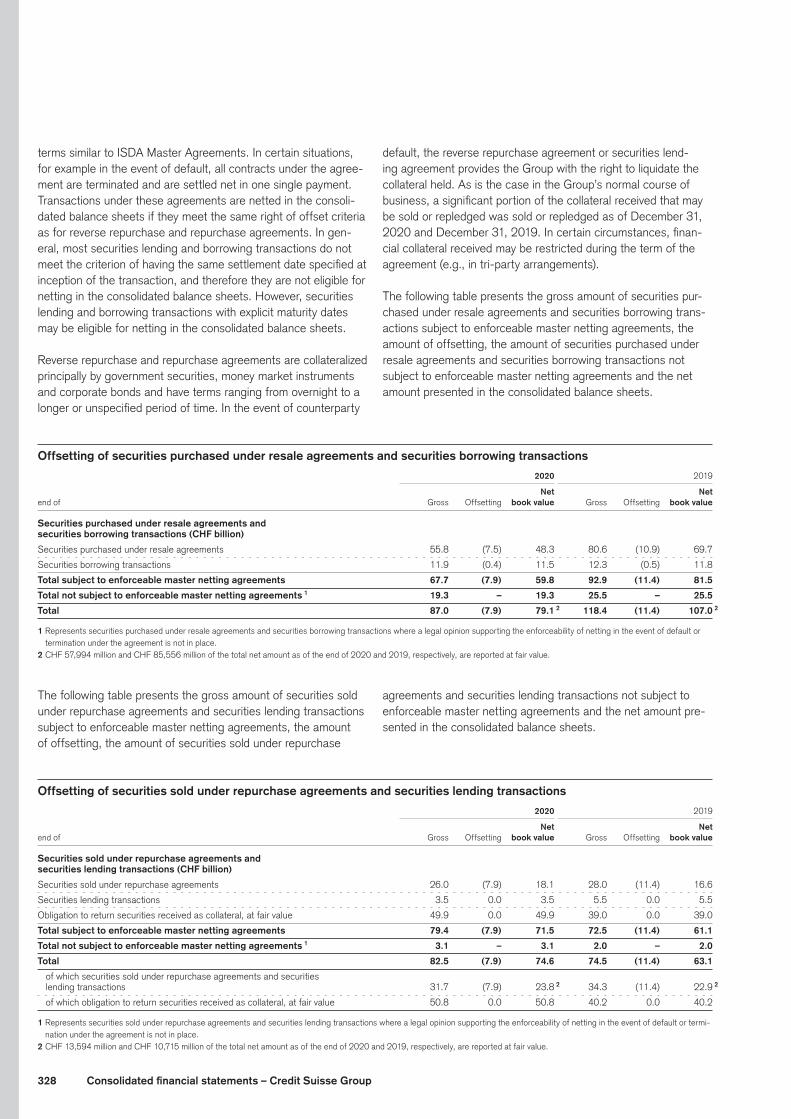
328 Consolidated financial statements – Credit Suisse Group
terms similar to ISDA Master Agreements. In certain situations, for example in the event of default, all contracts under the agree-ment are terminated and are settled net in one single payment. Transactions under these agreements are netted in the consoli-dated balance sheets if they meet the same right of offset criteria as for reverse repurchase and repurchase agreements. In gen-eral, most securities lending and borrowing transactions do not meet the criterion of having the same settlement date specified at inception of the transaction, and therefore they are not eligible for netting in the consolidated balance sheets. However, securities lending and borrowing transactions with explicit maturity dates may be eligible for netting in the consolidated balance sheets.
Reverse repurchase and repurchase agreements are collateralized principally by government securities, money market instruments and corporate bonds and have terms ranging from overnight to a longer or unspecified period of time. In the event of counterparty
default, the reverse repurchase agreement or securities lend-ing agreement provides the Group with the right to liquidate the collateral held. As is the case in the Group’s normal course of business, a significant portion of the collateral received that may be sold or repledged was sold or repledged as of December 31, 2020 and December 31, 2019. In certain circumstances, finan-cial collateral received may be restricted during the term of the agreement (e.g., in tri-party arrangements).
The following table presents the gross amount of securities pur-chased under resale agreements and securities borrowing trans-actions subject to enforceable master netting agreements, the amount of offsetting, the amount of securities purchased under resale agreements and securities borrowing transactions not subject to enforceable master netting agreements and the net amount presented in the consolidated balance sheets.
Offsetting of securities purchased under resale agreements and securities borrowing transactions 2020 2019
Net Net
end of Gross Offsetting book value Gross Offsetting book value
Securities purchased under resale agreements and
securities borrowing transactions (CHF billion)
Securities purchased under resale agreements 55.8 (7.5) 48.3 80.6 (10.9) 69.7
Securities borrowing transactions 11.9 (0.4) 11.5 12.3 (0.5) 11.8
Total subject to enforceable master netting agreements 67.7 (7.9) 59.8 92.9 (11.4) 81.5
Total not subject to enforceable master netting agreements 1 19.3 – 19.3 25.5 – 25.5
Total 87.0 (7.9) 79.1 2 118.4 (11.4) 107.0 2
1 Represents securities purchased under resale agreements and securities borrowing transactions where a legal opinion supporting the enforceability of netting in the event of default or termination under the agreement is not in place.
2 CHF 57,994 million and CHF 85,556 million of the total net amount as of the end of 2020 and 2019, respectively, are reported at fair value.
The following table presents the gross amount of securities sold under repurchase agreements and securities lending transactions subject to enforceable master netting agreements, the amount of offsetting, the amount of securities sold under repurchase
agreements and securities lending transactions not subject to enforceable master netting agreements and the net amount pre-sented in the consolidated balance sheets.
Offsetting of securities sold under repurchase agreements and securities lending transactions 2020 2019
Net Net
end of Gross Offsetting book value Gross Offsetting book value
Securities sold under repurchase agreements and
securities lending transactions (CHF billion)
Securities sold under repurchase agreements 26.0 (7.9) 18.1 28.0 (11.4) 16.6
Securities lending transactions 3.5 0.0 3.5 5.5 0.0 5.5
Obligation to return securities received as collateral, at fair value 49.9 0.0 49.9 39.0 0.0 39.0
Total subject to enforceable master netting agreements 79.4 (7.9) 71.5 72.5 (11.4) 61.1
Total not subject to enforceable master netting agreements 1 3.1 – 3.1 2.0 – 2.0
Total 82.5 (7.9) 74.6 74.5 (11.4) 63.1
of which securities sold under repurchase agreements and securities
lending transactions 31.7 (7.9) 23.8 2 34.3 (11.4) 22.9 2
of which obligation to return securities received as collateral, at fair value 50.8 0.0 50.8 40.2 0.0 40.2
1 Represents securities sold under repurchase agreements and securities lending transactions where a legal opinion supporting the enforceability of netting in the event of default or termi-nation under the agreement is not in place.
2 CHF 13,594 million and CHF 10,715 million of the total net amount as of the end of 2020 and 2019, respectively, are reported at fair value.
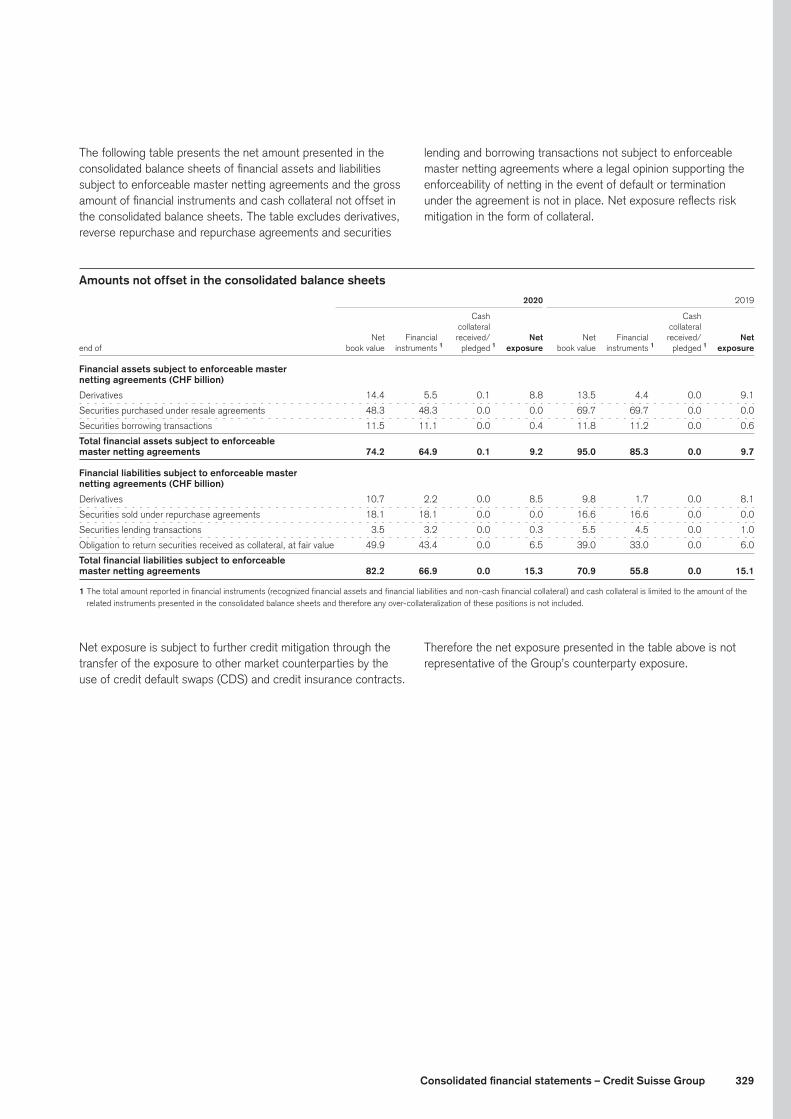
329Consolidated financial statements – Credit Suisse Group
The following table presents the net amount presented in the consolidated balance sheets of financial assets and liabilities subject to enforceable master netting agreements and the gross amount of financial instruments and cash collateral not offset in the consolidated balance sheets. The table excludes derivatives, reverse repurchase and repurchase agreements and securities
lending and borrowing transactions not subject to enforceable master netting agreements where a legal opinion supporting the enforceability of netting in the event of default or termination under the agreement is not in place. Net exposure reflects risk mitigation in the form of collateral.
Amounts not offset in the consolidated balance sheets 2020 2019
Cash Cash
collateral collateral
Net Financial received/ Net Net Financial received/ Net
end of book value instruments 1 pledged 1 exposure book value instruments 1 pledged 1 exposure
Financial assets subject to enforceable master
netting agreements (CHF billion)
Derivatives 14.4 5.5 0.1 8.8 13.5 4.4 0.0 9.1
Securities purchased under resale agreements 48.3 48.3 0.0 0.0 69.7 69.7 0.0 0.0
Securities borrowing transactions 11.5 11.1 0.0 0.4 11.8 11.2 0.0 0.6
Total financial assets subject to enforceable
master netting agreements 74.2 64.9 0.1 9.2 95.0 85.3 0.0 9.7
Financial liabilities subject to enforceable master
netting agreements (CHF billion)
Derivatives 10.7 2.2 0.0 8.5 9.8 1.7 0.0 8.1
Securities sold under repurchase agreements 18.1 18.1 0.0 0.0 16.6 16.6 0.0 0.0
Securities lending transactions 3.5 3.2 0.0 0.3 5.5 4.5 0.0 1.0
Obligation to return securities received as collateral, at fair value 49.9 43.4 0.0 6.5 39.0 33.0 0.0 6.0
Total financial liabilities subject to enforceable
master netting agreements 82.2 66.9 0.0 15.3 70.9 55.8 0.0 15.1
1 The total amount reported in financial instruments (recognized financial assets and financial liabilities and non-cash financial collateral) and cash collateral is limited to the amount of the related instruments presented in the consolidated balance sheets and therefore any over-collateralization of these positions is not included.
Net exposure is subject to further credit mitigation through the transfer of the exposure to other market counterparties by the use of credit default swaps (CDS) and credit insurance contracts.
Therefore the net exposure presented in the table above is not representative of the Group’s counterparty exposure.
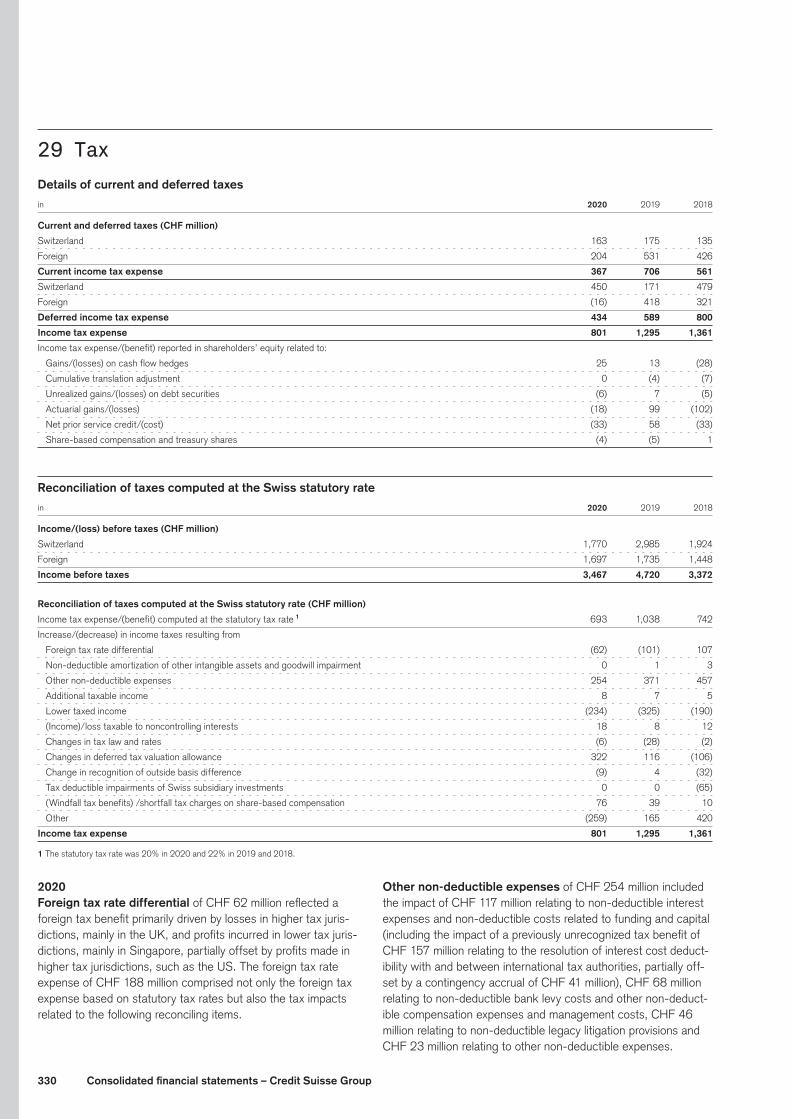
330 Consolidated financial statements – Credit Suisse Group
29 TaxDetails of current and deferred taxes
in 2020 2019 2018
Current and deferred taxes (CHF million)
Switzerland 163 175 135
Foreign 204 531 426
Current income tax expense 367 706 561
Switzerland 450 171 479
Foreign (16) 418 321
Deferred income tax expense 434 589 800
Income tax expense 801 1,295 1,361
Income tax expense/(benefit) reported in shareholders’ equity related to:
Gains/(losses) on cash flow hedges 25 13 (28)
Cumulative translation adjustment 0 (4) (7)
Unrealized gains/(losses) on debt securities (6) 7 (5)
Actuarial gains/(losses) (18) 99 (102)
Net prior service credit/(cost) (33) 58 (33)
Share-based compensation and treasury shares (4) (5) 1
Reconciliation of taxes computed at the Swiss statutory rate
in 2020 2019 2018
Income/(loss) before taxes (CHF million)
Switzerland 1,770 2,985 1,924
Foreign 1,697 1,735 1,448
Income before taxes 3,467 4,720 3,372
Reconciliation of taxes computed at the Swiss statutory rate (CHF million)
Income tax expense/(benefit) computed at the statutory tax rate 1 693 1,038 742
Increase/(decrease) in income taxes resulting from
Foreign tax rate differential (62) (101) 107
Non-deductible amortization of other intangible assets and goodwill impairment 0 1 3
Other non-deductible expenses 254 371 457
Additional taxable income 8 7 5
Lower taxed income (234) (325) (190)
(Income)/loss taxable to noncontrolling interests 18 8 12
Changes in tax law and rates (6) (28) (2)
Changes in deferred tax valuation allowance 322 116 (106)
Change in recognition of outside basis difference (9) 4 (32)
Tax deductible impairments of Swiss subsidiary investments 0 0 (65)
(Windfall tax benefits) /shortfall tax charges on share-based compensation 76 39 10
Other (259) 165 420
Income tax expense 801 1,295 1,361
1 The statutory tax rate was 20% in 2020 and 22% in 2019 and 2018.
2020Foreign tax rate differential of CHF 62 million reflected a foreign tax benefit primarily driven by losses in higher tax juris-dictions, mainly in the UK, and profits incurred in lower tax juris-dictions, mainly in Singapore, partially offset by profits made in higher tax jurisdictions, such as the US. The foreign tax rate expense of CHF 188 million comprised not only the foreign tax expense based on statutory tax rates but also the tax impacts related to the following reconciling items.
Other non-deductible expenses of CHF 254 million included the impact of CHF 117 million relating to non-deductible interest expenses and non-deductible costs related to funding and capital (including the impact of a previously unrecognized tax benefit of CHF 157 million relating to the resolution of interest cost deduct-ibility with and between international tax authorities, partially off-set by a contingency accrual of CHF 41 million), CHF 68 million relating to non-deductible bank levy costs and other non-deduct-ible compensation expenses and management costs, CHF 46 million relating to non-deductible legacy litigation provisions and CHF 23 million relating to other non-deductible expenses.

331Consolidated financial statements – Credit Suisse Group
Lower taxed income of CHF 234 million included a tax benefit of CHF 79 million related to the revaluations of the equity invest-ments in SIX Group AG, Allfunds Group and Pfandbriefbank in Switzerland, CHF 67 million related to concessionary and lower taxed income, CHF 67 million related to non-taxable life insur-ance income, CHF 19 million related to the transfer of the Invest-lab fund platform to Allfunds Group and various smaller items.
Changes in deferred tax valuation allowances of CHF 322 million included a tax charge from the increase in valuation allowances on deferred tax assets of CHF 353 million, mainly in respect of the re-assessment of deferred tax assets reflect-ing changes in the forecasted future profitability of two of the Group’s operating entities in Switzerland of CHF 252 million, and also in respect of one of the Group’s operating entities in the UK. Also included was the net impact of the release of valuation allowances on deferred tax assets of CHF 31 million, mainly in respect of one of the Group’s operating entities in Hong Kong and another of the Group’s operating entities in the UK.
Other of CHF 259 million included an income tax benefit from the re-assessment of the US base erosion and anti-abuse tax (BEAT) provision for 2019 of CHF 180 million and the impact of a change in US tax rules relating to federal net operating losses (NOLs), where federal NOLs generated in tax years 2018, 2019 or 2020 can be carried back for five years instead of no carry back before and also the deductible interest expense limitations for the years 2019 and 2020 have been increased from 30% to 50% of adjusted taxable income for the year, which in aggregate resulted in a benefit of CHF 141 million. Additionally, this included an income tax benefit of CHF 82 million relating to prior years’ adjustments and a tax benefit of CHF 34 million relating to the beneficial earnings mix of one of the Group’s operating entities in Switzerland. These benefits were partially offset by CHF 78 million relating to the tax impact of an accounting standard implementation transition adjustment for own credit movements, CHF 61 million relating to withholding taxes, CHF 26 million relating to the current year BEAT provision and CHF 14 million relating to own credit valuation movements. The remaining bal-ance included various smaller items.
The US tax reform enacted in December 2017 introduced the BEAT tax regime, effective as of January 1, 2018, for which final regulations were issued by the US Department of Treasury on December 2, 2019. Following the publication of the 2019 finan-cial statements, Credit Suisse continued its analysis of the final regulations, resulting in a revision to the technical application of the prior BEAT estimate. This new information was not available or reasonably knowable at the time of the publication of the 2019
financial statements and resulted in a change of accounting esti-mate reflected in 2020.
2019Foreign tax rate differential of CHF 101 million reflected a for-eign tax benefit mainly driven by losses in higher tax jurisdictions, mainly in the UK, and profits incurred in lower tax jurisdictions, mainly in Singapore, partially offset by profits made in higher tax jurisdictions, such as Brazil. The foreign tax rate expense of CHF 949 million comprised not only the foreign tax expense based on statutory tax rates but also the tax impacts related to the following reconciling items.
Other non-deductible expenses of CHF 371 million included the impact of CHF 274 million relating to non-deductible interest expenses (including a contingency accrual of CHF 28 million), CHF 56 million relating to non-deductible bank levy costs and other non-deductible compensation expenses and management costs, CHF 34 million relating to non-deductible fines and various smaller non-deductible expenses.
Lower taxed income of CHF 325 million included a tax benefit of CHF 160 million related to the transfer of the InvestLab fund platform to Allfunds Group and SIX Group AG equity investment revaluation gain in Switzerland, CHF 73 million related to non-tax-able life insurance income, CHF 45 million related to non-taxable dividend income, CHF 26 million related to concessionary and lower taxed income, CHF 14 million related to exempt income and various smaller items.
Changes in deferred tax valuation allowances of CHF 116 million included a tax charge from the increase in valuation allow-ances on deferred tax assets of CHF 273 million, mainly in respect of three of the Group’s operating entities in Japan, the UK and the US. Also included was the net impact of the release of valuation allowances on deferred tax assets of CHF 157 mil-lion, mainly in respect of one of the Group’s operating entities in the UK.
Other of CHF 165 million included CHF 165 million relating to BEAT and CHF 123 million relating to the tax impact of an accounting standard implementation transition adjustment for own credit movements. This was partially offset by CHF 58 mil-lion from own credit valuation gains, CHF 53 million relating to agreements reached with tax authorities relating to an advanced pricing agreement and the closure of a tax audit and CHF 20 million relating to a prior year adjustment. The remaining balance included various smaller items.

332 Consolidated financial statements – Credit Suisse Group
2018Foreign tax rate differential of CHF 107 million reflected a for-eign tax expense mainly driven by profits made in higher tax juris-dictions, such as the US, partially offset by foreign tax rate dif-ferential related to profits incurred in lower tax jurisdictions, mainly in Singapore. The foreign tax rate expense of CHF 747 million comprised not only the foreign tax expense based on statutory tax rates but also the tax impacts related to the following recon-ciling items.
Other non-deductible expenses of CHF 457 million included the impact of CHF 325 million relating to non-deductible interest expenses (including a contingency accrual of CHF 92 million), CHF 49 million related to non-deductible bank levy costs and other non-deductible compensation expenses and management costs, CHF 15 million related to non-deductible fines and various smaller non-deductible expenses.
Lower taxed income of CHF 190 million included a tax ben-efit of CHF 66 million related to non-taxable dividend income, CHF 48 million related to non-taxable life insurance income, CHF 33 million related to concessionary and lower taxed income, CHF 23 million related to exempt income and various smaller items.
Changes in deferred tax valuation allowances of CHF 106 million included a tax benefit from the release of valuation allow-ances of CHF 191 million, mainly in respect of two of the Group’s operating entities in the UK. Also included was the net impact of the increase in valuation allowances on deferred tax assets of CHF 85 million, mainly in respect of one of the Group’s operating entities in Switzerland.
Other of CHF 420 million included CHF 202 million relating to the tax impact of an accounting standard implementation transi-tion adjustment for own credit movements, CHF 130 million from own credit valuation gains, CHF 65 million relating to BEAT, CHF 56 million relating to the net re-assessment of deferred tax balances in respect of one of the Group’s operating entities in Switzerland, CHF 26 million relating to the increase of tax con-tingency accruals and other smaller balances. This was partially offset by prior year adjustments of CHF 76 million.
As of December 31, 2020, the Group had accumulated undistrib-uted earnings from foreign subsidiaries of CHF 20.1 billion com-pared to CHF 17.8 billion as of December 31, 2019. The increase compared to the end of 2019 reflected a reserve transfer in one of the Group’s entities. No deferred tax liability was recorded in respect of those amounts as these earnings are considered indefi-nitely reinvested. It is not practicable to estimate the amount of unrecognized deferred tax liabilities for these undistributed foreign earnings.
Deferred tax assets and liabilities
end of 2020 2019
Deferred tax assets and liabilities (CHF million)
Compensation and benefits 931 956
Loans 653 598
Investment securities 1,347 1,437
Provisions 999 769
Leases 384 439
Derivatives 53 72
Real estate 175 189
Net operating loss carry-forwards 5,425 5,753
Goodwill and intangible assets 209 405
Other 119 78
Gross deferred tax assets
before valuation allowance 10,295 10,696
Less valuation allowance (4,465) (4,136)
Gross deferred tax assets
net of valuation allowance 5,830 6,560
Compensation and benefits (666) (650)
Loans (352) (348)
Investment securities (523) (503)
Provisions (333) (337)
Leases (365) (405)
Derivatives (231) (224)
Real estate (36) (35)
Other (187) (182)
Gross deferred tax liabilities (2,693) (2,684)
Net deferred tax assets 3,137 3,876
of which deferred tax assets 3,667 4,399
of which net operating losses 1,070 1,465
of which deductible temporary differences 2,597 2,934
of which deferred tax liabilities (530) (523)
Net deferred tax assets of CHF 3,137 million decreased CHF 739 million from 2019 to 2020, primarily due to the impact of for-eign exchange translation losses of CHF 348 million, which were included within the currency translation adjustments recorded in AOCI, CHF 252 million from the re-assessment of deferred tax balances in Switzerland and CHF 177 million related to current year earnings. These decreases were partially offset by the tax impacts directly recorded in equity and OCI of CHF 38 million, mainly related to own credit movements.
In 2019, the US and Switzerland contributed the majority of the net deferred tax assets, CHF 3,855 million, net of a valuation allowance of CHF 606 million. In 2020, following the deferred tax asset re-assessment in Switzerland, the US contributed the majority of the net deferred tax assets, CHF 3,040 million. No valuation allowance was required on the US deferred tax assets as of the end of 2020.
Due to uncertainty concerning its ability to generate the neces-sary amount and mix of taxable income in future periods, the Group recorded a valuation allowance against gross deferred tax assets in the amount of CHF 4.5 billion as of December 31, 2020 compared to CHF 4.1 billion as of December 31, 2019.

333Consolidated financial statements – Credit Suisse Group
Amounts and expiration dates of net operating loss carry-forwards
end of 2020 Total
Net operating loss carry-forwards (CHF million)
Due to expire within 1 year 17
Due to expire within 2 to 5 years 4,774
Due to expire within 6 to 10 years 4,145
Due to expire within 11 to 20 years 5,303
Amount due to expire 14,239
Amount not due to expire 16,162
Total net operating loss carry-forwards 30,401
Movements in the valuation allowance
in 2020 2019 2018
Movements (CHF million)
Balance at beginning of period 4,136 4,021 4,279
Net changes 329 115 (258)
Balance at end of period 4,465 4,136 4,021
As part of its normal practice, the Group conducted a detailed evaluation of its expected future results. This evaluation was dependent on management estimates and assumptions in devel-oping the expected future results, which were based on a stra-tegic business planning process influenced by current economic conditions and assumptions of future economic conditions that are subject to change. This evaluation took into account both positive and negative evidence related to expected future taxable income and also considered stress scenarios. This evaluation has indicated the expected future results that are likely to be earned in jurisdictions where the Group has significant gross deferred tax assets, primarily in the US, Switzerland and the UK. The Group then compared those expected future results with the applicable law governing the utilization of deferred tax assets. US tax law allowed for a 20-year carry-forward period for existing NOLs as of the end of 2017, federal NOLs generated in tax years 2018, 2019 and 2020 can be carried back for five years and any new NOLs will have an unlimited carry-forward period. UK tax law allows for an unlimited carry-forward period for NOLs. Based
on the expected future results in the Bank parent company and given that Swiss tax law allows for a seven-year carry-forward period for NOLs, a valuation allowance was recorded on the deferred tax assets of this entity.
Tax benefits associated with share-based compensation
in 2020 2019 2018
Tax benefits (CHF million)
Tax benefits recorded in the consolidated
statements of operations 1 264 263 242
1 Calculated at the statutory tax rate before valuation allowance considerations.
> Refer to “Note 30 – Employee deferred compensation” for further information on share-based compensation.
If, upon settlement of share-based compensation, the tax deduc-tion exceeds the cumulative compensation cost that the Group has recognized in the consolidated financial statements, the utilized tax benefit associated with any excess deduction is con-sidered a “windfall” and recognized in the consolidated state-ments of operations and reflected as an operating cash inflow in the consolidated statements of cash flows. If, upon settlement, the tax deduction is lower than the cumulative compensation cost that the Group has recognized in the consolidated financial state-ments, the tax charge associated with the lower deduction is considered a “shortfall”. Tax charges arising on shortfalls are rec-ognized in the consolidated statements of operations.
Uncertain tax positionsUS GAAP requires a two-step process in evaluating uncertain income tax positions. In the first step, an enterprise determines whether it is more likely than not that an income tax position will be sustained upon examination, including resolution of any related appeals or litigation processes, based on the technical merits of the position. Income tax positions meeting the more-likely-than-not recognition threshold are then measured to determine the amount of benefit eligible for recognition in the consolidated financial statements. Each income tax position is measured at the largest amount of tax benefit that is more likely than not to be realized upon ultimate settlement.
Reconciliation of gross unrecognized tax benefits 2020 2019 2018
Movements in gross unrecognized tax benefits (CHF million)
Balance at beginning of period 595 574 481
Increases in unrecognized tax benefits as a result of tax positions taken during a prior period 14 27 10
Decreases in unrecognized tax benefits as a result of tax positions taken during a prior period (249) (64) (2)
Increases in unrecognized tax benefits as a result of tax positions taken during the current period 90 105 112
Decreases in unrecognized tax benefits relating to settlements with tax authorities (3) 0 0
Reductions to unrecognized tax benefits as a result of a lapse of the applicable statute of limitations (17) (35) (4)
Other (including foreign currency translation) (48) (12) (23)
Balance at end of period 382 595 574
of which, if recognized, would affect the effective tax rate 382 595 574

334 Consolidated financial statements – Credit Suisse Group
Interest and penalties
in 2020 2019 2018
Interest and penalties (CHF million)
Interest and penalties recognized in the
consolidated statements of operations (16) (10) (28)
Interest and penalties recognized in the
consolidated balance sheets 61 77 87
Interest and penalties are reported as tax expense. The Group is currently subject to ongoing tax audits, inquiries and litigation with the tax authorities in a number of jurisdictions, including Brazil, the Netherlands, the US, the UK and Switzerland. Although the
timing of completion is uncertain, it is reasonably possible that some of these will be resolved within 12 months of the report-ing date. It is reasonably possible that there will be a decrease of between zero and CHF 40 million in unrecognized tax benefits within 12 months of the reporting date.
The Group remains open to examination from federal, state, pro-vincial or similar local jurisdictions from the following years onward in these major countries: Brazil – 2016; Switzerland – 2015 (fed-eral and Zurich cantonal level); the UK – 2012; the US – 2010; and the Netherlands – 2010.

335Consolidated financial statements – Credit Suisse Group
30 Employee deferred compensationPayment of deferred compensation to employees is determined by the nature of the business, role, location and performance of the employee. Unless there is a contractual obligation, granting deferred compensation is solely at the discretion of the Com-pensation Committee and senior management. Special deferred compensation granted as part of a contractual obligation is typi-cally used to compensate new senior employees for forfeited awards from previous employers upon joining the Group. It is the Group’s policy not to make multi-year guarantees.
Compensation expense recognized in the consolidated statement of operations for share-based and other awards that were granted as deferred compensation is recognized in accordance with the specific terms and conditions of each respective award and is primarily recognized over the future requisite service and vesting period, which is determined by the plan, retirement eligibility of employees and certain other terms. All deferred compensation plans are subject to restrictive covenants, which generally include non-compete and non-solicit provisions. Compensation expense for share-based and other awards that were granted as deferred compensation also includes the current estimated outcome of applicable performance criteria, estimated future forfeitures and mark-to-market adjustments for certain cash awards that are still outstanding.
The following tables show the compensation expense for deferred compensation awards granted in 2020 and prior years that was recognized in the consolidated statements of operations during 2020, 2019 and 2018, the total shares delivered, the estimated unrecognized compensation expense for deferred compensa-tion awards granted in 2020 and prior years outstanding as of December 31, 2020 and the remaining requisite service period over which the estimated unrecognized compensation expense will be recognized. The estimated unrecognized compensation expense was based on the fair value of each award on the grant date and included the current estimated outcome of relevant per-formance criteria and estimated future forfeitures but no estimate for future mark-to-market adjustments. The recognition of com-pensation expense for the deferred compensation awards granted in February 2021 began in 2021 and thus had no impact on the 2020 consolidated financial statements.
Deferred compensation awards for 2020
In February 2021, the Group granted share awards, performance share awards and Contingent Capital Awards (CCA) as deferred compensation. Deferred compensation was awarded to employ-ees with total compensation of CHF/USD 250,000 or the local currency equivalent or higher.
Deferred compensation expense
in 2020 2019 2018
Deferred compensation expense (CHF million)
Share awards 573 589 516
Performance share awards 448 438 382
Contingent Capital Awards 255 308 154
Deferred cash awards 398 420 233
Retention awards 43 22 54
Total deferred compensation expense 1,717 1,777 1,339
Total shares delivered (million)
Total shares delivered 50.7 41.8 46.6
In 2020, Contingent Capital share awards are included in the category share awards, and Capital Opportunity Facility awards are included in the category deferred cash awards. Prior periods have been reclassified to conform to the current presentation.
Estimated unrecognized deferred compensation
end of 2020
Estimated unrecognized compensation expense (CHF million)
Share awards 449
Performance share awards 194
Contingent Capital Awards 151
Deferred cash awards 201
Retention awards 40
Total 1,035
Aggregate remaining weighted-average requisite service period (years)
Aggregate remaining weighted-average requisite service period 1.2
Does not include the estimated unrecognized compensation expense relating to grants made in 2021 for 2020.
Share awards
Share awards granted in February 2021 are similar to those granted in February 2020. Each share award granted entitles the holder of the award to receive one Group share, subject to ser-vice conditions. Share awards vest over three years with one third of the share awards vesting on each of the three anniversaries of the grant date (ratable vesting), with the exception of awards granted to individuals classified as risk managers or senior man-agers under the UK PRA Remuneration Code or similar regula-tions in other jurisdictions. Share awards granted to risk managers vest over five years with one fifth of the award vesting on each of the five anniversaries of the grant date, while share awards granted to senior managers vest over five years commencing on the third anniversary of the grant date, with one fifth of the award vesting on each of the third to seventh anniversaries of the grant date. Share awards are expensed over the service period of the awards. The value of the share awards is solely dependent on the Group share price at the time of delivery.
The Group’s share awards include other awards, such as blocked shares and special awards, which may be granted to new employ-ees. Other share awards entitle the holder to receive one Group share and are generally subject to continued employment with the

336 Consolidated financial statements – Credit Suisse Group
Group, contain restrictive covenants and cancellation provisions and generally vest between zero and five years.
On February 19, 2021, the Group granted 44.6 million share awards with a total value of CHF 592 million. The number of share awards granted to employees was generally determined by dividing the deferred component of variable compensation being granted as share awards by the average price of a Group share over the ten consecutive trading days which ended on March 4, 2021. The fair value of each share award was CHF 12.59, the Group share price on the grant date. The majority of share awards granted include the right to receive dividend equivalents on vested shares. The estimated unrecognized compensation expense of CHF 538 million was determined based on the fair value of the awards on the grant date, includes the current esti-mated future forfeitures and will be recognized over the vesting period, subject to early retirement rules.
Share awards granted for previous years
For compensation year 2020 2019 2018
Shares awarded (million) 44.6 57.9 55.6
Value of shares awarded (CHF million) 592 626 638
Fair value of each share awarded (CHF) 1 12.59 10.81 11.75
1 Based on the Group’s share price on the grant date.
In order to comply with Capital Requirements Directive IV require-ments, employees who hold key roles in respect of certain Group subsidiaries receive shares that are subject to transfer restric-tions for 50% of the amount that would have been paid to them in cash. These shares are vested at the time of grant but remain blocked, that is, subject to transfer restrictions, for six months to one year from the date of grant, depending on the location.
On February 19, 2021, the Group granted 2.6 million blocked shares with a total value of CHF 35 million that vested immedi-ately upon grant, have no future service requirements and were attributed to services performed in 2020.
Blocked share awards granted for previous years
For compensation year 2020 2019 2018
Blocked shares awarded (million) 2.6 3.2 3.0
Value of shares awarded (CHF million) 35 37 35
Share award activities 2020 2019 2018
Weighted- Weighted- Weighted-
Number of average Number of average Number of average
share grant-date share grant-date share grant-date
awards fair value awards fair value awards fair value
in million in CHF in million in CHF in million in CHF
Share awards
Balance at beginning of period 110.5 13.46 83.2 16.15 84.9 15.73
Granted 69.1 10.61 69.3 11.68 43.8 16.91
Settled (47.9) 13.76 (36.9) 16.15 (40.7) 16.09
Forfeited (5.4) 11.72 (5.1) 13.83 (4.8) 16.24
Balance at end of period 126.3 11.86 110.5 13.46 83.2 16.15
of which vested 13.5 – 11.9 – 8.6 –
of which unvested 112.8 – 98.6 – 74.6 –

337Consolidated financial statements – Credit Suisse Group
Performance share awards
Managing directors and all material risk takers and controllers (employees whose activities are considered to have a potentially material impact on the Group’s risk profile) received a portion of their deferred variable compensation in the form of performance share awards. Performance share awards are similar to share awards, except that the full balance of outstanding performance share awards, including those awarded in prior years, are subject to performance-based malus provisions.
Performance share awards are subject to a negative adjust-ment in the event of a divisional loss by the division in which the employees worked as of December 31, 2020, or a negative ROE of the Group, whichever results in a larger adjustment. For employees in corporate functions and the Asset Resolution Unit, the negative adjustment only applies in the event of a negative ROE of the Group and is not linked to the performance of the divisions. The basis for the ROE calculation may vary from year to year, depending on the Compensation Committee’s determination for the year in which the performance shares are granted.
On February 19, 2021, the Group granted 37.8 million perfor-mance share awards with a total value of CHF 493 million. The
number of performance share awards granted to employees was generally determined by dividing the deferred component of vari-able compensation being granted as performance share awards by the average price of a Group share over the ten consecu-tive trading days which ended on March 4, 2021. The fair value of each performance share award was CHF 12.59, the Group share price on the grant date. The majority of performance share awards granted include the right to receive dividend equiva-lents on vested shares. The estimated unrecognized compensa-tion expense of CHF 453 million was determined based on the fair value of the awards on the grant date, includes the current estimated outcome of the relevant performance criteria and esti-mated future forfeitures and will be recognized over the vesting period, subject to early retirement rules.
Performance share awards granted for previous years
For compensation year 2020 2019 2018
Performance shares awarded (million) 37.8 50.7 46.1
Value of performance shares
awarded (CHF million) 493 553 532
Fair value of each performance
share awarded (CHF) 1 12.59 10.81 11.75
1 Based on the Group’s share price on the grant date.
Performance share award activities 2020 2019 2018
Number of Weighted- Number of Weighted- Number of Weighted-
performance average performance average performance average
share grant-date share grant-date share grant-date
awards fair value awards fair value awards fair value
in million in CHF in million in CHF in million in CHF
Performance share awards
Balance at beginning of period 72.4 13.38 51.7 16.33 54.2 15.88
Granted 50.9 10.63 45.4 11.60 26.5 16.98
Settled (29.0) 14.13 (22.8) 16.51 (26.3) 16.07
Forfeited (2.6) 11.62 (1.9) 13.67 (2.7) 16.26
Balance at end of period 91.7 11.66 72.4 13.38 51.7 16.33
of which vested 10.4 – 6.7 – 5.4 –
of which unvested 81.3 – 65.7 – 46.3 –

338 Consolidated financial statements – Credit Suisse Group
Contingent Capital Awards
CCA were granted in February 2021, 2020 and 2019 to manag-ing directors and directors as part of the 2020, 2019 and 2018 deferred variable compensation and have rights and risks similar to those of certain contingent capital instruments issued by the Group in the market. CCA are scheduled to vest on the third anni-versary of the grant date, other than those granted to individu-als classified as risk managers or senior managers under the UK PRA Remuneration Code or similar regulations in other jurisdic-tions, where CCA vest on the fifth and seventh anniversaries of the grant date, respectively, and will be expensed over the vest-ing period. CCA generally provide a conditional right to receive semi-annual cash payments of interest equivalents until settled, with rates being dependent upon the vesting period and currency of denomination. CCA granted in 2021, 2020 and 2019 that vest five or seven years from the date of grant are not eligible for semi-annual cash payments of interest equivalents. CCA granted to certain regulated employees that vest over three years are not eligible for semi-annual cash payments of interest equivalents.p CCA granted in 2021 that are denominated in US dollars
and vest three years from the date of grant receive inter-est equivalents at a rate of 3.60%, per annum plus the daily compounded (spread exclusive) US dollar Secured Overnight Financing Rate (SOFR);
p CCA granted in 2020 and 2019 that are denominated in US dollars and vest three years from the date of grant receive interest equivalents at a rate of 3.77% and 4.46% respec-tively, per annum over the six-month US dollar LIBOR;
p CCA granted in 2021 that are denominated in Swiss francs and vest three years from the date of grant receive interest equivalents at a rate of 3.06%, per annum plus the daily com-pounded (spread exclusive) Swiss franc Swiss Average Rate Overnight (SARON);
p CCA granted in 2020 and 2019 that are denominated in Swiss francs and vest three years from the date of grant receive interest equivalents at a rate of 3.29% and 3.73%, respec-tively, per annum over the six-month Swiss franc LIBOR; and
p The semi-annual interest equivalent cash payments calcula-tion cycle with effect from February 2021 will be based on the SOFR for CCA denominated in US dollars and the SARON for CCA denominated in Swiss francs.
The rates were set in line with market conditions at the time of grant and existing high-trigger and low-trigger contingent capi-tal instruments that the Group has issued. For CCA granted in February 2021, employees who received compensation in Swiss francs received CCA denominated in Swiss francs and all other employees received CCA denominated in US dollars.
As CCA qualify as going concern loss-absorbing capital of the Group, the timing and form of distribution upon settlement is sub-ject to approval by FINMA. At settlement, employees will receive either a contingent capital instrument or a cash payment based on the fair value of the CCA. The fair value will be determined by the Group. In the case of a cash settlement, the CCA award will be converted into the local currency of each respective employee.
CCA have loss-absorbing features such that prior to settlement, the principal amount of the CCA would be written down to zero and forfeited if any of the following trigger events were to occur:p the Group’s reported common equity tier 1 (CET1) ratio falls
below 7%; orp FINMA determines that cancellation of the CCA and other
similar contingent capital instruments is necessary, or that the Group requires public sector capital support, in either case to prevent it from becoming insolvent or otherwise failing.
On February 19, 2021, the Group awarded CHF 253 million of CCA that will be expensed over the vesting period. The estimated unrecognized compensation expense of CHF 241 million was determined based on the fair value of the awards on the grant date, including the current estimated outcome of the relevant per-formance criteria and estimated future forfeitures. This will be rec-ognized over the vesting period, subject to early retirement rules.
Contingent Capital Awards granted for previous years
For compensation year 2020 2019 2018
CCA awarded (CHF million) 253 268 299
Deferred cash awards
Deferred cash awards include certain special awards as well as voluntary deferred compensation plans and employee investment plans. For certain special awards, compensation expense was primarily driven by their vesting schedule; for other deferred cash awards, compensation expense was driven by mark to market and performance adjustments, as the majority of the awards are fully vested.
Deferred fixed cash awardsThe Group granted deferred fixed cash compensation during 2020, 2019 and 2018 of CHF 120 million, CHF 108 million and CHF 98 million, respectively, to certain employees in the Americas. This compensation has been expensed in the Invest-ment Bank and International Wealth Management divisions over a three-year vesting period from the grant date. Amortization of this compensation in 2020 totaled CHF 112 million, of which CHF 65 million was related to awards granted in 2020.
Upfront cash awardsIn February 2021, certain managing directors and directors in International Wealth Management were granted CHF 59 million of upfront cash awards as part of the cash component of their 2020 variable compensation. During 2020 and 2019, the Group granted upfront cash awards of CHF 146 million and CHF 47 million, respectively. These awards are subject to repayment (clawback) by the employee in the event of voluntary resigna-tion, termination for cause or in connection with other specified events or conditions within three years of the award grant. The amount subject to repayment is reduced in equal monthly install-ments during the three-year period following the grant date. The expense recognition will occur over the three-year vesting period,

339Consolidated financial statements – Credit Suisse Group
subject to service conditions. Amortization of this compensation in 2020 totaled CHF 79 million.
Retention awards
The Group granted deferred cash and stock retention awards dur-ing 2020, 2019 and 2018 of CHF 40 million, CHF 40 million and CHF 25 million, respectively. These awards are expensed over
the applicable vesting period from the grant date. Amortization of these awards in 2020 totaled CHF 43 million, of which CHF 13 million was related to awards granted in 2020.
Delivered shares
The Group fully covered its share delivery obligations through market purchases in 2020, 2019 and 2018.
31 Related partiesParties are considered to be related if one party has the ability to control the other party or exercise significant influence over the other party in making financial or operational decisions, or if another party controls both. The Group’s related parties include key management personnel, close family members of key man-agement personnel and entities that are controlled, significantly influenced, or for which significant voting power is held, by key management personnel or their close family members. Key man-agement personnel are those individuals having authority and responsibility for planning, directing and controlling the activities of the Group, that is, members of the Executive Board and the Board of Directors.
Banking relationships
The Group is a global financial services provider. Many of the members of the Executive Board and the Board of Directors, their close family members or companies associated with them main-tain banking relationships with the Group. The Group or any of its banking subsidiaries may from time to time enter into financing and other banking agreements with companies in which current members of the Executive Board or the Board of Directors have a significant influence as defined by the SEC, such as holding executive and/or board level roles in these companies. With the exception of the transactions described below, relationships with members of the Executive Board or the Board of Directors and such companies are in the ordinary course of business and are entered into on an arm’s length basis. Also, unless otherwise noted, all loans to members of the Executive Board, members of the Board of Directors, their close family members or compa-nies associated with them were made in the ordinary course of business, were made on substantially the same terms, including interest rates and collateral, as those prevailing at the time for comparable transactions with other persons and did not involve more than the normal risk of collectability or present other unfa-vorable features. As of December 31, 2020, 2019 and 2018,
there were no loan exposures to such related parties that were not made in the ordinary course of business and at prevailing market conditions.
Related party loans
Executive Board and Board of Directors loansThe majority of loans outstanding to members of the Executive Board and the Board of Directors are mortgages or loans against securities.
All mortgage loans to members of the Executive Board are granted either with variable or fixed interest rates over a certain period. Typically, mortgages are granted for periods of up to ten years. Interest rates applied are based on refinancing costs plus a margin, and interest rates and other terms are consistent with those applicable to other employees. Loans against securities are granted at interest rates and on terms applicable to such loans granted to other employees. The same credit approval and risk assessment procedures apply to members of the Executive Board as for other employees. The highest loan outstanding to an Executive Board member was CHF 6 million to Thomas Gottstein as of December 31, 2020.
Members of the Board of Directors with loans, including the Chairman of the Board of Directors, do not benefit from employee conditions, but are subject to conditions applied to clients with a comparable credit standing.
Unless otherwise noted, all loans to members of the Execu-tive Board and the Board of Directors were made in the ordinary course of business and substantially on the same terms, includ-ing interest rates and collateral, as those prevailing at the time for comparable transactions with other persons. These loans did not involve more than the normal risk of collectability or present other unfavorable features.

340 Consolidated financial statements – Credit Suisse Group
Executive Board and Board of Directors loans
in 2020 2019 2018
Executive Board loans (CHF million)
Balance at beginning of period 32 1 33 26
Additions 5 13 8
Reductions (24) (14) (1)
Balance at end of period 13 1 32 33
Board of Directors loans (CHF million)
Balance at beginning of period 9 2 10 11
Additions 0 3 0
Reductions 0 (4) (1)
Balance at end of period 9 2 9 10
1 The number of individuals with outstanding loans was five at the beginning of the year and four at the end of the year.
2 The number of individuals with outstanding loans was four at the beginning of the year and three at the end of the year.
Equity method investees loans
The Group or its subsidiaries grant loans to equity method invest-ees in the normal course of business.
> Refer to “Note 41 – Significant subsidiaries and equity method investments” for a list of equity method investments.
Loans made by the Group or any subsidiaries to equity method investees
in 2020 2019 2018
Loans to equity method investees (CHF million)
Balance at beginning of period 299 253 173
Net borrowings/(repayments) 115 46 80
Balance at end of period 414 299 253
Other related party transaction
In December 2018, a subsidiary of the Group executed a transac-tion with an affiliate to sell a minority interest in a trading platform for a gain of approximately USD 80 million.
Liabilities due to own pension plans
Liabilities due to the Group’s own defined benefit pension plans as of December 31, 2020 and 2019 of CHF 643 million and CHF 703 million, respectively, were reflected in various liability accounts in the Group’s consolidated balance sheets.
341Consolidated financial statements – Credit Suisse Group
32 Pension and other post-retirement benefitsThe Group sponsors defined contribution pension plans, defined benefit pension plans and other post-retirement defined benefit plans.
Defined contribution pension plans
Defined contribution plans provide each participant with an individual account. The benefits to be provided to a participant are solely based on the contributions made to that employee’s account and are affected by income, expenses and gains and losses allocated to the account. As such, there are no stipulations of a defined annuity benefit at retirement and the participants bear the full actuarial as well as investment risk.
The Group contributes to various defined contribution pension plans primarily in Switzerland, the US and the UK as well as other countries throughout the world. During 2020, 2019 and 2018, the Group contributed to these plans and recognized as expense CHF 299 million, CHF 167 million and CHF 153 million, respec-tively. This included expenses of CHF 143 million in 2020 related to the new Swiss defined contribution pension plan which took effect on January 1, 2020.
Defined benefit pension and other post-retirement defined benefit plans
Defined benefit pension plansDefined benefit pension plans are pension plans that define spe-cific benefits for an employee upon that employee’s retirement. These benefits are usually determined by taking into account the employee’s salary, years of service and age of retirement. Retir-ees bear neither the actuarial risk (for example, the risk that the retirees of the plan live longer than expected), nor the investment risk (that is, that plan assets invested and associated returns will be insufficient to meet the expected benefits due to low or nega-tive returns on contributions). The Group’s funding policy for these plans is in accordance with local laws and tax requirements.
Swiss pension planThe Group’s most significant defined benefit pension plan, the Credit Suisse Swiss Pension Plan (Swiss pension plan), is located and covers its employees in Switzerland and is set up as a trust domiciled in Zurich. The Swiss pension plan provides benefits in the event of retirement, death and disability and meets or exceeds the minimum benefits required under the Swiss Federal Law on Occupational Retirement, Survivors’ and Disability Pension Plans (BVG). Benefits in the Swiss pension plan are determined on the basis of the accumulated employer and employee contributions and accumulated interest credited. Although the Swiss pension plan is largely defined contribution in nature, it is treated as a defined benefit plan under US GAAP, mainly due to a guaran-teed minimum return on contributions and guaranteed payment of lifetime pensions. As of December 31, 2020 and 2019, the
Swiss pension plan comprised 66% and 71%, respectively, of all the Group’s employees participating in defined benefit plans, 81% and 81%, respectively, of the fair value of plan assets, and 82% and 82%, respectively, of the pension benefit obligation of the Group’s defined benefit plans.
Employee contributions in the savings section depend on their age and are determined as a percentage of the pensionable sal-ary. The employees can select between three different levels of contributions which vary between 5% and 14% depending on their age. The Group’s contribution varies between 7.5% and 25% of the pensionable salary depending on the employee’s age.
The Swiss Federal council sets the minimum statutory interest rate on savings balances on an annual basis that applies to the BVG minimum pensionable salary (1.0% as of January 1, 2021 and 2020). The statutory interest rate on savings balances does not apply to extra mandatory benefits. The Board of Trustees of the Swiss pension fund sets the interest rate to be applied on the accumulated savings balance on an annual basis.
When employees retire, their savings balance is converted into an annuity and the conversion rate is the percentage used to convert the assets accrued in the Swiss pension plan to an annual lifetime retirement pension. The level of the conversion rate depends on the life expectancy of future retirees and on the long-term poten-tial for returns in the capital markets. The Board of Trustees of the Swiss pension plan has the responsibility to set the conver-sion rates for the plan. Decisions on conversion rates are to be set for a planning horizon of at least seven years.
International pension plansVarious defined benefit pension plans cover the Group’s employ-ees outside Switzerland. These plans provide benefits in the event of retirement, death, disability or termination of employ-ment. Retirement benefits under the international pension plans depend on age, contributions and salary. The Group’s principal defined benefit pension plans outside Switzerland are located in the US and in the UK. Both of these plans are funded, closed to new participants and have ceased accruing new benefits. Smaller defined benefit pension plans, both funded and unfunded, are operated in other locations.
Other post-retirement defined benefit planIn the US, the Group has a defined benefit plan that provides post-retirement benefits other than pension benefits that pri-marily focus on health and welfare benefits for certain retired employees. In exchange for the current services provided by the employee, the Group promises to provide health and welfare ben-efits after the employee retires. The Group’s obligation for that compensation is incurred as employees render the services nec-essary to earn their post-retirement benefits.

342 Consolidated financial statements – Credit Suisse Group
Components of net periodic benefit costs Defined benefit Other post-retirement pension plans defined benefit plan
Switzerland International International
in 2020 2019 2018 2020 2019 2018 2020 2019 2018
Net periodic benefit costs (CHF million)
Service costs on benefit obligation 203 256 242 15 14 16 0 0 0
Interest costs on benefit obligation 20 52 63 68 90 86 4 6 5
Expected return on plan assets (352) (394) (483) (85) (108) (114) 0 0 0
Amortization of recognized prior service cost/(credit) (167) (155) (126) 1 1 0 0 0 0
Amortization of recognized actuarial losses/(gains) 334 293 306 13 19 47 1 3 8
Settlement losses/(gains) 8 41 35 (1) 0 0 0 0 0
Curtailment losses/(gains) (10) 0 (12) 0 0 (1) 0 0 0
Special termination benefits 8 14 38 0 0 0 0 0 0
Net periodic benefit costs/(credits) 44 107 63 11 16 34 5 9 13
Service costs on benefit obligation are reflected in compensation and benefits. Other components of net periodic benefit costs are reflected in general and administrative expenses or, except for 2019, in restructuring expenses.
Net periodic benefit costs of defined benefit plansThe net periodic benefit costs for defined benefit pension and other post-retirement defined benefit plans are the costs of the respective plan for a period during which an employee renders services. The actual amount to be recognized is determined using the standard actuarial methodology which considers, among other factors, current service cost, interest cost, expected return on plan assets and the amortization of both prior service costs/(cred-its) and actuarial losses/(gains) recognized in AOCI.
Service costs on benefit obligation reflected in compensation and benefits – other for 2020, 2019 and 2018 were CHF 218 million, CHF 270 million and CHF 258 million, respectively.
As part of its strategic plan, the Group has launched a num-ber of cost efficiency measures, including headcount reduction. This resulted in curtailment gains of CHF 10 million and CHF 12 million in 2020 and 2018, respectively, reflecting the immedi-ate recognition of a credit relating to the years of service no lon-ger expected to be rendered. Additional costs of CHF 8 million, CHF 41 million and CHF 35 million in 2020, 2019 and 2018, respectively, related to the settlement of the pension obligation for employees in Switzerland whose employment has effectively been terminated or who have left the Group due to a sale of their busi-ness. Special termination benefit costs of CHF 8 million, CHF 14 million and CHF 38 million have been recognized in 2020, 2019 and 2018, respectively, relating to early retirements in Switzerland in the context of the cost efficiency measures.
Benefit obligationThe benefit obligation is expressed as either accumulated benefit obligation (ABO) or PBO. While the ABO refers to the actuarial pres-ent value based on employee services rendered prior to that date and takes into account current and past compensation levels, the PBO also applies an assumption as to future compensation levels.
The “Obligations and funded status of the plans” table shows the changes in the PBO, the ABO, the fair value of plan assets and the amounts recognized in the consolidated balance sheets for the defined benefit pension and other post-retirement defined benefit plans.
US GAAP requires an employer to recognize the funded status of the defined benefit pension and other post-retirement defined benefit plans on the balance sheet. The funded status of these plans is determined as the difference between the fair value of plan assets and the PBO. The funded status may vary from year to year due to changes in the fair value of plan assets and varia-tions of the PBO following changes in the underlying assump-tions and membership data used to determine the PBO. In 2020 and 2019, the curtailments, settlements and special termina-tion benefits in Switzerland, which impacted the PBO, related to the headcount reduction in the context of the cost efficiency measures.

343Consolidated financial statements – Credit Suisse Group
Obligations and funded status of the plans Defined benefit Other post-retirement pension plans defined benefit plan
Switzerland International International
in / end of 2020 2019 2020 2019 2020 2019
PBO (CHF million) 1
Beginning of the measurement period 15,979 15,432 3,325 2,951 164 160
Plan participant contributions 143 205 0 0 0 0
Service cost 203 256 15 14 0 0
Interest cost 20 52 68 90 4 6
Plan amendments 0 (428) 5 0 0 0
Settlements (28) (152) (23) 0 0 0
Curtailments (17) 0 0 0 0 0
Special termination benefits 8 14 0 0 0 0
Actuarial losses/(gains) 857 1,262 456 410 13 13
Benefit payments (1,063) (662) (156) (149) (11) (12)
Exchange rate losses/(gains) 0 0 (208) 9 (14) (3)
End of the measurement period 16,102 15,979 3,482 3,325 156 164
Fair value of plan assets (CHF million)
Beginning of the measurement period 17,790 16,225 4,111 3,604 0 0
Actual return on plan assets 860 1,767 476 487 0 0
Employer contributions 298 407 61 130 11 12
Plan participant contributions 143 205 0 0 0 0
Settlements (28) (152) (23) 0 0 0
Benefit payments (1,063) (662) (156) (149) (11) (12)
Exchange rate gains/(losses) 0 0 (257) 39 0 0
End of the measurement period 18,000 17,790 4,212 4,111 0 0
Funded status recognized (CHF million)
Funded status of the plan – overfunded/(underfunded) 1,898 1,811 730 786 (156) (164)
Funded status recognized in the consolidated balance sheet as of December 31 1,898 1,811 730 786 (156) (164)
Total amount recognized (CHF million)
Noncurrent assets 1,898 1,811 975 1,068 0 0
Current liabilities 0 0 (8) (6) (11) (11)
Noncurrent liabilities 0 0 (237) (276) (145) (153)
Net amount recognized in the consolidated balance sheet as of December 31 1,898 1,811 730 786 (156) (164)
ABO (CHF million) 2
End of the measurement period 15,637 15,459 3,449 3,294 156 164
1 Including estimated future salary increases.2 Excluding estimated future salary increases.
The net amount recognized in the consolidated balance sheets as of December 31, 2020 and 2019 for the defined benefit pension plans was an overfunding of CHF 2,628 million and CHF 2,597 million, respectively.
The remeasurement loss on the Swiss pension plan recorded as of December 31, 2020 consisted of losses on the PBO of CHF 857 million due to changes in financial and demographic assumptions, primarily a decrease in the discount rate, an increase in the interest rate on savings balances and updates on the membership data, partially offset by gains on the asset port-folio of CHF 508 million. The remeasurement gain on the Swiss pension plan recorded as of December 31, 2019 consisted of gains on the asset portfolio of CHF 1,373 million, partially offset by losses on the PBO of CHF 1,262 million due to changes in
financial and demographic assumptions, primarily a decrease in the discount rate and updates on the membership data.
The remeasurement loss on the international pension plans recorded as of December 31, 2020 consisted of losses on the PBO of CHF 456 million due to changes in financial and demo-graphic assumptions, primarily a decrease in the discount rate and updates on the membership data, partially offset by gains on the asset portfolio of CHF 391 million. The remeasurement loss on the international pension plans recorded as of December 31, 2019 consisted of losses on the PBO of CHF 410 million due to changes in financial and demographic assumptions, primarily a decrease in the discount rate and updates on the membership data, partially offset by gains on the asset portfolio of CHF 379 million.
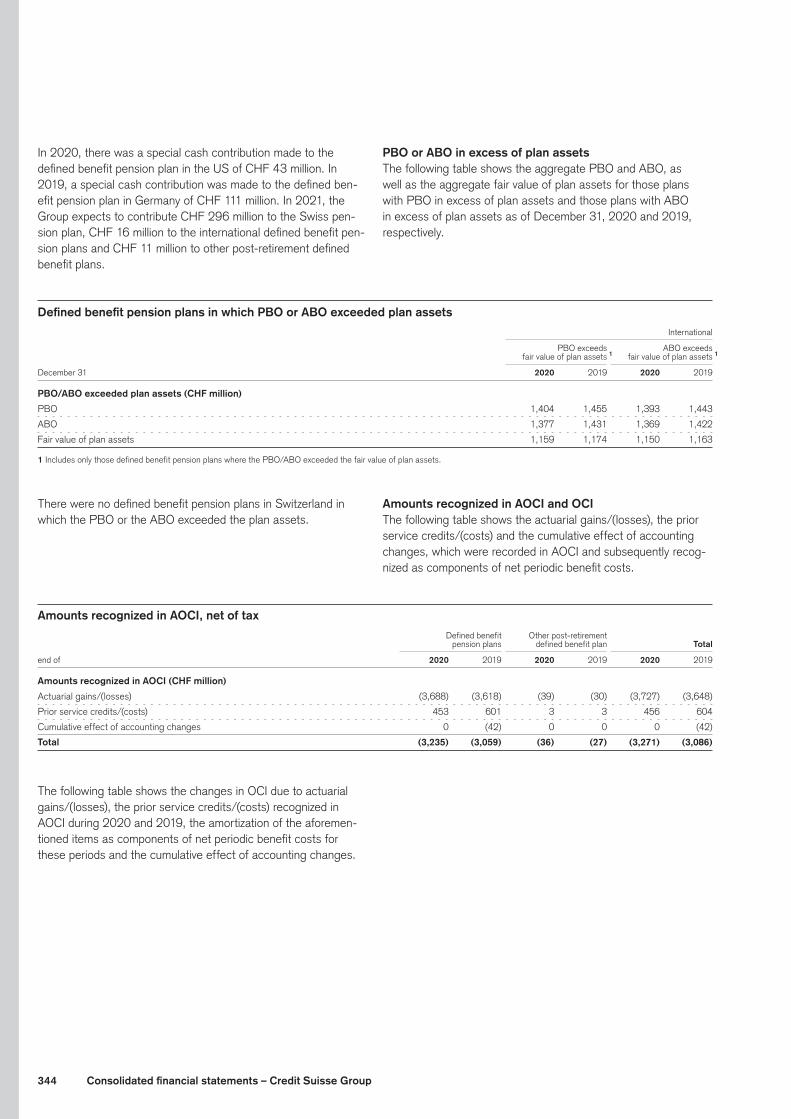
344 Consolidated financial statements – Credit Suisse Group
In 2020, there was a special cash contribution made to the defined benefit pension plan in the US of CHF 43 million. In 2019, a special cash contribution was made to the defined ben-efit pension plan in Germany of CHF 111 million. In 2021, the Group expects to contribute CHF 296 million to the Swiss pen-sion plan, CHF 16 million to the international defined benefit pen-sion plans and CHF 11 million to other post-retirement defined benefit plans.
PBO or ABO in excess of plan assetsThe following table shows the aggregate PBO and ABO, as well as the aggregate fair value of plan assets for those plans with PBO in excess of plan assets and those plans with ABO in excess of plan assets as of December 31, 2020 and 2019, respectively.
Defined benefit pension plans in which PBO or ABO exceeded plan assets International
PBO exceeds ABO exceeds fair value of plan assets 1 fair value of plan assets 1
December 31 2020 2019 2020 2019
PBO/ABO exceeded plan assets (CHF million)
PBO 1,404 1,455 1,393 1,443
ABO 1,377 1,431 1,369 1,422
Fair value of plan assets 1,159 1,174 1,150 1,163
1 Includes only those defined benefit pension plans where the PBO/ABO exceeded the fair value of plan assets.
There were no defined benefit pension plans in Switzerland in which the PBO or the ABO exceeded the plan assets.
Amounts recognized in AOCI and OCIThe following table shows the actuarial gains/(losses), the prior service credits/(costs) and the cumulative effect of accounting changes, which were recorded in AOCI and subsequently recog-nized as components of net periodic benefit costs.
Amounts recognized in AOCI, net of tax Defined benefit Other post-retirement pension plans defined benefit plan Total
end of 2020 2019 2020 2019 2020 2019
Amounts recognized in AOCI (CHF million)
Actuarial gains/(losses) (3,688) (3,618) (39) (30) (3,727) (3,648)
Prior service credits/(costs) 453 601 3 3 456 604
Cumulative effect of accounting changes 0 (42) 0 0 0 (42)
Total (3,235) (3,059) (36) (27) (3,271) (3,086)
The following table shows the changes in OCI due to actuarial gains/(losses), the prior service credits/(costs) recognized in AOCI during 2020 and 2019, the amortization of the aforemen-tioned items as components of net periodic benefit costs for these periods and the cumulative effect of accounting changes.

345Consolidated financial statements – Credit Suisse Group
Amounts recognized in OCI Defined benefit Other post-retirement pension plans defined benefit plan
in Gross Tax Net Gross Tax Net Total net
2020 (CHF million)
Actuarial gains/(losses) (414) 83 (331) (13) 3 (10) (341)
Prior service credits/(costs) (5) 0 (5) 0 0 0 (5)
Amortization of actuarial losses/(gains) 347 (64) 283 1 0 1 284
Amortization of prior service costs/(credits) (166) 31 (135) 0 0 0 (135)
Immediate recognition due to curtailment/settlement 14 (2) 12 0 0 0 12
Total (224) 48 (176) (12) 3 (9) (185)
2019 (CHF million)
Actuarial gains/(losses) 82 (29) 53 (12) 3 (9) 44
Prior service credits/(costs) 428 (90) 338 0 0 0 338
Amortization of actuarial losses/(gains) 312 (65) 247 3 (1) 2 249
Amortization of prior service costs/(credits) (154) 33 (121) 0 0 0 (121)
Immediate recognition due to curtailment/settlement 41 (8) 33 0 0 0 33
Cumulative effect of accounting changes 0 (42) (42) 0 0 0 (42)
Total 709 (201) 508 (9) 2 (7) 501
AssumptionsThe measurement of both the net periodic benefit costs and the benefit obligation is determined using explicit assumptions, each
of which individually represents the best estimate of a particular future event.
Weighted-average assumptions used to determine net periodic benefit costs and benefit obligation Defined benefit Other post-retirement pension plans defined benefit plan
Switzerland International International
December 31 2020 2019 2018 2020 2019 2018 2020 2019 2018
Net periodic benefit cost (%)
Discount rate – service costs 0.69 1.19 1.02 3.04 3.28 2.96 – 4.38 3.86
Discount rate – interest costs 0.13 0.57 0.41 2.39 3.28 2.77 2.77 3.95 3.28
Salary increases 1.50 0.75 0.50 2.84 2.92 2.97 – – –
Interest rate on savings balances 0.45 1.03 0.86 – – – – – –
Expected long-term rate of return on plan assets 2.10 2.40 3.00 2.37 3.00 3.22 – – –
Benefit obligation (%)
Discount rate 0.40 0.45 1.03 1.67 2.38 3.30 2.55 3.23 4.37
Salary increases 1.50 1.50 0.75 2.98 2.84 2.90 – – –
Interest rate on savings balances 1.25 0.45 1.03 – – – – – –
Net periodic benefit cost and benefit obligation assumptionsThe assumptions used to determine the benefit obligation as of the measurement date are also used to calculate the net periodic benefit costs for the 12-month period following this date.
The discount rates are determined based on yield curves, con-structed from high-quality corporate bonds currently available and observable in the market and are expected to be available during the period to maturity of the pension benefits. In countries where there is no deep market in high-quality corporate bonds with longer durations, the best available market information, including governmental bond yields and risk premiums, is used to construct the yield curve. Credit Suisse uses the spot rate approach for
valuations, whereby individual spot rates on the yield curve are applied to each year’s cash flow in measuring the plan’s benefit obligation as well as future service costs and interest costs.
The assumption pertaining to salary increases is used to calculate the PBO, which is measured using an assumption as to future compensation levels.
Credit Suisse estimates the future interest rate on savings bal-ances taking into consideration actions and rates approved by the Board of Trustees of the Swiss pension plan and expected future changes in the interest rate environment. In prior years, Credit Suisse used the cash flow weighted-average of the yield curve used for the discount rate as the best estimate for the interest

346 Consolidated financial statements – Credit Suisse Group
rate on savings balances for these long-term projections. Due to the higher actual interest rate on savings balances payments over prior years, the interest rate on savings balances has been updated to 1.25% for 2020. This resulted in an increase to the PBO of approximately CHF 450 million.
The expected long-term rate of return on plan assets assumption is applied to the market-related value of assets to calculate the expected return on plan assets as a component of the net peri-odic benefit costs. It reflects the average rate of returns expected on the funds invested or to be invested to provide for the benefits included in the PBO. In estimating that rate, appropriate consider-ation is given to the returns being earned by the plan assets and the rates of return expected to be available for reinvestment. The expected long-term rate of return on plan assets is based on total return forecasts, expected volatility and correlation estimates, reflecting interrelationships between and within asset classes held. Where possible, similar, if not related, approaches are fol-lowed to forecast returns for the various asset classes.
The expected long-term rate of return on debt securities reflects both accruing interest and price returns. The probable long-term relationship between the total return and certain exogenous vari-ables is used, which links the total return forecasts on debt secu-rities to forecasts of the macroeconomic environment.
The expected long-term rate of ROE securities is based on a two-stage dividend discount model which considers economic and market forecasts to compute a market-implied equity risk premium. Dividends are estimated using market consensus earn-ings and the historical payout ratio. A subsequent scenario analy-sis is used to stress test the level of the return.
The expected long-term rate of return on real estate is based on economic models that reflect both the rental and the capital market side of the direct real estate market. This allows for a rep-licable and robust forecasting methodology for expected returns on real estate equity, fund and direct market indices.
The expected long-term rate of return on private equity and hedge funds is estimated by determining the key factors in their historical performance using private equity and hedge fund benchmarks and indices. To capture these factors, multiple linear regression models with lagged returns are used.
Mortality assumptions are based on standard mortality tables and standard models and methodologies for projecting future improvements to mortality as developed and published by external independent actuarial societies and actuarial organizations.
Mortality tables and life expectancies for major plans Life expectancy at age 65 Life expectancy at age 65 for a male member currently for a female member currently
aged 65 aged 45 aged 65 aged 45
December 31 2020 2019 2020 2019 2020 2019 2020 2019
Life expectancy (years)
Switzerland BVG 2015 tables 1 21.7 21.6 23.3 23.2 23.7 23.6 25.3 25.2
UK SAPS S2 light tables 2 23.3 23.2 24.9 24.8 24.5 24.3 26.3 26.1
US Pri-2012 mortality tables 3 21.1 21.1 22.3 22.2 22.8 22.7 23.9 23.8
1 The BVG 2015 tables were used, which included final 2016 CMI projections, with a long-term rate of improvement of 1.25% per annum.2 95% of Self-Administered Pension Scheme (SAPS) S2 light tables were used, which included final CMI projections, with a long-term rate of improvement of 1.5% per annum.3 The Private retirement plan 2012 (Pri-2012) mortality tables were used, with projections based on the Social Security Administration’s intermediate improvement scale.
Under US GAAP, the assumptions used to value the PBO should always represent the best estimate as of the measurement date. Credit Suisse regularly reviews the actuarial assumptions used to value and measure the defined benefit obligation on a periodic basis as required by US GAAP.

347Consolidated financial statements – Credit Suisse Group
Health care cost assumptionsThe health care cost trend is used to determine the appropriate other post-retirement defined benefit costs. In determining those costs, an annual weighted-average rate is assumed in the cost of covered health care benefits.
The following table provides an overview of the assumed health care cost trend rates.
Health care cost trend rates
in / end of 2020 2019 2018
Health care cost trend rate (%)
Annual weighted-average health care cost trend rate 1 7.0 8.0 8.7
1 The annual health care cost trend rate is assumed to decrease gradually to achieve the long-term health care cost trend rate of 5% by 2025.
The annual health care cost trend rate used to determine the net periodic defined benefit costs for 2021 is 7.0%.
Plan assets and investment strategyPlan assets, which are assets that have been segregated and restricted to provide for plan benefits, are measured at their fair value as of the measurement date.
The Group’s defined benefit pension plans employ a total return investment approach, whereby a diversified mix of debt and equity securities and alternative investments, specifically hedge funds and private equity, are used to maximize the long-term return of plan assets while incurring a prudent level of risk. The intent of this strategy is to meet or outperform plan liabilities over the long term. Risk tolerance is established through careful consider-ation of plan liabilities, plan funded status and corporate financial condition. Furthermore, equity securities are diversified across different geographic regions as well as across growth, value and small and large capitalization stocks. Real estate and alternative investments, such as private equity and hedge funds, are used to enhance long-term returns while improving portfolio diversi-fication. Derivatives may be used to hedge or increase market
exposure, but are not used to leverage the portfolio beyond the market value of the underlying investments. Investment risk is measured and monitored on an ongoing basis through periodic asset/liability studies and quarterly investment portfolio reviews. To limit investment risk, the Group pension plans follow defined strategic asset allocation guidelines. At times of major mar-ket uncertainties and stress, these guidelines may be further restricted.
As of December 31, 2020 and 2019, the total fair value of Group equity securities and options was CHF 77 million and CHF 89 million, respectively.
Fair value hierarchy of plan assets > Refer to “Fair value measurement” in Note 36 – Financial instruments for dis-
cussion of the fair value hierarchy.
Fair value of plan assetsThe following tables present the plan assets measured at fair value on a recurring basis as of December 31, 2020 and 2019 for the Group’s defined benefit pension plans.
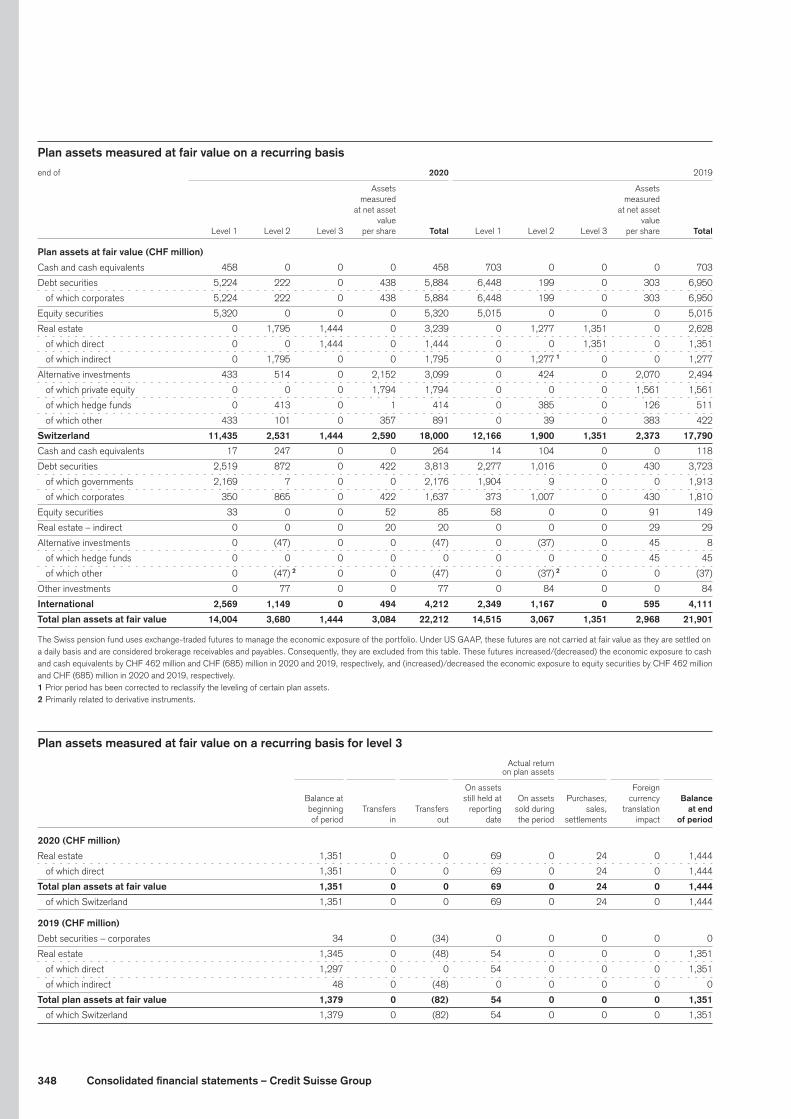
348 Consolidated financial statements – Credit Suisse Group
Plan assets measured at fair value on a recurring basis
end of 2020 2019
Assets Assets
measured measured
at net asset at net asset
value value
Level 1 Level 2 Level 3 per share Total Level 1 Level 2 Level 3 per share Total
Plan assets at fair value (CHF million)
Cash and cash equivalents 458 0 0 0 458 703 0 0 0 703
Debt securities 5,224 222 0 438 5,884 6,448 199 0 303 6,950
of which corporates 5,224 222 0 438 5,884 6,448 199 0 303 6,950
Equity securities 5,320 0 0 0 5,320 5,015 0 0 0 5,015
Real estate 0 1,795 1,444 0 3,239 0 1,277 1,351 0 2,628
of which direct 0 0 1,444 0 1,444 0 0 1,351 0 1,351
of which indirect 0 1,795 0 0 1,795 0 1,277 1 0 0 1,277
Alternative investments 433 514 0 2,152 3,099 0 424 0 2,070 2,494
of which private equity 0 0 0 1,794 1,794 0 0 0 1,561 1,561
of which hedge funds 0 413 0 1 414 0 385 0 126 511
of which other 433 101 0 357 891 0 39 0 383 422
Switzerland 11,435 2,531 1,444 2,590 18,000 12,166 1,900 1,351 2,373 17,790
Cash and cash equivalents 17 247 0 0 264 14 104 0 0 118
Debt securities 2,519 872 0 422 3,813 2,277 1,016 0 430 3,723
of which governments 2,169 7 0 0 2,176 1,904 9 0 0 1,913
of which corporates 350 865 0 422 1,637 373 1,007 0 430 1,810
Equity securities 33 0 0 52 85 58 0 0 91 149
Real estate – indirect 0 0 0 20 20 0 0 0 29 29
Alternative investments 0 (47) 0 0 (47) 0 (37) 0 45 8
of which hedge funds 0 0 0 0 0 0 0 0 45 45
of which other 0 (47) 2 0 0 (47) 0 (37) 2 0 0 (37)
Other investments 0 77 0 0 77 0 84 0 0 84
International 2,569 1,149 0 494 4,212 2,349 1,167 0 595 4,111
Total plan assets at fair value 14,004 3,680 1,444 3,084 22,212 14,515 3,067 1,351 2,968 21,901
The Swiss pension fund uses exchange-traded futures to manage the economic exposure of the portfolio. Under US GAAP, these futures are not carried at fair value as they are settled on a daily basis and are considered brokerage receivables and payables. Consequently, they are excluded from this table. These futures increased/(decreased) the economic exposure to cash and cash equivalents by CHF 462 million and CHF (685) million in 2020 and 2019, respectively, and (increased)/decreased the economic exposure to equity securities by CHF 462 million and CHF (685) million in 2020 and 2019, respectively.1 Prior period has been corrected to reclassify the leveling of certain plan assets.2 Primarily related to derivative instruments.
Plan assets measured at fair value on a recurring basis for level 3 Actual return on plan assets
On assets Foreign
Balance at still held at On assets Purchases, currency Balance
beginning Transfers Transfers reporting sold during sales, translation at end
of period in out date the period settlements impact of period
2020 (CHF million)
Real estate 1,351 0 0 69 0 24 0 1,444
of which direct 1,351 0 0 69 0 24 0 1,444
Total plan assets at fair value 1,351 0 0 69 0 24 0 1,444
of which Switzerland 1,351 0 0 69 0 24 0 1,444
2019 (CHF million)
Debt securities – corporates 34 0 (34) 0 0 0 0 0
Real estate 1,345 0 (48) 54 0 0 0 1,351
of which direct 1,297 0 0 54 0 0 0 1,351
of which indirect 48 0 (48) 0 0 0 0 0
Total plan assets at fair value 1,379 0 (82) 54 0 0 0 1,351
of which Switzerland 1,379 0 (82) 54 0 0 0 1,351
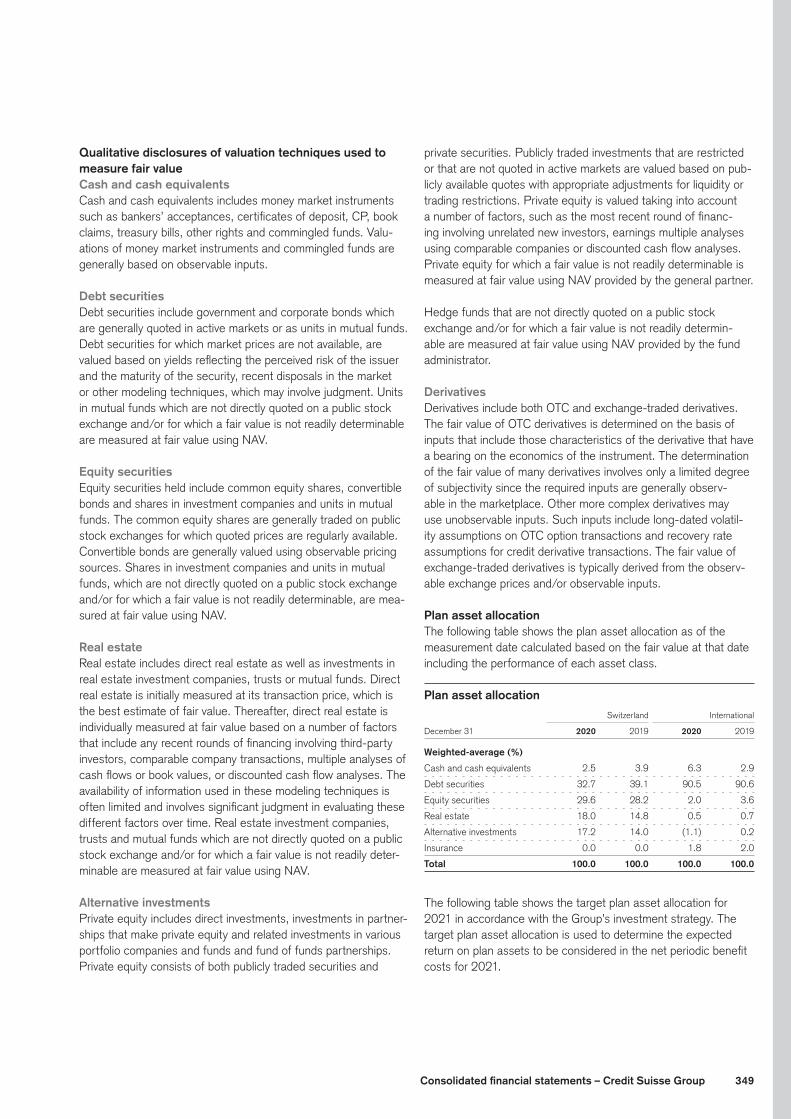
349Consolidated financial statements – Credit Suisse Group
Qualitative disclosures of valuation techniques used to measure fair valueCash and cash equivalentsCash and cash equivalents includes money market instruments such as bankers’ acceptances, certificates of deposit, CP, book claims, treasury bills, other rights and commingled funds. Valu-ations of money market instruments and commingled funds are generally based on observable inputs.
Debt securitiesDebt securities include government and corporate bonds which are generally quoted in active markets or as units in mutual funds. Debt securities for which market prices are not available, are valued based on yields reflecting the perceived risk of the issuer and the maturity of the security, recent disposals in the market or other modeling techniques, which may involve judgment. Units in mutual funds which are not directly quoted on a public stock exchange and/or for which a fair value is not readily determinable are measured at fair value using NAV.
Equity securitiesEquity securities held include common equity shares, convertible bonds and shares in investment companies and units in mutual funds. The common equity shares are generally traded on public stock exchanges for which quoted prices are regularly available. Convertible bonds are generally valued using observable pricing sources. Shares in investment companies and units in mutual funds, which are not directly quoted on a public stock exchange and/or for which a fair value is not readily determinable, are mea-sured at fair value using NAV.
Real estateReal estate includes direct real estate as well as investments in real estate investment companies, trusts or mutual funds. Direct real estate is initially measured at its transaction price, which is the best estimate of fair value. Thereafter, direct real estate is individually measured at fair value based on a number of factors that include any recent rounds of financing involving third-party investors, comparable company transactions, multiple analyses of cash flows or book values, or discounted cash flow analyses. The availability of information used in these modeling techniques is often limited and involves significant judgment in evaluating these different factors over time. Real estate investment companies, trusts and mutual funds which are not directly quoted on a public stock exchange and/or for which a fair value is not readily deter-minable are measured at fair value using NAV.
Alternative investmentsPrivate equity includes direct investments, investments in partner-ships that make private equity and related investments in various portfolio companies and funds and fund of funds partnerships. Private equity consists of both publicly traded securities and
private securities. Publicly traded investments that are restricted or that are not quoted in active markets are valued based on pub-licly available quotes with appropriate adjustments for liquidity or trading restrictions. Private equity is valued taking into account a number of factors, such as the most recent round of financ-ing involving unrelated new investors, earnings multiple analyses using comparable companies or discounted cash flow analyses. Private equity for which a fair value is not readily determinable is measured at fair value using NAV provided by the general partner.
Hedge funds that are not directly quoted on a public stock exchange and/or for which a fair value is not readily determin-able are measured at fair value using NAV provided by the fund administrator.
DerivativesDerivatives include both OTC and exchange-traded derivatives. The fair value of OTC derivatives is determined on the basis of inputs that include those characteristics of the derivative that have a bearing on the economics of the instrument. The determination of the fair value of many derivatives involves only a limited degree of subjectivity since the required inputs are generally observ-able in the marketplace. Other more complex derivatives may use unobservable inputs. Such inputs include long-dated volatil-ity assumptions on OTC option transactions and recovery rate assumptions for credit derivative transactions. The fair value of exchange-traded derivatives is typically derived from the observ-able exchange prices and/or observable inputs.
Plan asset allocationThe following table shows the plan asset allocation as of the measurement date calculated based on the fair value at that date including the performance of each asset class.
Plan asset allocation Switzerland International
December 31 2020 2019 2020 2019
Weighted-average (%)
Cash and cash equivalents 2.5 3.9 6.3 2.9
Debt securities 32.7 39.1 90.5 90.6
Equity securities 29.6 28.2 2.0 3.6
Real estate 18.0 14.8 0.5 0.7
Alternative investments 17.2 14.0 (1.1) 0.2
Insurance 0.0 0.0 1.8 2.0
Total 100.0 100.0 100.0 100.0
The following table shows the target plan asset allocation for 2021 in accordance with the Group’s investment strategy. The target plan asset allocation is used to determine the expected return on plan assets to be considered in the net periodic benefit costs for 2021.

350 Consolidated financial statements – Credit Suisse Group
2021 target plan asset allocation Switzerland International
Weighted-average (%)
Cash and cash equivalents 7.0 0.3
Debt securities 32.0 94.0
Equity securities 25.0 2.1
Real estate 21.0 0.6
Alternative investments 15.0 1.2
Insurance 0.0 1.8
Total 100.0 100.0
Estimated future benefit paymentsThe following table shows the estimated future benefit payments for defined benefit pension and other post-retirement defined benefit plans.
Estimated future benefit payments Defined benefit Other post-retirement pension plans defined benefit plan
Payments (CHF million)
2021 1,082 11
2022 903 10
2023 904 10
2024 903 10
2025 887 9
For five years thereafter 4,409 40

351Consolidated financial statements – Credit Suisse Group
33 Derivatives and hedging activitiesDerivatives are generally either privately negotiated OTC contracts or standard contracts transacted through regulated exchanges. The Group’s most frequently used freestanding derivative prod-ucts, entered into for trading and risk management purposes, include interest rate, credit default and cross-currency swaps, interest rate and foreign exchange options, interest rate and for-eign exchange forward contracts and foreign exchange and inter-est rate futures.
The Group also enters into contracts that are not considered derivatives in their entirety but include embedded derivative fea-tures. Such transactions primarily include issued and purchased structured debt instruments where the return may be calculated by reference to an equity security, index or third-party credit risk, or that have non-standard interest or foreign exchange terms.
On the date a derivative contract is entered into, the Group desig-nates it as belonging to one of the following categories:p trading activities;p a risk management transaction that does not qualify as a
hedge under accounting standards (referred to as an economic hedge);
p a hedge of the fair value of a recognized asset or liability;p a hedge of the variability of cash flows to be received or paid
relating to a recognized asset or liability or a forecasted trans-action; or
p a hedge of a net investment in a foreign operation.
Trading activities
The Group is active in most of the principal trading markets and transacts in many trading and hedging products. As noted above, this includes the use of swaps, futures, options and structured products, such as custom transactions using combinations of derivatives, in connection with its sales and trading activities. Trading activities include market making, positioning and arbitrage activities. The majority of the Group’s derivatives were used for trading activities.
Economic hedges
Economic hedges arise when the Group enters into derivative contracts for its own risk management purposes, but the con-tracts entered into do not qualify for hedge accounting under US GAAP. These economic hedges include the following types:p interest rate derivatives to manage net interest rate risk on
certain core banking business assets and liabilities;p foreign exchange derivatives to manage foreign exchange risk
on certain core banking business revenue and expense items, as well as on core banking business assets and liabilities;
p credit derivatives to manage credit risk on certain loan portfolios;
p futures to manage risk on equity positions including convertible bonds; and
p equity derivatives to manage equity/index risks on certain structured products.
Derivatives used in economic hedges are included as trading assets or trading liabilities in the consolidated balance sheets.
Hedge accounting
Fair value hedgesThe Group designates fair value hedges as part of an overall interest rate risk management strategy that incorporates the use of derivative instruments to minimize fluctuations in earnings that are caused by interest rate volatility. The Group uses derivatives to hedge for changes in fair value as a result of the interest rate risk associated with loans, debt securities held as available-for-sale and long-term debt instruments.
Cash flow hedgesThe Group hedges the variability in interest cash flows on mort-gages and loans by using interest rate swaps to convert variable rate assets to fixed rates. Further, the Group uses foreign cur-rency forwards to hedge the foreign currency risk associated with certain forecasted transactions. As of the end of 2020, the maxi-mum length of time over which the Group hedged its exposure to the variability in future cash flows for forecasted transactions, excluding those forecasted transactions related to the payment of variable interest on existing financial instruments, was 12 months.
Net investment hedges The Group designates net investment hedges as part of its strat-egy to hedge selected net investments in foreign operations against adverse movements in foreign exchange rates, typically using forward foreign exchange contracts.
Hedge effectiveness assessmentThe Group assesses the effectiveness of hedging relationships both prospectively and retrospectively. The prospective assess-ment is made both at the inception of a hedging relationship and on an ongoing basis, and requires the Group to justify its expec-tation that the relationship will be highly effective over future peri-ods. The retrospective assessment is also performed on an ongo-ing basis and requires the Group to determine whether or not the hedging relationship has actually been effective.

352 Consolidated financial statements – Credit Suisse Group
Fair value of derivative instruments
The tables below present gross derivative replacement values by type of contract and whether the derivative is used for trading purposes or in a qualifying hedging relationship. Notional amounts have also been provided as an indication of the volume of deriva-tive activity within the Group.
Information on bifurcated embedded derivatives has not been included in these tables. Under US GAAP, the Group elected to account for substantially all financial instruments with an embed-ded derivative that is not considered clearly and closely related to the host contract at fair value.
> Refer to “Note 36 – Financial instruments” for further information.
Fair value of derivative instruments Trading Hedging 1
Positive Negative Positive Negative
Notional replacement replacement Notional replacement replacement
end of 2020 amount value (PRV) value (NRV) amount value (PRV) value (NRV)
Derivative instruments (CHF billion)
Forwards and forward rate agreements 5,221.5 2.7 2.8 0.0 0.0 0.0
Swaps 8,087.8 53.5 50.2 126.1 0.9 0.1
Options bought and sold (OTC) 968.6 18.2 18.0 0.0 0.0 0.0
Futures 296.6 0.0 0.0 0.0 0.0 0.0
Options bought and sold (exchange-traded) 116.1 0.5 0.6 0.0 0.0 0.0
Interest rate products 14,690.6 74.9 71.6 126.1 0.9 0.1
Forwards 928.4 10.1 11.8 13.9 0.1 0.1
Swaps 345.8 10.9 13.4 0.0 0.0 0.0
Options bought and sold (OTC) 236.3 3.4 3.7 0.0 0.0 0.0
Futures 8.8 0.0 0.0 0.0 0.0 0.0
Options bought and sold (exchange-traded) 1.0 0.0 0.0 0.0 0.0 0.0
Foreign exchange products 1,520.3 24.4 28.9 13.9 0.1 0.1
Forwards 1.0 0.0 0.3 0.0 0.0 0.0
Swaps 167.6 4.3 8.8 0.0 0.0 0.0
Options bought and sold (OTC) 218.3 14.9 10.0 0.0 0.0 0.0
Futures 23.5 0.0 0.0 0.0 0.0 0.0
Options bought and sold (exchange-traded) 454.0 20.0 20.7 0.0 0.0 0.0
Equity/index-related products 864.4 39.2 39.8 0.0 0.0 0.0
Credit derivatives 2 467.8 4.9 6.0 0.0 0.0 0.0
Forwards 12.2 0.3 0.2 0.0 0.0 0.0
Swaps 9.8 1.1 0.5 0.0 0.0 0.0
Options bought and sold (OTC) 14.8 0.3 0.2 0.0 0.0 0.0
Futures 4.2 0.0 0.0 0.0 0.0 0.0
Options bought and sold (exchange-traded) 11.6 0.1 0.1 0.0 0.0 0.0
Other products 3 52.6 1.8 1.0 0.0 0.0 0.0
Total derivative instruments 17,595.7 145.2 147.3 140.0 1.0 0.2
The notional amount, PRV and NRV (trading and hedging) was CHF 17,735.7 billion, CHF 146.2 billion and CHF 147.5 billion, respectively, as of December 31, 2020.1 Relates to derivative contracts that qualify for hedge accounting under US GAAP.2 Primarily credit default swaps.3 Primarily precious metals, commodity and energy products.

353Consolidated financial statements – Credit Suisse Group
Fair value of derivative instruments (continued) Trading Hedging 1
Positive Negative Positive Negative
Notional replacement replacement Notional replacement replacement
end of 2019 amount value (PRV) value (NRV) amount value (PRV) value (NRV)
Derivative instruments (CHF billion)
Forwards and forward rate agreements 6,226.5 0.9 0.9 0.0 0.0 0.0
Swaps 9,183.5 50.8 48.4 113.2 0.5 0.1
Options bought and sold (OTC) 1,355.4 16.3 16.4 0.0 0.0 0.0
Futures 264.2 0.0 0.0 0.0 0.0 0.0
Options bought and sold (exchange-traded) 103.4 0.3 0.2 0.0 0.0 0.0
Interest rate products 17,133.0 68.3 65.9 113.2 0.5 0.1
Forwards 1,073.5 8.0 9.1 14.1 0.1 0.1
Swaps 389.5 10.9 13.7 0.0 0.0 0.0
Options bought and sold (OTC) 270.8 3.0 3.5 0.0 0.0 0.0
Futures 9.1 0.0 0.0 0.0 0.0 0.0
Options bought and sold (exchange-traded) 0.1 0.0 0.0 0.0 0.0 0.0
Foreign exchange products 1,743.0 21.9 26.3 14.1 0.1 0.1
Forwards 1.0 0.0 0.0 0.0 0.0 0.0
Swaps 175.2 4.3 4.6 0.0 0.0 0.0
Options bought and sold (OTC) 213.6 7.7 7.3 0.0 0.0 0.0
Futures 41.2 0.0 0.0 0.0 0.0 0.0
Options bought and sold (exchange-traded) 427.2 5.4 5.1 0.0 0.0 0.0
Equity/index-related products 858.2 17.4 17.0 0.0 0.0 0.0
Credit derivatives 2 538.1 6.2 7.2 0.0 0.0 0.0
Forwards 13.2 0.2 0.1 0.0 0.0 0.0
Swaps 11.6 1.0 0.5 0.0 0.0 0.0
Options bought and sold (OTC) 15.5 0.2 0.1 0.0 0.0 0.0
Futures 14.8 0.0 0.0 0.0 0.0 0.0
Options bought and sold (exchange-traded) 1.7 0.0 0.0 0.0 0.0 0.0
Other products 3 56.8 1.4 0.7 0.0 0.0 0.0
Total derivative instruments 20,329.1 115.2 117.1 127.3 0.6 0.2
The notional amount, PRV and NRV (trading and hedging) was CHF 20,456.4 billion, CHF 115.8 billion and CHF 117.3 billion, respectively, as of December 31, 2019.1 Relates to derivative contracts that qualify for hedge accounting under US GAAP.2 Primarily credit default swaps.3 Primarily precious metals, commodity and energy products.
Gains or (losses) on fair value hedges 2020 2019 2018
Net interest Net interest Trading
in income income revenues
Interest rate products (CHF million)
Hedged items (1,679) (1,721) 423
Derivatives designated as hedging instruments 1,564 1,550 (415)
Net gains/(losses) on the ineffective portion – – 8
As a result of the adoption of ASU 2017-12 on January 1, 2019, the gains/(losses) on interest rate risk hedges are included in net interest income since 2019, while in 2018 they were recorded in trading revenue. Additionally, the gains/(losses) on the ineffective portion are no longer separately measured and reported. The accrued interest on fair value hedges is recorded in net interest income and is excluded from this table.
354 Consolidated financial statements – Credit Suisse Group
Hedged items in fair value hedges 2020 2019
Hedged items Hedged items
Carrying Hedging Discontinued Carrying Hedging Discontinued
end of amount adjustments 1 hedges 2 amount adjustments 1 hedges 2
Assets and liabilities (CHF billion)
Investment securities 0.4 0.0 0.0 – – –
Net loans 20.5 0.2 0.5 15.2 0.1 0.7
Long-term debt 65.8 1.9 0.8 65.8 1.2 0.3
1 Relates to the cumulative amount of fair value hedging adjustments included in the carrying amount.2 Relates to the cumulative amount of fair value hedging adjustments remaining for any hedged items for which hedge accounting has been discontinued.
Cash flow hedges
in 2020 2019 2018
Interest rate products (CHF million)
Gains/(losses) recognized in AOCI on derivatives 134 85 (76)
Gains/(losses) reclassified from AOCI into
interest and dividend income (70) 3 (85)
Foreign exchange products (CHF million)
Gains/(losses) recognized in AOCI on derivatives (33) 4 (95)
Trading revenues (30) (7) (37)
Other revenues 0 (4) (6)
Total other operating expenses (2) (16) (5)
Gains/(losses) reclassified from AOCI into income (32) (27) (48)
Gains/(losses) excluded from the assessment of
effectiveness reported in trading revenues 1 1 (20) –
1 Related to the forward points of a foreign currency forward.
The net gain associated with cash flow hedges expected to be reclassified from AOCI within the next 12 months was CHF 119 million.
Net investment hedges
in 2020 2019 2018
Foreign exchange products (CHF million)
Gains/(losses) recognized in the cumulative
translation adjustments section of AOCI 458 (138) 133
Gains/(losses) reclassified from the cumulative
translation adjustments section of AOCI into
other revenues 10 0 (2)
The Group includes all derivative instruments not included in hedge accounting relationships in its trading activities.
> Refer to “Note 7 – Trading revenues” for gains and losses on trading activities by product type.
Disclosures relating to contingent credit risk
Certain of the Group’s derivative instruments contain provisions that require it to maintain a specified credit rating from each of the major credit rating agencies. If the ratings fall below the level specified in the contract, the counterparties to the agreements could request payment of additional collateral on those derivative instruments that are in a net liability position. Certain of the deriv-ative contracts also provide for termination of the contract, gener-ally upon a downgrade of either the Group or the counterparty. Such derivative contracts are reflected at close-out costs.
The following table provides the Group’s current net exposure from contingent credit risk relating to derivative contracts with bilateral counterparties and SPEs that include credit support agreements, the related collateral posted and the additional col-lateral required in a one-notch, two-notch and a three-notch downgrade event, respectively. The table also includes deriva-tive contracts with contingent credit risk features without credit support agreements that have accelerated termination event conditions. The current net exposure for derivative contracts with bilateral counterparties and contracts with accelerated termination event conditions is the aggregate fair value of derivative instru-ments that were in a net liability position. For SPEs, the current net exposure is the contractual amount that is used to determine the collateral payable in the event of a downgrade. The contrac-tual amount could include both the NRV and a percentage of the notional value of the derivative.

355Consolidated financial statements – Credit Suisse Group
Contingent credit risk 2020 2019
Special Special
Bilateral purpose Accelerated Bilateral purpose Accelerated
end of counterparties entities terminations Total counterparties entities terminations Total
Contingent credit risk (CHF billion)
Current net exposure 3.0 0.0 0.4 3.4 3.1 0.0 0.3 3.4
Collateral posted 2.4 0.0 – 2.4 2.7 0.1 – 2.8
Impact of a one-notch downgrade event 0.0 0.0 0.0 0.0 0.1 0.0 0.0 0.1
Impact of a two-notch downgrade event 0.0 0.0 0.0 0.0 0.2 0.0 0.0 0.2
Impact of a three-notch downgrade event 0.5 0.0 0.2 0.7 0.7 0.1 0.1 0.9
The impact of a downgrade event reflects the amount of additional collateral required for bilateral counterparties and special purpose entities and the amount of additional termination expenses for accelerated terminations, respectively.
Credit derivatives
Credit derivatives are contractual agreements in which the buyer generally pays a fee in exchange for a contingent payment by the seller if there is a credit event on the underlying referenced entity or asset. They are generally privately negotiated OTC contracts, with numerous settlement and payment terms, and most are structured so that they specify the occurrence of an identifiable credit event, which can include bankruptcy, insolvency, receiver-ship, material adverse restructuring of debt or failure to meet obli-gations when due.
The Group enters into credit derivative contracts in the normal course of business, buying and selling protection to facilitate cli-ent transactions and as a market maker. This includes providing structured credit products for its clients to enable them to hedge their credit risk. The referenced instruments of these structured credit products are both investment grade and non-investment grade and could include corporate bonds, sovereign debt, asset-backed securities (ABS) and loans. These instruments can be formed as single items (single-named instruments) or combined on a portfolio basis (multi-named instruments). The Group pur-chases protection to economically hedge various forms of credit exposure, for example, the economic hedging of loan portfolios or other cash positions. Finally, the Group also takes proprietary positions which can take the form of either purchased or sold protection.
The credit derivatives most commonly transacted by the Group are CDS and credit swaptions. CDSs are contractual agreements in which the buyer of the swap pays an upfront and/or a periodic fee in return for a contingent payment by the seller of the swap following a credit event of the referenced entity or asset. Credit swaptions are options with a specified maturity to buy or sell pro-tection under a CDS on a specific referenced credit event.
In addition, to reduce its credit risk, the Group enters into legally enforceable netting agreements with its derivative counterparties. Collateral on these derivative contracts is usually posted on a net
counterparty basis and cannot be allocated to a particular deriva-tive contract.
> Refer to “Note 28 – Offsetting of financial assets and financial liabilities” for further information on netting.
Credit protection soldCredit protection sold is the maximum potential payout, which is based on the notional value of derivatives and represents the amount of future payments that the Group would be required to make as a result of credit risk-related events. The Group believes that the maximum potential payout is not representative of the actual loss exposure based on historical experience. This amount has not been reduced by the Group’s rights to the underlying assets and the related cash flows. In accordance with most credit derivative contracts, should a credit event (or settlement trigger) occur, the Group is usually liable for the difference between the credit protection sold and the recourse it holds in the value of the underlying assets. The maximum potential amount of future payments has not been reduced for any cash collateral paid to a given counterparty as such payments would be calculated after netting all derivative exposures, including any credit derivatives with that counterparty in accordance with a related master net-ting agreement. Due to such netting processes, determining the amount of collateral that corresponds to credit derivative expo-sures only is not possible.
To reflect the quality of the payment risk on credit protection sold, the Group assigns an internally generated rating to those instru-ments referenced in the contracts. Internal ratings are assigned by experienced credit analysts based on expert judgment that incorporates analysis and evaluation of both quantitative and qualitative factors. The specific factors analyzed, and their rela-tive importance, are dependent on the type of counterparty. The analysis emphasizes a forward-looking approach, concentrat-ing on economic trends and financial fundamentals, and making use of peer analysis, industry comparisons and other quantitative tools. External ratings and market information are also used in the analysis process where available.

356 Consolidated financial statements – Credit Suisse Group
Credit protection purchasedCredit protection purchased represents those instruments where the underlying reference instrument is identical to the reference instrument of the credit protection sold. The maximum potential payout amount of credit protection purchased for each individual identical underlying reference instrument may be greater or lower than the notional amount of protection sold.
The Group also considers estimated recoveries that it would receive if the specified credit event occurred, including both the anticipated value of the underlying referenced asset that would, in most instances, be transferred to the Group and the impact of any purchased protection with an identical reference instrument and product type.
Other protection purchasedIn the normal course of business, the Group purchases protection to offset the risk of credit protection sold that may have similar, but not identical, reference instruments, and may use similar, but not identical, products, which reduces the total credit derivative exposure. Other protection purchased is based on the notional value of the instruments.
The Group purchases its protection from banks and broker deal-ers, other financial institutions and other counterparties.
Fair value of credit protection soldThe fair values of the credit protection sold give an indication of the amount of payment risk, as the negative fair values increase when the potential payment under the derivative contracts becomes more probable.
Credit protection sold/purchasedThe following tables do not include all credit derivatives and dif-fer from the credit derivatives in the “Fair value of derivative instruments” table. This is due to the exclusion of certain credit derivative instruments under US GAAP, which defines a credit derivative as a derivative instrument (a) in which one or more of its underlyings are related to the credit risk of a specified entity (or a group of entities) or an index based on the credit risk of a group of entities and (b) that exposes the seller to potential loss from credit risk-related events specified in the contract.
Total return swaps (TRS) of CHF 14.4 billion and CHF 16.7 bil-lion as of December 31, 2020 and 2019, respectively, were also excluded because a TRS does not expose the seller to potential loss from credit risk-related events specified in the contract. A TRS only provides protection against a loss in asset value and not against additional amounts as a result of specific credit events.
Credit protection sold/purchased 2020 2019
Net credit Fair value Net credit Fair value
Credit Credit protection Other of credit Credit Credit protection Other of credit protection protection (sold)/ protection protection protection protection (sold)/ protection protection
end of sold purchased 1 purchased purchased sold sold purchased 1 purchased purchased sold
Single-name instruments (CHF billion)
Investment grade 2 (52.5) 47.8 (4.7) 13.0 0.5 (52.6) 47.9 (4.7) 11.5 0.5
Non-investment grade (28.5) 26.5 (2.0) 11.8 0.4 (32.1) 29.5 (2.6) 16.1 0.9
Total single-name instruments (81.0) 74.3 (6.7) 24.8 0.9 (84.7) 77.4 (7.3) 27.6 1.4
of which sovereign (12.5) 11.6 (0.9) 5.3 0.0 (17.2) 15.4 (1.8) 4.1 0.0
of which non-sovereign (68.5) 62.7 (5.8) 19.5 0.9 (67.5) 62.0 (5.5) 23.5 1.4
Multi-name instruments (CHF billion)
Investment grade 2 (99.5) 95.2 (4.3) 23.1 (0.7) (109.5) 108.9 (0.6) 44.0 0.7
Non-investment grade (24.3) 19.9 (4.4) 11.3 3 0.2 (27.7) 24.5 (3.2) 17.1 3 1.0
Total multi-name instruments (123.8) 115.1 (8.7) 34.4 (0.5) (137.2) 133.4 (3.8) 61.1 1.7
of which non-sovereign (123.8) 115.1 (8.7) 34.4 (0.5) (137.2) 133.4 (3.8) 61.1 1.7
Total instruments (CHF billion)
Investment grade 2 (152.0) 143.0 (9.0) 36.1 (0.2) (162.1) 156.8 (5.3) 55.5 1.2
Non-investment grade (52.8) 46.4 (6.4) 23.1 0.6 (59.8) 54.0 (5.8) 33.2 1.9
Total instruments (204.8) 189.4 (15.4) 59.2 0.4 (221.9) 210.8 (11.1) 88.7 3.1
of which sovereign (12.5) 11.6 (0.9) 5.3 0.0 (17.2) 15.4 (1.8) 4.1 0.0
of which non-sovereign (192.3) 177.8 (14.5) 53.9 0.4 (204.7) 195.4 (9.3) 84.6 3.1
1 Represents credit protection purchased with identical underlyings and recoveries.2 Based on internal ratings of BBB and above.3 Includes synthetic securitized loan portfolios.
357Consolidated financial statements – Credit Suisse Group
The following table reconciles the notional amount of credit deriv-atives included in the table “Fair value of derivative instruments” to the table “Credit protection sold/purchased”.
Credit derivatives
end of 2020 2019
Credit derivatives (CHF billion)
Credit protection sold 204.8 221.9
Credit protection purchased 189.4 210.8
Other protection purchased 59.2 88.7
Other instruments 1 14.4 16.7
Total credit derivatives 467.8 538.1
1 Consists of total return swaps and other derivative instruments. The segregation of the future payments by maturity range and underlying risk gives an indication of the current status of the potential for performance under the derivative contracts.
Maturity of credit protection sold Maturity Maturity Maturity
less between greater
than 1 to 5 than
end of 1 year years 5 years Total
2020 (CHF billion)
Single-name instruments 14.0 62.7 4.3 81.0
Multi-name instruments 29.6 82.6 11.6 123.8
Total instruments 43.6 145.3 15.9 204.8
2019 (CHF billion)
Single-name instruments 19.2 60.6 4.9 84.7
Multi-name instruments 41.9 79.8 15.5 137.2
Total instruments 61.1 140.4 20.4 221.9
34 Guarantees and commitmentsGuarantees
In the ordinary course of business, guarantees are provided that contingently obligate the Group to make payments to third parties if the counterparty fails to fulfill its obligation under a borrowing or other contractual arrangement. The total gross amount disclosed within the Guarantees table reflects the maximum potential pay-ment under the guarantees. The carrying value represents the
higher of the initial fair value (generally the related fee received or receivable) less cumulative amortization and the Group’s cur-rent best estimate of payments that will be required under existing guarantee arrangements.
Guarantees provided by the Group are classified as follows: credit guarantees and similar instruments, performance guarantees and similar instruments, derivatives and other guarantees.
Guarantees Maturity Maturity Maturity Maturity
less between between greater Total Total
than 1 to 3 3 to 5 than gross net Carrying Collateral
end of 1 year 1 years years 5 years 1 amount amount 2 value received
2020 (CHF million)
Credit guarantees and similar instruments 1,645 649 203 582 3,079 3,016 27 1,637
Performance guarantees and similar instruments 3,607 1,885 526 514 6,532 5,601 30 2,535
Derivatives 3 10,531 3,921 698 1,423 16,573 16,573 380 – 4
Other guarantees 3,555 996 421 1,171 6,143 6,130 85 3,725
Total guarantees 19,338 7,451 1,848 3,690 32,327 31,320 522 7,897
2019 (CHF million)
Credit guarantees and similar instruments 1,813 252 185 864 3,114 3,061 10 1,655
Performance guarantees and similar instruments 4,407 3,059 668 723 8,857 7,833 31 2,793
Derivatives 3 13,194 2,665 695 690 17,244 17,244 295 – 4
Other guarantees 3,507 1,386 367 1,243 6,503 6,457 64 4,003
Total guarantees 22,921 7,362 1,915 3,520 35,718 34,595 400 8,451
1 Prior period has been corrected.2 Total net amount is computed as the gross amount less any participations.3 Excludes derivative contracts with certain active commercial and investment banks and certain other counterparties, as such contracts can be cash settled and the Group had no basis to
conclude it was probable that the counterparties held, at inception, the underlying instruments.4 Collateral for derivatives accounted for as guarantees is not significant.

358 Consolidated financial statements – Credit Suisse Group
Credit guarantees and similar instrumentsCredit guarantees and similar instruments are contracts that require the Group to make payments should a third party fail to do so under a specified existing credit obligation. The position includes standby letters of credit, commercial and residential mortgage guarantees, credit guarantees to clearing and settle-ment networks and exchanges and other guarantees associated with VIEs.
Standby letters of credit are made in connection with the cor-porate lending business and other corporate activities, where the Group provides guarantees to counterparties in the form of standby letters of credit, which represent obligations to make payments to third parties if the counterparties fail to fulfill their obligations under a borrowing arrangement or other contractual obligation.
Commercial and residential mortgage guarantees are made in connection with the Group’s commercial mortgage activities in the US, where the Group sells certain commercial and residen-tial mortgages to Fannie Mae and agrees to bear a percentage of the losses triggered by the borrowers failing to perform on the mortgage. The Group also issues guarantees that require it to reimburse Fannie Mae for losses on certain whole loans underly-ing mortgage-backed securities issued by Fannie Mae, which are triggered by borrowers failing to perform on the underlying mortgages.
The Group also provides guarantees to VIEs and other counter-parties under which it may be required to buy assets from such entities upon the occurrence of certain triggering events such as rating downgrades and/or substantial decreases in the fair value of those assets.
Performance guarantees and similar instrumentsPerformance guarantees and similar instruments are arrange-ments that require contingent payments to be made when certain performance-related targets or covenants are not met. Such covenants may include a customer’s obligation to deliver certain products and services or to perform under a construction con-tract. Performance guarantees are frequently executed as part of project finance transactions. The position includes private equity fund guarantees and guarantees related to residential mortgage securitization activities.
For private equity fund guarantees, the Group has provided inves-tors in private equity funds sponsored by a Group entity guaran-tees on potential obligations of certain general partners to return amounts previously paid as carried interest to those general part-ners if the performance of the remaining investments declines. To manage its exposure, the Group generally withholds a portion of carried interest distributions to cover any repayment obligations. In addition, pursuant to certain contractual arrangements, the Group is obligated to make cash payments to certain investors in certain private equity funds if specified performance thresholds are not met.
Further, as part of the Group’s residential mortgage securitiza-tion activities in the US, the Group may guarantee the collection by the servicer and remittance to the securitization trust of pre-payment penalties. The Group will have to perform under these guarantees in the event the servicer fails to remit the prepayment penalties.
DerivativesDerivatives which may also have the characteristics of a guaran-tee are issued in the ordinary course of business, generally in the form of written put options. Such derivative contracts do not meet the characteristics of a guarantee if they are cash settled and the Group has no basis to conclude it is probable that the counter-parties held, at inception, the underlying instruments related to the derivative contracts. The Group has concluded that these conditions were met for certain active commercial and invest-ment banks and certain other counterparties, and accordingly, the Group has reported such contracts as derivatives only.
The Group manages its exposure to these derivatives by engag-ing in various hedging strategies to reduce its exposure. For some contracts, such as written interest rate caps or foreign exchange options, the maximum payout is not determinable as interest rates or exchange rates could theoretically rise without limit. For these contracts, notional amounts were disclosed in the table above in order to provide an indication of the underlying exposure. In addition, the Group carries all derivatives at fair value in the con-solidated balance sheets and has considered the performance triggers and probabilities of payment when determining those fair values. It is more likely than not that written put options that are in-the-money to the counterparty will be exercised, for which the Group’s exposure was limited to the carrying value reflected in the table.
Other guaranteesOther guarantees include bankers’ acceptances, residual value guarantees, deposit insurance, contingent considerations in busi-ness combinations, the minimum value of an investment in mutual funds or private equity funds and all other guarantees that were not allocated to one of the categories above.
Deposit-taking banks and securities dealers in Switzerland and certain other European countries are required to ensure the payout of privileged deposits in case of specified restrictions or compulsory liquidation of a deposit-taking bank. In Switzerland, deposit-taking banks and securities dealers jointly guarantee an amount of up to CHF 6 billion. Upon occurrence of a payout event triggered by a specified restriction of business imposed by FINMA or by the compulsory liquidation of another deposit-taking bank, the Group’s contribution will be calculated based on its share of privileged deposits in proportion to total privileged deposits. Based on FINMA’s estimate for the Group’s banking subsidiaries in Switzerland, the Group’s share in the deposit insur-ance guarantee program for the period July 1, 2020 to June 30, 2021 is CHF 0.5 billion. These deposit insurance guarantees were reflected in other guarantees.
359Consolidated financial statements – Credit Suisse Group
Representations and warranties on residential mortgage loans sold
In connection with the Investment Bank division’s sale of US residential mortgage loans, the Group has provided certain representations and warranties relating to the loans sold. The Group has provided these representations and warranties relat-ing to sales of loans to institutional investors, primarily banks, and non-agency, or private label, securitizations. The loans sold are primarily loans that the Group has purchased from other parties. The scope of representations and warranties, if any, depends on the transaction, but can include: ownership of the mortgage loans and legal capacity to sell the loans; loan-to-value ratios and other characteristics of the property, the borrower and the loan; validity of the liens securing the loans and absence of delinquent taxes or related liens; conformity to underwriting standards and completeness of documentation; and origination in compliance with law. If it is determined that representations and warranties were breached, the Group may be required to repurchase the related loans or indemnify the investors to make them whole for losses. Whether the Group will incur a loss in connection with repurchases and make whole payments depends on: the extent to which claims are made; the validity of such claims made within the statute of limitations (including the likelihood and ability to enforce claims); whether the Group can successfully claim against parties that sold loans to the Group and made representations and warranties to the Group; the residential real estate market, including the number of defaults; and whether the obligations of the securitization vehicles were guaranteed or insured by third parties.
Repurchase claims on residential mortgage loans sold that are subject to arbitration or litigation proceedings, or become so during the reporting period, are not included in this Guarantees and commitments disclosure but are addressed in litigation and related loss contingencies and provisions. The Group is involved in litigation relating to representations and warranties on residential mortgages sold.
> Refer to “Note 40 – Litigation” for further information.
Disposal-related contingencies and other indemnifications
The Group has certain guarantees for which its maximum con-tingent liability cannot be quantified. These guarantees are not reflected in the “Guarantees” table and are discussed below.
Disposal-related contingenciesIn connection with the sale of assets or businesses, the Group sometimes provides the acquirer with certain indemnification provisions. These indemnification provisions vary by counterparty
in scope and duration and depend upon the type of assets or businesses sold. They are designed to transfer the potential risk of certain unquantifiable and unknowable loss contingencies, such as litigation, tax and intellectual property matters, from the acquirer to the seller. The Group closely monitors all such con-tractual agreements in order to ensure that indemnification pro-visions are adequately provided for in the Group’s consolidated financial statements.
Other indemnificationsThe Group provides indemnifications to certain counterparties in connection with its normal operating activities for which it is not possible to estimate the maximum amount that it could be obligated to pay. As a normal part of issuing its own securities, the Group typically agrees to reimburse holders for additional tax withholding charges or assessments resulting from changes in applicable tax laws or the interpretation of those laws. Securi-ties that include these agreements to pay additional amounts generally also include a related redemption or call provision if the obligation to pay the additional amounts results from a change in law or its interpretation and the obligation cannot be avoided by the issuer taking reasonable steps to avoid the payment of addi-tional amounts. Since such potential obligations are dependent on future changes in tax laws, the related liabilities the Group may incur as a result of such changes cannot be reasonably esti-mated. In light of the related call provisions typically included, the Group does not expect any potential liabilities in respect of tax gross-ups to be material.
The Group is a member of numerous securities exchanges and clearing houses and may, as a result of its membership arrange-ments, be required to perform if another member defaults and available amounts as defined in the relevant exchange’s or clear-ing house’s default waterfalls are not sufficient to cover losses of another member’s default. The exchange’s or clearing house’s default management procedures may provide for cash calls to non-defaulting members which may be limited to the amount (or a multiple of the amount) of the Group’s contribution to the guaran-tee fund. However, if these cash calls are not sufficient to cover losses, the default waterfall and default management procedures may foresee further loss allocation. Furthermore, some clearing house arrangements require members to assume a proportion-ate share of non-default losses, if such losses exceed the speci-fied resources allocated for such purpose by the clearing house. Non-default losses result from the clearing house’s investment of guarantee fund contributions and initial margin or are other losses unrelated to the default of a clearing member. The Group has determined that it is not possible to reasonably estimate the maxi-mum potential amount of future payments due under the mem-bership arrangements. In addition, the Group believes that any potential requirement to make payments under these membership arrangements is remote.

360 Consolidated financial statements – Credit Suisse Group
Other commitments
Irrevocable commitments under documentary creditsIrrevocable commitments under documentary credits include exposures from trade finance related to commercial letters of credit under which the Group guarantees payments to exporters against presentation of shipping and other documents.
Irrevocable loan commitmentsIrrevocable loan commitments are irrevocable credit facilities extended to clients and include fully or partially undrawn commit-ments that are legally binding and cannot be unconditionally can-celled by the Group. Commitments to originate mortgage loans that will be held for sale are considered derivatives for accounting purposes and are not included in this disclosure. Such commit-ments are reflected as derivatives in the consolidated balance sheets.
Forward reverse repurchase agreementsForward reverse repurchase agreements represent transactions in which the initial cash exchange of the reverse repurchase trans-actions takes place on specified future dates. The Group enters into forward reverse repurchase agreements with counterparties that may have existing funded reverse repurchase agreements. Depending on the details of the counterparty contract with Credit Suisse, both a counterparty’s existing funded reverse repurchase agreement and any forward reverse repurchase agreements under contract with the same counterparty are considered.
Other commitmentsOther commitments include private equity commitments, firm commitments in underwriting securities, commitments arising from deferred payment letters of credit and from acceptances in circulation and liabilities for call and put options on shares and other equity instruments.
Other commitments Maturity Maturity Maturity Maturity
less between between greater Total Total
than 1 to 3 3 to 5 than gross net Collateral
end of 1 year years years 5 years amount amount 1 received
2020 (CHF million)
Irrevocable commitments under documentary credits 3,915 97 0 0 4,012 3,963 2,404
Irrevocable loan commitments 2 19,813 48,855 39,605 10,749 119,022 115,116 53,039
Forward reverse repurchase agreements 17 0 0 0 17 17 17
Other commitments 135 1,418 9 381 1,943 1,943 19
Total other commitments 23,880 50,370 39,614 11,130 124,994 121,039 55,479
2019 (CHF million)
Irrevocable commitments under documentary credits 4,434 163 0 0 4,597 4,518 3,077
Irrevocable loan commitments 2 27,145 38,974 48,856 10,152 125,127 120,436 60,118
Forward reverse repurchase agreements 41 0 0 0 41 41 41
Other commitments 630 121 121 58 930 930 127
Total other commitments 32,250 39,258 48,977 10,210 130,695 125,925 63,363
1 Total net amount is computed as the gross amount less any participations.2 Irrevocable loan commitments do not include a total gross amount of CHF 130,877 million and CHF 128,294 million of unused credit limits as of December 31, 2020 and 2019, respec-
tively, which were revocable at the Group’s sole discretion upon notice to the client.
361Consolidated financial statements – Credit Suisse Group
35 Transfers of financial assets and variable interest entitiesIn the normal course of business, the Group enters into transac-tions with, and makes use of, SPEs. An SPE is an entity in the form of a trust or other legal structure designed to fulfill a specific limited need of the company that organized it and is generally structured to isolate the SPE’s assets from creditors of other entities, including the Group. The principal uses of SPEs are to assist the Group and its clients in securitizing financial assets and creating investment products. The Group also uses SPEs for other client-driven activity, such as to facilitate financings, and for Group tax or regulatory purposes.
Transfers of financial assetsSecuritizations
The majority of the Group’s securitization activities involve mort-gages and mortgage-related securities and are predominantly transacted using SPEs. In a typical securitization, the SPE pur-chases assets financed by proceeds received from the SPE’s issuance of debt and equity instruments, certificates, CP and other notes of indebtedness. These assets and liabilities are recorded on the balance sheet of the SPE and not reflected on the Group’s consolidated balance sheet, unless either the Group sold the assets to the entity and the accounting requirements for sale were not met or the Group consolidates the SPE.
The Group purchases commercial and residential mortgages for the purpose of securitization and sells these mortgage loans to SPEs. These SPEs issue commercial mortgage-backed securi-ties (CMBS), residential mortgage-backed securities (RMBS) and ABS that are collateralized by the assets transferred to the SPE and that pay a return based on the returns on those assets. Investors in these mortgage-backed securities or ABS typically have recourse to the assets in the SPEs. Third-party guaran-tees may further enhance the creditworthiness of the assets. The investors and the SPEs have no recourse to the Group’s assets. The Group is typically an underwriter of, and makes a market in, these securities.
The Group also transacts in re-securitizations of previously issued RMBS securities. Typically, certificates issued out of an existing securitization vehicle are sold into a newly created and separate securitization vehicle. Often, these re-securitizations are initiated in order to re-securitize an existing security to give the investor an investment with different risk ratings or characteristics.
The Group also uses SPEs for other asset-backed financings relating to client-driven activity and for Group tax or regulatory purposes. Types of structures included in this category include managed collateralized loan obligations (CLOs), CLOs, lever-aged finance, repack and other types of transactions, includ-ing life insurance structures, emerging market structures set up for financing, loan participation or loan origination purposes, and other alternative structures created for the purpose of invest-ing in venture capital-like investments. CLOs are collateralized by loans transferred to the CLO vehicle and pay a return based on the returns on the loans. Leveraged finance structures are used to assist in the syndication of certain loans held by the Group, while repack structures are designed to give a client collateralized exposure to specific cash flows or credit risk backed by collat-eral purchased from the Group. In these asset-backed financing structures, investors typically only have recourse to the collateral of the SPE and do not have recourse to the Group’s assets.
When the Group transfers assets into an SPE, it must assess whether that transfer is accounted for as a sale of the assets. Transfers of assets may not meet sale requirements if the assets have not been legally isolated from the Group and/or if the Group’s continuing involvement is deemed to give it effective control over the assets. If the transfer is not deemed a sale, it is instead accounted for as a secured borrowing, with the trans-ferred assets as collateral.
Gains and losses on securitization transactions depend, in part, on the carrying values of mortgages and loans involved in the transfer and are allocated between the assets sold and any ben-eficial interests retained according to the relative fair values at the date of sale.
The Group does not retain material servicing responsibilities from securitization activities.
The following table provides the gains or losses and proceeds from the transfer of assets relating to 2020, 2019 and 2018 securitizations of financial assets that qualify for sale account-ing and subsequent derecognition, along with the cash flows between the Group and the SPEs used in any securitizations in which the Group still has continuing involvement, regardless of when the securitization occurred.
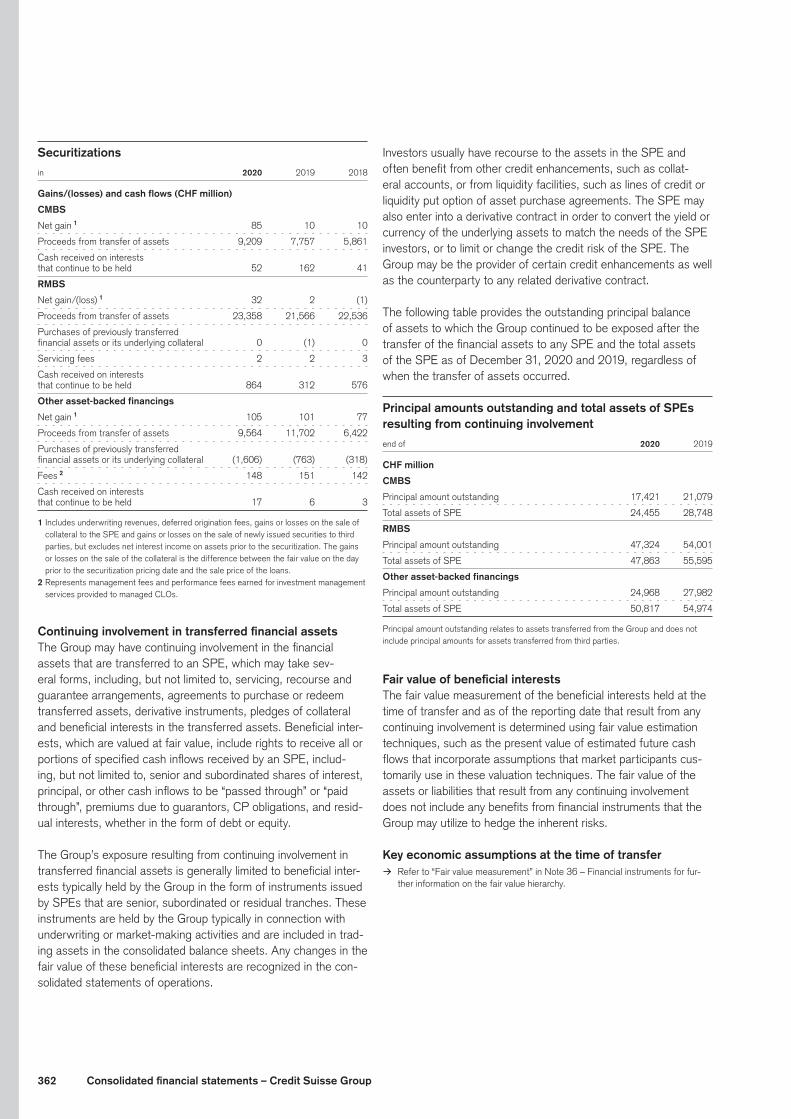
362 Consolidated financial statements – Credit Suisse Group
Securitizations
in 2020 2019 2018
Gains/(losses) and cash flows (CHF million)
CMBS
Net gain 1 85 10 10
Proceeds from transfer of assets 9,209 7,757 5,861
Cash received on interests
that continue to be held 52 162 41
RMBS
Net gain/(loss) 1 32 2 (1)
Proceeds from transfer of assets 23,358 21,566 22,536
Purchases of previously transferred
financial assets or its underlying collateral 0 (1) 0
Servicing fees 2 2 3
Cash received on interests
that continue to be held 864 312 576
Other asset-backed financings
Net gain 1 105 101 77
Proceeds from transfer of assets 9,564 11,702 6,422
Purchases of previously transferred
financial assets or its underlying collateral (1,606) (763) (318)
Fees 2 148 151 142
Cash received on interests
that continue to be held 17 6 3
1 Includes underwriting revenues, deferred origination fees, gains or losses on the sale of collateral to the SPE and gains or losses on the sale of newly issued securities to third parties, but excludes net interest income on assets prior to the securitization. The gains or losses on the sale of the collateral is the difference between the fair value on the day prior to the securitization pricing date and the sale price of the loans.
2 Represents management fees and performance fees earned for investment management services provided to managed CLOs.
Continuing involvement in transferred financial assetsThe Group may have continuing involvement in the financial assets that are transferred to an SPE, which may take sev-eral forms, including, but not limited to, servicing, recourse and guarantee arrangements, agreements to purchase or redeem transferred assets, derivative instruments, pledges of collateral and beneficial interests in the transferred assets. Beneficial inter-ests, which are valued at fair value, include rights to receive all or portions of specified cash inflows received by an SPE, includ-ing, but not limited to, senior and subordinated shares of interest, principal, or other cash inflows to be “passed through” or “paid through”, premiums due to guarantors, CP obligations, and resid-ual interests, whether in the form of debt or equity.
The Group’s exposure resulting from continuing involvement in transferred financial assets is generally limited to beneficial inter-ests typically held by the Group in the form of instruments issued by SPEs that are senior, subordinated or residual tranches. These instruments are held by the Group typically in connection with underwriting or market-making activities and are included in trad-ing assets in the consolidated balance sheets. Any changes in the fair value of these beneficial interests are recognized in the con-solidated statements of operations.
Investors usually have recourse to the assets in the SPE and often benefit from other credit enhancements, such as collat-eral accounts, or from liquidity facilities, such as lines of credit or liquidity put option of asset purchase agreements. The SPE may also enter into a derivative contract in order to convert the yield or currency of the underlying assets to match the needs of the SPE investors, or to limit or change the credit risk of the SPE. The Group may be the provider of certain credit enhancements as well as the counterparty to any related derivative contract.
The following table provides the outstanding principal balance of assets to which the Group continued to be exposed after the transfer of the financial assets to any SPE and the total assets of the SPE as of December 31, 2020 and 2019, regardless of when the transfer of assets occurred.
Principal amounts outstanding and total assets of SPEs resulting from continuing involvement
end of 2020 2019
CHF million
CMBS
Principal amount outstanding 17,421 21,079
Total assets of SPE 24,455 28,748
RMBS
Principal amount outstanding 47,324 54,001
Total assets of SPE 47,863 55,595
Other asset-backed financings
Principal amount outstanding 24,968 27,982
Total assets of SPE 50,817 54,974
Principal amount outstanding relates to assets transferred from the Group and does not include principal amounts for assets transferred from third parties.
Fair value of beneficial interestsThe fair value measurement of the beneficial interests held at the time of transfer and as of the reporting date that result from any continuing involvement is determined using fair value estimation techniques, such as the present value of estimated future cash flows that incorporate assumptions that market participants cus-tomarily use in these valuation techniques. The fair value of the assets or liabilities that result from any continuing involvement does not include any benefits from financial instruments that the Group may utilize to hedge the inherent risks.
Key economic assumptions at the time of transfer > Refer to “Fair value measurement” in Note 36 – Financial instruments for fur-
ther information on the fair value hierarchy.

363Consolidated financial statements – Credit Suisse Group
Key economic assumptions used in measuring fair value of beneficial interests at time of transfer
2020 2019 2018
at time of transfer, in CMBS RMBS CMBS RMBS CMBS RMBS
CHF million, except where indicated
Fair value of beneficial interests 342 2,692 549 3,171 662 3,613
of which level 2 305 2,398 455 2,978 640 3,509
of which level 3 37 294 94 193 22 103
Weighted-average life, in years 6.4 3.8 5.5 5.5 6.6 7.8
Prepayment speed assumption (rate per annum), in % 1 – 2 1.0–47.0 – 2 2.0–37.3 – 2 5.0–13.5
Cash flow discount rate (rate per annum), in % 3 1.4–20.9 0.2–40.8 2.5–8.3 1.5–15.7 3.6–9.8 3.0–13.6
Expected credit losses (rate per annum), in % 4 1.9–8.6 1.6–22.9 1.3–1.9 1.5–7.6 1.8–3.1 2.3–7.2
Transfers of assets in which the Group does not have beneficial interests are not included in this table.1 Prepayment speed assumption (PSA) is an industry standard prepayment speed metric used for projecting prepayments over the life of a residential mortgage loan. PSA utilizes the con-
stant prepayment rate (CPR) assumptions. A 100% prepayment assumption assumes a prepayment rate of 0.2% per annum of the outstanding principal balance of mortgage loans in the first month. This increases by 0.2 percentage points thereafter during the term of the mortgage loan, leveling off to a CPR of 6% per annum beginning in the 30th month and each month thereafter during the term of the mortgage loan. 100 PSA equals 6 CPR.
2 To deter prepayment, commercial mortgage loans typically have prepayment protection in the form of prepayment lockouts and yield maintenances.3 The rate is based on the weighted-average yield on the beneficial interests.4 The range of expected credit losses only reflects instruments with an expected credit loss greater than zero unless all of the instruments have an expected credit loss of zero.
Key economic assumptions as of the reporting dateThe following table provides the sensitivity analysis of key eco-nomic assumptions used in measuring the fair value of beneficial interests held in SPEs as of December 31, 2020 and 2019.
Key economic assumptions used in measuring fair value of beneficial interests held in SPEs 2020 2019
Other asset- Other asset-
backed backed
financing financing
end of CMBS 1 RMBS activities 2 CMBS 1 RMBS activities 2
CHF million, except where indicated
Fair value of beneficial interests 296 1,851 350 399 2,282 751
of which non-investment grade 36 631 23 46 711 15
Weighted-average life, in years 5.6 4.0 4.8 6.4 5.7 1.6
Prepayment speed assumption (rate per annum), in % 3 – 4.0–50.1 – – 3.0–35.7 –
Impact on fair value from 10% adverse change – (43.7) – – (38.1) –
Impact on fair value from 20% adverse change – (92.1) – – (72.6) –
Cash flow discount rate (rate per annum), in % 4 0.6–38.2 0.3–39.7 0.7–27.7 2.2–15.2 1.5–36.2 0.7–13.1
Impact on fair value from 10% adverse change (4.9) (22.4) (4.2) (6.8) (38.3) (2.1)
Impact on fair value from 20% adverse change (9.6) (43.5) (8.2) (13.4) (74.7) (4.2)
Expected credit losses (rate per annum), in % 5 0.4–14.7 0.6–39.6 0.7–26.8 0.5–8.5 1.1–34.5 0.7–12.8
Impact on fair value from 10% adverse change (4.3) (20.2) (4.5) (4.1) (24.1) (2.0)
Impact on fair value from 20% adverse change (8.5) (39.2) (8.9) (8.1) (47.3) (4.0)
1 To deter prepayment, commercial mortgage loans typically have prepayment protection in the form of prepayment lockouts and yield maintenances.2 CDOs and CLOs within this category are generally structured to be protected from prepayment risk.3 PSA is an industry standard prepayment speed metric used for projecting prepayments over the life of a residential mortgage loan. PSA utilizes the CPR assumptions. A 100% prepay-
ment assumption assumes a prepayment rate of 0.2% per annum of the outstanding principal balance of mortgage loans in the first month. This increases by 0.2 percentage points thereafter during the term of the mortgage loan, leveling off to a CPR of 6% per annum beginning in the 30th month and each month thereafter during the term of the mortgage loan. 100 PSA equals 6 CPR.
4 The rate is based on the weighted-average yield on the beneficial interests.5 The range of expected credit losses only reflects instruments with an expected credit loss greater than zero unless all of the instruments have an expected credit loss of zero.
These sensitivities are hypothetical and do not reflect economic hedging activities. Changes in fair value based on a 10% or 20% variation in assumptions generally cannot be extrapolated because the relationship of the change in assumption to the change in fair value may not be linear. Also, the effect of a varia-tion in a particular assumption on the fair value of the beneficial
interests is calculated without changing any other assumption. In practice, changes in one assumption may result in changes in other assumptions (for example, increases in market interest rates may result in lower prepayments and increased credit losses), which might magnify or counteract the sensitivities.
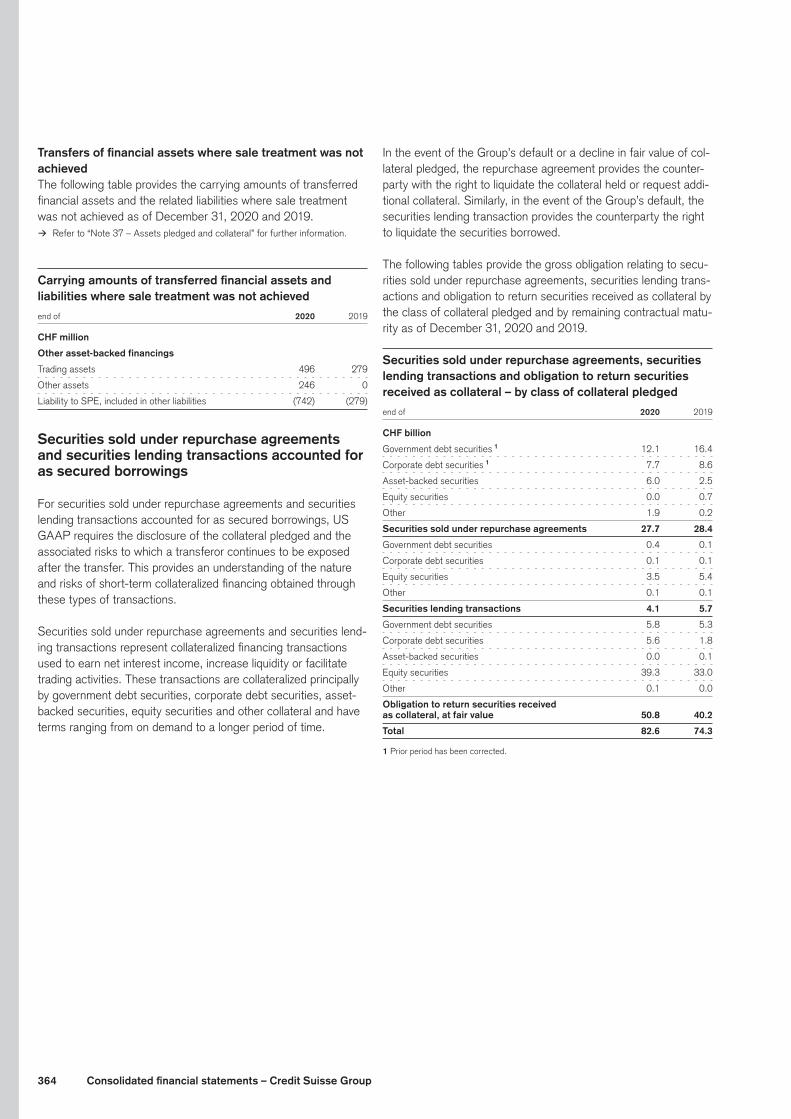
364 Consolidated financial statements – Credit Suisse Group
Transfers of financial assets where sale treatment was not achievedThe following table provides the carrying amounts of transferred financial assets and the related liabilities where sale treatment was not achieved as of December 31, 2020 and 2019.
> Refer to “Note 37 – Assets pledged and collateral” for further information.
Carrying amounts of transferred financial assets and liabilities where sale treatment was not achieved
end of 2020 2019
CHF million
Other asset-backed financings
Trading assets 496 279
Other assets 246 0
Liability to SPE, included in other liabilities (742) (279)
Securities sold under repurchase agreements and securities lending transactions accounted for as secured borrowings
For securities sold under repurchase agreements and securities lending transactions accounted for as secured borrowings, US GAAP requires the disclosure of the collateral pledged and the associated risks to which a transferor continues to be exposed after the transfer. This provides an understanding of the nature and risks of short-term collateralized financing obtained through these types of transactions.
Securities sold under repurchase agreements and securities lend-ing transactions represent collateralized financing transactions used to earn net interest income, increase liquidity or facilitate trading activities. These transactions are collateralized principally by government debt securities, corporate debt securities, asset-backed securities, equity securities and other collateral and have terms ranging from on demand to a longer period of time.
In the event of the Group’s default or a decline in fair value of col-lateral pledged, the repurchase agreement provides the counter-party with the right to liquidate the collateral held or request addi-tional collateral. Similarly, in the event of the Group’s default, the securities lending transaction provides the counterparty the right to liquidate the securities borrowed.
The following tables provide the gross obligation relating to secu-rities sold under repurchase agreements, securities lending trans-actions and obligation to return securities received as collateral by the class of collateral pledged and by remaining contractual matu-rity as of December 31, 2020 and 2019.
Securities sold under repurchase agreements, securities lending transactions and obligation to return securities received as collateral – by class of collateral pledged
end of 2020 2019
CHF billion
Government debt securities 1 12.1 16.4
Corporate debt securities 1 7.7 8.6
Asset-backed securities 6.0 2.5
Equity securities 0.0 0.7
Other 1.9 0.2
Securities sold under repurchase agreements 27.7 28.4
Government debt securities 0.4 0.1
Corporate debt securities 0.1 0.1
Equity securities 3.5 5.4
Other 0.1 0.1
Securities lending transactions 4.1 5.7
Government debt securities 5.8 5.3
Corporate debt securities 5.6 1.8
Asset-backed securities 0.0 0.1
Equity securities 39.3 33.0
Other 0.1 0.0
Obligation to return securities received
as collateral, at fair value 50.8 40.2
Total 82.6 74.3
1 Prior period has been corrected.

365Consolidated financial statements – Credit Suisse Group
Securities sold under repurchase agreements, securities lending transactions and obligation to return securities received as collateral – by remaining contractual maturity Remaining contractual maturities
No stated Up to 31 – 90 More than
end of maturity 1 30 days 2 days 90 days Total
2020 (CHF billion)
Securities sold under repurchase agreements 5.8 11.8 5.9 4.2 27.7
Securities lending transactions 4.0 0.0 0.1 0.0 4.1
Obligation to return securities received as collateral, at fair value 50.2 0.3 0.3 0.0 50.8
Total 60.0 12.1 6.3 4.2 82.6
2019 (CHF billion)
Securities sold under repurchase agreements 5.2 15.1 5.9 2.2 28.4
Securities lending transactions 5.7 0.0 0.0 0.0 5.7
Obligation to return securities received as collateral, at fair value 40.0 0.1 0.1 0.0 40.2
Total 50.9 15.2 6.0 2.2 74.3
1 Includes contracts with no contractual maturity that may contain termination arrangements subject to a notice period.2 Includes overnight transactions.
> Refer to “Note 28 – Offsetting of financial assets and financial liabilities” for further information on the gross amount of securities sold under repurchase agreements, securities lending transactions and obligation to return securities received as collateral and the net amounts disclosed in the consolidated bal-ance sheets.
Variable interest entitiesAs a normal part of its business, the Group engages in various transactions that include entities that are considered VIEs and are grouped into three primary categories: collateralized debt obliga-tions (CDOs)/CLOs, CP conduits and financial intermediation. VIEs are SPEs that typically either lack sufficient equity to finance their activities without additional subordinated financial support or are structured such that the holders of the voting rights do not substantively participate in the gains and losses of the entity. VIEs may be sponsored by the Group or third parties. Such entities are required to be assessed for consolidation, compelling the primary beneficiary to consolidate the VIE. The consolidation assess-ment requires an entity to determine whether it has the power to direct the activities that most significantly affect the economics of the VIE as well as whether the reporting entity has potentially significant benefits or losses in the VIE. The primary beneficiary assessment must be re-evaluated on an ongoing basis.
Application of the requirements for consolidation of VIEs may require the exercise of significant judgment. In the event consoli-dation of a VIE is required, the exposure to the Group is limited to that portion of the VIE’s assets attributable to any variable inter-est held by the Group prior to any risk management activities to hedge the Group’s net exposure. Any interests held in the VIE by third parties, even though consolidated by the Group, will not typi-cally impact its results of operations.
Transactions with VIEs are generally executed to facilitate securitization activities or to meet specific client needs, such as providing liquidity or investing opportunities, and, as part of these activities, the Group may hold interests in the VIEs.
Securitization-related transactions with VIEs involve selling or purchasing assets as well as possibly entering into related deriva-tives with those VIEs, providing liquidity, credit or other support. Other transactions with VIEs include derivative transactions in the Group’s capacity as the prime broker. The Group also enters into lending arrangements with VIEs for the purpose of financing projects or the acquisition of assets. Typically, the VIE’s assets are restricted in nature in that they are held primarily to satisfy the obligations of the entity. Further, the Group is involved with VIEs which were formed for the purpose of offering alternative invest-ment solutions to clients. Such VIEs relate primarily to private equity investments, fund-linked vehicles or funds of funds, where the Group acts as structurer, manager, distributor, broker, market maker or liquidity provider.
As a consequence of these activities, the Group holds vari-able interests in VIEs. Such variable interests consist of financial instruments issued by VIEs and which are held by the Group, certain derivatives with VIEs or loans to VIEs. Guarantees issued by the Group to or on behalf of VIEs may also qualify as variable interests. For such guarantees, including derivatives that act as guarantees, the notional amount of the respective guarantees is presented to represent the exposure. In general, investors in con-solidated VIEs do not have recourse to the Group in the event of a default, except where a guarantee was provided to the investors or where the Group is the counterparty to a derivative transaction involving VIEs.
Total assets of consolidated and non-consolidated VIEs for which the Group has involvement represent the total assets of the VIEs even though the Group’s involvement may be significantly less due to interests held by third-party investors. The asset bal-ances for non-consolidated VIEs where the Group has significant involvement represent the most current information available to the Group regarding the remaining principal balance of assets owned. In most cases, the asset balances represent an amortized cost basis without regards to impairments in fair value, unless fair value information is readily available.
366 Consolidated financial statements – Credit Suisse Group
The Group’s maximum exposure to loss is different from the car-rying value of the assets of the VIE. This maximum exposure to loss consists of the carrying value of the Group variable interests held as trading assets, derivatives and loans, the notional amount of guarantees and off-balance sheet commitments to VIEs, rather than the amount of total assets of the VIEs. The maximum expo-sure to loss does not reflect the Group’s risk management activi-ties, including effects from financial instruments that the Group may utilize to economically hedge the risks inherent in these VIEs. The economic risks associated with VIE exposures held by the Group, together with all relevant risk mitigation initiatives, are included in the Group’s risk management framework.
The Group has not provided financial or other support to con-solidated or non-consolidated VIEs that it was not contractually required to provide.
Collateralized debt and loan obligations
The Group engages in CDO/CLO transactions to meet client and investor needs, earn fees and sell financial assets and, for CLOs, loans. The Group may act as underwriter, placement agent or asset manager and may warehouse assets prior to the closing of a transaction. As part of its structured finance business, the Group purchases loans and other debt obligations from and on behalf of clients for the purpose of securitization. The loans and other debt obligations are sold to VIEs, which in turn issue CDO/CLOs to fund the purchase of assets such as investment grade and high yield corporate debt instruments.
Typically, the collateral manager in a managed CDO/CLO is deemed to be the entity that has the power to direct the activi-ties that most affect the economics of the entity. In a static CDO/CLO this “power” role is more difficult to analyze and may be the sponsor of the entity or the CDS counterparty.
CDO/CLOs provide credit risk exposure to a portfolio of ABS or loans (cash CDO/CLOs) or a reference portfolio of securities or loans (synthetic CDO/CLOs). Cash CDO/CLO transactions hold actual securities or loans whereas synthetic CDO/CLO transac-tions use CDS to exchange the underlying credit risk instead of using cash assets. The Group may also act as a derivative coun-terparty to the VIEs, which are typically not variable interests, and may invest in portions of the notes or equity issued by the VIEs. The CDO/CLO entities may have actively managed portfolios or static portfolios.
The securities issued by these VIEs are payable solely from the cash flows of the related collateral, and third-party creditors of these VIEs do not have recourse to the Group in the event of default.
The Group’s exposure in CDO/CLO transactions is typically lim-ited to interests retained in connection with its underwriting or market-making activities. Unless the Group has been deemed to have “power” over the entity and these interests are potentially significant, the Group is not the primary beneficiary of the vehicle
and does not consolidate the entity. The Group’s maximum expo-sure to loss does not include any effects from financial instru-ments used to economically hedge the risks of the VIEs.
Commercial paper conduit
The Group acts as the administrator and provider of liquidity and credit enhancement facilities for Alpine Securitization Ltd (Alpine), a multi-seller asset-backed CP conduit used for client and Group financing purposes. Alpine discloses to CP investors certain port-folio and asset data and submits its portfolio to rating agencies for public ratings on its CP. This CP conduit purchases assets such as loans and receivables or enters into reverse repurchase agreements and finances such activities through the issuance of CP backed by these assets. In addition to CP, Alpine may also issue term notes with maturities up to 30 months. The Group (including Alpine) can enter into liquidity facilities with third-party entities pursuant to which it may be required to purchase assets from these entities to provide them with liquidity and credit sup-port. The financing transactions are structured to provide credit support in the form of over-collateralization and other asset-spe-cific enhancements. Alpine is a separate legal entity that is wholly owned by the Group. However, its assets are available to satisfy only the claims of its creditors. In addition, the Group, as adminis-trator and liquidity facility provider, has significant exposure to and power over the activities of Alpine. Alpine is considered a VIE for accounting purposes and the Group is deemed the primary ben-eficiary and consolidates this entity.
The overall average maturity of Alpine’s outstanding CP was approximately 209 days as of December 31, 2020. Alpine’s CP was rated A-1(sf) by Standard & Poor’s and P-1(sf) by Moody’s and had exposures mainly in reverse repurchase agreements with a Group entity, solar loans and leases, consumer loans, aircraft loans and leases and car loans and leases.
The Group’s financial commitment to this CP conduit consists of obligations under liquidity agreements. The liquidity agreements are asset-specific arrangements, which require the Group to pro-vide short-term financing to the CP conduit or to purchase assets from the CP conduit in certain circumstances, including, but not limited to, a lack of liquidity in the CP market such that the CP conduit cannot refinance its obligations or a default of an underly-ing asset. The asset-specific credit enhancements provided by the client seller of the assets remain unchanged as a result of such a purchase. In entering into such agreements, the Group reviews the credit risk associated with these transactions on the same basis that would apply to other extensions of credit.
The Group enters into liquidity facilities with CP conduits admin-istrated and sponsored by third parties. These third-party CP conduits are considered to be VIEs for accounting purposes. The Group is not the primary beneficiary and does not consolidate these third-party CP conduits. The Group’s financial commitment to these third-party CP conduits consists of obligations under liquidity agreements. The liquidity agreements are asset-specific arrangements, which require the Group to provide short-term
367Consolidated financial statements – Credit Suisse Group
financing to the third-party CP conduits or to purchase assets from these CP conduits in certain circumstances, including, but not limited to, a lack of liquidity in the CP market such that the CP conduits cannot refinance their obligations or a default of an underlying asset. The asset-specific credit enhancements, if any, provided by the client seller of the assets remain unchanged as a result of such a purchase. In entering into such agreements, the Group reviews the credit risk associated with these transactions on the same basis that would apply to other extensions of credit. In some situations, the Group can enter into liquidity facilities with these third-party CP conduits through Alpine.
The Group’s economic risks associated with the Alpine CP con-duit and the third-party CP conduits are included in the Group’s risk management framework including counterparty, economic risk capital and scenario analysis.
Financial intermediation
The Group has significant involvement with VIEs in its role as a financial intermediary on behalf of clients.
The Group considers the likelihood of incurring a loss equal to the maximum exposure to be remote because of the Group’s risk mitigation efforts, including, but not limited to, economic hedging strategies and collateral arrangements. The Group’s economic risks associated with consolidated and non-consolidated VIE exposures arising from financial intermediation, together with all relevant risk mitigation initiatives, are included in the Group’s risk management framework.
Financial intermediation consists of securitizations, funds, loans, and other vehicles.
SecuritizationsSecuritizations are primarily CMBS, RMBS and ABS vehicles. The Group acts as an underwriter, market maker, liquidity pro-vider, derivative counterparty and/or provider of credit enhance-ments to VIEs related to certain securitization transactions.
The maximum exposure to loss is the carrying value of the loan securities and derivative positions that are variable interests, if any, plus the exposure arising from any credit enhancements the Group provided. The Group’s maximum exposure to loss does not include any effects from financial instruments used to economi-cally hedge the risks of the VIEs.
The activities that have the most significant impact on the securi-tization vehicle are the decisions relating to defaulted loans, which are controlled by the servicer. The party that controls the servic-ing has the ability to make decisions that significantly affect the result of the activities of the securitization vehicle. If a securitiza-tion vehicle has multiple parties that control servicing over specific assets, the Group determines it has power when it has control over the servicing of greater than 50% of the assets in the secu-ritization vehicle. When a servicer or its related party also has an
economic interest that has the potential to absorb a significant portion of the gains and/or losses, it will be deemed the primary beneficiary and consolidate the vehicle. If the Group determines that it controls the relevant servicing, it then determines if it has the obligation to absorb losses from, or the right to receive benefits of, the securitization vehicle that could potentially be significant to the vehicle, primarily by evaluating the amount and nature of securities issued by the vehicle that it holds. Factors considered in this analysis include the level of subordination of the securities held as well as the size of the position, based on the percentage of the class of securities and the total deal classes of securities issued. The more subordinated the level of securi-ties held, the more likely it is that the Group will be the primary beneficiary. This consolidation analysis is performed each report-ing period based on changes in inventory and the levels of assets remaining in the securitization. The Group typically consolidates securitization vehicles when it is the servicer and has holdings stemming from its role as underwriter. Short-term market making holdings in vehicles are not typically considered to be potentially significant for the purposes of this assessment.
In the case of re-securitizations of previously issued RMBS secu-rities, the re-securitization vehicles are passive in nature and do not have any significant ongoing activities that require manage-ment, and decisions relating to the design of the securitization transaction at its inception are the key power relating to the vehi-cle. Activities at inception include selecting the assets and deter-mining the capital structure. The power over a re-securitization vehicle is typically shared between the Group and the investor(s) involved in the design and creation of the vehicle. The Group concludes that it is the primary beneficiary of a re-securitization vehicle when it owns substantially all of the bonds issued from the vehicle.
FundsFunds include investment structures such as mutual funds, funds of funds, private equity funds and fund-linked products where the investors’ interest is typically in the form of debt rather than equity, thereby making them VIEs. The Group may have various relationships with such VIEs in the form of structurer, investment advisor, investment manager, administrator, custodian, under-writer, placement agent, market maker and/or as prime broker. These activities include the use of VIEs in structuring fund-linked products, hedge funds of funds or private equity investments to provide clients with investment opportunities in alternative invest-ments. In such transactions, a VIE holds underlying investments and issues securities that provide the investors with a return based on the performance of those investments.
The maximum exposure to loss consists of the fair value of instru-ments issued by such structures that are held by the Group as a result of underwriting or market-making activities, financing provided to the vehicles and the Group’s exposure resulting from principal protection and redemptions features. The investors typi-cally retain the risk of loss on such transactions, but for certain fund types, the Group may provide principal protection on the

368 Consolidated financial statements – Credit Suisse Group
securities to limit the investors’ exposure to downside market risk. The Group’s maximum exposure to loss does not include any effects from financial instruments used to economically hedge the risk of the VIEs.
Another model is used to assess funds for consolidation under US GAAP. Rather than the consolidation model which incor-porates power and the potential to absorb significant risk and rewards, a previous consolidation model is used which results in the Group being the primary beneficiary and consolidating the funds if it holds more than 50% of their outstanding issuances.
LoansThe Group provides loans to financing vehicles owned or spon-sored by clients or third-parties. These tailored lending arrange-ments are established to purchase, lease or otherwise finance and manage clients’ assets and include financing of specified cli-ent assets, of an individual single-asset used by the client or busi-ness ventures. The respective owner of the assets or manager of the businesses provides the equity in the vehicle.
The maximum exposure to loss is the carrying value of the Group’s loan exposure, which is subject to the same credit risk management procedures as loans issued directly to clients. The clients’ creditworthiness is carefully reviewed, loan-to-value ratios are strictly set and, in addition, clients provide equity, additional collateral or guarantees, all of which significantly reduce the Group’s exposure. The Group considers the likelihood of incurring a loss equal to the maximum exposure to be remote because of the Group’s risk mitigation efforts, which includes over-collateral-ization and effective monitoring to ensure that a sufficient loan-to-value ratio is maintained.
The third-party sponsor of the VIE will typically have control over the assets during the life of the structure and have the potential to absorb significant gains and losses; the Group is typically not the primary beneficiary of these structures and will not have to consolidate them. However, a change in the structure, such as a default of the sponsor, may result in the Group gaining control over the assets. If the Group’s lending is significant, it may then be required to consolidate the entity.
OtherOther includes additional vehicles where the Group provides financing and trust preferred issuance vehicles. Trust preferred issuance vehicles are utilized to assist the Group in raising cap-ital-efficient financing. The VIE issues preference shares which are guaranteed by the Group and uses the proceeds to purchase the debt of the Group. The Group’s guarantee of its own debt is not considered a variable interest and, as it has no holdings in these vehicles, the Group has no maximum exposure to loss. Non-consolidated VIEs include only the total assets of trust pre-ferred issuance vehicles, as the Group has no variable interests with these entities.
Consolidated VIEs
The Group has significant involvement with VIEs in its role as a financial intermediary on behalf of clients. The Group consolidates all VIEs related to financial intermediation for which it is the pri-mary beneficiary.
The consolidated VIEs table provides the carrying amounts and classifications of the assets and liabilities of consolidated VIEs as of December 31, 2020 and 2019.

369Consolidated financial statements – Credit Suisse Group
Consolidated VIEs in which the Group was the primary beneficiary Financial intermediation
CDO/ CP Securi-
end of CLO Conduit tizations Funds Loans Other Total
2020 (CHF million)
Cash and due from banks 0 0 23 22 37 8 90
Trading assets 0 0 1,255 50 840 19 2,164
Other investments 0 0 0 129 920 202 1,251
Net loans 0 653 0 51 29 167 900
Other assets 0 21 979 15 82 779 1,876
of which loans held-for-sale 0 0 462 10 0 0 472
of which premises and equipment 0 0 0 0 30 4 34
Total assets of consolidated VIEs 0 674 2,257 267 1,908 1,175 6,281
Customer deposits 0 0 0 0 0 1 1
Trading liabilities 0 0 0 0 10 0 10
Short-term borrowings 0 4,178 0 0 0 0 4,178
Long-term debt 0 0 1,701 0 10 35 1,746
Other liabilities 0 53 1 3 73 78 208
Total liabilities of consolidated VIEs 0 4,231 1,702 3 93 114 6,143
2019 (CHF million)
Cash and due from banks 6 1 71 11 39 10 138
Trading assets 75 0 1,554 82 1,063 14 2,788
Other investments 0 0 0 113 1,052 247 1,412
Net loans 0 325 53 1 29 241 649
Other assets 1 21 638 4 87 943 1,694
of which loans held-for-sale 0 0 93 0 0 0 93
of which premises and equipment 0 0 0 0 36 8 44
Total assets of consolidated VIEs 82 347 2,316 211 2,270 1,455 6,681
Trading liabilities 0 0 0 0 8 0 8
Short-term borrowings 0 4,885 0 0 0 0 4,885
Long-term debt 7 0 1,614 1 13 36 1,671
Other liabilities 0 54 1 4 92 146 297
Total liabilities of consolidated VIEs 7 4,939 1,615 5 113 182 6,861
Non-consolidated VIEs
The non-consolidated VIEs table provides the carrying amounts and classification of the assets of variable interests recorded in the Group’s consolidated balance sheets, maximum exposure to loss and total assets of the non-consolidated VIEs.
Total variable interest assets for which the company has involve-ment represent the carrying value of the variable interests in non-consolidated VIEs that are recorded in the consolidated balance sheet of the Group (for example, direct holdings in investment funds, loans and other receivables).
Maximum exposure to loss represents the carrying value of total variable interest assets in non-consolidated VIEs of the Group and the notional amounts of guarantees and off-balance sheet commitments which are variable interests that have been extended to non-consolidated VIEs. Such amounts, particu-larly notional amounts of derivatives, guarantees and off-balance sheet commitments, do not represent the anticipated losses in connection with these transactions as they do not take into
consideration the effect of collateral, recoveries or the probability of loss. In addition, they exclude the effect of offsetting financial instruments that are held to mitigate these risks and have not been reduced by unrealized losses previously recorded by the Group in connection with guarantees, off-balance sheet commit-ments or derivatives.
Total assets of non-consolidated VIEs are the assets of the non-consolidated VIEs themselves and are typically unrelated to the exposures the Group has with these entities due to variable inter-ests held by third-party investors. Accordingly, these amounts are not considered for risk management purposes.
Certain VIEs have not been included in the following table, includ-ing VIEs structured by third parties in which the Group’s interest is in the form of securities held in the Group’s inventory, cer-tain repurchase financings to funds and single-asset financing vehicles not sponsored by the Group to which the Group provides financing but has very little risk of loss due to over-collateralization and/or guarantees, failed sales where the Group does not have any other holdings and other entities out of scope.
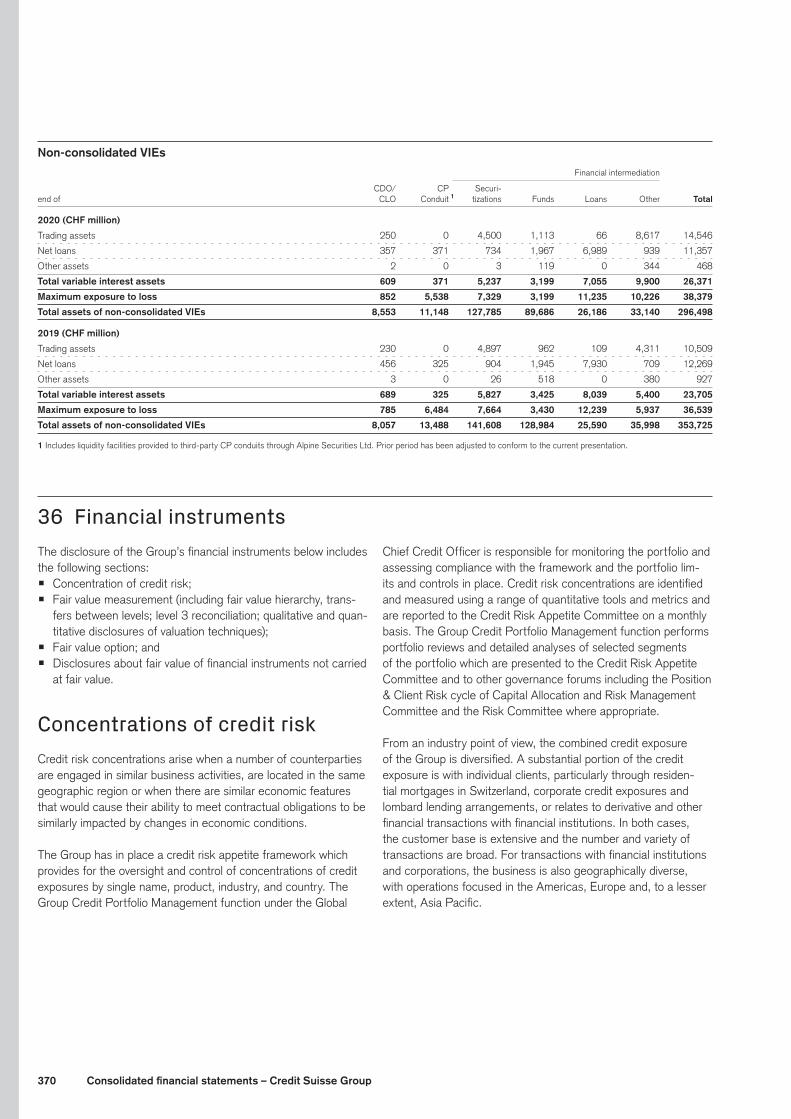
370 Consolidated financial statements – Credit Suisse Group
Non-consolidated VIEs Financial intermediation
CDO/ CP Securi-
end of CLO Conduit 1 tizations Funds Loans Other Total
2020 (CHF million)
Trading assets 250 0 4,500 1,113 66 8,617 14,546
Net loans 357 371 734 1,967 6,989 939 11,357
Other assets 2 0 3 119 0 344 468
Total variable interest assets 609 371 5,237 3,199 7,055 9,900 26,371
Maximum exposure to loss 852 5,538 7,329 3,199 11,235 10,226 38,379
Total assets of non-consolidated VIEs 8,553 11,148 127,785 89,686 26,186 33,140 296,498
2019 (CHF million)
Trading assets 230 0 4,897 962 109 4,311 10,509
Net loans 456 325 904 1,945 7,930 709 12,269
Other assets 3 0 26 518 0 380 927
Total variable interest assets 689 325 5,827 3,425 8,039 5,400 23,705
Maximum exposure to loss 785 6,484 7,664 3,430 12,239 5,937 36,539
Total assets of non-consolidated VIEs 8,057 13,488 141,608 128,984 25,590 35,998 353,725
1 Includes liquidity facilities provided to third-party CP conduits through Alpine Securities Ltd. Prior period has been adjusted to conform to the current presentation.
36 Financial instrumentsThe disclosure of the Group’s financial instruments below includes the following sections:p Concentration of credit risk;p Fair value measurement (including fair value hierarchy, trans-
fers between levels; level 3 reconciliation; qualitative and quan-titative disclosures of valuation techniques);
p Fair value option; andp Disclosures about fair value of financial instruments not carried
at fair value.
Concentrations of credit riskCredit risk concentrations arise when a number of counterparties are engaged in similar business activities, are located in the same geographic region or when there are similar economic features that would cause their ability to meet contractual obligations to be similarly impacted by changes in economic conditions.
The Group has in place a credit risk appetite framework which provides for the oversight and control of concentrations of credit exposures by single name, product, industry, and country. The Group Credit Portfolio Management function under the Global
Chief Credit Officer is responsible for monitoring the portfolio and assessing compliance with the framework and the portfolio lim-its and controls in place. Credit risk concentrations are identified and measured using a range of quantitative tools and metrics and are reported to the Credit Risk Appetite Committee on a monthly basis. The Group Credit Portfolio Management function performs portfolio reviews and detailed analyses of selected segments of the portfolio which are presented to the Credit Risk Appetite Committee and to other governance forums including the Position & Client Risk cycle of Capital Allocation and Risk Management Committee and the Risk Committee where appropriate.
From an industry point of view, the combined credit exposure of the Group is diversified. A substantial portion of the credit exposure is with individual clients, particularly through residen-tial mortgages in Switzerland, corporate credit exposures and lombard lending arrangements, or relates to derivative and other financial transactions with financial institutions. In both cases, the customer base is extensive and the number and variety of transactions are broad. For transactions with financial institutions and corporations, the business is also geographically diverse, with operations focused in the Americas, Europe and, to a lesser extent, Asia Pacific.

371Consolidated financial statements – Credit Suisse Group
Fair value measurementA significant portion of the Group’s financial instruments is carried at fair value. Deterioration of financial markets could significantly impact the fair value of these financial instruments and the results of operations.
The fair value of the majority of the Group’s financial instruments is based on quoted prices in active markets or observable inputs. These instruments include government and agency securities, certain short-term borrowings, most investment grade corporate debt, certain high yield debt securities, exchange-traded and cer-tain OTC derivatives and most listed equity securities.
In addition, the Group holds financial instruments for which no prices are available and which have few or no observable inputs. For these instruments, the determination of fair value requires subjective assessment and judgment, depending on liquidity, pricing assumptions, the current economic and competitive envi-ronment and the risks affecting the specific instrument. In such circumstances, valuation is determined based on management’s own judgments about the assumptions that market participants would use in pricing the asset or liability, including assumptions about risk. These instruments include certain OTC derivatives, including interest rate, foreign exchange, equity and credit deriva-tives, certain corporate equity-linked securities, mortgage-related securities, private equity investments and certain loans and credit products, including leveraged finance, certain syndicated loans and certain high yield bonds, and life finance instruments. The fair value measurement disclosures exclude derivative transactions that are daily settled.
The fair value of financial instruments is impacted by factors such as benchmark interest rates, prices of financial instruments issued by third parties, commodity prices, foreign exchange rates and index prices or rates. In addition, valuation adjustments are an integral part of the valuation process when market prices are not indicative of the credit quality of a counterparty, and are applied to both OTC derivatives and debt instruments. The impact of changes in a counterparty’s credit spreads (known as credit valuation adjustments) is considered when measuring the fair value of assets, and the impact of changes in the Group’s own credit spreads (known as debit valuation adjustments) is con-sidered when measuring the fair value of its liabilities. For OTC derivatives, the impact of changes in both the Group’s and the counterparty’s credit standing is considered when measuring their fair value, based on current CDS prices. The adjustments also take into account contractual factors designed to reduce the Group’s credit exposure to a counterparty, such as collateral held and master netting agreements. For hybrid debt instruments with embedded derivative features, the impact of changes in the Group’s credit standing is considered when measuring their fair value, based on current funded debt spreads.
US GAAP permits a reporting entity to measure the fair value of a group of financial assets and financial liabilities on the basis of the price that would be received to sell a net long position or paid to transfer a net short position for a particular risk exposure in an orderly transaction between market participants at the measure-ment date. As such, the Group continues to apply bid and offer adjustments to net portfolios of cash securities and/or derivative instruments to adjust the value of the net position from a mid-market price to the appropriate bid or offer level that would be realized under normal market conditions for the net long or net short position for a specific market risk. In addition, the Group reflects the net exposure to credit risk for its derivative instru-ments where the Group has legally enforceable agreements with its counterparties that mitigate credit risk exposure in the event of default.
Valuation adjustments are recorded in a reasonable and consis-tent manner that results in an allocation to the relevant disclosures in the notes to the financial statements as if the valuation adjust-ment had been allocated to the individual unit of account.
Fair value hierarchy
The levels of the fair value hierarchy are defined as follows:p Level 1: Quoted prices (unadjusted) in active markets for
identical assets or liabilities that the Group has the ability to access. This level of the fair value hierarchy provides the most reliable evidence of fair value and is used to measure fair value whenever available.
p Level 2: Inputs other than quoted prices included within level 1 that are observable for the asset or liability, either directly or indirectly. These inputs include: (i) quoted prices for similar assets or liabilities in active markets; (ii) quoted prices for iden-tical or similar assets or liabilities in markets that are not active, that is, markets in which there are few transactions for the asset or liability, the prices are not current or price quotations vary substantially either over time or among market makers, or in which little information is publicly available; (iii) inputs other than quoted prices that are observable for the asset or liability; or (iv) inputs that are derived principally from or corroborated by observable market data by correlation or other means.
p Level 3: Inputs that are unobservable for the asset or liabil-ity. These inputs reflect the Group’s own assumptions about the assumptions that market participants would use in pricing the asset or liability (including assumptions about risk). These inputs are developed based on the best information available in the circumstances, which include the Group’s own data. The Group’s own data used to develop unobservable inputs is adjusted if information indicates that market participants would use different assumptions.
The Group records net open positions at bid prices if long, or at ask prices if short, unless the Group is a market maker in such positions, in which case mid-pricing is utilized. Fair value mea-surements are not adjusted for transaction costs.

372 Consolidated financial statements – Credit Suisse Group
Qualitative disclosures of valuation techniques
OverviewThe Group has implemented and maintains a valuation control framework, which is supported by policies and procedures that define the principles for controlling the valuation of the Group’s financial instruments. Control functions such as Product Control and Risk Management review and approve significant valua-tion policies and procedures. The framework includes three main internal processes: (i) valuation governance; (ii) independent price verification and significant unobservable inputs review; and (iii) a cross-functional pricing model review. Through this framework, the Group determines the reasonableness of the fair value of its financial instruments.
On a monthly basis, meetings are held for each business line with senior representatives of the Front Office and Product Control to discuss independent price verification results, valuation adjust-ments, and other significant valuation issues. On a quarterly basis, a review of significant changes in the fair value of financial instruments is undertaken by Product Control and conclusions are reached regarding the reasonableness of those changes. Additionally, on a quarterly basis, meetings are held for each business line with senior representatives of the Front Office and control functions such as Product Control and Risk Management to discuss independent price verification results, valuation issues, business and market updates, as well as a review of significant changes in fair value from the prior quarter, significant unobserv-able inputs and prices used in valuation techniques, and valuation adjustments.
The valuation results are aggregated for reporting to the Valuation Risk Management Committee (VARMC) and the Audit Commit-tee. The VARMC, which is comprised of Executive Board mem-bers and the heads of the business and control functions, meets to review and ratify valuation review conclusions, and to resolve significant valuation issues for the Group. Oversight of the valu-ation control framework is through specific and regular reporting on valuation directly to the Group’s Executive Board through the VARMC.
One of the key components of the governance process is the segregation of duties between the Front Office and Product Con-trol. The Front Office is responsible for measuring inventory at fair value on a daily basis, while Product Control is responsible for independently reviewing and validating those valuations on a peri-odic basis. The Front Office values the inventory using, wherever possible, observable market data which may include executed transactions, dealer quotes or broker quotes for the same or similar instruments. Product Control validates this inventory using independently sourced data that also includes executed transac-tions, dealer quotes, and broker quotes.
In general, Product Control utilizes independent pricing service data as part of its review process. Independent pricing service data is analyzed to ensure that it is representative of fair value,
including confirming that the data corresponds to executed trans-actions or executable broker quotes, review and assessment of contributors to ensure they are active market participants, review of statistical data and utilization of pricing challenges. The analy-sis also includes understanding the sources of the pricing service data and any models or assumptions used in determining the results. The purpose of the review is to judge the quality and reli-ability of the data for fair value measurement purposes and its appropriate level of usage within the Product Control independent valuation review.
For certain financial instruments the fair value is estimated in full or in part using valuation techniques based on assumptions that are not supported by market observable prices, rates or other inputs. In addition, there may be uncertainty about a valuation resulting from the choice of valuation technique or model used, the assumptions embedded in those models, the extent to which inputs are not market observable, or as a consequence of other elements affecting the valuation technique or model. Model cali-bration is performed when significant new market information becomes available or at a minimum on a quarterly basis as part of the business review of significant unobservable inputs for level 3 instruments. For models that have been deemed to be significant to the overall fair value of the financial instrument, model valida-tion is performed as part of the periodic review of the related model.
The following information on the valuation techniques and signifi-cant unobservable inputs of the various financial instruments and the section “Uncertainty of fair value measurements at the report-ing date from the use of significant unobservable inputs” should be read in conjunction with the tables “Assets and liabilities mea-sured at fair value on a recurring basis”, “Quantitative information about level 3 assets measured at fair value on a recurring basis” and “Quantitative information about level 3 liabilities measured at fair value on a recurring basis”.
Central bank funds sold, securities purchased under resale agreements and securities borrowing transactionsSecurities purchased under resale agreements and securities sold under repurchase agreements are measured at fair value using discounted cash flow analysis. Future cash flows are dis-counted using observable market interest rate repurchase/resale curves for the applicable maturity and underlying collateral of the instruments. As such, the significant majority of both securities purchased under resale agreements and securities sold under repurchase agreements are included in level 2 of the fair value hierarchy. Structured resale and repurchase agreements include embedded derivatives, which are measured using the same tech-niques as described below for stand-alone derivative contracts held for trading purposes or used in hedge accounting relation-ships. If the value of the embedded derivative is determined using significant unobservable inputs, those structured resale and repurchase agreements included are classified as level 3 in the fair value hierarchy. The significant unobservable input is funding spread.
373Consolidated financial statements – Credit Suisse Group
Securities purchased under resale agreements are usually fully collateralized or over-collateralized by government securities, money market instruments, corporate bonds, or other debt instru-ments. In the event of counterparty default, the collateral service agreement provides the Group with the right to liquidate the col-lateral held.
Debt securitiesForeign governmentsForeign government debt securities typically have quoted prices in active markets and are mainly categorized as level 1 instruments. Valuations of foreign government debt securities for which mar-ket prices are not available are based on yields reflecting credit rating, historical performance, delinquencies, loss severity, the maturity of the security, recent transactions in the market or other modeling techniques, which may involve judgment. Those securi-ties where the price or model inputs are observable in the market are categorized as level 2 instruments, while those securities where prices are not observable and significant model inputs are unobservable are categorized as level 3 of the fair value hierarchy.
CorporatesCorporate bonds are priced to reflect current market levels either through recent market transactions or broker or dealer quotes. Where a market price for the particular security is not directly available, valuations are obtained based on yields reflected by other instruments in the specific or similar entity’s capital struc-ture and adjusting for differences in seniority and maturity, bench-marking to a comparable security where market data is available (taking into consideration differences in credit, liquidity and matu-rity), or through the application of cash flow modeling techniques utilizing observable inputs, such as current interest rate curves and observable CDS spreads. Significant unobservable inputs may include correlation and price. For securities using market comparable price, the differentiation between level 2 and level 3 is based upon the relative significance of any yield adjustments as well as the accuracy of the comparison characteristics (i.e., the observable comparable security may be in the same country but a different industry and may have a different seniority level – the lower the comparability the more likely the security will be level 3).
RMBS, CMBS and CDO securitiesFair values of RMBS, CMBS and CDO may be available through quoted prices, which are often based on the prices at which similarly structured and collateralized securities trade between dealers and to and from customers. Fair values of RMBS, CMBS and CDO for which there are significant unobservable inputs are valued using capitalization rate and discount rate. Price may not be observable for fair value measurement purposes for many reasons, such as the length of time since the last executed transaction for the related security, use of a price from a similar instrument, or use of a price from an indicative quote. Fair values determined by market comparable price may include discounted cash flow models using the inputs credit spread, default rate, dis-count rate, prepayment rate and loss severity. Prices from similar observable instruments are used to calculate implied inputs which are then used to value unobservable instruments using discounted
cash flow. The discounted cash flow price is then compared to the unobservable prices and assessed for reasonableness.
For most structured debt securities, determination of fair value requires subjective assessment depending on liquidity, owner-ship concentration, and the current economic and competitive environment. Valuation is determined based on the Front Office’s own assumptions about how market participants would price the asset. Collateralized bond and loan obligations are split into vari-ous structured tranches and each tranche is valued based upon its individual rating and the underlying collateral supporting the structure. Valuation models are used to value both cash and syn-thetic CDOs.
Equity securitiesThe majority of the Group’s positions in equity securities are traded on public stock exchanges for which quoted prices are readily and regularly available and are therefore categorized as level 1 instruments. Level 2 and level 3 equities include fund-linked products, convertible bonds or equity securities with restrictions that are not traded in active markets. Significant unobservable inputs may include earnings before interest, taxes, depreciation and amortization (EBITDA) multiple and market com-parable price.
DerivativesDerivatives held for trading purposes or used in hedge account-ing relationships include both OTC and exchange-traded deriva-tives. The fair values of exchange-traded derivatives measured using observable exchange prices are included in level 1 of the fair value hierarchy. For exchange-traded derivatives where the volume of trading is low, the observable exchange prices may not be considered executable at the reporting date. These derivatives are valued in the same manner as similar observable OTC deriva-tives and are included in level 2 of the fair value hierarchy. If the similar OTC derivative used for valuing the exchange-traded deriv-ative is not observable, the exchange-traded derivative is included in level 3 of the fair value hierarchy.
The fair values of OTC derivatives are determined on the basis of either industry standard models or internally developed proprietary models. Both model types use various observable and unobserv-able inputs in order to determine fair value. The inputs include those characteristics of the derivative that have a bearing on the economics of the instrument. The determination of the fair value of many derivatives involves only a limited degree of subjectivity because the required inputs are observable in the marketplace, while more complex derivatives may use unobservable inputs that rely on specific proprietary modeling assumptions. Where observ-able inputs (prices from exchanges, dealers, brokers or market consensus data providers) are not available, attempts are made to infer values from observable prices through model calibration (spot and forward rates, mean reversion, benchmark interest rate curves and volatility inputs for commonly traded option products). For inputs that cannot be derived from other sources, estimates from historical data may be made. OTC derivatives where the majority of the value is derived from market observable inputs are

374 Consolidated financial statements – Credit Suisse Group
categorized as level 2 instruments, while those where the majority of the value is derived from unobservable inputs are categorized as level 3 of the fair value hierarchy.
The valuation of derivatives includes an adjustment for the cost of funding uncollateralized OTC derivatives.
Interest rate derivativesOTC vanilla interest rate products, such as interest rate swaps, swaptions and caps and floors are valued by discounting the anticipated future cash flows. The future cash flows and discount-ing are derived from market standard yield curves and industry standard volatility inputs. Where applicable, exchange-traded prices are also used to value exchange-traded futures and options and can be used in yield curve construction. For more complex products, inputs include, but are not limited to basis spread, cor-relation, credit spread, prepayment rate and volatility skew.
Foreign exchange derivativesForeign exchange derivatives include vanilla products such as spot, forward and option contracts where the anticipated dis-counted future cash flows are determined from foreign exchange forward curves and industry standard optionality modeling tech-niques. Where applicable, exchange-traded prices are also used for futures and option prices. For more complex products inputs include, but are not limited to, contingent probability, correlation and prepayment rate.
Equity and index-related derivativesEquity derivatives include a variety of products ranging from vanilla options and swaps to exotic structures with bespoke pay-off profiles. The main inputs in the valuation of equity derivatives may include buyback probability, correlation, gap risk, price and volatility.
Generally, the interrelationship between the correlation and volatil-ity is positively correlated.
Credit derivativesCredit derivatives include index, single-name and multi-name CDS in addition to more complex structured credit products. Vanilla products are valued using industry standard models and inputs that are generally market observable including credit spread and recovery rate.
Complex structured credit derivatives are valued using propri-etary models requiring inputs such as correlation, credit spread, funding spread, loss severity, prepayment rate and recovery rate. These inputs are generally implied from available market observ-able data.
Other trading assetsOther trading assets primarily include life settlement and premium finance instruments and RMBS loans. Life settlement and pre-mium finance instruments are valued using proprietary models with several inputs. The significant unobservable inputs of the fair value for life settlement and premium finance instruments is the
estimate of market implied life expectancy, while for RMBS loans it is market comparable price.
For life settlement and premium finance instruments, individual life expectancy rates are typically obtained by multiplying a base mortality curve for the general insured population provided by a professional actuarial organization together with an individual-spe-cific multiplier. Individual-specific multipliers are determined based on data from third-party life expectancy data providers, which examine the insured individual’s medical conditions, family history and other factors to arrive at a life expectancy estimate.
For RMBS loans, the use of market comparable price varies depending upon each specific loan. For some loans, similar to unobservable RMBS securities, prices from similar observable instruments are used to calculate implied inputs which are then used to value unobservable instruments using discounted cash flow. The discounted cash flow price is then compared to the unobservable prices and assessed for reasonableness. For other RMBS loans, the loans are categorized by specific characteris-tics, such as loan-to-value ratio, average account balance, loan type (single or multi-family), lien, seasoning, coupon, FICO score, locality, delinquency status, cash flow velocity, roll rates, loan pur-pose, occupancy, servicers advance agreement type, modification status, Federal Housing Administration insurance, property value and documentation quality. Loans with unobservable prices are put into consistent buckets which are then compared to market observable comparable prices in order to assess the reasonable-ness of those unobservable prices.
Other investmentsPrivate equity funds, hedge funds and equity method investment fundsEquity method investment funds principally include equity invest-ments in the form of a) direct investments in third-party hedge funds, private equity funds and funds of funds, b) equity method investments where the Group has the ability to significantly influ-ence the operating and financial policies of the investee, and c) direct investments in non-marketable equity securities.
Direct investments in third-party hedge funds, private equity funds and funds of funds are measured at fair value based on their published NAVs as permitted by ASC Topic 820 – Fair Value Measurement. In some cases, NAVs may be adjusted where there is sufficient evidence that the NAV published by the invest-ment manager is not in line with the fund’s observable market data, it is probable that the investment will be sold for an amount other than NAV or other circumstances exist that would require an adjustment to the published NAV. Although rarely adjusted, significant judgment is involved in making any adjustments to the published NAVs. The investments for which the fair value is measured using the NAV practical expedient are not categorized within the fair value hierarchy.
Direct investments in non-marketable equity securities con-sist of both real estate investments and non-real estate invest-ments. Equity-method investments and direct investments in
375Consolidated financial statements – Credit Suisse Group
non-marketable equity securities are initially measured at their transaction price, as this is the best estimate of fair value. There-after, these investments are individually measured at fair value based upon a number of factors that include any recent rounds of financing involving third-party investors, comparable company transactions, multiple analyses of cash flows or book values, or discounted cash flow analyses. The availability of information used in these modeling techniques is often limited and involves significant judgment in evaluating these different factors over time. As a result, these investments are included in level 3 of the fair value hierarchy.
Life finance instrumentsLife finance instruments include single premium immediate annui-ties (SPIA) and other premium finance instruments. Life finance instruments are valued in a similar manner as described for life settlement and premium finance instruments under the other trading assets section above.
LoansThe Group’s loan portfolio which is measured at fair value pri-marily consists of commercial and industrial loans and loans to financial institutions. Within these categories, loans measured at fair value include commercial loans, real estate loans, corporate loans, leverage finance loans and emerging market loans. Fair value is based on recent transactions and quoted prices, where available. Where recent transactions and quoted prices are not available, fair value may be determined by relative value bench-marking (which includes pricing based upon another position in the same capital structure, other comparable loan issues, generic industry credit spreads, implied credit spreads derived from CDS for the specific borrower, and enterprise valuations) or calculated based on the exit price of the collateral, based on current market conditions.
Both the funded and unfunded portion of revolving credit lines on the corporate lending portfolio are valued using a loan pric-ing model, which requires estimates of significant inputs includ-ing credit conversion factors, credit spreads, recovery rates and weighted average life of the loan. Significant unobservable inputs may include credit spread and price.
The Group’s other assets and liabilities include mortgage loans held in conjunction with securitization activities and assets and liabilities of VIEs and mortgage securitizations that do not meet
the criteria for sale treatment under US GAAP. The fair value of mortgage loans held in conjunction with securitization activities is determined on a whole-loan basis and is consistent with the valu-ation of RMBS loans discussed in “Other trading assets” above. Whole-loan valuations are calculated based on the exit price reflecting the current market conditions. The fair value of assets and liabilities of VIEs and mortgage securitizations that do not meet the criteria for sale treatment under US GAAP are deter-mined based on the quoted prices for securitized bonds, where available, or on cash flow analyses for securitized bonds, when quoted prices are not available. The fair value of the consolidated financial assets of RMBS and CMBS securitization vehicles, which qualify as collateralized financing entities, are measured on the basis of the more observable fair value of the VIEs’ financial liabilities.
Short-term borrowings and long-term debtThe Group’s short-term borrowings and long-term debt include structured notes (hybrid financial instruments that are both bifur-catable and non-bifurcatable) and vanilla debt. The fair value of structured notes is based on quoted prices, where available. When quoted prices are not available, fair value is determined by using a discounted cash flow model incorporating the Group’s credit spreads, the value of derivatives embedded in the debt and the residual term of the issuance based on call options. Deriva-tives structured into the issued debt are valued consistently with the Group’s stand-alone derivative contracts held for trading pur-poses or used in hedge accounting relationships as discussed above. The fair value of structured debt is heavily influenced by the combined call options and performance of the underlying derivative returns. Significant unobservable inputs for short-term borrowings and long-term debt include buyback probability, cor-relation, credit spread, gap risk, mean reversion, price, recovery rate and volatility.
Generally, the interrelationships between correlation, credit spread, gap risk and volatility inputs are positively correlated.
Other liabilitiesFailed salesThese liabilities represent the financing of assets that did not achieve sale accounting treatment under US GAAP. Failed sales are valued in a manner consistent with the related underlying financial instruments.
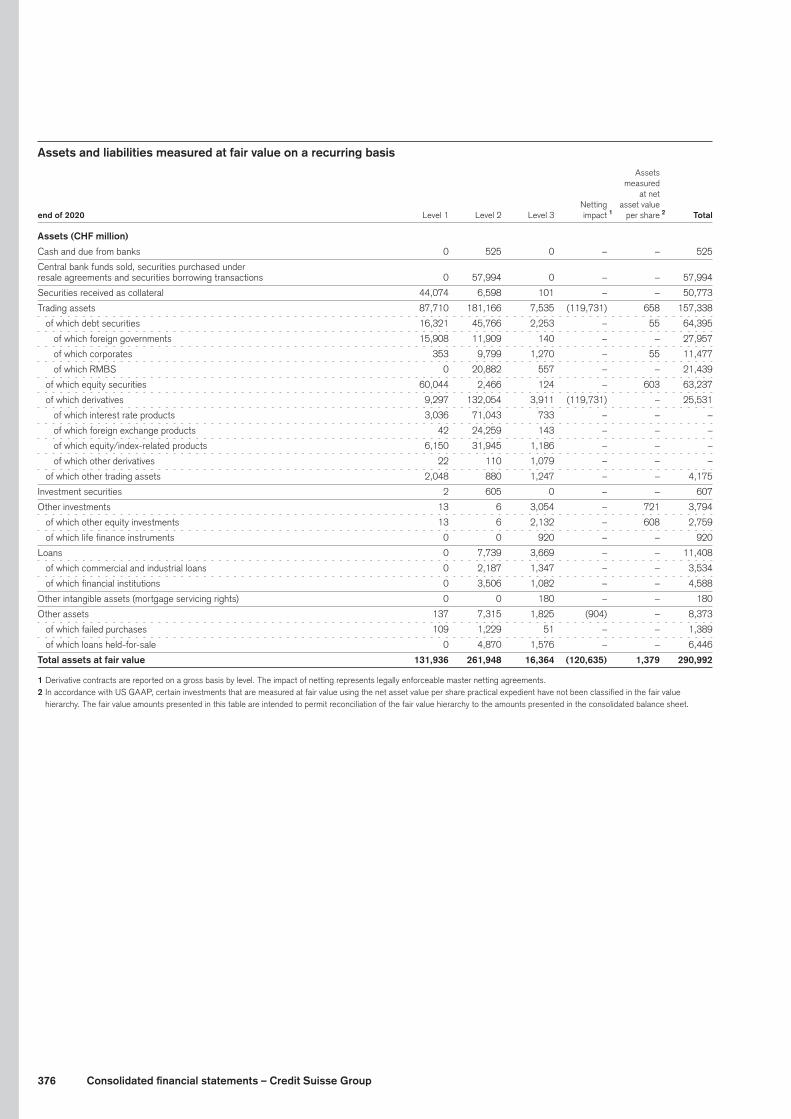
376 Consolidated financial statements – Credit Suisse Group
Assets and liabilities measured at fair value on a recurring basis Assets
measured
at net
Netting asset value
end of 2020 Level 1 Level 2 Level 3 impact 1 per share 2 Total
Assets (CHF million)
Cash and due from banks 0 525 0 – – 525
Central bank funds sold, securities purchased under
resale agreements and securities borrowing transactions 0 57,994 0 – – 57,994
Securities received as collateral 44,074 6,598 101 – – 50,773
Trading assets 87,710 181,166 7,535 (119,731) 658 157,338
of which debt securities 16,321 45,766 2,253 – 55 64,395
of which foreign governments 15,908 11,909 140 – – 27,957
of which corporates 353 9,799 1,270 – 55 11,477
of which RMBS 0 20,882 557 – – 21,439
of which equity securities 60,044 2,466 124 – 603 63,237
of which derivatives 9,297 132,054 3,911 (119,731) – 25,531
of which interest rate products 3,036 71,043 733 – – –
of which foreign exchange products 42 24,259 143 – – –
of which equity/index-related products 6,150 31,945 1,186 – – –
of which other derivatives 22 110 1,079 – – –
of which other trading assets 2,048 880 1,247 – – 4,175
Investment securities 2 605 0 – – 607
Other investments 13 6 3,054 – 721 3,794
of which other equity investments 13 6 2,132 – 608 2,759
of which life finance instruments 0 0 920 – – 920
Loans 0 7,739 3,669 – – 11,408
of which commercial and industrial loans 0 2,187 1,347 – – 3,534
of which financial institutions 0 3,506 1,082 – – 4,588
Other intangible assets (mortgage servicing rights) 0 0 180 – – 180
Other assets 137 7,315 1,825 (904) – 8,373
of which failed purchases 109 1,229 51 – – 1,389
of which loans held-for-sale 0 4,870 1,576 – – 6,446
Total assets at fair value 131,936 261,948 16,364 (120,635) 1,379 290,992
1 Derivative contracts are reported on a gross basis by level. The impact of netting represents legally enforceable master netting agreements.2 In accordance with US GAAP, certain investments that are measured at fair value using the net asset value per share practical expedient have not been classified in the fair value
hierarchy. The fair value amounts presented in this table are intended to permit reconciliation of the fair value hierarchy to the amounts presented in the consolidated balance sheet.
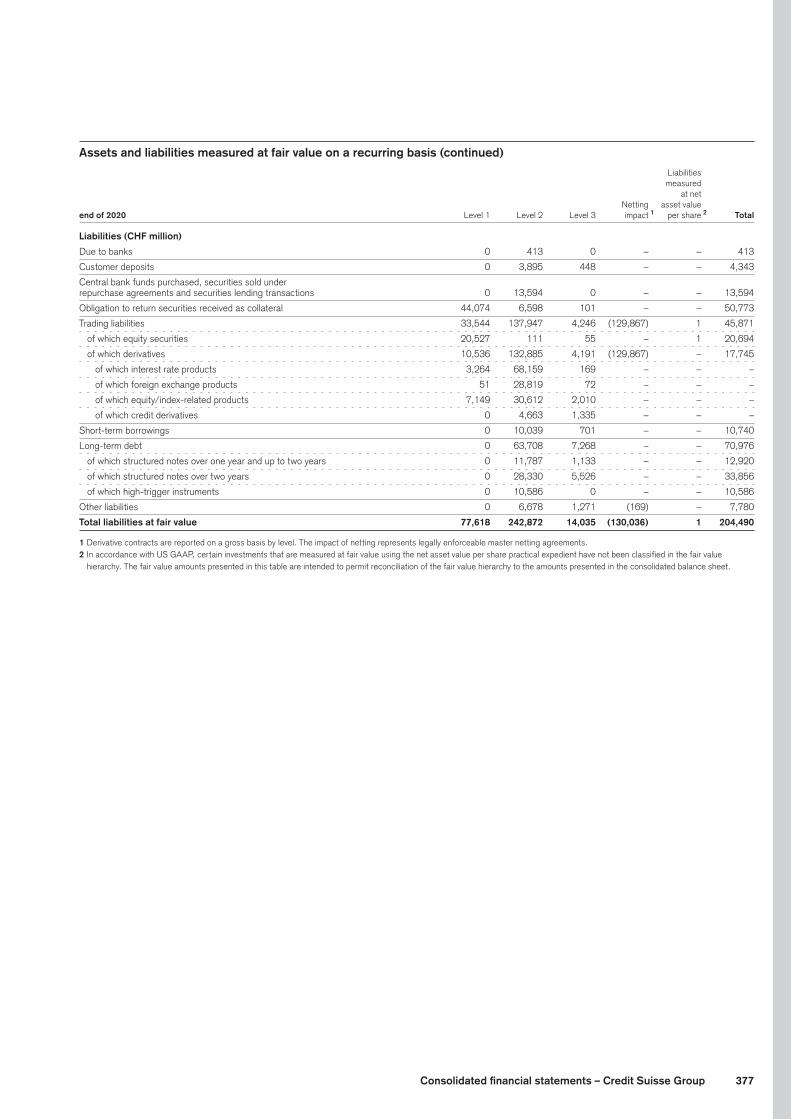
377Consolidated financial statements – Credit Suisse Group
Assets and liabilities measured at fair value on a recurring basis (continued) Liabilities
measured
at net
Netting asset value
end of 2020 Level 1 Level 2 Level 3 impact 1 per share 2 Total
Liabilities (CHF million)
Due to banks 0 413 0 – – 413
Customer deposits 0 3,895 448 – – 4,343
Central bank funds purchased, securities sold under
repurchase agreements and securities lending transactions 0 13,594 0 – – 13,594
Obligation to return securities received as collateral 44,074 6,598 101 – – 50,773
Trading liabilities 33,544 137,947 4,246 (129,867) 1 45,871
of which equity securities 20,527 111 55 – 1 20,694
of which derivatives 10,536 132,885 4,191 (129,867) – 17,745
of which interest rate products 3,264 68,159 169 – – –
of which foreign exchange products 51 28,819 72 – – –
of which equity/index-related products 7,149 30,612 2,010 – – –
of which credit derivatives 0 4,663 1,335 – – –
Short-term borrowings 0 10,039 701 – – 10,740
Long-term debt 0 63,708 7,268 – – 70,976
of which structured notes over one year and up to two years 0 11,787 1,133 – – 12,920
of which structured notes over two years 0 28,330 5,526 – – 33,856
of which high-trigger instruments 0 10,586 0 – – 10,586
Other liabilities 0 6,678 1,271 (169) – 7,780
Total liabilities at fair value 77,618 242,872 14,035 (130,036) 1 204,490
1 Derivative contracts are reported on a gross basis by level. The impact of netting represents legally enforceable master netting agreements.2 In accordance with US GAAP, certain investments that are measured at fair value using the net asset value per share practical expedient have not been classified in the fair value
hierarchy. The fair value amounts presented in this table are intended to permit reconciliation of the fair value hierarchy to the amounts presented in the consolidated balance sheet.

378 Consolidated financial statements – Credit Suisse Group
Assets and liabilities measured at fair value on a recurring basis (continued) Assets
measured
at net
Netting asset value
end of 2019 Level 1 Level 2 Level 3 impact 1 per share 2 Total
Assets (CHF million)
Cash and due from banks 0 356 0 – – 356
Central bank funds sold, securities purchased under
resale agreements and securities borrowing transactions 0 85,556 0 – – 85,556
Securities received as collateral 36,438 3,780 1 – – 40,219
Trading assets 85,559 157,151 7,885 (97,606) 808 153,797
of which debt securities 19,430 45,641 1,923 – – 66,994
of which foreign governments 19,281 7,484 198 – – 26,963
of which corporates 16 10,905 1,128 – – 12,049
of which RMBS 0 23,199 317 – – 23,516
of which equity securities 60,675 2,862 197 – 808 64,542
of which derivatives 3,539 108,264 3,534 (97,606) – 17,731
of which interest rate products 1,091 66,764 554 – – –
of which foreign exchange products 23 21,754 152 – – –
of which equity/index-related products 2,417 13,918 1,040 – – –
of which credit derivatives 0 5,336 879 – – –
of which other derivatives 5 66 909 – – –
of which other trading assets 1,915 384 2,231 – – 4,530
Investment securities 2 1,004 0 – – 1,006
Other investments 24 5 2,523 – 998 3,550
of which other equity investments 24 5 1,463 – 589 2,081
of which life finance instruments 0 0 1,052 – – 1,052
Loans 0 8,945 3,717 – – 12,662
of which commercial and industrial loans 0 2,491 1,283 – – 3,774
of which financial institutions 0 3,730 1,201 – – 4,931
of which government and public institutions 0 2,200 831 – 3,031
Other intangible assets (mortgage servicing rights) 0 0 244 – – 244
Other assets 101 8,902 1,846 (447) – 10,402
of which loans held-for-sale 0 6,594 1,619 – – 8,213
Total assets at fair value 122,124 265,699 16,216 (98,053) 1,806 307,792
1 Derivative contracts are reported on a gross basis by level. The impact of netting represents legally enforceable master netting agreements.2 In accordance with US GAAP, certain investments that are measured at fair value using the net asset value per share practical expedient have not been classified in the fair value
hierarchy. The fair value amounts presented in this table are intended to permit reconciliation of the fair value hierarchy to the amounts presented in the consolidated balance sheet.

379Consolidated financial statements – Credit Suisse Group
Assets and liabilities measured at fair value on a recurring basis (continued) Liabilities
measured
at net
Netting asset value
end of 2019 Level 1 Level 2 Level 3 impact 1 per share 2 Total
Liabilities (CHF million)
Due to banks 0 322 0 – – 322
Customer deposits 0 2,865 474 – – 3,339
Central bank funds purchased, securities sold under
repurchase agreements and securities lending transactions 0 10,715 0 – – 10,715
Obligation to return securities received as collateral 36,438 3,780 1 – – 40,219
Trading liabilities 23,010 115,062 3,854 (103,742) 2 38,186
of which debt securities 3,636 5,286 0 – – 8,922
of which foreign governments 3,544 345 0 – – 3,889
of which equity securities 15,628 109 53 – 2 15,792
of which derivatives 3,746 109,667 3,801 (103,742) – 13,472
of which interest rate products 1,101 64,643 167 – – –
of which foreign exchange products 31 26,156 98 – – –
of which equity/index-related products 2,603 12,518 1,921 – – –
of which credit derivatives 0 5,963 1,211 – – –
Short-term borrowings 0 10,336 997 – – 11,333
Long-term debt 0 57,721 12,610 – – 70,331
of which structured notes over one year and up to two years 0 9,291 891 – – 10,182
of which structured notes over two years 0 27,626 11,458 – – 39,084
Other liabilities 0 6,654 1,385 (148) – 7,891
Total liabilities at fair value 59,448 207,455 19,321 (103,890) 2 182,336
1 Derivative contracts are reported on a gross basis by level. The impact of netting represents legally enforceable master netting agreements.2 In accordance with US GAAP, certain investments that are measured at fair value using the net asset value per share practical expedient have not been classified in the fair value
hierarchy. The fair value amounts presented in this table are intended to permit reconciliation of the fair value hierarchy to the amounts presented in the consolidated balance sheet.
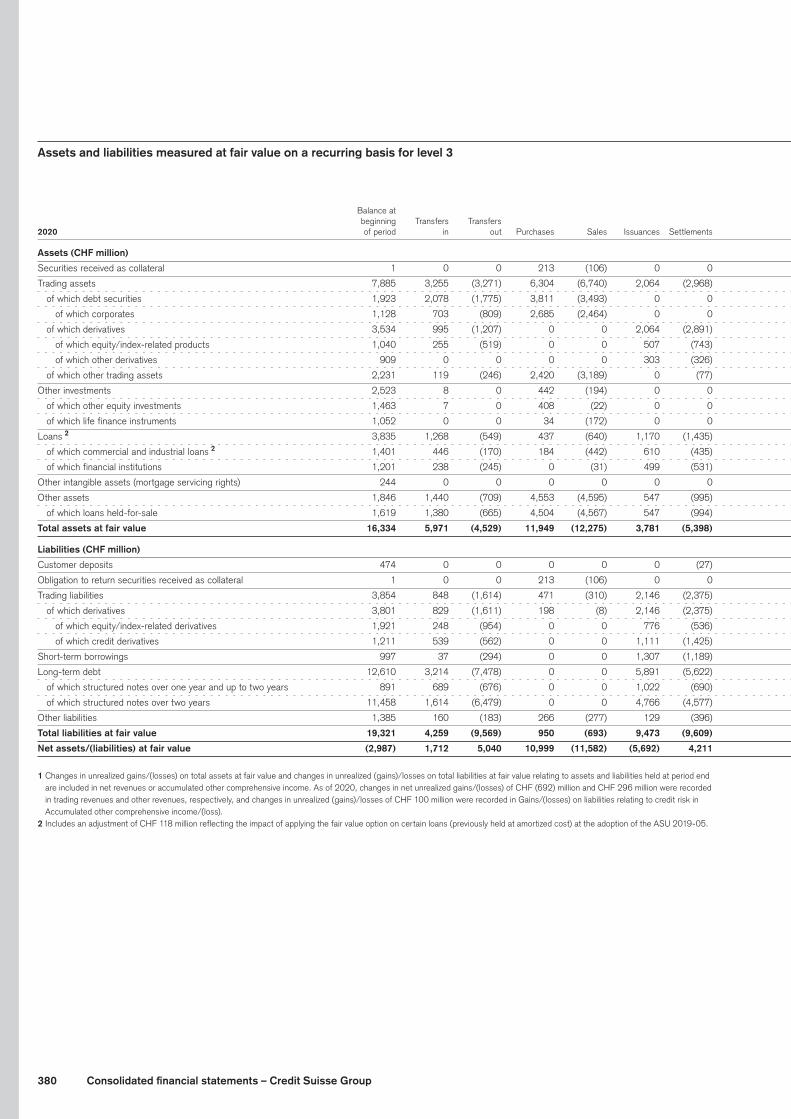
380 Consolidated financial statements – Credit Suisse Group
Assets and liabilities measured at fair value on a recurring basis for level 3 Accumulated other Trading revenues Other revenues comprehensive income
Foreign Balance at On On On currency Balance Changes in beginning Transfers Transfers transfers On all transfers On all transfers On all translation at end unrealized
2020 of period in out Purchases Sales Issuances Settlements out other out other out other impact of period gains/losses 1
Assets (CHF million)
Securities received as collateral 1 0 0 213 (106) 0 0 0 0 0 0 0 0 (7) 101 0
Trading assets 7,885 3,255 (3,271) 6,304 (6,740) 2,064 (2,968) 290 1,598 0 5 0 0 (887) 7,535 1,377
of which debt securities 1,923 2,078 (1,775) 3,811 (3,493) 0 0 1 14 0 5 0 0 (311) 2,253 166
of which corporates 1,128 703 (809) 2,685 (2,464) 0 0 26 211 0 0 0 0 (210) 1,270 196
of which derivatives 3,534 995 (1,207) 0 0 2,064 (2,891) 213 1,607 0 1 0 0 (405) 3,911 1,323
of which equity/index-related products 1,040 255 (519) 0 0 507 (743) 107 725 0 0 0 0 (186) 1,186 752
of which other derivatives 909 0 0 0 0 303 (326) (1) 291 0 0 0 0 (97) 1,079 310
of which other trading assets 2,231 119 (246) 2,420 (3,189) 0 (77) 72 76 0 (1) 0 0 (158) 1,247 (87)
Other investments 2,523 8 0 442 (194) 0 0 0 112 0 286 0 0 (123) 3,054 409
of which other equity investments 1,463 7 0 408 (22) 0 0 0 13 0 293 0 0 (30) 2,132 298
of which life finance instruments 1,052 0 0 34 (172) 0 0 0 99 0 0 0 0 (93) 920 112
Loans 2 3,835 1,268 (549) 437 (640) 1,170 (1,435) 52 (164) 0 1 0 0 (306) 3,669 (97)
of which commercial and industrial loans 2 1,401 446 (170) 184 (442) 610 (435) 6 (150) 0 1 0 0 (104) 1,347 (183)
of which financial institutions 1,201 238 (245) 0 (31) 499 (531) 20 43 0 0 0 0 (112) 1,082 47
Other intangible assets (mortgage servicing rights) 244 0 0 0 0 0 0 0 0 0 (44) 0 0 (20) 180 (44)
Other assets 1,846 1,440 (709) 4,553 (4,595) 547 (995) (17) (14) 0 0 0 0 (231) 1,825 (48)
of which loans held-for-sale 1,619 1,380 (665) 4,504 (4,567) 547 (994) (41) 4 0 0 0 0 (211) 1,576 (73)
Total assets at fair value 16,334 5,971 (4,529) 11,949 (12,275) 3,781 (5,398) 325 1,532 0 248 0 0 (1,574) 16,364 1,597
Liabilities (CHF million)
Customer deposits 474 0 0 0 0 0 (27) 0 7 0 0 0 10 (16) 448 46
Obligation to return securities received as collateral 1 0 0 213 (106) 0 0 0 0 0 0 0 0 (7) 101 0
Trading liabilities 3,854 848 (1,614) 471 (310) 2,146 (2,375) 260 1,428 0 0 0 0 (462) 4,246 1,653
of which derivatives 3,801 829 (1,611) 198 (8) 2,146 (2,375) 259 1,410 0 0 0 0 (458) 4,191 1,646
of which equity/index-related derivatives 1,921 248 (954) 0 0 776 (536) 167 644 0 0 0 0 (256) 2,010 1,162
of which credit derivatives 1,211 539 (562) 0 0 1,111 (1,425) 85 502 0 0 0 0 (126) 1,335 277
Short-term borrowings 997 37 (294) 0 0 1,307 (1,189) 4 (62) 0 0 0 0 (99) 701 94
Long-term debt 12,610 3,214 (7,478) 0 0 5,891 (5,622) 568 (708) 0 0 99 (81) (1,225) 7,268 236
of which structured notes over one year and up to two years 891 689 (676) 0 0 1,022 (690) 40 (38) 0 0 1 (1) (105) 1,133 (19)
of which structured notes over two years 11,458 1,614 (6,479) 0 0 4,766 (4,577) 532 (683) 0 0 98 (92) (1,111) 5,526 224
Other liabilities 1,385 160 (183) 266 (277) 129 (396) (33) 37 0 300 0 0 (117) 1,271 64
Total liabilities at fair value 19,321 4,259 (9,569) 950 (693) 9,473 (9,609) 799 702 0 300 99 (71) (1,926) 14,035 2,093
Net assets/(liabilities) at fair value (2,987) 1,712 5,040 10,999 (11,582) (5,692) 4,211 (474) 830 0 (52) (99) 71 352 2,329 (496)
1 Changes in unrealized gains/(losses) on total assets at fair value and changes in unrealized (gains)/losses on total liabilities at fair value relating to assets and liabilities held at period end are included in net revenues or accumulated other comprehensive income. As of 2020, changes in net unrealized gains/(losses) of CHF (692) million and CHF 296 million were recorded in trading revenues and other revenues, respectively, and changes in unrealized (gains)/losses of CHF 100 million were recorded in Gains/(losses) on liabilities relating to credit risk in Accumulated other comprehensive income/(loss).
2 Includes an adjustment of CHF 118 million reflecting the impact of applying the fair value option on certain loans (previously held at amortized cost) at the adoption of the ASU 2019-05.

381Consolidated financial statements – Credit Suisse Group
Assets and liabilities measured at fair value on a recurring basis for level 3 Accumulated other Trading revenues Other revenues comprehensive income
Foreign Balance at On On On currency Balance Changes in beginning Transfers Transfers transfers On all transfers On all transfers On all translation at end unrealized
2020 of period in out Purchases Sales Issuances Settlements out other out other out other impact of period gains/losses 1
Assets (CHF million)
Securities received as collateral 1 0 0 213 (106) 0 0 0 0 0 0 0 0 (7) 101 0
Trading assets 7,885 3,255 (3,271) 6,304 (6,740) 2,064 (2,968) 290 1,598 0 5 0 0 (887) 7,535 1,377
of which debt securities 1,923 2,078 (1,775) 3,811 (3,493) 0 0 1 14 0 5 0 0 (311) 2,253 166
of which corporates 1,128 703 (809) 2,685 (2,464) 0 0 26 211 0 0 0 0 (210) 1,270 196
of which derivatives 3,534 995 (1,207) 0 0 2,064 (2,891) 213 1,607 0 1 0 0 (405) 3,911 1,323
of which equity/index-related products 1,040 255 (519) 0 0 507 (743) 107 725 0 0 0 0 (186) 1,186 752
of which other derivatives 909 0 0 0 0 303 (326) (1) 291 0 0 0 0 (97) 1,079 310
of which other trading assets 2,231 119 (246) 2,420 (3,189) 0 (77) 72 76 0 (1) 0 0 (158) 1,247 (87)
Other investments 2,523 8 0 442 (194) 0 0 0 112 0 286 0 0 (123) 3,054 409
of which other equity investments 1,463 7 0 408 (22) 0 0 0 13 0 293 0 0 (30) 2,132 298
of which life finance instruments 1,052 0 0 34 (172) 0 0 0 99 0 0 0 0 (93) 920 112
Loans 2 3,835 1,268 (549) 437 (640) 1,170 (1,435) 52 (164) 0 1 0 0 (306) 3,669 (97)
of which commercial and industrial loans 2 1,401 446 (170) 184 (442) 610 (435) 6 (150) 0 1 0 0 (104) 1,347 (183)
of which financial institutions 1,201 238 (245) 0 (31) 499 (531) 20 43 0 0 0 0 (112) 1,082 47
Other intangible assets (mortgage servicing rights) 244 0 0 0 0 0 0 0 0 0 (44) 0 0 (20) 180 (44)
Other assets 1,846 1,440 (709) 4,553 (4,595) 547 (995) (17) (14) 0 0 0 0 (231) 1,825 (48)
of which loans held-for-sale 1,619 1,380 (665) 4,504 (4,567) 547 (994) (41) 4 0 0 0 0 (211) 1,576 (73)
Total assets at fair value 16,334 5,971 (4,529) 11,949 (12,275) 3,781 (5,398) 325 1,532 0 248 0 0 (1,574) 16,364 1,597
Liabilities (CHF million)
Customer deposits 474 0 0 0 0 0 (27) 0 7 0 0 0 10 (16) 448 46
Obligation to return securities received as collateral 1 0 0 213 (106) 0 0 0 0 0 0 0 0 (7) 101 0
Trading liabilities 3,854 848 (1,614) 471 (310) 2,146 (2,375) 260 1,428 0 0 0 0 (462) 4,246 1,653
of which derivatives 3,801 829 (1,611) 198 (8) 2,146 (2,375) 259 1,410 0 0 0 0 (458) 4,191 1,646
of which equity/index-related derivatives 1,921 248 (954) 0 0 776 (536) 167 644 0 0 0 0 (256) 2,010 1,162
of which credit derivatives 1,211 539 (562) 0 0 1,111 (1,425) 85 502 0 0 0 0 (126) 1,335 277
Short-term borrowings 997 37 (294) 0 0 1,307 (1,189) 4 (62) 0 0 0 0 (99) 701 94
Long-term debt 12,610 3,214 (7,478) 0 0 5,891 (5,622) 568 (708) 0 0 99 (81) (1,225) 7,268 236
of which structured notes over one year and up to two years 891 689 (676) 0 0 1,022 (690) 40 (38) 0 0 1 (1) (105) 1,133 (19)
of which structured notes over two years 11,458 1,614 (6,479) 0 0 4,766 (4,577) 532 (683) 0 0 98 (92) (1,111) 5,526 224
Other liabilities 1,385 160 (183) 266 (277) 129 (396) (33) 37 0 300 0 0 (117) 1,271 64
Total liabilities at fair value 19,321 4,259 (9,569) 950 (693) 9,473 (9,609) 799 702 0 300 99 (71) (1,926) 14,035 2,093
Net assets/(liabilities) at fair value (2,987) 1,712 5,040 10,999 (11,582) (5,692) 4,211 (474) 830 0 (52) (99) 71 352 2,329 (496)
1 Changes in unrealized gains/(losses) on total assets at fair value and changes in unrealized (gains)/losses on total liabilities at fair value relating to assets and liabilities held at period end are included in net revenues or accumulated other comprehensive income. As of 2020, changes in net unrealized gains/(losses) of CHF (692) million and CHF 296 million were recorded in trading revenues and other revenues, respectively, and changes in unrealized (gains)/losses of CHF 100 million were recorded in Gains/(losses) on liabilities relating to credit risk in Accumulated other comprehensive income/(loss).
2 Includes an adjustment of CHF 118 million reflecting the impact of applying the fair value option on certain loans (previously held at amortized cost) at the adoption of the ASU 2019-05.
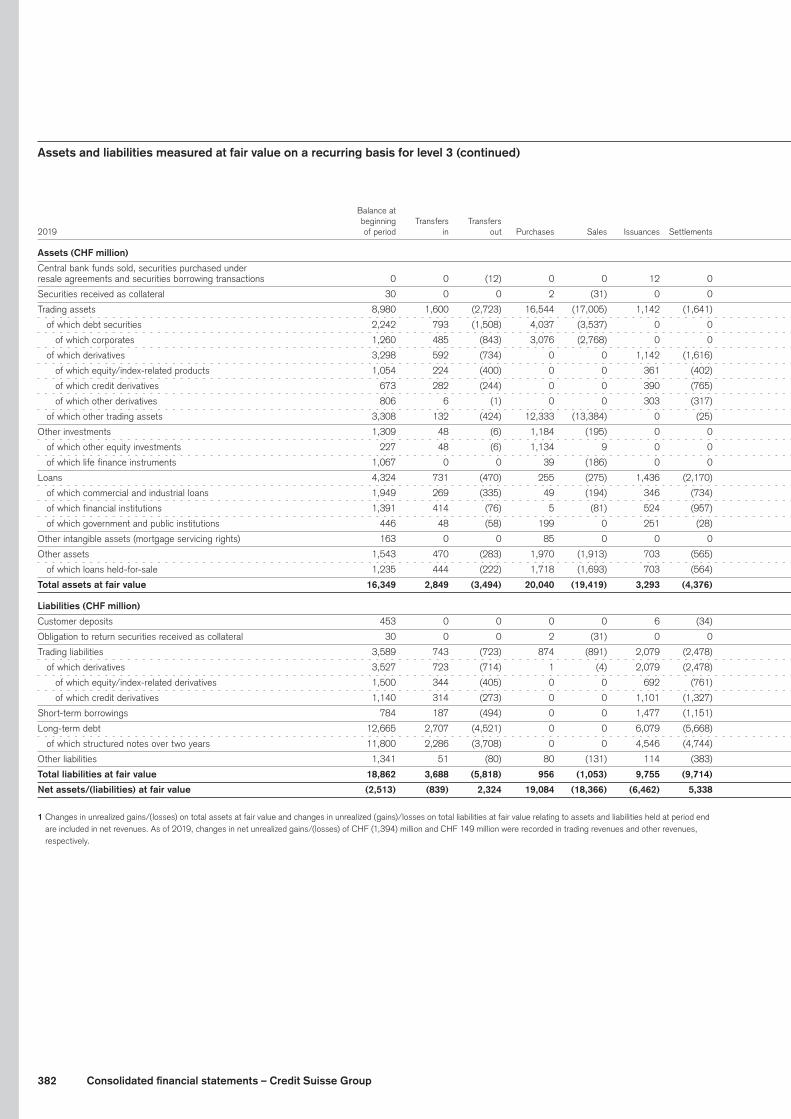
382 Consolidated financial statements – Credit Suisse Group
Assets and liabilities measured at fair value on a recurring basis for level 3 (continued) Accumulated other Trading revenues Other revenues comprehensive income
Foreign Balance at On On On currency Balance Changes in beginning Transfers Transfers transfers On all transfers On all transfers On all translation at end unrealized
2019 of period in out Purchases Sales Issuances Settlements out other out other out other impact of period gains/losses 1
Assets (CHF million)
Central bank funds sold, securities purchased under
resale agreements and securities borrowing transactions 0 0 (12) 0 0 12 0 0 0 0 0 0 0 0 0 0
Securities received as collateral 30 0 0 2 (31) 0 0 0 0 0 0 0 0 0 1 0
Trading assets 8,980 1,600 (2,723) 16,544 (17,005) 1,142 (1,641) (80) 1,281 0 0 0 0 (213) 7,885 1,085
of which debt securities 2,242 793 (1,508) 4,037 (3,537) 0 0 17 (41) 0 0 0 0 (80) 1,923 146
of which corporates 1,260 485 (843) 3,076 (2,768) 0 0 21 (52) 0 0 0 0 (51) 1,128 153
of which derivatives 3,298 592 (734) 0 0 1,142 (1,616) (92) 1,034 0 0 0 0 (90) 3,534 957
of which equity/index-related products 1,054 224 (400) 0 0 361 (402) (80) 316 0 0 0 0 (33) 1,040 404
of which credit derivatives 673 282 (244) 0 0 390 (765) (6) 565 0 0 0 0 (16) 879 320
of which other derivatives 806 6 (1) 0 0 303 (317) 0 128 0 0 0 0 (16) 909 266
of which other trading assets 3,308 132 (424) 12,333 (13,384) 0 (25) (2) 333 0 0 0 0 (40) 2,231 (43)
Other investments 1,309 48 (6) 1,184 (195) 0 0 0 151 0 56 0 0 (24) 2,523 328
of which other equity investments 227 48 (6) 1,134 9 0 0 0 1 0 56 0 0 (6) 1,463 84
of which life finance instruments 1,067 0 0 39 (186) 0 0 0 150 0 0 0 0 (18) 1,052 181
Loans 4,324 731 (470) 255 (275) 1,436 (2,170) 4 (64) 0 0 0 0 (54) 3,717 (7)
of which commercial and industrial loans 1,949 269 (335) 49 (194) 346 (734) 0 (49) 0 0 0 0 (18) 1,283 (9)
of which financial institutions 1,391 414 (76) 5 (81) 524 (957) 0 (9) 0 0 0 0 (10) 1,201 10
of which government and public institutions 446 48 (58) 199 0 251 (28) 2 (9) 0 0 0 0 (20) 831 (11)
Other intangible assets (mortgage servicing rights) 163 0 0 85 0 0 0 0 0 0 2 0 0 (6) 244 2
Other assets 1,543 470 (283) 1,970 (1,913) 703 (565) 17 (48) 0 0 0 0 (48) 1,846 28
of which loans held-for-sale 1,235 444 (222) 1,718 (1,693) 703 (564) 3 36 0 0 0 0 (41) 1,619 51
Total assets at fair value 16,349 2,849 (3,494) 20,040 (19,419) 3,293 (4,376) (59) 1,320 0 58 0 0 (345) 16,216 1,436
Liabilities (CHF million)
Customer deposits 453 0 0 0 0 6 (34) 0 23 0 0 0 51 (25) 474 29
Obligation to return securities received as collateral 30 0 0 2 (31) 0 0 0 0 0 0 0 0 0 1 0
Trading liabilities 3,589 743 (723) 874 (891) 2,079 (2,478) 108 626 0 0 0 0 (73) 3,854 1,019
of which derivatives 3,527 723 (714) 1 (4) 2,079 (2,478) 108 631 0 0 0 0 (72) 3,801 1,016
of which equity/index-related derivatives 1,500 344 (405) 0 0 692 (761) 92 500 0 0 0 0 (41) 1,921 841
of which credit derivatives 1,140 314 (273) 0 0 1,101 (1,327) 28 249 0 0 0 0 (21) 1,211 147
Short-term borrowings 784 187 (494) 0 0 1,477 (1,151) 30 191 0 0 0 0 (27) 997 127
Long-term debt 12,665 2,707 (4,521) 0 0 6,079 (5,668) 149 1,301 0 0 13 175 (290) 12,610 1,448
of which structured notes over two years 11,800 2,286 (3,708) 0 0 4,546 (4,744) 94 1,256 0 0 13 173 (258) 11,458 1,301
Other liabilities 1,341 51 (80) 80 (131) 114 (383) (4) 70 0 351 0 0 (24) 1,385 58
Total liabilities at fair value 18,862 3,688 (5,818) 956 (1,053) 9,755 (9,714) 283 2,211 0 351 13 226 (439) 19,321 2,681
Net assets/(liabilities) at fair value (2,513) (839) 2,324 19,084 (18,366) (6,462) 5,338 (342) (891) 0 (293) (13) (226) 94 (3,105) (1,245)
1 Changes in unrealized gains/(losses) on total assets at fair value and changes in unrealized (gains)/losses on total liabilities at fair value relating to assets and liabilities held at period end are included in net revenues. As of 2019, changes in net unrealized gains/(losses) of CHF (1,394) million and CHF 149 million were recorded in trading revenues and other revenues, respectively.
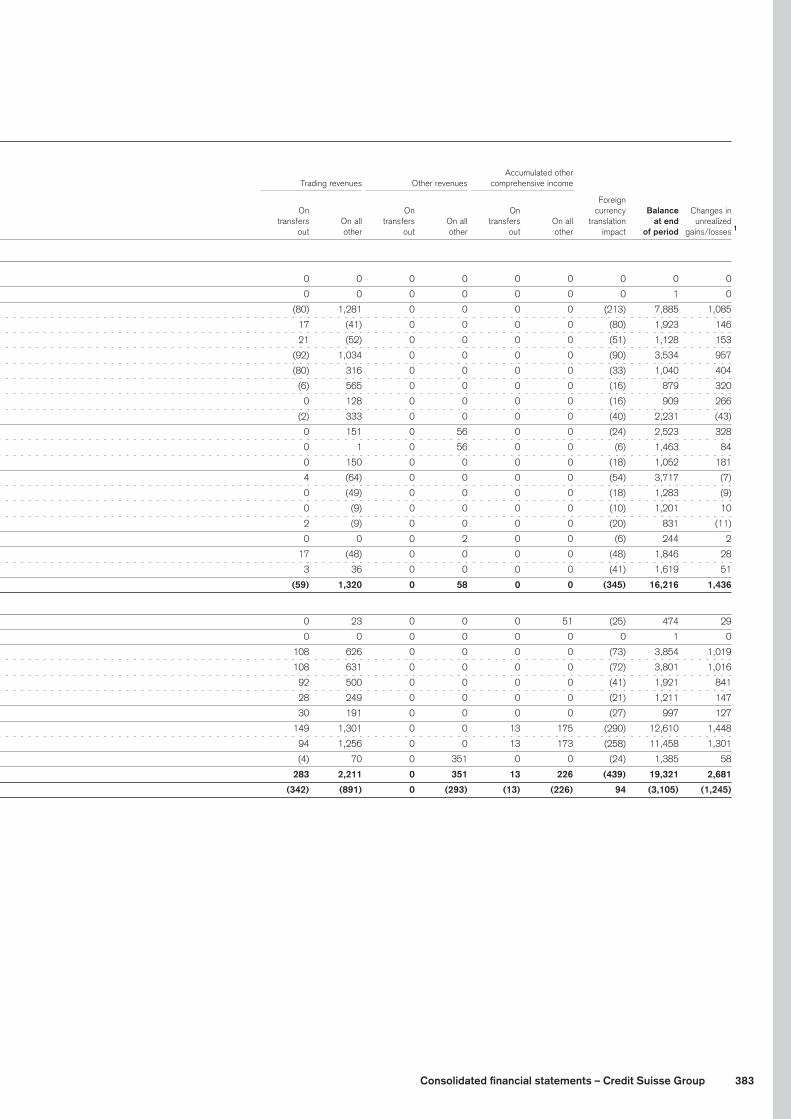
383Consolidated financial statements – Credit Suisse Group
Assets and liabilities measured at fair value on a recurring basis for level 3 (continued) Accumulated other Trading revenues Other revenues comprehensive income
Foreign Balance at On On On currency Balance Changes in beginning Transfers Transfers transfers On all transfers On all transfers On all translation at end unrealized
2019 of period in out Purchases Sales Issuances Settlements out other out other out other impact of period gains/losses 1
Assets (CHF million)
Central bank funds sold, securities purchased under
resale agreements and securities borrowing transactions 0 0 (12) 0 0 12 0 0 0 0 0 0 0 0 0 0
Securities received as collateral 30 0 0 2 (31) 0 0 0 0 0 0 0 0 0 1 0
Trading assets 8,980 1,600 (2,723) 16,544 (17,005) 1,142 (1,641) (80) 1,281 0 0 0 0 (213) 7,885 1,085
of which debt securities 2,242 793 (1,508) 4,037 (3,537) 0 0 17 (41) 0 0 0 0 (80) 1,923 146
of which corporates 1,260 485 (843) 3,076 (2,768) 0 0 21 (52) 0 0 0 0 (51) 1,128 153
of which derivatives 3,298 592 (734) 0 0 1,142 (1,616) (92) 1,034 0 0 0 0 (90) 3,534 957
of which equity/index-related products 1,054 224 (400) 0 0 361 (402) (80) 316 0 0 0 0 (33) 1,040 404
of which credit derivatives 673 282 (244) 0 0 390 (765) (6) 565 0 0 0 0 (16) 879 320
of which other derivatives 806 6 (1) 0 0 303 (317) 0 128 0 0 0 0 (16) 909 266
of which other trading assets 3,308 132 (424) 12,333 (13,384) 0 (25) (2) 333 0 0 0 0 (40) 2,231 (43)
Other investments 1,309 48 (6) 1,184 (195) 0 0 0 151 0 56 0 0 (24) 2,523 328
of which other equity investments 227 48 (6) 1,134 9 0 0 0 1 0 56 0 0 (6) 1,463 84
of which life finance instruments 1,067 0 0 39 (186) 0 0 0 150 0 0 0 0 (18) 1,052 181
Loans 4,324 731 (470) 255 (275) 1,436 (2,170) 4 (64) 0 0 0 0 (54) 3,717 (7)
of which commercial and industrial loans 1,949 269 (335) 49 (194) 346 (734) 0 (49) 0 0 0 0 (18) 1,283 (9)
of which financial institutions 1,391 414 (76) 5 (81) 524 (957) 0 (9) 0 0 0 0 (10) 1,201 10
of which government and public institutions 446 48 (58) 199 0 251 (28) 2 (9) 0 0 0 0 (20) 831 (11)
Other intangible assets (mortgage servicing rights) 163 0 0 85 0 0 0 0 0 0 2 0 0 (6) 244 2
Other assets 1,543 470 (283) 1,970 (1,913) 703 (565) 17 (48) 0 0 0 0 (48) 1,846 28
of which loans held-for-sale 1,235 444 (222) 1,718 (1,693) 703 (564) 3 36 0 0 0 0 (41) 1,619 51
Total assets at fair value 16,349 2,849 (3,494) 20,040 (19,419) 3,293 (4,376) (59) 1,320 0 58 0 0 (345) 16,216 1,436
Liabilities (CHF million)
Customer deposits 453 0 0 0 0 6 (34) 0 23 0 0 0 51 (25) 474 29
Obligation to return securities received as collateral 30 0 0 2 (31) 0 0 0 0 0 0 0 0 0 1 0
Trading liabilities 3,589 743 (723) 874 (891) 2,079 (2,478) 108 626 0 0 0 0 (73) 3,854 1,019
of which derivatives 3,527 723 (714) 1 (4) 2,079 (2,478) 108 631 0 0 0 0 (72) 3,801 1,016
of which equity/index-related derivatives 1,500 344 (405) 0 0 692 (761) 92 500 0 0 0 0 (41) 1,921 841
of which credit derivatives 1,140 314 (273) 0 0 1,101 (1,327) 28 249 0 0 0 0 (21) 1,211 147
Short-term borrowings 784 187 (494) 0 0 1,477 (1,151) 30 191 0 0 0 0 (27) 997 127
Long-term debt 12,665 2,707 (4,521) 0 0 6,079 (5,668) 149 1,301 0 0 13 175 (290) 12,610 1,448
of which structured notes over two years 11,800 2,286 (3,708) 0 0 4,546 (4,744) 94 1,256 0 0 13 173 (258) 11,458 1,301
Other liabilities 1,341 51 (80) 80 (131) 114 (383) (4) 70 0 351 0 0 (24) 1,385 58
Total liabilities at fair value 18,862 3,688 (5,818) 956 (1,053) 9,755 (9,714) 283 2,211 0 351 13 226 (439) 19,321 2,681
Net assets/(liabilities) at fair value (2,513) (839) 2,324 19,084 (18,366) (6,462) 5,338 (342) (891) 0 (293) (13) (226) 94 (3,105) (1,245)
1 Changes in unrealized gains/(losses) on total assets at fair value and changes in unrealized (gains)/losses on total liabilities at fair value relating to assets and liabilities held at period end are included in net revenues. As of 2019, changes in net unrealized gains/(losses) of CHF (1,394) million and CHF 149 million were recorded in trading revenues and other revenues, respectively.

384 Consolidated financial statements – Credit Suisse Group
Both observable and unobservable inputs may be used to deter-mine the fair value of positions that have been classified within level 3. As a result, the unrealized gains and losses for assets and liabilities within level 3 presented in the table above may include changes in fair value that were attributable to both observable and unobservable inputs.
The Group employs various economic hedging techniques in order to manage risks, including risks in level 3 positions. Such tech-niques may include the purchase or sale of financial instruments that are classified in levels 1 and/or 2. The realized and unrealized gains and losses for assets and liabilities in level 3 presented in the table above do not reflect the related realized or unrealized gains and losses arising on economic hedging instruments classi-fied in levels 1 and/or 2.
The Group typically uses nonfinancial assets measured at fair value on a recurring or nonrecurring basis in a manner that reflects their highest and best use.
Transfers in and out of level 3
Transfers into level 3 assets during 2020 were CHF 5,971 million, primarily from trading assets, loans held-for-sale and loans. The transfers were primarily in the securitized products, financing and global trading solution businesses due to limited observability of pricing data and reduced pricing information from external providers. Transfers out of level 3 assets during 2020 were CHF 4,529 million, primarily in trading assets, loans held-for-sale and loans. The transfers out of level 3 assets were primarily the securitized products, financing and global trading solution businesses due to improved observability of pricing data and increased availability of pricing information from external providers.
Transfers into level 3 assets during 2019 were CHF 2,849 mil-lion, primarily from trading assets and loans. The transfers were primarily in the credit and financing businesses due to limited observability of pricing data and reduced pricing information from external providers. Transfers out of level 3 assets during 2019 were CHF 3,494 million, primarily in trading assets and loans. The transfers out of level 3 assets were primarily in the credit, financing and equity derivatives businesses due to improved observability of pricing data and increased availability of pricing information from external providers.
Transfers out of level 3 liabilities of CHF 9,569 million in 2020 primarily reflected transfers of structured notes over two years
arising from an enhancement to the assessment of the valuation significance of unobservable input parameters on equity linked issuances.
Uncertainty of fair value measurements at the reporting date from the use of significant unobservable inputs
For level 3 assets with a significant unobservable input of buy-back probability, correlation, funding spread, pre-initial pub-lic offering (IPO) intrinsic option, mortality rate, price, recovery rate, unadjusted NAV, volatility or volatility skew, in general, an increase in the significant unobservable input would increase the fair value. For level 3 assets with a significant unobservable input of credit spread, default rate, discount rate, gap risk, market implied life expectancy (for life settlement and premium finance instruments) and prepayment rate, in general, an increase in the significant unobservable input would decrease the fair value.
For level 3 liabilities, in general, an increase in the related sig-nificant unobservable inputs would have the inverse impact on fair value. An increase in the significant unobservable input buy-back probability, correlation, credit spread, contingent probability, market implied life expectancy (for life settlement and premium finance instruments), mortality rate and volatility would increase the fair value. An increase in the significant unobservable input discount rate, fund gap risk, funding spread, gap risk, mean reversion, prepayment rate and price would decrease the fair value.
Interrelationships between significant unobservable inputs
Except as noted above, there are no material interrelationships between the significant unobservable inputs for the financial instruments. As the significant unobservable inputs move inde-pendently, generally an increase or decrease in one significant unobservable input will have no impact on the other significant unobservable inputs.
Quantitative disclosures of valuation techniques
The following tables provide the representative range of minimum and maximum values and the associated weighted averages of each significant unobservable input for level 3 assets and liabili-ties by the related valuation technique most significant to the related financial instrument.

385Consolidated financial statements – Credit Suisse Group
Quantitative information about level 3 assets measured at fair value on a recurring basis Valuation Unobservable Minimum Maximum Weighted
end of 2020 Fair value technique input value value average 1
CHF million, except where indicated Trading assets 7,535
of which debt securities 2,253
of which corporates 1,270
of which 386 Discounted cash flow Credit spread, in bp (9) 1,509 1,007
of which 321 Market comparable Price, in % 0 227 95
of which 416 Option model Correlation, in % (50) 100 55
Gap risk, in % 0 2 0
Recovery rate, in % 40 40 40
Volatility, in % 0 158 23
of which 71 Vendor price Price, in actuals 0 2,292 1,654
Unadjusted NAV, in actuals 1 1 1
of which derivatives 3,911
of which equity/index-related products 1,186 Option model Buyback probability, in % 50 100 66
Correlation, in % (50) 100 58
Gap risk, in % 2 0 4 0
Volatility, in % (2) 158 24
Market implied life
of which other derivatives 1,079 Discounted cash flow expectancy, in years 2 14 6
Mortality rate, in % 72 137 98
of which other trading assets 1,247
Market implied life
of which 766 Discounted cash flow expectancy, in years 3 14 7
Other investments 3,054
of which other equity investments 2,132
of which 840 Discounted cash flow Discount rate, in % 9 9 9
Terminal growth rate, in % 3 3 3
of which 118 Market comparable Price, in % 100 100 100
of which 974 Adjusted NAV Price, in actuals 310 310 310
of which 110 Vendor price Price, in actuals 1 1,249 713
Market implied life
of which life finance instruments 920 Discounted cash flow expectancy, in years 2 15 6
Loans 3,669
of which commercial and industrial loans 1,347
of which 908 Discounted cash flow Credit spread, in bp 237 1,480 554
Recovery rate, in % 25 25 25
of which 338 Market comparable Price, in % 0 100 70
Pre-IPO intrinsic
72 Option model option, in actuals 100 100 100
of which financial institutions 1,082
of which 674 Discounted cash flow Credit spread, in bp 192 1,698 612
Recovery rate, in % 25 40 25
of which 190 Market comparable Price, in % 0 100 54
Other assets 1,825
of which loans held-for-sale 1,576
of which 296 Discounted cash flow Credit spread, in bp 246 506 343
Recovery rate, in % 1 40 34
of which 1,277 Market comparable Price, in % 0 111 71
1 Weighted average is calculated based on the fair value of the instruments.2 Risk of unexpected large declines in the underlying values occurring between collateral settlement dates.

386 Consolidated financial statements – Credit Suisse Group
Quantitative information about level 3 assets measured at fair value on a recurring basis (continued) Valuation Unobservable Minimum Maximum Weighted
end of 2019 Fair value technique input value value average 1
CHF million, except where indicated Trading assets 7,885
of which debt securities 1,923
of which corporates 1,128
of which 503 Market comparable Price, in % 0 129 97
of which 913 Option model Correlation, in % (60) 100 63
Gap risk, in % 0 2 0
Volatility, in % 0 275 27
of which derivatives 3,534
of which equity/index-related products 1,040 Option model Buyback probability, in % 50 100 70
Correlation, in % (50) 100 64
Gap risk, in % 2 0 2 0
Volatility, in % 0 275 30
of which credit derivatives 879
of which 691 Discounted cash flow Correlation, in % 97 97 97
Credit spread, in bp 2 1,033 150
Default rate, in % 1 20 4
Discount rate, in % 8 27 16
Funding spread, in bp 100 115 102
Loss severity, in % 29 85 69
Prepayment rate, in % 0 7 4
Recovery rate, in % 0 40 26
of which 142 Market comparable Price, in % 86 110 98
Market implied life
of which other derivatives 909 Discounted cash flow expectancy, in years 2 15 6
Mortality rate, in % 71 134 97
of which other trading assets 2,231
Market implied life
of which 856 Discounted cash flow expectancy, in years 2 15 7
of which 1,118 Market comparable Price, in % 0 112 27
of which 233 Option model Mortality rate, in % 0 70 6
Other investments 2,523
of which other equity investments 1,463
of which 398 Discounted cash flow Discount rate, in % 9 9 9
Terminal growth rate, in % 3 3 3
of which 147 Market comparable Price, in % 100 100 100
of which 857 Vendor price Price, in actuals 1 869 231
Market implied life
of which life finance instruments 1,052 Discounted cash flow expectancy, in years 2 16 6
Loans 3,717
of which commercial and industrial loans 1,283
of which 996 Discounted cash flow Credit spread, in bp 96 1,484 654
Recovery rate, in % 25 25 25
of which 273 Market comparable Price, in % 0 99 64
of which financial institutions 1,201
of which 984 Discounted cash flow Credit spread, in bp 111 1,261 412
Recovery rate, in % 25 25 25
of which 135 Market comparable Price, in % 16 100 36
of which government and public institutions 831
of which 468 Discounted cash flow Credit spread, in bp 457 526 500
Recovery rate, in % 25 40 30
of which 166 Market comparable Price, in % 62 62 62
Other assets 1,846
of which loans held-for-sale 1,619
of which 501 Discounted cash flow Credit spread, in bp 117 381 243
Recovery rate, in % 0 1 1
of which 1,026 Market comparable Price, in % 0 180 91
1 Cash instruments are generally presented on a weighted average basis, while certain derivative instruments either contain a combination of weighted averages and arithmetic means of the related inputs or are presented on an arithmetic mean basis.
2 Risk of unexpected large declines in the underlying values occurring between collateral settlement dates.
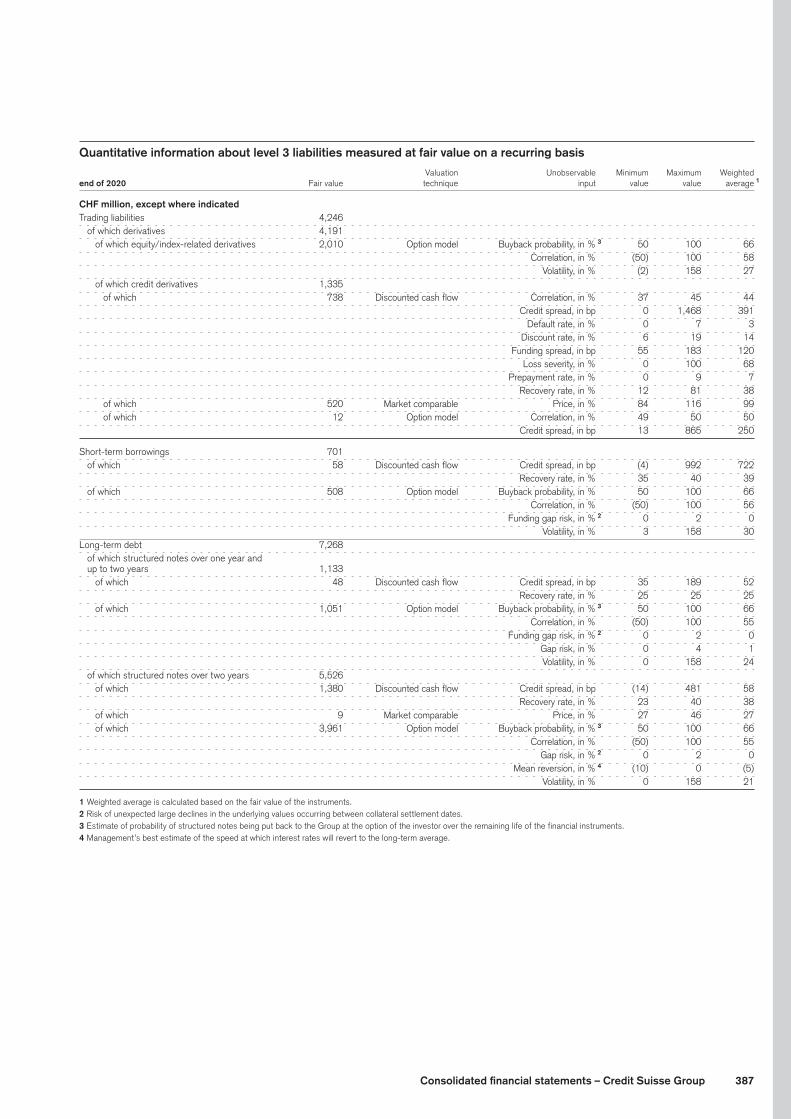
387Consolidated financial statements – Credit Suisse Group
Quantitative information about level 3 liabilities measured at fair value on a recurring basis Valuation Unobservable Minimum Maximum Weighted
end of 2020 Fair value technique input value value average 1
CHF million, except where indicated
Trading liabilities 4,246
of which derivatives 4,191
of which equity/index-related derivatives 2,010 Option model Buyback probability, in % 3 50 100 66
Correlation, in % (50) 100 58
Volatility, in % (2) 158 27
of which credit derivatives 1,335
of which 738 Discounted cash flow Correlation, in % 37 45 44
Credit spread, in bp 0 1,468 391
Default rate, in % 0 7 3
Discount rate, in % 6 19 14
Funding spread, in bp 55 183 120
Loss severity, in % 0 100 68
Prepayment rate, in % 0 9 7
Recovery rate, in % 12 81 38
of which 520 Market comparable Price, in % 84 116 99
of which 12 Option model Correlation, in % 49 50 50
Credit spread, in bp 13 865 250
Short-term borrowings 701
of which 58 Discounted cash flow Credit spread, in bp (4) 992 722
Recovery rate, in % 35 40 39
of which 508 Option model Buyback probability, in % 50 100 66
Correlation, in % (50) 100 56
Funding gap risk, in % 2 0 2 0
Volatility, in % 3 158 30
Long-term debt 7,268
of which structured notes over one year and
up to two years 1,133
of which 48 Discounted cash flow Credit spread, in bp 35 189 52
Recovery rate, in % 25 25 25
of which 1,051 Option model Buyback probability, in % 3 50 100 66
Correlation, in % (50) 100 55
Funding gap risk, in % 2 0 2 0
Gap risk, in % 0 4 1
Volatility, in % 0 158 24
of which structured notes over two years 5,526
of which 1,380 Discounted cash flow Credit spread, in bp (14) 481 58
Recovery rate, in % 23 40 38
of which 9 Market comparable Price, in % 27 46 27
of which 3,961 Option model Buyback probability, in % 3 50 100 66
Correlation, in % (50) 100 55
Gap risk, in % 2 0 2 0
Mean reversion, in % 4 (10) 0 (5) Volatility, in % 0 158 21
1 Weighted average is calculated based on the fair value of the instruments.2 Risk of unexpected large declines in the underlying values occurring between collateral settlement dates.3 Estimate of probability of structured notes being put back to the Group at the option of the investor over the remaining life of the financial instruments.4 Management’s best estimate of the speed at which interest rates will revert to the long-term average.

388 Consolidated financial statements – Credit Suisse Group
Quantitative information about level 3 liabilities measured at fair value on a recurring basis (continued) Valuation Unobservable Minimum Maximum Weighted
end of 2019 Fair value technique input value value average 1
CHF million, except where indicated
Trading liabilities 3,854
of which derivatives 3,801
of which equity/index-related derivatives 1,921 Option model Buyback probability, in % 2 50 100 70
Correlation, in % (60) 100 66
Volatility, in % 0 275 26
of which credit derivatives 1,211
of which 745 Discounted cash flow Correlation, in % 38 45 44
Credit spread, in bp 2 1,041 142
Default rate, in % 1 20 4
Discount rate, in % 8 27 15
Funding spread, in bp 100 154 122
Loss severity, in % 29 85 69
Prepayment rate, in % 0 8 5
Recovery rate, in % 0 40 31
of which 412 Market comparable Price, in % 89 110 99
of which 23 Option model Correlation, in % 49 50 49
Credit spread, in bp 17 1,225 270
Short-term borrowings 997
of which 847 Option model Buyback probability, in % 50 100 70
Correlation, in % (50) 100 62
Funding gap risk, in % 3 0 2 0
Volatility, in % 1 275 39
Long-term debt 12,610
of which structured notes over two years 11,458
of which 1,141 Discounted cash flow Credit spread, in bp (12) 1,260 40
Recovery rate, in % 25 40 29
of which 22 Market comparable Price, in % 43 46 43
of which 9,972 Option model Buyback probability, in % 2 50 100 70
Correlation, in % (60) 100 63
Gap risk, in % 3 0 2 0
Mean reversion, in % 4 (55) 0 (7) Volatility, in % 0 275 26
1 Cash instruments are generally presented on a weighted average basis, while certain derivative instruments either contain a combination of weighted averages and arithmetic means of the related inputs or are presented on an arithmetic mean basis.
2 Estimate of probability of structured notes being put back to the Group at the option of the investor over the remaining life of the financial instruments.3 Risk of unexpected large declines in the underlying values occurring between collateral settlement dates.4 Management’s best estimate of the speed at which interest rates will revert to the long-term average.

389Consolidated financial statements – Credit Suisse Group
Qualitative discussion of the ranges of significant unobservable inputs
The following sections provide further information about the ranges of significant unobservable inputs included in the tables above. The level of aggregation and diversity within the financial instruments disclosed in the tables above results in certain ranges of significant inputs being wide and unevenly distributed across asset and liability categories.
Basis spreadBasis spread is the primary significant unobservable input for non-callable constant maturity treasury-constant maturity swap (CMS) products and is used to determine interest rate risk as a result of differing lending and borrowing rates.
Buyback probabilityBuyback probability is the probability assigned to structured notes being unwound prior to their legal maturity.
Contingent probabilityContingent probability is the primary significant unobservable input for contingent foreign exchange forward trades where the delivery or exercise and the premium payment are contingent on an event such as completion of an M&A deal or regulatory approval for a product.
CorrelationThere are many different types of correlation inputs, including credit correlation, cross-asset correlation (such as equity-inter-est rate correlation) and same-asset correlation (such as interest rate-interest rate correlation). Correlation inputs are generally used to value hybrid and exotic instruments. Due to the complex and unique nature of these instruments, the ranges for correlation inputs can vary widely across portfolios.
Credit spread and recovery rateFor financial instruments where credit spread is the significant unobservable input, the wide range represents positions with varying levels of risk. The lower end of the credit spread range typically represents shorter-dated instruments and/or those with better perceived credit risk. The higher end of the range typically comprises longer-dated financial instruments or those referencing non-performing, distressed or impaired reference credits. Simi-larly, the spread between the reference credit and an index can vary significantly based on the risk of the instrument. The spread will be positive for instruments that have a higher risk of default than the index (which is based on a weighted average of its com-ponents) and negative for instruments that have a lower risk of default than the index.
Similarly, recovery rates can vary significantly depending upon the specific assets and terms of each transaction. Transactions with higher seniority or more valuable collateral will have higher recov-ery rates, while those transactions which are more subordinated or with less valuable collateral will have lower recovery rates.
Default rate and loss severityFor financial instruments backed by residential real estate or other assets, diversity in the portfolio is reflected in a wide range for loss severity due to varying levels of default. The lower end of the range represents high performing or government guaranteed col-lateral with a low PD or guaranteed timely payment of principal and interest, while the higher end of the range relates to collateral with a greater risk of default.
Discount rateThe discount rate is the rate of interest used to calculate the present value of the expected cash flows of a financial instru-ment. There are multiple factors that will impact the discount rate for any given financial instrument including the coupon on the instrument, the term and the underlying risk of the expected cash flows. Two instruments of similar term and expected cash flows may have significantly different discount rates because the cou-pons on the instruments are different.
EBITDA multipleEBITDA multiple is a primary significant unobservable input for some equity deals which are benchmarked using industry com-parables. The EBITDA multiple may be preferred over other measures because it is normalized for differences between the accounting policies of similar companies.
Funding gap risk and gap riskGap risk is the primary significant unobservable input for fund-linked Constant Proportion Portfolio Insurance products and structures where the payoff may be sensitive to discontinuity in the hedging portfolio.
Funding spreadFunding spread is the primary significant unobservable input for special purpose vehicle funding facilities. Synthetic funding curves which represent the assets pledged as collateral are used to value structured financing transactions. The curves provide an estimate of where secured funding can be sourced and are expressed as a basis point spread in relation to the referenced benchmark rate.
Market implied life expectancyMarket implied life expectancy is the primary significant unobserv-able input on such products as life settlement, premium finance and SPIA, and represents the estimated mortality rate for the underlying insured for each contract. This estimate may vary depending upon multiple factors including the age and specific health characteristics of the insured.
Mean reversionMean reversion is the primary significant unobservable input for callable CMS spread exotics and represents the idea that prices and returns eventually move back towards the historical average.

390 Consolidated financial statements – Credit Suisse Group
Mortality rateMortality rate is the primary significant unobservable input for pension swaps. The expected present value of future cash flow of the trades depend on the mortality of individuals in the pen-sion fund who are grouped into categories such as gender, age, pension amount and other factors. In some cases mortality rates include a “scaler” (also referred to as a loading or multiplier) that align mortality projections with historical experience and calibrate to exit level.
Pre-IPO intrinsic optionPre-IPO intrinsic option represents the share price of a company in advance of its listing on a public exchange. It is typically a dis-counted price from the IPO price.
Prepayment ratePrepayment rates may vary from collateral pool to collateral pool, and are driven by a variety of collateral-specific factors, including the type and location of the underlying borrower, the remaining tenor of the obligation and the level and type (e.g., fixed or float-ing) of interest rate being paid by the borrower.
PriceBond equivalent price is a primary significant unobservable input for multiple products. Where market prices are not available for an instrument, benchmarking may be utilized to identify com-parable issues (same industry and similar product mixes) while adjustments are considered for differences in deal terms and performance.
Terminal Growth RateThe terminal growth rate is the rate at which free cash flows are expected to grow in perpetuity as part of an overall firm valuation process. The terminal growth rate typically parallels the historical inflation rate (2-3%) and is applied to the discounted cash flow model to represent mature stage company valuation.
Volatility and volatility skewVolatility and its skew are both impacted by the underlying risk, term and strike price of the derivative. In the case of interest rate derivatives, volatility may vary significantly between differ-ent underlying currencies and expiration dates on the options. Similarly, in the case of equity derivatives, the volatility attributed to a structure may vary depending upon the underlying reference name on the derivative.
Investment funds measured at NAV per share
Investments in funds held in trading assets and trading liabili-ties primarily include positions held in equity funds of funds as an economic hedge for structured notes and derivatives issued to clients that reference the same underlying risk and liquidity terms of the fund. A majority of these funds have limitations imposed on the amount of withdrawals from the fund during the redemp-tion period due to illiquidity of the investments. In other instances, the withdrawal amounts may vary depending on the redemption notice period and are usually larger for the longer redemption notice periods. In addition, penalties may apply if redemption is within a certain time period from initial investment.
Investments in funds held in other investments principally involves private equity securities and, to a lesser extent, publicly traded securities and fund of funds. Several of these investments have redemption restrictions subject to the discretion of the board of directors of the fund and/or redemption is permitted without restriction, but is limited to a certain percentage of total assets or only after a certain date.
The following table pertains to investments in certain entities that calculate NAV per share or its equivalent, primarily private equity and hedge funds. These investments do not have a readily deter-minable fair value and are measured at fair value using NAV.
Fair value, unfunded commitments and term of redemption conditions of investment funds measured at NAV per share 2020 2019
Unfunded Unfunded
Non- Total commit- Non- Total commit-
end of redeemable Redeemable fair value ments redeemable Redeemable fair value ments
Fair value of investment funds and unfunded commitments (CHF million)
Funds held in trading assets and trading liabilities 138 519 657 45 58 748 806 53
Private equity funds 94 0 94 77 323 0 323 161
Hedge funds 12 7 19 0 21 65 86 0
Equity method investment funds 321 287 608 226 187 402 589 14
Funds held in other investments 427 294 721 303 531 467 998 175
Total fair value of investment funds and unfunded commitments 565 1 813 2 1,378 348 589 3 1,215 4 1,804 228
1 CHF 190 million of the underlying assets have known liquidation periods and for CHF 375 million, the timing of liquidation is unknown.2 CHF 540 million is redeemable on demand with a notice period of primarily less than 30 days. CHF 4 million of the investment funds had restrictions on redemptions, which have a
redemption restriction of less than 1 year.3 CHF 163 million of the underlying assets have known liquidation periods and for CHF 426 million, the timing of liquidation is unknown.4 CHF 724 million is redeemable on demand with a notice period of primarily less than 30 days. CHF 13 million of the investment funds had restrictions on redemptions, which have a
redemption restriction of less than 1 year.

391Consolidated financial statements – Credit Suisse Group
Assets and liabilities measured at fair value on a nonrecurring basis
Certain assets and liabilities are measured at fair value on a non-recurring basis; that is, they are not measured at fair value on an ongoing basis but are subject to fair value adjustments in certain circumstances. Nonrecurring measurements reported are as of the end of the period, unless otherwise stated. The market value
for loans held-for-sale and commitments held-for-sale is deter-mined by benchmarking to comparable instruments.
The following table provides the fair value and the fair value hierarchy of all assets that were held as of December 31, 2020 and 2019, for which a nonrecurring fair value measurement was recorded.
Assets and liabilities measured at fair value on a nonrecurring basis
end of 2020 Level 1 Level 2 Level 3 Total
Assets (CHF million)
Other investments 0 217 326 543
of which equity method investments 0 0 303 303
of which equity securities (without a readily determinable fair value) 0 217 10 227
Net loans 0 67 4 71
Other assets 0 104 97 201
of which loans held-for-sale 0 97 39 136
of which premises, equipment and right-of-use assets 0 4 54 58
Total assets recorded at fair value on a nonrecurring basis 0 388 427 815
Liabilities (CHF million)
Other liabilities 0 0 14 14
of which commitments held-for-sale 0 0 14 14
Total liabilities recorded at fair value on a nonrecurring basis 0 0 14 14
end of 2019
Assets (CHF million)
Other investments 0 0 1 1
Other intangible assets 0 0 10 10
Other assets 0 0 60 60
of which loans held-for-sale 0 0 29 29
of which premises, equipment and right-of-use assets 0 0 5 5
of which real estate held-for-sale 0 0 26 26
Total assets recorded at fair value on a nonrecurring basis 0 0 71 71
Liabilities (CHF million)
Other liabilities 0 0 22 22
of which commitments held-for-sale 0 0 22 22
Total liabilities recorded at fair value on a nonrecurring basis 0 0 22 22

392 Consolidated financial statements – Credit Suisse Group
The following table provide the representative range of mini-mum and maximum values and the associated weighted aver-ages of each significant unobservable input for level 3 assets and liabilities by the related valuation technique most significant to
the related financial instrument that were held as of December 31, 2020, for which a nonrecurring fair value measurement was recorded.
Quantitative information about level 3 assets and liabilities measured at fair value on a nonrecurring basis Valuation Unobservable Minimum Maximum Weighted
end of 2020 Fair value technique input value value average 1
Assets (CHF million, except where indicated)
Other investments 326
of which equity method investments 303 Discounted cash flow Discount rate, in % 10 14 12
Other assets 97
of which loans held-for-sale 39 Market comparable Price, in % 83 100 95
of which premises, equipment and right-of-use assets 54
of which 52 Discounted cash flow Price, in actuals 52 52 52
Discount rate, in % 1 3 3
of which 2 Market comparable Price, in actuals 2 2 2
Liabilities (CHF million, except where indicated)
Other liabilities 14
of which commitments held-for-sale 14 Market comparable Price, in % 83 98 89
1 Weighted average is calculated based on the fair value of the instruments.
Fair value optionThe Group has availed itself of the simplification in accounting offered under the fair value option. This has been accomplished generally by electing the fair value option, both at initial adoption and for subsequent transactions, on items impacted by the hedge accounting requirements of US GAAP. For instruments for which hedge accounting could not be achieved but for which the Group is economically hedged, the Group has generally elected the fair value option. Where the Group manages an activity on a fair value basis but previously has been unable to achieve fair value accounting, the Group has generally utilized the fair value option to align its financial accounting to its risk management reporting.
The Group elected fair value for certain of its financial statement captions as follows:
Central bank funds sold, securities purchased under resale agreements and securities borrowing transactions
The Group has elected to account for structured resale agree-ments and most matched book resale agreements at fair value. These activities are managed on a fair value basis; thus, fair value accounting is deemed more appropriate for reporting purposes. The Group did not elect the fair value option for firm financing resale agreements as these agreements are generally overnight agreements which approximate fair value, but which are not man-aged on a fair value basis.
Other investments
The Group has elected to account for certain equity method investments at fair value. These activities are managed on a fair value basis; thus, fair value accounting is deemed more appropri-ate for reporting purposes.
In December 2019, Credit Suisse completed a review of the accounting treatment of the shares that it holds in SIX Group AG and elected fair value accounting under US GAAP in respect of this equity investment.
Loans
The Group has elected to account for substantially all commercial loans and loan commitments from the investment banking busi-nesses and certain emerging market loans from the investment banking businesses at fair value. These activities are managed on a fair value basis and fair value accounting was deemed more appropriate for reporting purposes. Additionally, recognition on a fair value basis eliminates the mismatch that existed due to the economic hedging the Group employs to manage these loans. Certain similar loans, such as project finance, lease finance, cash collateralized and some bridge loans, which were eligible for the fair value option, were not elected due to the lack of currently available infrastructure to fair value such loans and/or the inability to economically hedge such loans. Additionally, the Group elected not to account for loans granted by its private, corporate and insti-tutional banking businesses at fair value, such as domestic con-sumer lending, mortgages and corporate loans, as these loans are not managed on a fair value basis.
393Consolidated financial statements – Credit Suisse Group
Other assets
The Group elected the fair value option for loans held-for-sale, due to the short period over which such loans are held and the intention to sell such loans in the near term. Other assets also include assets of VIEs and mortgage securitizations which do not meet the criteria for sale treatment under US GAAP. The Group did elect the fair value option for these types of transactions.
Due to banks and customer deposits
The Group elected the fair value option for certain time depos-its associated with its emerging markets activities. The Group’s customer deposits include fund-linked deposits. The Group elected the fair value option for these fund-linked deposits. Fund-linked products are managed on a fair value basis and fair value accounting was deemed more appropriate for reporting purposes.
Central bank funds purchased, securities sold under repurchase agreements and securities lending transactions
The Group has elected to account for structured repurchase agreements and most matched book repurchase agreements at fair value. These activities are managed on a fair value basis and fair value accounting was deemed more appropriate for report-ing purposes. The Group did not elect the fair value option for firm financing repurchase agreements as these agreements are generally overnight agreements which approximate fair value, but which are not managed on a fair value basis.
Short-term borrowings
The Group’s short-term borrowings include hybrid debt instru-ments with embedded derivative features. Some of these embed-ded derivative features create bifurcatable debt instruments. The Group elected the fair value option for some of these instruments as of January 1, 2006, in accordance with the provisions of US GAAP. New bifurcatable debt instruments which were entered into in 2006 are carried at fair value. Some hybrid debt instru-ments do not result in bifurcatable debt instruments. US GAAP
permits the Group to elect fair value accounting for non-bifur-catable hybrid debt instruments. With the exception of certain bifurcatable hybrid debt instruments which the Group did not elect to account for at fair value, the Group has elected to account for all hybrid debt instruments held as of January 1, 2007, and hybrid debt instruments originated after January 1, 2007, at fair value. These activities are managed on a fair value basis and fair value accounting was deemed appropriate for reporting pur-poses. There are two main populations of similar instruments for which fair value accounting was not elected. The first relates to the lending business transacted by the Group’s private, corporate and institutional banking businesses, which includes structured deposits and similar investment products. These are managed on a bifurcated or accrual basis and fair value accounting was not considered appropriate. The second is where the instruments were or will be maturing in the near term and their fair value will be realized at that time.
Long-term debt
The Group’s long-term debt includes hybrid debt instruments with embedded derivative features as described above in short-term borrowings. The Group’s long-term debt also includes debt issu-ances managed by the Treasury department that do not contain derivative features (vanilla debt). The Group actively manages the interest rate risk on these instruments with derivatives. In particu-lar, fixed-rate debt is hedged with receive-fixed, pay-floating inter-est rate swaps. The Group elected to fair value fixed-rate debt upon implementation of the fair value option on January 1, 2007, with changes in fair value recognized as a component of trading revenues. The Group did not elect to apply the fair value option to fixed-rate debt issued by the Group since January 1, 2008, but instead applies hedge accounting.
Other liabilities
Other liabilities include liabilities of VIEs and mortgage securiti-zations that do not meet the criteria for sale treatment under US GAAP. The Group elected the fair value option for these types of transactions.

394 Consolidated financial statements – Credit Suisse Group
Difference between the aggregate fair value and unpaid principal balances of fair value option-elected financial instruments 2020 2019
Aggregate Aggregate Aggregate Aggregate
fair unpaid fair unpaid
end of value principal Difference value principal Difference
Financial instruments (CHF million)
Central bank funds sold, securities purchased under
resale agreements and securities borrowing transactions 57,994 57,895 99 85,556 85,463 93
Loans 11,408 12,079 (671) 12,662 13,104 (442)
Other assets 1 7,834 10,090 (2,256) 9,710 12,006 (2,296)
Due to banks and customer deposits (578) (489) (89) (582) (508) (74)
Central bank funds purchased, securities sold under
repurchase agreements and securities lending transactions (13,594) (13,578) (16) (10,715) (10,719) 4
Short-term borrowings (10,740) (10,632) (108) (11,333) (11,187) (146)
Long-term debt 2 (70,976) (73,842) 2,866 (70,331) (72,126) 1,795
Other liabilities (616) (1,569) 953 (709) (1,681) 972
Non-performing and non-interest-earning loans 3 543 3,364 (2,821) 543 3,235 (2,692)
1 Primarily loans held-for-sale.2 Long-term debt includes both principal-protected and non-principal protected instruments. For non-principal-protected instruments, the original notional amount has been reported in the
aggregate unpaid principal.3 Included in loans or other assets.
Gains and losses on financial instruments 2020 2019 2018
Net Net Net gains/ gains/ gains/
in (losses) (losses) (losses)
Financial instruments (CHF million)
Interest-bearing deposits with banks 15 1 29 1 2 1
of which related to credit risk 0 11 (10)
Central bank funds sold, securities purchased under
resale agreements and securities borrowing transactions 1,198 1 2,696 1 2,451 1
Other investments 397 2 268 3 241 2
of which related to credit risk 1 2 (1)
Loans 510 1 908 1 717 1
of which related to credit risk (181) 26 (296)
Other assets 489 1 892 1 770 1
of which related to credit risk (106) 111 61
Due to banks and customer deposits (10) 3 (29) 3 (39) 3
of which related to credit risk 0 1 (37)
Central bank funds purchased, securities sold under
repurchase agreements and securities lending transactions (58) 1 (612) 1 (890) 1
Short-term borrowings (687) 3 (50) 3 2,807 3
of which related to credit risk 0 8 (5)
Long-term debt (2,294) 3 (8,501) 3 4,206 3
of which related to credit risk 11 (5) 7
Other liabilities (20) 3 92 2 73 2
of which related to credit risk (15) 50 4
1 Primarily recognized in net interest income.2 Primarily recognized in other revenues.3 Primarily recognized in trading revenues.

395Consolidated financial statements – Credit Suisse Group
The impact of credit risk on assets presented in the table above has been calculated as the component of the total change in fair value, excluding the impact of changes in base or risk-free inter-est rates. The impact of changes in own credit risk on liabilities presented in the table above has been calculated as the dif-ference between the fair values of those instruments as of the reporting date and the theoretical fair values of those instruments calculated by using the yield curve prevailing at the end of the reporting period, adjusted up or down for changes in the Group’s own credit spreads from the transition date to the reporting date.
Interest income and expense, which are calculated based on con-tractual rates specified in the transactions, are recorded in the consolidated statements of operations depending on the nature of the instrument and its related market convention. When interest is included as a component of the change in the instrument’s fair value, it is included in trading revenues. Otherwise, it is included
in interest and dividend income or interest expense. Interest and dividend income is recognized separately from trading revenues.
Gains and losses attributable to changes in instrument-specific credit risk on fair value option elected liabilities
The following table provides additional information regarding the gains and losses attributable to changes in instrument-specific credit risk on fair value option elected liabilities, which have been recorded in AOCI. The table includes both the amount of change during the period and the cumulative amount that were attribut-able to the changes in instrument-specific credit risk. In addition, the table includes the gains and losses related to instrument-spe-cific credit risk, which were previously recorded in AOCI but have been transferred to net income during the period.
Gains/(losses) attributable to changes in instrument-specific credit risk Gains/(losses) recorded in AOCI transferred Gains/(losses) recorded into AOCI 1 to net income 1
in 2020 Cumulative 2019 2020 2019
Financial instruments (CHF million)
Customer deposits (9) (75) (51) 0 0
Short-term borrowings (13) (66) (2) 1 2
Long-term debt 70 (2,513) (2,190) 155 190
of which treasury debt over two years 234 (796) (1,198) 0 0
of which structured notes over two years (177) (1,591) (769) 155 179
Total 48 (2,654) (2,243) 156 192
1 Amounts are reflected gross of tax.
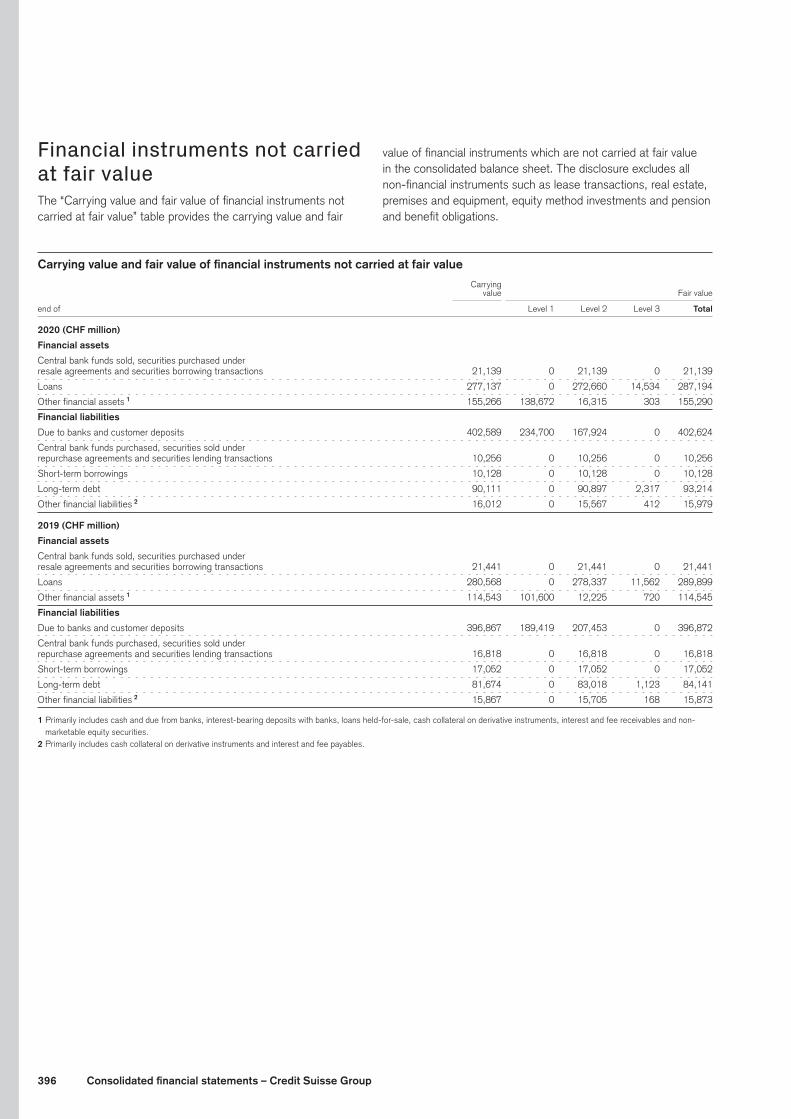
396 Consolidated financial statements – Credit Suisse Group
Financial instruments not carried at fair valueThe “Carrying value and fair value of financial instruments not carried at fair value” table provides the carrying value and fair
value of financial instruments which are not carried at fair value in the consolidated balance sheet. The disclosure excludes all non-financial instruments such as lease transactions, real estate, premises and equipment, equity method investments and pension and benefit obligations.
Carrying value and fair value of financial instruments not carried at fair value Carrying value Fair value
end of Level 1 Level 2 Level 3 Total
2020 (CHF million)
Financial assets
Central bank funds sold, securities purchased under
resale agreements and securities borrowing transactions 21,139 0 21,139 0 21,139
Loans 277,137 0 272,660 14,534 287,194
Other financial assets 1 155,266 138,672 16,315 303 155,290
Financial liabilities
Due to banks and customer deposits 402,589 234,700 167,924 0 402,624
Central bank funds purchased, securities sold under
repurchase agreements and securities lending transactions 10,256 0 10,256 0 10,256
Short-term borrowings 10,128 0 10,128 0 10,128
Long-term debt 90,111 0 90,897 2,317 93,214
Other financial liabilities 2 16,012 0 15,567 412 15,979
2019 (CHF million)
Financial assets
Central bank funds sold, securities purchased under
resale agreements and securities borrowing transactions 21,441 0 21,441 0 21,441
Loans 280,568 0 278,337 11,562 289,899
Other financial assets 1 114,543 101,600 12,225 720 114,545
Financial liabilities
Due to banks and customer deposits 396,867 189,419 207,453 0 396,872
Central bank funds purchased, securities sold under
repurchase agreements and securities lending transactions 16,818 0 16,818 0 16,818
Short-term borrowings 17,052 0 17,052 0 17,052
Long-term debt 81,674 0 83,018 1,123 84,141
Other financial liabilities 2 15,867 0 15,705 168 15,873
1 Primarily includes cash and due from banks, interest-bearing deposits with banks, loans held-for-sale, cash collateral on derivative instruments, interest and fee receivables and non-marketable equity securities.
2 Primarily includes cash collateral on derivative instruments and interest and fee payables.

397Consolidated financial statements – Credit Suisse Group
37 Assets pledged and collateralAssets pledged
The Group pledges assets mainly for repurchase agreements and other securities financing. Certain pledged assets may be encum-bered, meaning they have the right to be sold or repledged. The encumbered assets are parenthetically disclosed on the consoli-dated balance sheet.
Assets pledged
end of 2020 2019
CHF million
Total assets pledged or assigned as collateral 144,355 121,800
of which encumbered 71,471 59,013
Prior period has been corrected.
Collateral
The Group receives cash and securities in connection with resale agreements, securities borrowing and loans, derivative transac-tions and margined broker loans. A significant portion of the col-lateral and securities received by the Group was sold or repledged in connection with repurchase agreements, securities sold not yet
purchased, securities borrowings and loans, pledges to clearing organizations, segregation requirements under securities laws and regulations, derivative transactions and bank loans.
Collateral
end of 2020 2019
CHF million
Fair value of collateral received
with the right to sell or repledge 413,154 412,765
of which sold or repledged 184,837 185,935
Other information
end of 2020 2019
CHF million
Swiss National Bank required minimum liquidity reserves 2,092 2,059
Other restricted cash, securities and receivables 1 5,065 5,310
1 Includes cash, securities and receivables recorded on the Group’s consolidated balance sheets and restricted under Swiss or foreign regulations for financial institutions; excludes restricted cash, securities and receivables held on behalf of clients which are not recorded on the Group’s consolidated balance sheet. Prior periods have been adjusted to conform to the current presentation.
38 Capital adequacyThe Group is subject to the Basel III framework, as implemented in Switzerland, as well as Swiss legislation and regulations for systemi-cally important banks (Swiss Requirements), which include capital, liquidity, leverage and large exposure requirements and rules for emergency plans designed to maintain systemically relevant func-tions in the event of threatened insolvency. The legislation imple-menting the Basel III framework in Switzerland in respect of capital requirements for systemically relevant banks, including the Group, goes beyond the Basel III minimum standards for systemically rel-evant banks. The Swiss TLAC standards were phased in from 2016 through 2019 and became fully effective on January 1, 2020. The Group, which is subject to regulation by FINMA, has based its capi-tal adequacy calculations on US GAAP financial statements, as per-mitted by FINMA Circular 2013/1.
Under the Capital Adequacy Ordinance, Swiss banks classified as systemically important banks operating internationally, such as the Group, are subject to two different minimum requirements for loss-absorbing capacity: such banks must hold sufficient capital that absorbs losses to ensure continuity of service (going concern requirement), and they must issue sufficient debt instruments to fund an orderly resolution without recourse to public resources (gone concern requirement). Going concern capital and gone con-cern capital together form the Group’s total loss-absorbing capac-ity. The going concern and gone concern requirements are gener-ally aligned with the Financial Stability Board’s total loss-absorbing
capacity standard. Both the going concern and the gone concern requirements were subject to phase-in, with gradually increas-ing requirements as well as grandfathering provisions for certain outstanding instruments, and became fully effective on January 1, 2020. Under the Capital Adequacy Ordinance’s grandfathering provisions, additional tier 1 capital instruments with a low trigger qualify as going concern capital until their first call date; additional tier 1 capital instruments and tier 2 capital instruments that no longer qualify as going concern capital, qualify as gone concern capital until termination or one year before their final maturity, respectively. Additionally, there are FINMA decrees that apply to the Group as a systemically important bank operating internation-ally, including capital adequacy requirements as well as liquidity and risk diversification requirements. Banks that do not maintain the minimum requirements may be limited in their ability to pay divi-dends and make discretionary bonus payments and other earnings distributions.
The Group’s balance sheet positions and off-balance sheet expo-sures translate into risk-weighted assets, which are categorized as credit, market and operational risk-weighted assets. When assessing risk-weighted assets, it is not the nominal size, but rather the nature (including risk mitigation such as collateral or hedges) of the balance sheet positions or off-balance sheet expo-sures that determines the risk-weighted assets.

398 Consolidated financial statements – Credit Suisse Group
Leverage exposure consists of period-end total assets and pre-scribed regulatory adjustments, such as derivative financial instru-ments, securities financing transactions and off-balance sheet exposures.
Capital ratios measure the Group’s capital components against risk-weighted assets and leverage ratios measure them against the end-of-period leverage exposure.
As of December 31, 2020 and 2019, the Group’s capital position exceeded its capital requirements under the regulatory provisions outlined under Swiss Requirements.
Broker-dealer operations
Certain of the Group’s broker-dealer subsidiaries are also subject to capital adequacy requirements. As of December 31, 2020 and 2019, the Group and its subsidiaries complied with all applicable regulatory capital adequacy requirements.
Dividend restrictions
Certain of the Group’s subsidiaries are subject to legal restric-tions governing the amount of dividends they can pay (for exam-ple, pursuant to corporate law as defined by the Swiss Code of Obligations).
Under the Swiss Code of Obligations, dividends may be paid out only if and to the extent the corporation has distributable profits from previous business years, or if the free reserves of the corpo-ration are sufficient to allow distribution of a dividend. In addition, at least 5% of the annual net profits must be retained and booked as general legal reserves for so long as these reserves amount to less than 20% of the paid-in share capital. The reserves cur-rently exceed this 20% threshold. Furthermore, dividends may be paid out only after shareholder approval at the Annual General Meeting.
As of December 31, 2020 and 2019, Credit Suisse Group AG was not subject to restrictions on its ability to pay the proposed dividends.
Swiss metrics
end of 2020 2019
Swiss capital (CHF million)
Swiss CET1 capital 35,351 36,740
Going concern capital 51,192 49,757
Gone concern capital 1 41,852 41,138
Total loss-absorbing capacity 93,044 90,895
Swiss risk-weighted assets and leverage exposure (CHF million)
Swiss risk-weighted assets 275,576 291,282
Leverage exposure 799,853 2 909,994
Swiss capital ratios (%)
Swiss CET1 ratio 12.8 12.6
Going concern capital ratio 18.6 17.1
Gone concern capital ratio 15.2 14.1
TLAC ratio 33.8 31.2
Swiss leverage ratios (%)
Swiss CET1 leverage ratio 4.4 4.0
Going concern leverage ratio 6.4 5.5
Gone concern leverage ratio 5.2 3 4.5
TLAC leverage ratio 11.6 10.0
Swiss capital ratio requirements (%)
Swiss CET1 ratio requirement 10.0 9.68
Going concern capital ratio requirement 14.3 13.58
Gone concern capital ratio requirement 14.3 11.6
TLAC ratio requirement 28.6 25.18
Swiss leverage ratio requirements (%)
Swiss CET1 leverage ratio requirement 3.5 3.2
Going concern leverage ratio requirement 5.0 4.5
Gone concern leverage ratio requirement 5.0 4.0
TLAC leverage ratio requirement 10.0 8.5
The Swiss capital requirements have been fully phased-in as of January 1, 2020 and the 2019 balances are presented on a comparative basis. Does not include the effects of the countercyclical buffers and any rebates for resolvability and for certain tier 2 low-trigger instruments recognized in gone concern capital.1 Amounts are shown on a look-through basis. Certain tier 2 instruments and their related
tier 2 amortization components are subject to phase out through 2022. As of 2020 and 2019, gone concern capital was CHF 42,198 million and CHF 38,576 million, including CHF 346 million and CHF 372 million, respectively, of such instruments.
2 Excludes CHF 110,677 million of cash held at central banks, after adjusting for the divi-dend paid in 2020.
3 The gone concern ratio would be 4.6%, if calculated using a leverage exposure of CHF 910,530 million, without the temporary exclusion of cash held at central banks, after adjusting for the dividend paid in 2020, of CHF 110,677 million.
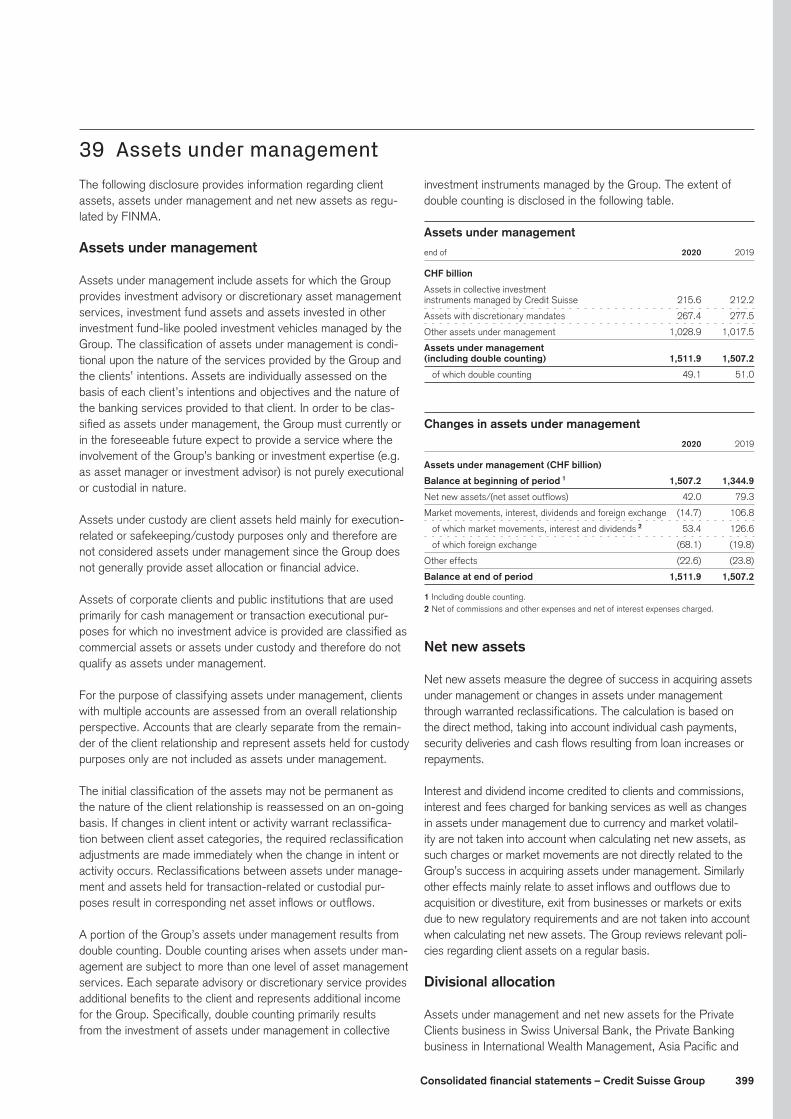
399Consolidated financial statements – Credit Suisse Group
39 Assets under managementThe following disclosure provides information regarding client assets, assets under management and net new assets as regu-lated by FINMA.
Assets under management
Assets under management include assets for which the Group provides investment advisory or discretionary asset management services, investment fund assets and assets invested in other investment fund-like pooled investment vehicles managed by the Group. The classification of assets under management is condi-tional upon the nature of the services provided by the Group and the clients’ intentions. Assets are individually assessed on the basis of each client’s intentions and objectives and the nature of the banking services provided to that client. In order to be clas-sified as assets under management, the Group must currently or in the foreseeable future expect to provide a service where the involvement of the Group’s banking or investment expertise (e.g. as asset manager or investment advisor) is not purely executional or custodial in nature.
Assets under custody are client assets held mainly for execution-related or safekeeping/custody purposes only and therefore are not considered assets under management since the Group does not generally provide asset allocation or financial advice.
Assets of corporate clients and public institutions that are used primarily for cash management or transaction executional pur-poses for which no investment advice is provided are classified as commercial assets or assets under custody and therefore do not qualify as assets under management.
For the purpose of classifying assets under management, clients with multiple accounts are assessed from an overall relationship perspective. Accounts that are clearly separate from the remain-der of the client relationship and represent assets held for custody purposes only are not included as assets under management.
The initial classification of the assets may not be permanent as the nature of the client relationship is reassessed on an on-going basis. If changes in client intent or activity warrant reclassifica-tion between client asset categories, the required reclassification adjustments are made immediately when the change in intent or activity occurs. Reclassifications between assets under manage-ment and assets held for transaction-related or custodial pur-poses result in corresponding net asset inflows or outflows.
A portion of the Group’s assets under management results from double counting. Double counting arises when assets under man-agement are subject to more than one level of asset management services. Each separate advisory or discretionary service provides additional benefits to the client and represents additional income for the Group. Specifically, double counting primarily results from the investment of assets under management in collective
investment instruments managed by the Group. The extent of double counting is disclosed in the following table.
Assets under management
end of 2020 2019
CHF billion
Assets in collective investment
instruments managed by Credit Suisse 215.6 212.2
Assets with discretionary mandates 267.4 277.5
Other assets under management 1,028.9 1,017.5
Assets under management
(including double counting) 1,511.9 1,507.2
of which double counting 49.1 51.0
Changes in assets under management 2020 2019
Assets under management (CHF billion)
Balance at beginning of period 1 1,507.2 1,344.9
Net new assets/(net asset outflows) 42.0 79.3
Market movements, interest, dividends and foreign exchange (14.7) 106.8
of which market movements, interest and dividends 2 53.4 126.6
of which foreign exchange (68.1) (19.8)
Other effects (22.6) (23.8)
Balance at end of period 1,511.9 1,507.2
1 Including double counting.2 Net of commissions and other expenses and net of interest expenses charged.
Net new assets
Net new assets measure the degree of success in acquiring assets under management or changes in assets under management through warranted reclassifications. The calculation is based on the direct method, taking into account individual cash payments, security deliveries and cash flows resulting from loan increases or repayments.
Interest and dividend income credited to clients and commissions, interest and fees charged for banking services as well as changes in assets under management due to currency and market volatil-ity are not taken into account when calculating net new assets, as such charges or market movements are not directly related to the Group’s success in acquiring assets under management. Similarly other effects mainly relate to asset inflows and outflows due to acquisition or divestiture, exit from businesses or markets or exits due to new regulatory requirements and are not taken into account when calculating net new assets. The Group reviews relevant poli-cies regarding client assets on a regular basis.
Divisional allocation
Assets under management and net new assets for the Private Clients business in Swiss Universal Bank, the Private Banking business in International Wealth Management, Asia Pacific and
400 Consolidated financial statements – Credit Suisse Group
the Corporate & Institutional Banking business in Swiss Universal Bank are allocated based on the management areas (business areas) that effectively manage the assets. The distribution of net new assets resulting from internal referral arrangements is gov-erned under the net new asset referral framework, which includes preset percentages for the allocation of net new assets to the businesses.
The allocation of assets under management and net new assets for Asset Management in the Internal Wealth Management divi-sion reflects the location where the investment vehicles are man-aged and where the costs of managing the funds are incurred.
40 LitigationThe Group is involved in a number of judicial, regulatory and arbi-tration proceedings concerning matters arising in connection with the conduct of its businesses, including those disclosed below. Some of these proceedings have been brought on behalf of vari-ous classes of claimants and seek damages of material and/or indeterminate amounts.
The Group accrues loss contingency litigation provisions and takes a charge to income in connection with certain proceedings when losses, additional losses or ranges of loss are probable and reasonably estimable. The Group also accrues litigation provisions for the estimated fees and expenses of external lawyers and other service providers in relation to such proceedings, including in cases for which it has not accrued a loss contingency provision. The Group accrues these fee and expense litigation provisions and takes a charge to income in connection therewith when such fees and expenses are probable and reasonably estimable. The Group reviews its legal proceedings each quarter to determine the adequacy of its litigation provisions and may increase or release provisions based on management’s judgment and the advice of counsel. The establishment of additional provisions or releases of litigation provisions may be necessary in the future as develop-ments in such proceedings warrant.
The specific matters described below include (a) proceedings where the Group has accrued a loss contingency provision, given that it is probable that a loss may be incurred and such loss is reasonably estimable; and (b) proceedings where the Group has not accrued such a loss contingency provision for various rea-sons, including, but not limited to, the fact that any related losses are not reasonably estimable. The description of certain of the matters below includes a statement that the Group has estab-lished a loss contingency provision and discloses the amount of such provision; for the other matters no such statement is made. With respect to the matters for which no such statement is made, either (a) the Group has not established a loss contingency provi-sion, in which case the matter is treated as a contingent liability under the applicable accounting standard, or (b) the Group has established such a provision but believes that disclosure of that fact would violate confidentiality obligations to which the Group is subject or otherwise compromise attorney-client privilege, work product protection or other protections against disclosure or compromise the Group’s management of the matter. The future outflow of funds in respect of any matter for which the Group has accrued loss contingency provisions cannot be determined with
certainty based on currently available information, and accordingly may ultimately prove to be substantially greater (or may be less) than the provision that is reflected on the Group’s balance sheet.
It is inherently difficult to determine whether a loss is probable or even reasonably possible or to estimate the amount of any loss or loss range for many of the Group’s legal proceedings. Estimates, by their nature, are based on judgment and currently available infor-mation and involve a variety of factors, including, but not limited to, the type and nature of the proceeding, the progress of the matter, the advice of counsel, the Group’s defenses and its experience in similar matters, as well as its assessment of matters, including set-tlements, involving other defendants in similar or related cases or proceedings. Factual and legal determinations, many of which are complex, must be made before a loss, additional losses or ranges of loss can be reasonably estimated for any proceeding.
Most matters pending against the Group seek damages of an indeterminate amount. While certain matters specify the damages claimed, such claimed amount may not represent the Group’s reasonably possible losses. For certain of the proceedings dis-cussed below the Group has disclosed the amount of damages claimed and certain other quantifiable information that is publicly available.
The following table presents a roll forward of the Group’s aggre-gate litigation provisions.
Litigation provisions 2020
CHF million
Balance at beginning of period 898
Increase in litigation accruals 1,358
Decrease in litigation accruals (131)
Decrease for settlements and other cash payments (391)
Foreign exchange translation (74)
Balance at end of period 1,660
The Group’s aggregate litigation provisions include estimates of losses, additional losses or ranges of loss for proceedings for which such losses are probable and can be reasonably estimated. The Group does not believe that it can estimate an aggregate range of reasonably possible losses for certain of its proceedings because of their complexity, the novelty of some of the claims, the early
401Consolidated financial statements – Credit Suisse Group
stage of the proceedings, the limited amount of discovery that has occurred and/or other factors. The Group’s estimate of the aggre-gate range of reasonably possible losses that are not covered by existing provisions for the proceedings discussed below for which the Group believes an estimate is possible is zero to CHF 0.9 billion.
After taking into account its litigation provisions, the Group believes, based on currently available information and advice of counsel, that the results of its legal proceedings, in the aggregate, will not have a material adverse effect on the Group’s financial condition. However, in light of the inherent uncertainties of such proceedings, includ-ing those brought by regulators or other governmental authorities, the ultimate cost to the Group of resolving such proceedings may exceed current litigation provisions and any excess may be material to its operating results for any particular period, depending, in part, upon the operating results for such period.
Mortgage-related matters
Government and regulatory related mattersVarious financial institutions, including Credit Suisse Securities (USA) LLC (CSS LLC) and certain of its affiliates, have received requests for information from, and/or have been defending civil actions by, certain regulators and/or government entities, includ-ing the US Department of Justice (DOJ) and other members of the Residential Mortgage-Backed Securities (RMBS) Work-ing Group of the US Financial Fraud Enforcement Task Force, regarding the origination, purchase, securitization, servicing and trading of subprime and non-subprime residential and commer-cial mortgages and related issues. CSS LLC and its affiliates are cooperating with such requests for information.
DOJ RMBS settlementAs previously disclosed, on January 18, 2017, CSS LLC and its current and former US subsidiaries and US affiliates reached a settlement with the DOJ related to its legacy RMBS business, a business conducted through 2007. The settlement resolved potential civil claims by the DOJ related to certain of those Credit Suisse entities’ packaging, marketing, structuring, arrangement, underwriting, issuance and sale of RMBS. Pursuant to the terms of the settlement a civil monetary penalty was paid to the DOJ in January 2017. The settlement also required the above-mentioned entities to provide a specified amount of consumer relief mea-sures, including affordable housing payments and loan forgive-ness, within five years of the settlement, and the DOJ and Credit Suisse agreed to the appointment of an independent monitor to oversee the completion of the consumer relief requirements of the settlement. The monitor has published reports periodically noting Credit Suisse’s cooperation and progress toward satisfaction of the consumer relief requirements.
NJAG litigationOn December 18, 2013, the New Jersey Attorney General (NJAG), on behalf of the State of New Jersey, filed a civil action in the Superior Court of New Jersey, Chancery Division, Mercer County (SCNJ), against CSS LLC and affiliated entities in their roles as
issuer, sponsor, depositor and/or underwriter of RMBS transactions prior to 2008. The original complaint, which referenced 13 RMBS issued, sponsored, deposited and underwritten by CSS LLC and its affiliates in 2006 and 2007, alleges that CSS LLC and its affiliates misled investors and engaged in fraud or deceit in connection with the offer and sale of RMBS, and seeks an unspecified amount of damages. On August 21, 2014, the SCNJ dismissed without preju-dice the action brought against CSS LLC and its affiliates by the NJAG. On September 4, 2014, the NJAG filed an amended com-plaint against CSS LLC and its affiliates, asserting additional allega-tions but not expanding the number of claims or RMBS referenced in the original complaint. On August 21, 2019, the NJAG filed a motion for partial summary judgment. On November 18, 2019, CSS LLC and its affiliates filed a cross-motion for partial summary judgment.
Civil litigationCSS LLC and/or certain of its affiliates have also been named as defendants in various civil litigation matters related to their roles as issuer, sponsor, depositor, underwriter and/or servicer of RMBS transactions. These cases include or have included class action lawsuits, actions by individual investors in RMBS, actions by monoline insurance companies that guaranteed payments of principal and interest for certain RMBS, and repurchase actions by RMBS trusts, trustees and/or investors. Although the allega-tions vary by lawsuit, plaintiffs in the class actions and individual investor actions generally allege that the offering documents of securities issued by various RMBS securitization trusts contained material misrepresentations and omissions, including state-ments regarding the underwriting standards pursuant to which the underlying mortgage loans were issued; monoline insurers generally allege that loans that collateralize RMBS they insured breached representations and warranties made with respect to the loans at the time of securitization and that they were fraudu-lently induced to enter into the transactions; and repurchase action plaintiffs generally allege breached representations and warranties in respect of mortgage loans and failure to repurchase such mortgage loans as required under the applicable agree-ments. The amounts disclosed below do not reflect actual realized plaintiff losses to date or anticipated future litigation exposure. Rather, unless otherwise stated, these amounts reflect the origi-nal unpaid principal balance amounts as alleged in these actions and do not include any reduction in principal amounts since issu-ance. Further, unless otherwise stated, amounts attributable to an “operative pleading” for the individual investor actions are not altered for settlements, dismissals or other occurrences, if any, that may have caused the amounts to change subsequent to the operative pleading. In addition to the mortgage-related actions discussed below, a number of other entities have threatened to assert claims against CSS LLC and/or its affiliates in connection with various RMBS issuances.
Individual investor actionsCSS LLC and, in one instance, its affiliates, as an RMBS issuer, underwriter and/or other participant, along with other defen-dants, have been named as defendants in: (i) one action brought by the Federal Deposit Insurance Corporation (FDIC), as receiver
402 Consolidated financial statements – Credit Suisse Group
for Citizens National Bank and Strategic Capital Bank, in the US District Court for the Southern District of New York (SDNY), in which claims against CSS LLC and its affiliates relate to approxi-mately USD 28 million of the RMBS at issue (approximately 20% of the USD 141 million at issue against all defendants in the operative pleading) and (ii) one action brought by the FDIC, as receiver for Colonial Bank, in the SDNY, in which claims against CSS LLC relate to approximately USD 92 million of the RMBS at issue (approximately 23% of the USD 394 million at issue against all defendants in the operative pleading). These actions are at intermediate procedural stages.
CSS LLC and certain of its affiliates are the only defendants named in an action brought by IKB Deutsche Industriebank AG and affiliated entities in the Supreme Court for the State of New York, New York County (SCNY), in which claims against CSS LLC and its affiliates relate to approximately USD 97 million of RMBS at issue; this action is at an intermediate procedural stage.
As disclosed in Credit Suisse’s second quarter Financial Report of 2020, on July 16, 2020, following a settlement, the Wash-ington state court presiding in an investor action brought by the Federal Home Loan Bank of Seattle dismissed with prejudice all claims against CSS LLC and its affiliates relating to approximately USD 145 million of RMBS at issue.
On December 8, 2020, following a settlement, the Massachu-setts state court presiding in an investor action brought by the Federal Home Loan Bank of Boston dismissed with prejudice all claims against CSS LLC and its affiliates relating to approximately USD 333 million of RMBS at issue.
Monoline insurer disputesCSS LLC and certain of its affiliates are defendants in one mono-line insurer action pending in the SCNY, commenced by MBIA Insurance Corp. (MBIA) as guarantor for payments of principal and interest related to approximately USD 770 million of RMBS issued in an offering sponsored by the Credit Suisse defendants. One theory of liability advanced by MBIA is that an affiliate of CSS LLC must repurchase certain mortgage loans from the trusts at issue. MBIA claims that the vast majority of the underly-ing mortgage loans breach certain representations and warran-ties, and that the affiliate has failed to repurchase the allegedly defective loans. In addition, MBIA brought claims for fraudulent inducement, material misrepresentations, breaches of warran-ties, repurchase obligations, and reimbursement. MBIA submit-ted repurchase demands for loans with an original principal bal-ance of approximately USD 549 million. On March 31, 2017, the SCNY granted in part and denied in part both parties’ respec-tive summary judgment motions, which resulted, among other things, in the dismissal of MBIA’s fraudulent inducement claim with prejudice. On September 13, 2018, the First Department issued a decision that, among other things, affirmed the dismissal of MBIA’s fraudulent inducement claim with prejudice. Follow-ing its decision, the First Department remanded the action to the trial court for further proceedings. On August 2, 2019, the SCNY concluded a two-week bench trial. On November 30, 2020, the
SCNY issued a post-trial order determining liability, and on Janu-ary 25, 2021 entered an order setting damages in the amount of USD 604 million. On February 11, 2021, following a settlement in the amount of USD 600 million, for which Credit Suisse was fully reserved, the SCNY dismissed with prejudice all claims against CSS LLC and its affiliates.
Repurchase litigationsDLJ Mortgage Capital, Inc. (DLJ) is a defendant in: (i) one action brought by Asset Backed Securities Corporation Home Equity Loan Trust, Series 2006-HE7, in which plaintiff alleges damages of not less than USD 374 million, increased from not less than USD 341 million, in an amended complaint filed on August 19, 2019, which action is proceeding in the SCNY following the resolution of a pre-viously pending appeal; on January 13, 2020, DLJ filed a motion to dismiss; (ii) one action brought by Home Equity Asset Trust, Series 2006-8, in which plaintiff alleges damages of not less than USD 436 million; (iii) one action brought by Home Equity Asset Trust 2007-1, in which plaintiff alleges damages of not less than USD 420 million; on December 27, 2018, the SCNY denied DLJ’s motion for partial summary judgment in this action, and the First Department affirmed the SCNY’s summary judgment order on October 10, 2019; on January 30, 2020, DLJ obtained leave to further appeal to the New York State Court of Appeals; subject to final resolution of DLJ’s summary judgment appeal, the SCNY has scheduled trial in this action to begin on October 11, 2021; (iv) one action brought by Home Equity Asset Trust Series 2007-3, in which plaintiff alleges damages of not less than USD 206 million; (v) one action brought by Home Equity Asset Trust 2007-2, in which plain-tiff alleges damages of not less than USD 495 million; and (vi) one action brought by CSMC Asset-Backed Trust 2007-NC1, in which no damages amount is alleged. These actions are brought in the SCNY and are at various procedural stages. DLJ and its affiliate, Select Portfolio Servicing, Inc. (SPS), are defendants in two actions that have been consolidated for certain procedural purposes, includ-ing trial, in the SCNY: one action brought by Home Equity Mortgage Trust Series 2006-1, Home Equity Mortgage Trust Series 2006-3 and Home Equity Mortgage Trust Series 2006-4, in which plaintiffs allege damages of not less than USD 730 million, and allege that SPS obstructed the investigation into the full extent of the defects in the mortgage pools by refusing to afford the trustee reasonable access to certain origination files; and one action brought by Home Equity Mortgage Trust Series 2006-5, in which plaintiff alleges damages of not less than USD 500 million, and alleges that SPS likely discovered DLJ’s alleged breaches of representations and warranties but did not notify the trustee of such breaches, in alleged violation of its contractual obligations. On January 10, 2019, the SCNY denied DLJ’s motion for partial summary judgment in these actions, and the First Department affirmed the SCNY’s summary judgment order on September 17, 2019. On December 12, 2019, DLJ obtained leave to further appeal to the New York State Court of Appeals. Subject to final resolution of DLJ’s summary judgment appeal, the SCNY has scheduled trial in these actions to begin on January 10, 2022.
As disclosed in Credit Suisse’s fourth quarter Financial Report of 2013, the following repurchase actions were dismissed with
403Consolidated financial statements – Credit Suisse Group
prejudice in 2013: the three consolidated actions brought by Home Equity Asset Trust 2006-5, Home Equity Asset Trust 2006-6 and Home Equity Asset Trust 2006-7 against DLJ. Those dismissals were upheld by the New York State Court of Appeals on February 19, 2019. On July 8, 2019, the notice of appeal plaintiffs filed before the First Department from the SCNY’s April 2017 denial of plaintiffs’ request that its 2013 dismissal decision be modified to allow plaintiffs to assert new claims not previously included in plaintiffs’ consolidated complaint was deemed dismissed when plaintiffs declined to further pursue their appeal by a court-ordered deadline. On August 15, 2019, the trustees for Home Equity Asset Trust 2006-5, Home Equity Asset Trust 2006-6 and Home Equity Asset Trust 2006-7 com-menced a new repurchase action against DLJ in the SCNY, in which plaintiffs alleged damages of not less than USD 936 mil-lion, asserting substantially similar claims against DLJ as those alleged in the three consolidated repurchase actions that were dismissed with prejudice in 2013. On September 20, 2019, DLJ filed a motion to dismiss and on November 25, 2019, the SCNY entered an order dismissing this new action with prejudice. On December 20, 2019, the plaintiffs filed a notice of appeal to the First Department.
Bank loan litigation
CSS LLC and certain of its affiliates are the subject of certain litigation relating to certain real estate developments including Yel-lowstone Club and Lake Las Vegas as well as other similar real estate developments. Credit Suisse defendants in these matters arranged, and acted as the agent bank for, syndicated loans pro-vided to borrowers affiliated with such real estate developments, and who have since gone through bankruptcy or foreclosure. Such litigation includes two cases brought in Texas and New York state courts by entities related to Highland Capital Management LP (Highland). In the case in Texas state court, a jury trial was held in December 2014 on Highland’s claim for fraudulent inducement by affirmative misrepresentation and omission. A verdict was issued for the plaintiff on its claim for fraudulent inducement by affirma-tive misrepresentation, but the jury rejected its claim that CSS LLC and an affiliate had committed fraudulent inducement by omission. The Texas judge held a bench trial on Highland’s remaining claims in May and June 2015, and entered judgment in the amount of USD 287 million (including prejudgment interest) for the plaintiff on September 4, 2015. Both parties appealed and on February 21, 2018 the appeals court affirmed the lower court’s decision. On March 7, 2018, the defendants filed a motion for rehearing with the appeals court. On April 2, 2018, the motion for rehearing with the appeals court was denied. On July 18, 2018, the defendants filed a request for review by the Texas Supreme Court. On Decem-ber 14, 2018, the court issued an order requiring briefs on the merits in the request for review. On October 4, 2019, the Texas Supreme Court granted the request for review. On January 8, 2020, the Texas Supreme Court heard oral argument. On April 24, 2020, the Texas Supreme Court issued a ruling reversing the portion of the trial court’s judgment related to the bench trial held in May and June 2015, thereby dismissing plaintiff’s breach of contract, breach of the implied duty of good faith and fair dealing,
aiding and abetting fraud, and civil conspiracy claims, including damages of approximately USD 212 million, exclusive of inter-est, but left standing the separate December 2014 jury verdict for plaintiff on its claim for fraudulent inducement by affirma-tive misrepresentation. The Texas Supreme Court has remanded the case back to the trial court for further proceedings related to the calculation of damages. On June 10, 2020, Highland filed a motion for rehearing in the Texas Supreme Court, which the court denied on October 2, 2020.
In the case in New York state court, the court granted in part and denied in part CSS LLC and certain of its affiliates’ sum-mary judgment motion. Both parties appealed that decision, but the appellate court affirmed the decision in full. The case is cur-rently in discovery. CSS LLC and certain of its affiliates separately sued Highland-managed funds on related trades and received a favorable judgment awarding both principal owed and prejudgment interest. Highland appealed the portion of the judgment awarding prejudgment interest, however the original decision was affirmed in its entirety. The parties subsequently agreed to settle the amount owed by the Highland-managed funds under the judgment.
Tax and securities law matters
On May 19, 2014, Credit Suisse AG entered into settlement agreements with several US regulators regarding its US cross-border matters. As part of the agreements, Credit Suisse AG, among other things, engaged an independent corporate monitor that reports to the New York State Department of Financial Ser-vices. As of July 31, 2018, the monitor concluded both his review and his assignment. Credit Suisse AG continues to report to and cooperate with US authorities in accordance with Credit Suisse AG’s obligations under the agreements.
Rates-related matters
Regulatory mattersRegulatory authorities in a number of jurisdictions, including the US, UK, EU and Switzerland, have for an extended period of time been conducting investigations into the setting of LIBOR and other reference rates with respect to a number of curren-cies, as well as the pricing of certain related derivatives. These ongoing investigations have included information requests from regulators regarding LIBOR-setting practices and reviews of the activities of various financial institutions, including Credit Suisse Group AG, which is a member of three LIBOR rate-setting panels (US Dollar LIBOR, Swiss Franc LIBOR and Euro LIBOR). Credit Suisse is cooperating fully with these investigations. In particu-lar, it has been reported that regulators are investigating whether financial institutions engaged in an effort to manipulate LIBOR, either individually or in concert with other institutions, in order to improve market perception of these institutions’ financial health and/or to increase the value of their proprietary trading positions. In response to regulatory inquiries, Credit Suisse commissioned a review of these issues. To date, Credit Suisse has seen no evi-dence to suggest that it is likely to have any material exposure in connection with these issues.

404 Consolidated financial statements – Credit Suisse Group
Regulatory authorities in a number of jurisdictions, including the Swiss Competition Commission (COMCO), the European Com-mission (Commission), the South African Competition Commis-sion, and the Brazilian Competition Authority have been conduct-ing investigations into the trading activities, information sharing and the setting of benchmark rates in the foreign exchange (including electronic trading) markets.
On March 31, 2014, COMCO announced its formal investigation of numerous Swiss and international financial institutions, includ-ing Credit Suisse Group AG, in relation to the setting of exchange rates in foreign exchange trading. Credit Suisse continues to cooperate with this ongoing investigation.
On July 26, 2018, Credit Suisse Group AG and certain affili-ates received a Statement of Objections from the Commission, alleging that Credit Suisse entities engaged in anticompetitive practices in connection with their foreign exchange trading busi-ness. The Statement of Objections sets out the Commission’s preliminary views and does not prejudge the final outcome of its investigation.
The reference rates investigations have also included information requests from regulators concerning supranational, sub-sovereign and agency (SSA) bonds and commodities (including precious metals) markets. Credit Suisse is cooperating fully with these investigations.
On December 20, 2018, Credit Suisse Group AG and Credit Suisse Securities (Europe) Limited received a Statement of Objections from the Commission, alleging that Credit Suisse enti-ties engaged in anticompetitive practices in connection with its SSA bonds trading business. The Statement of Objections sets out the Commission’s preliminary views and does not prejudge the final outcome of its investigation.
The investigations are ongoing and it is too soon to predict the final outcome of the investigations.
Civil litigationUSD LIBOR litigationBeginning in 2011, certain Credit Suisse entities were named in various civil lawsuits filed in the US, alleging banks on the US dollar LIBOR panel manipulated US dollar LIBOR to benefit their reputation and increase profits. All remaining matters have been consolidated for pre-trial purposes into a multi-district litigation in the SDNY. The majority of the actions have been stayed since their outset, while a handful of individual actions and putative class actions have been proceeding. The Credit Suisse entities have been dismissed from all non-stayed putative class actions.
In a series of rulings between 2013 and 2019 on motions to dismiss, the SDNY (i) narrowed the claims against the Credit Suisse entities and the other defendants (dismissing antitrust, Racketeer Influenced and Corrupt Organizations Act (RICO), Commodity Exchange Act, and state law claims), (ii) narrowed the set of plaintiffs who may bring claims, and (iii) narrowed the
set of defendants in the LIBOR actions (including the dismissal of several Credit Suisse entities from various cases on personal jurisdiction and statute of limitation grounds). The plaintiffs have appealed several of the SDNY’s rulings to the United States Court of Appeals for the Second Circuit (Second Circuit), and two appeals remain pending. The first pending appeal was filed 2017 and is a consolidated appeal brought by a number of putative class and individual plaintiffs challenging the district courts’ dis-missal of plaintiffs’ antitrust claims. The second pending appeal was filed on June 23, 2020 by the plaintiffs in one of the non-stayed putative class actions challenging the district court’s per-sonal jurisdiction and statute of limitations rulings.
Separately, on May 4, 2017, the plaintiffs in the three non-stayed putative class actions moved for class certification. On February 28, 2018, the SDNY denied certification in two of the actions and granted certification over a single antitrust claim in an action brought by over-the-counter purchasers of LIBOR-linked deriva-tives. In the same decision, the court dismissed Credit Suisse AG, the only remaining Credit Suisse entity in the action, from the over-the-counter action. All parties moved for immediate appellate review of the class-certification decisions, and the Second Circuit denied their petitions for review.
USD ICE LIBOR litigationIn January 2019, members of the US dollar Intercontinental Exchange (ICE) LIBOR panel, including Credit Suisse Group AG and certain of its affiliates, were named in three civil puta-tive class action lawsuits alleging that panel banks suppressed US dollar ICE LIBOR to benefit defendants’ trading positions. These actions have been consolidated in the SDNY. On July 1, 2019, plaintiffs filed a consolidated complaint. On August 30, 2019, defendants filed a motion to dismiss. On March 26, 2020, the SDNY granted defendants’ motion to dismiss. On April 24, 2020, plaintiffs filed a notice of appeal. On December 28, 2020, a proposed intervener filed a motion to intervene because of the current plaintiffs’ intent to withdraw. On January 7, 2021, defen-dants filed a motion to dismiss the appeal based on the current plaintiffs’ intent to withdraw.
On August 18, 2020, members of the ICE LIBOR panel, includ-ing Credit Suisse Group AG and certain of its affiliates, were named in a civil action in the US District Court for the North-ern District of California, alleging that panel banks manipulated ICE LIBOR to profit from variable interest loans and credit cards. On November 10, 2020, plaintiffs filed a motion for preliminary and permanent injunction that seeks to enjoin the panel banks from continuing to set LIBOR or that would automatically set the benchmark to zero every day. On November 11, 2020, defen-dants filed a motion to transfer the case to the SDNY.
CHF LIBOR litigationIn February 2015, various banks that served on the Swiss franc LIBOR panel, including Credit Suisse Group AG, were named in a civil putative class action lawsuit filed in the SDNY, alleg-ing manipulation of Swiss franc LIBOR to benefit defendants’ trading positions. On September 25, 2017, the SDNY granted

405Consolidated financial statements – Credit Suisse Group
defendants’ motion to dismiss all claims, but permitted the plain-tiffs to file an amended complaint. Defendants filed motions to dismiss the amended complaint on February 7, 2018. On Sep-tember 16, 2019, the SDNY granted defendants’ motions to dis-miss, finding that the court lacked subject matter jurisdiction over the case. On October 16, 2019, plaintiffs filed a notice of appeal.
SIBOR/SOR litigationIn July 2016, various banks that served on the Singapore Interbank Offered Rate (SIBOR) and Singapore Swap Offer Rate (SOR) panels, including Credit Suisse Group AG and affiliates, were named in a civil putative class action lawsuit filed in the SDNY, alleging manipulation of SIBOR and SOR to benefit defendants’ trading positions. On August 18, 2017, the SDNY dismissed all claims against Credit Suisse Group AG and affiliates (and various other defendants) but granted the plaintiffs leave to amend their complaint. On October 4, 2018, the SDNY granted in part and denied in part defendants’ motion to dismiss plaintiffs’ second amended complaint, upholding antitrust claims against Credit Suisse AG and other panel bank defendants, but narrowing the claims to those related to Singapore Dollar SIBOR and dismissing all but one plaintiff from the action. The court also dismissed the RICO claims without leave to amend. On October 25, 2018, the remaining plaintiff filed a third amended complaint. The remain-ing defendants moved to dismiss on November 15, 2018. On July 26, 2019, the SDNY granted defendants’ motion to dismiss and denied plaintiff’s motion for leave to amend, holding that the court lacked subject matter jurisdiction over the action. On August 26, 2019, plaintiff filed a notice of appeal.
Foreign exchange litigationCredit Suisse Group AG and affiliates as well as other financial insti-tutions are named in five pending civil lawsuits in the SDNY relating to the alleged manipulation of foreign exchange rates.
The first pending matter is a putative consolidated class action. On January 28, 2015, the court denied defendants’ motion to dismiss the original consolidated complaint brought by US-based investors and foreign plaintiffs who transacted in the US, but granted their motion to dismiss the claims of foreign-based inves-tors for transactions outside of the US. In July 2015, plaintiffs filed a second consolidated amended complaint, adding additional defendants and asserting additional claims on behalf of a second putative class of exchange investors. On September 20, 2016, the SDNY granted in part and denied in part a motion to dismiss filed by the Group and affiliates, along with other financial institu-tions, which reduced the size of the putative class, but allowed the primary antitrust and Commodity Exchange Act claims to survive. On May 31, 2018, plaintiffs served a motion for class certification, which the Group and affiliates opposed on October 25, 2018. On September 3, 2019, the SDNY denied plaintiffs’ motion for certification of a Rule 23(b)(3) damages class, rul-ing that proof of both injury and damages must proceed on an individual basis, but granted certification as to two threshold issues concerning the alleged conspiracy. The SDNY also denied plaintiffs’ motion for certification of a second proposed class in its entirety. On January 29, 2021, Credit Suisse Group AG and
affiliates moved for summary judgment. On March 5, 2021, plain-tiffs moved for summary judgment.
The second pending matter names Credit Suisse AG and affili-ates, as well as other financial institutions in a putative class action filed in the SDNY on June 3, 2015. This action is based on the same alleged conduct as the consolidated class action and alleges violations of the US Employee Retirement Income Security Act of 1974 (ERISA). On August 23, 2016, the SDNY granted a motion to dismiss filed by affiliates of Credit Suisse AG, along with other financial institutions. Plaintiffs appealed that decision, and on July 10, 2018, the Second Circuit issued an order affirming in full the SDNY’s decision to dismiss the putative ERISA class action against Credit Suisse AG and affiliates as well as other defendant financial institutions and denying plaintiffs’ request for leave to amend their complaint.
The third pending matter originally named Credit Suisse Group AG and affiliates, as well as other financial institutions, in a consolidated putative class action filed in the SDNY, alleging manipulation of the foreign exchange market on behalf of indirect purchasers of foreign exchange instruments. On March 15, 2018, the court issued a decision granting defendants’ joint motion to dismiss and dismissing the consolidated complaint in its entirety. On October 25, 2018, the SDNY granted in substantial part plaintiffs’ motion for leave to file a proposed second consolidated class action complaint, which plaintiffs filed on November 28, 2018. On December 20, 2018, the Group, together with other financial institutions, filed a motion to dismiss on the basis of personal jurisdiction. On February 19, 2019, plaintiffs voluntarily dismissed Credit Suisse Group AG. On July 17, 2020, the court entered an order preliminarily approving a group settlement of USD 10 million with the remaining defendants, including Credit Suisse AG and an affiliate. On November 19, 2020, the court entered an order granting final approval of the settlement and directing that the litigation be dismissed with prejudice.
The fourth pending matter names Credit Suisse Group AG and affiliates in a putative class action filed in the SDNY on July 12, 2017, alleging improper practices in connection with electronic foreign exchange trading. On April 12, 2018, the SDNY granted defendants’ motion to compel arbitration.
The fifth pending matter originally named Credit Suisse Group AG and affiliates, as well as other financial institutions, in a civil action filed in the SDNY on November 13, 2018. This action is based on the same alleged conduct as the consolidated class action. On March 1, 2019, plaintiffs filed an amended complaint. On April 1, 2019, defendants filed motions to dismiss. On April 23, 2019, plaintiffs sought leave to file a second amended complaint in lieu of responding to defendants’ motions. On April 26, 2019, the SDNY ordered plaintiffs to file their second amended complaint subject to defendants’ right to oppose the amendment and to renew their motions to dismiss, and on June 11, 2019, plaintiffs filed a second amended complaint. On June 28, 2019, plain-tiffs voluntarily dismissed Credit Suisse Group AG. On July 25, 2019, defendants filed motions to dismiss the second amended
406 Consolidated financial statements – Credit Suisse Group
complaint. On September 6, 2019, plaintiffs voluntarily dismissed Credit Suisse International. The claims against Credit Suisse AG and CSS LLC remain pending. On May 28, 2020, the court granted in part and denied in part defendants’ motion to dismiss the second amended complaint. On July 28, 2020, plaintiffs filed a third amended complaint.
Credit Suisse Group AG and certain of its affiliates, together with other financial institutions, have also been named in two Canadian putative class actions proceeding in Ontario and Quebec, which make allegations similar to the consolidated class action. On April 14, 2020, in the matter proceeding in Ontario, the court granted in part and denied in part plaintiffs’ motion for class certification, certifying a class comprising all persons in Canada who, between 2003 and 2013, entered into an FX instrument transaction with a defendant or through an intermediary.
Credit Suisse AG, together with other financial institutions, has also been named in a consolidated putative class action in Israel, which makes allegations similar to the consolidated class action.
Treasury markets litigationCSS LLC, along with over 20 other primary dealers of US trea-sury securities, has been named in a number of putative civil class action complaints in the US relating to the US treasury markets. These complaints generally allege that defendants colluded to manipulate US treasury auctions, as well as the pricing of US treasury securities in the when-issued market, with impacts upon related futures and options. These actions have been consolidated into a multi-district litigation in the SDNY. On August 23, 2017, the SDNY appointed lead counsel, and on August 25, 2017, three pur-ported class representatives re-filed their complaints as a collective individual action. On November 15, 2017, plaintiffs filed a consoli-dated amended class action complaint naming CSS LLC, Credit Suisse Group AG, and Credit Suisse International (CSI), along with a narrower group of other defendants. The consolidated complaint contains previously-asserted allegations as well as new allega-tions concerning a group boycott to prevent the emergence of anonymous, all-to-all trading in the secondary market for treasury securities. On February 23, 2018, defendants served motions to dismiss on plaintiffs and the SDNY entered a stipulation voluntarily dismissing Credit Suisse Group AG and other defendant holding companies. On March 26, 2018, the SDNY entered a stipulation voluntarily dismissing CSI for lack of personal jurisdiction.
SSA bonds litigationCredit Suisse Group AG and affiliates, along with other financial institutions and individuals, have been named in several putative class action complaints filed in the SDNY relating to SSA bonds. The complaints generally allege that defendants conspired to fix the prices of SSA bonds sold to and purchased from investors in the secondary market. These actions have been consolidated in the SDNY. On April 7, 2017, plaintiffs filed a consolidated class action complaint. Plaintiffs filed a consolidated amended class action complaint on November 3, 2017, which defendants moved to dismiss on December 12, 2017. On August 24, 2018, the
SDNY granted defendants’ motion to dismiss for failure to state a claim, but granted plaintiffs leave to amend. On November 6, 2018, plaintiffs filed a second consolidated amended class action complaint, which defendants moved to dismiss on December 21, 2018. On September 30, 2019, the SDNY granted the motion to dismiss for lack of personal jurisdiction and improper venue made by Credit Suisse and certain other defendants and subsequently indicated that it would further address the motion to dismiss for failure to state a claim made by CSS LLC and certain other defendants. On March 18, 2020, the SDNY issued an additional opinion granting the motion to dismiss for failure to state a claim. On June 1, 2020, plaintiffs filed a notice of appeal.
Separately, on February 7, 2019, Credit Suisse AG and certain of its affiliates, together with other financial institutions and indi-viduals, were named in a putative class action filed in the SDNY, which makes allegations similar to the consolidated class action, but seeks to represent a putative class of indirect purchasers of US dollar SSA bonds where the purchase was made in or con-nected to New York. On June 25, 2020, plaintiff voluntarily dis-missed the lawsuit.
Credit Suisse Group AG and certain of its affiliates, together with other financial institutions, have also been named in two Cana-dian putative class actions, which make allegations similar to the consolidated class action.
Bank Bill Swap litigationOn August 16, 2016, Credit Suisse Group AG and Credit Suisse AG, along with other financial institutions, were named in a puta-tive class action brought in the SDNY, alleging manipulation of the Australian Bank Bill Swap reference rate. Plaintiffs filed an amended complaint on December 16, 2016, which defendants moved to dismiss on February 24, 2017. On November 26, 2018, the SDNY granted in part and denied in part defendants’ motions to dismiss, including dismissing the complaint in its entirety against Credit Suisse Group AG and Credit Suisse AG. On March 4, 2019, plaintiffs were granted leave to file a second amended complaint. On April 3, 2019, plaintiffs filed a second amended complaint. On May 20, 2019, defendants filed motions to dismiss. On February 13, 2020, the SDNY granted in part and denied in part defendants’ motion to dismiss.
Mexican government bonds litigation Credit Suisse AG and affiliates have been named in multiple puta-tive class actions in US federal court alleging a conspiracy among Credit Suisse entities and other dealer banks to manipulate the Mexican government bond market. These actions have been consolidated in the SDNY and on July 18, 2018, plaintiffs filed their consolidated amended complaint. On September 17, 2018, defendants filed motions to dismiss the consolidated amended complaint. On September 30, 2019, the SDNY granted defen-dants’ motion to dismiss. On December 9, 2019, plaintiffs filed a second consolidated amended complaint that does not name any Credit Suisse entity as a defendant.

407Consolidated financial statements – Credit Suisse Group
Government-sponsored entity bonds litigationSince February 22, 2019, Credit Suisse AG and CSS LLC, together with other financial institutions, have been named in multiple putative class action complaints filed in the SDNY, alleg-ing a conspiracy among the financial institutions to fix prices for unsecured bonds issued by Freddie Mac, Fannie Mae, the Federal Home Loan Banks and the Federal Farm Credit Banks.
On April 3, 2019, the SDNY consolidated the putative class action complaints. On May 23, 2019, class plaintiffs in the con-solidated putative class action filed a consolidated amended complaint that removed Credit Suisse AG as a defendant. On June 13, 2019, defendants filed a motion to dismiss. On July 12, 2019, plaintiffs filed a second consolidated amended complaint. On August 29, 2019, the SDNY granted defendants’ motion to dismiss, but granted plaintiffs leave to amend. On September 10, 2019, plaintiffs filed a third consolidated amended complaint. On September 17, 2019, defendants filed a motion to dismiss certain aspects of the complaint, which was denied on October 15, 2019. On December 6, 2019, the parties reached an agree-ment in principle to settle the putative class action in its entirety. Class plaintiffs filed a motion seeking preliminary approval of the global settlement on December 16, 2019, and the SDNY issued an order preliminarily approving the global settlement on February 3, 2020. On June 16, 2020, the court issued an order granting final approval to all settlements, including the global settlement to which CSS LLC is a party.
Credit Suisse AG and CSS LLC, along with other financial insti-tutions, have been named in two civil actions in the US District Court for the Middle District of Louisiana, alleging a conspiracy among financial institutions to fix prices for unsecured bonds issued by certain government-sponsored entities: one action brought by the Louisiana Attorney General on behalf of the State of Louisiana on September 23, 2019, and one action brought by the City of Baton Rouge on October 21, 2019. On July 13, 2020, in the civil action filed on September 23, 2019, plaintiff filed an amended complaint. On July 24, 2020, Credit Suisse AG and CSS LLC filed an answer.
On April 1, 2020, Credit Suisse AG and CSS LLC, along with other financial institutions, were named in a civil action in the US District Court for the Eastern District of Louisiana, alleging a conspiracy among financial institutions to fix prices for unsecured bonds issued by certain government-sponsored entities. On June 26, 2020, CSS LLC and certain other defendants filed a partial motion to dismiss state law claims brought under the Louisiana Unfair Trade Practices Act. On July 17, 2020, the plaintiff filed a first amended complaint in response to the partial motion to dis-miss. On July 31, 2020, CSS LLC and certain other defendants filed a partial motion to dismiss plaintiff’s first amended complaint alleging state law claims brought under the Louisiana Unfair Trade Practices Act. On December 31, 2020, the court transferred the action to the US District Court for the Middle District of Louisiana for consolidation with the two earlier-filed Louisiana cases.
On September 21, 2020, Credit Suisse AG and CSS LLC, along with other financial institutions, were named in a civil action brought by the City of New Orleans, the New Orleans Munici-pal Employees Retirement System and the New Orleans Aviation Board in the US District Court for the Eastern District of Louisi-ana, which also alleges a conspiracy among financial institutions to fix prices for unsecured bonds issued by certain government-sponsored entities. On February 17, 2021, the court dismissed without prejudice the claims against Credit Suisse AG for lack of service. The claim against CSS LLC remains pending. On March 8, 2021, the court transferred the action to the US District Court for the Middle District of Louisiana for consolidation with the three earlier-filed Louisiana cases.
OTC trading cases
Credit Suisse Group AG and affiliates, along with other financial institutions, have been named in one consolidated putative civil class action complaint and one consolidated complaint filed by indi-vidual plaintiffs relating to interest rate swaps, alleging that dealer defendants conspired with trading platforms to prevent the develop-ment of interest rate swap exchanges. The individual lawsuits were brought by TeraExchange LLC, a swap execution facility, and affili-ates, and Javelin Capital Markets LLC, a swap execution facility, and an affiliate, which claim to have suffered lost profits as a result of defendants’ alleged conspiracy. All interest rate swap actions have been consolidated in a multi-district litigation in the SDNY. Both class and individual plaintiffs filed second amended consoli-dated complaints on December 9, 2016, which defendants moved to dismiss on January 20, 2017. On July 28, 2017, the SDNY granted in part and denied in part defendants’ motions to dismiss. On May 30, 2018, class plaintiffs filed a third amended consoli-dated class action complaint.
On June 14, 2018, a new direct action complaint was filed by swap execution facility trueEX LLC. On June 20, 2018, the trueEX LLC complaint was added to the existing multi-district liti-gation. On August 9, 2018, trueEX LLC filed an amended com-plaint against Credit Suisse Group AG and affiliates, along with other financial institutions, which defendants moved to dismiss on August 28, 2018. On November 20, 2018, the SDNY issued an order granting in part and denying in part defendants’ motion to dismiss the trueEX LLC amended complaint.
On February 20, 2019, class plaintiffs in the consolidated multi-district litigation filed a motion for class certification. On March 20, 2019, class plaintiffs filed a fourth amended consolidated class action complaint. On June 18, 2019, defendants filed their opposition to plaintiffs’ motion for class certification.
On June 8, 2017, Credit Suisse Group AG and affiliates, along with other financial institutions, were named in a civil action filed in the SDNY by Tera Group, Inc. and related entities (collectively “Tera”), alleging violations of antitrust law in connection with the allegation that credit default swap (CDS) dealers conspired to block Tera’s electronic CDS trading platform from successfully entering the mar-ket. On September 11, 2017, defendants filed a motion to dismiss.
408 Consolidated financial statements – Credit Suisse Group
On July 30, 2019, the SDNY granted in part and denied in part defendants’ motion to dismiss. On January 30, 2020, plaintiffs filed an amended complaint. On April 3, 2020, defendants filed a motion to dismiss.
Credit Suisse Group AG and certain of its affiliates, as well as other financial institutions, were originally named in a number of civil lawsuits in the SDNY, certain of which are brought by class action plaintiffs alleging that the defendants conspired to keep stock-loan trading in an over-the-counter market and collec-tively boycotted certain trading platforms that sought to enter the market, and certain of which are brought by trading platforms that sought to enter the market alleging that the defendants col-lectively boycotted the platforms. The SDNY denied defendants’ motions to dismiss in the putative class action. On February 22, 2021, plaintiffs filed a motion for class certification in the putative class action. In each of the lawsuits, the court entered a stipu-lation voluntarily dismissing Credit Suisse Group AG and other defendant holding companies, although certain Credit Suisse Group AG affiliates remain part of the ongoing action.
On August 6, 2019, in one of the civil actions filed in the SDNY by a purported successor in interest to a trading platform for stock loans that sought to enter the market, the SDNY granted defendants’ motion to dismiss and entered judgment in favor of the defendants. On September 3, 2019, plaintiff filed a motion to amend the judgment to permit plaintiff to file an amended com-plaint or, in the alternative, to dismiss certain claims without preju-dice. On September 10, 2019, the SDNY denied in part plaintiff’s motion to amend the judgment but ordered additional briefing on whether certain claims should be dismissed without prejudice. On January 6, 2020, the SDNY denied plaintiff’s motion to amend the judgment.
On April 21, 2020, CSS LLC and other financial institutions were named in a putative class action complaint filed in the SDNY, alleging a conspiracy among the financial institutions to boycott electronic trading platforms and fix prices in the secondary mar-ket for odd-lot corporate bonds. On July 14, 2020, plaintiff filed an amended complaint. On September 10, 2020, defendants filed a motion to dismiss.
ATA litigation
A lawsuit was filed on November 10, 2014 in the US District Court for the Eastern District of New York (EDNY) against a number of banks, including Credit Suisse AG, alleging claims under the United States Anti-Terrorism Act (ATA). The action alleges a conspiracy between Iran and various international financial institutions, includ-ing the defendants, in which they agreed to alter, falsify or omit information from payment messages that involved Iranian parties for the express purpose of concealing the Iranian parties’ financial activities and transactions from detection by US authorities. The complaint, brought by approximately 200 plaintiffs, alleges that this conspiracy has made it possible for Iran to transfer funds to Hez-bollah and other terrorist organizations actively engaged in harming US military personnel and civilians. On July 12, 2016, plaintiffs filed
a second amended complaint in the EDNY against a number of banks, including Credit Suisse AG, alleging claims under the ATA. On September 14, 2016, Credit Suisse AG and the other defen-dants filed motions to dismiss the plaintiffs’ second amended com-plaint in the EDNY. On September 16, 2019, the EDNY granted defendants’ motion to dismiss. Plaintiffs moved for partial recon-sideration of portions of the dismissal that do not relate to Credit Suisse, which the court denied on October 28, 2019. On Novem-ber 26, 2019, plaintiffs filed a notice of appeal.
Another lawsuit was filed on November 9, 2017 in the SDNY against a number of banks, including Credit Suisse AG, alleging claims under the ATA. On March 2, 2018, Credit Suisse AG and other defendants filed motions to dismiss the plaintiffs’ complaint. On March 28, 2019, the SDNY granted the motion to dismiss. On April 22, 2019, plaintiffs filed a motion for leave to amend their complaint, which defendants opposed on May 20, 2019. On February 25, 2020, the court denied plaintiffs’ motion to amend their complaint and dismissed the case with prejudice as to Credit Suisse AG and the other moving bank defendants. On May 28, 2020, plaintiffs filed a motion to appeal the court’s February 25, 2020 decision, which the moving defendants opposed on June 11, 2020.
In December 2018, five additional lawsuits were filed in the EDNY or SDNY against a number of banks, including Credit Suisse AG and, in two instances, Credit Suisse AG, New York Branch alleg-ing claims under the ATA and the Justice Against Sponsors of Terrorism Act. These actions similarly allege a conspiracy between Iran and various international financial institutions, including the defendants, in which they agreed to alter, falsify or omit informa-tion from payment messages that involved Iranian parties, and that this conspiracy made it possible for Iran to transfer funds to terror-ist organizations actively engaged in harming US military personnel and civilians.
On April 11, 2019, another action alleging claims under the ATA was filed in the EDNY that is related to, and makes allegations materially similar to, the other ATA cases already pending in the EDNY. On January 6, 2020, defendants filed a motion to dismiss two of these cases, which were filed in December 2018 and April 2019 in the EDNY. On June 5, 2020, the EDNY granted defen-dants’ motion to dismiss as to Credit Suisse AG and most of the other bank defendants.
Other than cases that have been decided or where a motion to dismiss is pending, these cases have been stayed pending the outcome of certain of the decisions described above.
Customer account matters
Several clients have claimed that a former relationship man-ager in Switzerland had exceeded his investment authority in the management of their portfolios, resulting in excessive concentra-tions of certain exposures and investment losses. Credit Suisse AG is investigating the claims, as well as transactions among the clients. Credit Suisse AG filed a criminal complaint against the
409Consolidated financial statements – Credit Suisse Group
former relationship manager with the Geneva Prosecutor’s Office upon which the prosecutor initiated a criminal investigation. Sev-eral clients of the former relationship manager also filed criminal complaints with the Geneva Prosecutor’s Office. On February 9, 2018, the former relationship manager was sentenced to five years in prison by the Geneva criminal court for fraud, forgery and criminal mismanagement and ordered to pay damages of approximately USD 130 million. Several parties have appealed the judgement. On June 26, 2019, the Criminal Court of Appeals of Geneva ruled in the appeal of the judgment against the former relationship manager, upholding the main findings of the Geneva criminal court. Several parties have appealed the decision to the Swiss Federal Supreme Court. On February 19, 2020, the Swiss Federal Supreme Court rendered its judgment on the appeals, substantially confirming the findings of the Criminal Court of Appeals of Geneva.
Civil lawsuits were initiated between August 7, 2017 and August 25, 2017 in the High Court of Singapore and the Supreme Court of Bermuda against Credit Suisse AG and certain affiliates, based on the findings established in the criminal proceedings against the former relationship manager.
In Singapore, on August 31, 2018, the civil lawsuit was stayed by an Assistant Registrar of the High Court of Singapore and plaintiffs appealed the decision. On January 18, 2019, the Sin-gapore High Court dismissed the plaintiffs’ appeal and upheld the Assistant Registrar’s decision to stay the civil proceedings in Singapore. On April 29, 2019, the plaintiffs appealed the deci-sion of the Singapore High Court only with respect to their action against the Credit Suisse affiliate. On June 21, 2019, the plain-tiffs discontinued their action against Credit Suisse AG. On July 3, 2020, the Singapore Court of Appeals granted the plaintiffs’ appeal against the Credit Suisse affiliate and lifted the stay of the civil proceedings, allowing the plaintiffs’ civil claim to proceed in the Singapore High Court. On July 10, 2020, plaintiffs filed an amended statement of claim in the Singapore High Court. On March 9, 2021 the Singapore High Court transferred the civil lawsuit to the Singapore International Commercial Court.
FIFA-related matters
In connection with investigations by US and Swiss government authorities into the involvement of financial institutions in the alleged bribery and corruption surrounding the Fédération Inter-nationale de Football Association (FIFA), Credit Suisse received inquiries from these authorities regarding its banking relationships with certain individuals and entities associated with FIFA, includ-ing but not limited to certain persons and entities named and/or described in the May 20, 2015 indictment and the November 25, 2015 superseding indictment filed by the Eastern District of New York US Attorney’s Office. The US and Swiss investiga-tions encompassed whether multiple financial institutions, includ-ing Credit Suisse, permitted the processing of suspicious or otherwise improper transactions, or failed to observe anti-money laundering laws and regulations, with respect to the accounts of certain persons and entities associated with FIFA. Credit Suisse
continues to cooperate with US authorities on this matter. As pre-viously disclosed, the Swiss Financial Market Supervisory Author-ity FINMA has announced the conclusion of its investigation.
External asset manager matter
Several clients have claimed that an external asset manager based in Geneva misappropriated funds, forged bank statements, transferred assets between client accounts at Credit Suisse AG as custodian to conceal losses and made investments without the authorization of those clients. The Geneva Prosecutor’s Office initiated a criminal investigation against representatives of the external asset manager and two former Credit Suisse AG employ-ees. This investigation was expanded in November 2018 to also include one former and one current Credit Suisse AG employee and Credit Suisse AG itself in order to assess the sufficiency of Credit Suisse AG’s controls and supervision. In the third quarter of 2019, Credit Suisse AG entered into a two stage, conditional settlement agreement with affected clients. With the cooperation of the Geneva Prosecutor’s Office, the first stage of the settle-ment was completed in November 2019.
Mossack Fonseca/Israel Desk matters
Credit Suisse, along with many financial institutions, has received inquiries from governmental and regulatory authorities concern-ing banking relationships between financial institutions, their clients and the Panama-based law firm of Mossack Fonseca. Credit Suisse has also received governmental and regulatory inquiries concerning cross-border services provided by Credit Suisse’s Switzerland-based Israel Desk. Credit Suisse is conduct-ing a review of these issues and has been cooperating with the authorities.
Mozambique matter
Credit Suisse is continuing to respond to requests from regulatory and enforcement authorities, and is in ongoing dialogue with cer-tain of these authorities, related to certain Credit Suisse entities’ arrangement of loan financing to Mozambique state enterprises, Proindicus S.A. and Empresa Mocambiacana de Atum S.A. (EMATUM), a distribution to private investors of loan participa-tion notes (LPN) related to the EMATUM financing in Septem-ber 2013, and certain Credit Suisse entities’ subsequent role in arranging the exchange of those LPNs for Eurobonds issued by the Republic of Mozambique. On January 3, 2019, the United States Attorney for the Eastern District of New York unsealed an indictment against several individuals in connection with the mat-ter, including three former Credit Suisse employees. On May 20, 2019, July 19, 2019 and September 6, 2019, the three former employees pleaded guilty to accepting improper personal ben-efits in connection with financing transactions carried out with two Mozambique state enterprises. Credit Suisse is cooperat-ing with the authorities on this matter. On February 27, 2019, certain Credit Suisse entities, the same three former employees, and several other unrelated entities were sued in the English High Court by the Republic of Mozambique. On January 21, 2020, the
410 Consolidated financial statements – Credit Suisse Group
Credit Suisse entities filed their defense. On June 26, 2020 the Credit Suisse entities filed third party claims against the project contractor and several Mozambique officials. The Republic of Mozambique filed an updated Particulars of Claim on October 27, 2020, and the Credit Suisse entities filed their amended defense and counterclaim on January 15, 2021. The Republic of Mozam-bique seeks a declaration that the sovereign guarantee issued in connection with the ProIndicus loan syndication arranged and funded, in part, by a Credit Suisse subsidiary is void and also seeks unspecified damages alleged to have arisen in connec-tion with the transactions involving ProIndicus and EMATUM, and a transaction in which Credit Suisse had no involvement with Mozambique Asset Management S.A. Also on January 15, 2021, the project contractor filed a cross claim against the Credit Suisse entities (as well as the three former Credit Suisse employees and various Mozambican officials) seeking an indemnity and/or contribution in the event that the contractor is found liable to the Republic of Mozambique.
On April 27, 2020, Banco Internacional de Moçambique (BIM), a member of the ProIndicus syndicate, brought a claim against certain Credit Suisse entities seeking, contingent on the Republic of Mozambique’s claim, a declaration that Credit Suisse is liable to compensate it for alleged losses suffered as a result of any inva-lidity of the sovereign guarantee. The Credit Suisse entities filed their defense to this claim on August 28, 2020, to which BIM replied on October 16, 2020.
On December 17, 2020, two members of the ProIndicus syn-dicate, Beauregarde Holdings LLP and Orobica Holdings LLC, filed a claim against certain Credit Suisse entities in respect of their interests in the ProIndicus loan, seeking unspecified dam-ages stemming from the alleged loss suffered due to their reli-ance on representations made by Credit Suisse to the syndicate lenders.
Cross-border private banking matters
Credit Suisse offices in various locations, including the UK, the Netherlands and France, have been contacted by regulatory and law enforcement authorities that are seeking records and infor-mation concerning investigations into our historical private bank-ing services on a cross-border basis and in part through our local branches and banks. A similar inquiry has been opened in Bel-gium. Credit Suisse has conducted a review of these issues, the UK aspects of which have now been closed with no action being taken against the bank, and is continuing to cooperate with the authorities. Credit Suisse applies a strict zero tolerance policy on tax evasion.
Hiring practices investigation
On May 30, 2018, Credit Suisse (Hong Kong) Limited (CSHKL) entered into a non-prosecution agreement to resolve the inves-tigation of past hiring practices between 2007 and 2013 in the Asia Pacific region by the DOJ, under which CSHKL paid a penalty of USD 47 million. No criminal charges were filed and no
monitor was required. As part of the agreement, Credit Suisse AG has ongoing obligations, including cooperating with the DOJ, maintaining prescribed standards in its compliance programs and reporting to the DOJ on the functioning of its enhanced com-pliance programs. On July 5, 2018, Credit Suisse Group AG reached a settlement with the US Securities and Exchange Com-mission to resolve the parallel investigation of the same conduct for USD 29.8 million.
Write-downs litigation
On December 22, 2017, Credit Suisse Group AG and certain cur-rent and former executives were named in a class action complaint filed in the SDNY on behalf of a putative class of purchasers of Credit Suisse Group AG American Depositary Receipts (ADRs), asserting claims for violations of Sections 10(b) and 20(a) of the US Securities Exchange Act of 1934 and Rule 10b-5 thereunder, alleging that defendants sanctioned increases to trading limits that ultimately led to write-downs in the fourth quarter of 2015 and the first quarter of 2016 and a decline in the market value of the ADRs. On April 18, 2018, plaintiffs filed an amended complaint, which asserted substantially the same claims as the original complaint. On February 19, 2019, the SDNY granted in part and denied in part, defendants’ motion to dismiss the amended com-plaint. The decision narrowed the scope of the action to claims related to statements concerning Credit Suisse’s risk limits and controls. On May 16, 2019, the SDNY denied defendants’ motion for reconsideration. On July 8, 2020, the parties entered into an agreement to settle all claims for USD 15.5 million. On December 16, 2020, the court issued an order granting final approval to the settlement.
ETN-related litigation
Since March 14, 2018, three class action complaints were filed in the SDNY on behalf of a putative class of purchasers of Veloci-tyShares Daily Inverse VIX Short Term Exchange Traded Notes linked to the S&P 500 VIX Short-Term Futures Index due Decem-ber 4, 2030 (XIV ETNs). On August 20, 2018, plaintiffs filed a consolidated amended class action complaint, naming Credit Suisse Group AG and certain affiliates and executives, along with Janus Index & Calculation Services LLC and affiliates, which asserts claims for violations of Sections 9(a)(4), 9(f), 10(b) and 20(a) of the US Securities Exchange Act of 1934 and Rule 10b-5 thereunder and Sections 11 and 15 of the US Securities Act of 1933 and alleges that the defendants are responsible for losses to investors following a decline in the value of XIV ETNs on February 5, 2018. Defendants moved to dismiss the amended complaint on November 2, 2018. On September 25, 2019, the SDNY granted defendants’ motion to dismiss and dismissed with preju-dice all claims against the defendants. On October 18, 2019, plaintiffs filed a notice of appeal.
On April 17, 2018, Credit Suisse AG, along with Janus Index & Calculation Services LLC, was named in an individual civil action in the Northern District of Alabama that makes allegations similar to those alleged in the consolidated New York class action. On
411Consolidated financial statements – Credit Suisse Group
August 10, 2018, defendants filed a motion to transfer the action to the SDNY, which was denied on December 17, 2018. On September 26, 2018, defendants filed a motion to dismiss the Alabama complaint. On December 4, 2018, plaintiffs filed an amended complaint, which defendants moved to dismiss on January 11, 2019. On August 22, 2019, the court granted in part and denied in part defendants’ motion to dismiss. On October 1, 2020, plaintiffs voluntarily dismissed with prejudice their claims against Credit Suisse AG.
On February 4, 2019, Credit Suisse Group AG and certain affili-ates and executives, along with Janus Index & Calculation Services LLC and affiliates, were named in a separate individual action brought in the EDNY, which asserts claims substantially similar to those brought in the consolidated class action. On March 29, 2019, plaintiff voluntarily dismissed its action and filed a substan-tially similar complaint in the SDNY. On May 16, 2019, defendants filed a motion to dismiss. On January 2, 2020, the SDNY granted defendants’ motion to dismiss. On February 3, 2020, plaintiff filed a notice of appeal. On April 14, 2020, plaintiff filed a motion for voluntary dismissal with prejudice of its appeal, which was granted by the Second Circuit on April 15, 2020.
On June 3, 2019, Credit Suisse AG, an affiliate and executives were named in a separate individual action brought in the SDNY by a purchaser of XIV ETNs, which asserts claims similar to those brought in the consolidated class action complaint as well as additional claims under New York and Pennsylvania state law. On November 12, 2019, defendants filed a motion to dismiss. Plaintiffs responded to the motion to dismiss by filing an amended complaint in lieu of opposing the motion to dismiss. The action has been stayed pending a resolution of the appeal in the consoli-dated class action.
On February 4, 2019, Credit Suisse Group AG and certain affili-ates and executives, along with Janus Index & Calculation Services LLC and affiliates, were named in a class action complaint filed in the SDNY brought on behalf of a putative class of purchas-ers of VelocityShares Daily Inverse VIX Medium Term Exchange Traded Notes linked to the S&P 500 VIX Mid-Term Futures Index due December 4, 2030 (ZIV ETNs). The complaint asserts claims for violations of Sections 9(a)(4), 9(f), 10(b) and 20(a) of the US Securities Exchange Act of 1934 and Rule 10b-5 thereunder and Sections 11 and 15 of the US Securities Act of 1933 and alleges that the defendants are responsible for losses to investors following
a decline in the value of ZIV ETNs in February 2018. On August 20, 2019, plaintiffs filed an amended complaint. On October 21, 2019, defendants filed a motion to dismiss. On April 28, 2020, the SDNY granted defendants’ motion to dismiss and dismissed all claims against the defendants. Plaintiffs did not appeal and the judgment is now final.
TWINT
On November 13, 2018, COMCO announced an investigation into several Swiss financial institutions, including UBS Switzerland AG, Credit Suisse (Schweiz) AG, Aduno Holding AG, PostFi-nance AG, and Swisscard AECS GmbH. According to COMCO, its investigation is focused on whether these institutions entered into an agreement to boycott mobile payment solutions of interna-tional providers, including Apple Pay and Samsung Pay, in order to protect TWINT, their own Swiss payment solution.
SWM
CSI is the defendant in a lawsuit brought by the German public utility company Stadtwerke München GmbH (SWM) in a German court, in connection with a series of interest rate swaps entered into between 2008 and 2012. The claimant alleges breach of an advisory duty to provide both investor- and investment-specific advice, including in particular a duty to disclose the initial mark-to-market value of the trades at inception. On March 22, 2019, the trial court (the Regional Court of Frankfurt am Main) dismissed in their entirety claims against CSI. On April 29, 2019, plaintiff filed a notice of appeal and an application for a supplementary judg-ment. On November 29, 2019, the court ruled on the supple-mentary judgment application, finding that SWM was entitled to a refund of negative interest from CSI. CSI is appealing this ruling.
Bulgarian former clients matter
Credit Suisse AG has been responding to an investigation by the Swiss Office of the Attorney General (SOAG) concerning the diligence and controls applied to a historical relationship with Bulgarian former clients who are alleged to have laundered funds through Credit Suisse AG accounts. On December 17, 2020, the SOAG brought charges against Credit Suisse AG and other par-ties. Credit Suisse AG believes its diligence and controls complied with applicable legal requirements, and intends to defend itself vigorously.
41 Significant subsidiaries and equity method investments The entities presented in the table below generally include sub-sidiaries with total assets over CHF 100 million or net income attributable to shareholders over CHF 10 million. Also included
are entities which are deemed regionally significant or otherwise relevant from an operational perspective.

412 Consolidated financial statements – Credit Suisse Group
Significant subsidiaries Nominal Equity
capital interest
Company name Domicile Currency in million in %
End of 2020
Credit Suisse Group AG
Credit Suisse AG Zurich, Switzerland CHF 4,399.7 100
Credit Suisse Insurance Linked Strategies Ltd Zurich, Switzerland CHF 0.2 100
Credit Suisse (Poland) SP. z o.o Warsaw, Poland PLN 20.0 100
Credit Suisse Services AG Zurich, Switzerland CHF 1.0 100
Credit Suisse Trust AG Zurich, Switzerland CHF 5.0 100
Credit Suisse Trust Holdings Limited St. Peter Port, Guernsey GBP 2.0 100
CS LP Holding AG Zug, Switzerland CHF 0.1 100
Inreska Limited St. Peter Port, Guernsey GBP 3.0 100
Savoy Hotel Baur en Ville AG Zurich, Switzerland CHF 7.5 88
Credit Suisse AG
Alpine Securitization LTD George Town, Cayman Islands USD 83.0 100
Asset Management Finance LLC Wilmington, United States USD 167.4 100
Banco Credit Suisse (Brasil) S.A. São Paulo, Brazil BRL 53.6 100
Banco Credit Suisse (Mexico), S.A. Mexico City, Mexico MXN 1,716.7 100
Banco de Investimentos Credit Suisse (Brasil) S.A. São Paulo, Brazil BRL 164.8 100
Bank-now AG Horgen, Switzerland CHF 30.0 100
Boston Re Ltd. Hamilton, Bermuda USD 2.0 100
Casa de Bolsa Credit Suisse (Mexico), S.A. de C.V. Mexico City, Mexico MXN 274.0 100
Column Financial, Inc. Wilmington, United States USD 0.0 100
Credit Suisse (Australia) Limited Sydney, Australia AUD 34.1 100
Credit Suisse (Brasil) S.A. Corretora de Titulos e Valores Mobiliarios São Paulo, Brazil BRL 98.4 100
Credit Suisse (Deutschland) Aktiengesellschaft Frankfurt, Germany EUR 130.0 100
Credit Suisse (Hong Kong) Limited Hong Kong, China HKD 8,192.9 100
Credit Suisse (Italy) S.p.A. Milan, Italy EUR 170.0 100
Credit Suisse (Luxembourg) S.A. Luxembourg, Luxembourg CHF 230.9 100
Credit Suisse (Qatar) LLC Doha, Qatar USD 29.0 100
Credit Suisse (Schweiz) AG Zurich, Switzerland CHF 100.0 100
Credit Suisse (Singapore) Limited Singapore, Singapore SGD 743.3 100
Credit Suisse (UK) Limited London, United Kingdom GBP 245.2 100
Credit Suisse (USA), Inc. Wilmington, United States USD 0.0 100
Credit Suisse Asset Management (UK) Holding Limited London, United Kingdom GBP 144.2 100
Credit Suisse Asset Management
Immobilien Kapitalanlagegesellschaft mbH Frankfurt, Germany EUR 6.1 100
Credit Suisse Asset Management International Holding Ltd Zurich, Switzerland CHF 20.0 100
Credit Suisse Asset Management Investments Ltd Zurich, Switzerland CHF 0.1 100
Credit Suisse Asset Management Limited London, United Kingdom GBP 45.0 100
Credit Suisse Asset Management, LLC Wilmington, United States USD 1,115.9 100
Credit Suisse Atlas I Investments (Luxembourg) S.à.r.l. Luxembourg, Luxembourg USD 0.0 100
Credit Suisse Brazil (Bahamas) Limited Nassau, Bahamas USD 70.0 100
Credit Suisse Business Analytics (India) Private Limited Mumbai, India INR 40.0 100
Credit Suisse Capital LLC Wilmington, United States USD 2,137.3 100
Credit Suisse Entrepreneur Capital AG Zurich, Switzerland CHF 15.0 100
Credit Suisse Equities (Australia) Limited Sydney, Australia AUD 62.5 100
Credit Suisse Finance (India) Private Limited Mumbai, India INR 1,050.1 100
Credit Suisse First Boston (Latam Holdings) LLC George Town, Cayman Islands USD 28.8 100
Credit Suisse First Boston Finance B.V. Amsterdam, The Netherlands EUR 0.0 100

413Consolidated financial statements – Credit Suisse Group
Significant subsidiaries (continued) Nominal Equity
capital interest
Company name Domicile Currency in million in %
Credit Suisse First Boston Mortgage Capital LLC Wilmington, United States USD 356.6 100
Credit Suisse First Boston Next Fund, Inc. Wilmington, United States USD 0.0 100
Credit Suisse Fund Management S.A. Luxembourg, Luxembourg CHF 0.3 100
Credit Suisse Fund Services (Luxembourg) S.A. Luxembourg, Luxembourg CHF 1.5 100
Credit Suisse Funds AG Zurich, Switzerland CHF 7.0 100
Credit Suisse Hedging-Griffo Corretora de Valores S.A. São Paulo, Brazil BRL 29.6 100
Credit Suisse Holding Europe (Luxembourg) S.A. Luxembourg, Luxembourg CHF 32.6 100
Credit Suisse Holdings (Australia) Limited Sydney, Australia AUD 3.0 100
Credit Suisse Holdings (USA), Inc. Wilmington, United States USD 550.0 100
Credit Suisse International London, United Kingdom USD 11,366.2 100 1
Credit Suisse Istanbul Menkul Degerler A.S. Istanbul, Turkey TRY 10.0 100
Credit Suisse Life & Pensions AG Vaduz, Liechtenstein CHF 15.0 100
Credit Suisse Life (Bermuda) Ltd. Hamilton, Bermuda USD 0.5 100
Credit Suisse Loan Funding LLC Wilmington, United States USD 1.7 100
Credit Suisse Management LLC Wilmington, United States USD 891.4 100
Credit Suisse Prime Securities Services (USA) LLC Wilmington, United States USD 73.3 100
Credit Suisse PSL GmbH Zurich, Switzerland CHF 0.0 100
Credit Suisse Saudi Arabia Riyadh, Saudi Arabia SAR 737.5 100
Credit Suisse Securities (Canada), Inc. Toronto, Canada CAD 3.4 100
Credit Suisse Securities (Europe) Limited London, United Kingdom USD 3,859.3 100
Credit Suisse Securities (Hong Kong) Limited Hong Kong, China HKD 2,080.9 100
Credit Suisse Securities (India) Private Limited Mumbai, India INR 2,214.7 100
Credit Suisse Securities (Japan) Limited Tokyo, Japan JPY 78,100.0 100
Credit Suisse Securities (Johannesburg) Proprietary Limited – in liquidation Johannesburg, South Africa ZAR 0.0 100
Credit Suisse Securities (Malaysia) Sdn. Bhd. Kuala Lumpur, Malaysia MYR 100.0 100
Credit Suisse Securities (Singapore) Pte Limited Singapore, Singapore SGD 30.0 100
Credit Suisse Securities, Sociedad de Valores, S.A. Spain, Madrid EUR 5.3 100
Credit Suisse Securities (Thailand) Limited Bangkok, Thailand THB 500.0 100
Credit Suisse Securities (USA) LLC Wilmington, United States USD 2,200.7 100
Credit Suisse Services (India) Private Limited Pune, India INR 0.1 100
Credit Suisse Services (USA) LLC Wilmington, United States USD 15.4 100
CS Non-Traditional Products Ltd. Nassau, Bahamas USD 0.1 100
DLJ Mortgage Capital, Inc. Wilmington, United States USD 0.0 100
Fides Treasury Services AG Zurich, Switzerland CHF 2.0 100
JSC “Bank Credit Suisse (Moscow)” Moscow, Russia USD 37.8 100
Lime Residential, Ltd. Nassau, Bahamas USD 100.0 100
LLC “Credit Suisse Securities (Moscow)” Moscow, Russia RUB 97.1 100
Merban Equity AG Zug, Switzerland CHF 0.1 100
Solar Investco II Ltd. George Town, Cayman Islands USD 0.0 100
SP Holding Enterprises Corp. Wilmington, United States USD 0.0 100
SR Lease Co VI Ltd. Cayman Islands USD 0.0 100
PT Credit Suisse Sekuritas Indonesia Jakarta, Indonesia IDR 235,000.0 99
Credit Suisse Hypotheken AG Zurich, Switzerland CHF 0.1 98
Credit Suisse Founder Securities Limited Beijing, China CNY 1,089.0 51
1 98% of voting rights and 98% of equity interest held by Credit Suisse AG.

414 Consolidated financial statements – Credit Suisse Group
Significant equity method investments Equity
interest
Company name Domicile in %
Credit Suisse Group AG
Credit Suisse Group Funding (Guernsey) Limited St. Peter Port, Guernsey 100 1
Credit Suisse AG
Swisscard AECS GmbH Horgen, Switzerland 50
Stockbrokers Holdings Pty Ltd. Melbourne, Australia 23
ICBC Credit Suisse Asset Management Co., Ltd. Beijing, China 20
ALLFUNDS (UK) LIMITED London, United Kingdom 14
York Capital Management Global Advisors, LLC New York, United States 5 2
Holding Verde Empreendimentos e Participações S.A. São Paulo, Brazil 0 2
1 Deconsolidated under US GAAP as the Group is not the primary beneficiary.2 The Group holds a significant noncontrolling interest.
42 Subsidiary guarantee informationCertain wholly owned finance subsidiaries of the Group, includ-ing Credit Suisse Group Funding (Guernsey) Limited, which is a Guernsey incorporated non-cellular company limited by shares, have issued securities fully and unconditionally guaranteed by the Group. There are various legal and regulatory requirements, including the satisfaction of a solvency test under Guernsey law for the Guernsey subsidiary, applicable to some of the Group’s subsidiaries that may limit their ability to pay dividends or distribu-tions and make loans and advances to the Group.
The Group and the Bank have issued full, unconditional and sev-eral guarantees of Credit Suisse (USA), Inc.’s outstanding SEC-registered debt securities. In accordance with the guarantees, if Credit Suisse (USA), Inc. fails to make any timely payment under the agreements governing such debt securities, the holders of the debt securities may demand payment from either the Group or the Bank, without first proceeding against Credit Suisse (USA), Inc. The guarantee from the Group is subordinated to senior liabilities. Credit Suisse (USA), Inc. is an indirect, wholly owned subsidiary of the Group.

415Consolidated financial statements – Credit Suisse Group
Condensed consolidating statements of operations Bank
Credit parent Eliminations
Suisse company Group and Credit (USA), Inc. and other parent consolidation Suisse
in 2020 consolidated subsidiaries 1 Bank company adjustments Group
Condensed consolidating statements of operations (CHF million)
Interest and dividend income 2,363 11,515 13,878 1,633 (1,592) 13,919
Interest expense (2,549) (5,369) (7,918) (1,649) 1,596 (7,971)
Net interest income (186) 6,146 5,960 (16) 4 5,948
Commissions and fees 3,952 7,898 11,850 18 (15) 11,853
Trading revenues 436 2,742 3,178 12 105 3,295
Other revenues 2,006 (491) 1,515 2,723 2 (2,945) 1,293
Net revenues 6,208 16,295 22,503 2,737 (2,851) 22,389
Provision for credit losses 14 1,078 1,092 0 4 1,096
Compensation and benefits 2,627 6,233 8,860 84 946 9,890
General and administrative expenses 2,540 5,422 7,962 (13) (1,426) 6,523
Commission expenses 225 1,031 1,256 2 (2) 1,256
Restructuring expenses 27 95 122 0 35 157
Total other operating expenses 2,792 6,548 9,340 (11) (1,393) 7,936
Total operating expenses 5,419 12,781 18,200 73 (447) 17,826
Income/(loss) before taxes 775 2,436 3,211 2,664 (2,408) 3,467
Income tax expense/(benefit) 139 558 697 (5) 109 801
Net income/(loss) 636 1,878 2,514 2,669 (2,517) 2,666
Net income/(loss) attributable to noncontrolling interests (2) 5 3 0 (6) (3)
Net income/(loss) attributable to shareholders 638 1,873 2,511 2,669 (2,511) 2,669
1 Includes eliminations and consolidation adjustments.2 Primarily consists of revenues from investments in Group companies accounted for under the equity method.
Condensed consolidating statements of comprehensive income Bank
Credit parent Eliminations
Suisse company Group and Credit (USA), Inc. and other parent consolidation Suisse
in 2020 consolidated subsidiaries 1 Bank company adjustments Group
Comprehensive income (CHF million)
Net income/(loss) 636 1,878 2,514 2,669 (2,517) 2,666
Gains/(losses) on cash flow hedges 0 177 177 0 1 178
Foreign currency translation (1,608) (1,406) (3,014) 12 (63) (3,065)
Unrealized gains/(losses) on securities 0 (17) (17) 0 0 (17)
Actuarial gains/(losses) (13) (31) (44) 0 7 (37)
Net prior service credit/(cost) 0 (4) (4) 0 (144) (148)
Gains/(losses) on liabilities related to credit risk 2 149 151 37 14 202
Other comprehensive income/(loss), net of tax (1,619) (1,132) (2,751) 49 (185) (2,887)
Comprehensive income/(loss) (983) 746 (237) 2,718 (2,702) (221)
Comprehensive income/(loss) attributable to noncontrolling interests (7) (48) (55) 0 46 (9)
Comprehensive income/(loss) attributable to shareholders (976) 794 (182) 2,718 (2,748) (212)
1 Includes eliminations and consolidation adjustments.

416 Consolidated financial statements – Credit Suisse Group
Condensed consolidating statements of operations (continued) Bank
Credit parent Eliminations
Suisse company Group and Credit (USA), Inc. and other parent consolidation Suisse
in 2019 consolidated subsidiaries 1 Bank company adjustments Group
Condensed consolidating statements of operations (CHF million)
Interest and dividend income 4,040 16,140 20,180 1,307 (1,303) 20,184
Interest expense (4,191) (8,940) (13,131) (1,343) 1,307 (13,167)
Net interest income (151) 7,200 7,049 (36) 4 7,017
Commissions and fees 3,217 7,854 11,071 23 64 11,158
Trading revenues 543 1,230 1,773 (68) 34 1,739
Other revenues 2,058 735 2,793 3,565 2 (3,788) 2,570
Net revenues 5,667 17,019 22,686 3,484 (3,686) 22,484
Provision for credit losses 14 310 324 0 0 324
Compensation and benefits 2,772 6,333 9,105 101 830 10,036
General and administrative expenses 2,193 5,395 7,588 (37) (1,423) 6,128
Commission expenses 213 1,063 1,276 1 (1) 1,276
Total other operating expenses 2,406 6,458 8,864 (36) (1,424) 7,404
Total operating expenses 5,178 12,791 17,969 65 (594) 17,440
Income/(loss) before taxes 475 3,918 4,393 3,419 (3,092) 4,720
Income tax expense/(benefit) 167 1,131 1,298 0 (3) 1,295
Net income/(loss) 308 2,787 3,095 3,419 (3,089) 3,425
Net income/(loss) attributable to noncontrolling interests 5 9 14 0 (8) 6
Net income/(loss) attributable to shareholders 303 2,778 3,081 3,419 (3,081) 3,419
1 Includes eliminations and consolidation adjustments.2 Primarily consists of revenues from investments in Group companies accounted for under the equity method.
Condensed consolidating statements of comprehensive income (continued) Bank
Credit parent Eliminations
Suisse company Group and Credit (USA), Inc. and other parent consolidation Suisse
in 2019 consolidated subsidiaries 1 Bank company adjustments Group
Comprehensive income (CHF million)
Net income/(loss) 308 2,787 3,095 3,419 (3,089) 3,425
Gains/(losses) on cash flow hedges 0 86 86 14 0 100
Foreign currency translation (284) (711) (995) (15) (15) (1,025)
Unrealized gains/(losses) on securities 0 21 21 0 (1) 20
Actuarial gains/(losses) (7) (17) (24) 0 350 326
Net prior service credit/(cost) 0 1 1 0 216 217
Gains/(losses) on liabilities related to credit risk (73) (1,665) (1,738) (65) (57) (1,860)
Other comprehensive income/(loss), net of tax (364) (2,285) (2,649) (66) 493 (2,222)
Comprehensive income/(loss) (56) 502 446 3,353 (2,596) 1,203
Comprehensive income attributable to noncontrolling interests 4 3 7 0 1 8
Comprehensive income/(loss) attributable to shareholders (60) 499 439 3,353 (2,597) 1,195
1 Includes eliminations and consolidation adjustments.

417Consolidated financial statements – Credit Suisse Group
Condensed consolidating statements of operations (continued) Bank
Credit parent Eliminations
Suisse company Group and Credit (USA), Inc. and other parent consolidation Suisse
in 2018 consolidated subsidiaries 1 Bank company adjustments Group
Condensed consolidating statements of operations (CHF million)
Interest and dividend income 4,086 15,537 19,623 932 (942) 19,613
Interest expense (4,210) (8,288) (12,498) (983) 877 (12,604)
Net interest income (124) 7,249 7,125 (51) (65) 7,009
Commissions and fees 3,725 8,017 11,742 26 122 11,890
Trading revenues 474 (18) 456 88 80 624
Other revenues 2,006 (509) 1,497 2,020 2 (2,120) 1,397
Net revenues 6,081 14,739 20,820 2,083 (1,983) 20,920
Provision for credit losses (1) 246 245 0 0 245
Compensation and benefits 2,653 6,211 8,864 58 698 9,620
General and administrative expenses 1,944 5,124 7,068 0 (1,270) 5,798
Commission expenses 229 1,030 1,259 0 0 1,259
Restructuring expenses 237 291 528 0 98 626
Total other operating expenses 2,410 6,445 8,855 0 (1,172) 7,683
Total operating expenses 5,063 12,656 17,719 58 (474) 17,303
Income/(loss) before taxes 1,019 1,837 2,856 2,025 (1,509) 3,372
Income tax benefit 261 873 1,134 1 226 1,361
Net income/(loss) 758 964 1,722 2,024 (1,735) 2,011
Net income/(loss) attributable to noncontrolling interests 6 (13) (7) 0 (6) (13)
Net income/(loss) attributable to shareholders 752 977 1,729 2,024 (1,729) 2,024
1 Includes eliminations and consolidation adjustments.2 Primarily consists of revenues from investments in Group companies accounted for under the equity method.
Condensed consolidating statements of comprehensive income (continued) Bank
Credit parent Eliminations
Suisse company Group and Credit (USA), Inc. and other parent consolidation Suisse
in 2018 consolidated subsidiaries 1 Bank company adjustments Group
Comprehensive income (CHF million)
Net income/(loss) 758 964 1,722 2,024 (1,735) 2,011
Gains/(losses) on cash flow hedges 0 (7) (7) (3) 0 (10)
Foreign currency translation 142 (463) (321) (11) 7 (325)
Unrealized gains/(losses) on securities 0 (18) (18) 0 1 (17)
Actuarial gains/(losses) 22 9 31 0 (422) (391)
Net prior service credit/(cost) 0 (10) (10) 0 (125) (135)
Gains/(losses) on liabilities related to credit risk 28 1,414 1,442 83 129 1,654
Other comprehensive income/(loss), net of tax 192 925 1,117 69 (410) 776
Comprehensive income/(loss) 950 1,889 2,839 2,093 (2,145) 2,787
Comprehensive income/(loss) attributable to noncontrolling interests 6 (9) (3) 0 (12) (15)
Comprehensive income/(loss) attributable to shareholders 944 1,898 2,842 2,093 (2,133) 2,802
1 Includes eliminations and consolidation adjustments.
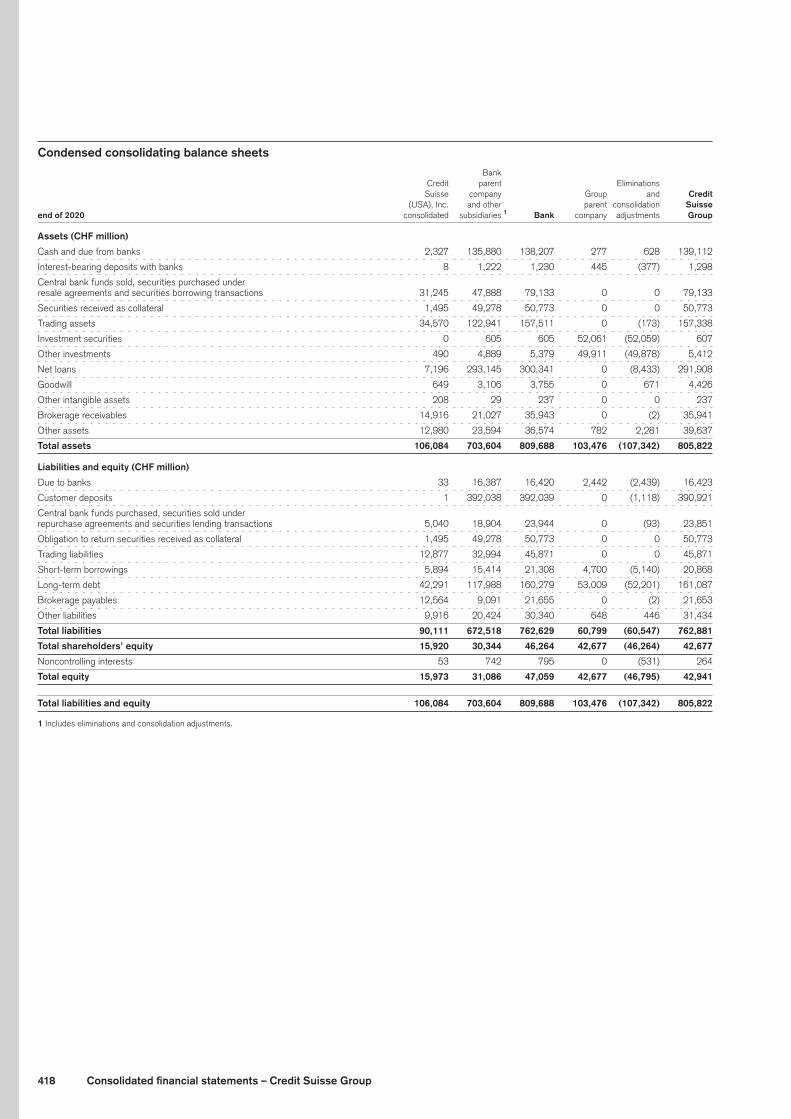
418 Consolidated financial statements – Credit Suisse Group
Condensed consolidating balance sheets Bank
Credit parent Eliminations
Suisse company Group and Credit (USA), Inc. and other parent consolidation Suisse
end of 2020 consolidated subsidiaries 1 Bank company adjustments Group
Assets (CHF million)
Cash and due from banks 2,327 135,880 138,207 277 628 139,112
Interest-bearing deposits with banks 8 1,222 1,230 445 (377) 1,298
Central bank funds sold, securities purchased under
resale agreements and securities borrowing transactions 31,245 47,888 79,133 0 0 79,133
Securities received as collateral 1,495 49,278 50,773 0 0 50,773
Trading assets 34,570 122,941 157,511 0 (173) 157,338
Investment securities 0 605 605 52,061 (52,059) 607
Other investments 490 4,889 5,379 49,911 (49,878) 5,412
Net loans 7,196 293,145 300,341 0 (8,433) 291,908
Goodwill 649 3,106 3,755 0 671 4,426
Other intangible assets 208 29 237 0 0 237
Brokerage receivables 14,916 21,027 35,943 0 (2) 35,941
Other assets 12,980 23,594 36,574 782 2,281 39,637
Total assets 106,084 703,604 809,688 103,476 (107,342) 805,822
Liabilities and equity (CHF million)
Due to banks 33 16,387 16,420 2,442 (2,439) 16,423
Customer deposits 1 392,038 392,039 0 (1,118) 390,921
Central bank funds purchased, securities sold under
repurchase agreements and securities lending transactions 5,040 18,904 23,944 0 (93) 23,851
Obligation to return securities received as collateral 1,495 49,278 50,773 0 0 50,773
Trading liabilities 12,877 32,994 45,871 0 0 45,871
Short-term borrowings 5,894 15,414 21,308 4,700 (5,140) 20,868
Long-term debt 42,291 117,988 160,279 53,009 (52,201) 161,087
Brokerage payables 12,564 9,091 21,655 0 (2) 21,653
Other liabilities 9,916 20,424 30,340 648 446 31,434
Total liabilities 90,111 672,518 762,629 60,799 (60,547) 762,881
Total shareholders’ equity 15,920 30,344 46,264 42,677 (46,264) 42,677
Noncontrolling interests 53 742 795 0 (531) 264
Total equity 15,973 31,086 47,059 42,677 (46,795) 42,941
Total liabilities and equity 106,084 703,604 809,688 103,476 (107,342) 805,822
1 Includes eliminations and consolidation adjustments.
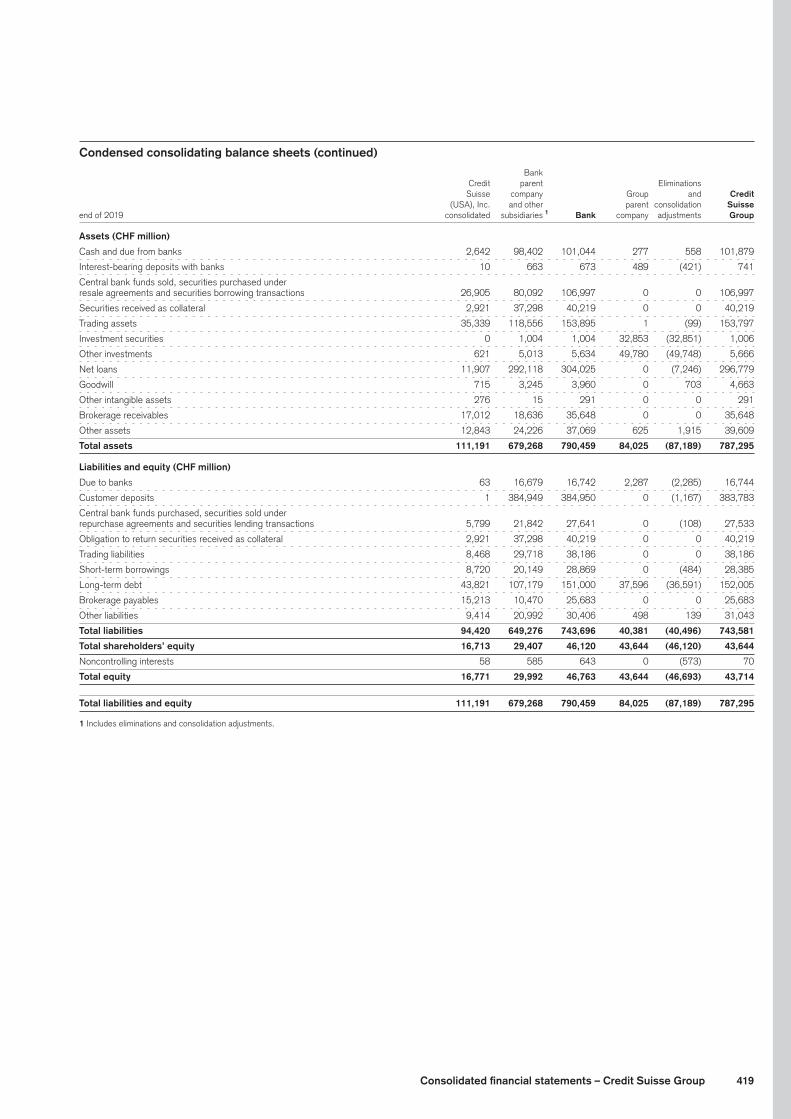
419Consolidated financial statements – Credit Suisse Group
Condensed consolidating balance sheets (continued) Bank
Credit parent Eliminations
Suisse company Group and Credit (USA), Inc. and other parent consolidation Suisse
end of 2019 consolidated subsidiaries 1 Bank company adjustments Group
Assets (CHF million)
Cash and due from banks 2,642 98,402 101,044 277 558 101,879
Interest-bearing deposits with banks 10 663 673 489 (421) 741
Central bank funds sold, securities purchased under
resale agreements and securities borrowing transactions 26,905 80,092 106,997 0 0 106,997
Securities received as collateral 2,921 37,298 40,219 0 0 40,219
Trading assets 35,339 118,556 153,895 1 (99) 153,797
Investment securities 0 1,004 1,004 32,853 (32,851) 1,006
Other investments 621 5,013 5,634 49,780 (49,748) 5,666
Net loans 11,907 292,118 304,025 0 (7,246) 296,779
Goodwill 715 3,245 3,960 0 703 4,663
Other intangible assets 276 15 291 0 0 291
Brokerage receivables 17,012 18,636 35,648 0 0 35,648
Other assets 12,843 24,226 37,069 625 1,915 39,609
Total assets 111,191 679,268 790,459 84,025 (87,189) 787,295
Liabilities and equity (CHF million)
Due to banks 63 16,679 16,742 2,287 (2,285) 16,744
Customer deposits 1 384,949 384,950 0 (1,167) 383,783
Central bank funds purchased, securities sold under
repurchase agreements and securities lending transactions 5,799 21,842 27,641 0 (108) 27,533
Obligation to return securities received as collateral 2,921 37,298 40,219 0 0 40,219
Trading liabilities 8,468 29,718 38,186 0 0 38,186
Short-term borrowings 8,720 20,149 28,869 0 (484) 28,385
Long-term debt 43,821 107,179 151,000 37,596 (36,591) 152,005
Brokerage payables 15,213 10,470 25,683 0 0 25,683
Other liabilities 9,414 20,992 30,406 498 139 31,043
Total liabilities 94,420 649,276 743,696 40,381 (40,496) 743,581
Total shareholders’ equity 16,713 29,407 46,120 43,644 (46,120) 43,644
Noncontrolling interests 58 585 643 0 (573) 70
Total equity 16,771 29,992 46,763 43,644 (46,693) 43,714
Total liabilities and equity 111,191 679,268 790,459 84,025 (87,189) 787,295
1 Includes eliminations and consolidation adjustments.

420 Consolidated financial statements – Credit Suisse Group
Condensed consolidating statements of cash flows Bank
Credit parent Eliminations
Suisse company Group and Credit (USA), Inc. and other parent consolidation Suisse
in 2020 consolidated subsidiaries 1 Bank company adjustments Group
Operating activities (CHF million)
Net cash provided by/(used in) operating activities 3,981 (10,144) (6,163) (81) 2 (270) (6,514)
Investing activities (CHF million)
(Increase)/decrease in interest-bearing deposits with banks 1 (521) (520) 45 (44) (519)
(Increase)/decrease in central bank funds sold, securities purchased under
resale agreements and securities borrowing transactions (7,244) 26,463 19,219 0 0 19,219
Purchase of investment securities 0 (402) (402) (12,644) 12,644 (402)
Proceeds from sale of investment securities 0 629 629 0 0 629
Maturities of investment securities 0 184 184 0 0 184
Investments in subsidiaries and other investments (17) (193) (210) 0 0 (210)
Proceeds from sale of other investments 132 545 677 0 1 678
(Increase)/decrease in loans 3,860 (10,839) (6,979) 0 1,244 (5,735)
Proceeds from sales of loans 0 3,860 3,860 0 0 3,860
Capital expenditures for premises and equipment and other intangible assets (293) (751) (1,044) 0 (144) (1,188)
Proceeds from sale of premises and equipment and other intangible assets 0 45 45 0 0 45
Other, net 3 110 113 0 0 113
Net cash provided by/(used in) investing activities (3,558) 19,130 15,572 (12,599) 13,701 16,674
Financing activities (CHF million)
Increase/(decrease) in due to banks and customer deposits (26) 21,361 21,335 155 (126) 21,364
Increase/(decrease) in short-term borrowings (2,166) (3,124) (5,290) 0 44 (5,246)
Increase/(decrease) in central bank funds purchased, securities sold under
repurchase agreements and securities lending transactions (245) (1,224) (1,469) 0 5 (1,464)
Issuances of long-term debt 223,638 (165,997) 57,641 13,644 (13,276) 58,009
Repayments of long-term debt (221,868) 179,100 (42,768) 0 0 (42,768)
Sale of treasury shares 0 0 0 0 12,364 12,364
Repurchase of treasury shares 0 0 0 (882) (12,371) (13,253)
Dividends paid 0 (10) (10) (716) 10 (716)
Other, net 168 766 934 480 36 1,450
Net cash provided by/(used in) financing activities (499) 30,872 30,373 12,681 (13,314) 29,740
Effect of exchange rate changes on cash and due from banks (CHF million)
Effect of exchange rate changes on cash and due from banks (239) (2,380) (2,619) (1) (47) (2,667)
Net increase/(decrease) in cash and due from banks (CHF million)
Net increase/(decrease) in cash and due from banks (315) 37,478 37,163 0 70 37,233
Cash and due from banks at beginning of period 3 2,642 98,402 101,044 277 558 101,879
Cash and due from banks at end of period 3 2,327 135,880 138,207 277 628 139,112
1 Includes eliminations and consolidation adjustments.2 Consists of dividend payments from Group companies of CHF 10 million and CHF 14 million from bank and non-bank subsidiaries, respectively, and other cash items from parent com-
pany operations such as Group financing. 3 Includes restricted cash.

421Consolidated financial statements – Credit Suisse Group
Condensed consolidating statements of cash flows (continued) Bank
Credit parent Eliminations
Suisse company Group and Credit (USA), Inc. and other parent consolidation Suisse
in 2019 consolidated subsidiaries 1 Bank company adjustments Group
Operating activities (CHF million)
Net cash provided by/(used in) operating activities (4,694) (13,724) (18,418) (141) 2 135 (18,424)
Investing activities (CHF million)
(Increase)/decrease in interest-bearing deposits with banks 12 399 411 9 (9) 411
(Increase)/decrease in central bank funds sold, securities purchased under
resale agreements and securities borrowing transactions 8,321 65 8,386 0 0 8,386
Purchase of investment securities 0 (557) (557) (9,396) 9,396 (557)
Proceeds from sale of investment securities 0 6 6 0 0 6
Maturities of investment securities 0 1,007 1,007 942 (942) 1,007
Investments in subsidiaries and other investments (34) (250) (284) (10) 9 (285)
Proceeds from sale of other investments 516 617 1,133 48 (23) 1,158
(Increase)/decrease in loans 93 (17,402) (17,309) 0 1,965 (15,344)
Proceeds from sales of loans 0 4,612 4,612 0 0 4,612
Capital expenditures for premises and equipment and other intangible assets (397) (736) (1,133) 0 (160) (1,293)
Proceeds from sale of premises and equipment and other intangible assets 0 30 30 0 0 30
Other, net 27 510 537 6 0 543
Net cash provided by/(used in) investing activities 8,538 (11,699) (3,161) (8,401) 10,236 (1,326)
Financing activities (CHF million)
Increase/(decrease) in due to banks and customer deposits 6 24,678 24,684 923 (754) 24,853
Increase/(decrease) in short-term borrowings (809) 7,720 6,911 0 8 6,919
Increase/(decrease) in central bank funds purchased, securities sold under
repurchase agreements and securities lending transactions (397) 3,888 3,491 0 (110) 3,381
Issuances of long-term debt 206,056 (171,145) 34,911 10,396 (10,344) 34,963
Repayments of long-term debt (208,631) 162,341 (46,290) (942) 942 (46,290)
Issuances of common shares 0 0 0 (10) 10 0
Sale of treasury shares 0 0 0 3 9,621 9,624
Repurchase of treasury shares 0 0 0 (1,916) (9,620) (11,536)
Dividends paid (1) (10) (11) (728) 43 (696)
Other, net 75 133 208 768 (5) 971
Net cash provided by/(used in) financing activities (3,701) 27,605 23,904 8,494 (10,209) 22,189
Effect of exchange rate changes on cash and due from banks (CHF million)
Effect of exchange rate changes on cash and due from banks (41) (554) (595) 1 (13) (607)
Net increase/(decrease) in cash and due from banks (CHF million)
Net increase/(decrease) in cash and due from banks 102 1,628 1,730 (47) 149 1,832
Cash and due from banks at beginning of period 3 2,540 96,774 99,314 324 409 100,047
Cash and due from banks at end of period 3 2,642 98,402 101,044 277 558 101,879
1 Includes eliminations and consolidation adjustments.2 Consists of dividend payments from Group companies of CHF 10 million and CHF 14 million from bank and non-bank subsidiaries, respectively, and other cash items from parent com-
pany operations such as Group financing.3 Includes restricted cash.
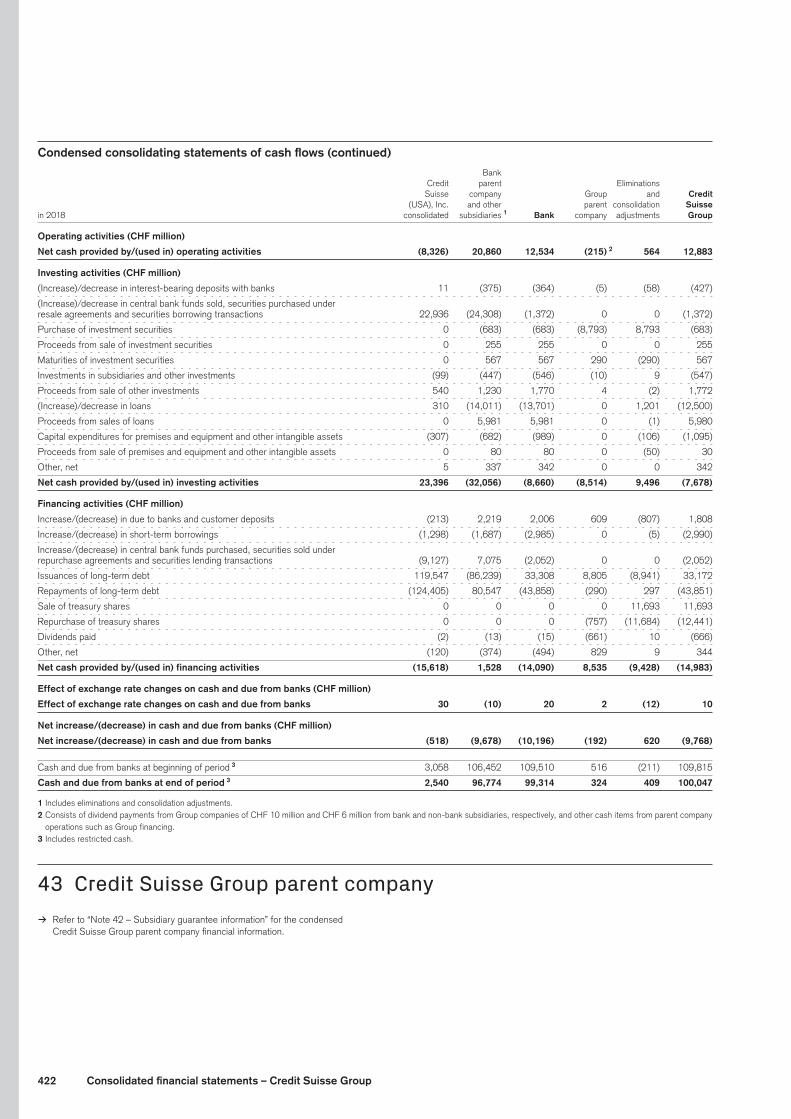
422 Consolidated financial statements – Credit Suisse Group
Condensed consolidating statements of cash flows (continued) Bank
Credit parent Eliminations
Suisse company Group and Credit (USA), Inc. and other parent consolidation Suisse
in 2018 consolidated subsidiaries 1 Bank company adjustments Group
Operating activities (CHF million)
Net cash provided by/(used in) operating activities (8,326) 20,860 12,534 (215) 2 564 12,883
Investing activities (CHF million)
(Increase)/decrease in interest-bearing deposits with banks 11 (375) (364) (5) (58) (427)
(Increase)/decrease in central bank funds sold, securities purchased under
resale agreements and securities borrowing transactions 22,936 (24,308) (1,372) 0 0 (1,372)
Purchase of investment securities 0 (683) (683) (8,793) 8,793 (683)
Proceeds from sale of investment securities 0 255 255 0 0 255
Maturities of investment securities 0 567 567 290 (290) 567
Investments in subsidiaries and other investments (99) (447) (546) (10) 9 (547)
Proceeds from sale of other investments 540 1,230 1,770 4 (2) 1,772
(Increase)/decrease in loans 310 (14,011) (13,701) 0 1,201 (12,500)
Proceeds from sales of loans 0 5,981 5,981 0 (1) 5,980
Capital expenditures for premises and equipment and other intangible assets (307) (682) (989) 0 (106) (1,095)
Proceeds from sale of premises and equipment and other intangible assets 0 80 80 0 (50) 30
Other, net 5 337 342 0 0 342
Net cash provided by/(used in) investing activities 23,396 (32,056) (8,660) (8,514) 9,496 (7,678)
Financing activities (CHF million)
Increase/(decrease) in due to banks and customer deposits (213) 2,219 2,006 609 (807) 1,808
Increase/(decrease) in short-term borrowings (1,298) (1,687) (2,985) 0 (5) (2,990)
Increase/(decrease) in central bank funds purchased, securities sold under
repurchase agreements and securities lending transactions (9,127) 7,075 (2,052) 0 0 (2,052)
Issuances of long-term debt 119,547 (86,239) 33,308 8,805 (8,941) 33,172
Repayments of long-term debt (124,405) 80,547 (43,858) (290) 297 (43,851)
Sale of treasury shares 0 0 0 0 11,693 11,693
Repurchase of treasury shares 0 0 0 (757) (11,684) (12,441)
Dividends paid (2) (13) (15) (661) 10 (666)
Other, net (120) (374) (494) 829 9 344
Net cash provided by/(used in) financing activities (15,618) 1,528 (14,090) 8,535 (9,428) (14,983)
Effect of exchange rate changes on cash and due from banks (CHF million)
Effect of exchange rate changes on cash and due from banks 30 (10) 20 2 (12) 10
Net increase/(decrease) in cash and due from banks (CHF million)
Net increase/(decrease) in cash and due from banks (518) (9,678) (10,196) (192) 620 (9,768)
Cash and due from banks at beginning of period 3 3,058 106,452 109,510 516 (211) 109,815
Cash and due from banks at end of period 3 2,540 96,774 99,314 324 409 100,047
1 Includes eliminations and consolidation adjustments.2 Consists of dividend payments from Group companies of CHF 10 million and CHF 6 million from bank and non-bank subsidiaries, respectively, and other cash items from parent company
operations such as Group financing.3 Includes restricted cash.
43 Credit Suisse Group parent company > Refer to “Note 42 – Subsidiary guarantee information” for the condensed
Credit Suisse Group parent company financial information.

423Consolidated financial statements – Credit Suisse Group
44 Significant valuation and income recognition differences between US GAAP and Swiss GAAP banking law (true and fair view)
The Group’s consolidated financial statements have been pre-pared in accordance with US GAAP.
FINMA requires Swiss-domiciled banks which present their finan-cial statements under either US GAAP or International Financial Reporting Standards (IFRS) to provide a narrative explanation of the major differences between Swiss GAAP banking law (true and fair view) and its primary accounting standard.
The principal provisions of the Swiss Ordinance on Banks and Savings Banks (Banking Ordinance), the Swiss Finan-cial Market Supervisory Authority’s Ordinance on Accounting (FINMA Accounting Ordinance) and the FINMA circular 2020/1, “Accounting – banks”, governing financial reporting for banks (Swiss GAAP) differ in certain aspects from US GAAP. The fol-lowing are the major differences:
> Refer to “Note 1 – Summary of significant accounting policies” for a detailed description of the Group’s accounting policies.
Scope of consolidation
Under Swiss GAAP, majority-owned subsidiaries that are not con-sidered long-term investments or do not operate in the core busi-ness of the Group are either accounted for as financial investments or as equity method investments. US GAAP has no such exception relating to the consolidation of majority-owned subsidiaries.
Foreign currency translations
Under US GAAP, foreign currency translation adjustments result-ing from the consolidation of branches with functional currencies other than the Swiss franc are included in AOCI in shareholders’ equity. Under Swiss GAAP, foreign currency translation adjust-ments from the consolidation of foreign branches are recognized in net income/(loss) from trading activities and fair value option.
Under US GAAP, foreign currency measurement adjustments for available-for-sale securities are reported in AOCI, which is part of total shareholder’s equity, whereas for Swiss GAAP statutory purposes they are included in the statements of income.
Investments in securities
Under Swiss GAAP, classification and measurement of invest-ments in securities depends on the nature of the investment.
Non-consolidated participationsUnder US GAAP, investments in equity securities where a company has the ability to significantly influence the operating and financial policies of an investee are accounted for under the equity method of accounting or the fair value option. Under the equity method of
accounting, a company’s share of the profit or loss as well as any impairment on the participation are reported in other revenues.
Under Swiss GAAP, investments in equity securities which are held with the intention of a permanent investment or which are investments in financial industry infrastructure are included in participations irrespective of the percentage ownership of voting shares held. Other participations are initially recognized at histori-cal cost and tested for impairment at least annually. The fair value option is not allowed for participations.
Under Swiss GAAP, participations held by a company are tested for impairment on the level of each individual participation. An impairment is recorded if the carrying value of a participation exceeds its fair value. Should the fair value of an impaired par-ticipation recover in subsequent periods and such recovery is considered sustainable, the impairment from prior periods can be reversed up to the fair value but not exceeding the historical cost basis. A reversal of an impairment is recorded as extraordinary income in the statements of income.
Available-for-sale debt securitiesUnder US GAAP, available-for-sale debt securities are valued at fair value. Unrealized gains and losses due to fluctuations in fair value (including foreign exchange) are not recorded in the consolidated statements of operations but included net of tax in AOCI, which is part of total shareholders’ equity. Credit-related impairments may have to be recognized in the consolidated statements of operations if the fair value of an individual debt security decreases below its amortized cost basis due to credit-related factors.
Under Swiss GAAP, available-for-sale securities are accounted for at the lower of amortized cost or market with valuation reduc-tions and recoveries due to market fluctuations recorded in other ordinary expenses and income, respectively. Foreign exchange gains and losses are recognized in net income/(loss) from trading activities and fair value option.
Non-marketable equity securitiesUnder US GAAP, equity securities which do not have a readily deter-minable fair value are measured in accordance with the NAV practi-cal expedient by using the measurement alternative or at fair value.
Under Swiss GAAP, non-marketable equity securities are carried at the lower of cost or market.
Allowances and provisions for credit lossesUnder US GAAP, allowances and provisions for credit losses on financial instruments are estimated based on a CECL model. The credit loss requirements apply to financial assets measured at amortized cost as well as off-balance sheet credit exposures,
424 Consolidated financial statements – Credit Suisse Group
such as irrevocable loan commitments, credit guarantees and similar instruments. The credit loss requirements are based on a forward-looking, lifetime CECL model by incorporating historical experience, current conditions and reasonable and supportable forecasts of future economic conditions available as of the report-ing date.
Under Swiss GAAP, an incurred loss model is applied for the measurement of credit losses. Valuation allowances and provi-sions are recognized for credit exposures that are considered impaired. In addition, an inherent (or general) loss allowance is estimated and recognized for all loans not specifically identified as impaired which, on a portfolio basis, are considered to contain inherent losses.
Fair value option
Unlike US GAAP, Swiss GAAP generally does not allow the fair value option concept that creates an optional alternative measure-ment treatment for certain non-trading financial assets and liabilities, guarantees and commitments. The fair value option permits the use of fair value for initial and subsequent measurement with changes in fair value recorded in the consolidated statements of operations.
For issued structured products that meet certain conditions, fair value measurement can be applied. The related changes in fair value of both the embedded derivative and the host contract are recorded in trading revenues, except for fair value adjustments relating to own credit that cannot be recognized in the consoli-dated statements of income. Impacts of changes in own credit spreads are recognized in the compensation accounts which are either recorded in other assets or other liabilities.
Derivative financial instruments used for fair value hedging
Under US GAAP, for fair value hedges, the carrying value of the underlying hedged items is adjusted to the change in the fair value of the hedged risk. Changes in the fair value of the related designated derivatives are recorded in the same line item of the consolidated statements of operations as the change in fair value of the hedged risk for the respective assets or liabilities.
Under Swiss GAAP, the carrying value of hedged items is not adjusted. The amount representing the change in fair value of the hedged item with regard to the hedged risk is recorded in the compensation account included in other assets or other liabilities.
Derivative financial instruments used for cash flow hedging
Under US GAAP, the change in the fair value of a designated derivative of a cash flow hedge is reported in AOCI.
Under Swiss GAAP, the change in the fair value of a designated derivative of a cash flow hedge is recorded in the compensation account included in other assets or other liabilities.
Derecognition of financial instruments
Under US GAAP, financial instruments are only derecognized if the transaction meets the following criteria: (i) the financial asset has been legally isolated from the transferor, (ii) the transferee has the right to repledge or resell the transferred asset, and (iii) the transferor does not maintain effective control over the transferred asset.
Under Swiss GAAP, a financial instrument is derecognized when the economic control has been transferred from the seller to the buyer. A party which has the controlling ability to receive the future returns from the financial instrument and the obligation to absorb the risk of the financial instrument is deemed to have eco-nomic control over a financial instrument.
Debt issuance costs
Under US GAAP, debt issuance costs are presented as a direct deduction from the carrying amount of the related debt.
Under Swiss GAAP, debt issuance costs are reported as a bal-ance sheet asset in accrued income and prepaid expenses.
Operating leases – lessee arrangements
Under US GAAP, at commencement of an operating lease, the lessee recognizes a lease liability for future lease payments and a right-of-use asset which reflects the future benefits from the lease contract. The initial lease liability equals the present value of the future lease payments; amounts paid upfront are not included. The right-of-use asset equals the sum of the initial lease liability, initial direct costs and prepaid lease payments, with lease incentives received deducted. Operating lease costs, which include amortiza-tion and an interest component, are recognized over the remaining lease term on a straight-line basis. If the reporting entity perma-nently vacates premises and sub-leases a leased asset to another party at a loss, an impairment is recognized on the right-of-use asset. The impairment is determined as the difference between the carrying value of the right-of-use asset and the present value of the expected sub-lease income over the sub-lease term.
Under Swiss GAAP, at commencement of an operating lease, no right-of-use assets and lease liabilities are recognized on the balance sheet of the lessee. For the calculation of the periodic lease expenses, initial direct costs, lease incentives and prepaid lease payments are considered and the total cost of a lease con-tract is expensed on a straight-line basis over the lease term. If the reporting entity permanently vacates premises, a provision for future payments under the lease contract is recorded, net of expected sub-lease income.
Goodwill amortization
Under US GAAP, goodwill is not amortized but must be tested for impairment annually or more frequently if an event or change in circumstances indicates that the goodwill may be impaired.

425Consolidated financial statements – Credit Suisse Group
Under Swiss GAAP, goodwill is amortized over its useful life, gen-erally not exceeding five years, except for justified cases where a maximum useful life of up to ten years is acceptable. In addition, goodwill is tested at least annually for impairment.
Amortization of intangible assets
Under US GAAP, intangible assets with indefinite lives are not amortized but are tested for impairment annually or more fre-quently if an event or change in circumstances indicates that the asset may be impaired.
Under Swiss GAAP, intangible assets are amortized over a useful life, up to a maximum of five years, in justified cases up to a max-imum of ten years. In addition, these assets are tested at least annually for impairment.
Guarantees
US GAAP requires all guarantees to be initially recognized at fair value. Upon issuance of a guarantee, the guarantor is required to recognize a liability that reflects the initial fair value; simultane-ously, a receivable is recorded to reflect the future guarantee fee income over the entire life of the guarantee.
Under Swiss GAAP, only accrued or prepaid guarantee fees are recorded on the balance sheet. No guarantee liability and receiv-able for future guarantee fees are recorded upon issuance of a guarantee.
Loan origination fees and costs
US GAAP requires the deferral of fees received upfront and direct costs incurred in connection with the origination of loans not held under the fair value option.
Under Swiss GAAP, only upfront payments or fees that are con-sidered interest-related components are deferred (e.g., premiums and discounts). Fees received from the borrower which are con-sidered service-related fees such as commitment fees, structur-ing fees and arrangement fees are immediately recognized in commission income.
Extraordinary income and expenses
Unlike US GAAP, Swiss GAAP does report certain expenses or revenues as extraordinary if the recorded income or expense is non-operating and non-recurring.
Pensions and post-retirement benefits
Under US GAAP, the liability and related pension expense is determined based on the projected unit credit actuarial calculation of the benefit obligation.
Under Swiss GAAP, the liability and related pension expense is primarily determined based on the pension plan valuation
in accordance with Swiss GAAP FER 26. A pension asset is recorded if a statutory overfunding of a pension plan leads to a future economic benefit, and a pension liability is recorded if a statutory underfunding of a pension plan leads to a future economic obligation. Employer contribution reserves must be capitalized if they represent a future economic benefit. A future economic benefit exists if the employer can reduce its future statutory annual contribution to the pension plan by releasing employer contribution reserves. Pension expenses include the required contributions defined by Swiss law, any additional contri-bution mandated by the pension fund trustees and any change in value of the pension asset or liability between two measurement dates as determined on the basis of the annual year-end pension plan valuation.
Discontinued operations
Under US GAAP, the assets and liabilities of a discontinued operation are separated from the ordinary captions of the con-solidated balance sheets and are reported as discontinued opera-tions measured at the lower of the carrying value or fair value less cost to sell. Accordingly, income and expense from discontinued operations are reported in a separate line item of the consolidated statements of operations.
Under Swiss GAAP, these positions remain in their initial bal-ance sheet captions until disposed of and continue to be valued according to the respective captions.
Security collateral received in securities lending transactions
Under US GAAP, security collateral received in securities lend-ing transactions with the right to sell or repledge are recorded as assets and a corresponding liability to return the collateral is recognized.
Under Swiss GAAP, security collateral received and the obligation to return collateral of securities lending transactions are not rec-ognized on the balance sheet.
Loan commitments
Under US GAAP, loan commitments include all commitments to extend loans, unfunded commitments under commercial lines of credit, revolving credit lines, credit guarantees in the future and overdraft protection agreements, except for commitments that can be revoked by the Group at any time at the Group’s sole dis-cretion without prior notice.
Under Swiss GAAP, loan commitments include all commitments to extend loans, unfunded commitments under commercial lines of credit, revolving credit lines, credit guarantees in the future and overdraft protection agreements, except for commitments that can be revoked by the Group at any time at the Group’s sole dis-cretion with a notice period not exceeding six weeks.
426 Consolidated financial statements – Credit Suisse Group
Controls and procedures
Evaluation of disclosure controls and proceduresThe Group has evaluated the effectiveness of the design and operation of its disclosure controls and procedures as of the end of the period covered by this report under the supervision and with the participation of management, including the Group Chief Executive Officer (CEO) and Chief Financial Officer (CFO), pur-suant to Rule 13(a)-15(a) under the Securities Exchange Act of 1934 (the Exchange Act). There are inherent limitations to the effectiveness of any system of controls and procedures, including the possibility of human error and the circumvention or overriding of the controls and procedures. Accordingly, even effective con-trols and procedures can only provide reasonable assurance of achieving their control objectives.
The CEO and CFO concluded that, as of December 31, 2020, the design and operation of the Group’s disclosure controls and procedures were effective, in all material respects, to ensure that information required to be disclosed in reports filed and submitted under the Exchange Act is recorded, processed, summarized and reported as and when required.
Management report on internal control over financial reportingThe management of the Group is responsible for establishing and maintaining adequate internal control over financial reporting. The Group’s internal control over financial reporting is a process designed to provide reasonable assurance regarding the reliability of financial reporting and the preparation of financial statements for external purposes in accordance with US GAAP. Because of its inherent limitations, internal control over financial reporting may not prevent or detect misstatements. Also, projections of any evaluation of effectiveness to future periods are subject to the risk that controls may become inadequate because of changes in conditions, or that the degree of compliance with policies or pro-cedures may deteriorate.
Management has made an evaluation and assessment of the Group’s internal control over financial reporting as of December 31, 2020 using the criteria issued in 2013 by the Committee of Sponsoring Organizations of the Treadway Commission (COSO) in “Internal Control – Integrated Framework”.
Based upon its review and evaluation, management, including the Group CEO and CFO, has concluded that the Group’s internal control over financial reporting is effective as of December 31, 2020.
The Group’s independent registered public accounting firm, Price-waterhouseCoopers AG, has issued an unqualified opinion on the effectiveness of the Group’s internal control over financial report-ing as of December 31, 2020, as stated in their report.
Changes in internal control over financial reportingThere were no changes in the Group’s internal control over finan-cial reporting during the period covered by this report that have materially affected, or are reasonably likely to materially affect, the Group’s internal control over financial reporting.
427
Report of the Statutory Auditor 429
Parent company financial statements 431
Notes to the financial statements 432
Proposed appropriation of retained earnings and capital distribution 444
VII – Parent company financial statements – Credit Suisse Group

428 Parent company financial statements – Credit Suisse Group
Notes to the financial statements
1 General information, business developments and subsequent events ......................................4322 Accounting and valuation principles ......................................................................................4333 Other financial income .........................................................................................................4334 Other operating income .......................................................................................................4335 Financial expenses ..............................................................................................................4346 Personnel expenses ............................................................................................................4347 Other operating expenses ....................................................................................................4348 Other short-term receivables ................................................................................................4349 Accrued income and prepaid expenses .................................................................................434
10 Financial investments ..........................................................................................................43411 Participations .....................................................................................................................43512 Short-term interest-bearing liabilities ....................................................................................43513 Accrued expenses and deferred income ...............................................................................43514 Long-term interest-bearing liabilities .....................................................................................43615 Share capital, conditional, conversion and authorized capital .................................................43816 Credit Suisse Group shares held by subsidiaries ....................................................................43917 Purchases and sales of treasury shares ................................................................................43918 Significant shareholders .......................................................................................................43919 Assets subject to retention of title ........................................................................................44020 Contingent liabilities ............................................................................................................44021 Assets and liabilities with related parties ...............................................................................44122 Subordinated assets and liabilities ........................................................................................44123 Shareholdings ....................................................................................................................442

429Parent company fi nancial statements – Credit Suisse Group
PricewaterhouseCoopers AG, Birchstrasse 160, Postfach, CH-8050 Zurich, Switzerland Telefon: +41 58 792 44 00, Telefax: +41 58 792 44 10, www.pwc.ch
PricewaterhouseCoopers AG is a member of the global PricewaterhouseCoopers network of firms, each of which is a separate and independent legal entity.
Report of the statutory auditor to the General Meeting of Credit Suisse Group AG, Zurich
Report on the audit of the financial statements
Opinion We have audited the financial statements of Credit Suisse Group AG, which comprise the statements of income, balance sheets and notes for the year ended December 31, 2020, including a summary of significant accounting policies.
In our opinion, the financial statements as at December 31, 2020 comply with Swiss law and the company’s articles of association.
Basis for opinion We conducted our audit in accordance with Swiss law and Swiss Auditing Standards. Our responsibilities under those provisions and standards are further described in the “Auditor’s responsibilities for the audit of the financial statements” section of our report.
We are independent of the entity in accordance with the provisions of Swiss law and the requirements of the Swiss audit profession and we have fulfilled our other ethical responsibilities in accordance with these requirements. We believe that the audit evidence we have obtained is sufficient and appropriate to provide a basis for our opinion.
Our audit approach
Overview Overall materiality: CHF 850 million
We tailored the scope of our audit in order to perform sufficient work to enable us to provide an opinion on the financial statements as a whole, taking into account the structure of the entity, the accounting processes and controls, and the industry in which the entity operates.
● Our audit identified one key audit matter, carrying value of participations

429-I Parent company fi nancial statements – Credit Suisse Group
2 Credit Suisse Group AG | Report of the statutory auditor to the General Meeting
Materiality The scope of our audit was influenced by our application of materiality. Our audit opinion aims to provide reasonable assurance that the financial statements are free from material misstatement. Misstatements may arise due to fraud or error. They are considered material if, individually or in aggregate, they could reasonably be expected to influence the economic decisions of users taken on the basis of the financial statements.
Based on our professional judgement, we determined certain quantitative thresholds for materiality, including the overall materiality for the financial statements as a whole as set out in the table below. These, together with qualitative considerations, helped us to determine the scope of our audit and the nature, timing and extent of our audit procedures and to evaluate the effect of misstatements, both individually and in aggregate, on the financial statements as a whole.
Overall materiality CHF 850 million
How we determined it 0.8% of total assets
Rationale for the materiality benchmark applied
We have applied this benchmark, which is generally accepted in audit practice, based on our analysis of the common information needs of users of the financial statements.
As the entity is a holding company, we believe a measure of balance sheet assets to be more relevant than an earnings measure.
We agreed with the Audit Committee that we would report to them misstatements above CHF 42 million identified during our audit as well as any misstatements below that amount which, in our view, warranted reporting for qualitative reasons.
Audit scope We designed our audit by determining materiality and assessing the risks of material misstatement in the financial statements. In particular, we considered where subjective judgements were made; for example, in respect of significant accounting estimates that involved making assumptions and considering future events that are inherently uncertain. As in all of our audits, we also addressed the risk of management override of internal controls, including among other matters consideration of whether there was evidence of bias that represented a risk of material misstatement due to fraud.
Report on key audit matters based on the circular 1/2015 of the Federal Audit Oversight Authority Key audit matters are those matters that, in our professional judgement, were of most significance in our audit of the financial statements of the current period. These matters were addressed in the context of our audit of the financial statements as a whole, and in forming our opinion thereon, and we do not provide a separate opinion on these matters.
Carrying value of participations
Key audit matter How our audit addressed the key audit matter
As set out in the balance sheet and described in Note 11 to the financial statements, Credit Suisse Group AG held participations with a carrying value of CHF 52,066 million as of December 31, 2020. Participations are valued at acquisition cost less impairment. For the purpose of impairment testing, portfolio valuation method is applied for economically closely related participations. Due to the high level of sensitivity of the fair value to the assumptions used in the impairment assessment and the significance of the participations to the financial statements of Credit Suisse Group AG, we identified the impairment assessment of participations as a key audit matter.
We addressed the key audit matter by testing the design and effectiveness of controls relating to management’s impairment assessment of participations. We further compared the carrying value with the fair valuation of each participation. For a sample of participations, we reviewed managements’ assumptions such as five-year financial plans, discount rates used under the income approach and market multiples used under the market approach. We used professionals with specialized skill and knowledge to assist in the evaluation of the valuation methodology applied as well as the discount rate and multiples assumptions.

429-IIParent company fi nancial statements – Credit Suisse Group
3 Credit Suisse Group AG | Report of the statutory auditor to the General Meeting
Other matter
The financial statements of Credit Suisse Group AG for the year ended December 31, 2019 were audited by another firm of auditors whose report, dated 25 March 2020, expressed an unmodified opinion on those statements.
Responsibilities of the Board of Directors for the financial statements The Board of Directors is responsible for the preparation of the financial statements in accordance with the provisions of Swiss law and the company’s articles of association, and for such internal control as the Board of Directors determines is necessary to enable the preparation of financial statements that are free from material misstatement, whether due to fraud or error.
In preparing the financial statements, the Board of Directors is responsible for assessing the entity’s ability to continue as a going concern, disclosing, as applicable, matters related to going concern and using the going concern basis of accounting unless the Board of Directors either intends to liquidate the entity or to cease operations, or has no realistic alternative but to do so.
Auditor’s responsibilities for the audit of the financial statements Our objectives are to obtain reasonable assurance about whether the financial statements as a whole are free from material misstatement, whether due to fraud or error, and to issue an auditor’s report that includes our opinion. Reasonable assurance is a high level of assurance, but is not a guarantee that an audit conducted in accordance with Swiss law and Swiss Auditing Standards will always detect a material misstatement when it exists. Misstatements can arise from fraud or error and are considered material if, individually or in the aggregate, they could reasonably be expected to influence the economic decisions of users taken on the basis of these financial statements.
As part of an audit in accordance with Swiss law and Swiss Auditing Standards, we exercise professional judgment and maintain professional scepticism throughout the audit. We also:
● Identify and assess the risks of material misstatement of the financial statements, whether due to fraud or error, design and perform audit procedures responsive to those risks, and obtain audit evidence that is sufficient and appropriate to provide a basis for our opinion. The risk of not detecting a material misstatement resulting from fraud is higher than for one resulting from error, as fraud may involve collusion, forgery, intentional omissions, misrepresentations, or the override of internal control.
● Obtain an understanding of internal control relevant to the audit in order to design audit procedures that are appropriate in the circumstances, but not for the purpose of expressing an opinion on the effectiveness of the entity’s internal control.
● Evaluate the appropriateness of accounting policies used and the reasonableness of accounting estimates and related disclosures made.
● Conclude on the appropriateness of the Board of Directors’ use of the going concern basis of accounting and, based on the audit evidence obtained, whether a material uncertainty exists related to events or conditions that may cast significant doubt on the entity’s ability to continue as a going concern. If we conclude that a material uncertainty exists, we are required to draw attention in our auditor’s report to the related disclosures in the financial statements or, if such disclosures are inadequate, to modify our opinion. Our conclusions are based on the audit evidence obtained up to the date of our auditor’s report. However, future events or conditions may cause the entity to cease to continue as a going concern.
We communicate with the Board of Directors or its relevant committee regarding, among other matters, the planned scope and timing of the audit and significant audit findings, including any significant deficiencies in internal control that we identify during our audit.
We also provide the Board of Directors or its relevant committee with a statement that we have complied with relevant ethical requirements regarding independence, and communicate with them all relationships and other matters that may reasonably be thought to bear on our independence, and where applicable, related safeguards.
From the matters communicated with the Board of Directors or its relevant committee, we determine those matters that were of most significance in the audit of the financial statements of the current period and are therefore the key audit matters. We describe these matters in our auditor’s report unless law or regulation precludes public disclosure about the matter or when, in extremely rare circumstances, we determine that a matter should not be communicated in our report

430 Parent company fi nancial statements – Credit Suisse Group
4 Credit Suisse Group AG | Report of the statutory auditor to the General Meeting
because the adverse consequences of doing so would reasonably be expected to outweigh the public interest benefits of such communication.
Report on other legal and regulatory requirements
In accordance with article 728a paragraph 1 item 3 CO and Swiss Auditing Standard 890, we confirm that an internal control system exists which has been designed for the preparation of financial statements according to the instructions of the Board of Directors.
We further confirm that the proposed appropriation of available earnings and reserves complies with Swiss law and the company’s articles of association. We recommend that the financial statements submitted to you be approved.
PricewaterhouseCoopers AG
Matthew Falconer Beresford Caloia
Audit expert Auditor in charge
Audit expert
Zurich, Switzerland March 18, 2021

431Parent company financial statements – Credit Suisse Group
Parent company financial statements
Statements of incomein Note 2020 2019
Statements of income (CHF million)
Dividend income from participations 24 30
Other financial income 3 1,670 1,440
Other operating income 4 154 206
Total operating income 1,848 1,676
Financial expenses 5 1,818 1,445
Personnel expenses 6 82 103
Other operating expenses 7 113 106
Amortization, depreciation and impairment losses on noncurrent assets 25 9
Total operating expenses 2,038 1,663
Net profit/(loss) before taxes (190) 13
Direct tax expenses 7 17
Net profit/(loss) (197) (4)
Balance sheetsend of Note 2020 2019
Assets (CHF million)
Cash and cash equivalents 92 79
Other short-term receivables 8 277 253
Accrued income and prepaid expenses 9 883 593
Total current assets 1,252 925
Financial investments 10 50,900 31,848
Participations 11 52,066 52,090
Total noncurrent assets 102,966 83,938
Total assets 104,218 84,863
Liabilities and shareholders’ equity (CHF million)
Short-term interest-bearing liabilities 12 6,636 2,331
Other short-term liabilities 7 46
Accrued expenses and deferred income 13 978 672
Total short-term liabilities 7,621 3,049
Long-term interest-bearing liabilities 14 51,780 35,828
Provisions 311 311
Total long-term liabilities 52,091 36,139
Total liabilities 59,712 39,188
Share capital 15 98 102
Capital contribution reserves 25,160 25,659
Other capital reserves 1,800 1,800
Legal capital reserves 26,960 27,459
Reserves for treasury shares 16 500 500
Legal income reserves 500 500
Statutory and discretionary reserves 10,500 10,500
Retained earnings carried forward 7,037 8,538
Net profit/(loss) (197) (4)
Voluntary retained earnings 17,340 19,034
Treasury shares against other capital reserves (392) (420)
Treasury shares against voluntary retained earnings 0 (1,000)
Treasury shares 17 (392) (1,420)
Total shareholders’ equity 44,506 45,675
Total liabilities and shareholders’ equity 104,218 84,863

432 Parent company financial statements – Credit Suisse Group
Notes to the financial statements
1 General information, business developments and subsequent events
Company
Credit Suisse Group AG is a Swiss holding company incorporated as a joint stock corporation (public limited company) with its reg-istered office in Zurich, Switzerland. The financial statements of Credit Suisse Group AG are prepared in accordance with the reg-ulations of the Swiss Code of Obligations and are stated in Swiss francs (CHF). The financial year ends on December 31.
Number of employees
The average number of employees (full-time equivalents) for the current year, as well as for the previous year, did not exceed 50.
Business developments
Effective November 3, 2020, Credit Suisse Group AG and Credit Suisse Group Funding (Guernsey) Limited exercised the voluntary issuer substitution clause included in the terms of senior unse-cured notes issued by Credit Suisse Group Funding (Guernsey) Limited with a maturity date post December 31, 2022. As a result of the substitution, Credit Suisse Group AG succeeded to, and was substituted for, and became bound by every obligation of, Credit Suisse Group Funding (Guernsey) Limited as principal obligor under these notes, which qualify as total loss-absorbing capacity (TLAC) debt instruments. In addition, the related sub-ordinated internal TLAC notes issued by Credit Suisse AG and
held by Credit Suisse Group Funding (Guernsey) Limited have been transferred to Credit Suisse Group AG. This resulted in an increase in financial investments and long-term interest-bearing liabilities in the amount of CHF 9.5 billion and the contingent liabilities entered into on behalf of subsidiaries have been reduced accordingly. The issuer substitution had no impact on net profit/(loss) of Credit Suisse Group AG.
> Refer to “Note 14 – Long-term interest-bearing liabilities” for further information.
COVID-19 pandemic
The pandemic and the consequences for markets and the global economy affected Credit Suisse Group AG’s financial perfor-mance in 2020. Credit Suisse Group AG continues to closely monitor the COVID-19 pandemic and its effects on the compa-ny’s operations and businesses. Should current economic condi-tions persist or continue to deteriorate, the macroeconomic envi-ronment could have an adverse effect on these and other aspects of the Group’s business, operations and financial performance, including decreased client activity or demand for its products.
Subsequent events
> Refer to “Note 3 – Business developments, significant shareholders and sub-sequent events” in VI – Consolidated financial statements – Credit Suisse Group for information on subsequent events.
433Parent company financial statements – Credit Suisse Group
2 Accounting and valuation principlesThese financial statements were prepared in accordance with the provisions of the Swiss Law on Accounting and Financial Report-ing (32nd title of the Swiss Code of Obligations).
Cash and cash equivalents
Cash and cash equivalents are carried at nominal value.
Financial investments
Financial investments include debt securities with a remaining maturity of more than 12 months after the balance sheet date. These securities are carried at cost. No valuation adjustments or impairment losses were required.
Participations
Participations are valued at historical cost less impairment. For the purpose of impairment testing, with a clearly defined sub-portfolio of economically closely related participations, the portfolio valuation method is applied. Impairment is assessed at each balance sheet date or at any point in time when facts and circumstances would indicate that an event has occurred which triggers an impairment review. The amount of impairment, if any, is assessed on the level of this sub-portfolio and not individually for each participation. All other participations are valued individu-ally. An impairment is recorded if the carrying value exceeds the fair value of the participation sub-portfolio. If the fair value of par-ticipations recovers significantly and is considered sustainable, a prior period impairment can be reversed up to the historical cost value of the participations.
Interest-bearing liabilities
Short-term and long-term interest-bearing liabilities are carried at nominal value. Issuance costs and discounts are recognized as prepaid expenses and are amortized on a straight-line basis over the contractual term of the notes. Premiums are recognized as accrued expenses and are amortized on a straight-line basis over the contractual term of the notes.
Treasury shares
Own shares are recorded at cost and reported as treasury shares, resulting in a reduction to total shareholders’ equity. Realized gains and losses on the sale of own shares are recognized through the statements of income as other financial income or financial expenses.
Revenue recognition
Revenues are recognized when they are realized or realizable, and are earned. Dividend income is recorded in the reporting period in which the dividend is declared.
Foreign currency translations
Assets and liabilities denominated in foreign currencies are trans-lated into Swiss francs at the exchange rates prevailing at year-end, with the exception of non-monetary assets and liabilities, which are maintained in Swiss francs at historical exchange rates. All currency translation effects are recognized in other financial income or financial expenses.
3 Other financial incomein 2020 2019
Other financial income (CHF million)
Interest income 1,662 1,325
Foreign exchange gains 7 1
Gains on sale of treasury shares 1 69
Realized and unrealized gains on derivative
financial instruments 0 45
Other financial income 1,670 1,440
4 Other operating incomein 2020 2019
Other operating income (CHF million)
Management fees 75 98
Trademark fees 59 62
Guarantee fees 18 22
Gain on sale of participations 0 23
Other 2 1
Other operating income 154 206

434 Parent company financial statements – Credit Suisse Group
5 Financial expensesin 2020 2019
Financial expenses (CHF million)
Interest expense 1 1,659 1,358
Losses on sale of treasury shares 157 2
Realized and unrealized losses on derivative
financial instruments 0 84
Other 2 1
Financial expenses 1,818 1,445
1 Includes negative interest expense of CHF 39 million in 2020 and CHF 14 million in 2019, respectively.
6 Personnel expensesin 2020 2019
Personnel expenses (CHF million)
Salaries 39 38
Variable compensation expenses 33 55
Other 10 10
Personnel expenses 82 103
7 Other operating expensesin 2020 2019
Other operating expenses (CHF million)
Branding expenses 59 62
Other general and administrative expenses 54 44
Other operating expenses 113 106
8 Other short-term receivablesend of 2020 2019
Other short-term receivables (CHF million)
Receivables for trademark fees 202 234
Debt securities 53 –
Other 22 19
Other short-term receivables 277 253
9 Accrued income and prepaid expenses
end of 2020 2019
Accrued income and prepaid expenses (CHF million)
Accrued interest income 609 412
Deferred debt issuance costs 243 167
Unamortized discount on notes issued 26 8
Other 5 6
Accrued income and prepaid expenses 883 593
Credit Suisse Group AG entered into a hedging transaction to hedge an open interest rate risk exposure from a fixed rate liability with a nominal amount of USD 1.0 billion with a fixed receiver inter-est rate swap with equivalent notional and maturity. This hedg-ing relationship is considered to be highly effective over the entire maturity of the hedge. The hedging instrument follows the account-ing treatment of the underlying liability. The interest on the interest rate swap is recorded as financial expenses in the statement of income. The interest rate swap was initially recorded at cost. Sub-sequently, no replacement values and no valuation changes, i.e., change of clean replacement values, are recorded on the balance sheet and in the statement of income of the company.
10 Financial investmentsend of 2020 2019
Financial investments (CHF million)
Debt securities 1 50,899 31,847
Equity securities 1 1
Financial investments 50,900 31,848
1 Reflects notes issued by Credit Suisse AG. Refer to “Business developments” in Note 1 – General information, business developments and subsequent events for further information.

435Parent company financial statements – Credit Suisse Group
11 Participations Direct participations Nominal Voting Equity
capital interest interest
Company name Domicile Currency in million in % in %
as of December 31, 2020
Capital Union Bank B.S.C. (closed) (under liquidation) Manama, Kingdom of Bahrain USD 50.0 26 26
Credit Suisse AG 1 Zurich, Switzerland CHF 4,399.7 100 100
Credit Suisse Group Finance (Guernsey) Limited
(in Guernsey members’ voluntary liquidation) St. Peter Port, Guernsey USD 0.0 100 100
Credit Suisse Group Funding (Guernsey) Limited 1 St. Peter Port, Guernsey USD 0.1 100 100
Credit Suisse Insurance Linked Strategies Ltd 1 Zurich, Switzerland CHF 0.2 100 100
Credit Suisse International 1 London, United Kingdom USD 11,366.2 2 2 2 2
Credit Suisse IP GmbH Zurich, Switzerland CHF 0.0 100 100
Credit Suisse Services AG 1 Zurich, Switzerland CHF 1.0 100 100
Credit Suisse Trust AG 1 Zurich, Switzerland CHF 5.0 100 100
Credit Suisse Trust Holdings Limited 1 St. Peter Port, Guernsey GBP 2.0 100 100
CS LP Holding AG Zug, Switzerland CHF 0.1 100 100
Inreska Limited 1 St. Peter Port, Guernsey GBP 3.0 100 100
Savoy Hotel Baur en Ville AG Zurich, Switzerland CHF 7.5 88 88
1 For the purpose of impairment testing, these participations form part of a sub-portfolio for which the portfolio valuation method is applied.2 98% held by other group companies.
Indirect participations
The company’s principal indirect participations are shown in Note 41 – Significant subsidiaries and equity method investments in VI – Consolidated financial statements – Credit Suisse Group.
12 Short-term interest-bearing liabilities
end of 2020 2019
Short-term interest-bearing liabilities (CHF million)
Due to banks 6,513 2,287
Cash collateral received 70 44
Senior bail-in notes 53 –
Short-term interest-bearing liabilities 6,636 2,331
13 Accrued expenses and deferred income
end of 2020 2019
Accrued expenses and deferred income (CHF million)
Accrued interest expense 610 415
Deferred fees on acquired debt securities 238 161
Accrued personnel and other operating expenses 103 87
Unamortized discount on debt securities 26 8
Other 1 1
Accrued expenses and deferred income 978 672