Embed Size (px)
Citation preview
ANNUAL REPORT 2020
CONTENTS
OVERVIEW
AT A GLANCE 04
FINANCIAL HIGHLIGHTS 08
LEADERSHIP
CHAIRPERSON’S REPORT 14
CHIEF EXECUTIVE OFFICER'S REPORT 18
DIRECTORS’ PROFILES 22
SENIOR MANAGEMENT TEAM'S PROFILES 26
CORPORATE GOVERNANCE
CORPORATE PROFILE 64
CORPORATE GOVERNANCE REPORT 66
STATEMENT OF COMPLIANCE 78
OTHER STATUTORY DISCLOSURES 79
COMPANY SECRETARY’S CERTIFICATE 80
STATEMENT OF DIRECTORS’ RESPONSIBILITIES
IN RESPECT OF FINANCIAL STATEMENTS 81
STATEMENT OF MANAGEMENT’S RESPONSIBILITIES
IN RESPECT OF FINANCIAL STATEMENTS 82
PERFORMANCE
ECONOMIC OUTLOOK 32
FINANCIAL ANALYSIS 34
FINANCIAL STATEMENTS
INDEPENDENT AUDITOR’S REPORT 86
STATEMENT OF PROFIT OR LOSS AND OTHER
COMPREHENSIVE INCOME 90
STATEMENT OF FINANCIAL POSITION 92
STATEMENT OF CHANGES IN EQUITY 93
STATEMENT OF CASH FLOWS 95
NOTES TO THE FINANCIAL STATEMENTS 96
STRATEGY
OUR REVENUE GENERATORS 42
MAIN BUSINESS ENABLERS 44
RISK MANAGEMENT 46
SUSTAINABILITY 59
02
12
62
3084
40

BANK ONE ANNUAL REPORT 2020 - OVERVIEW
2 3
BANK ONE ANNUAL REPORT 2020 - OVERVIEW
OVERVIEWAT A GLANCE
FINANCIAL HIGHLIGHTS
BANK ONE ANNUAL REPORT 2020 - OVERVIEW
5
BANK ONE ANNUAL REPORT 2020 - OVERVIEW
5
BANK ONE ANNUAL REPORT 2020 - OVERVIEW
AT A GLANCE
4
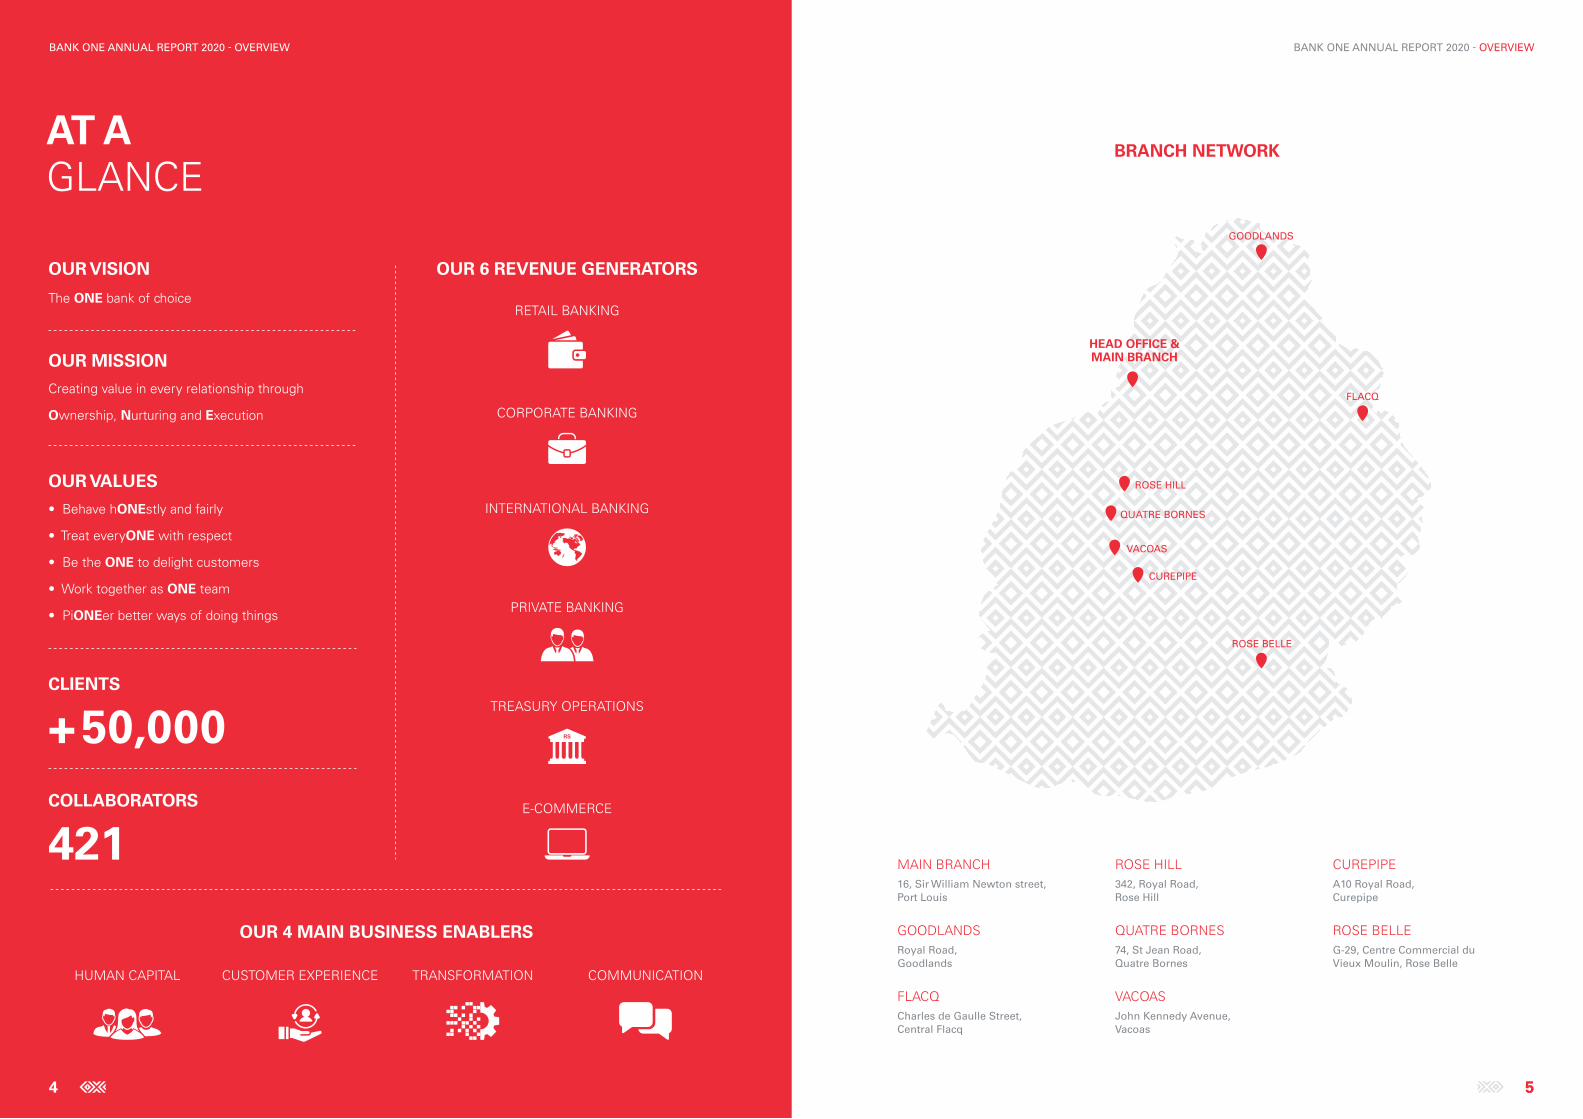
OUR VISION
The ONE bank of choice
OUR 6 REVENUE GENERATORS
OUR 4 MAIN BUSINESS ENABLERS
RETAIL BANKING
PRIVATE BANKING
INTERNATIONAL BANKING
TREASURY OPERATIONS
RS
E-COMMERCE
CORPORATE BANKING
HUMAN CAPITAL CUSTOMER EXPERIENCE TRANSFORMATION COMMUNICATION
CLIENTS
+ 50,000COLLABORATORS
421
OUR VALUES
• Behave hONEstly and fairly
• Treat everyONE with respect
• Be the ONE to delight customers
• Work together as ONE team
• PiONEer better ways of doing things
OUR MISSION
Creating value in every relationship through
Ownership, Nurturing and Execution
HEAD OFFICE &MAIN BRANCH
ROSE BELLE
FLACQ
GOODLANDS
ROSE HILL
QUATRE BORNES
VACOAS
CUREPIPE
BRANCH NETWORK
MAIN BRANCH16, Sir William Newton street,Port Louis
GOODLANDSRoyal Road, Goodlands
FLACQCharles de Gaulle Street, Central Flacq
ROSE HILL342, Royal Road, Rose Hill
QUATRE BORNES74, St Jean Road, Quatre Bornes
VACOASJohn Kennedy Avenue,Vacoas
CUREPIPEA10 Royal Road, Curepipe
ROSE BELLEG-29, Centre Commercial du Vieux Moulin, Rose Belle

BANK ONE ANNUAL REPORT 2020 - OVERVIEW
6 7
BANK ONE ANNUAL REPORT 2020 - OVERVIEW
AT A GLANCE
BUSINESS REGISTRATION NO:C07040612
REGISTERED OFFICE:16, Sir William Newton Street Port Louis, Mauritius
Telephone: (230) 202 9200
Fax: (230) 212 8883
Website: www.bankone.mu
NATURE OF BUSINESS:Bank One is licensed by the Bank of Mauritius (BOM) to carry out banking business in Mauritius.
THE BANK ALSO HOLDS THE FOLLOWING LICENCES:
LICENCE ISSUER
Licence to act as Insurance Agent in Mauritius Financial Services Commission of Mauritius
Licence for distribution of financial products in Mauritius Financial Services Commission of Mauritius
Investment Adviser (Unrestricted) Licence in Mauritius Financial Services Commission of Mauritius
Custodian Licence Financial Services Commission of Mauritius
Custodian Services (NON-CIS) Licence Financial Services Commission of Mauritius
Representative of Investment Adviser (Unrestricted) Licence Mr Guillaume Passebecq Financial Services Commission of Mauritius
Phone: +230 202 9200
Fax: +230 212 8883
Email: [email protected]
MAIN CORRESPONDENT BANKS:
EXTERNAL AUDITORS:Deloitte 7th-8th Floor
Standard Chartered Tower
19-21 Bank Street
Cybercity, Ebène, Mauritius
Citibank NA, London
Citibank NA, New York
JP Morgan, New York, USA
Natixis Bank, Paris
Sumitomo Mitsui Banking Corporation, Japan
Mizuho Bank Limited, United Kingdom
Mashreq Bank PSC, Dubai City
Axis Bank, Mumbai
Bank of China Limited, Johannesburg
SBM Bank (Mauritius) Ltd, Mumbai
I & M Bank Limited, Nairobi
BNI Madagascar, Antananarivo
DBS Bank Ltd, Singapore
Absa Bank Ltd, Johannesburg
FirstRand Bank Ltd, Johannesburg
The Standard Bank of South Africa Limited, Johannesburg
Abu Dhabi Commercial Bank, Abu Dhabi
OUR ACCOLADES IN 2020
GLOBAL BANKING & FINANCE REVIEW
Best Custodian Bank Mauritius 2020
Best SME Bank Mauritius 2020
Best Corporate Governance Bank Mauritius 2020
THE DIGITAL BANKER
Global Private Banking Innovation Awards 2020
Global Retail Banking Innovation Awards 2020
Best Product Innovation Best Private Bank (South Africa) Credit Card of the Year
CAPITAL FINANCE INTERNATIONAL (CFI.CO)
GLOBAL FINANCE MAGAZINE
Best Corporate Bank 2020 (Indian Ocean)
Best International Banking Services 2020 (Indian Ocean)
Best Private Bank Mauritius 2020
BANK ONE ANNUAL REPORT 2020 - OVERVIEW
8 9
BANK ONE ANNUAL REPORT 2020 - OVERVIEW
FINANCIAL HIGHLIGHTS
GROSS ADVANCESTOTAL ASSETS
TOTAL DEPOSITS
MUR Million Dec 2020Dec 2019Dec 2018Dec 2017Dec 2016
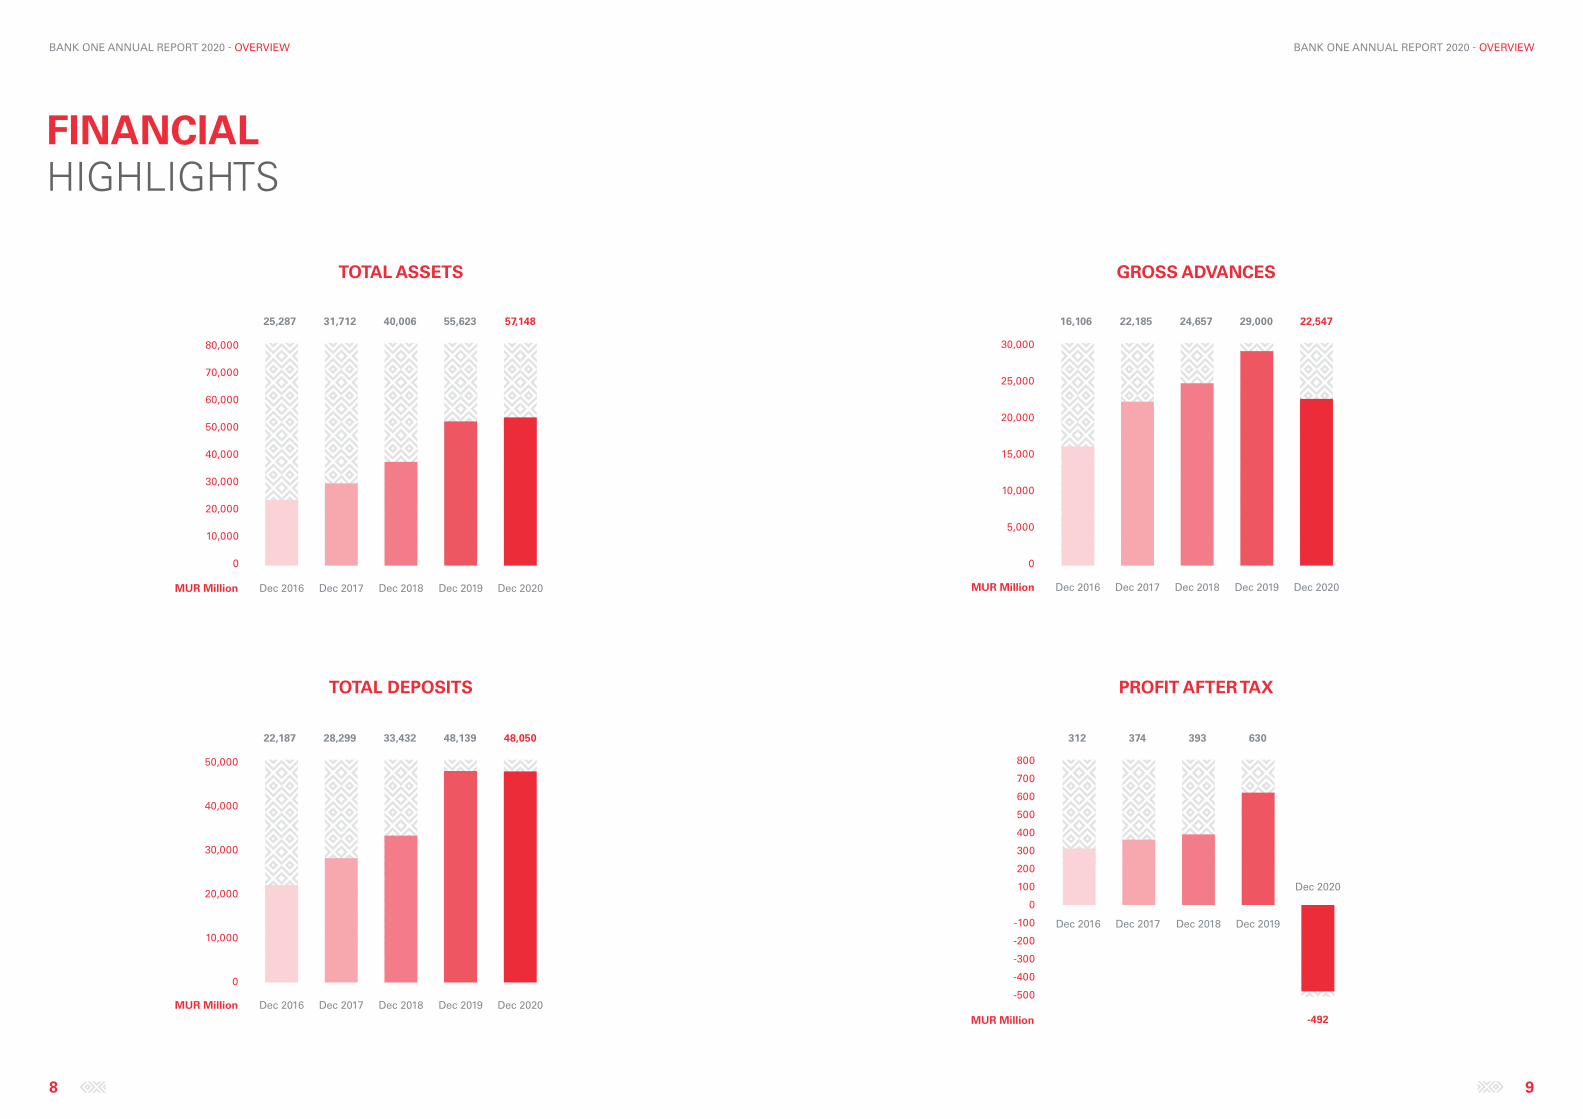
25,287 31,712 40,006 55,623 57,148
0
10,000
20,000
30,000
40,000
50,000
60,000
70,000
80,000
MUR Million Dec 2020Dec 2019Dec 2018Dec 2017Dec 2016
22,187 28,299 33,432 48,139 48,050
0
10,000
20,000
30,000
40,000
50,000
0
5,000
10,000
15,000
20,000
25,000
30,000
MUR Million Dec 2020Dec 2019Dec 2018Dec 2017Dec 2016
16,106 22,185 24,657 29,000 22,547
PROFIT AFTER TAX
MUR Million
Dec 2020
Dec 2019Dec 2018Dec 2017Dec 2016
312 374 393 630
-492
-500
-400
-300
-200
-100
0
100
200
300
400
500
600
700
800
BANK ONE ANNUAL REPORT 2020 - OVERVIEW
10 11
BANK ONE ANNUAL REPORT 2020 - OVERVIEW
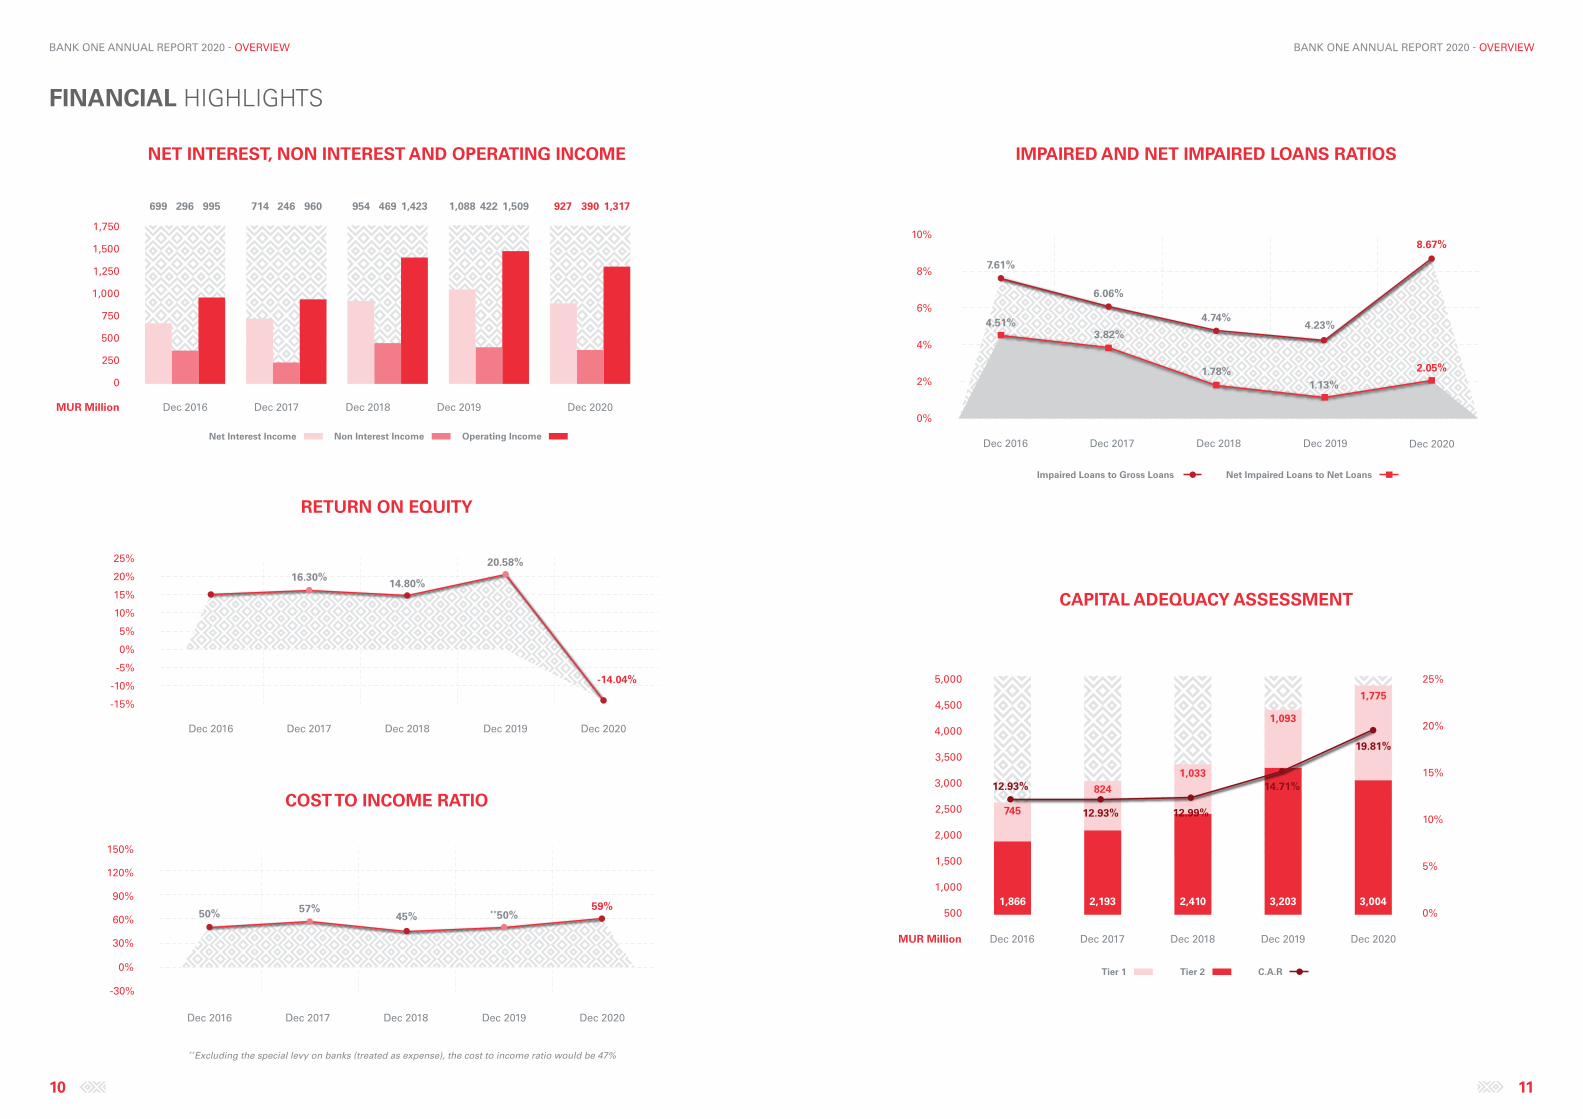
IMPAIRED AND NET IMPAIRED LOANS RATIOS
CAPITAL ADEQUACY ASSESSMENT
NET INTEREST, NON INTEREST AND OPERATING INCOME
MUR Million Dec 2020Dec 2018Dec 2017Dec 2016
699 995296 714 960246 954 1,423469 927 1,317390
Dec 2019
1,088 1,509422
0
500
250
750
1,250
1,000
1,500
1,750
Net Interest Income Non Interest Income Operating Income
Net Impaired Loans to Net LoansImpaired Loans to Gross Loans
0%
2%
4%
6%
8%
10%
7.61%
6.06%
4.74%4.23%
8.67%
1.13%1.78%
3.82%4.51%
2.05%
Dec 2020Dec 2019Dec 2018Dec 2017Dec 2016
1,093
Dec 2020Dec 2019Dec 2018Dec 2017Dec 2016
1,000
500
1,500
2,500
3,500
2,000
3,000
4,000
4,500
5,000
0%
10%
5%
15%
20%
25%
1,866
745
2,193
824
2,410 3,203 3,004
1,033
1,775
19.81%
14.71%
12.93%
12.93%
12.99%
MUR Million
Tier 1 Tier 2 C.A.R
RETURN ON EQUITY
Dec 2020Dec 2019Dec 2018Dec 2017Dec 2016
-15%
-10%
-5%
0%
5%
10%
15%
20%
25%
16.30%14.80%
20.58%
-14.04%
COST TO INCOME RATIO
0%
-30%
30%
60%
90%
120%
150%
Dec 2020Dec 2019Dec 2018Dec 2017Dec 2016
50% 57%45% **50%
59%
FINANCIAL HIGHLIGHTS
**Excluding the special levy on banks (treated as expense), the cost to income ratio would be 47%

BANK ONE ANNUAL REPORT 2020 - LEADERSHIP
12 13
BANK ONE ANNUAL REPORT 2020 - LEADERSHIP
LEADERSHIPCHAIRPERSON’S REPORT
CHIEF EXECUTIVE OFFICER’S REPORT
DIRECTORS’ PROFILES
SENIOR MANAGEMENT TEAM’S PROFILES

BANK ONE ANNUAL REPORT 2020 - LEADERSHIP
14 15
BANK ONE ANNUAL REPORT 2020 - LEADERSHIP
CHAIRPERSON’S REPORTTHE BANK WAS
SUCCESSFUL IN RAISING ADDITIONAL CAPITAL, TOTALLING MUR 900M DESPITE THE DOOM AND GLOOM OF THE PANDEMIC.
- Sandra Martyres
Looking back to 2017, when I took over as Chairperson of Bank One, a lot has changed. To begin with, thanks to the guidance received from our Board of Directors and the combined efforts of our Senior Management and their committed teams we have been able to bring the bank where it stands today, from a US$ 800m assets company to + US$ 1.4bn today.
2020 can best be described as ”annus horribilis” one that most of us would like to obliterate from memory. The outbreak of the Covid-19 pandemic changed the world forever. Its deadly impact on the health of both populations and economies across the world has dominated the headlines over the past twelve months. The virus has claimed more than 2.2 million lives and left over a 100 million people infected. Fortunately, many pharma companies went into over-drive mode to develop and produce anti-virus vaccines in record time. These are now being rolled out systematically in various countries.Hopefully in 2021 we will see the end of this crisis.
The Mauritian government was among the countries that took some early and strong measures to contain Covid-19. An immediate lockdown for three months was declared effective 18th March 2020 to protect citizens from contracting the virus. The borders have since remained closed for the last ten months leading to adverse consequences for the hospitality sector - the second largest economic driver of the country. Simultaneously, the government also introduced several measures to help those affected by the pandemic which include a reduction in the cash reserve ratio, a special relief support of MUR 5 billion, a moratorium on loan repayments, and the creation of the MIC with a fund of MUR 2bn to support the affected sectors of the Economy. They have also placed on hold the revised impairment recognition and measurement guidelines for Banks. These actions are intended to mitigate a potential socio-economic crisis.
Brexit was another major international event in 2020 that occupied the minds of economists and decision-makers not only in Europe and the UK but the rest of the world as well. Negotiations to come up with an acceptable deal before the 31-12-2020 deadline reached a feverish pitch towards the end of the year. Fortunately an agreement was inked in time. The future will decide the success or otherwise of this UK move.
2020 will also be remembered for the unprecedented presidential elections and the Black Lives matter movement in the United States. In November, Joe Biden and Kamala Harris defeated the incumbent President Trump and Vice President Mike Pence in an election that was different from the previous ones. America experienced record numbers of people voting early and by mail. Both candidates received more votes than any other U.S. presidential candidate in history, with Trump receiving more than 74 million votes and Biden more than 81 million.
The world awaits dramatic policy changes in the US under the Biden-Harris leadership in respect of the Paris agreement on climate change, improvements in the UK/US and the US/China relationships, a slow but positive solution to the Iran situation, more liberal and pragmatic immigration policies etc. However the foremost item on the President’s mind will be the successful tackling of the Covid Crisis and the clearance of his $ 1.9 trillion Relief Plan.
On the Economic front even though anti-Covid vaccines have been released, the environment in which we operate remains highly volatile and uncertain. 2021 is expected to be another challenging year both on the international and local fronts. The low interest rate environment is expected to persist and the credit risk to be under further stress. All these have reckoned an immediate review of the short, medium as well as long term strategy of the bank.
In Bank One we have had some major leadership changes. On behalf of the Board, I would like to introduce Mark Watkinson who took over as CEO of Bank One in April 2020. Mark is a seasoned international banker who spent 33 years with the HSBC Group handling senior leadership roles in 10 countries. We are sure that under his able management, Bank One will scale greater heights in the years to come. I would also like to take this opportunity to thank the outgoing CEO Ravneet Chowdhury for his contribution to the growth and progress of the bank over the past six years. Other Senior Management changes include Eric Hautefeuille who took over as COO from Saleem Ul Haq in September 2020. Saleem left to pursue a career outside the Bank.
The Board of Directors recognises all the efforts put in by the management to contain the virus through the introduction of the hygiene and other measures and are proud to claim that the situation was admirably managed. The pandemic also brought changes in the functioning of the Board. During the pandemic, all our Board meetings were conducted virtually something that would have been unthinkable earlier. The Directors adapted to the new way of working almost seamlessly. We have been able to stay in touch with the Management to get regular updates `on the ground realities` (not all the directors are based in Mauritius) as well as work with them on different stress scenarios and the resultant effects on the bank`s performance, capital and most importantly the liquidity positions.
Against this negative global environment as a result of the pandemic it is no wonder that Bank One too has seen a dent in its financials - further exacerbated by two overseas exposures to the hospital sector in the Middle East. The operating income went down from MUR 1.51bn in 2019 to MUR 1.32bn for the year under review (a decline of 12%). The implementation of some cost control measures put in place by the management did help to reduce the impact on the bottom line. Unfortunately, impairment losses to the tune of MUR 1.1bn were booked owing to a deterioration in the probability of default as a consequence of the Covid economic slowdown, but more significantly related to the two Gulf region loans that were classified. Bank One finally closed the year with a post-tax loss of MUR 492 million.

BANK ONE ANNUAL REPORT 2020 - LEADERSHIP
16
It is indeed pertinent to point out here that the bank was successful in raising additional capital totalling MUR 900m in spite of the doom and gloom pandemic scenario. Our shareholders injected an additional MUR 300m as Tier 1 capital while a further MUR 600m was raised from the market in the form of Subordinated bond issue. With a capital adequacy ratio of 19.81%, the bank is well positioned to consolidate and grow its asset base selectively. The management is also revisiting its strategy for all business lines in light of the events that affected the world in 2020 which will crystallise in the second semester of 2021.
Under the strong leadership of Mark Watkinson and his team, the various initiatives taken in 2020 to improve capital and liquidity will definitely go a long way in helping Bank One to realise its ambitions and confront any future challenges going forward.
On that positive note, I would like to thank our shareholders who have always been available to support the bank in difficult times, my fellow directors for their active and valuable participation in Board meetings, the Bank One team for their commitment and unstinted efforts as well as our External Auditors and Regulators for their guidance and support.
Sandra MartyresChairperson
09 March 2021
CHAIRPERSON’S REPORT

BANK ONE ANNUAL REPORT 2020 - LEADERSHIP
18 19
BANK ONE ANNUAL REPORT 2020 - LEADERSHIP
THANKS TO A CAR OF 19.81%, THE BANK REMAINS AMONGST THE BEST CAPITALISED BANKS IN MAURITIUS.
- Mark Watkinson
As Bank One’s new CEO, I am pleased to share an update of the Bank’s performance for the year ended December 2020. I took over as CEO on 1 April 2020, in the midst of the Covid crisis and national lockdown, and consider myself fortunate to have been supported by a team of motivated professionals and a very engaged board.
A combination of the Covid crisis and of the impact of two significant frauds in the UAE has made 2020 a particularly difficult year for Bank One - and this is clearly reflected in our results. However, some excellent work has taken place and the business now has historically high levels of capital and liquidity. This, along with the Board and shareholders’ support for the Bank’s biggest investment programme in people, property, systems and processes, places Bank One in an excellent position to take advantage of the return of economic growth as the Covid crisis comes under control.
The Covid crisis
In these extraordinary times, the word “challenging” has become somewhat overused. That being said, the last 10 months have been unprecedented for most people, putting both individuals and businesses across the world under enormous pressure. Globally, there have been over 100 million confirmed Covid-19 cases, with some 2 million losing their lives as a result of the pandemic. This has indeed been a very challenging year for the world.
Mauritius has faced up to the crisis robustly but at no small cost to the island, its people and the economy. Border controls and quarantine came into effect in March last year and, to a very large extent, have insulated Mauritius from the worst health effects of the pandemic. Economically, they have effectively closed the tourist sector, which represent some 25% of the country’s GDP. However, the government’s and Bank of Mauritius’ Covid-19 support programmes have provided very large-scale assistance to the worst impacted sectors of the Mauritian economy.
Relief is however on the way in the form of global vaccination programmes, with some six vaccines cleared for use in numerous countries, 20 further vaccines in the late-stage development pipeline, and another 60 in early-stage development - a significant tribute to human ingenuity. The impact of the vaccines will likely start to be felt in the second semester of 2021.
Addressing the crisis
At Bank One, the focus was very much on our team’s safety and well-being, as well as on-going support to our customers. The Bank’s crisis management protocol was triggered early and proved robust. A range of staff health initiatives were immediately put into effect as well, and split operations and new digital processes followed quickly to safeguard customer services. Significant work was also put into bolstering IT infrastructure and supporting new “work from home” procedures.
Managing liquidity during the crisis was a priority and the Bank bolstered its liquidity buffer through a number of well executed repos and swaps. In addition, a phased reduction in the cross-border loan portfolio reduced credit risk and enhanced capital.
Throughout the year, the Bank worked closely with its customers, in line with the measures introduced by the Bank of Mauritius to support the businesses and people impacted by the pandemic.
At the half year, our shareholders showed their commitment to Bank One with a MUR 300M Tier 1 capital injection, which was further bolstered by a MUR 600M subordinated bond issue, that was very well received by the market. The Bank now has historically high levels of capital. As a result, the Bank’s CARE rating was confirmed at A+ Stable in June 2020.
Financial performance
Bank revenue declined by 12% as a result of a general fall in business activity, a sharp decline in interest rates (both MUR and USD) and the decision to manage down the cross-border loan portfolio, with the gross loan book falling by 22%. Profit before impairment declined by 32% as the business took the position to protect employment and continue on key long-term investment programmes.
The impact of Covid-19 on PDs and LGDs, and the provisions taken on the two UAE fraud cases (a blended 91%), resulted in the overall loss incurred.
Despite these challenges, the Bank has managed to grow its balance sheet by 3% and continues to maintain high levels of liquidity, with a Liquidity Coverage Ratio of 394% against a regulatory requirement of 100%, and a strong capital base. Thanks to a Capital Adequacy Ratio of 19.81%, the Bank remains amongst the best capitalised banks in Mauritius.
CEO'S REPORTDear shareholders, directors and colleagues,
BANK ONE ANNUAL REPORT 2020 - LEADERSHIP
20
Regulatory environment
The local regulators at both the Bank of Mauritius and Financial Services Commission (FSC), have been very focused on supporting businesses and the economy during the pandemic. In addition, the government’s decision to establish the Mauritius Investment Corporation (MIC) to provide long-term funding to the largest businesses on the island worst effected by Covid, has provided the market with a much needed confidence boost.
The FATF “Grey list” and EU Blacklist added to international difficulties, though government has responded resolutely with significant legal and regulatory enhancements to meet FATF requirements. Feedback on Mauritius’ efforts have been very positive and it seems likely the island’s FATF position will be regularised and that it will come off the EU Blacklist later this year.
The direct impact on businesses appears relatively muted at this stage, but it is understood a number of banks on the island have lost correspondent banking relationships and new investment has been impacted. It is therefore of real importance that there is continued effort to ensure Mauritius is seen to adopt and act on global best practices in this area.
As part of the response to the FATF challenges, there has been a considerable local regulatory focus on AML and CFT. Bank One has made material investment during the year in its own Compliance Transformation Programme and the build out of its compliance capabilities, which will serve the business well in the years to come and has already played a major role in the decision of JP Morgan to onboard Bank One to clear US dollars at the end of 2020. With both Citibank and JP Morgan as its USD clearers, Bank One is definitely well positioned.
The opportunity
Bank One is operating in one of the most exciting regions of the world. While not without its difficulties, the potential of the Sub-Saharan African region over the coming decades is enormous and Mauritius, leveraging its stability and well-regulated markets, has the opportunity to act as a platform to serve the coming needs of the continent.
Through its shareholders, Bank One has direct relationships with banks in seven important Sub-Saharan African markets, stretching from East to West Africa. This puts Bank One, as a local Mauritian Bank, in the unique position to support African companies and people wishing to do business on the island, as well as Mauritian customers trading or looking to trade in Sub-Saharan Africa.
On another note, Bank One will continue to build and invest in its domestic franchise to serve its local customers. In 2021, the Bank will open a new head office in Port Louis Waterfront, underlying its commitment to the island. These new opportunities for growth will require investment in both people and systems.
With the support of our shareholders and Board, despite the difficulties of the pandemic, a major new investment plan was adopted in December 2020. This will require significant work to implement but, over the coming quarters, it will materially lift the Bank’s capabilities to serve both its existing and new customers.
Acknowledgements
I would like to take this opportunity to thank the Bank One team for their support in 2020 - our shareholders, the Board, all our work colleagues, our customers, auditors and regulators, make Bank One. They can take pride in the achievements of the organisation in facing up to a year without precedent and helping to set the business on course for an exciting future. I look forward to working with you all in 2021!
Mark WatkinsonCEO and Director
CEO’S REPORT

BANK ONE ANNUAL REPORT 2020 - LEADERSHIP
22 23
BANK ONE ANNUAL REPORT 2020 - LEADERSHIP
DIRECTORS’ PROFILES
1SANDRA MARTYRESIndependent Chairperson
2RAVNEET CHOWDHURYChief Executive Officer & Executive Director (till 31.03.2020)
3MARK WATKINSONChief Executive Officer & Executive Director (as from 01.04.2020)
4GAURI A. GUPTANon-Executive Director
5PAUL E. LEECHNon-Executive Director
6LEONARD C. MUSUSAIndependent Director
7IGNASI SERRAHIMA ARBESTAINIndependent Director
8L. A. SIVARAMAKRISHNANNon-Executive Director
9NIKHIL TREEBHOOHUNIndependent Director
10MARC-EMMANUEL VIVESNon-Executive Director
22
1
4
7
10
2
5
8
3
6
9
BANK ONE ANNUAL REPORT 2020 - OUR LEADERSHIP
BANK ONE ANNUAL REPORT 2020 - LEADERSHIP
24 25
BANK ONE ANNUAL REPORT 2020 - LEADERSHIP
SANDRA MARTYRES
Independent Chairperson(Appointed as Independent Director on 02.09.13 and Chairperson on 07.09.17)
Sandra Martyres has over 25 years of experience in banking at Senior Management level, overseeing all areas from front office (corporate banking, trade finance, treasury & foreign exchange trading) to support functions (Finance, HR, Admin, IT, Operations). She retired from Société Générale as Deputy CEO – India. She is currently an Independent Director on the Boards of Novartis India Ltd, Franklin Templeton Trustee Services India P. Ltd, HNI India Office Ltd and an Executive Member of the Managing Committee of Alliance Française de Bombay.
Sandra holds a Master’s Degree in Economics from the University of Mumbai.
RAVNEET CHOWDHURY
Chief Executive Officer & Executive Director (Appointed on 01.01.14, Employment contract expired on 31.03.20)
Ravneet Chowdhury has a long career in the banking industry, occupying various senior positions within the Standard Chartered Bank prior to his appointment as CEO of Standard Chartered Bank, Oman. He possesses extensive African experience, having worked in Southern and East Africa for a number of years and he has also worked for ABN AMRO and American Express Bank.
Ravneet is a qualified chartered accountant and holds a Bachelor of Commerce from the University of Delhi and an MBA from Henley Management College.
MARK WATKINSON
Chief Executive Officer & Executive Director (Appointed on 01.04.20)
Mark Watkinson has been a career banker with the HSBC Group for 33 years, during which time he held senior leadership roles in 10 countries in North America, Europe, Asia and the Middle East. In particular, Mark was CEO and Main Board Director for HSBC Bank Bermuda Limited (2015-2018), CEO and Main Board Director for HSBC Bank Malta Ltd (2011-2015), Executive Vice President Commercial Banking Canada and North America (2010-2011), President and CEO for HSBC Bank Philippines (2006-2010), Senior Vice President Commercial Banking HSBC Bank USA (2004-2006) and Senior Manager Commercial Banking HSBC Bank United Arab Emirates (2001-2004).
Mark holds a law degree and is a Barrister at Law in the United Kingdom, he is an Associate of the Chartered Institute of Bankers. He also holds a MBA (with Distinctions) from the University of Warwick and is a qualified Chartered Director from the Institute of Directors, United Kingdom.
Mark was appointed as Independent Non-Executive Director of the Mauritius Institute of Directors (MIoD) in July 2020 and Deputy Chairman of the Mauritius Bankers Association (MBA) in August 2020.
GAURI A. GUPTA
Non-Executive Director(Appointed on 02.03.17)
Gauri Gupta heads I&M Group’s Corporate Advisory function. Under Corporate Finance, Gauri’s forte lies in M&A transactions including transaction structuring and negotiation of legal documentation. She holds a BCom degree and is a Chartered Accountant from the Institute of Chartered Accountants of India. Her experience of over 20 years in Banking covers Credit, Risk Management, Product Development, Finance, and Strategic Planning. She has been instrumental in the enhancement of the corporate governance framework at I&M for over 15 years and oversees governance matters for I&M Holdings Plc, the parent entity for I&M Bank Group, listed on the Nairobi Securities Exchange. She is a Director on the board for several companies under the I&M Bank Group including I&M Burbidge Capital Limited, an East African Corporate Advisory firm.
PAUL E. LEECH
Non-Executive Director (Appointed on 26.06.19)
Paul Leech is currently the Non-Executive Chairman of CIEL Finance Limited, the Chairman of the Strategy Committee and a Member of the Audit and Risk Committee of CIEL Finance Limited. He is also the Non-Executive Chairman of the IQ EQ group companies in Mauritius. Prior to these roles, he was Group CEO of Cim Financial Services Ltd from 2014 to 2017 and worked for 33 years with the HSBC Group in Asia, Africa and Europe. He held the position of Head of International at HSBC in Asia-Pacific prior to his retirement from HSBC in 2011.
Paul holds a bachelor’s degree from the University of Birmingham.
LEONARD C. MUSUSA
Independent Director(Appointed on 02.03.17)
Leonard Mususa is a Private Management Consultant with extensive experience in transaction services including due diligence and business valuations, business recovery and reconstruction services.
Leonard previously worked with PwC for 36 years and developed expertise in corporate governance, financial reporting, risk management and control. He served as Country Senior Partner with PwC (Tanzania) for 14 years prior to his retirement. He also served in other roles as Head of Assurance Risk and Quality in the PwC Africa Central region for three years and Head of Risk, Independence and Quality in the East Africa Market Area for a period of two years.
Leonard also holds directorships in diverse companies in Kenya and Tanzania in financial, consumer industry and media sectors. He is a Fellow of the Association of Chartered Certified Accountants (FCCA) and Fellow Certified Public Accountant (Tanzania).
IGNASI SERRAHIMA ARBESTAIN
Independent Director(Appointed on 16.04.19)
Ignasi Serrahima Arbestain has been a freelance consultant since March 2014, advising various entities in Madrid, Barcelona, Dubai, Riyadh, Nairobi and Mumbai in areas of strategic development and human resources. Prior to launching his consultancy business, Mr. Serrahima occupied various M&A roles at Banco Popular Espanol, S.A (Madrid) and Bankinter, S.A. (Madrid) between September 2000 to March 2014.
He holds a degree in Business Administration and an MBA at ESADE, Spain, as well as a Master in International Management from the Thunderbird School of Global Management, USA.
L. A. SIVARAMAKRISHNAN
Non-Executive Director(Appointed 07.03.16)
L. A. Sivaramakrishnan is the Head of Business Development at I&M Bank Limited. He has over 38 years of banking experience and has previously occupied the post of Head of Corporate Banking at I&M Bank Limited and Head of I&M Kenya’s Main Branch in Nairobi. He also held senior positions in Bank of Baroda in India and Kenya. He is also a director of I&M Insurance Agency Ltd, a fully owned subsidiary of I&M Bank Ltd.
L. A. Sivaramakrishnan holds an MSc in Agricultural Sciences and is a Certified Associate of the Indian Institute of Bankers (CAIIB).
NIKHIL TREEBHOOHUN
Independent Director(Appointed on 21.12.17)
Nikhil Treebhoohun has over 30 years of professional experience in the field of development at both the national level (as the Chief Executive of such intermediary organizations like the Export Processing Zones Development Authority and the National Productivity and Competitiveness Council which were involved in improving competitiveness at both industry and national level), and at international level (as Head of the Trade Section at the Commonwealth Secretariat in London). He was also the CEO of Global Finance Mauritius which is the voice of the financial services industry in Mauritius.
Nikhil holds a BSc (Hons) Econ (Industry and Trade) from the London School of Economics & Political Science, a post graduate diploma in Development Planning Techniques from the Institute of Social Studies, Hague and a post graduate diploma in Financial Management from the University of New England, Australia. He is also a Fellow of the World Academy of Productivity Science and was a Senior Fulbright Fellow at Georgetown University, Washington DC.
Directorship in listed entities in Mauritius: Terra Mauricia Ltd.
MARC-EMMANUEL VIVES
Non-Executive Director(Appointed on 15.04.15)
Marc-Emmanuel Vives joined CIEL Finance Limited as Chief Executive Officer in September 2014, bringing with him more than 25 years of experience at Société Générale.
After starting within the General Inspection of the Société Générale Group, he spent the next 18 years of his career in various assignments in emerging countries, first in Argentina as Commercial Director, then Chairman & CEO of Société Générale Argentina, later in Russia, as CEO of Bank Société Générale Vostok, before becoming First Deputy Chairman of Rosbank, and finally in India as Country Manager.
Marc-Emmanuel holds a Master’s degree in Business Administration from HEC Business School France, as well as a degree in History from Sorbonne University in Paris.
Directorship in listed entities in Mauritius: IPRO Growth Fund Ltd, IPRO Funds Ltd.
DIRECTORS’ PROFILES

BANK ONE ANNUAL REPORT 2020 - LEADERSHIP
26 27
BANK ONE ANNUAL REPORT 2020 - LEADERSHIP
SENIOR MANAGEMENTTEAM’S PROFILES
1ERIC HAUTEFEUILLEChief Operations Officer
2RANJEEVE GOWREESUNKURChief Financial Officer
3STEPHEN VLOKChief Risk Officer
4FAREED SOOBADARHead of Corporate Banking
5CARL STEPHEN CHIRWAHead of International Banking
6GUILLAUME PASSEBECQHead of Private Banking & Wealth Management
7SHEHRYAR BAKHT ALIHead of Retail Banking
8RISHYRAJ (RISHY) LUTCHMANHead of Treasury
9VALERIE DUVALHead of Legal and Regulatory Affairs
10PRISCILLA MUTTYHead of Human Resources
26
1
4
7
10
2
5
8
3
6
9
BANK ONE ANNUAL REPORT 2020 - OUR LEADERSHIP
BANK ONE ANNUAL REPORT 2020 - LEADERSHIP
28 29
BANK ONE ANNUAL REPORT 2020 - LEADERSHIP
ERIC HAUTEFEUILLE
Chief Operations Officer
Eric has a career spanning almost three decades at senior level in the banking sector. He spent 24 years at Société Générale whereby he worked in various countries namely in Europe, Asia and Africa. During his tenure, he successively held the positions of Chief Information Officer and Project Director in Cameroon (1997-2000) and in Tahiti (2000-2005), Project Director in Russia (2005-2007), Head of Operations and Deputy Chief Operating Officer in China (2007-2011), Chief Operating Officer (COO) in India (2011-2014) and Head of Transversal Operations in France (2014-2015). Prior to joining Bank One as COO in October 2020, Eric held the positions of COO and Head of Transformation at BNI Madagascar for the last five years. He was instrumental in developing the BNI footprint, particularly on mobile, cards and payments businesses and branchless digital microfinance.
RANJEEVESINGH (RANJEEVE) GOWREESUNKUR
Chief Financial Officer
Ranjeeve holds an MBA with Finance from Herriot Watt University. Fellow of the Association of Chartered Certified Accountants, he is also a Professional Accountant registered with the Mauritius Institute of Professional Accountants.
He started his career in 1998 at the Union International Bank and has since held various senior positions and gained extensive banking experience in his different roles at Delphis Bank, First City Bank, SBI (Mauritius) and Deutsche Bank (Mauritius). Ranjeeve joined Bank One in 2008 as Financial Accountant and was appointed as CFO since 2014.
STEPHEN VLOK
Chief Risk Officer
Stephen holds a Bachelor of Commerce and a Master of Commerce degree specializing in Financial Management. Stephen is also a certified member of the Institute of Bankers of South Africa and obtained an Associate Diploma from the Institute. Before joining Bank One, Stephen has had twenty years’ experience in risk management in the South African banking and investment industries. Stephen joined the Bank in November 2014 as Chief Risk Officer.
FAREED SOOBADAR
Head of Corporate Banking
Fareed is a Fellow of the Chartered Association of Accountants (UK) - FCCA and an associate member of the London Institute of Banking and Finance (UK) - ACIB and holder of an MBA from Durham University.
He has more than 20 years of work experience in the financial services industry, having worked in auditing, accounting, offshore, HP financing, and including 15 years of banking experiences gained at senior management level. He held several key positions in various organisations over these years namely KPMG, Deloitte, HSBC, AAMIL, Barclays and before joining Bank One, as Corporate Director at Banque des Mascareignes. He also had international exposure with ABSA, Barclays Dubai, and Barclays Africa, where he worked principally in the credit field. Fareed was appointed Head of Corporate Banking of Bank One Limited in February 2015.
CARL STEPHEN CHIRWA
Head of International Banking
Carl is a seasoned Pan-African banking executive with a special focus on corporate banking, structured trade and commodity finance, project finance and financial advisory services. He has developed deep networks on the subcontinent through 20 years of proven track record of origination, structuring and executing of large ticket strategic transactions across a wide variety of sectors in over 26 African countries.
A Fellow Chartered Accountant with a BSc in Applied Accounting, Carl was previously Head of Trade Finance at Citi for the Sub Sahara Africa region. Carl joined Bank One in September 2018.
GUILLAUME PASSEBECQ
Head of Private Banking & Wealth Management Guillaume is an International School of Management (IDRAC) graduate who has spent his entire career in the banking sector. He started off as a Portfolio Manager at B* capital Paris, the BNP Paribas brokerage house in 1999. In 2007, he was appointed as Head of Sales at BNP Paribas Personal Investors Luxembourg. He joined AfrAsia Bank in 2014 and was subsequently appointed as Head of Private Banking.
Guillaume joined Bank One as the new Head of Private Banking in March 2017. He brought along the needed expertise to uplift the Private Banking offer. Following the setting up of the International Custody Platform, Securities Services and the External Wealth Managers Desk, our clients, both high-net-worth and institutional now have the tools for their wealth management experience. The Bank’s array of clients has also been widened to accommodate Asset Managers, Investment Funds, Pension Funds and Family Offices through a one stop shop and open architecture model.
SENIOR MANAGEMENT TEAM’S PROFILES
SHEHRYAR BAKHT ALI
Head of Retail Banking
Shehryar is a seasoned banker with over 16 years of experience at Citibank, Barclays and more recently Mashreq Bank Egypt as Head of Assets and Personal Banking. Over his career, Shehryar has successfully led Payments, Credit Cards Issuing/Acquiring, E-commerce, Personal Loans, Personal Banking and SME Business. Shehryar is a graduate of University of Texas at Austin in Computer Sciences and has joined Bank One as Head of Retail Banking in May 2018.
RISHYRAJ (RISHY) LUTCHMAN
Head of Treasury
Rishy holds an ACI Diploma, a PGCE in derivatives and financial products and a BBA from Management College of Southern Africa.
Before joining Bank One in February 2014, he worked for 26 years in the Treasury division of the State Bank of Mauritius, where he covered different desks such as sales, interbank and fixed income and acquired a comprehensive knowledge of the Mauritian and Malagasy markets. Rishy held the post of Chief Dealer prior to leaving SBM.
VALERIE DUVAL
Head of Legal and Regulatory Affairs
Called to the bar in 1995, Valerie joined Bank One in 2008 and acquired in depth exposure and expertise in banking operations and legal matters.
Valerie is a versatile executive with 23 years of diversified experience. She comes with a unique mix of experience in a senior leadership position in matters pertaining to the general insurance sector and the banking sector. Her expertise ranges from handling high level claims for key general insurers of the market and advising Bank One on all legal aspects relating to the affairs of the Bank including complex recovery of assets in foreign jurisdictions. After having headed the Credit Administration Department of the Bank for 11 years, she was appointed as Head of Legal and Regulatory Affairs since September 2019.
PRISCILLA MUTTY
Head of Human Resources
With over 20 years of experience in the human resource field, Priscilla is a seasoned Human Resources professional who is skilled at partnering with senior management teams to develop and execute strategic HR plans aligned with organizational objectives. She brings to the table her expertise in managing the full employee life-cycle and engaging with employees. She holds a Master in ‘Administration d’Entreprises’ from the University of Poitiers, France.
Prior to joining Bank One, Priscilla has worked across regional and global corporations such as DCDM Consulting (Managed by Accenture) where she was responsible for HR-related consultancy assignments for a portfolio of clients in various industries including banking. Her assignments were conducted both in Mauritius and regionally (i.e. Madagascar, Kenya, Tanzania, Zambia, Djibouti, among others). From 2011 to 2014, she headed the HR department at Bramer Bank before moving to GroFin in January 2015, a development financier specialized in financing and supporting small and growing businesses (SGBs) with 16 offices across Africa and the Middle East, as its Chief HR Officer. Priscilla joined the Bank in December 2017 as Head of HR.
Priscilla received The Women of Wonder Award Mauritius 2018. This patented Award is granted in recognition and appreciation to women who are constantly striving to uplift as well as inspire and empower themselves and other women. She has also been conferred the 101 Most Influential Global HR Leaders by the World HR Congress and more recently led the Bank to win the LinkedIn Best Employer Brand Award for Sub-Saharan Africa below 500 employees category.

PERFORMANCEECONOMIC OUTLOOK
FINANCIAL ANALYSIS
BANK ONE ANNUAL REPORT 2020 - PERFORMANCE BANK ONE ANNUAL REPORT 2020 - PERFORMANCE
32 33
Global economy
The year 2020 saw tremendous change and suffering - not only because of the pandemic but also due to heightened concerns over climate change. The Corona virus, a respiratory disease also known as Covid-19, has prompted schools to shut down, employees to work remotely and people to remain inside their homes in an attempt to contain the spread. The pandemic has caused a severe loss of life, is tipping millions into extreme poverty, and is expected to inflict deep scars that will push activity and income well below pre-pandemic levels for a number of years.
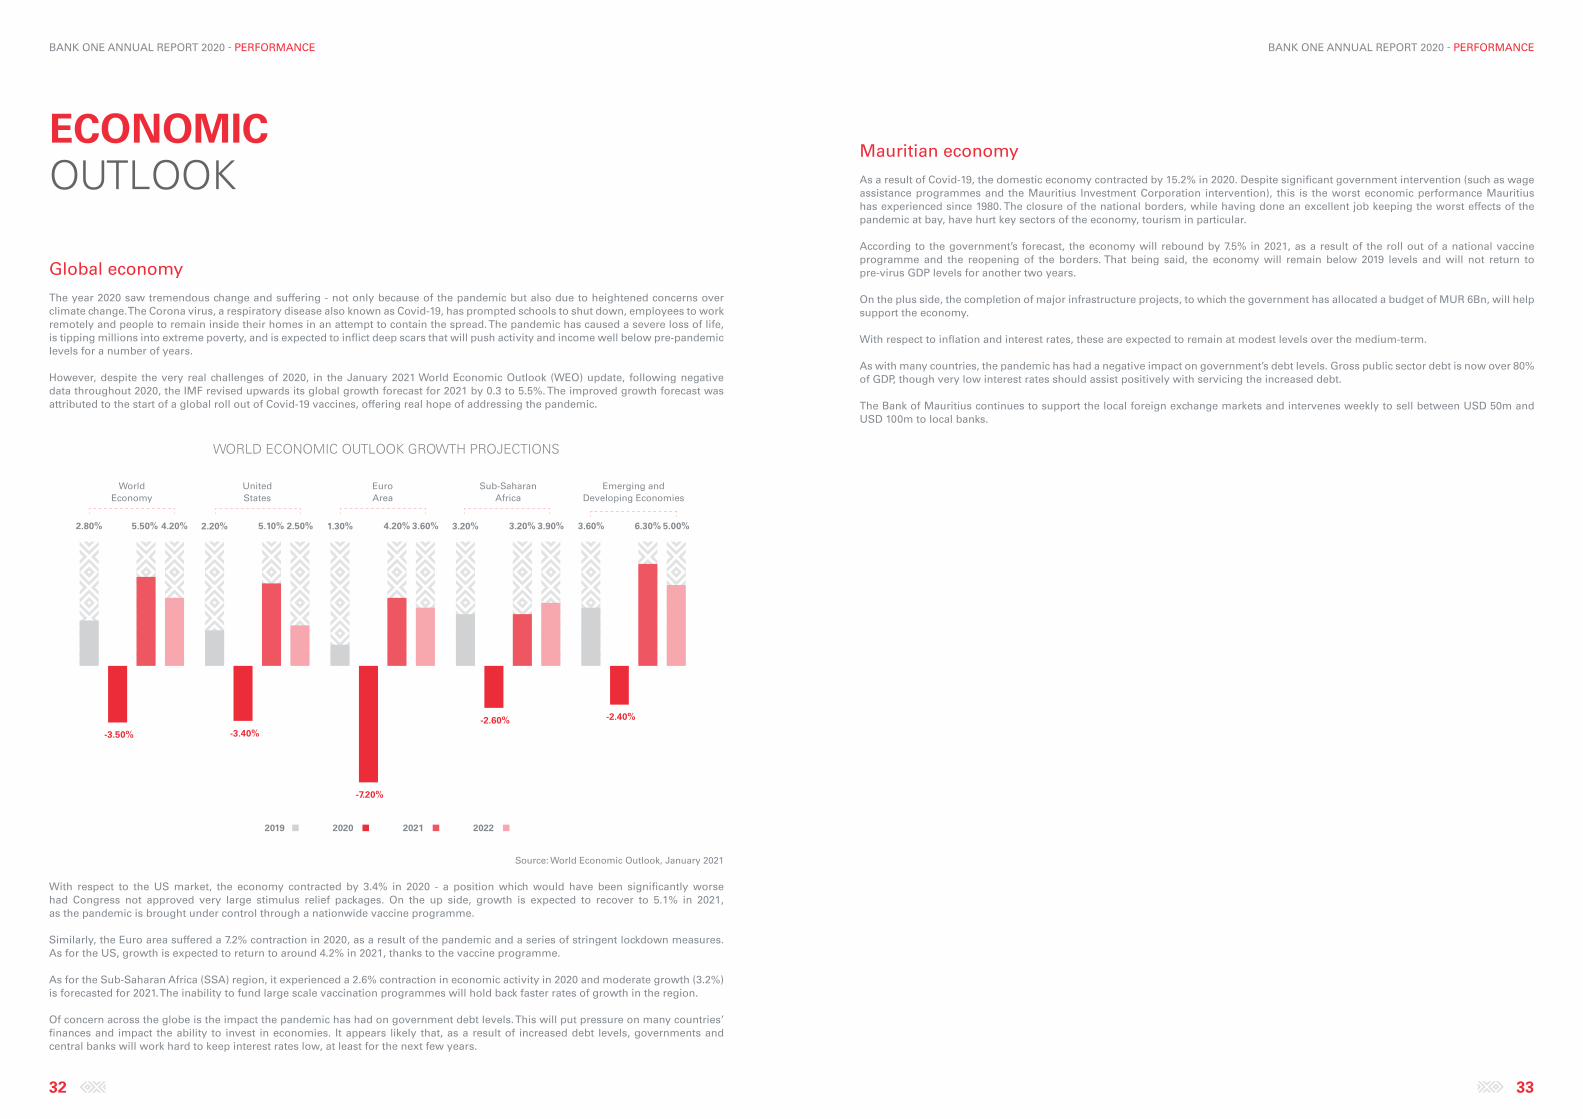
However, despite the very real challenges of 2020, in the January 2021 World Economic Outlook (WEO) update, following negative data throughout 2020, the IMF revised upwards its global growth forecast for 2021 by 0.3 to 5.5%. The improved growth forecast was attributed to the start of a global roll out of Covid-19 vaccines, offering real hope of addressing the pandemic.
Source: World Economic Outlook, January 2021
With respect to the US market, the economy contracted by 3.4% in 2020 - a position which would have been significantly worse had Congress not approved very large stimulus relief packages. On the up side, growth is expected to recover to 5.1% in 2021, as the pandemic is brought under control through a nationwide vaccine programme.
Similarly, the Euro area suffered a 7.2% contraction in 2020, as a result of the pandemic and a series of stringent lockdown measures. As for the US, growth is expected to return to around 4.2% in 2021, thanks to the vaccine programme.
As for the Sub-Saharan Africa (SSA) region, it experienced a 2.6% contraction in economic activity in 2020 and moderate growth (3.2%) is forecasted for 2021. The inability to fund large scale vaccination programmes will hold back faster rates of growth in the region.
Of concern across the globe is the impact the pandemic has had on government debt levels. This will put pressure on many countries’ finances and impact the ability to invest in economies. It appears likely that, as a result of increased debt levels, governments and central banks will work hard to keep interest rates low, at least for the next few years.
Mauritian economy
As a result of Covid-19, the domestic economy contracted by 15.2% in 2020. Despite significant government intervention (such as wage assistance programmes and the Mauritius Investment Corporation intervention), this is the worst economic performance Mauritius has experienced since 1980. The closure of the national borders, while having done an excellent job keeping the worst effects of the pandemic at bay, have hurt key sectors of the economy, tourism in particular.
According to the government’s forecast, the economy will rebound by 7.5% in 2021, as a result of the roll out of a national vaccine programme and the reopening of the borders. That being said, the economy will remain below 2019 levels and will not return to pre-virus GDP levels for another two years.
On the plus side, the completion of major infrastructure projects, to which the government has allocated a budget of MUR 6Bn, will help support the economy.
With respect to inflation and interest rates, these are expected to remain at modest levels over the medium-term.
As with many countries, the pandemic has had a negative impact on government’s debt levels. Gross public sector debt is now over 80% of GDP, though very low interest rates should assist positively with servicing the increased debt.
The Bank of Mauritius continues to support the local foreign exchange markets and intervenes weekly to sell between USD 50m and USD 100m to local banks.
ECONOMICOUTLOOK
WORLD ECONOMIC OUTLOOK GROWTH PROJECTIONS
2.80% 2.20% 5.10% 2.50% 1.30% 4.20% 3.20%3.60%5.50% 4.20%
-3.50% -3.40%
-7.20%
-2.60%
3.20% 3.90% 3.60% 6.30% 5.00%
-2.40%
2019 2020 2021 2022
Emerging and Developing Economies
Sub-Saharan Africa
World Economy
United States
Euro Area
BANK ONE ANNUAL REPORT 2020 - PERFORMANCE BANK ONE ANNUAL REPORT 2020 - PERFORMANCE
34 35
Statement of financial position
The Covid-19 pandemic has intensified the uncertainties in the economic environment, both domestically and on the international front. The impact on the Bank’s operations was visible as from the second quarter of year 2020. During the last weeks of the first quarter, the Bank’s strategy has been to maintain a cushion of liquidity (both USD and MUR) and consolidate its capital level. To do so, the Bank took steps to bring back liquidity (mainly USD) in its books. These included selective redeployment of funds received from loan and other repayments, call back of facilities from certain banks where the credit risk had gone up, and making use of short-term treasury products to maintain liquidity.
On the capital front, the Bank has successfully raised total capital to MUR 900M in June 2020. This included the injection of MUR 300M from our existing shareholders as Tier 1 capital, as well as MUR 600M in the form of subordinated bonds raised from local investors. The Bank gets comfort not only from the support of its existing shareholders, but also from the confidence of local investors in its potential. As at December 2020, the bank’s capital adequacy ratio stood at a record high of 19.81%, and the Tier 1 ratio at 12.45%.
Despite the unfavourable business and economic environment, the Bank has been successful in improving its asset base by a modest 3%, from MUR 55Bn in 2019 to MUR 57Bn as at 31 December 2020. Deposits, being the Bank’s core source of funding, remained stable to close at MUR 48Bn at year end.
The gross loans book was consciously brought down from MUR 29Bn in December 2019 to MUR 22.5Bn in December 2020. The main impacted segment of the strategy was the international business, where a significant decline was noted. The strategy of the Bank to bring back liquidity worked well as evidenced by the level of cash or cash equivalent disclosed in the statement of financial position. The LCR stood at 394% as at December 2020.
During the course of the year, the Bank was also impacted by a major fraud event in segment B, resulting in the impairment of an exposure of USD 25M. The impaired assets went up considerably by 59%, from MUR 1,227M to MUR 1,955M, and the related impairment ratio amplified from 4.23% in December 2019 to 8.67% in December 2020.
Statement of comprehensive income
The strategies enumerated above resulted in a fall in the Bank’s overall income. Added to that was the significant fall in PLR and LIBOR, which added to the pressure on the interest margins. The Bank’s operating income went down from MUR 1,509M in 2019 to MUR 1,317M for the year ended December 2020.
Net interest income fell by 14% compared to last year, on account of significantly lower yields on financial assets exerting pressure on margins and the costs related to liquidity amplification. The interest on borrowings also went up with the additional subordinated loans raised.
With the business volumes going down, the non-interest income declined by 8% compared to last year. The strategy is to continue the initiatives to further diversify the income sources started in previous years. Higher income on treasury operations in Q1/2020 and custody business, helped mitigating the impact of this shortfall.
The Bank continued its investment in digitalisation and technology, resulting in an increase in its non-interest expense by 8% in 2020. With the decline in business volumes, the Bank worked out a cost containment plan which was successfully implemented in 2020, thus reducing the impact on the bottom line.
Despite the negative results in 2020, the Bank intends to direct its efforts towards digitalisation and automation, with a substantial budget being approved by the Board in this regard. The Bank is simultaneously continuing to invest in its people and various initiatives are planned to uplift the skills of its team members.
Significant impairment provisions had to be taken in 2020, related to the fraud event mentioned earlier as well as the result of the worsening economic environment and related impact on our clients’ PDs. Total net impairment charges of MUR 1,074M were booked for stage 1, 2 and 3 in 2020. This resulted in a net loss of MUR 492M for the year.
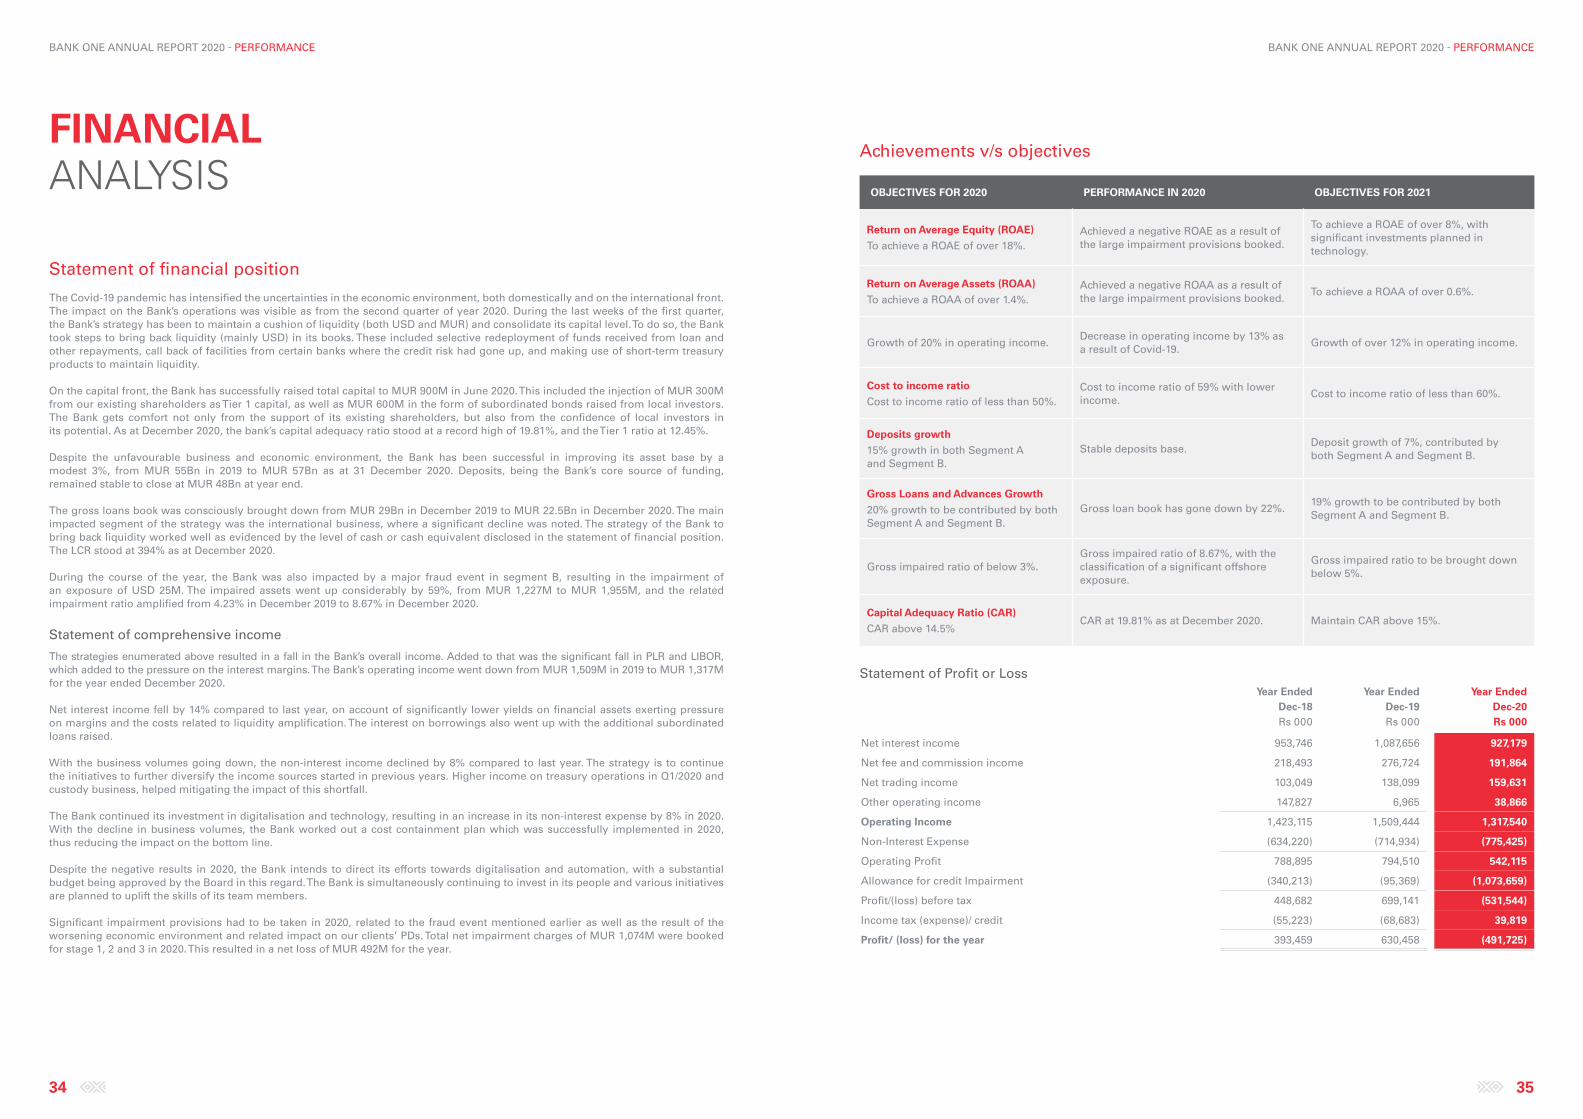
Achievements v/s objectives
OBJECTIVES FOR 2020 PERFORMANCE IN 2020 OBJECTIVES FOR 2021
Return on Average Equity (ROAE)
To achieve a ROAE of over 18%.Achieved a negative ROAE as a result of the large impairment provisions booked.
To achieve a ROAE of over 8%, with significant investments planned in technology.
Return on Average Assets (ROAA)
To achieve a ROAA of over 1.4%.Achieved a negative ROAA as a result of the large impairment provisions booked.
To achieve a ROAA of over 0.6%.
Growth of 20% in operating income.Decrease in operating income by 13% as a result of Covid-19.
Growth of over 12% in operating income.
Cost to income ratio
Cost to income ratio of less than 50%.Cost to income ratio of 59% with lower income.
Cost to income ratio of less than 60%.
Deposits growth
15% growth in both Segment A and Segment B.
Stable deposits base.Deposit growth of 7%, contributed by both Segment A and Segment B.
Gross Loans and Advances Growth
20% growth to be contributed by both Segment A and Segment B.
Gross loan book has gone down by 22%.19% growth to be contributed by both Segment A and Segment B.
Gross impaired ratio of below 3%.Gross impaired ratio of 8.67%, with the classification of a significant offshore exposure.
Gross impaired ratio to be brought down below 5%.
Capital Adequacy Ratio (CAR)
CAR above 14.5%CAR at 19.81% as at December 2020. Maintain CAR above 15%.
Statement of Profit or LossYear Ended Year Ended Year Ended
Dec-18 Dec-19 Dec-20Rs 000 Rs 000 Rs 000
Net interest income 953,746 1,087,656 927,179
Net fee and commission income 218,493 276,724 191,864
Net trading income 103,049 138,099 159,631
Other operating income 147,827 6,965 38,866
Operating Income 1,423,115 1,509,444 1,317,540
Non-Interest Expense (634,220) (714,934) (775,425)
Operating Profit 788,895 794,510 542,115
Allowance for credit Impairment (340,213) (95,369) (1,073,659)
Profit/(loss) before tax 448,682 699,141 (531,544)
Income tax (expense)/ credit (55,223) (68,683) 39,819
Profit/ (loss) for the year 393,459 630,458 (491,725)
FINANCIALANALYSIS
BANK ONE ANNUAL REPORT 2020 - PERFORMANCE BANK ONE ANNUAL REPORT 2020 - PERFORMANCE
36 37
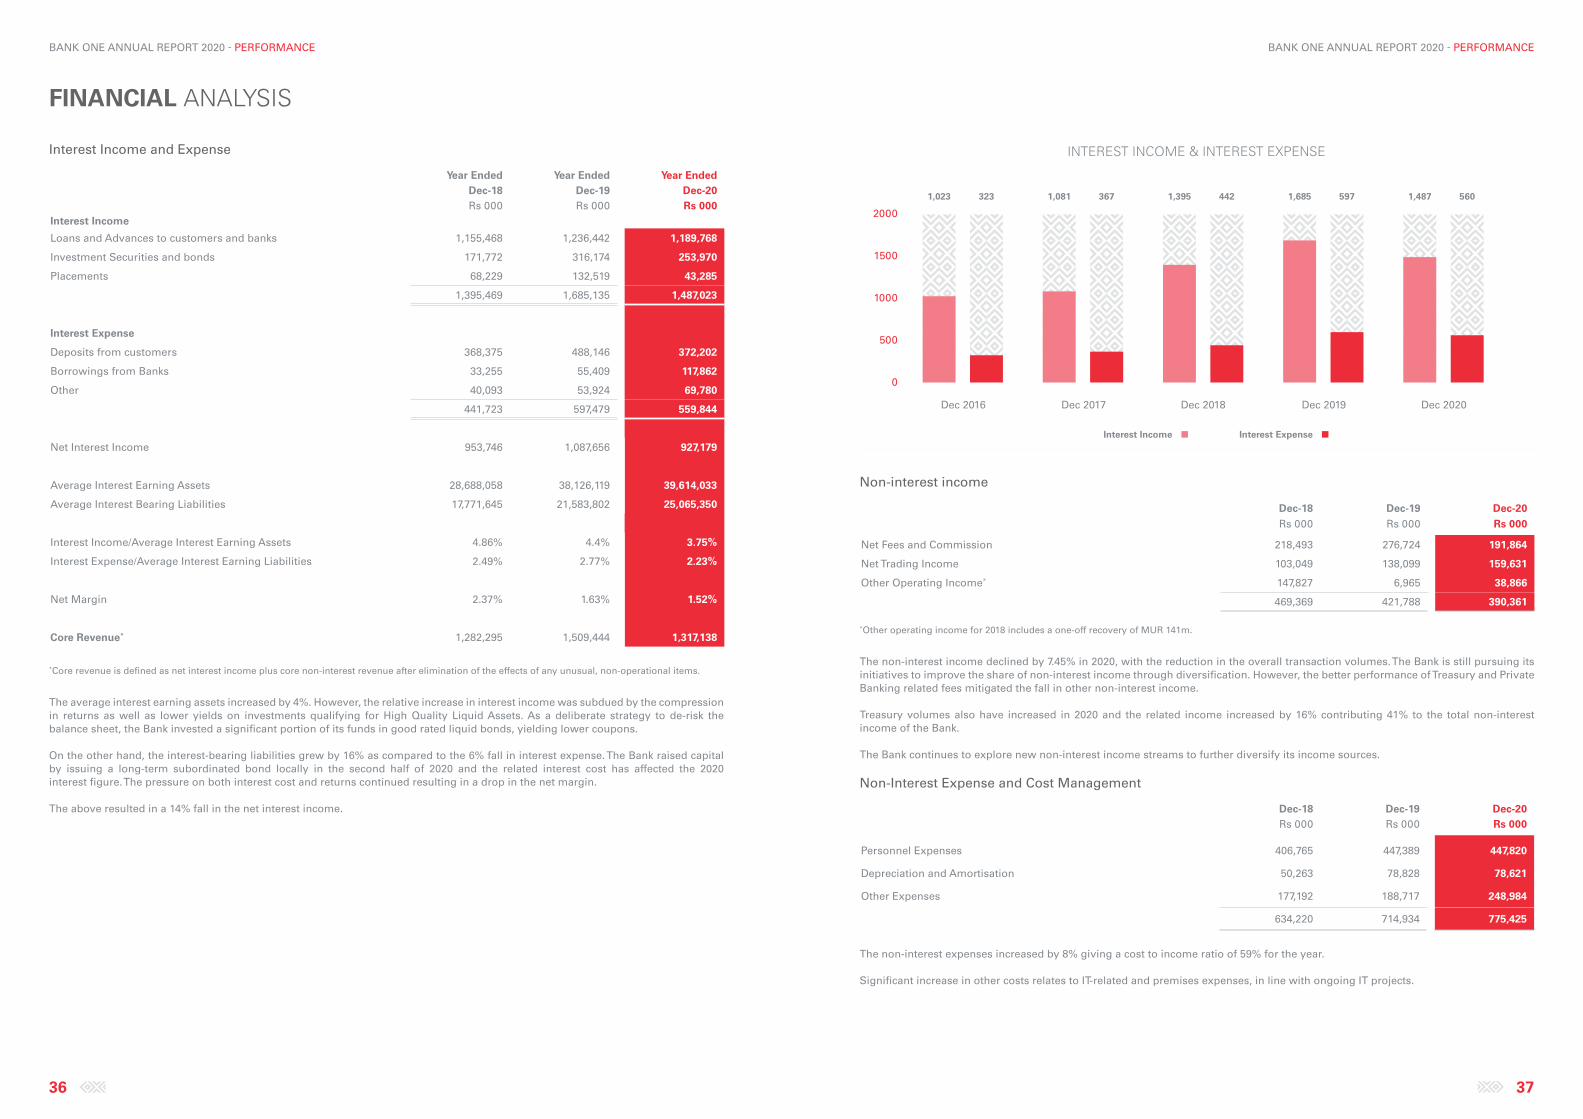
Interest Income and Expense
Year Ended Year Ended Year EndedDec-18 Dec-19 Dec-20Rs 000 Rs 000 Rs 000
Interest Income
Loans and Advances to customers and banks 1,155,468 1,236,442 1,189,768
Investment Securities and bonds 171,772 316,174 253,970
Placements 68,229 132,519 43,285
1,395,469 1,685,135 1,487,023
Interest Expense
Deposits from customers 368,375 488,146 372,202
Borrowings from Banks 33,255 55,409 117,862
Other 40,093 53,924 69,780
441,723 597,479 559,844
Net Interest Income 953,746 1,087,656 927,179
Average Interest Earning Assets 28,688,058 38,126,119 39,614,033
Average Interest Bearing Liabilities 17,771,645 21,583,802 25,065,350
Interest Income/Average Interest Earning Assets 4.86% 4.4% 3.75%
Interest Expense/Average Interest Earning Liabilities 2.49% 2.77% 2.23%
Net Margin 2.37% 1.63% 1.52%
Core Revenue* 1,282,295 1,509,444 1,317,138
* Core revenue is defined as net interest income plus core non-interest revenue after elimination of the effects of any unusual, non-operational items.
The average interest earning assets increased by 4%. However, the relative increase in interest income was subdued by the compression in returns as well as lower yields on investments qualifying for High Quality Liquid Assets. As a deliberate strategy to de-risk the balance sheet, the Bank invested a significant portion of its funds in good rated liquid bonds, yielding lower coupons.
On the other hand, the interest-bearing liabilities grew by 16% as compared to the 6% fall in interest expense. The Bank raised capital by issuing a long-term subordinated bond locally in the second half of 2020 and the related interest cost has affected the 2020 interest figure. The pressure on both interest cost and returns continued resulting in a drop in the net margin.
The above resulted in a 14% fall in the net interest income.
Non-interest income
Dec-18 Dec-19 Dec-20Rs 000 Rs 000 Rs 000
Net Fees and Commission 218,493 276,724 191,864
Net Trading Income 103,049 138,099 159,631
Other Operating Income* 147,827 6,965 38,866
469,369 421,788 390,361
*Other operating income for 2018 includes a one-off recovery of MUR 141m.
The non-interest income declined by 7.45% in 2020, with the reduction in the overall transaction volumes. The Bank is still pursuing its initiatives to improve the share of non-interest income through diversification. However, the better performance of Treasury and Private Banking related fees mitigated the fall in other non-interest income.
Treasury volumes also have increased in 2020 and the related income increased by 16% contributing 41% to the total non-interest income of the Bank.
The Bank continues to explore new non-interest income streams to further diversify its income sources.
Non-Interest Expense and Cost Management
Dec-18 Dec-19 Dec-20Rs 000 Rs 000 Rs 000
Personnel Expenses 406,765 447,389 447,820
Depreciation and Amortisation 50,263 78,828 78,621
Other Expenses 177,192 188,717 248,984
634,220 714,934 775,425
The non-interest expenses increased by 8% giving a cost to income ratio of 59% for the year.
Significant increase in other costs relates to IT-related and premises expenses, in line with ongoing IT projects.
FINANCIAL ANALYSIS
INTEREST INCOME & INTEREST EXPENSE
Interest Income Interest Expense
0
500
1000
1500
2000
1,081 367 1,395 4421,023 323 1,685 597 1,487 560
Dec 2016 Dec 2017 Dec 2018 Dec 2019 Dec 2020
BANK ONE ANNUAL REPORT 2020 - PERFORMANCE BANK ONE ANNUAL REPORT 2020 - PERFORMANCE
38 39
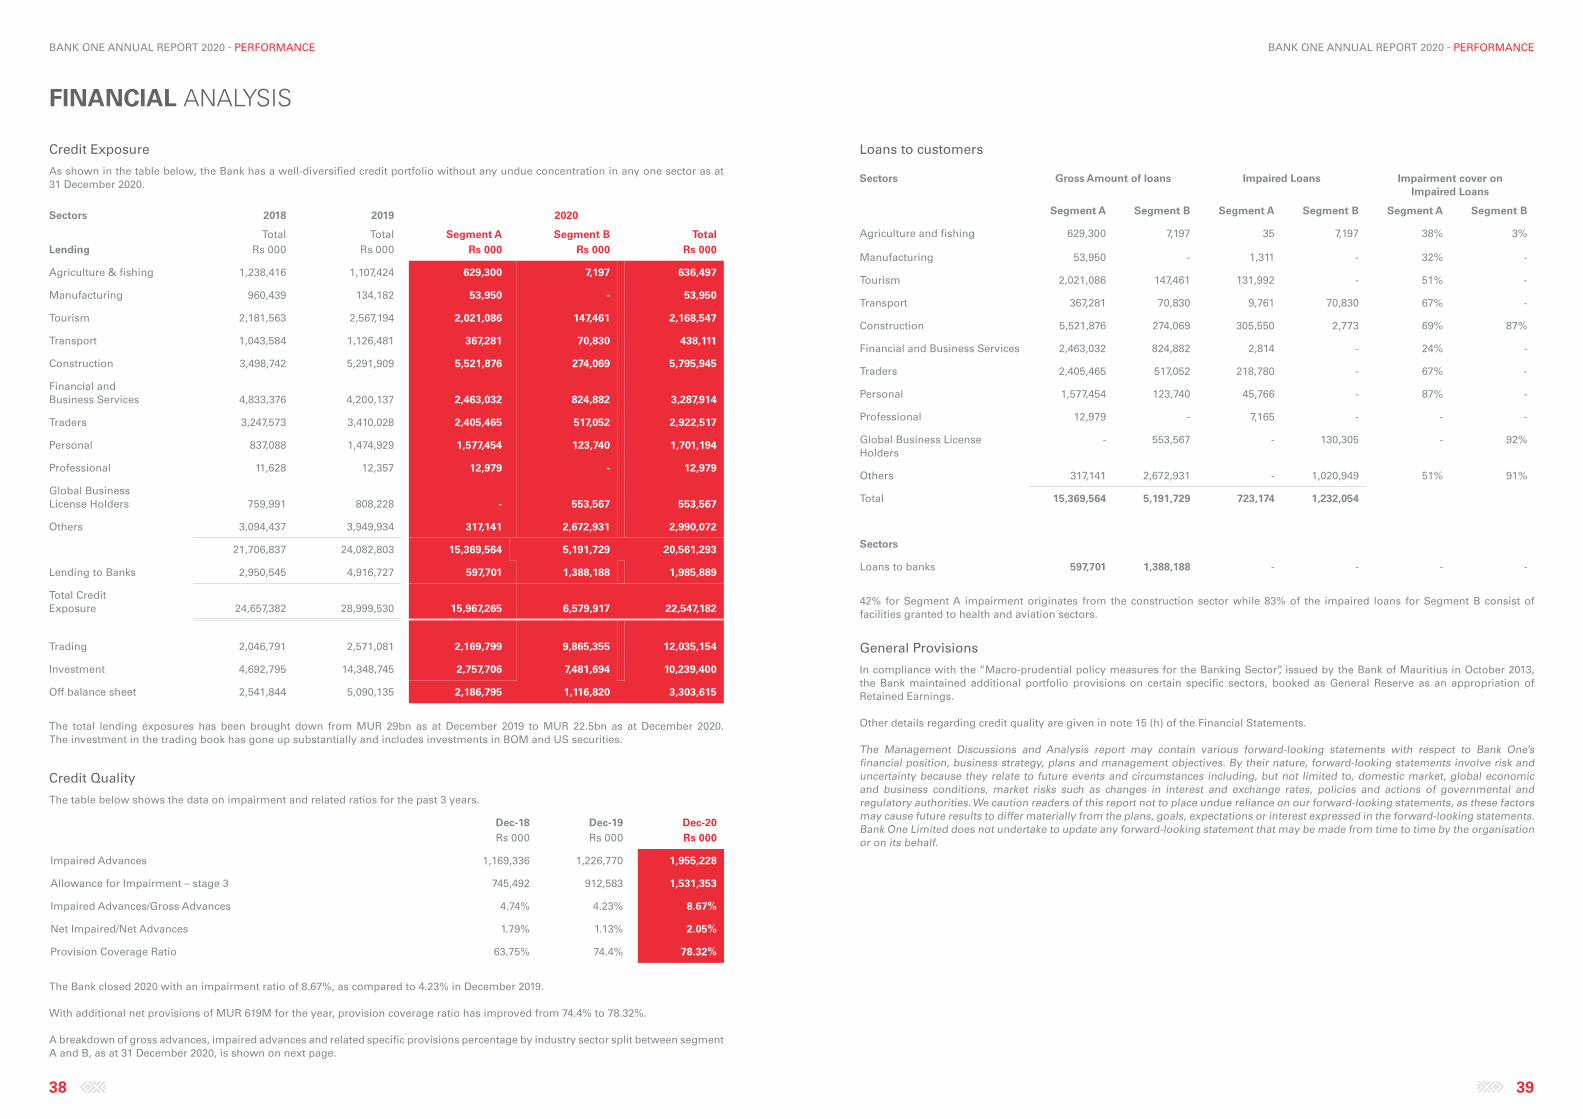
Credit Exposure
As shown in the table below, the Bank has a well-diversified credit portfolio without any undue concentration in any one sector as at 31 December 2020.
Sectors 2018 2019 2020
Total Total Segment A Segment B TotalLending Rs 000 Rs 000 Rs 000 Rs 000 Rs 000
Agriculture & fishing 1,238,416 1,107,424 629,300 7,197 636,497
Manufacturing 960,439 134,182 53,950 - 53,950
Tourism 2,181,563 2,567,194 2,021,086 147,461 2,168,547
Transport 1,043,584 1,126,481 367,281 70,830 438,111
Construction 3,498,742 5,291,909 5,521,876 274,069 5,795,945
Financial andBusiness Services 4,833,376 4,200,137 2,463,032 824,882 3,287,914
Traders 3,247,573 3,410,028 2,405,465 517,052 2,922,517
Personal 837,088 1,474,929 1,577,454 123,740 1,701,194
Professional 11,628 12,357 12,979 - 12,979
Global BusinessLicense Holders 759,991 808,228 - 553,567 553,567
Others 3,094,437 3,949,934 317,141 2,672,931 2,990,072
21,706,837 24,082,803 15,369,564 5,191,729 20,561,293
Lending to Banks 2,950,545 4,916,727 597,701 1,388,188 1,985,889
Total CreditExposure 24,657,382 28,999,530 15,967,265 6,579,917 22,547,182
Trading 2,046,791 2,571,081 2,169,799 9,865,355 12,035,154
Investment 4,692,795 14,348,745 2,757,706 7,481,694 10,239,400
Off balance sheet 2,541,844 5,090,135 2,186,795 1,116,820 3,303,615
The total lending exposures has been brought down from MUR 29bn as at December 2019 to MUR 22.5bn as at December 2020. The investment in the trading book has gone up substantially and includes investments in BOM and US securities.
Credit Quality
The table below shows the data on impairment and related ratios for the past 3 years.
Dec-18 Dec-19 Dec-20Rs 000 Rs 000 Rs 000
Impaired Advances 1,169,336 1,226,770 1,955,228
Allowance for Impairment – stage 3 745,492 912,583 1,531,353
Impaired Advances/Gross Advances 4.74% 4.23% 8.67%
Net Impaired/Net Advances 1.79% 1.13% 2.05%
Provision Coverage Ratio 63.75% 74.4% 78.32%
The Bank closed 2020 with an impairment ratio of 8.67%, as compared to 4.23% in December 2019.
With additional net provisions of MUR 619M for the year, provision coverage ratio has improved from 74.4% to 78.32%.
A breakdown of gross advances, impaired advances and related specific provisions percentage by industry sector split between segment A and B, as at 31 December 2020, is shown on next page.
Loans to customers
Sectors Gross Amount of loans Impaired Loans Impairment cover on Impaired Loans
Segment A Segment B Segment A Segment B Segment A Segment B
Agriculture and fishing 629,300 7,197 35 7,197 38% 3%
Manufacturing 53,950 - 1,311 - 32% -
Tourism 2,021,086 147,461 131,992 - 51% -
Transport 367,281 70,830 9,761 70,830 67% -
Construction 5,521,876 274,069 305,550 2,773 69% 87%
Financial and Business Services 2,463,032 824,882 2,814 - 24% -
Traders 2,405,465 517,052 218,780 - 67% -
Personal 1,577,454 123,740 45,766 - 87% -
Professional 12,979 - 7,165 - - -
Global Business LicenseHolders
- 553,567 - 130,305 - 92%
Others 317,141 2,672,931 - 1,020,949 51% 91%
Total 15,369,564 5,191,729 723,174 1,232,054
Sectors
Loans to banks 597,701 1,388,188 - - - -
42% for Segment A impairment originates from the construction sector while 83% of the impaired loans for Segment B consist of facilities granted to health and aviation sectors.
General Provisions
In compliance with the “Macro-prudential policy measures for the Banking Sector”, issued by the Bank of Mauritius in October 2013, the Bank maintained additional portfolio provisions on certain specific sectors, booked as General Reserve as an appropriation of Retained Earnings.
Other details regarding credit quality are given in note 15 (h) of the Financial Statements.
The Management Discussions and Analysis report may contain various forward-looking statements with respect to Bank One’s financial position, business strategy, plans and management objectives. By their nature, forward-looking statements involve risk and uncertainty because they relate to future events and circumstances including, but not limited to, domestic market, global economic and business conditions, market risks such as changes in interest and exchange rates, policies and actions of governmental and regulatory authorities. We caution readers of this report not to place undue reliance on our forward-looking statements, as these factors may cause future results to differ materially from the plans, goals, expectations or interest expressed in the forward-looking statements. Bank One Limited does not undertake to update any forward-looking statement that may be made from time to time by the organisation or on its behalf.
FINANCIAL ANALYSIS
STRATEGYOUR REVENUE GENERATORS
MAIN BUSINESS ENABLERS
RISK MANAGEMENT
SUSTAINABILITY
BANK ONE ANNUAL REPORT 2020 - STRATEGY
42 43
BANK ONE ANNUAL REPORT 2020 - STRATEGY
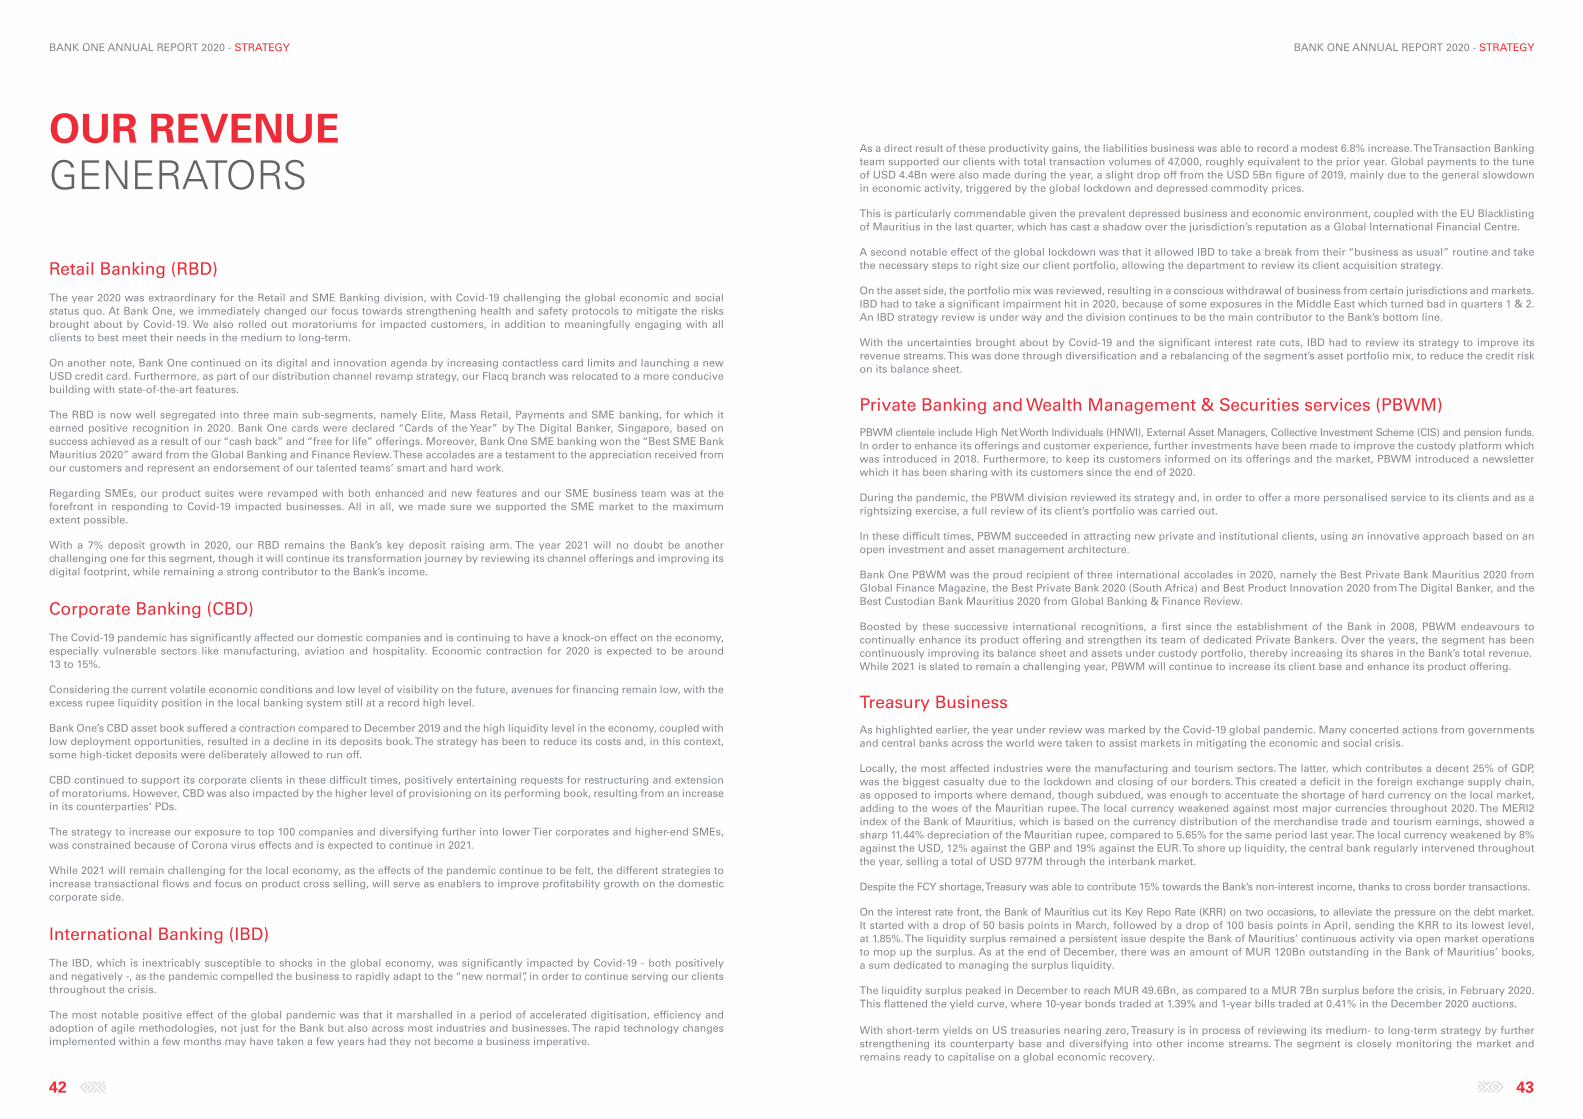
Retail Banking (RBD)
The year 2020 was extraordinary for the Retail and SME Banking division, with Covid-19 challenging the global economic and social status quo. At Bank One, we immediately changed our focus towards strengthening health and safety protocols to mitigate the risks brought about by Covid-19. We also rolled out moratoriums for impacted customers, in addition to meaningfully engaging with all clients to best meet their needs in the medium to long-term.
On another note, Bank One continued on its digital and innovation agenda by increasing contactless card limits and launching a new USD credit card. Furthermore, as part of our distribution channel revamp strategy, our Flacq branch was relocated to a more conducive building with state-of-the-art features.
The RBD is now well segregated into three main sub-segments, namely Elite, Mass Retail, Payments and SME banking, for which it earned positive recognition in 2020. Bank One cards were declared “Cards of the Year” by The Digital Banker, Singapore, based on success achieved as a result of our “cash back” and “free for life” offerings. Moreover, Bank One SME banking won the “Best SME Bank Mauritius 2020” award from the Global Banking and Finance Review. These accolades are a testament to the appreciation received from our customers and represent an endorsement of our talented teams’ smart and hard work.
Regarding SMEs, our product suites were revamped with both enhanced and new features and our SME business team was at the forefront in responding to Covid-19 impacted businesses. All in all, we made sure we supported the SME market to the maximum extent possible.
With a 7% deposit growth in 2020, our RBD remains the Bank’s key deposit raising arm. The year 2021 will no doubt be another challenging one for this segment, though it will continue its transformation journey by reviewing its channel offerings and improving its digital footprint, while remaining a strong contributor to the Bank’s income.
Corporate Banking (CBD)
The Covid-19 pandemic has significantly affected our domestic companies and is continuing to have a knock-on effect on the economy, especially vulnerable sectors like manufacturing, aviation and hospitality. Economic contraction for 2020 is expected to be around 13 to 15%.
Considering the current volatile economic conditions and low level of visibility on the future, avenues for financing remain low, with the excess rupee liquidity position in the local banking system still at a record high level.
Bank One’s CBD asset book suffered a contraction compared to December 2019 and the high liquidity level in the economy, coupled with low deployment opportunities, resulted in a decline in its deposits book. The strategy has been to reduce its costs and, in this context, some high-ticket deposits were deliberately allowed to run off.
CBD continued to support its corporate clients in these difficult times, positively entertaining requests for restructuring and extension of moratoriums. However, CBD was also impacted by the higher level of provisioning on its performing book, resulting from an increase in its counterparties’ PDs.
The strategy to increase our exposure to top 100 companies and diversifying further into lower Tier corporates and higher-end SMEs, was constrained because of Corona virus effects and is expected to continue in 2021.
While 2021 will remain challenging for the local economy, as the effects of the pandemic continue to be felt, the different strategies to increase transactional flows and focus on product cross selling, will serve as enablers to improve profitability growth on the domestic corporate side.
International Banking (IBD)
The IBD, which is inextricably susceptible to shocks in the global economy, was significantly impacted by Covid-19 - both positively and negatively -, as the pandemic compelled the business to rapidly adapt to the “new normal”, in order to continue serving our clients throughout the crisis.
The most notable positive effect of the global pandemic was that it marshalled in a period of accelerated digitisation, efficiency and adoption of agile methodologies, not just for the Bank but also across most industries and businesses. The rapid technology changes implemented within a few months may have taken a few years had they not become a business imperative.
As a direct result of these productivity gains, the liabilities business was able to record a modest 6.8% increase. The Transaction Banking team supported our clients with total transaction volumes of 47,000, roughly equivalent to the prior year. Global payments to the tune of USD 4.4Bn were also made during the year, a slight drop off from the USD 5Bn figure of 2019, mainly due to the general slowdown in economic activity, triggered by the global lockdown and depressed commodity prices.
This is particularly commendable given the prevalent depressed business and economic environment, coupled with the EU Blacklisting of Mauritius in the last quarter, which has cast a shadow over the jurisdiction’s reputation as a Global International Financial Centre.
A second notable effect of the global lockdown was that it allowed IBD to take a break from their “business as usual” routine and take the necessary steps to right size our client portfolio, allowing the department to review its client acquisition strategy.
On the asset side, the portfolio mix was reviewed, resulting in a conscious withdrawal of business from certain jurisdictions and markets. IBD had to take a significant impairment hit in 2020, because of some exposures in the Middle East which turned bad in quarters 1 & 2. An IBD strategy review is under way and the division continues to be the main contributor to the Bank’s bottom line.
With the uncertainties brought about by Covid-19 and the significant interest rate cuts, IBD had to review its strategy to improve its revenue streams. This was done through diversification and a rebalancing of the segment’s asset portfolio mix, to reduce the credit risk on its balance sheet.
Private Banking and Wealth Management & Securities services (PBWM)PBWM clientele include High Net Worth Individuals (HNWI), External Asset Managers, Collective Investment Scheme (CIS) and pension funds. In order to enhance its offerings and customer experience, further investments have been made to improve the custody platform which was introduced in 2018. Furthermore, to keep its customers informed on its offerings and the market, PBWM introduced a newsletter which it has been sharing with its customers since the end of 2020.
During the pandemic, the PBWM division reviewed its strategy and, in order to offer a more personalised service to its clients and as a rightsizing exercise, a full review of its client’s portfolio was carried out.
In these difficult times, PBWM succeeded in attracting new private and institutional clients, using an innovative approach based on an open investment and asset management architecture.
Bank One PBWM was the proud recipient of three international accolades in 2020, namely the Best Private Bank Mauritius 2020 from Global Finance Magazine, the Best Private Bank 2020 (South Africa) and Best Product Innovation 2020 from The Digital Banker, and the Best Custodian Bank Mauritius 2020 from Global Banking & Finance Review.
Boosted by these successive international recognitions, a first since the establishment of the Bank in 2008, PBWM endeavours to continually enhance its product offering and strengthen its team of dedicated Private Bankers. Over the years, the segment has been continuously improving its balance sheet and assets under custody portfolio, thereby increasing its shares in the Bank’s total revenue.While 2021 is slated to remain a challenging year, PBWM will continue to increase its client base and enhance its product offering.
Treasury BusinessAs highlighted earlier, the year under review was marked by the Covid-19 global pandemic. Many concerted actions from governments and central banks across the world were taken to assist markets in mitigating the economic and social crisis.
Locally, the most affected industries were the manufacturing and tourism sectors. The latter, which contributes a decent 25% of GDP, was the biggest casualty due to the lockdown and closing of our borders. This created a deficit in the foreign exchange supply chain, as opposed to imports where demand, though subdued, was enough to accentuate the shortage of hard currency on the local market, adding to the woes of the Mauritian rupee. The local currency weakened against most major currencies throughout 2020. The MERI2 index of the Bank of Mauritius, which is based on the currency distribution of the merchandise trade and tourism earnings, showed a sharp 11.44% depreciation of the Mauritian rupee, compared to 5.65% for the same period last year. The local currency weakened by 8% against the USD, 12% against the GBP and 19% against the EUR. To shore up liquidity, the central bank regularly intervened throughout the year, selling a total of USD 977M through the interbank market.
Despite the FCY shortage, Treasury was able to contribute 15% towards the Bank’s non-interest income, thanks to cross border transactions.
On the interest rate front, the Bank of Mauritius cut its Key Repo Rate (KRR) on two occasions, to alleviate the pressure on the debt market. It started with a drop of 50 basis points in March, followed by a drop of 100 basis points in April, sending the KRR to its lowest level, at 1.85%. The liquidity surplus remained a persistent issue despite the Bank of Mauritius’ continuous activity via open market operations to mop up the surplus. As at the end of December, there was an amount of MUR 120Bn outstanding in the Bank of Mauritius’ books, a sum dedicated to managing the surplus liquidity.
The liquidity surplus peaked in December to reach MUR 49.6Bn, as compared to a MUR 7Bn surplus before the crisis, in February 2020. This flattened the yield curve, where 10-year bonds traded at 1.39% and 1-year bills traded at 0.41% in the December 2020 auctions.
With short-term yields on US treasuries nearing zero, Treasury is in process of reviewing its medium- to long-term strategy by further strengthening its counterparty base and diversifying into other income streams. The segment is closely monitoring the market and remains ready to capitalise on a global economic recovery.
OUR REVENUEGENERATORS
BANK ONE ANNUAL REPORT 2020 - STRATEGY
44 45
BANK ONE ANNUAL REPORT 2020 - STRATEGY
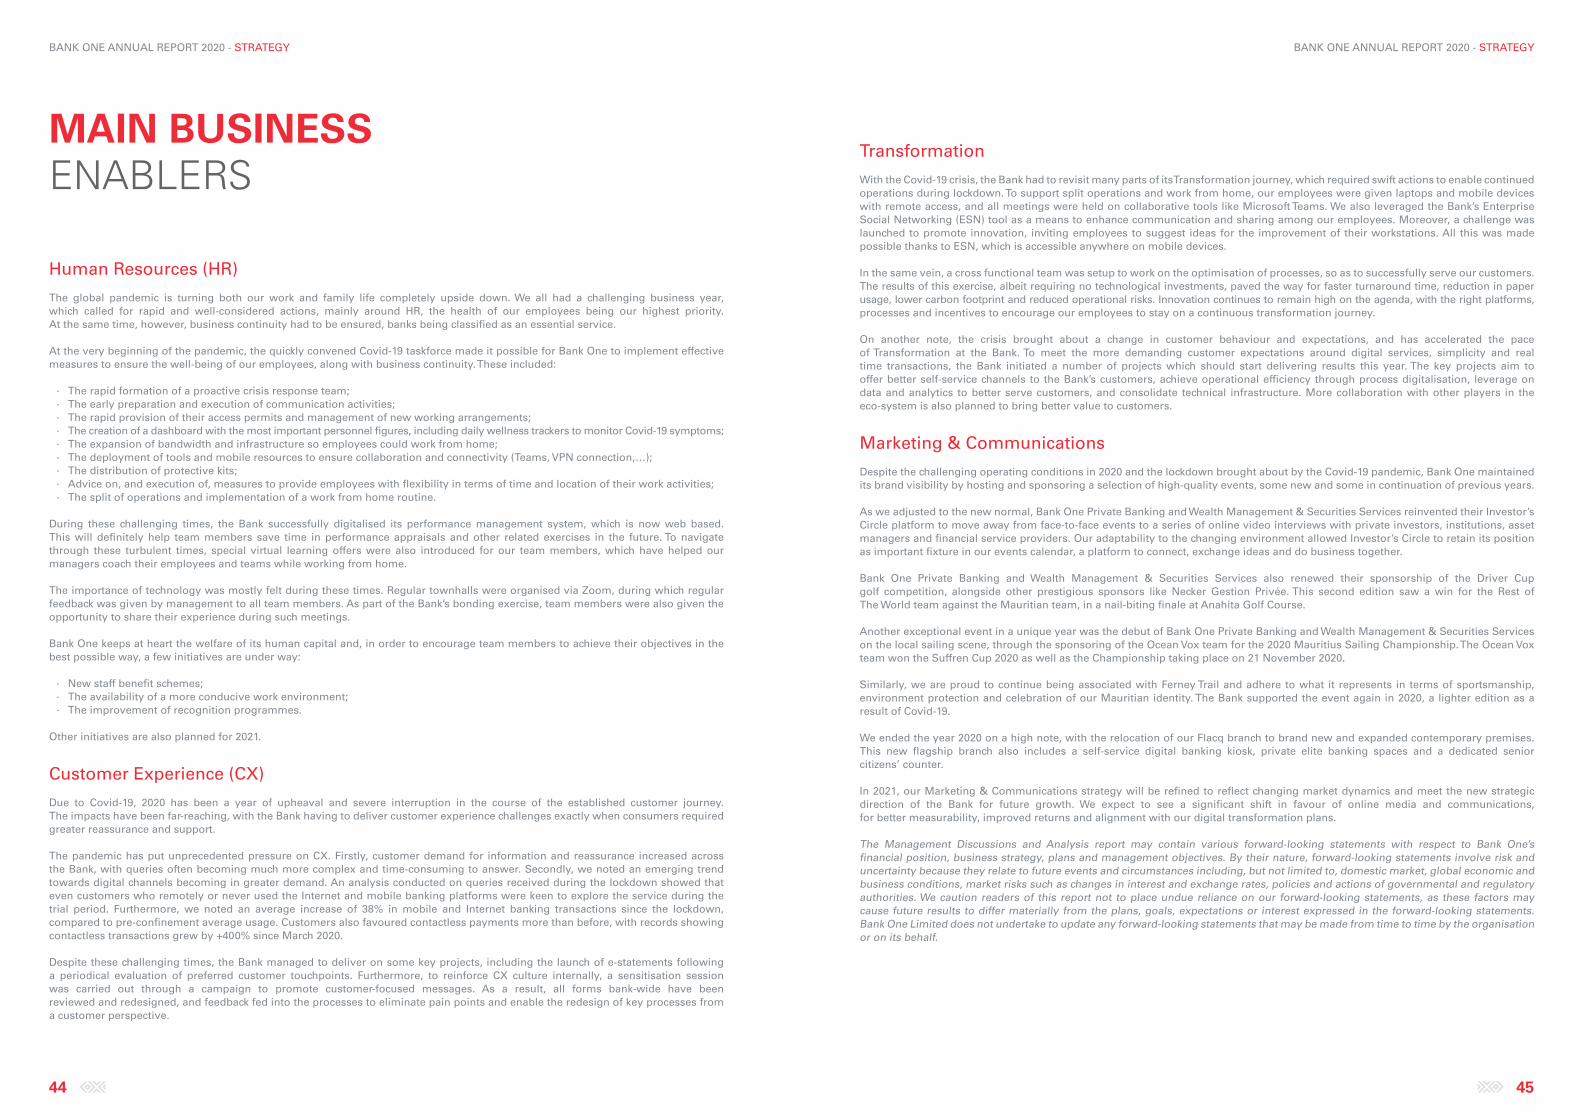
Human Resources (HR)
The global pandemic is turning both our work and family life completely upside down. We all had a challenging business year, which called for rapid and well-considered actions, mainly around HR, the health of our employees being our highest priority. At the same time, however, business continuity had to be ensured, banks being classified as an essential service.
At the very beginning of the pandemic, the quickly convened Covid-19 taskforce made it possible for Bank One to implement effective measures to ensure the well-being of our employees, along with business continuity. These included:
∙ The rapid formation of a proactive crisis response team; ∙ The early preparation and execution of communication activities; ∙ The rapid provision of their access permits and management of new working arrangements; ∙ The creation of a dashboard with the most important personnel figures, including daily wellness trackers to monitor Covid-19 symptoms; ∙ The expansion of bandwidth and infrastructure so employees could work from home; ∙ The deployment of tools and mobile resources to ensure collaboration and connectivity (Teams, VPN connection,…); ∙ The distribution of protective kits; ∙ Advice on, and execution of, measures to provide employees with flexibility in terms of time and location of their work activities; ∙ The split of operations and implementation of a work from home routine.
During these challenging times, the Bank successfully digitalised its performance management system, which is now web based. This will definitely help team members save time in performance appraisals and other related exercises in the future. To navigate through these turbulent times, special virtual learning offers were also introduced for our team members, which have helped our managers coach their employees and teams while working from home.
The importance of technology was mostly felt during these times. Regular townhalls were organised via Zoom, during which regular feedback was given by management to all team members. As part of the Bank’s bonding exercise, team members were also given the opportunity to share their experience during such meetings.
Bank One keeps at heart the welfare of its human capital and, in order to encourage team members to achieve their objectives in the best possible way, a few initiatives are under way:
∙ New staff benefit schemes; ∙ The availability of a more conducive work environment; ∙ The improvement of recognition programmes.
Other initiatives are also planned for 2021.
Customer Experience (CX)
Due to Covid-19, 2020 has been a year of upheaval and severe interruption in the course of the established customer journey. The impacts have been far-reaching, with the Bank having to deliver customer experience challenges exactly when consumers required greater reassurance and support.
The pandemic has put unprecedented pressure on CX. Firstly, customer demand for information and reassurance increased across the Bank, with queries often becoming much more complex and time-consuming to answer. Secondly, we noted an emerging trend towards digital channels becoming in greater demand. An analysis conducted on queries received during the lockdown showed that even customers who remotely or never used the Internet and mobile banking platforms were keen to explore the service during the trial period. Furthermore, we noted an average increase of 38% in mobile and Internet banking transactions since the lockdown, compared to pre-confinement average usage. Customers also favoured contactless payments more than before, with records showing contactless transactions grew by +400% since March 2020.
Despite these challenging times, the Bank managed to deliver on some key projects, including the launch of e-statements following a periodical evaluation of preferred customer touchpoints. Furthermore, to reinforce CX culture internally, a sensitisation session was carried out through a campaign to promote customer-focused messages. As a result, all forms bank-wide have been reviewed and redesigned, and feedback fed into the processes to eliminate pain points and enable the redesign of key processes from a customer perspective.
Transformation
With the Covid-19 crisis, the Bank had to revisit many parts of its Transformation journey, which required swift actions to enable continued operations during lockdown. To support split operations and work from home, our employees were given laptops and mobile devices with remote access, and all meetings were held on collaborative tools like Microsoft Teams. We also leveraged the Bank’s Enterprise Social Networking (ESN) tool as a means to enhance communication and sharing among our employees. Moreover, a challenge was launched to promote innovation, inviting employees to suggest ideas for the improvement of their workstations. All this was made possible thanks to ESN, which is accessible anywhere on mobile devices.
In the same vein, a cross functional team was setup to work on the optimisation of processes, so as to successfully serve our customers. The results of this exercise, albeit requiring no technological investments, paved the way for faster turnaround time, reduction in paper usage, lower carbon footprint and reduced operational risks. Innovation continues to remain high on the agenda, with the right platforms, processes and incentives to encourage our employees to stay on a continuous transformation journey.
On another note, the crisis brought about a change in customer behaviour and expectations, and has accelerated the pace of Transformation at the Bank. To meet the more demanding customer expectations around digital services, simplicity and real time transactions, the Bank initiated a number of projects which should start delivering results this year. The key projects aim to offer better self-service channels to the Bank’s customers, achieve operational efficiency through process digitalisation, leverage on data and analytics to better serve customers, and consolidate technical infrastructure. More collaboration with other players in the eco-system is also planned to bring better value to customers.
Marketing & Communications
Despite the challenging operating conditions in 2020 and the lockdown brought about by the Covid-19 pandemic, Bank One maintained its brand visibility by hosting and sponsoring a selection of high-quality events, some new and some in continuation of previous years.
As we adjusted to the new normal, Bank One Private Banking and Wealth Management & Securities Services reinvented their Investor’s Circle platform to move away from face-to-face events to a series of online video interviews with private investors, institutions, asset managers and financial service providers. Our adaptability to the changing environment allowed Investor’s Circle to retain its position as important fixture in our events calendar, a platform to connect, exchange ideas and do business together.
Bank One Private Banking and Wealth Management & Securities Services also renewed their sponsorship of the Driver Cup golf competition, alongside other prestigious sponsors like Necker Gestion Privée. This second edition saw a win for the Rest of The World team against the Mauritian team, in a nail-biting finale at Anahita Golf Course.
Another exceptional event in a unique year was the debut of Bank One Private Banking and Wealth Management & Securities Services on the local sailing scene, through the sponsoring of the Ocean Vox team for the 2020 Mauritius Sailing Championship. The Ocean Vox team won the Suffren Cup 2020 as well as the Championship taking place on 21 November 2020.
Similarly, we are proud to continue being associated with Ferney Trail and adhere to what it represents in terms of sportsmanship, environment protection and celebration of our Mauritian identity. The Bank supported the event again in 2020, a lighter edition as a result of Covid-19.
We ended the year 2020 on a high note, with the relocation of our Flacq branch to brand new and expanded contemporary premises. This new flagship branch also includes a self-service digital banking kiosk, private elite banking spaces and a dedicated senior citizens’ counter.
In 2021, our Marketing & Communications strategy will be refined to reflect changing market dynamics and meet the new strategic direction of the Bank for future growth. We expect to see a significant shift in favour of online media and communications, for better measurability, improved returns and alignment with our digital transformation plans.
The Management Discussions and Analysis report may contain various forward-looking statements with respect to Bank One’s financial position, business strategy, plans and management objectives. By their nature, forward-looking statements involve risk and uncertainty because they relate to future events and circumstances including, but not limited to, domestic market, global economic and business conditions, market risks such as changes in interest and exchange rates, policies and actions of governmental and regulatory authorities. We caution readers of this report not to place undue reliance on our forward-looking statements, as these factors may cause future results to differ materially from the plans, goals, expectations or interest expressed in the forward-looking statements. Bank One Limited does not undertake to update any forward-looking statements that may be made from time to time by the organisation or on its behalf.
MAIN BUSINESSENABLERS
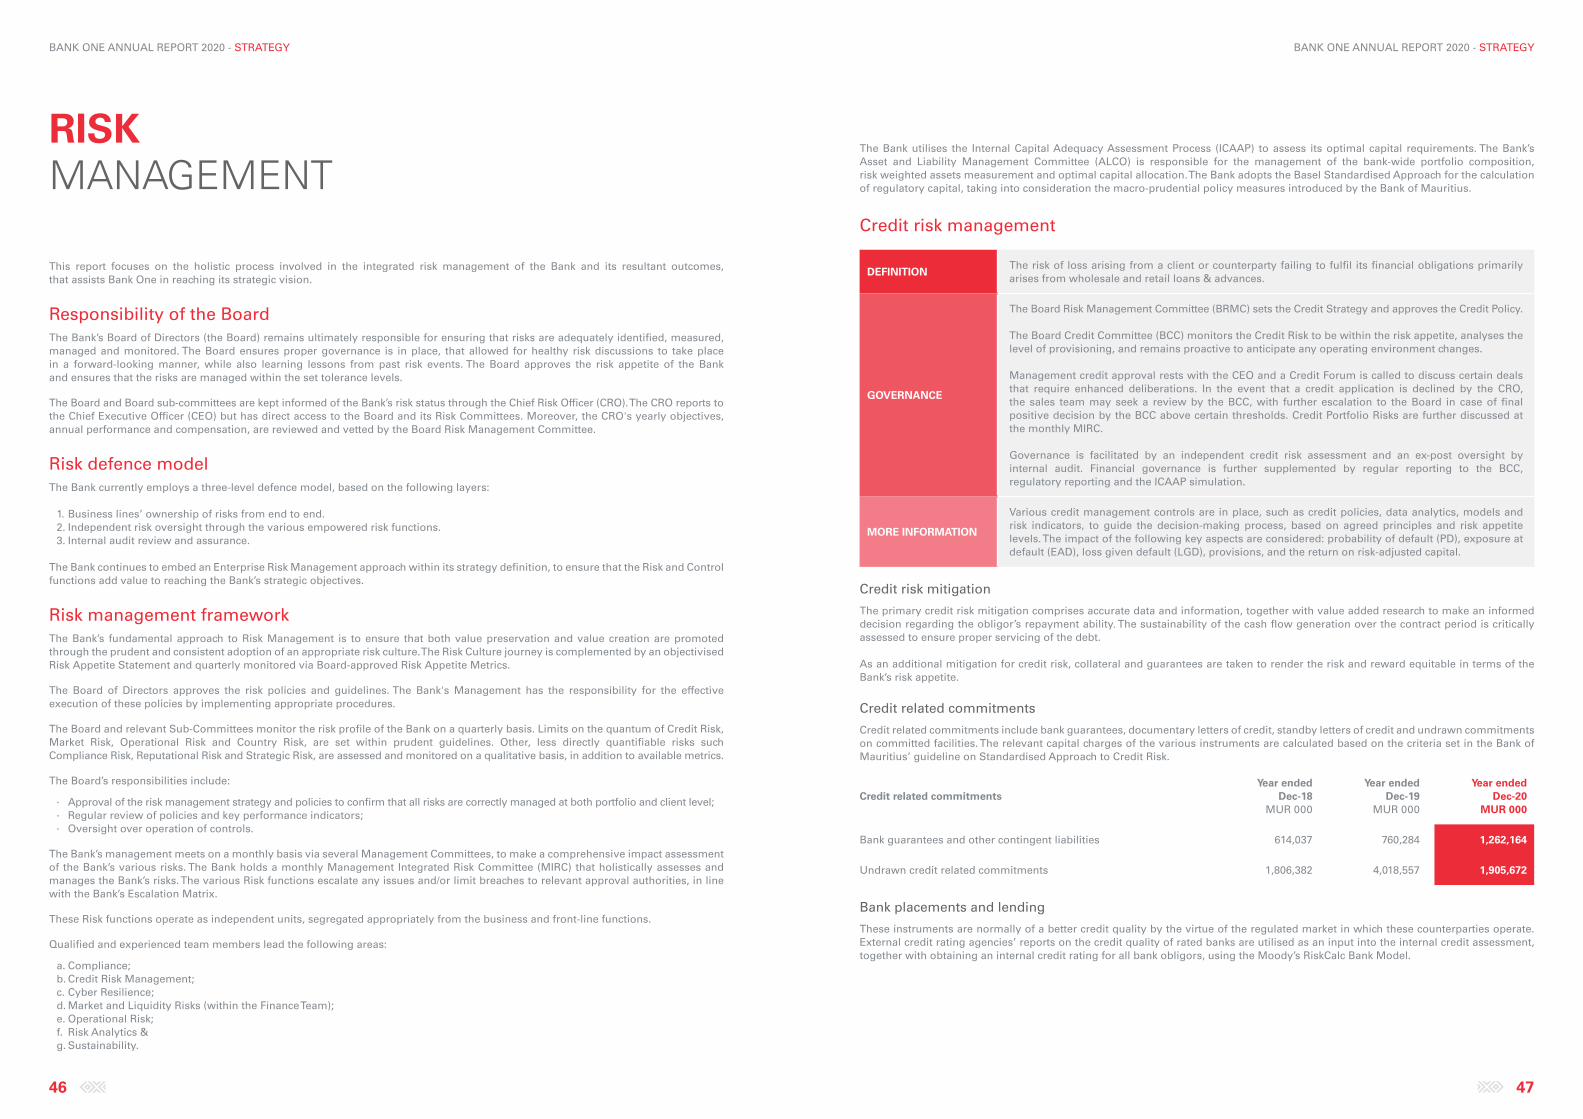
BANK ONE ANNUAL REPORT 2020 - STRATEGY
46 47
BANK ONE ANNUAL REPORT 2020 - STRATEGY
This report focuses on the holistic process involved in the integrated risk management of the Bank and its resultant outcomes, that assists Bank One in reaching its strategic vision.
Responsibility of the BoardThe Bank’s Board of Directors (the Board) remains ultimately responsible for ensuring that risks are adequately identified, measured, managed and monitored. The Board ensures proper governance is in place, that allowed for healthy risk discussions to take place in a forward-looking manner, while also learning lessons from past risk events. The Board approves the risk appetite of the Bank and ensures that the risks are managed within the set tolerance levels.
The Board and Board sub-committees are kept informed of the Bank’s risk status through the Chief Risk Officer (CRO). The CRO reports to the Chief Executive Officer (CEO) but has direct access to the Board and its Risk Committees. Moreover, the CRO's yearly objectives, annual performance and compensation, are reviewed and vetted by the Board Risk Management Committee.
Risk defence modelThe Bank currently employs a three-level defence model, based on the following layers:
1. Business lines’ ownership of risks from end to end. 2. Independent risk oversight through the various empowered risk functions. 3. Internal audit review and assurance.
The Bank continues to embed an Enterprise Risk Management approach within its strategy definition, to ensure that the Risk and Control functions add value to reaching the Bank’s strategic objectives.
Risk management frameworkThe Bank’s fundamental approach to Risk Management is to ensure that both value preservation and value creation are promoted through the prudent and consistent adoption of an appropriate risk culture. The Risk Culture journey is complemented by an objectivised Risk Appetite Statement and quarterly monitored via Board-approved Risk Appetite Metrics.
The Board of Directors approves the risk policies and guidelines. The Bank's Management has the responsibility for the effective execution of these policies by implementing appropriate procedures.
The Board and relevant Sub-Committees monitor the risk profile of the Bank on a quarterly basis. Limits on the quantum of Credit Risk, Market Risk, Operational Risk and Country Risk, are set within prudent guidelines. Other, less directly quantifiable risks such Compliance Risk, Reputational Risk and Strategic Risk, are assessed and monitored on a qualitative basis, in addition to available metrics.
The Board’s responsibilities include:
∙ Approval of the risk management strategy and policies to confirm that all risks are correctly managed at both portfolio and client level; ∙ Regular review of policies and key performance indicators; ∙ Oversight over operation of controls.
The Bank’s management meets on a monthly basis via several Management Committees, to make a comprehensive impact assessment of the Bank’s various risks. The Bank holds a monthly Management Integrated Risk Committee (MIRC) that holistically assesses and manages the Bank’s risks. The various Risk functions escalate any issues and/or limit breaches to relevant approval authorities, in line with the Bank’s Escalation Matrix.
These Risk functions operate as independent units, segregated appropriately from the business and front-line functions.
Qualified and experienced team members lead the following areas:
a. Compliance;b. Credit Risk Management;c. Cyber Resilience;d. Market and Liquidity Risks (within the Finance Team);e. Operational Risk;f. Risk Analytics &g. Sustainability.
The Bank utilises the Internal Capital Adequacy Assessment Process (ICAAP) to assess its optimal capital requirements. The Bank’s Asset and Liability Management Committee (ALCO) is responsible for the management of the bank-wide portfolio composition, risk weighted assets measurement and optimal capital allocation. The Bank adopts the Basel Standardised Approach for the calculation of regulatory capital, taking into consideration the macro-prudential policy measures introduced by the Bank of Mauritius.
Credit risk management
DEFINITION The risk of loss arising from a client or counterparty failing to fulfil its financial obligations primarily arises from wholesale and retail loans & advances.
GOVERNANCE
The Board Risk Management Committee (BRMC) sets the Credit Strategy and approves the Credit Policy.
The Board Credit Committee (BCC) monitors the Credit Risk to be within the risk appetite, analyses the level of provisioning, and remains proactive to anticipate any operating environment changes.
Management credit approval rests with the CEO and a Credit Forum is called to discuss certain deals that require enhanced deliberations. In the event that a credit application is declined by the CRO, the sales team may seek a review by the BCC, with further escalation to the Board in case of final positive decision by the BCC above certain thresholds. Credit Portfolio Risks are further discussed at the monthly MIRC.
Governance is facilitated by an independent credit risk assessment and an ex-post oversight by internal audit. Financial governance is further supplemented by regular reporting to the BCC, regulatory reporting and the ICAAP simulation.
MORE INFORMATION
Various credit management controls are in place, such as credit policies, data analytics, models and risk indicators, to guide the decision-making process, based on agreed principles and risk appetite levels. The impact of the following key aspects are considered: probability of default (PD), exposure at default (EAD), loss given default (LGD), provisions, and the return on risk-adjusted capital.
Credit risk mitigation
The primary credit risk mitigation comprises accurate data and information, together with value added research to make an informed decision regarding the obligor’s repayment ability. The sustainability of the cash flow generation over the contract period is critically assessed to ensure proper servicing of the debt.
As an additional mitigation for credit risk, collateral and guarantees are taken to render the risk and reward equitable in terms of the Bank’s risk appetite.
Credit related commitments
Credit related commitments include bank guarantees, documentary letters of credit, standby letters of credit and undrawn commitments on committed facilities. The relevant capital charges of the various instruments are calculated based on the criteria set in the Bank of Mauritius’ guideline on Standardised Approach to Credit Risk.
Credit related commitmentsYear ended
Dec-18MUR 000
Year ended Dec-19
MUR 000
Year ended Dec-20
MUR 000
Bank guarantees and other contingent liabilities 614,037 760,284 1,262,164
Undrawn credit related commitments 1,806,382 4,018,557 1,905,672
Bank placements and lending
These instruments are normally of a better credit quality by the virtue of the regulated market in which these counterparties operate. External credit rating agencies’ reports on the credit quality of rated banks are utilised as an input into the internal credit assessment, together with obtaining an internal credit rating for all bank obligors, using the Moody’s RiskCalc Bank Model.
RISKMANAGEMENT
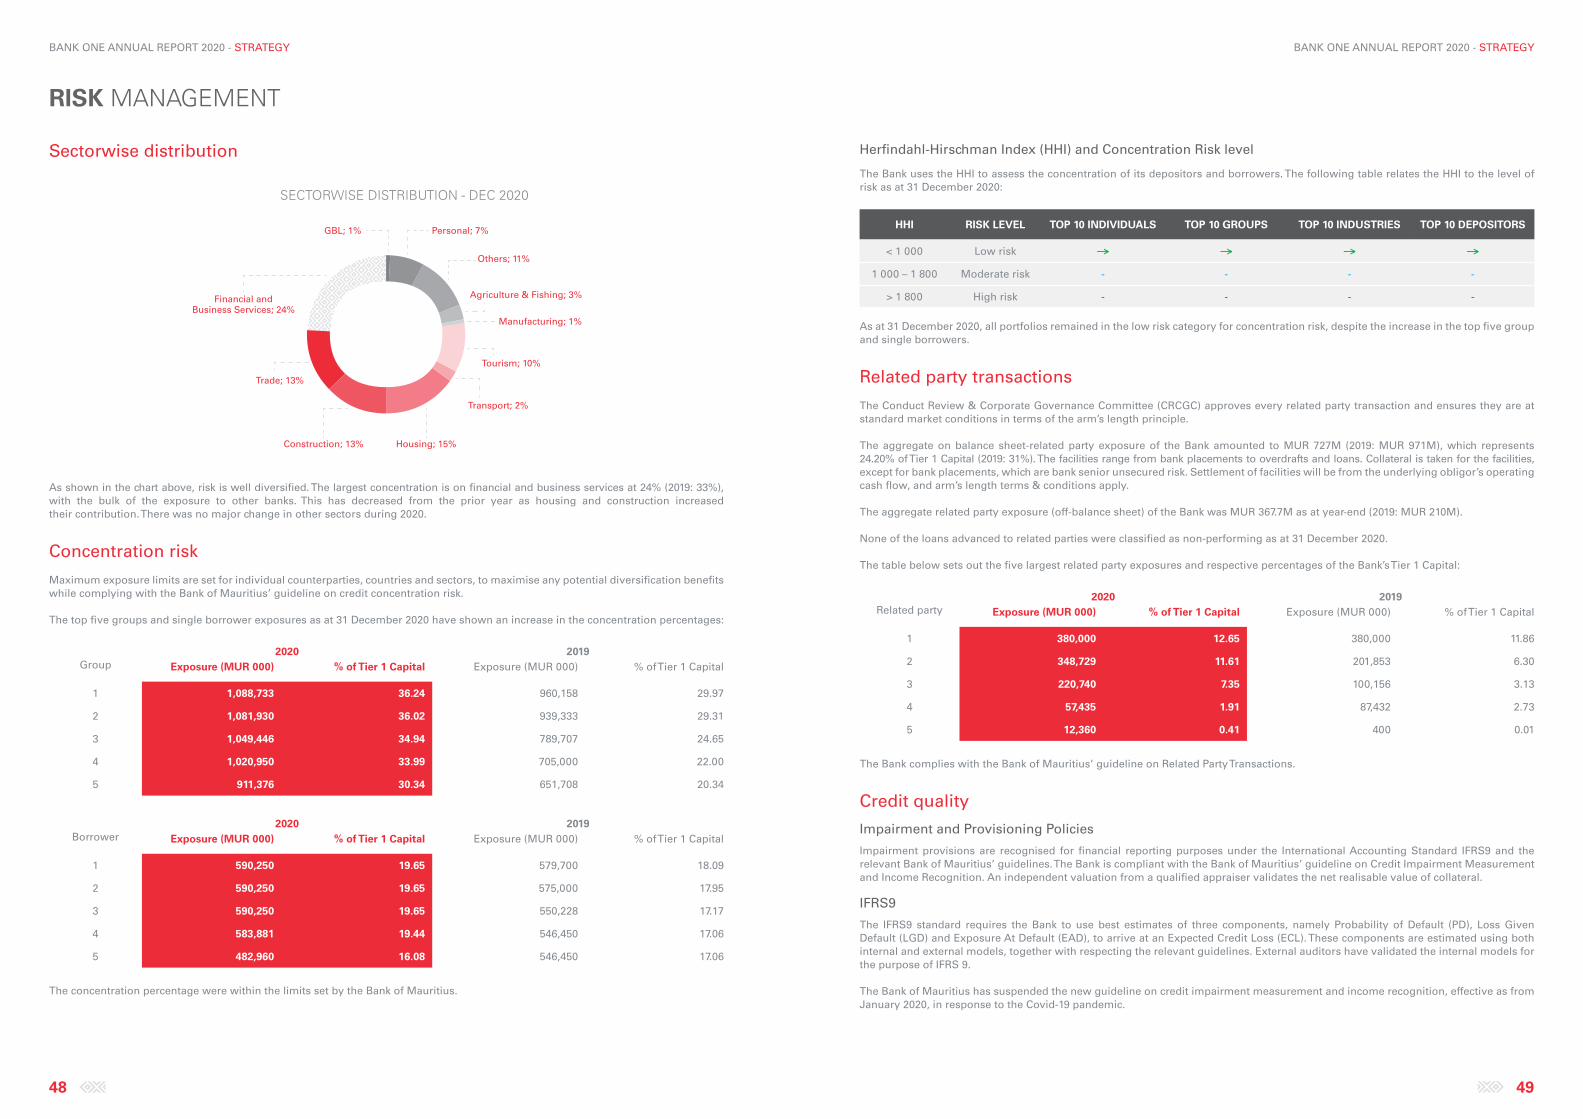
BANK ONE ANNUAL REPORT 2020 - STRATEGY
48 49
BANK ONE ANNUAL REPORT 2020 - STRATEGY
Sectorwise distribution
As shown in the chart above, risk is well diversified. The largest concentration is on financial and business services at 24% (2019: 33%), with the bulk of the exposure to other banks. This has decreased from the prior year as housing and construction increased their contribution. There was no major change in other sectors during 2020.
Concentration risk
Maximum exposure limits are set for individual counterparties, countries and sectors, to maximise any potential diversification benefits while complying with the Bank of Mauritius’ guideline on credit concentration risk.
The top five groups and single borrower exposures as at 31 December 2020 have shown an increase in the concentration percentages:
Group2020 2019
Exposure (MUR 000) % of Tier 1 Capital Exposure (MUR 000) % of Tier 1 Capital
1 1,088,733 36.24 960,158 29.97
2 1,081,930 36.02 939,333 29.31
3 1,049,446 34.94 789,707 24.65
4 1,020,950 33.99 705,000 22.00
5 911,376 30.34 651,708 20.34
Borrower2020 2019
Exposure (MUR 000) % of Tier 1 Capital Exposure (MUR 000) % of Tier 1 Capital
1 590,250 19.65 579,700 18.09
2 590,250 19.65 575,000 17.95
3 590,250 19.65 550,228 17.17
4 583,881 19.44 546,450 17.06
5 482,960 16.08 546,450 17.06
The concentration percentage were within the limits set by the Bank of Mauritius.
Herfindahl-Hirschman Index (HHI) and Concentration Risk level
The Bank uses the HHI to assess the concentration of its depositors and borrowers. The following table relates the HHI to the level of risk as at 31 December 2020:
HHI RISK LEVEL TOP 10 INDIVIDUALS TOP 10 GROUPS TOP 10 INDUSTRIES TOP 10 DEPOSITORS
< 1 000 Low risk
1 000 – 1 800 Moderate risk - - - -
> 1 800 High risk - - - -
As at 31 December 2020, all portfolios remained in the low risk category for concentration risk, despite the increase in the top five group and single borrowers.
Related party transactions
The Conduct Review & Corporate Governance Committee (CRCGC) approves every related party transaction and ensures they are at standard market conditions in terms of the arm’s length principle.
The aggregate on balance sheet-related party exposure of the Bank amounted to MUR 727M (2019: MUR 971M), which represents 24.20% of Tier 1 Capital (2019: 31%). The facilities range from bank placements to overdrafts and loans. Collateral is taken for the facilities, except for bank placements, which are bank senior unsecured risk. Settlement of facilities will be from the underlying obligor’s operating cash flow, and arm’s length terms & conditions apply.
The aggregate related party exposure (off-balance sheet) of the Bank was MUR 367.7M as at year-end (2019: MUR 210M).
None of the loans advanced to related parties were classified as non-performing as at 31 December 2020.
The table below sets out the five largest related party exposures and respective percentages of the Bank’s Tier 1 Capital:
Related party2020 2019
Exposure (MUR 000) % of Tier 1 Capital Exposure (MUR 000) % of Tier 1 Capital
1 380,000 12.65 380,000 11.86
2 348,729 11.61 201,853 6.30
3 220,740 7.35 100,156 3.13
4 57,435 1.91 87,432 2.73
5 12,360 0.41 400 0.01
The Bank complies with the Bank of Mauritius’ guideline on Related Party Transactions.
Credit quality
Impairment and Provisioning Policies
Impairment provisions are recognised for financial reporting purposes under the International Accounting Standard IFRS9 and the relevant Bank of Mauritius’ guidelines. The Bank is compliant with the Bank of Mauritius’ guideline on Credit Impairment Measurement and Income Recognition. An independent valuation from a qualified appraiser validates the net realisable value of collateral.
IFRS9
The IFRS9 standard requires the Bank to use best estimates of three components, namely Probability of Default (PD), Loss Given Default (LGD) and Exposure At Default (EAD), to arrive at an Expected Credit Loss (ECL). These components are estimated using both internal and external models, together with respecting the relevant guidelines. External auditors have validated the internal models for the purpose of IFRS 9.
The Bank of Mauritius has suspended the new guideline on credit impairment measurement and income recognition, effective as from January 2020, in response to the Covid-19 pandemic.
SECTORWISE DISTRIBUTION - DEC 2020
Financial and Business Services; 24%
Trade; 13%
Construction; 13% Housing; 15%
Transport; 2%
Tourism; 10%
Manufacturing; 1%
Agriculture & Fishing; 3%
Others; 11%
Personal; 7%GBL; 1%
RISK MANAGEMENT
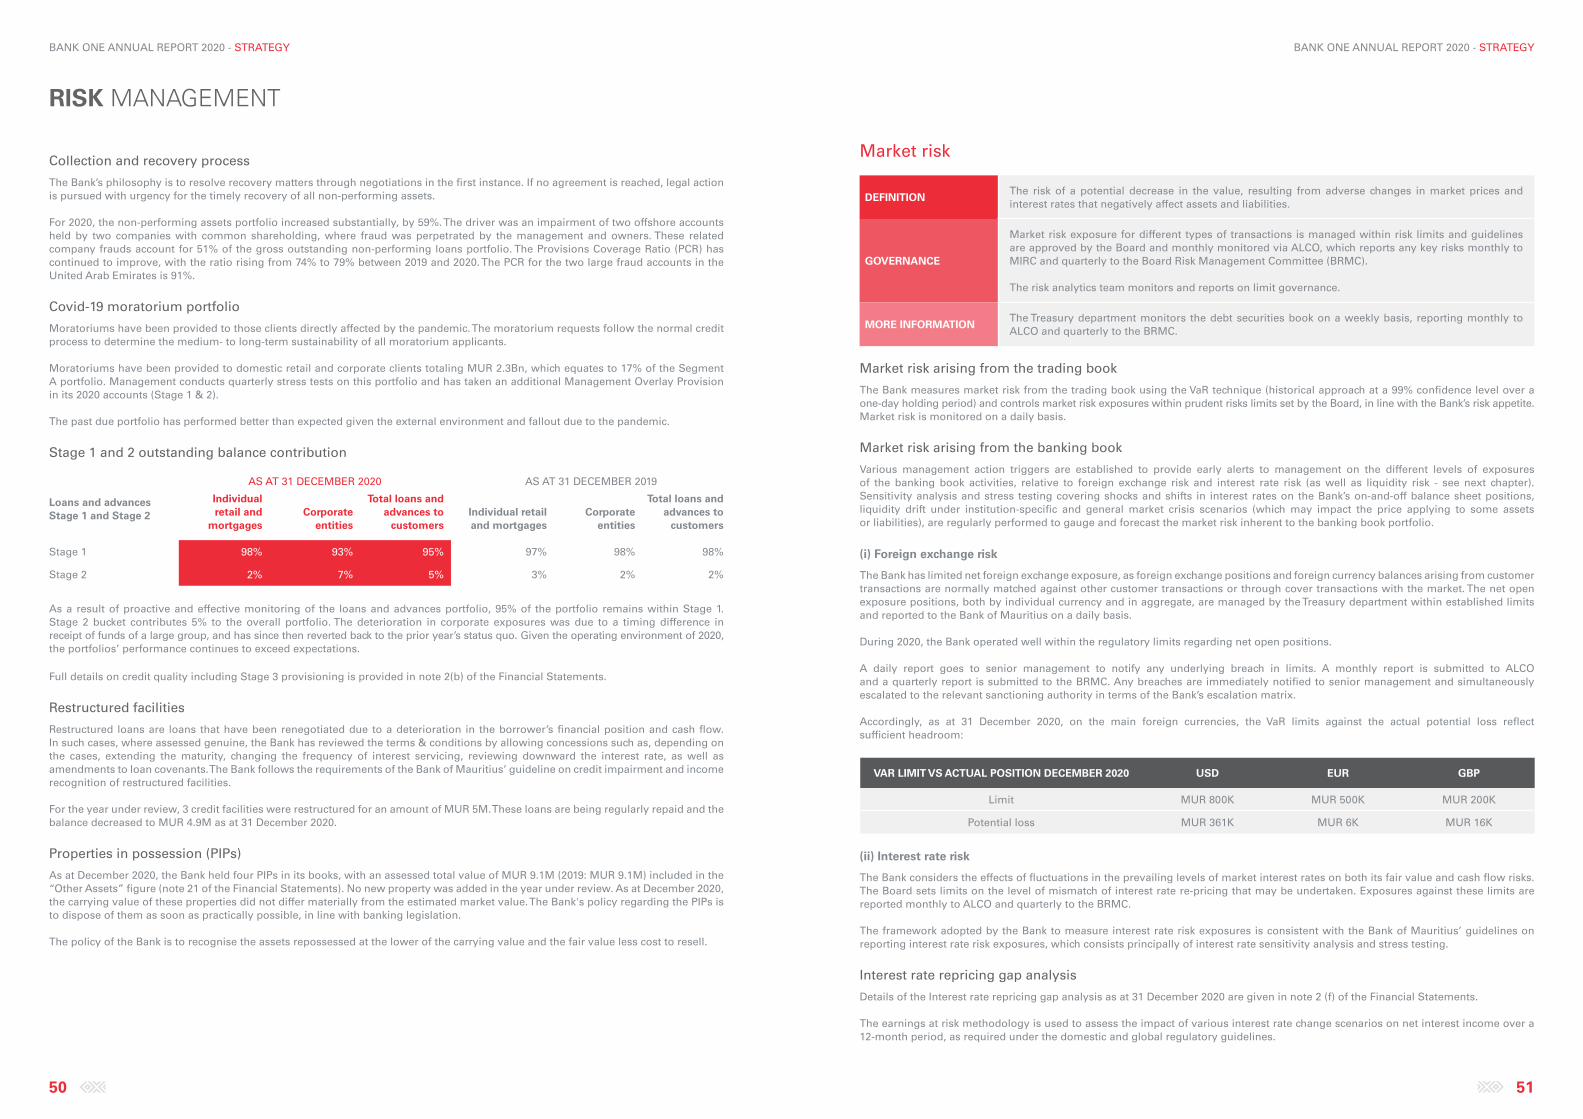
BANK ONE ANNUAL REPORT 2020 - STRATEGY
50 51
BANK ONE ANNUAL REPORT 2020 - STRATEGY
Collection and recovery process
The Bank’s philosophy is to resolve recovery matters through negotiations in the first instance. If no agreement is reached, legal action is pursued with urgency for the timely recovery of all non-performing assets.
For 2020, the non-performing assets portfolio increased substantially, by 59%. The driver was an impairment of two offshore accounts held by two companies with common shareholding, where fraud was perpetrated by the management and owners. These related company frauds account for 51% of the gross outstanding non-performing loans portfolio. The Provisions Coverage Ratio (PCR) has continued to improve, with the ratio rising from 74% to 79% between 2019 and 2020. The PCR for the two large fraud accounts in the United Arab Emirates is 91%.
Covid-19 moratorium portfolio
Moratoriums have been provided to those clients directly affected by the pandemic. The moratorium requests follow the normal credit process to determine the medium- to long-term sustainability of all moratorium applicants.
Moratoriums have been provided to domestic retail and corporate clients totaling MUR 2.3Bn, which equates to 17% of the Segment A portfolio. Management conducts quarterly stress tests on this portfolio and has taken an additional Management Overlay Provision in its 2020 accounts (Stage 1 & 2).
The past due portfolio has performed better than expected given the external environment and fallout due to the pandemic.
Stage 1 and 2 outstanding balance contribution
Loans and advances Stage 1 and Stage 2
AS AT 31 DECEMBER 2020 AS AT 31 DECEMBER 2019
Individual retail and
mortgagesCorporate
entities
Total loans and advances to
customersIndividual retail and mortgages
Corporate entities
Total loans and advances to
customers
Stage 1 98% 93% 95% 97% 98% 98%
Stage 2 2% 7% 5% 3% 2% 2%
As a result of proactive and effective monitoring of the loans and advances portfolio, 95% of the portfolio remains within Stage 1. Stage 2 bucket contributes 5% to the overall portfolio. The deterioration in corporate exposures was due to a timing difference in receipt of funds of a large group, and has since then reverted back to the prior year’s status quo. Given the operating environment of 2020, the portfolios’ performance continues to exceed expectations.
Full details on credit quality including Stage 3 provisioning is provided in note 2(b) of the Financial Statements.
Restructured facilities
Restructured loans are loans that have been renegotiated due to a deterioration in the borrower’s financial position and cash flow. In such cases, where assessed genuine, the Bank has reviewed the terms & conditions by allowing concessions such as, depending on the cases, extending the maturity, changing the frequency of interest servicing, reviewing downward the interest rate, as well as amendments to loan covenants. The Bank follows the requirements of the Bank of Mauritius’ guideline on credit impairment and income recognition of restructured facilities.
For the year under review, 3 credit facilities were restructured for an amount of MUR 5M. These loans are being regularly repaid and the balance decreased to MUR 4.9M as at 31 December 2020.
Properties in possession (PIPs)
As at December 2020, the Bank held four PIPs in its books, with an assessed total value of MUR 9.1M (2019: MUR 9.1M) included in the “Other Assets” figure (note 21 of the Financial Statements). No new property was added in the year under review. As at December 2020, the carrying value of these properties did not differ materially from the estimated market value. The Bank's policy regarding the PIPs is to dispose of them as soon as practically possible, in line with banking legislation.
The policy of the Bank is to recognise the assets repossessed at the lower of the carrying value and the fair value less cost to resell.
Market risk
DEFINITION The risk of a potential decrease in the value, resulting from adverse changes in market prices and interest rates that negatively affect assets and liabilities.
GOVERNANCE
Market risk exposure for different types of transactions is managed within risk limits and guidelines are approved by the Board and monthly monitored via ALCO, which reports any key risks monthly to MIRC and quarterly to the Board Risk Management Committee (BRMC).
The risk analytics team monitors and reports on limit governance.
MORE INFORMATIONThe Treasury department monitors the debt securities book on a weekly basis, reporting monthly to ALCO and quarterly to the BRMC.
Market risk arising from the trading book
The Bank measures market risk from the trading book using the VaR technique (historical approach at a 99% confidence level over a one-day holding period) and controls market risk exposures within prudent risks limits set by the Board, in line with the Bank’s risk appetite. Market risk is monitored on a daily basis.
Market risk arising from the banking book
Various management action triggers are established to provide early alerts to management on the different levels of exposures of the banking book activities, relative to foreign exchange risk and interest rate risk (as well as liquidity risk - see next chapter). Sensitivity analysis and stress testing covering shocks and shifts in interest rates on the Bank’s on-and-off balance sheet positions, liquidity drift under institution-specific and general market crisis scenarios (which may impact the price applying to some assets or liabilities), are regularly performed to gauge and forecast the market risk inherent to the banking book portfolio.
(i) Foreign exchange risk
The Bank has limited net foreign exchange exposure, as foreign exchange positions and foreign currency balances arising from customer transactions are normally matched against other customer transactions or through cover transactions with the market. The net open exposure positions, both by individual currency and in aggregate, are managed by the Treasury department within established limits and reported to the Bank of Mauritius on a daily basis.
During 2020, the Bank operated well within the regulatory limits regarding net open positions.
A daily report goes to senior management to notify any underlying breach in limits. A monthly report is submitted to ALCO and a quarterly report is submitted to the BRMC. Any breaches are immediately notified to senior management and simultaneously escalated to the relevant sanctioning authority in terms of the Bank’s escalation matrix.
Accordingly, as at 31 December 2020, on the main foreign currencies, the VaR limits against the actual potential loss reflect sufficient headroom:
VAR LIMIT VS ACTUAL POSITION DECEMBER 2020 USD EUR GBP
Limit MUR 800K MUR 500K MUR 200K
Potential loss MUR 361K MUR 6K MUR 16K
(ii) Interest rate risk
The Bank considers the effects of fluctuations in the prevailing levels of market interest rates on both its fair value and cash flow risks. The Board sets limits on the level of mismatch of interest rate re-pricing that may be undertaken. Exposures against these limits are reported monthly to ALCO and quarterly to the BRMC.
The framework adopted by the Bank to measure interest rate risk exposures is consistent with the Bank of Mauritius’ guidelines on reporting interest rate risk exposures, which consists principally of interest rate sensitivity analysis and stress testing.
Interest rate repricing gap analysis
Details of the Interest rate repricing gap analysis as at 31 December 2020 are given in note 2 (f) of the Financial Statements.
The earnings at risk methodology is used to assess the impact of various interest rate change scenarios on net interest income over a 12-month period, as required under the domestic and global regulatory guidelines.
RISK MANAGEMENT
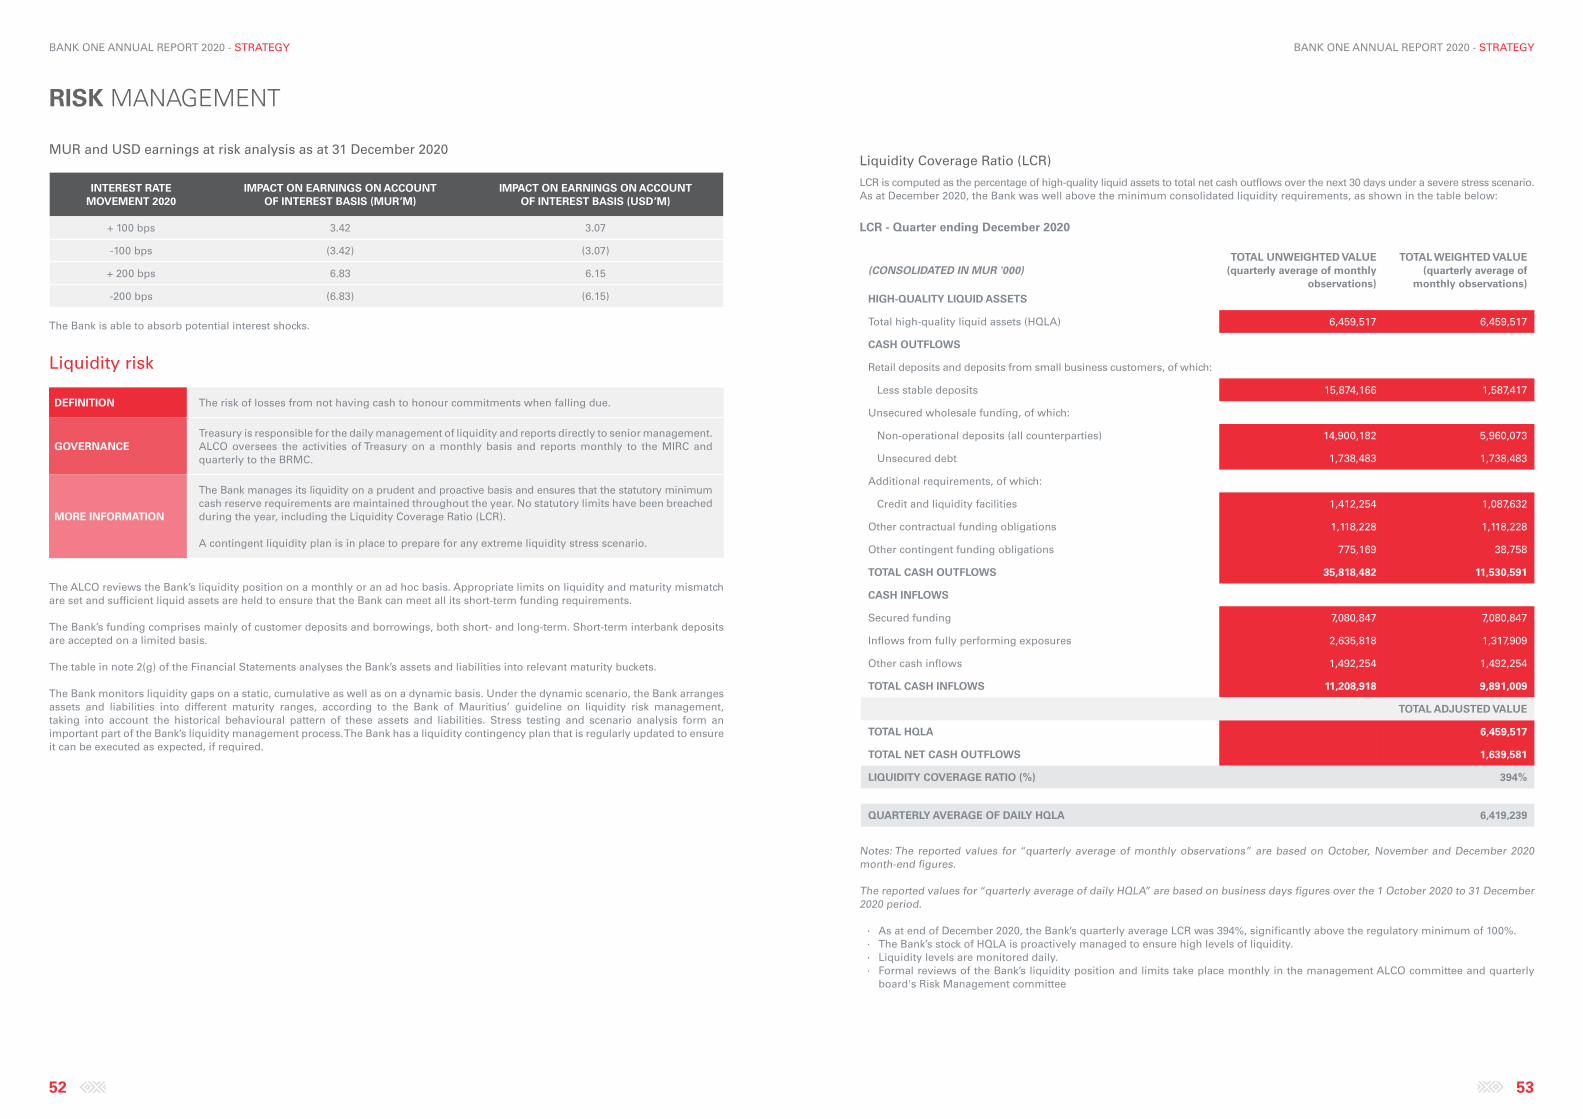
BANK ONE ANNUAL REPORT 2020 - STRATEGY
52 53
BANK ONE ANNUAL REPORT 2020 - STRATEGY
MUR and USD earnings at risk analysis as at 31 December 2020
INTEREST RATE MOVEMENT 2020
IMPACT ON EARNINGS ON ACCOUNT OF INTEREST BASIS (MUR’M)
IMPACT ON EARNINGS ON ACCOUNT OF INTEREST BASIS (USD’M)
+ 100 bps 3.42 3.07
-100 bps (3.42) (3.07)
+ 200 bps 6.83 6.15
-200 bps (6.83) (6.15)
The Bank is able to absorb potential interest shocks.
Liquidity risk
DEFINITION The risk of losses from not having cash to honour commitments when falling due.
GOVERNANCETreasury is responsible for the daily management of liquidity and reports directly to senior management. ALCO oversees the activities of Treasury on a monthly basis and reports monthly to the MIRC and quarterly to the BRMC.
MORE INFORMATION
The Bank manages its liquidity on a prudent and proactive basis and ensures that the statutory minimum cash reserve requirements are maintained throughout the year. No statutory limits have been breached during the year, including the Liquidity Coverage Ratio (LCR).
A contingent liquidity plan is in place to prepare for any extreme liquidity stress scenario.
The ALCO reviews the Bank’s liquidity position on a monthly or an ad hoc basis. Appropriate limits on liquidity and maturity mismatch are set and sufficient liquid assets are held to ensure that the Bank can meet all its short-term funding requirements.
The Bank’s funding comprises mainly of customer deposits and borrowings, both short- and long-term. Short-term interbank deposits are accepted on a limited basis.
The table in note 2(g) of the Financial Statements analyses the Bank’s assets and liabilities into relevant maturity buckets.
The Bank monitors liquidity gaps on a static, cumulative as well as on a dynamic basis. Under the dynamic scenario, the Bank arranges assets and liabilities into different maturity ranges, according to the Bank of Mauritius’ guideline on liquidity risk management, taking into account the historical behavioural pattern of these assets and liabilities. Stress testing and scenario analysis form an important part of the Bank’s liquidity management process. The Bank has a liquidity contingency plan that is regularly updated to ensure it can be executed as expected, if required.
Liquidity Coverage Ratio (LCR)
LCR is computed as the percentage of high-quality liquid assets to total net cash outflows over the next 30 days under a severe stress scenario. As at December 2020, the Bank was well above the minimum consolidated liquidity requirements, as shown in the table below:
LCR - Quarter ending December 2020
(CONSOLIDATED IN MUR '000)TOTAL UNWEIGHTED VALUE
(quarterly average of monthly observations)
TOTAL WEIGHTED VALUE (quarterly average of
monthly observations)HIGH-QUALITY LIQUID ASSETS
Total high-quality liquid assets (HQLA) 6,459,517 6,459,517
CASH OUTFLOWS
Retail deposits and deposits from small business customers, of which:
Less stable deposits 15,874,166 1,587,417
Unsecured wholesale funding, of which:
Non-operational deposits (all counterparties) 14,900,182 5,960,073
Unsecured debt 1,738,483 1,738,483
Additional requirements, of which:
Credit and liquidity facilities 1,412,254 1,087,632
Other contractual funding obligations 1,118,228 1,118,228
Other contingent funding obligations 775,169 38,758
TOTAL CASH OUTFLOWS 35,818,482 11,530,591
CASH INFLOWS
Secured funding 7,080,847 7,080,847
Inflows from fully performing exposures 2,635,818 1,317,909
Other cash inflows 1,492,254 1,492,254
TOTAL CASH INFLOWS 11,208,918 9,891,009
TOTAL ADJUSTED VALUE
TOTAL HQLA 6,459,517
TOTAL NET CASH OUTFLOWS 1,639,581
LIQUIDITY COVERAGE RATIO (%) 394%
QUARTERLY AVERAGE OF DAILY HQLA 6,419,239
Notes: The reported values for “quarterly average of monthly observations” are based on October, November and December 2020 month-end figures.
The reported values for “quarterly average of daily HQLA” are based on business days figures over the 1 October 2020 to 31 December 2020 period.
∙ As at end of December 2020, the Bank’s quarterly average LCR was 394%, significantly above the regulatory minimum of 100%. ∙ The Bank’s stock of HQLA is proactively managed to ensure high levels of liquidity. ∙ Liquidity levels are monitored daily. ∙ Formal reviews of the Bank’s liquidity position and limits take place monthly in the management ALCO committee and quarterly
board's Risk Management committee
RISK MANAGEMENT
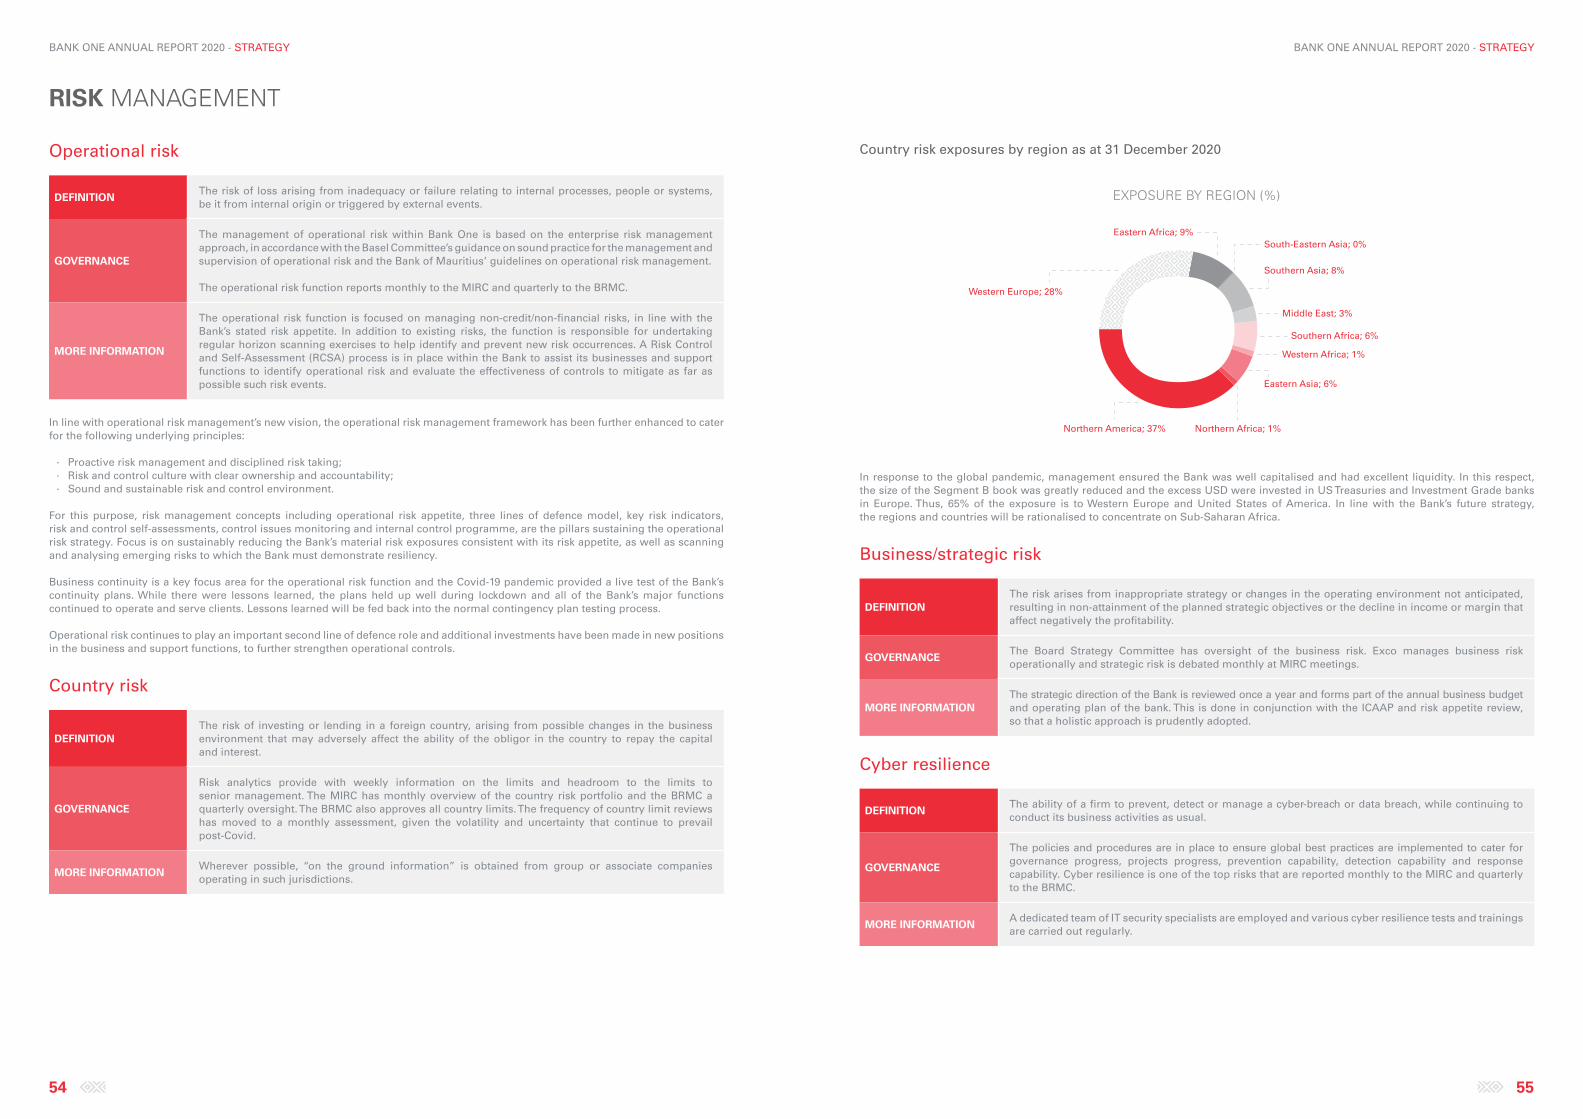
BANK ONE ANNUAL REPORT 2020 - STRATEGY
54 55
BANK ONE ANNUAL REPORT 2020 - STRATEGY
Operational risk
DEFINITION The risk of loss arising from inadequacy or failure relating to internal processes, people or systems, be it from internal origin or triggered by external events.
GOVERNANCE
The management of operational risk within Bank One is based on the enterprise risk management approach, in accordance with the Basel Committee’s guidance on sound practice for the management and supervision of operational risk and the Bank of Mauritius’ guidelines on operational risk management.
The operational risk function reports monthly to the MIRC and quarterly to the BRMC.
MORE INFORMATION
The operational risk function is focused on managing non-credit/non-financial risks, in line with the Bank’s stated risk appetite. In addition to existing risks, the function is responsible for undertaking regular horizon scanning exercises to help identify and prevent new risk occurrences. A Risk Control and Self-Assessment (RCSA) process is in place within the Bank to assist its businesses and support functions to identify operational risk and evaluate the effectiveness of controls to mitigate as far as possible such risk events.
In line with operational risk management’s new vision, the operational risk management framework has been further enhanced to cater for the following underlying principles:
∙ Proactive risk management and disciplined risk taking; ∙ Risk and control culture with clear ownership and accountability; ∙ Sound and sustainable risk and control environment.
For this purpose, risk management concepts including operational risk appetite, three lines of defence model, key risk indicators, risk and control self-assessments, control issues monitoring and internal control programme, are the pillars sustaining the operational risk strategy. Focus is on sustainably reducing the Bank’s material risk exposures consistent with its risk appetite, as well as scanning and analysing emerging risks to which the Bank must demonstrate resiliency.
Business continuity is a key focus area for the operational risk function and the Covid-19 pandemic provided a live test of the Bank’s continuity plans. While there were lessons learned, the plans held up well during lockdown and all of the Bank’s major functions continued to operate and serve clients. Lessons learned will be fed back into the normal contingency plan testing process.
Operational risk continues to play an important second line of defence role and additional investments have been made in new positions in the business and support functions, to further strengthen operational controls.
Country risk
DEFINITION The risk of investing or lending in a foreign country, arising from possible changes in the business environment that may adversely affect the ability of the obligor in the country to repay the capital and interest.
GOVERNANCE
Risk analytics provide with weekly information on the limits and headroom to the limits to senior management. The MIRC has monthly overview of the country risk portfolio and the BRMC a quarterly oversight. The BRMC also approves all country limits. The frequency of country limit reviews has moved to a monthly assessment, given the volatility and uncertainty that continue to prevail post-Covid.
MORE INFORMATIONWherever possible, “on the ground information” is obtained from group or associate companies operating in such jurisdictions.
Country risk exposures by region as at 31 December 2020
In response to the global pandemic, management ensured the Bank was well capitalised and had excellent liquidity. In this respect, the size of the Segment B book was greatly reduced and the excess USD were invested in US Treasuries and Investment Grade banks in Europe. Thus, 65% of the exposure is to Western Europe and United States of America. In line with the Bank’s future strategy, the regions and countries will be rationalised to concentrate on Sub-Saharan Africa.
Business/strategic risk
DEFINITION The risk arises from inappropriate strategy or changes in the operating environment not anticipated, resulting in non-attainment of the planned strategic objectives or the decline in income or margin that affect negatively the profitability.
GOVERNANCEThe Board Strategy Committee has oversight of the business risk. Exco manages business risk operationally and strategic risk is debated monthly at MIRC meetings.
MORE INFORMATIONThe strategic direction of the Bank is reviewed once a year and forms part of the annual business budget and operating plan of the bank. This is done in conjunction with the ICAAP and risk appetite review, so that a holistic approach is prudently adopted.
Cyber resilience
DEFINITION The ability of a firm to prevent, detect or manage a cyber-breach or data breach, while continuing to conduct its business activities as usual.
GOVERNANCE
The policies and procedures are in place to ensure global best practices are implemented to cater for governance progress, projects progress, prevention capability, detection capability and response capability. Cyber resilience is one of the top risks that are reported monthly to the MIRC and quarterly to the BRMC.
MORE INFORMATIONA dedicated team of IT security specialists are employed and various cyber resilience tests and trainings are carried out regularly.
EXPOSURE BY REGION (%)
Western Europe; 28%
Northern America; 37% Northern Africa; 1%
Southern Africa; 6%
Middle East; 3%
Western Africa; 1%
Eastern Asia; 6%
Southern Asia; 8%
South-Eastern Asia; 0%Eastern Africa; 9%
RISK MANAGEMENT
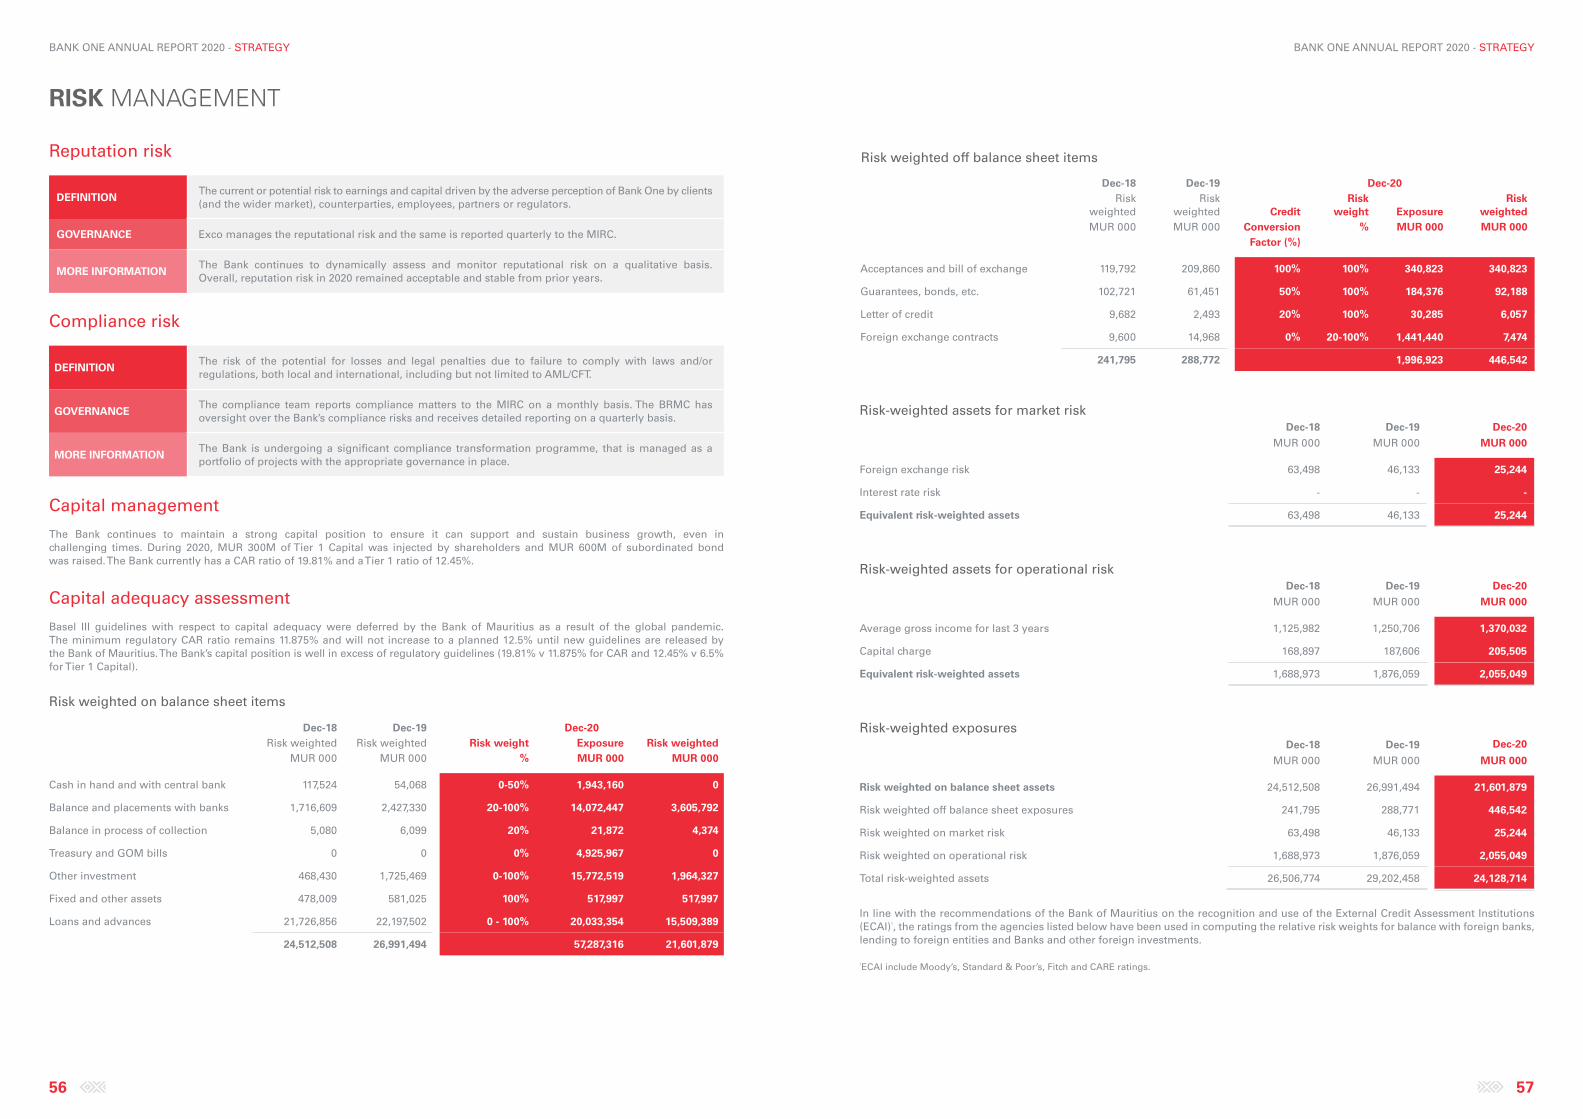
BANK ONE ANNUAL REPORT 2020 - STRATEGY
56 57
BANK ONE ANNUAL REPORT 2020 - STRATEGY
Reputation risk
DEFINITION The current or potential risk to earnings and capital driven by the adverse perception of Bank One by clients (and the wider market), counterparties, employees, partners or regulators.
GOVERNANCE Exco manages the reputational risk and the same is reported quarterly to the MIRC.
MORE INFORMATIONThe Bank continues to dynamically assess and monitor reputational risk on a qualitative basis. Overall, reputation risk in 2020 remained acceptable and stable from prior years.
Compliance risk
DEFINITION The risk of the potential for losses and legal penalties due to failure to comply with laws and/or regulations, both local and international, including but not limited to AML/CFT.
GOVERNANCEThe compliance team reports compliance matters to the MIRC on a monthly basis. The BRMC has oversight over the Bank’s compliance risks and receives detailed reporting on a quarterly basis.
MORE INFORMATIONThe Bank is undergoing a significant compliance transformation programme, that is managed as a portfolio of projects with the appropriate governance in place.
Capital management
The Bank continues to maintain a strong capital position to ensure it can support and sustain business growth, even in challenging times. During 2020, MUR 300M of Tier 1 Capital was injected by shareholders and MUR 600M of subordinated bond was raised. The Bank currently has a CAR ratio of 19.81% and a Tier 1 ratio of 12.45%.
Capital adequacy assessment
Basel III guidelines with respect to capital adequacy were deferred by the Bank of Mauritius as a result of the global pandemic. The minimum regulatory CAR ratio remains 11.875% and will not increase to a planned 12.5% until new guidelines are released by the Bank of Mauritius. The Bank’s capital position is well in excess of regulatory guidelines (19.81% v 11.875% for CAR and 12.45% v 6.5% for Tier 1 Capital).
Risk weighted on balance sheet items
Dec-18 Dec-19 Dec-20Risk weighted Risk weighted Risk weight Exposure Risk weighted
MUR 000 MUR 000 % MUR 000 MUR 000
Cash in hand and with central bank 117,524 54,068 0-50% 1,943,160 0
Balance and placements with banks 1,716,609 2,427,330 20-100% 14,072,447 3,605,792
Balance in process of collection 5,080 6,099 20% 21,872 4,374
Treasury and GOM bills 0 0 0% 4,925,967 0
Other investment 468,430 1,725,469 0-100% 15,772,519 1,964,327
Fixed and other assets 478,009 581,025 100% 517,997 517,997
Loans and advances 21,726,856 22,197,502 0 - 100% 20,033,354 15,509,389
24,512,508 26,991,494 57,287,316 21,601,879
Risk weighted off balance sheet items
Dec-18 Dec-19 Dec-20Risk
weighted Risk
weighted Credit Risk
weight ExposureRisk
weighted MUR 000 MUR 000 Conversion % MUR 000 MUR 000
Factor (%)
Acceptances and bill of exchange 119,792 209,860 100% 100% 340,823 340,823
Guarantees, bonds, etc. 102,721 61,451 50% 100% 184,376 92,188
Letter of credit 9,682 2,493 20% 100% 30,285 6,057
Foreign exchange contracts 9,600 14,968 0% 20-100% 1,441,440 7,474
241,795 288,772 1,996,923 446,542
Risk-weighted assets for market risk
Dec-18 Dec-19 Dec-20
MUR 000 MUR 000 MUR 000
Foreign exchange risk 63,498 46,133 25,244
Interest rate risk - - -
Equivalent risk-weighted assets 63,498 46,133 25,244
Risk-weighted assets for operational risk
Dec-18 Dec-19 Dec-20
MUR 000 MUR 000 MUR 000
Average gross income for last 3 years 1,125,982 1,250,706 1,370,032
Capital charge 168,897 187,606 205,505
Equivalent risk-weighted assets 1,688,973 1,876,059 2,055,049
Risk-weighted exposures
Dec-18 Dec-19 Dec-20
MUR 000 MUR 000 MUR 000
Risk weighted on balance sheet assets 24,512,508 26,991,494 21,601,879
Risk weighted off balance sheet exposures 241,795 288,771 446,542
Risk weighted on market risk 63,498 46,133 25,244
Risk weighted on operational risk 1,688,973 1,876,059 2,055,049
Total risk-weighted assets 26,506,774 29,202,458 24,128,714
In line with the recommendations of the Bank of Mauritius on the recognition and use of the External Credit Assessment Institutions (ECAI)¹, the ratings from the agencies listed below have been used in computing the relative risk weights for balance with foreign banks, lending to foreign entities and Banks and other foreign investments.
¹ECAI include Moody’s, Standard & Poor’s, Fitch and CARE ratings.
RISK MANAGEMENT
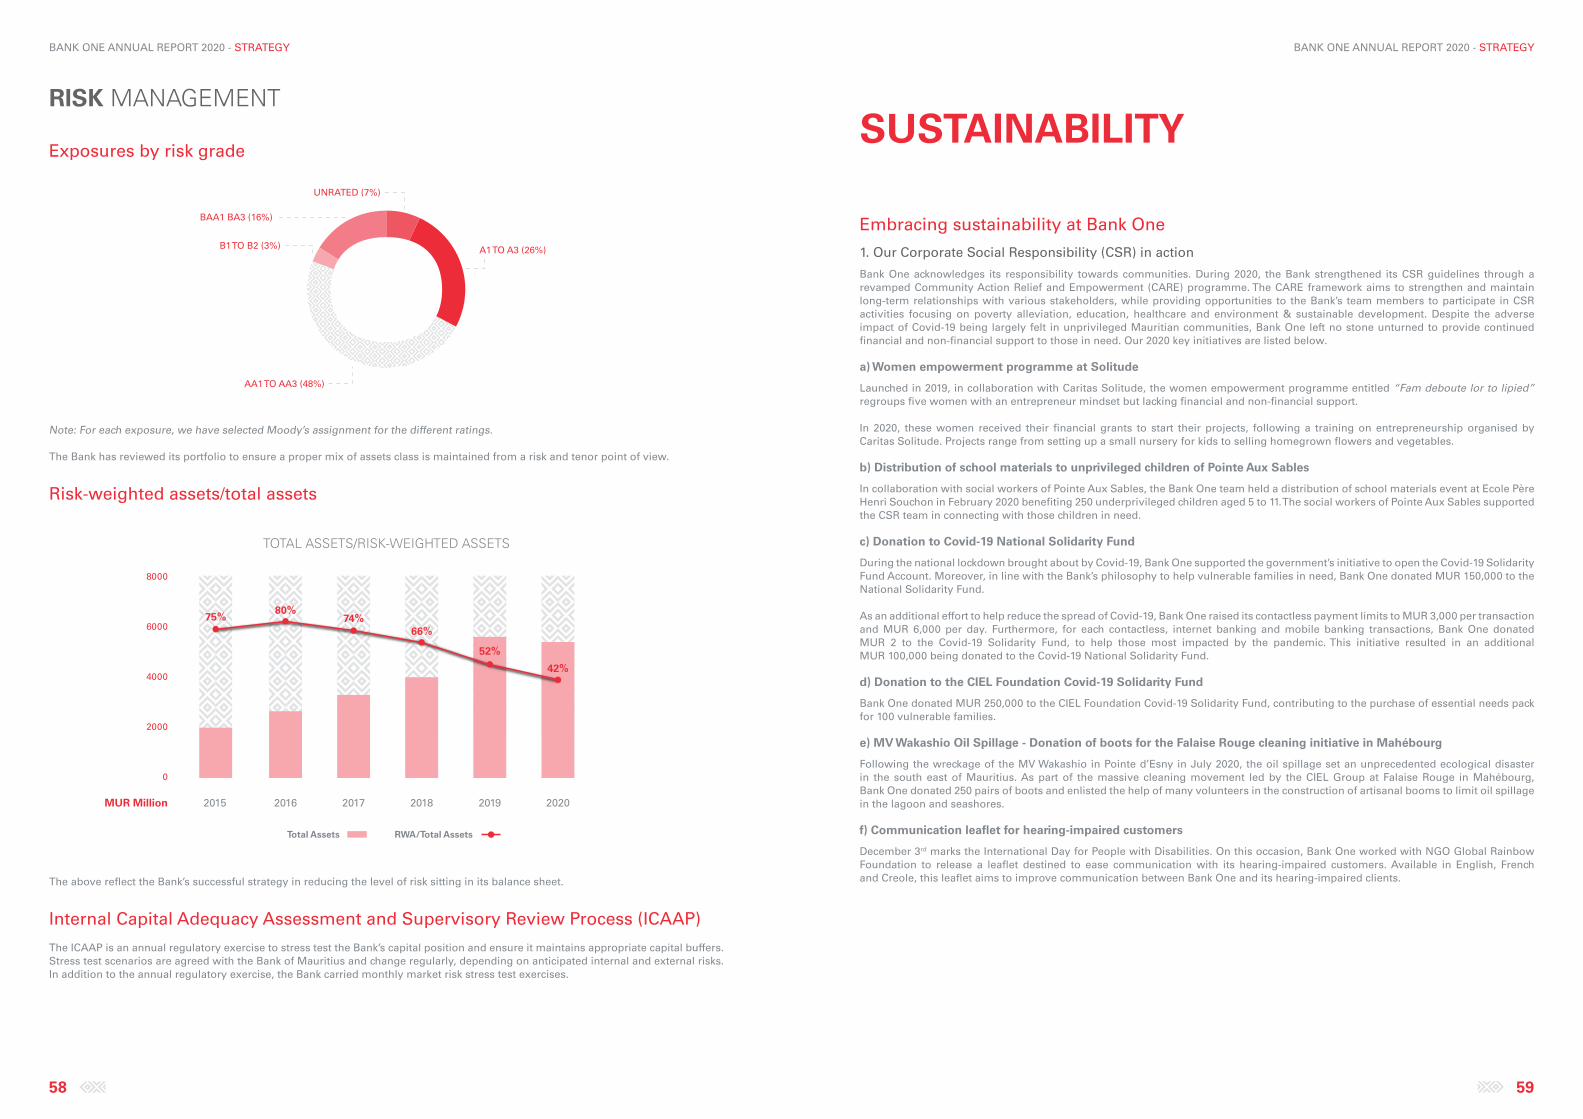
BANK ONE ANNUAL REPORT 2020 - STRATEGY
58 59
BANK ONE ANNUAL REPORT 2020 - STRATEGY
Exposures by risk grade
Note: For each exposure, we have selected Moody’s assignment for the different ratings.
The Bank has reviewed its portfolio to ensure a proper mix of assets class is maintained from a risk and tenor point of view.
Risk-weighted assets/total assets
The above reflect the Bank’s successful strategy in reducing the level of risk sitting in its balance sheet.
Internal Capital Adequacy Assessment and Supervisory Review Process (ICAAP)
The ICAAP is an annual regulatory exercise to stress test the Bank’s capital position and ensure it maintains appropriate capital buffers. Stress test scenarios are agreed with the Bank of Mauritius and change regularly, depending on anticipated internal and external risks. In addition to the annual regulatory exercise, the Bank carried monthly market risk stress test exercises.
Embracing sustainability at Bank One
1. Our Corporate Social Responsibility (CSR) in action
Bank One acknowledges its responsibility towards communities. During 2020, the Bank strengthened its CSR guidelines through a revamped Community Action Relief and Empowerment (CARE) programme. The CARE framework aims to strengthen and maintain long-term relationships with various stakeholders, while providing opportunities to the Bank’s team members to participate in CSR activities focusing on poverty alleviation, education, healthcare and environment & sustainable development. Despite the adverse impact of Covid-19 being largely felt in unprivileged Mauritian communities, Bank One left no stone unturned to provide continued financial and non-financial support to those in need. Our 2020 key initiatives are listed below.
a) Women empowerment programme at Solitude
Launched in 2019, in collaboration with Caritas Solitude, the women empowerment programme entitled “Fam deboute lor to lipied” regroups five women with an entrepreneur mindset but lacking financial and non-financial support.
In 2020, these women received their financial grants to start their projects, following a training on entrepreneurship organised by Caritas Solitude. Projects range from setting up a small nursery for kids to selling homegrown flowers and vegetables.
b) Distribution of school materials to unprivileged children of Pointe Aux Sables
In collaboration with social workers of Pointe Aux Sables, the Bank One team held a distribution of school materials event at Ecole Père Henri Souchon in February 2020 benefiting 250 underprivileged children aged 5 to 11. The social workers of Pointe Aux Sables supported the CSR team in connecting with those children in need.
c) Donation to Covid-19 National Solidarity Fund
During the national lockdown brought about by Covid-19, Bank One supported the government’s initiative to open the Covid-19 Solidarity Fund Account. Moreover, in line with the Bank’s philosophy to help vulnerable families in need, Bank One donated MUR 150,000 to the National Solidarity Fund.
As an additional effort to help reduce the spread of Covid-19, Bank One raised its contactless payment limits to MUR 3,000 per transaction and MUR 6,000 per day. Furthermore, for each contactless, internet banking and mobile banking transactions, Bank One donated MUR 2 to the Covid-19 Solidarity Fund, to help those most impacted by the pandemic. This initiative resulted in an additional MUR 100,000 being donated to the Covid-19 National Solidarity Fund.
d) Donation to the CIEL Foundation Covid-19 Solidarity Fund
Bank One donated MUR 250,000 to the CIEL Foundation Covid-19 Solidarity Fund, contributing to the purchase of essential needs pack for 100 vulnerable families.
e) MV Wakashio Oil Spillage - Donation of boots for the Falaise Rouge cleaning initiative in Mahébourg
Following the wreckage of the MV Wakashio in Pointe d’Esny in July 2020, the oil spillage set an unprecedented ecological disaster in the south east of Mauritius. As part of the massive cleaning movement led by the CIEL Group at Falaise Rouge in Mahébourg, Bank One donated 250 pairs of boots and enlisted the help of many volunteers in the construction of artisanal booms to limit oil spillage in the lagoon and seashores.
f) Communication leaflet for hearing-impaired customers
December 3rd marks the International Day for People with Disabilities. On this occasion, Bank One worked with NGO Global Rainbow Foundation to release a leaflet destined to ease communication with its hearing-impaired customers. Available in English, French and Creole, this leaflet aims to improve communication between Bank One and its hearing-impaired clients.
BAA1 BA3 (16%)
B1 TO B2 (3%)
AA1 TO AA3 (48%)
A1 TO A3 (26%)
UNRATED (7%)
0
2000
4000
6000
8000
RWA/Total AssetsTotal Assets
75%80%
74%66%
52%
42%
2015 2016 2017 2018 2019 2020
TOTAL ASSETS/RISK-WEIGHTED ASSETS
MUR Million
BAA1 BA3 (16%)
B1 TO B2 (3%)
AA1 TO AA3 (48%)
A1 TO A3 (26%)
UNRATED (7%)
0
2000
4000
6000
8000
RWA/Total AssetsTotal Assets
75%80%
74%66%
52%
42%
2015 2016 2017 2018 2019 2020
TOTAL ASSETS/RISK-WEIGHTED ASSETS
MUR Million
SUSTAINABILITYRISK MANAGEMENT

BANK ONE ANNUAL REPORT 2020 - STRATEGY
60
g) Christmas party for children at Jean Blaise Community, Pointe Aux Sables
Picture: Distribution of gifts by Bank One’s CEO, Mark Watkinson
In December, Bank One teamed up with NGO Association des Frères Auxiliaires to organise a Christmas party for 70 Grades 1 to 6 children of the Jean Blaise Community, Pointe Aux Sables.
2. The Bank One sustainability journey
Bank One is committed to integrating sustainability criteria into its business strategies, a statement that reflects the Bank’s approach to mitigating the direct environmental and social impacts of its operations as well as managing their indirect impacts.
In 2020, Bank One worked through a guiding approach to apply best industry practices for:
∙ Ensuring environmental and social responsibility across Bank One’s operations, through environmental and socially responsible initiatives; ∙ Integrating financial risks considerations arising from environmental and social impacts in the decision-making process, that comply
with the Bank’s commitment towards responsible financing, supported by a revamped Environment and Social Management Policy and implemented by an Environmental and Social Management System (ESMS).
a) Environmental and Social Management System (ESMS) and staff training
Last year, the Bank directed its efforts towards developing a robust ESMS, in line with IFC Performance Standards, to ensure greater environmental and social efficacy among our customers, especially our medium- to high-risks clients. Moreover, with the support of a renowned international expert, Bank One kick-started its journey towards creating a best-in-class ESMS.
The key milestones achieved during 2020 include:
∙ The presentation of the ESMS project to the Bank’s senior executives by the external consultant at project kick-off in February 2020; ∙ The involvement of 30 team members, comprising Relationship Managers and Analysts from the Bank’s various business clusters,
in online learning ESMS courses on the DEG Online Sustainability Platform; ∙ The revision of the Bank’s Environment and Social Management Policy, which depicts the guiding principles on effective
environmental and social management practices across all activities, products and services; ∙ The thorough revision and upgrade of the Bank’s Environmental and Social Management Procedures Manual.
The project is set to continue in 2021, with the objective to fully incorporate the ESMS process within the Credit Risk Assessment Framework.
b) Reducing our environmental footprint
Bank One is committed to reducing its environmental footprint across its operations.
During 2020, we started collecting used paper, old magazines and newspapers arising from our operations, for recycling. As a result of this initiative, the Bank collected over 4,200 Kg of waste paper.
In the same vein, Bank One is setting the path to energy and pollution preventive measures across its operations.
SUSTAINABILITY
BANK ONE ANNUAL REPORT 2020 - CORPORATE GOVERNANCE REPORT
62 63
BANK ONE ANNUAL REPORT 2020 - CORPORATE GOVERNANCE REPORT
CORPORATE GOVERNANCECORPORATE PROFILE
CORPORATE GOVERNANCE REPORT
STATEMENT OF COMPLIANCE
OTHER STATUTORY DISCLOSURES
COMPANY SECRETARY'S CERTIFICATE
STATEMENT OF DIRECTORS’ RESPONSIBILITIES IN RESPECT OF FINANCIAL STATEMENTS
STATEMENT OF MANAGEMENT'S RESPONSIBILITIES IN RESPECT OF FINANCIAL STATEMENT
BANK ONE ANNUAL REPORT 2020 - CORPORATE GOVERNANCE REPORT
64
Bank One Limited (hereinafter referred to as “Bank One” or the “Bank”) is a top-tier banking institution incorporated in 2008 following a joint venture between Mauritian conglomerate CIEL Ltd and Kenya-based I&M Holdings PLC.
Leveraging on a team of 421 talented professionals across its four main business segments namely Retail, Corporate, Private and International Banking, Bank One has strengthened its presence both locally and regionally in the last 12 years whilst mastering the complexities of the different geographies and markets where it is present.
Bank One is acknowledged as an award-winning institution ranked 21st most profitable company in Mauritius by the 2020 Top 100 Companies publication (30th in 2019). It is recognised for its bespoke products and services delivered to more than 50,000 domestic and international customers and has built a strong asset base of MUR 57.1 billion. In line with its digital ambitions, Bank One has embarked on a series of key initiatives which are expected to materialise as from 2021 onwards. Over and above its ATM footprint and network of 9 branches across the island of Mauritius, Bank One plans to relocate its headquarters to Port Louis Waterfront in 2021 to cater for its expanding business needs.
The Bank also plays an active role in supporting businesses in Sub-Saharan Africa. It has deep development finance institution relationships and long-term funding lines in place with the German Investment Corporation (DEG), the International Finance Corporation (IFC) and the French Development Agency (Proparco). Bank One is well-capitalised with a Capital Adequacy Ratio of 19.81% as at December 2020 against a regulatory limit of 11.875%. It is well-positioned to continue its local and international growth strategy. Bank One has been rated A+ Stable by CARE Ratings (Africa).
Directors in office during the financial year ended 31 December 2020
Ms. Sandra Martyres (Appointed as Independent Chairperson on 07.09.2017)Mr. Ravneet Chowdhury (Executive, ceased to be a director as of 31.03.2020)Mr. Mark R. P. Watkinson (Executive, appointed on 01.04.2020)Ms. Gauri A. Gupta (Non-Executive)Mr. Paul E. Leech (Non-Executive)Mr. Leonard C. Mususa (Independent)Mr. Ignasi Serrahima Arbestain (Independent)Mr. L.A. Sivaramakrishnan (Non-Executive)Mr. Nikhil Treebhoohun (Independent) Mr. Marc-Emmanuel Vives (Non-Executive)
Secretary to the Board and Board Committees
Ms. Kareen Ng Chit Wing ACIS
Board committees’ composition as at 31 December 2020
Audit Committee
Mr. Leonard C. Mususa (Chairperson)Ms. Sandra MartyresMr. Nikhil Treebhoohun
Risk Management Committee
Mr. Marc-Emmanuel Vives (Chairperson)Ms. Sandra MartyresMr. Leonard C. Mususa Mr. L. A SivaramakrishnanMr. Mark R. P. Watkinson
Conduct Review & Corporate Governance Committee
Mr. Nikhil Treebhoohun (Chairperson)Ms. Sandra Martyres Mr. Leonard C. Mususa
Investment & Transformation Committee
Mr. Marc-Emmanuel Vives (Chairperson)Mr. Ignasi Serrahima ArbestainMr. L. A. Sivaramakrishnan Mr. Mark R. P. Watkinson
Nomination & Remuneration Committee
Ms. Gauri A. Gupta (Chairperson)Mr. Ignasi Serrahima ArbestainMr. Nikhil TreebhoohunMr. Marc-Emmanuel Vives
Credit Committee
Mr. L. A Sivaramakrishnan (Chairperson)Ms. Sandra Martyres Mr. Marc-Emmanuel Vives
Strategy Committee
Mr. Paul E. Leech (Chairperson)Ms. Gauri A. Gupta Ms. Sandra Martyres Mr. Ignasi Serrahima ArbestainMr. Mark R. P. Watkinson
Executive management team
Chief Executive Officer: Mr. Mark R. P. Watkinson Chief Operating Officer: Mr. Eric HautefeuilleChief Financial Officer: Mr. Ranjeevesingh Gowreesunkur Chief Risk Officer: Mr. Stephen VlokHead of Corporate Banking: Mr. Fareed SoobadarHead of International Banking: Mr. Carl ChirwaHead of Private Banking and Wealth Management: Mr. Guillaume PassebecqHead of Retail Banking: Mr. Shehryar AliHead of Treasury: Mr. Rishyraj LutchmanHead of Human Resources: Ms. Priscilla MuttyHead of Legal and Regulatory Affairs: Ms. Valérie Duval
CORPORATEPROFILE
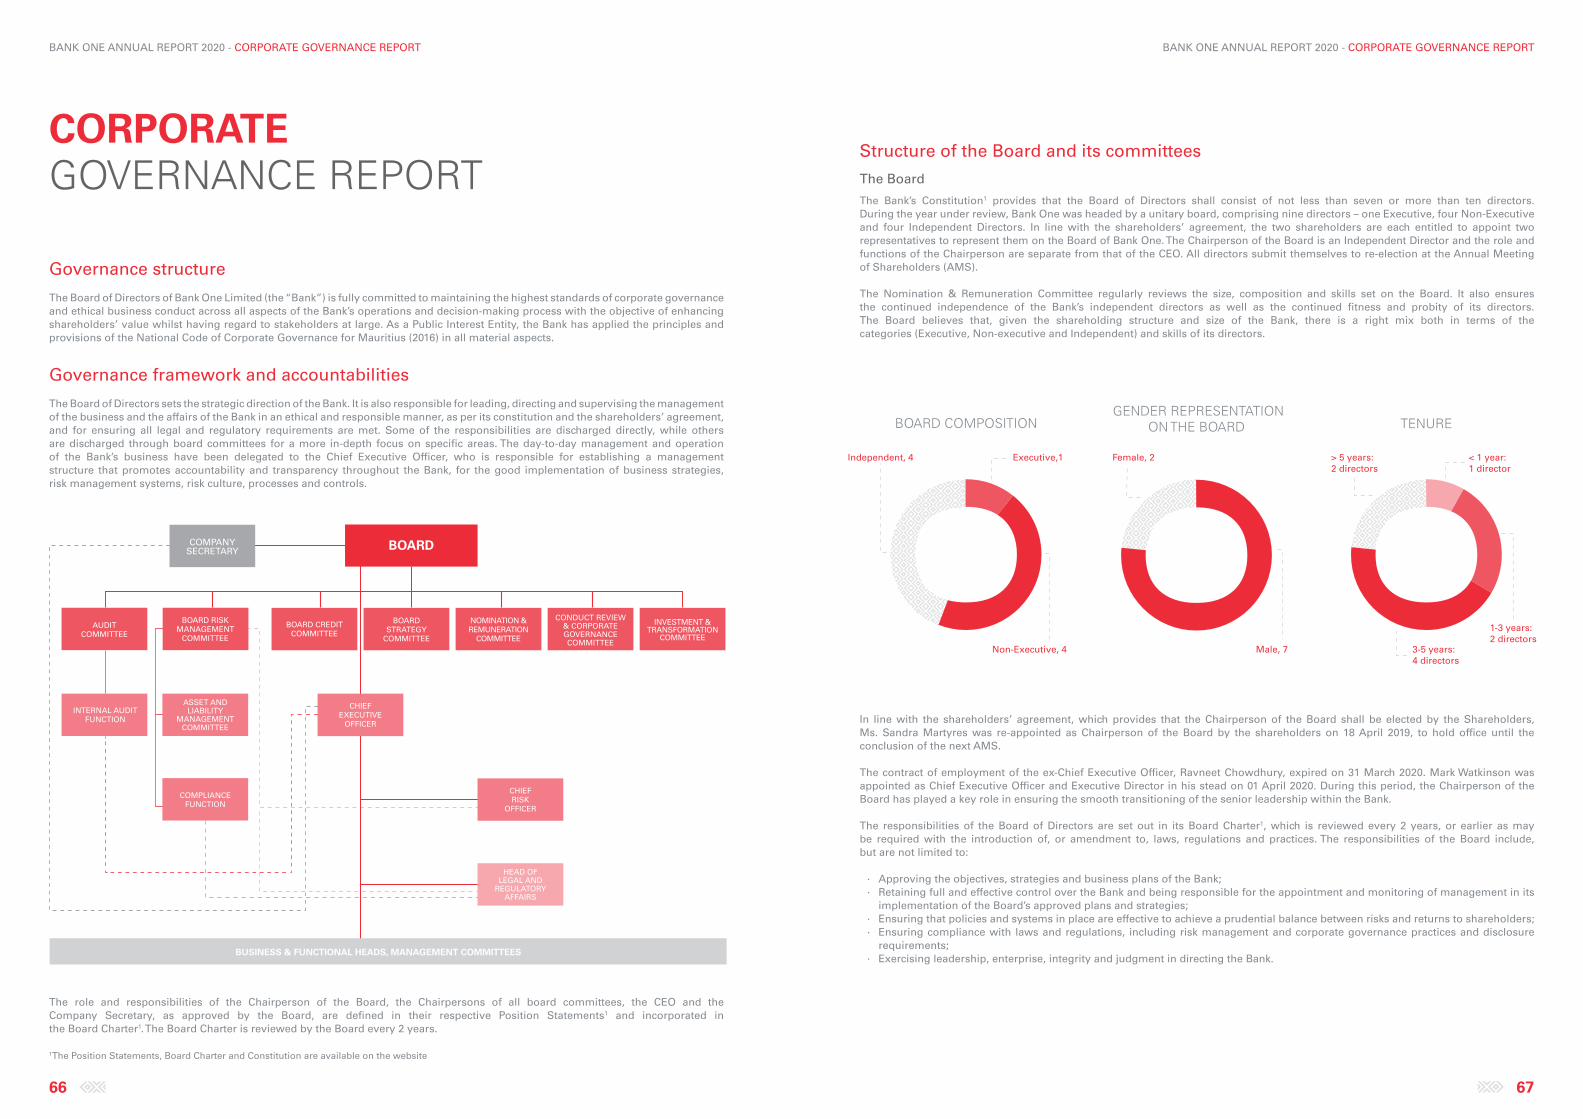
BANK ONE ANNUAL REPORT 2020 - CORPORATE GOVERNANCE REPORT
66 67
BANK ONE ANNUAL REPORT 2020 - CORPORATE GOVERNANCE REPORT
Governance structure
The Board of Directors of Bank One Limited (the “Bank”) is fully committed to maintaining the highest standards of corporate governance and ethical business conduct across all aspects of the Bank’s operations and decision-making process with the objective of enhancing shareholders’ value whilst having regard to stakeholders at large. As a Public Interest Entity, the Bank has applied the principles and provisions of the National Code of Corporate Governance for Mauritius (2016) in all material aspects.
Governance framework and accountabilities
The Board of Directors sets the strategic direction of the Bank. It is also responsible for leading, directing and supervising the management of the business and the affairs of the Bank in an ethical and responsible manner, as per its constitution and the shareholders’ agreement, and for ensuring all legal and regulatory requirements are met. Some of the responsibilities are discharged directly, while others are discharged through board committees for a more in-depth focus on specific areas. The day-to-day management and operation of the Bank’s business have been delegated to the Chief Executive Officer, who is responsible for establishing a management structure that promotes accountability and transparency throughout the Bank, for the good implementation of business strategies, risk management systems, risk culture, processes and controls.
The role and responsibilities of the Chairperson of the Board, the Chairpersons of all board committees, the CEO and the Company Secretary, as approved by the Board, are defined in their respective Position Statements1 and incorporated in the Board Charter1. The Board Charter is reviewed by the Board every 2 years.
1The Position Statements, Board Charter and Constitution are available on the website
CORPORATE GOVERNANCE REPORT
BOARD
BUSINESS & FUNCTIONAL HEADS, MANAGEMENT COMMITTEES
BOARD CREDITCOMMITTEE
BOARD STRATEGY
COMMITTEE
NOMINATION &REMUNERATION
COMMITTEE
INVESTMENT & TRANSFORMATION
COMMITTEE
CONDUCT REVIEW & CORPORATEGOVERNANCECOMMITTEE
BOARD RISKMANAGEMENT
COMMITTEE
ASSET AND LIABILITY
MANAGEMENTCOMMITTEE
AUDITCOMMITTEE
CHIEFEXECUTIVE
OFFICER
INTERNAL AUDITFUNCTION
COMPLIANCEFUNCTION
CHIEFRISK
OFFICER
HEAD OF LEGAL AND
REGULATORYAFFAIRS
COMPANYSECRETARY
Structure of the Board and its committees
The Board
The Bank’s Constitution1 provides that the Board of Directors shall consist of not less than seven or more than ten directors. During the year under review, Bank One was headed by a unitary board, comprising nine directors – one Executive, four Non-Executive and four Independent Directors. In line with the shareholders’ agreement, the two shareholders are each entitled to appoint two representatives to represent them on the Board of Bank One. The Chairperson of the Board is an Independent Director and the role and functions of the Chairperson are separate from that of the CEO. All directors submit themselves to re-election at the Annual Meeting of Shareholders (AMS).
The Nomination & Remuneration Committee regularly reviews the size, composition and skills set on the Board. It also ensures the continued independence of the Bank’s independent directors as well as the continued fitness and probity of its directors. The Board believes that, given the shareholding structure and size of the Bank, there is a right mix both in terms of the categories (Executive, Non-executive and Independent) and skills of its directors.
In line with the shareholders’ agreement, which provides that the Chairperson of the Board shall be elected by the Shareholders, Ms. Sandra Martyres was re-appointed as Chairperson of the Board by the shareholders on 18 April 2019, to hold office until the conclusion of the next AMS.
The contract of employment of the ex-Chief Executive Officer, Ravneet Chowdhury, expired on 31 March 2020. Mark Watkinson was appointed as Chief Executive Officer and Executive Director in his stead on 01 April 2020. During this period, the Chairperson of the Board has played a key role in ensuring the smooth transitioning of the senior leadership within the Bank.
The responsibilities of the Board of Directors are set out in its Board Charter1, which is reviewed every 2 years, or earlier as may be required with the introduction of, or amendment to, laws, regulations and practices. The responsibilities of the Board include, but are not limited to:
∙ Approving the objectives, strategies and business plans of the Bank; ∙ Retaining full and effective control over the Bank and being responsible for the appointment and monitoring of management in its
implementation of the Board’s approved plans and strategies; ∙ Ensuring that policies and systems in place are effective to achieve a prudential balance between risks and returns to shareholders; ∙ Ensuring compliance with laws and regulations, including risk management and corporate governance practices and disclosure
requirements; ∙ Exercising leadership, enterprise, integrity and judgment in directing the Bank.
Executive,1
Male, 7
Female, 2Independent, 4
BOARD COMPOSITION TENURE GENDER REPRESENTATION
ON THE BOARD
< 1 year: 1 director
1-3 years:2 directors
3-5 years: 4 directors
> 5 years:2 directors
Non-Executive, 4
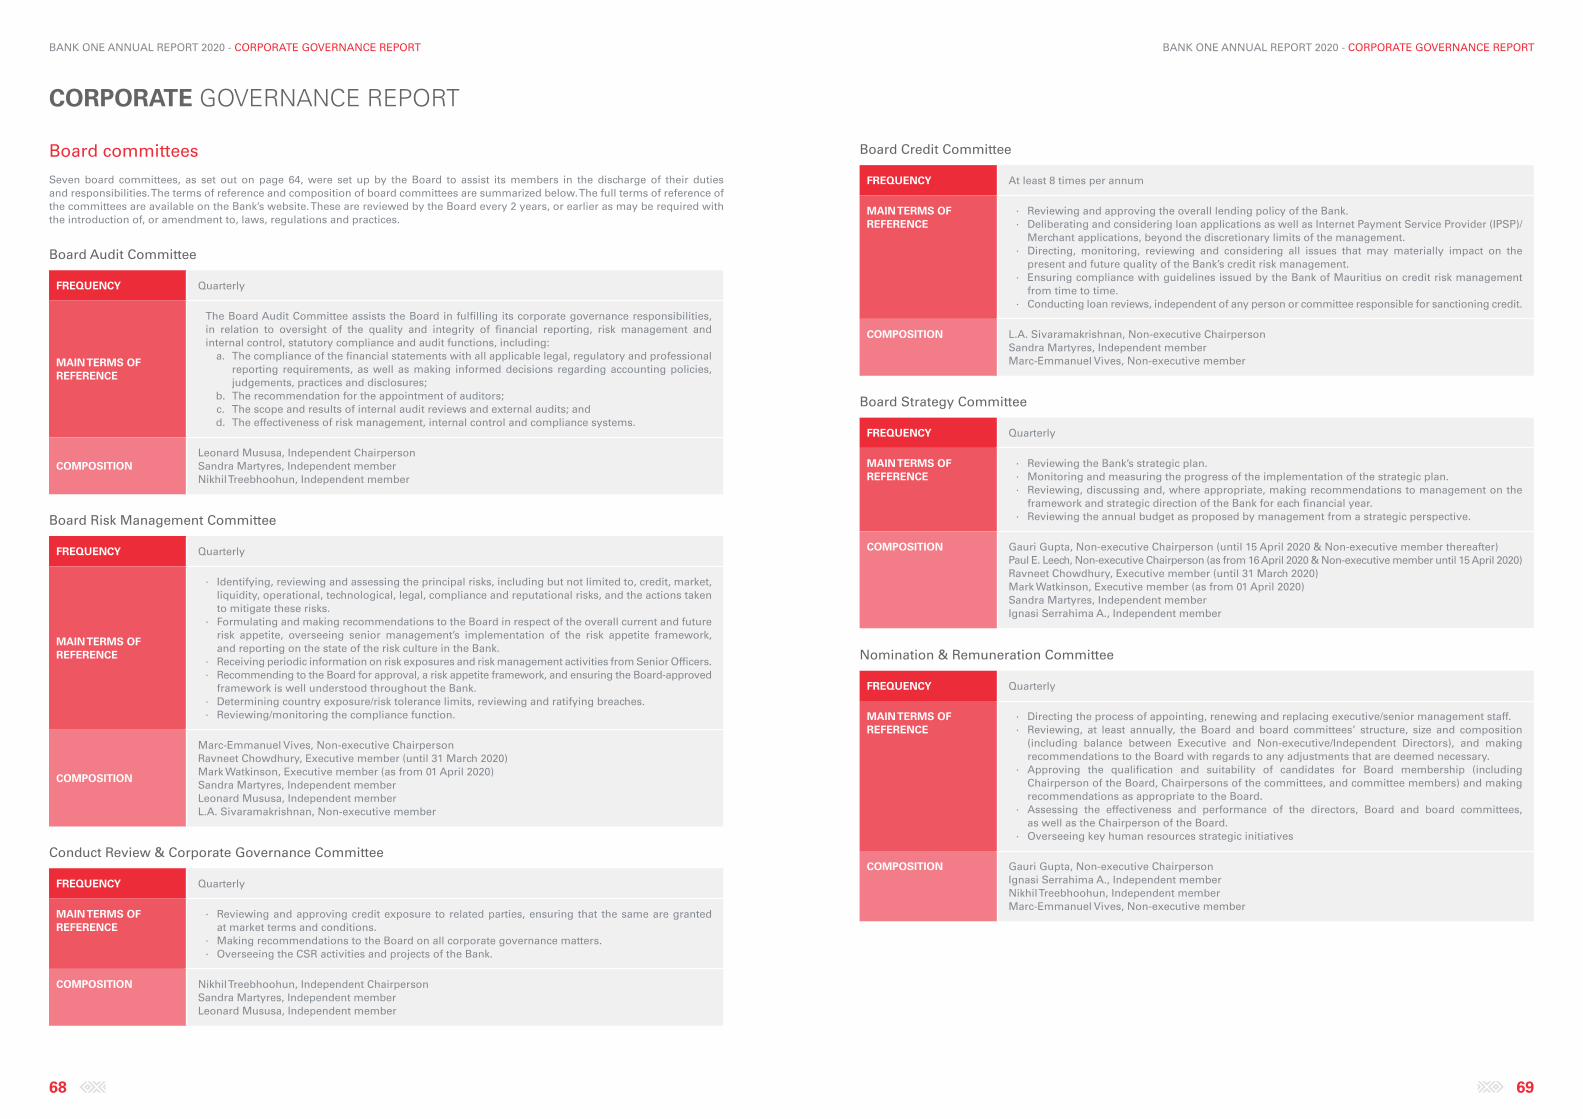
BANK ONE ANNUAL REPORT 2020 - CORPORATE GOVERNANCE REPORT
68 69
BANK ONE ANNUAL REPORT 2020 - CORPORATE GOVERNANCE REPORT
Board committees
Seven board committees, as set out on page 64, were set up by the Board to assist its members in the discharge of their duties and responsibilities. The terms of reference and composition of board committees are summarized below. The full terms of reference of the committees are available on the Bank’s website. These are reviewed by the Board every 2 years, or earlier as may be required with the introduction of, or amendment to, laws, regulations and practices.
Board Audit Committee
FREQUENCY Quarterly
MAIN TERMS OF REFERENCE
The Board Audit Committee assists the Board in fulfilling its corporate governance responsibilities, in relation to oversight of the quality and integrity of financial reporting, risk management and internal control, statutory compliance and audit functions, including:
a. The compliance of the financial statements with all applicable legal, regulatory and professional reporting requirements, as well as making informed decisions regarding accounting policies, judgements, practices and disclosures;
b. The recommendation for the appointment of auditors; c. The scope and results of internal audit reviews and external audits; and d. The effectiveness of risk management, internal control and compliance systems.
COMPOSITIONLeonard Mususa, Independent ChairpersonSandra Martyres, Independent memberNikhil Treebhoohun, Independent member
Board Risk Management Committee
FREQUENCY Quarterly
MAIN TERMS OF REFERENCE
∙ Identifying, reviewing and assessing the principal risks, including but not limited to, credit, market, liquidity, operational, technological, legal, compliance and reputational risks, and the actions taken to mitigate these risks.
∙ Formulating and making recommendations to the Board in respect of the overall current and future risk appetite, overseeing senior management’s implementation of the risk appetite framework, and reporting on the state of the risk culture in the Bank.
∙ Receiving periodic information on risk exposures and risk management activities from Senior Officers. ∙ Recommending to the Board for approval, a risk appetite framework, and ensuring the Board-approved
framework is well understood throughout the Bank. ∙ Determining country exposure/risk tolerance limits, reviewing and ratifying breaches. ∙ Reviewing/monitoring the compliance function.
COMPOSITION
Marc-Emmanuel Vives, Non-executive Chairperson Ravneet Chowdhury, Executive member (until 31 March 2020)Mark Watkinson, Executive member (as from 01 April 2020)Sandra Martyres, Independent memberLeonard Mususa, Independent memberL.A. Sivaramakrishnan, Non-executive member
Conduct Review & Corporate Governance Committee
FREQUENCY Quarterly
MAIN TERMS OF REFERENCE
∙ Reviewing and approving credit exposure to related parties, ensuring that the same are granted at market terms and conditions.
∙ Making recommendations to the Board on all corporate governance matters. ∙ Overseeing the CSR activities and projects of the Bank.
COMPOSITION Nikhil Treebhoohun, Independent Chairperson Sandra Martyres, Independent memberLeonard Mususa, Independent member
Board Credit Committee
FREQUENCY At least 8 times per annum
MAIN TERMS OF REFERENCE
∙ Reviewing and approving the overall lending policy of the Bank. ∙ Deliberating and considering loan applications as well as Internet Payment Service Provider (IPSP)/
Merchant applications, beyond the discretionary limits of the management. ∙ Directing, monitoring, reviewing and considering all issues that may materially impact on the
present and future quality of the Bank’s credit risk management. ∙ Ensuring compliance with guidelines issued by the Bank of Mauritius on credit risk management
from time to time. ∙ Conducting loan reviews, independent of any person or committee responsible for sanctioning credit.
COMPOSITION L.A. Sivaramakrishnan, Non-executive ChairpersonSandra Martyres, Independent memberMarc-Emmanuel Vives, Non-executive member
Board Strategy Committee
FREQUENCY Quarterly
MAIN TERMS OF REFERENCE
∙ Reviewing the Bank’s strategic plan. ∙ Monitoring and measuring the progress of the implementation of the strategic plan. ∙ Reviewing, discussing and, where appropriate, making recommendations to management on the
framework and strategic direction of the Bank for each financial year. ∙ Reviewing the annual budget as proposed by management from a strategic perspective.
COMPOSITION Gauri Gupta, Non-executive Chairperson (until 15 April 2020 & Non-executive member thereafter)Paul E. Leech, Non-executive Chairperson (as from 16 April 2020 & Non-executive member until 15 April 2020)Ravneet Chowdhury, Executive member (until 31 March 2020)Mark Watkinson, Executive member (as from 01 April 2020)Sandra Martyres, Independent memberIgnasi Serrahima A., Independent member
Nomination & Remuneration Committee
FREQUENCY Quarterly
MAIN TERMS OF REFERENCE
∙ Directing the process of appointing, renewing and replacing executive/senior management staff. ∙ Reviewing, at least annually, the Board and board committees’ structure, size and composition
(including balance between Executive and Non-executive/Independent Directors), and making recommendations to the Board with regards to any adjustments that are deemed necessary.
∙ Approving the qualification and suitability of candidates for Board membership (including Chairperson of the Board, Chairpersons of the committees, and committee members) and making recommendations as appropriate to the Board.
∙ Assessing the effectiveness and performance of the directors, Board and board committees, as well as the Chairperson of the Board.
∙ Overseeing key human resources strategic initiatives
COMPOSITION Gauri Gupta, Non-executive Chairperson Ignasi Serrahima A., Independent member Nikhil Treebhoohun, Independent memberMarc-Emmanuel Vives, Non-executive member
CORPORATE GOVERNANCE REPORT
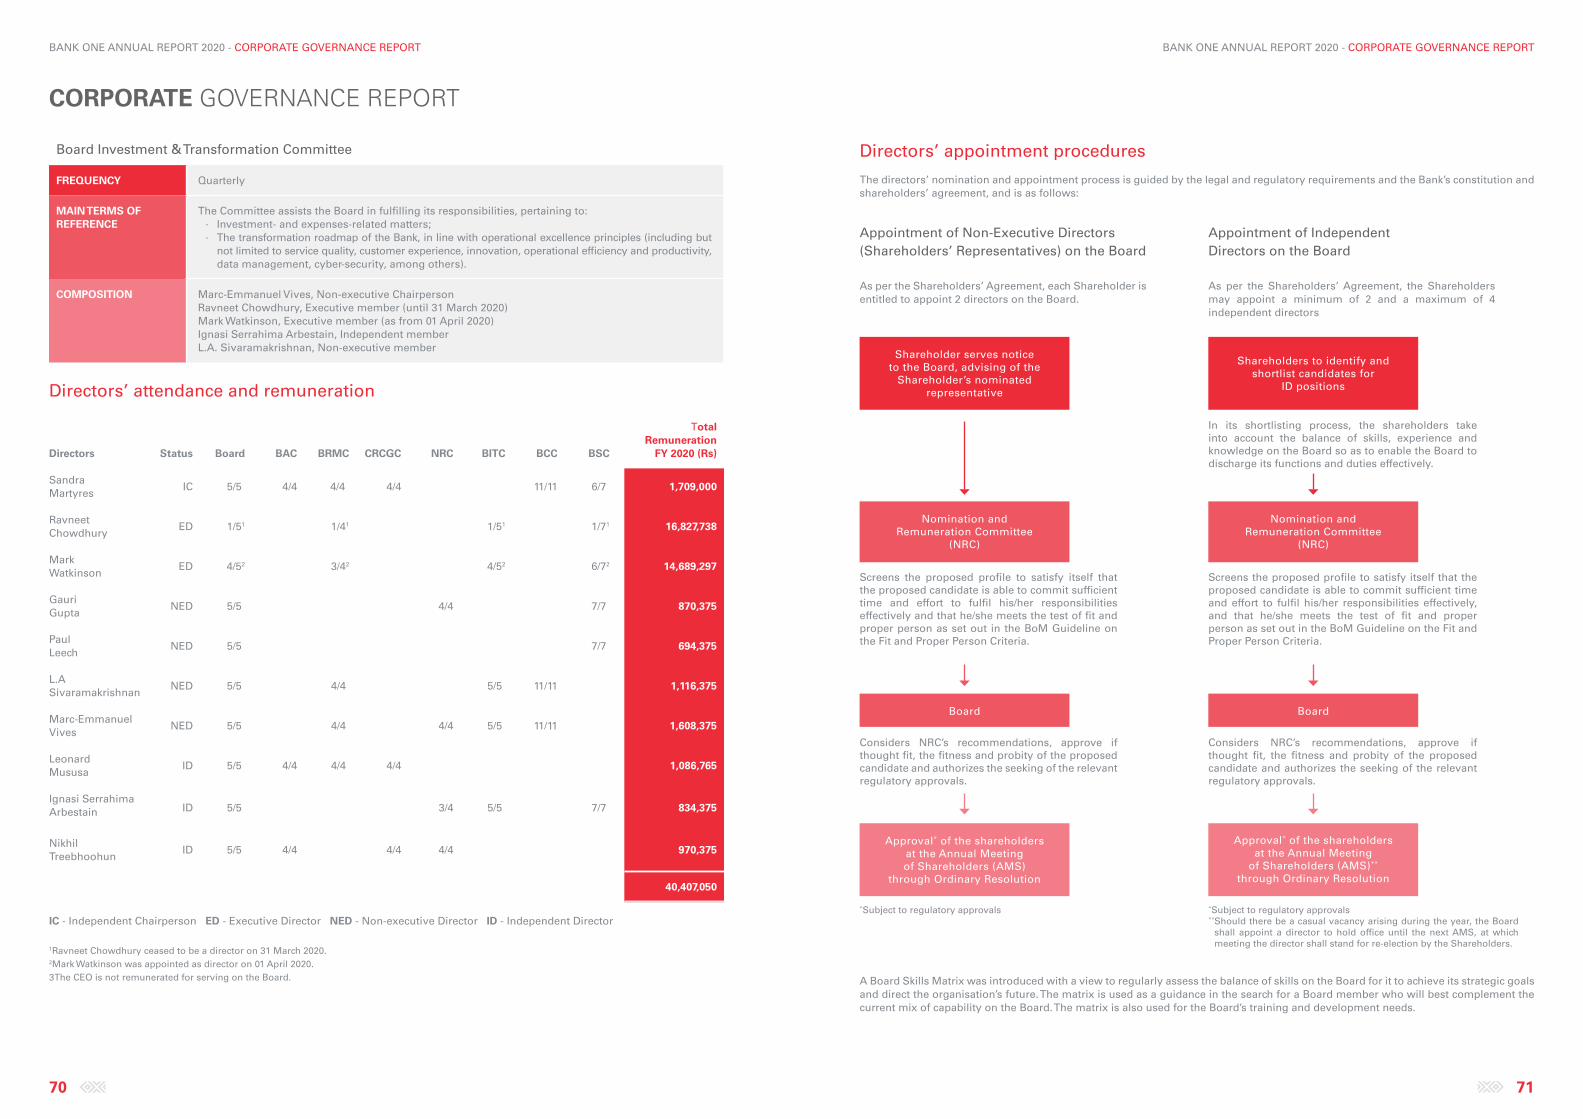
BANK ONE ANNUAL REPORT 2020 - CORPORATE GOVERNANCE REPORT
70 71
BANK ONE ANNUAL REPORT 2020 - CORPORATE GOVERNANCE REPORT
Board Investment & Transformation Committee
FREQUENCY Quarterly
MAIN TERMS OF REFERENCE
The Committee assists the Board in fulfilling its responsibilities, pertaining to: ∙ Investment- and expenses-related matters; ∙ The transformation roadmap of the Bank, in line with operational excellence principles (including but
not limited to service quality, customer experience, innovation, operational efficiency and productivity, data management, cyber-security, among others).
COMPOSITION Marc-Emmanuel Vives, Non-executive ChairpersonRavneet Chowdhury, Executive member (until 31 March 2020)Mark Watkinson, Executive member (as from 01 April 2020)Ignasi Serrahima Arbestain, Independent member L.A. Sivaramakrishnan, Non-executive member
Directors’ attendance and remuneration
Directors Status Board BAC BRMC CRCGC NRC BITC BCC BSC
Total Remuneration
FY 2020 (Rs)
Sandra Martyres
IC 5/5 4/4 4/4 4/4 11/11 6/7 1,709,000
Ravneet Chowdhury
ED 1/51 1/41 1/51 1/71 16,827,738
Mark Watkinson
ED 4/52 3/42 4/52 6/72 14,689,297
Gauri Gupta
NED 5/5 4/4 7/7 870,375
Paul Leech
NED 5/5 7/7 694,375
L.A Sivaramakrishnan
NED 5/5 4/4 5/5 11/11 1,116,375
Marc-Emmanuel Vives
NED 5/5 4/4 4/4 5/5 11/11 1,608,375
Leonard Mususa
ID 5/5 4/4 4/4 4/4 1,086,765
Ignasi Serrahima Arbestain ID 5/5 3/4 5/5 7/7 834,375
Nikhil Treebhoohun
ID 5/5 4/4 4/4 4/4 970,375
40,407,050
IC - Independent Chairperson ED - Executive Director NED - Non-executive Director ID - Independent Director
1Ravneet Chowdhury ceased to be a director on 31 March 2020.2Mark Watkinson was appointed as director on 01 April 2020. 3The CEO is not remunerated for serving on the Board.
Directors’ appointment procedures
The directors’ nomination and appointment process is guided by the legal and regulatory requirements and the Bank’s constitution and shareholders’ agreement, and is as follows:
Appointment of Non-Executive Directors (Shareholders’ Representatives) on the Board
As per the Shareholders’ Agreement, each Shareholder is entitled to appoint 2 directors on the Board.
Appointment of Independent Directors on the Board
As per the Shareholders’ Agreement, the Shareholders may appoint a minimum of 2 and a maximum of 4 independent directors
A Board Skills Matrix was introduced with a view to regularly assess the balance of skills on the Board for it to achieve its strategic goals and direct the organisation’s future. The matrix is used as a guidance in the search for a Board member who will best complement the current mix of capability on the Board. The matrix is also used for the Board’s training and development needs.
Shareholder serves notice to the Board, advising of the
Shareholder’s nominated representative
Nomination and Remuneration Committee
(NRC)
Nomination and Remuneration Committee
(NRC)
Board
Approval* of the shareholders at the Annual Meeting of Shareholders (AMS)
through Ordinary Resolution
Board
Approval* of the shareholders at the Annual Meeting
of Shareholders (AMS)** through Ordinary Resolution
Shareholders to identify and shortlist candidates for
ID positions
In its shortlisting process, the shareholders take into account the balance of skills, experience and knowledge on the Board so as to enable the Board to discharge its functions and duties effectively.
Screens the proposed profile to satisfy itself that the proposed candidate is able to commit sufficient time and effort to fulfil his/her responsibilities effectively and that he/she meets the test of fit and proper person as set out in the BoM Guideline on the Fit and Proper Person Criteria.
Screens the proposed profile to satisfy itself that the proposed candidate is able to commit sufficient time and effort to fulfil his/her responsibilities effectively, and that he/she meets the test of fit and proper person as set out in the BoM Guideline on the Fit and Proper Person Criteria.
Considers NRC’s recommendations, approve if thought fit, the fitness and probity of the proposed candidate and authorizes the seeking of the relevant regulatory approvals.
*Subject to regulatory approvals** Should there be a casual vacancy arising during the year, the Board
shall appoint a director to hold office until the next AMS, at which meeting the director shall stand for re-election by the Shareholders.
*Subject to regulatory approvals
Considers NRC’s recommendations, approve if thought fit, the fitness and probity of the proposed candidate and authorizes the seeking of the relevant regulatory approvals.
CORPORATE GOVERNANCE REPORT
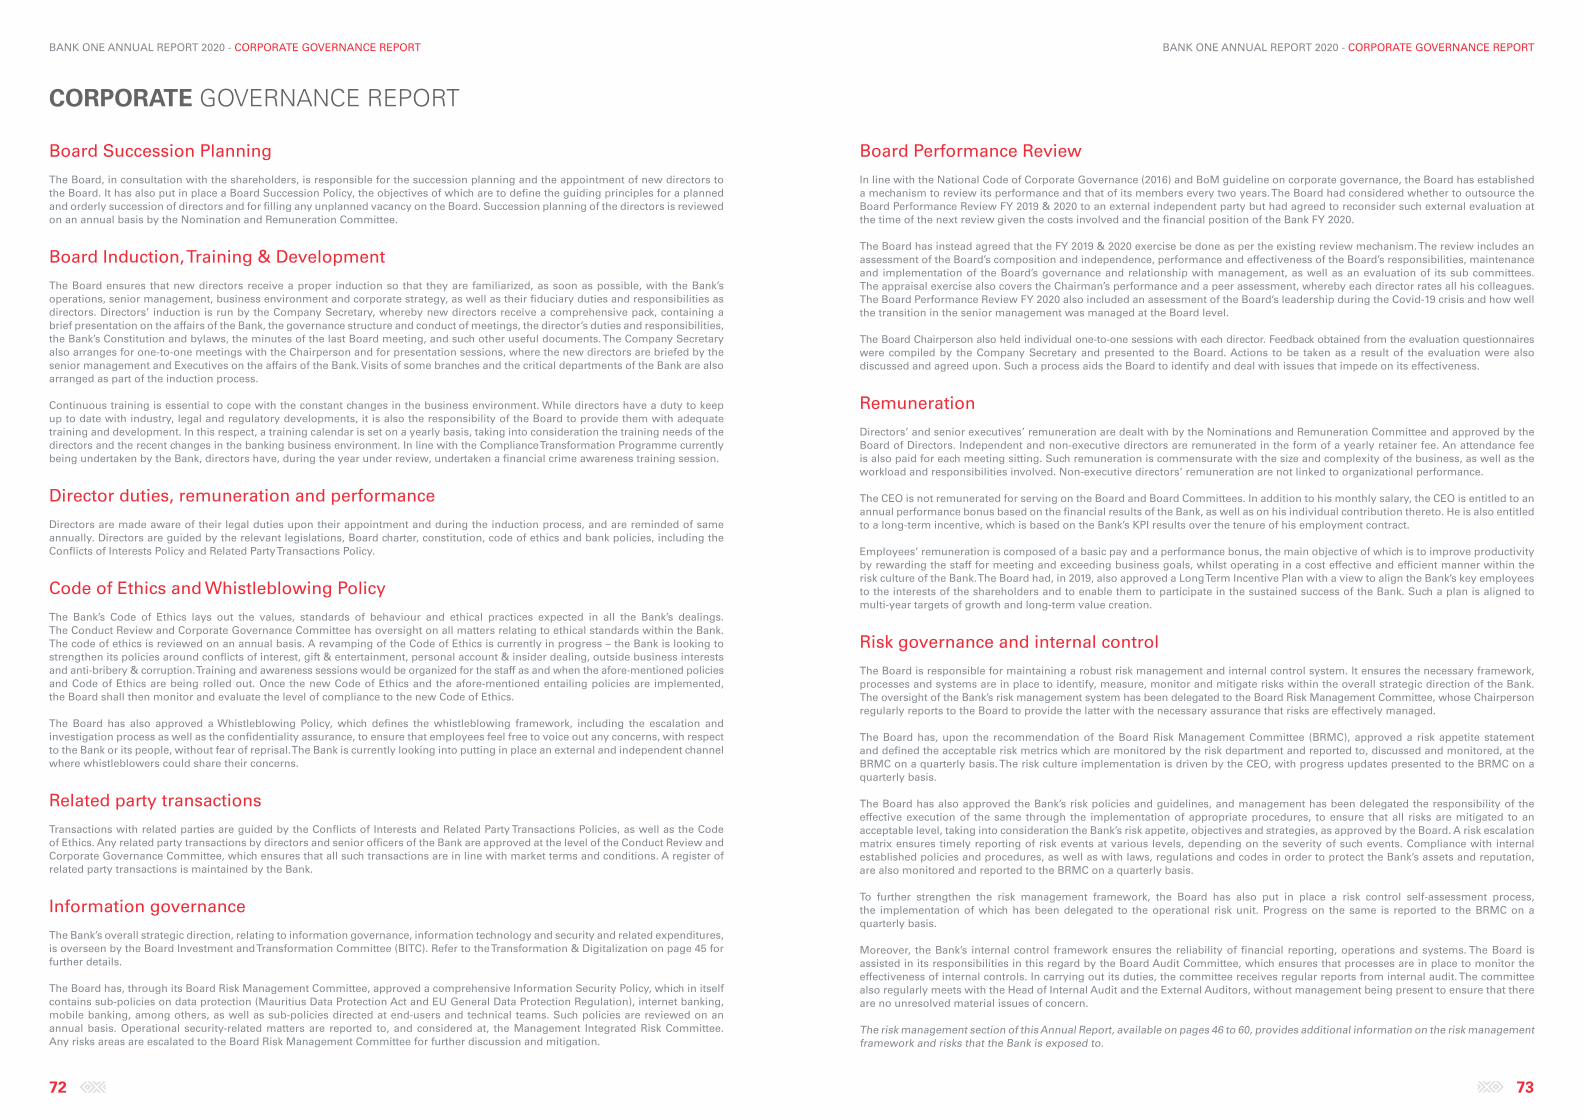
BANK ONE ANNUAL REPORT 2020 - CORPORATE GOVERNANCE REPORT
72 73
BANK ONE ANNUAL REPORT 2020 - CORPORATE GOVERNANCE REPORT
Board Succession Planning
The Board, in consultation with the shareholders, is responsible for the succession planning and the appointment of new directors to the Board. It has also put in place a Board Succession Policy, the objectives of which are to define the guiding principles for a planned and orderly succession of directors and for filling any unplanned vacancy on the Board. Succession planning of the directors is reviewed on an annual basis by the Nomination and Remuneration Committee.
Board Induction, Training & Development
The Board ensures that new directors receive a proper induction so that they are familiarized, as soon as possible, with the Bank’s operations, senior management, business environment and corporate strategy, as well as their fiduciary duties and responsibilities as directors. Directors’ induction is run by the Company Secretary, whereby new directors receive a comprehensive pack, containing a brief presentation on the affairs of the Bank, the governance structure and conduct of meetings, the director’s duties and responsibilities, the Bank’s Constitution and bylaws, the minutes of the last Board meeting, and such other useful documents. The Company Secretary also arranges for one-to-one meetings with the Chairperson and for presentation sessions, where the new directors are briefed by the senior management and Executives on the affairs of the Bank. Visits of some branches and the critical departments of the Bank are also arranged as part of the induction process.
Continuous training is essential to cope with the constant changes in the business environment. While directors have a duty to keep up to date with industry, legal and regulatory developments, it is also the responsibility of the Board to provide them with adequate training and development. In this respect, a training calendar is set on a yearly basis, taking into consideration the training needs of the directors and the recent changes in the banking business environment. In line with the Compliance Transformation Programme currently being undertaken by the Bank, directors have, during the year under review, undertaken a financial crime awareness training session.
Director duties, remuneration and performance
Directors are made aware of their legal duties upon their appointment and during the induction process, and are reminded of same annually. Directors are guided by the relevant legislations, Board charter, constitution, code of ethics and bank policies, including the Conflicts of Interests Policy and Related Party Transactions Policy.
Code of Ethics and Whistleblowing Policy
The Bank’s Code of Ethics lays out the values, standards of behaviour and ethical practices expected in all the Bank’s dealings. The Conduct Review and Corporate Governance Committee has oversight on all matters relating to ethical standards within the Bank. The code of ethics is reviewed on an annual basis. A revamping of the Code of Ethics is currently in progress – the Bank is looking to strengthen its policies around conflicts of interest, gift & entertainment, personal account & insider dealing, outside business interests and anti-bribery & corruption. Training and awareness sessions would be organized for the staff as and when the afore-mentioned policies and Code of Ethics are being rolled out. Once the new Code of Ethics and the afore-mentioned entailing policies are implemented, the Board shall then monitor and evaluate the level of compliance to the new Code of Ethics.
The Board has also approved a Whistleblowing Policy, which defines the whistleblowing framework, including the escalation and investigation process as well as the confidentiality assurance, to ensure that employees feel free to voice out any concerns, with respect to the Bank or its people, without fear of reprisal. The Bank is currently looking into putting in place an external and independent channel where whistleblowers could share their concerns.
Related party transactions
Transactions with related parties are guided by the Conflicts of Interests and Related Party Transactions Policies, as well as the Code of Ethics. Any related party transactions by directors and senior officers of the Bank are approved at the level of the Conduct Review and Corporate Governance Committee, which ensures that all such transactions are in line with market terms and conditions. A register of related party transactions is maintained by the Bank.
Information governance
The Bank’s overall strategic direction, relating to information governance, information technology and security and related expenditures, is overseen by the Board Investment and Transformation Committee (BITC). Refer to the Transformation & Digitalization on page 45 for further details.
The Board has, through its Board Risk Management Committee, approved a comprehensive Information Security Policy, which in itself contains sub-policies on data protection (Mauritius Data Protection Act and EU General Data Protection Regulation), internet banking, mobile banking, among others, as well as sub-policies directed at end-users and technical teams. Such policies are reviewed on an annual basis. Operational security-related matters are reported to, and considered at, the Management Integrated Risk Committee. Any risks areas are escalated to the Board Risk Management Committee for further discussion and mitigation.
Board Performance Review
In line with the National Code of Corporate Governance (2016) and BoM guideline on corporate governance, the Board has established a mechanism to review its performance and that of its members every two years. The Board had considered whether to outsource the Board Performance Review FY 2019 & 2020 to an external independent party but had agreed to reconsider such external evaluation at the time of the next review given the costs involved and the financial position of the Bank FY 2020.
The Board has instead agreed that the FY 2019 & 2020 exercise be done as per the existing review mechanism. The review includes an assessment of the Board’s composition and independence, performance and effectiveness of the Board’s responsibilities, maintenance and implementation of the Board’s governance and relationship with management, as well as an evaluation of its sub committees. The appraisal exercise also covers the Chairman’s performance and a peer assessment, whereby each director rates all his colleagues. The Board Performance Review FY 2020 also included an assessment of the Board’s leadership during the Covid-19 crisis and how well the transition in the senior management was managed at the Board level.
The Board Chairperson also held individual one-to-one sessions with each director. Feedback obtained from the evaluation questionnaires were compiled by the Company Secretary and presented to the Board. Actions to be taken as a result of the evaluation were also discussed and agreed upon. Such a process aids the Board to identify and deal with issues that impede on its effectiveness.
Remuneration
Directors’ and senior executives’ remuneration are dealt with by the Nominations and Remuneration Committee and approved by the Board of Directors. Independent and non-executive directors are remunerated in the form of a yearly retainer fee. An attendance fee is also paid for each meeting sitting. Such remuneration is commensurate with the size and complexity of the business, as well as the workload and responsibilities involved. Non-executive directors’ remuneration are not linked to organizational performance.
The CEO is not remunerated for serving on the Board and Board Committees. In addition to his monthly salary, the CEO is entitled to an annual performance bonus based on the financial results of the Bank, as well as on his individual contribution thereto. He is also entitled to a long-term incentive, which is based on the Bank’s KPI results over the tenure of his employment contract.
Employees’ remuneration is composed of a basic pay and a performance bonus, the main objective of which is to improve productivity by rewarding the staff for meeting and exceeding business goals, whilst operating in a cost effective and efficient manner within the risk culture of the Bank. The Board had, in 2019, also approved a Long Term Incentive Plan with a view to align the Bank’s key employees to the interests of the shareholders and to enable them to participate in the sustained success of the Bank. Such a plan is aligned to multi-year targets of growth and long-term value creation.
Risk governance and internal control
The Board is responsible for maintaining a robust risk management and internal control system. It ensures the necessary framework, processes and systems are in place to identify, measure, monitor and mitigate risks within the overall strategic direction of the Bank. The oversight of the Bank’s risk management system has been delegated to the Board Risk Management Committee, whose Chairperson regularly reports to the Board to provide the latter with the necessary assurance that risks are effectively managed.
The Board has, upon the recommendation of the Board Risk Management Committee (BRMC), approved a risk appetite statement and defined the acceptable risk metrics which are monitored by the risk department and reported to, discussed and monitored, at the BRMC on a quarterly basis. The risk culture implementation is driven by the CEO, with progress updates presented to the BRMC on a quarterly basis.
The Board has also approved the Bank’s risk policies and guidelines, and management has been delegated the responsibility of the effective execution of the same through the implementation of appropriate procedures, to ensure that all risks are mitigated to an acceptable level, taking into consideration the Bank’s risk appetite, objectives and strategies, as approved by the Board. A risk escalation matrix ensures timely reporting of risk events at various levels, depending on the severity of such events. Compliance with internal established policies and procedures, as well as with laws, regulations and codes in order to protect the Bank’s assets and reputation, are also monitored and reported to the BRMC on a quarterly basis.
To further strengthen the risk management framework, the Board has also put in place a risk control self-assessment process, the implementation of which has been delegated to the operational risk unit. Progress on the same is reported to the BRMC on a quarterly basis.
Moreover, the Bank’s internal control framework ensures the reliability of financial reporting, operations and systems. The Board is assisted in its responsibilities in this regard by the Board Audit Committee, which ensures that processes are in place to monitor the effectiveness of internal controls. In carrying out its duties, the committee receives regular reports from internal audit. The committee also regularly meets with the Head of Internal Audit and the External Auditors, without management being present to ensure that there are no unresolved material issues of concern.
The risk management section of this Annual Report, available on pages 46 to 60, provides additional information on the risk management framework and risks that the Bank is exposed to.
CORPORATE GOVERNANCE REPORT
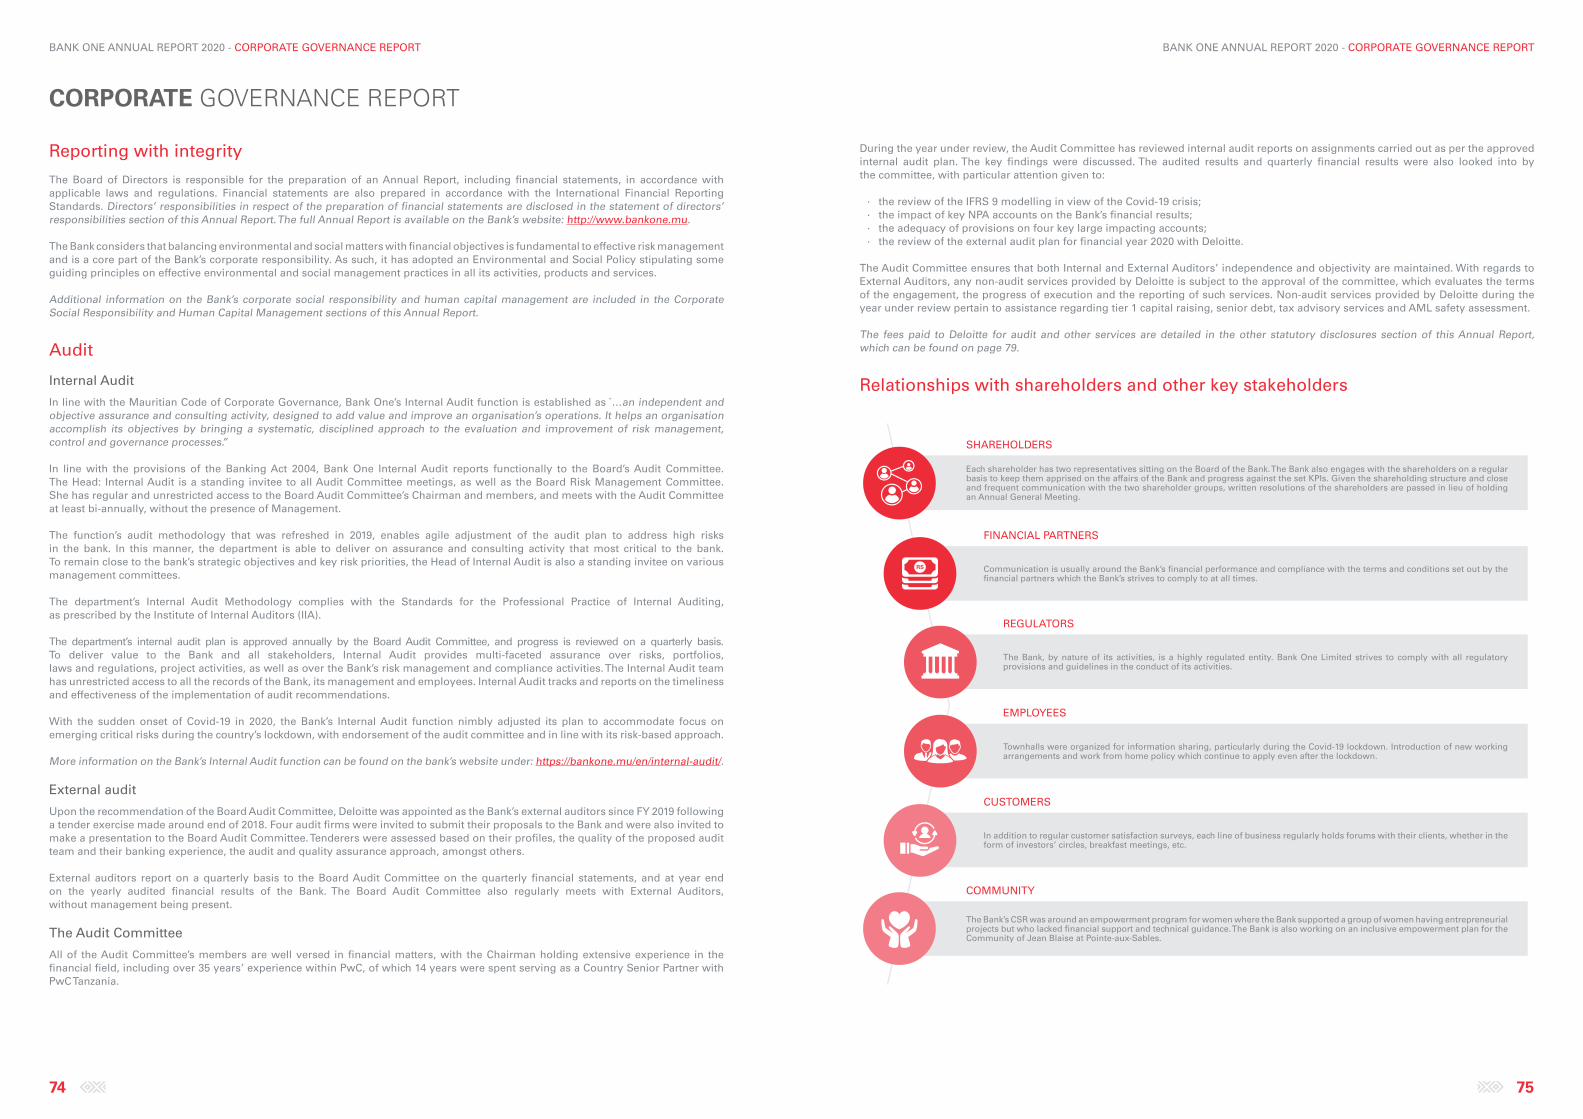
BANK ONE ANNUAL REPORT 2020 - CORPORATE GOVERNANCE REPORT
74 75
BANK ONE ANNUAL REPORT 2020 - CORPORATE GOVERNANCE REPORT
Reporting with integrity
The Board of Directors is responsible for the preparation of an Annual Report, including financial statements, in accordance with applicable laws and regulations. Financial statements are also prepared in accordance with the International Financial Reporting Standards. Directors’ responsibilities in respect of the preparation of financial statements are disclosed in the statement of directors’ responsibilities section of this Annual Report. The full Annual Report is available on the Bank’s website: http://www.bankone.mu.
The Bank considers that balancing environmental and social matters with financial objectives is fundamental to effective risk management and is a core part of the Bank’s corporate responsibility. As such, it has adopted an Environmental and Social Policy stipulating some guiding principles on effective environmental and social management practices in all its activities, products and services.
Additional information on the Bank’s corporate social responsibility and human capital management are included in the Corporate Social Responsibility and Human Capital Management sections of this Annual Report.
Audit
Internal Audit
In line with the Mauritian Code of Corporate Governance, Bank One’s Internal Audit function is established as “…an independent and objective assurance and consulting activity, designed to add value and improve an organisation’s operations. It helps an organisation accomplish its objectives by bringing a systematic, disciplined approach to the evaluation and improvement of risk management, control and governance processes.”
In line with the provisions of the Banking Act 2004, Bank One Internal Audit reports functionally to the Board’s Audit Committee. The Head: Internal Audit is a standing invitee to all Audit Committee meetings, as well as the Board Risk Management Committee. She has regular and unrestricted access to the Board Audit Committee’s Chairman and members, and meets with the Audit Committee at least bi-annually, without the presence of Management.
The function’s audit methodology that was refreshed in 2019, enables agile adjustment of the audit plan to address high risks in the bank. In this manner, the department is able to deliver on assurance and consulting activity that most critical to the bank. To remain close to the bank’s strategic objectives and key risk priorities, the Head of Internal Audit is also a standing invitee on various management committees.
The department’s Internal Audit Methodology complies with the Standards for the Professional Practice of Internal Auditing, as prescribed by the Institute of Internal Auditors (IIA).
The department’s internal audit plan is approved annually by the Board Audit Committee, and progress is reviewed on a quarterly basis. To deliver value to the Bank and all stakeholders, Internal Audit provides multi-faceted assurance over risks, portfolios, laws and regulations, project activities, as well as over the Bank’s risk management and compliance activities. The Internal Audit team has unrestricted access to all the records of the Bank, its management and employees. Internal Audit tracks and reports on the timeliness and effectiveness of the implementation of audit recommendations.
With the sudden onset of Covid-19 in 2020, the Bank’s Internal Audit function nimbly adjusted its plan to accommodate focus on emerging critical risks during the country’s lockdown, with endorsement of the audit committee and in line with its risk-based approach.
More information on the Bank’s Internal Audit function can be found on the bank’s website under: https://bankone.mu/en/internal-audit/.
External audit
Upon the recommendation of the Board Audit Committee, Deloitte was appointed as the Bank’s external auditors since FY 2019 following a tender exercise made around end of 2018. Four audit firms were invited to submit their proposals to the Bank and were also invited to make a presentation to the Board Audit Committee. Tenderers were assessed based on their profiles, the quality of the proposed audit team and their banking experience, the audit and quality assurance approach, amongst others.
External auditors report on a quarterly basis to the Board Audit Committee on the quarterly financial statements, and at year end on the yearly audited financial results of the Bank. The Board Audit Committee also regularly meets with External Auditors, without management being present.
The Audit Committee
All of the Audit Committee’s members are well versed in financial matters, with the Chairman holding extensive experience in the financial field, including over 35 years’ experience within PwC, of which 14 years were spent serving as a Country Senior Partner with PwC Tanzania.
During the year under review, the Audit Committee has reviewed internal audit reports on assignments carried out as per the approved internal audit plan. The key findings were discussed. The audited results and quarterly financial results were also looked into by the committee, with particular attention given to:
∙ the review of the IFRS 9 modelling in view of the Covid-19 crisis; ∙ the impact of key NPA accounts on the Bank’s financial results; ∙ the adequacy of provisions on four key large impacting accounts; ∙ the review of the external audit plan for financial year 2020 with Deloitte.
The Audit Committee ensures that both Internal and External Auditors’ independence and objectivity are maintained. With regards to External Auditors, any non-audit services provided by Deloitte is subject to the approval of the committee, which evaluates the terms of the engagement, the progress of execution and the reporting of such services. Non-audit services provided by Deloitte during the year under review pertain to assistance regarding tier 1 capital raising, senior debt, tax advisory services and AML safety assessment.
The fees paid to Deloitte for audit and other services are detailed in the other statutory disclosures section of this Annual Report, which can be found on page 79.
Relationships with shareholders and other key stakeholders
Each shareholder has two representatives sitting on the Board of the Bank. The Bank also engages with the shareholders on a regular basis to keep them apprised on the affairs of the Bank and progress against the set KPIs. Given the shareholding structure and close and frequent communication with the two shareholder groups, written resolutions of the shareholders are passed in lieu of holding an Annual General Meeting.
Communication is usually around the Bank’s financial performance and compliance with the terms and conditions set out by the financial partners which the Bank’s strives to comply to at all times.
The Bank, by nature of its activities, is a highly regulated entity. Bank One Limited strives to comply with all regulatory provisions and guidelines in the conduct of its activities.
Townhalls were organized for information sharing, particularly during the Covid-19 lockdown. Introduction of new working arrangements and work from home policy which continue to apply even after the lockdown.
In addition to regular customer satisfaction surveys, each line of business regularly holds forums with their clients, whether in the form of investors’ circles, breakfast meetings, etc.
The Bank’s CSR was around an empowerment program for women where the Bank supported a group of women having entrepreneurial projects but who lacked financial support and technical guidance. The Bank is also working on an inclusive empowerment plan for the Community of Jean Blaise at Pointe-aux-Sables.
SHAREHOLDERS
REGULATORS
CUSTOMERS
FINANCIAL PARTNERS
EMPLOYEES
COMMUNITY
RS
CORPORATE GOVERNANCE REPORT
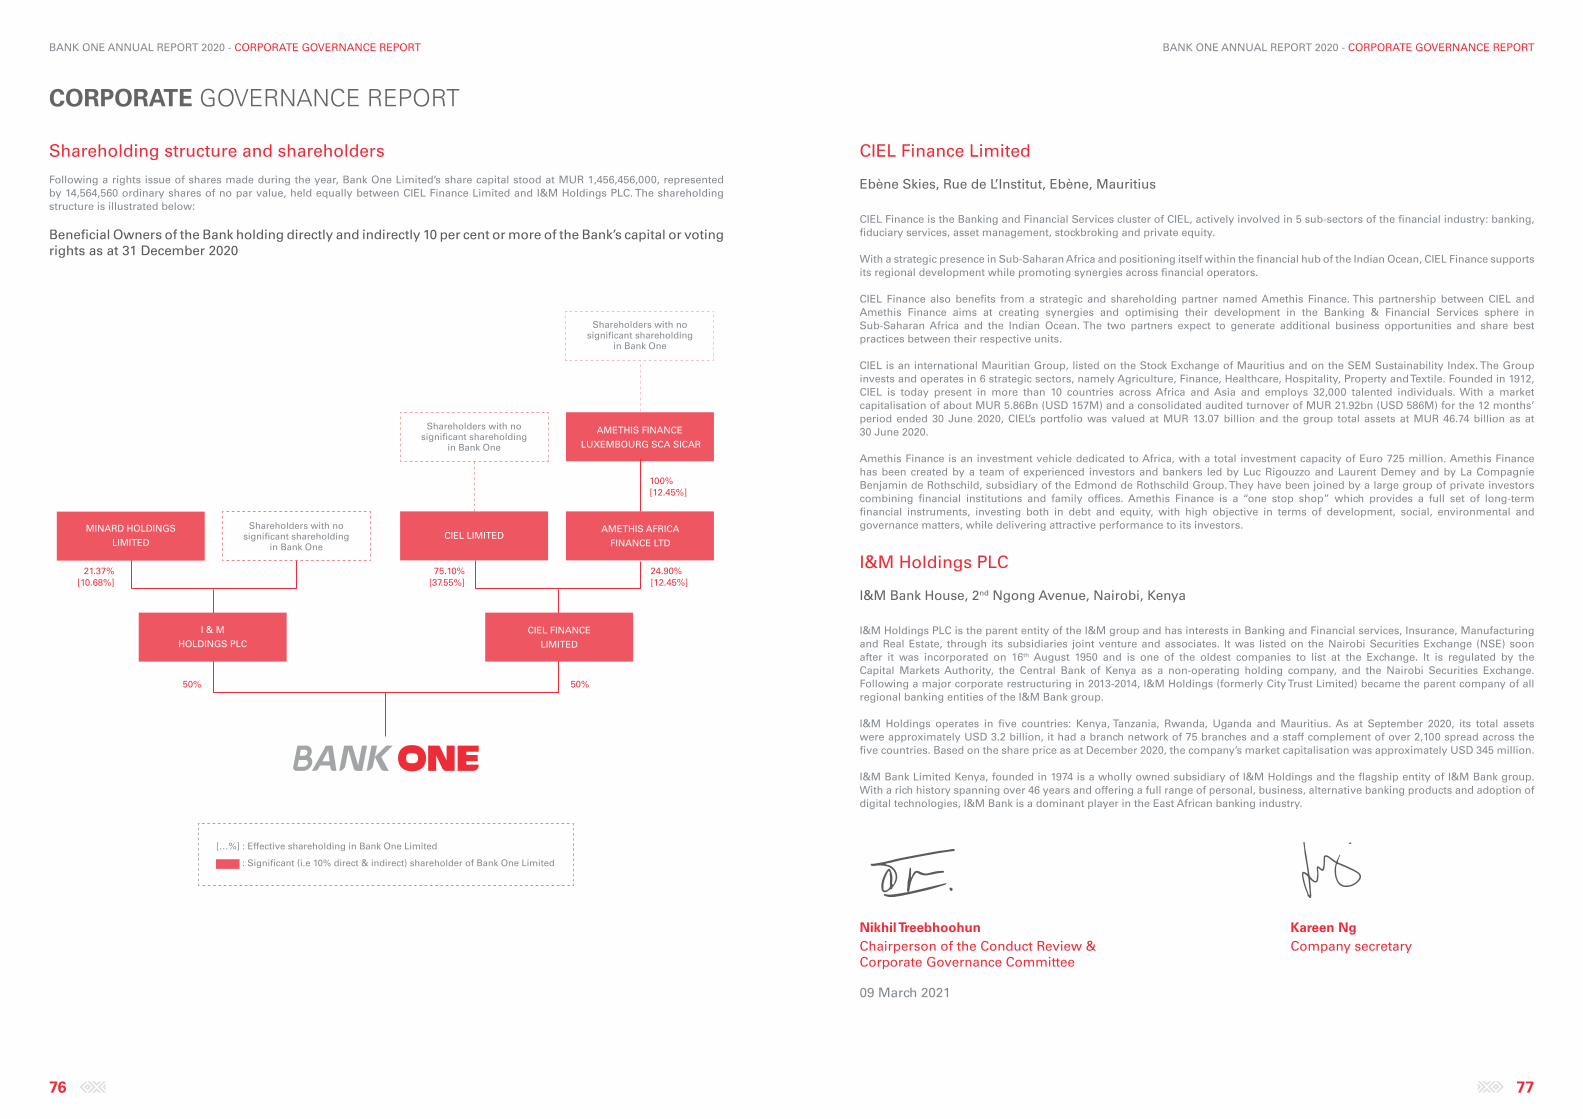
BANK ONE ANNUAL REPORT 2020 - CORPORATE GOVERNANCE REPORT
76 77
BANK ONE ANNUAL REPORT 2020 - CORPORATE GOVERNANCE REPORT
Shareholding structure and shareholders
Following a rights issue of shares made during the year, Bank One Limited’s share capital stood at MUR 1,456,456,000, represented by 14,564,560 ordinary shares of no par value, held equally between CIEL Finance Limited and I&M Holdings PLC. The shareholding structure is illustrated below:
Beneficial Owners of the Bank holding directly and indirectly 10 per cent or more of the Bank’s capital or voting rights as at 31 December 2020
MINARD HOLDINGS
LIMITEDCIEL LIMITED
I & M
HOLDINGS PLC
[…%] : Effective shareholding in Bank One Limited
: Significant (i.e 10% direct & indirect) shareholder of Bank One Limited
CIEL FINANCE
LIMITED
Shareholders with no significant shareholding
in Bank One
21.37%[10.68%]
75.10%[37.55%]
24.90%[12.45%]
100%[12.45%]
50% 50%
AMETHIS AFRICA
FINANCE LTD
AMETHIS FINANCE
LUXEMBOURG SCA SICAR
Shareholders with no significant shareholding
in Bank One
Shareholders with no significant shareholding
in Bank One
CIEL Finance Limited
Ebène Skies, Rue de L’Institut, Ebène, Mauritius
CIEL Finance is the Banking and Financial Services cluster of CIEL, actively involved in 5 sub-sectors of the financial industry: banking, fiduciary services, asset management, stockbroking and private equity.
With a strategic presence in Sub-Saharan Africa and positioning itself within the financial hub of the Indian Ocean, CIEL Finance supports its regional development while promoting synergies across financial operators.
CIEL Finance also benefits from a strategic and shareholding partner named Amethis Finance. This partnership between CIEL and Amethis Finance aims at creating synergies and optimising their development in the Banking & Financial Services sphere in Sub-Saharan Africa and the Indian Ocean. The two partners expect to generate additional business opportunities and share best practices between their respective units.
CIEL is an international Mauritian Group, listed on the Stock Exchange of Mauritius and on the SEM Sustainability Index. The Group invests and operates in 6 strategic sectors, namely Agriculture, Finance, Healthcare, Hospitality, Property and Textile. Founded in 1912, CIEL is today present in more than 10 countries across Africa and Asia and employs 32,000 talented individuals. With a market capitalisation of about MUR 5.86Bn (USD 157M) and a consolidated audited turnover of MUR 21.92bn (USD 586M) for the 12 months’ period ended 30 June 2020, CIEL’s portfolio was valued at MUR 13.07 billion and the group total assets at MUR 46.74 billion as at 30 June 2020.
Amethis Finance is an investment vehicle dedicated to Africa, with a total investment capacity of Euro 725 million. Amethis Finance has been created by a team of experienced investors and bankers led by Luc Rigouzzo and Laurent Demey and by La Compagnie Benjamin de Rothschild, subsidiary of the Edmond de Rothschild Group. They have been joined by a large group of private investors combining financial institutions and family offices. Amethis Finance is a “one stop shop” which provides a full set of long-term financial instruments, investing both in debt and equity, with high objective in terms of development, social, environmental and governance matters, while delivering attractive performance to its investors.
I&M Holdings PLC
I&M Bank House, 2nd Ngong Avenue, Nairobi, Kenya
I&M Holdings PLC is the parent entity of the I&M group and has interests in Banking and Financial services, Insurance, Manufacturing and Real Estate, through its subsidiaries joint venture and associates. It was listed on the Nairobi Securities Exchange (NSE) soon after it was incorporated on 16th August 1950 and is one of the oldest companies to list at the Exchange. It is regulated by the Capital Markets Authority, the Central Bank of Kenya as a non-operating holding company, and the Nairobi Securities Exchange. Following a major corporate restructuring in 2013-2014, I&M Holdings (formerly City Trust Limited) became the parent company of all regional banking entities of the I&M Bank group.
I&M Holdings operates in five countries: Kenya, Tanzania, Rwanda, Uganda and Mauritius. As at September 2020, its total assets were approximately USD 3.2 billion, it had a branch network of 75 branches and a staff complement of over 2,100 spread across the five countries. Based on the share price as at December 2020, the company’s market capitalisation was approximately USD 345 million.
I&M Bank Limited Kenya, founded in 1974 is a wholly owned subsidiary of I&M Holdings and the flagship entity of I&M Bank group. With a rich history spanning over 46 years and offering a full range of personal, business, alternative banking products and adoption of digital technologies, I&M Bank is a dominant player in the East African banking industry.
Nikhil Treebhoohun Kareen NgChairperson of the Conduct Review & Company secretaryCorporate Governance Committee
09 March 2021
CORPORATE GOVERNANCE REPORT
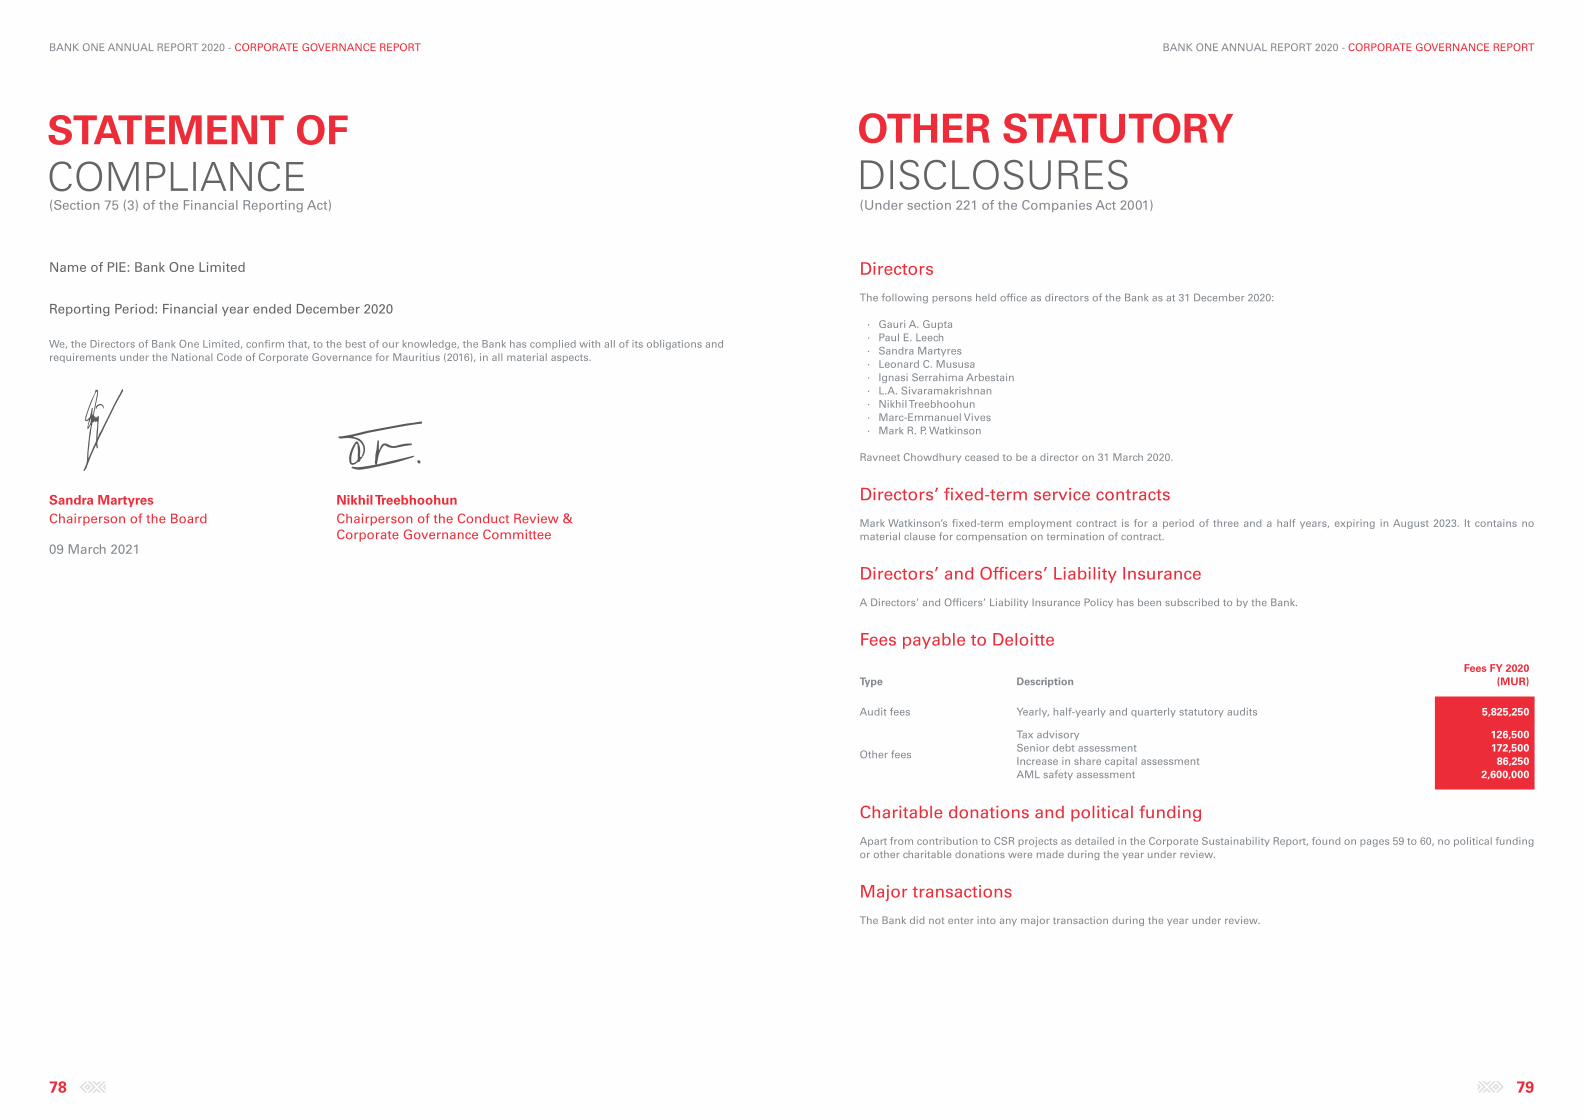
BANK ONE ANNUAL REPORT 2020 - CORPORATE GOVERNANCE REPORT
78 79
BANK ONE ANNUAL REPORT 2020 - CORPORATE GOVERNANCE REPORT
(Section 75 (3) of the Financial Reporting Act) (Under section 221 of the Companies Act 2001)
STATEMENT OF COMPLIANCE
Name of PIE: Bank One Limited
Reporting Period: Financial year ended December 2020
We, the Directors of Bank One Limited, confirm that, to the best of our knowledge, the Bank has complied with all of its obligations and requirements under the National Code of Corporate Governance for Mauritius (2016), in all material aspects.
Sandra Martyres Nikhil TreebhoohunChairperson of the Board Chairperson of the Conduct Review & Corporate Governance Committee09 March 2021
Directors
The following persons held office as directors of the Bank as at 31 December 2020:
∙ Gauri A. Gupta ∙ Paul E. Leech ∙ Sandra Martyres ∙ Leonard C. Mususa ∙ Ignasi Serrahima Arbestain ∙ L.A. Sivaramakrishnan ∙ Nikhil Treebhoohun ∙ Marc-Emmanuel Vives ∙ Mark R. P. Watkinson
Ravneet Chowdhury ceased to be a director on 31 March 2020.
Directors’ fixed-term service contracts
Mark Watkinson’s fixed-term employment contract is for a period of three and a half years, expiring in August 2023. It contains no material clause for compensation on termination of contract.
Directors’ and Officers’ Liability Insurance
A Directors’ and Officers’ Liability Insurance Policy has been subscribed to by the Bank.
Fees payable to Deloitte
Type DescriptionFees FY 2020
(MUR)
Audit fees Yearly, half-yearly and quarterly statutory audits 5,825,250
Other fees
Tax advisorySenior debt assessmentIncrease in share capital assessmentAML safety assessment
126,500172,50086,250
2,600,000
Charitable donations and political funding
Apart from contribution to CSR projects as detailed in the Corporate Sustainability Report, found on pages 59 to 60, no political funding or other charitable donations were made during the year under review.
Major transactions
The Bank did not enter into any major transaction during the year under review.
OTHER STATUTORYDISCLOSURES
BANK ONE ANNUAL REPORT 2020 - CORPORATE GOVERNANCE REPORT
80 81
BANK ONE ANNUAL REPORT 2020 - CORPORATE GOVERNANCE REPORT
COMPANY SECRETARY’SCERTIFICATE
In my capacity as Company Secretary, I confirm that, to the best of my knowledge and belief, the Bank has filed with the Registrar of Companies, in respect of the financial year ended 31 December 2020, all such returns as are required under the Companies Act 2001, in terms of section 166(d).
Kareen Ng, ACISCompany Secretary
09 March 2021
STATEMENT OF DIRECTORS’ RESPONSIBILITIES IN RESPECT OF FINANCIAL STATEMENTS
The directors are responsible for the preparation of financial statements, which give a true and fair view of the financial position, financial performance and cash flows of the Bank, and which comply with the Mauritius Companies Act 2001, the Banking Act 2004 and the International Financial Reporting Standards.
In preparing those financial statements, the directors are required to:
∙ Select suitable accounting policies and then apply them consistently. ∙ Make judgments and estimates that are reasonable and prudent. ∙ State whether International Financial Reporting Standards have been followed, subject to any material departures disclosed and
explained in the financial statements. ∙ Prepare the financial statements on the going concern basis, unless it is inappropriate to presume that the Bank will continue in
business.
The directors are also responsible for safeguarding the assets of the Bank and hence taking reasonable steps for the prevention and detection of fraud and other irregularities.
The directors confirm that they have complied with the above requirements in preparing the Annual Report and financial statements. The Board acknowledges its responsibility for ensuring the preparation of the financial statements, in accordance with the International Financial Reporting Standards and the responsibility of external auditors to report on these financial statements. The Board also acknowledges its responsibility to ensure the maintenance of adequate accounting records and an effective system of internal controls and risk management.
Approved by the Board of Directors on 09 March 2021 and signed on its behalf by:
Sandra Martyres Leonard Mususa Mark WatkinsonIndependent Chairperson Chairman of the Chief Executive Officer Board Audit Committee
BANK ONE ANNUAL REPORT 2020 - CORPORATE GOVERNANCE REPORT
82
STATEMENT OF MANAGEMENT’S RESPONSIBILITIES IN RESPECT OF FINANCIAL STATEMENTS
The Bank’s financial statements, presented in this Annual Report, have been prepared by management, who is responsible for their integrity, consistency, objectivity and reliability. International Accounting Standards/International Financial Reporting Standards as well as the requirements of the Banking Act 2004 and the guidelines issued thereunder, have been applied. Management has exercised its judgement and made the best estimates where deemed necessary.
The Bank has designed and maintained its accounting systems, related internal controls and supporting procedures, to provide reasonable assurance that financial records are complete and accurate, and that assets are safeguarded against loss from unauthorised use or disposal. These supporting procedures include careful selection and training of qualified staff, the implementation of organisational and governance structures providing a well-defined division of responsibilities, authorisation levels and accountability for performance, and the communication of the Bank’s policies, procedures manuals and guidelines of the Bank of Mauritius throughout the Bank.
The Bank’s Board of Directors, acting in part through the Audit Committee, Conduct Review and Corporate Governance, and Risk Management Committee, oversees management’s responsibility for financial reporting, internal controls, assessment and control of major risk areas, and assessment of significant and related party transactions.
The Bank’s Internal Auditor, who has full and free access to the Audit Committee, conducts a well-designed programme of internal audits in coordination with the Bank’s External Auditors. In addition, the Bank’s compliance function maintains policies, procedures and programmes directed at ensuring compliance with regulatory requirements.
Pursuant to the provisions of the Banking Act 2004, the Bank of Mauritius makes such examination and inquiry into the operations and affairs of the Bank as it deems necessary.
The Bank’s External Auditors, Deloitte, have full and free access to the Board of Directors and its committees, to discuss the audit and matters arising therefrom, such as their observations on the fairness of financial reporting and the adequacy of internal controls.
Sandra Martyres Mark Watkinson Leonard C. MususaChairperson of the Chief Executive Officer DirectorBoard of Directors
09 March 2021

FINANCIAL STATEMENTSINDEPENDENT AUDITOR’S REPORT
STATEMENT OF PROFIT OR LOSS AND OTHER COMPREHENSIVE INCOME
STATEMENT OF FINANCIAL POSITION
STATEMENT OF CHANGES IN EQUITY
STATEMENT OF CASH FLOWS
NOTES TO THE FINANCIAL STATEMENTS
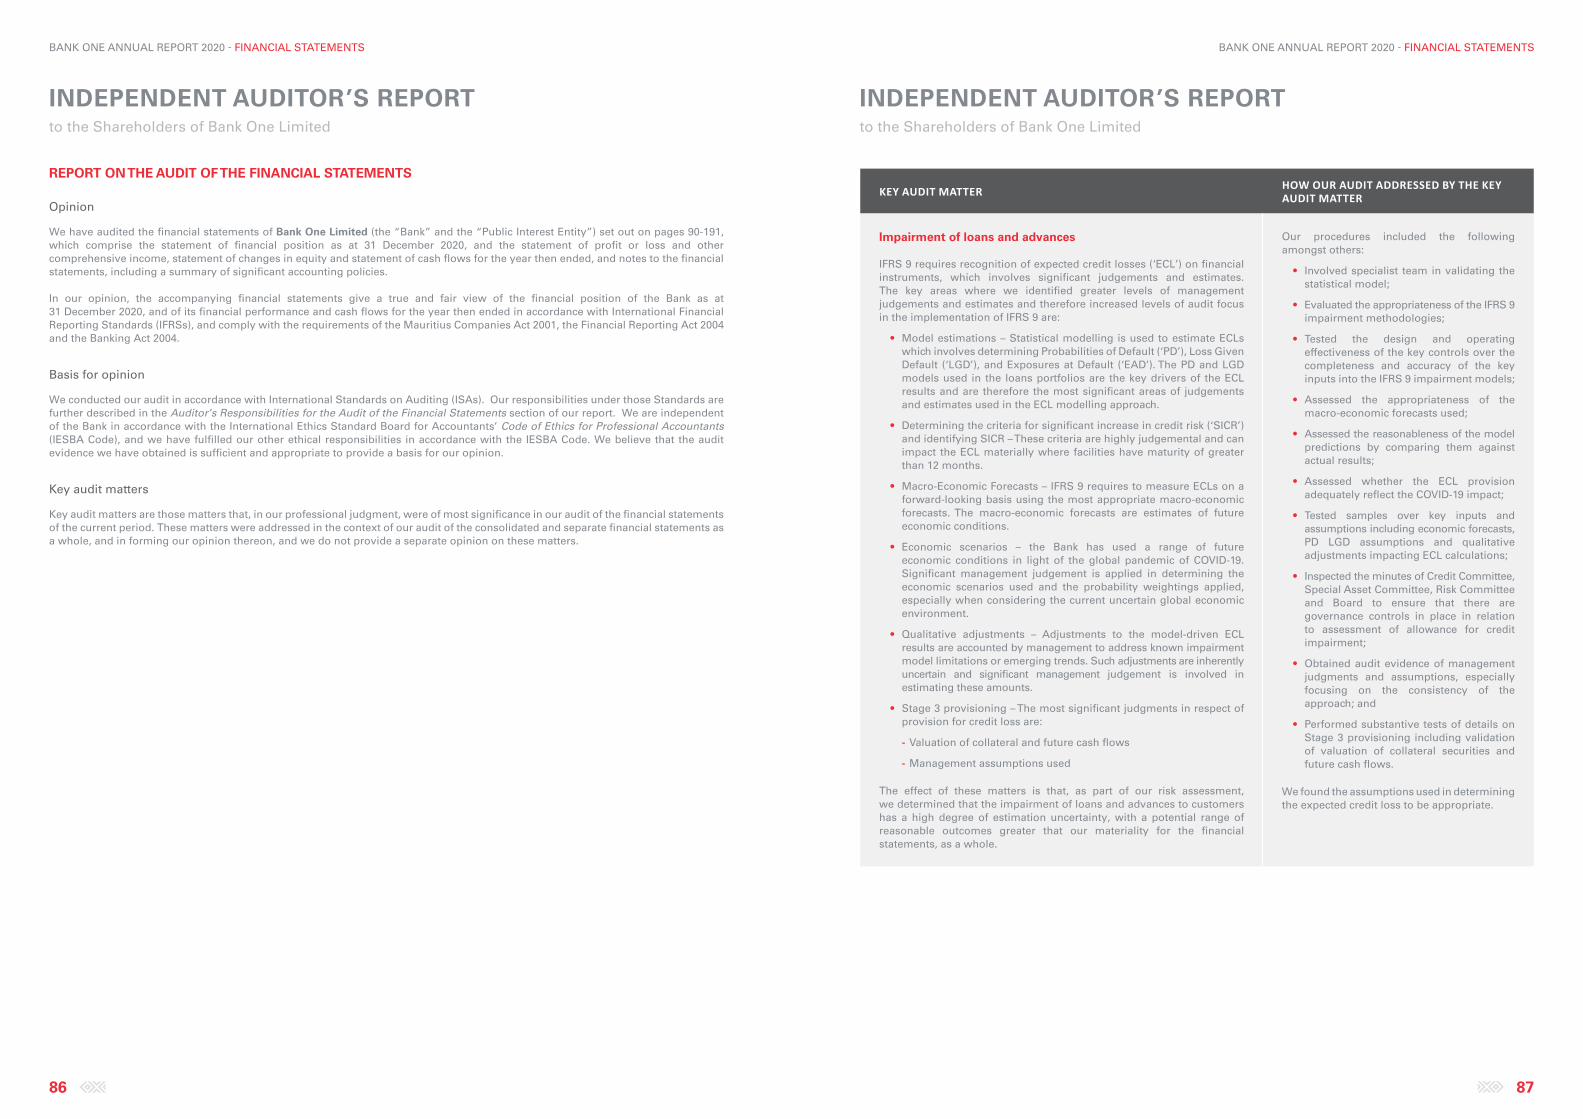
BANK ONE ANNUAL REPORT 2020 - FINANCIAL STATEMENTS BANK ONE ANNUAL REPORT 2020 - FINANCIAL STATEMENTS
86 87
INDEPENDENT AUDITOR’S REPORT to the Shareholders of Bank One Limited
INDEPENDENT AUDITOR’S REPORT to the Shareholders of Bank One Limited
REPORT ON THE AUDIT OF THE FINANCIAL STATEMENTS
Opinion
We have audited the financial statements of Bank One Limited (the “Bank” and the “Public Interest Entity”) set out on pages 90-191, which comprise the statement of financial position as at 31 December 2020, and the statement of profit or loss and other comprehensive income, statement of changes in equity and statement of cash flows for the year then ended, and notes to the financial statements, including a summary of significant accounting policies.
In our opinion, the accompanying financial statements give a true and fair view of the financial position of the Bank as at 31 December 2020, and of its financial performance and cash flows for the year then ended in accordance with International Financial Reporting Standards (IFRSs), and comply with the requirements of the Mauritius Companies Act 2001, the Financial Reporting Act 2004 and the Banking Act 2004.
Basis for opinion
We conducted our audit in accordance with International Standards on Auditing (ISAs). Our responsibilities under those Standards are further described in the Auditor’s Responsibilities for the Audit of the Financial Statements section of our report. We are independent of the Bank in accordance with the International Ethics Standard Board for Accountants’ Code of Ethics for Professional Accountants (IESBA Code), and we have fulfilled our other ethical responsibilities in accordance with the IESBA Code. We believe that the audit evidence we have obtained is sufficient and appropriate to provide a basis for our opinion.
Key audit matters
Key audit matters are those matters that, in our professional judgment, were of most significance in our audit of the financial statements of the current period. These matters were addressed in the context of our audit of the consolidated and separate financial statements as a whole, and in forming our opinion thereon, and we do not provide a separate opinion on these matters.
KEY AUDIT MATTER HOW OUR AUDIT ADDRESSED BY THE KEY AUDIT MATTER
Impairment of loans and advances
IFRS 9 requires recognition of expected credit losses (‘ECL’) on financial instruments, which involves significant judgements and estimates. The key areas where we identified greater levels of management judgements and estimates and therefore increased levels of audit focus in the implementation of IFRS 9 are:
• Model estimations – Statistical modelling is used to estimate ECLs which involves determining Probabilities of Default (‘PD’), Loss Given Default (‘LGD’), and Exposures at Default (‘EAD’). The PD and LGD models used in the loans portfolios are the key drivers of the ECL results and are therefore the most significant areas of judgements and estimates used in the ECL modelling approach.
• Determining the criteria for significant increase in credit risk (‘SICR’) and identifying SICR – These criteria are highly judgemental and can impact the ECL materially where facilities have maturity of greater than 12 months.
• Macro-Economic Forecasts – IFRS 9 requires to measure ECLs on a forward-looking basis using the most appropriate macro-economic forecasts. The macro-economic forecasts are estimates of future economic conditions.
• Economic scenarios – the Bank has used a range of future economic conditions in light of the global pandemic of COVID-19. Significant management judgement is applied in determining the economic scenarios used and the probability weightings applied, especially when considering the current uncertain global economic environment.
• Qualitative adjustments – Adjustments to the model-driven ECL results are accounted by management to address known impairment model limitations or emerging trends. Such adjustments are inherently uncertain and significant management judgement is involved in estimating these amounts.
• Stage 3 provisioning – The most significant judgments in respect of provision for credit loss are:
- Valuation of collateral and future cash flows
- Management assumptions used
The effect of these matters is that, as part of our risk assessment, we determined that the impairment of loans and advances to customers has a high degree of estimation uncertainty, with a potential range of reasonable outcomes greater that our materiality for the financial statements, as a whole.
Our procedures included the following amongst others:
• Involved specialist team in validating the statistical model;
• Evaluated the appropriateness of the IFRS 9 impairment methodologies;
• Tested the design and operating effectiveness of the key controls over the completeness and accuracy of the key inputs into the IFRS 9 impairment models;
• Assessed the appropriateness of the macro-economic forecasts used;
• Assessed the reasonableness of the model predictions by comparing them against actual results;
• Assessed whether the ECL provision adequately reflect the COVID-19 impact;
• Tested samples over key inputs and assumptions including economic forecasts, PD LGD assumptions and qualitative adjustments impacting ECL calculations;
• Inspected the minutes of Credit Committee, Special Asset Committee, Risk Committee and Board to ensure that there are governance controls in place in relation to assessment of allowance for credit impairment;
• Obtained audit evidence of management judgments and assumptions, especially focusing on the consistency of the approach; and
• Performed substantive tests of details on Stage 3 provisioning including validation of valuation of collateral securities and future cash flows.
We found the assumptions used in determining the expected credit loss to be appropriate.
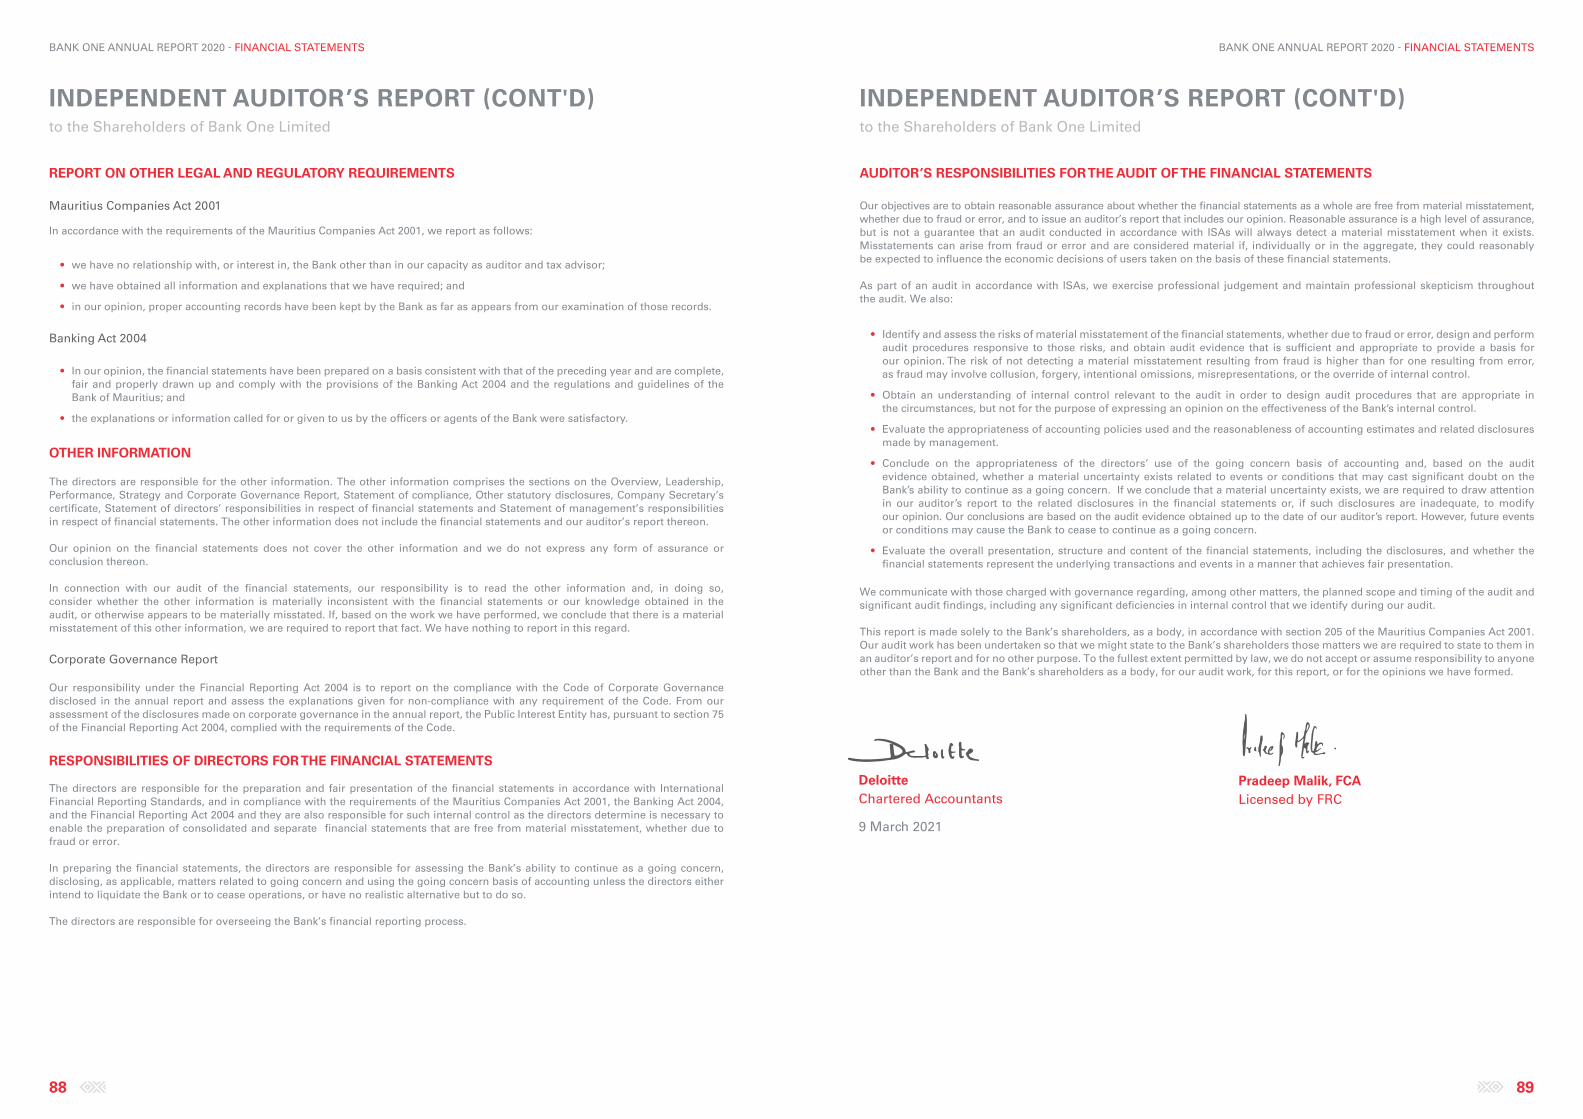
BANK ONE ANNUAL REPORT 2020 - FINANCIAL STATEMENTS BANK ONE ANNUAL REPORT 2020 - FINANCIAL STATEMENTS
88 89
INDEPENDENT AUDITOR’S REPORT (CONT'D)to the Shareholders of Bank One Limited
INDEPENDENT AUDITOR’S REPORT (CONT'D)to the Shareholders of Bank One Limited
REPORT ON OTHER LEGAL AND REGULATORY REQUIREMENTS
Mauritius Companies Act 2001
In accordance with the requirements of the Mauritius Companies Act 2001, we report as follows:
• we have no relationship with, or interest in, the Bank other than in our capacity as auditor and tax advisor;
• we have obtained all information and explanations that we have required; and
• in our opinion, proper accounting records have been kept by the Bank as far as appears from our examination of those records.
Banking Act 2004
• In our opinion, the financial statements have been prepared on a basis consistent with that of the preceding year and are complete, fair and properly drawn up and comply with the provisions of the Banking Act 2004 and the regulations and guidelines of the Bank of Mauritius; and
• the explanations or information called for or given to us by the officers or agents of the Bank were satisfactory.
OTHER INFORMATION
The directors are responsible for the other information. The other information comprises the sections on the Overview, Leadership, Performance, Strategy and Corporate Governance Report, Statement of compliance, Other statutory disclosures, Company Secretary’s certificate, Statement of directors’ responsibilities in respect of financial statements and Statement of management’s responsibilities in respect of financial statements. The other information does not include the financial statements and our auditor’s report thereon.
Our opinion on the financial statements does not cover the other information and we do not express any form of assurance or conclusion thereon.
In connection with our audit of the financial statements, our responsibility is to read the other information and, in doing so, consider whether the other information is materially inconsistent with the financial statements or our knowledge obtained in the audit, or otherwise appears to be materially misstated. If, based on the work we have performed, we conclude that there is a material misstatement of this other information, we are required to report that fact. We have nothing to report in this regard.
Corporate Governance Report
Our responsibility under the Financial Reporting Act 2004 is to report on the compliance with the Code of Corporate Governance disclosed in the annual report and assess the explanations given for non-compliance with any requirement of the Code. From our assessment of the disclosures made on corporate governance in the annual report, the Public Interest Entity has, pursuant to section 75 of the Financial Reporting Act 2004, complied with the requirements of the Code.
RESPONSIBILITIES OF DIRECTORS FOR THE FINANCIAL STATEMENTS
The directors are responsible for the preparation and fair presentation of the financial statements in accordance with International Financial Reporting Standards, and in compliance with the requirements of the Mauritius Companies Act 2001, the Banking Act 2004, and the Financial Reporting Act 2004 and they are also responsible for such internal control as the directors determine is necessary to enable the preparation of consolidated and separate financial statements that are free from material misstatement, whether due to fraud or error.
In preparing the financial statements, the directors are responsible for assessing the Bank’s ability to continue as a going concern, disclosing, as applicable, matters related to going concern and using the going concern basis of accounting unless the directors either intend to liquidate the Bank or to cease operations, or have no realistic alternative but to do so.
The directors are responsible for overseeing the Bank’s financial reporting process.
AUDITOR’S RESPONSIBILITIES FOR THE AUDIT OF THE FINANCIAL STATEMENTS
Our objectives are to obtain reasonable assurance about whether the financial statements as a whole are free from material misstatement, whether due to fraud or error, and to issue an auditor’s report that includes our opinion. Reasonable assurance is a high level of assurance, but is not a guarantee that an audit conducted in accordance with ISAs will always detect a material misstatement when it exists. Misstatements can arise from fraud or error and are considered material if, individually or in the aggregate, they could reasonably be expected to influence the economic decisions of users taken on the basis of these financial statements.
As part of an audit in accordance with ISAs, we exercise professional judgement and maintain professional skepticism throughout the audit. We also:
• Identify and assess the risks of material misstatement of the financial statements, whether due to fraud or error, design and perform audit procedures responsive to those risks, and obtain audit evidence that is sufficient and appropriate to provide a basis for our opinion. The risk of not detecting a material misstatement resulting from fraud is higher than for one resulting from error, as fraud may involve collusion, forgery, intentional omissions, misrepresentations, or the override of internal control.
• Obtain an understanding of internal control relevant to the audit in order to design audit procedures that are appropriate in the circumstances, but not for the purpose of expressing an opinion on the effectiveness of the Bank’s internal control.
• Evaluate the appropriateness of accounting policies used and the reasonableness of accounting estimates and related disclosures made by management.
• Conclude on the appropriateness of the directors’ use of the going concern basis of accounting and, based on the audit evidence obtained, whether a material uncertainty exists related to events or conditions that may cast significant doubt on the Bank’s ability to continue as a going concern. If we conclude that a material uncertainty exists, we are required to draw attention in our auditor’s report to the related disclosures in the financial statements or, if such disclosures are inadequate, to modify our opinion. Our conclusions are based on the audit evidence obtained up to the date of our auditor’s report. However, future events or conditions may cause the Bank to cease to continue as a going concern.
• Evaluate the overall presentation, structure and content of the financial statements, including the disclosures, and whether the financial statements represent the underlying transactions and events in a manner that achieves fair presentation.
We communicate with those charged with governance regarding, among other matters, the planned scope and timing of the audit and significant audit findings, including any significant deficiencies in internal control that we identify during our audit.
This report is made solely to the Bank’s shareholders, as a body, in accordance with section 205 of the Mauritius Companies Act 2001. Our audit work has been undertaken so that we might state to the Bank’s shareholders those matters we are required to state to them in an auditor’s report and for no other purpose. To the fullest extent permitted by law, we do not accept or assume responsibility to anyone other than the Bank and the Bank’s shareholders as a body, for our audit work, for this report, or for the opinions we have formed.
Pradeep Malik, FCALicensed by FRC
Deloitte Chartered Accountants
9 March 2021
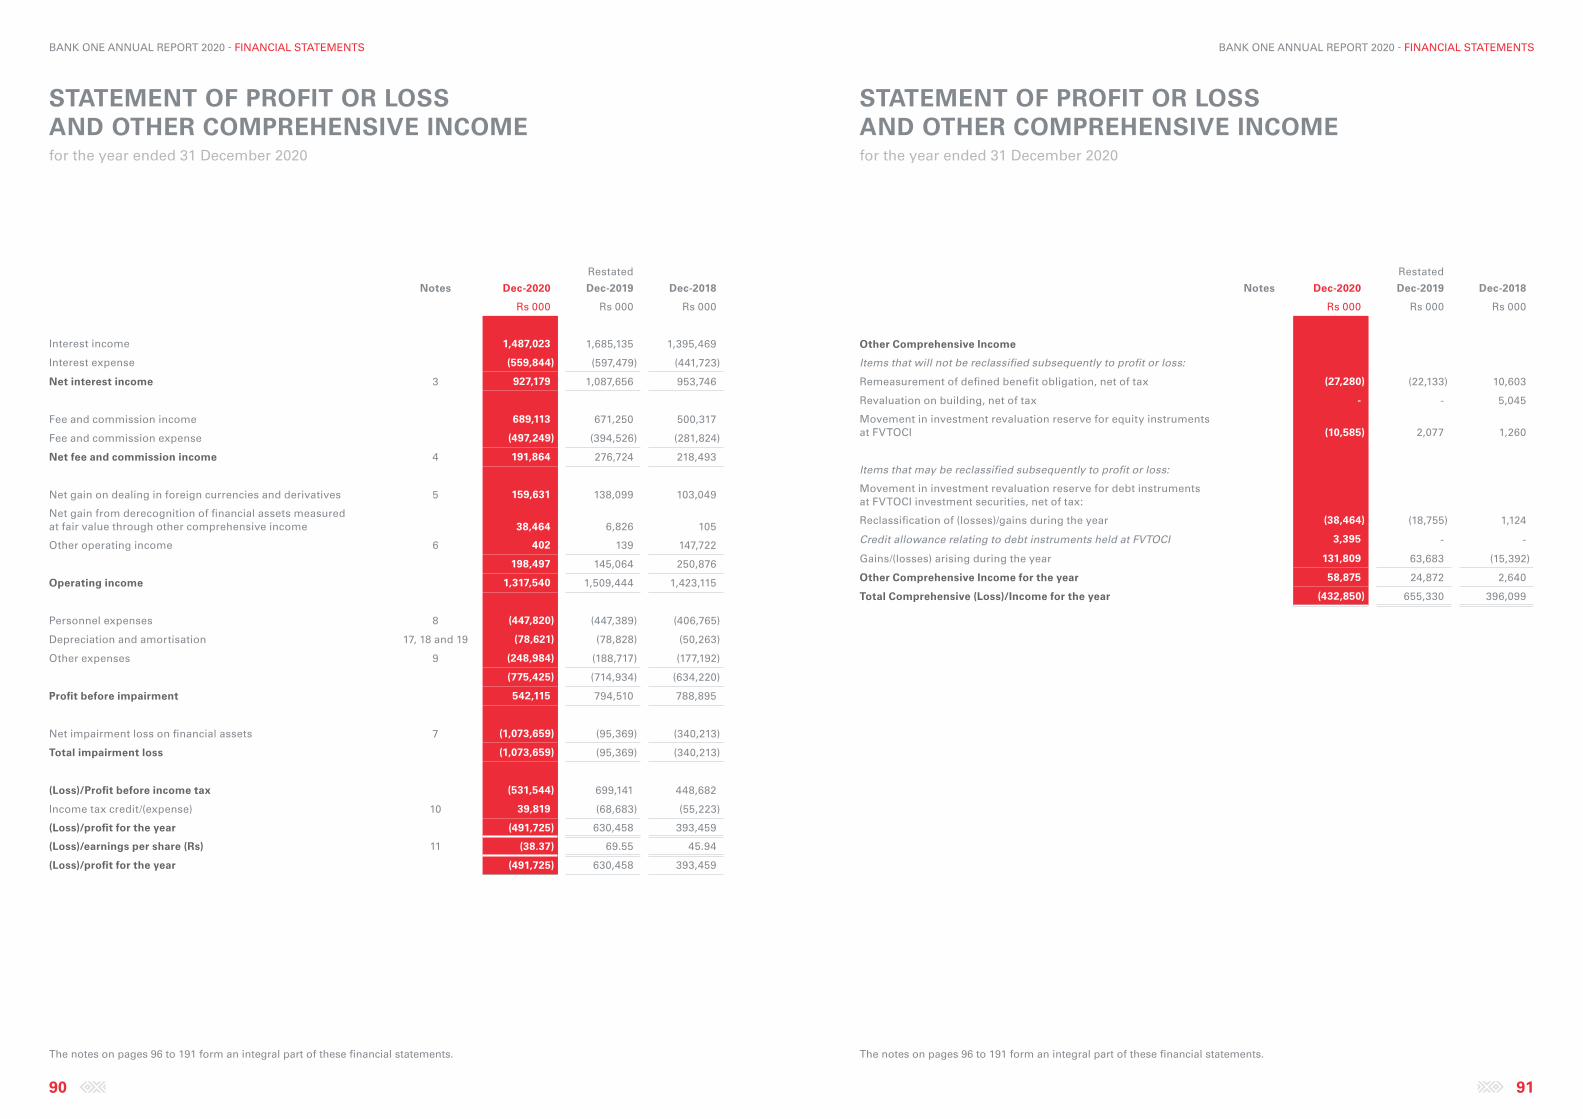
BANK ONE ANNUAL REPORT 2020 - FINANCIAL STATEMENTS
STATEMENT OF PROFIT OR LOSS AND OTHER COMPREHENSIVE INCOMEfor the year ended 31 December 2020
91
BANK ONE ANNUAL REPORT 2020 - FINANCIAL STATEMENTS
STATEMENT OF PROFIT OR LOSS AND OTHER COMPREHENSIVE INCOMEfor the year ended 31 December 2020
90
Notes Dec-2020
Restated
Dec-2019 Dec-2018
Rs 000 Rs 000 Rs 000
Interest income 1,487,023 1,685,135 1,395,469
Interest expense (559,844) (597,479) (441,723)
Net interest income 3 927,179 1,087,656 953,746
Fee and commission income 689,113 671,250 500,317
Fee and commission expense (497,249) (394,526) (281,824)
Net fee and commission income 4 191,864 276,724 218,493
Net gain on dealing in foreign currencies and derivatives 5 159,631 138,099 103,049
Net gain from derecognition of financial assets measured at fair value through other comprehensive income 38,464 6,826 105
Other operating income 6 402 139 147,722
198,497 145,064 250,876
Operating income 1,317,540 1,509,444 1,423,115
Personnel expenses 8 (447,820) (447,389) (406,765)
Depreciation and amortisation 17, 18 and 19 (78,621) (78,828) (50,263)
Other expenses 9 (248,984) (188,717) (177,192)
(775,425) (714,934) (634,220)
Profit before impairment 542,115 794,510 788,895
Net impairment loss on financial assets 7 (1,073,659) (95,369) (340,213)
Total impairment loss (1,073,659) (95,369) (340,213)
(Loss)/Profit before income tax (531,544) 699,141 448,682
Income tax credit/(expense) 10 39,819 (68,683) (55,223)
(Loss)/profit for the year (491,725) 630,458 393,459
(Loss)/earnings per share (Rs) 11 (38.37) 69.55 45.94
(Loss)/profit for the year (491,725) 630,458 393,459
The notes on pages 96 to 191 form an integral part of these financial statements.
Notes Dec-2020
Restated
Dec-2019 Dec-2018
Rs 000 Rs 000 Rs 000
Other Comprehensive Income
Items that will not be reclassified subsequently to profit or loss:
Remeasurement of defined benefit obligation, net of tax (27,280) (22,133) 10,603
Revaluation on building, net of tax - - 5,045
Movement in investment revaluation reserve for equity instruments at FVTOCI (10,585) 2,077 1,260
Items that may be reclassified subsequently to profit or loss:
Movement in investment revaluation reserve for debt instruments at FVTOCI investment securities, net of tax:
Reclassification of (losses)/gains during the year (38,464) (18,755) 1,124
Credit allowance relating to debt instruments held at FVTOCI 3,395 - -
Gains/(losses) arising during the year 131,809 63,683 (15,392)
Other Comprehensive Income for the year 58,875 24,872 2,640
Total Comprehensive (Loss)/Income for the year (432,850) 655,330 396,099
The notes on pages 96 to 191 form an integral part of these financial statements.
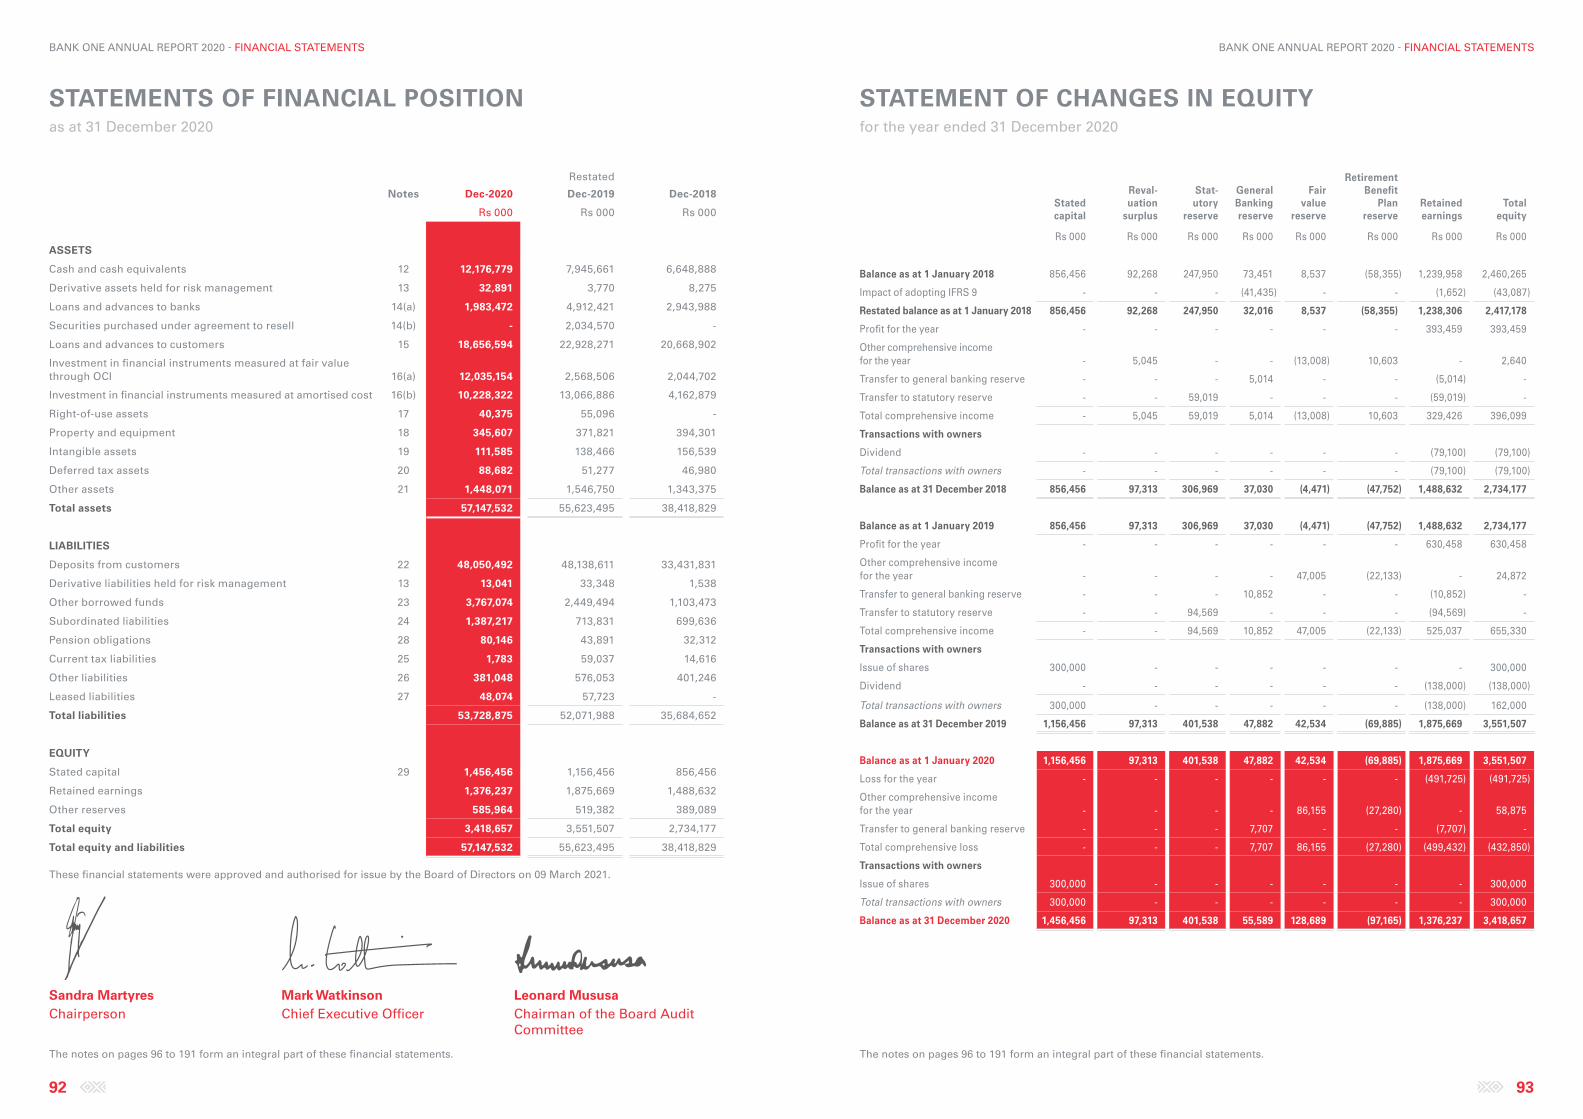
BANK ONE ANNUAL REPORT 2020 - FINANCIAL STATEMENTS
STATEMENTS OF FINANCIAL POSITIONas at 31 December 2020
BANK ONE ANNUAL REPORT 2020 - FINANCIAL STATEMENTS
STATEMENT OF CHANGES IN EQUITYfor the year ended 31 December 2020
92 93
Stated capital
Reval-uation
surplus
Stat-utory
reserve
General Banking reserve
Fair value
reserve
Retirement Benefit
Plan reserve
Retained earnings
Total equity
Rs 000 Rs 000 Rs 000 Rs 000 Rs 000 Rs 000 Rs 000 Rs 000
Balance as at 1 January 2018 856,456 92,268 247,950 73,451 8,537 (58,355) 1,239,958 2,460,265
Impact of adopting IFRS 9 - - - (41,435) - - (1,652) (43,087)
Restated balance as at 1 January 2018 856,456 92,268 247,950 32,016 8,537 (58,355) 1,238,306 2,417,178
Profit for the year - - - - - - 393,459 393,459
Other comprehensive income for the year - 5,045 - - (13,008) 10,603 - 2,640
Transfer to general banking reserve - - - 5,014 - - (5,014) -
Transfer to statutory reserve - - 59,019 - - - (59,019) -
Total comprehensive income - 5,045 59,019 5,014 (13,008) 10,603 329,426 396,099
Transactions with owners
Dividend - - - - - - (79,100) (79,100)
Total transactions with owners - - - - - - (79,100) (79,100)
Balance as at 31 December 2018 856,456 97,313 306,969 37,030 (4,471) (47,752) 1,488,632 2,734,177
Balance as at 1 January 2019 856,456 97,313 306,969 37,030 (4,471) (47,752) 1,488,632 2,734,177
Profit for the year - - - - - - 630,458 630,458
Other comprehensive income for the year - - - - 47,005 (22,133) - 24,872
Transfer to general banking reserve - - - 10,852 - - (10,852) -
Transfer to statutory reserve - - 94,569 - - - (94,569) -
Total comprehensive income - - 94,569 10,852 47,005 (22,133) 525,037 655,330
Transactions with owners
Issue of shares 300,000 - - - - - - 300,000
Dividend - - - - - - (138,000) (138,000)
Total transactions with owners 300,000 - - - - - (138,000) 162,000
Balance as at 31 December 2019 1,156,456 97,313 401,538 47,882 42,534 (69,885) 1,875,669 3,551,507
Balance as at 1 January 2020 1,156,456 97,313 401,538 47,882 42,534 (69,885) 1,875,669 3,551,507
Loss for the year - - - - - - (491,725) (491,725)
Other comprehensive income for the year - - - - 86,155 (27,280) - 58,875
Transfer to general banking reserve - - - 7,707 - - (7,707) -
Total comprehensive loss - - - 7,707 86,155 (27,280) (499,432) (432,850)
Transactions with owners
Issue of shares 300,000 - - - - - - 300,000
Total transactions with owners 300,000 - - - - - - 300,000
Balance as at 31 December 2020 1,456,456 97,313 401,538 55,589 128,689 (97,165) 1,376,237 3,418,657
The notes on pages 96 to 191 form an integral part of these financial statements.
Restated
Notes Dec-2020 Dec-2019 Dec-2018
Rs 000 Rs 000 Rs 000
ASSETS
Cash and cash equivalents 12 12,176,779 7,945,661 6,648,888
Derivative assets held for risk management 13 32,891 3,770 8,275
Loans and advances to banks 14(a) 1,983,472 4,912,421 2,943,988
Securities purchased under agreement to resell 14(b) - 2,034,570 -
Loans and advances to customers 15 18,656,594 22,928,271 20,668,902
Investment in financial instruments measured at fair value through OCI 16(a) 12,035,154 2,568,506 2,044,702
Investment in financial instruments measured at amortised cost 16(b) 10,228,322 13,066,886 4,162,879
Right-of-use assets 17 40,375 55,096 -
Property and equipment 18 345,607 371,821 394,301
Intangible assets 19 111,585 138,466 156,539
Deferred tax assets 20 88,682 51,277 46,980
Other assets 21 1,448,071 1,546,750 1,343,375
Total assets 57,147,532 55,623,495 38,418,829
LIABILITIES
Deposits from customers 22 48,050,492 48,138,611 33,431,831
Derivative liabilities held for risk management 13 13,041 33,348 1,538
Other borrowed funds 23 3,767,074 2,449,494 1,103,473
Subordinated liabilities 24 1,387,217 713,831 699,636
Pension obligations 28 80,146 43,891 32,312
Current tax liabilities 25 1,783 59,037 14,616
Other liabilities 26 381,048 576,053 401,246
Leased liabilities 27 48,074 57,723 -
Total liabilities 53,728,875 52,071,988 35,684,652
EQUITY
Stated capital 29 1,456,456 1,156,456 856,456
Retained earnings 1,376,237 1,875,669 1,488,632
Other reserves 585,964 519,382 389,089
Total equity 3,418,657 3,551,507 2,734,177
Total equity and liabilities 57,147,532 55,623,495 38,418,829
These financial statements were approved and authorised for issue by the Board of Directors on 09 March 2021.
The notes on pages 96 to 191 form an integral part of these financial statements.
Mark WatkinsonChief Executive Officer
Sandra Martyres Chairperson
Leonard Mususa Chairman of the Board Audit Committee
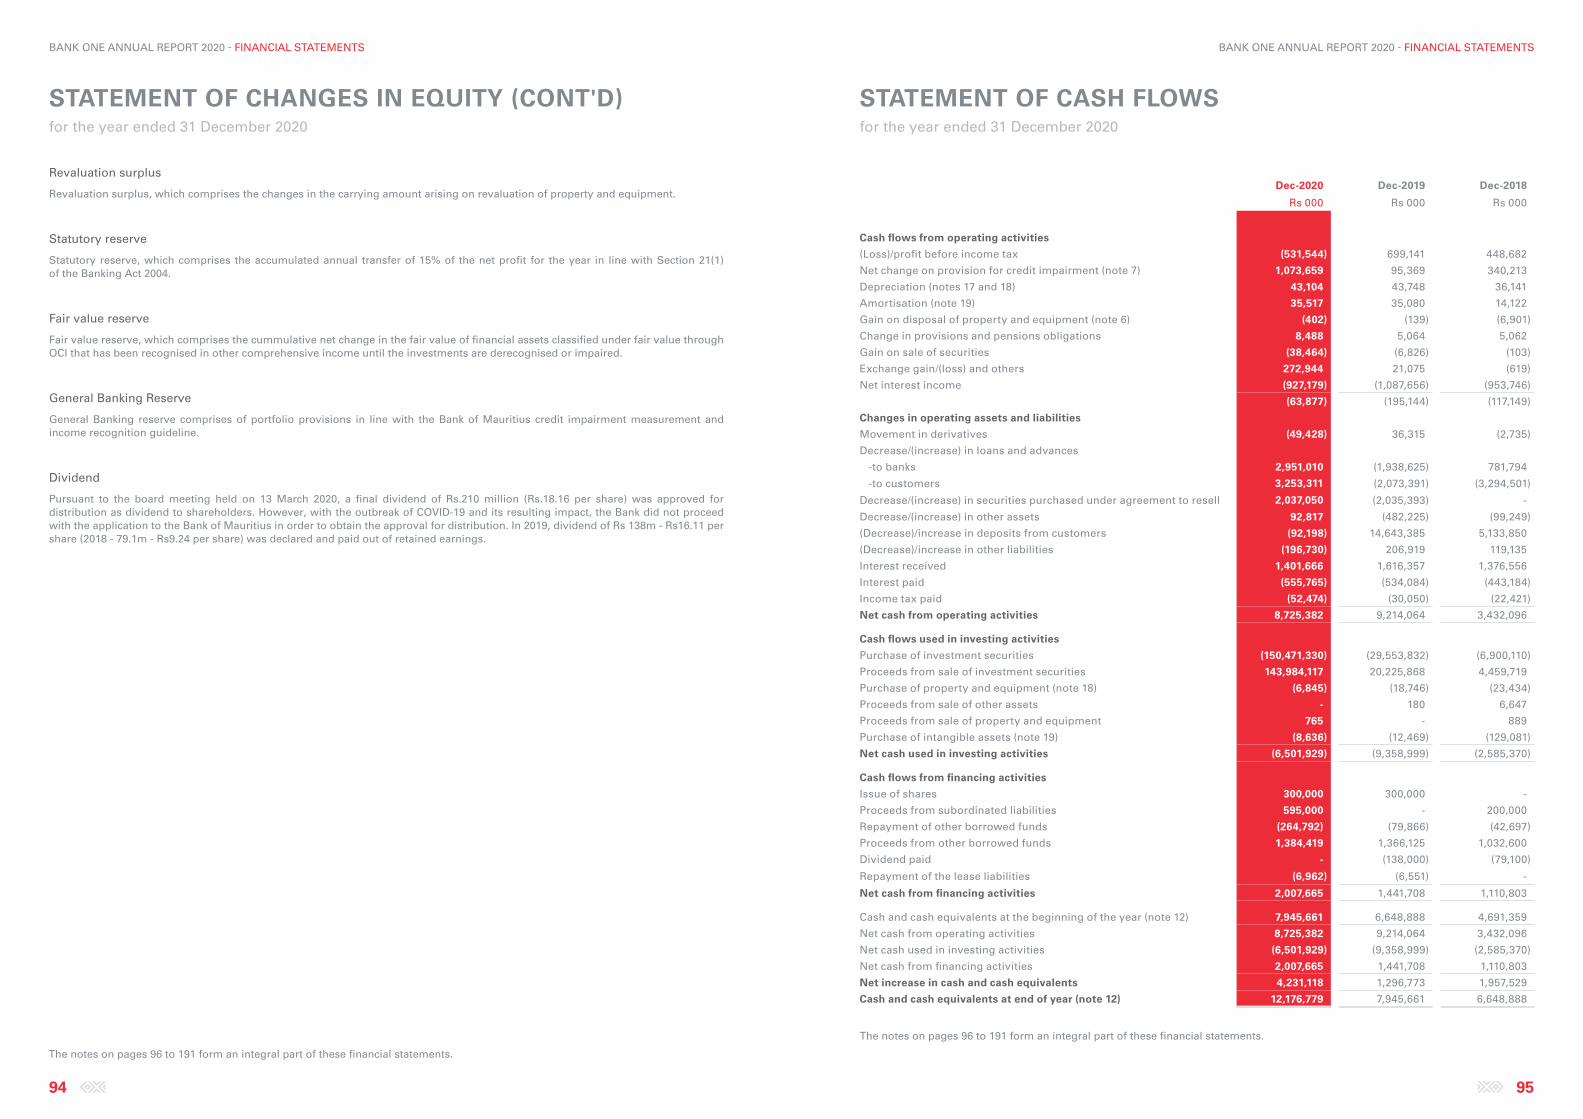
BANK ONE ANNUAL REPORT 2020 - FINANCIAL STATEMENTS
STATEMENT OF CHANGES IN EQUITY (CONT'D)for the year ended 31 December 2020
BANK ONE ANNUAL REPORT 2020 - FINANCIAL STATEMENTS
STATEMENT OF CASH FLOWSfor the year ended 31 December 2020
94 95
Revaluation surplus
Revaluation surplus, which comprises the changes in the carrying amount arising on revaluation of property and equipment.
Statutory reserve
Statutory reserve, which comprises the accumulated annual transfer of 15% of the net profit for the year in line with Section 21(1) of the Banking Act 2004.
Fair value reserve
Fair value reserve, which comprises the cummulative net change in the fair value of financial assets classified under fair value through OCI that has been recognised in other comprehensive income until the investments are derecognised or impaired.
General Banking Reserve
General Banking reserve comprises of portfolio provisions in line with the Bank of Mauritius credit impairment measurement and income recognition guideline.
Dividend
Pursuant to the board meeting held on 13 March 2020, a final dividend of Rs.210 million (Rs.18.16 per share) was approved for distribution as dividend to shareholders. However, with the outbreak of COVID-19 and its resulting impact, the Bank did not proceed with the application to the Bank of Mauritius in order to obtain the approval for distribution. In 2019, dividend of Rs 138m - Rs16.11 per share (2018 - 79.1m - Rs9.24 per share) was declared and paid out of retained earnings.
Dec-2020 Dec-2019 Dec-2018
Rs 000 Rs 000 Rs 000
Cash flows from operating activities
(Loss)/profit before income tax (531,544) 699,141 448,682
Net change on provision for credit impairment (note 7) 1,073,659 95,369 340,213
Depreciation (notes 17 and 18) 43,104 43,748 36,141
Amortisation (note 19) 35,517 35,080 14,122
Gain on disposal of property and equipment (note 6) (402) (139) (6,901)
Change in provisions and pensions obligations 8,488 5,064 5,062
Gain on sale of securities (38,464) (6,826) (103)
Exchange gain/(loss) and others 272,944 21,075 (619)
Net interest income (927,179) (1,087,656) (953,746)
(63,877) (195,144) (117,149)
Changes in operating assets and liabilities
Movement in derivatives (49,428) 36,315 (2,735)
Decrease/(increase) in loans and advances
-to banks 2,951,010 (1,938,625) 781,794
-to customers 3,253,311 (2,073,391) (3,294,501)
Decrease/(increase) in securities purchased under agreement to resell 2,037,050 (2,035,393) -
Decrease/(increase) in other assets 92,817 (482,225) (99,249)
(Decrease)/increase in deposits from customers (92,198) 14,643,385 5,133,850
(Decrease)/increase in other liabilities (196,730) 206,919 119,135
Interest received 1,401,666 1,616,357 1,376,556
Interest paid (555,765) (534,084) (443,184)
Income tax paid (52,474) (30,050) (22,421)
Net cash from operating activities 8,725,382 9,214,064 3,432,096
Cash flows used in investing activities
Purchase of investment securities (150,471,330) (29,553,832) (6,900,110)
Proceeds from sale of investment securities 143,984,117 20,225,868 4,459,719
Purchase of property and equipment (note 18) (6,845) (18,746) (23,434)
Proceeds from sale of other assets - 180 6,647
Proceeds from sale of property and equipment 765 - 889
Purchase of intangible assets (note 19) (8,636) (12,469) (129,081)
Net cash used in investing activities (6,501,929) (9,358,999) (2,585,370)
Cash flows from financing activities
Issue of shares 300,000 300,000 -
Proceeds from subordinated liabilities 595,000 - 200,000
Repayment of other borrowed funds (264,792) (79,866) (42,697)
Proceeds from other borrowed funds 1,384,419 1,366,125 1,032,600
Dividend paid - (138,000) (79,100)
Repayment of the lease liabilities (6,962) (6,551) -
Net cash from financing activities 2,007,665 1,441,708 1,110,803
Cash and cash equivalents at the beginning of the year (note 12) 7,945,661 6,648,888 4,691,359
Net cash from operating activities 8,725,382 9,214,064 3,432,096
Net cash used in investing activities (6,501,929) (9,358,999) (2,585,370)
Net cash from financing activities 2,007,665 1,441,708 1,110,803
Net increase in cash and cash equivalents 4,231,118 1,296,773 1,957,529
Cash and cash equivalents at end of year (note 12) 12,176,779 7,945,661 6,648,888
The notes on pages 96 to 191 form an integral part of these financial statements.
The notes on pages 96 to 191 form an integral part of these financial statements.
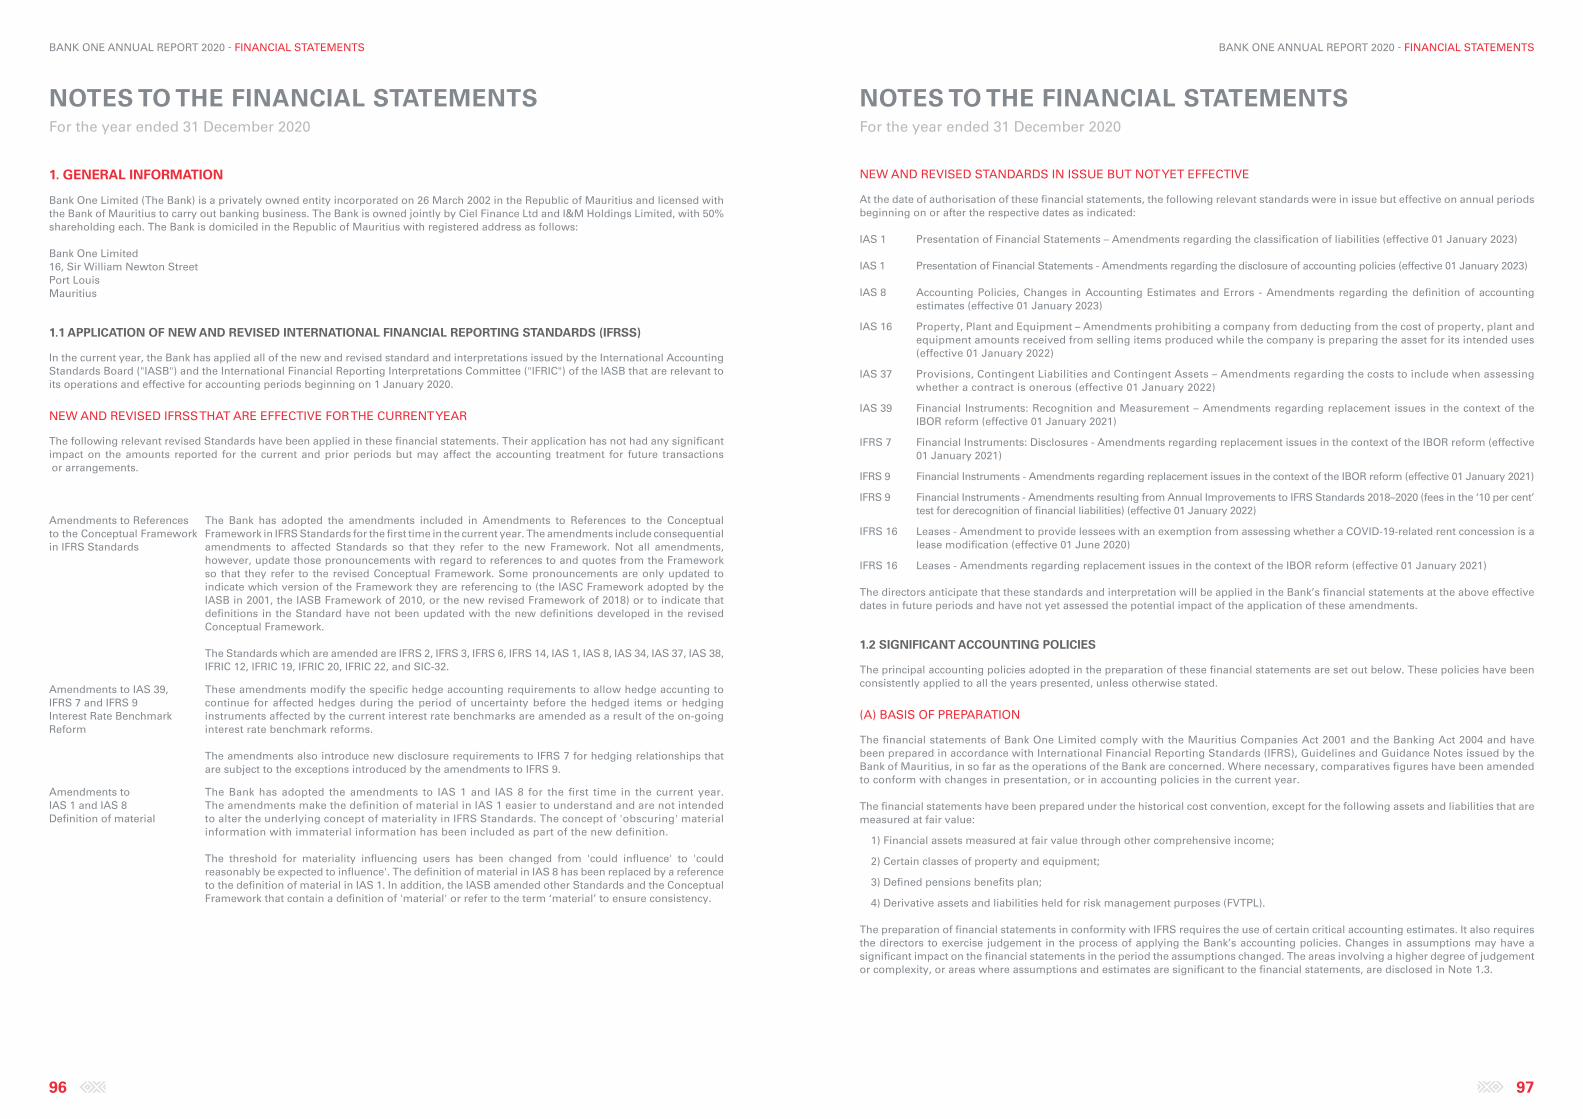
NOTES TO THE FINANCIAL STATEMENTS For the year ended 31 December 2020
NOTES TO THE FINANCIAL STATEMENTS For the year ended 31 December 2020
96 97
BANK ONE ANNUAL REPORT 2020 - FINANCIAL STATEMENTS BANK ONE ANNUAL REPORT 2020 - FINANCIAL STATEMENTS
1. GENERAL INFORMATION
Bank One Limited (The Bank) is a privately owned entity incorporated on 26 March 2002 in the Republic of Mauritius and licensed with the Bank of Mauritius to carry out banking business. The Bank is owned jointly by Ciel Finance Ltd and I&M Holdings Limited, with 50% shareholding each. The Bank is domiciled in the Republic of Mauritius with registered address as follows:
Bank One Limited16, Sir William Newton StreetPort LouisMauritius
1.1 APPLICATION OF NEW AND REVISED INTERNATIONAL FINANCIAL REPORTING STANDARDS (IFRSS)
In the current year, the Bank has applied all of the new and revised standard and interpretations issued by the International Accounting Standards Board ("IASB") and the International Financial Reporting Interpretations Committee ("IFRIC") of the IASB that are relevant to its operations and effective for accounting periods beginning on 1 January 2020.
NEW AND REVISED IFRSS THAT ARE EFFECTIVE FOR THE CURRENT YEAR
The following relevant revised Standards have been applied in these financial statements. Their application has not had any significant impact on the amounts reported for the current and prior periods but may affect the accounting treatment for future transactions or arrangements.
Amendments to References to the Conceptual Framework in IFRS Standards
The Bank has adopted the amendments included in Amendments to References to the Conceptual Framework in IFRS Standards for the first time in the current year. The amendments include consequential amendments to affected Standards so that they refer to the new Framework. Not all amendments, however, update those pronouncements with regard to references to and quotes from the Framework so that they refer to the revised Conceptual Framework. Some pronouncements are only updated to indicate which version of the Framework they are referencing to (the IASC Framework adopted by the IASB in 2001, the IASB Framework of 2010, or the new revised Framework of 2018) or to indicate that definitions in the Standard have not been updated with the new definitions developed in the revised Conceptual Framework.
The Standards which are amended are IFRS 2, IFRS 3, IFRS 6, IFRS 14, IAS 1, IAS 8, IAS 34, IAS 37, IAS 38, IFRIC 12, IFRIC 19, IFRIC 20, IFRIC 22, and SIC-32.
Amendments to IAS 39, IFRS 7 and IFRS 9 Interest Rate Benchmark Reform
These amendments modify the specific hedge accounting requirements to allow hedge accunting to continue for affected hedges during the period of uncertainty before the hedged items or hedging instruments affected by the current interest rate benchmarks are amended as a result of the on-going interest rate benchmark reforms.
The amendments also introduce new disclosure requirements to IFRS 7 for hedging relationships that are subject to the exceptions introduced by the amendments to IFRS 9.
Amendments to IAS 1 and IAS 8Definition of material
The Bank has adopted the amendments to IAS 1 and IAS 8 for the first time in the current year. The amendments make the definition of material in IAS 1 easier to understand and are not intended to alter the underlying concept of materiality in IFRS Standards. The concept of 'obscuring' material information with immaterial information has been included as part of the new definition.
The threshold for materiality influencing users has been changed from 'could influence' to 'could reasonably be expected to influence'. The definition of material in IAS 8 has been replaced by a reference to the definition of material in IAS 1. In addition, the IASB amended other Standards and the Conceptual Framework that contain a definition of 'material' or refer to the term ‘material’ to ensure consistency.
NEW AND REVISED STANDARDS IN ISSUE BUT NOT YET EFFECTIVE
At the date of authorisation of these financial statements, the following relevant standards were in issue but effective on annual periods beginning on or after the respective dates as indicated:
IAS 1 Presentation of Financial Statements – Amendments regarding the classification of liabilities (effective 01 January 2023)
IAS 1 Presentation of Financial Statements - Amendments regarding the disclosure of accounting policies (effective 01 January 2023) IAS 8 Accounting Policies, Changes in Accounting Estimates and Errors - Amendments regarding the definition of accounting
estimates (effective 01 January 2023)
IAS 16 Property, Plant and Equipment – Amendments prohibiting a company from deducting from the cost of property, plant and equipment amounts received from selling items produced while the company is preparing the asset for its intended uses (effective 01 January 2022)
IAS 37 Provisions, Contingent Liabilities and Contingent Assets – Amendments regarding the costs to include when assessing whether a contract is onerous (effective 01 January 2022)
IAS 39 Financial Instruments: Recognition and Measurement – Amendments regarding replacement issues in the context of the IBOR reform (effective 01 January 2021)
IFRS 7 Financial Instruments: Disclosures - Amendments regarding replacement issues in the context of the IBOR reform (effective 01 January 2021)
IFRS 9 Financial Instruments - Amendments regarding replacement issues in the context of the IBOR reform (effective 01 January 2021)
IFRS 9 Financial Instruments - Amendments resulting from Annual Improvements to IFRS Standards 2018–2020 (fees in the ‘10 per cent’ test for derecognition of financial liabilities) (effective 01 January 2022)
IFRS 16 Leases - Amendment to provide lessees with an exemption from assessing whether a COVID-19-related rent concession is a lease modification (effective 01 June 2020)
IFRS 16 Leases - Amendments regarding replacement issues in the context of the IBOR reform (effective 01 January 2021)
The directors anticipate that these standards and interpretation will be applied in the Bank’s financial statements at the above effective dates in future periods and have not yet assessed the potential impact of the application of these amendments.
1.2 SIGNIFICANT ACCOUNTING POLICIES
The principal accounting policies adopted in the preparation of these financial statements are set out below. These policies have been consistently applied to all the years presented, unless otherwise stated.
(A) BASIS OF PREPARATION
The financial statements of Bank One Limited comply with the Mauritius Companies Act 2001 and the Banking Act 2004 and have been prepared in accordance with International Financial Reporting Standards (IFRS), Guidelines and Guidance Notes issued by the Bank of Mauritius, in so far as the operations of the Bank are concerned. Where necessary, comparatives figures have been amended to conform with changes in presentation, or in accounting policies in the current year.
The financial statements have been prepared under the historical cost convention, except for the following assets and liabilities that are measured at fair value:
1) Financial assets measured at fair value through other comprehensive income;
2) Certain classes of property and equipment;
3) Defined pensions benefits plan;
4) Derivative assets and liabilities held for risk management purposes (FVTPL).
The preparation of financial statements in conformity with IFRS requires the use of certain critical accounting estimates. It also requires the directors to exercise judgement in the process of applying the Bank’s accounting policies. Changes in assumptions may have a significant impact on the financial statements in the period the assumptions changed. The areas involving a higher degree of judgement or complexity, or areas where assumptions and estimates are significant to the financial statements, are disclosed in Note 1.3.
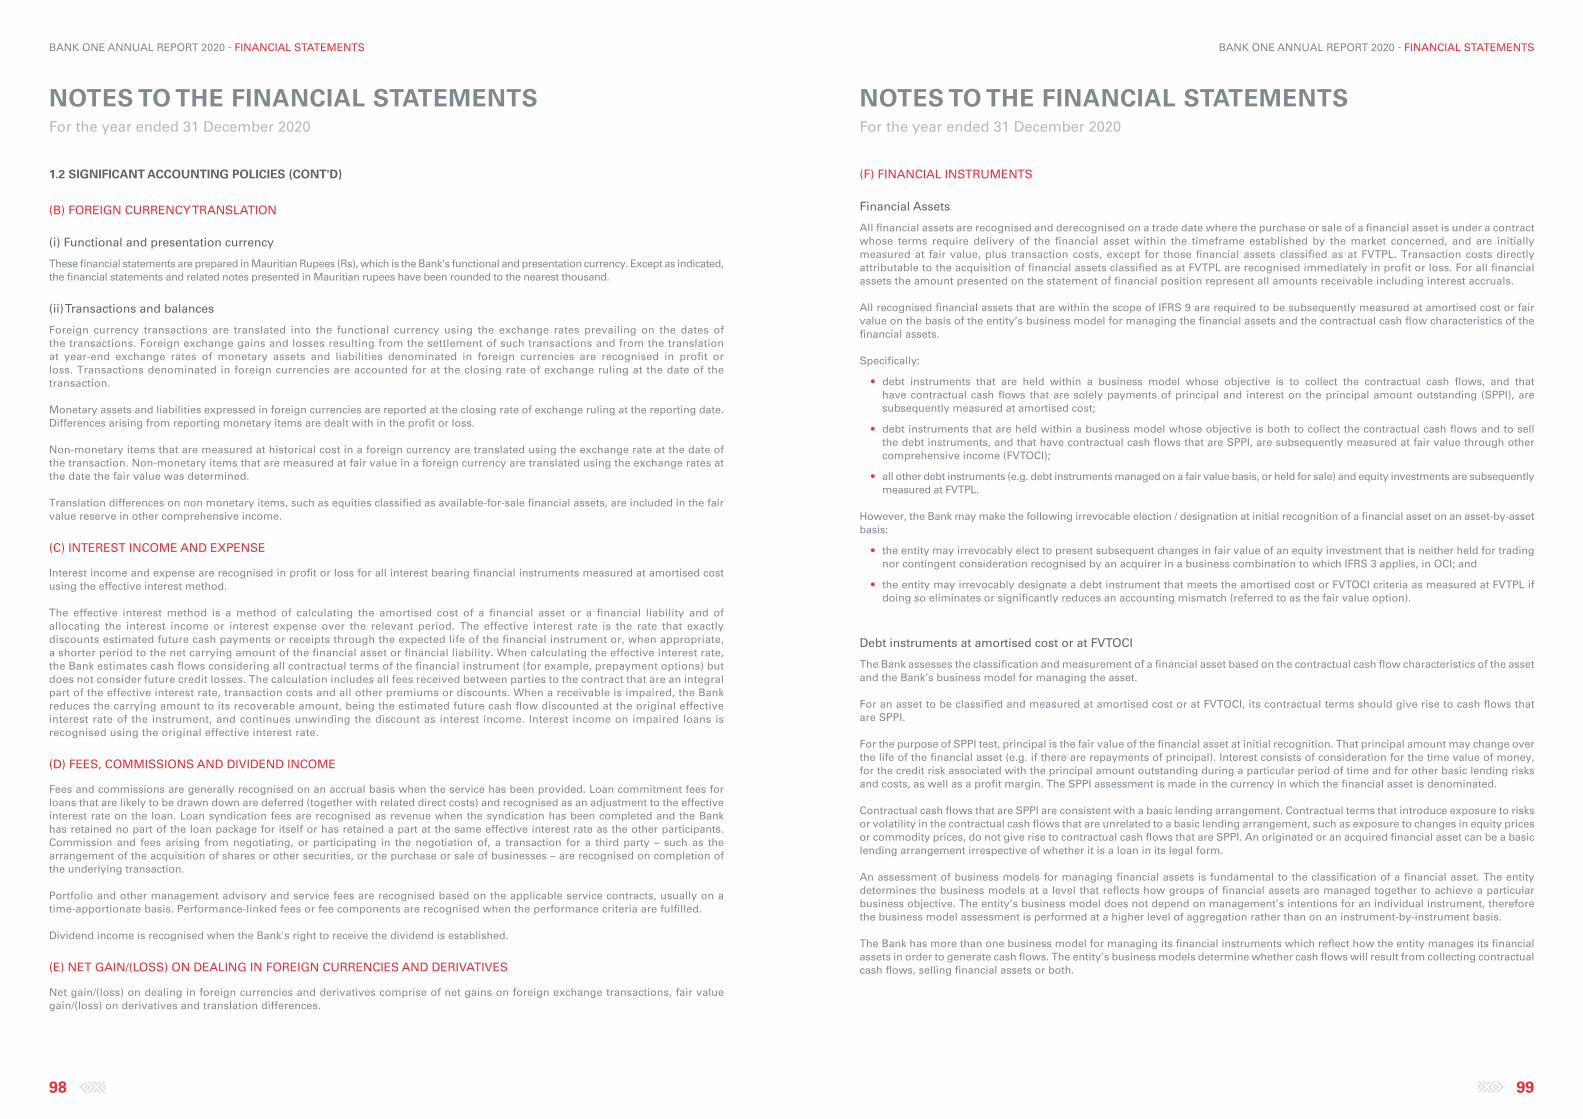
NOTES TO THE FINANCIAL STATEMENTS For the year ended 31 December 2020
NOTES TO THE FINANCIAL STATEMENTS For the year ended 31 December 2020
98 99
BANK ONE ANNUAL REPORT 2020 - FINANCIAL STATEMENTS BANK ONE ANNUAL REPORT 2020 - FINANCIAL STATEMENTS
(F) FINANCIAL INSTRUMENTS
Financial Assets
All financial assets are recognised and derecognised on a trade date where the purchase or sale of a financial asset is under a contract whose terms require delivery of the financial asset within the timeframe established by the market concerned, and are initially measured at fair value, plus transaction costs, except for those financial assets classified as at FVTPL. Transaction costs directly attributable to the acquisition of financial assets classified as at FVTPL are recognised immediately in profit or loss. For all financial assets the amount presented on the statement of financial position represent all amounts receivable including interest accruals.
All recognised financial assets that are within the scope of IFRS 9 are required to be subsequently measured at amortised cost or fair value on the basis of the entity’s business model for managing the financial assets and the contractual cash flow characteristics of the financial assets.
Specifically:
• debt instruments that are held within a business model whose objective is to collect the contractual cash flows, and that have contractual cash flows that are solely payments of principal and interest on the principal amount outstanding (SPPI), are subsequently measured at amortised cost;
• debt instruments that are held within a business model whose objective is both to collect the contractual cash flows and to sell the debt instruments, and that have contractual cash flows that are SPPI, are subsequently measured at fair value through other comprehensive income (FVTOCI);
• all other debt instruments (e.g. debt instruments managed on a fair value basis, or held for sale) and equity investments are subsequently measured at FVTPL.
However, the Bank may make the following irrevocable election / designation at initial recognition of a financial asset on an asset-by-asset basis:
• the entity may irrevocably elect to present subsequent changes in fair value of an equity investment that is neither held for trading nor contingent consideration recognised by an acquirer in a business combination to which IFRS 3 applies, in OCI; and
• the entity may irrevocably designate a debt instrument that meets the amortised cost or FVTOCI criteria as measured at FVTPL if doing so eliminates or significantly reduces an accounting mismatch (referred to as the fair value option).
Debt instruments at amortised cost or at FVTOCI
The Bank assesses the classification and measurement of a financial asset based on the contractual cash flow characteristics of the asset and the Bank’s business model for managing the asset.
For an asset to be classified and measured at amortised cost or at FVTOCI, its contractual terms should give rise to cash flows that are SPPI.
For the purpose of SPPI test, principal is the fair value of the financial asset at initial recognition. That principal amount may change over the life of the financial asset (e.g. if there are repayments of principal). Interest consists of consideration for the time value of money, for the credit risk associated with the principal amount outstanding during a particular period of time and for other basic lending risks and costs, as well as a profit margin. The SPPI assessment is made in the currency in which the financial asset is denominated.
Contractual cash flows that are SPPI are consistent with a basic lending arrangement. Contractual terms that introduce exposure to risks or volatility in the contractual cash flows that are unrelated to a basic lending arrangement, such as exposure to changes in equity prices or commodity prices, do not give rise to contractual cash flows that are SPPI. An originated or an acquired financial asset can be a basic lending arrangement irrespective of whether it is a loan in its legal form.
An assessment of business models for managing financial assets is fundamental to the classification of a financial asset. The entity determines the business models at a level that reflects how groups of financial assets are managed together to achieve a particular business objective. The entity’s business model does not depend on management’s intentions for an individual instrument, therefore the business model assessment is performed at a higher level of aggregation rather than on an instrument-by-instrument basis.
The Bank has more than one business model for managing its financial instruments which reflect how the entity manages its financial assets in order to generate cash flows. The entity’s business models determine whether cash flows will result from collecting contractual cash flows, selling financial assets or both.
1.2 SIGNIFICANT ACCOUNTING POLICIES (CONT'D)
(B) FOREIGN CURRENCY TRANSLATION
(i) Functional and presentation currency
These financial statements are prepared in Mauritian Rupees (Rs), which is the Bank's functional and presentation currency. Except as indicated, the financial statements and related notes presented in Mauritian rupees have been rounded to the nearest thousand.
(ii) Transactions and balances
Foreign currency transactions are translated into the functional currency using the exchange rates prevailing on the dates of the transactions. Foreign exchange gains and losses resulting from the settlement of such transactions and from the translation at year-end exchange rates of monetary assets and liabilities denominated in foreign currencies are recognised in profit or loss. Transactions denominated in foreign currencies are accounted for at the closing rate of exchange ruling at the date of the transaction.
Monetary assets and liabilities expressed in foreign currencies are reported at the closing rate of exchange ruling at the reporting date. Differences arising from reporting monetary items are dealt with in the profit or loss.
Non-monetary items that are measured at historical cost in a foreign currency are translated using the exchange rate at the date of the transaction. Non-monetary items that are measured at fair value in a foreign currency are translated using the exchange rates at the date the fair value was determined.
Translation differences on non monetary items, such as equities classified as available-for-sale financial assets, are included in the fair value reserve in other comprehensive income.
(C) INTEREST INCOME AND EXPENSE
Interest income and expense are recognised in profit or loss for all interest bearing financial instruments measured at amortised cost using the effective interest method.
The effective interest method is a method of calculating the amortised cost of a financial asset or a financial liability and of allocating the interest income or interest expense over the relevant period. The effective interest rate is the rate that exactly discounts estimated future cash payments or receipts through the expected life of the financial instrument or, when appropriate, a shorter period to the net carrying amount of the financial asset or financial liability. When calculating the effective interest rate, the Bank estimates cash flows considering all contractual terms of the financial instrument (for example, prepayment options) but does not consider future credit losses. The calculation includes all fees received between parties to the contract that are an integral part of the effective interest rate, transaction costs and all other premiums or discounts. When a receivable is impaired, the Bank reduces the carrying amount to its recoverable amount, being the estimated future cash flow discounted at the original effective interest rate of the instrument, and continues unwinding the discount as interest income. Interest income on impaired loans is recognised using the original effective interest rate.
(D) FEES, COMMISSIONS AND DIVIDEND INCOME
Fees and commissions are generally recognised on an accrual basis when the service has been provided. Loan commitment fees for loans that are likely to be drawn down are deferred (together with related direct costs) and recognised as an adjustment to the effective interest rate on the loan. Loan syndication fees are recognised as revenue when the syndication has been completed and the Bank has retained no part of the loan package for itself or has retained a part at the same effective interest rate as the other participants. Commission and fees arising from negotiating, or participating in the negotiation of, a transaction for a third party – such as the arrangement of the acquisition of shares or other securities, or the purchase or sale of businesses – are recognised on completion of the underlying transaction.
Portfolio and other management advisory and service fees are recognised based on the applicable service contracts, usually on a time-apportionate basis. Performance-linked fees or fee components are recognised when the performance criteria are fulfilled.
Dividend income is recognised when the Bank's right to receive the dividend is established.
(E) NET GAIN/(LOSS) ON DEALING IN FOREIGN CURRENCIES AND DERIVATIVES
Net gain/(loss) on dealing in foreign currencies and derivatives comprise of net gains on foreign exchange transactions, fair value gain/(loss) on derivatives and translation differences.
NOTES TO THE FINANCIAL STATEMENTS For the year ended 31 December 2020
NOTES TO THE FINANCIAL STATEMENTS For the year ended 31 December 2020
100 101
BANK ONE ANNUAL REPORT 2020 - FINANCIAL STATEMENTS BANK ONE ANNUAL REPORT 2020 - FINANCIAL STATEMENTS
Financial instruments - initial recognition and subsequent measurement
Reclassifications
If the business model under which the entity holds financial assets changes, the financial assets affected are reclassified. The classification and measurement requirements related to the new category apply prospectively from the first day of the first reporting period following the change in business model that results in reclassifying the Bank’s financial assets. During the current financial year and previous accounting period there was no change in the business model under which the Bank holds financial assets and therefore no reclassifications were made. Changes in contractual cash flows are considered under the accounting policy on Modification and derecognition of financial assets described below.
Foreign exchange gains and losses
The carrying amount of financial assets that are denominated in a foreign currency is determined in that foreign currency and translated at the spot rate at the end of each reporting period. For financial assets measured at amortised cost, debt instruments measured at FVTOCI and derivatives, exchange differences are recognised in profit or loss in the ‘Net gain/(loss) on dealing in foreign currencies and derivatives’ line item.
Cash and cash equivalents
Cash and cash equivalents are carried at amortised cost in the statement of financial position.
Financial liabilities
Debt and equity instruments that are issued are classified as either financial liabilities or as equity in accordance with the substance of the contractual arrangement.
A financial liability is a contractual obligation to deliver cash or another financial asset or to exchange financial assets or financial liabilities with another entity under conditions that are potentially unfavourable to the Bank or a contract that will or may be settled in the Bank’s own equity instruments and is a non-derivative contract for which the Bank is or may be obliged to deliver a variable number of its own equity instruments, or a derivative contract over own equity that will or may be settled other than by the exchange of a fixed amount of cash (or another financial asset) for a fixed number of the Bank’s own equity instruments.
Financial liabilities are classified as either financial liabilities ‘at FVTPL’ or ‘other financial liabilities’. For all financial liabilities the amount presented on the statement of financial position represent all amounts payable including interest accruals.
Other financial liabilities, including deposits and borrowings, are initially measured at fair value, net of transaction costs. Other financial liabilities are subsequently measured at amortised cost using the effective interest method.
Acceptances, letters of credit and Financial guarantee contracts
Acceptances and letters of credit
Acceptances comprise undertakings by the Bank to pay bills of exchange drawn on customers. The Bank expects most acceptances to be settled simultaneously with the reimbursement from customers. Acceptances and letters of credit are accounted for as off-balance sheet items and are disclosed as contingent liabilities and commitments.
Financial guarantee contracts
Financial guarantee contracts are contracts that require the issuer to make specified payments to reimburse the holder for a loss it incurs because a specified debtor fails to make payments when due, in accordance with the terms of a debt instrument. Such financial guarantees are given to banks, financial institutions and other bodies on behalf of customers to secure loans, overdrafts and other banking facilities.
Financial guarantees are initially recognised in the financial statements at fair value on the date the guarantee was given. The fair value of a financial guarantee at the time of signature is zero because all guarantees are agreed on arm’s length terms and the value of the premium agreed corresponds to the value of the guarantee obligation. No receivable for the future premiums is recognised. Subsequent to initial recognition, the Bank’s liabilities under such guarantees are measured at the higher of the initial amount, less amortisation calculated to recognise in profit or loss the fee income earned on a straight-line basis over the life of the guarantee and the best estimate of the expenditure required to settle the guarantee. These estimates are determined based on experience of similar transactions and history of past losses, supplemented by the judgement of management. Any increase in the liability relating to guarantees is taken to profit or loss.
1.2 SIGNIFICANT ACCOUNTING POLICIES (CONT'D)
(F) FINANCIAL INSTRUMENTS (CONT'D)
Debt instruments at amortised cost or at FVTOCI (Cont'd)
The Bank considers all relevant information available when making the business model assessment. However this assessment is not performed on the basis of scenarios that the Bank does not reasonably expect to occur, such as so-called ‘worst case’ or ‘stress case’ scenarios. The Bank takes into account all relevant evidence available such as:
• how the performance of the business model and the financial assets held within that business model are evaluated and reported to the entity’s key management personnel;
• the risks that affect the performance of the business model (and the financial assets held within that business model) and, in particular, the way in which those risks are managed; and
• how managers of the business are compensated (e.g. whether the compensation is based on the fair value of the assets managed or on the contractual cash flows collected).
At initial recognition of a financial asset, the Bank determines whether newly recognised financial assets are part of an existing business model or whether they reflect the commencement of a new business model. The Bank reassesses its business models each reporting period to determine whether the business models have changed since the preceding period.
When a debt instrument measured at FVTOCI is derecognised, the cumulative gain/loss previously recognised in OCI is reclassified from equity to profit or loss.
Debt instruments that are subsequently measured at amortised cost or at FVTOCI are subject to impairment.
Financial assets at FVTPL
Financial assets at FVTPL are:
• assets with contractual cash flows that are not SPPI; or/and
• assets that are held in a business model other than held to collect contractual cash flows or held to collect and sell; or
• assets designated at FVTPL using the fair value option.
These assets are measured at fair value, with any gains/losses arising on remeasurement recognised in profit or loss.
Equity instruments designated at FVTOCI
On initial recognition, the Bank may make an irrevocable election (on an instrument by instrument basis) to designate investments in equity instruments as at FVTOCI. Designation at FVTOCI is not permitted if the equity investment is held for trading or if it is contingent consideration recognised by an acquirer in a business combination.
A financial asset is held for trading if:
• it has been acquired principally for the purpose of selling it in the near term; or
• on initial recognition it is part of a portfolio of identified financial instruments that the entity manages together and has evidence of a recent actual pattern of short term profit taking; or
• it is a derivative (except for a derivative that is a financial guarantee contract or a designated and effective hedging instrument).
Investments in equity instruments at FVTOCI are initially measured at fair value plus transaction costs. Subsequently, they are measured at fair value with gains and losses arising from changes in fair value recognised in other comprehensive income and accumulated in the fair value reserve. The cumulative gain or loss is not be reclassified to profit or loss on disposal of the equity investments, instead, it is transferred to retained earnings.
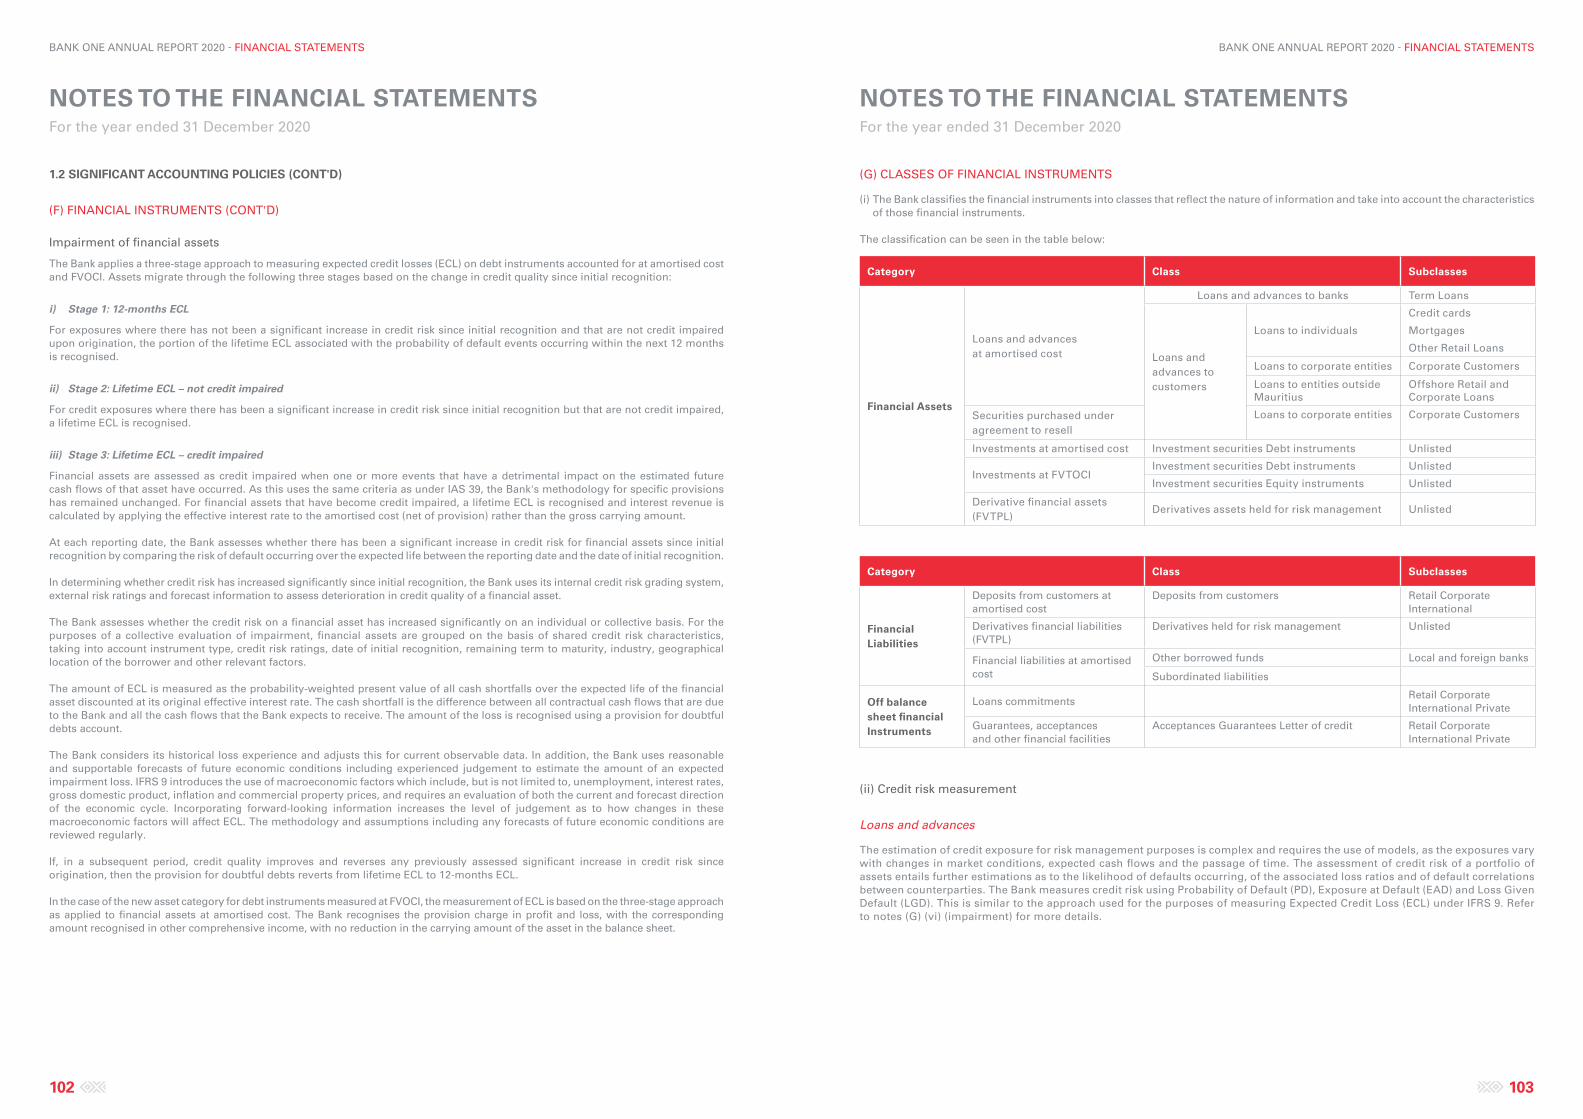
NOTES TO THE FINANCIAL STATEMENTS For the year ended 31 December 2020
NOTES TO THE FINANCIAL STATEMENTS For the year ended 31 December 2020
102 103
BANK ONE ANNUAL REPORT 2020 - FINANCIAL STATEMENTS BANK ONE ANNUAL REPORT 2020 - FINANCIAL STATEMENTS
(G) CLASSES OF FINANCIAL INSTRUMENTS
(i) The Bank classifies the financial instruments into classes that reflect the nature of information and take into account the characteristics of those financial instruments.
The classification can be seen in the table below:
Category Class Subclasses
Financial Assets
Loans and advances at amortised cost
Loans and advances to banks Term Loans
Loans and advances to customers
Loans to individuals
Credit cards
Mortgages
Other Retail Loans
Loans to corporate entities Corporate Customers
Loans to entities outside Mauritius
Offshore Retail and Corporate Loans
Securities purchased under agreement to resell
Loans to corporate entities Corporate Customers
Investments at amortised cost Investment securities Debt instruments Unlisted
Investments at FVTOCIInvestment securities Debt instruments Unlisted
Investment securities Equity instruments Unlisted
Derivative financial assets (FVTPL)
Derivatives assets held for risk management Unlisted
Category Class Subclasses
Financial Liabilities
Deposits from customers at amortised cost
Deposits from customers Retail Corporate International
Derivatives financial liabilities (FVTPL)
Derivatives held for risk management Unlisted
Financial liabilities at amortised cost
Other borrowed funds Local and foreign banks
Subordinated liabilities
Off balance sheet financial Instruments
Loans commitmentsRetail Corporate International Private
Guarantees, acceptances and other financial facilities
Acceptances Guarantees Letter of credit Retail Corporate International Private
(ii) Credit risk measurement
Loans and advances
The estimation of credit exposure for risk management purposes is complex and requires the use of models, as the exposures vary with changes in market conditions, expected cash flows and the passage of time. The assessment of credit risk of a portfolio of assets entails further estimations as to the likelihood of defaults occurring, of the associated loss ratios and of default correlations between counterparties. The Bank measures credit risk using Probability of Default (PD), Exposure at Default (EAD) and Loss Given Default (LGD). This is similar to the approach used for the purposes of measuring Expected Credit Loss (ECL) under IFRS 9. Refer to notes (G) (vi) (impairment) for more details.
1.2 SIGNIFICANT ACCOUNTING POLICIES (CONT'D)
(F) FINANCIAL INSTRUMENTS (CONT'D)
Impairment of financial assets
The Bank applies a three-stage approach to measuring expected credit losses (ECL) on debt instruments accounted for at amortised cost and FVOCI. Assets migrate through the following three stages based on the change in credit quality since initial recognition:
i) Stage 1: 12-months ECL
For exposures where there has not been a significant increase in credit risk since initial recognition and that are not credit impaired upon origination, the portion of the lifetime ECL associated with the probability of default events occurring within the next 12 months is recognised.
ii) Stage 2: Lifetime ECL – not credit impaired
For credit exposures where there has been a significant increase in credit risk since initial recognition but that are not credit impaired, a lifetime ECL is recognised.
iii) Stage 3: Lifetime ECL – credit impaired
Financial assets are assessed as credit impaired when one or more events that have a detrimental impact on the estimated future cash flows of that asset have occurred. As this uses the same criteria as under IAS 39, the Bank's methodology for specific provisions has remained unchanged. For financial assets that have become credit impaired, a lifetime ECL is recognised and interest revenue is calculated by applying the effective interest rate to the amortised cost (net of provision) rather than the gross carrying amount.
At each reporting date, the Bank assesses whether there has been a significant increase in credit risk for financial assets since initial recognition by comparing the risk of default occurring over the expected life between the reporting date and the date of initial recognition.
In determining whether credit risk has increased significantly since initial recognition, the Bank uses its internal credit risk grading system, external risk ratings and forecast information to assess deterioration in credit quality of a financial asset.
The Bank assesses whether the credit risk on a financial asset has increased significantly on an individual or collective basis. For the purposes of a collective evaluation of impairment, financial assets are grouped on the basis of shared credit risk characteristics, taking into account instrument type, credit risk ratings, date of initial recognition, remaining term to maturity, industry, geographical location of the borrower and other relevant factors.
The amount of ECL is measured as the probability-weighted present value of all cash shortfalls over the expected life of the financial asset discounted at its original effective interest rate. The cash shortfall is the difference between all contractual cash flows that are due to the Bank and all the cash flows that the Bank expects to receive. The amount of the loss is recognised using a provision for doubtful debts account.
The Bank considers its historical loss experience and adjusts this for current observable data. In addition, the Bank uses reasonable and supportable forecasts of future economic conditions including experienced judgement to estimate the amount of an expected impairment loss. IFRS 9 introduces the use of macroeconomic factors which include, but is not limited to, unemployment, interest rates, gross domestic product, inflation and commercial property prices, and requires an evaluation of both the current and forecast direction of the economic cycle. Incorporating forward-looking information increases the level of judgement as to how changes in these macroeconomic factors will affect ECL. The methodology and assumptions including any forecasts of future economic conditions are reviewed regularly.
If, in a subsequent period, credit quality improves and reverses any previously assessed significant increase in credit risk since origination, then the provision for doubtful debts reverts from lifetime ECL to 12-months ECL.
In the case of the new asset category for debt instruments measured at FVOCI, the measurement of ECL is based on the three-stage approach as applied to financial assets at amortised cost. The Bank recognises the provision charge in profit and loss, with the corresponding amount recognised in other comprehensive income, with no reduction in the carrying amount of the asset in the balance sheet.
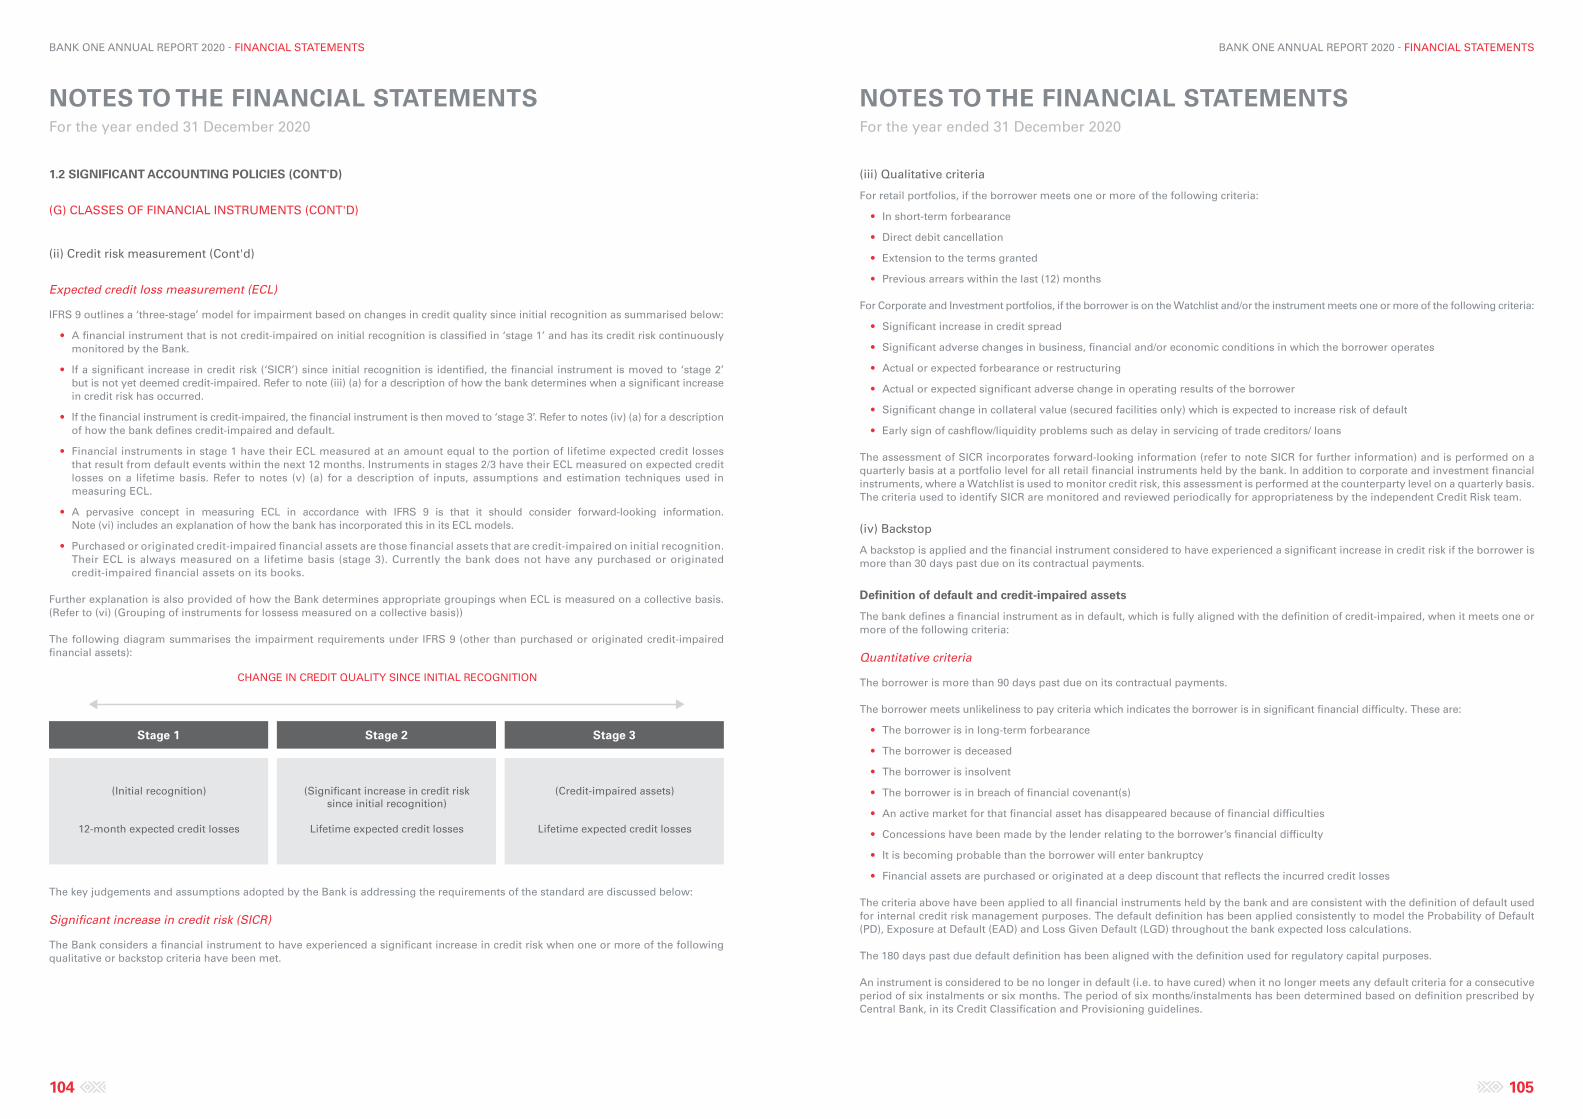
NOTES TO THE FINANCIAL STATEMENTS For the year ended 31 December 2020
NOTES TO THE FINANCIAL STATEMENTS For the year ended 31 December 2020
104 105
BANK ONE ANNUAL REPORT 2020 - FINANCIAL STATEMENTS BANK ONE ANNUAL REPORT 2020 - FINANCIAL STATEMENTS
(iii) Qualitative criteria
For retail portfolios, if the borrower meets one or more of the following criteria:
• In short-term forbearance
• Direct debit cancellation
• Extension to the terms granted
• Previous arrears within the last (12) months
For Corporate and Investment portfolios, if the borrower is on the Watchlist and/or the instrument meets one or more of the following criteria:
• Significant increase in credit spread
• Significant adverse changes in business, financial and/or economic conditions in which the borrower operates
• Actual or expected forbearance or restructuring
• Actual or expected significant adverse change in operating results of the borrower
• Significant change in collateral value (secured facilities only) which is expected to increase risk of default
• Early sign of cashflow/liquidity problems such as delay in servicing of trade creditors/ loans
The assessment of SICR incorporates forward-looking information (refer to note SICR for further information) and is performed on a quarterly basis at a portfolio level for all retail financial instruments held by the bank. In addition to corporate and investment financial instruments, where a Watchlist is used to monitor credit risk, this assessment is performed at the counterparty level on a quarterly basis. The criteria used to identify SICR are monitored and reviewed periodically for appropriateness by the independent Credit Risk team.
(iv) Backstop
A backstop is applied and the financial instrument considered to have experienced a significant increase in credit risk if the borrower is more than 30 days past due on its contractual payments.
Definition of default and credit-impaired assets
The bank defines a financial instrument as in default, which is fully aligned with the definition of credit-impaired, when it meets one or more of the following criteria:
Quantitative criteria
The borrower is more than 90 days past due on its contractual payments.
The borrower meets unlikeliness to pay criteria which indicates the borrower is in significant financial difficulty. These are:
• The borrower is in long-term forbearance
• The borrower is deceased
• The borrower is insolvent
• The borrower is in breach of financial covenant(s)
• An active market for that financial asset has disappeared because of financial difficulties
• Concessions have been made by the lender relating to the borrower’s financial difficulty
• It is becoming probable than the borrower will enter bankruptcy
• Financial assets are purchased or originated at a deep discount that reflects the incurred credit losses
The criteria above have been applied to all financial instruments held by the bank and are consistent with the definition of default used for internal credit risk management purposes. The default definition has been applied consistently to model the Probability of Default (PD), Exposure at Default (EAD) and Loss Given Default (LGD) throughout the bank expected loss calculations.
The 180 days past due default definition has been aligned with the definition used for regulatory capital purposes.
An instrument is considered to be no longer in default (i.e. to have cured) when it no longer meets any default criteria for a consecutive period of six instalments or six months. The period of six months/instalments has been determined based on definition prescribed by Central Bank, in its Credit Classification and Provisioning guidelines.
1.2 SIGNIFICANT ACCOUNTING POLICIES (CONT'D)
(G) CLASSES OF FINANCIAL INSTRUMENTS (CONT'D)
(ii) Credit risk measurement (Cont'd)
Expected credit loss measurement (ECL)
IFRS 9 outlines a ‘three-stage’ model for impairment based on changes in credit quality since initial recognition as summarised below:
• A financial instrument that is not credit-impaired on initial recognition is classified in ‘stage 1’ and has its credit risk continuously monitored by the Bank.
• If a significant increase in credit risk (‘SICR’) since initial recognition is identified, the financial instrument is moved to ‘stage 2’ but is not yet deemed credit-impaired. Refer to note (iii) (a) for a description of how the bank determines when a significant increase in credit risk has occurred.
• If the financial instrument is credit-impaired, the financial instrument is then moved to ‘stage 3’. Refer to notes (iv) (a) for a description of how the bank defines credit-impaired and default.
• Financial instruments in stage 1 have their ECL measured at an amount equal to the portion of lifetime expected credit losses that result from default events within the next 12 months. Instruments in stages 2/3 have their ECL measured on expected credit losses on a lifetime basis. Refer to notes (v) (a) for a description of inputs, assumptions and estimation techniques used in measuring ECL.
• A pervasive concept in measuring ECL in accordance with IFRS 9 is that it should consider forward-looking information. Note (vi) includes an explanation of how the bank has incorporated this in its ECL models.
• Purchased or originated credit-impaired financial assets are those financial assets that are credit-impaired on initial recognition. Their ECL is always measured on a lifetime basis (stage 3). Currently the bank does not have any purchased or originated credit-impaired financial assets on its books.
Further explanation is also provided of how the Bank determines appropriate groupings when ECL is measured on a collective basis. (Refer to (vi) (Grouping of instruments for lossess measured on a collective basis))
The following diagram summarises the impairment requirements under IFRS 9 (other than purchased or originated credit-impaired financial assets):
CHANGE IN CREDIT QUALITY SINCE INITIAL RECOGNITION
Stage 1 Stage 2 Stage 3
(Initial recognition)
12-month expected credit losses
(Signi�cant increase in credit risk since initial recognition)
Lifetime expected credit losses
(Credit-impaired assets)
Lifetime expected credit losses
The key judgements and assumptions adopted by the Bank is addressing the requirements of the standard are discussed below:
Significant increase in credit risk (SICR)
The Bank considers a financial instrument to have experienced a significant increase in credit risk when one or more of the following qualitative or backstop criteria have been met.
NOTES TO THE FINANCIAL STATEMENTS For the year ended 31 December 2020
NOTES TO THE FINANCIAL STATEMENTS For the year ended 31 December 2020
106 107
BANK ONE ANNUAL REPORT 2020 - FINANCIAL STATEMENTS BANK ONE ANNUAL REPORT 2020 - FINANCIAL STATEMENTS
Sensitivity Analysis
The most significant assumptions affecting the ECL allowances are as follows:
(i) Unemployment rate, given its impact on secured and unsecured borrower’s ability to meet their contractual repayments;
(ii) GDP, given the significant impact on individual and companies’ performance and collateral valuations; and
(iii) Inflation rate, given its impact on likelihood of default.
Grouping of instruments for losses measured on a collective basis
For expected credit loss provisions modelled on a collective basis, a grouping of exposures is performed on the basis of shared risk characteristics, such that risk exposures within the bank are homogeneous.
In performing this grouping, there must be sufficient information for the bank to be statistically credible. Where sufficient information is not available internally, the bank has considered benchmarking against internal/external supplementary data to use for modelling purposes. The characteristics and any supplementary data used to determine groupings are outlined below:
Retail- Groupings for collective measurement:
• Product type (e.g. residential loan, overdraft, etc.)
• Repayment type (e.g. interest only)
Corporate- Groupings for collective measurement
• Industry
• Collateral type
The stage 3 exposures are assessed individually. The appropriateness of groupings is monitored and reviewed on a periodic basis by the Credit Risk team.
(H) WRITE-OFF POLICY
The Bank writes off financial assets, in whole or in part, when it has exhausted all practical recovery efforts and has concluded there is no reasonable expectation of recovery. Indicators that there is no reasonable recovery include (i) ceasing enforcement activity; and (ii) where the bank’s recovery method is foreclosing on collateral and the value of the collateral is such that there is no reasonable expectation of recovering in full.
The Bank may write off financial assets that are still subject to enforcement activity. The bank still seeks to recover amounts it is legally owed in full, but which have been partially written off due to no reasonable expectation of full recovery.
(I) MODIFICATION OF FINANCIAL ASSETS
The Bank sometimes modifies the terms of loans provided to customers due to commercial renegotiations, or for distressed loans, with a view to maximising recovery. Such restructuring activities may include extended payment term arrangements, payment holidays and payment forgiveness. Restructuring policies and practices are based on indicators or criteria which, in the judgement of management indicate that payment will most likely continue. These policies are kept under continuous review. Restructuring is most commonly applied to term loans.
The risk of default of such assets after modification is assessed at the reporting date and compared with the risk under the original terms at initial recognition, when the modification is not substantial and so does not result in derecognition of the original assets. The Bank monitors the subsequent performance of modified assets. The Bank may determine that the credit risk has significantly improved after restructuring, so that the assets are moved from stage 3 or Stage 2. This is only the case for assets which have performed in accordance with the new terms for six consecutive months or more.
1.2 SIGNIFICANT ACCOUNTING POLICIES (CONT'D)
(G) CLASSES OF FINANCIAL INSTRUMENTS (CONT'D)
(v) Measuring ECL- Explanation of inputs, assumptions and estimation techniques
The Expected Credit Loss (ECL) is measured on either a 12-month (12M) or Lifetime basis depending on whether a significant increase in credit risk has occurred since initial recognition or whether an asset is considered to be credit-impaired. Expected credit losses are discounted product of the Probability of Default (PD), Exposure at Default (EAD) and Loss Given Default (LGD), defined as follows:
• The PD represents the likelihood of a borrower defaulting on its financial obligation (as per ‘Definition of default and credit-impaired’ above), either over the next 12 months (12M PD), or over the remaining lifetime (Lifetime ED) of the obligation.
• EAD is based on the amounts the bank expects to be owed at the time of default, over the next 12 months (12M PD), or over the remaining lifetime (Lifetime EAD). For example, for a revolving commitment, the bank includes the current drawn balance plus any further amount that is expected to be drawn up to the current contractual limit by the time of default, should it occur.
• Loss Given Default (LGD) represents the bank expectation of the extent of loss on a defaulted exposure. LGD varies by type of counterparty, type and seniority of claim and availability of collateral or other credit support.
LGD is expressed as a percentage loss per unit of exposure at the time of default (EAD). LGD is calculated on a 12-month or lifetime basis, where 12-month LGD is the percentage loss expected to be made if the default occurs in the next 12 months and Lifetime LGD is the percentage of loss expected to be made if the default occurs over the remaining expected lifetime of the loan.
The ECL is determined by projecting the PD, LGD and EAD for each future year and for each individual exposure or collective segment. These three components are multiplied together and adjusted for the likelihood of survival (i.e. the exposure has not prepaid or defaulted in an earlier month). This effectively calculates an ECL for each future year, which is then discounted back to the reporting date and summed. The discount rate used in the ECL calculation is the original effective interest rate or an approximation thereof.
The lifetime PD is developed by applying a maturity profile to the current 12M PD. The maturity profile looks at how defaults develop on a portfolio from the point of initial recognition throughout the lifetime of the loans. The maturity profile is based on historical observed data and is assumed to be the same across all assets within a portfolio, which is supported by historical analysis.
The 12-month and lifetime EADs are determined based on the expected payment profile, which varies by product type.
• For amortising products and bullet repayment loans, this is based on the contractual repayments owned by the borrower over a 12M or lifetime basis. This will be adjusted for any expected overpayments made by a borrower. Early repayment/ refinance assumptions are also incorporated into the calculation.
• For revolving products, the exposure at default is predicted by taking current drawn balance and adding a ‘credit conversion factor’ (CCF) which allows for the expected drawdown of the remaining limit by adding the time of default. These assumptions vary by product type and current limit utilisation band, based on analysis of the bank’s recent default data.
The 12-month and lifetime LGDs are determined based on the factors which impact the recoveries made post default. These vary by product type.
• For secured products, this is primarily based on collateral type and projected collateral values, historical discounts to market/book values due to forced sales, time to repossession and recovery costs observed.
• For unsecured products, LGD’s are typically set at product level due to limited differentiation in recoveries achieved across different borrowers.
Forward-looking economic information is also included in determining the 12-month and lifetime PD, EAD and LGD.
The assumptions under the ECL calculation- such as how the maturity profile of the PDs and how collateral value change, etc.- are monitored and reviewed on a quarterly basis.
There have been no significant changes in estimation techniques or significant assumptions made during the reporting period.
(vi) Forward-looking information incorporated in the ECL models
The assessment of SICR and the calculation of ECL both incorporate forward-looking information. The Bank has performed a historical analysis and identified the key economic variables impacting credit risk and the expected credit losses for each portfolio. These economic variables and their associated impact on the PD, EAD and LGD vary by financial instrument.
The impact of these economic variables on the PD, EAD and LGD has been determined by performing statistical regression analysis to understand the impact changes in these variables have historically on default rates and on the components of LGD and EAD.
NOTES TO THE FINANCIAL STATEMENTS For the year ended 31 December 2020
NOTES TO THE FINANCIAL STATEMENTS For the year ended 31 December 2020
108 109
BANK ONE ANNUAL REPORT 2020 - FINANCIAL STATEMENTS BANK ONE ANNUAL REPORT 2020 - FINANCIAL STATEMENTS
Directly attributable costs that are capitalised as part of the software product include the software development employee costs and an appropriate portion of relevant overheads. Other development expenditures that do not meet these criteria are recognised as an expense as incurred.
Development costs previously recognised as an expense are not recognised as an asset in a subsequent period. Computer software development costs recognised as assets are amortised over their estimated useful lives, which does not exceed five years.
(M) IMPAIRMENT OF NON-FINANCIAL ASSETS
Assets are reviewed for impairment whenever events or changes in circumstances indicate that the carrying amount may not be recoverable. An impairment loss is recognised for the amount by which the asset’s carrying amount exceeds its recoverable amount. The recoverable amount is the higher of an asset’s fair value less costs to sell and value in use. For the purpose of assessing impairment, assets are grouped at the lowest levels for which there is separately identifiable cash flow (cash generating units).
The impairment test also can be performed on a single asset when the fair value less cost to sell or the value in use can be determined reliably. Non-financial assets that suffered impairment are reviewed for possible reversal of the impairment at each reporting date.
(N) STATED CAPITAL
Ordinary shares are classified as equity. Incremental costs directly attributable to the issue of new shares are shown in equity as a deduction, net of tax, from the proceeds.
(O) DIVIDEND POLICY
Dividends are recorded in equity in the period in which they are declared. Any dividends declared after the end of the reporting period and before the financial statements are authorised for issue, are disclosed in the subsequent events note. The statutory accounting results of the Bank are the basis for profit distribution and other appropriations.
(P) PROVISIONS FOR LIABILITIES
Provisions are recognised when the Bank has a present legal or constructive obligation as a result of past events, it is probable that an outflow of resources embodying economic benefits will be required to settle the obligation, and a reliable estimate of the amount of the obligation can be made.
(Q) EMPLOYEE BENEFITS
(i) Defined contribution pension plan
The Bank operates a defined contribution pension plan. The contribution payable to the defined contribution plan is in proportion to the services rendered to the Bank by the employees and is recorded as an expense under 'Personnel expenses'. Unpaid contributions are recorded as a liability.
(ii) Retirement and other benefit obligations
The present value of retirement gratuity as provided under the Workers Rights Act 2019 is recognised in the statement of financial position as a liability.
Re-measurement, comprising actuarial gains and losses, is reflected immediately in the statement of financial position with a charge or credit recognised in other comprehensive income in the period in which they occur. Re-measurement recognised in other comprehensive income is reflected immediately in retained earnings and will not be reclassified to profit or loss. Past service cost is recognised in profit or loss in the period of a plan amendment. Net interest is calculated by applying the discount rate at the beginning of the period to the net defined benefit liability or asset.
Defined benefit costs are categorised as follows:
• Service cost (including current service cost, past service cost, as well as gains and losses on curtailments and settlements)
• Net interest expense or income
• Remeasurement
1.2 SIGNIFICANT ACCOUNTING POLICIES (CONT'D)
(J) OFFSETTING FINANCIAL INSTRUMENTS
Financial assets and liabilities are offset and the net amount reported in the Statement of Financial Position when there is a legally enforceable right to set off the recognised amounts and there is an intention to settle on a net basis, or realise the asset and settle the liability simultaneously.
This is not generally the case with master netting agreements. The Bank has entered into such agreements with few correspondent banks.The related assets and liabilities are therefore presented gross in the statement of financial position.
(K) PROPERTY AND EQUIPMENT
Property and equipment (except land and building) are carried at historical cost less accumulated depreciation and impairment. Historical cost includes expenditure that is directly attributable to the acquisition of the items. Land and buildings are stated at revalued amounts. Subsequent costs are included in the assets carrying amount or recognised as a separate asset as appropriate, only when it is probable that the future economic benefits associated with the item will flow to the Bank and the cost of the item can be measured reliably. The carrying amount of the replaced part is derecognised. All other repairs and maintenance costs are charged to the profit or loss during the financial period in which they are incurred.
Land and work-in-progress are not depreciated. Depreciation is calculated to write down the cost or amount of the valuation of such assets to their residual values on a straight-line basis over their estimated useful lives as follows:
Buildings 50 yearsComputer and other equipment 5 yearsFurniture and fittings 10 yearsMotor vehicles 5 years
The assets’ residual values and useful lives and depreciation methods are reviewed and adjusted prospectively, if appropriate, at the end of each reporting period. Where the carrying amount of an asset is greater than its estimated recoverable amount, it is written down immediately to its recoverable amount.
Gains or losses on disposal of property and equipment are determined by reference to their carrying amount and are recognised as income or expense in profit or loss. On disposal of revalued assets, the corresponding amounts included in the revaluation surplus are transferred to retained earnings.
Revaluation of property
Properties are subject to revaluation with sufficient regularity to ensure that the carrying amount does not differ materially from that which would be determined using fair value at the end of the reporting period. Increases in the carrying amount arising on revaluation are credited to Other Comprehensive Income and increase the revaluation surplus in equity. Decreases that offset previous increases of the same asset are recognised in Other Comprehensive Income and decrease the previously recognised revaluation surplus in equity; all other decreases are charged to profit or loss for the year. The revaluation reserve for premises included in equity is transferred directly to retained earnings when the revaluation surplus is realised on the retirement or disposal of the asset.
(L) INTANGIBLE ASSETS
Computer software
Acquired computer software licences are capitalised on the basis of the costs incurred to acquire and bring to use the specific software. These costs are amortised over their estimated useful lives of five years.
Costs associated with developing or maintaining computer software programmes are recognised as an expense as incurred. Development costs that are directly attributable to the design and testing of identifiable and unique software products controlled by the Bank are recognised as intangible assets when the following criteria are met:
• It is technically feasible to complete the software product so that it will be available for use;
• Management intends to complete the software product and use or sell it;
• There is an ability to use or sell the software product;
• It can be demonstrated how the software product will generate probable future economic benefits;
• Adequate technical, financial and other resources to complete the development and to use or sell the software product are available; and
• The expenditure attributable to the software product during its development can be reliably measured.
NOTES TO THE FINANCIAL STATEMENTS For the year ended 31 December 2020
NOTES TO THE FINANCIAL STATEMENTS For the year ended 31 December 2020
110 111
BANK ONE ANNUAL REPORT 2020 - FINANCIAL STATEMENTS BANK ONE ANNUAL REPORT 2020 - FINANCIAL STATEMENTS
(R) INCOME TAX
Tax expense for the period includes current and deferred tax. Tax is recognised in the statement of profit or loss, except to the extent that it relates to items recognised in other comprehensive income or directly in equity. In such cases, the tax is recognised in other comprehensive income or directly in equity, respectively.
(i) Current tax
Current income tax assets and/or liabilities comprise those obligations to, or claims from, fiscal authorities relating to the current or prior reporting periods, that are recoverable or unpaid at the reporting date. Current tax is payable on taxable profit, which differs from profit or loss in the financial statements. Calculation of current tax is based on tax rates and tax laws that have been enacted or substantively enacted by the end of the reporting period.
(ii) Special Levy
Special levy on banks having leviable income not exceeding Rs 1.2 billion are calculated at the rate of 5.5% of net interest income and other income before deduction of expenses. Special levy is not applicable on income derived from transactions with Global Business Licence holders and Mauritian companies to the extent of their banking transactions carried out through a foreign permanent establishment.
The levy for a bank in operation as at 30 September 2018 shall be capped at 1.5 times of the levy payable for the year of assessment 2017-2018.No levy shall be paid for an accounting period where a bank incurred a loss in the accounting period.
(iii) Corporate Social Responsibility
The Bank also makes a statutory provision for CSR activities at the rate of 2% of chargeable income (Segment A only) as per Income Tax Act 1995 Section 50L.
The required CSR fund for the year is recognised in tax expense in the statement of profit or loss and other comprehensive income.The net amount of CSR fund payable to the taxation authority is included in current tax liabilities in the statement of financial position.
(iv) Deferred income tax
Deferred tax is provided for, using the liability method, on all taxable temporary differences arising between the tax bases of assets and liabilities and their carrying amounts in the financial statements.
The principal temporary differences arise from depreciation of property, plant and equipment, provisions for impairment losses on loans and advances and provisions for employee benefits. Deferred tax assets are recognised to the extent that it is probable that future taxable profit will be available against which deductible temporary differences can be utilised.
Deferred income tax is determined using tax rates (and laws) that have been enacted or substantially enacted by the reporting date and are expected to apply when the related deferred income tax asset is realised or the deferred income tax liability is settled.
Deferred income tax assets and liabilities are offset when there is a legally enforceable right to offset current tax assets against current tax liabilities and when the deferred income tax assets and liabilities relate to income taxes levied by the same tax authorities.
As per the Mauritian Finance (Miscellaneous Provisions) Act 2018, the tax rate will be amended to 5% (2016-17- 15% less the foreign tax credit of 80%) effective as from 1 July 2020. The directors have agreed to amend the deferred income tax asset rate to 7% (Segment A) and 5% (Segment B) as from 2018.
(S) LEASES
Policies applicable prior to 1 January 2019
Leases are classified as finance leases whenever the terms of the lease transfer substantially all the risks and rewards of ownership to the lessee. All other leases are classified as operating leases.
The Bank as a lessor - Finance leases
When assets are leased out under finance leases, the present value of the lease payments is recognised as a receivable, the amount being equal to the net investment in the leases after specific provision for bad and doubtful debts in respect of all identified impaired leases in the light of periodical reviews.
The difference between the gross receivable and the present value of the receivable is recognised as unearned finance income. Lease income is recognised over the term of the lease using the net investment method, which reflects a constant periodic rate of return.
1.2 SIGNIFICANT ACCOUNTING POLICIES (CONT'D)
(Q) EMPLOYEE BENEFITS (CONT'D)
(ii) Retirement and other benefit obligations (Cont'd)
The Bank presents the first two components of defined benefit costs in profit or loss in the line item administrative expenses as part of staff costs. Curtailment gains and losses are accounted for as past service costs.
State plan
Contributions to the National Pension Scheme are expensed to profit or loss in the period in which they fall due.
Defined benefit plans
A defined benefit plan is a pension plan that is not a defined contribution plan. Typically defined benefit plans define an amount of pension benefit that an employee will receive on retirement, usually dependent on one or more factors such as age, years of service and compensation.
The liability recognised in the statement of financial position in respect of defined benefit pension plans is the present value of the defined benefit obligation at the end of the reporting period less the fair value of plan assets. The defined benefit obligation is calculated annually by independent actuaries using the projected unit credit method. The present value of the defined benefit obligation is determined by discounting the estimated future cash flow using interest rates of high quality corporate or government bonds that are denominated in the currency in which the benefits will be paid, and that have terms to maturity approximating the terms of the related pension obligations.
Actuarial gains and losses arising from experience adjustments and changes in actuarial assumptions are charged or credited to equity in other comprehensive income in the period in which they occur.
The Bank determines the net interest expense/(income) on the net defined benefit liability/(asset) for the period by applying the discount rate to the net defined benefit liability/(asset) and the fair value of the planned asset.
Net interest expense/(income) is recognised in statement of profit or loss.
Service costs comprising current service cost and past service cost are recognised immediately in the statement of profit or loss. Current service cost reflects the increase in the defined benefit obligation resulting from employee service in the current year, benefit charges curtailments and settlements.
(iii) Preferential rate loans to employees
The Bank grants loans to its employees at preferential rates. The prepaid employee benefits on these loans is accounted for under ‘other assets’ and is recognised in profit or loss over the shorter of the life of the loan and the expected service life of the employee. The interest rate on the loan reverts to market rate from the day the employee is no longer employed by the Bank. There may be cases where, following special arrangements, the Bank agrees to keep the loan of the leavers at preferential rates. The prepaid employee benefits are the difference between the present value of future cash flows discounted at commercial rate (which are rates that would be given to similar customers in arm’s length transactions), and the carrying amount of the loan. Interest on such loans is then recognised at market rate over the life of the loan.
(iv) Termination Benefits
Termination benefits are payable when employment is terminated by the Bank before the normal retirement date, or when the employee accepts voluntary redundancy in exchange of these benefits. The Bank recognises termination benefits at the earlier of the following dates:
(a) When the Bank can no longer withdraw the offer of those benefits;
(b) When the Bank recognises costs for a restructuring that is within the scope of IAS 37 and involves payment of termination benefits.
In the case of an offer made to encourage voluntary redundancy, the termination benefits are measured based on the number of employees expected to accept the offer. Benefits falling due more than 12 months after the end of the reporting period are discounted to present value.
As at 31 December 2020, no provision has been made for termination benefits.
NOTES TO THE FINANCIAL STATEMENTS For the year ended 31 December 2020
NOTES TO THE FINANCIAL STATEMENTS For the year ended 31 December 2020
112 113
BANK ONE ANNUAL REPORT 2020 - FINANCIAL STATEMENTS BANK ONE ANNUAL REPORT 2020 - FINANCIAL STATEMENTS
The Bank did not make any such adjustments in the current year.
The right-of-use assets comprise the initial measurement of the corresponding lease liability, lease payments made at or before the commencement day, less any lease incentives received and any initial direct costs. They are subsequently measured at cost less accumulated depreciation and impairment losses.
Whenever the Bank incurs an obligation for costs to dismantle and remove a leased asset, restore the site on which it is located or restore the underlying asset to the condition required by the terms and conditions of the lease, a provision is recognised and measured under IAS 37 Provisions, Contingent Liabilities and Contingent Assets. To the extent that the costs relate to a right-of-use asset, the costs are included in the related right-of-use asset, unless those costs are incurred to produce inventories.
Right-of-use assets are depreciated over the shorter period of lease term and useful life of the underlying asset. If a lease transfers ownership of the underlying asset or the cost of the right-of-use asset reflects that the Bank expects to exercise a purchase option, the related right-of-use asset is depreciated over the useful life of the underlying asset. The depreciation starts at the commencement date of the lease.
The right-of-use assets are presented as a separate line item in the statement of financial position.
The Bank applies IAS 36 Impairment of Assets to determine whether a right-of-use asset is impaired and accounts for any identified impairment loss as described in the ‘Property, Plant and Equipment’ policy.
Variable rents that do not depend on an index or rate are not included in the measurement of the lease liability and the right-of-use asset. The related payments are recognised as an expense in the period in which the event or condition that triggers those payments occurs and are included in ‘Other expenses’ in profit or loss.
As a practical expedient, IFRS 16 permits a lessee not to separate non-lease components, and instead account for any lease and associated non-lease components as a single arrangement. The Bank has not used this practical expedient. For contracts that contain a lease component and one or more additional lease or non-lease components, the Bank allocates the consideration in the contract to each lease component on the basis of the relative stand-alone price of the lease component and the aggregate stand-alone price of the non-lease components.
(T) SEGMENT REPORTING
In accordance with the Bank of Mauritius Guidelines, the Bank’s business has been split into Segment A and Segment B.
Segment B is essentially directed to the provision of international financial services that gives rise to foreign source income. Such services may be fund based or non-fund based.
Segment A relates to banking business other than Segment B business.
Expenditure incurred by the Bank but which is not directly attributable to its income derived from Mauritius or its foreign source income is apportioned in a fair and reasonable manner.
Neither these guidelines nor IFRS mandate the application of IFRS 8 Operating Segments to the financial statements of the Bank. The financial statements do not purport to comply with the requirements of IFRS 8.
1.2 SIGNIFICANT ACCOUNTING POLICIES (CONT'D)
(S) LEASES (CONT'D)
Policies applicable prior to 1 January 2019 (Cont'd)
The Bank as a lessee - Operating leases
Where the Bank is a lessee which does not transfer substantially all the risks and rewards incidental to ownership from the lessor to the Bank, the total lease payments are charged to profit or loss for the year (rental expense) on a straight line basis over the period of the lease.
Policies applicable from 1 January 2019
The Bank as a lessee
The Bank assesses whether a contract is or contains a lease, at inception of the contract. The Bank recognises a right-of-use asset and a corresponding lease liability with respect to all lease arrangements in which it is the lessee, except for short-term leases (defined as leases with a lease term of 12 months or less) and leases of low value assets (such as tablets and personal computers, small items of office furniture and telephones). For these leases, the Bank recognises the lease payments as an operating expense on a straight-line basis over the term of the lease unless another systematic basis is more representative of the time pattern in which economic benefits from the leased assets are consumed.
Policies applicable from 1 January 2019
The Bank as a lessee
The lease liability is initially measured at the present value of the lease payments that are not paid at the commencement date, discounted by using the rate implicit in the lease. If this rate cannot be readily determined, the lessee uses its incremental borrowing rate.
Lease payments included in the measurement of the lease liability comprise:
Fixed lease payments (including in-substance fixed payments), less any lease incentives receivable:
• Variable lease payments that depend on an index or rate, initially measured using the index or rate at the commencement date;
• The amount expected to be payable by the lessee under residual value guarantees;
• The exercise price of purchase options, if the lessee is reasonably certain to exercise the options; and
• Payments of penalties for terminating the lease, if the lease term reflects the exercise of an option to terminate the lease.
The lease liability is presented as a separate line in the statement of financial position.
The lease liability is subsequently measured by increasing the carrying amount to reflect interest on the lease liability (using the effective interest method) and by reducing the carrying amount to reflect the lease payments made.
The Bank remeasures the lease liability (and makes a corresponding adjustment to the related right-of-use asset) whenever:
• The lease term has changed or there is a significant event or change in circumstances resulting in a change in the assessment of exercise of a purchase option, in which case the lease liability is remeasured by discounting the revised lease payments using a revised discount rate.
• The lease payments change due to changes in an index or rate or a change in expected payment under a guaranteed residual value, in which cases the lease liability is remeasured by discounting the revised lease payments using an unchanged discount rate (unless the lease payments change is due to a change in a floating interest rate, in which case a revised discount rate is used).
• A lease contract is modified and the lease modification is not accounted for as a separate lease, in which case the lease liability is remeasured based on the lease term of the modified lease by discounting the revised lease payments using a revised discount rate at the effective date of the modification.
NOTES TO THE FINANCIAL STATEMENTS For the year ended 31 December 2020
NOTES TO THE FINANCIAL STATEMENTS For the year ended 31 December 2020
114 115
BANK ONE ANNUAL REPORT 2020 - FINANCIAL STATEMENTS BANK ONE ANNUAL REPORT 2020 - FINANCIAL STATEMENTS
Actual loss experience may differ from changes in estimated forward looking information and economic drivers.
The Bank reviews its individually significant loans and advances at each reporting date to assess whether an impairment loss should be recorded in profit or loss. In particular, judgement by management is required in the estimation of the amount and timing of future cash flows when determining the impairment loss. In estimating these cash flows, the Bank makes judgements about the borrower’s financial situation and the net realisable value of collaterals. These estimates are based on assumptions about a number of factors and actual results may differ, resulting in future changes to the allowance.
(E) FAIR VALUE OF FINANCIAL INSTRUMENTS
Where the fair values of financial assets and financial liabilities recorded on the statements of financial position cannot be derived from active markets, they are determined using a variety of valuation techniques that include the use of mathematical models. The input to these models is taken from observable market data where possible, but where observable data is not available, a degree of judgement is required in establishing fair values. The judgements include considerations of liquidity and model inputs such as correlation and volatility for longer dated derivatives. Further details on the fair valuation of financial instruments are included in Note 2(i) to the financial statements.
(F) IMPAIRMENT OF INTANGIBLE ASSETS
An impairment exists when the carrying value of an asset exceeds its recoverable amount, which is the higher of its fair value less costs to sell and its value in use. The fair value less costs to sell calculation is based on available data from binding sales transactions in an arm’s length transaction of similar assets or observable market prices less incremental costs for disposing of the asset. The value in use calculation is based on a discounted cash flow model. The recoverable amount is most sensitive to the discount rate used for the discounted cash flow model as well as the expected future cash inflows and the growth rate used for extrapolation purposes.
(G) USEFUL LIVES OF PROPERTY AND EQUIPMENT AND INTANGIBLE ASSETS
The Bank reviews the estimated useful lives of property and equipment and intangible assets at the end of each reporting period. The cost of the property and equipment and intangible assets are depreciated and amortised respectively over the estimated useful life of the asset. The estimated life is based on expected usage of the asset and expected physical wear and tear which depends on operational factors.
(H) RETIREMENT BENEFITS
The present value of the retirement benefit obligations depends on a number of factors that are determined on an actuarial basis using a number of assumptions. Any changes in these assumptions will impact the carrying amount of pension obligations.
The assumptions used in determining the net cost (income) for pensions include the discount rate. The actuarial report determines the appropriate discount rate at the end of each year and which is validated by the Bank. This is the interest rate that should be used to determine the present value of estimated future cash outflows expected to be required to settle the pension obligations. In determining the appropriate discount rate, the actuary considers the interest rates of high-quality corporate bonds that are denominated in the currency in which the benefits will be paid and that have terms to maturity approximating the terms of the related pension liability. Other key assumptions for pension obligations are based in part on current market conditions.
(I) LEASES
The application of IFRS 16 requires significant judgements and certain key estimations. Critical judgements include determination of whether it is reasonably certain that an extension or termination option will be exercised. Key sources of estimation uncertainty in the application of IFRS 16 include estimation of the lease terms, determination of the appropriate rate to discount the lease payments and assessment of whether a right-of-use asset is impaired.
(J) PROVISIONS AND OTHER CONTINGENT LIABILITIES
Provision is recognised in the financial statements when the Bank has met the recognition criterion. The directors measure the provision at the best estimate of the amount required to settle the obligation at the reporting date. Actual results may be different from their estimates.
In specific circumstances, significant judgment is required from directors to identify the financial effects to be disclosed attributable to the uncertainties inherent in contingent liabilities.
1.3 CRITICAL ACCOUNTING ESTIMATES AND JUDGEMENTS
The Bank makes estimates and assumptions that affect the reported amounts of assets and liabilities within the next financial year. All estimates and assumptions required in conformity with IFRS are best estimates undertaken in accordance with the applicable standard. Estimates and judgements are evaluated on a continuous basis, and are based on past experience and other factors, including expectations with regard to future events.
Accounting policies and directors’ judgements for certain items are especially critical for the Bank’s results and financial situation due to their materiality.
(A) GOING CONCERN
Directors have made an assessment of the the Bank’s ability to continue as a going concern and are satisfied that the Bank have the resources to continue in business for the foreseeable future. Furthermore, directors are not aware of any material uncertainties that may cast significant doubt upon the Bank’s ability to continue as a going concern. Hence, the financial statements continue to be prepared on the going concern basis.
(B) DETERMINATION OF FUNCTIONAL CURRENCY
The determination of the functional currency of the Bank is critical since the way in which every transaction is recorded and whether exchange differences arise are dependent on the functional currency selected. The directors have considered those factors therein and have determined the functional currency of the Bank as Mauritian Rupees (MUR).
(C) BUSINESS MODEL ASSESSMENT
Classification and measurement of financial assets depends on the results of the SPPI and the business model test (please see financial assets sections of Note 1.1 (g). The Bank determines the business model at a level that reflects how groups of financial assets are managed together to achieve a particular business objective. This assessment includes judgement reflecting all relevant evidence including how the performance of the assets is evaluated and their performance is measured, the risks that affect the performance of the assets and how these are managed and how the managers of the assets are compensated. The Bank monitors financial assets measured at amortised cost or fair value through other comprehensive income that are derecognised prior to their maturity to understand the reason for their disposal and whether the reasons are consistent with the objective of the business for which the asset was held. Monitoring is part of the Bank’s continuous assessment of whether the business model for which the remaining financial assets are held continues to be appropriate and if it is not appropriate whether there has been a change in business model and so a prospective change to the classification of those assets.
(D) CALCULATION OF ECL ALLOWANCE
Significant increase of credit risk: As explained in note 1.1(g), ECL are measured as an allowance equal to 12-month ECL for stage 1 assets, or lifetime ECL for stage 2 or stage 3 assets. An asset moves to stage 2 when its credit risk has increased significantly since initial recognition. IFRS 9 does not define what constitutes a significant increase in credit risk. In assessing whether the credit risk of an asset has significantly increased the Bank takes into account qualitative and quantitative reasonable and supportable forward-looking information.
Establishing groups of assets with similar credit risk characteristics: When ECLs are measured on a collective basis, the financial instruments are grouped on the basis of shared risk characteristics. Refer to note 1.2 (g) for details of the characteristics considered in this judgement. The Bank monitors the appropriateness of the credit risk characteristics on an ongoing basis to assess whether they continue to be similar. This is required in order to ensure that should credit risk characteristics change there is appropriate re-segmentation of the assets. This may result in new portfolios being created or assets moving to an existing portfolio that better reflects the similar credit risk characteristics of that group of assets. Re-segmentation of portfolios and movement between portfolios is more common when there is a significant increase in credit risk (or when that significant increase reverses) and so assets move from 12-month to lifetime ECLs, or vice versa, but it can also occur within portfolios that continue to be measured on the same basis of 12-month or lifetime ECLs but the amount of ECL changes because the credit risk of the portfolios differs.
Models and assumptions used: The Bank uses various models and assumptions in measuring fair value of financial assets as well as in estimating ECL. Judgement is applied in identifying the most appropriate model for each type of asset, as well as for determining the assumptions used in these models, including assumptions that relate to key drivers of credit risk.
• When measuring ECL the Bank uses reasonable and supportable forward-looking information, which is based on assumptions for the future movement of different economic drivers and how these drivers will affect each other.
• Probability of default: PD constitutes a key input in measuring ECL. PD is an estimate of the likelihood of default over a given time horizon, the calculation of which includes historical information, assumptions and expectations of future conditions.
• Loss Given Default: LGD is an estimate of the loss arising on default. It is based on the difference between the contractual cash flows due and those that the lender would expect to receive, taking into account cash flows from collateral and integral credit enhancements. Refer to Note 1.2(g) for more details.
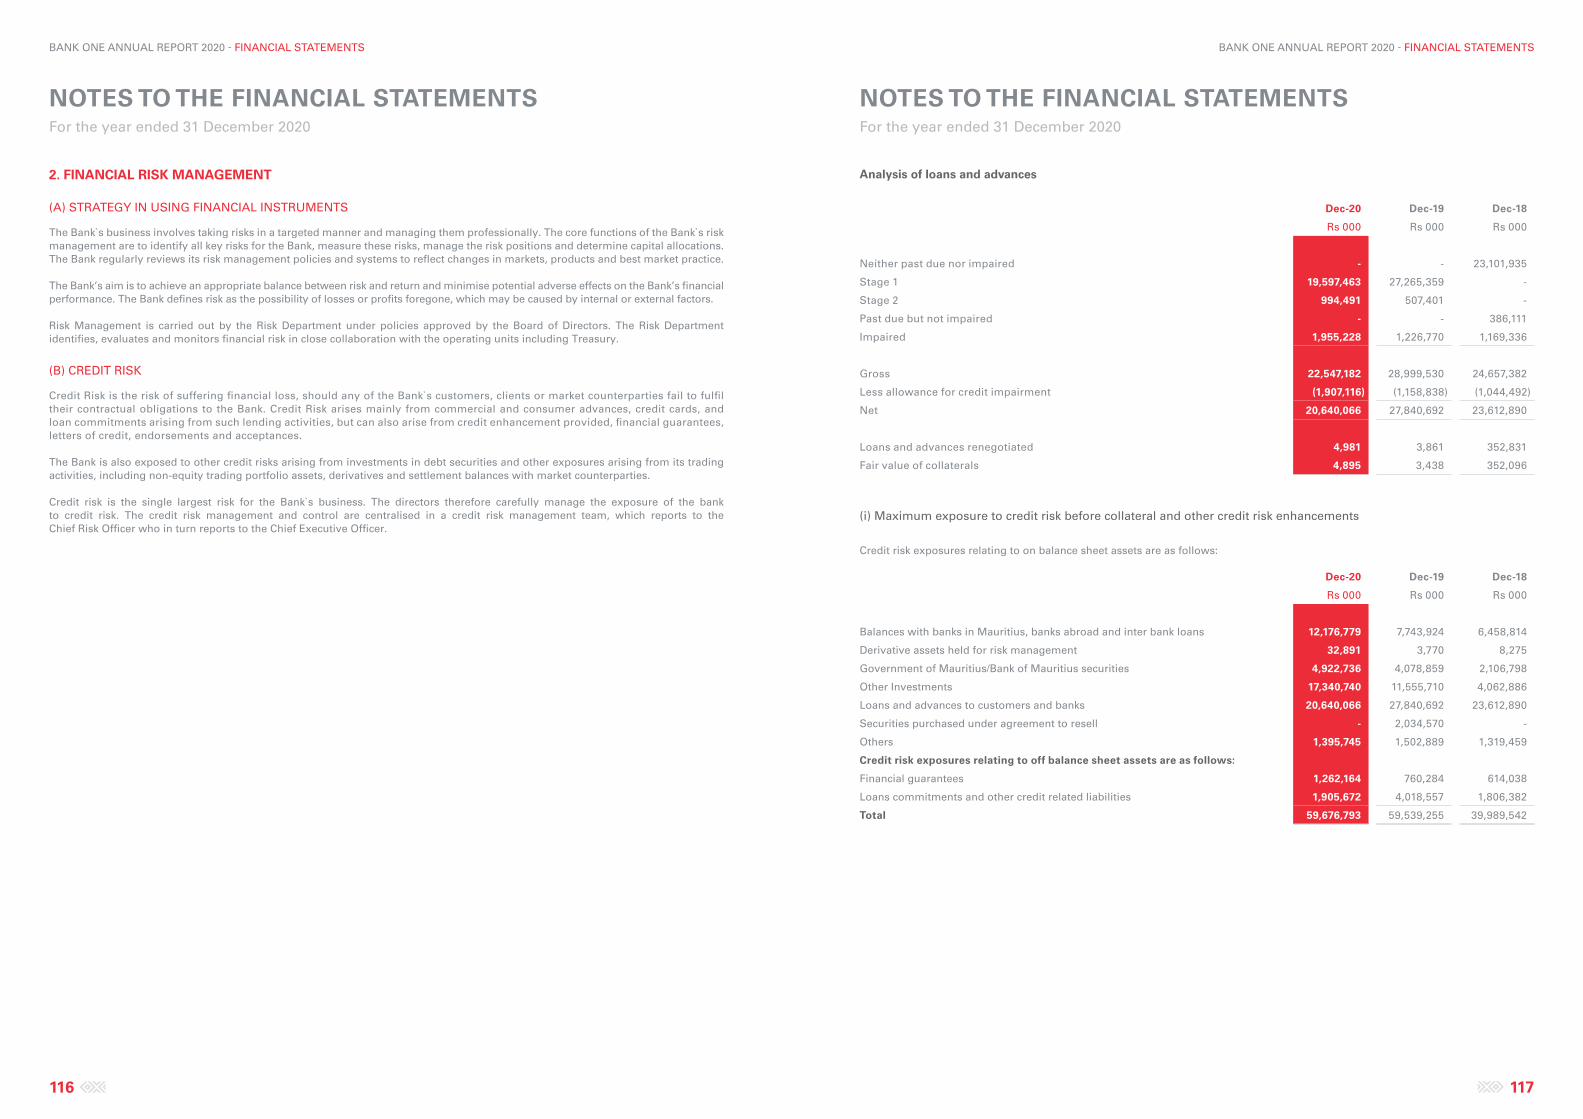
NOTES TO THE FINANCIAL STATEMENTS For the year ended 31 December 2020
NOTES TO THE FINANCIAL STATEMENTS For the year ended 31 December 2020
116 117
BANK ONE ANNUAL REPORT 2020 - FINANCIAL STATEMENTS BANK ONE ANNUAL REPORT 2020 - FINANCIAL STATEMENTS
Analysis of loans and advances
Dec-20 Dec-19 Dec-18
Rs 000 Rs 000 Rs 000
Neither past due nor impaired - - 23,101,935
Stage 1 19,597,463 27,265,359 -
Stage 2 994,491 507,401 -
Past due but not impaired - - 386,111
Impaired 1,955,228 1,226,770 1,169,336
Gross 22,547,182 28,999,530 24,657,382
Less allowance for credit impairment (1,907,116) (1,158,838) (1,044,492)
Net 20,640,066 27,840,692 23,612,890
Loans and advances renegotiated 4,981 3,861 352,831
Fair value of collaterals 4,895 3,438 352,096
(i) Maximum exposure to credit risk before collateral and other credit risk enhancements
Credit risk exposures relating to on balance sheet assets are as follows:
Dec-20 Dec-19 Dec-18
Rs 000 Rs 000 Rs 000
Balances with banks in Mauritius, banks abroad and inter bank loans 12,176,779 7,743,924 6,458,814
Derivative assets held for risk management 32,891 3,770 8,275
Government of Mauritius/Bank of Mauritius securities 4,922,736 4,078,859 2,106,798
Other Investments 17,340,740 11,555,710 4,062,886
Loans and advances to customers and banks 20,640,066 27,840,692 23,612,890
Securities purchased under agreement to resell - 2,034,570 -
Others 1,395,745 1,502,889 1,319,459
Credit risk exposures relating to off balance sheet assets are as follows:
Financial guarantees 1,262,164 760,284 614,038
Loans commitments and other credit related liabilities 1,905,672 4,018,557 1,806,382
Total 59,676,793 59,539,255 39,989,542
2. FINANCIAL RISK MANAGEMENT
(A) STRATEGY IN USING FINANCIAL INSTRUMENTS
The Bank`s business involves taking risks in a targeted manner and managing them professionally. The core functions of the Bank`s risk management are to identify all key risks for the Bank, measure these risks, manage the risk positions and determine capital allocations. The Bank regularly reviews its risk management policies and systems to reflect changes in markets, products and best market practice.
The Bank’s aim is to achieve an appropriate balance between risk and return and minimise potential adverse effects on the Bank’s financial performance. The Bank defines risk as the possibility of losses or profits foregone, which may be caused by internal or external factors.
Risk Management is carried out by the Risk Department under policies approved by the Board of Directors. The Risk Department identifies, evaluates and monitors financial risk in close collaboration with the operating units including Treasury.
(B) CREDIT RISK
Credit Risk is the risk of suffering financial loss, should any of the Bank`s customers, clients or market counterparties fail to fulfil their contractual obligations to the Bank. Credit Risk arises mainly from commercial and consumer advances, credit cards, and loan commitments arising from such lending activities, but can also arise from credit enhancement provided, financial guarantees, letters of credit, endorsements and acceptances.
The Bank is also exposed to other credit risks arising from investments in debt securities and other exposures arising from its trading activities, including non-equity trading portfolio assets, derivatives and settlement balances with market counterparties.
Credit risk is the single largest risk for the Bank`s business. The directors therefore carefully manage the exposure of the bank to credit risk. The credit risk management and control are centralised in a credit risk management team, which reports to the Chief Risk Officer who in turn reports to the Chief Executive Officer.
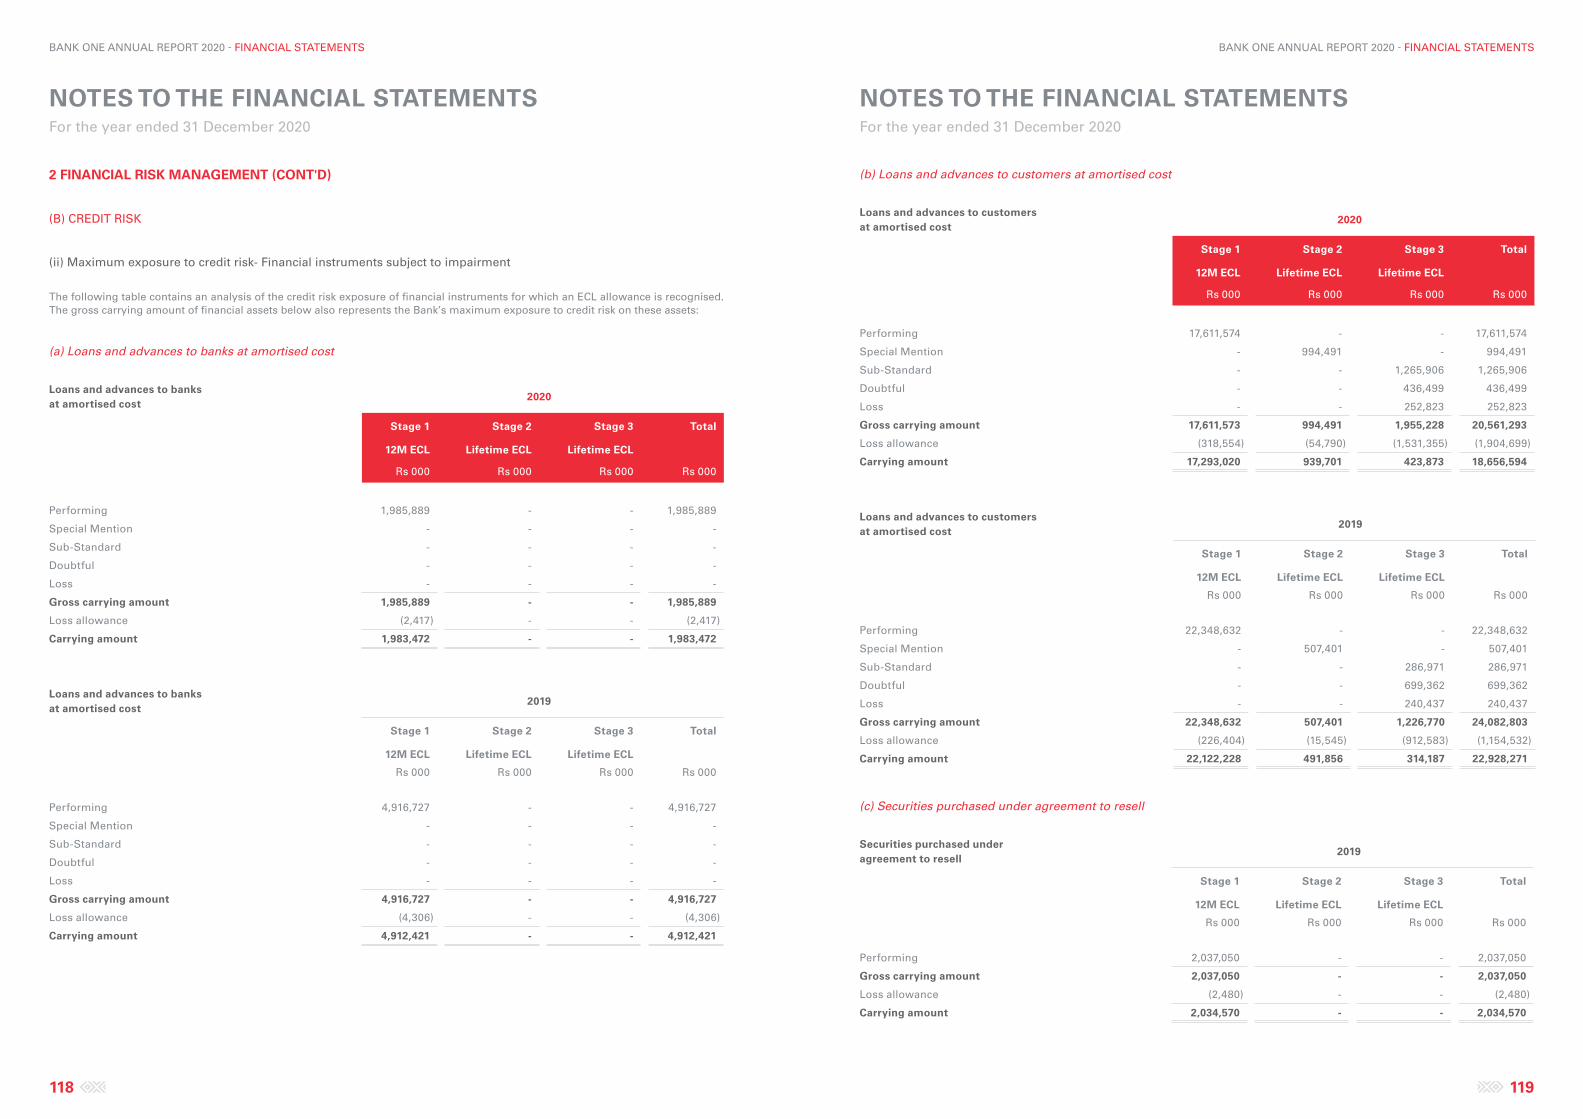
NOTES TO THE FINANCIAL STATEMENTS For the year ended 31 December 2020
NOTES TO THE FINANCIAL STATEMENTS For the year ended 31 December 2020
118 119
BANK ONE ANNUAL REPORT 2020 - FINANCIAL STATEMENTS BANK ONE ANNUAL REPORT 2020 - FINANCIAL STATEMENTS
(b) Loans and advances to customers at amortised cost
Loans and advances to customers at amortised cost
2020
Stage 1 Stage 2 Stage 3 Total
12M ECL Lifetime ECL Lifetime ECL
Rs 000 Rs 000 Rs 000 Rs 000
Performing 17,611,574 - - 17,611,574
Special Mention - 994,491 - 994,491
Sub-Standard - - 1,265,906 1,265,906
Doubtful - - 436,499 436,499
Loss - - 252,823 252,823
Gross carrying amount 17,611,573 994,491 1,955,228 20,561,293
Loss allowance (318,554) (54,790) (1,531,355) (1,904,699)
Carrying amount 17,293,020 939,701 423,873 18,656,594
Loans and advances to customers at amortised cost
2019
Stage 1 Stage 2 Stage 3 Total
12M ECL Lifetime ECL Lifetime ECL
Rs 000 Rs 000 Rs 000 Rs 000
Performing 22,348,632 - - 22,348,632
Special Mention - 507,401 - 507,401
Sub-Standard - - 286,971 286,971
Doubtful - - 699,362 699,362
Loss - - 240,437 240,437
Gross carrying amount 22,348,632 507,401 1,226,770 24,082,803
Loss allowance (226,404) (15,545) (912,583) (1,154,532)
Carrying amount 22,122,228 491,856 314,187 22,928,271
(c) Securities purchased under agreement to resell
Securities purchased under agreement to resell
2019
Stage 1 Stage 2 Stage 3 Total
12M ECL Lifetime ECL Lifetime ECL
Rs 000 Rs 000 Rs 000 Rs 000
Performing 2,037,050 - - 2,037,050
Gross carrying amount 2,037,050 - - 2,037,050
Loss allowance (2,480) - - (2,480)
Carrying amount 2,034,570 - - 2,034,570
2 FINANCIAL RISK MANAGEMENT (CONT'D)
(B) CREDIT RISK
(ii) Maximum exposure to credit risk- Financial instruments subject to impairment
The following table contains an analysis of the credit risk exposure of financial instruments for which an ECL allowance is recognised. The gross carrying amount of financial assets below also represents the Bank’s maximum exposure to credit risk on these assets:
(a) Loans and advances to banks at amortised cost
Loans and advances to banks at amortised cost
2020
Stage 1 Stage 2 Stage 3 Total
12M ECL Lifetime ECL Lifetime ECL
Rs 000 Rs 000 Rs 000 Rs 000
Performing 1,985,889 - - 1,985,889
Special Mention - - - -
Sub-Standard - - - -
Doubtful - - - -
Loss - - - -
Gross carrying amount 1,985,889 - - 1,985,889
Loss allowance (2,417) - - (2,417)
Carrying amount 1,983,472 - - 1,983,472
Loans and advances to banks at amortised cost
2019
Stage 1 Stage 2 Stage 3 Total
12M ECL Lifetime ECL Lifetime ECL
Rs 000 Rs 000 Rs 000 Rs 000
Performing 4,916,727 - - 4,916,727
Special Mention - - - -
Sub-Standard - - - -
Doubtful - - - -
Loss - - - -
Gross carrying amount 4,916,727 - - 4,916,727
Loss allowance (4,306) - - (4,306)
Carrying amount 4,912,421 - - 4,912,421
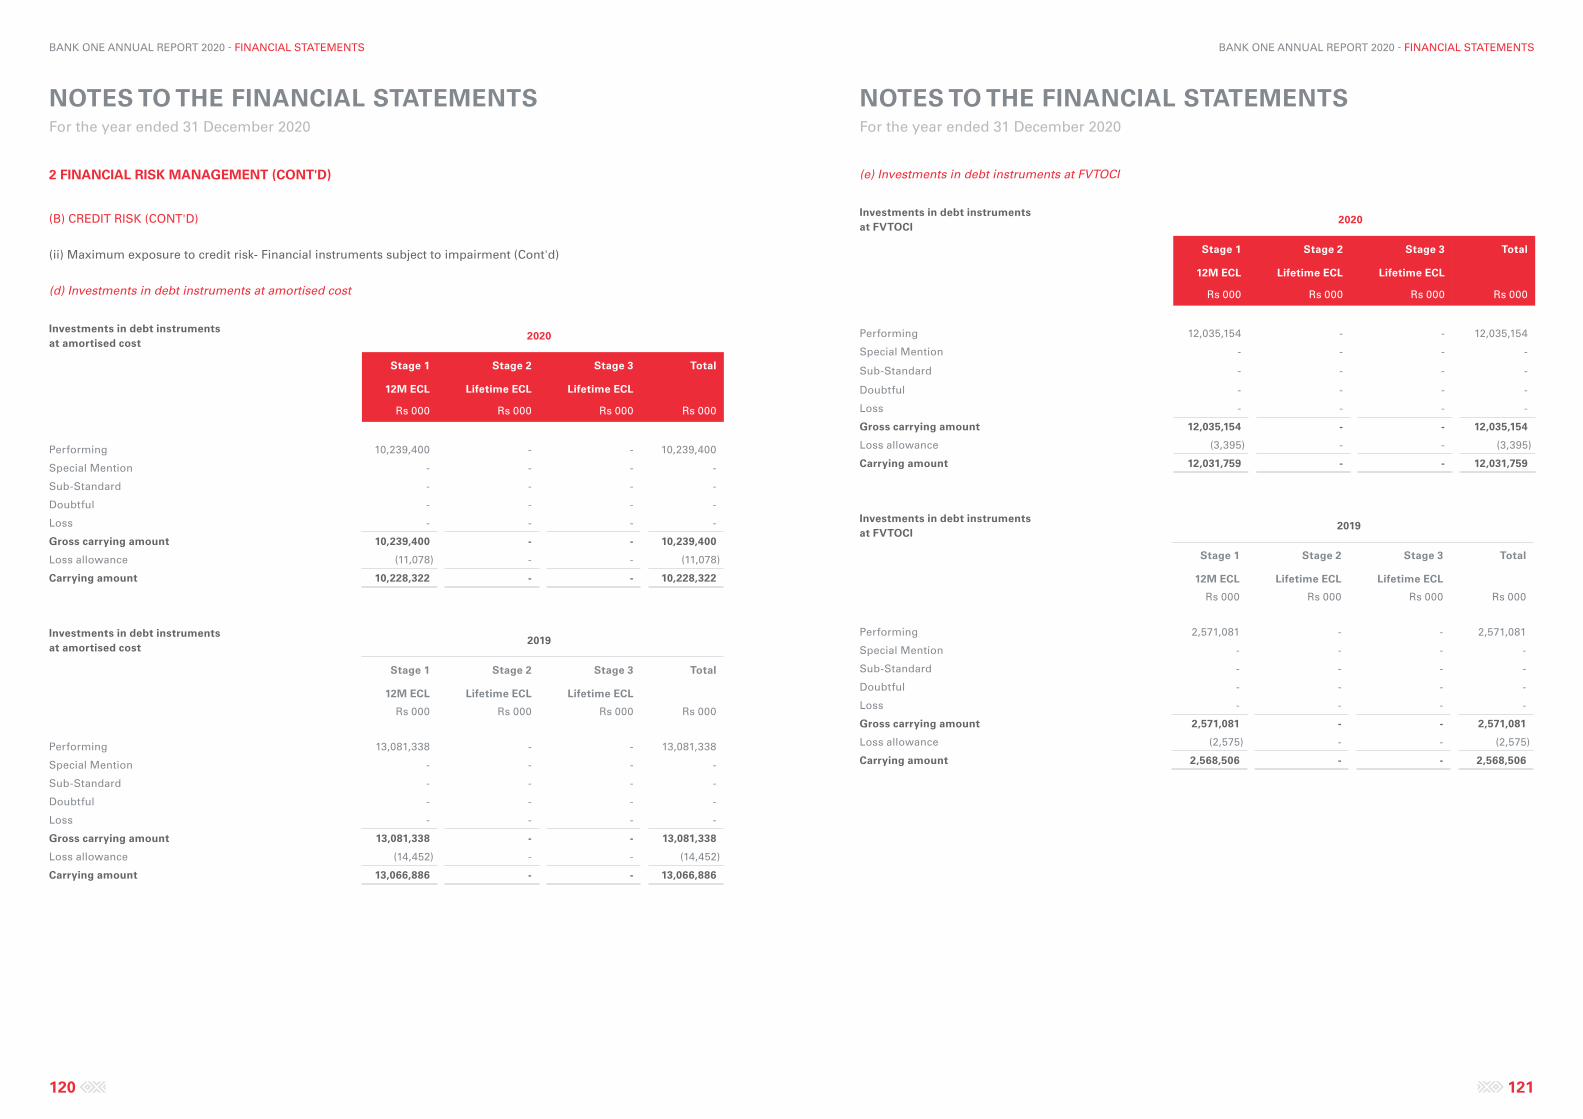
NOTES TO THE FINANCIAL STATEMENTS For the year ended 31 December 2020
NOTES TO THE FINANCIAL STATEMENTS For the year ended 31 December 2020
120 121
BANK ONE ANNUAL REPORT 2020 - FINANCIAL STATEMENTS BANK ONE ANNUAL REPORT 2020 - FINANCIAL STATEMENTS
(e) Investments in debt instruments at FVTOCI
Investments in debt instruments at FVTOCI
2020
Stage 1 Stage 2 Stage 3 Total
12M ECL Lifetime ECL Lifetime ECL
Rs 000 Rs 000 Rs 000 Rs 000
Performing 12,035,154 - - 12,035,154
Special Mention - - - -
Sub-Standard - - - -
Doubtful - - - -
Loss - - - -
Gross carrying amount 12,035,154 - - 12,035,154
Loss allowance (3,395) - - (3,395)
Carrying amount 12,031,759 - - 12,031,759
Investments in debt instruments at FVTOCI
2019
Stage 1 Stage 2 Stage 3 Total
12M ECL Lifetime ECL Lifetime ECL
Rs 000 Rs 000 Rs 000 Rs 000
Performing 2,571,081 - - 2,571,081
Special Mention - - - -
Sub-Standard - - - -
Doubtful - - - -
Loss - - - -
Gross carrying amount 2,571,081 - - 2,571,081
Loss allowance (2,575) - - (2,575)
Carrying amount 2,568,506 - - 2,568,506
2 FINANCIAL RISK MANAGEMENT (CONT'D)
(B) CREDIT RISK (CONT'D)
(ii) Maximum exposure to credit risk- Financial instruments subject to impairment (Cont'd)
(d) Investments in debt instruments at amortised cost
Investments in debt instruments at amortised cost
2020
Stage 1 Stage 2 Stage 3 Total
12M ECL Lifetime ECL Lifetime ECL
Rs 000 Rs 000 Rs 000 Rs 000
Performing 10,239,400 - - 10,239,400
Special Mention - - - -
Sub-Standard - - - -
Doubtful - - - -
Loss - - - -
Gross carrying amount 10,239,400 - - 10,239,400
Loss allowance (11,078) - - (11,078)
Carrying amount 10,228,322 - - 10,228,322
Investments in debt instruments at amortised cost
2019
Stage 1 Stage 2 Stage 3 Total
12M ECL Lifetime ECL Lifetime ECL
Rs 000 Rs 000 Rs 000 Rs 000
Performing 13,081,338 - - 13,081,338
Special Mention - - - -
Sub-Standard - - - -
Doubtful - - - -
Loss - - - -
Gross carrying amount 13,081,338 - - 13,081,338
Loss allowance (14,452) - - (14,452)
Carrying amount 13,066,886 - - 13,066,886
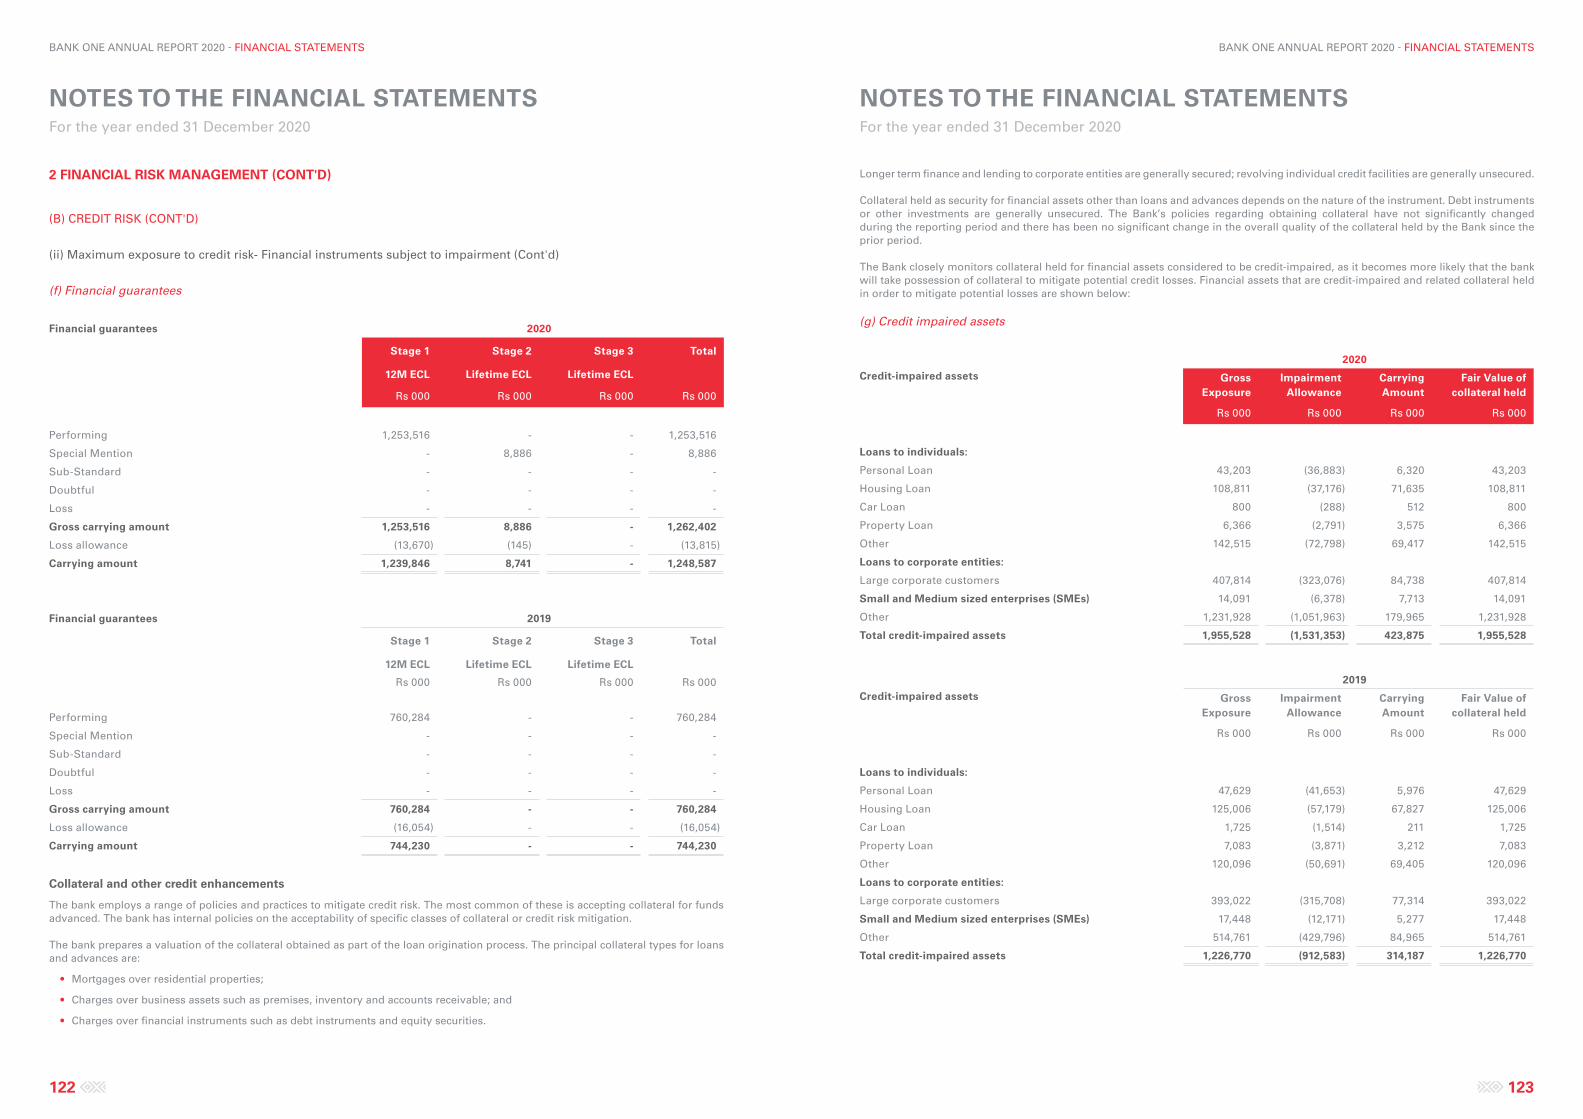
NOTES TO THE FINANCIAL STATEMENTS For the year ended 31 December 2020
NOTES TO THE FINANCIAL STATEMENTS For the year ended 31 December 2020
122 123
BANK ONE ANNUAL REPORT 2020 - FINANCIAL STATEMENTS BANK ONE ANNUAL REPORT 2020 - FINANCIAL STATEMENTS
Longer term finance and lending to corporate entities are generally secured; revolving individual credit facilities are generally unsecured.
Collateral held as security for financial assets other than loans and advances depends on the nature of the instrument. Debt instruments or other investments are generally unsecured. The Bank’s policies regarding obtaining collateral have not significantly changed during the reporting period and there has been no significant change in the overall quality of the collateral held by the Bank since the prior period.
The Bank closely monitors collateral held for financial assets considered to be credit-impaired, as it becomes more likely that the bank will take possession of collateral to mitigate potential credit losses. Financial assets that are credit-impaired and related collateral held in order to mitigate potential losses are shown below:
(g) Credit impaired assets
Credit-impaired assets
2020
Gross Exposure
Impairment Allowance
Carrying Amount
Fair Value of collateral held
Rs 000 Rs 000 Rs 000 Rs 000
Loans to individuals:
Personal Loan 43,203 (36,883) 6,320 43,203
Housing Loan 108,811 (37,176) 71,635 108,811
Car Loan 800 (288) 512 800
Property Loan 6,366 (2,791) 3,575 6,366
Other 142,515 (72,798) 69,417 142,515
Loans to corporate entities:
Large corporate customers 407,814 (323,076) 84,738 407,814
Small and Medium sized enterprises (SMEs) 14,091 (6,378) 7,713 14,091
Other 1,231,928 (1,051,963) 179,965 1,231,928
Total credit-impaired assets 1,955,528 (1,531,353) 423,875 1,955,528
Credit-impaired assets
2019
Gross Exposure
Impairment Allowance
Carrying Amount
Fair Value of collateral held
Rs 000 Rs 000 Rs 000 Rs 000
Loans to individuals:
Personal Loan 47,629 (41,653) 5,976 47,629
Housing Loan 125,006 (57,179) 67,827 125,006
Car Loan 1,725 (1,514) 211 1,725
Property Loan 7,083 (3,871) 3,212 7,083
Other 120,096 (50,691) 69,405 120,096
Loans to corporate entities:
Large corporate customers 393,022 (315,708) 77,314 393,022
Small and Medium sized enterprises (SMEs) 17,448 (12,171) 5,277 17,448
Other 514,761 (429,796) 84,965 514,761
Total credit-impaired assets 1,226,770 (912,583) 314,187 1,226,770
2 FINANCIAL RISK MANAGEMENT (CONT'D)
(B) CREDIT RISK (CONT'D)
(ii) Maximum exposure to credit risk- Financial instruments subject to impairment (Cont'd)
(f) Financial guarantees
Financial guarantees 2020
Stage 1 Stage 2 Stage 3 Total
12M ECL Lifetime ECL Lifetime ECL
Rs 000 Rs 000 Rs 000 Rs 000
Performing 1,253,516 - - 1,253,516
Special Mention - 8,886 - 8,886
Sub-Standard - - - -
Doubtful - - - -
Loss - - - -
Gross carrying amount 1,253,516 8,886 - 1,262,402
Loss allowance (13,670) (145) - (13,815)
Carrying amount 1,239,846 8,741 - 1,248,587
Financial guarantees 2019
Stage 1 Stage 2 Stage 3 Total
12M ECL Lifetime ECL Lifetime ECL
Rs 000 Rs 000 Rs 000 Rs 000
Performing 760,284 - - 760,284
Special Mention - - - -
Sub-Standard - - - -
Doubtful - - - -
Loss - - - -
Gross carrying amount 760,284 - - 760,284
Loss allowance (16,054) - - (16,054)
Carrying amount 744,230 - - 744,230
Collateral and other credit enhancements
The bank employs a range of policies and practices to mitigate credit risk. The most common of these is accepting collateral for funds advanced. The bank has internal policies on the acceptability of specific classes of collateral or credit risk mitigation.
The bank prepares a valuation of the collateral obtained as part of the loan origination process. The principal collateral types for loans and advances are:
• Mortgages over residential properties;
• Charges over business assets such as premises, inventory and accounts receivable; and
• Charges over financial instruments such as debt instruments and equity securities.
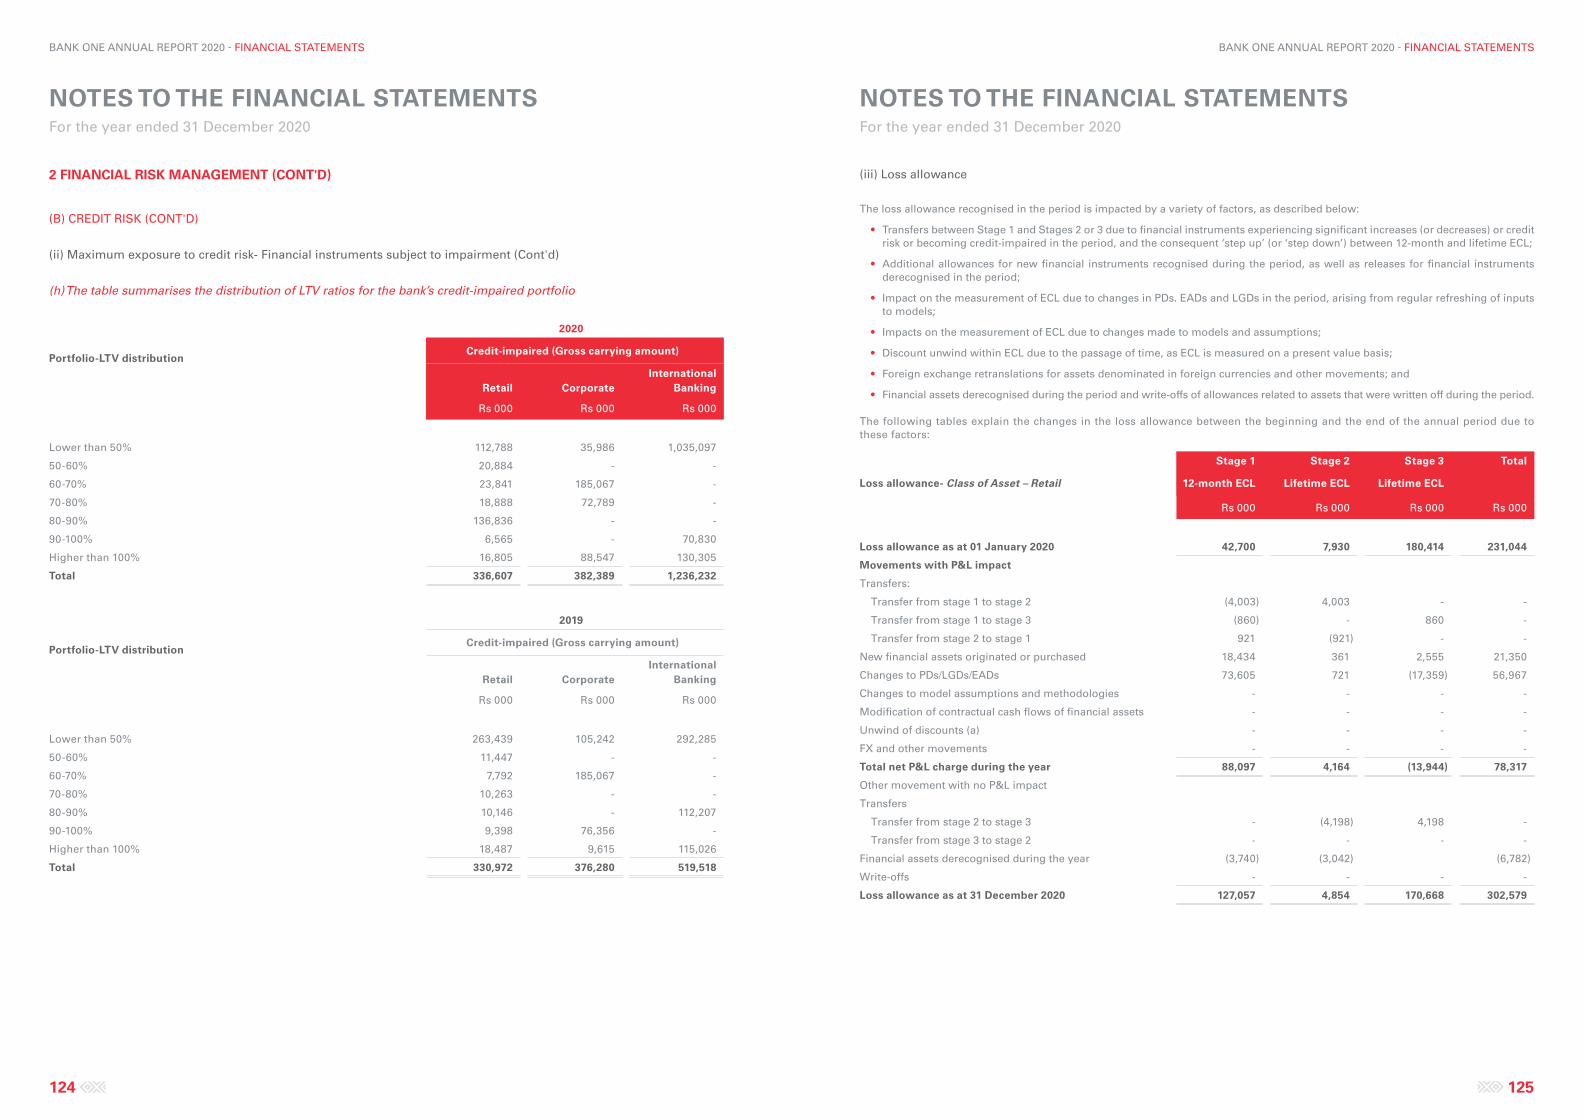
NOTES TO THE FINANCIAL STATEMENTS For the year ended 31 December 2020
NOTES TO THE FINANCIAL STATEMENTS For the year ended 31 December 2020
124 125
BANK ONE ANNUAL REPORT 2020 - FINANCIAL STATEMENTS BANK ONE ANNUAL REPORT 2020 - FINANCIAL STATEMENTS
(iii) Loss allowance
The loss allowance recognised in the period is impacted by a variety of factors, as described below:
• Transfers between Stage 1 and Stages 2 or 3 due to financial instruments experiencing significant increases (or decreases) or credit risk or becoming credit-impaired in the period, and the consequent ‘step up’ (or ‘step down’) between 12-month and lifetime ECL;
• Additional allowances for new financial instruments recognised during the period, as well as releases for financial instruments derecognised in the period;
• Impact on the measurement of ECL due to changes in PDs. EADs and LGDs in the period, arising from regular refreshing of inputs to models;
• Impacts on the measurement of ECL due to changes made to models and assumptions;
• Discount unwind within ECL due to the passage of time, as ECL is measured on a present value basis;
• Foreign exchange retranslations for assets denominated in foreign currencies and other movements; and
• Financial assets derecognised during the period and write-offs of allowances related to assets that were written off during the period.
The following tables explain the changes in the loss allowance between the beginning and the end of the annual period due to these factors:
Stage 1 Stage 2 Stage 3 Total
Loss allowance- Class of Asset – Retail 12-month ECL Lifetime ECL Lifetime ECL
Rs 000 Rs 000 Rs 000 Rs 000
Loss allowance as at 01 January 2020 42,700 7,930 180,414 231,044
Movements with P&L impact
Transfers:
Transfer from stage 1 to stage 2 (4,003) 4,003 - -
Transfer from stage 1 to stage 3 (860) - 860 -
Transfer from stage 2 to stage 1 921 (921) - -
New financial assets originated or purchased 18,434 361 2,555 21,350
Changes to PDs/LGDs/EADs 73,605 721 (17,359) 56,967
Changes to model assumptions and methodologies - - - -
Modification of contractual cash flows of financial assets - - - -
Unwind of discounts (a) - - - -
FX and other movements - - - -
Total net P&L charge during the year 88,097 4,164 (13,944) 78,317
Other movement with no P&L impact
Transfers
Transfer from stage 2 to stage 3 - (4,198) 4,198 -
Transfer from stage 3 to stage 2 - - - -
Financial assets derecognised during the year (3,740) (3,042) (6,782)
Write-offs - - - -
Loss allowance as at 31 December 2020 127,057 4,854 170,668 302,579
2 FINANCIAL RISK MANAGEMENT (CONT'D)
(B) CREDIT RISK (CONT'D)
(ii) Maximum exposure to credit risk- Financial instruments subject to impairment (Cont'd)
(h) The table summarises the distribution of LTV ratios for the bank’s credit-impaired portfolio
Portfolio-LTV distribution
2020
Credit-impaired (Gross carrying amount)
Retail Corporate International
Banking
Rs 000 Rs 000 Rs 000
Lower than 50% 112,788 35,986 1,035,097
50-60% 20,884 - -
60-70% 23,841 185,067 -
70-80% 18,888 72,789 -
80-90% 136,836 - -
90-100% 6,565 - 70,830
Higher than 100% 16,805 88,547 130,305
Total 336,607 382,389 1,236,232
Portfolio-LTV distribution
2019
Credit-impaired (Gross carrying amount)
Retail Corporate International
Banking
Rs 000 Rs 000 Rs 000
Lower than 50% 263,439 105,242 292,285
50-60% 11,447 - -
60-70% 7,792 185,067 -
70-80% 10,263 - -
80-90% 10,146 - 112,207
90-100% 9,398 76,356 -
Higher than 100% 18,487 9,615 115,026
Total 330,972 376,280 519,518
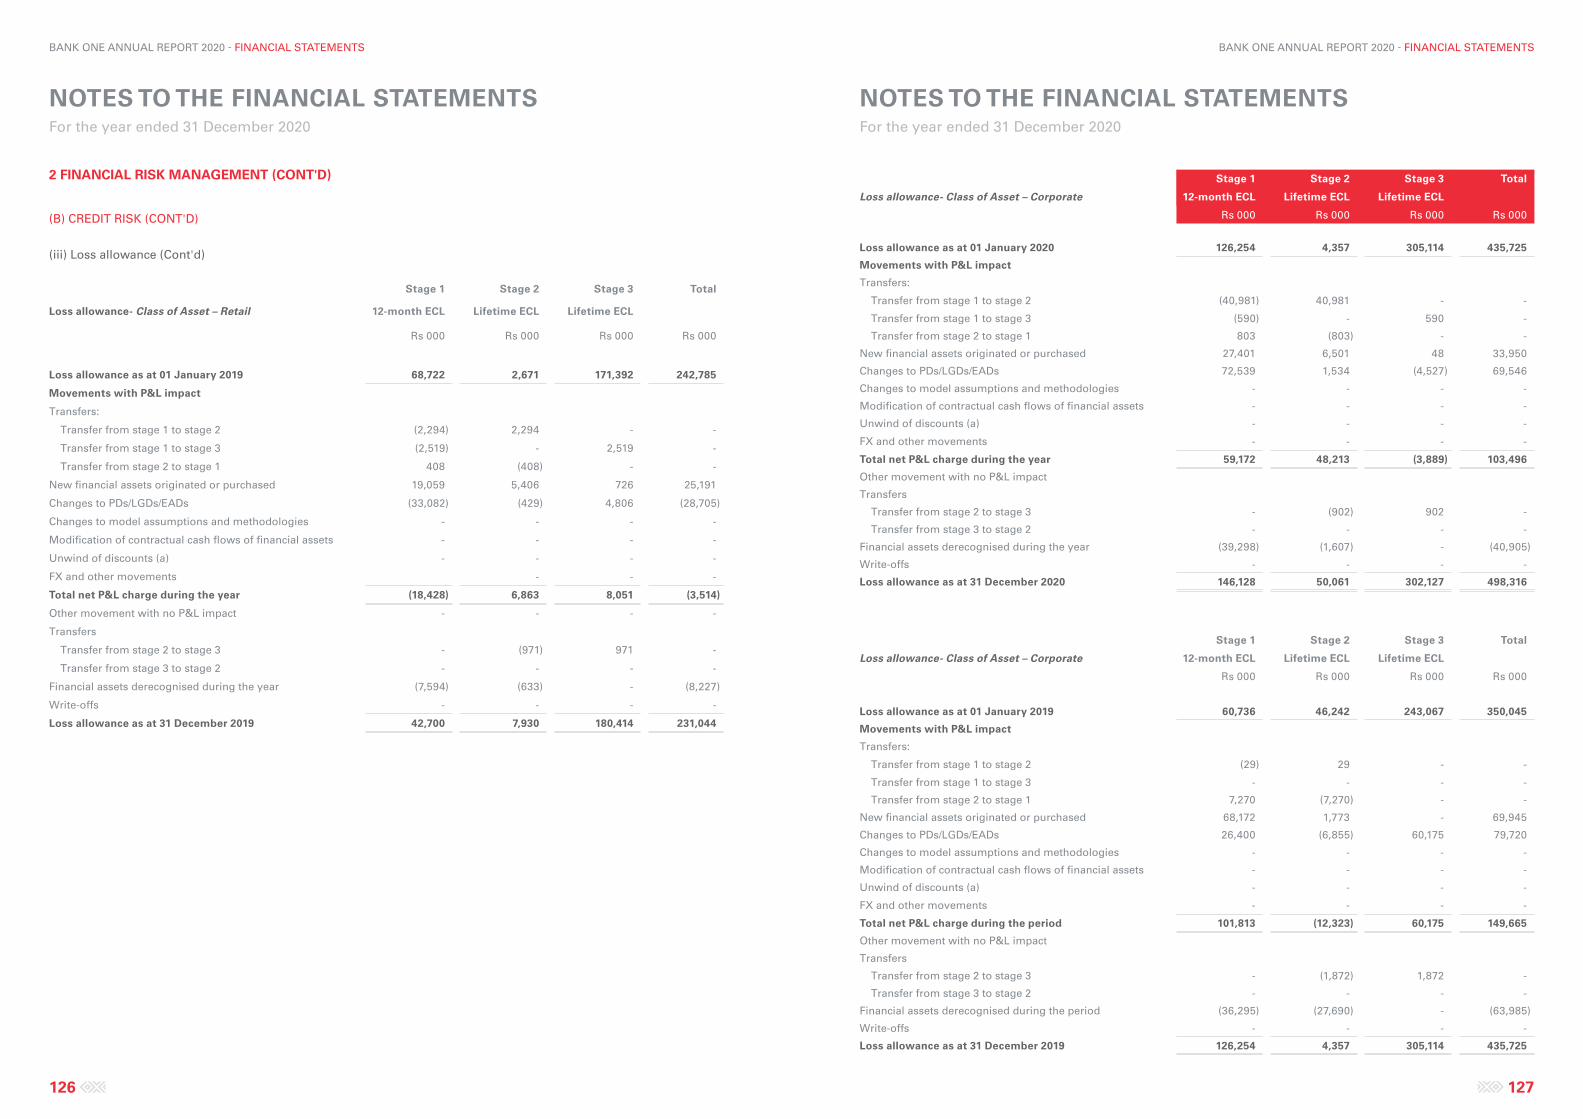
NOTES TO THE FINANCIAL STATEMENTS For the year ended 31 December 2020
NOTES TO THE FINANCIAL STATEMENTS For the year ended 31 December 2020
126 127
BANK ONE ANNUAL REPORT 2020 - FINANCIAL STATEMENTS BANK ONE ANNUAL REPORT 2020 - FINANCIAL STATEMENTS
Stage 1 Stage 2 Stage 3 Total
Loss allowance- Class of Asset – Corporate 12-month ECL Lifetime ECL Lifetime ECL
Rs 000 Rs 000 Rs 000 Rs 000
Loss allowance as at 01 January 2020 126,254 4,357 305,114 435,725
Movements with P&L impact
Transfers:
Transfer from stage 1 to stage 2 (40,981) 40,981 - -
Transfer from stage 1 to stage 3 (590) - 590 -
Transfer from stage 2 to stage 1 803 (803) - -
New financial assets originated or purchased 27,401 6,501 48 33,950
Changes to PDs/LGDs/EADs 72,539 1,534 (4,527) 69,546
Changes to model assumptions and methodologies - - - -
Modification of contractual cash flows of financial assets - - - -
Unwind of discounts (a) - - - -
FX and other movements - - - -
Total net P&L charge during the year 59,172 48,213 (3,889) 103,496
Other movement with no P&L impact
Transfers
Transfer from stage 2 to stage 3 - (902) 902 -
Transfer from stage 3 to stage 2 - - - -
Financial assets derecognised during the year (39,298) (1,607) - (40,905)
Write-offs - - - -
Loss allowance as at 31 December 2020 146,128 50,061 302,127 498,316
Stage 1 Stage 2 Stage 3 Total
Loss allowance- Class of Asset – Corporate 12-month ECL Lifetime ECL Lifetime ECL
Rs 000 Rs 000 Rs 000 Rs 000
Loss allowance as at 01 January 2019 60,736 46,242 243,067 350,045
Movements with P&L impact
Transfers:
Transfer from stage 1 to stage 2 (29) 29 - -
Transfer from stage 1 to stage 3 - - - -
Transfer from stage 2 to stage 1 7,270 (7,270) - -
New financial assets originated or purchased 68,172 1,773 - 69,945
Changes to PDs/LGDs/EADs 26,400 (6,855) 60,175 79,720
Changes to model assumptions and methodologies - - - -
Modification of contractual cash flows of financial assets - - - -
Unwind of discounts (a) - - - -
FX and other movements - - - -
Total net P&L charge during the period 101,813 (12,323) 60,175 149,665
Other movement with no P&L impact
Transfers
Transfer from stage 2 to stage 3 - (1,872) 1,872 -
Transfer from stage 3 to stage 2 - - - -
Financial assets derecognised during the period (36,295) (27,690) - (63,985)
Write-offs - - - -
Loss allowance as at 31 December 2019 126,254 4,357 305,114 435,725
2 FINANCIAL RISK MANAGEMENT (CONT'D)
(B) CREDIT RISK (CONT'D)
(iii) Loss allowance (Cont'd)
Stage 1 Stage 2 Stage 3 Total
Loss allowance- Class of Asset – Retail 12-month ECL Lifetime ECL Lifetime ECL
Rs 000 Rs 000 Rs 000 Rs 000
Loss allowance as at 01 January 2019 68,722 2,671 171,392 242,785
Movements with P&L impact
Transfers:
Transfer from stage 1 to stage 2 (2,294) 2,294 - -
Transfer from stage 1 to stage 3 (2,519) - 2,519 -
Transfer from stage 2 to stage 1 408 (408) - -
New financial assets originated or purchased 19,059 5,406 726 25,191
Changes to PDs/LGDs/EADs (33,082) (429) 4,806 (28,705)
Changes to model assumptions and methodologies - - - -
Modification of contractual cash flows of financial assets - - - -
Unwind of discounts (a) - - - -
FX and other movements - - -
Total net P&L charge during the year (18,428) 6,863 8,051 (3,514)
Other movement with no P&L impact - - - -
Transfers
Transfer from stage 2 to stage 3 - (971) 971 -
Transfer from stage 3 to stage 2 - - - -
Financial assets derecognised during the year (7,594) (633) - (8,227)
Write-offs - - - -
Loss allowance as at 31 December 2019 42,700 7,930 180,414 231,044
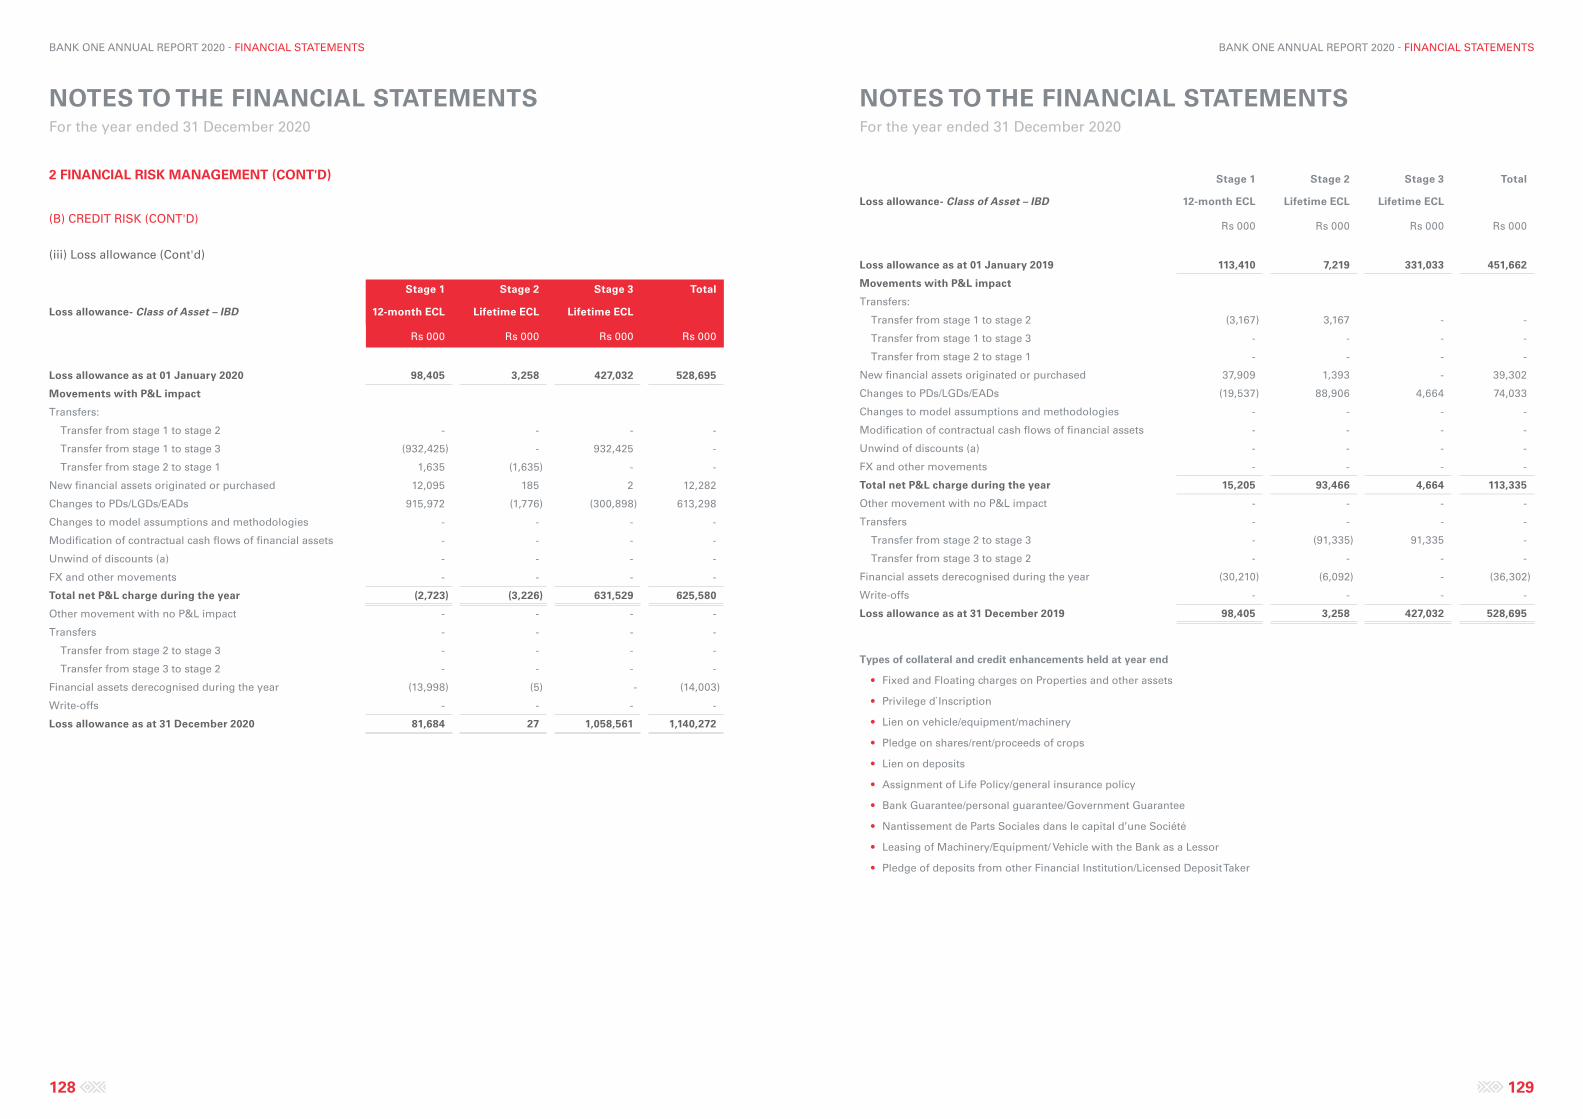
NOTES TO THE FINANCIAL STATEMENTS For the year ended 31 December 2020
NOTES TO THE FINANCIAL STATEMENTS For the year ended 31 December 2020
128 129
BANK ONE ANNUAL REPORT 2020 - FINANCIAL STATEMENTS BANK ONE ANNUAL REPORT 2020 - FINANCIAL STATEMENTS
Stage 1 Stage 2 Stage 3 Total
Loss allowance- Class of Asset – IBD 12-month ECL Lifetime ECL Lifetime ECL
Rs 000 Rs 000 Rs 000 Rs 000
Loss allowance as at 01 January 2019 113,410 7,219 331,033 451,662
Movements with P&L impact
Transfers:
Transfer from stage 1 to stage 2 (3,167) 3,167 - -
Transfer from stage 1 to stage 3 - - - -
Transfer from stage 2 to stage 1 - - - -
New financial assets originated or purchased 37,909 1,393 - 39,302
Changes to PDs/LGDs/EADs (19,537) 88,906 4,664 74,033
Changes to model assumptions and methodologies - - - -
Modification of contractual cash flows of financial assets - - - -
Unwind of discounts (a) - - - -
FX and other movements - - - -
Total net P&L charge during the year 15,205 93,466 4,664 113,335
Other movement with no P&L impact - - - -
Transfers - - - -
Transfer from stage 2 to stage 3 - (91,335) 91,335 -
Transfer from stage 3 to stage 2 - - - -
Financial assets derecognised during the year (30,210) (6,092) - (36,302)
Write-offs - - - -
Loss allowance as at 31 December 2019 98,405 3,258 427,032 528,695
Types of collateral and credit enhancements held at year end
• Fixed and Floating charges on Properties and other assets
• Privilege d`Inscription
• Lien on vehicle/equipment/machinery
• Pledge on shares/rent/proceeds of crops
• Lien on deposits
• Assignment of Life Policy/general insurance policy
• Bank Guarantee/personal guarantee/Government Guarantee
• Nantissement de Parts Sociales dans le capital d’une Société
• Leasing of Machinery/Equipment/ Vehicle with the Bank as a Lessor
• Pledge of deposits from other Financial Institution/Licensed Deposit Taker
2 FINANCIAL RISK MANAGEMENT (CONT'D)
(B) CREDIT RISK (CONT'D)
(iii) Loss allowance (Cont'd)
Stage 1 Stage 2 Stage 3 Total
Loss allowance- Class of Asset – IBD 12-month ECL Lifetime ECL Lifetime ECL
Rs 000 Rs 000 Rs 000 Rs 000
Loss allowance as at 01 January 2020 98,405 3,258 427,032 528,695
Movements with P&L impact
Transfers:
Transfer from stage 1 to stage 2 - - - -
Transfer from stage 1 to stage 3 (932,425) - 932,425 -
Transfer from stage 2 to stage 1 1,635 (1,635) - -
New financial assets originated or purchased 12,095 185 2 12,282
Changes to PDs/LGDs/EADs 915,972 (1,776) (300,898) 613,298
Changes to model assumptions and methodologies - - - -
Modification of contractual cash flows of financial assets - - - -
Unwind of discounts (a) - - - -
FX and other movements - - - -
Total net P&L charge during the year (2,723) (3,226) 631,529 625,580
Other movement with no P&L impact - - - -
Transfers - - - -
Transfer from stage 2 to stage 3 - - - -
Transfer from stage 3 to stage 2 - - - -
Financial assets derecognised during the year (13,998) (5) - (14,003)
Write-offs - - - -
Loss allowance as at 31 December 2020 81,684 27 1,058,561 1,140,272
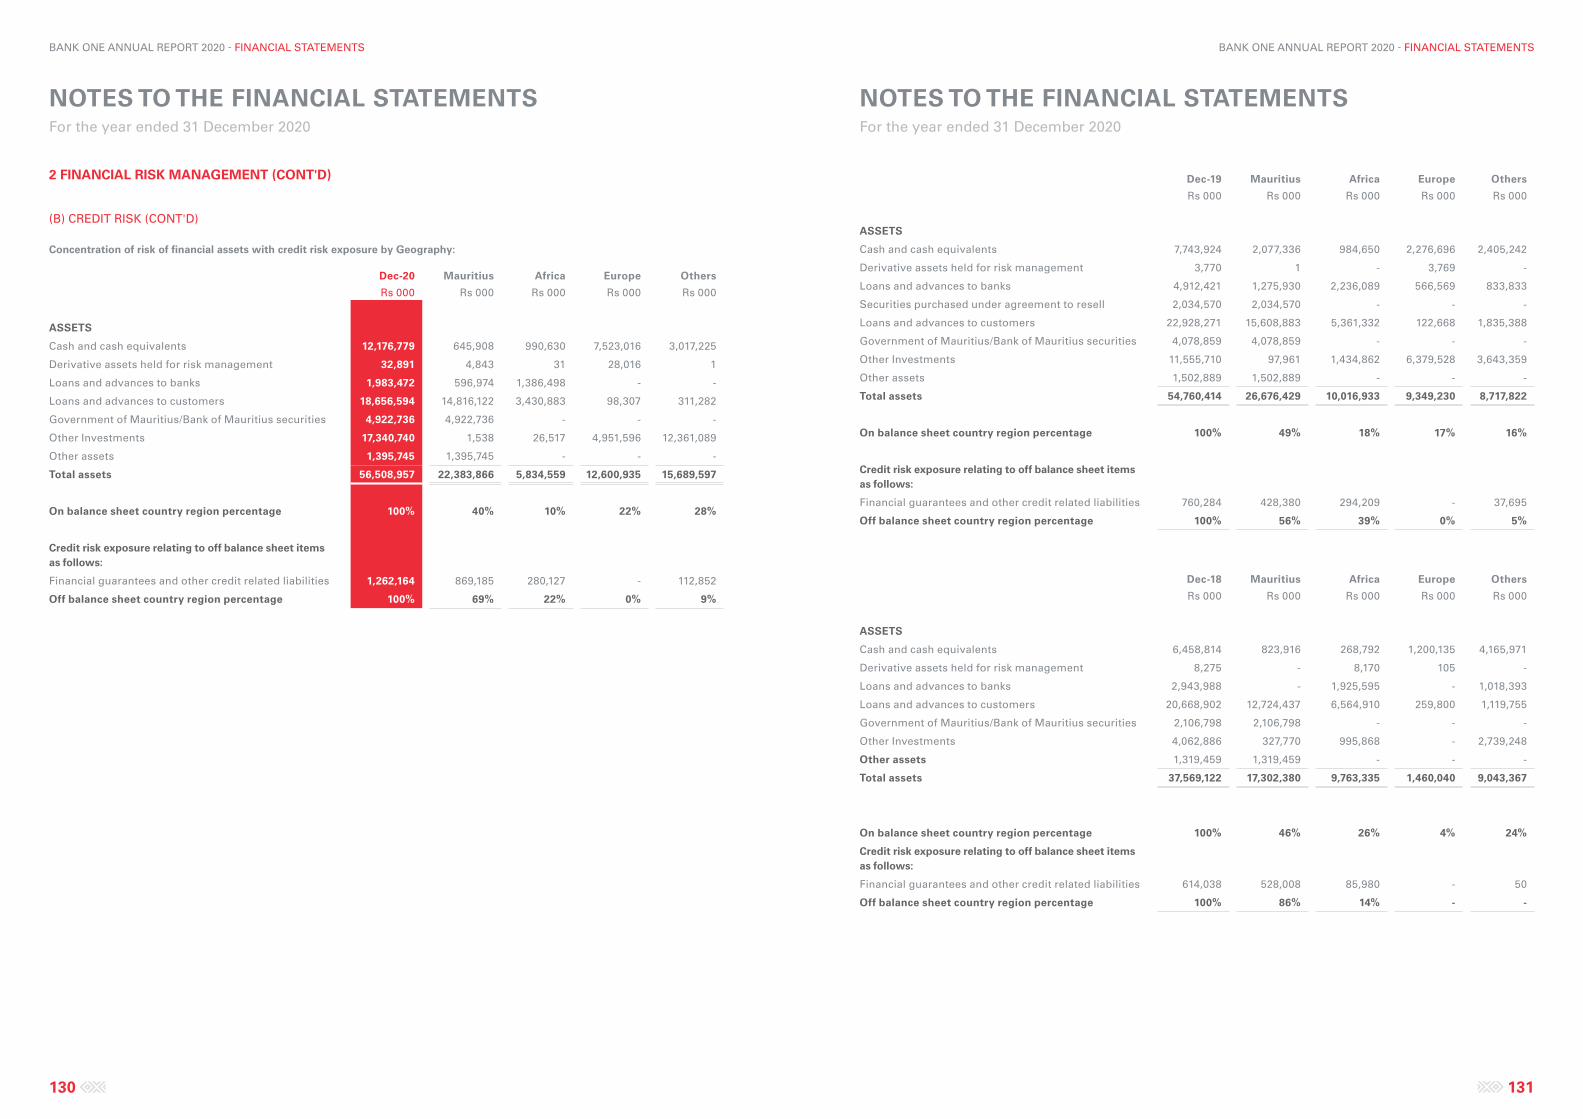
NOTES TO THE FINANCIAL STATEMENTS For the year ended 31 December 2020
NOTES TO THE FINANCIAL STATEMENTS For the year ended 31 December 2020
130 131
BANK ONE ANNUAL REPORT 2020 - FINANCIAL STATEMENTS BANK ONE ANNUAL REPORT 2020 - FINANCIAL STATEMENTS
Dec-19 Mauritius Africa Europe Others
Rs 000 Rs 000 Rs 000 Rs 000 Rs 000
ASSETS
Cash and cash equivalents 7,743,924 2,077,336 984,650 2,276,696 2,405,242
Derivative assets held for risk management 3,770 1 - 3,769 -
Loans and advances to banks 4,912,421 1,275,930 2,236,089 566,569 833,833
Securities purchased under agreement to resell 2,034,570 2,034,570 - - -
Loans and advances to customers 22,928,271 15,608,883 5,361,332 122,668 1,835,388
Government of Mauritius/Bank of Mauritius securities 4,078,859 4,078,859 - - -
Other Investments 11,555,710 97,961 1,434,862 6,379,528 3,643,359
Other assets 1,502,889 1,502,889 - - -
Total assets 54,760,414 26,676,429 10,016,933 9,349,230 8,717,822
On balance sheet country region percentage 100% 49% 18% 17% 16%
Credit risk exposure relating to off balance sheet items as follows:
Financial guarantees and other credit related liabilities 760,284 428,380 294,209 - 37,695
Off balance sheet country region percentage 100% 56% 39% 0% 5%
Dec-18 Mauritius Africa Europe Others
Rs 000 Rs 000 Rs 000 Rs 000 Rs 000
ASSETS
Cash and cash equivalents 6,458,814 823,916 268,792 1,200,135 4,165,971
Derivative assets held for risk management 8,275 - 8,170 105 -
Loans and advances to banks 2,943,988 - 1,925,595 - 1,018,393
Loans and advances to customers 20,668,902 12,724,437 6,564,910 259,800 1,119,755
Government of Mauritius/Bank of Mauritius securities 2,106,798 2,106,798 - - -
Other Investments 4,062,886 327,770 995,868 - 2,739,248
Other assets 1,319,459 1,319,459 - - -
Total assets 37,569,122 17,302,380 9,763,335 1,460,040 9,043,367
On balance sheet country region percentage 100% 46% 26% 4% 24%
Credit risk exposure relating to off balance sheet items as follows:
Financial guarantees and other credit related liabilities 614,038 528,008 85,980 - 50
Off balance sheet country region percentage 100% 86% 14% - -
2 FINANCIAL RISK MANAGEMENT (CONT'D)
(B) CREDIT RISK (CONT'D)
Concentration of risk of financial assets with credit risk exposure by Geography:
Dec-20 Mauritius Africa Europe Others
Rs 000 Rs 000 Rs 000 Rs 000 Rs 000
ASSETS
Cash and cash equivalents 12,176,779 645,908 990,630 7,523,016 3,017,225
Derivative assets held for risk management 32,891 4,843 31 28,016 1
Loans and advances to banks 1,983,472 596,974 1,386,498 - -
Loans and advances to customers 18,656,594 14,816,122 3,430,883 98,307 311,282
Government of Mauritius/Bank of Mauritius securities 4,922,736 4,922,736 - - -
Other Investments 17,340,740 1,538 26,517 4,951,596 12,361,089
Other assets 1,395,745 1,395,745 - - -
Total assets 56,508,957 22,383,866 5,834,559 12,600,935 15,689,597
On balance sheet country region percentage 100% 40% 10% 22% 28%
Credit risk exposure relating to off balance sheet items as follows:
Financial guarantees and other credit related liabilities 1,262,164 869,185 280,127 - 112,852
Off balance sheet country region percentage 100% 69% 22% 0% 9%
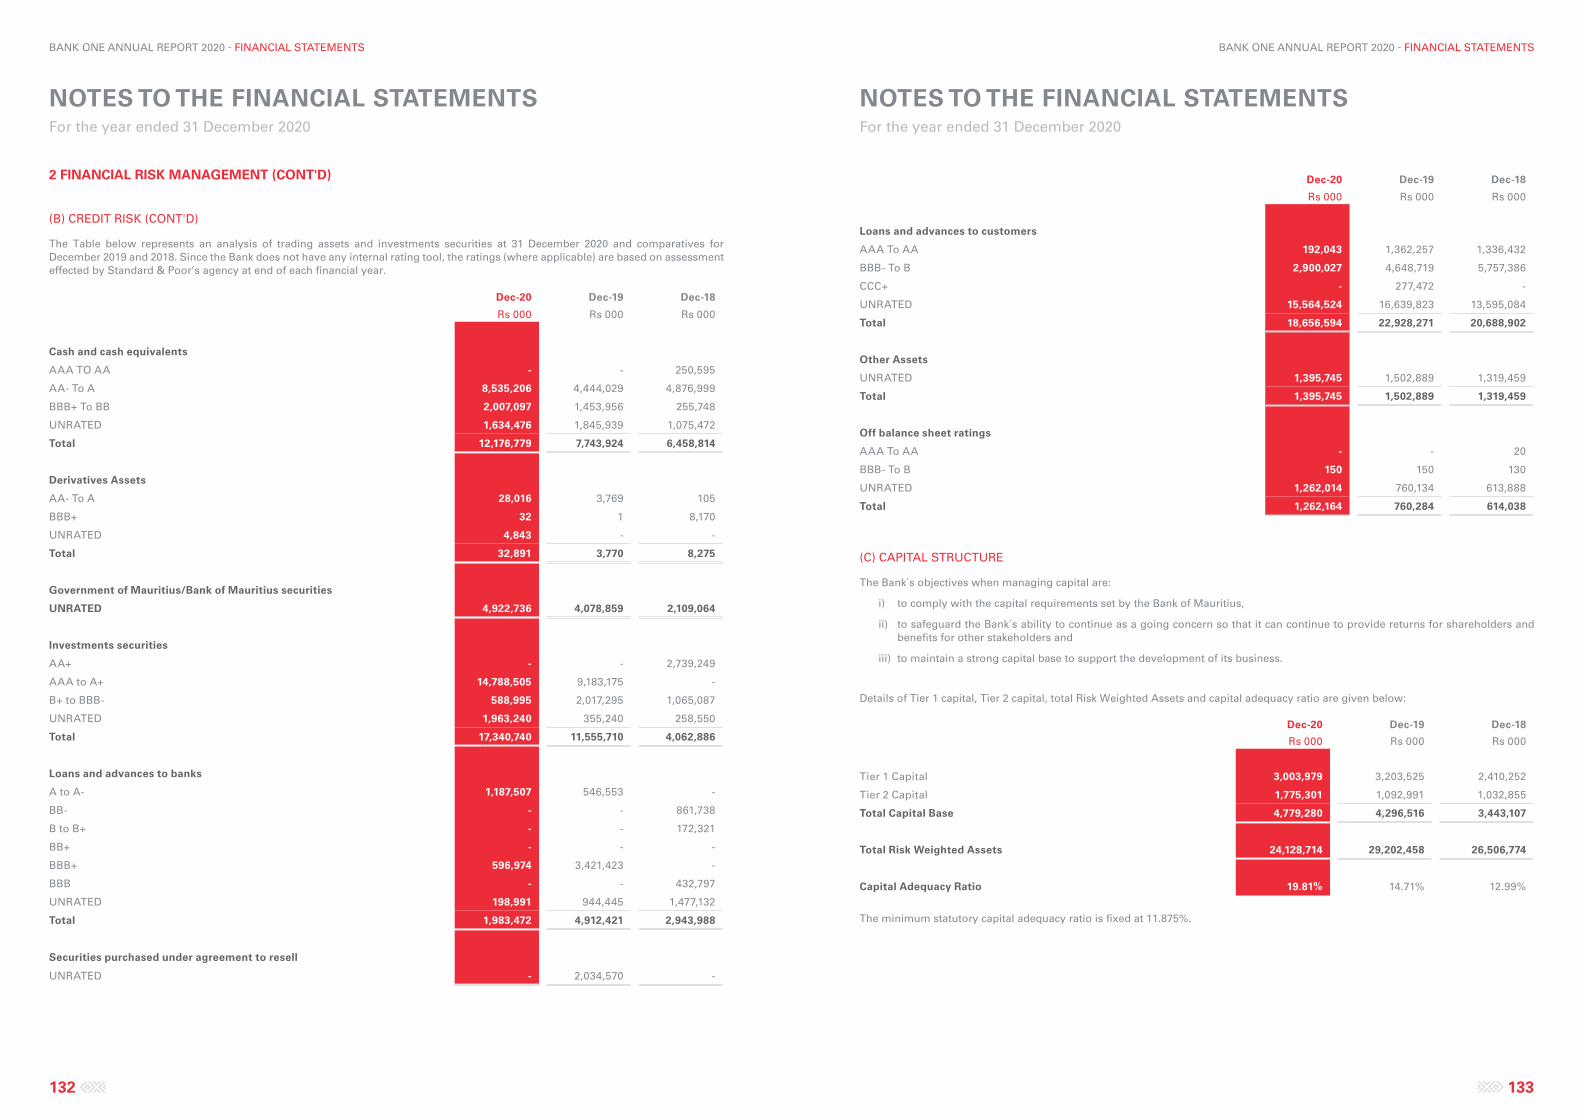
NOTES TO THE FINANCIAL STATEMENTS For the year ended 31 December 2020
NOTES TO THE FINANCIAL STATEMENTS For the year ended 31 December 2020
132 133
BANK ONE ANNUAL REPORT 2020 - FINANCIAL STATEMENTS BANK ONE ANNUAL REPORT 2020 - FINANCIAL STATEMENTS
Dec-20 Dec-19 Dec-18
Rs 000 Rs 000 Rs 000
Loans and advances to customers
AAA To AA 192,043 1,362,257 1,336,432
BBB- To B 2,900,027 4,648,719 5,757,386
CCC+ - 277,472 -
UNRATED 15,564,524 16,639,823 13,595,084
Total 18,656,594 22,928,271 20,688,902
Other Assets
UNRATED 1,395,745 1,502,889 1,319,459
Total 1,395,745 1,502,889 1,319,459
Off balance sheet ratings
AAA To AA - - 20
BBB- To B 150 150 130
UNRATED 1,262,014 760,134 613,888
Total 1,262,164 760,284 614,038
(C) CAPITAL STRUCTURE
The Bank`s objectives when managing capital are:
i) to comply with the capital requirements set by the Bank of Mauritius,
ii) to safeguard the Bank`s ability to continue as a going concern so that it can continue to provide returns for shareholders and benefits for other stakeholders and
iii) to maintain a strong capital base to support the development of its business.
Details of Tier 1 capital, Tier 2 capital, total Risk Weighted Assets and capital adequacy ratio are given below:
Dec-20 Dec-19 Dec-18
Rs 000 Rs 000 Rs 000
Tier 1 Capital 3,003,979 3,203,525 2,410,252
Tier 2 Capital 1,775,301 1,092,991 1,032,855
Total Capital Base 4,779,280 4,296,516 3,443,107
Total Risk Weighted Assets 24,128,714 29,202,458 26,506,774
Capital Adequacy Ratio 19.81% 14.71% 12.99%
The minimum statutory capital adequacy ratio is fixed at 11.875%.
2 FINANCIAL RISK MANAGEMENT (CONT'D)
(B) CREDIT RISK (CONT'D)
The Table below represents an analysis of trading assets and investments securities at 31 December 2020 and comparatives for December 2019 and 2018. Since the Bank does not have any internal rating tool, the ratings (where applicable) are based on assessment effected by Standard & Poor’s agency at end of each financial year.
Dec-20 Dec-19 Dec-18
Rs 000 Rs 000 Rs 000
Cash and cash equivalents
AAA TO AA - - 250,595
AA- To A 8,535,206 4,444,029 4,876,999
BBB+ To BB 2,007,097 1,453,956 255,748
UNRATED 1,634,476 1,845,939 1,075,472
Total 12,176,779 7,743,924 6,458,814
Derivatives Assets
AA- To A 28,016 3,769 105
BBB+ 32 1 8,170
UNRATED 4,843 - -
Total 32,891 3,770 8,275
Government of Mauritius/Bank of Mauritius securities
UNRATED 4,922,736 4,078,859 2,109,064
Investments securities
AA+ - - 2,739,249
AAA to A+ 14,788,505 9,183,175 -
B+ to BBB- 588,995 2,017,295 1,065,087
UNRATED 1,963,240 355,240 258,550
Total 17,340,740 11,555,710 4,062,886
Loans and advances to banks
A to A- 1,187,507 546,553 -
BB- - - 861,738
B to B+ - - 172,321
BB+ - - -
BBB+ 596,974 3,421,423 -
BBB - - 432,797
UNRATED 198,991 944,445 1,477,132
Total 1,983,472 4,912,421 2,943,988
Securities purchased under agreement to resell
UNRATED - 2,034,570 -
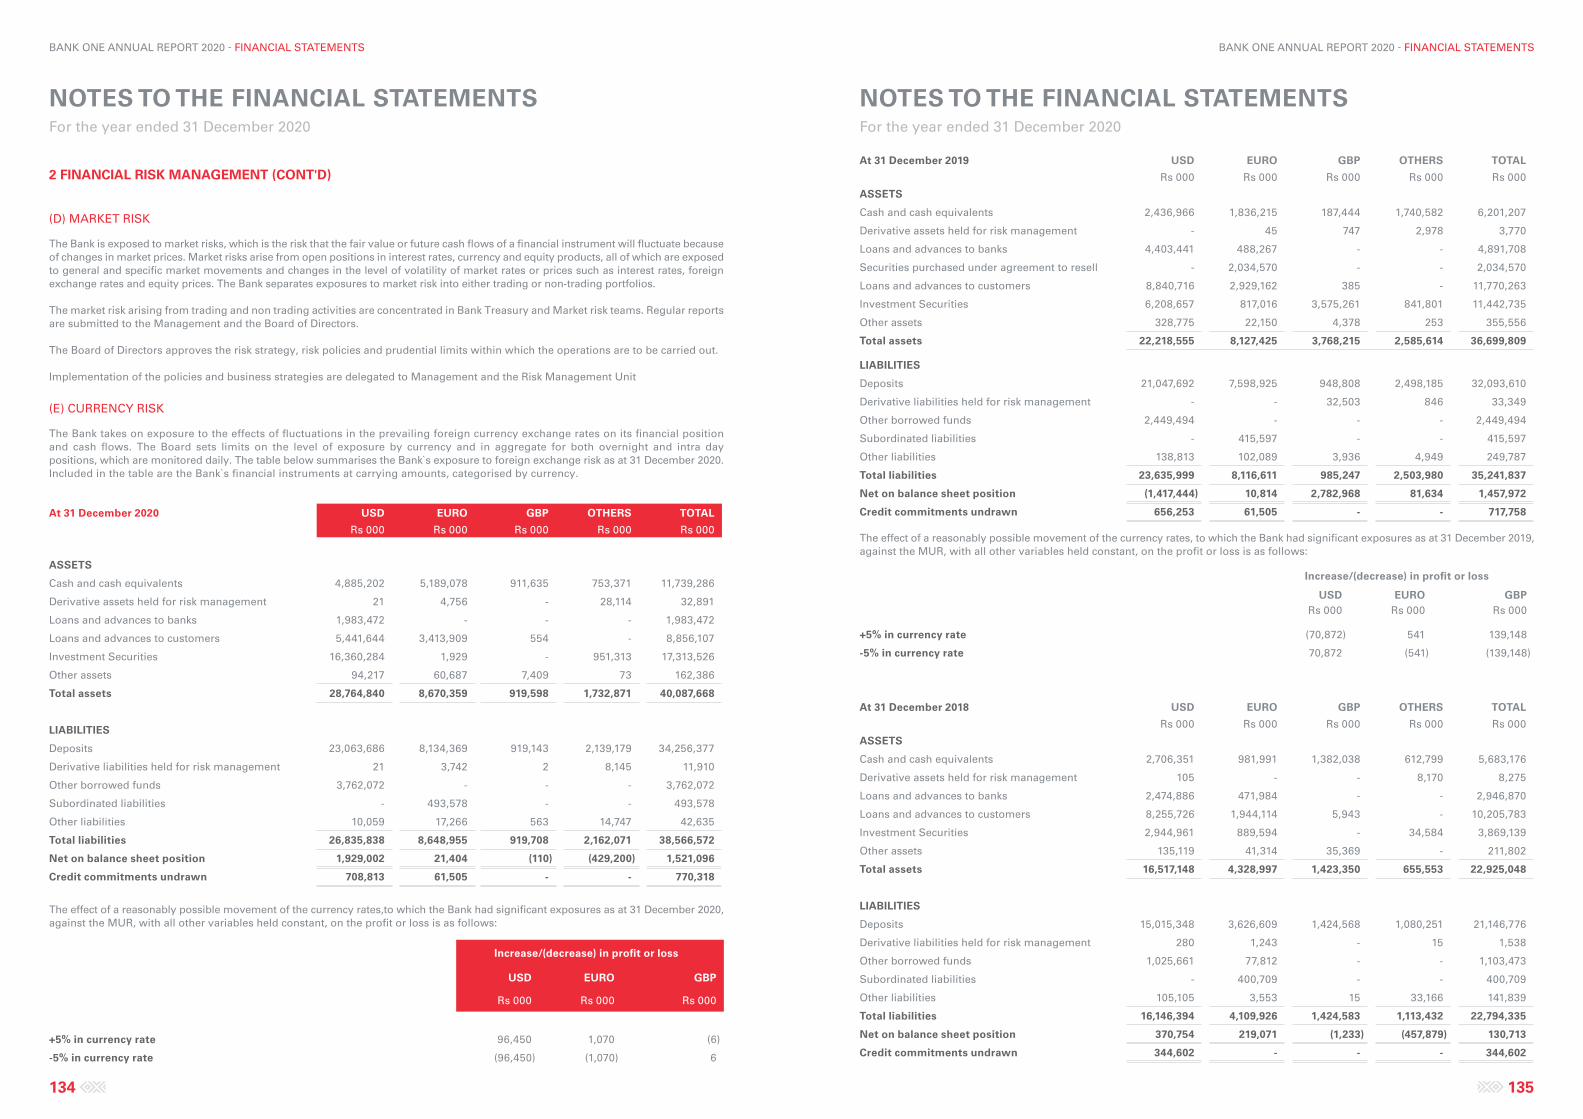
NOTES TO THE FINANCIAL STATEMENTS For the year ended 31 December 2020
NOTES TO THE FINANCIAL STATEMENTS For the year ended 31 December 2020
134 135
BANK ONE ANNUAL REPORT 2020 - FINANCIAL STATEMENTS BANK ONE ANNUAL REPORT 2020 - FINANCIAL STATEMENTS
At 31 December 2019 USD EURO GBP OTHERS TOTAL
Rs 000 Rs 000 Rs 000 Rs 000 Rs 000
ASSETS
Cash and cash equivalents 2,436,966 1,836,215 187,444 1,740,582 6,201,207
Derivative assets held for risk management - 45 747 2,978 3,770
Loans and advances to banks 4,403,441 488,267 - - 4,891,708
Securities purchased under agreement to resell - 2,034,570 - - 2,034,570
Loans and advances to customers 8,840,716 2,929,162 385 - 11,770,263
Investment Securities 6,208,657 817,016 3,575,261 841,801 11,442,735
Other assets 328,775 22,150 4,378 253 355,556
Total assets 22,218,555 8,127,425 3,768,215 2,585,614 36,699,809
LIABILITIES
Deposits 21,047,692 7,598,925 948,808 2,498,185 32,093,610
Derivative liabilities held for risk management - - 32,503 846 33,349
Other borrowed funds 2,449,494 - - - 2,449,494
Subordinated liabilities - 415,597 - - 415,597
Other liabilities 138,813 102,089 3,936 4,949 249,787
Total liabilities 23,635,999 8,116,611 985,247 2,503,980 35,241,837
Net on balance sheet position (1,417,444) 10,814 2,782,968 81,634 1,457,972
Credit commitments undrawn 656,253 61,505 - - 717,758
The effect of a reasonably possible movement of the currency rates, to which the Bank had significant exposures as at 31 December 2019, against the MUR, with all other variables held constant, on the profit or loss is as follows:
Increase/(decrease) in profit or loss
USD EURO GBPRs 000 Rs 000 Rs 000
+5% in currency rate (70,872) 541 139,148
-5% in currency rate 70,872 (541) (139,148)
At 31 December 2018 USD EURO GBP OTHERS TOTAL
Rs 000 Rs 000 Rs 000 Rs 000 Rs 000
ASSETS
Cash and cash equivalents 2,706,351 981,991 1,382,038 612,799 5,683,176
Derivative assets held for risk management 105 - - 8,170 8,275
Loans and advances to banks 2,474,886 471,984 - - 2,946,870
Loans and advances to customers 8,255,726 1,944,114 5,943 - 10,205,783
Investment Securities 2,944,961 889,594 - 34,584 3,869,139
Other assets 135,119 41,314 35,369 - 211,802
Total assets 16,517,148 4,328,997 1,423,350 655,553 22,925,048
LIABILITIES
Deposits 15,015,348 3,626,609 1,424,568 1,080,251 21,146,776
Derivative liabilities held for risk management 280 1,243 - 15 1,538
Other borrowed funds 1,025,661 77,812 - - 1,103,473
Subordinated liabilities - 400,709 - - 400,709
Other liabilities 105,105 3,553 15 33,166 141,839
Total liabilities 16,146,394 4,109,926 1,424,583 1,113,432 22,794,335
Net on balance sheet position 370,754 219,071 (1,233) (457,879) 130,713
Credit commitments undrawn 344,602 - - - 344,602
2 FINANCIAL RISK MANAGEMENT (CONT'D)
(D) MARKET RISK
The Bank is exposed to market risks, which is the risk that the fair value or future cash flows of a financial instrument will fluctuate because of changes in market prices. Market risks arise from open positions in interest rates, currency and equity products, all of which are exposed to general and specific market movements and changes in the level of volatility of market rates or prices such as interest rates, foreign exchange rates and equity prices. The Bank separates exposures to market risk into either trading or non-trading portfolios.
The market risk arising from trading and non trading activities are concentrated in Bank Treasury and Market risk teams. Regular reports are submitted to the Management and the Board of Directors.
The Board of Directors approves the risk strategy, risk policies and prudential limits within which the operations are to be carried out.
Implementation of the policies and business strategies are delegated to Management and the Risk Management Unit
(E) CURRENCY RISK
The Bank takes on exposure to the effects of fluctuations in the prevailing foreign currency exchange rates on its financial position and cash flows. The Board sets limits on the level of exposure by currency and in aggregate for both overnight and intra day positions, which are monitored daily. The table below summarises the Bank`s exposure to foreign exchange risk as at 31 December 2020. Included in the table are the Bank`s financial instruments at carrying amounts, categorised by currency.
At 31 December 2020 USD EURO GBP OTHERS TOTAL
Rs 000 Rs 000 Rs 000 Rs 000 Rs 000
ASSETS
Cash and cash equivalents 4,885,202 5,189,078 911,635 753,371 11,739,286
Derivative assets held for risk management 21 4,756 - 28,114 32,891
Loans and advances to banks 1,983,472 - - - 1,983,472
Loans and advances to customers 5,441,644 3,413,909 554 - 8,856,107
Investment Securities 16,360,284 1,929 - 951,313 17,313,526
Other assets 94,217 60,687 7,409 73 162,386
Total assets 28,764,840 8,670,359 919,598 1,732,871 40,087,668
LIABILITIES
Deposits 23,063,686 8,134,369 919,143 2,139,179 34,256,377
Derivative liabilities held for risk management 21 3,742 2 8,145 11,910
Other borrowed funds 3,762,072 - - - 3,762,072
Subordinated liabilities - 493,578 - - 493,578
Other liabilities 10,059 17,266 563 14,747 42,635
Total liabilities 26,835,838 8,648,955 919,708 2,162,071 38,566,572
Net on balance sheet position 1,929,002 21,404 (110) (429,200) 1,521,096
Credit commitments undrawn 708,813 61,505 - - 770,318
The effect of a reasonably possible movement of the currency rates,to which the Bank had significant exposures as at 31 December 2020, against the MUR, with all other variables held constant, on the profit or loss is as follows:
Increase/(decrease) in profit or loss
USD EURO GBP
Rs 000 Rs 000 Rs 000
+5% in currency rate 96,450 1,070 (6)
-5% in currency rate (96,450) (1,070) 6
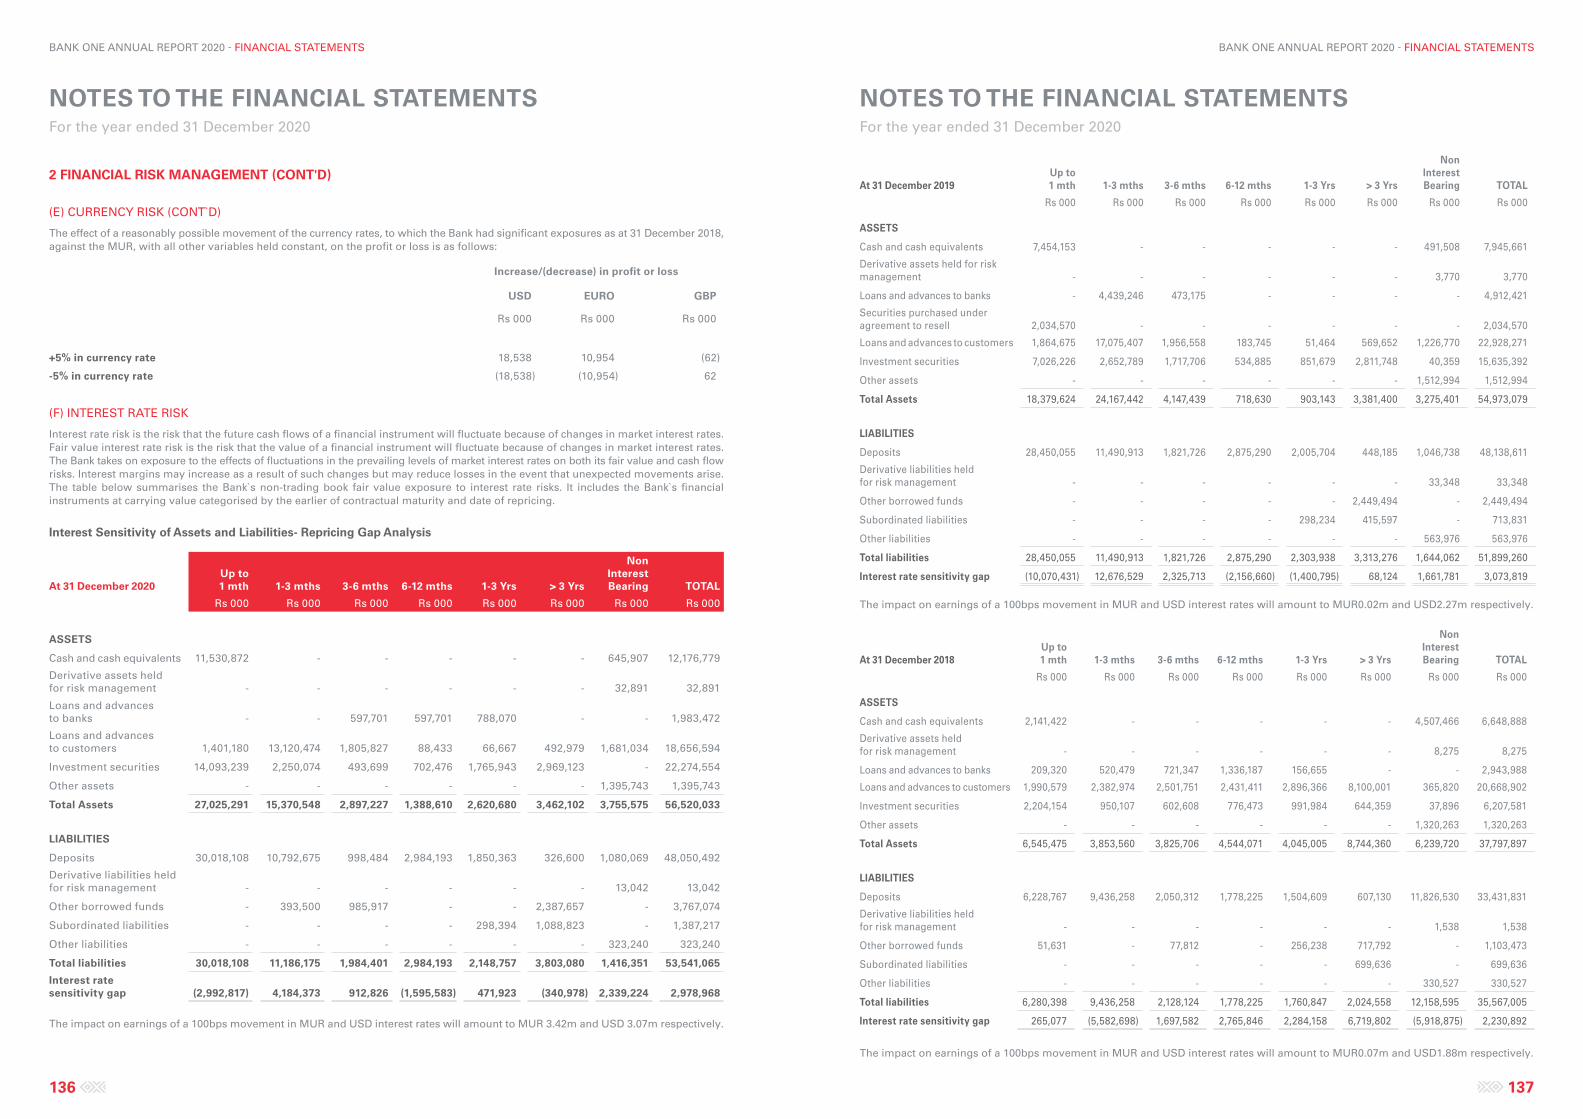
NOTES TO THE FINANCIAL STATEMENTS For the year ended 31 December 2020
NOTES TO THE FINANCIAL STATEMENTS For the year ended 31 December 2020
136 137
BANK ONE ANNUAL REPORT 2020 - FINANCIAL STATEMENTS BANK ONE ANNUAL REPORT 2020 - FINANCIAL STATEMENTS
At 31 December 2019Up to 1 mth 1-3 mths 3-6 mths 6-12 mths 1-3 Yrs > 3 Yrs
Non Interest Bearing TOTAL
Rs 000 Rs 000 Rs 000 Rs 000 Rs 000 Rs 000 Rs 000 Rs 000
ASSETS
Cash and cash equivalents 7,454,153 - - - - - 491,508 7,945,661
Derivative assets held for risk management - - - - - - 3,770 3,770
Loans and advances to banks - 4,439,246 473,175 - - - - 4,912,421
Securities purchased under agreement to resell 2,034,570 - - - - - - 2,034,570
Loans and advances to customers 1,864,675 17,075,407 1,956,558 183,745 51,464 569,652 1,226,770 22,928,271
Investment securities 7,026,226 2,652,789 1,717,706 534,885 851,679 2,811,748 40,359 15,635,392
Other assets - - - - - - 1,512,994 1,512,994
Total Assets 18,379,624 24,167,442 4,147,439 718,630 903,143 3,381,400 3,275,401 54,973,079
LIABILITIES
Deposits 28,450,055 11,490,913 1,821,726 2,875,290 2,005,704 448,185 1,046,738 48,138,611
Derivative liabilities held for risk management - - - - - - 33,348 33,348
Other borrowed funds - - - - - 2,449,494 - 2,449,494
Subordinated liabilities - - - - 298,234 415,597 - 713,831
Other liabilities - - - - - - 563,976 563,976
Total liabilities 28,450,055 11,490,913 1,821,726 2,875,290 2,303,938 3,313,276 1,644,062 51,899,260
Interest rate sensitivity gap (10,070,431) 12,676,529 2,325,713 (2,156,660) (1,400,795) 68,124 1,661,781 3,073,819
The impact on earnings of a 100bps movement in MUR and USD interest rates will amount to MUR0.02m and USD2.27m respectively.
At 31 December 2018Up to 1 mth 1-3 mths 3-6 mths 6-12 mths 1-3 Yrs > 3 Yrs
Non Interest Bearing TOTAL
Rs 000 Rs 000 Rs 000 Rs 000 Rs 000 Rs 000 Rs 000 Rs 000
ASSETS
Cash and cash equivalents 2,141,422 - - - - - 4,507,466 6,648,888
Derivative assets held for risk management - - - - - - 8,275 8,275
Loans and advances to banks 209,320 520,479 721,347 1,336,187 156,655 - - 2,943,988
Loans and advances to customers 1,990,579 2,382,974 2,501,751 2,431,411 2,896,366 8,100,001 365,820 20,668,902
Investment securities 2,204,154 950,107 602,608 776,473 991,984 644,359 37,896 6,207,581
Other assets - - - - - - 1,320,263 1,320,263
Total Assets 6,545,475 3,853,560 3,825,706 4,544,071 4,045,005 8,744,360 6,239,720 37,797,897
LIABILITIES
Deposits 6,228,767 9,436,258 2,050,312 1,778,225 1,504,609 607,130 11,826,530 33,431,831
Derivative liabilities held for risk management - - - - - - 1,538 1,538
Other borrowed funds 51,631 - 77,812 - 256,238 717,792 - 1,103,473
Subordinated liabilities - - - - - 699,636 - 699,636
Other liabilities - - - - - - 330,527 330,527
Total liabilities 6,280,398 9,436,258 2,128,124 1,778,225 1,760,847 2,024,558 12,158,595 35,567,005
Interest rate sensitivity gap 265,077 (5,582,698) 1,697,582 2,765,846 2,284,158 6,719,802 (5,918,875) 2,230,892
The impact on earnings of a 100bps movement in MUR and USD interest rates will amount to MUR0.07m and USD1.88m respectively.
2 FINANCIAL RISK MANAGEMENT (CONT'D)
(E) CURRENCY RISK (CONT`D)
The effect of a reasonably possible movement of the currency rates, to which the Bank had significant exposures as at 31 December 2018, against the MUR, with all other variables held constant, on the profit or loss is as follows:
Increase/(decrease) in profit or loss
USD EURO GBP
Rs 000 Rs 000 Rs 000
+5% in currency rate 18,538 10,954 (62)
-5% in currency rate (18,538) (10,954) 62
(F) INTEREST RATE RISK
Interest rate risk is the risk that the future cash flows of a financial instrument will fluctuate because of changes in market interest rates. Fair value interest rate risk is the risk that the value of a financial instrument will fluctuate because of changes in market interest rates. The Bank takes on exposure to the effects of fluctuations in the prevailing levels of market interest rates on both its fair value and cash flow risks. Interest margins may increase as a result of such changes but may reduce losses in the event that unexpected movements arise. The table below summarises the Bank`s non-trading book fair value exposure to interest rate risks. It includes the Bank`s financial instruments at carrying value categorised by the earlier of contractual maturity and date of repricing.
Interest Sensitivity of Assets and Liabilities- Repricing Gap Analysis
At 31 December 2020Up to 1 mth 1-3 mths 3-6 mths 6-12 mths 1-3 Yrs > 3 Yrs
Non Interest Bearing TOTAL
Rs 000 Rs 000 Rs 000 Rs 000 Rs 000 Rs 000 Rs 000 Rs 000
ASSETS
Cash and cash equivalents 11,530,872 - - - - - 645,907 12,176,779
Derivative assets held for risk management - - - - - - 32,891 32,891
Loans and advances to banks - - 597,701 597,701 788,070 - - 1,983,472
Loans and advances to customers 1,401,180 13,120,474 1,805,827 88,433 66,667 492,979 1,681,034 18,656,594
Investment securities 14,093,239 2,250,074 493,699 702,476 1,765,943 2,969,123 - 22,274,554
Other assets - - - - - - 1,395,743 1,395,743
Total Assets 27,025,291 15,370,548 2,897,227 1,388,610 2,620,680 3,462,102 3,755,575 56,520,033
LIABILITIES
Deposits 30,018,108 10,792,675 998,484 2,984,193 1,850,363 326,600 1,080,069 48,050,492
Derivative liabilities held for risk management - - - - - - 13,042 13,042
Other borrowed funds - 393,500 985,917 - - 2,387,657 - 3,767,074
Subordinated liabilities - - - - 298,394 1,088,823 - 1,387,217
Other liabilities - - - - - - 323,240 323,240
Total liabilities 30,018,108 11,186,175 1,984,401 2,984,193 2,148,757 3,803,080 1,416,351 53,541,065
Interest rate sensitivity gap (2,992,817) 4,184,373 912,826 (1,595,583) 471,923 (340,978) 2,339,224 2,978,968
The impact on earnings of a 100bps movement in MUR and USD interest rates will amount to MUR 3.42m and USD 3.07m respectively.
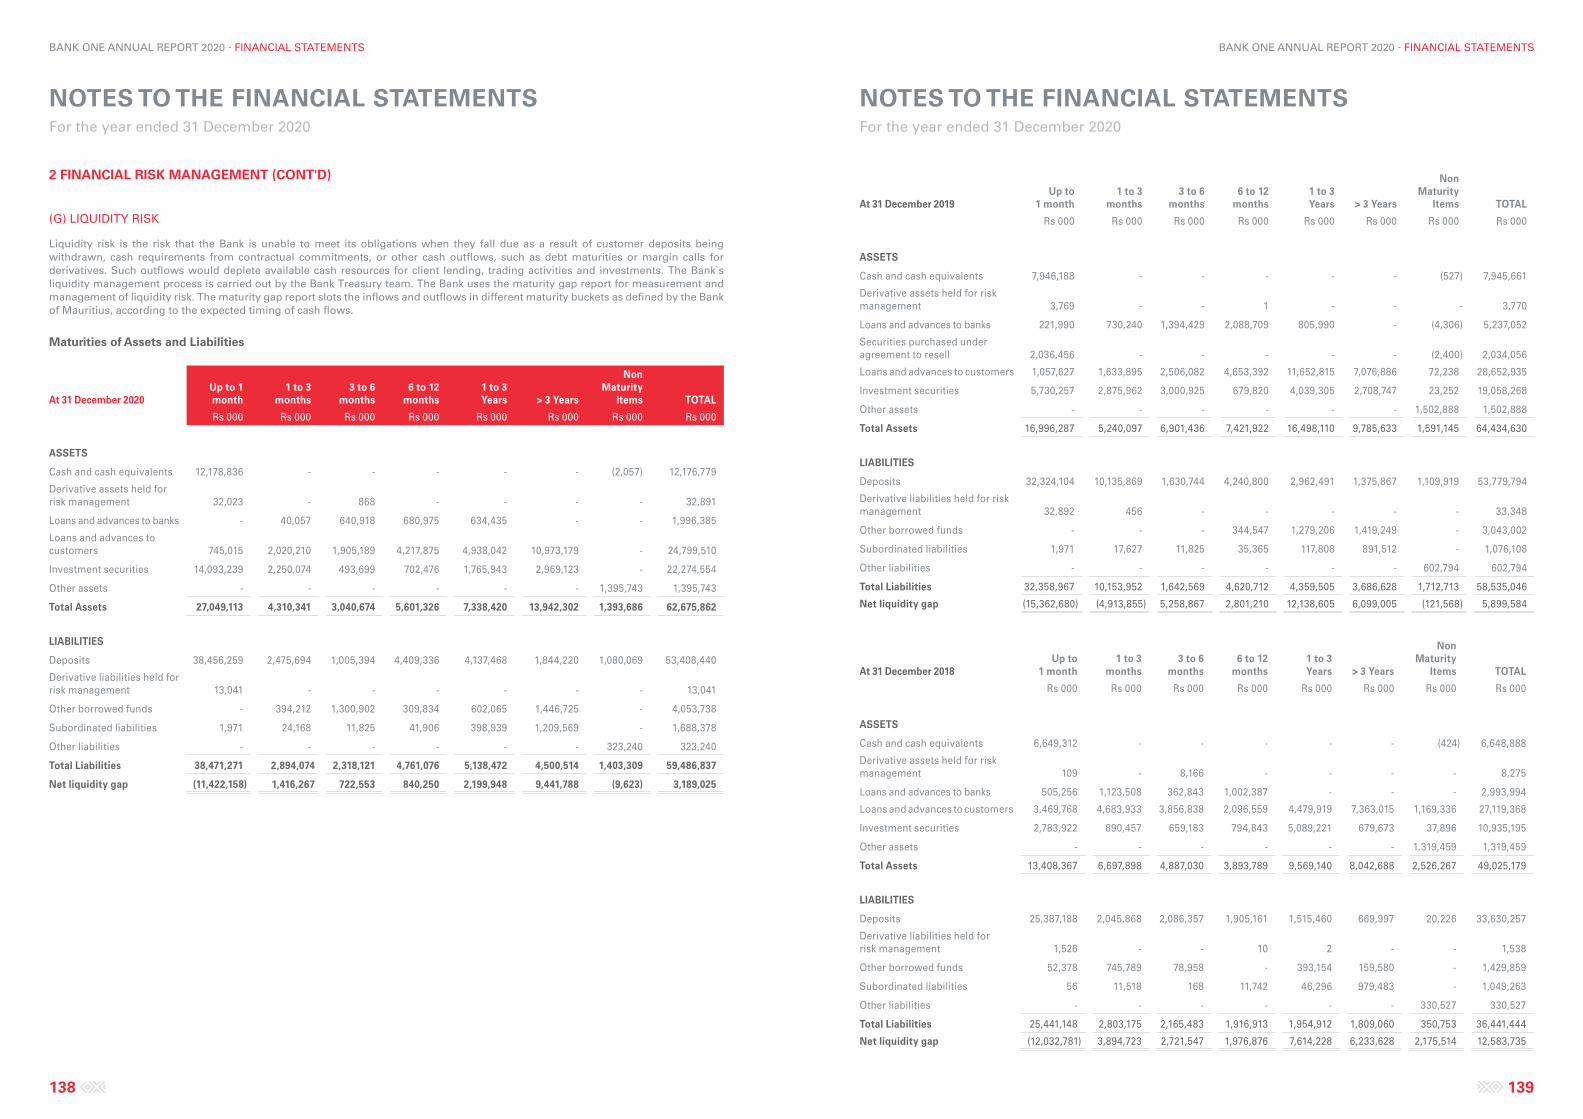
NOTES TO THE FINANCIAL STATEMENTS For the year ended 31 December 2020
NOTES TO THE FINANCIAL STATEMENTS For the year ended 31 December 2020
138 139
BANK ONE ANNUAL REPORT 2020 - FINANCIAL STATEMENTS BANK ONE ANNUAL REPORT 2020 - FINANCIAL STATEMENTS
At 31 December 2019Up to
1 month1 to 3
months3 to 6
months6 to 12
months 1 to 3 Years > 3 Years
Non Maturity
Items TOTAL
Rs 000 Rs 000 Rs 000 Rs 000 Rs 000 Rs 000 Rs 000 Rs 000
ASSETS
Cash and cash equivalents 7,946,188 - - - - - (527) 7,945,661
Derivative assets held for risk management 3,769 - - 1 - - - 3,770
Loans and advances to banks 221,990 730,240 1,394,429 2,088,709 805,990 - (4,306) 5,237,052
Securities purchased under agreement to resell 2,036,456 - - - - - (2,400) 2,034,056
Loans and advances to customers 1,057,627 1,633,895 2,506,082 4,653,392 11,652,815 7,076,886 72,238 28,652,935
Investment securities 5,730,257 2,875,962 3,000,925 679,820 4,039,305 2,708,747 23,252 19,058,268
Other assets - - - - - - 1,502,888 1,502,888
Total Assets 16,996,287 5,240,097 6,901,436 7,421,922 16,498,110 9,785,633 1,591,145 64,434,630
LIABILITIES
Deposits 32,324,104 10,135,869 1,630,744 4,240,800 2,962,491 1,375,867 1,109,919 53,779,794
Derivative liabilities held for risk management 32,892 456 - - - - - 33,348
Other borrowed funds - - - 344,547 1,279,206 1,419,249 - 3,043,002
Subordinated liabilities 1,971 17,627 11,825 35,365 117,808 891,512 - 1,076,108
Other liabilities - - - - - - 602,794 602,794
Total Liabilities 32,358,967 10,153,952 1,642,569 4,620,712 4,359,505 3,686,628 1,712,713 58,535,046
Net liquidity gap (15,362,680) (4,913,855) 5,258,867 2,801,210 12,138,605 6,099,005 (121,568) 5,899,584
At 31 December 2018Up to
1 month1 to 3
months3 to 6
months6 to 12
months 1 to 3 Years > 3 Years
Non Maturity
Items TOTAL
Rs 000 Rs 000 Rs 000 Rs 000 Rs 000 Rs 000 Rs 000 Rs 000
ASSETS
Cash and cash equivalents 6,649,312 - - - - - (424) 6,648,888
Derivative assets held for risk management 109 - 8,166 - - - - 8,275
Loans and advances to banks 505,256 1,123,508 362,843 1,002,387 - - - 2,993,994
Loans and advances to customers 3,469,768 4,683,933 3,856,838 2,096,559 4,479,919 7,363,015 1,169,336 27,119,368
Investment securities 2,783,922 890,457 659,183 794,843 5,089,221 679,673 37,896 10,935,195
Other assets - - - - - - 1,319,459 1,319,459
Total Assets 13,408,367 6,697,898 4,887,030 3,893,789 9,569,140 8,042,688 2,526,267 49,025,179
LIABILITIES
Deposits 25,387,188 2,045,868 2,086,357 1,905,161 1,515,460 669,997 20,226 33,630,257
Derivative liabilities held for risk management 1,526 - - 10 2 - - 1,538
Other borrowed funds 52,378 745,789 78,958 - 393,154 159,580 - 1,429,859
Subordinated liabilities 56 11,518 168 11,742 46,296 979,483 - 1,049,263
Other liabilities - - - - - - 330,527 330,527
Total Liabilities 25,441,148 2,803,175 2,165,483 1,916,913 1,954,912 1,809,060 350,753 36,441,444
Net liquidity gap (12,032,781) 3,894,723 2,721,547 1,976,876 7,614,228 6,233,628 2,175,514 12,583,735
2 FINANCIAL RISK MANAGEMENT (CONT'D)
(G) LIQUIDITY RISK
Liquidity risk is the risk that the Bank is unable to meet its obligations when they fall due as a result of customer deposits being withdrawn, cash requirements from contractual commitments, or other cash outflows, such as debt maturities or margin calls for derivatives. Such outflows would deplete available cash resources for client lending, trading activities and investments. The Bank`s liquidity management process is carried out by the Bank Treasury team. The Bank uses the maturity gap report for measurement and management of liquidity risk. The maturity gap report slots the inflows and outflows in different maturity buckets as defined by the Bank of Mauritius, according to the expected timing of cash flows.
Maturities of Assets and Liabilities
At 31 December 2020Up to 1 month
1 to 3 months
3 to 6 months
6 to 12 months
1 to 3 Years > 3 Years
Non Maturity
Items TOTAL
Rs 000 Rs 000 Rs 000 Rs 000 Rs 000 Rs 000 Rs 000 Rs 000
ASSETS
Cash and cash equivalents 12,178,836 - - - - - (2,057) 12,176,779
Derivative assets held for risk management 32,023 - 868 - - - - 32,891
Loans and advances to banks - 40,057 640,918 680,975 634,435 - - 1,996,385
Loans and advances to customers 745,015 2,020,210 1,905,189 4,217,875 4,938,042 10,973,179 - 24,799,510
Investment securities 14,093,239 2,250,074 493,699 702,476 1,765,943 2,969,123 - 22,274,554
Other assets - - - - - - 1,395,743 1,395,743
Total Assets 27,049,113 4,310,341 3,040,674 5,601,326 7,338,420 13,942,302 1,393,686 62,675,862
LIABILITIES
Deposits 38,456,259 2,475,694 1,005,394 4,409,336 4,137,468 1,844,220 1,080,069 53,408,440
Derivative liabilities held for risk management 13,041 - - - - - - 13,041
Other borrowed funds - 394,212 1,300,902 309,834 602,065 1,446,725 - 4,053,738
Subordinated liabilities 1,971 24,168 11,825 41,906 398,939 1,209,569 - 1,688,378
Other liabilities - - - - - - 323,240 323,240
Total Liabilities 38,471,271 2,894,074 2,318,121 4,761,076 5,138,472 4,500,514 1,403,309 59,486,837
Net liquidity gap (11,422,158) 1,416,267 722,553 840,250 2,199,948 9,441,788 (9,623) 3,189,025
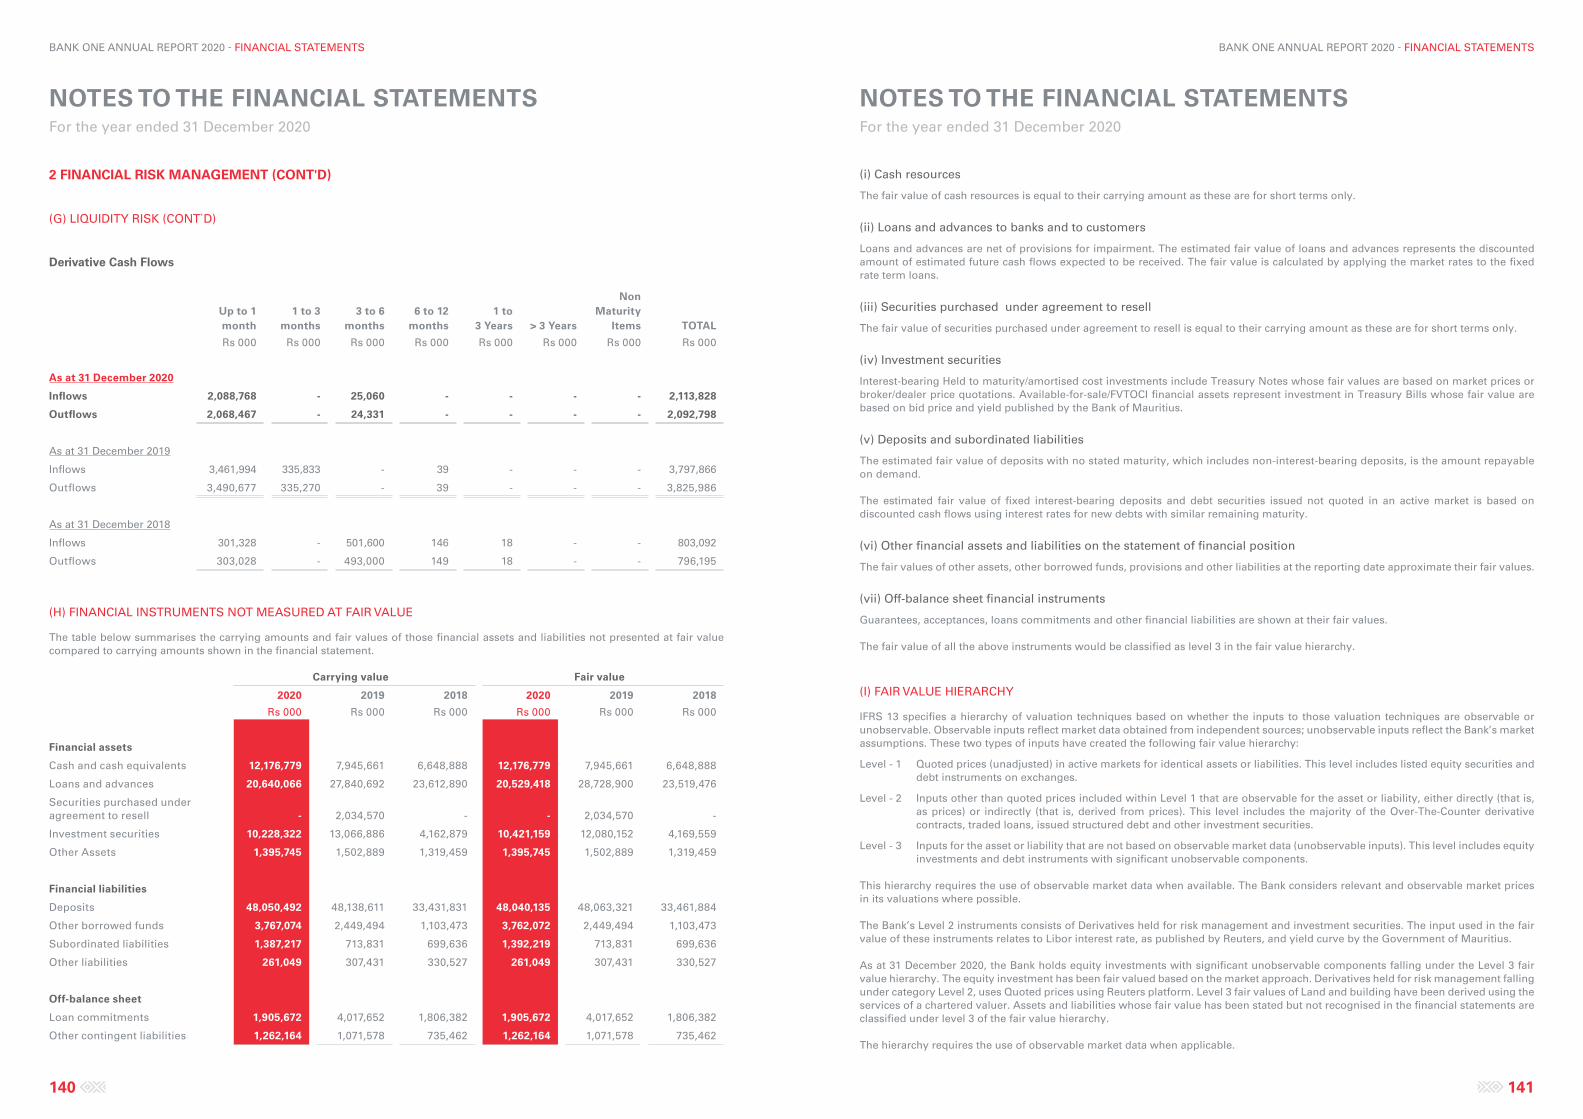
NOTES TO THE FINANCIAL STATEMENTS For the year ended 31 December 2020
NOTES TO THE FINANCIAL STATEMENTS For the year ended 31 December 2020
140 141
BANK ONE ANNUAL REPORT 2020 - FINANCIAL STATEMENTS BANK ONE ANNUAL REPORT 2020 - FINANCIAL STATEMENTS
(i) Cash resources
The fair value of cash resources is equal to their carrying amount as these are for short terms only.
(ii) Loans and advances to banks and to customers
Loans and advances are net of provisions for impairment. The estimated fair value of loans and advances represents the discounted amount of estimated future cash flows expected to be received. The fair value is calculated by applying the market rates to the fixed rate term loans.
(iii) Securities purchased under agreement to resell
The fair value of securities purchased under agreement to resell is equal to their carrying amount as these are for short terms only.
(iv) Investment securities
Interest-bearing Held to maturity/amortised cost investments include Treasury Notes whose fair values are based on market prices or broker/dealer price quotations. Available-for-sale/FVTOCI financial assets represent investment in Treasury Bills whose fair value are based on bid price and yield published by the Bank of Mauritius.
(v) Deposits and subordinated liabilities
The estimated fair value of deposits with no stated maturity, which includes non-interest-bearing deposits, is the amount repayable on demand.
The estimated fair value of fixed interest-bearing deposits and debt securities issued not quoted in an active market is based on discounted cash flows using interest rates for new debts with similar remaining maturity.
(vi) Other financial assets and liabilities on the statement of financial position
The fair values of other assets, other borrowed funds, provisions and other liabilities at the reporting date approximate their fair values.
(vii) Off-balance sheet financial instruments
Guarantees, acceptances, loans commitments and other financial liabilities are shown at their fair values.
The fair value of all the above instruments would be classified as level 3 in the fair value hierarchy.
(I) FAIR VALUE HIERARCHY
IFRS 13 specifies a hierarchy of valuation techniques based on whether the inputs to those valuation techniques are observable or unobservable. Observable inputs reflect market data obtained from independent sources; unobservable inputs reflect the Bank’s market assumptions. These two types of inputs have created the following fair value hierarchy:
Level - 1 Quoted prices (unadjusted) in active markets for identical assets or liabilities. This level includes listed equity securities and debt instruments on exchanges.
Level - 2 Inputs other than quoted prices included within Level 1 that are observable for the asset or liability, either directly (that is, as prices) or indirectly (that is, derived from prices). This level includes the majority of the Over-The-Counter derivative contracts, traded loans, issued structured debt and other investment securities.
Level - 3 Inputs for the asset or liability that are not based on observable market data (unobservable inputs). This level includes equity investments and debt instruments with significant unobservable components.
This hierarchy requires the use of observable market data when available. The Bank considers relevant and observable market prices in its valuations where possible.
The Bank’s Level 2 instruments consists of Derivatives held for risk management and investment securities. The input used in the fair value of these instruments relates to Libor interest rate, as published by Reuters, and yield curve by the Government of Mauritius.
As at 31 December 2020, the Bank holds equity investments with significant unobservable components falling under the Level 3 fair value hierarchy. The equity investment has been fair valued based on the market approach. Derivatives held for risk management falling under category Level 2, uses Quoted prices using Reuters platform. Level 3 fair values of Land and building have been derived using the services of a chartered valuer. Assets and liabilities whose fair value has been stated but not recognised in the financial statements are classified under level 3 of the fair value hierarchy.
The hierarchy requires the use of observable market data when applicable.
2 FINANCIAL RISK MANAGEMENT (CONT'D)
(G) LIQUIDITY RISK (CONT`D)
Derivative Cash Flows
Up to 1 month
1 to 3 months
3 to 6 months
6 to 12 months
1 to 3 Years > 3 Years
Non Maturity
Items TOTAL
Rs 000 Rs 000 Rs 000 Rs 000 Rs 000 Rs 000 Rs 000 Rs 000
As at 31 December 2020
Inflows 2,088,768 - 25,060 - - - - 2,113,828
Outflows 2,068,467 - 24,331 - - - - 2,092,798
As at 31 December 2019
Inflows 3,461,994 335,833 - 39 - - - 3,797,866
Outflows 3,490,677 335,270 - 39 - - - 3,825,986
As at 31 December 2018
Inflows 301,328 - 501,600 146 18 - - 803,092
Outflows 303,028 - 493,000 149 18 - - 796,195
(H) FINANCIAL INSTRUMENTS NOT MEASURED AT FAIR VALUE
The table below summarises the carrying amounts and fair values of those financial assets and liabilities not presented at fair value compared to carrying amounts shown in the financial statement.
Carrying value Fair value
2020 2019 2018 2020 2019 2018
Rs 000 Rs 000 Rs 000 Rs 000 Rs 000 Rs 000
Financial assets
Cash and cash equivalents 12,176,779 7,945,661 6,648,888 12,176,779 7,945,661 6,648,888
Loans and advances 20,640,066 27,840,692 23,612,890 20,529,418 28,728,900 23,519,476
Securities purchased under agreement to resell - 2,034,570 - - 2,034,570 -
Investment securities 10,228,322 13,066,886 4,162,879 10,421,159 12,080,152 4,169,559
Other Assets 1,395,745 1,502,889 1,319,459 1,395,745 1,502,889 1,319,459
Financial liabilities
Deposits 48,050,492 48,138,611 33,431,831 48,040,135 48,063,321 33,461,884
Other borrowed funds 3,767,074 2,449,494 1,103,473 3,762,072 2,449,494 1,103,473
Subordinated liabilities 1,387,217 713,831 699,636 1,392,219 713,831 699,636
Other liabilities 261,049 307,431 330,527 261,049 307,431 330,527
Off-balance sheet
Loan commitments 1,905,672 4,017,652 1,806,382 1,905,672 4,017,652 1,806,382
Other contingent liabilities 1,262,164 1,071,578 735,462 1,262,164 1,071,578 735,462
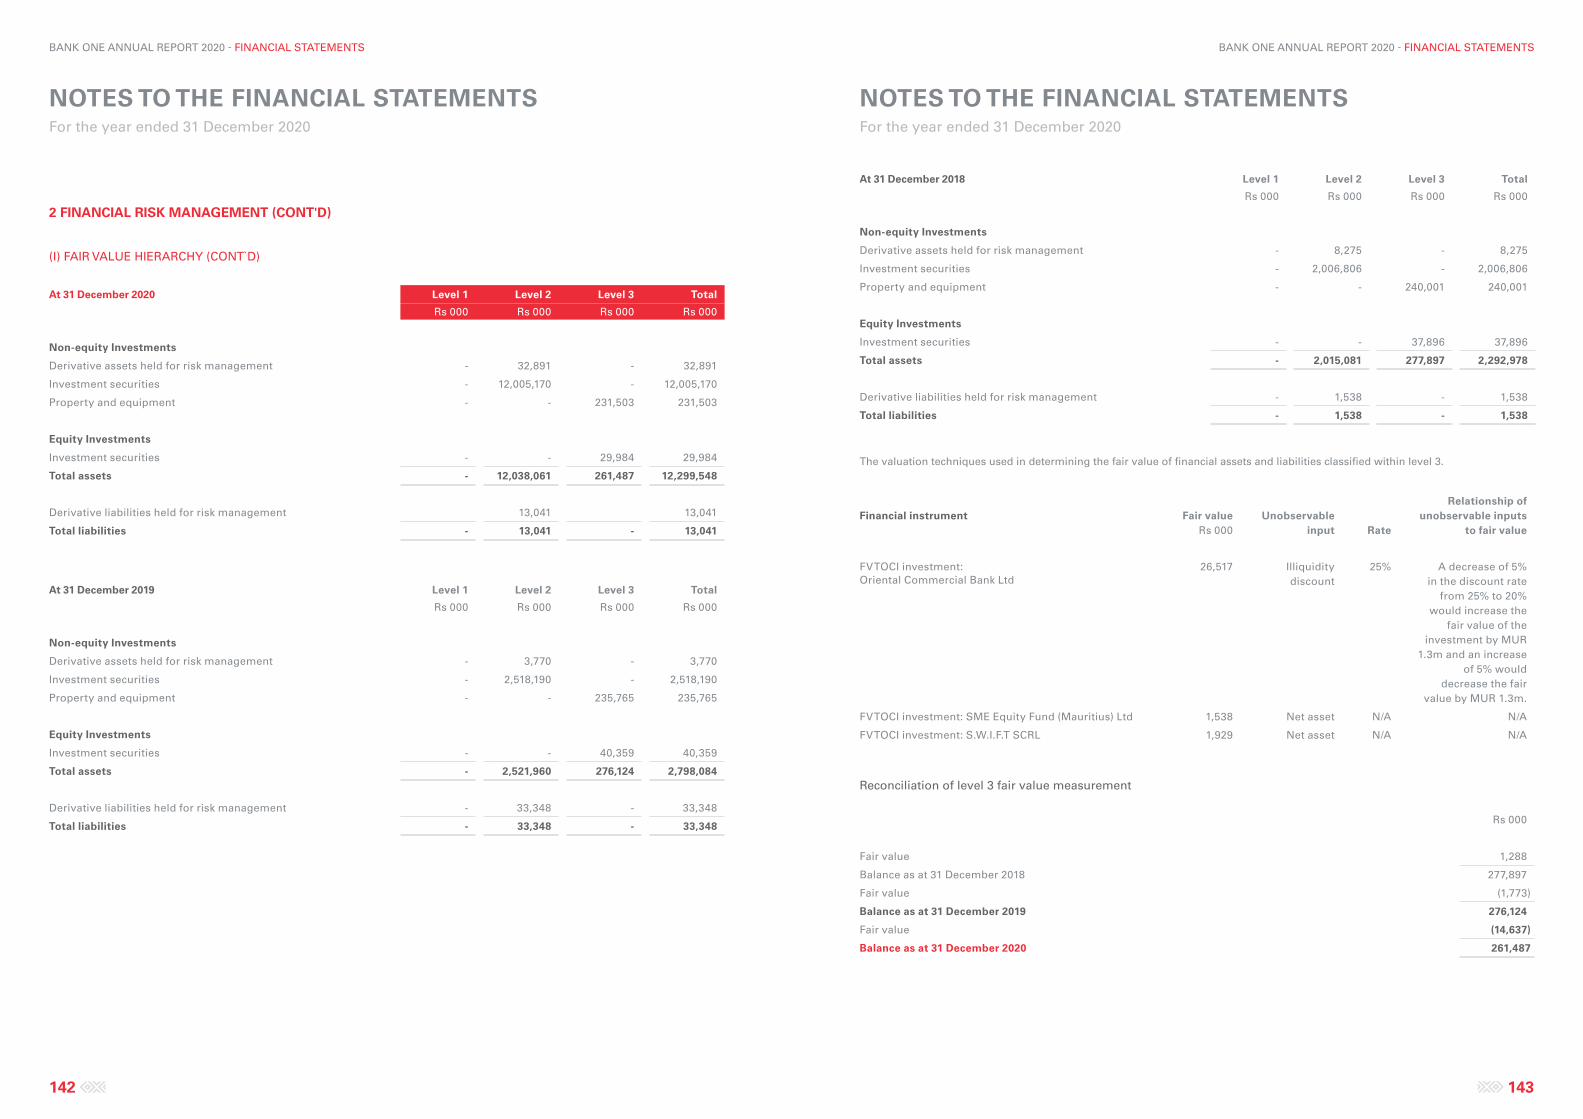
NOTES TO THE FINANCIAL STATEMENTS For the year ended 31 December 2020
NOTES TO THE FINANCIAL STATEMENTS For the year ended 31 December 2020
142 143
BANK ONE ANNUAL REPORT 2020 - FINANCIAL STATEMENTS BANK ONE ANNUAL REPORT 2020 - FINANCIAL STATEMENTS
At 31 December 2018 Level 1 Level 2 Level 3 Total
Rs 000 Rs 000 Rs 000 Rs 000
Non-equity Investments
Derivative assets held for risk management - 8,275 - 8,275
Investment securities - 2,006,806 - 2,006,806
Property and equipment - - 240,001 240,001
Equity Investments
Investment securities - - 37,896 37,896
Total assets - 2,015,081 277,897 2,292,978
Derivative liabilities held for risk management - 1,538 - 1,538
Total liabilities - 1,538 - 1,538
The valuation techniques used in determining the fair value of financial assets and liabilities classified within level 3.
Financial instrument Fair valueRs 000
Unobservable input Rate
Relationship of unobservable inputs
to fair value
FVTOCI investment: Oriental Commercial Bank Ltd
26,517 Illiquidity discount
25% A decrease of 5% in the discount rate
from 25% to 20% would increase the
fair value of the investment by MUR
1.3m and an increase of 5% would
decrease the fair value by MUR 1.3m.
FVTOCI investment: SME Equity Fund (Mauritius) Ltd 1,538 Net asset N/A N/A
FVTOCI investment: S.W.I.F.T SCRL 1,929 Net asset N/A N/A
Reconciliation of level 3 fair value measurement
Rs 000
Fair value 1,288
Balance as at 31 December 2018 277,897
Fair value (1,773)
Balance as at 31 December 2019 276,124
Fair value (14,637)
Balance as at 31 December 2020 261,487
2 FINANCIAL RISK MANAGEMENT (CONT'D)
(I) FAIR VALUE HIERARCHY (CONT`D)
At 31 December 2020 Level 1 Level 2 Level 3 Total
Rs 000 Rs 000 Rs 000 Rs 000
Non-equity Investments
Derivative assets held for risk management - 32,891 - 32,891
Investment securities - 12,005,170 - 12,005,170
Property and equipment - - 231,503 231,503
Equity Investments
Investment securities - - 29,984 29,984
Total assets - 12,038,061 261,487 12,299,548
Derivative liabilities held for risk management 13,041 13,041
Total liabilities - 13,041 - 13,041
At 31 December 2019 Level 1 Level 2 Level 3 Total
Rs 000 Rs 000 Rs 000 Rs 000
Non-equity Investments
Derivative assets held for risk management - 3,770 - 3,770
Investment securities - 2,518,190 - 2,518,190
Property and equipment - - 235,765 235,765
Equity Investments
Investment securities - - 40,359 40,359
Total assets - 2,521,960 276,124 2,798,084
Derivative liabilities held for risk management - 33,348 - 33,348
Total liabilities - 33,348 - 33,348
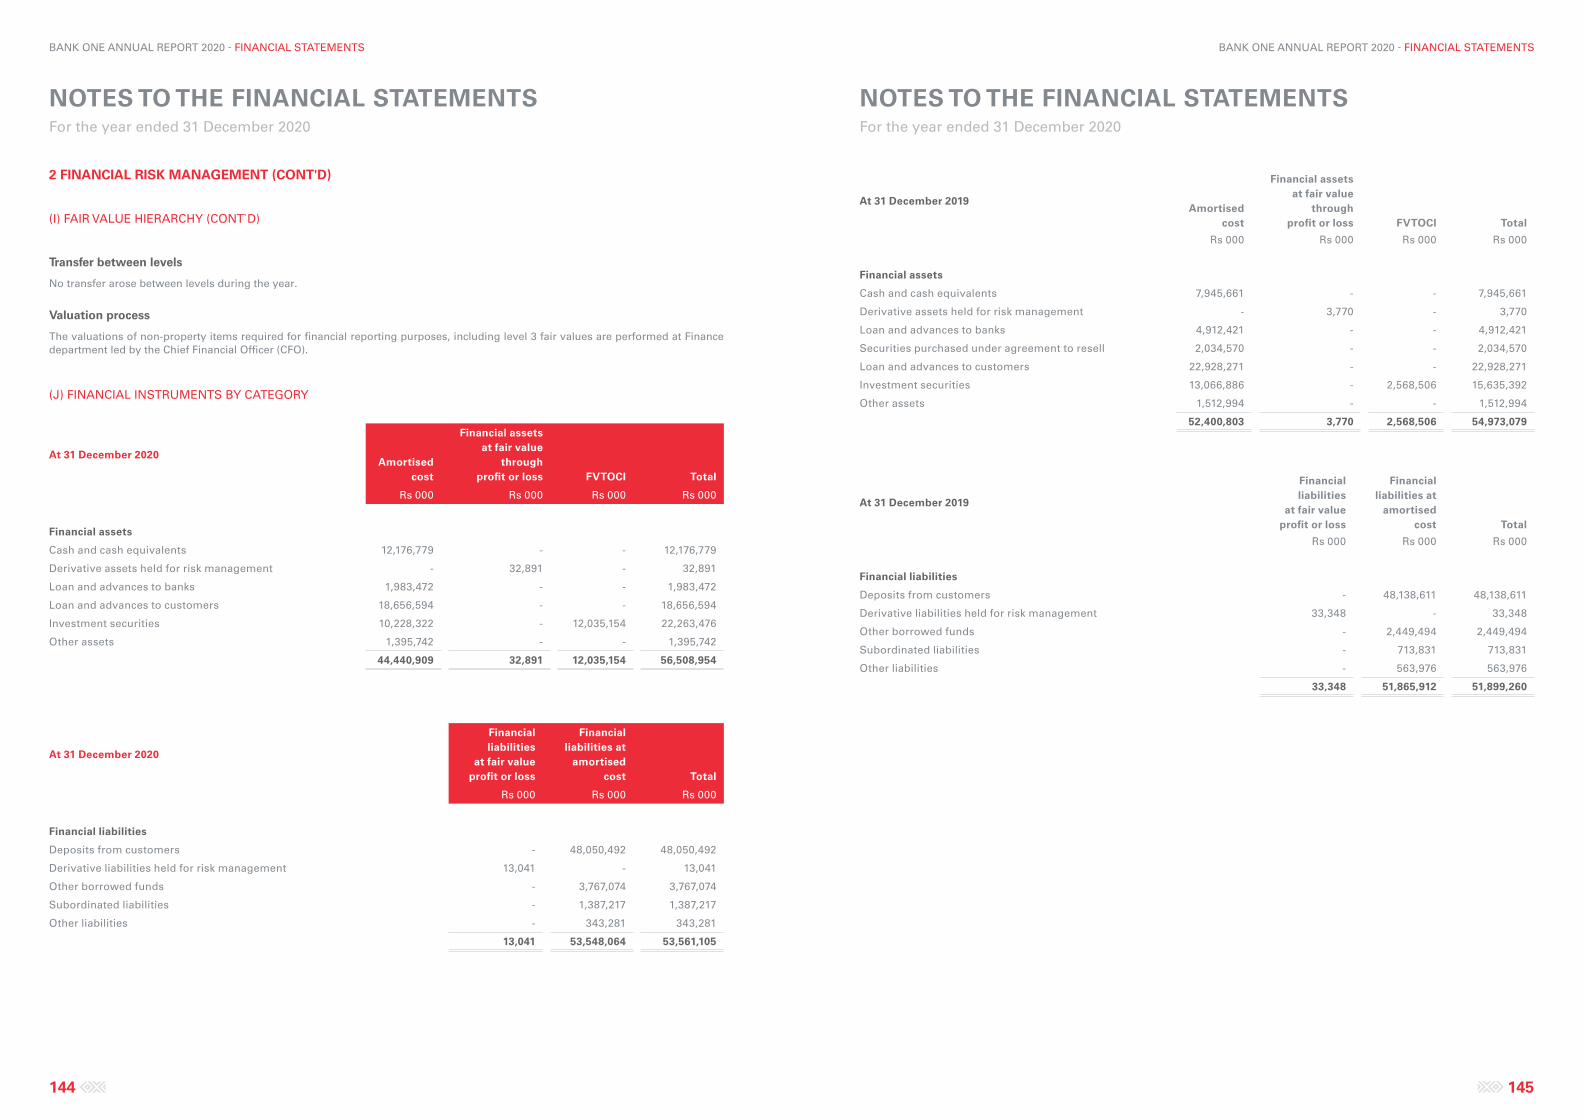
NOTES TO THE FINANCIAL STATEMENTS For the year ended 31 December 2020
NOTES TO THE FINANCIAL STATEMENTS For the year ended 31 December 2020
144 145
BANK ONE ANNUAL REPORT 2020 - FINANCIAL STATEMENTS BANK ONE ANNUAL REPORT 2020 - FINANCIAL STATEMENTS
At 31 December 2019Amortised
cost
Financial assets at fair value
through profit or loss FVTOCI Total
Rs 000 Rs 000 Rs 000 Rs 000
Financial assets
Cash and cash equivalents 7,945,661 - - 7,945,661
Derivative assets held for risk management - 3,770 - 3,770
Loan and advances to banks 4,912,421 - - 4,912,421
Securities purchased under agreement to resell 2,034,570 - - 2,034,570
Loan and advances to customers 22,928,271 - - 22,928,271
Investment securities 13,066,886 - 2,568,506 15,635,392
Other assets 1,512,994 - - 1,512,994
52,400,803 3,770 2,568,506 54,973,079
At 31 December 2019
Financial liabilities
at fair value profit or loss
Financial liabilities at
amortised cost Total
Rs 000 Rs 000 Rs 000
Financial liabilities
Deposits from customers - 48,138,611 48,138,611
Derivative liabilities held for risk management 33,348 - 33,348
Other borrowed funds - 2,449,494 2,449,494
Subordinated liabilities - 713,831 713,831
Other liabilities - 563,976 563,976
33,348 51,865,912 51,899,260
2 FINANCIAL RISK MANAGEMENT (CONT'D)
(I) FAIR VALUE HIERARCHY (CONT`D)
Transfer between levels
No transfer arose between levels during the year.
Valuation process
The valuations of non-property items required for financial reporting purposes, including level 3 fair values are performed at Finance department led by the Chief Financial Officer (CFO).
(J) FINANCIAL INSTRUMENTS BY CATEGORY
At 31 December 2020Amortised
cost
Financial assets at fair value
through profit or loss FVTOCI Total
Rs 000 Rs 000 Rs 000 Rs 000
Financial assets
Cash and cash equivalents 12,176,779 - - 12,176,779
Derivative assets held for risk management - 32,891 - 32,891
Loan and advances to banks 1,983,472 - - 1,983,472
Loan and advances to customers 18,656,594 - - 18,656,594
Investment securities 10,228,322 - 12,035,154 22,263,476
Other assets 1,395,742 - - 1,395,742
44,440,909 32,891 12,035,154 56,508,954
At 31 December 2020
Financial liabilities
at fair value profit or loss
Financial liabilities at
amortised cost Total
Rs 000 Rs 000 Rs 000
Financial liabilities
Deposits from customers - 48,050,492 48,050,492
Derivative liabilities held for risk management 13,041 - 13,041
Other borrowed funds - 3,767,074 3,767,074
Subordinated liabilities - 1,387,217 1,387,217
Other liabilities - 343,281 343,281
13,041 53,548,064 53,561,105
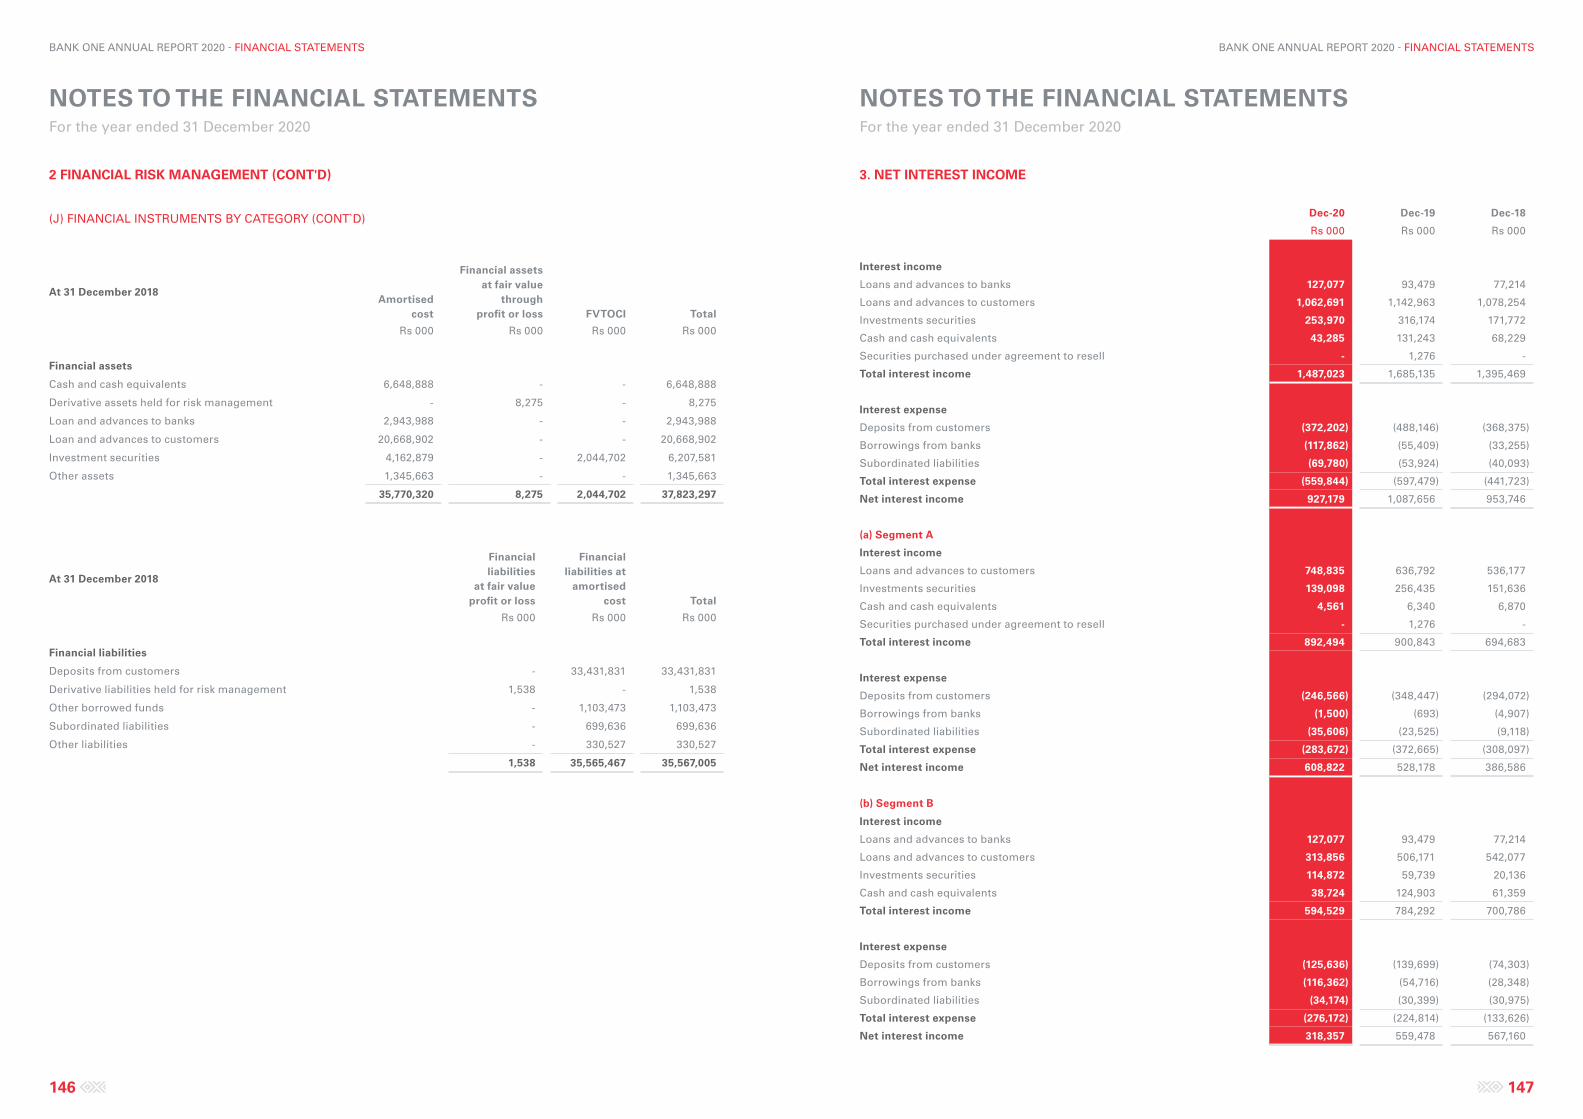
NOTES TO THE FINANCIAL STATEMENTS For the year ended 31 December 2020
NOTES TO THE FINANCIAL STATEMENTS For the year ended 31 December 2020
146 147
BANK ONE ANNUAL REPORT 2020 - FINANCIAL STATEMENTS BANK ONE ANNUAL REPORT 2020 - FINANCIAL STATEMENTS
3. NET INTEREST INCOME
Dec-20 Dec-19 Dec-18
Rs 000 Rs 000 Rs 000
Interest income
Loans and advances to banks 127,077 93,479 77,214
Loans and advances to customers 1,062,691 1,142,963 1,078,254
Investments securities 253,970 316,174 171,772
Cash and cash equivalents 43,285 131,243 68,229
Securities purchased under agreement to resell - 1,276 -
Total interest income 1,487,023 1,685,135 1,395,469
Interest expense
Deposits from customers (372,202) (488,146) (368,375)
Borrowings from banks (117,862) (55,409) (33,255)
Subordinated liabilities (69,780) (53,924) (40,093)
Total interest expense (559,844) (597,479) (441,723)
Net interest income 927,179 1,087,656 953,746
(a) Segment A
Interest income
Loans and advances to customers 748,835 636,792 536,177
Investments securities 139,098 256,435 151,636
Cash and cash equivalents 4,561 6,340 6,870
Securities purchased under agreement to resell - 1,276 -
Total interest income 892,494 900,843 694,683
Interest expense
Deposits from customers (246,566) (348,447) (294,072)
Borrowings from banks (1,500) (693) (4,907)
Subordinated liabilities (35,606) (23,525) (9,118)
Total interest expense (283,672) (372,665) (308,097)
Net interest income 608,822 528,178 386,586
(b) Segment B
Interest income
Loans and advances to banks 127,077 93,479 77,214
Loans and advances to customers 313,856 506,171 542,077
Investments securities 114,872 59,739 20,136
Cash and cash equivalents 38,724 124,903 61,359
Total interest income 594,529 784,292 700,786
Interest expense
Deposits from customers (125,636) (139,699) (74,303)
Borrowings from banks (116,362) (54,716) (28,348)
Subordinated liabilities (34,174) (30,399) (30,975)
Total interest expense (276,172) (224,814) (133,626)
Net interest income 318,357 559,478 567,160
2 FINANCIAL RISK MANAGEMENT (CONT'D)
(J) FINANCIAL INSTRUMENTS BY CATEGORY (CONT`D)
At 31 December 2018Amortised
cost
Financial assets at fair value
through profit or loss FVTOCI Total
Rs 000 Rs 000 Rs 000 Rs 000
Financial assets
Cash and cash equivalents 6,648,888 - - 6,648,888
Derivative assets held for risk management - 8,275 - 8,275
Loan and advances to banks 2,943,988 - - 2,943,988
Loan and advances to customers 20,668,902 - - 20,668,902
Investment securities 4,162,879 - 2,044,702 6,207,581
Other assets 1,345,663 - - 1,345,663
35,770,320 8,275 2,044,702 37,823,297
At 31 December 2018
Financial liabilities
at fair value profit or loss
Financial liabilities at
amortised cost Total
Rs 000 Rs 000 Rs 000
Financial liabilities
Deposits from customers - 33,431,831 33,431,831
Derivative liabilities held for risk management 1,538 - 1,538
Other borrowed funds - 1,103,473 1,103,473
Subordinated liabilities - 699,636 699,636
Other liabilities - 330,527 330,527
1,538 35,565,467 35,567,005
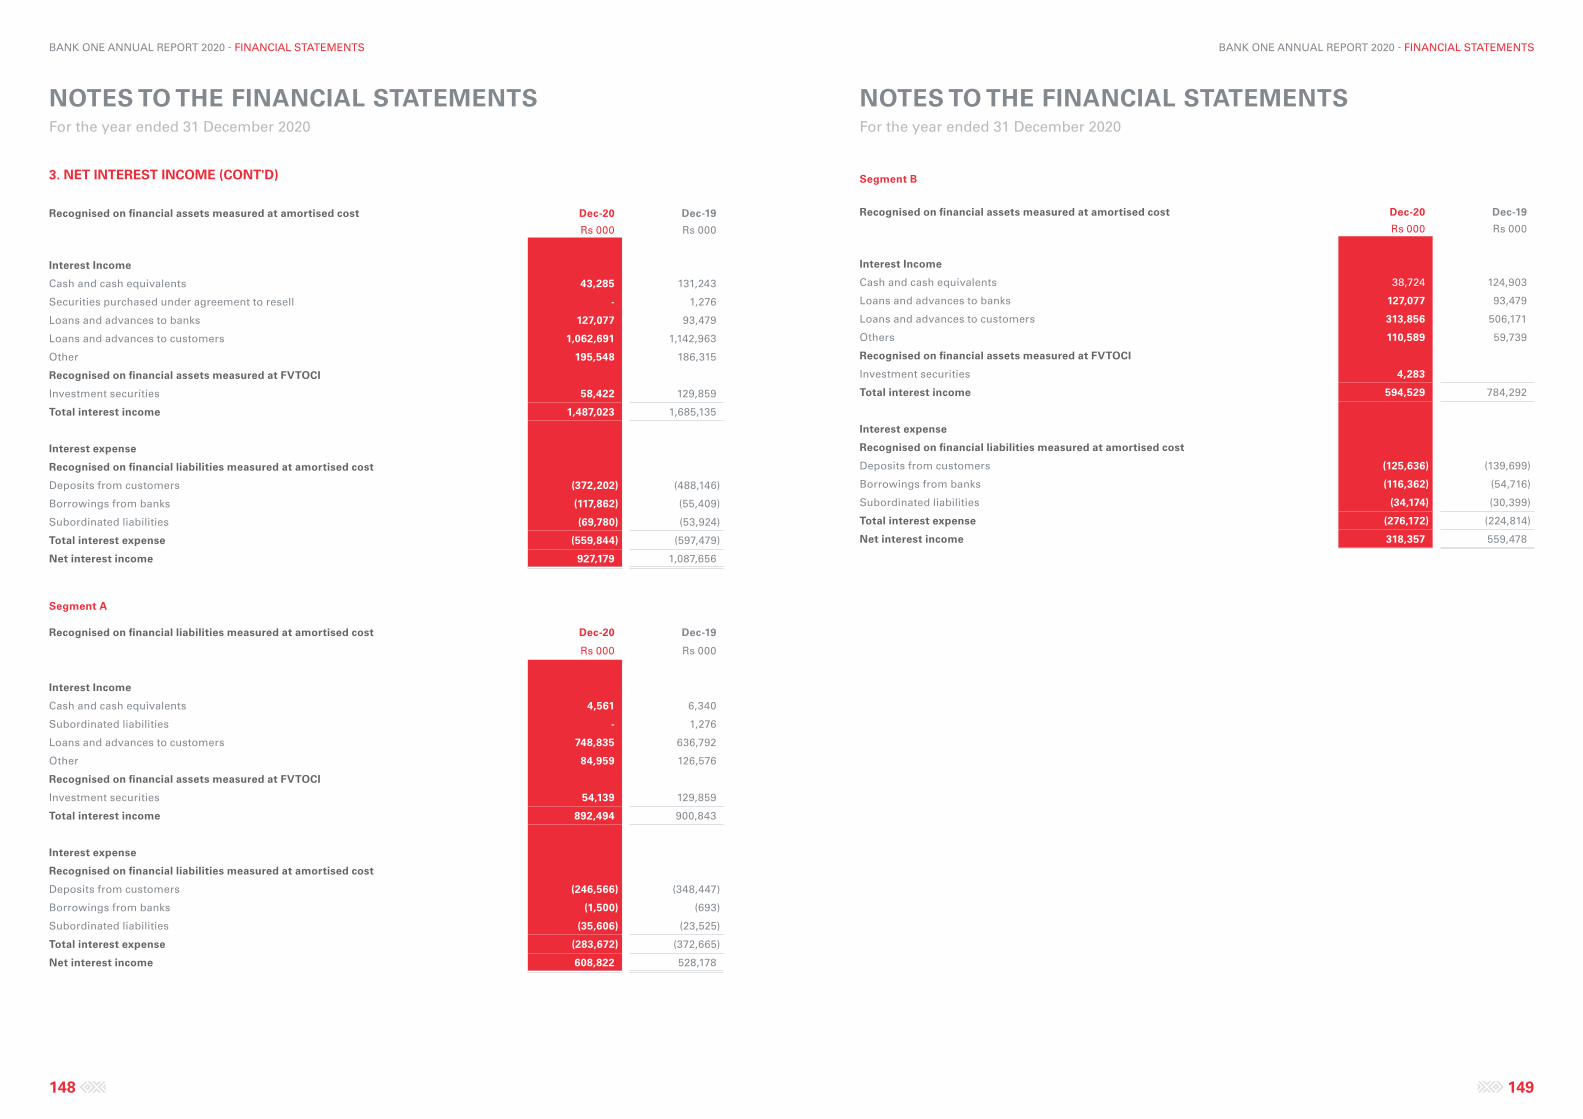
NOTES TO THE FINANCIAL STATEMENTS For the year ended 31 December 2020
NOTES TO THE FINANCIAL STATEMENTS For the year ended 31 December 2020
148 149
BANK ONE ANNUAL REPORT 2020 - FINANCIAL STATEMENTS BANK ONE ANNUAL REPORT 2020 - FINANCIAL STATEMENTS
Segment B
Recognised on financial assets measured at amortised cost Dec-20 Dec-19
Rs 000 Rs 000
Interest Income
Cash and cash equivalents 38,724 124,903
Loans and advances to banks 127,077 93,479
Loans and advances to customers 313,856 506,171
Others 110,589 59,739
Recognised on financial assets measured at FVTOCI
Investment securities 4,283
Total interest income 594,529 784,292
Interest expense
Recognised on financial liabilities measured at amortised cost
Deposits from customers (125,636) (139,699)
Borrowings from banks (116,362) (54,716)
Subordinated liabilities (34,174) (30,399)
Total interest expense (276,172) (224,814)
Net interest income 318,357 559,478
3. NET INTEREST INCOME (CONT'D)
Recognised on financial assets measured at amortised cost Dec-20 Dec-19
Rs 000 Rs 000
Interest Income
Cash and cash equivalents 43,285 131,243
Securities purchased under agreement to resell - 1,276
Loans and advances to banks 127,077 93,479
Loans and advances to customers 1,062,691 1,142,963
Other 195,548 186,315
Recognised on financial assets measured at FVTOCI
Investment securities 58,422 129,859
Total interest income 1,487,023 1,685,135
Interest expense
Recognised on financial liabilities measured at amortised cost
Deposits from customers (372,202) (488,146)
Borrowings from banks (117,862) (55,409)
Subordinated liabilities (69,780) (53,924)
Total interest expense (559,844) (597,479)
Net interest income 927,179 1,087,656
Segment A
Recognised on financial liabilities measured at amortised cost Dec-20 Dec-19
Rs 000 Rs 000
Interest Income
Cash and cash equivalents 4,561 6,340
Subordinated liabilities - 1,276
Loans and advances to customers 748,835 636,792
Other 84,959 126,576
Recognised on financial assets measured at FVTOCI
Investment securities 54,139 129,859
Total interest income 892,494 900,843
Interest expense
Recognised on financial liabilities measured at amortised cost
Deposits from customers (246,566) (348,447)
Borrowings from banks (1,500) (693)
Subordinated liabilities (35,606) (23,525)
Total interest expense (283,672) (372,665)
Net interest income 608,822 528,178
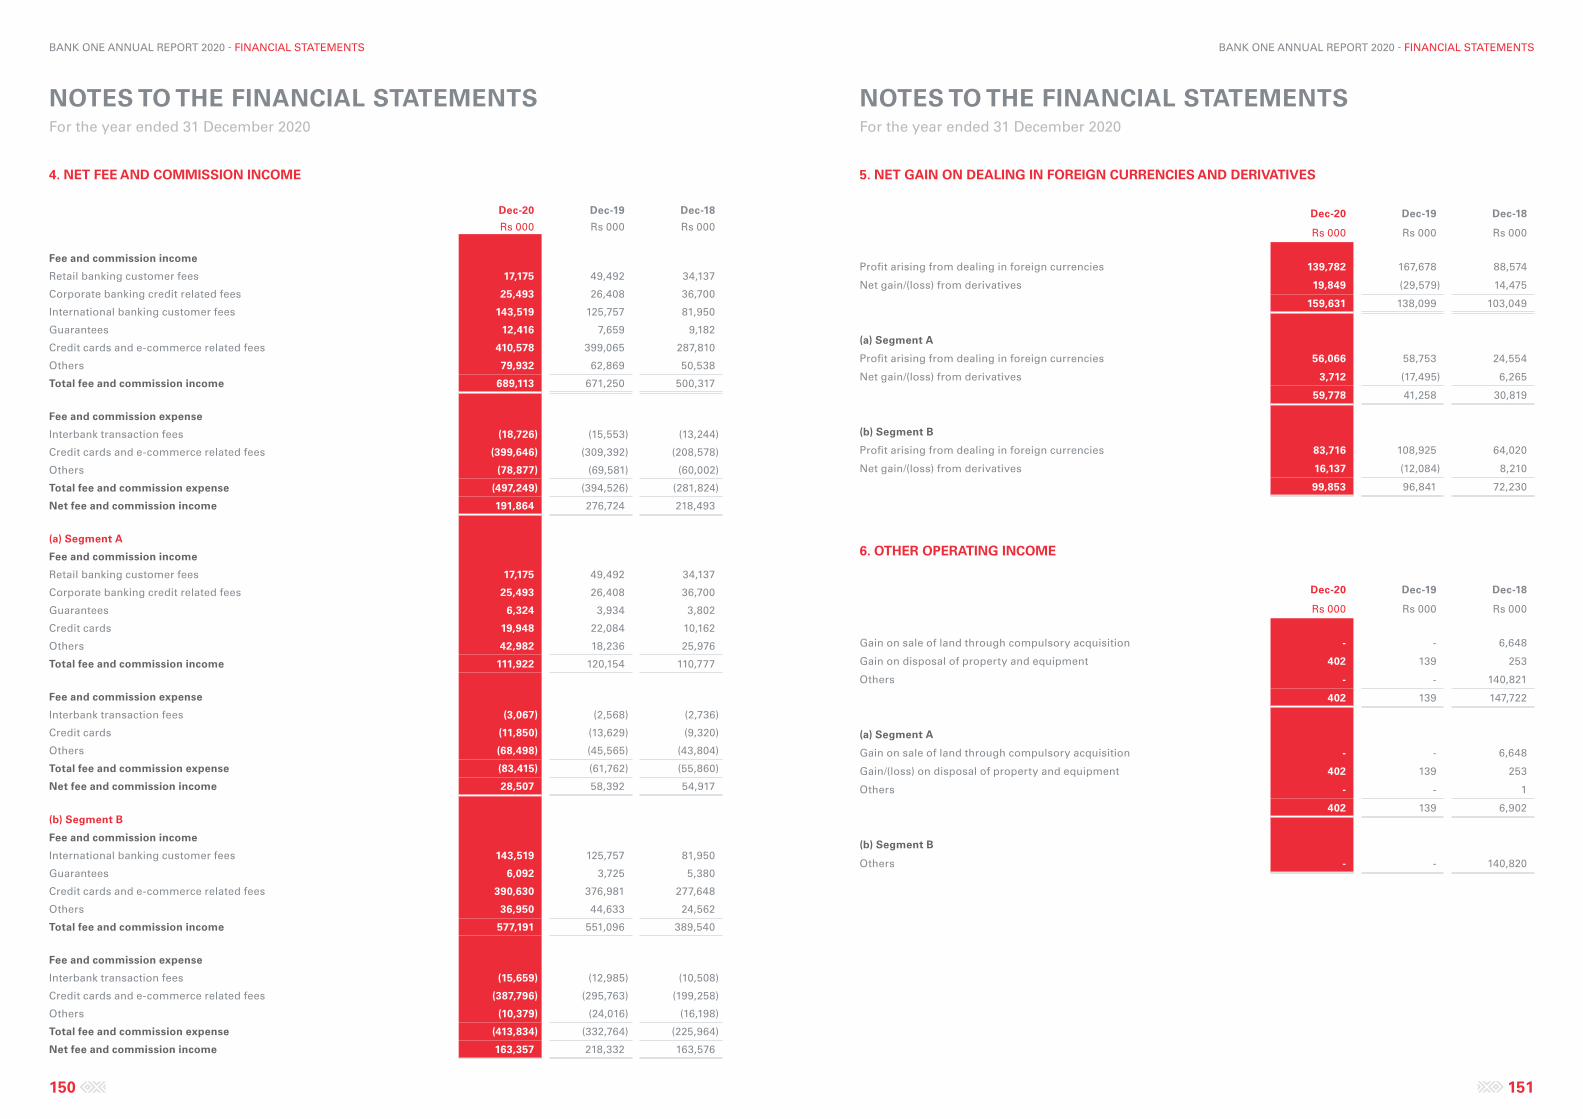
NOTES TO THE FINANCIAL STATEMENTS For the year ended 31 December 2020
NOTES TO THE FINANCIAL STATEMENTS For the year ended 31 December 2020
150 151
BANK ONE ANNUAL REPORT 2020 - FINANCIAL STATEMENTS BANK ONE ANNUAL REPORT 2020 - FINANCIAL STATEMENTS
5. NET GAIN ON DEALING IN FOREIGN CURRENCIES AND DERIVATIVES
Dec-20 Dec-19 Dec-18
Rs 000 Rs 000 Rs 000
Profit arising from dealing in foreign currencies 139,782 167,678 88,574
Net gain/(loss) from derivatives 19,849 (29,579) 14,475
159,631 138,099 103,049
(a) Segment A
Profit arising from dealing in foreign currencies 56,066 58,753 24,554
Net gain/(loss) from derivatives 3,712 (17,495) 6,265
59,778 41,258 30,819
(b) Segment B
Profit arising from dealing in foreign currencies 83,716 108,925 64,020
Net gain/(loss) from derivatives 16,137 (12,084) 8,210
99,853 96,841 72,230
6. OTHER OPERATING INCOME
Dec-20 Dec-19 Dec-18
Rs 000 Rs 000 Rs 000
Gain on sale of land through compulsory acquisition - - 6,648
Gain on disposal of property and equipment 402 139 253
Others - - 140,821
402 139 147,722
(a) Segment A
Gain on sale of land through compulsory acquisition - - 6,648
Gain/(loss) on disposal of property and equipment 402 139 253
Others - - 1
402 139 6,902
(b) Segment B
Others - - 140,820
4. NET FEE AND COMMISSION INCOME
Dec-20 Dec-19 Dec-18
Rs 000 Rs 000 Rs 000
Fee and commission income
Retail banking customer fees 17,175 49,492 34,137
Corporate banking credit related fees 25,493 26,408 36,700
International banking customer fees 143,519 125,757 81,950
Guarantees 12,416 7,659 9,182
Credit cards and e-commerce related fees 410,578 399,065 287,810
Others 79,932 62,869 50,538
Total fee and commission income 689,113 671,250 500,317
Fee and commission expense
Interbank transaction fees (18,726) (15,553) (13,244)
Credit cards and e-commerce related fees (399,646) (309,392) (208,578)
Others (78,877) (69,581) (60,002)
Total fee and commission expense (497,249) (394,526) (281,824)
Net fee and commission income 191,864 276,724 218,493
(a) Segment A
Fee and commission income
Retail banking customer fees 17,175 49,492 34,137
Corporate banking credit related fees 25,493 26,408 36,700
Guarantees 6,324 3,934 3,802
Credit cards 19,948 22,084 10,162
Others 42,982 18,236 25,976
Total fee and commission income 111,922 120,154 110,777
Fee and commission expense
Interbank transaction fees (3,067) (2,568) (2,736)
Credit cards (11,850) (13,629) (9,320)
Others (68,498) (45,565) (43,804)
Total fee and commission expense (83,415) (61,762) (55,860)
Net fee and commission income 28,507 58,392 54,917
(b) Segment B
Fee and commission income
International banking customer fees 143,519 125,757 81,950
Guarantees 6,092 3,725 5,380
Credit cards and e-commerce related fees 390,630 376,981 277,648
Others 36,950 44,633 24,562
Total fee and commission income 577,191 551,096 389,540
Fee and commission expense
Interbank transaction fees (15,659) (12,985) (10,508)
Credit cards and e-commerce related fees (387,796) (295,763) (199,258)
Others (10,379) (24,016) (16,198)
Total fee and commission expense (413,834) (332,764) (225,964)
Net fee and commission income 163,357 218,332 163,576
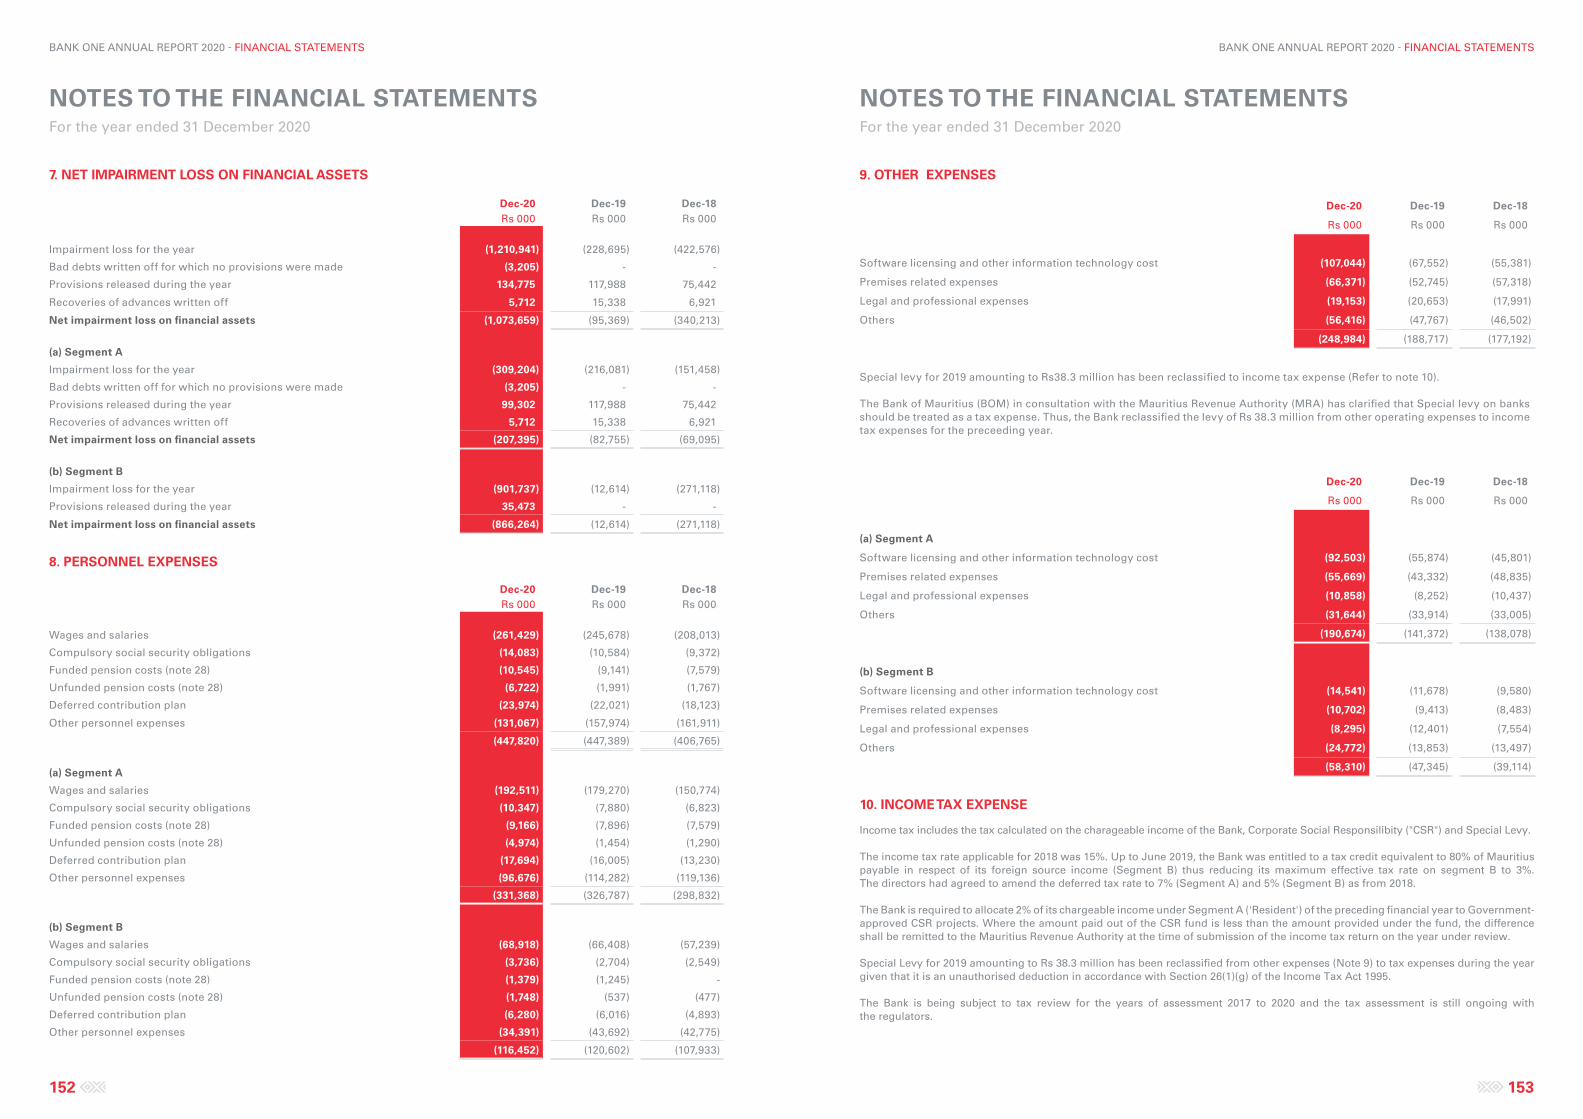
NOTES TO THE FINANCIAL STATEMENTS For the year ended 31 December 2020
NOTES TO THE FINANCIAL STATEMENTS For the year ended 31 December 2020
152 153
BANK ONE ANNUAL REPORT 2020 - FINANCIAL STATEMENTS BANK ONE ANNUAL REPORT 2020 - FINANCIAL STATEMENTS
7. NET IMPAIRMENT LOSS ON FINANCIAL ASSETS
Dec-20 Dec-19 Dec-18Rs 000 Rs 000 Rs 000
Impairment loss for the year (1,210,941) (228,695) (422,576)
Bad debts written off for which no provisions were made (3,205) - -
Provisions released during the year 134,775 117,988 75,442
Recoveries of advances written off 5,712 15,338 6,921
Net impairment loss on financial assets (1,073,659) (95,369) (340,213)
(a) Segment A
Impairment loss for the year (309,204) (216,081) (151,458)
Bad debts written off for which no provisions were made (3,205) - -
Provisions released during the year 99,302 117,988 75,442
Recoveries of advances written off 5,712 15,338 6,921
Net impairment loss on financial assets (207,395) (82,755) (69,095)
(b) Segment B
Impairment loss for the year (901,737) (12,614) (271,118)
Provisions released during the year 35,473 - -
Net impairment loss on financial assets (866,264) (12,614) (271,118)
8. PERSONNEL EXPENSES
Dec-20 Dec-19 Dec-18Rs 000 Rs 000 Rs 000
Wages and salaries (261,429) (245,678) (208,013)
Compulsory social security obligations (14,083) (10,584) (9,372)
Funded pension costs (note 28) (10,545) (9,141) (7,579)
Unfunded pension costs (note 28) (6,722) (1,991) (1,767)
Deferred contribution plan (23,974) (22,021) (18,123)
Other personnel expenses (131,067) (157,974) (161,911)
(447,820) (447,389) (406,765)
(a) Segment A
Wages and salaries (192,511) (179,270) (150,774)
Compulsory social security obligations (10,347) (7,880) (6,823)
Funded pension costs (note 28) (9,166) (7,896) (7,579)
Unfunded pension costs (note 28) (4,974) (1,454) (1,290)
Deferred contribution plan (17,694) (16,005) (13,230)
Other personnel expenses (96,676) (114,282) (119,136)
(331,368) (326,787) (298,832)
(b) Segment B
Wages and salaries (68,918) (66,408) (57,239)
Compulsory social security obligations (3,736) (2,704) (2,549)
Funded pension costs (note 28) (1,379) (1,245) -
Unfunded pension costs (note 28) (1,748) (537) (477)
Deferred contribution plan (6,280) (6,016) (4,893)
Other personnel expenses (34,391) (43,692) (42,775)
(116,452) (120,602) (107,933)
9. OTHER EXPENSES
Dec-20 Dec-19 Dec-18
Rs 000 Rs 000 Rs 000
Software licensing and other information technology cost (107,044) (67,552) (55,381)
Premises related expenses (66,371) (52,745) (57,318)
Legal and professional expenses (19,153) (20,653) (17,991)
Others (56,416) (47,767) (46,502)
(248,984) (188,717) (177,192)
Special levy for 2019 amounting to Rs38.3 million has been reclassified to income tax expense (Refer to note 10).
The Bank of Mauritius (BOM) in consultation with the Mauritius Revenue Authority (MRA) has clarified that Special levy on banks should be treated as a tax expense. Thus, the Bank reclassified the levy of Rs 38.3 million from other operating expenses to income tax expenses for the preceeding year.
Dec-20 Dec-19 Dec-18
Rs 000 Rs 000 Rs 000
(a) Segment A
Software licensing and other information technology cost (92,503) (55,874) (45,801)
Premises related expenses (55,669) (43,332) (48,835)
Legal and professional expenses (10,858) (8,252) (10,437)
Others (31,644) (33,914) (33,005)
(190,674) (141,372) (138,078)
(b) Segment B
Software licensing and other information technology cost (14,541) (11,678) (9,580)
Premises related expenses (10,702) (9,413) (8,483)
Legal and professional expenses (8,295) (12,401) (7,554)
Others (24,772) (13,853) (13,497)
(58,310) (47,345) (39,114)
10. INCOME TAX EXPENSE
Income tax includes the tax calculated on the charageable income of the Bank, Corporate Social Responsilibity ("CSR") and Special Levy. The income tax rate applicable for 2018 was 15%. Up to June 2019, the Bank was entitled to a tax credit equivalent to 80% of Mauritius payable in respect of its foreign source income (Segment B) thus reducing its maximum effective tax rate on segment B to 3%. The directors had agreed to amend the deferred tax rate to 7% (Segment A) and 5% (Segment B) as from 2018. The Bank is required to allocate 2% of its chargeable income under Segment A ('Resident') of the preceding financial year to Government-approved CSR projects. Where the amount paid out of the CSR fund is less than the amount provided under the fund, the difference shall be remitted to the Mauritius Revenue Authority at the time of submission of the income tax return on the year under review. Special Levy for 2019 amounting to Rs 38.3 million has been reclassified from other expenses (Note 9) to tax expenses during the year given that it is an unauthorised deduction in accordance with Section 26(1)(g) of the Income Tax Act 1995.
The Bank is being subject to tax review for the years of assessment 2017 to 2020 and the tax assessment is still ongoing with the regulators.
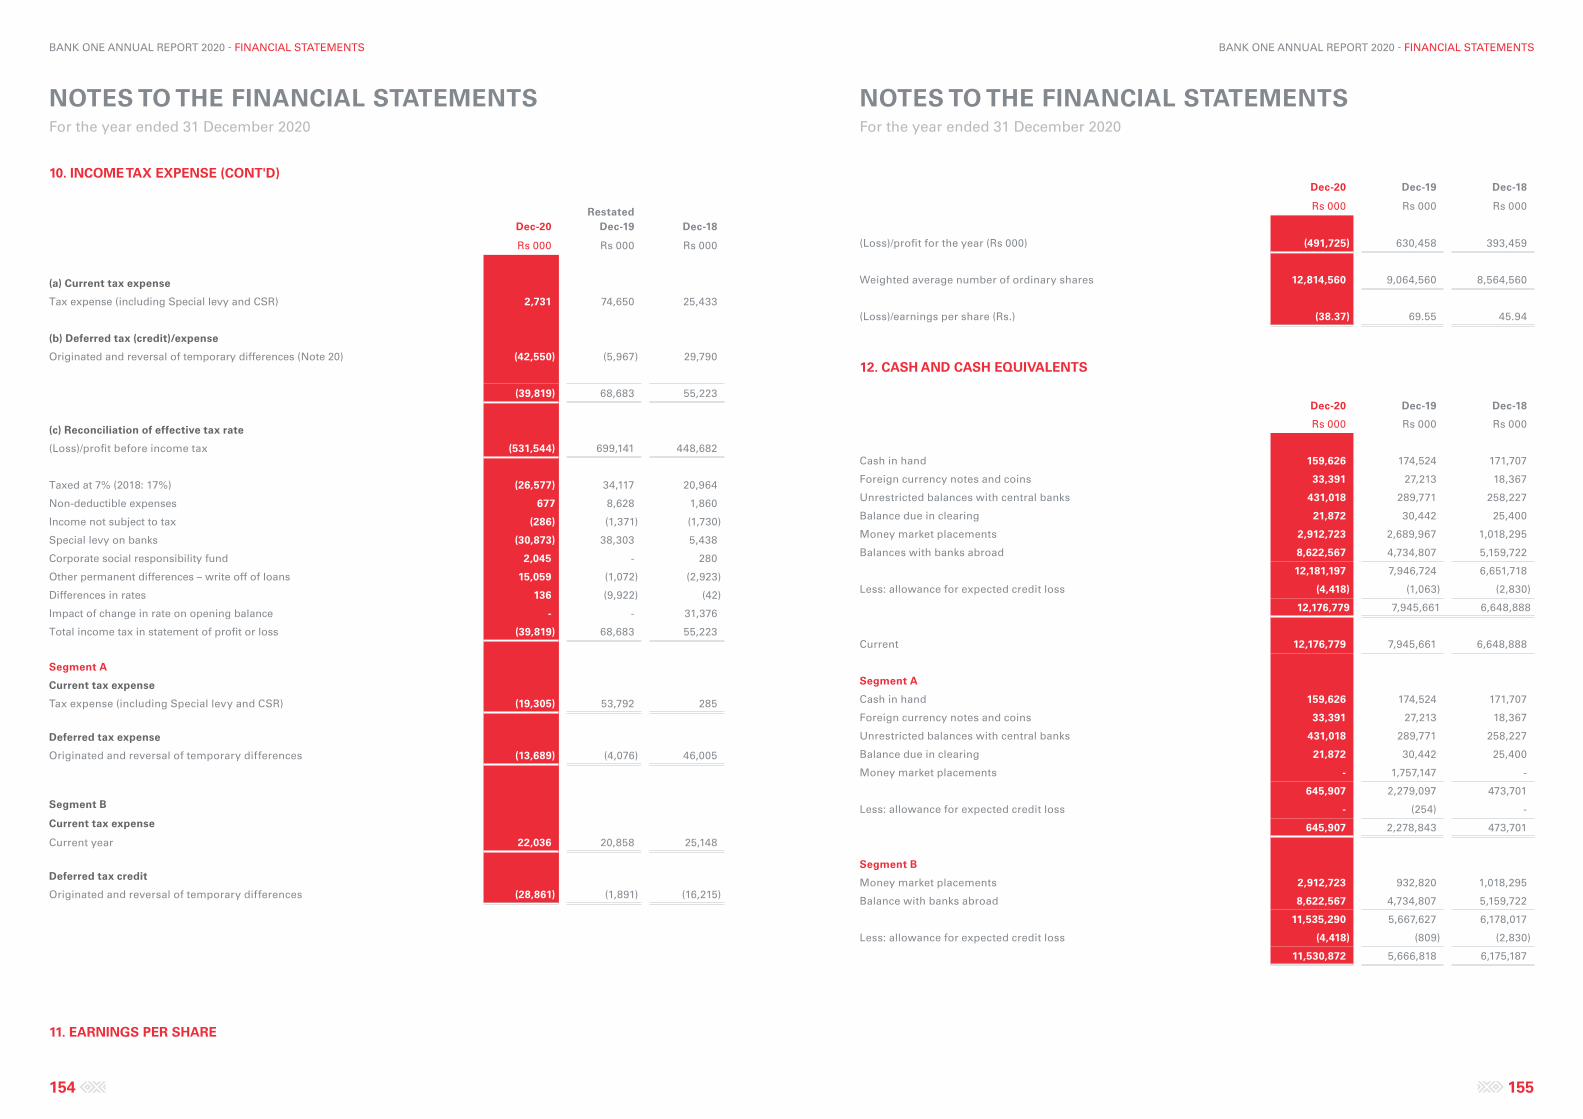
NOTES TO THE FINANCIAL STATEMENTS For the year ended 31 December 2020
NOTES TO THE FINANCIAL STATEMENTS For the year ended 31 December 2020
154 155
BANK ONE ANNUAL REPORT 2020 - FINANCIAL STATEMENTS BANK ONE ANNUAL REPORT 2020 - FINANCIAL STATEMENTS
Dec-20 Dec-19 Dec-18
Rs 000 Rs 000 Rs 000
(Loss)/profit for the year (Rs 000) (491,725) 630,458 393,459
Weighted average number of ordinary shares 12,814,560 9,064,560 8,564,560
(Loss)/earnings per share (Rs.) (38.37) 69.55 45.94
12. CASH AND CASH EQUIVALENTS
Dec-20 Dec-19 Dec-18
Rs 000 Rs 000 Rs 000
Cash in hand 159,626 174,524 171,707
Foreign currency notes and coins 33,391 27,213 18,367
Unrestricted balances with central banks 431,018 289,771 258,227
Balance due in clearing 21,872 30,442 25,400
Money market placements 2,912,723 2,689,967 1,018,295
Balances with banks abroad 8,622,567 4,734,807 5,159,722
12,181,197 7,946,724 6,651,718
Less: allowance for expected credit loss (4,418) (1,063) (2,830)
12,176,779 7,945,661 6,648,888
Current 12,176,779 7,945,661 6,648,888
Segment A
Cash in hand 159,626 174,524 171,707
Foreign currency notes and coins 33,391 27,213 18,367
Unrestricted balances with central banks 431,018 289,771 258,227
Balance due in clearing 21,872 30,442 25,400
Money market placements - 1,757,147 -
645,907 2,279,097 473,701
Less: allowance for expected credit loss - (254) -
645,907 2,278,843 473,701
Segment B
Money market placements 2,912,723 932,820 1,018,295
Balance with banks abroad 8,622,567 4,734,807 5,159,722
11,535,290 5,667,627 6,178,017
Less: allowance for expected credit loss (4,418) (809) (2,830)
11,530,872 5,666,818 6,175,187
10. INCOME TAX EXPENSE (CONT'D)
Dec-20Restated
Dec-19 Dec-18
Rs 000 Rs 000 Rs 000
(a) Current tax expense
Tax expense (including Special levy and CSR) 2,731 74,650 25,433
(b) Deferred tax (credit)/expense
Originated and reversal of temporary differences (Note 20) (42,550) (5,967) 29,790
(39,819) 68,683 55,223
(c) Reconciliation of effective tax rate
(Loss)/profit before income tax (531,544) 699,141 448,682
Taxed at 7% (2018: 17%) (26,577) 34,117 20,964
Non-deductible expenses 677 8,628 1,860
Income not subject to tax (286) (1,371) (1,730)
Special levy on banks (30,873) 38,303 5,438
Corporate social responsibility fund 2,045 - 280
Other permanent differences – write off of loans 15,059 (1,072) (2,923)
Differences in rates 136 (9,922) (42)
Impact of change in rate on opening balance - - 31,376
Total income tax in statement of profit or loss (39,819) 68,683 55,223
Segment A
Current tax expense
Tax expense (including Special levy and CSR) (19,305) 53,792 285
Deferred tax expense
Originated and reversal of temporary differences (13,689) (4,076) 46,005
Segment B
Current tax expense
Current year 22,036 20,858 25,148
Deferred tax credit
Originated and reversal of temporary differences (28,861) (1,891) (16,215)
11. EARNINGS PER SHARE
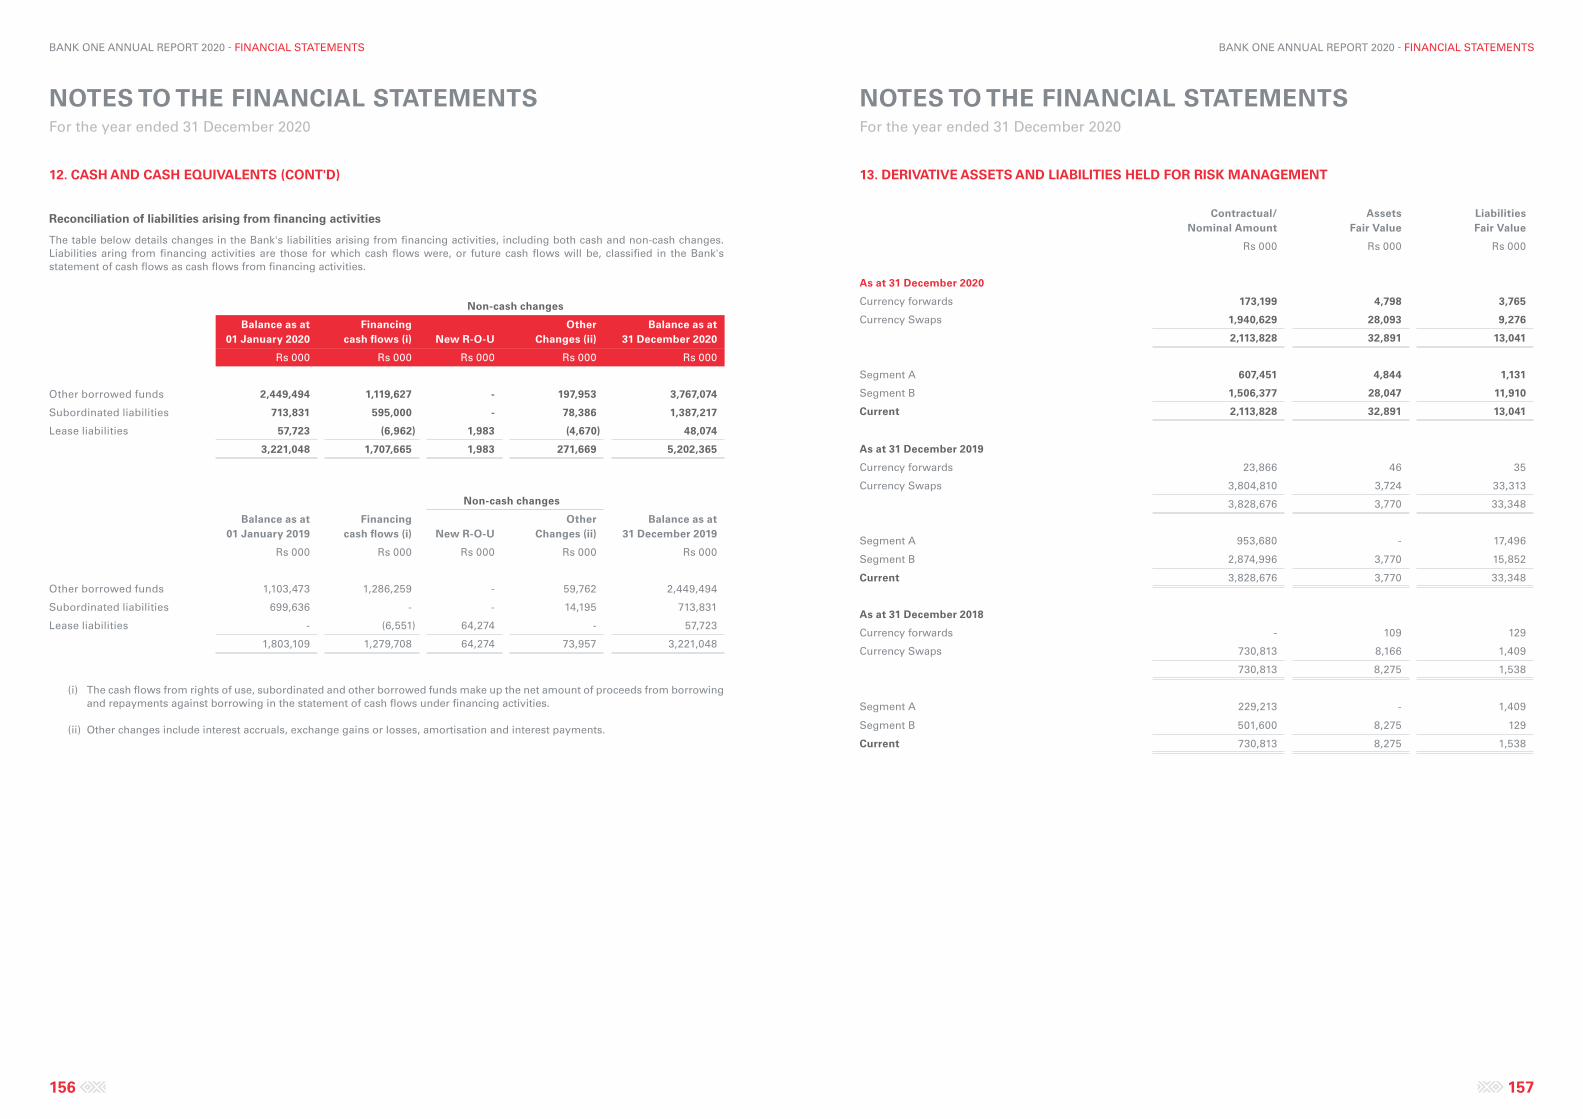
NOTES TO THE FINANCIAL STATEMENTS For the year ended 31 December 2020
NOTES TO THE FINANCIAL STATEMENTS For the year ended 31 December 2020
156 157
BANK ONE ANNUAL REPORT 2020 - FINANCIAL STATEMENTS BANK ONE ANNUAL REPORT 2020 - FINANCIAL STATEMENTS
13. DERIVATIVE ASSETS AND LIABILITIES HELD FOR RISK MANAGEMENT
Contractual/ Nominal Amount
Assets Fair Value
Liabilities Fair Value
Rs 000 Rs 000 Rs 000
As at 31 December 2020
Currency forwards 173,199 4,798 3,765
Currency Swaps 1,940,629 28,093 9,276
2,113,828 32,891 13,041
Segment A 607,451 4,844 1,131
Segment B 1,506,377 28,047 11,910
Current 2,113,828 32,891 13,041
As at 31 December 2019
Currency forwards 23,866 46 35
Currency Swaps 3,804,810 3,724 33,313
3,828,676 3,770 33,348
Segment A 953,680 - 17,496
Segment B 2,874,996 3,770 15,852
Current 3,828,676 3,770 33,348
As at 31 December 2018
Currency forwards - 109 129
Currency Swaps 730,813 8,166 1,409
730,813 8,275 1,538
Segment A 229,213 - 1,409
Segment B 501,600 8,275 129
Current 730,813 8,275 1,538
12. CASH AND CASH EQUIVALENTS (CONT'D)
Reconciliation of liabilities arising from financing activities
The table below details changes in the Bank's liabilities arising from financing activities, including both cash and non-cash changes. Liabilities aring from financing activities are those for which cash flows were, or future cash flows will be, classified in the Bank's statement of cash flows as cash flows from financing activities.
Non-cash changes
Balance as at 01 January 2020
Financing cash flows (i) New R-O-U
Other Changes (ii)
Balance as at 31 December 2020
Rs 000 Rs 000 Rs 000 Rs 000 Rs 000
Other borrowed funds 2,449,494 1,119,627 - 197,953 3,767,074
Subordinated liabilities 713,831 595,000 - 78,386 1,387,217
Lease liabilities 57,723 (6,962) 1,983 (4,670) 48,074
3,221,048 1,707,665 1,983 271,669 5,202,365
Non-cash changes
Balance as at 01 January 2019
Financing cash flows (i) New R-O-U
Other Changes (ii)
Balance as at 31 December 2019
Rs 000 Rs 000 Rs 000 Rs 000 Rs 000
Other borrowed funds 1,103,473 1,286,259 - 59,762 2,449,494
Subordinated liabilities 699,636 - - 14,195 713,831
Lease liabilities - (6,551) 64,274 - 57,723
1,803,109 1,279,708 64,274 73,957 3,221,048
(i) The cash flows from rights of use, subordinated and other borrowed funds make up the net amount of proceeds from borrowing and repayments against borrowing in the statement of cash flows under financing activities.
(ii) Other changes include interest accruals, exchange gains or losses, amortisation and interest payments.
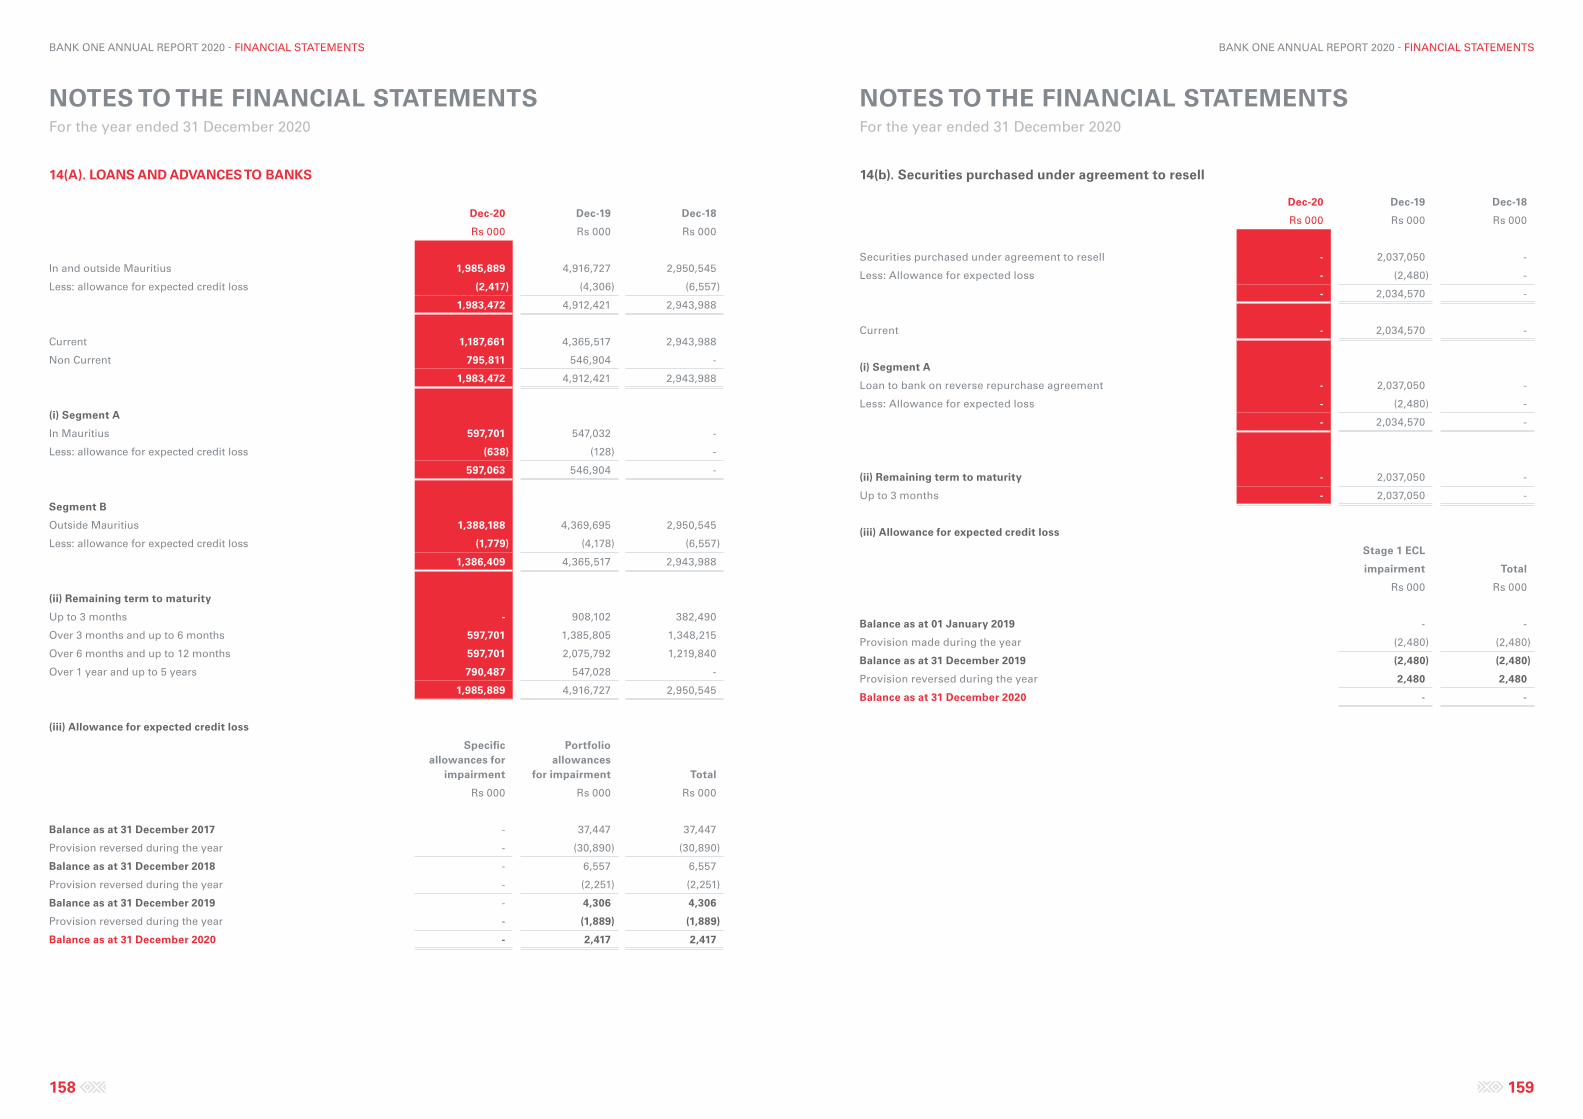
NOTES TO THE FINANCIAL STATEMENTS For the year ended 31 December 2020
NOTES TO THE FINANCIAL STATEMENTS For the year ended 31 December 2020
158 159
BANK ONE ANNUAL REPORT 2020 - FINANCIAL STATEMENTS BANK ONE ANNUAL REPORT 2020 - FINANCIAL STATEMENTS
14(b). Securities purchased under agreement to resell
Dec-20 Dec-19 Dec-18
Rs 000 Rs 000 Rs 000
Securities purchased under agreement to resell - 2,037,050 -
Less: Allowance for expected loss - (2,480) -
- 2,034,570 -
Current - 2,034,570 -
(i) Segment A
Loan to bank on reverse repurchase agreement - 2,037,050 -
Less: Allowance for expected loss - (2,480) -
- 2,034,570 -
(ii) Remaining term to maturity - 2,037,050 -
Up to 3 months - 2,037,050 -
(iii) Allowance for expected credit loss
Stage 1 ECL
impairment Total
Rs 000 Rs 000
Balance as at 01 January 2019 - -
Provision made during the year (2,480) (2,480)
Balance as at 31 December 2019 (2,480) (2,480)
Provision reversed during the year 2,480 2,480
Balance as at 31 December 2020 - -
14(A). LOANS AND ADVANCES TO BANKS
Dec-20 Dec-19 Dec-18
Rs 000 Rs 000 Rs 000
In and outside Mauritius 1,985,889 4,916,727 2,950,545
Less: allowance for expected credit loss (2,417) (4,306) (6,557)
1,983,472 4,912,421 2,943,988
Current 1,187,661 4,365,517 2,943,988
Non Current 795,811 546,904 -
1,983,472 4,912,421 2,943,988
(i) Segment A
In Mauritius 597,701 547,032 -
Less: allowance for expected credit loss (638) (128) -
597,063 546,904 -
Segment B
Outside Mauritius 1,388,188 4,369,695 2,950,545
Less: allowance for expected credit loss (1,779) (4,178) (6,557)
1,386,409 4,365,517 2,943,988
(ii) Remaining term to maturity
Up to 3 months - 908,102 382,490
Over 3 months and up to 6 months 597,701 1,385,805 1,348,215
Over 6 months and up to 12 months 597,701 2,075,792 1,219,840
Over 1 year and up to 5 years 790,487 547,028 -
1,985,889 4,916,727 2,950,545
(iii) Allowance for expected credit loss
Specific allowances for
impairment
Portfolioallowances
for impairment Total
Rs 000 Rs 000 Rs 000
Balance as at 31 December 2017 - 37,447 37,447
Provision reversed during the year - (30,890) (30,890)
Balance as at 31 December 2018 - 6,557 6,557
Provision reversed during the year - (2,251) (2,251)
Balance as at 31 December 2019 - 4,306 4,306
Provision reversed during the year - (1,889) (1,889)
Balance as at 31 December 2020 - 2,417 2,417
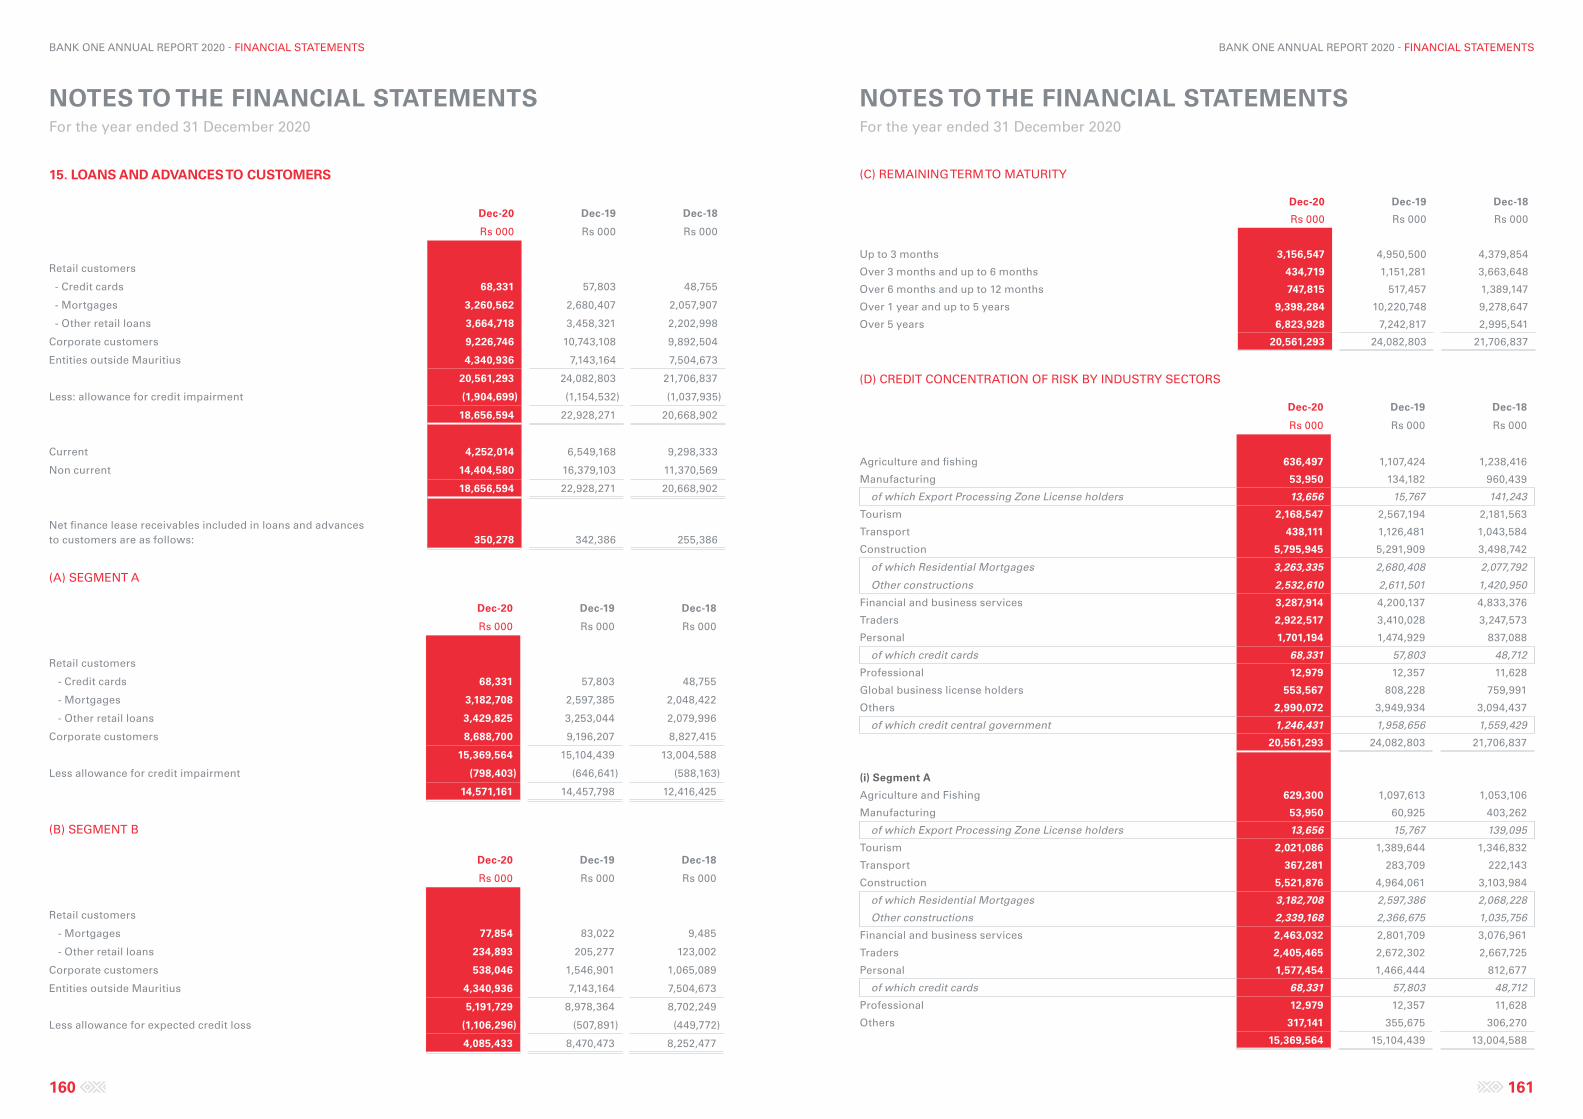
NOTES TO THE FINANCIAL STATEMENTS For the year ended 31 December 2020
NOTES TO THE FINANCIAL STATEMENTS For the year ended 31 December 2020
160 161
BANK ONE ANNUAL REPORT 2020 - FINANCIAL STATEMENTS BANK ONE ANNUAL REPORT 2020 - FINANCIAL STATEMENTS
(C) REMAINING TERM TO MATURITY
Dec-20 Dec-19 Dec-18
Rs 000 Rs 000 Rs 000
Up to 3 months 3,156,547 4,950,500 4,379,854
Over 3 months and up to 6 months 434,719 1,151,281 3,663,648
Over 6 months and up to 12 months 747,815 517,457 1,389,147
Over 1 year and up to 5 years 9,398,284 10,220,748 9,278,647
Over 5 years 6,823,928 7,242,817 2,995,541
20,561,293 24,082,803 21,706,837
(D) CREDIT CONCENTRATION OF RISK BY INDUSTRY SECTORS
Dec-20 Dec-19 Dec-18
Rs 000 Rs 000 Rs 000
Agriculture and fishing 636,497 1,107,424 1,238,416
Manufacturing 53,950 134,182 960,439
of which Export Processing Zone License holders 13,656 15,767 141,243
Tourism 2,168,547 2,567,194 2,181,563
Transport 438,111 1,126,481 1,043,584
Construction 5,795,945 5,291,909 3,498,742
of which Residential Mortgages 3,263,335 2,680,408 2,077,792
Other constructions 2,532,610 2,611,501 1,420,950
Financial and business services 3,287,914 4,200,137 4,833,376
Traders 2,922,517 3,410,028 3,247,573
Personal 1,701,194 1,474,929 837,088
of which credit cards 68,331 57,803 48,712
Professional 12,979 12,357 11,628
Global business license holders 553,567 808,228 759,991
Others 2,990,072 3,949,934 3,094,437
of which credit central government 1,246,431 1,958,656 1,559,429
20,561,293 24,082,803 21,706,837
(i) Segment A
Agriculture and Fishing 629,300 1,097,613 1,053,106
Manufacturing 53,950 60,925 403,262
of which Export Processing Zone License holders 13,656 15,767 139,095
Tourism 2,021,086 1,389,644 1,346,832
Transport 367,281 283,709 222,143
Construction 5,521,876 4,964,061 3,103,984
of which Residential Mortgages 3,182,708 2,597,386 2,068,228
Other constructions 2,339,168 2,366,675 1,035,756
Financial and business services 2,463,032 2,801,709 3,076,961
Traders 2,405,465 2,672,302 2,667,725
Personal 1,577,454 1,466,444 812,677
of which credit cards 68,331 57,803 48,712
Professional 12,979 12,357 11,628
Others 317,141 355,675 306,270
15,369,564 15,104,439 13,004,588
15. LOANS AND ADVANCES TO CUSTOMERS
Dec-20 Dec-19 Dec-18
Rs 000 Rs 000 Rs 000
Retail customers
- Credit cards 68,331 57,803 48,755
- Mortgages 3,260,562 2,680,407 2,057,907
- Other retail loans 3,664,718 3,458,321 2,202,998
Corporate customers 9,226,746 10,743,108 9,892,504
Entities outside Mauritius 4,340,936 7,143,164 7,504,673
20,561,293 24,082,803 21,706,837
Less: allowance for credit impairment (1,904,699) (1,154,532) (1,037,935)
18,656,594 22,928,271 20,668,902
Current 4,252,014 6,549,168 9,298,333
Non current 14,404,580 16,379,103 11,370,569
18,656,594 22,928,271 20,668,902
Net finance lease receivables included in loans and advances to customers are as follows: 350,278 342,386 255,386
(A) SEGMENT A
Dec-20 Dec-19 Dec-18
Rs 000 Rs 000 Rs 000
Retail customers
- Credit cards 68,331 57,803 48,755
- Mortgages 3,182,708 2,597,385 2,048,422
- Other retail loans 3,429,825 3,253,044 2,079,996
Corporate customers 8,688,700 9,196,207 8,827,415
15,369,564 15,104,439 13,004,588
Less allowance for credit impairment (798,403) (646,641) (588,163)
14,571,161 14,457,798 12,416,425
(B) SEGMENT B
Dec-20 Dec-19 Dec-18
Rs 000 Rs 000 Rs 000
Retail customers
- Mortgages 77,854 83,022 9,485
- Other retail loans 234,893 205,277 123,002
Corporate customers 538,046 1,546,901 1,065,089
Entities outside Mauritius 4,340,936 7,143,164 7,504,673
5,191,729 8,978,364 8,702,249
Less allowance for expected credit loss (1,106,296) (507,891) (449,772)
4,085,433 8,470,473 8,252,477
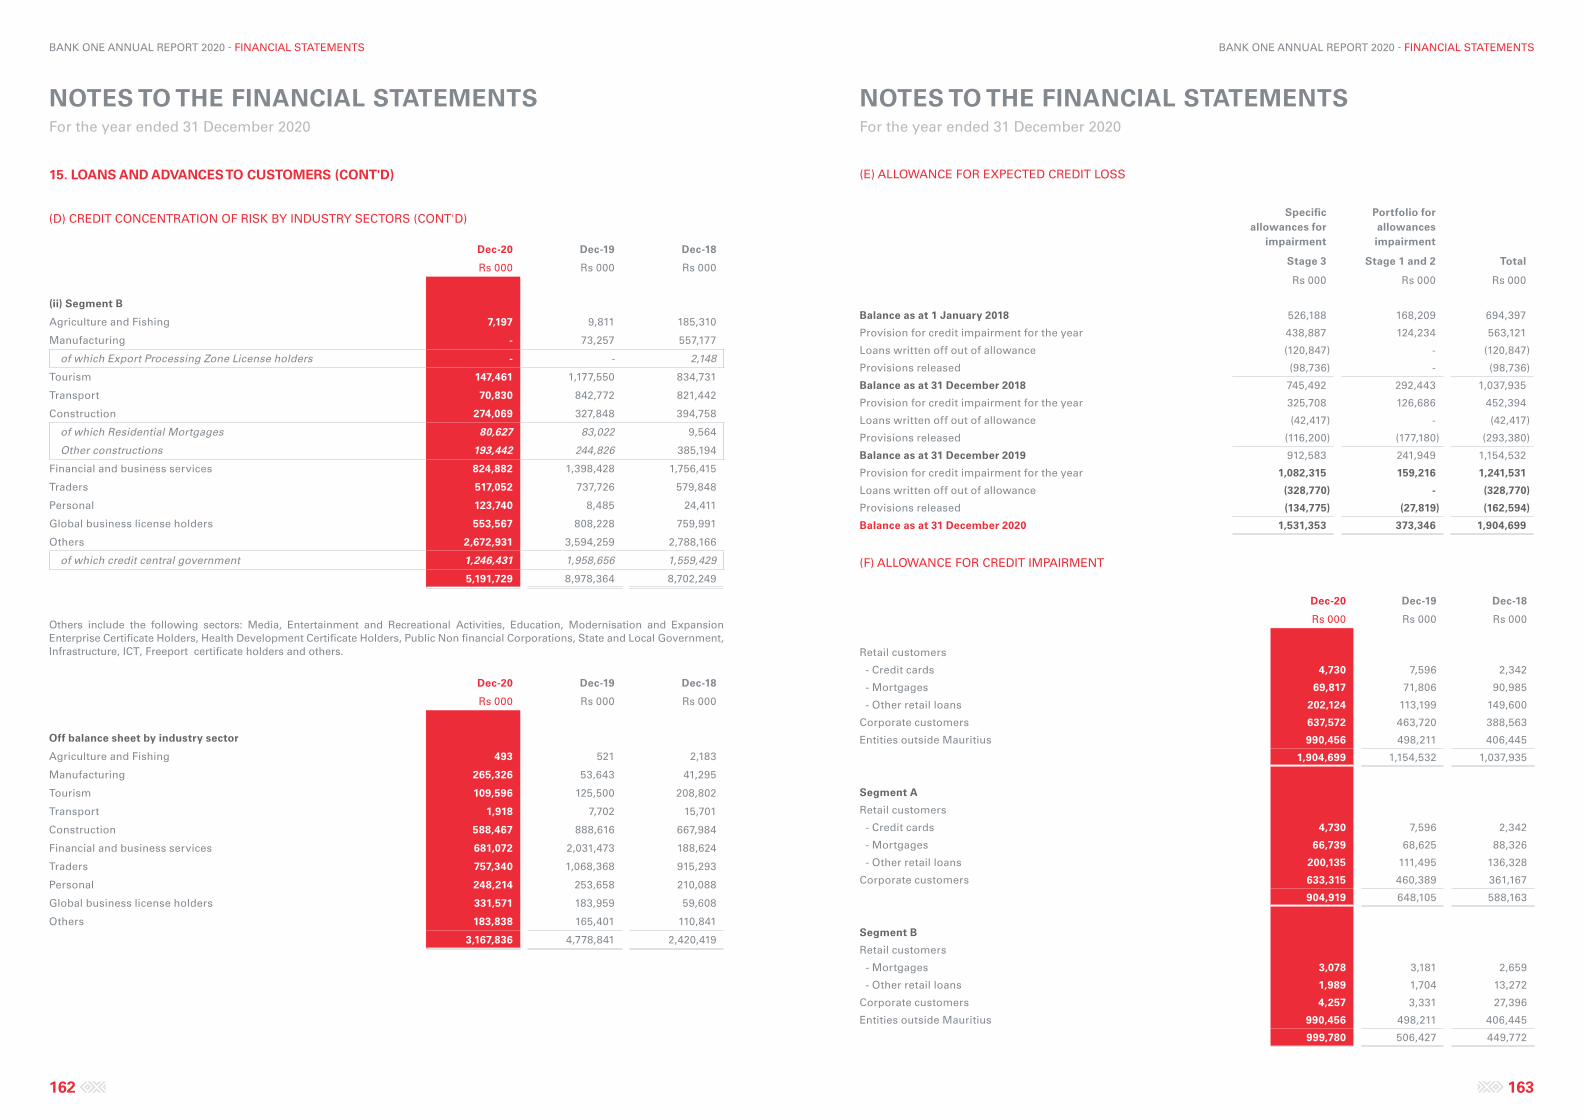
NOTES TO THE FINANCIAL STATEMENTS For the year ended 31 December 2020
NOTES TO THE FINANCIAL STATEMENTS For the year ended 31 December 2020
162 163
BANK ONE ANNUAL REPORT 2020 - FINANCIAL STATEMENTS BANK ONE ANNUAL REPORT 2020 - FINANCIAL STATEMENTS
(E) ALLOWANCE FOR EXPECTED CREDIT LOSS
Specific allowances for
impairment
Portfolio for allowances impairment
Stage 3 Stage 1 and 2 Total
Rs 000 Rs 000 Rs 000
Balance as at 1 January 2018 526,188 168,209 694,397
Provision for credit impairment for the year 438,887 124,234 563,121
Loans written off out of allowance (120,847) - (120,847)
Provisions released (98,736) - (98,736)
Balance as at 31 December 2018 745,492 292,443 1,037,935
Provision for credit impairment for the year 325,708 126,686 452,394
Loans written off out of allowance (42,417) - (42,417)
Provisions released (116,200) (177,180) (293,380)
Balance as at 31 December 2019 912,583 241,949 1,154,532
Provision for credit impairment for the year 1,082,315 159,216 1,241,531
Loans written off out of allowance (328,770) - (328,770)
Provisions released (134,775) (27,819) (162,594)
Balance as at 31 December 2020 1,531,353 373,346 1,904,699
(F) ALLOWANCE FOR CREDIT IMPAIRMENT
Dec-20 Dec-19 Dec-18
Rs 000 Rs 000 Rs 000
Retail customers
- Credit cards 4,730 7,596 2,342
- Mortgages 69,817 71,806 90,985
- Other retail loans 202,124 113,199 149,600
Corporate customers 637,572 463,720 388,563
Entities outside Mauritius 990,456 498,211 406,445
1,904,699 1,154,532 1,037,935
Segment A
Retail customers
- Credit cards 4,730 7,596 2,342
- Mortgages 66,739 68,625 88,326
- Other retail loans 200,135 111,495 136,328
Corporate customers 633,315 460,389 361,167
904,919 648,105 588,163
Segment B
Retail customers
- Mortgages 3,078 3,181 2,659
- Other retail loans 1,989 1,704 13,272
Corporate customers 4,257 3,331 27,396
Entities outside Mauritius 990,456 498,211 406,445
999,780 506,427 449,772
Dec-20 Dec-19 Dec-18
Rs 000 Rs 000 Rs 000
(ii) Segment B
Agriculture and Fishing 7,197 9,811 185,310
Manufacturing - 73,257 557,177
of which Export Processing Zone License holders - - 2,148
Tourism 147,461 1,177,550 834,731
Transport 70,830 842,772 821,442
Construction 274,069 327,848 394,758
of which Residential Mortgages 80,627 83,022 9,564
Other constructions 193,442 244,826 385,194
Financial and business services 824,882 1,398,428 1,756,415
Traders 517,052 737,726 579,848
Personal 123,740 8,485 24,411
Global business license holders 553,567 808,228 759,991
Others 2,672,931 3,594,259 2,788,166
of which credit central government 1,246,431 1,958,656 1,559,429
5,191,729 8,978,364 8,702,249
Others include the following sectors: Media, Entertainment and Recreational Activities, Education, Modernisation and Expansion Enterprise Certificate Holders, Health Development Certificate Holders, Public Non financial Corporations, State and Local Government, Infrastructure, ICT, Freeport certificate holders and others.
Dec-20 Dec-19 Dec-18
Rs 000 Rs 000 Rs 000
Off balance sheet by industry sector
Agriculture and Fishing 493 521 2,183
Manufacturing 265,326 53,643 41,295
Tourism 109,596 125,500 208,802
Transport 1,918 7,702 15,701
Construction 588,467 888,616 667,984
Financial and business services 681,072 2,031,473 188,624
Traders 757,340 1,068,368 915,293
Personal 248,214 253,658 210,088
Global business license holders 331,571 183,959 59,608
Others 183,838 165,401 110,841
3,167,836 4,778,841 2,420,419
15. LOANS AND ADVANCES TO CUSTOMERS (CONT'D)
(D) CREDIT CONCENTRATION OF RISK BY INDUSTRY SECTORS (CONT'D)
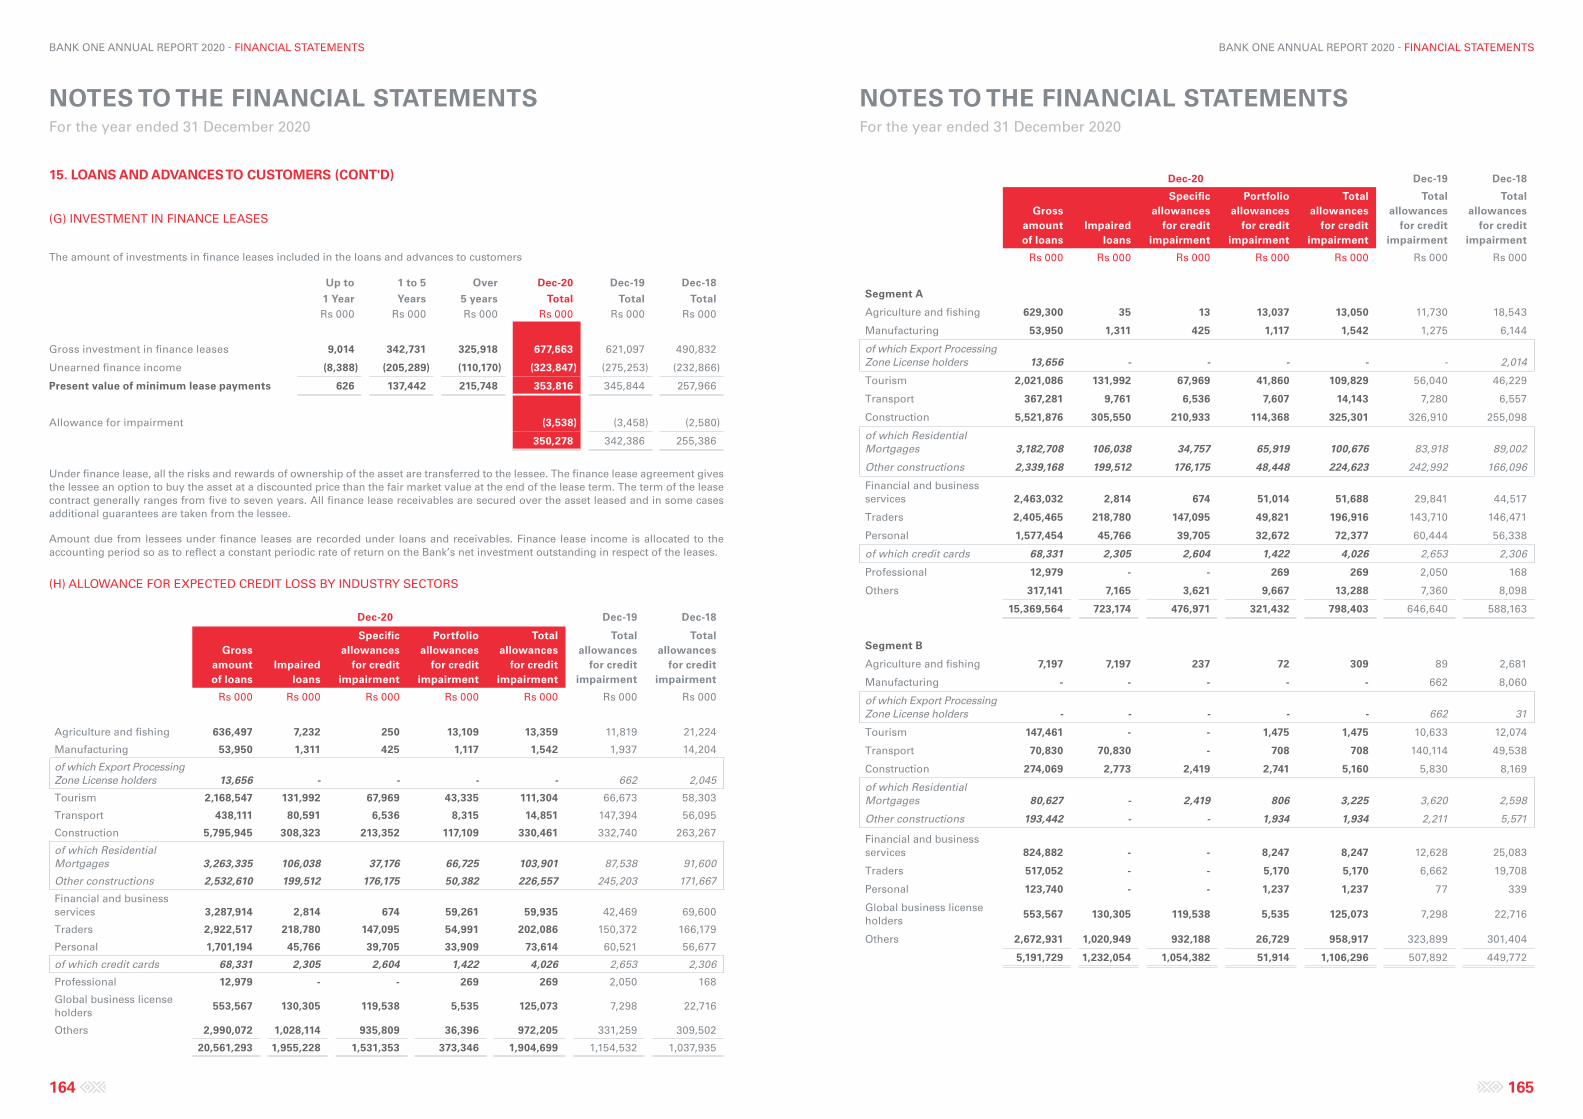
NOTES TO THE FINANCIAL STATEMENTS For the year ended 31 December 2020
NOTES TO THE FINANCIAL STATEMENTS For the year ended 31 December 2020
164 165
BANK ONE ANNUAL REPORT 2020 - FINANCIAL STATEMENTS BANK ONE ANNUAL REPORT 2020 - FINANCIAL STATEMENTS
Dec-20 Dec-19 Dec-18
Gross amount of loans
Impaired loans
Specific allowances
for credit impairment
Portfolio allowances
for credit impairment
Total allowances
for credit impairment
Total allowances
for credit impairment
Total allowances
for credit impairment
Rs 000 Rs 000 Rs 000 Rs 000 Rs 000 Rs 000 Rs 000
Segment A
Agriculture and fishing 629,300 35 13 13,037 13,050 11,730 18,543
Manufacturing 53,950 1,311 425 1,117 1,542 1,275 6,144
of which Export Processing Zone License holders 13,656 - - - - - 2,014
Tourism 2,021,086 131,992 67,969 41,860 109,829 56,040 46,229
Transport 367,281 9,761 6,536 7,607 14,143 7,280 6,557
Construction 5,521,876 305,550 210,933 114,368 325,301 326,910 255,098
of which Residential Mortgages 3,182,708 106,038 34,757 65,919 100,676 83,918 89,002
Other constructions 2,339,168 199,512 176,175 48,448 224,623 242,992 166,096
Financial and business services 2,463,032 2,814 674 51,014 51,688 29,841 44,517
Traders 2,405,465 218,780 147,095 49,821 196,916 143,710 146,471
Personal 1,577,454 45,766 39,705 32,672 72,377 60,444 56,338
of which credit cards 68,331 2,305 2,604 1,422 4,026 2,653 2,306
Professional 12,979 - - 269 269 2,050 168
Others 317,141 7,165 3,621 9,667 13,288 7,360 8,098
15,369,564 723,174 476,971 321,432 798,403 646,640 588,163
Segment B
Agriculture and fishing 7,197 7,197 237 72 309 89 2,681
Manufacturing - - - - - 662 8,060
of which Export Processing Zone License holders - - - - - 662 31
Tourism 147,461 - - 1,475 1,475 10,633 12,074
Transport 70,830 70,830 - 708 708 140,114 49,538
Construction 274,069 2,773 2,419 2,741 5,160 5,830 8,169
of which Residential Mortgages 80,627 - 2,419 806 3,225 3,620 2,598
Other constructions 193,442 - - 1,934 1,934 2,211 5,571
Financial and business services 824,882 - - 8,247 8,247 12,628 25,083
Traders 517,052 - - 5,170 5,170 6,662 19,708
Personal 123,740 - - 1,237 1,237 77 339
Global business license holders
553,567 130,305 119,538 5,535 125,073 7,298 22,716
Others 2,672,931 1,020,949 932,188 26,729 958,917 323,899 301,404
5,191,729 1,232,054 1,054,382 51,914 1,106,296 507,892 449,772
15. LOANS AND ADVANCES TO CUSTOMERS (CONT'D)
(G) INVESTMENT IN FINANCE LEASES
The amount of investments in finance leases included in the loans and advances to customers
Up to 1 to 5 Over Dec-20 Dec-19 Dec-18
1 Year Years 5 years Total Total TotalRs 000 Rs 000 Rs 000 Rs 000 Rs 000 Rs 000
Gross investment in finance leases 9,014 342,731 325,918 677,663 621,097 490,832
Unearned finance income (8,388) (205,289) (110,170) (323,847) (275,253) (232,866)
Present value of minimum lease payments 626 137,442 215,748 353,816 345,844 257,966
Allowance for impairment (3,538) (3,458) (2,580)
350,278 342,386 255,386
Under finance lease, all the risks and rewards of ownership of the asset are transferred to the lessee. The finance lease agreement gives the lessee an option to buy the asset at a discounted price than the fair market value at the end of the lease term. The term of the lease contract generally ranges from five to seven years. All finance lease receivables are secured over the asset leased and in some cases additional guarantees are taken from the lessee.
Amount due from lessees under finance leases are recorded under loans and receivables. Finance lease income is allocated to the accounting period so as to reflect a constant periodic rate of return on the Bank’s net investment outstanding in respect of the leases.
(H) ALLOWANCE FOR EXPECTED CREDIT LOSS BY INDUSTRY SECTORS
Dec-20 Dec-19 Dec-18
Gross amount of loans
Impaired loans
Specific allowances
for credit impairment
Portfolio allowances
for credit impairment
Total allowances
for credit impairment
Total allowances
for credit impairment
Total allowances
for credit impairment
Rs 000 Rs 000 Rs 000 Rs 000 Rs 000 Rs 000 Rs 000
Agriculture and fishing 636,497 7,232 250 13,109 13,359 11,819 21,224
Manufacturing 53,950 1,311 425 1,117 1,542 1,937 14,204
of which Export Processing Zone License holders 13,656 - - - - 662 2,045
Tourism 2,168,547 131,992 67,969 43,335 111,304 66,673 58,303
Transport 438,111 80,591 6,536 8,315 14,851 147,394 56,095
Construction 5,795,945 308,323 213,352 117,109 330,461 332,740 263,267
of which Residential Mortgages 3,263,335 106,038 37,176 66,725 103,901 87,538 91,600
Other constructions 2,532,610 199,512 176,175 50,382 226,557 245,203 171,667
Financial and business services 3,287,914 2,814 674 59,261 59,935 42,469 69,600
Traders 2,922,517 218,780 147,095 54,991 202,086 150,372 166,179
Personal 1,701,194 45,766 39,705 33,909 73,614 60,521 56,677
of which credit cards 68,331 2,305 2,604 1,422 4,026 2,653 2,306
Professional 12,979 - - 269 269 2,050 168
Global business license holders
553,567 130,305 119,538 5,535 125,073 7,298 22,716
Others 2,990,072 1,028,114 935,809 36,396 972,205 331,259 309,502
20,561,293 1,955,228 1,531,353 373,346 1,904,699 1,154,532 1,037,935
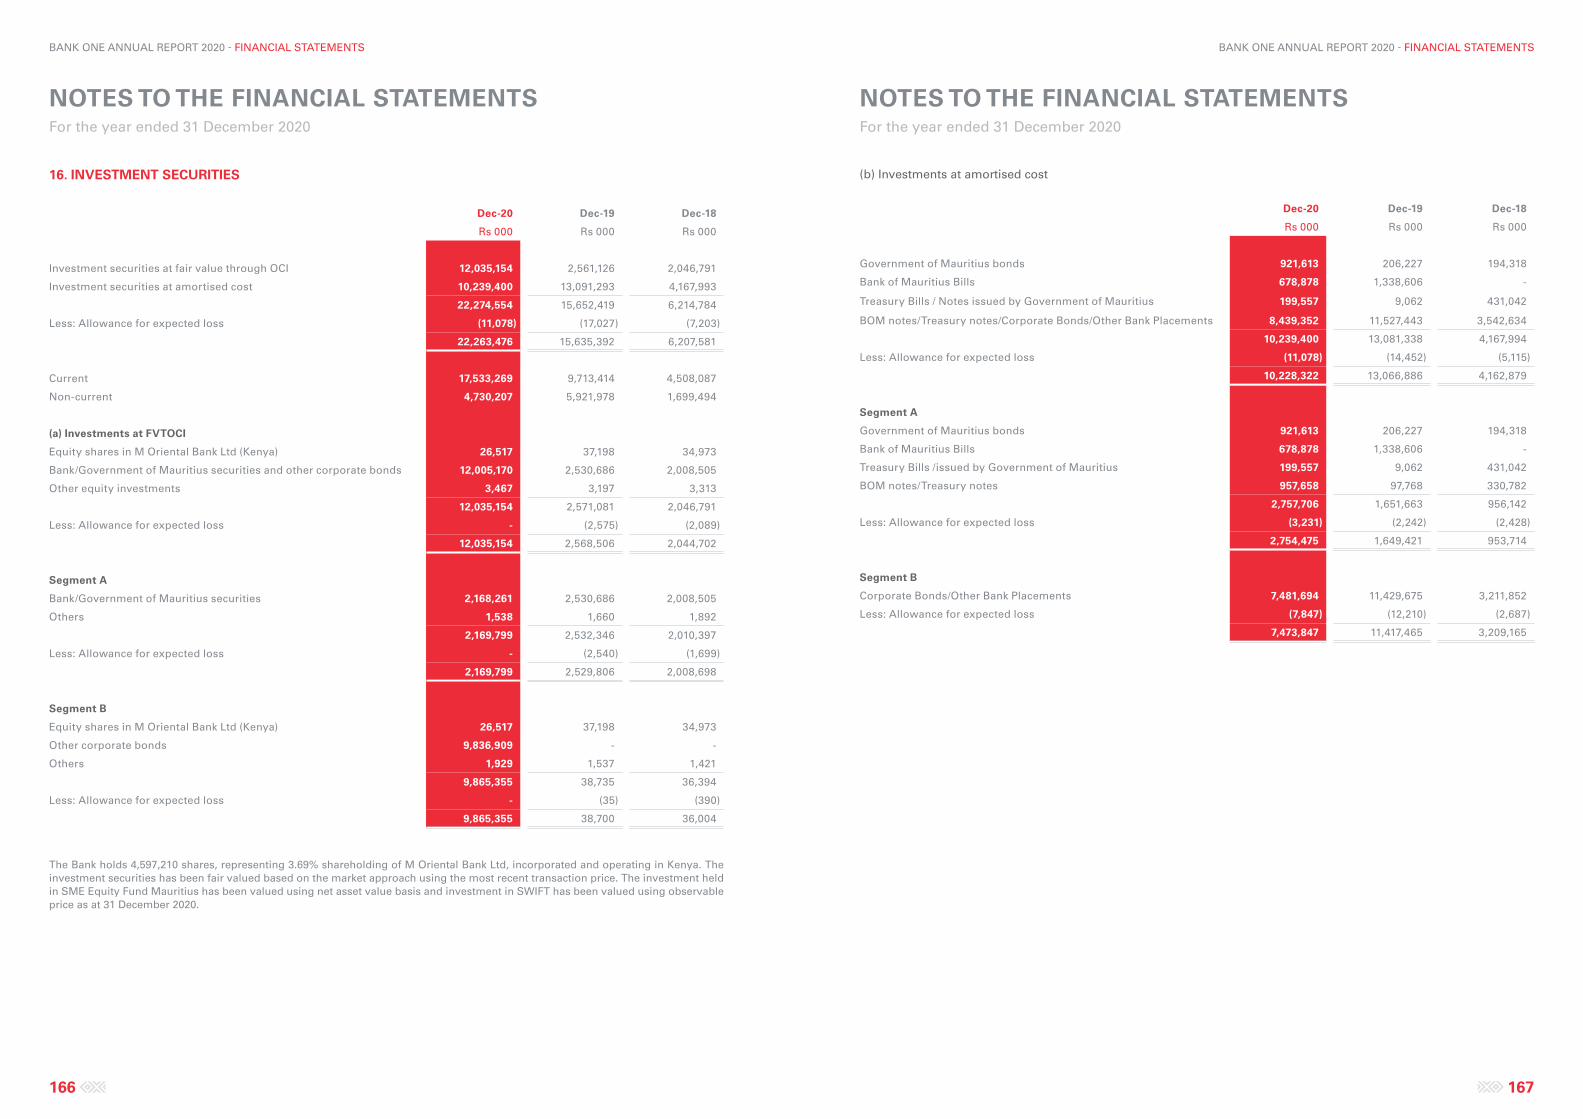
NOTES TO THE FINANCIAL STATEMENTS For the year ended 31 December 2020
NOTES TO THE FINANCIAL STATEMENTS For the year ended 31 December 2020
166 167
BANK ONE ANNUAL REPORT 2020 - FINANCIAL STATEMENTS BANK ONE ANNUAL REPORT 2020 - FINANCIAL STATEMENTS
(b) Investments at amortised cost
Dec-20 Dec-19 Dec-18
Rs 000 Rs 000 Rs 000
Government of Mauritius bonds 921,613 206,227 194,318
Bank of Mauritius Bills 678,878 1,338,606 -
Treasury Bills / Notes issued by Government of Mauritius 199,557 9,062 431,042
BOM notes/Treasury notes/Corporate Bonds/Other Bank Placements 8,439,352 11,527,443 3,542,634
10,239,400 13,081,338 4,167,994
Less: Allowance for expected loss (11,078) (14,452) (5,115)
10,228,322 13,066,886 4,162,879
Segment A
Government of Mauritius bonds 921,613 206,227 194,318
Bank of Mauritius Bills 678,878 1,338,606 -
Treasury Bills /issued by Government of Mauritius 199,557 9,062 431,042
BOM notes/Treasury notes 957,658 97,768 330,782
2,757,706 1,651,663 956,142
Less: Allowance for expected loss (3,231) (2,242) (2,428)
2,754,475 1,649,421 953,714
Segment B
Corporate Bonds/Other Bank Placements 7,481,694 11,429,675 3,211,852
Less: Allowance for expected loss (7,847) (12,210) (2,687)
7,473,847 11,417,465 3,209,165
16. INVESTMENT SECURITIES
Dec-20 Dec-19 Dec-18
Rs 000 Rs 000 Rs 000
Investment securities at fair value through OCI 12,035,154 2,561,126 2,046,791
Investment securities at amortised cost 10,239,400 13,091,293 4,167,993
22,274,554 15,652,419 6,214,784
Less: Allowance for expected loss (11,078) (17,027) (7,203)
22,263,476 15,635,392 6,207,581
Current 17,533,269 9,713,414 4,508,087
Non-current 4,730,207 5,921,978 1,699,494
(a) Investments at FVTOCI
Equity shares in M Oriental Bank Ltd (Kenya) 26,517 37,198 34,973
Bank/Government of Mauritius securities and other corporate bonds 12,005,170 2,530,686 2,008,505
Other equity investments 3,467 3,197 3,313
12,035,154 2,571,081 2,046,791
Less: Allowance for expected loss - (2,575) (2,089)
12,035,154 2,568,506 2,044,702
Segment A
Bank/Government of Mauritius securities 2,168,261 2,530,686 2,008,505
Others 1,538 1,660 1,892
2,169,799 2,532,346 2,010,397
Less: Allowance for expected loss - (2,540) (1,699)
2,169,799 2,529,806 2,008,698
Segment B
Equity shares in M Oriental Bank Ltd (Kenya) 26,517 37,198 34,973
Other corporate bonds 9,836,909 - -
Others 1,929 1,537 1,421
9,865,355 38,735 36,394
Less: Allowance for expected loss - (35) (390)
9,865,355 38,700 36,004
The Bank holds 4,597,210 shares, representing 3.69% shareholding of M Oriental Bank Ltd, incorporated and operating in Kenya. The investment securities has been fair valued based on the market approach using the most recent transaction price. The investment held in SME Equity Fund Mauritius has been valued using net asset value basis and investment in SWIFT has been valued using observable price as at 31 December 2020.
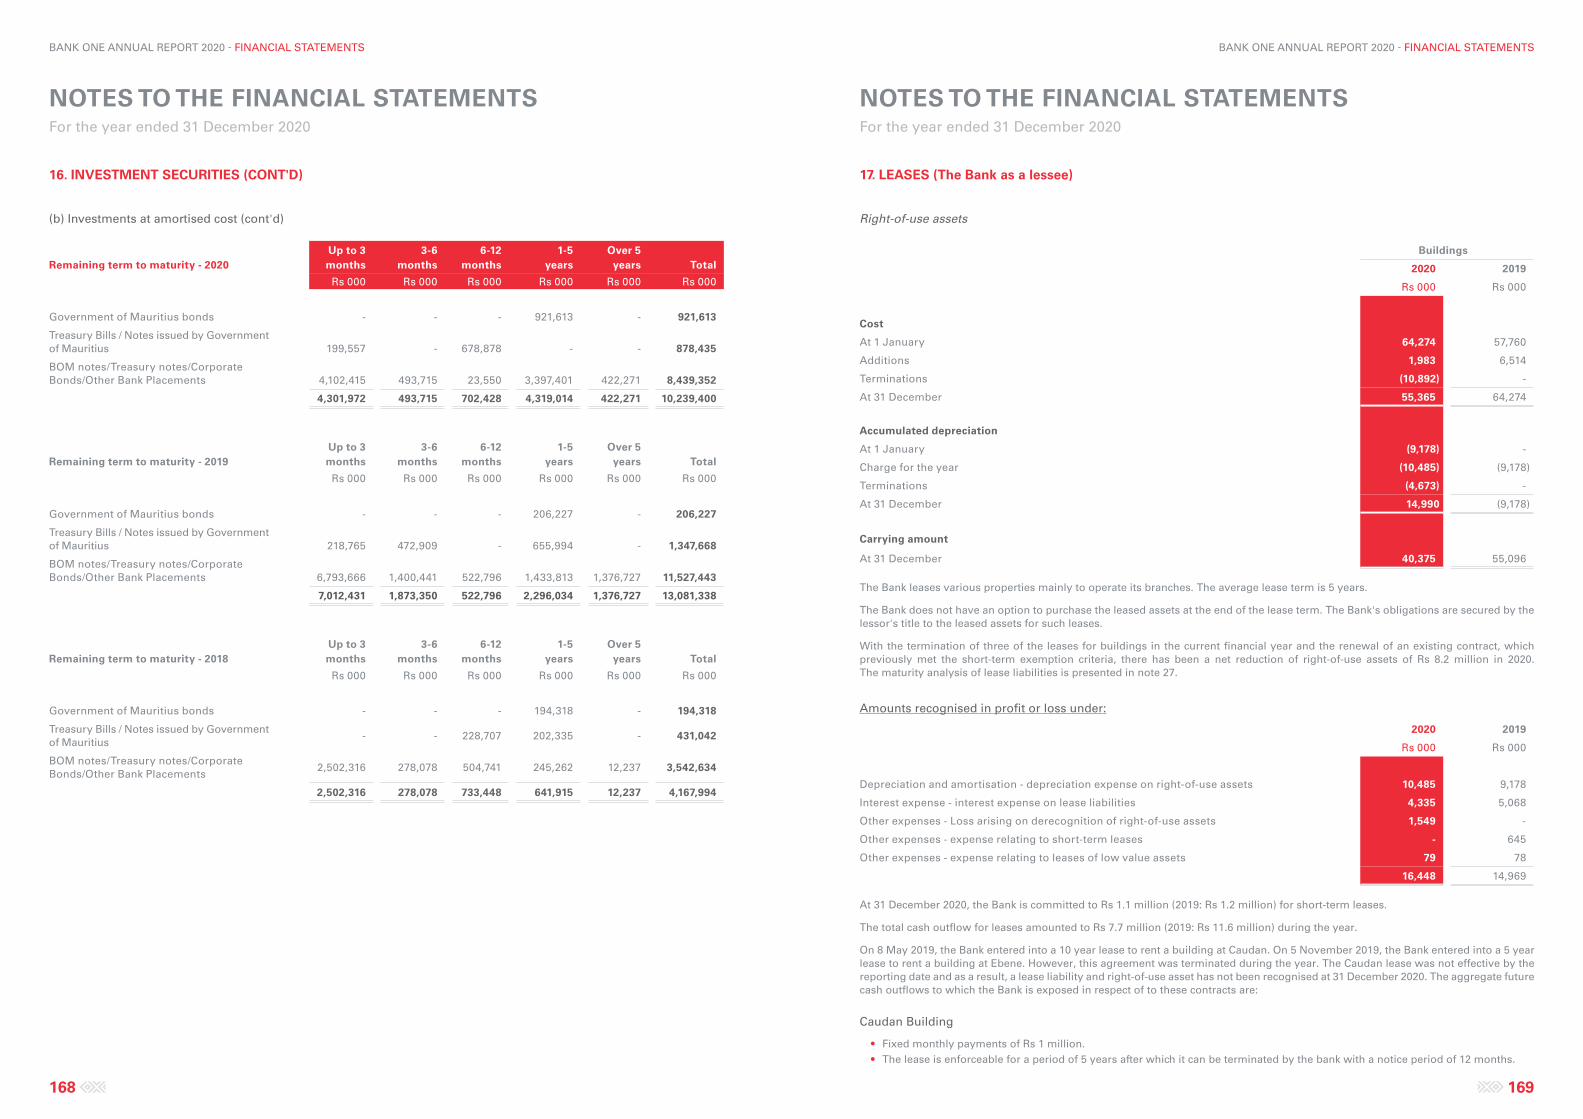
NOTES TO THE FINANCIAL STATEMENTS For the year ended 31 December 2020
NOTES TO THE FINANCIAL STATEMENTS For the year ended 31 December 2020
168 169
BANK ONE ANNUAL REPORT 2020 - FINANCIAL STATEMENTS BANK ONE ANNUAL REPORT 2020 - FINANCIAL STATEMENTS
17. LEASES (The Bank as a lessee)
Right-of-use assets
Buildings
2020 2019
Rs 000 Rs 000
Cost
At 1 January 64,274 57,760
Additions 1,983 6,514
Terminations (10,892) -
At 31 December 55,365 64,274
Accumulated depreciation
At 1 January (9,178) -
Charge for the year (10,485) (9,178)
Terminations (4,673) -
At 31 December 14,990 (9,178)
Carrying amount
At 31 December 40,375 55,096
The Bank leases various properties mainly to operate its branches. The average lease term is 5 years.
The Bank does not have an option to purchase the leased assets at the end of the lease term. The Bank's obligations are secured by the lessor's title to the leased assets for such leases.
With the termination of three of the leases for buildings in the current financial year and the renewal of an existing contract, which previously met the short-term exemption criteria, there has been a net reduction of right-of-use assets of Rs 8.2 million in 2020. The maturity analysis of lease liabilities is presented in note 27.
Amounts recognised in profit or loss under:
2020 2019
Rs 000 Rs 000
Depreciation and amortisation - depreciation expense on right-of-use assets 10,485 9,178
Interest expense - interest expense on lease liabilities 4,335 5,068
Other expenses - Loss arising on derecognition of right-of-use assets 1,549 --
Other expenses - expense relating to short-term leases - 645
Other expenses - expense relating to leases of low value assets 79 78
16,448 14,969
At 31 December 2020, the Bank is committed to Rs 1.1 million (2019: Rs 1.2 million) for short-term leases.
The total cash outflow for leases amounted to Rs 7.7 million (2019: Rs 11.6 million) during the year.
On 8 May 2019, the Bank entered into a 10 year lease to rent a building at Caudan. On 5 November 2019, the Bank entered into a 5 year lease to rent a building at Ebene. However, this agreement was terminated during the year. The Caudan lease was not effective by the reporting date and as a result, a lease liability and right-of-use asset has not been recognised at 31 December 2020. The aggregate future cash outflows to which the Bank is exposed in respect of to these contracts are:
Caudan Building
• Fixed monthly payments of Rs 1 million.• The lease is enforceable for a period of 5 years after which it can be terminated by the bank with a notice period of 12 months.
16. INVESTMENT SECURITIES (CONT'D)
(b) Investments at amortised cost (cont'd)
Remaining term to maturity - 2020Up to 3 months
3-6months
6-12 months
1-5 years
Over 5 years Total
Rs 000 Rs 000 Rs 000 Rs 000 Rs 000 Rs 000
Government of Mauritius bonds - - - 921,613 - 921,613
Treasury Bills / Notes issued by Government of Mauritius 199,557 - 678,878 - - 878,435
BOM notes/Treasury notes/Corporate Bonds/Other Bank Placements 4,102,415 493,715 23,550 3,397,401 422,271 8,439,352
4,301,972 493,715 702,428 4,319,014 422,271 10,239,400
Remaining term to maturity - 2019Up to 3 months
3-6months
6-12 months
1-5 years
Over 5 years Total
Rs 000 Rs 000 Rs 000 Rs 000 Rs 000 Rs 000
Government of Mauritius bonds - - - 206,227 - 206,227
Treasury Bills / Notes issued by Government of Mauritius 218,765 472,909 - 655,994 - 1,347,668
BOM notes/Treasury notes/Corporate Bonds/Other Bank Placements 6,793,666 1,400,441 522,796 1,433,813 1,376,727 11,527,443
7,012,431 1,873,350 522,796 2,296,034 1,376,727 13,081,338
Remaining term to maturity - 2018Up to 3 months
3-6months
6-12 months
1-5 years
Over 5 years Total
Rs 000 Rs 000 Rs 000 Rs 000 Rs 000 Rs 000
Government of Mauritius bonds - - - 194,318 - 194,318
Treasury Bills / Notes issued by Government of Mauritius
- - 228,707 202,335 - 431,042
BOM notes/Treasury notes/Corporate Bonds/Other Bank Placements
2,502,316 278,078 504,741 245,262 12,237 3,542,634
2,502,316 278,078 733,448 641,915 12,237 4,167,994
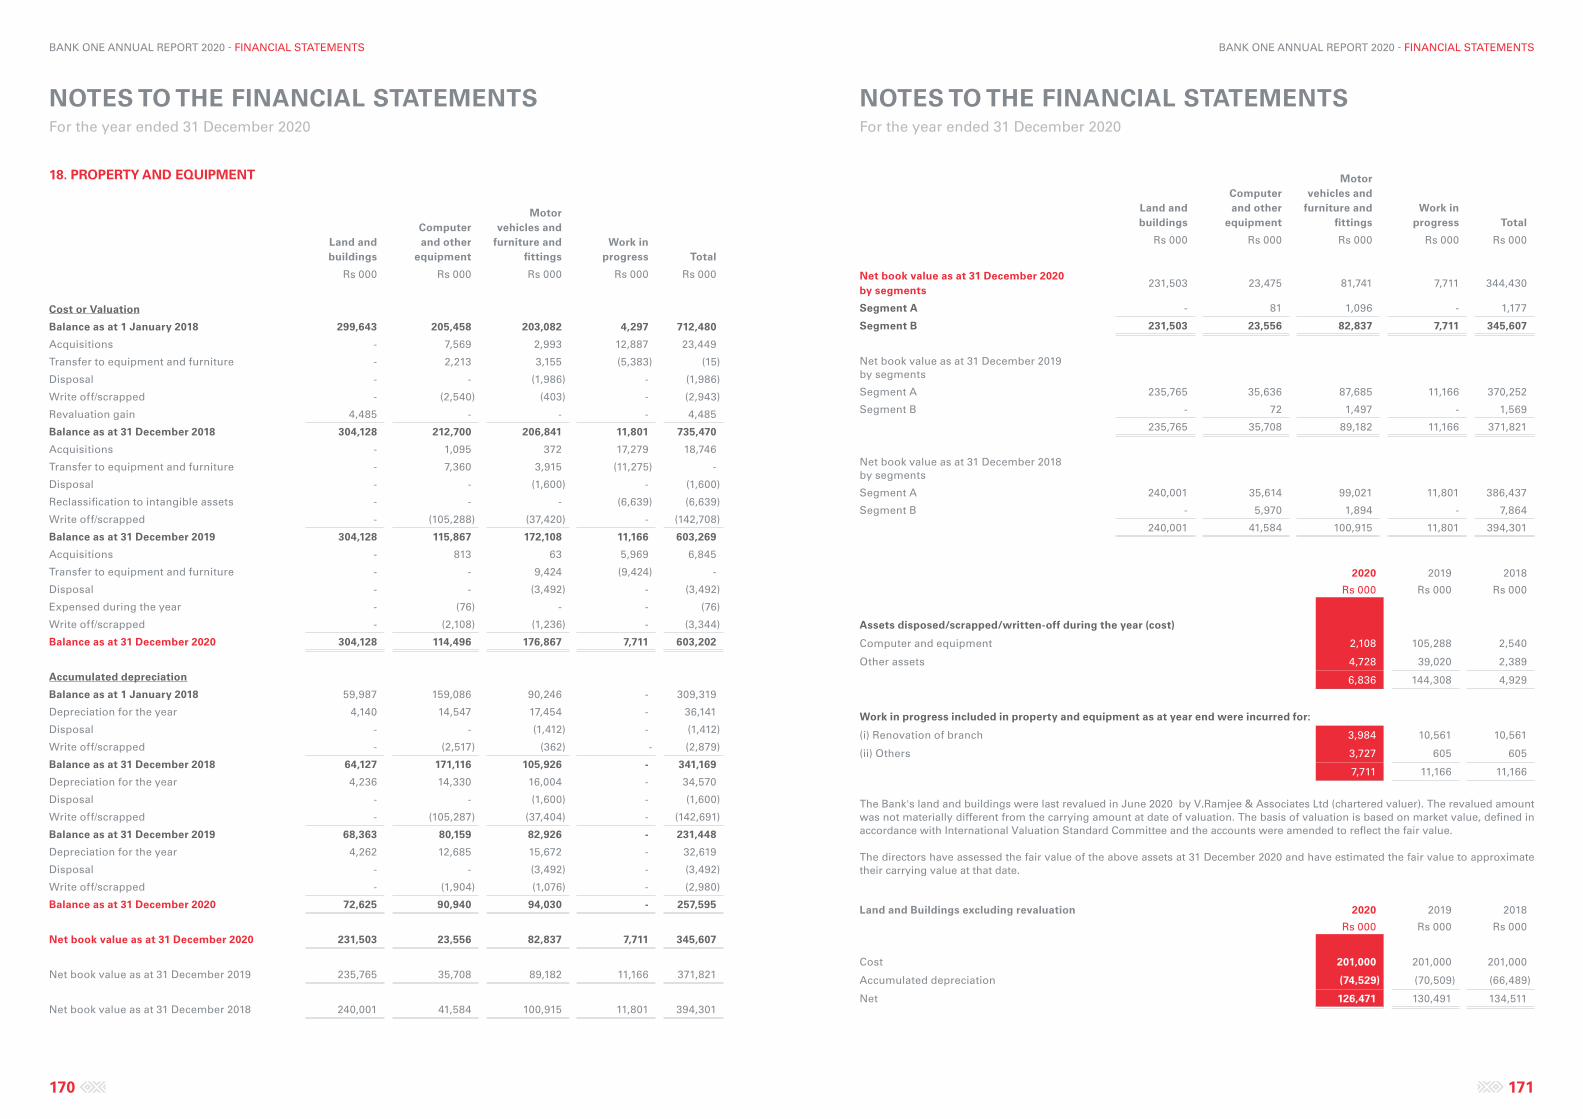
NOTES TO THE FINANCIAL STATEMENTS For the year ended 31 December 2020
NOTES TO THE FINANCIAL STATEMENTS For the year ended 31 December 2020
170 171
BANK ONE ANNUAL REPORT 2020 - FINANCIAL STATEMENTS BANK ONE ANNUAL REPORT 2020 - FINANCIAL STATEMENTS
Land and buildings
Computer and other
equipment
Motor vehicles and
furniture and fittings
Work in progress Total
Rs 000 Rs 000 Rs 000 Rs 000 Rs 000
Net book value as at 31 December 2020 by segments
231,503 23,475 81,741 7,711 344,430
Segment A - 81 1,096 - 1,177
Segment B 231,503 23,556 82,837 7,711 345,607
Net book value as at 31 December 2019 by segments
Segment A 235,765 35,636 87,685 11,166 370,252
Segment B - 72 1,497 - 1,569
235,765 35,708 89,182 11,166 371,821
Net book value as at 31 December 2018 by segments
Segment A 240,001 35,614 99,021 11,801 386,437
Segment B - 5,970 1,894 - 7,864
240,001 41,584 100,915 11,801 394,301
2020 2019 2018
Rs 000 Rs 000 Rs 000
Assets disposed/scrapped/written-off during the year (cost)
Computer and equipment 2,108 105,288 2,540
Other assets 4,728 39,020 2,389
6,836 144,308 4,929
Work in progress included in property and equipment as at year end were incurred for:
(i) Renovation of branch 3,984 10,561 10,561
(ii) Others 3,727 605 605
7,711 11,166 11,166
The Bank's land and buildings were last revalued in June 2020 by V.Ramjee & Associates Ltd (chartered valuer). The revalued amount was not materially different from the carrying amount at date of valuation. The basis of valuation is based on market value, defined in accordance with International Valuation Standard Committee and the accounts were amended to reflect the fair value.
The directors have assessed the fair value of the above assets at 31 December 2020 and have estimated the fair value to approximate their carrying value at that date.
Land and Buildings excluding revaluation 2020 2019 2018
Rs 000 Rs 000 Rs 000
Cost 201,000 201,000 201,000
Accumulated depreciation (74,529) (70,509) (66,489)
Net 126,471 130,491 134,511
18. PROPERTY AND EQUIPMENT
Land and buildings
Computer and other
equipment
Motor vehicles and
furniture and fittings
Work in progress Total
Rs 000 Rs 000 Rs 000 Rs 000 Rs 000
Cost or Valuation
Balance as at 1 January 2018 299,643 205,458 203,082 4,297 712,480
Acquisitions - 7,569 2,993 12,887 23,449
Transfer to equipment and furniture - 2,213 3,155 (5,383) (15)
Disposal - - (1,986) - (1,986)
Write off/scrapped - (2,540) (403) - (2,943)
Revaluation gain 4,485 - - - 4,485
Balance as at 31 December 2018 304,128 212,700 206,841 11,801 735,470
Acquisitions - 1,095 372 17,279 18,746
Transfer to equipment and furniture - 7,360 3,915 (11,275) -
Disposal - - (1,600) - (1,600)
Reclassification to intangible assets - - - (6,639) (6,639)
Write off/scrapped - (105,288) (37,420) - (142,708)
Balance as at 31 December 2019 304,128 115,867 172,108 11,166 603,269
Acquisitions - 813 63 5,969 6,845
Transfer to equipment and furniture - - 9,424 (9,424) -
Disposal - - (3,492) - (3,492)
Expensed during the year - (76) - - (76)
Write off/scrapped - (2,108) (1,236) - (3,344)
Balance as at 31 December 2020 304,128 114,496 176,867 7,711 603,202
Accumulated depreciation
Balance as at 1 January 2018 59,987 159,086 90,246 - 309,319
Depreciation for the year 4,140 14,547 17,454 - 36,141
Disposal - - (1,412) - (1,412)
Write off/scrapped - (2,517) (362) - (2,879)
Balance as at 31 December 2018 64,127 171,116 105,926 - 341,169
Depreciation for the year 4,236 14,330 16,004 - 34,570
Disposal - - (1,600) - (1,600)
Write off/scrapped - (105,287) (37,404) - (142,691)
Balance as at 31 December 2019 68,363 80,159 82,926 - 231,448
Depreciation for the year 4,262 12,685 15,672 - 32,619
Disposal - - (3,492) - (3,492)
Write off/scrapped - (1,904) (1,076) - (2,980)
Balance as at 31 December 2020 72,625 90,940 94,030 - 257,595
Net book value as at 31 December 2020 231,503 23,556 82,837 7,711 345,607
Net book value as at 31 December 2019 235,765 35,708 89,182 11,166 371,821
Net book value as at 31 December 2018 240,001 41,584 100,915 11,801 394,301
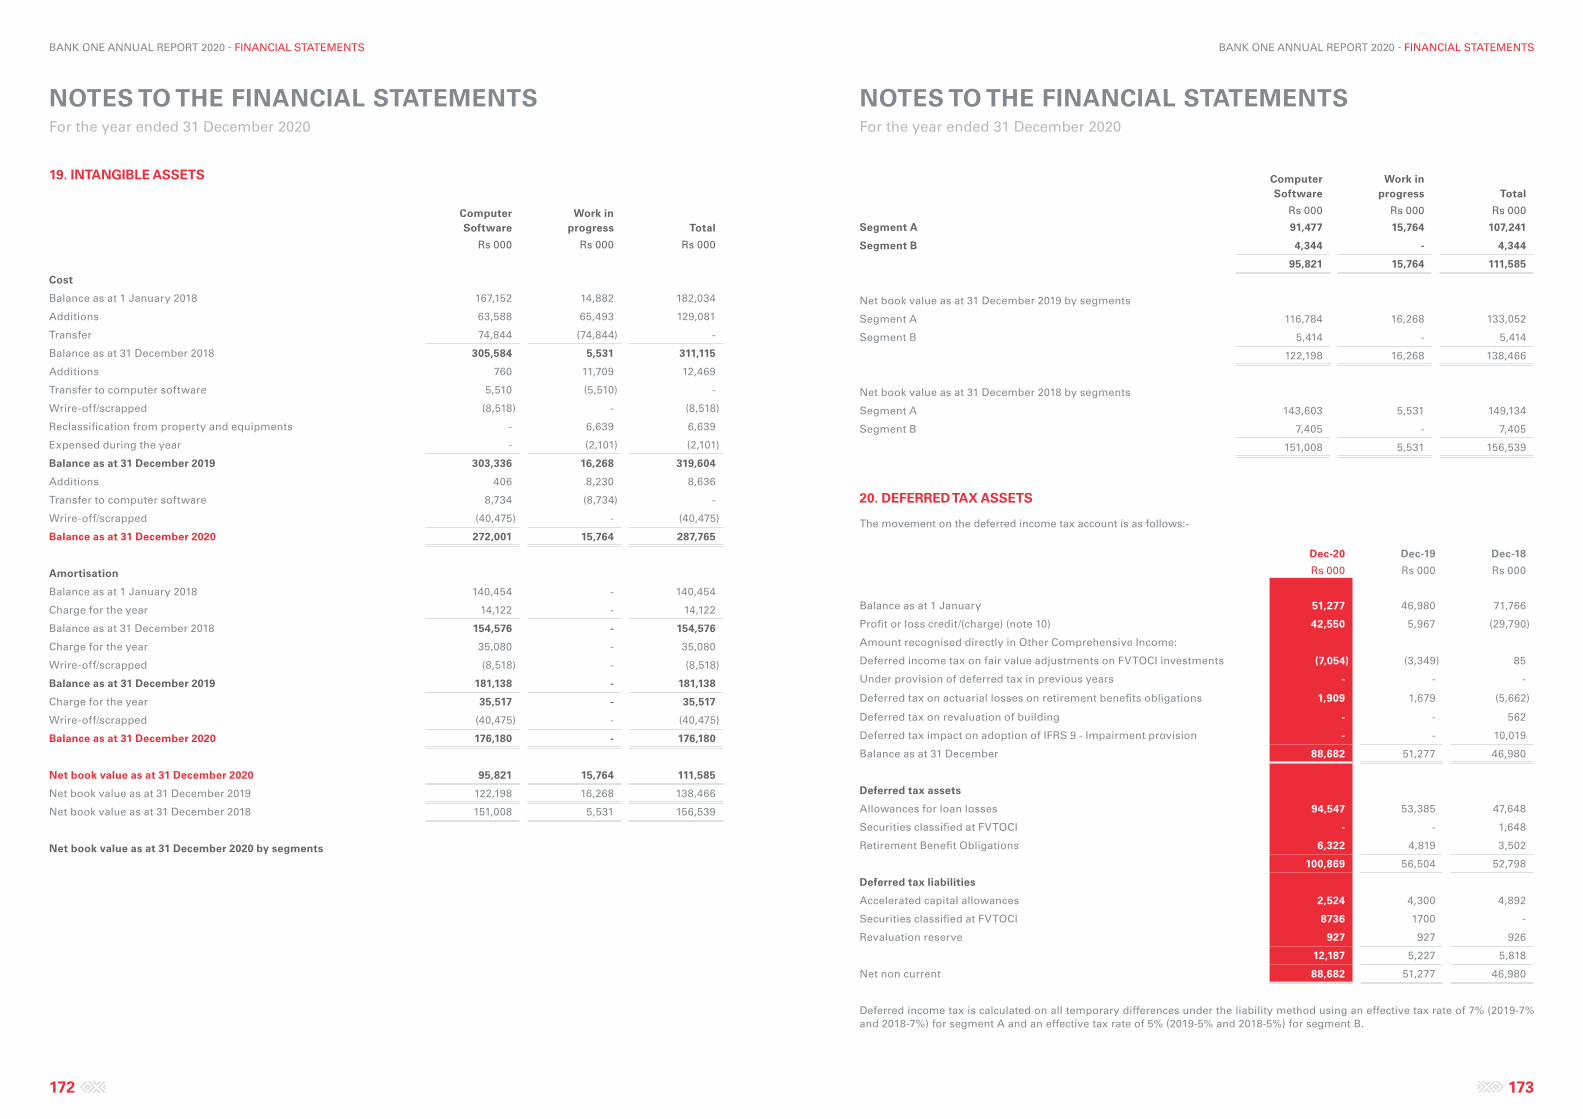
NOTES TO THE FINANCIAL STATEMENTS For the year ended 31 December 2020
NOTES TO THE FINANCIAL STATEMENTS For the year ended 31 December 2020
172 173
BANK ONE ANNUAL REPORT 2020 - FINANCIAL STATEMENTS BANK ONE ANNUAL REPORT 2020 - FINANCIAL STATEMENTS
ComputerSoftware
Work in progress Total
Rs 000 Rs 000 Rs 000
Segment A 91,477 15,764 107,241
Segment B 4,344 - 4,344
95,821 15,764 111,585
Net book value as at 31 December 2019 by segments
Segment A 116,784 16,268 133,052
Segment B 5,414 - 5,414
122,198 16,268 138,466
Net book value as at 31 December 2018 by segments
Segment A 143,603 5,531 149,134
Segment B 7,405 - 7,405
151,008 5,531 156,539
20. DEFERRED TAX ASSETS
The movement on the deferred income tax account is as follows:-
Dec-20 Dec-19 Dec-18
Rs 000 Rs 000 Rs 000
Balance as at 1 January 51,277 46,980 71,766
Profit or loss credit/(charge) (note 10) 42,550 5,967 (29,790)
Amount recognised directly in Other Comprehensive Income:
Deferred income tax on fair value adjustments on FVTOCI investments (7,054) (3,349) 85
Under provision of deferred tax in previous years - - -
Deferred tax on actuarial losses on retirement benefits obligations 1,909 1,679 (5,662)
Deferred tax on revaluation of building - - 562
Deferred tax impact on adoption of IFRS 9 - Impairment provision - - 10,019
Balance as at 31 December 88,682 51,277 46,980
Deferred tax assets
Allowances for loan losses 94,547 53,385 47,648
Securities classified at FVTOCI - - 1,648
Retirement Benefit Obligations 6,322 4,819 3,502
100,869 56,504 52,798
Deferred tax liabilities
Accelerated capital allowances 2,524 4,300 4,892
Securities classified at FVTOCI 8736 1700 -
Revaluation reserve 927 927 926
12,187 5,227 5,818
Net non current 88,682 51,277 46,980
Deferred income tax is calculated on all temporary differences under the liability method using an effective tax rate of 7% (2019-7% and 2018-7%) for segment A and an effective tax rate of 5% (2019-5% and 2018-5%) for segment B.
19. INTANGIBLE ASSETS
ComputerSoftware
Work in progress Total
Rs 000 Rs 000 Rs 000
Cost
Balance as at 1 January 2018 167,152 14,882 182,034
Additions 63,588 65,493 129,081
Transfer 74,844 (74,844) -
Balance as at 31 December 2018 305,584 5,531 311,115
Additions 760 11,709 12,469
Transfer to computer software 5,510 (5,510) -
Wrire-off/scrapped (8,518) - (8,518)
Reclassification from property and equipments - 6,639 6,639
Expensed during the year - (2,101) (2,101)
Balance as at 31 December 2019 303,336 16,268 319,604
Additions 406 8,230 8,636
Transfer to computer software 8,734 (8,734) -
Wrire-off/scrapped (40,475) - (40,475)
Balance as at 31 December 2020 272,001 15,764 287,765
Amortisation
Balance as at 1 January 2018 140,454 - 140,454
Charge for the year 14,122 - 14,122
Balance as at 31 December 2018 154,576 - 154,576
Charge for the year 35,080 - 35,080
Wrire-off/scrapped (8,518) - (8,518)
Balance as at 31 December 2019 181,138 - 181,138
Charge for the year 35,517 - 35,517
Wrire-off/scrapped (40,475) - (40,475)
Balance as at 31 December 2020 176,180 - 176,180
Net book value as at 31 December 2020 95,821 15,764 111,585
Net book value as at 31 December 2019 122,198 16,268 138,466
Net book value as at 31 December 2018 151,008 5,531 156,539
Net book value as at 31 December 2020 by segments
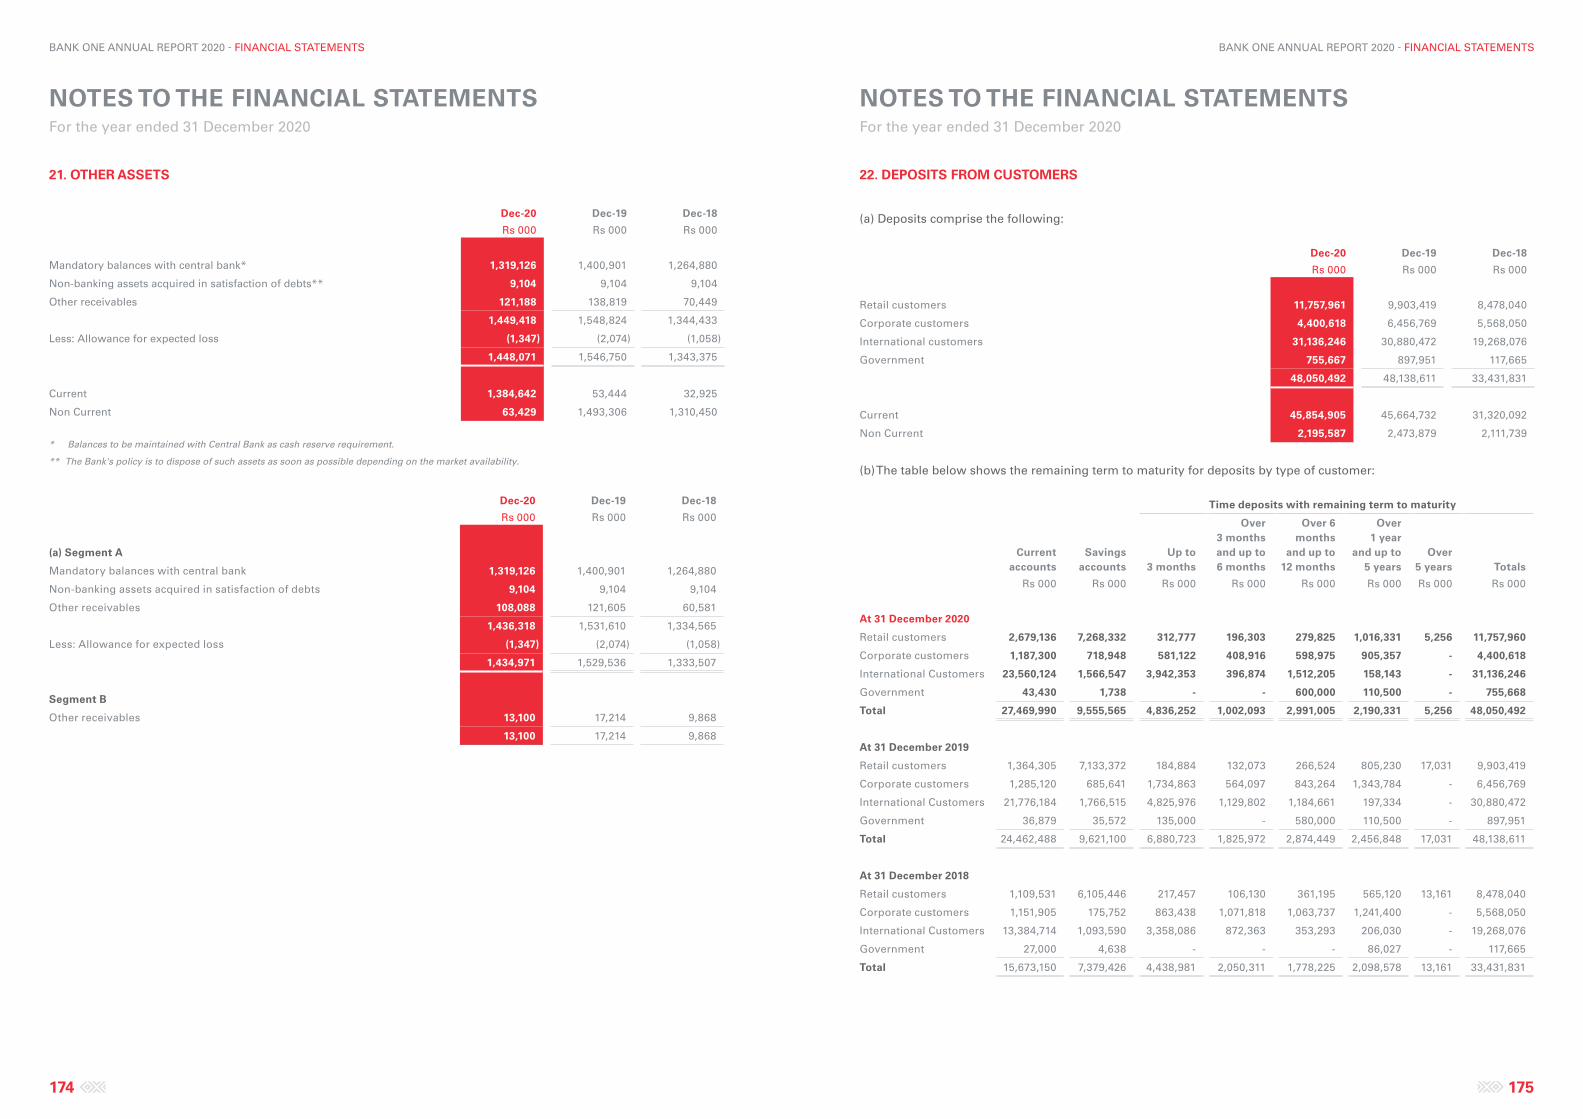
NOTES TO THE FINANCIAL STATEMENTS For the year ended 31 December 2020
NOTES TO THE FINANCIAL STATEMENTS For the year ended 31 December 2020
174 175
BANK ONE ANNUAL REPORT 2020 - FINANCIAL STATEMENTS BANK ONE ANNUAL REPORT 2020 - FINANCIAL STATEMENTS
22. DEPOSITS FROM CUSTOMERS
(a) Deposits comprise the following:
Dec-20 Dec-19 Dec-18
Rs 000 Rs 000 Rs 000
Retail customers 11,757,961 9,903,419 8,478,040
Corporate customers 4,400,618 6,456,769 5,568,050
International customers 31,136,246 30,880,472 19,268,076
Government 755,667 897,951 117,665
48,050,492 48,138,611 33,431,831
Current 45,854,905 45,664,732 31,320,092
Non Current 2,195,587 2,473,879 2,111,739
(b) The table below shows the remaining term to maturity for deposits by type of customer:
Time deposits with remaining term to maturity
Current accounts
Savings accounts
Up to 3 months
Over 3 months and up to 6 months
Over 6 months
and up to 12 months
Over 1 year
and up to 5 years
Over 5 years Totals
Rs 000 Rs 000 Rs 000 Rs 000 Rs 000 Rs 000 Rs 000 Rs 000
At 31 December 2020
Retail customers 2,679,136 7,268,332 312,777 196,303 279,825 1,016,331 5,256 11,757,960
Corporate customers 1,187,300 718,948 581,122 408,916 598,975 905,357 - 4,400,618
International Customers 23,560,124 1,566,547 3,942,353 396,874 1,512,205 158,143 - 31,136,246
Government 43,430 1,738 - - 600,000 110,500 - 755,668
Total 27,469,990 9,555,565 4,836,252 1,002,093 2,991,005 2,190,331 5,256 48,050,492
At 31 December 2019
Retail customers 1,364,305 7,133,372 184,884 132,073 266,524 805,230 17,031 9,903,419
Corporate customers 1,285,120 685,641 1,734,863 564,097 843,264 1,343,784 - 6,456,769
International Customers 21,776,184 1,766,515 4,825,976 1,129,802 1,184,661 197,334 - 30,880,472
Government 36,879 35,572 135,000 - 580,000 110,500 - 897,951
Total 24,462,488 9,621,100 6,880,723 1,825,972 2,874,449 2,456,848 17,031 48,138,611
At 31 December 2018
Retail customers 1,109,531 6,105,446 217,457 106,130 361,195 565,120 13,161 8,478,040
Corporate customers 1,151,905 175,752 863,438 1,071,818 1,063,737 1,241,400 - 5,568,050
International Customers 13,384,714 1,093,590 3,358,086 872,363 353,293 206,030 - 19,268,076
Government 27,000 4,638 - - - 86,027 - 117,665
Total 15,673,150 7,379,426 4,438,981 2,050,311 1,778,225 2,098,578 13,161 33,431,831
21. OTHER ASSETS
Dec-20 Dec-19 Dec-18
Rs 000 Rs 000 Rs 000
Mandatory balances with central bank* 1,319,126 1,400,901 1,264,880
Non-banking assets acquired in satisfaction of debts** 9,104 9,104 9,104
Other receivables 121,188 138,819 70,449
1,449,418 1,548,824 1,344,433
Less: Allowance for expected loss (1,347) (2,074) (1,058)
1,448,071 1,546,750 1,343,375
Current 1,384,642 53,444 32,925
Non Current 63,429 1,493,306 1,310,450
* Balances to be maintained with Central Bank as cash reserve requirement.
** The Bank's policy is to dispose of such assets as soon as possible depending on the market availability.
Dec-20 Dec-19 Dec-18
Rs 000 Rs 000 Rs 000
(a) Segment A
Mandatory balances with central bank 1,319,126 1,400,901 1,264,880
Non-banking assets acquired in satisfaction of debts 9,104 9,104 9,104
Other receivables 108,088 121,605 60,581
1,436,318 1,531,610 1,334,565
Less: Allowance for expected loss (1,347) (2,074) (1,058)
1,434,971 1,529,536 1,333,507
Segment B
Other receivables 13,100 17,214 9,868
13,100 17,214 9,868
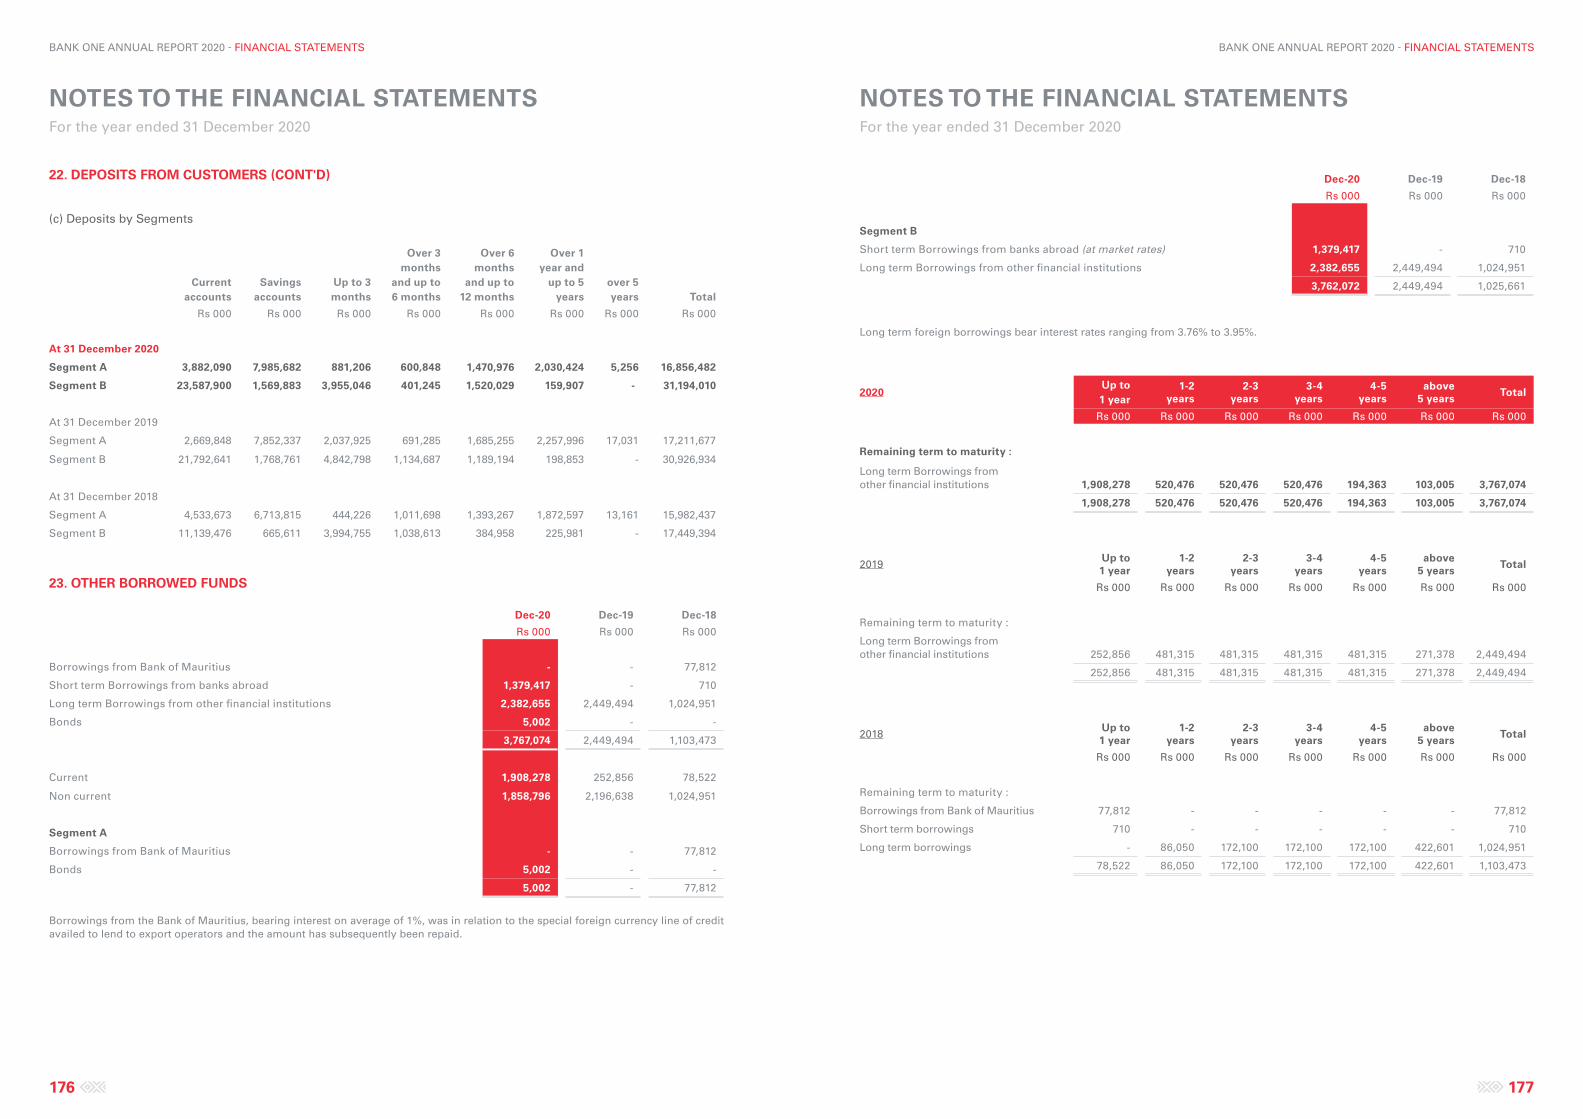
NOTES TO THE FINANCIAL STATEMENTS For the year ended 31 December 2020
NOTES TO THE FINANCIAL STATEMENTS For the year ended 31 December 2020
176 177
BANK ONE ANNUAL REPORT 2020 - FINANCIAL STATEMENTS BANK ONE ANNUAL REPORT 2020 - FINANCIAL STATEMENTS
Dec-20 Dec-19 Dec-18
Rs 000 Rs 000 Rs 000
Segment B
Short term Borrowings from banks abroad (at market rates) 1,379,417 - 710
Long term Borrowings from other financial institutions 2,382,655 2,449,494 1,024,951
3,762,072 2,449,494 1,025,661
Long term foreign borrowings bear interest rates ranging from 3.76% to 3.95%.
2020Up to 1 year
1-2 years
2-3 years
3-4 years
4-5 years
above 5 years
Total
Rs 000 Rs 000 Rs 000 Rs 000 Rs 000 Rs 000 Rs 000
Remaining term to maturity :
Long term Borrowings from other financial institutions 1,908,278 520,476 520,476 520,476
194,363 103,005 3,767,074
1,908,278 520,476 520,476 520,476 194,363 103,005 3,767,074
2019Up to 1 year
1-2 years
2-3 years
3-4 years
4-5 years
above 5 years
Total
Rs 000 Rs 000 Rs 000 Rs 000 Rs 000 Rs 000 Rs 000
Remaining term to maturity :
Long term Borrowings from other financial institutions 252,856 481,315 481,315 481,315 481,315 271,378 2,449,494
252,856 481,315 481,315 481,315 481,315 271,378 2,449,494
2018Up to 1 year
1-2 years
2-3 years
3-4 years
4-5 years
above 5 years
Total
Rs 000 Rs 000 Rs 000 Rs 000 Rs 000 Rs 000 Rs 000
Remaining term to maturity :
Borrowings from Bank of Mauritius 77,812 - - - - - 77,812
Short term borrowings 710 - - - - - 710
Long term borrowings - 86,050 172,100 172,100 172,100 422,601 1,024,951
78,522 86,050 172,100 172,100 172,100 422,601 1,103,473
22. DEPOSITS FROM CUSTOMERS (CONT'D)
(c) Deposits by Segments
Current accounts
Savings accounts
Up to 3 months
Over 3 months
and up to 6 months
Over 6 months
and up to 12 months
Over 1 year and
up to 5 years
over 5 years Total
Rs 000 Rs 000 Rs 000 Rs 000 Rs 000 Rs 000 Rs 000 Rs 000
At 31 December 2020
Segment A 3,882,090 7,985,682 881,206 600,848 1,470,976 2,030,424 5,256 16,856,482
Segment B 23,587,900 1,569,883 3,955,046 401,245 1,520,029 159,907 - 31,194,010
At 31 December 2019
Segment A 2,669,848 7,852,337 2,037,925 691,285 1,685,255 2,257,996 17,031 17,211,677
Segment B 21,792,641 1,768,761 4,842,798 1,134,687 1,189,194 198,853 - 30,926,934
At 31 December 2018
Segment A 4,533,673 6,713,815 444,226 1,011,698 1,393,267 1,872,597 13,161 15,982,437
Segment B 11,139,476 665,611 3,994,755 1,038,613 384,958 225,981 - 17,449,394
23. OTHER BORROWED FUNDS
Dec-20 Dec-19 Dec-18
Rs 000 Rs 000 Rs 000
Borrowings from Bank of Mauritius - - 77,812
Short term Borrowings from banks abroad 1,379,417 - 710
Long term Borrowings from other financial institutions 2,382,655 2,449,494 1,024,951
Bonds 5,002 - -
3,767,074 2,449,494 1,103,473
Current 1,908,278 252,856 78,522
Non current 1,858,796 2,196,638 1,024,951
Segment A
Borrowings from Bank of Mauritius - - 77,812
Bonds 5,002 - -
5,002 - 77,812
Borrowings from the Bank of Mauritius, bearing interest on average of 1%, was in relation to the special foreign currency line of credit availed to lend to export operators and the amount has subsequently been repaid.
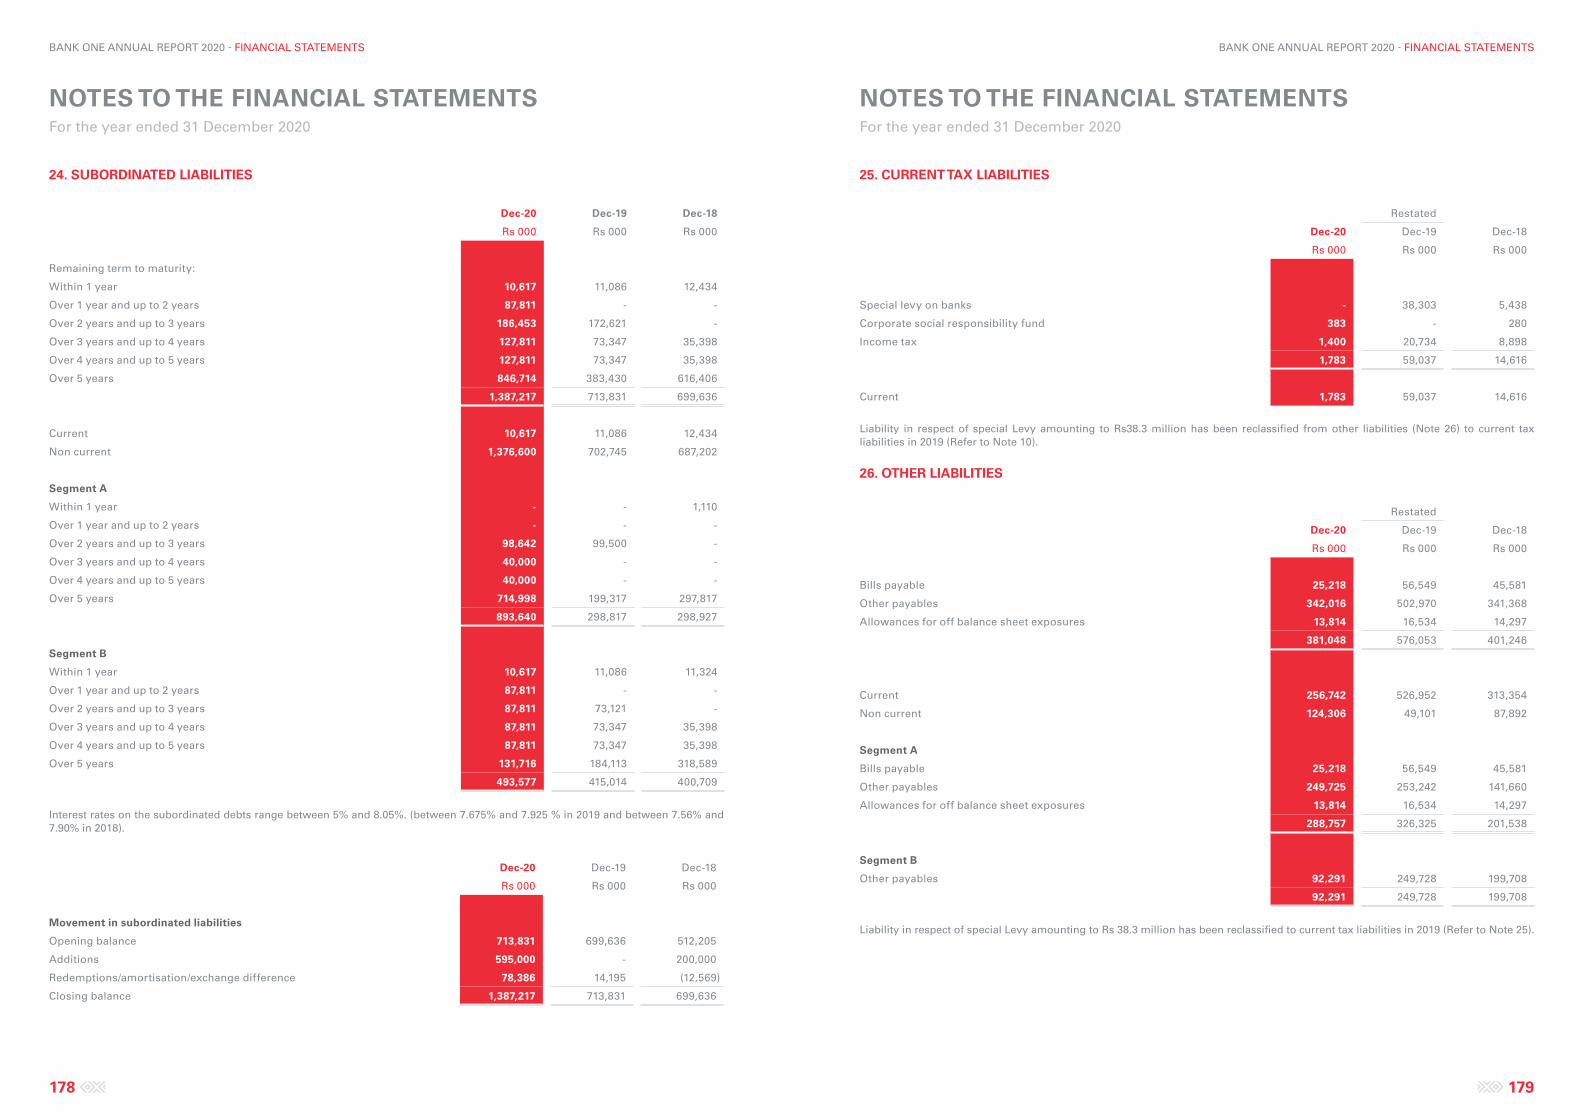
NOTES TO THE FINANCIAL STATEMENTS For the year ended 31 December 2020
NOTES TO THE FINANCIAL STATEMENTS For the year ended 31 December 2020
178 179
BANK ONE ANNUAL REPORT 2020 - FINANCIAL STATEMENTS BANK ONE ANNUAL REPORT 2020 - FINANCIAL STATEMENTS
25. CURRENT TAX LIABILITIES
Restated
Dec-20 Dec-19 Dec-18
Rs 000 Rs 000 Rs 000
Special levy on banks - 38,303 5,438
Corporate social responsibility fund 383 - 280
Income tax 1,400 20,734 8,898
1,783 59,037 14,616
Current 1,783 59,037 14,616
Liability in respect of special Levy amounting to Rs38.3 million has been reclassified from other liabilities (Note 26) to current tax liabilities in 2019 (Refer to Note 10).
26. OTHER LIABILITIES
Restated
Dec-20 Dec-19 Dec-18
Rs 000 Rs 000 Rs 000
Bills payable 25,218 56,549 45,581
Other payables 342,016 502,970 341,368
Allowances for off balance sheet exposures 13,814 16,534 14,297
381,048 576,053 401,246
Current 256,742 526,952 313,354
Non current 124,306 49,101 87,892
Segment A
Bills payable 25,218 56,549 45,581
Other payables 249,725 253,242 141,660
Allowances for off balance sheet exposures 13,814 16,534 14,297
288,757 326,325 201,538
Segment B
Other payables 92,291 249,728 199,708
92,291 249,728 199,708
Liability in respect of special Levy amounting to Rs 38.3 million has been reclassified to current tax liabilities in 2019 (Refer to Note 25).
24. SUBORDINATED LIABILITIES
Dec-20 Dec-19 Dec-18
Rs 000 Rs 000 Rs 000
Remaining term to maturity:
Within 1 year 10,617 11,086 12,434
Over 1 year and up to 2 years 87,811 - -
Over 2 years and up to 3 years 186,453 172,621 -
Over 3 years and up to 4 years 127,811 73,347 35,398
Over 4 years and up to 5 years 127,811 73,347 35,398
Over 5 years 846,714 383,430 616,406
1,387,217 713,831 699,636
Current 10,617 11,086 12,434
Non current 1,376,600 702,745 687,202
Segment A
Within 1 year - - 1,110
Over 1 year and up to 2 years - - -
Over 2 years and up to 3 years 98,642 99,500 -
Over 3 years and up to 4 years 40,000 - -
Over 4 years and up to 5 years 40,000 - -
Over 5 years 714,998 199,317 297,817
893,640 298,817 298,927
Segment B
Within 1 year 10,617 11,086 11,324
Over 1 year and up to 2 years 87,811 - -
Over 2 years and up to 3 years 87,811 73,121 -
Over 3 years and up to 4 years 87,811 73,347 35,398
Over 4 years and up to 5 years 87,811 73,347 35,398
Over 5 years 131,716 184,113 318,589
493,577 415,014 400,709
Interest rates on the subordinated debts range between 5% and 8.05%. (between 7.675% and 7.925 % in 2019 and between 7.56% and 7.90% in 2018).
Dec-20 Dec-19 Dec-18
Rs 000 Rs 000 Rs 000
Movement in subordinated liabilities
Opening balance 713,831 699,636 512,205
Additions 595,000 - 200,000
Redemptions/amortisation/exchange difference 78,386 14,195 (12,569)
Closing balance 1,387,217 713,831 699,636
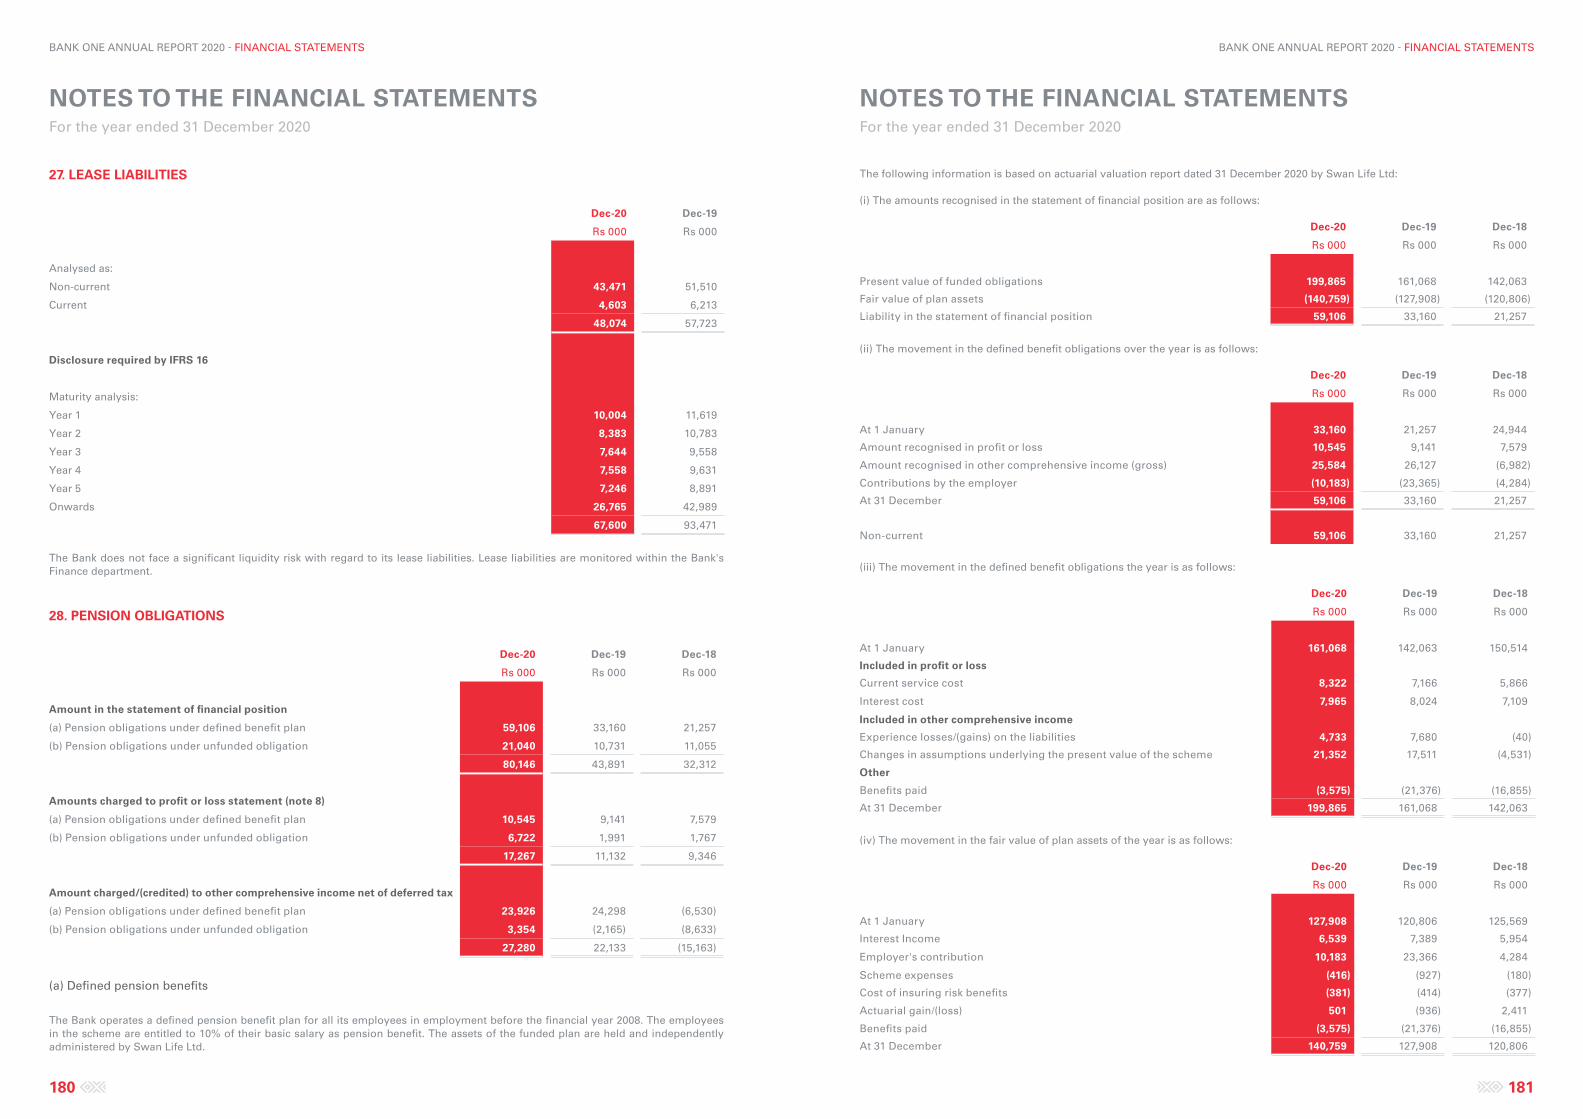
NOTES TO THE FINANCIAL STATEMENTS For the year ended 31 December 2020
NOTES TO THE FINANCIAL STATEMENTS For the year ended 31 December 2020
180 181
BANK ONE ANNUAL REPORT 2020 - FINANCIAL STATEMENTS BANK ONE ANNUAL REPORT 2020 - FINANCIAL STATEMENTS
The following information is based on actuarial valuation report dated 31 December 2020 by Swan Life Ltd:
(i) The amounts recognised in the statement of financial position are as follows:
Dec-20 Dec-19 Dec-18
Rs 000 Rs 000 Rs 000
Present value of funded obligations 199,865 161,068 142,063
Fair value of plan assets (140,759) (127,908) (120,806)
Liability in the statement of financial position 59,106 33,160 21,257
(ii) The movement in the defined benefit obligations over the year is as follows:
Dec-20 Dec-19 Dec-18
Rs 000 Rs 000 Rs 000
At 1 January 33,160 21,257 24,944
Amount recognised in profit or loss 10,545 9,141 7,579
Amount recognised in other comprehensive income (gross) 25,584 26,127 (6,982)
Contributions by the employer (10,183) (23,365) (4,284)
At 31 December 59,106 33,160 21,257
Non-current 59,106 33,160 21,257
(iii) The movement in the defined benefit obligations the year is as follows:
Dec-20 Dec-19 Dec-18
Rs 000 Rs 000 Rs 000
At 1 January 161,068 142,063 150,514
Included in profit or loss
Current service cost 8,322 7,166 5,866
Interest cost 7,965 8,024 7,109
Included in other comprehensive income
Experience losses/(gains) on the liabilities 4,733 7,680 (40)
Changes in assumptions underlying the present value of the scheme 21,352 17,511 (4,531)
Other
Benefits paid (3,575) (21,376) (16,855)
At 31 December 199,865 161,068 142,063
(iv) The movement in the fair value of plan assets of the year is as follows:
Dec-20 Dec-19 Dec-18
Rs 000 Rs 000 Rs 000
At 1 January 127,908 120,806 125,569
Interest Income 6,539 7,389 5,954
Employer's contribution 10,183 23,366 4,284
Scheme expenses (416) (927) (180)
Cost of insuring risk benefits (381) (414) (377)
Actuarial gain/(loss) 501 (936) 2,411
Benefits paid (3,575) (21,376) (16,855)
At 31 December 140,759 127,908 120,806
27. LEASE LIABILITIES
Dec-20 Dec-19
Rs 000 Rs 000
Analysed as:
Non-current 43,471 51,510
Current 4,603 6,213
48,074 57,723
Disclosure required by IFRS 16
Maturity analysis:
Year 1 10,004 11,619
Year 2 8,383 10,783
Year 3 7,644 9,558
Year 4 7,558 9,631
Year 5 7,246 8,891
Onwards 26,765 42,989
67,600 93,471
The Bank does not face a significant liquidity risk with regard to its lease liabilities. Lease liabilities are monitored within the Bank's Finance department.
28. PENSION OBLIGATIONS
Dec-20 Dec-19 Dec-18
Rs 000 Rs 000 Rs 000
Amount in the statement of financial position
(a) Pension obligations under defined benefit plan 59,106 33,160 21,257
(b) Pension obligations under unfunded obligation 21,040 10,731 11,055
80,146 43,891 32,312
Amounts charged to profit or loss statement (note 8)
(a) Pension obligations under defined benefit plan 10,545 9,141 7,579
(b) Pension obligations under unfunded obligation 6,722 1,991 1,767
17,267 11,132 9,346
Amount charged/(credited) to other comprehensive income net of deferred tax
(a) Pension obligations under defined benefit plan 23,926 24,298 (6,530)
(b) Pension obligations under unfunded obligation 3,354 (2,165) (8,633)
27,280 22,133 (15,163)
(a) Defined pension benefits
The Bank operates a defined pension benefit plan for all its employees in employment before the financial year 2008. The employees in the scheme are entitled to 10% of their basic salary as pension benefit. The assets of the funded plan are held and independently administered by Swan Life Ltd.
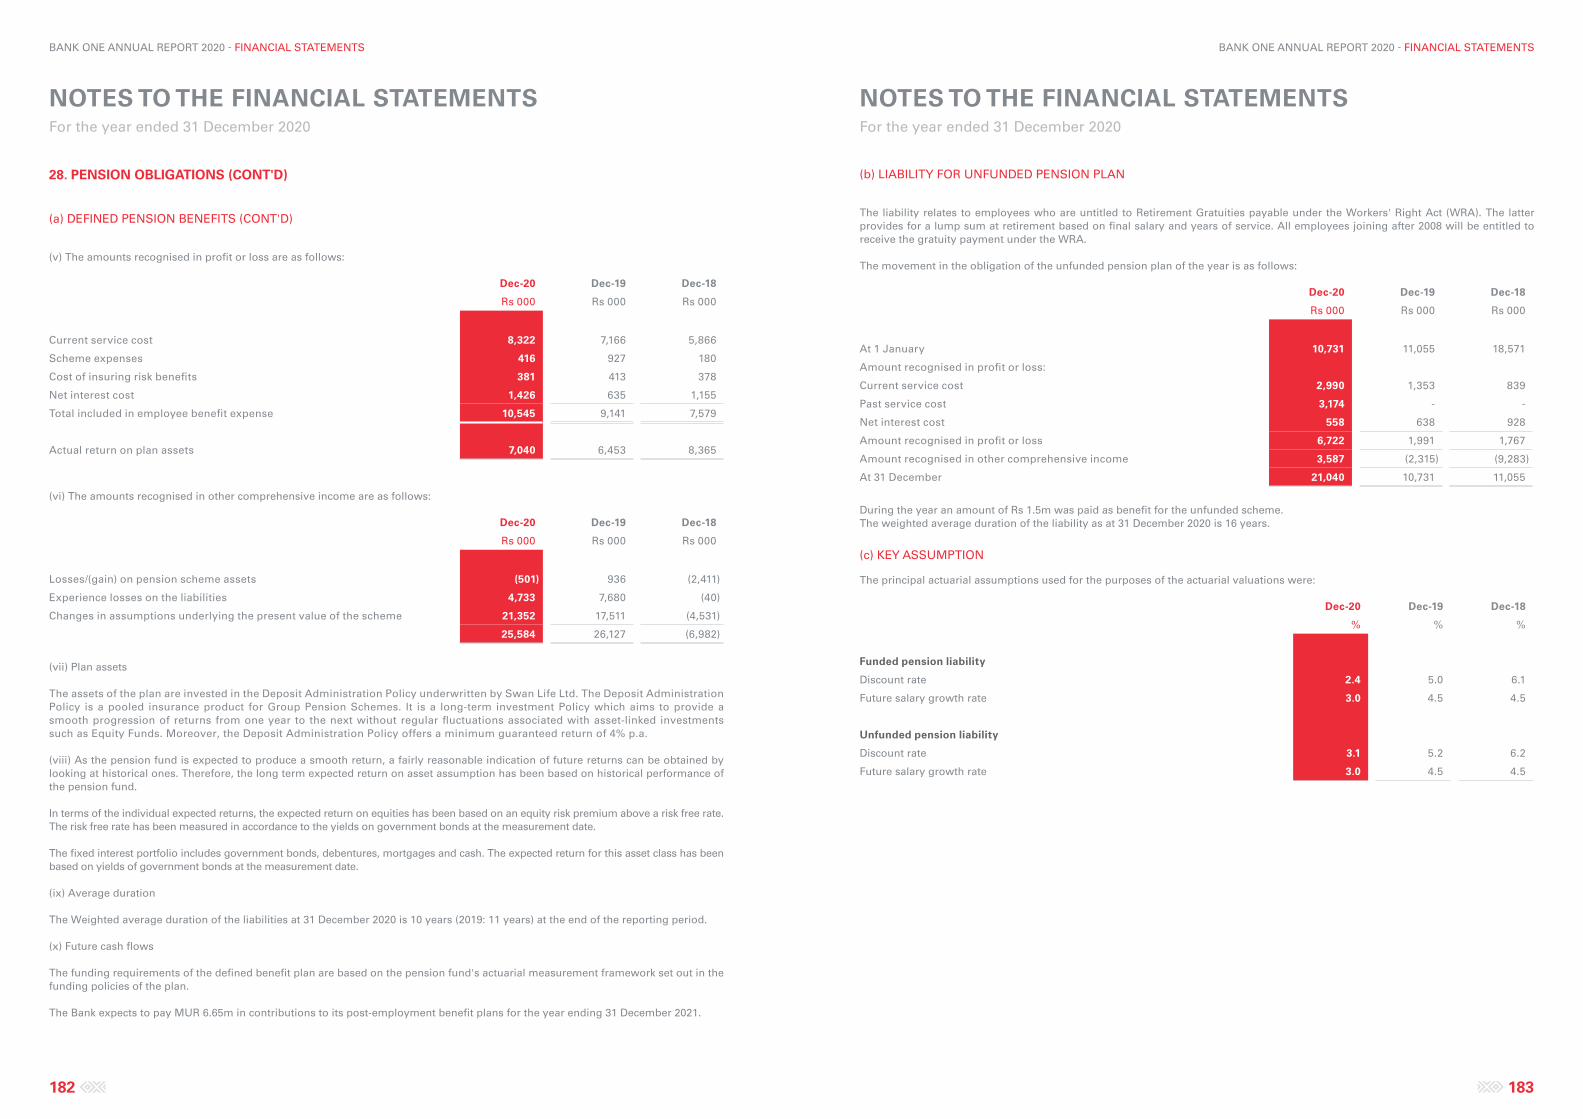
NOTES TO THE FINANCIAL STATEMENTS For the year ended 31 December 2020
NOTES TO THE FINANCIAL STATEMENTS For the year ended 31 December 2020
182 183
BANK ONE ANNUAL REPORT 2020 - FINANCIAL STATEMENTS BANK ONE ANNUAL REPORT 2020 - FINANCIAL STATEMENTS
(b) LIABILITY FOR UNFUNDED PENSION PLAN
The liability relates to employees who are untitled to Retirement Gratuities payable under the Workers' Right Act (WRA). The latter provides for a lump sum at retirement based on final salary and years of service. All employees joining after 2008 will be entitled to receive the gratuity payment under the WRA.
The movement in the obligation of the unfunded pension plan of the year is as follows:
Dec-20 Dec-19 Dec-18
Rs 000 Rs 000 Rs 000
At 1 January 10,731 11,055 18,571
Amount recognised in profit or loss:
Current service cost 2,990 1,353 839
Past service cost 3,174 - -
Net interest cost 558 638 928
Amount recognised in profit or loss 6,722 1,991 1,767
Amount recognised in other comprehensive income 3,587 (2,315) (9,283)
At 31 December 21,040 10,731 11,055
During the year an amount of Rs 1.5m was paid as benefit for the unfunded scheme.The weighted average duration of the liability as at 31 December 2020 is 16 years.
(c) KEY ASSUMPTION
The principal actuarial assumptions used for the purposes of the actuarial valuations were:
Dec-20 Dec-19 Dec-18
% % %
Funded pension liability
Discount rate 2.4 5.0 6.1
Future salary growth rate 3.0 4.5 4.5
Unfunded pension liability
Discount rate 3.1 5.2 6.2
Future salary growth rate 3.0 4.5 4.5
28. PENSION OBLIGATIONS (CONT'D)
(a) DEFINED PENSION BENEFITS (CONT'D)
(v) The amounts recognised in profit or loss are as follows:
Dec-20 Dec-19 Dec-18
Rs 000 Rs 000 Rs 000
Current service cost 8,322 7,166 5,866
Scheme expenses 416 927 180
Cost of insuring risk benefits 381 413 378
Net interest cost 1,426 635 1,155
Total included in employee benefit expense 10,545 9,141 7,579
Actual return on plan assets 7,040 6,453 8,365
(vi) The amounts recognised in other comprehensive income are as follows:
Dec-20 Dec-19 Dec-18
Rs 000 Rs 000 Rs 000
Losses/(gain) on pension scheme assets (501) 936 (2,411)
Experience losses on the liabilities 4,733 7,680 (40)
Changes in assumptions underlying the present value of the scheme 21,352 17,511 (4,531)
25,584 26,127 (6,982)
(vii) Plan assets
The assets of the plan are invested in the Deposit Administration Policy underwritten by Swan Life Ltd. The Deposit Administration Policy is a pooled insurance product for Group Pension Schemes. It is a long-term investment Policy which aims to provide a smooth progression of returns from one year to the next without regular fluctuations associated with asset-linked investments such as Equity Funds. Moreover, the Deposit Administration Policy offers a minimum guaranteed return of 4% p.a.
(viii) As the pension fund is expected to produce a smooth return, a fairly reasonable indication of future returns can be obtained by looking at historical ones. Therefore, the long term expected return on asset assumption has been based on historical performance of the pension fund.
In terms of the individual expected returns, the expected return on equities has been based on an equity risk premium above a risk free rate. The risk free rate has been measured in accordance to the yields on government bonds at the measurement date.
The fixed interest portfolio includes government bonds, debentures, mortgages and cash. The expected return for this asset class has been based on yields of government bonds at the measurement date.
(ix) Average duration
The Weighted average duration of the liabilities at 31 December 2020 is 10 years (2019: 11 years) at the end of the reporting period.
(x) Future cash flows
The funding requirements of the defined benefit plan are based on the pension fund's actuarial measurement framework set out in the funding policies of the plan.
The Bank expects to pay MUR 6.65m in contributions to its post-employment benefit plans for the year ending 31 December 2021.
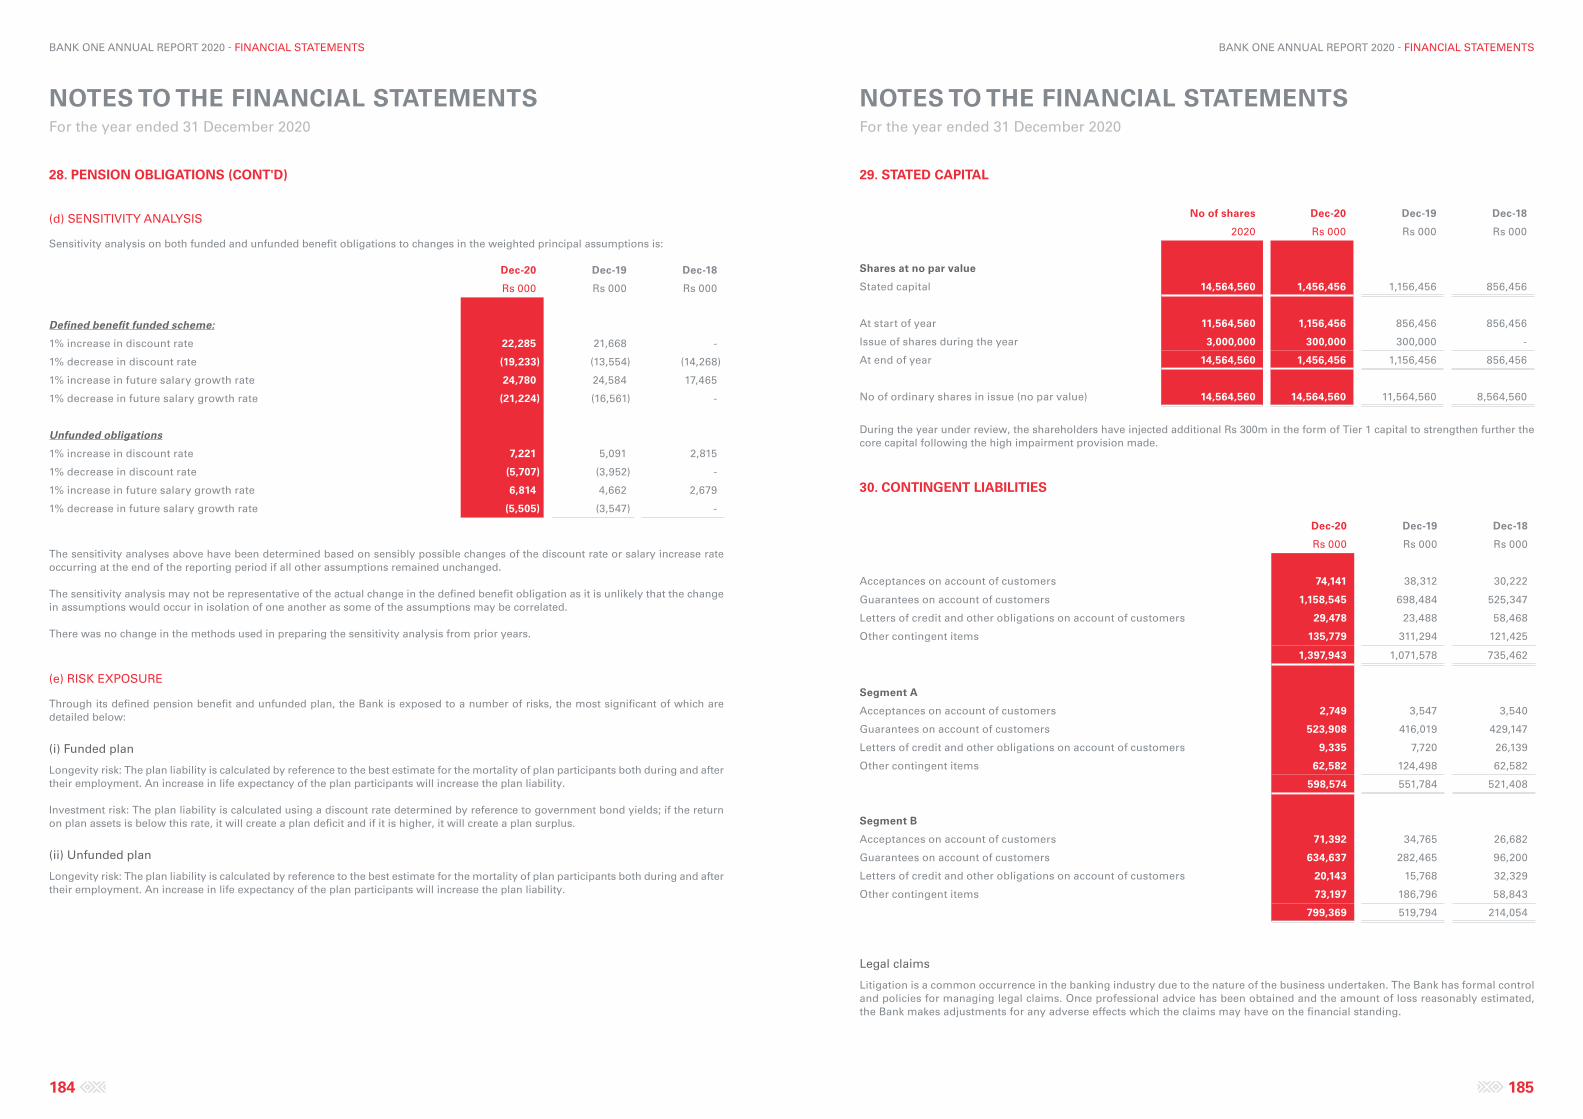
NOTES TO THE FINANCIAL STATEMENTS For the year ended 31 December 2020
NOTES TO THE FINANCIAL STATEMENTS For the year ended 31 December 2020
184 185
BANK ONE ANNUAL REPORT 2020 - FINANCIAL STATEMENTS BANK ONE ANNUAL REPORT 2020 - FINANCIAL STATEMENTS
29. STATED CAPITAL
No of shares Dec-20 Dec-19 Dec-18
2020 Rs 000 Rs 000 Rs 000
Shares at no par value
Stated capital 14,564,560 1,456,456 1,156,456 856,456
At start of year 11,564,560 1,156,456 856,456 856,456
Issue of shares during the year 3,000,000 300,000 300,000 -
At end of year 14,564,560 1,456,456 1,156,456 856,456
No of ordinary shares in issue (no par value) 14,564,560 14,564,560 11,564,560 8,564,560
During the year under review, the shareholders have injected additional Rs 300m in the form of Tier 1 capital to strengthen further the core capital following the high impairment provision made.
30. CONTINGENT LIABILITIES
Dec-20 Dec-19 Dec-18
Rs 000 Rs 000 Rs 000
Acceptances on account of customers 74,141 38,312 30,222
Guarantees on account of customers 1,158,545 698,484 525,347
Letters of credit and other obligations on account of customers 29,478 23,488 58,468
Other contingent items 135,779 311,294 121,425
1,397,943 1,071,578 735,462
Segment A
Acceptances on account of customers 2,749 3,547 3,540
Guarantees on account of customers 523,908 416,019 429,147
Letters of credit and other obligations on account of customers 9,335 7,720 26,139
Other contingent items 62,582 124,498 62,582
598,574 551,784 521,408
Segment B
Acceptances on account of customers 71,392 34,765 26,682
Guarantees on account of customers 634,637 282,465 96,200
Letters of credit and other obligations on account of customers 20,143 15,768 32,329
Other contingent items 73,197 186,796 58,843
799,369 519,794 214,054
Legal claims
Litigation is a common occurrence in the banking industry due to the nature of the business undertaken. The Bank has formal control and policies for managing legal claims. Once professional advice has been obtained and the amount of loss reasonably estimated, the Bank makes adjustments for any adverse effects which the claims may have on the financial standing.
28. PENSION OBLIGATIONS (CONT'D)
(d) SENSITIVITY ANALYSIS
Sensitivity analysis on both funded and unfunded benefit obligations to changes in the weighted principal assumptions is:
Dec-20 Dec-19 Dec-18
Rs 000 Rs 000 Rs 000
Defined benefit funded scheme:
1% increase in discount rate 22,285 21,668 -
1% decrease in discount rate (19,233) (13,554) (14,268)
1% increase in future salary growth rate 24,780 24,584 17,465
1% decrease in future salary growth rate (21,224) (16,561) -
Unfunded obligations
1% increase in discount rate 7,221 5,091 2,815
1% decrease in discount rate (5,707) (3,952) -
1% increase in future salary growth rate 6,814 4,662 2,679
1% decrease in future salary growth rate (5,505) (3,547) -
The sensitivity analyses above have been determined based on sensibly possible changes of the discount rate or salary increase rate occurring at the end of the reporting period if all other assumptions remained unchanged.
The sensitivity analysis may not be representative of the actual change in the defined benefit obligation as it is unlikely that the change in assumptions would occur in isolation of one another as some of the assumptions may be correlated.
There was no change in the methods used in preparing the sensitivity analysis from prior years.
(e) RISK EXPOSURE
Through its defined pension benefit and unfunded plan, the Bank is exposed to a number of risks, the most significant of which are detailed below:
(i) Funded plan
Longevity risk: The plan liability is calculated by reference to the best estimate for the mortality of plan participants both during and after their employment. An increase in life expectancy of the plan participants will increase the plan liability.
Investment risk: The plan liability is calculated using a discount rate determined by reference to government bond yields; if the return on plan assets is below this rate, it will create a plan deficit and if it is higher, it will create a plan surplus.
(ii) Unfunded plan
Longevity risk: The plan liability is calculated by reference to the best estimate for the mortality of plan participants both during and after their employment. An increase in life expectancy of the plan participants will increase the plan liability.
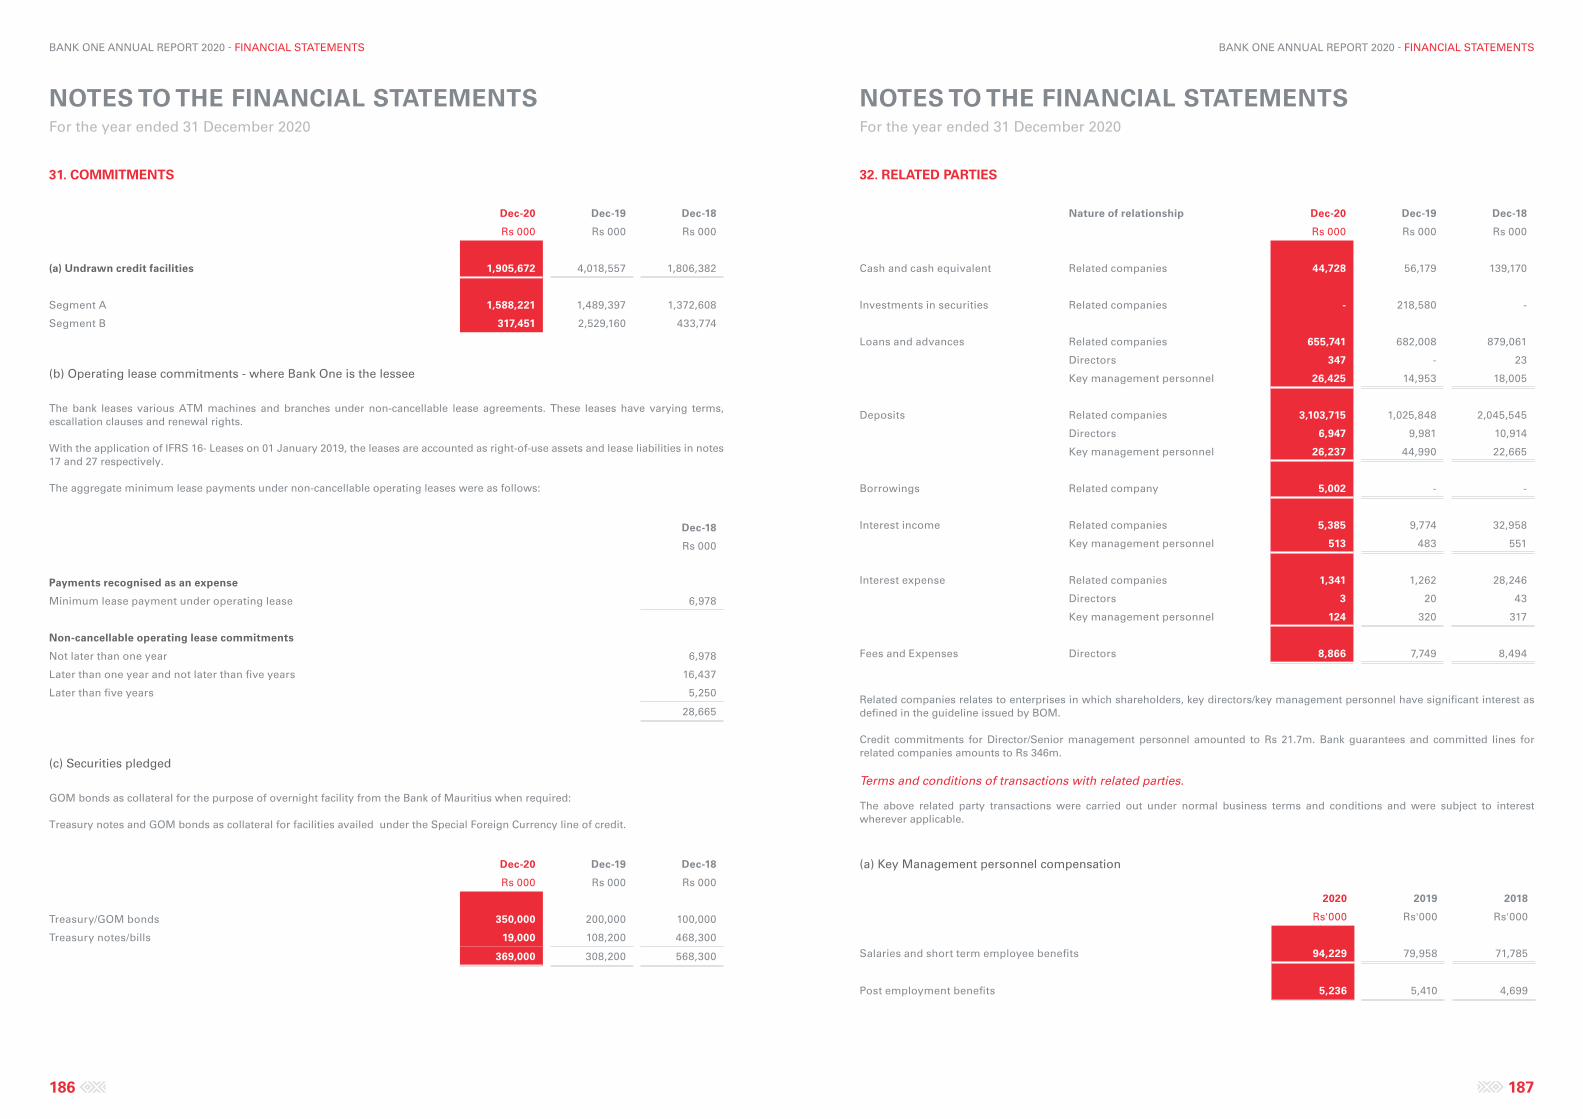
NOTES TO THE FINANCIAL STATEMENTS For the year ended 31 December 2020
NOTES TO THE FINANCIAL STATEMENTS For the year ended 31 December 2020
186 187
BANK ONE ANNUAL REPORT 2020 - FINANCIAL STATEMENTS BANK ONE ANNUAL REPORT 2020 - FINANCIAL STATEMENTS
32. RELATED PARTIES
Nature of relationship Dec-20 Dec-19 Dec-18
Rs 000 Rs 000 Rs 000
Cash and cash equivalent Related companies 44,728 56,179 139,170
Investments in securities Related companies - 218,580 -
Loans and advances Related companies 655,741 682,008 879,061
Directors 347 - 23
Key management personnel 26,425 14,953 18,005
Deposits Related companies 3,103,715 1,025,848 2,045,545
Directors 6,947 9,981 10,914
Key management personnel 26,237 44,990 22,665
Borrowings Related company 5,002 - -
Interest income Related companies 5,385 9,774 32,958
Key management personnel 513 483 551
Interest expense Related companies 1,341 1,262 28,246
Directors 3 20 43
Key management personnel 124 320 317
Fees and Expenses Directors 8,866 7,749 8,494
Related companies relates to enterprises in which shareholders, key directors/key management personnel have significant interest as defined in the guideline issued by BOM.
Credit commitments for Director/Senior management personnel amounted to Rs 21.7m. Bank guarantees and committed lines for related companies amounts to Rs 346m.
Terms and conditions of transactions with related parties.
The above related party transactions were carried out under normal business terms and conditions and were subject to interest wherever applicable.
(a) Key Management personnel compensation
2020 2019 2018
Rs'000 Rs'000 Rs'000
Salaries and short term employee benefits 94,229 79,958 71,785
Post employment benefits 5,236 5,410 4,699
31. COMMITMENTS
Dec-20 Dec-19 Dec-18
Rs 000 Rs 000 Rs 000
(a) Undrawn credit facilities 1,905,672 4,018,557 1,806,382
Segment A 1,588,221 1,489,397 1,372,608
Segment B 317,451 2,529,160 433,774
(b) Operating lease commitments - where Bank One is the lessee
The bank leases various ATM machines and branches under non-cancellable lease agreements. These leases have varying terms, escallation clauses and renewal rights.
With the application of IFRS 16- Leases on 01 January 2019, the leases are accounted as right-of-use assets and lease liabilities in notes 17 and 27 respectively.
The aggregate minimum lease payments under non-cancellable operating leases were as follows:
Dec-18
Rs 000
Payments recognised as an expense
Minimum lease payment under operating lease 6,978
Non-cancellable operating lease commitments
Not later than one year 6,978
Later than one year and not later than five years 16,437
Later than five years 5,250
28,665
(c) Securities pledged
GOM bonds as collateral for the purpose of overnight facility from the Bank of Mauritius when required:
Treasury notes and GOM bonds as collateral for facilities availed under the Special Foreign Currency line of credit.
Dec-20 Dec-19 Dec-18
Rs 000 Rs 000 Rs 000
Treasury/GOM bonds 350,000 200,000 100,000
Treasury notes/bills 19,000 108,200 468,300
369,000 308,200 568,300
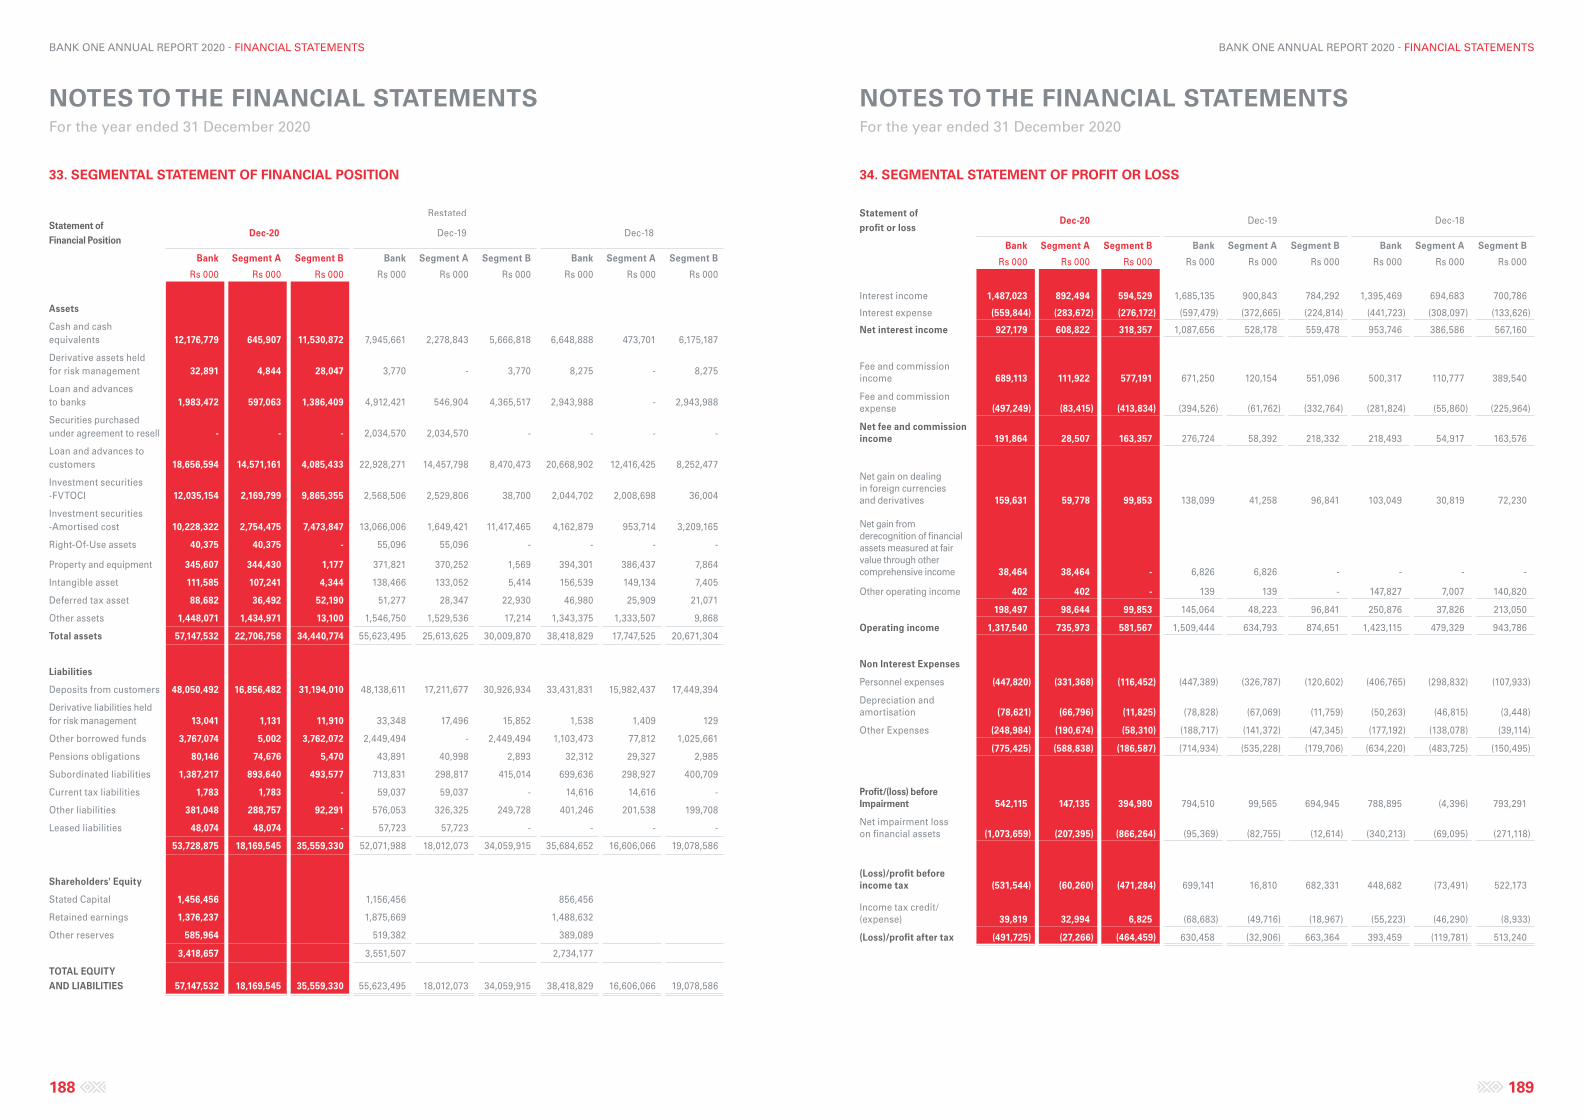
NOTES TO THE FINANCIAL STATEMENTS For the year ended 31 December 2020
NOTES TO THE FINANCIAL STATEMENTS For the year ended 31 December 2020
188 189
BANK ONE ANNUAL REPORT 2020 - FINANCIAL STATEMENTS BANK ONE ANNUAL REPORT 2020 - FINANCIAL STATEMENTS
34. SEGMENTAL STATEMENT OF PROFIT OR LOSS
Statement of profit or loss
Dec-20 Dec-19 Dec-18
Bank Segment A Segment B Bank Segment A Segment B Bank Segment A Segment B
Rs 000 Rs 000 Rs 000 Rs 000 Rs 000 Rs 000 Rs 000 Rs 000 Rs 000
Interest income 1,487,023 892,494 594,529 1,685,135 900,843 784,292 1,395,469 694,683 700,786
Interest expense (559,844) (283,672) (276,172) (597,479) (372,665) (224,814) (441,723) (308,097) (133,626)
Net interest income 927,179 608,822 318,357 1,087,656 528,178 559,478 953,746 386,586 567,160
Fee and commission income 689,113 111,922 577,191 671,250 120,154 551,096 500,317 110,777 389,540
Fee and commission expense (497,249) (83,415) (413,834) (394,526) (61,762) (332,764) (281,824) (55,860) (225,964)
Net fee and commission income 191,864 28,507 163,357 276,724 58,392 218,332 218,493 54,917 163,576
Net gain on dealing in foreign currencies and derivatives 159,631 59,778 99,853 138,099 41,258 96,841 103,049 30,819 72,230
Net gain from derecognition of financial assets measured at fair value through other comprehensive income 38,464 38,464 - 6,826 6,826 - - - -
Other operating income 402 402 - 139 139 - 147,827 7,007 140,820
198,497 98,644 99,853 145,064 48,223 96,841 250,876 37,826 213,050
Operating income 1,317,540 735,973 581,567 1,509,444 634,793 874,651 1,423,115 479,329 943,786
Non Interest Expenses
Personnel expenses (447,820) (331,368) (116,452) (447,389) (326,787) (120,602) (406,765) (298,832) (107,933)
Depreciation and amortisation (78,621) (66,796) (11,825) (78,828) (67,069) (11,759) (50,263) (46,815) (3,448)
Other Expenses (248,984) (190,674) (58,310) (188,717) (141,372) (47,345) (177,192) (138,078) (39,114)
(775,425) (588,838) (186,587) (714,934) (535,228) (179,706) (634,220) (483,725) (150,495)
Profit/(loss) before Impairment 542,115 147,135 394,980 794,510 99,565 694,945 788,895 (4,396) 793,291
Net impairment loss on financial assets (1,073,659) (207,395) (866,264) (95,369) (82,755) (12,614) (340,213) (69,095) (271,118)
(Loss)/profit before income tax (531,544) (60,260) (471,284) 699,141 16,810 682,331 448,682 (73,491) 522,173
Income tax credit/ (expense) 39,819 32,994 6,825 (68,683) (49,716) (18,967) (55,223) (46,290) (8,933)
(Loss)/profit after tax (491,725) (27,266) (464,459) 630,458 (32,906) 663,364 393,459 (119,781) 513,240
33. SEGMENTAL STATEMENT OF FINANCIAL POSITION
RestatedStatement of Financial Position
Dec-20 Dec-19 Dec-18
Bank Segment A Segment B Bank Segment A Segment B Bank Segment A Segment B
Rs 000 Rs 000 Rs 000 Rs 000 Rs 000 Rs 000 Rs 000 Rs 000 Rs 000
Assets
Cash and cash equivalents 12,176,779 645,907 11,530,872 7,945,661 2,278,843 5,666,818 6,648,888 473,701 6,175,187
Derivative assets held for risk management 32,891 4,844 28,047 3,770 - 3,770 8,275 - 8,275
Loan and advances to banks 1,983,472 597,063 1,386,409 4,912,421 546,904 4,365,517 2,943,988 - 2,943,988
Securities purchased under agreement to resell - - - 2,034,570 2,034,570 - - - -
Loan and advances to customers 18,656,594 14,571,161 4,085,433 22,928,271 14,457,798 8,470,473 20,668,902 12,416,425 8,252,477
Investment securities -FVTOCI 12,035,154 2,169,799 9,865,355 2,568,506 2,529,806 38,700 2,044,702 2,008,698 36,004
Investment securities -Amortised cost 10,228,322 2,754,475 7,473,847 13,066,006 1,649,421 11,417,465 4,162,879 953,714 3,209,165
Right-Of-Use assets 40,375 40,375 - 55,096 55,096 - - - -
Property and equipment 345,607 344,430 1,177 371,821 370,252 1,569 394,301 386,437 7,864
Intangible asset 111,585 107,241 4,344 138,466 133,052 5,414 156,539 149,134 7,405
Deferred tax asset 88,682 36,492 52,190 51,277 28,347 22,930 46,980 25,909 21,071
Other assets 1,448,071 1,434,971 13,100 1,546,750 1,529,536 17,214 1,343,375 1,333,507 9,868
Total assets 57,147,532 22,706,758 34,440,774 55,623,495 25,613,625 30,009,870 38,418,829 17,747,525 20,671,304
Liabilities
Deposits from customers 48,050,492 16,856,482 31,194,010 48,138,611 17,211,677 30,926,934 33,431,831 15,982,437 17,449,394
Derivative liabilities held for risk management 13,041 1,131 11,910 33,348 17,496 15,852 1,538 1,409 129
Other borrowed funds 3,767,074 5,002 3,762,072 2,449,494 - 2,449,494 1,103,473 77,812 1,025,661
Pensions obligations 80,146 74,676 5,470 43,891 40,998 2,893 32,312 29,327 2,985
Subordinated liabilities 1,387,217 893,640 493,577 713,831 298,817 415,014 699,636 298,927 400,709
Current tax liabilities 1,783 1,783 - 59,037 59,037 - 14,616 14,616 -
Other liabilities 381,048 288,757 92,291 576,053 326,325 249,728 401,246 201,538 199,708
Leased liabilities 48,074 48,074 - 57,723 57,723 - - - -
53,728,875 18,169,545 35,559,330 52,071,988 18,012,073 34,059,915 35,684,652 16,606,066 19,078,586
Shareholders' Equity
Stated Capital 1,456,456 1,156,456 856,456
Retained earnings 1,376,237 1,875,669 1,488,632
Other reserves 585,964 519,382 389,089
3,418,657 3,551,507 2,734,177
TOTAL EQUITY AND LIABILITIES 57,147,532 18,169,545 35,559,330 55,623,495 18,012,073 34,059,915 38,418,829 16,606,066 19,078,586
NOTES TO THE FINANCIAL STATEMENTS For the year ended 31 December 2020
NOTES TO THE FINANCIAL STATEMENTS For the year ended 31 December 2020
190 191
BANK ONE ANNUAL REPORT 2020 - FINANCIAL STATEMENTS BANK ONE ANNUAL REPORT 2020 - FINANCIAL STATEMENTS
35. SUBSEQUENT EVENT
There are no events after the reporting date which require adjustment or disclosures to the financial statements as at 31 December 2020.
36. IMPACT OF COVID-19 OUTBREAK
The COVID-19 pandemic has had an adverse impact on economies, households, businesses, and financial institutions around the world. These included business closures, travel restrictions, quarantines, and limits on public and private gatherings. These measures led to a sharp reduction in economic activity over the March to May period in a large number of developed and emerging economies. Governments and Central Banks around the world implemented a number of measures to curtail the outbreak and slow its progression.
Mauritius being no exception, severely felt the impact of these measures on its economy which is largely hospitality driven.
In fact, the Mauritian authorities imposed a lockdown starting from 23 March 2020 to 14 June 2020. However, the borders remained closed and the wearing of masks remained compulsory. The closure of the borders resulted in lower activities relating to the tourism sector impacting severely the whole chain of operations related to the industry.
Governments, Central banks and the private sector had to work hand in hand in order to find means and ways to mitigate at the maximum the impact of the pandemic on the economies.
In Mauritius, the Government of Mauritius (GOM) and the Central Bank (BOM) came up with a list of measures to support both the individuals as well as the entities affected by the pandemic. These included:
a) The Key Repo Rate was brought down from 3.35% in early 2020 to 1.85% as from April 2020.
b) The cash reserve ratio relating to the rupee deposits required by BOM to be held by banks, were brought down from 9% to 8%. The banks were encouraged to support their clients with the 1% under certain conditions.
c) A special relief fund of Rs5bn was introduced to support companies having cash flow and working capital difficulties. This was made through commercial banks who would borrow with BOM at 1% for onward lending to its affected customers at 1.5%. These facilities were partly guaranteed by the State Investment Corporation under certain conditions.
d) Affected households were allowed nine months of moratorium for the repayment of their credit facilities as from April 2020. These moratoriums were subsequently extended till June 2021.
e) Additional support in the form of credit lines were given to importers and exporters.
f) Financial assistance was introduced under the Investment Support Programme operating under the aegis of the Government of Finance.
g) In order to support economic operators facing cash flow strains, a Wage Assistance Scheme was introduced by the GOM.
h) Furthermore, a self-employed assistance scheme was created for the more informal sector.
i) As a tactical move to support the most affected industries and preserve employment, a Special Purpose Vehicle which is called MIC (Mauritius Investment Corporation) was created.
j) Financial institutions allowed adding back a proportion of Stage 1 and Stage 2 provisions under IFRS 9 to their Tier 1 Capital. Banks shall add the provisions back to Common Equity Tier 1 (CET1) Capital and non-bank deposit taking institutions (NBDTIs) shall add the provisions back to Tier 1 Core Capital.
As an additional measure, the Central Bank put on hold the guideline on Credit Impairment Measurement and Income recognition so as not to put further stress on the banking sector. The BOM, in alignment with the global practice, provided the banking sector with some broad guiding principles regarding the IFRS 9 requirements relating to the classification and staging of financial assets.
The immediate strategy of the bank, in these circumstances was to secure its balance sheet, protect its capital and ensure it has sufficient liquidity to meet any unforeseen outflows. In these turbulent times, the bank was successful in raising additional Tier 1 capital of Rs 300m from its existing shareholders and a further Rs 595m in the form of a subordinated debt qualifying for Tier 2 from local investors. This has substantially consolidated the capital position of the bank and kept the bank ready of any shocks. The bank closed the year under review at a record high Capital Adequacy Ratio of 19.81% against a regulatory minimum of 11.875% and a Tier 1 ratio of 12.45% (minimum 8% as per BOM guideline).
On the liquidity front, the bank made use of its treasury arm to raise additional liquidity through instruments such as Swaps, Repos and short-term borrowings to ensure it has an enhanced liquidity buffer. As at December 2020, our liquidity level was the highest the bank has ever held. This additional cost had an important impact on our interest expense. As at December 2020, the bank`s LCR stood at a high 394% compared to a regulatory minimum of 100%.
Another measure taken at the bank level was to review its credit portfolio (both local and offshore) and reduce the exposures, where feasible. In this context, the bank called back quite some short-term facilities, mainly offshore, where the bank was not satisfied with the associated risk. New disbursements also were limited. During the nine months period to December 2020, our offshore loan portfolio was strategically halved. This not only improved our cash flow, but also helped in consolidating further the capital level.
On the local front, the bank continued its support to its corporate and individual clients in line with the measures introduced by the Bank of Mauritius. As at end of 2020, forbearances for a total amount of Rs 2.3bn were approved to the local clients.
In this declining interest rate environment, the bank`s portfolio of investment securities held at fair value through OCI will definitely gain value while at the same time any maturing securities will be replaced at lower yields.
Following the pandemic, the bank carried out a review on its Property, Plant and Equipment portfolio to assess any impact on its value. As at December 2020, no major impact on the bank`s PPE and projects in progress were noted.
On the liabilities side, the bank did not experience any major outflow regarding its deposits in these turbulent times, which remained stable, both in local and foreign currencies.
The pandemic resulted not only in a decline in business volumes but also a significant fall in the interest rates which has had a substantial impact on our returns, both in loans and advances and other interest earning investments. Additionally, the flows from loans were re-invested in US securities at very low rates eroding our interest income. With the fall in Libor rates, the interest payable on our long-term borrowings were adjusted. The low interest rate environment is expected to persist in the near to medium term.
The spread of the pandemic eventually resulted in a decline in business activities. The transactional non-interest income of the bank was negatively impacted but mitigated by some one-off deals finalised during the year.
In anticipation of the negative impact of the coronavirus on the bottom line of the bank, some cost containment measures were introduced as from Q2/2020. These measures allowed the bank to limit the increase in its operating costs to 8% and this mitigating the impact on its profitability.
The most impactful area following the pandemic was on the Expected Credit Loss numbers, both on the local as well as the offshore portfolios. The ECL model had to be reviewed and new factors had to be incorporated to cater for the change in the economic landscape. These include the forbearance measures, new forward-looking information, negative growth scenarios, relief programmes, etc.
The accounts which were allowed moratoriums were maintained in stage 1 and the appropriate provisions booked.
The bank has been working on probable scenarios as well to arrive at the most appropriate provisioning numbers. Furthermore, assessments were also made on the forbearance portfolios, despite sitting in stage 1, to assess the probability of the assets changing stage and the impact on the provisioning. Following the assessment, additional provisions (over and above the IFRS 9 requirements) were booked for the most vulnerable accounts in the 2020 financial statements.

DESIGNED BY BEYOND COMMUNICATIONS

BANK ONE LIMITEDREGISTERED OFFICE: 16, SIR WILLIAM NEWTON STREET,
PORT LOUIS, MAURITIUS
T: + 230 202 9200 | F: +230 212 8883E: [email protected] | W: WWW.BANKONE.MU
BRN: C07040612