Embed Size (px)
Citation preview
SHEPHERD NEAME LIMITED17 COURT STREET, FAVERSHAM,
KENT, ME13 7AX
TEL: 01795 532206
FAX: 01795 538907
EMAIL: [email protected]
WWW.SHEPHERDNEAME.CO.UK
REGISTERED IN ENGLAND NUMBER 138256
ANNUAL REPORT 2019
SHEPHERD NEAME LIMITED
ANNUAL REPORT 2019
SHEPHERD NEAME IS AN INDEPENDENT FAMILY BUSINESS AND
Our vision – is to be a Great British
Brewer and run the best pubs.
Our mission – is to give our customers
a great and memorable experience to
make for a better day!
BRITAIN’S OLDEST BREWER
Bear Island Triple Hopped Lager launches at Craft Beer Rising, London in February 2019
Kent-based band Salvation Jayne at this year’s Ramblin’ Man Festival
1WWW.SHEPHERDNEAME.CO.UK
| OT
HE
R IN
FO
RM
AT
ION
| FIN
AN
CIA
L S
TA
TE
ME
NT
S| G
OV
ER
NA
NC
E| S
TR
AT
EG
IC R
EP
OR
T
CONTENTS
STRATEGIC REPORT
2 Financial Highlights
3 Our Strategy
4 At a Glance
6 Chairman’s Statement
8 Key Strategic Objectives
16 Chief Executive’s Review
21 Financial Commentary
24 Principal Risks and Uncertainties
28 Our Community
GOVERNANCE
30 Board of Directors
32 Corporate Governance
34 Remuneration Report
39 Report of the Directors
40 Directors’ Responsibilities Statement
FINANCIAL STATEMENTS
41 Independent Auditor’s Report
44 Consolidated Profit and Loss Account
44 Consolidated Statement of Comprehensive Income
45 Consolidated and Parent Company Balance Sheet
46 Consolidated Statement of Changes in Equity
47 Consolidated Cash Flow Statement
48 Notes to the Accounts
OTHER INFORMATION
68 Financial Calendar
68 Company Advisors
69 Glossary – Alternative Performance Measures
71 Five Year Financial Summary
2 SHEPHERD NEAME ANNUAL REPORT AND ACCOUNTS 2019
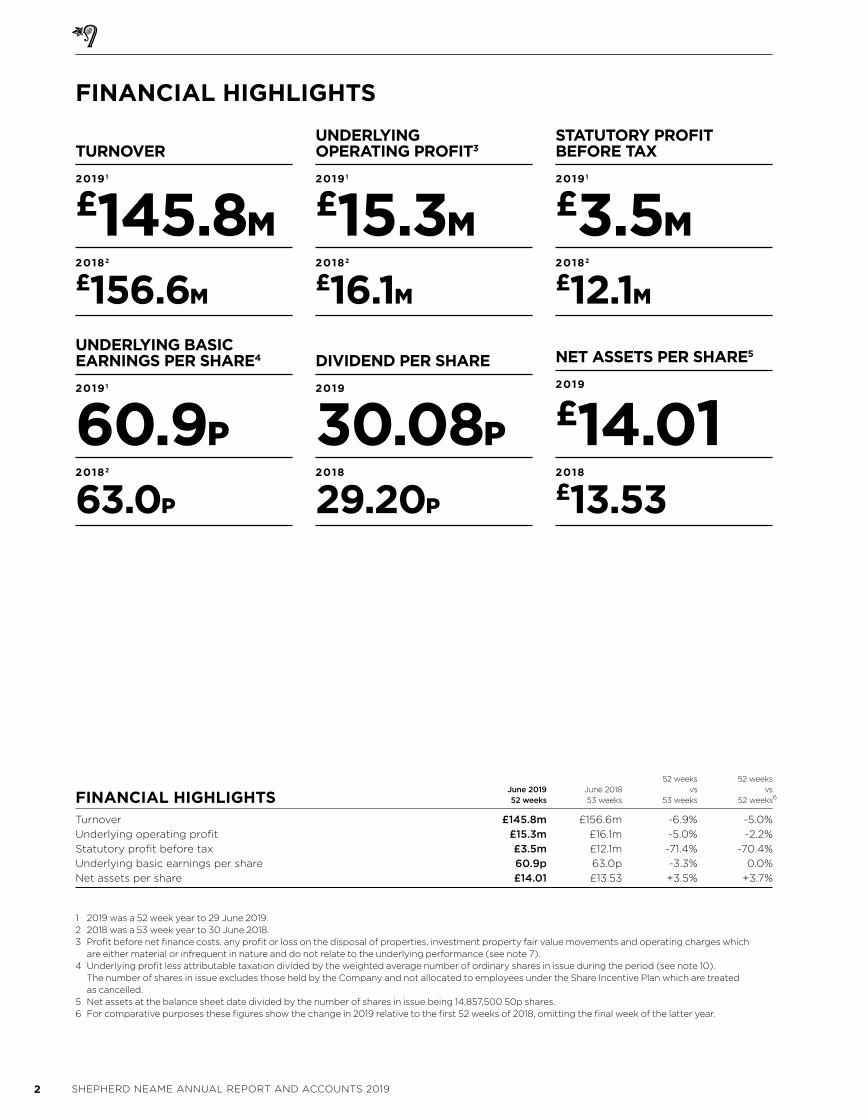
FINANCIAL HIGHLIGHTS
1 2019 was a 52 week year to 29 June 2019. 2 2018 was a 53 week year to 30 June 2018. 3 Profit before net finance costs, any profit or loss on the disposal of properties, investment property fair value movements and operating charges which
are either material or infrequent in nature and do not relate to the underlying performance (see note 7). 4 Underlying profit less attributable taxation divided by the weighted average number of ordinary shares in issue during the period (see note 10).
The number of shares in issue excludes those held by the Company and not allocated to employees under the Share Incentive Plan which are treated as cancelled.
5 Net assets at the balance sheet date divided by the number of shares in issue being 14,857,500 50p shares.6 For comparative purposes these figures show the change in 2019 relative to the first 52 weeks of 2018, omitting the final week of the latter year.
UNDERLYING OPERATING PROFIT3
20191
£15.3M20182
£16.1MUNDERLYING BASIC EARNINGS PER SHARE4
20191
60.9P20182
63.0P
NET ASSETS PER SHARE5
2019
£14.012018
£13.53
STATUTORY PROFIT BEFORE TAX
20191
£3.5M20182
£12.1M
DIVIDEND PER SHARE
2019
30.08P2018
29.20P
TURNOVER
20191
£145.8M20182
£156.6M
52 weeks 52 weeks
June 2019 June 2018 vs vs
FINANCIAL HIGHLIGHTS 52 weeks 53 weeks 53 weeks 52 weeks6
Turnover £145.8m £156.6m -6.9% -5.0%
Underlying operating profit £15.3m £16.1m -5.0% -2.2%
Statutory profit before tax £3.5m £12.1m -71.4% -70.4%
Underlying basic earnings per share 60.9p 63.0p -3.3% 0.0%
Net assets per share £14.01 £13.53 +3.5% +3.7%
3WWW.SHEPHERDNEAME.CO.UK
| OT
HE
R IN
FO
RM
AT
ION
| FIN
AN
CIA
L S
TA
TE
ME
NT
S| G
OV
ER
NA
NC
E| S
TR
AT
EG
IC R
EP
OR
T
OUR STRATEGY
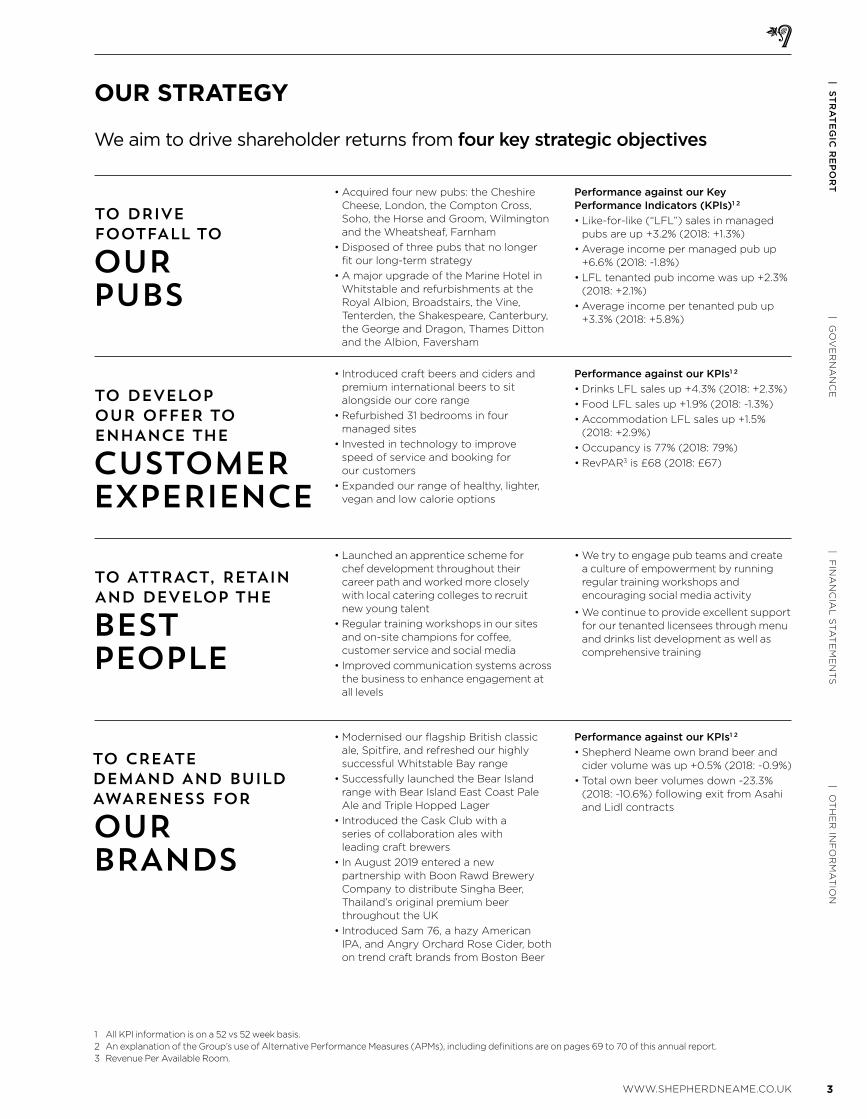
We aim to drive shareholder returns from four key strategic objectives
1 All KPI information is on a 52 vs 52 week basis.2 An explanation of the Group’s use of Alternative Performance Measures (APMs), including definitions are on pages 69 to 70 of this annual report.3 Revenue Per Available Room.
• Acquired four new pubs: the Cheshire Cheese, London, the Compton Cross, Soho, the Horse and Groom, Wilmington and the Wheatsheaf, Farnham
• Disposed of three pubs that no longer fit our long-term strategy
• A major upgrade of the Marine Hotel in Whitstable and refurbishments at the Royal Albion, Broadstairs, the Vine, Tenterden, the Shakespeare, Canterbury, the George and Dragon, Thames Ditton and the Albion, Faversham
Performance against our Key Performance Indicators (KPIs)1 2
• Like-for-like (“LFL”) sales in managed pubs are up +3.2% (2018: +1.3%)
• Average income per managed pub up +6.6% (2018: -1.8%)
• LFL tenanted pub income was up +2.3% (2018: +2.1%)
• Average income per tenanted pub up +3.3% (2018: +5.8%)
Page 8
TO DRIVE FOOTFALL TO
OUR PUBS
• Introduced craft beers and ciders and premium international beers to sit alongside our core range
• Refurbished 31 bedrooms in four managed sites
• Invested in technology to improve speed of service and booking for our customers
• Expanded our range of healthy, lighter, vegan and low calorie options
Performance against our KPIs1 2
• Drinks LFL sales up +4.3% (2018: +2.3%)
• Food LFL sales up +1.9% (2018: -1.3%)
• Accommodation LFL sales up +1.5% (2018: +2.9%)
• Occupancy is 77% (2018: 79%)
• RevPAR3 is £68 (2018: £67)
Page 10
TO DEVELOP OUR OFFER TO ENHANCE THE
CUSTOMER EXPERIENCE
• Launched an apprentice scheme for chef development throughout their career path and worked more closely with local catering colleges to recruit new young talent
• Regular training workshops in our sites and on-site champions for coffee, customer service and social media
• Improved communication systems across the business to enhance engagement at all levels
• We try to engage pub teams and create a culture of empowerment by running regular training workshops and encouraging social media activity
• We continue to provide excellent support for our tenanted licensees through menu and drinks list development as well as comprehensive training
Page 12
TO ATTRACT, RETAIN AND DEVELOP THE
BEST PEOPLE
• Modernised our flagship British classic ale, Spitfire, and refreshed our highly successful Whitstable Bay range
• Successfully launched the Bear Island range with Bear Island East Coast Pale Ale and Triple Hopped Lager
• Introduced the Cask Club with a series of collaboration ales with leading craft brewers
• In August 2019 entered a new partnership with Boon Rawd Brewery Company to distribute Singha Beer, Thailand’s original premium beer throughout the UK
• Introduced Sam 76, a hazy American IPA, and Angry Orchard Rose Cider, both on trend craft brands from Boston Beer
Performance against our KPIs1 2
• Shepherd Neame own brand beer and cider volume was up +0.5% (2018: -0.9%)
• Total own beer volumes down -23.3% (2018: -10.6%) following exit from Asahi and Lidl contracts
Page 14
TO CREATE DEMAND AND BUILD AWARENESS FOR
OUR BRANDS
4
AT A GLANCE
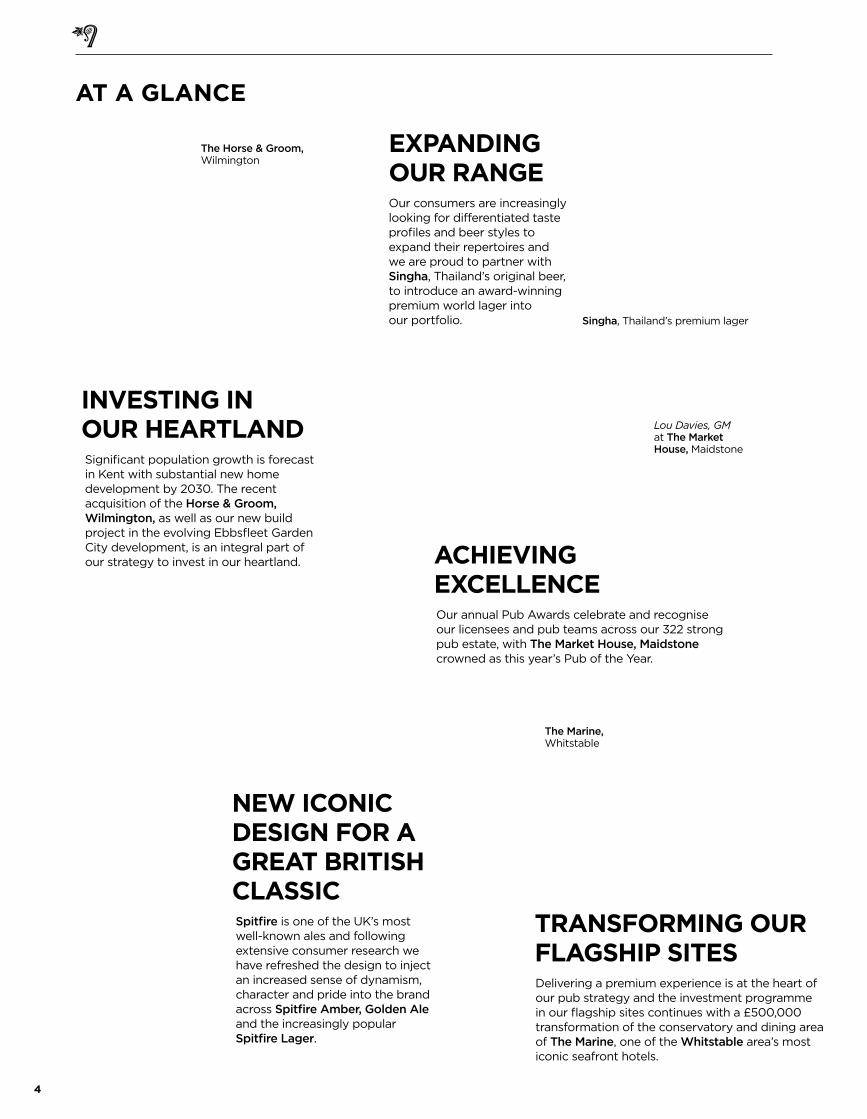
NEW ICONIC DESIGN FOR A GREAT BRITISH CLASSICSpitfire is one of the UK’s most well-known ales and following extensive consumer research we have refreshed the design to inject an increased sense of dynamism, character and pride into the brand across Spitfire Amber, Golden Ale and the increasingly popular Spitfire Lager.
EXPANDING OUR RANGEOur consumers are increasingly looking for differentiated taste profiles and beer styles to expand their repertoires and we are proud to partner with Singha, Thailand’s original beer, to introduce an award-winning premium world lager into our portfolio. Singha, Thailand’s premium lager
INVESTING IN OUR HEARTLAND
Significant population growth is forecast in Kent with substantial new home development by 2030. The recent acquisition of the Horse & Groom, Wilmington, as well as our new build project in the evolving Ebbsfleet Garden City development, is an integral part of our strategy to invest in our heartland.
The Horse & Groom, Wilmington
ACHIEVING EXCELLENCE
Our annual Pub Awards celebrate and recognise our licensees and pub teams across our 322 strong pub estate, with The Market House, Maidstone crowned as this year’s Pub of the Year.
Lou Davies, GM at The Market House, Maidstone
TRANSFORMING OUR FLAGSHIP SITESDelivering a premium experience is at the heart of our pub strategy and the investment programme in our flagship sites continues with a £500,000 transformation of the conservatory and dining area of The Marine, one of the Whitstable area’s most iconic seafront hotels.
The Marine, Whitstable
5WWW.SHEPHERDNEAME.CO.UK
| OT
HE
R IN
FO
RM
AT
ION
| FIN
AN
CIA
L S
TA
TE
ME
NT
S| G
OV
ER
NA
NC
E| S
TR
AT
EG
IC R
EP
OR
T
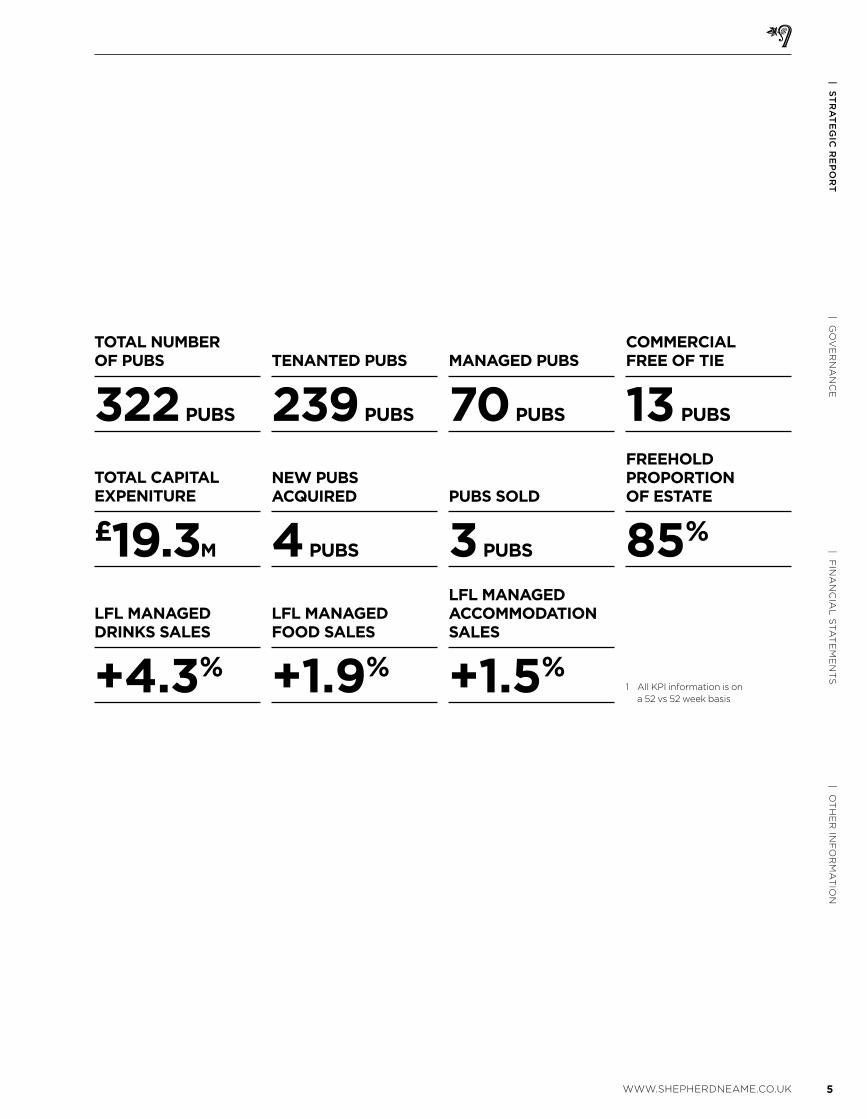
1 All KPI information is on a 52 vs 52 week basis
TOTAL NUMBER OF PUBS
322 PUBS
TOTAL CAPITAL EXPENITURE
£19.3M
TENANTED PUBS
239 PUBS
NEW PUBS ACQUIRED
4 PUBS
MANAGED PUBS
70 PUBS
PUBS SOLD
3 PUBS
COMMERCIAL FREE OF TIE
13 PUBS
FREEHOLD PROPORTION OF ESTATE
85%
LFL MANAGED FOOD SALES
+1.9%
LFL MANAGED ACCOMMODATION SALES
+1.5%
LFL MANAGED DRINKS SALES
+4.3%
6 SHEPHERD NEAME ANNUAL REPORT AND ACCOUNTS 2019
Overview
I am pleased to report a year of
good strategic progress and a
solid financial performance for
the 52 weeks to 29 June 2019,
in line with our expectations.
In this year, the performance in
both managed and tenanted
pubs has been excellent and
we continue to outperform the
market. Our brewing and brands
business is in a period of transition
and has delivered lower turnover
and profits, as anticipated.
However, growth in our pub
business has largely offset the
reduction in brewing profits. In
spite of a slight fall in Company
turnover and profits, as a result
of these combined outcomes,
we have delivered a satisfactory
overall underlying result.
Our aim is to own and operate
the best estate of characterful and
individual pubs within our Kent
and south east heartland, to deliver
a great customer experience and
to maximise our core strengths as
a leading independent brewer with
a unique heritage.
We are a modern, successful
business with a clear vision.
We invest in high quality, cash
generative assets that will provide
good sustainable returns, and look
to build the equity of our brands.
The company is financed for the
long term backed by a high quality
freehold property base which
delivers consistent long term
growth in dividend and net
asset value per share.
We sustain the long term success
of the business by achieving a
balance between the different
market and financial
characteristics of each division.
This year, we have met some
important objectives to position
the Company for the long term:
• acquired some great new
managed pubs in those areas
of North Kent due for major
economic development over
the next decade;
• expanded and positioned our
beer portfolio to meet increasing
demand in world lager and craft
beers and since the year end,
entered an important new
partnership for distributing
the leading Thai beer, Singha.
We believe this will be a good
medium term platform for
growth. We continue to
pursue other opportunities;
• entered into a new financing
structure that provides certainty
of funds, at a lower cost of debt
and with an improved maturity
profile, which enables us to
continue to invest for the long
term; and
• agreed future changes to the
Board of Directors.
These steps, and our long-term
strategy, give me great confidence
that Shepherd Neame has an
exciting future ahead.
Financial Results
The results are in line with our
expectations. Key factors to
note are:
• 2019 was a 52 week year vs 53
weeks in 2018. All commentary
throughout this report is on that
basis, unless otherwise stated;
• the refinancing and cancellation
of the swap contracts resulted in
a one-off total charge of £10.8m;
and
• the headline reduction in revenue
and operating profit is largely as
a result of the transition out of
the Asahi and Lidl own brand
contracts.
Total revenue for the 52 week
period (2018: 53 weeks) reduced by
-6.9% to £145.8m (2018: £156.6m).
Managed pubs is our key area of
investment and continued to grow
and perform well, tenanted pubs
maintained their strong like-for-like
performance and brewing and
brands, for the reasons outlined
in the Chief Executive’s report,
saw a reduction in sales.
Underlying profit before tax was
£11.4m (2018: £11.8m), or -0.3% on
an adjusted 52 week basis.
Statutory profit before tax was
£3.5m (2018: £12.1m) after the
charge of £10.8m related to
the refinancing.
The business is strongly cash
generative and underlying EBITDA
was robust. Margins in the business
as a whole have continued to
increase, as the mix of our business
changes, with underlying operating
profit margin at 10.5% (2018: 10.3%)
and underlying EBITDA margin at
16.2% (2018: 15.7%).
“ A YEAR OF GOOD STRATEGIC PROGRESS AND A SOLID FINANCIAL PERFORMANCE”
MILES TEMPLEMAN CHAIRMAN
CHAIRMAN’S STATEMENT
The Albion, Faversham
7WWW.SHEPHERDNEAME.CO.UK
| OT
HE
R IN
FO
RM
AT
ION
| FIN
AN
CIA
L S
TA
TE
ME
NT
S| G
OV
ER
NA
NC
E| S
TR
AT
EG
IC R
EP
OR
T
various senior sales and marketing
positions within Molson Coors. Kevin
is a non-executive Director of St.
Austell Brewery and in January 2020
becomes its Chief Executive. He is
also Deputy Chairman of The British
Beer and Pub Association.
Summary
The Board is focused on investing
for the long-term benefit of
shareholders with the aim to run
the best pubs in our heartland and
be a great British brewer.
The last few years have seen
significant progress in developing
Shepherd Neame into the modern,
balanced business that it is today.
The quality of our pub portfolio
has improved materially and the
acquisitions made this year continue
to strengthen our asset base.
The operational improvements to
enhance the quality of our offer
and attract the best people are
impressive and set out in the
Chief Executive’s report.
The Brewing and Brands business
has been more challenging this
year, but we have repositioned
and modernised our portfolio, built
new partnerships, developed our
marketing and built the skills in our
team. All of this will enable us to
build on our unique heritage, our
geography and expertise and to
take advantage of our position
as a strong independent brewer.
Consumer behaviour is changing
fast and will continue to change; but
beer and pubs will remain central to
British social life for a very long time
to come. Our challenge is to keep
evolving to meet changing needs
and to invest to ensure that our
offer remains fresh and relevant to
the consumer. As our heartland
demographics and population
changes, we aim to change with it,
so as to be central to the life of
tomorrow’s customer base.
Our balance sheet is strong, cash
flow robust and margins healthy.
The senior team has a good balance
of skills and experiences and is
motivated to take the Company
forward and deliver long-term
success.
Miles Templeman Chairman
We continue to manage our
property assets actively and have
realised £7.8m (2018: £6.0m) from
property disposals.
The cancellation of the previous
swap contracts was a cash cost
of £9.4m (£7.6m net of tax).
Net debt has consequently risen
to £82.0m (2018: £74.8m) as
at June 2019 and net debt to
EBITDA has increased to 3.5 times
(2018: 3.0 times). Unlike many
companies we have no outstanding
final salary pension liabilities and a
low proportion of lease liabilities.
Board of Directors
After what will have been 15 years as
Chairman and 18 years as a Director,
I feel that it is appropriate for me
to step down at the AGM in
October 2020.
I am delighted to announce that
Richard Oldfield will become
Chairman at that time. Richard
currently is a Non-Executive
Director, a position he has held since
2016. Richard brings significant skills
and expertise in finance, investment
and governance to complement the
wide range of skills and experience
of the Board.
He is the Founder and Chairman
of Oldfield Partners LLP, an
investment management firm with
a global client base, a Director of
Witan Investment Trust plc and
former Chairman of Keystone
Investment Trust plc. He was
previously chief executive of Alta
Advisers, the investment office of
the Rausing family, and before this
a director of Mercury Asset
Management plc.
With Richard taking the Chair in 2020,
a further Non-Executive Director has
been sought to ensure that we retain
extensive pub and brewing industry
skills and knowledge amongst the
Non-Executives. The Board is pleased
to announce the proposed
appointment of Kevin Georgel from
July 2020. Kevin has spent over 20
years working in the UK brewing and
pub sector. Appointed CEO of
Admiral Taverns in 2014, Kevin joined
Admiral Taverns in 2010 as Managing
Director with responsibility for the
Operations and Commercial aspects
of the business. He was previously
Operations Director at Punch Taverns
with responsibility for the leased and
tenanted estate. Prior to this he held
Underlying basic earnings per share
are 60.9p (2018: 63.0p), or level on
an adjusted 52 week basis, and
basic earnings per share are 17.6p
(2018: 68.1p).
Dividend
The Board is proposing a final
dividend of 24.21p (2018: 23.45p)
making the total dividend for the
year of 30.08p (2018: 29.20p), an
increase of +3.0%. This represents
underlying dividend cover of
2.0 times (2018: 2.2 times).
We will continue to target our
dividend cover at or around this
level in the future, consistent
with our dividend policy. The final
dividend will be paid on 18 October
2019 to shareholders on the register
at the close of business on
4 October 2019.
New Financing Structure
In October 2018, the Company put
in place a new financing structure
with £107.5m of committed long
term facilities. The key features
of this financing structure are a
private placement with BAE
Systems Pensions Funds
Investment Management Ltd
raising £35m at 3.99% for 20 years
and a new five-year revolving credit
facility of £50m with Lloyds Bank
plc and Santander UK plc.
We have seen the underlying
finance charge reduce against
the prior year, despite higher
debt levels, as we are now on
new and better terms.
In conjunction with the new
financing structure, an off-balance
sheet Directors’ valuation of our
licensed property assets has been
undertaken which showed a surplus
over current book value of £24m
as at 30 June 2018. In future, the
Board intends to carry out
Directors’ valuations of our
managed and tenanted pub
estates every four years.
Our new financing structure
provides us with an excellent
platform to take advantage of the
opportunities we anticipate will exist
in the market in the coming years.
Capital and Investment
Capital expenditure was £19.3m
(2018: £14.7m) including £9.0m in
new site acquisitions and £10.3m
on investing in our pub estate
and brewery.
8 SHEPHERD NEAME ANNUAL REPORT AND ACCOUNTS 2019
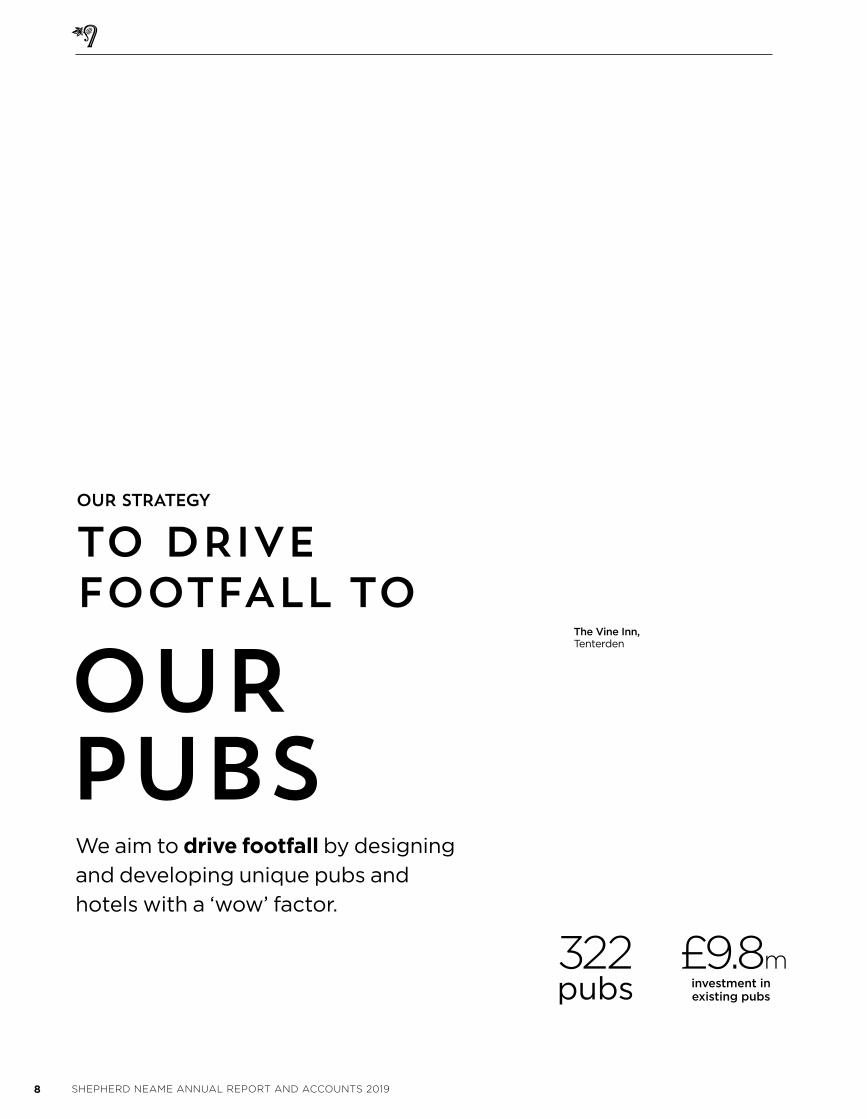
We aim to drive footfall by designing
and developing unique pubs and
hotels with a ‘wow’ factor.
OUR PUBS
OUR STRATEGY
TO DRIVE FOOTFALL TO
322pubs
The Vine Inn, Tenterden
£9.8minvestment in existing pubs
9WWW.SHEPHERDNEAME.CO.UK
| OT
HE
R IN
FO
RM
AT
ION
| FIN
AN
CIA
L S
TA
TE
ME
NT
S| G
OV
ER
NA
NC
E| S
TR
AT
EG
IC R
EP
OR
T
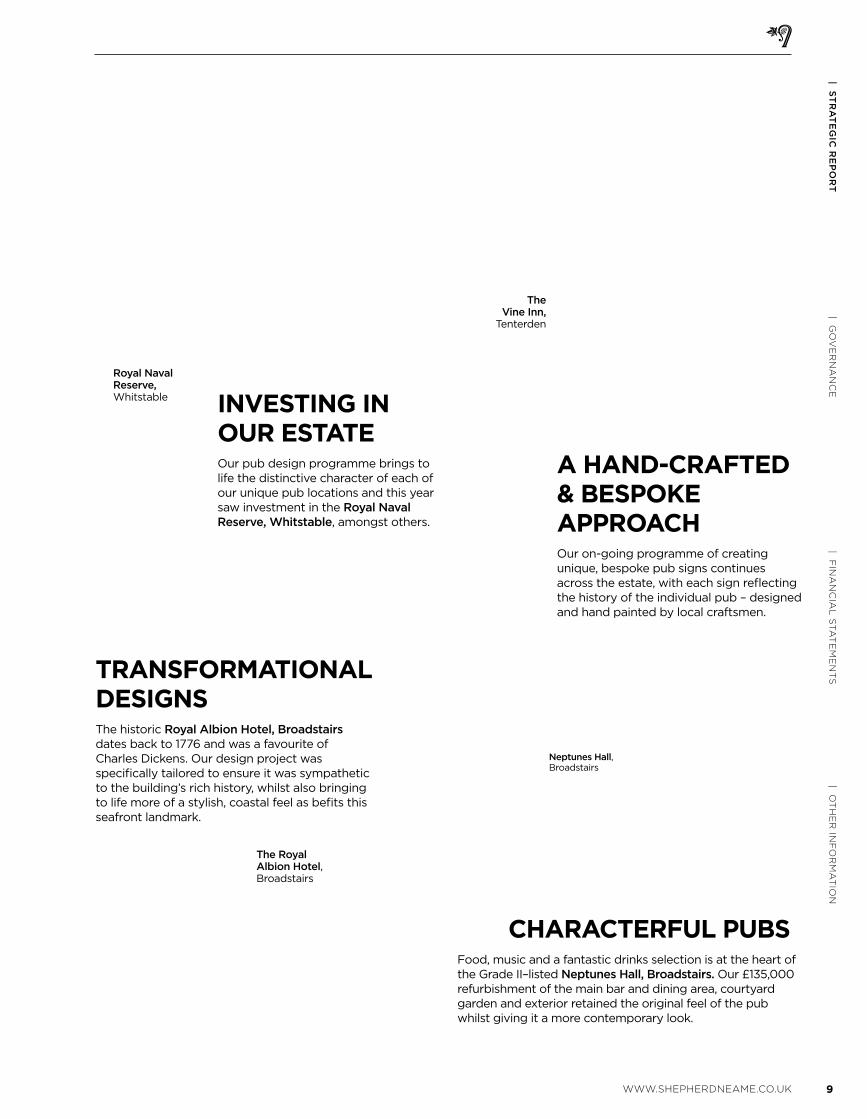
TRANSFORMATIONAL DESIGNS
The historic Royal Albion Hotel, Broadstairs dates back to 1776 and was a favourite of Charles Dickens. Our design project was specifically tailored to ensure it was sympathetic to the building’s rich history, whilst also bringing to life more of a stylish, coastal feel as befits this seafront landmark.
The Royal Albion Hotel, Broadstairs
CHARACTERFUL PUBS Food, music and a fantastic drinks selection is at the heart of the Grade II–listed Neptunes Hall, Broadstairs. Our £135,000 refurbishment of the main bar and dining area, courtyard garden and exterior retained the original feel of the pub whilst giving it a more contemporary look.
Neptunes Hall, Broadstairs
INVESTING IN OUR ESTATEOur pub design programme brings to life the distinctive character of each of our unique pub locations and this year saw investment in the Royal Naval Reserve, Whitstable, amongst others.
Royal Naval Reserve, Whitstable
A HAND-CRAFTED & BESPOKE APPROACH
Our on-going programme of creating unique, bespoke pub signs continues across the estate, with each sign reflecting the history of the individual pub – designed and hand painted by local craftsmen.
The Vine Inn,
Tenterden
10 SHEPHERD NEAME ANNUAL REPORT AND ACCOUNTS 2019
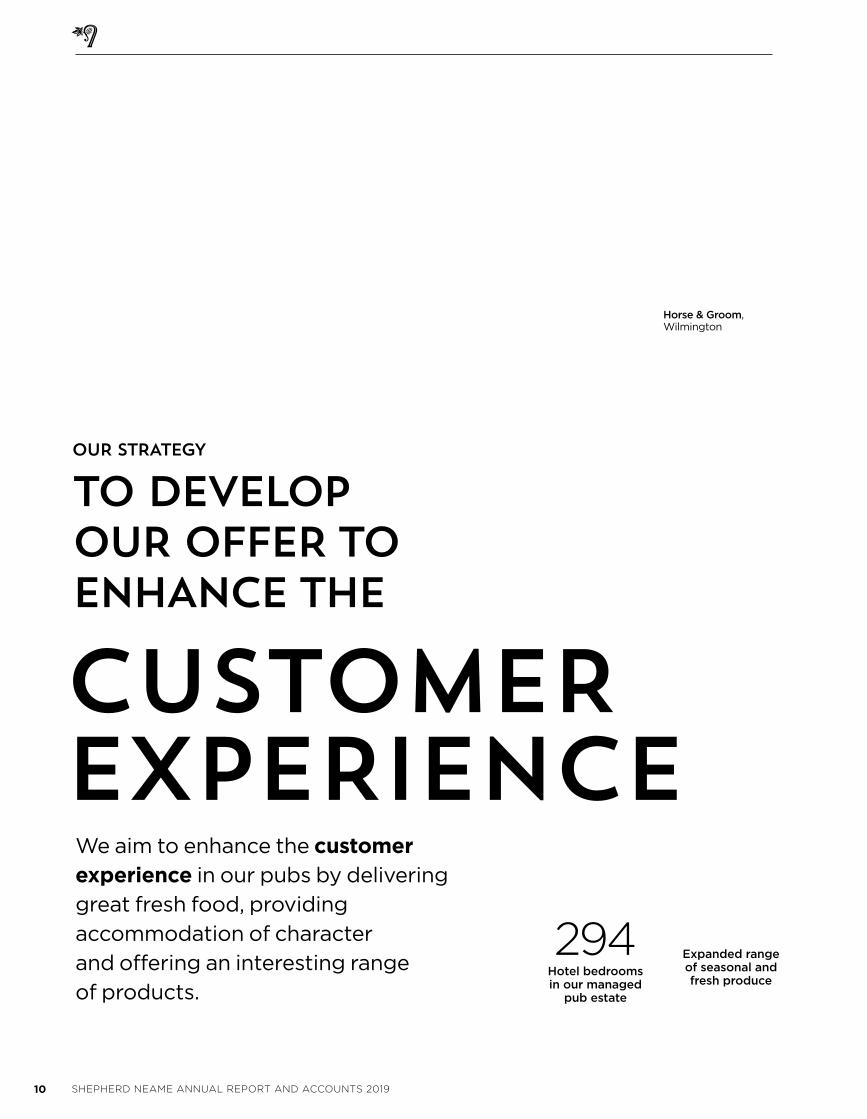
We aim to enhance the customer experience in our pubs by delivering
great fresh food, providing
accommodation of character
and offering an interesting range
of products.
CUSTOMER EXPERIENCE
OUR STRATEGY
TO DEVELOP OUR OFFER TO ENHANCE THE
294Hotel bedrooms in our managed
pub estate
Horse & Groom, Wilmington
Expanded range of seasonal and fresh produce
11WWW.SHEPHERDNEAME.CO.UK
| OT
HE
R IN
FO
RM
AT
ION
| FIN
AN
CIA
L S
TA
TE
ME
NT
S| G
OV
ER
NA
NC
E| S
TR
AT
EG
IC R
EP
OR
T
GREATER RANGE FOR OUR CUSTOMERS
Pink is on point and we were excited to launch Angry Orchard Rosé cider across our pub estate and to national customers this year in collaboration with our partner Boston Beer Company. We have seen consumers switching from gin and wine to the brand, which at 4% abv offers a refreshing and fruity alternative for consumers.
Angry Orchard Rosé cider
HIDDEN LONDON HERITAGEOur locally illustrated City of London walk that takes consumers on a journey around some of our classic London pubs was launched this year, unveiling hidden heritage stories and taking in some of the best drinking spots in the City. Download your copy here: www.shepherdneame.co.uk/city-london-walk
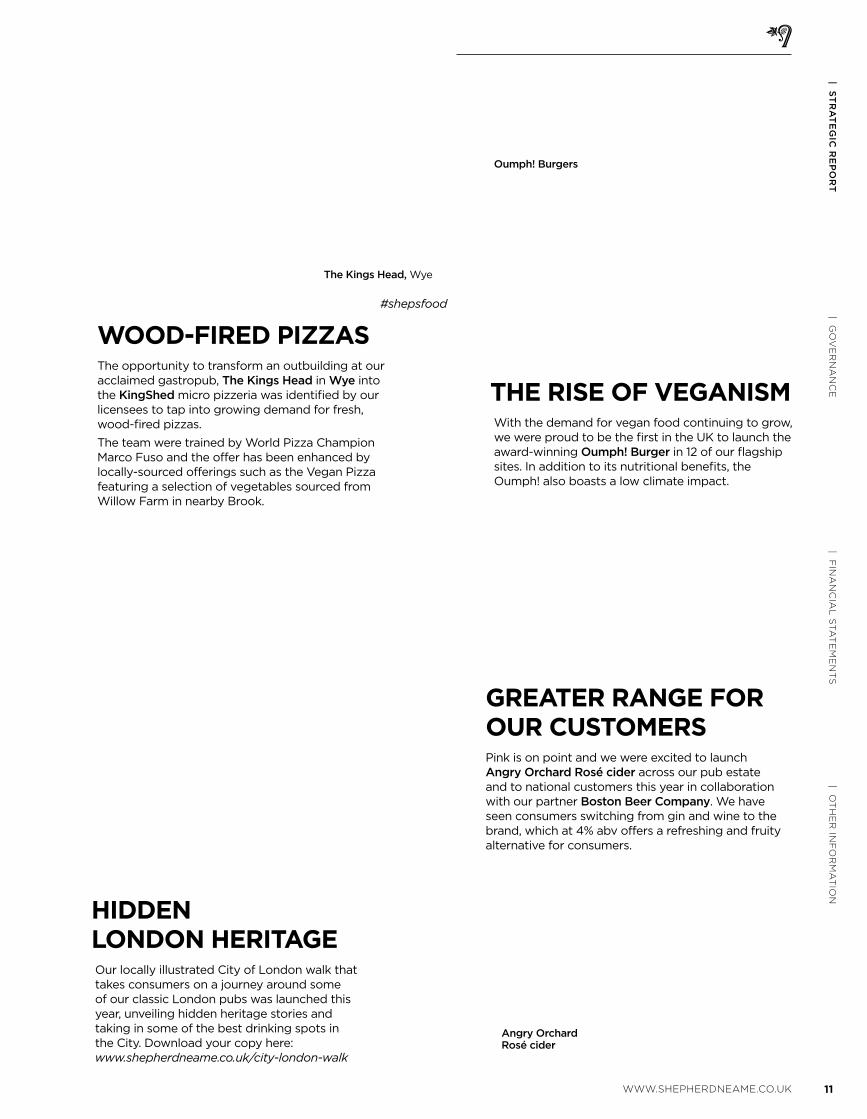
WOOD-FIRED PIZZAS The opportunity to transform an outbuilding at our
acclaimed gastropub, The Kings Head in Wye into the KingShed micro pizzeria was identified by our licensees to tap into growing demand for fresh, wood-fired pizzas.
The team were trained by World Pizza Champion Marco Fuso and the offer has been enhanced by locally-sourced offerings such as the Vegan Pizza featuring a selection of vegetables sourced from Willow Farm in nearby Brook.
The Kings Head, Wye
THE RISE OF VEGANISM With the demand for vegan food continuing to grow, we were proud to be the first in the UK to launch the award-winning Oumph! Burger in 12 of our flagship sites. In addition to its nutritional benefits, the Oumph! also boasts a low climate impact.
Oumph! Burgers
#shepsfood
12 SHEPHERD NEAME ANNUAL REPORT AND ACCOUNTS 2019
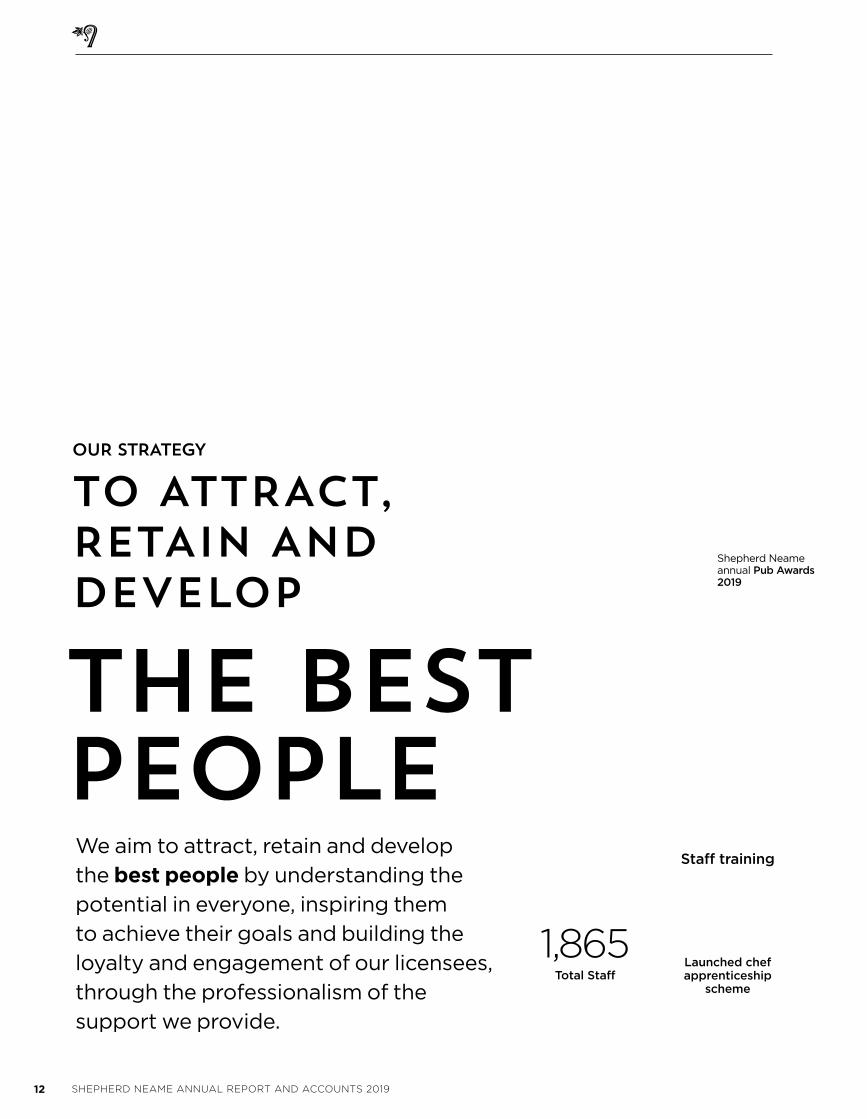
We aim to attract, retain and develop
the best people by understanding the
potential in everyone, inspiring them
to achieve their goals and building the
loyalty and engagement of our licensees,
through the professionalism of the
support we provide.
THE BEST PEOPLE
OUR STRATEGY
TO ATTRACT, RETAIN AND DEVELOP
1,865Total Staff
Staff training
Launched chef apprenticeship
scheme
Shepherd Neame annual Pub Awards 2019
13WWW.SHEPHERDNEAME.CO.UK
| OT
HE
R IN
FO
RM
AT
ION
| FIN
AN
CIA
L S
TA
TE
ME
NT
S| G
OV
ER
NA
NC
E| S
TR
AT
EG
IC R
EP
OR
T
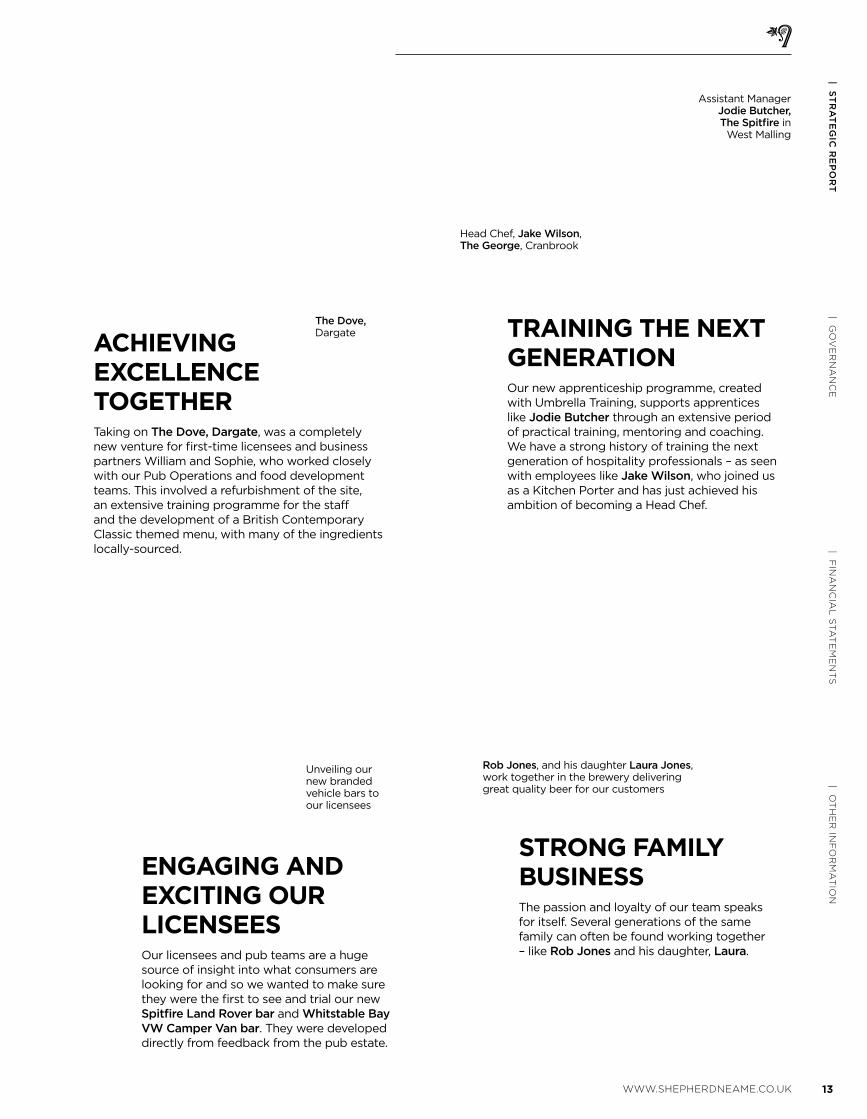
ACHIEVING EXCELLENCE TOGETHER
Taking on The Dove, Dargate, was a completely new venture for first-time licensees and business partners William and Sophie, who worked closely with our Pub Operations and food development teams. This involved a refurbishment of the site, an extensive training programme for the staff and the development of a British Contemporary Classic themed menu, with many of the ingredients locally-sourced.
The Dove, Dargate
Assistant Manager Jodie Butcher, The Spitfire in
West Malling
Head Chef, Jake Wilson, The George, Cranbrook
TRAINING THE NEXT GENERATION
Our new apprenticeship programme, created with Umbrella Training, supports apprentices like Jodie Butcher through an extensive period of practical training, mentoring and coaching. We have a strong history of training the next generation of hospitality professionals – as seen with employees like Jake Wilson, who joined us as a Kitchen Porter and has just achieved his ambition of becoming a Head Chef.
ENGAGING AND EXCITING OUR LICENSEES
Our licensees and pub teams are a huge source of insight into what consumers are looking for and so we wanted to make sure they were the first to see and trial our new Spitfire Land Rover bar and Whitstable Bay VW Camper Van bar. They were developed directly from feedback from the pub estate.
Unveiling our new branded vehicle bars to our licensees
STRONG FAMILY BUSINESS
The passion and loyalty of our team speaks for itself. Several generations of the same family can often be found working together – like Rob Jones and his daughter, Laura.
Rob Jones, and his daughter Laura Jones, work together in the brewery delivering great quality beer for our customers
14 SHEPHERD NEAME ANNUAL REPORT AND ACCOUNTS 2019
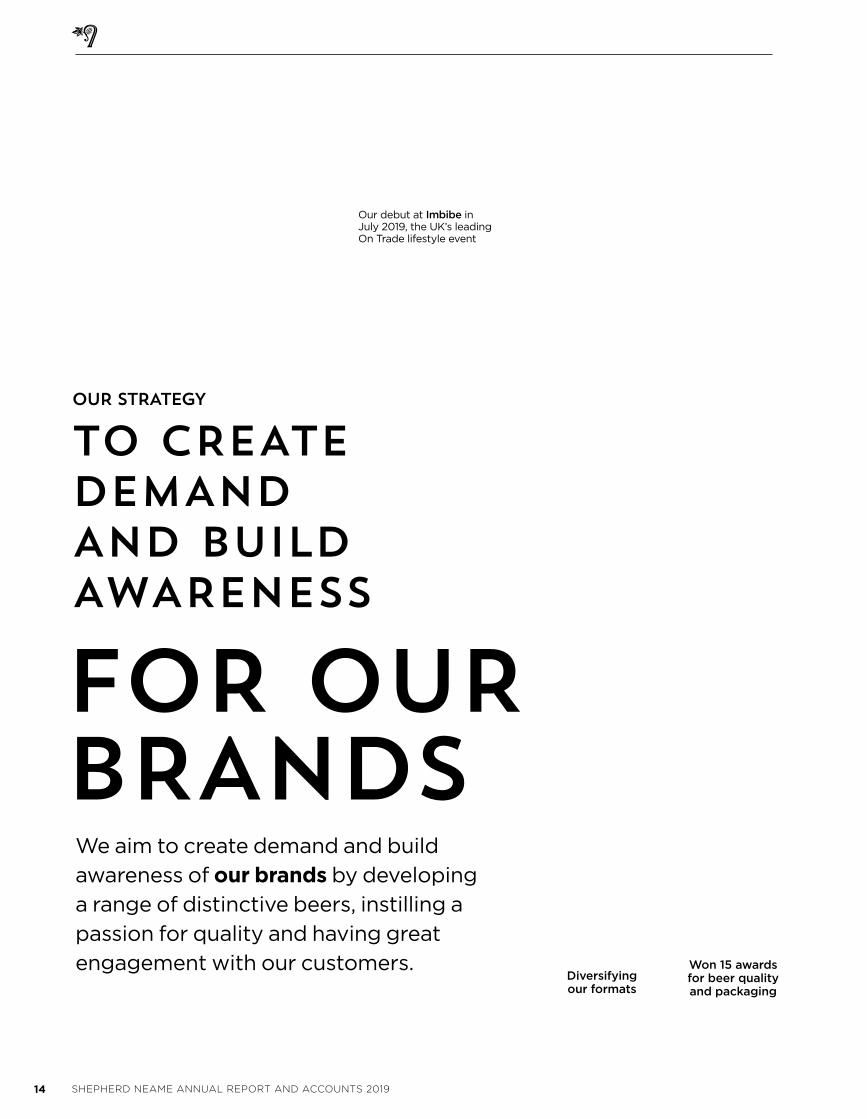
We aim to create demand and build
awareness of our brands by developing
a range of distinctive beers, instilling a
passion for quality and having great
engagement with our customers.
FOR OUR BRANDS
OUR STRATEGY
TO CREATE DEMAND AND BUILD AWARENESS
Our debut at Imbibe in July 2019, the UK’s leading On Trade lifestyle event
Won 15 awards for beer quality and packaging
Diversifying our formats
15WWW.SHEPHERDNEAME.CO.UK
| OT
HE
R IN
FO
RM
AT
ION
| FIN
AN
CIA
L S
TA
TE
ME
NT
S| G
OV
ER
NA
NC
E| S
TR
AT
EG
IC R
EP
OR
T
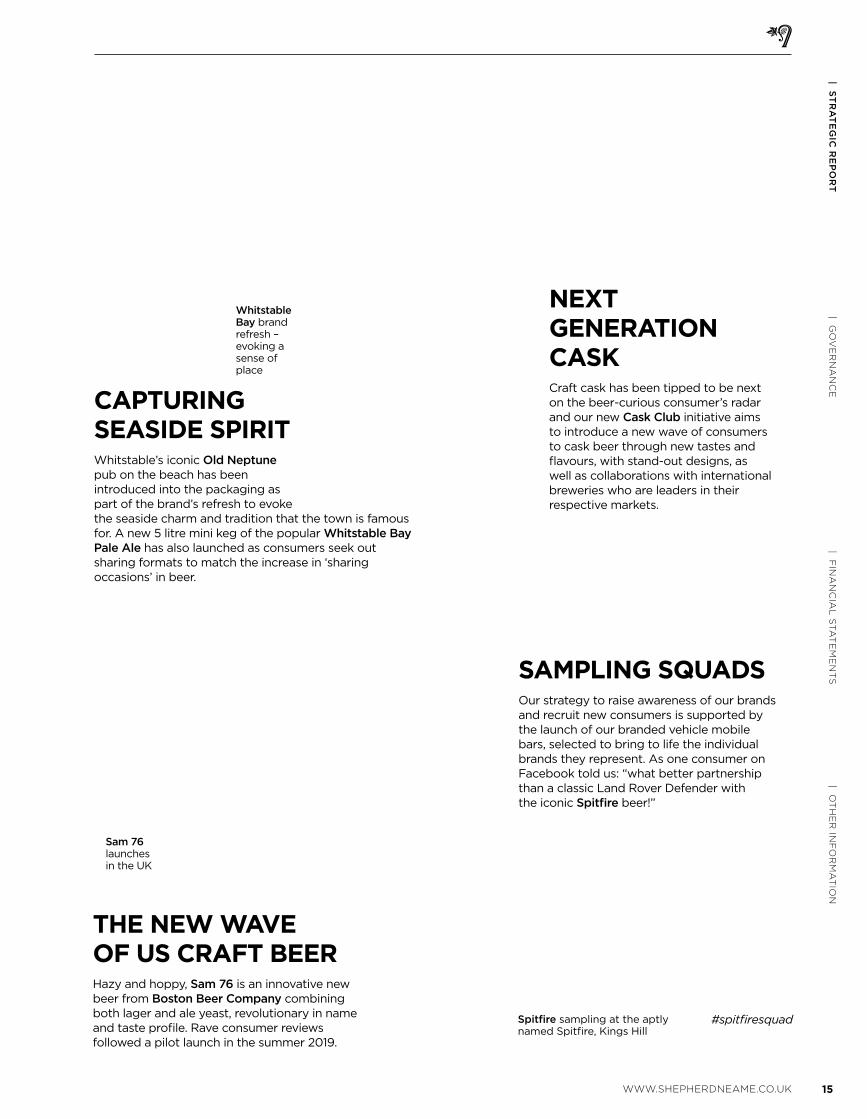
NEXT GENERATION CASK
Craft cask has been tipped to be next on the beer-curious consumer’s radar and our new Cask Club initiative aims to introduce a new wave of consumers to cask beer through new tastes and flavours, with stand-out designs, as well as collaborations with international breweries who are leaders in their respective markets.
THE NEW WAVE OF US CRAFT BEER
Hazy and hoppy, Sam 76 is an innovative new beer from Boston Beer Company combining both lager and ale yeast, revolutionary in name and taste profile. Rave consumer reviews followed a pilot launch in the summer 2019.
Sam 76 launches in the UK
SAMPLING SQUADS Our strategy to raise awareness of our brands
and recruit new consumers is supported by the launch of our branded vehicle mobile bars, selected to bring to life the individual brands they represent. As one consumer on Facebook told us: “what better partnership than a classic Land Rover Defender with the iconic Spitfire beer!”
Spitfire sampling at the aptly named Spitfire, Kings Hill
#spitfiresquad
Whitstable Bay brand refresh – evoking a sense of place
CAPTURING SEASIDE SPIRITWhitstable’s iconic Old Neptune pub on the beach has been introduced into the packaging as part of the brand’s refresh to evoke the seaside charm and tradition that the town is famous for. A new 5 litre mini keg of the popular Whitstable Bay Pale Ale has also launched as consumers seek out sharing formats to match the increase in ‘sharing occasions’ in beer.
16 SHEPHERD NEAME ANNUAL REPORT AND ACCOUNTS 2019
This has been a great year for our
pubs, and, as expected, a year of
transition for brewing and brands
but also one of new opportunities
for the business as a whole.
The underlying performance of
the business has been good, the
balance sheet is strong and our
overall market positioning has great
potential. We have modernised and
enhanced our beer range to offer a
high quality, broad-based portfolio
and entered new partnerships
that can provide a platform for
future growth.
We are well positioned to meet and
exceed the expectations of today’s
consumer. In all sectors, and in
particular leisure and hospitality,
demand is increasingly driven
by the experience economy, with
consumers willing to pay more for
products and services that deliver
something special, unique or
memorable.
Drinks choice is often driven by a
desire for premiumisation, food
choice is increasingly driven by a
desire for a healthy lifestyle or as a
rewarding treat. Consumers want
more taste and flavour. Purchase
decisions are often influenced by
the sustainable practices of the
manufacturer, the provenance of
the ingredients and the authenticity
of the company or brand.
These trends play to the inherent
strengths of Shepherd Neame: an
outstanding portfolio of pubs with
character and individuality, a great
reputation for our drinks brands,
a strong local and community
presence and unique heritage
and history.
There are many and varied factors
in the sector that influence
performance at this time:
• At the macroeconomic level,
the UK economy shrank for the
first time since 2012 in the final
quarter of our financial year*
and business and consumer
confidence is lower. The tough
weather and FIFA World Cup
driven comparatives in summer
2019 versus 2018 and pre Brexit
stockpiling in the third quarter,
may have contributed to this.
• Within the sector, well publicised
cost pressures from business rates
increases and National Living
Wage continue. Cost pressure is
likely to continue in these areas as
well as from utility costs.
Competition remains fierce at the
supply and retail levels but there
are always opportunities in such
a fragmented market for those
companies with high quality
products, great service and a
distinct market position to succeed.
Further, and over the medium
term, our geographic location is
becoming an increasing
advantage. As the level of
economic re-generation and
housebuilding within our heartland
gathers pace, this will provide us
with longer term opportunities.
It is against this backdrop that
we remain focused in pursuit of
our consistent and successful
long-term strategy:
• to drive footfall to our pubs
• to develop the offer to enhance
the customer experience
• to create demand and build
awareness for our brands; and
• to attract, retain and develop
the best people.
Tenanted and managed
pub operations
OverviewAt the year end we operated
322 pubs (2018: 321) of which 274
(2018: 276), or 85% of our outlets,
are freehold. Of the total pubs, 239
are tenanted or leased (2018: 242)
and 70 (2018: 68) are managed
and 13 (2018: 11) operated under
commercial free-of-tie leases.
Approximately two thirds of
our pubs are in Kent, but with a
growing presence of 37 pubs in
central London and the rest in
Essex, Sussex, Surrey, Berkshire
and Hampshire. We are acquiring
pubs throughout this core territory
with gradual geographical
expansion as appropriate.
Our acquisition strategy is to buy
predominantly, but not exclusively,
managed pubs, with unique
CHIEF EXECUTIVE’S REVIEW
The Albion, Faversham
“ A GREAT YEAR FOR OUR PUBS AND A YEAR OF TRANSITION FOR BREWING AND BRANDS”
JONATHAN NEAME CHIEF EXECUTIVE
322PUBS AND HOTELS * Source: Office for National Statistics
17WWW.SHEPHERDNEAME.CO.UK
| OT
HE
R IN
FO
RM
AT
ION
| FIN
AN
CIA
L S
TA
TE
ME
NT
S| G
OV
ER
NA
NC
E| S
TR
AT
EG
IC R
EP
OR
T
In the tenanted estate, we have
carried out developments at the
Queens Head at Boughton, the
Royal Naval Reserve in Whitstable,
the White Horse at Hawkinge and
Neptunes Hall in Broadstairs, as
well as numerous smaller schemes.
We are investing ever greater
amounts in the external
appearance of our pubs to
improve signage and lighting,
to enhance garden and car park
facilities and generally improve
overall amenities for our
customers. We expect to have
installed our new look signage on
half the pub estate by the end of
the 2019 calendar year.
Developing our offer to
enhance the customer
experience
We aim to enhance the customer
experience in our pubs by
delivering great fresh food,
providing accommodation
of character and offering an
interesting range of drinks.
We operate a well invested,
balanced portfolio of pubs and
derive our income from three key
streams. Drinks sales, in our
managed pubs, represents 58%
of the total mix (2018: 56%), with
food sales 33% (2018: 34%) and
accommodation 9% (2018: 9%).
Our tenanted and leased pubs are
also well positioned across drinks,
food and accommodation offers.
At the start of this financial year,
we enjoyed exceptionally warm
weather and success for the
England football team in the FIFA
World Cup. As a consequence, we
had buoyant drink sales with lager
and cider brands performing
especially well. Our coastal sites, in
particular, benefitted from these
favourable summer conditions. As
the year has unfolded the trading
conditions have become more
difficult with a challenging final
quarter as we lapped the
exceptional trading in the prior
year. Christmas trading 2018 was
buoyant with period like-for-like
managed pub sales up +7.1% and
Easter 2019 was strong too, but
periods in between these holiday
peaks have been more testing.
£9.8M INVESTMENT
IN OUR PUBSDrive footfall to our pubs
We aim to drive footfall to our
pubs by designing and developing
unique pubs and hotels with a
‘wow’ factor. We believe that
continuous investment in our
internal facilities and improvement
to the kerb appeal of our pubs,
make our outlets stand out from
the local competition and so
recruit new customers and retain
existing. Great pub design plays a
hugely important part in creating
a premium and differentiated
experience. We have excellent
skills in house, and use external
consultants as appropriate.
This year, we have invested
£7.0m (2018: £10.2m) in capital
expenditure to improve the look
and feel of our pubs and a further
£2.8m (2018: £2.8m) in repairs
and decorations. This is consistent
with our long term plan to maintain
the highest standards for our
customers.
We have completed an upgrade
of the restaurant and extended the
conservatory at the Marine Hotel
at Whitstable and a refurbishment
of the restaurant and bar at the
Royal Albion in Broadstairs, with
further projects at the Vine in
Tenterden, the Shakespeare in
Canterbury, the George and
Dragon in Thames Ditton and the
Albion in Faversham, as well as a
number of smaller developments
this year.
The Woolpack, Banstead
transferred from the tenanted
to managed estate in February
2019. We plan a substantial
redevelopment later in 2019
to exploit this great site and
expect this, alongside the Wharf
in Dartford, to be our major
investment projects in 2020.
character, in landmark or high
footfall locations so as to create
a premium and differentiated
customer experience. Our ambition
is to own and operate the stand-
out pubs in each community we
serve. We look to grow through
selective single site acquisitions
or small pub groups if the right
opportunity arises.
We have acquired four pubs in the
year, a fifth since the year end and
a further site for a new build.
All will be operated as managed
houses. The pubs are:
• The Cheshire Cheese, near the
Temple, and the Compton Cross,
in Soho, in central London;
• the Horse and Groom in
Wilmington, a well-positioned
pub in this densely populated
area of North Kent;
• the Wheatsheaf in Farnham;
• since the end of the year the
Crown at Rochester, which will join
the estate in autumn 2019; and
• a site to build a new pub
restaurant and hotel at Castle Hill
in the centre of Ebbsfleet Garden
City. We anticipate starting to
build during 2020 with a target
opening date mid 2021.
The two additions in London
makes a total of four pubs, –
alongside the Savoy Tap and
Samuel Pepys, that we have
acquired in the capital in the last
18 months. The three pubs in north
Kent are all in the heart of planned
major housing and economic
development projects.
As we strengthen the quality of
our estate, we continue to dispose
of those outlets that no longer fit
our strategy. In the last year,
we have disposed of three pubs
(2018: eight), sold the freehold
and leased back one other, and
sold five (2018: one) unlicensed
properties and land holdings.
We have realised £7.8m (2018:
£6.0m) of total disposal proceeds.
Over the last ten years, we have
acquired 37 pubs and disposed
of 95. These acquisitions and
disposals have transformed the
profile of our pub estate, with
average income per managed pub
growing by +72.1% in ten years and
average income per tenanted pub
growing by +42.4%.
“ OUR
AMBITION
IS TO OWN
AND
OPERATE
STAND OUT
PUBS IN EACH
COMMUNITY
WE SERVE”
18 SHEPHERD NEAME ANNUAL REPORT AND ACCOUNTS 2019
We employed 1,865 people
(2018: 1,662) at the year end, of
which the majority are in our
managed pubs: 1,611 (2018: 1,403),
a number that has nearly doubled
in the last ten years.
Across the business, we have an
enviable reputation for attracting
great staff and looking after them.
We provide comprehensive
training, support and engender
a strong family culture across the
business. We aim to create an
aspirational career pathway and
position ourselves as the local
hospitality employer of choice.
In the past year, we have added
new systems to help us manage
this growing team and support
their training and personal
development more effectively.
In the coming year, we will
add further systems to enable
enhanced communication and
engagement at all levels across
our employee base.
We try to engage pub teams
as much as possible in the
development of their individual
businesses and to create a culture
of empowerment. We have on-site
champions for coffee, customer
service and social media. We
encourage our food teams to
build our online presence by
showcasing great fresh food
and individual chef stories.
A particular challenge in the sector
has been to attract quality chefs.
In the last year, we have worked
more closely with local catering
colleges to recruit new young
talent. We have launched an
apprentice scheme for chef
development at various stages of
their career path. We have a
programme to improve the kitchen
working environments and deliver
improved air conditioning.
We also enjoy great relationships
with our tenanted and leased
partners and are proud to support
their achievements. We greatly
value personal relationships and
offer a flexible and tailored
approach to the challenges and
opportunities in each outlet.
more in online engagement with
our chefs and communications
about our local supplier network
via #shepsfood.
We recognise that people are
often time-poor and some
customers may want to ensure
that their visit to our pubs is as
fast and efficient as possible.
In response to these demands we
are exploring ways to improve the
overall speed of service through
automated table ordering and
online booking.
As a consequence of all these
measures, our managed like-for-
like food sales grew by +1.9%
(2018: -1.3%).
Providing high quality
accommodation is a key part
of our offer and this part of the
business has enjoyed rapid growth
in recent years. At the year end
there were 294 (2018: 294) letting
rooms in the managed estate and
220 (2018: 220) in the tenanted
estate. The new site in Ebbsfleet
will add 17 rooms to the managed
estate in 2021.
Our managed like-for-like
accommodation sales grew by
+1.5% (2018: +2.9%). During the
year we refurbished 31 bedrooms
(2018: 16 bedrooms) at the Dog
and Bear, Lenham, the Millers
Arms, Canterbury, the Sun Inn,
Faversham, and the Crown,
Chislehurst as part of our ongoing
programme to upgrade and
maintain high standards in
our managed inns and hotels.
Occupancy fell slightly to 77%
from the prior year level of 79%,
but RevPAR continued to grow
marginally to £68 (2018: £67).
Attracting, retaining and
developing the best people
We aim to attract, retain and
develop the best people by
understanding the potential in
everyone, inspiring them to
achieve their goals, and by building
loyalty and engagement of our
licensees and employees through
the professionalism of the support
we provide.
In these circumstances it is
particularly pleasing that we still
managed to grow like-for-like sales
in all categories with like-for-like
food sales returning to growth.
Like-for-like drinks sales in the
managed estate grew by +4.3%
(2018: +2.3%). The demand for
premium drinks and ever wider
choice of beers continues.
We have enhanced our bars,
and are continually evolving our
range to meet consumer demand.
In beer, world lagers and fuller
flavoured, craft beers drive growth.
In cider, craft and red fruit based
products are popular. The good
performance of cocktails, gin
and flavoured mixers continues.
In the eating out market pubs
have continued to outperform
restaurants because pubs are
more flexible at adapting their
offer to changing consumer
needs. Visit frequency, according
to MCA*, has fallen by -0.6%,
driven predominantly by
decline in daytime meals.
We have focused efforts on
developing menus to respond
to health conscious customers
and now provide a variety of
vegetarian and vegan options.
We have launched a new vegan
burger and expanded our range
of seasonal and fresh produce.
We have made improvements to
the way we communicate our food
offer. We are proud of our position
in the community and look to use
local suppliers where possible
within our menus and have invested
CHIEF EXECUTIVE’S REVIEW CONTINUED
+3.2%
LFL MANAGED SALES GROWTH
“ WE AIM TO
UNDERSTAND
THE
POTENTIAL
IN EVERYONE
AND INSPIRE
THEM TO
ACHIEVE
THEIR GOALS”
* Source: MCA Insight UK Eating Out Market Report 2019
19WWW.SHEPHERDNEAME.CO.UK
| OT
HE
R IN
FO
RM
AT
ION
| FIN
AN
CIA
L S
TA
TE
ME
NT
S| G
OV
ER
NA
NC
E| S
TR
AT
EG
IC R
EP
OR
T
brand contract allowed us to focus
capacity on our own brands but
was always going to require
change for us, because of lower
production volume and also
because we no longer had a strong
world lager brand. Recent portfolio
enhancements are designed to
address this.
Creating demand and building
awareness for our brands
In response to the market trends,
we have taken a number of
important steps in the last year to
strengthen the company’s beer
portfolio over the next few years.
We have:
• modernised our flagship British
classic ale, Spitfire
• refreshed our highly successful
Whitstable Bay range
• successfully launched the Bear
Island range with Bear Island
East Coast Pale Ale and Triple
Hopped Lager
• introduced the Cask Club with
a series of collaboration ales
with leading craft brewers.
In addition, and having evaluated
a number of potential partnerships
in world lager and craft beer
opportunities, we have:
• introduced Sam 76, a hazy
American IPA, and Angry
Orchard Rose Cider, both
on trend craft brands imported
from Boston Beer
• entered a new partnership with
Boon Rawd Brewery Company to
import distribute Singha Beer,
Thailand’s original premium beer
throughout the UK.
The move to go into partnership
with Boon Rawd Brewery Company
puts an exciting world lager in
our sales portfolio which appeals
to younger, discerning and
adventurous consumers. This is
backed up by top level brand
sponsorships at Chelsea FC
and Moto GP races.
Whilst this brand will take some
time to build we believe it will
complement our own portfolio and
see good opportunities for growth
over the medium term. We are
engaged in discussions with other
potential partners for further
opportunities to access different
parts of the market.
have strong local provenance,
and enjoy excellent customer
relationships. We also see
considerable new opportunities
emerging as the market evolves.
Achieving the highest quality
standards in production is a key
success criterion. In the last year,
we have won 15 different awards
for the quality of our beer and
packaging. We have invested
£1.1m in new plant and
infrastructure. In 2020 we plan to
install new yeast and filter plants
to further improve product
quality at similar levels of capital
expenditure. We have invested
£0.5m more in marketing and
brand activity than the prior year,
which we believe is the right step
for the long term as we build the
Shepherd Neame brand.
The overall beer market grew by
+1.7% in the 12 months to June
2019*, with growth largely driven
through the off trade, which now
accounts for 54% of total volume*.
The on trade also grew by +0.3%*.
The growth in the category has
been driven by world lager.
Cask ale and premium bottled
ale, categories where we have
traditionally been strong have
declined. Canned volume is
growing ahead of bottled. We have
seen increased demand for more
taste and flavour and hop-forward
character in beers which is driving
considerable brand switch in
each category.
As previously communicated, the
termination of the Asahi contract
in 2018 and the end of the Lidl own
We were delighted with the recent
results from this year’s KAM Media
industry survey, which gave us
great feedback from our licensees
on the support and service levels
we provide. We score highly against
our key competitors in most
categories and firmly believe we
attract some of the best talent
within the sector.
We are firm supporters of
Voluntary Code of Practice for
the operation of Tenanted and
Leased pubs. We are particularly
pleased with the take up of one
of the initiatives launched this
year, to provide a comprehensive
regulatory compliance support
package.
Every year, we hold a celebration
to recognise and reward the
outstanding talent of our licensees.
I am delighted that Lou Davies
and her team at the Market House,
Maidstone were named as the
Shepherd Neame Pub of the Year
for their remarkable transformation
of this pub.
Pub performance
Our Managed pubs continue to
outperform the market. The Coffer
Peach Business Tracker recorded
like-for-like sales growth in the
market of +1.6% for the 12 months
to June 2019. Our same outlet
like-for-like managed pub sales
were up +3.2% for the 52 weeks to
29 June 2019 (2018: +1.3%). Average
income per managed pub grew by
+6.6% (2018: -1.8%).
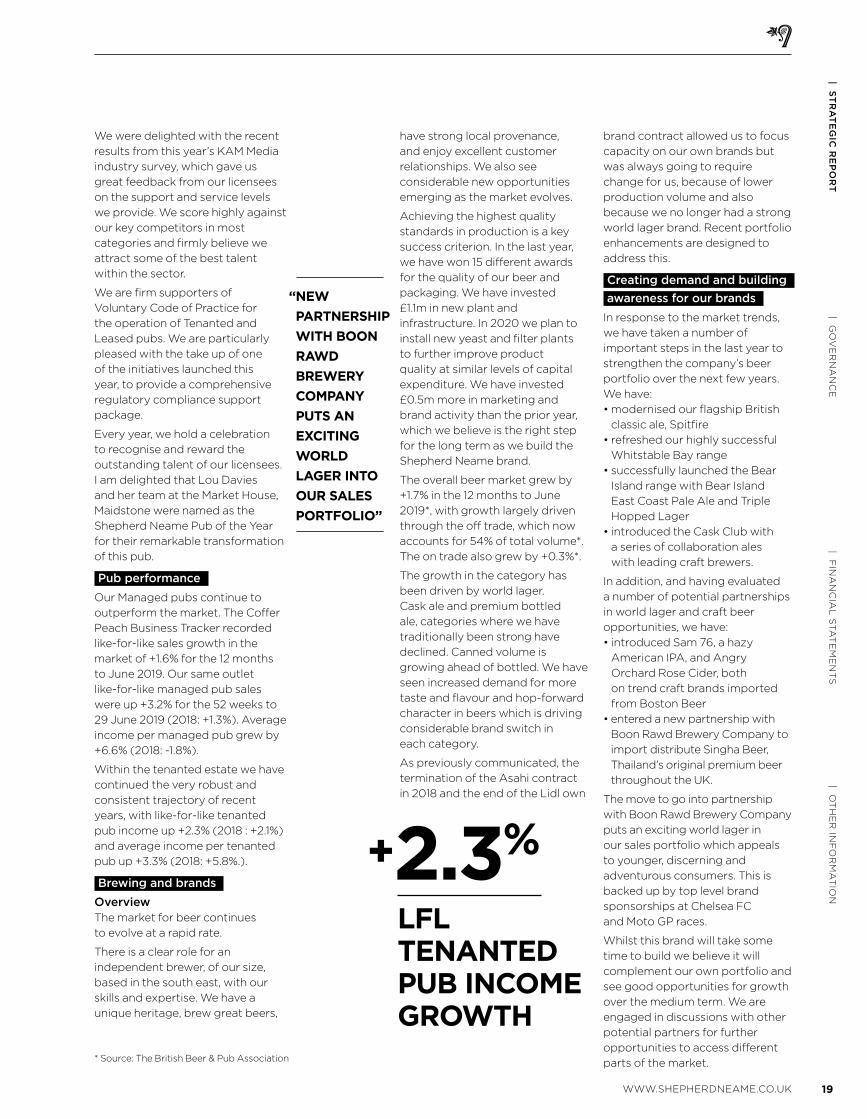
Within the tenanted estate we have
continued the very robust and
consistent trajectory of recent
years, with like-for-like tenanted
pub income up +2.3% (2018 : +2.1%)
and average income per tenanted
pub up +3.3% (2018: +5.8%.).
Brewing and brands
OverviewThe market for beer continues
to evolve at a rapid rate.
There is a clear role for an
independent brewer, of our size,
based in the south east, with our
skills and expertise. We have a
unique heritage, brew great beers,
+2.3%
LFL TENANTED PUB INCOME GROWTH
“ NEW
PARTNERSHIP
WITH BOON
RAWD
BREWERY
COMPANY
PUTS AN
EXCITING
WORLD
LAGER INTO
OUR SALES
PORTFOLIO”
* Source: The British Beer & Pub Association
20 SHEPHERD NEAME ANNUAL REPORT AND ACCOUNTS 2019
Brewing and Brands performance
has been more challenging as
expected this year, but we are
excited by the potential of our
recent portfolio enhancements.
Shepherd Neame is a modern,
well invested, balanced business.
We have transformed our pub
operations in recent years to
increase our exposure to the
growth areas of the market.
We see further opportunities
emerging in both beer and
pubs to unlock more.
As an authentic and independent
business we appeal to many
of todays consumer attitudes.
We think for the long term, we
invest for the long term and we
are financed for the long term,
but we are flexible and agile
to respond to changes in the
market over the short term.
Jonathan Neame Chief Executive
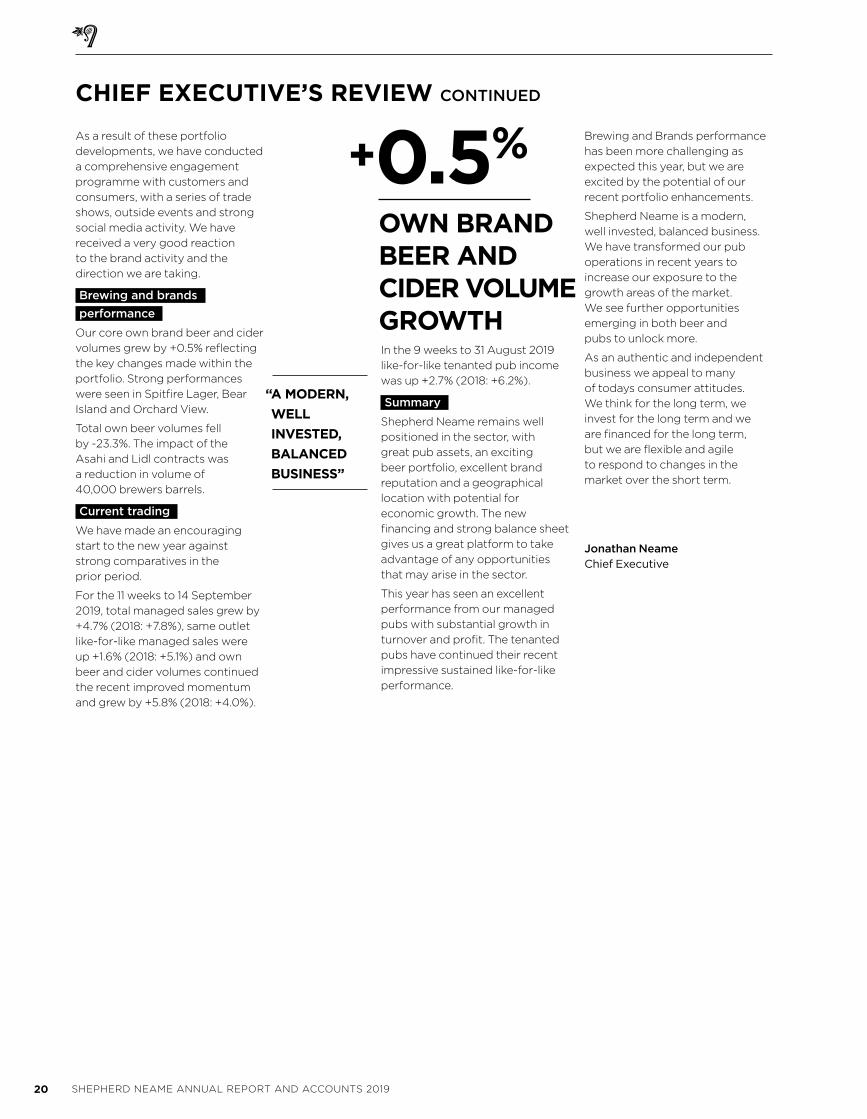
In the 9 weeks to 31 August 2019
like-for-like tenanted pub income
was up +2.7% (2018: +6.2%).
Summary
Shepherd Neame remains well
positioned in the sector, with
great pub assets, an exciting
beer portfolio, excellent brand
reputation and a geographical
location with potential for
economic growth. The new
financing and strong balance sheet
gives us a great platform to take
advantage of any opportunities
that may arise in the sector.
This year has seen an excellent
performance from our managed
pubs with substantial growth in
turnover and profit. The tenanted
pubs have continued their recent
impressive sustained like-for-like
performance.
As a result of these portfolio
developments, we have conducted
a comprehensive engagement
programme with customers and
consumers, with a series of trade
shows, outside events and strong
social media activity. We have
received a very good reaction
to the brand activity and the
direction we are taking.
Brewing and brands
performance
Our core own brand beer and cider
volumes grew by +0.5% reflecting
the key changes made within the
portfolio. Strong performances
were seen in Spitfire Lager, Bear
Island and Orchard View.
Total own beer volumes fell
by -23.3%. The impact of the
Asahi and Lidl contracts was
a reduction in volume of
40,000 brewers barrels.
Current trading
We have made an encouraging
start to the new year against
strong comparatives in the
prior period.
For the 11 weeks to 14 September
2019, total managed sales grew by
+4.7% (2018: +7.8%), same outlet
like-for-like managed sales were
up +1.6% (2018: +5.1%) and own
beer and cider volumes continued
the recent improved momentum
and grew by +5.8% (2018: +4.0%).
CHIEF EXECUTIVE’S REVIEW CONTINUED
+0.5%
OWN BRAND BEER AND CIDER VOLUME GROWTH
“ A MODERN,
WELL
INVESTED,
BALANCED
BUSINESS”
21WWW.SHEPHERDNEAME.CO.UK
| OT
HE
R IN
FO
RM
AT
ION
| FIN
AN
CIA
L S
TA
TE
ME
NT
S| G
OV
ER
NA
NC
E| S
TR
AT
EG
IC R
EP
OR
T
FINANCIAL COMMENTARY
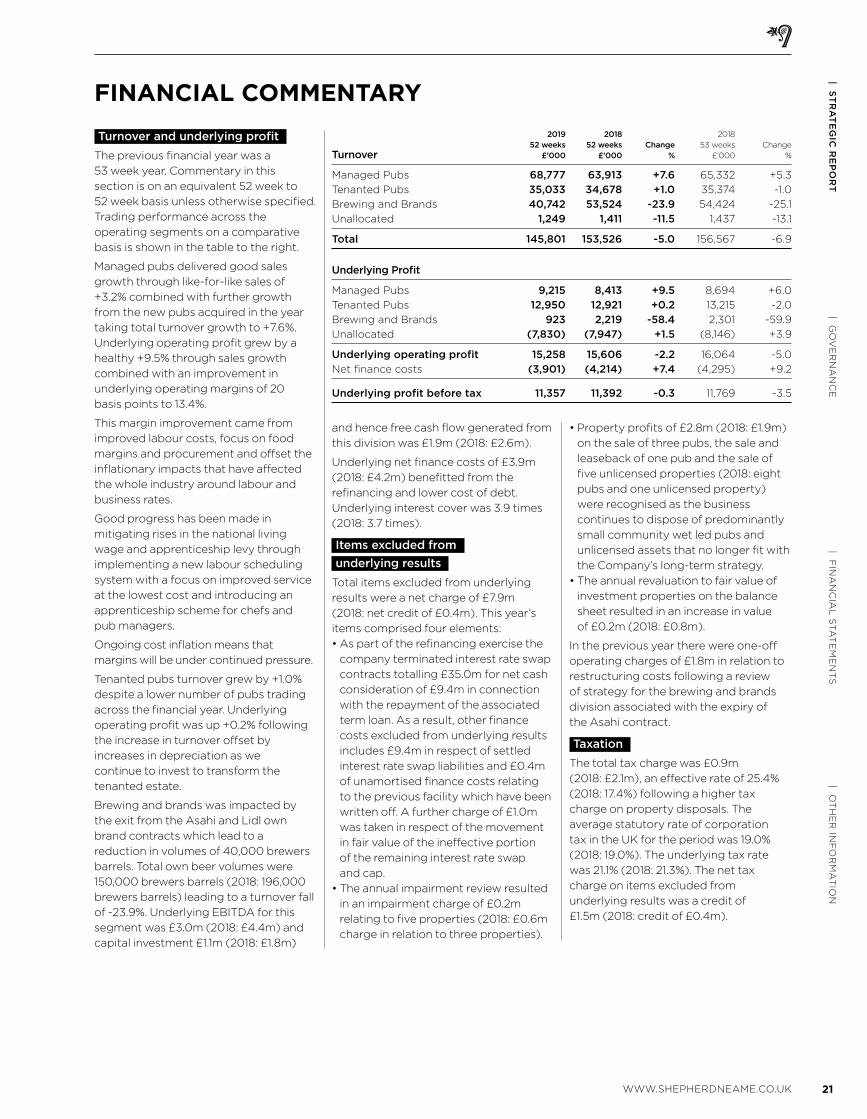
Turnover and underlying profit
The previous financial year was a
53 week year. Commentary in this
section is on an equivalent 52 week to
52 week basis unless otherwise specified.
Trading performance across the
operating segments on a comparative
basis is shown in the table to the right.
Managed pubs delivered good sales
growth through like-for-like sales of
+3.2% combined with further growth
from the new pubs acquired in the year
taking total turnover growth to +7.6%.
Underlying operating profit grew by a
healthy +9.5% through sales growth
combined with an improvement in
underlying operating margins of 20
basis points to 13.4%.
This margin improvement came from
improved labour costs, focus on food
margins and procurement and offset the
inflationary impacts that have affected
the whole industry around labour and
business rates.
Good progress has been made in
mitigating rises in the national living
wage and apprenticeship levy through
implementing a new labour scheduling
system with a focus on improved service
at the lowest cost and introducing an
apprenticeship scheme for chefs and
pub managers.
Ongoing cost inflation means that
margins will be under continued pressure.
Tenanted pubs turnover grew by +1.0%
despite a lower number of pubs trading
across the financial year. Underlying
operating profit was up +0.2% following
the increase in turnover offset by
increases in depreciation as we
continue to invest to transform the
tenanted estate.
Brewing and brands was impacted by
the exit from the Asahi and Lidl own
brand contracts which lead to a
reduction in volumes of 40,000 brewers
barrels. Total own beer volumes were
150,000 brewers barrels (2018: 196,000
brewers barrels) leading to a turnover fall
of -23.9%. Underlying EBITDA for this
segment was £3.0m (2018: £4.4m) and
capital investment £1.1m (2018: £1.8m)
and hence free cash flow generated from
this division was £1.9m (2018: £2.6m).
Underlying net finance costs of £3.9m
(2018: £4.2m) benefitted from the
refinancing and lower cost of debt.
Underlying interest cover was 3.9 times
(2018: 3.7 times).
Items excluded from
underlying results
Total items excluded from underlying
results were a net charge of £7.9m
(2018: net credit of £0.4m). This year’s
items comprised four elements:
• As part of the refinancing exercise the
company terminated interest rate swap
contracts totalling £35.0m for net cash
consideration of £9.4m in connection
with the repayment of the associated
term loan. As a result, other finance
costs excluded from underlying results
includes £9.4m in respect of settled
interest rate swap liabilities and £0.4m
of unamortised finance costs relating
to the previous facility which have been
written off. A further charge of £1.0m
was taken in respect of the movement
in fair value of the ineffective portion
of the remaining interest rate swap
and cap.
• The annual impairment review resulted
in an impairment charge of £0.2m
relating to five properties (2018: £0.6m
charge in relation to three properties).
• Property profits of £2.8m (2018: £1.9m)
on the sale of three pubs, the sale and
leaseback of one pub and the sale of
five unlicensed properties (2018: eight
pubs and one unlicensed property)
were recognised as the business
continues to dispose of predominantly
small community wet led pubs and
unlicensed assets that no longer fit with
the Company’s long-term strategy.
• The annual revaluation to fair value of
investment properties on the balance
sheet resulted in an increase in value
of £0.2m (2018: £0.8m).
In the previous year there were one-off
operating charges of £1.8m in relation to
restructuring costs following a review
of strategy for the brewing and brands
division associated with the expiry of
the Asahi contract.
Taxation
The total tax charge was £0.9m
(2018: £2.1m), an effective rate of 25.4%
(2018: 17.4%) following a higher tax
charge on property disposals. The
average statutory rate of corporation
tax in the UK for the period was 19.0%
(2018: 19.0%). The underlying tax rate
was 21.1% (2018: 21.3%). The net tax
charge on items excluded from
underlying results was a credit of
£1.5m (2018: credit of £0.4m).
2019 2018 2018
52 weeks 52 weeks Change 53 weeks Change
Turnover £’000 £’000 % £’000 %
Managed Pubs 68,777 63,913 +7.6 65,332 +5.3
Tenanted Pubs 35,033 34,678 +1.0 35,374 -1.0
Brewing and Brands 40,742 53,524 -23.9 54,424 -25.1
Unallocated 1,249 1,411 -11.5 1,437 -13.1
Total 145,801 153,526 -5.0 156,567 -6.9
Underlying Profit
Managed Pubs 9,215 8,413 +9.5 8,694 +6.0
Tenanted Pubs 12,950 12,921 +0.2 13,215 -2.0
Brewing and Brands 923 2,219 -58.4 2,301 -59.9
Unallocated (7,830) (7,947) +1.5 (8,146) +3.9
Underlying operating profit 15,258 15,606 -2.2 16,064 -5.0
Net finance costs (3,901) (4,214) +7.4 (4,295) +9.2
Underlying profit before tax 11,357 11,392 -0.3 11,769 -3.5
22 SHEPHERD NEAME ANNUAL REPORT AND ACCOUNTS 2019
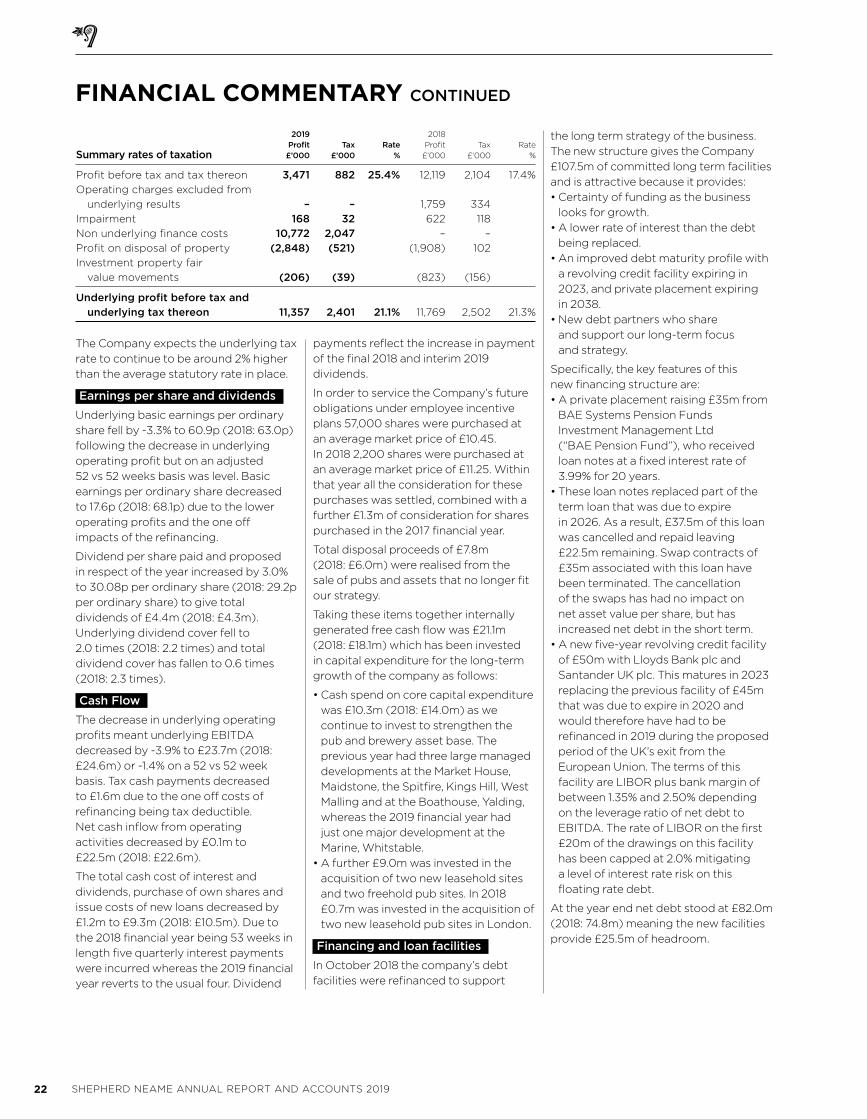
The Company expects the underlying tax
rate to continue to be around 2% higher
than the average statutory rate in place.
Earnings per share and dividends
Underlying basic earnings per ordinary
share fell by -3.3% to 60.9p (2018: 63.0p)
following the decrease in underlying
operating profit but on an adjusted
52 vs 52 weeks basis was level. Basic
earnings per ordinary share decreased
to 17.6p (2018: 68.1p) due to the lower
operating profits and the one off
impacts of the refinancing.
Dividend per share paid and proposed
in respect of the year increased by 3.0%
to 30.08p per ordinary share (2018: 29.2p
per ordinary share) to give total
dividends of £4.4m (2018: £4.3m).
Underlying dividend cover fell to
2.0 times (2018: 2.2 times) and total
dividend cover has fallen to 0.6 times
(2018: 2.3 times).
Cash Flow
The decrease in underlying operating
profits meant underlying EBITDA
decreased by -3.9% to £23.7m (2018:
£24.6m) or -1.4% on a 52 vs 52 week
basis. Tax cash payments decreased
to £1.6m due to the one off costs of
refinancing being tax deductible.
Net cash inflow from operating
activities decreased by £0.1m to
£22.5m (2018: £22.6m).
The total cash cost of interest and
dividends, purchase of own shares and
issue costs of new loans decreased by
£1.2m to £9.3m (2018: £10.5m). Due to
the 2018 financial year being 53 weeks in
length five quarterly interest payments
were incurred whereas the 2019 financial
year reverts to the usual four. Dividend
payments reflect the increase in payment
of the final 2018 and interim 2019
dividends.
In order to service the Company’s future
obligations under employee incentive
plans 57,000 shares were purchased at
an average market price of £10.45.
In 2018 2,200 shares were purchased at
an average market price of £11.25. Within
that year all the consideration for these
purchases was settled, combined with a
further £1.3m of consideration for shares
purchased in the 2017 financial year.
Total disposal proceeds of £7.8m
(2018: £6.0m) were realised from the
sale of pubs and assets that no longer fit
our strategy.
Taking these items together internally
generated free cash flow was £21.1m
(2018: £18.1m) which has been invested
in capital expenditure for the long-term
growth of the company as follows:
• Cash spend on core capital expenditure
was £10.3m (2018: £14.0m) as we
continue to invest to strengthen the
pub and brewery asset base. The
previous year had three large managed
developments at the Market House,
Maidstone, the Spitfire, Kings Hill, West
Malling and at the Boathouse, Yalding,
whereas the 2019 financial year had
just one major development at the
Marine, Whitstable.
• A further £9.0m was invested in the
acquisition of two new leasehold sites
and two freehold pub sites. In 2018
£0.7m was invested in the acquisition of
two new leasehold pub sites in London.
Financing and loan facilities
In October 2018 the company’s debt
facilities were refinanced to support
the long term strategy of the business.
The new structure gives the Company
£107.5m of committed long term facilities
and is attractive because it provides:
• Certainty of funding as the business
looks for growth.
• A lower rate of interest than the debt
being replaced.
• An improved debt maturity profile with
a revolving credit facility expiring in
2023, and private placement expiring
in 2038.
• New debt partners who share
and support our long-term focus
and strategy.
Specifically, the key features of this
new financing structure are:
• A private placement raising £35m from
BAE Systems Pension Funds
Investment Management Ltd
(“BAE Pension Fund”), who received
loan notes at a fixed interest rate of
3.99% for 20 years.
• These loan notes replaced part of the
term loan that was due to expire
in 2026. As a result, £37.5m of this loan
was cancelled and repaid leaving
£22.5m remaining. Swap contracts of
£35m associated with this loan have
been terminated. The cancellation
of the swaps has had no impact on
net asset value per share, but has
increased net debt in the short term.
• A new five-year revolving credit facility
of £50m with Lloyds Bank plc and
Santander UK plc. This matures in 2023
replacing the previous facility of £45m
that was due to expire in 2020 and
would therefore have had to be
refinanced in 2019 during the proposed
period of the UK’s exit from the
European Union. The terms of this
facility are LIBOR plus bank margin of
between 1.35% and 2.50% depending
on the leverage ratio of net debt to
EBITDA. The rate of LIBOR on the first
£20m of the drawings on this facility
has been capped at 2.0% mitigating
a level of interest rate risk on this
floating rate debt.
At the year end net debt stood at £82.0m
(2018: 74.8m) meaning the new facilities
provide £25.5m of headroom.
2019 2018 Profit Tax Rate Profit Tax Rate
Summary rates of taxation £’000 £’000 % £’000 £’000 %
Profit before tax and tax thereon 3,471 882 25.4% 12,119 2,104 17.4%
Operating charges excluded from
underlying results – – 1,759 334
Impairment 168 32 622 118
Non underlying finance costs 10,772 2,047 – –
Profit on disposal of property (2,848) (521) (1,908) 102
Investment property fair
value movements (206) (39) (823) (156)
Underlying profit before tax and
underlying tax thereon 11,357 2,401 21.1% 11,769 2,502 21.3%
FINANCIAL COMMENTARY CONTINUED
23WWW.SHEPHERDNEAME.CO.UK
| OT
HE
R IN
FO
RM
AT
ION
| FIN
AN
CIA
L S
TA
TE
ME
NT
S| G
OV
ER
NA
NC
E| S
TR
AT
EG
IC R
EP
OR
T
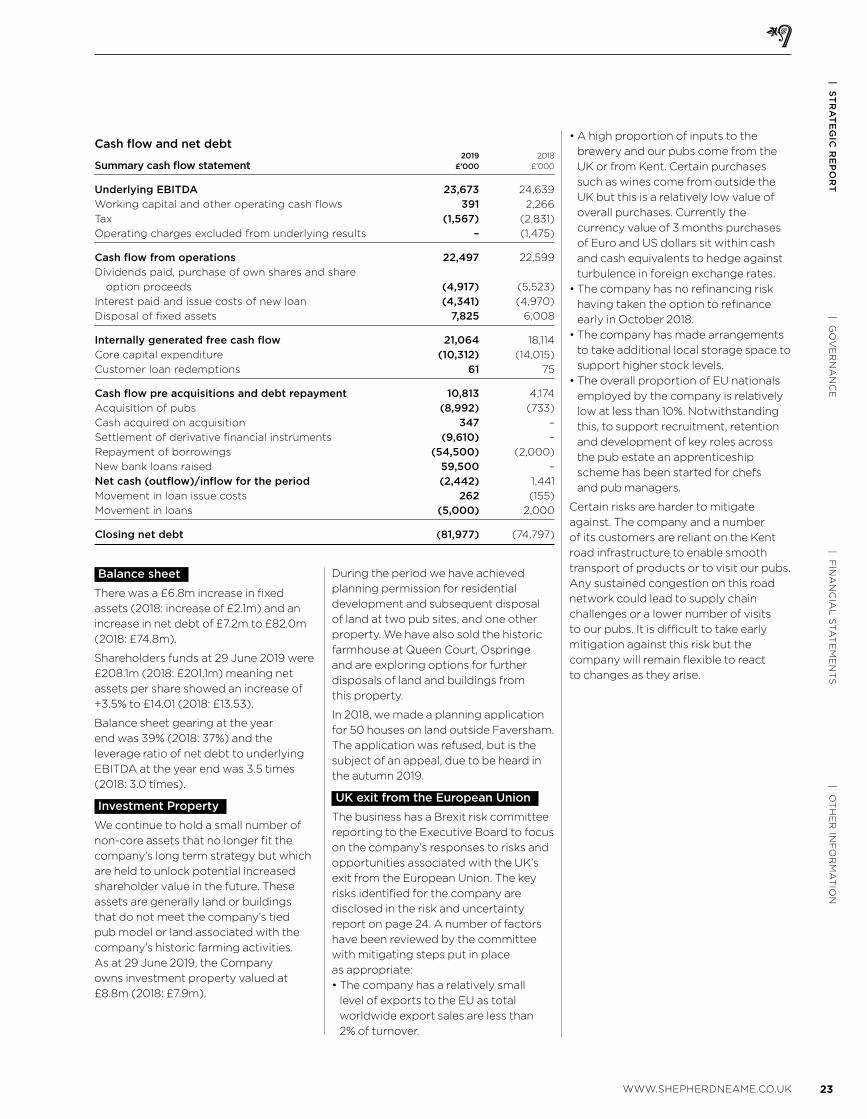
Balance sheet
There was a £6.8m increase in fixed
assets (2018: increase of £2.1m) and an
increase in net debt of £7.2m to £82.0m
(2018: £74.8m).
Shareholders funds at 29 June 2019 were
£208.1m (2018: £201.1m) meaning net
assets per share showed an increase of
+3.5% to £14.01 (2018: £13.53).
Balance sheet gearing at the year
end was 39% (2018: 37%) and the
leverage ratio of net debt to underlying
EBITDA at the year end was 3.5 times
(2018: 3.0 times).
Investment Property
We continue to hold a small number of
non-core assets that no longer fit the
company’s long term strategy but which
are held to unlock potential increased
shareholder value in the future. These
assets are generally land or buildings
that do not meet the company’s tied
pub model or land associated with the
company’s historic farming activities.
As at 29 June 2019, the Company
owns investment property valued at
£8.8m (2018: £7.9m).
During the period we have achieved
planning permission for residential
development and subsequent disposal
of land at two pub sites, and one other
property. We have also sold the historic
farmhouse at Queen Court, Ospringe
and are exploring options for further
disposals of land and buildings from
this property.
In 2018, we made a planning application
for 50 houses on land outside Faversham.
The application was refused, but is the
subject of an appeal, due to be heard in
the autumn 2019.
UK exit from the European Union
The business has a Brexit risk committee
reporting to the Executive Board to focus
on the company’s responses to risks and
opportunities associated with the UK’s
exit from the European Union. The key
risks identified for the company are
disclosed in the risk and uncertainty
report on page 24. A number of factors
have been reviewed by the committee
with mitigating steps put in place
as appropriate:
• The company has a relatively small
level of exports to the EU as total
worldwide export sales are less than
2% of turnover.
• A high proportion of inputs to the
brewery and our pubs come from the
UK or from Kent. Certain purchases
such as wines come from outside the
UK but this is a relatively low value of
overall purchases. Currently the
currency value of 3 months purchases
of Euro and US dollars sit within cash
and cash equivalents to hedge against
turbulence in foreign exchange rates.
• The company has no refinancing risk
having taken the option to refinance
early in October 2018.
• The company has made arrangements
to take additional local storage space to
support higher stock levels.
• The overall proportion of EU nationals
employed by the company is relatively
low at less than 10%. Notwithstanding
this, to support recruitment, retention
and development of key roles across
the pub estate an apprenticeship
scheme has been started for chefs
and pub managers.
Certain risks are harder to mitigate
against. The company and a number
of its customers are reliant on the Kent
road infrastructure to enable smooth
transport of products or to visit our pubs.
Any sustained congestion on this road
network could lead to supply chain
challenges or a lower number of visits
to our pubs. It is difficult to take early
mitigation against this risk but the
company will remain flexible to react
to changes as they arise.
Cash flow and net debt 2019 2018
Summary cash flow statement £’000 £’000
Underlying EBITDA 23,673 24,639
Working capital and other operating cash flows 391 2,266
Tax (1,567) (2,831)
Operating charges excluded from underlying results – (1,475)
Cash flow from operations 22,497 22,599
Dividends paid, purchase of own shares and share
option proceeds (4,917) (5,523)
Interest paid and issue costs of new loan (4,341) (4,970)
Disposal of fixed assets 7,825 6,008
Internally generated free cash flow 21,064 18,114
Core capital expenditure (10,312) (14,015)
Customer loan redemptions 61 75
Cash flow pre acquisitions and debt repayment 10,813 4,174
Acquisition of pubs (8,992) (733)
Cash acquired on acquisition 347 –
Settlement of derivative financial instruments (9,610) –
Repayment of borrowings (54,500) (2,000)
New bank loans raised 59,500 –
Net cash (outflow)/inflow for the period (2,442) 1,441
Movement in loan issue costs 262 (155)
Movement in loans (5,000) 2,000
Closing net debt (81,977) (74,797)
24 SHEPHERD NEAME ANNUAL REPORT AND ACCOUNTS 2019
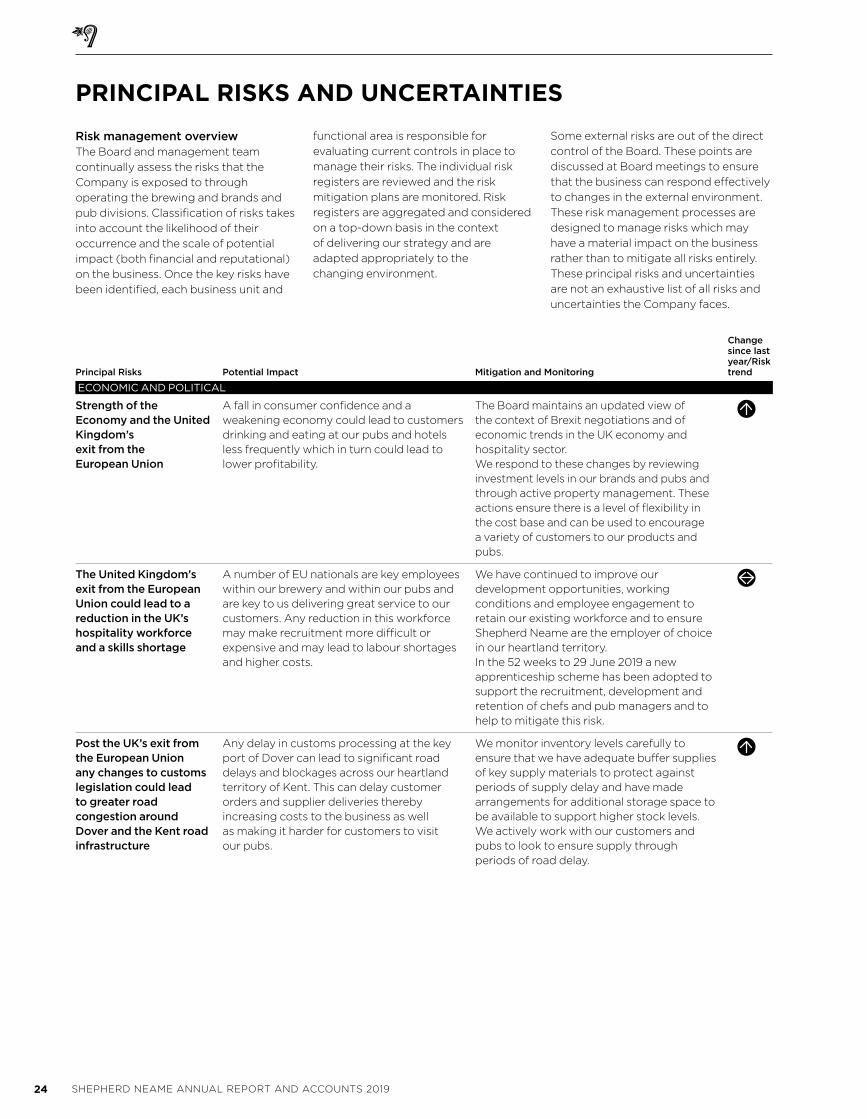
Principal Risks Potential Impact Mitigation and Monitoring
Change since last year/Risk trend
ECONOMIC AND POLITICAL
Strength of the Economy and the United Kingdom’s exit from the European Union
A fall in consumer confidence and a weakening economy could lead to customers drinking and eating at our pubs and hotels less frequently which in turn could lead to lower profitability.
The Board maintains an updated view of the context of Brexit negotiations and of economic trends in the UK economy and hospitality sector. We respond to these changes by reviewing investment levels in our brands and pubs and through active property management. These actions ensure there is a level of flexibility in the cost base and can be used to encourage a variety of customers to our products and pubs.
The United Kingdom’s exit from the European Union could lead to a reduction in the UK’s hospitality workforce and a skills shortage
A number of EU nationals are key employees within our brewery and within our pubs and are key to us delivering great service to our customers. Any reduction in this workforce may make recruitment more difficult or expensive and may lead to labour shortages and higher costs.
We have continued to improve our development opportunities, working conditions and employee engagement to retain our existing workforce and to ensure Shepherd Neame are the employer of choice in our heartland territory.In the 52 weeks to 29 June 2019 a new apprenticeship scheme has been adopted to support the recruitment, development and retention of chefs and pub managers and to help to mitigate this risk.
Post the UK’s exit from the European Union any changes to customs legislation could lead to greater road congestion around Dover and the Kent road infrastructure
Any delay in customs processing at the key port of Dover can lead to significant road delays and blockages across our heartland territory of Kent. This can delay customer orders and supplier deliveries thereby increasing costs to the business as well as making it harder for customers to visit our pubs.
We monitor inventory levels carefully to ensure that we have adequate buffer supplies of key supply materials to protect against periods of supply delay and have made arrangements for additional storage space to be available to support higher stock levels.We actively work with our customers and pubs to look to ensure supply through periods of road delay.
PRINCIPAL RISKS AND UNCERTAINTIES
Risk management overviewThe Board and management team
continually assess the risks that the
Company is exposed to through
operating the brewing and brands and
pub divisions. Classification of risks takes
into account the likelihood of their
occurrence and the scale of potential
impact (both financial and reputational)
on the business. Once the key risks have
been identified, each business unit and
functional area is responsible for
evaluating current controls in place to
manage their risks. The individual risk
registers are reviewed and the risk
mitigation plans are monitored. Risk
registers are aggregated and considered
on a top-down basis in the context
of delivering our strategy and are
adapted appropriately to the
changing environment.
Some external risks are out of the direct
control of the Board. These points are
discussed at Board meetings to ensure
that the business can respond effectively
to changes in the external environment.
These risk management processes are
designed to manage risks which may
have a material impact on the business
rather than to mitigate all risks entirely.
These principal risks and uncertainties
are not an exhaustive list of all risks and
uncertainties the Company faces.
25WWW.SHEPHERDNEAME.CO.UK
| OT
HE
R IN
FO
RM
AT
ION
| FIN
AN
CIA
L S
TA
TE
ME
NT
S| G
OV
ER
NA
NC
E| S
TR
AT
EG
IC R
EP
OR
T
Principal Risks Potential Impact Mitigation and Monitoring
Change since last year/Risk trend
REGULATORY
Regulation and Taxation of the Sale of Alcohol
The drinks industry is tightly regulated and heavily taxed through excise duty. There is a risk that future increases or changes in taxation could affect customer demand for our products and our profitability.There is a further risk that the government introduces a deposit recycling scheme for bottled products. If introduced this could lead to an increase in costs for the Company
Legislative developments are monitored and we aim to continue to grow income streams from other sources such as non-alcoholic beverages, food and accommodation. We are committed to acting responsibly and promote safe drinking. The company has membership of the BBPA and Directors are members of key industry bodies where regulatory matters are discussed and influenced.
Regulation of Tied pub agreements
The Company operates a number of arrangements under the tied pub model. This model continues to attract a level of political scrutiny in the light of the introduction of the new statutory pub code which came into place in 2016. The Company is currently not impacted by the statutory code as it owns and operates fewer than 500 tied pubs. If the code were to change and apply to operators of fewer than 500 tied pubs this could lead to higher costs and lower profits.
Regulatory developments are monitored and the Company has membership of the BBPA and Directors are members of key industry bodies where regulatory matters are discussed and influenced.The Company works hard to ensure good relations with licensees, provides flexible agreements and continues to invest in property repairs and support.
Health and Safety Operating a large number of pubs and a brewery manufacturing site increases the complexity of operations and processes. Any non-compliance with health and safety legislation could have serious consequences for our customers, employees and licensees.
The Company has a Head of Health and Safety and an assistant whose sole focus is to manage the delegated responsibilities of the Board. The Head of Health and Safety reports directly to the Executive Board on all health and safety matters across the organisation and carries out all key risk assessments. Health and safety policies are approved and adhered to across all areas of the company and we provide regular training to employees.A panel of employees act as health and safety representatives for their respective areas of the business at the brewery site to ensure risks are identified and procedures are followed.To support our licensees in the tenanted estate a new compliance package has been made available which provides support and management of pub health and safety requirements. Initial take up of this package has been significant.
Increased legislation and regulation
The Company is exposed to increasing levels of regulation and legislation across all areas of its operations. This greater regulation and compliance leads to increased costs and lower profitability.Any significant failure to adhere to legislation and regulation could lead to reputation and brand damage for the Company.
Full procedures and policies are in place to reflect current legislation and regulation and external legal advice is used to monitor new and amended legislation.In addition a number of processes and controls are in place to protect personal data to ensure the company is compliant with GDPR regulations. External training and consulting services are engaged where appropriate to develop training and communication materials for employees and licensees.
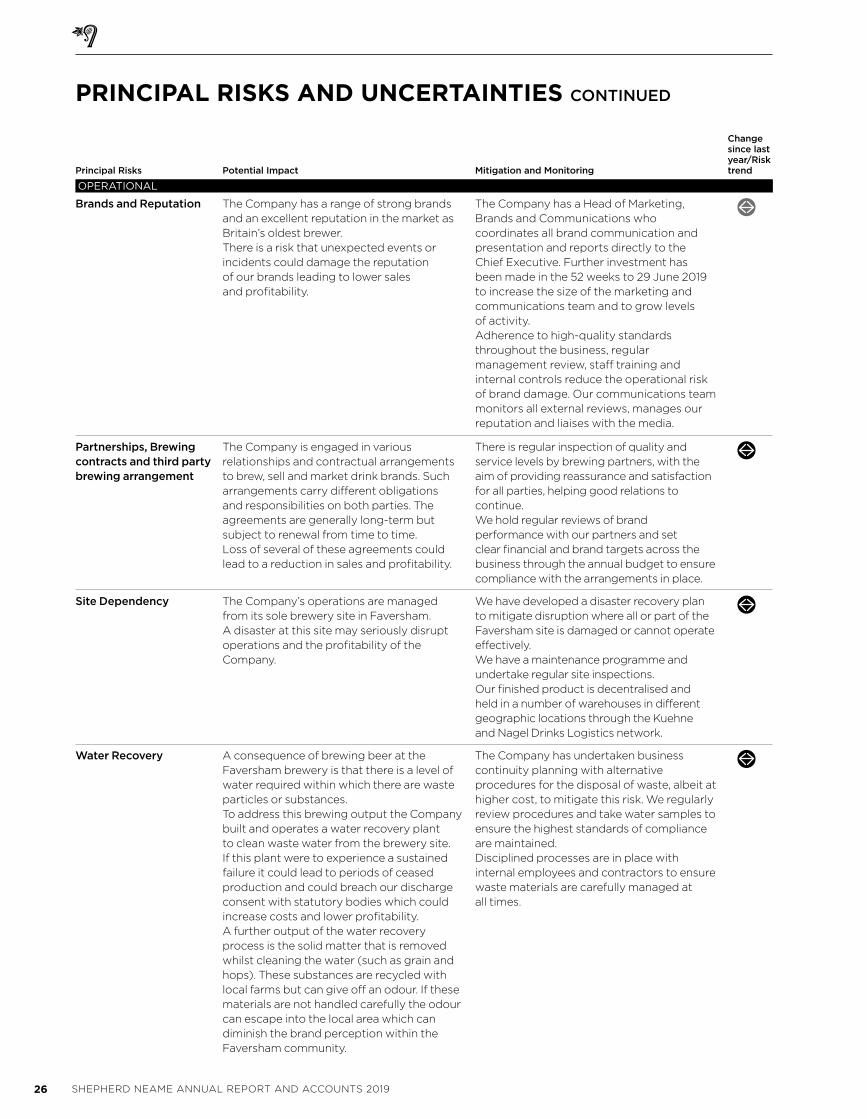
26 SHEPHERD NEAME ANNUAL REPORT AND ACCOUNTS 2019
PRINCIPAL RISKS AND UNCERTAINTIES CONTINUED
Principal Risks Potential Impact Mitigation and Monitoring
Change since last year/Risk trend
OPERATIONAL
Brands and Reputation The Company has a range of strong brands and an excellent reputation in the market as Britain’s oldest brewer.There is a risk that unexpected events or incidents could damage the reputation of our brands leading to lower sales and profitability.
The Company has a Head of Marketing, Brands and Communications who coordinates all brand communication and presentation and reports directly to the Chief Executive. Further investment has been made in the 52 weeks to 29 June 2019 to increase the size of the marketing and communications team and to grow levels of activity.Adherence to high-quality standards throughout the business, regular management review, staff training and internal controls reduce the operational risk of brand damage. Our communications team monitors all external reviews, manages our reputation and liaises with the media.
Partnerships, Brewing contracts and third party brewing arrangement
The Company is engaged in various relationships and contractual arrangements to brew, sell and market drink brands. Such arrangements carry different obligations and responsibilities on both parties. The agreements are generally long-term but subject to renewal from time to time.Loss of several of these agreements could lead to a reduction in sales and profitability.
There is regular inspection of quality and service levels by brewing partners, with the aim of providing reassurance and satisfaction for all parties, helping good relations to continue.We hold regular reviews of brand performance with our partners and set clear financial and brand targets across the business through the annual budget to ensure compliance with the arrangements in place.
Site Dependency The Company’s operations are managed from its sole brewery site in Faversham. A disaster at this site may seriously disrupt operations and the profitability of the Company.
We have developed a disaster recovery plan to mitigate disruption where all or part of the Faversham site is damaged or cannot operate effectively. We have a maintenance programme and undertake regular site inspections. Our finished product is decentralised and held in a number of warehouses in different geographic locations through the Kuehne and Nagel Drinks Logistics network.
Water Recovery A consequence of brewing beer at the Faversham brewery is that there is a level of water required within which there are waste particles or substances.To address this brewing output the Company built and operates a water recovery plant to clean waste water from the brewery site. If this plant were to experience a sustained failure it could lead to periods of ceased production and could breach our discharge consent with statutory bodies which could increase costs and lower profitability.A further output of the water recovery process is the solid matter that is removed whilst cleaning the water (such as grain and hops). These substances are recycled with local farms but can give off an odour. If these materials are not handled carefully the odour can escape into the local area which can diminish the brand perception within the Faversham community.
The Company has undertaken business continuity planning with alternative procedures for the disposal of waste, albeit at higher cost, to mitigate this risk. We regularly review procedures and take water samples to ensure the highest standards of compliance are maintained.Disciplined processes are in place with internal employees and contractors to ensure waste materials are carefully managed at all times.
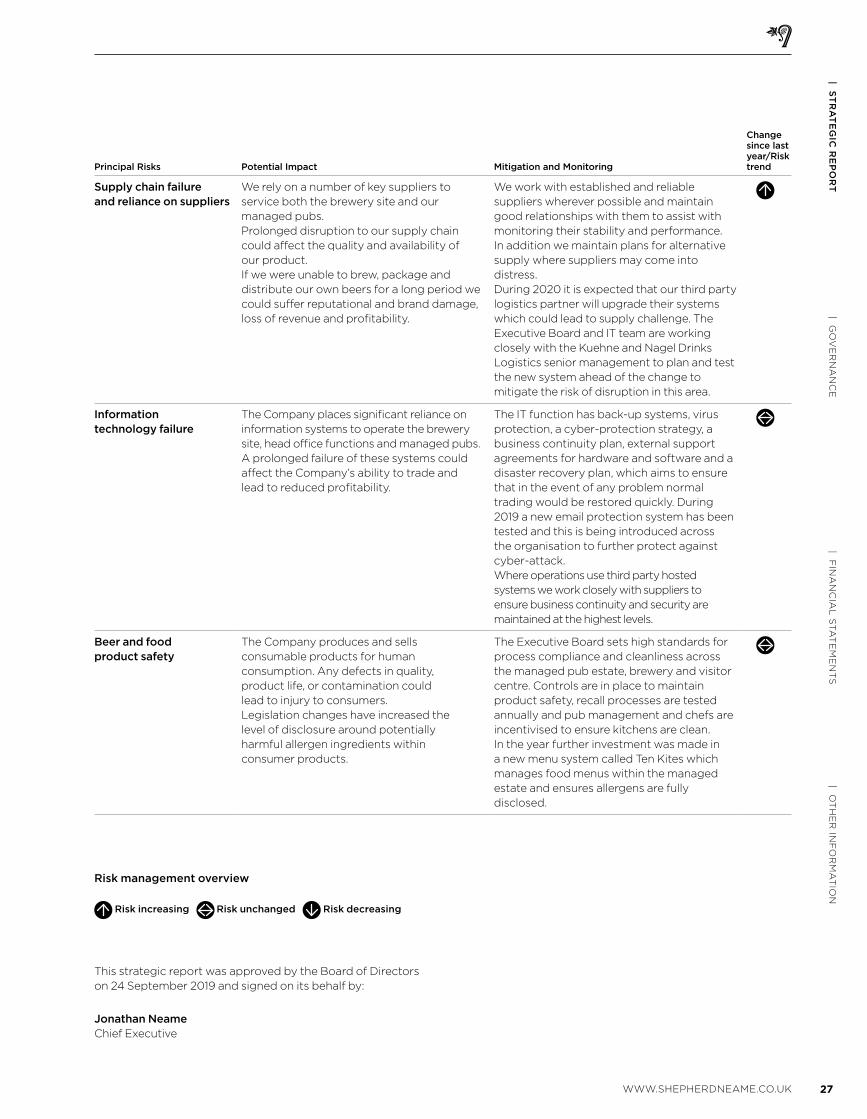
27WWW.SHEPHERDNEAME.CO.UK
| OT
HE
R IN
FO
RM
AT
ION
| FIN
AN
CIA
L S
TA
TE
ME
NT
S| G
OV
ER
NA
NC
E| S
TR
AT
EG
IC R
EP
OR
T
Risk management overview
Risk increasing
Risk unchanged
Risk decreasing
This strategic report was approved by the Board of Directors on 24 September 2019 and signed on its behalf by:
Jonathan NeameChief Executive
Principal Risks Potential Impact Mitigation and Monitoring
Change since last year/Risk trend
Supply chain failure and reliance on suppliers
We rely on a number of key suppliers to service both the brewery site and our managed pubs.Prolonged disruption to our supply chain could affect the quality and availability of our product. If we were unable to brew, package and distribute our own beers for a long period we could suffer reputational and brand damage, loss of revenue and profitability.
We work with established and reliable suppliers wherever possible and maintain good relationships with them to assist with monitoring their stability and performance. In addition we maintain plans for alternative supply where suppliers may come into distress.During 2020 it is expected that our third party logistics partner will upgrade their systems which could lead to supply challenge. The Executive Board and IT team are working closely with the Kuehne and Nagel Drinks Logistics senior management to plan and test the new system ahead of the change to mitigate the risk of disruption in this area.
Information technology failure
The Company places significant reliance on information systems to operate the brewery site, head office functions and managed pubs. A prolonged failure of these systems could affect the Company’s ability to trade and lead to reduced profitability.
The IT function has back-up systems, virus protection, a cyber-protection strategy, a business continuity plan, external support agreements for hardware and software and a disaster recovery plan, which aims to ensure that in the event of any problem normal trading would be restored quickly. During 2019 a new email protection system has been tested and this is being introduced across the organisation to further protect against cyber-attack.Where operations use third party hosted systems we work closely with suppliers to ensure business continuity and security are maintained at the highest levels.
Beer and food product safety
The Company produces and sells consumable products for human consumption. Any defects in quality, product life, or contamination could lead to injury to consumers. Legislation changes have increased the level of disclosure around potentially harmful allergen ingredients within consumer products.
The Executive Board sets high standards for process compliance and cleanliness across the managed pub estate, brewery and visitor centre. Controls are in place to maintain product safety, recall processes are tested annually and pub management and chefs are incentivised to ensure kitchens are clean.In the year further investment was made in a new menu system called Ten Kites which manages food menus within the managed estate and ensures allergens are fully disclosed.
28 SHEPHERD NEAME ANNUAL REPORT AND ACCOUNTS 2019
Shepherd Neame has supported the
community it serves for many years.
Our brewery and pubs are at the heart
of their communities, raising large sums
each year for local and national charities.
OUR COMMUNITY
£25,000Raised through
ShepsGiving
Pier Five’s charity shuffleboard tournament
Locally sourced hops
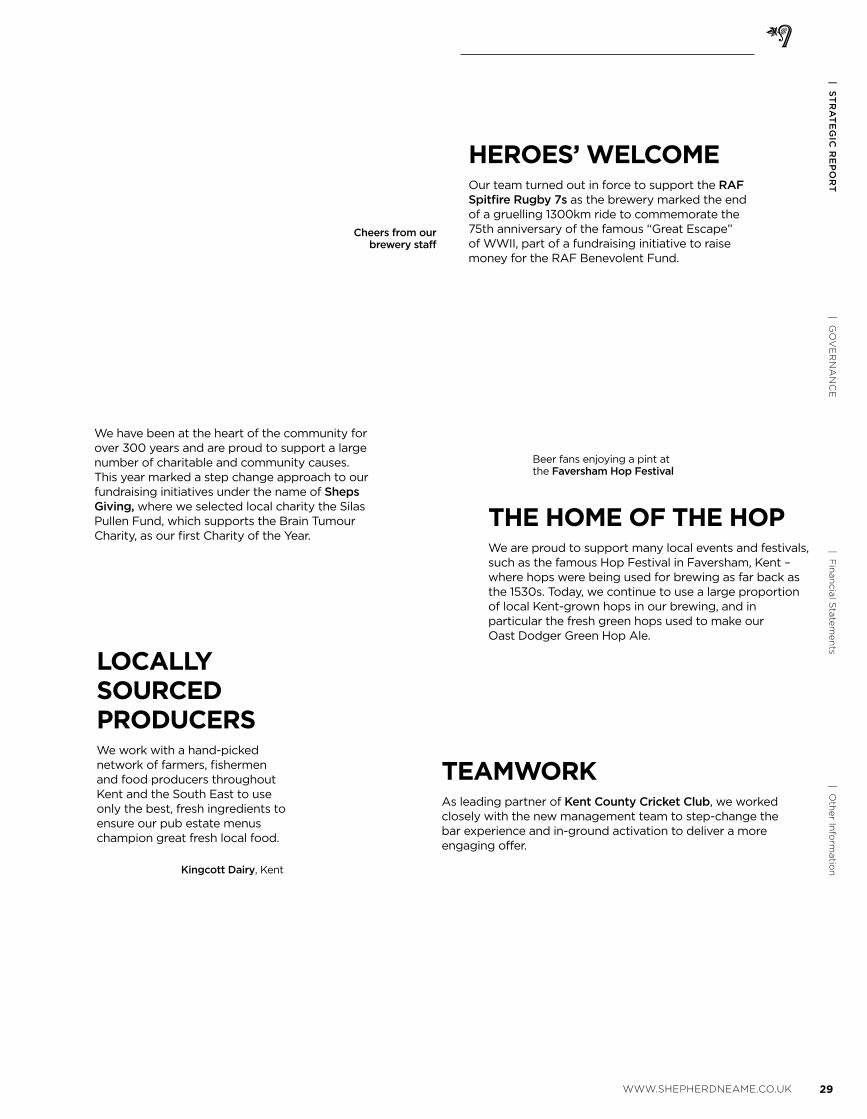
| GO
VE
RN
AN
CE
| ST
RA
TE
GIC
RE
PO
RT
| Oth
er In
form
atio
n| F
inan
cia
l Sta
tem
en
ts
29WWW.SHEPHERDNEAME.CO.UK
LOCALLY SOURCED PRODUCERSWe work with a hand-picked network of farmers, fishermen and food producers throughout Kent and the South East to use only the best, fresh ingredients to ensure our pub estate menus champion great fresh local food.
Kingcott Dairy, Kent
HEROES’ WELCOMEOur team turned out in force to support the RAF Spitfire Rugby 7s as the brewery marked the end of a gruelling 1300km ride to commemorate the 75th anniversary of the famous “Great Escape” of WWII, part of a fundraising initiative to raise money for the RAF Benevolent Fund.
We have been at the heart of the community for over 300 years and are proud to support a large number of charitable and community causes. This year marked a step change approach to our fundraising initiatives under the name of Sheps Giving, where we selected local charity the Silas Pullen Fund, which supports the Brain Tumour Charity, as our first Charity of the Year.
TEAMWORK As leading partner of Kent County Cricket Club, we worked
closely with the new management team to step-change the bar experience and in-ground activation to deliver a more engaging offer.
Cheers from our brewery staff
THE HOME OF THE HOP We are proud to support many local events and festivals,
such as the famous Hop Festival in Faversham, Kent – where hops were being used for brewing as far back as the 1530s. Today, we continue to use a large proportion of local Kent-grown hops in our brewing, and in particular the fresh green hops used to make our Oast Dodger Green Hop Ale.
Beer fans enjoying a pint at the Faversham Hop Festival

30 SHEPHERD NEAME ANNUAL REPORT AND ACCOUNTS 2019
BOARD OF DIRECTORS
BILL BRETT NON-EXECUTIVE
DIRECTOR
NIGEL BUNTING RETAIL &
TENANTED OPERATIONS
DIRECTOR
JONATHAN NEAME CHIEF EXECUTIVE
MILES TEMPLEMAN CHAIRMAN
HILARY RIVA NON-EXECUTIVE
DIRECTOR
ROBIN DUNCAN COMPANY
SECRETARY
RICHARD OLDFIELD
NON-EXECUTIVE DIRECTOR
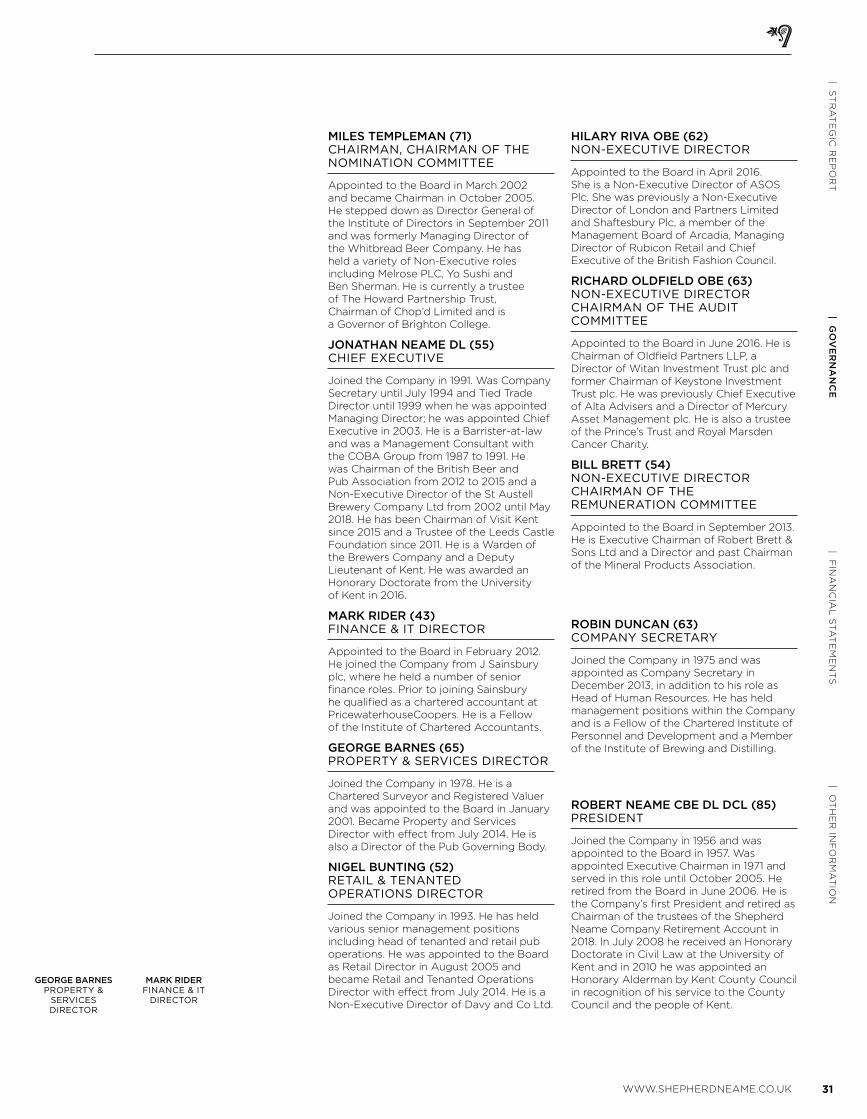
31WWW.SHEPHERDNEAME.CO.UK
| OT
HE
R IN
FO
RM
AT
ION
| FIN
AN
CIA
L S
TA
TE
ME
NT
S| G
OV
ER
NA
NC
E| S
TR
AT
EG
IC R
EP
OR
T
MILES TEMPLEMAN (71) CHAIRMAN, CHAIRMAN OF THE NOMINATION COMMITTEE
Appointed to the Board in March 2002 and became Chairman in October 2005. He stepped down as Director General of the Institute of Directors in September 2011 and was formerly Managing Director of the Whitbread Beer Company. He has held a variety of Non-Executive roles including Melrose PLC, Yo Sushi and Ben Sherman. He is currently a trustee of The Howard Partnership Trust, Chairman of Chop’d Limited and is a Governor of Brighton College.
JONATHAN NEAME DL (55) CHIEF EXECUTIVE
Joined the Company in 1991. Was Company Secretary until July 1994 and Tied Trade Director until 1999 when he was appointed Managing Director; he was appointed Chief Executive in 2003. He is a Barrister-at-law and was a Management Consultant with the COBA Group from 1987 to 1991. He was Chairman of the British Beer and Pub Association from 2012 to 2015 and a Non-Executive Director of the St Austell Brewery Company Ltd from 2002 until May 2018. He has been Chairman of Visit Kent since 2015 and a Trustee of the Leeds Castle Foundation since 2011. He is a Warden of the Brewers Company and a Deputy Lieutenant of Kent. He was awarded an Honorary Doctorate from the University of Kent in 2016.
MARK RIDER (43) FINANCE & IT DIRECTOR
Appointed to the Board in February 2012. He joined the Company from J Sainsbury plc, where he held a number of senior finance roles. Prior to joining Sainsbury he qualified as a chartered accountant at PricewaterhouseCoopers. He is a Fellow of the Institute of Chartered Accountants.
GEORGE BARNES (65) PROPERTY & SERVICES DIRECTOR
Joined the Company in 1978. He is a Chartered Surveyor and Registered Valuer and was appointed to the Board in January 2001. Became Property and Services Director with effect from July 2014. He is also a Director of the Pub Governing Body.
NIGEL BUNTING (52) RETAIL & TENANTED OPERATIONS DIRECTOR
Joined the Company in 1993. He has held various senior management positions including head of tenanted and retail pub operations. He was appointed to the Board as Retail Director in August 2005 and became Retail and Tenanted Operations Director with effect from July 2014. He is a Non-Executive Director of Davy and Co Ltd.
HILARY RIVA OBE (62) NON-EXECUTIVE DIRECTOR
Appointed to the Board in April 2016. She is a Non-Executive Director of ASOS Plc. She was previously a Non-Executive Director of London and Partners Limited and Shaftesbury Plc, a member of the Management Board of Arcadia, Managing Director of Rubicon Retail and Chief Executive of the British Fashion Council.
RICHARD OLDFIELD OBE (63) NON-EXECUTIVE DIRECTOR CHAIRMAN OF THE AUDIT COMMITTEE
Appointed to the Board in June 2016. He is Chairman of Oldfield Partners LLP, a Director of Witan Investment Trust plc and former Chairman of Keystone Investment Trust plc. He was previously Chief Executive of Alta Advisers and a Director of Mercury Asset Management plc. He is also a trustee of the Prince’s Trust and Royal Marsden Cancer Charity.
BILL BRETT (54) NON-EXECUTIVE DIRECTOR CHAIRMAN OF THE REMUNERATION COMMITTEE
Appointed to the Board in September 2013. He is Executive Chairman of Robert Brett & Sons Ltd and a Director and past Chairman of the Mineral Products Association.
ROBIN DUNCAN (63) COMPANY SECRETARY
Joined the Company in 1975 and was appointed as Company Secretary in December 2013, in addition to his role as Head of Human Resources. He has held management positions within the Company and is a Fellow of the Chartered Institute of Personnel and Development and a Member of the Institute of Brewing and Distilling.
ROBERT NEAME CBE DL DCL (85) PRESIDENT
Joined the Company in 1956 and was appointed to the Board in 1957. Was appointed Executive Chairman in 1971 and served in this role until October 2005. He retired from the Board in June 2006. He is the Company’s first President and retired as Chairman of the trustees of the Shepherd Neame Company Retirement Account in 2018. In July 2008 he received an Honorary Doctorate in Civil Law at the University of Kent and in 2010 he was appointed an Honorary Alderman by Kent County Council in recognition of his service to the County Council and the people of Kent.
GEORGE BARNES PROPERTY &
SERVICES DIRECTOR
MARK RIDERFINANCE & IT
DIRECTOR
32 SHEPHERD NEAME ANNUAL REPORT AND ACCOUNTS 2019
CORPORATE GOVERNANCE
The Company is a private company
limited by shares. These shares are
quoted on the NEX Exchange Growth
Market, which enjoys certain personal
tax advantages for our shareholders
compared to a full stock market listing.
As a NEX company, Shepherd Neame
Limited is not required to comply with
any corporate governance code.
However, the Board is committed to
maintaining the highest standards
within the Group.
The BoardThe Board currently comprises the
Non-Executive Chairman, the Chief
Executive, three Non-Executive and
three Executive Directors. The
biographical details on pages 30 and 31
show the broad range of experience and
skills the Directors bring to the Board.
Each Director is subject to re-election at
the third Annual General Meeting after
the meeting at which he or she was
previously elected or re-elected. Non-
Executive Directors serving a period
beyond nine years are subject to annual
re-election. All newly appointed Directors
stand for election at the Annual General
Meeting following their appointment.
The Board governs through its Executive
and other committees. Each Board
Committee has specific terms of
reference and there is a list of Matters
Reserved for the Board, which
distinguishes which types of decision are
taken by the Board or delegated to
management. The terms of reference for
each Committee are available on the
Company’s website. The chairmen of
each Committee report to the Board on
proceedings of Committee meetings.
The Board meets regularly throughout
the year. Its responsibilities include
approving the Group’s strategy, annual
budget, and the annual and half year
results. The Board authorises major
investments, acquisitions and capital
expenditure, and monitors the
performance of the business.
Attendance at scheduled meetings held
during the year is set out on the right:
Committees of the Board Executive
The Executive Committee of the Board
comprises the Executive Directors and is
chaired by the Chief Executive. It meets
monthly to review operating
performance and has delegated
authority from the Board to deal
with operational matters such as the
approval of minor capital projects and
refurbishments, the agreement and
approval of minor contracts with third
parties and employee appointments.
Nomination
The Nomination Committee is chaired
by Miles Templeman and comprises the
Non-Executive Directors. The Committee
met three times during the year.
Attendance is shown in the table
below. The Committee is responsible
for identifying and proposing
prospective candidates for Directors for
consideration and appointment by the
Board as a whole. It reviews the size,
structure and composition of the Board
and makes recommendations to the
Board with regard to any adjustments
deemed necessary.
The Committee is responsible for
considering the Company’s succession
plans for Board members, and
determining what skills, knowledge
and experience will be necessary. This
year it considered and recommended
the appointment of a new Chairman
and Non-Executive Director. Other
matters considered during the year
included the re-election of directors.
Before any appointment is made, the
Committee evaluates the balance of
skills, knowledge and experience on the
Board, and, in the light of this evaluation
prepares a description of the role and
capabilities required for a particular
appointment. In identifying suitable
candidates the Committee shall:
• Consider candidates from a wide
range of backgrounds;
• Consider candidates on merit and
against objective criteria, taking care
that appointees have enough time
available to devote to the position;
• Consider the use of external advisers
or advertising to facilitate the search,
if applicable; and
• Consider the requirements set out
in the Company’s Memorandum and
Articles of Association.
Prior to the appointment of any Director
the Committee obtains from the
proposed appointee details regarding
any other business interests which may
result in a conflict of interest and to
ensure that consideration is given to
whether these need to be approved
by the Board prior to appointment.
Disclosure
The Disclosure Committee comprises the
Chairman, the Chief Executive and the
Finance and IT Director. The committee
meets by exception to consider legal
and regulatory requirements and
makes recommendations to the
Board accordingly.
Audit
The Audit Committee is chaired by
Richard Oldfield. It comprises the
Non-Executive Directors. The Executive
Directors and external auditor attend its
meetings by invitation. The Committee
has defined terms of reference, reviews
the audit appointment periodically,
discusses the audit plan with the auditor
and agrees the scope of work, and also
recommends approval of the financial
statements to the Board. It is responsible
for reviewing internal financial controls
and risk management systems.
The Committee had one meeting during
the year which the Chief Executive and
Finance and IT Director also attended.
Audit Remuneration Nomination Disclosure Board Committee Committee Committee Committee
Number of meetings 6 1 3 3 3
Executive Directors
George Barnes 6 * – – –
Nigel Bunting 6 * – – –
Jonathan Neame 6 * * * 3
Mark Rider 6 * – – 3
Non-Executive Directors
Bill Brett 6 1 3 3 –
Richard Oldfield 6 1 3 3 *
Hilary Riva 5 1 3 3 –
Miles Templeman 6 1 3 3 3
* These directors are not members of the Committees but are invited to be in attendance at meetings as appropriate.
33WWW.SHEPHERDNEAME.CO.UK
| OT
HE
R IN
FO
RM
AT
ION
| FIN
AN
CIA
L S
TA
TE
ME
NT
S| G
OV
ER
NA
NC
E| S
TR
AT
EG
IC R
EP
OR
T
The Audit Committee receives reports
from the Finance and IT Director and
external auditor on the key accounting
issues and areas of significant
judgement. The key matter for
this financial year was the results of
the annual impairment exercise.
The Chairman of the Committee is in
regular contact with the audit partner to
discuss matters relevant to the Company.
Deloitte LLP has been the Company’s
auditor since 2009. Their performance is
reviewed by the Committee which
considers their effectiveness and
independence, and partner rotation,
which occurred at the start of 2017.
The auditor provides taxation advisory
services in addition to audit services and
from time to time may provide non-audit
services to the Group. In relation to 2019
Deloitte provided audit services in
respect of the Group accounts of
£120,000 tax services of £26,000, and
other services of £10,000.
It is the policy of the Board to seek
proposals and quotations from a number
of suppliers when undertaking significant
non-audit work to ensure that the Group
benefits from the best combination of
quality of work and value for money.
Remuneration
The activities of the Remuneration
Committee are explained fully in the
Remuneration Report on pages 34 to 38.
Internal controlThe Board acknowledges its ultimate
responsibility for the system of internal
control within the Group and for its
effectiveness. The system is designed to
manage rather than eliminate the risk of
failure to achieve business objectives,
and can only provide reasonable and
not absolute assurance against material
misstatement or loss. The Board has
carried out an assessment of the key
operational and financial risks for the
Group, the control exercised at Board
level, the controls relied upon by the
Board and the exceptions for
consideration by the Board. This review
is updated on a regular basis.
The responsibility for the implementation
and day-to-day operation of the systems
of internal control within the business is
delegated to the Chief Executive and
Executive Directors and through them to
members of management and staff. Key
features of the system of internal control
include a detailed review of performance
against budgets and forecasts which are
subject to scrutiny and approval, reports
to the Board from each operating area, a
requirement for authorisation of capital
expenditure following formal investment
appraisals and a close involvement of the
Executive Directors in the operation of
the business.
The Company does not have an internal
audit function and the Board does not
consider that one is required for a
business of Shepherd Neame’s size.
Ongoing quality visits and counts by
independent stocktakers provide
assurance over activities in the
managed pub estate.
Investor relationsThe Board believes in an open and
regular dialogue with its shareholders.
Information is provided to shareholders
in the interim and annual financial
statements. The Chairman, Chief
Executive and Finance and IT Director
make an annual presentation of the
Group’s results to professional investors
and analysts. This presentation is
simultaneously posted on the Company’s
website. The Board offers to hold
individual briefings with its major
shareholders and twice a year meets
with the Family Council, which was
established in 2014 to improve
communications with major family
shareholders, to make presentations
on the Company’s performance. The
Chairman and Chief Executive discuss
governance and strategy with major
shareholders and the Board receives
updates on these meetings which helps
develop the Non-Executive Directors’
understanding of the views of major
shareholders. The Chairman and Chief
Executive update them on the
Company’s performance and progress.
Peel Hunt LLP provided broking and
advisory services during the year.
The Company’s shares are traded on
the CREST trading platform.
All formal Company announcements are
posted on the Company’s website and
on the NEX Exchange Growth Market
website (www.nexexchange.com).
Employees and pensionersThe health and wellbeing of our
employees are paramount. We strive
to improve their safety at work by
undertaking regular risk assessments
and training. We believe in open and
transparent communication with our
employees and hold regular briefings
on relevant matters such as the
performance of the business,
forthcoming events, initiatives
and targets.
We encourage employees to participate
in activities beyond their daily jobs
and to contribute to the Company’s
community involvement. We are
supportive of their participation in local
government, and in other voluntary
services and we support various sporting
and social activities for employees. We
place an emphasis on longevity of
service and loyalty and reward it.
We believe strongly in supporting our
former employees. In addition to funding
a pension, the Company maintains an
active social programme for pensioners,
which enables them to maintain contact
with former colleagues.
34 SHEPHERD NEAME ANNUAL REPORT AND ACCOUNTS 2019
REMUNERATION REPORT
OverviewThe Board has voluntarily included a remuneration report. The information discussed in this report is not as extensive as that
required for a fully listed entity to disclose.
The Remuneration Committee is chaired by Bill Brett. It comprises the Non-Executive Directors. The Chief Executive attends
the meetings by invitation. The work of the Committee is set out in its terms of reference which are available on the Company’s
website. It meets regularly and determines on behalf of the Board the remuneration package of the Executive Directors.
The Remuneration Committee is also responsible for approving the bonus targets and payments for the Company’s Executive
Directors and Senior Managers.
The Committee aims to ensure that remuneration packages for Executive Directors are competitive and comparable with
companies of a similar size, complexity and activity and are designed to attract, retain and motivate Executive Directors with
appropriate skills and capabilities.
Remuneration for Executive Directors comprises fixed remuneration (salary, car allowance and other taxable benefits), pension
contributions and performance related remuneration designed to motivate maximum performance over a sustained period.
Salary levels for Executive Directors are reviewed annually in line with the overall company pay review process.
In coming to these decisions the Remuneration Committee considers the overall performance of the business and of the
individual Directors and Senior Managers and the performance of our national and regional competitors when appropriate.
External consultants are used periodically to help with these decisions. In 2017 the Remuneration Committee engaged the
services of Aon Hewitt to support a review of the Company’s Executive remuneration arrangements, considering best practice,
competitiveness in the market and the alignment between the executive remuneration structure and business strategy.
The performance-related pay element of Executive Director remuneration has two components:
• A cash bonus scheme providing for annual bonuses to a value of up to 30% of salary based on a series of financial performance
and non-financial targets. These targets are set at the start of the financial year and performance evaluated after the financial
year is complete.
• Secondary options over ordinary shares granted annually to a value of up to 70% of salary in accordance with the rules of the
2015 Restricted Share Scheme. Under this scheme options are granted every year but only vest three years after grant by
reference to performance in underlying earnings per share, net asset value per share, dividend growth and total shareholder
return over the three-year period. Directors are not expected to sell the vested shares for a further two years.
Share options are issued to Executive Directors under the Shepherd Neame Limited 2015 Restricted Share Scheme
(the “2015 Scheme”). This scheme was introduced as a replacement to the Shepherd Neame Limited 2005 Restricted Share
Scheme (the “2005 Scheme”) which expired on 28 October 2015. The 2015 Scheme aims to make awards which are closely
aligned to Company performance and the interests of shareholders over the long term. The 2015 Scheme includes features
consistent with prevailing market and best practices, including malus and clawback provisions, which may apply, at the
discretion of the Remuneration Committee.
The malus provision allows that options may be granted on terms that all or a proportion of unvested options may be forfeited
back to the Company in exceptional circumstances of fraud, financial misstatement and misconduct.
In addition, and if specified at the time of grant, the clawback provision allows that in exceptional circumstances of fraud,
financial misstatement and misconduct, the Company may reclaim and/or be compensated for all or a proportion of the
shares acquired by an employee under their vested options.
In addition to these incentives, Executive Directors are free to participate in the All Employee Share Incentive Plan (SIP).
This scheme is open to all employees with 18 months’ service at the date of award and provides a free award of shares
based on length of service and salary. The maximum award available to any employee is £3,600 per annum.
Non-Executive FeesNon-Executive Directors receive fees which are reviewed annually by the Board in line with the overall Company pay
review process.
35WWW.SHEPHERDNEAME.CO.UK
| OT
HE
R IN
FO
RM
AT
ION
| FIN
AN
CIA
L S
TA
TE
ME
NT
S| G
OV
ER
NA
NC
E| S
TR
AT
EG
IC R
EP
OR
T
Directors’ emolumentsThe information in this table is subject to audit and as required to be disclosed in note 11.
53 weeks ended
52 weeks ended 30 June 2018
29 June 2019 restated (v)
Group and Company £’000 £’000
Aggregate amount:
Salary (i) 1,059 1,172
Annual bonus (ii) 125 165
Salary in lieu of pension contributions (iii) 178 187
Taxable benefits 97 109
Cash payment in lieu of share options – 16
Share Incentive Plan (iv) 13 15
Directors emoluments 1,472 1,664
Primary and secondary share options vesting in the year (v) 180 312
Compensation for loss of office – 126
Pension contributions 10 25
1,662 2,127
The number of Directors who:
Had pension benefits accruing under money purchase schemes 4 5
Exercised options over shares in the scheme 3 4
Had awards receivable in the form of shares under a long-term incentive plan 4 4
Details of Directors’ share options are shown on page 37
Highest paid Director:
Salary (i) 261 255
Annual bonus (ii) 44 55
Salary in lieu of pension contributions (iii) 60 59
Taxable benefits 39 36
Share Incentive Plan (iv) 3 3
Primary and secondary share options vesting in the year (v) 56 81
463 489
(i) The average salary increase for Executive Directors in July 2018 for the 2019 financial year was 2.5% (2018: 2.0%). The salary increase for the highest paid Director was 2.5% (2018: 2.0%).
(ii) The annual bonus accrued in 2019 relates to performance in the 2019 financial year and will be paid in September 2019. The aggregate bonus paid to Executive Directors in the 2019 financial year relating to the 2018 financial year was £157,000 or 19% of the 2018 executive salaries.
(iii) Due to changes in legislation, the highest paid Director and two other Executive Directors are no longer contributing members of the Company pension scheme. In addition, the pension contributions for the remaining Executive Director are capped.
(iv) SIP benefit is calculated as the share price at the year end multiplied by the number of shares awarded in the year.
(v) Option benefit is calculated as the share price at the date the shares vest (less the exercise price) multiplied by the number of options vesting in the year. The vesting of the primary share options is conditional upon Directors remaining in employment with the Company for three years from the date of grant of the options. The vesting of the secondary share options is conditional upon the achievement of certain performance criteria in the financial years ending in the three years following the grant, and exercise of options is conditional upon Directors remaining in employment with the Company for three years from the date of grant of the options.
The comparative has been restated in respect of primary share options vesting in October 2017 with a value of £136,000 which were omitted from last year’s disclosure. The value of the restatement for the highest paid director was £35,000.
(vi) In 2019, options were exercised by the highest paid Director over 18,015 shares (2018: no options were exercised). The gross gain, not included above, made by the highest paid Director on the exercise of share options was £197,000 (2018: nil). This gain is subject to tax.
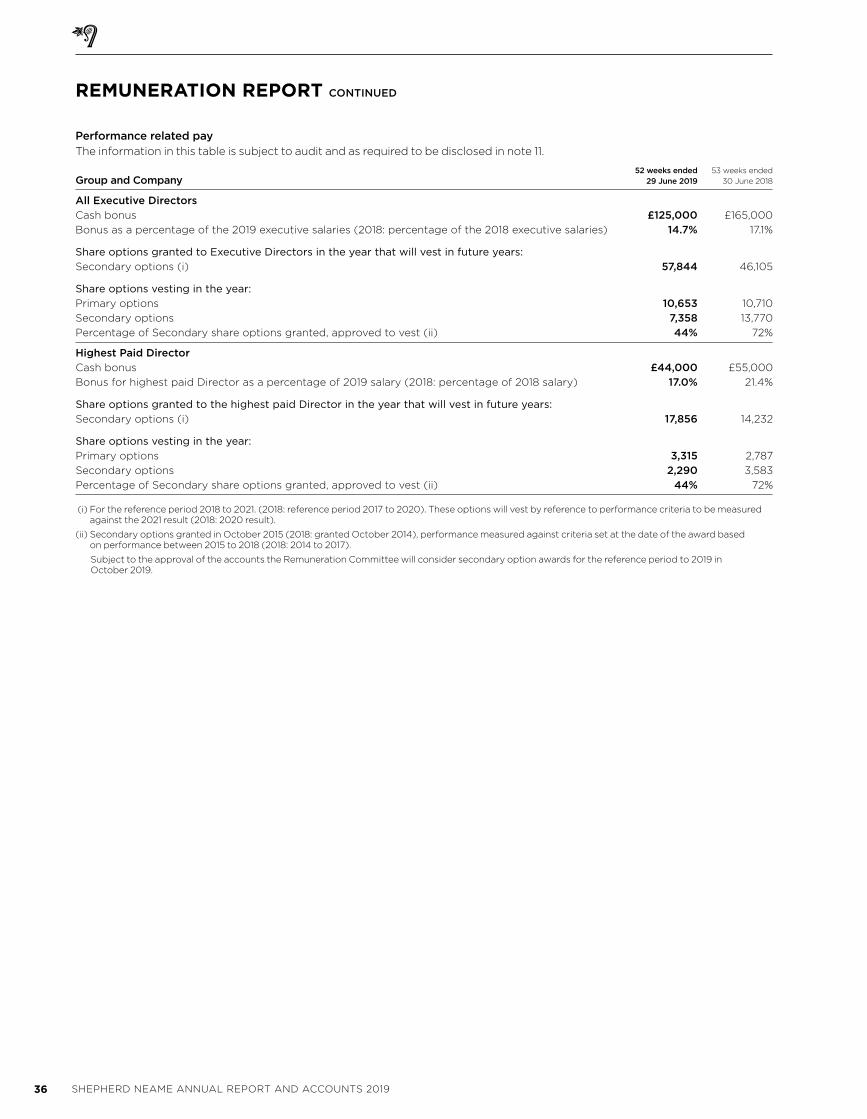
36 SHEPHERD NEAME ANNUAL REPORT AND ACCOUNTS 2019
REMUNERATION REPORT CONTINUED
Performance related payThe information in this table is subject to audit and as required to be disclosed in note 11.
52 weeks ended 53 weeks ended
Group and Company 29 June 2019 30 June 2018
All Executive Directors
Cash bonus £125,000 £165,000
Bonus as a percentage of the 2019 executive salaries (2018: percentage of the 2018 executive salaries) 14.7% 17.1%
Share options granted to Executive Directors in the year that will vest in future years:
Secondary options (i) 57,844 46,105
Share options vesting in the year:
Primary options 10,653 10,710
Secondary options 7,358 13,770
Percentage of Secondary share options granted, approved to vest (ii) 44% 72%
Highest Paid Director
Cash bonus £44,000 £55,000
Bonus for highest paid Director as a percentage of 2019 salary (2018: percentage of 2018 salary) 17.0% 21.4%
Share options granted to the highest paid Director in the year that will vest in future years:
Secondary options (i) 17,856 14,232
Share options vesting in the year:
Primary options 3,315 2,787
Secondary options 2,290 3,583
Percentage of Secondary share options granted, approved to vest (ii) 44% 72%
(i) For the reference period 2018 to 2021. (2018: reference period 2017 to 2020). These options will vest by reference to performance criteria to be measured against the 2021 result (2018: 2020 result).
(ii) Secondary options granted in October 2015 (2018: granted October 2014), performance measured against criteria set at the date of the award based on performance between 2015 to 2018 (2018: 2014 to 2017).
Subject to the approval of the accounts the Remuneration Committee will consider secondary option awards for the reference period to 2019 in October 2019.
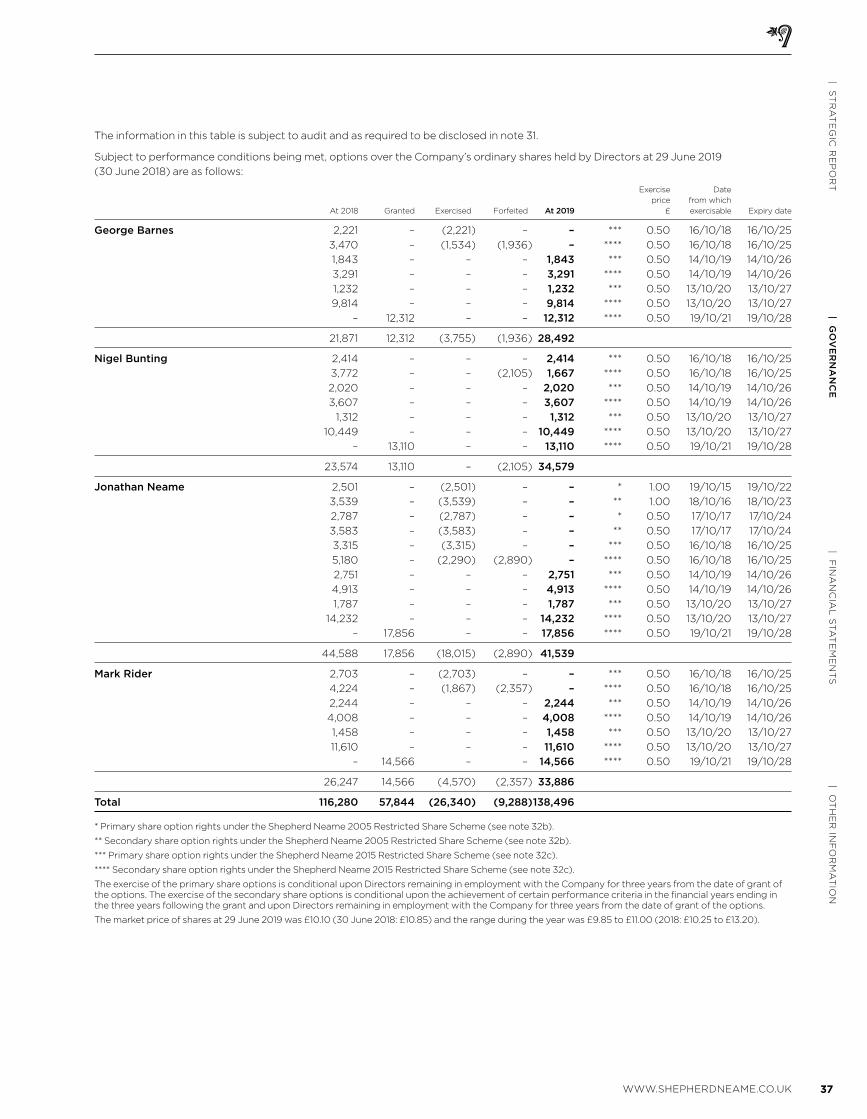
37WWW.SHEPHERDNEAME.CO.UK
| OT
HE
R IN
FO
RM
AT
ION
| FIN
AN
CIA
L S
TA
TE
ME
NT
S| G
OV
ER
NA
NC
E| S
TR
AT
EG
IC R
EP
OR
T
The information in this table is subject to audit and as required to be disclosed in note 31.
Subject to performance conditions being met, options over the Company’s ordinary shares held by Directors at 29 June 2019
(30 June 2018) are as follows:
Exercise Date
price from which
At 2018 Granted Exercised Forfeited At 2019 £ exercisable Expiry date
George Barnes 2,221 – (2,221) – – *** 0.50 16/10/18 16/10/25
3,470 – (1,534) (1,936) – **** 0.50 16/10/18 16/10/25
1,843 – – – 1,843 *** 0.50 14/10/19 14/10/26
3,291 – – – 3,291 **** 0.50 14/10/19 14/10/26
1,232 – – – 1,232 *** 0.50 13/10/20 13/10/27
9,814 – – – 9,814 **** 0.50 13/10/20 13/10/27
– 12,312 – – 12,312 **** 0.50 19/10/21 19/10/28
21,871 12,312 (3,755) (1,936) 28,492
Nigel Bunting 2,414 – – – 2,414 *** 0.50 16/10/18 16/10/25
3,772 – – (2,105) 1,667 **** 0.50 16/10/18 16/10/25
2,020 – – – 2,020 *** 0.50 14/10/19 14/10/26
3,607 – – – 3,607 **** 0.50 14/10/19 14/10/26
1,312 – – – 1,312 *** 0.50 13/10/20 13/10/27
10,449 – – – 10,449 **** 0.50 13/10/20 13/10/27
– 13,110 – – 13,110 **** 0.50 19/10/21 19/10/28
23,574 13,110 – (2,105) 34,579
Jonathan Neame 2,501 – (2,501) – – * 1.00 19/10/15 19/10/22
3,539 – (3,539) – – ** 1.00 18/10/16 18/10/23
2,787 – (2,787) – – * 0.50 17/10/17 17/10/24
3,583 – (3,583) – – ** 0.50 17/10/17 17/10/24
3,315 – (3,315) – – *** 0.50 16/10/18 16/10/25
5,180 – (2,290) (2,890) – **** 0.50 16/10/18 16/10/25
2,751 – – – 2,751 *** 0.50 14/10/19 14/10/26
4,913 – – – 4,913 **** 0.50 14/10/19 14/10/26
1,787 – – – 1,787 *** 0.50 13/10/20 13/10/27
14,232 – – – 14,232 **** 0.50 13/10/20 13/10/27
– 17,856 – – 17,856 **** 0.50 19/10/21 19/10/28
44,588 17,856 (18,015) (2,890) 41,539
Mark Rider 2,703 – (2,703) – – *** 0.50 16/10/18 16/10/25
4,224 – (1,867) (2,357) – **** 0.50 16/10/18 16/10/25
2,244 – – – 2,244 *** 0.50 14/10/19 14/10/26
4,008 – – – 4,008 **** 0.50 14/10/19 14/10/26
1,458 – – – 1,458 *** 0.50 13/10/20 13/10/27
11,610 – – – 11,610 **** 0.50 13/10/20 13/10/27
– 14,566 – – 14,566 **** 0.50 19/10/21 19/10/28
26,247 14,566 (4,570) (2,357) 33,886
Total 116,280 57,844 (26,340) (9,288) 138,496
* Primary share option rights under the Shepherd Neame 2005 Restricted Share Scheme (see note 32b).
** Secondary share option rights under the Shepherd Neame 2005 Restricted Share Scheme (see note 32b).
*** Primary share option rights under the Shepherd Neame 2015 Restricted Share Scheme (see note 32c).
**** Secondary share option rights under the Shepherd Neame 2015 Restricted Share Scheme (see note 32c).
The exercise of the primary share options is conditional upon Directors remaining in employment with the Company for three years from the date of grant of the options. The exercise of the secondary share options is conditional upon the achievement of certain performance criteria in the financial years ending in the three years following the grant and upon Directors remaining in employment with the Company for three years from the date of grant of the options.
The market price of shares at 29 June 2019 was £10.10 (30 June 2018: £10.85) and the range during the year was £9.85 to £11.00 (2018: £10.25 to £13.20).
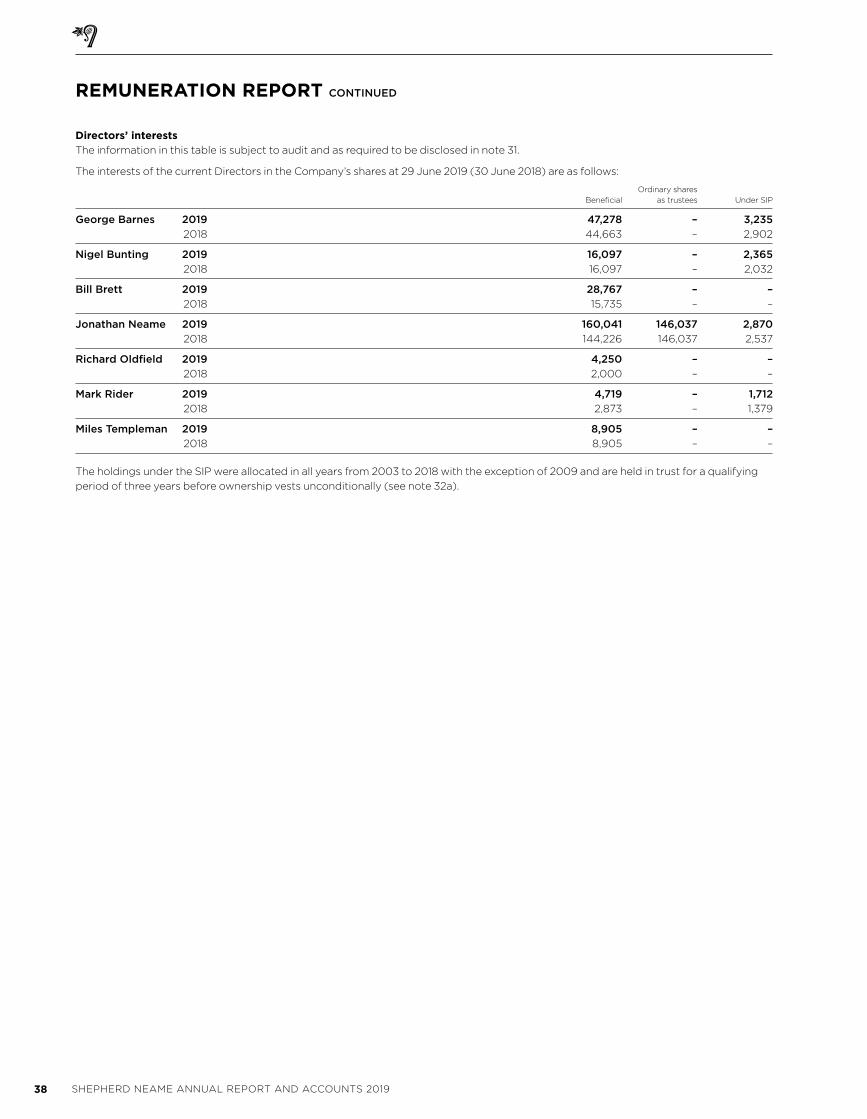
38 SHEPHERD NEAME ANNUAL REPORT AND ACCOUNTS 2019
REMUNERATION REPORT CONTINUED
Directors’ interestsThe information in this table is subject to audit and as required to be disclosed in note 31.
The interests of the current Directors in the Company’s shares at 29 June 2019 (30 June 2018) are as follows:
Ordinary shares
Beneficial as trustees Under SIP
George Barnes 2019 47,278 – 3,235
2018 44,663 – 2,902
Nigel Bunting 2019 16,097 – 2,365
2018 16,097 – 2,032
Bill Brett 2019 28,767 – –
2018 15,735 – –
Jonathan Neame 2019 160,041 146,037 2,870
2018 144,226 146,037 2,537
Richard Oldfield 2019 4,250 – –
2018 2,000 – –
Mark Rider 2019 4,719 – 1,712
2018 2,873 – 1,379
Miles Templeman 2019 8,905 – –
2018 8,905 – –
The holdings under the SIP were allocated in all years from 2003 to 2018 with the exception of 2009 and are held in trust for a qualifying
period of three years before ownership vests unconditionally (see note 32a).
| OT
HE
R IN
FO
RM
AT
ION
| FIN
AN
CIA
L S
TA
TE
ME
NT
S| G
OV
ER
NA
NC
E| S
TR
AT
EG
IC R
EP
OR
T
39WWW.SHEPHERDNEAME.CO.UK
REPORT OF THE DIRECTORS
The Directors have pleasure in presenting
their Annual Report and Accounts for the
52 weeks ended 29 June 2019.
Activities and review of businessThe principal activities of the Group are
the brewing and packaging of beer; the
wholesaling and retailing of beer, cider,
wines, spirits and minerals; property
ownership and public house and hotel
management. This report should be read
in conjunction with the Strategic Report
which comprises the statements and
reviews on pages 3 to 27. The Strategic
report includes information on the
Group’s strategy and provides further
details of the Group’s performance for
the 52 weeks ended 29 June 2019 and
likely future developments.
DividendsThe Company paid an interim dividend
of 5.87p per ordinary share (2018: 5.75p).
The Directors now recommend a final
dividend of 24.21p per ordinary share
(2018: 23.45p). This makes a total
dividend for the year of 30.08p per
ordinary share (2018: 29.20p).
The total proposed final dividend on
ordinary shares will be £3,578,000
(2018: £3,466,000) which together
with the 2019 interim dividend paid
of £866,000 (2018: £849,000) will
make total dividends of £4,444,000
(2018: £4,315,000).
DirectorsThe names of the Directors at 29June 2019
are set out on pages 30 and 31. Details of
all Directors’ interests are set out in the
Remuneration Report on pages 34–38.
Jonathan Neame, George Barnes, Bill
Brett, Hilary Riva, and Richard Oldfield
retire from the Board by rotation and will
be offering themselves for re-election.
Miles Templeman, having served longer
than nine years, submits himself for
re-election in accordance with the
Articles of Association.
Purchase of own sharesDuring the year the Company purchased
a total of 57,000 ordinary shares at a
total cost of £595,000 representing
0.4% of the Company’s issued share
capital (2018: 2,200 ordinary shares at
a total cost of £25,000 being 0.01% of
the Company’s issued share capital).
The shares were acquired in connection
with the Company’s future obligations
under the Share Schemes.
Use of financial instrumentsA statement in relation to the use of
financial instruments and financial risk
management by the Group is given in
note 23 to the accounts.
EmployeesIt is the Group’s policy to give full
consideration to suitable applications
for employment by disabled persons.
Opportunities also exist for employees
who become disabled to continue in
their employment or to be trained for
other positions in the Group’s
employment.
The Group provides employees with a
regular summary of its financial position
and continually aims to provide them
with information on matters of concern
to them as employees.
Employees continue to participate
directly in the success of the business
through the Share Incentive Plan.
Third-party indemnity provisions The Company has in place a Directors’
and Officers’ Liability Insurance Policy
which indemnifies the Directors and
Officers from any claim or claims on
them in the course of their business
activities to the extent that they do not
relate to acts of fraud or dishonesty.
Political ContributionsThe Group made no political
contributions during the year (2018: £nil).
AuditorA resolution to reappoint Deloitte LLP
will be put to the forthcoming Annual
General Meeting.
By order of the Board
Robin Duncan Company Secretary
17 Court Street
Faversham, Kent
24 September 2019
Registered in England number 138256
40 SHEPHERD NEAME ANNUAL REPORT AND ACCOUNTS 2019
DIRECTORS’ RESPONSIBILITIES STATEMENT FOR THE FINANCIAL STATEMENTSThe Directors are responsible for
preparing the Annual Report, Strategic
Report, the Directors’ Report and the
financial statements in accordance
with applicable law and regulations.
Company law requires the Directors to
prepare financial statements for each
financial year. Under that law, the
Directors have elected to prepare the
financial statements in accordance with
United Kingdom Generally Accepted
Accounting Practice (United Kingdom
Accounting Standards and applicable
law) including FRS 102 “The Financial
Reporting Standard applicable in the UK
and Republic of Ireland”. Under company
law, the Directors must not approve the
financial statements unless they are
satisfied that they give a true and fair
view of the state of affairs and profit or
loss of the Group and Company for that
period. In preparing those financial
statements, the Directors are required to:
• select suitable accounting policies
and then apply them consistently;
• make judgements and accounting
estimates that are reasonable and
prudent;
• state whether applicable UK
Accounting Standards have been
followed, subject to any material
departures disclosed and explained
in the financial statements; and
• prepare the financial statements on
the going concern basis unless it is
inappropriate to presume that the
Company will continue in business.
The Directors are responsible for keeping
adequate accounting records that are
sufficient to show and explain the
Group’s transactions and disclose with
reasonable accuracy at any time, the
financial position of the Group and
Company and enable them to ensure
that the financial statements comply
with the Companies Act 2006. They are
also responsible for safeguarding the
assets of the Group and hence for
taking reasonable steps for the
prevention and detection of fraud
and other irregularities.
The maintenance and integrity of the
corporate and financial information on
the Shepherd Neame website is the
responsibility of the Directors. Legislation
in the United Kingdom governing the
preparation and dissemination of
financial statements may differ from
legislation in other jurisdictions.
Going concernThe Directors have reviewed the current
financial projections, together with the
bank facilities, as discussed in the Cash
Flow and Financing sections of the
Financial Commentary on pages 21 to 23
and in accordance with the capital and
risk management process set out in
note 23; and, on the basis of reasonable
expectation, have concluded that the
Group and Company have adequate
resources to continue in operational
existence for the foreseeable future
and accordingly consider that it is
appropriate to continue to adopt the
going concern basis in preparing the
financial statements.
Directors’ statement as to disclosure of information to the auditorThe Directors who held office as at the
date of approval of this Directors’ Report
confirm that:
• so far as they are each aware, there
is no relevant audit information
(as defined in Section 418(2) of the
Companies Act 2006) of which the
Company’s auditor is unaware; and
• each Director has taken all the steps
that they ought to have taken as a
director to be aware of any relevant
audit information and to establish
that the Company’s auditor is aware
of that information.
| OT
HE
R IN
FO
RM
AT
ION
| FIN
AN
CIA
L S
TA
TE
ME
NT
S| G
OV
ER
NA
NC
E| S
TR
AT
EG
IC R
EP
OR
T
41WWW.SHEPHERDNEAME.CO.UK
INDEPENDENT AUDITOR’S REPORT TO THE MEMBERS OF SHEPHERD NEAME LIMITEDOpinionIn our opinion:• the financial statements of Shepherd
Neame Limited (the ‘parent company’) and its subsidiaries (the ‘group’) give a true and fair view of the state of the group’s and of the parent company’s affairs as at 29 June 2019 and of the group’s profit for the year then ended;
• the group financial statements have been properly prepared in accordance with United Kingdom Generally Accepted Accounting Practice, including Financial Reporting Standard 102 “The Financial Reporting Standard applicable in the UK and Republic of Ireland”;
• the parent company statements have been properly prepared in accordance with United Kingdom Generally Accepted Accounting Practice, including Financial Reporting Standard 102 “The Financial Reporting Standard applicable in the UK and Republic of Ireland”; and
• the financial statements have been prepared in accordance with the requirements of the Companies Act 2006.
We have audited the financial statements which comprise:• the Consolidated Profit and Loss
Account;• the Consolidated Statement of
Comprehensive Income;• the Consolidated and Parent Company
Balance Sheet;• the Consolidated and Parent Company
Statement of Changes in Equity;• the Consolidated Cash Flow Statement;
and• the related notes 1 to 34.
The financial reporting framework that has been applied in the preparation of the group and parent company financial statements is applicable law and United Kingdom Accounting Standards, including FRS 102 “The Financial Reporting Standard applicable in the UK and Republic of Ireland” (United Kingdom Generally Accepted Accounting Practice).
Basis for opinionWe conducted our audit in accordance with International Standards on Auditing (UK) (ISAs (UK)) and applicable law. Our responsibilities under those standards are further described in the auditor’s responsibilities for the audit of the financial statements section of our report.
We are independent of the group and the parent company in accordance with the ethical requirements that are relevant to our audit of the financial statements in the UK, including the Financial Reporting Council’s (the ‘FRC’s’) Ethical Standard as applied to listed entities, and we have fulfilled our other ethical responsibilities in accordance with these requirements. We believe that the audit evidence we have obtained is sufficient and appropriate to provide a basis for our opinion.
Summary of our audit approachKey audit mattersThe key audit matter that we identified in the current year was the discount rate and forecast growth rates used as part of the tangible fixed assets impairment review.
Materiality The materiality that we used for the group financial statements was £640,000 (2018: £706,000) which was determined on the basis of 6% (2018: 6%) of forecast underlying profit before taxation.
ScopingWe performed full scope audit procedures over the entire group.
Significant changes in our approachThere are no changes in our audit approach.
Conclusions relating to going concernWe are required by ISAs (UK) to report in respect of the following matters where:• the directors’ use of the going concern
basis of accounting in preparation of the financial statements is not appropriate; or
• the directors have not disclosed in the financial statements any identified material uncertainties that may cast significant doubt about the group’s or the parent company’s ability to continue to adopt the going concern basis of accounting for a period of at least twelve months from the date when the financial statements are authorised for issue.
We have nothing to report in respect of these matters.
Key audit mattersKey audit matters are those matters that, in our professional judgement, were of most significance in our audit of the financial statements of the current period and include the most significant assessed risks of material misstatement (whether or not due to fraud) that we identified. These matters included those which had the greatest effect on: the overall audit strategy, the allocation of resources in the audit; and directing the efforts of the engagement team.
These matters were addressed in the context of our audit of the financial statements as a whole, and in forming our opinion thereon, and we do not provide a separate opinion on these matters.
Key audit matter descriptionThe Group has property, plant and equipment with a net book value of £306m as at 29 June 2019 (30 June 2018: £300m). Tangible fixed assets are stated at cost or valuation, net of depreciation and any provision for impairment. Licensed freehold properties were revalued on transition to FRS 102, with fair value treated as deemed cost.
In assessing impairment, Management estimates the recoverable amount of each cash-generating unit (CGU) by reference to the higher of its value in use (based on the group’s key assumptions in relation to future profits and a discount rate) and fair value less costs of disposal. The recoverable
amount is compared to the carrying value of each CGU to determine whether any impairment is required, where triggers have been met. A CGU is defined as an individual tenanted or managed public house because this is the lowest level at which a group of assets (in this case, the land, buildings and fixtures and fittings) generate independent cash inflows.
There is a significant element of judgement in determining the recoverable amount of assets, specifically the assumptions used by the Management in the value in use calculations, which also gives rise to a potential fraud risk. The discount rate and EBITDA growth rates are impacted by various factors, both internal as well as wider external economic factors (inflationary pressures, tax levies, consumer demand).
The discount rate and forecast profit calculations therefore have a high degree of judgement and carry a higher level of inherent risk of material error. These areas therefore formed a key audit matter for our audit purposes.
Refer to accounting policies (page 48) and note 14 of the group financial statements (page 56).
How the scope of our audit responded to the key audit matterWe obtained an understanding of the group’s processes and relevant controls employed to identify impairment indicators and to calculate appropriate impairments of property, plant and equipment at a cash-generating unit level. We then performed the following procedures in order to address the above key audit matter:1. Engaged valuation specialists to
benchmark discount rates against market data and competitors and also performed sensitivity analysis using our specialist’s discount rate thresholds;
2. Tested the arithmetical accuracy and integrity of Management’s model;
3. Challenged Management’s growth forecasts and assumptions used through detailed discussions with Management and a retrospective review of budget accuracy and historic growth. We have assessed the extent to which Brexit may impact upon assumptions;
4. Reviewed and challenged Management’s consideration of what indicates an impairment ‘trigger’;
5. Challenged Management’s value in use calculations and assumptions for pubs requiring impairment tests. This included those deemed “at risk”;
6. Reviewed and followed up the ’at risk’ properties identified as part of the 2018 impairment review to note whether these were still deemed to be at risk of impairment;
7. Assessed the reasonability of impairment indicators used by Management in order to highlight potentially impaired properties;
42 SHEPHERD NEAME ANNUAL REPORT AND ACCOUNTS 2019
INDEPENDENT AUDITOR’S REPORT TO THE MEMBERS OF SHEPHERD NEAME LIMITED CONTINUED
8. Evaluated the appropriateness, sufficiency and clarity of any impairment-related disclosures provided in the group financial statements, including the disclosure of key sensitivities;
9. Performed peer analysis for similar entities to determine whether the WACC rate and long-term growth rates applied within the VIU calculations are appropriate;
10. Considered the completeness of pubs at risk of impairment identified through use of cumulative audit knowledge and challenged the pubs excluded from the impairment model;
11. Considered the level of profits and losses on disposal of properties in the current year;
12. Challenged the appropriateness of Management’s sensitivity analysis; and
13. Engaged valuation specialists in order to calculate an Enterprise value for the Group which we compared with the Group market capitalisation.
Key observationsWe are satisfied Management’s assumptions in growth rates and the discount rate used in the impairment review performed are reasonable.
Limited (the Parent company) and The Horse & Groom (Dartford) Limited which is a wholly owned subsidiary at the balance sheet date.
We obtained a thorough understanding of the entity-level controls of the Group. This assisted us in identifying and assessing the risks of material misstatement due to fraud or error and supported us in determining the most appropriate audit strategy.
We performed an audit of the complete financial information of all trading components which represented 100% of the Group’s results for the year. Parent company materiality was calculated to be £633,600 as discussed above.
We agreed with the Audit Committee that we would report to the Committee all audit differences in excess of £32,000 (2018: £35,300), as well as differences below that threshold that, in our view, warranted reporting on qualitative grounds. We also report to the Audit Committee on disclosure matters that we identified when assessing the overall presentation of the financial statements.
An overview of the scope of our auditThe Group’s operations are all conducted in the United Kingdom. The audit was performed by one audit team based in the head office location in Faversham. The Group is made up of Shepherd Neame
Our application of materialityWe define materiality as the magnitude of misstatement in the financial statements that makes it probable that the economic decisions of a reasonably knowledgeable person would be changed or influenced. We use materiality both in planning the scope of our audit work and in evaluating the results of our work.
Based on our professional judgement, we determined materiality for the financial statements as a whole as follows:
Group financial statements Parent company financial statements
Materiality £640,000 (2018: £706,000) £633,600 (2018: £698,940)
Basis for determining materiality
6% (2018: 6%) of underlying profit before taxation. Considering the fact that there has been no significant changes in the Group’s business this year, we agreed with the Group’s Audit Committee that we would keep a consistent percentage applied for materiality calculation. Please see page 53 for reconciliation to profit before taxation.
6% (2018: 6%) of underlying profit before taxation. Parent company financial statement materiality was capped at 99% (2018: 99%) of Group materiality.
Rationale for the benchmark applied
We judged underlying profit before taxation to be the most appropriate benchmark for determining materiality as it is a key performance indicator for the Board of Directors and various stakeholders including shareholders.
The parent company comprises all of the trading results of the Group. The cap has been applied to ensure that Parent Company materiality is lower than Group materiality.
| OT
HE
R IN
FO
RM
AT
ION
| FIN
AN
CIA
L S
TA
TE
ME
NT
S| G
OV
ER
NA
NC
E| S
TR
AT
EG
IC R
EP
OR
T
43WWW.SHEPHERDNEAME.CO.UK
Other informationThe directors are responsible for the other information. The other information comprises the information included in the annual report, other than the financial statements and our auditor’s report thereon.
Our opinion on the financial statements does not cover the other information and, except to the extent otherwise explicitly stated in our report, we do not express any form of assurance conclusion thereon.
In connection with our audit of the financial statements, our responsibility is to read the other information and, in doing so, consider whether the other information is materially inconsistent with the financial statements or our knowledge obtained in the audit or otherwise appears to be materially misstated.
If we identify such material inconsistencies or apparent material misstatements, we are required to determine whether there is a material misstatement in the financial statements or a material misstatement of the other information. If, based on the work we have performed, we conclude that there is a material misstatement of this other information, we are required to report that fact.
We have nothing to report in respect of these matters.
Responsibilities of directorsAs explained more fully in the directors’ responsibilities statement, the directors are responsible for the preparation of the financial statements and for being satisfied that they give a true and fair view, and for such internal control as the directors determine is necessary to enable the preparation of financial statements that are free from material misstatement, whether due to fraud or error.
In preparing the financial statements, the directors are responsible for assessing the group’s and the parent company’s ability to continue as a going concern, disclosing as applicable, matters related to going concern and using the going concern basis of accounting unless the directors either intend to liquidate the group or the parent company or to cease operations, or have no realistic alternative but to do so.
Auditor’s responsibilities for the audit of the financial statementsOur objectives are to obtain reasonable assurance about whether the financial statements as a whole are free from material misstatement, whether due to fraud or error, and to issue an auditor’s report that includes our opinion. Reasonable assurance is a high level of assurance, but is not a guarantee that an audit conducted in accordance with ISAs (UK) will always detect a material misstatement when it exists. Misstatements can arise from fraud or error and are considered material if, individually or in
the aggregate, they could reasonably be expected to influence the economic decisions of users taken on the basis of these financial statements.
Details of the extent to which the audit was considered capable of detecting irregularities, including fraud are set out below.
A further description of our responsibilities for the audit of the financial statements is located on the FRC’s website at: www.frc.org.uk/auditorsresponsibilities. This description forms part of our auditor’s report.
Report on other legal and regulatory requirementsOpinions on other matters prescribed by the Companies Act 2006In our opinion, based on the work undertaken in the course of the audit:• the information given in the strategic
report and the directors’ report for the financial year for which the financial statements are prepared is consistent with the financial statements; and
• the strategic report and the directors’ report have been prepared in accordance with applicable legal requirements.
In the light of the knowledge and understanding of the group and or the parent company and their environment obtained in the course of the audit, we have not identified any material misstatements in the strategic report or the directors’ report.
Opinion on other matter prescribed by our engagement letterIn our opinion the part of the Directors’ Remuneration Report to be audited has been properly prepared in accordance with the provisions of the Companies Act 2006.
Matters on which we are required to report by exceptionAdequacy of explanations received and accounting recordsUnder the Companies Act 2006 we are required to report to you if, in our opinion:• we have not received all the information
and explanations we require for our audit; or
• adequate accounting records have not been kept by the parent company, or returns adequate for our audit have not been received from branches not visited by us; or
• the parent company financial statements are not in agreement with the accounting records and returns.
We have nothing to report in respect of these matters.
Directors’ remunerationUnder the Companies Act 2006 we are also required to report if in our opinion certain disclosures of directors’ remuneration have not been made.
We have nothing to report in respect of this matter.
Use of our reportThis report is made solely to the company’s members, as a body, in accordance with Chapter 3 of Part 16 of the Companies Act 2006. Our audit work has been undertaken so that we might state to the company’s members those matters we are required to state to them in an auditor’s report and for no other purpose. To the fullest extent permitted by law, we do not accept or assume responsibility to anyone other than the company and the company’s members as a body, for our audit work, for this report, or for the opinions we have formed.
Ian James Smith FCA (Senior statutory auditor)
For and on behalf of Deloitte LLP
Statutory Auditor
London24 September 2019
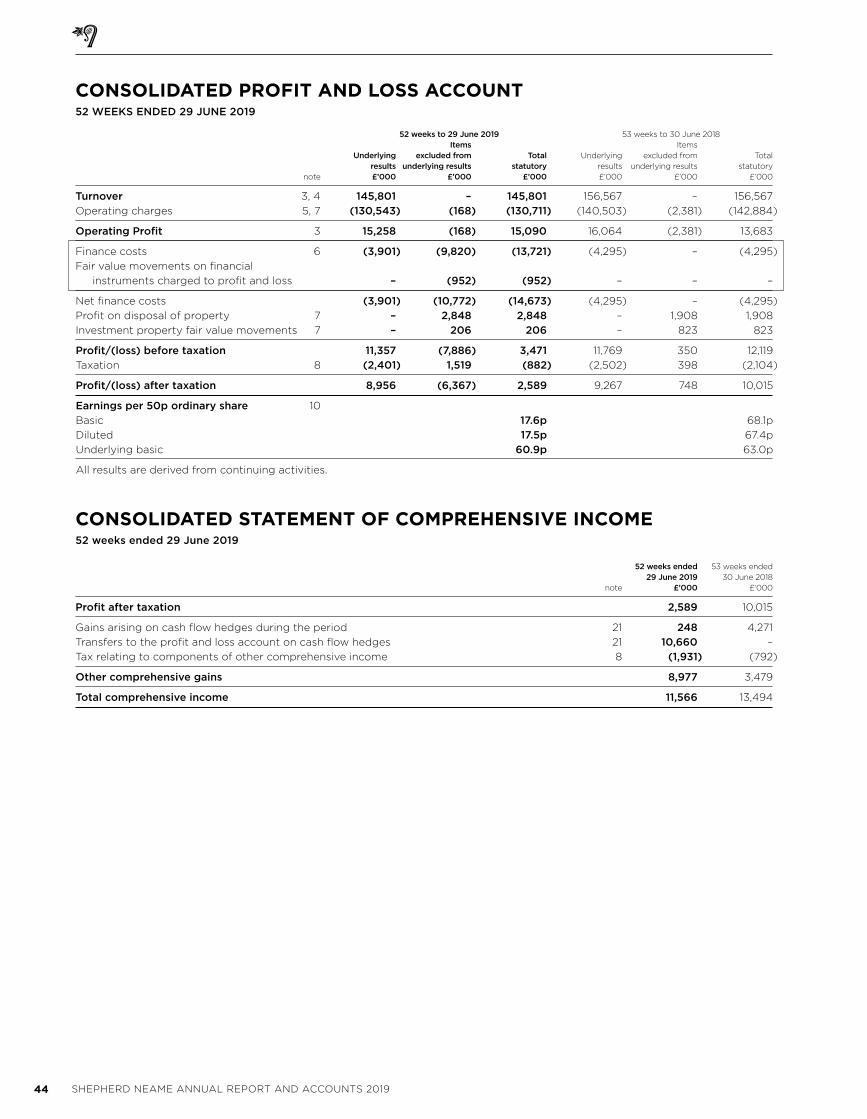
44 SHEPHERD NEAME ANNUAL REPORT AND ACCOUNTS 2019
CONSOLIDATED PROFIT AND LOSS ACCOUNT
52 WEEKS ENDED 29 JUNE 2019
52 weeks to 29 June 2019 53 weeks to 30 June 2018 Items Items
Underlying excluded from Total Underlying excluded from Total
results underlying results statutory results underlying results statutory
note £’000 £’000 £’000 £’000 £’000 £’000
Turnover 3, 4 145,801 – 145,801 156,567 – 156,567
Operating charges 5, 7 (130,543) (168) (130,711) (140,503) (2,381) (142,884)
Operating Profit 3 15,258 (168) 15,090 16,064 (2,381) 13,683
Finance costs 6 (3,901) (9,820) (13,721) (4,295) – (4,295)
Fair value movements on financial
instruments charged to profit and loss – (952) (952) – – –
Net finance costs (3,901) (10,772) (14,673) (4,295) – (4,295)
Profit on disposal of property 7 – 2,848 2,848 – 1,908 1,908
Investment property fair value movements 7 – 206 206 – 823 823
Profit/(loss) before taxation 11,357 (7,886) 3,471 11,769 350 12,119
Taxation 8 (2,401) 1,519 (882) (2,502) 398 (2,104)
Profit/(loss) after taxation 8,956 (6,367) 2,589 9,267 748 10,015
Earnings per 50p ordinary share 10
Basic 17.6p 68.1p
Diluted 17.5p 67.4p
Underlying basic 60.9p 63.0p
All results are derived from continuing activities.
CONSOLIDATED STATEMENT OF COMPREHENSIVE INCOME 52 weeks ended 29 June 2019
52 weeks ended 53 weeks ended
29 June 2019 30 June 2018
note £’000 £’000
Profit after taxation 2,589 10,015
Gains arising on cash flow hedges during the period 21 248 4,271
Transfers to the profit and loss account on cash flow hedges 21 10,660 –
Tax relating to components of other comprehensive income 8 (1,931) (792)
Other comprehensive gains 8,977 3,479
Total comprehensive income 11,566 13,494
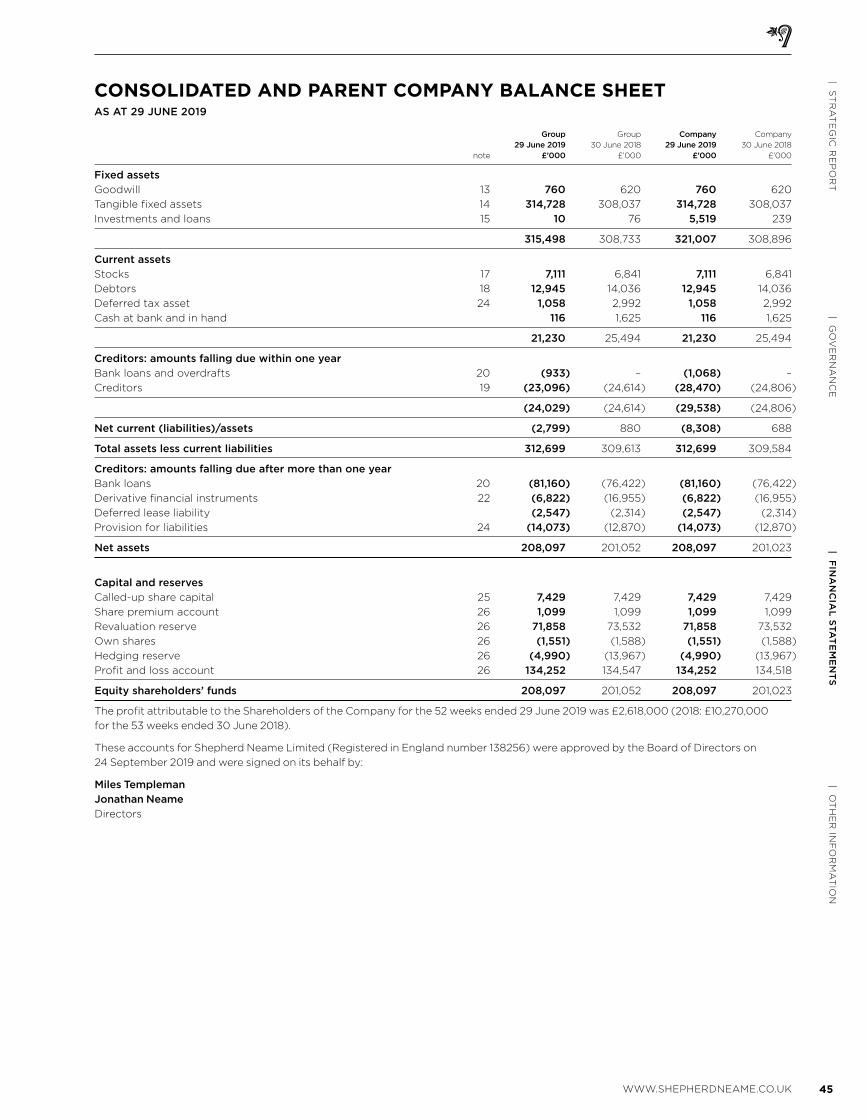
45WWW.SHEPHERDNEAME.CO.UK
| OT
HE
R IN
FO
RM
AT
ION
| FIN
AN
CIA
L S
TA
TE
ME
NT
S| G
OV
ER
NA
NC
E| S
TR
AT
EG
IC R
EP
OR
T
CONSOLIDATED AND PARENT COMPANY BALANCE SHEET
AS AT 29 JUNE 2019
Group Group Company Company
29 June 2019 30 June 2018 29 June 2019 30 June 2018
note £’000 £’000 £’000 £’000
Fixed assets
Goodwill 13 760 620 760 620
Tangible fixed assets 14 314,728 308,037 314,728 308,037
Investments and loans 15 10 76 5,519 239
315,498 308,733 321,007 308,896
Current assets
Stocks 17 7,111 6,841 7,111 6,841
Debtors 18 12,945 14,036 12,945 14,036
Deferred tax asset 24 1,058 2,992 1,058 2,992
Cash at bank and in hand 116 1,625 116 1,625
21,230 25,494 21,230 25,494
Creditors: amounts falling due within one year
Bank loans and overdrafts 20 (933) – (1,068) –
Creditors 19 (23,096) (24,614) (28,470) (24,806)
(24,029) (24,614) (29,538) (24,806)
Net current (liabilities)/assets (2,799) 880 (8,308) 688
Total assets less current liabilities 312,699 309,613 312,699 309,584
Creditors: amounts falling due after more than one year
Bank loans 20 (81,160) (76,422) (81,160) (76,422)
Derivative financial instruments 22 (6,822) (16,955) (6,822) (16,955)
Deferred lease liability (2,547) (2,314) (2,547) (2,314)
Provision for liabilities 24 (14,073) (12,870) (14,073) (12,870)
Net assets 208,097 201,052 208,097 201,023
Capital and reserves
Called-up share capital 25 7,429 7,429 7,429 7,429
Share premium account 26 1,099 1,099 1,099 1,099
Revaluation reserve 26 71,858 73,532 71,858 73,532
Own shares 26 (1,551) (1,588) (1,551) (1,588)
Hedging reserve 26 (4,990) (13,967) (4,990) (13,967)
Profit and loss account 26 134,252 134,547 134,252 134,518
Equity shareholders’ funds 208,097 201,052 208,097 201,023
The profit attributable to the Shareholders of the Company for the 52 weeks ended 29 June 2019 was £2,618,000 (2018: £10,270,000
for the 53 weeks ended 30 June 2018).
These accounts for Shepherd Neame Limited (Registered in England number 138256) were approved by the Board of Directors on
24 September 2019 and were signed on its behalf by:
Miles Templeman
Jonathan Neame
Directors
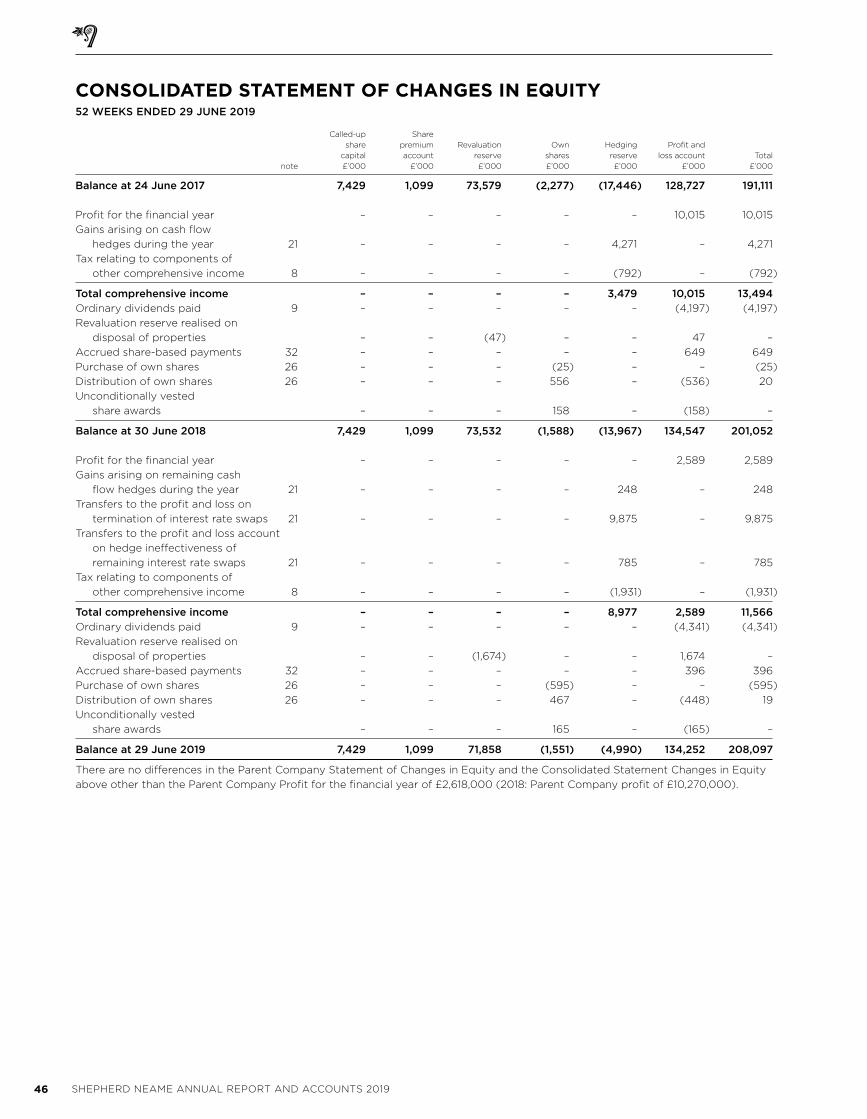
46 SHEPHERD NEAME ANNUAL REPORT AND ACCOUNTS 2019
Called-up Share
share premium Revaluation Own Hedging Profit and
capital account reserve shares reserve loss account Total
note £’000 £’000 £’000 £’000 £’000 £’000 £’000
Balance at 24 June 2017 7,429 1,099 73,579 (2,277) (17,446) 128,727 191,111
Profit for the financial year – – – – – 10,015 10,015
Gains arising on cash flow
hedges during the year 21 – – – – 4,271 – 4,271
Tax relating to components of
other comprehensive income 8 – – – – (792) – (792)
Total comprehensive income – – – – 3,479 10,015 13,494
Ordinary dividends paid 9 – – – – – (4,197) (4,197)
Revaluation reserve realised on
disposal of properties – – (47) – – 47 –
Accrued share-based payments 32 – – – – – 649 649
Purchase of own shares 26 – – – (25) – – (25)
Distribution of own shares 26 – – – 556 – (536) 20
Unconditionally vested
share awards – – – 158 – (158) –
Balance at 30 June 2018 7,429 1,099 73,532 (1,588) (13,967) 134,547 201,052
Profit for the financial year – – – – – 2,589 2,589
Gains arising on remaining cash
flow hedges during the year 21 – – – – 248 – 248
Transfers to the profit and loss on
termination of interest rate swaps 21 – – – – 9,875 – 9,875
Transfers to the profit and loss account
on hedge ineffectiveness of
remaining interest rate swaps 21 – – – – 785 – 785
Tax relating to components of
other comprehensive income 8 – – – – (1,931) – (1,931)
Total comprehensive income – – – – 8,977 2,589 11,566
Ordinary dividends paid 9 – – – – – (4,341) (4,341)
Revaluation reserve realised on
disposal of properties – – (1,674) – – 1,674 –
Accrued share-based payments 32 – – – – – 396 396
Purchase of own shares 26 – – – (595) – – (595)
Distribution of own shares 26 – – – 467 – (448) 19
Unconditionally vested
share awards – – – 165 – (165) –
Balance at 29 June 2019 7,429 1,099 71,858 (1,551) (4,990) 134,252 208,097
There are no differences in the Parent Company Statement of Changes in Equity and the Consolidated Statement Changes in Equity
above other than the Parent Company Profit for the financial year of £2,618,000 (2018: Parent Company profit of £10,270,000).
CONSOLIDATED STATEMENT OF CHANGES IN EQUITY
52 WEEKS ENDED 29 JUNE 2019
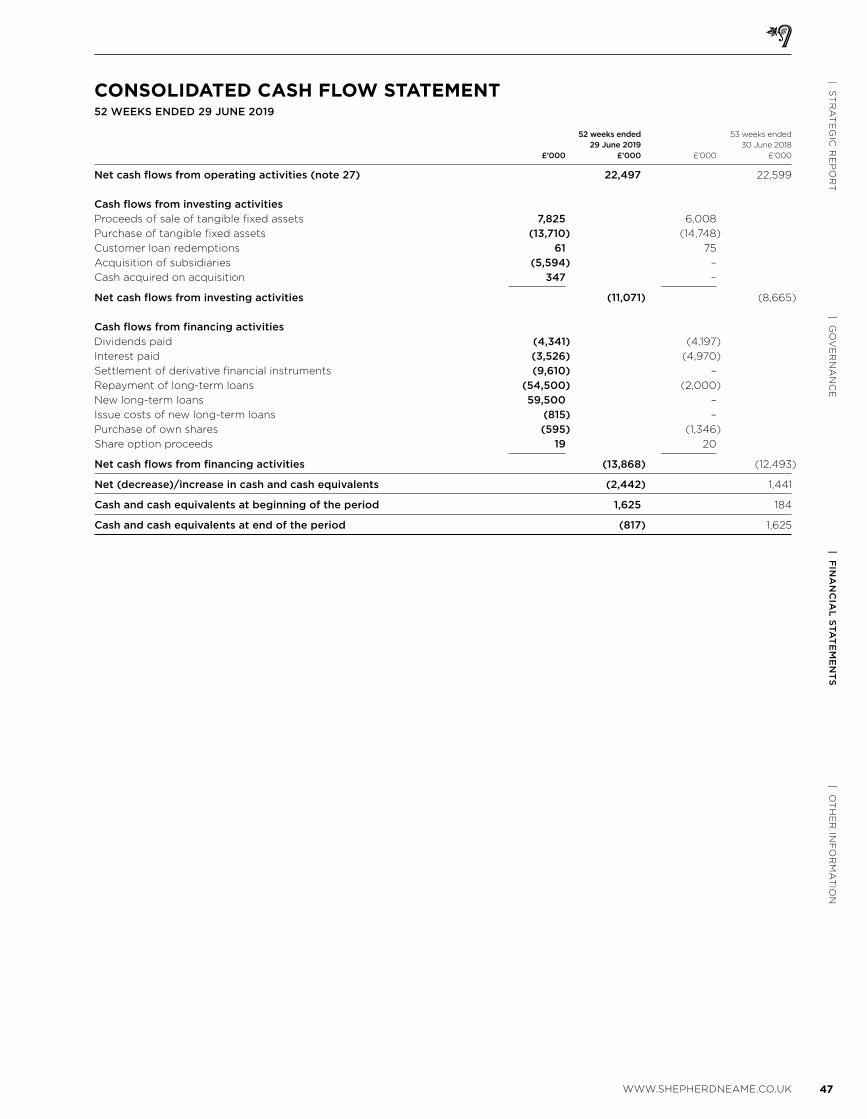
47WWW.SHEPHERDNEAME.CO.UK
| OT
HE
R IN
FO
RM
AT
ION
| FIN
AN
CIA
L S
TA
TE
ME
NT
S| G
OV
ER
NA
NC
E| S
TR
AT
EG
IC R
EP
OR
T
52 weeks ended 53 weeks ended
29 June 2019 30 June 2018
£’000 £’000 £’000 £’000
Net cash flows from operating activities (note 27) 22,497 22,599
Cash flows from investing activities
Proceeds of sale of tangible fixed assets 7,825 6,008
Purchase of tangible fixed assets (13,710) (14,748)
Customer loan redemptions 61 75
Acquisition of subsidiaries (5,594) –
Cash acquired on acquisition 347 –
Net cash flows from investing activities (11,071) (8,665)
Cash flows from financing activities
Dividends paid (4,341) (4,197)
Interest paid (3,526) (4,970)
Settlement of derivative financial instruments (9,610) –
Repayment of long-term loans (54,500) (2,000)
New long-term loans 59,500 –
Issue costs of new long-term loans (815) –
Purchase of own shares (595) (1,346)
Share option proceeds 19 20
Net cash flows from financing activities (13,868) (12,493)
Net (decrease)/increase in cash and cash equivalents (2,442) 1,441
Cash and cash equivalents at beginning of the period 1,625 184
Cash and cash equivalents at end of the period (817) 1,625
CONSOLIDATED CASH FLOW STATEMENT
52 WEEKS ENDED 29 JUNE 2019
48 SHEPHERD NEAME ANNUAL REPORT AND ACCOUNTS 2019
1 Accounting PoliciesThe principal accounting policies are summarised below and have been consistently applied throughout the year and the preceding year.
a General information and basis of accounting
Shepherd Neame Limited (the Company) is a company incorporated in the United Kingdom under the Companies Act. The Company
is a private company limited by shares and is registered in England and Wales. The registered office is 17 Court Street, Faversham,
Kent ME13 7AX. The principal activities of the Company and its subsidiaries (the Group) and the nature of the Group’s operations are set
out in the Directors’ report on page 39. Shepherd Neame Limited is the ultimate controlling party of the Group.
The functional currency of the Company is considered to be pounds sterling because that is the currency of the primary economic
environment in which the Company operates. The financial statements are also presented in pounds sterling, rounded to the nearest
thousand (£’000) unless otherwise stated.
The accounts have been prepared on a going concern basis under the historical cost convention, modified to include investment properties
held at fair value and by the revaluation of freehold licensed properties as at 28 June 2014. They are prepared in accordance with Financial
Reporting Standard 102 (FRS 102) issued by the Financial Reporting Council.
The Group has adopted FRS 102.25 regarding borrowing costs during the period. There has been no impact on the recognition of borrowing
costs in the current or comparative period, accordingly no separate presentation of its impact on the financial statements is presented nor
comparative period restated.
b Basis of consolidation
The Group financial statements consolidate the financial statements of the Company and its subsidiary undertakings drawn up for the
52 weeks ended 29 June 2019 (2018: 53 weeks ended 30 June 2018). A subsidiary is an entity that is controlled by the parent. The results
of subsidiaries acquired or sold are consolidated for the periods from or to the date on which control passed.
Business combinations are accounted for under the purchase method. Where necessary, adjustments are made to the financial statements
of subsidiaries to bring accounting policies used into line with those used by the Group. All intra-group transactions, balances, income and
expenses are eliminated on consolidation.
Under Section 408 of the Companies Act 2006 the Company is exempt from the requirement to present its own profit and loss account.
In the parent financial statements, investments in subsidiaries are carried at cost less impairment.
c Intangible assets – goodwill
Goodwill arising on acquisition of subsidiary undertakings and businesses, representing any excess of the fair value of the consideration
given over the fair value of the identifiable assets and liabilities acquired, is capitalised and written off on a straight-line basis over its useful
economic life, which is five or ten years. Provision is made for any impairment.
d Tangible fixed assets and depreciation
Tangible fixed assets are stated at cost or valuation, net of depreciation and any provision for impairment. Licensed freehold properties
were revalued on transition to FRS 102, with fair value treated as deemed cost.
Assets under construction are not depreciated until they are brought into use. All other tangible assets are depreciated at varying rates
calculated to write off their carrying value, less estimated residual value, evenly over their expected useful lives as follows:
• Freehold brewery properties 25 to 30 years
• Other freehold properties 50 years
• Leasehold properties over the lease term
• Plant, machinery, vehicles and containers 3 to 25 years
• Fixtures and fittings 2 to 30 years
• Computer hardware and software (included in fixtures and fittings) 3 to 10 years
Residual value represents the estimated amount which would currently be obtained from disposal of an asset, after deducting estimated
costs of disposal, if the asset were already of the age and in the condition expected at the end of its useful life.
e Investment properties
Investment properties are carried at fair value and measured at each reporting date with any change recognised in the profit and loss
account.
f Fixed asset investments
Fixed asset investments are measured at cost less impairment. The carrying values of the fixed asset investments are annually reviewed
for indicators of impairment if events or changes in circumstances suggest that the carrying value may not be recoverable.
g Financial instruments
Financial assets and financial liabilities are recognised when the Group becomes a party to the contractual provisions of the instrument.
Financial liabilities and equity instruments are classified according to the substance of the contractual arrangements entered into.
An equity instrument is any contract that evidences a residual interest in the assets of the Group after deducting all of its liabilities.
NOTES TO THE ACCOUNTS 29 JUNE 2019
49WWW.SHEPHERDNEAME.CO.UK
| OT
HE
R IN
FO
RM
AT
ION
| FIN
AN
CIA
L S
TA
TE
ME
NT
S| G
OV
ER
NA
NC
E| S
TR
AT
EG
IC R
EP
OR
T
i) Financial assets and liabilities
All financial assets and liabilities are initially measured at transaction price (including transaction costs), except for those financial assets
classified as at fair value through profit or loss, which are initially measured at fair value (which is normally the transaction price excluding
transaction costs), unless the arrangement constitutes a financing transaction. If an arrangement constitutes a financing transaction, the
financial asset or financial liability is measured at the present value of the future payments discounted at a market rate of interest for a
similar debt instrument.
Debt instruments are subsequently measured at amortised cost using the effective interest method. Debt instruments that are classified as
payable or receivable within one year on initial recognition and which meet certain conditions, are measured at the undiscounted amount of
the cash or other consideration expected to be paid or received, net of impairment.
Financial assets are derecognised when and only when a) the contractual rights to the cash flows from the financial asset expire or
are settled, b) the Group transfers to another party substantially all of the risks and rewards of ownership of the financial asset, or c)
the Group, despite having retained some, but not all, significant risks and rewards of ownership, has transferred control of the asset to
another party.
Financial liabilities are derecognised only when the obligation specified in the contract is discharged, cancelled or expires.
ii) Derivative financial instruments and hedge accounting
The Group uses derivative financial instruments (interest rate swaps and interest rate caps) to adjust interest rate exposures. The Group
does not hold or issue derivative financial instruments for speculative purposes.
Derivatives are initially recognised at fair value at the date a derivative contract is entered into and are subsequently re-measured to their
fair value at each reporting date. At the inception of the hedge relationship, the economic relationship between the hedging instrument and
the hedged item is documented, along with the risk management objectives and clear identification of the risk in the hedged item that is
being hedged by the hedging instrument. Furthermore, at the inception of the hedge the Company determines and documents causes for
hedge ineffectiveness.
The interest rate swaps are classified as cash flow hedges because the derivative financial instruments hedge the variable interest rate risk
of the cash flows associated with the recognised debt instrument measured at amortised cost (the £22.5m long-term loan to 2026).
The effective portion of changes in the fair value of the designated hedging instrument is recognised in other comprehensive income.
The gain or loss relating to any ineffective portion is recognised immediately in profit or loss. Amounts previously recognised in other
comprehensive income and accumulated in equity are reclassified to profit or loss in the periods in which the hedged item affects profit or
loss or when the hedging relationship ends.
Hedge accounting is discontinued when the Group revokes the hedging relationship, the hedging instrument expires or is sold, terminated,
or exercised, or no longer qualifies for hedge accounting. Any gain or loss accumulated in equity at that time is reclassified to profit or loss
when the hedged item is recognised in profit or loss. When a forecast transaction is no longer expected to occur, any gain or loss that was
recognised in other comprehensive income is reclassified immediately to profit or loss.
The current interest rate cap has not been designated as a cash flow hedge and fair value movements are recognised immediately in the
profit and loss account.
h Stocks
Stocks are valued at the lower of cost and estimated selling price less costs to sell, which is equivalent to the net realisable value. Cost of
own beers produced includes materials and directly attributable fixed and variable production overheads. Cost is calculated using the
average cost method. Provision is made for obsolete, slow-moving or defective items where appropriate.
i Accounting for leases
Rentals payable and receivable under operating leases are charged on a straight-line basis over the lease term, even if the payments are not
made on such a basis.
j Impairment of assets
Assets, other than those measured at fair value, are assessed for indicators of impairment at each balance sheet date. If there is objective
evidence of impairment, an impairment loss is recognised in the profit and loss account as described below.
Non-financial assets
An asset is impaired where there is objective evidence that, as a result of one or more events that occurred after initial recognition, the
estimated recoverable value of the asset has been reduced. The recoverable amount of an asset is the higher of its fair value less costs to sell
and its value in use.
Where indicators exist for a decrease in impairment loss, the prior impairment loss is tested to determine reversal. An impairment loss is
reversed on an individual impaired asset to the extent that the revised recoverable value does not lead to a revised carrying amount higher
than the carrying value had no impairment been recognised.
Financial assets
For financial assets carried at amortised cost, the amount of an impairment is the difference between the asset’s carrying amount and the
present value of estimated future cash flows, discounted at the financial asset’s original effective interest rate.
For financial assets carried at cost less impairment, the impairment loss is the difference between the asset’s carrying amount and the best
estimate of the amount that would be received for the asset if it were to be sold at the reporting date.
50 SHEPHERD NEAME ANNUAL REPORT AND ACCOUNTS 2019
1 Accounting Policies continued
Where indicators exist for a decrease in impairment loss, and the decrease can be related objectively to an event occurring after the
impairment was recognised, the prior impairment loss is tested to determine reversal. An impairment loss is reversed on an individual
impaired financial asset to the extent that the revised recoverable value does not lead to a revised carrying amount higher than the carrying
value had no impairment been recognised.
k Taxation
Current tax
Corporation tax payable is provided at amounts expected to be paid (or recovered) using the tax rates and laws that have been enacted
or substantively enacted by the balance sheet date.
Deferred tax
Deferred tax is recognised in respect of all timing differences that have originated but not reversed at the balance sheet date where
transactions or events that will result in an obligation to pay more tax in the future or a right to pay less tax in the future have occurred
at the balance sheet date.
Unrelieved tax losses and other deferred tax assets are recognised only to the extent that, on the basis of all available evidence, it can be
regarded as more likely than not that there will be suitable taxable profits from which the future reversal of the underlying timing differences
can be deducted.
Deferred tax is measured on an undiscounted basis at the tax rates that are expected to apply in the periods in which timing differences
reverse, based on the tax rate and laws that have been enacted or substantively enacted at the balance sheet date. Deferred tax relating
to property, plant and equipment is measured using the revaluation model and investment property is measured using the tax rates and
allowances that apply to sale of the asset.
The tax expense or income is presented in the same component of comprehensive income or equity as the transaction or other event that
resulted in the tax expense or income.
l Turnover
Turnover is recognised when the significant risks and rewards of ownership of the goods have passed to the buyer, usually on dispatch or
delivery of the goods; or on provision of services. Turnover comprises the invoice value of goods inclusive of excise duty and services, net of
VAT and discounts. Rental income received from tied estate properties is recognised in the period in which it arises on an accruals basis or
for leased properties on a straight-line basis over the term of the lease.
m Borrowing costs
Borrowing costs are generally recognised as an expense when incurred. Interest expenses directly attributable to the acquisition or
construction of an asset that takes a substantial period of time to get ready for use are capitalised as part of the cost of the assets being
created. This is applied to development projects where the development is expected to last in excess of six months at the commencement
of the project.
n Items excluded from underlying results
Items which are either material or infrequent in nature and do not relate to the underlying performance are excluded from underlying
results.
o Retirement benefits
The Group operates defined contribution pension schemes. Contributions are charged to the profit and loss account as they become
payable in accordance with the rules of the schemes.
Other long-term employee benefits are measured at the present value of the benefit obligation at the financial reporting date.
p Foreign currency
Transactions expressed in foreign currencies are translated into sterling and recorded at the rate of exchange at the date of the transaction.
Monetary assets and liabilities denominated in foreign currencies at the balance sheet date are reported at rates of exchange prevailing at
that date. All differences are taken to the profit and loss account.
q Dividends
Dividends payable are shown as a movement in reserves when declared (interim dividend) or approved (final dividend).
r Share-based payment
All options are equity-settled. The cost of equity-settled transactions with employees is measured by reference to the fair value at the date
at which they are granted and is recognised as an expense over the vesting period, which ends on the date on which the relevant employees
become fully entitled to the award. Fair value is determined using the Black-Scholes and Stochastic pricing models which is considered by
management to be the most appropriate method of valuation. In valuing equity-settled transactions, no account is taken of any vesting
conditions, other than conditions linked to the price of the shares of the Group (market conditions). The amount recognised as an expense
is adjusted to reflect the actual number of share options that vest except where forfeiture is only due to market-based conditions not
achieving the threshold for vesting.
At each balance sheet date before vesting, the cumulative expense is calculated, representing the extent to which the vesting period has
expired and management’s best estimate of the achievement or otherwise of non-market conditions. The movement in cumulative expense
since the previous balance sheet is recognised in the profit and loss account, with a corresponding entry in equity.
NOTES TO THE ACCOUNTS 29 JUNE 2019
51WWW.SHEPHERDNEAME.CO.UK
| OT
HE
R IN
FO
RM
AT
ION
| FIN
AN
CIA
L S
TA
TE
ME
NT
S| G
OV
ER
NA
NC
E| S
TR
AT
EG
IC R
EP
OR
T
s Investment in subsidiaries
The Company recognises its investment in subsidiaries at cost. Income is recognised from these investments only in relation to distributions
received from post-acquisition profits. Distributions received in excess of post-acquisition profits are deducted from
the cost of the investment.
2 Critical accounting judgements and key sources of estimation uncertainty
In the application of the Group’s accounting policies, which are described in note 1, the Directors are required to make judgements,
estimates and assumptions about the carrying amounts of assets and liabilities that are not readily apparent from other sources.
The estimates and associated assumptions are based on historical experience and other factors that are considered to be relevant.
Actual results may differ from these estimates.
The estimates and underlying assumptions are reviewed on an ongoing basis. Revisions to accounting estimates are recognised in
the period in which the estimate is revised if the revision affects both current and future periods.
Key source of estimation uncertainty
Impairment of assets
Financial and non-financial assets are subject to impairment reviews at the balance sheet date based on whether current or future events
and circumstances suggest that their recoverable amount may be less than their carrying value. Recoverable amount is based on the higher
of the value in use and fair value less costs to dispose. Value in use is calculated from expected future cash flows using suitable discount
rates and includes management assumptions and estimates of future performance as disclosed in note 14.
The net impact on the impairment charge of applying different assumptions to cash flow forecast, the growth rates used to calculate
cash flow projections and the pre-tax discount rates would be as follows;
A 10% reduction in A 0.5% increase in A 0.5% reduction
cash flow forecast in discount rate in growth rate
2019 2018 2019 2018 2019 2018
£’000 £’000 £’000 £’000 £’000 £’000
Increased impairment resulting from 866 452 689 290 689 290
Critical judgements
There have been no critical judgements made in the current or prior financial years.
3 Segmental reportingThe operating segment disclosure requirements of IFRS 8 are required as the Group has publicly traded equity instruments.
The accounting policy for identifying segments is based on internal management reporting information that is regularly reviewed
by the chief operating decision-maker.
The Group has three operating segments, which are largely organised and managed separately according to the nature of the
products and services provided and the profile of the customers:
• Brewing and Brands which comprises the brewing, marketing and sales of beer and other products;
• Managed Pubs; and
• Tenanted Pubs which comprises pubs operated by third parties under tenancy or tied lease agreements.
Transfer prices between operating segments are set on an arm’s length basis.
Brewing and Brands Managed Pubs Tenanted Pubs Unallocated Total 52 weeks ended 29 June 2019 £’000 £’000 £’000 £’000 £’000
Turnover 40,742 68,777 35,033 1,249 145,801
Underlying operating profit 923 9,215 12,950 (7,830) 15,258
Items excluded from underlying results – 140 (308) – (168)
Divisional operating profit 923 9,355 12,642 (7,830) 15,090
Net underlying finance costs (3,901)
Finance costs excluded from underlying results (9,820)
Fair value movements on ineffective element of cash flow hedges (952)
Profit on disposal of property 2,848
Investment property fair value movements 206
Profit on ordinary activities before taxation 3,471
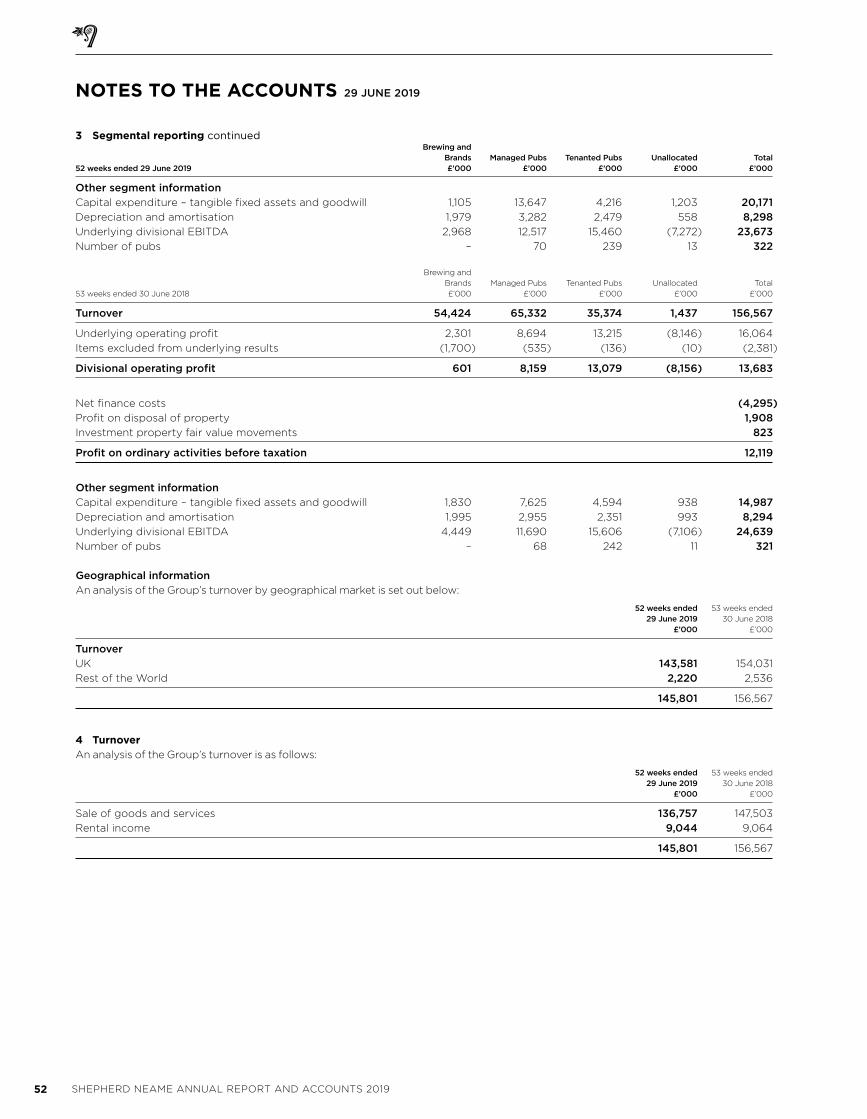
52 SHEPHERD NEAME ANNUAL REPORT AND ACCOUNTS 2019
3 Segmental reporting continued Brewing and Brands Managed Pubs Tenanted Pubs Unallocated Total 52 weeks ended 29 June 2019 £’000 £’000 £’000 £’000 £’000
Other segment information
Capital expenditure – tangible fixed assets and goodwill 1,105 13,647 4,216 1,203 20,171
Depreciation and amortisation 1,979 3,282 2,479 558 8,298
Underlying divisional EBITDA 2,968 12,517 15,460 (7,272) 23,673
Number of pubs – 70 239 13 322
Brewing and
Brands Managed Pubs Tenanted Pubs Unallocated Total
53 weeks ended 30 June 2018 £’000 £’000 £’000 £’000 £’000
Turnover 54,424 65,332 35,374 1,437 156,567
Underlying operating profit 2,301 8,694 13,215 (8,146) 16,064
Items excluded from underlying results (1,700) (535) (136) (10) (2,381)
Divisional operating profit 601 8,159 13,079 (8,156) 13,683
Net finance costs (4,295)
Profit on disposal of property 1,908
Investment property fair value movements 823
Profit on ordinary activities before taxation 12,119
Other segment information
Capital expenditure – tangible fixed assets and goodwill 1,830 7,625 4,594 938 14,987
Depreciation and amortisation 1,995 2,955 2,351 993 8,294
Underlying divisional EBITDA 4,449 11,690 15,606 (7,106) 24,639
Number of pubs – 68 242 11 321
Geographical information
An analysis of the Group’s turnover by geographical market is set out below:
52 weeks ended 53 weeks ended
29 June 2019 30 June 2018
£’000 £’000
Turnover
UK 143,581 154,031
Rest of the World 2,220 2,536
145,801 156,567
4 TurnoverAn analysis of the Group’s turnover is as follows:
52 weeks ended 53 weeks ended 29 June 2019 30 June 2018 £’000 £’000
Sale of goods and services 136,757 147,503
Rental income 9,044 9,064
145,801 156,567
NOTES TO THE ACCOUNTS 29 JUNE 2019
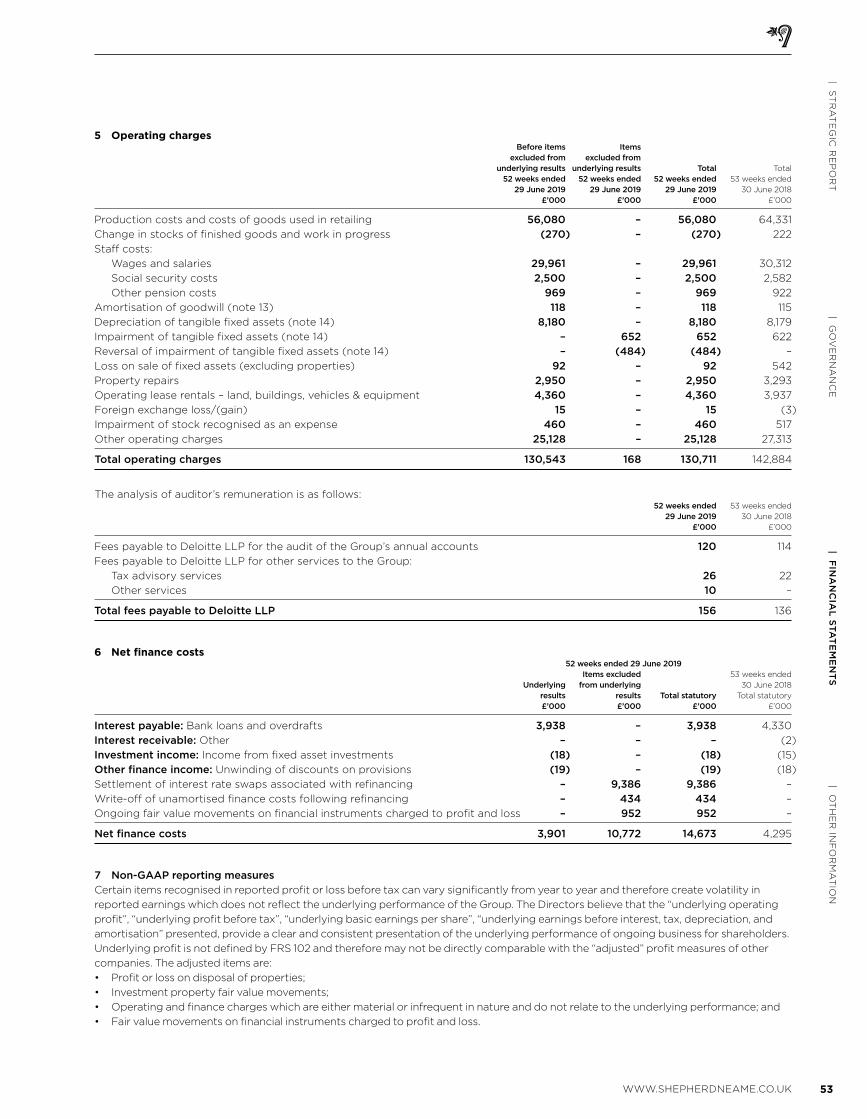
53WWW.SHEPHERDNEAME.CO.UK
| OT
HE
R IN
FO
RM
AT
ION
| FIN
AN
CIA
L S
TA
TE
ME
NT
S| G
OV
ER
NA
NC
E| S
TR
AT
EG
IC R
EP
OR
T
5 Operating charges Before items Items excluded from excluded from underlying results underlying results Total Total 52 weeks ended 52 weeks ended 52 weeks ended 53 weeks ended 29 June 2019 29 June 2019 29 June 2019 30 June 2018 £’000 £’000 £’000 £’000
Production costs and costs of goods used in retailing 56,080 – 56,080 64,331
Change in stocks of finished goods and work in progress (270) – (270) 222
Staff costs:
Wages and salaries 29,961 – 29,961 30,312
Social security costs 2,500 – 2,500 2,582
Other pension costs 969 – 969 922
Amortisation of goodwill (note 13) 118 – 118 115
Depreciation of tangible fixed assets (note 14) 8,180 – 8,180 8,179
Impairment of tangible fixed assets (note 14) – 652 652 622
Reversal of impairment of tangible fixed assets (note 14) – (484) (484) –
Loss on sale of fixed assets (excluding properties) 92 – 92 542
Property repairs 2,950 – 2,950 3,293
Operating lease rentals – land, buildings, vehicles & equipment 4,360 – 4,360 3,937
Foreign exchange loss/(gain) 15 – 15 (3)
Impairment of stock recognised as an expense 460 – 460 517
Other operating charges 25,128 – 25,128 27,313
Total operating charges 130,543 168 130,711 142,884
The analysis of auditor’s remuneration is as follows: 52 weeks ended 53 weeks ended 29 June 2019 30 June 2018 £’000 £’000
Fees payable to Deloitte LLP for the audit of the Group’s annual accounts 120 114
Fees payable to Deloitte LLP for other services to the Group:
Tax advisory services 26 22
Other services 10 –
Total fees payable to Deloitte LLP 156 136
6 Net finance costs 52 weeks ended 29 June 2019
Items excluded 53 weeks ended Underlying from underlying 30 June 2018 results results Total statutory Total statutory £’000 £’000 £’000 £’000
Interest payable: Bank loans and overdrafts 3,938 – 3,938 4,330
Interest receivable: Other – – – (2)
Investment income: Income from fixed asset investments (18) – (18) (15)
Other finance income: Unwinding of discounts on provisions (19) – (19) (18)
Settlement of interest rate swaps associated with refinancing – 9,386 9,386 –
Write-off of unamortised finance costs following refinancing – 434 434 –
Ongoing fair value movements on financial instruments charged to profit and loss – 952 952 –
Net finance costs 3,901 10,772 14,673 4,295
7 Non-GAAP reporting measures
Certain items recognised in reported profit or loss before tax can vary significantly from year to year and therefore create volatility in
reported earnings which does not reflect the underlying performance of the Group. The Directors believe that the “underlying operating
profit”, “underlying profit before tax”, “underlying basic earnings per share”, “underlying earnings before interest, tax, depreciation, and
amortisation” presented, provide a clear and consistent presentation of the underlying performance of ongoing business for shareholders.
Underlying profit is not defined by FRS 102 and therefore may not be directly comparable with the “adjusted” profit measures of other
companies. The adjusted items are:
• Profit or loss on disposal of properties;
• Investment property fair value movements;
• Operating and finance charges which are either material or infrequent in nature and do not relate to the underlying performance; and
• Fair value movements on financial instruments charged to profit and loss.
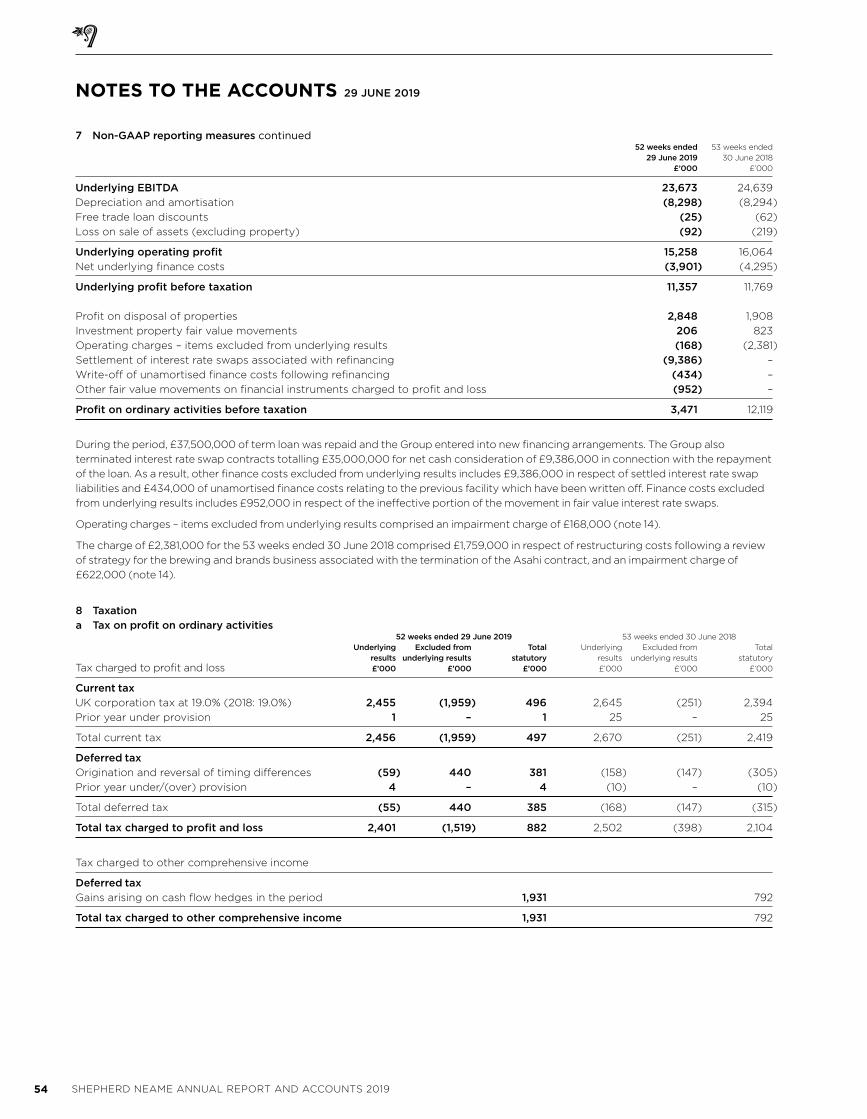
54 SHEPHERD NEAME ANNUAL REPORT AND ACCOUNTS 2019
7 Non-GAAP reporting measures continued 52 weeks ended 53 weeks ended 29 June 2019 30 June 2018 £’000 £’000
Underlying EBITDA 23,673 24,639
Depreciation and amortisation (8,298) (8,294)
Free trade loan discounts (25) (62)
Loss on sale of assets (excluding property) (92) (219)
Underlying operating profit 15,258 16,064
Net underlying finance costs (3,901) (4,295)
Underlying profit before taxation 11,357 11,769
Profit on disposal of properties 2,848 1,908
Investment property fair value movements 206 823
Operating charges – items excluded from underlying results (168) (2,381)
Settlement of interest rate swaps associated with refinancing (9,386) –
Write-off of unamortised finance costs following refinancing (434) –
Other fair value movements on financial instruments charged to profit and loss (952) –
Profit on ordinary activities before taxation 3,471 12,119
During the period, £37,500,000 of term loan was repaid and the Group entered into new financing arrangements. The Group also
terminated interest rate swap contracts totalling £35,000,000 for net cash consideration of £9,386,000 in connection with the repayment
of the loan. As a result, other finance costs excluded from underlying results includes £9,386,000 in respect of settled interest rate swap
liabilities and £434,000 of unamortised finance costs relating to the previous facility which have been written off. Finance costs excluded
from underlying results includes £952,000 in respect of the ineffective portion of the movement in fair value interest rate swaps.
Operating charges – items excluded from underlying results comprised an impairment charge of £168,000 (note 14).
The charge of £2,381,000 for the 53 weeks ended 30 June 2018 comprised £1,759,000 in respect of restructuring costs following a review
of strategy for the brewing and brands business associated with the termination of the Asahi contract, and an impairment charge of
£622,000 (note 14).
8 Taxation
a Tax on profit on ordinary activities 52 weeks ended 29 June 2019 53 weeks ended 30 June 2018
Underlying Excluded from Total Underlying Excluded from Total
results underlying results statutory results underlying results statutory
Tax charged to profit and loss £’000 £’000 £’000 £’000 £’000 £’000
Current tax
UK corporation tax at 19.0% (2018: 19.0%) 2,455 (1,959) 496 2,645 (251) 2,394
Prior year under provision 1 – 1 25 – 25
Total current tax 2,456 (1,959) 497 2,670 (251) 2,419
Deferred tax
Origination and reversal of timing differences (59) 440 381 (158) (147) (305)
Prior year under/(over) provision 4 – 4 (10) – (10)
Total deferred tax (55) 440 385 (168) (147) (315)
Total tax charged to profit and loss 2,401 (1,519) 882 2,502 (398) 2,104
Tax charged to other comprehensive income
Deferred tax
Gains arising on cash flow hedges in the period 1,931 792
Total tax charged to other comprehensive income 1,931 792
NOTES TO THE ACCOUNTS 29 JUNE 2019
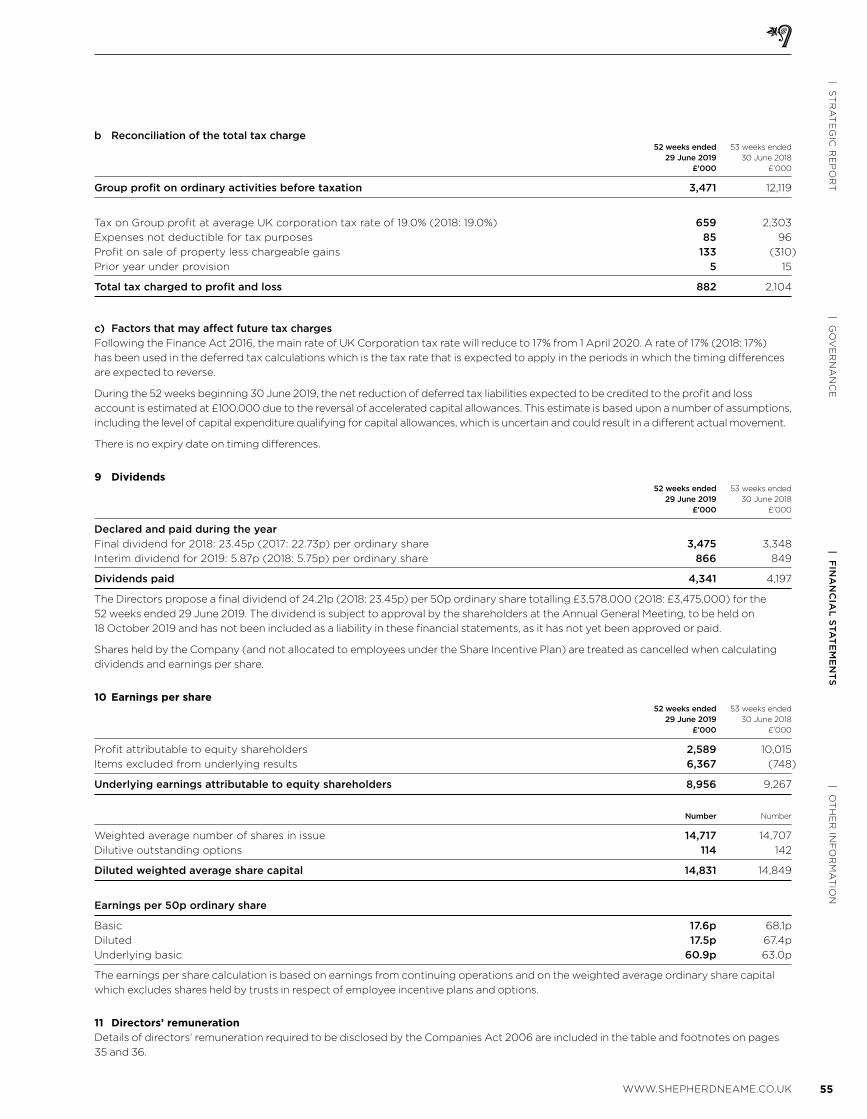
55WWW.SHEPHERDNEAME.CO.UK
| OT
HE
R IN
FO
RM
AT
ION
| FIN
AN
CIA
L S
TA
TE
ME
NT
S| G
OV
ER
NA
NC
E| S
TR
AT
EG
IC R
EP
OR
T
b Reconciliation of the total tax charge 52 weeks ended 53 weeks ended 29 June 2019 30 June 2018 £’000 £’000
Group profit on ordinary activities before taxation 3,471 12,119
Tax on Group profit at average UK corporation tax rate of 19.0% (2018: 19.0%) 659 2,303
Expenses not deductible for tax purposes 85 96
Profit on sale of property less chargeable gains 133 (310)
Prior year under provision 5 15
Total tax charged to profit and loss 882 2,104
c) Factors that may affect future tax charges
Following the Finance Act 2016, the main rate of UK Corporation tax rate will reduce to 17% from 1 April 2020. A rate of 17% (2018: 17%)
has been used in the deferred tax calculations which is the tax rate that is expected to apply in the periods in which the timing differences
are expected to reverse.
During the 52 weeks beginning 30 June 2019, the net reduction of deferred tax liabilities expected to be credited to the profit and loss
account is estimated at £100,000 due to the reversal of accelerated capital allowances. This estimate is based upon a number of assumptions,
including the level of capital expenditure qualifying for capital allowances, which is uncertain and could result in a different actual movement.
There is no expiry date on timing differences.
9 Dividends 52 weeks ended 53 weeks ended
29 June 2019 30 June 2018
£’000 £’000
Declared and paid during the year
Final dividend for 2018: 23.45p (2017: 22.73p) per ordinary share 3,475 3,348
Interim dividend for 2019: 5.87p (2018: 5.75p) per ordinary share 866 849
Dividends paid 4,341 4,197
The Directors propose a final dividend of 24.21p (2018: 23.45p) per 50p ordinary share totalling £3,578,000 (2018: £3,475,000) for the
52 weeks ended 29 June 2019. The dividend is subject to approval by the shareholders at the Annual General Meeting, to be held on
18 October 2019 and has not been included as a liability in these financial statements, as it has not yet been approved or paid.
Shares held by the Company (and not allocated to employees under the Share Incentive Plan) are treated as cancelled when calculating
dividends and earnings per share.
10 Earnings per share 52 weeks ended 53 weeks ended
29 June 2019 30 June 2018
£’000 £’000
Profit attributable to equity shareholders 2,589 10,015
Items excluded from underlying results 6,367 (748)
Underlying earnings attributable to equity shareholders 8,956 9,267
Number Number
Weighted average number of shares in issue 14,717 14,707
Dilutive outstanding options 114 142
Diluted weighted average share capital 14,831 14,849
Earnings per 50p ordinary share
Basic 17.6p 68.1p
Diluted 17.5p 67.4p
Underlying basic 60.9p 63.0p
The earnings per share calculation is based on earnings from continuing operations and on the weighted average ordinary share capital
which excludes shares held by trusts in respect of employee incentive plans and options.
11 Directors’ remunerationDetails of directors’ remuneration required to be disclosed by the Companies Act 2006 are included in the table and footnotes on pages
35 and 36.
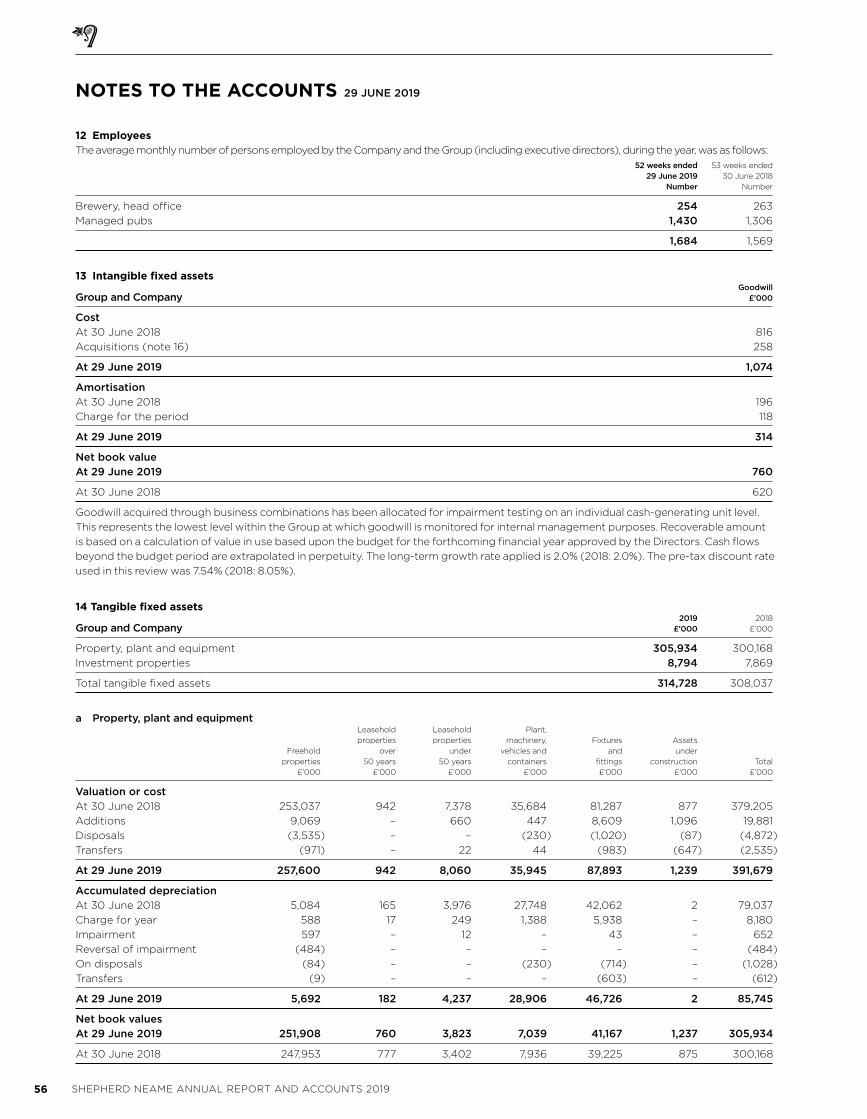
56 SHEPHERD NEAME ANNUAL REPORT AND ACCOUNTS 2019
12 EmployeesThe average monthly number of persons employed by the Company and the Group (including executive directors), during the year, was as follows:
52 weeks ended 53 weeks ended 29 June 2019 30 June 2018 Number Number
Brewery, head office 254 263
Managed pubs 1,430 1,306
1,684 1,569
13 Intangible fixed assets Goodwill Group and Company £’000
Cost
At 30 June 2018 816
Acquisitions (note 16) 258
At 29 June 2019 1,074
Amortisation
At 30 June 2018 196
Charge for the period 118
At 29 June 2019 314
Net book value
At 29 June 2019 760
At 30 June 2018 620
Goodwill acquired through business combinations has been allocated for impairment testing on an individual cash-generating unit level.
This represents the lowest level within the Group at which goodwill is monitored for internal management purposes. Recoverable amount
is based on a calculation of value in use based upon the budget for the forthcoming financial year approved by the Directors. Cash flows
beyond the budget period are extrapolated in perpetuity. The long-term growth rate applied is 2.0% (2018: 2.0%). The pre-tax discount rate
used in this review was 7.54% (2018: 8.05%).
14 Tangible fixed assets 2019 2018
Group and Company £’000 £’000
Property, plant and equipment 305,934 300,168
Investment properties 8,794 7,869
Total tangible fixed assets 314,728 308,037
a Property, plant and equipment Leasehold Leasehold Plant,
properties properties machinery, Fixtures Assets
Freehold over under vehicles and and under
properties 50 years 50 years containers fittings construction Total
£’000 £’000 £’000 £’000 £’000 £’000 £’000
Valuation or cost
At 30 June 2018 253,037 942 7,378 35,684 81,287 877 379,205
Additions 9,069 – 660 447 8,609 1,096 19,881
Disposals (3,535) – – (230) (1,020) (87) (4,872)
Transfers (971) – 22 44 (983) (647) (2,535)
At 29 June 2019 257,600 942 8,060 35,945 87,893 1,239 391,679
Accumulated depreciation
At 30 June 2018 5,084 165 3,976 27,748 42,062 2 79,037
Charge for year 588 17 249 1,388 5,938 – 8,180
Impairment 597 – 12 – 43 – 652
Reversal of impairment (484) – – – – – (484)
On disposals (84) – – (230) (714) – (1,028)
Transfers (9) – – – (603) – (612)
At 29 June 2019 5,692 182 4,237 28,906 46,726 2 85,745
Net book values
At 29 June 2019 251,908 760 3,823 7,039 41,167 1,237 305,934
At 30 June 2018 247,953 777 3,402 7,936 39,225 875 300,168
NOTES TO THE ACCOUNTS 29 JUNE 2019
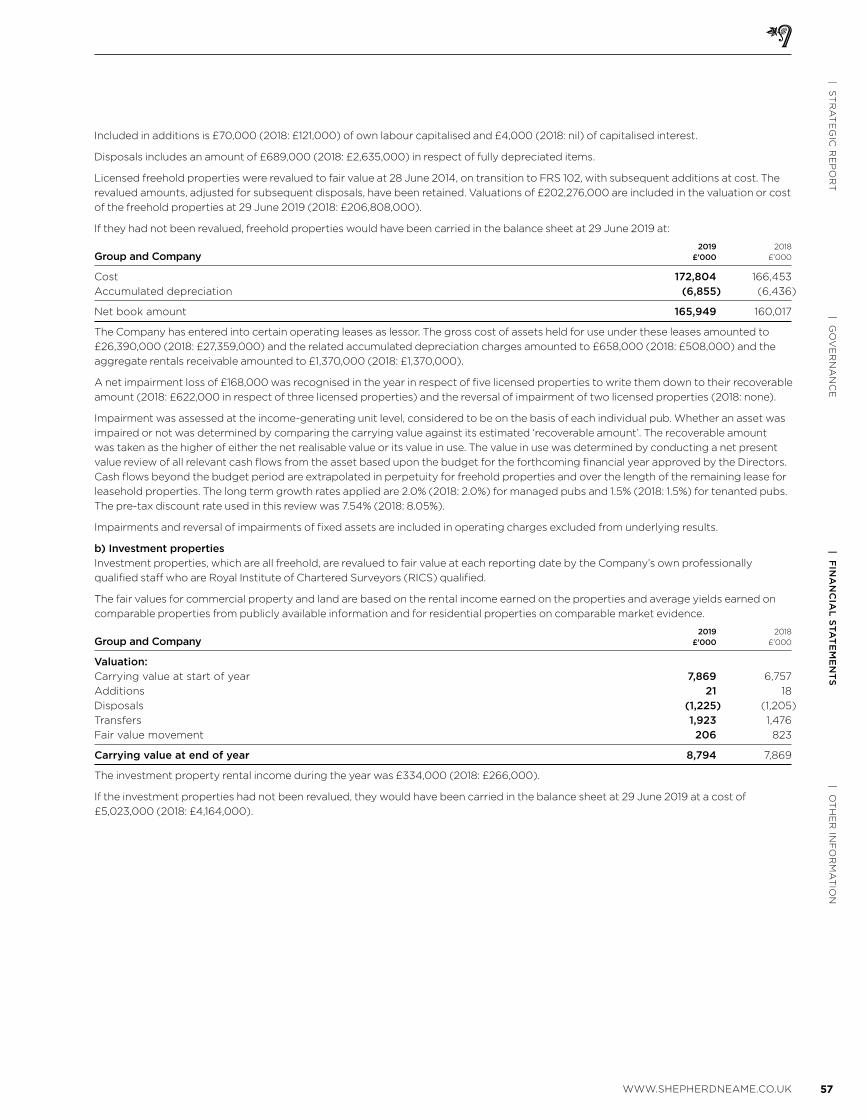
57WWW.SHEPHERDNEAME.CO.UK
| OT
HE
R IN
FO
RM
AT
ION
| FIN
AN
CIA
L S
TA
TE
ME
NT
S| G
OV
ER
NA
NC
E| S
TR
AT
EG
IC R
EP
OR
T
Included in additions is £70,000 (2018: £121,000) of own labour capitalised and £4,000 (2018: nil) of capitalised interest.
Disposals includes an amount of £689,000 (2018: £2,635,000) in respect of fully depreciated items.
Licensed freehold properties were revalued to fair value at 28 June 2014, on transition to FRS 102, with subsequent additions at cost. The
revalued amounts, adjusted for subsequent disposals, have been retained. Valuations of £202,276,000 are included in the valuation or cost
of the freehold properties at 29 June 2019 (2018: £206,808,000).
If they had not been revalued, freehold properties would have been carried in the balance sheet at 29 June 2019 at:
2019 2018
Group and Company £’000 £’000
Cost 172,804 166,453
Accumulated depreciation (6,855) (6,436)
Net book amount 165,949 160,017
The Company has entered into certain operating leases as lessor. The gross cost of assets held for use under these leases amounted to
£26,390,000 (2018: £27,359,000) and the related accumulated depreciation charges amounted to £658,000 (2018: £508,000) and the
aggregate rentals receivable amounted to £1,370,000 (2018: £1,370,000).
A net impairment loss of £168,000 was recognised in the year in respect of five licensed properties to write them down to their recoverable
amount (2018: £622,000 in respect of three licensed properties) and the reversal of impairment of two licensed properties (2018: none).
Impairment was assessed at the income-generating unit level, considered to be on the basis of each individual pub. Whether an asset was
impaired or not was determined by comparing the carrying value against its estimated ‘recoverable amount’. The recoverable amount
was taken as the higher of either the net realisable value or its value in use. The value in use was determined by conducting a net present
value review of all relevant cash flows from the asset based upon the budget for the forthcoming financial year approved by the Directors.
Cash flows beyond the budget period are extrapolated in perpetuity for freehold properties and over the length of the remaining lease for
leasehold properties. The long term growth rates applied are 2.0% (2018: 2.0%) for managed pubs and 1.5% (2018: 1.5%) for tenanted pubs.
The pre-tax discount rate used in this review was 7.54% (2018: 8.05%).
Impairments and reversal of impairments of fixed assets are included in operating charges excluded from underlying results.
b) Investment properties
Investment properties, which are all freehold, are revalued to fair value at each reporting date by the Company’s own professionally
qualified staff who are Royal Institute of Chartered Surveyors (RICS) qualified.
The fair values for commercial property and land are based on the rental income earned on the properties and average yields earned on
comparable properties from publicly available information and for residential properties on comparable market evidence.
2019 2018
Group and Company £’000 £’000
Valuation:
Carrying value at start of year 7,869 6,757
Additions 21 18
Disposals (1,225) (1,205)
Transfers 1,923 1,476
Fair value movement 206 823
Carrying value at end of year 8,794 7,869
The investment property rental income during the year was £334,000 (2018: £266,000).
If the investment properties had not been revalued, they would have been carried in the balance sheet at 29 June 2019 at a cost of
£5,023,000 (2018: £4,164,000).

58 SHEPHERD NEAME ANNUAL REPORT AND ACCOUNTS 2019
15 Investments and loans Group Group Company Company 2019 2018 2019 2018 £’000 £’000 £’000 £’000
Investment in subsidiaries – – 5,509 163
Loans to customers 10 76 10 76
Carrying value 10 76 5,519 239
a Investment in subsidiaries
At 29 June 2019 the parent Company and the Group had investments in the following subsidiary undertakings: Proportion
Subsidiary undertakings Holding held
Invicta Inns Limited* £1 Ordinary shares 50%
Shepherd Neame (Trustees) Limited* £1 Ordinary shares 100%
SN Finance plc* £1 Ordinary shares 50%
£0.25 Ordinary shares 100%
The Horse and Groom (Dartford) Limited £1 Ordinary shares 100%
Thomas Grant & Sons Limited* £1 Preference shares 100%
£1 Ordinary shares 99.9%
Todd Vintners Limited* £1 Ordinary shares 50%
The above companies are incorporated in England and Wales and the registered office for each of them is 17 Court Street, Faversham,
Kent ME13 7AX. All subsidiary undertakings have been included in the consolidation.
* These companies were dormant throughout the period.
Investment in principal subsidiaries 2019 2018 Company £’000 £’000
Cost
At beginning of period 11,583 11,583
Additions 5,487 –
Disposals (11,561) –
5,509 11,583
Provisions for impairment
At beginning of period (11,420) –
Charged to profit and loss – (11,420)
Disposals 11,420 –
– (11,420)
Carrying value at end of period 5,509 163
On 16 April 2019, the Company acquired 100% of the issued share capital of The Horse and Groom (Dartford) Limited for £5,745,000.
During the year, Village Green Restaurants Limited, Ultimate Entertainment Services Limited and Mexxa Mexxa Limited were liquidated.
The provision for impairment charged in the year ended 30 June 2018 related solely to Village Green Restaurants Limited. These movements
are eliminated on consolidation of the Group.
b Loans to customers 2019 2018
Group and Company £’000 £’000
Carrying value at start of period 76 194
Redemptions (61) (75)
Loan discounts awarded (25) (62)
Unwinding of discounts on loans receivable 20 19
Carrying value at end of period 10 76
c The maturity profile of the loans is: 2019 2018
Group and Company £’000 £’000
Recoverable within one year 3 14
Recoverable between one and five years 7 15
Recoverable after five years – 47
10 76
NOTES TO THE ACCOUNTS 29 JUNE 2019
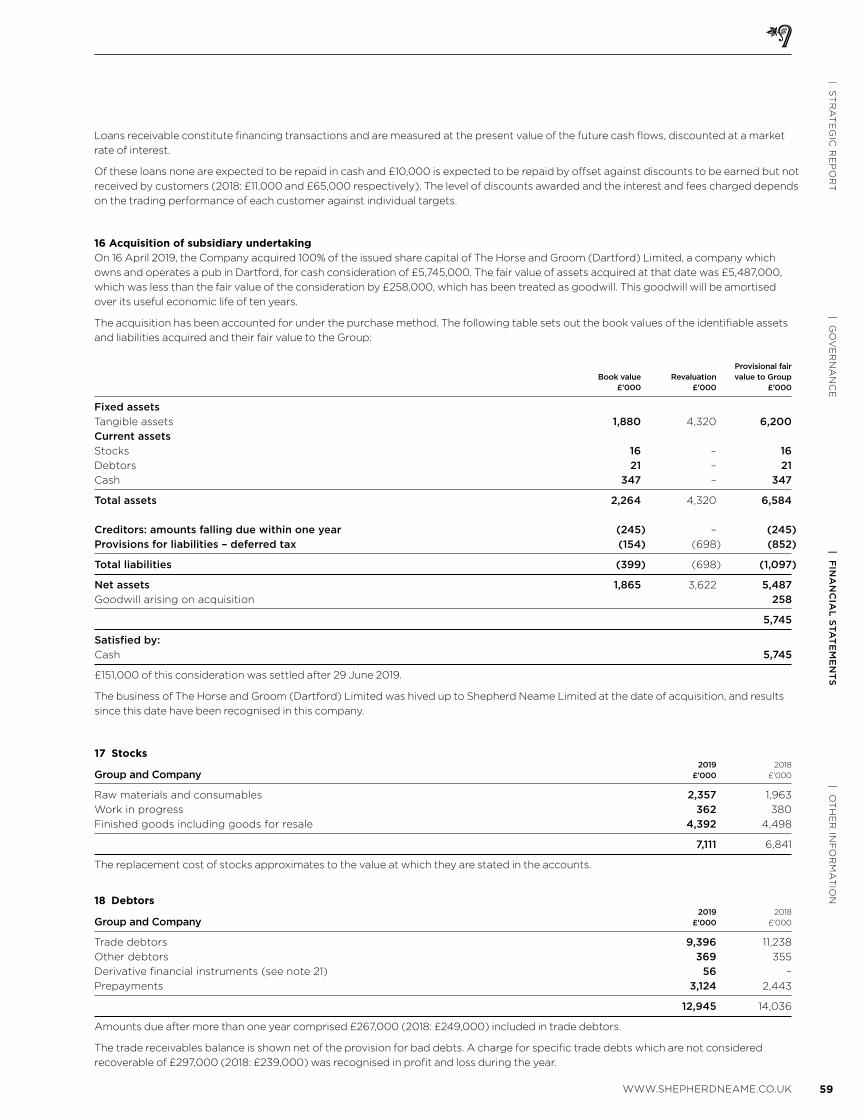
59WWW.SHEPHERDNEAME.CO.UK
| OT
HE
R IN
FO
RM
AT
ION
| FIN
AN
CIA
L S
TA
TE
ME
NT
S| G
OV
ER
NA
NC
E| S
TR
AT
EG
IC R
EP
OR
T
Loans receivable constitute financing transactions and are measured at the present value of the future cash flows, discounted at a market
rate of interest.
Of these loans none are expected to be repaid in cash and £10,000 is expected to be repaid by offset against discounts to be earned but not
received by customers (2018: £11,000 and £65,000 respectively). The level of discounts awarded and the interest and fees charged depends
on the trading performance of each customer against individual targets.
16 Acquisition of subsidiary undertakingOn 16 April 2019, the Company acquired 100% of the issued share capital of The Horse and Groom (Dartford) Limited, a company which
owns and operates a pub in Dartford, for cash consideration of £5,745,000. The fair value of assets acquired at that date was £5,487,000,
which was less than the fair value of the consideration by £258,000, which has been treated as goodwill. This goodwill will be amortised
over its useful economic life of ten years.
The acquisition has been accounted for under the purchase method. The following table sets out the book values of the identifiable assets
and liabilities acquired and their fair value to the Group:
Provisional fair Book value Revaluation value to Group £’000 £’000 £’000
Fixed assets
Tangible assets 1,880 4,320 6,200
Current assets
Stocks 16 – 16
Debtors 21 – 21
Cash 347 – 347
Total assets 2,264 4,320 6,584
Creditors: amounts falling due within one year (245) – (245)
Provisions for liabilities – deferred tax (154) (698) (852)
Total liabilities (399) (698) (1,097)
Net assets 1,865 3,622 5,487
Goodwill arising on acquisition 258
5,745
Satisfied by:
Cash 5,745
£151,000 of this consideration was settled after 29 June 2019.
The business of The Horse and Groom (Dartford) Limited was hived up to Shepherd Neame Limited at the date of acquisition, and results
since this date have been recognised in this company.
17 Stocks 2019 2018
Group and Company £’000 £’000
Raw materials and consumables 2,357 1,963
Work in progress 362 380
Finished goods including goods for resale 4,392 4,498
7,111 6,841
The replacement cost of stocks approximates to the value at which they are stated in the accounts.
18 Debtors 2019 2018 Group and Company £’000 £’000
Trade debtors 9,396 11,238
Other debtors 369 355
Derivative financial instruments (see note 21) 56 –
Prepayments 3,124 2,443
12,945 14,036
Amounts due after more than one year comprised £267,000 (2018: £249,000) included in trade debtors.
The trade receivables balance is shown net of the provision for bad debts. A charge for specific trade debts which are not considered
recoverable of £297,000 (2018: £239,000) was recognised in profit and loss during the year.
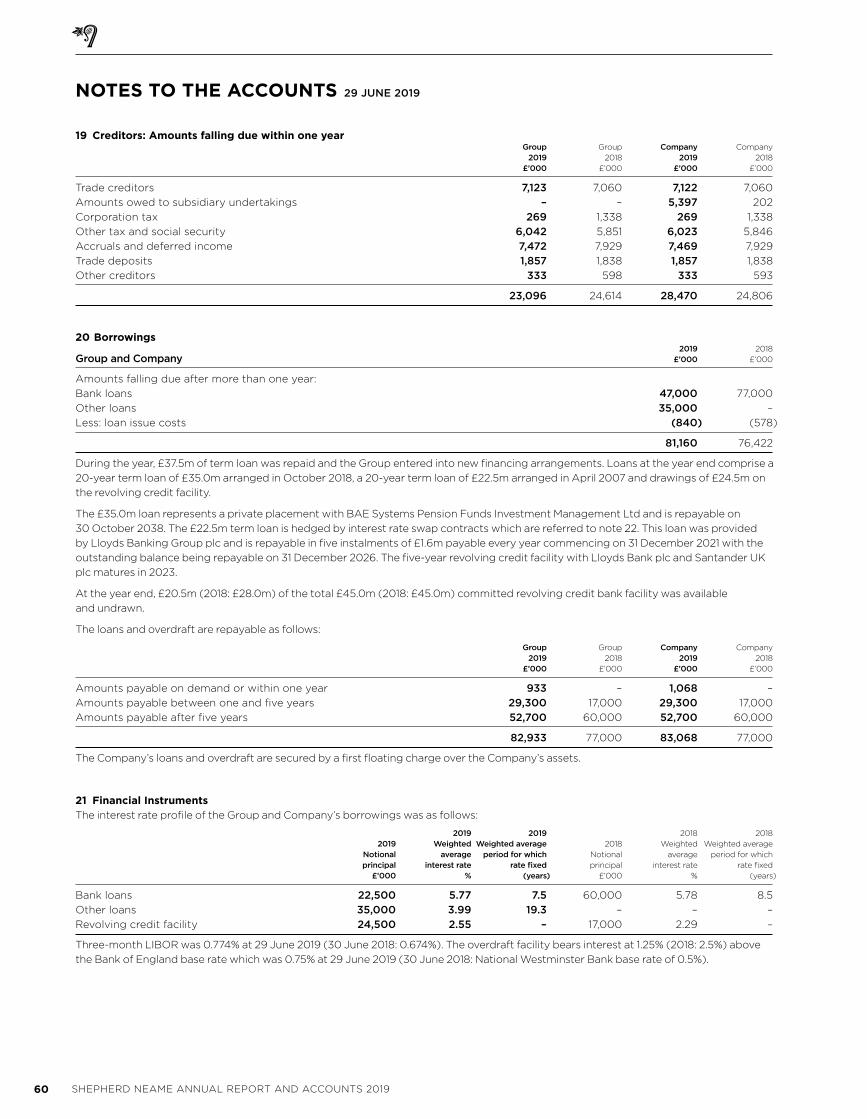
60 SHEPHERD NEAME ANNUAL REPORT AND ACCOUNTS 2019
19 Creditors: Amounts falling due within one year Group Group Company Company
2019 2018 2019 2018
£’000 £’000 £’000 £’000
Trade creditors 7,123 7,060 7,122 7,060
Amounts owed to subsidiary undertakings – – 5,397 202
Corporation tax 269 1,338 269 1,338
Other tax and social security 6,042 5,851 6,023 5,846
Accruals and deferred income 7,472 7,929 7,469 7,929
Trade deposits 1,857 1,838 1,857 1,838
Other creditors 333 598 333 593
23,096 24,614 28,470 24,806
20 Borrowings 2019 2018 Group and Company £’000 £’000
Amounts falling due after more than one year:
Bank loans 47,000 77,000
Other loans 35,000 –
Less: loan issue costs (840) (578)
81,160 76,422
During the year, £37.5m of term loan was repaid and the Group entered into new financing arrangements. Loans at the year end comprise a
20-year term loan of £35.0m arranged in October 2018, a 20-year term loan of £22.5m arranged in April 2007 and drawings of £24.5m on
the revolving credit facility.
The £35.0m loan represents a private placement with BAE Systems Pension Funds Investment Management Ltd and is repayable on
30 October 2038. The £22.5m term loan is hedged by interest rate swap contracts which are referred to note 22. This loan was provided
by Lloyds Banking Group plc and is repayable in five instalments of £1.6m payable every year commencing on 31 December 2021 with the
outstanding balance being repayable on 31 December 2026. The five-year revolving credit facility with Lloyds Bank plc and Santander UK
plc matures in 2023.
At the year end, £20.5m (2018: £28.0m) of the total £45.0m (2018: £45.0m) committed revolving credit bank facility was available
and undrawn.
The loans and overdraft are repayable as follows:
Group Group Company Company 2019 2018 2019 2018 £’000 £’000 £’000 £’000
Amounts payable on demand or within one year 933 – 1,068 –
Amounts payable between one and five years 29,300 17,000 29,300 17,000
Amounts payable after five years 52,700 60,000 52,700 60,000
82,933 77,000 83,068 77,000
The Company’s loans and overdraft are secured by a first floating charge over the Company’s assets.
21 Financial InstrumentsThe interest rate profile of the Group and Company’s borrowings was as follows:
2019 2019 2018 2018
2019 Weighted Weighted average 2018 Weighted Weighted average
Notional average period for which Notional average period for which
principal interest rate rate fixed principal interest rate rate fixed
£’000 % (years) £’000 % (years)
Bank loans 22,500 5.77 7.5 60,000 5.78 8.5
Other loans 35,000 3.99 19.3 – – –
Revolving credit facility 24,500 2.55 – 17,000 2.29 –
Three-month LIBOR was 0.774% at 29 June 2019 (30 June 2018: 0.674%). The overdraft facility bears interest at 1.25% (2018: 2.5%) above
the Bank of England base rate which was 0.75% at 29 June 2019 (30 June 2018: National Westminster Bank base rate of 0.5%).
NOTES TO THE ACCOUNTS 29 JUNE 2019
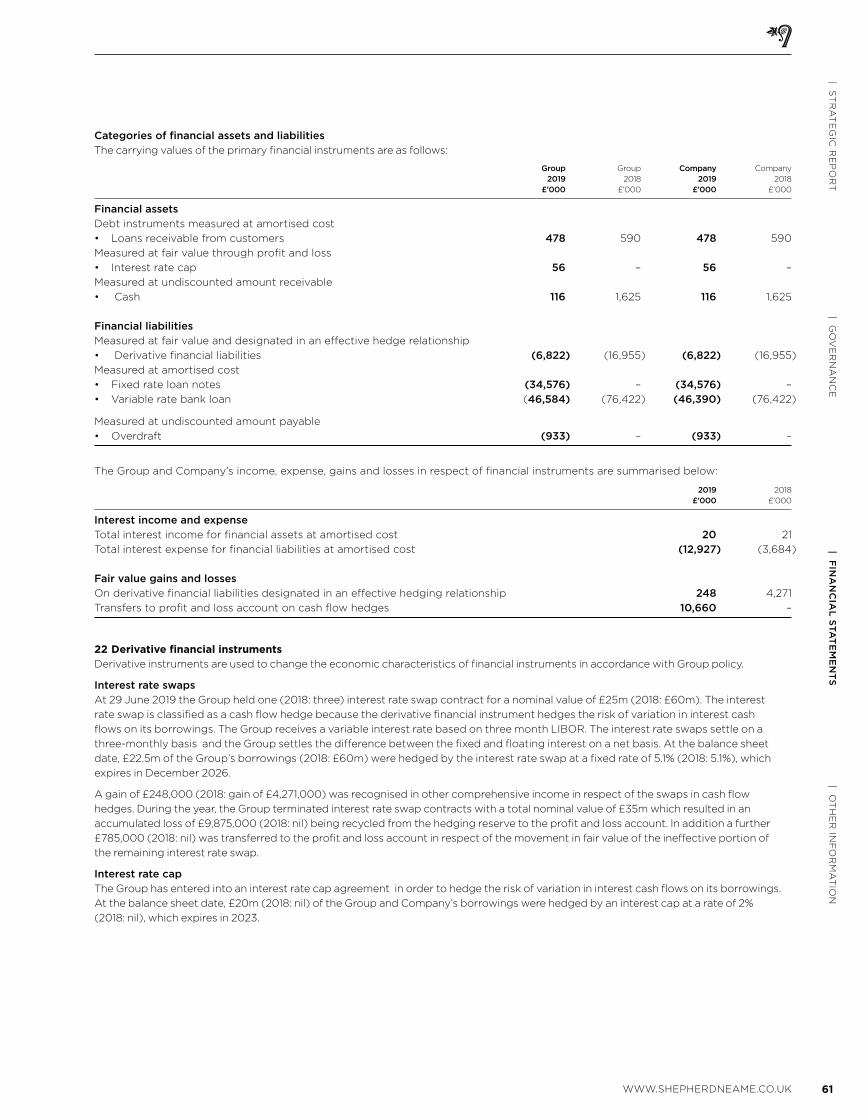
61WWW.SHEPHERDNEAME.CO.UK
| OT
HE
R IN
FO
RM
AT
ION
| FIN
AN
CIA
L S
TA
TE
ME
NT
S| G
OV
ER
NA
NC
E| S
TR
AT
EG
IC R
EP
OR
T
Categories of financial assets and liabilities
The carrying values of the primary financial instruments are as follows:
Group Group Company Company
2019 2018 2019 2018
£’000 £’000 £’000 £’000
Financial assets
Debt instruments measured at amortised cost
• Loans receivable from customers 478 590 478 590
Measured at fair value through profit and loss
• Interest rate cap 56 – 56 –
Measured at undiscounted amount receivable
• Cash 116 1,625 116 1,625
Financial liabilities
Measured at fair value and designated in an effective hedge relationship
• Derivative financial liabilities (6,822) (16,955) (6,822) (16,955)
Measured at amortised cost
• Fixed rate loan notes (34,576) – (34,576) –
• Variable rate bank loan (46,584) (76,422) (46,390) (76,422)
Measured at undiscounted amount payable
• Overdraft (933) – (933) –
The Group and Company’s income, expense, gains and losses in respect of financial instruments are summarised below:
2019 2018
£’000 £’000
Interest income and expense
Total interest income for financial assets at amortised cost 20 21
Total interest expense for financial liabilities at amortised cost (12,927) (3,684)
Fair value gains and losses
On derivative financial liabilities designated in an effective hedging relationship 248 4,271
Transfers to profit and loss account on cash flow hedges 10,660 –
22 Derivative financial instrumentsDerivative instruments are used to change the economic characteristics of financial instruments in accordance with Group policy.
Interest rate swaps
At 29 June 2019 the Group held one (2018: three) interest rate swap contract for a nominal value of £25m (2018: £60m). The interest
rate swap is classified as a cash flow hedge because the derivative financial instrument hedges the risk of variation in interest cash
flows on its borrowings. The Group receives a variable interest rate based on three month LIBOR. The interest rate swaps settle on a
three-monthly basis and the Group settles the difference between the fixed and floating interest on a net basis. At the balance sheet
date, £22.5m of the Group’s borrowings (2018: £60m) were hedged by the interest rate swap at a fixed rate of 5.1% (2018: 5.1%), which
expires in December 2026.
A gain of £248,000 (2018: gain of £4,271,000) was recognised in other comprehensive income in respect of the swaps in cash flow
hedges. During the year, the Group terminated interest rate swap contracts with a total nominal value of £35m which resulted in an
accumulated loss of £9,875,000 (2018: nil) being recycled from the hedging reserve to the profit and loss account. In addition a further
£785,000 (2018: nil) was transferred to the profit and loss account in respect of the movement in fair value of the ineffective portion of
the remaining interest rate swap.
Interest rate cap
The Group has entered into an interest rate cap agreement in order to hedge the risk of variation in interest cash flows on its borrowings.
At the balance sheet date, £20m (2018: nil) of the Group and Company’s borrowings were hedged by an interest cap at a rate of 2%
(2018: nil), which expires in 2023.
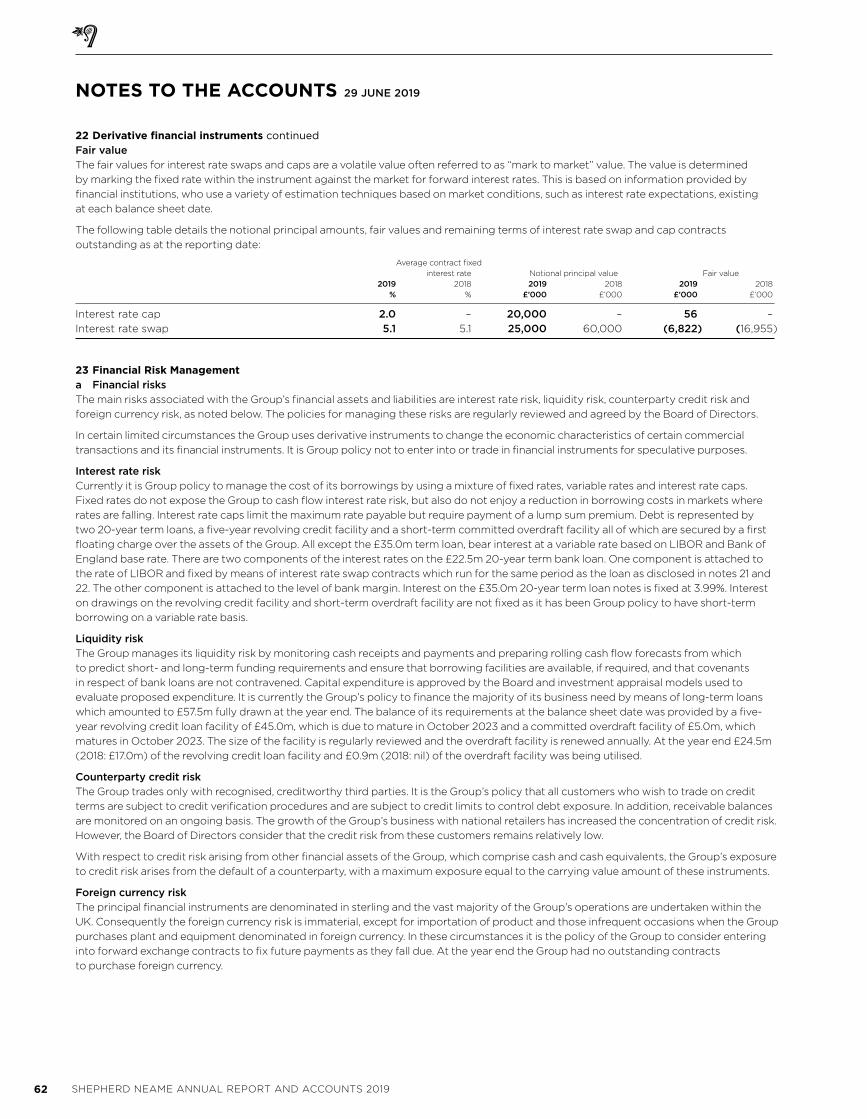
62 SHEPHERD NEAME ANNUAL REPORT AND ACCOUNTS 2019
22 Derivative financial instruments continued
Fair value
The fair values for interest rate swaps and caps are a volatile value often referred to as “mark to market” value. The value is determined
by marking the fixed rate within the instrument against the market for forward interest rates. This is based on information provided by
financial institutions, who use a variety of estimation techniques based on market conditions, such as interest rate expectations, existing
at each balance sheet date.
The following table details the notional principal amounts, fair values and remaining terms of interest rate swap and cap contracts
outstanding as at the reporting date:
Average contract fixed
interest rate Notional principal value Fair value
2019 2018 2019 2018 2019 2018
% % £’000 £’000 £’000 £’000
Interest rate cap 2.0 – 20,000 – 56 –
Interest rate swap 5.1 5.1 25,000 60,000 (6,822) (16,955)
23 Financial Risk Managementa Financial risks
The main risks associated with the Group’s financial assets and liabilities are interest rate risk, liquidity risk, counterparty credit risk and
foreign currency risk, as noted below. The policies for managing these risks are regularly reviewed and agreed by the Board of Directors.
In certain limited circumstances the Group uses derivative instruments to change the economic characteristics of certain commercial
transactions and its financial instruments. It is Group policy not to enter into or trade in financial instruments for speculative purposes.
Interest rate risk
Currently it is Group policy to manage the cost of its borrowings by using a mixture of fixed rates, variable rates and interest rate caps.
Fixed rates do not expose the Group to cash flow interest rate risk, but also do not enjoy a reduction in borrowing costs in markets where
rates are falling. Interest rate caps limit the maximum rate payable but require payment of a lump sum premium. Debt is represented by
two 20-year term loans, a five-year revolving credit facility and a short-term committed overdraft facility all of which are secured by a first
floating charge over the assets of the Group. All except the £35.0m term loan, bear interest at a variable rate based on LIBOR and Bank of
England base rate. There are two components of the interest rates on the £22.5m 20-year term bank loan. One component is attached to
the rate of LIBOR and fixed by means of interest rate swap contracts which run for the same period as the loan as disclosed in notes 21 and
22. The other component is attached to the level of bank margin. Interest on the £35.0m 20-year term loan notes is fixed at 3.99%. Interest
on drawings on the revolving credit facility and short-term overdraft facility are not fixed as it has been Group policy to have short-term
borrowing on a variable rate basis.
Liquidity risk
The Group manages its liquidity risk by monitoring cash receipts and payments and preparing rolling cash flow forecasts from which
to predict short- and long-term funding requirements and ensure that borrowing facilities are available, if required, and that covenants
in respect of bank loans are not contravened. Capital expenditure is approved by the Board and investment appraisal models used to
evaluate proposed expenditure. It is currently the Group’s policy to finance the majority of its business need by means of long-term loans
which amounted to £57.5m fully drawn at the year end. The balance of its requirements at the balance sheet date was provided by a five-
year revolving credit loan facility of £45.0m, which is due to mature in October 2023 and a committed overdraft facility of £5.0m, which
matures in October 2023. The size of the facility is regularly reviewed and the overdraft facility is renewed annually. At the year end £24.5m
(2018: £17.0m) of the revolving credit loan facility and £0.9m (2018: nil) of the overdraft facility was being utilised.
Counterparty credit risk
The Group trades only with recognised, creditworthy third parties. It is the Group’s policy that all customers who wish to trade on credit
terms are subject to credit verification procedures and are subject to credit limits to control debt exposure. In addition, receivable balances
are monitored on an ongoing basis. The growth of the Group’s business with national retailers has increased the concentration of credit risk.
However, the Board of Directors consider that the credit risk from these customers remains relatively low.
With respect to credit risk arising from other financial assets of the Group, which comprise cash and cash equivalents, the Group’s exposure
to credit risk arises from the default of a counterparty, with a maximum exposure equal to the carrying value amount of these instruments.
Foreign currency risk
The principal financial instruments are denominated in sterling and the vast majority of the Group’s operations are undertaken within the
UK. Consequently the foreign currency risk is immaterial, except for importation of product and those infrequent occasions when the Group
purchases plant and equipment denominated in foreign currency. In these circumstances it is the policy of the Group to consider entering
into forward exchange contracts to fix future payments as they fall due. At the year end the Group had no outstanding contracts
to purchase foreign currency.
NOTES TO THE ACCOUNTS 29 JUNE 2019
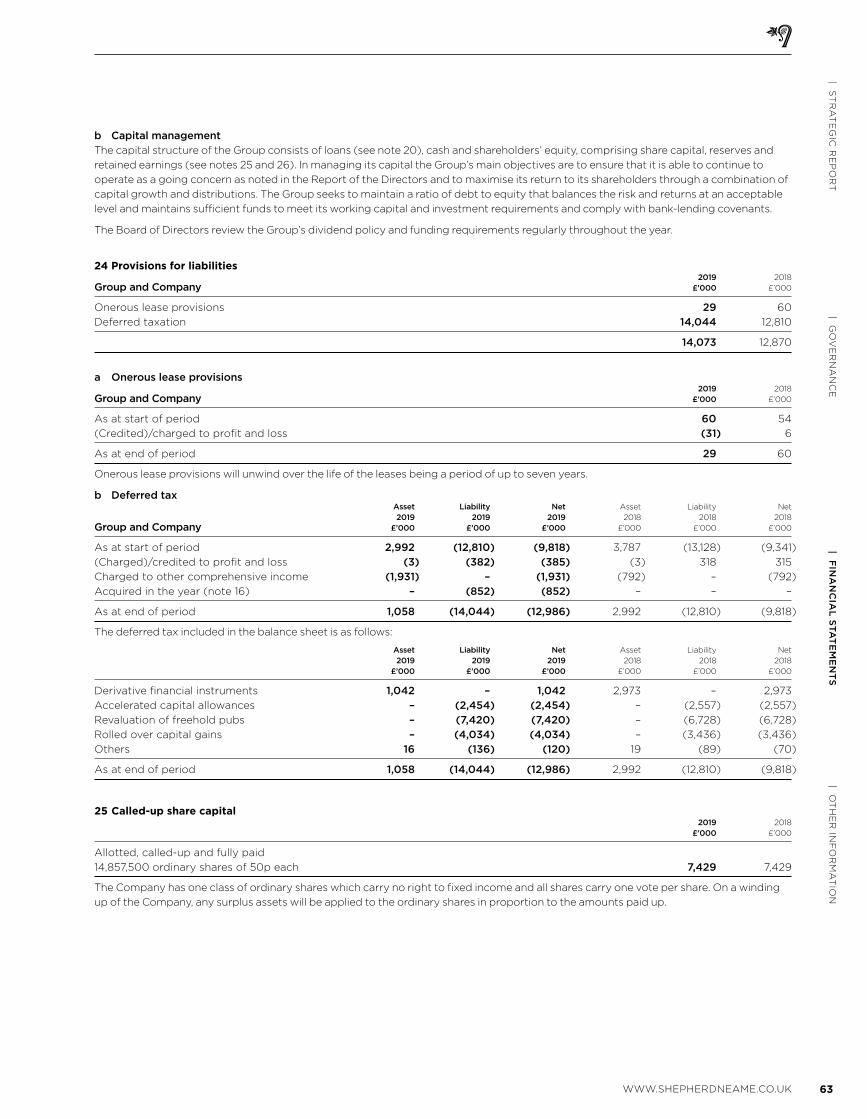
63WWW.SHEPHERDNEAME.CO.UK
| OT
HE
R IN
FO
RM
AT
ION
| FIN
AN
CIA
L S
TA
TE
ME
NT
S| G
OV
ER
NA
NC
E| S
TR
AT
EG
IC R
EP
OR
T
b Capital management
The capital structure of the Group consists of loans (see note 20), cash and shareholders’ equity, comprising share capital, reserves and
retained earnings (see notes 25 and 26). In managing its capital the Group’s main objectives are to ensure that it is able to continue to
operate as a going concern as noted in the Report of the Directors and to maximise its return to its shareholders through a combination of
capital growth and distributions. The Group seeks to maintain a ratio of debt to equity that balances the risk and returns at an acceptable
level and maintains sufficient funds to meet its working capital and investment requirements and comply with bank-lending covenants.
The Board of Directors review the Group’s dividend policy and funding requirements regularly throughout the year.
24 Provisions for liabilities 2019 2018
Group and Company £’000 £’000
Onerous lease provisions 29 60
Deferred taxation 14,044 12,810
14,073 12,870
a Onerous lease provisions 2019 2018
Group and Company £’000 £’000
As at start of period 60 54
(Credited)/charged to profit and loss (31) 6
As at end of period 29 60
Onerous lease provisions will unwind over the life of the leases being a period of up to seven years.
b Deferred tax Asset Liability Net Asset Liability Net
2019 2019 2019 2018 2018 2018
Group and Company £’000 £’000 £’000 £’000 £’000 £’000
As at start of period 2,992 (12,810) (9,818) 3,787 (13,128) (9,341)
(Charged)/credited to profit and loss (3) (382) (385) (3) 318 315
Charged to other comprehensive income (1,931) – (1,931) (792) – (792)
Acquired in the year (note 16) – (852) (852) – – –
As at end of period 1,058 (14,044) (12,986) 2,992 (12,810) (9,818)
The deferred tax included in the balance sheet is as follows:
Asset Liability Net Asset Liability Net
2019 2019 2019 2018 2018 2018
£’000 £’000 £’000 £’000 £’000 £’000
Derivative financial instruments 1,042 – 1,042 2,973 – 2,973
Accelerated capital allowances – (2,454) (2,454) – (2,557) (2,557)
Revaluation of freehold pubs – (7,420) (7,420) – (6,728) (6,728)
Rolled over capital gains – (4,034) (4,034) – (3,436) (3,436)
Others 16 (136) (120) 19 (89) (70)
As at end of period 1,058 (14,044) (12,986) 2,992 (12,810) (9,818)
25 Called-up share capital 2019 2018
£’000 £’000
Allotted, called-up and fully paid
14,857,500 ordinary shares of 50p each 7,429 7,429
The Company has one class of ordinary shares which carry no right to fixed income and all shares carry one vote per share. On a winding
up of the Company, any surplus assets will be applied to the ordinary shares in proportion to the amounts paid up.
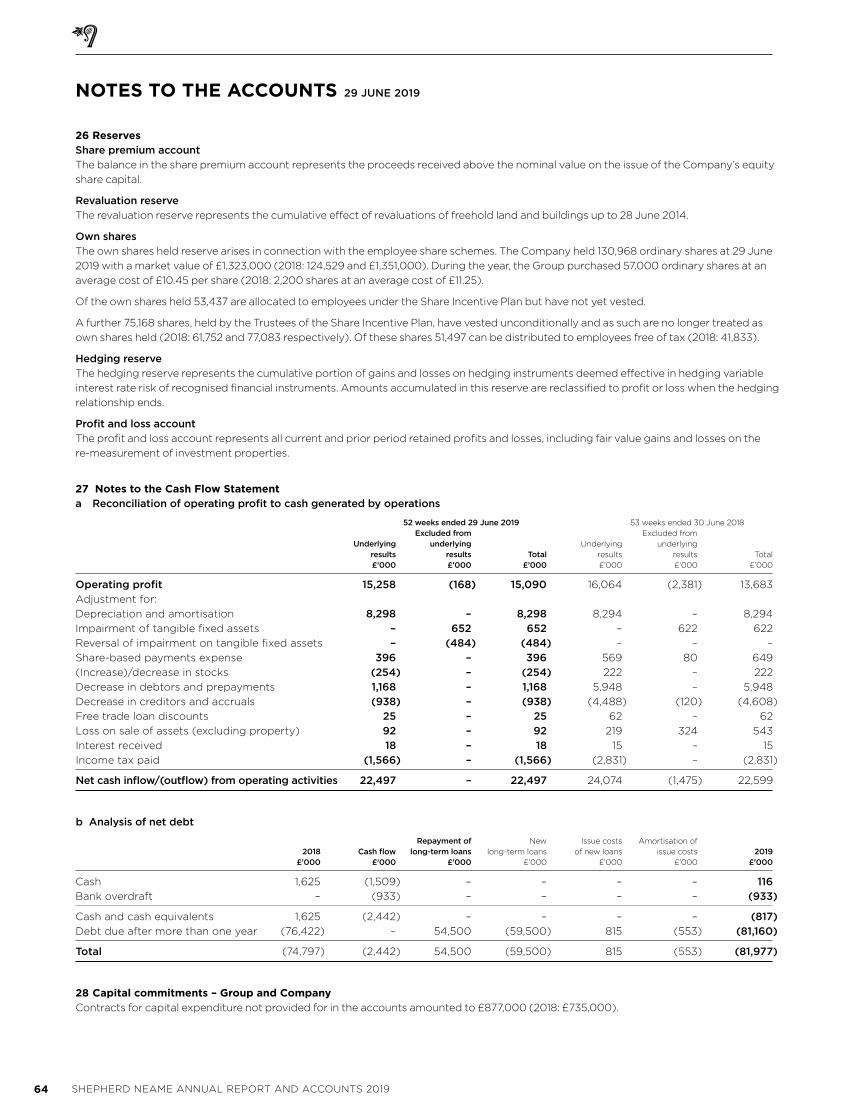
64 SHEPHERD NEAME ANNUAL REPORT AND ACCOUNTS 2019
26 ReservesShare premium account
The balance in the share premium account represents the proceeds received above the nominal value on the issue of the Company’s equity
share capital.
Revaluation reserve
The revaluation reserve represents the cumulative effect of revaluations of freehold land and buildings up to 28 June 2014.
Own shares
The own shares held reserve arises in connection with the employee share schemes. The Company held 130,968 ordinary shares at 29 June
2019 with a market value of £1,323,000 (2018: 124,529 and £1,351,000). During the year, the Group purchased 57,000 ordinary shares at an
average cost of £10.45 per share (2018: 2,200 shares at an average cost of £11.25).
Of the own shares held 53,437 are allocated to employees under the Share Incentive Plan but have not yet vested.
A further 75,168 shares, held by the Trustees of the Share Incentive Plan, have vested unconditionally and as such are no longer treated as
own shares held (2018: 61,752 and 77,083 respectively). Of these shares 51,497 can be distributed to employees free of tax (2018: 41,833).
Hedging reserve
The hedging reserve represents the cumulative portion of gains and losses on hedging instruments deemed effective in hedging variable
interest rate risk of recognised financial instruments. Amounts accumulated in this reserve are reclassified to profit or loss when the hedging
relationship ends.
Profit and loss account
The profit and loss account represents all current and prior period retained profits and losses, including fair value gains and losses on the
re-measurement of investment properties.
27 Notes to the Cash Flow Statementa Reconciliation of operating profit to cash generated by operations
52 weeks ended 29 June 2019 53 weeks ended 30 June 2018
Excluded from Excluded from
Underlying underlying Underlying underlying
results results Total results results Total
£’000 £’000 £’000 £’000 £’000 £’000
Operating profit 15,258 (168) 15,090 16,064 (2,381) 13,683
Adjustment for:
Depreciation and amortisation 8,298 – 8,298 8,294 – 8,294
Impairment of tangible fixed assets – 652 652 – 622 622
Reversal of impairment on tangible fixed assets – (484) (484) – – –
Share-based payments expense 396 – 396 569 80 649
(Increase)/decrease in stocks (254) – (254) 222 – 222
Decrease in debtors and prepayments 1,168 – 1,168 5,948 – 5,948
Decrease in creditors and accruals (938) – (938) (4,488) (120) (4,608)
Free trade loan discounts 25 – 25 62 – 62
Loss on sale of assets (excluding property) 92 – 92 219 324 543
Interest received 18 – 18 15 – 15
Income tax paid (1,566) – (1,566) (2,831) – (2,831)
Net cash inflow/(outflow) from operating activities 22,497 – 22,497 24,074 (1,475) 22,599
b Analysis of net debt
Repayment of New Issue costs Amortisation of
2018 Cash flow long-term loans long-term loans of new loans issue costs 2019
£’000 £’000 £’000 £’000 £’000 £’000 £’000
Cash 1,625 (1,509) – – – – 116
Bank overdraft – (933) – – – – (933)
Cash and cash equivalents 1,625 (2,442) – – – – (817)
Debt due after more than one year (76,422) – 54,500 (59,500) 815 (553) (81,160)
Total (74,797) (2,442) 54,500 (59,500) 815 (553) (81,977)
28 Capital commitments – Group and CompanyContracts for capital expenditure not provided for in the accounts amounted to £877,000 (2018: £735,000).
NOTES TO THE ACCOUNTS 29 JUNE 2019
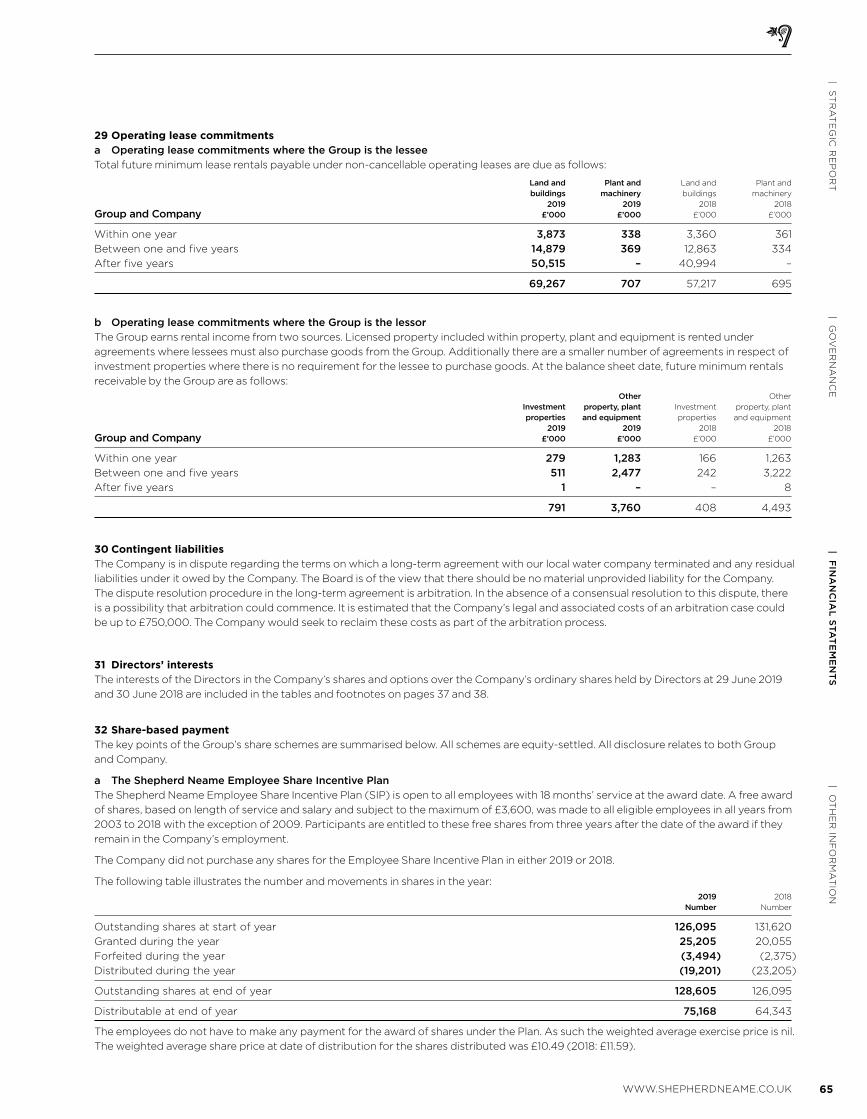
65WWW.SHEPHERDNEAME.CO.UK
| OT
HE
R IN
FO
RM
AT
ION
| FIN
AN
CIA
L S
TA
TE
ME
NT
S| G
OV
ER
NA
NC
E| S
TR
AT
EG
IC R
EP
OR
T
29 Operating lease commitmentsa Operating lease commitments where the Group is the lessee
Total future minimum lease rentals payable under non-cancellable operating leases are due as follows:
Land and Plant and Land and Plant and
buildings machinery buildings machinery
2019 2019 2018 2018
Group and Company £’000 £’000 £’000 £’000
Within one year 3,873 338 3,360 361
Between one and five years 14,879 369 12,863 334
After five years 50,515 – 40,994 –
69,267 707 57,217 695
b Operating lease commitments where the Group is the lessor
The Group earns rental income from two sources. Licensed property included within property, plant and equipment is rented under
agreements where lessees must also purchase goods from the Group. Additionally there are a smaller number of agreements in respect of
investment properties where there is no requirement for the lessee to purchase goods. At the balance sheet date, future minimum rentals
receivable by the Group are as follows:
Other Other
Investment property, plant Investment property, plant
properties and equipment properties and equipment
2019 2019 2018 2018
Group and Company £’000 £’000 £’000 £’000
Within one year 279 1,283 166 1,263
Between one and five years 511 2,477 242 3,222
After five years 1 – – 8
791 3,760 408 4,493
30 Contingent liabilitiesThe Company is in dispute regarding the terms on which a long-term agreement with our local water company terminated and any residual
liabilities under it owed by the Company. The Board is of the view that there should be no material unprovided liability for the Company.
The dispute resolution procedure in the long-term agreement is arbitration. In the absence of a consensual resolution to this dispute, there
is a possibility that arbitration could commence. It is estimated that the Company’s legal and associated costs of an arbitration case could
be up to £750,000. The Company would seek to reclaim these costs as part of the arbitration process.
31 Directors’ interestsThe interests of the Directors in the Company’s shares and options over the Company’s ordinary shares held by Directors at 29 June 2019
and 30 June 2018 are included in the tables and footnotes on pages 37 and 38.
32 Share-based paymentThe key points of the Group’s share schemes are summarised below. All schemes are equity-settled. All disclosure relates to both Group
and Company.
a The Shepherd Neame Employee Share Incentive Plan
The Shepherd Neame Employee Share Incentive Plan (SIP) is open to all employees with 18 months’ service at the award date. A free award
of shares, based on length of service and salary and subject to the maximum of £3,600, was made to all eligible employees in all years from
2003 to 2018 with the exception of 2009. Participants are entitled to these free shares from three years after the date of the award if they
remain in the Company’s employment.
The Company did not purchase any shares for the Employee Share Incentive Plan in either 2019 or 2018.
The following table illustrates the number and movements in shares in the year:
2019 2018
Number Number
Outstanding shares at start of year 126,095 131,620
Granted during the year 25,205 20,055
Forfeited during the year (3,494) (2,375)
Distributed during the year (19,201) (23,205)
Outstanding shares at end of year 128,605 126,095
Distributable at end of year 75,168 64,343
The employees do not have to make any payment for the award of shares under the Plan. As such the weighted average exercise price is nil.
The weighted average share price at date of distribution for the shares distributed was £10.49 (2018: £11.59).
66 SHEPHERD NEAME ANNUAL REPORT AND ACCOUNTS 2019
32 Share-based payment continued
The weighted average fair value of the shares granted in November 2018 was £10.80 (November 2017: £12.85). The fair value, taking into
account the terms and conditions upon which the shares were granted, equates to the market price at the date of grant.
The expense recognised for share-based payments made under SIP in respect of employee services during the year to 29 June 2019
was £224,000 (2018: £223,000).
b The Shepherd Neame 2005 Restricted Share Scheme
This is a restricted share scheme for Senior Managers and Executive Directors, including the highest paid Director and three other Directors.
The scheme ended in 2015.
Under the 2005 restricted share scheme, primary options were awarded which are exercisable three years after they were awarded subject,
normally, to the grantee remaining in the Company’s employment. The Directors were also granted secondary options. Upon the Group
having achieved certain financial performance criteria, a proportion of the options originally granted are exercisable three years after the
date of grant and, normally, provided that the Director remains in the Company’s employment.
The contractual life of each option granted is ten years and the options outstanding at 29 June 2019 had a remaining contractual life of
3.43 years.
The following table illustrates the number and movements in share options in the year:
2019 2019 2018 2018
Number Weighted average Number Weighted average
exercise price exercise price
Outstanding at start of year 16,006 £0.75 50,027 £0.60
Exercised (13,865) £0.73 (28,666) £0.53
Forfeited during the year – – (5,355) £0.50
Outstanding options at end of year 2,141 £0.83 16,006 £0.75
Exercisable at end of year 2,141 £0.83 16,006 £0.75
The range of the exercise price for options outstanding at the end of the year was £0.50 – £1.00.
The fair value of the equity-settled share options granted under the scheme is estimated at the date of grant using the Black-Scholes option
pricing model, which is considered by management to be the most appropriate method of valuation. In valuing equity-settled transactions,
no account is taken of any vesting conditions, other than conditions linked to the price of the shares of the Company (market conditions).
There was no charge recognised for share-based payments made under this scheme in respect of employee service during the year to
29 June 2019 (2018: £46,000).
c The Shepherd Neame 2015 Restricted Share Scheme
This is a restricted share scheme for Senior Managers and Executive Directors, including the highest paid Director and three other Directors.
This scheme replaced the 2005 Restricted Share Scheme following its cessation in 2015. The 2015 scheme provides for the grant of primary
and secondary share options under similar terms and restricted to the same maximum limits as those that applied to the 2005 scheme. It
was updated to reflect changes in market practice since the 2005 scheme was adopted.
Under the 2015 restricted share scheme, primary options are awarded which are exercisable three years after they are awarded subject,
normally, to the grantee remaining in the Company’s employment. The Directors were also granted secondary options which are
exercisable three years after they were awarded if the Group achieves certain financial performance criteria and, normally, provided that
the Director remains in the Company’s employment.
During the year the company purchased 57,000 shares at an average cost of £10.45 (2018: 58,369 shares at an average cost of £11.25).
The contractual life of each option granted is ten years and the options outstanding at 29 June 2019 had a remaining contractual life of
8.36 years.
The following table illustrates the number and movements in share options in the year:
2019 2019 2018 2018
Number Weighted average Number Weighted average
exercise price exercise price
Outstanding at start of year 130,683 £0.50 87,675 £0.50
Granted during the year 66,014 £0.50 57,576 £0.50
Exercised (19,410) £0.50 (8,799) £0.50
Forfeited during the year (9,288) £0.50 (5,769) £0.50
Outstanding options at end of year 167,999 £0.50 130,683 £0.50
Exercisable at end of year 11,098 £0.50 – –
The weighted average fair value of the options granted during the year was £8.02 (2018: £12.36). The exercise price for all options
outstanding at the end of the year was £0.50.
NOTES TO THE ACCOUNTS 29 JUNE 2019
67WWW.SHEPHERDNEAME.CO.UK
| OT
HE
R IN
FO
RM
AT
ION
| FIN
AN
CIA
L S
TA
TE
ME
NT
S| G
OV
ER
NA
NC
E| S
TR
AT
EG
IC R
EP
OR
T
The fair value of the components of the equity-settled share options granted under the scheme is estimated at the date of grant using the
Black-Scholes and Stochastic option pricing models which are considered by management to be the most appropriate method of valuation.
In valuing equity-settled transactions, no account is taken of any vesting conditions, other than conditions linked to the price of the shares of
the Company (market conditions). The following table lists the inputs to the models used for the years ended 29 June 2019 and 30 June 2018:
2019 2018
Expected share price volatility 12% 10%
Risk-free interest rate 0.80% 0.56%
Dividend yield 2.78% 2.21%
Expected life of option (years) 3 3
Weighted average share price £10.50 £12.80
A charge of £172,000 was recognised for share-based payments made under the Shepherd Neame 2015 Restricted Share Scheme in
respect of employee service during the year to 29 June 2019 (2018: £380,000).
33 Pension commitmentsThe Group operates two defined contribution schemes. The assets of the schemes are held separately from those of the Group in
independently administered funds. The total expense charged to profit or loss in the period for pension costs in respect of the schemes
amounts to £969,000 (2018: £922,000). Contributions of £174,000 (2018: £152,000) were payable to the schemes at the year end. One of
the executive Directors (2018: one) is a contributing member of one of the Company’s defined contribution schemes. During the previous
financial year, changes in legislation meant that the highest paid Director and two other executive Directors were no longer contributing
members of this scheme although they do have entitlement to deferred benefits.
The Company also meets the pension costs of certain former employees which have not been funded through the pension schemes.
The amount of this unfunded liability is not significant.
34 Related party transactionsThe key management personnel of the Group are considered to be the Executive Directors, the total remuneration for whom was
£1,662,000 for the year (2018: £2,127,000) being remuneration of £1,469,000 (2018: £1,800,000) and share-based payment expenses of
£193,000 (2018: £327,000) as disclosed in the Remuneration Report on pages 34 to 38. The Directors are granted discounts on purchases
from the Company, in line with the discount given to all other staff.
During the year no advances were paid to Directors. In the year ended 30 June 2018 advances totalling £53,000 were paid to two Directors
in respect of tax and NI payable on the exercise and sale of share options. The sums were repaid within one month with no interest payable.
No amounts were outstanding at either year end.
Jonathan Neame, Chief Executive of Shepherd Neame Limited, is Chairman of Visit Kent. During the year ended 29 June 2019, fees and
sponsorship activity paid to Visit Kent amounted to £12,000 including VAT (2018: £26,000). There was no balance owed to Visit Kent
Limited at either 29 June 2019 or 30 June 2018.
Jonathan Neame was a non-executive Director of St Austell Brewery Company Limited until May 2018, hence only comparative figures are
disclosed for related party transactions. During the prior year, the Group purchased goods to the value of £16,000 including VAT and made
sales of £58,000 to St Austell Brewery Company Limited. As at 30 June 2018, Shepherd Neame Limited was owed £2,000, including VAT,
by St Austell Brewery Company Limited and Shepherd Neame Limited owed a balance of nil to St Austell Brewery Company Limited.
George Barnes is an executive director of Shepherd Neame Limited. Mr A J A Barnes, a close member of George Barnes’ family, is a partner
of Clarke Barnes Solicitors LLP, which provided legal services in respect of Group properties during the year to 29 June 2019 at a cost of
£33,000 including VAT and disbursements to third parties (2018: £21,000). No balance was owed to the partnership by Shepherd Neame
Limited as at 29 June 2019 (2018: nil).
Nigel Bunting, an executive director of Shepherd Neame Limited, is also a director of Davy and Company Limited. During the year, the
Group did not purchase any goods (2018: nil) but made sales to the value of £212,000 (2018: £214,000) to Davy and Company Limited and
its associated companies. At the year end, no balance was owed by Shepherd Neame Limited to the Davy Group of companies (2018: nil)
and the balance owed to the Group by the Davy Group of companies, including VAT, was £14,000 (2018: £24,000).
All the transactions referred to above were made in the ordinary course of business and outstanding balances were not overdue. There is no
overall controlling party of Shepherd Neame Limited.
68 SHEPHERD NEAME ANNUAL REPORT AND ACCOUNTS 2019
FINANCIAL CALENDAR AND COMPANY ADVISORS
Financial Calendar
2019
3 October Ex-dividend date
4 October Record date*
18 October Annual General Meeting and
payment of final dividend
2020
March Announcement of
interim results
March Payment of interim dividend
September Preliminary results
announcement
October Annual General Meeting
* Shareholders on the register at this date
Company Advisors
Corporate Broker
Peel Hunt LLP
Moor House
120 London Wall
London
EC2Y 5ET
Registrars
Computershare Investor Services PLC
The Pavilions, Bridgwater Road
Bristol
BS99 6ZZ
Tel: 0370 702 0003
Dedicated Shareholder Tel: 0370 707 1291
www.computershare.com/investor/uk
Auditor
Deloitte LLP
2 New Street Square
London
EC4A 3BZ
Stockbrokers
JP Morgan Cazenove Limited
25 Bank Street
Canary Wharf
London
E14 5JP
Peel Hunt LLP
Moor House
120 London Wall
London
EC2Y 5ET
James Sharp & Co
The Exchange
5 Bank Street
Bury
Lancashire
BL9 0DN
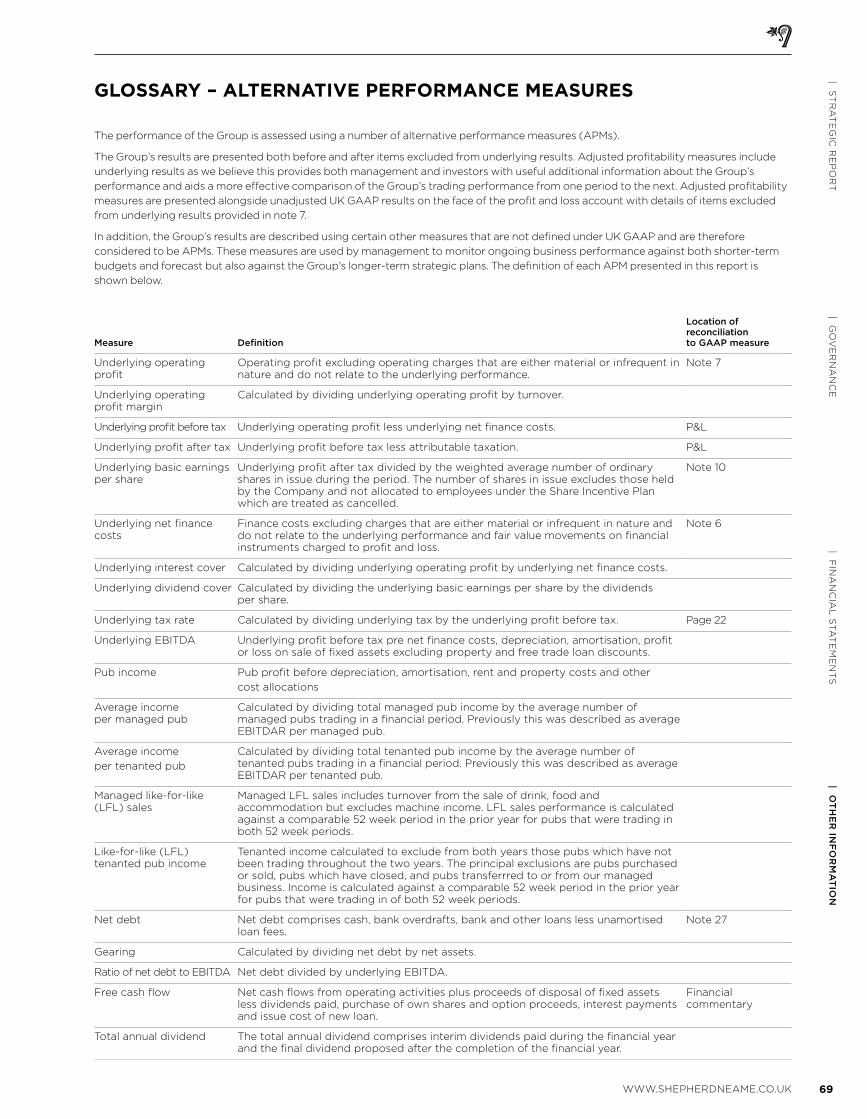
| OT
HE
R IN
FO
RM
AT
ION
| FIN
AN
CIA
L S
TA
TE
ME
NT
S| G
OV
ER
NA
NC
E| S
TR
AT
EG
IC R
EP
OR
T
69WWW.SHEPHERDNEAME.CO.UK
GLOSSARY – ALTERNATIVE PERFORMANCE MEASURES
The performance of the Group is assessed using a number of alternative performance measures (APMs).
The Group’s results are presented both before and after items excluded from underlying results. Adjusted profitability measures include
underlying results as we believe this provides both management and investors with useful additional information about the Group’s
performance and aids a more effective comparison of the Group’s trading performance from one period to the next. Adjusted profitability
measures are presented alongside unadjusted UK GAAP results on the face of the profit and loss account with details of items excluded
from underlying results provided in note 7.
In addition, the Group’s results are described using certain other measures that are not defined under UK GAAP and are therefore
considered to be APMs. These measures are used by management to monitor ongoing business performance against both shorter-term
budgets and forecast but also against the Group’s longer-term strategic plans. The definition of each APM presented in this report is
shown below.
Measure Definition
Location of reconciliationto GAAP measure
Underlying operating profit
Operating profit excluding operating charges that are either material or infrequent in nature and do not relate to the underlying performance.
Note 7
Underlying operating profit margin
Calculated by dividing underlying operating profit by turnover.
Underlying profit before tax Underlying operating profit less underlying net finance costs. P&L
Underlying profit after tax Underlying profit before tax less attributable taxation. P&L
Underlying basic earnings per share
Underlying profit after tax divided by the weighted average number of ordinary shares in issue during the period. The number of shares in issue excludes those held by the Company and not allocated to employees under the Share Incentive Plan which are treated as cancelled.
Note 10
Underlying net finance costs
Finance costs excluding charges that are either material or infrequent in nature and do not relate to the underlying performance and fair value movements on financial instruments charged to profit and loss.
Note 6
Underlying interest cover Calculated by dividing underlying operating profit by underlying net finance costs.
Underlying dividend cover Calculated by dividing the underlying basic earnings per share by the dividends per share.
Underlying tax rate Calculated by dividing underlying tax by the underlying profit before tax. Page 22
Underlying EBITDA Underlying profit before tax pre net finance costs, depreciation, amortisation, profit or loss on sale of fixed assets excluding property and free trade loan discounts.
Pub income Pub profit before depreciation, amortisation, rent and property costs and other
cost allocations
Average income per managed pub
Calculated by dividing total managed pub income by the average number of managed pubs trading in a financial period. Previously this was described as average EBITDAR per managed pub.
Average income
per tenanted pub
Calculated by dividing total tenanted pub income by the average number of tenanted pubs trading in a financial period. Previously this was described as average EBITDAR per tenanted pub.
Managed like-for-like (LFL) sales
Managed LFL sales includes turnover from the sale of drink, food and accommodation but excludes machine income. LFL sales performance is calculated against a comparable 52 week period in the prior year for pubs that were trading in both 52 week periods.
Like-for-like (LFL) tenanted pub income
Tenanted income calculated to exclude from both years those pubs which have not been trading throughout the two years. The principal exclusions are pubs purchased or sold, pubs which have closed, and pubs transferrred to or from our managed business. Income is calculated against a comparable 52 week period in the prior year for pubs that were trading in of both 52 week periods.
Net debt Net debt comprises cash, bank overdrafts, bank and other loans less unamortised loan fees.
Note 27
Gearing Calculated by dividing net debt by net assets.
Ratio of net debt to EBITDA Net debt divided by underlying EBITDA.
Free cash flow Net cash flows from operating activities plus proceeds of disposal of fixed assets less dividends paid, purchase of own shares and option proceeds, interest payments and issue cost of new loan.
Financial commentary
Total annual dividend The total annual dividend comprises interim dividends paid during the financial year and the final dividend proposed after the completion of the financial year.
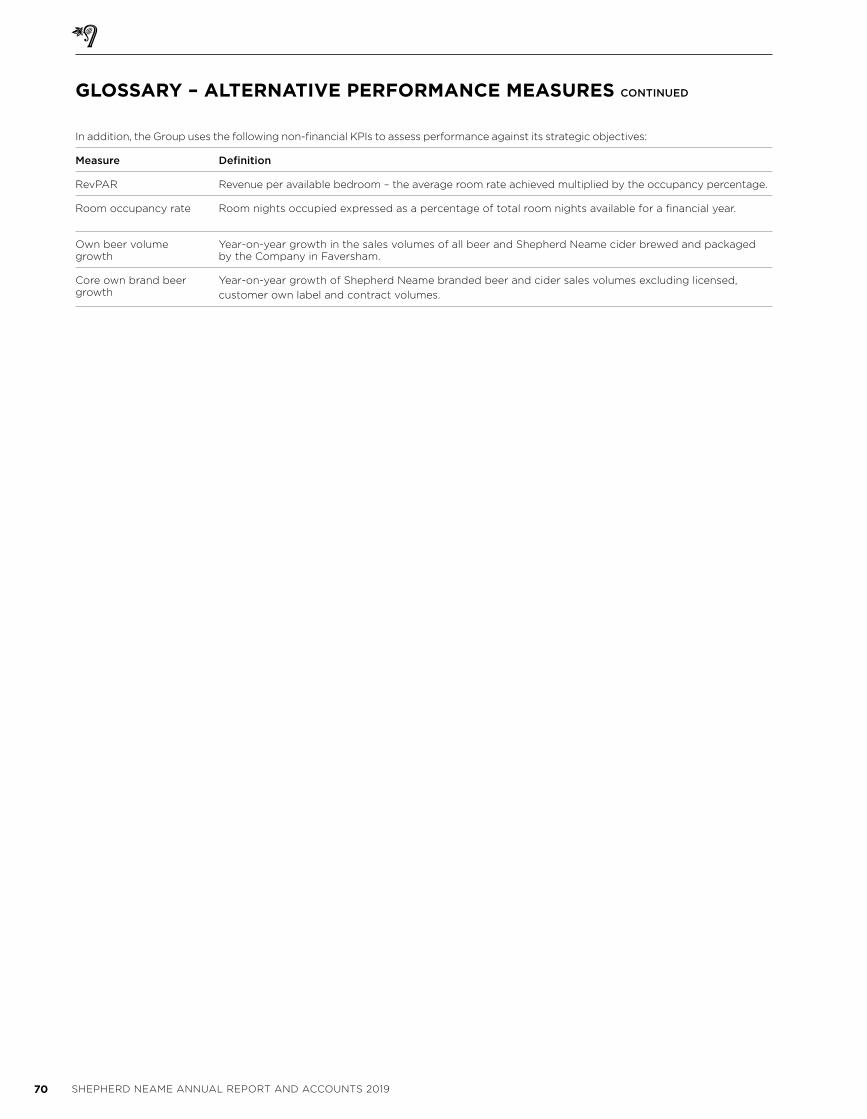
70 SHEPHERD NEAME ANNUAL REPORT AND ACCOUNTS 2019
GLOSSARY – ALTERNATIVE PERFORMANCE MEASURES CONTINUED
In addition, the Group uses the following non-financial KPIs to assess performance against its strategic objectives:
Measure Definition
RevPAR Revenue per available bedroom – the average room rate achieved multiplied by the occupancy percentage.
Room occupancy rate Room nights occupied expressed as a percentage of total room nights available for a financial year.
Own beer volume growth
Year-on-year growth in the sales volumes of all beer and Shepherd Neame cider brewed and packaged by the Company in Faversham.
Core own brand beer growth
Year-on-year growth of Shepherd Neame branded beer and cider sales volumes excluding licensed,
customer own label and contract volumes.
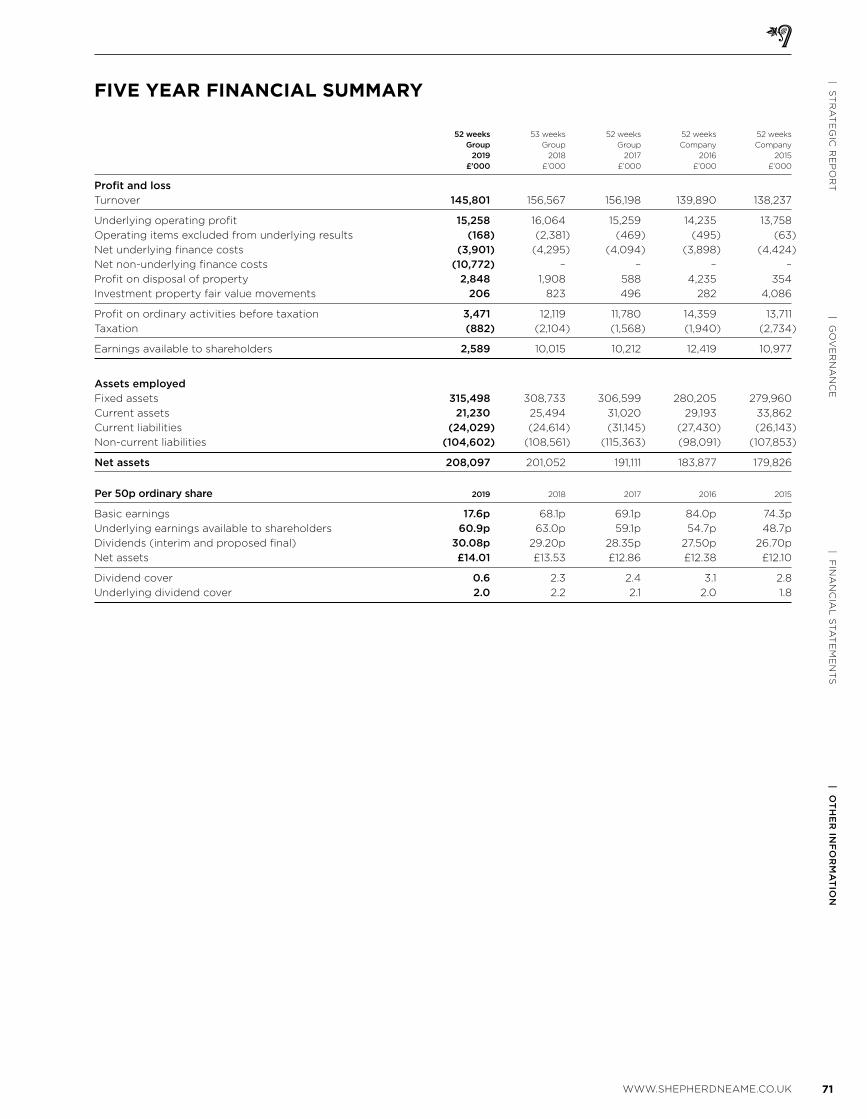
| OT
HE
R IN
FO
RM
AT
ION
| FIN
AN
CIA
L S
TA
TE
ME
NT
S| G
OV
ER
NA
NC
E| S
TR
AT
EG
IC R
EP
OR
T
71WWW.SHEPHERDNEAME.CO.UK
52 weeks 53 weeks 52 weeks 52 weeks 52 weeks
Group Group Group Company Company
2019 2018 2017 2016 2015
£’000 £’000 £’000 £’000 £’000
Profit and loss
Turnover 145,801 156,567 156,198 139,890 138,237
Underlying operating profit 15,258 16,064 15,259 14,235 13,758
Operating items excluded from underlying results (168) (2,381) (469) (495) (63)
Net underlying finance costs (3,901) (4,295) (4,094) (3,898) (4,424)
Net non-underlying finance costs (10,772) – – – –
Profit on disposal of property 2,848 1,908 588 4,235 354
Investment property fair value movements 206 823 496 282 4,086
Profit on ordinary activities before taxation 3,471 12,119 11,780 14,359 13,711
Taxation (882) (2,104) (1,568) (1,940) (2,734)
Earnings available to shareholders 2,589 10,015 10,212 12,419 10,977
Assets employed
Fixed assets 315,498 308,733 306,599 280,205 279,960
Current assets 21,230 25,494 31,020 29,193 33,862
Current liabilities (24,029) (24,614) (31,145) (27,430) (26,143)
Non-current liabilities (104,602) (108,561) (115,363) (98,091) (107,853)
Net assets 208,097 201,052 191,111 183,877 179,826
Per 50p ordinary share 2019 2018 2017 2016 2015
Basic earnings 17.6p 68.1p 69.1p 84.0p 74.3p
Underlying earnings available to shareholders 60.9p 63.0p 59.1p 54.7p 48.7p
Dividends (interim and proposed final) 30.08p 29.20p 28.35p 27.50p 26.70p
Net assets £14.01 £13.53 £12.86 £12.38 £12.10
Dividend cover 0.6 2.3 2.4 3.1 2.8
Underlying dividend cover 2.0 2.2 2.1 2.0 1.8
FIVE YEAR FINANCIAL SUMMARY

72 SHEPHERD NEAME ANNUAL REPORT AND ACCOUNTS 2019

ANNUAL REPORT 2019
SHEPHERD NEAME IS AN INDEPENDENT FAMILY BUSINESS AND
Our vision – is to be a Great British
Brewer and run the best pubs.
Our mission – is to give our customers
a great and memorable experience to
make for a better day!
BRITAIN’S OLDEST BREWER
Bear Island Triple Hopped Lager launches at Craft Beer Rising, London in February 2019
Kent-based band Salvation Jayne at this year’s Ramblin’ Man Festival

SHEPHERD NEAME LIMITED17 COURT STREET, FAVERSHAM,
KENT, ME13 7AX
TEL: 01795 532206
FAX: 01795 538907
EMAIL: [email protected]
WWW.SHEPHERDNEAME.CO.UK
REGISTERED IN ENGLAND NUMBER 138256
ANNUAL REPORT 2019
SHEPHERD NEAME LIMITED