Embed Size (px)
Citation preview
Productivity Commission
Annual Report 2019-20

© Commonwealth of Australia 2020
ISSN 2205-5673 (print)
ISSN 2205-5681 (online)
Except for the Commonwealth Coat of Arms and content supplied by third parties, this copyright work is
licensed under a Creative Commons Attribution 3.0 Australia licence. To view a copy of this licence, visit
http://creativecommons.org/licenses/by/3.0/au. In essence, you are free to copy, communicate and adapt the
work, as long as you attribute the work to the Productivity Commission (but not in any way that suggests the
Commission endorses you or your use) and abide by the other licence terms.
Use of the Commonwealth Coat of Arms
Terms of use for the Coat of Arms are available from the Department of the Prime Minister and Cabinet’s website:
www.pmc.gov.au/government/commonwealth-coat-arms
Third party copyright
Wherever a third party holds copyright in this material, the copyright remains with that party. Their permission
may be required to use the material, please contact them directly.
Attribution
This work should be attributed as follows, Source: Productivity Commission, Annual Report 2019-20.
An appropriate reference for this publication is:
Productivity Commission 2020, Annual Report 2019-20, Annual Report Series, Canberra.
Publications enquiries
Media, Publications and Web, phone: (03) 9653 2244 or email: [email protected]
The Productivity Commission
The Productivity Commission is the Australian Government’s independent research and advisory
body on a range of economic, social and environmental issues affecting the welfare of Australians.
Its role, expressed most simply, is to help governments make better policies, in the long term
interest of the Australian community.
The Commission’s independence is underpinned by an Act of Parliament. Its processes and
outputs are open to public scrutiny and are driven by concern for the wellbeing of the community
as a whole.
Further information on the Productivity Commission can be obtained from the Commission’s
website (www.pc.gov.au).
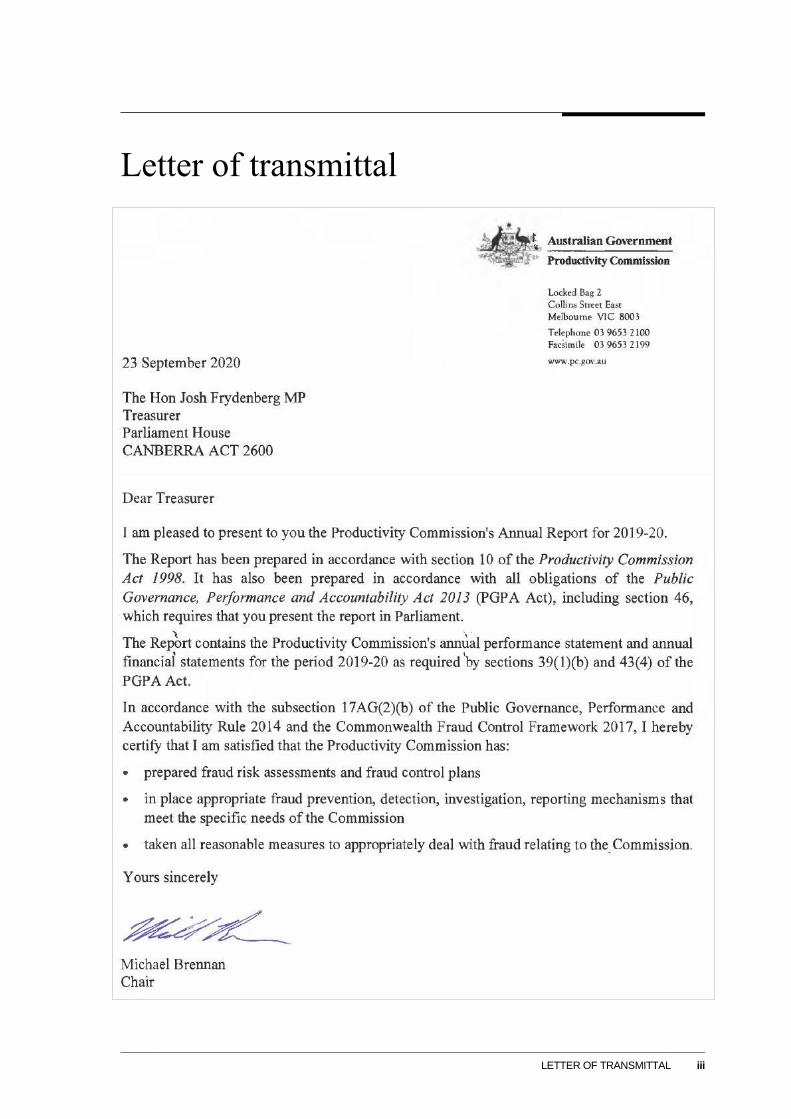
LETTER OF TRANSMITTAL iii
Letter of transmittal

CONTENTS v
Contents
Letter of transmittal iii
Foreword vii
Commissioners ix
1 About the Commission 1
The Commission’s role 1
Commissioners and staff 2
2 Annual Performance Statement 5
Introductory statement 5
Entity purpose 5
Results 5
3 The year in review: Commission activities 11
Public inquiries and commissioned studies 11
Performance reporting and other services to government bodies 13
Competitive neutrality activities 15
Other research activities and annual reporting 15
4 The policy and wider impact of Commission activities 17
Assessing the Commission’s performance 17
Generating effective debate 17
Transparency and community engagement 20
Timeliness and cost effectiveness 21
Commission capabilities, linkages and networks 22
5 Management and accountability 23
Commissioners and staff 23
Outcome objective and resources 25
Governance 26

vi ANNUAL REPORT 2019-20
External and internal scrutiny 29
Management of human resources 30
Financial performance 35
Other reporting requirements 35
6 Financial Statements 39
Independent Auditor’s Report 39
Statement by the Chair and Chief Finance Officer 41
Statement of Comprehensive Income 42
Statement of Financial Position 43
Statement of Changes in Equity 44
Cash Flow Statement 46
Overview 47
Notes to and forming part of the Financial Statements 53
Appendix 71
Executive remuneration 71
Accountable authority 74
Resource statement 74
Human resources 75
Indexes 83
Annual reporting requirements and aids to access 83
List of requirements – non-corporate Commonwealth entities 84
Index 91
Abbreviations 94

FOREWORD vii
Foreword
In 2019‑20, the Commission continued to provide evidence‑based policy and inform the
public debate on a range of topics of significance to the Australian community.
During the year we completed two inquiries commissioned by the Australian Government.
The first reviewed national transport regulatory reforms, while the second looked at the role
of mental health in social and economic participation.
We also completed two Government-commissioned studies during the year, reviewing the
zone tax offset and related remote area tax concessions and payments, as well as examining
government expenditure on children and family services in the Northern Territory.
In addition, the Commission took part in efforts across the Australian Public Service to
support the whole-of-government response to the COVID-19 pandemic, providing research
and analytical support for the economic response to the crisis, including by deploying staff
to other agencies.
We also continued to develop a whole‑of‑government evaluation strategy for policies and
programs affecting Aboriginal and Torres Strait Islander people, as well as working on the
next Overcoming Indigenous Disadvantage: Key Indicators report. The Commission is also
making changes to its ways of engaging and working with Aboriginal and Torres Strait
Islander people and organisations.
During the year, we released research that examined the experiences of vulnerable people in
the private rental market, and the policies that affect their outcomes. We also published
research on the impediments to adopting Integrated Water Cycle Management in urban
environments, including the policy and implementation frameworks for urban water. And
we progressed research looking at youth incomes.
We continued to fulfil our legislated role to promote public understanding of matters relating to
industry, industry development and productivity, including through our annual Trade and
Assistance Review and Productivity Insights publications. With reporting on foreign
investment to be part of the annual Trade and Assistance Review, we produced a research paper
examining foreign investment in Australia and the Australian Government’s related policies.
The 2020 edition of the Report on Government Services was published during the year,
providing comparative performance information on government service delivery areas. The
staged transition of this material to interactive online reporting continued, with three more
sectors moving to the new format.

viii ANNUAL REPORT 2019-20
New inquiries and studies referred to us by the Australian Government during the year and
currently underway include a study on regulation in the resources sector, a review of the
National Agreement for Skills and Workforce Development and the second triennial inquiry
into the progress of national water reforms.
In 2019-20, the Commission also commenced case studies on productivity reform within
Australia for the Council on Federal Financial Relations. These case studies are intended to
inform and to diffuse knowledge and practices across governments and identify reform
opportunities.
I would like to thank the Commission’s staff and my fellow Commissioners for their hard
work over the course of the year.
Michael Brennan
Chair
COMMISSIONERS ix
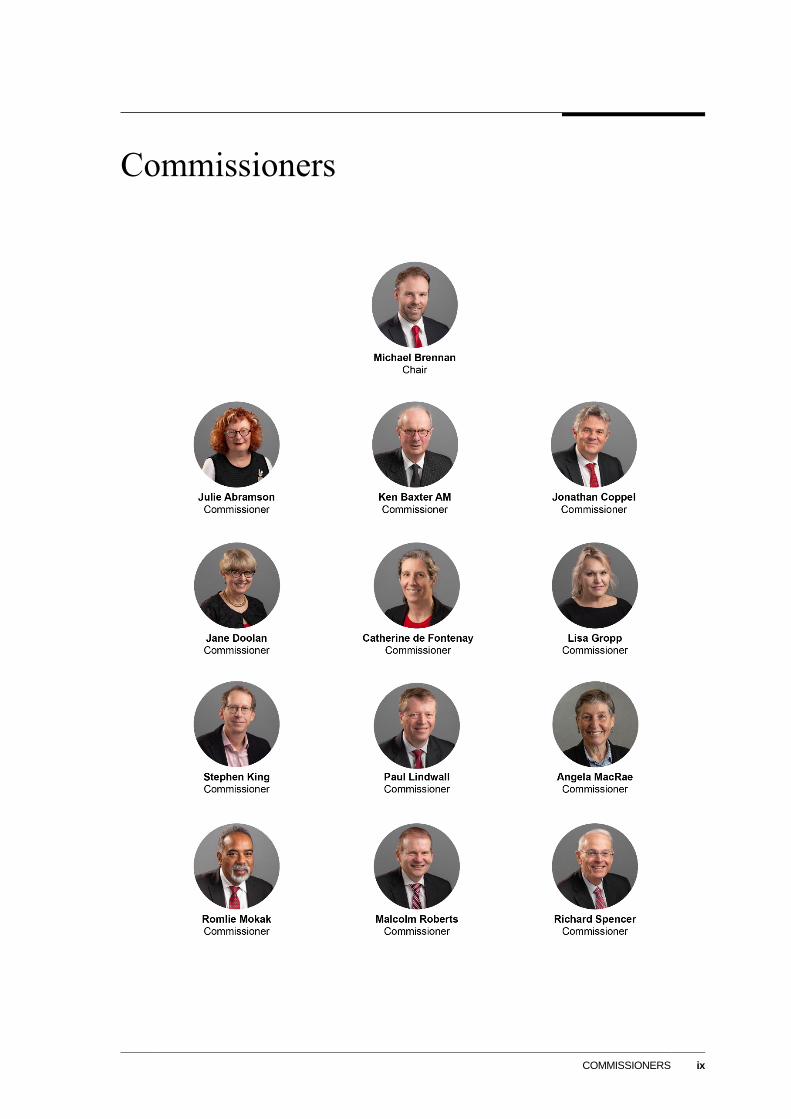
Commissioners

ABOUT THE COMMISSION 1
1 About the Commission
The Commission’s role
The Productivity Commission is the Australian Government’s independent research and
advisory body on a range of economic, social and environmental issues affecting the welfare
of Australians. Its remit covers all sectors of the economy, with a view to better informing
policy making to raise national productivity and living standards.
The Productivity Commission’s outcome objective is:
Well‑informed policy decision making and public understanding on matters relating to
Australia’s productivity and living standards, based on independent and transparent analysis from
a community‑wide perspective.
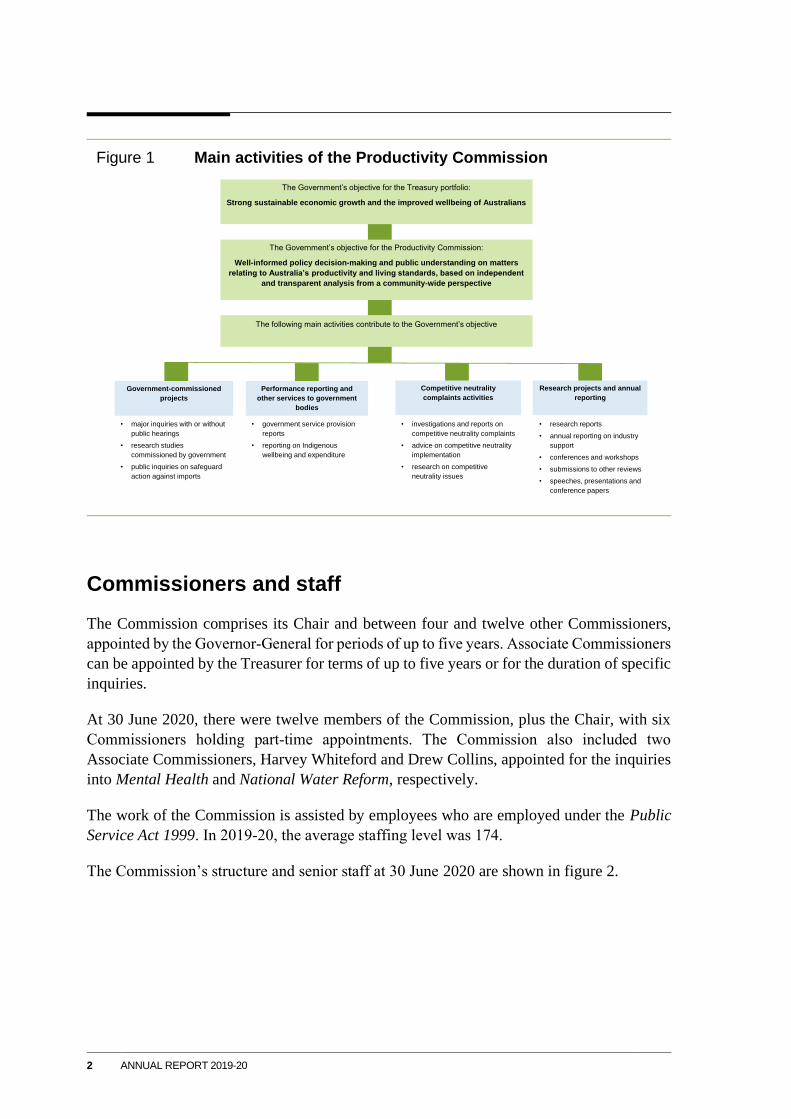
This objective is pursued in four broad work streams (outlined in figure 1):
• government‑commissioned inquiries and studies
• other research projects and annual reporting on industry support
• performance reporting and related analysis of Commonwealth and State service provision
• competitive neutrality complaints.
The Commission’s activities over 2019‑20 are outlined in chapter 3.
2 ANNUAL REPORT 2019-20
Figure 1 Main activities of the Productivity Commission
Commissioners and staff
The Commission comprises its Chair and between four and twelve other Commissioners,
appointed by the Governor‑General for periods of up to five years. Associate Commissioners
can be appointed by the Treasurer for terms of up to five years or for the duration of specific
inquiries.
At 30 June 2020, there were twelve members of the Commission, plus the Chair, with six
Commissioners holding part‑time appointments. The Commission also included two
Associate Commissioners, Harvey Whiteford and Drew Collins, appointed for the inquiries
into Mental Health and National Water Reform, respectively.
The work of the Commission is assisted by employees who are employed under the Public
Service Act 1999. In 2019‑20, the average staffing level was 174.
The Commission’s structure and senior staff at 30 June 2020 are shown in figure 2.
• major inquiries with or without
public hearings
• research studies
commissioned by government
• public inquiries on safeguard
action against imports
• research reports
• annual reporting on industry
support
• conferences and workshops
• submissions to other reviews
• speeches, presentations and
conference papers
• investigations and reports on
competitive neutrality complaints
• advice on competitive neutrality
implementation
• research on competitive
neutrality issues
• government service provision
reports
• reporting on Indigenous
wellbeing and expenditure
Government-commissioned
projects
Performance reporting and
other services to government
bodies
Competitive neutrality
complaints activities
Research projects and annual
reporting
The following main activities contribute to the Government’s objective
The Government’s objective for the Productivity Commission:
Well-informed policy decision-making and public understanding on matters
relating to Australia’s productivity and living standards, based on independent
and transparent analysis from a community-wide perspective
The Government’s objective for the Treasury portfolio:
Strong sustainable economic growth and the improved wellbeing of Australians

ABOUT THE COMMISSION 3
Figure 2 Commission structure and senior staff
As at 30 June 2020.
Commissioners
Julie Abramson
Ken Baxter AM
Jonathan Coppel
Jane Doolan
Catherine de Fontenay
Lisa Gropp
Stephen King
Paul Lindwall
Angela MacRae
Romlie Mokak
Malcolm Roberts
Richard Spencer
Associate
Commissioners
Drew Collins
Harvey Whiteford
Inquiry Group
Assistant
Commissioners
Rosalyn Bell
Anna Heaney
Ana Markulev
Rosalie McLachlan
Jane Melanie
John Salerian
Clare Sibly
Lou Will (a/g)
Angela Woo
Corporate Group
Assistant
Commissioner
Jane Holmes (a/g)
Media, Publications
and Web
Director
Leonora Nicol
Head of Office
Nina DavidsonExecutive Manager
Melbourne
Mary Cavar
Executive Manager
Canberra
Ralph Lattimore
* Australian Government Competitive Neutrality Complaints Office
Director
Stewart Plain
AGCNCO*
Assistant
Commissioner
Catherine Andersson
Government
Performance
Reporting and
Analysis Group
Chair
Michael Brennan
Research and
Modelling Group
Head of Modelling
John Salerian
Assistant
Commissioner
Patrick Jomini

ANNUAL PERFORMANCE STATEMENT 5
2 Annual Performance Statement
Introductory statement
This annual performance statement meets the Productivity Commission’s requirements
under s. 39(1)(a) of the Public Governance, Performance and Accountability Act 2013
(Cwlth) (PGPA Act) for the 2019‑20 financial year, and accurately reflects the entity’s
performance in accordance with s. 39(2) of the PGPA Act.
Entity purpose
The Commission’s purpose, as embodied in the Productivity Commission Act 1998 (Cwlth),
is to provide governments and the Australian community with information and advice that
better informs policy decisions to improve Australians’ wellbeing. The Commission applies
robust, transparent analysis, and adopts a community‑wide perspective.
Results
The Commission has assessed its performance against six criteria associated with its impact
and delivery. In 2019‑20, the Commission performed consistent with these criteria. The
criteria, as set out in the Corporate Plan 2019‑20 (p. 7) and Portfolio Budget Statement
2019‑20 (p. 314), are:
• providing a valuable source of robust evidence‑based analysis
• generating effective public debate
• being recognised as valuable by other governments
• engaging effectively with the community
• having open and transparent processes
• delivering timely reports.
Performance against each of the Commission’s impact and delivery criteria is summarised
below, with analysis presented in more detail in chapter 3. The COVID-19 pandemic
affected the Commission’s prioritisation and approach during the year.
A number of factors complicate the assessment of the Commission’s performance. The
Commission is only one contributor among many to the Australian policy debate and policy

6 ANNUAL REPORT 2019-20
decision making; and the nature, scope and timing of projects commissioned by the
Australian Government varies from one year to the next. Further, the Commission’s inquiry
and research outputs contribute over a period of years to the public debate and policy
development on a range of complex and often contentious issues. Their impact can go far
beyond their immediate release. This means that the Commission’s contribution is best
considered over the medium term.
Given the nature of its work, the Commission relies mainly on qualitative indicators of
performance, with quantitative indicators helping to inform the assessment in some areas.
The Commission also undertakes periodic surveys of stakeholders to help gauge the
relevance, analytical rigour and clarity of its work, as well as the effectiveness of its
participatory processes and its openness and transparency. Such a survey informed the
2017‑18 Annual Performance Statement, with the next due for 2020‑21.
Impact Criteria
The Productivity Commission is a valuable source of evidence‑based analysis to
inform public policy in Australia.
In 2019-20, the demand for the Commission to undertake work on complex policy issues
continued.
The Commission received references from the Government for three new projects, including
a study on resource sector regulation, and the second triennial inquiry into the progress of
reform in Australia’s water resources sector. The second review of nationally significant,
sector‑wide agreements between the Australian, State and Territory governments also
commenced, with a review of the National Agreement for Skills and Workforce
Development.
During the year, the Commission also commenced work on case studies on productivity
reform in Australia, following a request from the Council on Federal Financial Relations.
The purpose of these case studies is to diffuse knowledge and practices across governments,
and identify reform opportunities.
The Commission completed four government‑commissioned inquiries and studies on a
diverse set of topics during 2019‑20:
• a major inquiry into the impact of mental health on social and economic participation
• an inquiry into national transport regulatory reform
• a study into government expenditure in the Northern Territory on children and family
services aimed at preventing harm to children
• a study of remote area tax concessions and payments.
ANNUAL PERFORMANCE STATEMENT 7
The Commission also continued its work to develop a whole‑of‑government evaluation
strategy for policies and programs affecting Aboriginal and Torres Strait Islander people.
In addition, the Commission continued its annual reporting of Australian Government
assistance to industry through the Trade and Assistance Review, and released research on
foreign investment in Australia. The Commission also continued to provide secretariat,
research and report preparation services to the Steering Committee for the Review of
Government Service Provision, including for the 2020 Overcoming Indigenous
Disadvantage: Key Indicators report.
As part of efforts across the Australian Public Service to support the whole-of-government
response to the COVID-19 pandemic, the Commission provided support to agencies engaged
in the economic response to the crisis. This included providing research and analytical
support, and seconding staff to other agencies.
The Productivity Commission generates effective public debate.
Contributions to parliamentary debate and the extent of media coverage indicate a high level
of public interest in the Commission’s work and its potential influence.
During 2019‑20, about 115 federal members and senators referred to at least 47 different
Commission reports or inquiries, or to the Commission’s role in the policy process. At the
state and territory level, about 92 members of state and territory parliaments referred to
26 different Commission projects or to the Commission’s role during the 2019‑20 sittings.
The Commission rated, on average, more than 145 media mentions a month in connection
with the four completed inquiries and studies during 2019‑20, with particular interest in the
Mental Health and the Remote Area Tax Concessions and Payments study. The 2020 Report
on Government Services also generated a substantial amount of public interest during the
year, reflected in media articles and downloads of the report.
Commission reports from previous years also appeared in media reporting and were cited in
academic literature during 2019‑20, including the 2017 Shifting the Dial: 5-Year
Productivity Review and the 2010 Australian Gambling Industries inquiry.
In 2019-20, there were slightly fewer presentations and speeches by the Chair,
Commissioners and staff than in previous years, as a result of the COVID-19 pandemic.
The Productivity Commission is recognised as a model for evidence‑based policy
analysis worthy of consideration by other governments.
In 2019‑20, the Commission was approached by a number of other governments interested
in its institutional arrangements, how it approaches its work and to discuss the outcomes of
specific inquiries. The Commission briefed visiting officials and delegations from eight

8 ANNUAL REPORT 2019-20
countries, including Chile, Indonesia and the United Kingdom, covering a wide range of
topics, from the role of the Commission, to performance benchmarking of government
services, to productivity measurement in the non-market sector.
The OECD and IMF cited the Commission’s work in 28 reports published throughout the
year. This included references to the Data Availability and Use and Murray-Darling Basin
Plan: Five-year assessment reports, along with older reports such as the Commission's
reviews of mutual recognition schemes and the inquiry into Rural Research and
Development Corporations.
Delivery Criteria
The Productivity Commission engages effectively with the community.
In 2019‑20, the Commission’s processes provided opportunities for extensive public input
and feedback through visits, hearings, workshops and other consultative forums, and the
release of draft reports and preliminary findings.
For all major projects commenced during 2019-20, the Commission published issues papers
— outlining relevant issues and calling for public submissions — shortly after receiving the
terms of reference. And interested parties had another opportunity to make submissions
following the release of draft or interim reports.
In total, the Commission received 1160 submissions to Government-commissioned projects
during 2019-20. The Commission also received ‘brief comments’ on all government-
commissioned projects during 2019-20, providing an opportunity for a more informal
avenue for feedback. The Mental Health inquiry received the highest volume of submissions
and comments.
For all inquiries and studies, there was also an opportunity for participants to appear at public
hearings, roundtable discussions and/or workshops during 2019-20. As well as visits to all
capital cities, the Commission travelled to a number of regional and remote communities,
such as Karratha, Kalgoorlie-Boulder, Groote Eylandt, Rockhampton, Broken Hill and
others during 2019-20. Further, given the priority efforts devoted by governments,
businesses, organisations and communities in responding to the COVID-19 pandemic, the
Commission adjusted its processes to ensure adequate opportunities to engage, including
extending timelines for submissions and using videoconferencing.
The Commission is also expanding its mechanisms for engaging and working with
Aboriginal and Torres Strait Islander people and organisations. Oral submissions were used
to inform the Indigenous Evaluation Strategy, while Commission staff also spent time in
Yuendumu to inform the Expenditure on Children in the Northern Territory study and obtain
practical insights into service delivery, including through interviewing service providers and
community members.
ANNUAL PERFORMANCE STATEMENT 9
The Productivity Commission’s processes are open and transparent.
The Commission operates under the powers, protection and guidance of its own legislation.
Its independence is formally exercised under the Productivity Commission Act 1998 (Cwlth)
through the Chair and Commissioners, who are appointed by the Governor‑General for fixed
periods.
The Commission has its own budgetary allocation and a small permanent staff, operating at
arm’s length from other government agencies. While the Government initiates the
Commission’s inquiries and studies, the Commission’s findings and recommendations are
based on its own analysis and judgment.
The Commission’s objectivity and independence are key strengths of its work. The
Commission delivers high quality advice by ensuring analysis and judgements are
scrutinised and drawing on public input.
The Commission’s advice to government, and the information and analysis on which it is
based, continued to be open to public scrutiny in 2019‑20. As noted above, the Commission’s
processes provided for extensive public input and feedback through hearings, workshops and
other consultative forums, and through the release of draft or interim reports. For example,
the Commission conducted 13 days of public hearings around Australia and hosted
11 roundtables on a range of topics for the Mental Health inquiry.
In addition, the Commission made a number of key data sets and modelling publicly
available to support the release of its reports in 2019‑20, including analysis and supporting
data for the Mental Health and National Transport Regulatory Reform draft reports, as well
as an interactive map and associated data alongside the release of the final report of the
Economic Regulation of Airports inquiry.
The Productivity Commission delivers reports within agreed timeframes.
All of the completed major projects in 2019‑20 were finished within the timeframes
originally established by Government or as subsequently varied. The timeframes for some
projects were adjusted due to the COVID-19 pandemic, to ensure that there were adequate
opportunities for interested parties to engage and to allow consideration of the implications
of the pandemic.
The timing of tabling of commissioned inquiry reports, following completion of a project, is
a matter for Government.

THE YEAR IN REVIEW: COMMISSION ACTIVITIES 11
3 The year in review: Commission
activities
Public inquiries and commissioned studies
The Commission commenced three new projects at the request of the Australian Government
in 2019‑20, compared to the commencement of six new projects in 2018-19.
• In August 2019, the Commission received a reference to conduct a study into regulation
in the resources sector, to identify effective regulatory approaches, highlight examples
of best practice regulation, and examine where successful relationships have been
developed with the community. A draft report was released in March 2020.
• In November 2019, the Government asked the Commission to review the National
Agreement for Skills and Workforce Development. The study is to examine how well
the Agreement's goals have been achieved and its suitability for the future, including
options for reform across coordination, funding, pricing and efficiency. An interim report
was released in June 2020.
• In May 2020, the Commission commenced the second of its triennial inquiries into the
progress of reform in Australia’s water resources sector, as required by the Water Act
2007. A draft report is expected to be released later in 2020.
During 2019-20, the Commission also continued developing a whole‑of‑government
evaluation strategy for policies and programs affecting Aboriginal and Torres Strait Islander
people. A draft strategy was released in June 2020.
The Commission completed four inquiries or studies in 2019‑20, compared with six in
2018-19.
• A review into the zone tax offset and related remote area tax concessions and payments,
making recommendations on whether the tax concessions and payments should continue
and, if so, what form they should take.
• A study into government expenditure in the Northern Territory on children and family
services, including how decisions about expenditure are being made and ways to improve
funding arrangements and service delivery.
• A review of national transport regulatory reform, to investigate the long‑run economic
impacts of recent heavy vehicle, rail and maritime reforms.
• An inquiry into the role of mental health in social and economic participation, which
considered measures to improve mental health to produce long-term economic benefits.

12 ANNUAL REPORT 2019-20
This meant there were three inquiries and five studies underway at some point during
2019‑20 (figure 3). In addition, the Commission commenced case studies on productivity
reform within Australia for the Council on Federal Financial Relations, to inform and diffuse
knowledge and practices across governments and identify reform opportunities.
Trends in public inquiry activity and participation over the past five years are shown in figure
4 and table 1. Further information on public inquiries and commissioned studies undertaken
during 2019‑20 is available on the Commission’s website.
Figure 3 Program of public inquiries and other government-commissioned projects
Shaded areas indicates the approximate duration of the project in the period covered by the figure.
Figure 4 Projects commenced, on hand and completed
a Figures are for financial years. b As at 30 June 2020.
2018-19 2019-20 2020-21
Month J F M A M J J A S O N D J F M A M J J A S O N D
Public Inquiries
Compensation and Rehabilitation for Veterans
Economic Regulation of Airports
Mental Health
National Transport Regulatory Reform
National Water Reform
Commissioned research studies
Remote Area Tax Concessions and Payments
Expenditure on Children in the Northern Territory
Indigenous Evaluation Strategy
Resources Sector Regulation
National Agreement for Skills and Workforce
Development
0
2
4
6
8
10
12
2016 2017 2018 2019 2020
References receiveda
0
2
4
6
8
10
12
2016 2017 2018 2019 2020
Projects on handa, b
0
2
4
6
8
10
12
2016 2017 2018 2019 2020
Projects completeda
Inquiry Study
THE YEAR IN REVIEW: COMMISSION ACTIVITIES 13
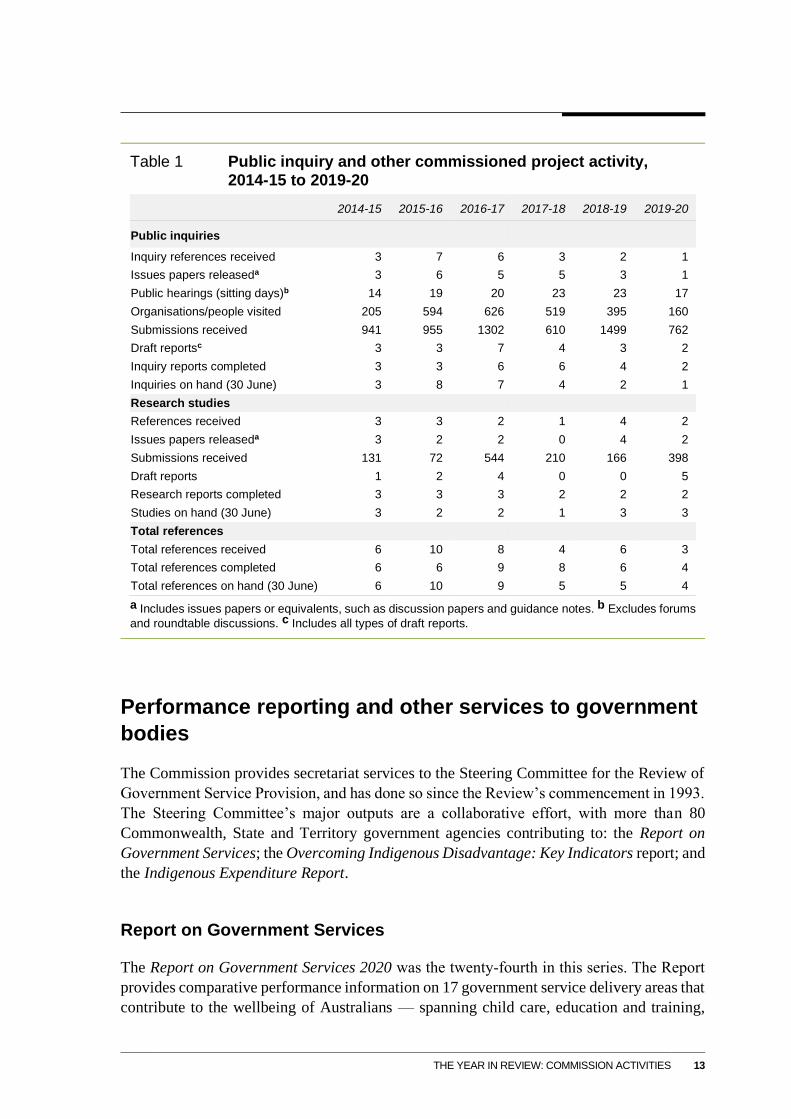
Table 1 Public inquiry and other commissioned project activity, 2014-15 to 2019-20
2014-15 2015-16 2016-17 2017-18 2018-19 2019-20
Public inquiries
Inquiry references received 3 7 6 3 2 1
Issues papers releaseda 3 6 5 5 3 1
Public hearings (sitting days)b 14 19 20 23 23 17
Organisations/people visited 205 594 626 519 395 160
Submissions received 941 955 1302 610 1499 762
Draft reportsc 3 3 7 4 3 2
Inquiry reports completed 3 3 6 6 4 2
Inquiries on hand (30 June) 3 8 7 4 2 1
Research studies
References received 3 3 2 1 4 2
Issues papers releaseda 3 2 2 0 4 2
Submissions received 131 72 544 210 166 398
Draft reports 1 2 4 0 0 5
Research reports completed 3 3 3 2 2 2
Studies on hand (30 June) 3 2 2 1 3 3
Total references
Total references received 6 10 8 4 6 3
Total references completed 6 6 9 8 6 4
Total references on hand (30 June) 6 10 9 5 5 4
a Includes issues papers or equivalents, such as discussion papers and guidance notes. b Excludes forums
and roundtable discussions. c Includes all types of draft reports.
Performance reporting and other services to government
bodies
The Commission provides secretariat services to the Steering Committee for the Review of
Government Service Provision, and has done so since the Review’s commencement in 1993.
The Steering Committee’s major outputs are a collaborative effort, with more than 80
Commonwealth, State and Territory government agencies contributing to: the Report on
Government Services; the Overcoming Indigenous Disadvantage: Key Indicators report; and
the Indigenous Expenditure Report.
Report on Government Services
The Report on Government Services 2020 was the twenty‑fourth in this series. The Report
provides comparative performance information on 17 government service delivery areas that
contribute to the wellbeing of Australians — spanning child care, education and training,
14 ANNUAL REPORT 2019-20
health, justice, community services, emergency management, housing and homelessness.
The services covered in the 2020 Report collectively account for $247 billion of government
recurrent expenditure, equivalent to about 13 per cent of GDP.
As part of the continued development of the Report, a staged transition to interactive online
reporting continued in 2019‑20 with the transition of Justice, Emergency Management and
Health material. In addition, a pilot to improve the timeliness of reporting was completed,
with a mid-2020 release of a subset of the Report's data (Police Services). It is anticipated
that subsequent mid-year releases will occur for selected Report material.
Reporting specific to Aboriginal and Torres Strait Islander people
The Overcoming Indigenous Disadvantage: Key Indicators (OID) reports, commissioned by
COAG in 2002, measure the wellbeing of Aboriginal and Torres Strait Islander people. The
latest report was the seventh edition and was released in November 2016, with the next report
expected to be released in December 2020.
Engagement on the report with governments and Aboriginal and Torres Strait Islander
people and organisations continued through 2019-20. The 2020 report will have a greater
strengths-based narrative and its case study focus will be on shared decision making between
Aboriginal and Torres Strait Islander people and governments
COAG agreed to the reporting of Indigenous expenditure in 2007, with the Productivity
Commission assuming secretariat responsibilities in November 2008. The Indigenous
Expenditure Report (IER) seeks to contribute to understanding of the levels and patterns of
expenditure on services for Aboriginal and Torres Strait Islander people across over
150 expenditure categories. The report does not attempt to assess the adequacy, effectiveness
or efficiency of government expenditure. The latest IER was published in October 2017, and
was the fourth edition.
National Agreement reporting
The Commission supports the provision of information to assess performance against the six
National Agreements agreed by COAG under the Intergovernmental Agreement on Federal
Financial Relations.
During 2019-20, the Steering Committee collated performance information for the National
Indigenous Reform Agreement, and incorporated applicable indicators and data from other
National Agreements in its Report on Government Services.

THE YEAR IN REVIEW: COMMISSION ACTIVITIES 15
Performance Reporting Dashboard
The Commission maintains the Performance Reporting Dashboard, which provides a single,
streamlined source of information on progress towards key commitments agreed by COAG.
In 2019‑20, the Commission published its third update of the Dashboard.
Competitive neutrality activities
Competitive neutrality policy seeks to ensure that government businesses do not have
advantages (or disadvantages) relative to their private sector competitors, simply by virtue
of their public ownership.
The Australian Government Competitive Neutrality Complaints Office (AGCNCO) operates
as a separate unit within the Commission. Its function is to receive and investigate
complaints and provide advice to the Treasurer on the application of competitive neutrality
arrangements. The AGCNCO also provides informal advice to individuals and private
organisations on the application of competitive neutrality to government activities, and to
government agencies on implementing their competitive neutrality obligations.
In 2019‑20, the AGCNCO received 35 queries about competitive neutrality matters from
various parties, including one formal competitive neutrality complaint.
In response to requests for information, the AGCNCO also provided advice to the Treasury
on a revised edition of the Australian Government’s Competitive Neutrality Guidelines for
Managers and to a Senate Committee to assist its consideration of legislation to establish the
Australian Business Growth Fund.
Other research activities and annual reporting
The Commission is required under its Act to undertake research to complement its other
activities. This research supports its role in promoting public understanding of the trade‑offs
involved in different policy approaches, and how productivity and the living standards of
Australians can be enhanced. It also reports annually on the effects of assistance and
regulation.
The Commission’s research program is guided by government statements on policy
priorities, including potential commissioned work; parliamentary debate and committee
work; and informal and formal consultations with Australian Government departments,
business, community and environmental groups, union bodies and academics.
16 ANNUAL REPORT 2019-20
During 2019-20, the Commission released three research papers, on:
• the experiences of vulnerable people in the private rental market and the policies that
affect outcomes for vulnerable renters
• policy and implementation frameworks in urban water, to identify where there may be
impediments to the adoption of Integrated Water Cycle Management (the joint
management of water, wastewater and stormwater resources in urban environments)
• the trends and drivers of foreign investment in Australia, its positive and negative effects,
and the Australian Government’s foreign investment policies
– Future Trade and Assistance Reviews will build on this initial work through regular
reporting on foreign investment, following Government support for the
Commission’s recommendation to this effect in the 2016 Regulation of Australian
Agriculture inquiry.
As part of efforts across the Australian Public Service to support the whole-of-government
response to the COVID-19 pandemic, the Commission also provided research and analytical
support to agencies engaged in the economic response to the crisis, including by deploying
several staff to other agencies.
During the year, the Commission commenced work on case studies on Australian
productivity reforms, following a request from the Council on Federal Financial Relations
in October 2019. The first case study, focusing on Victoria's commercial land use zoning,
was released in September.
The Commission released the Trade and Assistance Review 2018‑19 in April 2020. The
review outlined the latest quantitative estimates of Australian Government assistance to
industry and discussed recent developments in industry assistance and trade policy. Industry
support measures associated with the COVID-19 pandemic are expected to be considered in
the next Review, where relevant.
The Commission also published its annual stocktake of productivity performance through
the release of two Productivity Insights papers in February and March 2020. The papers
discussed recent productivity trends and Australia’s relative levels of productivity and
income compared with other advanced economies.
THE POLICY AND WIDER IMPACT OF COMMISSION ACTIVITIES 17
4 The policy and wider impact of
Commission activities
Assessing the Commission’s performance
The Commission assesses its overall performance against the following outcome objective:
Well‑informed policy decision making and public understanding on matters relating to
Australia’s productivity and living standards, based on independent and transparent analysis from
a community‑wide perspective.
Assessment of the Commission’s performance can be complicated by it being one
contributor among many to any policy outcome. As such, the Commission's contribution is
best considered over the medium term. Even when its specific recommendations are not
supported by government, the Commission can play a significant role in helping
governments, parliaments and the community understand the trade‑offs involved with
different policy choices, and in providing data that is a source of reference for policy makers.
The Commission monitors reaction to its work in order to improve its performance and its
contribution to public understanding and policy making. Those with an interest in the
Commission’s reports and users of the Commission’s website have the opportunity to
provide feedback.
Generating effective debate
The Commission obtains an indicator of its success in generating effective public debate by
considering the degree of acceptance of recommendations, the quantity of report downloads,
and the number of mentions in the media and parliaments.
Internal analysis (both qualitative and quantitative) across the four projects completed in
2019‑20 indicates that the Mental Health inquiry generated a high level of public debate and
the Remote Area Tax Concessions and Payments study generated a medium level of debate.
There were relatively low levels of debate for National Transport Regulatory Reform and
Expenditure on Children in the Northern Territory.
Government decisions in response to the Commission’s inquiry reports and commissioned
research studies provide a tangible indication of their usefulness to the Australian
Government, Parliament and the broader community.
18 ANNUAL REPORT 2019-20
During 2019‑20, the Government issued responses to two of the reports released during the
year.
• In December 2019, the Government responded to the Commission’s Economic
Regulation of Airports inquiry report (released October 2019), with nine out of the
report’s 14 recommendations agreed to or supported.
• In February 2020, the Government stated that it would not be acting on any of the
recommendations in the Remote Area Tax Concessions and Payments final study report,
due to the challenges faced by regional Australia, including recent droughts and
bushfires.
In addition, some of the actions taken by the Australian, State and Territory governments in
response to the COVID-19 pandemic (including some of the temporary measures) align with
previous Commission recommendations. For example, the expansion of retail trading hours
for supermarkets and pharmacies (Economic Structure and Performance of the Australian
Retail Industry 2011; Workplace Relations Framework 2015), the introduction of electronic
pharmaceutical prescriptions (Shifting the Dial: 5 Year Productivity Review 2017), and the
expansion of telehealth services (Shifting the Dial 2017).
Commission inquiry and research reports were frequently cited by parliamentarians in
debates and questions during 2019‑20. In the Federal Parliament, about 115 members and
senators referred to more than 47 different Commission reports or inquiries, or to the
Commission’s role in policy processes. In addition, there were at least 69 mentions of
29 different Commission inquiries and its work in the Hansard proceedings of Federal
Parliamentary Committees in 2019‑20. The most frequent mentions were Superannuation
and Compensation and Rehabilitation for Veterans.
The Commission’s inquiry and research reports were also used extensively in debate and
questions by state and territory parliamentarians. During the 2019‑20 sittings of the eight
state and territory parliaments, 92 members referred to about 26 different Commission
publications or inquiries (including the Report on Government Services), or to the
Commission’s role in policy processes. In about 75 per cent of the 131 total mentions the
Commission was cited as an authoritative source, while 5 per cent of mentions were critical
of a particular finding, report or Commission attribute. The Report on Government Services
was mentioned most frequently, while the Commission’s Gambling and Mental Health
reports also featured prominently.
Another indicator of the Commission's success in generating effective public debate is the
traffic to the Commission's website and the number of downloads of Commission reports.
In 2019‑20, the Commission’s website received a high level of traffic from external users,
with more than 117 000 downloads of government‑commissioned inquiry and study reports.
The projects of most interest were the Mental Health draft report (around 25 000 downloads),
the Compensation and Rehabilitation for Veterans inquiry (around 9000 downloads) and the
superannuation inquiry (around 5000 downloads). The 2020 Report on Government Services
THE POLICY AND WIDER IMPACT OF COMMISSION ACTIVITIES 19
was also highly sought after by website users — as in previous years — with a large number
of report downloads (about 9000).
During 2019‑20, there were an average of 145 media mentions each month for the four
inquiries and studies that were completed during the year. More broadly, there were at least
1100 media mentions of the Productivity Commission each month, which includes
discussion of the Commission's previous reports and its role in the policy process. The
Mental Health inquiry received the highest number of media mentions of the reports
published in 2019-20, while the Superannuation and Shifting the Dial reports also received
significant media interest during the year.
Invitations to give briefings and present papers to conferences and to parliamentary, business
and community groups are another indicator of the Commission’s role in generating public
debate. However, the COVID-19 pandemic resulted in some events being cancelled during
early 2020. In total, there were 58 presentations by the Chair, Commissioners and staff
during the year, slightly fewer than the previous year (65 presentations). Common topics
included mental health and water reform, as well as discussion of evidence-based
policymaking and regulation.
International recognition of the Commission as a model for evidence‑based policy is also an
indicator of the Commission’s impact. The Commission briefed 12 international delegations
and visitors from eight countries during 2019‑20, including officials and delegations from
Chile, Indonesia and the United Kingdom. Topics of discussion included the Commission’s
role and activities, performance benchmarking of government services, and productivity
measurement in the non-market sector.
Some of the Commission’s international liaison has been with other productivity
organisations around the world, and with officials in countries where there is a desire to
strengthen the focus on productivity‑enhancing policies.
The OECD and IMF cited the Commission’s work in 28 of their reports published throughout
the year. This included references to the 2017 Data Availability and Use and 2019 Murray-
Darling Basin Plan: Five-year Assessment reports, along with older reports such as the
Commission's reviews of mutual recognition schemes and the 2011 inquiry into Rural
Research and Development Corporations.
The Commission also continued to be well cited in academic literature during the year. In
2019-20, new academic literature referred to a number of reports, such as the Commission’s
inquiry into superannuation, along with older reports, such as the 2010 Australian Gambling
Industries inquiry, the latter being the most cited of the Commission’s publications in the
academic literature over time. This demonstrates that the Commission’s role as a source of
evidence‑based policy advice can continue long after the release of a report.
20 ANNUAL REPORT 2019-20
Transparency and community engagement
A central feature of the Commission’s processes is the opportunity for people to participate
in and scrutinise its work. Engaging with the community through open and transparent
processes ensures that the Commission’s research and policy advice is informed by those
who are interested in, and affected by, that advice, and that the analysis is tested publicly.
The Commission conducts public hearings, calls for submissions that are made publicly
available, and publishes draft and final reports. Roundtables, workshops and other forums
provide valuable opportunities for the Commission to access wider sources of expertise in
its inquiries and research.
The Commission provided a range of opportunities for public participation in each of the
inquiries and studies completed in 2019‑20, including public hearings, roundtables,
workshops and the release of papers for public comment. For all of inquiries and studies
completed in 2019‑20, the Commission released an issues paper, issued a draft report and
held two rounds of submissions to allow written participation from interested parties.
Given the priority efforts devoted by governments, businesses, organisations and
communities in responding to the COVID-19 pandemic, the Commission also adjusted its
processes to ensure participants had adequate opportunities to engage, including extending
timelines for submissions and using videoconferencing to engage with participants.
During its 2019‑20 inquiry activities, the Commission met with approximately 160
organisations or groups, held 17 days of public hearings, and received 762 submissions. And
for studies, the Commission received a total of 398 submissions during the year. As part of
this engagement, the Commission visited all capital cities during 2019-20, as well as a
number of regional and remote communities, such as Karratha, Kalgoorlie-Boulder, Groote
Eylandt, Rockhampton, Broken Hill and others.
A number of inquiries provided opportunities for ‘brief comments’, a more informal avenue
for feedback compared to submissions. The Mental Health inquiry received 308 brief
comments during 2019‑20, in addition to the 680 submissions it received following the
release of the draft report in October 2019.
The Commission used a variety of means to communicate with inquiry participants during
2019‑20. For example, the Commission released videos alongside the draft reports for the
Mental Health and Indigenous Evaluation Strategy projects, in order to reach a wider
audience of interested parties. The Commission is also expanding its mechanisms for
engaging and working with Aboriginal and Torres Strait Islander people and organisations
(box 1).
Extensive consultation with all Australian governments continued throughout 2019-20 for
the Commission's government performance reporting work, through the processes agreed by
the Steering Committee for the Review of Government Service Provision. The Commission
THE POLICY AND WIDER IMPACT OF COMMISSION ACTIVITIES 21
provided opportunities for the public to provide feedback on its government performance
reporting and analysis work via the Commission’s website.
As part of its open and transparent processes, the Commission also makes key data sets and
modelling available. In 2019‑20, this included releasing analysis and supporting data for the
Mental Health and National Transport Regulatory Reform draft reports, as well as an
interactive map and associated data alongside the release of the final report of the Economic
Regulation of Airports inquiry in October 2019.
Box 1 Engaging with Aboriginal and Torres Strait Islander people
Several Commission inquiries and studies undertaken during the year had a focus on issues of
particular relevance to Aboriginal and Torres Strait Islander people. For each of these inquiries
and studies, the Commission undertook engagement using a range of methods.
For example, Commission staff spent time in Yuendumu to strengthen our understanding of the
local context, including through interviewing service providers and community members, to inform
the Expenditure on Children in the Northern Territory study and obtain practical insights into
service delivery.
To inform the Indigenous Evaluation Strategy, the Commission took oral submissions, and
engaged with Aboriginal and Torres Strait Islander people and organisations across the country,
including visits and meetings in all capital cities, the Kimberley, and the Torres Strait.
The Mental Health inquiry convened a roundtable discussion on the experiences of Aboriginal
and Torres Strait Islander people with the mental health system in urban areas, with a Torres
Strait Islander facilitator.
Engagement with Aboriginal and Torres Strait Islander people and organisations also continued
throughout 2019-20 for the next Overcoming Indigenous Disadvantage: Key Indicators report,
due in late 2020.
Timeliness and cost effectiveness
In 2019‑20, all of the Commission’s inquiry and study reports, as well as all reports produced
as part of the Commission’s performance reporting and other functions, were completed
within the timeframes originally established by Government, or as subsequently varied. The
timeframes for some projects were adjusted due to the COVID-19 pandemic, to ensure that
there were adequate opportunities for interested parties to engage, and to allow consideration
of the policy implications of the pandemic.
The timing of tabling of commissioned inquiry reports following completion of a project is
a matter for Government.
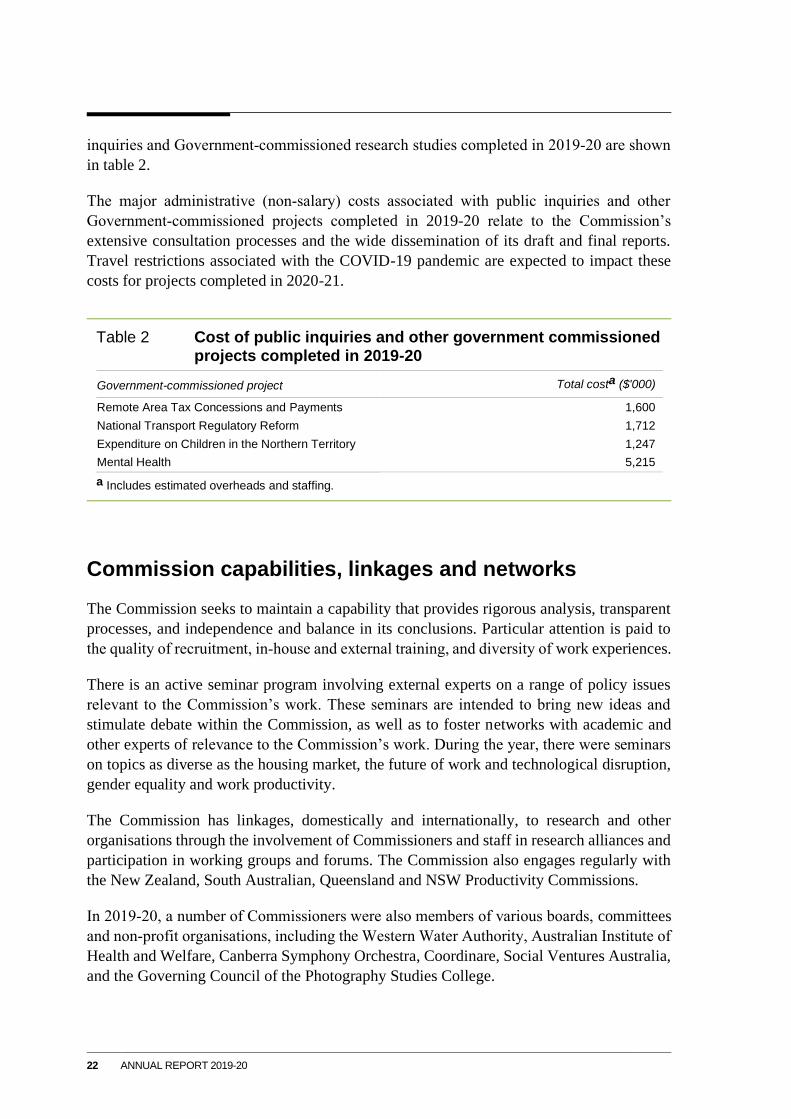
The Commission endeavours to conduct projects efficiently, while ensuring rigorous
analysis and maximising the opportunity for participation. Total estimated costs (covering
salaries, direct administrative expenses and an allocation for corporate overheads) for
22 ANNUAL REPORT 2019-20
inquiries and Government‑commissioned research studies completed in 2019‑20 are shown
in table 2.
The major administrative (non‑salary) costs associated with public inquiries and other
Government‑commissioned projects completed in 2019-20 relate to the Commission’s
extensive consultation processes and the wide dissemination of its draft and final reports.
Travel restrictions associated with the COVID-19 pandemic are expected to impact these
costs for projects completed in 2020-21.
Table 2 Cost of public inquiries and other government commissioned projects completed in 2019-20
Government-commissioned project Total costa ($'000)
Remote Area Tax Concessions and Payments 1,600
National Transport Regulatory Reform 1,712
Expenditure on Children in the Northern Territory 1,247
Mental Health 5,215
a Includes estimated overheads and staffing.
Commission capabilities, linkages and networks
The Commission seeks to maintain a capability that provides rigorous analysis, transparent
processes, and independence and balance in its conclusions. Particular attention is paid to
the quality of recruitment, in‑house and external training, and diversity of work experiences.
There is an active seminar program involving external experts on a range of policy issues
relevant to the Commission’s work. These seminars are intended to bring new ideas and
stimulate debate within the Commission, as well as to foster networks with academic and
other experts of relevance to the Commission’s work. During the year, there were seminars
on topics as diverse as the housing market, the future of work and technological disruption,
gender equality and work productivity.
The Commission has linkages, domestically and internationally, to research and other
organisations through the involvement of Commissioners and staff in research alliances and
participation in working groups and forums. The Commission also engages regularly with
the New Zealand, South Australian, Queensland and NSW Productivity Commissions.
In 2019‑20, a number of Commissioners were also members of various boards, committees
and non‑profit organisations, including the Western Water Authority, Australian Institute of
Health and Welfare, Canberra Symphony Orchestra, Coordinare, Social Ventures Australia,
and the Governing Council of the Photography Studies College.
MANAGEMENT AND ACCOUNTABILITY 23
5 Management and accountability
Commissioners and staff
The Commission operates under the powers, protection and guidance of its own legislation.
Its independence is formally exercised under the Productivity Commission Act 1998 through
the Chair and Commissioners.
Commissioners
At 30 June 2020, there were twelve members of the Commission, plus the Chair. Six
Commissioners held part‑time appointments.
Dr Catherine de Fontenay commenced her term as a full‑time Commissioner on 1 July 2019.
Prior to her appointment, Dr de Fontenay was an Associate Professor of Economics at the
Melbourne Business School, University of Melbourne. After completing her PhD in 1998 at
Stanford University, Dr de Fontenay taught at the University of New South Wales. She also
held visiting positions at the Stanford Institute for Economic Policy Research, Stanford
University, and the Stern School of Business, New York University.
Following the end of the term of his initial five-year appointment, Mr Ken Baxter AM was
re-appointed as a part-time Commissioner from 14 May 2020 to 31 December 2020.
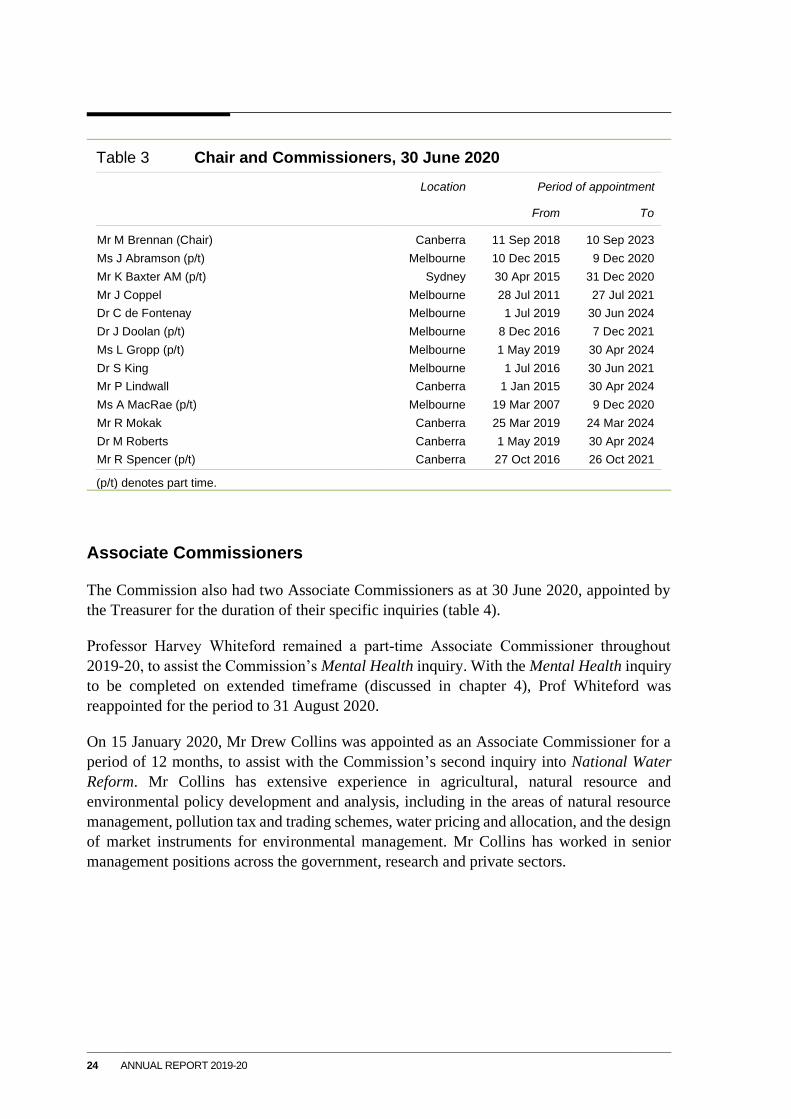
Biographical information on all Commissioners is available on the Commission’s website
and their terms of appointment are listed in table 3.
24 ANNUAL REPORT 2019-20
Table 3 Chair and Commissioners, 30 June 2020
Location Period of appointment
From To
Mr M Brennan (Chair) Canberra 11 Sep 2018 10 Sep 2023
Ms J Abramson (p/t) Melbourne 10 Dec 2015 9 Dec 2020
Mr K Baxter AM (p/t) Sydney 30 Apr 2015 31 Dec 2020
Mr J Coppel Melbourne 28 Jul 2011 27 Jul 2021
Dr C de Fontenay Melbourne 1 Jul 2019 30 Jun 2024
Dr J Doolan (p/t) Melbourne 8 Dec 2016 7 Dec 2021
Ms L Gropp (p/t) Melbourne 1 May 2019 30 Apr 2024
Dr S King Melbourne 1 Jul 2016 30 Jun 2021
Mr P Lindwall Canberra 1 Jan 2015 30 Apr 2024
Ms A MacRae (p/t) Melbourne 19 Mar 2007 9 Dec 2020
Mr R Mokak Canberra 25 Mar 2019 24 Mar 2024
Dr M Roberts Canberra 1 May 2019 30 Apr 2024
Mr R Spencer (p/t) Canberra 27 Oct 2016 26 Oct 2021
(p/t) denotes part time.
Associate Commissioners
The Commission also had two Associate Commissioners as at 30 June 2020, appointed by
the Treasurer for the duration of their specific inquiries (table 4).
Professor Harvey Whiteford remained a part‑time Associate Commissioner throughout
2019-20, to assist the Commission’s Mental Health inquiry. With the Mental Health inquiry
to be completed on extended timeframe (discussed in chapter 4), Prof Whiteford was
reappointed for the period to 31 August 2020.
On 15 January 2020, Mr Drew Collins was appointed as an Associate Commissioner for a
period of 12 months, to assist with the Commission’s second inquiry into National Water
Reform. Mr Collins has extensive experience in agricultural, natural resource and
environmental policy development and analysis, including in the areas of natural resource
management, pollution tax and trading schemes, water pricing and allocation, and the design
of market instruments for environmental management. Mr Collins has worked in senior
management positions across the government, research and private sectors.
MANAGEMENT AND ACCOUNTABILITY 25
Table 4 Associate Commissioners, 30 June 2020
Period of appointment
Location Inquiry/study From To
Prof H Whiteford (p/t) Canberra Mental Health 21 Nov 2018 31 Aug 2020
Mr D Collins Canberra National Water Reform 15 Jan 2020 14 Jan 2021
Staff
The average staffing level during 2019‑20 was 174, compared with 168 in 2018-19. The
Commission recruited 23 staff during the year, including seven through its graduate
recruitment program. Staff turnover was approximately 14 per cent.
Statistical information on staffing is provided in the Appendix.
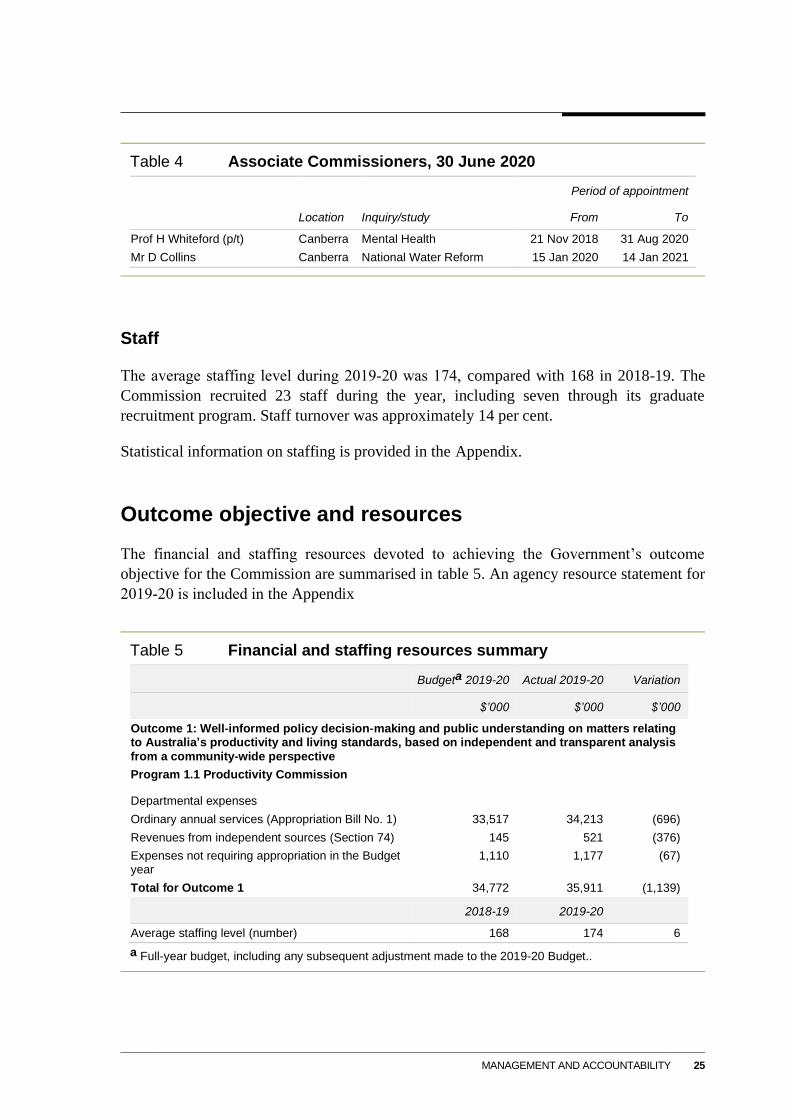
Outcome objective and resources
The financial and staffing resources devoted to achieving the Government’s outcome
objective for the Commission are summarised in table 5. An agency resource statement for
2019‑20 is included in the Appendix
Table 5 Financial and staffing resources summary
Budgeta 2019-20 Actual 2019-20 Variation
$’000 $’000 $’000
Outcome 1: Well‑informed policy decision‑making and public understanding on matters relating to Australia’s productivity and living standards, based on independent and transparent analysis
from a community‑wide perspective
Program 1.1 Productivity Commission
Departmental expenses
Ordinary annual services (Appropriation Bill No. 1) 33,517 34,213 (696)
Revenues from independent sources (Section 74) 145 521 (376)
Expenses not requiring appropriation in the Budget year
1,110 1,177 (67)
Total for Outcome 1 34,772 35,911 (1,139)
2018-19 2019-20
Average staffing level (number) 168 174 6
a Full-year budget, including any subsequent adjustment made to the 2019-20 Budget..
26 ANNUAL REPORT 2019-20
Governance
The Commission’s governance arrangements are designed to achieve efficient, effective and
ethical use of resources in delivering the Commission’s mandated outcome objective. The
arrangements are also designed to ensure compliance with legislative and other external
requirements in regard to administrative and financial management practices.
In keeping with good governance principles, the Commission’s governance arrangements
encompass:
• establishing clear responsibilities for decision making and the undertaking of mandated
activities
• ensuring accountability through the monitoring of progress, and compliance with
legislative and other requirements, of mandated activities
• underpinning these arrangements through the promotion of a risk management and
ethical behaviour culture.
Key responsibilities
The Commission’s Chair is responsible for the overall management and governance of the
Commission, its reputation and public handling of issues, and the quality of its output. The
Chair is the ‘Accountable Authority’ under the PGPA Act.
The Chair is assisted in these tasks by the Head of Office and a Management Committee that
addresses matters of strategic direction, organisational development, policies and practices,
monitoring of performance and resource allocation. Management Committee comprises the
Chair (as chair), the Head of Office, the Executive Managers of the Melbourne and Canberra
offices, and the Assistant Commissioner responsible for Corporate Group. It meets monthly,
or more frequently as needed.
The Research Committee oversees the Commission’s self-initiated research program to
ensure delivery of high quality, policy relevant research in a timely way. It also oversees
data analysis, and modelling capability and development to promote fit for purpose model
use that is quality assured. It meets monthly and comprises the Chair (as chair), two
Commissioners, the Head of Office, the Executive Managers, the Head of Modelling, and
the Assistant Commissioners for Research and Modelling.
Commissioners are responsible for the conduct and quality of the individual inquiries,
studies or other activities to which they are assigned by the Chair, and the overall quality of
Commission work via their contributions to monthly Commission meetings.
MANAGEMENT AND ACCOUNTABILITY 27
Accountability
Management Committee’s monitoring of the Commission is aided through the provision of
regular reports covering staffing, expenditure, staff development and other operational matters.
Monthly Commission meetings — also attended by senior staff — are used to discuss and
monitor progress across the Commission’s four mandated outputs. Specifically:
• the responsible Commissioners on government commissioned projects report at each
Commission meeting on significant issues and progress against key milestones
• reports are provided on the status and future directions of the research program at each
Commission meeting
• the activities of the Steering Committee for the Review of Government Service
Provision, chaired by the Chair of the Commission, are reported on a quarterly basis
• a Commissioner designated with responsibility for competitive neutrality issues reports
to the Commission annually
• the Head of Office provides monthly updates on key management issues.
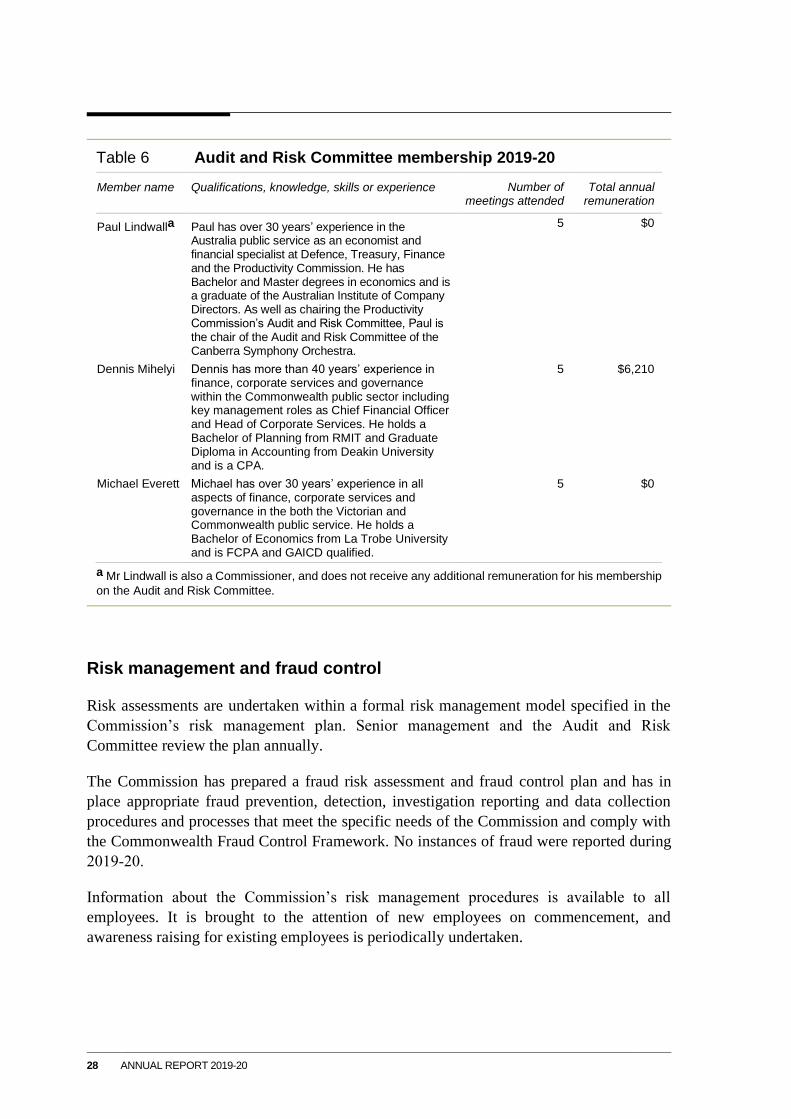
The Audit and Risk Committee is a further source of accountability through its periodic
review of particular aspects of the Commission’s operations. Its membership comprises a
chairperson (a Commissioner) and two external members (table 6). The Commission’s
contracted internal auditors generally attend meetings, as does a representative of the
Australian National Audit Office on an ‘as required’ basis. The Audit and Risk Committee
meets at least four times a year. The charter determining the functions of the Audit and Risk
Committee can be found at www.pc.gov.au/about/governance/audit-committee.
28 ANNUAL REPORT 2019-20
Table 6 Audit and Risk Committee membership 2019-20
Member name Qualifications, knowledge, skills or experience Number of meetings attended
Total annual remuneration
Paul Lindwalla Paul has over 30 years’ experience in the Australia public service as an economist and financial specialist at Defence, Treasury, Finance and the Productivity Commission. He has Bachelor and Master degrees in economics and is a graduate of the Australian Institute of Company Directors. As well as chairing the Productivity Commission’s Audit and Risk Committee, Paul is the chair of the Audit and Risk Committee of the Canberra Symphony Orchestra.
5 $0
Dennis Mihelyi Dennis has more than 40 years’ experience in finance, corporate services and governance within the Commonwealth public sector including key management roles as Chief Financial Officer and Head of Corporate Services. He holds a Bachelor of Planning from RMIT and Graduate Diploma in Accounting from Deakin University and is a CPA.
5 $6,210
Michael Everett Michael has over 30 years’ experience in all aspects of finance, corporate services and governance in the both the Victorian and Commonwealth public service. He holds a Bachelor of Economics from La Trobe University and is FCPA and GAICD qualified.
5 $0
a Mr Lindwall is also a Commissioner, and does not receive any additional remuneration for his membership
on the Audit and Risk Committee.
Risk management and fraud control
Risk assessments are undertaken within a formal risk management model specified in the
Commission’s risk management plan. Senior management and the Audit and Risk
Committee review the plan annually.
The Commission has prepared a fraud risk assessment and fraud control plan and has in
place appropriate fraud prevention, detection, investigation reporting and data collection
procedures and processes that meet the specific needs of the Commission and comply with
the Commonwealth Fraud Control Framework. No instances of fraud were reported during
2019‑20.
Information about the Commission’s risk management procedures is available to all
employees. It is brought to the attention of new employees on commencement, and
awareness raising for existing employees is periodically undertaken.
MANAGEMENT AND ACCOUNTABILITY 29
Ethical standards
The Commission has adopted a range of measures to promote ethical standards.
• It has embraced the Australian Public Service (APS) Values, Employment Principles and
Code of Conduct.
• Senior managers are encouraged to set an example through the ethical and prudent use
of Commonwealth resources.
The Commission has a number of specific policies relating to ethical standards that have
regard to its own operational context. These deal with matters such as email and internet use,
harassment and bullying, discrimination, fraud, disclosure of information, and managing
conflicts of interest. The policies are readily available to all employees, including as part of
induction, and are updated as required. Staff awareness and training sessions are offered
periodically on these topics, with workplace behaviour training delivered to all staff in
2019-20.
External and internal scrutiny
The Commission’s processes, which provide for high levels of transparency and community
participation in its work, are a key means of promoting external scrutiny. These processes
are outlined in detail in chapter 4.
External scrutiny is also promoted through the Commission’s extensive reporting, in various
publications, of different aspects of its work.
Both the Commission and the Australian Government Competitive Neutrality Complaints
Office (which has separate functions although located within the Commission) have service
charters. Performance against the charters is monitored on an exceptions basis — that is, by
complaints to designated senior managers. No complaints were received during 2019‑20 in
respect of either charter.
The Auditor‑General issued an unqualified independent audit report on the Commission’s
2019‑20 financial statements. The Commission also engages an accounting firm to undertake
a program of internal audit reviews. In 2019‑20, the internal auditors conducted a review of
workforce planning, to assess the extent to which the Commission’s current arrangements
and activities support development of the capacity of its workforce. In addition, the internal
auditors reviewed the Commission’s fraud control plan and fraud risk assessment.
The Audit and Risk Committee also plays an important internal scrutiny role. The
Committee’s efforts during the year related mainly to:
• oversight of the Commission’s internal audit program
• consideration of the annual financial statements

30 ANNUAL REPORT 2019-20
• scrutiny of the Commission’s risk management assessment and plan
• reviews of relevant ANAO reports.
The use of Commission reports by Federal parliamentary committees during the year is
discussed in chapters 2 and 4. The Commission is often invited to appear before Senate
Committees to assist the work of Federal Parliament and facilitate scrutiny of its work. In
previous years, the Commission has frequently been requested to attend Senate Estimates
hearings, with appearances by the Chair and senior staff before the Senate Standing
Committee on Economics.
The Commission’s website continues to provide a valuable source of information about the
current work of the Commission, its publications and other activities. During 2019‑20, the
Commission continued to develop its use of social media to raise awareness of its work and
promote participation in its public inquiries. The use of infographics and videos to highlight
and promote aspects of the Commission’s work also continued.
Management of human resources
The Commission’s human resources management operates within the context of relevant
legislation, government policy and Commission‑developed policy. Day‑to‑day management
is devolved to senior managers within a broad framework agreed by Management
Committee. The Committee routinely monitors the performance of people management
functions, including through standing reports to its monthly meetings.
Workforce planning
The Commission undertakes a range of workforce planning strategies, programs and
practices designed to develop and maintain its workforce capability. Management
Committee plays the key role of ensuring alignment between the Commission’s resources
and its future capability requirements.
The Commission regularly considers a range of workforce planning issues associated with
the attraction, retention and development of staff. Regular recruitment activity was
undertaken in 2019‑20, to further build capability across roles and classifications.
The Commission also reviews its graduate recruitment process annually, with a view to
increasing the awareness of graduating university students of the Commission as a potential
employer. Seven new employees were engaged during 2019‑20 through the graduate
recruitment program (a decrease from 13 graduates in 2018‑19).
An important input to workforce planning is the information obtained from departing
employees through exit questionnaires and, where possible, personal interviews on exit.
Such information is considered by Management Committee and applied to a variety of
MANAGEMENT AND ACCOUNTABILITY 31
initiatives including conditions of service, developing employment agreements, employee
retention strategies, and learning and development initiatives.
Work was undertaken during 2019-20 to draw together key information, strategies and
activities associated with the Commission’s workforce planning practices.
Remuneration and employment conditions
Remuneration for the Chair and Commissioners is set directly by the Remuneration Tribunal
in determinations that are publicly available on the Tribunal’s website.
The Commission’s Senior Executive Service (SES) employees are employed under
individual determinations made under section 24(1) of the Public Service Act 1999. SES
remuneration is set by the Chair, and subject to review periodically, in the context of
particular role requirements and how the roles are performed, and taking account of public
and private sector benchmarks, including those contained in the APS Remuneration Report
published by the Australian Public Service Commission.
Information on key management personnel remuneration is set out in note 1 to the Financial
Statements (chapter 6) and disaggregated reporting is in the Appendix. Average
remuneration for senior executives and other highly paid staff is also in the Appendix.
APS salary ranges for non‑SES staff, which correspond to the Commission’s broadbanded
classifications, are shown in the enterprise agreement (available on the Commission’s
website). The Appendix provides details of salary ranges at 30 June 2020.
The remuneration and terms and conditions of the Commission’s non‑SES employees are
covered by the Enterprise Agreement 2017‑2020 (the Agreement), which came into effect
on 5 September 2017. On 24 January 2020, following consultation with staff, the Chair made
a determination (under subsection 24(1) of the Public Service Act 1999), which sits alongside
the Agreement. This determination provides additional annual salary increases out to
September 2022. All other terms and conditions remain in the Agreement.
The Agreement also includes provisions aimed at providing work‑life balance and a
satisfying and rewarding environment for employees. At 30 June 2020, four individual
flexibility agreements were in place, addressing allowances and working arrangements.
Performance management and pay
All Commission employees participate in regular performance management activities. The
Commission’s performance management policy and practice was reviewed in 2019-20, to
provide a greater focus on regular, meaningful feedback to support individuals’
development.
32 ANNUAL REPORT 2019-20
The practical elements of the Commission’s policy and practice are designed to:
• develop and maintain a strong culture of conversation between employees and managers,
where two-way discussions and feedback are part of regular work practices
• focus on individual’s capability development, including building and maintaining the
capability of employees and managers to support and sustain high performance
• recognise that an individual’s performance is shaped by both results and outcomes, and
the behaviours demonstrated along the way
• continue to focus efforts on learning and development in a way that can be tailored to
individuals’ needs at different points in their careers.
Ahead of each formal feedback round — which occur at six-monthly intervals — training is
conducted for employees and managers to ensure readiness for formal feedback sessions.
Under the Commission’s enterprise agreement, all salary increases are conditional upon
employees being rated fully effective in their formal performance feedback. Performance
bonuses are not a feature of remuneration for Commission employees.
Consultative arrangements
The formal employee consultative mechanism is the Productivity Commission Consultative
Committee. The committee comprises elected employee representatives, a CPSU
representative, and management representatives. The committee met four times in 2019-20.
In addition, there is regular direct consultation between management and employees,
including through regular team and all-staff meetings.
Learning and development
The Commission encourages employees to undertake learning and development across four
core competencies:
• management and leadership
• conceptual and analytical skills
• time and work management
• oral and written communication.
The need for learning and development can be employee identified (including through
individual development plans settled with supervisors as part of performance feedback), be
supervisor‑encouraged or directed, or reflect organisation‑wide initiatives.
The Commission’s Learning and Development Strategy and Action Plan 2018–2020 sets out
a range of priorities and activities to foster and maintain a vibrant learning culture, and
MANAGEMENT AND ACCOUNTABILITY 33
support the Commission’s work and employees’ career development. In 2019‑20, a number
of internal learning and development activities were introduced or expanded as part of this
strategy, with further refinements to in-house economic modelling and ‘new starter’ courses.
Training on giving and receiving feedback was another area of focus, to support the
Commission’s revised performance management policy and practice. A mentoring program
to support the development of Executive Level staff was also launched in early 2020.
The Commission continued to provide access to specific training and development activities
for individuals, including one‑on‑one coaching to address particular development needs and
extensive on‑the‑job training within the Commission. A program of internal seminars on a
range of topical economic, social and environmental issues also contributed to staff
development.
Employees may also seek to access studies assistance (in the form of paid leave and/or
assistance with fees) in the pursuit of tertiary qualifications.
Work health and safety
A Work Health and Safety (WHS) Committee oversees the Commission’s work health and
safety program. Committee membership includes management and staff health and safety
representatives from both the Commission’s Canberra and Melbourne offices. The
Committee met four times during 2019‑20.
Regular workplace hazard inspections are conducted by members of the WHS Committee.
No formal WHS investigations were conducted during the year and there were no notifiable
incidents. No notices under Part 10 of the Work Health Safety Act 2011 were given to the
Commission during 2019‑20. Training is provided for employees who have specific WHS
related responsibilities.
WHS activities and offerings during the year included:
• Commission‑funded flu vaccinations and health checks
• sessions on Building and Maintaining Resilience, and 'understanding and managing your
mental health' (for any interested staff) and 'managing for team wellbeing' (for managers)
• ergonomic workstation assessments, as required.
Work health and safety has been a key priority for the Commission during 2019-20, given
the impacts of the COVID-19 pandemic across Australia. The Commission’s focus has been
on supporting the wellbeing of employees, ensuring technology and WHS practices support
greater use of home-based work, and developing COVIDSafe plans and protocols to mitigate
risk. There has been regular communication and consultation on WHS matters arising from
COVID-19, and a range of supports have been made available to employees.
34 ANNUAL REPORT 2019-20
An indicator of the effectiveness of the Commission’s WHS programs is Comcare’s
workers’ compensation rate. The Commission’s rate for 2019‑20 was 0.14 per cent of
payroll, compared to an overall scheme premium rate of 0.87 per cent. There was one claim
for injury that was accepted by Comcare in 2019‑20.
Employee Assistance Program
The Commission offers its employees and their immediate family members access to
independent, confidential and professional counselling and assistance for work-related or
personal issues.
Workplace diversity
The Commission is committed to building and maintaining a workplace culture that values
and serves people with different backgrounds, experiences, and perspectives. The
Commission continues to foster a culture that is supportive of employees achieving their
potential and which values employee diversity. As at 30 June 2020:
• 55 per cent of staff were female
• 1 per cent of staff identified as Indigenous
• 21 per cent of staff were born outside Australia
• 13 per cent of staff identified as having a first language other than English
• 3 per cent of staff identified as having a disability
• 28 per cent of staff were aged 50 years or older
• 24 per cent of staff were under 30 years of age.
In 2019‑20, the Commission reviewed its Workplace Diversity and Inclusion Strategy,
which outlines a range of actions and activities to support diversity and inclusion.
The Strategy reflects the Commission’s commitment to focus efforts on three priority areas
— disability employment, Indigenous employment and awareness of Indigenous cultures,
and Culturally and Linguistically Diverse (CALD) / multicultural employment — as well as
support for diversity and inclusion matters more broadly.
A staff-led CALD network was also formed in 2019-20, open to all employees interested in
promoting and celebrating cultural awareness and diversity.
MANAGEMENT AND ACCOUNTABILITY 35
Financial performance
The Productivity Commission is a listed entity under the Public Governance, Performance
and Accountability Act 2013.
Revenue from government remained unchanged in 2019‑20 at $33.5 million ($33.5 million
in 2018‑19). Revenue from other sources remained unchanged at $0.6 million ($0.6 million
in 2018‑19).
Operating expenses increased in 2019‑20 to $35.9 million ($34.0 million in 2018‑19). The
major expenses in 2019-20 were $27.6 million in respect of employee expenses, $4.4 million
relating to supplier payments, and $3.6 million in asset depreciation, amortisation and related
expenses.
Under the Australian Government’s net cash appropriation arrangements, individual
agencies are not funded for depreciation or amortisation expenses through appropriation
revenue. The operating result for 2019‑20 was a $0.5 million deficit, after excluding those
depreciation and amortisation expenses. The deficit mainly arose from the change in
accounting standards for leases (AASB 16) and from lower than anticipated staff turnover.
Table 5 (above) provides a summary of financial and staffing resources. The agency resource
statement is provided in the Appendix. The audited financial statements for 2019‑20 are
shown in chapter 6 and include commentary on major budget variances.
Other reporting requirements
Purchasing
The Commission applies the Commonwealth Procurement Rules. The Commission’s
purchases of goods and services during 2019‑20 were consistent with the ‘value‑for‑money’
principle underpinning those rules.
The Commission did not enter into any contracts or standing offers that were exempt from
AusTender publication. Contracts of $100 000 or more (inclusive of GST) during 2019‑20
included a provision for the ANAO to have access to the contractor’s premises if required.
The Commission supports small business participation in the Commonwealth Government
procurement market by, for example, use of the Commonwealth Contracting suite for
low‑risk procurements valued under $200 000 and communication in clear, simple language
in accordance with the Small Business Engagement Principles. Small and medium
enterprises and small enterprise participation statistics are available on the Department of
Finance’s website at www.finance.gov.au/procurement/statistics-on-commonwealth-
purchasing-contracts/.
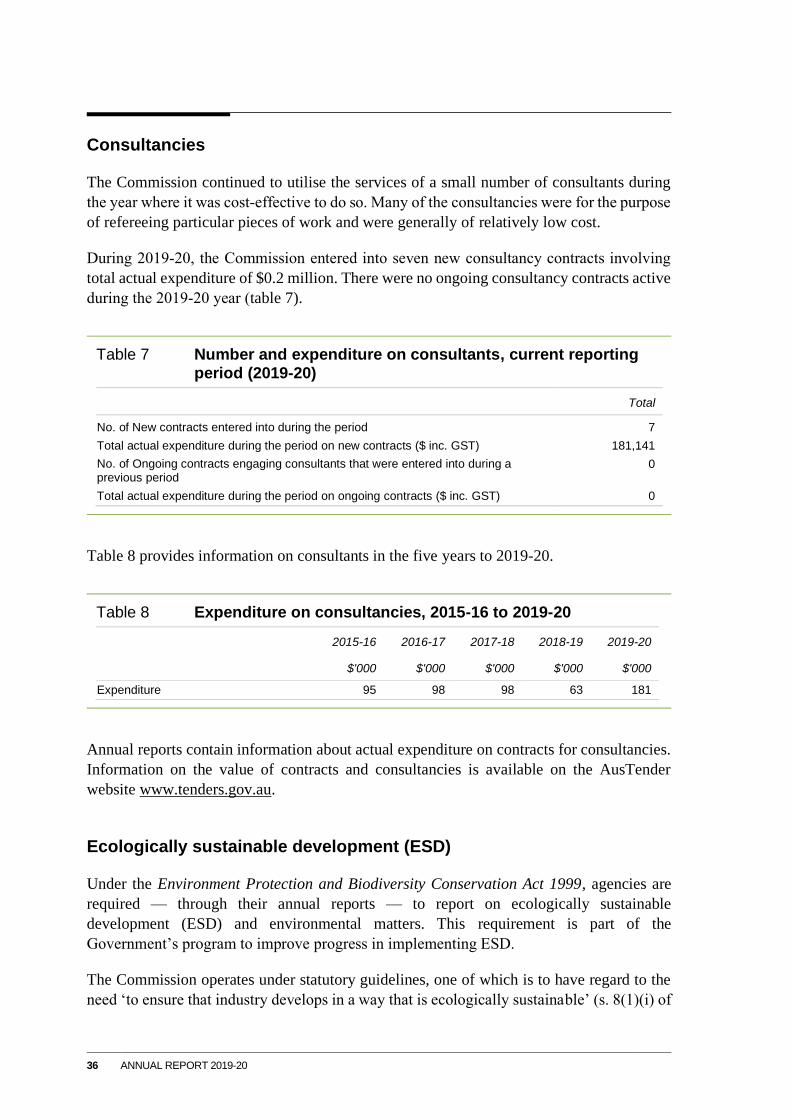
36 ANNUAL REPORT 2019-20
Consultancies
The Commission continued to utilise the services of a small number of consultants during
the year where it was cost‑effective to do so. Many of the consultancies were for the purpose
of refereeing particular pieces of work and were generally of relatively low cost.
During 2019‑20, the Commission entered into seven new consultancy contracts involving
total actual expenditure of $0.2 million. There were no ongoing consultancy contracts active
during the 2019‑20 year (table 7).
Table 7 Number and expenditure on consultants, current reporting period (2019-20)
Total
No. of New contracts entered into during the period 7
Total actual expenditure during the period on new contracts ($ inc. GST) 181,141
No. of Ongoing contracts engaging consultants that were entered into during a previous period
0
Total actual expenditure during the period on ongoing contracts ($ inc. GST) 0
Table 8 provides information on consultants in the five years to 2019-20.
Table 8 Expenditure on consultancies, 2015-16 to 2019-20
2015-16 2016-17 2017-18 2018-19 2019-20
$'000 $'000 $'000 $'000 $'000
Expenditure 95 98 98 63 181
Annual reports contain information about actual expenditure on contracts for consultancies.
Information on the value of contracts and consultancies is available on the AusTender
website www.tenders.gov.au.
Ecologically sustainable development (ESD)
Under the Environment Protection and Biodiversity Conservation Act 1999, agencies are
required — through their annual reports — to report on ecologically sustainable
development (ESD) and environmental matters. This requirement is part of the
Government’s program to improve progress in implementing ESD.
The Commission operates under statutory guidelines, one of which is to have regard to the
need ‘to ensure that industry develops in a way that is ecologically sustainable’ (s. 8(1)(i) of
MANAGEMENT AND ACCOUNTABILITY 37
the Productivity Commission Act 1998). This legislation also prescribes that at least one
member of the Commission ‘must have extensive skills and experience in matters relating
to the principles of ecologically sustainable development and environmental conservation’
(s. 26(3)).
There are five aspects against which agencies are required to report.
The first relates to how an agency’s actions during the reporting period accorded with the
principles of ESD. Reflecting its statutory guidelines, ESD principles are integral to the
Commission’s analytical frameworks, their weighting depending on the particular inquiry
or research topic. The Commission’s five‑year assessment of the Murray‑Darling Basin
Plan is a recent example of work undertaken requiring integration of complex economic,
social and environmental considerations, while the ongoing Resources Sector Regulation
study is another.
The second reporting requirement asks how the Government’s outcome for the Commission
contributes to ESD. As stated elsewhere in this report, the outcome nominated for the
Commission is:
Well‑informed policy decision making and public understanding on matters relating to
Australia’s productivity and living standards, based on independent and transparent analysis from
a community‑wide perspective.
In pursuing this outcome, the Commission is required to take into account impacts on the
community as a whole — these may be economic, social and/or environmental. The
transparency of its processes provides the opportunity for anyone with an interest in an
inquiry to make their views known and to have these considered. Consequently, a broad
range of views and circumstances are taken into account, in keeping with the ESD principle
that ‘decision‑making processes should effectively integrate both long‑term and short‑term
economic, environmental, social and equity considerations’.
The third to fifth reporting requirements relate to the impact of the Commission’s internal
operations on the environment. The Commission is a relatively small, largely office‑based,
organisation in rented accommodation, and it adopts measures aimed at the efficient
management of waste and minimising energy consumption.
In order to manage its impacts on the environment in a systematic and ongoing way, the
Commission maintains an Environmental Management System. The Environmental
Management System contains the Commission’s environmental policy, an environmental
management program to address identified impacts, and provision for monitoring and
reporting on performance.
During 2019‑20, the Commission recorded energy usage of 4407 MJ/person/annum
(2018‑19: 4853 MJ/person/annum) against the Government’s energy target of 7500
MJ/person/annum for tenant light and power usage in office buildings. The Commission has
offices in Melbourne and Canberra in buildings that have 4.5 star NABERS Energy ratings.
38 ANNUAL REPORT 2019-20
National Disability Strategy
Since 1994, Commonwealth departments and agencies have reported on their performance
as policy adviser, purchaser, employer, regulator and provider under the Commonwealth
Disability Strategy. In 2007‑08, reporting on the employer role was transferred to the
Australian Public Service Commission’s State of the Service reports and the APS Statistical
Bulletin. These reports are available at www.apsc.gov.au. From 2010‑11, departments and
agencies have no longer been required to report on these functions.
The Commonwealth Disability Strategy has been overtaken by the National Disability
Strategy 2010–2020, which sets out a ten‑year national policy framework to improve the
lives of people with disability, promote participation and create a more inclusive society. A
high‑level two‑yearly report will track progress against each of the six outcome areas of the
Strategy and present a picture of how people with disability are faring. The first of these
progress reports was published in 2014, and can be found at www.dss.gov.au.
Freedom of information
Entities subject to the Freedom of Information Act 1982 (FOI Act) are required to publish
information to the public as part of the Information Publication Scheme (IPS). This
requirement is in Part II of the FOI Act and has replaced the former requirement to publish
a section 8 statement in an annual report. Each agency must display on its website a plan
showing what information it publishes in accordance with the IPS requirements. The
Commission’s plan is at www.pc.gov.au/about/governance/freedom-of-information.
Advertising and market research
The Commission does not undertake ‘advertising campaigns’. But it does publicise its
government‑commissioned inquiries and studies so that any individual, firm or organisation
with an interest has an opportunity to present their views. Publicity takes the form of
newspaper advertisements (as required by the Productivity Commission Act 1998), press
releases, email alerts, notification on the Commission’s website and via social media, and
distribution of Commission circulars.
In 2019‑20, a total of $25,748 was paid to Universal McCann for advertising (including
recruitment advertising).
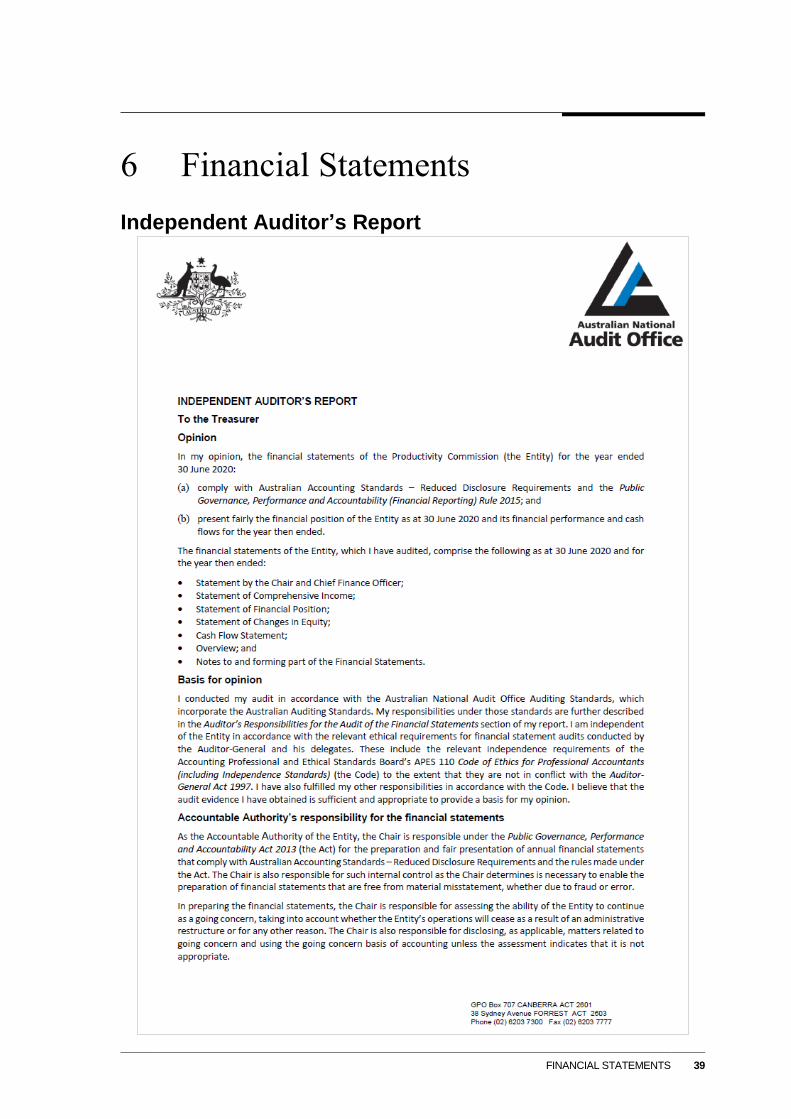
FINANCIAL STATEMENTS 39
6 Financial Statements
Independent Auditor’s Report
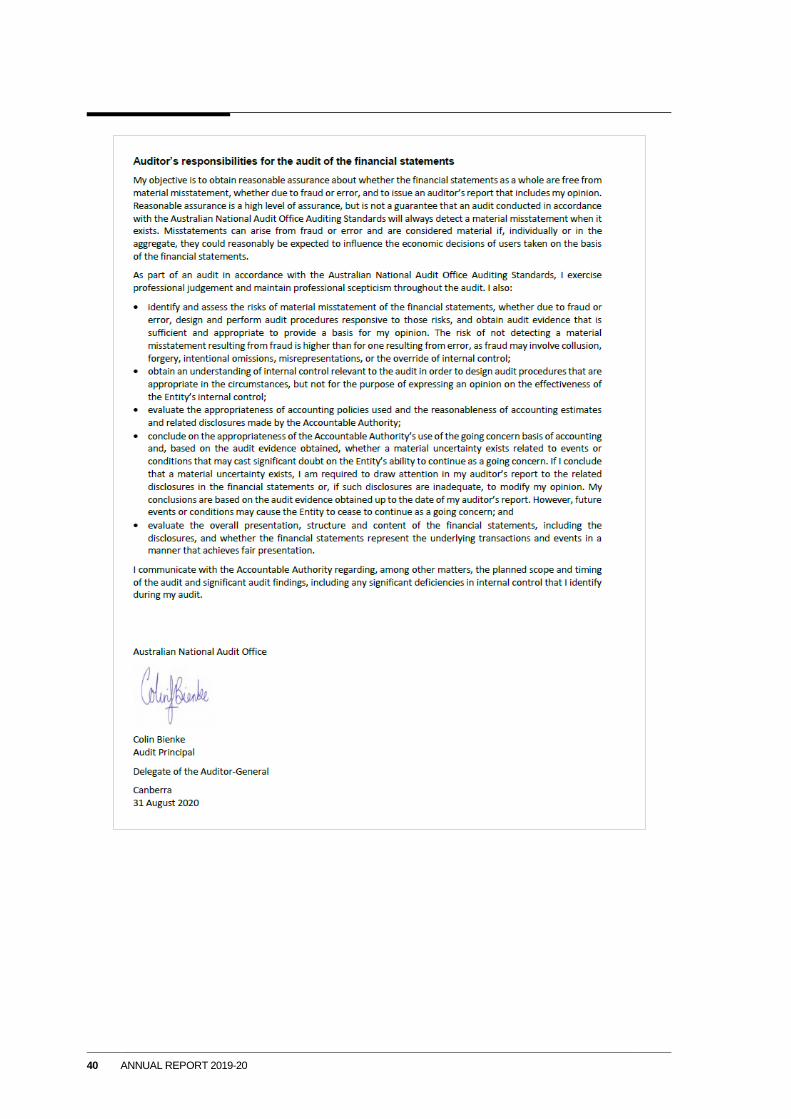
40 ANNUAL REPORT 2019-20
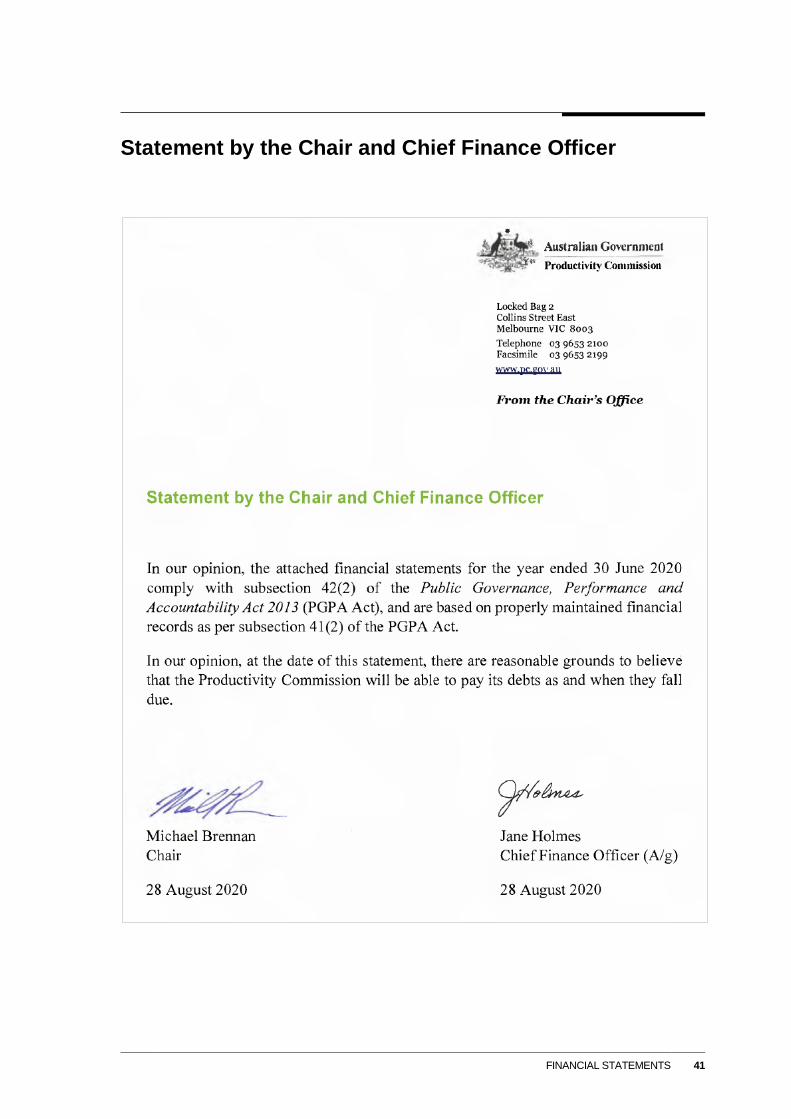
FINANCIAL STATEMENTS 41
Statement by the Chair and Chief Finance Officer
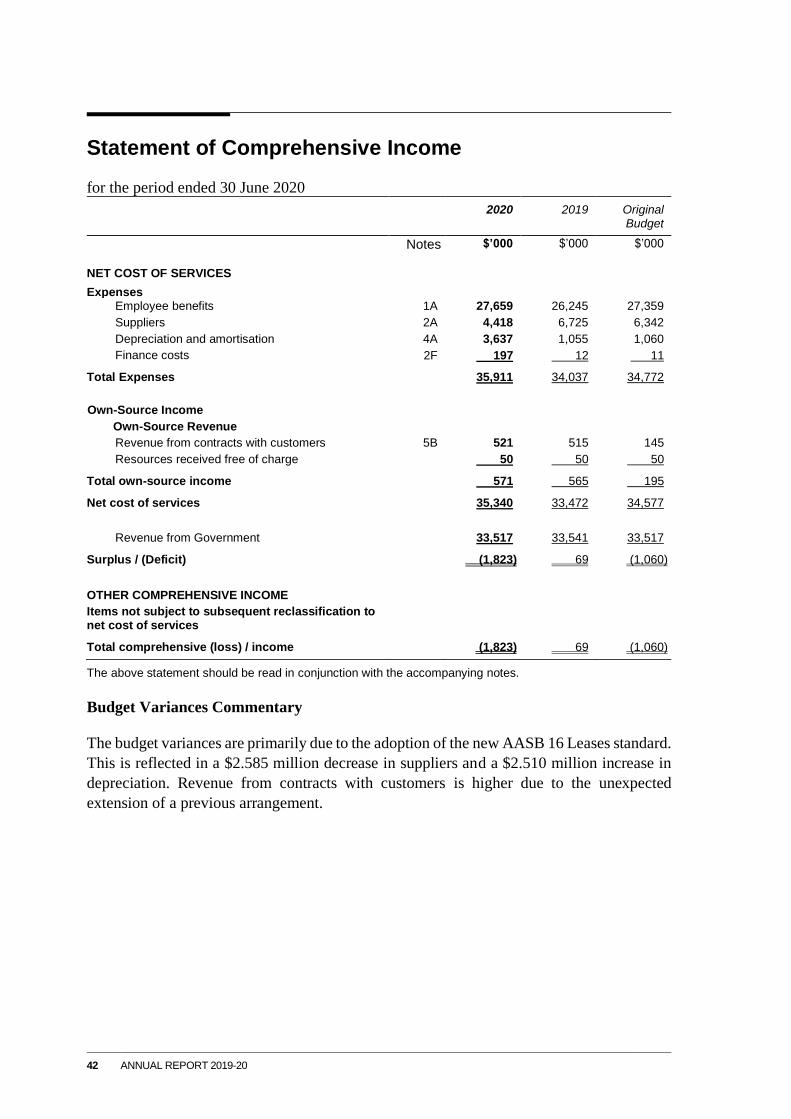
42 ANNUAL REPORT 2019-20
Statement of Comprehensive Income
for the period ended 30 June 2020
2020 2019 Original Budget
Notes $’000 $’000 $’000
NET COST OF SERVICES
Expenses
Employee benefits 1A 27,659 26,245 27,359
Suppliers 2A 4,418 6,725 6,342
Depreciation and amortisation 4A 3,637 1,055 1,060
Finance costs 2F 197 12 11
Total Expenses 35,911 34,037 34,772
Own-Source Income
Own-Source Revenue
Revenue from contracts with customers 5B 521 515 145
Resources received free of charge 50 50 50
Total own-source income 571 565 195
Net cost of services 35,340 33,472 34,577
Revenue from Government 33,517 33,541 33,517
Surplus / (Deficit) (1,823) 69 (1,060)
OTHER COMPREHENSIVE INCOME
Items not subject to subsequent reclassification to net cost of services
Total comprehensive (loss) / income (1,823) 69 (1,060)
The above statement should be read in conjunction with the accompanying notes.
Budget Variances Commentary
The budget variances are primarily due to the adoption of the new AASB 16 Leases standard.
This is reflected in a $2.585 million decrease in suppliers and a $2.510 million increase in
depreciation. Revenue from contracts with customers is higher due to the unexpected
extension of a previous arrangement.
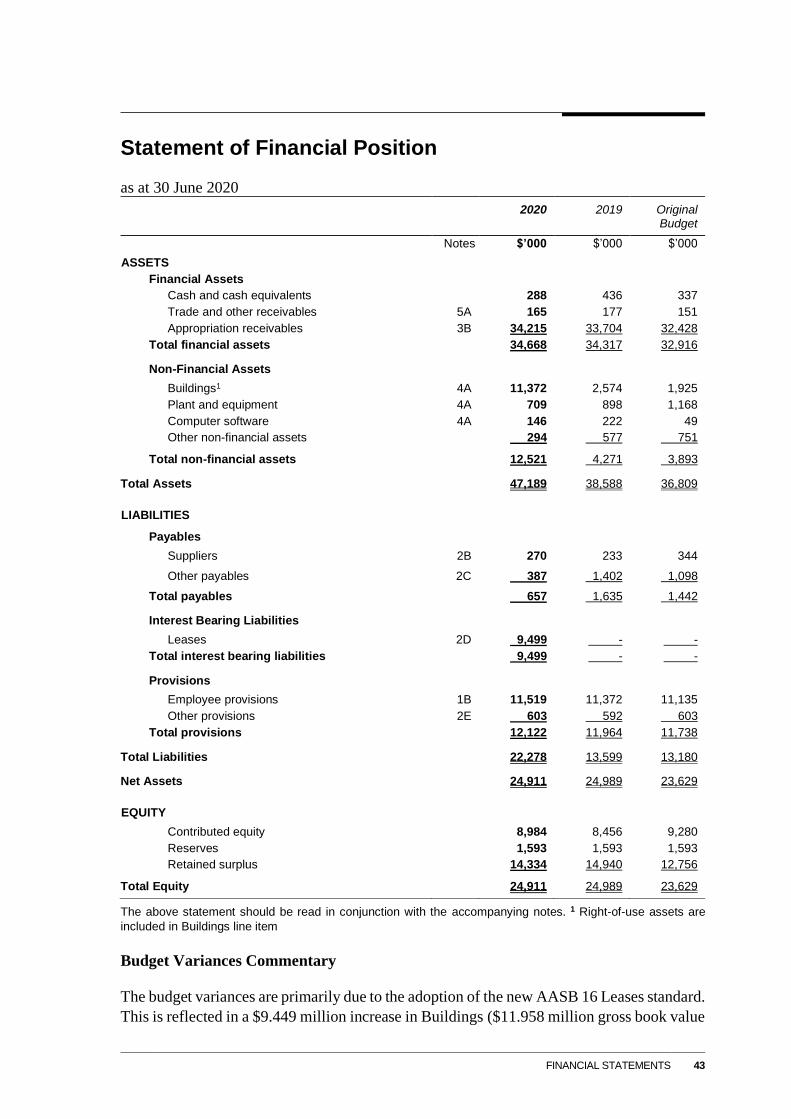
FINANCIAL STATEMENTS 43
Statement of Financial Position
as at 30 June 2020
2020 2019 Original Budget
Notes $’000 $’000 $’000
ASSETS
Financial Assets
Cash and cash equivalents 288 436 337
Trade and other receivables 5A 165 177 151
Appropriation receivables 3B 34,215 33,704 32,428
Total financial assets 34,668 34,317 32,916
Non-Financial Assets
Buildings1 4A 11,372 2,574 1,925
Plant and equipment 4A 709 898 1,168
Computer software 4A 146 222 49
Other non-financial assets 294 577 751
Total non-financial assets 12,521 4,271 3,893
Total Assets 47,189 38,588 36,809
LIABILITIES
Payables
Suppliers 2B 270 233 344
Other payables 2C 387 1,402 1,098
Total payables 657 1,635 1,442
Interest Bearing Liabilities
Leases 2D 9,499 - -
Total interest bearing liabilities 9,499 - -
Provisions
Employee provisions 1B 11,519 11,372 11,135
Other provisions 2E 603 592 603
Total provisions 12,122 11,964 11,738
Total Liabilities 22,278 13,599 13,180
Net Assets 24,911 24,989 23,629
EQUITY
Contributed equity 8,984 8,456 9,280
Reserves 1,593 1,593 1,593
Retained surplus 14,334 14,940 12,756
Total Equity 24,911 24,989 23,629
The above statement should be read in conjunction with the accompanying notes. 1 Right-of-use assets are
included in Buildings line item
Budget Variances Commentary
The budget variances are primarily due to the adoption of the new AASB 16 Leases standard.
This is reflected in a $9.449 million increase in Buildings ($11.958 million gross book value
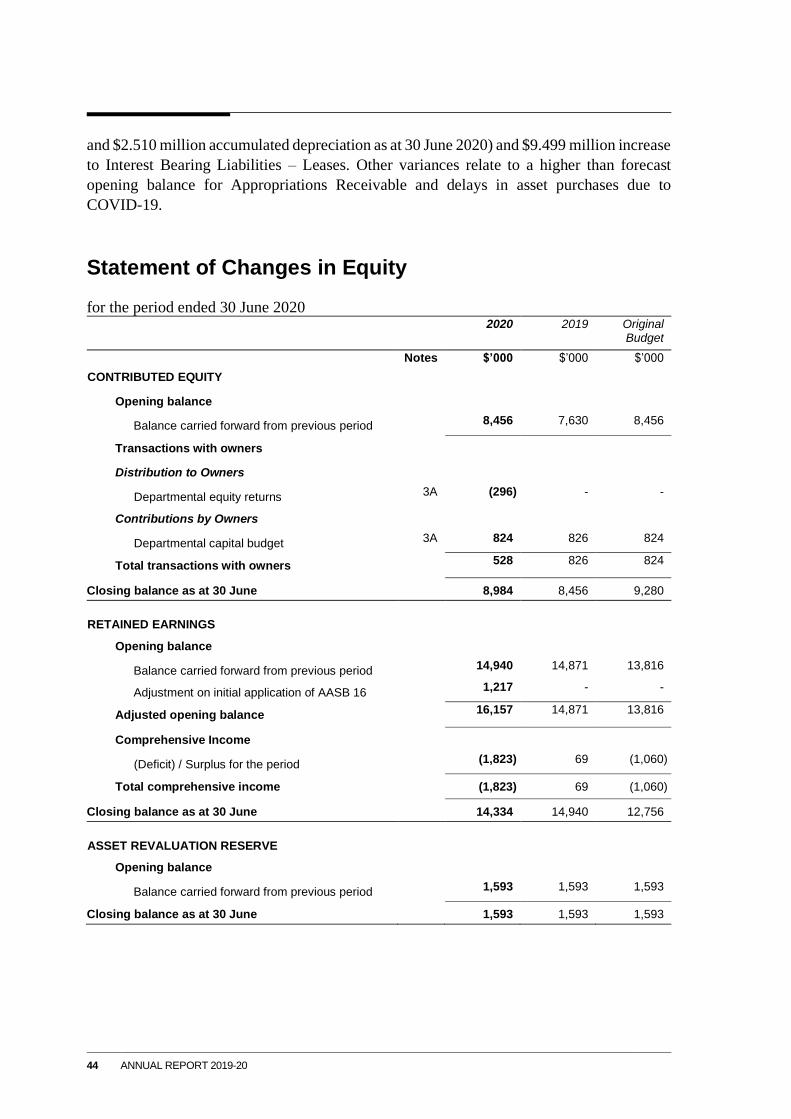
44 ANNUAL REPORT 2019-20
and $2.510 million accumulated depreciation as at 30 June 2020) and $9.499 million increase
to Interest Bearing Liabilities – Leases. Other variances relate to a higher than forecast
opening balance for Appropriations Receivable and delays in asset purchases due to
COVID-19.
Statement of Changes in Equity
for the period ended 30 June 2020 2020 2019 Original
Budget
Notes $’000 $’000 $’000
CONTRIBUTED EQUITY
Opening balance
Balance carried forward from previous period 8,456 7,630 8,456
Transactions with owners
Distribution to Owners
Departmental equity returns 3A (296) - -
Contributions by Owners
Departmental capital budget 3A 824 826 824
Total transactions with owners 528 826 824
Closing balance as at 30 June 8,984 8,456 9,280
RETAINED EARNINGS
Opening balance
Balance carried forward from previous period 14,940 14,871 13,816
Adjustment on initial application of AASB 16 1,217 - -
Adjusted opening balance 16,157 14,871 13,816
Comprehensive Income
(Deficit) / Surplus for the period (1,823) 69 (1,060)
Total comprehensive income (1,823) 69 (1,060)
Closing balance as at 30 June 14,334 14,940 12,756
ASSET REVALUATION RESERVE
Opening balance
Balance carried forward from previous period 1,593 1,593 1,593
Closing balance as at 30 June 1,593 1,593 1,593
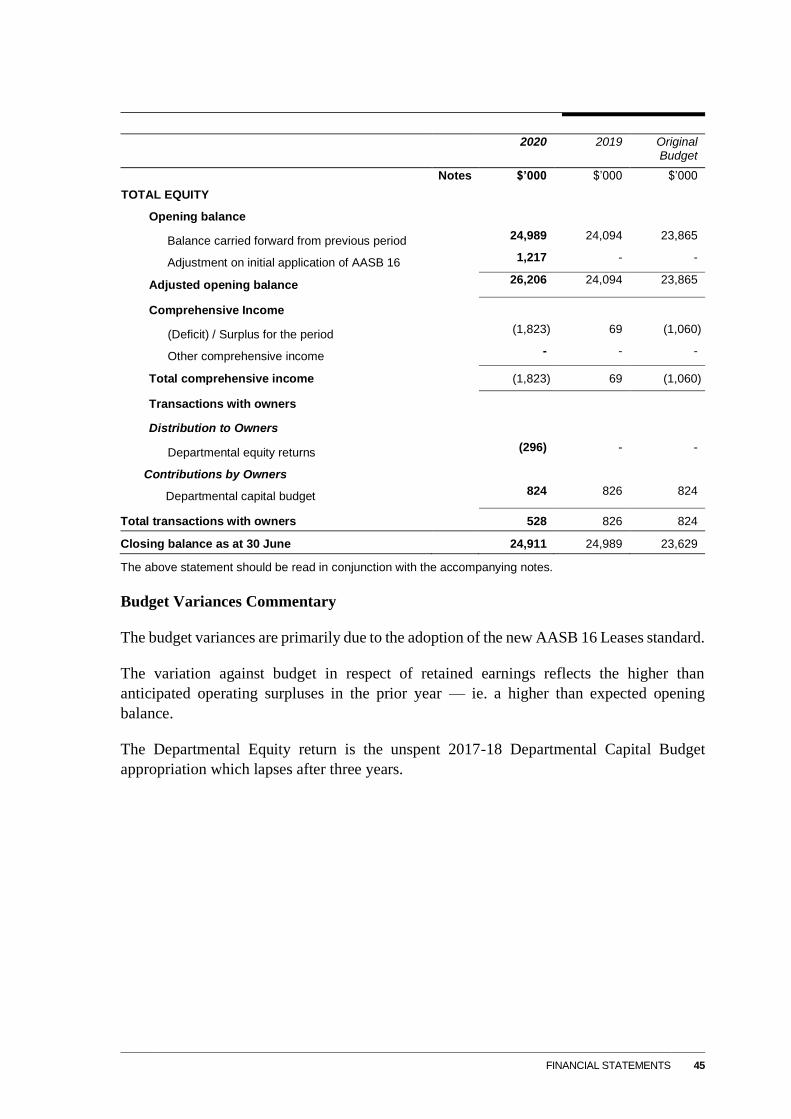
FINANCIAL STATEMENTS 45
2020 2019 Original Budget
Notes $’000 $’000 $’000
TOTAL EQUITY
Opening balance
Balance carried forward from previous period 24,989 24,094 23,865
Adjustment on initial application of AASB 16 1,217 - -
Adjusted opening balance 26,206 24,094 23,865
Comprehensive Income
(Deficit) / Surplus for the period (1,823) 69 (1,060)
Other comprehensive income - - -
Total comprehensive income (1,823) 69 (1,060)
Transactions with owners
Distribution to Owners
Departmental equity returns (296) - -
Contributions by Owners
Departmental capital budget 824 826 824
Total transactions with owners 528 826 824
Closing balance as at 30 June 24,911 24,989 23,629
The above statement should be read in conjunction with the accompanying notes.
Budget Variances Commentary
The budget variances are primarily due to the adoption of the new AASB 16 Leases standard.
The variation against budget in respect of retained earnings reflects the higher than
anticipated operating surpluses in the prior year — ie. a higher than expected opening
balance.
The Departmental Equity return is the unspent 2017-18 Departmental Capital Budget
appropriation which lapses after three years.
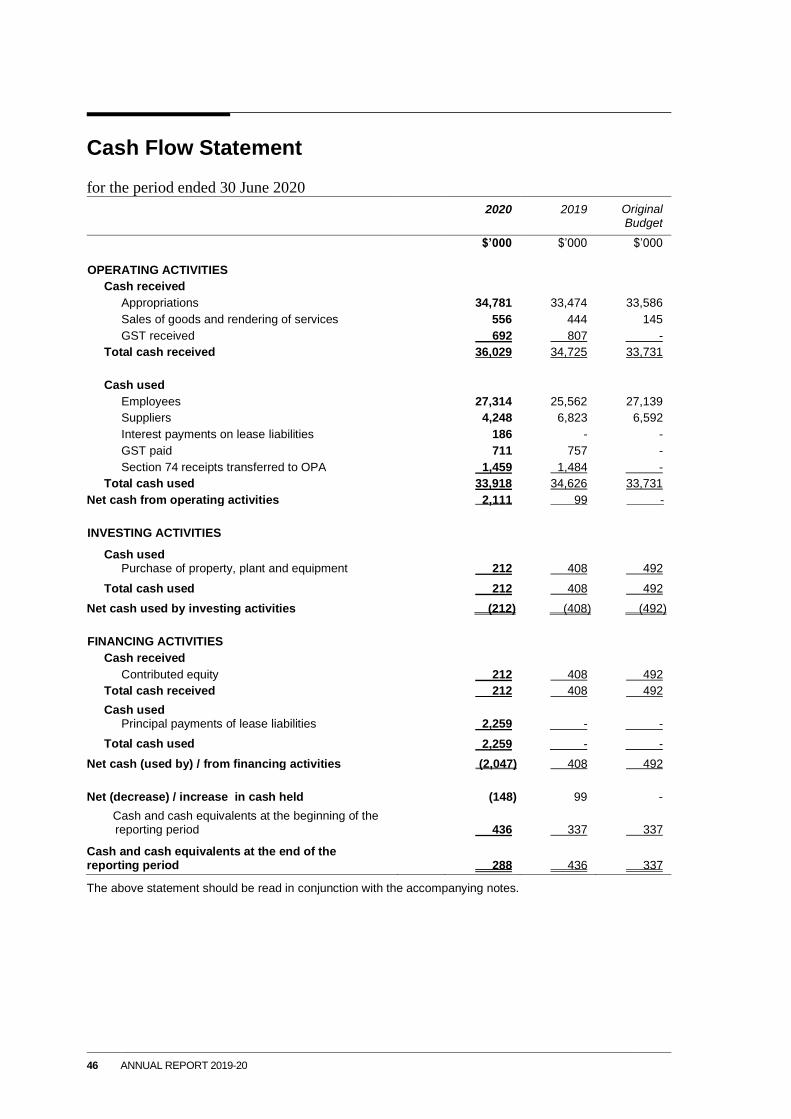
46 ANNUAL REPORT 2019-20
Cash Flow Statement
for the period ended 30 June 2020
2020 2019 Original Budget
$’000 $’000 $’000
OPERATING ACTIVITIES
Cash received
Appropriations 34,781 33,474 33,586
Sales of goods and rendering of services 556 444 145
GST received 692 807 -
Total cash received 36,029 34,725 33,731
Cash used
Employees 27,314 25,562 27,139
Suppliers 4,248 6,823 6,592
Interest payments on lease liabilities 186 - -
GST paid 711 757 -
Section 74 receipts transferred to OPA 1,459 1,484 -
Total cash used 33,918 34,626 33,731
Net cash from operating activities 2,111 99 -
INVESTING ACTIVITIES
Cash used Purchase of property, plant and equipment 212 408 492
Total cash used 212 408 492
Net cash used by investing activities (212) (408) (492)
FINANCING ACTIVITIES
Cash received
Contributed equity 212 408 492
Total cash received 212 408 492
Cash used Principal payments of lease liabilities 2,259 - -
Total cash used 2,259 - -
Net cash (used by) / from financing activities (2,047) 408 492
Net (decrease) / increase in cash held (148) 99 -
Cash and cash equivalents at the beginning of the reporting period
436 337 337
Cash and cash equivalents at the end of the reporting period
288 436 337
The above statement should be read in conjunction with the accompanying notes.

FINANCIAL STATEMENTS 47
Budget Variances Commentary
The budget variances are primarily due to the adoption of the new AASB 16 Leases standard.
Other variances reflect higher rendering of services revenue due to the unexpected extension
of a previous arrangement and delays in asset purchases due to COVID-19.
On 30 January 2020, COVID-19 was declared as a global health emergency of international
concern by the World Health Organisation. In response, the Commission placed restrictions
on non-essential visitors, reduced travel, and implemented work from home arrangements
where appropriate.
The COVID-19 pandemic has created unprecedented economic uncertainty. It has impacted
the Commission operations in the following areas for the financial year ended 30 June 2020:
• Financial savings because of reduced travel amounted to $0.35 million
• Financial savings due to postponed or cancelled face to face contact activities including
staff development amounted to $0.1 million
• Caused delays in asset purchases of $0.30 million due to delivery issues
Overview
Objectives of the Productivity Commission
The Productivity Commission is an Australian Government controlled entity. It is a not-for-
profit entity.
The objective of the Productivity Commission (Commission) is to provide independent
research and advice on a range of economic, social and environmental issues affecting the
welfare of Australians. The Commission’s work encompasses all sectors of the economy as
well as social and environmental issues. Its activities cover all levels of government
responsibility — Federal, State and Territory and Local.
As a review and advisory body, the Commission does not have responsibility for
implementing government programs. It carries out inquiry, research, advising and incidental
functions prescribed under the Productivity Commission Act 1998.
The Basis of Preparation
The financial statements are general purpose financial statements and are required by section
42 of the Public Governance, Performance and Accountability Act 2013.
The financial statements have been prepared in accordance with:
48 ANNUAL REPORT 2019-20
• Public Governance, Performance and Accountability (Financial Reporting) Rule 2015
(FRR); and
• Australian Accounting Standards and Interpretations — Reduced Disclosure
Requirements issued by the Australian Accounting Standards Board (AASB) that apply
for the reporting period.
The financial statements have been prepared on an accrual basis and in accordance with
the historical cost convention, except for certain assets and liabilities at fair value. Except
where stated, no allowance is made for the effect of changing prices on the results or the
financial position.
The financial statements are presented in Australian dollars and values are rounded to the
nearest thousand dollars unless otherwise specified.
New Accounting Standards
All new standards, revised standards, amendments to standards or interpretations that were
issued prior to the sign-off date and are applicable to the current reporting period did not
have a material effect on the Commission’s financial statements.
Standard/ Interpretation
Nature of change in accounting policy, transitional provisions, and adjustment to financial statements
AASB 15 Revenue from Contracts with Customers / AASB 2016-8 Amendments to Australian Accounting Standards – Australian Implementation Guidance for Not-for-Profit Entities and AASB 1058 Income of Not-For-Profit Entities
AASB 15, AASB 2016-8 and AASB 1058 became effective 1 July 2019. AASB 15 establishes a comprehensive framework for determining whether, how much and when revenue is recognised. It replaces existing revenue recognition guidance, including AASB 118 Revenue, AASB 111 Construction Contracts and Interpretation 13 Customer Loyalty Programmes. The core principle of AASB 15 is that an entity recognises revenue to depict the transfer of promised goods or services to customers in an amount that reflects the consideration to which the entity expects to be entitled in exchange for those goods or services. AASB 1058 is relevant in circumstances where AASB 15 does not apply. AASB 1058 replaces most of the not-for-profit (NFP) provisions of AASB 1004 Contributions and applies to transactions where the consideration to acquire an asset is significantly less than fair value principally to enable the entity to further its objectives, and where volunteer services are received. The details of the changes in accounting policies, transitional provisions and adjustments are disclosed below and in the relevant notes to the financial statements.
AASB 16 Leases
AASB 16 became effective on 1 July 2019. This new standard has replaced AASB 117 Leases, Interpretation 4 Determining whether an Arrangement contains a Lease, Interpretation 115 Operating Leases—Incentives and Interpretation 127 Evaluating the Substance of Transactions Involving the Legal Form of a Lease. AASB 16 provides a single lessee accounting model, requiring the recognition of
FINANCIAL STATEMENTS 49
assets and liabilities for all leases, together with options to exclude leases where the lease term is 12 months or less, or where the underlying asset is of low value. AASB 16 substantially carries forward the lessor accounting in AASB 117, with the distinction between operating leases and finance leases being retained. The details of the changes in accounting policies, transitional provisions and adjustments are disclosed below and in the relevant notes to the financial statements.
Application of AASB 15 Revenue from Contracts with Customers / AASB 1058
Income of Not-For-Profit Entities
The Commission adopted AASB 15 and AASB 1058 using the modified retrospective
approach, under which the cumulative effect of initial application is recognised in retained
earnings at 1 July 2019. Accordingly, the comparative information is presented as previously
reported under the various applicable AASBs and related interpretations.
Under the new income recognition model the Commission will first determine whether an
enforceable agreement exists and whether the promises to transfer goods or services to the
customer are ‘sufficiently specific’. If an enforceable agreement exists and the promises are
‘sufficiently specific’ (to a transaction or part of a transaction), the Commission applies the
general AASB 15 principles to determine the appropriate revenue recognition. If these
criteria are not met, the Commission shall consider whether AASB 1058 applies.
In relation to AASB 15, the Commission elected to apply the new standard to all new and
uncompleted contracts from the date of initial application. The Commission aggregated the
effect of all of the contract modifications that occur before the date of initial application.
AASB 1058 will apply when the Commission:
• Enters into a transaction where the consideration to acquire an asset is significantly less
than fair value principally to enable the Commission to further its objectives; and
• Receives volunteer services
There were no transactions in 2019-20 financial year where the Commission acquired an
assets (including cash) in exchange for no or significantly less than fair value consideration.
There was no impact on the Commission on transition.
Application of AASB 16 Leases
The Commission adopted AASB 16 using the modified retrospective approach, under which
the cumulative effect of the initial application was recognised in retained earnings at
1 July 2019. Accordingly, the comparative information presented for 2019 is not restated.
The Commission elected to apply the practical expedient to not reassess whether a contract
is, or contains a lease at the date of initial application. Contracts entered into before the
transition date that were not identified as leases under AASB 117 were not reassessed. The
50 ANNUAL REPORT 2019-20
definition of a lease under AASB 16 was applied only to contracts entered into or changed
on or after 1 July 2019.
AASB 16 provides for certain optional practical expedients, including those related to the
initial adoption of the standard. The Commission applied the following practical expedients
when applying AASB 16 to leases previously classified as operating leases under AASB 117:
• Applied a single discount rate to a portfolio of leases with reasonably similar
characteristics;
• Excluded initial direct costs from the measurement of right-of-use assets at the date of
initial application for leases where the right-of-use asset was determined as if AASB 16
had been applied since the commencement date;
• Relied on previous assessments on whether leases are onerous as opposed to preparing
an impairment review under AASB 136 Impairment of assets as at the date of initial
application; and
• Applied the exemption not to recognise right-of-use assets and liabilities for leases with
less than 12 months of lease term remaining as of the date of initial application.
As a lessee, the Commission previously classified leases as operating or finance leases based
on its assessment of whether the lease transferred substantially all of the risks and rewards
of ownership. Under AASB 16, the Commission recognises right-of-use assets and lease
liabilities for most leases. However, the Commission has elected not to recognise right-of-
use assets and lease liabilities for some leases of low value assets based on the value of the
underlying asset when new or for short-term leases with a lease term of 12 months or less.
On adoption of AASB 16, the Commission recognised right-of-use assets and lease liabilities
in relation to leases of office space which had previously been classified as operating leases.
The lease liabilities were measured at the present value of the remaining lease payments,
discounted using the Commission’s incremental borrowing rate as at 1 July 2019. The
Commission’s incremental borrowing rate is the rate at which a similar borrowing could be
obtained from an independent creditor under comparable terms and conditions. The
weighted-average rate applied was 1.96%.
The right-of-use assets were measured as follows:
(a) Office space: measured at an amount equal to the lease liability, adjusted by the amount
of any prepaid or accrued lease payments.
(b) All other leases: the carrying value that would have resulted from AASB 16 being
applied from the commencement date of the leases, subject to the practical expedients
noted above.
FINANCIAL STATEMENTS 51
Impact on transition
On transition to AASB 16, the Commission recognised additional right-of-use assets and
additional lease liabilities, recognising the difference in retained earnings. The impact on
transition is summarised below:
Departmental 1 July 2019
$’000
Right-of-use assets – buildings 11,958
Lease liabilities -11,758
Retained earnings -1,217
Reversal / de-recognition of provisions 1,217
Reversal / de-recognition of prepayments -200
The following table reconciles the Departmental minimum lease commitments disclosed in
the Commission's 30 June 2019 annual financial statements to the amount of lease liabilities
recognised on 1 July 2019:
1 July 2019
$’000 Minimum operating lease commitment at 30 June 2019
14,896 Less: short-term leases not recognised under AASB 16 4 Plus: effect of extension options reasonable certain to be exercised -
Undiscounted lease payments 14,892
Less: effect of discounting using the incremental borrowing rate as at the date of initial application 3,134
Lease liabilities recognised at 1 July 2019 11,758
Cash
Cash is recognised at its nominal amount. Cash and cash equivalents includes cash on hand,
deposits in bank accounts with an original maturity of 3 months or less that are readily
convertible to known amounts of cash and subject to insignificant risk of changes in value.
Resources Received Free of Charge
Resources received free of charge are recognised as revenue when, and only when, a fair
value can be reliably determined and the services would be have purchased if they had not
been donated. Use of those resources is recognised as an expense. Resources free of charge
are recorded as either revenue or gains depending on their nature.
52 ANNUAL REPORT 2019-20
Taxation
The Commission is exempt from all forms of taxation except Fringe Benefits Tax (FBT) and
the Goods and Services Tax (GST).
Events after the Reporting Period
There was no subsequent event that had the potential to significantly affect the on-going
structure and financial activities of the Commission.

FINANCIAL STATEMENTS 53
Notes to and forming part of the Financial Statements
1 Employee Related
1A Employee Benefits
1B Employee Provisions
1C Key Management Personnel Remuneration
1D Related Party Disclosures
2 Supplier Related
2A Suppliers (Expense)
2B Suppliers (Liability)
2C Other Payables
2D Interest Bearing Liabilities - Leases
2E Other Provisions
2F Finance Costs
3 Funding from Government and Other Sources
3A Appropriations
3B Appropriations Receivable
3C Net Cash Appropriation Arrangements
4 Property, Plant and Equipment
4A Analysis of Property, Plant and Equipment and Intangibles
4B Fair Value Measurement
5 Other Financial Assets and Own Source Income
5A Trade and Other Receivables
5B Own-Source Income – Revenue from Contracts with Customers
6 Other Information
6A Contingent Assets and Liabilities
6B Financial Instruments
6C Aggregate Assets and Liabilities (Maturity Information)
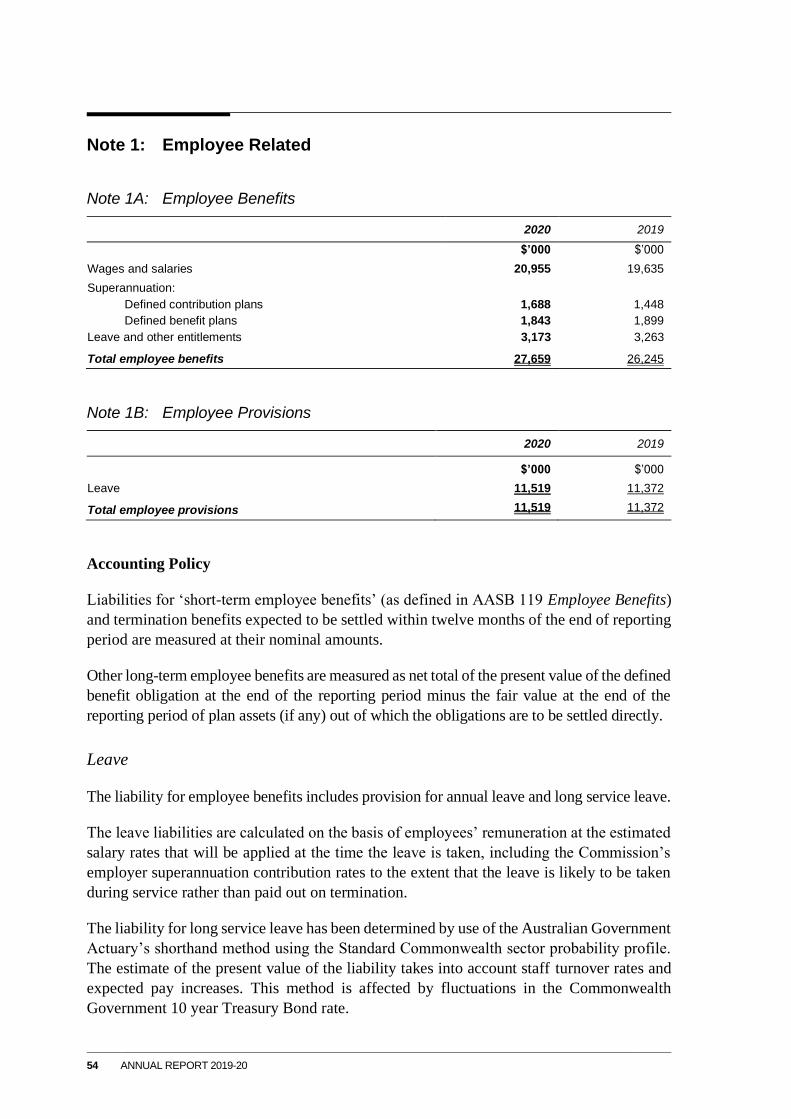
54 ANNUAL REPORT 2019-20
Note 1: Employee Related
Note 1A: Employee Benefits
2020 2019
$’000 $’000
Wages and salaries 20,955 19,635
Superannuation:
Defined contribution plans 1,688 1,448
Defined benefit plans 1,843 1,899
Leave and other entitlements 3,173 3,263
Total employee benefits 27,659 26,245
Note 1B: Employee Provisions
2020 2019
$’000 $’000
Leave 11,519 11,372
Total employee provisions 11,519 11,372
Accounting Policy
Liabilities for ‘short-term employee benefits’ (as defined in AASB 119 Employee Benefits)
and termination benefits expected to be settled within twelve months of the end of reporting
period are measured at their nominal amounts.
Other long-term employee benefits are measured as net total of the present value of the defined
benefit obligation at the end of the reporting period minus the fair value at the end of the
reporting period of plan assets (if any) out of which the obligations are to be settled directly.
Leave
The liability for employee benefits includes provision for annual leave and long service leave.
The leave liabilities are calculated on the basis of employees’ remuneration at the estimated
salary rates that will be applied at the time the leave is taken, including the Commission’s
employer superannuation contribution rates to the extent that the leave is likely to be taken
during service rather than paid out on termination.
The liability for long service leave has been determined by use of the Australian Government
Actuary’s shorthand method using the Standard Commonwealth sector probability profile.
The estimate of the present value of the liability takes into account staff turnover rates and
expected pay increases. This method is affected by fluctuations in the Commonwealth
Government 10 year Treasury Bond rate.
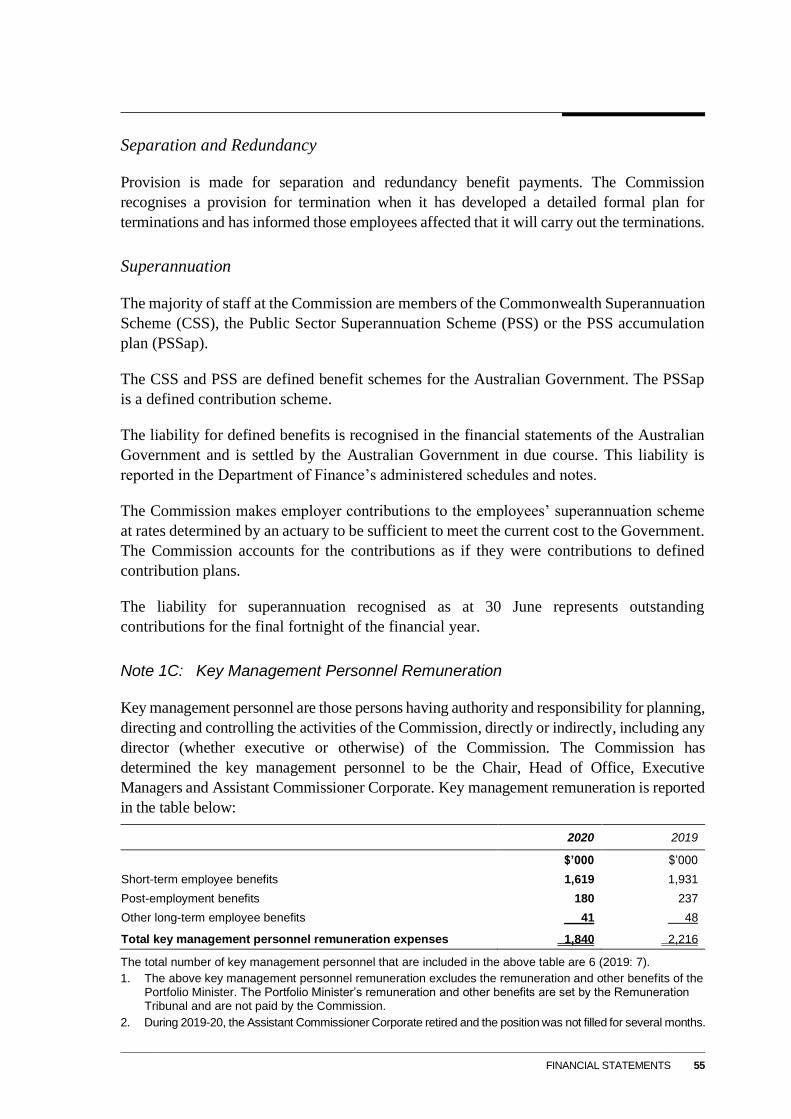
FINANCIAL STATEMENTS 55
Separation and Redundancy
Provision is made for separation and redundancy benefit payments. The Commission
recognises a provision for termination when it has developed a detailed formal plan for
terminations and has informed those employees affected that it will carry out the terminations.
Superannuation
The majority of staff at the Commission are members of the Commonwealth Superannuation
Scheme (CSS), the Public Sector Superannuation Scheme (PSS) or the PSS accumulation
plan (PSSap).
The CSS and PSS are defined benefit schemes for the Australian Government. The PSSap
is a defined contribution scheme.
The liability for defined benefits is recognised in the financial statements of the Australian
Government and is settled by the Australian Government in due course. This liability is
reported in the Department of Finance’s administered schedules and notes.
The Commission makes employer contributions to the employees’ superannuation scheme
at rates determined by an actuary to be sufficient to meet the current cost to the Government.
The Commission accounts for the contributions as if they were contributions to defined
contribution plans.
The liability for superannuation recognised as at 30 June represents outstanding
contributions for the final fortnight of the financial year.
Note 1C: Key Management Personnel Remuneration
Key management personnel are those persons having authority and responsibility for planning,
directing and controlling the activities of the Commission, directly or indirectly, including any
director (whether executive or otherwise) of the Commission. The Commission has
determined the key management personnel to be the Chair, Head of Office, Executive
Managers and Assistant Commissioner Corporate. Key management remuneration is reported
in the table below:
2020 2019
$’000 $’000
Short-term employee benefits 1,619 1,931
Post-employment benefits 180 237
Other long-term employee benefits 41 48
Total key management personnel remuneration expenses 1,840 2,216
The total number of key management personnel that are included in the above table are 6 (2019: 7).
1. The above key management personnel remuneration excludes the remuneration and other benefits of the Portfolio Minister. The Portfolio Minister’s remuneration and other benefits are set by the Remuneration Tribunal and are not paid by the Commission.
2. During 2019-20, the Assistant Commissioner Corporate retired and the position was not filled for several months.
56 ANNUAL REPORT 2019-20
Note 1D: Related Party Disclosures
Related party relationships:
The Commission is an Australian Government controlled entity. Related parties to the
Commission are Key Management Personnel, the Portfolio Minister and Executive and other
Australian Government entities.
Transactions with related parties:
Given the breadth of Government activities, related parties may transact with the government
sector in the same capacity as ordinary citizens. Such transactions are the payment or refund
of taxes, receipt of Medicare rebate or higher education loans. These transactions have not
been disclosed in this note.
The Commission transacts with other Australian Government controlled entities consistent
with normal day-to-day business operations provided under normal terms and conditions,
including payment of workers compensation and insurance premiums; transfer of employee
entitlements; purchase of statistical data; and other payments required by/according to
Government policy or regulations. These are not considered individually significant to
warrant separate disclosure as related party transactions.
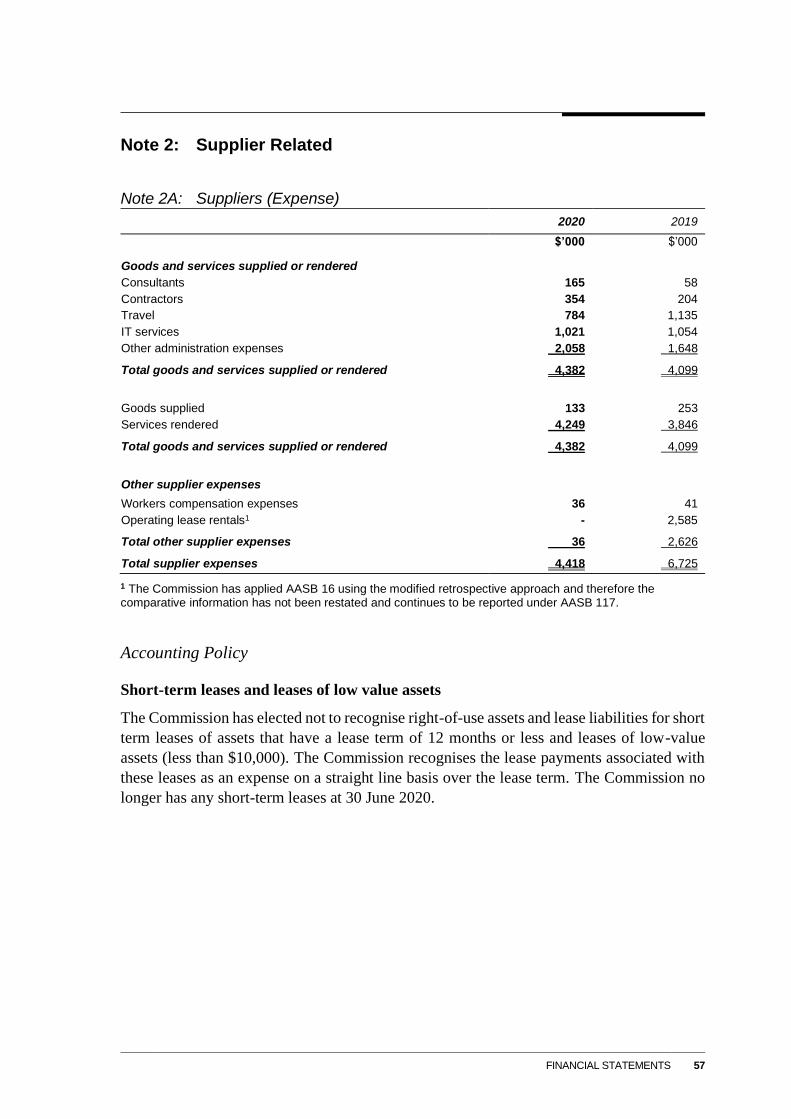
FINANCIAL STATEMENTS 57
Note 2: Supplier Related
Note 2A: Suppliers (Expense)
2020 2019
$’000 $’000
Goods and services supplied or rendered
Consultants 165 58
Contractors 354 204
Travel 784 1,135
IT services 1,021 1,054
Other administration expenses 2,058 1,648
Total goods and services supplied or rendered 4,382 4,099
Goods supplied 133 253
Services rendered 4,249 3,846
Total goods and services supplied or rendered 4,382 4,099
Other supplier expenses
Workers compensation expenses 36 41
Operating lease rentals1 - 2,585
Total other supplier expenses 36 2,626
Total supplier expenses 4,418 6,725
1 The Commission has applied AASB 16 using the modified retrospective approach and therefore the comparative information has not been restated and continues to be reported under AASB 117.
Accounting Policy
Short-term leases and leases of low value assets
The Commission has elected not to recognise right-of-use assets and lease liabilities for short
term leases of assets that have a lease term of 12 months or less and leases of low-value
assets (less than $10,000). The Commission recognises the lease payments associated with
these leases as an expense on a straight line basis over the lease term. The Commission no
longer has any short-term leases at 30 June 2020.
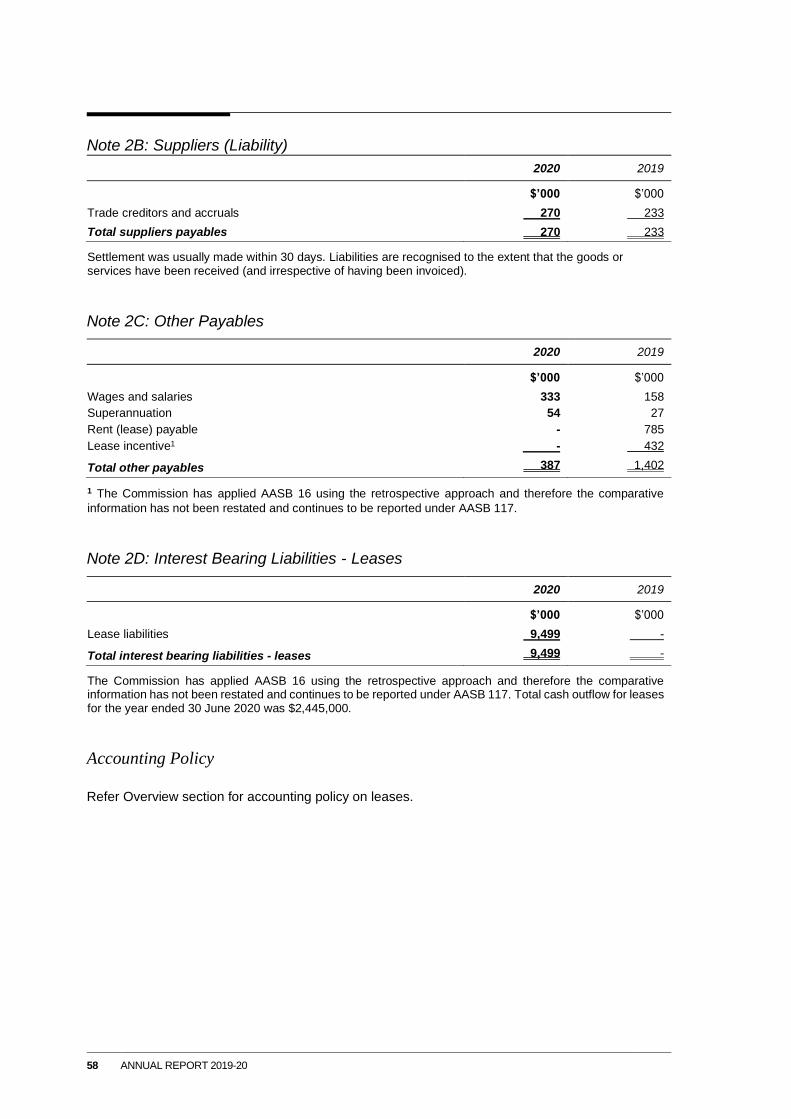
58 ANNUAL REPORT 2019-20
Note 2B: Suppliers (Liability)
2020 2019
$’000 $’000
Trade creditors and accruals 270 233
Total suppliers payables 270 233
Settlement was usually made within 30 days. Liabilities are recognised to the extent that the goods or services have been received (and irrespective of having been invoiced).
Note 2C: Other Payables
2020 2019
$’000 $’000
Wages and salaries 333 158
Superannuation 54 27
Rent (lease) payable - 785
Lease incentive1 - 432
Total other payables 387 1,402
1 The Commission has applied AASB 16 using the retrospective approach and therefore the comparative
information has not been restated and continues to be reported under AASB 117.
Note 2D: Interest Bearing Liabilities - Leases
2020 2019
$’000 $’000
Lease liabilities 9,499 -
Total interest bearing liabilities - leases 9,499 -
The Commission has applied AASB 16 using the retrospective approach and therefore the comparative information has not been restated and continues to be reported under AASB 117. Total cash outflow for leases for the year ended 30 June 2020 was $2,445,000.
Accounting Policy
Refer Overview section for accounting policy on leases.
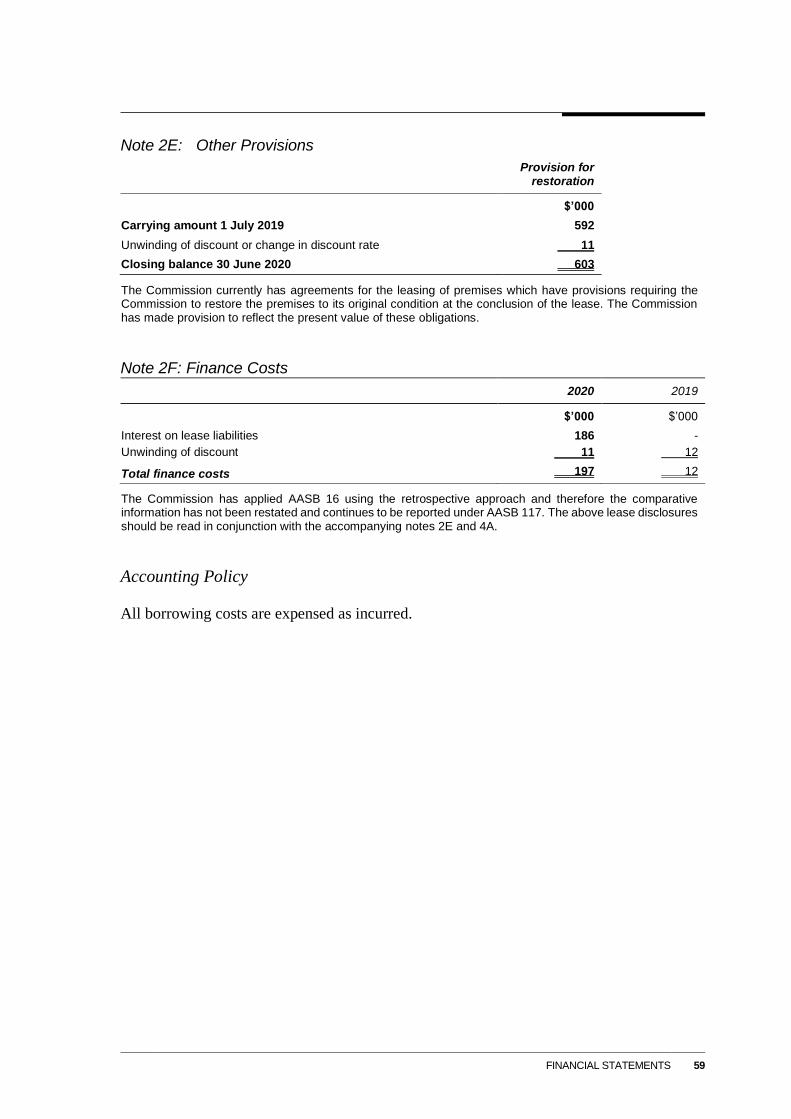
FINANCIAL STATEMENTS 59
Note 2E: Other Provisions
Provision for restoration
$’000
Carrying amount 1 July 2019 592
Unwinding of discount or change in discount rate 11
Closing balance 30 June 2020 603
The Commission currently has agreements for the leasing of premises which have provisions requiring the Commission to restore the premises to its original condition at the conclusion of the lease. The Commission has made provision to reflect the present value of these obligations.
Note 2F: Finance Costs
2020 2019
$’000 $’000
Interest on lease liabilities 186 -
Unwinding of discount 11 12
Total finance costs 197 12
The Commission has applied AASB 16 using the retrospective approach and therefore the comparative information has not been restated and continues to be reported under AASB 117. The above lease disclosures should be read in conjunction with the accompanying notes 2E and 4A.
Accounting Policy
All borrowing costs are expensed as incurred.
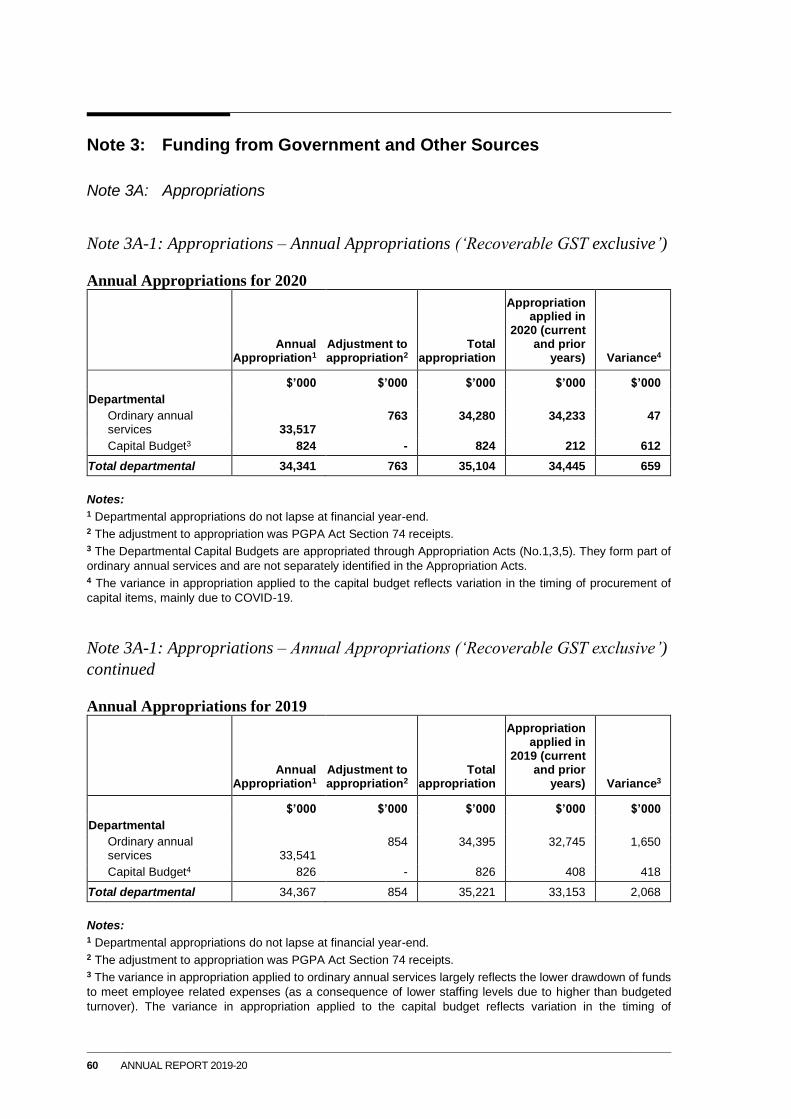
60 ANNUAL REPORT 2019-20
Note 3: Funding from Government and Other Sources
Note 3A: Appropriations
Note 3A-1: Appropriations – Annual Appropriations (‘Recoverable GST exclusive’)
Annual Appropriations for 2020
Annual
Appropriation1 Adjustment to appropriation2
Total appropriation
Appropriation applied in
2020 (current and prior
years) Variance4
$’000 $’000 $’000 $’000 $’000
Departmental
Ordinary annual services 33,517
763 34,280 34,233 47
Capital Budget3 824 - 824 212 612
Total departmental 34,341 763 35,104 34,445 659
Notes: 1 Departmental appropriations do not lapse at financial year-end. 2 The adjustment to appropriation was PGPA Act Section 74 receipts. 3 The Departmental Capital Budgets are appropriated through Appropriation Acts (No.1,3,5). They form part of
ordinary annual services and are not separately identified in the Appropriation Acts. 4 The variance in appropriation applied to the capital budget reflects variation in the timing of procurement of
capital items, mainly due to COVID-19.
Note 3A-1: Appropriations – Annual Appropriations (‘Recoverable GST exclusive’)
continued
Annual Appropriations for 2019
Annual
Appropriation1 Adjustment to appropriation2
Total appropriation
Appropriation applied in
2019 (current and prior
years) Variance3
$’000 $’000 $’000 $’000 $’000
Departmental
Ordinary annual services 33,541
854 34,395 32,745 1,650
Capital Budget4 826 - 826 408 418
Total departmental 34,367 854 35,221 33,153 2,068
Notes: 1 Departmental appropriations do not lapse at financial year-end. 2 The adjustment to appropriation was PGPA Act Section 74 receipts. 3 The variance in appropriation applied to ordinary annual services largely reflects the lower drawdown of funds
to meet employee related expenses (as a consequence of lower staffing levels due to higher than budgeted
turnover). The variance in appropriation applied to the capital budget reflects variation in the timing of
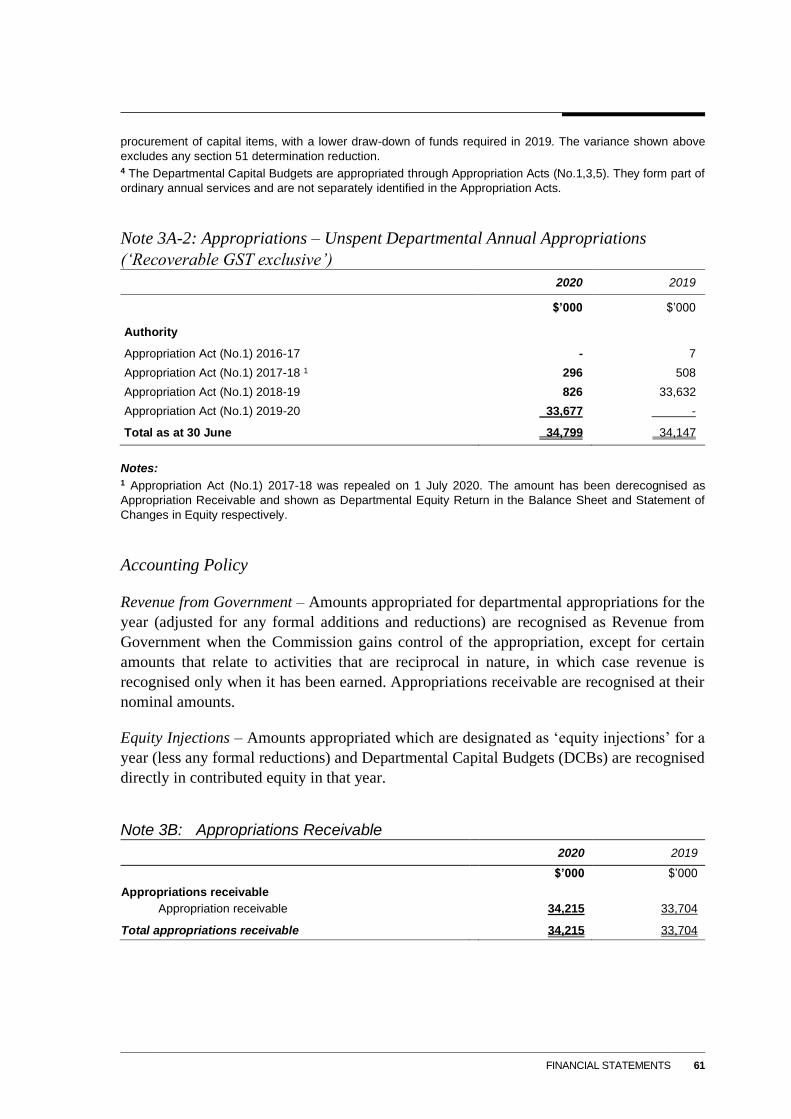
FINANCIAL STATEMENTS 61
procurement of capital items, with a lower draw-down of funds required in 2019. The variance shown above
excludes any section 51 determination reduction. 4 The Departmental Capital Budgets are appropriated through Appropriation Acts (No.1,3,5). They form part of
ordinary annual services and are not separately identified in the Appropriation Acts.
Note 3A-2: Appropriations – Unspent Departmental Annual Appropriations
(‘Recoverable GST exclusive’)
2020 2019
$’000 $’000
Authority
Appropriation Act (No.1) 2016-17 - 7
Appropriation Act (No.1) 2017-18 1 296 508
Appropriation Act (No.1) 2018-19 826 33,632
Appropriation Act (No.1) 2019-20 33,677 -
Total as at 30 June 34,799 34,147
Notes: 1 Appropriation Act (No.1) 2017-18 was repealed on 1 July 2020. The amount has been derecognised as
Appropriation Receivable and shown as Departmental Equity Return in the Balance Sheet and Statement of
Changes in Equity respectively.
Accounting Policy
Revenue from Government – Amounts appropriated for departmental appropriations for the
year (adjusted for any formal additions and reductions) are recognised as Revenue from
Government when the Commission gains control of the appropriation, except for certain
amounts that relate to activities that are reciprocal in nature, in which case revenue is
recognised only when it has been earned. Appropriations receivable are recognised at their
nominal amounts.
Equity Injections – Amounts appropriated which are designated as ‘equity injections’ for a
year (less any formal reductions) and Departmental Capital Budgets (DCBs) are recognised
directly in contributed equity in that year.
Note 3B: Appropriations Receivable
2020 2019
$’000 $’000
Appropriations receivable
Appropriation receivable 34,215 33,704
Total appropriations receivable 34,215 33,704

62 ANNUAL REPORT 2019-20
Note 3C: Net Cash Appropriation Arrangements
2020 2019
$’000 $’000
Total comprehensive (loss) / income less depreciation / amortisation expenses previously funded through revenue appropriations (445) 1,124
Plus: depreciation/amortisation expenses previously funded thorough revenue appropriation (1,127) (1,055)
Plus: depreciation right-of-use assets (2,510) -
Less: principal repayments - leased assets 2,259 -
Total comprehensive (loss) / income - as per the Statement of Comprehensive Income (1,823) 69
From 2010-11, the Government introduced net cash appropriation arrangements where revenue appropriations for depreciation/amortisation expenses ceased. Entities now receive a separate capital budget provided through equity appropriations. Capital budgets are to be appropriated in the period when cash payment for capital expenditure is required.
The inclusion of depreciation/amortisation expenses related to ROU leased assets and the lease liability principle repayment amount reflects the cash impact on implementation of AASB 16 Leases, it does not directly reflect a change in appropriation arrangements.
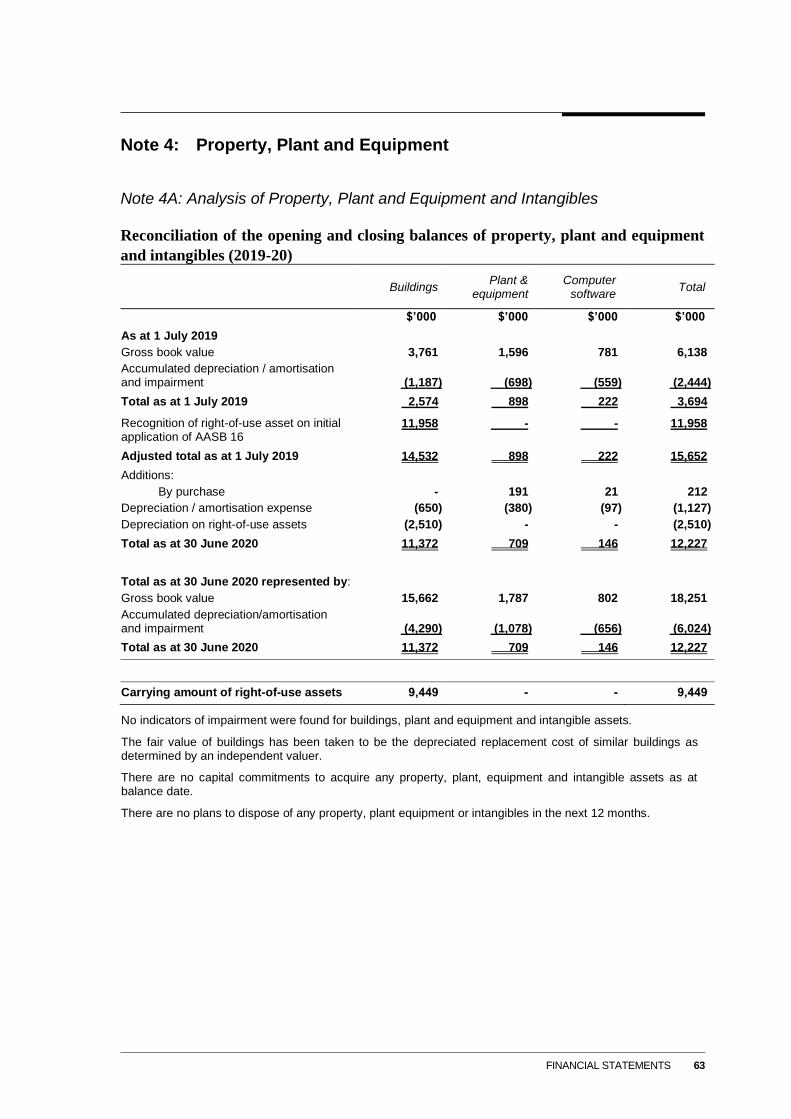
FINANCIAL STATEMENTS 63
Note 4: Property, Plant and Equipment
Note 4A: Analysis of Property, Plant and Equipment and Intangibles
Reconciliation of the opening and closing balances of property, plant and equipment
and intangibles (2019-20)
Buildings
Plant & equipment
Computer software
Total
$’000 $’000 $’000 $’000
As at 1 July 2019
Gross book value 3,761 1,596 781 6,138
Accumulated depreciation / amortisation and impairment (1,187) (698) (559) (2,444)
Total as at 1 July 2019 2,574 898 222 3,694
Recognition of right-of-use asset on initial application of AASB 16
11,958 - - 11,958
Adjusted total as at 1 July 2019 14,532 898 222 15,652
Additions:
By purchase
-
191
21
212
Depreciation / amortisation expense (650) (380) (97) (1,127)
Depreciation on right-of-use assets (2,510) - - (2,510)
Total as at 30 June 2020 11,372 709 146 12,227
Total as at 30 June 2020 represented by:
Gross book value 15,662 1,787 802 18,251
Accumulated depreciation/amortisation and impairment (4,290) (1,078) (656) (6,024)
Total as at 30 June 2020 11,372 709 146 12,227
Carrying amount of right-of-use assets 9,449 - - 9,449
No indicators of impairment were found for buildings, plant and equipment and intangible assets.
The fair value of buildings has been taken to be the depreciated replacement cost of similar buildings as determined by an independent valuer.
There are no capital commitments to acquire any property, plant, equipment and intangible assets as at balance date.
There are no plans to dispose of any property, plant equipment or intangibles in the next 12 months.
64 ANNUAL REPORT 2019-20
Accounting Policy
Asset Recognition Threshold
Purchases of property, plant and equipment and software are recognised initially at cost in
the statement of financial position, except for purchases costing less than $2,000, which are
expensed in the year of acquisition (other than where they form part of a group of similar
items which are significant in total).
The initial cost of an asset includes an estimate of the cost of dismantling and removing the
item and restoring the site on which it is located. This is particularly relevant to ‘make-good’
provisions in property leases taken up by the Commission where there exists an obligation
to ‘make-good’ premises. These costs are included in the value of the Commission’s
leasehold improvements with a corresponding provision for the ‘make-good’ recognised.
Lease Right of Use (ROU) Assets
Leased ROU assets are capitalised at the commencement date of the lease and comprise of the
initial lease liability amount, initial direct costs incurred when entering into the lease less any
lease incentives received. These assets are accounted for by Commonwealth lessees as
separate asset classes to corresponding assets owned outright, but included in the same column
as where the corresponding underlying assets would be presented if they were owned.
On initial adoption of AASB 16 the Commission has adjusted the ROU assets at the date of
initial application by the amount of any provision for onerous leases recognised immediately
before the date of initial application. Following initial application, an impairment review is
undertaken for any right of use lease asset that shows indicators of impairment and an
impairment loss is recognised against any right of use lease asset that is impaired. Lease
ROU assets continue to be measured at cost after initial recognition in Commonwealth
agency, General Government Sector and Whole of Government financial statements.
Revaluations
Following initial recognition at cost, property, plant and equipment excluding ROU assets
are carried at fair value less subsequent accumulated depreciation and accumulated
impairment losses. Valuations are conducted with sufficient frequency to ensure that the
carrying amounts of assets do not differ materially from the assets’ fair values at the
reporting date. The regularity of independent valuations depends upon the volatility of
movements in market values for the relevant assets.
Assets were revalued by Jones Lang LaSalle Advisory Services Pty Ltd as at 30 June 2017.
The revaluation decrement for leasehold improvements and increment for plant and
equipment were debited and credited respectively to the asset revaluation reserve by asset
class and included in the equity section of the statement of financial position.
Management reviewed the valuation at 30 June 2020 and concluded that the fair value does
not differ materially from the carrying amount; and is satisfied that the carry amount does
not exceed the recoverable amount.
FINANCIAL STATEMENTS 65
Revaluation adjustments are made on a class basis. Any revaluation increment is credited
to equity under the heading of asset revaluation reserve except to the extent that it reverses
a previous revaluation decrement of the same asset class that was previously recognised in
surplus/deficit. Revaluation decrements for a class of assets are recognised directly in the
surplus/deficit except to the extent that they reverse a previous revaluation increment for
that class.
Any accumulated depreciation as at the revaluation date is eliminated against the gross
carrying amount of the asset and the asset restated to the revalued amount.
Depreciation and Amortisation
Depreciable property, plant and equipment assets and intangible assets are written-off to
their estimated residual values over their estimated useful lives to the Commission using, in
all cases, the straight-line method of depreciation.
Depreciation and amortisation rates (useful lives), residual values and methods are reviewed
at each reporting date and necessary adjustments are recognised in the current, or current
and future reporting periods as appropriate.
Depreciation and amortisation rates applying to each class of depreciable asset are based on
the following useful lives:
2020 2019
Buildings (leasehold improvements, make-good and ROU assets)
Lease term Lease term
Plant and equipment 3 to 20 years 3 to 20 years
Intangibles (computer software) 3 to 5 years 3 to 5 years
Impairment
All assets were assessed for impairment at 30 June 2020. Where indications of impairment
exist, the asset’s recoverable amount is estimated and an impairment adjustment made if the
asset’s recoverable amount is less than its carrying amount.
The recoverable amount of an asset is the higher of its fair value less costs of disposal and
its value in use. Value in use is the present value of the future cash flows expected to be
derived from the asset. Where the future economic benefit of an asset is not primarily
dependent on the asset’s ability to generate future cash flows and the asset would be replaced
if the Commission were deprived of the asset, its value in use is taken to be its depreciated
replacement cost.
Derecognition
An item of property, plant and equipment and software is derecognised upon disposal or
when no further future economic benefits are expected from its use or disposal.
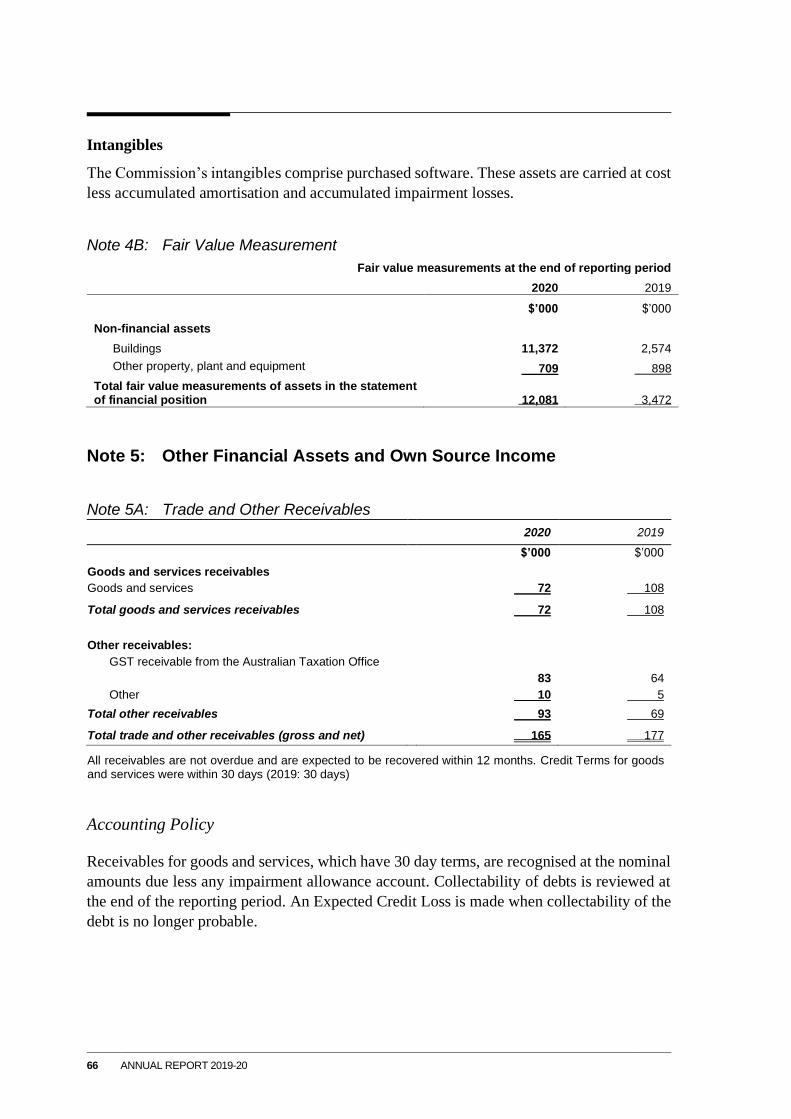
66 ANNUAL REPORT 2019-20
Intangibles
The Commission’s intangibles comprise purchased software. These assets are carried at cost
less accumulated amortisation and accumulated impairment losses.
Note 4B: Fair Value Measurement
Fair value measurements at the end of reporting period
2020 2019
$’000 $’000
Non-financial assets
Buildings 11,372 2,574
Other property, plant and equipment 709 898
Total fair value measurements of assets in the statement of financial position 12,081 3,472
Note 5: Other Financial Assets and Own Source Income
Note 5A: Trade and Other Receivables
2020 2019
$’000 $’000
Goods and services receivables
Goods and services 72 108
Total goods and services receivables 72 108
Other receivables:
GST receivable from the Australian Taxation Office
83
64
Other 10 5
Total other receivables 93 69
Total trade and other receivables (gross and net) 165 177
All receivables are not overdue and are expected to be recovered within 12 months. Credit Terms for goods and services were within 30 days (2019: 30 days)
Accounting Policy
Receivables for goods and services, which have 30 day terms, are recognised at the nominal
amounts due less any impairment allowance account. Collectability of debts is reviewed at
the end of the reporting period. An Expected Credit Loss is made when collectability of the
debt is no longer probable.
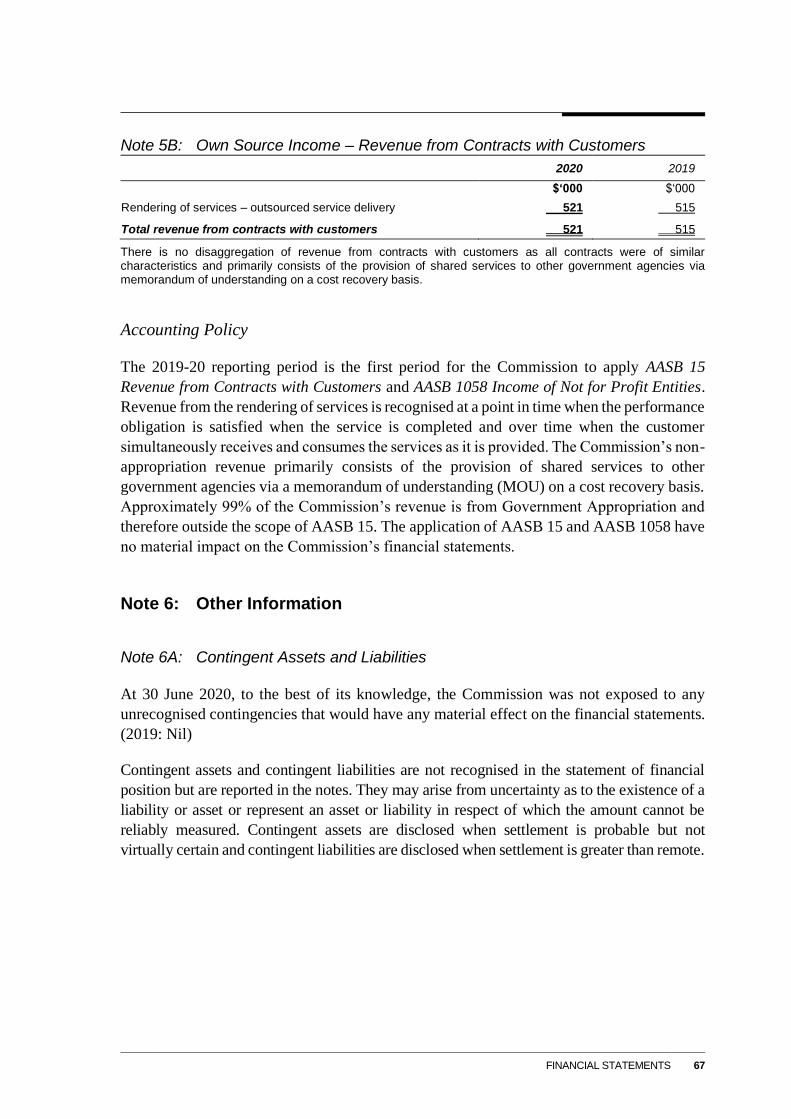
FINANCIAL STATEMENTS 67
Note 5B: Own Source Income – Revenue from Contracts with Customers
2020 2019
$‘000 $‘000
Rendering of services – outsourced service delivery 521 515
Total revenue from contracts with customers 521 515
There is no disaggregation of revenue from contracts with customers as all contracts were of similar characteristics and primarily consists of the provision of shared services to other government agencies via memorandum of understanding on a cost recovery basis.
Accounting Policy
The 2019-20 reporting period is the first period for the Commission to apply AASB 15
Revenue from Contracts with Customers and AASB 1058 Income of Not for Profit Entities.
Revenue from the rendering of services is recognised at a point in time when the performance
obligation is satisfied when the service is completed and over time when the customer
simultaneously receives and consumes the services as it is provided. The Commission’s non-
appropriation revenue primarily consists of the provision of shared services to other
government agencies via a memorandum of understanding (MOU) on a cost recovery basis.
Approximately 99% of the Commission’s revenue is from Government Appropriation and
therefore outside the scope of AASB 15. The application of AASB 15 and AASB 1058 have
no material impact on the Commission’s financial statements.
Note 6: Other Information
Note 6A: Contingent Assets and Liabilities
At 30 June 2020, to the best of its knowledge, the Commission was not exposed to any
unrecognised contingencies that would have any material effect on the financial statements.
(2019: Nil)
Contingent assets and contingent liabilities are not recognised in the statement of financial
position but are reported in the notes. They may arise from uncertainty as to the existence of a
liability or asset or represent an asset or liability in respect of which the amount cannot be
reliably measured. Contingent assets are disclosed when settlement is probable but not
virtually certain and contingent liabilities are disclosed when settlement is greater than remote.

68 ANNUAL REPORT 2019-20
Note 6B: Financial Instruments
Note 6B-1: Financial Instruments - Categories of financial instruments
2020 2019
$’000 $’000
Financial Assets
Financial assets at amortised cost
Cash and cash equivalents 288 436
Trade receivables 72 108
Total financial assets 360 544
Financial Liabilities
Financial liabilities measured at amortised cost
Payables – suppliers 270 233
Total financial liabilities 270 233
Accounting Policy
Financial Assets
The Commission classifies its financial assets in the following categories:
a) financial assets at fair value through profit or loss;
b) financial assets at fair value through other comprehensive income; and
c) financial assets measured at amortised cost.
The classification depends on both the Commission's business model for managing the
financial assets and contractual cash flow characteristics at the time of initial recognition.
Financial assets are recognised when the Commission becomes a party to the contract and,
as a consequence, has a legal right to receive or a legal obligation to pay cash and
derecognised when the contractual rights to the cash flows from the financial asset expire or
are transferred upon trade date.
The Commission currently only has financial assets at amortised cost.
Financial Assets at Amortised Cost
Financial assets included in this category need to meet two criteria:
1. the financial asset is held in order to collect the contractual cash flows; and
2. the cash flows are solely payments of principal and interest (SPPI) on the principal
outstanding amount.
Amortised cost is determined using the effective interest method.
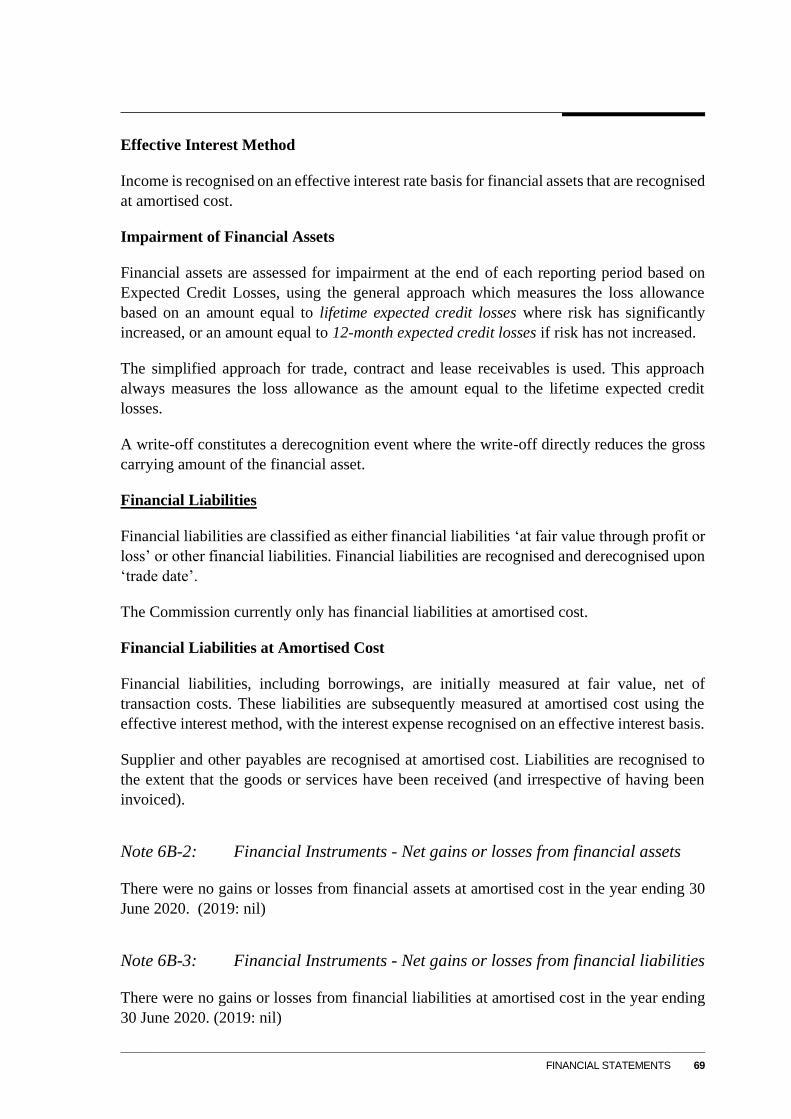
FINANCIAL STATEMENTS 69
Effective Interest Method
Income is recognised on an effective interest rate basis for financial assets that are recognised
at amortised cost.
Impairment of Financial Assets
Financial assets are assessed for impairment at the end of each reporting period based on
Expected Credit Losses, using the general approach which measures the loss allowance
based on an amount equal to lifetime expected credit losses where risk has significantly
increased, or an amount equal to 12-month expected credit losses if risk has not increased.
The simplified approach for trade, contract and lease receivables is used. This approach
always measures the loss allowance as the amount equal to the lifetime expected credit
losses.
A write-off constitutes a derecognition event where the write-off directly reduces the gross
carrying amount of the financial asset.
Financial Liabilities
Financial liabilities are classified as either financial liabilities ‘at fair value through profit or
loss’ or other financial liabilities. Financial liabilities are recognised and derecognised upon
‘trade date’.
The Commission currently only has financial liabilities at amortised cost.
Financial Liabilities at Amortised Cost
Financial liabilities, including borrowings, are initially measured at fair value, net of
transaction costs. These liabilities are subsequently measured at amortised cost using the
effective interest method, with the interest expense recognised on an effective interest basis.
Supplier and other payables are recognised at amortised cost. Liabilities are recognised to
the extent that the goods or services have been received (and irrespective of having been
invoiced).
Note 6B-2: Financial Instruments - Net gains or losses from financial assets
There were no gains or losses from financial assets at amortised cost in the year ending 30
June 2020. (2019: nil)
Note 6B-3: Financial Instruments - Net gains or losses from financial liabilities
There were no gains or losses from financial liabilities at amortised cost in the year ending
30 June 2020. (2019: nil)

70 ANNUAL REPORT 2019-20
Note 6C: Aggregate Assets and Liabilities
2020 2019
$‘000 $‘000
Assets expected to be recovered in:
No more than 12 months
Cash and cash equivalents 288 436
Trade and other receivables 165 177
Appropriation receivables 34,215 33,704
Prepayments 294 577
34,962 34,894
More than 12 months
Leasehold improvements 11,372 2,574
Plant and equipment 709 898
Computer software 146 222
12,227 3,694
Total assets 47,189 38,588
Liabilities expected to be recovered in:
No more than 12 months
Suppliers 270 233
Other payables 387 580
Employee provisions 2,098 1,933
Other provisions 603 -
3,358 2,746
More than 12 months
Other payables - 822
Employee provisions 9,421 9,439
Other provisions - 592
9,421 10,853
Total liabilities 12,779 13,599
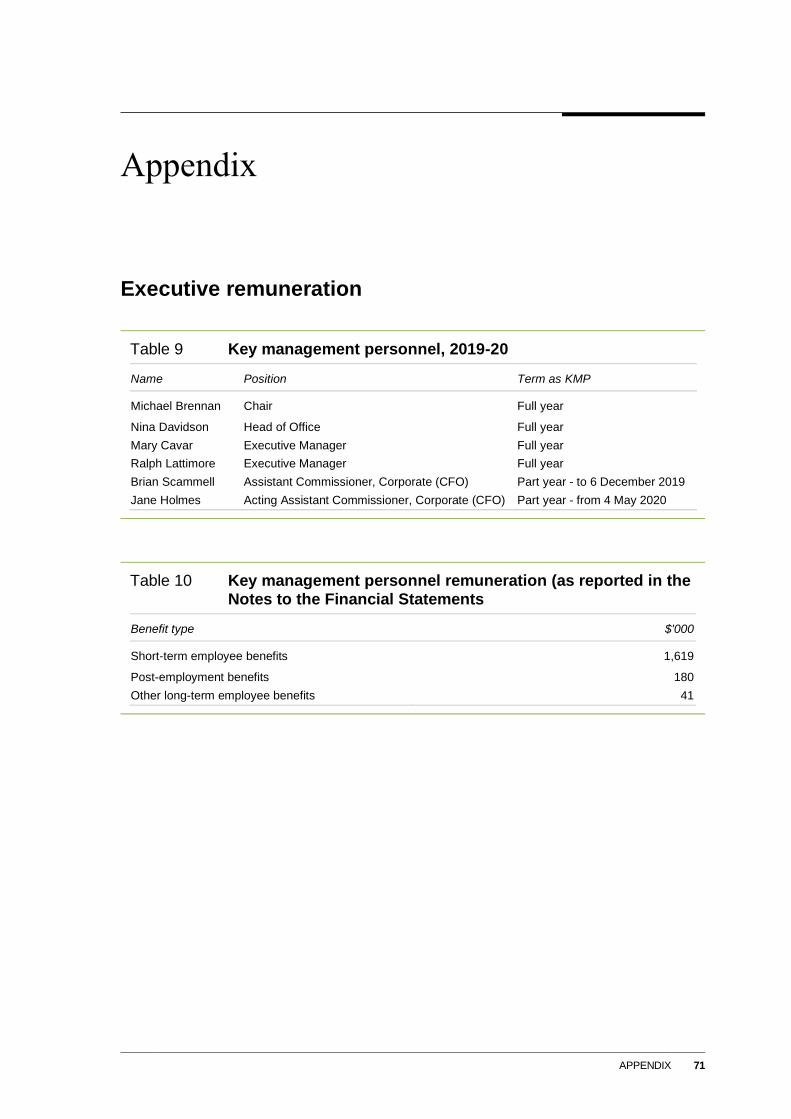
APPENDIX 71
Appendix
Executive remuneration
Table 9 Key management personnel, 2019-20
Name Position Term as KMP
Michael Brennan Chair Full year
Nina Davidson Head of Office Full year
Mary Cavar Executive Manager Full year
Ralph Lattimore Executive Manager Full year
Brian Scammell Assistant Commissioner, Corporate (CFO) Part year - to 6 December 2019
Jane Holmes Acting Assistant Commissioner, Corporate (CFO) Part year - from 4 May 2020
Table 10 Key management personnel remuneration (as reported in the Notes to the Financial Statements
Benefit type $'000
Short-term employee benefits 1,619
Post-employment benefits 180
Other long-term employee benefits 41
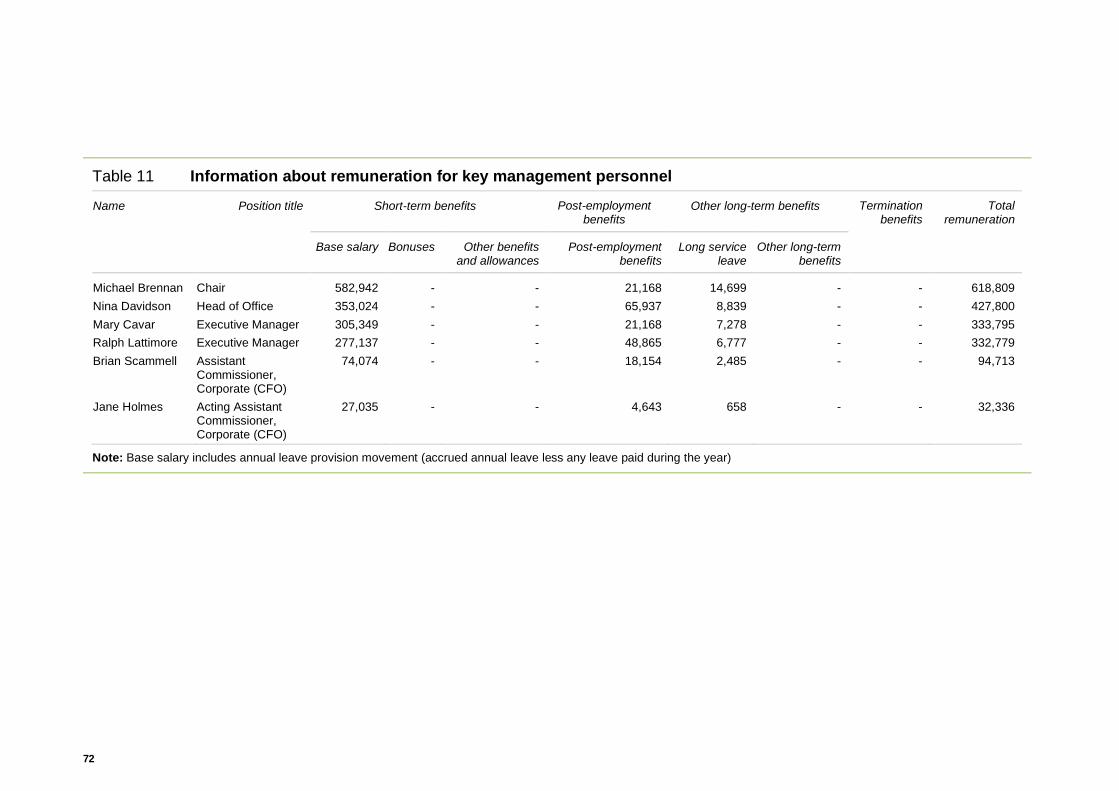
72
Table 11 Information about remuneration for key management personnel
Name Position title Short-term benefits Post-employment benefits
Other long-term benefits Termination benefits
Total remuneration
Base salary Bonuses Other benefits and allowances
Post-employment benefits
Long service leave
Other long-term benefits
Michael Brennan Chair 582,942 - - 21,168 14,699 - - 618,809
Nina Davidson Head of Office 353,024 - - 65,937 8,839 - - 427,800
Mary Cavar Executive Manager 305,349 - - 21,168 7,278 - - 333,795
Ralph Lattimore Executive Manager 277,137 - - 48,865 6,777 - - 332,779
Brian Scammell Assistant Commissioner, Corporate (CFO)
74,074 - - 18,154 2,485 - - 94,713
Jane Holmes Acting Assistant Commissioner, Corporate (CFO)
27,035 - - 4,643 658 - - 32,336
Note: Base salary includes annual leave provision movement (accrued annual leave less any leave paid during the year)
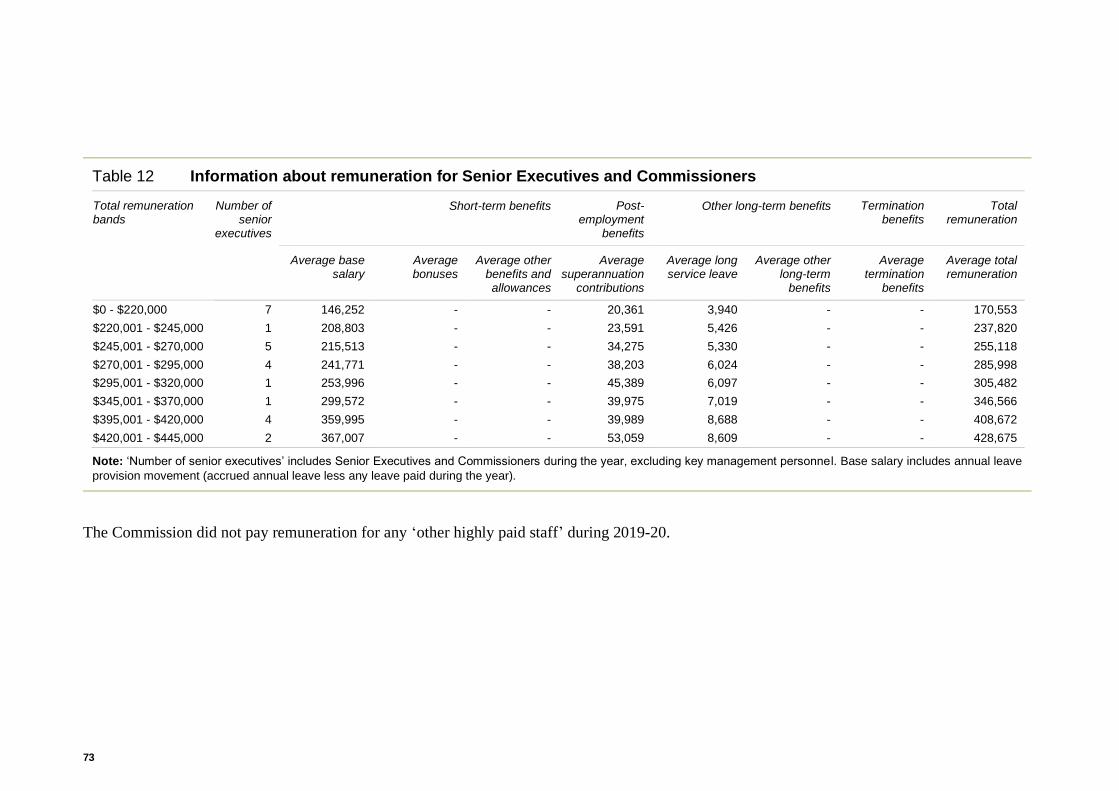
73
Table 12 Information about remuneration for Senior Executives and Commissioners
Total remuneration bands
Number of senior
executives
Short-term benefits Post-employment
benefits
Other long-term benefits Termination benefits
Total remuneration
Average base salary
Average bonuses
Average other benefits and allowances
Average superannuation
contributions
Average long service leave
Average other long-term
benefits
Average termination
benefits
Average total remuneration
$0 - $220,000 7 146,252 - - 20,361 3,940 - - 170,553
$220,001 - $245,000 1 208,803 - - 23,591 5,426 - - 237,820
$245,001 - $270,000 5 215,513 - - 34,275 5,330 - - 255,118
$270,001 - $295,000 4 241,771 - - 38,203 6,024 - - 285,998
$295,001 - $320,000 1 253,996 - - 45,389 6,097 - - 305,482
$345,001 - $370,000 1 299,572 - - 39,975 7,019 - - 346,566
$395,001 - $420,000 4 359,995 - - 39,989 8,688 - - 408,672
$420,001 - $445,000 2 367,007 - - 53,059 8,609 - - 428,675
Note: ‘Number of senior executives’ includes Senior Executives and Commissioners during the year, excluding key management personnel. Base salary includes annual leave
provision movement (accrued annual leave less any leave paid during the year).
The Commission did not pay remuneration for any ‘other highly paid staff’ during 2019-20.
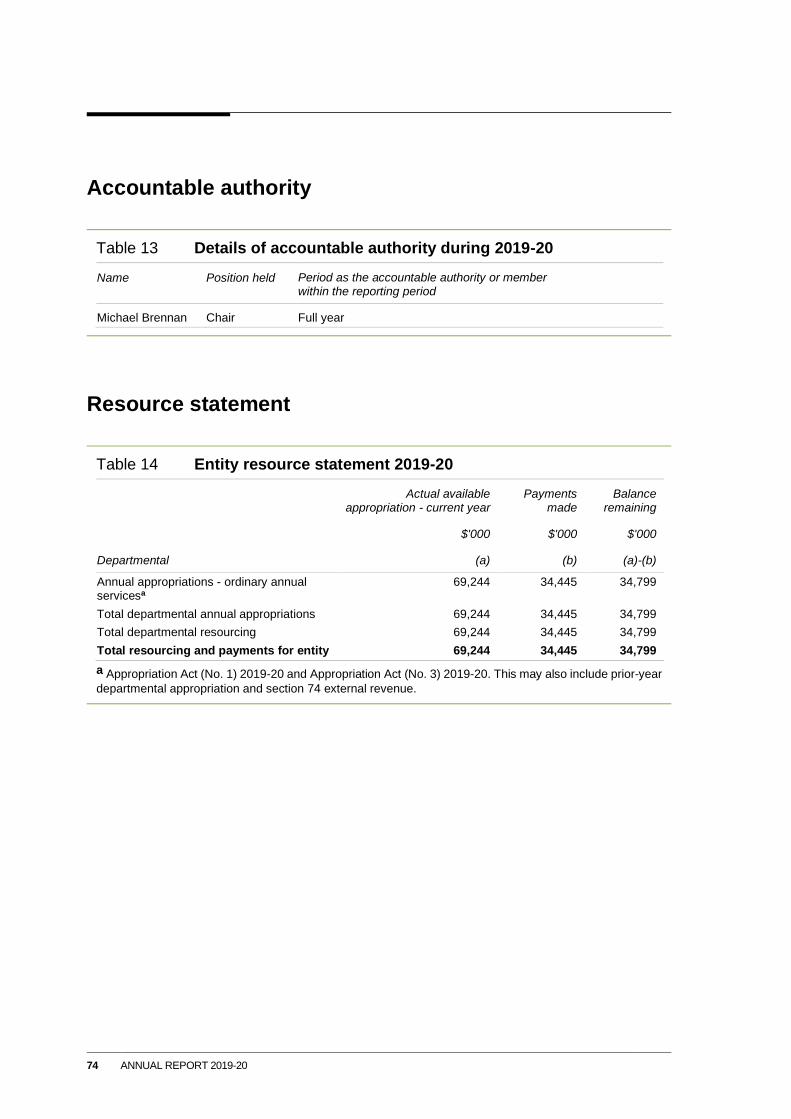
74 ANNUAL REPORT 2019-20
Accountable authority
Table 13 Details of accountable authority during 2019-20
Name Position held Period as the accountable authority or member within the reporting period
Michael Brennan Chair Full year
Resource statement
Table 14 Entity resource statement 2019-20
Actual available appropriation - current year
Payments made
Balance remaining
$'000 $'000 $'000
Departmental (a) (b) (a)-(b)
Annual appropriations - ordinary annual servicesa
69,244 34,445 34,799
Total departmental annual appropriations 69,244 34,445 34,799
Total departmental resourcing 69,244 34,445 34,799
Total resourcing and payments for entity 69,244 34,445 34,799
a Appropriation Act (No. 1) 2019-20 and Appropriation Act (No. 3) 2019-20. This may also include prior-year
departmental appropriation and section 74 external revenue.
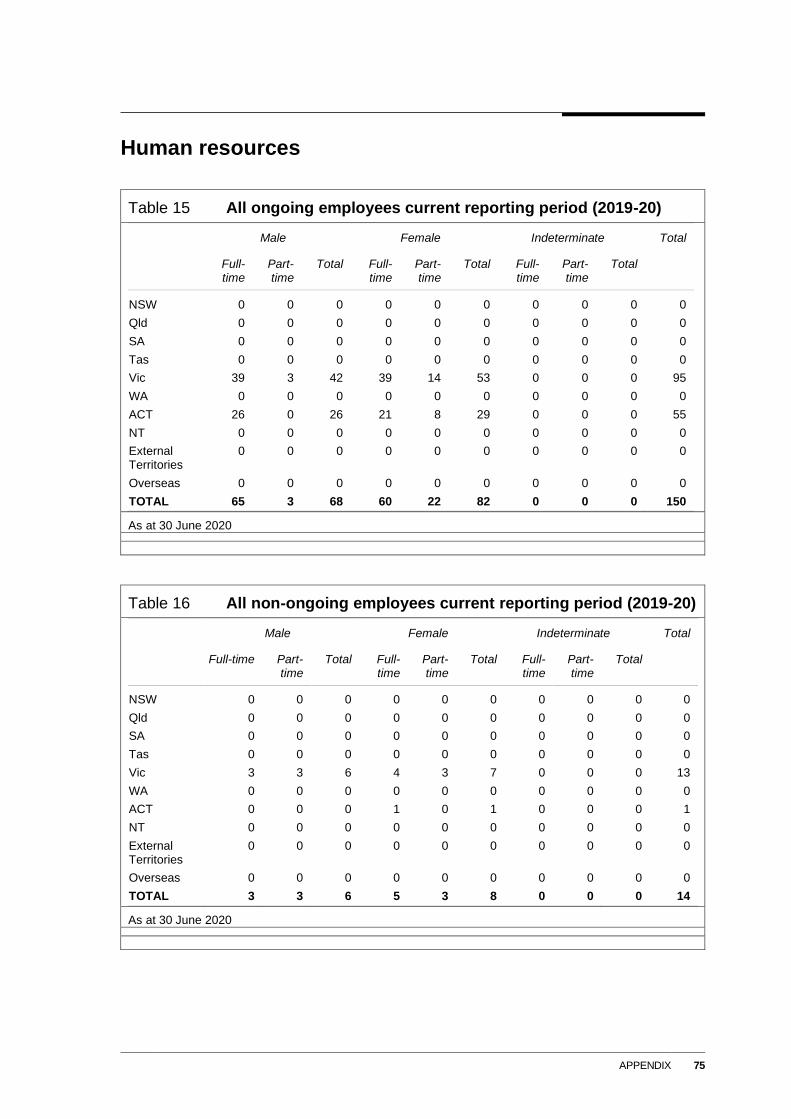
APPENDIX 75
Human resources
Table 15 All ongoing employees current reporting period (2019-20)
Male Female Indeterminate Total
Full-time
Part-time
Total Full-time
Part-time
Total Full-time
Part-time
Total
NSW 0 0 0 0 0 0 0 0 0 0
Qld 0 0 0 0 0 0 0 0 0 0
SA 0 0 0 0 0 0 0 0 0 0
Tas 0 0 0 0 0 0 0 0 0 0
Vic 39 3 42 39 14 53 0 0 0 95
WA 0 0 0 0 0 0 0 0 0 0
ACT 26 0 26 21 8 29 0 0 0 55
NT 0 0 0 0 0 0 0 0 0 0
External Territories
0 0 0 0 0 0 0 0 0 0
Overseas 0 0 0 0 0 0 0 0 0 0
TOTAL 65 3 68 60 22 82 0 0 0 150
As at 30 June 2020
Table 16 All non-ongoing employees current reporting period (2019-20)
Male Female Indeterminate Total
Full-time Part-time
Total Full-time
Part-time
Total Full-time
Part-time
Total
NSW 0 0 0 0 0 0 0 0 0 0
Qld 0 0 0 0 0 0 0 0 0 0
SA 0 0 0 0 0 0 0 0 0 0
Tas 0 0 0 0 0 0 0 0 0 0
Vic 3 3 6 4 3 7 0 0 0 13
WA 0 0 0 0 0 0 0 0 0 0
ACT 0 0 0 1 0 1 0 0 0 1
NT 0 0 0 0 0 0 0 0 0 0
External Territories
0 0 0 0 0 0 0 0 0 0
Overseas 0 0 0 0 0 0 0 0 0 0
TOTAL 3 3 6 5 3 8 0 0 0 14
As at 30 June 2020
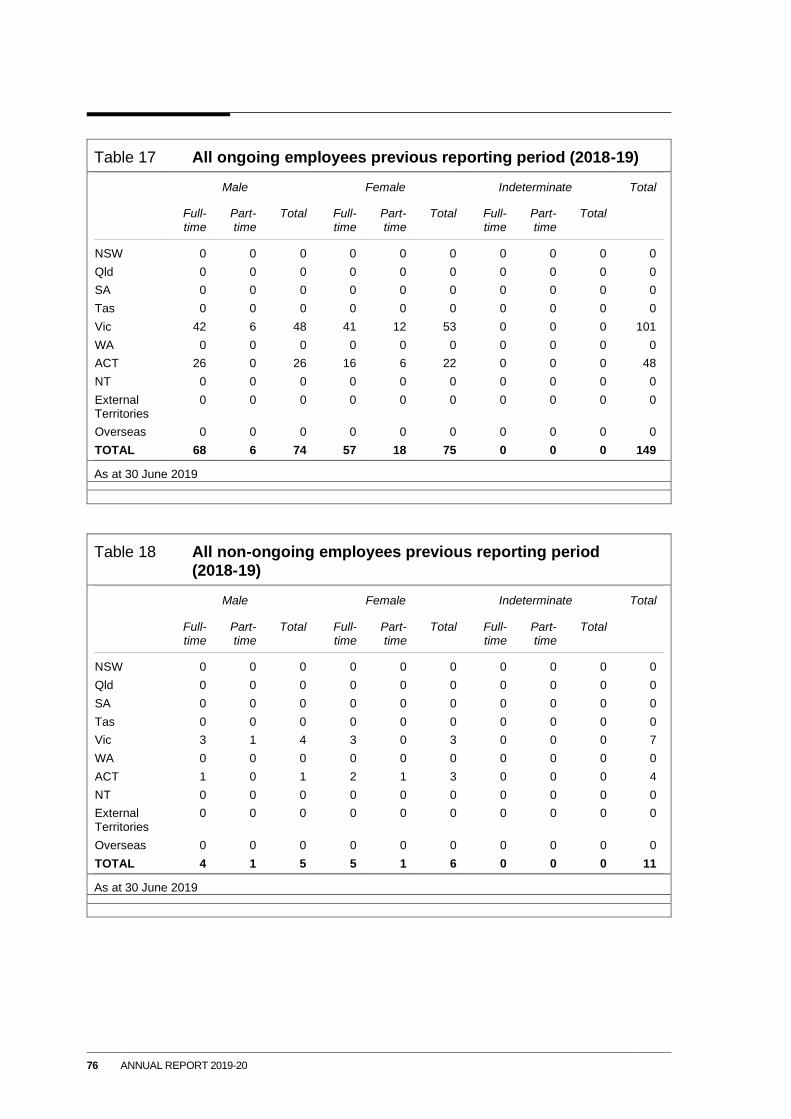
76 ANNUAL REPORT 2019-20
Table 17 All ongoing employees previous reporting period (2018-19)
Male Female Indeterminate Total
Full-time
Part-time
Total Full-time
Part-time
Total Full-time
Part-time
Total
NSW 0 0 0 0 0 0 0 0 0 0
Qld 0 0 0 0 0 0 0 0 0 0
SA 0 0 0 0 0 0 0 0 0 0
Tas 0 0 0 0 0 0 0 0 0 0
Vic 42 6 48 41 12 53 0 0 0 101
WA 0 0 0 0 0 0 0 0 0 0
ACT 26 0 26 16 6 22 0 0 0 48
NT 0 0 0 0 0 0 0 0 0 0
External Territories
0 0 0 0 0 0 0 0 0 0
Overseas 0 0 0 0 0 0 0 0 0 0
TOTAL 68 6 74 57 18 75 0 0 0 149
As at 30 June 2019
Table 18 All non-ongoing employees previous reporting period (2018-19)
Male Female Indeterminate Total
Full-time
Part-time
Total Full-time
Part-time
Total Full-time
Part-time
Total
NSW 0 0 0 0 0 0 0 0 0 0
Qld 0 0 0 0 0 0 0 0 0 0
SA 0 0 0 0 0 0 0 0 0 0
Tas 0 0 0 0 0 0 0 0 0 0
Vic 3 1 4 3 0 3 0 0 0 7
WA 0 0 0 0 0 0 0 0 0 0
ACT 1 0 1 2 1 3 0 0 0 4
NT 0 0 0 0 0 0 0 0 0 0
External Territories
0 0 0 0 0 0 0 0 0 0
Overseas 0 0 0 0 0 0 0 0 0 0
TOTAL 4 1 5 5 1 6 0 0 0 11
As at 30 June 2019
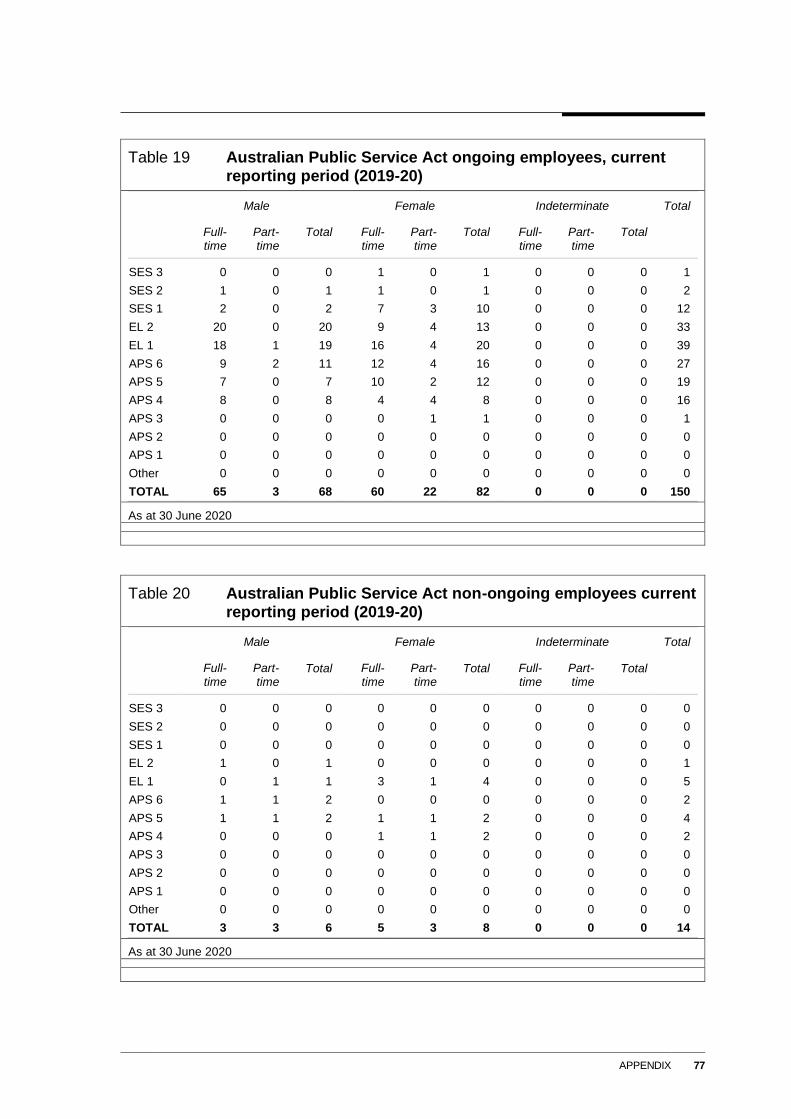
APPENDIX 77
Table 19 Australian Public Service Act ongoing employees, current reporting period (2019-20)
Male Female Indeterminate Total
Full-time
Part-time
Total Full-time
Part-time
Total Full-time
Part-time
Total
SES 3 0 0 0 1 0 1 0 0 0 1
SES 2 1 0 1 1 0 1 0 0 0 2
SES 1 2 0 2 7 3 10 0 0 0 12
EL 2 20 0 20 9 4 13 0 0 0 33
EL 1 18 1 19 16 4 20 0 0 0 39
APS 6 9 2 11 12 4 16 0 0 0 27
APS 5 7 0 7 10 2 12 0 0 0 19
APS 4 8 0 8 4 4 8 0 0 0 16
APS 3 0 0 0 0 1 1 0 0 0 1
APS 2 0 0 0 0 0 0 0 0 0 0
APS 1 0 0 0 0 0 0 0 0 0 0
Other 0 0 0 0 0 0 0 0 0 0
TOTAL 65 3 68 60 22 82 0 0 0 150
As at 30 June 2020
Table 20 Australian Public Service Act non-ongoing employees current reporting period (2019-20)
Male Female Indeterminate Total
Full-time
Part-time
Total Full-time
Part-time
Total Full-time
Part-time
Total
SES 3 0 0 0 0 0 0 0 0 0 0
SES 2 0 0 0 0 0 0 0 0 0 0
SES 1 0 0 0 0 0 0 0 0 0 0
EL 2 1 0 1 0 0 0 0 0 0 1
EL 1 0 1 1 3 1 4 0 0 0 5
APS 6 1 1 2 0 0 0 0 0 0 2
APS 5 1 1 2 1 1 2 0 0 0 4
APS 4 0 0 0 1 1 2 0 0 0 2
APS 3 0 0 0 0 0 0 0 0 0 0
APS 2 0 0 0 0 0 0 0 0 0 0
APS 1 0 0 0 0 0 0 0 0 0 0
Other 0 0 0 0 0 0 0 0 0 0
TOTAL 3 3 6 5 3 8 0 0 0 14
As at 30 June 2020
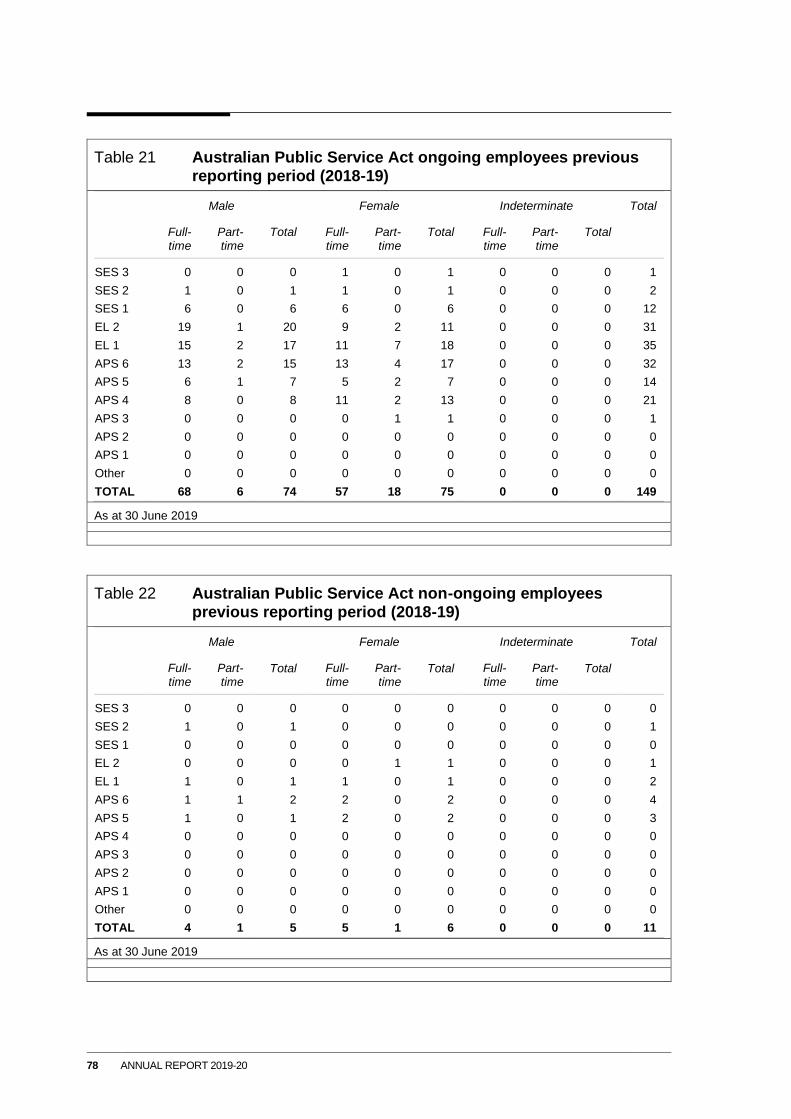
78 ANNUAL REPORT 2019-20
Table 21 Australian Public Service Act ongoing employees previous reporting period (2018-19)
Male Female Indeterminate Total
Full-time
Part-time
Total Full-time
Part-time
Total Full-time
Part-time
Total
SES 3 0 0 0 1 0 1 0 0 0 1
SES 2 1 0 1 1 0 1 0 0 0 2
SES 1 6 0 6 6 0 6 0 0 0 12
EL 2 19 1 20 9 2 11 0 0 0 31
EL 1 15 2 17 11 7 18 0 0 0 35
APS 6 13 2 15 13 4 17 0 0 0 32
APS 5 6 1 7 5 2 7 0 0 0 14
APS 4 8 0 8 11 2 13 0 0 0 21
APS 3 0 0 0 0 1 1 0 0 0 1
APS 2 0 0 0 0 0 0 0 0 0 0
APS 1 0 0 0 0 0 0 0 0 0 0
Other 0 0 0 0 0 0 0 0 0 0
TOTAL 68 6 74 57 18 75 0 0 0 149
As at 30 June 2019
Table 22 Australian Public Service Act non-ongoing employees previous reporting period (2018-19)
Male Female Indeterminate Total
Full-time
Part-time
Total Full-time
Part-time
Total Full-time
Part-time
Total
SES 3 0 0 0 0 0 0 0 0 0 0
SES 2 1 0 1 0 0 0 0 0 0 1
SES 1 0 0 0 0 0 0 0 0 0 0
EL 2 0 0 0 0 1 1 0 0 0 1
EL 1 1 0 1 1 0 1 0 0 0 2
APS 6 1 1 2 2 0 2 0 0 0 4
APS 5 1 0 1 2 0 2 0 0 0 3
APS 4 0 0 0 0 0 0 0 0 0 0
APS 3 0 0 0 0 0 0 0 0 0 0
APS 2 0 0 0 0 0 0 0 0 0 0
APS 1 0 0 0 0 0 0 0 0 0 0
Other 0 0 0 0 0 0 0 0 0 0
TOTAL 4 1 5 5 1 6 0 0 0 11
As at 30 June 2019
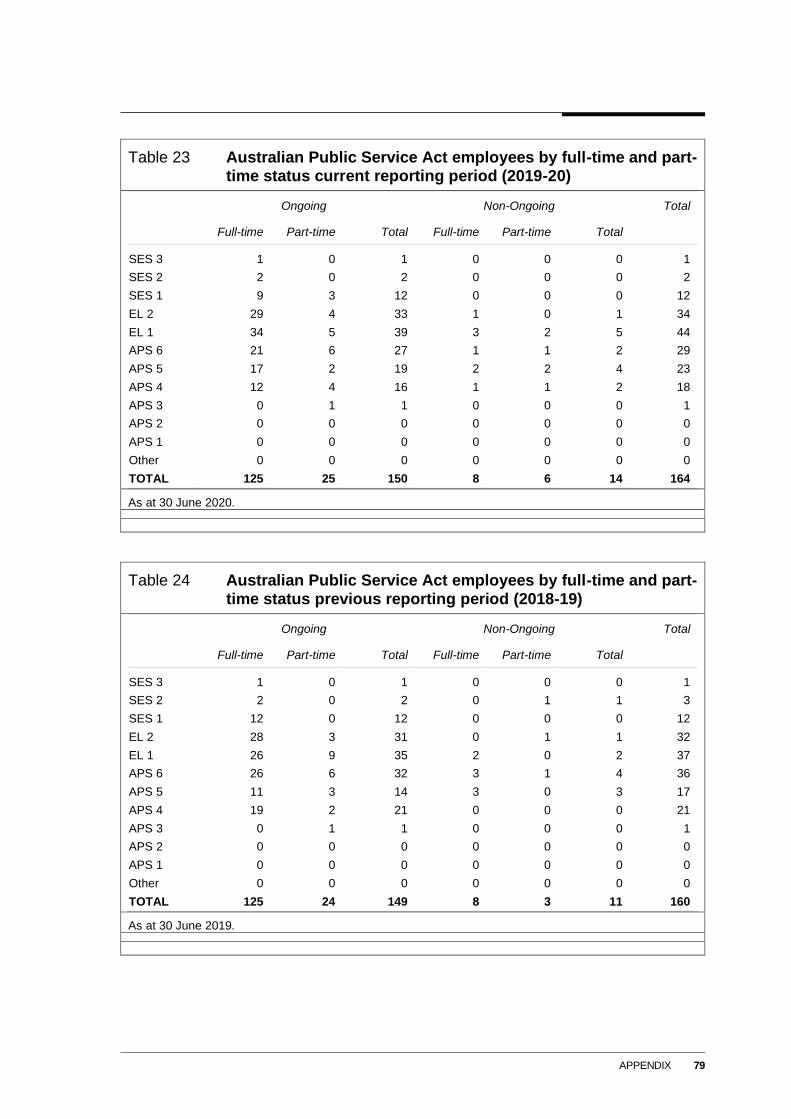
APPENDIX 79
Table 23 Australian Public Service Act employees by full-time and part-time status current reporting period (2019-20)
Ongoing Non-Ongoing Total
Full-time Part-time Total Full-time Part-time Total
SES 3 1 0 1 0 0 0 1
SES 2 2 0 2 0 0 0 2
SES 1 9 3 12 0 0 0 12
EL 2 29 4 33 1 0 1 34
EL 1 34 5 39 3 2 5 44
APS 6 21 6 27 1 1 2 29
APS 5 17 2 19 2 2 4 23
APS 4 12 4 16 1 1 2 18
APS 3 0 1 1 0 0 0 1
APS 2 0 0 0 0 0 0 0
APS 1 0 0 0 0 0 0 0
Other 0 0 0 0 0 0 0
TOTAL 125 25 150 8 6 14 164
As at 30 June 2020.
Table 24 Australian Public Service Act employees by full-time and part-time status previous reporting period (2018-19)
Ongoing Non-Ongoing Total
Full-time Part-time Total Full-time Part-time Total
SES 3 1 0 1 0 0 0 1
SES 2 2 0 2 0 1 1 3
SES 1 12 0 12 0 0 0 12
EL 2 28 3 31 0 1 1 32
EL 1 26 9 35 2 0 2 37
APS 6 26 6 32 3 1 4 36
APS 5 11 3 14 3 0 3 17
APS 4 19 2 21 0 0 0 21
APS 3 0 1 1 0 0 0 1
APS 2 0 0 0 0 0 0 0
APS 1 0 0 0 0 0 0 0
Other 0 0 0 0 0 0 0
TOTAL 125 24 149 8 3 11 160
As at 30 June 2019.
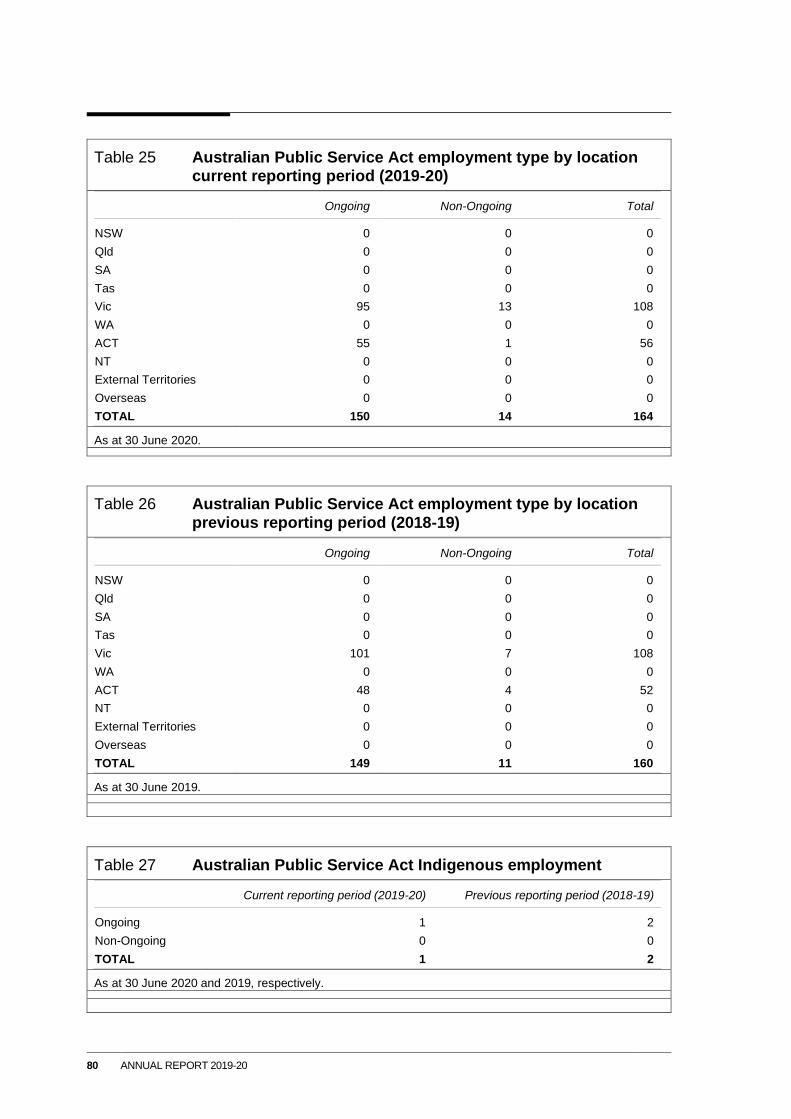
80 ANNUAL REPORT 2019-20
Table 25 Australian Public Service Act employment type by location current reporting period (2019-20)
Ongoing Non-Ongoing Total
NSW 0 0 0
Qld 0 0 0
SA 0 0 0
Tas 0 0 0
Vic 95 13 108
WA 0 0 0
ACT 55 1 56
NT 0 0 0
External Territories 0 0 0
Overseas 0 0 0
TOTAL 150 14 164
As at 30 June 2020.
Table 26 Australian Public Service Act employment type by location previous reporting period (2018-19)
Ongoing Non-Ongoing Total
NSW 0 0 0
Qld 0 0 0
SA 0 0 0
Tas 0 0 0
Vic 101 7 108
WA 0 0 0
ACT 48 4 52
NT 0 0 0
External Territories 0 0 0
Overseas 0 0 0
TOTAL 149 11 160
As at 30 June 2019.
Table 27 Australian Public Service Act Indigenous employment
Current reporting period (2019-20) Previous reporting period (2018-19)
Ongoing 1 2
Non-Ongoing 0 0
TOTAL 1 2
As at 30 June 2020 and 2019, respectively.
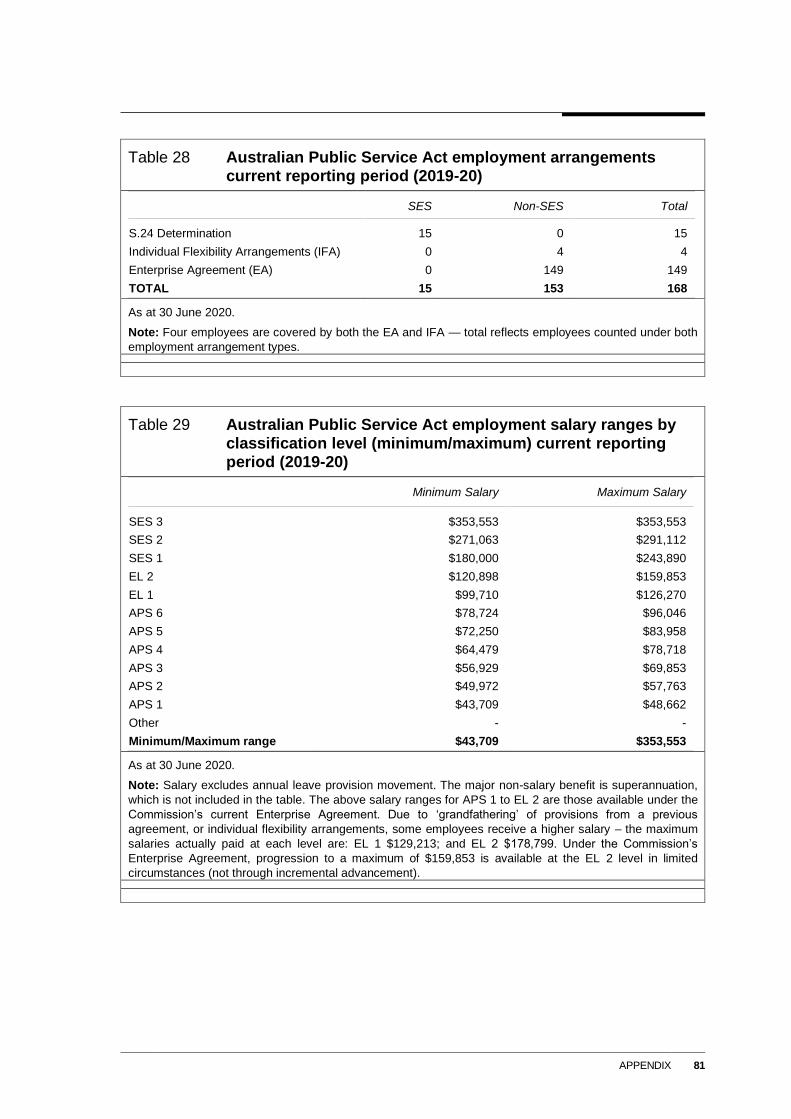
APPENDIX 81
Table 28 Australian Public Service Act employment arrangements current reporting period (2019-20)
SES Non-SES Total
S.24 Determination 15 0 15
Individual Flexibility Arrangements (IFA) 0 4 4
Enterprise Agreement (EA) 0 149 149
TOTAL 15 153 168
As at 30 June 2020.
Note: Four employees are covered by both the EA and IFA — total reflects employees counted under both
employment arrangement types.
Table 29 Australian Public Service Act employment salary ranges by classification level (minimum/maximum) current reporting period (2019-20)
Minimum Salary Maximum Salary
SES 3 $353,553 $353,553
SES 2 $271,063 $291,112
SES 1 $180,000 $243,890
EL 2 $120,898 $159,853
EL 1 $99,710 $126,270
APS 6 $78,724 $96,046
APS 5 $72,250 $83,958
APS 4 $64,479 $78,718
APS 3 $56,929 $69,853
APS 2 $49,972 $57,763
APS 1 $43,709 $48,662
Other - -
Minimum/Maximum range $43,709 $353,553
As at 30 June 2020.
Note: Salary excludes annual leave provision movement. The major non-salary benefit is superannuation,
which is not included in the table. The above salary ranges for APS 1 to EL 2 are those available under the
Commission’s current Enterprise Agreement. Due to ‘grandfathering’ of provisions from a previous
agreement, or individual flexibility arrangements, some employees receive a higher salary – the maximum
salaries actually paid at each level are: EL 1 $129,213; and EL 2 $178,799. Under the Commission’s
Enterprise Agreement, progression to a maximum of $159,853 is available at the EL 2 level in limited
circumstances (not through incremental advancement).
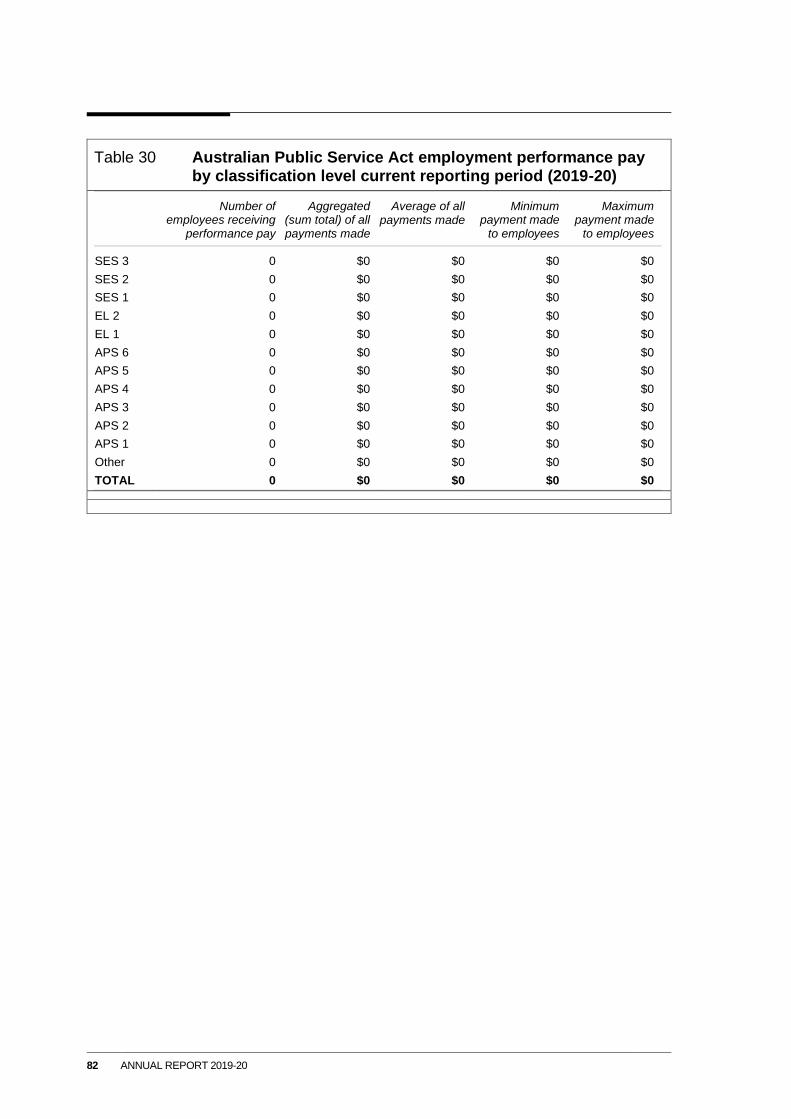
82 ANNUAL REPORT 2019-20
Table 30 Australian Public Service Act employment performance pay by classification level current reporting period (2019-20)
Number of employees receiving
performance pay
Aggregated (sum total) of all payments made
Average of all payments made
Minimum payment made
to employees
Maximum payment made
to employees
SES 3 0 $0 $0 $0 $0
SES 2 0 $0 $0 $0 $0
SES 1 0 $0 $0 $0 $0
EL 2 0 $0 $0 $0 $0
EL 1 0 $0 $0 $0 $0
APS 6 0 $0 $0 $0 $0
APS 5 0 $0 $0 $0 $0
APS 4 0 $0 $0 $0 $0
APS 3 0 $0 $0 $0 $0
APS 2 0 $0 $0 $0 $0
APS 1 0 $0 $0 $0 $0
Other 0 $0 $0 $0 $0
TOTAL 0 $0 $0 $0 $0
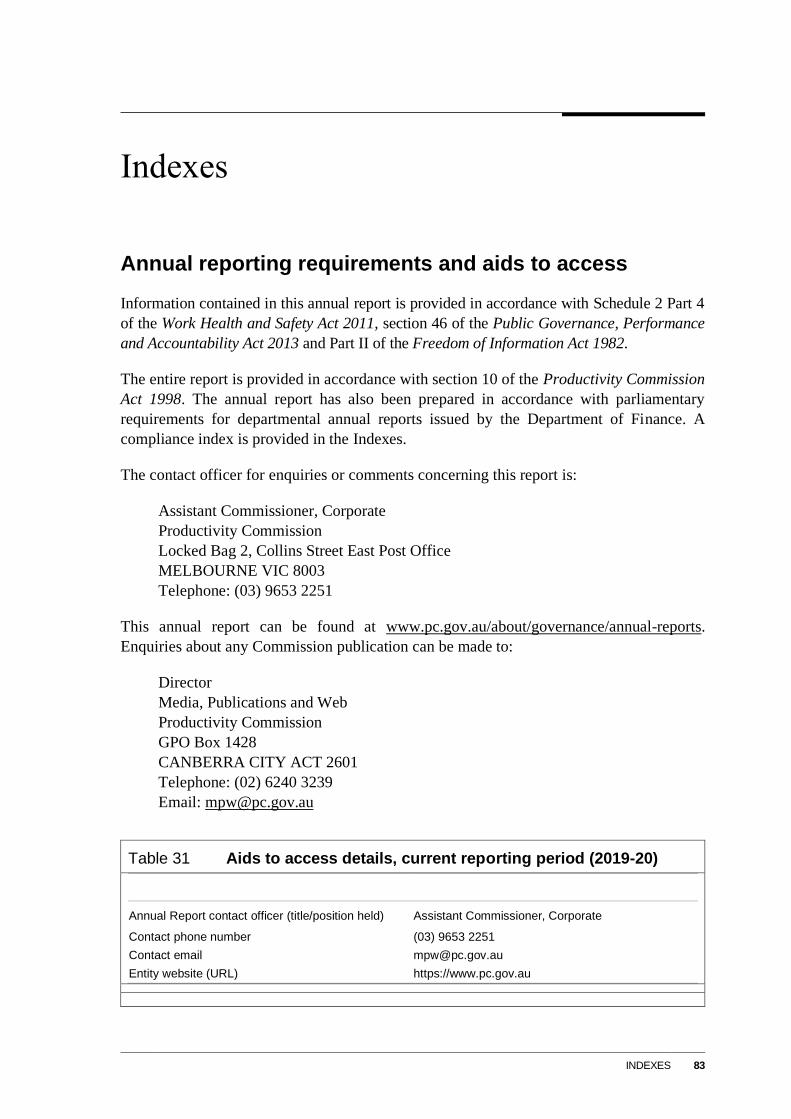
INDEXES 83
Indexes
Annual reporting requirements and aids to access
Information contained in this annual report is provided in accordance with Schedule 2 Part 4
of the Work Health and Safety Act 2011, section 46 of the Public Governance, Performance
and Accountability Act 2013 and Part II of the Freedom of Information Act 1982.
The entire report is provided in accordance with section 10 of the Productivity Commission
Act 1998. The annual report has also been prepared in accordance with parliamentary
requirements for departmental annual reports issued by the Department of Finance. A
compliance index is provided in the Indexes.
The contact officer for enquiries or comments concerning this report is:
Assistant Commissioner, Corporate
Productivity Commission
Locked Bag 2, Collins Street East Post Office
MELBOURNE VIC 8003
Telephone: (03) 9653 2251
This annual report can be found at www.pc.gov.au/about/governance/annual-reports.
Enquiries about any Commission publication can be made to:
Director
Media, Publications and Web
Productivity Commission
GPO Box 1428
CANBERRA CITY ACT 2601
Telephone: (02) 6240 3239
Email: [email protected]
Table 31 Aids to access details, current reporting period (2019-20)
Annual Report contact officer (title/position held) Assistant Commissioner, Corporate
Contact phone number (03) 9653 2251
Contact email [email protected]
Entity website (URL) https://www.pc.gov.au
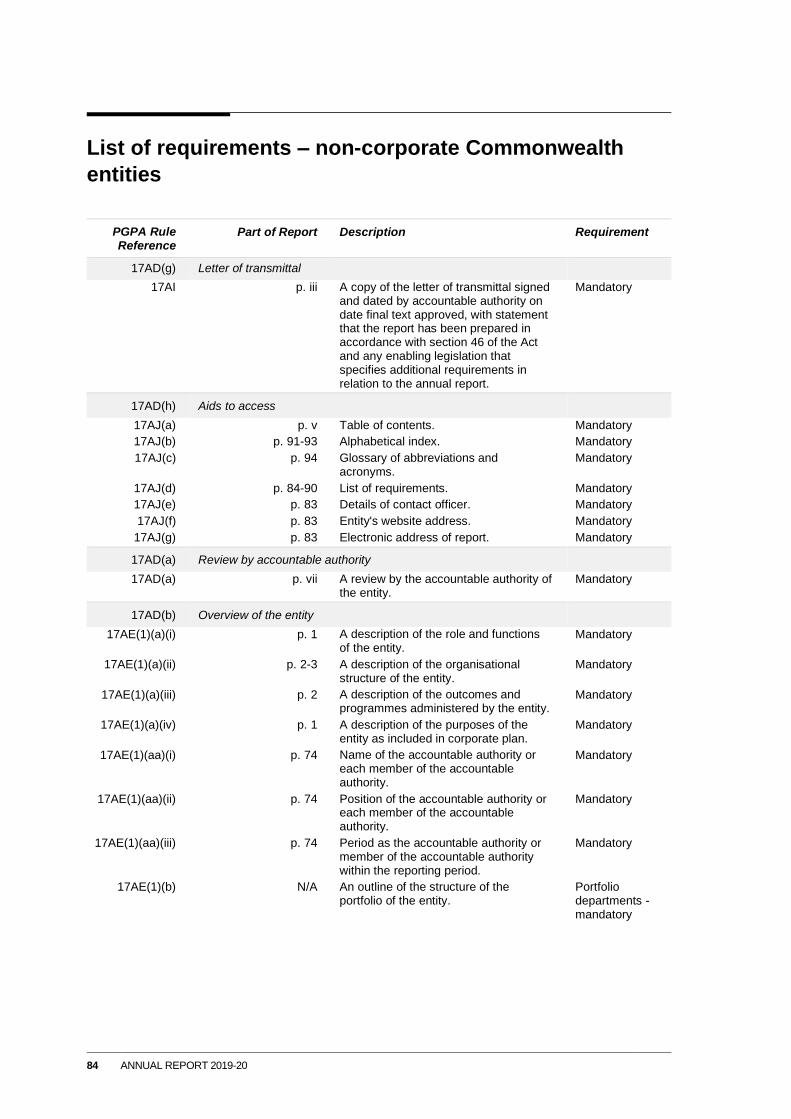
84 ANNUAL REPORT 2019-20
List of requirements – non-corporate Commonwealth
entities
PGPA Rule Reference
Part of Report Description Requirement
17AD(g) Letter of transmittal
17AI p. iii A copy of the letter of transmittal signed and dated by accountable authority on date final text approved, with statement that the report has been prepared in accordance with section 46 of the Act and any enabling legislation that specifies additional requirements in relation to the annual report.
Mandatory
17AD(h) Aids to access
17AJ(a) p. v Table of contents. Mandatory
17AJ(b) p. 91-93 Alphabetical index. Mandatory
17AJ(c) p. 94 Glossary of abbreviations and acronyms.
Mandatory
17AJ(d) p. 84-90 List of requirements. Mandatory
17AJ(e) p. 83 Details of contact officer. Mandatory
17AJ(f) p. 83 Entity's website address. Mandatory
17AJ(g) p. 83 Electronic address of report. Mandatory
17AD(a) Review by accountable authority
17AD(a) p. vii A review by the accountable authority of the entity.
Mandatory
17AD(b) Overview of the entity
17AE(1)(a)(i) p. 1 A description of the role and functions of the entity.
Mandatory
17AE(1)(a)(ii) p. 2-3 A description of the organisational structure of the entity.
Mandatory
17AE(1)(a)(iii) p. 2 A description of the outcomes and programmes administered by the entity.
Mandatory
17AE(1)(a)(iv) p. 1 A description of the purposes of the entity as included in corporate plan.
Mandatory
17AE(1)(aa)(i) p. 74 Name of the accountable authority or each member of the accountable authority.
Mandatory
17AE(1)(aa)(ii) p. 74 Position of the accountable authority or each member of the accountable authority.
Mandatory
17AE(1)(aa)(iii) p. 74 Period as the accountable authority or member of the accountable authority within the reporting period.
Mandatory
17AE(1)(b) N/A An outline of the structure of the portfolio of the entity.
Portfolio departments - mandatory
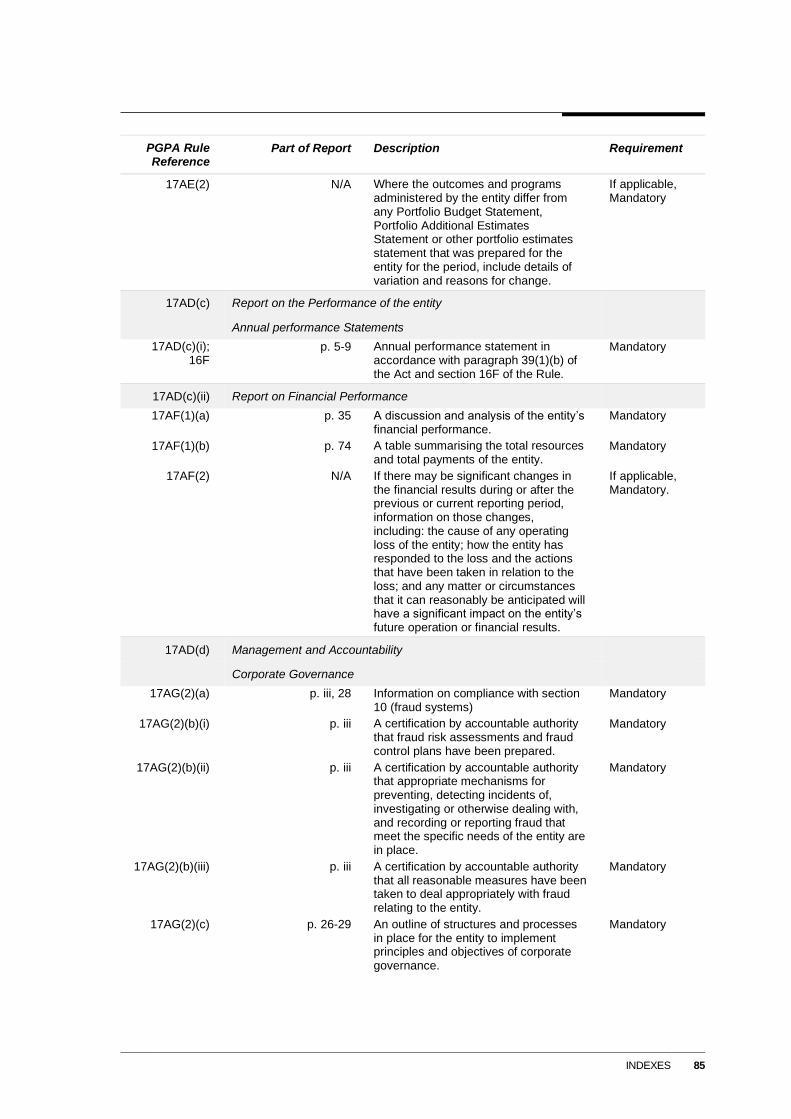
INDEXES 85
PGPA Rule Reference
Part of Report Description Requirement
17AE(2) N/A Where the outcomes and programs administered by the entity differ from any Portfolio Budget Statement, Portfolio Additional Estimates Statement or other portfolio estimates statement that was prepared for the entity for the period, include details of variation and reasons for change.
If applicable, Mandatory
17AD(c) Report on the Performance of the entity
Annual performance Statements
17AD(c)(i); 16F
p. 5-9 Annual performance statement in accordance with paragraph 39(1)(b) of the Act and section 16F of the Rule.
Mandatory
17AD(c)(ii) Report on Financial Performance
17AF(1)(a) p. 35 A discussion and analysis of the entity’s financial performance.
Mandatory
17AF(1)(b) p. 74 A table summarising the total resources and total payments of the entity.
Mandatory
17AF(2) N/A If there may be significant changes in the financial results during or after the previous or current reporting period, information on those changes, including: the cause of any operating loss of the entity; how the entity has responded to the loss and the actions that have been taken in relation to the loss; and any matter or circumstances that it can reasonably be anticipated will have a significant impact on the entity’s future operation or financial results.
If applicable, Mandatory.
17AD(d) Management and Accountability
Corporate Governance
17AG(2)(a) p. iii, 28 Information on compliance with section 10 (fraud systems)
Mandatory
17AG(2)(b)(i) p. iii A certification by accountable authority that fraud risk assessments and fraud control plans have been prepared.
Mandatory
17AG(2)(b)(ii) p. iii A certification by accountable authority that appropriate mechanisms for preventing, detecting incidents of, investigating or otherwise dealing with, and recording or reporting fraud that meet the specific needs of the entity are in place.
Mandatory
17AG(2)(b)(iii) p. iii A certification by accountable authority that all reasonable measures have been taken to deal appropriately with fraud relating to the entity.
Mandatory
17AG(2)(c) p. 26-29 An outline of structures and processes in place for the entity to implement principles and objectives of corporate governance.
Mandatory

86 ANNUAL REPORT 2019-20
PGPA Rule Reference
Part of Report Description Requirement
17AG(2)(d) – (e)
N/A A statement of significant issues reported to Minister under paragraph 19(1)(e) of the Act that relates to non-compliance with Finance law and action taken to remedy non-compliance.
If applicable, Mandatory
Audit Committee
17AG(2A)(a) p. 27 A direct electronic address of the charter determining the functions of the entity’s audit committee.
Mandatory
17AG(2A)(b) p. 28 The name of each member of the entity’s audit committee.
Mandatory
17AG(2A)(c) p. 28 The qualifications, knowledge, skills or experience of each member of the entity’s audit committee.
Mandatory
17AG(2A)(d) p. 28 Information about the attendance of each member of the entity’s audit committee at committee meetings.
Mandatory
17AG(2A)(e) p. 28 The remuneration of each member of the entity’s audit committee.
Mandatory
External Scrutiny
17AG(3) p. 29-30 Information on the most significant developments in external scrutiny and the entity’s response to the scrutiny.
Mandatory
17AG(3)(a) N/A Information on judicial decisions and decisions of administrative tribunals and by the Australian Information Commissioner that may have a significant effect on the operations of the entity.
If applicable, Mandatory
17AG(3)(b) p. 29-30 Information on any reports on operations of the entity by the Auditor-General (other than report under section 43 of the Act), a Parliamentary Committee, or the Commonwealth Ombudsman.
If applicable, Mandatory
17AG(3)(c) N/A Information on any capability reviews on the entity that were released during the period.
If applicable, Mandatory
Management of Human Resources
17AG(4)(a) p. 30-35 An assessment of the entity’s effectiveness in managing and developing employees to achieve entity objectives.
Mandatory
17AG(4)(aa) p. 75-76 Statistics on the entity’s employees on an ongoing and non-ongoing basis, including the following:
• statistics on full-time employees;
• statistics on part-time employees;
• statistics on gender;
• statistics on staff location.
Mandatory
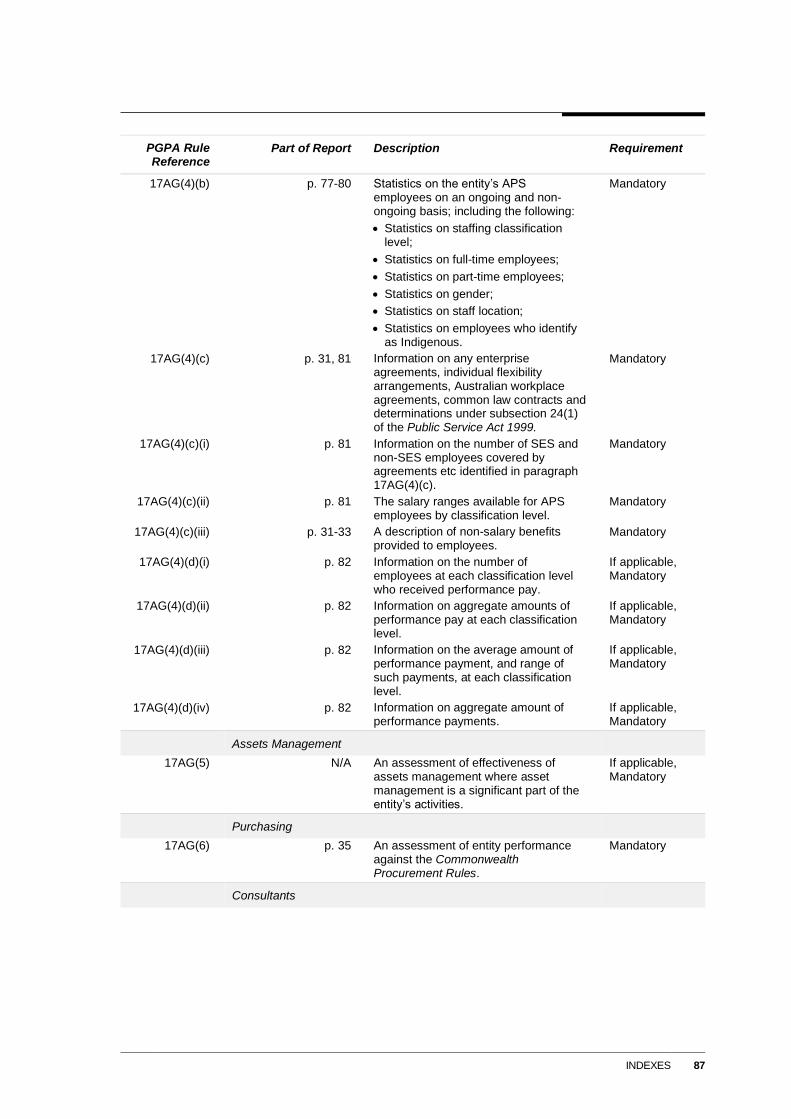
INDEXES 87
PGPA Rule Reference
Part of Report Description Requirement
17AG(4)(b) p. 77-80 Statistics on the entity’s APS employees on an ongoing and non-ongoing basis; including the following:
• Statistics on staffing classification level;
• Statistics on full-time employees;
• Statistics on part-time employees;
• Statistics on gender;
• Statistics on staff location;
• Statistics on employees who identify as Indigenous.
Mandatory
17AG(4)(c) p. 31, 81 Information on any enterprise agreements, individual flexibility arrangements, Australian workplace agreements, common law contracts and determinations under subsection 24(1) of the Public Service Act 1999.
Mandatory
17AG(4)(c)(i) p. 81 Information on the number of SES and non-SES employees covered by agreements etc identified in paragraph 17AG(4)(c).
Mandatory
17AG(4)(c)(ii) p. 81 The salary ranges available for APS employees by classification level.
Mandatory
17AG(4)(c)(iii) p. 31-33 A description of non-salary benefits provided to employees.
Mandatory
17AG(4)(d)(i) p. 82 Information on the number of employees at each classification level who received performance pay.
If applicable, Mandatory
17AG(4)(d)(ii) p. 82 Information on aggregate amounts of performance pay at each classification level.
If applicable, Mandatory
17AG(4)(d)(iii) p. 82 Information on the average amount of performance payment, and range of such payments, at each classification level.
If applicable, Mandatory
17AG(4)(d)(iv) p. 82 Information on aggregate amount of performance payments.
If applicable, Mandatory
Assets Management
17AG(5) N/A An assessment of effectiveness of assets management where asset management is a significant part of the entity’s activities.
If applicable, Mandatory
Purchasing
17AG(6) p. 35 An assessment of entity performance against the Commonwealth Procurement Rules.
Mandatory
Consultants
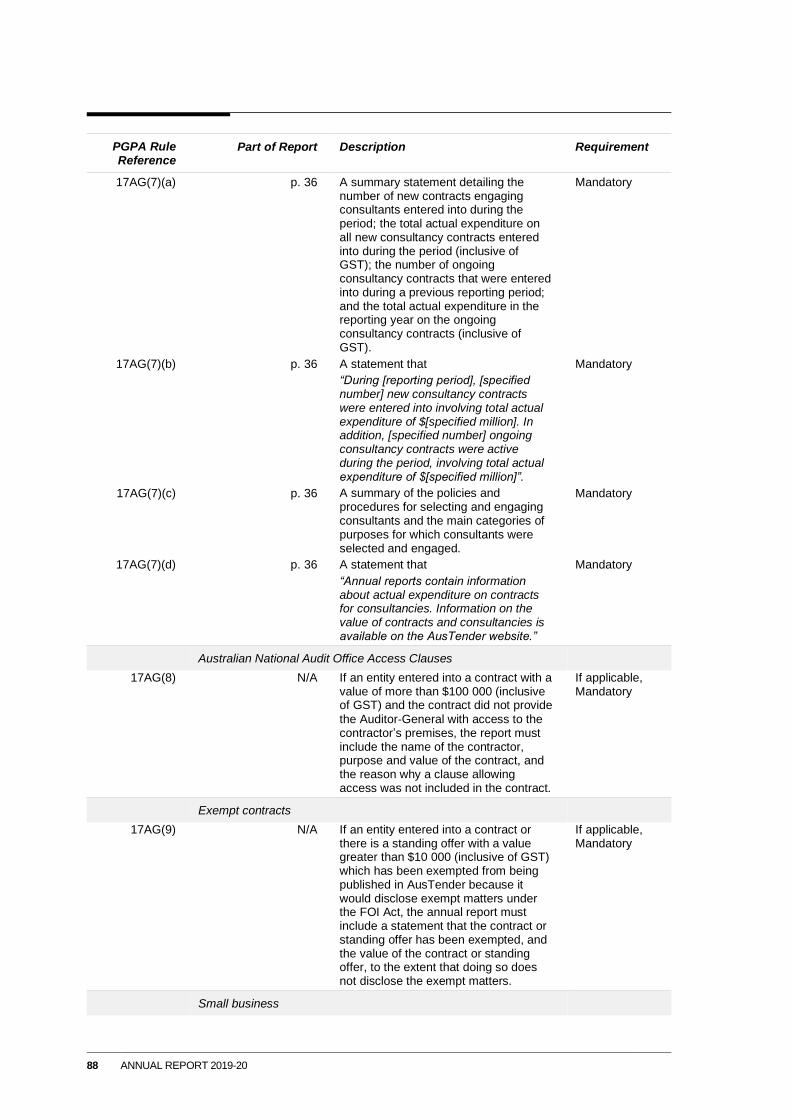
88 ANNUAL REPORT 2019-20
PGPA Rule Reference
Part of Report Description Requirement
17AG(7)(a) p. 36 A summary statement detailing the number of new contracts engaging consultants entered into during the period; the total actual expenditure on all new consultancy contracts entered into during the period (inclusive of GST); the number of ongoing consultancy contracts that were entered into during a previous reporting period; and the total actual expenditure in the reporting year on the ongoing consultancy contracts (inclusive of GST).
Mandatory
17AG(7)(b) p. 36 A statement that
“During [reporting period], [specified number] new consultancy contracts were entered into involving total actual expenditure of $[specified million]. In addition, [specified number] ongoing consultancy contracts were active during the period, involving total actual expenditure of $[specified million]”.
Mandatory
17AG(7)(c) p. 36 A summary of the policies and procedures for selecting and engaging consultants and the main categories of purposes for which consultants were selected and engaged.
Mandatory
17AG(7)(d) p. 36 A statement that
“Annual reports contain information about actual expenditure on contracts for consultancies. Information on the value of contracts and consultancies is available on the AusTender website.”
Mandatory
Australian National Audit Office Access Clauses
17AG(8) N/A If an entity entered into a contract with a value of more than $100 000 (inclusive of GST) and the contract did not provide
the Auditor‑General with access to the contractor’s premises, the report must include the name of the contractor, purpose and value of the contract, and the reason why a clause allowing access was not included in the contract.
If applicable, Mandatory
Exempt contracts
17AG(9) N/A If an entity entered into a contract or there is a standing offer with a value greater than $10 000 (inclusive of GST) which has been exempted from being published in AusTender because it would disclose exempt matters under the FOI Act, the annual report must include a statement that the contract or standing offer has been exempted, and the value of the contract or standing offer, to the extent that doing so does not disclose the exempt matters.
If applicable, Mandatory
Small business
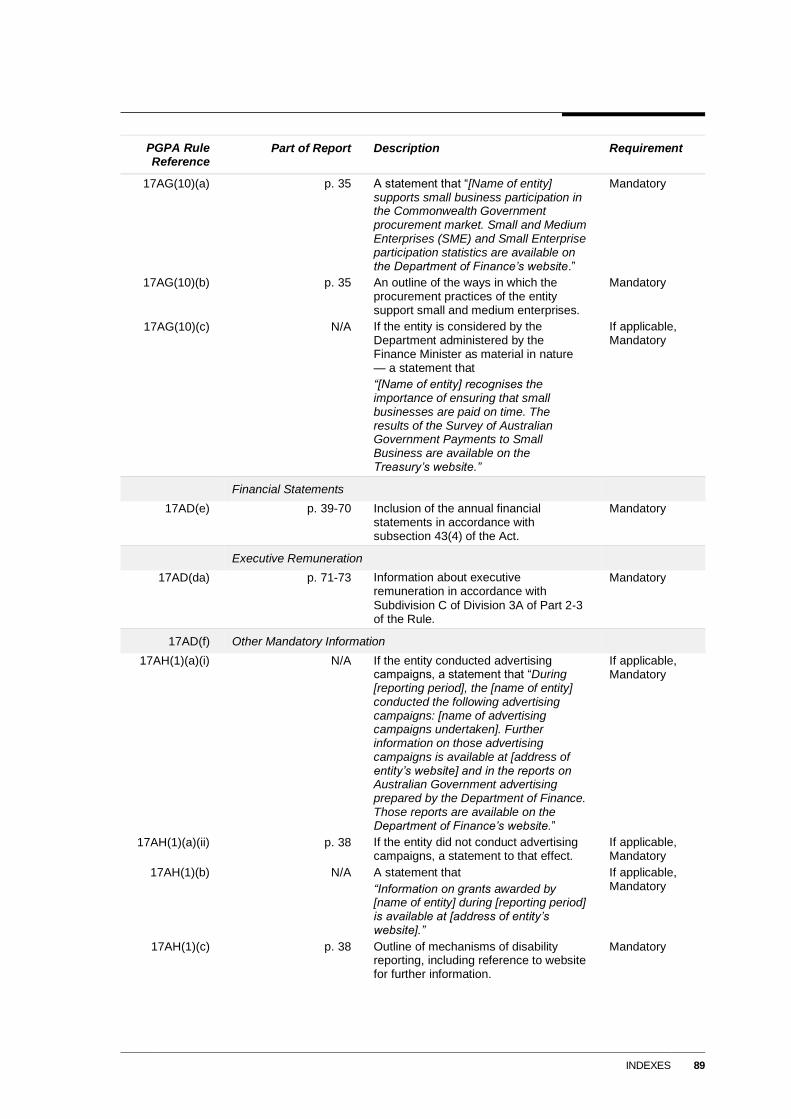
INDEXES 89
PGPA Rule Reference
Part of Report Description Requirement
17AG(10)(a) p. 35 A statement that “[Name of entity] supports small business participation in the Commonwealth Government procurement market. Small and Medium Enterprises (SME) and Small Enterprise participation statistics are available on the Department of Finance’s website.”
Mandatory
17AG(10)(b) p. 35 An outline of the ways in which the procurement practices of the entity support small and medium enterprises.
Mandatory
17AG(10)(c) N/A If the entity is considered by the Department administered by the Finance Minister as material in nature — a statement that
“[Name of entity] recognises the importance of ensuring that small businesses are paid on time. The results of the Survey of Australian Government Payments to Small Business are available on the Treasury’s website.”
If applicable, Mandatory
Financial Statements
17AD(e) p. 39-70 Inclusion of the annual financial statements in accordance with subsection 43(4) of the Act.
Mandatory
Executive Remuneration
17AD(da) p. 71-73 Information about executive remuneration in accordance with
Subdivision C of Division 3A of Part 2‑3 of the Rule.
Mandatory
17AD(f) Other Mandatory Information
17AH(1)(a)(i) N/A If the entity conducted advertising campaigns, a statement that “During [reporting period], the [name of entity] conducted the following advertising campaigns: [name of advertising campaigns undertaken]. Further information on those advertising campaigns is available at [address of entity’s website] and in the reports on Australian Government advertising prepared by the Department of Finance. Those reports are available on the Department of Finance’s website.”
If applicable, Mandatory
17AH(1)(a)(ii) p. 38 If the entity did not conduct advertising campaigns, a statement to that effect.
If applicable, Mandatory
17AH(1)(b) N/A A statement that
“Information on grants awarded by [name of entity] during [reporting period] is available at [address of entity’s website].”
If applicable, Mandatory
17AH(1)(c) p. 38 Outline of mechanisms of disability reporting, including reference to website for further information.
Mandatory

90 ANNUAL REPORT 2019-20
PGPA Rule Reference
Part of Report Description Requirement
17AH(1)(d) p. 38 Website reference to where the entity’s Information Publication Scheme statement pursuant to Part II of FOI Act can be found.
Mandatory
17AH(1)(e) N/A Correction of material errors in previous annual report.
If applicable, mandatory
17AH(2) p. 36-37 Information required by other legislation.
Mandatory
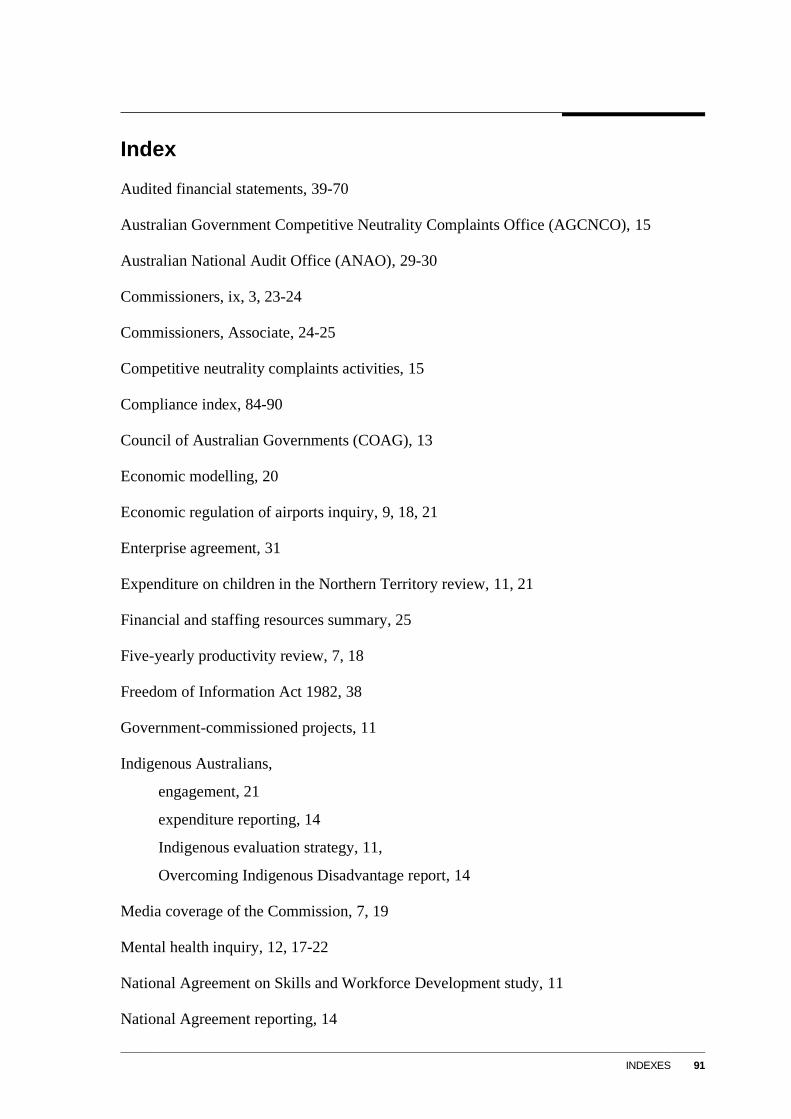
INDEXES 91
Index
Audited financial statements, 39-70
Australian Government Competitive Neutrality Complaints Office (AGCNCO), 15
Australian National Audit Office (ANAO), 29-30
Commissioners, ix, 3, 23-24
Commissioners, Associate, 24-25
Competitive neutrality complaints activities, 15
Compliance index, 84-90
Council of Australian Governments (COAG), 13
Economic modelling, 20
Economic regulation of airports inquiry, 9, 18, 21
Enterprise agreement, 31
Expenditure on children in the Northern Territory review, 11, 21
Financial and staffing resources summary, 25
Five-yearly productivity review, 7, 18
Freedom of Information Act 1982, 38
Government-commissioned projects, 11
Indigenous Australians,
engagement, 21
expenditure reporting, 14
Indigenous evaluation strategy, 11,
Overcoming Indigenous Disadvantage report, 14
Media coverage of the Commission, 7, 19
Mental health inquiry, 12, 17-22
National Agreement on Skills and Workforce Development study, 11
National Agreement reporting, 14
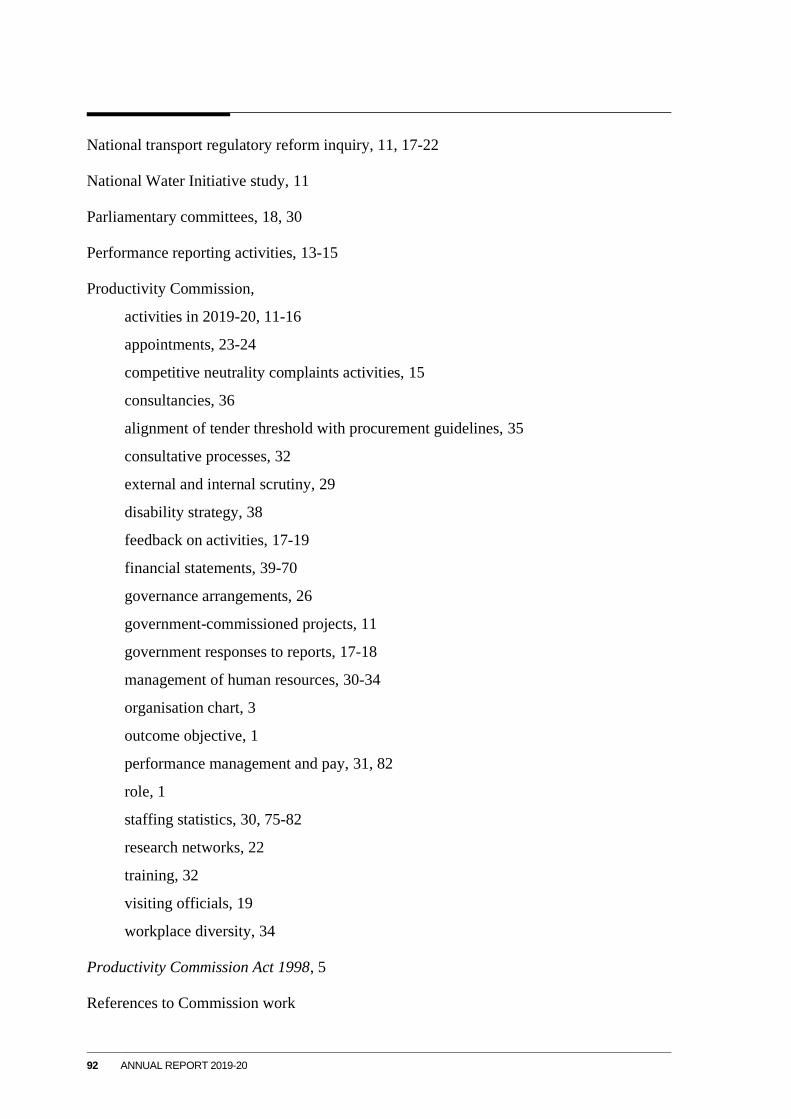
92 ANNUAL REPORT 2019-20
National transport regulatory reform inquiry, 11, 17-22
National Water Initiative study, 11
Parliamentary committees, 18, 30
Performance reporting activities, 13-15
Productivity Commission,
activities in 2019-20, 11-16
appointments, 23-24
competitive neutrality complaints activities, 15
consultancies, 36
alignment of tender threshold with procurement guidelines, 35
consultative processes, 32
external and internal scrutiny, 29
disability strategy, 38
feedback on activities, 17-19
financial statements, 39-70
governance arrangements, 26
government-commissioned projects, 11
government responses to reports, 17-18
management of human resources, 30-34
organisation chart, 3
outcome objective, 1
performance management and pay, 31, 82
role, 1
staffing statistics, 30, 75-82
research networks, 22
training, 32
visiting officials, 19
workplace diversity, 34
Productivity Commission Act 1998, 5
References to Commission work
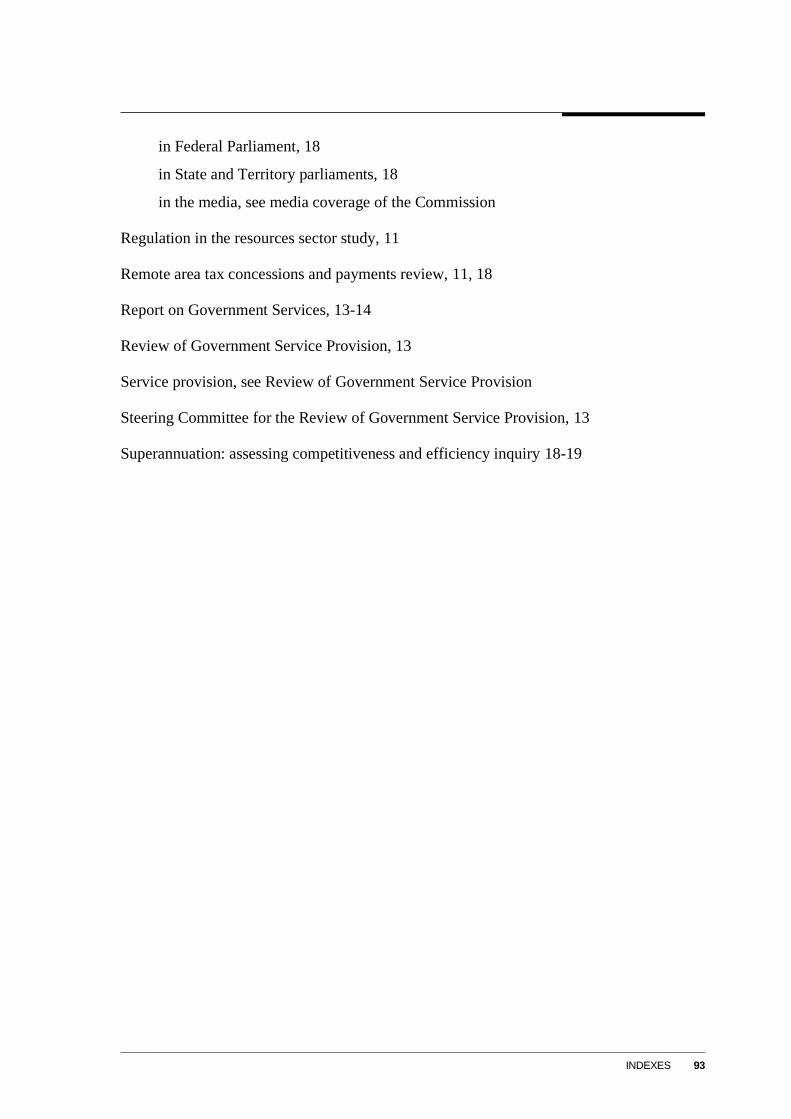
INDEXES 93
in Federal Parliament, 18
in State and Territory parliaments, 18
in the media, see media coverage of the Commission
Regulation in the resources sector study, 11
Remote area tax concessions and payments review, 11, 18
Report on Government Services, 13-14
Review of Government Service Provision, 13
Service provision, see Review of Government Service Provision
Steering Committee for the Review of Government Service Provision, 13
Superannuation: assessing competitiveness and efficiency inquiry 18-19
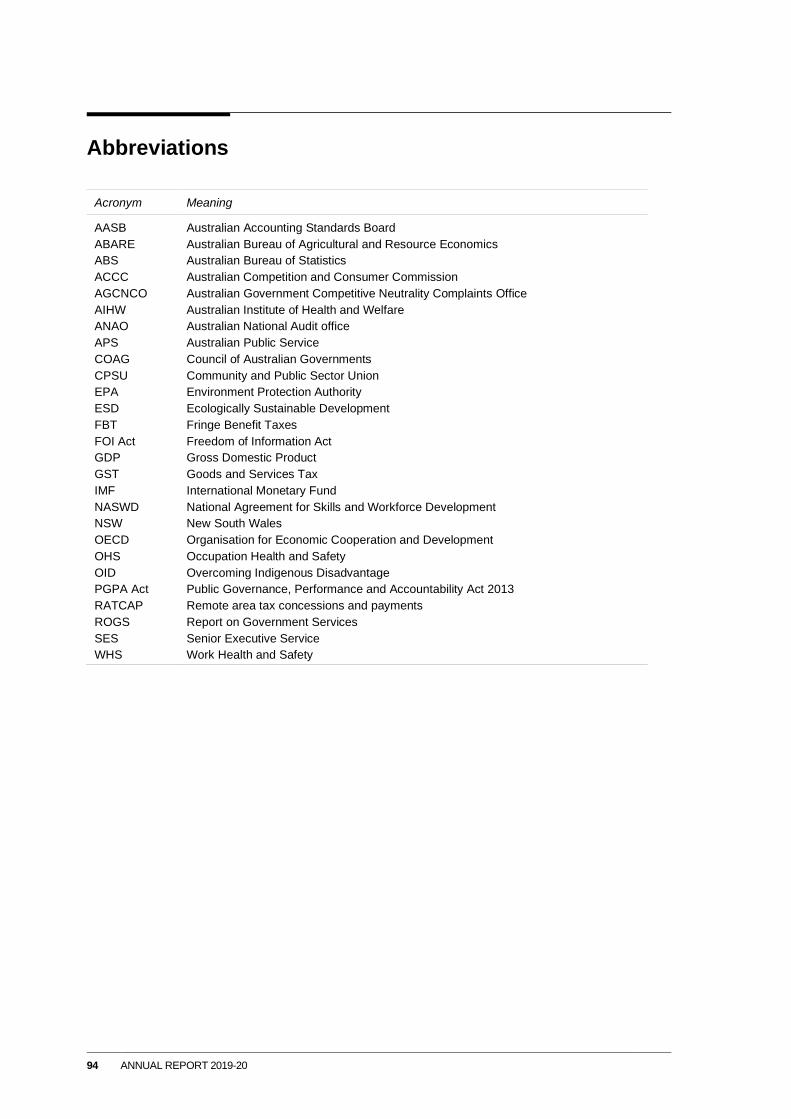
94 ANNUAL REPORT 2019-20
Abbreviations
Acronym Meaning
AASB Australian Accounting Standards Board
ABARE Australian Bureau of Agricultural and Resource Economics
ABS Australian Bureau of Statistics
ACCC Australian Competition and Consumer Commission
AGCNCO Australian Government Competitive Neutrality Complaints Office
AIHW Australian Institute of Health and Welfare
ANAO Australian National Audit office
APS Australian Public Service
COAG Council of Australian Governments
CPSU Community and Public Sector Union
EPA Environment Protection Authority
ESD Ecologically Sustainable Development
FBT Fringe Benefit Taxes
FOI Act Freedom of Information Act
GDP Gross Domestic Product
GST Goods and Services Tax
IMF International Monetary Fund
NASWD National Agreement for Skills and Workforce Development
NSW New South Wales
OECD Organisation for Economic Cooperation and Development
OHS Occupation Health and Safety
OID Overcoming Indigenous Disadvantage
PGPA Act Public Governance, Performance and Accountability Act 2013
RATCAP Remote area tax concessions and payments
ROGS Report on Government Services
SES Senior Executive Service
WHS Work Health and Safety