Embed Size (px)
Citation preview

Annual report 2017

OFZ transforms raw materials into high value-added products using modern technologies. The importance of OFZ goes far beyond the Slovak borders.
IMPORTANT PILLARS OF OFZ
02 / SATISFYING CUSTOMERS` NEEDSIn 2017, OFZ sold more than 132,000 tonnes of ferroalloys and other products including services amounting to 169 mil. EUR. The share of revenues from the sale of ferroalloys and cored wires was as follows: Czech Republic (35 %), Slovakia (15 %), Poland (14 %), Germany (7 %) and Hungary (5 %).
01 / PRODUCING QUALITY PRODUCTSIn 2017, OFZ manufactured almost 137,000 tonnes of ferroalloys and cored wires, an increase of over 20 % compared to the previous year.
03 / INVESTING INTO PRODUCTION AND THE ENVIRONMENTIn 2017, OFZ invested into enhancing environmental protection more than 860,000 EUR. The company invested mainly into the dedusting of crushing & screening lines and thus minimized dust generation in the next stage of the production process. The ecological aspect can also be seen in investment into the pelletizing & briquetting line which utilizes waste heat from the production of ferroalloys.
04 / EMPLOYING A CAPABLE WORKFORCEIn 2017, the average wage in OFZ was 1,157 EUR which is 15 % higher than the average wage paid in the district of Dolný Kubín and 7.2 % higher than the average wage paid in 2016.
1
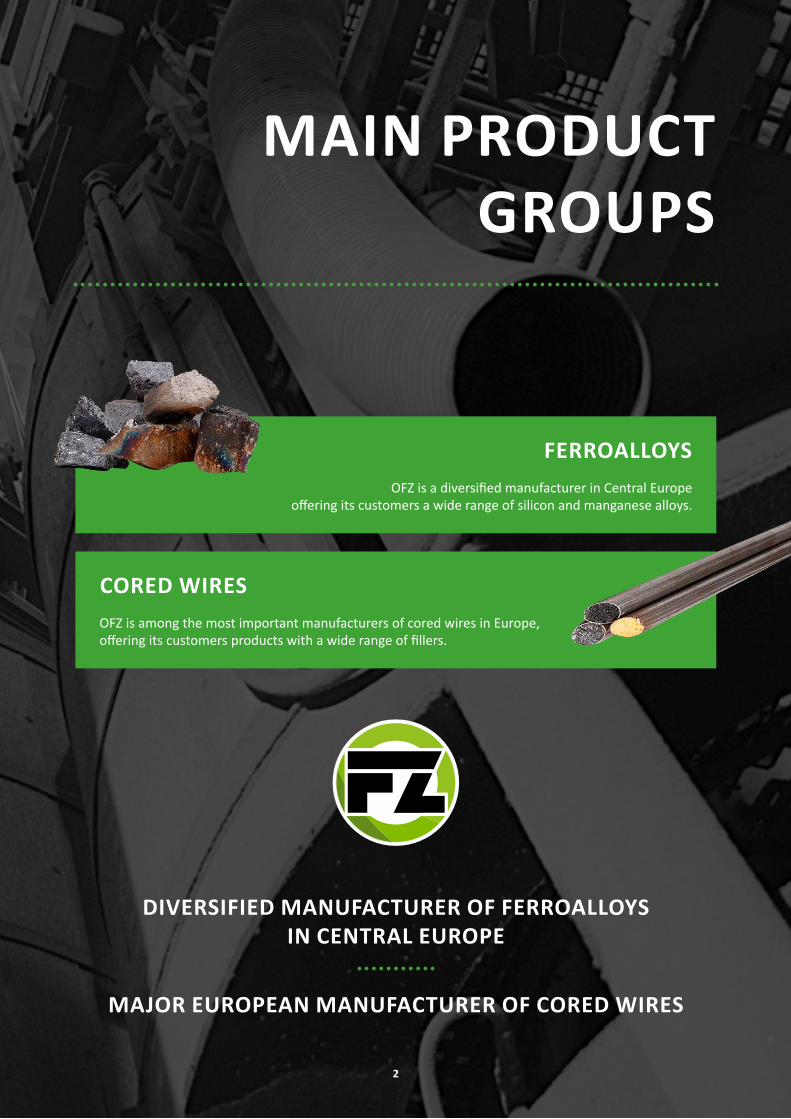
MAIN PRODUCT GROUPS
FERROALLOYSOFZ is a diversified manufacturer in Central Europe
offering its customers a wide range of silicon and manganese alloys.
CORED WIRESOFZ is among the most important manufacturers of cored wires in Europe, offering its customers products with a wide range of fillers.
DIVERSIFIED MANUFACTURER OF FERROALLOYS IN CENTRAL EUROPE
MAJOR EUROPEAN MANUFACTURER OF CORED WIRES
2

TABLE OF CONTENTS
Important Pillars of OFZ, a. s. 01
Main Product Groups 02
Key Figures 05
Interview with Managing Director of OFZ, a.s. 08
OFZ, a. s. in 2017 09
Ferroalloys 11
Cored Wires 13
Investments & Research 15
Employees 16
Company Bodies 17
Financial Situation 18
Financial Statements 19
Independent Auditor`s Opinion on Annual Report 27
3

OFZ AS A COMPANY WITH A DIVERSIFIED PRODUCT RANGE
OFZ is a Slovak metallurgical company with significance going far beyond the region of Central Europe. The main strategy for our company is to expand our product portfolio while maintaining sustainable development. The aforementioned is even more apparent in launching new projects in the field of ferroalloys, metals and cored wires production and preparing extensive investments into enhancing environmental protection and power effectiveness.
OFZ, a.s. SLOVAKIA:
FERROALLOYS PRODUCTION CAPACITY7 electric arc furnaces: 136,000 tpa
CORED WIRES PRODUCTION CAPACITY2 lines, 10,000 tpa
169.1 mil. EUR in net turnover12 kinds of ferroalloys and cored wires manufactured
4

KEY FIGURES
mil. EUR 2017 2016 2015 Change % 2017-2016
Net turnover 169.1 104.6 116.5 61.7%
Total operating income 176.1 108.1 121.7 62.9%
Total operating expenses 156.9 107.7 119.5 45.7%
Operating income 19.1 0.4 2.1 >10x
Earnings before taxes (EBT) 18.1 1.2 2.7 >10x
Earnings after taxes (EAT) 14.3 0.7 2.6 >10x
EBITDA 20.6 1.0 3.0 >10x
Non-current assets 22.9 20.6 14.1 11.1%
Current assets 97.2 74.7 81.8 30.2%
Equity 48.7 34.4 38.6 41.3%
Total liabilities 71.5 60.9 57.1 17.4%
Gross margin 17.7% 8.0% 10.0% 9.7%
Operating Margin 11.3% 0.4% 1.8% 10.9%
EBITDA margin 12.2% 1.0% 2.6% 11.2%
Working capital 1 47.1 34.7 68.0 35.9%
Quick ratio 2 1.32 1.11 1.10 20.8%
Total debt ratio 3 59.5% 63.9% 59.5% -4.4%
Average number of employees 4 505 476 429 6.1%
1 Working capital = Current assets - Current liabilities2 Acid test ratio3 Total liabilities / Total Assets4 Average number of employees for the accounting period
5

EARNINGS AFTER TAXES (mil. EUR)
The net income for OFZ increased by more than 20-fold YOY. The reason lying behind this increase can be seen in the high selling prices of ferroalloys.
Despite the volatility in strategic raw material prices, the prices for ferroalloys showed a positive trend in 2017 which wasalso reflected in the net income of OFZ, a.s.
NET TURNOVER (mil. EUR)
In 2017, OFZ`s net turnover increased by more than 60 % YOY to 169.1 mil. EUR, which was mainly caused by higher product prices and higher sales volume.
EBITDA (mil. EUR)
Due to higher ferroalloy prices, OFZ`s EBITDA increased by 20-fold in 2017 and hit 20.6 mil. EUR.
6

cored wires 5.4% ferroalloys & metals 93.9% by-products 0.7%
cored wires 9.8% ferroalloys 89.4% by-products 0.8%
EBITDA margin 12.2% net turnover
EBITDA margin 1.0% net turnover
net income margin 8.5% net turnover
net income margin 0.6% net turnover
KEY FIGURES
EBITDA Margin
Net Income Margin
Sales Value of Different Types of Products as a Percentage of Total Sales (excluding revenues from the sales of services) (EUR)
2017 2016
2017 2016
2017 2016
7

EBITDA margin 1.0% net turnover
net income margin 0.6% net turnover
How would you evaluate the year 2017 in terms of the development of the Slovak and European metallurgical industry?
The year 2017 was a positive year for metallurgy. The prices for manganese alloys stayed high and despite the volatility in Mn ore prices, their production proved profitable. A similar situation was seen in the market for silicon alloys; therefore, OFZ has decided to maintain the same range of products. However, this situation is not likely to persist over a long time and the year 2018 appears to be worse due to expectations of higher prices for energy. This is among the main reasons, why OFZ is a proponent of diversifying its product range, alternative raw materials sourcing and enhancing technologies that are a must for an effective production process.
What is the company doing to protect the environment?
OFZ continually works on mitigating the environmental impact of its activities. The environmentally responsible behaviour of OFZ is apparent not only in waste-free management, but also in its investing into even better air protection using Best Available Technologies (BATs) for dedusting. In 2017, OFZ invested a considerable amount of money into dedusting of crushing & screening lines, which minimizes dust generation in the next stage of production process. Investment was also targeted into the plasma furnace which could be used for remelting the fines from the production of manganese alloys and their reuse in the production process.
Why have you decided to invest into a briquetting & pelletizing line?
Briquetting & pelletizing line is used to process a wood waste and produce briquettes suitable for heating. The ecological aspect of this line can be seen in utilizing waste heat from the production of ferroalloys as a source of energy for drying raw materials that otherwise would have to be dried using conventional fuels. How do you see the outlook of OFZ in the future?
As life passes by, bad years always come after good ones. The coming year will be the time when we need to prepare ourselves for the bad years. Therefore, it is necessary to complete the diversification of our product range and to continually reduce our manufacturing costs.
Managing Director, OFZ, a. s. Ing. Branislav Klocok
04
03
02
01
the price of energy and the Mn ore purchasing strategy are still playing a key role in the production of ferroalloys due to
the high price volatility of Mn ore in the world markets
8

In 2017, OFZ focused on manufacturing traditional alloys and increased its capacity utilization ratio to almost 96 %. However, for the company this year was also a year of introducing new procedures mainly in the area of raw material unloading and furnace charging. OFZ invested further into EAF 22 and plans to launch silicon metal production in H2 2018. This is fully aligned with the company`s
strategy to manufacture high value-added products. OFZ also increased the production of medium carbon FeMn when compared to the previous year. We strongly believe that bringing more products to our customers will be a success in the following years.
In 2017, the ferroalloys made a considerable portion of product range with a 94.6 % on the total weight of products. In 2017, the production of ferroalloys increased by 21.6 % to more than 129,000 tonnes and cored wires production was almost flat and increased only by 2.0 % and reached more than 7,000 tonnes.
Capacity utilization ratio (%) (2014-2017)
OFZ, a. s. IN 2017
Production (thousands
tonnes)2017 2016 2015
Change % 2017-
2016
Ferroalloys 129.5 106.5 96.3 21.6%
Cored wires 7.4 7.2 6.9 2.0%
Total 136.9 113.7 103.2 20.3%
ferroalloys cored wires
Production (tonnes) (2014-2017)
9

CUSTOMERSThe strategy of diversification stemming from customer needs is a main focus for OFZ. The ratio of ferroalloys to cored wires production has not materially changed throughout the year. However, in 2017, OFZ produced more ferroalloys, there was also a moderate increase in the production of medium carbon FeMn and some investments were targeted into EAF 22 for the production of silicon metal. Among the top priorities for the company are still the flexible delivery schedules and focus on the customer.
INVESTMENTSIn 2017, investments were targeted into several different areas. Besides the production hall building, machinery, slag raking machine and vehicles, the investments were mainly put into EAF 22 for silicon metal production, a change in furnace charging, revamping of dedusting for crushing & screening lines, a plasma furnace, and into briquetting line for the production of briquettes into a wood waste.
ENVIRONMENTOFZ constantly pays maximum attention to environmental protection of which the waste-free management might serve as a strong evidence. Improving technologies and continually enhancing environmental protection still remain among our top priorities. In 2017, The company invested mainly into the dedusting of crushing & screening lines and thus minimized dust generation in the next stage of the production process. In 2018, OFZ also plans to obtain environmental management certification according to the ISO 14001 standard.
EMPLOYEESOFZ focuses on educating and training experts in the field of metallurgy in the long term. In 2017, OFZ in cooperation with local high schools provided special training for 22 students in the field of electromechanics, electromechanics - high voltage equipment and electromechanics of machinery & equipment. During the summer holidays, the students of metallurgy at the university were offered the option to gain experience by performing auxiliary tasks in metallurgical production.
Different kinds of Products (in tonnes) as a Percentage of Total Production (%)
ferroalloys 94.6% cored wires 5.4%
20142017
ferroalloys 93.6% cored wires 6.4%
20142016
10

FERROALLOYSmore than 129,000 tonnes produced
Ferroalloy Production (thousands tonnes) 2017 2016 2015 Change % 2017-2016
FeSi 44.6 30.9 38.2 44.7%
FeSiMn 40.1 35.7 27.1 12.1%
HC FeMn 41.3 35.0 24.5 18.0%
FeSiCa 2.7 4.1 5.0 -34.9%
MC FeMn 0.8 0.6 0.8 39.9%
FeSiCr 0.0 0.2 0.7 -100.0%
Total 129.5 106.5 96.3 21.6%
FeSi
FeSiMn
HC FeMn
FeSiCa
MC FeMn
FeSiCr and FeSiMg
2017 2016
FeSi 34.5% FeSiMn 30.9% HC FeMn 31.9% FeSiCa 2.1% MC FeMn 0.6%
FeSi 29.0% FeSiMn 33.6% HC FeMn 32.9% FeSiCa 3.8% MC FeMn 0.6% FeSiCr and FeSiMg 0.2%
Different Types of Ferroalloys as a Percentage of Total Production (%)
Production of ferroalloys (tonnes) (2015-2017)
In 2017, production of FeSi due to positive price trends played a part in the biggest percentage increase when compared with 2016. The production of manganese alloys accelerated at a
more moderate pace which together triggered an increase in total ferroalloy production by almost 22 % YOY. In 2017, the production of FeSiCr was absent.
11

FERROALLOYSmore than 125,000 tonnes of ferroalloys sold
Ferroalloys Sales (thousands tonnes) 2017 2016 2015 Change % 2017-2016
FeSi 46.4 34.0 37.5 36.6%FeSiMn 35.7 33.4 33.7 7.0%HC FeMn 38.8 36.4 29.7 6.6%FeSiCa 0.7 1.4 2.2 -47.3%MC FeMn 0.2 1.1 0.9 -85.8%FeCrC 0.0 0.2 0.2 -100.0%FeSiCr + metals 3.6 1.3 0.0 173.8%Total 125.5 107.8 104.2 16.4%
2017 2016
FeSi 36.5% FeSiMn 26.3% HC FeMn 31.8% FeSiCa 0.7% MC FeMn 0.2% FeSiCr + metals 4.4%
FeSi 36.7% FeSiMn 27.9% HC FeMn 29.2% FeSiCa 2.5% MC FeMn 1.3% FeSiCr + metals 2.2% FeCrC 0.2 %
2014
2015
2016
2017
Ferroalloy Sales by Country (in tonnes) (2014-2017)
Sales Value of the Different Ferroalloys as a Percentage of Total Ferroalloys Sales (%)
In 2017, sales of ferroalloys and metals increased by 16.4 %. The main reason lying behind that can be seen in an increase in the sales of FeSi and also
manganese alloys, but to a much lesser extent.
In 2017, the sales of ferroalloys were mainly targeted on closer markets and Central Europe with a major portion going to the Czech Republic and Poland, while the sales in these countries increased. A considerable
amount of sales was also made to Slovakia; however, the sales was lower when compared to the previous years. A steady, high level of sales was also made to Germany, Hungary, Slovenia and Italy.
12

Production of Cored Wires (tonnes) (2015-2017)
CORED WIRES more than 7,000 tonnes of cored wires produced
Cored Wire Production (tonnes) 2017 2016 2015 Change % 2017-2016
CaSi 5,556 5,734 3,775 -3.1%
C 976 703 1,367 38.9%
S 348 277 275 25.7%
CaFe, FeNb 513 533 1,523 -3.7%
Total 7,393 7,247 6,941 2.0%
CaSi
C
S
CaFe, FeNb
2017 2016
CaSi 75% C 13% S 5% CaFe, FeNb 7%
CaSi 79% C 10% S 4% CaFe, FeNb 7%
Different Types of Cored Wires as a Percentage of Total Cored Wires Production (%)
CaSi cored wire also made up the biggest portion of cored wire products in 2017. The production of cored wires increased only by 2.0 % YOY. The
decrease in CaSi and CaFe cored wire production was erased by the increase in the production of cored wires with C and S fillers.
13

In 2017, OFZ sold 7,000 tonnes of cored wires, which was a decrease by 3.2 % when compared to the previous year. The higher sales of S and C cored wires were not able to offset the lower
sales of CaSi and CaFe cored wires.
CORED WIRES7,000 tonnes of cored wires sold
With the firm place in the steel production, cored wires are also used for alloying and deoxidation of steel and for inoculating and modifying cast iron. The markets for cored wire sales are, to a great extent, similar to countries of ferroalloy sales. In 2017, the major portion of sales were made to the Czech Republic, Italy, Germany and Slovakia.
2014
2015
2016
2017
Sales Value of Different Cored Wires as a Percentage of Total Cored Wires Sales
2017 2016
CaSi 83% CaFe 7% C 8% S 2%
CaSi 79% CaFe 13% C 6% S 2%
Sales Value of Different Cored Wires as a Percentage of Total Cored Wires Sales (%)
Cored Wire Sales (tonnes) 2017 2016 2015 Change % 2017-2016
CaSi 5,251 5,686 4,037 -7.7%
C 946 704 1,434 34.4%
S 315 277 277 13.5%
CaFe, FeNb, Ca 490 562 1,543 -12.9%
Total 7,001 7,229 7,292 -3.2%
14

Investments (thousands EUR) 2017
Vehicles 1,438 €
Silicon metal furnace 869 €
Pelletizing plant & advances 603 €
Machinery & equipment 474 €
Change in furnace charging 348 €
Dedusting of screening & crushing lines 257 €
Buildings & halls 148 €
Software 138 €
Plasma furnace 125 €
Total 4,400 €
Description 2017 2016
Research costs - Change in ladle linings in OFZ, a.s. 42,404 € 0 €
OFZ, a. s. and Trends in Investments (thousands EUR)
INVESTMENTS & RESEARCH4.4 mil. EUR invested
The funds reserved for investment projects decreased in 2017 when compared to the record year 2016. The total amount of investments have thus decreased by almost 51 % mainly due
to the lower investments that were put into EAF 22 for the production of silicon metal.
In 2017, the company invested mainly into the production hall, machinery, slag raking machine, vehicles, EAF 22 for the production of silicon metal, a change in furnace charging, revamping of dedusting for crushing & screening lines and into a briquetting & pelletizing line.
In 2017, OFZ initiated a research project on designing and producing ladles without using refractory bricks. The ladle lining should be made of a monolithic refractory concrete. The research should bring a higher level of safety into ladle handling and lead to an improvement in the economic aspects of using them in the production process.
4 400 €
15

EMPLOYEES505 employees, average wage 1,157 EUR
Average Wages & Salaries € in Slovakia
Average Wages & Salaries at OFZ, a. s. €
management 7.4 % other staff 92.6 %
management 6.9 % other staff 93.1 %
20162017
Average Wages & Salaries Compared with Slovakia (2017)
Management as a Percentage of Total Workforce (%)
In 2017, the company continued in supporting the social activities for its employees. The total amount paid for legal social costs for training & education, recovery stays and the canteen reached almost 274,000 EUR.
OFZ keeps a close eye on continuous improvement of the working conditions and quality of the working place. The average number of employees in 2017 increased by more than 6 %. The average wage was
1,157 EUR which represented an increase by more than 7 % YOY and was among the highest in the region.
1 157 €
16

17
COMPANY BODIES
Ing. Vladimír KlocokGENERAL DIRECTOR
Ing. Stanislav HubaDIRECTOR FOR FINANCE & DEVELOPMENT
Ing. Branislav KlocokMANAGING DIRECTOR
Ing. Martin LevčíkCOMMERCIAL DIRECTOR
Ing. Andrzej JabłonskiPRODUCTION & TECHNICAL DIRECTOR
BOARD OF DRECTORS
Ing. Vladimír KlocokCHAIRMAN
Ing. Branislav KlocokMEMBER
Ing. Anton SklárčikMEMBER
Ing. Jozef ŠeligaMEMBER
Vladimír KlocokMEMBER
Ing. Michal SuroviakMEMBER
SUPERVISORY BOARD
COMPANY MANAGEMENT
17

In 2017 with better market prices for ferroalloys and cored wires, OFZ achieved very good financial results. The sound financial performance is a pre-requisite for extending investment activities and for
ensuring and pursuing the strategy of sustainable development. Net turnover increased by more than 60 % YOY and there was also a significant increase in operating income and EBITDA.
FINANCIAL SITUATION net turnover 169.1 mil. EURearnings after taxes 14.3 mil. EUR
Item 2017
Net profit 14,253,224 €
Reserve fund 1,425,324 €
Retained earnings 12,827,900 €
Legal Entity Equity Interest (EUR) Equity Interest (%)
ESI, s.r.o. Istebné 220,000 € 100.00%
OFZ Novokuzneck 144 € 100.00%
Item 2016
Net profit 674,514 €
Reserve fund 67,452 €
Retained earnings 607,062 €
Proposed Settlement of Earnings for the Current Accounting Period (as of December 31, 2017)
Equity Participations & Interests of OFZ, a.s. in Subsidiaries (as of December 31, 2017)
Proposed Settlement of Earnings for the Preceding Accounting Period (as of December 31, 2016)
18

Class Item No.Current
Accounting Period €
Preceding Accounting
Period €
* Net turnover (part of accounting Class 6 according to the Act) 01 169,134,898 104,581,150
** Operating income - total (lines 03 to 09) 02 175,991,707 108,112,180
I. Revenue from the sale of merchandise (604, 607) 03 13,567,385 8,414,821
II. Revenue from the sale of own products (601) 04 142,418,993 84,554,620
III. Revenue from the sale of services (602, 606) 05 12,642,277 10,855,997
IV. Changes in internal inventory (+/- acct. grp. 61) 06 2,008,463 -2,215,468
V. Own work capitalized (acct. grp. 62) 07 1,173,222 1,068,118
VI. Revenue from the sales of non-current intangible assets, property, plant, equipment, and raw materials (641, 642) 08 1,442,318 1,991,788
VII. Other operating income (644, 645, 646, 648, 655, 657) 09 2,739,049 3,442,304
** Operating expenses - total line 11 + line 12 + line 13 + line 14 + line 15 + line 20 + line 21 + line 24 + line 25 + line 26 10 156,873,026 107,686,798
A. Costs of merchandise sold (504, 507) 11 13,140,821 8,333,989
B. Consumed raw materials, energy consumption, and consumption of other non-inventory supplies (501, 502, 503) 12 110,702,169 78,790,217
C. Value adjustments to inventory (+/-) (505) 13
D. Services (acct. grp. 51) 14 18,053,355 7,166,797
E. Personnel expenses - total (lines 16 to 19) 15 10,363,101 8,998,929
E. 1. Wages and salaries (521, 522) 16 7,316,005 6,359,305
2. Remuneration of board members of the company or cooperatives (523) 17
3. Social security expenses (524, 525, 526) 18 2,663,133 2,272,432
4. Social expenses (527, 528) 19 383,963 367,192
F. Taxes and fees (acct. grp. 53) 20 276,878 283,443
G. Amortization and value adjustments to non-current intangible assets and depreciation and value adjustments to PP & E (line 22 + line 23) 21 2,068,888 1,453,297
G. 1. Amortization and value adjustments to non-current intangible assets and depreciation and value adjustments to PP & E (551) 22 2,069,740 1,453,329
2. Value adjustments to non-current intangible assets and PP & E (+/-) (553) 23 -852 -32
H. Carrying value of non-current assets sold and raw materials sold (541, 542) 24 838,494 1,121,403
I. Value adjustments to receivables (+/-) (547) 25 -488,928 -499,988
J. Other operating expenses (543, 544, 545, 546, 548, 549, 555, 557)) 26 1,918,248 2,038,711
*** Profit/loss from operations (line 02 - line 10) 27 19,118,681 425,382
* Added value (line 03 + line 04 + line 05 + line 06 + line 07) - (line 11 + line 12 + line 13 + line 14) 28 29,913,995 8,387,085
** Income from financial activities - total line 30 + line 31 + line 35 + line 39 + line 42 + line 43 + line 44 29 1,026,984 1,685,878
VIII. Revenue from the sale of securities and shares (661) 30
Profit and Loss Statement (as of December 31, 2017) 1/2
19

Profit and Loss Statement (as of December 31, 2017) 2/2
Class Item No.Current
Accounting Period €
Preceding Accounting
Period €
IX. Income from non-current financial assets (line 32 to 34) 31
IX. 1. Income from securities and ownership interests in affiliated accounting entities (665A) 32
2. Income from securities and ownership interests within participating interest, except for income of affiliated accounting entities (665A) 33
3. Other income from securities and ownership interests (665A) 34
X. Income from current financial assets - total (line 36 to 38) 35
X. 1. Income from current financial assets in affiliated accounting entities (666A) 36
2. Income from current financial assets within a participating interest, except for the income of affiliated accounting entities (666A) 37
3. Other income from current financial assets (666A) 38
XI. Interest income (line 40 + line 41) 39 506,243 755,712
XI. 1. Interest income from affiliated accounting entities (662A) 40 342,984 418,616
2. Other interest income (662A) 41 163,259 337,096
XII. Exchange rate gains (663) 42 150,256 522,514
XIII. Gains on the revaluation of securities and income from derivative transactions (664, 667) 43 370,485 407,041
XIV. Other income from financial activities (668) 44 611
** Expenses related to financial activities - total line 46 + line 47 + line 48 + line 49 + line 52 + line 53 + line 54 45 2,088,800 914,932
K. Securities and shares sold (561) 46
L. Expenses related to current financial assets (566) 47
M. Value adjustments to financial assets (+/-) (565) 48
N. Interest expenses (line 51 + line 52) 49 206,410 648,403
N. 1. Interest expenses related to affiliated accounting entities (562A) 50 117,700 599,600
2. Other interest expenses (562A) 51 88,710 48,803
O. Exchange rate losses (563) 52 770,195 55,653
P. Loss on the revaluation of securities and expenses related to derivative transactions (564, 567) 53 993,100 137,535
Q. Other expenses related to financial activities (568, 569) 54 119,095 73,341
*** Profit/loss from financial activities (+/-) (line 29 - line 45) 55 -1,061,816 770,946
**** Profit/loss for the accounting period before taxes (+/-) (line 27 + line 55) 56 18,056,865 1,196,328
R. Income tax (line 58 + line 59) 57 3,803,641 521,813
R. 1. Income tax - current (591, 595) 58 5,067,198 3,010
2. Income tax - deferred (+/-) (592) 59 -1,263,557 518,803
S. Transfer of net profit/net loss shares to partners (+/-596) 60
**** Profit/loss for the accounting period after taxes (+/-) (line 56 - line 57 - line 60) 61 14,253,224 674,515
20

Balance Sheet (as of December 31, 2017) 1/6
Class ASSETS No. Current Accounting Period € Preceding
Accounting Period €
a b c Gross Net for
Current Period Net for
Previous PeriodAdjustment
TOTAL ASSETS line 002 + line 033 + line 074 001149,221,831
120,254,213 95,317,47828,967,618
A. Non-current assets line 003 + line 011 + line 021 00248,672,171
22,886,445 20,583,22025,785,726
A.I. Non-current Intangible assets - total (lines 004 to 010) 003674,830
196,689 1,018,798478,141
A.I.1. Capitalized development costs (012) - /072, 091A/ 004
2. Software (013) - /073, 091 A/ 005479,441
196,689 86,697282,752
3. Valuable rights (014) - /074, 091A/ 00662,302
2,10162,302
4. Goodwill (015) - /075, 091A/ 007
5. Other non-current intangible assets (019, 01X) - /079, 07X, 091A/ 008
133,087
133,087
6. Acquisition of non-current intangible assets (041)-093 009 930,000
7. Advance payments made for non-current intangible assets (051) – 095A 010
A.II. Property, plant & equipment - total (lines 012 to 020) 01147,958,863
22,659,245 19,538,66425,299,618
A.II.1. Land (031) - 092A 012752,795
752,795 752,795
2. Structures (021) - /081, 092A/ 01316,209,031
8,544,518 7,545,1717,664,513
3. Machinery (022) - /082, 092A/ 01428,988,992
11,426,541 3,372,51517,562,451
4. Perennial crops (025) - /085, 092A/ 015
5. Livestock (026) - /086, 092A/ 016
6. Other property, plant & equipment (029, 02X, 032) - /089, 08X, 092A/ 017
169,16796,513 96,514
72,654
7. Acquisition of property, plant & equipment (042) -094 0181,274,402
1,274,402 7,669,969
8. Advance payments made for property, plant & equipment (052) -095A 019
564,476564,476 101,700
9. Value adjustment to acquired assets (+/-097) +/-098 020
21

Balance Sheet (as of December 31, 2017) 2/6
Class ASSETS No. Current Accounting Period € Preceding
Accounting Period €
a b c Gross Net for
Current Period Net for
Previous PeriodAdjustment
A.III. Non-current financial assets - total (lines 022 to 029) 02138,478
30,511 25,7587,967
A.III.1. Shares and ownership interests in affiliated accounting entities (061A, 062A, 063A) - /096A/ 022
30,48530,485 25,758
2. Shares and ownership interests with a participating interest, except for affiliated accounting entities (062A) – 096A 023
7,303
7,303
3. Other available-for-sale securities and ownership interests (063A) - /096A/ 024
664
664
4. Loans to affiliated accounting entities (066A) - 096A 025
5. Loans with a participating interest, except for affiliated accounting entities (066A) -/096A/ 026
6. Other loans (067A) - /096A/ 027
7. Debt securities and other non-current financial assets (065A, 069A, 06XA) - /096A/ 028
8.Loans and other financial assets with a remaining maturity of 1 year (066A, 067A, 069A, 06XA) - /096A/ 029
9. Bank accounts with a notice period exceeding 1 year (22XA) 030
10. Acquisition of non-current financial assets (043) - /096A/ 03126
26
11. Advance payments made for non-current financial assets (053) - /095A/ 032
B. Current assets line 034 + line 041 + line 053 + line 066 + line 071 033
100,420,82397,238,931 74,691,142
3,181,892
B.I. Inventory - total (lines 035 to 040) 03426,426,528
26,426,528 21,426,087
B.I.1. Raw material (112,119, 11X) - /191, 19X/ 03512,909,380
12,909,380 11,606,778
2. Work-in-progress and semi-finished products (121,122, 12X) - /192,193, 19X/ 036
444,927444,927 575,425
3. Finished goods (123) – /194/ 0379,540,339
9,540,339 7,401,377
4. Animals (124) – /195/ 038
5. Merchandise (132, 133, 13X, 139) – /196, 19X/ 0391,300,248
1,300,248 1,178,249
6. Advance payments made for inventory (314A) – /391A/ 0402,231,634
2,231,634 664,258
22
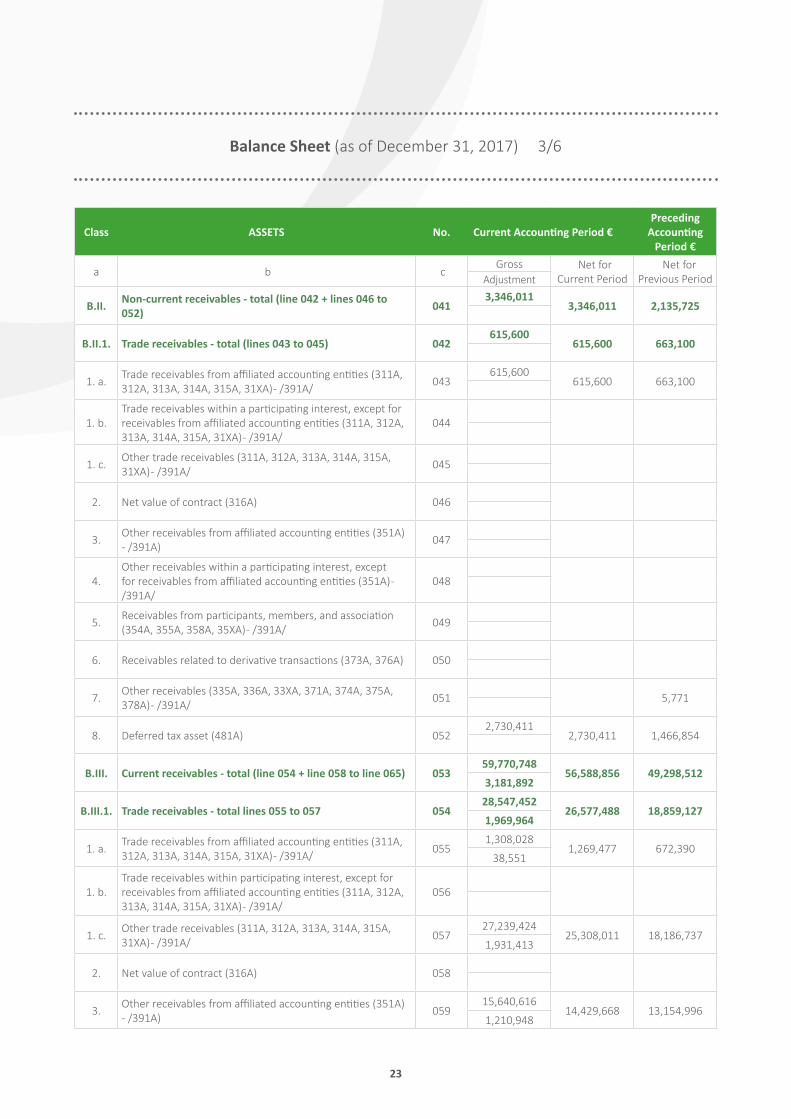
Balance Sheet (as of December 31, 2017) 3/6
Class ASSETS No. Current Accounting Period € Preceding
Accounting Period €
a b c Gross Net for
Current Period Net for
Previous PeriodAdjustment
B.II. Non-current receivables - total (line 042 + lines 046 to 052) 041
3,346,0113,346,011 2,135,725
B.II.1. Trade receivables - total (lines 043 to 045) 042615,600
615,600 663,100
1. a. Trade receivables from affiliated accounting entities (311A, 312A, 313A, 314A, 315A, 31XA) - /391A/ 043
615,600615,600 663,100
1. b. Trade receivables within a participating interest, except for receivables from affiliated accounting entities (311A, 312A, 313A, 314A, 315A, 31XA) - /391A/
044
1. c. Other trade receivables (311A, 312A, 313A, 314A, 315A, 31XA) - /391A/ 045
2. Net value of contract (316A) 046
3. Other receivables from affiliated accounting entities (351A) - /391A) 047
4. Other receivables within a participating interest, except for receivables from affiliated accounting entities (351A) - /391A/
048
5. Receivables from participants, members, and association (354A, 355A, 358A, 35XA) - /391A/ 049
6. Receivables related to derivative transactions (373A, 376A) 050
7. Other receivables (335A, 336A, 33XA, 371A, 374A, 375A, 378A) - /391A/ 051 5,771
8. Deferred tax asset (481A) 0522,730,411
2,730,411 1,466,854
B.III. Current receivables - total (line 054 + line 058 to line 065) 05359,770,748
56,588,856 49,298,5123,181,892
B.III.1. Trade receivables - total lines 055 to 057 05428,547,452
26,577,488 18,859,1271,969,964
1. a. Trade receivables from affiliated accounting entities (311A, 312A, 313A, 314A, 315A, 31XA) - /391A/ 055
1,308,0281,269,477 672,390
38,551
1. b.Trade receivables within participating interest, except for receivables from affiliated accounting entities (311A, 312A, 313A, 314A, 315A, 31XA) - /391A/
056
1. c. Other trade receivables (311A, 312A, 313A, 314A, 315A, 31XA) - /391A/ 057
27,239,42425,308,011 18,186,737
1,931,413
2. Net value of contract (316A) 058
3. Other receivables from affiliated accounting entities (351A) - /391A) 059
15,640,61614,429,668 13,154,996
1,210,948
23

Balance Sheet (as of December 31, 2017) 4/6
Class ASSETS No. Current Accounting Period € Preceding
Accounting Period €
a b c Gross Net for
Current Period Net for
Previous PeriodAdjustment
4.Other receivables within a participating interest, except for receivables from affiliated accounting entities (351A) - /391A/
060
5. Receivables from participants, members, and association (354A, 355A, 358A, 35XA) - /391A/ 061
7,0267,026
6. Social security receivables (336A) - /391A/ 062
7. Tax assets and subsidies (341, 342, 343, 345, 346, 347) - /391A/ 063
3,733,4793,733,479 4,064,315
8. Receivables related to derivative transactions (373A, 376A) 064 82,518
9. Other receivables (335A, 33XA, 371A, 374A, 375A, 378A) - /391A/ 065
11,842,17511,841,195 13,137,556
980
B.IV. Current financial assets - total (lines 067 to 070) 0661,331,395
1,331,395 1,469,273
B.IV.1 Current financial assets in affiliated accounting entities (251A, 253A, 256A, 257A, 25XA) - /291A, 29XA/ 067
2.Current financial assets not including current financial assets in affiliated accounting entities (251A, 253A, 256A, 257A, 25XA) - /291A, 29XA/
0681,331,395
1,331,395 1,469,273
3. Own shares and own ownership interests (252) 069
4. Acquisition of current financial assets (259, 314A) - /291A/ 070
B.V. Financial accounts (line 72 + line 73) 0719,546,141
9,546,141 361,545
B.V.1. Cash (211, 213, 21X) 072117,408
117,408 96,236
2. Bank accounts (221A, 22X, +/- 261) 0739,428,733
9,428,733 265,309
C. Accruals/deferrals - total (lines 075 to 078) 074128,837
128,837 43,116
C.1. Prepaid expenses - long-term (381A, 382A) 0752,631
2,631 6,570
2. Prepaid expenses - short-term (381A, 382A) 07635,367
35,367 28,336
3. Accrued income - long-term (385A) 077
4. Accrued income - short-term (385A) 07890,839
90,839 8,210
24

Balance Sheet (as of December 31, 2017) 5/6
Class LIABILITIES No.Current
Accounting Period €
Preceding Accounting
Period €
TOTAL EQUITY AND LIABILITIES line 080 + line 101 + line 141 079 120,254,213 95,317,478
A Equity line 081+ line 085+ line 086 + line 087 + line 090 + line 093 + line 097 + line 100 080 48,654,951 34,439,424
A.I. Share capital - total (r. 082 to 084) 081 33,400,000 33,400,000
A.I.1. Share capital (411 or +/-491) 082 33,400,000 33,400,000
2. Change in share capital +/- 419 083
3. Unpaid share capital (/-/353) 084
A.II. Share premium (412) 085
A.III. Other capital funds (413) 086
A.IV. Legal reserve funds (line 088 + line 089) 087 607,909 540,457
A.IV.1. Legal reserve fund and non-distributable fund (417A, 418, 421A, 422) 088 607,909 540,457
2. Reserve fund for own shares and own ownership interests (417A, 421A) 089
A.V. Other funds created from profit (line 091 + line 092) 090
A.V.1. Statutory funds (423, 42X) 091
2. Other funds (427, 42X) 092
A.VI. Differences from revaluation - total (lines 094 to 096) 093 -213,246 -175,548
A.VI.1. Differences from the revaluation of assets and liabilities (+/- 414) 094 -213,246 -175,548
2. Investment revaluation reserves (+/- 415) 095
3. Difference from the revaluation in the event of mergers, amalgamation into a separate accounting entity, or demerger (+/- 416) 096
A.VII. Net profit/loss of previous years (line 098 + line 099) 097 607,064
A.VII.1. Retained earnings from previous years (428) 098 607,064
2. Accumulated losses from previous years (/-/429) 099
A.VIII. Net profit/loss for the accounting period after taxes /+ -/ line 001 - (line 081 + line 085 + line 086 + line 087 + line 090 + line 093 + line 097 + line 101 + line 141)
100 14,253,224 674,515
B. Liabilities line 102 + line 118 + line 121 + line 122 + line 136 + line 139 + line 140 101 71,459,876 60,851,429
B.I. Non-current liabilities - total (line 103 + lines 107 to 117) 102 839,470 493,939
B.I.1. Non-current trade liabilities (lines 104 to 106) 103
1.a. Trade liabilities to affiliated accounting entities (321A, 475A, 476A) 104
1.b. Trade liabilities within a participating interest, except for liabilities to affiliated accounting entities (321A, 475A, 476A) 105
1.c. Other trade liabilities (321A, 475A, 476A) 106
2. Net value of contract (316A) 107
3. Other liabilities to affiliated accounting entities (471A, 47XA) 108
4. Other liabilities within a participating interest, except for liabilities to affiliated accounting entities (471A, 4XA) 109
5. Other non-current liabilities (479A, 47XA) 110
25
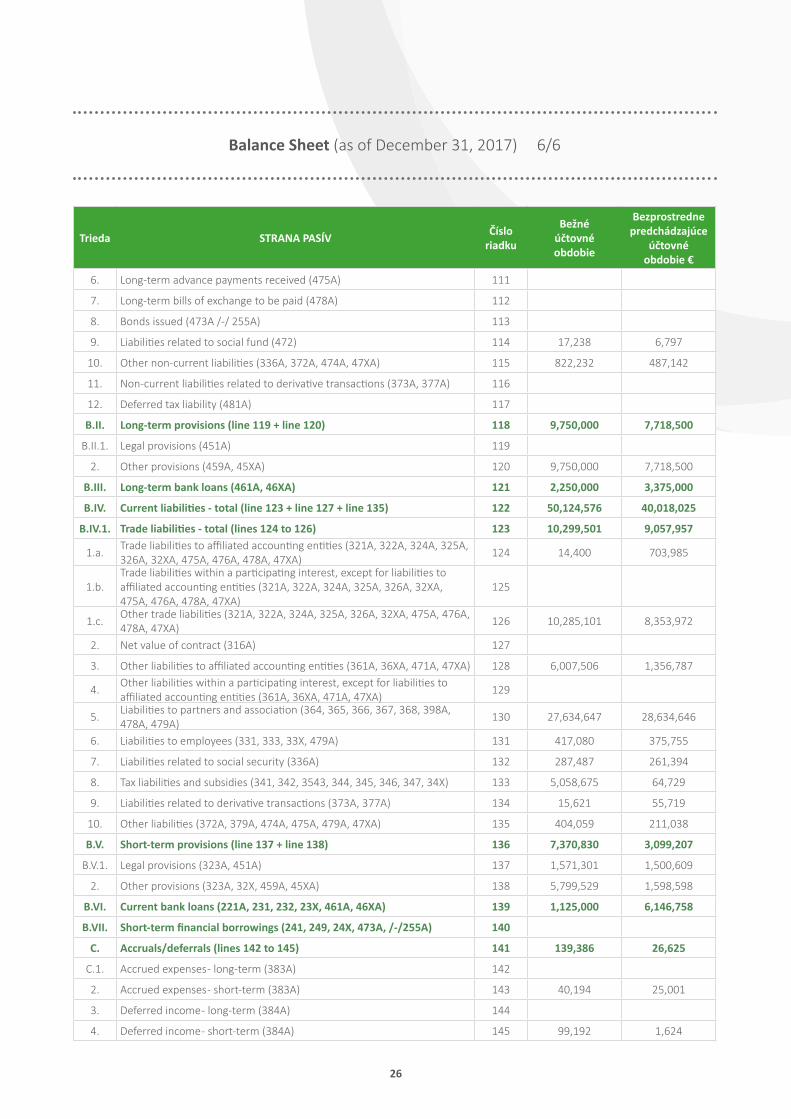
Balance Sheet (as of December 31, 2017) 6/6
Trieda STRANA PASÍV Číslo riadku
Bežné účtovné obdobie
Bezprostredne predchádzajúce
účtovné obdobie €
6. Long-term advance payments received (475A) 111
7. Long-term bills of exchange to be paid (478A) 112
8. Bonds issued (473A /-/ 255A) 113
9. Liabilities related to social fund (472) 114 17,238 6,797
10. Other non-current liabilities (336A, 372A, 474A, 47XA) 115 822,232 487,142
11. Non-current liabilities related to derivative transactions (373A, 377A) 116
12. Deferred tax liability (481A) 117
B.II. Long-term provisions (line 119 + line 120) 118 9,750,000 7,718,500
B.II.1. Legal provisions (451A) 119
2. Other provisions (459A, 45XA) 120 9,750,000 7,718,500
B.III. Long-term bank loans (461A, 46XA) 121 2,250,000 3,375,000
B.IV. Current liabilities - total (line 123 + line 127 + line 135) 122 50,124,576 40,018,025
B.IV.1. Trade liabilities - total (lines 124 to 126) 123 10,299,501 9,057,957
1.a. Trade liabilities to affiliated accounting entities (321A, 322A, 324A, 325A, 326A, 32XA, 475A, 476A, 478A, 47XA) 124 14,400 703,985
1.b.Trade liabilities within a participating interest, except for liabilities to affiliated accounting entities (321A, 322A, 324A, 325A, 326A, 32XA, 475A, 476A, 478A, 47XA)
125
1.c. Other trade liabilities (321A, 322A, 324A, 325A, 326A, 32XA, 475A, 476A, 478A, 47XA) 126 10,285,101 8,353,972
2. Net value of contract (316A) 127
3. Other liabilities to affiliated accounting entities (361A, 36XA, 471A, 47XA) 128 6,007,506 1,356,787
4. Other liabilities within a participating interest, except for liabilities to affiliated accounting entities (361A, 36XA, 471A, 47XA) 129
5. Liabilities to partners and association (364, 365, 366, 367, 368, 398A, 478A, 479A) 130 27,634,647 28,634,646
6. Liabilities to employees (331, 333, 33X, 479A) 131 417,080 375,755
7. Liabilities related to social security (336A) 132 287,487 261,394
8. Tax liabilities and subsidies (341, 342, 3543, 344, 345, 346, 347, 34X) 133 5,058,675 64,729
9. Liabilities related to derivative transactions (373A, 377A) 134 15,621 55,719
10. Other liabilities (372A, 379A, 474A, 475A, 479A, 47XA) 135 404,059 211,038
B.V. Short-term provisions (line 137 + line 138) 136 7,370,830 3,099,207
B.V.1. Legal provisions (323A, 451A) 137 1,571,301 1,500,609
2. Other provisions (323A, 32X, 459A, 45XA) 138 5,799,529 1,598,598
B.VI. Current bank loans (221A, 231, 232, 23X, 461A, 46XA) 139 1,125,000 6,146,758
B.VII. Short-term financial borrowings (241, 249, 24X, 473A, /-/255A) 140
C. Accruals/deferrals (lines 142 to 145) 141 139,386 26,625
C.1. Accrued expenses - long-term (383A) 142
2. Accrued expenses - short-term (383A) 143 40,194 25,001
3. Deferred income - long-term (384A) 144
4. Deferred income - short-term (384A) 145 99,192 1,624
26


OFZ, a. s., Široká 381, 027 41 Oravský Podzámok, Slovakia www.ofz.company
OFZ, a. s. is a company with more than 60 years of ferroalloy production history, a material without
which steel production would not be possible.
OFZ, a. s. is a company where natural resources are transformed into products that
have long been known for their premium quality. OFZ, a.s. is also a company with
a presence in Central Europe.
OFZ, a. s. uses modern technologies that protect the environment to
ensure sustainable development for future generations.
OFZ, a. s. - changing more than just the properties of steel
FERROALLOYSare used for alloying and deoxidation of steel, for the inoculating and modifying of cast iron. OFZ, a. s. manufactures a great variety of Mn and Si alloys.
CORED WIRESare used for alloying and deoxidation of steel, for the inoculating and modifying of cast iron. OFZ, a. s. manufactures a great variety of cored wires with different types of powder fillers.
BY-PRODUCTSThe production of by-products through waste-free manufacturing processes is undoubtedly an integral part of the company. By-products can be used as additives to concrete, and as refractory materials, in the building industry and for ground completion.