Embed Size (px)
Citation preview

Annual Report
2018/19

Contents
Page
General Information 1
Shire History 2
The Council 3
President’s Report 5
Chief Executive Officer’s Report 10
Annual Financial Report 12
Auditor’s Report 64
Notice of Meeting – Annual General 67 Meeting of Electors
Minutes of Annual General Meeting 68 of Electors
Freedom of Information Statement 74
National Competition Policy 75
Disability Access & Inclusion Plan 76
Record Keeping Plan 77
Employee Remuneration 78
Complaints Register 79

General Information
Administration Office Office Hours: Monday – Friday, 9:00am – 4:00pm
Street Address Postal Address 80 Monger St PO Box 20 Tel: 08 9685 1202 BENCUBBIN WA 6477 BENCUBBIN WA 6477 Fax: 08 9685 1299
Email: [email protected] Website: www.mtmarshall.wa.gov.au Facebook: www.facebook.com/ShireMtMarshall Twitter: https://twitter.com/MtMarshallShire
Localities Bencubbin, Beacon, Cleary, Gabbin, Welbungin and Wialki.
Economy The economic activity of the Shire is dominated by agriculture, including the growing of wheat, lupins, barley, peas, oats, canola and the breeding of sheep, pigs and cattle.
Local industries include retail, shearing, grain cleaning and servicing of farm machinery.
Significant Local Events
Australia Day Community Breakfast and Shire Citizen of the Year presentation,held in Bencubbin;
Australia Day Community BBQ held in Beacon;
Mt Marshall & Districts Agricultural Show held annually in March.
WAORRA Off Road Rally held annually on the June long weekend.
Tourist Attractions Marshall Rock; Pergandes Granite Sheep Yards; Datjoin Well; Billiburning Rock; Wildflower season (August – September); Heritage Walk Trail (Bencubbin), Sandalwood Interpretation Centre (Bencubbin).
Statistics (2018/19) Distance from Perth (km) 273 Area (sq km) 10,134 Length of Sealed Roads (km) 307 Length of Unsealed Roads (km) 1,440 Population 527 Number of Electors 382 Number of Dwellings 353 Total Rates Levied ($) 1,407,637 Total Revenue ($) 6,298,849 Number of Employees (FTE) 27
1

Shire History
The Sandalwood Shire In September and November 1836 the Surveyor General Captain John Septimus Roe led a forty-day expedition out to the unknown east of the settled districts of the Avon Valley. Mt Marshall and Lake McDermott were named after Captain Marshall McDermott, an early settler to the Swan River Colony. Captain Roe was loathe to give any native names as he considered them unpronounceable and impossible to spell.
In 1889 Surveyor HS King fixed Trigg Station at Mt Marshall. When the Wyalkatchem-Mt Marshall Railway Line was built, the siding was not named as there was already a Mt Marshall in Tasmania.
Sandalwooders and graziers were the early settlers in the Mt Marshall area. The first grazing lease was taken up in 1868. Sandalwood was removed from this area from the 1880’s through to the 1920’s. Permanent settlement and the development and clearing of the land for farms commenced around 1910.
The Mt Marshall Roads Board was formed in 1923.
2

The Council
The Shire of Mt Marshall Council has an elected body of seven Councillors. The Council: govern the affairs of the Shire; is responsible for the performance of the Shire’s functions; oversee the allocation of the Shire’s finances and resources; and determine the Shire’s policies.
Council is committed to providing open and accountable government that meets the needs of the community and protects and improves the Shire’s assets and resources.
The Chief Executive Officer has the responsibility for ensuring all decisions of Council comply with the Local Government Act, other relevant legislation and local laws. The Chief Executive Officer and staff undertake the tasks necessary to implement the decisions of the Council.
Elections Elections for Councillors are conducted in October every second year with the term of office being four years. Approximately one half of Council’s membership vacates each election. The next election is to be held in October 2019.
The President is elected by the members following each Local Government election, for a two year term.
President Cr Tony Sachse
Deputy President Cr Nick Gillett
Elected Members
Name Contact Years of Service
Term Expires
Cr Stuart FAULKNER T : 08 9686 1050 [email protected]
4 2019
Cr Nick GILLETT T: 08 9686 2007 [email protected]
3 2021
Cr Leeanne GOBBART T: 08 9684 8042 [email protected]
2 2021
Cr Rachel KIRBY T: 08 9686 1160 [email protected]
4 2019
Cr Stuart PUTT T: 08 9686 2078 [email protected]
2 2021
Cr Tony SACHSE T: 08 9685 1257 [email protected]
4 2019
Cr Ian SANDERS T: 08 9685 1213 [email protected]
2 2021
3

Wards The Shire of Mt Marshall does not operate a ward structure ensuring all Councillors
represent the whole of the shire instead of any particular ward which is considered outdated
in modern local government environment.
Council Meetings Ordinary meetings of Council are held on the third Tuesday of every month except January, and these meetings are open to the public. Meetings commence at the advertised times (generally 3:00pm) with a period of 15 minutes at the start of the meeting being set aside as public question time as required by the Local Government Act 1995.
Electors’ General Meeting An Electors’ General Meeting is held each financial year typically in December with notification being provided in the local newspapers, shire notice boards and libraries.
Committees The Shire of Mt Marshall has two standing committees: The Mt Marshall Audit Committee as required by the Local Government Act; and the Local Emergency Management Committee as required by the Emergency Management Act.
The Council has formally resolved to establish the following committees and working groups: Mt Marshall Safety Committee; Bush Fire Advisory Committee; Economic Development Grant Fund Committee; Bencubbin Multipurpose Complex Steering Committee; Off Road Racing Working Group.
Representation on External Organisations There are a number of external organisations on which the Shire is represented including: Great Eastern Zone of WALGA; North Eastern Wheatbelt Organisation of Councils (NEWROC); North Eastern Wheatbelt Health Group Scheme; Wheatbelt North East Sub Regional Road Group; Rural Water Council; Kununoppin Medical Practice; Kununoppin Local Health Advisory Group; Mt Marshall Land Conservation District Committee and Central East Aged Care Alliance (CEACA).
4

President’s Report
It gives me great pleasure to be able to table the Presidents Report for the financial year ended
30 June, 2019.
Councillors
Councillors have continued on in their roles with no changes in positions or representation. I
would like to thank all the Councillors for their considerable contribution during the period, and
for their efforts in sitting on the various Committees of Council, both internal and external.
Being well represented, relevant and ready to meet the challenges of Local Government is of
the utmost importance, and I believe the Council has done well in this regard.
Chief Executive Officer
The CEO, John Nuttall, having completed just under 2 ½ years as CEO for the Shire of Mt
Marshall, is very thorough and continues to work in a very professional manner. His
attendance at meetings is exemplary and his input is always thorough, considered and
constructive. The continuation of the “open door” policy with the CEO available to meet with
ratepayers, residents, and Councillors, has been well received. John has always encouraged
good governance. The investment in Civic Legal’s “Project Aware” governance training this
year has gone well, with the ongoing benefit to be realized well into the future. As President,
I really appreciate the support that John has been able to provide to everyone, least of all
myself. Thank you John.
Staff
Aaron Wootton, the Works Supervisor, has now completed his first full year. I believe he has
brought a very cohesive culture for the betterment of everyone, and his considerable
experience has been of great value. All our staff, in all their various roles and responsibilities,
have worked with dedication and efficiency towards a common goal. Our community members
and ratepayers are the beneficiaries of this work as the Shire deliver all the services, programs
and works as efficiently as we can, given the resources available. Thank you to all of the staff
on a job well done.
Communities
2018 rainfall was above average with very solid agricultural crop and pasture production, with
the benefits flowing through to local businesses and the communities generally. However,
2019 rainfall has been very low and patchy which will result in below average production.
Volunteerism has continued on at a very high level, with the contribution of so many over a
wide range of areas including ambulance and emergency services, sports, culture, progress
associations, community fundraising and cropping, plus all the numerous clubs and
committees both within the Shire and at regional level.
The Beacon Theatre Arts ran a very humorous production of “A Winx at the Sphinx” in
September, 2018.
5

The Beacon community also ran the very successful Living on the Edge Concert in October,
2018. A range of country musicians performed, including icon Adam Harvey. It was very well
run and a credit to those involved.
The 88th Mt Marshall and Districts Agricultural Show was run in March, 2019. The show had
excellent numbers attending, with the opening being conducted by the Member for the Central
Wheatbelt, Mia Davies MLA. Congratulations to the Society on another signature event.
The Annual Community Fox Shoot took place in March, 2019, again being well run and
supported with the end result being a real difference to endangered wildlife.
Also successful was the 2019 Marsue Transport Bencubbin 400 Off Road Car Rally, which
represented the 10th anniversary of the running of this motorsport event.
The Shire, with the support from the Primary Schools in the area, and the Njaki Njaki people,
have been running a Cultural Day each year, supporting increased knowledge and
appreciation of cultural matters.
The Shire has been able to provide day care services in both towns during the year, with the
hope of expanding this service in future years.
There are also a number of other community and sporting events, too numerous to mention
in this report. The Shire will continue to support these activities and events, both in terms of
infrastructure, preparedness and promotion. The bottom line is that many of these events,
which keep our communities vibrant and active, and add so much to the lives of all of those
living here, as well as visitors to our Shire, need not only volunteer contributions, but
Government support as well. Council are also thankful for those community members who
have taken time to attend community and Council meetings, complete surveys and contacted
the Shire to provide information and feedback.
Capital Works
The road capital works program is always the major focus each year. With funding through
the Regional Road Group, Direct Grants, Black Spot and Roads to Recovery, all of the
budgeted road projects were either completed or near completed. With weather, supply and
other considerations, this is very commendable and the Works Supervisor and Works Crew
are to be congratulated.
The Bencubbin Multipurpose Complex Redevelopment was officially opened by the Member
for Durack, the Hon Melissa Price MP, in September 2018. The redevelopment will be of
considerable benefit to current and future generations.
The Beacon Airstrip Upgrade was completed and will be opened later in 2019. The upgrade,
which allows for night take off and landings, will aid in Royal flying Doctor Service capability,
with improved patient outcomes and reduced volunteer St John’s Ambulance workload. The
upgrade will also benefit recreational, private, and charter flights.
During 2018/19 the construction of eight single person rooms at the Beacon Caravan Park
took place. The rooms have individual bathroom facilities, air-conditioning and television
services. A feature of the development is that it uses a solar powered energy supply with
battery backup. By way of background, the Public Transport Authority WA (PTA) wrote to the
Shire in May 2017 stating that they had decided to terminate the lease of the Beacon Barracks.
6

As a result, the Shire undertook community consultation on whether to take on ownership of
the Beacon Barracks, or construct new workers accommodation. After much consideration
Council decided in September 2017 to construct this new accommodation to meet present
and future needs. However, the Shire also wrote to the PTA requesting that one of the existing
rooms at the Beacon Barracks be retained and gifted to the Shire to be preserved and used
as a historical feature for the town. While the construction of the new accommodation at the
caravan park was underway, new caravan bays were also constructed, reflecting high
seasonal demand.
The construction of three Central East Aged Care Alliance Inc (CEACA) aged care units, two
of which are in Beacon and one in Bencubbin, is taking place and are expected to be ready
for rental later in 2019.
Further footpath construction also took place, and this will be ongoing.
Both the Beacon and Bencubbin Cemeteries have had works completed during the year.
The Shire has also been able to now provide a community bus based in both towns. This is
an excellent outcome and will further encourage the use of bus transport for groups and clubs
within the Shire.
Regional Collaboration
The rollout of the $958,500 Telecommunications Project for fast, fixed wireless
telecommunications across the North Eastern Wheatbelt through Crisp Wireless has taken
place. This will vastly improve communications and data capability within the Shire. It will help
with economic development, small business and agriculture, as well as help meeting the ever-
increasing need for data as part of everyone’s lives.
The Kununoppin Medical Practice Committee, of which the Shire is part, has supported the
local medical practice. This has in turn helped with the clinics at the Silver Chain in Bencubbin
and Beacon with further services available at the Kununoppin Hospital. Council
representatives also sit on the Kununoppin Local Health Advisory Group.
The Wheatbelt North-East Sub Regional Road Group is also an important regional group that
the Shire participates in.
WALGA Great Eastern Country Zone (GECZ), of which Mt Marshall is a member Shire, has
focused on health, transport, education and communication over the past year. As well as
gaining information, the GECZ has been able to advocate in these areas.
Biosecurity, Skeleton Weed and Water are other committees at regional level that the Shire
has representation on.
Economic Development
The financial year also saw the Economic Development Fund for both clubs, group and
business projects continue. Although not taken up in full, the fund has helped deliver on some
excellent initiatives.
7
Multiple sponsored events to do with economic development took place. In March 2019, the
Shire ran a very successful “Wheatbelt Women Mean Business” workshop. The guest
speakers were of a high order, with good promotion and attendance.
Emergency Management
The Local Emergency Management Committee has continued to function well and is up to
date and compliant. In June 2019 a local exercise took place involving a simulated road crash
near Beacon. All the attending agencies worked well together, which is all part of keeping our
communities safe.
Council acknowledges all the efforts of local bush fire and volunteer emergency service
brigades especially during firefighting operations in November 2018, when multiple fires
occurred with extreme weather and lightning.
A lot of planning, risk management, training and the provision of equipment takes place in
Emergency Management. Having dedicated people on the ground and ready is essential.
We very much appreciate the support of all the agencies, their staff and volunteers.
Tourism
Membership of NEWTRAVEL with its flagship “Wheatbelt Way” has continued. The Council
rates tourism highly with visitor numbers swelling during the wildflower season. Both caravan
parks continue to have reasonable occupancy with the Beacon Caravan Park reaching peak
occupancy in the tourist season. The online booking service has also been running well.
Occupancy rates have certainly been aided by the vouchers on offer, which have the additional
flow on benefit to local business. This has been a very good initiative. Free camping numbers
seem to have increased, although this has been inheritably difficult to measure.
Developing Projects
On 31 January, 2019 the Shire received notification from the Minister for Sport and Recreation,
the Hon Mick Murray MLA, that the application for funding support through the Community
Sporting and Recreation Facilities Fund (CSRFF) was successful. A grant for $488,642 was
awarded to assist with the conversion of the 50m pool to 25m at the Mt Marshall Aquatic
Facility. This project is to be claimed in the 2019/20 financial year. Budgeting in the 2019/20
financial year, a tender process and evaluation for consideration by Council will need to take
place.
A Zero Water Project in Beacon will continue to be investigated. Design and planning,
financial modelling, community consultation and possible grant fund applications will all be
considered.
The Shire is hopeful that the State Government Native Title announcements will now mean
that the transfer of the AA Water Corporation Tanks and associated land can soon take place.
As well as being beneficial for tourism, the tanks remain a resource for the collection of non-
potable water that could continue to be used by residents in the future.
The changes to Water Corporation Standpipes commence next year. The Shire has been in
communication with the Water Corporation regarding these changes. The changes are to be
introduced throughout the South West of WA because of abuse of community water by some
parties. Unfortunately, our Shire will be impacted by the changes, not only affecting what
8

standpipe water supply is available, but also the increased cost to the Shire and the potential
cost to users of this water in the future.
Now that the CEACA aged care units are nearing completion, the next phase is to the provision
of services to support the aged by the Alliance. The Federal Government’s Royal Commission
into Aged Care Quality and Safety should provide further guidance and funds of meeting the
needs of the aged in our communities.
Council will be reviewing our Strategic Community Plan this coming year. It’s hoped that this
review will allow for updating and improving this important document in meeting the needs of
those within the Shire of Mt Marshall, given the resources available.
In closing as per last year, I would like to encourage everyone to continue being engaged. By
working together the vision and future aspirations of our community can be maximized, within
the constraints that we have, for the betterment of everyone.
Cr Tony Sachse
President
9

CEO’s Report
The 2018-2019 financial year was a time of change in Local Government with the State
Government working towards a new Local Government Act in two phases. Phase one meant
that some new legislation was introduced and phase two will involve the Local Government
Act being totally rewritten.
The Shire continued to work towards its strategic priorities, with staff and Council working
extremely well together to achieve these targets. This allowed the majority of the budgeted
works to be delivered on time and within budget. As an organisation we continue to search
for best value when expending rate payer funds.
A major capital expenditure item was the much needed upgrade of the Beacon Airstrip to allow
for night time RFDS flights. This upgrade, which was funded by State and Federal grant
monies along with a sizeable contribution by the Shire (and was completed within budget), is
vital to assist both those taken ill and the volunteers who look after them and will hopefully
prevent the need for volunteers and patients to drive for long periods of time to a hospital.
Further items of capital expenditure included the Shire taking delivery of two new graders,
various light vehicles and other works to maintain Shire owned assets including the
Administration Building, Recreation Centres and housing.
As usual the majority of the budget was spent on the road program. All of this program was
completed by the end of the financial year, and as always the outdoor crew did their best to
have the roads most used at harvest time in the best condition possible during that busy
period. As an organisation we continue to strive to have the works done in budget and in a
good time, and looking forward are extending our long term road planning to allow for best
use of resources.
Although the Mt Marshall Aquatic Facility remained closed during the season, good news was
provided during the course of the year when the Shire was awarded State CSRFF funding of
close to half a million dollars for an upgrade to be undertaken during the 2019/20 financial
year. Again, the Shire will be contributing towards this upgrade from reserves which have
been saved over a number of years for this upgrade.
Regionally the Shire continued to work with its neighbours in NEWROC and at WALGA Zone
level. The NEWROC Crisp wireless project was completed with installation across much of
the Shire and our neighbouring Shires. This has delivered super-fast internet to businesses
and residents and the uptake of the service continues to grow.
10

Finally as always it is important that all of the Shire staff are acknowledged. Their hard work
is vital for the success of the Shire, and I appreciate all that they do. We are fortunate to have
dedicated staff who maintain the road network, keep the towns looking great, provide excellent
customer service and all do their best to deliver for the community. With this hard work and
the continuing strong relationship between Council and administration, the Shire has a bright
future.
John Nuttall
Chief Executive Officer
11

Annual Financial Report
SHIRE OF MT MARSHALL
FINANCIAL REPORT
FOR THE YEAR ENDED 30TH JUNE 2019
TABLE OF CONTENTS
Statement by Chief Executive Officer 13
Statement of Comprehensive Income by Nature or Type 14
Statement of Comprehensive Income by Program 15
Statement of Financial Position 16
Statement of Changes in Equity 17
Statement of Cash Flows 18
Rate Setting Statement 19
Notes to and forming part of the Financial Report 20
Independent Auditor’s Report 64
12
SHIRE OF MT MARSHALL
FINANCIAL REPORT
FOR THE YEAR ENDED 30TH JUNE 2019
Local Government Act 1995
Local Government (Financial Management) Regulations 1996
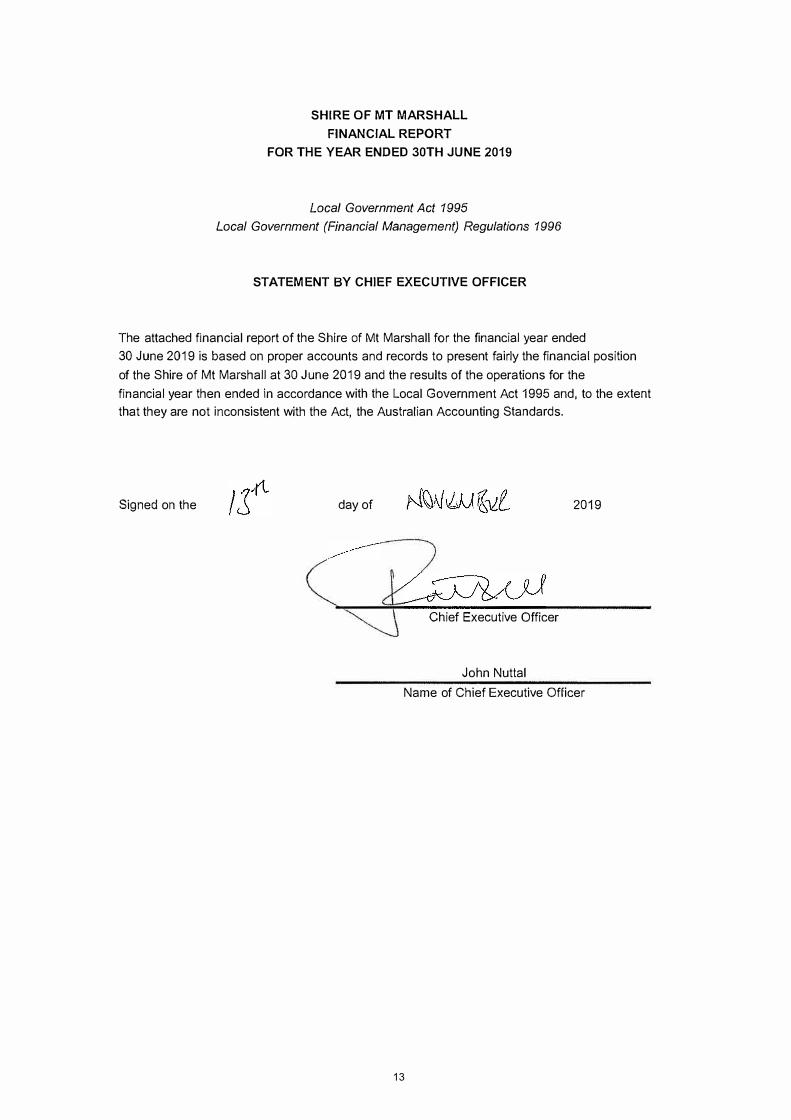
STATEMENT BY CHIEF EXECUTIVE OFFICER
The attached financial report of the Shire of Mt Marshall for the financial year ended
30 June 2019 is based on proper accounts and records to present fairly the financial position
of the Shire of Mt Marshall at 30 June 2019 and the results of the operations for the
financial year then ended in accordance with the Local Government Act 1995 and, to the extent
that they are not inconsistent with the Act, the Australian Accounting Standards.
Signed on the day of 2019
Chief Executive Officer
John Nuttal
Name of Chief Executive Officer
13
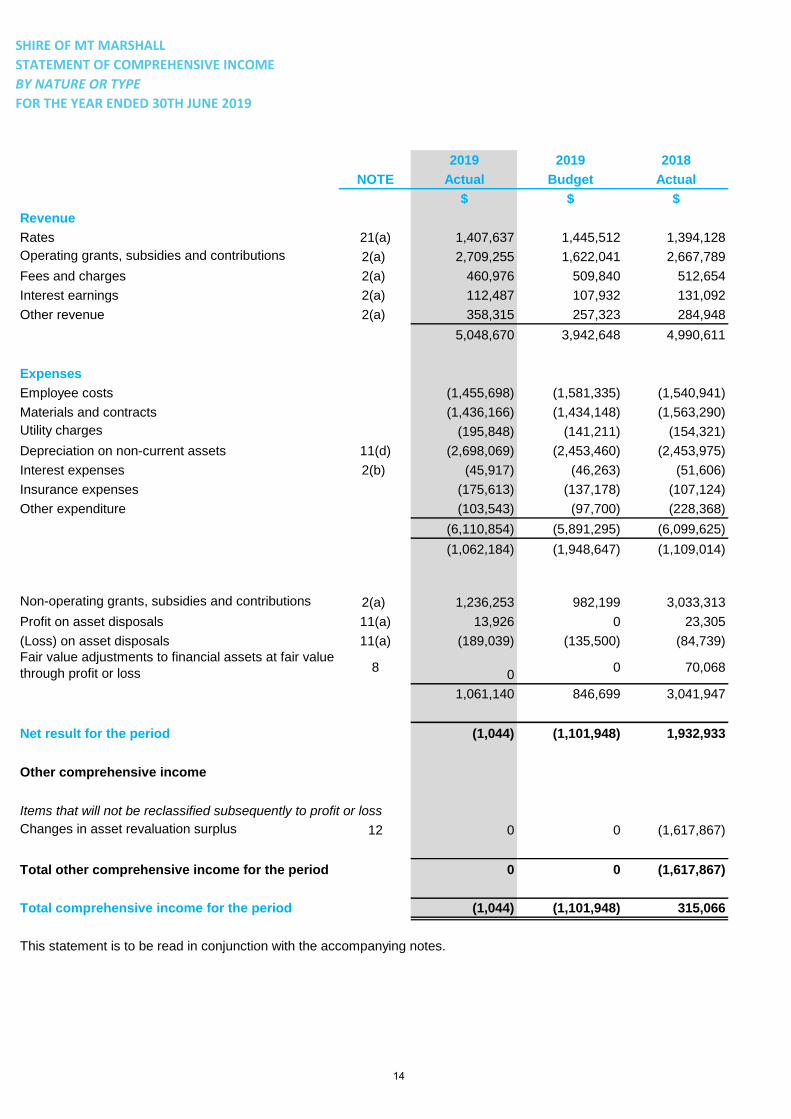
SHIRE OF MT MARSHALL
STATEMENT OF COMPREHENSIVE INCOME
BY NATURE OR TYPE
FOR THE YEAR ENDED 30TH JUNE 2019
2019 2019 2018
NOTE Actual Budget Actual
$ $ $
Revenue
Rates 21(a) 1,407,637 1,445,512 1,394,128
Operating grants, subsidies and contributions 2(a) 2,709,255 1,622,041 2,667,789
Fees and charges 2(a) 460,976 509,840 512,654
Interest earnings 2(a) 112,487 107,932 131,092
Other revenue 2(a) 358,315 257,323 284,948
5,048,670 3,942,648 4,990,611
Expenses
Employee costs (1,455,698) (1,581,335) (1,540,941)
Materials and contracts (1,436,166) (1,434,148) (1,563,290)
Utility charges (195,848) (141,211) (154,321)
Depreciation on non-current assets 11(d) (2,698,069) (2,453,460) (2,453,975)
Interest expenses 2(b) (45,917) (46,263) (51,606)
Insurance expenses (175,613) (137,178) (107,124)
Other expenditure (103,543) (97,700) (228,368)
(6,110,854) (5,891,295) (6,099,625)
(1,062,184) (1,948,647) (1,109,014)
Non-operating grants, subsidies and contributions 2(a) 1,236,253 982,199 3,033,313
Profit on asset disposals 11(a) 13,926 0 23,305
(Loss) on asset disposals 11(a) (189,039) (135,500) (84,739)
Fair value adjustments to financial assets at fair value
through profit or loss 80
0 70,068
1,061,140 846,699 3,041,947
Net result for the period (1,044) (1,101,948) 1,932,933
Other comprehensive income
Items that will not be reclassified subsequently to profit or loss
Changes in asset revaluation surplus 12 0 0 (1,617,867)
Total other comprehensive income for the period 0 0 (1,617,867)
Total comprehensive income for the period (1,044) (1,101,948) 315,066
This statement is to be read in conjunction with the accompanying notes.
14
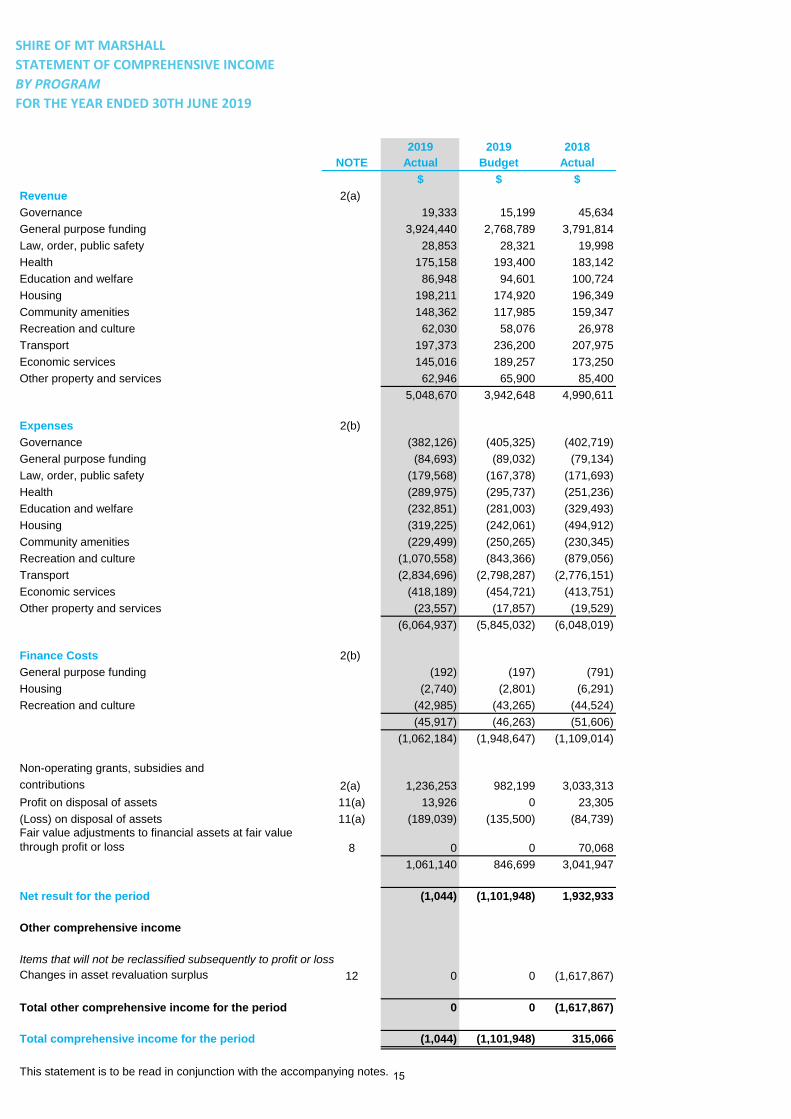
SHIRE OF MT MARSHALL
STATEMENT OF COMPREHENSIVE INCOME
BY PROGRAM
FOR THE YEAR ENDED 30TH JUNE 2019
2019 2019 2018
NOTE Actual Budget Actual
$ $ $
Revenue 2(a)
Governance 19,333 15,199 45,634
General purpose funding 3,924,440 2,768,789 3,791,814
Law, order, public safety 28,853 28,321 19,998
Health 175,158 193,400 183,142
Education and welfare 86,948 94,601 100,724
Housing 198,211 174,920 196,349
Community amenities 148,362 117,985 159,347
Recreation and culture 62,030 58,076 26,978
Transport 197,373 236,200 207,975
Economic services 145,016 189,257 173,250
Other property and services 62,946 65,900 85,400
5,048,670 3,942,648 4,990,611
Expenses 2(b)
Governance (382,126) (405,325) (402,719)
General purpose funding (84,693) (89,032) (79,134)
Law, order, public safety (179,568) (167,378) (171,693)
Health (289,975) (295,737) (251,236)
Education and welfare (232,851) (281,003) (329,493)
Housing (319,225) (242,061) (494,912)
Community amenities (229,499) (250,265) (230,345)
Recreation and culture (1,070,558) (843,366) (879,056)
Transport (2,834,696) (2,798,287) (2,776,151)
Economic services (418,189) (454,721) (413,751)
Other property and services (23,557) (17,857) (19,529)
(6,064,937) (5,845,032) (6,048,019)
Finance Costs 2(b)
General purpose funding (192) (197) (791)
Housing (2,740) (2,801) (6,291)
Recreation and culture (42,985) (43,265) (44,524)
(45,917) (46,263) (51,606)
(1,062,184) (1,948,647) (1,109,014)
Non-operating grants, subsidies and
contributions 2(a) 1,236,253 982,199 3,033,313
Profit on disposal of assets 11(a) 13,926 0 23,305
(Loss) on disposal of assets 11(a) (189,039) (135,500) (84,739)
Fair value adjustments to financial assets at fair value
through profit or loss 8 0 0 70,068
1,061,140 846,699 3,041,947
Net result for the period (1,044) (1,101,948) 1,932,933
Other comprehensive income
Items that will not be reclassified subsequently to profit or loss
Changes in asset revaluation surplus 12 0 0 (1,617,867)
Total other comprehensive income for the period 0 0 (1,617,867)
Total comprehensive income for the period (1,044) (1,101,948) 315,066
This statement is to be read in conjunction with the accompanying notes. 15
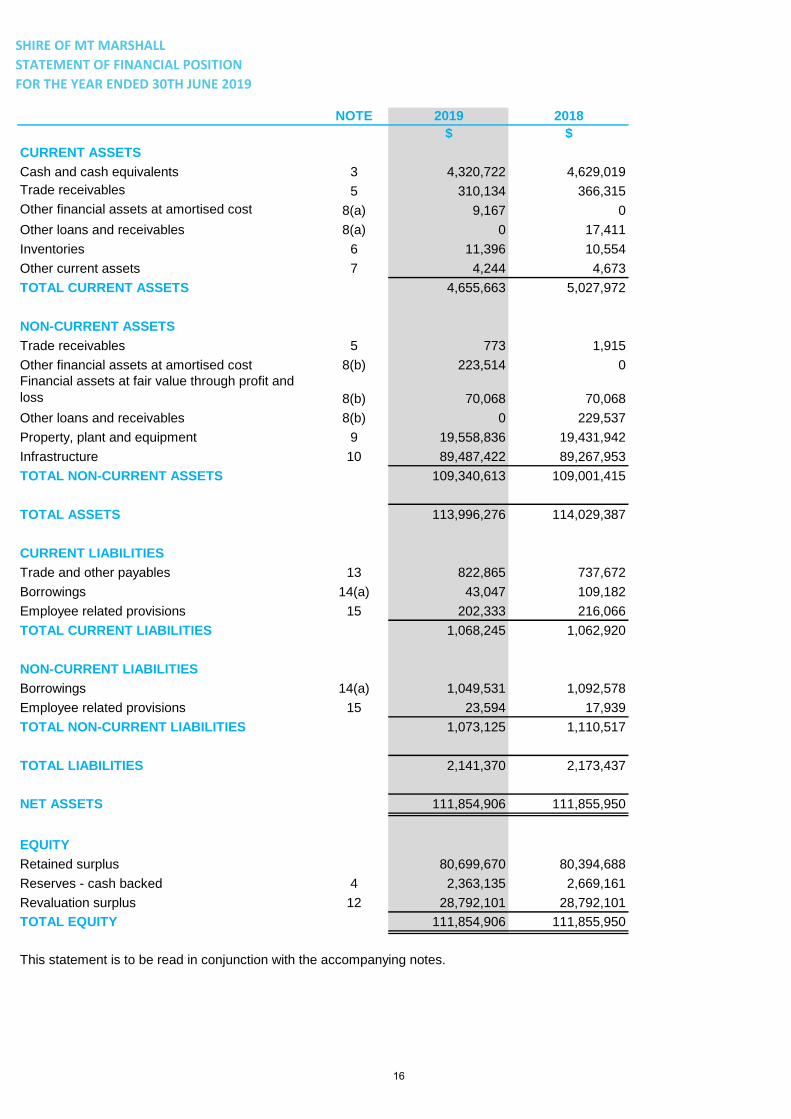
SHIRE OF MT MARSHALL
STATEMENT OF FINANCIAL POSITION
FOR THE YEAR ENDED 30TH JUNE 2019
NOTE 2019 2018
$ $
CURRENT ASSETS
Cash and cash equivalents 3 4,320,722 4,629,019
Trade receivables 5 310,134 366,315
Other financial assets at amortised cost 8(a) 9,167 0
Other loans and receivables 8(a) 0 17,411
Inventories 6 11,396 10,554
Other current assets 7 4,244 4,673
TOTAL CURRENT ASSETS 4,655,663 5,027,972
NON-CURRENT ASSETS
Trade receivables 5 773 1,915
Other financial assets at amortised cost 8(b) 223,514 0
Financial assets at fair value through profit and
loss 8(b) 70,068 70,068
Other loans and receivables 8(b) 0 229,537
Property, plant and equipment 9 19,558,836 19,431,942
Infrastructure 10 89,487,422 89,267,953
TOTAL NON-CURRENT ASSETS 109,340,613 109,001,415
TOTAL ASSETS 113,996,276 114,029,387
CURRENT LIABILITIES
Trade and other payables 13 822,865 737,672
Borrowings 14(a) 43,047 109,182
Employee related provisions 15 202,333 216,066
TOTAL CURRENT LIABILITIES 1,068,245 1,062,920
NON-CURRENT LIABILITIES
Borrowings 14(a) 1,049,531 1,092,578
Employee related provisions 15 23,594 17,939
TOTAL NON-CURRENT LIABILITIES 1,073,125 1,110,517
TOTAL LIABILITIES 2,141,370 2,173,437
NET ASSETS 111,854,906 111,855,950
EQUITY
Retained surplus 80,699,670 80,394,688
Reserves - cash backed 4 2,363,135 2,669,161
Revaluation surplus 12 28,792,101 28,792,101
TOTAL EQUITY 111,854,906 111,855,950
This statement is to be read in conjunction with the accompanying notes.
16

SHIRE OF MT MARSHALL
STATEMENT OF CHANGES IN EQUITY
FOR THE YEAR ENDED 30TH JUNE 2019
RESERVES
RETAINED CASH REVALUATION TOTAL
NOTE SURPLUS BACKED SURPLUS EQUITY
$ $ $ $
Balance as at 1 July 2017 77,607,676 3,523,240 30,409,968 111,540,884
Comprehensive income
Net result for the period 1,932,933 0 0 1,932,933
Other comprehensive income 12 0 0 (1,617,867) (1,617,867)
Total comprehensive income 1,932,933 0 (1,617,867) 315,066
Transfers from/(to) reserves 854,079 (854,079) 0 0
Balance as at 30 June 2018 80,394,688 2,669,161 28,792,101 111,855,950
Comprehensive income
Net result for the period (1,044) 0 0 (1,044)
Total comprehensive income (1,044) 0 0 (1,044)
Transfers from/(to) reserves 306,026 (306,026) 0 0
Balance as at 30 June 2019 80,699,670 2,363,135 28,792,101 111,854,906
This statement is to be read in conjunction with the accompanying notes.
17

SHIRE OF MT MARSHALL
STATEMENT OF CASH FLOWS
FOR THE YEAR ENDED 30TH JUNE 2019
2019 2019 2018
NOTE Actual Budget Actual
$ $ $
CASH FLOWS FROM OPERATING ACTIVITIES
Receipts
Rates 1,415,673 1,443,012 1,414,581
Operating grants, subsidies and contributions 2,712,426 1,587,041 2,634,289
Fees and charges 460,976 509,840 512,654
Interest received 112,487 107,932 129,461
Goods and services tax received 318,065 0 603,666
Other revenue 358,315 257,323 281,906
5,377,942 3,905,148 5,576,557
Payments
Employee costs (1,490,995) (1,579,835) (1,481,639)
Materials and contracts (1,324,167) (1,434,748) (1,722,289)
Utility charges (195,848) (141,211) (154,321)
Interest expenses (45,917) (43,963) (51,960)
Insurance paid (175,613) (137,178) (107,124)
Goods and services tax paid (271,949) 0 (665,821)
Other expenditure (103,543) (97,700) (228,948)
(3,608,032) (3,434,635) (4,412,102)
Net cash provided by (used in)
operating activities 16 1,769,910 470,513 1,164,455
CASH FLOWS FROM INVESTING ACTIVITIES
Payments for purchase of
property, plant & equipment (1,402,975) (1,586,000) (3,138,210)
Payments for construction of infrastructure (2,117,441) (2,182,400) (2,273,928)
Payments for financial assets at amortised cost (3,144) 0 0
Non-operating grants,
subsidies and contributions 1,236,253 982,199 3,033,313
Advances to community groups 0 0 (250,000)
Proceeds from self supporting loans 17,411 17,411 19,407
Proceeds from sale of property, plant & equipment 300,871 332,500 209,115
Net cash provided by (used in)
investment activities (1,969,025) (2,436,290) (2,400,303)
CASH FLOWS FROM FINANCING ACTIVITIES
Repayment of borrowings (109,182) (109,182) (106,411)
Proceeds from new borrowings 0 135,000 0
Net cash provided by (used In)
financing activities (109,182) 25,818 (106,411)
Net increase (decrease) in cash held (308,297) (1,939,959) (1,342,259)
Cash at beginning of year 4,629,019 4,629,019 5,971,278
Cash and cash equivalents
at the end of the year 16 4,320,722 2,689,060 4,629,019
This statement is to be read in conjunction with the accompanying notes.18

SHIRE OF MT MARSHALL
RATE SETTING STATEMENT
FOR THE YEAR ENDED 30TH JUNE 2019
2019 2019 2018
NOTE Actual Budget Actual
$ $ $
OPERATING ACTIVITIES
Net current assets at start of financial year - surplus/(deficit) 22 (b) 1,483,330 1,449,422 1,788,610
1,483,330 1,449,422 1,788,610
Revenue from operating activities (excluding rates)
Governance 33,259 15,199 121,984
General purpose funding 2,541,127 1,378,277 2,447,250
Law, order, public safety 28,853 28,321 19,998
Health 175,158 193,400 183,142
Education and welfare 86,948 94,601 100,724
Housing 198,211 174,920 196,349
Community amenities 148,362 117,985 159,347
Recreation and culture 62,030 58,076 26,978
Transport 197,373 236,200 224,998
Economic services 145,016 189,257 173,250
Other property and services 62,946 65,900 85,400
3,679,283 2,552,136 3,739,420
Expenditure from operating activities
Governance (384,562) (405,325) (402,719)
General purpose funding (84,885) (89,229) (79,925)
Law, order, public safety (179,568) (167,378) (206,269)
Health (294,434) (295,737) (251,236)
Education and welfare (232,851) (281,003) (329,493)
Housing (383,953) (308,362) (547,259)
Community amenities (229,599) (250,265) (230,345)
Recreation and culture (1,113,543) (886,631) (923,580)
Transport (2,954,752) (2,870,287) (2,780,258)
Economic services (418,189) (454,721) (413,751)
Other property and services (23,557) (17,857) (19,529)
(6,299,893) (6,026,795) (6,184,364)
Non-cash amounts excluded from operating activities 22(a) 2,882,322 2,588,960 2,447,735
Amount attributable to operating activities 1,745,042 563,723 1,791,401
INVESTING ACTIVITIES
Non-operating grants, subsidies and contributions 1,236,253 982,199 3,033,313
Proceeds from disposal of assets 11(a) 300,871 332,500 209,115
Proceeds from self supporting loans 14(b) 17,411 17,411 19,407
Purchase of property, plant and equipment 9(a) (1,402,975) (1,586,000) (3,138,210)
Purchase and construction of infrastructure 10(a) (2,117,441) (2,182,400) (2,273,928)
Purchase of financial assets at amortised cost (3,144) 0 0
Amount attributable to investing activities (1,969,025) (2,436,290) (2,150,303)
FINANCING ACTIVITIES
Advances to community groups 0 0 (250,000)
Repayment of borrowings 14(b) (109,182) (109,182) (106,411)
Proceeds from borrowings 14(c) 0 135,000 0
Transfers to reserves (restricted assets) 4 (334,033) (183,821) (809,048)
Transfers from reserves (restricted assets) 4 640,059 640,058 1,663,127
Amount attributable to financing activities 196,844 482,055 497,668
Surplus/(deficit) before imposition of general rates (27,139) (1,390,512) 138,766
Total amount raised from general rates 21 1,383,313 1,390,512 1,344,564
Surplus/(deficit) after imposition of general rates 22(b) 1,356,174 0 1,483,330
This statement is to be read in conjunction with the accompanying notes.19

SHIRE OF MT MARSHALL
NOTES TO AND FORMING PART OF THE FINANCIAL REPORT
FOR THE YEAR ENDED 30TH JUNE 2019
1. BASIS OF PREPARATION
The financial report comprises general purpose financial CRITICAL ACCOUNTING ESTIMATES
statements which have been prepared in accordance with The preparation of a financial report in conformity with
Australian Accounting Standards (as they apply to local Australian Accounting Standards requires management to
governments and not-for-profit entities) and Interpretations make judgements, estimates and assumptions that effect the
of the Australian Accounting Standards Board, and the Local application of policies and reported amounts of assets and
Government Act 1995 and accompanying regulations. liabilities, income and expenses.
The Local Government (Financial Management) Regulations The estimates and associated assumptions are based on
1996 take precedence over Australian Accounting Standards. historical experience and various other factors that are
Regulation 16 prohibits a local government from recognising believed to be reasonable under the circumstances; the
as assets Crown land that is a public thoroughfare, such as results of which form the basis of making the judgements
land under roads, and land not owned by but under the about carrying values of assets and liabilities that are not
control or management of the local government, unless it is a readily apparent from other sources. Actual results may differ
golf course, showground, racecourse or recreational facility from these estimates.
of State or regional significance. Consequently, some assets,
including land under roads acquired on or after 1 July 2008, THE LOCAL GOVERNMENT REPORTING ENTITY
have not been recognised in this financial report. This is not All funds through which the Shire controls resources to carry
in accordance with the requirements of AASB 1051 Land on its functions have been included in the financial statements
Under Roads paragraph 15 and AASB 116 Property, Plant forming part of this financial report.
and Equipment paragraph 7.
In the process of reporting on the local government as a single
Accounting policies which have been adopted in the unit, all transactions and balances between those funds (for
preparation of this financial report have been consistently example, loans and transfers between funds) have been
applied unless stated otherwise. Except for cash flow and eliminated.
rate setting information, the report has been prepared on
the accrual basis and is based on historical costs, modified, All monies held in the Trust Fund are excluded from the
where applicable, by the measurement at fair value of financial statements. A separate statement of those monies
selected non-current assets, financial assets and liabilities. appears at Note 24 to these financial statements.
20
SHIRE OF MT MARSHALL
NOTES TO AND FORMING PART OF THE FINANCIAL REPORT
FOR THE YEAR ENDED 30TH JUNE 2019
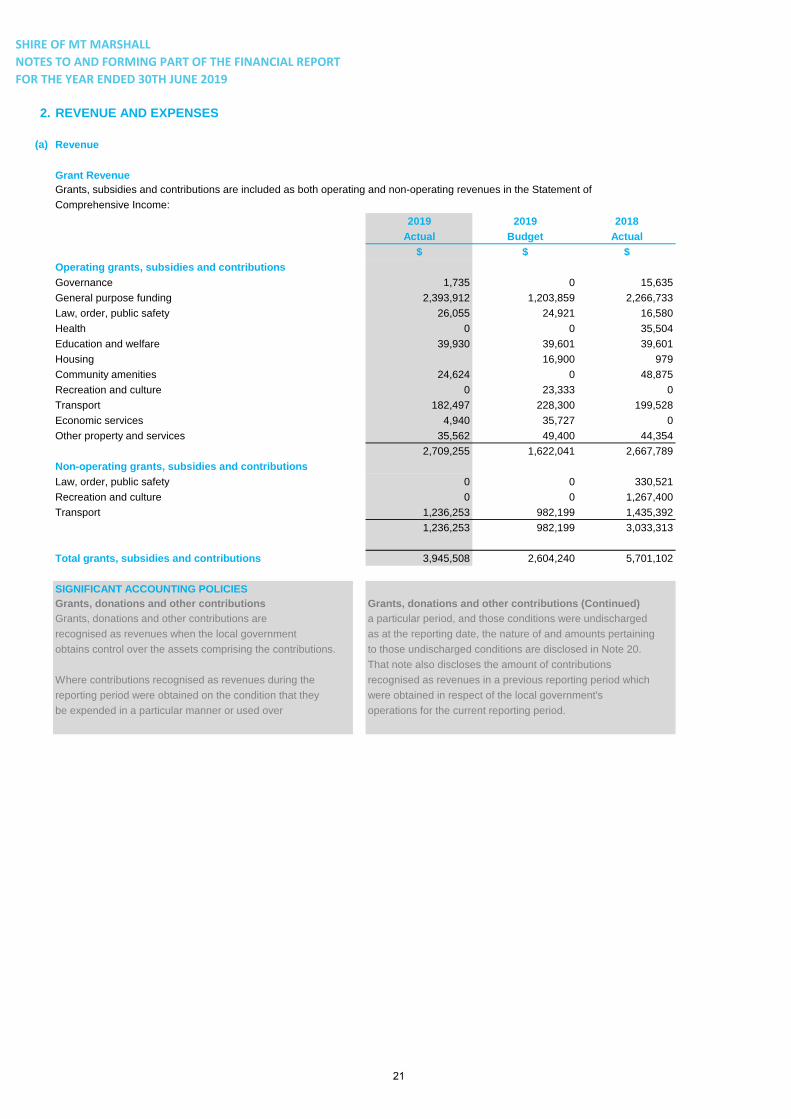
2. REVENUE AND EXPENSES
(a) Revenue
Grant Revenue
Grants, subsidies and contributions are included as both operating and non-operating revenues in the Statement of
Comprehensive Income:
2019 2019 2018
Actual Budget Actual
$ $ $
Operating grants, subsidies and contributions
Governance 1,735 0 15,635
General purpose funding 2,393,912 1,203,859 2,266,733
Law, order, public safety 26,055 24,921 16,580
Health 0 0 35,504
Education and welfare 39,930 39,601 39,601
Housing 16,900 979
Community amenities 24,624 0 48,875
Recreation and culture 0 23,333 0
Transport 182,497 228,300 199,528
Economic services 4,940 35,727 0
Other property and services 35,562 49,400 44,354
2,709,255 1,622,041 2,667,789
Non-operating grants, subsidies and contributions
Law, order, public safety 0 0 330,521
Recreation and culture 0 0 1,267,400
Transport 1,236,253 982,199 1,435,392
1,236,253 982,199 3,033,313
Total grants, subsidies and contributions 3,945,508 2,604,240 5,701,102
SIGNIFICANT ACCOUNTING POLICIES
Grants, donations and other contributions Grants, donations and other contributions (Continued)
Grants, donations and other contributions are a particular period, and those conditions were undischarged
recognised as revenues when the local government as at the reporting date, the nature of and amounts pertaining
obtains control over the assets comprising the contributions. to those undischarged conditions are disclosed in Note 20.
That note also discloses the amount of contributions
Where contributions recognised as revenues during the recognised as revenues in a previous reporting period which
reporting period were obtained on the condition that they were obtained in respect of the local government's
be expended in a particular manner or used over operations for the current reporting period.
21

SHIRE OF MT MARSHALL
NOTES TO AND FORMING PART OF THE FINANCIAL REPORT
FOR THE YEAR ENDED 30TH JUNE 2019
2. REVENUE AND EXPENSES (Continued)
2019 2019 2018
(a) Revenue (Continued) Actual Budget Actual
$ $ $
Other revenue
Reimbursements and recoveries 330,440 243,424 271,908
Other 27,875 13,899 13,040
358,315 257,323 284,948
Fees and Charges
Governance 1,367 1,200 1,423
General purpose funding 1,548 1,200 1,188
Law, order, public safety 2,082 2,900 2,928
Health 2,380 0 0
Education and welfare 45,636 55,000 48,613
Housing 139,394 158,020 175,976
Community amenities 117,831 116,485 110,381
Recreation and culture 7,539 10,505 6,835
Economic services 134,149 153,530 156,461
Other property and services 9,050 11,000 8,849
460,976 509,840 512,654
There were no changes during the year to the amount of the fees or charges detailed in the original budget.
Interest earnings
Loans receivable - clubs/institutions 12,490 9,411 11,972
Reserve accounts interest 64,707 66,321 85,474
Rates instalment and penalty interest (refer Note 21(d)) 16,606 17,200 17,267
Other interest earnings 18,684 15,000 16,379
112,487 107,932 131,092
SIGNIFICANT ACCOUNTING POLICIES
Interest earnings Interest earnings (Continued)
Interest income is calculated by applying the effective interest Interest income is presented as finance income where it is
rate to the gross carrying amount of a financial asset except earned from financial assets that are held for cash management
for financial assets that subsequently become credit-impaired. purposes
For credit-impaired financial assets the effective interest rate
is applied to the net carrying amount of the financial asset
(after deduction of the loss allowance).
22

SHIRE OF MT MARSHALL
NOTES TO AND FORMING PART OF THE FINANCIAL REPORT
FOR THE YEAR ENDED 30TH JUNE 2019
2. REVENUE AND EXPENSES (Continued)
2019 2019 2018
(b) Expenses Actual Budget Actual
$ $ $
Auditors remuneration
- Audit of the Annual Financial Report 24,170 25,000 21,985
- Other services 11,950 0 850
36,120 25,000 22,835
Interest expenses (finance costs)
Borrowings (refer Note 14(b)) 45,917 46,263 51,606
45,917 46,263 51,606
Rental charges
- Operating leases 7,344 0 7,129
7,344 0 7,129
23

SHIRE OF MT MARSHALL
NOTES TO AND FORMING PART OF THE FINANCIAL REPORT
FOR THE YEAR ENDED 30TH JUNE 2019
3. CASH AND CASH EQUIVALENTS NOTE 2019 2018
$ $
Cash at bank and on hand 4,320,722 4,629,019
4,320,722 4,629,019
Comprises:
- Unrestricted cash and cash equivalents 1,888,805 1,870,639
- Restricted cash and cash equivalents 2,431,917 2,758,380
4,320,722 4,629,019
The following restrictions have been imposed by
regulations or other externally imposed requirements:
Reserve accounts
Employee entitlements 4 98,011 95,669
Plant Replacement 4 420,497 645,180
Aged Care Units 4 44,443 91,017
Housing 4 403,137 291,450
Public Amenities & Buildings 4 209,073 254,808
Mt Marshall Aquatic Centre Development 4 1,074,448 940,024
Community Bus 4 20,138 117,847
Bencubbin Recreation Complex 4 4,183 4,081
Office Equipment 4 0 16,325
Economic Development 4 77,451 75,602
Beacon Accommodation 4 3,645 121,384
Medical Enhancement 4 7,818 7,633
Bencubbin Community Resource Centre 4 291 8,141
2,363,135 2,669,161
Other restricted cash and cash equivalents
Unspent grants/contributions 20 28,634 89,219
Bonds and deposits held 24 40,148 0
Total restricted cash and cash equivalents 2,431,917 2,758,380
SIGNIFICANT ACCOUNTING POLICIES
Cash and cash equivalents Cash and cash equivalents (Continued)
Cash and cash equivalents include cash on hand, cash at bank, and which are subject to an insignificant risk of
deposits available on demand with banks and other short term changes in value and bank overdrafts. Bank overdrafts
highly liquid investments with original maturities of three months are reported as short term borrowings in current
or less that are readily convertible to known amounts of cash liabilities in the statement of financial position.
24

SHIRE OF MT MARSHALL
NOTES TO AND FORMING PART OF THE FINANCIAL REPORT
FOR THE YEAR ENDED 30TH JUNE 2019
2019 2019 2019 2019 2019 2019 2019 2019 2018 2018 2018 2018
Actual Actual Actual Actual Budget Budget Budget Budget Actual Actual Actual Actual
Opening Transfer Transfer Closing Opening Transfer Transfer Closing Opening Transfer Transfer Closing
4. RESERVES - CASH BACKED Balance to (from) Balance Balance to (from) Balance Balance to (from) Balance
$ $ $ $ $ $ $ $ $ $ $ $
(a) Employee entitlements 95,669 2,342 0 98,011 95,669 2,392 0 98,061 93,414 2,255 0 95,669
(b) Plant Replacement 645,180 70,867 (295,550) 420,497 645,180 16,129 (295,550) 365,759 423,392 294,788 (73,000) 645,180
(c) Aged Care Units 91,017 1,943 (48,517) 44,443 91,017 2,275 (48,517) 44,775 169,020 3,597 (81,600) 91,017
(d) Community Housing 0 0 0 0 0 0 0 0 39,103 0 (39,103) 0
(e) Housing 291,450 111,687 0 403,137 291,451 84,786 0 376,237 33,500 257,950 0 291,450
(f) Public Amenities & Buildings 254,808 5,932 (51,667) 209,073 254,808 6,370 (51,667) 209,511 552,005 11,503 (308,700) 254,808
(g) Mt Marshall Aquatic Centre Development 940,024 134,424 0 1,074,448 940,024 63,501 0 1,003,525 868,179 71,845 0 940,024
(h) Community Bus 117,847 2,291 (100,000) 20,138 117,847 2,946 (100,000) 20,793 115,072 2,775 0 117,847
(i) Bencubbin Recreation Complex 4,081 102 0 4,183 4,081 102 0 4,183 1,138,653 24,275 (1,158,847) 4,081
(j) Office Equipment 16,325 0 (16,325) 0 16,324 0 (16,324) 0 15,941 384 0 16,325
(k) Economic Development 75,602 1,849 0 77,451 75,602 1,890 0 77,492 4,250 71,352 0 75,602
(l) Integrated Planning/Financial Reporting 0 0 0 0 0 0 0 0 1,877 0 (1,877) 0
(m) Beacon Accommodation 121,384 2,261 (120,000) 3,645 121,384 3,035 (120,000) 4,419 68,834 52,550 0 121,384
(n) Medical Enhancement 7,633 185 0 7,818 7,633 191 0 7,824 0 7,633 0 7,633
(o) Bencubbin Community Resource Centre 8,141 150 (8,000) 291 8,141 204 (8,000) 345 0 8,141 0 8,141
2,669,161 334,033 (640,059) 2,363,135 2,669,161 183,821 (640,058) 2,212,924 3,523,240 809,048 (1,663,127) 2,669,161
All of the reserve accounts are supported by money held in financial institutions and match the amount shown as restricted cash in Note 3 to this financial report.
In accordance with Council resolutions in relation to each reserve account, the purpose for which the reserves are set aside and their anticipated date of use are as follows:
Name of Reserve
Anticipated
date of use Purpose of the reserve
(a) Employee entitlements Ongoing to fund Long Service Leave required/other accrued leave.
(b) Plant Replacement Ongoing to fund the purchase of road construction plant, so as to avoid undue heavy burden in a single year.
(c) Aged Care Units Ongoing to fund capital works on existing Aged Care Units or construction of new Aged Care Units.
(d) Community Housing June 2018 combined with (e) Housing
(e) Housing Ongoing to fund the replacement of housing and any major maintenance.
(f) Public Amenities & Buildings Ongoing to help fund future building maintenance requirements to the shire's buildings.
(g) Mt Marshall Aquatic Centre Development June 2020 to finance future capital and maintenance upgrades for the Bencubbin Aquatic centre.
(h) Community Bus Ongoing to finance the replacement of the community bus.
(i) Bencubbin Recreation Complex Ongoing to provide funding for future extensions to the Bencubbin Complex.
(j) Office Equipment June 2019 to replace office equipment as required.
(k) Economic Development Ongoing to set aside funds for Economic Development initiatives.
(l) Integrated Planning/Financial Reporting June 2018 to set aside funds for expenditure on Council's integrated planning process.
(m) Beacon Accommodation Ongoing to set aside funds for reconstruction or major maintenance on the Beacon Barracks.
(n) Medical Enhancement Ongoing to be used for projects that may arise through the NEWROC Health Strategy.
(o) Bencubbin Community Resource Centre Ongoing to be used for refurbishment of the Bencubbin Community Resource Centre
25

SHIRE OF MT MARSHALL
NOTES TO AND FORMING PART OF THE FINANCIAL REPORT
FOR THE YEAR ENDED 30TH JUNE 2019
5. TRADE RECEIVABLES 2019 2018
$ $
Current
Rates receivable 102,995 109,889
Sundry receivables 175,276 240,843
GST receivable 39,084 85,200
Allowance for impairment of receivables (7,221) (69,617)
310,134 366,315
Non-current
Pensioner's rates and ESL deferred 773 1,915
773 1,915
SIGNIFICANT ACCOUNTING POLICIES
Trade and other receivables Classification and subsequent measurement
Trade and other receivables include amounts due from Receivables expected to be collected within 12 months
ratepayers for unpaid rates and service charges and of the end of the reporting period are classified as
other amounts due from third parties for goods sold and current assets. All other receivables are classified as
services performed in the ordinary course of business. non-current assets.
Trade receivables are recognised at original invoice Trade receivables are held with the objective to collect
amount less any allowances for uncollectible amounts the contractual cashflows and therefore measures them
(i.e. impairment). The carrying amount of net trade subsequently at amortised cost using the effective
receivables is equivalent to fair value as it is due for interest rate method.
settlement within 30 days.
Due to the short term nature of current receivables, their
Impairment and risk exposure carrying amount is considered to be the same as their
Information about the impairment of trade receivables fair value. Non-current receivables are indexed to
and their exposure to credit risk and interest rate risk inflation, any difference between the face value and fair
can be found in Note 23. value is considered immaterial.
Previous accounting policy: Impairment of trade
receivables
In the prior year, the impairment of trade receivables was
assessed based on the incurred loss model. Individual
receivables which were known to be uncollectible were
written off by reducing the carrying amount directly. The
other receivables were assessed collectively to determine
whether there was objective evidence that an impairment
had been incurred but not yet identified. For these
receivables the estimated impairment losses were
recognised in a separate provision for impairment.
26

SHIRE OF MT MARSHALL
NOTES TO AND FORMING PART OF THE FINANCIAL REPORT
FOR THE YEAR ENDED 30TH JUNE 2019
6. INVENTORIES 2019 2018
$ $
Current
Fuel and materials 11,396 10,554
11,396 10,554
The following movements in inventories occurred during the year:
Carrying amount at 1 July 10,554 21,963
Inventories expensed during the year 0 (11,409)
Additions to inventory 842 0
Carrying amount at 30 June 11,396 10,554
SIGNIFICANT ACCOUNTING POLICIES
General
Inventories are measured at the lower of cost and net
realisable value.
Net realisable value is the estimated selling price in the
ordinary course of business less the estimated costs of
completion and the estimated costs necessary to make
the sale.
27
SHIRE OF MT MARSHALL
NOTES TO AND FORMING PART OF THE FINANCIAL REPORT
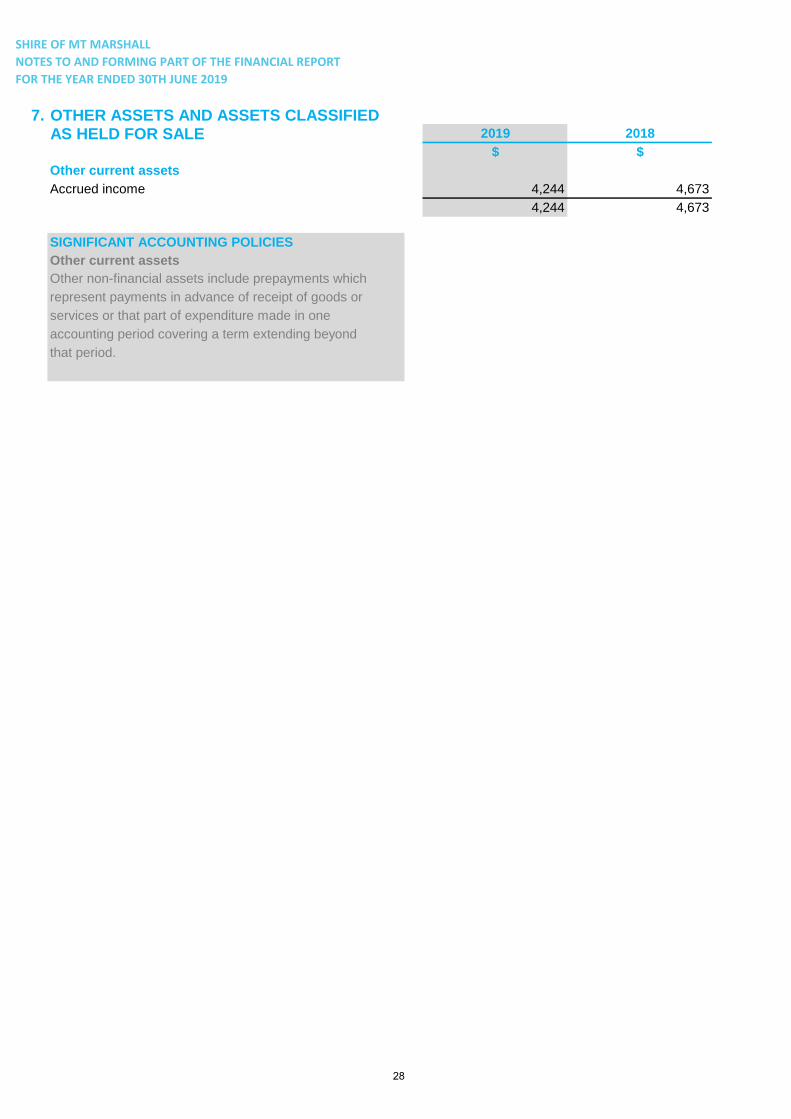
FOR THE YEAR ENDED 30TH JUNE 2019
7. OTHER ASSETS AND ASSETS CLASSIFIEDAS HELD FOR SALE 2019 2018
$ $
Other current assets
Accrued income 4,244 4,673
4,244 4,673
SIGNIFICANT ACCOUNTING POLICIES
Other current assets
Other non-financial assets include prepayments which
represent payments in advance of receipt of goods or
services or that part of expenditure made in one
accounting period covering a term extending beyond
that period.
28

SHIRE OF MT MARSHALL
NOTES TO AND FORMING PART OF THE FINANCIAL REPORT
FOR THE YEAR ENDED 30TH JUNE 2019
8. OTHER FINANCIAL ASSETS 2019 2018
$ $
(a) Current assets
Other financial assets at amortised cost 9,167 0
Other loans and receivables 0 17,411
9,167 17,411
Other financial assets at amortised cost
- Financial assets at amortised cost - self supporting loans 9,167 0
9,167 0
Financial assets previously classified as loans and receivables
- Loans receivable - clubs/institutions 0 17,411
0 17,411
(b) Non-current assets
Other financial assets at amortised cost 223,514 0
Financial assets at fair value through profit and loss 70,068 70,068
Other loans and receivables 0 229,537
293,582 299,605
Other financial assets at amortised cost
- Financial assets at amortised cost - self supporting loans 223,514 0
223,514 0
Financial assets at fair value through profit and loss
- Unlisted equity investments
- Units in Local Government House Trust 70,068 70,068
70,068 70,068
Financial assets previously classified as loans and receivables
- Loans receivable - clubs/institutions 0 229,537
0 229,537
Loans receivable from clubs/institutions have the same terms and conditions as the related borrowing disclosed in Note 14(b) as self supporting loans.
SIGNIFICANT ACCOUNTING POLICIES SIGNIFICANT ACCOUNTING POLICIES (Continued)
Other financial assets at amortised cost Previous accounting policy: available for sale financial assets
The Shire classifies financial assets at amortised cost if both of the Available-for-sale financial assets were non-derivative financial assets
following criteria are met: that were either not suitable to be classified as other categories of
- the asset is held within a business model whose objective is to collect financial assets due to their nature, or they are designated as such by
the contractual cashflows, and management. They comprise investments in the equity of other entities
- the contractual terms give rise to cash flows that are solely payments where there is neither a fixed maturity nor fixed or determinable
of principal and interest. payments.
Financial assets at fair value through profit and loss Previous accounting policy: Loans and receivables
The Shire classifies the following financial assets at fair value through profit Non-derivative financial assets with fixed or determinable payments that
and loss: were not quoted in an active market and are solely payments of principal
- debt investments which do not qualify for measurement at either and interest were classified as loans and receivables and are subsequently
amortised cost or fair value through other comprehensive income. measured at amortised cost, using the effective interest rate method.
- equity investments which the Shire has not elected to recognise
fair value gains and losses through other comprehensive income. Refer to Note 25 for explanations regarding the change in accounting policy
and reclassification of available for sale financial assets to financial assets
Impairment and risk at fair value through profit and loss.
Information regarding impairment and exposure to risk can be found at
Note 23.
29

SHIRE OF MT MARSHALL
NOTES TO AND FORMING PART OF THE FINANCIAL REPORT
FOR THE YEAR ENDED 30TH JUNE 2019
9. PROPERTY, PLANT AND EQUIPMENT
(a) Movements in Carrying Amounts
Movement in the carrying amounts of each class of property, plant and equipment between the beginning and the end of the current financial year.
Land -
freehold
land
Land -
vested in
and under
the control
of Council Total land
Buildings -
non-
specialised
Buildings -
specialised
Total
buildings
Total land
and
buildings
Furniture
and
equipment
Plant and
equipment
Motor
Vehicles
Total
property,
plant and
equipment
$ $ $ $ $ $ $ $ $ $ $
Balance at 1 July 2017 764,489 372,057 1,136,546 2,336,000 10,484,980 12,820,980 13,957,526 39,360 2,778,147 378,854 17,153,887
Additions 0 0 0 22,397 2,452,606 2,475,003 2,475,003 0 430,132 233,075 3,138,210
(Disposals) (14,000) 0 (14,000) (67,485) 0 (67,485) (81,485) 0 (50,940) (138,124) (270,549)
Depreciation (expense) 0 0 0 (87,459) (261,785) (349,244) (349,244) (7,335) (188,660) (44,367) (589,606)
Carrying amount at 30 June 2018 750,489 372,057 1,122,546 2,203,453 12,675,801 14,879,254 16,001,800 32,025 2,968,679 429,438 19,431,942
Comprises:
Gross carrying amount at 30 June 2018 750,489 372,057 1,122,546 2,288,397 12,937,586 15,225,983 16,348,529 246,309 3,295,680 493,137 20,383,655
Accumulated depreciation at 30 June 2018 0 0 0 (84,944) (261,785) (346,729) (346,729) (214,284) (327,001) (63,699) (951,713)
Carrying amount at 30 June 2018 750,489 372,057 1,122,546 2,203,453 12,675,801 14,879,254 16,001,800 32,025 2,968,679 429,438 19,431,942
Additions 0 0 0 292,325 124,128 416,453 416,453 0 773,411 213,111 1,402,975
(Disposals) (14,000) 0 (14,000) (85,231) (100) (85,331) (99,331) (9,643) (208,975) (158,035) (475,984)
Depreciation (expense) 0 0 0 (90,893) (360,295) (451,188) (451,188) (6,944) (288,913) (53,052) (800,097)
Carrying amount at 30 June 2019 736,489 372,057 1,108,546 2,319,654 12,439,534 14,759,188 15,867,734 15,438 3,244,202 431,462 19,558,836
Comprises:
Gross carrying amount at 30 June 2019 736,489 372,057 1,108,546 2,490,722 13,061,614 15,552,336 16,660,882 186,861 3,814,091 498,083 21,159,917
Accumulated depreciation at 30 June 2019 0 0 0 (171,068) (622,080) (793,148) (793,148) (171,423) (569,889) (66,621) (1,601,081)
Carrying amount at 30 June 2019 736,489 372,057 1,108,546 2,319,654 12,439,534 14,759,188 15,867,734 15,438 3,244,202 431,462 19,558,836
30

SHIRE OF MT MARSHALL
NOTES TO AND FORMING PART OF THE FINANCIAL REPORT
FOR THE YEAR ENDED 30TH JUNE 2019
9. PROPERTY, PLANT AND EQUIPMENT (Continued)
(b) Fair Value Measurements
Asset Class
Fair Value
Hierarchy Valuation Technique
Basis of
Valuation
Date of Last
Valuation Inputs Used
Land and buildings
Land - freehold land 2
Market approach using recent
observable market data for similar
properties
Independent
registered
valuers
June 2017 Price per hectare
Land - freehold land 3
Improvements to land valued using
cost approach using depreciated
replacement cost
Independent
registered
valuers
June 2017
Improvements to land using construction costs and
current condition (Level 2), residual values and
remaining useful life assessments (Level 3) inputs
Land - vested in and under the
control of Council3
Improvements to land valued using
cost approach using depreciated
replacement cost
Independent
registered
valuers
June 2017
Improvements to land using construction costs and
current condition (Level 2), residual values and
remaining useful life assessments (Level 3) inputs
Buildings - non-specialised 2
Market approach using recent
observable market data for similar
properties
Independent
registered
valuers
June 2017 Price per square metre
Buildings - specialised 3
Improvements to land valued using
cost approach using depreciated
replacement cost
Independent
registered
valuers
June 2017
Improvements to land using construction costs and
current condition (Level 2), residual values and
remaining useful life assessments (Level 3) inputs
Furniture and equipment 3Cost approach using depreciated
replacement cost
Management
valuationJune 2016
Purchase costs and current condition (Level 2),
residual values and remaining useful life
assessments (Level 3) inputs
Plant and equipment
- Independent valuation 2016 2
Market approach using recent
observable market data for similar
items
Independent
registered
valuers
June 2016 Price per item
- Management valuation 2016 3Cost approach using depreciated
replacement cost
Management
valuationJune 2016
Purchase costs and current condition (Level 2),
residual values and remaining useful life
assessments (Level 3) inputs
Motor Vehicles 2
Market approach using recent
observable market data for similar
items
Independent
registered
valuers
June 2016 Price per item
Level 3 inputs are based on assumptions with regards to future values and patterns of consumption utilising current information. If the basis of these assumptions were varied,
they have the potential to result in a significantly higher or lower fair value measurement.
During the period there were no changes in the valuation techniques used by the local government to determine the fair value of property, plant and equipment using either
level 2 or level 3 inputs. 31

SHIRE OF MT MARSHALL
NOTES TO AND FORMING PART OF THE FINANCIAL REPORT
FOR THE YEAR ENDED 30TH JUNE 2019
10. INFRASTRUCTURE
(a) Movements in Carrying Amounts
Movement in the carrying amounts of each class of infrastructure between the beginning and the end of the current financial year.
Infrastructure -
Roads
Infrastructure -
Footpaths
Infrastructure -
Parks and ovals
Infrastructure -
Playground
equipment
Infrastructure -
Airports
Infrastructure -
Other Total Infrastructure
$ $ $ $ $ $ $
Balance at 1 July 2017 85,607,262 591,258 976,777 41,201 758,384 2,501,379 90,476,261
Additions 2,168,766 15,995 0 0 491 88,676 2,273,928
Revaluation increments / (decrements) transferred to revaluation
surplus (1,814,784) 235,519 (480,262) 90,402 (97,627) 448,885 (1,617,867)
Depreciation (expense) (1,742,062) (14,787) (36,138) (6,100) (15,810) (49,472) (1,864,369)
Carrying amount at 30 June 2018 84,219,182 827,985 460,377 125,503 645,438 2,989,468 89,267,953
Comprises:
Gross carrying amount at 30 June 2018 115,212,656 1,149,337 945,450 190,934 651,138 5,759,480 123,908,995
Accumulated depreciation at 30 June 2018 (30,993,474) (321,352) (485,073) (65,431) (5,700) (2,770,012) (34,641,042)
Carrying amount at 30 June 2018 84,219,182 827,985 460,377 125,503 645,438 2,989,468 89,267,953
Additions 1,664,860 50,601 0 0 401,980 0 2,117,441
Depreciation (expense) (1,691,992) (21,585) (63,470) (5,149) (34) (115,742) (1,897,972)
Carrying amount at 30 June 2019 84,192,050 857,001 396,907 120,354 1,047,384 2,873,726 89,487,422
Comprises:
Gross carrying amount at 30 June 2019 116,877,516 1,199,938 945,450 190,934 1,053,118 5,759,480 126,026,436
Accumulated depreciation at 30 June 2019 (32,685,466) (342,937) (548,543) (70,580) (5,734) (2,885,754) (36,539,014)
Carrying amount at 30 June 2019 84,192,050 857,001 396,907 120,354 1,047,384 2,873,726 89,487,422
32
SHIRE OF MT MARSHALL
NOTES TO AND FORMING PART OF THE FINANCIAL REPORT
FOR THE YEAR ENDED 30TH JUNE 2019
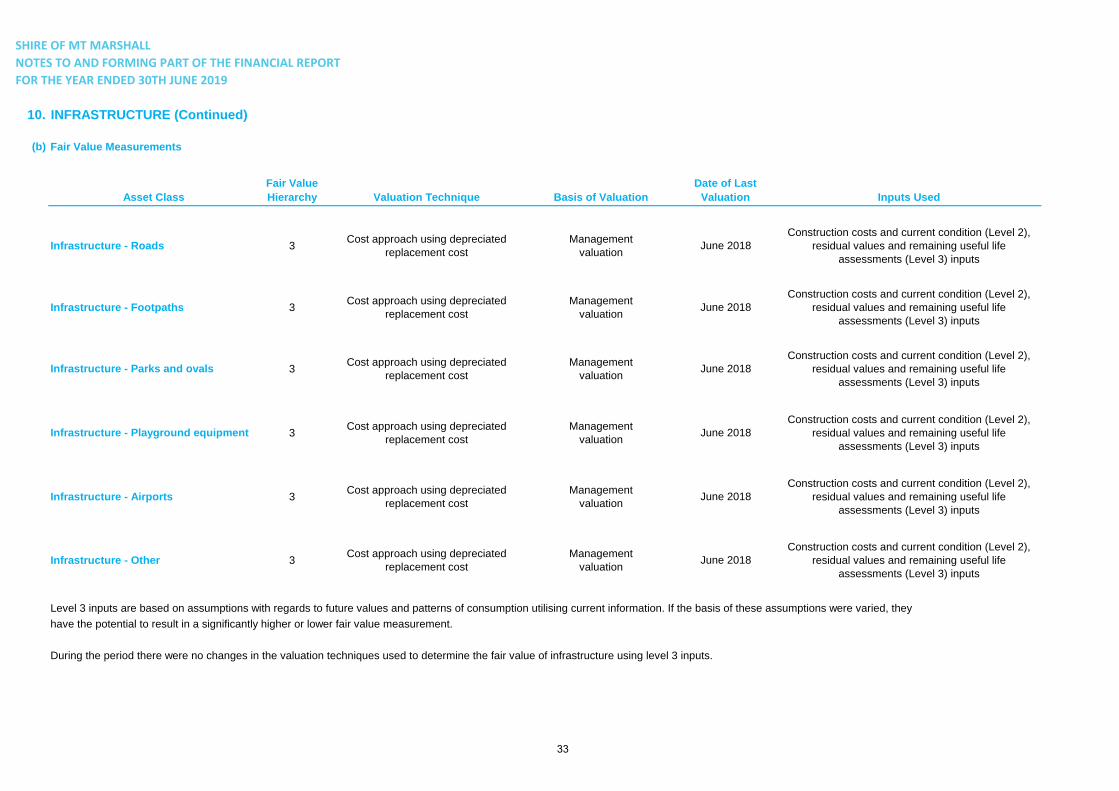
10. INFRASTRUCTURE (Continued)
(b) Fair Value Measurements
Asset Class
Fair Value
Hierarchy Valuation Technique Basis of Valuation
Date of Last
Valuation Inputs Used
Infrastructure - Roads 3Cost approach using depreciated
replacement cost
Management
valuationJune 2018
Construction costs and current condition (Level 2),
residual values and remaining useful life
assessments (Level 3) inputs
Infrastructure - Footpaths 3Cost approach using depreciated
replacement cost
Management
valuationJune 2018
Construction costs and current condition (Level 2),
residual values and remaining useful life
assessments (Level 3) inputs
Infrastructure - Parks and ovals 3Cost approach using depreciated
replacement cost
Management
valuationJune 2018
Construction costs and current condition (Level 2),
residual values and remaining useful life
assessments (Level 3) inputs
Infrastructure - Playground equipment 3Cost approach using depreciated
replacement cost
Management
valuationJune 2018
Construction costs and current condition (Level 2),
residual values and remaining useful life
assessments (Level 3) inputs
Infrastructure - Airports 3Cost approach using depreciated
replacement cost
Management
valuationJune 2018
Construction costs and current condition (Level 2),
residual values and remaining useful life
assessments (Level 3) inputs
Infrastructure - Other 3Cost approach using depreciated
replacement cost
Management
valuationJune 2018
Construction costs and current condition (Level 2),
residual values and remaining useful life
assessments (Level 3) inputs
Level 3 inputs are based on assumptions with regards to future values and patterns of consumption utilising current information. If the basis of these assumptions were varied, they
have the potential to result in a significantly higher or lower fair value measurement.
During the period there were no changes in the valuation techniques used to determine the fair value of infrastructure using level 3 inputs.
33

SHIRE OF MT MARSHALL
NOTES TO AND FORMING PART OF THE FINANCIAL REPORT
FOR THE YEAR ENDED 30TH JUNE 2019
11. PROPERTY, PLANT AND EQUIPMENT (INCLUDING INFRASTRUCTURE)
SIGNIFICANT ACCOUNTING POLICIES
Fixed assets AUSTRALIAN ACCOUNTING STANDARDS - INCONSISTENCY
Each class of fixed assets within either plant and equipment or Land under control
infrastructure, is carried at cost or fair value as indicated less, In accordance with Local Government (Financial Management)
where applicable, any accumulated depreciation and impairment Regulation 16(a)(ii), the Shire was required to include as an asset
losses. (by 30 June 2013), Crown Land operated by the local government
as a golf course, showground, racecourse or other sporting or
Initial recognition and measurement between recreational facility of State or Regional significance.
mandatory revaluation dates
All assets are initially recognised at cost where the fair value of the Upon initial recognition, these assets were recorded at cost in
asset at date of acquisition is equal to or above $5,000. All assets accordance with AASB 116. They were then classified as Land
are subsequently revalued in accordance with the mandatory and revalued along with other land in accordance with the other
measurement framework. policies detailed in this Note.
In relation to this initial measurement, cost is determined as the fair Land under roads
value of the assets given as consideration plus costs incidental to In Western Australia, all land under roads is Crown Land, the
the acquisition. For assets acquired at no cost or for nominal responsibility for managing which, is vested in the local government.
consideration, cost is determined as fair value at the date of
acquisition. The cost of non-current assets constructed by the Effective as at 1 July 2008, Council elected not to recognise any
Shire includes the cost of all materials used in construction, direct value for land under roads acquired on or before 30 June 2008.
labour on the project and an appropriate proportion of variable and This accords with the treatment available in Australian Accounting
fixed overheads. Standard AASB 1051 Land Under Roads and the fact Local
Government (Financial Management) Regulation 16(a)(i) prohibits
Individual assets acquired between initial recognition and the next local governments from recognising such land as an asset.
revaluation of the asset class in accordance with the mandatory
measurement framework, are recognised at cost and disclosed as In respect of land under roads acquired on or after 1 July 2008, as
being at fair value as management believes cost approximates detailed above, Local Government (Financial Management)
fair value. They are subject to subsequent revaluation at the Regulation 16(a)(i) prohibits local governments from recognising
next anniversary date in accordance with the mandatory such land as an asset.
measurement framework.
Whilst such treatment is inconsistent with the requirements of
Revaluation AASB 1051, Local Government (Financial Management)
The fair value of fixed assets is determined at least every three Regulation 4(2) provides, in the event of such an inconsistency,
years and no more than five years in accordance with the the Local Government (Financial Management) Regulations prevail.
regulatory framework. At the end of each period the valuation is
reviewed and where appropriate the fair value is updated to reflect Consequently, any land under roads acquired on or after 1 July
current market conditions. This process is considered to be in 2008 is not included as an asset of the Shire.
accordance with Local Government (Financial Management)
Regulation 17A (2) which requires property, plant and equipment
to be shown at fair value.
Increases in the carrying amount arising on revaluation of assets
are credited to a revaluation surplus in equity. Decreases that offset
previous increases of the same class of asset are recognised
against revaluation surplus directly in equity. All other decreases
are recognised in profit or loss.
34
SHIRE OF MT MARSHALL
NOTES TO AND FORMING PART OF THE FINANCIAL REPORT
FOR THE YEAR ENDED 30TH JUNE 2019
11. PROPERTY, PLANT AND EQUIPMENT (INCLUDING INFRASTRUCTURE) (Continued)
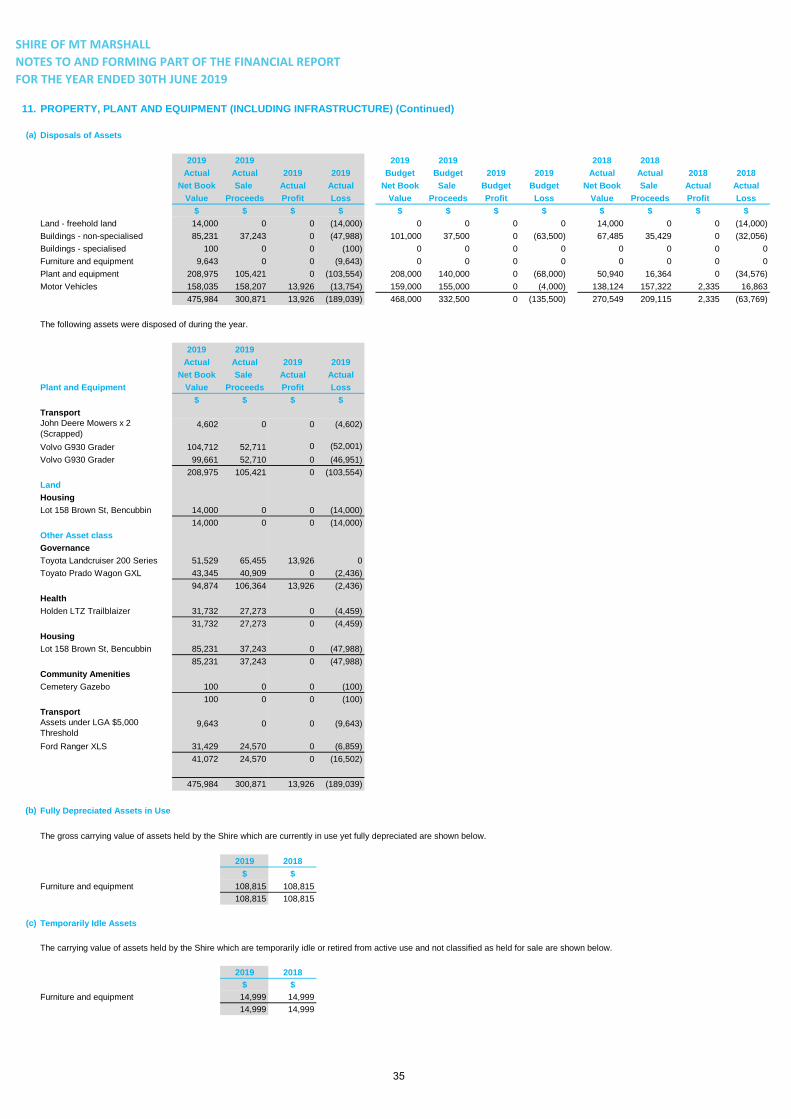
(a) Disposals of Assets
2019 2019 2019 2019 2018 2018
Actual Actual 2019 2019 Budget Budget 2019 2019 Actual Actual 2018 2018
Net Book Sale Actual Actual Net Book Sale Budget Budget Net Book Sale Actual Actual
Value Proceeds Profit Loss Value Proceeds Profit Loss Value Proceeds Profit Loss
$ $ $ $ $ $ $ $ $ $ $ $
Land - freehold land 14,000 0 0 (14,000) 0 0 0 0 14,000 0 0 (14,000)
Buildings - non-specialised 85,231 37,243 0 (47,988) 101,000 37,500 0 (63,500) 67,485 35,429 0 (32,056)
Buildings - specialised 100 0 0 (100) 0 0 0 0 0 0 0 0
Furniture and equipment 9,643 0 0 (9,643) 0 0 0 0 0 0 0 0
Plant and equipment 208,975 105,421 0 (103,554) 208,000 140,000 0 (68,000) 50,940 16,364 0 (34,576)
Motor Vehicles 158,035 158,207 13,926 (13,754) 159,000 155,000 0 (4,000) 138,124 157,322 2,335 16,863
475,984 300,871 13,926 (189,039) 468,000 332,500 0 (135,500) 270,549 209,115 2,335 (63,769)
The following assets were disposed of during the year.
2019 2019
Actual Actual 2019 2019
Net Book Sale Actual Actual
Plant and Equipment Value Proceeds Profit Loss
$ $ $ $
Transport
John Deere Mowers x 2
(Scrapped)4,602 0 0 (4,602)
Volvo G930 Grader 104,712 52,711 0 (52,001)
Volvo G930 Grader 99,661 52,710 0 (46,951)
208,975 105,421 0 (103,554)
Land
Housing
Lot 158 Brown St, Bencubbin 14,000 0 0 (14,000)
14,000 0 0 (14,000)
Other Asset class
Governance
Toyota Landcruiser 200 Series 51,529 65,455 13,926 0
Toyato Prado Wagon GXL 43,345 40,909 0 (2,436)
94,874 106,364 13,926 (2,436)
Health
Holden LTZ Trailblaizer 31,732 27,273 0 (4,459)
31,732 27,273 0 (4,459)
Housing
Lot 158 Brown St, Bencubbin 85,231 37,243 0 (47,988)
85,231 37,243 0 (47,988)
Community Amenities
Cemetery Gazebo 100 0 0 (100)
100 0 0 (100)
Transport
Assets under LGA $5,000
Threshold9,643 0 0 (9,643)
Ford Ranger XLS 31,429 24,570 0 (6,859)
41,072 24,570 0 (16,502)
475,984 300,871 13,926 (189,039)
(b) Fully Depreciated Assets in Use
The gross carrying value of assets held by the Shire which are currently in use yet fully depreciated are shown below.
2019 2018
$ $
Furniture and equipment 108,815 108,815
108,815 108,815
(c) Temporarily Idle Assets
The carrying value of assets held by the Shire which are temporarily idle or retired from active use and not classified as held for sale are shown below.
2019 2018
$ $
Furniture and equipment 14,999 14,999
14,999 14,999
35

SHIRE OF MT MARSHALL
NOTES TO AND FORMING PART OF THE FINANCIAL REPORT
FOR THE YEAR ENDED 30TH JUNE 2019
11. PROPERTY, PLANT AND EQUIPMENT (INCLUDING INFRASTRUCTURE) (Continued)
(d) Depreciation 2019 2019 2018
Actual Budget Actual
$ $ $
Buildings - non-specialised 90,893 87,441 87,459
Buildings - specialised 360,295 261,730 261,785
Furniture and equipment 6,944 7,333 7,335
Plant and equipment 288,913 188,620 188,660
Motor Vehicles 53,052 44,358 44,367
Infrastructure - Roads 1,691,992 1,741,696 1,742,062
Infrastructure - Footpaths 21,585 14,784 14,787
Infrastructure - Parks and ovals 63,470 36,130 36,138
Infrastructure - Playground equipment 5,149 6,099 6,100
Infrastructure - Airports 34 15,807 15,810
Infrastructure - Other 115,742 49,462 49,472
2,698,069 2,453,460 2,453,975
SIGNIFICANT ACCOUNTING POLICIES
Depreciation Depreciation (Continued)
The depreciable amount of all fixed assets including buildings When an item of property, plant and equipment is
but excluding freehold land and vested land, are depreciated revalued, any accumulated depreciation at the date of
on a straight-line basis over the individual asset’s useful life the revaluation is treated in one of the following ways:
from the time the asset is held ready for use. Leasehold (a) The gross carrying amount is adjusted in a manner
improvements are depreciated over the shorter of either the that is consistent with the revaluation of the carrying
unexpired period of the lease or the estimated useful life of amount of the asset. For example, the gross carrying
the improvements. amount may be restated by reference to observable
market data or it may be restated proportionately to the
The assets residual values and useful lives are reviewed, and change in the carrying amount. The accumulated
adjusted if appropriate, at the end of each reporting period. depreciation at the date of the revaluation is adjusted
to equal the difference between the gross carrying
An asset's carrying amount is written down immediately to its amount and the carrying amount of the asset after
recoverable amount if the asset's carrying amount is greater taking into account accumulated impairment losses; or
than its estimated recoverable amount. (b) Eliminated against the gross carrying amount of the
asset and the net amount restated to the revalued
Gains and losses on disposals are determined by amount of the asset.
comparing proceeds with the carrying amount. These
gains and losses are included in the statement of
comprehensive income in the period in which they arise.
Depreciation rates
Typical estimated useful lives for the different asset classes
for the current and prior years are included in the table below:
Asset Class Useful life Asset Class Useful life
Buildings 3 to 50 years Parks and ovals 8 to 30 years
Furniture and equipment 4 to 10 years Playground equipment 10 to 50 years
Plant and equipment 4 to 15 years Airstrips 25 to 50 years
Sealed roads and streets Other infrastructure 10 to 50 years
formation not depreciated
pavement 50 to 60 years
seal
- bituminous seals 20 years
- asphalt surfaces 25 years
Gravel roads
formation not depreciated
pavement 40 years
Road signs 15 years
Footpaths - slab 20 years
Sewerage piping 100 years
Water supply piping and drainage
systems 75 years
36

SHIRE OF MT MARSHALL
NOTES TO AND FORMING PART OF THE FINANCIAL REPORT
FOR THE YEAR ENDED 30TH JUNE 2019
12. REVALUATION SURPLUS
2019 2019 2019 Total 2019 2018 2018 2018 Total 2018
Opening Revaluation Revaluation Movement on Closing Opening Revaluation Revaluation Movement on Closing
Balance Increment (Decrement) Revaluation Balance Balance Increment (Decrement) Revaluation Balance
$ $ $ $ $ $ $ $ $ $
Revaluation surplus - Land & buildinsg 6,784,657 0 0 0 6,784,657 6,784,657 0 0 0 6,784,657
Revaluation surplus - Infrastructure - Roads 18,941,495 0 0 0 18,941,495 20,756,279 0 (1,814,784) (1,814,784) 18,941,495
Revaluation surplus - Infrastructure - Footpaths 431,791 0 0 0 431,791 196,272 235,519 0 235,519 431,791
Revaluation surplus - Infrastructure - Parks and ovals 369,597 0 0 0 369,597 849,859 0 (480,262) (480,262) 369,597
Revaluation surplus - Infrastructure - Playground equipment 141,311 0 0 0 141,311 50,909 90,402 0 90,402 141,311
Revaluation surplus - Infrastructure - Airports 692,373 0 0 0 692,373 790,000 0 (97,627) (97,627) 692,373
Revaluation surplus - Infrastructure - Other 1,430,877 0 0 0 1,430,877 981,992 448,885 0 448,885 1,430,877
28,792,101 0 0 0 28,792,101 30,409,968 774,806 (2,392,673) (1,617,867) 28,792,101
Movements on revaluation of property, plant and equipment (including infrastructure) are not able to be reliably attributed to a program as the assets were revalued by class as provided for by AASB 116 Aus 40.1.
37

SHIRE OF MT MARSHALL
NOTES TO AND FORMING PART OF THE FINANCIAL REPORT
FOR THE YEAR ENDED 30TH JUNE 2019
13. TRADE AND OTHER PAYABLES 2019 2018
$ $
Current
Sundry creditors 703,380 630,770
Accrued salaries and wages 36,711 40,066
ATO liabilities 35,271 59,135
Accrued interest on long term borrowings 7,355 7,701
Bonds and deposits (refer to Note 24) 40,148 0
822,865 737,672
SIGNIFICANT ACCOUNTING POLICIES
Trade and other payables Trade and other payables (Continued)
Trade and other payables represent liabilities for goods of the purchase of these goods and services. The amounts
and services provided to the Shire prior to the end of the are unsecured, are recognised as a current liability and are
financial year that are unpaid and arise when the Shire normally paid within 30 days of recognition.
becomes obliged to make future payments in respect
38
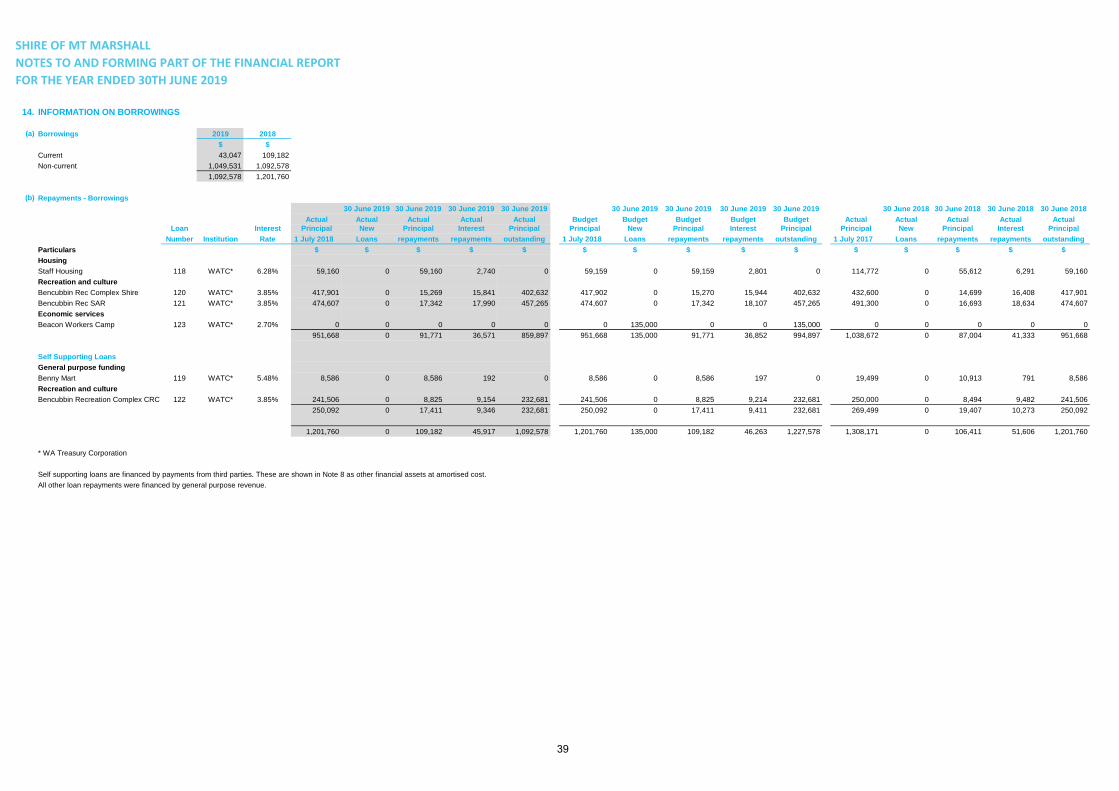
SHIRE OF MT MARSHALL
NOTES TO AND FORMING PART OF THE FINANCIAL REPORT
FOR THE YEAR ENDED 30TH JUNE 2019
14. INFORMATION ON BORROWINGS
(a) Borrowings 2019 2018
$ $
Current 43,047 109,182
Non-current 1,049,531 1,092,578
1,092,578 1,201,760
(b) Repayments - Borrowings
30 June 2019 30 June 2019 30 June 2019 30 June 2019 30 June 2019 30 June 2019 30 June 2019 30 June 2019 30 June 2018 30 June 2018 30 June 2018 30 June 2018
Actual Actual Actual Actual Actual Budget Budget Budget Budget Budget Actual Actual Actual Actual Actual
Loan Interest Principal New Principal Interest Principal Principal New Principal Interest Principal Principal New Principal Interest Principal
Number Institution Rate 1 July 2018 Loans repayments repayments outstanding 1 July 2018 Loans repayments repayments outstanding 1 July 2017 Loans repayments repayments outstanding
Particulars $ $ $ $ $ $ $ $ $ $ $ $ $ $ $
Housing
Staff Housing 118 WATC* 6.28% 59,160 0 59,160 2,740 0 59,159 0 59,159 2,801 0 114,772 0 55,612 6,291 59,160
Recreation and culture
Bencubbin Rec Complex Shire 120 WATC* 3.85% 417,901 0 15,269 15,841 402,632 417,902 0 15,270 15,944 402,632 432,600 0 14,699 16,408 417,901
Bencubbin Rec SAR 121 WATC* 3.85% 474,607 0 17,342 17,990 457,265 474,607 0 17,342 18,107 457,265 491,300 0 16,693 18,634 474,607
Economic services
Beacon Workers Camp 123 WATC* 2.70% 0 0 0 0 0 0 135,000 0 0 135,000 0 0 0 0 0
951,668 0 91,771 36,571 859,897 951,668 135,000 91,771 36,852 994,897 1,038,672 0 87,004 41,333 951,668
Self Supporting Loans
General purpose funding
Benny Mart 119 WATC* 5.48% 8,586 0 8,586 192 0 8,586 0 8,586 197 0 19,499 0 10,913 791 8,586
Recreation and culture
Bencubbin Recreation Complex CRC 122 WATC* 3.85% 241,506 0 8,825 9,154 232,681 241,506 0 8,825 9,214 232,681 250,000 0 8,494 9,482 241,506
250,092 0 17,411 9,346 232,681 250,092 0 17,411 9,411 232,681 269,499 0 19,407 10,273 250,092
1,201,760 0 109,182 45,917 1,092,578 1,201,760 135,000 109,182 46,263 1,227,578 1,308,171 0 106,411 51,606 1,201,760
* WA Treasury Corporation
Self supporting loans are financed by payments from third parties. These are shown in Note 8 as other financial assets at amortised cost.
All other loan repayments were financed by general purpose revenue.
39

SHIRE OF MT MARSHALL
NOTES TO AND FORMING PART OF THE FINANCIAL REPORT
FOR THE YEAR ENDED 30TH JUNE 2019
14. INFORMATION ON BORROWINGS (Continued)
(c) New Borrowings - 2018/19
Total Actual
Loan Term Interest 2019 2019 2019 2019 Interest & Balance
Institution Type Years Rate Actual Budget Actual Budget Charges Unspent
Particulars/Purpose % $ $ $ $ $ $
Beacon Workers Camp WATC* Debenture 10 2.70% 0 135,000 0 0 0 0
0 135,000 0 0 0 0
* WA Treasury Corporation
2019 2018
(d) Undrawn Borrowing Facilities $ $
Credit Standby Arrangements
Credit card limit 20,000 20,000
Credit card balance at balance date (2,271) (582)
Total amount of credit unused 17,729 19,418
Loan facilities
Loan facilities - current 43,047 109,182
Loan facilities - non-current 1,049,531 1,092,578
Total facilities in use at balance date 1,092,578 1,201,760
SIGNIFICANT ACCOUNTING POLICIES
Financial liabilities Borrowing costs
Financial liabilities are recognised at fair value when the Shire becomes Borrowing costs are recognised as an expense when incurred except
a party to the contractual provisions to the instrument. where they are directly attributable to the acquisition, construction or
production of a qualifying asset. Where this is the case, they are
Non-derivative financial liabilities (excluding financial guarantees) are capitalised as part of the cost of the particular asset until such time
subsequently measured at amortised cost. Gains or losses are as the asset is substantially ready for its intended use or sale.
recognised in profit or loss.
Risk
Financial liabilities are derecognised where the related obligations are Information regarding exposure to risk can be found at Note 23.
discharged, cancelled or expired. The difference between the carrying
amount of the financial liability extinguished or transferred to another
party and the fair value of the consideration paid, including the transfer
of non-cash assets or liabilities assumed, is recognised in profit or loss.
Amount Borrowed Amount (Used)
40
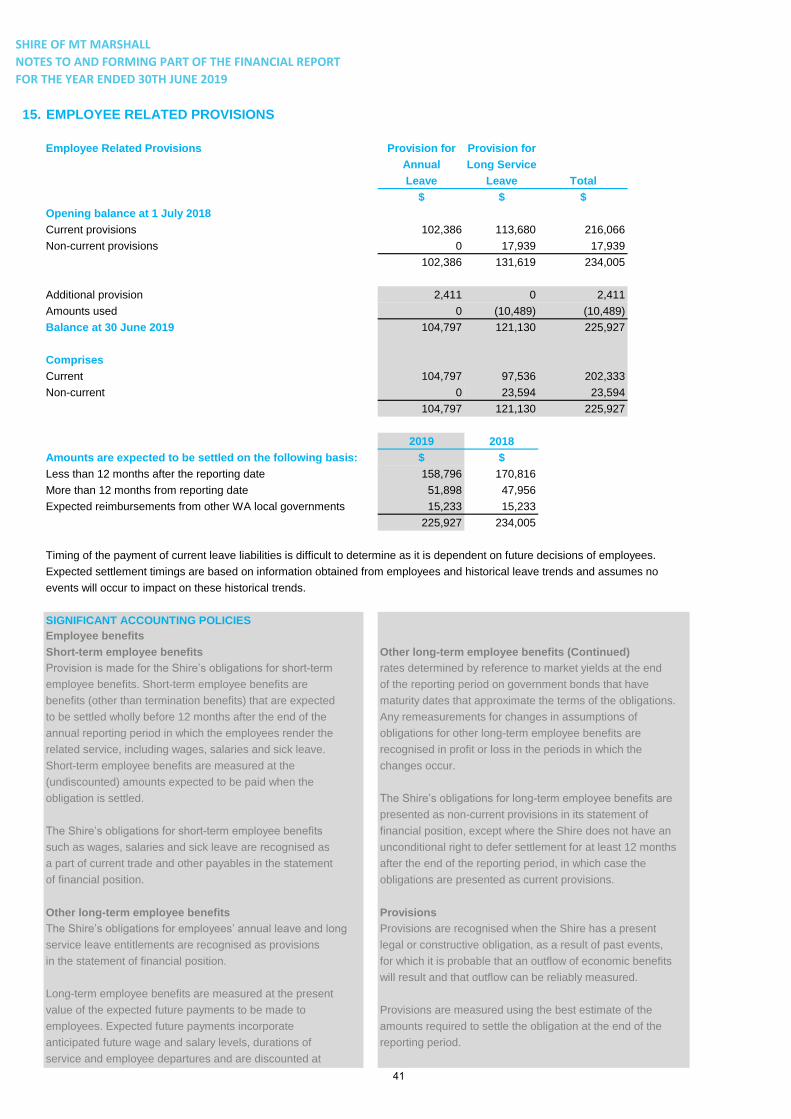
SHIRE OF MT MARSHALL
NOTES TO AND FORMING PART OF THE FINANCIAL REPORT
FOR THE YEAR ENDED 30TH JUNE 2019
15. EMPLOYEE RELATED PROVISIONS
Employee Related Provisions Provision for Provision for
Annual Long Service
Leave Leave Total
$ $ $
Opening balance at 1 July 2018
Current provisions 102,386 113,680 216,066
Non-current provisions 0 17,939 17,939
102,386 131,619 234,005
Additional provision 2,411 0 2,411
Amounts used 0 (10,489) (10,489)
Balance at 30 June 2019 104,797 121,130 225,927
Comprises
Current 104,797 97,536 202,333
Non-current 0 23,594 23,594
104,797 121,130 225,927
2019 2018
Amounts are expected to be settled on the following basis: $ $
Less than 12 months after the reporting date 158,796 170,816
More than 12 months from reporting date 51,898 47,956
Expected reimbursements from other WA local governments 15,233 15,233
225,927 234,005
Timing of the payment of current leave liabilities is difficult to determine as it is dependent on future decisions of employees.
Expected settlement timings are based on information obtained from employees and historical leave trends and assumes no
events will occur to impact on these historical trends.
SIGNIFICANT ACCOUNTING POLICIES
Employee benefits
Short-term employee benefits Other long-term employee benefits (Continued)
Provision is made for the Shire’s obligations for short-term rates determined by reference to market yields at the end
employee benefits. Short-term employee benefits are of the reporting period on government bonds that have
benefits (other than termination benefits) that are expected maturity dates that approximate the terms of the obligations.
to be settled wholly before 12 months after the end of the Any remeasurements for changes in assumptions of
annual reporting period in which the employees render the obligations for other long-term employee benefits are
related service, including wages, salaries and sick leave. recognised in profit or loss in the periods in which the
Short-term employee benefits are measured at the changes occur.
(undiscounted) amounts expected to be paid when the
obligation is settled. The Shire’s obligations for long-term employee benefits are
presented as non-current provisions in its statement of
The Shire’s obligations for short-term employee benefits financial position, except where the Shire does not have an
such as wages, salaries and sick leave are recognised as unconditional right to defer settlement for at least 12 months
a part of current trade and other payables in the statement after the end of the reporting period, in which case the
of financial position. obligations are presented as current provisions.
Other long-term employee benefits Provisions
The Shire’s obligations for employees’ annual leave and long Provisions are recognised when the Shire has a present
service leave entitlements are recognised as provisions legal or constructive obligation, as a result of past events,
in the statement of financial position. for which it is probable that an outflow of economic benefits
will result and that outflow can be reliably measured.
Long-term employee benefits are measured at the present
value of the expected future payments to be made to Provisions are measured using the best estimate of the
employees. Expected future payments incorporate amounts required to settle the obligation at the end of the
anticipated future wage and salary levels, durations of reporting period.
service and employee departures and are discounted at
41

SHIRE OF MT MARSHALL
NOTES TO AND FORMING PART OF THE FINANCIAL REPORT
FOR THE YEAR ENDED 30TH JUNE 2019
16. NOTES TO THE STATEMENT OF CASH FLOWS
Reconciliation of Cash
For the purposes of the Statement of Cash Flows, cash includes cash and cash equivalents,
net of outstanding bank overdrafts. Cash at the end of the reporting period is reconciled to the
related items in the Statement of Financial Position as follows:
2019 2019 2018
Actual Budget Actual
$ $ $
Cash and cash equivalents 4,320,722 2,689,060 4,629,019
Reconciliation of Net Cash Provided By
Operating Activities to Net Result
Net result (1,044) (1,101,948) 1,932,933
Non-cash flows in Net result:
Depreciation 2,698,069 2,453,460 2,453,975
(Profit)/loss on sale of asset 175,113 135,500 61,434
Fair value adjustments to fixed assets
at fair value through profit or loss 0 0 (70,068)
Changes in assets and liabilities:
(Increase)/decrease in receivables 57,323 (37,500) (102,920)
(Increase)/decrease in other assets 429 0 0
(Increase)/decrease in inventories (842) (2,800) 11,409
Increase/(decrease) in payables 85,193 6,000 (77,044)
Increase/(decrease) in provisions (8,078) 0 (11,951)
Grants contributions for
the development of assets (1,236,253) (982,199) (3,033,313)
Net cash from operating activities 1,769,910 470,513 1,164,455
42

SHIRE OF MT MARSHALL
NOTES TO AND FORMING PART OF THE FINANCIAL REPORT
FOR THE YEAR ENDED 30TH JUNE 2019
17. TOTAL ASSETS CLASSIFIED BY FUNCTION AND ACTIVITY
2019 2018
$ $
Governance 1,132,959 1,197,144
General purpose funding 103,768 111,804
Law, order, public safety 1,308,957 1,384,585
Health 118,459 113,930
Education and welfare 1,258,521 1,268,927
Housing 2,165,353 2,190,212
Community amenities 821,774 828,448
Recreation and culture 13,112,622 13,380,363
Transport 88,347,655 88,236,941
Economic services 1,521,525 1,467,585
Other property and services 1,796,268 1,551,973
Unallocated 2,308,415 2,297,475
113,996,276 114,029,387
43

SHIRE OF MT MARSHALL
NOTES TO AND FORMING PART OF THE FINANCIAL REPORT
FOR THE YEAR ENDED 30TH JUNE 2019
18. RELATED PARTY TRANSACTIONS
Elected Members Remuneration
2019 2019 2018
The following fees, expenses and allowances were Actual Budget Actual
paid to council members and/or the President. $ $ $
Meeting fees 32,335 33,000 32,181
President’s allowance 5,250 5,500 5,250
Deputy President's allowance 1,193 1,500 1,063
Travelling expenses 10,112 14,000 12,806
Telecommunications allowance 12,091 15,500 11,888
60,981 69,500 63,188
Key Management Personnel (KMP) Compensation Disclosure
2019 2018
The total of remuneration paid to KMP of the Actual Actual
Shire during the year are as follows: $ $
Short-term employee benefits 443,840 461,651
Post-employment benefits 54,514 48,858
Other long-term benefits 37,142 11,178
535,496 521,687
Short-term employee benefits
These amounts include all salary, fringe benefits and cash bonuses awarded to KMP except
for details in respect to fees and benefits paid to elected members which may be found above.
Post-employment benefits
These amounts are the current-year's estimated cost of providing for the Shire's superannuation
contributions made during the year.
Other long-term benefits
These amounts represent long service benefits accruing during the year.
44

SHIRE OF MT MARSHALL
NOTES TO AND FORMING PART OF THE FINANCIAL REPORT
FOR THE YEAR ENDED 30TH JUNE 2019
18. RELATED PARTY TRANSACTIONS (Continued)
Transactions with related parties
Transactions between related parties and the Shire are on normal commercial terms and conditions,
no more favourable than those available to other parties, unless otherwise stated.
No outstanding balances or provisions for doubtful debts or guaranties exist in relation to related parties at year end.
2019 2018
The following transactions occurred with related parties: Actual Actual
$ $
- Building maintenance contract 309,062 276,407
- Lease of the rubbish tip 1,000 1,000
Related Parties
The Shire's main related parties are as follows:
i. Key management personnel
Any person(s) having authority and responsibility for planning, directing and controlling the activities
of the entity, directly or indirectly, including any elected member, are considered key management
personnel.
ii. Other Related Parties
The associate person of KMP was employed by the Shire under normal employement terms
and conditions.
iii. Entities subject to significant influence by the Shire
An entity that has the power to participate in the financial and operating policy decisions of an
entity, but does not have control over those policies, is an entity which holds significant influence.
Significant influence may be gained by share ownership, statute or agreement.
45

SHIRE OF MT MARSHALL
NOTES TO AND FORMING PART OF THE FINANCIAL REPORT
FOR THE YEAR ENDED 30TH JUNE 2019
19. JOINT ARRANGEMENTS
2019 2018
$ $
(a) Share of joint operations
The Shire of Mt Marshall participates in the following joint
arrangements:
NEW Health Group Joint Arrangement
The Shire of Mt Marshall is part of the NEW Health group which
provides health services in the North Eastern Wheatbelt.
From 1 July 2017, the Shire of Mt Marshall has managed the
income and expenditure for this arrangement.
NEW Health joint arrangement which employs an Environmental
Health/Building Surveyor to provide regulatory health and building
assessment services to the member shires:
Wyalkatchem, Trayning, Mukinbudin, Koorda, Nungarin and Mt Marshall.
The Shire of Mt Marshall holds the following assets on behalf
of member shires. All associated expenses are attributed to
member shires on the following basis:
Shire of Mount Marshall expenses in relation to this joint venture
amounted to $36,170 in 2018/19 and $25,670 in 2017/18.
Non-current assets
Light vehicles 42,657 37,301
Less: accumulated depreciation (1,753) (3,372)
Total assets 40,904 33,929
Kununoppin Medical Practice Joint Arrangement
The Kununoppin Medical Practice employs a General Practitioner to provide medical consultation and
accident and emergency services to the member shires: Mount Marshall, Trayning, Mukinbudin and
Nungarin. Shire of Mount Marshall expenses in relation to this joint arrangement amounted to $28,393
in 2018/19 and $33,592 in 2017/18.
SIGNIFICANT ACCOUNTING POLICIES
Interests in joint arrangements Interests in joint arrangements (Continued)
Joint arrangements represent the contractual sharing of control Joint operations represent arrangements
between parties in a business venture where unanimous whereby joint operators maintain direct interests in
decisions about relevant activities are required. each asset and exposure to each liability of the
arrangement. The Shire’s interests in the assets,
Separate joint arrangements providing joint ventures with an liabilities, revenue and expenses of joint operations
interest to net assets are classified as a joint venture and are included in the respective line items of the
accounted for using the equity method. The equity method of financial statements.
accounting, whereby the investment is initially recognised at
cost and adjusted thereafter for the post-acquisition change in the
Shire’s share of net assets of the associate. In addition,
the Shire’s share of the profit or loss of the associate is included in
the Shire’s profit or loss.
46

SHIRE OF MT MARSHALL
NOTES TO AND FORMING PART OF THE FINANCIAL REPORT
FOR THE YEAR ENDED 30TH JUNE 2019
20. CONDITIONS OVER GRANTS/CONTRIBUTIONS
Opening Closing Closing
Balance (1)
Received (2)
Balance (1)
Received (2)
Expended (3)
Balance
Grant/Contribution 1/07/17 2017/18 30/06/18 2018/19 2018/19 30/06/19
$ $ $ $ $ $ $
Community amenities
Department of Water - Water
Collection Projects
38,966 28,875 (67,841) 0 0 0 0
Department of Primary Industries &
Regional Development - Combat
Vegetation Decline
0 20,000 (15,990) 4,010 24,624 0 28,634
Transport
Federal Government - Roads to
Recovery Funding
170,798 793,031 (963,829) 0 436,679 (436,679) 0
MRWA - Blackspot Funding 16,880 25,320 (42,200) 0 0 0 0
Department of Infrastructure, Regional
Development & Cities - Beacon
Airstrip Grant
0 85,700 (491) 85,209 182,497 (267,706) 0
Total 226,644 952,926 (1,090,351) 89,219 643,800 (704,385) 28,634
Notes:
(1) - Grants/contributions recognised as revenue in a previous reporting period which were not expended at the close of the previous reporting period.
(2) - New grants/contributions which were recognised as revenues during the reporting period and which had not yet been fully expended in the manner specified by the contributor.
(3) - Grants/contributions which had been recognised as revenues in a previous reporting period or received in the current reporting period and which were expended in the
current reporting period in the manner specified by the contributor.
2017/18
Expended (3)
47
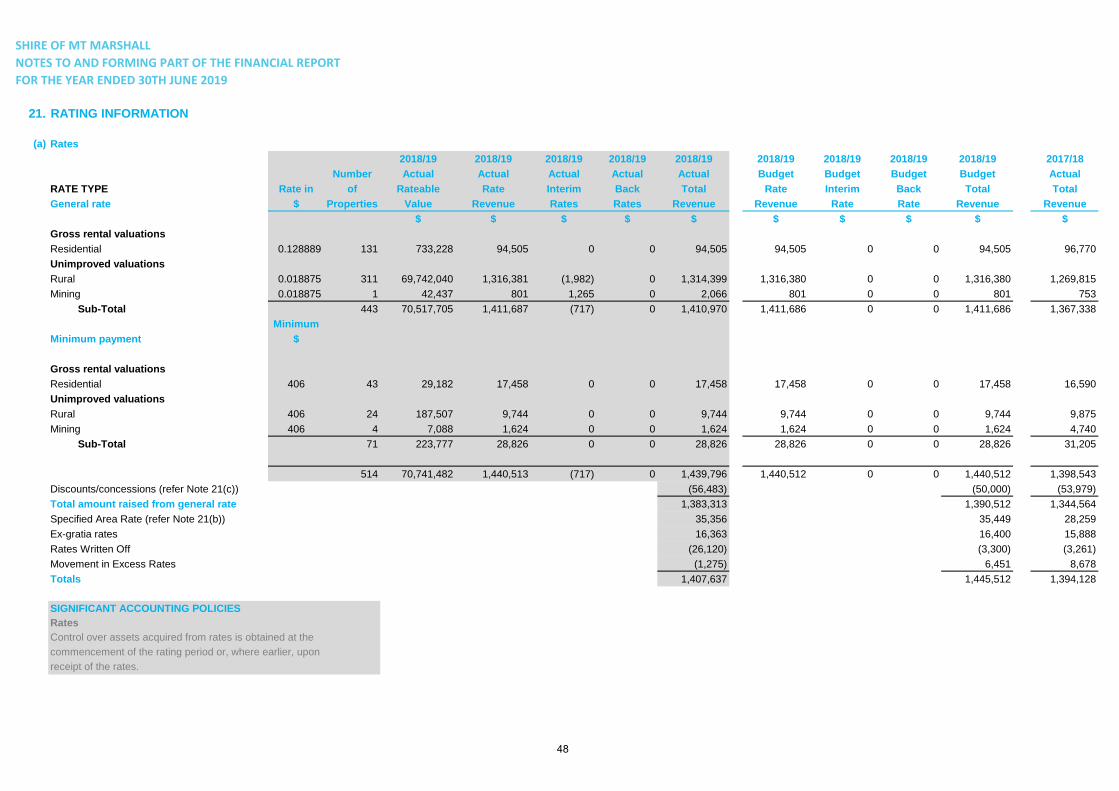
SHIRE OF MT MARSHALL
NOTES TO AND FORMING PART OF THE FINANCIAL REPORT
FOR THE YEAR ENDED 30TH JUNE 2019
21. RATING INFORMATION
(a) Rates
2018/19 2018/19 2018/19 2018/19 2018/19 2018/19 2018/19 2018/19 2018/19 2017/18
Number Actual Actual Actual Actual Actual Budget Budget Budget Budget Actual
RATE TYPE Rate in of Rateable Rate Interim Back Total Rate Interim Back Total Total
$ Properties Value Revenue Rates Rates Revenue Revenue Rate Rate Revenue Revenue
$ $ $ $ $ $ $ $ $ $
0.128889 131 733,228 94,505 0 0 94,505 94,505 0 0 94,505 96,770
Unimproved valuations
0.018875 311 69,742,040 1,316,381 (1,982) 0 1,314,399 1,316,380 0 0 1,316,380 1,269,815
0.018875 1 42,437 801 1,265 0 2,066 801 0 0 801 753
Sub-Total 443 70,517,705 1,411,687 (717) 0 1,410,970 1,411,686 0 0 1,411,686 1,367,338
Minimum
$
406 43 29,182 17,458 0 0 17,458 17,458 0 0 17,458 16,590
Unimproved valuations
406 24 187,507 9,744 0 0 9,744 9,744 0 0 9,744 9,875
406 4 7,088 1,624 0 0 1,624 1,624 0 0 1,624 4,740
Sub-Total 71 223,777 28,826 0 0 28,826 28,826 0 0 28,826 31,205
514 70,741,482 1,440,513 (717) 0 1,439,796 1,440,512 0 0 1,440,512 1,398,543
Discounts/concessions (refer Note 21(c)) (56,483) (50,000) (53,979)
1,383,313 1,390,512 1,344,564
35,356 35,449 28,259
16,363 16,400 15,888
(26,120) (3,300) (3,261)
(1,275) 6,451 8,678
Totals 1,407,637 1,445,512 1,394,128
SIGNIFICANT ACCOUNTING POLICIES
Rates
Control over assets acquired from rates is obtained at the
commencement of the rating period or, where earlier, upon
receipt of the rates.
Rates Written Off
Movement in Excess Rates
Specified Area Rate (refer Note 21(b))
Ex-gratia rates
Residential
Rural
Mining
Total amount raised from general rate
General rate
Gross rental valuations
Minimum payment
Gross rental valuations
Rural
Mining
Residential
48

SHIRE OF MT MARSHALL
NOTES TO AND FORMING PART OF THE FINANCIAL REPORT
FOR THE YEAR ENDED 30TH JUNE 2019
21. RATING INFORMATION (Continued)
(b) Specified Area Rate 2018/19
2018/19 2018/19 Total 2018/19 2018/19 2018/19 2018/19 2017/18
Basis Rate 2018/19 2018/19 Interim Back Specified Area Budget Budget Budget Total Total
of in Rateable Rate Rate Rate Rate Rate Back Rate Interim Rate Budget Actual
Specified Area Rate Valuation $ Value Revenue Revenue Revenue Revenue Revenue Revenue Revenue Revenue Revenue
$ $ $ $ $ $ $ $ $ $
Bencubbin Multipurpose
Complex Redevelopment
GRV 0.005759 482,008 2,776 0 0 2,776 2,776 0 0 2,776 2,346
Bencubbin Multipurpose
Complex Redevelopment
UV 0.000959 34,077,960 32,681 (101) 0 32,580 32,673 0 0 32,673 25,913
35,457 (101) 0 35,356 35,449 0 0 35,449 28,259
2018/19 2018/19 2018/19 2018/19 2018/19 2018/19
Actual Actual Actual Budget Budget Budget
Rate Rate Reserve Rate Rate Reserve
Area/properties Applied Set Aside Applied to Applied Set Aside Applied
Specified Area Rate Purpose of the rate Rate Imposed to Costs to Reserve Costs to Costs to Reserve to Costs
$ $ $ $ $ $
Bencubbin Multipurpose
Complex Redevelopment
35,356 0 0 35,449 0 0
35,356 0 0 35,449 0 0
Servicing a loan for the
redevelopment of the
Bencubbin Multipurpose
Complex
The area to which
Specified Area Rates
apply is identified on a
map of the Shire which is
attached as Appendix A.
49
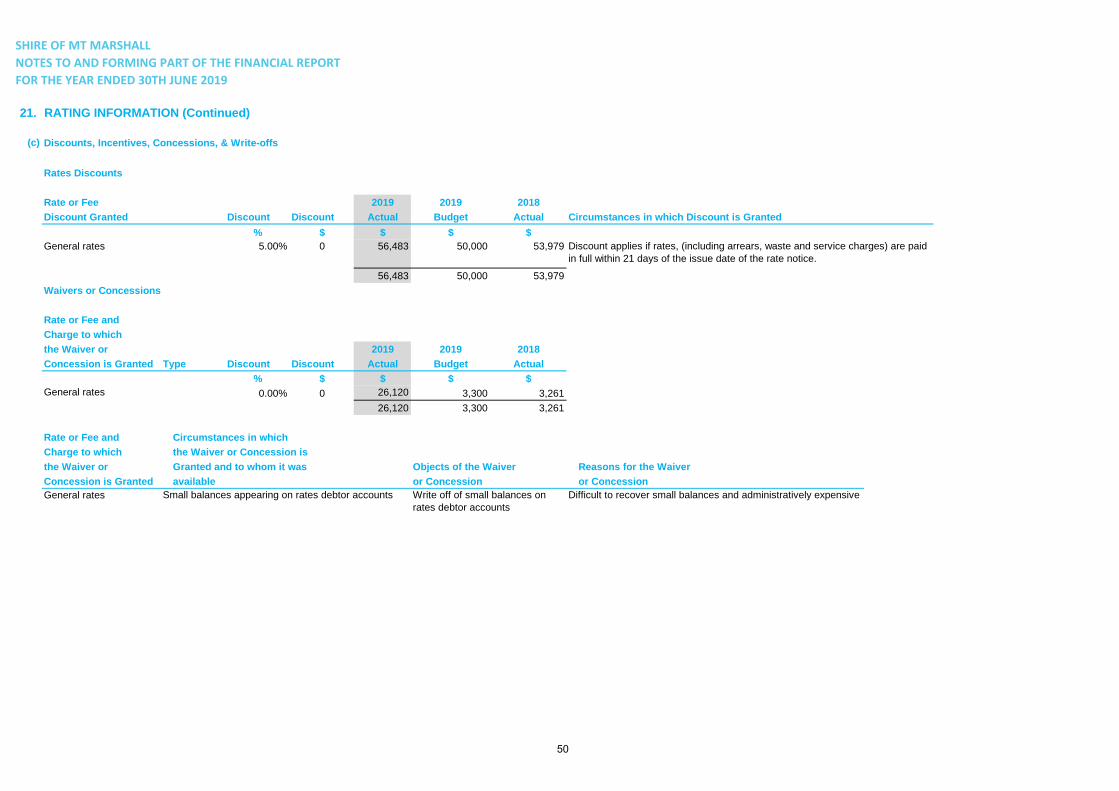
SHIRE OF MT MARSHALL
NOTES TO AND FORMING PART OF THE FINANCIAL REPORT
FOR THE YEAR ENDED 30TH JUNE 2019
21. RATING INFORMATION (Continued)
(c) Discounts, Incentives, Concessions, & Write-offs
Rates Discounts
Rate or Fee 2019 2019 2018
Discount Granted Discount Discount Actual Budget Actual Circumstances in which Discount is Granted
% $ $ $ $
5.00% 0 56,483 50,000 53,979
56,483 50,000 53,979
Waivers or Concessions
Rate or Fee and
Charge to which
the Waiver or 2019 2019 2018
Concession is Granted Type Discount Discount Actual Budget Actual
% $ $ $ $
General rates 0.00% 0 26,120 3,300 3,261
26,120 3,300 3,261
Rate or Fee and Circumstances in which
Charge to which the Waiver or Concession is
the Waiver or Granted and to whom it was Objects of the Waiver Reasons for the Waiver
Concession is Granted available or Concession or Concession
General rates
General rates Discount applies if rates, (including arrears, waste and service charges) are paid
in full within 21 days of the issue date of the rate notice.
Small balances appearing on rates debtor accounts Write off of small balances on
rates debtor accounts
Difficult to recover small balances and administratively expensive
50

SHIRE OF MT MARSHALL
NOTES TO AND FORMING PART OF THE FINANCIAL REPORT
FOR THE YEAR ENDED 30TH JUNE 2019
21. RATING INFORMATION (Continued)
(d) Interest Charges & Instalments
Instalment Instalment Unpaid Rates
Date Plan Plan Interest
Instalment Options Due Admin Charge Interest Rate Rate
$ % %
Option One
Full Payment 28/09/2018 11.00%
Option Two
First Instalment 28/09/2018 11.00%
Second Instalment 28/11/2018 12 5.00% 11.00%
Third Instalment 28/02/2019 12 5.00% 11.00%
Fourth Instalment 30/04/2019 12 5.00% 11.00%
2019 2019 2018
Actual Budget Actual
$ $ $
Interest on unpaid rates 14,140 15,600 15,642
Interest on instalment plan 1,988 1,100 1,145
DFES penalty interest 478 500 480
Charges on instalment plan 1,548 1,200 1,188
18,154 18,400 18,455
51

SHIRE OF MT MARSHALL
NOTES TO AND FORMING PART OF THE FINANCIAL REPORT
FOR THE YEAR ENDED 30TH JUNE 2019
22. RATE SETTING STATEMENT INFORMATION
2018/19
2018/19 Budget 2018/19
(30 June 2019 (30 June 2019 (1 July 2018
Carried Carried Brought
Note Forward) Forward) Forward)
$ $ $
(a) Non-cash amounts excluded from operating activities
The following non-cash revenue or expenditure has been excluded
from amounts attributable to operating activities within the Rate Setting
Statement in accordance with Financial Management Regulation 32.
Adjustments to operating activities
Less: Profit on asset disposals 11(a) (13,926) 0 (23,305)
Less: Initial recognition of investments 0 0 (70,068)
Less: Movement in liabilities associated with restricted cash 2,342 0 2,255
Movement in pensioner deferred rates (non-current) 1,143 0 (418)
Movement in employee benefit provisions (non-current) 5,655 0 557
Add: Loss on disposal of assets 11(a) 189,039 135,500 84,739
Add: Depreciation on assets 11(d) 2,698,069 2,453,460 2,453,975
Non cash amounts excluded from operating activities 2,882,322 2,588,960 2,447,735
(b) Surplus/(deficit) after imposition of general rates
The following current assets and liabilities have been excluded
from the net current assets used in the Rate Setting Statement
in accordance with Financial Management Regulation 32 to
agree to the surplus/(deficit) after imposition of general rates.
Adjustments to net current assets
Less: Reserves - restricted cash 3 (2,363,135) (2,212,924) (2,669,161)
Less: - Financial assets at amortised cost - self supporting loans 8(a) (9,167) 3,144 (17,411)
Add: Borrowings 14(a) 43,047 1 109,182
Add: Component of leave liability not required to be funded 3 98,011 95,668 95,668
Total adjustments to net current assets (2,231,244) (2,114,111) (2,481,722)
Net current assets used in the Rate Setting Statement
Total current assets 4,655,663 3,014,042 5,027,972
Less: Total current liabilities (1,068,245) (899,931) (1,062,920)
Less: Total adjustments to net current assets (2,231,244) (2,114,111) (2,481,722)
Net current assets used in the Rate Setting Statement 1,356,174 0 1,483,330
52

SHIRE OF MT MARSHALL
NOTES TO AND FORMING PART OF THE FINANCIAL REPORT
FOR THE YEAR ENDED 30TH JUNE 2019
23. FINANCIAL RISK MANAGEMENT
This note explains the Shire’s exposure to financial risks and how these risks could affect the Shire’s future financial
performance.
Risk Measurement
Market risk - interest rateSensitivity
analysis
Credit riskAging analysis
Credit analysis
Liquidity riskRolling cash flow
forecasts
The Shire does not engage in transactions expressed in foreign currencies and is therefore not subject to foreign currency risk.
Financial risk management is carried out by the finance area under policies approved by the Council. The finance
area identifies, evaluates and manages financial risks in close co-operation with the operating divisions. Council have
approved the overall risk management policy and provide policies on specific areas such as investment policy.
(a) Interest rate risk
Cash and cash equivalents
The Shire's main interest rate risk arises from cash and cash equivalents with variable interest rates, which exposes the
Shire to cash flow interest rate risk. Short term overdraft facilities also have variable interest rates however these are
repaid within 12 months, reducing the risk level to minimal.
Excess cash and cash equivalents are invested in fixed interest rate term deposits which do not expose the Shire to cash
flow interest rate risk. Cash and cash equivalents required for working capital are held in variable interest rate accounts
and non-interest bearing accounts. Carrying amounts of cash and cash equivalents at the 30 June and the weighted average
interest rate across all cash and cash equivalents and term deposits held disclosed as financial assets at amortised cost
are reflected in the table below.
Weighted
Average Carrying Fixed Variable Non Interest
Interest Rate Amounts Interest Rate Interest Rate Bearing
% $ $ $ $
2019
Cash and cash equivalents 1.50% 4,320,722 3,849,910 0 470,812
2018
Cash and cash equivalents 1.58% 4,629,019 3,984,753 0 644,266
Sensitivity
2019 2018
$ $
Impact of a 1% movement in interest rates on profit and loss and equity 37,600 38,613
Borrowings
Borrowings are subject to interest rate risk - the risk that movements in interest rates could adversely affect funding costs.
The Shire manages this risk by borrowing long term and fixing the interest rate to the situation considered the most
advantageous at the time of negotiation. The Shire does not consider there to be any interest rate risk in relation to borrowings.
Details of interest rates applicable to each borrowing may be found at Note 14(b).
Borrowings and other liabilitiesAvailablity of commited credit lines
and borrowing facilities
Management
Long term borrowings at variable
rates
Exposure arising from
Cash and cash equivalents, trade
receivables, financial assets and
debt investments
Diversification of bank deposits,
credit limits. Investment policy
Utilise fixed interest rate borrowings
53

SHIRE OF MT MARSHALL
NOTES TO AND FORMING PART OF THE FINANCIAL REPORT
FOR THE YEAR ENDED 30TH JUNE 2019
23. FINANCIAL RISK MANAGEMENT (Continued)
(b) Credit risk
Trade Receivables
The Shire’s major receivables comprise rates annual charges and user fees and charges. The major risk associated
with these receivables is credit risk – the risk that the debts may not be repaid. The Shire manages this risk by monitoring
outstanding debt and employing debt recovery policies. It also encourages ratepayers to pay rates by the due date
through incentives.
Credit risk on rates and annual charges is minimised by the ability of the Shire to recover these debts as a secured charge
over the land, that is, the land can be sold to recover the debt. The Shire is also able to charge interest on overdue rates
and annual charges at higher than market rates, which further encourages payment.
The level of outstanding receivables is reported to Council monthly and benchmarks are set and monitored for acceptable
collection performance.
The Shire applies the AASB 9 simplified approach to measuring expected credit losses using a lifetime expected loss
allowance for all trade receivables. To measure the expected credit losses, rates receivable are separated from other
trade receivables due to the difference in payment terms and security for rates receivable.
The expected loss rates are based on the payment profiles of rates and fees and charges over a period of 36 months
before 1 July 2018 or 1 July 2019 respectively and the corresponding historical losses experienced within this period.
Historical credit loss rates are adjusted to reflect current and forward-looking information on macroeconomic factors
such as the ability of ratepayers and residents to settle the receivables. Housing prices and unemployment rates have been
identified as the most relevant factor in repayment rates, and accordingly adjustments are made to the expected credit loss
rate based on these factors. There are no material receivables that have been subject to a re-negotiation of repayment terms.
The loss allowance as at 30 June 2019 and 1 July 2018 (on adoption of AASB 9) was determined as follows for rates
receivable. No expected credit loss was forecast on 30 June 2019 for rates receivable as penalty interest
applies to unpaid rates and properties associated with unpaid rates may be disposed of to recover unpaid rates.
More than 1 More than 2 More than 3
Current year past due years past due years past due Total
30 June 2019
Rates receivable
Expected credit loss 0.00% 0.00% 0.00% 0.00%
Gross carrying amount 2,032 60,427 22,607 18,702 103,768
Loss allowance 0 0 0 0 0
01 July 2018
Rates receivable
Expected credit loss 0.36% 53.87% 1.41% 0.00%
Gross carrying amount 53,977 38,785 12,277 6,765 111,804
Loss allowance 193 20,894 173 0 21,260
The loss allowance as at 30 June 2019 and 1 July 2018 (on adoption of AASB 9) was determined as follows for sundry
receivables.
More than 30 More than 60 More than 90
Current days past due days past due days past due Total
30 June 2019
Sundry Receivables
Expected credit loss 0.05% 0.00% 3.08% 80.17%
Gross carrying amount 129,416 32,115 5,005 8,740 175,276
Loss allowance 60 0 154 7,007 7,221
01 July 2018
Sundry Receivables
Expected credit loss 0.05% 0.00% 3.08% 80.17%
Gross carrying amount 174,319 5,596 1,614 59,314 240,843
Loss allowance 81 0 50 48,226 48,35754
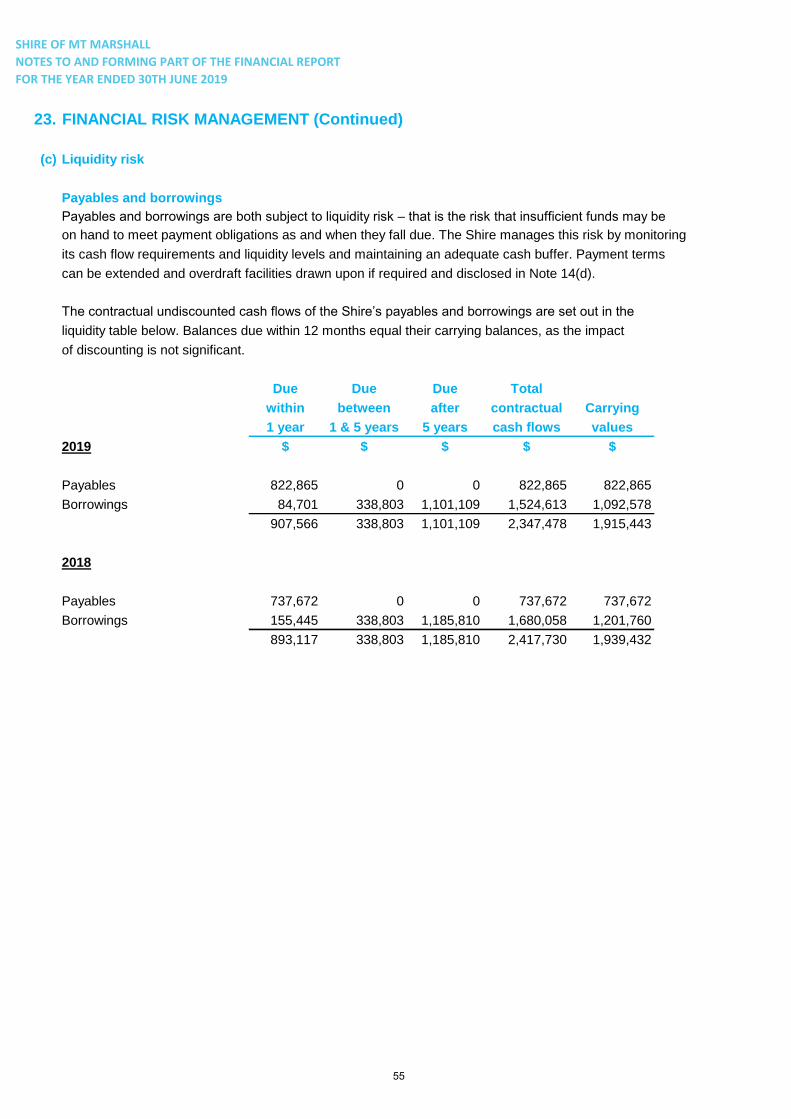
SHIRE OF MT MARSHALL
NOTES TO AND FORMING PART OF THE FINANCIAL REPORT
FOR THE YEAR ENDED 30TH JUNE 2019
23. FINANCIAL RISK MANAGEMENT (Continued)
(c) Liquidity risk
Payables and borrowings
Payables and borrowings are both subject to liquidity risk – that is the risk that insufficient funds may be
on hand to meet payment obligations as and when they fall due. The Shire manages this risk by monitoring
its cash flow requirements and liquidity levels and maintaining an adequate cash buffer. Payment terms
can be extended and overdraft facilities drawn upon if required and disclosed in Note 14(d).
The contractual undiscounted cash flows of the Shire’s payables and borrowings are set out in the
liquidity table below. Balances due within 12 months equal their carrying balances, as the impact
of discounting is not significant.
Due Due Due Total
within between after contractual Carrying
1 year 1 & 5 years 5 years cash flows values
2019 $ $ $ $ $
Payables 822,865 0 0 822,865 822,865
Borrowings 84,701 338,803 1,101,109 1,524,613 1,092,578
907,566 338,803 1,101,109 2,347,478 1,915,443
2018
Payables 737,672 0 0 737,672 737,672
Borrowings 155,445 338,803 1,185,810 1,680,058 1,201,760
893,117 338,803 1,185,810 2,417,730 1,939,432
55
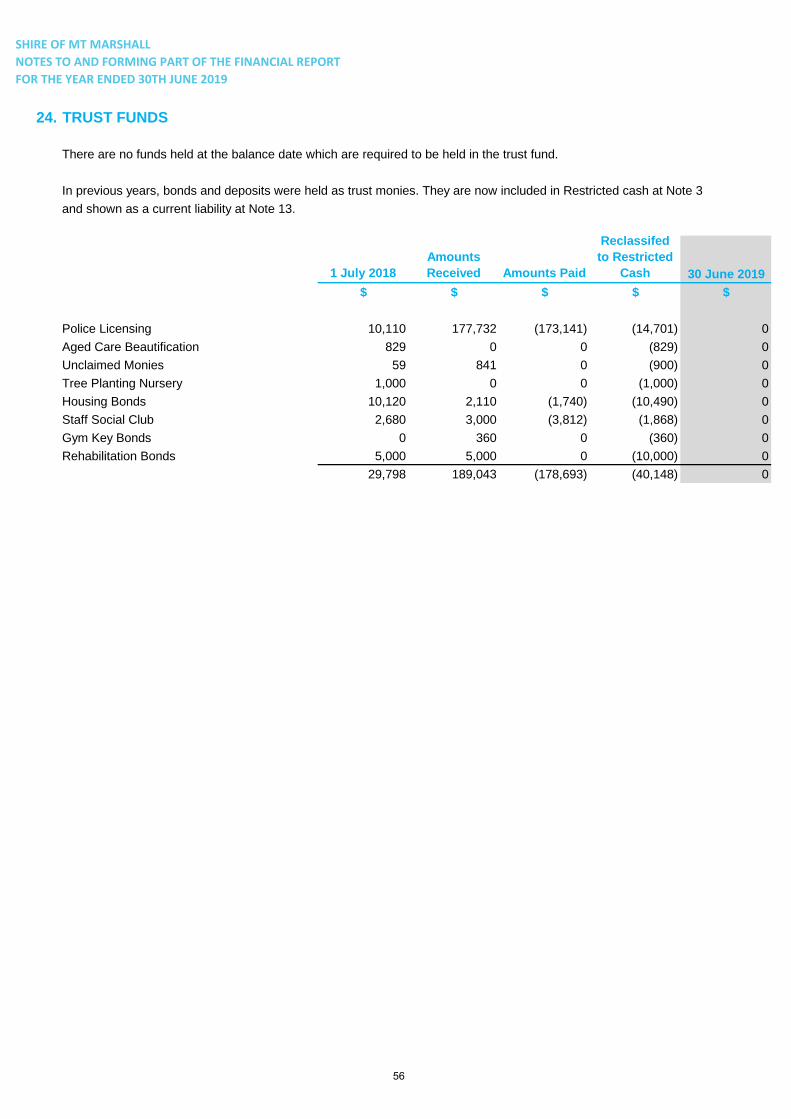
SHIRE OF MT MARSHALL
NOTES TO AND FORMING PART OF THE FINANCIAL REPORT
FOR THE YEAR ENDED 30TH JUNE 2019
24. TRUST FUNDS
There are no funds held at the balance date which are required to be held in the trust fund.
In previous years, bonds and deposits were held as trust monies. They are now included in Restricted cash at Note 3
and shown as a current liability at Note 13.
1 July 2018
Amounts
Received Amounts Paid
Reclassifed
to Restricted
Cash 30 June 2019
$ $ $ $ $
Police Licensing 10,110 177,732 (173,141) (14,701) 0
Aged Care Beautification 829 0 0 (829) 0
Unclaimed Monies 59 841 0 (900) 0
Tree Planting Nursery 1,000 0 0 (1,000) 0
Housing Bonds 10,120 2,110 (1,740) (10,490) 0
Staff Social Club 2,680 3,000 (3,812) (1,868) 0
Gym Key Bonds 0 360 0 (360) 0
Rehabilitation Bonds 5,000 5,000 0 (10,000) 0
29,798 189,043 (178,693) (40,148) 0
56

SHIRE OF MT MARSHALL
NOTES TO AND FORMING PART OF THE FINANCIAL REPORT
FOR THE YEAR ENDED 30TH JUNE 2019
25. INITIAL APPLICATION OF AUSTRALIAN ACCOUNTING STANDARDS
During the current year, the Shire adopted all of the new and revised Australian Accounting Standards and
Interpretations which were compiled, became mandatory and which were applicable to its operations.
Whilst many reflected consequential changes associated with the amendment of existing standards, the only
new standard with material application is AASB 9 Financial Instruments .
AASB 9 Financial instruments
AASB 9 Financial Instruments replaces AASB 139 Financial Instruments: Recognition and Measurement
for annual reporting periods beginning on or after 1 January 2018, bringing together all three aspects
of the accounting for financial instruments: classification and measurement; impairment; and hedge
accounting.
The Shire applied AASB 9 prospectively, with an initial application date of 1 July 2018. The adoption of
AASB 9 has resulted in changes in accounting policies and adjustments to the amounts recognised in
the financial statements. In accordance with AASB 9.7.2.15, the Shire has not restated the comparative
information which continues to be reported under AASB 139. Differences arising from adoption have
been recognised directly in accumulated surplus/(deficit).
The effect of adopting AASB 9 was assessed as not material and therefore, no adjustment was required
to be made.
(a) Classification and measurement
Under AASB 9, financial assets are subsequently measured at amortised cost, fair value through other
comprehensive income (fair value through OCI) or fair value through profit or loss (fair value through
P/L). The classification is based on two criteria: the Shire’s business model for managing the assets; and
whether the assets’ contractual cash flows represent ‘solely payments of principal and interest’ on the
principal amount outstanding.
The assessment of the Shire’s business model was made as of the date of initial application, 1 July 2018.
The assessment of whether contractual cash flows on financial assets are solely comprised of principal
and interest was made based on the facts and circumstances as at the initial recognition of the assets.
57

SHIRE OF MT MARSHALL
NOTES TO AND FORMING PART OF THE FINANCIAL REPORT
FOR THE YEAR ENDED 30TH JUNE 2019
25. INITIAL APPLICATION OF AUSTRALIAN ACCOUNTING STANDARDS (Continued)
The classification and measurement requirements of AASB 9 did not have a significant impact on the
Shire. The following are the changes in the classification of the Shire’s financial assets:
- Trade receivables and Loans and advances classified as Loans and receivables as at
30 June 2018 are held to collect contractual cash flows and give rise to cash flows representing solely
payments of principal and interest. These are classified and measured as Financial assets at amortised
cost beginning 1 July 2018.
In summary, upon the adoption of AASB 9, the Shire had the following required (or elected) reclassifications
as at 1 July 2018:
AASB 9 category
Financial assets Fair value Fair value
at amortised through through
AASB 139 value cost OCI P/L
Financial asset category $ $ $ $
Trade receivables 283,030 283,030 0 0
Loan receivables 246,948 246,948 0 0
529,978 529,978 0 0
(b) Impairment
The adoption of AASB 9 has fundamentally changed the Shire’s accounting for impairment losses for
financial assets by replacing AASB 139’s incurred loss approach with a forward-looking expected credit
loss (ECL) approach. AASB 9 requires the Shire to recognise an allowance for ECLs for all financial assets
not held at fair value through P/L.
Set out below is the reconciliation of the ending impairment allowances in accordance with AASB 139
to the opening loss allowances determined, in accordance with AASB 9:
Impairment
under ECL under
AASB 139 AASB 9 as
as at at
30 June 2018 Remeasurement 01 July 2018
$ $ $
Loans and receivables under
AASB 139 ∕ Financial assets
at amortised cost under
AASB 9 69,617 0 69,617
69,617 0 69,617
58

SHIRE OF MT MARSHALL
NOTES TO AND FORMING PART OF THE FINANCIAL REPORT
FOR THE YEAR ENDED 30TH JUNE 2019
26. NEW ACCOUNTING STANDARDS AND INTERPRETATIONS FOR APPLICATION IN FUTURE YEARS
The AASB has issued a number of new and amended Accounting Standards and Interpretations that have mandatory application dates
for future reporting periods,some of which are relevant to the Shire.
This note explains management's assessment of the new and amended pronouncements that are relevant to the Shire, the impact of the
adoption of AASB 15 Revenue from Contracts with Customers , AASB 16 Leases and AASB 1058 Income for Not-for-Profit Entities .
These standards are applicable to future reporting periods and have not yet been adopted.
(a) Revenue from Contracts with Customers
The Shire will adopt AASB 15 Revenue from Contracts with Customers (issued December 2014) on 1 July 2019 resulting in changes
in accounting policies. In accordance with the transition provisions AASB 15, the Shire will adopt the new rules retrospectively
with the cumulative effect of initially applying these rules recognised on 1 July 2019. In summary the following adjustments are
expected to be made to the amounts recognised in the Statement of Financial Position at the date of initial application (1 July 2019):
AASB 118 AASB 15
carrying amount carrying amount
Note 30 June 2019 Reclassification 01 July 2019
$ $ $
Contract liabilities - current
Unspent grants, contributions and reimbursements 0 28,634 28,634
Adjustment to retained surplus from adoption of AASB 15 26(d) 0 (28,634) (28,634)
(b) Leases
The Shire adopted AASB 16 retrospectively from 1 July 2019 which resulted in changes in accounting policies. In accordance with
the transition provisions of AASB 16, the Shire has applied this Standard to its leases prospectively, with the cumulative effect
of initially applying AASB16 recognised on 1 July 2019. In applying the AASB 16 under the specific transition provisions chosen,
the Shire will not restate comparatives for prior reporting periods.
On adoption of AASB 16, the Shire will not recognise a right-of-use asset in relation to lease liabilities which previously
were classified as an operating lease applying AASB 117.
On adoption of AASB 16 Leases (issued February 2016), for leases which had previously been classified as an 'operating lease'
when applying AASB 117, the net impact on retained earnings on 1 July 2019 will be nil. The Shire is not required to make any
adjustments on transition for leases for which the underlying asset is of low value.
59

SHIRE OF MT MARSHALL
NOTES TO AND FORMING PART OF THE FINANCIAL REPORT
FOR THE YEAR ENDED 30TH JUNE 2019
26. NEW ACCOUNTING STANDARDS AND INTERPRETATIONS FOR APPLICATION IN FUTURE YEARS (Continued)
(c) Income For Not-For-Profit Entities
The Shire will adopt AASB 1058 Income for Not-for-Profit Entities (issued December 2016) on 1 July 2019 which will result in changes
in accounting policies. In accordance with the transition provisions AASB 1058, the Shire will adopt the new rules retrospectively with the
cumulative effect of initially applying AASB 1058 recognised at 1 July 2019. Comparative information for prior reporting periods shall
not be restated in accordance with AASB 1058 transition requirements.
In applying AASB 1058 retrospectively with the cumulative effect of initially applying the Standard on 1 July 2019 changes will occur
to the following financial statement line items by application of AASB 1058 as compared to AASB 1004 Contributions before the change:
AASB 1004 AASB 1058
carrying amount carrying amount
Note 30 June 2019 Reclassification 01 July 2019
$ $ $
Trade and other payables 822,865 0 822,865
Adjustment to retained surplus from adoption of AASB 1058 26(d) 822,865 0 822,865
Prepaid rates are, until the taxable event for the rates has occurred, refundable at the request of the ratepayer. Therefore the rates
received in advance give rise to a financial liability that is within the scope of AASB 9. On 1 July 2019 the prepaid rates will be recognised
as a financial asset and a related amount recognised as a financial liability and no income recognised by the Shire. When the taxable event
occurs the financial liability will be extinguished and the Shire will recognise income for the prepaid rates that have not been refunded.
Assets that were acquired for consideration, that were significantly less than fair value principally to enable the Shire to further its objectives,
may have been measured on initial recognition under other Australian Accounting Standards at a cost that was significantly less than fair
value. Such assets are not required to be remeasured at fair value.
Volunteer Services in relation to Volunteer Fire Services will not be recognised in revenue and expenditure as the fair value of the
services as they cannot be reliably estimated.
(d) Impact of changes to Retained Surplus
The impact on the Shire of the changes as at 1 July 2019 is as follows:
Note Adjustments 2019
$
Retained surplus - 30 June 2019 80,699,670
Adjustment to retained surplus from adoption of AASB 15 26(a) (28,634)
Adjustment to retained surplus from adoption of AASB 16 26(b) 0
Adjustment to retained surplus from adoption of AASB 1058 26(c) 0 (28,634)
Retained surplus - 01 July 2019 80,671,036
60
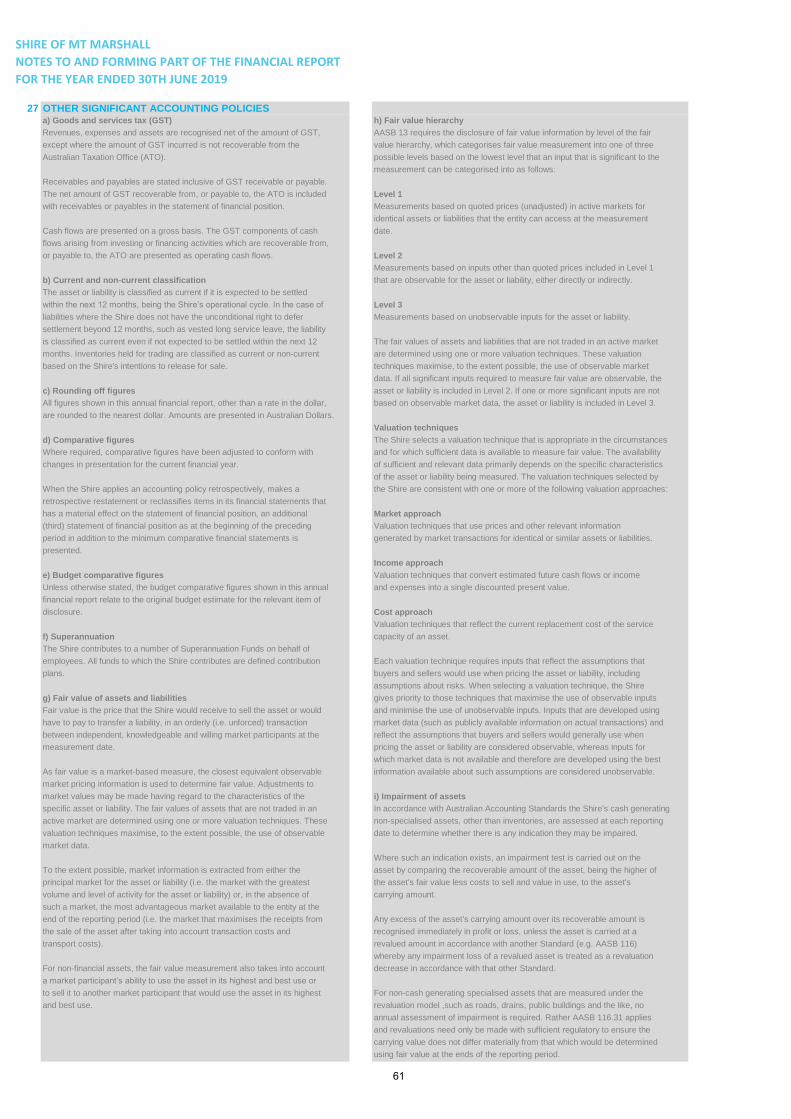
SHIRE OF MT MARSHALL
NOTES TO AND FORMING PART OF THE FINANCIAL REPORT
FOR THE YEAR ENDED 30TH JUNE 2019
27 OTHER SIGNIFICANT ACCOUNTING POLICIESa) Goods and services tax (GST) h) Fair value hierarchy
Revenues, expenses and assets are recognised net of the amount of GST, AASB 13 requires the disclosure of fair value information by level of the fair
except where the amount of GST incurred is not recoverable from the value hierarchy, which categorises fair value measurement into one of three
Australian Taxation Office (ATO). possible levels based on the lowest level that an input that is significant to the
measurement can be categorised into as follows:
Receivables and payables are stated inclusive of GST receivable or payable.
The net amount of GST recoverable from, or payable to, the ATO is included Level 1
with receivables or payables in the statement of financial position. Measurements based on quoted prices (unadjusted) in active markets for
identical assets or liabilities that the entity can access at the measurement
Cash flows are presented on a gross basis. The GST components of cash date.
flows arising from investing or financing activities which are recoverable from,
or payable to, the ATO are presented as operating cash flows. Level 2
Measurements based on inputs other than quoted prices included in Level 1
b) Current and non-current classification that are observable for the asset or liability, either directly or indirectly.
The asset or liability is classified as current if it is expected to be settled
within the next 12 months, being the Shire’s operational cycle. In the case of Level 3
liabilities where the Shire does not have the unconditional right to defer Measurements based on unobservable inputs for the asset or liability.
settlement beyond 12 months, such as vested long service leave, the liability
is classified as current even if not expected to be settled within the next 12 The fair values of assets and liabilities that are not traded in an active market
months. Inventories held for trading are classified as current or non-current are determined using one or more valuation techniques. These valuation
based on the Shire's intentions to release for sale. techniques maximise, to the extent possible, the use of observable market
data. If all significant inputs required to measure fair value are observable, the
c) Rounding off figures asset or liability is included in Level 2. If one or more significant inputs are not
All figures shown in this annual financial report, other than a rate in the dollar, based on observable market data, the asset or liability is included in Level 3.
are rounded to the nearest dollar. Amounts are presented in Australian Dollars.
Valuation techniques
d) Comparative figures The Shire selects a valuation technique that is appropriate in the circumstances
Where required, comparative figures have been adjusted to conform with and for which sufficient data is available to measure fair value. The availability
changes in presentation for the current financial year. of sufficient and relevant data primarily depends on the specific characteristics
of the asset or liability being measured. The valuation techniques selected by
When the Shire applies an accounting policy retrospectively, makes a the Shire are consistent with one or more of the following valuation approaches:
retrospective restatement or reclassifies items in its financial statements that
has a material effect on the statement of financial position, an additional Market approach
(third) statement of financial position as at the beginning of the preceding Valuation techniques that use prices and other relevant information
period in addition to the minimum comparative financial statements is generated by market transactions for identical or similar assets or liabilities.
presented.
Income approach
e) Budget comparative figures Valuation techniques that convert estimated future cash flows or income
Unless otherwise stated, the budget comparative figures shown in this annual and expenses into a single discounted present value.
financial report relate to the original budget estimate for the relevant item of
disclosure. Cost approach
Valuation techniques that reflect the current replacement cost of the service
f) Superannuation capacity of an asset.
The Shire contributes to a number of Superannuation Funds on behalf of
employees. All funds to which the Shire contributes are defined contribution Each valuation technique requires inputs that reflect the assumptions that
plans. buyers and sellers would use when pricing the asset or liability, including
assumptions about risks. When selecting a valuation technique, the Shire
g) Fair value of assets and liabilities gives priority to those techniques that maximise the use of observable inputs
Fair value is the price that the Shire would receive to sell the asset or would and minimise the use of unobservable inputs. Inputs that are developed using
have to pay to transfer a liability, in an orderly (i.e. unforced) transaction market data (such as publicly available information on actual transactions) and
between independent, knowledgeable and willing market participants at the reflect the assumptions that buyers and sellers would generally use when
measurement date. pricing the asset or liability are considered observable, whereas inputs for
which market data is not available and therefore are developed using the best
As fair value is a market-based measure, the closest equivalent observable information available about such assumptions are considered unobservable.
market pricing information is used to determine fair value. Adjustments to
market values may be made having regard to the characteristics of the i) Impairment of assets
specific asset or liability. The fair values of assets that are not traded in an In accordance with Australian Accounting Standards the Shire's cash generating
active market are determined using one or more valuation techniques. These non-specialised assets, other than inventories, are assessed at each reporting
valuation techniques maximise, to the extent possible, the use of observable date to determine whether there is any indication they may be impaired.
market data.
Where such an indication exists, an impairment test is carried out on the
To the extent possible, market information is extracted from either the asset by comparing the recoverable amount of the asset, being the higher of
principal market for the asset or liability (i.e. the market with the greatest the asset's fair value less costs to sell and value in use, to the asset's
volume and level of activity for the asset or liability) or, in the absence of carrying amount.
such a market, the most advantageous market available to the entity at the
end of the reporting period (i.e. the market that maximises the receipts from Any excess of the asset's carrying amount over its recoverable amount is
the sale of the asset after taking into account transaction costs and recognised immediately in profit or loss, unless the asset is carried at a
transport costs). revalued amount in accordance with another Standard (e.g. AASB 116)
whereby any impairment loss of a revalued asset is treated as a revaluation
For non-financial assets, the fair value measurement also takes into account decrease in accordance with that other Standard.
a market participant’s ability to use the asset in its highest and best use or
to sell it to another market participant that would use the asset in its highest For non-cash generating specialised assets that are measured under the
and best use. revaluation model ,such as roads, drains, public buildings and the like, no
annual assessment of impairment is required. Rather AASB 116.31 applies
and revaluations need only be made with sufficient regulatory to ensure the
carrying value does not differ materially from that which would be determined
using fair value at the ends of the reporting period.
61

SHIRE OF MT MARSHALL
NOTES TO AND FORMING PART OF THE FINANCIAL REPORT
FOR THE YEAR ENDED 30TH JUNE 2019
28. ACTIVITIES/PROGRAMS
Shire operations as disclosed in these financial statements encompass the following service orientated activities/programs.
PROGRAM NAME AND OBJECTIVES ACTIVITIES
GOVERNANCE
To provide a decision making process for the Administration and operation of facilities and services to members of the Council. Other
efficient allocation of scarce resources costs that relate to the tasks of assisting elected members and ratepayers on matters which are
which are not directly related to specific shire services.
GENERAL PURPOSE FUNDING
To collect revenue to allow for the provision of
services.
Rates, general purpose government grants and interest revenue.
LAW, ORDER, PUBLIC SAFETY
To provide services to help ensure a safer
community.
Supervision of various by-laws, fire prevention, emergency services and animal control.
HEALTH
To provide an operational framework for good
community
Food and water quality, pest control, immunisation services, child health services and
health. health education.
EDUCATION AND WELFARE
To meet the needs of the community in these
areas.
Management and support for families, children, youth and the aged within the community by
providing Youth, Aged and Family Centres, Home and Community Aged Care Programs and
assistance to schools.
HOUSING
To help ensure adequate housing. Provision of residential housing for council staff. Provision of housing for aged persons, low
incomeincome families, government and semi government employees.
COMMUNITY AMENITIES
Provide services required by the community. Rubbish collection services and disposal of waste, stormwater drainage, protection of the
environment, town planning and regional development and other community amenities
(cemeteries and public toilets).
RECREATION AND CULTURE
To establish and manage efficiently infrastructure
and
Public halls, recreation and aquatic centres, parks and reserves, libraries, heritage and
resources which will help the social wellbeing of
the
culture.
community.
TRANSPORT
To provide effective and efficient transport
services toConstruction and maintenance of roads, footpaths, bridges, street cleaning and lighting,
the community. road verges, streetscaping and depot maintenance.
ECONOMIC SERVICES
To help promote the Municipality and improve its The regulation and provision of tourism, area promotion, building control, noxious weeds, vermin
controleconomic wellbeing. and standpipes.
OTHER PROPERTY AND SERVICES
To monitor and control the Shire's overhead Private works, public works overheads, plant and equipment operations, town planning
operating accounts. schemes and activities not reported in the above programs.
62

SHIRE OF MT MARSHALL
NOTES TO AND FORMING PART OF THE FINANCIAL REPORT
FOR THE YEAR ENDED 30TH JUNE 2019
29. FINANCIAL RATIOS 2019 2018 2017
Actual Actual Actual
Current ratio 2.39 2.35 2.60
Asset consumption ratio 0.60 0.65 0.53
Asset renewal funding ratio 1.23 0.84 0.83
Asset sustainability ratio 1.04 1.53 1.18
Debt service cover ratio 9.71 8.89 24.14
Operating surplus ratio (0.53) (0.47) (0.33)
Own source revenue coverage ratio 0.37 0.38 0.34
The above ratios are calculated as follows:
Current ratio current assets minus restricted assets
current liabilities minus liabilities associated
with restricted assets
Asset consumption ratio
Asset renewal funding ratio
Asset sustainability ratio
depreciation
Debt service cover ratio annual operating surplus before interest and depreciation
principal and interest
Operating surplus ratio operating revenue minus operating expenses
own source operating revenue
Own source revenue coverage ratio own source operating revenue
operating expense
depreciated replacement costs of depreciable assets
current replacement cost of depreciable assets
NPV of planned capital renewal over 10 years
NPV of required capital expenditure over 10 years
capital renewal and replacement expenditure
63
Auditor’s Report
INDEPENDENT AUDITOR'S REPORT
TO THE COUNCILLORS OF THE SHIRE OF MT MARSHALL
Opinion
Level 15, Exchange Tower,
2 The Esplanade, Pert h, WA 6000
PO Box 5785, St Georges Terrace, WA 6831
T +61 (0)8 9225 5355
F +61 (0)8 9225 6181
www.moorestephens.com.au
We have audited the accompanying financial report of the Shire of Mt Marshall (the Shire), which comprises the Statement of Financial Position as at 30 June 2019, Statement of Comprehensive Income by Nature or Type, Statement of Comprehensive Income by Program, Statement of Changes in Equity, Statement of Cash Flows and the Rate Setting Statement for the year then ended, notes comprising a summary of significant
accounting policies and other explanatory information and the Statement by Chief Executive Officer.
In our opinion, the financial report of the Shire of Mt Marshall: i. is based on proper accounts and reports; andii. fairly represents, in all material respects, the results of the operations of the Shire for the year ended
30 June 2019 and its financial position at the end of that period in accordance with the LocalGovernment Act 1995 (the Act) and, to the extent that they are not inconsistent with the Act,Australian Accounting Standards.
Basis for Opinion We conducted our audit in accordance with Australian Auditing Standards. Our responsibilities under those standards are further described in the Auditor’s Responsibilities for the Audit of the Financial Report section of our report. We are independent of the Shire in accordance with the ethical requirements of the Accounting Professional and Ethical Standards Board’s APES 110 Code of Ethics for Professional Accountants (the 'Code ‘) that are relevant to our audit of the financial report in Australia . We have also fulfilled our other ethical responsibilities in accordance with the Code. We believe that the audit evidence we have obtained is sufficient and appropriate to provide a basis for our opinion.
Emphasis of Matter - Basis of Preparation We draw attention to Note 1 to the financial report, which describes the basis of preparation. The financial report has been prepared for the purpose of fulfilling the Shire's financial reporting responsibilities under the Act. Regulation 16 of the Local Government (Financial Management) Regulations 1996 (Regulations), does not allow a local government to recognise some categories of land, including land under roads, as assets in the annual financial report. Our opinion is not modified in respect of this matter.
Responsibilities of the Chief Executive Officer and Council for the Financial Report The Chief Executive Officer (CEO) of the Shire is responsible for the preparation and fair presentation of the annual financial report in accordance with the requirements of the Act, the Regulations and, to the extent that they are not inconsistent with the Act, Australian Accounting Standards. The CEO is also responsible for such internal control as the CEO determines is necessary to enable the preparation of a financial report that is free from material misstatement, whether due to fraud or error.
64

INDEPENDENT AUDITOR'S REPORT
TO THE COUNCILLORS OF THE SHIRE OF MT
MARSHALL (CONTINUED)
In preparing the financial report, the CEO is responsible for assessing the Shire' s ability to continue as a going concern, disclosing, as applicable, matters related to going concern and using the going concern basis of accounting unless the State government has made decisions affecting the continued existence of the Shire.
The Council is responsible for overseeing the Shire's financial reporting process.
Auditor's Responsibilities for the Audit of the Financial Report Our objectives of the audit are to obtain reasonable assurance about whether the financial report as a whole is free from material misstatement, whether due to fraud or error, and to issue an auditor's report that includes our opinion. Reasonable assurance is a high level of assurance but is not a guarantee that an audit conducted in accordance with Australian Auditing Standards will always detect a material misstatement when it exists. Misstatements can arise from fraud or error and are considered material if, individually or in the aggregate, they could reasonably be expected to influence the economic decisions of users taken on the basis of the financial report.
As part of an audit in accordance with the Australian Auditing Standards, we exercise professional judgement and maintain professional scepticism throughout the audit. We also:
• Identify and assess the risks of material misstatement of the financial report, whether due to fraud orerror, design and perform audit procedures responsive to those risks, and obtain audit evidence that issufficient and appropriate to provide a basis for our opinion. The risk of not detecting a materialmisstatement resulting from fraud is higher than for one resulting from error, as fraud may involvecollusion, forgery, international omissions, misrepresentation, or the override of internal control.
• Obtain an understanding of internal control relevant to the audit in order to design audit procedures thatare appropriate in the circumstances, but not for the purpose of expressing an opinion on theeffectiveness of the Shire's internal control.
• Evaluate the appropriateness of accounting policies used and the reasonableness of accountingestimates and related disclosures made by the CEO.
• Conclude on the appropriateness of the CEO's use of the going concern basis of accounting and, basedon the audit evidence obtained, whether a material uncertainty exists related to events or conditions thatmay cast significant doubt on the Shire's ability to continue as a going concern. If we conclude that amaterial uncertainty exists, we are required to draw attention in our auditor's report to the relateddisclosures in the financial report or, if such disclosures are inadequate, to modify our opinion. Ourconclusions are based on the audit evidence obtained up to the date of our auditor's report, as we cannotpredict future events or conditions that may have an impact.
• Evaluate the overall presentation, structure and content of the financial report, including the disclosures,and whether the financial report represents the underlying transactions and events in a manner thatachieves fair presentation.
We communicate with the Council and the CEO regarding, among other matters, the planned scope and timing of the audit and significant audit findings, including any significant deficiencies in internal control that we identify during our audit.
65
INDEPENDENT AUDITOR'S REPORT
TO THE COUNCILLORS OF THE SHIRE OF MT
MARSHALL (CONTINUED)
REPORT ON OTHER LEGAL AND REGULATORY REQUIREMENTS
In accordance with the Local Government (Audit) Regulations 1996, we also report that:
a) In our opinion, the following matter indicates a significant adverse trend in the financial position of theShire:
i) The Operating Surplus Ratio has been below the DLGSCI standard for the past 3 years as reportedin the financial report.
b) All required information and explanations were obtained by us;c) All audit procedures were satisfactorily completed in conducting our audit; andd) In our opinion, the asset consumption ratio and the asset renewal funding ratio included in the annual
financial report were supported by verifiable information and reasonable assumption s.
Matters Relating to the Electronic Publication of the Audited Financial Report This auditor's report relates to the annual financial report of the Shire of Mt Marshall for the year ended 30 June 2019 included on the Shire's website. The Shire's management is responsible for the integrity of the Shire's website. This audit does not provide assurance on the integrity of the Shire's website. The auditor's report refers only to the financial report described above. It does not provide an opinion on any other information which may have been hyperlinked to/from this financial report. If users of the financial report are concerned with the inherent risks arising from publication on a website, they are advised to refer to the hard copy of the audited financial report to confirm the information contained in this website version of the financial report.
Signed at Perth this 14th day of November 2019
66

Notice of Meeting Annual General Meeting of Electors
Notice is hereby given that the Annual General Meeting of Electors of the Shire of Mt Marshall
will be held on Tuesday 17 December 2019, in the Council Chambers, Bencubbin,
commencing at 5:00pm.
Order of Business
1. Attendance and Apologies.
2. Confirmation of Minutes of the Annual General Meeting of electors held on
Monday, 12 February 2019
3. Reading of the Auditors Report for 2018/2019.
4. Reading of the President’s Report for the year ended 30 June 2019.
5. Receiving of the Annual Report for 2018/2019.
6. General Business as the President thinks fit or as the majority of the electors
present may decide.
By order of Council
John Nuttall
Chief Executive Officer
67
Minutes of the Annual General Meeting of Electors
SHIRE OF MT MARSHALL
MINUTES
Electors’ General Meeting
Minutes of Annual General Meeting of Electors held on Tuesday 12 February 2019, in Council
Chambers, 80 Monger Street, Bencubbin commencing at 6:01pm
68
TABLE OF CONTENTS
1. Declaration Of Opening
2. Attendance and Apologies
3. Confirmation of Minutes of the Electors’ General Meeting held on Monday 12February 2018
4. Reading of the Auditor’s Report for 2017/2018
5. Reading of the President’s Report for the year ended 30 June 2018
6. Receiving of Annual Report for the year ending 30 June 2018.
7. General business as the President thinks fit or as the majority of the electorspresent may decide.
8. Closure of Meeting
69
1.0 Declaration of Opening / Announcement of Visitors
The Presiding Member declared the meeting open at 6:01pm
2.0 Record of Attendance / Apologies / Approved Leave of Absence
In Attendance
Cr ARC Sachse President / Presiding Member / Elector Cr NR Gillett Deputy President / Elector Cr RM Kirby Councillor / Elector Cr SE Faulkner Councillor / Elector Cr LN Gobbart Councillor / Elector Cr IC Sanders Councillor / Elector Cr SR Putt Councillor / Elector
Mr John Nuttall Chief Executive Officer Ms Nadine Richmond Executive Assistant / Elector Ms Tanika McLennan Finance Administration Manager / Elector Mr John Beagley Elector Mrs Jeanette Beagley Elector Mrs Tracy Tranter Elector Mr Michael Carr Elector Mrs Megan Beagley Elector Mr Len Cargeeg Elector Mr Peter Waters Elector 6.02 – 6.33
Apologies
Mrs Tanya Gibson Elector
3.0 Confirmation of Minutes of Previous Electors’ General Meeting
3.1 Minutes of the Electors’ General Meeting held 12 February 2018
2019/1-001 ELECTORS RESOLUTION:
That the Minutes of the Electors’ General Meeting held on Monday 12 February 2018 be confirmed as a true and correct record of proceedings.
Moved Mr Len Cargeeg Seconded Mrs Tracy Tranter Carried
70
4.0 Reading of the Auditor’s Report for 2017/18
5.0 Reading of the President’s Report for the Year Ended 30 June 2018
6.0 Receiving of Annual Report for the year ending 30 June 2018
2019/1-002 ELECTORS RESOLUTION:
That the Annual Report for the year ended 30 June 2018 as previously adopted by Council incorporating;
- The Financial Statements- Auditors Report- President’s Report- CEO’s Report
Be received by the Electors of the Shire of Mt Marshall.
Moved Mr Len Cargeeg Seconded Mrs Jeanette Beagley Carried
7.0 General business as the President thinks fit or as the majority of the Electors present may decide
Summary of question from Megan Beagley: Now that it has been determined that funding is available for the Bencubbin Swimming Pool refurbishment, is there finally going to be full transparency in the total costs and financial implications of the project, and further opportunity for rate payers to properly consider the project? Until this occurs, all prior consultation and responses can only be considered as being emotive and baseless.
Summary of response from the Presiding Member: Thank you for your question Megan. Firstly the CSRFF funding application was for the Mt Marshall Aquatic Facility, situated at the existing site in Bencubbin. The site was chosen so as to minimize the cost and financial burden on ratepayers. Council had determined that the current site was of significantly lower cost than the other identified locations, namely the Bencubbin Multipurpose Complex and the Beacon Sporting Complex.
I believe that there has already been full transparency, given what Council can reasonably provide with regard to commercial confidentiality. Furthermore the aquatic facility redevelopment has been identified and planned for in Council’s Strategic Plan, Corporate Business Plan and Long Term Financial Plan. There has also been extensive community consultation, and it is incorrect to say that this has been emotive and baseless. Council will continue to release information on the refurbishment, as it has done in the past.
If the proposed redevelopment does take place, it will need to go to a full tender, and any recommendation following this tender process will need to be considered and voted on by Council.
71
Summary of question from Megan Beagley: What consideration is the Council taking towards the residents who live in the North of the Mt Marshall Shire who have always had to travel to access an aquatic facility? If the Council considered the same reason of travel as a valid response from southern residents to support a swimming pool facility, there is therefore an acceptance that travelling 40-60kms to a swimming pool is inappropriate for any rate payer. How will this inequity be addressed?
Summary of response from the Presiding Member: Thank you for your question Megan. The location of the Mt Marshall aquatic facility redevelopment was primarily determined by what was considered to be affordable and achievable, given the resources available. This is in line with responsible asset management. In regard to the travel distance involved, Council has and will continue to help fund primary school in term swimming lessons.
At the June 2018 Ordinary Meeting of Council, resolution 2018/5-006 was carried. Part 3 of the resolution was “Direct the Chief Executive Officer to seek indicative quotes for a zero water (splash pad) aquatic option located at the Beacon Recreation Complex”. Some initial investigation has already taken place and further consultation and modelling will be undertaken over the coming months.
2019/1-003 ELECTORS MOTION:
That the Mt Marshall Shire Council adhere to their own motion of 14 Feb 2017 MOTION 12.4.6
That: 1. Council acknowledge an historic equity imbalance in the provision
of facilities between the towns of Beacon and Bencubbin;2. A desktop review be undertaken on proposed infrastructure upgrades
for Beacon and that a further report be made to Council with aview to implementing a 5 year development program for the town;
3. That the Shire’s Community Development Officer investigate and report onother local government models for the development and support ofvolunteers in both communities; and
4. That any agreed infrastructure development program and volunteersupport program be incorporated into the Shire’s Community StrategicPlan
and in doing so create a plan for bridging the growing imbalance in the provision of facilities and services between the towns of Beacon and Bencubbin, and make public the desktop review and subsequent 5 year development plan.
Moved Mrs Megan Beagley Seconded Mr Michael Carr Lost
72

8.0 Closure of Meeting
The Presiding Member thanked everyone for their attendance and declared the meeting closed at 6:33pm.
These Minutes were confirmed at the Electors’ General Meeting held on
___________________ __________________________ Date President
73

Freedom of Information Statement
The Shire of Mt Marshall maintains records relating to each property within the Shire and also
records relating to the function and administration of the Shire including minutes of meetings,
a financial interests register, register of delegations, rates book, electoral roll, financial
statements, and local laws. These documents amongst others, can be inspected (or copies
of which may be made available for purchase) at the Shire Office, 80 Monger St, Bencubbin
during business hours.
The Shire of Mt Marshall will provide information held to people requesting it. Should a request
not be met satisfactorily, then a more Freedom of Information Application can be lodged.
Requests for information under the Freedom of Information Act can be lodged with the
Freedom of Information Co-ordinator, Ms Nadine Richmond – Executive Assistant, Shire of
Mt Marshall, 80 Monger St, Bencubbin.
Requests for changes to personal information must be made in writing.
The Shire’s full Freedom of Information Statement may be found on the Shire’s website
www.mtmarshall.wa.gov.au or a copy may be obtained by contacting the Shire Office by
telephone on 08 9685 1202 or via email to [email protected]
During the year ended 30 June 2019, no Freedom of Information applications were received.
74

National Competition Policy
National Competition Policy (NCP) is designed to enhance the effectiveness of public sector agencies and lead to more efficient use of all economic resources. There are a number of specific requirements placed on local government in the areas of competitive neutrality, legislation review and structural reform.
1. Competitive NeutralityThe principle of competitive neutrality is that government businesses should not enjoy acompetitive advantage, or disadvantage, simply as a result of their public sector ownership.Measures should be introduced to effectively neutralise any net competitive advantage flowingfrom government ownership.
Competitive neutrality should apply to all business activities, which generate a users-pay income of over $200,000 unless it can be shown it is not in the public interest. Public benefit tests are used to determine if competitive neutrality is in the public interest.
The Shire of Mt Marshall does not operate a business activity, which generates a user-pays income over $200,000 per annum.
Consequently, the Shire of Mt Marshall is not required to implement competitive neutrality.
2. Legislation ReviewAll local governments are required to assess which of their local laws might impact oncompetition and conduct a review of each to determine how any restrictive practices might beovercome.
Where necessary Clause 7 legislation review principles will be complied with and the Shire of Mt Marshall remains committed to reviewing its existing local laws, as well as proposed local laws.
3. Structural ReformBefore local governments privatise a monopoly business or introduce competition into a sectordominated by a monopoly or near monopoly, the regulatory and commercial activities must beseparated and a review undertaken.
The Shire of Mt Marshall did not privatise any activities in 2018/19 , consequently there were no obligations for structural reform. Nevertheless, the Shire of Mt Marshall is committed to the principles of structural reform under National Competition Policy.
75
Disability Access & Inclusion Plan
The Shire of Mt Marshall Disability Plan has been in place since 1996. The Shire’s Disability and Access Plan is required to be reviewed every five years. A review of the Shire’s 2012-2017 plan began in 2018 and will be drafted alongside and in conjunction with the review of the Shire’s strategic plans as well as being made available to the public during the community consultation period. The plan will be valid from 2018 – 2023.
All the Shire’s functions, facilities and services are reviewed annually to ensure they meet the needs of people with disabilities.
The Shire of Mt Marshall is committed to ensuring that the community is an accessible community for people with disabilities, their families and carers.
The Shire of Mt Marshall believes that people with disabilities, their families and carers who live in country areas should be supported to remain in the community of their choice.
The Shire of Mt Marshall is committed to consulting with people with disabilities, their families and carers and where required, disability organizations to ensure that barriers to access are addressed appropriately.
The Shire of Mt Marshall aims to ensure that all new constructions are designed incorporating disability access.
The Shire of Mt Marshall is committed to achieving the following outcomes:
Outcome 1: Existing functions, facilities and services are adapted to meet the needs of people with disabilities.
Outcome 2: Access to buildings and facilities is improved.
Outcome 3: Information about functions, facilities and services is provided in formats, which meet the communication requirements of people with disabilities.
Outcome 4: Staff awareness of the needs of people with disabilities and skill in delivering advice and services are improved.
Outcome 5: Opportunities for people with disabilities to participate in public consultation, grievance mechanisms and decision-making processes are provided.
Outcome 6: People with disabilities have the same opportunities as other people to participate in any public consultation by the Shire of Mt Marshall.
Outcome7: People with disabilities have the same opportunities as other people to obtain and maintain employment with a public authority.
Copies of the Disability Services Plan and the Disability Access & Inclusion Plan (DAIP) are available upon request by contacting the Shire Office by telephone on 08 9685 1202 or via email to [email protected]
76

Record Keeping Plan
The State Records Act 2000 requires that the Shire maintains and disposes of all records in the prescribed manner. The Shire of Mt Marshall maintains a Record Keeping Plan, which was reviewed in early 2018 and approved by the State Records Office.
Evaluation Evaluation of the efficiency and effectiveness of the shire’s record keeping plan is ongoing and considered each time a function is carried out. Internal performance indicators such as spot checks for accuracy of stored records are undertaken, and on the basis of response times the record keeping system is assessed as being appropriate.
Staff Training Staff members responsible for the management of records receive external record keeping training with a focus on local government records, including the retention and disposal methods.
All administrative staff receive an introduction to record keeping and the shire’s record keeping system as part of their induction program ensuring compliance with the record keeping plan. In addition, staff information sessions and presentations are conducted as required.
Internal performance indicators such as spot checks for accuracy of stored records are undertaken, and on the basis of response times the effectiveness of staff training is assessed as being appropriate.
77

Employee Remuneration
As per Section 19B of the Local Government (Administration) Regulations 1996, the annual
report must contain information on the number of employees entitled to an annual salary of
$100,000 or more. It also must be reported the number of employees in each band of $10,000
over $100,000.
One employee received a salary between $120,000 and $130,000 during the year ended 30
June 2019.
One employee received a salary between $150,000 and $160,000 during the year ended 30
June 2019
78
Complaints Register
As per Section 5.53(2)(hb) of the Local Government Act 1995, the annual report must contain
details of entries made under section 5.121 during the financial year in the register of
complaints, including —
(i) the number of complaints recorded in the register of complaints; and
(ii) how the recorded complaints were dealt with.
During the year ended 30 June 2019, no complaints were recorded in the register of
complaints.
79