Embed Size (px)
Citation preview
ANNUAL REPORT2018

— 1 —SUZUKI MOTOR CORPORATION
ContentsA Message from the Management ____________________________________________ 2
Financial Highlights _________________________________________________________ 4
Year in Review ______________________________________________________________ 6
Automobiles ____________________________________________________________ 6
Motorcycles _____________________________________________________________ 8
Marine, etc. ____________________________________________________________ 10
ESG Information ___________________________________________________________ 11
Environmental Initiatives ________________________________________________ 11
CSR Policy _____________________________________________________________ 13
Corporate Governance ___________________________________________________ 14
Directors, Auditors and Officers ________________________________________ 14
Corporate Governance Issues __________________________________________ 15
Risks in Operations ___________________________________________________ 16
Financial Section __________________________________________________________ 18
Company Outline __________________________________________________________ 48
— 2 —SUZUKI MOTOR CORPORATION
A Message from the Management
Thank you very much for your continued support.
Management results of FY2017With respect to the management environment of the Group for FY2017, the economy is recovering moderately as a whole. On the other hand, there are concerns about the in-fluence of the US tariff policy, uncertainties about prospects for the economy of China and developing countries in Asia, and others. In India, an important market for the Group, the economy is expanding mainly owing to increase of domestic consumption. Also in Japan, the economy is recovering mod-erately on the back of various measures introduced by the government.Under these circumstances, the consolidated net sales of the fiscal year (April 2017 to March 2018) increased by ¥587.7 billion (18.5%) to ¥3,757.2 billion compared to the previous fiscal year. The Japanese domestic net sales increased by ¥79.2 billion (7.6%) to ¥1,116.7 billion year-on-year mainly owing to increase in automobile sales. The overseas net sales increased by ¥508.5 billion (23.8%) to ¥2,640.5 billion year-on-year mainly owing to increase in automobile and motor-cycle sales in markets including India and Europe.In terms of the consolidated income, the operating income increased by ¥107.5 billion (40.3%) to ¥374.2 billion year-on-year mainly owing to improvement in profit in Asia, Japan, and Europe. The ordinary income increased by ¥96.1 billion (33.5%) to ¥382.8 billion year-on-year. The net income attributable to shareholders of the parent increased by ¥55.7 billion (34.9%) to ¥215.7 billion year-on-year.
Basic policies for profit distributionUnder the Mid-Term Management Plan SUZUKI NEXT 100 (from FY2015 to FY2019), the Company prioritises invest-ment for growth, and set the dividend payout ratio target to 15% or more.The Company was able to achieve the FY2019 net sales target of ¥3,700 billion and operating income margin target of 7% in the fiscal year, which is ahead of schedule. On the other hand, improvement of shareholders’ equity ratio remains an impor-tant issue.Taking the above into consideration, the Company applied the dividend payout ratio target of 15% to the annual divi-dends, which became ¥74.00 per share, up by ¥30.00 per share from the previous fiscal year, and to the year-end divi-dends, which became ¥44.00 per share.The annual dividends of ¥74.00 per share is the eighth con-secutive increase in annual dividends.
Outstanding issuesThe automobile industry is undergoing a period of great trans-formation. In such transformation, it is necessary to open up the future in long-term outlook by imaging the targeted as-pect of 10 years and 15 years ahead, and tracing back to the present to think about what should be done from now.In or around 2030, there is possibility that India would grow up to be a market of 10 million units. If we are to maintain the current market share of 50%, Suzuki would become 5 million units. Suppose the other markets would be 2 million units, Suzuki as a whole would be 7 million units. This is rath-er a theoretical figure than a target, but Suzuki will challenge toward the future growth.Also, we believe that fulfilling India would lead to fulfilling oth-er markets through globally expanding the models developed for India.But still, this is a total frontier for the Company, which would be more than double the present size. The management and every single one of our employees need to change the way of thinking and effectively distribute management resources of people, goods, and capital.By that means, the activity toward this long-term outlook is a challenge that dedicates future of Suzuki without extension.Amidst such conditions, the Group is addressing the following issues.
n QualityThe quality problem remains unchanged as the most impor-tant issue for the Company.Customer safety and security is the top priority for the Group, and we are working to develop and produce high-quality products which customers can use safely and securely and to provide after-sales services.In the future, while accurately ascertaining the quality needs of customers, the Group will maintain a high level of quality awareness in all departments and will continue to make the utmost effort to ensure that customers can use our products safely and securely.
A Message from the Management

— 3 —SUZUKI MOTOR CORPORATION
A Message from the Management
n Products and R&DAs for products, along with continuing to introduce unique products with value exceeding customer expectations, with 2030 in mind, we need to efficiently set development models while the sales units continue to expand.As for environmental problems, we not only need to boost the extension of conventional technologies but initiatives for new technologies as well. Along with making of small cars and development of high-efficiency powertrain which Suzuki excels in, we will proactively make efforts in expansion and strengthening of hybrids and new development of EVs.Further, we will also work on safety technology and infor-mation communications technology such as connected technology.
n ProductionAs for production, the Group will work to construct Safety First and optimal global production system. In India, in particular, we will proactively work on strengthening production system of Gujarat Plant and battery plant from the Make in India point of view, which is an initiative promoted by the Government of India.
n Sales and ServiceThe Group will reinforce the sales network and service net-work globally.In India, in particular, although we currently have acquired the majority share in the passenger car sector, we would like to secure the majority share even in 2030. We will proactively deal with ways to realise this in detail.
n Automobile BusinessThe Group has positioned Japan at the centre of global auto-mobile development, the base of production.Our strategy for products in this sector is to concentrate on the mini vehicle, A, and B segments to match the growing compact car market worldwide.As for our regional strategy, we will continue to reinforce our operation base with a focus on Asia, such as Japan, India, In-donesia, and Pakistan.
n Motorcycle BusinessWhile focussing on the 150cc and up, backbone, and sport categories, the Group is strengthening the consistency of the Suzuki brand by ranging the series from large engine dis-placement motorcycles to small engine displacement motor-cycles.
Other reforms include reinforcing the scooter category in the growing market of India, improving operation rate by expand-ing ASEAN-produced models within and outside the market, and consolidating development, production, and sales at the Hamamatsu Plant. The Group will aim to maintain its profitable structure through continuously remaining vigilant with such management reforms.
n Marine BusinessThe Group will reinforce and expand its large four-stroke out-board lineup and cultivate the business and leisure markets to build the world’s top four-stroke outboard brand under the brand slogan “THE ULTIMATE 4-STROKE OUTBOARD.”
n Further ESG (Environmental, Social, and Governance) Initiatives
As for environment, the Group will apply the Suzuki Environ-mental Plan 2020 and work for the development and adoption of environmental technologies and to reduce CO2 emissions.As for society, we will actively work on product safety and quality, contribution to the community, investment in people, development of human resources, and work safety, so that we can respond to expectations by the stakeholders.As for governance, we will advance our corporate governance and compliance systems and strengthen our initiatives on management systems and legal compliance.The Group will actively take on environmental, social, and governance issues and strive to become a group worthy of the love and confidence of customers around the world.
With respect to the case in August 2018 where emission and fuel consumption sample testing result that should be made invalid was treated as valid data, we would like to offer our sincere apologies for the concern this matter has caused to our customers and business partners. We will make efforts in preventive measures through fulfilling checking structure and carrying out thorough employee education.
As mentioned before, the activity toward the long-term out-look is a challenge that dedicates future of Suzuki without extension. The Company as a whole will make efforts toward this initiative.
We look forward to the continued support and encourage-ment of our shareholders and investors.
Representative Director and President Toshihiro Suzuki

— 4 —SUZUKI MOTOR CORPORATION
Financial Highlights
2,938,3143,015,461
3,180,659 3,169,542
3,757,219
229,693268,325
266,329 257,585
294,210
65,08465,976
67,002 56,115
62,454
398,902372,028
404,722 425,332
510,643
1,111,900 1,214,5191,394,720 1,392,961
1,773,145
2014 2015 2016 2017 2018
1,132,732 1,094,611 1,047,883 1,037,5461,116,764
OthersNorth AmericaEuropeAsiaJapan
2,938,3143,015,461
3,180,659 3,169,542
3,757,219
Marine, etc.MotorcyclesAutomobiles
266,602250,485
233,889 206,289
246,362
56,04663,033
68,253 67,633
75,053
2014 2015 2016 2017 2018
2,615,6642,701,942
2,878,515 2,895,619
3,435,802
191.60172.67
234.98
362.54
488.86
107,484
96,862
116,660
159,956
215,730
20172014 2015 2016 2018
Net income (Millions of yen)
Net income per share (Yen)
6.4%6.0% 6.1%
8.4%
10.0%
187,747179,424
195,308
266,685
374,182
20172014 2015 2016 2018
Operating income
Margin
10
14
24
10
17
27
15
30
17
32
17
27
44
74
44
20172014 2015 2016 2018
Year-end dividends
Interim dividends
Dividend payout ratio
Dividend payout ratio (excl. gain on sales of investment securities)
12.5%
15.6%17.3%
13.6%
15.2% 15.1%
12.1%
Financial HighlightsYears ended 31 March
n Net sales by geographic region (Millions of yen)
n Operating income (Millions of yen) n Net income attributable to owners of the parent
n Dividends (Yen)
n Net sales by segment (Millions of yen)

— 5 —SUZUKI MOTOR CORPORATION
Financial Highlights
4.3% 4.2% 4.1% 4.2%3.7%
127,090 125,897131,031 131,539
139,390
20172014 2015 2016 2018
R&D expenses
Ratio of R&D expenses to sales
213,619
117,188
194,457
134,377
171,535168,315 163,397
198,782
150,877
213,376
20172014 2015 2016 2018
Capital expenditure
Depreciation
8.7%6.9%
9.6%
15.4%
17.9%
20172014 2015 2016 2018
ROE
2,874,074
1,494,357
3,252,800
1,701,390
2,702,008
1,187,7031,387,041
3,115,985
20172014 2015 2016 2018
46.2% 45.6%
35.4% 35.9%
1,595,227
3,340,828
38.8%
Total assets Net assets Shareholders’ equity ratio
-286,559
-520,361
-120,909
-242,435-288,564
322,915
36,356
255,037
2,809
134,128
51,66084,472 89,505
294,095
77,751
366,315
-341,585
-113,922
103,586
445,171
20172014 2015 2016 2018
Cash �ows from operating activitiesCash �ows from investing activitiesCash �ows from �nancing activities Free cash �ows
1,981
2,709
2,111
2,867
2,231
2,861
2,279
2,918
728 756630 639
2,556
3,224
668
2014 2015 2016 2017 2018
1,852
2,033
1,645
1,799
1,358
1,480
1,229
1,370
180 154 122 141
1,478
1,630
152
2014 2015 2016 2017 2018
Overseas
Japan
1,948
2,022
1,699
1,766
1,440
1,501
1,305
1,367
74 67 61 62
1,520
1,580
60
2014 2015 2016 2017 20182014 2015 2016 2017 2018
1,859
2,857
1,988
3,043
2,090
2,951
2,203
3,074
998 1,055861 871
2,367
3,338
971
Years ended 31 March
n Capital expenditure/Depreciation (Millions of yen)
n Total assets/Net assets/Shareholders' equity ratio (Millions of yen)
n Automobile production (Thousand units)
n Motorcycle production (ATV included) (Thousand units)
n Motorcycle sales (ATV included) (Thousand units)
n Automobile sales (Thousand units)
n Cash flows (Millions of yen)
n R&D expenses (Millions of yen) n ROE
— 6 —SUZUKI MOTOR CORPORATION
Year in Review
Automobiles
Swift Sport (launched in September 2017)
Spacia (launched in December 2017)
Spacia Custom (launched in December 2017)
XBEE (launched in December 2017)
Year in Review
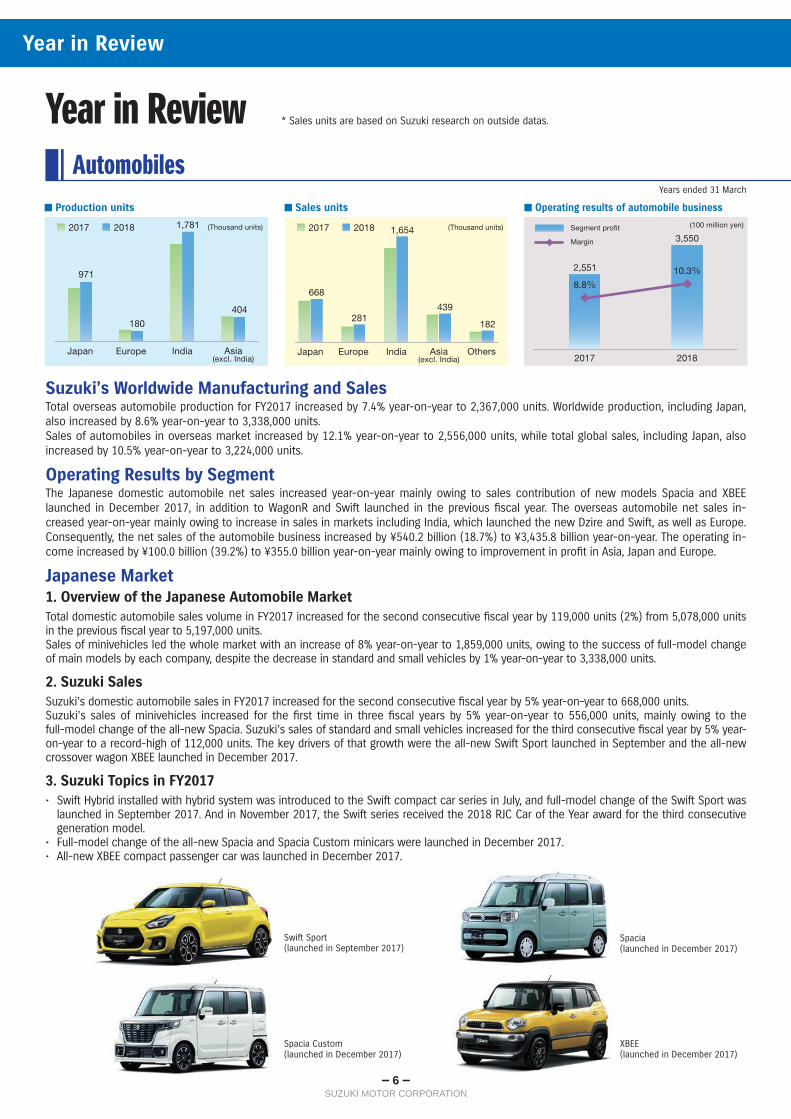
Years ended 31 March
Suzuki’s Worldwide Manufacturing and SalesTotal overseas automobile production for FY2017 increased by 7.4% year-on-year to 2,367,000 units. Worldwide production, including Japan, also increased by 8.6% year-on-year to 3,338,000 units.Sales of automobiles in overseas market increased by 12.1% year-on-year to 2,556,000 units, while total global sales, including Japan, also increased by 10.5% year-on-year to 3,224,000 units.
Operating Results by SegmentThe Japanese domestic automobile net sales increased year-on-year mainly owing to sales contribution of new models Spacia and XBEE launched in December 2017, in addition to WagonR and Swift launched in the previous fiscal year. The overseas automobile net sales in-creased year-on-year mainly owing to increase in sales in markets including India, which launched the new Dzire and Swift, as well as Europe. Consequently, the net sales of the automobile business increased by ¥540.2 billion (18.7%) to ¥3,435.8 billion year-on-year. The operating in-come increased by ¥100.0 billion (39.2%) to ¥355.0 billion year-on-year mainly owing to improvement in profit in Asia, Japan and Europe.
Japanese Market1. Overview of the Japanese Automobile MarketTotal domestic automobile sales volume in FY2017 increased for the second consecutive fiscal year by 119,000 units (2%) from 5,078,000 units in the previous fiscal year to 5,197,000 units.Sales of minivehicles led the whole market with an increase of 8% year-on-year to 1,859,000 units, owing to the success of full-model change of main models by each company, despite the decrease in standard and small vehicles by 1% year-on-year to 3,338,000 units.
2. Suzuki SalesSuzuki’s domestic automobile sales in FY2017 increased for the second consecutive fiscal year by 5% year-on-year to 668,000 units.Suzuki’s sales of minivehicles increased for the first time in three fiscal years by 5% year-on-year to 556,000 units, mainly owing to the full-model change of the all-new Spacia. Suzuki’s sales of standard and small vehicles increased for the third consecutive fiscal year by 5% year-on-year to a record-high of 112,000 units. The key drivers of that growth were the all-new Swift Sport launched in September and the all-new crossover wagon XBEE launched in December 2017.
3. Suzuki Topics in FY2017• Swift Hybrid installed with hybrid system was introduced to the Swift compact car series in July, and full-model change of the Swift Sport was
launched in September 2017. And in November 2017, the Swift series received the 2018 RJC Car of the Year award for the third consecutive generation model.
• Full-model change of the all-new Spacia and Spacia Custom minicars were launched in December 2017.• All-new XBEE compact passenger car was launched in December 2017.
* Sales units are based on Suzuki research on outside datas.
n Production units n Sales units n Operating results of automobile business
971
1,781
180
404
2017 2018
Japan India Asia(excl. India)
(Thousand units)
Europe
668
281
2017 2018 1,654
439
182
Japan India Asia(excl. India)
Others
(Thousand units)
Europe
8.8%10.3%2,551
3,550
2017 2018
(100 million yen)Segment pro�t
Margin

— 7 —SUZUKI MOTOR CORPORATION
Year in Review
Overseas Markets1. Overview of Suzuki’s Main Overseas Automobile MarketsNew car sales (total market of passenger and commercial vehicles) in India increased in FY2017 by 10% year-on-year to 4,144,000 units, while new car sales in Europe increased by 2% year-on-year to 20,820,000 units.
As for other countries and areas, new car sales in Indonesia increased by 4% year-on-year to 1,107,000 units, Pakistan increased by 18% year-on-year to 247,000 units, Oceania in total increased by 5% year-on-year to 1,387,000 units, and Latin America in total increased by 9% year-on-year to 6,047,000 units, while the Middle East in total decreased by 8% year-on-year to 2,235,000 units, and Africa in total decreased by 4% year-on-year to 1,188,000 units.
2. Suzuki SalesSuzuki’s overseas automobile sales volume in FY2017 increased by 12% year-on-year to 2,556,000 units. Suzuki’s sales in India increased by 15% year-on-year to a record-high 1,654,000 units owing mainly to strong demand for models including the Baleno, Vitara Brezza, and Dzire, as well as launching of the all-new Swift. Suzuki’s sales in Europe increased by 15% year-on-year to 281,000 units owing to launching of the all-new Swift and Ignis, in addition to strong demand for other lineup of models.
As for other countries and areas, Suzuki’s sales in Indonesia increased by 24% year-on-year to 114,000 units, Pakistan increased by 23% year-on-year to 139,000 units, Oceania in total increased by 3% year-on-year to 27,000 units, Latin America in total increased by 14% year-on-year to 117,000 units, the Middle East in total increased by 29% year-on-year to 16,000 units, and Africa in total decreased by 6% year-on-year to 21,000 units.
3. Suzuki Topics in FY2017• The all-new Swift was unveiled to the overseas market for the first time at the Geneva Motor Show in March 2017 and subsequently start-
ed sales in the overseas market. The all-new Swift is produced in and exported from Japan, India, and Thailand.• In April 2017, Suzuki’s Hungarian subsidiary Magyar Suzuki Corporation achieved accumulated production of 3 million units. Up until now,
cars produced in Hungary have been exported to more than 100 countries and regions worldwide.• The all-new Swift was selected as TOP3 of the 2018 World Urban Car category at the World Car Awards in March 2018. This is the second
consecutive year for Suzuki’s model to be selected as TOP3 following the Ignis in 2017.
Swift (unveiled for overseas market in March 2017)

— 8 —SUZUKI MOTOR CORPORATION
Year in Review
Suzuki’s Worldwide Manufacturing and SalesTotal overseas motorcycle production (including ATVs) in FY2017 increased by 20.2% year-on-year to 1,478,000 units. Worldwide production, including production in Japan, also increased by 19.0% year-on-year to 1,630,000 units.Sales of motorcycles (including ATVs) in overseas market increased by 16.4% year-on-year to 1,520,000 units, while total global sales, including Japan, also increased by 15.5% year-on-year to 1,580,000 units.
Operating Results by SegmentThe net sales increased by ¥40.1 billion (19.4%) to ¥246.4 billion year-on-year mainly owing to sales contribution of scooters in India and large displacement models in developed countries. The operating loss of ¥0.9 billion in the previous fiscal year improved to an operating income of ¥4.6 billion.
Japanese Market1. Overview of Japanese Motorcycle MarketThe total domestic motorcycle sales (factory shipments) of the four Japanese manufacturers in FY2017 increased by 2% year-on-year to 349,000 units. Sales of models with engine displacements of 126cm3 and higher were up 29% year-on-year at 97,000 units. Sales of models with engine displacements up to 125cm3 were down 5% year-on-year at 252,000 units. While there are structural concerns of poor demand in the domestic market such as aging of users and decrease in younger population, it is assumed that last-minute demand of models which were discontinued due to environmental restrictions, and launching of new models raised the level of demands.
2. Suzuki SalesSuzuki’s domestic sales (factory shipments) in FY2017 were flat on the year at 60,000 units. Sales of models with engine displacements of 126cm3 and higher were up 73% year-on-year to 14,000 units. Sales of models with engine displacements up to 125cm3 were down 11% year-on-year to 46,000 units. Models with engine displacements between 126cm3 and 250cm3 largely grew by 121% to 9,000 units owing to launch of new models GSX250R and V-Strom 250. On the other hand, models with engine displacements of up to 125cm3 fell year-on-year owing to decrease of models due to environmental restrictions.
3. Suzuki Topics in FY2017• Japan specification model of Suzuki’s flagship supersport bike, the all-new GSX-R1000R ABS, was launched in July 2017. With the concept
of No.1 Sportbike, by thoroughly reviewing the fundamental design and adopting technologies developed in MotoGP, it underwent its first full-model change in eight years, and Japan-specification model was launched for the first-time ever.
• GSX250R and V-Strom 250 received the 2017 Good Design Award in October 2017. They were valued for having different concepts and de-signs while sharing the common platform.
Motorcycles
GSX250R (launched in April 2017)GSX-R1000R ABS (launched in July 2017) V-Strom 250 (launched in July 2017)
Years ended 31 March
n Operating results of motorcycle businessn Production units (ATV included) n Sales units (ATV included)
152
2017 2018
4 42
1,431
Japan North America Asia Others
(Thousand units)
4060
2017 2018
35184
1,261
Japan North America Asia Others
(Thousand units)
Europe
-9
1.9%
46
2017 2018
(100 million yen)Segment pro�t
Margin

— 9 —SUZUKI MOTOR CORPORATION
Year in Review
Overseas Markets1. Overview of Suzuki’s Main Overseas Motorcycle MarketsSales of motorcycles in Europe in FY2017 decreased by 8% year-on-year to 961,000 units. Sales of motorcycles (including ATVs) in North America also decreased by 2% year-on-year to 777,000 units.Sales in the six key ASEAN countries (Indonesia, Thailand, Vietnam, the Philippines, Malaysia, and Cambodia) increased by 5% year-on-year to 13,146,000 units. Sales in China decreased by 1% year-on-year to 7,796,000 units. Sales in India increased by 15% year-on-year to 20,193,000 units.
2. Suzuki SalesSuzuki’s overseas motorcycle sales in FY2017 increased by 16% year-on-year to 1,520,000 units.Sales in Europe decreased by 11% year-on-year to 40,000 units, but North America increased by 11% year-on-year to 35,000 units.Sales in the six key ASEAN countries increased by 12% year-on-year to 296,000 units, China increased by 9% year-on-year to 392,000 units, and India increased by 43% year-on-year to 501,000 units.
3. Suzuki Topics in FY2017• Full-model change of motocross bike RM-Z450 was announced in July 2017.
• New standard model SV650X ABS was unveiled at EICMA (Milan Show) held in Milan, Italy in November 2017.
• New 125cm3 scooter BURGMAN STREET produced by Suzuki Motorcycle India was unveiled at the Auto Expo held in India in February 2018.
• New 125cm3 scooter SWISH produced by Tai Ling Motor was announced in Taiwan in March 2018.
• In its motorsport activities, Suzuki participated in the MotoGP class of the Road Racing Grand Prix with a new team structure. Also, the all-new supersport bike GSX-R1000 made excellent results worldwide. It won at the Isle of Man TT, achieved champions of superbike champi-onships in the US and Australia, and ended second overall in Japan superbike championship and Endurance World Championship.
RM-Z450 (unveiled for overseas market in July 2017) SV650X ABS (unveiled for overseas market in November 2017)
BURGMAN STREET (unveiled in India in February 2018) SWISH (unveiled in Taiwan in March 2018)
— 10 —SUZUKI MOTOR CORPORATION
Year in Review
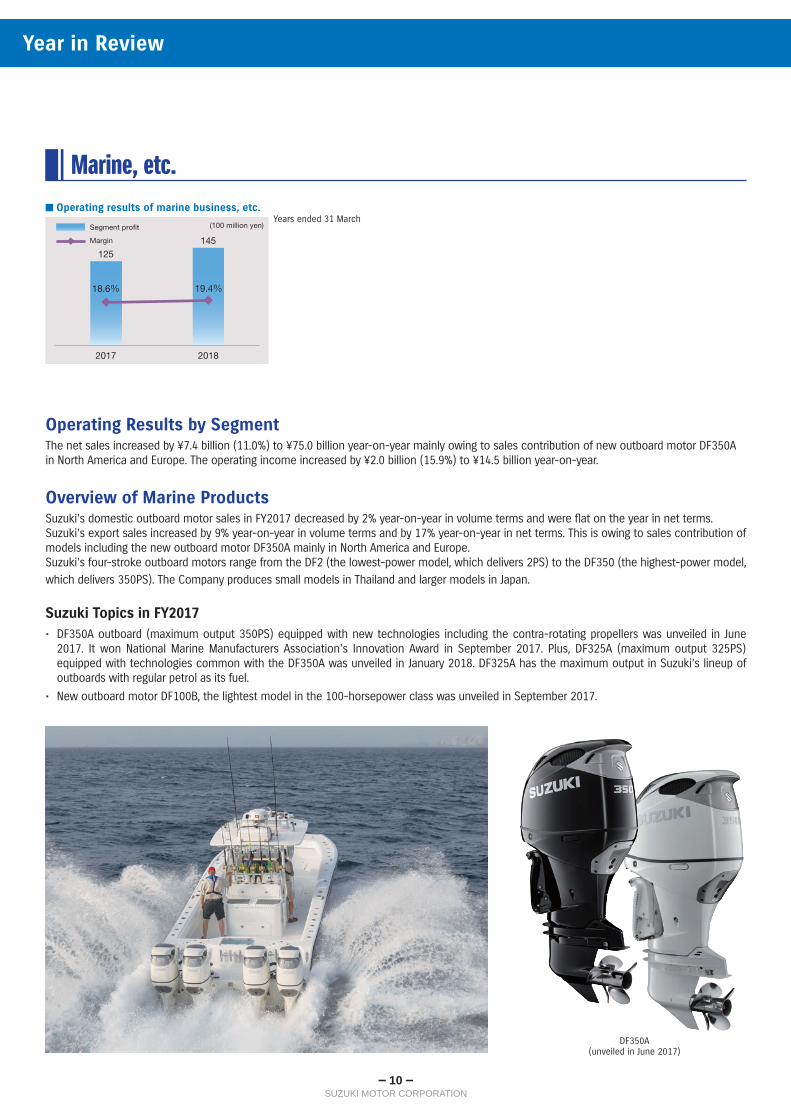
Operating Results by SegmentThe net sales increased by ¥7.4 billion (11.0%) to ¥75.0 billion year-on-year mainly owing to sales contribution of new outboard motor DF350A in North America and Europe. The operating income increased by ¥2.0 billion (15.9%) to ¥14.5 billion year-on-year.
Overview of Marine ProductsSuzuki’s domestic outboard motor sales in FY2017 decreased by 2% year-on-year in volume terms and were flat on the year in net terms.Suzuki’s export sales increased by 9% year-on-year in volume terms and by 17% year-on-year in net terms. This is owing to sales contribution of models including the new outboard motor DF350A mainly in North America and Europe.Suzuki’s four-stroke outboard motors range from the DF2 (the lowest-power model, which delivers 2PS) to the DF350 (the highest-power model, which delivers 350PS). The Company produces small models in Thailand and larger models in Japan.
Suzuki Topics in FY2017• DF350A outboard (maximum output 350PS) equipped with new technologies including the contra-rotating propellers was unveiled in June
2017. It won National Marine Manufacturers Association’s Innovation Award in September 2017. Plus, DF325A (maximum output 325PS) equipped with technologies common with the DF350A was unveiled in January 2018. DF325A has the maximum output in Suzuki’s lineup of outboards with regular petrol as its fuel.
• New outboard motor DF100B, the lightest model in the 100-horsepower class was unveiled in September 2017.
Marine, etc.
DF350A(unveiled in June 2017)
Years ended 31 March
125145
18.6% 19.4%
2017 2018
(100 million yen)Segment pro�t
Margin
n Operating results of marine business, etc.
— 11 —SUZUKI MOTOR CORPORATION
ESG Information
As a manufacturer of automobiles, motorcycles, marine, and other items, Suzuki acts in consideration of the environment at all product stages from development to disposal.In product development, our environmental initiatives include improving fuel economy, reducing exhaust emissions, developing next-generation vehicles, and acting in consideration of recycling. In manufacturing, our efforts include reducing global CO2 emissions, reducing energy requirements, and promoting the use of alternative energy sources. In distribution, we focus on im-proving the operational efficiency and energy efficiency of transportation and on promoting the 3Rs (Reduce, Reuse and Recycle). In marketing, we promote environmental management among our dealers and strive to ensure proper disposal of end-of-life products.We also pursue environmental initiatives that are not directly related to our products. For instance, we promote energy savings and green purchasing in our offices, give our workers environmental education, and support social action programs in local communities.
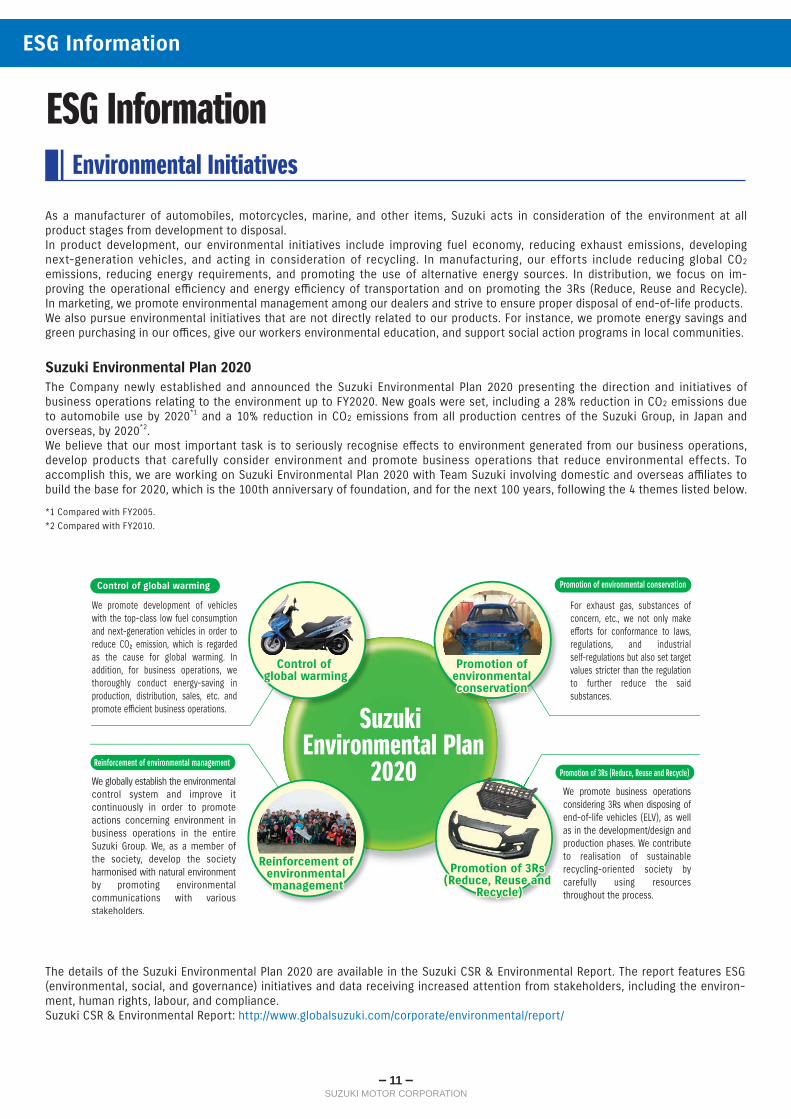
Suzuki Environmental Plan 2020The Company newly established and announced the Suzuki Environmental Plan 2020 presenting the direction and initiatives of business operations relating to the environment up to FY2020. New goals were set, including a 28% reduction in CO2 emissions due to automobile use by 2020*1 and a 10% reduction in CO2 emissions from all production centres of the Suzuki Group, in Japan and overseas, by 2020*2.We believe that our most important task is to seriously recognise effects to environment generated from our business operations, develop products that carefully consider environment and promote business operations that reduce environmental effects. To accomplish this, we are working on Suzuki Environmental Plan 2020 with Team Suzuki involving domestic and overseas affiliates to build the base for 2020, which is the 100th anniversary of foundation, and for the next 100 years, following the 4 themes listed below.
*1 Compared with FY2005.*2 Compared with FY2010.
Environmental Initiatives
ESG Information
The details of the Suzuki Environmental Plan 2020 are available in the Suzuki CSR & Environmental Report. The report features ESG (environmental, social, and governance) initiatives and data receiving increased attention from stakeholders, including the environ-ment, human rights, labour, and compliance.Suzuki CSR & Environmental Report: http://www.globalsuzuki.com/corporate/environmental/report/
— 12 —SUZUKI MOTOR CORPORATION
ESG Information
Topics• In April 2017, Suzuki, Toshiba Corporation, and Denso Corporation reached basic agreement on establishing a joint venture company for
production of automotive lithium-ion battery packs in India, and signed the agreement. Subsequently, a ceremony for the cornerstone-lay-ing of a lithium-ion battery plant was held in September. The battery pack manufacturing joint venture by the three companies will realise stable supply of lithium-ion battery packs in India in the course of promoting sustainable cars in the country and will contribute to “Make in India” initiative by the Government of India.
• In November 2017, the Company and Toyota Motor Corporation agreed to consider a cooperative structure with the aim of introducing electric vehicles into the Indian market around 2020. Further, in March 2018, the companies came to a basic agreement to mutually supply hybrid vehicles and other products in the Indian market. Both companies will continue to consider further cooperation with the goal of at-taining a society of sustainable mobility.
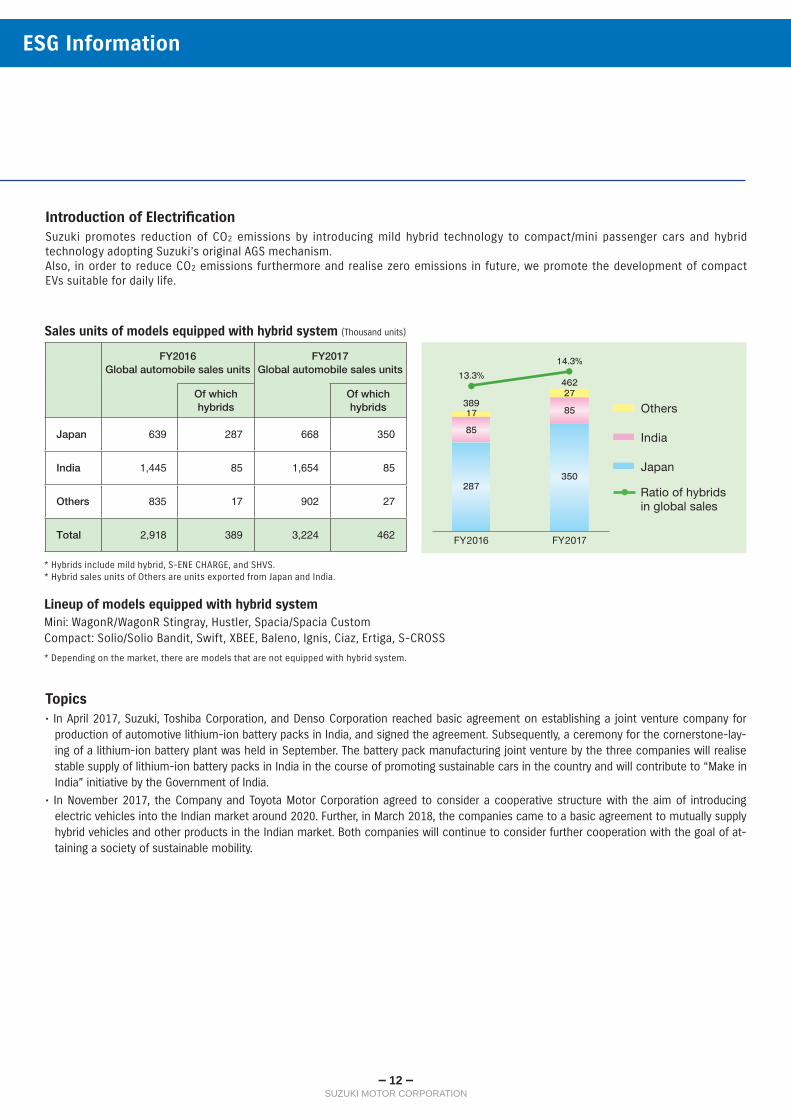
FY2016Global automobile sales units
FY2017Global automobile sales units
Of which hybrids
Of which hybrids
Japan 639 287 668 350
India 1,445 85 1,654 85
Others 835 17 902 27
Total 2,918 389 3,224 462
Sales units of models equipped with hybrid system (Thousand units)
* Hybrids include mild hybrid, S-ENE CHARGE, and SHVS.* Hybrid sales units of Others are units exported from Japan and India.
Lineup of models equipped with hybrid systemMini: WagonR/WagonR Stingray, Hustler, Spacia/Spacia CustomCompact: Solio/Solio Bandit, Swift, XBEE, Baleno, Ignis, Ciaz, Ertiga, S-CROSS
* Depending on the market, there are models that are not equipped with hybrid system.
Introduction of ElectrificationSuzuki promotes reduction of CO2 emissions by introducing mild hybrid technology to compact/mini passenger cars and hybrid technology adopting Suzuki’s original AGS mechanism.Also, in order to reduce CO2 emissions furthermore and realise zero emissions in future, we promote the development of compact EVs suitable for daily life.
389
287
17
85
13.3%462
350
27
85
14.3%
Others
India
Japan
Ratio of hybrids in global sales
FY2016 FY2017

— 13 —SUZUKI MOTOR CORPORATION
ESG Information
CSR Policy
Structure for promoting CSRAt the Executive Committee meetings attended by Representative Directors and Directors and Managing Officers concerned, issues, policies, and measures concerning CSR activities are discussed. Along with the management, the Company as a whole, aims to pro-mote viable CSR activities.
Steps in defining materiality (key issues) in CSR activitiesWe have defined the materiality (key issues) in CSR activities of the Suzuki Group, led by the departments in charge of CSR including corporate planning departments (Corporate Communications and Corporate Management/IR) and environmental departments, using the following steps.
SDGs and CSR activities of the Suzuki GroupSustainable Development Goals (SDGs), which were adopted by the United Nations in September 2015, aims to realise better in-ternational society by setting 17 goals in society, economy, and environment to be worked on by 2030 and make efforts for their solutions. All entities including corporations and all persons in all countries and regions are required to take necessary actions.The Suzuki Group supports SDGs and will actively take respon-sibilities in goals that we can contribute in their achievements through our CSR activities.
Step 1 Extract issues based on GRI guidelines, etc.
Step 2 Departments in charge of CSR organise and discuss issues extracted, and decide their significance for the Suzuki Group
Step 3 Decide significance for the stakeholders through meetings with ESG investors and environmental NGOs
Step 4 Define materiality and decide their priority from two axis: significance for the Suzuki Group and for the stakeholders
Step 5 Check their compliance with the mid-term management plan
Sig
nificance for the S
takehold
ers
Extrem
ely Hig
h
・Occupational health and safety
・Traffic safety
・Environmental conservation
・Respect for human rights
・Supply chain management
・Enhancement of product quality
(development, production, sales, and service)
・Reduction of CO2 emissions
・Development and popularisation of environmental technologies
・Development and popularisation of safety technologies
・Corporate governance and compliance
・Stable growth of sales and incomeH
igh
・Effective use of resources
(raw materials, energy, and water)
・Diversity
・Educational support
・Contribution to the local communities
・Enhancement of corporate value
・Nurturing of human resources
・Stable labour/management relations
・Enforcement of risk management
High Extremely High
Significance for the Suzuki Group
The defined materiality is shown in the following matrix. Based on this materiality, the Company will work on the CSR activities and review it periodically.
Steps in defining materiality in CSR activities

— 14 —SUZUKI MOTOR CORPORATION
ESG Information
[Representative Directors]
[Directors]
[Senior Managing Officers]
[Executive Vice President]
[Managing Officers]
[Audit & Supervisory Board Members]
Representative Director and Chairman (Chairman of the Board of Directors) Osamu Suzuki
Representative Director and Vice Chairman Yasuhito Harayama Supporting Chairman
Representative Director and President Toshihiro Suzuki
Director and Senior Technical Executive Osamu Honda
Director andManaging Officer
Masahiko Nagao Managing Officer in charge of Human Resources, and Executive General Manager, Corporate Planning Office
Hiroaki Matsuura Executive General Manager, Manufacturing
Director(Outside Director)
Masakazu Iguchi
Sakutaro Tanino
* Norio Tanaka, Yasuhiro Yamazaki and Nobuyuki Araki are the outside audit & supervisory board members as stipulated in Article 2, Item 16 of Companies Act of Japan. Yasuhiro Yamazaki is a full-time audit & supervisory board member.
* Masakazu Iguchi and Sakutaro Tanino are the outside directors as stipulated in Article 2, Item 15 of Companies Act of Japan.
Audit & Supervisory Board Member (full-time)
Kunio Nakamura
Eiji Mochizuki
Audit & Supervisory Board Member (Outside)
Norio Tanaka
Yasuhiro Yamazaki
Nobuyuki Araki
Senior ManagingOfficer
Ichizo Aoyama President, Automotive Electronics Power Private Limited
Toshiaki Hasuike Executive General Manager, Automobile Engineering
Executive Vice President Kenichi Ayukawa Managing Director and CEO, Maruti Suzuki India Ltd.
Managing Officer
Kazuo Hakamata Production & Purchasing, and Engineering, PT. Suzuki Indomobil Motor (Indonesia)Masato Kasai Managing Officer, Environment Engineering Group, Vehicle Regulations and Engineering AdministrationTaisuke Toyoda Executive General Manager, FinanceKeiichi Asai President, Chongqing Changan Suzuki Automobile Co., Ltd. (China)Shuji Oishi Deputy Executive General Manager, Global Automobile MarketingKazuki Yamaguchi President, Suzuki Motor Sales Kinki Inc.Shigeyuki Yamamura Managing Officer in charge of Human Resources DevelopmentToshiaki Suzuki Executive General Manager, Domestic Marketing I, Domestic MarketingHidenori Yamashita Deputy Executive General Manager, ManufacturingKinji Saito Executive General Manager, Global Automobile MarketingIchiro Onishi Executive General Manager, Customer Quality Assurance and ServiceKeiji Miyamoto Executive General Manager, Domestic Marketing II, Domestic MarketingKazuhiko Ayabe Executive General Manager, PurchasingShinichi Imaizumi Deputy Executive General Manager, Domestic MarketingNaoki Suzuki Managing Officer in charge of Engineering, Corporate Planning OfficeKazunobu Hori Managing Officer in charge of Engineering Human ResourcesKatsuhiro Kato Executive General Manager, Automobile Product & Cost PlanningShigeo Yamagishi Executive General Manager, Vehicle Regulations and Engineering AdministrationYoshikazu Ozawa Managing Officer based in Maruti Suzuki India Limited (India Human Resources Management)Yasuharu Osawa Division General Manager, Marine OperationsSatoshi Uchida Deputy Executive General Manager, Motorcycle Operations, and President, Suzuki Motorcycle India Private LimitedShigetoshi Torii Deputy Executive General Manager, ManufacturingMasayuki Fujisaki Managing Officer in charge of Partnership Promotion, Corporate Planning Office
Directors, Auditors and Officers
Corporate Governance(as of 1 July 2018)
— 15 —SUZUKI MOTOR CORPORATION
ESG Information
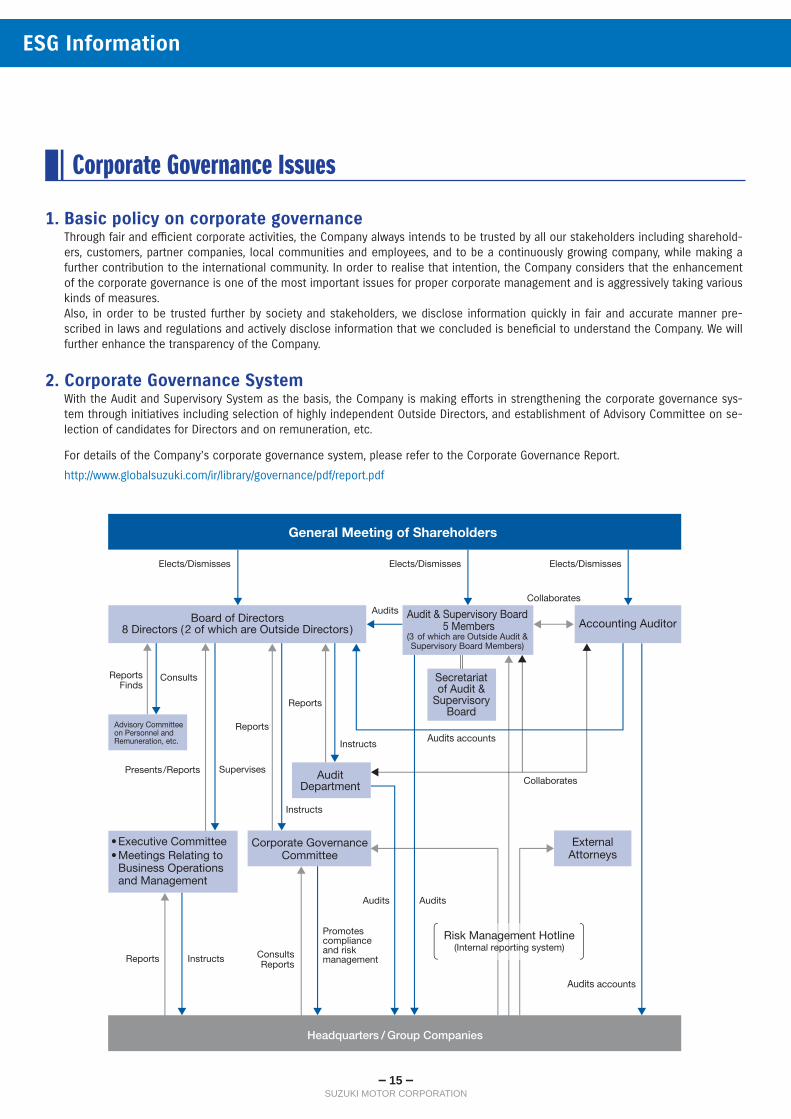
Headquarters / Group Companies
General Meeting of Shareholders
Elects/Dismisses Elects/Dismisses Elects/Dismisses
Board of Directors8 Directors (2 of which are Outside Directors )
Advisory Committee on Personnel and Remuneration, etc.
Reports Finds
Consults
SupervisesPresents /Reports
Reports
• Executive Committee• Meetings Relating to
Business Operations and Management
InstructsReports ConsultsReports
Promotes compliance and risk management
AuditDepartment
Corporate GovernanceCommittee
Audits
Instructs
Instructs
Reports
Accounting Auditor
Secretariat of Audit &
Supervisory Board
Collaborates
Audits accounts
Risk Management Hotline(Internal reporting system)
ExternalAttorneys
AuditsAudits
Collaborates
Audits accounts
Audit & Supervisory Board 5 Members
(3 of which are Outside Audit & Supervisory Board Members)
1. Basic policy on corporate governanceThrough fair and efficient corporate activities, the Company always intends to be trusted by all our stakeholders including sharehold-ers, customers, partner companies, local communities and employees, and to be a continuously growing company, while making a further contribution to the international community. In order to realise that intention, the Company considers that the enhancement of the corporate governance is one of the most important issues for proper corporate management and is aggressively taking various kinds of measures. Also, in order to be trusted further by society and stakeholders, we disclose information quickly in fair and accurate manner pre-scribed in laws and regulations and actively disclose information that we concluded is beneficial to understand the Company. We will further enhance the transparency of the Company.
2. Corporate Governance SystemWith the Audit and Supervisory System as the basis, the Company is making efforts in strengthening the corporate governance sys-tem through initiatives including selection of highly independent Outside Directors, and establishment of Advisory Committee on se-lection of candidates for Directors and on remuneration, etc.
For details of the Company’s corporate governance system, please refer to the Corporate Governance Report.
http://www.globalsuzuki.com/ir/library/governance/pdf/report.pdf
Corporate Governance Issues
— 16 —SUZUKI MOTOR CORPORATION
ESG Information
Risks that may affect the management results, stock price and financial situation of the Group include the followings.Forward-looking statements in this section are based on our conclusions as of the end of FY2017.
1. Risk relating to marketsn Change in economic situations, demand fluctuation in the marketsThe long term economic slowdown, world economic deterioration and financial crisis, and the reduced buying motivation of the con-sumers may lead to a substantially reduced demand for the products of the Group including automobiles, motorcycles and outboard mo-tors. They may also adversely affect the performance and financial conditions of the Group.In addition, we conduct businesses around the world, and our dependency on the overseas manufacturing plants especially in the emerging countries of the Asian regions has been increasing over the years. The unexpected situation in these markets such as the rapid change in the economic situations may adversely affect the performance and financial conditions of the Group. Further, unexpected change or new application of tax systems, financial policies and others in each country may also adversely affect the performance and financial conditions of the Group.n Severer competitions with other companiesWe are facing competitions with rival companies in every global market where we conduct our businesses. As the automobiles and motorcycles industries in the world are globalised further, competitions may get harder. Competitions with other companies include various aspects such as product quality, safety, price, environmental performance, as well as efficiency of product development and manufacturing system, establishment of sales and service systems and sales finance.We will make further efforts for maintaining and improving our competitive edges, but there may be risks that impede our competitive advantages.
2. Risk relating to businessn New product development and launching abilitiesIt is very important for an automobile and motorcycle manufacturer to grasp correctly the customer needs and environment surrounding cars and to develop and launch to the market new attractive products that satisfy the customers in a timely manner. It has become more important than ever to grasp the customer needs that rapidly change and environment surrounding cars, such as the reduced demands caused by domestic and overseas economic slowdown, the increased interest in the environmental performance and the rapid spread of cars loaded with advanced technology.Besides, launching of new products will require abilities of specific product development, development capability of advanced technology toward the future, and further abilities of continually manufacture products, in addition to appropriately understanding customer needs and environment surrounding cars.However, even if we are able to grasp correctly the customer needs and environment surrounding cars, we may not be able to develop new products matching the customer needs in a timely manner on account of technical abilities, procurement of parts, production ca-pabilities, securities of superior human resources and other factors. If we are unable to launch products matching the customer needs to the market in a timely manner, the sales share and sales may be reduced, which may adversely affect the performance and financial conditions of the Group.n Change in product prices and purchase prices, dependence on specific suppliersVarious factors including insufficient supply or price rise of specific parts and raw materials, unstable economic conditions, revisions of import regulations and harder price competition may rapidly change the product prices and purchase prices of the Group. There is no guarantee that such rapid price change does not last long or such change does not occur in the markets where there have not been such changes so far. Rapid changes in product prices and purchase prices may adversely affect the performance and financial positions of the Group in any market where we conduct our businesses.In addition, the procurement of some of the parts has been limited to specific suppliers on account of technical abilities, quality, and price competitiveness. If we are unable to obtain the parts continuously and stably on account of unforeseeable accidents of the suppli-ers, it may adversely affect the performance and financial conditions of the Group.n Business development in various countries in the worldWe have been conducting our businesses in various countries in the world, and in some of the countries, we conduct joint ventures with local companies in accordance with local laws or other requirements. These businesses are restricted by various legal and other regula-tions in each country (including those related to tax, tariff, overseas investment and fund transfer to the home country). Any changes to such regulations, or management policies or management environment of the joint venture partners may adversely affect the perfor-mance and financial conditions of the Group.n Fluctuations of exchange rates and interest ratesWe export automobiles, motorcycles, outboard motors and related parts to various countries in the world from Japan. In addition, we export those products and parts from the overseas manufacturing plants to multiple other countries. The ratio of the overseas sales has reached 70 percent of consolidated sales for the current consolidated fiscal year. As the Group depends heavily on the overseas manu-facturing plants located mainly in emerging countries, it is susceptible to fluctuations in the foreign currencies. Also, since the Group procures a major part of fund in Japan where interest rates continue to be low, it is susceptible to changes in the interest rates.We take hedging measures such as forward exchange contracts and decentralisation of production sites to optimise the production sys-tem globally to reduce the risks of exchange rates and interest rates fluctuations, but it is impossible to hedge every risk. The currencies appreciation in main production countries against other currencies may adversely affect the performance and financial conditions of the Group. On the other hand, by transferring production sites to other countries, it may result in opportunity losses that the Group can no longer benefit from foreign exchange gain in export even when the currency of its local country weakens.Further, rapid increase of interest rates in Japan may adversely affect the performance and financial conditions of the Group.
Risks in Operations

— 17 —SUZUKI MOTOR CORPORATION
ESG Information
n Government regulationsVarious legal regulations are applied to the automobiles, motorcycles and outboard motor industries in relation to the emission level of emission gas, mileage, noises, safety and contaminated material emission level from the manufacturing plants. These regulations may be revised, in many cases strengthened. Expenses to comply with these regulations may largely affect the performance of the Group.In addition, many governments determine the imposition of tariffs, price control regulations and exchange control regulations. The Group is paying expenses to comply with these regulations and will expect to continue bearing them.We may pay more expenses depending on the establishment of new laws or changes of existing laws. Further, unexpected changes or new application of tax systems and economic measures of each country may adversely affect the performance and financial conditions of the Group.
n Quality assuranceWe place the top priority on the product safety and make efforts to establish the quality assurance system from development to sales. We buy insurance for the product liability, but there are risks not covered by insurance. The occurrence of large expenses for a large-scale recall to ensure safety of the customers may adversely affect the performance and financial conditions of the Group.
n Alliance with other companiesWe conduct various alliance activities with automobile manufacturer around the world and other companies such as for research and development, manufacturing, sales and finance, but factors that cannot be controlled by the Group such as situations inherent to the al-liance partners may adversely affect the performance and financial conditions of the Group.
n Dependency on information technologyWe create, process and stock information in the form of electronic data in all areas of the business activities such as design and develop-ment, production, marketing and accounting. The Group’s products are also equipped with a variety of electronic control systems, which control vehicles and mounted equipment. While safety measures have been taken on the said items, infrastructure failure such as power shutoff and attacks by computer hacker and viruses may occur. If the group’s operation is interrupted, and data is destroyed or lost, and leakage of confidential information takes place, it may adversely affect the performance and financial conditions of the Group.
n Leakage of informationWe have adopted a structure to prevent leakage of personal information of inside and outside of company and confidential information related to the Group’s management, operation and technology, etc. But if such information is leaked or used without due authorisation attributable to unexpected circumstances, the Group may be subject to legal demand, lawsuit, indemnity liability and obligation to pay a fine, and this may adversely affect the performance and financial conditions of the Group.
n ComplianceWe have established a compliance system to prevent violation of laws and regulations and respond quickly to various issues related to compliance. Nevertheless, if we detect a fact of violation of laws or inappropriate response to compliance issues due to unexpected circumstances, the Group’s social credibility may be affected seriously, which may adversely affect the performance and financial condi-tions of the Group.
n Protection of intellectual propertyWe have stocked intellectual property such as technology and knowhow to distinguish its products with those of competitors, and have taken measures to protect such property and to prevent infringement of intellectual property rights by a third party. Nonetheless, if the Group’s intellectual property is infringed unlawfully, or if the Group is pointed out by a third party to have infringed intellectual property rights and faces lawsuit or asked to terminate manufacturing and marketing of its products and to pay indemnity, it may adversely affect the performance and financial conditions of the Group.
n Legal proceedingsWe may become a party to lawsuits and other legal proceedings in the course of our business activities. In the case where any judgments disadvantageous to us are made in such legal proceedings, it may adversely affect the performance and financial conditions of the Group.
n Influences of natural disasters, epidemics, wars, terrorism and strikes, etc.In Japan, we are exposed to a variety of risks such as natural disasters including earthquake, typhoon and flood and unexpected ac-cident. Especially, the Group’s major facilities including head office, R&D sites and major manufacturing plants are concentrated in the Tokai region where occurrence of periodic massive earthquakes is highly probable.We have taken various preventive measurements such as quake-resistant measures for buildings and facilities, fire preventive measures, establishment of BCP (Business Continuity Plan), purchases of earthquake insurances and others to minimise the influences of damage by natural disasters such as Tokai and Tonankai Earthquake. But, occurrences of any Tokai and Tonankai Earthquake may adversely affect the performance and financial condition of the Group largely.We also conduct businesses around the world and are exposed to number of risks relating to our overseas operations. These risks around the world are natural disasters, epidemics, wars, terrorism, strikes, and various matters attributable to unstable political and social situation and difficulties, etc. These unexpected events may delay or suspend the purchase of raw materials and parts, manufacturing, sales of products, and provision of logistics and services. If such delay or suspension caused by any of these factors occur or prolong, it may adversely affect the performance and financial conditions of the Group.
Further, there are various risks other than those mentioned above, and what have been stated in this section does not represent all the risks of the Group.
— 18 —SUZUKI MOTOR CORPORATION
FINANCIAL SECTION
CONTENTSFive-Year Summary...................................................................................... 19
Consolidated Financial Statement .............................................................. 20Consolidated Balance Sheets ............................................................................. 20
Consolidated Statement of Income and Consolidated Statement of Comprehensive Income ...................................... 22
Consolidated Statement of Changes in Net Assets ............................................. 24
Consolidated Statement of Cash Flows .............................................................. 26
Notes to Consolidated Financial Statements ...................................................... 27
Independent Auditor’s Report ............................................................................. 47
— 19 —SUZUKI MOTOR CORPORATION
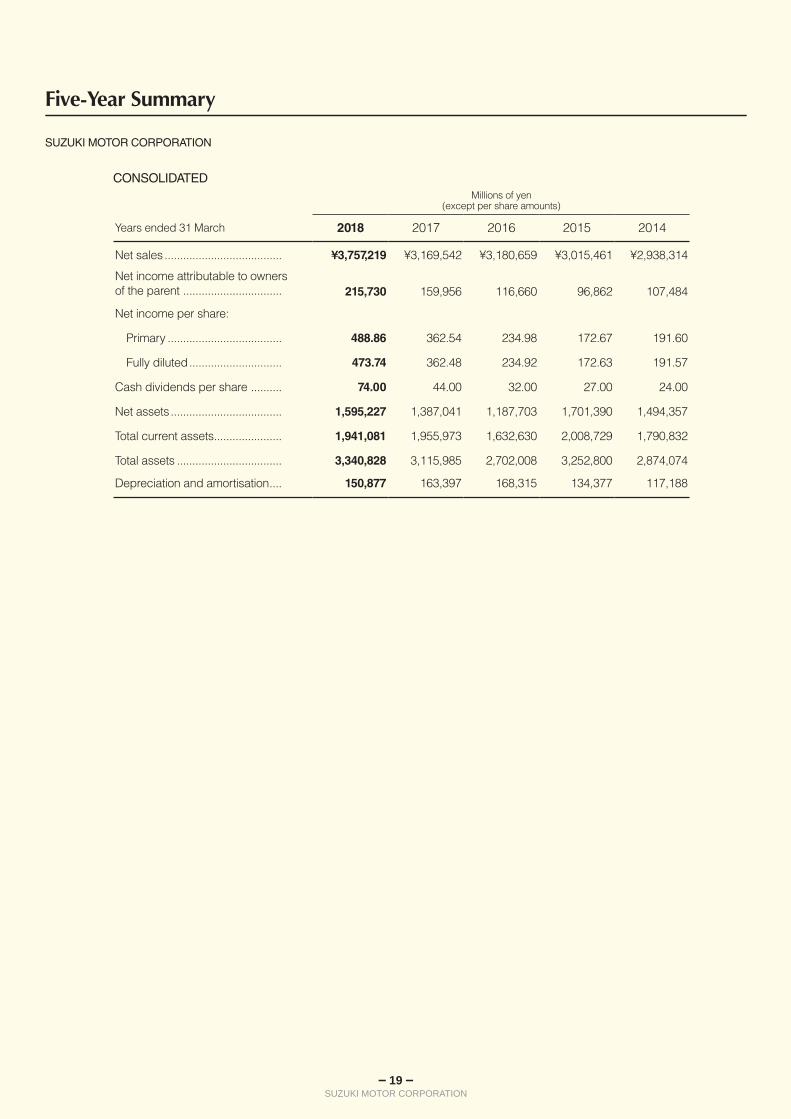
SUZUKI MOTOR CORPORATION
CONSOLIDATEDMillions of yen
(except per share amounts)
Years ended 31 March 2018 2017 2016 2015 2014
Net sales ...................................... ¥3,757,219 ¥3,169,542 ¥3,180,659 ¥3,015,461 ¥2,938,314
Net income attributable to owners of the parent ................................ 215,730 159,956 116,660 96,862 107,484
Net income per share:
Primary ..................................... 488.86 362.54 234.98 172.67 191.60
Fully diluted .............................. 473.74 362.48 234.92 172.63 191.57
Cash dividends per share .......... 74.00 44.00 32.00 27.00 24.00
Net assets .................................... 1,595,227 1,387,041 1,187,703 1,701,390 1,494,357
Total current assets ...................... 1,941,081 1,955,973 1,632,630 2,008,729 1,790,832
Total assets .................................. 3,340,828 3,115,985 2,702,008 3,252,800 2,874,074
Depreciation and amortisation .... 150,877 163,397 168,315 134,377 117,188
Five-Year Summary

— 20 —SUZUKI MOTOR CORPORATION
Consolidated Balance SheetsAs of 31 March 2018 and 2017
Consolidated Financial Statement
SUZUKI MOTOR CORPORATIONAND CONSOLIDATED SUBSIDIARIES
Millions of yen
2018 2017
ASSETSCurrent assets:
Cash and cash equivalents *NOTE 12 ................................... ¥ 600,846 ¥ 614,031
Receivables:
Notes and accounts receivable-trade *NOTE 4 ................ 388,973 349,224
Allowance for doubtful accounts ................................... (4,769) (4,821)
Inventories .......................................................................... 352,916 332,116
Deferred tax assets *NOTE 9 ................................................. 122,092 113,845
Others ................................................................................. 481,022 551,576
Total current assets ............................................................ 1,941,081 1,955,973
Property, plant and equipment:
Land *NOTE 6 ......................................................................... 280,866 261,130
Buildings and structures *NOTE 6 ......................................... 454,347 438,043
Machinery,equipment and vehicles ................................ 1,217,050 1,363,140
Tools, furniture and fixtures .............................................. 585,610 396,523
Construction in progress ................................................... 106,393 48,223
2,644,269 2,507,061
Accumulated depreciation............................................... (1,840,003) (1,750,717)
Total property, plant and equipment ................................. 804,265 756,344
Investments and other assets:
Investment securities *NOTE 4 .............................................. 517,693 314,594
Investments in affiliates *NOTE 4 ........................................... 35,509 52,841
Assets for retirement benefits *NOTE 8 ................................. 42 44
Deferred tax assets *NOTE 9 ................................................. 23,471 21,140
Others ................................................................................. 18,764 15,047
Total investments and other assets ............................... 595,481 403,667
Total assets ......................................................................... ¥3,340,828 ¥3,115,985
The accompanying Notes to Consolidated Financial Statement are an integral part of these statements.

— 21 —SUZUKI MOTOR CORPORATION
Consolidated Financial Statement
SUZUKI MOTOR CORPORATIONAND CONSOLIDATED SUBSIDIARIES
Millions of yen
2018 2017
LIABILITIES AND NET ASSETSCurrent liabilities:
Short-term loans payable *NOTE 4 and 6 ................................. ¥ 97,598 ¥ 96,643Current portion of long-term loans payable *NOTE 4 and 6 ..... 93,157 119,958Accounts payable-trade *NOTE 4 ......................................... 443,916 428,063Electronically recorded obligations ................................... 68,322 83,070Income taxes payable ....................................................... 40,598 31,863Accrued expenses *NOTE 4 .................................................. 215,335 191,068Provision for product warranties ....................................... 105,106 76,995Deferred tax liabilities *NOTE 9 .............................................. 929 55Others *NOTE 6 ...................................................................... 177,305 160,402Total current liabilities ......................................................... 1,242,270 1,188,121
Noncurrent liabilities:
Bonds with subscription rights to shares *NOTE 4 and 5 ......... 194,211 200,400Long-term loans payable *NOTE 4 and 6 .................................. 192,943 222,870Liabilities for retirement benefits *NOTE 8 ............................. 65,224 63,099Provision for disaster ........................................................ 1,914 1,976Deferred tax liabilities *NOTE 9 .............................................. 1,175 1,384Others *NOTE 6 ....................................................................... 47,860 51,091Total noncurrent liabilities .................................................. 503,330 540,822Total liabilities ..................................................................... 1,745,601 1,728,943
Net assets:Shareholders’ equity:
Capital stock:Common stock:
Authorised: 1,500,000,000 shares Issued:as of 31 March 2018: 491,018,100 sharesas of 31 March 2017: 491,000,000 shares ................... 138,064 138,014
Capital surplus ................................................................... 143,868 144,035Retained earnings ............................................................. 1,247,242 1,058,549Treasury stock ................................................................... (189,126) (191,051)Total shareholders’ equity .................................................. 1,340,047 1,149,548
Accumulated other comprehensive income:
Valuation difference on available-for-sale securities ........ 108,528 98,827Deferred gains or losses on hedges ................................. 22 1,269Foreign currency translation adjustment .......................... (140,136) (119,236)Accumulated adjustment for retirement benefits ............. (10,925) (10,543)Total accumulated other comprehensive income ............ (42,511) (29,683)
Subscription rights to shares *NOTE 15 ............................. 126 126Non-controlling interests ................................................ 297,564 267,049Total net assets .................................................................. 1,595,227 1,387,041Total liabilities and net assets ............................................ ¥3,340,828 ¥3,115,985
As of 31 March 2018 and 2017
— 22 —SUZUKI MOTOR CORPORATION
Consolidated Financial Statement
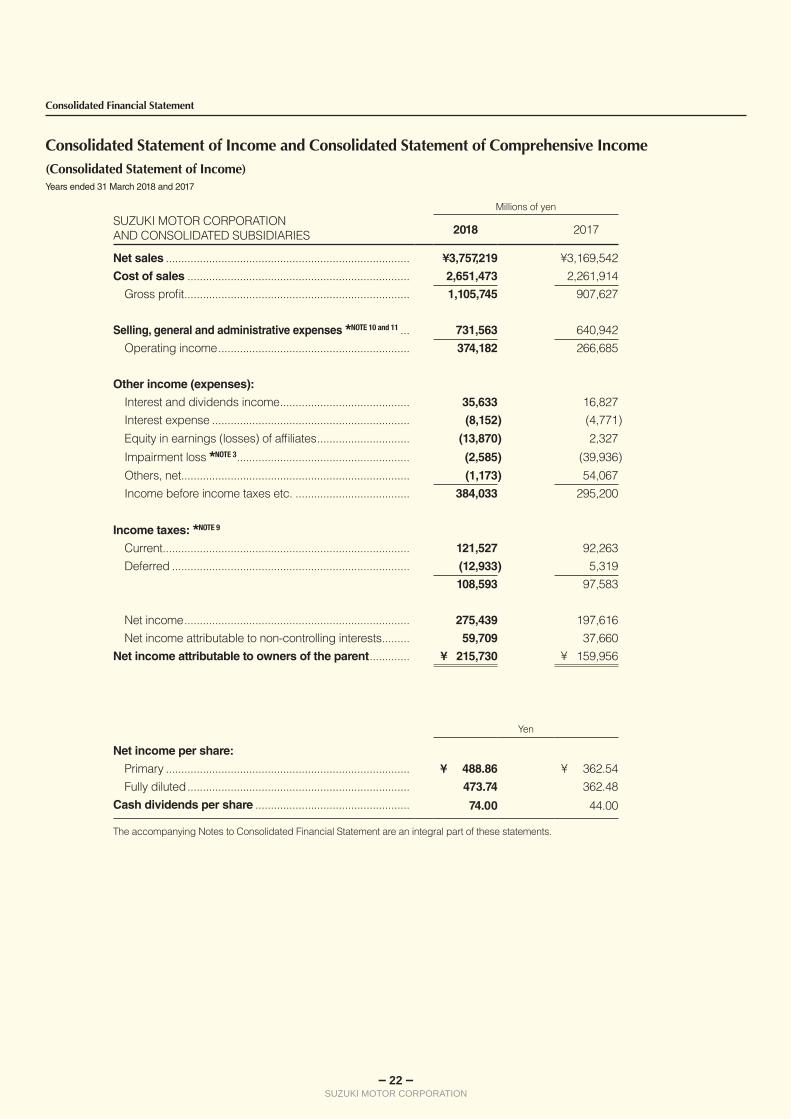
Consolidated Statement of Income and Consolidated Statement of Comprehensive Income(Consolidated Statement of Income)Years ended 31 March 2018 and 2017
SUZUKI MOTOR CORPORATIONAND CONSOLIDATED SUBSIDIARIES
Millions of yen
2018 2017
Net sales ............................................................................... ¥3,757,219 ¥3,169,542Cost of sales ........................................................................ 2,651,473 2,261,914
Gross profit ......................................................................... 1,105,745 907,627
Selling, general and administrative expenses *NOTE 10 and 11 ... 731,563 640,942Operating income .............................................................. 374,182 266,685
Other income (expenses):
Interest and dividends income .......................................... 35,633 16,827Interest expense ................................................................ (8,152) (4,771)Equity in earnings (losses) of affiliates .............................. (13,870) 2,327
Impairment loss *NOTE 3 ........................................................ (2,585) (39,936)Others, net .......................................................................... (1,173) 54,067Income before income taxes etc. ..................................... 384,033 295,200
Income taxes: *NOTE 9
Current ................................................................................ 121,527 92,263Deferred ............................................................................. (12,933) 5,319
108,593 97,583
Net income ......................................................................... 275,439 197,616Net income attributable to non-controlling interests ......... 59,709 37,660
Net income attributable to owners of the parent ............. ¥ 215,730 ¥ 159,956
Yen
Net income per share:
Primary ............................................................................... ¥ 488.86 ¥ 362.54Fully diluted ........................................................................ 473.74 362.48
Cash dividends per share .................................................. 74.00 44.00
The accompanying Notes to Consolidated Financial Statement are an integral part of these statements.

— 23 —SUZUKI MOTOR CORPORATION
Consolidated Financial Statement
(Consolidated Statement of Comprehensive Income)Years ended 31 March 2018 and 2017
SUZUKI MOTOR CORPORATIONAND CONSOLIDATED SUBSIDIARIES
Millions of yen
2018 2017
Net Income .......................................................................... ¥275,439 ¥197,616
Other comprehensive income *NOTE 13
Valuation difference on available-for-sale securities ........ 16,036 28,375Deferred gains or losses on hedges ................................. (1,232) 505Foreign currency translation adjustment .......................... (35,936) 3,634
Adjustment for retirement benefits .................................... (514) (655)Share of other comprehensive income of associatesaccounted for using equity method .................................. 234 (2,318)Total other comprehensive income ................................... (21,411) 29,541
Comprehensive income...................................................... 254,027 227,158Comprehensive income attributable to:Comprehensive income attributable to owners of the parent... 202,870 177,276Comprehensive income attributable to non-controlling interests .. 51,157 49,881
The accompanying Notes to Consolidated Financial Statement are an integral part of these statements.

— 24 —SUZUKI MOTOR CORPORATION
Consolidated Financial Statement
Millions of yen
SUZUKI MOTOR CORPORATIONAND CONSOLIDATED SUBSIDIARIES
Thousands of shares
of common stock
Capital stock
Capital surplus
Retained earnings Treasury stock
TotalShareholders’
equity
Balance as of 31 March 2016 491,000 ¥138,014 ¥144,166 ¥913,656 ¥(191,169) ¥1,004,668
Dividends from surplus ..... — — — (15,003) — (15,003)Net income attributable to owners of the parent ......... — — — 159,956 — 159,956
Purchase of treasury stock ... — — — — (4) (4)
Disposal of treasury stock ..... — — (60) — 122 62Transfer to capital surplusfrom retained earnings ..... — — 60 (60) — —Capital increase ofConsolidated subsidiaries .... — — (130) — — (130)Net changes of items otherthan shareholders’ equity .... — — — — — —Total changes during the fiscal year .......................... — — (130) 144,892 118 144,880
Balance as of 31 March 2017 491,000 ¥138,014 ¥144,035 ¥1,058,549 ¥(191,051) ¥1,149,548
Issuance of new shares .... 18 49 49 — — 98
Dividends from surplus ..... — — — (25,153) — (25,153)Net income attributable to owners of the parent ......... — — — 215,730 — 215,730
Purchase of treasury stock ... — — — — (6) (6)
Disposal of treasury stock ..... — — (1,912) — 1,930 18Transfer to capital surplusfrom retained earnings ..... — — 1,912 (1,912) — —Capital increase of consolidated subsidiaries ..... — — (216) — — (216)Change of scope of equitymethod ............................... — — — 28 — 28Net changes of items otherthan shareholders’ equity .... — — — — — —Total changes during the fiscal year .......................... 18 49 (166) 188,692 1,924 190,498
Balance as of 31 March 2018 491,018 ¥138,064 ¥143,868 ¥1,247,242 ¥(189,126) ¥1,340,047
Consolidated Statement of Changes in Net AssetsYears ended 31 March 2018 and 2017

— 25 —SUZUKI MOTOR CORPORATION
Consolidated Financial Statement
Millions of yen
SUZUKI MOTOR CORPORATIONAND CONSOLIDATED SUBSIDIARIES
Valuationdifference
onavailable-for-sale
securities
Deferred gains or
losses on hedges
Foreign currency
translation adjustment
Accumulatedadjustment
for retirementbenefits
Total accumulated
othercomprehensive
income
Subscriptionrights toshares
Non- controlling interests
Total net assets
Balance as of 31 March 2016 ¥77,624 ¥536 ¥(115,551) ¥(9,580) ¥(46,970) ¥188 ¥229,816 ¥1,187,703
Dividends from surplus ..... — — — — — — — (15,003)Net income attributable to owners of the parent ......... — — — — — — — 159,956
Purchase of treasury stock ... — — — — — — — (4)
Disposal of treasury stock ..... — — — — — — — 62
Transfer to capital surplus from retained earnings ..... — — — — — — — —
Capital increase of Consolidated subsidiaries .... — — — — — — — (130)
Net changes of items other than shareholders’ equity .... 21,202 732 (3,685) (962) 17,287 (62) 37,232 54,458
Total changes during the fiscal year .......................... 21,202 732 (3,685) (962) 17,287 (62) 37,232 199,338
Balance as of 31 March 2017 ¥98,827 ¥1,269 ¥(119,236) ¥(10,543) ¥(29,683) ¥126 ¥267,049 ¥1,387,041
Issuance of new shares .... — — — — — — — 98
Dividends from surplus .....— — — — — — — (25,153)
Net income attributable to owners of the parent ......... — — — — — — — 215,730
Purchase of treasury stock ... — — — — — — — (6)
Disposal of treasury stock ..... — — — — — — — 18
Transfer to capital surplus from retained earnings ..... — — — — — — — —
Capital increase of Consolidated subsidiaries .... — — — — — — — (216)
Change of scope of equitymethod ............................... — — — — — — — 28
Net changes of items other than shareholders’ equity .... 9,700 (1,246) (20,900) (381) (12,828) — 30,514 17,686
Total changes during the fiscal year .......................... 9,700 (1,246) (20,900) (381) (12,828) — 30,514 208,185
Balance as of 31 March 2018 ¥108,528 ¥22 ¥(140,136) ¥(10,925) ¥(42,511) ¥126 ¥297,564 ¥1,595,227
The accompanying Notes to Consolidated Financial Statement are an integral part of these statements.
— 26 —SUZUKI MOTOR CORPORATION
Consolidated Financial Statement
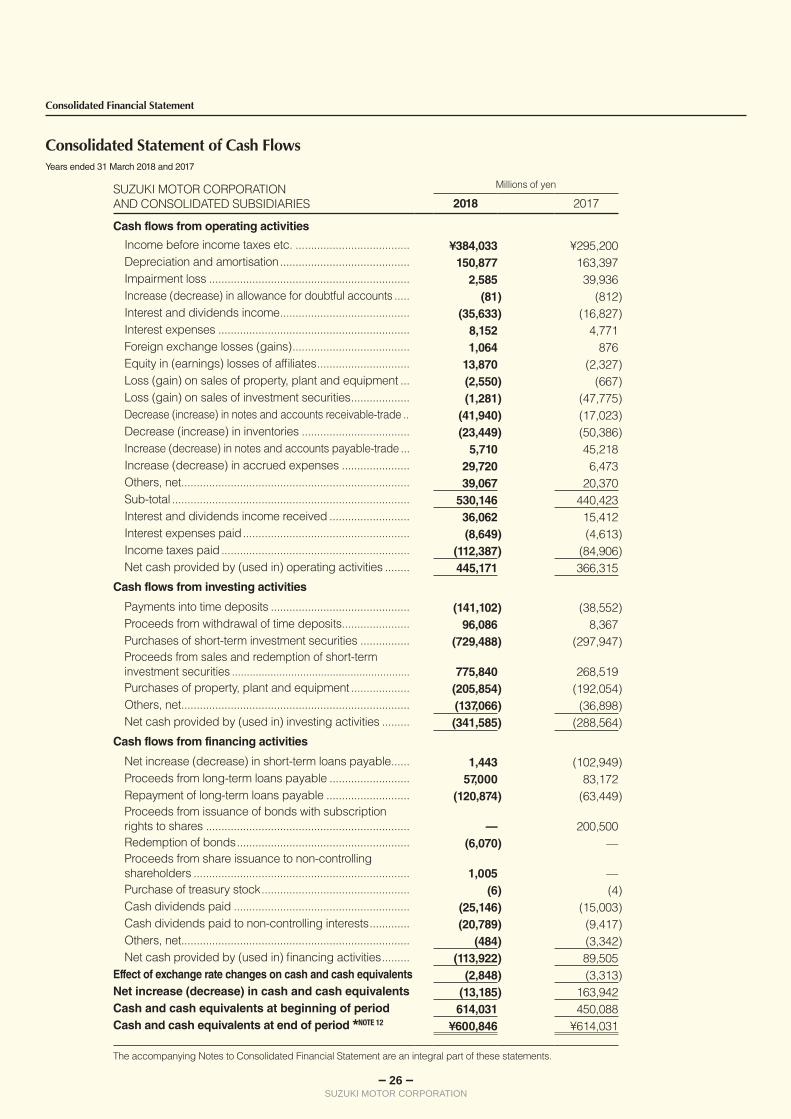
Consolidated Statement of Cash FlowsYears ended 31 March 2018 and 2017
SUZUKI MOTOR CORPORATIONAND CONSOLIDATED SUBSIDIARIES
Millions of yen
2018 2017
Cash flows from operating activities
Income before income taxes etc. ..................................... ¥384,033 ¥295,200Depreciation and amortisation .......................................... 150,877 163,397Impairment loss ................................................................. 2,585 39,936Increase (decrease) in allowance for doubtful accounts ..... (81) (812)Interest and dividends income .......................................... (35,633) (16,827)Interest expenses .............................................................. 8,152 4,771Foreign exchange losses (gains) ...................................... 1,064 876Equity in (earnings) losses of affiliates .............................. 13,870 (2,327)Loss (gain) on sales of property, plant and equipment ... (2,550) (667)Loss (gain) on sales of investment securities ................... (1,281) (47,775)Decrease (increase) in notes and accounts receivable-trade .. (41,940) (17,023)Decrease (increase) in inventories ................................... (23,449) (50,386)Increase (decrease) in notes and accounts payable-trade ... 5,710 45,218Increase (decrease) in accrued expenses ...................... 29,720 6,473Others, net .......................................................................... 39,067 20,370Sub-total ............................................................................. 530,146 440,423Interest and dividends income received .......................... 36,062 15,412Interest expenses paid ...................................................... (8,649) (4,613)Income taxes paid ............................................................. (112,387) (84,906)Net cash provided by (used in) operating activities ........ 445,171 366,315
Cash flows from investing activities
Payments into time deposits ............................................. (141,102) (38,552)Proceeds from withdrawal of time deposits...................... 96,086 8,367Purchases of short-term investment securities ................ (729,488) (297,947)Proceeds from sales and redemption of short-term investment securities ............................................................ 775,840 268,519Purchases of property, plant and equipment ................... (205,854) (192,054)Others, net .......................................................................... (137,066) (36,898)Net cash provided by (used in) investing activities ......... (341,585) (288,564)
Cash flows from financing activities
Net increase (decrease) in short-term loans payable ...... 1,443 (102,949)Proceeds from long-term loans payable .......................... 57,000 83,172Repayment of long-term loans payable ........................... (120,874) (63,449)Proceeds from issuance of bonds with subscriptionrights to shares .................................................................. — 200,500Redemption of bonds ........................................................ (6,070) —Proceeds from share issuance to non-controlling shareholders ...................................................................... 1,005 —Purchase of treasury stock ................................................ (6) (4)Cash dividends paid ......................................................... (25,146) (15,003)Cash dividends paid to non-controlling interests ............. (20,789) (9,417)Others, net .......................................................................... (484) (3,342)Net cash provided by (used in) financing activities ......... (113,922) 89,505
Effect of exchange rate changes on cash and cash equivalents (2,848) (3,313)Net increase (decrease) in cash and cash equivalents (13,185) 163,942Cash and cash equivalents at beginning of period 614,031 450,088Cash and cash equivalents at end of period *NOTE 12 ¥600,846 ¥614,031
The accompanying Notes to Consolidated Financial Statement are an integral part of these statements.
— 27 —SUZUKI MOTOR CORPORATION
Consolidated Financial Statement
Notes to Consolidated Financial StatementsNOTE 1: Basis of presenting consolidated financial statements
The accompanying consolidated financial statements of Suzuki Motor Corporation (the “Company”), consolidated Subsidiaries, and Affiliates (the “Group”) have been prepared on the basis of generally accepted accounting principles and practices in Japan, and the consolidated financial statements were filed with the Financial Services Agency as required by the Financial Instruments and Exchange Act of Japan.The preparation of the consolidated financial statements requires the management to select and adopt accounting standards and make estimates and assumptions that affect the reported amount of assets and liabilities, revenue and expenses, and the cor-responding methods of disclosure.As such, the management’s estimates are made reasonably based on historical results. However, due to the inherent uncertain-ties involved in making estimates, actual results could differ from these estimates.For the convenience of readers outside Japan, certain reclassifications and modifications have been made to the original consoli-dated financial statements.As permitted, an amount of less than one million yen has been omitted.
NOTE 2: Summary of significant accounting policies(a) Principles of consolidation
The consolidated financial statements for the years ended 31 March 2018 and 2017 include the accounts of the Group, and the numbers of consolidated subsidiaries were 131 and 136 respectively. In addition, the numbers of investments in affiliated companies for the years ended 31 March 2018 and 2017 were 31 and 32 respectively. All significant inter-company accounts and transactions are eliminated in consolidation. Investments in affiliated companies are accounted for by the equity method.The difference at the time of acquisition between the cost and underlying net equity of investments in consolidated subsidiar-ies (goodwill) and in affiliated companies accounted for under the equity method is, as a rule, amortised on a straight-line basis over a period of five years after appropriate adjustments.The account settlement date of 19 consolidated subsidiaries is 31 December, however Magyar Suzuki Corporation Ltd. and others are consolidated based on the financial statements of provisional account settlement as of 31 March.The account settlement date of other consolidated subsidiaries is the same as the consolidated account settlement date.
(b) Allowance for doubtful accountsIn order to allow for loss from bad debts, estimated uncollectible amount based on actual ratio of bad debt is appropriated as general allowance. With respect to specific receivable with higher default possibility, recoverable amount is estimated respec-tively and uncollectible amount is appropriated.
(c) Allowance for investment lossThe differences between the book value and the fair value of securities and investment not quoted at an exchange are deter-mined and appropriated as reserve in order to allow for losses from these investments.
(d) Provision for product warrantiesThe provision is appropriated into this account based on the warranty agreement and past experience in order to allow for expenses related to the maintenance service of products sold.
(e) Provision for Directors' bonusesIn order to defray bonuses for Directors and Audit & Supervisory Board Members, estimated amount of such bonuses is ap-propriated.
(f) Provision for Directors' retirement benefitsThe amount to be paid at the end of fiscal year had been posted pursuant to the Company’s regulations on the retirement allowance of Directors and Audit & Supervisory Board Members, however the Company’s retirement benefit system for them was abolished at the closure of the Ordinary General Meeting of Shareholders held on 29 June 2006. And it was approved at Ordinary General Meeting of Shareholders that reappointed Directors and Audit & Supervisory Board Members would be paid their retirement benefit at the time of their retirement, based on their years of service. Estimated amount of such retirement benefits is appropriated at the end of the current consolidated fiscal year. Furthermore, for the Directors and Audit & Supervi-sory Board Members. Of some consolidated subsidiaries, the amount to be paid at the end of the year is posted pursuant to their regulation on the retirement allowance of Directors and Audit & Supervisory Board Members.
(g) Provision for disasterReasonably estimated amount is appropriated for anticipated loss mainly caused by relocation of plants and facilities located in the Ryuyo Region in Iwata City, Shizuoka Prefecture where massive tsunami damages caused by Tokai and Tonankai Earth-quake are anticipated.
(h) Provision for product liabilitiesThe provision is appropriated for product compensation related to North American market which is not covered by “Product Liability Insurance” based on the actual payments.
(i) Provision for recycling expensesThe provision is appropriated for an estimated expense related to the recycle of products of the Company based on num-ber of vehicles owned in the market, etc.

— 28 —SUZUKI MOTOR CORPORATION
Consolidated Financial Statement
( j) Short-term investment securities and Investment securitiesThe Company and its subsidiaries hold securities of listed companies, which have a risk of price fluctuations, and non-listed companies whose stock prices are difficult to be evaluated.If the Company and its subsidiaries judge the decline in investment value is not temporary, the Company and its subsidiaries recognise revaluation loss based on the reasonable standard. If the stock market falls, the Company and its subsidiaries may incur significant loss on valuation of securities.Securities have to be classified into four categories: trading securities; held-to-maturity debt securities; investments of the Company in equity securities issued by consolidated subsidiaries and affiliates; and available-for-sale securities.According to this classification, securities held by the Company and its subsidiaries are available-for-sale securities. Available-for-sale securities for which market quotations are available are stated at market value method based on the market values as of the consolidated account settlement date (the evaluation differences shall be reported as other comprehensive income, and sales costs shall be calculated mainly by moving average method).Available-for-sale securities for which market quotations are unavailable are stated at cost by moving average method.
(k) Hedge accountingGains or losses arising from changes in fair value of the derivatives designated as “hedging instruments” are deferred until the gains and losses on the hedged items or transactions are recognised.If foreign currency forward contracts meet certain criteria, special exceptional hedge accounting is applied and these contracts are handled together with hedged items. If interest rate swap contracts meet certain criteria, exceptional hedge accounting is applied and these contracts are handled together with hedged items. If cross currency interest rate swap contracts meet certain criteria, integration method (special exceptional method and exceptional method) is applied and these contracts are handled together with hedged items.The derivatives designated as hedging instruments by the Company and its subsidiaries are principally forward exchange contracts, interest swaps and cross currency interest rate swaps. The related hedged items are foreign currency denominated transaction and borrowings.The Company and its subsidiaries have a policy to utilise the above hedging instruments in order to reduce our exposure to the risks of the fluctuation of interest rate and foreign exchange. Thus, our purchases of the hedging instruments are limited to, at maximum, the amounts of the hedged items. The Company and its subsidiaries evaluate effectiveness of their hedging activities by reference to the accumulated gains or losses on the hedging instruments and the related hedged items from the commencement of the hedges.
(l) Foreign currency translationAll monetary assets and liabilities denominated in foreign currencies, whether long-term or short-term, are converted into Japanese yen at the exchange rates prevailing at the balance sheet date. Resulting gains and losses are included in net income or loss for the period.Assets and liabilities of the foreign subsidiaries and affiliates are converted into Japanese yen at the exchange rates prevailing at the balance sheet date.The components of net assets are converted into Japanese yen at their historical rates. Profit and loss accounts for the fiscal year are converted into Japanese yen by using the average exchange rate during the fiscal year. Differences in yen amounts arising from the use of different rates are presented as “Foreign currency translation adjustment” and “Non-controlling interests” in the net assets.
(m) InventoriesStated at cost mainly determined by the gross average method (figures on the consolidated balance sheet are measured by the method of book devaluation based on the reduction of profitability).
(n) Method of depreciation and amortisation of significant depreciable assetsa. Property, plant and equipment (excluding lease assets)
................. Mainly declining balance method for the Company and domestic subsidiaries and mainly straight-line method for foreign subsidiaries.Main durable years are as follows:Buildings and structures 3 to 75 yearsMachinery, equipment and vehicles 3 to 15 years
b. Intangible assets (excluding lease assets) ................. Straight-line method
c. Lease assetsFinance leases which transfer ownership ................. The same method as depreciation and amortisation of self-owned noncurrent assets.Finance leases which do not transfer ownership ................. Straight-line method with the lease period as the durable years. With respect to lease assets with guaran-
teed residual value under lease agreement, remaining value is the guaranteed residual value. With respect to other lease assets, remaining value is zero.
— 29 —SUZUKI MOTOR CORPORATION
Consolidated Financial Statement
(o) Income taxesThe provision for income taxes is computed based on the income before income taxes included in the consolidated state-ments of income. The asset and liability approach is adopted to recognise deferred tax assets and liabilities for the expected future tax consequences of temporary differences between the carrying amounts and the tax bases of assets and liabilities.In making a valuation for the possibility of collection of deferred tax assets, the Company and its subsidiaries estimate their future taxable income reasonably. If the estimated amounts of future taxable income decrease, deferred tax assets may de-crease and income taxes may be posted.Consolidated tax payment has been applied to the Company and its domestic wholly owned subsidiaries from the fiscal year ended 31 March 2012.
(p) Retirement benefitsWith respect to calculation of retirement benefit obligations, benefit formula basis method is used to attribute expected benefit to period up to the end of this fiscal year. With respect to past service costs, they are treated as expense on a straight line ba-sis over the certain years within the period of average length of employees’ remaining service years at the time when it occurs. With respect to the actuarial gain or loss, the amounts, prorated on a straight line basis over the certain years within the period of average length of employees’ remaining service years in each year in which the differences occur, are respectively treated as expenses from the next term of the year in which they arise.Retirement benefit cost and retirement benefit obligation are calculated based on the actuarial assumptions, which include discount rate, assumed return of investment ratio, revaluation ratio, salary rise ratio, retirement ratio and mortality ratio. Dis-count rate is decided based on yield on low-risk and long-term bonds, and assumed return of investment ratio is decided based on the investment policies of pension assets of each pension system etc.Decreased yield on long-term bond leads to a decrease in discount rate and it has an adverse influence on the calculation of retirement benefit cost. However, the pension system adopted by the Company has a cash balance type plan, and thus the revaluation ratio, which is one of the base ratios, can reduce adverse effects caused by the decrease in discount rate.If the investment yield of pension assets is less than the assumed return of investment ratio, it will have an adverse effect on the calculation of retirement benefit cost. However, by focussing on low-risk investments, this influence should be minimal in the case of the pension fund systems of the Company and its subsidiaries.
(q) Net income per sharePrimary net income per share is computed based on the weighted average number of shares issued during the respective years. Fully diluted net income per share is computed assuming that all stock options are exercised. Cash dividends per share are the amounts applicable to the respective periods including dividends to be paid after the end of the period.
(r) Cash and cash equivalentsAll highly liquid investments with original maturities of three months or less when purchased are considered cash equivalents.
(s) ReclassificationCertain reclassifications of previously reported amounts are made to conform to current classifications.
(t) New accounting standards to be applied(1) “Guidance on Accounting Standard for Tax Effect Accounting” (ASBJ Guidance No. 28, revised on 16 February 2018) “Guidance on Recoverability of Deferred Tax Assets” (ASBJ Guidance No. 26, revised on 16 February 2018)
1) Outline These guidances change the treatment of taxable temporary differences pertaining to shares of subsidiaries and
affiliates in non-consolidated financial statements, and clarify the treatment of recoverability of deferred tax assets for an entity classified as type 1.
2) Scheduled date of application The aforementioned guidances are scheduled to be applied at the start of the fiscal year ending 31 March 2019.3) Effect of application of the accounting standards The effect of the application of the aforementioned guidances on the Group’s consolidated financial statements is under
evaluation.(2) “Accounting Standard for Revenue Recognition” (ASBJ Statement No. 29, issued on 30 March 2018) “Guidance on Accounting Standard for Revenue Recognition” (ASBJ Guidance No. 30, issued on 30 March 2018)
1) Outline The aforementioned standard and guidance are comprehensive revenue recognition standards. Revenue is recognised
by applying the following steps: Step 1: Identify the contract(s) with a customer Step 2: Identify the performance obligations in the contract Step 3: Determine the transaction price Step 4: Allocate the transaction price to the performance obligations in the contract Step 5: Recognise revenue when (or as) the entity satisfies a performance obligation2) Scheduled date of application The aforementioned standard and guidance will be applied at the start of the fiscal year ending 31 March 2022.3) Effect of application of the accounting standards The effect of the application of the aforementioned standards and guidance on the Group’s consolidated financial state-
ments is under evaluation.
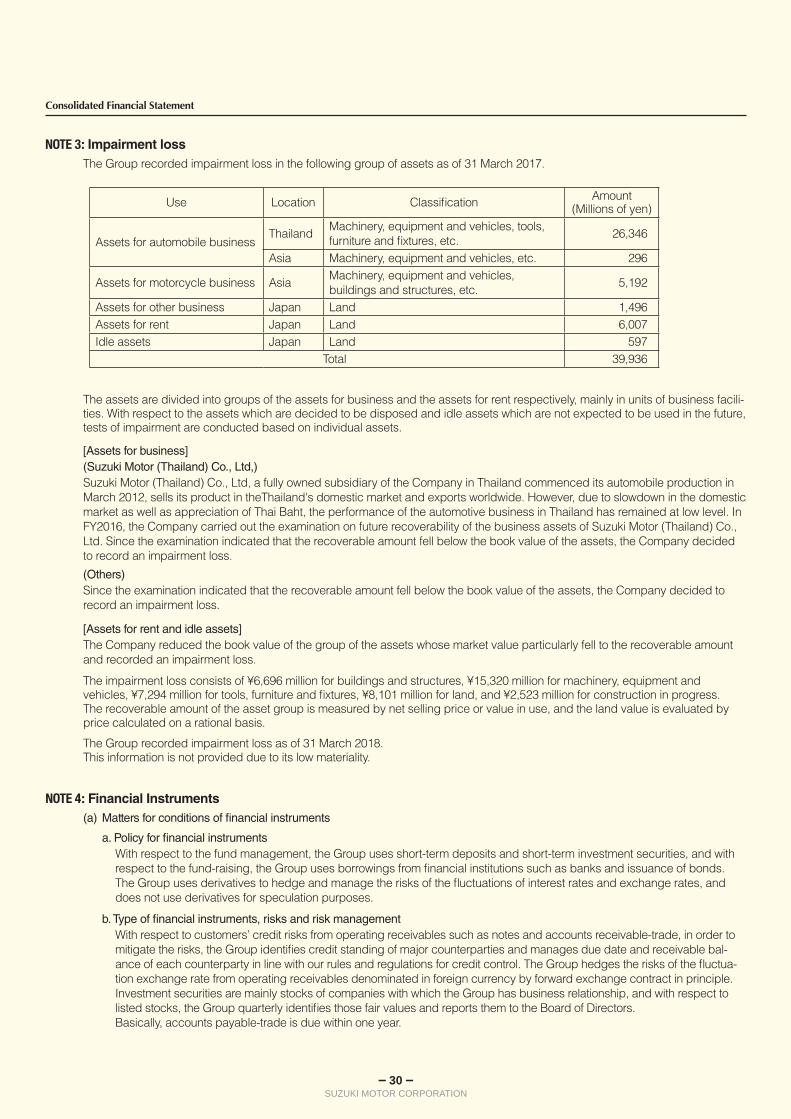
— 30 —SUZUKI MOTOR CORPORATION
Consolidated Financial Statement
Use Location Classification Amount (Millions of yen)
Assets for automobile businessThailand Machinery, equipment and vehicles, tools,
furniture and fixtures, etc. 26,346
Asia Machinery, equipment and vehicles, etc. 296
Assets for motorcycle business Asia Machinery, equipment and vehicles,buildings and structures, etc. 5,192
Assets for other business Japan Land 1,496Assets for rent Japan Land 6,007Idle assets Japan Land 597
Total 39,936
The assets are divided into groups of the assets for business and the assets for rent respectively, mainly in units of business facili-ties. With respect to the assets which are decided to be disposed and idle assets which are not expected to be used in the future, tests of impairment are conducted based on individual assets.
[Assets for business] (Suzuki Motor (Thailand) Co., Ltd,)
Suzuki Motor (Thailand) Co., Ltd, a fully owned subsidiary of the Company in Thailand commenced its automobile production in March 2012, sells its product in theThailand's domestic market and exports worldwide. However, due to slowdown in the domestic market as well as appreciation of Thai Baht, the performance of the automotive business in Thailand has remained at low level. In FY2016, the Company carried out the examination on future recoverability of the business assets of Suzuki Motor (Thailand) Co., Ltd. Since the examination indicated that the recoverable amount fell below the book value of the assets, the Company decided to record an impairment loss.
(Others)Since the examination indicated that the recoverable amount fell below the book value of the assets, the Company decided to record an impairment loss.
[Assets for rent and idle assets] The Company reduced the book value of the group of the assets whose market value particularly fell to the recoverable amount
and recorded an impairment loss.
The impairment loss consists of ¥6,696 million for buildings and structures, ¥15,320 million for machinery, equipment and vehicles, ¥7,294 million for tools, furniture and fixtures, ¥8,101 million for land, and ¥2,523 million for construction in progress.The recoverable amount of the asset group is measured by net selling price or value in use, and the land value is evaluated by price calculated on a rational basis.
The Group recorded impairment loss as of 31 March 2018.This information is not provided due to its low materiality.
NOTE 4: Financial Instruments(a) Matters for conditions of financial instruments
a. Policy for financial instrumentsWith respect to the fund management, the Group uses short-term deposits and short-term investment securities, and with respect to the fund-raising, the Group uses borrowings from financial institutions such as banks and issuance of bonds. The Group uses derivatives to hedge and manage the risks of the fluctuations of interest rates and exchange rates, and does not use derivatives for speculation purposes.
b. Type of financial instruments, risks and risk managementWith respect to customers’ credit risks from operating receivables such as notes and accounts receivable-trade, in order to mitigate the risks, the Group identifies credit standing of major counterparties and manages due date and receivable bal-ance of each counterparty in line with our rules and regulations for credit control. The Group hedges the risks of the fluctua-tion exchange rate from operating receivables denominated in foreign currency by forward exchange contract in principle.Investment securities are mainly stocks of companies with which the Group has business relationship, and with respect to listed stocks, the Group quarterly identifies those fair values and reports them to the Board of Directors.Basically, accounts payable-trade is due within one year.
NOTE 3: Impairment loss The Group recorded impairment loss in the following group of assets as of 31 March 2017.
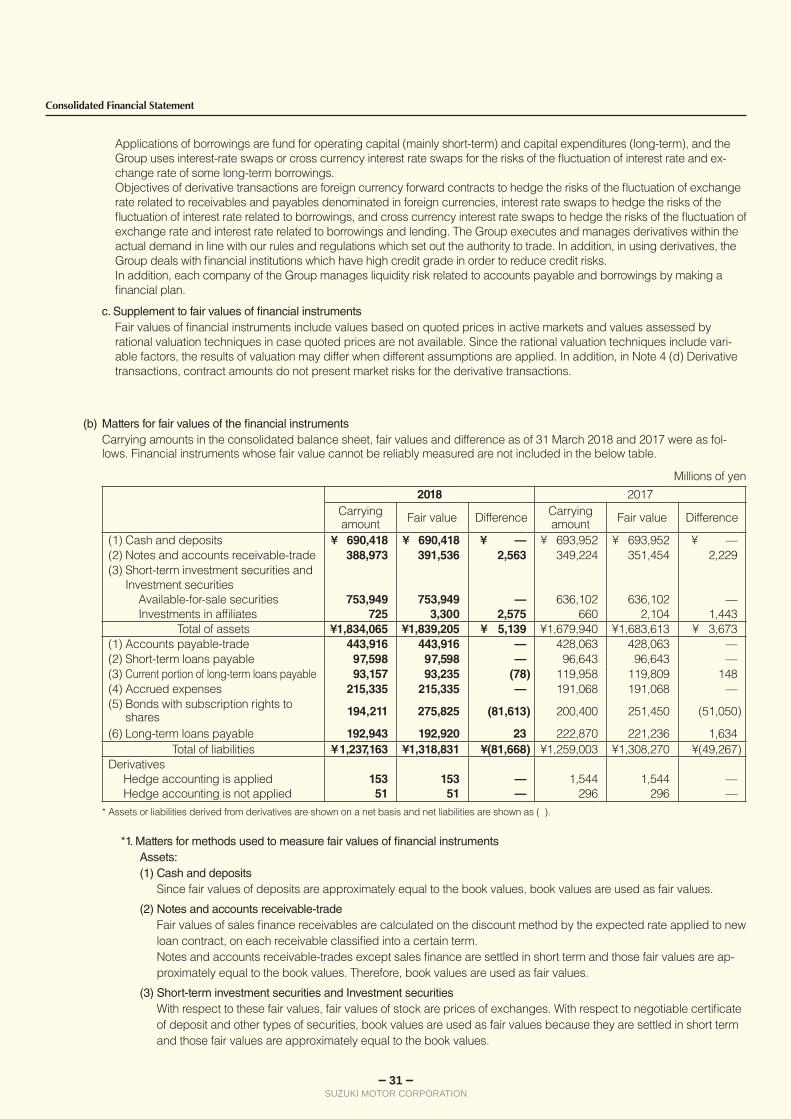
— 31 —SUZUKI MOTOR CORPORATION
Consolidated Financial Statement
Applications of borrowings are fund for operating capital (mainly short-term) and capital expenditures (long-term), and the Group uses interest-rate swaps or cross currency interest rate swaps for the risks of the fluctuation of interest rate and ex-change rate of some long-term borrowings.Objectives of derivative transactions are foreign currency forward contracts to hedge the risks of the fluctuation of exchange rate related to receivables and payables denominated in foreign currencies, interest rate swaps to hedge the risks of the fluctuation of interest rate related to borrowings, and cross currency interest rate swaps to hedge the risks of the fluctuation of exchange rate and interest rate related to borrowings and lending. The Group executes and manages derivatives within the actual demand in line with our rules and regulations which set out the authority to trade. In addition, in using derivatives, the Group deals with financial institutions which have high credit grade in order to reduce credit risks.In addition, each company of the Group manages liquidity risk related to accounts payable and borrowings by making a financial plan.
c. Supplement to fair values of financial instrumentsFair values of financial instruments include values based on quoted prices in active markets and values assessed by rational valuation techniques in case quoted prices are not available. Since the rational valuation techniques include vari-able factors, the results of valuation may differ when different assumptions are applied. In addition, in Note 4 (d) Derivative transactions, contract amounts do not present market risks for the derivative transactions.
(b) Matters for fair values of the financial instrumentsCarrying amounts in the consolidated balance sheet, fair values and difference as of 31 March 2018 and 2017 were as fol-lows. Financial instruments whose fair value cannot be reliably measured are not included in the below table.
Millions of yen2018 2017
Carrying amount Fair value Difference Carrying
amount Fair value Difference
(1) Cash and deposits ¥ 690,418 ¥ 690,418 ¥ — ¥ 693,952 ¥ 693,952 ¥ —(2) Notes and accounts receivable-trade 388,973 391,536 2,563 349,224 351,454 2,229(3) Short-term investment securities and
Investment securitiesAvailable-for-sale securitiesInvestments in affiliates
753,949725
753,9493,300
—2,575
636,102660
636,1022,104
—1,443
Total of assets ¥1,834,065 ¥1,839,205 ¥ 5,139 ¥1,679,940 ¥1,683,613 ¥ 3,673(1) Accounts payable-trade 443,916 443,916 — 428,063 428,063 —(2) Short-term loans payable 97,598 97,598 — 96,643 96,643 —(3) Current portion of long-term loans payable 93,157 93,235 (78) 119,958 119,809 148(4) Accrued expenses 215,335 215,335 — 191,068 191,068 —(5) Bonds with subscription rights to
shares 194,211 275,825 (81,613) 200,400 251,450 (51,050)
(6) Long-term loans payable 192,943 192,920 23 222,870 221,236 1,634Total of liabilities ¥1,237,163 ¥1,318,831 ¥(81,668) ¥1,259,003 ¥1,308,270 ¥(49,267)
DerivativesHedge accounting is appliedHedge accounting is not applied
15351
15351
——
1,544296
1,544296
——
* Assets or liabilities derived from derivatives are shown on a net basis and net liabilities are shown as ( ).
*1. Matters for methods used to measure fair values of financial instrumentsAssets:(1) Cash and deposits
Since fair values of deposits are approximately equal to the book values, book values are used as fair values.
(2) Notes and accounts receivable-tradeFair values of sales finance receivables are calculated on the discount method by the expected rate applied to new loan contract, on each receivable classified into a certain term.Notes and accounts receivable-trades except sales finance are settled in short term and those fair values are ap-proximately equal to the book values. Therefore, book values are used as fair values.
(3) Short-term investment securities and Investment securitiesWith respect to these fair values, fair values of stock are prices of exchanges. With respect to negotiable certificate of deposit and other types of securities, book values are used as fair values because they are settled in short term and those fair values are approximately equal to the book values.
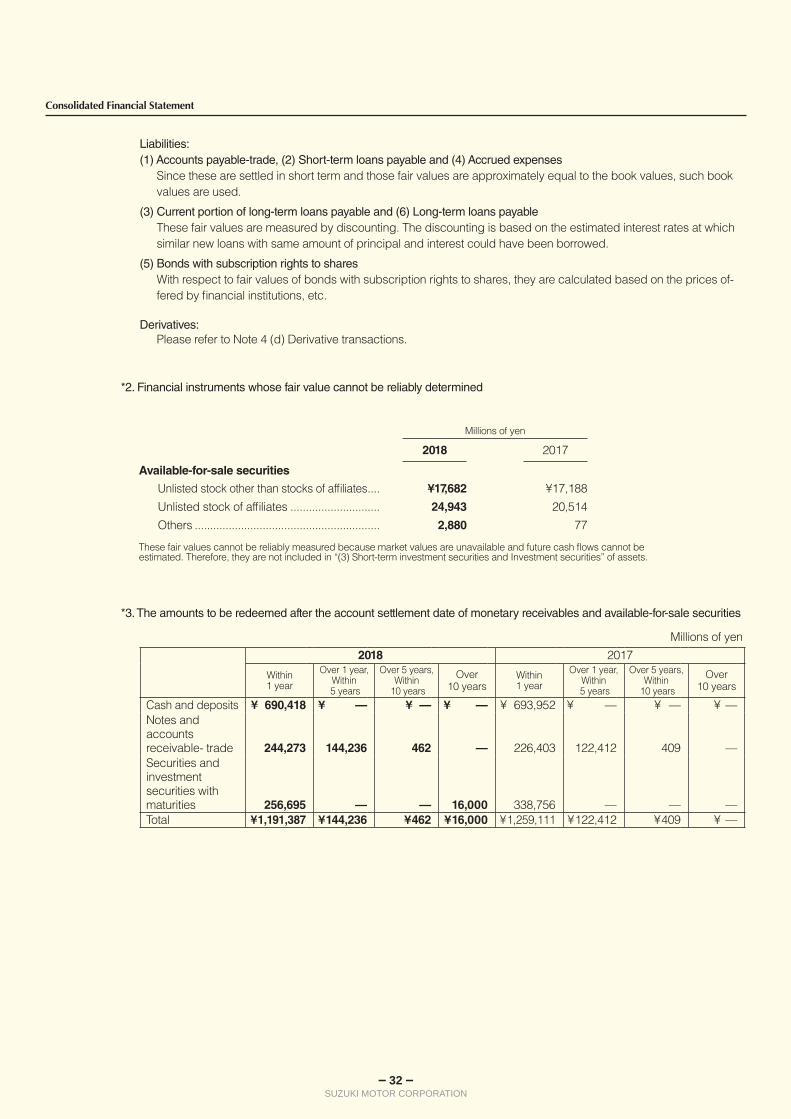
— 32 —SUZUKI MOTOR CORPORATION
Consolidated Financial Statement
Liabilities:(1) Accounts payable-trade, (2) Short-term loans payable and (4) Accrued expenses
Since these are settled in short term and those fair values are approximately equal to the book values, such book values are used.
(3) Current portion of long-term loans payable and (6) Long-term loans payableThese fair values are measured by discounting. The discounting is based on the estimated interest rates at which similar new loans with same amount of principal and interest could have been borrowed.
(5) Bonds with subscription rights to sharesWith respect to fair values of bonds with subscription rights to shares, they are calculated based on the prices of-fered by financial institutions, etc.
Derivatives:Please refer to Note 4 (d) Derivative transactions.
*2. Financial instruments whose fair value cannot be reliably determined
Millions of yen
2018 2017
Available-for-sale securities
Unlisted stock other than stocks of affiliates .... ¥17,682 ¥17,188Unlisted stock of affiliates ............................. 24,943 20,514Others ............................................................ 2,880 77
These fair values cannot be reliably measured because market values are unavailable and future cash flows cannot be estimated. Therefore, they are not included in “(3) Short-term investment securities and Investment securities” of assets.
*3. The amounts to be redeemed after the account settlement date of monetary receivables and available-for-sale securities
Millions of yen2018 2017
Within1 year
Over 1 year,Within
5 years
Over 5 years,Within
10 years
Over10 years
Within1 year
Over 1 year,Within
5 years
Over 5 years,Within
10 years
Over10 years
Cash and deposits ¥ 690,418 ¥ — ¥ — ¥ — ¥ 693,952 ¥ — ¥ — ¥ —Notes and accounts receivable- trade 244,273 144,236 462 — 226,403 122,412 409 —Securities and investmentsecurities with maturities 256,695 — — 16,000 338,756 — — —Total ¥1,191,387 ¥144,236 ¥462 ¥16,000 ¥1,259,111 ¥122,412 ¥409 ¥ —
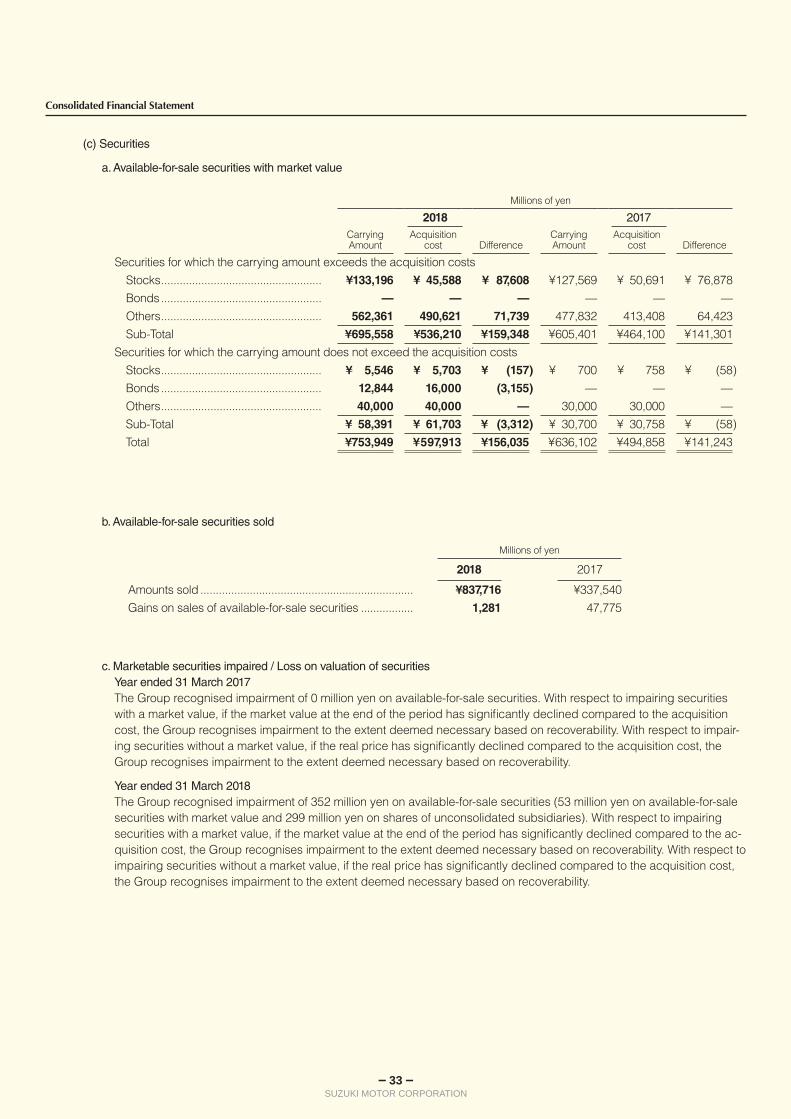
— 33 —SUZUKI MOTOR CORPORATION
Consolidated Financial Statement
(c) Securities
a. Available-for-sale securities with market value
Millions of yen
2018 2017 CarryingAmount
Acquisitioncost Difference
CarryingAmount
Acquisitioncost Difference
Securities for which the carrying amount exceeds the acquisition costsStocks .................................................... ¥133,196 ¥ 45,588 ¥ 87,608 ¥127,569 ¥ 50,691 ¥ 76,878Bonds .................................................... — — — — — —Others .................................................... 562,361 490,621 71,739 477,832 413,408 64,423Sub-Total ¥695,558 ¥536,210 ¥159,348 ¥605,401 ¥464,100 ¥141,301
Securities for which the carrying amount does not exceed the acquisition costsStocks .................................................... ¥ 5,546 ¥ 5,703 ¥ (157) ¥ 700 ¥ 758 ¥ (58)Bonds .................................................... 12,844 16,000 (3,155) — — —Others .................................................... 40,000 40,000 — 30,000 30,000 —Sub-Total ¥ 58,391 ¥ 61,703 ¥ (3,312) ¥ 30,700 ¥ 30,758 ¥ (58)Total ¥753,949 ¥597,913 ¥156,035 ¥636,102 ¥494,858 ¥141,243
b. Available-for-sale securities sold
c. Marketable securities impaired / Loss on valuation of securitiesYear ended 31 March 2017The Group recognised impairment of 0 million yen on available-for-sale securities. With respect to impairing securities with a market value, if the market value at the end of the period has significantly declined compared to the acquisition cost, the Group recognises impairment to the extent deemed necessary based on recoverability. With respect to impair-ing securities without a market value, if the real price has significantly declined compared to the acquisition cost, the Group recognises impairment to the extent deemed necessary based on recoverability.
Year ended 31 March 2018The Group recognised impairment of 352 million yen on available-for-sale securities (53 million yen on available-for-sale securities with market value and 299 million yen on shares of unconsolidated subsidiaries). With respect to impairing securities with a market value, if the market value at the end of the period has significantly declined compared to the ac-quisition cost, the Group recognises impairment to the extent deemed necessary based on recoverability. With respect to impairing securities without a market value, if the real price has significantly declined compared to the acquisition cost, the Group recognises impairment to the extent deemed necessary based on recoverability.
Millions of yen
2018 2017
Amounts sold ..................................................................... ¥837,716 ¥337,540Gains on sales of available-for-sale securities ................. 1,281 47,775
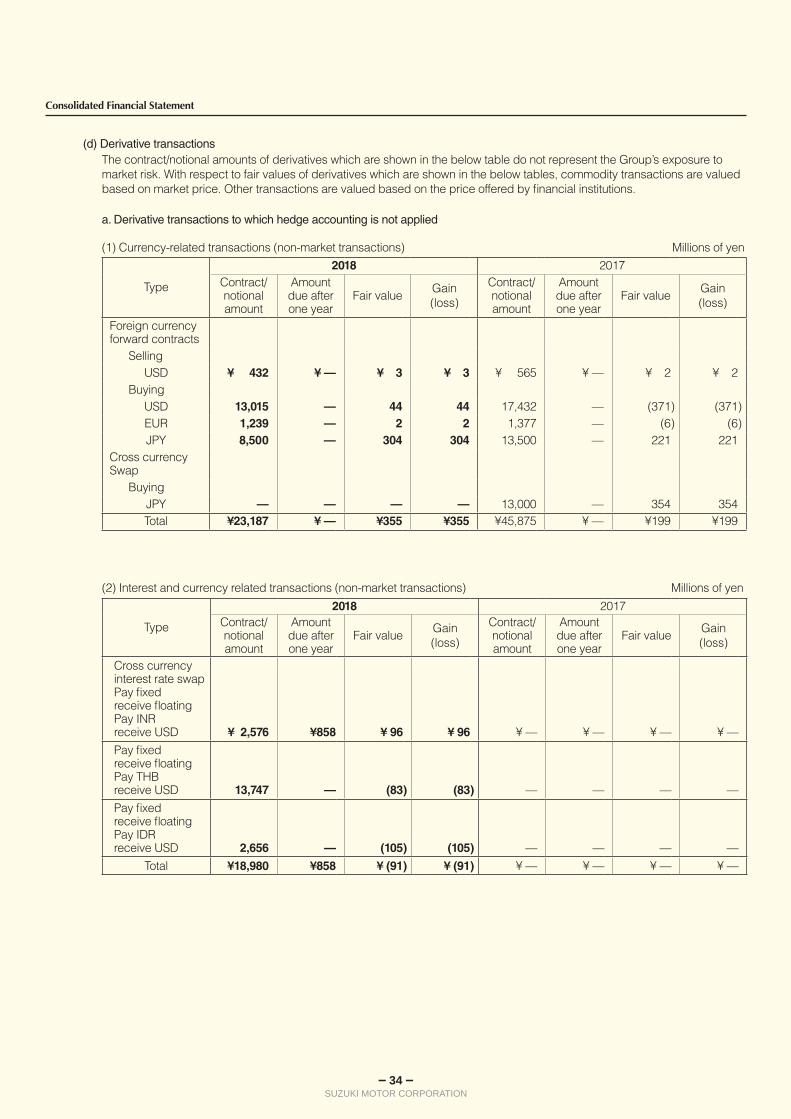
— 34 —SUZUKI MOTOR CORPORATION
Consolidated Financial Statement
(d) Derivative transactionsThe contract/notional amounts of derivatives which are shown in the below table do not represent the Group’s exposure to market risk. With respect to fair values of derivatives which are shown in the below tables, commodity transactions are valued based on market price. Other transactions are valued based on the price offered by financial institutions.
a. Derivative transactions to which hedge accounting is not applied
(1) Currency-related transactions (non-market transactions) Millions of yen
Type
2018 2017Contract/notional amount
Amountdue afterone year
Fair value Gain (loss)
Contract/notional amount
Amountdue afterone year
Fair value Gain (loss)
Foreign currency forward contracts
SellingUSD ¥ 432 ¥ — ¥ 3 ¥ 3 ¥ 565 ¥ — ¥ 2 ¥ 2
BuyingUSD 13,015 — 44 44 17,432 — (371) (371)EUR 1,239 — 2 2 1,377 — (6) (6)JPY 8,500 — 304 304 13,500 — 221 221
Cross currencySwap
BuyingJPY — — — — 13,000 — 354 354Total ¥23,187 ¥ — ¥355 ¥355 ¥45,875 ¥ — ¥199 ¥199
(2) Interest and currency related transactions (non-market transactions) Millions of yen
Type
2018 2017Contract/notional amount
Amountdue afterone year
Fair value Gain (loss)
Contract/notional amount
Amountdue afterone year
Fair value Gain (loss)
Cross currency interest rate swapPay fixedreceive floatingPay INRreceive USD ¥ 2,576 ¥858 ¥ 96 ¥ 96 ¥ — ¥ — ¥ — ¥ —Pay fixedreceive floatingPay THBreceive USD 13,747 — (83) (83) — — — —Pay fixedreceive floatingPay IDRreceive USD 2,656 — (105) (105) — — — —
Total ¥18,980 ¥858 ¥ (91) ¥ (91) ¥ — ¥ — ¥ — ¥ —
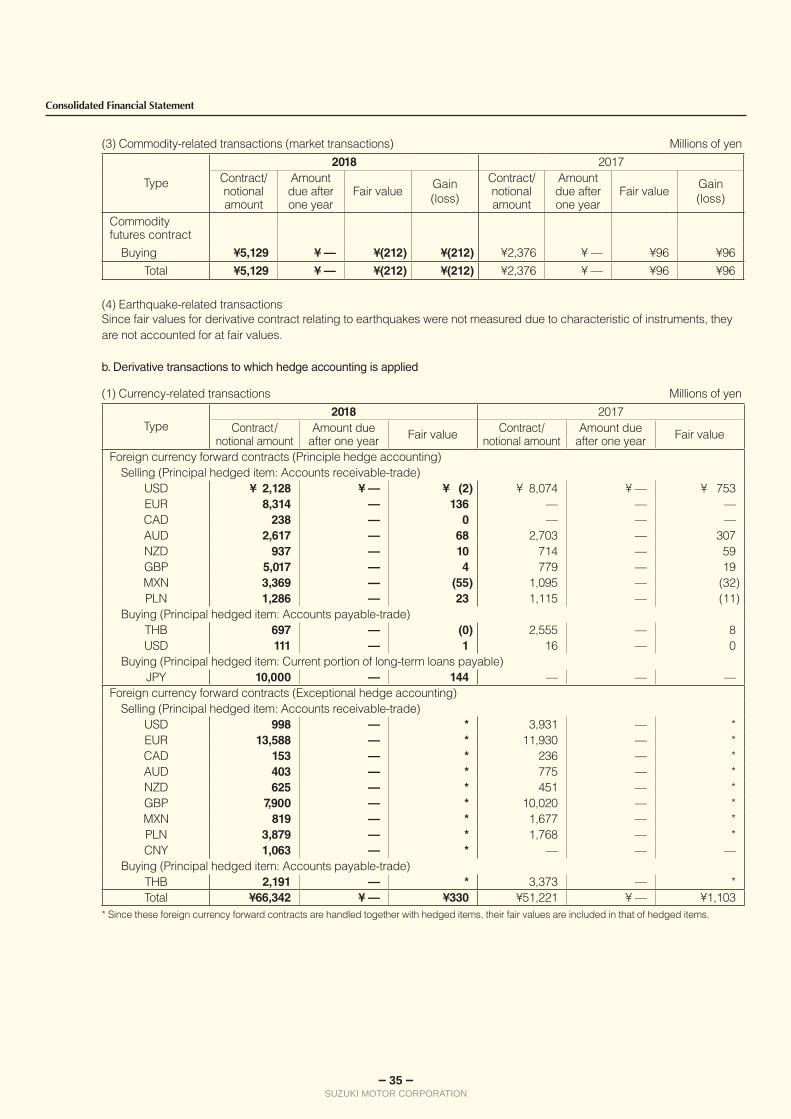
— 35 —SUZUKI MOTOR CORPORATION
Consolidated Financial Statement
(3) Commodity-related transactions (market transactions) Millions of yen
Type
2018 2017Contract/notional amount
Amountdue afterone year
Fair value Gain (loss)
Contract/notional amount
Amountdue afterone year
Fair value Gain (loss)
Commodity futures contract
Buying ¥5,129 ¥ — ¥(212) ¥(212) ¥2,376 ¥ — ¥96 ¥96Total ¥5,129 ¥ — ¥(212) ¥(212) ¥2,376 ¥ — ¥96 ¥96
(4) Earthquake-related transactionsSince fair values for derivative contract relating to earthquakes were not measured due to characteristic of instruments, they are not accounted for at fair values.
b. Derivative transactions to which hedge accounting is applied
(1) Currency-related transactions Millions of yen
Type2018 2017
Contract/notional amount
Amount due after one year Fair value Contract/
notional amountAmount due
after one year Fair value
Foreign currency forward contracts (Principle hedge accounting)Selling (Principal hedged item: Accounts receivable-trade)
USD ¥ 2,128 ¥ — ¥ (2) ¥ 8,074 ¥ — ¥ 753EUR 8,314 — 136 — — —CAD 238 — 0 — — —AUD 2,617 — 68 2,703 — 307NZD 937 — 10 714 — 59GBP 5,017 — 4 779 — 19MXN 3,369 — (55) 1,095 — (32)PLN 1,286 — 23 1,115 — (11)
Buying (Principal hedged item: Accounts payable-trade)THB 697 — (0) 2,555 — 8USD 111 — 1 16 — 0
Buying (Principal hedged item: Current portion of long-term loans payable)JPY 10,000 — 144 — — —
Foreign currency forward contracts (Exceptional hedge accounting)Selling (Principal hedged item: Accounts receivable-trade)
USD 998 — * 3,931 — *EUR 13,588 — * 11,930 — *CAD 153 — * 236 — *AUD 403 — * 775 — *NZD 625 — * 451 — *GBP 7,900 — * 10,020 — *MXN 819 — * 1,677 — *PLN 3,879 — * 1,768 — *CNY 1,063 — * — — —
Buying (Principal hedged item: Accounts payable-trade)THB 2,191 — * 3,373 — *Total ¥66,342 ¥ — ¥330 ¥51,221 ¥ — ¥1,103
* Since these foreign currency forward contracts are handled together with hedged items, their fair values are included in that of hedged items.
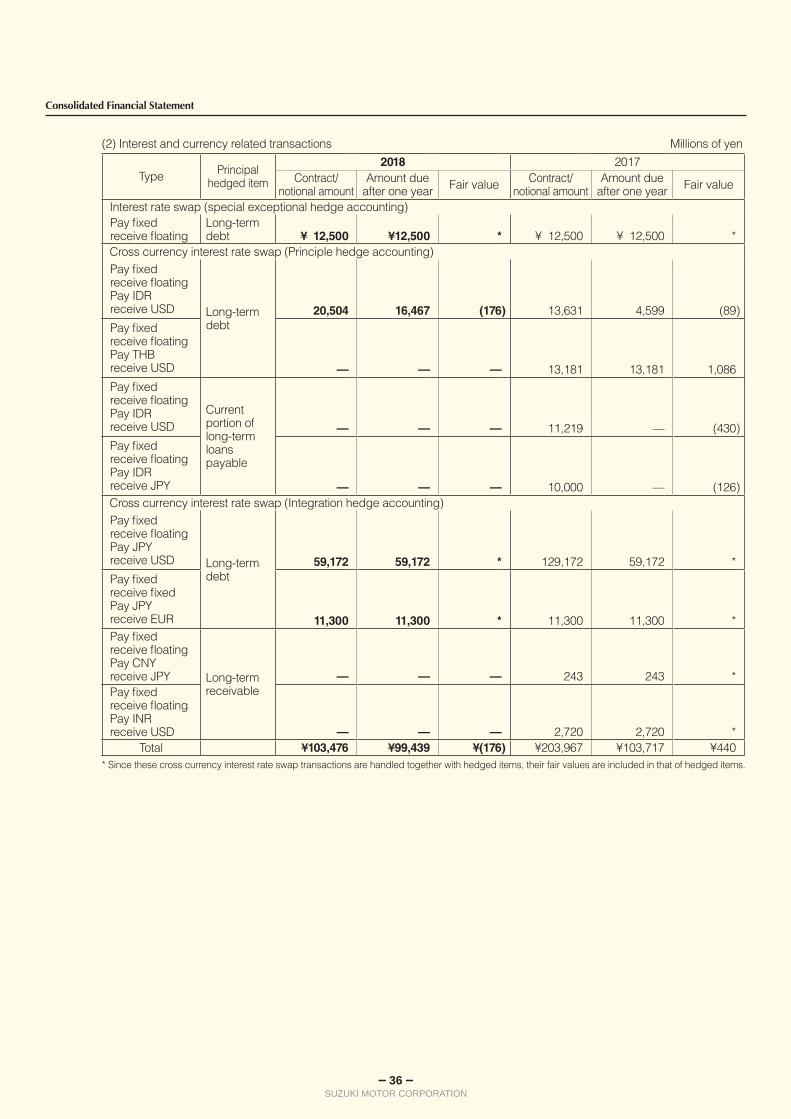
— 36 —SUZUKI MOTOR CORPORATION
Consolidated Financial Statement
(2) Interest and currency related transactions Millions of yen
Type Principalhedged item
2018 2017Contract/
notional amountAmount due
after one year Fair value Contract/notional amount
Amount due after one year Fair value
Interest rate swap (special exceptional hedge accounting)Pay fixedreceive floating
Long-termdebt ¥ 12,500 ¥12,500 * ¥ 12,500 ¥ 12,500 *
Cross currency interest rate swap (Principle hedge accounting)Pay fixedreceive floatingPay IDRreceive USD Long-term
debt20,504 16,467 (176) 13,631 4,599 (89)
Pay fixedreceive floatingPay THBreceive USD — — — 13,181 13,181 1,086Pay fixedreceive floatingPay IDRreceive USD
Current portion of long-term loans payable
— — — 11,219 — (430)Pay fixedreceive floatingPay IDRreceive JPY — — — 10,000 — (126)Cross currency interest rate swap (Integration hedge accounting)Pay fixedreceive floatingPay JPYreceive USD Long-term
debt59,172 59,172 * 129,172 59,172 *
Pay fixedreceive fixedPay JPYreceive EUR 11,300 11,300 * 11,300 11,300 *Pay fixedreceive floatingPay CNYreceive JPY Long-term
receivable— — — 243 243 *
Pay fixedreceive floatingPay INRreceive USD — — — 2,720 2,720 *
Total ¥103,476 ¥99,439 ¥(176) ¥203,967 ¥103,717 ¥440* Since these cross currency interest rate swap transactions are handled together with hedged items, their fair values are included in that of hedged items.
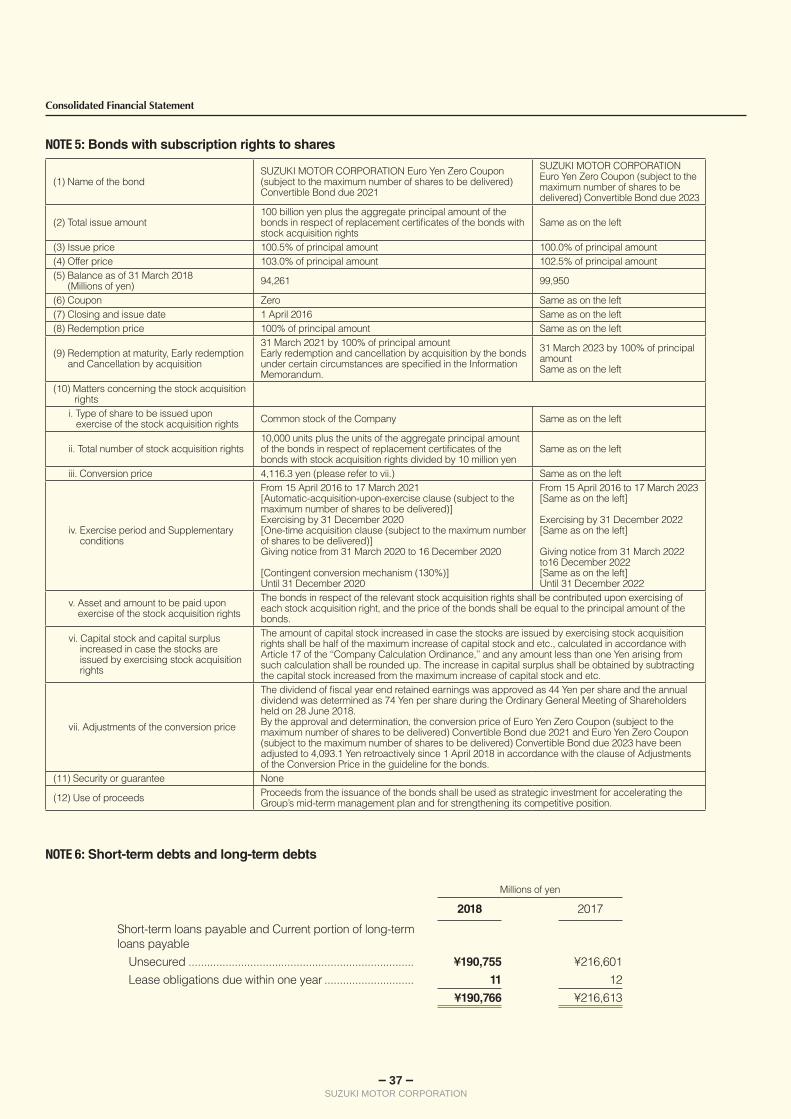
— 37 —SUZUKI MOTOR CORPORATION
Consolidated Financial Statement
NOTE 5: Bonds with subscription rights to shares
(1) Name of the bondSUZUKI MOTOR CORPORATION Euro Yen Zero Coupon (subject to the maximum number of shares to be delivered) Convertible Bond due 2021
SUZUKI MOTOR CORPORATION Euro Yen Zero Coupon (subject to the maximum number of shares to be delivered) Convertible Bond due 2023
(2) Total issue amount100 billion yen plus the aggregate principal amount of the bonds in respect of replacement certificates of the bonds with stock acquisition rights
Same as on the left
(3) Issue price 100.5% of principal amount 100.0% of principal amount(4) Offer price 103.0% of principal amount 102.5% of principal amount(5) Balance as of 31 March 2018
(Millions of yen) 94,261 99,950
(6) Coupon Zero Same as on the left(7) Closing and issue date 1 April 2016 Same as on the left(8) Redemption price 100% of principal amount Same as on the left
(9) Redemption at maturity, Early redemption and Cancellation by acquisition
31 March 2021 by 100% of principal amountEarly redemption and cancellation by acquisition by the bonds under certain circumstances are specified in the Information Memorandum.
31 March 2023 by 100% of principal amountSame as on the left
(10) Matters concerning the stock acquisition rights
i. Type of share to be issued upon exercise of the stock acquisition rights Common stock of the Company Same as on the left
ii. Total number of stock acquisition rights10,000 units plus the units of the aggregate principal amount of the bonds in respect of replacement certificates of the bonds with stock acquisition rights divided by 10 million yen
Same as on the left
iii. Conversion price 4,116.3 yen (please refer to vii.) Same as on the left
iv. Exercise period and Supplementary conditions
From 15 April 2016 to 17 March 2021[Automatic-acquisition-upon-exercise clause (subject to the maximum number of shares to be delivered)]Exercising by 31 December 2020[One-time acquisition clause (subject to the maximum number of shares to be delivered)]Giving notice from 31 March 2020 to 16 December 2020
[Contingent conversion mechanism (130%)]Until 31 December 2020
From 15 April 2016 to 17 March 2023[Same as on the left]
Exercising by 31 December 2022[Same as on the left]
Giving notice from 31 March 2022 to16 December 2022[Same as on the left]Until 31 December 2022
v. Asset and amount to be paid upon exercise of the stock acquisition rights
The bonds in respect of the relevant stock acquisition rights shall be contributed upon exercising of each stock acquisition right, and the price of the bonds shall be equal to the principal amount of the bonds.
vi. Capital stock and capital surplus increased in case the stocks are issued by exercising stock acquisition rights
The amount of capital stock increased in case the stocks are issued by exercising stock acquisition rights shall be half of the maximum increase of capital stock and etc., calculated in accordance with Article 17 of the ‘‘Company Calculation Ordinance,’’ and any amount less than one Yen arising from such calculation shall be rounded up. The increase in capital surplus shall be obtained by subtracting the capital stock increased from the maximum increase of capital stock and etc.
vii. Adjustments of the conversion price
The dividend of fiscal year end retained earnings was approved as 44 Yen per share and the annual dividend was determined as 74 Yen per share during the Ordinary General Meeting of Shareholders held on 28 June 2018.By the approval and determination, the conversion price of Euro Yen Zero Coupon (subject to the maximum number of shares to be delivered) Convertible Bond due 2021 and Euro Yen Zero Coupon (subject to the maximum number of shares to be delivered) Convertible Bond due 2023 have been adjusted to 4,093.1 Yen retroactively since 1 April 2018 in accordance with the clause of Adjustments of the Conversion Price in the guideline for the bonds.
(11) Security or guarantee None
(12) Use of proceeds Proceeds from the issuance of the bonds shall be used as strategic investment for accelerating the Group’s mid-term management plan and for strengthening its competitive position.
NOTE 6: Short-term debts and long-term debts
Millions of yen
2018 2017
Short-term loans payable and Current portion of long-term loans payable
Unsecured ......................................................................... ¥190,755 ¥216,601Lease obligations due within one year ............................. 11 12
¥190,766 ¥216,613

— 38 —SUZUKI MOTOR CORPORATION
Consolidated Financial Statement
As is customary in Japan, both short-term and long-term bank loans are subjected to general agreements which provide that the banks may, under certain circumstances, request additional security for those loans, and may treat any security furnished to the banks, as well as cash deposited with them, as security for all present and future indebtedness.
Long-term debts were as follows:Millions of yen
2018 2017Long-term loans payable maturing through 2022
Unsecured ......................................................................... ¥192,943 ¥222,870Lease obligations due more than one year .......................... 13 7Other interest-bearing debts (Long-term guarantee deposited) ... 13,217 12,540
¥206,175 ¥235,419
The aggregate annual maturities of long-term debts excluding other interest-bearing debts as of 31 March 2018 were as follows:
Year ending 31 March Millions of yen
2020 ....................................................................................... ¥ 54,496
2021 ....................................................................................... 33,020
2022 ....................................................................................... 105,439
Thereafter ............................................................................... 0
¥192,956
Assets pledged as collateral as of 31 March 2018: Millions of yen
Buildings and structures ....................................................... ¥524
Land ....................................................................................... 97
¥621
Secured liabilities as of 31 March 2018: Millions of yen
Others (noncurrent liabilities) ................................................ ¥228
NOTE 7: Loan commitmentThe Company has the commitment line contracts with six banks for effective financing. The outstanding balance of these contracts was as follows:
Millions of yen
2018 2017
Commitment line contract total ............................................. ¥250,000 ¥250,000Actual loan balance ............................................................... — —Variance ¥250,000 ¥250,000
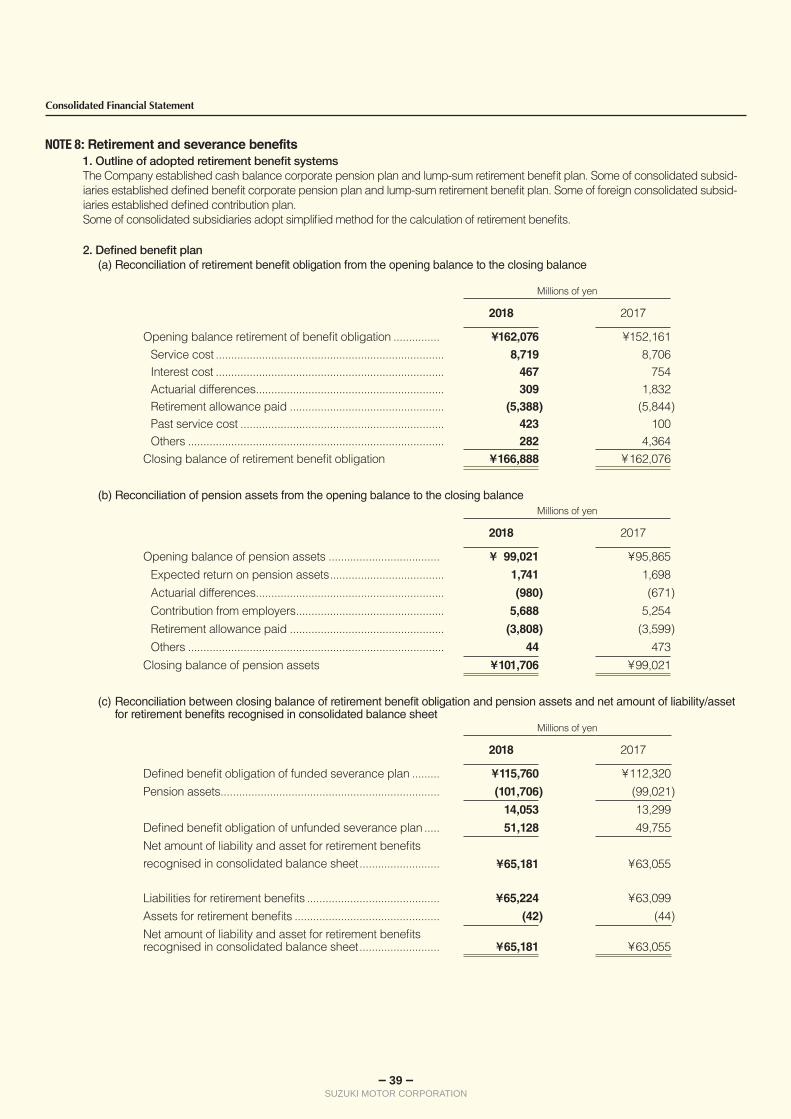
— 39 —SUZUKI MOTOR CORPORATION
Consolidated Financial Statement
NOTE 8: Retirement and severance benefits1. Outline of adopted retirement benefit systemsThe Company established cash balance corporate pension plan and lump-sum retirement benefit plan. Some of consolidated subsid-iaries established defined benefit corporate pension plan and lump-sum retirement benefit plan. Some of foreign consolidated subsid-iaries established defined contribution plan.Some of consolidated subsidiaries adopt simplified method for the calculation of retirement benefits.
2. Defined benefit plan(a) Reconciliation of retirement benefit obligation from the opening balance to the closing balance
Millions of yen
2018 2017
Opening balance retirement of benefit obligation ............... ¥162,076 ¥152,161Service cost .......................................................................... 8,719 8,706Interest cost .......................................................................... 467 754Actuarial differences ............................................................. 309 1,832Retirement allowance paid .................................................. (5,388) (5,844)Past service cost .................................................................. 423 100Others ................................................................................... 282 4,364
Closing balance of retirement benefit obligation ¥166,888 ¥162,076
(b) Reconciliation of pension assets from the opening balance to the closing balanceMillions of yen
2018 2017
Opening balance of pension assets .................................... ¥ 99,021 ¥95,865Expected return on pension assets ..................................... 1,741 1,698Actuarial differences ............................................................. (980) (671)Contribution from employers ................................................ 5,688 5,254Retirement allowance paid .................................................. (3,808) (3,599)Others ................................................................................... 44 473
Closing balance of pension assets ¥101,706 ¥99,021
(c) Reconciliation between closing balance of retirement benefit obligation and pension assets and net amount of liability/asset for retirement benefits recognised in consolidated balance sheet
Millions of yen
2018 2017
Defined benefit obligation of funded severance plan ......... ¥115,760 ¥112,320Pension assets ....................................................................... (101,706) (99,021)
14,053 13,299Defined benefit obligation of unfunded severance plan ..... 51,128 49,755Net amount of liability and asset for retirement benefits recognised in consolidated balance sheet .......................... ¥65,181 ¥63,055
Liabilities for retirement benefits ........................................... ¥65,224 ¥63,099Assets for retirement benefits ............................................... (42) (44)Net amount of liability and asset for retirement benefits recognised in consolidated balance sheet .......................... ¥65,181 ¥63,055

— 40 —SUZUKI MOTOR CORPORATION
Consolidated Financial Statement
(d) Breakdown of retirement benefit expensesMillions of yen
2018 2017
Service cost ........................................................................... ¥8,719 ¥8,706Interest cost ........................................................................... 467 754Expected return on pension assets ...................................... (1,741) (1,698)Recognition of actuarial gains and losses ........................... 950 1,875Amortisation of past service cost .......................................... 1 (333)Others .................................................................................... (197) 110Total amount of retirement benefit expensesfor defined benefit plans ....................................................... ¥8,199 ¥9,415
(e) Adjustment for retirement benefits Breakdown of adjustment for retirement benefit recognised were as follows:
Millions of yen
2018 2017Past service cost ................................................................... ¥(340) ¥(433)Actuarial gains and losses .................................................... (435) (447)Total ¥(776) ¥(881)
(f) Accumulated adjustment for retirement benefits Breakdown of accumulated adjustment for retirement benefit recognised were as follows:
Millions of yen
2018 2017Unrecognised past service cost ........................................... ¥(2,932) ¥(2,591)Unrecognised actuarial gains and losses ............................ (12,321) (11,885)Total ¥(15,253) ¥(14,477)
(g) Pension assetsa. Major breakdown of pension assets
Portion of major components to total pension assets were as follows:
2018 2017Debt securities ....................................................................... 41.7% 45.4%General account of life insurance companies ..................... 38.7% 37.6%Others .................................................................................... 19.6% 17.0%Total 100.0% 100.0%
b. Method to determine long-term expected return on pension assets Expected return on pension assets were determined by considering the current and anticipated future portfolio of pen-
sion assets and current and anticipated future long-term performance of various asset classes that comprise pension assets.
(h) Actuarial assumptions2018 2017
Discount rate.......................................................................... mainly 0.15% mainly 0.15%Expected long-term return on pension assets ..................... mainly 1.80% mainly 1.80%
3. Defined contribution planYear ended 31 March 2017Contribution to defined contribution plan by the Company and consolidated subsidiaries was 340 million yen.
Year ended 31 March 2018Contribution to defined contribution plan by the Company and consolidated subsidiaries was 231 million yen.
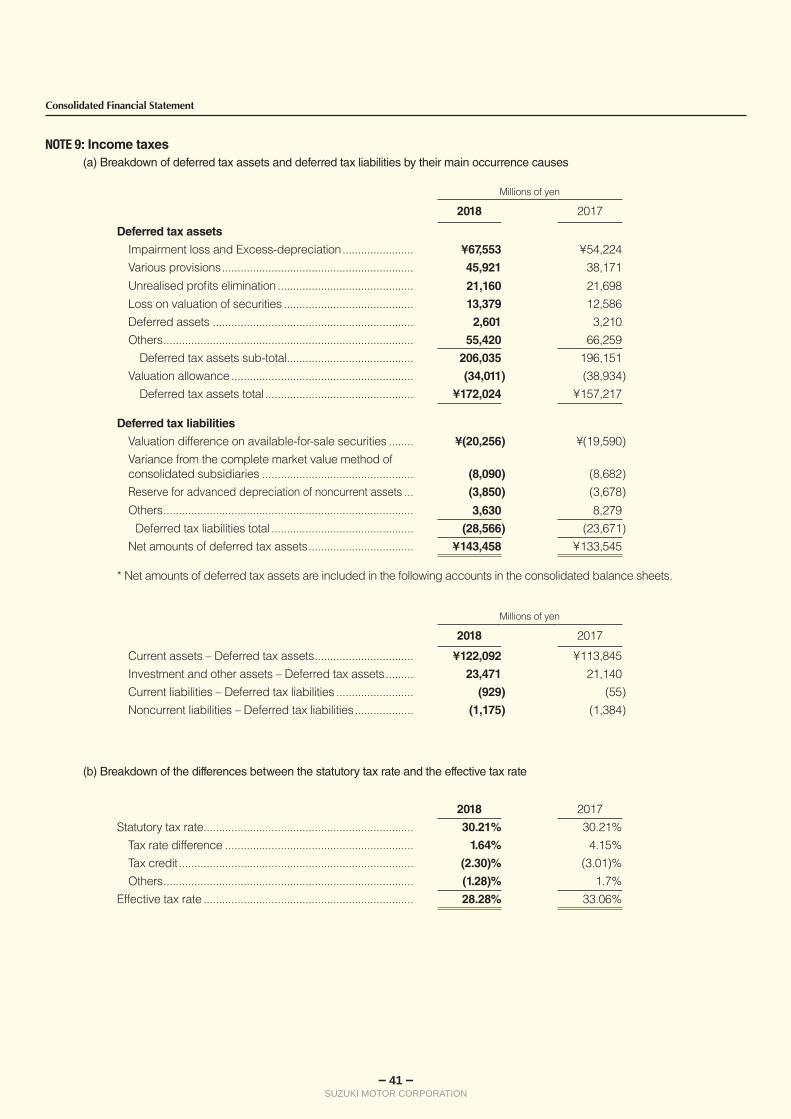
— 41 —SUZUKI MOTOR CORPORATION
Consolidated Financial Statement
NOTE 9: Income taxes(a) Breakdown of deferred tax assets and deferred tax liabilities by their main occurrence causes
Millions of yen
2018 2017
Deferred tax assets
Impairment loss and Excess-depreciation ....................... ¥67,553 ¥54,224Various provisions .............................................................. 45,921 38,171Unrealised profits elimination ............................................ 21,160 21,698Loss on valuation of securities .......................................... 13,379 12,586Deferred assets ................................................................. 2,601 3,210Others ................................................................................. 55,420 66,259
Deferred tax assets sub-total ......................................... 206,035 196,151Valuation allowance ........................................................... (34,011) (38,934)
Deferred tax assets total ................................................ ¥172,024 ¥157,217
Deferred tax liabilities
Valuation difference on available-for-sale securities ........ ¥(20,256) ¥(19,590)Variance from the complete market value method of consolidated subsidiaries ................................................. (8,090) (8,682)Reserve for advanced depreciation of noncurrent assets ... (3,850) (3,678)Others ................................................................................. 3,630 8,279
Deferred tax liabilities total .............................................. (28,566) (23,671)Net amounts of deferred tax assets .................................. ¥143,458 ¥133,545
* Net amounts of deferred tax assets are included in the following accounts in the consolidated balance sheets.
Millions of yen
2018 2017
Current assets – Deferred tax assets ................................ ¥122,092 ¥113,845Investment and other assets – Deferred tax assets ......... 23,471 21,140Current liabilities – Deferred tax liabilities ......................... (929) (55)Noncurrent liabilities – Deferred tax liabilities ................... (1,175) (1,384)
2018 2017Statutory tax rate .................................................................... 30.21% 30.21%
Tax rate difference ............................................................. 1.64% 4.15%Tax credit ............................................................................ (2.30)% (3.01)%Others ................................................................................. (1.28)% 1.7%
Effective tax rate .................................................................... 28.28% 33.06%
(b) Breakdown of the differences between the statutory tax rate and the effective tax rate
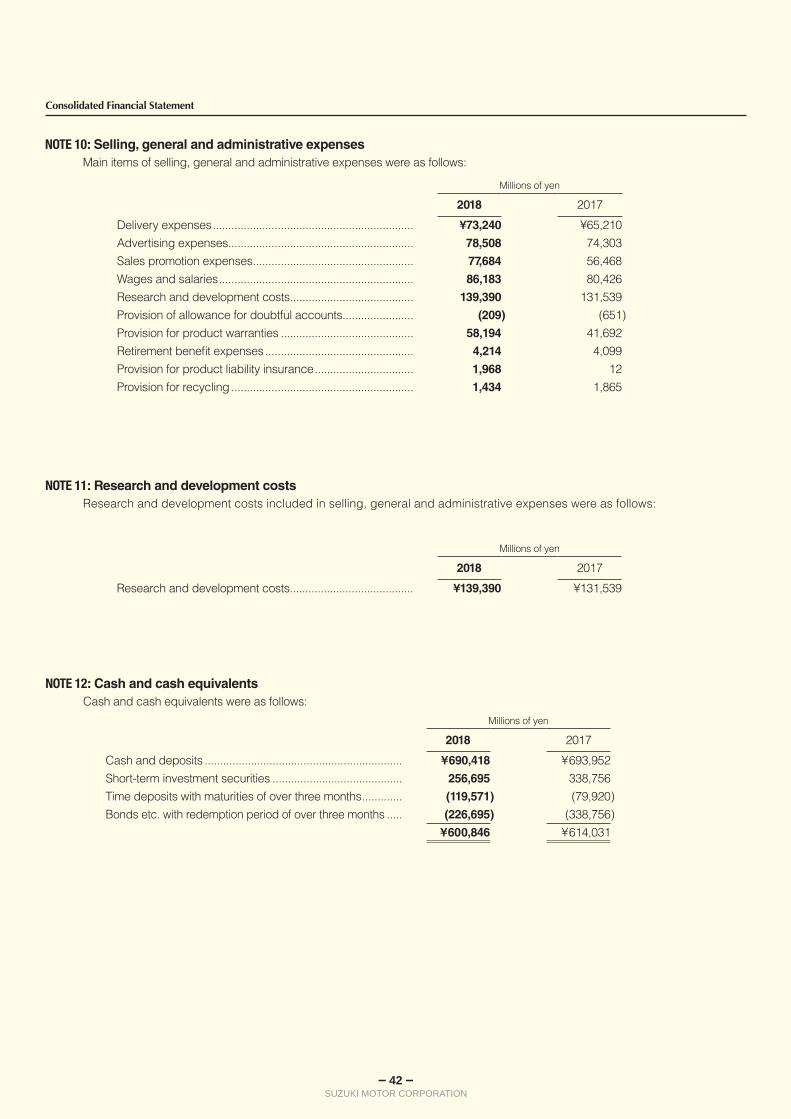
— 42 —SUZUKI MOTOR CORPORATION
Consolidated Financial Statement
NOTE 10: Selling, general and administrative expensesMain items of selling, general and administrative expenses were as follows:
Millions of yen
2018 2017
Delivery expenses ................................................................. ¥73,240 ¥65,210Advertising expenses ............................................................ 78,508 74,303Sales promotion expenses .................................................... 77,684 56,468Wages and salaries ............................................................... 86,183 80,426Research and development costs ........................................ 139,390 131,539Provision of allowance for doubtful accounts ....................... (209) (651)Provision for product warranties ........................................... 58,194 41,692Retirement benefit expenses ................................................ 4,214 4,099Provision for product liability insurance ................................ 1,968 12Provision for recycling ........................................................... 1,434 1,865
NOTE 12: Cash and cash equivalentsCash and cash equivalents were as follows:
Millions of yen
2018 2017
Cash and deposits ................................................................ ¥690,418 ¥693,952Short-term investment securities .......................................... 256,695 338,756Time deposits with maturities of over three months ............. (119,571) (79,920)Bonds etc. with redemption period of over three months ..... (226,695) (338,756)
¥600,846 ¥614,031
NOTE 11: Research and development costsResearch and development costs included in selling, general and administrative expenses were as follows:
Millions of yen
2018 2017
Research and development costs ........................................ ¥139,390 ¥131,539
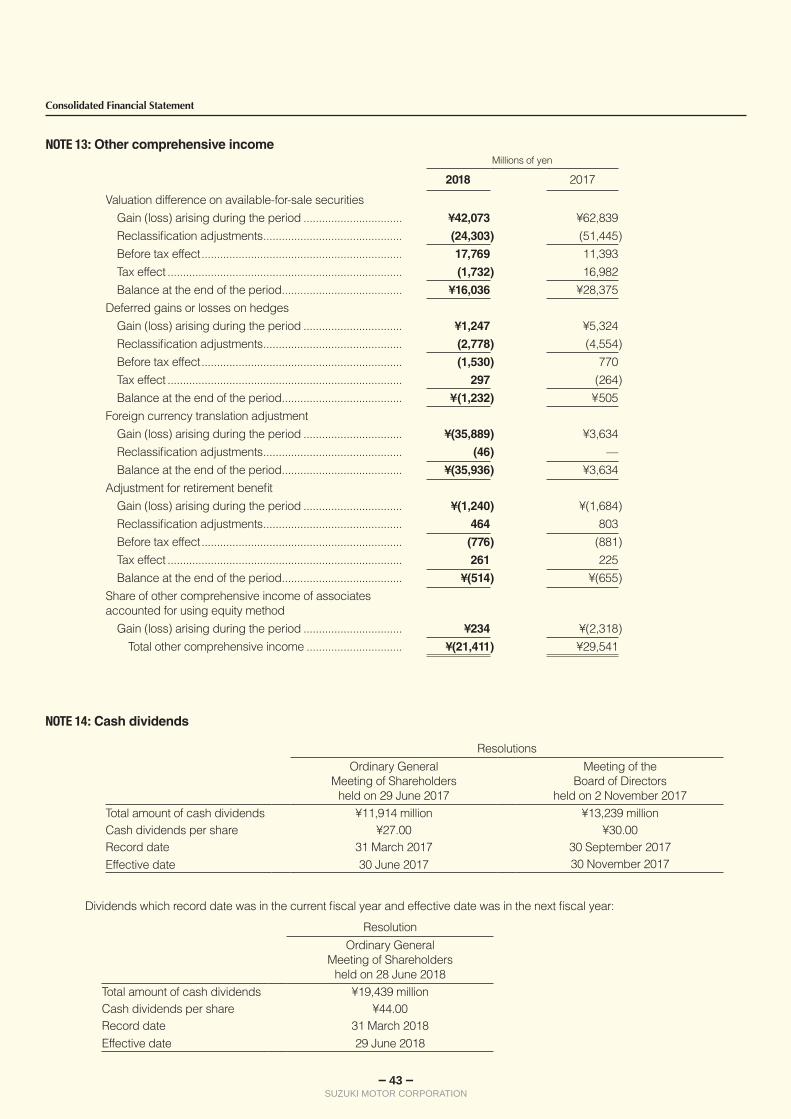
— 43 —SUZUKI MOTOR CORPORATION
Consolidated Financial Statement
NOTE 13: Other comprehensive incomeMillions of yen
2018 2017
Valuation difference on available-for-sale securitiesGain (loss) arising during the period ................................ ¥42,073 ¥62,839Reclassification adjustments ............................................. (24,303) (51,445)Before tax effect ................................................................. 17,769 11,393Tax effect ............................................................................ (1,732) 16,982Balance at the end of the period ....................................... ¥16,036 ¥28,375
Deferred gains or losses on hedgesGain (loss) arising during the period ................................ ¥1,247 ¥5,324Reclassification adjustments ............................................. (2,778) (4,554)Before tax effect ................................................................. (1,530) 770Tax effect ............................................................................ 297 (264)Balance at the end of the period ....................................... ¥(1,232) ¥505
Foreign currency translation adjustmentGain (loss) arising during the period ................................ ¥(35,889) ¥3,634Reclassification adjustments ............................................. (46) —Balance at the end of the period ....................................... ¥(35,936) ¥3,634
Adjustment for retirement benefit Gain (loss) arising during the period ................................ ¥(1,240) ¥(1,684)Reclassification adjustments ............................................. 464 803Before tax effect ................................................................. (776) (881)Tax effect ............................................................................ 261 225Balance at the end of the period ....................................... ¥(514) ¥(655)
Share of other comprehensive income of associatesaccounted for using equity method
Gain (loss) arising during the period ................................ ¥234 ¥(2,318)Total other comprehensive income ............................... ¥(21,411) ¥29,541
Dividends which record date was in the current fiscal year and effective date was in the next fiscal year:
NOTE 14: Cash dividends
ResolutionsOrdinary General
Meeting of Shareholdersheld on 29 June 2017
Meeting of theBoard of Directors
held on 2 November 2017Total amount of cash dividends ¥11,914 million ¥13,239 millionCash dividends per share ¥27.00 ¥30.00Record date 31 March 2017 30 September 2017Effective date 30 June 2017 30 November 2017
ResolutionOrdinary General
Meeting of Shareholdersheld on 28 June 2018
Total amount of cash dividends ¥19,439 millionCash dividends per share ¥44.00Record date 31 March 2018Effective date 29 June 2018

— 44 —SUZUKI MOTOR CORPORATION
Consolidated Financial Statement
NOTE 15: Stock option plansThe Company adopts stock option plan by using subscription rights to shares.The details of the plans were as follows:
The plan adopted at 28 June 2012
The plan adopted at 27 June 2013
The plan adopted at 27 June 2014
Category and number of people to whom stock options are granted
10 Directors of the Company (excluding Outside Directors)6 Managing Officers who do not concurrently serve as Directors
7 Directors of the Company (excluding Outside Directors)10 Senior Managing Officers and Managing Officers who do not concurrently serve as Directors
6 Directors of the Company (excluding Outside Directors)6 Managing Officers who do not concurrently serve as Directors
Class of shares that are the subject of subscription rights to shares
92,000 of Common stock of the Company
49,800 of Common stock of the Company
32,400 of Common stock of the Company
Adoption date 20 July 2012 19 July 2013 22 July 2014
Terms of exercise of subscription rights to shares
(1) A person who is allocated subscription rights to shares shall be able to exercise share sub-scription rights only up until 10th day (the next business day if the 10th day falls on a non-busi-ness day) from the day immediately following the date of resignation as the Company’s Director as well as the Senior Managing Officer or Managing Officer without the role of Director being served concurrently.
(2) If a person who is allocated subscription rights to shares was dead, the person’s heir shall be able to exercise the rights.
Period during which subscription rights to shares can be exercised
From 21 July 2012 to 20 July 2042
From 20 July 2013 to 19 July 2043
From 23 July 2014 to 22 July 2044
Number of shares which subscription rights to shares have not exercised
35,000 20,400 12,600
NOTE 16: Contingent liabilitiesAs of 31 March 2018 and 2017, the Company and some of consolidated subsidiaries had the contingent liabilities as follows:
Millions of yen
2018 2017Guarantee of indebtedness of affiliates and others ......... ¥1,351 ¥2,051
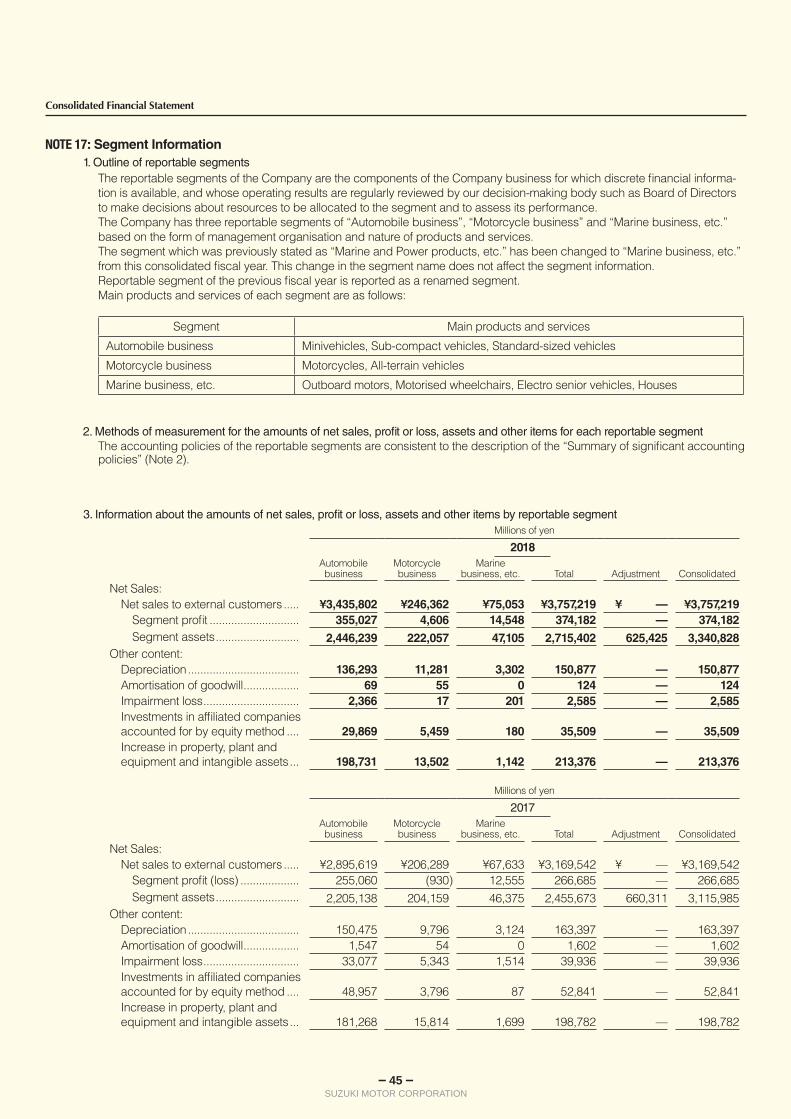
— 45 —SUZUKI MOTOR CORPORATION
Consolidated Financial Statement
3. Information about the amounts of net sales, profit or loss, assets and other items by reportable segmentMillions of yen
2018 Automobile business
Motorcycle business
Marine business, etc. Total Adjustment Consolidated
Net Sales:Net sales to external customers ..... ¥3,435,802 ¥246,362 ¥75,053 ¥3,757,219 ¥ — ¥3,757,219
Segment profit ............................. 355,027 4,606 14,548 374,182 — 374,182Segment assets ........................... 2,446,239 222,057 47,105 2,715,402 625,425 3,340,828
Other content:Depreciation .................................... 136,293 11,281 3,302 150,877 — 150,877Amortisation of goodwill .................. 69 55 0 124 — 124Impairment loss ............................... 2,366 17 201 2,585 — 2,585Investments in affiliated companies accounted for by equity method .... 29,869 5,459 180 35,509 — 35,509Increase in property, plant and equipment and intangible assets ... 198,731 13,502 1,142 213,376 — 213,376
Millions of yen
2017 Automobile business
Motorcycle business
Marine business, etc. Total Adjustment Consolidated
Net Sales:Net sales to external customers ..... ¥2,895,619 ¥206,289 ¥67,633 ¥3,169,542 ¥ — ¥3,169,542
Segment profit (loss) ................... 255,060 (930) 12,555 266,685 — 266,685Segment assets ........................... 2,205,138 204,159 46,375 2,455,673 660,311 3,115,985
Other content:Depreciation .................................... 150,475 9,796 3,124 163,397 — 163,397Amortisation of goodwill .................. 1,547 54 0 1,602 — 1,602Impairment loss ............................... 33,077 5,343 1,514 39,936 — 39,936Investments in affiliated companies accounted for by equity method .... 48,957 3,796 87 52,841 — 52,841Increase in property, plant and equipment and intangible assets ... 181,268 15,814 1,699 198,782 — 198,782
NOTE 17: Segment Information1. Outline of reportable segments
The reportable segments of the Company are the components of the Company business for which discrete financial informa-tion is available, and whose operating results are regularly reviewed by our decision-making body such as Board of Directors to make decisions about resources to be allocated to the segment and to assess its performance.The Company has three reportable segments of “Automobile business”, “Motorcycle business” and “Marine business, etc.” based on the form of management organisation and nature of products and services.The segment which was previously stated as “Marine and Power products, etc.” has been changed to “Marine business, etc.” from this consolidated fiscal year. This change in the segment name does not affect the segment information.Reportable segment of the previous fiscal year is reported as a renamed segment.Main products and services of each segment are as follows:
Segment Main products and services
Automobile business Minivehicles, Sub-compact vehicles, Standard-sized vehicles
Motorcycle business Motorcycles, All-terrain vehicles
Marine business, etc. Outboard motors, Motorised wheelchairs, Electro senior vehicles, Houses
2. Methods of measurement for the amounts of net sales, profit or loss, assets and other items for each reportable segmentThe accounting policies of the reportable segments are consistent to the description of the “Summary of significant accounting policies” (Note 2).
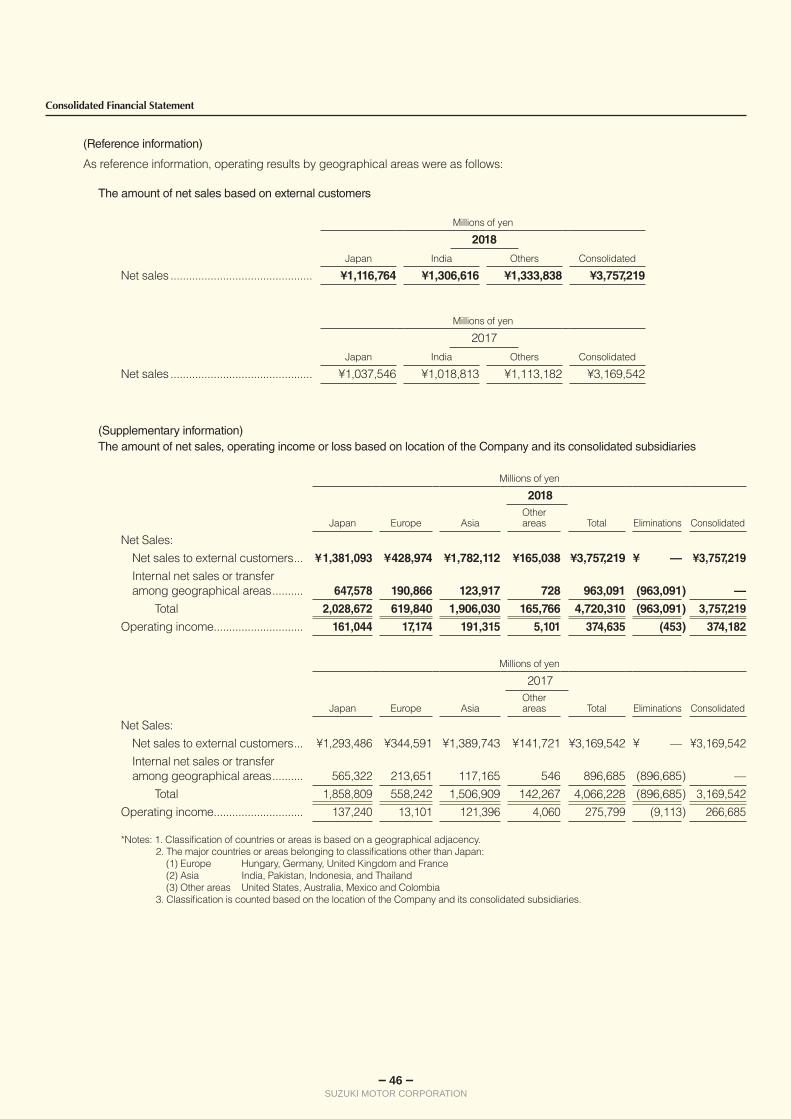
— 46 —SUZUKI MOTOR CORPORATION
Consolidated Financial Statement
(Reference information)
As reference information, operating results by geographical areas were as follows:
The amount of net sales based on external customers
Millions of yen
2018
Japan India Others Consolidated
Net sales .............................................. ¥1,116,764 ¥1,306,616 ¥1,333,838 ¥3,757,219
Millions of yen
2017
Japan India Others Consolidated
Net sales .............................................. ¥1,037,546 ¥1,018,813 ¥1,113,182 ¥3,169,542
(Supplementary information)The amount of net sales, operating income or loss based on location of the Company and its consolidated subsidiaries
Millions of yen
2018
Japan Europe AsiaOther areas Total Eliminations Consolidated
Net Sales:Net sales to external customers ... ¥1,381,093 ¥428,974 ¥1,782,112 ¥165,038 ¥3,757,219 ¥ — ¥3,757,219
Internal net sales or transfer among geographical areas .......... 647,578 190,866 123,917 728 963,091 (963,091) —
Total 2,028,672 619,840 1,906,030 165,766 4,720,310 (963,091) 3,757,219
Operating income ............................. 161,044 17,174 191,315 5,101 374,635 (453) 374,182
Millions of yen
2017
Japan Europe AsiaOther areas Total Eliminations Consolidated
Net Sales:Net sales to external customers ... ¥1,293,486 ¥344,591 ¥1,389,743 ¥141,721 ¥3,169,542 ¥ — ¥3,169,542Internal net sales or transfer among geographical areas .......... 565,322 213,651 117,165 546 896,685 (896,685) —
Total 1,858,809 558,242 1,506,909 142,267 4,066,228 (896,685) 3,169,542Operating income ............................. 137,240 13,101 121,396 4,060 275,799 (9,113) 266,685
*Notes: 1. Classification of countries or areas is based on a geographical adjacency. 2. The major countries or areas belonging to classifications other than Japan:
(1) Europe Hungary, Germany, United Kingdom and France (2) Asia India, Pakistan, Indonesia, and Thailand (3) Other areas United States, Australia, Mexico and Colombia 3. Classification is counted based on the location of the Company and its consolidated subsidiaries.
— 47 —SUZUKI MOTOR CORPORATION
Consolidated Financial Statement
To the Board of Directors ofSuzuki Motor Corporation
We have audited the accompanying consolidated financial statements of Suzuki Motor Corporation and its consolidated subsidiaries, which comprise the consolidated balance sheet as of 31 March 2018, and the consolidated statement of income, consolidated statement of comprehensive income, consolidated statement of changes in net assets and con-solidated statement of cash flows for the year then ended, all expressed in Japanese Yen, and a summary of significant accounting policies and other explanatory information.
Management’s Responsibility for the Consolidated Financial StatementsManagement is responsible for the preparation and fair presentation of these consolidated financial statements in accor-dance with accounting principles generally accepted in Japan, and for such internal control as management determines is necessary to enable the preparation of consolidated financial statements that are free from material misstatement, whether due to fraud or error.
Auditor’s ResponsibilityOur responsibility is to express an opinion on these consolidated financial statements based on our audit. We conducted our audit in accordance with auditing standards generally accepted in Japan. Those standards require that we comply with ethical requirements and we plan and perform the audit to obtain reasonable assurance about whether the consoli-dated financial statements are free from material misstatement.An audit involves performing procedures to obtain audit evidence about the amounts and disclosures in the consolidated financial statements. The procedures selected depend on the auditor’s judgment, including the assessment of the risks of material misstatement of the consolidated financial statements, whether due to fraud or error. In making those risk assess-ments, the auditor considers internal control relevant to the entity’s preparation and fair presentation of the consolidated financial statements in order to design audit procedures that are appropriate in the circumstances, while the purpose of the financial statement audit is not express an opinion on the effectiveness of the entity’s internal control. An audit also includes evaluating the appropriateness of accounting policies used and the reasonableness of accounting estimates made by management, as well as evaluating the overall presentation of the consolidated financial statements.We believe that the audit evidence we have obtained is sufficient and appropriate to provide a basis for our audit opinion.
OpinionIn our opinion, the consolidated financial statements present fairly, in all material respects, the financial position of Suzuki Motor Corporation and its consolidated subsidiaries as at 31 March 2018, and their financial performance and cash flows for the year then ended in accordance with accounting principles generally accepted in Japan.
Independent Auditor’s Report
Seimei Audit CorporationTokyo, Japan28 June 2018
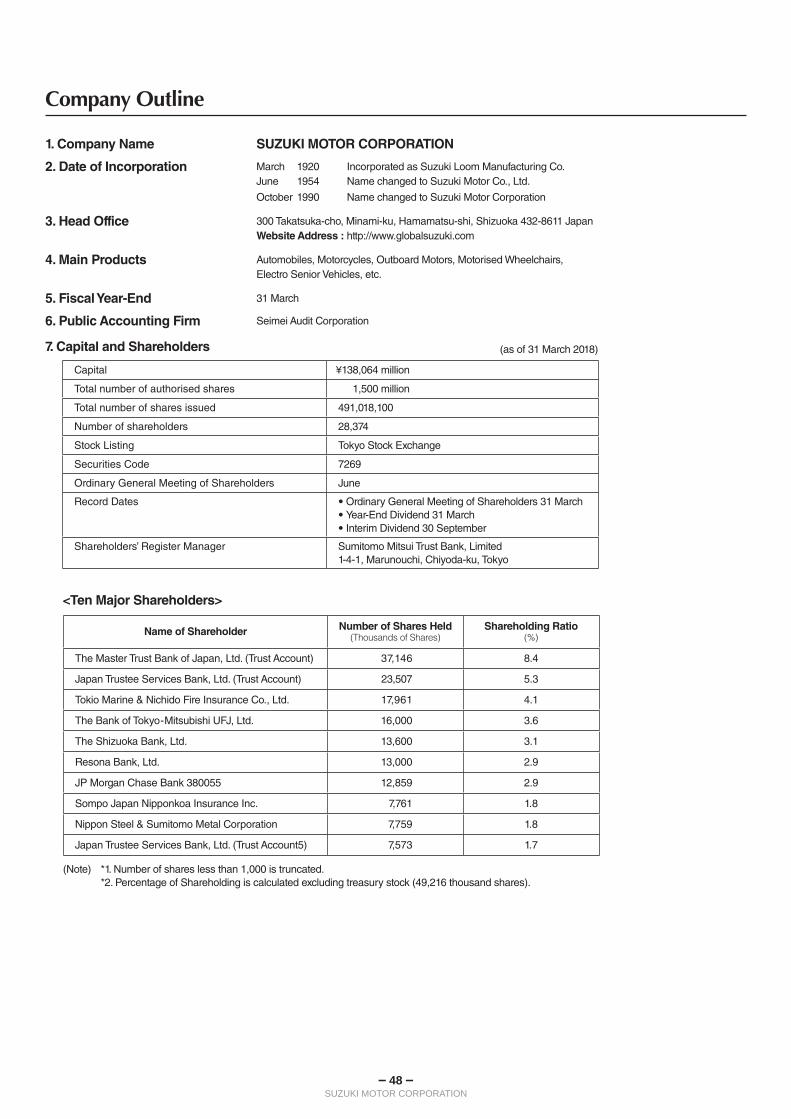
— 48 —SUZUKI MOTOR CORPORATION
1. Company Name SUZUKI MOTOR CORPORATION
2. Date of Incorporation March 1920 Incorporated as Suzuki Loom Manufacturing Co. June 1954 Name changed to Suzuki Motor Co., Ltd.
October 1990 Name changed to Suzuki Motor Corporation
3. Head Office 300 Takatsuka-cho, Minami-ku, Hamamatsu-shi, Shizuoka 432-8611 Japan Website Address : http://www.globalsuzuki.com
4. Main Products Automobiles, Motorcycles, Outboard Motors, Motorised Wheelchairs, Electro Senior Vehicles, etc.
5. Fiscal Year-End 31 March
6. Public Accounting Firm Seimei Audit Corporation
7. Capital and Shareholders
<Ten Major Shareholders>
(as of 31 March 2018)
(Note) *1. Number of shares less than 1,000 is truncated. *2. Percentage of Shareholding is calculated excluding treasury stock (49,216 thousand shares).
Name of Shareholder Number of Shares Held(Thousands of Shares)
Shareholding Ratio(%)
The Master Trust Bank of Japan, Ltd. (Trust Account) 37,146 8.4
Japan Trustee Services Bank, Ltd. (Trust Account) 23,507 5.3
Tokio Marine & Nichido Fire Insurance Co., Ltd. 17,961 4.1
The Bank of Tokyo-Mitsubishi UFJ, Ltd. 16,000 3.6
The Shizuoka Bank, Ltd. 13,600 3.1
Resona Bank, Ltd. 13,000 2.9
JP Morgan Chase Bank 380055 12,859 2.9
Sompo Japan Nipponkoa Insurance Inc. 7,761 1.8
Nippon Steel & Sumitomo Metal Corporation 7,759 1.8
Japan Trustee Services Bank, Ltd. (Trust Account5) 7,573 1.7
Capital ¥138,064 million
Total number of authorised shares 1,500 million
Total number of shares issued 491,018,100
Number of shareholders 28,374
Stock Listing Tokyo Stock Exchange
Securities Code 7269
Ordinary General Meeting of Shareholders June
Record Dates • Ordinary General Meeting of Shareholders 31 March• Year-End Dividend 31 March• Interim Dividend 30 September
Shareholders’ Register Manager Sumitomo Mitsui Trust Bank, Limited1-4-1, Marunouchi, Chiyoda-ku, Tokyo
Company Outline


![Worthy of Your Name Worthy of Your Name [C#, 81 bpm, 4/4] · Gb. Worthy of Your Name](https://img.pdfslide.us/doc/110x75/5e31f98f2fbf0257e83338d8/worthy-of-your-name-worthy-of-your-name-c-81-bpm-44-gb-worthy-of-your-name.jpg)