Embed Size (px)
Citation preview
1KVAERNER ANNUAL REPORT 2018CHAPTER
Annual Report 2018

3KVAERNER ANNUAL REPORT 2018
Contents
Board of Directors’ report 4
Annual accounts Kvaerner group 17
Annual accounts Kværner ASA 60
Board of Directors 73
Company information 75

4KVAERNER ANNUAL REPORT 2018BOARD OF DIRECTORS’ REPORT
Board of Directors' report 2018
Operational highlights
New contracts worth a total of NOK 9.8 billion secured:
Highlights
> NOK 3.8 billion contract with Equinor for delivery of the
topside modules for the Johan Castberg FPSO, plus hook-
up and integration to the topside modules with the hull
> Agreement with Equinor, in a 50/50 joint venture with
Aker Solutions, for modifications of the riser platform
and the field centre for the Johan Sverdrup development
with total value of approximately NOK 3.4 billion
> NOK 900 million contract with Equinor for delivery of
the steel substructure for the Johan Sverdrup phase 2
process platform
> Additional scope, estimated at NOK 500 million, at Njord
A to enable Equinor’s platform to receive oil from the
Fenja field
> Exercise of option for hook-up and commissioning
assistance of the utility and living quarters (ULQ)
platform as well as offshore work connected with phase
2 modifications of the riser platform at Equinor’s Johan
Sverdrup field
> Decommissioning contracts:
− With Allseas for the recycling of the topside and bridge of
the Valhall QP platform
− With Saipem UK for disposal of the Varg A installation
> Concept study for Krafla unmanned wellhead platform
for Equinor
> Three front-end engineering and design (FEED) studies
for the offshore wind industry, including a study for
Equinor for the planned Hywind Tampen project in the
North Sea
Key project milestones and deliveries
> Johan Sverdrup drilling platform jacket completed:
delivered on schedule in March
> Yme New Development project: permanent caisson
support structure was completed on schedule. Agreed
delivery to Repsol Norge in 2019
> FEED study for P2 jacket for Johan Sverdrup phase 2:
delivered to Equinor in June
> Nord Stream 2; work begun at landfall site in the second
quarter
> Johan Sverdrup riser platform hook-up and
modifications; achieved the critical “ready for drilling”
milestone as planned in September. Offshore work to
prepare the platform for production start-up has been
ongoing, as planned, throughout the second half of the
year
> Decommissioning; 40 000 tonnes of steel arrived at
Eldøyane during the summer, recycling of Nyhamna
subsea gas compression pilot completed in September
> Johan Sverdrup process platform jacket; sail-away from
Verdal on schedule and delivered end-July
> Njord A upgrade; heavy lift and installation campaign
started as planned in August, lasting until the spring of
2019. Project is on schedule for completion in 2020
> Johan Sverdrup utility and living quarter (ULQ) topside;
reached mechanical completion 1 October, in line with plan
> Johan Castberg FPSO; first steel cut on schedule late
November, as planned
> Johan Sverdrup phase 2 riser platform modifications;
first steel cut, on schedule, on 13 December
> Aasta Hansteen; wells hooked-up to process system on
schedule in early August, completion assistance led to
production of first gas in December
> Valhall Flank West; assembly of topside and steel jacket
started early-September, one month ahead of plan.
Topside painted and outfitting started in November. First
roll-up was completed in December; second roll-up was
completed in January 2019
Strategic development
The fundamentals in the oil and gas industry have
improved compared to the past few years with oil prices
now at a higher level and an increasing number of final
investment decisions (FIDs) for offshore projects globally.
Kvaerner’s tendering activity was high during 2018
and key newbuild contracts such as the Johan Castberg
FPSO and steel substructure for the Johan Sverdrup phase
2 process platform were secured. Tendering activity
is expected to remain high during 2019, which should
contribute to healthy activity level for Kvaerner in the
medium term. However, few sizable discoveries have been
made on the Norwegian continental shelf (NCS) in recent
years, and it may take some time before new discoveries
mature into newbuild projects. To offset the potential
longer term drop in newbuilds on the NCS, Kvaerner is
positioning for new segments and markets such as tie-
backs with unmanned installations, larger modifications
of offshore installations, niches in offshore wind, and
decommissioning. This positioning has already materialised
into contract wins such as Johan Sverdrup riser platform
modification, additional scope at the upgrade of Njord A to
enable the platform to receive oil from the Fenja field, and
several decommissioning contracts.
Several improvement initiatives launched over recent
5KVAERNER ANNUAL REPORT 2018BOARD OF DIRECTORS’ REPORT
years were successfully concluded in 2017 and cost levels
for upcoming projects has been reduced typically by more
than 20 percent. Continuous improvement has become part
of normal operations. Kvaerner has throughout 2018 taken
steps to reduce costs further and increase productivity
and quality, including identification and implementation
of several digitalisation initiatives. In addition, ongoing
projects have successfully proven the competitive effect of
sourcing certain components from international low cost
suppliers. Refinement of this cost-effective delivery model
will be key in the strategic development throughout 2019,
as this is vital for Kvaerner’s competitive position.
The foundation of Kvaerner’s competitive position is
the combination of effective yard facilities at Stord and
Verdal, together with employees with industry leading skills
and experience. In 2018, the company has continued to
invest in upgrading its facilities, including the large quay
development at Stord which will be completed in 2020.
In addition to organic strategic development, Kvaerner
will consider selected structural measures to grow
and create an even more robust company, if the right
opportunities arise. As an example, Kvaerner made a
small acquisition in 2018, GMC Decom, to expand the
decommissioning capacity at its Eldøyane site.
The Kvaerner Academy was rolled out throughout 2018
as an umbrella covering all internal training. The key
focus for Kvaerner Academy in 2018 has been leadership
training. This coordinated approach to training and sharing
of best practices will increase Kvaerner’s competitiveness
and strengthen its ability to retain and attract the most
talented people.
Business overview
Principle operations
Kvaerner is one of the industry’s market leaders for
delivery of complete offshore platforms and onshore plants
for oil and gas upstream projects. The company has been
a key contractor for around 70 percent of the platform
development projects on the Norwegian continental shelf,
and has also delivered a number of challenging offshore
projects elsewhere in the world.
For deliveries of complete platform topsides, Kvaerner’s
capabilities include expertise to integrate systems such
as oil and gas treatment, oil and gas storage, offloading
and export, utility and process support systems, drilling
facilities and living quarters.
Within steel substructures, Kvaerner’s track record
includes 46 steel jackets delivered in 45 years. In 2019,
the company will deliver the topside and steel jacket
substructure for the normally unmanned Valhall Flank
West wellhead platform. Steel jackets for such platforms
represent an interesting future market opportunity.
For concrete substructures to field developments
globally, Kvaerner is the undisputed market leader with two
dozen reference projects. The company has also been a key
contractor for all seven of Norway’s largest onshore oil and
gas plants in Norway.
Kvaerner is also one of the world’s most experienced
contractors for delivery of floating oil and gas installations.
The company has had a key role in delivery of more
than 15 of the world’s most recognised floating platform
projects.
In all of the above-mentioned segments, Kvaerner has a
particularly strong position for projects where engineering,
procurement and construction (EPC) are integrated in one
contract. With the technical complexity of large oil and gas
installations and a relatively short schedule for delivery,
there are few contractors world-wide who have credible
expertise to complete such deliveries.
In recent years, Kvaerner has identified a number of
growth segments where the company offers additional,
specialised services to the oil and gas industry. These
services include hook-up and completion of onshore
platforms, marine operations, platform modifications
and upgrades (such as the Njord A upgrade) and
decommissioning services. For the latter, Kvaerner has
been a front runner for establishing the first purpose-
built facility for effective and environmentally friendly
decommissioning and recycling of offshore platforms after
shut down. The company has extensive experience in the
decommissioning of offshore installations from both the
Norwegian and UK continental shelf, with a recycling rate
of more than 99 percent.
In addition, Kvaerner has identified the offshore wind
power industry as an additional growth segment. Within
offshore wind, the company provides fixed and floating
foundations, in both steel and concrete, for wind turbines,
and Kvaerner also offers converter platforms for offshore
wind power developments.
To ensure effective use of common resources across
Kvaerner, and to provide the best possible support to
Kvaerner’s projects, the execution of all key projects is
organised as one of the three operational areas’ responsibility:
> Process Solutions: Responsible for delivering contracts
for platform topsides and onshore facilities. Current
projects include execution of the Johan Sverdrup ULQ
project, the EPC upgrade of the Njord A platform, Johan
Castberg topside and FPSO integration project, and
Johan Sverdrup phase 2 – riser platform modification
> Structural Solutions: Responsible for steel jacket
substructure projects. Also responsible for Kvaerner’s
Subsea on a Stick® concept and the high-tech piping
technology unit which is integrated in the facility at
Verdal. Current projects include an EPC contract for the
steel jacket substructure to the Johan Sverdrup phase
2 process platform, and the topside and steel jacket
substructure for normally unmanned Valhall Flank West
wellhead platform. The Verdal facility also fabricates the
new flare tower for Njord A, the module for seawater
handling and the main pipe rack to Johan Castberg for
delivery to Kvaerner’s facility at Stord, plus several
smaller projects within piping technology
> Concrete & New Solutions: Responsible for concrete
marine structure projects. Also responsible for hook-up,
completion, decommissioning and business opportunities
in adjacent segments. Current projects include hook-up
and commissioning related to both the Aasta Hansteen
platform and the Johan Sverdrup riser platform,
dismantling and recycling of three North Sea platforms,
marine operations for the West White Rose concrete
gravity structure offshore Canada, and the Nord Stream
2 project in Russia. Study work for offshore wind power
projects are also part of the ongoing activities
6KVAERNER ANNUAL REPORT 2018BOARD OF DIRECTORS’ REPORT
Strategic partnerships and use of subcontractors
Kvaerner’s business model includes a clear strategy to use
long term partners and subcontractors in order to optimise
the value chain for its project delivery models. Key examples
that illustrate potential synergy effects of such partnerships
are the joint venture with KBR as a partner for the ongoing
Johan Sverdrup ULQ topside contract, and the wellhead
platform alliance established in 2017 with Aker BP, Kvaerner,
ABB and Aker Solutions. Kvaerner has a continuous focus to
develop and build on effective and flexible delivery models,
and optimise contributions from external partners.
Project Execution Model
Kvaerner’s Project Execution Model (PEMTM) is based on
40 years’ experience with complex oil and gas industry
projects. The model is continuously improved by including
learnings and experiences from execution of EPCI projects.
The PEMTM ensures that the work progresses in a controlled
manner, ensuring that projects are executed at the right
time, to the right quality and at the agreed cost, thereby
enabling Kvaerner to meet its business objectives.
Consequently, the PEMTM contributes to maintaining
Kvaerner’s record of safe and successful project execution.
The Kvaerner PEMTM shall safeguards safety, the
environment, quality and cost efficiency by constantly
focusing on:
> Quality in deliveries by proper quality planning,
assurance and control throughout the value chain.
Significant efforts shall be invested in the early phases
to secure quality in all aspects, no changes or repairs
required and therefore robust safety standards during
construction and operation
> Continuous improvement of processes and products.
Lessons learnt from previous projects are always taken
into account
> Predictability in project execution and operations by
using standard and transparent methodology well known
to the teams
> Avoiding rework – making sure work is completed
correctly the first time
> Coordinated efforts across disciplines based on
understanding of interactions between work processes
> Control of internal and external interfaces as a
foundation for a successful project execution
> Effective management within the defined scope, quality,
resources (time and budget) and risk criteria
> That appropriate governance and control are developed,
executed and monitored throughout the project’s life-time
Markets and target regions
Markets
The fundamental driver for Kvaerner’s business is global
demand for oil and gas, influenced by factors such as world
trade, international economic development and political
direction. Over the last two years the oil price has reached
levels where oil companies find it profitable to develop
several new resources. That said, oil and gas prices are still
volatile, hence there is significant uncertainty regarding
the timing of large investments in field developments.
Competition remains fierce, both from Norwegian and
international companies. Compared to one year ago,
tendering activity is higher. Exploration drilling on the
Norwegian continental shelf is again at a high level, which
is positive for the long term opportunities.
Target regions
Kvaerner’s traditional home market, the North Sea, is
evolving as the Norwegian continental shelf is becoming
more mature. As a consequence, more tie-ins and associated
host platform modifications are anticipated in the North
Sea and Norwegian Sea. Gradually, Kvaerner expects to
see more opportunities in the Barents Sea and thus, an
increasing share of floating production facilities relative to
fixed platforms.
Kvaerner offers effective execution of challenging
projects, particularly for developments in regions with
harsh weather conditions. Geographically, the company has
a strong position for oil and gas projects in the North Sea,
Canada and Russia. Regarding harsh environment FPSO
solutions, Kvaerner has identified a number of candidates
similar to the Johan Castberg FPSO, where the company
is currently executing the main topside fabrication and
integration contract.
In the Russian market, the geopolitical situation with
trade restrictions remains unchanged since 2017. EU and
US sanctions against specific companies and persons as
well as general sector restrictions (offshore deep water and
Arctic oil and shale oil projects) remain in place. Kvaerner
remains highly vigilant to ensure 100 percent compliance
with applicable trade restrictions in all our operations and
within our value chain.
Renewables is a market segment where Kvaerner is now
more active. Target deliveries are linked to foundations for
offshore wind, steel and concrete solutions as well as HVDC
(high voltage direct current) platforms linked to wind farms.
There are project opportunities in Europe and North America.
Market segments
Kvaerner remains primarily focused on upstream oil and
gas projects primarily, and pursues opportunities within the
following market segments:
> EPC projects for fixed and floating oil and gas production
facilities
> EPC projects for steel and concrete substructures for
offshore platforms
> EPC projects for onshore oil and gas upstream facilities
> EPC projects for larger rebuilds/refurbishment of
offshore platforms/onshore plants
> Separate contracts for assembly, hook-up, completion,
commissioning of offshore platforms and onshore plants
> Separate contracts for engineering, procurement,
fabrication or project managements related to offshore
platforms or onshore plants
> Unmanned wellhead platforms for tieback of satellite
fields and reservoirs
> Major modifications and redeployments of offshore
facilities
> Decommissioning of offshore installations
> Renewables projects such as wind turbine foundations
and HVDC high voltage direct current platforms as part
of windfarms
7KVAERNER ANNUAL REPORT 2018BOARD OF DIRECTORS’ REPORT
Objectives and strategic direction
Kvaerner’s ambition is to support oil companies in
developing their most challenging projects.
Kvaerner’s mission as a supplier in this industry is
clear: the company makes it possible for its customers to
realise the world’s most amazing and demanding projects.
Kvaerner makes it possible for clients and societies
to realise energy projects for prosperity, in balance
with a target of zero harm to people, property and the
environment.
Strategic direction
The fundamentals in oil and gas industry have improved
compared to the past few years with oil prices now at
a higher level and an increasing number of FIDs for
offshore projects internationally. However, as competition
remains fierce and commercial terms are under continuous
pressure, Kvaerner continues its efforts to further improve
competitiveness. The company has a strong track record
of delivery on time and with expected quality and will
continue its focus on improving its delivery model and cost
position. The company has seen positive effects of this
during recent years and expects to see further benefits
from these efforts when bidding for projects in 2019 and
beyond.
Against this background, Kvaerner’s future focus is to:
> Maintain the drive towards best in class HSSE
performance, and zero unwanted incidents
> Successfully execute its existing backlog
> Continue cost and operational improvement initiatives
> Achieve a profitable development of business
opportunities in adjacent market segments
> Gradually strengthen its position as a leading EPC player
Report for 2018
Financials
Kvaerner presents its accounts in accordance with
International Financial Reporting Standards (IFRS), as
adopted by the EU. Unless otherwise specified, figures in
brackets represent figures for the previous year (2017).
Profit and loss
Consolidated operating revenue for 2018 was NOK 7 220
million (NOK 6 536 million). Whilst overall activity levels
in 2018 were comparable to 2017, consolidated operating
revenues were higher in 2018 compared to 2017 due to
a larger share of revenue from wholly owned projects in
the year. In 2017, the group’s revenues were to a larger
extent impacted by activity in jointly controlled entities,
where only the share of net result is reflected within group
revenue.
Earnings before interest, taxes, depreciation,
amortisation and impairment (EBITDA) were NOK 437
million for 2018 (NOK 799 million). The group’s key
measure of financial performance is adjusted EBITDA.
Adjusted EBITDA excludes the impact of embedded foreign
currency derivatives reported in jointly controlled entities
closely related to Kvaerner’s operating activities. Refer
to Note 4 Operating segments (page 28) to see how the
Adjusted EBITDA measure is derived from the consolidated
financial statements.
Adjusted EBITDA amounted to NOK 427 million, a
significant decrease of NOK 359 million from 2017 (NOK
786 million). The adjusted EBITDA margin for 2018 was
5.9 percent (12 percent). The negative margin development
reflects phasing of projects; projects in early phases not
yet recognising margin, and last year was significantly
impacted by close-out activities and recognition of bonuses
and incentives towards the end of completed projects.
Adjusted EBITDA excludes NOK 9 million income
accounting impact from embedded foreign currency
derivatives, related to equity accounted investees closely
related to Kvaerner’s operating activities (NOK 12 million
income).
Depreciation and amortisation charges totalled NOK
110 million, an increase of NOK 4 million from 2017 (NOK
106 million). Consolidated earnings before interest and
taxes (EBIT) were NOK 327 million (NOK 693 million).
Net financial income amounted to NOK 11 million (NOK 4
million) and reflects higher interest income and embedded
derivative gains compared to last year.
The tax expense was NOK 60 million (NOK 186 million),
which corresponded to an effective tax rate of 18 percent
(27 percent). Compared to the nominal Norwegian statutory
tax rate in 2018 of 23 percent, the effective tax rate
reflects various tax reconciling items. The relatively low tax
rate for the year is a result of permanent differences and
change in nominal tax rate in Norway as from 2019 from
23 to 22 percent and the associated impact on deferred
taxes. Profit from continuing operations amounted to
NOK 278 million (NOK 511 million), and basic and diluted
earnings per share from continuing operations were NOK
1.04 (NOK 1.92).
Net profit from discontinued operations was NOK
nil (NOK 31 million). The result reflects net insurance
recoveries of more than USD 2 million (more than USD 5
million), offsetting the associated legacy costs. Basic and
diluted earnings per share for discontinued operations were
NOK nil (NOK 0.12).
Net profit for total operations in 2018 was NOK 278
million (NOK 542 million), with basic and diluted earnings
per share of NOK 1.04 (NOK 2.04).
Cash flow
Consolidated cash flow from operating activities depend on
a number of factors, including progress on and delivery of
projects, changes in working capital and pre-payments from
customers. Net cash inflow from operating activities was
NOK 719 million in 2018 (outflow of NOK 113 million). The
increase mainly reflects improved working capital position
in 2018, compared to a worsening in 2017.
Net cash outflow from investing activities in 2018 was
NOK 335 million (outflow of NOK 93 million) and mainly
relate to capacity and maintenance investments at the
facilities at Stord and in Verdal, Norway and strategic
digitalisation initiatives. Kvaerner’s Board of Directors
has approved an investment of NOK 370 million in a new
quay at Stord and the upgrade is progressing according to
plan. For 2019, progress of the quay investment will imply
a capex of around NOK 200 million. A total maintenance
capex for the group of approximately NOK 30−50
million is expected annually and additional strategic and
capacity investments at the yards such as equipment and
8KVAERNER ANNUAL REPORT 2018BOARD OF DIRECTORS’ REPORT
digitalisation tools will result in an expected capex of up to
NOK 300 million for 2019.
Net cash outflow from financing activities was NOK 29
million in 2018 (NOK 27 million), reflecting fees on credit
facility and transactions in own shares.
Balance sheet and liquidity
The group’s total assets were NOK 6 320 million on 31
December 2018 (NOK 5 823 million). Net current operating
assets (NCOA) were negative NOK 949 million at year-end,
an improvement of NOK 300 million from the end of 2017
(negative NOK 650 million). Movements in working capital
will impact cash balances and at year-end 2018, net cash
excluding negative NCOA was NOK 2 216 million. Equity
as of 31 December 2018 totalled NOK 3 439 million
(NOK 3 176 million). The group’s equity ratio was 54.4
percent at year-end 2018, compared with 54.5 percent at
year-end 2017. The equity ratio is calculated as total equity
divided by total assets.
The loan agreement that was refinanced in July 2015, a
revolving credit facility of NOK 2 000 million, is maturing
in July 2020. The facility is provided by a syndicate of
high quality international banks. The revolving credit
facility was undrawn during 2018 and as per 31 December
2018. The terms and conditions include restrictions which
are customary for these kinds of facilities, including inter
alia negative pledge provisions and restrictions related to
acquisitions, disposals and mergers. There are also certain
provisions of change of control included in the agreement.
There are no restrictions for dividend payments. The facility
is unsecured.
The financial covenants are based on three sets of key
financial parameters; an equity ratio based on consolidated
total borrowings/consolidated total equity, a cash covenant
calculated by consolidated total borrowings less consolidated
net current operating assets and consolidated cash and cash
equivalent assets and an interest coverage ratio based on
consolidated EBITDA/consolidated finance costs. The financial
covenants are tested on a quarterly basis. As of 31 December
2018 the company is in compliance with all covenants. The
margin applicable to the facility is based on a price grid
determined by the gearing ratio.
Consolidated non-current assets totalled NOK 1 753
million (NOK 1 474 million) as of 31 December 2018, of
which goodwill amounted to NOK 607 million (NOK 607
million). Net interest-bearing deposits and loans amounted to
NOK 3 165 million at the end of 2018 (NOK 2 812 million).
With undrawn, committed, long-term credit facilities of NOK
2 billion, the Board considers available capital adequacy and
liquidity as good and ensures that Kvaerner is well positioned
to meet the challenges and opportunities over the coming
years.
Segment review
Kvaerner does not have any remaining operations in the
US within the Downstream & Industrials segment, and
the segment is presented as discontinued operations
in the group’s financial statements. Consequently,
Kvaerner continues to have one reportable segment; Field
Development. The Field Development segment includes
results from Kvaerner’s own operations and Kvaerner’s
share (proportionate consolidation) of jointly controlled
entities closely related to Kvaerner’s operating activities.
Kvaerner has a matrix-based organisational model, with
operational areas and resource centres, where the projects
are the main focus. The Field Development segment
includes the following operational areas: Process Solutions
delivering topsides, floaters and onshore upstream
facilities; Structural Solutions delivering large steel jackets
for oil and gas installations; Concrete and New Solutions
delivering concrete substructures, performing hook-up,
decommissioning and completion projects and working with
new strategic initiatives.
Field Development
Operating revenues in 2018 totalled NOK 7 253 million
(NOK 7 625 million). EBITDA was NOK 487 million (NOK
846 million), with an EBITDA margin of 6.7 percent, a
decrease of 11.1 percent in 2017. Reduced activity is
mainly within operational area Process Solutions, but
activity has also been lower within Structural Solutions.
Activity within Concrete & New Solutions has increased
in 2018. The lower EBITDA and margin reflects phasing
of projects. Projects awarded in the year are not yet
recognising margin and results from projects that were
delivered in 2017 were positively impacted by achieved
milestone incentives and close-out activities.
Order intake for the year amounted to NOK 9 827
million (NOK 9 215 million) and reflects new secured
contracts, listed under Operational highlights in this report,
growth in existing projects and smaller orders. Order
backlog as of 31 December 2018 was NOK 10 625 million
(NOK 8 077 million).
Process Solutions’ activity in the year was mainly related
to the Njord A project and Johan Sverdrup ULQ topside.
In March 2017 Kvaerner was awarded the contract for
complete upgrade of the Njord A platform. The overall
progress is in line with plan. 2018 activities have mainly
been related to fabrication and installation. The drilling
derrick and compensator module have been reinstalled on
board Njord A after upgrade and modifications. All four
blisters and column top extensions have been fabricated,
pre-outfitted and installed. The deck boxes/winch houses
have been fabricated and pre-outfitting is ongoing. The
critical lifting programme started in August 2018. Heavy
lifts will continue until spring 2019 and the remaining
upgrade work will continue until planned delivery in 2020.
In 2015, a joint venture between Kvaerner and KBR,
was awarded a contract for the complete delivery of the
utility and living quarter platform topside to the Johan
Sverdrup field development. The project has progressed
according to schedule, and all milestones in 2018 were
achieved. The project entered commissioning phase and
commencement of loop testing in March 2018. Achievement
of the mechanical completion milestone was announced
on 1 October 2018 and the pedestal crane was received
and installed on the platform in the same month. The ULQ
topside is on track to be delivered first quarter 2019.
Kvaerner’s work with the Nyhamna Expansion project
started in 2012. The contract for upgrading of the onshore
gas processing and export facility has included planning
and project management, engineering, procurement,
construction management, completion and commissioning.
9KVAERNER ANNUAL REPORT 2018BOARD OF DIRECTORS’ REPORT
Kvaerner has also assisted in the comprehensive periodical
turnarounds for maintenance during this period. In 2018,
Kvaerner have been involved in final work and close-out
activities, and in supporting Shell’s project organisation in
taking over the facility.
The Johan Castberg topside fabrication contract
and floating production storage and offloading (FPSO)
integration contracts were awarded to Kvaerner in
February 2018. The first phase of the project was defined
as familiarisation and procurement phase which lasted
until 1 October 2018. Shop engineering was mobilised in
Poland, Stord, Egersund and Verdal and started fabrication
in November. All 2018 project milestones were achieved.
On 3 May 2018, Kvaerner and Aker Solutions formally
signed the contract for Johan Sverdrup phase 2 riser
platform modifications, through a joint venture company,
ASK JV AS. The project organisation is located in Stavanger,
Norway with engineering support from Mumbai, India.
Structural prefabrication contracts were signed with Polish
subcontractors in October and the assembly site is located
at Stord.
Structural Solutions has delivered the three largest steel
jacket substructures to the Johan Sverdrup phase 1 field
development. Kvaerner’s work with the project started in
2014 when Kvaerner and Equinor established and signed a
frame agreement for delivery of steel jackets substructures
to Equinor-operated fields. The giant riser platform jacket
weighing 26 000 tonnes was delivered in 2017. The drilling
platform jacket was completed on schedule and delivered
in March 2018, and the process platform jacket sailed away
from Verdal on schedule in July 2018. In October 2018
Kvaerner won the EPC contract for delivery of the steel
jacket substructure for the phase 2 process platform. With
this award Kvaerner will deliver four substructures for the
Johan Sverdrup Field, one of the world’s largest ongoing
offshore projects.
In December 2017, Aker BP awarded Kvaerner a contract
for delivery of the topside and steel jacket substructure for
Valhall Flank West. This is the first project in the Wellhead
Platform Alliance, which consists of Aker BP, Kvaerner, ABB
and Aker Solutions. The first steel plate for the Valhall Flank
Vest platform was cut in April 2018 and marked fabrication
start of the normally unmanned platform project.
Prefabrication, outfitting and assembly of topside and steel
jacket substructure is proceeding according to plan and
the project will be delivered in early summer 2019. The
caisson support for the Yme New Development project was
completed in summer 2018 and will be stored at the yard
in Verdal until sailaway in early 2019. The Verdal facility is
to fabricate the Njord flare tower, the module for seawater
handling and the main pipe rack on Johan Castberg for
delivery to Kvaerner’s facility at Stord.
Within Concrete & New Solutions, work continued with
the completion of the cylindrical substructure (spar) for
Equinor’s Aasta Hansteen platform. The inshore activities
in Digernessundet were successfully completed during the
summer of 2018, and Kvaerner’s experts subsequently
contributed with preparations for production to start
offshore. The platform commenced production in December
2018, and Kvaerner continues to support the Equinor crew
offshore into the first part of 2019. Similarly, Kvaerner
is performing hook-up and completion work on Equinor’s
Johan Sverdrup riser platform. This work will continue
in 2019 when the hook-up and completion of the ULQ
platform is added to the scope. Planned production start
is scheduled for autumn 2019. In addition, Kvaerner is
performing construction work on the landfall and pig trap
area for the Nord Stream 2 gas pipeline project in Russia.
This work will continue into 2020.
Demolition of platforms is also part of Concrete &
New Solutions’ portfolio. Recycling of the Nyhamna
subsea compression test pilot modules was completed in
September. A set of offshore oil and gas structures from the
UK continental shelf and the Varg A platform have been
subject for demolition and recycling since July 2018.
Within Marine operations, Kvaerner’s Canada operations
are currently performing engineering and preparation work
for tow and installation of Husky Energy’s White Rose
concrete gravity structure in Newfoundland. The project is
scheduled to be completed in spring 2022.
Discontinued operations
Following the sale of Kvaerner’s onshore construction
business in North America in December 2013, Kvaerner
does not have any remaining operations in the USA within
the Downstream & Industrials segment, and the segment
a have been presented as discontinued operations in the
group’s financial statements since the sale.
Net profit from discontinued operations was NOK
nil (NOK 31 million). The operating results for 2018 is
reflecting recognition of insurance recoveries of more than
net USD 2 million in 2018 (USD 5 million), offsetting the
associated legacy costs. Please see Note 26 Discontinued
operations (page 59) for Summary of financial data for
discontinued operations.
Corporate and unallocated costs
For the full year, unallocated costs were NOK 60 million
(NOK 60 million). It is expected that the recurring level
of net corporate costs will be approximately NOK 60−70
million annually.
Going concern
Based on the group’s financial results and position
described above, the Board of Directors confirms that the
company is a going concern and that the annual accounts
for 2018 have been prepared under this assumption.
Parent company accounts
The parent company, Kværner ASA, had a net loss of NOK
14 million for 2018 (loss of NOK 32 million). Kværner
ASA has no employees and operating expenses are
mainly shareholder costs for the parent holding company.
The parent company’s main asset is shareholdings in
subsidiaries. Equity ratio was 66.9 percent at year-end
2018 (62.1 percent).
Dividend policy
The dividend policy reflects the strategy that retaining a
solid balance sheet and cash position is a priority.
Kværner ASA’s dividend policy is based on semi-annual
dividend payments. Decisions as to dividend payments
10KVAERNER ANNUAL REPORT 2018BOARD OF DIRECTORS’ REPORT
depend on outlook, liquidity and considerations such as
alternative use of cash and strengthening of the company’s
financial structure. In periods of weak economic conditions,
the dividend can be paid as long as the group’s capital
structure permits. The Board approves interim dividends
based on an authorisation from the General Meeting, while
the Annual General Meeting approves the final (and total
annual) dividend based on a proposal from the Board of
Directors.
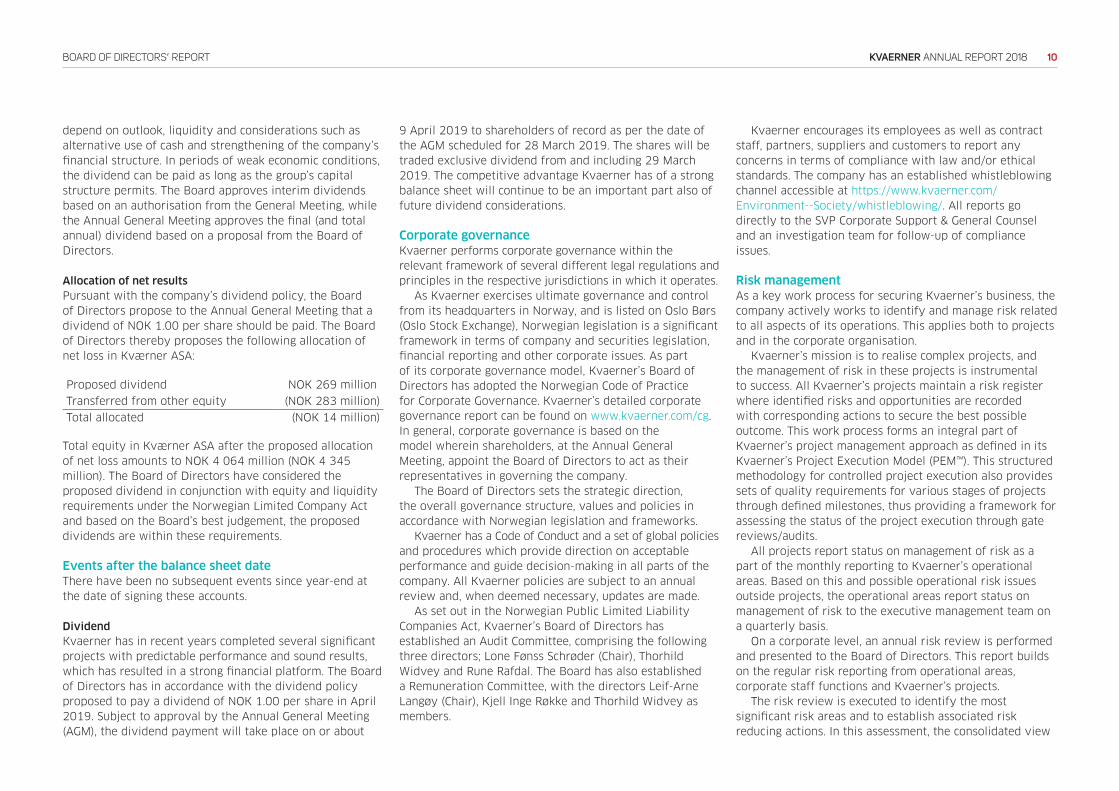
Allocation of net results
Pursuant with the company’s dividend policy, the Board
of Directors propose to the Annual General Meeting that a
dividend of NOK 1.00 per share should be paid. The Board
of Directors thereby proposes the following allocation of
net loss in Kværner ASA:
Proposed dividend NOK 269 million
Transferred from other equity (NOK 283 million)
Total allocated (NOK 14 million)
Total equity in Kværner ASA after the proposed allocation
of net loss amounts to NOK 4 064 million (NOK 4 345
million). The Board of Directors have considered the
proposed dividend in conjunction with equity and liquidity
requirements under the Norwegian Limited Company Act
and based on the Board’s best judgement, the proposed
dividends are within these requirements.
Events after the balance sheet date
There have been no subsequent events since year-end at
the date of signing these accounts.
Dividend
Kvaerner has in recent years completed several significant
projects with predictable performance and sound results,
which has resulted in a strong financial platform. The Board
of Directors has in accordance with the dividend policy
proposed to pay a dividend of NOK 1.00 per share in April
2019. Subject to approval by the Annual General Meeting
(AGM), the dividend payment will take place on or about
9 April 2019 to shareholders of record as per the date of
the AGM scheduled for 28 March 2019. The shares will be
traded exclusive dividend from and including 29 March
2019. The competitive advantage Kvaerner has of a strong
balance sheet will continue to be an important part also of
future dividend considerations.
Corporate governance
Kvaerner performs corporate governance within the
relevant framework of several different legal regulations and
principles in the respective jurisdictions in which it operates.
As Kvaerner exercises ultimate governance and control
from its headquarters in Norway, and is listed on Oslo Børs
(Oslo Stock Exchange), Norwegian legislation is a significant
framework in terms of company and securities legislation,
financial reporting and other corporate issues. As part
of its corporate governance model, Kvaerner’s Board of
Directors has adopted the Norwegian Code of Practice
for Corporate Governance. Kvaerner’s detailed corporate
governance report can be found on www.kvaerner.com/cg.
In general, corporate governance is based on the
model wherein shareholders, at the Annual General
Meeting, appoint the Board of Directors to act as their
representatives in governing the company.
The Board of Directors sets the strategic direction,
the overall governance structure, values and policies in
accordance with Norwegian legislation and frameworks.
Kvaerner has a Code of Conduct and a set of global policies
and procedures which provide direction on acceptable
performance and guide decision-making in all parts of the
company. All Kvaerner policies are subject to an annual
review and, when deemed necessary, updates are made.
As set out in the Norwegian Public Limited Liability
Companies Act, Kvaerner’s Board of Directors has
established an Audit Committee, comprising the following
three directors; Lone Fønss Schrøder (Chair), Thorhild
Widvey and Rune Rafdal. The Board has also established
a Remuneration Committee, with the directors Leif-Arne
Langøy (Chair), Kjell Inge Røkke and Thorhild Widvey as
members.
Kvaerner encourages its employees as well as contract
staff, partners, suppliers and customers to report any
concerns in terms of compliance with law and/or ethical
standards. The company has an established whistleblowing
channel accessible at https://www.kvaerner.com/
Environment--Society/whistleblowing/. All reports go
directly to the SVP Corporate Support & General Counsel
and an investigation team for follow-up of compliance
issues.
Risk management
As a key work process for securing Kvaerner’s business, the
company actively works to identify and manage risk related
to all aspects of its operations. This applies both to projects
and in the corporate organisation.
Kvaerner’s mission is to realise complex projects, and
the management of risk in these projects is instrumental
to success. All Kvaerner’s projects maintain a risk register
where identified risks and opportunities are recorded
with corresponding actions to secure the best possible
outcome. This work process forms an integral part of
Kvaerner’s project management approach as defined in its
Kvaerner’s Project Execution Model (PEM™). This structured
methodology for controlled project execution also provides
sets of quality requirements for various stages of projects
through defined milestones, thus providing a framework for
assessing the status of the project execution through gate
reviews/audits.
All projects report status on management of risk as a
part of the monthly reporting to Kvaerner’s operational
areas. Based on this and possible operational risk issues
outside projects, the operational areas report status on
management of risk to the executive management team on
a quarterly basis.
On a corporate level, an annual risk review is performed
and presented to the Board of Directors. This report builds
on the regular risk reporting from operational areas,
corporate staff functions and Kvaerner’s projects.
The risk review is executed to identify the most
significant risk areas and to establish associated risk
reducing actions. In this assessment, the consolidated view
11KVAERNER ANNUAL REPORT 2018BOARD OF DIRECTORS’ REPORT
across all Kvaerner’s units is looked into, top company risks
are identified and risk reducing measures agreed upon.
Please see Note 20 Financial risk management
and exposures (page 50), for a detailed description
of the group’s financial risks and Note 18 Provisions
and contingent liabilities (page 48) for an overview
of significant current disputes. Kvaerner has defined
procedures and routines for managing the group’s financial
market exposure.
Further to this, Kvaerner’s Corporate Risk Committee
performs risk assessment of all major tenders prior to
submission and also performs reviews of selected projects
after start-up. Internal audits are undertaken to ensure
compliance with Kvaerner policies, laws and regulations as
well as project specific audits.
Kvaerner works with a number of partners and hundreds
of suppliers and subcontractors around the world. The
company performs risk based due diligence as part of
the pre-qualification processes. Kvaerner’s supplier
qualification and information system database is a key
enabler for raising the quality for supplier performance.
All potential joint venture partners and third party
representatives must go through due diligence assessments
and have to be approved by the President & CEO of
Kvaerner.
Health, safety, security and environment (HSSE)
Care for health, safety, security and the environment (HSSE)
is a core value in Kvaerner and expressed in the Just Care™
mind-set. HSSE is fundamental to all Kvaerner’s operations
and the people working for Kvaerner are all keystones in
its work towards the ultimate goal of an injury- and illness-
free workplace, causing zero harm to people, material,
non-material assets and to the environment. This ambition
is not only part of the company’s core values, but is the
company’s licence to operate.
Kvaerner’s HSSE management is based on strong and
visible management responsibility and commitment, where
all HSSE processes are driven by the line management from
the President & CEO to first-line supervisors. HSSE is the
cornerstone in all Kvaerner’s work and a core value in the
company. Kvaerner’s HSSE mind-set states that: we take
personal responsibility for HSSE because we care.
In 2018, there has been a negative trend in the total
recordable injury frequency (TRIF) as well as increases
in serious incidents and serious near-misses compared
to the previous year. Kvaerner has started a number of
new initiatives during 2018 to break this trend, including
enforcing more visible management in field, training
sessions within safety leadership, safety behaviour and
risk awareness, a new app for reporting of incidents, HSSE
development of subcontractors, revision of crane standards
with an associated eLearning introduction programme, and
more.
At year-end 2018, a lost time incident frequency (LTIF)
of 0.5 and a total recordable injury frequency (TRIF) of 2.9
was recorded, compared to corresponding 0.5 and 2.5 for
2017. These figures include Kvaerner’s subcontractors and
are calculated per million man-hours worked. The company
had four lost time injuries in 2018. These injuries were a
bruised arm, various fractures and a cut hand.
In 2018, eleven serious incidents or serious near-misses
were identified and thoroughly investigated. Actions for
improvement are identified and implemented. Following
serious incidents, lessons learned packages are produced
and shared throughout Kvaerner with the aim of preventing
similar incidents. In 2018, the number of documented risk
observations was 36 458, equivalent to 8.1 observations
per man-year worked, compared to 27 118 observations in
2017, equivalent to 5.2 observations per man-year worked.
For further information about Kvaerner’s HSSE
programme and activities, including key performance
indicators, please see the chapter “Caring about health,
safety, security and the environment” in the company’s CSR
report: www.kvaerner.com/csr.
The HSSE operating environment
HSSE is an integral part of Kvaerner’s management system
and is divided into seven main sections: leadership,
organisation, communication, risk management, product
realisation, third-party relationships and continual
improvement.
The Just Care™ mind-set is Kvaerner’s umbrella
for driving HSSE-related awareness-building and
understanding. A key element in the Kvaerner’s Just
Care™ approach is that all employees accept personal
responsibility for HSSE by actively caring for themselves,
co-workers and the environment.
A common HSSE operating system sets expectations
for the key elements in HSSE management and leadership.
Regular reviews uncover possible gaps in relation to
expectations, and the necessary activities for improvement
are identified and initiated. Key HSSE performance
indicators have been implemented. A strong focus on
leading activities in the HSSE field, combined with defined
targets measured against actual results, guides Kvaerner
towards continual improvements in HSSE performance.
Just Rules is a set of concrete guidelines within
Kvaerner’s HSSE operating system. These have been
established to control the most safety-critical activities in
our operations. Just Rules is a mandatory part of Kvaerner’s
safety training for all employees, providing clear and simple
check-lists and controls for operations.
HSSE training
Competence occupies a central place in Kvaerner’s HSSE
programme. All personnel must be competent, possess
the necessary knowledge, skills and behaviour to perform
their work safely. To reach out to all employees in an
efficient way, Kvaerner uses dedicated training programmes
at operational and project levels, as well as eLearning
programmes for key areas within HSSE.
During 2018, 1.2 percent of total worked hours were
invested in HSSE training, compared to 1.2 percent in 2017.
Training programmes and key performance indicators have
been established to promote observation, interaction and
intervention in the areas of HSSE.
Safety
In 2018 there has been a slight increase in both injury
frequency and incidents with high-risk potential.
Improvement actions have been implemented to address
these issues. The high risk potential incidents are especially
12KVAERNER ANNUAL REPORT 2018BOARD OF DIRECTORS’ REPORT
related to crane operations and work at heights. Safety
culture initiatives, improved training programmes and
management follow-up has been implemented. Several
good initiatives have been introduced in 2018, such as
an updated app for the reporting of incidents, training
programmes in risk awareness and safety leadership and
HSSE development of subcontractors.
The HSSE development of subcontractors has continued
in 2018. In addition, compliance and leadership, barriers
and risk awareness have been key focus areas.
Digitalisation of the HSSE work has been further
developed with roll-out of an improved mobile phone
application for reporting of incidents and non-conformities.
Digitalisation will be part of the improvement initiatives in
2019.
There has been a positive transfer of experience
between Kvaerner projects. In addition, an incentive
programme contributes to local clubs and associations upon
achievement of the project HSSE targets. These awards
provide positive incentives and are connected to high
scores in inspections, housekeeping, and reporting rates of
HSSE observations.
Kvaerner will continue the development of safety
culture, tools and processes and will strive to ensure
compliance with the company’s rules and regulations. Close
cooperation and further development of relationships
with our subcontractors within HSSE will also continue
to be a priority. In addition, it is important for Kvaerner
to maintain an active dialogue between employees and
management.
Occupational health
Total sick leave for Kvaerner in 2018 was 229 142 hours
for own employees, compared to 234 471 in 2017. This
constitutes 5.27 percent sick leave in 2018, compared to
5.43 percent of total man-hours in 2017. However, sick
leave is still above the target of 4.8 percent. During the
spring of 2017, Kvaerner initiated a project to analyse the
sick leave and propose mitigating actions. This resulted in
detailed action plans per region. This programme continued
throughout 2018 with training of all managers, union
representatives and safety delegates. The implementation
of actions continues and results are improving. Reducing
sick leave is important to Kvaerner and will remain a key
focus area in 2019.
Kvaerner in Norway participates in the More Inclusive
Working Life (IA) agreement. The IA Agreement is an
instrument aimed at reducing sick leave and increasing the
focus on job presence.
Kvaerner cooperates with some other companies who
have a relationship with Aker. The company’s participation
in the Aker Active programme, which offers a wide
range of activities within physical exercise and nutrition
for employees on all locations, is an example of health
initiatives.
Environment
All companies should contribute to protection of the
environment. Kvaerner continuously works to reduce the
environmental footprint of our operations and products.
The Kvaerner methodology for reporting environmental
impact derives from the Greenhouse Gas Protocol (GHG) and
the Global Reporting Initiative (GRI). Kvaerner is certified
according to the ISO 14001:2015 standard. In its supplier
declaration, which all suppliers to Kvaerner must sign in
order to be pre-qualified, suppliers commit to work to
minimise negative impacts on the environment, taking into
consideration the full life cycle of their products. Suppliers
commit to work to achieve energy efficiency and minimise
harmful discharge, emissions and waste production, and to
comply with national environmental legislation and discharge
permits.
HSSE leadership development initiatives, eLearning and
management system all incorporate clear components that
focus on the environment. Collectively, these contribute to
continuous improvements in environmental awareness and
attitudes among managers and employees, and support
customers in making environmental improvements through
executed projects.
There are several energy efficiency initiatives in progress
within the company. In addition, Kvaerner is continuously
conducs environmental monitoring of dust, water, sediments
and noise. In September, Kvaerner reported to the Norwegian
Environment Agency increased values of some PFAS
substances from the decommissioning facility, but the levels
since normalised without the source ever being detected.
Safe handling of polluted sediments and collection of plastic
from blasting activities have had a high focus in the Stord
yard development project. The demolition site at Stord has
been upgraded with more concrete pads with membranes for
environmental purposes.
Primary energy consumption, carbon emissions and
waste disposal vary according to activities at the yards. Total
energy intensity was 5 295 (MWh per million worked hours)
in 2018 compared to 4 578 in 2017. The energy intensity
(MWh per million worked hours) has increased in 2018 due
to higher activities at Kvaerner’s yards compared to the
previous year. CO2 emissions (tonnes per million worked
hours) were 537 in 2018 compared to 167 in 2017. This
was due to higher activity at the yards. Waste recorded in
connection with the business totalled 7 836 tonnes in 2018
compared to 6 321 tonnes in 2017, of which 65 percent was
recycled in 2018, compared to 51 percent in 2017. The main
reason for the low recycling factor in 2017 was extensive
use of non-recyclable sandblasting. These masses are safely
disposed.
Kvaerner has actively participated in clean the beach-day
on Kvaerner’s locations.
Security
Due to the global nature of Kvaerner’s operations, the
company is exposed to changes in the global risk situation.
Kvaerner operates in a wide range of regions, which means
that potential security threats may arise. Kvaerner is linked
to International SOS and Control Risks, which provides a
global tool for risk assessment and risk control. To mitigate
possible risk situations, all employees can at all times be
provided with a reliable and updated risk assessment and
have access to information, as well as to local contacts
and a pre-established network. Currently, Kvaerner has no
operations in areas with high or extreme risk as classified
by International SOS.
With regards to cyber security, Kvaerner has joined
13KVAERNER ANNUAL REPORT 2018BOARD OF DIRECTORS’ REPORT
the Aker group-wide security initiative, further promoting
a uniform security approach across the Aker companies.
Several security products have been implemented as
countermeasure to the increased cyber security threat, with
emphasis on phishing.
Corporate social responsibility (CSR)
Kvaerner is committed to conduct its business with
integrity and high ethical standards. That is why CSR is
an integral part of the management responsibility within
Kvaerner. The company’s corporate goals and activities
within CSR are anchored at the Board of Directors level.
Kvaerner is a significant part of some of the communities
in which it operates, both locally and internationally.
Kvaerner’s aim within CSR is to ensure that the operations
are run in line with the company’s values, Code of Conduct
and policies, relevant laws and regulations and society’s
expectations, with integrity. Kvaerner continuously works
to identify opportunities to improve, and aims at running a
business which has a positive impact on people, society and
the environment.
The company is committed to respect fundamental
human and trade union rights, including a specific focus
on non-discrimination. Kvaerner’s CSR principles are
based on the company’s values as well as on a wide range
of Norwegian and international guidelines, standards,
regulations and laws.
The results of the company’s CSR efforts are
systematically measured, and Kvaerner annually publish a
separate in-depth report on CSR results and principles. For
further information regarding Kvaerner’s CSR efforts, please
see the separate CSR report published on
www.kvaerner.com/csr.
People and organisation
The Kvaerner’s operating structure has been the same
through 2018.
For further information about people and organisation,
including key performance indicators, please see the
chapter “Caring about our people” in the company’s CSR
report: www.kvaerner.com/csr.
Executive management team (EMT)
The executive management team represents broad and
strategic national and international business experience.
The nine EMT members have experience from senior
positions in major oil and gas companies as well as from
the supply industry, and have worked on some of the
largest field development projects in the world. The
EMT members have also worked in a broad range of
complementary and associated industries.
Karl-Petter Løken started as the new President & CEO
on 7 May 2018, succeeding Jan Arve Haugan who left
Kvaerner on 28 February. CFO Idar Eikrem was Interim
President & CEO from 1 March until 7 May 2018. A
complete presentation of the EMT is available at
www.kvaerner.com/emt.
Developing people and teams
Kvaerner is globally recognised for its expertise in
executing oil and gas projects. Kvaerner’s expertise within
the fields of engineering, procurement and construction
builds on multidisciplinary competence from engineering,
yards and project teams.
Kvaerner has earned this reputation due to extensive
investments in organised workplace training and continuous
focus on developing skills and capabilities.
Investments in employees over time are crucial for
Kvaerner’s ability to execute projects and develop new
projects successfully.
Consequently, Kvaerner focuses on continuous training
at all levels and business areas of the organisation,
including professional employees, support staff, teams,
project management and leaders.
All training is based on the company’s six core values,
Code of Conduct and leadership principles. HSSE is one of
the core values and always part of all training activities and
organised sessions.
For further information about developing people and
teams, including key performance indicators, please see the
chapter “Learning and development” in the company’s CSR
report: www.kvaerner.com/csr.
Organisation and recruitment
As of 31 December 2018, the overall workforce comprised
4 038 individuals which included 2 727 permanent
employees and 1 311 contract staff. Corresponding figures
for 2017 were 2 659 permanent employees and 841
contract staff. The gender distribution is approximately 15
percent female and 85 percent male employees. 97 percent
of the permanent employees work in Norway, while the
remaining three percent work in US, Finland, China, UK,
Canada and Russia.
The company offers an inspiring and challenging
workplace with a high degree of teamwork and good
individual career and development opportunities. In 2018,
Kvaerner recruited 116 new employees, of which 21 were
women and 95 were men. 17 percent of the new employees
were below 30 years of age, 64 percent were between 30
and 50 years old, and 19 percent were above the age of 50.
The total voluntary employee turnover was four percent in
2018, and for comparison the voluntary employee turnover
2017 was three percent.
Kvaerner operates two specialised fabrication and
assembly facilities in Norway; at Stord in the west of
Norway and in Verdal in mid-Norway. To ensure a solid and
consistent competence base in Kvaerner, it is vital to have a
proper inflow of younger generations of skilled employees.
Kvaerner’s arrangements for apprenticeship provide an
important means of recruiting operators to our yards at
Stord and in Verdal, and Kvaerner will continue to have a
strong focus on recruiting new apprentices. In 2018, 56 new
apprentices were recruited. At year-end 2018, there were
a total of 115 apprentices under applicable agreements,
compared to a total of 96 apprentices at year-end 2017.
Up to September 2018, the results from Kvaerner’s
People Survey 2016 have been in focus, and identified key
focus areas for concrete actions and improvements have
been completed and finalised.
Employee engagement is important for Kvaerner, and in
October 2018, Kvaerner launched a new (the third) People
Survey with a response rate of more than 90 percent. In
comparison the response rate in 2016 was 82 percent.
The results showed that in some areas there has been a
14KVAERNER ANNUAL REPORT 2018BOARD OF DIRECTORS’ REPORT
positive development compared to 2016. In addition, new
improvement areas have been identified and new actions
and plans will be launched in 2019.
Diversity and equal opportunity
As the nature of Kvaerner’s operations calls for employees
from different operating entities and geographical regions
nationally and internationally, the principles of equal
opportunity are well established throughout the group.
No differences shall exist when it comes to treatment
of gender, nationality, religion or ethnicity. Employment
conditions and compensation packages are based on
responsibility, complexity of job and personal performance,
irrespective of gender or ethnicity.
Kvaerner’s commitment to diversity and equal
opportunities are described in the policies and in the Global
Framework Agreement for development of good working
relations, a three-party frame agreement with national and
international trade unions.
Kvaerner has a strong focus on training of all employees
to avoid any form of discrimination, harassment or
bullying. Throughout 2018, Kvaerner has been cooperating
with the Working Environment Specialists (Arbeidsmiljø-
spesialistene) and implemented its methods and concepts
for preventing unwanted behaviour in the workplace.
Kvaerner has a zero tolerance policy against any form of
discrimination, harassment and bullying in the workplace,
and there are now well established procedures and
guidelines for how to report and handle unwanted
incidents.
Leadership training is an important contribution towards
increasing the number of women promoted to managerial
positions. In 2018 the share of women holding senior
management positions was 22 percent compared to 18
percent in 2017, whereof the share of women completing
leadership training in 2018 was 46 percent. In 2018, two of
the nine EMT members were women and two of Kvaerner’s
five shareholder-elected Directors are women. All of the
Directors elected by and among the employees are men.
Remuneration and performance culture
Kvaerner shall maintain an individual compensation
level for employees and management which enables the
company to attract and retain employees and leaders with
the right attitudes, skills and the ability to deliver strong
performance in accordance with Kvaerner’s values and the
Code of Conduct. Kvaerner aims to reward performance,
results, skills and attitude. The total remuneration shall be
internally fair, consistent, comprehensible and competitive
without being market leading.
The total remuneration for executives, senior
management and management consists of three main
elements:
> Annual base salary
> Benefits
> Participation in a variable pay programme
The executives, senior management and management are
members of the standard pension and insurance schemes
applicable to all employees in the company. Other benefit
programmes are not granted. The variable pay programmes
shall secure a market competitive total remuneration as
well as being a driver for exceptional financial, operational
and personal performance.
Completion of the performance management process
is fundamental to secure the connection between
performance and remuneration. For management taking
part in variable pay programmes, predefined financial,
operational and personal objectives are set on annual basis.
The achievement of the objectives is assessed and forms
the basis for the remuneration triggered by the variable
pay programmes.
The assessment of achieved goals and performance
takes place in an annual performance management process,
where the performance dialogue between the leader
and his/her direct reports is essential. This performance
dialogue provides the opportunity for recognition of
achieved results, consideration of career and competence
development and future actions and direction for individual
performance improvements.
Further details about remuneration to EMT members
are provided in Note 5 Employee benefit expenses (page
31) in the consolidated financial statements. The report to
shareholders on executives’ remuneration is approved by
the Board of Directors and is available on
www.kvaerner.com.
Digitalisation
Based on a comprehensive analysis conducted in 2017,
Kvaerner has established a digitalisation roadmap with
an associated business case showing significant potential
for cost savings and productivity increase. Ranging from
automated application portfolio setup for EPC projects,
through use of mobile technology to increase operator/
foreman productivity, to advanced use of machine learning
and establishing a digital twin of Kvaerner’s yards, the
roadmap defines both the strategic direction for Kvaerner’s
increasing use of information technology, as well as a
prioritised list of specific initiatives to be deployed across
our project portfolio. Key among the current initiatives,
is the Mobile Construction Workforce project, which will
provide a digital work surface for operators and foremen
working on Kvaerner projects. Using smartphones and
tablets, elements such as work orders, fabrication drawings,
progress reporting, hour capturing, team collaboration,
scaffolding reservation will be available through an
intuitive user interface, developed in collaboration with
foremen and operators at the Kvaerner yards. Over the
coming years, Kvaerner will continue to invest selectively
in digitalisation, driven by specific project needs in
combination with longer-term investments in capabilities
needed in the future EPC landscape.
Continuous improvement
During 2018 a LEAN based systematic improvement
programme has been prepared. This programme is called
Kvaerner Beyond and is set to improve the quality of all
work processes down to the lowest level. The programme
builds on LEAN philosophy and methods and aims to
increase the productivity of all work processes.
15KVAERNER ANNUAL REPORT 2018BOARD OF DIRECTORS’ REPORT
Kvaerner Beyond engages all staff in continuous
improvement of their work processes by following a
coherent approach to the company.
The overall ambition of Kvaerner Beyond is: “We
will work smarter, more predictably and deliver faster
– to create value”. Experience from successful LEAN
implementation in other companies has shown that taking
out unnecessary activities (so-called “waste”) from work
processes, improve throughput time and perfect the
handovers between processes, will as an end result give
significantly improved overall productivity.
Kvaerner Beyond has been tested and rolled out in
three fabrication units at Stord and Verdal during 2018,
and full implementation will take place in 2019 and
thereafter. Kvaerner Beyond is designed to perfect the way
the company works at all levels. It will also provide the
framework for specific improvement projects that will run
according to business needs, like digitalisation projects and
other major specific improvement initiatives.
Research and development (R&D)
There is a growing demand for field development solutions
that can help oil companies reduce their overall costs and
increase value creation. Part of Kvaerner’s competitive
strength is solutions and methods that make it technically
possible and financially attractive to develop reserves
which have previously been considered non-viable.
Kvaerner can also offer concepts and effective project
execution models that may contribute towards reducing the
total costs of new field developments.
Kvaerner’s R&D strategy has a clear focus on creating
values and results. The company strives to identify the
potential commercial opportunities before new R&D
activities are started, and new developments are preferably
executed with customers or business partners as sponsors.
This approach increases the market interest in new
technologies and methods.
Offshore wind is a developing market. Kvaerner’s focus
in 2018 has been on turbine foundation installations and
converter platforms.
For turbine foundations, Kvaerner has investigated
opportunities within the floating foundation space and
looked into concrete gravity base foundations for wind
power turbines, both with special attention on cost-
effective, execution-friendly design for large volume
fabrication and installation. Kvaerner aims at leveraging its
EPCI expertise and experience to provide new and cost-
effective development solutions.
Further, within the offshore wind segment, Kvaerner has
spent time on activities relating to developing competitive
execution models for high voltage direct current (HVDC)
converter platforms.
In 2018, Kvaerner has continued the development
of the company’s concrete floater solutions for future
Barents Sea developments and ice-prone waters offshore
Newfoundland, Canada. Focus has been on cost reduction
through effective methods for topside hull integration.
Kvaerner actively participates in several joint
industry research projects, with the main focus on Arctic
technology and concrete technology. Kvaerner is engaged
in approximately ten research projects in Norway, EU and
Canada, together with national and international industry
partners, universities and research organisations, with
public funding through various research programmes.
One of these research projects is the Durable Advanced
Concrete Solutions (DACS) project managed by Kvaerner,
which is now approaching the harvesting phase and is
starting to deliver on the defined objectives. Focus areas
are early phase cracking, frost resistance, ice abrasion
and ductility in lightweight concrete. The project is jointly
funded by Kvaerner, industry partners and the Research
Council of Norway. Kvaerner also participates in several
new research applications submitted in 2018, to continue to
harvest knowledge and to stay in front of the development
for selected key areas.
Share capital
The company’s shares are listed on Oslo Børs (Oslo Stock
Exchange) and are freely transferable. No transferability
restrictions are incorporated into the Articles of Association.
There are 269 000 000 shares issued and outstanding, all
of which are of the same class and with equal voting and
dividend rights. Each share has a par value of NOK 0.34.
The largest shareholder of Kværner ASA is Aker Kværner
Holding AS, holding 41.02 percent of the shares. Aker ASA
owns 70 percent of Aker Kværner Holding AS, while the
Norwegian Government owns 30 percent as of 31 December
2018. Proposition No. 88 (2006–2007) to the Storting
(Norwegian Parliament) contains more detailed information
concerning the establishment of Aker Kværner Holding AS,
and the agreement between Aker ASA and the Norwegian
Government. The company is not party to any agreement that
is conditional upon offerings of take-over in the company.
Kvaerner had 8 085 shareholders (8 291) as of 31
December 2018, of which 26 percent (28 percent) were
non-Norwegian. The share price was NOK 12.06 at year-end
2018, compared to NOK 15.80 at year-end 2017. During
2018 Kvaerner’s share price decreased by 24 percent, the
Oslo Stock Exchange benchmark index increased by two
percent and the Philadelphia Oil Service Index decreased by
46 percent.
As of 31 December 2018, Kværner ASA held 1 113 079
treasury shares.
Outlook
Compared to 12 months ago, Kvaerner sees an improved
market and more customers considering new projects.
During 2019, it is expected that several key prospects
will pass important decision gates and move further
towards project sanctioning and project execution. The
company anticipates that potential contract awards for
near term larger contracts will mostly come in 2020 and
2021. The market in and around Norway will continue
to be important, but several key prospects are also in
international regions. For 2019, the full year gross revenue
is expected to be above NOK 7 billion. CAPEX level for
2019 is expected to be about NOK 300 million. The working
capital level is expected to increase somewhat during 2019.
16KVAERNER ANNUAL REPORT 2018BOARD OF DIRECTORS’ REPORT
Acknowledgements
During 2018, Kvaerner has continued to execute projects
according to customers’ plans and expectations. At year-
end, all projects were on track.
World class HSSE performance is important both as a
value and for competitiveness, and the Board of Directors
supports the further initiatives to drive Kvaerner’s HSSE
improvements further.
The company’s continued intense work to improve
quality, cost, productivity and competitiveness is vital to
put Kvaerner in a good position for upcoming prospects.
The Board of Directors extends its appreciation to
the management and employees for its efforts and
achievements in 2018.
Leif-Arne Langøy
Chairman
Jan Arve Haugan
Director
Thorhild Widvey
Director
Kjell Inge Røkke
Director
Lone Fønss Schrøder
Director
Rune Rafdal
Director
Ståle Knoff Johansen
Director
Bernt Harald Kilnes
Director
Karl-Petter Løken
President & CEO
Fornebu, 11 February 2019
The Board of Directors and the President & CEO of Kværner ASA
Stål K ff J h
one Fønss Schrøder
Bernt Harald Kilnes
Thorhild WidveyJan Arve Hauga Kjell Inge Røkke
rl-Petter Løke
resident & CEO
17KVAERNER ANNUAL REPORT 2018BOARD OF DIRECTORS’ REPORT
Annual accounts Kvaerner group
Annual consolidated financial statements 18
Income statement 01.01–31.12 18
Other comprehensive income 01.01–31.12 19
Balance sheet as of 31 December 20
Equity 01.01–31.12 21
Cash flows 01.01–31.12 22
Notes to the annual consolidated financial statements
General information 23
Note 1 Company information 23
Note 2 Basis of preparation 23
Information on income statement 25
Note 3 Revenue and contract balances (IFRS 15) 25
Note 4 Operating segments 28
Note 5 Employee benefit expenses 31
Note 6 Other operating expenses 37
Note 7 Finance income and expenses 37
Note 8 Income taxes 38
Note 9 Earnings per share 40
Information on assets, liabilities and equity 40
Note 10 Property, plant and equipment 40
Note 11 Intangible assets 41
Note 12 Trade and other receivables 43
Note 13 Cash and cash equivalents 43
Note 14 Equity 43
Note 15 Pension obligations 44
Note 16 Operating leases 47
Note 17 Interest-bearing liabilities 48
Note 18 Provisions and contingent liabilities 48
Note 19 Trade and other payables 50
Financial and capital management 50
Note 20 Financial risk management and exposures 50
Note 21 Derivative financial instruments 53
Note 22 Financial instruments 55
Group companies and other investments 55
Note 23 Group companies as of 31 December 2018 55
Note 24 Equity-accounted investees 56
Other matters 58
Note 25 Related parties 58
Note 26 Discontinued operations 59
Note 27 Subsequent events 59
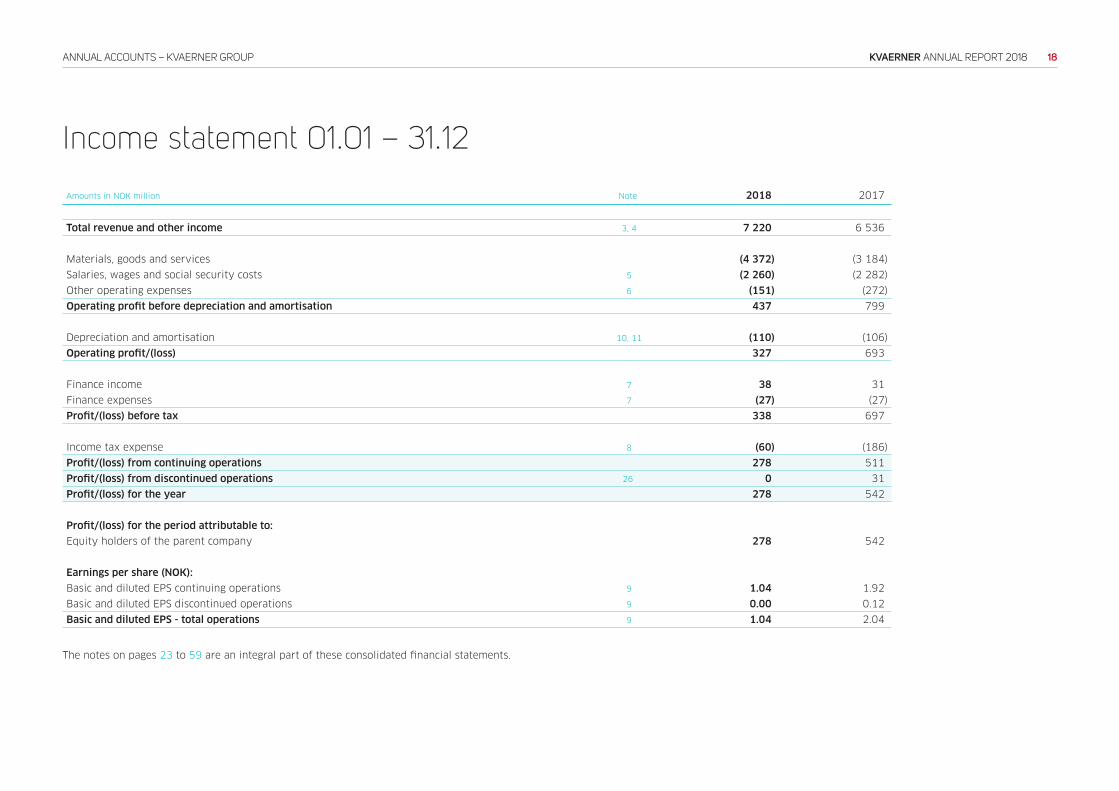
18KVAERNER ANNUAL REPORT 2018ANNUAL ACCOUNTS – KVAERNER GROUP
Amounts in NOK million Note 2018 2017
Total revenue and other income 3, 4 7 220 6 536
Materials, goods and services (4 372) (3 184)
Salaries, wages and social security costs 5 (2 260) (2 282)
Other operating expenses 6 (151) (272)
Operating profit before depreciation and amortisation 437 799
Depreciation and amortisation 10, 11 (110) (106)
Operating profit/(loss) 327 693
Finance income 7 38 31
Finance expenses 7 (27) (27)
Profit/(loss) before tax 338 697
Income tax expense 8 (60) (186)
Profit/(loss) from continuing operations 278 511
Profit/(loss) from discontinued operations 26 0 31
Profit/(loss) for the year 278 542
Profit/(loss) for the period attributable to:
Equity holders of the parent company 278 542
Earnings per share (NOK):
Basic and diluted EPS continuing operations 9 1.04 1.92
Basic and diluted EPS discontinued operations 9 0.00 0.12
Basic and diluted EPS - total operations 9 1.04 2.04
The notes on pages 23 to 59 are an integral part of these consolidated financial statements.
Income statement 01.01 – 31.12
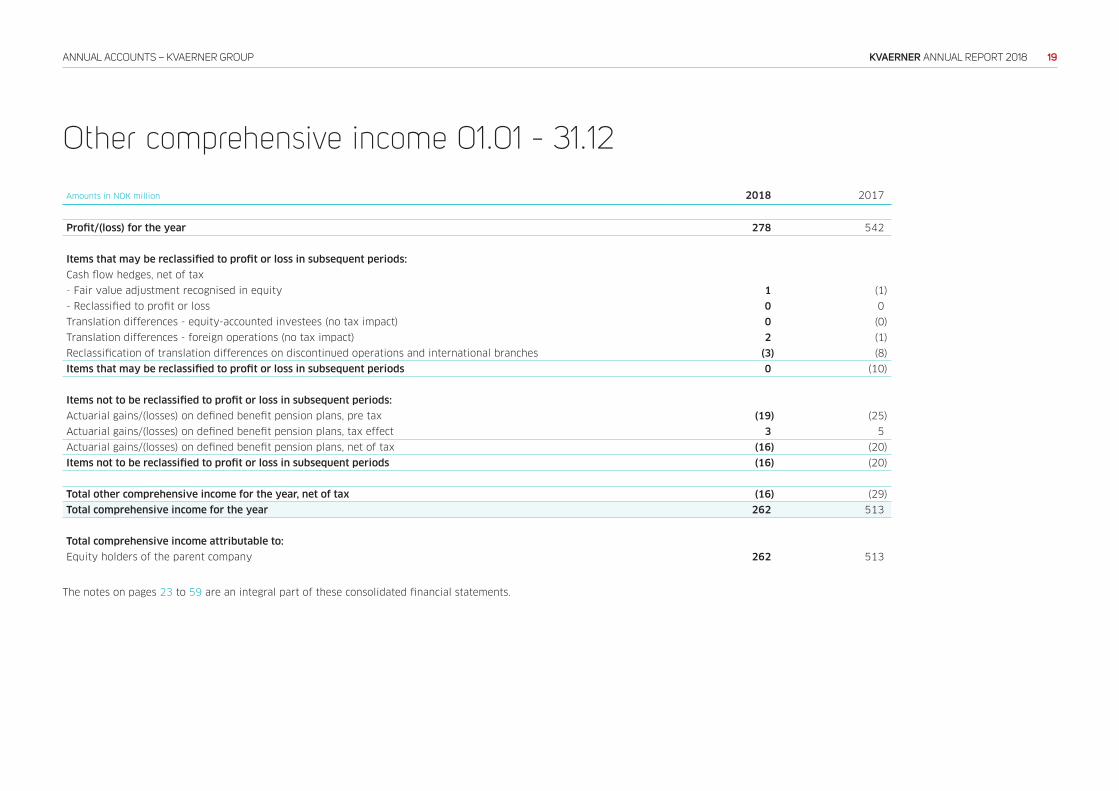
19KVAERNER ANNUAL REPORT 2018ANNUAL ACCOUNTS – KVAERNER GROUP
Amounts in NOK million 2018 2017
Profit/(loss) for the year 278 542
Items that may be reclassified to profit or loss in subsequent periods:
Cash flow hedges, net of tax
- Fair value adjustment recognised in equity 1 (1)
- Reclassified to profit or loss 0 0
Translation differences - equity-accounted investees (no tax impact) 0 (0)
Translation differences - foreign operations (no tax impact) 2 (1)
Reclassification of translation differences on discontinued operations and international branches (3) (8)
Items that may be reclassified to profit or loss in subsequent periods 0 (10)
Items not to be reclassified to profit or loss in subsequent periods:
Actuarial gains/(losses) on defined benefit pension plans, pre tax (19) (25)
Actuarial gains/(losses) on defined benefit pension plans, tax effect 3 5
Actuarial gains/(losses) on defined benefit pension plans, net of tax (16) (20)
Items not to be reclassified to profit or loss in subsequent periods (16) (20)
Total other comprehensive income for the year, net of tax (16) (29)
Total comprehensive income for the year 262 513
Total comprehensive income attributable to:
Equity holders of the parent company 262 513
The notes on pages 23 to 59 are an integral part of these consolidated financial statements.
Other comprehensive income 01.01 - 31.12
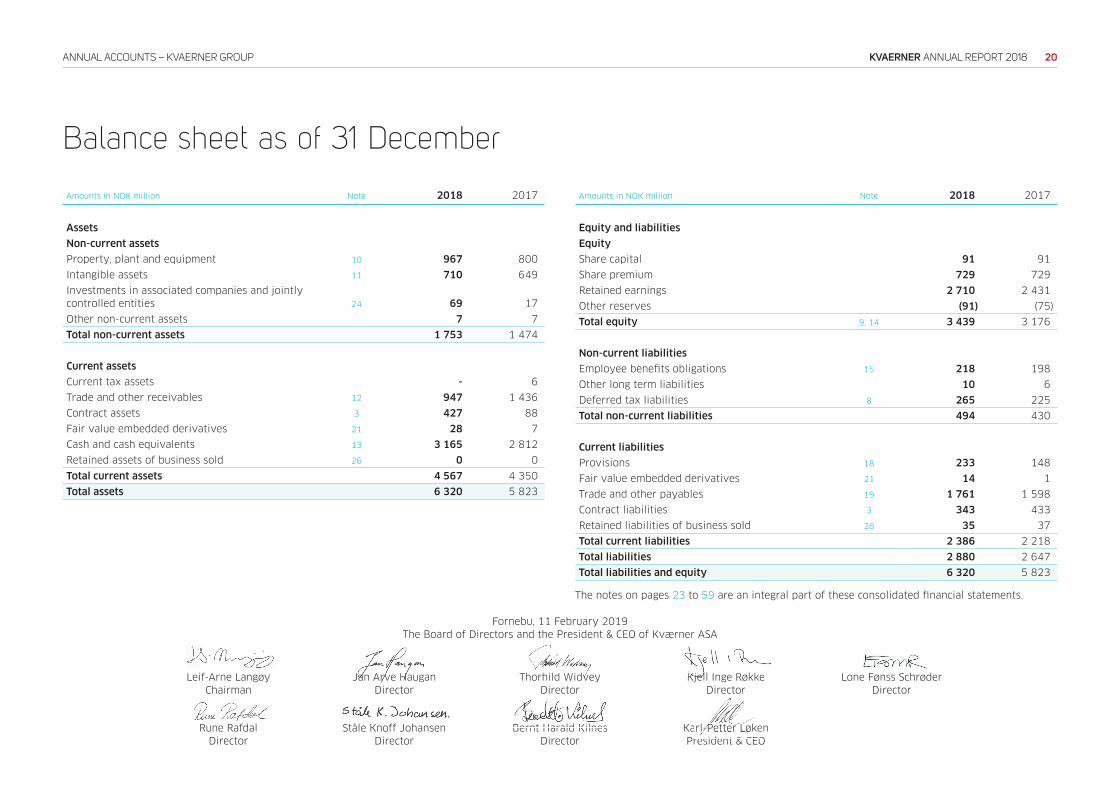
20KVAERNER ANNUAL REPORT 2018ANNUAL ACCOUNTS – KVAERNER GROUP
Amounts in NOK million Note 2018 2017
Assets
Non-current assets
Property, plant and equipment 10 967 800
Intangible assets 11 710 649
Investments in associated companies and jointly
controlled entities 24 69 17
Other non-current assets 7 7
Total non-current assets 1 753 1 474
Current assets
Current tax assets - 6
Trade and other receivables 12 947 1 436
Contract assets 3 427 88
Fair value embedded derivatives 21 28 7
Cash and cash equivalents 13 3 165 2 812
Retained assets of business sold 26 0 0
Total current assets 4 567 4 350
Total assets 6 320 5 823
Amounts in NOK million Note 2018 2017
Equity and liabilities
Equity
Share capital 91 91
Share premium 729 729
Retained earnings 2 710 2 431
Other reserves (91) (75)
Total equity 9, 14 3 439 3 176
Non-current liabilities
Employee benefits obligations 15 218 198
Other long term liabilities 10 6
Deferred tax liabilities 8 265 225
Total non-current liabilities 494 430
Current liabilities
Provisions 18 233 148
Fair value embedded derivatives 21 14 1
Trade and other payables 19 1 761 1 598
Contract liabilities 3 343 433
Retained liabilities of business sold 26 35 37
Total current liabilities 2 386 2 218
Total liabilities 2 880 2 647
Total liabilities and equity 6 320 5 823
The notes on pages 23 to 59 are an integral part of these consolidated financial statements.
Balance sheet as of 31 December
Leif-Arne Langøy
Chairman
Jan Arve Haugan
Director
Thorhild Widvey
Director
Kjell Inge Røkke
Director
Lone Fønss Schrøder
Director
Rune Rafdal
Director
Ståle Knoff Johansen
Director
Bernt Harald Kilnes
Director
Karl-Petter Løken
President & CEO
Fornebu, 11 February 2019
The Board of Directors and the President & CEO of Kværner ASA
Stål K ff J h
one Fønss Schrøder
Bernt Harald Kilnes
Thorhild WidveyJan Arve Hauga Kjell Inge Røkke
rl-Petter Løke
resident & CEO
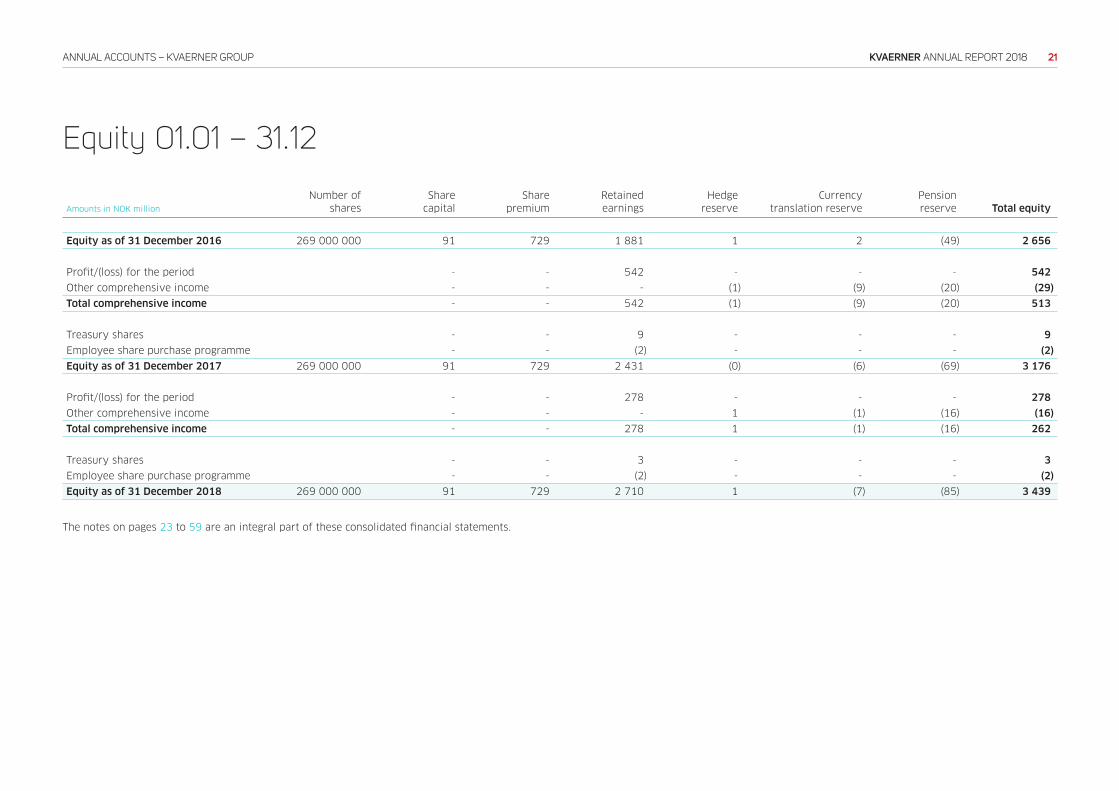
21KVAERNER ANNUAL REPORT 2018ANNUAL ACCOUNTS – KVAERNER GROUP
Amounts in NOK million
Number of
shares
Share
capital
Share
premium
Retained
earnings
Hedge
reserve
Currency
translation reserve
Pension
reserve Total equity
Equity as of 31 December 2016 269 000 000 91 729 1 881 1 2 (49) 2 656
Profit/(loss) for the period - - 542 - - - 542
Other comprehensive income - - - (1) (9) (20) (29)
Total comprehensive income - - 542 (1) (9) (20) 513
Treasury shares - - 9 - - - 9
Employee share purchase programme - - (2) - - - (2)
Equity as of 31 December 2017 269 000 000 91 729 2 431 (0) (6) (69) 3 176
Profit/(loss) for the period - - 278 - - - 278
Other comprehensive income - - - 1 (1) (16) (16)
Total comprehensive income - - 278 1 (1) (16) 262
Treasury shares - - 3 - - - 3
Employee share purchase programme - - (2) - - - (2)
Equity as of 31 December 2018 269 000 000 91 729 2 710 1 (7) (85) 3 439
The notes on pages 23 to 59 are an integral part of these consolidated financial statements.
Equity 01.01 – 31.12
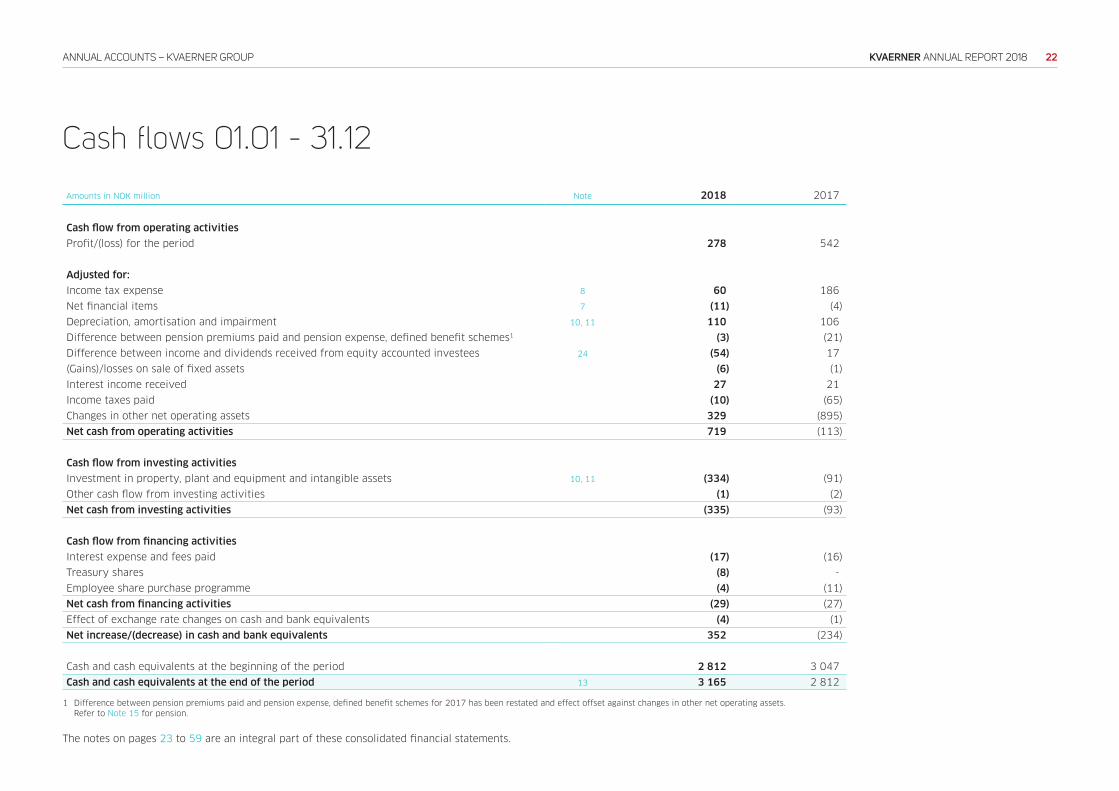
22KVAERNER ANNUAL REPORT 2018ANNUAL ACCOUNTS – KVAERNER GROUP
Amounts in NOK million Note 2018 2017
Cash flow from operating activities
Profit/(loss) for the period 278 542
Adjusted for:
Income tax expense 8 60 186
Net financial items 7 (11) (4)
Depreciation, amortisation and impairment 10, 11 110 106
Difference between pension premiums paid and pension expense, defined benefit schemes1 (3) (21)
Difference between income and dividends received from equity accounted investees 24 (54) 17
(Gains)/losses on sale of fixed assets (6) (1)
Interest income received 27 21
Income taxes paid (10) (65)
Changes in other net operating assets 329 (895)
Net cash from operating activities 719 (113)
Cash flow from investing activities
Investment in property, plant and equipment and intangible assets 10, 11 (334) (91)
Other cash flow from investing activities (1) (2)
Net cash from investing activities (335) (93)
Cash flow from financing activities
Interest expense and fees paid (17) (16)
Treasury shares (8) -
Employee share purchase programme (4) (11)
Net cash from financing activities (29) (27)
Effect of exchange rate changes on cash and bank equivalents (4) (1)
Net increase/(decrease) in cash and bank equivalents 352 (234)
Cash and cash equivalents at the beginning of the period 2 812 3 047
Cash and cash equivalents at the end of the period 13 3 165 2 812
1 Difference between pension premiums paid and pension expense, defined benefit schemes for 2017 has been restated and effect offset against changes in other net operating assets.
Refer to Note 15 for pension.
The notes on pages 23 to 59 are an integral part of these consolidated financial statements.
Cash flows 01.01 - 31.12
23KVAERNER ANNUAL REPORT 2018ANNUAL ACCOUNTS – KVAERNER GROUP
Note 1 Company information
Kværner ASA (the company) and its subsidiaries (together Kvaerner or the group) is a specialised
provider of engineering, procurement and construction services for offshore platforms and
onshore plants. Kværner ASA is listed on the Oslo Stock Exchange under the ticker KVAER.
Kværner ASA’s registered office address is Oksenøyveien 10, 1366 Lysaker, Norway.
Note 2 Basis of preparation
Statement of compliance
These consolidated financial statements have been prepared in accordance with International
Financial Reporting Standards (IFRS) as adopted by the European Union, relevant interpretations
and additional requirements following the Norwegian Accounting Act as of 31 December 2018.
The consolidated financial statements were approved by the Board of Directors and President &
CEO as shown on the dated and signed balance sheet.
The consolidated financial statements will be approved by the Annual General Meeting on
28 March 2019.
Basis of measurement
The consolidated financial statements are prepared on the historical cost basis, except for
derivative financial instruments and defined benefit pension plan assets and liabilities which are
measured at fair value.
Functional and presentation currency
The consolidated financial statements are presented in Norwegian kroner (NOK), which is Kværner
ASA’s functional currency.
All financial information presented in NOK has been rounded to the nearest million, except where
otherwise indicated. As a result of rounding differences, numbers or percentages may not add up
to the total.
Alternative Performance Measures
Kvaerner discloses alternative performance measures in addition to those normally required by
IFRS. The group’s key measure of financial performance is adjusted EBITDA. Adjusted EBITDA
excludes the impact of embedded foreign currency derivatives reported in jointly controlled
entities closely related to Kvaerner’s operating activities. See Note 4 for adjusted EBITDA
performance. EBITDA definition: earnings before interest (net financial items), taxes, depreciation,
amortisation and impairment.
Financial reporting principles
The relevant financial reporting principles are described in the relevant note to the consolidated
statements. In the section below, principles applicable to several notes and/or the overall financial
statements are detailed. This is the first set of annual financial statements in which IFRS 15
Revenue from contracts with customers and IFRS 9 Financial instruments have been applied. The
effects of the transition to IFRS 15 are described in Note 3. The impact of IFRS 9 has been limited
and is described in the below.
IFRS 9 Financial Instruments
The group has adopted IFRS 9 as from 1 January 2018. The implementation resulted in changes to
the accounting policies, but no adjustments to the consolidated financial statements.
Classification of financial assets and financial liabilities
IFRS 9 contains three principal classification categories for financial assets; measured at amortised
cost, Fair Value through Other Comprehensive Income (FVOCI) and Fair value through Profit or
Loss (FVPL). The classification of financial assets under IFRS 9 is generally based on the business
model in which a financial asset is managed and its contractual cash flow characteristics. The
adoption of IFRS 9 has not had a significant effect on the group’s accounting for financial
liabilities.
Notes to the annual consolidated financial statements
General information
24KVAERNER ANNUAL REPORT 2018ANNUAL ACCOUNTS – KVAERNER GROUP
The below table summarises reclassifications of financial instruments on adoption of IFRS 9:
Measurement category Carrying amount
Previous
(IAS 39)
New
(IFRS 9)
Previous
(IAS 39)
New
(IFRS 9)
Other investments Available for sale FVOCI 7 7
Non-current financial assets 7 7
Trade and other receivables Loans and receivables Amortised cost 888 888
Derivatives Fair value - hedging Fair value - hedging 14 14
Cash and cash equivalents Loans and receivables Amortised cost 2 812 2 812
Current financial assets 3 714 3 714
Derivatives Fair value - hedging Fair value - hedging 15 15
Trade and other payables
Other financial
liabilities
Other financial
liabilities 425 425
Current financial liabilties 440 440
The reclassifications of financial instruments on adoption of IFRS 9 did not result in any changes
to their measurement.
Impairment of financial assets
Other than trade receivables and contract assets, the group has limited financial assets subject to
IFRS 9’s new expected credit loss model (ECL). For trade receivables, the group applies a simplified
approach to provide for expected credit losses as prescribed by IFRS 9. The new model did not
result in any changes to allowance for doubtful receivables as at 1 January 2018.
Hedge accounting
The group’s existing risk management strategies and hedge documentation are aligned with
the requirements of IFRS 9. Implementation of the new standard has not resulted in any hedge
accounting impacts on transition date.
All other financial reporting principles have been applied consistently to all periods presented in
these consolidated financial statements.
Consolidation
The consolidated financial statements of Kværner ASA incorporate the financial statements of the
company and its subsidiaries, and the group’s interests in associates and joint arrangements.
Transactions eliminated in consolidation
Intra-group balances and transactions, and any unrealised gains and losses or income and
expenses arising from intra-group transactions, are eliminated when preparing the consolidated
financial statements. Unrealised gains arising from transactions with associates and joint
ventures are eliminated to the extent of the group’s interest in the entity. Unrealised losses are
eliminated in the same way as unrealised gains, but only to the extent that there is no evidence of
impairment.
Foreign currency
Foreign currency transactions and balances
Transactions in foreign currencies are translated to the respective functional currencies of the
group entities at the exchange rate at the date of the transaction. Monetary assets and liabilities
denominated in foreign currencies at the balance sheet date are retranslated to the functional
currency at the exchange rate on that date. Non-monetary assets and liabilities measured at
historical cost in a foreign currency are translated using the exchange rate on the date of the
transaction. Non-monetary assets and liabilities denominated in foreign currencies that are stated
at fair value are translated according to the functional currency at the exchange rates on the date
the fair value was determined.
Foreign operations
Items included in the financial statements of each of the group’s entities are measured using the
currency of the primary economic environment in which the entity operates. The results and
financial position of all group entities that have a functional currency different from the group’s
presentation currency are translated to the group’s presentation currency of NOK as follows:
> Assets and liabilities, including goodwill and applicable consolidation adjustments, for each
balance sheet presented, are translated at the closing rate on the date of that balance sheet
> Income and expenses for each income statement are translated at the average exchange rates
for the year, calculated on the basis of 12 monthly rates
Foreign exchange differences arising from this translation are recognised in other comprehensive
income, and presented as a separate component in equity.
Exchange differences arising from the translation of the net investment in foreign operations are
included in other comprehensive income as a translation reserve. These translation differences are
reclassified to the income statement upon disposal or liquidation of the related operations.
Exchange differences arising from non-current monetary receivable or payable by a foreign
operation where settlement is neither planned nor likely in the foreseeable future, forms part
of the net investment in that entity and are recognised in other comprehensive income. These
translation differences are reclassified to the income statement upon disposal of the related
operations or when settlement of the receivable or payable is planned or is considered likely to
happen in the foreseeable future.
Accounting estimates and judgments
The preparation of these consolidated financial statements requires management to make
judgments, estimates and assumptions that affect the group’s reported revenues, expenses,
assets and liabilities. Given the size and complexity of Kvaerner’s projects, the financial
results could be materially impacted for any differences between current estimates and actual
outcomes. Estimation uncertainties result primarily from the outcome of arbitration processes
and final project results impacted by costs to complete, incentives etc. Estimates and underlying
assumptions are continuously reviewed, based on historical experiences and expectations of
25KVAERNER ANNUAL REPORT 2018ANNUAL ACCOUNTS – KVAERNER GROUP
future events. Revisions to accounting estimates are recognised in the period in which the
estimates are revised and in any future periods affected. Relevant accounting estimates and
judgments are described in the respective note to the consolidated financial statements.
New financial reporting standards
A number of new standards, amendments to standards and interpretations have been published,
but are not yet effective and have not been applied in preparing these consolidated financial
statements.
The most relevant changes for Kvaerner are:
IFRS 16 Leases
The new standard, effective for annual reporting periods beginning from 1 January 2019, replaces
the existing requirements of IAS 17 Leases. The new standard will significantly change how the
group accounts for its leased assets (principally offices and certain operational facilities), as IFRS
16 introduces a single on-balance sheet accounting model for lessees that has some similarities
to the current accounting for financial leases. Only leases for items of low value and short term
leases may be exempt from on-balance sheet recognition based on available practical expedients.
The group will apply these practical expedients. There will be no impact of IFRS 16 on loan
covenants as these are based on accounting standards that were effective at the time when the
agreement was entered into (8 July 2015).
Kvaerner has elected to apply the modified retrospective approach (with practical expedients)
at the date of initial application; 1 January 2019, with no restatement of comparable periods.
The group will measure right-of-use assets at an amount equal to the liability, adjusted for
any prepaid or accrued lease payments and not choose the option to measure right-of-use
assets retrospectively. There will be no impact on equity as at 1 January 2019 as a result of
implementing IFRS 16.
The following available practical expedients will be applied on transition to IFRS 16:
> Onerous lease assessment; rely on assessment of whether leases are onerous applying IAS 37
on 31 December 2018 as an alternative to performing an impairment review of right-of-use
assets for all its leases on 1 January 2019. Kvaerner will reduce the right-of-use assets at
1 January 2019 by the NOK 33 million of onerous lease provisions recognised in liabilities in
the balance sheet at 31 December 2018.
> Apply the short term lease practical expedient to leases ending within 2019.
> Exclude initial direct costs from measurement of right-of-use assets at the date of initial
application..
> Use hindsight where permitted by IFRS 16, such as in determining lease term
(use of option periods).
Impacts on financial statements
On transition to IFRS 16, the group will recognise NOK 248 million of right-of-use assets and NOK
283 million of lease liabilities. Right-of-use assets have been adjusted by the amounts of onerous
lease provisions and provisions for required office upgrades. When measuring the lease liabilities,
Kvaerner discounted lease payments using its incremental borrowing rate at 1 January 2019,
adjusted for currency and length of lease terms. The weighted-average rate applied is 5 percent.
Amounts in NOK million 1 January 2019
Operating lease commitment at 31 December 2018 as disclosed in the group's
consolidated financial statements 424
Discounted using the incremental borrowing rate at 1 January 2019 372
Recognition exemptions for:
- Short term leases (35)
- Leases of low-value assets (57)
Extension and termination options reasonably certain to be exercised 4
Lease liabilities recognised at 1 January 2019 283
Based on leases at transition date the following effects of IFRS 16 are expected for 2019:
> Earnings before interest, taxes, depreciation and amortisation (EBITDA) will increase by
approximately NOK 58 million, as lease payments will be presented as depreciation and
finance cost rather than operating expense
> Interest expense will increase by approximately NOK 13 million
> Depreciation will increase by approximately NOK 47 million
> Cash flow from operating activities will increase and cash flow from financing activities will
decrease by approximately NOK 58 million as the interest portion paid for the lease liability
and the principle portion of the lease payments will be presented within financing activities.
Payments for short term leases, payments for leases of low-value assets and variable lease
payments, not included in the measurement of lease liabilities, will be presented within
operating activities
Refer to Note 16 for more information regarding Kvaerner’s lease contracts.
Note 3 Revenue and contract balances (IFRS 15)
Financial reporting principles
IFRS 15 Revenue from contracts with customers was adopted on 1 January 2018. The new
standard replaced IAS 11 Construction contracts, IAS 18 Revenue and related interpretations.
Kvaerner has applied a modified retrospective implementation method and the information for
2017 has accordingly not been restated. For presentation purposes, amounts related to contract
assets and liabilities have been reclassified in the 2017 balance sheet. Upon transition to the new
standard, there were immaterial impacts on equity.
IFRS 15 introduces a new five step model that applies to all customer contracts. The deliveries in
contracts are reviewed to identify if there are distinct performance obligations. As Kvaerner’s EPC
contracts normally represent a single, combined output for the customers, contracts will ordinarily
contain one performance obligation. For the majority of performance obligations/contracts,
control has been assessed to be transferred to the customer over time as the performance
obligation is satisfied. Revenue is recognised over time using a cost progress method, best
reflecting the pattern of transfer of control of goods and services to the customer.
26KVAERNER ANNUAL REPORT 2018ANNUAL ACCOUNTS – KVAERNER GROUP
Variation orders are included in the transaction price when they have been approved, either
verbally, in writing or implied by customary business practice. Variable considerations, such as
incentive payments, are included in the transaction price when they are highly probable to be
realised. Potential liquidated damages (LD) are recognised as a reduction of the transaction price
unless it is highly probable that they will not be incurred. Profit on projects is not recognised until
the outcome of the performance obligations can be measured reliably. Contract costs are expensed
as incurred. The full loss is recognised immediately if contracts are forecast to be loss making.
The group’s revenue is mainly derived from contracts with customers. The disaggregation of
revenue is disclosed in Note 4, based on the following categories:
Construction contracts
Revenues from contracts with customers to provide engineering, procurement and construction
services (EPC-contracts) for offshore installations or onshore plants and decommissioning which
have no alternative use for the group. It has been assessed that these contracts ordinarily will be
one performance obligation and that revenue will be recognised over time using a cost progress
method. The cost progress method is based on the proportion of costs incurred to date compared
to the estimated total contract costs. Time and material are normally invoiced on a monthly basis
in accordance with progress and/or in line with achieved milestones, also representing progress.
Payment terms on invoiced amounts are normally 30 days. Some EPC contracts include lease
revenue, though these amounts are insignificant in context of the contract and are therefore
included in Construction revenue.
Services revenue
Revenue from contracts with customers for other services is recognised over time using a cost
progress method, or is recognised over time as man-hours and materials are delivered to the
customer. Payment terms are on average around 45 days after time and materials are delivered.
Hook-up contracts will normally be included within this category of revenue.
Revenue/share of result from joint ventures
On segment level, revenue and results from associated companies and jointly controlled
operations closely related to the group’s operating activities are presented gross. At group level,
the net share of result from joint ventures is presented in line with the equity method as part of
operating revenue and other income.
Other revenue
Other revenue relates to FEEDs, studies, sale of man hours and other projects.
Lease revenue
Sublease arrangement for offices.
Accounting estimates and judgments
Contract accounting estimates
The majority of the group’s revenues and profits are derived from long-term construction
contracts which often have duration of up to four years from award date. These contracts
typically comprise integrated engineering, procurement, construction and integration activities,
often with the use of subcontractors, and give rise to complex technical and execution risks as
they are highly customised to customer requirements. Contracts may be lump sum, reimbursable,
target cost or a combination thereof, and often include incentive payments based on key
performance indicators (KPIs) and meeting key milestones, in particular towards the end of
the projects. KPIs can be related to schedule, cost targets, HSSE measures and others of which
some are objective, subject to interpretation or at the discretion of customers, and can include
reductions for penalty clauses for late delivery (liquidated damages). The scope of work to be
performed by the group may also change over time and can be subject to variations and claims
with both the customer and subcontractors which impact various factors including compensation,
costs, and contractual delivery dates.
Following the above, estimates are inherent in the group’s accounting for long-term construction
contracts and judgments are required to:
> Determine the forecast revenues and profit margin on each contract based on:
− Estimates of contract revenues including variable revenues which may be dependent upon
future performance; and
− Forecasts of contract costs at completion including risk contingencies for uncertain costs to
complete
> Assess the stage of completion of the contract, which determines the revenues, costs and
margins to be recognised based on the project forecast. Progress measurement based on costs
has an inherent risk related to the cost estimate and the estimation uncertainty during the
early stages of a contract is mitigated by not recognising revenue in excess of costs on large
projects before project forecast is considered reliable, normally around 20 percent completion
> Appropriately provide for any loss-making contracts
Even though management has extensive experience in assessing project revenue, cost and margin,
uncertainties exist.
Cost to complete depends on productivity factors and the cost of inputs. Weather conditions,
performance of subcontractors and others with an impact on schedules, commodity prices and
currency rates can all affect cost estimates. Experience, systematic use of the project execution
model and focus on core competencies reduces, but do not eliminate the risk that estimates may
change significantly. A risk contingency is included in project cost based on the risk register that
is prepared for every project and is updated throughout the project as the need for contingencies
lapses or new risks are identified.
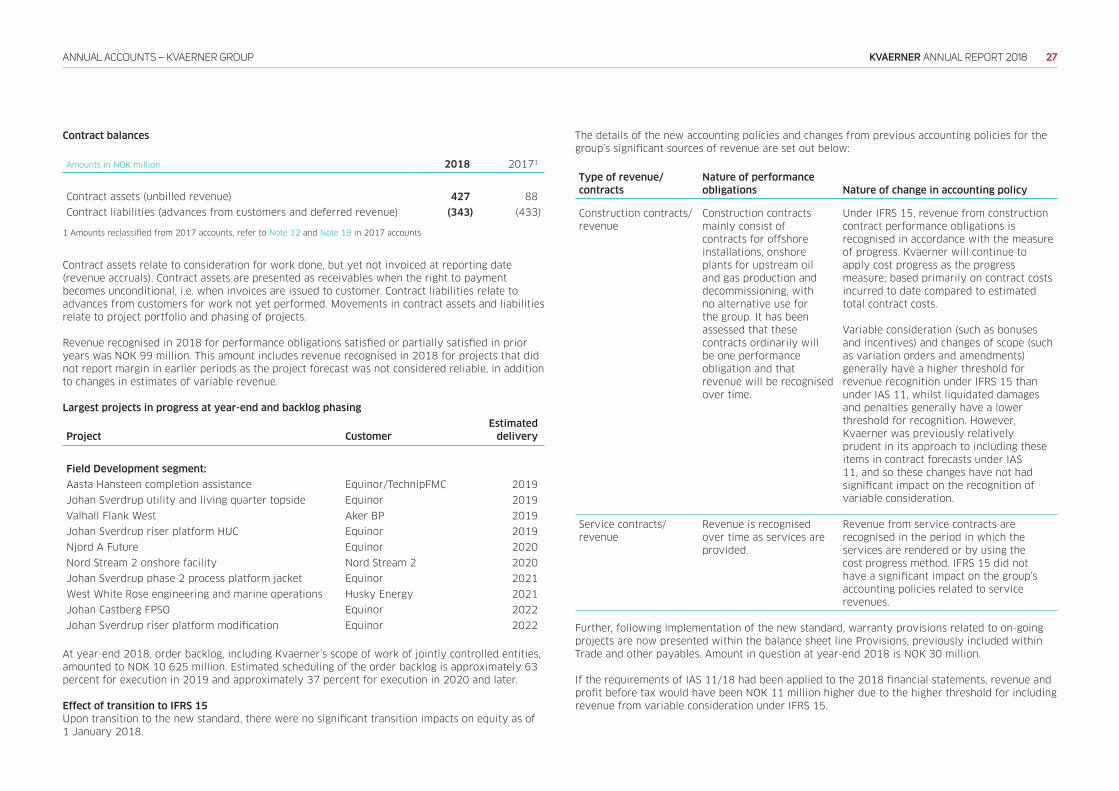
27KVAERNER ANNUAL REPORT 2018ANNUAL ACCOUNTS – KVAERNER GROUP
Contract balances
Amounts in NOK million 2018 20171
Contract assets (unbilled revenue) 427 88
Contract liabilities (advances from customers and deferred revenue) (343) (433)
1 Amounts reclassified from 2017 accounts, refer to Note 12 and Note 19 in 2017 accounts
Contract assets relate to consideration for work done, but yet not invoiced at reporting date
(revenue accruals). Contract assets are presented as receivables when the right to payment
becomes unconditional, i.e. when invoices are issued to customer. Contract liabilities relate to
advances from customers for work not yet performed. Movements in contract assets and liabilities
relate to project portfolio and phasing of projects.
Revenue recognised in 2018 for performance obligations satisfied or partially satisfied in prior
years was NOK 99 million. This amount includes revenue recognised in 2018 for projects that did
not report margin in earlier periods as the project forecast was not considered reliable, in addition
to changes in estimates of variable revenue.
Largest projects in progress at year-end and backlog phasing
Project Customer
Estimated
delivery
Field Development segment:
Aasta Hansteen completion assistance Equinor/TechnipFMC 2019
Johan Sverdrup utility and living quarter topside Equinor 2019
Valhall Flank West Aker BP 2019
Johan Sverdrup riser platform HUC Equinor 2019
Njord A Future Equinor 2020
Nord Stream 2 onshore facility Nord Stream 2 2020
Johan Sverdrup phase 2 process platform jacket Equinor 2021
West White Rose engineering and marine operations Husky Energy 2021
Johan Castberg FPSO Equinor 2022
Johan Sverdrup riser platform modification Equinor 2022
At year-end 2018, order backlog, including Kvaerner’s scope of work of jointly controlled entities,
amounted to NOK 10 625 million. Estimated scheduling of the order backlog is approximately 63
percent for execution in 2019 and approximately 37 percent for execution in 2020 and later.
Effect of transition to IFRS 15
Upon transition to the new standard, there were no significant transition impacts on equity as of
1 January 2018.
The details of the new accounting policies and changes from previous accounting policies for the
group’s significant sources of revenue are set out below:
Type of revenue/
contracts
Nature of performance
obligations Nature of change in accounting policy
Construction contracts/
revenue
Construction contracts
mainly consist of
contracts for offshore
installations, onshore
plants for upstream oil
and gas production and
decommissioning, with
no alternative use for
the group. It has been
assessed that these
contracts ordinarily will
be one performance
obligation and that
revenue will be recognised
over time.
Under IFRS 15, revenue from construction
contract performance obligations is
recognised in accordance with the measure
of progress. Kvaerner will continue to
apply cost progress as the progress
measure; based primarily on contract costs
incurred to date compared to estimated
total contract costs.
Variable consideration (such as bonuses
and incentives) and changes of scope (such
as variation orders and amendments)
generally have a higher threshold for
revenue recognition under IFRS 15 than
under IAS 11, whilst liquidated damages
and penalties generally have a lower
threshold for recognition. However,
Kvaerner was previously relatively
prudent in its approach to including these
items in contract forecasts under IAS
11, and so these changes have not had
significant impact on the recognition of
variable consideration.
Service contracts/
revenue
Revenue is recognised
over time as services are
provided.
Revenue from service contracts are
recognised in the period in which the
services are rendered or by using the
cost progress method. IFRS 15 did not
have a significant impact on the group’s
accounting policies related to service
revenues.
Further, following implementation of the new standard, warranty provisions related to on-going
projects are now presented within the balance sheet line Provisions, previously included within
Trade and other payables. Amount in question at year-end 2018 is NOK 30 million.
If the requirements of IAS 11/18 had been applied to the 2018 financial statements, revenue and
profit before tax would have been NOK 11 million higher due to the higher threshold for including
revenue from variable consideration under IFRS 15.
28KVAERNER ANNUAL REPORT 2018ANNUAL ACCOUNTS – KVAERNER GROUP
Note 4 Operating segments
Kvaerner does not have any remaining operations in the US within the Downstream & Industrials
segment, and remaining legacies within the segment are presented as discontinued operations
in the group’s financial statements. Consequently, Kvaerner continues to have one reportable
segment; Field Development.
Kvaerner has a matrix based organisational model, with operational areas and resource centres,
where the projects are the main focus. The Field Development segment includes the following
operational areas: Process Solutions delivering topsides, floaters and onshore upstream facilities;
Structural Solutions delivering large steel jackets for oil and gas installations; Concrete and New
Solutions delivering concrete substructures, performing hook-up, decommissioning and completion
projects and working with new strategic initiatives.
Financial reporting principles
The accounting principles of the reportable segment are the same as described in this annual
report, except for hedge accounting and accounting for joint ventures. When contract revenues
and contract costs are denominated in a foreign currency, the subsidiaries hedge the exposure
with Kvaerner Treasury. Hedge accounting is applied in segment reporting independently of
whether or not the hedge qualifies for hedge accounting in accordance with IFRS. The Field
Development segment reporting includes Kvaerner’s share (proportionate consolidation) of jointly
controlled entities closely related to Kvaerner’s operating activities while under IFRS, Kvaerner’s
investment is accounted for using the equity method. The correction of the non-qualifying hedges
to ensure that the consolidated financial statements are in accordance with IFRS, is made as an
adjustment at Kvaerner’s corporate level. This means that the group’s segment reporting reflects
all hedging relationships as if hedge accounting applies even though they may not qualify in
accordance with IFRS. Inter-segment pricing is determined according to arm’s length principles.
Aggregation
The operational areas within the Field Development segment may meet the definition of an
operating segment but have been aggregated based upon criteria in IFRS. Aggregation of the
operating segments are considered to be consistent with the core principle of IFRS 8, as the
projects within all operational areas are engineering, procurement and construction services
relating to the construction of onshore and offshore facilities to be used in the upstream oil and
gas industry. The operating segments are considered to have similar economic characteristics.
Demand for the products and services in all the operational areas are driven by the oil price.
The gross margin and profit/loss in a given year is not necessarily similar. There are few
projects within each operational area and the gross margin and profit/loss in a given year may
be influenced by specific circumstances in one project. However, the long term gross margin is
expected to be similar over the long term and into the future.
Cash flows and capex are also similar, as well as the use of EPC contracts. Customer contracts for
the operational areas are typically a combination of reimbursable elements, lump sum elements,
incentives and penalties. The operational areas are considered similar in the respects of nature
of product/service, nature of production processes, the type of customer, distribution method
and regulatory environment. All operational areas execute large and complex EPC projects. The
different operational area products are to some extent substitute solutions, for example both
jackets and concrete gravity based structures (GBS) are substructures for offshore platforms.
Projects within all operational areas typically construct the equipment on-shore, either on a yard
or at site. The majority of Kvaerner employees can be used for projects within all areas, as skills
and knowledge needed is similar in the projects within the different areas. The main customers
for all projects are the large, international oil companies.
Measurement of segment performance
Performance is measured by segment earnings before interest (net financial items), taxes,
depreciation, amortisation and impairment (EBITDA) and earnings before interest (net financial
items) and taxes (EBIT), as included in the internal management reports. The Field Development
segment reporting includes Kvaerner’s share (proportionate consolidation) of jointly controlled
entities closely related to Kvaerner’s operating activities. Segment profit, together with key
financial information as presented below, gives management relevant information in evaluating
the results of the operating segment and is relevant in evaluating the results of the segment
relative to other entities operating within the industry. The President & CEO will normally not
review financial items or total liabilities on segment level.
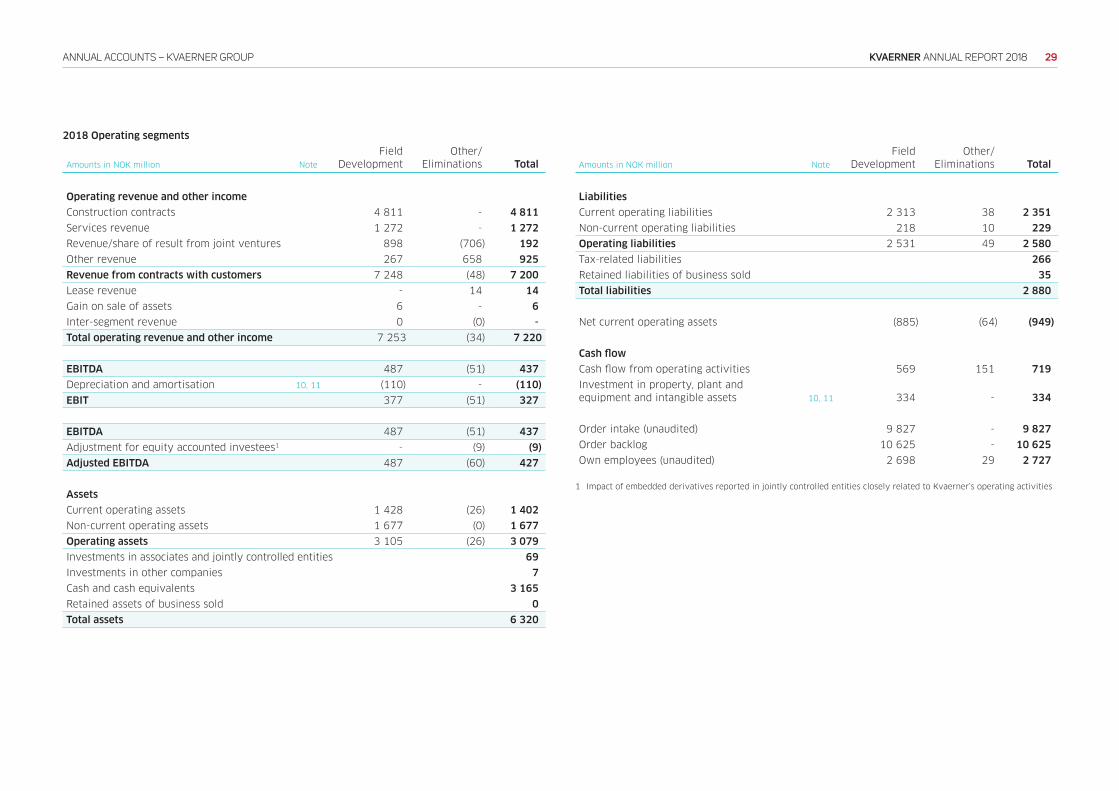
29KVAERNER ANNUAL REPORT 2018ANNUAL ACCOUNTS – KVAERNER GROUP
2018 Operating segments
Amounts in NOK million Note
Field
Development
Other/
Eliminations Total
Operating revenue and other income
Construction contracts 4 811 - 4 811
Services revenue 1 272 - 1 272
Revenue/share of result from joint ventures 898 (706) 192
Other revenue 267 658 925
Revenue from contracts with customers 7 248 (48) 7 200
Lease revenue - 14 14
Gain on sale of assets 6 - 6
Inter-segment revenue 0 (0) -
Total operating revenue and other income 7 253 (34) 7 220
EBITDA 487 (51) 437
Depreciation and amortisation 10, 11 (110) - (110)
EBIT 377 (51) 327
EBITDA 487 (51) 437
Adjustment for equity accounted investees1 - (9) (9)
Adjusted EBITDA 487 (60) 427
Assets
Current operating assets 1 428 (26) 1 402
Non-current operating assets 1 677 (0) 1 677
Operating assets 3 105 (26) 3 079
Investments in associates and jointly controlled entities 69
Investments in other companies 7
Cash and cash equivalents 3 165
Retained assets of business sold 0
Total assets 6 320
Amounts in NOK million Note
Field
Development
Other/
Eliminations Total
Liabilities
Current operating liabilities 2 313 38 2 351
Non-current operating liabilities 218 10 229
Operating liabilities 2 531 49 2 580
Tax-related liabilities 266
Retained liabilities of business sold 35
Total liabilities 2 880
Net current operating assets (885) (64) (949)
Cash flow
Cash flow from operating activities 569 151 719
Investment in property, plant and
equipment and intangible assets 10, 11 334 - 334
Order intake (unaudited) 9 827 - 9 827
Order backlog 10 625 - 10 625
Own employees (unaudited) 2 698 29 2 727
1 Impact of embedded derivatives reported in jointly controlled entities closely related to Kvaerner’s operating activities
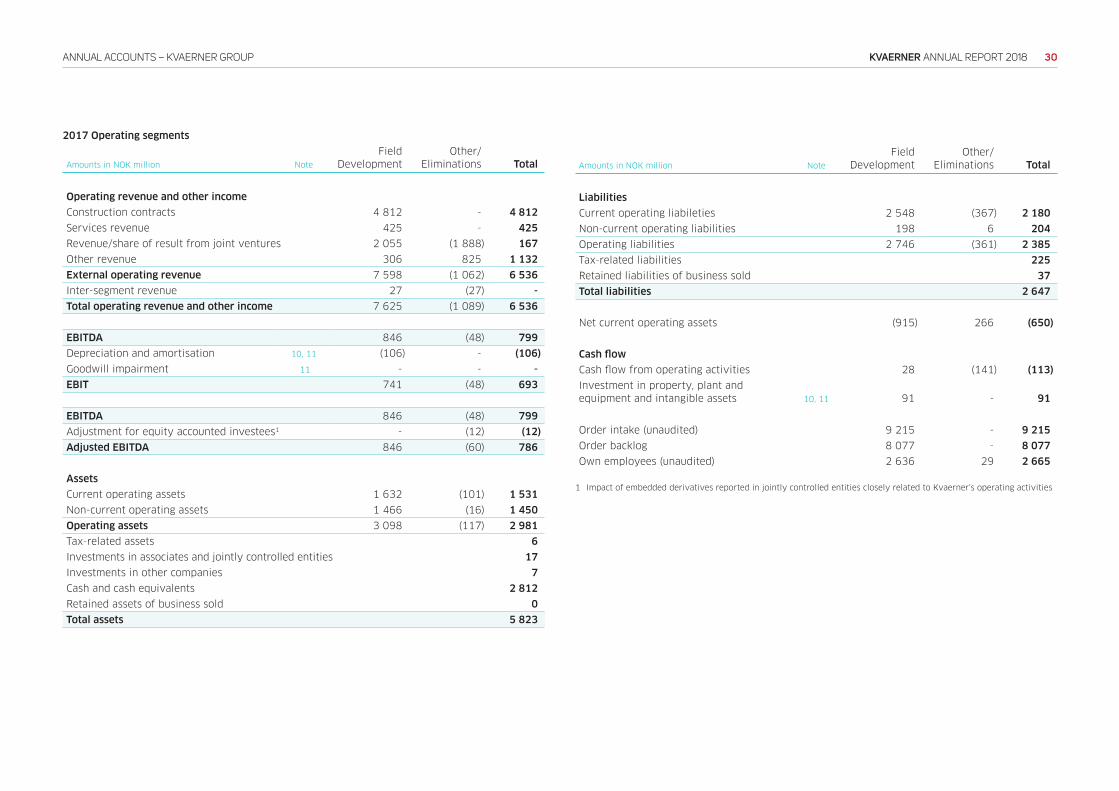
30KVAERNER ANNUAL REPORT 2018ANNUAL ACCOUNTS – KVAERNER GROUP
2017 Operating segments
Amounts in NOK million Note
Field
Development
Other/
Eliminations Total
Operating revenue and other income
Construction contracts 4 812 - 4 812
Services revenue 425 - 425
Revenue/share of result from joint ventures 2 055 (1 888) 167
Other revenue 306 825 1 132
External operating revenue 7 598 (1 062) 6 536
Inter-segment revenue 27 (27) -
Total operating revenue and other income 7 625 (1 089) 6 536
EBITDA 846 (48) 799
Depreciation and amortisation 10, 11 (106) - (106)
Goodwill impairment 11 - - -
EBIT 741 (48) 693
EBITDA 846 (48) 799
Adjustment for equity accounted investees1 - (12) (12)
Adjusted EBITDA 846 (60) 786
Assets
Current operating assets 1 632 (101) 1 531
Non-current operating assets 1 466 (16) 1 450
Operating assets 3 098 (117) 2 981
Tax-related assets 6
Investments in associates and jointly controlled entities 17
Investments in other companies 7
Cash and cash equivalents 2 812
Retained assets of business sold 0
Total assets 5 823
Amounts in NOK million Note
Field
Development
Other/
Eliminations Total
Liabilities
Current operating liabileties 2 548 (367) 2 180
Non-current operating liabilities 198 6 204
Operating liabilities 2 746 (361) 2 385
Tax-related liabilities 225
Retained liabilities of business sold 37
Total liabilities 2 647
Net current operating assets (915) 266 (650)
Cash flow
Cash flow from operating activities 28 (141) (113)
Investment in property, plant and
equipment and intangible assets 10, 11 91 - 91
Order intake (unaudited) 9 215 - 9 215
Order backlog 8 077 - 8 077
Own employees (unaudited) 2 636 29 2 665
1 Impact of embedded derivatives reported in jointly controlled entities closely related to Kvaerner’s operating activities
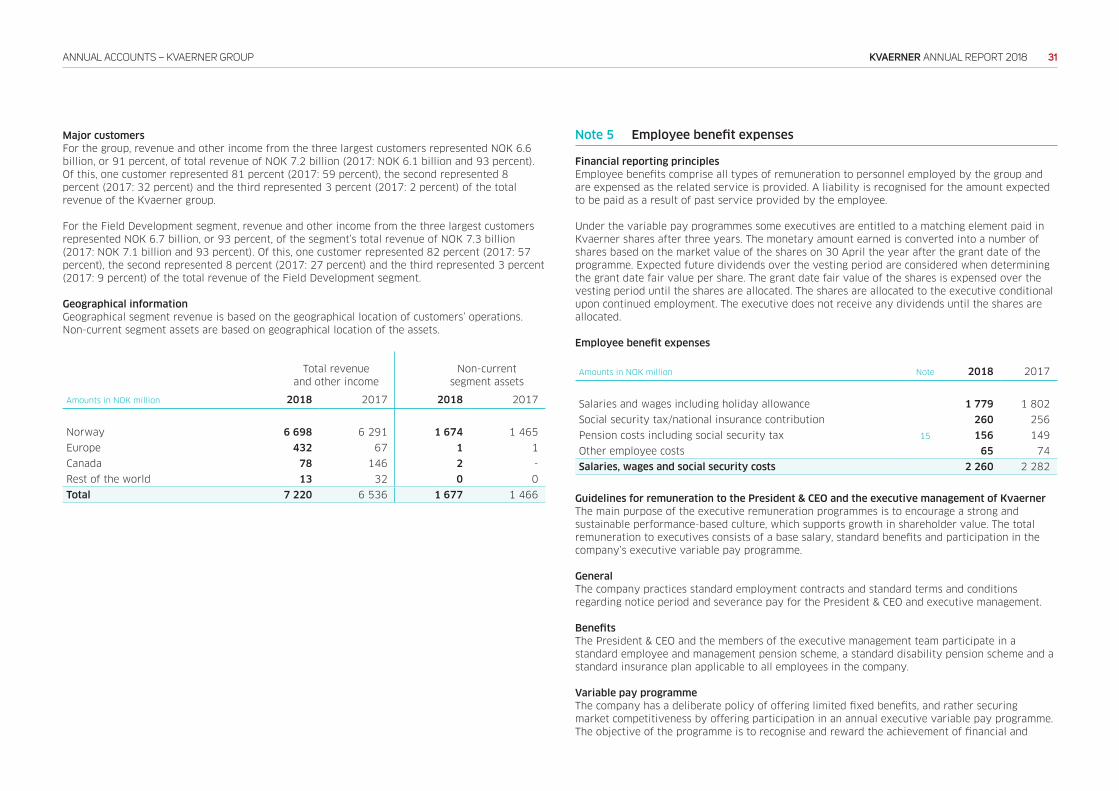
31KVAERNER ANNUAL REPORT 2018ANNUAL ACCOUNTS – KVAERNER GROUP
Major customers
For the group, revenue and other income from the three largest customers represented NOK 6.6
billion, or 91 percent, of total revenue of NOK 7.2 billion (2017: NOK 6.1 billion and 93 percent).
Of this, one customer represented 81 percent (2017: 59 percent), the second represented 8
percent (2017: 32 percent) and the third represented 3 percent (2017: 2 percent) of the total
revenue of the Kvaerner group.
For the Field Development segment, revenue and other income from the three largest customers
represented NOK 6.7 billion, or 93 percent, of the segment’s total revenue of NOK 7.3 billion
(2017: NOK 7.1 billion and 93 percent). Of this, one customer represented 82 percent (2017: 57
percent), the second represented 8 percent (2017: 27 percent) and the third represented 3 percent
(2017: 9 percent) of the total revenue of the Field Development segment.
Geographical information
Geographical segment revenue is based on the geographical location of customers’ operations.
Non-current segment assets are based on geographical location of the assets.
Total revenue
and other income
Non-current
segment assets
Amounts in NOK million 2018 2017 2018 2017
Norway 6 698 6 291 1 674 1 465
Europe 432 67 1 1
Canada 78 146 2 -
Rest of the world 13 32 0 0
Total 7 220 6 536 1 677 1 466
Note 5 Employee benefit expenses
Financial reporting principles
Employee benefits comprise all types of remuneration to personnel employed by the group and
are expensed as the related service is provided. A liability is recognised for the amount expected
to be paid as a result of past service provided by the employee.
Under the variable pay programmes some executives are entitled to a matching element paid in
Kvaerner shares after three years. The monetary amount earned is converted into a number of
shares based on the market value of the shares on 30 April the year after the grant date of the
programme. Expected future dividends over the vesting period are considered when determining
the grant date fair value per share. The grant date fair value of the shares is expensed over the
vesting period until the shares are allocated. The shares are allocated to the executive conditional
upon continued employment. The executive does not receive any dividends until the shares are
allocated.
Employee benefit expenses
Amounts in NOK million Note 2018 2017
Salaries and wages including holiday allowance 1 779 1 802
Social security tax/national insurance contribution 260 256
Pension costs including social security tax 15 156 149
Other employee costs 65 74
Salaries, wages and social security costs 2 260 2 282
Guidelines for remuneration to the President & CEO and the executive management of Kvaerner
The main purpose of the executive remuneration programmes is to encourage a strong and
sustainable performance-based culture, which supports growth in shareholder value. The total
remuneration to executives consists of a base salary, standard benefits and participation in the
company’s executive variable pay programme.
General
The company practices standard employment contracts and standard terms and conditions
regarding notice period and severance pay for the President & CEO and executive management.
Benefits
The President & CEO and the members of the executive management team participate in a
standard employee and management pension scheme, a standard disability pension scheme and a
standard insurance plan applicable to all employees in the company.
Variable pay programme
The company has a deliberate policy of offering limited fixed benefits, and rather securing
market competitiveness by offering participation in an annual executive variable pay programme.
The objective of the programme is to recognise and reward the achievement of financial and
32KVAERNER ANNUAL REPORT 2018ANNUAL ACCOUNTS – KVAERNER GROUP
operational results as well as personal performance. The earnings under the programme are
dependent on annual achievement of financial targets, the company’s key performance indicators
and personal performance rating.
Executive management and some senior managers are entitled to a matching element under the
programme paid in Kvaerner shares after three years. In 2018 the company awarded 239 363
shares under the 2017 programme which will be delivered to executive management in 2020, if
still employed. Expected dividends per annum at grant date has been reflected in determining the
grant date fair value per share of NOK 16.65. The total expense in 2018 related to the matching
element was NOK 3.0 million (NOK 3.2 million in 2017) for executive management.
Employee share purchase programmes
In 2018 a share purchase programme was offered to all Norwegian employees. A total of
1 032 973 Kværner ASA shares were distributed to the employees in December 2018 at a price
of NOK 12.04 per share. A share purchase programme was also offered in 2017.
Share options programme
The company does not offer share options programmes to any managers or employees or other
share based payment compensation programmes, except for the share based variable pay
programme described above.
Severance pay
Severance pay is applicable in case there is a mutual understanding between the company and
the executive or some senior managers that the employment shall be terminated or the company
requests the resignation of the executive management and senior managers out of concern for
the affairs of Kvaerner. If so, they would be entitled to severance pay corresponding to three or
six month’s regular fixed salary. Severance pay does not include holiday allowance or pension
entitlements.
Kvaerner has no outstanding loans or guarantees to any employees, managers or Directors.
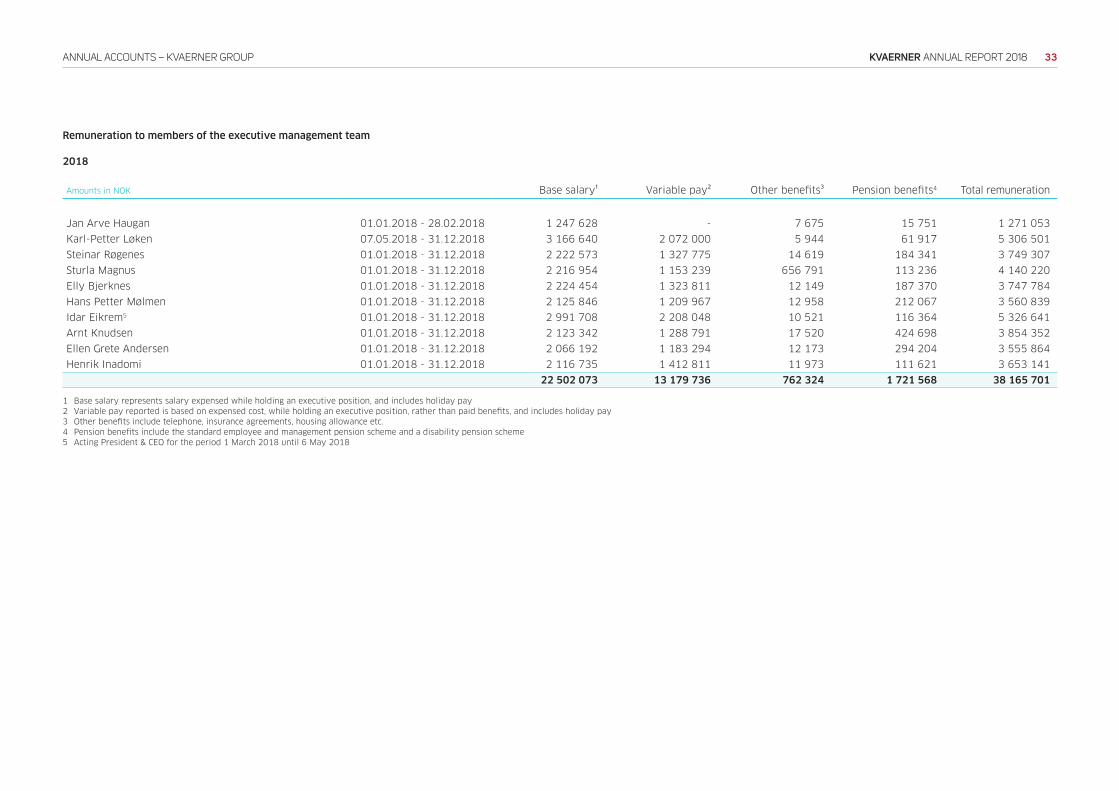
33KVAERNER ANNUAL REPORT 2018ANNUAL ACCOUNTS – KVAERNER GROUP
Remuneration to members of the executive management team
2018
Amounts in NOK Base salary¹ Variable pay² Other benefits³ Pension benefits4 Total remuneration
Jan Arve Haugan 01.01.2018 - 28.02.2018 1 247 628 - 7 675 15 751 1 271 053
Karl-Petter Løken 07.05.2018 - 31.12.2018 3 166 640 2 072 000 5 944 61 917 5 306 501
Steinar Røgenes 01.01.2018 - 31.12.2018 2 222 573 1 327 775 14 619 184 341 3 749 307
Sturla Magnus 01.01.2018 - 31.12.2018 2 216 954 1 153 239 656 791 113 236 4 140 220
Elly Bjerknes 01.01.2018 - 31.12.2018 2 224 454 1 323 811 12 149 187 370 3 747 784
Hans Petter Mølmen 01.01.2018 - 31.12.2018 2 125 846 1 209 967 12 958 212 067 3 560 839
Idar Eikrem5 01.01.2018 - 31.12.2018 2 991 708 2 208 048 10 521 116 364 5 326 641
Arnt Knudsen 01.01.2018 - 31.12.2018 2 123 342 1 288 791 17 520 424 698 3 854 352
Ellen Grete Andersen 01.01.2018 - 31.12.2018 2 066 192 1 183 294 12 173 294 204 3 555 864
Henrik Inadomi 01.01.2018 - 31.12.2018 2 116 735 1 412 811 11 973 111 621 3 653 141
22 502 073 13 179 736 762 324 1 721 568 38 165 701
1 Base salary represents salary expensed while holding an executive position, and includes holiday pay
2 Variable pay reported is based on expensed cost, while holding an executive position, rather than paid benefits, and includes holiday pay
3 Other benefits include telephone, insurance agreements, housing allowance etc.
4 Pension benefits include the standard employee and management pension scheme and a disability pension scheme
5 Acting President & CEO for the period 1 March 2018 until 6 May 2018
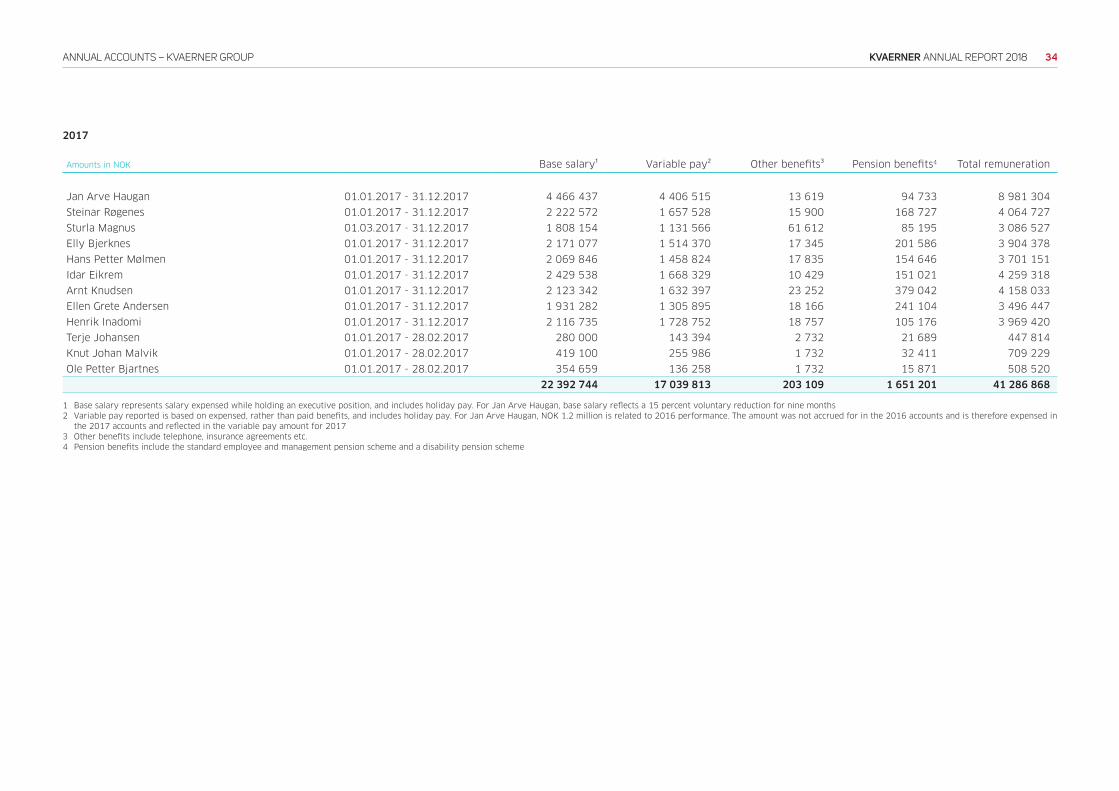
34KVAERNER ANNUAL REPORT 2018ANNUAL ACCOUNTS – KVAERNER GROUP
2017
Amounts in NOK Base salary¹ Variable pay² Other benefits³ Pension benefits4 Total remuneration
Jan Arve Haugan 01.01.2017 - 31.12.2017 4 466 437 4 406 515 13 619 94 733 8 981 304
Steinar Røgenes 01.01.2017 - 31.12.2017 2 222 572 1 657 528 15 900 168 727 4 064 727
Sturla Magnus 01.03.2017 - 31.12.2017 1 808 154 1 131 566 61 612 85 195 3 086 527
Elly Bjerknes 01.01.2017 - 31.12.2017 2 171 077 1 514 370 17 345 201 586 3 904 378
Hans Petter Mølmen 01.01.2017 - 31.12.2017 2 069 846 1 458 824 17 835 154 646 3 701 151
Idar Eikrem 01.01.2017 - 31.12.2017 2 429 538 1 668 329 10 429 151 021 4 259 318
Arnt Knudsen 01.01.2017 - 31.12.2017 2 123 342 1 632 397 23 252 379 042 4 158 033
Ellen Grete Andersen 01.01.2017 - 31.12.2017 1 931 282 1 305 895 18 166 241 104 3 496 447
Henrik Inadomi 01.01.2017 - 31.12.2017 2 116 735 1 728 752 18 757 105 176 3 969 420
Terje Johansen 01.01.2017 - 28.02.2017 280 000 143 394 2 732 21 689 447 814
Knut Johan Malvik 01.01.2017 - 28.02.2017 419 100 255 986 1 732 32 411 709 229
Ole Petter Bjartnes 01.01.2017 - 28.02.2017 354 659 136 258 1 732 15 871 508 520
22 392 744 17 039 813 203 109 1 651 201 41 286 868
1 Base salary represents salary expensed while holding an executive position, and includes holiday pay. For Jan Arve Haugan, base salary reflects a 15 percent voluntary reduction for nine months
2 Variable pay reported is based on expensed, rather than paid benefits, and includes holiday pay. For Jan Arve Haugan, NOK 1.2 million is related to 2016 performance. The amount was not accrued for in the 2016 accounts and is therefore expensed in
the 2017 accounts and reflected in the variable pay amount for 2017
3 Other benefits include telephone, insurance agreements etc.
4 Pension benefits include the standard employee and management pension scheme and a disability pension scheme
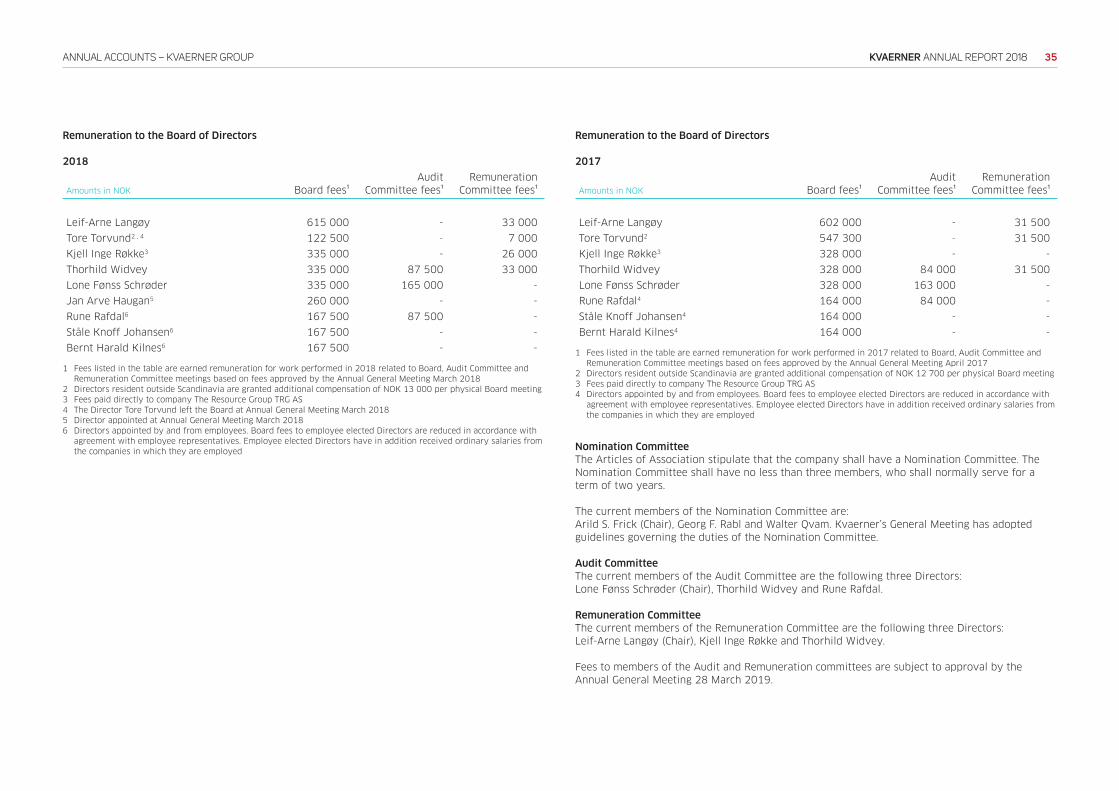
35KVAERNER ANNUAL REPORT 2018ANNUAL ACCOUNTS – KVAERNER GROUP
Remuneration to the Board of Directors
2018
Amounts in NOK Board fees¹
Audit
Committee fees¹
Remuneration
Committee fees¹
Leif-Arne Langøy 615 000 - 33 000
Tore Torvund2 , 4 122 500 - 7 000
Kjell Inge Røkke3 335 000 - 26 000
Thorhild Widvey 335 000 87 500 33 000
Lone Fønss Schrøder 335 000 165 000 -
Jan Arve Haugan5 260 000 - -
Rune Rafdal6 167 500 87 500 -
Ståle Knoff Johansen6 167 500 - -
Bernt Harald Kilnes6 167 500 - -
1 Fees listed in the table are earned remuneration for work performed in 2018 related to Board, Audit Committee and
Remuneration Committee meetings based on fees approved by the Annual General Meeting March 2018
2 Directors resident outside Scandinavia are granted additional compensation of NOK 13 000 per physical Board meeting
3 Fees paid directly to company The Resource Group TRG AS
4 The Director Tore Torvund left the Board at Annual General Meeting March 2018
5 Director appointed at Annual General Meeting March 2018
6 Directors appointed by and from employees. Board fees to employee elected Directors are reduced in accordance with
agreement with employee representatives. Employee elected Directors have in addition received ordinary salaries from
the companies in which they are employed
Remuneration to the Board of Directors
2017
Amounts in NOK Board fees¹
Audit
Committee fees¹
Remuneration
Committee fees¹
Leif-Arne Langøy 602 000 - 31 500
Tore Torvund2 547 300 - 31 500
Kjell Inge Røkke3 328 000 - -
Thorhild Widvey 328 000 84 000 31 500
Lone Fønss Schrøder 328 000 163 000 -
Rune Rafdal4 164 000 84 000 -
Ståle Knoff Johansen4 164 000 - -
Bernt Harald Kilnes4 164 000 - -
1 Fees listed in the table are earned remuneration for work performed in 2017 related to Board, Audit Committee and
Remuneration Committee meetings based on fees approved by the Annual General Meeting April 2017
2 Directors resident outside Scandinavia are granted additional compensation of NOK 12 700 per physical Board meeting
3 Fees paid directly to company The Resource Group TRG AS
4 Directors appointed by and from employees. Board fees to employee elected Directors are reduced in accordance with
agreement with employee representatives. Employee elected Directors have in addition received ordinary salaries from
the companies in which they are employed
Nomination Committee
The Articles of Association stipulate that the company shall have a Nomination Committee. The
Nomination Committee shall have no less than three members, who shall normally serve for a
term of two years.
The current members of the Nomination Committee are:
Arild S. Frick (Chair), Georg F. Rabl and Walter Qvam. Kvaerner’s General Meeting has adopted
guidelines governing the duties of the Nomination Committee.
Audit Committee
The current members of the Audit Committee are the following three Directors:
Lone Fønss Schrøder (Chair), Thorhild Widvey and Rune Rafdal.
Remuneration Committee
The current members of the Remuneration Committee are the following three Directors:
Leif-Arne Langøy (Chair), Kjell Inge Røkke and Thorhild Widvey.
Fees to members of the Audit and Remuneration committees are subject to approval by the
Annual General Meeting 28 March 2019.
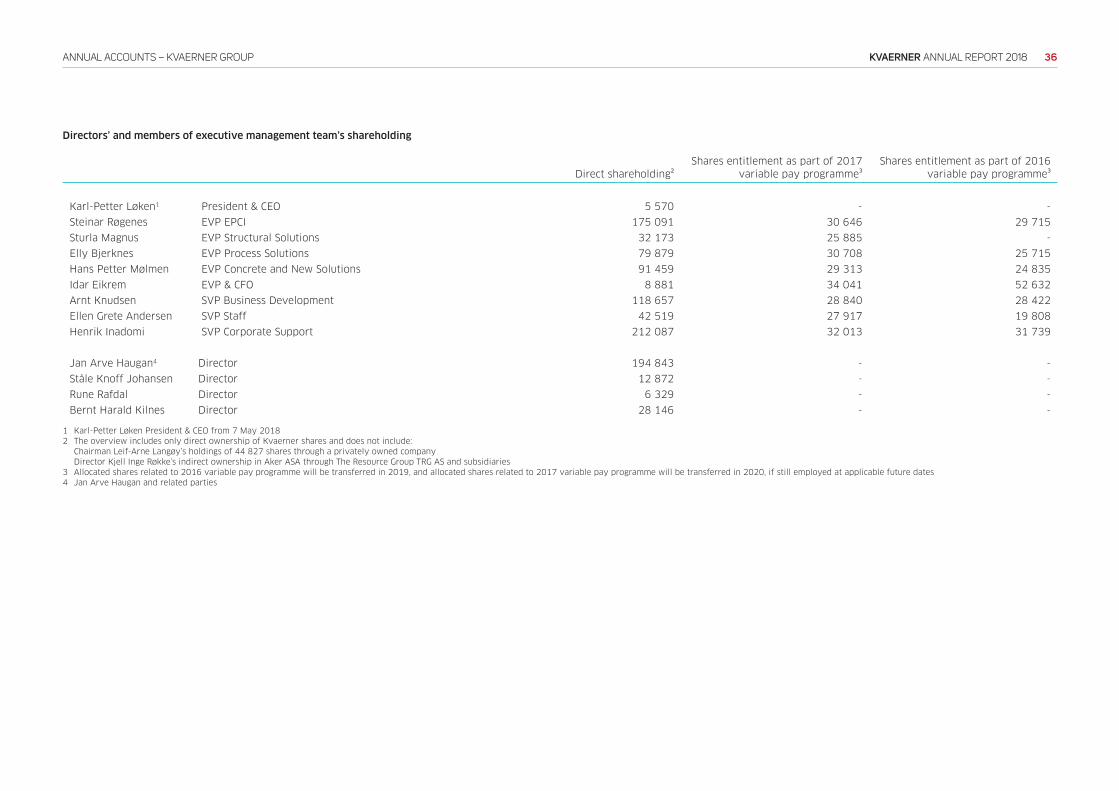
36KVAERNER ANNUAL REPORT 2018ANNUAL ACCOUNTS – KVAERNER GROUP
Direct shareholding²
Shares entitlement as part of 2017
variable pay programme³
Shares entitlement as part of 2016
variable pay programme³
Karl-Petter Løken1 President & CEO 5 570 - -
Steinar Røgenes EVP EPCI 175 091 30 646 29 715
Sturla Magnus EVP Structural Solutions 32 173 25 885 -
Elly Bjerknes EVP Process Solutions 79 879 30 708 25 715
Hans Petter Mølmen EVP Concrete and New Solutions 91 459 29 313 24 835
Idar Eikrem EVP & CFO 8 881 34 041 52 632
Arnt Knudsen SVP Business Development 118 657 28 840 28 422
Ellen Grete Andersen SVP Staff 42 519 27 917 19 808
Henrik Inadomi SVP Corporate Support 212 087 32 013 31 739
Jan Arve Haugan4 Director 194 843 - -
Ståle Knoff Johansen Director 12 872 - -
Rune Rafdal Director 6 329 - -
Bernt Harald Kilnes Director 28 146 - -
1 Karl-Petter Løken President & CEO from 7 May 2018
2 The overview includes only direct ownership of Kvaerner shares and does not include:
Chairman Leif-Arne Langøy’s holdings of 44 827 shares through a privately owned company
Director Kjell Inge Røkke’s indirect ownership in Aker ASA through The Resource Group TRG AS and subsidiaries
3 Allocated shares related to 2016 variable pay programme will be transferred in 2019, and allocated shares related to 2017 variable pay programme will be transferred in 2020, if still employed at applicable future dates
4 Jan Arve Haugan and related parties
Directors’ and members of executive management team’s shareholding
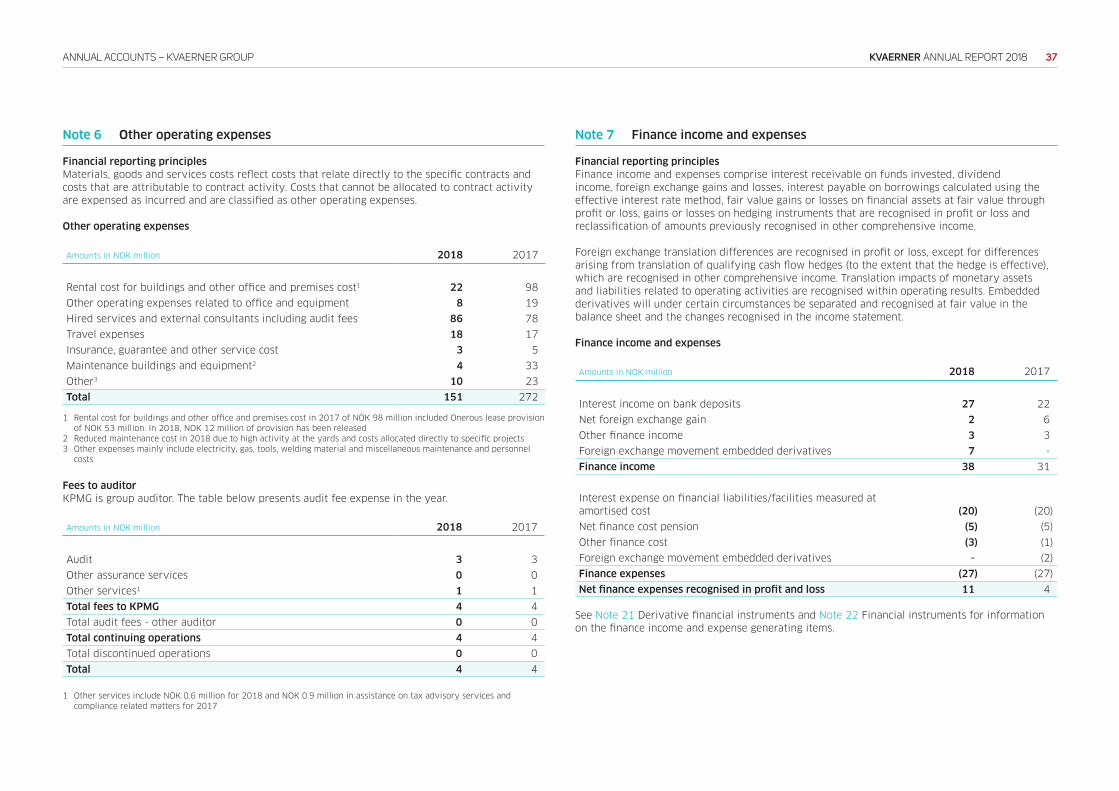
37KVAERNER ANNUAL REPORT 2018ANNUAL ACCOUNTS – KVAERNER GROUP
Note 6 Other operating expenses
Financial reporting principles
Materials, goods and services costs reflect costs that relate directly to the specific contracts and
costs that are attributable to contract activity. Costs that cannot be allocated to contract activity
are expensed as incurred and are classified as other operating expenses.
Other operating expenses
Amounts in NOK million 2018 2017
Rental cost for buildings and other office and premises cost1 22 98
Other operating expenses related to office and equipment 8 19
Hired services and external consultants including audit fees 86 78
Travel expenses 18 17
Insurance, guarantee and other service cost 3 5
Maintenance buildings and equipment2 4 33
Other3 10 23
Total 151 272
1 Rental cost for buildings and other office and premises cost in 2017 of NOK 98 million included Onerous lease provision
of NOK 53 million. In 2018, NOK 12 million of provision has been released
2 Reduced maintenance cost in 2018 due to high activity at the yards and costs allocated directly to specific projects
3 Other expenses mainly include electricity, gas, tools, welding material and miscellaneous maintenance and personnel
costs
Fees to auditor
KPMG is group auditor. The table below presents audit fee expense in the year.
Amounts in NOK million 2018 2017
Audit 3 3
Other assurance services 0 0
Other services1 1 1
Total fees to KPMG 4 4
Total audit fees - other auditor 0 0
Total continuing operations 4 4
Total discontinued operations 0 0
Total 4 4
1 Other services include NOK 0.6 million for 2018 and NOK 0.9 million in assistance on tax advisory services and
compliance related matters for 2017
Note 7 Finance income and expenses
Financial reporting principles
Finance income and expenses comprise interest receivable on funds invested, dividend
income, foreign exchange gains and losses, interest payable on borrowings calculated using the
effective interest rate method, fair value gains or losses on financial assets at fair value through
profit or loss, gains or losses on hedging instruments that are recognised in profit or loss and
reclassification of amounts previously recognised in other comprehensive income.
Foreign exchange translation differences are recognised in profit or loss, except for differences
arising from translation of qualifying cash flow hedges (to the extent that the hedge is effective),
which are recognised in other comprehensive income. Translation impacts of monetary assets
and liabilities related to operating activities are recognised within operating results. Embedded
derivatives will under certain circumstances be separated and recognised at fair value in the
balance sheet and the changes recognised in the income statement.
Finance income and expenses
Amounts in NOK million 2018 2017
Interest income on bank deposits 27 22
Net foreign exchange gain 2 6
Other finance income 3 3
Foreign exchange movement embedded derivatives 7 -
Finance income 38 31
Interest expense on financial liabilities/facilities measured at
amortised cost (20) (20)
Net finance cost pension (5) (5)
Other finance cost (3) (1)
Foreign exchange movement embedded derivatives - (2)
Finance expenses (27) (27)
Net finance expenses recognised in profit and loss 11 4
See Note 21 Derivative financial instruments and Note 22 Financial instruments for information
on the finance income and expense generating items.
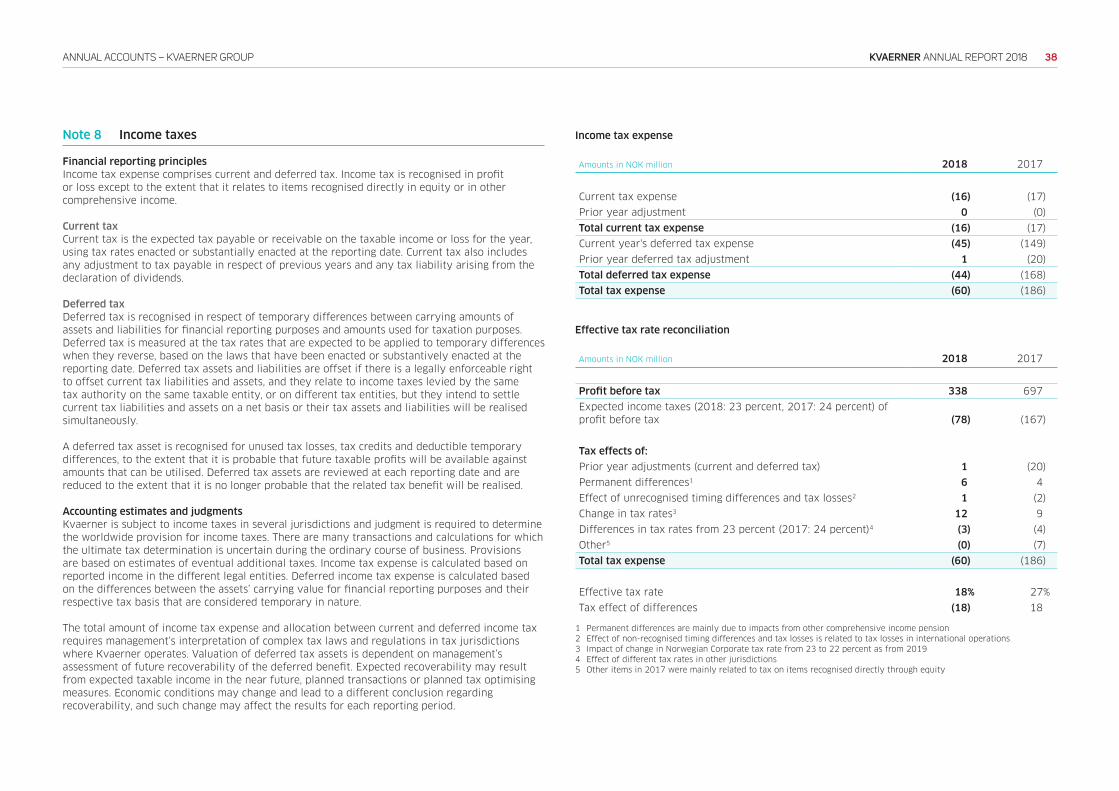
38KVAERNER ANNUAL REPORT 2018ANNUAL ACCOUNTS – KVAERNER GROUP
Note 8 Income taxes
Financial reporting principles
Income tax expense comprises current and deferred tax. Income tax is recognised in profit
or loss except to the extent that it relates to items recognised directly in equity or in other
comprehensive income.
Current tax
Current tax is the expected tax payable or receivable on the taxable income or loss for the year,
using tax rates enacted or substantially enacted at the reporting date. Current tax also includes
any adjustment to tax payable in respect of previous years and any tax liability arising from the
declaration of dividends.
Deferred tax
Deferred tax is recognised in respect of temporary differences between carrying amounts of
assets and liabilities for financial reporting purposes and amounts used for taxation purposes.
Deferred tax is measured at the tax rates that are expected to be applied to temporary differences
when they reverse, based on the laws that have been enacted or substantively enacted at the
reporting date. Deferred tax assets and liabilities are offset if there is a legally enforceable right
to offset current tax liabilities and assets, and they relate to income taxes levied by the same
tax authority on the same taxable entity, or on different tax entities, but they intend to settle
current tax liabilities and assets on a net basis or their tax assets and liabilities will be realised
simultaneously.
A deferred tax asset is recognised for unused tax losses, tax credits and deductible temporary
differences, to the extent that it is probable that future taxable profits will be available against
amounts that can be utilised. Deferred tax assets are reviewed at each reporting date and are
reduced to the extent that it is no longer probable that the related tax benefit will be realised.
Accounting estimates and judgments
Kvaerner is subject to income taxes in several jurisdictions and judgment is required to determine
the worldwide provision for income taxes. There are many transactions and calculations for which
the ultimate tax determination is uncertain during the ordinary course of business. Provisions
are based on estimates of eventual additional taxes. Income tax expense is calculated based on
reported income in the different legal entities. Deferred income tax expense is calculated based
on the differences between the assets’ carrying value for financial reporting purposes and their
respective tax basis that are considered temporary in nature.
The total amount of income tax expense and allocation between current and deferred income tax
requires management’s interpretation of complex tax laws and regulations in tax jurisdictions
where Kvaerner operates. Valuation of deferred tax assets is dependent on management’s
assessment of future recoverability of the deferred benefit. Expected recoverability may result
from expected taxable income in the near future, planned transactions or planned tax optimising
measures. Economic conditions may change and lead to a different conclusion regarding
recoverability, and such change may affect the results for each reporting period.
Income tax expense
Amounts in NOK million 2018 2017
Current tax expense (16) (17)
Prior year adjustment 0 (0)
Total current tax expense (16) (17)
Current year's deferred tax expense (45) (149)
Prior year deferred tax adjustment 1 (20)
Total deferred tax expense (44) (168)
Total tax expense (60) (186)
Effective tax rate reconciliation
Amounts in NOK million 2018 2017
Profit before tax 338 697
Expected income taxes (2018: 23 percent, 2017: 24 percent) of
profit before tax (78) (167)
Tax effects of:
Prior year adjustments (current and deferred tax) 1 (20)
Permanent differences1 6 4
Effect of unrecognised timing differences and tax losses2 1 (2)
Change in tax rates3 12 9
Differences in tax rates from 23 percent (2017: 24 percent)4 (3) (4)
Other5 (0) (7)
Total tax expense (60) (186)
Effective tax rate 18% 27%
Tax effect of differences (18) 18
1 Permanent differences are mainly due to impacts from other comprehensive income pension
2 Effect of non-recognised timing differences and tax losses is related to tax losses in international operations
3 Impact of change in Norwegian Corporate tax rate from 23 to 22 percent as from 2019
4 Effect of different tax rates in other jurisdictions
5 Other items in 2017 were mainly related to tax on items recognised directly through equity
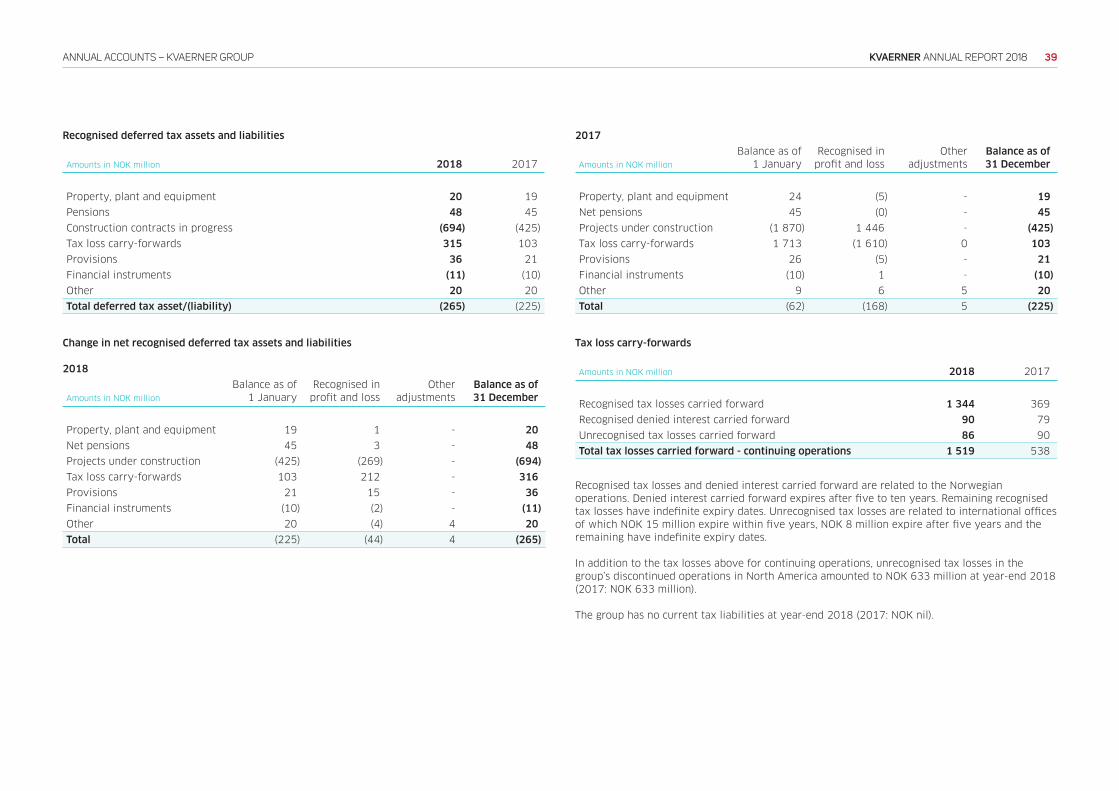
39KVAERNER ANNUAL REPORT 2018ANNUAL ACCOUNTS – KVAERNER GROUP
Recognised deferred tax assets and liabilities
Amounts in NOK million 2018 2017
Property, plant and equipment 20 19
Pensions 48 45
Construction contracts in progress (694) (425)
Tax loss carry-forwards 315 103
Provisions 36 21
Financial instruments (11) (10)
Other 20 20
Total deferred tax asset/(liability) (265) (225)
Change in net recognised deferred tax assets and liabilities
2018
Amounts in NOK million
Balance as of
1 January
Recognised in
profit and loss
Other
adjustments
Balance as of
31 December
Property, plant and equipment 19 1 - 20
Net pensions 45 3 - 48
Projects under construction (425) (269) - (694)
Tax loss carry-forwards 103 212 - 316
Provisions 21 15 - 36
Financial instruments (10) (2) - (11)
Other 20 (4) 4 20
Total (225) (44) 4 (265)
2017
Amounts in NOK million
Balance as of
1 January
Recognised in
profit and loss
Other
adjustments
Balance as of
31 December
Property, plant and equipment 24 (5) - 19
Net pensions 45 (0) - 45
Projects under construction (1 870) 1 446 - (425)
Tax loss carry-forwards 1 713 (1 610) 0 103
Provisions 26 (5) - 21
Financial instruments (10) 1 - (10)
Other 9 6 5 20
Total (62) (168) 5 (225)
Tax loss carry-forwards
Amounts in NOK million 2018 2017
Recognised tax losses carried forward 1 344 369
Recognised denied interest carried forward 90 79
Unrecognised tax losses carried forward 86 90
Total tax losses carried forward - continuing operations 1 519 538
Recognised tax losses and denied interest carried forward are related to the Norwegian
operations. Denied interest carried forward expires after five to ten years. Remaining recognised
tax losses have indefinite expiry dates. Unrecognised tax losses are related to international offices
of which NOK 15 million expire within five years, NOK 8 million expire after five years and the
remaining have indefinite expiry dates.
In addition to the tax losses above for continuing operations, unrecognised tax losses in the
group’s discontinued operations in North America amounted to NOK 633 million at year-end 2018
(2017: NOK 633 million).
The group has no current tax liabilities at year-end 2018 (2017: NOK nil).
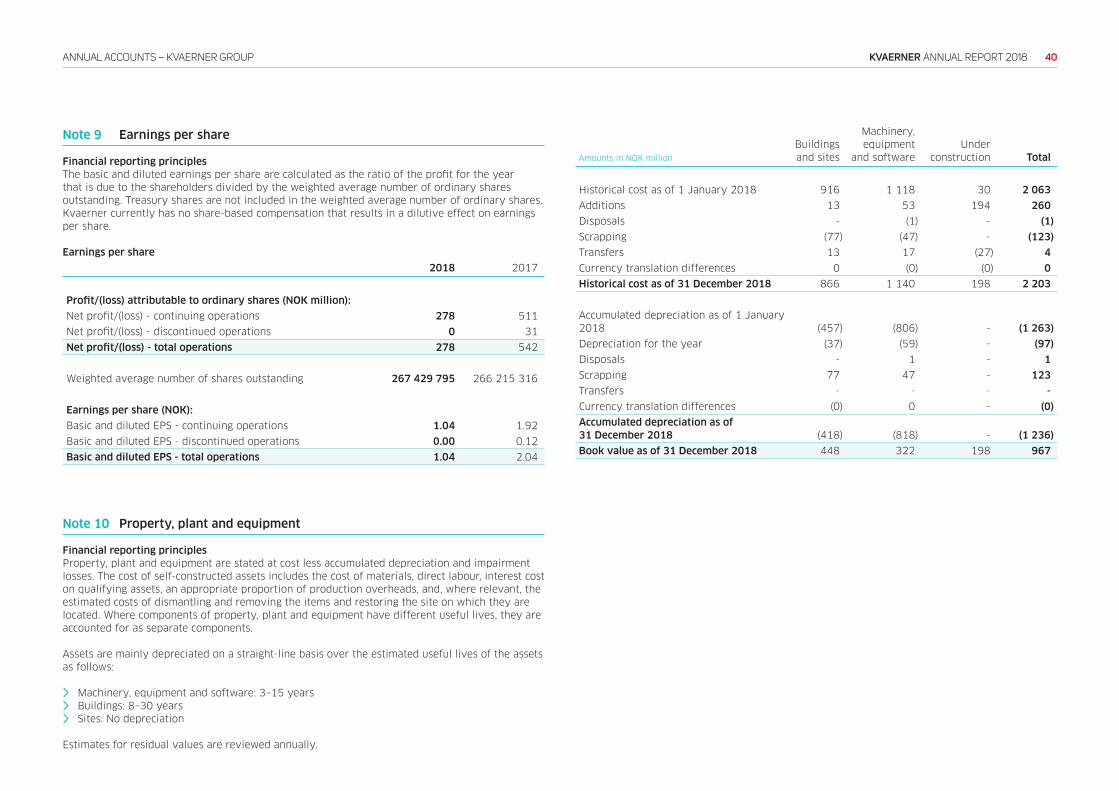
40KVAERNER ANNUAL REPORT 2018ANNUAL ACCOUNTS – KVAERNER GROUP
Note 9 Earnings per share
Financial reporting principles
The basic and diluted earnings per share are calculated as the ratio of the profit for the year
that is due to the shareholders divided by the weighted average number of ordinary shares
outstanding. Treasury shares are not included in the weighted average number of ordinary shares.
Kvaerner currently has no share-based compensation that results in a dilutive effect on earnings
per share.
Earnings per share
2018 2017
Profit/(loss) attributable to ordinary shares (NOK million):
Net profit/(loss) - continuing operations 278 511
Net profit/(loss) - discontinued operations 0 31
Net profit/(loss) - total operations 278 542
Weighted average number of shares outstanding 267 429 795 266 215 316
Earnings per share (NOK):
Basic and diluted EPS - continuing operations 1.04 1.92
Basic and diluted EPS - discontinued operations 0.00 0.12
Basic and diluted EPS - total operations 1.04 2.04
Note 10 Property, plant and equipment
Financial reporting principles
Property, plant and equipment are stated at cost less accumulated depreciation and impairment
losses. The cost of self-constructed assets includes the cost of materials, direct labour, interest cost
on qualifying assets, an appropriate proportion of production overheads, and, where relevant, the
estimated costs of dismantling and removing the items and restoring the site on which they are
located. Where components of property, plant and equipment have different useful lives, they are
accounted for as separate components.
Assets are mainly depreciated on a straight-line basis over the estimated useful lives of the assets
as follows:
> Machinery, equipment and software: 3–15 years
> Buildings: 8–30 years
> Sites: No depreciation
Estimates for residual values are reviewed annually.
Amounts in NOK million
Buildings
and sites
Machinery,
equipment
and software
Under
construction Total
Historical cost as of 1 January 2018 916 1 118 30 2 063
Additions 13 53 194 260
Disposals - (1) - (1)
Scrapping (77) (47) - (123)
Transfers 13 17 (27) 4
Currency translation differences 0 (0) (0) 0
Historical cost as of 31 December 2018 866 1 140 198 2 203
Accumulated depreciation as of 1 January
2018 (457) (806) - (1 263)
Depreciation for the year (37) (59) - (97)
Disposals - 1 - 1
Scrapping 77 47 - 123
Transfers - - - -
Currency translation differences (0) 0 - (0)
Accumulated depreciation as of
31 December 2018 (418) (818) - (1 236)
Book value as of 31 December 2018 448 322 198 967
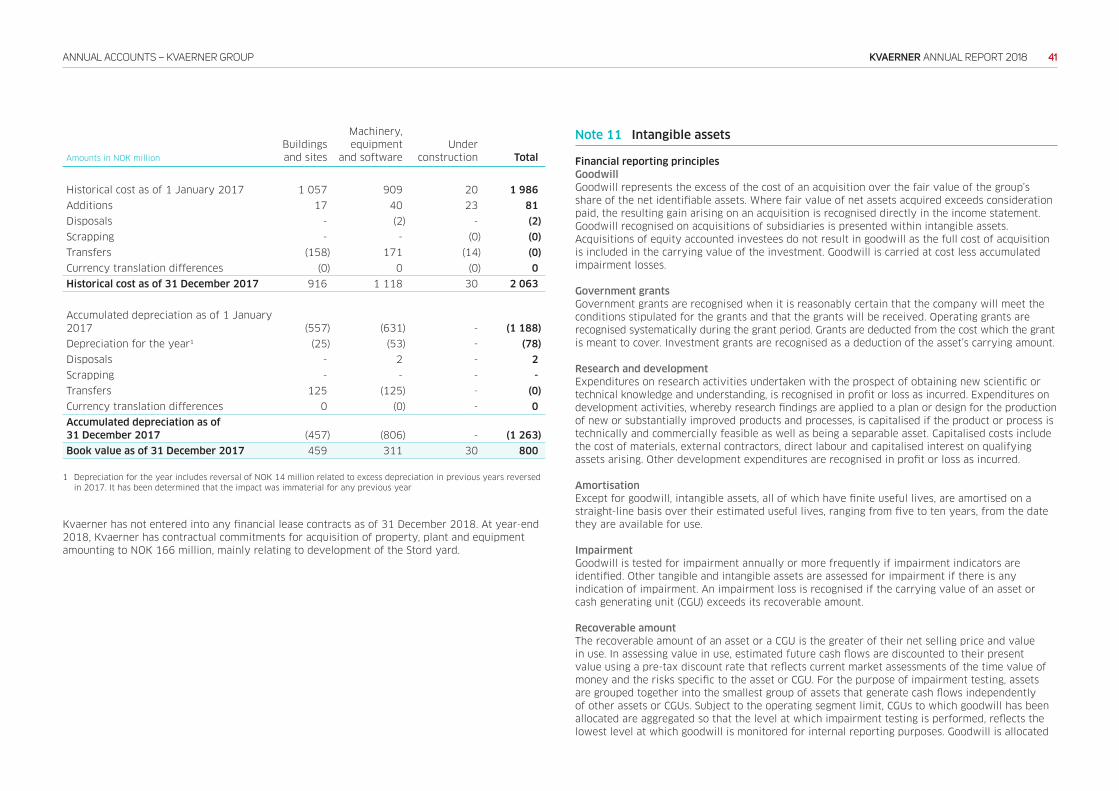
41KVAERNER ANNUAL REPORT 2018ANNUAL ACCOUNTS – KVAERNER GROUP
Amounts in NOK million
Buildings
and sites
Machinery,
equipment
and software
Under
construction Total
Historical cost as of 1 January 2017 1 057 909 20 1 986
Additions 17 40 23 81
Disposals - (2) - (2)
Scrapping - - (0) (0)
Transfers (158) 171 (14) (0)
Currency translation differences (0) 0 (0) 0
Historical cost as of 31 December 2017 916 1 118 30 2 063
Accumulated depreciation as of 1 January
2017 (557) (631) - (1 188)
Depreciation for the year1 (25) (53) - (78)
Disposals - 2 - 2
Scrapping - - - -
Transfers 125 (125) - (0)
Currency translation differences 0 (0) - 0
Accumulated depreciation as of
31 December 2017 (457) (806) - (1 263)
Book value as of 31 December 2017 459 311 30 800
1 Depreciation for the year includes reversal of NOK 14 million related to excess depreciation in previous years reversed
in 2017. It has been determined that the impact was immaterial for any previous year
Kvaerner has not entered into any financial lease contracts as of 31 December 2018. At year-end
2018, Kvaerner has contractual commitments for acquisition of property, plant and equipment
amounting to NOK 166 million, mainly relating to development of the Stord yard.
Note 11 Intangible assets
Financial reporting principles
Goodwill
Goodwill represents the excess of the cost of an acquisition over the fair value of the group’s
share of the net identifiable assets. Where fair value of net assets acquired exceeds consideration
paid, the resulting gain arising on an acquisition is recognised directly in the income statement.
Goodwill recognised on acquisitions of subsidiaries is presented within intangible assets.
Acquisitions of equity accounted investees do not result in goodwill as the full cost of acquisition
is included in the carrying value of the investment. Goodwill is carried at cost less accumulated
impairment losses.
Government grants
Government grants are recognised when it is reasonably certain that the company will meet the
conditions stipulated for the grants and that the grants will be received. Operating grants are
recognised systematically during the grant period. Grants are deducted from the cost which the grant
is meant to cover. Investment grants are recognised as a deduction of the asset’s carrying amount.
Research and development
Expenditures on research activities undertaken with the prospect of obtaining new scientific or
technical knowledge and understanding, is recognised in profit or loss as incurred. Expenditures on
development activities, whereby research findings are applied to a plan or design for the production
of new or substantially improved products and processes, is capitalised if the product or process is
technically and commercially feasible as well as being a separable asset. Capitalised costs include
the cost of materials, external contractors, direct labour and capitalised interest on qualifying
assets arising. Other development expenditures are recognised in profit or loss as incurred.
Amortisation
Except for goodwill, intangible assets, all of which have finite useful lives, are amortised on a
straight-line basis over their estimated useful lives, ranging from five to ten years, from the date
they are available for use.
Impairment
Goodwill is tested for impairment annually or more frequently if impairment indicators are
identified. Other tangible and intangible assets are assessed for impairment if there is any
indication of impairment. An impairment loss is recognised if the carrying value of an asset or
cash generating unit (CGU) exceeds its recoverable amount.
Recoverable amount
The recoverable amount of an asset or a CGU is the greater of their net selling price and value
in use. In assessing value in use, estimated future cash flows are discounted to their present
value using a pre-tax discount rate that reflects current market assessments of the time value of
money and the risks specific to the asset or CGU. For the purpose of impairment testing, assets
are grouped together into the smallest group of assets that generate cash flows independently
of other assets or CGUs. Subject to the operating segment limit, CGUs to which goodwill has been
allocated are aggregated so that the level at which impairment testing is performed, reflects the
lowest level at which goodwill is monitored for internal reporting purposes. Goodwill is allocated
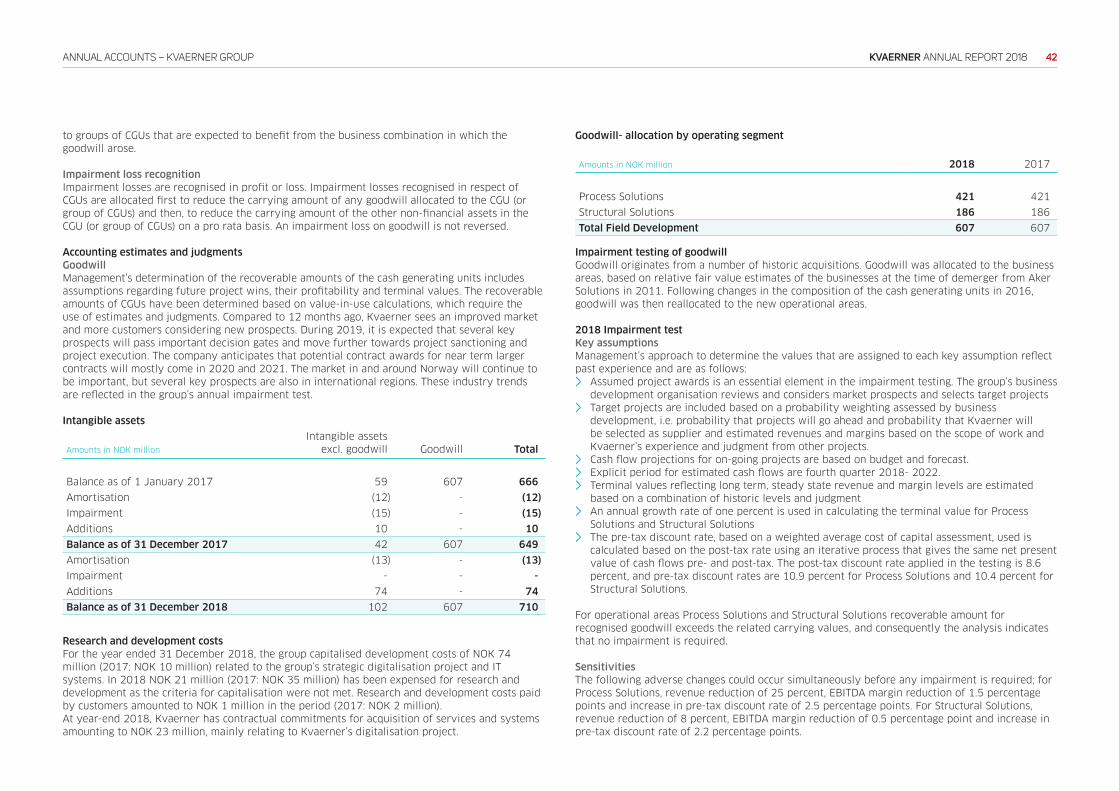
42KVAERNER ANNUAL REPORT 2018ANNUAL ACCOUNTS – KVAERNER GROUP
to groups of CGUs that are expected to benefit from the business combination in which the
goodwill arose.
Impairment loss recognition
Impairment losses are recognised in profit or loss. Impairment losses recognised in respect of
CGUs are allocated first to reduce the carrying amount of any goodwill allocated to the CGU (or
group of CGUs) and then, to reduce the carrying amount of the other non-financial assets in the
CGU (or group of CGUs) on a pro rata basis. An impairment loss on goodwill is not reversed.
Accounting estimates and judgments
Goodwill
Management’s determination of the recoverable amounts of the cash generating units includes
assumptions regarding future project wins, their profitability and terminal values. The recoverable
amounts of CGUs have been determined based on value-in-use calculations, which require the
use of estimates and judgments. Compared to 12 months ago, Kvaerner sees an improved market
and more customers considering new prospects. During 2019, it is expected that several key
prospects will pass important decision gates and move further towards project sanctioning and
project execution. The company anticipates that potential contract awards for near term larger
contracts will mostly come in 2020 and 2021. The market in and around Norway will continue to
be important, but several key prospects are also in international regions. These industry trends
are reflected in the group’s annual impairment test.
Intangible assets
Amounts in NOK million
Intangible assets
excl. goodwill Goodwill Total
Balance as of 1 January 2017 59 607 666
Amortisation (12) - (12)
Impairment (15) - (15)
Additions 10 - 10
Balance as of 31 December 2017 42 607 649
Amortisation (13) - (13)
Impairment - - -
Additions 74 - 74
Balance as of 31 December 2018 102 607 710
Research and development costs
For the year ended 31 December 2018, the group capitalised development costs of NOK 74
million (2017: NOK 10 million) related to the group’s strategic digitalisation project and IT
systems. In 2018 NOK 21 million (2017: NOK 35 million) has been expensed for research and
development as the criteria for capitalisation were not met. Research and development costs paid
by customers amounted to NOK 1 million in the period (2017: NOK 2 million).
At year-end 2018, Kvaerner has contractual commitments for acquisition of services and systems
amounting to NOK 23 million, mainly relating to Kvaerner’s digitalisation project.
Goodwill- allocation by operating segment
Amounts in NOK million 2018 2017
Process Solutions 421 421
Structural Solutions 186 186
Total Field Development 607 607
Impairment testing of goodwill
Goodwill originates from a number of historic acquisitions. Goodwill was allocated to the business
areas, based on relative fair value estimates of the businesses at the time of demerger from Aker
Solutions in 2011. Following changes in the composition of the cash generating units in 2016,
goodwill was then reallocated to the new operational areas.
2018 Impairment test
Key assumptions
Management’s approach to determine the values that are assigned to each key assumption reflect
past experience and are as follows:
> Assumed project awards is an essential element in the impairment testing. The group’s business
development organisation reviews and considers market prospects and selects target projects
> Target projects are included based on a probability weighting assessed by business
development, i.e. probability that projects will go ahead and probability that Kvaerner will
be selected as supplier and estimated revenues and margins based on the scope of work and
Kvaerner’s experience and judgment from other projects.
> Cash flow projections for on-going projects are based on budget and forecast.
> Explicit period for estimated cash flows are fourth quarter 2018- 2022.
> Terminal values reflecting long term, steady state revenue and margin levels are estimated
based on a combination of historic levels and judgment
> An annual growth rate of one percent is used in calculating the terminal value for Process
Solutions and Structural Solutions
> The pre-tax discount rate, based on a weighted average cost of capital assessment, used is
calculated based on the post-tax rate using an iterative process that gives the same net present
value of cash flows pre- and post-tax. The post-tax discount rate applied in the testing is 8.6
percent, and pre-tax discount rates are 10.9 percent for Process Solutions and 10.4 percent for
Structural Solutions.
For operational areas Process Solutions and Structural Solutions recoverable amount for
recognised goodwill exceeds the related carrying values, and consequently the analysis indicates
that no impairment is required.
Sensitivities
The following adverse changes could occur simultaneously before any impairment is required; for
Process Solutions, revenue reduction of 25 percent, EBITDA margin reduction of 1.5 percentage
points and increase in pre-tax discount rate of 2.5 percentage points. For Structural Solutions,
revenue reduction of 8 percent, EBITDA margin reduction of 0.5 percentage point and increase in
pre-tax discount rate of 2.2 percentage points.
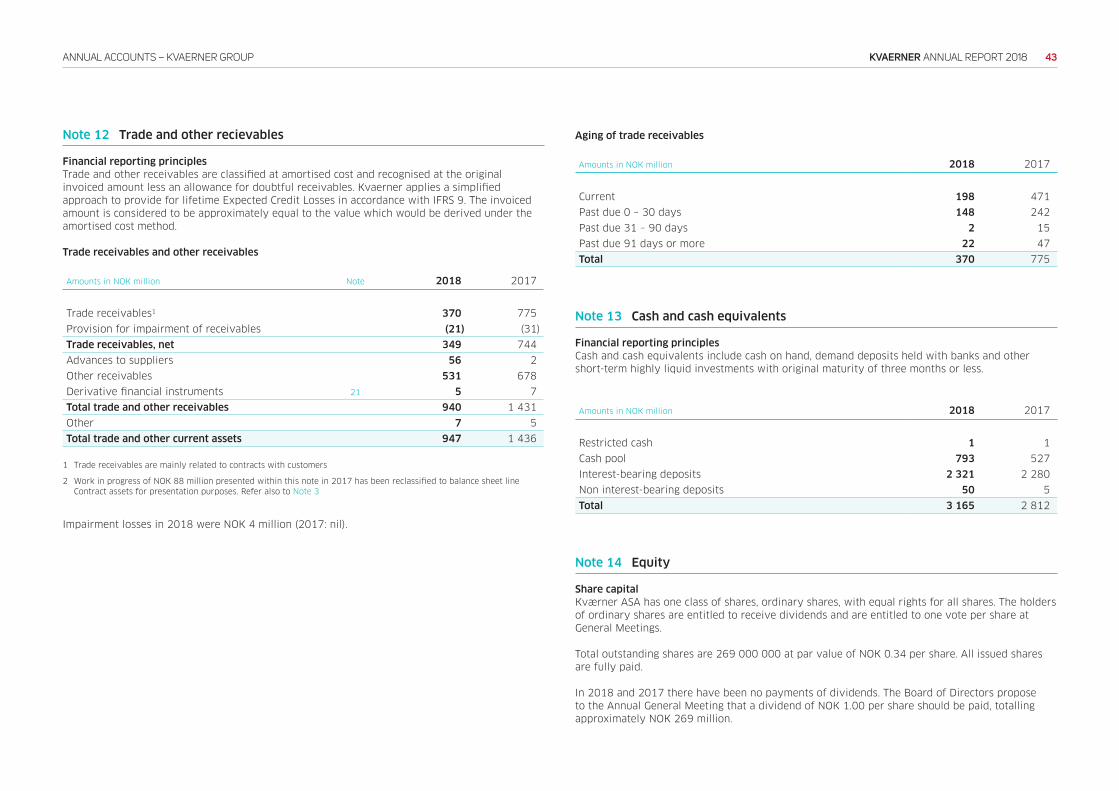
43KVAERNER ANNUAL REPORT 2018ANNUAL ACCOUNTS – KVAERNER GROUP
Note 12 Trade and other recievables
Financial reporting principles
Trade and other receivables are classified at amortised cost and recognised at the original
invoiced amount less an allowance for doubtful receivables. Kvaerner applies a simplified
approach to provide for lifetime Expected Credit Losses in accordance with IFRS 9. The invoiced
amount is considered to be approximately equal to the value which would be derived under the
amortised cost method.
Trade receivables and other receivables
Amounts in NOK million Note 2018 2017
Trade receivables1 370 775
Provision for impairment of receivables (21) (31)
Trade receivables, net 349 744
Advances to suppliers 56 2
Other receivables 531 678
Derivative financial instruments 21 5 7
Total trade and other receivables 940 1 431
Other 7 5
Total trade and other current assets 947 1 436
1 Trade receivables are mainly related to contracts with customers
2 Work in progress of NOK 88 million presented within this note in 2017 has been reclassified to balance sheet line
Contract assets for presentation purposes. Refer also to Note 3
Impairment losses in 2018 were NOK 4 million (2017: nil).
Aging of trade receivables
Amounts in NOK million 2018 2017
Current 198 471
Past due 0 – 30 days 148 242
Past due 31 – 90 days 2 15
Past due 91 days or more 22 47
Total 370 775
Note 13 Cash and cash equivalents
Financial reporting principles
Cash and cash equivalents include cash on hand, demand deposits held with banks and other
short-term highly liquid investments with original maturity of three months or less.
Amounts in NOK million 2018 2017
Restricted cash 1 1
Cash pool 793 527
Interest-bearing deposits 2 321 2 280
Non interest-bearing deposits 50 5
Total 3 165 2 812
Note 14 Equity
Share capital
Kværner ASA has one class of shares, ordinary shares, with equal rights for all shares. The holders
of ordinary shares are entitled to receive dividends and are entitled to one vote per share at
General Meetings.
Total outstanding shares are 269 000 000 at par value of NOK 0.34 per share. All issued shares
are fully paid.
In 2018 and 2017 there have been no payments of dividends. The Board of Directors propose
to the Annual General Meeting that a dividend of NOK 1.00 per share should be paid, totalling
approximately NOK 269 million.
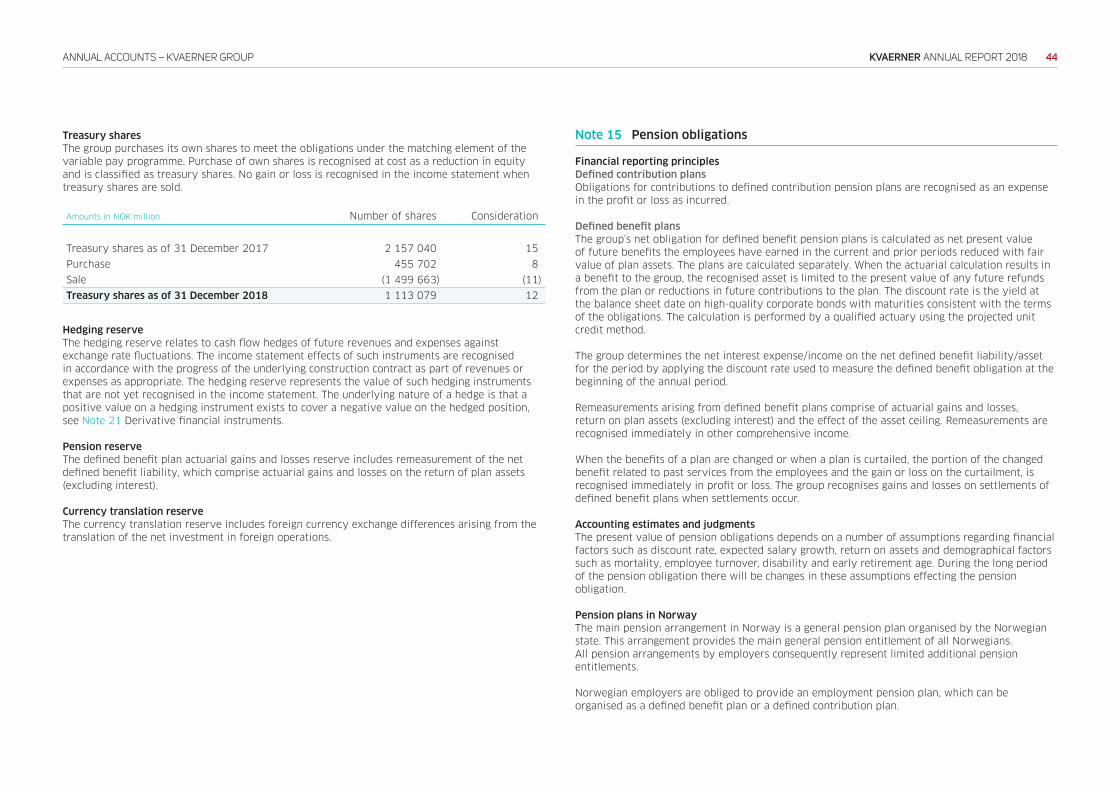
44KVAERNER ANNUAL REPORT 2018ANNUAL ACCOUNTS – KVAERNER GROUP
Treasury shares
The group purchases its own shares to meet the obligations under the matching element of the
variable pay programme. Purchase of own shares is recognised at cost as a reduction in equity
and is classified as treasury shares. No gain or loss is recognised in the income statement when
treasury shares are sold.
Amounts in NOK million Number of shares Consideration
Treasury shares as of 31 December 2017 2 157 040 15
Purchase 455 702 8
Sale (1 499 663) (11)
Treasury shares as of 31 December 2018 1 113 079 12
Hedging reserve
The hedging reserve relates to cash flow hedges of future revenues and expenses against
exchange rate fluctuations. The income statement effects of such instruments are recognised
in accordance with the progress of the underlying construction contract as part of revenues or
expenses as appropriate. The hedging reserve represents the value of such hedging instruments
that are not yet recognised in the income statement. The underlying nature of a hedge is that a
positive value on a hedging instrument exists to cover a negative value on the hedged position,
see Note 21 Derivative financial instruments.
Pension reserve
The defined benefit plan actuarial gains and losses reserve includes remeasurement of the net
defined benefit liability, which comprise actuarial gains and losses on the return of plan assets
(excluding interest).
Currency translation reserve
The currency translation reserve includes foreign currency exchange differences arising from the
translation of the net investment in foreign operations.
Note 15 Pension obligations
Financial reporting principles
Defined contribution plans
Obligations for contributions to defined contribution pension plans are recognised as an expense
in the profit or loss as incurred.
Defined benefit plans
The group’s net obligation for defined benefit pension plans is calculated as net present value
of future benefits the employees have earned in the current and prior periods reduced with fair
value of plan assets. The plans are calculated separately. When the actuarial calculation results in
a benefit to the group, the recognised asset is limited to the present value of any future refunds
from the plan or reductions in future contributions to the plan. The discount rate is the yield at
the balance sheet date on high-quality corporate bonds with maturities consistent with the terms
of the obligations. The calculation is performed by a qualified actuary using the projected unit
credit method.
The group determines the net interest expense/income on the net defined benefit liability/asset
for the period by applying the discount rate used to measure the defined benefit obligation at the
beginning of the annual period.
Remeasurements arising from defined benefit plans comprise of actuarial gains and losses,
return on plan assets (excluding interest) and the effect of the asset ceiling. Remeasurements are
recognised immediately in other comprehensive income.
When the benefits of a plan are changed or when a plan is curtailed, the portion of the changed
benefit related to past services from the employees and the gain or loss on the curtailment, is
recognised immediately in profit or loss. The group recognises gains and losses on settlements of
defined benefit plans when settlements occur.
Accounting estimates and judgments
The present value of pension obligations depends on a number of assumptions regarding financial
factors such as discount rate, expected salary growth, return on assets and demographical factors
such as mortality, employee turnover, disability and early retirement age. During the long period
of the pension obligation there will be changes in these assumptions effecting the pension
obligation.
Pension plans in Norway
The main pension arrangement in Norway is a general pension plan organised by the Norwegian
state. This arrangement provides the main general pension entitlement of all Norwegians.
All pension arrangements by employers consequently represent limited additional pension
entitlements.
Norwegian employers are obliged to provide an employment pension plan, which can be
organised as a defined benefit plan or a defined contribution plan.
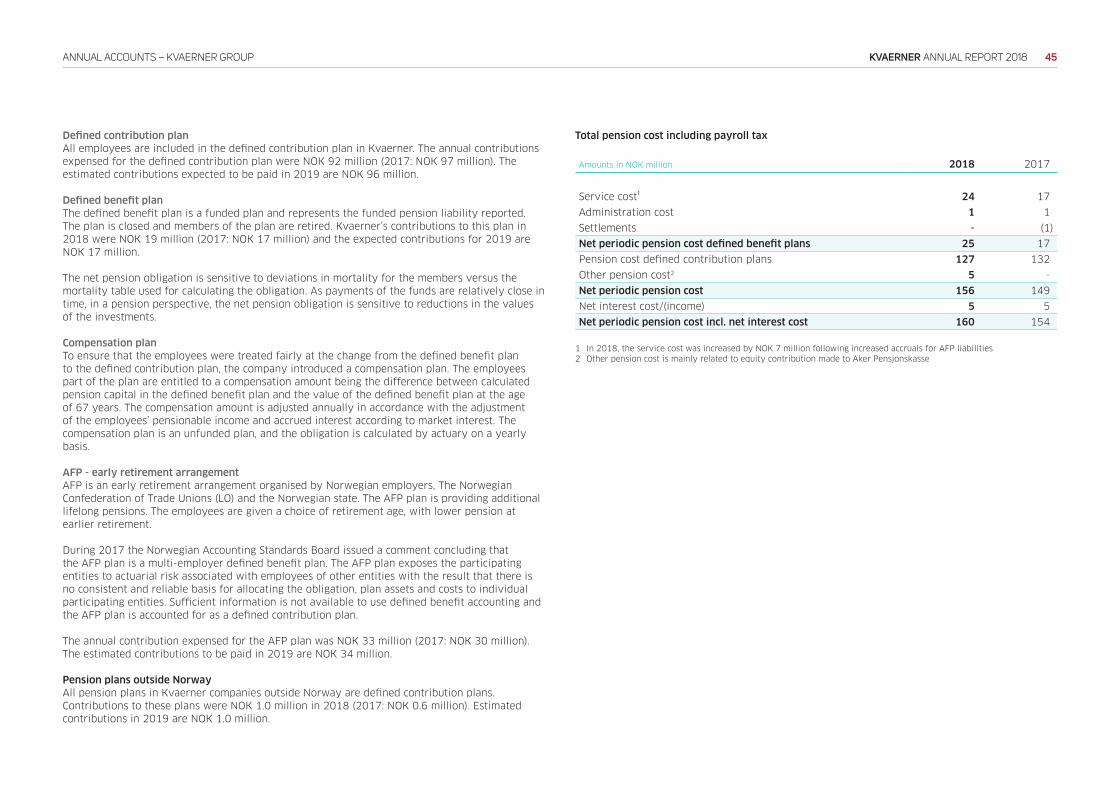
45KVAERNER ANNUAL REPORT 2018ANNUAL ACCOUNTS – KVAERNER GROUP
Defined contribution plan
All employees are included in the defined contribution plan in Kvaerner. The annual contributions
expensed for the defined contribution plan were NOK 92 million (2017: NOK 97 million). The
estimated contributions expected to be paid in 2019 are NOK 96 million.
Defined benefit plan
The defined benefit plan is a funded plan and represents the funded pension liability reported.
The plan is closed and members of the plan are retired. Kvaerner’s contributions to this plan in
2018 were NOK 19 million (2017: NOK 17 million) and the expected contributions for 2019 are
NOK 17 million.
The net pension obligation is sensitive to deviations in mortality for the members versus the
mortality table used for calculating the obligation. As payments of the funds are relatively close in
time, in a pension perspective, the net pension obligation is sensitive to reductions in the values
of the investments.
Compensation plan
To ensure that the employees were treated fairly at the change from the defined benefit plan
to the defined contribution plan, the company introduced a compensation plan. The employees
part of the plan are entitled to a compensation amount being the difference between calculated
pension capital in the defined benefit plan and the value of the defined benefit plan at the age
of 67 years. The compensation amount is adjusted annually in accordance with the adjustment
of the employees’ pensionable income and accrued interest according to market interest. The
compensation plan is an unfunded plan, and the obligation is calculated by actuary on a yearly
basis.
AFP - early retirement arrangement
AFP is an early retirement arrangement organised by Norwegian employers, The Norwegian
Confederation of Trade Unions (LO) and the Norwegian state. The AFP plan is providing additional
lifelong pensions. The employees are given a choice of retirement age, with lower pension at
earlier retirement.
During 2017 the Norwegian Accounting Standards Board issued a comment concluding that
the AFP plan is a multi-employer defined benefit plan. The AFP plan exposes the participating
entities to actuarial risk associated with employees of other entities with the result that there is
no consistent and reliable basis for allocating the obligation, plan assets and costs to individual
participating entities. Sufficient information is not available to use defined benefit accounting and
the AFP plan is accounted for as a defined contribution plan.
The annual contribution expensed for the AFP plan was NOK 33 million (2017: NOK 30 million).
The estimated contributions to be paid in 2019 are NOK 34 million.
Pension plans outside Norway
All pension plans in Kvaerner companies outside Norway are defined contribution plans.
Contributions to these plans were NOK 1.0 million in 2018 (2017: NOK 0.6 million). Estimated
contributions in 2019 are NOK 1.0 million.
Total pension cost including payroll tax
Amounts in NOK million 2018 2017
Service cost¹ 24 17
Administration cost 1 1
Settlements - (1)
Net periodic pension cost defined benefit plans 25 17
Pension cost defined contribution plans 127 132
Other pension cost2 5 -
Net periodic pension cost 156 149
Net interest cost/(income) 5 5
Net periodic pension cost incl. net interest cost 160 154
1 In 2018, the service cost was increased by NOK 7 million following increased accruals for AFP liabilities
2 Other pension cost is mainly related to equity contribution made to Aker Pensjonskasse
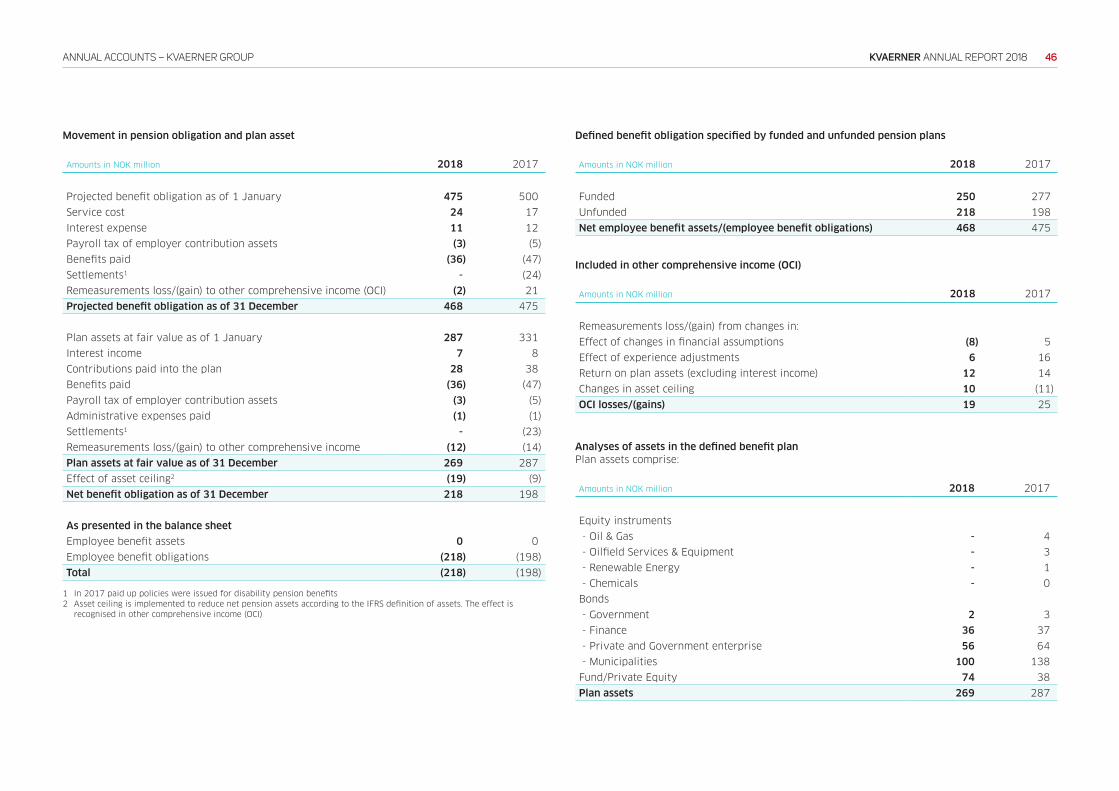
46KVAERNER ANNUAL REPORT 2018ANNUAL ACCOUNTS – KVAERNER GROUP
Movement in pension obligation and plan asset
Amounts in NOK million 2018 2017
Projected benefit obligation as of 1 January 475 500
Service cost 24 17
Interest expense 11 12
Payroll tax of employer contribution assets (3) (5)
Benefits paid (36) (47)
Settlements1 - (24)
Remeasurements loss/(gain) to other comprehensive income (OCI) (2) 21
Projected benefit obligation as of 31 December 468 475
Plan assets at fair value as of 1 January 287 331
Interest income 7 8
Contributions paid into the plan 28 38
Benefits paid (36) (47)
Payroll tax of employer contribution assets (3) (5)
Administrative expenses paid (1) (1)
Settlements1 - (23)
Remeasurements loss/(gain) to other comprehensive income (12) (14)
Plan assets at fair value as of 31 December 269 287
Effect of asset ceiling2 (19) (9)
Net benefit obligation as of 31 December 218 198
As presented in the balance sheet
Employee benefit assets 0 0
Employee benefit obligations (218) (198)
Total (218) (198)
1 In 2017 paid up policies were issued for disability pension benefits
2 Asset ceiling is implemented to reduce net pension assets according to the IFRS definition of assets. The effect is
recognised in other comprehensive income (OCI)
Defined benefit obligation specified by funded and unfunded pension plans
Amounts in NOK million 2018 2017
Funded 250 277
Unfunded 218 198
Net employee benefit assets/(employee benefit obligations) 468 475
Included in other comprehensive income (OCI)
Amounts in NOK million 2018 2017
Remeasurements loss/(gain) from changes in:
Effect of changes in financial assumptions (8) 5
Effect of experience adjustments 6 16
Return on plan assets (excluding interest income) 12 14
Changes in asset ceiling 10 (11)
OCI losses/(gains) 19 25
Analyses of assets in the defined benefit plan
Plan assets comprise:
Amounts in NOK million 2018 2017
Equity instruments
- Oil & Gas - 4
- Oilfield Services & Equipment - 3
- Renewable Energy - 1
- Chemicals - 0
Bonds
- Government 2 3
- Finance 36 37
- Private and Government enterprise 56 64
- Municipalities 100 138
Fund/Private Equity 74 38
Plan assets 269 287
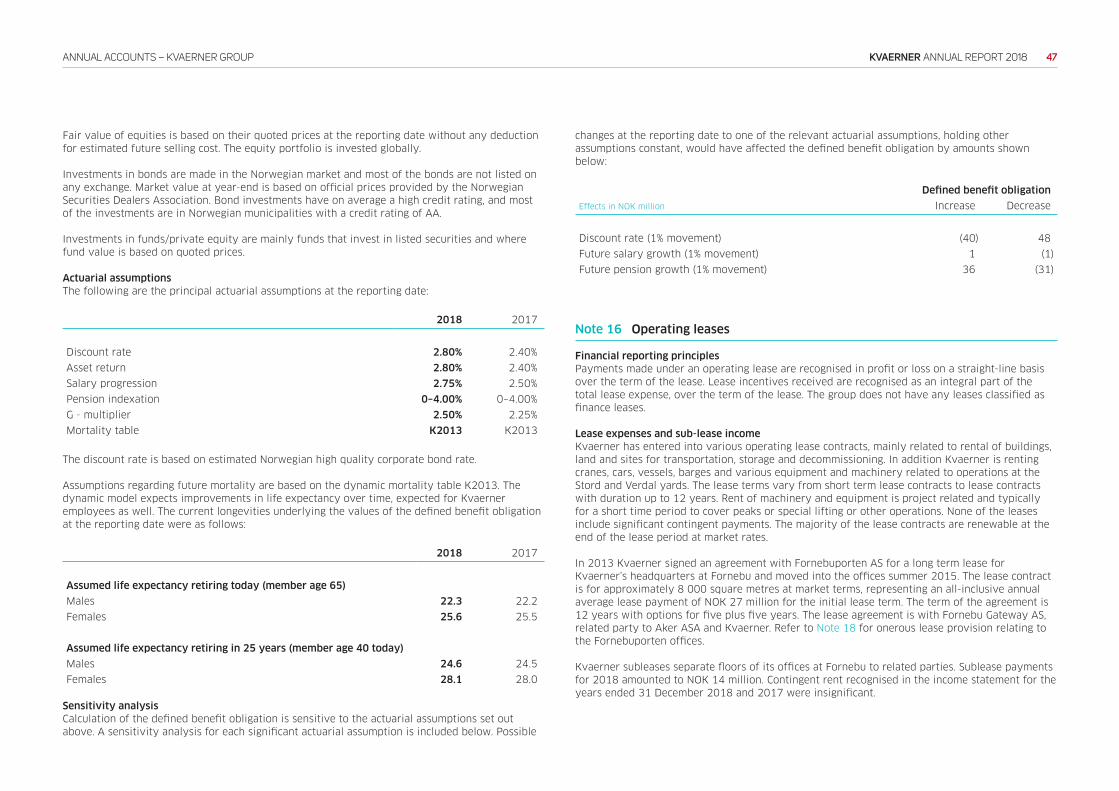
47KVAERNER ANNUAL REPORT 2018ANNUAL ACCOUNTS – KVAERNER GROUP
Fair value of equities is based on their quoted prices at the reporting date without any deduction
for estimated future selling cost. The equity portfolio is invested globally.
Investments in bonds are made in the Norwegian market and most of the bonds are not listed on
any exchange. Market value at year-end is based on official prices provided by the Norwegian
Securities Dealers Association. Bond investments have on average a high credit rating, and most
of the investments are in Norwegian municipalities with a credit rating of AA.
Investments in funds/private equity are mainly funds that invest in listed securities and where
fund value is based on quoted prices.
Actuarial assumptions
The following are the principal actuarial assumptions at the reporting date:
2018 2017
Discount rate 2.80% 2.40%
Asset return 2.80% 2.40%
Salary progression 2.75% 2.50%
Pension indexation 0–4.00% 0–4.00%
G - multiplier 2.50% 2.25%
Mortality table K2013 K2013
The discount rate is based on estimated Norwegian high quality corporate bond rate.
Assumptions regarding future mortality are based on the dynamic mortality table K2013. The
dynamic model expects improvements in life expectancy over time, expected for Kvaerner
employees as well. The current longevities underlying the values of the defined benefit obligation
at the reporting date were as follows:
2018 2017
Assumed life expectancy retiring today (member age 65)
Males 22.3 22.2
Females 25.6 25.5
Assumed life expectancy retiring in 25 years (member age 40 today)
Males 24.6 24.5
Females 28.1 28.0
Sensitivity analysis
Calculation of the defined benefit obligation is sensitive to the actuarial assumptions set out
above. A sensitivity analysis for each significant actuarial assumption is included below. Possible
changes at the reporting date to one of the relevant actuarial assumptions, holding other
assumptions constant, would have affected the defined benefit obligation by amounts shown
below:
Defined benefit obligation
Effects in NOK million Increase Decrease
Discount rate (1% movement) (40) 48
Future salary growth (1% movement) 1 (1)
Future pension growth (1% movement) 36 (31)
Note 16 Operating leases
Financial reporting principles
Payments made under an operating lease are recognised in profit or loss on a straight-line basis
over the term of the lease. Lease incentives received are recognised as an integral part of the
total lease expense, over the term of the lease. The group does not have any leases classified as
finance leases.
Lease expenses and sub-lease income
Kvaerner has entered into various operating lease contracts, mainly related to rental of buildings,
land and sites for transportation, storage and decommissioning. In addition Kvaerner is renting
cranes, cars, vessels, barges and various equipment and machinery related to operations at the
Stord and Verdal yards. The lease terms vary from short term lease contracts to lease contracts
with duration up to 12 years. Rent of machinery and equipment is project related and typically
for a short time period to cover peaks or special lifting or other operations. None of the leases
include significant contingent payments. The majority of the lease contracts are renewable at the
end of the lease period at market rates.
In 2013 Kvaerner signed an agreement with Fornebuporten AS for a long term lease for
Kvaerner’s headquarters at Fornebu and moved into the offices summer 2015. The lease contract
is for approximately 8 000 square metres at market terms, representing an all-inclusive annual
average lease payment of NOK 27 million for the initial lease term. The term of the agreement is
12 years with options for five plus five years. The lease agreement is with Fornebu Gateway AS,
related party to Aker ASA and Kvaerner. Refer to Note 18 for onerous lease provision relating to
the Fornebuporten offices.
Kvaerner subleases separate floors of its offices at Fornebu to related parties. Sublease payments
for 2018 amounted to NOK 14 million. Contingent rent recognised in the income statement for the
years ended 31 December 2018 and 2017 were insignificant.
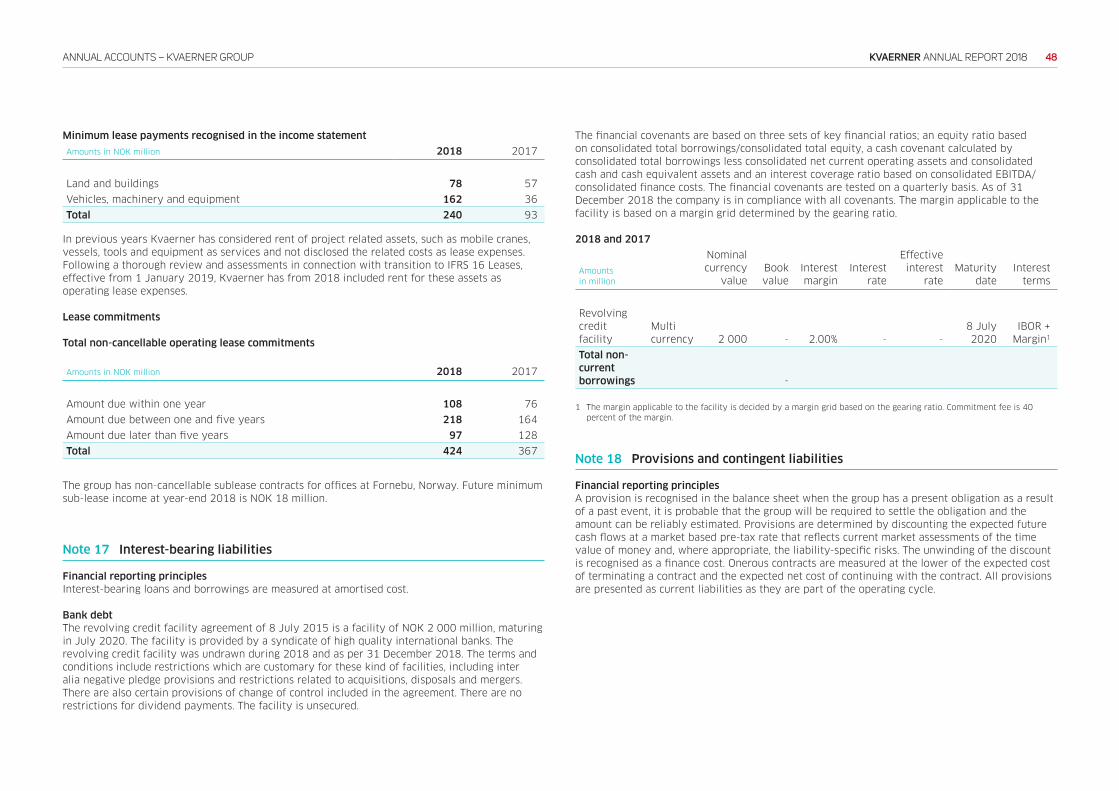
48KVAERNER ANNUAL REPORT 2018ANNUAL ACCOUNTS – KVAERNER GROUP
Minimum lease payments recognised in the income statement
Amounts in NOK million 2018 2017
Land and buildings 78 57
Vehicles, machinery and equipment 162 36
Total 240 93
In previous years Kvaerner has considered rent of project related assets, such as mobile cranes,
vessels, tools and equipment as services and not disclosed the related costs as lease expenses.
Following a thorough review and assessments in connection with transition to IFRS 16 Leases,
effective from 1 January 2019, Kvaerner has from 2018 included rent for these assets as
operating lease expenses.
Lease commitments
Total non-cancellable operating lease commitments
Amounts in NOK million 2018 2017
Amount due within one year 108 76
Amount due between one and five years 218 164
Amount due later than five years 97 128
Total 424 367
The group has non-cancellable sublease contracts for offices at Fornebu, Norway. Future minimum
sub-lease income at year-end 2018 is NOK 18 million.
Note 17 Interest-bearing liabilities
Financial reporting principles
Interest-bearing loans and borrowings are measured at amortised cost.
Bank debt
The revolving credit facility agreement of 8 July 2015 is a facility of NOK 2 000 million, maturing
in July 2020. The facility is provided by a syndicate of high quality international banks. The
revolving credit facility was undrawn during 2018 and as per 31 December 2018. The terms and
conditions include restrictions which are customary for these kind of facilities, including inter
alia negative pledge provisions and restrictions related to acquisitions, disposals and mergers.
There are also certain provisions of change of control included in the agreement. There are no
restrictions for dividend payments. The facility is unsecured.
The financial covenants are based on three sets of key financial ratios; an equity ratio based
on consolidated total borrowings/consolidated total equity, a cash covenant calculated by
consolidated total borrowings less consolidated net current operating assets and consolidated
cash and cash equivalent assets and an interest coverage ratio based on consolidated EBITDA/
consolidated finance costs. The financial covenants are tested on a quarterly basis. As of 31
December 2018 the company is in compliance with all covenants. The margin applicable to the
facility is based on a margin grid determined by the gearing ratio.
2018 and 2017
Amounts
in million
Nominal
currency
value
Book
value
Interest
margin
Interest
rate
Effective
interest
rate
Maturity
date
Interest
terms
Revolving
credit
facility
Multi
currency 2 000 - 2.00% - -
8 July
2020
IBOR +
Margin1
Total non-
current
borrowings -
1 The margin applicable to the facility is decided by a margin grid based on the gearing ratio. Commitment fee is 40
percent of the margin.
Note 18 Provisions and contingent liabilities
Financial reporting principles
A provision is recognised in the balance sheet when the group has a present obligation as a result
of a past event, it is probable that the group will be required to settle the obligation and the
amount can be reliably estimated. Provisions are determined by discounting the expected future
cash flows at a market based pre-tax rate that reflects current market assessments of the time
value of money and, where appropriate, the liability-specific risks. The unwinding of the discount
is recognised as a finance cost. Onerous contracts are measured at the lower of the expected cost
of terminating a contract and the expected net cost of continuing with the contract. All provisions
are presented as current liabilities as they are part of the operating cycle.
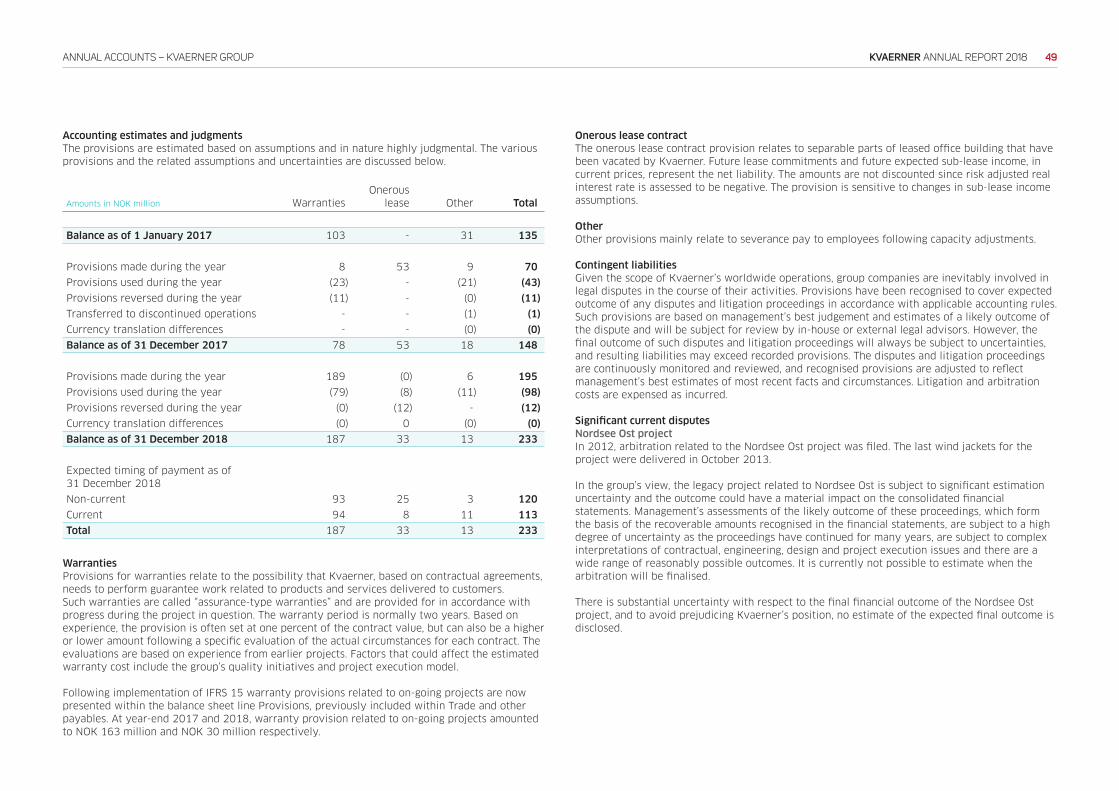
49KVAERNER ANNUAL REPORT 2018ANNUAL ACCOUNTS – KVAERNER GROUP
Accounting estimates and judgments
The provisions are estimated based on assumptions and in nature highly judgmental. The various
provisions and the related assumptions and uncertainties are discussed below.
Amounts in NOK million Warranties
Onerous
lease Other Total
Balance as of 1 January 2017 103 - 31 135
Provisions made during the year 8 53 9 70
Provisions used during the year (23) - (21) (43)
Provisions reversed during the year (11) - (0) (11)
Transferred to discontinued operations - - (1) (1)
Currency translation differences - - (0) (0)
Balance as of 31 December 2017 78 53 18 148
Provisions made during the year 189 (0) 6 195
Provisions used during the year (79) (8) (11) (98)
Provisions reversed during the year (0) (12) - (12)
Currency translation differences (0) 0 (0) (0)
Balance as of 31 December 2018 187 33 13 233
Expected timing of payment as of
31 December 2018
Non-current 93 25 3 120
Current 94 8 11 113
Total 187 33 13 233
Warranties
Provisions for warranties relate to the possibility that Kvaerner, based on contractual agreements,
needs to perform guarantee work related to products and services delivered to customers.
Such warranties are called “assurance-type warranties” and are provided for in accordance with
progress during the project in question. The warranty period is normally two years. Based on
experience, the provision is often set at one percent of the contract value, but can also be a higher
or lower amount following a specific evaluation of the actual circumstances for each contract. The
evaluations are based on experience from earlier projects. Factors that could affect the estimated
warranty cost include the group’s quality initiatives and project execution model.
Following implementation of IFRS 15 warranty provisions related to on-going projects are now
presented within the balance sheet line Provisions, previously included within Trade and other
payables. At year-end 2017 and 2018, warranty provision related to on-going projects amounted
to NOK 163 million and NOK 30 million respectively.
Onerous lease contract
The onerous lease contract provision relates to separable parts of leased office building that have
been vacated by Kvaerner. Future lease commitments and future expected sub-lease income, in
current prices, represent the net liability. The amounts are not discounted since risk adjusted real
interest rate is assessed to be negative. The provision is sensitive to changes in sub-lease income
assumptions.
Other
Other provisions mainly relate to severance pay to employees following capacity adjustments.
Contingent liabilities
Given the scope of Kvaerner’s worldwide operations, group companies are inevitably involved in
legal disputes in the course of their activities. Provisions have been recognised to cover expected
outcome of any disputes and litigation proceedings in accordance with applicable accounting rules.
Such provisions are based on management’s best judgement and estimates of a likely outcome of
the dispute and will be subject for review by in-house or external legal advisors. However, the
final outcome of such disputes and litigation proceedings will always be subject to uncertainties,
and resulting liabilities may exceed recorded provisions. The disputes and litigation proceedings
are continuously monitored and reviewed, and recognised provisions are adjusted to reflect
management’s best estimates of most recent facts and circumstances. Litigation and arbitration
costs are expensed as incurred.
Significant current disputes
Nordsee Ost project
In 2012, arbitration related to the Nordsee Ost project was filed. The last wind jackets for the
project were delivered in October 2013.
In the group’s view, the legacy project related to Nordsee Ost is subject to significant estimation
uncertainty and the outcome could have a material impact on the consolidated financial
statements. Management’s assessments of the likely outcome of these proceedings, which form
the basis of the recoverable amounts recognised in the financial statements, are subject to a high
degree of uncertainty as the proceedings have continued for many years, are subject to complex
interpretations of contractual, engineering, design and project execution issues and there are a
wide range of reasonably possible outcomes. It is currently not possible to estimate when the
arbitration will be finalised.
There is substantial uncertainty with respect to the final financial outcome of the Nordsee Ost
project, and to avoid prejudicing Kvaerner’s position, no estimate of the expected final outcome is
disclosed.
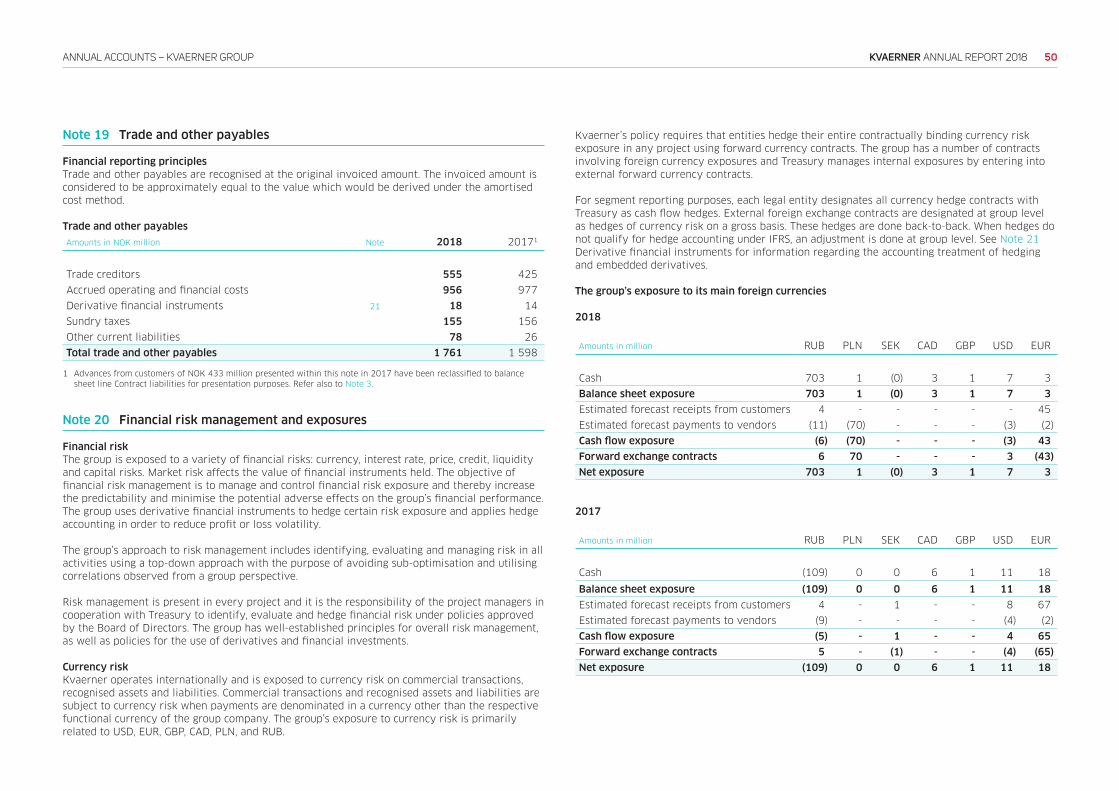
50KVAERNER ANNUAL REPORT 2018ANNUAL ACCOUNTS – KVAERNER GROUP
Note 19 Trade and other payables
Financial reporting principles
Trade and other payables are recognised at the original invoiced amount. The invoiced amount is
considered to be approximately equal to the value which would be derived under the amortised
cost method.
Trade and other payables
Amounts in NOK million Note 2018 20171
Trade creditors 555 425
Accrued operating and financial costs 956 977
Derivative financial instruments 21 18 14
Sundry taxes 155 156
Other current liabilities 78 26
Total trade and other payables 1 761 1 598
1 Advances from customers of NOK 433 million presented within this note in 2017 have been reclassified to balance
sheet line Contract liabilities for presentation purposes. Refer also to Note 3.
Note 20 Financial risk management and exposures
Financial risk
The group is exposed to a variety of financial risks: currency, interest rate, price, credit, liquidity
and capital risks. Market risk affects the value of financial instruments held. The objective of
financial risk management is to manage and control financial risk exposure and thereby increase
the predictability and minimise the potential adverse effects on the group’s financial performance.
The group uses derivative financial instruments to hedge certain risk exposure and applies hedge
accounting in order to reduce profit or loss volatility.
The group’s approach to risk management includes identifying, evaluating and managing risk in all
activities using a top-down approach with the purpose of avoiding sub-optimisation and utilising
correlations observed from a group perspective.
Risk management is present in every project and it is the responsibility of the project managers in
cooperation with Treasury to identify, evaluate and hedge financial risk under policies approved
by the Board of Directors. The group has well-established principles for overall risk management,
as well as policies for the use of derivatives and financial investments.
Currency risk
Kvaerner operates internationally and is exposed to currency risk on commercial transactions,
recognised assets and liabilities. Commercial transactions and recognised assets and liabilities are
subject to currency risk when payments are denominated in a currency other than the respective
functional currency of the group company. The group’s exposure to currency risk is primarily
related to USD, EUR, GBP, CAD, PLN, and RUB.
Kvaerner’s policy requires that entities hedge their entire contractually binding currency risk
exposure in any project using forward currency contracts. The group has a number of contracts
involving foreign currency exposures and Treasury manages internal exposures by entering into
external forward currency contracts.
For segment reporting purposes, each legal entity designates all currency hedge contracts with
Treasury as cash flow hedges. External foreign exchange contracts are designated at group level
as hedges of currency risk on a gross basis. These hedges are done back-to-back. When hedges do
not qualify for hedge accounting under IFRS, an adjustment is done at group level. See Note 21
Derivative financial instruments for information regarding the accounting treatment of hedging
and embedded derivatives.
The group’s exposure to its main foreign currencies
2018
Amounts in million RUB PLN SEK CAD GBP USD EUR
Cash 703 1 (0) 3 1 7 3
Balance sheet exposure 703 1 (0) 3 1 7 3
Estimated forecast receipts from customers 4 - - - - - 45
Estimated forecast payments to vendors (11) (70) - - - (3) (2)
Cash flow exposure (6) (70) - - - (3) 43
Forward exchange contracts 6 70 - - - 3 (43)
Net exposure 703 1 (0) 3 1 7 3
2017
Amounts in million RUB PLN SEK CAD GBP USD EUR
Cash (109) 0 0 6 1 11 18
Balance sheet exposure (109) 0 0 6 1 11 18
Estimated forecast receipts from customers 4 - 1 - - 8 67
Estimated forecast payments to vendors (9) - - - - (4) (2)
Cash flow exposure (5) - 1 - - 4 65
Forward exchange contracts 5 - (1) - - (4) (65)
Net exposure (109) 0 0 6 1 11 18
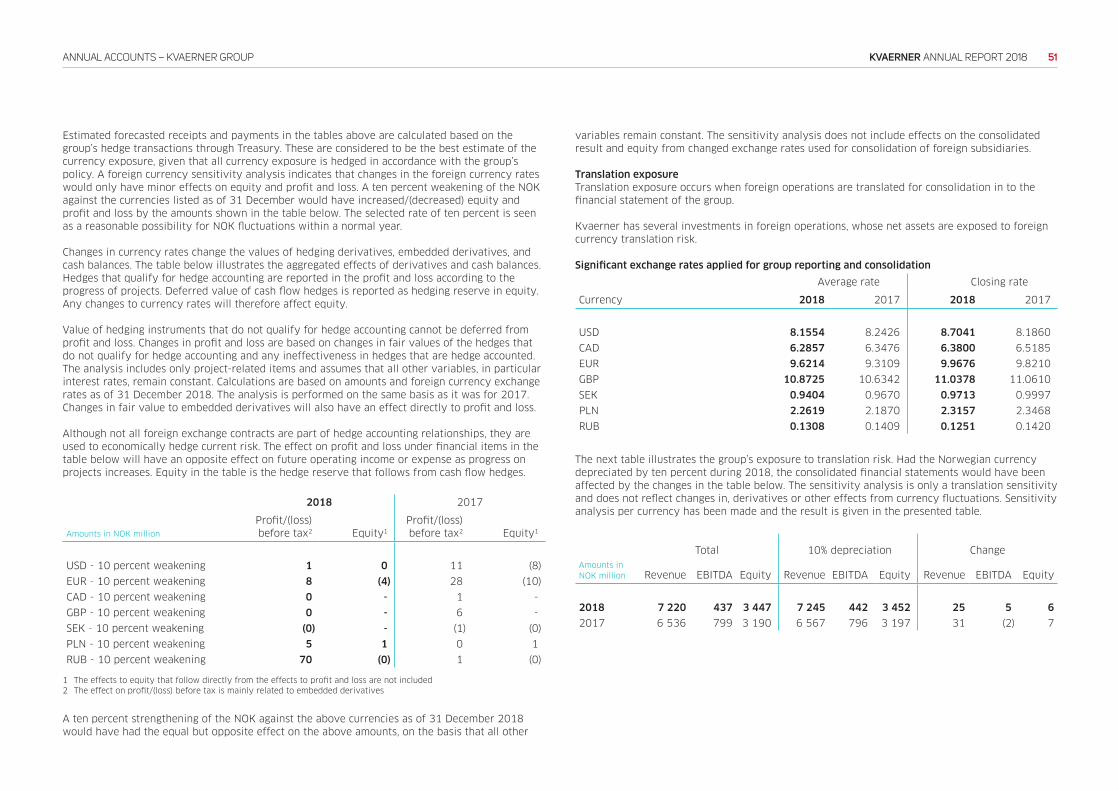
51KVAERNER ANNUAL REPORT 2018ANNUAL ACCOUNTS – KVAERNER GROUP
Estimated forecasted receipts and payments in the tables above are calculated based on the
group’s hedge transactions through Treasury. These are considered to be the best estimate of the
currency exposure, given that all currency exposure is hedged in accordance with the group’s
policy. A foreign currency sensitivity analysis indicates that changes in the foreign currency rates
would only have minor effects on equity and profit and loss. A ten percent weakening of the NOK
against the currencies listed as of 31 December would have increased/(decreased) equity and
profit and loss by the amounts shown in the table below. The selected rate of ten percent is seen
as a reasonable possibility for NOK fluctuations within a normal year.
Changes in currency rates change the values of hedging derivatives, embedded derivatives, and
cash balances. The table below illustrates the aggregated effects of derivatives and cash balances.
Hedges that qualify for hedge accounting are reported in the profit and loss according to the
progress of projects. Deferred value of cash flow hedges is reported as hedging reserve in equity.
Any changes to currency rates will therefore affect equity.
Value of hedging instruments that do not qualify for hedge accounting cannot be deferred from
profit and loss. Changes in profit and loss are based on changes in fair values of the hedges that
do not qualify for hedge accounting and any ineffectiveness in hedges that are hedge accounted.
The analysis includes only project-related items and assumes that all other variables, in particular
interest rates, remain constant. Calculations are based on amounts and foreign currency exchange
rates as of 31 December 2018. The analysis is performed on the same basis as it was for 2017.
Changes in fair value to embedded derivatives will also have an effect directly to profit and loss.
Although not all foreign exchange contracts are part of hedge accounting relationships, they are
used to economically hedge current risk. The effect on profit and loss under financial items in the
table below will have an opposite effect on future operating income or expense as progress on
projects increases. Equity in the table is the hedge reserve that follows from cash flow hedges.
2018 2017
Amounts in NOK million
Profit/(loss)
before tax2 Equity1
Profit/(loss)
before tax2 Equity1
USD - 10 percent weakening 1 0 11 (8)
EUR - 10 percent weakening 8 (4) 28 (10)
CAD - 10 percent weakening 0 - 1 -
GBP - 10 percent weakening 0 - 6 -
SEK - 10 percent weakening (0) - (1) (0)
PLN - 10 percent weakening 5 1 0 1
RUB - 10 percent weakening 70 (0) 1 (0)
1 The effects to equity that follow directly from the effects to profit and loss are not included
2 The effect on profit/(loss) before tax is mainly related to embedded derivatives
A ten percent strengthening of the NOK against the above currencies as of 31 December 2018
would have had the equal but opposite effect on the above amounts, on the basis that all other
variables remain constant. The sensitivity analysis does not include effects on the consolidated
result and equity from changed exchange rates used for consolidation of foreign subsidiaries.
Translation exposure
Translation exposure occurs when foreign operations are translated for consolidation in to the
financial statement of the group.
Kvaerner has several investments in foreign operations, whose net assets are exposed to foreign
currency translation risk.
Significant exchange rates applied for group reporting and consolidation
Average rate Closing rate
Currency 2018 2017 2018 2017
USD 8.1554 8.2426 8.7041 8.1860
CAD 6.2857 6.3476 6.3800 6.5185
EUR 9.6214 9.3109 9.9676 9.8210
GBP 10.8725 10.6342 11.0378 11.0610
SEK 0.9404 0.9670 0.9713 0.9997
PLN 2.2619 2.1870 2.3157 2.3468
RUB 0.1308 0.1409 0.1251 0.1420
The next table illustrates the group’s exposure to translation risk. Had the Norwegian currency
depreciated by ten percent during 2018, the consolidated financial statements would have been
affected by the changes in the table below. The sensitivity analysis is only a translation sensitivity
and does not reflect changes in, derivatives or other effects from currency fluctuations. Sensitivity
analysis per currency has been made and the result is given in the presented table.
Total 10% depreciation Change
Amounts in
NOK million Revenue EBITDA Equity Revenue EBITDA Equity Revenue EBITDA Equity
2018 7 220 437 3 447 7 245 442 3 452 25 5 6
2017 6 536 799 3 190 6 567 796 3 197 31 (2) 7
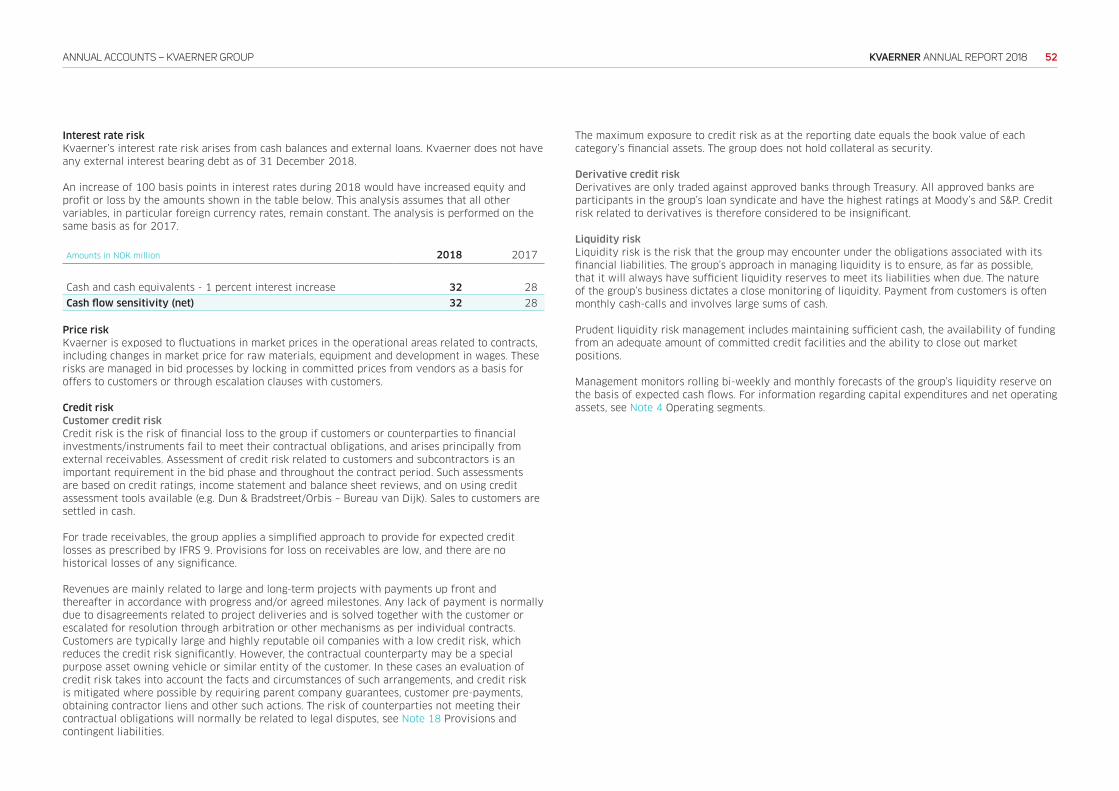
52KVAERNER ANNUAL REPORT 2018ANNUAL ACCOUNTS – KVAERNER GROUP
Interest rate risk
Kvaerner’s interest rate risk arises from cash balances and external loans. Kvaerner does not have
any external interest bearing debt as of 31 December 2018.
An increase of 100 basis points in interest rates during 2018 would have increased equity and
profit or loss by the amounts shown in the table below. This analysis assumes that all other
variables, in particular foreign currency rates, remain constant. The analysis is performed on the
same basis as for 2017.
Amounts in NOK million 2018 2017
Cash and cash equivalents - 1 percent interest increase 32 28
Cash flow sensitivity (net) 32 28
Price risk
Kvaerner is exposed to fluctuations in market prices in the operational areas related to contracts,
including changes in market price for raw materials, equipment and development in wages. These
risks are managed in bid processes by locking in committed prices from vendors as a basis for
offers to customers or through escalation clauses with customers.
Credit risk
Customer credit risk
Credit risk is the risk of financial loss to the group if customers or counterparties to financial
investments/instruments fail to meet their contractual obligations, and arises principally from
external receivables. Assessment of credit risk related to customers and subcontractors is an
important requirement in the bid phase and throughout the contract period. Such assessments
are based on credit ratings, income statement and balance sheet reviews, and on using credit
assessment tools available (e.g. Dun & Bradstreet/Orbis – Bureau van Dijk). Sales to customers are
settled in cash.
For trade receivables, the group applies a simplified approach to provide for expected credit
losses as prescribed by IFRS 9. Provisions for loss on receivables are low, and there are no
historical losses of any significance.
Revenues are mainly related to large and long-term projects with payments up front and
thereafter in accordance with progress and/or agreed milestones. Any lack of payment is normally
due to disagreements related to project deliveries and is solved together with the customer or
escalated for resolution through arbitration or other mechanisms as per individual contracts.
Customers are typically large and highly reputable oil companies with a low credit risk, which
reduces the credit risk significantly. However, the contractual counterparty may be a special
purpose asset owning vehicle or similar entity of the customer. In these cases an evaluation of
credit risk takes into account the facts and circumstances of such arrangements, and credit risk
is mitigated where possible by requiring parent company guarantees, customer pre-payments,
obtaining contractor liens and other such actions. The risk of counterparties not meeting their
contractual obligations will normally be related to legal disputes, see Note 18 Provisions and
contingent liabilities.
The maximum exposure to credit risk as at the reporting date equals the book value of each
category’s financial assets. The group does not hold collateral as security.
Derivative credit risk
Derivatives are only traded against approved banks through Treasury. All approved banks are
participants in the group’s loan syndicate and have the highest ratings at Moody’s and S&P. Credit
risk related to derivatives is therefore considered to be insignificant.
Liquidity risk
Liquidity risk is the risk that the group may encounter under the obligations associated with its
financial liabilities. The group’s approach in managing liquidity is to ensure, as far as possible,
that it will always have sufficient liquidity reserves to meet its liabilities when due. The nature
of the group’s business dictates a close monitoring of liquidity. Payment from customers is often
monthly cash-calls and involves large sums of cash.
Prudent liquidity risk management includes maintaining sufficient cash, the availability of funding
from an adequate amount of committed credit facilities and the ability to close out market
positions.
Management monitors rolling bi-weekly and monthly forecasts of the group’s liquidity reserve on
the basis of expected cash flows. For information regarding capital expenditures and net operating
assets, see Note 4 Operating segments.
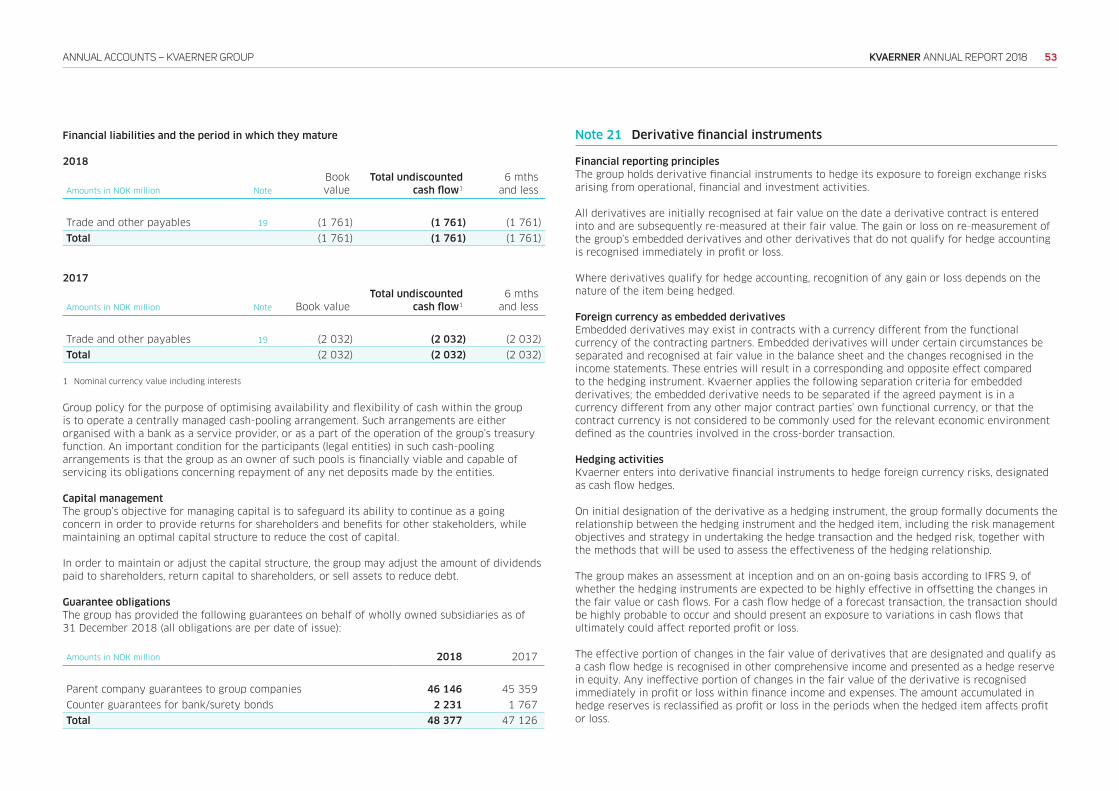
53KVAERNER ANNUAL REPORT 2018ANNUAL ACCOUNTS – KVAERNER GROUP
Financial liabilities and the period in which they mature
2018
Amounts in NOK million Note
Book
value
Total undiscounted
cash flow1
6 mths
and less
Trade and other payables 19 (1 761) (1 761) (1 761)
Total (1 761) (1 761) (1 761)
2017
Amounts in NOK million Note Book value
Total undiscounted
cash flow1
6 mths
and less
Trade and other payables 19 (2 032) (2 032) (2 032)
Total (2 032) (2 032) (2 032)
1 Nominal currency value including interests
Group policy for the purpose of optimising availability and flexibility of cash within the group
is to operate a centrally managed cash-pooling arrangement. Such arrangements are either
organised with a bank as a service provider, or as a part of the operation of the group’s treasury
function. An important condition for the participants (legal entities) in such cash-pooling
arrangements is that the group as an owner of such pools is financially viable and capable of
servicing its obligations concerning repayment of any net deposits made by the entities.
Capital management
The group’s objective for managing capital is to safeguard its ability to continue as a going
concern in order to provide returns for shareholders and benefits for other stakeholders, while
maintaining an optimal capital structure to reduce the cost of capital.
In order to maintain or adjust the capital structure, the group may adjust the amount of dividends
paid to shareholders, return capital to shareholders, or sell assets to reduce debt.
Guarantee obligations
The group has provided the following guarantees on behalf of wholly owned subsidiaries as of
31 December 2018 (all obligations are per date of issue):
Amounts in NOK million 2018 2017
Parent company guarantees to group companies 46 146 45 359
Counter guarantees for bank/surety bonds 2 231 1 767
Total 48 377 47 126
Note 21 Derivative financial instruments
Financial reporting principles
The group holds derivative financial instruments to hedge its exposure to foreign exchange risks
arising from operational, financial and investment activities.
All derivatives are initially recognised at fair value on the date a derivative contract is entered
into and are subsequently re-measured at their fair value. The gain or loss on re-measurement of
the group’s embedded derivatives and other derivatives that do not qualify for hedge accounting
is recognised immediately in profit or loss.
Where derivatives qualify for hedge accounting, recognition of any gain or loss depends on the
nature of the item being hedged.
Foreign currency as embedded derivatives
Embedded derivatives may exist in contracts with a currency different from the functional
currency of the contracting partners. Embedded derivatives will under certain circumstances be
separated and recognised at fair value in the balance sheet and the changes recognised in the
income statements. These entries will result in a corresponding and opposite effect compared
to the hedging instrument. Kvaerner applies the following separation criteria for embedded
derivatives; the embedded derivative needs to be separated if the agreed payment is in a
currency different from any other major contract parties’ own functional currency, or that the
contract currency is not considered to be commonly used for the relevant economic environment
defined as the countries involved in the cross-border transaction.
Hedging activities
Kvaerner enters into derivative financial instruments to hedge foreign currency risks, designated
as cash flow hedges.
On initial designation of the derivative as a hedging instrument, the group formally documents the
relationship between the hedging instrument and the hedged item, including the risk management
objectives and strategy in undertaking the hedge transaction and the hedged risk, together with
the methods that will be used to assess the effectiveness of the hedging relationship.
The group makes an assessment at inception and on an on-going basis according to IFRS 9, of
whether the hedging instruments are expected to be highly effective in offsetting the changes in
the fair value or cash flows. For a cash flow hedge of a forecast transaction, the transaction should
be highly probable to occur and should present an exposure to variations in cash flows that
ultimately could affect reported profit or loss.
The effective portion of changes in the fair value of derivatives that are designated and qualify as
a cash flow hedge is recognised in other comprehensive income and presented as a hedge reserve
in equity. Any ineffective portion of changes in the fair value of the derivative is recognised
immediately in profit or loss within finance income and expenses. The amount accumulated in
hedge reserves is reclassified as profit or loss in the periods when the hedged item affects profit
or loss.
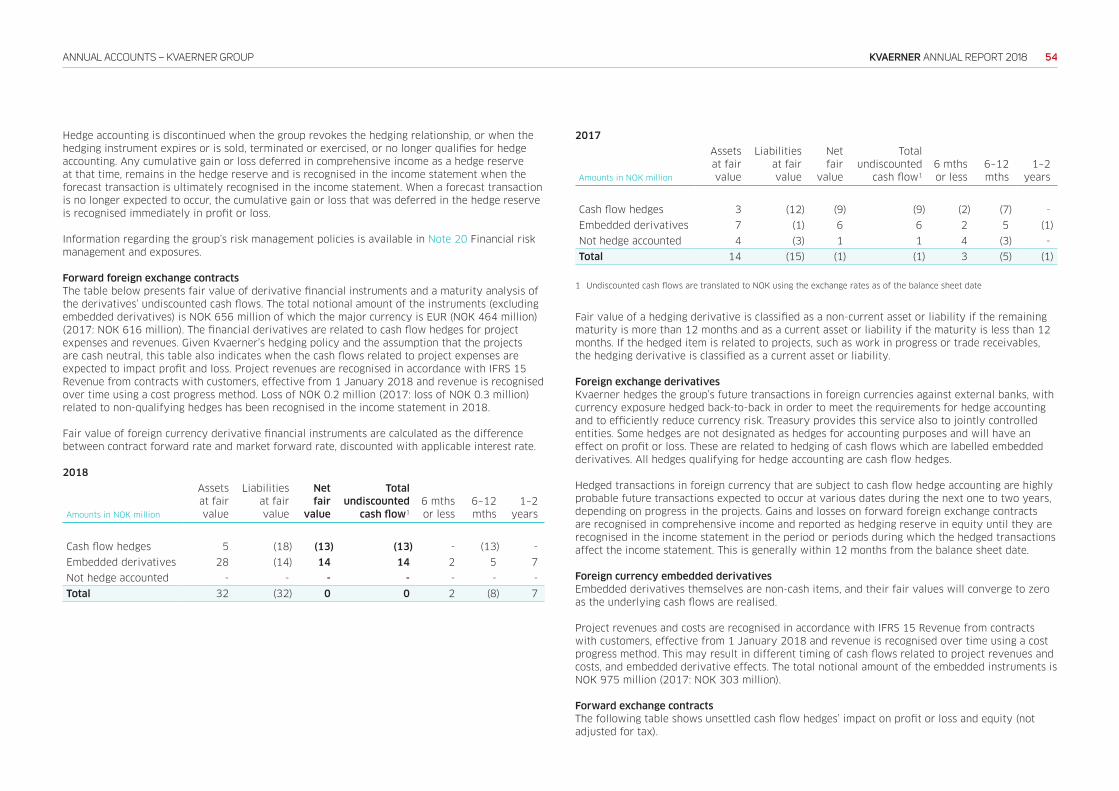
54KVAERNER ANNUAL REPORT 2018ANNUAL ACCOUNTS – KVAERNER GROUP
Hedge accounting is discontinued when the group revokes the hedging relationship, or when the
hedging instrument expires or is sold, terminated or exercised, or no longer qualifies for hedge
accounting. Any cumulative gain or loss deferred in comprehensive income as a hedge reserve
at that time, remains in the hedge reserve and is recognised in the income statement when the
forecast transaction is ultimately recognised in the income statement. When a forecast transaction
is no longer expected to occur, the cumulative gain or loss that was deferred in the hedge reserve
is recognised immediately in profit or loss.
Information regarding the group’s risk management policies is available in Note 20 Financial risk
management and exposures.
Forward foreign exchange contracts
The table below presents fair value of derivative financial instruments and a maturity analysis of
the derivatives’ undiscounted cash flows. The total notional amount of the instruments (excluding
embedded derivatives) is NOK 656 million of which the major currency is EUR (NOK 464 million)
(2017: NOK 616 million). The financial derivatives are related to cash flow hedges for project
expenses and revenues. Given Kvaerner’s hedging policy and the assumption that the projects
are cash neutral, this table also indicates when the cash flows related to project expenses are
expected to impact profit and loss. Project revenues are recognised in accordance with IFRS 15
Revenue from contracts with customers, effective from 1 January 2018 and revenue is recognised
over time using a cost progress method. Loss of NOK 0.2 million (2017: loss of NOK 0.3 million)
related to non-qualifying hedges has been recognised in the income statement in 2018.
Fair value of foreign currency derivative financial instruments are calculated as the difference
between contract forward rate and market forward rate, discounted with applicable interest rate.
2018
Amounts in NOK million
Assets
at fair
value
Liabilities
at fair
value
Net
fair
value
Total
undiscounted
cash flow1
6 mths
or less
6–12
mths
1–2
years
Cash flow hedges 5 (18) (13) (13) - (13) -
Embedded derivatives 28 (14) 14 14 2 5 7
Not hedge accounted - - - - - - -
Total 32 (32) 0 0 2 (8) 7
2017
Amounts in NOK million
Assets
at fair
value
Liabilities
at fair
value
Net
fair
value
Total
undiscounted
cash flow1
6 mths
or less
6–12
mths
1–2
years
Cash flow hedges 3 (12) (9) (9) (2) (7) -
Embedded derivatives 7 (1) 6 6 2 5 (1)
Not hedge accounted 4 (3) 1 1 4 (3) -
Total 14 (15) (1) (1) 3 (5) (1)
1 Undiscounted cash flows are translated to NOK using the exchange rates as of the balance sheet date
Fair value of a hedging derivative is classified as a non-current asset or liability if the remaining
maturity is more than 12 months and as a current asset or liability if the maturity is less than 12
months. If the hedged item is related to projects, such as work in progress or trade receivables,
the hedging derivative is classified as a current asset or liability.
Foreign exchange derivatives
Kvaerner hedges the group’s future transactions in foreign currencies against external banks, with
currency exposure hedged back-to-back in order to meet the requirements for hedge accounting
and to efficiently reduce currency risk. Treasury provides this service also to jointly controlled
entities. Some hedges are not designated as hedges for accounting purposes and will have an
effect on profit or loss. These are related to hedging of cash flows which are labelled embedded
derivatives. All hedges qualifying for hedge accounting are cash flow hedges.
Hedged transactions in foreign currency that are subject to cash flow hedge accounting are highly
probable future transactions expected to occur at various dates during the next one to two years,
depending on progress in the projects. Gains and losses on forward foreign exchange contracts
are recognised in comprehensive income and reported as hedging reserve in equity until they are
recognised in the income statement in the period or periods during which the hedged transactions
affect the income statement. This is generally within 12 months from the balance sheet date.
Foreign currency embedded derivatives
Embedded derivatives themselves are non-cash items, and their fair values will converge to zero
as the underlying cash flows are realised.
Project revenues and costs are recognised in accordance with IFRS 15 Revenue from contracts
with customers, effective from 1 January 2018 and revenue is recognised over time using a cost
progress method. This may result in different timing of cash flows related to project revenues and
costs, and embedded derivative effects. The total notional amount of the embedded instruments is
NOK 975 million (2017: NOK 303 million).
Forward exchange contracts
The following table shows unsettled cash flow hedges’ impact on profit or loss and equity (not
adjusted for tax).
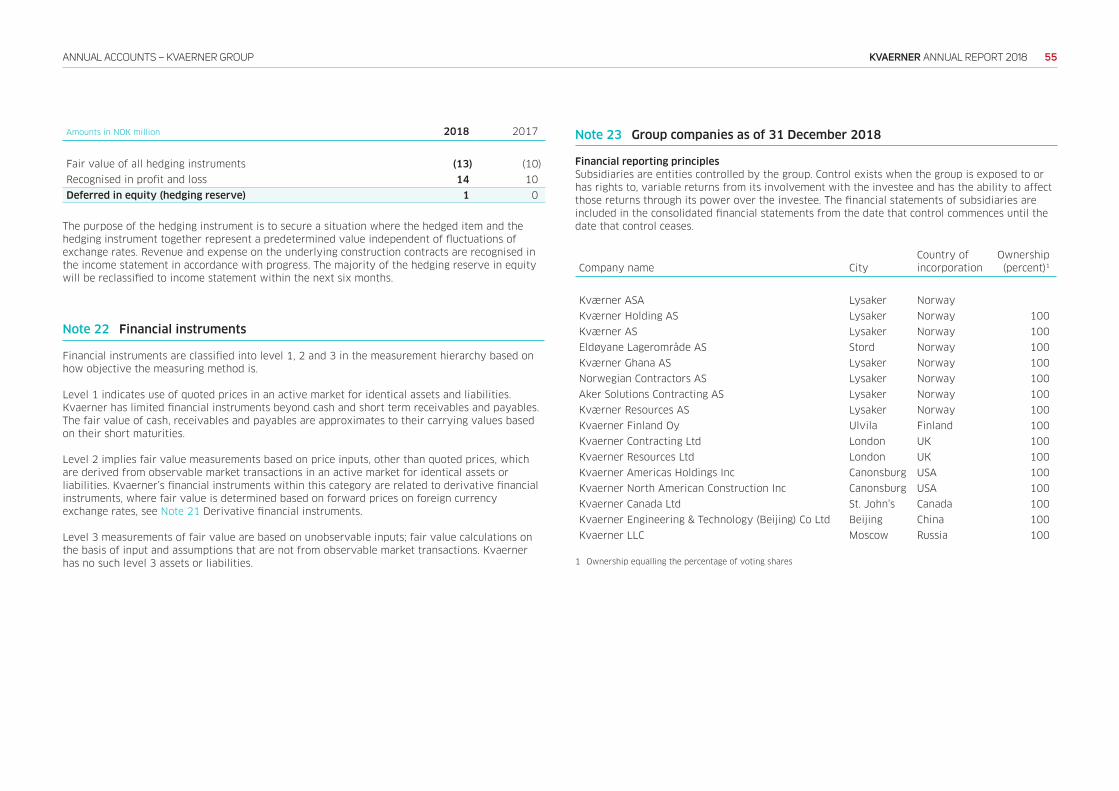
55KVAERNER ANNUAL REPORT 2018ANNUAL ACCOUNTS – KVAERNER GROUP
Amounts in NOK million 2018 2017
Fair value of all hedging instruments (13) (10)
Recognised in profit and loss 14 10
Deferred in equity (hedging reserve) 1 0
The purpose of the hedging instrument is to secure a situation where the hedged item and the
hedging instrument together represent a predetermined value independent of fluctuations of
exchange rates. Revenue and expense on the underlying construction contracts are recognised in
the income statement in accordance with progress. The majority of the hedging reserve in equity
will be reclassified to income statement within the next six months.
Note 22 Financial instruments
Financial instruments are classified into level 1, 2 and 3 in the measurement hierarchy based on
how objective the measuring method is.
Level 1 indicates use of quoted prices in an active market for identical assets and liabilities.
Kvaerner has limited financial instruments beyond cash and short term receivables and payables.
The fair value of cash, receivables and payables are approximates to their carrying values based
on their short maturities.
Level 2 implies fair value measurements based on price inputs, other than quoted prices, which
are derived from observable market transactions in an active market for identical assets or
liabilities. Kvaerner’s financial instruments within this category are related to derivative financial
instruments, where fair value is determined based on forward prices on foreign currency
exchange rates, see Note 21 Derivative financial instruments.
Level 3 measurements of fair value are based on unobservable inputs; fair value calculations on
the basis of input and assumptions that are not from observable market transactions. Kvaerner
has no such level 3 assets or liabilities.
Note 23 Group companies as of 31 December 2018
Financial reporting principles
Subsidiaries are entities controlled by the group. Control exists when the group is exposed to or
has rights to, variable returns from its involvement with the investee and has the ability to affect
those returns through its power over the investee. The financial statements of subsidiaries are
included in the consolidated financial statements from the date that control commences until the
date that control ceases.
Company name City
Country of
incorporation
Ownership
(percent)1
Kværner ASA Lysaker Norway
Kværner Holding AS Lysaker Norway 100
Kværner AS Lysaker Norway 100
Eldøyane Lagerområde AS Stord Norway 100
Kværner Ghana AS Lysaker Norway 100
Norwegian Contractors AS Lysaker Norway 100
Aker Solutions Contracting AS Lysaker Norway 100
Kværner Resources AS Lysaker Norway 100
Kvaerner Finland Oy Ulvila Finland 100
Kvaerner Contracting Ltd London UK 100
Kvaerner Resources Ltd London UK 100
Kvaerner Americas Holdings Inc Canonsburg USA 100
Kvaerner North American Construction Inc Canonsburg USA 100
Kvaerner Canada Ltd St. John’s Canada 100
Kvaerner Engineering & Technology (Beijing) Co Ltd Beijing China 100
Kvaerner LLC Moscow Russia 100
1 Ownership equalling the percentage of voting shares
56KVAERNER ANNUAL REPORT 2018ANNUAL ACCOUNTS – KVAERNER GROUP
Note 24 Equity-accounted investees
Financial reporting principles
Investments in associates
Associates are those entities in which the group has significant influence, but not control or joint
control, over the financial and operating policies. Significant influence is presumed to exist when
the group holds between 20 and 50 percent of the voting power of another entity, but this is
assessed on a case-by-case basis. Investments in associates are accounted for using the equity
method and are recognised initially at cost.
The consolidated financial statements include the group’s share of the profit or loss and other
comprehensive income of equity accounted investees, after adjustments to align the accounting
policies with those of the group, from the date that significant influence or joint control
commences until the date that significant influence or joint control ceases.
When the group’s share of losses exceeds its interest in an equity-accounted investee, the carrying
amount of that interest, including any long-term investments, is reduced to zero, and further
losses are not recognised except to the extent that the group has legal or constructive obligations
or has made payments on behalf of the investee.
Joint arrangements
Joint arrangements exist when the group has joint control over such an arrangement, established
by contractual agreement and requiring unanimous consent of the parties to the arrangement for
strategic, financial and operating decisions. Joint arrangements may be either joint ventures or
joint operations.
Joint ventures
A joint venture is a joint arrangement whereby the venturers have rights to the net assets of
the arrangement. Investments in joint ventures are accounted for using the equity method, with
Kvaerner’s share of net result after tax recognised in profit or loss. For joint ventures where tax is
levied on the partners rather than the joint venture, Kvaerner’s share of the tax will be included
in the tax expense line in the group’s consolidated income statement.
Joint operations
A joint operation is a joint arrangement whereby the parties have rights to the assets, liabilities
and obligations relating to the arrangement. Joint operations are proportionately consolidated in
the group financial statements.
Presentation of results
The purpose of the investment determines where its results are presented in profit or loss.
When entities are formed to share risk in executing a project or are closely related to Kvaerner’s
operating activities, the share of the profit or loss is reported as part of revenue and other
income in operating profit. Share of profit or loss from financial investments is reported as part of
financial items.
Associated companies and joint ventures are defined as related parties to Kvaerner. See Note 25
Related parties, for overview of transactions and balances between Kvaerner and associated
companies and joint ventures.
Joint Venture Agreement with Peter Kiewit Infrastructure Co
Kiewit-Kvaerner Contractors (KKC) is a partnership under Newfoundland and Labrador law, owned
50 percent by each of the partners Peter Kiewit Infrastructure Co and Kvaerner. KKC has been
building the gravity base structure (GBS) for the Hebron oil platform for ExxonMobil Corporation.
The work has been performed in Newfoundland and Labrador, Canada and was completed in third
quarter 2017.
Joint Venture Agreement with Kellogg Brown & Root (Norway) AS
Kvaerner and Kellogg Brown & Root (Norway) AS (KBR) formed a joint venture in 2015, K2JV
ANS, for project execution with an ownership of 51 percent to Kvaerner and 49 percent to KBR. A
Norwegian ANS entity implies that both partners are jointly and several liable for the obligations
of the partnership. The risk is limited on partner level as the partners are limited liabilities
companies. Parent company guarantee is issued by parent company Kværner ASA for the
contractual obligations, refer to Note 20 Financial risk management and exposures. Partnership
property is held in the name of the partnership. Profit is shared 51:49 by the partners. K2JV is
executing the Johan Sverdrup utility and living quarter (ULQ) platform topside EPC project for
Equinor and will be completed in first quarter 2019.
Valhall Flank West
In April 2017 Kvaerner signed a frame agreement with Aker BP, and later an alliance agreement
was signed for construction and hook-up of fixed offshore platforms, including topsides and steel
jacket substructures. 18 December 2017, Aker BP has awarded Kvaerner a contract for delivery
of the topside and steel jacket substructure for Valhall Flank West. This is the first project in
the Wellhead Platform Alliance, which was established in the spring of 2017 between Aker BP,
Kvaerner, ABB and Aker Solutions. Kvaerner will account for its activities as a joint operation, and
report its scope of work in the group accounts. The project will be delivered in 2019.
Joint Venture Agreement with Aker Solutions AS
Kvaerner and Aker Solutions AS have formed a joint venture, ASK JV AS, for project execution
with an ownership of 50 percent to each of the partners. A Norwegian AS entity is a limited
liability company. Parent company guarantees are issued by the partners’ ultimate parents for
the contractual obligations, refer to Note 20 Financial risk management and exposures. Profit
is shared 50:50 by the partners. ASK JV is executing modification work for the Johan Sverdrup
process platform topside EPC project for Equinor. The project will be delivered in 2022.
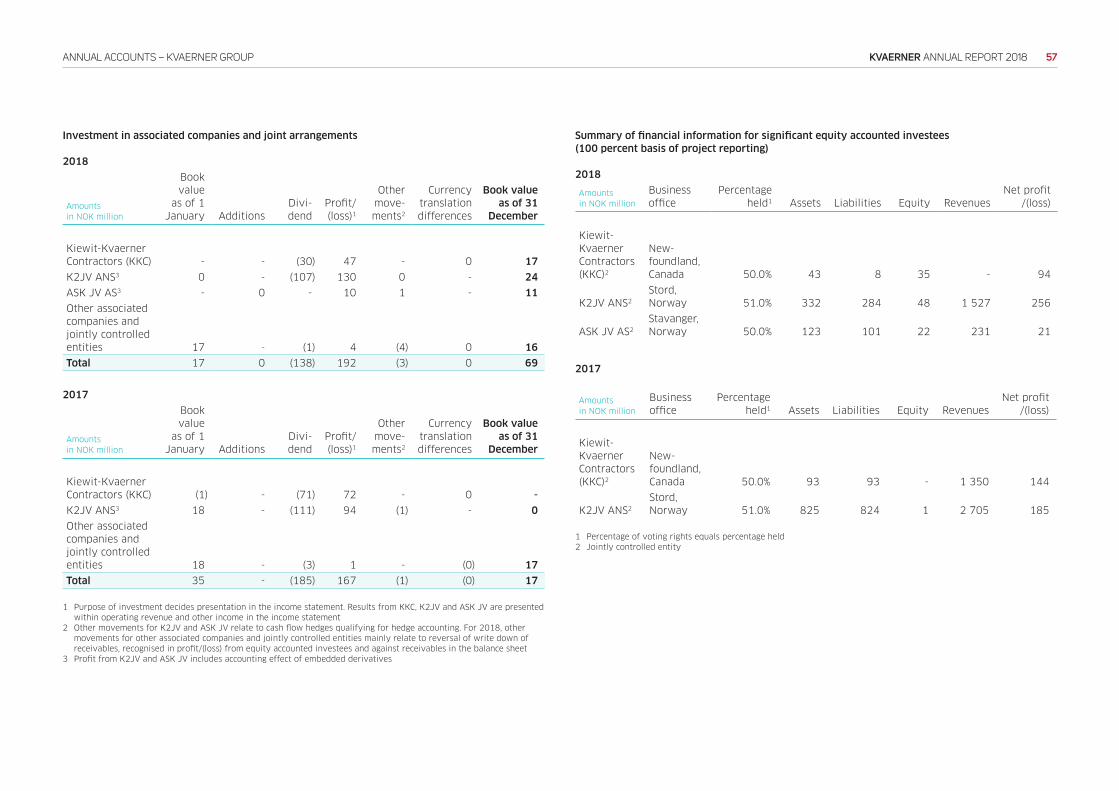
57KVAERNER ANNUAL REPORT 2018ANNUAL ACCOUNTS – KVAERNER GROUP
Investment in associated companies and joint arrangements
2018
Amounts
in NOK million
Book
value
as of 1
January Additions
Divi-
dend
Profit/
(loss)1
Other
move-
ments2
Currency
translation
differences
Book value
as of 31
December
Kiewit-Kvaerner
Contractors (KKC) - - (30) 47 - 0 17
K2JV ANS3 0 - (107) 130 0 - 24
ASK JV AS3 - 0 - 10 1 - 11
Other associated
companies and
jointly controlled
entities 17 - (1) 4 (4) 0 16
Total 17 0 (138) 192 (3) 0 69
2017
Amounts
in NOK million
Book
value
as of 1
January Additions
Divi-
dend
Profit/
(loss)1
Other
move-
ments2
Currency
translation
differences
Book value
as of 31
December
Kiewit-Kvaerner
Contractors (KKC) (1) - (71) 72 - 0 -
K2JV ANS3 18 - (111) 94 (1) - 0
Other associated
companies and
jointly controlled
entities 18 - (3) 1 - (0) 17
Total 35 - (185) 167 (1) (0) 17
1 Purpose of investment decides presentation in the income statement. Results from KKC, K2JV and ASK JV are presented
within operating revenue and other income in the income statement
2 Other movements for K2JV and ASK JV relate to cash flow hedges qualifying for hedge accounting. For 2018, other
movements for other associated companies and jointly controlled entities mainly relate to reversal of write down of
receivables, recognised in profit/(loss) from equity accounted investees and against receivables in the balance sheet
3 Profit from K2JV and ASK JV includes accounting effect of embedded derivatives
Summary of financial information for significant equity accounted investees
(100 percent basis of project reporting)
2018
Amounts
in NOK million
Business
office
Percentage
held1 Assets Liabilities Equity Revenues
Net profit
/(loss)
Kiewit-
Kvaerner
Contractors
(KKC)2
New-
foundland,
Canada 50.0% 43 8 35 - 94
K2JV ANS2
Stord,
Norway 51.0% 332 284 48 1 527 256
ASK JV AS2
Stavanger,
Norway 50.0% 123 101 22 231 21
2017
Amounts
in NOK million
Business
office
Percentage
held1 Assets Liabilities Equity Revenues
Net profit
/(loss)
Kiewit-
Kvaerner
Contractors
(KKC)2
New-
foundland,
Canada 50.0% 93 93 - 1 350 144
K2JV ANS2
Stord,
Norway 51.0% 825 824 1 2 705 185
1 Percentage of voting rights equals percentage held
2 Jointly controlled entity
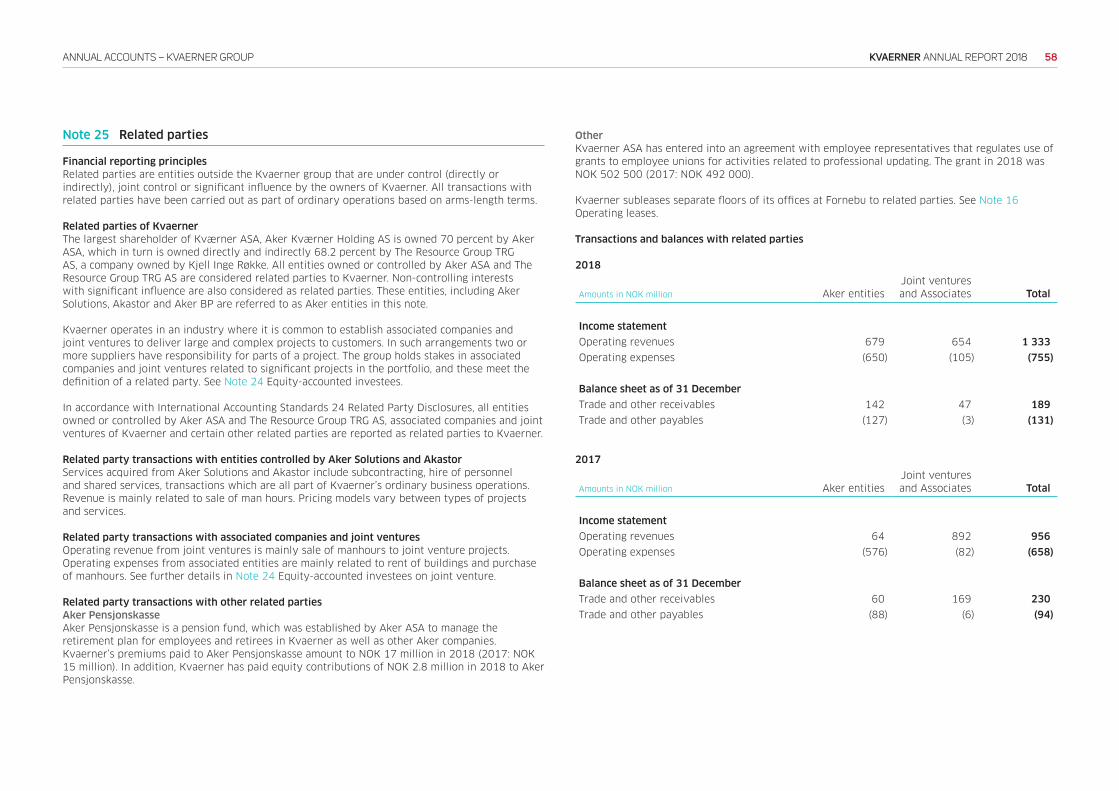
58KVAERNER ANNUAL REPORT 2018ANNUAL ACCOUNTS – KVAERNER GROUP
Note 25 Related parties
Financial reporting principles
Related parties are entities outside the Kvaerner group that are under control (directly or
indirectly), joint control or significant influence by the owners of Kvaerner. All transactions with
related parties have been carried out as part of ordinary operations based on arms-length terms.
Related parties of Kvaerner
The largest shareholder of Kværner ASA, Aker Kværner Holding AS is owned 70 percent by Aker
ASA, which in turn is owned directly and indirectly 68.2 percent by The Resource Group TRG
AS, a company owned by Kjell Inge Røkke. All entities owned or controlled by Aker ASA and The
Resource Group TRG AS are considered related parties to Kvaerner. Non-controlling interests
with significant influence are also considered as related parties. These entities, including Aker
Solutions, Akastor and Aker BP are referred to as Aker entities in this note.
Kvaerner operates in an industry where it is common to establish associated companies and
joint ventures to deliver large and complex projects to customers. In such arrangements two or
more suppliers have responsibility for parts of a project. The group holds stakes in associated
companies and joint ventures related to significant projects in the portfolio, and these meet the
definition of a related party. See Note 24 Equity-accounted investees.
In accordance with International Accounting Standards 24 Related Party Disclosures, all entities
owned or controlled by Aker ASA and The Resource Group TRG AS, associated companies and joint
ventures of Kvaerner and certain other related parties are reported as related parties to Kvaerner.
Related party transactions with entities controlled by Aker Solutions and Akastor
Services acquired from Aker Solutions and Akastor include subcontracting, hire of personnel
and shared services, transactions which are all part of Kvaerner’s ordinary business operations.
Revenue is mainly related to sale of man hours. Pricing models vary between types of projects
and services.
Related party transactions with associated companies and joint ventures
Operating revenue from joint ventures is mainly sale of manhours to joint venture projects.
Operating expenses from associated entities are mainly related to rent of buildings and purchase
of manhours. See further details in Note 24 Equity-accounted investees on joint venture.
Related party transactions with other related parties
Aker Pensjonskasse
Aker Pensjonskasse is a pension fund, which was established by Aker ASA to manage the
retirement plan for employees and retirees in Kvaerner as well as other Aker companies.
Kvaerner’s premiums paid to Aker Pensjonskasse amount to NOK 17 million in 2018 (2017: NOK
15 million). In addition, Kvaerner has paid equity contributions of NOK 2.8 million in 2018 to Aker
Pensjonskasse.
Other
Kvaerner ASA has entered into an agreement with employee representatives that regulates use of
grants to employee unions for activities related to professional updating. The grant in 2018 was
NOK 502 500 (2017: NOK 492 000).
Kvaerner subleases separate floors of its offices at Fornebu to related parties. See Note 16
Operating leases.
Transactions and balances with related parties
2018
Amounts in NOK million Aker entities
Joint ventures
and Associates Total
Income statement
Operating revenues 679 654 1 333
Operating expenses (650) (105) (755)
Balance sheet as of 31 December
Trade and other receivables 142 47 189
Trade and other payables (127) (3) (131)
2017
Amounts in NOK million Aker entities
Joint ventures
and Associates Total
Income statement
Operating revenues 64 892 956
Operating expenses (576) (82) (658)
Balance sheet as of 31 December
Trade and other receivables 60 169 230
Trade and other payables (88) (6) (94)
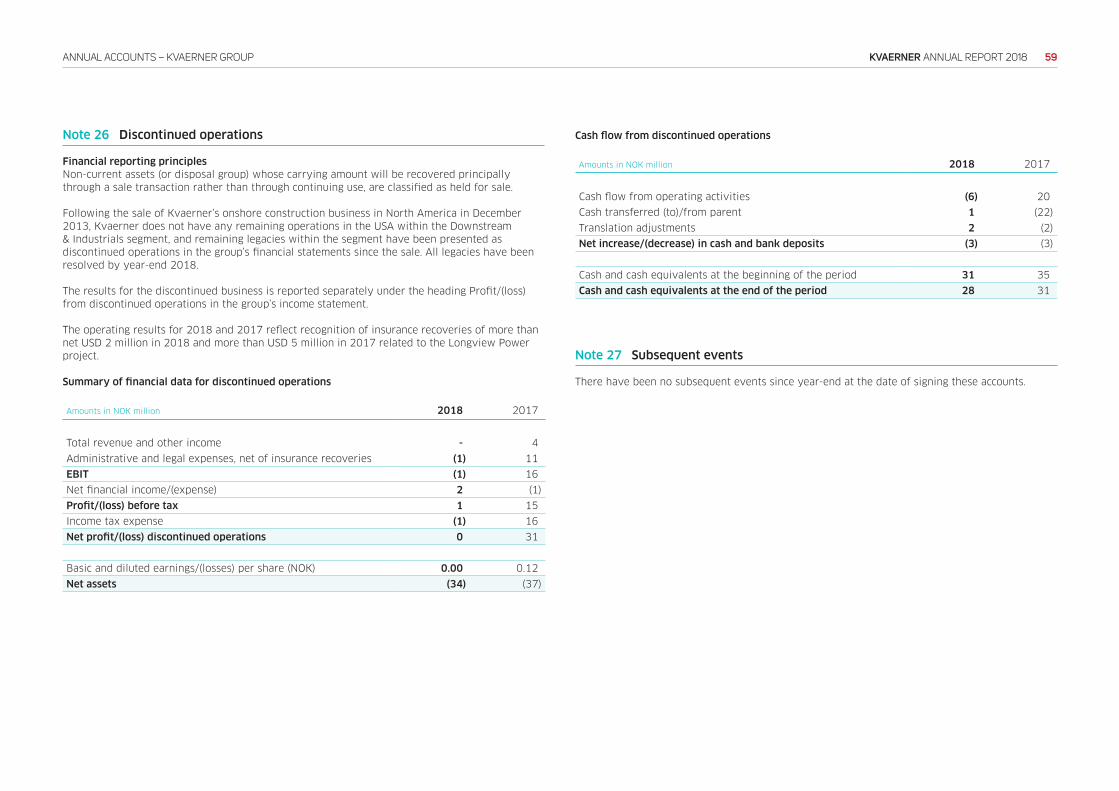
59KVAERNER ANNUAL REPORT 2018ANNUAL ACCOUNTS – KVAERNER GROUP
Note 26 Discontinued operations
Financial reporting principles
Non-current assets (or disposal group) whose carrying amount will be recovered principally
through a sale transaction rather than through continuing use, are classified as held for sale.
Following the sale of Kvaerner’s onshore construction business in North America in December
2013, Kvaerner does not have any remaining operations in the USA within the Downstream
& Industrials segment, and remaining legacies within the segment have been presented as
discontinued operations in the group’s financial statements since the sale. All legacies have been
resolved by year-end 2018.
The results for the discontinued business is reported separately under the heading Profit/(loss)
from discontinued operations in the group’s income statement.
The operating results for 2018 and 2017 reflect recognition of insurance recoveries of more than
net USD 2 million in 2018 and more than USD 5 million in 2017 related to the Longview Power
project.
Summary of financial data for discontinued operations
Amounts in NOK million 2018 2017
Total revenue and other income - 4
Administrative and legal expenses, net of insurance recoveries (1) 11
EBIT (1) 16
Net financial income/(expense) 2 (1)
Profit/(loss) before tax 1 15
Income tax expense (1) 16
Net profit/(loss) discontinued operations 0 31
Basic and diluted earnings/(losses) per share (NOK) 0.00 0.12
Net assets (34) (37)
Cash flow from discontinued operations
Amounts in NOK million 2018 2017
Cash flow from operating activities (6) 20
Cash transferred (to)/from parent 1 (22)
Translation adjustments 2 (2)
Net increase/(decrease) in cash and bank deposits (3) (3)
Cash and cash equivalents at the beginning of the period 31 35
Cash and cash equivalents at the end of the period 28 31
Note 27 Subsequent events
There have been no subsequent events since year-end at the date of signing these accounts.
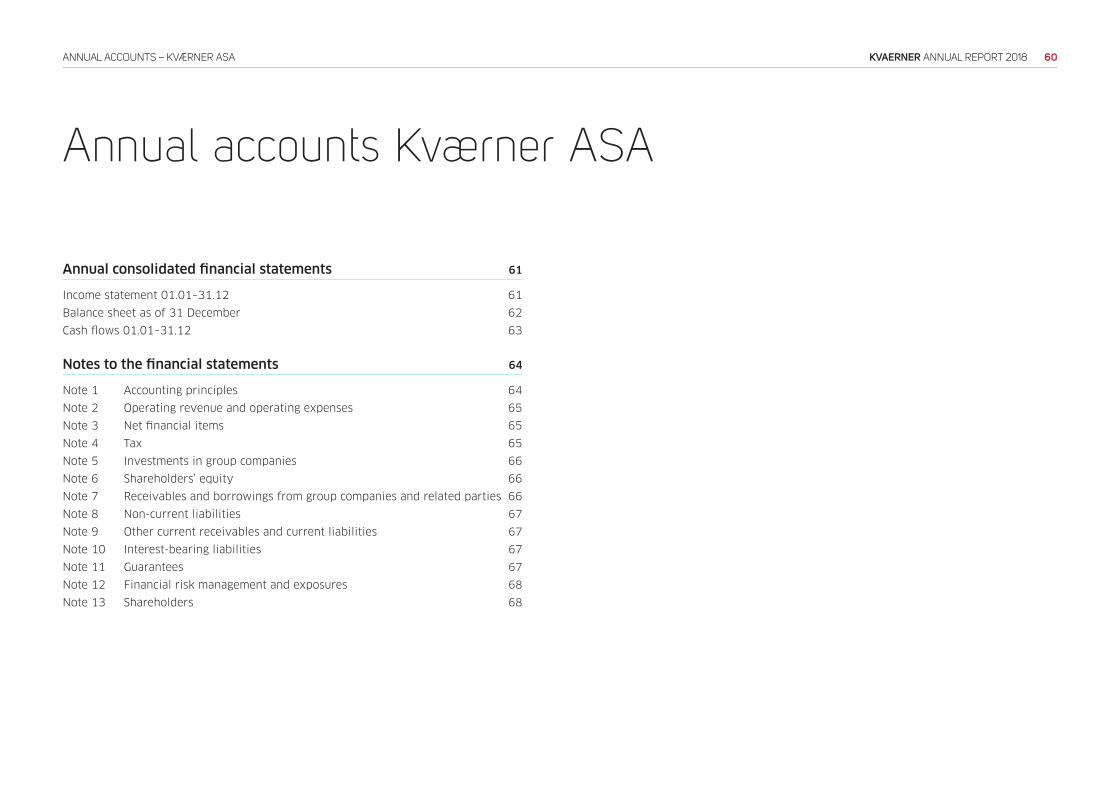
60KVAERNER ANNUAL REPORT 2018ANNUAL ACCOUNTS – KVÆRNER ASA
Annual accounts Kværner ASA
Annual consolidated financial statements 61
Income statement 01.01–31.12 61
Balance sheet as of 31 December 62
Cash flows 01.01–31.12 63
Notes to the financial statements 64
Note 1 Accounting principles 64
Note 2 Operating revenue and operating expenses 65
Note 3 Net financial items 65
Note 4 Tax 65
Note 5 Investments in group companies 66
Note 6 Shareholders’ equity 66
Note 7 Receivables and borrowings from group companies and related parties 66
Note 8 Non-current liabilities 67
Note 9 Other current receivables and current liabilities 67
Note 10 Interest-bearing liabilities 67
Note 11 Guarantees 67
Note 12 Financial risk management and exposures 68
Note 13 Shareholders 68
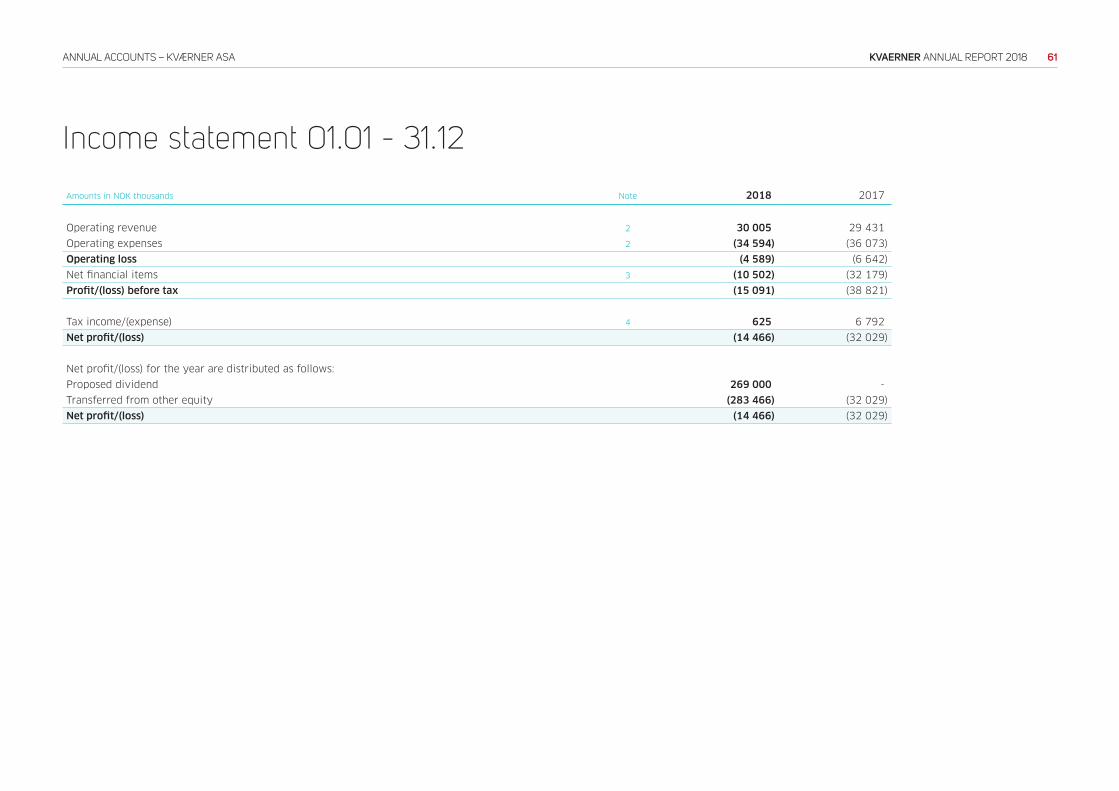
61KVAERNER ANNUAL REPORT 2018ANNUAL ACCOUNTS – KVÆRNER ASA
Amounts in NOK thousands Note 2018 2017
Operating revenue 2 30 005 29 431
Operating expenses 2 (34 594) (36 073)
Operating loss (4 589) (6 642)
Net financial items 3 (10 502) (32 179)
Profit/(loss) before tax (15 091) (38 821)
Tax income/(expense) 4 625 6 792
Net profit/(loss) (14 466) (32 029)
Net profit/(loss) for the year are distributed as follows:
Proposed dividend 269 000 -
Transferred from other equity (283 466) (32 029)
Net profit/(loss) (14 466) (32 029)
Income statement 01.01 - 31.12
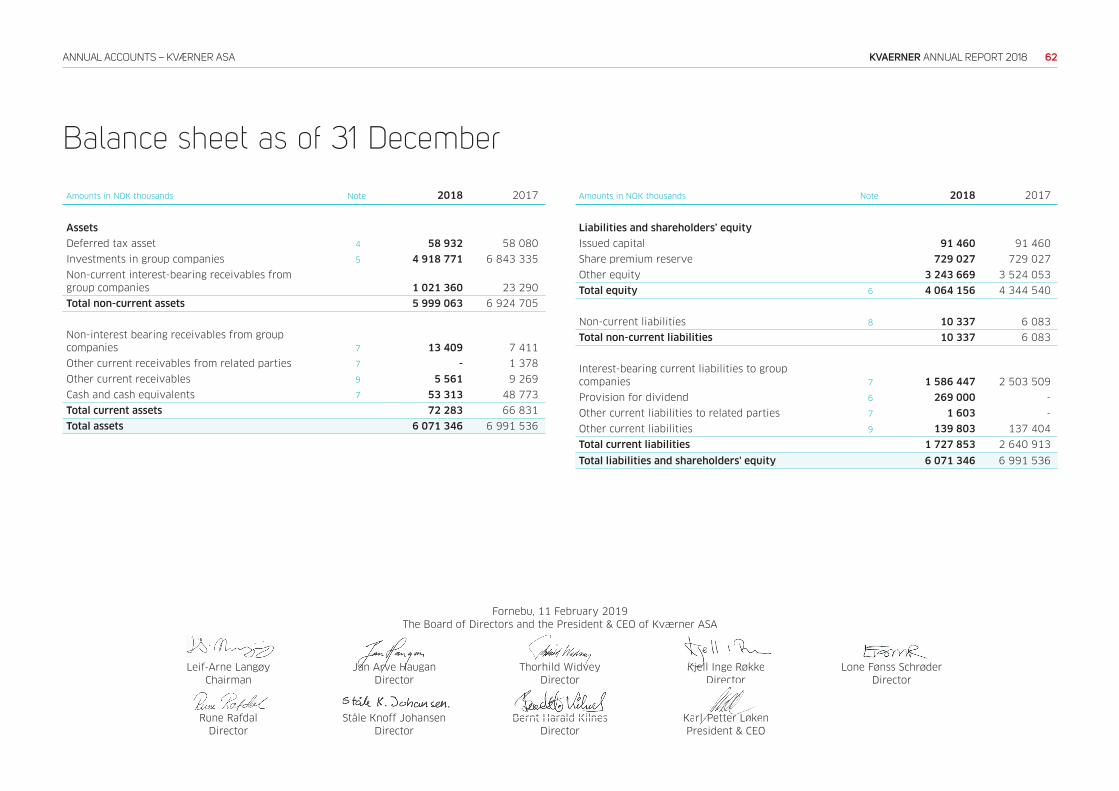
62KVAERNER ANNUAL REPORT 2018ANNUAL ACCOUNTS – KVÆRNER ASA
Balance sheet as of 31 December
Amounts in NOK thousands Note 2018 2017
Assets
Deferred tax asset 4 58 932 58 080
Investments in group companies 5 4 918 771 6 843 335
Non-current interest-bearing receivables from
group companies 1 021 360 23 290
Total non-current assets 5 999 063 6 924 705
Non-interest bearing receivables from group
companies 7 13 409 7 411
Other current receivables from related parties 7 - 1 378
Other current receivables 9 5 561 9 269
Cash and cash equivalents 7 53 313 48 773
Total current assets 72 283 66 831
Total assets 6 071 346 6 991 536
Amounts in NOK thousands Note 2018 2017
Liabilities and shareholders’ equity
Issued capital 91 460 91 460
Share premium reserve 729 027 729 027
Other equity 3 243 669 3 524 053
Total equity 6 4 064 156 4 344 540
Non-current liabilities 8 10 337 6 083
Total non-current liabilities 10 337 6 083
Interest-bearing current liabilities to group
companies 7 1 586 447 2 503 509
Provision for dividend 6 269 000 -
Other current liabilities to related parties 7 1 603 -
Other current liabilities 9 139 803 137 404
Total current liabilities 1 727 853 2 640 913
Total liabilities and shareholders' equity 6 071 346 6 991 536
Leif-Arne Langøy
Chairman
Jan Arve Haugan
Director
Thorhild Widvey
Director
Kjell Inge Røkke
Director
Lone Fønss Schrøder
Director
Rune Rafdal
Director
Ståle Knoff Johansen
Director
Bernt Harald Kilnes
Director
Karl-Petter Løken
President & CEO
Fornebu, 11 February 2019
The Board of Directors and the President & CEO of Kværner ASA
Stål K ff J h
one Fønss Schrøder
Bernt Harald Kilnes
Thorhild WidveyJan Arve Hauga Kjell Inge Røkke
rl-Petter Løke
resident & CEO
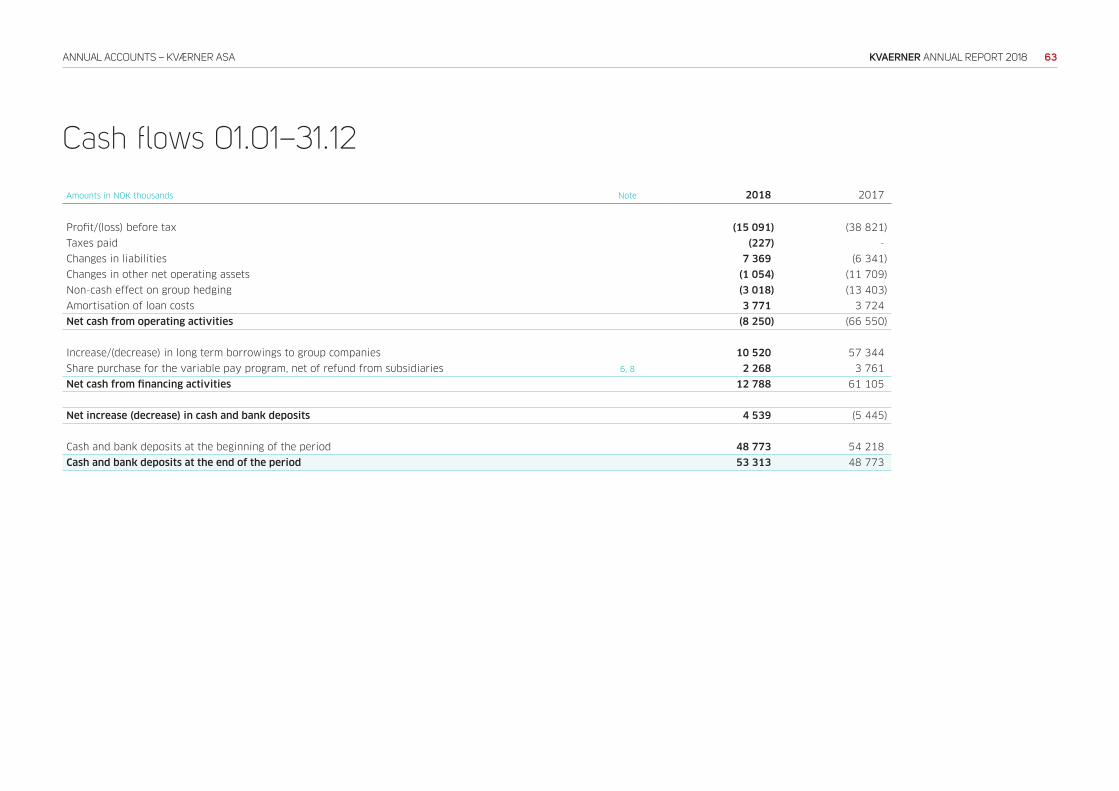
63KVAERNER ANNUAL REPORT 2018ANNUAL ACCOUNTS – KVÆRNER ASA
Cash flows 01.01–31.12
Amounts in NOK thousands Note 2018 2017
Profit/(loss) before tax (15 091) (38 821)
Taxes paid (227) -
Changes in liabilities 7 369 (6 341)
Changes in other net operating assets (1 054) (11 709)
Non-cash effect on group hedging (3 018) (13 403)
Amortisation of loan costs 3 771 3 724
Net cash from operating activities (8 250) (66 550)
Increase/(decrease) in long term borrowings to group companies 10 520 57 344
Share purchase for the variable pay program, net of refund from subsidiaries 6, 8 2 268 3 761
Net cash from financing activities 12 788 61 105
Net increase (decrease) in cash and bank deposits 4 539 (5 445)
Cash and bank deposits at the beginning of the period 48 773 54 218
Cash and bank deposits at the end of the period 53 313 48 773
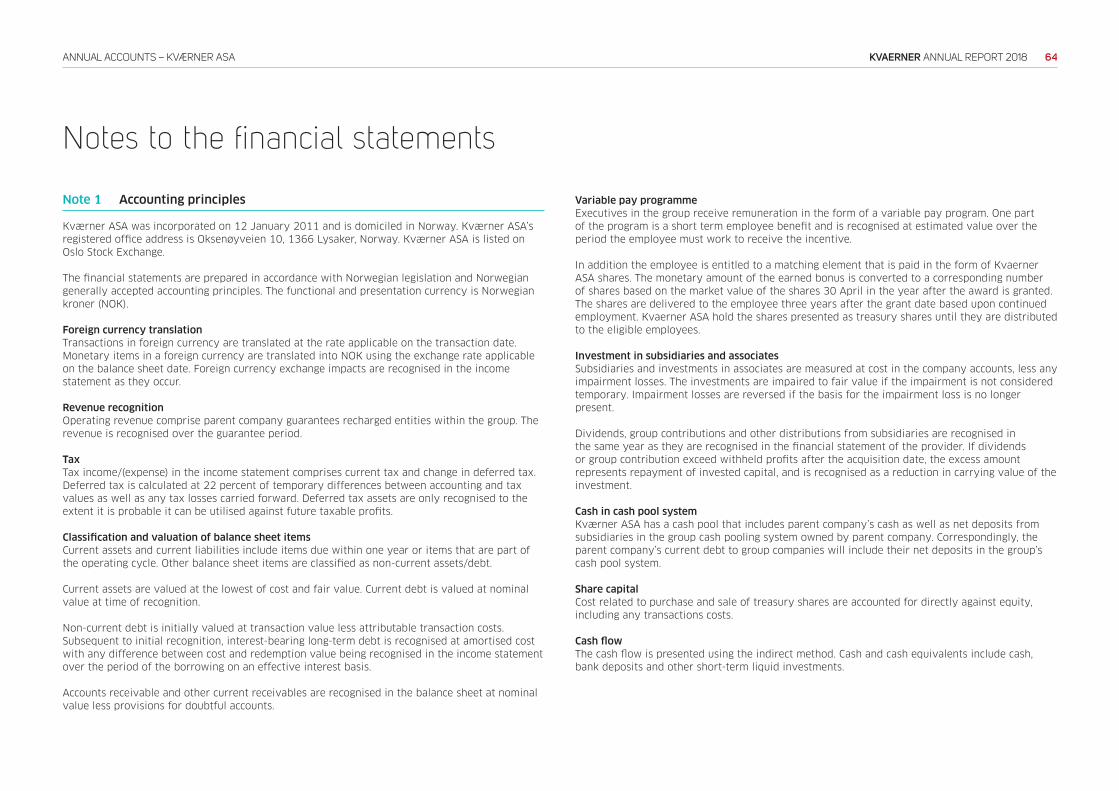
64KVAERNER ANNUAL REPORT 2018ANNUAL ACCOUNTS – KVÆRNER ASA
Note 1 Accounting principles
Kværner ASA was incorporated on 12 January 2011 and is domiciled in Norway. Kværner ASA’s
registered office address is Oksenøyveien 10, 1366 Lysaker, Norway. Kværner ASA is listed on
Oslo Stock Exchange.
The financial statements are prepared in accordance with Norwegian legislation and Norwegian
generally accepted accounting principles. The functional and presentation currency is Norwegian
kroner (NOK).
Foreign currency translation
Transactions in foreign currency are translated at the rate applicable on the transaction date.
Monetary items in a foreign currency are translated into NOK using the exchange rate applicable
on the balance sheet date. Foreign currency exchange impacts are recognised in the income
statement as they occur.
Revenue recognition
Operating revenue comprise parent company guarantees recharged entities within the group. The
revenue is recognised over the guarantee period.
Tax
Tax income/(expense) in the income statement comprises current tax and change in deferred tax.
Deferred tax is calculated at 22 percent of temporary differences between accounting and tax
values as well as any tax losses carried forward. Deferred tax assets are only recognised to the
extent it is probable it can be utilised against future taxable profits.
Classification and valuation of balance sheet items
Current assets and current liabilities include items due within one year or items that are part of
the operating cycle. Other balance sheet items are classified as non-current assets/debt.
Current assets are valued at the lowest of cost and fair value. Current debt is valued at nominal
value at time of recognition.
Non-current debt is initially valued at transaction value less attributable transaction costs.
Subsequent to initial recognition, interest-bearing long-term debt is recognised at amortised cost
with any difference between cost and redemption value being recognised in the income statement
over the period of the borrowing on an effective interest basis.
Accounts receivable and other current receivables are recognised in the balance sheet at nominal
value less provisions for doubtful accounts.
Variable pay programme
Executives in the group receive remuneration in the form of a variable pay program. One part
of the program is a short term employee benefit and is recognised at estimated value over the
period the employee must work to receive the incentive.
In addition the employee is entitled to a matching element that is paid in the form of Kvaerner
ASA shares. The monetary amount of the earned bonus is converted to a corresponding number
of shares based on the market value of the shares 30 April in the year after the award is granted.
The shares are delivered to the employee three years after the grant date based upon continued
employment. Kvaerner ASA hold the shares presented as treasury shares until they are distributed
to the eligible employees.
Investment in subsidiaries and associates
Subsidiaries and investments in associates are measured at cost in the company accounts, less any
impairment losses. The investments are impaired to fair value if the impairment is not considered
temporary. Impairment losses are reversed if the basis for the impairment loss is no longer
present.
Dividends, group contributions and other distributions from subsidiaries are recognised in
the same year as they are recognised in the financial statement of the provider. If dividends
or group contribution exceed withheld profits after the acquisition date, the excess amount
represents repayment of invested capital, and is recognised as a reduction in carrying value of the
investment.
Cash in cash pool system
Kværner ASA has a cash pool that includes parent company’s cash as well as net deposits from
subsidiaries in the group cash pooling system owned by parent company. Correspondingly, the
parent company’s current debt to group companies will include their net deposits in the group’s
cash pool system.
Share capital
Cost related to purchase and sale of treasury shares are accounted for directly against equity,
including any transactions costs.
Cash flow
The cash flow is presented using the indirect method. Cash and cash equivalents include cash,
bank deposits and other short-term liquid investments.
Notes to the financial statements
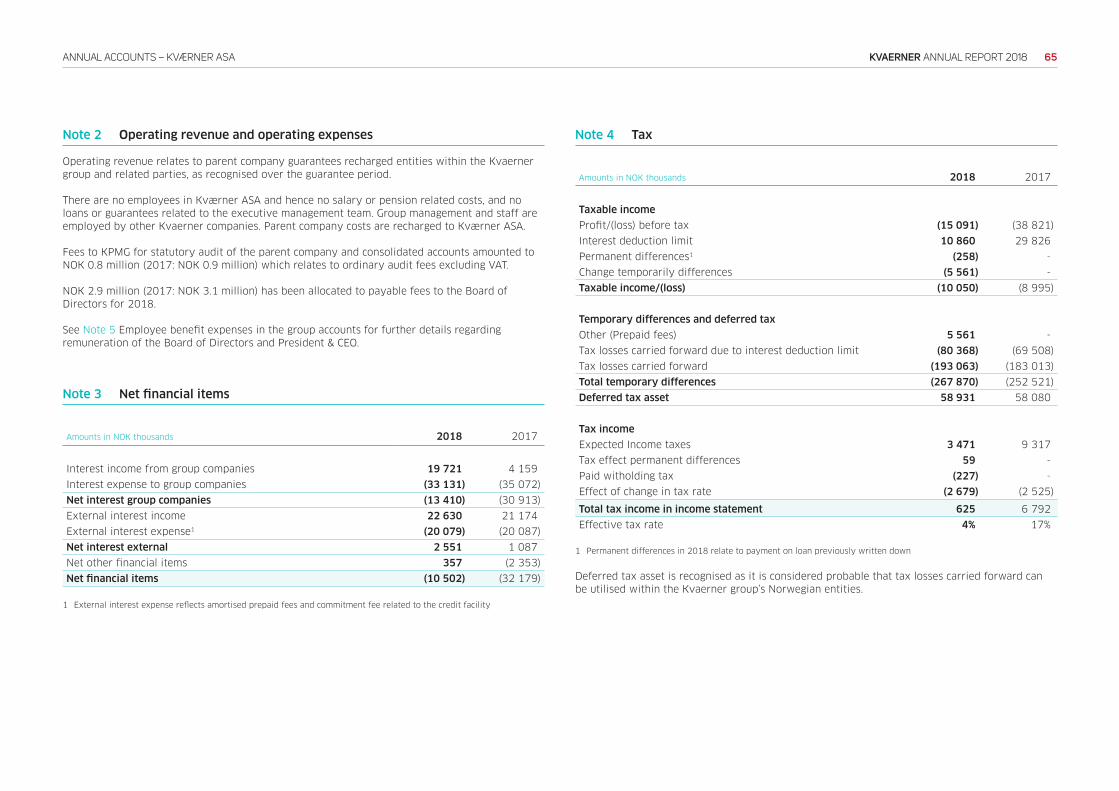
65KVAERNER ANNUAL REPORT 2018ANNUAL ACCOUNTS – KVÆRNER ASA
Note 2 Operating revenue and operating expenses
Operating revenue relates to parent company guarantees recharged entities within the Kvaerner
group and related parties, as recognised over the guarantee period.
There are no employees in Kværner ASA and hence no salary or pension related costs, and no
loans or guarantees related to the executive management team. Group management and staff are
employed by other Kvaerner companies. Parent company costs are recharged to Kværner ASA.
Fees to KPMG for statutory audit of the parent company and consolidated accounts amounted to
NOK 0.8 million (2017: NOK 0.9 million) which relates to ordinary audit fees excluding VAT.
NOK 2.9 million (2017: NOK 3.1 million) has been allocated to payable fees to the Board of
Directors for 2018.
See Note 5 Employee benefit expenses in the group accounts for further details regarding
remuneration of the Board of Directors and President & CEO.
Note 3 Net financial items
Amounts in NOK thousands 2018 2017
Interest income from group companies 19 721 4 159
Interest expense to group companies (33 131) (35 072)
Net interest group companies (13 410) (30 913)
External interest income 22 630 21 174
External interest expense1 (20 079) (20 087)
Net interest external 2 551 1 087
Net other financial items 357 (2 353)
Net financial items (10 502) (32 179)
1 External interest expense reflects amortised prepaid fees and commitment fee related to the credit facility
Note 4 Tax
Amounts in NOK thousands 2018 2017
Taxable income
Profit/(loss) before tax (15 091) (38 821)
Interest deduction limit 10 860 29 826
Permanent differences1 (258) -
Change temporarily differences (5 561) -
Taxable income/(loss) (10 050) (8 995)
Temporary differences and deferred tax
Other (Prepaid fees) 5 561 -
Tax losses carried forward due to interest deduction limit (80 368) (69 508)
Tax losses carried forward (193 063) (183 013)
Total temporary differences (267 870) (252 521)
Deferred tax asset 58 931 58 080
Tax income
Expected Income taxes 3 471 9 317
Tax effect permanent differences 59 -
Paid witholding tax (227) -
Effect of change in tax rate (2 679) (2 525)
Total tax income in income statement 625 6 792
Effective tax rate 4% 17%
1 Permanent differences in 2018 relate to payment on loan previously written down
Deferred tax asset is recognised as it is considered probable that tax losses carried forward can
be utilised within the Kvaerner group’s Norwegian entities.
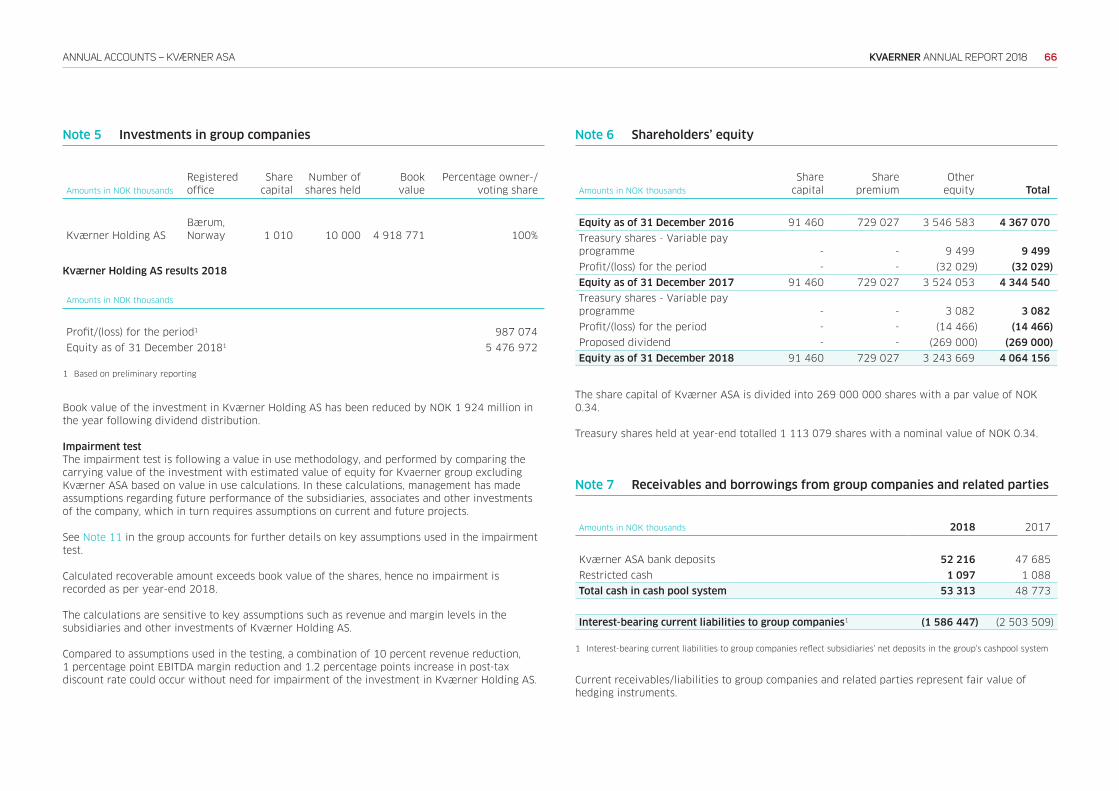
66KVAERNER ANNUAL REPORT 2018ANNUAL ACCOUNTS – KVÆRNER ASA
Note 5 Investments in group companies
Amounts in NOK thousands
Registered
office
Share
capital
Number of
shares held
Book
value
Percentage owner-/
voting share
Kværner Holding AS
Bærum,
Norway 1 010 10 000 4 918 771 100%
Kværner Holding AS results 2018
Amounts in NOK thousands
Profit/(loss) for the period1 987 074
Equity as of 31 December 20181 5 476 972
1 Based on preliminary reporting
Book value of the investment in Kværner Holding AS has been reduced by NOK 1 924 million in
the year following dividend distribution.
Impairment test
The impairment test is following a value in use methodology, and performed by comparing the
carrying value of the investment with estimated value of equity for Kvaerner group excluding
Kværner ASA based on value in use calculations. In these calculations, management has made
assumptions regarding future performance of the subsidiaries, associates and other investments
of the company, which in turn requires assumptions on current and future projects.
See Note 11 in the group accounts for further details on key assumptions used in the impairment
test.
Calculated recoverable amount exceeds book value of the shares, hence no impairment is
recorded as per year-end 2018.
The calculations are sensitive to key assumptions such as revenue and margin levels in the
subsidiaries and other investments of Kværner Holding AS.
Compared to assumptions used in the testing, a combination of 10 percent revenue reduction,
1 percentage point EBITDA margin reduction and 1.2 percentage points increase in post-tax
discount rate could occur without need for impairment of the investment in Kværner Holding AS.
Note 6 Shareholders’ equity
Amounts in NOK thousands
Share
capital
Share
premium
Other
equity Total
Equity as of 31 December 2016 91 460 729 027 3 546 583 4 367 070
Treasury shares - Variable pay
programme - - 9 499 9 499
Profit/(loss) for the period - - (32 029) (32 029)
Equity as of 31 December 2017 91 460 729 027 3 524 053 4 344 540
Treasury shares - Variable pay
programme - - 3 082 3 082
Profit/(loss) for the period - - (14 466) (14 466)
Proposed dividend - - (269 000) (269 000)
Equity as of 31 December 2018 91 460 729 027 3 243 669 4 064 156
The share capital of Kværner ASA is divided into 269 000 000 shares with a par value of NOK
0.34.
Treasury shares held at year-end totalled 1 113 079 shares with a nominal value of NOK 0.34.
Note 7 Receivables and borrowings from group companies and related parties
Amounts in NOK thousands 2018 2017
Kværner ASA bank deposits 52 216 47 685
Restricted cash 1 097 1 088
Total cash in cash pool system 53 313 48 773
Interest-bearing current liabilities to group companies1 (1 586 447) (2 503 509)
1 Interest-bearing current liabilities to group companies reflect subsidiaries’ net deposits in the group’s cashpool system
Current receivables/liabilities to group companies and related parties represent fair value of
hedging instruments.
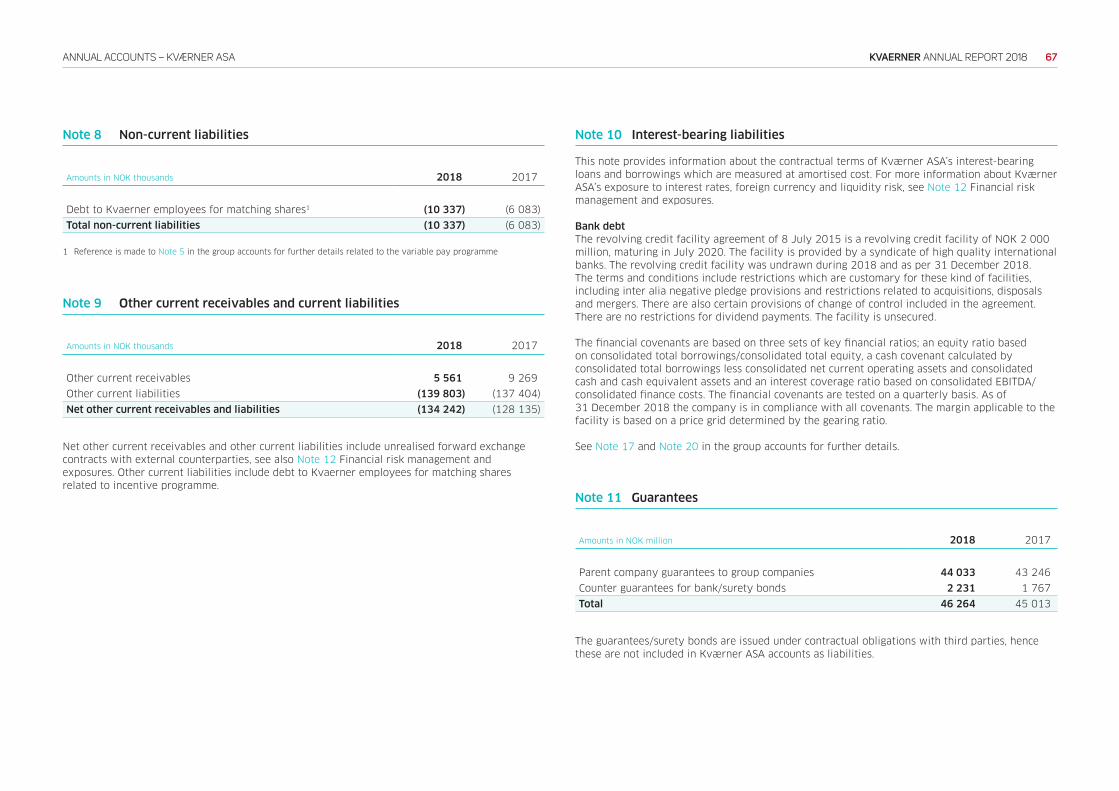
67KVAERNER ANNUAL REPORT 2018ANNUAL ACCOUNTS – KVÆRNER ASA
Note 8 Non-current liabilities
Amounts in NOK thousands 2018 2017
Debt to Kvaerner employees for matching shares1 (10 337) (6 083)
Total non-current liabilities (10 337) (6 083)
1 Reference is made to Note 5 in the group accounts for further details related to the variable pay programme
Note 9 Other current receivables and current liabilities
Amounts in NOK thousands 2018 2017
Other current receivables 5 561 9 269
Other current liabilities (139 803) (137 404)
Net other current receivables and liabilities (134 242) (128 135)
Net other current receivables and other current liabilities include unrealised forward exchange
contracts with external counterparties, see also Note 12 Financial risk management and
exposures. Other current liabilities include debt to Kvaerner employees for matching shares
related to incentive programme.
Note 10 Interest-bearing liabilities
This note provides information about the contractual terms of Kværner ASA’s interest-bearing
loans and borrowings which are measured at amortised cost. For more information about Kværner
ASA’s exposure to interest rates, foreign currency and liquidity risk, see Note 12 Financial risk
management and exposures.
Bank debt
The revolving credit facility agreement of 8 July 2015 is a revolving credit facility of NOK 2 000
million, maturing in July 2020. The facility is provided by a syndicate of high quality international
banks. The revolving credit facility was undrawn during 2018 and as per 31 December 2018.
The terms and conditions include restrictions which are customary for these kind of facilities,
including inter alia negative pledge provisions and restrictions related to acquisitions, disposals
and mergers. There are also certain provisions of change of control included in the agreement.
There are no restrictions for dividend payments. The facility is unsecured.
The financial covenants are based on three sets of key financial ratios; an equity ratio based
on consolidated total borrowings/consolidated total equity, a cash covenant calculated by
consolidated total borrowings less consolidated net current operating assets and consolidated
cash and cash equivalent assets and an interest coverage ratio based on consolidated EBITDA/
consolidated finance costs. The financial covenants are tested on a quarterly basis. As of
31 December 2018 the company is in compliance with all covenants. The margin applicable to the
facility is based on a price grid determined by the gearing ratio.
See Note 17 and Note 20 in the group accounts for further details.
Note 11 Guarantees
Amounts in NOK million 2018 2017
Parent company guarantees to group companies 44 033 43 246
Counter guarantees for bank/surety bonds 2 231 1 767
Total 46 264 45 013
The guarantees/surety bonds are issued under contractual obligations with third parties, hence
these are not included in Kværner ASA accounts as liabilities.
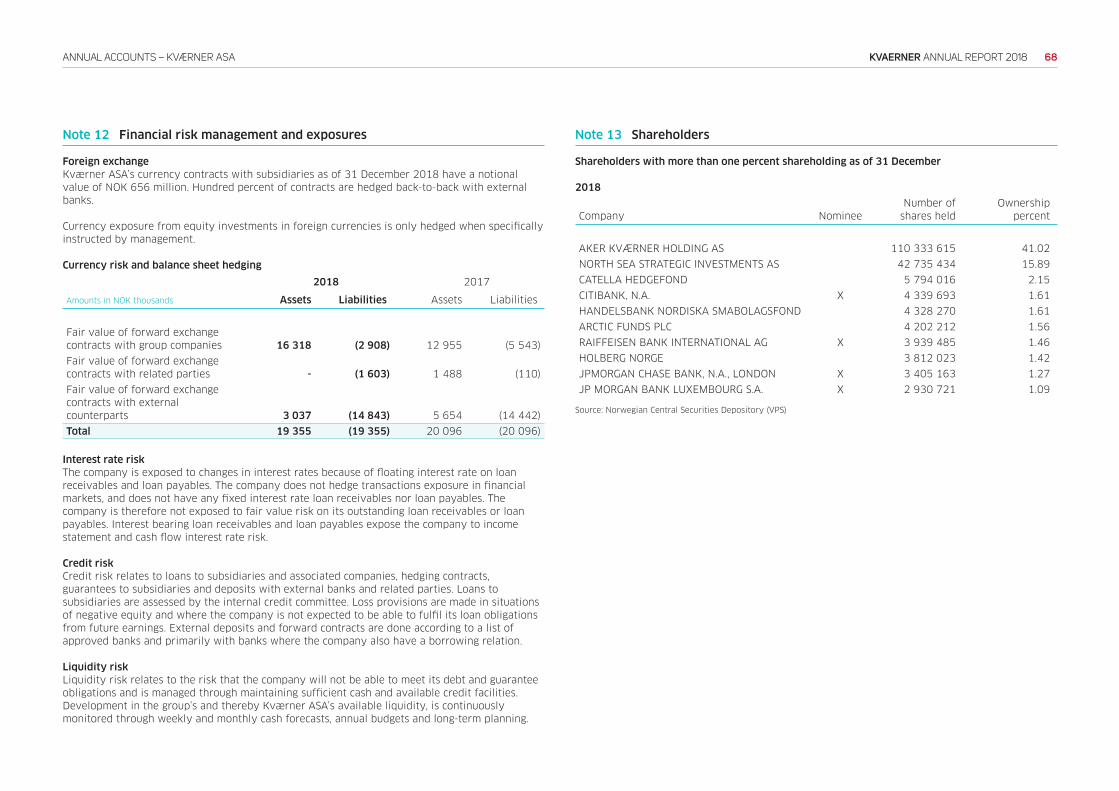
68KVAERNER ANNUAL REPORT 2018ANNUAL ACCOUNTS – KVÆRNER ASA
Note 12 Financial risk management and exposures
Foreign exchange
Kværner ASA’s currency contracts with subsidiaries as of 31 December 2018 have a notional
value of NOK 656 million. Hundred percent of contracts are hedged back-to-back with external
banks.
Currency exposure from equity investments in foreign currencies is only hedged when specifically
instructed by management.
Currency risk and balance sheet hedging
2018 2017
Amounts in NOK thousands Assets Liabilities Assets Liabilities
Fair value of forward exchange
contracts with group companies 16 318 (2 908) 12 955 (5 543)
Fair value of forward exchange
contracts with related parties - (1 603) 1 488 (110)
Fair value of forward exchange
contracts with external
counterparts 3 037 (14 843) 5 654 (14 442)
Total 19 355 (19 355) 20 096 (20 096)
Interest rate risk
The company is exposed to changes in interest rates because of floating interest rate on loan
receivables and loan payables. The company does not hedge transactions exposure in financial
markets, and does not have any fixed interest rate loan receivables nor loan payables. The
company is therefore not exposed to fair value risk on its outstanding loan receivables or loan
payables. Interest bearing loan receivables and loan payables expose the company to income
statement and cash flow interest rate risk.
Credit risk
Credit risk relates to loans to subsidiaries and associated companies, hedging contracts,
guarantees to subsidiaries and deposits with external banks and related parties. Loans to
subsidiaries are assessed by the internal credit committee. Loss provisions are made in situations
of negative equity and where the company is not expected to be able to fulfil its loan obligations
from future earnings. External deposits and forward contracts are done according to a list of
approved banks and primarily with banks where the company also have a borrowing relation.
Liquidity risk
Liquidity risk relates to the risk that the company will not be able to meet its debt and guarantee
obligations and is managed through maintaining sufficient cash and available credit facilities.
Development in the group’s and thereby Kværner ASA’s available liquidity, is continuously
monitored through weekly and monthly cash forecasts, annual budgets and long-term planning.
Note 13 Shareholders
Shareholders with more than one percent shareholding as of 31 December
2018
Company Nominee
Number of
shares held
Ownership
percent
AKER KVÆRNER HOLDING AS 110 333 615 41.02
NORTH SEA STRATEGIC INVESTMENTS AS 42 735 434 15.89
CATELLA HEDGEFOND 5 794 016 2.15
CITIBANK, N.A. X 4 339 693 1.61
HANDELSBANK NORDISKA SMABOLAGSFOND 4 328 270 1.61
ARCTIC FUNDS PLC 4 202 212 1.56
RAIFFEISEN BANK INTERNATIONAL AG X 3 939 485 1.46
HOLBERG NORGE 3 812 023 1.42
JPMORGAN CHASE BANK, N.A., LONDON X 3 405 163 1.27
JP MORGAN BANK LUXEMBOURG S.A. X 2 930 721 1.09
Source: Norwegian Central Securities Depository (VPS)
69KVAERNER ANNUAL REPORT 2018DECLARATION BY THE BOARD OF DIRECTORS AND PRESIDENT & CEO
The Board of Directors and the President & CEO of Kværner ASA have today considered
and approved the annual report and financial statements for the 2018 calendar year
ended on 31 December 2018 for the Kvaerner group and its parent company Kværner
ASA.
The Board has based this declaration on reports and statements from the President & CEO
of Kværner ASA, on the results of the group’s activities, and on other information that is
essential to assess the group’s position.
We confirm to the best of our knowledge that:
> The 2018 financial statements for the group and parent company have been prepared
in accordance with all applicable accounting standards
> The information provided in the financial statements gives a true and fair view of the
group’s assets, liabilities, profit and overall financial position as of 31 December 2018
> The annual report provides a true and fair overview of:
– the development, profit and financial position of the group and parent company
– the most significant risks and uncertainties facing the group and the parent company
Declaration by the Board of Directors and President & CEO
Leif-Arne Langøy
Chairman
Jan Arve Haugan
Director
Thorhild Widvey
Director
Kjell Inge Røkke
Director
Lone Fønss Schrøder
Director
Rune Rafdal
Director
Ståle Knoff Johansen
Director
Bernt Harald Kilnes
Director
Karl-Petter Løken
President & CEO
Fornebu, 11 February 2019
The Board of Directors and the President & CEO of Kværner ASA
Stål K ff J h
one Fønss Schrøder
Bernt Harald Kilnes
Thorhild WidveyJan Arve Hauga Kjell Inge Røkke
rl-Petter Løke
resident & CEO
70KVAERNER ANNUAL REPORT 2018AUDITOR’S REPORT
71KVAERNER ANNUAL REPORT 2018AUDITOR’S REPORT
72KVAERNER ANNUAL REPORT 2018AUDITOR’S REPORT
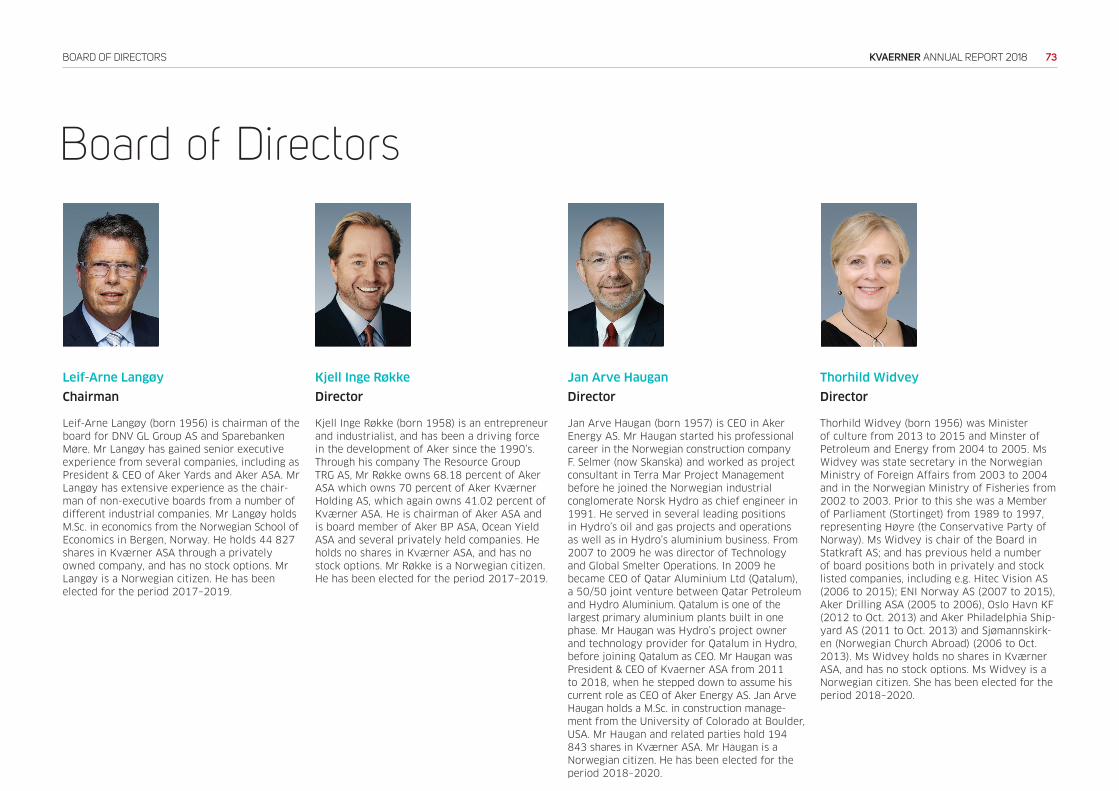
73KVAERNER ANNUAL REPORT 2018BOARD OF DIRECTORS
Board of Directors
Leif-Arne Langøy
Chairman
Leif-Arne Langøy (born 1956) is chairman of the
board for DNV GL Group AS and Sparebanken
Møre. Mr Langøy has gained senior executive
experience from several companies, including as
President & CEO of Aker Yards and Aker ASA. Mr
Langøy has extensive experience as the chair-
man of non-executive boards from a number of
different industrial companies. Mr Langøy holds
M.Sc. in economics from the Norwegian School of
Economics in Bergen, Norway. He holds 44 827
shares in Kværner ASA through a privately
owned company, and has no stock options. Mr
Langøy is a Norwegian citizen. He has been
elected for the period 2017–2019.
Kjell Inge Røkke
Director
Kjell Inge Røkke (born 1958) is an entrepreneur
and industrialist, and has been a driving force
in the development of Aker since the 1990’s.
Through his company The Resource Group
TRG AS, Mr Røkke owns 68.18 percent of Aker
ASA which owns 70 percent of Aker Kværner
Holding AS, which again owns 41.02 percent of
Kværner ASA. He is chairman of Aker ASA and
is board member of Aker BP ASA, Ocean Yield
ASA and several privately held companies. He
holds no shares in Kværner ASA, and has no
stock options. Mr Røkke is a Norwegian citizen.
He has been elected for the period 2017–2019.
Jan Arve Haugan
Director
Jan Arve Haugan (born 1957) is CEO in Aker
Energy AS. Mr Haugan started his professional
career in the Norwegian construction company
F. Selmer (now Skanska) and worked as project
consultant in Terra Mar Project Management
before he joined the Norwegian industrial
conglomerate Norsk Hydro as chief engineer in
1991. He served in several leading positions
in Hydro’s oil and gas projects and operations
as well as in Hydro’s aluminium business. From
2007 to 2009 he was director of Technology
and Global Smelter Operations. In 2009 he
became CEO of Qatar Aluminium Ltd (Qatalum),
a 50/50 joint venture between Qatar Petroleum
and Hydro Aluminium. Qatalum is one of the
largest primary aluminium plants built in one
phase. Mr Haugan was Hydro’s project owner
and technology provider for Qatalum in Hydro,
before joining Qatalum as CEO. Mr Haugan was
President & CEO of Kvaerner ASA from 2011
to 2018, when he stepped down to assume his
current role as CEO of Aker Energy AS. Jan Arve
Haugan holds a M.Sc. in construction manage-
ment from the University of Colorado at Boulder,
USA. Mr Haugan and related parties hold 194
843 shares in Kværner ASA. Mr Haugan is a
Norwegian citizen. He has been elected for the
period 2018–2020.
Thorhild Widvey
Director
Thorhild Widvey (born 1956) was Minister
of culture from 2013 to 2015 and Minster of
Petroleum and Energy from 2004 to 2005. Ms
Widvey was state secretary in the Norwegian
Ministry of Foreign Affairs from 2003 to 2004
and in the Norwegian Ministry of Fisheries from
2002 to 2003. Prior to this she was a Member
of Parliament (Stortinget) from 1989 to 1997,
representing Høyre (the Conservative Party of
Norway). Ms Widvey is chair of the Board in
Statkraft AS; and has previous held a number
of board positions both in privately and stock
listed companies, including e.g. Hitec Vision AS
(2006 to 2015); ENI Norway AS (2007 to 2015),
Aker Drilling ASA (2005 to 2006), Oslo Havn KF
(2012 to Oct. 2013) and Aker Philadelphia Ship-
yard AS (2011 to Oct. 2013) and Sjømannskirk-
en (Norwegian Church Abroad) (2006 to Oct.
2013). Ms Widvey holds no shares in Kværner
ASA, and has no stock options. Ms Widvey is a
Norwegian citizen. She has been elected for the
period 2018–2020.
74KVAERNER ANNUAL REPORT 2018BOARD OF DIRECTORS
Lone Fønss Schrøder
Director
Ms Fønss Schrøder previously served as Direc-
tor on the Board of Kværner ASA from 2011–
2013. She has held several senior management
positions in A.P. Møller-Maersk A/S, was CEO
and president of Wallenius Lines AB, and has
board experience from e.g Aker Solutions ASA,
Akastor ASA, Volvo AB, Vattenfall AB, and Ikea
group. She is chair of Saxo Bank, senior advisor
for Credit Suisse and developper and co-ower
of FinTech. She is chair of the audit committee
in Akastor ASA, Volvo AB and Valmet OY. Ms
Fønss Schrøder is Master in laws, LL.M. from
the University of Copenhagen, and is economist
from Copenhagen Business School. She holds no
shares in Kværner ASA, and has no stock op-
tions. Ms Fønss Schrøder is a Danish citizen. She
has been elected for the period 2018–2020.
Bernt Harald Kilnes
Director
Bernt Harald Kilnes (born 1949) was elected
by the employees of Kvaerner to the Board
of Directors in June 2011. Mr Kilnes has been
employed by Kvaerner since 1989 and is a
group union representative for white-collar em-
ployees on a half-time basis and has served on
the boards of Kværner ASA, Aker Kværner ASA
and Aker Verdal AS. Mr Kilnes holds degrees
within telecommunication as well as economics
and business administration. He holds 28 146
shares in Kværner ASA, and has no stock op-
tions. Mr Kilnes is a Norwegian citizen. He has
been elected for the period 2017–2019.
Rune Rafdal
Director
Rune Rafdal (born 1963) was elected by the em-
ployees of Kvaerner to the Board of Directors
in June 2011. Mr Rafdal has been employed
by Kvaerner since 1980 and has been a local
union representative for Aker Stord AS and
Kværner Stord AS on a full-time basis since
1996, a group union leader since 2005 and
served several periods on the boards of Aker
Stord AS and Aker Kværner Stord AS during the
period between 2000 and 2011. Mr Rafdal is
a sheet metal worker and holds a certificate of
apprenticeship in the sheet metal discipline. He
holds 6 329 shares in Kværner ASA, and has no
stock options. Mr Rafdal is a Norwegian citizen.
He has been elected for the period 2017–2019.
Ståle Knoff Johansen
Director
Ståle K. Johansen (born 1968) was elected by
the employees of Kvaerner to the Board of
Directors in June 2011. Mr Johansen has been
employed by Kvaerner since 1986 and has been
a local union representative for Aker Verdal
AS and Kværner Verdal AS on a full-time basis
since 2010 and served on the boards of Aker
Verdal AS and Kvaerner Verdal AS. Mr Johansen
is a welder and sheet metal worker and holds
a certificate of apprenticeship in the welding
discipline. He holds 10 381 shares in Kværner
ASA, and has no stock options. Mr Johansen is a
Norwegian citizen. He has been elected for the
period 2017–2019.
75KVAERNER ANNUAL REPORT 2018COMPANY INFORMATION
Company information
Kværner ASA
Oksenøyveien 10,
1366 Lysaker
Postal address:
P.O.Box 74
NO-1325 Lysaker
Telephone: +47 21 08 90 00
e-mail: [email protected]
www.kvaerner.com
COPYRIGHT AND LEGAL NOTICE Copyright in all published material including photographs, drawings and images in this publication
remains vested in Kvaerner and third party contributors to this publication as appropriate. Accordingly, neither the whole nor any
part of this publication can be reproduced in any form without express prior permission. Articles and opinions appearing in this
publication do not necessarily represent the views of Kvaerner. While all steps have been taken to ensure the accuracy of the
published contents, Kvaerner does not accept any responsibility for any errors or resulting loss or damage whatsoever caused and
readers have the responsibility to thoroughly check these aspects for themselves. Enquiries about reproduction of content from
this publication should be directed to Kværner ASA.

77KVAERNER ANNUAL REPORT 2018CHAPTER
Production: Bolt Communication AS Photos: StudioVest AS; Bård Gudim, Bård Sætre.
www.kvaerner.com© 2019 KvaernerAll rights reserved