Embed Size (px)
Citation preview
AnnualReport2016
For
per
sona
l use
onl
y

For
per
sona
l use
onl
y
2 3
Letter from the chairman
Annual ReportAnnual Report Letter from the chairmanLetter from the chairman
We launched our Mitula branded fashion vertical in October with the objective of allowing us to participate in the fashion transaction stream. For each buyer we send to a retail partner, we receive a percentage of their spend over the first 30 days. On the back of this, we completed the acquisition of Kleding BV in the Netherlands at the beginning of March 2017. They are the operator of 16 fashion vertical sites across 15 different countries thus rapidly accelerating our entry to this lucrative transaction-based market.
Finally, we have started 2017 on a positive note with record revenue, visits and clicks to our partners in January. We had 80 million visits to our network of sites and we delivered 125 million click outs to our advertising partners.
On behalf of the Board, I would like to thank our CEO, Gonzalo del Pozo, and his management team. Over the course of the year, they have managed two acquisitions and their integration into our existing business, expanded the number of employees from 83 to 158, and delivered strong organic growth.
We look forward to the continued growth and success of the Mitula Group in 2017.
Simon BakerChairman
Dear Shareholders
On behalf of the Board, I thank you for your continued support of the Mitula Group.
2016 was a very good year for the Mitula Group. The key highlights included:
Strong revenue and EBITDA growth with revenue increasing by 36.2% year on year to $28.0 million and Adjusted EBITDA increasing by 32.9% year on year to $12.7 million;
A 215.7% increase in profit after tax to $8.2 million; Strong positive adjusted operating cash flow of $11.0 million with $20.5 million cash at bank at the end of the year – even after paying the cash components of two acquisitions;
The successful acquisition and integration of Nuroa Internet in February 2016 and the DotProperty Group in September 2016;
The launch of vertical search sites in 7 new countries and the launch of an additional 11 new sites in existing countries under the Nuroa and Nestoria brands;
Our entry to the fashion vertical with the launch of Mitula Fashion in Spain; The setting up of a big data team to analyse the terabytes of data we collect on both listings and consumer behaviour; and
The enhancement of our leadership team with the appointment of Miguel Galera as COO and Georg Chmiel to the Board.
Perhaps more importantly for the business was clarification of our future growth strategy. Historically we have been a vertical search business that focused on the generation and sale of clicks – either as CPC to our advertising partners or via Google AdSense.
However, as we have grown in visits and become more relevant in some markets, we are transitioning the business from the sale of clicks, in selected markets, to the more lucrative advertising and transaction parts of the value chain. Our strategy will vary market by market and segment by segment depending on our relevance and the opportunities presented to us.
We started this transition in 2016 with the launch of display advertising products and with the acquisition of the DotProperty network of property portals in SE Asia. In both instances, we are now providing a broader range of customers with display advertising or listing packages to promote themselves and/or their listings to our ever-increasing audience.
During the year, we launched a big data team with the responsibility to analyse the terabytes of data that we collect on listings and on consumer behavior. This will allow us to enhance the quality of the clicks that we provide our customers as well as to position ourselves as a thought leader in what is happening in the global, selected local, real estate, motoring and employment markets.
For
per
sona
l use
onl
y
Annual ReportGeneral Summary
ÍndiceGeneral summary
1.1 Corporate directory
1.2 Directors’ report
Directors and company secretary
Principal activities
Dividends
Significant changes in the state of affairs
Non-IFRS financial information
Review of operations
Result of 2016 with 2015 exchange rates
Risk
Risk Management
Events since the end of the financial year
Likely developments and expected results of operations
Environmental regulation
Information on directors
Meetings of directors
Remuneration report
Corporate governance statement
Shares under option
Insurance of officers and indemnities
Proceedings on behalf of the group
Non-audit services
Auditor’s independence declaration
Rounding of amounts
1.3 Auditor’s independence declaration
14
16
16
16
17
17
18
18
20
20
20
21
21
21
22
25
26
40
40
41
41
42
43
43
44
1.0 Annual Report 10
50
52
54
56
58
58
60
68
69
72
73
74
75
76
77
79
80
83
83
84
85
88
88
90
90
92
92
93
94
95
96
97
98
98
99
100
102
108
2.1 Consolidated Statement of Comprehensive Income
2.2 Consolidated Balance Sheet
2.3 Consolidated Statement of Changes in Equity
2.4 Consolidated Statement of Cash Flows
2.5 Notes to the Consolidated Financial Report
1. Basis of preparation
2. Summary of significant accounting policies
3. Critical accounting estimates and judgements
4. Financial risk management and financial instruments
5. Subsidiaries
6. Segment information
7. Expenses
8. Income tax
9. Cash and cash equivalents
10. Trade and other receivables
11. Property, plant and equipment
12. Intangible assets
13. Other non-current financial assets
14. Trade and other payables
15. Deferred tax balances
16. Business combinations
17. Capital risk management policy
18. Contributed equity
19. Other reserves
20. Share-based payments
21. Dividends
22. Earnings per share
23. Key management Personnel disclosures
24. Remuneration of auditors
25. Commitments
26. Related party transactions
27. Contingencies
28. Cash flow information
29. Parent entity financial information
30. Events occurring after the reporting period
2.6 Directors’ Declaration
2.7 Independent Auditor’s Report
2.8 Shareholder information
462.0 Financial Statement
For
per
sona
l use
onl
y
6 Annual Report
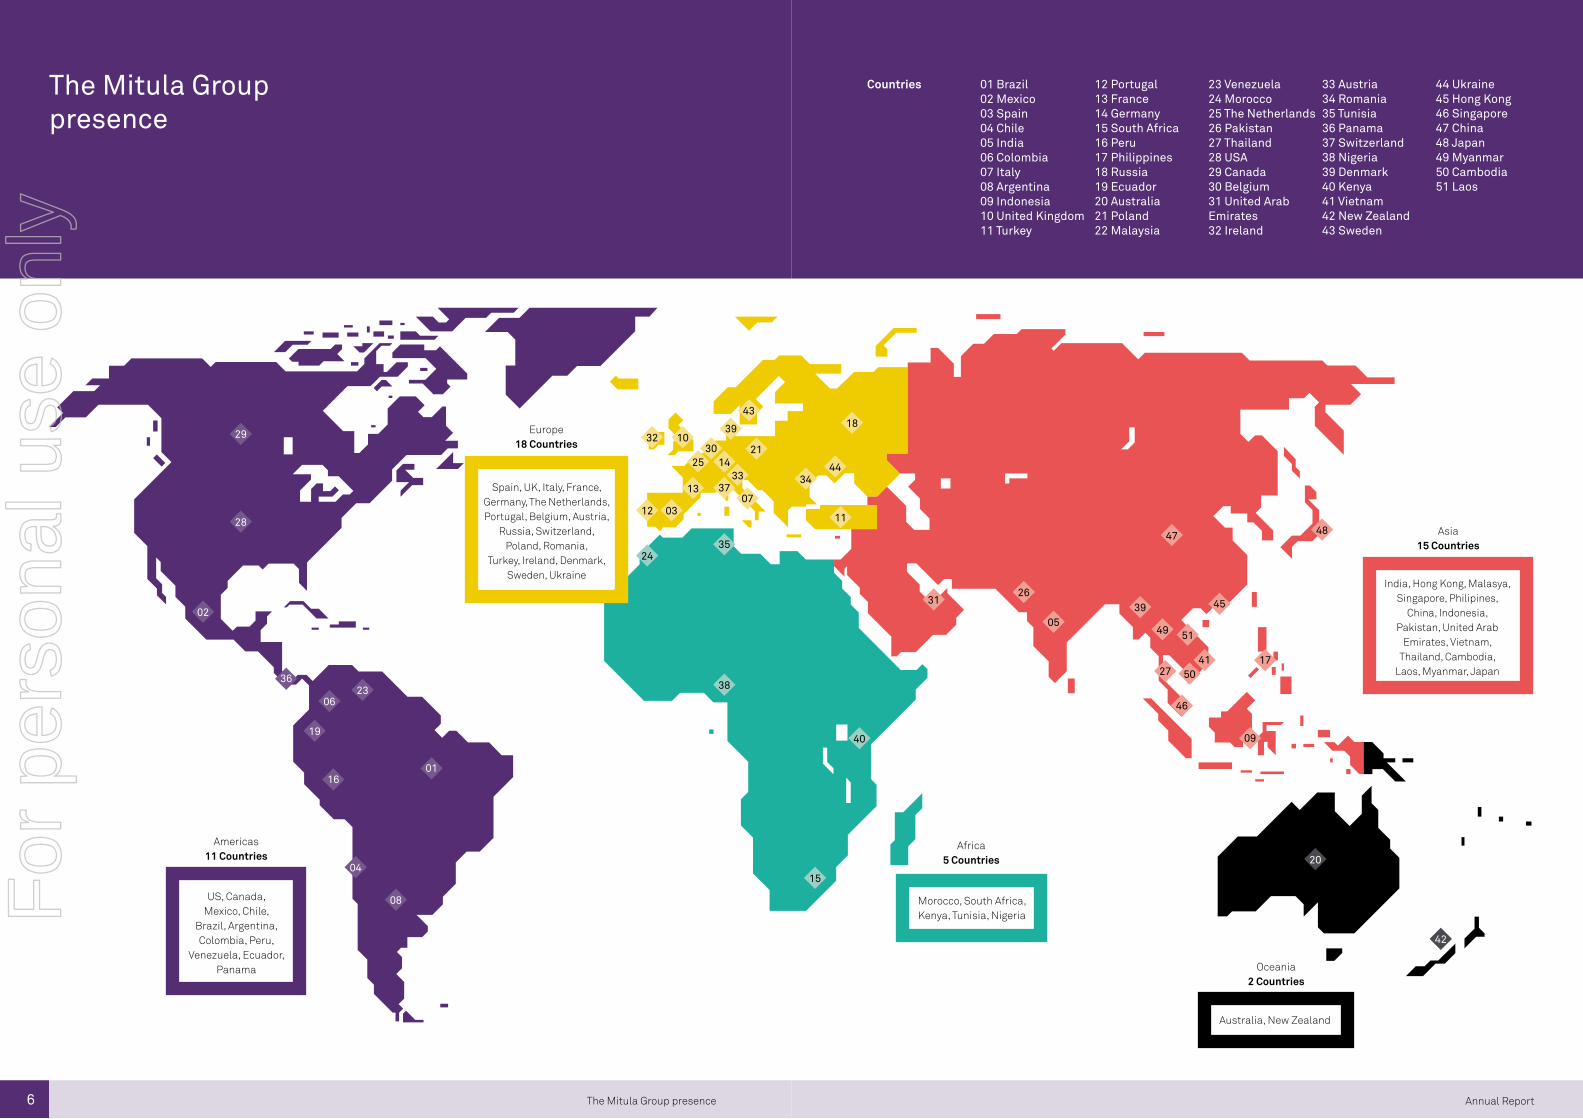
The Mitula Group presence
Countries 01 Brazil02 Mexico03 Spain04 Chile05 India06 Colombia07 Italy08 Argentina09 Indonesia10 United Kingdom11 Turkey
23 Venezuela24 Morocco25 The Netherlands26 Pakistan27 Thailand28 USA29 Canada30 Belgium31 United Arab Emirates32 Ireland
12 Portugal13 France14 Germany15 South Africa16 Peru17 Philippines18 Russia19 Ecuador20 Australia21 Poland22 Malaysia
33 Austria34 Romania35 Tunisia36 Panama37 Switzerland38 Nigeria39 Denmark40 Kenya41 Vietnam42 New Zealand43 Sweden
44 Ukraine45 Hong Kong46 Singapore47 China48 Japan49 Myanmar50 Cambodia51 Laos
The Mitula Group presence
Europe18 Countries
29
28
02
3623
06
19
1601
04
08
32
12
2435
38
40
3126
05
47 48
39 45
49 51
5041
27
46
09
17
20
42
15
03
13
2530
39
4318
344414
33
21
3707
10
Americas11 Countries
US, Canada, Mexico, Chile,
Brazil, Argentina, Colombia, Peru,
Venezuela, Ecuador, Panama
Spain, UK, Italy, France, Germany, The Netherlands, Portugal, Belgium, Austria,
Russia, Switzerland, Poland, Romania,
Turkey, Ireland, Denmark, Sweden, Ukraine
Morocco, South Africa, Kenya, Tunisia, Nigeria
India, Hong Kong, Malasya, Singapore, Philipines,
China, Indonesia, Pakistan, United Arab
Emirates, Vietnam, Thailand, Cambodia,
Laos, Myanmar, Japan
Australia, New Zealand
Africa5 Countries
Asia15 Countries
Oceania2 Countries
11
For
per
sona
l use
onl
y
8 Annual ReportMitula Group in numbers
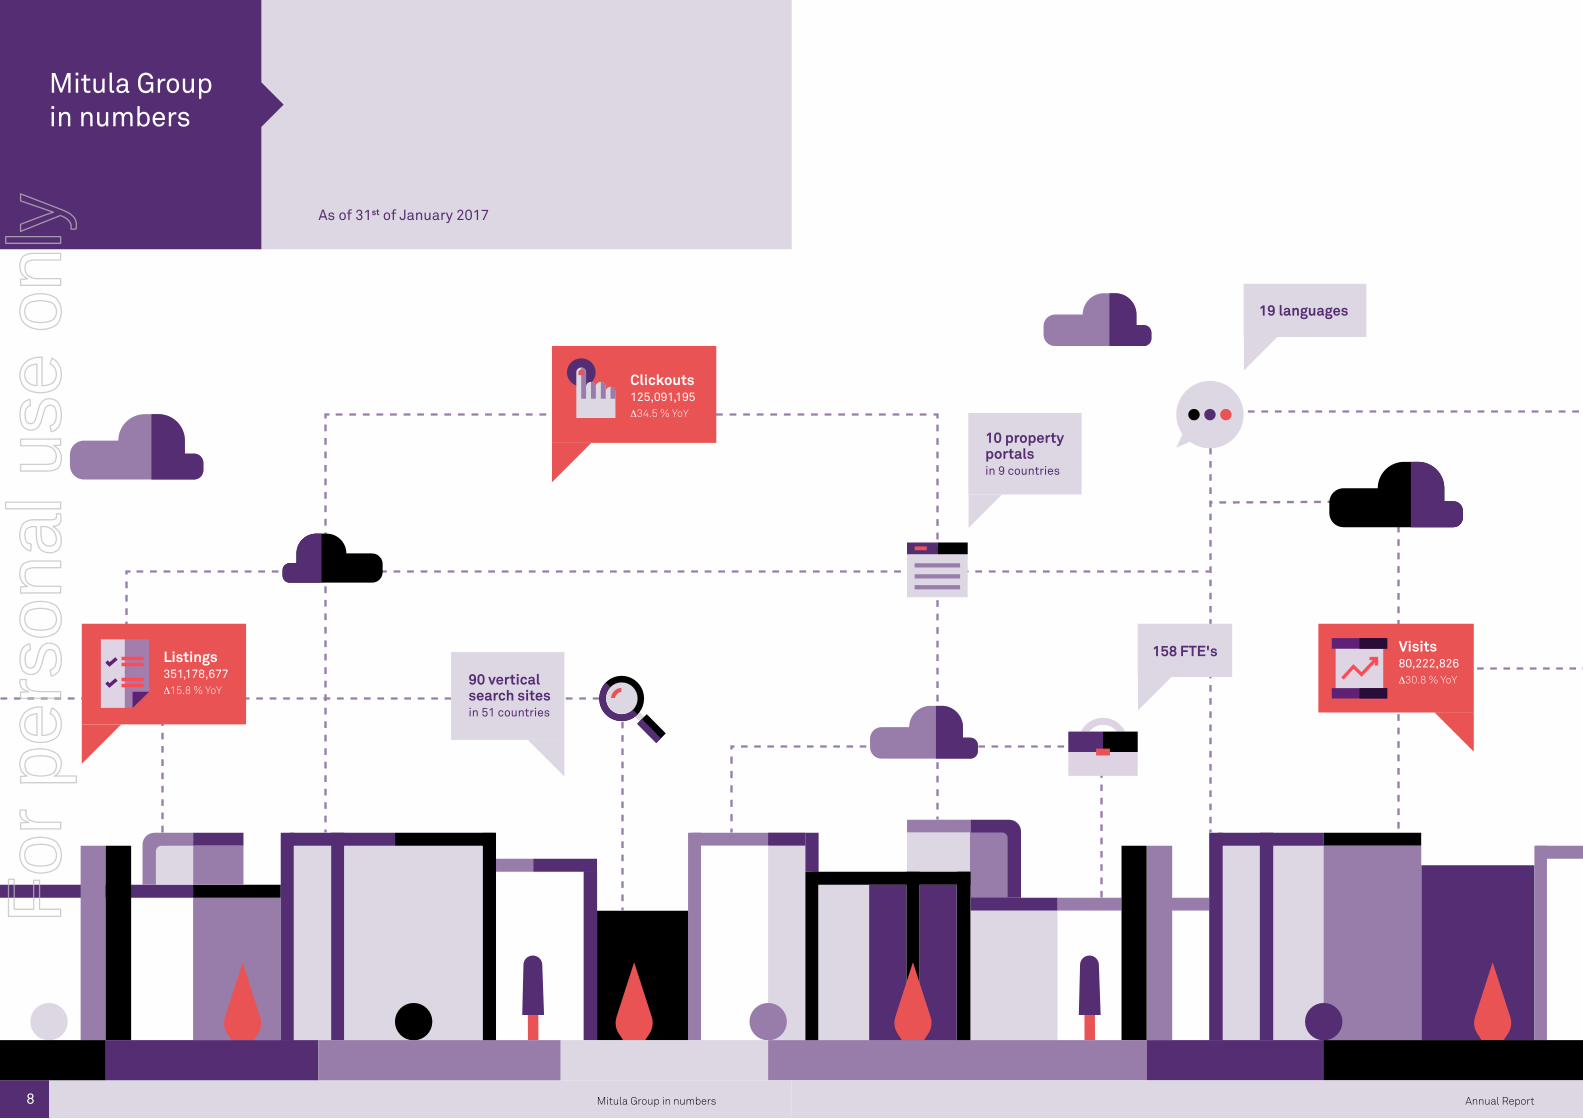
Mitula Group in numbers
As of 31st of January 2017
90 vertical search sites in 51 countries
19 languages
Clickouts125,091,195∆34.5 % YoY
158 FTE'sListings351,178,677∆15.8 % YoY
10 property portals in 9 countries
Visits80,222,826∆30.8 % YoY
For
per
sona
l use
onl
y

10
Annual Report
1.0
For
per
sona
l use
onl
y
13 Annual Report
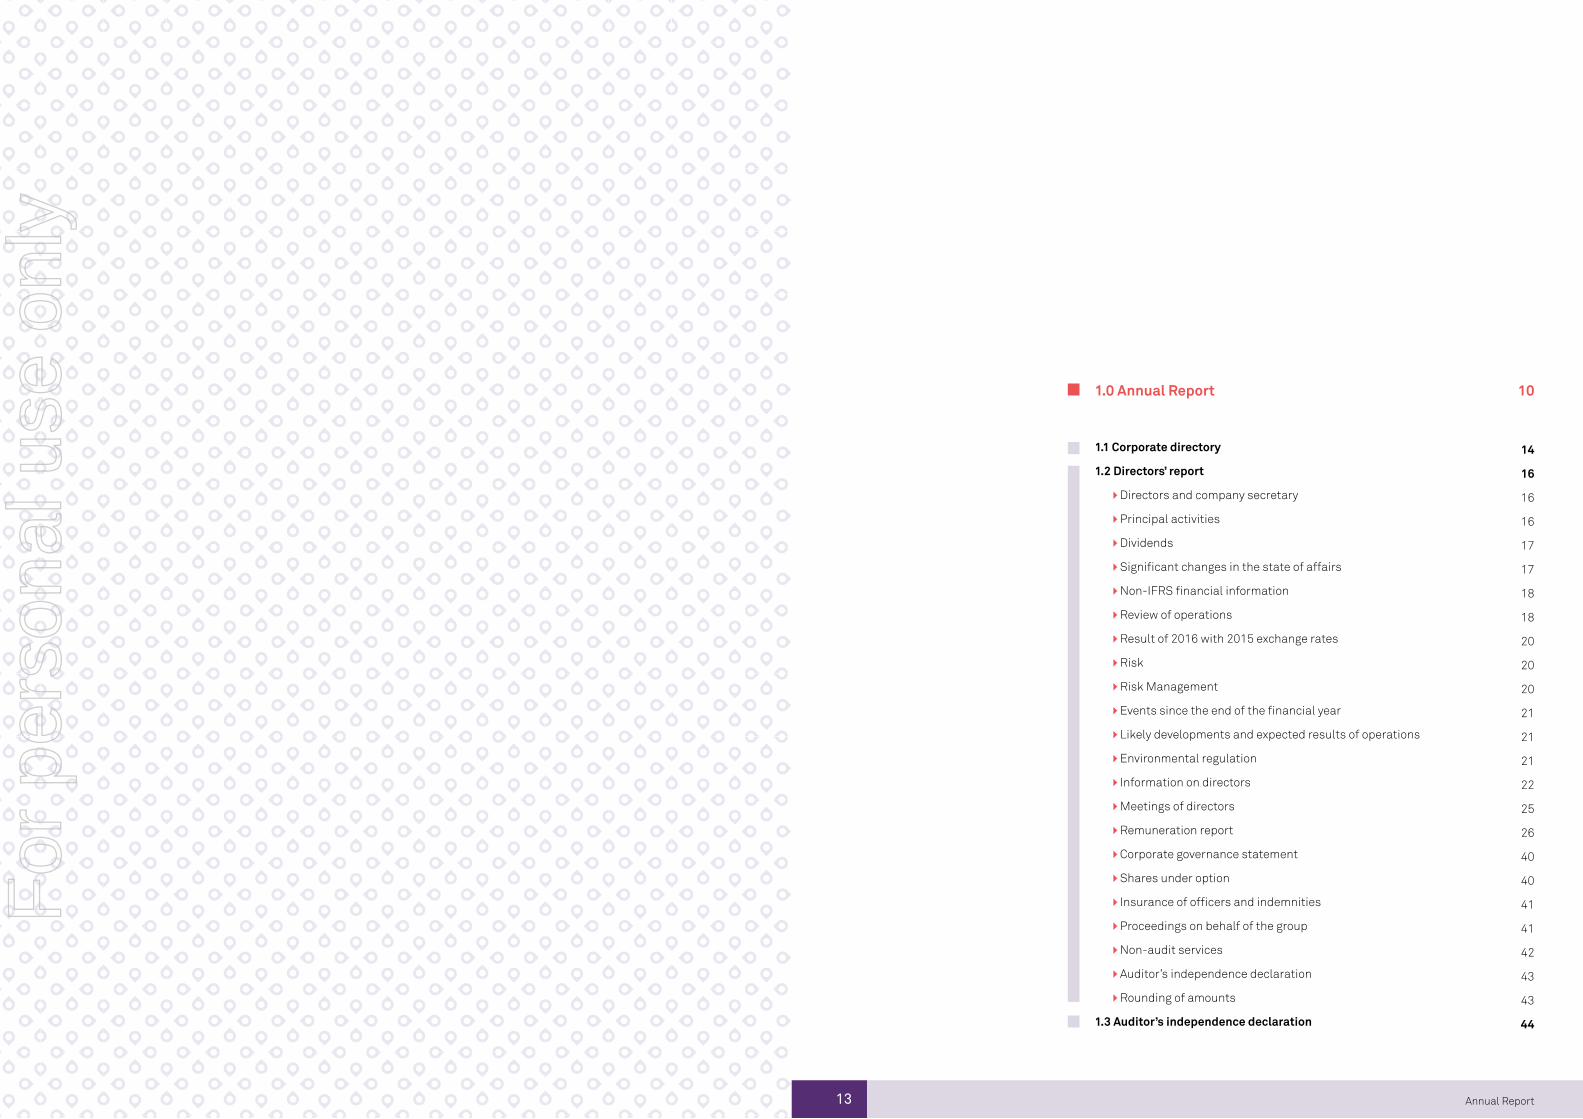
1.1 Corporate directory
1.2 Directors’ report
Directors and company secretary
Principal activities
Dividends
Significant changes in the state of affairs
Non-IFRS financial information
Review of operations
Result of 2016 with 2015 exchange rates
Risk
Risk Management
Events since the end of the financial year
Likely developments and expected results of operations
Environmental regulation
Information on directors
Meetings of directors
Remuneration report
Corporate governance statement
Shares under option
Insurance of officers and indemnities
Proceedings on behalf of the group
Non-audit services
Auditor’s independence declaration
Rounding of amounts
1.3 Auditor’s independence declaration
14
16
16
16
17
17
18
18
20
20
20
21
21
21
22
25
26
40
40
41
41
42
43
43
44
1.0 Annual Report 10
For
per
sona
l use
onl
y
14 15
Corporate Directory
1.1
Annual ReportAnnual Report Corporate DirectoryCorporate Directory
1
2
3
4
5
6
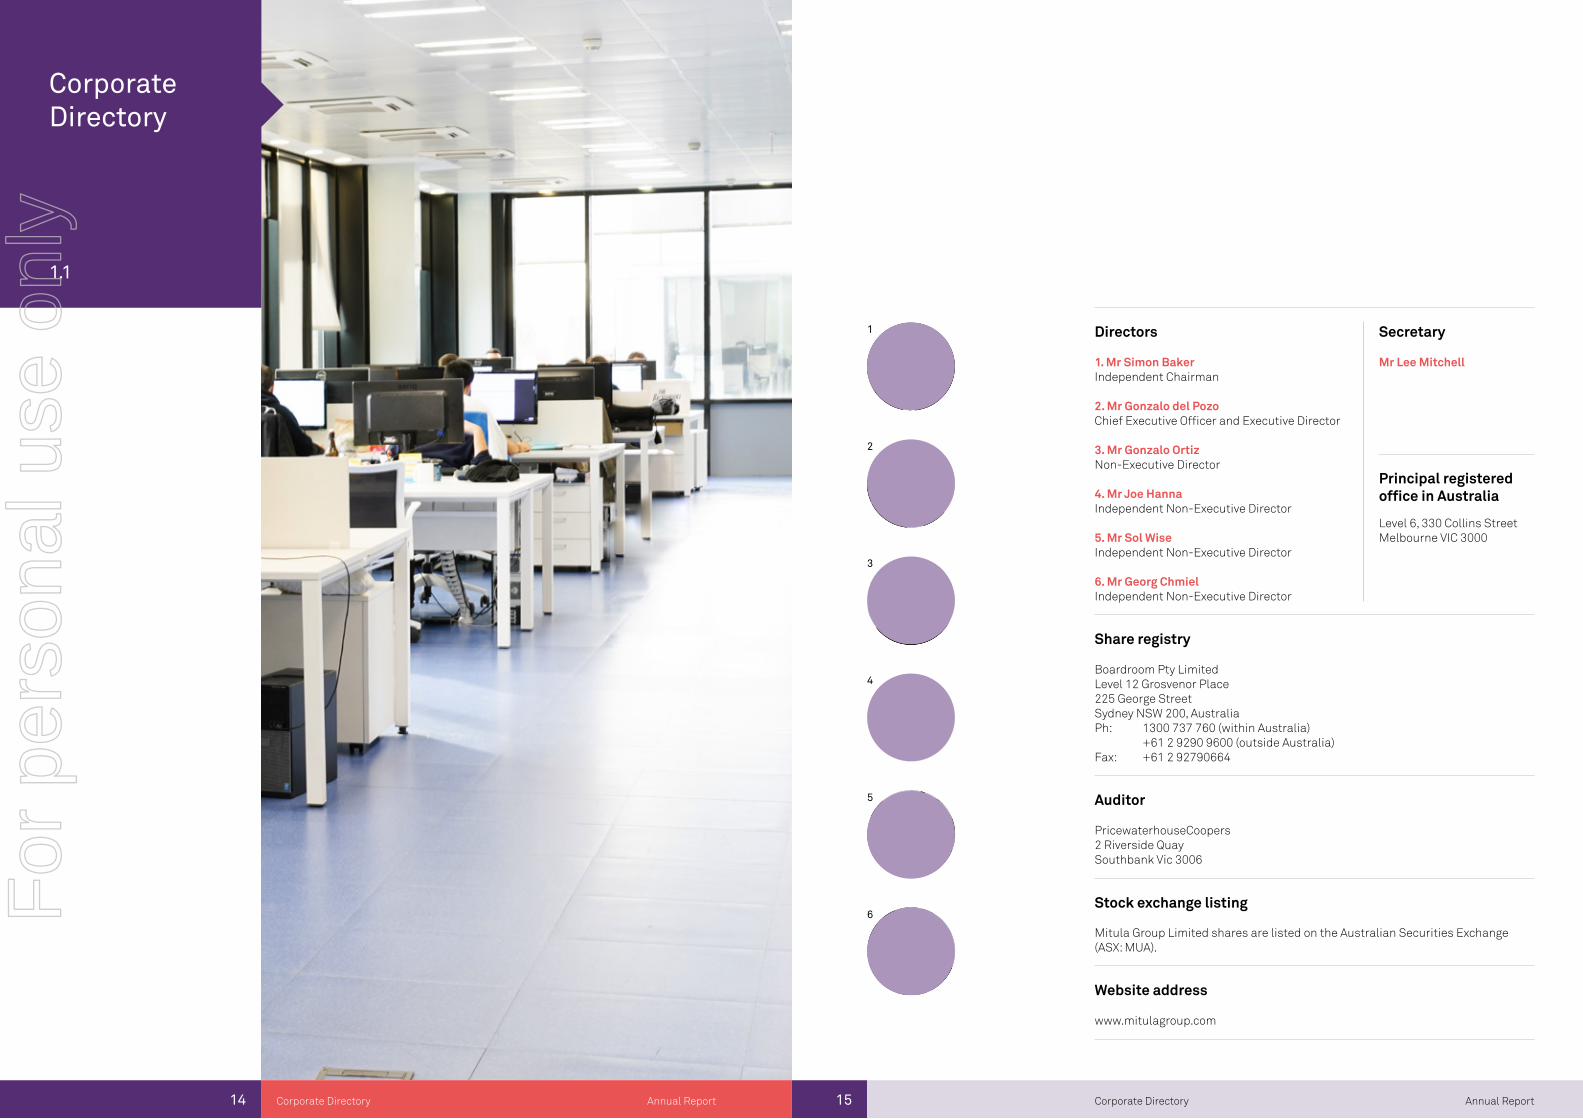
Directors
Principal registered office in Australia
Stock exchange listing
Auditor
Share registry
Website address
Secretary
Mr Lee Mitchell1. Mr Simon BakerIndependent Chairman
2. Mr Gonzalo del PozoChief Executive Officer and Executive Director
3. Mr Gonzalo OrtizNon-Executive Director
4. Mr Joe HannaIndependent Non-Executive Director
5. Mr Sol WiseIndependent Non-Executive Director
6. Mr Georg ChmielIndependent Non-Executive Director
Level 6, 330 Collins StreetMelbourne VIC 3000
Mitula Group Limited shares are listed on the Australian Securities Exchange (ASX: MUA).
PricewaterhouseCoopers 2 Riverside QuaySouthbank Vic 3006
Boardroom Pty LimitedLevel 12 Grosvenor Place225 George StreetSydney NSW 200, AustraliaPh: 1300 737 760 (within Australia) +61 2 9290 9600 (outside Australia)Fax: +61 2 92790664
www.mitulagroup.com
For
per
sona
l use
onl
y
16
Directors’ report
1.2
Annual ReportDirectors’ report
Directors and company secretary
The following persons were directors of Mitula Group Limited during the year and up to the date of this report:
Simon Baker Independent ChairmanGonzalo del Pozo Chief Executive Officer and Executive DirectorGonzalo Ortiz Non-Executive DirectorJoe Hanna Independent Non-Executive DirectorSol Wise Independent Non-Executive DirectorGeorg Chmiel Independent Non-Executive Director (appointed 18 January 2017)
The company secretary is Mr Lee Mitchell. Lee is a director of Convergence Legal, a boutique commercial law firm based in Melbourne, Victoria and is a qualified solicitor with 22 years experience. Lee practices principally in corporate and commercial law advising on corporate and securities regulation, equity capital raisings, formulation and implementation of mergers and acquisitions, corporate governance and company secretarial matters.
Principal activities
The Mitula Group is a leading digital classifieds group operating classifieds vertical search and portals sites.
It operates 90 vertical search sites across property, employment, motoring and fashion in 51 different countries and 19 different languages. These sites operate under the Mitula, Nestoria and Nuroa brands.
It operates 10 property portals in nine South East Asian countries under the DotProperty and Thailand-property brands.
The Mitula Group generates over 80 million visits per month to its network of classified vertical search and portal sites.
The Mitula Group’s vertical search functionality gives its website users the ability to search across listings from multiple verticals, being real estate, automotive, employment, and, in some countries holiday rentals, and obtain search results from multiple advertisers with one search query. With access to the search results of multiple advertisers, users are offered a more convenient and efficient search experience than performing a search on a single advertiser’s website.
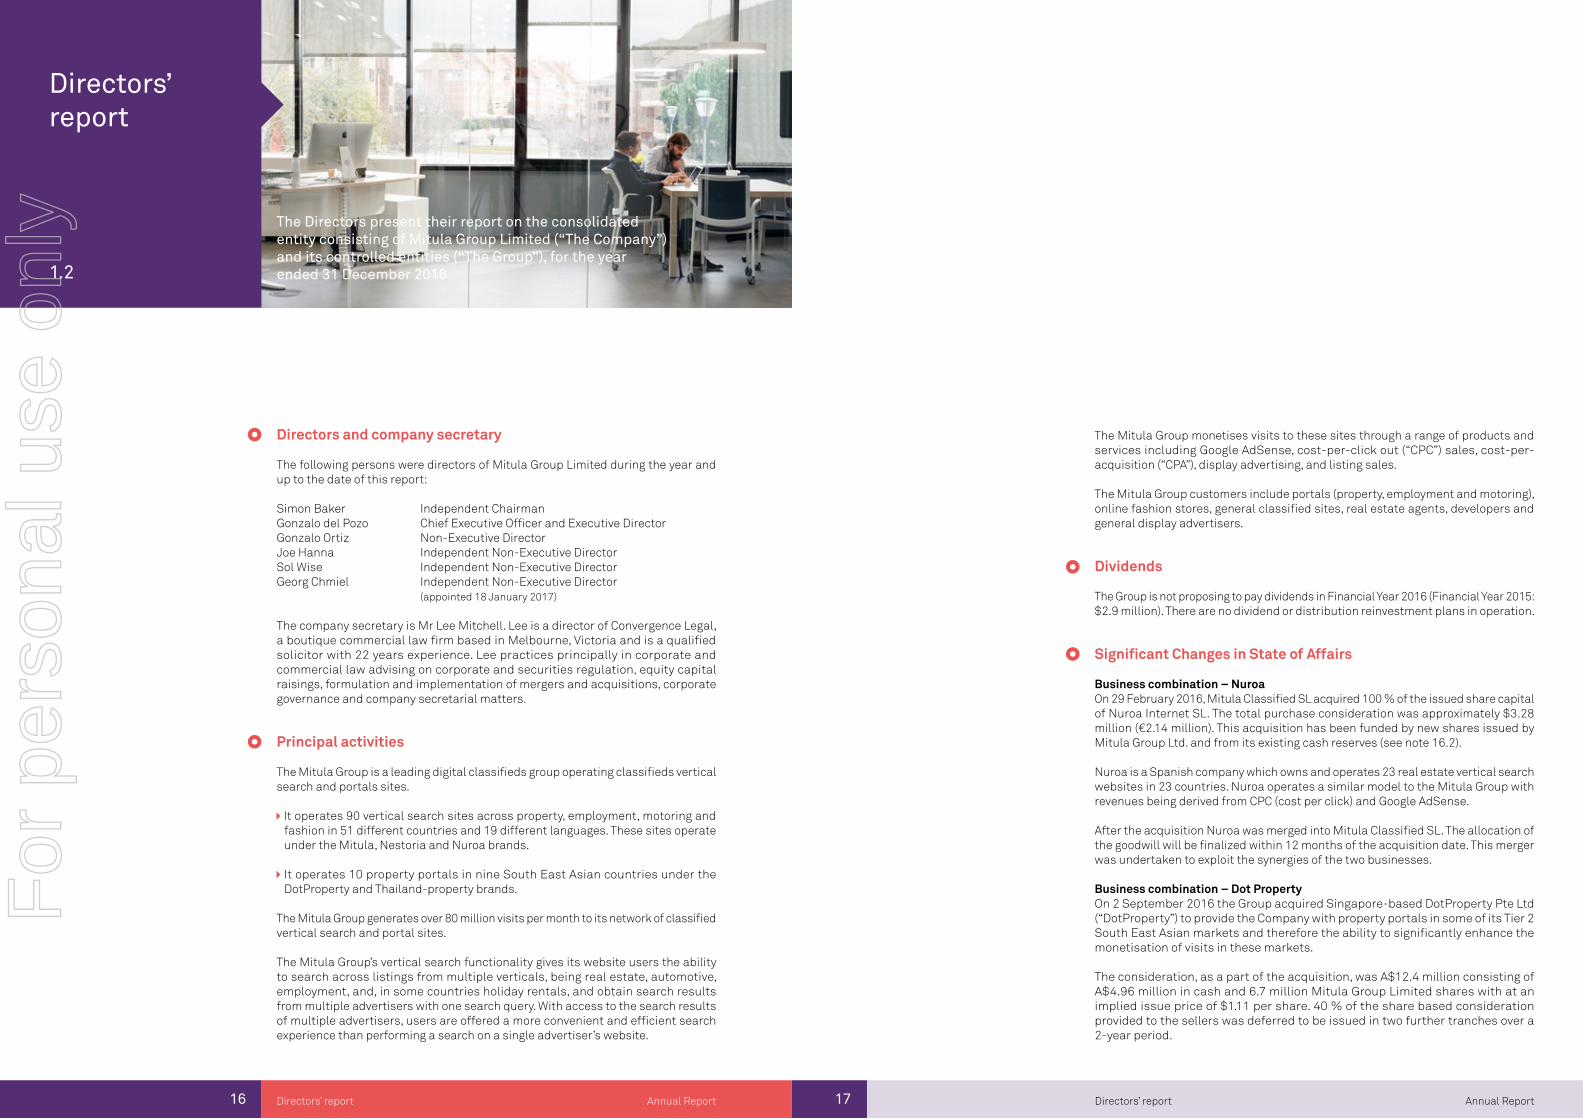
The Directors present their report on the consolidated entity consisting of Mitula Group Limited (“The Company”) and its controlled entities (“The Group”), for the year ended 31 December 2016
17 Annual ReportDirectors’ report
The Mitula Group monetises visits to these sites through a range of products and services including Google AdSense, cost-per-click out (“CPC”) sales, cost-per-acquisition (“CPA”), display advertising, and listing sales.
The Mitula Group customers include portals (property, employment and motoring), online fashion stores, general classified sites, real estate agents, developers and general display advertisers.
Dividends
The Group is not proposing to pay dividends in Financial Year 2016 (Financial Year 2015: $2.9 million). There are no dividend or distribution reinvestment plans in operation.
Significant Changes in State of Affairs
Business combination – NuroaOn 29 February 2016, Mitula Classified SL acquired 100 % of the issued share capital of Nuroa Internet SL. The total purchase consideration was approximately $3.28 million (€2.14 million). This acquisition has been funded by new shares issued by Mitula Group Ltd. and from its existing cash reserves (see note 16.2).
Nuroa is a Spanish company which owns and operates 23 real estate vertical search websites in 23 countries. Nuroa operates a similar model to the Mitula Group with revenues being derived from CPC (cost per click) and Google AdSense.
After the acquisition Nuroa was merged into Mitula Classified SL. The allocation of the goodwill will be finalized within 12 months of the acquisition date. This merger was undertaken to exploit the synergies of the two businesses.
Business combination – Dot PropertyOn 2 September 2016 the Group acquired Singapore-based DotProperty Pte Ltd (“DotProperty”) to provide the Company with property portals in some of its Tier 2 South East Asian markets and therefore the ability to significantly enhance the monetisation of visits in these markets.
The consideration, as a part of the acquisition, was A$12.4 million consisting of A$4.96 million in cash and 6.7 million Mitula Group Limited shares with at an implied issue price of $1.11 per share. 40 % of the share based consideration provided to the sellers was deferred to be issued in two further tranches over a 2-year period.
For
per
sona
l use
onl
y
18 19 Annual ReportAnnual ReportDirectors’ report Directors’ report
Non-IFRS financial information
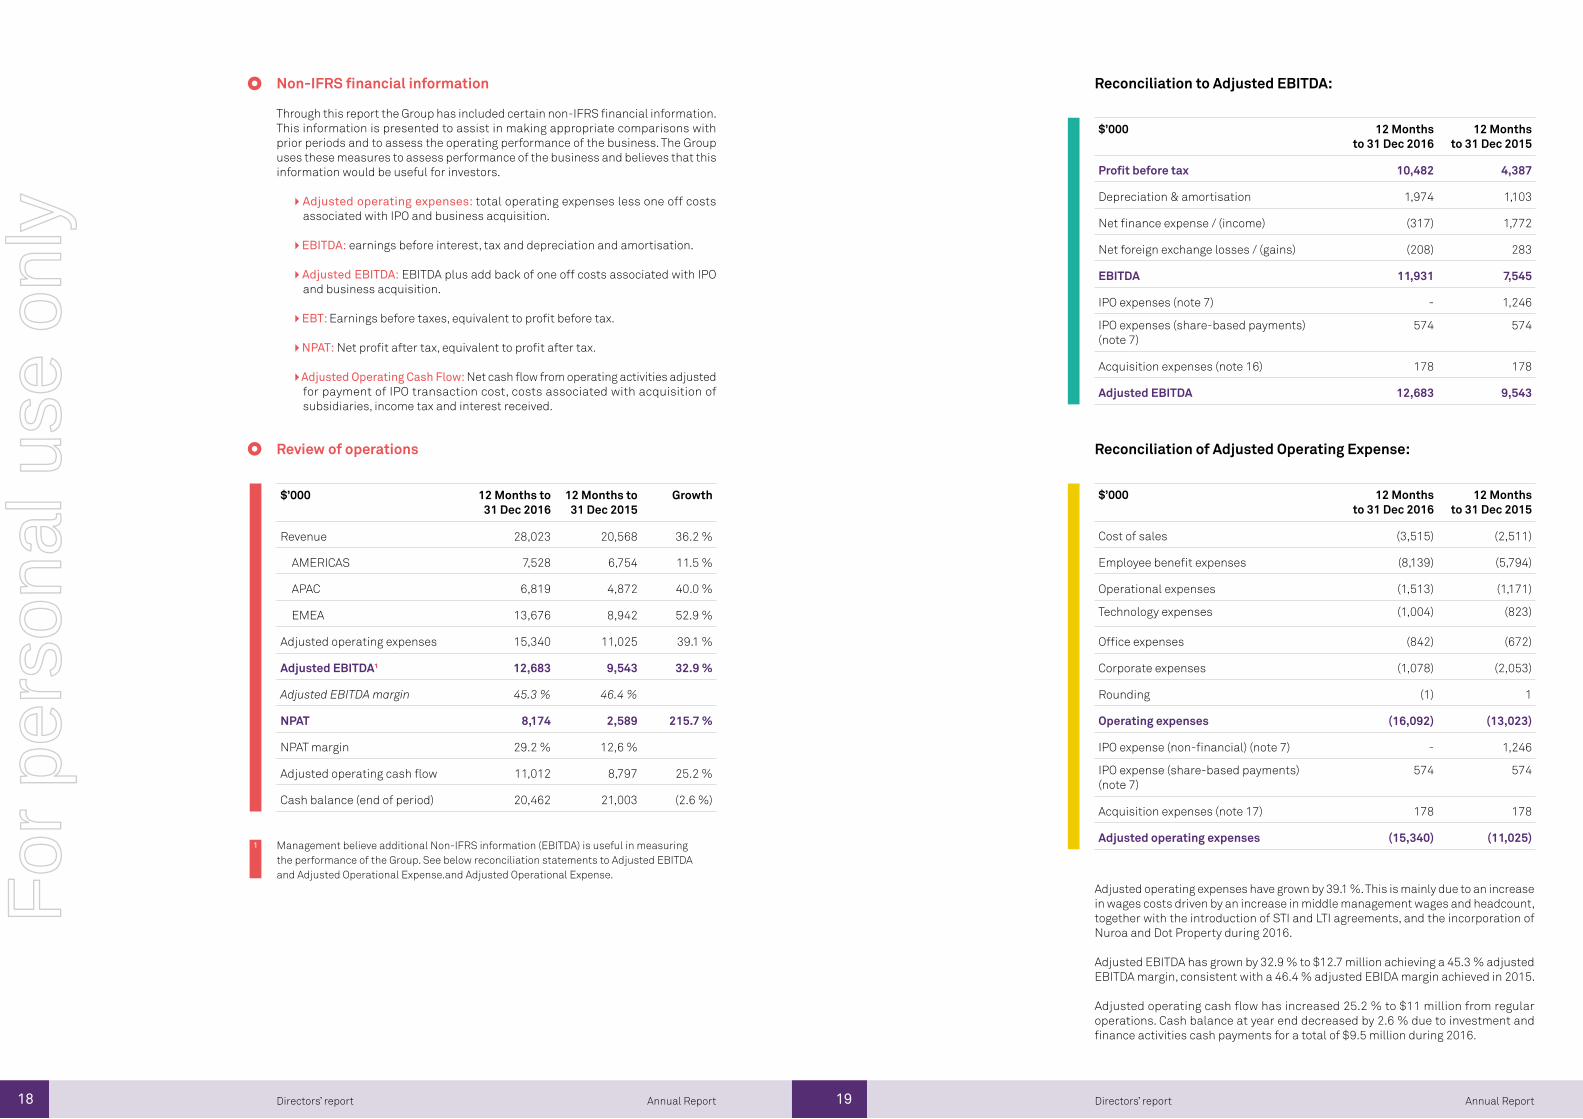
Through this report the Group has included certain non-IFRS financial information. This information is presented to assist in making appropriate comparisons with prior periods and to assess the operating performance of the business. The Group uses these measures to assess performance of the business and believes that this information would be useful for investors.
Adjusted operating expenses: total operating expenses less one off costs associated with IPO and business acquisition.
EBITDA: earnings before interest, tax and depreciation and amortisation.
Adjusted EBITDA: EBITDA plus add back of one off costs associated with IPO and business acquisition.
EBT: Earnings before taxes, equivalent to profit before tax.
NPAT: Net profit after tax, equivalent to profit after tax.
Adjusted Operating Cash Flow: Net cash flow from operating activities adjusted for payment of IPO transaction cost, costs associated with acquisition of subsidiaries, income tax and interest received.
Review of operations
$’000 12 Months to 31 Dec 2016
12 Months to 31 Dec 2015
Growth
Revenue 28,023 20,568 36.2 %
AMERICAS 7,528 6,754 11.5 %
APAC 6,819 4,872 40.0 %
EMEA 13,676 8,942 52.9 %
Adjusted operating expenses 15,340 11,025 39.1 %
Adjusted EBITDA¹ 12,683 9,543 32.9 %
Adjusted EBITDA margin 45.3 % 46.4 %
NPAT 8,174 2,589 215.7 %
NPAT margin 29.2 % 12,6 %
Adjusted operating cash flow 11,012 8,797 25.2 %
Cash balance (end of period) 20,462 21,003 (2.6 %)
$’000 12 Months to 31 Dec 2016
12 Months to 31 Dec 2015
Profit before tax 10,482 4,387
Depreciation & amortisation 1,974 1,103
Net finance expense / (income) (317) 1,772
Net foreign exchange losses / (gains) (208) 283
EBITDA 11,931 7,545
IPO expenses (note 7) - 1,246
IPO expenses (share-based payments) (note 7)
574 574
Acquisition expenses (note 16) 178 178
Adjusted EBITDA 12,683 9,543
$’000 12 Months to 31 Dec 2016
12 Months to 31 Dec 2015
Cost of sales (3,515) (2,511)
Employee benefit expenses (8,139) (5,794)
Operational expenses (1,513) (1,171)
Technology expenses (1,004) (823)
Office expenses (842) (672)
Corporate expenses (1,078) (2,053)
Rounding (1) 1
Operating expenses (16,092) (13,023)
IPO expense (non-financial) (note 7) - 1,246
IPO expense (share-based payments) (note 7)
574 574
Acquisition expenses (note 17) 178 178
Adjusted operating expenses (15,340) (11,025)
Reconciliation to Adjusted EBITDA:
Management believe additional Non-IFRS information (EBITDA) is useful in measuring the performance of the Group. See below reconciliation statements to Adjusted EBITDA and Adjusted Operational Expense.and Adjusted Operational Expense.
1
Reconciliation of Adjusted Operating Expense:
Adjusted operating expenses have grown by 39.1 %. This is mainly due to an increase in wages costs driven by an increase in middle management wages and headcount, together with the introduction of STI and LTI agreements, and the incorporation of Nuroa and Dot Property during 2016.
Adjusted EBITDA has grown by 32.9 % to $12.7 million achieving a 45.3 % adjusted EBITDA margin, consistent with a 46.4 % adjusted EBIDA margin achieved in 2015.
Adjusted operating cash flow has increased 25.2 % to $11 million from regular operations. Cash balance at year end decreased by 2.6 % due to investment and finance activities cash payments for a total of $9.5 million during 2016.
For
per
sona
l use
onl
y
20 21 Annual ReportAnnual Report Directors’ reportDirectors’ report
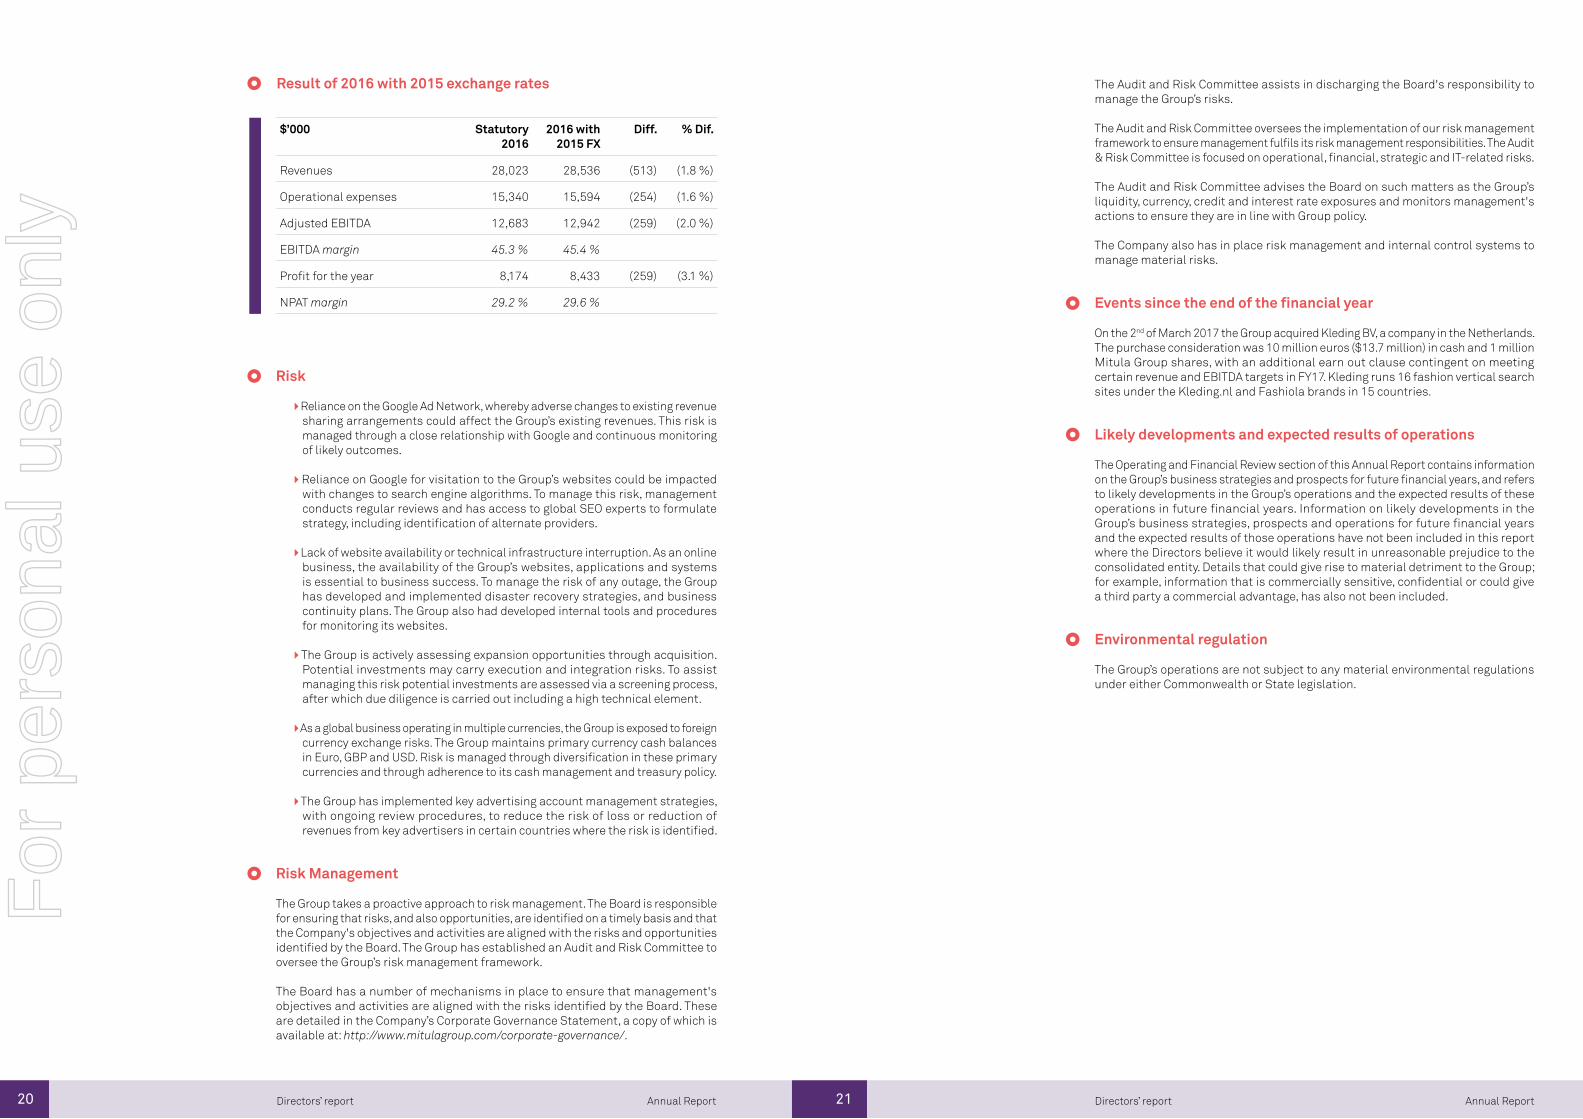
Result of 2016 with 2015 exchange rates
$’000 Statutory 2016
2016 with 2015 FX
Diff. % Dif.
Revenues 28,023 28,536 (513) (1.8 %)
Operational expenses 15,340 15,594 (254) (1.6 %)
Adjusted EBITDA 12,683 12,942 (259) (2.0 %)
EBITDA margin 45.3 % 45.4 %
Profit for the year 8,174 8,433 (259) (3.1 %)
NPAT margin 29.2 % 29.6 %
Risk
Reliance on the Google Ad Network, whereby adverse changes to existing revenue sharing arrangements could affect the Group’s existing revenues. This risk is managed through a close relationship with Google and continuous monitoring of likely outcomes.
Reliance on Google for visitation to the Group’s websites could be impacted with changes to search engine algorithms. To manage this risk, management conducts regular reviews and has access to global SEO experts to formulate strategy, including identification of alternate providers.
Lack of website availability or technical infrastructure interruption. As an online business, the availability of the Group’s websites, applications and systems is essential to business success. To manage the risk of any outage, the Group has developed and implemented disaster recovery strategies, and business continuity plans. The Group also had developed internal tools and procedures for monitoring its websites.
The Group is actively assessing expansion opportunities through acquisition. Potential investments may carry execution and integration risks. To assist managing this risk potential investments are assessed via a screening process, after which due diligence is carried out including a high technical element.
As a global business operating in multiple currencies, the Group is exposed to foreign currency exchange risks. The Group maintains primary currency cash balances in Euro, GBP and USD. Risk is managed through diversification in these primary currencies and through adherence to its cash management and treasury policy.
The Group has implemented key advertising account management strategies, with ongoing review procedures, to reduce the risk of loss or reduction of revenues from key advertisers in certain countries where the risk is identified.
Risk Management
The Group takes a proactive approach to risk management. The Board is responsible for ensuring that risks, and also opportunities, are identified on a timely basis and that the Company's objectives and activities are aligned with the risks and opportunities identified by the Board. The Group has established an Audit and Risk Committee to oversee the Group’s risk management framework.
The Board has a number of mechanisms in place to ensure that management's objectives and activities are aligned with the risks identified by the Board. These are detailed in the Company’s Corporate Governance Statement, a copy of which is available at: http://www.mitulagroup.com/corporate-governance/.
The Audit and Risk Committee assists in discharging the Board's responsibility to manage the Group’s risks.
The Audit and Risk Committee oversees the implementation of our risk management framework to ensure management fulfils its risk management responsibilities. The Audit & Risk Committee is focused on operational, financial, strategic and IT-related risks.
The Audit and Risk Committee advises the Board on such matters as the Group’s liquidity, currency, credit and interest rate exposures and monitors management's actions to ensure they are in line with Group policy.
The Company also has in place risk management and internal control systems to manage material risks.
Events since the end of the financial year
On the 2nd of March 2017 the Group acquired Kleding BV, a company in the Netherlands. The purchase consideration was 10 million euros ($13.7 million) in cash and 1 million Mitula Group shares, with an additional earn out clause contingent on meeting certain revenue and EBITDA targets in FY17. Kleding runs 16 fashion vertical search sites under the Kleding.nl and Fashiola brands in 15 countries.
Likely developments and expected results of operations
The Operating and Financial Review section of this Annual Report contains information on the Group’s business strategies and prospects for future financial years, and refers to likely developments in the Group’s operations and the expected results of these operations in future financial years. Information on likely developments in the Group’s business strategies, prospects and operations for future financial years and the expected results of those operations have not been included in this report where the Directors believe it would likely result in unreasonable prejudice to the consolidated entity. Details that could give rise to material detriment to the Group; for example, information that is commercially sensitive, confidential or could give a third party a commercial advantage, has also not been included.
Environmental regulation
The Group’s operations are not subject to any material environmental regulations under either Commonwealth or State legislation.
For
per
sona
l use
onl
y
22 23 Annual ReportAnnual Report Directors’ reportDirectors’ report
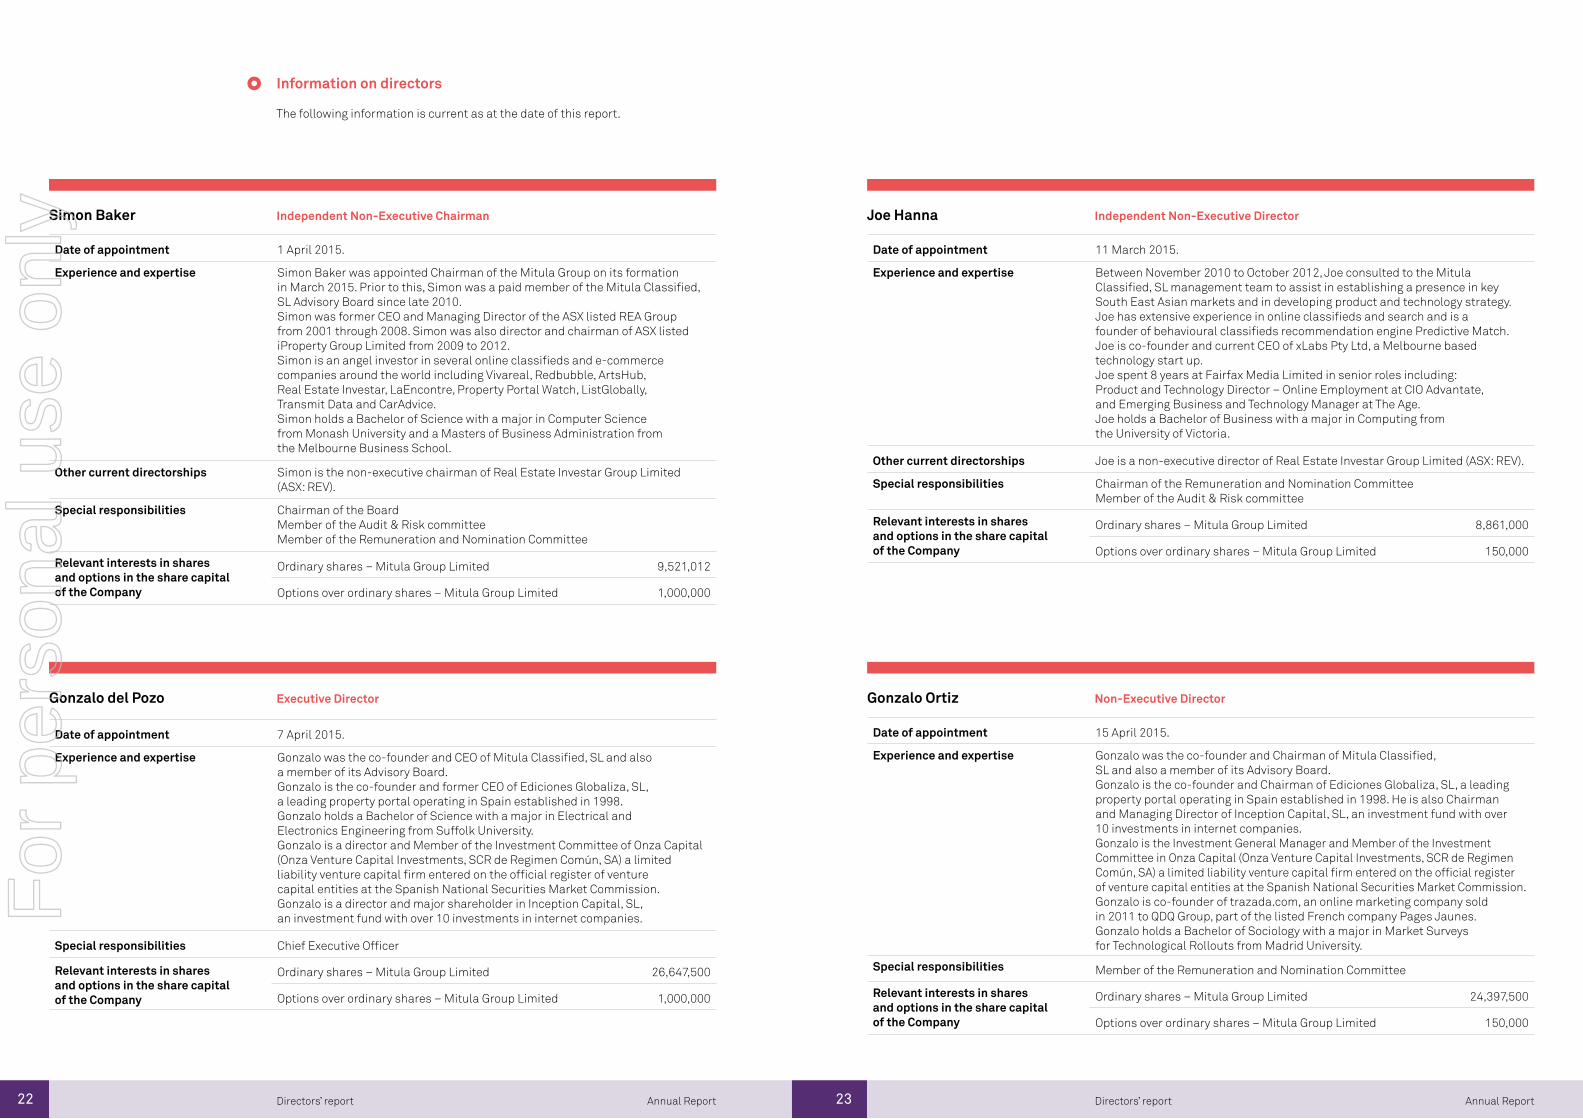
Information on directors
The following information is current as at the date of this report.
Date of appointment 1 April 2015.
Experience and expertise Simon Baker was appointed Chairman of the Mitula Group on its formation in March 2015. Prior to this, Simon was a paid member of the Mitula Classified, SL Advisory Board since late 2010.Simon was former CEO and Managing Director of the ASX listed REA Group from 2001 through 2008. Simon was also director and chairman of ASX listed iProperty Group Limited from 2009 to 2012.Simon is an angel investor in several online classifieds and e-commerce companies around the world including Vivareal, Redbubble, ArtsHub, Real Estate Investar, LaEncontre, Property Portal Watch, ListGlobally, Transmit Data and CarAdvice. Simon holds a Bachelor of Science with a major in Computer Science from Monash University and a Masters of Business Administration from the Melbourne Business School.
Other current directorships Simon is the non-executive chairman of Real Estate Investar Group Limited (ASX: REV).
Special responsibilities Chairman of the BoardMember of the Audit & Risk committeeMember of the Remuneration and Nomination Committee
Relevant interests in shares and options in the share capital of the Company
Ordinary shares – Mitula Group Limited 9,521,012
Options over ordinary shares – Mitula Group Limited 1,000,000
Simon Baker Joe Hanna
Gonzalo del Pozo Gonzalo Ortiz
Independent Non-Executive Chairman Independent Non-Executive Director
Executive Director Non-Executive Director
Date of appointment 7 April 2015.
Experience and expertise Gonzalo was the co-founder and CEO of Mitula Classified, SL and also a member of its Advisory Board.Gonzalo is the co-founder and former CEO of Ediciones Globaliza, SL, a leading property portal operating in Spain established in 1998.Gonzalo holds a Bachelor of Science with a major in Electrical and Electronics Engineering from Suffolk University.Gonzalo is a director and Member of the Investment Committee of Onza Capital (Onza Venture Capital Investments, SCR de Regimen Común, SA) a limited liability venture capital firm entered on the official register of venture capital entities at the Spanish National Securities Market Commission.Gonzalo is a director and major shareholder in Inception Capital, SL, an investment fund with over 10 investments in internet companies.
Special responsibilities Chief Executive Officer
Relevant interests in shares and options in the share capital of the Company
Ordinary shares – Mitula Group Limited 26,647,500
Options over ordinary shares – Mitula Group Limited 1,000,000
Date of appointment 11 March 2015.
Experience and expertise Between November 2010 to October 2012, Joe consulted to the Mitula Classified, SL management team to assist in establishing a presence in key South East Asian markets and in developing product and technology strategy.Joe has extensive experience in online classifieds and search and is a founder of behavioural classifieds recommendation engine Predictive Match. Joe is co-founder and current CEO of xLabs Pty Ltd, a Melbourne based technology start up.Joe spent 8 years at Fairfax Media Limited in senior roles including: Product and Technology Director – Online Employment at CIO Advantate, and Emerging Business and Technology Manager at The Age.Joe holds a Bachelor of Business with a major in Computing from the University of Victoria.
Other current directorships Joe is a non-executive director of Real Estate Investar Group Limited (ASX: REV).
Special responsibilities Chairman of the Remuneration and Nomination CommitteeMember of the Audit & Risk committee
Relevant interests in shares and options in the share capital of the Company
Ordinary shares – Mitula Group Limited 8,861,000
Options over ordinary shares – Mitula Group Limited 150,000
Date of appointment 15 April 2015.
Experience and expertise Gonzalo was the co-founder and Chairman of Mitula Classified, SL and also a member of its Advisory Board.Gonzalo is the co-founder and Chairman of Ediciones Globaliza, SL, a leading property portal operating in Spain established in 1998. He is also Chairman and Managing Director of Inception Capital, SL, an investment fund with over 10 investments in internet companies.Gonzalo is the Investment General Manager and Member of the Investment Committee in Onza Capital (Onza Venture Capital Investments, SCR de Regimen Común, SA) a limited liability venture capital firm entered on the official register of venture capital entities at the Spanish National Securities Market Commission.Gonzalo is co-founder of trazada.com, an online marketing company sold in 2011 to QDQ Group, part of the listed French company Pages Jaunes.Gonzalo holds a Bachelor of Sociology with a major in Market Surveys for Technological Rollouts from Madrid University.
Special responsibilities Member of the Remuneration and Nomination Committee
Relevant interests in shares and options in the share capital of the Company
Ordinary shares – Mitula Group Limited 24,397,500
Options over ordinary shares – Mitula Group Limited 150,000
For
per
sona
l use
onl
y
24 25 Annual ReportAnnual Report Directors’ reportDirectors’ report
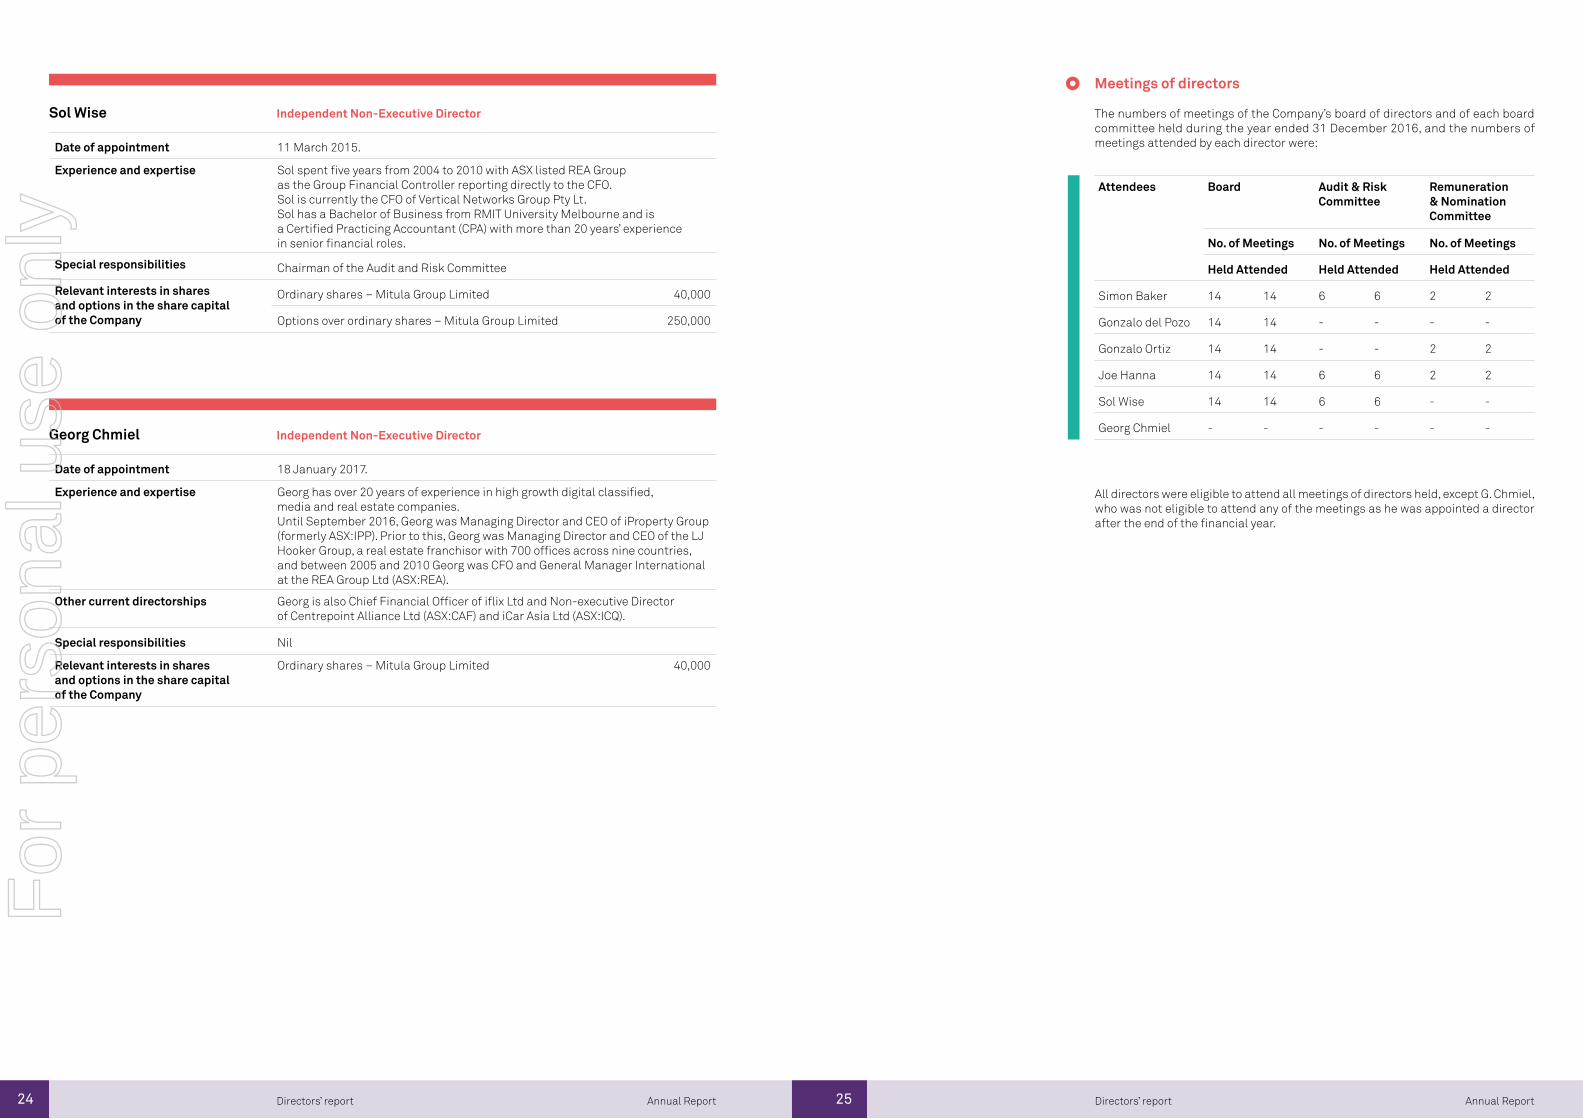
Date of appointment 11 March 2015.
Experience and expertise Sol spent five years from 2004 to 2010 with ASX listed REA Group as the Group Financial Controller reporting directly to the CFO.Sol is currently the CFO of Vertical Networks Group Pty Lt.Sol has a Bachelor of Business from RMIT University Melbourne and is a Certified Practicing Accountant (CPA) with more than 20 years’ experience in senior financial roles.
Special responsibilities Chairman of the Audit and Risk Committee
Relevant interests in shares and options in the share capital of the Company
Ordinary shares – Mitula Group Limited 40,000
Options over ordinary shares – Mitula Group Limited 250,000
Date of appointment 18 January 2017.
Experience and expertise Georg has over 20 years of experience in high growth digital classified, media and real estate companies. Until September 2016, Georg was Managing Director and CEO of iProperty Group (formerly ASX:IPP). Prior to this, Georg was Managing Director and CEO of the LJ Hooker Group, a real estate franchisor with 700 offices across nine countries, and between 2005 and 2010 Georg was CFO and General Manager International at the REA Group Ltd (ASX:REA).
Other current directorships Georg is also Chief Financial Officer of iflix Ltd and Non-executive Director of Centrepoint Alliance Ltd (ASX:CAF) and iCar Asia Ltd (ASX:ICQ).
Special responsibilities Nil
Relevant interests in shares and options in the share capital of the Company
Ordinary shares – Mitula Group Limited 40,000
Sol Wise
Georg Chmiel
Independent Non-Executive Director
Independent Non-Executive Director
Meetings of directors
The numbers of meetings of the Company’s board of directors and of each board committee held during the year ended 31 December 2016, and the numbers of meetings attended by each director were:
Attendees Board Audit & Risk Committee
Remuneration & Nomination Committee
No. of Meetings No. of Meetings No. of Meetings
Held Attended Held Attended Held Attended
Simon Baker 14 14 6 6 2 2
Gonzalo del Pozo 14 14 - - - -
Gonzalo Ortiz 14 14 - - 2 2
Joe Hanna 14 14 6 6 2 2
Sol Wise 14 14 6 6 - -
Georg Chmiel - - - - - -
All directors were eligible to attend all meetings of directors held, except G. Chmiel, who was not eligible to attend any of the meetings as he was appointed a director after the end of the financial year.
For
per
sona
l use
onl
y
26 27 Annual ReportAnnual Report Directors’ reportDirectors’ report
Remuneration Report
Introduction
This Remuneration Report for the year ended 31 December 2016 outlines the remuneration arrangements in place for the Group during that period in accordance with s. 300A of the Corporations Act 2001 (the ‘Act’) and its regulations. All sections contained in this report have been subject to audit as required by section 308(3C) of the Act.
The remuneration report is presented under the following sections:
1. Individual Key Management Personnel (KMP) Disclosures2. Principles of Remuneration and Strategy3. Non-Executive Director Remuneration Arrangements4. Executive Remuneration Arrangements5. Executive Contracts6. Remuneration Expenses for KMP7. Current Shareholding for KMP8. Other transactions9. Statutory Performance Indicators10. Cash remuneration earned by executives in 2016
Individual Key Management Personnel (KMP) Disclosures
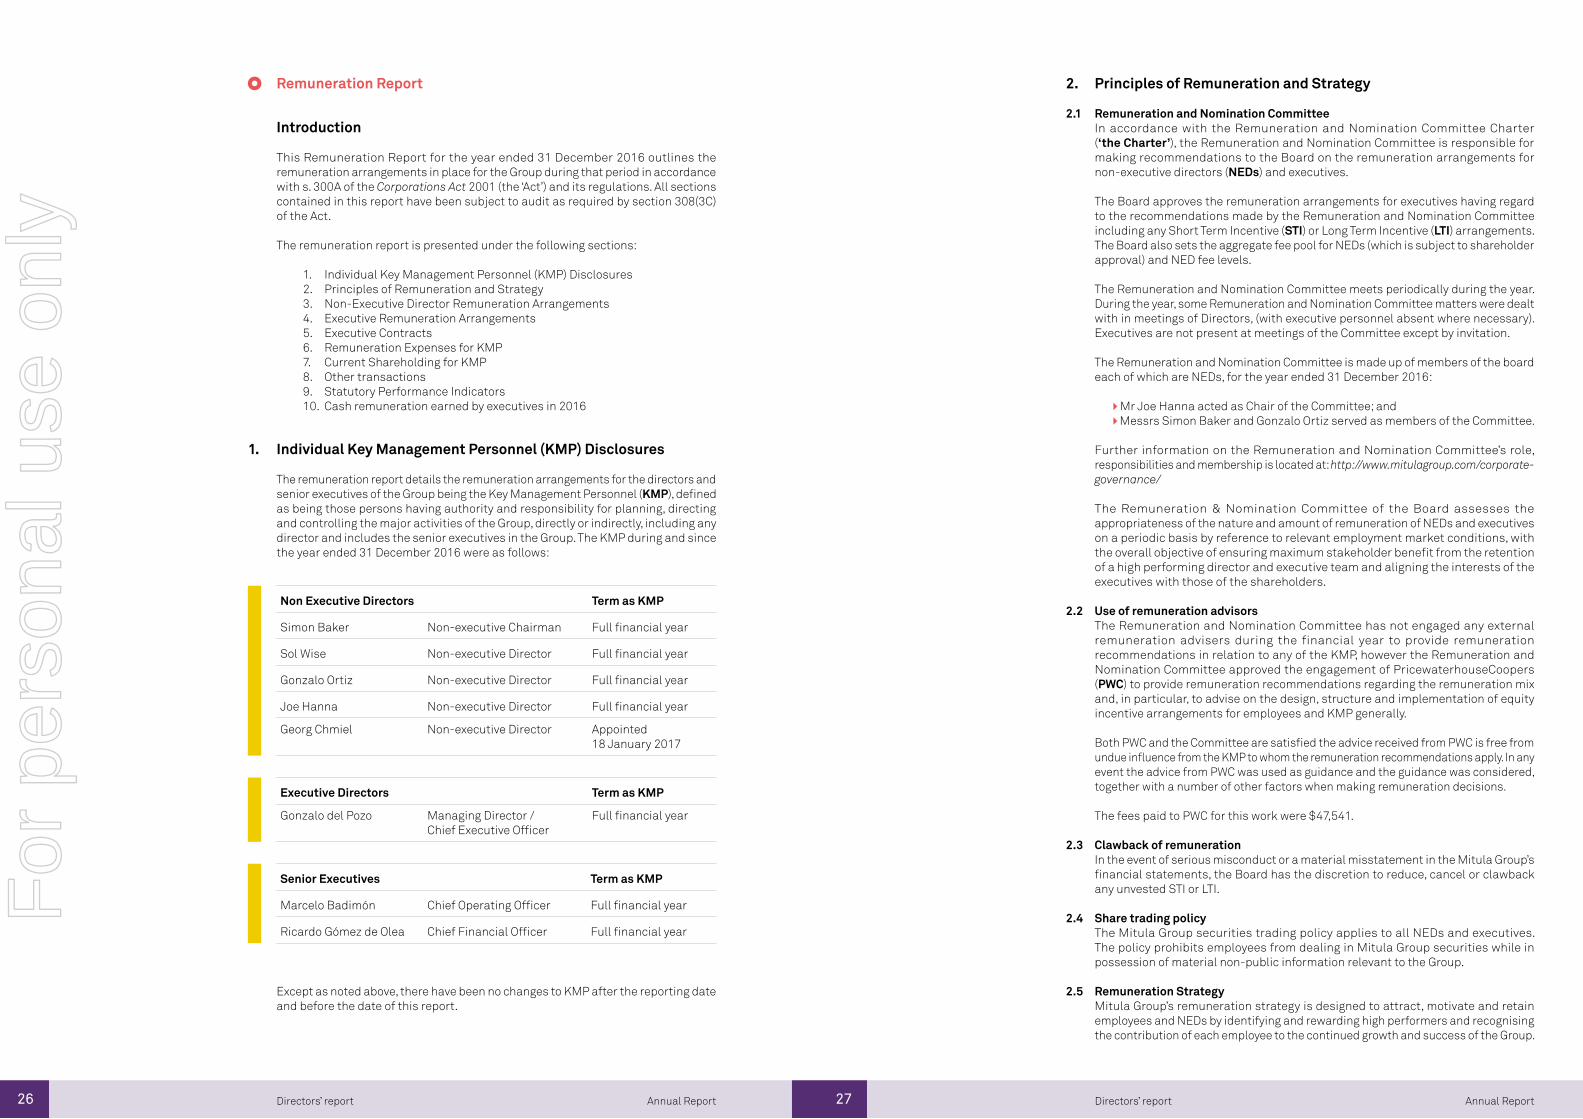
The remuneration report details the remuneration arrangements for the directors and senior executives of the Group being the Key Management Personnel (KMP), defined as being those persons having authority and responsibility for planning, directing and controlling the major activities of the Group, directly or indirectly, including any director and includes the senior executives in the Group. The KMP during and since the year ended 31 December 2016 were as follows:
1.
2.
Non Executive Directors Term as KMP
Simon Baker Non-executive Chairman Full financial year
Sol Wise Non-executive Director Full financial year
Gonzalo Ortiz Non-executive Director Full financial year
Joe Hanna Non-executive Director Full financial year
Georg Chmiel Non-executive Director Appointed 18 January 2017
Executive Directors Term as KMP
Gonzalo del Pozo Managing Director / Chief Executive Officer
Full financial year
Senior Executives Term as KMP
Marcelo Badimón Chief Operating Officer Full financial year
Ricardo Gómez de Olea Chief Financial Officer Full financial year
Except as noted above, there have been no changes to KMP after the reporting date and before the date of this report.
Principles of Remuneration and Strategy
Remuneration and Nomination CommitteeIn accordance with the Remuneration and Nomination Committee Charter (‘the Charter’), the Remuneration and Nomination Committee is responsible for making recommendations to the Board on the remuneration arrangements for non-executive directors (NEDs) and executives.
The Board approves the remuneration arrangements for executives having regard to the recommendations made by the Remuneration and Nomination Committee including any Short Term Incentive (STI) or Long Term Incentive (LTI) arrangements. The Board also sets the aggregate fee pool for NEDs (which is subject to shareholder approval) and NED fee levels.
The Remuneration and Nomination Committee meets periodically during the year. During the year, some Remuneration and Nomination Committee matters were dealt with in meetings of Directors, (with executive personnel absent where necessary). Executives are not present at meetings of the Committee except by invitation.
The Remuneration and Nomination Committee is made up of members of the board each of which are NEDs, for the year ended 31 December 2016:
Mr Joe Hanna acted as Chair of the Committee; and Messrs Simon Baker and Gonzalo Ortiz served as members of the Committee.
Further information on the Remuneration and Nomination Committee’s role, responsibilities and membership is located at: http://www.mitulagroup.com/corporate-governance/
The Remuneration & Nomination Committee of the Board assesses the appropriateness of the nature and amount of remuneration of NEDs and executives on a periodic basis by reference to relevant employment market conditions, with the overall objective of ensuring maximum stakeholder benefit from the retention of a high performing director and executive team and aligning the interests of the executives with those of the shareholders.
Use of remuneration advisorsThe Remuneration and Nomination Committee has not engaged any external remuneration advisers during the financial year to provide remuneration recommendations in relation to any of the KMP, however the Remuneration and Nomination Committee approved the engagement of PricewaterhouseCoopers (PWC) to provide remuneration recommendations regarding the remuneration mix and, in particular, to advise on the design, structure and implementation of equity incentive arrangements for employees and KMP generally.
Both PWC and the Committee are satisfied the advice received from PWC is free from undue influence from the KMP to whom the remuneration recommendations apply. In any event the advice from PWC was used as guidance and the guidance was considered, together with a number of other factors when making remuneration decisions.
The fees paid to PWC for this work were $47,541.
Clawback of remunerationIn the event of serious misconduct or a material misstatement in the Mitula Group’s financial statements, the Board has the discretion to reduce, cancel or clawback any unvested STI or LTI.
Share trading policyThe Mitula Group securities trading policy applies to all NEDs and executives. The policy prohibits employees from dealing in Mitula Group securities while in possession of material non-public information relevant to the Group.
Remuneration StrategyMitula Group’s remuneration strategy is designed to attract, motivate and retain employees and NEDs by identifying and rewarding high performers and recognising the contribution of each employee to the continued growth and success of the Group.
2.1
2.2
2.3
2.4
2.5
For
per
sona
l use
onl
y
28 29 Annual ReportAnnual Report Directors’ reportDirectors’ report
To this end, key objectives of the Group’s reward framework are to ensure that remuneration practices:
are aligned to the Group’s business strategy, offer competitive remuneration benchmarked against the external market, and provide strong linkage between individual and Group performance and rewards and align the interests of executives with shareholders.
Where relevant, the remuneration framework incorporates at risk components through STI and LTI arrangements tailored to the particular executive by reference to both financial and other metrics which generate value for shareholders.
The Board assumes full responsibility for compensation policies and packages applicable to directors and senior executives of the Company. The broad compensation policy is to ensure the compensation package appropriately reflects the person’s duties and responsibilities, and that compensation levels are competitive in attracting, retaining and motivating people who possess the requisite level of skill and experience. Employees may receive at-risk incentive payments based on the achievement of specific goals related to the performance of the individual and the Company (as determined by the directors). Incentives are provided to senior executives and employees for the achievement of individual and strategic objectives with the broader view of creating value for shareholders.
Components of total compensation for executives are ‘at risk’ (variable compensation) and dependent on meeting pre-determined performance benchmarks including Key Performance Indicators (KPIs). The inclusion of appropriate challenging performance hurdles in relation to variable compensation is designed to align employee performance with the creation of shareholder value and wealth. KPIs are agreed and set each year for KMP with the specific objective of generating shareholder wealth.
In accordance with best practice corporate governance, the structure of NED and executive remuneration is separate and distinct.
The structure of executive remuneration in 2016 consisted of the following:
Fixed RemunerationBase Salary
Variable RemunerationSTI Plan based 100 % on the Company’s financial performance.
Proposed LTI PlanIn October 2016 the Board resolved to introduce a Long Term Incentive (LTI) plan for the Group primarily as a retention strategy for key employees but also to focus executives and senior management on the achievement of sustainable long-term value creation and success of the Group (including appropriate management of business risks).
The proposed LTI plan was not operational in 2016 and, as at the date of this Report, no awards have been made under the proposed LTI plan. However, as the broad design features of the LTI plan have been approved by the Board in principle and because continued employment with the Group from July 2016 will count towards duration of service for the purpose of determining eligibility to an LTI award, an amount of $240,717 has been recognised in the 2016 financial year by way of share based payment expense in respect of awards to be issued in 2017 under the LTI plan.
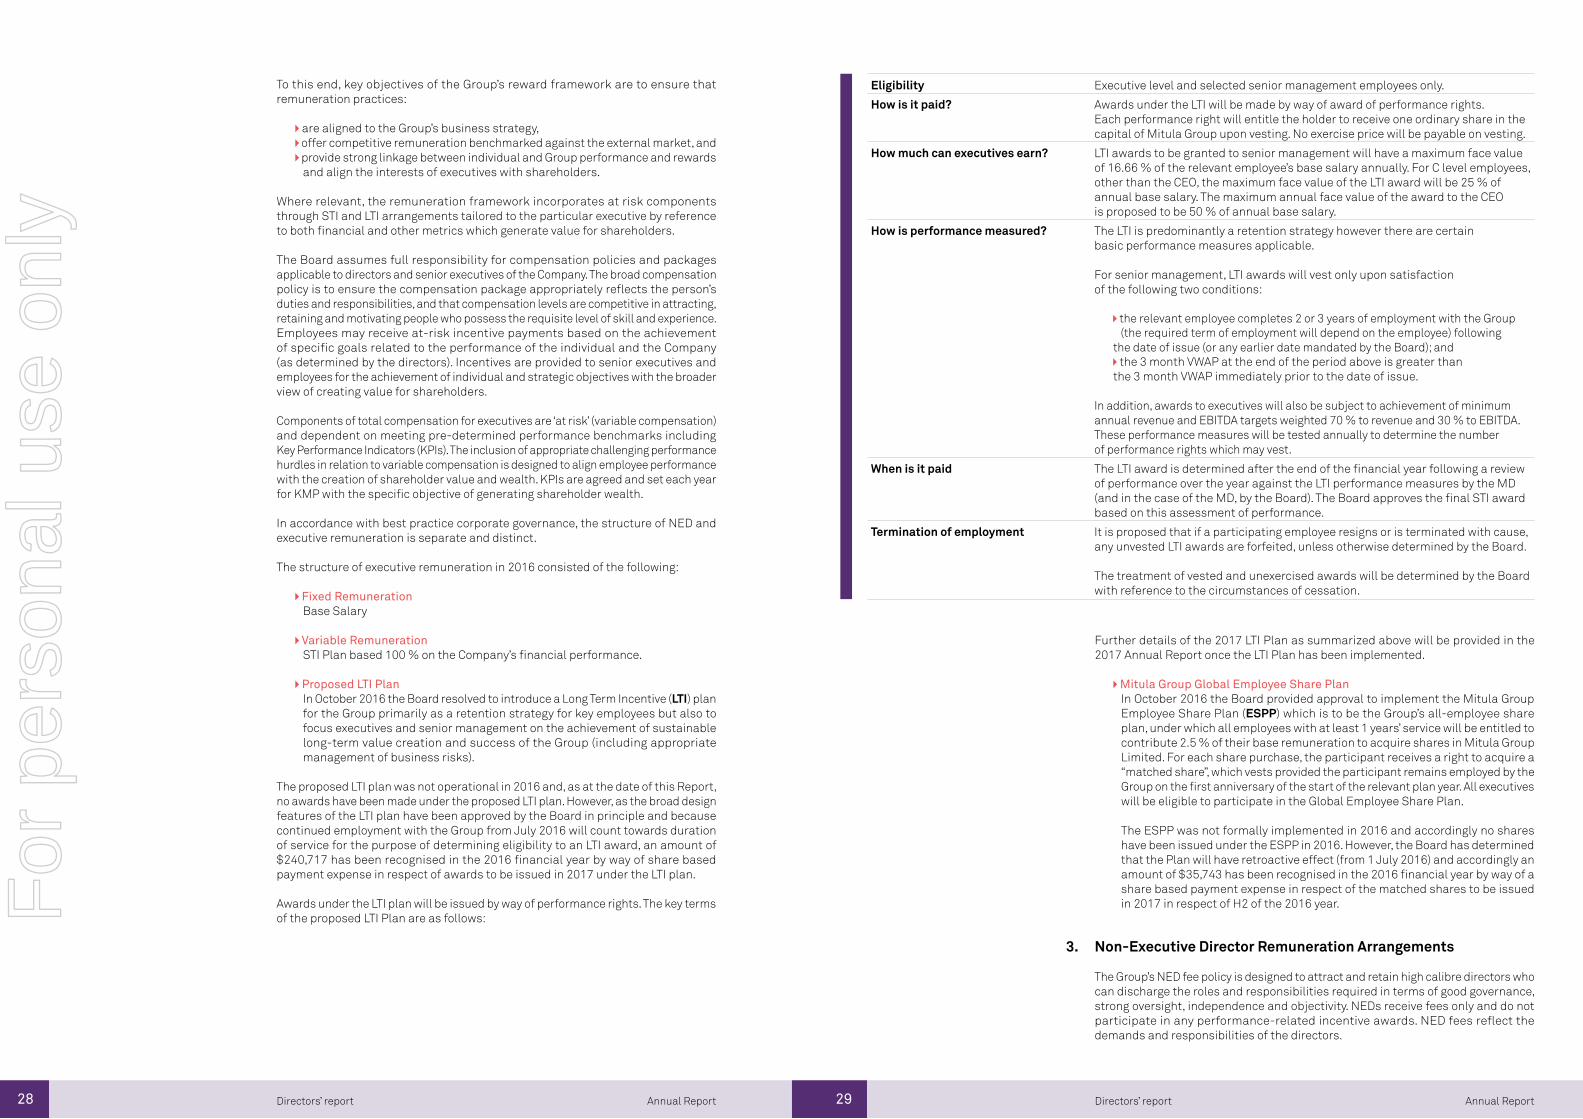
Awards under the LTI plan will be issued by way of performance rights. The key terms of the proposed LTI Plan are as follows:
Eligibility Executive level and selected senior management employees only.
How is it paid? Awards under the LTI will be made by way of award of performance rights. Each performance right will entitle the holder to receive one ordinary share in the capital of Mitula Group upon vesting. No exercise price will be payable on vesting.
How much can executives earn? LTI awards to be granted to senior management will have a maximum face value of 16.66 % of the relevant employee’s base salary annually. For C level employees, other than the CEO, the maximum face value of the LTI award will be 25 % of annual base salary. The maximum annual face value of the award to the CEO is proposed to be 50 % of annual base salary.
How is performance measured? The LTI is predominantly a retention strategy however there are certain basic performance measures applicable.
For senior management, LTI awards will vest only upon satisfaction of the following two conditions:
the relevant employee completes 2 or 3 years of employment with the Group (the required term of employment will depend on the employee) following
the date of issue (or any earlier date mandated by the Board); and the 3 month VWAP at the end of the period above is greater than
the 3 month VWAP immediately prior to the date of issue.
In addition, awards to executives will also be subject to achievement of minimum annual revenue and EBITDA targets weighted 70 % to revenue and 30 % to EBITDA. These performance measures will be tested annually to determine the number of performance rights which may vest.
When is it paid The LTI award is determined after the end of the financial year following a review of performance over the year against the LTI performance measures by the MD (and in the case of the MD, by the Board). The Board approves the final STI award based on this assessment of performance.
Termination of employment It is proposed that if a participating employee resigns or is terminated with cause, any unvested LTI awards are forfeited, unless otherwise determined by the Board.
The treatment of vested and unexercised awards will be determined by the Board with reference to the circumstances of cessation.
Further details of the 2017 LTI Plan as summarized above will be provided in the 2017 Annual Report once the LTI Plan has been implemented.
Mitula Group Global Employee Share PlanIn October 2016 the Board provided approval to implement the Mitula Group Employee Share Plan (ESPP) which is to be the Group’s all-employee share plan, under which all employees with at least 1 years’ service will be entitled to contribute 2.5 % of their base remuneration to acquire shares in Mitula Group Limited. For each share purchase, the participant receives a right to acquire a “matched share”, which vests provided the participant remains employed by the Group on the first anniversary of the start of the relevant plan year. All executives will be eligible to participate in the Global Employee Share Plan.
The ESPP was not formally implemented in 2016 and accordingly no shares have been issued under the ESPP in 2016. However, the Board has determined that the Plan will have retroactive effect (from 1 July 2016) and accordingly an amount of $35,743 has been recognised in the 2016 financial year by way of a share based payment expense in respect of the matched shares to be issued in 2017 in respect of H2 of the 2016 year.
Non-Executive Director Remuneration Arrangements
The Group’s NED fee policy is designed to attract and retain high calibre directors who can discharge the roles and responsibilities required in terms of good governance, strong oversight, independence and objectivity. NEDs receive fees only and do not participate in any performance-related incentive awards. NED fees reflect the demands and responsibilities of the directors.
3.
For
per
sona
l use
onl
y
30 31 Annual ReportAnnual Report Directors’ reportDirectors’ report
The Remuneration and Nominations Committee reviews NED remuneration annually against comparable companies.
The remuneration of non-executive directors consists of base director fees and committee fees (where applicable). Under the current policy NEDs are not entitled to receive performance related remuneration. Remuneration levels are to be reviewed by the Board annually.
NED fees are determined within an aggregate NED fee pool limit, which is periodically approved by shareholders. The maximum aggregate amount that may be paid to NEDs for their services is $400,000 during any financial year.
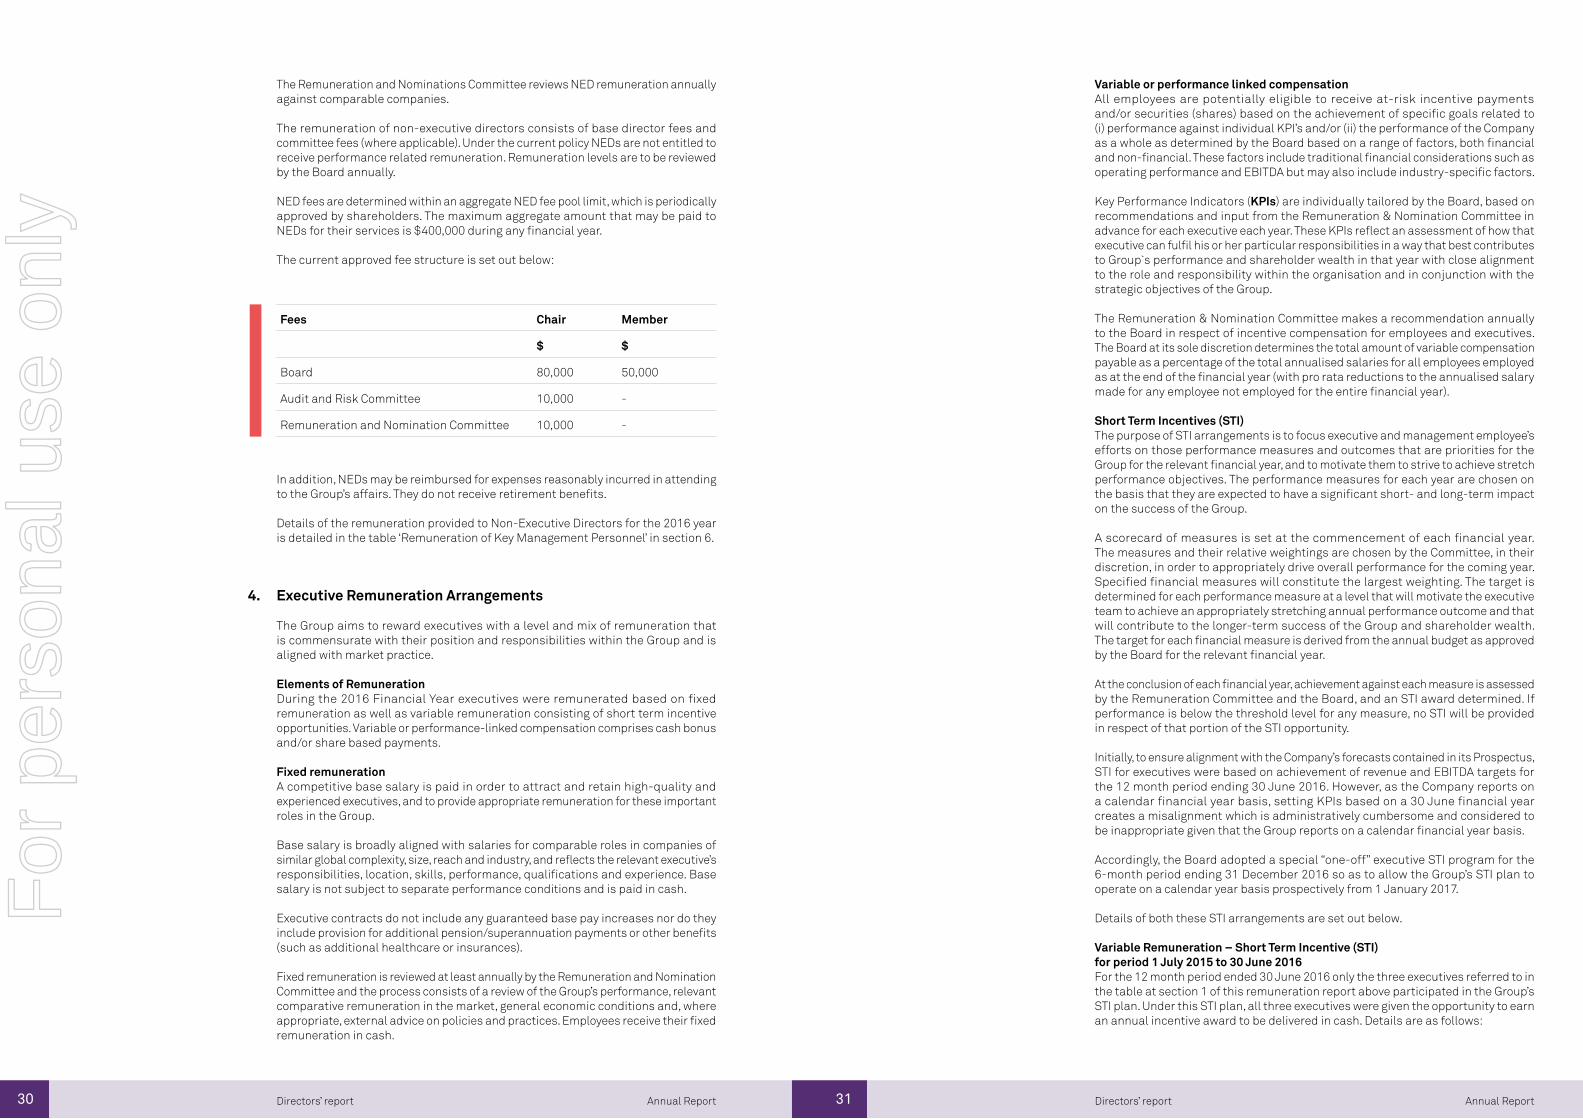
The current approved fee structure is set out below:
Fees Chair Member
$ $
Board 80,000 50,000
Audit and Risk Committee 10,000 -
Remuneration and Nomination Committee 10,000 -
In addition, NEDs may be reimbursed for expenses reasonably incurred in attending to the Group’s affairs. They do not receive retirement benefits.
Details of the remuneration provided to Non-Executive Directors for the 2016 year is detailed in the table ‘Remuneration of Key Management Personnel’ in section 6.
Executive Remuneration Arrangements
The Group aims to reward executives with a level and mix of remuneration that is commensurate with their position and responsibilities within the Group and is aligned with market practice.
Elements of RemunerationDuring the 2016 Financial Year executives were remunerated based on fixed remuneration as well as variable remuneration consisting of short term incentive opportunities. Variable or performance-linked compensation comprises cash bonus and/or share based payments.
Fixed remunerationA competitive base salary is paid in order to attract and retain high-quality and experienced executives, and to provide appropriate remuneration for these important roles in the Group.
Base salary is broadly aligned with salaries for comparable roles in companies of similar global complexity, size, reach and industry, and reflects the relevant executive’s responsibilities, location, skills, performance, qualifications and experience. Base salary is not subject to separate performance conditions and is paid in cash.
Executive contracts do not include any guaranteed base pay increases nor do they include provision for additional pension/superannuation payments or other benefits (such as additional healthcare or insurances).
Fixed remuneration is reviewed at least annually by the Remuneration and Nomination Committee and the process consists of a review of the Group’s performance, relevant comparative remuneration in the market, general economic conditions and, where appropriate, external advice on policies and practices. Employees receive their fixed remuneration in cash.
4.
Variable or performance linked compensationAll employees are potentially eligible to receive at-risk incentive payments and/or securities (shares) based on the achievement of specific goals related to (i) performance against individual KPI’s and/or (ii) the performance of the Company as a whole as determined by the Board based on a range of factors, both financial and non-financial. These factors include traditional financial considerations such as operating performance and EBITDA but may also include industry-specific factors.
Key Performance Indicators (KPIs) are individually tailored by the Board, based on recommendations and input from the Remuneration & Nomination Committee in advance for each executive each year. These KPIs reflect an assessment of how that executive can fulfil his or her particular responsibilities in a way that best contributes to Group`s performance and shareholder wealth in that year with close alignment to the role and responsibility within the organisation and in conjunction with the strategic objectives of the Group.
The Remuneration & Nomination Committee makes a recommendation annually to the Board in respect of incentive compensation for employees and executives. The Board at its sole discretion determines the total amount of variable compensation payable as a percentage of the total annualised salaries for all employees employed as at the end of the financial year (with pro rata reductions to the annualised salary made for any employee not employed for the entire financial year).
Short Term Incentives (STI) The purpose of STI arrangements is to focus executive and management employee’s efforts on those performance measures and outcomes that are priorities for the Group for the relevant financial year, and to motivate them to strive to achieve stretch performance objectives. The performance measures for each year are chosen on the basis that they are expected to have a significant short- and long-term impact on the success of the Group.
A scorecard of measures is set at the commencement of each financial year. The measures and their relative weightings are chosen by the Committee, in their discretion, in order to appropriately drive overall performance for the coming year. Specified financial measures will constitute the largest weighting. The target is determined for each performance measure at a level that will motivate the executive team to achieve an appropriately stretching annual performance outcome and that will contribute to the longer-term success of the Group and shareholder wealth. The target for each financial measure is derived from the annual budget as approved by the Board for the relevant financial year.
At the conclusion of each financial year, achievement against each measure is assessed by the Remuneration Committee and the Board, and an STI award determined. If performance is below the threshold level for any measure, no STI will be provided in respect of that portion of the STI opportunity.
Initially, to ensure alignment with the Company’s forecasts contained in its Prospectus, STI for executives were based on achievement of revenue and EBITDA targets for the 12 month period ending 30 June 2016. However, as the Company reports on a calendar financial year basis, setting KPIs based on a 30 June financial year creates a misalignment which is administratively cumbersome and considered to be inappropriate given that the Group reports on a calendar financial year basis.
Accordingly, the Board adopted a special “one-off” executive STI program for the 6-month period ending 31 December 2016 so as to allow the Group’s STI plan to operate on a calendar year basis prospectively from 1 January 2017.
Details of both these STI arrangements are set out below.
Variable Remuneration – Short Term Incentive (STI) for period 1 July 2015 to 30 June 2016For the 12 month period ended 30 June 2016 only the three executives referred to in the table at section 1 of this remuneration report above participated in the Group’s STI plan. Under this STI plan, all three executives were given the opportunity to earn an annual incentive award to be delivered in cash. Details are as follows:
For
per
sona
l use
onl
y
32 33 Annual ReportAnnual Report Directors’ reportDirectors’ report
Performance outcomes for – Short Term Incentive (STI) for period 1 July 2015 to 30 June 2016The Board and the Remuneration Committee reviewed the Group’s performance for the 12 months to 30 June 2016 for the purpose of determining the STI outcome for each of the executives.
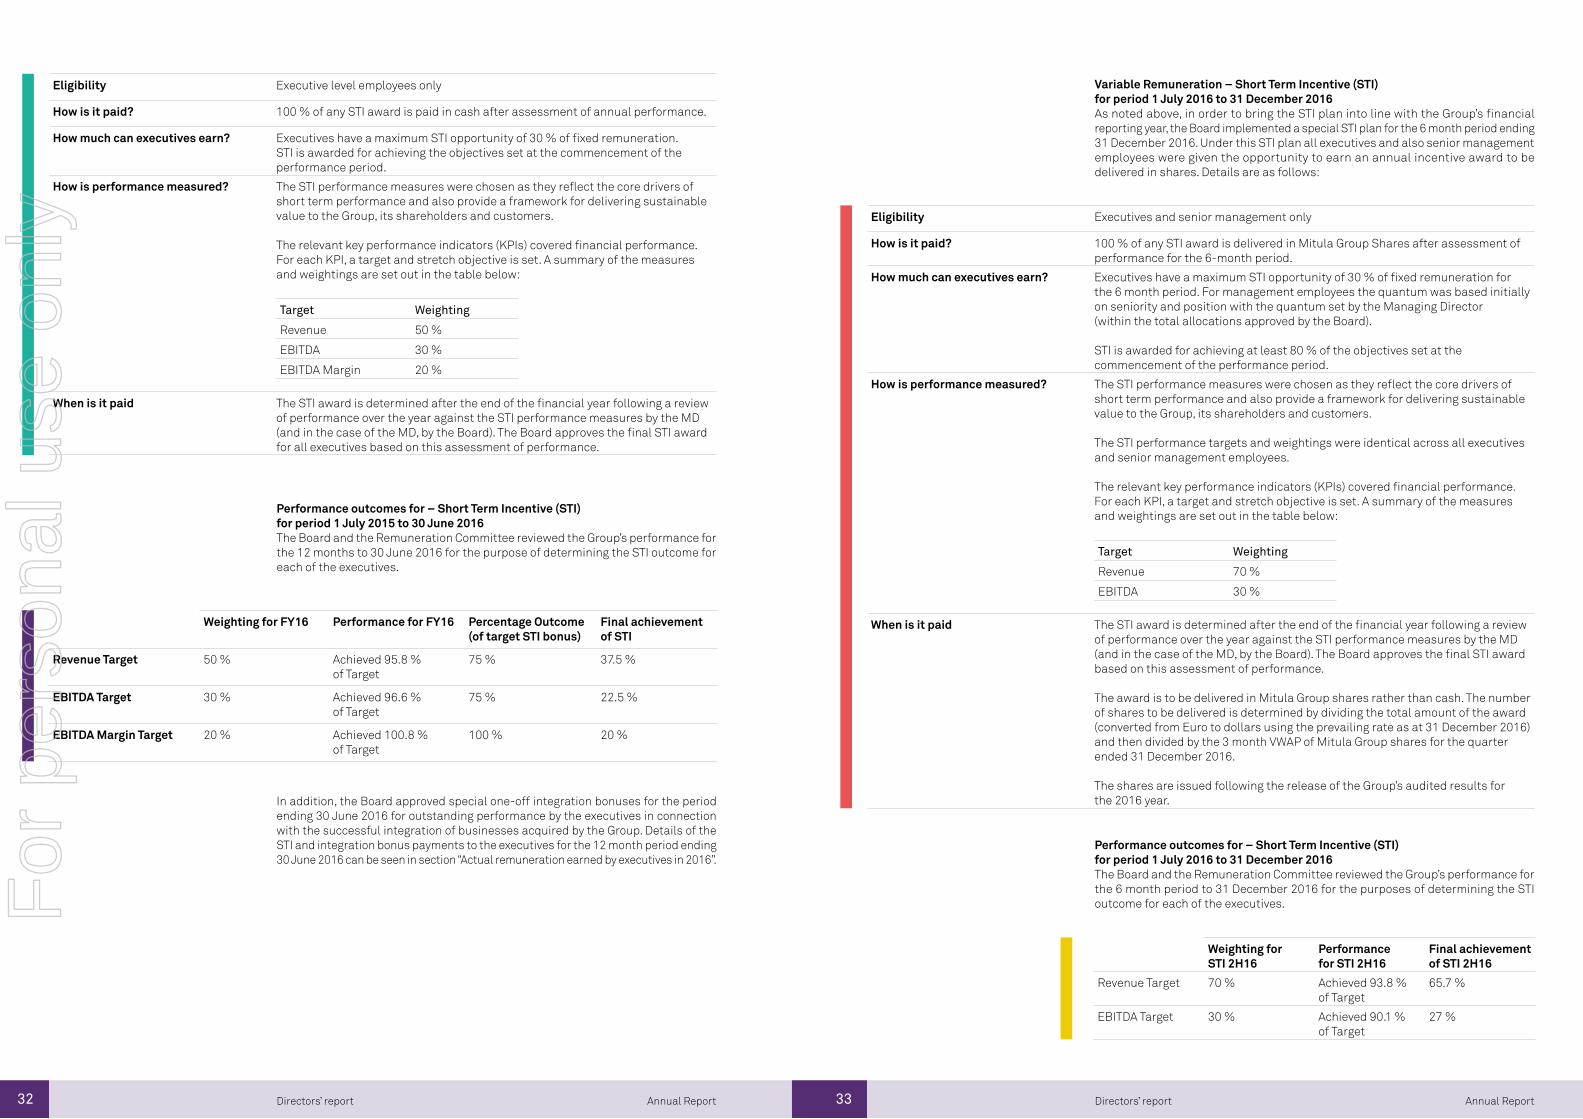
Eligibility Executive level employees only
How is it paid? 100 % of any STI award is paid in cash after assessment of annual performance.
How much can executives earn? Executives have a maximum STI opportunity of 30 % of fixed remuneration. STI is awarded for achieving the objectives set at the commencement of the performance period.
How is performance measured? The STI performance measures were chosen as they reflect the core drivers of short term performance and also provide a framework for delivering sustainable value to the Group, its shareholders and customers.
The relevant key performance indicators (KPIs) covered financial performance. For each KPI, a target and stretch objective is set. A summary of the measures and weightings are set out in the table below:
Target Weighting
Revenue 50 %
EBITDA 30 %
EBITDA Margin 20 %
When is it paid The STI award is determined after the end of the financial year following a review of performance over the year against the STI performance measures by the MD (and in the case of the MD, by the Board). The Board approves the final STI award for all executives based on this assessment of performance.
Eligibility Executives and senior management only
How is it paid? 100 % of any STI award is delivered in Mitula Group Shares after assessment of performance for the 6-month period.
How much can executives earn? Executives have a maximum STI opportunity of 30 % of fixed remuneration for the 6 month period. For management employees the quantum was based initially on seniority and position with the quantum set by the Managing Director (within the total allocations approved by the Board). STI is awarded for achieving at least 80 % of the objectives set at the commencement of the performance period.
How is performance measured? The STI performance measures were chosen as they reflect the core drivers of short term performance and also provide a framework for delivering sustainable value to the Group, its shareholders and customers.
The STI performance targets and weightings were identical across all executives and senior management employees.
The relevant key performance indicators (KPIs) covered financial performance. For each KPI, a target and stretch objective is set. A summary of the measures and weightings are set out in the table below:
Target Weighting
Revenue 70 %
EBITDA 30 %
When is it paid The STI award is determined after the end of the financial year following a review of performance over the year against the STI performance measures by the MD (and in the case of the MD, by the Board). The Board approves the final STI award based on this assessment of performance.
The award is to be delivered in Mitula Group shares rather than cash. The number of shares to be delivered is determined by dividing the total amount of the award (converted from Euro to dollars using the prevailing rate as at 31 December 2016) and then divided by the 3 month VWAP of Mitula Group shares for the quarter ended 31 December 2016.
The shares are issued following the release of the Group’s audited results for the 2016 year. In addition, the Board approved special one-off integration bonuses for the period
ending 30 June 2016 for outstanding performance by the executives in connection with the successful integration of businesses acquired by the Group. Details of the STI and integration bonus payments to the executives for the 12 month period ending 30 June 2016 can be seen in section “Actual remuneration earned by executives in 2016”.
Performance outcomes for – Short Term Incentive (STI) for period 1 July 2016 to 31 December 2016The Board and the Remuneration Committee reviewed the Group’s performance for the 6 month period to 31 December 2016 for the purposes of determining the STI outcome for each of the executives.
Variable Remuneration – Short Term Incentive (STI) for period 1 July 2016 to 31 December 2016As noted above, in order to bring the STI plan into line with the Group’s financial reporting year, the Board implemented a special STI plan for the 6 month period ending 31 December 2016. Under this STI plan all executives and also senior management employees were given the opportunity to earn an annual incentive award to be delivered in shares. Details are as follows:
Weighting for FY16 Performance for FY16 Percentage Outcome (of target STI bonus)
Final achievement of STI
Revenue Target 50 % Achieved 95.8 % of Target
75 % 37.5 %
EBITDA Target 30 % Achieved 96.6 % of Target
75 % 22.5 %
EBITDA Margin Target 20 % Achieved 100.8 % of Target
100 % 20 %
Weighting for STI 2H16
Performance for STI 2H16
Final achievement of STI 2H16
Revenue Target 70 % Achieved 93.8 % of Target
65.7 %
EBITDA Target 30 % Achieved 90.1 % of Target
27 %
For
per
sona
l use
onl
y
34 35 Annual ReportAnnual Report Directors’ reportDirectors’ report
Executive Contracts
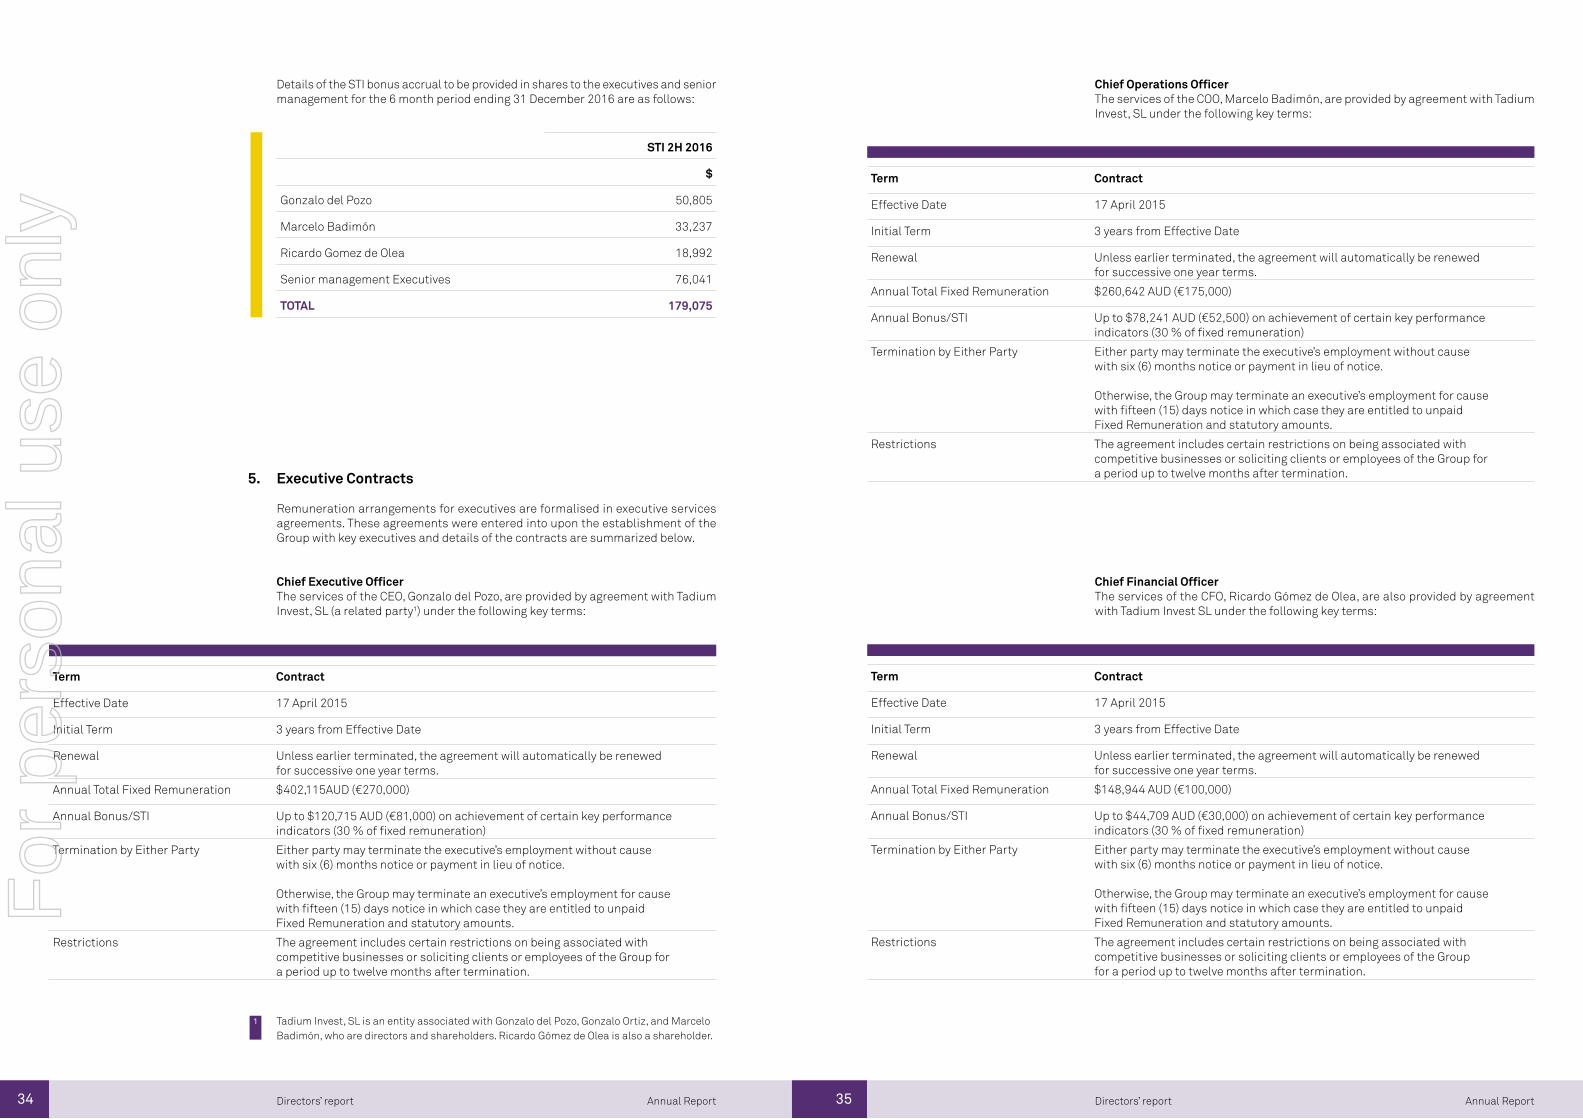
Remuneration arrangements for executives are formalised in executive services agreements. These agreements were entered into upon the establishment of the Group with key executives and details of the contracts are summarized below.
Chief Executive OfficerThe services of the CEO, Gonzalo del Pozo, are provided by agreement with Tadium Invest, SL (a related party¹) under the following key terms:
5.
Tadium Invest, SL is an entity associated with Gonzalo del Pozo, Gonzalo Ortiz, and Marcelo Badimón, who are directors and shareholders. Ricardo Gómez de Olea is also a shareholder.
Term Contract
Effective Date 17 April 2015
Initial Term 3 years from Effective Date
Renewal Unless earlier terminated, the agreement will automatically be renewed for successive one year terms.
Annual Total Fixed Remuneration $402,115AUD (€270,000)
Annual Bonus/STI Up to $120,715 AUD (€81,000) on achievement of certain key performance indicators (30 % of fixed remuneration)
Termination by Either Party Either party may terminate the executive’s employment without cause with six (6) months notice or payment in lieu of notice.
Otherwise, the Group may terminate an executive’s employment for cause with fifteen (15) days notice in which case they are entitled to unpaid Fixed Remuneration and statutory amounts.
Restrictions The agreement includes certain restrictions on being associated with competitive businesses or soliciting clients or employees of the Group for a period up to twelve months after termination.
Term Contract
Effective Date 17 April 2015
Initial Term 3 years from Effective Date
Renewal Unless earlier terminated, the agreement will automatically be renewed for successive one year terms.
Annual Total Fixed Remuneration $260,642 AUD (€175,000)
Annual Bonus/STI Up to $78,241 AUD (€52,500) on achievement of certain key performance indicators (30 % of fixed remuneration)
Termination by Either Party Either party may terminate the executive’s employment without cause with six (6) months notice or payment in lieu of notice.
Otherwise, the Group may terminate an executive’s employment for cause with fifteen (15) days notice in which case they are entitled to unpaid Fixed Remuneration and statutory amounts.
Restrictions The agreement includes certain restrictions on being associated with competitive businesses or soliciting clients or employees of the Group for a period up to twelve months after termination.
Term Contract
Effective Date 17 April 2015
Initial Term 3 years from Effective Date
Renewal Unless earlier terminated, the agreement will automatically be renewed for successive one year terms.
Annual Total Fixed Remuneration $148,944 AUD (€100,000)
Annual Bonus/STI Up to $44,709 AUD (€30,000) on achievement of certain key performance indicators (30 % of fixed remuneration)
Termination by Either Party Either party may terminate the executive’s employment without cause with six (6) months notice or payment in lieu of notice.
Otherwise, the Group may terminate an executive’s employment for cause with fifteen (15) days notice in which case they are entitled to unpaid Fixed Remuneration and statutory amounts.
Restrictions The agreement includes certain restrictions on being associated with competitive businesses or soliciting clients or employees of the Group for a period up to twelve months after termination.
STI 2H 2016
$
Gonzalo del Pozo 50,805
Marcelo Badimón 33,237
Ricardo Gomez de Olea 18,992
Senior management Executives 76,041
TOTAL 179,075
1
Chief Operations OfficerThe services of the COO, Marcelo Badimón, are provided by agreement with Tadium Invest, SL under the following key terms:
Chief Financial OfficerThe services of the CFO, Ricardo Gómez de Olea, are also provided by agreement with Tadium Invest SL under the following key terms:
Details of the STI bonus accrual to be provided in shares to the executives and senior management for the 6 month period ending 31 December 2016 are as follows:
For
per
sona
l use
onl
y
36 37 Annual ReportAnnual Report Directors’ reportDirectors’ report
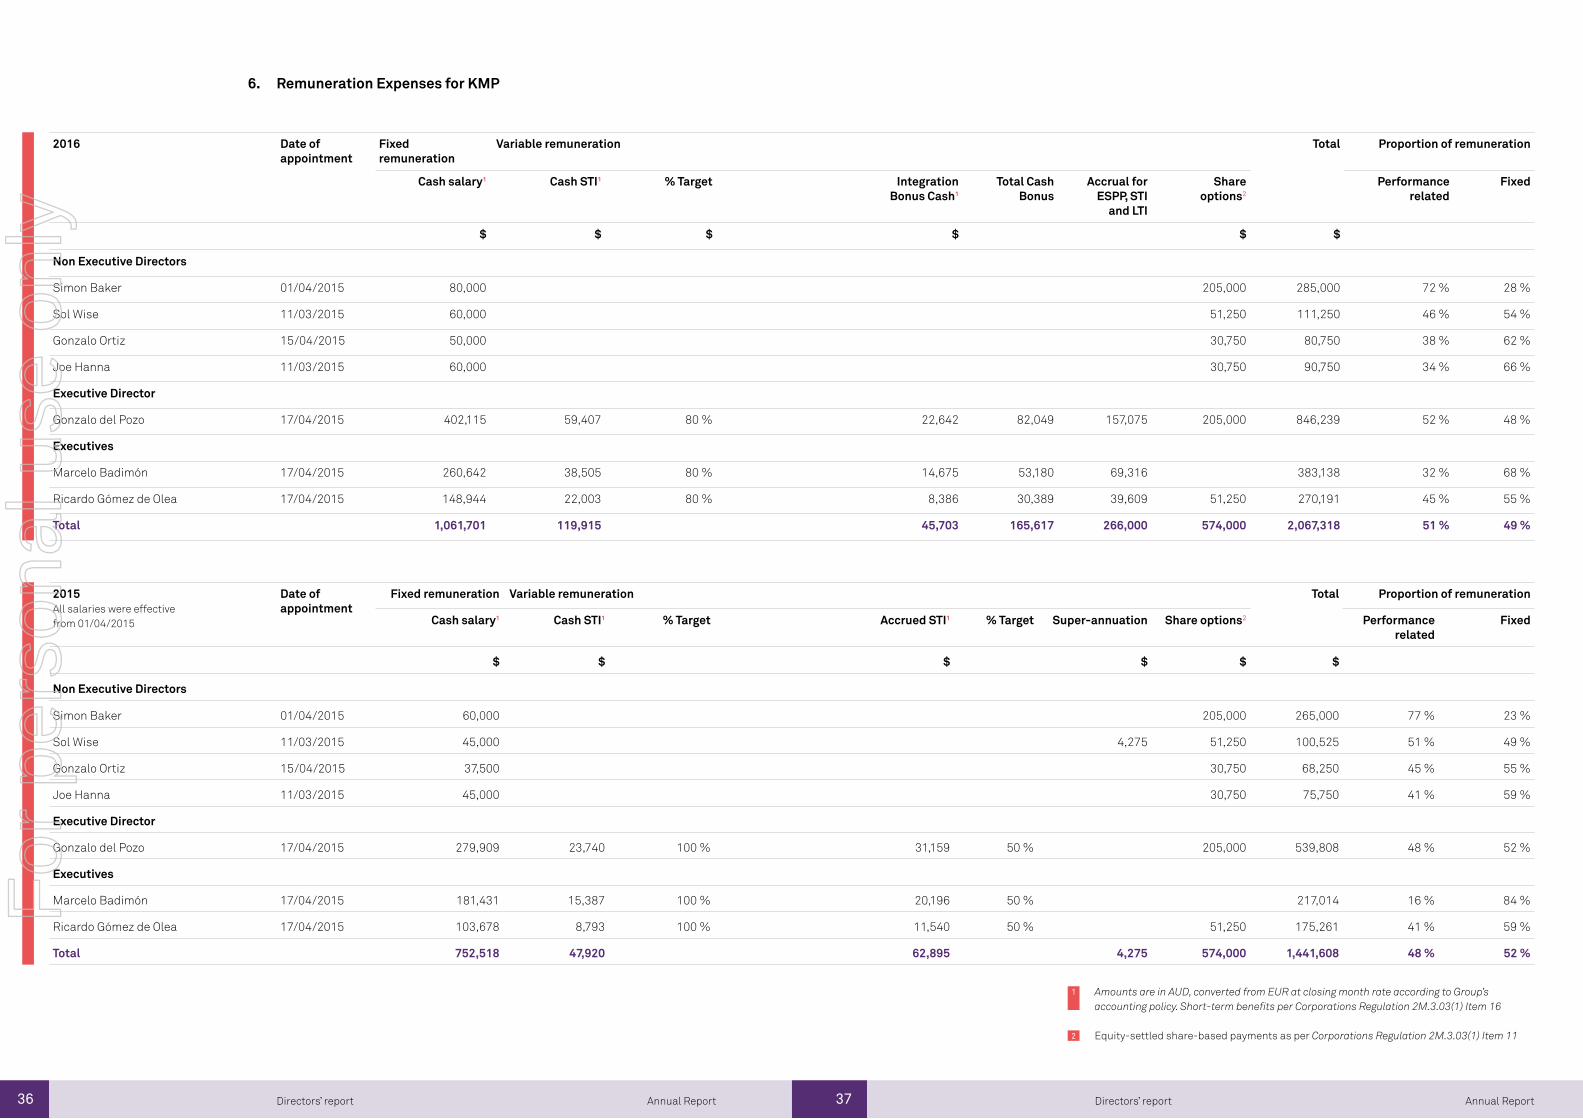
Remuneration Expenses for KMP
2016 Date of appointment
Fixed remuneration
Variable remuneration Total Proportion of remuneration
Cash salary¹
Cash STI¹ % Target Integration Bonus Cash¹
Total Cash Bonus
Accrual for ESPP, STI
and LTI
Share options2
Performance related
Fixed
$ $ $ $ $ $
Non Executive Directors
Simon Baker 01/04/2015 80,000 205,000 285,000 72 % 28 %
Sol Wise 11/03/2015 60,000 51,250 111,250 46 % 54 %
Gonzalo Ortiz 15/04/2015 50,000 30,750 80,750 38 % 62 %
Joe Hanna 11/03/2015 60,000 30,750 90,750 34 % 66 %
Executive Director
Gonzalo del Pozo 17/04/2015 402,115 59,407 80 % 22,642 82,049 157,075 205,000 846,239 52 % 48 %
Executives
Marcelo Badimón 17/04/2015 260,642 38,505 80 % 14,675 53,180 69,316 383,138 32 % 68 %
Ricardo Gómez de Olea 17/04/2015 148,944 22,003 80 % 8,386 30,389 39,609 51,250 270,191 45 % 55 %
Total 1,061,701 119,915 45,703 165,617 266,000 574,000 2,067,318 51 % 49 %
2015All salaries were effective from 01/04/2015
Date of appointment
Fixed remuneration Variable remuneration Total Proportion of remuneration
Cash salary¹ Cash STI¹ % Target Accrued STI¹ % Target Super-annuation Share options2 Performance related
Fixed
$ $ $ $ $ $
Non Executive Directors
Simon Baker 01/04/2015 60,000 205,000 265,000 77 % 23 %
Sol Wise 11/03/2015 45,000 4,275 51,250 100,525 51 % 49 %
Gonzalo Ortiz 15/04/2015 37,500 30,750 68,250 45 % 55 %
Joe Hanna 11/03/2015 45,000 30,750 75,750 41 % 59 %
Executive Director
Gonzalo del Pozo 17/04/2015 279,909 23,740 100 % 31,159 50 % 205,000 539,808 48 % 52 %
Executives
Marcelo Badimón 17/04/2015 181,431 15,387 100 % 20,196 50 % 217,014 16 % 84 %
Ricardo Gómez de Olea 17/04/2015 103,678 8,793 100 % 11,540 50 % 51,250 175,261 41 % 59 %
Total 752,518 47,920 62,895 4,275 574,000 1,441,608 48 % 52 %
Amounts are in AUD, converted from EUR at closing month rate according to Group’s accounting policy. Short-term benefits per Corporations Regulation 2M.3.03(1) Item 16
Equity-settled share-based payments as per Corporations Regulation 2M.3.03(1) Item 11
1
2
6.
For
per
sona
l use
onl
y
38 39 Annual ReportAnnual Report Directors’ reportDirectors’ report
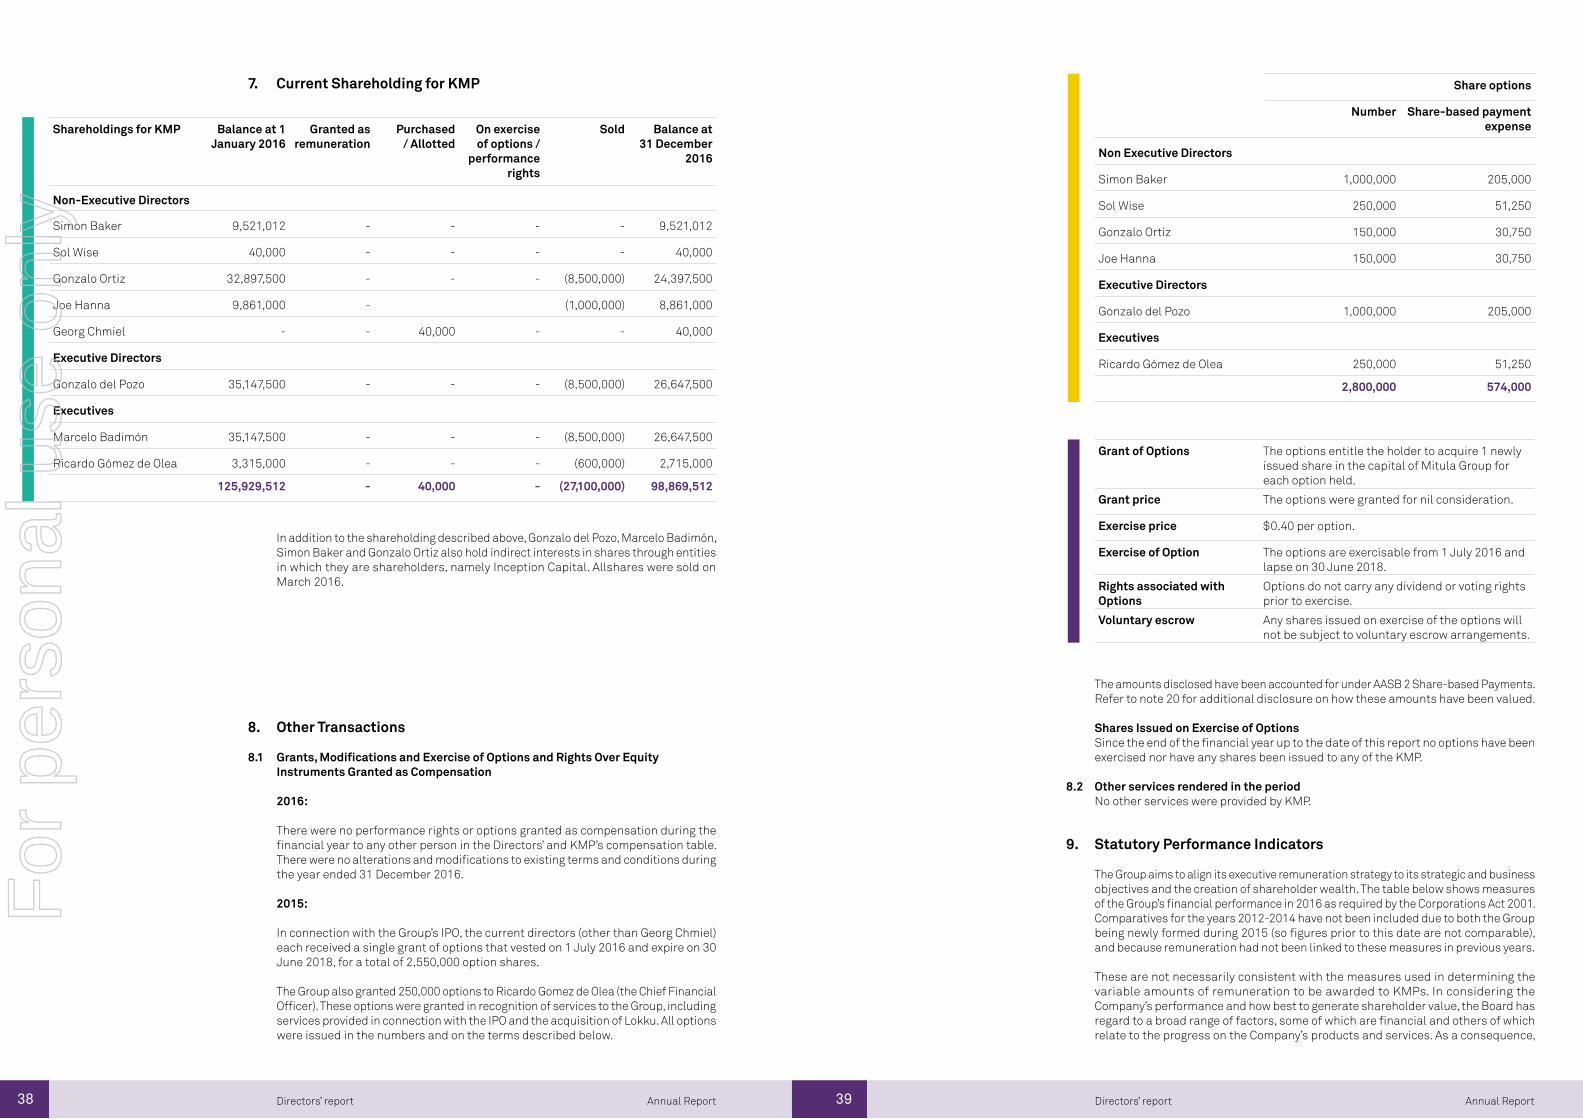
Shareholdings for KMP Balance at 1 January 2016
Granted as remuneration
Purchased / Allotted
On exercise of options /
performance rights
Sold Balance at 31 December
2016
Non-Executive Directors
Simon Baker 9,521,012 - - - - 9,521,012
Sol Wise 40,000 - - - - 40,000
Gonzalo Ortiz 32,897,500 - - - (8,500,000) 24,397,500
Joe Hanna 9,861,000 - (1,000,000) 8,861,000
Georg Chmiel - - 40,000 - - 40,000
Executive Directors
Gonzalo del Pozo 35,147,500 - - - (8,500,000) 26,647,500
Executives
Marcelo Badimón 35,147,500 - - - (8,500,000) 26,647,500
Ricardo Gómez de Olea 3,315,000 - - - (600,000) 2,715,000
125,929,512 - 40,000 - (27,100,000) 98,869,512
Current Shareholding for KMP
In addition to the shareholding described above, Gonzalo del Pozo, Marcelo Badimón, Simon Baker and Gonzalo Ortiz also hold indirect interests in shares through entities in which they are shareholders, namely Inception Capital. Allshares were sold on March 2016.
7.
8.
9.
Other Transactions
Grants, Modifications and Exercise of Options and Rights Over Equity Instruments Granted as Compensation
2016:
There were no performance rights or options granted as compensation during the financial year to any other person in the Directors’ and KMP’s compensation table. There were no alterations and modifications to existing terms and conditions during the year ended 31 December 2016.
2015:
In connection with the Group’s IPO, the current directors (other than Georg Chmiel) each received a single grant of options that vested on 1 July 2016 and expire on 30 June 2018, for a total of 2,550,000 option shares.
The Group also granted 250,000 options to Ricardo Gomez de Olea (the Chief Financial Officer). These options were granted in recognition of services to the Group, including services provided in connection with the IPO and the acquisition of Lokku. All options were issued in the numbers and on the terms described below.
Share options
Number Share-based payment expense
Non Executive Directors
Simon Baker 1,000,000 205,000
Sol Wise 250,000 51,250
Gonzalo Ortiz 150,000 30,750
Joe Hanna 150,000 30,750
Executive Directors
Gonzalo del Pozo 1,000,000 205,000
Executives
Ricardo Gómez de Olea 250,000 51,250
2,800,000 574,000
The amounts disclosed have been accounted for under AASB 2 Share-based Payments. Refer to note 20 for additional disclosure on how these amounts have been valued.
Shares Issued on Exercise of OptionsSince the end of the financial year up to the date of this report no options have been exercised nor have any shares been issued to any of the KMP.
Other services rendered in the periodNo other services were provided by KMP.
Statutory Performance Indicators
The Group aims to align its executive remuneration strategy to its strategic and business objectives and the creation of shareholder wealth. The table below shows measures of the Group’s financial performance in 2016 as required by the Corporations Act 2001. Comparatives for the years 2012-2014 have not been included due to both the Group being newly formed during 2015 (so figures prior to this date are not comparable), and because remuneration had not been linked to these measures in previous years.
These are not necessarily consistent with the measures used in determining the variable amounts of remuneration to be awarded to KMPs. In considering the Company’s performance and how best to generate shareholder value, the Board has regard to a broad range of factors, some of which are financial and others of which relate to the progress on the Company’s products and services. As a consequence,
Grant of Options The options entitle the holder to acquire 1 newly issued share in the capital of Mitula Group for each option held.
Grant price The options were granted for nil consideration.
Exercise price $0.40 per option.
Exercise of Option The options are exercisable from 1 July 2016 and lapse on 30 June 2018.
Rights associated with Options
Options do not carry any dividend or voting rights prior to exercise.
Voluntary escrow Any shares issued on exercise of the options will not be subject to voluntary escrow arrangements.
8.2
8.1
For
per
sona
l use
onl
y
40 41 Annual ReportAnnual Report Directors’ reportDirectors’ report
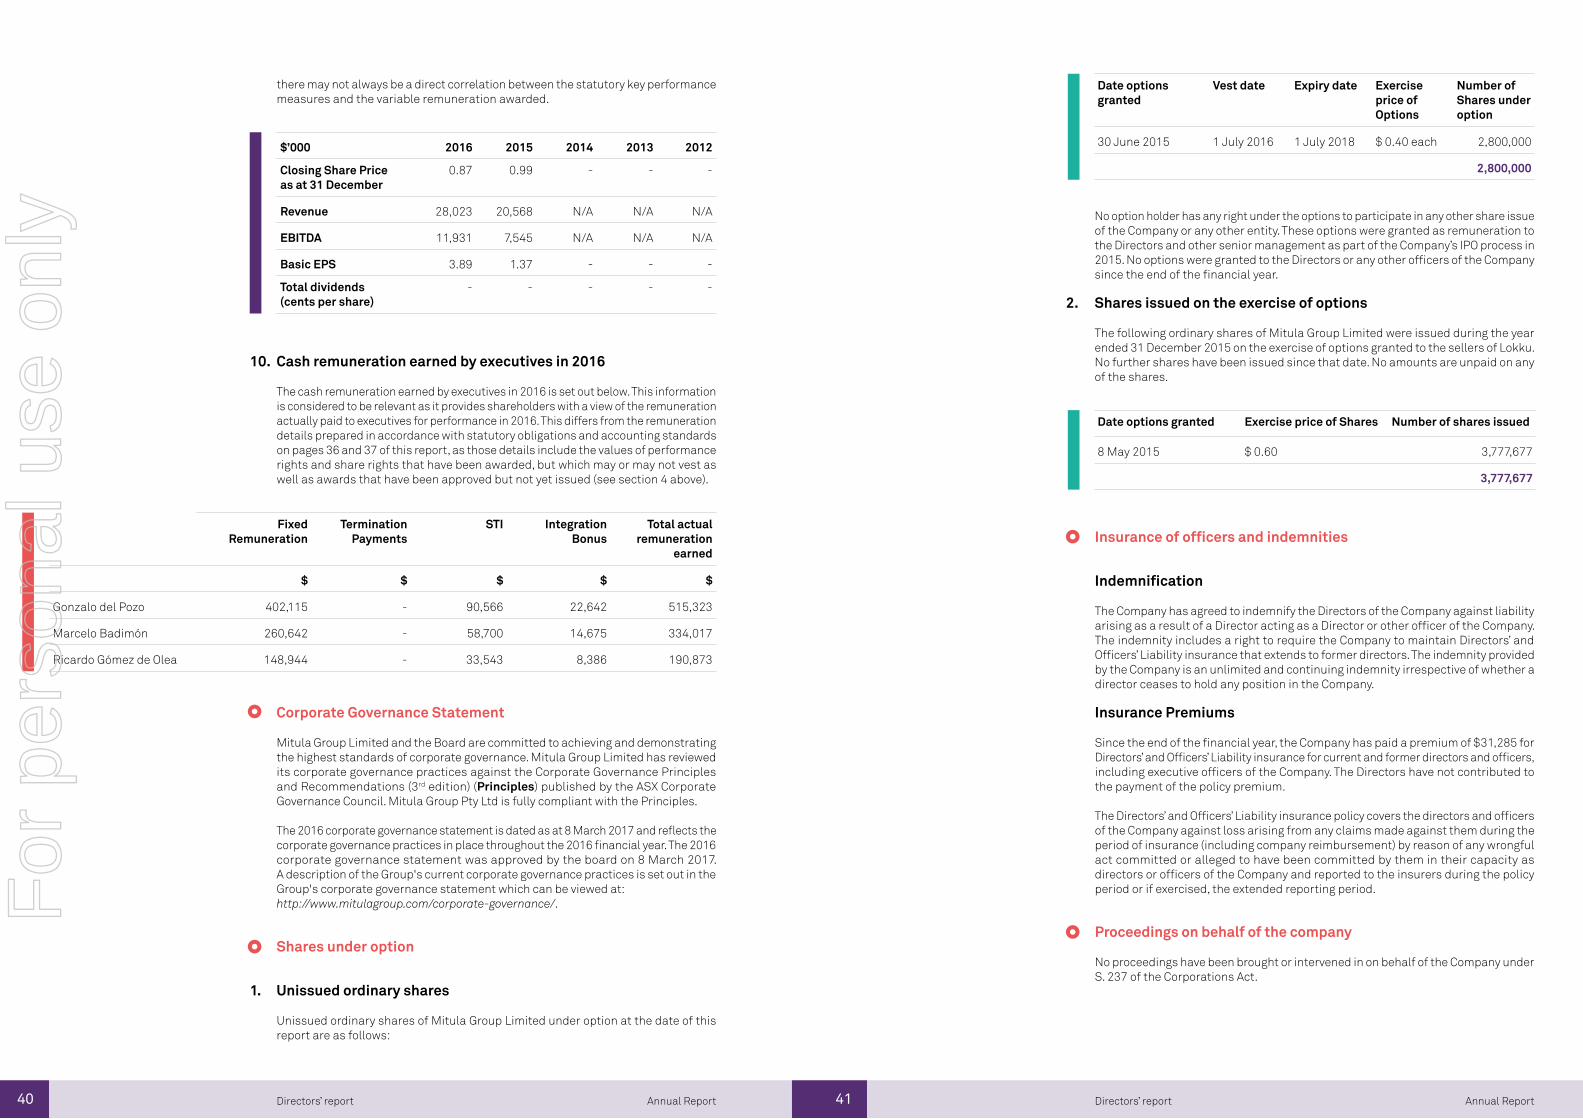
Cash remuneration earned by executives in 2016
The cash remuneration earned by executives in 2016 is set out below. This information is considered to be relevant as it provides shareholders with a view of the remuneration actually paid to executives for performance in 2016. This differs from the remuneration details prepared in accordance with statutory obligations and accounting standards on pages 36 and 37 of this report, as those details include the values of performance rights and share rights that have been awarded, but which may or may not vest as well as awards that have been approved but not yet issued (see section 4 above).
$’000 2016 2015 2014 2013 2012
Closing Share Price as at 31 December
0.87 0.99 - - -
Revenue 28,023 20,568 N/A N/A N/A
EBITDA 11,931 7,545 N/A N/A N/A
Basic EPS 3.89 1.37 - - -
Total dividends (cents per share)
- - - - -
there may not always be a direct correlation between the statutory key performance measures and the variable remuneration awarded.
10.
Fixed Remuneration
Termination Payments
STI Integration Bonus
Total actual remuneration
earned
$ $ $ $ $
Gonzalo del Pozo 402,115 - 90,566 22,642 515,323
Marcelo Badimón 260,642 - 58,700 14,675 334,017
Ricardo Gómez de Olea 148,944 - 33,543 8,386 190,873
1.
2.
No option holder has any right under the options to participate in any other share issue of the Company or any other entity. These options were granted as remuneration to the Directors and other senior management as part of the Company’s IPO process in 2015. No options were granted to the Directors or any other officers of the Company since the end of the financial year.
Shares issued on the exercise of options
The following ordinary shares of Mitula Group Limited were issued during the year ended 31 December 2015 on the exercise of options granted to the sellers of Lokku. No further shares have been issued since that date. No amounts are unpaid on any of the shares.
Date options granted
Vest date Expiry date Exercise price of Options
Number of Shares under option
30 June 2015 1 July 2016 1 July 2018 $ 0.40 each 2,800,000
2,800,000
Date options granted Exercise price of Shares Number of shares issued
8 May 2015 $ 0.60 3,777,677
3,777,677
Insurance of officers and indemnities
Indemnification
The Company has agreed to indemnify the Directors of the Company against liability arising as a result of a Director acting as a Director or other officer of the Company. The indemnity includes a right to require the Company to maintain Directors’ and Officers’ Liability insurance that extends to former directors. The indemnity provided by the Company is an unlimited and continuing indemnity irrespective of whether a director ceases to hold any position in the Company.
Insurance Premiums
Since the end of the financial year, the Company has paid a premium of $31,285 for Directors’ and Officers’ Liability insurance for current and former directors and officers, including executive officers of the Company. The Directors have not contributed to the payment of the policy premium.
The Directors’ and Officers’ Liability insurance policy covers the directors and officers of the Company against loss arising from any claims made against them during the period of insurance (including company reimbursement) by reason of any wrongful act committed or alleged to have been committed by them in their capacity as directors or officers of the Company and reported to the insurers during the policy period or if exercised, the extended reporting period.
Proceedings on behalf of the company
No proceedings have been brought or intervened in on behalf of the Company under S. 237 of the Corporations Act.
Corporate Governance Statement
Mitula Group Limited and the Board are committed to achieving and demonstrating the highest standards of corporate governance. Mitula Group Limited has reviewed its corporate governance practices against the Corporate Governance Principles and Recommendations (3rd edition) (Principles) published by the ASX Corporate Governance Council. Mitula Group Pty Ltd is fully compliant with the Principles.
The 2016 corporate governance statement is dated as at 8 March 2017 and reflects thecorporate governance practices in place throughout the 2016 financial year. The 2016 corporate governance statement was approved by the board on 8 March 2017. A description of the Group's current corporate governance practices is set out in the Group's corporate governance statement which can be viewed at:http://www.mitulagroup.com/corporate-governance/.
Shares under option
Unissued ordinary shares
Unissued ordinary shares of Mitula Group Limited under option at the date of this report are as follows:
For
per
sona
l use
onl
y
42 43 Annual ReportAnnual Report Directors’ reportDirectors’ report
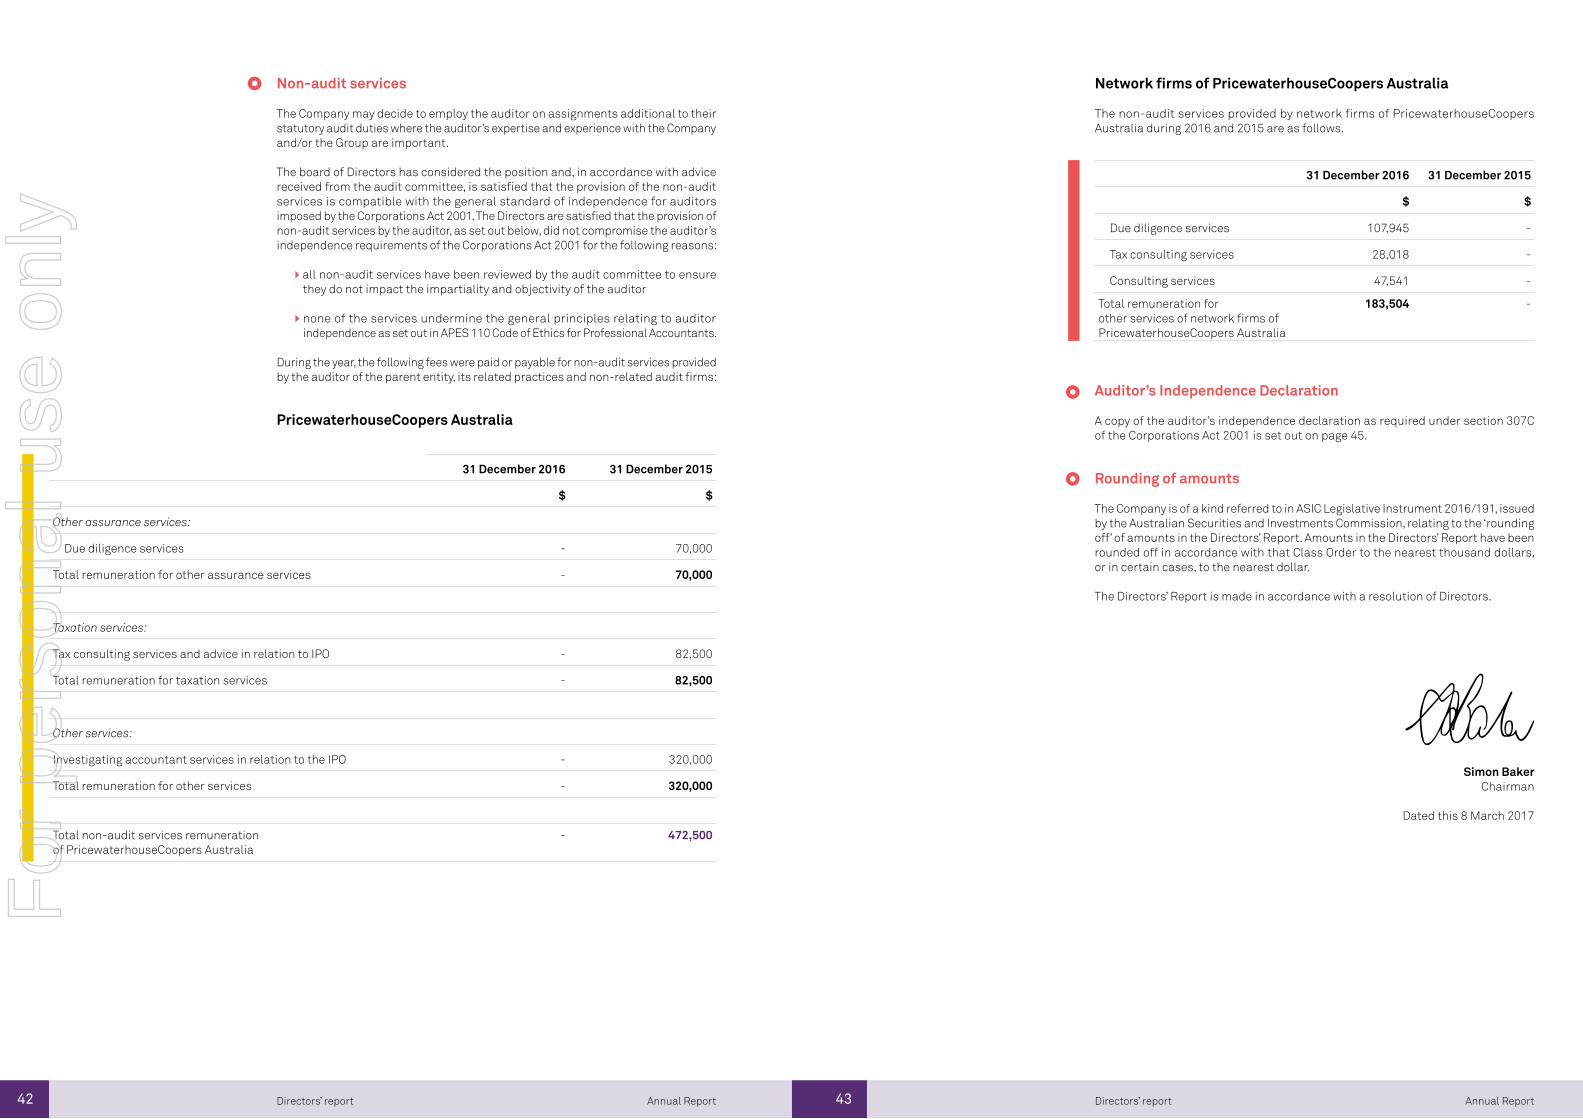
Non-audit services
The Company may decide to employ the auditor on assignments additional to their statutory audit duties where the auditor’s expertise and experience with the Company and/or the Group are important.
The board of Directors has considered the position and, in accordance with advice received from the audit committee, is satisfied that the provision of the non-audit services is compatible with the general standard of independence for auditors imposed by the Corporations Act 2001. The Directors are satisfied that the provision of non-audit services by the auditor, as set out below, did not compromise the auditor’s independence requirements of the Corporations Act 2001 for the following reasons:
all non-audit services have been reviewed by the audit committee to ensure they do not impact the impartiality and objectivity of the auditor
none of the services undermine the general principles relating to auditor independence as set out in APES 110 Code of Ethics for Professional Accountants.
During the year, the following fees were paid or payable for non-audit services provided by the auditor of the parent entity, its related practices and non-related audit firms:
PricewaterhouseCoopers Australia
31 December 2016 31 December 2015
$ $
Other assurance services:
Due diligence services - 70,000
Total remuneration for other assurance services - 70,000
Taxation services:
Tax consulting services and advice in relation to IPO - 82,500
Total remuneration for taxation services - 82,500
Other services:
Investigating accountant services in relation to the IPO - 320,000
Total remuneration for other services - 320,000
Total non-audit services remuneration of PricewaterhouseCoopers Australia
- 472,500
Network firms of PricewaterhouseCoopers Australia
The non-audit services provided by network firms of PricewaterhouseCoopers Australia during 2016 and 2015 are as follows.
31 December 2016 31 December 2015
$ $
Due diligence services 107,945 -
Tax consulting services 28,018 -
Consulting services 47,541 -
Total remuneration for other services of network firms of PricewaterhouseCoopers Australia
183,504 -
Auditor’s Independence Declaration
A copy of the auditor’s independence declaration as required under section 307C of the Corporations Act 2001 is set out on page 45.
Rounding of amounts
The Company is of a kind referred to in ASIC Legislative Instrument 2016/191, issued by the Australian Securities and Investments Commission, relating to the ‘rounding off’ of amounts in the Directors’ Report. Amounts in the Directors’ Report have been rounded off in accordance with that Class Order to the nearest thousand dollars, or in certain cases, to the nearest dollar.
The Directors’ Report is made in accordance with a resolution of Directors.
Simon BakerChairman
Dated this 8 March 2017
For
per
sona
l use
onl
y
44 Annual Report
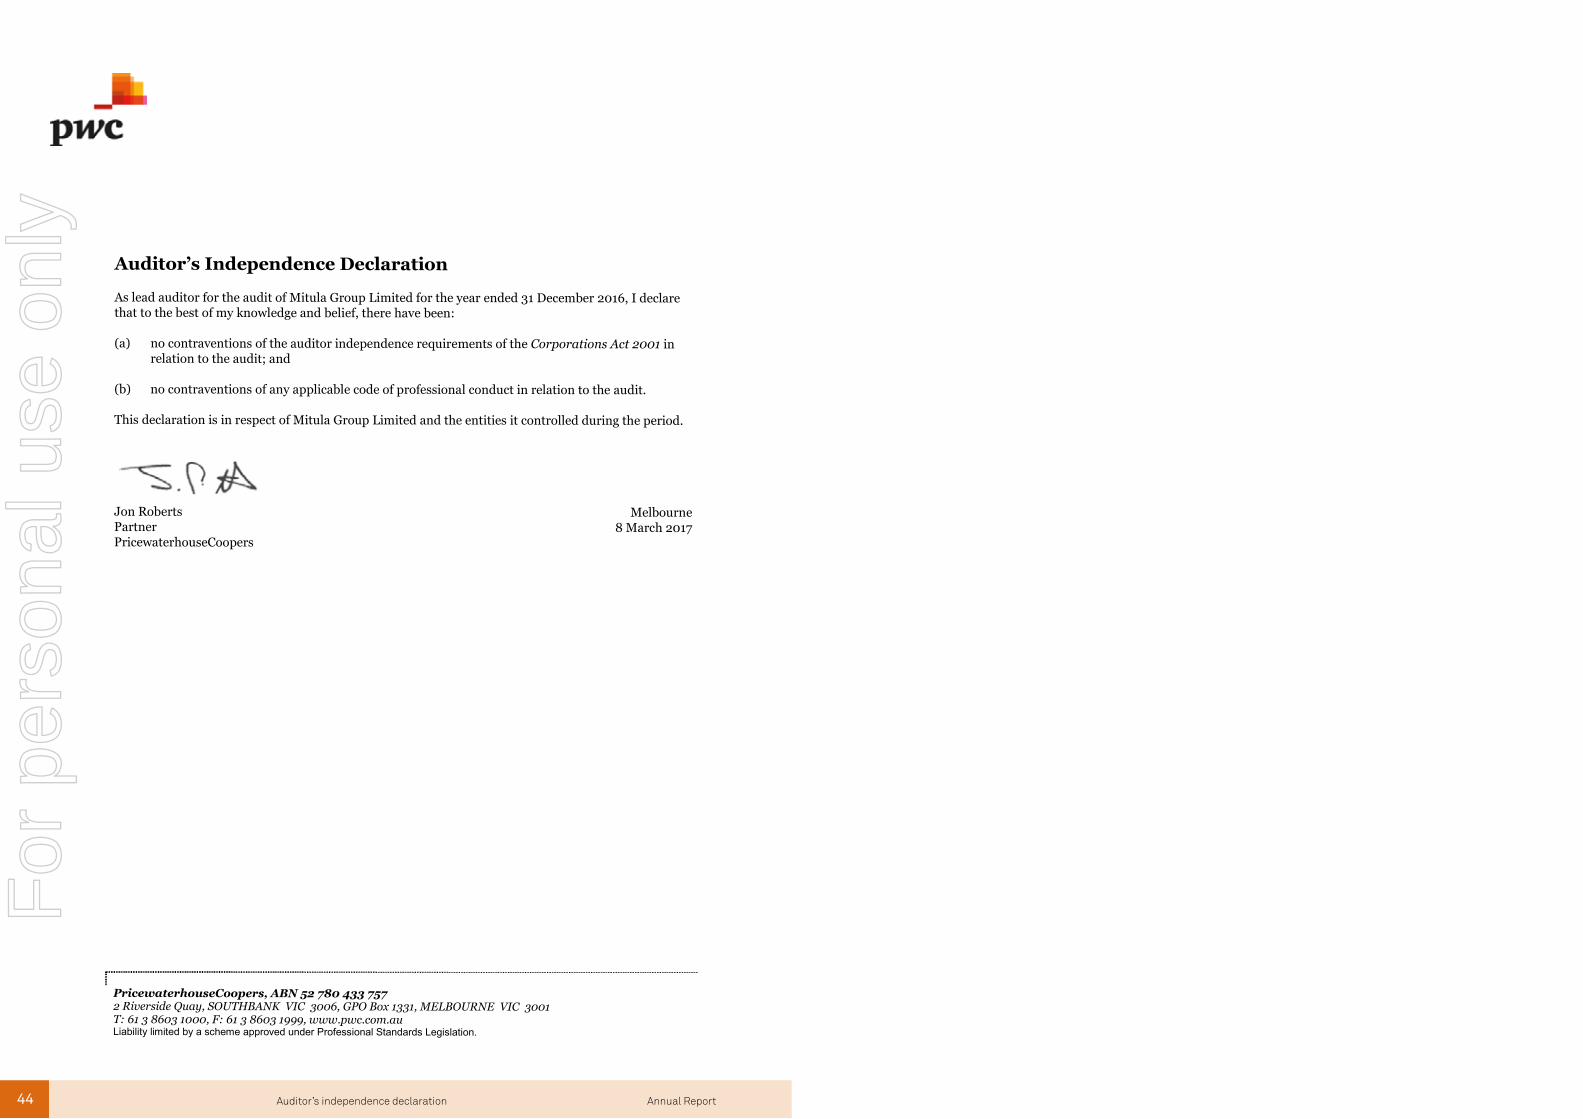
PricewaterhouseCoopers, ABN 52 780 433 7572 Riverside Quay, SOUTHBANK VIC 3006, GPO Box 1331, MELBOURNE VIC 3001T: 61 3 8603 1000, F: 61 3 8603 1999, www.pwc.com.auLiability limited by a scheme approved under Professional Standards Legislation.
Auditor’s Independence Declaration
As lead auditor for the audit of Mitula Group Limited for the year ended 31 December 2016, I declarethat to the best of my knowledge and belief, there have been:
(a) no contraventions of the auditor independence requirements of the Corporations Act 2001 inrelation to the audit; and
(b) no contraventions of any applicable code of professional conduct in relation to the audit.
This declaration is in respect of Mitula Group Limited and the entities it controlled during the period.
Jon Roberts MelbournePartnerPricewaterhouseCoopers
8 March 2017
Auditor’s independence declaration
For
per
sona
l use
onl
y

46
Financial Statements
2.0
For
per
sona
l use
onl
y
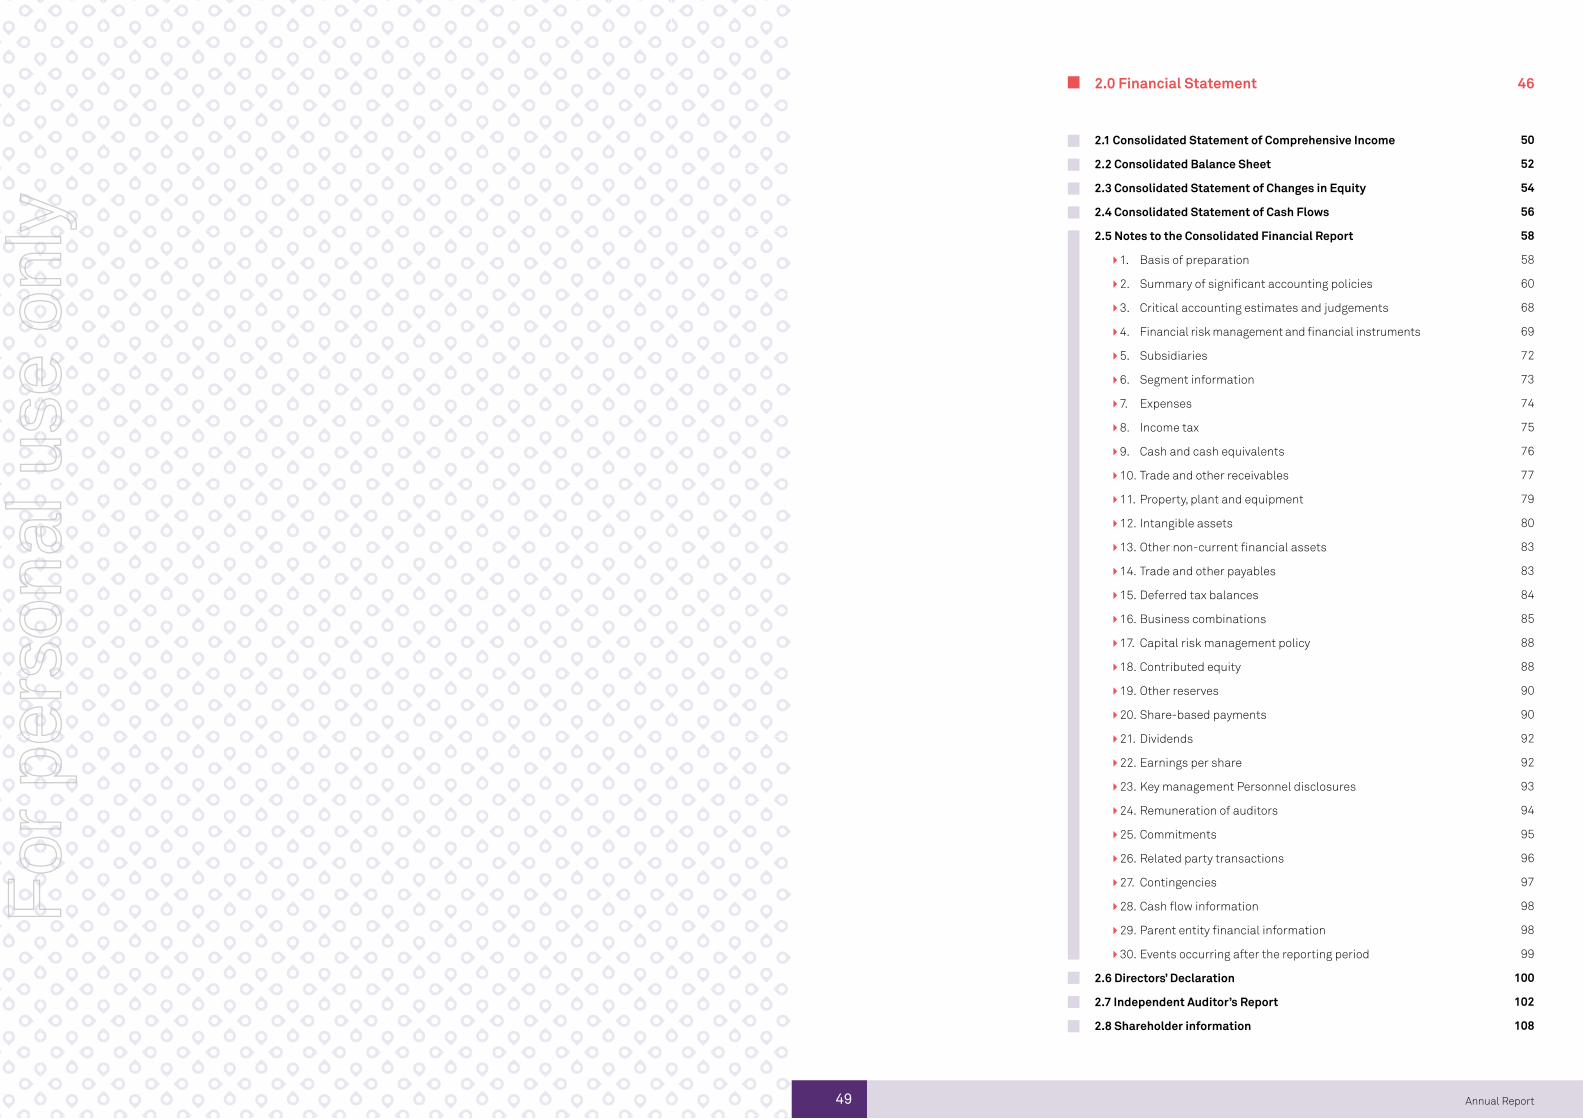
49 Annual Report
50
52
54
56
58
58
60
68
69
72
73
74
75
76
77
79
80
83
83
84
85
88
88
90
90
92
92
93
94
95
96
97
98
98
99
100
102
108
2.1 Consolidated Statement of Comprehensive Income
2.2 Consolidated Balance Sheet
2.3 Consolidated Statement of Changes in Equity
2.4 Consolidated Statement of Cash Flows
2.5 Notes to the Consolidated Financial Report
1. Basis of preparation
2. Summary of significant accounting policies
3. Critical accounting estimates and judgements
4. Financial risk management and financial instruments
5. Subsidiaries
6. Segment information
7. Expenses
8. Income tax
9. Cash and cash equivalents
10. Trade and other receivables
11. Property, plant and equipment
12. Intangible assets
13. Other non-current financial assets
14. Trade and other payables
15. Deferred tax balances
16. Business combinations
17. Capital risk management policy
18. Contributed equity
19. Other reserves
20. Share-based payments
21. Dividends
22. Earnings per share
23. Key management Personnel disclosures
24. Remuneration of auditors
25. Commitments
26. Related party transactions
27. Contingencies
28. Cash flow information
29. Parent entity financial information
30. Events occurring after the reporting period
2.6 Directors’ Declaration
2.7 Independent Auditor’s Report
2.8 Shareholder information
462.0 Financial Statement
For
per
sona
l use
onl
y
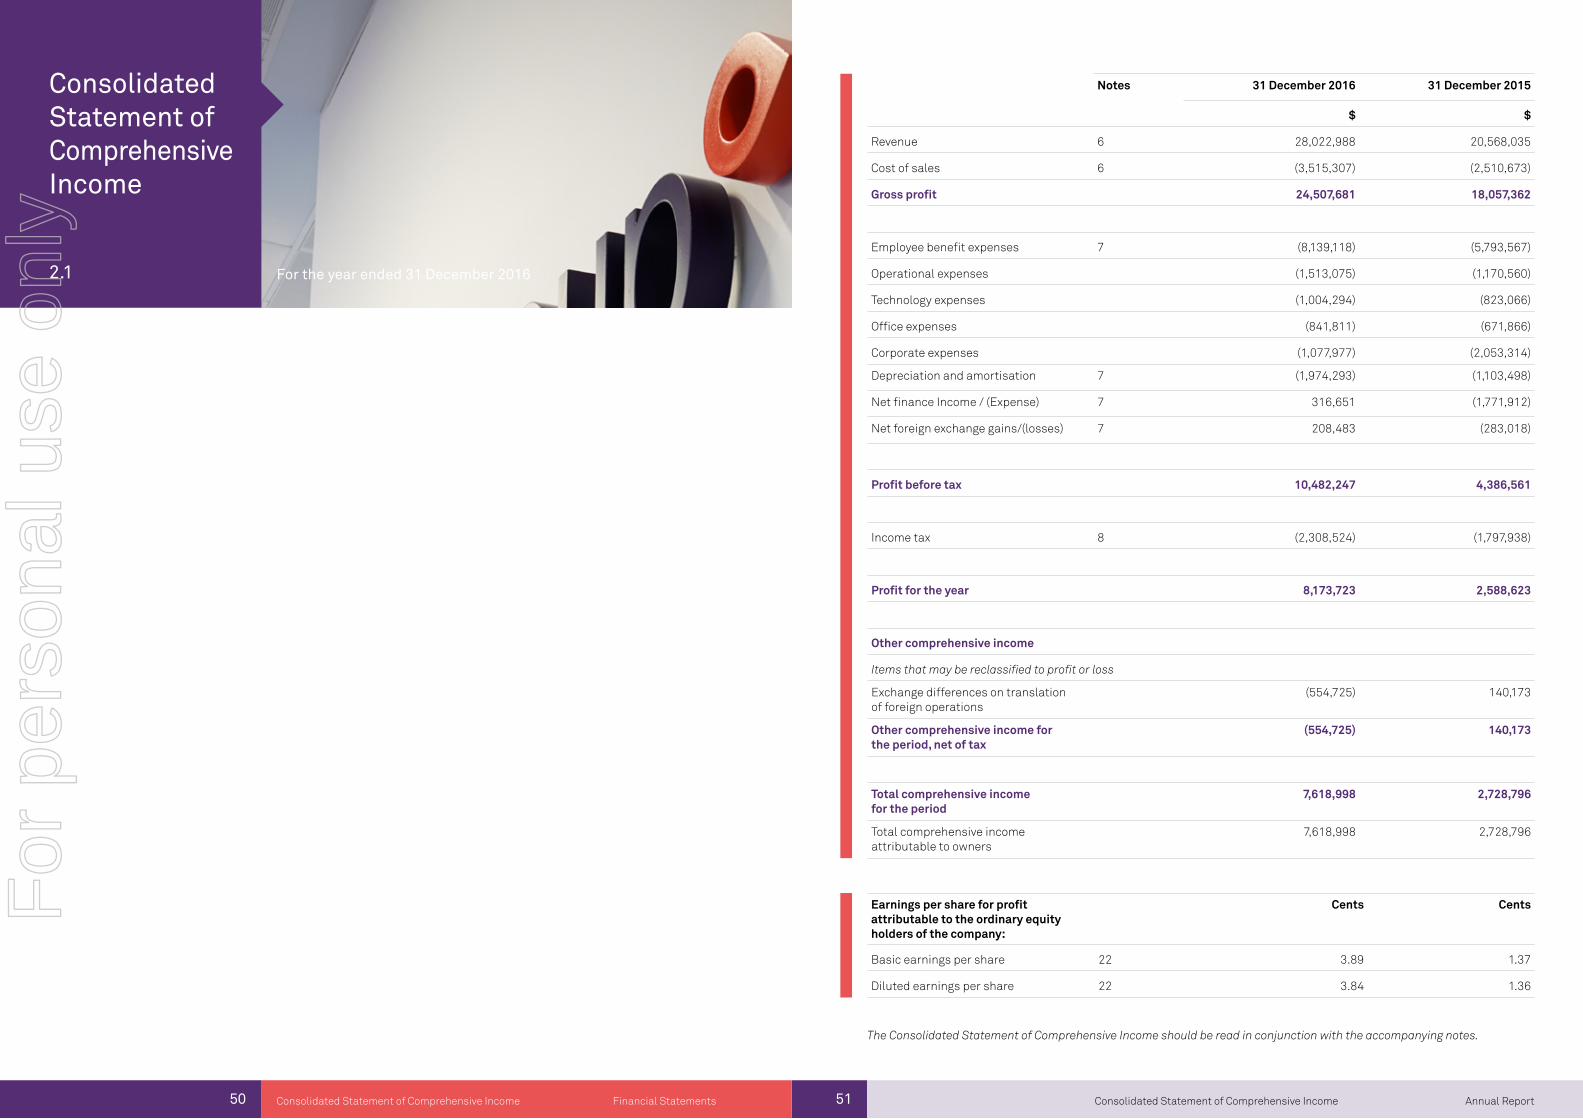
2.1
Consolidated Statement of Comprehensive Income
51 Annual ReportConsolidated Statement of Comprehensive Income50 Financial StatementsConsolidated Statement of Comprehensive Income
Notes 31 December 2016 31 December 2015
$ $
Revenue 6 28,022,988 20,568,035
Cost of sales 6 (3,515,307) (2,510,673)
Gross profit 24,507,681 18,057,362
Employee benefit expenses 7 (8,139,118) (5,793,567)
Operational expenses (1,513,075) (1,170,560)
Technology expenses (1,004,294) (823,066)
Office expenses (841,811) (671,866)
Corporate expenses (1,077,977) (2,053,314)
Depreciation and amortisation 7 (1,974,293) (1,103,498)
Net finance Income / (Expense) 7 316,651 (1,771,912)
Net foreign exchange gains/(losses) 7 208,483 (283,018)
Profit before tax 10,482,247 4,386,561
Income tax 8 (2,308,524) (1,797,938)
Profit for the year 8,173,723 2,588,623
Other comprehensive income
Items that may be reclassified to profit or loss
Exchange differences on translation of foreign operations
(554,725) 140,173
Other comprehensive income for the period, net of tax
(554,725) 140,173
Total comprehensive income for the period
7,618,998 2,728,796
Total comprehensive income attributable to owners
7,618,998 2,728,796
The Consolidated Statement of Comprehensive Income should be read in conjunction with the accompanying notes.
Earnings per share for profit attributable to the ordinary equity holders of the company:
Cents Cents
Basic earnings per share 22 3.89 1.37
Diluted earnings per share 22 3.84 1.36
For the year ended 31 December 2016
For
per
sona
l use
onl
y
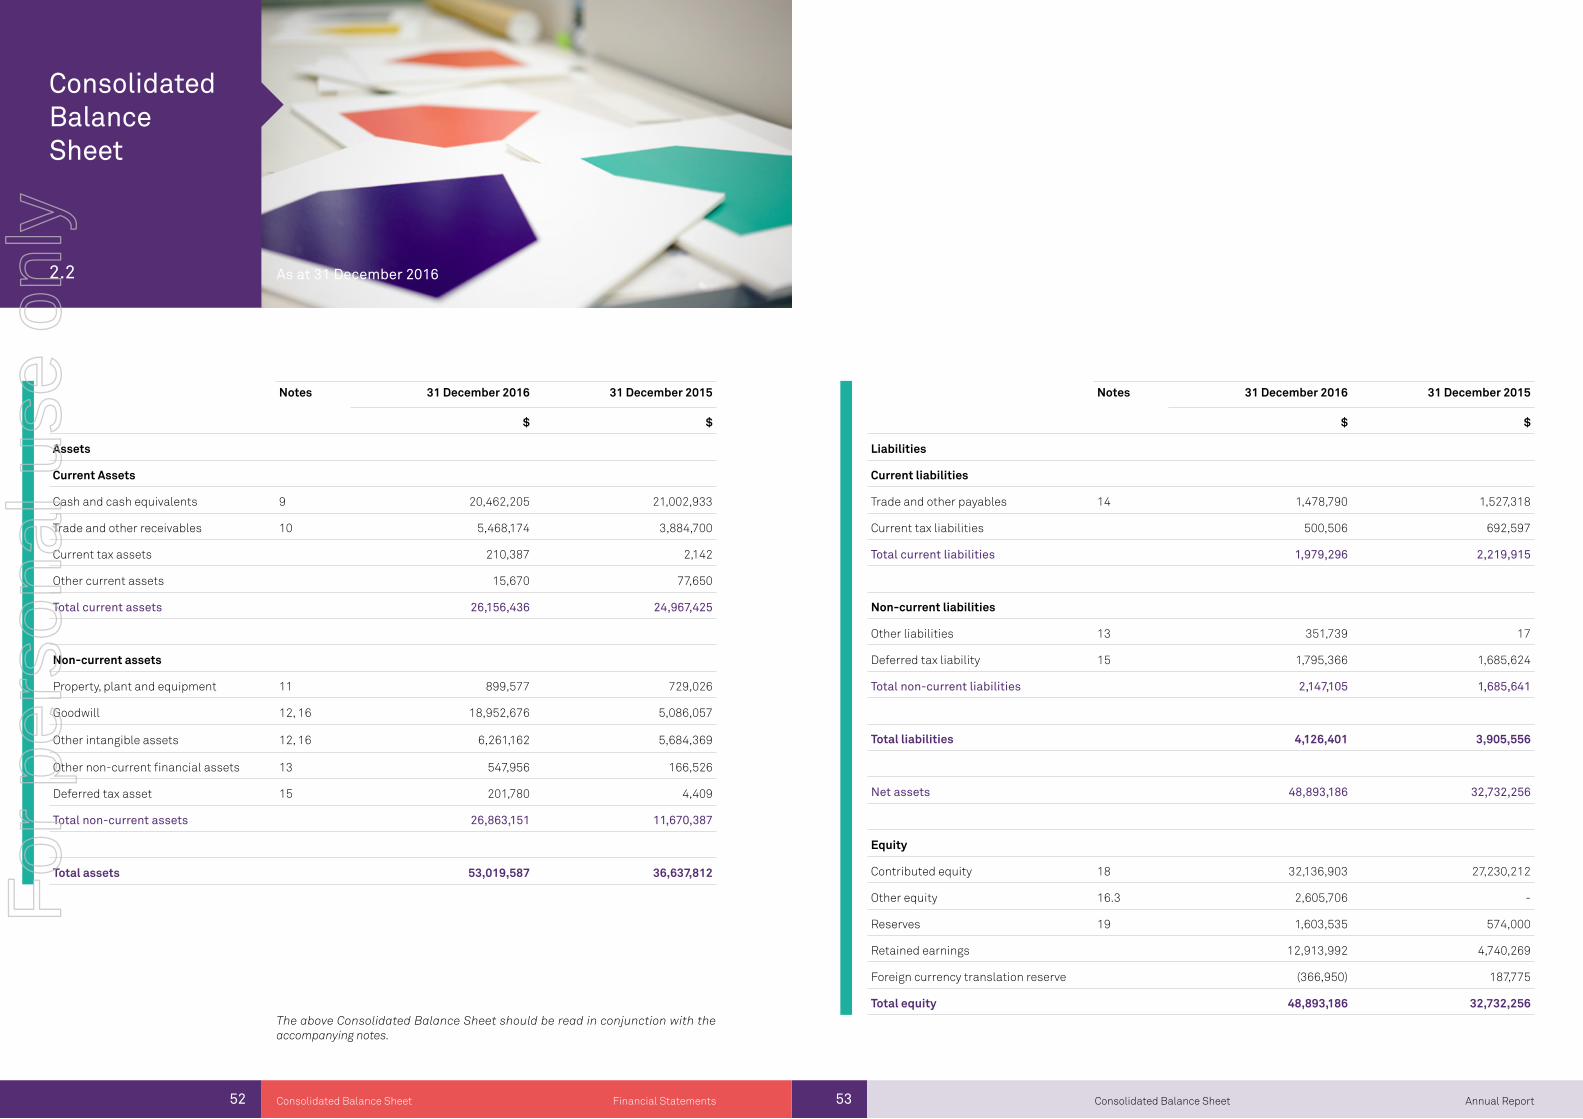
2.2
Consolidated Balance Sheet
53 Annual ReportConsolidated Balance Sheet52 Consolidated Balance Sheet
The above Consolidated Balance Sheet should be read in conjunction with the accompanying notes.
As at 31 December 2016
Notes 31 December 2016 31 December 2015
$ $
Assets
Current Assets
Cash and cash equivalents 9 20,462,205 21,002,933
Trade and other receivables 10 5,468,174 3,884,700
Current tax assets 210,387 2,142
Other current assets 15,670 77,650
Total current assets 26,156,436 24,967,425
Non-current assets
Property, plant and equipment 11 899,577 729,026
Goodwill 12, 16 18,952,676 5,086,057
Other intangible assets 12, 16 6,261,162 5,684,369
Other non-current financial assets 13 547,956 166,526
Deferred tax asset 15 201,780 4,409
Total non-current assets 26,863,151 11,670,387
Total assets 53,019,587 36,637,812
Equity
Contributed equity 18 32,136,903 27,230,212
Other equity 16.3 2,605,706 -
Reserves 19 1,603,535 574,000
Retained earnings 12,913,992 4,740,269
Foreign currency translation reserve (366,950) 187,775
Total equity 48,893,186 32,732,256
Notes 31 December 2016 31 December 2015
$ $
Liabilities
Current liabilities
Trade and other payables 14 1,478,790 1,527,318
Current tax liabilities 500,506 692,597
Total current liabilities 1,979,296 2,219,915
Non-current liabilities
Other liabilities 13 351,739 17
Deferred tax liability 15 1,795,366 1,685,624
Total non-current liabilities 2,147,105 1,685,641
Total liabilities 4,126,401 3,905,556
Net assets 48,893,186 32,732,256
Financial Statements
For
per
sona
l use
onl
y
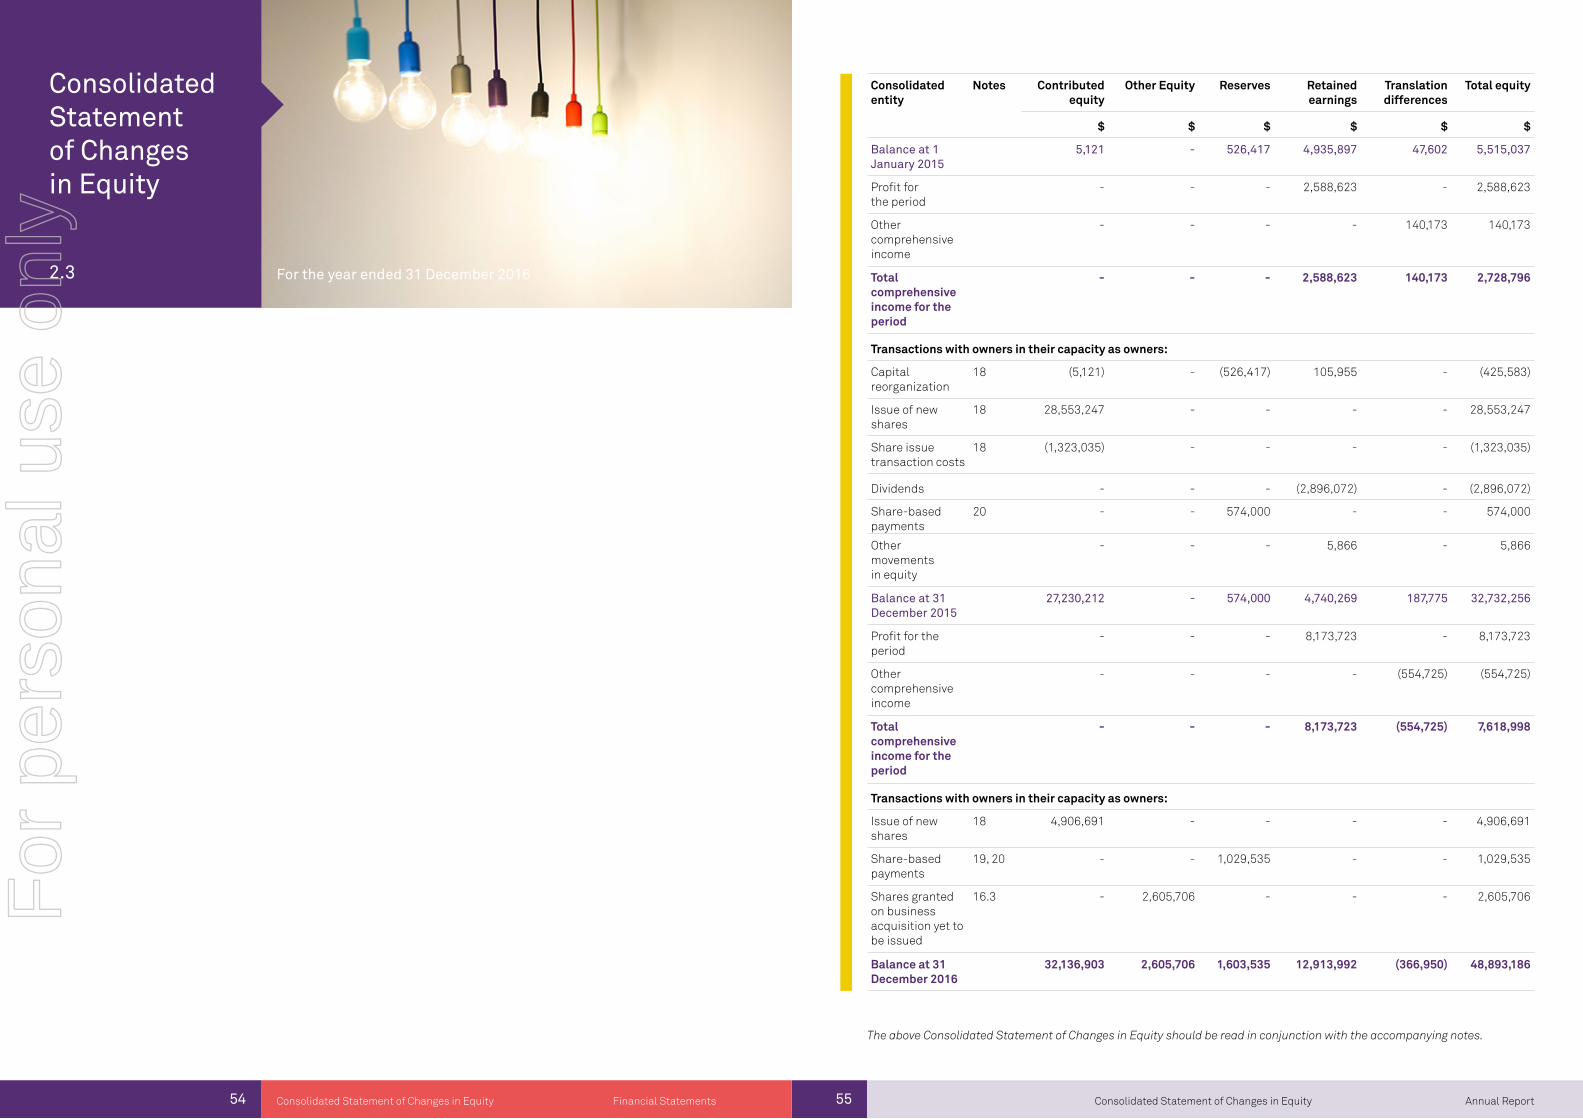
2.3
Consolidated Statement of Changes in Equity
55 Annual ReportConsolidated Statement of Changes in Equity54 Consolidated Statement of Changes in Equity
The above Consolidated Statement of Changes in Equity should be read in conjunction with the accompanying notes.
For the year ended 31 December 2016
Consolidated entity
Notes Contributed equity
Other Equity Reserves Retained earnings
Translation differences
Total equity
$ $ $ $ $ $
Balance at 1 January 2015
5,121 - 526,417 4,935,897 47,602 5,515,037
Profit for the period
- - - 2,588,623 - 2,588,623
Other comprehensive income
- - - - 140,173 140,173
Total comprehensive income for the period
- - - 2,588,623 140,173 2,728,796
Transactions with owners in their capacity as owners:
Capital reorganization
18 (5,121) - (526,417) 105,955 - (425,583)
Issue of new shares
18 28,553,247 - - - - 28,553,247
Share issue transaction costs
18 (1,323,035) - - - - (1,323,035)
Dividends - - - (2,896,072) - (2,896,072)
Share-based payments
20 - - 574,000 - - 574,000
Other movements in equity
- - - 5,866 - 5,866
Balance at 31 December 2015
27,230,212 - 574,000 4,740,269 187,775 32,732,256
Profit for the period
- - - 8,173,723 - 8,173,723
Other comprehensive income
- - - - (554,725) (554,725)
Total comprehensive income for the period
- - - 8,173,723 (554,725) 7,618,998
Transactions with owners in their capacity as owners:
Issue of new shares
18 4,906,691 - - - - 4,906,691
Share-based payments
19, 20 - - 1,029,535 - - 1,029,535
Shares granted on business acquisition yet to be issued
16.3 - 2,605,706 - - - 2,605,706
Balance at 31 December 2016
32,136,903 2,605,706 1,603,535 12,913,992 (366,950) 48,893,186
Financial Statements
For
per
sona
l use
onl
y
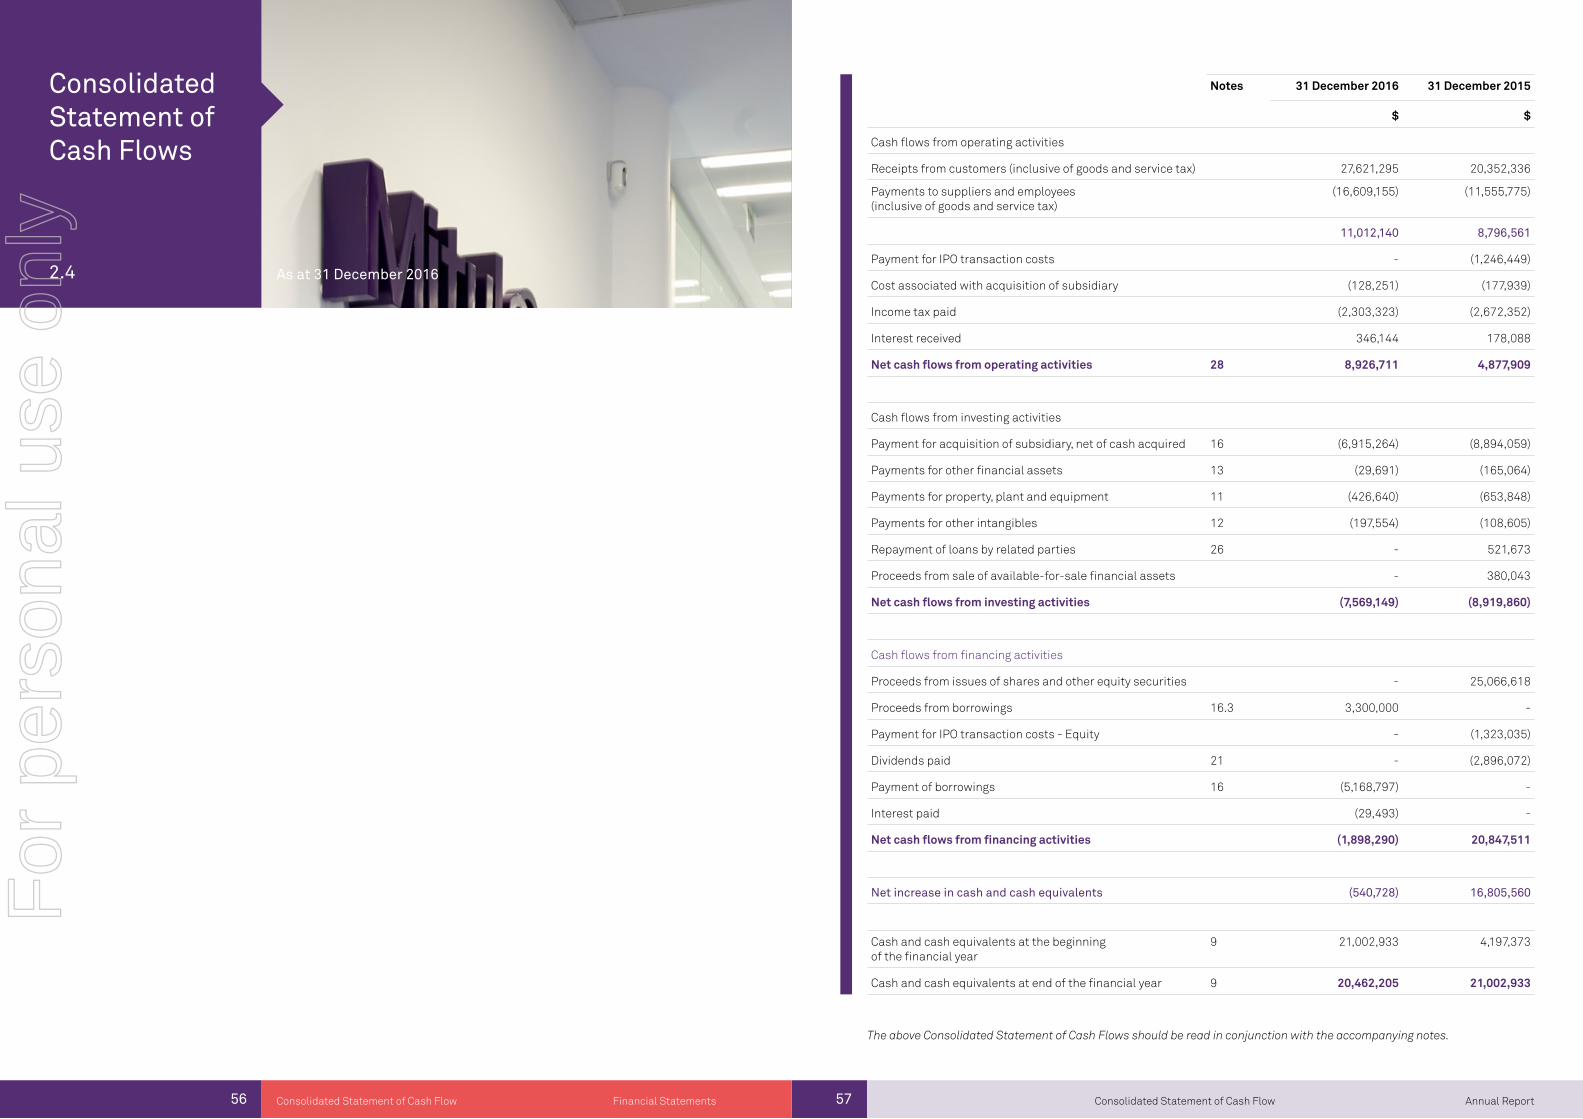
2.4
Consolidated Statement of Cash Flows
57 Annual ReportConsolidated Statement of Cash Flow56 Consolidated Statement of Cash Flow
The above Consolidated Statement of Cash Flows should be read in conjunction with the accompanying notes.
As at 31 December 2016
Notes 31 December 2016 31 December 2015
$ $
Cash flows from operating activities
Receipts from customers (inclusive of goods and service tax) 27,621,295 20,352,336
Payments to suppliers and employees (inclusive of goods and service tax)
(16,609,155) (11,555,775)
11,012,140 8,796,561
Payment for IPO transaction costs - (1,246,449)
Cost associated with acquisition of subsidiary (128,251) (177,939)
Income tax paid (2,303,323) (2,672,352)
Interest received 346,144 178,088
Net cash flows from operating activities 28 8,926,711 4,877,909
Cash flows from investing activities
Payment for acquisition of subsidiary, net of cash acquired 16 (6,915,264) (8,894,059)
Payments for other financial assets 13 (29,691) (165,064)
Payments for property, plant and equipment 11 (426,640) (653,848)
Payments for other intangibles 12 (197,554) (108,605)
Repayment of loans by related parties 26 - 521,673
Proceeds from sale of available-for-sale financial assets - 380,043
Net cash flows from investing activities (7,569,149) (8,919,860)
Cash flows from financing activities
Proceeds from issues of shares and other equity securities - 25,066,618
Proceeds from borrowings 16.3 3,300,000 -
Payment for IPO transaction costs - Equity - (1,323,035)
Dividends paid 21 - (2,896,072)
Payment of borrowings 16 (5,168,797) -
Interest paid (29,493) -
Net cash flows from financing activities (1,898,290) 20,847,511
Net increase in cash and cash equivalents (540,728) 16,805,560
Cash and cash equivalents at the beginning of the financial year
9 21,002,933 4,197,373
Cash and cash equivalents at end of the financial year 9 20,462,205 21,002,933
Financial Statements
For
per
sona
l use
onl
y
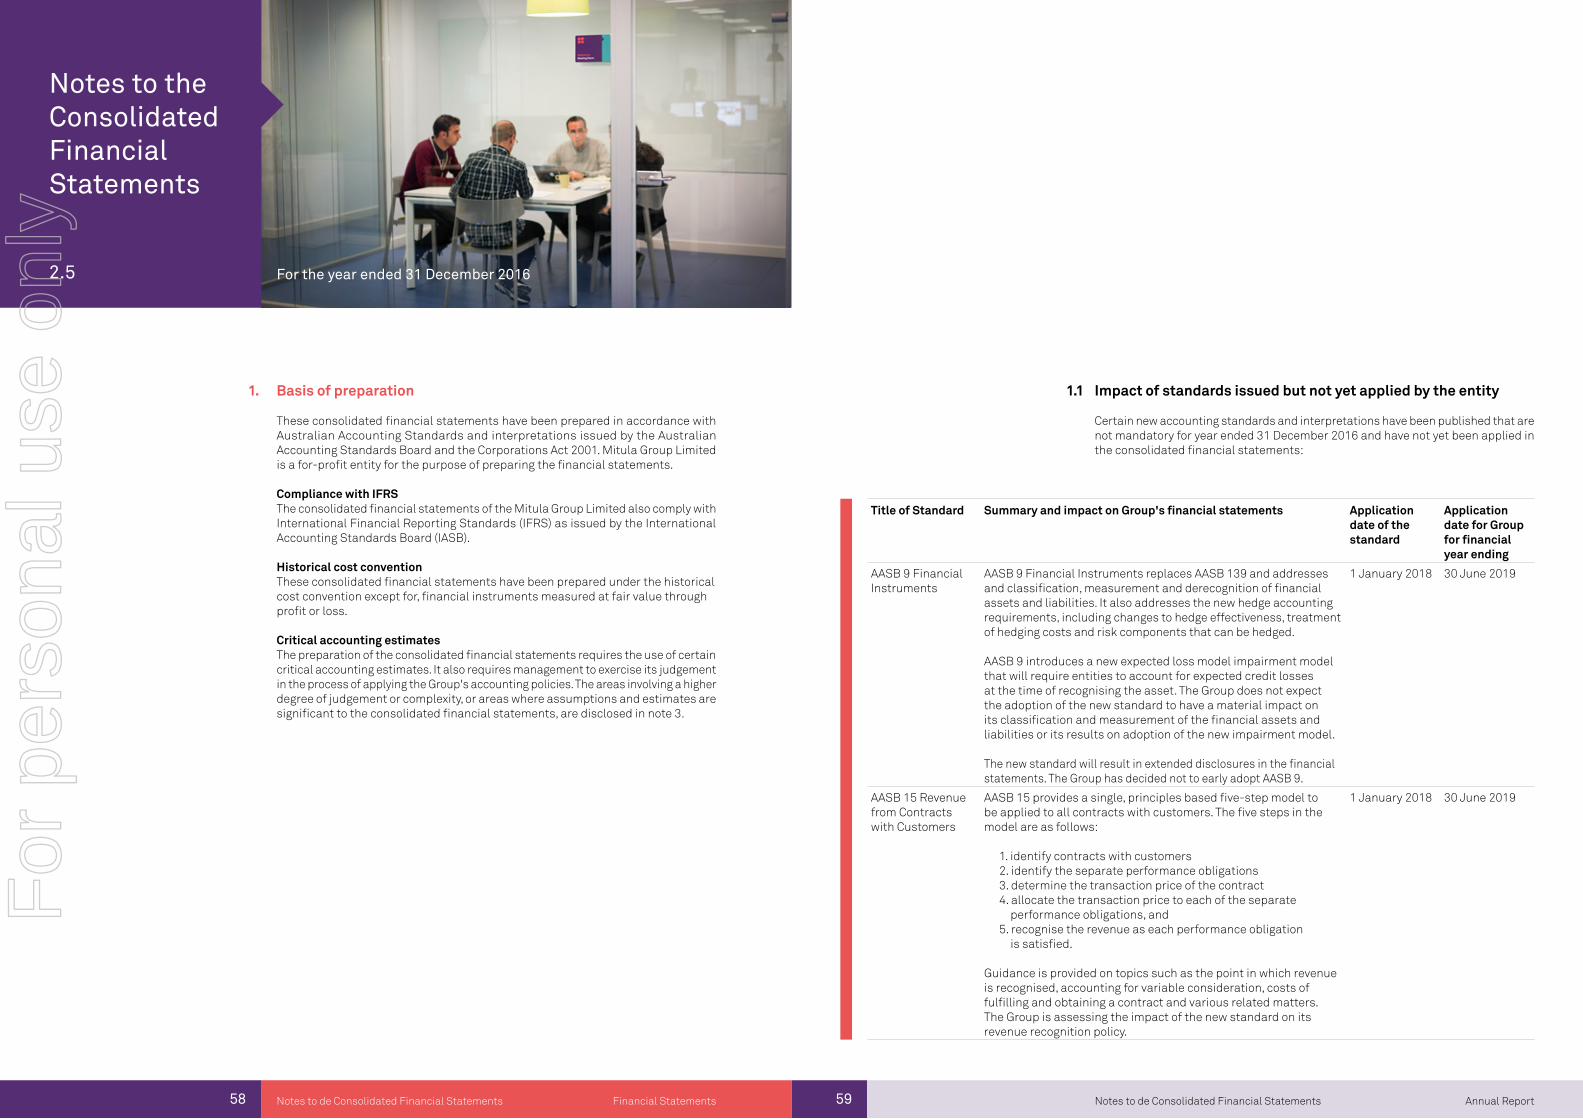
58
Notes to the Consolidated Financial Statements
2.5
Notes to de Consolidated Financial Statements
Basis of preparation
These consolidated financial statements have been prepared in accordance with Australian Accounting Standards and interpretations issued by the Australian Accounting Standards Board and the Corporations Act 2001. Mitula Group Limited is a for-profit entity for the purpose of preparing the financial statements.
Compliance with IFRSThe consolidated financial statements of the Mitula Group Limited also comply with International Financial Reporting Standards (IFRS) as issued by the International Accounting Standards Board (IASB).
Historical cost conventionThese consolidated financial statements have been prepared under the historical cost convention except for, financial instruments measured at fair value through profit or loss.
Critical accounting estimatesThe preparation of the consolidated financial statements requires the use of certain critical accounting estimates. It also requires management to exercise its judgement in the process of applying the Group's accounting policies. The areas involving a higher degree of judgement or complexity, or areas where assumptions and estimates are significant to the consolidated financial statements, are disclosed in note 3.
For the year ended 31 December 2016
59 Annual ReportNotes to de Consolidated Financial Statements
Title of Standard Summary and impact on Group's financial statements Application date of the standard
Application date for Group for financial year ending
AASB 9 Financial Instruments
AASB 9 Financial Instruments replaces AASB 139 and addresses and classification, measurement and derecognition of financial assets and liabilities. It also addresses the new hedge accounting requirements, including changes to hedge effectiveness, treatment of hedging costs and risk components that can be hedged.
AASB 9 introduces a new expected loss model impairment model that will require entities to account for expected credit losses at the time of recognising the asset. The Group does not expect the adoption of the new standard to have a material impact on its classification and measurement of the financial assets and liabilities or its results on adoption of the new impairment model.
The new standard will result in extended disclosures in the financial statements. The Group has decided not to early adopt AASB 9.
1 January 2018 30 June 2019
AASB 15 Revenue from Contracts with Customers
AASB 15 provides a single, principles based five-step model to be applied to all contracts with customers. The five steps in the model are as follows:
1. identify contracts with customers 2. identify the separate performance obligations 3. determine the transaction price of the contract 4. allocate the transaction price to each of the separate
performance obligations, and 5. recognise the revenue as each performance obligation
is satisfied.
Guidance is provided on topics such as the point in which revenue is recognised, accounting for variable consideration, costs of fulfilling and obtaining a contract and various related matters. The Group is assessing the impact of the new standard on its revenue recognition policy.
1 January 2018 30 June 2019
Impact of standards issued but not yet applied by the entity
Certain new accounting standards and interpretations have been published that are not mandatory for year ended 31 December 2016 and have not yet been applied in the consolidated financial statements:
Financial Statements
1. 1.1
For
per
sona
l use
onl
y
60 61 Annual ReportFinancial Statements Notes to the Consolidated Financial StatementsNotes to the Consolidated Financial Statements
Title of Standard Summary and impact on Group's financial statements Application date of the standard
Application date for Group for financial year ending
AASB 16 Leases AASB 16 was issued in February 2016. It will result in almost all leases being recognised on the balance sheet, as the distinction between operating and finance leases is removed. Under the new standard, an asset (the right to use the leased item) and a financial liability to pay rentals are recognised. The only exceptions are short-term and low-value leases.
The accounting for lessors will not significantly change.
The standard will affect primarily the accounting for the Group’s operating leases. As at the reporting date, the Group has non-cancellable operating lease commitments of $285,709. However, the Group has not yet determined to what extent these commitments will result in the recognition of an asset and a liability for future payments and how this will affect the Group’s profit and classification of cash flows.
Some of the commitments may be covered by the exception for short-term and low-value leases and some commitments may relate to arrangements that will not qualify as leases under AASB 16.
Mandatory for financial years commencing on or after 1 January 2019. At this stage, the Group does not intend to adopt the standard before its effective date.
1 January2019
30 June 2019
There are no other standards that are not yet effective and that are expected to have a material impact on the entity in the current or future reporting periods and on foreseeable future transactions.
Summary of significant accounting policies
The principal accounting policies adopted in the preparation of these consolidated financial statements are set out below. These policies have been consistently applied to all the periods presented, unless otherwise stated. The consolidated financial statements are for the consolidated entity consisting of Mitula Group Limited and its subsidiaries.
Principles of consolidation
SubsidiariesSubsidiaries are all entities (including structured entities) over which the Group has control. The Group controls an entity when the Group is exposed to, or has rights to, variable returns from its involvement with the entity and has the ability to affect those returns through its power to direct the activities of the entity. Subsidiaries are fully consolidated from the date on which control is transferred to the Group. They are deconsolidated from the date that control ceases.
The acquisition method of accounting is used to account for business combinations by the Group.
Intercompany transactions, balances and unrealised gains on transactions between group companies are eliminated. Unrealised losses are also eliminated unless the transaction provides evidence of an impairment of the transferred asset. Accounting policies of subsidiaries have been changed where necessary to ensure consistency with the policies adopted by the Group.
Segment reporting
Operating segments are reported in a manner consistent with the internal reporting provided to the chief operating decision maker, who is responsible for allocating resources and assessing performance of the operating segments. The chief operating decision maker has been identified as the CEO that makes strategic decisions. The business is being monitored on an operating gross margin (revenues less cost of sales) basis distinguishing by geography (EMEA, AMERICAS and APAC). Given the nature of the services rendered by the Group, consisting of rendering vertical search engine for classifieds in internet services, it is not possible to separate assets and liabilities by client nor allocate operating or financial results and taxes, following this criteria.
Foreign currency translation
Functional and presentation currencyItems included in the financial statements of each of the Group’s entities are measured using the currency of the primary economic environment in which the entity is established (‘the functional currency’). The Group operates in several functional currencies, mainly Euro. The consolidated financial statements have been presented in Australian dollars, which is the Company’s presentation and functional currency.
Transactions and balancesForeign currency transactions are translated into the functional currency using the exchange rates at the dates of the transactions. Foreign exchange gains and losses resulting from the settlement of such transactions and from the translation of monetary assets and liabilities denominated in foreign currencies at year end exchange rates are generally recognised in the profit or loss. They are deferred in equity if they relate to qualifying cash flow hedges and qualifying net investment hedges or are attributable to part of the net investment in a foreign operation.
Foreign exchange gains and losses that relate to borrowings are presented in the statement of profit or loss, within finance costs. All other foreign exchange gains and losses are presented in the statement of profit or loss on a net basis within other income or other expenses.
Non-monetary items that are measured at fair value in a foreign currency are translated using the exchange rates at the date when the fair value was determined. Translation differences on assets and liabilities carried at fair value are reported as part of the fair value gain or loss.
For example, translation differences on non-monetary assets and liabilities such as equities held at fair value through profit or loss are recognised in profit or loss as part of the fair value gain or loss and translation differences on non-monetary assets such as equities classified as available-for-sale financial assets are recognised in other comprehensive income.
Group companiesThe results and financial position of foreign operations (none of which has the currency of a hyperinflationary economy) that have a functional currency different from the presentation currency are translated into the presentation currency as follows:
assets and liabilities for each balance sheet presented are translated at the closing rate at the date of that balance sheet income and expenses for each statement of profit or loss and statement of comprehensive income are translated at average exchange rates (unless this is not a reasonable approximation of the cumulative effect of the rates prevailing on the transaction dates, in which case income and expenses are translated at the dates of the transactions), and
all resulting exchange differences are recognised in other comprehensive income.
Goodwill and fair value adjustments arising on the acquisition of a foreign operation are treated as assets and liabilities of the foreign operation and translated at the closing rate.
2.
For
per
sona
l use
onl
y
62 63 Annual ReportFinancial Statements Notes to the Consolidated Financial StatementsNotes to the Consolidated Financial Statements
Share capital
Ordinary shares are classified as equity. Incremental costs directly attributable to the issuance of new shares are shown in equity as a deduction, net of tax, from the proceeds.
Dividend distributionsProvision is made for the amount of any dividend declared, being appropriately authorised and no longer at the discretion of the entity, on or before the end of the reporting period but not distributed at the end of the reporting period.
Earnings per share
Basic earnings per shareBasic earnings per share is calculated by dividing:
the profit attributable to owners of the Group, excluding any costs of servicing equity other than ordinary shares
by the weighted average number of ordinary shares outstanding during the financial year.
Diluted earnings per shareDiluted earnings per share adjusts the figures used in the determination of basic earnings per share to take into account:
the after-income tax effect of interest and other financing costs associated with dilutive potential ordinary shares, and
the weighted average number of additional ordinary shares that would have been outstanding assuming the conversion of all dilutive potential ordinary shares.
Revenue Recognition
Revenue is measured at the fair value of the consideration received or receivable.
The Group recognises revenue when the amount of revenue can be reliably measured, it is probable that future economic benefits will flow to the entity and specific criteria have been met for each of the Group’s activities as described below. The Group bases its estimates on historical results, taking into consideration the type of customer, the type of transaction and the specifics of each arrangement.
The main sources of the Group’s revenue are:
CPC (cost-per-click): Most of the customers pay on a cost-per-click basis, which means that an advertiser (customer) pays to the Group only when a user clicks on one of its ads. The Group recognizes as revenue the fees charged to advertisers each time a user clicks on one of the ads that appears next to the search results or content on the Group’s websites.
Revenue derived from the traffic operations in the Google AdSense program, a web advertising platform, in which Mitula is a Search Partner. Google pays to Mitula on a cost-per-click basis. The Group recognizes as revenue the fees paid to it by Google based on the volume of clicks through to Google AdSense advertisements.
Other sources of revenue generation are through CPL (cost-per lead) and CPA (cost-per acquisition) associated with the sale of a range of advertising products. In addition, with the acquisition of Dot Property, revenues are generated by sale of listing and advertising products related with property portal business.
Other operating expenses
Other operating expenses includes the expenses associated with the operation of the data centre, including, labour, energy and other transaction fees related to processing customer transactions.
Income tax
The income tax expense or credit for the period is the tax payable on the current period’s taxable income based on the applicable income tax rate for each jurisdiction adjusted by changes in deferred tax assets and liabilities attributable to temporary differences and to unused tax losses.
The current income tax charge is calculated on the basis of the tax laws enacted or substantively enacted at the end of the reporting period in the countries where the Group’s subsidiaries and associates operate and generate taxable income. Management periodically evaluates positions taken in tax returns with respect to situations in which applicable tax regulation is subject to interpretation. It establishes provisions where appropriate on the basis of amounts expected to be paid to the tax authorities.
Deferred income tax is provided in full, using the liability method, on temporary differences arising between the tax bases of assets and liabilities and their carrying amounts in the consolidated financial statements. However, deferred tax liabilities are not recognised if they arise from the initial recognition of goodwill. Deferred income tax is also not accounted for if it arises from initial recognition of an asset or liability on a transaction other than a business combination that at the time of the transaction affects neither accounting nor taxable profit or loss. Deferred income tax is determined using tax rates (and laws) that have been enacted or substantially enacted by the end of the reporting period and are expected to apply when the related deferred income tax asset is realised or the deferred income tax liability is settled.
Deferred tax assets are recognised only if it is probable that future taxable amounts will be available to utilise those temporary differences and losses.
Deferred tax liabilities and assets are not recognised for temporary differences between the carrying amount and tax bases of investments in foreign operations where the Group is able to control the timing of the reversal of the temporary differences and it is probable that the differences will not reverse in the foreseeable future.
Deferred tax assets and liabilities are offset when there is a legally enforceable right to offset current tax assets and liabilities and when the deferred tax balances relate to the same taxation authority. Current tax assets and tax liabilities are offset where the entity has a legally enforceable right to offset and intends either to settle on a net basis, or to realise the asset and settle the liability simultaneously.
Current and deferred tax is recognised in profit or loss, except to the extent that it relates to items recognised in other comprehensive income or directly in equity. In this case, the tax is also recognised in other comprehensive income or directly in equity, respectively.
Leases
Leases in which a significant portion of the risks and rewards of ownership are not transferred to the Group as lessee are classified as operating leases. Payments made under operating leases (net of any incentives received from the lessor) are charged to profit or loss on a straight-line basis over the period of the lease.
Business combinations
The acquisition method of accounting is used to account for all business combinations, regardless of whether equity instruments or other assets are acquired. The consideration transferred for the acquisition of a subsidiary comprises the
fair values of the assets transferred liabilities incurred to the former owners of the acquired business equity interests issued by the Group fair value of any asset or liability resulting from a contingent consideration arrangement, and
fair value of any pre-existing equity interest in the subsidiary.
For
per
sona
l use
onl
y
64 65 Annual ReportFinancial Statements Notes to the Consolidated Financial StatementsNotes to the Consolidated Financial Statements
Identifiable assets acquired and liabilities and contingent liabilities assumed in a business combination are, with limited exceptions, measured initially at their fair values at the acquisition date. The Group recognises any non-controlling interest in the acquired entity on an acquisition-by-acquisition basis either at fair value or at the non-controlling interest’s proportionate share of the acquired entity’s net identifiable assets.
Acquisition-related costs are expensed as incurred.
The excess of the:
consideration transferred, amount of any non-controlling interest in the acquired entity, and acquisition-date fair value of any previous equity interest in the acquired entity
Over the fair value of the net identifiable assets acquired is recorded as goodwill. If those amounts are less than the fair value of the net identifiable assets of the subsidiary acquired, the difference is recognised directly in profit or loss as a bargain purchase.
Where settlement of any part of cash consideration is deferred, the amounts payable in the future are discounted to their present value as at the date of exchange. The discount rate used is the entity’s incremental borrowing rate, being the rate at which a similar borrowing could be obtained from an independent financier under comparable terms and conditions.
Contingent consideration is classified either as equity or a financial liability. Amounts classified as a financial liability are subsequently remeasured to fair value with changes in fair value recognised in profit or loss.
If the business combination is achieved in stages, the acquisition date carrying value of the acquirer’s previously held equity interest in the acquired asset is remeasured to fair value at the acquisition date. Any gains or losses arising from such remeasurement are recognised in the profit or loss.
Impairment of assets
Goodwill and intangible assets that have an indefinite useful life are not subject to depreciation and are tested annually for impairment, or more frequently if events or changes in circumstances indicate that they might be impaired. Other assets are tested for impairment whenever events or changes in circumstances indicate that the carrying amount may not be recoverable. An impairment loss is recognised for the amount by which the asset’s carrying amount exceeds its recoverable amount. The recoverable amount is the higher of an asset’s fair value less costs of disposal and value in use. For the purposes of assessing impairment, assets are grouped at the lowest levels for which there are separately identifiable cash inflows which are largely independent of the cash inflows from other assets or groups of assets (cash-generating units). Non-financial assets other than goodwill that suffered an impairment are reviewed for possible reversal of the impairment at the end of each reporting period.
Cash and cash equivalents
For the purpose of presentation in the statement of cash flows, cash and cash equivalents includes cash on hand, deposits held at call with financial institutions, other short-term, highly liquid investments with original maturities of three months or less that are readily convertible to known amounts of cash and which are subject to an insignificant risk of changes in value, and bank overdrafts. Bank overdrafts are shown within borrowings in current liabilities in the balance sheet.
Trade receivables
Trade receivables are recognised initially at fair value and subsequently measured at amortised cost using the effective interest method, less provision for impairment.
Trade receivables are amounts due from customers for services performed in the ordinary course of business. Loans and other receivables are non-derivative financial assets with fixed or determinable payments that are not quoted in an active market. If collection of the amounts is expected in one year or less they are classified as current assets. If not, they are presented as non-current assets.
Investment and other financial assets
ClassificationThe Group classifies its financial assets in the following categories:
financial assets at fair value through profit or loss, loans and receivables,
The classification depends on the purpose for which the investments were acquired. Management determines the classification of its investments at initial recognition and, in the case of assets classified as held-to-maturity, re-evaluates this designation at the end of each reporting period.
Recognition and derecognitionRegular way purchases and sales of financial assets are recognised on trade-date, the date on which the Group commits to purchase or sell the asset. Financial assets are derecognised when the rights to receive cash flows from the financial assets have expired or have been transferred and the Group has transferred substantially all the risks and rewards of ownership.
When securities classified as available-for-sale are sold, the accumulated fair value adjustments recognised in other comprehensive income are reclassified to profit or loss as gains and losses from investment securities.
Measurement At initial recognition, the Group measures a financial asset at its fair value plus, in the case of a financial asset not at fair value through profit or loss, transaction costs that are directly attributable to the acquisition of the financial asset. Transaction costs of financial assets carried at fair value through profit or loss are expensed in profit or loss.
Loans and receivables and held-to-maturity investments are subsequently carried at amortised cost using the effective interest method.
Available-for-sale financial assets and financial assets at fair value through profit or loss are subsequently carried at fair value. Gains or losses arising from changes in the fair value are recognised as follows:
for ‘financial assets at fair value through profit or loss’ – in profit or loss within other income or other expenses
for available-for-sale financial assets that are monetary securities denominated in a foreign currency – translation differences related to changes in the amortised cost of the security are recognised in profit or loss and other changes in the carrying amount are recognised in other comprehensive income
for other monetary and non-monetary securities classified as available-for-sale – in other comprehensive income
Interest income from financial assets at fair value through profit or loss is included in the net gains/ (losses). Interest on available-for-sale securities, held-to-maturity investments and loans and receivables calculated using the effective interest method is recognised in the statement of profit or loss as part of revenue from continuing operations.
ImpairmentThe Group assesses at the end of each reporting period whether there is objective evidence that a financial asset or group of financial assets is impaired. A financial asset or a group of financial assets is impaired and impairment losses are incurred only if there is objective evidence of impairment as a result of one or more events that occurred after the initial recognition of the asset (a ‘loss event’) and that loss
For
per
sona
l use
onl
y
66 67 Annual ReportFinancial Statements Notes to the Consolidated Financial StatementsNotes to the Consolidated Financial Statements
event (or events) has an impact on the estimated future cash flows of the financial asset or group of financial assets that can be reliably estimated. In the case of equity investments classified as available-for-sale, a significant or prolonged decline in the fair value of the security below its cost is considered an indicator that the assets are impaired.
Assets carried at amortised cost For loans and receivables, the amount of the loss is measured as the difference between the asset’s carrying amount and the present value of estimated future cash flows (excluding future credit losses that have not been incurred) discounted at the financial asset’s original effective interest rate. The carrying amount of the asset is reduced and the amount of the loss is recognised in profit or loss. If a loan or held-to-maturity investment has a variable interest rate, the discount rate for measuring any impairment loss is the current effective interest rate determined under the contract. As a practical expedient, the Group may measure impairment on the basis of an instrument’s fair value using an observable market price.
If, in a subsequent period, the amount of the impairment loss decreases and the decrease can be related objectively to an event occurring after the impairment was recognised (such as an improvement in the debtor’s credit rating), the reversal of the previously recognised impairment loss is recognised in profit or loss.
Income recognitionInterest income Interest income is recognised using the effective interest method. When a receivable is impaired, the Group reduces the carrying amount to its recoverable amount, being the estimated future cash flow discounted at the original effective interest rate of the instrument, and continues unwinding the discount as interest income. Interest income on impaired loans is recognised using the original effective interest rate.
Dividends Dividends are recognised as revenue when the right to receive payment is established. This applies even if they are paid out of pre-acquisition profits. However, the investment may need to be tested for impairment as a consequence.
Property, plant and equipment
Property, plant and equipment is recognised at historical cost less depreciation. Historical cost includes expenditure that is directly attributable to the acquisition of the items. Cost may also include transfers from equity of any gains or losses on qualifying cash flow hedges of foreign currency purchases of property, plant and equipment.
Subsequent costs are included in the asset’s carrying amount or recognised as a separate asset, as appropriate, only when it is probable that future economic benefits associated with the item will flow to the Group and the cost of the item can be measured reliably. The carrying amount of any component accounted for as a separate asset is derecognised when replaced. All other repairs and maintenance are charged to profit or loss during the reporting period in which they are incurred .
The depreciation methods and periods used by the Group are disclosed as follow:
Item Useful life
Fittings 3 - 4 years
Equipment 3 - 4 years
Furniture and others 10 years
Intangible assets
GoodwillGoodwill on acquisitions of subsidiaries is included in intangible assets. Goodwill is not depreciated but it is tested for impairment annually or more frequently if events or changes in circumstances indicate that it might be impaired, and is carried at cost less accumulated impairment losses. Gains and losses on the disposal of an entity include the carrying amount of goodwill relating to the entity sold.
Computer software and website developmentCosts associated with maintaining software programmes are recognised as an expense as incurred. Development costs that are directly attributable to the design and testing of identifiable and unique software products controlled by the Group are recognised as intangible assets when the following criteria are met:
it is technically feasible to complete the software so that it will be available for use management intends to complete the software and use or sell it
there is an ability to use or sell the software it can be demonstrated how the software will generate probable future economic benefits
adequate technical, financial and other resources to complete the development and to use or sell the software are available, and
the expenditure attributable to the software during its development can be reliably measured.
Directly attributable costs that are capitalised as part of the software include employee costs and an appropriate portion of relevant overheads.
Capitalised development costs are recorded as intangible assets and amortised from the point at which the asset is ready for use.
These costs are amortised over their estimated useful lives between 3 or 4 years.
Cost incurred in acquiring new websites are recognised as intangibles assets only when it is probable that future economic benefits associated with the item will flow to the Group and the cost of the item can be measured reliably.
Website developments have a finite useful life and are carried at cost less accumulated amortisation and impairment losses. Amortisation is calculated using a straight-line method to allocate the cost of website developments over their estimated useful life, which is five years.
Trademarks and licensesSeparately acquired trademarks and licences are shown at historical cost. Trademarks, licenses and customer contracts acquired in a business combination are recognised at fair value at the acquisition date. They have a finite useful life and are subsequently carried at cost less accumulated depreciation and impairment losses.
Depreciation is calculated using the straight-line method to allocate the cost of trademarks and licences over their estimated useful lives of 5 years. Acquired computer software licences are capitalised on the basis of the costs incurred to acquire and bring to use the specific software. These costs are depreciated over their estimated useful lives of 5 years.
Customer relationshipsAcquired customer relationships have a finite useful life and are carried at fair value at acquisition date less accumulated amortization and impairment losses. Amortisation is calculated using the straight-line method to allocate the cost of the asset over its estimated useful life, which is five years.
Trade and other payable
These amounts represent liabilities for goods and services provided to the Group prior to the end of financial year which are unpaid. The amounts are unsecured and are
For
per
sona
l use
onl
y
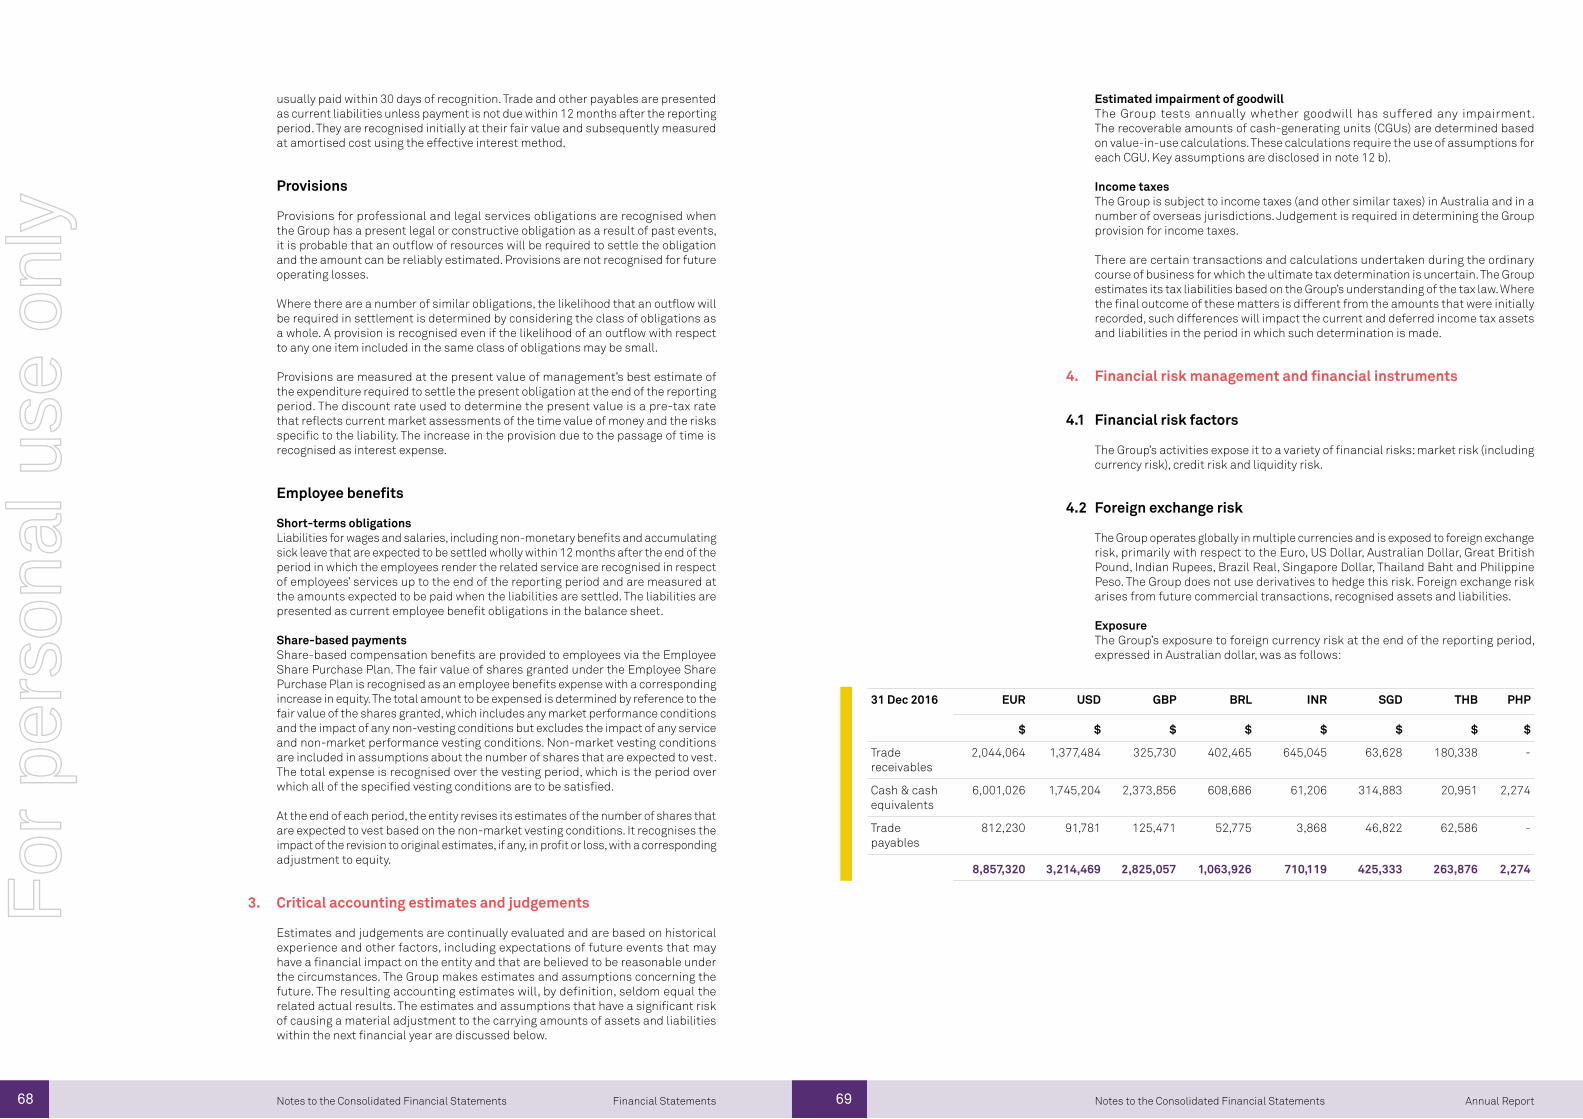
68 69 Annual ReportFinancial Statements Notes to the Consolidated Financial StatementsNotes to the Consolidated Financial Statements
usually paid within 30 days of recognition. Trade and other payables are presented as current liabilities unless payment is not due within 12 months after the reporting period. They are recognised initially at their fair value and subsequently measured at amortised cost using the effective interest method.
Provisions
Provisions for professional and legal services obligations are recognised when the Group has a present legal or constructive obligation as a result of past events, it is probable that an outflow of resources will be required to settle the obligation and the amount can be reliably estimated. Provisions are not recognised for future operating losses.
Where there are a number of similar obligations, the likelihood that an outflow will be required in settlement is determined by considering the class of obligations as a whole. A provision is recognised even if the likelihood of an outflow with respect to any one item included in the same class of obligations may be small.
Provisions are measured at the present value of management’s best estimate of the expenditure required to settle the present obligation at the end of the reporting period. The discount rate used to determine the present value is a pre-tax rate that reflects current market assessments of the time value of money and the risks specific to the liability. The increase in the provision due to the passage of time is recognised as interest expense.
Employee benefits
Short-terms obligationsLiabilities for wages and salaries, including non-monetary benefits and accumulating sick leave that are expected to be settled wholly within 12 months after the end of the period in which the employees render the related service are recognised in respect of employees’ services up to the end of the reporting period and are measured at the amounts expected to be paid when the liabilities are settled. The liabilities are presented as current employee benefit obligations in the balance sheet.
Share-based paymentsShare-based compensation benefits are provided to employees via the Employee Share Purchase Plan. The fair value of shares granted under the Employee Share Purchase Plan is recognised as an employee benefits expense with a corresponding increase in equity. The total amount to be expensed is determined by reference to the fair value of the shares granted, which includes any market performance conditions and the impact of any non-vesting conditions but excludes the impact of any service and non-market performance vesting conditions. Non-market vesting conditions are included in assumptions about the number of shares that are expected to vest. The total expense is recognised over the vesting period, which is the period over which all of the specified vesting conditions are to be satisfied. At the end of each period, the entity revises its estimates of the number of shares that are expected to vest based on the non-market vesting conditions. It recognises the impact of the revision to original estimates, if any, in profit or loss, with a corresponding adjustment to equity.
Critical accounting estimates and judgements
Estimates and judgements are continually evaluated and are based on historical experience and other factors, including expectations of future events that may have a financial impact on the entity and that are believed to be reasonable under the circumstances. The Group makes estimates and assumptions concerning the future. The resulting accounting estimates will, by definition, seldom equal the related actual results. The estimates and assumptions that have a significant risk of causing a material adjustment to the carrying amounts of assets and liabilities within the next financial year are discussed below.
Estimated impairment of goodwillThe Group tests annually whether goodwill has suffered any impairment. The recoverable amounts of cash-generating units (CGUs) are determined based on value-in-use calculations. These calculations require the use of assumptions for each CGU. Key assumptions are disclosed in note 12 b).
Income taxesThe Group is subject to income taxes (and other similar taxes) in Australia and in a number of overseas jurisdictions. Judgement is required in determining the Group provision for income taxes.
There are certain transactions and calculations undertaken during the ordinary course of business for which the ultimate tax determination is uncertain. The Group estimates its tax liabilities based on the Group’s understanding of the tax law. Where the final outcome of these matters is different from the amounts that were initially recorded, such differences will impact the current and deferred income tax assets and liabilities in the period in which such determination is made.
Financial risk management and financial instruments
Financial risk factors
The Group’s activities expose it to a variety of financial risks: market risk (including currency risk), credit risk and liquidity risk.
Foreign exchange risk
The Group operates globally in multiple currencies and is exposed to foreign exchange risk, primarily with respect to the Euro, US Dollar, Australian Dollar, Great British Pound, Indian Rupees, Brazil Real, Singapore Dollar, Thailand Baht and Philippine Peso. The Group does not use derivatives to hedge this risk. Foreign exchange risk arises from future commercial transactions, recognised assets and liabilities. Exposure The Group’s exposure to foreign currency risk at the end of the reporting period, expressed in Australian dollar, was as follows:
31 Dec 2016 EUR USD GBP BRL INR SGD THB PHP
$ $ $ $ $ $ $ $
Trade receivables
2,044,064 1,377,484 325,730 402,465 645,045 63,628 180,338 -
Cash & cash equivalents
6,001,026 1,745,204 2,373,856 608,686 61,206 314,883 20,951 2,274
Trade payables
812,230 91,781 125,471 52,775 3,868 46,822 62,586 -
8,857,320 3,214,469 2,825,057 1,063,926 710,119 425,333 263,876 2,274
3.
4.
4.1
4.2
For
per
sona
l use
onl
y
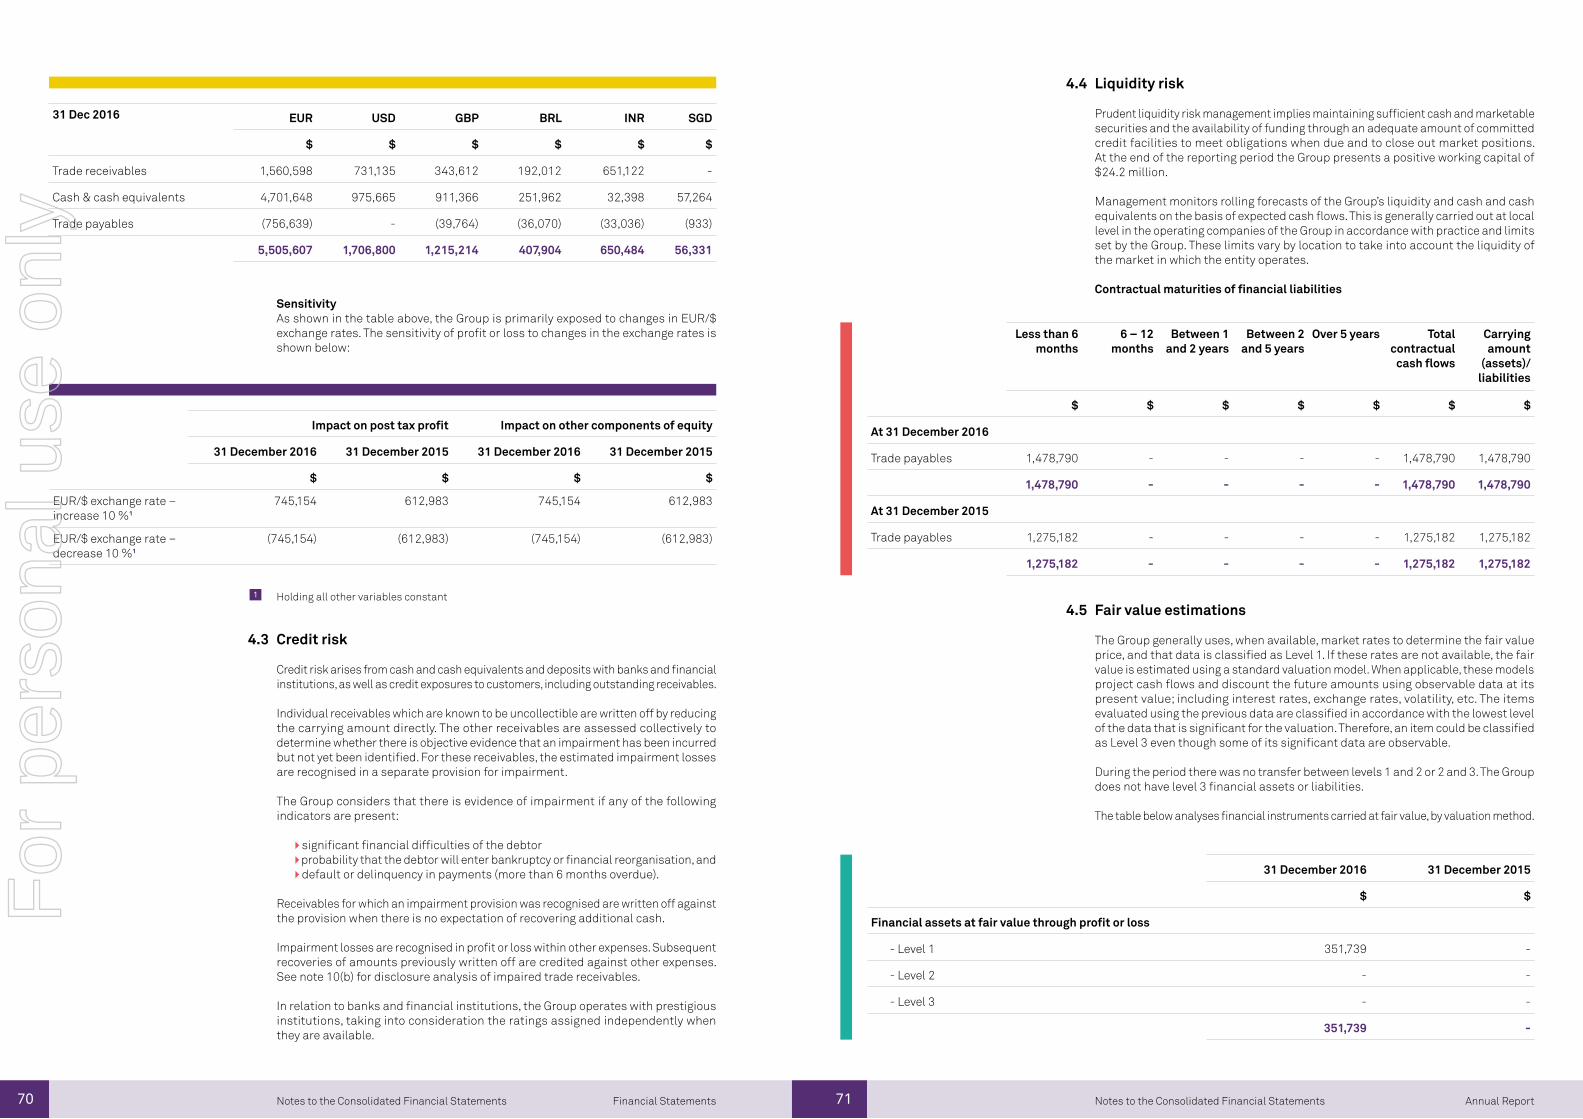
70 71 Annual ReportFinancial Statements Notes to the Consolidated Financial StatementsNotes to the Consolidated Financial Statements
Impact on post tax profit Impact on other components of equity
31 December 2016 31 December 2015 31 December 2016 31 December 2015
$ $ $ $
EUR/$ exchange rate – increase 10 %¹
745,154 612,983 745,154 612,983
EUR/$ exchange rate – decrease 10 %¹
(745,154) (612,983) (745,154) (612,983)
Sensitivity As shown in the table above, the Group is primarily exposed to changes in EUR/$ exchange rates. The sensitivity of profit or loss to changes in the exchange rates is shown below:
31 Dec 2016 EUR USD GBP BRL INR SGD
$ $ $ $ $ $
Trade receivables 1,560,598 731,135 343,612 192,012 651,122 -
Cash & cash equivalents 4,701,648 975,665 911,366 251,962 32,398 57,264
Trade payables (756,639) - (39,764) (36,070) (33,036) (933)
5,505,607 1,706,800 1,215,214 407,904 650,484 56,331
Credit risk
Credit risk arises from cash and cash equivalents and deposits with banks and financial institutions, as well as credit exposures to customers, including outstanding receivables.
Individual receivables which are known to be uncollectible are written off by reducing the carrying amount directly. The other receivables are assessed collectively to determine whether there is objective evidence that an impairment has been incurred but not yet been identified. For these receivables, the estimated impairment losses are recognised in a separate provision for impairment.
The Group considers that there is evidence of impairment if any of the following indicators are present:
significant financial difficulties of the debtor probability that the debtor will enter bankruptcy or financial reorganisation, and default or delinquency in payments (more than 6 months overdue).
Receivables for which an impairment provision was recognised are written off against the provision when there is no expectation of recovering additional cash.
Impairment losses are recognised in profit or loss within other expenses. Subsequent recoveries of amounts previously written off are credited against other expenses. See note 10(b) for disclosure analysis of impaired trade receivables.
In relation to banks and financial institutions, the Group operates with prestigious institutions, taking into consideration the ratings assigned independently when they are available.
Holding all other variables constant 1
Liquidity risk
Prudent liquidity risk management implies maintaining sufficient cash and marketable securities and the availability of funding through an adequate amount of committed credit facilities to meet obligations when due and to close out market positions. At the end of the reporting period the Group presents a positive working capital of $24.2 million.
Management monitors rolling forecasts of the Group’s liquidity and cash and cash equivalents on the basis of expected cash flows. This is generally carried out at local level in the operating companies of the Group in accordance with practice and limits set by the Group. These limits vary by location to take into account the liquidity of the market in which the entity operates.
Contractual maturities of financial liabilities
Less than 6 months
6 – 12 months
Between 1 and 2 years
Between 2 and 5 years
Over 5 years Total contractual
cash flows
Carrying amount
(assets)/ liabilities
$ $ $ $ $ $ $
At 31 December 2016
Trade payables 1,478,790 - - - - 1,478,790 1,478,790
1,478,790 - - - - 1,478,790 1,478,790
At 31 December 2015
Trade payables 1,275,182 - - - - 1,275,182 1,275,182
1,275,182 - - - - 1,275,182 1,275,182
Fair value estimations
The Group generally uses, when available, market rates to determine the fair value price, and that data is classified as Level 1. If these rates are not available, the fair value is estimated using a standard valuation model. When applicable, these models project cash flows and discount the future amounts using observable data at its present value; including interest rates, exchange rates, volatility, etc. The items evaluated using the previous data are classified in accordance with the lowest level of the data that is significant for the valuation. Therefore, an item could be classified as Level 3 even though some of its significant data are observable.
During the period there was no transfer between levels 1 and 2 or 2 and 3. The Group does not have level 3 financial assets or liabilities.
The table below analyses financial instruments carried at fair value, by valuation method.
31 December 2016 31 December 2015
$ $
Financial assets at fair value through profit or loss
- Level 1 351,739 -
- Level 2 - -
- Level 3 - -
351,739 -
4.3
4.5
4.4
For
per
sona
l use
onl
y
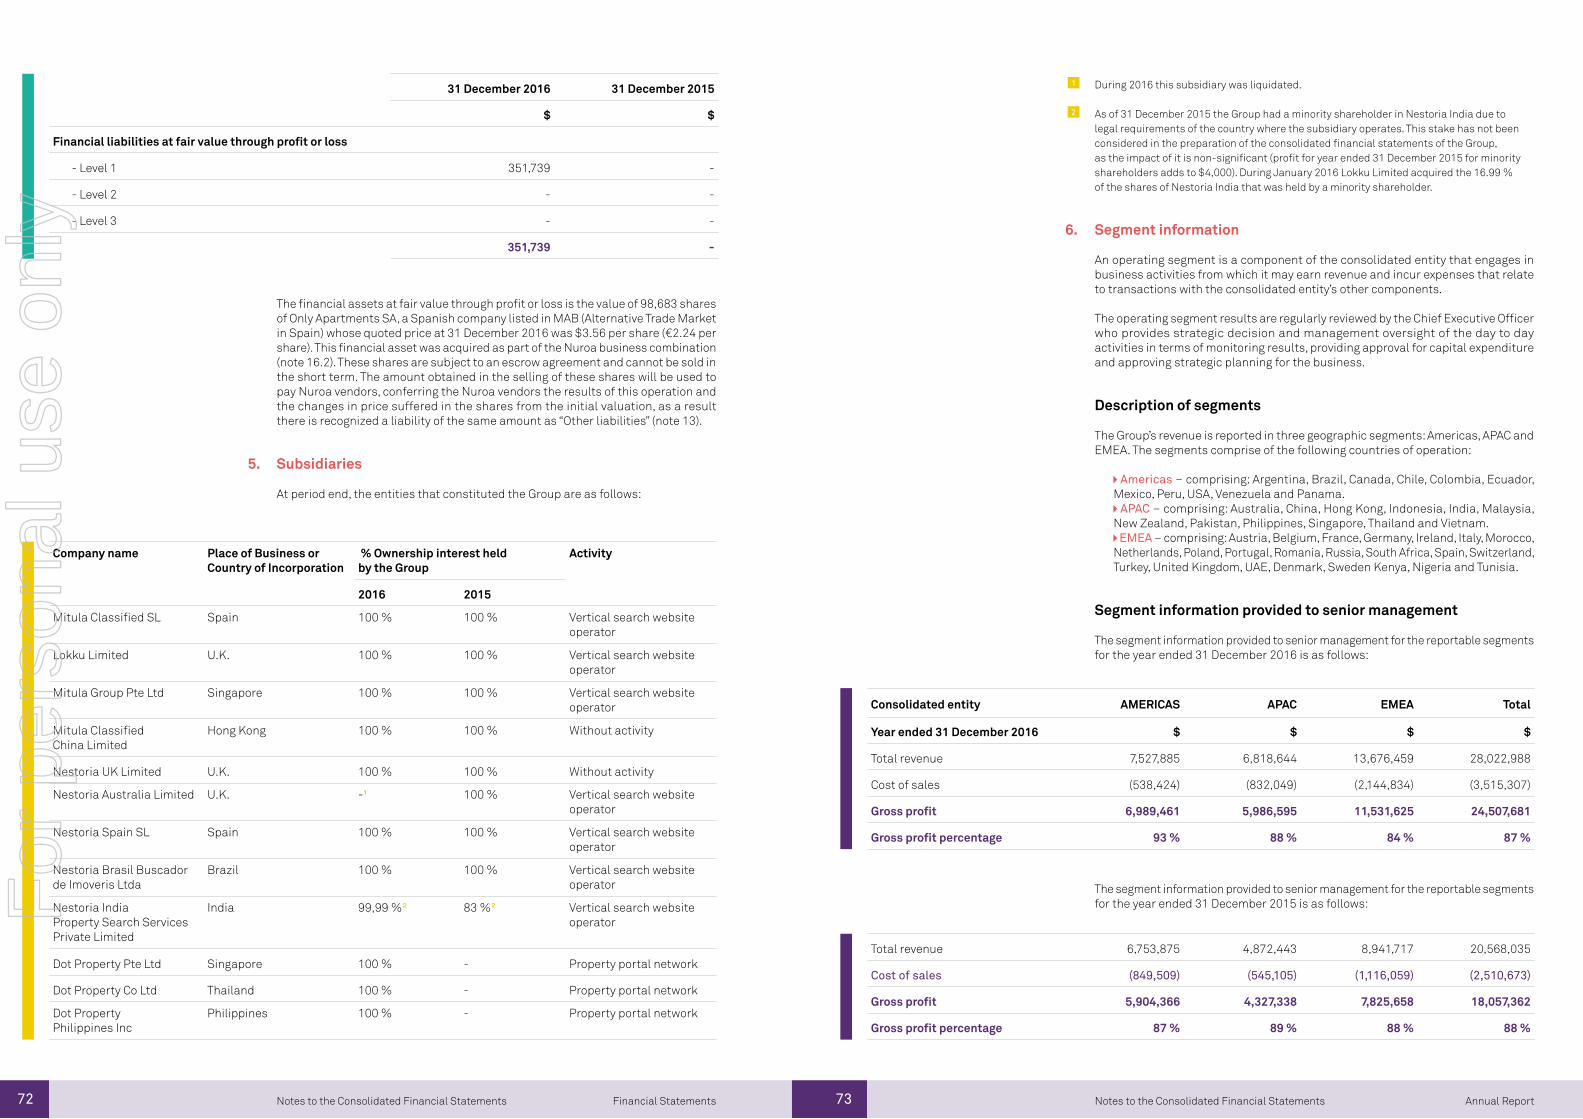
72 73 Annual ReportFinancial Statements Notes to the Consolidated Financial StatementsNotes to the Consolidated Financial Statements
31 December 2016 31 December 2015
$ $
Financial liabilities at fair value through profit or loss
- Level 1 351,739 -
- Level 2 - -
- Level 3 - -
351,739 -
The financial assets at fair value through profit or loss is the value of 98,683 shares of Only Apartments SA, a Spanish company listed in MAB (Alternative Trade Market in Spain) whose quoted price at 31 December 2016 was $3.56 per share (€2.24 per share). This financial asset was acquired as part of the Nuroa business combination (note 16.2). These shares are subject to an escrow agreement and cannot be sold in the short term. The amount obtained in the selling of these shares will be used to pay Nuroa vendors, conferring the Nuroa vendors the results of this operation and the changes in price suffered in the shares from the initial valuation, as a result there is recognized a liability of the same amount as “Other liabilities” (note 13).
Subsidiaries
At period end, the entities that constituted the Group are as follows:
Company name Place of Business or Country of Incorporation
% Ownership interest held by the Group
Activity
2016 2015
Mitula Classified SL Spain 100 % 100 % Vertical search website operator
Lokku Limited U.K. 100 % 100 % Vertical search website operator
Mitula Group Pte Ltd Singapore 100 % 100 % Vertical search website operator
Mitula Classified China Limited
Hong Kong 100 % 100 % Without activity
Nestoria UK Limited U.K. 100 % 100 % Without activity
Nestoria Australia Limited U.K. -¹ 100 % Vertical search website operator
Nestoria Spain SL Spain 100 % 100 % Vertical search website operator
Nestoria Brasil Buscador de Imoveris Ltda
Brazil 100 % 100 % Vertical search website operator
Nestoria India Property Search Services Private Limited
India 99,99 %² 83 %² Vertical search website operator
Dot Property Pte Ltd Singapore 100 % - Property portal network
Dot Property Co Ltd Thailand 100 % - Property portal network
Dot Property Philippines Inc
Philippines 100 % - Property portal network
During 2016 this subsidiary was liquidated.
As of 31 December 2015 the Group had a minority shareholder in Nestoria India due to legal requirements of the country where the subsidiary operates. This stake has not been considered in the preparation of the consolidated financial statements of the Group, as the impact of it is non-significant (profit for year ended 31 December 2015 for minority shareholders adds to $4,000). During January 2016 Lokku Limited acquired the 16.99 % of the shares of Nestoria India that was held by a minority shareholder.
1
2
Segment information
An operating segment is a component of the consolidated entity that engages in business activities from which it may earn revenue and incur expenses that relate to transactions with the consolidated entity’s other components.
The operating segment results are regularly reviewed by the Chief Executive Officer who provides strategic decision and management oversight of the day to day activities in terms of monitoring results, providing approval for capital expenditure and approving strategic planning for the business.
Description of segments
The Group’s revenue is reported in three geographic segments: Americas, APAC and EMEA. The segments comprise of the following countries of operation:
Americas – comprising: Argentina, Brazil, Canada, Chile, Colombia, Ecuador, Mexico, Peru, USA, Venezuela and Panama. APAC – comprising: Australia, China, Hong Kong, Indonesia, India, Malaysia,
New Zealand, Pakistan, Philippines, Singapore, Thailand and Vietnam. EMEA – comprising: Austria, Belgium, France, Germany, Ireland, Italy, Morocco,
Netherlands, Poland, Portugal, Romania, Russia, South Africa, Spain, Switzerland, Turkey, United Kingdom, UAE, Denmark, Sweden Kenya, Nigeria and Tunisia.
Segment information provided to senior management
The segment information provided to senior management for the reportable segments for the year ended 31 December 2016 is as follows:
Consolidated entity AMERICAS APAC EMEA Total
Year ended 31 December 2016 $ $ $ $
Total revenue 7,527,885 6,818,644 13,676,459 28,022,988
Cost of sales (538,424) (832,049) (2,144,834) (3,515,307)
Gross profit 6,989,461 5,986,595 11,531,625 24,507,681
Gross profit percentage 93 % 88 % 84 % 87 %
The segment information provided to senior management for the reportable segments for the year ended 31 December 2015 is as follows:
Total revenue 6,753,875 4,872,443 8,941,717 20,568,035
Cost of sales (849,509) (545,105) (1,116,059) (2,510,673)
Gross profit 5,904,366 4,327,338 7,825,658 18,057,362
Gross profit percentage 87 % 89 % 88 % 88 %
5.
6.
For
per
sona
l use
onl
y
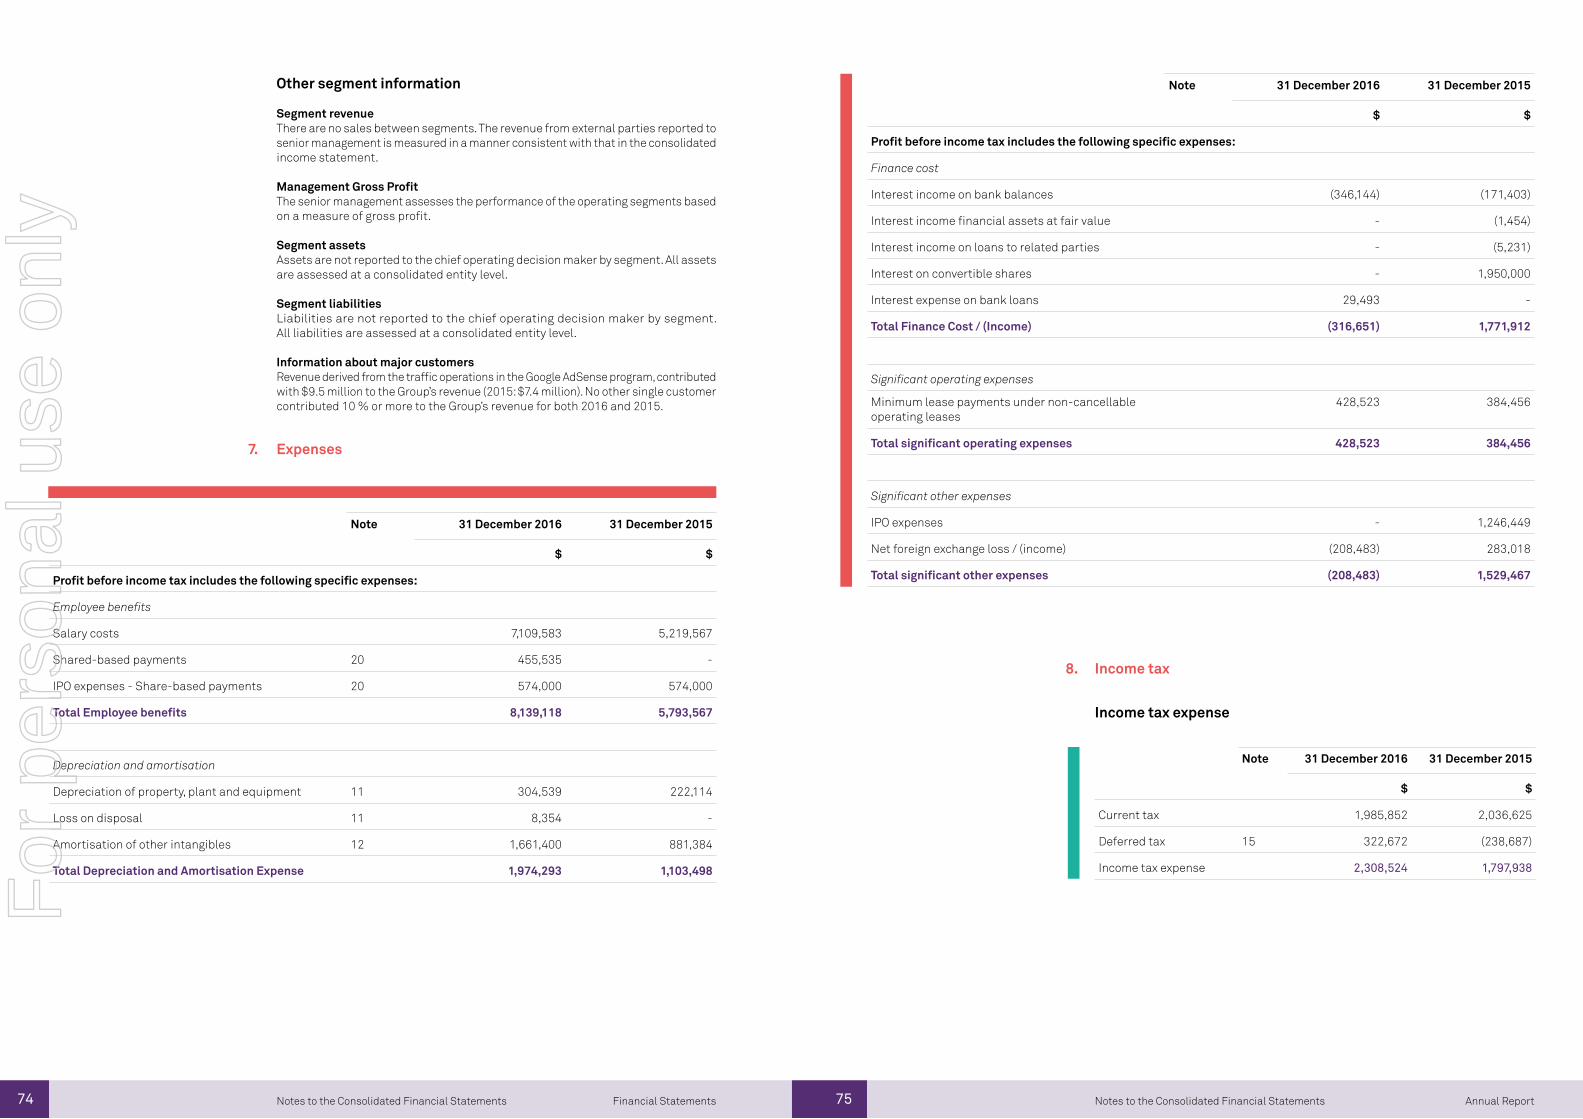
74 75 Annual ReportFinancial Statements Notes to the Consolidated Financial StatementsNotes to the Consolidated Financial Statements
Other segment information
Segment revenueThere are no sales between segments. The revenue from external parties reported to senior management is measured in a manner consistent with that in the consolidated income statement.
Management Gross ProfitThe senior management assesses the performance of the operating segments based on a measure of gross profit.
Segment assetsAssets are not reported to the chief operating decision maker by segment. All assets are assessed at a consolidated entity level.
Segment liabilitiesLiabilities are not reported to the chief operating decision maker by segment. All liabilities are assessed at a consolidated entity level.
Information about major customersRevenue derived from the traffic operations in the Google AdSense program, contributed with $9.5 million to the Group’s revenue (2015: $7.4 million). No other single customer contributed 10 % or more to the Group’s revenue for both 2016 and 2015.
Expenses
Note 31 December 2016 31 December 2015
$ $
Profit before income tax includes the following specific expenses:
Employee benefits
Salary costs 7,109,583 5,219,567
Shared-based payments 20 455,535 -
IPO expenses - Share-based payments 20 574,000 574,000
Total Employee benefits 8,139,118 5,793,567
Depreciation and amortisation
Depreciation of property, plant and equipment 11 304,539 222,114
Loss on disposal 11 8,354 -
Amortisation of other intangibles 12 1,661,400 881,384
Total Depreciation and Amortisation Expense 1,974,293 1,103,498
Note 31 December 2016 31 December 2015
$ $
Profit before income tax includes the following specific expenses:
Finance cost
Interest income on bank balances (346,144) (171,403)
Interest income financial assets at fair value - (1,454)
Interest income on loans to related parties - (5,231)
Interest on convertible shares - 1,950,000
Interest expense on bank loans 29,493 -
Total Finance Cost / (Income) (316,651) 1,771,912
Significant operating expenses
Minimum lease payments under non-cancellable operating leases
428,523 384,456
Total significant operating expenses 428,523 384,456
Significant other expenses
IPO expenses - 1,246,449
Net foreign exchange loss / (income) (208,483) 283,018
Total significant other expenses (208,483) 1,529,467
Income tax
Income tax expense
Note 31 December 2016 31 December 2015
$ $
Current tax 1,985,852 2,036,625
Deferred tax 15 322,672 (238,687)
Income tax expense 2,308,524 1,797,938
7.
8.
For
per
sona
l use
onl
y
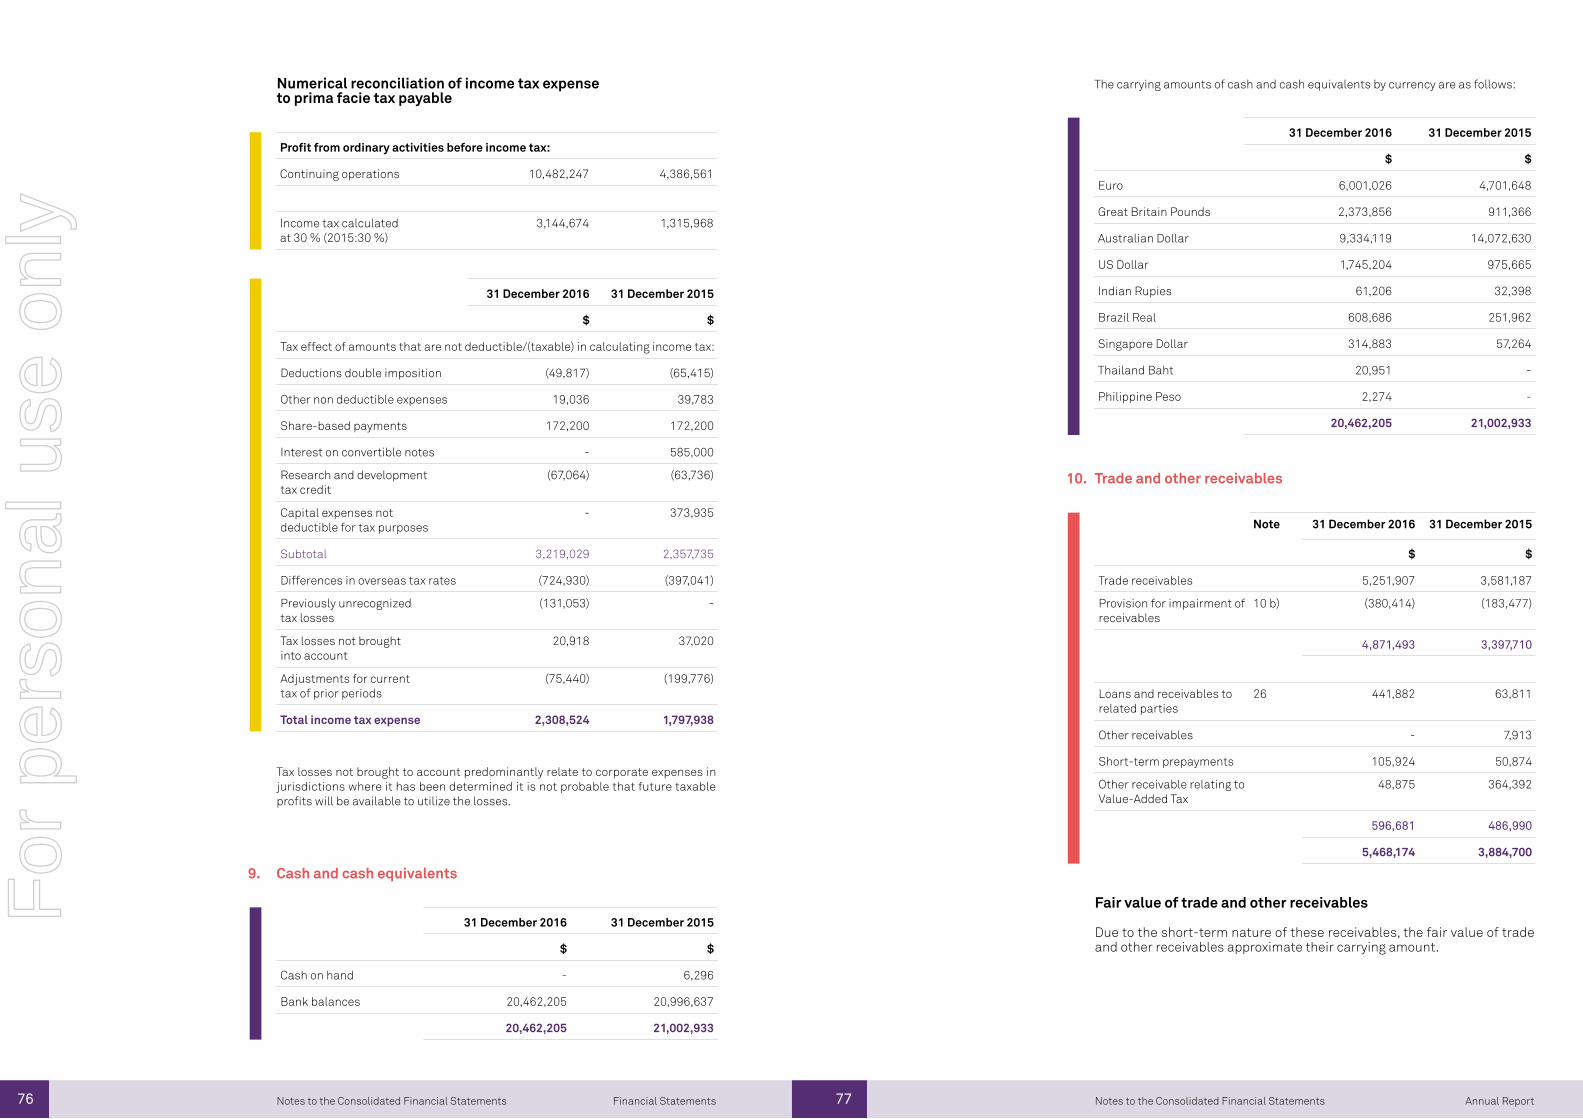
76 77 Annual ReportFinancial Statements Notes to the Consolidated Financial StatementsNotes to the Consolidated Financial Statements
31 December 2016 31 December 2015
$ $
Tax effect of amounts that are not deductible/(taxable) in calculating income tax:
Deductions double imposition (49,817) (65,415)
Other non deductible expenses 19,036 39,783
Share-based payments 172,200 172,200
Interest on convertible notes - 585,000
Research and development tax credit
(67,064) (63,736)
Capital expenses not deductible for tax purposes
- 373,935
Subtotal 3,219,029 2,357,735
Differences in overseas tax rates (724,930) (397,041)
Previously unrecognized tax losses
(131,053) -
Tax losses not brought into account
20,918 37,020
Adjustments for current tax of prior periods
(75,440) (199,776)
Total income tax expense 2,308,524 1,797,938
Tax losses not brought to account predominantly relate to corporate expenses in jurisdictions where it has been determined it is not probable that future taxable profits will be available to utilize the losses.
Cash and cash equivalents
Note 31 December 2016 31 December 2015
$ $
Trade receivables 5,251,907 3,581,187
Provision for impairment of receivables
10 b) (380,414) (183,477)
4,871,493 3,397,710
Loans and receivables to related parties
26 441,882 63,811
Other receivables - 7,913
Short-term prepayments 105,924 50,874
Other receivable relating to Value-Added Tax
48,875 364,392
596,681 486,990
5,468,174 3,884,700
31 December 2016 31 December 2015
$ $
Euro 6,001,026 4,701,648
Great Britain Pounds 2,373,856 911,366
Australian Dollar 9,334,119 14,072,630
US Dollar 1,745,204 975,665
Indian Rupies 61,206 32,398
Brazil Real 608,686 251,962
Singapore Dollar 314,883 57,264
Thailand Baht 20,951 -
Philippine Peso 2,274 -
20,462,205 21,002,933
31 December 2016 31 December 2015
$ $
Cash on hand - 6,296
Bank balances 20,462,205 20,996,637
20,462,205 21,002,933
The carrying amounts of cash and cash equivalents by currency are as follows:
Trade and other receivables
Fair value of trade and other receivables
Due to the short-term nature of these receivables, the fair value of trade and other receivables approximate their carrying amount.
9.
10.
Profit from ordinary activities before income tax:
Continuing operations 10,482,247 4,386,561
Income tax calculated at 30 % (2015:30 %)
3,144,674 1,315,968
Numerical reconciliation of income tax expense to prima facie tax payable
For
per
sona
l use
onl
y
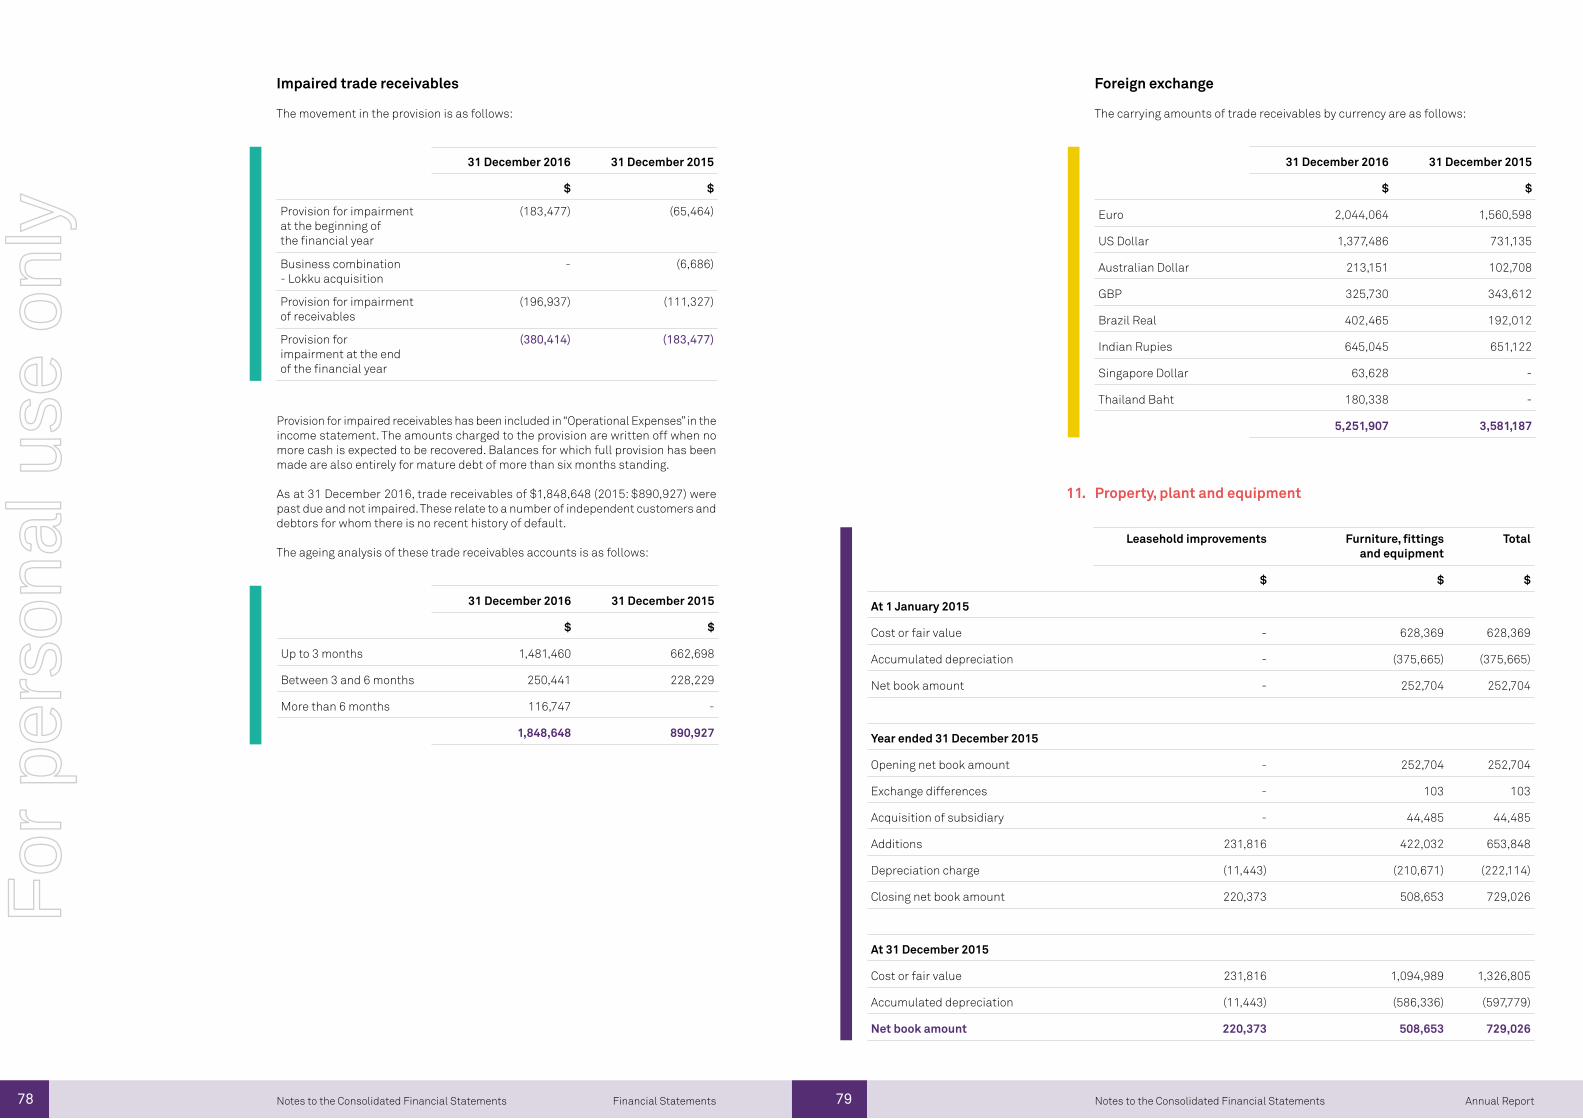
78 79 Annual ReportFinancial Statements Notes to the Consolidated Financial StatementsNotes to the Consolidated Financial Statements
Impaired trade receivables
The movement in the provision is as follows:
31 December 2016 31 December 2015
$ $
Up to 3 months 1,481,460 662,698
Between 3 and 6 months 250,441 228,229
More than 6 months 116,747 -
1,848,648 890,927
31 December 2016 31 December 2015
$ $
Provision for impairment at the beginning of the financial year
(183,477) (65,464)
Business combination - Lokku acquisition
- (6,686)
Provision for impairment of receivables
(196,937) (111,327)
Provision for impairment at the end of the financial year
(380,414) (183,477)
Provision for impaired receivables has been included in “Operational Expenses” in the income statement. The amounts charged to the provision are written off when no more cash is expected to be recovered. Balances for which full provision has been made are also entirely for mature debt of more than six months standing.
As at 31 December 2016, trade receivables of $1,848,648 (2015: $890,927) were past due and not impaired. These relate to a number of independent customers and debtors for whom there is no recent history of default.
The ageing analysis of these trade receivables accounts is as follows:
Foreign exchange
The carrying amounts of trade receivables by currency are as follows:
31 December 2016 31 December 2015
$ $
Euro 2,044,064 1,560,598
US Dollar 1,377,486 731,135
Australian Dollar 213,151 102,708
GBP 325,730 343,612
Brazil Real 402,465 192,012
Indian Rupies 645,045 651,122
Singapore Dollar 63,628 -
Thailand Baht 180,338 -
5,251,907 3,581,187
Property, plant and equipment
Leasehold improvements Furniture, fittings and equipment
Total
$ $ $
At 1 January 2015
Cost or fair value - 628,369 628,369
Accumulated depreciation - (375,665) (375,665)
Net book amount - 252,704 252,704
Year ended 31 December 2015
Opening net book amount - 252,704 252,704
Exchange differences - 103 103
Acquisition of subsidiary - 44,485 44,485
Additions 231,816 422,032 653,848
Depreciation charge (11,443) (210,671) (222,114)
Closing net book amount 220,373 508,653 729,026
At 31 December 2015
Cost or fair value 231,816 1,094,989 1,326,805
Accumulated depreciation (11,443) (586,336) (597,779)
Net book amount 220,373 508,653 729,026
11.
For
per
sona
l use
onl
y
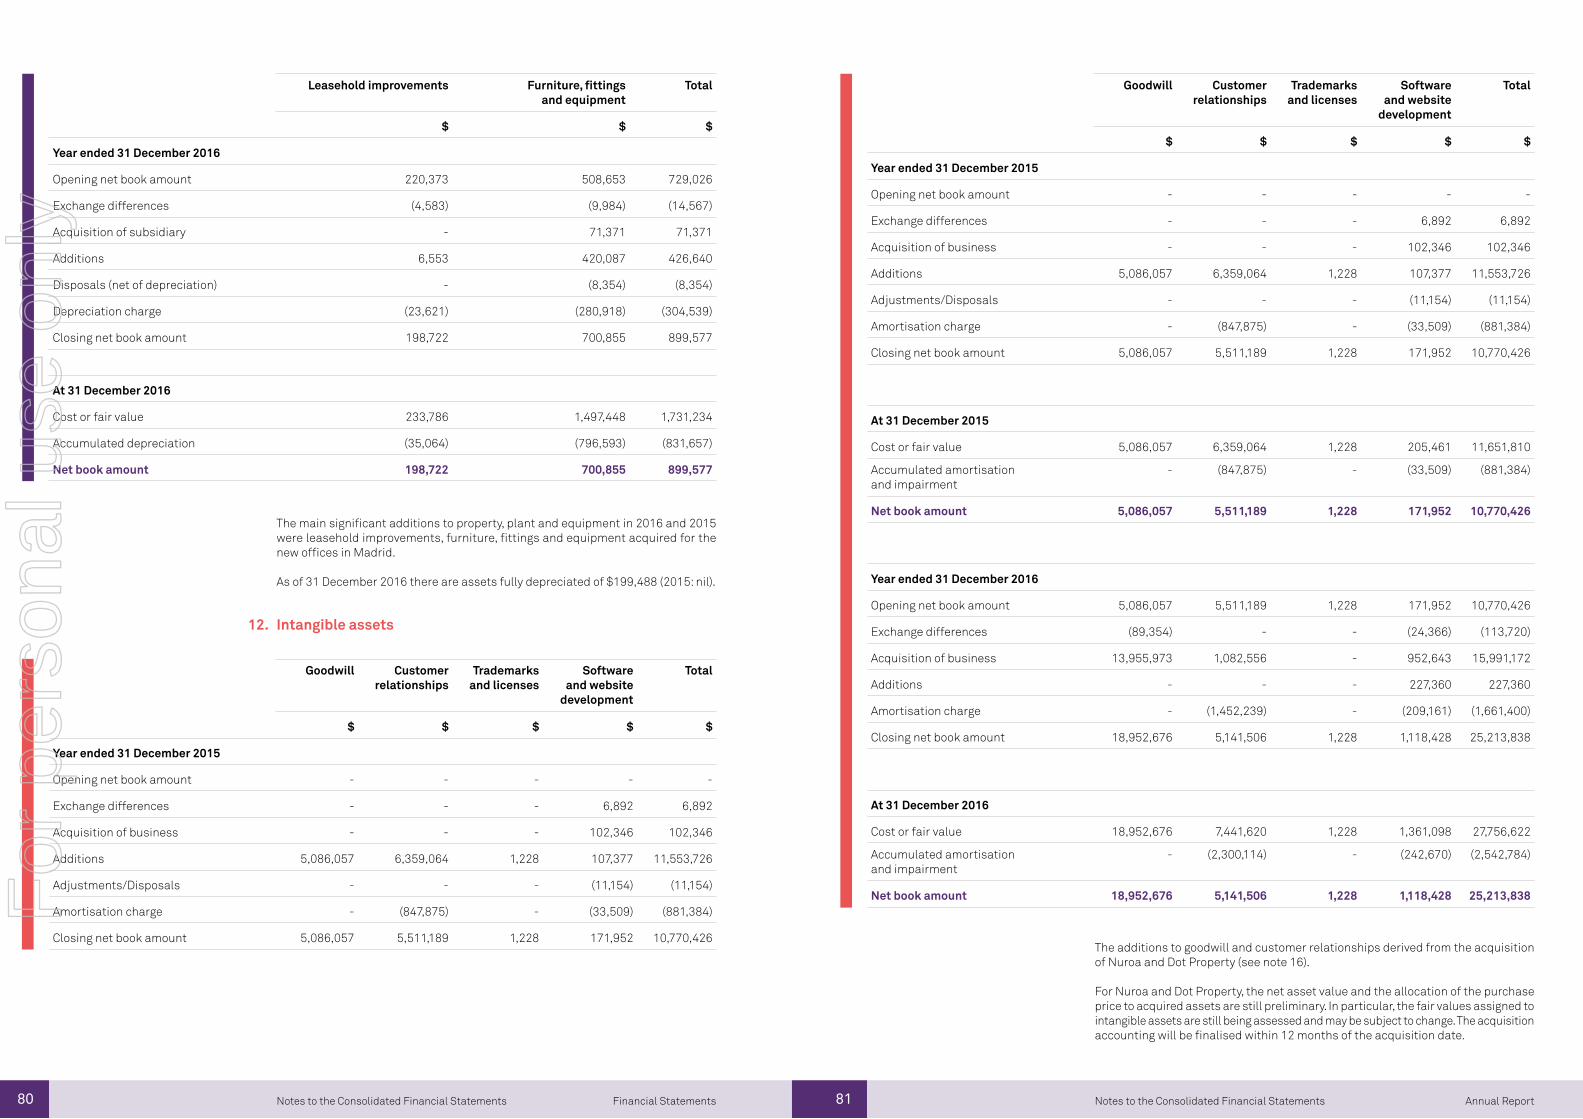
80 81 Annual ReportFinancial Statements Notes to the Consolidated Financial StatementsNotes to the Consolidated Financial Statements
Leasehold improvements Furniture, fittings and equipment
Total
$ $ $
Year ended 31 December 2016
Opening net book amount 220,373 508,653 729,026
Exchange differences (4,583) (9,984) (14,567)
Acquisition of subsidiary - 71,371 71,371
Additions 6,553 420,087 426,640
Disposals (net of depreciation) - (8,354) (8,354)
Depreciation charge (23,621) (280,918) (304,539)
Closing net book amount 198,722 700,855 899,577
At 31 December 2016
Cost or fair value 233,786 1,497,448 1,731,234
Accumulated depreciation (35,064) (796,593) (831,657)
Net book amount 198,722 700,855 899,577
The main significant additions to property, plant and equipment in 2016 and 2015 were leasehold improvements, furniture, fittings and equipment acquired for the new offices in Madrid.
As of 31 December 2016 there are assets fully depreciated of $199,488 (2015: nil).
Intangible assets
Goodwill Customer relationships
Trademarks and licenses
Software and website
development
Total
$ $ $ $ $
Year ended 31 December 2015
Opening net book amount - - - - -
Exchange differences - - - 6,892 6,892
Acquisition of business - - - 102,346 102,346
Additions 5,086,057 6,359,064 1,228 107,377 11,553,726
Adjustments/Disposals - - - (11,154) (11,154)
Amortisation charge - (847,875) - (33,509) (881,384)
Closing net book amount 5,086,057 5,511,189 1,228 171,952 10,770,426
At 31 December 2015
Cost or fair value 5,086,057 6,359,064 1,228 205,461 11,651,810
Accumulated amortisation and impairment
- (847,875) - (33,509) (881,384)
Net book amount 5,086,057 5,511,189 1,228 171,952 10,770,426
Year ended 31 December 2016
Opening net book amount 5,086,057 5,511,189 1,228 171,952 10,770,426
Exchange differences (89,354) - - (24,366) (113,720)
Acquisition of business 13,955,973 1,082,556 - 952,643 15,991,172
Additions - - - 227,360 227,360
Amortisation charge - (1,452,239) - (209,161) (1,661,400)
Closing net book amount 18,952,676 5,141,506 1,228 1,118,428 25,213,838
At 31 December 2016
Cost or fair value 18,952,676 7,441,620 1,228 1,361,098 27,756,622
Accumulated amortisation and impairment
- (2,300,114) - (242,670) (2,542,784)
Net book amount 18,952,676 5,141,506 1,228 1,118,428 25,213,838
Goodwill Customer relationships
Trademarks and licenses
Software and website
development
Total
$ $ $ $ $
Year ended 31 December 2015
Opening net book amount - - - - -
Exchange differences - - - 6,892 6,892
Acquisition of business - - - 102,346 102,346
Additions 5,086,057 6,359,064 1,228 107,377 11,553,726
Adjustments/Disposals - - - (11,154) (11,154)
Amortisation charge - (847,875) - (33,509) (881,384)
Closing net book amount 5,086,057 5,511,189 1,228 171,952 10,770,426The additions to goodwill and customer relationships derived from the acquisition of Nuroa and Dot Property (see note 16).
For Nuroa and Dot Property, the net asset value and the allocation of the purchase price to acquired assets are still preliminary. In particular, the fair values assigned to intangible assets are still being assessed and may be subject to change. The acquisition accounting will be finalised within 12 months of the acquisition date.
12.
For
per
sona
l use
onl
y
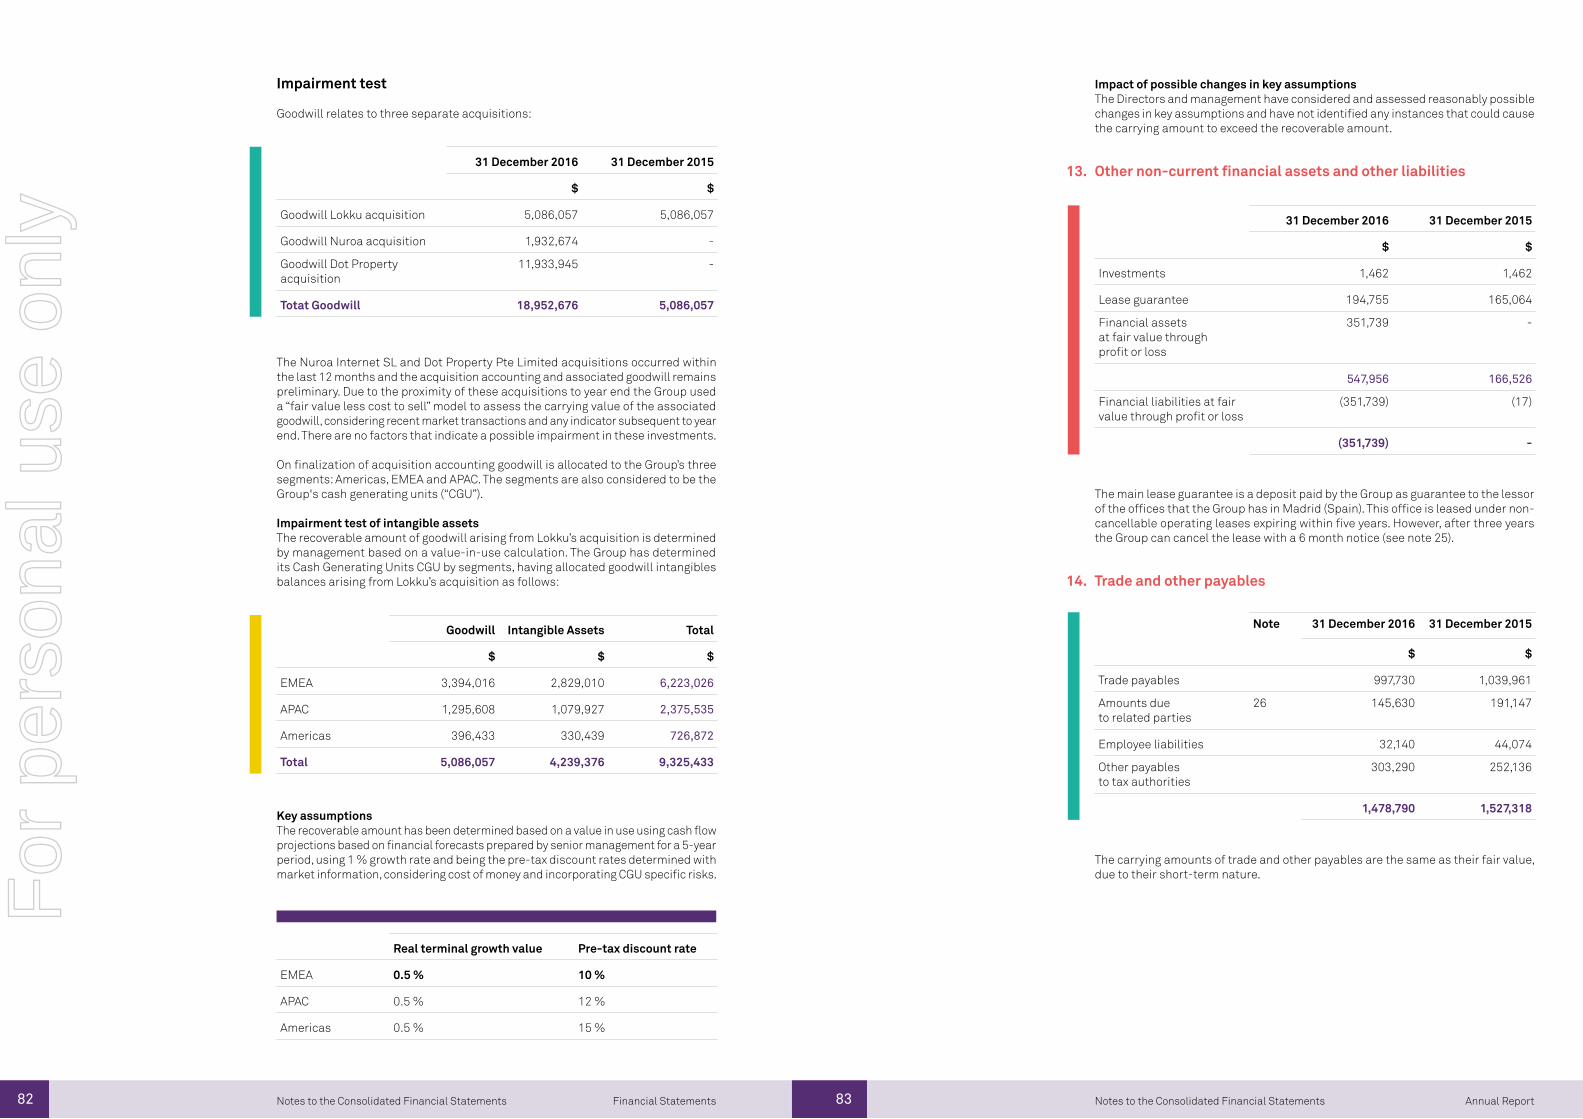
82 83 Annual ReportFinancial Statements Notes to the Consolidated Financial StatementsNotes to the Consolidated Financial Statements
Impairment test
Goodwill relates to three separate acquisitions:
31 December 2016 31 December 2015
$ $
Goodwill Lokku acquisition 5,086,057 5,086,057
Goodwill Nuroa acquisition 1,932,674 -
Goodwill Dot Property acquisition
11,933,945 -
Totat Goodwill 18,952,676 5,086,057
The Nuroa Internet SL and Dot Property Pte Limited acquisitions occurred within the last 12 months and the acquisition accounting and associated goodwill remains preliminary. Due to the proximity of these acquisitions to year end the Group used a “fair value less cost to sell” model to assess the carrying value of the associated goodwill, considering recent market transactions and any indicator subsequent to year end. There are no factors that indicate a possible impairment in these investments.
On finalization of acquisition accounting goodwill is allocated to the Group’s three segments: Americas, EMEA and APAC. The segments are also considered to be the Group's cash generating units (“CGU”).
Impairment test of intangible assetsThe recoverable amount of goodwill arising from Lokku’s acquisition is determined by management based on a value-in-use calculation. The Group has determined its Cash Generating Units CGU by segments, having allocated goodwill intangibles balances arising from Lokku’s acquisition as follows:
Goodwill Intangible Assets Total
$ $ $
EMEA 3,394,016 2,829,010 6,223,026
APAC 1,295,608 1,079,927 2,375,535
Americas 396,433 330,439 726,872
Total 5,086,057 4,239,376 9,325,433
Real terminal growth value Pre-tax discount rate
EMEA 0.5 % 10 %
APAC 0.5 % 12 %
Americas 0.5 % 15 %
31 December 2016 31 December 2015
$ $
Investments 1,462 1,462
Lease guarantee 194,755 165,064
Financial assets at fair value through profit or loss
351,739 -
547,956 166,526
Financial liabilities at fairvalue through profit or loss
(351,739) (17)
(351,739) -
Note 31 December 2016 31 December 2015
$ $
Trade payables 997,730 1,039,961
Amounts due to related parties
26 145,630 191,147
Employee liabilities 32,140 44,074
Other payables to tax authorities
303,290 252,136
1,478,790 1,527,318Key assumptionsThe recoverable amount has been determined based on a value in use using cash flow projections based on financial forecasts prepared by senior management for a 5-year period, using 1 % growth rate and being the pre-tax discount rates determined with market information, considering cost of money and incorporating CGU specific risks.
Impact of possible changes in key assumptionsThe Directors and management have considered and assessed reasonably possible changes in key assumptions and have not identified any instances that could cause the carrying amount to exceed the recoverable amount.
Other non-current financial assets and other liabilities
The main lease guarantee is a deposit paid by the Group as guarantee to the lessor of the offices that the Group has in Madrid (Spain). This office is leased under non-cancellable operating leases expiring within five years. However, after three years the Group can cancel the lease with a 6 month notice (see note 25).
The carrying amounts of trade and other payables are the same as their fair value, due to their short-term nature.
13.
14. Trade and other payables
For
per
sona
l use
onl
y
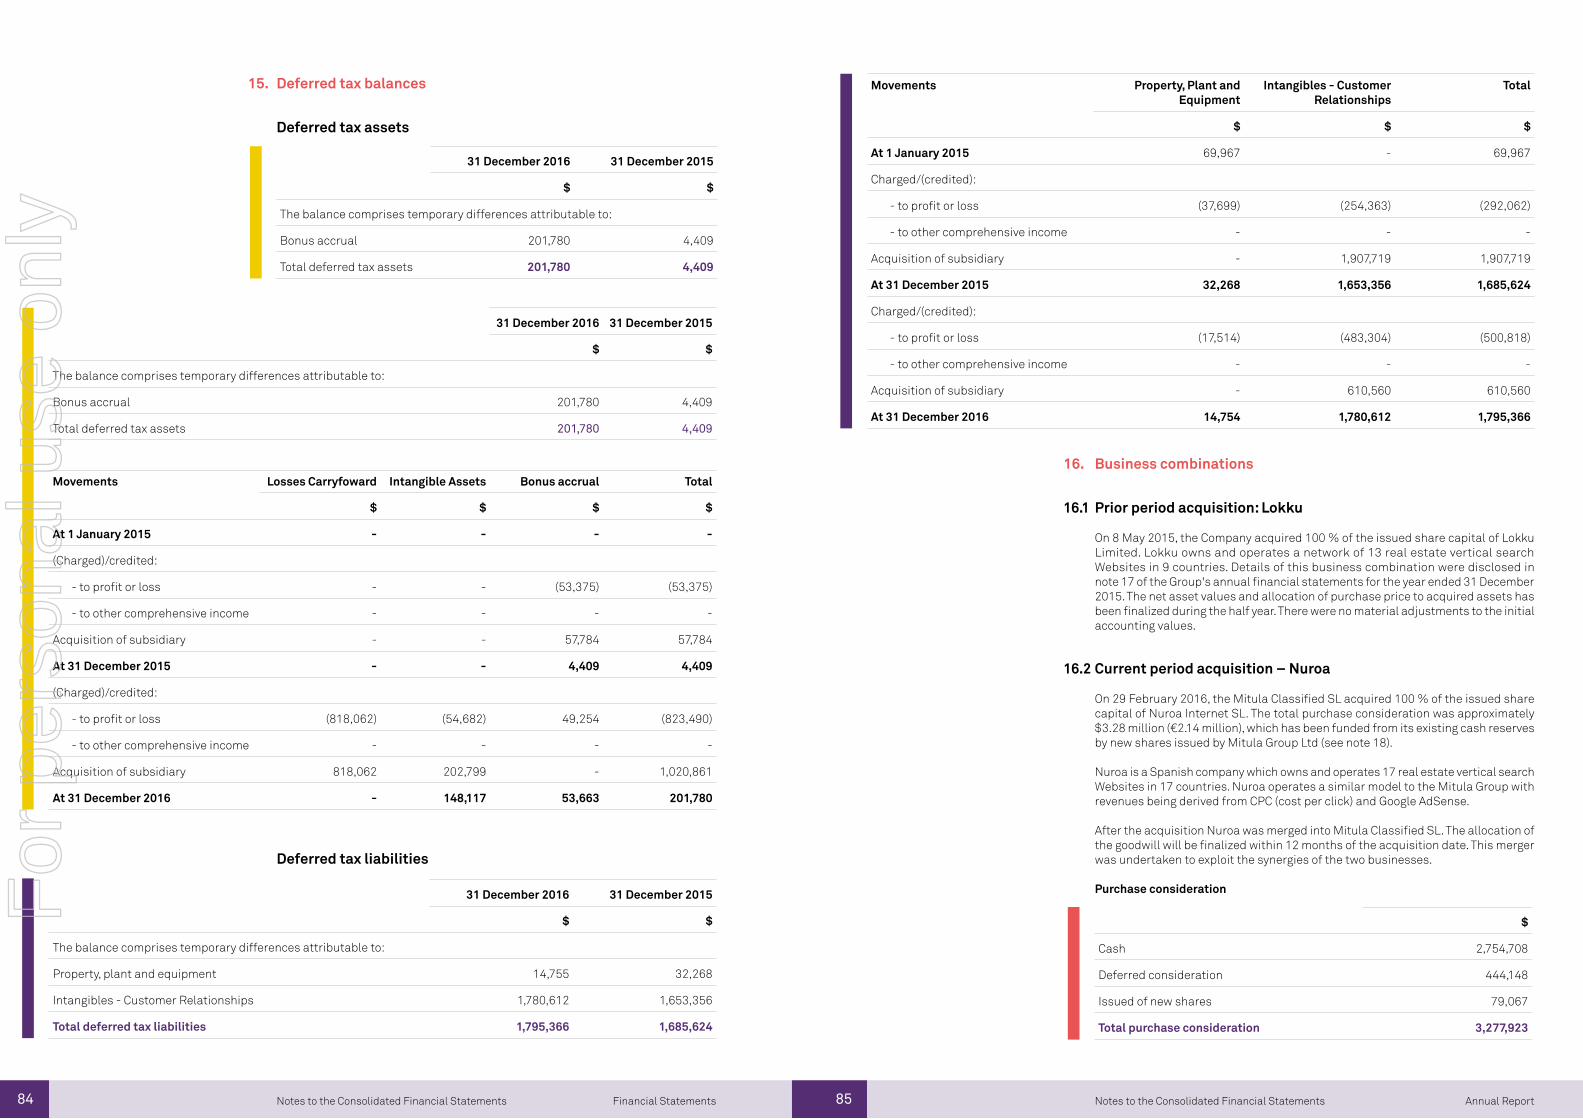
84 85 Annual ReportFinancial Statements Notes to the Consolidated Financial StatementsNotes to the Consolidated Financial Statements
Deferred tax balances
Deferred tax assets
Deferred tax liabilities
Movements Property, Plant and Equipment
Intangibles - Customer Relationships
Total
$ $ $
At 1 January 2015 69,967 - 69,967
Charged/(credited):
- to profit or loss (37,699) (254,363) (292,062)
- to other comprehensive income - - -
Acquisition of subsidiary - 1,907,719 1,907,719
At 31 December 2015 32,268 1,653,356 1,685,624
Charged/(credited):
- to profit or loss (17,514) (483,304) (500,818)
- to other comprehensive income - - -
Acquisition of subsidiary - 610,560 610,560
At 31 December 2016 14,754 1,780,612 1,795,366
Business combinations
Prior period acquisition: Lokku
On 8 May 2015, the Company acquired 100 % of the issued share capital of Lokku Limited. Lokku owns and operates a network of 13 real estate vertical search Websites in 9 countries. Details of this business combination were disclosed in note 17 of the Group's annual financial statements for the year ended 31 December 2015. The net asset values and allocation of purchase price to acquired assets has been finalized during the half year. There were no material adjustments to the initial accounting values.
Current period acquisition – Nuroa
On 29 February 2016, the Mitula Classified SL acquired 100 % of the issued share capital of Nuroa Internet SL. The total purchase consideration was approximately $3.28 million (€2.14 million), which has been funded from its existing cash reserves by new shares issued by Mitula Group Ltd (see note 18).
Nuroa is a Spanish company which owns and operates 17 real estate vertical search Websites in 17 countries. Nuroa operates a similar model to the Mitula Group with revenues being derived from CPC (cost per click) and Google AdSense.
After the acquisition Nuroa was merged into Mitula Classified SL. The allocation of the goodwill will be finalized within 12 months of the acquisition date. This merger was undertaken to exploit the synergies of the two businesses.
Purchase consideration
$
Cash 2,754,708
Deferred consideration 444,148
Issued of new shares 79,067
Total purchase consideration 3,277,923
31 December 2016 31 December 2015
$ $
The balance comprises temporary differences attributable to:
Bonus accrual 201,780 4,409
Total deferred tax assets 201,780 4,409
Movements Losses Carryfoward Intangible Assets Bonus accrual Total
$ $ $ $
At 1 January 2015 - - - -
(Charged)/credited:
- to profit or loss - - (53,375) (53,375)
- to other comprehensive income - - - -
Acquisition of subsidiary - - 57,784 57,784
At 31 December 2015 - - 4,409 4,409
(Charged)/credited:
- to profit or loss (818,062) (54,682) 49,254 (823,490)
- to other comprehensive income - - - -
Acquisition of subsidiary 818,062 202,799 - 1,020,861
At 31 December 2016 - 148,117 53,663 201,780
31 December 2016 31 December 2015
$ $
The balance comprises temporary differences attributable to:
Property, plant and equipment 14,755 32,268
Intangibles - Customer Relationships 1,780,612 1,653,356
Total deferred tax liabilities 1,795,366 1,685,624
15.
16.
16.1
16.2
31 December 2016 31 December 2015
$ $
The balance comprises temporary differences attributable to:
Bonus accrual 201,780 4,409
Total deferred tax assets 201,780 4,409
For
per
sona
l use
onl
y
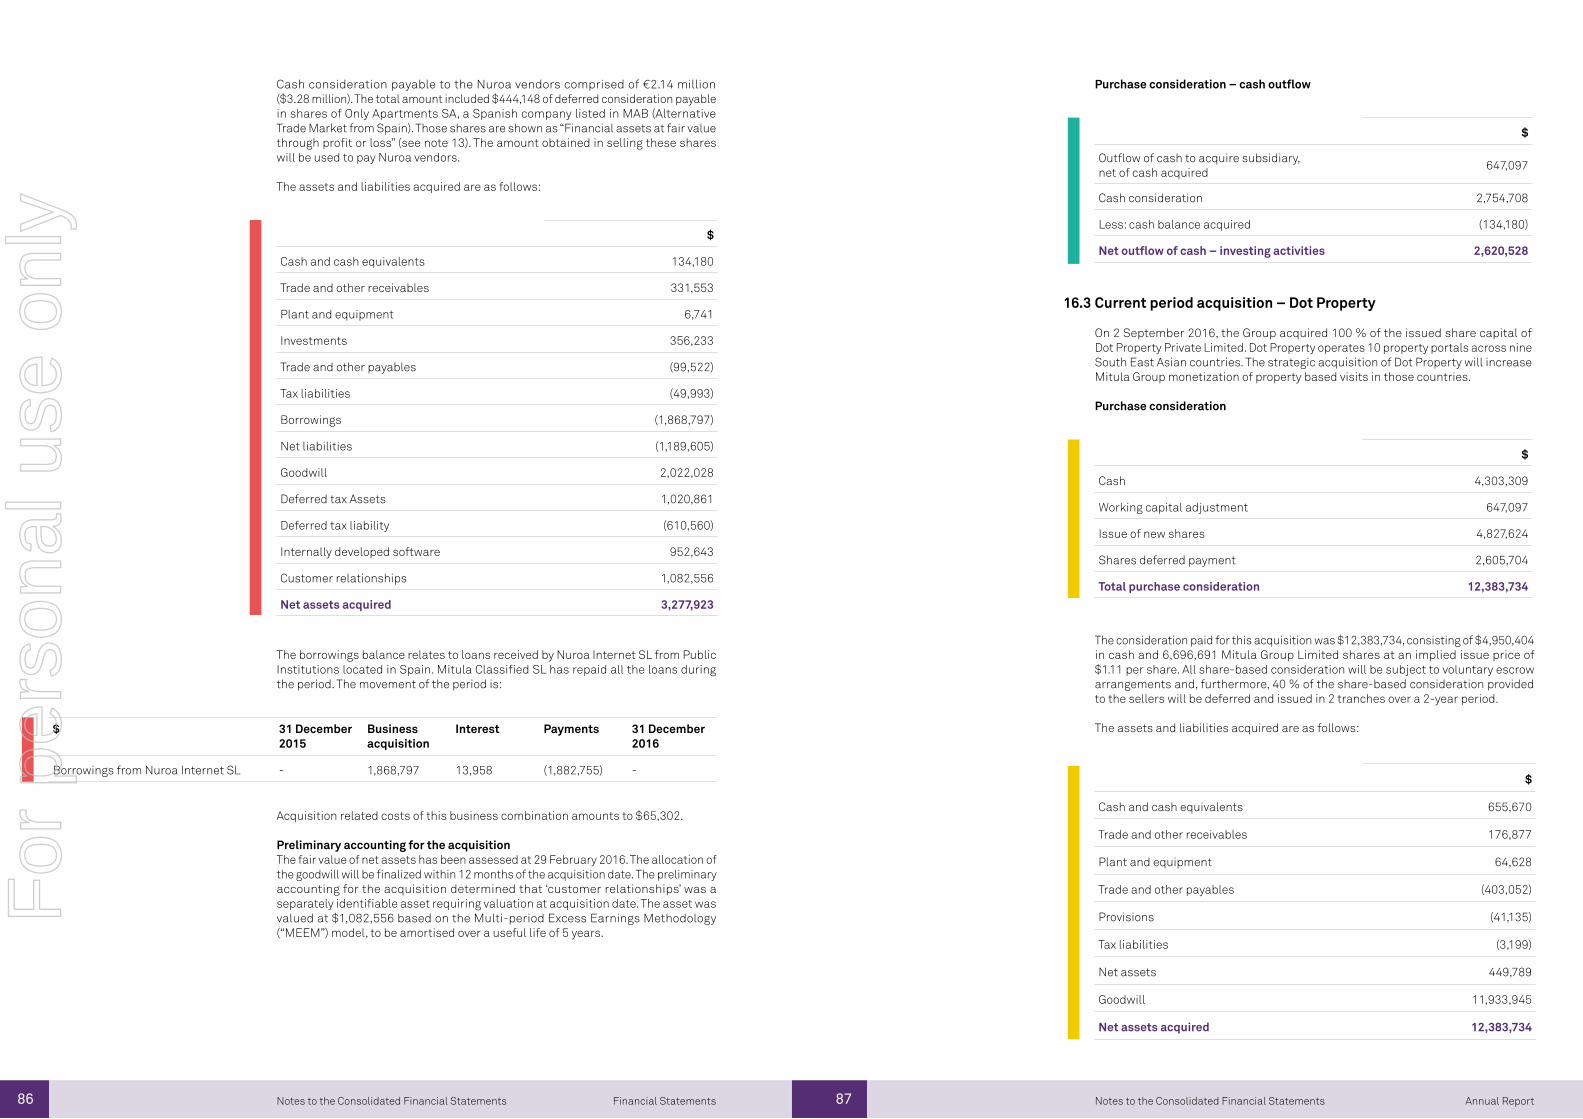
86 87 Annual ReportFinancial Statements Notes to the Consolidated Financial StatementsNotes to the Consolidated Financial Statements
Cash consideration payable to the Nuroa vendors comprised of €2.14 million ($3.28 million). The total amount included $444,148 of deferred consideration payable in shares of Only Apartments SA, a Spanish company listed in MAB (Alternative Trade Market from Spain). Those shares are shown as “Financial assets at fair value through profit or loss” (see note 13). The amount obtained in selling these shares will be used to pay Nuroa vendors.
The assets and liabilities acquired are as follows:
$
Cash and cash equivalents 134,180
Trade and other receivables 331,553
Plant and equipment 6,741
Investments 356,233
Trade and other payables (99,522)
Tax liabilities (49,993)
Borrowings (1,868,797)
Net liabilities (1,189,605)
Goodwill 2,022,028
Deferred tax Assets 1,020,861
Deferred tax liability (610,560)
Internally developed software 952,643
Customer relationships 1,082,556
Net assets acquired 3,277,923
$ 31 December 2015
Business acquisition
Interest Payments 31 December 2016
Borrowings from Nuroa Internet SL - 1,868,797 13,958 (1,882,755) -
The borrowings balance relates to loans received by Nuroa Internet SL from Public Institutions located in Spain. Mitula Classified SL has repaid all the loans during the period. The movement of the period is:
Acquisition related costs of this business combination amounts to $65,302.
Preliminary accounting for the acquisitionThe fair value of net assets has been assessed at 29 February 2016. The allocation of the goodwill will be finalized within 12 months of the acquisition date. The preliminary accounting for the acquisition determined that ‘customer relationships’ was a separately identifiable asset requiring valuation at acquisition date. The asset was valued at $1,082,556 based on the Multi-period Excess Earnings Methodology (“MEEM”) model, to be amortised over a useful life of 5 years.
Purchase consideration – cash outflow
Current period acquisition – Dot Property
On 2 September 2016, the Group acquired 100 % of the issued share capital of Dot Property Private Limited. Dot Property operates 10 property portals across nine South East Asian countries. The strategic acquisition of Dot Property will increase Mitula Group monetization of property based visits in those countries.
Purchase consideration
$
Outflow of cash to acquire subsidiary, net of cash acquired 647,097
Cash consideration 2,754,708
Less: cash balance acquired (134,180)
Net outflow of cash – investing activities 2,620,528
$
Cash 4,303,309
Working capital adjustment 647,097
Issue of new shares 4,827,624
Shares deferred payment 2,605,704
Total purchase consideration 12,383,734
$
Cash and cash equivalents 655,670
Trade and other receivables 176,877
Plant and equipment 64,628
Trade and other payables (403,052)
Provisions (41,135)
Tax liabilities (3,199)
Net assets 449,789
Goodwill 11,933,945
Net assets acquired 12,383,734
16.3
The consideration paid for this acquisition was $12,383,734, consisting of $4,950,404 in cash and 6,696,691 Mitula Group Limited shares at an implied issue price of $1.11 per share. All share-based consideration will be subject to voluntary escrow arrangements and, furthermore, 40 % of the share-based consideration provided to the sellers will be deferred and issued in 2 tranches over a 2-year period.
The assets and liabilities acquired are as follows:
For
per
sona
l use
onl
y
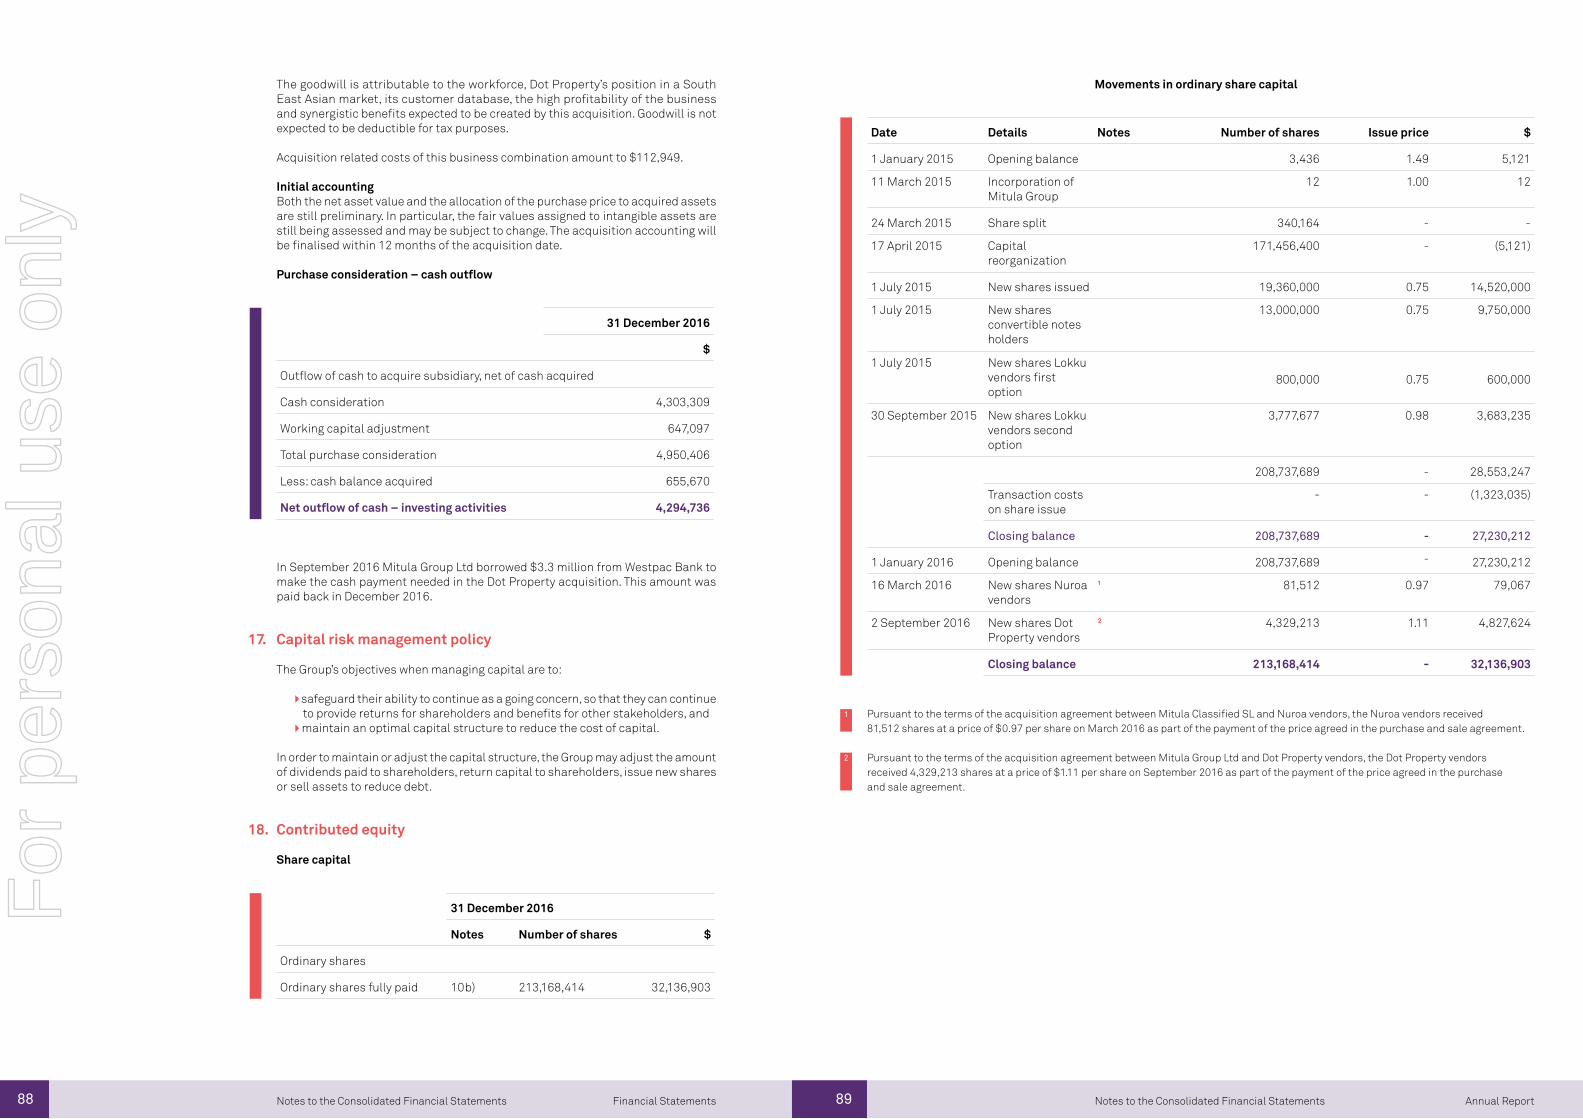
88 89 Annual ReportFinancial Statements Notes to the Consolidated Financial StatementsNotes to the Consolidated Financial Statements
The goodwill is attributable to the workforce, Dot Property’s position in a South East Asian market, its customer database, the high profitability of the business and synergistic benefits expected to be created by this acquisition. Goodwill is not expected to be deductible for tax purposes.
Acquisition related costs of this business combination amount to $112,949.
Initial accountingBoth the net asset value and the allocation of the purchase price to acquired assets are still preliminary. In particular, the fair values assigned to intangible assets are still being assessed and may be subject to change. The acquisition accounting will be finalised within 12 months of the acquisition date.
Purchase consideration – cash outflow
31 December 2016
$
Outflow of cash to acquire subsidiary, net of cash acquired
Cash consideration 4,303,309
Working capital adjustment 647,097
Total purchase consideration 4,950,406
Less: cash balance acquired 655,670
Net outflow of cash – investing activities 4,294,736
31 December 2016
Notes Number of shares $
Ordinary shares
Ordinary shares fully paid 10b) 213,168,414 32,136,903
In September 2016 Mitula Group Ltd borrowed $3.3 million from Westpac Bank to make the cash payment needed in the Dot Property acquisition. This amount was paid back in December 2016.
Capital risk management policy
The Group’s objectives when managing capital are to:
safeguard their ability to continue as a going concern, so that they can continue to provide returns for shareholders and benefits for other stakeholders, and
maintain an optimal capital structure to reduce the cost of capital.
In order to maintain or adjust the capital structure, the Group may adjust the amount of dividends paid to shareholders, return capital to shareholders, issue new shares or sell assets to reduce debt.
Contributed equity
Share capital
Movements in ordinary share capital
Date Details Notes Number of shares Issue price $
1 January 2015 Opening balance 3,436 1.49 5,121
11 March 2015 Incorporation of Mitula Group
12 1.00 12
24 March 2015 Share split 340,164 - -
17 April 2015 Capital reorganization
171,456,400 - (5,121)
1 July 2015 New shares issued 19,360,000 0.75 14,520,000
1 July 2015 New shares convertible notes holders
13,000,000 0.75 9,750,000
1 July 2015 New shares Lokku vendors first option
800,000 0.75 600,000
30 September 2015 New shares Lokku vendors second option
3,777,677 0.98 3,683,235
208,737,689 - 28,553,247
Transaction costs on share issue
- - (1,323,035)
Closing balance 208,737,689 - 27,230,212
1 January 2016 Opening balance 208,737,689 - 27,230,212
16 March 2016 New shares Nuroa vendors
¹ 81,512 0.97 79,067
2 September 2016 New shares Dot Property vendors
² 4,329,213 1.11 4,827,624
Closing balance 213,168,414 - 32,136,903
Pursuant to the terms of the acquisition agreement between Mitula Classified SL and Nuroa vendors, the Nuroa vendors received 81,512 shares at a price of $0.97 per share on March 2016 as part of the payment of the price agreed in the purchase and sale agreement.
Pursuant to the terms of the acquisition agreement between Mitula Group Ltd and Dot Property vendors, the Dot Property vendors received 4,329,213 shares at a price of $1.11 per share on September 2016 as part of the payment of the price agreed in the purchase and sale agreement.
1
2
17.
18.
For
per
sona
l use
onl
y
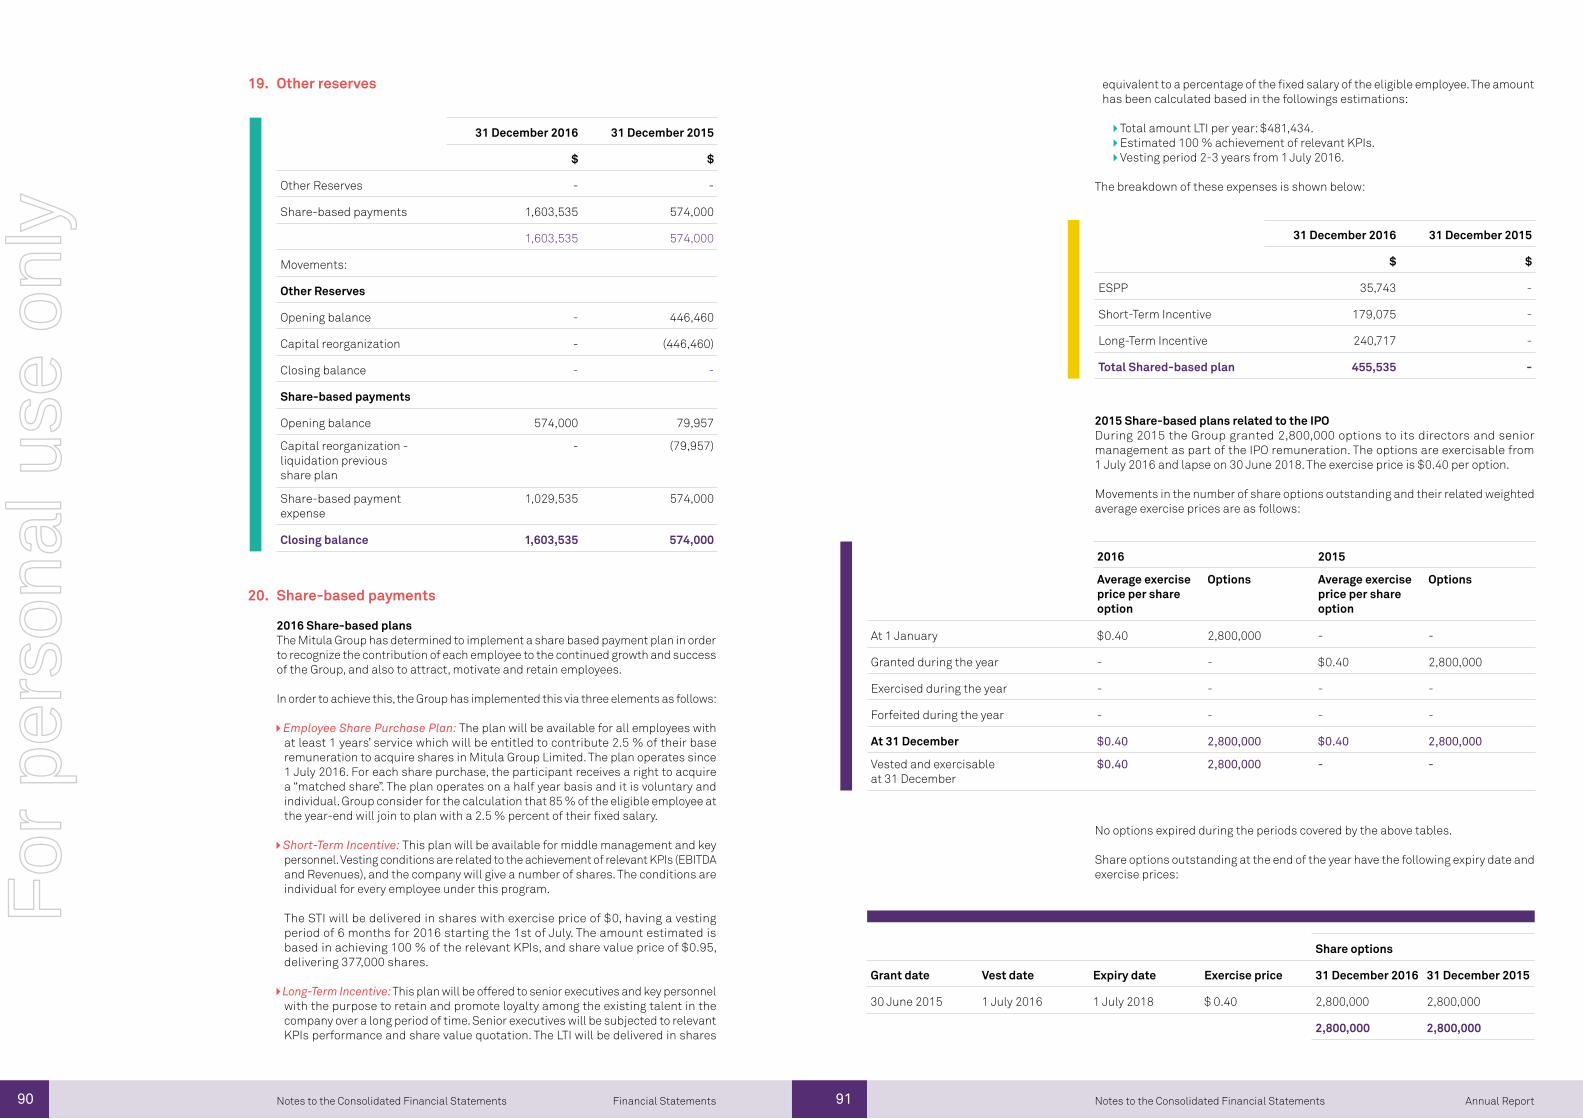
90 91 Annual ReportFinancial Statements Notes to the Consolidated Financial StatementsNotes to the Consolidated Financial Statements
Other reserves
31 December 2016 31 December 2015
$ $
Other Reserves - -
Share-based payments 1,603,535 574,000
1,603,535 574,000
Movements:
Other Reserves
Opening balance - 446,460
Capital reorganization - (446,460)
Closing balance - -
Share-based payments
Opening balance 574,000 79,957
Capital reorganization - liquidation previous share plan
- (79,957)
Share-based payment expense
1,029,535 574,000
Closing balance 1,603,535 574,000
Share-based payments
2016 Share-based plansThe Mitula Group has determined to implement a share based payment plan in order to recognize the contribution of each employee to the continued growth and success of the Group, and also to attract, motivate and retain employees.
In order to achieve this, the Group has implemented this via three elements as follows: Employee Share Purchase Plan: The plan will be available for all employees with at least 1 years’ service which will be entitled to contribute 2.5 % of their base remuneration to acquire shares in Mitula Group Limited. The plan operates since 1 July 2016. For each share purchase, the participant receives a right to acquire a “matched share”. The plan operates on a half year basis and it is voluntary and individual. Group consider for the calculation that 85 % of the eligible employee at the year-end will join to plan with a 2.5 % percent of their fixed salary.
Short-Term Incentive: This plan will be available for middle management and key personnel. Vesting conditions are related to the achievement of relevant KPIs (EBITDA and Revenues), and the company will give a number of shares. The conditions are individual for every employee under this program.
The STI will be delivered in shares with exercise price of $0, having a vesting period of 6 months for 2016 starting the 1st of July. The amount estimated is based in achieving 100 % of the relevant KPIs, and share value price of $0.95, delivering 377,000 shares.
Long-Term Incentive: This plan will be offered to senior executives and key personnel with the purpose to retain and promote loyalty among the existing talent in the company over a long period of time. Senior executives will be subjected to relevant KPIs performance and share value quotation. The LTI will be delivered in shares
equivalent to a percentage of the fixed salary of the eligible employee. The amount has been calculated based in the followings estimations:
Total amount LTI per year: $481,434. Estimated 100 % achievement of relevant KPIs. Vesting period 2-3 years from 1 July 2016.
The breakdown of these expenses is shown below:
2016 2015
Average exercise price per share option
Options Average exercise price per share option
Options
At 1 January $0.40 2,800,000 - -
Granted during the year - - $0.40 2,800,000
Exercised during the year - - - -
Forfeited during the year - - - -
At 31 December $0.40 2,800,000 $0.40 2,800,000
Vested and exercisable at 31 December
$0.40 2,800,000 - -
31 December 2016 31 December 2015
$ $
ESPP 35,743 -
Short-Term Incentive 179,075 -
Long-Term Incentive 240,717 -
Total Shared-based plan 455,535 -
2015 Share-based plans related to the IPODuring 2015 the Group granted 2,800,000 options to its directors and senior management as part of the IPO remuneration. The options are exercisable from 1 July 2016 and lapse on 30 June 2018. The exercise price is $0.40 per option.
Movements in the number of share options outstanding and their related weighted average exercise prices are as follows:
No options expired during the periods covered by the above tables.
Share options outstanding at the end of the year have the following expiry date and exercise prices:
Share options
Grant date Vest date Expiry date Exercise price 31 December 2016 31 December 2015
30 June 2015 1 July 2016 1 July 2018 $ 0.40 2,800,000 2,800,000
2,800,000 2,800,000
19.
20.
For
per
sona
l use
onl
y
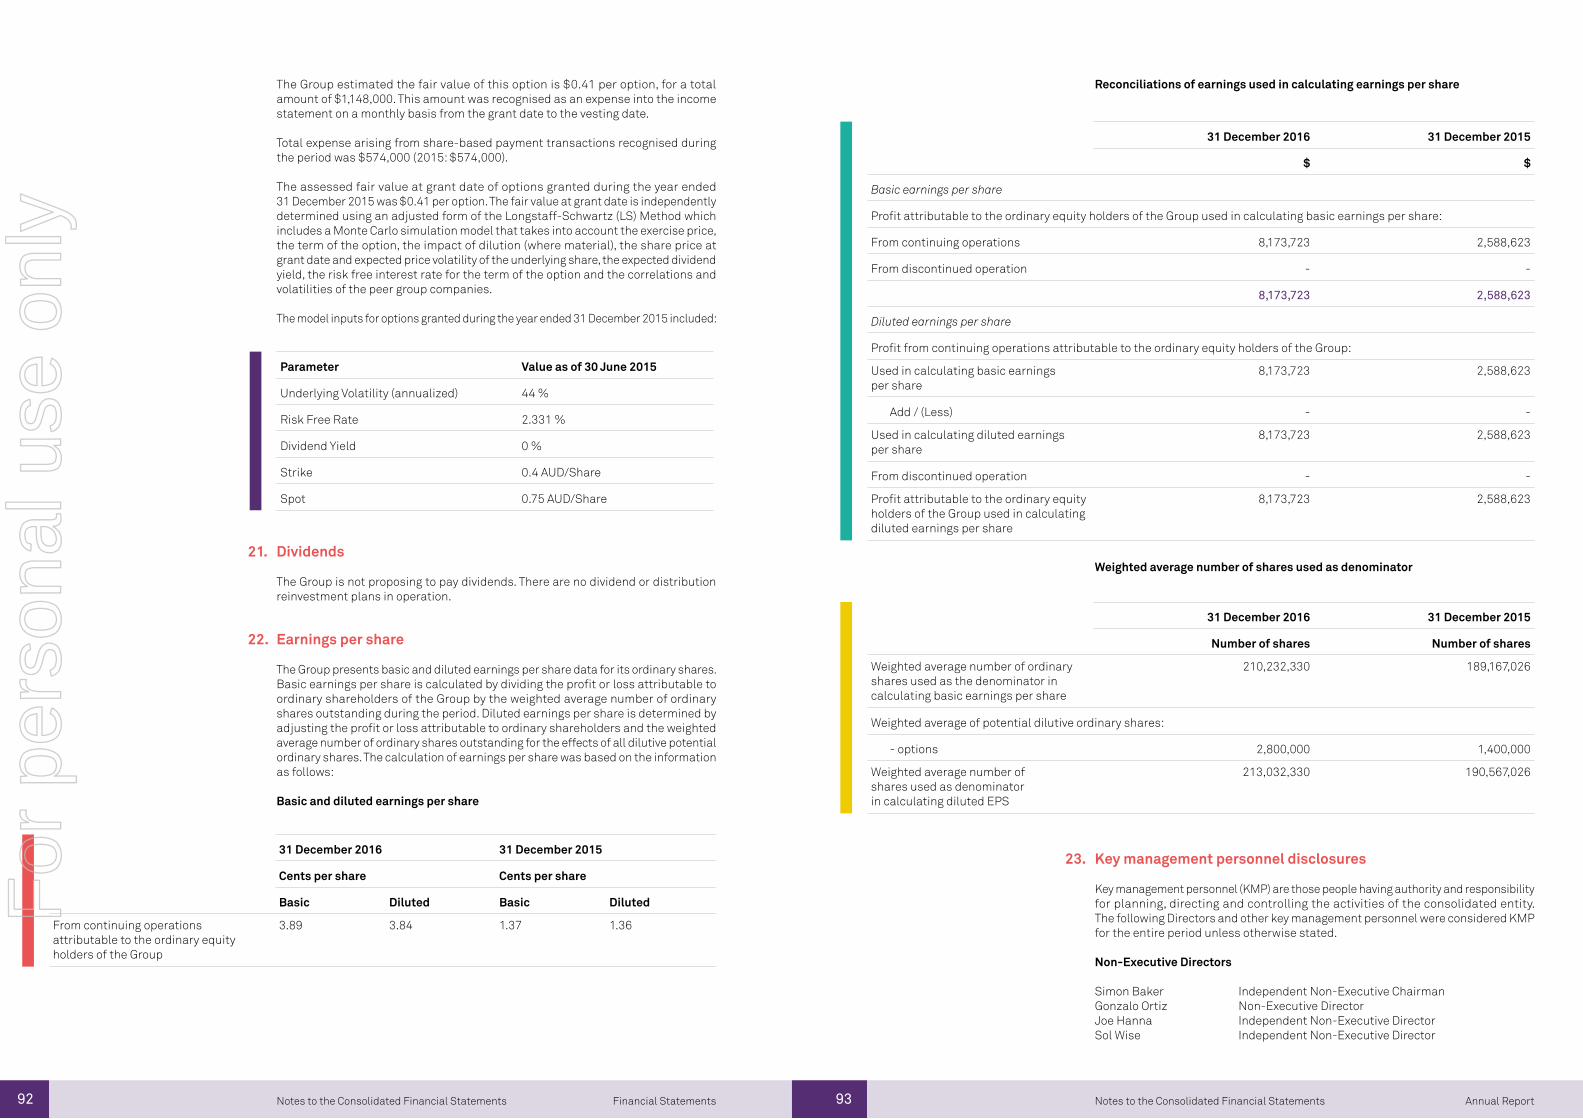
92 93 Annual ReportFinancial Statements Notes to the Consolidated Financial StatementsNotes to the Consolidated Financial Statements
Parameter Value as of 30 June 2015
Underlying Volatility (annualized) 44 %
Risk Free Rate 2.331 %
Dividend Yield 0 %
Strike 0.4 AUD/Share
Spot 0.75 AUD/Share
The Group estimated the fair value of this option is $0.41 per option, for a total amount of $1,148,000. This amount was recognised as an expense into the income statement on a monthly basis from the grant date to the vesting date.
Total expense arising from share-based payment transactions recognised during the period was $574,000 (2015: $574,000).
The assessed fair value at grant date of options granted during the year ended 31 December 2015 was $0.41 per option. The fair value at grant date is independently determined using an adjusted form of the Longstaff-Schwartz (LS) Method which includes a Monte Carlo simulation model that takes into account the exercise price, the term of the option, the impact of dilution (where material), the share price at grant date and expected price volatility of the underlying share, the expected dividend yield, the risk free interest rate for the term of the option and the correlations and volatilities of the peer group companies.
The model inputs for options granted during the year ended 31 December 2015 included:
Dividends
The Group is not proposing to pay dividends. There are no dividend or distribution reinvestment plans in operation.
Earnings per share
The Group presents basic and diluted earnings per share data for its ordinary shares. Basic earnings per share is calculated by dividing the profit or loss attributable to ordinary shareholders of the Group by the weighted average number of ordinary shares outstanding during the period. Diluted earnings per share is determined by adjusting the profit or loss attributable to ordinary shareholders and the weighted average number of ordinary shares outstanding for the effects of all dilutive potential ordinary shares. The calculation of earnings per share was based on the information as follows:
Basic and diluted earnings per share
31 December 2016 31 December 2015
$ $
Basic earnings per share
Profit attributable to the ordinary equity holders of the Group used in calculating basic earnings per share:
From continuing operations 8,173,723 2,588,623
From discontinued operation - -
8,173,723 2,588,623
Diluted earnings per share
Profit from continuing operations attributable to the ordinary equity holders of the Group:
Used in calculating basic earnings per share
8,173,723 2,588,623
Add / (Less) - -
Used in calculating diluted earnings per share
8,173,723 2,588,623
From discontinued operation - -
Profit attributable to the ordinary equity holders of the Group used in calculating diluted earnings per share
8,173,723 2,588,623
31 December 2016 31 December 2015
Cents per share Cents per share
Basic Diluted Basic Diluted
From continuing operations attributable to the ordinary equity holders of the Group
3.89 3.84 1.37 1.36
31 December 2016 31 December 2015
Number of shares Number of shares
Weighted average number of ordinary shares used as the denominator in calculating basic earnings per share
210,232,330 189,167,026
Weighted average of potential dilutive ordinary shares:
- options 2,800,000 1,400,000
Weighted average number of shares used as denominator in calculating diluted EPS
213,032,330 190,567,026
Reconciliations of earnings used in calculating earnings per share
Weighted average number of shares used as denominator
Key management personnel disclosures
Key management personnel (KMP) are those people having authority and responsibility for planning, directing and controlling the activities of the consolidated entity. The following Directors and other key management personnel were considered KMP for the entire period unless otherwise stated.
Non-Executive Directors
Simon Baker Independent Non-Executive ChairmanGonzalo Ortiz Non-Executive DirectorJoe Hanna Independent Non-Executive DirectorSol Wise Independent Non-Executive Director
21.
22.
23.
For
per
sona
l use
onl
y
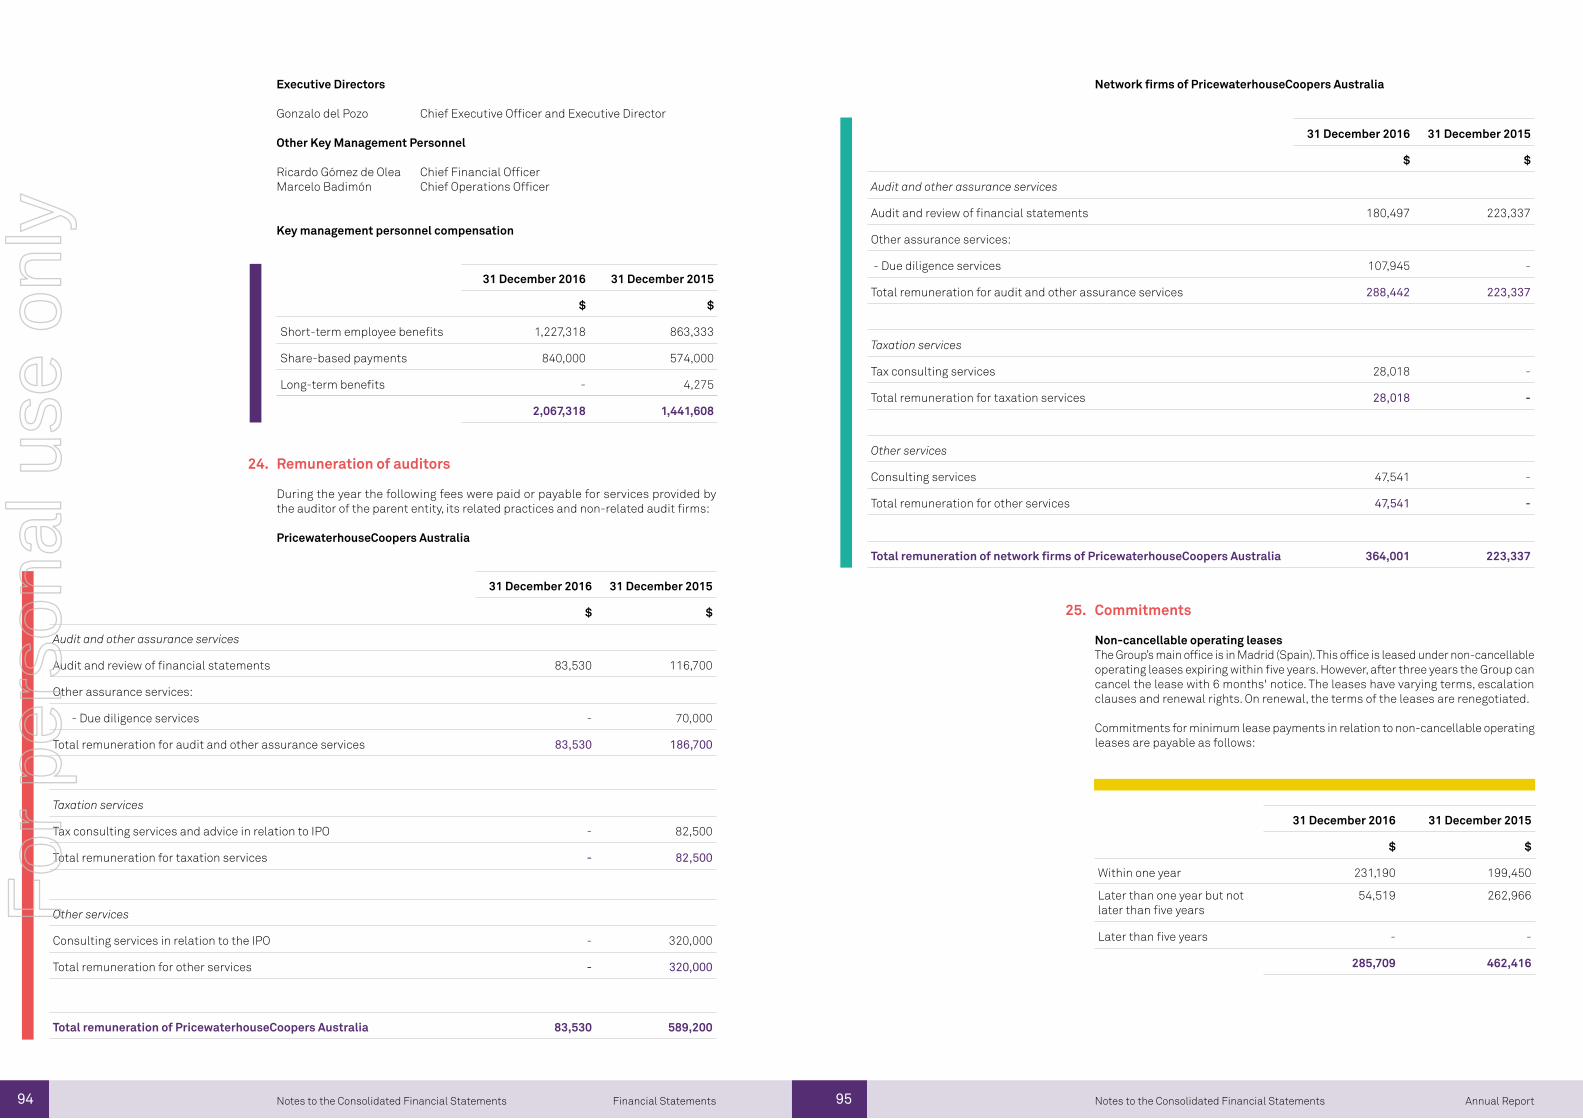
94 95 Annual ReportFinancial Statements Notes to the Consolidated Financial StatementsNotes to the Consolidated Financial Statements
31 December 2016 31 December 2015
$ $
Short-term employee benefits 1,227,318 863,333
Share-based payments 840,000 574,000
Long-term benefits - 4,275
2,067,318 1,441,608
Executive Directors
Gonzalo del Pozo Chief Executive Officer and Executive Director
Other Key Management Personnel
Ricardo Gómez de Olea Chief Financial OfficerMarcelo Badimón Chief Operations Officer
Key management personnel compensation
Remuneration of auditors
During the year the following fees were paid or payable for services provided by the auditor of the parent entity, its related practices and non-related audit firms:
PricewaterhouseCoopers Australia
31 December 2016 31 December 2015
$ $
Audit and other assurance services
Audit and review of financial statements 83,530 116,700
Other assurance services:
- Due diligence services - 70,000
Total remuneration for audit and other assurance services 83,530 186,700
Taxation services
Tax consulting services and advice in relation to IPO - 82,500
Total remuneration for taxation services - 82,500
Other services
Consulting services in relation to the IPO - 320,000
Total remuneration for other services - 320,000
Total remuneration of PricewaterhouseCoopers Australia 83,530 589,200
31 December 2016 31 December 2015
$ $
Audit and other assurance services
Audit and review of financial statements 180,497 223,337
Other assurance services:
- Due diligence services 107,945 -
Total remuneration for audit and other assurance services 288,442 223,337
Taxation services
Tax consulting services 28,018 -
Total remuneration for taxation services 28,018 -
Other services
Consulting services 47,541 -
Total remuneration for other services 47,541 -
Total remuneration of network firms of PricewaterhouseCoopers Australia 364,001 223,337
Network firms of PricewaterhouseCoopers Australia
Commitments
Non-cancellable operating leasesThe Group’s main office is in Madrid (Spain). This office is leased under non-cancellable operating leases expiring within five years. However, after three years the Group can cancel the lease with 6 months' notice. The leases have varying terms, escalation clauses and renewal rights. On renewal, the terms of the leases are renegotiated.
Commitments for minimum lease payments in relation to non-cancellable operating leases are payable as follows:
31 December 2016 31 December 2015
$ $
Within one year 231,190 199,450
Later than one year but not later than five years
54,519 262,966
Later than five years - -
285,709 462,416
24.
25.
For
per
sona
l use
onl
y
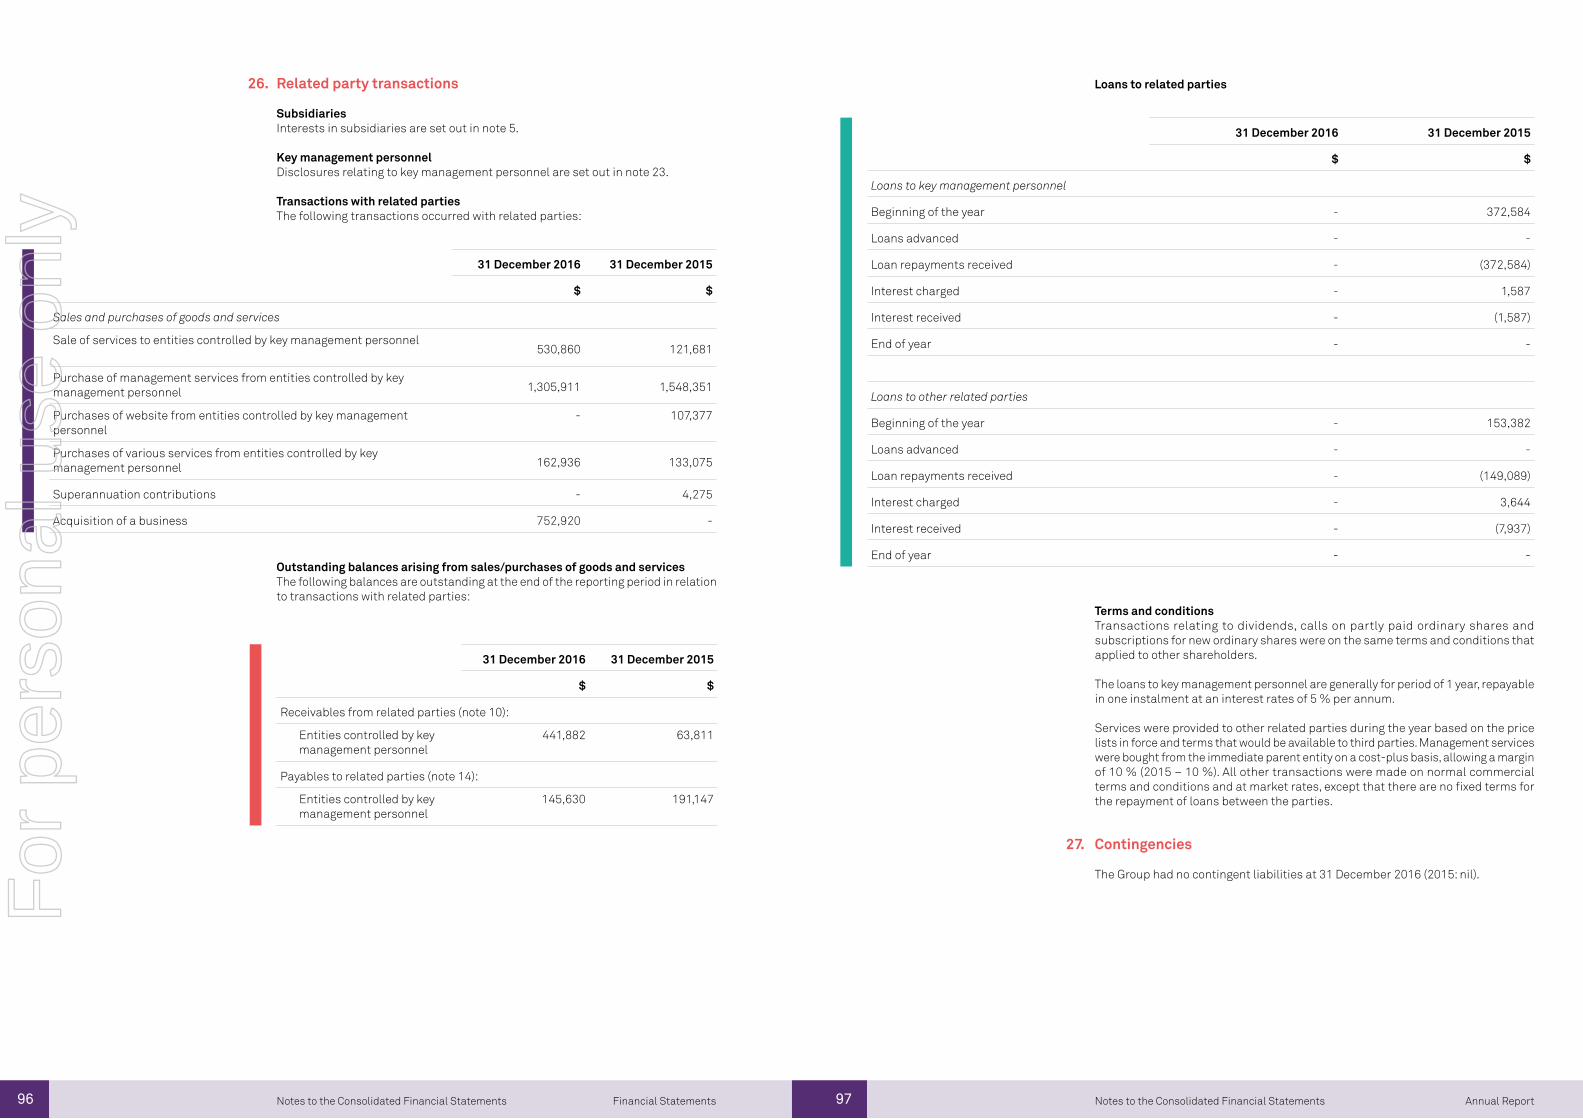
96 97 Annual ReportFinancial Statements Notes to the Consolidated Financial StatementsNotes to the Consolidated Financial Statements
31 December 2016 31 December 2015
$ $
Receivables from related parties (note 10):
Entities controlled by key management personnel
441,882 63,811
Payables to related parties (note 14):
Entities controlled by key management personnel
145,630 191,147
31 December 2016 31 December 2015
$ $
Sales and purchases of goods and services
Sale of services to entities controlled by key management personnel530,860 121,681
Purchase of management services from entities controlled by key management personnel 1,305,911 1,548,351
Purchases of website from entities controlled by key management personnel
- 107,377
Purchases of various services from entities controlled by key management personnel 162,936 133,075
Superannuation contributions - 4,275
Acquisition of a business 752,920 -
Related party transactions
SubsidiariesInterests in subsidiaries are set out in note 5. Key management personnelDisclosures relating to key management personnel are set out in note 23.
Transactions with related partiesThe following transactions occurred with related parties:
Outstanding balances arising from sales/purchases of goods and servicesThe following balances are outstanding at the end of the reporting period in relation to transactions with related parties:
31 December 2016 31 December 2015
$ $
Loans to key management personnel
Beginning of the year - 372,584
Loans advanced - -
Loan repayments received - (372,584)
Interest charged - 1,587
Interest received - (1,587)
End of year - -
Loans to other related parties
Beginning of the year - 153,382
Loans advanced - -
Loan repayments received - (149,089)
Interest charged - 3,644
Interest received - (7,937)
End of year - -
Loans to related parties
Terms and conditionsTransactions relating to dividends, calls on partly paid ordinary shares and subscriptions for new ordinary shares were on the same terms and conditions that applied to other shareholders.
The loans to key management personnel are generally for period of 1 year, repayable in one instalment at an interest rates of 5 % per annum.
Services were provided to other related parties during the year based on the price lists in force and terms that would be available to third parties. Management services were bought from the immediate parent entity on a cost-plus basis, allowing a margin of 10 % (2015 – 10 %). All other transactions were made on normal commercial terms and conditions and at market rates, except that there are no fixed terms for the repayment of loans between the parties.
Contingencies
The Group had no contingent liabilities at 31 December 2016 (2015: nil).
26.
27.
For
per
sona
l use
onl
y
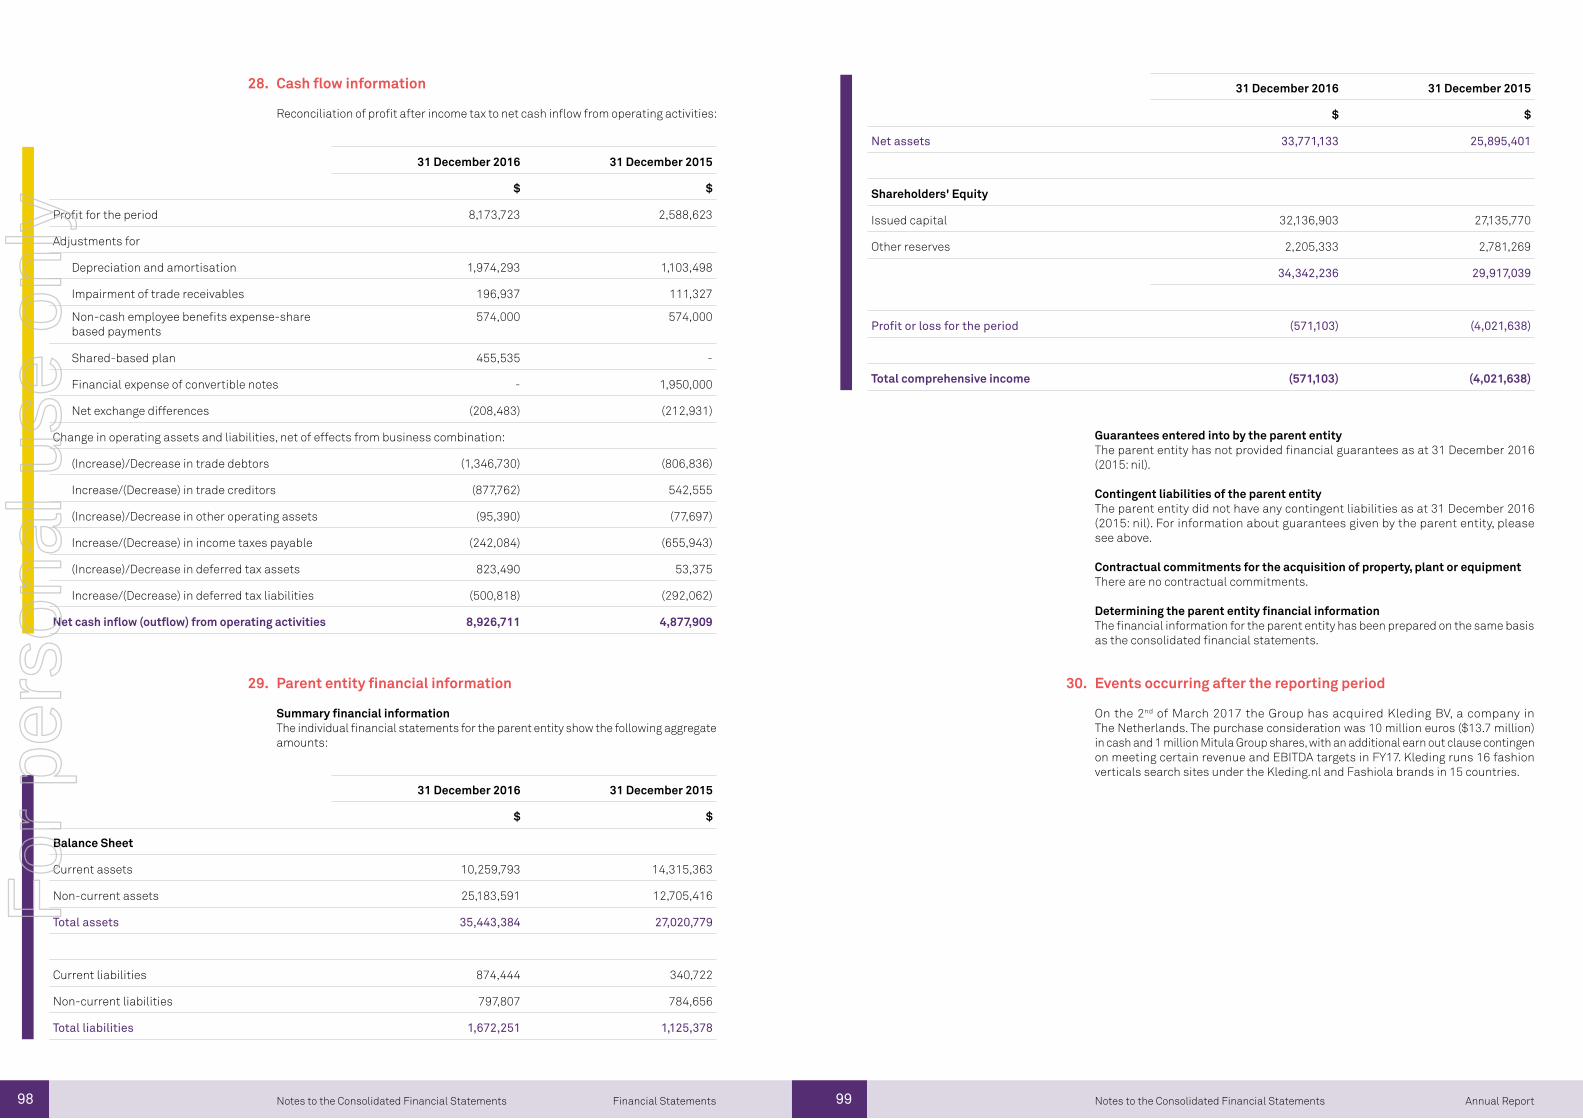
98 99 Annual ReportFinancial Statements Notes to the Consolidated Financial StatementsNotes to the Consolidated Financial Statements
31 December 2016 31 December 2015
$ $
Balance Sheet
Current assets 10,259,793 14,315,363
Non-current assets 25,183,591 12,705,416
Total assets 35,443,384 27,020,779
Current liabilities 874,444 340,722
Non-current liabilities 797,807 784,656
Total liabilities 1,672,251 1,125,378
31 December 2016 31 December 2015
$ $
Net assets 33,771,133 25,895,401
Shareholders' Equity
Issued capital 32,136,903 27,135,770
Other reserves 2,205,333 2,781,269
34,342,236 29,917,039
Profit or loss for the period (571,103) (4,021,638)
Total comprehensive income (571,103) (4,021,638)
31 December 2016 31 December 2015
$ $
Profit for the period 8,173,723 2,588,623
Adjustments for
Depreciation and amortisation 1,974,293 1,103,498
Impairment of trade receivables 196,937 111,327
Non-cash employee benefits expense-share based payments
574,000 574,000
Shared-based plan 455,535 -
Financial expense of convertible notes - 1,950,000
Net exchange differences (208,483) (212,931)
Change in operating assets and liabilities, net of effects from business combination:
(Increase)/Decrease in trade debtors (1,346,730) (806,836)
Increase/(Decrease) in trade creditors (877,762) 542,555
(Increase)/Decrease in other operating assets (95,390) (77,697)
Increase/(Decrease) in income taxes payable (242,084) (655,943)
(Increase)/Decrease in deferred tax assets 823,490 53,375
Increase/(Decrease) in deferred tax liabilities (500,818) (292,062)
Net cash inflow (outflow) from operating activities 8,926,711 4,877,909
Cash flow information
Reconciliation of profit after income tax to net cash inflow from operating activities:
Parent entity financial information
Summary financial informationThe individual financial statements for the parent entity show the following aggregate amounts:
Guarantees entered into by the parent entity The parent entity has not provided financial guarantees as at 31 December 2016 (2015: nil).
Contingent liabilities of the parent entity The parent entity did not have any contingent liabilities as at 31 December 2016 (2015: nil). For information about guarantees given by the parent entity, please see above.
Contractual commitments for the acquisition of property, plant or equipment There are no contractual commitments.
Determining the parent entity financial informationThe financial information for the parent entity has been prepared on the same basis as the consolidated financial statements.
Events occurring after the reporting period
On the 2nd of March 2017 the Group has acquired Kleding BV, a company in The Netherlands. The purchase consideration was 10 million euros ($13.7 million) in cash and 1 million Mitula Group shares, with an additional earn out clause contingen on meeting certain revenue and EBITDA targets in FY17. Kleding runs 16 fashion verticals search sites under the Kleding.nl and Fashiola brands in 15 countries.
28.
29. 30.
For
per
sona
l use
onl
y
100
Directors’ Declaration
2.6
Annual ReportDirectors’ Declaration 101 Annual ReportDirectors’ Declaration
In the Directors’ opinion:
the financial statements and notes set out on pages 46 to 99 are in accordance with the Corporations Act 2001, including:
complying with Australian Accounting Standards, the Corporations Regulations 2001 and other mandatory professional reporting requirements, and
giving a true and fair view of the consolidated entity’s financial position as at 31 December 2016 and of its performance for the year ended on that date, and
there are reasonable grounds to believe that the group will be able to pay its debts as and when they become due and payable.
Note 1 confirms that the financial statements also comply with International Financial Reporting Standards as issued by the International Accounting Standards Board.
The Directors have been given the declarations by the Chief Executive Officer and Chief Financial Officer required by section 295A of the Corporations Act 2001.
This declaration is made in accordance with a resolution of the Directors.
Simon BakerChairman
Dated this 8 March 2017
For
per
sona
l use
onl
y
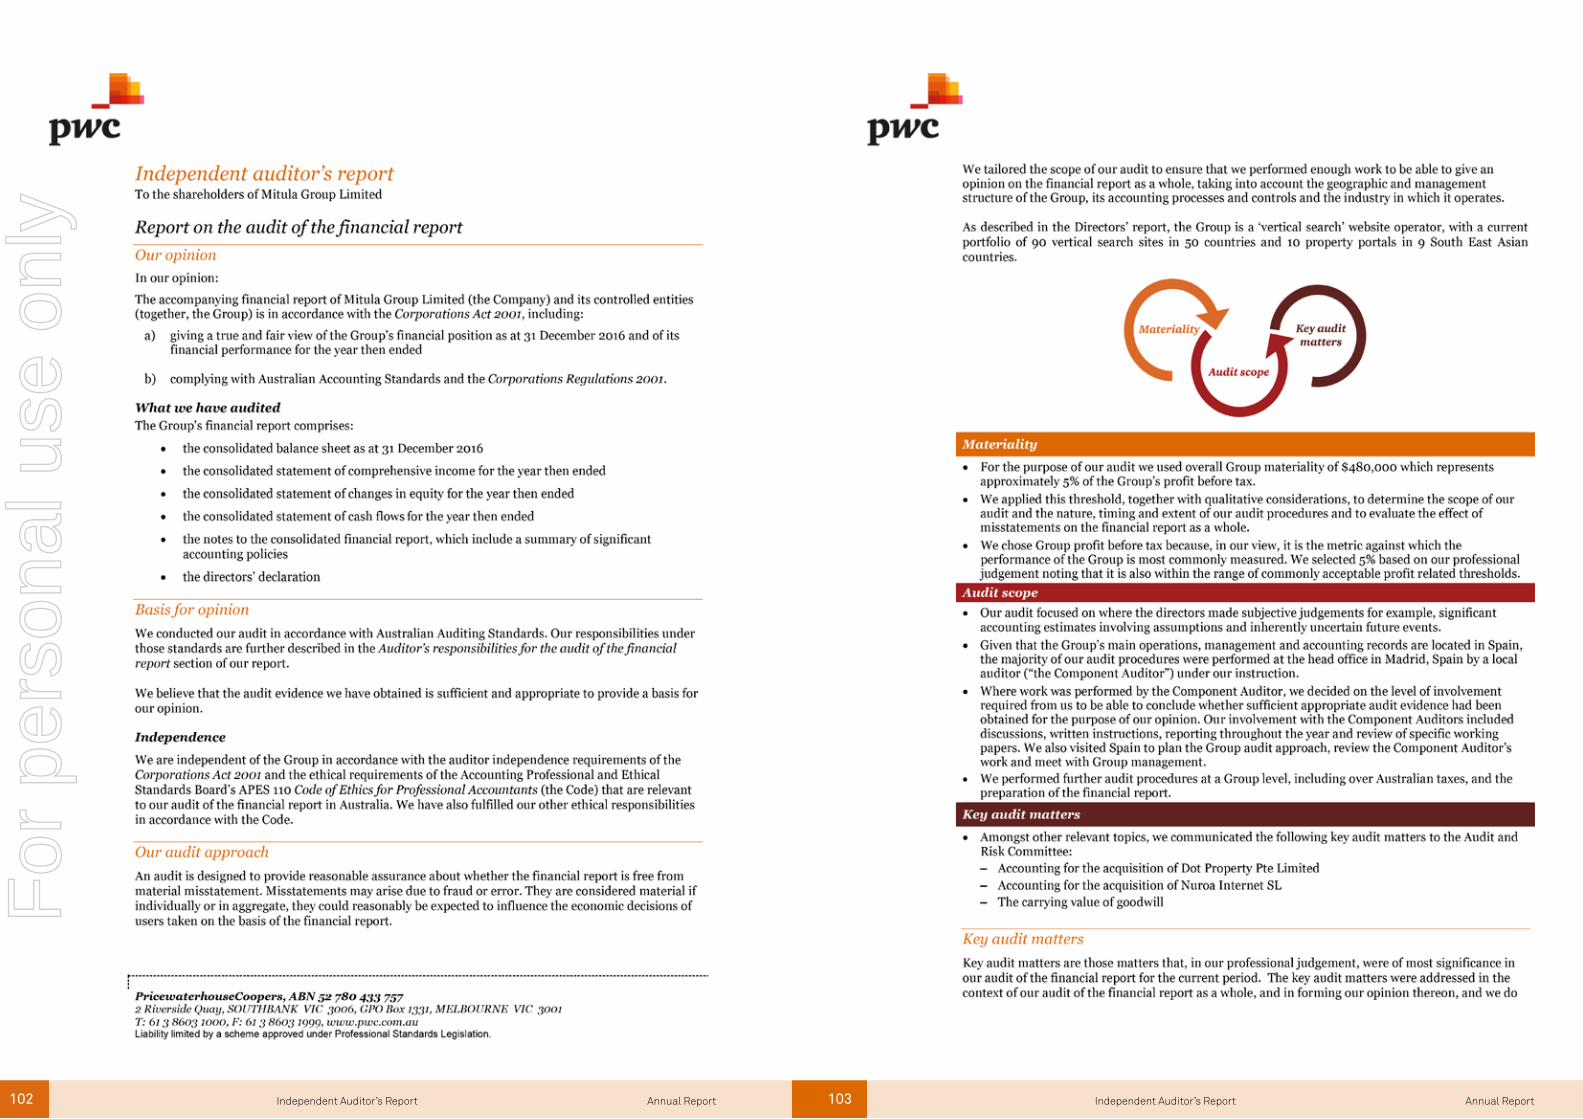
102 103 Annual ReportAnnual Report Independent Auditor’s ReportIndependent Auditor’s Report
For
per
sona
l use
onl
y
104 105 Annual ReportAnnual Report Independent Auditor’s ReportIndependent Auditor’s Report
For
per
sona
l use
onl
y
106 107 Annual ReportAnnual Report Independent Auditor’s ReportIndependent Auditor’s Report
For
per
sona
l use
onl
y
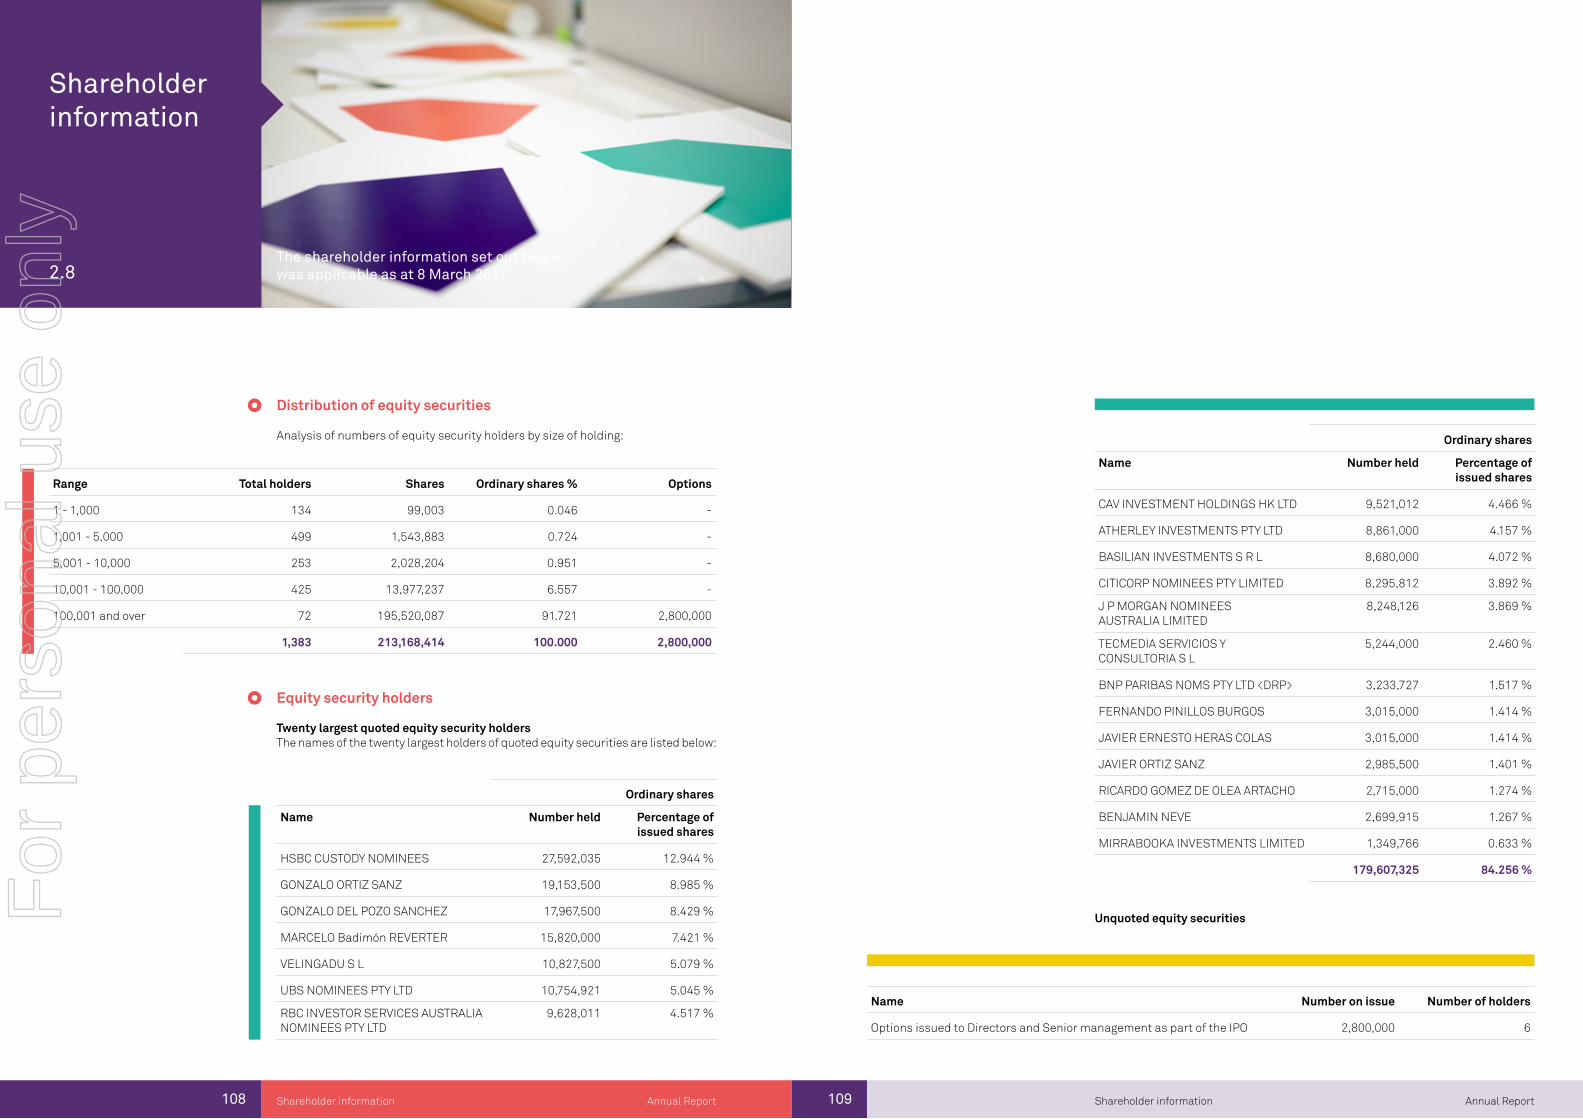
108
Shareholder information
2.8
Annual ReportShareholder information
Distribution of equity securities
Analysis of numbers of equity security holders by size of holding:
Equity security holders
Twenty largest quoted equity security holders The names of the twenty largest holders of quoted equity securities are listed below:
The shareholder information set out below was applicable as at 8 March 2017
109 Annual ReportShareholder information
Range Total holders Shares Ordinary shares % Options
1 - 1,000 134 99,003 0.046 -
1,001 - 5,000 499 1,543,883 0.724 -
5,001 - 10,000 253 2,028,204 0.951 -
10,001 - 100,000 425 13,977,237 6.557 -
100,001 and over 72 195,520,087 91.721 2,800,000
1,383 213,168,414 100.000 2,800,000
Ordinary shares
Name Number held Percentage of issued shares
HSBC CUSTODY NOMINEES 27,592,035 12.944 %
GONZALO ORTIZ SANZ 19,153,500 8.985 %
GONZALO DEL POZO SANCHEZ 17,967,500 8.429 %
MARCELO Badimón REVERTER 15,820,000 7.421 %
VELINGADU S L 10,827,500 5.079 %
UBS NOMINEES PTY LTD 10,754,921 5.045 %
RBC INVESTOR SERVICES AUSTRALIA NOMINEES PTY LTD
9,628,011 4.517 %
Ordinary shares
Name Number held Percentage of issued shares
CAV INVESTMENT HOLDINGS HK LTD 9,521,012 4.466 %
ATHERLEY INVESTMENTS PTY LTD 8,861,000 4.157 %
BASILIAN INVESTMENTS S R L 8,680,000 4.072 %
CITICORP NOMINEES PTY LIMITED 8,295,812 3.892 %
J P MORGAN NOMINEES AUSTRALIA LIMITED
8,248,126 3.869 %
TECMEDIA SERVICIOS Y CONSULTORIA S L
5,244,000 2.460 %
BNP PARIBAS NOMS PTY LTD <DRP> 3,233,727 1.517 %
FERNANDO PINILLOS BURGOS 3,015,000 1.414 %
JAVIER ERNESTO HERAS COLAS 3,015,000 1.414 %
JAVIER ORTIZ SANZ 2,985,500 1.401 %
RICARDO GOMEZ DE OLEA ARTACHO 2,715,000 1.274 %
BENJAMIN NEVE 2,699,915 1.267 %
MIRRABOOKA INVESTMENTS LIMITED 1,349,766 0.633 %
179,607,325 84.256 %
Name Number on issue Number of holders
Options issued to Directors and Senior management as part of the IPO 2,800,000 6
Unquoted equity securitiesFor
per
sona
l use
onl
y
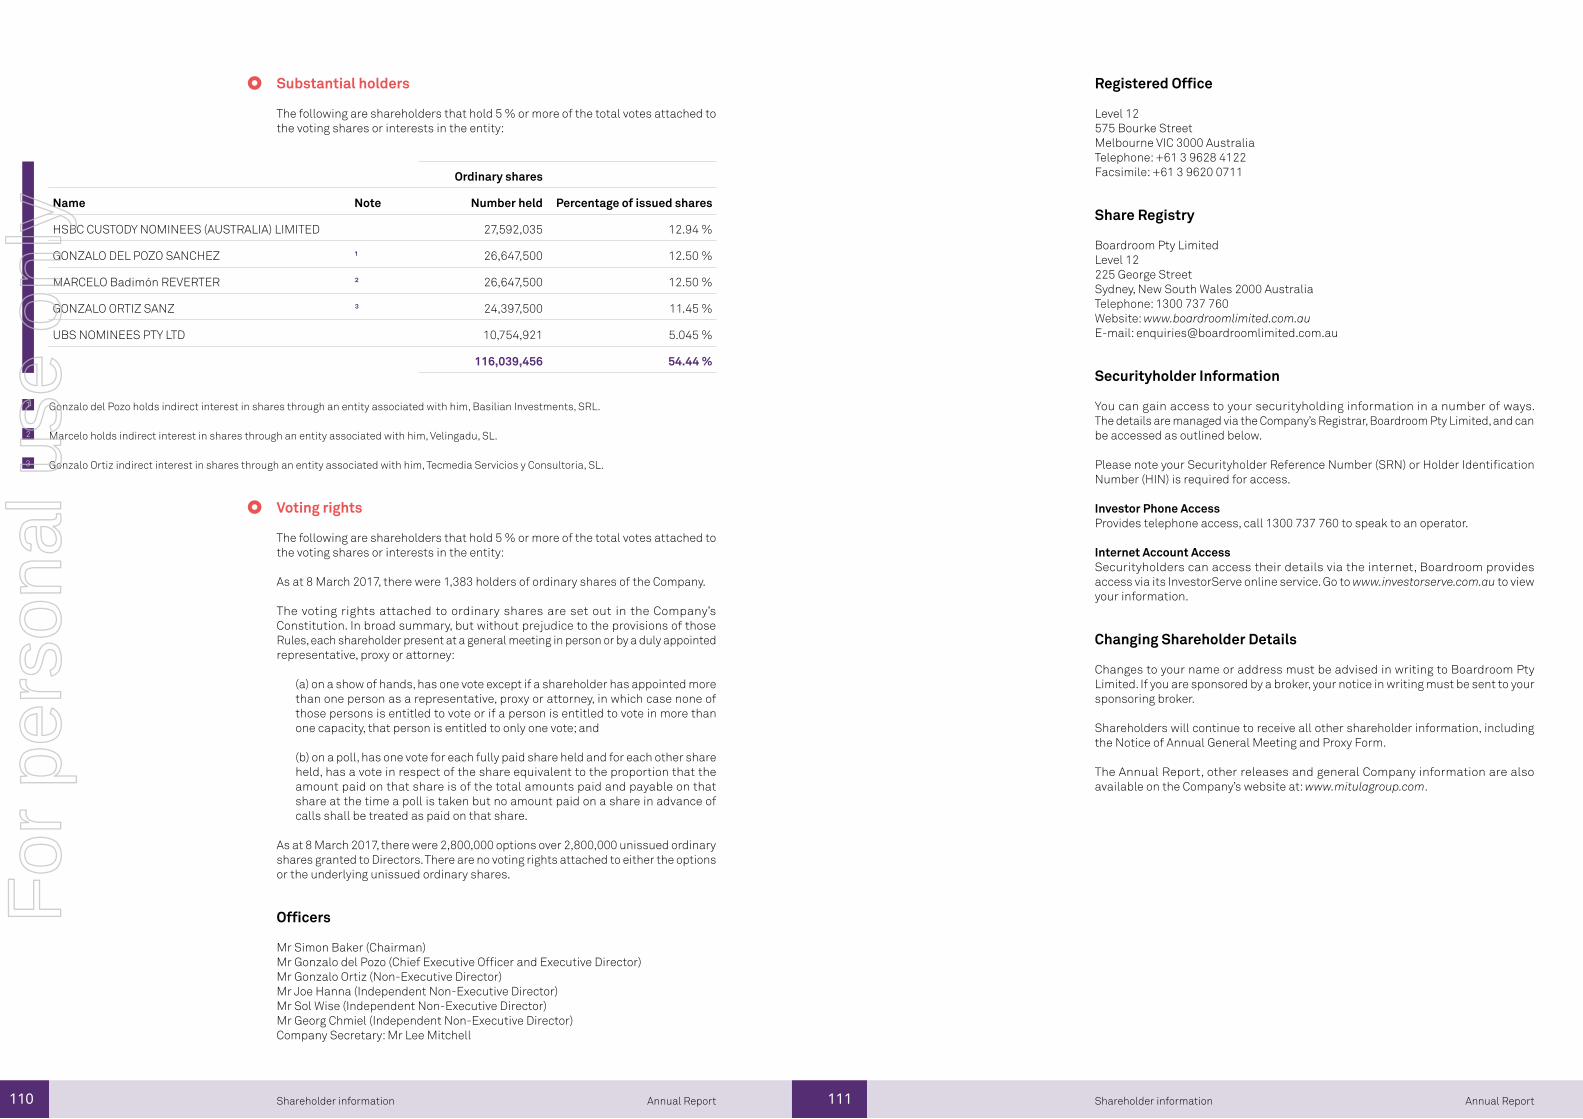
110 111 Annual ReportAnnual Report Shareholder informationShareholder information
Substantial holders
The following are shareholders that hold 5 % or more of the total votes attached to the voting shares or interests in the entity:
Voting rights
The following are shareholders that hold 5 % or more of the total votes attached to the voting shares or interests in the entity:
As at 8 March 2017, there were 1,383 holders of ordinary shares of the Company.
The voting rights attached to ordinary shares are set out in the Company’s Constitution. In broad summary, but without prejudice to the provisions of those Rules, each shareholder present at a general meeting in person or by a duly appointed representative, proxy or attorney:
(a) on a show of hands, has one vote except if a shareholder has appointed more than one person as a representative, proxy or attorney, in which case none of those persons is entitled to vote or if a person is entitled to vote in more than one capacity, that person is entitled to only one vote; and
(b) on a poll, has one vote for each fully paid share held and for each other share held, has a vote in respect of the share equivalent to the proportion that the amount paid on that share is of the total amounts paid and payable on that share at the time a poll is taken but no amount paid on a share in advance of calls shall be treated as paid on that share.
As at 8 March 2017, there were 2,800,000 options over 2,800,000 unissued ordinary shares granted to Directors. There are no voting rights attached to either the options or the underlying unissued ordinary shares.
Officers
Mr Simon Baker (Chairman)Mr Gonzalo del Pozo (Chief Executive Officer and Executive Director)Mr Gonzalo Ortiz (Non-Executive Director)Mr Joe Hanna (Independent Non-Executive Director)Mr Sol Wise (Independent Non-Executive Director)Mr Georg Chmiel (Independent Non-Executive Director)Company Secretary: Mr Lee Mitchell
Ordinary shares
Name Note Number held Percentage of issued shares
HSBC CUSTODY NOMINEES (AUSTRALIA) LIMITED 27,592,035 12.94 %
GONZALO DEL POZO SANCHEZ ¹ 26,647,500 12.50 %
MARCELO Badimón REVERTER ² 26,647,500 12.50 %
GONZALO ORTIZ SANZ ³ 24,397,500 11.45 %
UBS NOMINEES PTY LTD 10,754,921 5.045 %
116,039,456 54.44 %
Gonzalo del Pozo holds indirect interest in shares through an entity associated with him, Basilian Investments, SRL.
Marcelo holds indirect interest in shares through an entity associated with him, Velingadu, SL.
Gonzalo Ortiz indirect interest in shares through an entity associated with him, Tecmedia Servicios y Consultoria, SL.
1
2
3
Registered Office
Level 12575 Bourke StreetMelbourne VIC 3000 AustraliaTelephone: +61 3 9628 4122Facsimile: +61 3 9620 0711
Share Registry
Boardroom Pty LimitedLevel 12225 George StreetSydney, New South Wales 2000 AustraliaTelephone: 1300 737 760Website: www.boardroomlimited.com.auE-mail: [email protected]
Securityholder Information
You can gain access to your securityholding information in a number of ways. The details are managed via the Company’s Registrar, Boardroom Pty Limited, and can be accessed as outlined below.
Please note your Securityholder Reference Number (SRN) or Holder Identification Number (HIN) is required for access.
Investor Phone AccessProvides telephone access, call 1300 737 760 to speak to an operator.
Internet Account AccessSecurityholders can access their details via the internet, Boardroom provides access via its InvestorServe online service. Go to www.investorserve.com.au to view your information.
Changing Shareholder Details
Changes to your name or address must be advised in writing to Boardroom Pty Limited. If you are sponsored by a broker, your notice in writing must be sent to your sponsoring broker.
Shareholders will continue to receive all other shareholder information, including the Notice of Annual General Meeting and Proxy Form.
The Annual Report, other releases and general Company information are also available on the Company’s website at: www.mitulagroup.com.
For
per
sona
l use
onl
y

For
per
sona
l use
onl
y

For
per
sona
l use
onl
y