Embed Size (px)
Citation preview

© 2017 Sektion NIS of the German Trauma Society (DGU) / AUC - Akademie der Unfallchirurgie GmbH
German Trauma Society (DGU)
Committee on Emergency Medicine, Intensive Care and Trauma Management (Sektion NIS)
and AUC - Academy for Trauma Surgery
TraumaRegister DGU®
Annual Report 2017
with patients admitted until end of 2016
TR-DGU
TraumaRegister DGU®
All Hospitals
This report does not contain individual hospital results (where
indicated as ‘Your hospital‘) but provides summary data from the
whole registry, or artificial values, in order to generate an impression
of how an individual hospital report looks like
TraumaRegister DGU® TR-DGU gesamt Preface
© 2017 Sektion NIS der DGU / AUC
Preface
Dear participant of TraumaRegister DGU®,
we are happy to present the Annual Report 2017 of the TraumaRegister DGU® for your hospital. This report contains all trauma patients admitted until end of 2016, and documented completely until end of March 2017.
The number of documented patients has stabilized on a high level. Last year, more than 40,000 trauma patients have been documented in the registry. However, not all documented cases were severely injured. Like in the previous years, we used a ‘basic patient group’ for this report. Pa-tients with minor injuries only (e.g., a brain concussion) were excluded. Nearly all results were lim-ited to this patient group in order to increase the comparability of the findings. This basic patient group consisted of 33 374 patients in 2016.
Also the number of participating hospitals was rather stable (n=645), with nearly 600 trauma cen-ters from Germany. Hospitals from eight other countries participated in the registry as well. Among them, Austria (n=23), Switzerland (n=7), and Belgium (n=6) provided the most hospitals.
What is new in this report 2017? Early in 2016, after intensive discussions and preparations, the documentation interface has been adapted to the updated dataset of the TraumaRegister DGU®. Besides some thousand cases from 2015, nearly all patients from 2016 have now been documented with the new dataset. This has influence on the actual report, and in some places new results have been introduced. For ex-ample, tranexamic acid is now documented both in the pre-hospital setting and in the emergency room. There are also some items which are now obligatory in the reduced QM dataset, and thus available for all cases now, like surgical procedures and pupil reactivity.
The most obvious change, however, refers to page 4 where quality indicators are reported. This page has hardly been changed during the last decades and urgently needed an update. The exist-ing quality indicators as well as a large number of new indicators (from the literature, the guideline, and other registries) were systematically reviewed and evaluated. As a result, some of the previ-ously used indicators were discarded (like ‘Time to abdominal sonography’), othe indicators were kept (like ‘Time to whole-body CT’), and again others were newly introduced (like ‘Capnometry in intubated patients’). The presentaion has also been updated, including a graphical comparison for each indicator. This needs, however, more space than before. The results are presented on three pages now.
On page 11 (General Results) you will find more details about the evaluation process of the quality indicators. There is also an overview about the different definitions of severely injured patients.
Kindest regards
Rolf Lefering Christian Waydhas Stefan Huber-Wagner Ulrike Nienaber
Sektion NIS of DGU – Arbeitskreis TraumaRegister and AUC - Akademie der Unfallchirurgie GmbH

TraumaRegister DGU® TR-DGU gesamt Content
© 2017 Sektion NIS of DGU / AUC
Content Page
1. Sample and severity ...................................................................................................................... 1 Overview of patients and injury severity; Definition of the basic patient group
2. Observed mortality and prognosis ........................................................................... 2.1 – 2.2 Hospital outcome (mortality) and RISC II prognosis, compated over time and to the overall result in the registry; data quality of prognosis
3. Basic data from the last 3 years ............................................................................................... 3 Change of patient characteristics, treatment, and outcome over time (3 years) and compared to the last 10 years of TraumaRegister DGU®
4. Quality indicators .......................................................................................... 4.1 – 4.3 Selected indicators of process performance, compared with all other hospitals and and to the overall values of the TraumaRegister DGU®
5. Individual cases ............................................................................................................................... 5 Listing of individual cases in whom prognosis and actual outcome differ considerably; to be used as a basis for internal M&M conferences
6. Graphical comparisons ................................................................................................... 6.1 - 6.3 Number of patients and selected variables are presented graphically for all hospitals; the results of your hospital are highlighted among the sorted results
7. Basic data ....................................................................................................... 7.1 - 7.3 On three pages basic data of the patients, the accident, the pre-hospital care, the early in-hospital treatment, intensive care and outcome are reported. Data are compared to the actual year and the last 10 years of TraumaRegister DGU®
8. Subgroup analyses ........................................................................................ 8.1 - 8.2 Outcome, RISC II prognosis and patient characteristics in specific subgroups of your own hospital (8.1) as well as comparison with hospitals of the same level (8.2)
9. Data quality and completeness ..................................................................... 9.1 - 9.2 The completeness of important variables, especially those needed for outcome prediction, are presented and classified; average data completeness rate
10. Pattern of injuries ................................................................................................... 10 The pattern of injuries are presented for different body regions; results are compared with the TraumaRegister DGU®
11. General results .......................................................................................... 11.1 - 11.3 These pages contain interesting results from the TraumaRegister DGU® not specified for each hospital, like number of cases and hospitals, severity of injuries, and quality indicators
Imprint ........................................................................................................................... 12
Appendix ....................................................................................................................... 13
List of publications from the TraumaRegister DGU®, published in the last three years
List of abbreviations used

TraumaRegister DGU® - TR-DGU gesamt 1
© 2017 Sektion NIS of DGU / AUC
1. Sample and Severity Admission via the shock room and need for intensive care are the official inclusion criteria for documenting a patient in the TraumaRegister DGU® (TR-DGU). Patients who died before ICU admission should also be included. This pragmatic criterion was chosen to avoid complicated score calculations in the emergency room, and to limit the documentation to patients with relevant injuries. However, in recent years, the number of patients with only minor injuries continuously increased. On the one hand, this means a higher workload, but more important it limits also the comparability of findings both between hospitals and over time. Therefore, a ‘basic patient group’ has been defined in 2015, and nearly all analyses presented in this report refer to this patient group only (and not to all documented patients). The severity of an injury is determined by the Abbreviated Injury Scale (AIS) which assigns a severity grade from 1 (minor) to 6 (maximal) points to each injury. Using these severity grades, more sophisticated measures like the maximum AIS (MAIS), the Injury Severity Score (ISS) or the New ISS (NISS) could be derived. The following table gives an overview about the different patient groups and severity levels in 2016.
Your hospital
2016
primary admitted
transfer in
early transfer
out
TR-DGU 2016
Total number of documented patients 40 836 35 066 3 095 2 675 40 836
MAIS 1 The most severe injury of these patients were of AIS grade 1 (MAIS = 1). Thus they were not severely injured. Furthermore, the RISC II prognostic score has not been validated for these cases. These cases were excluded from further analysis (except page 5, chapter 3)
4 647 (11%)
4 482 32 133 4 647 (11%)
MAIS 2 The worst injury was of AIS grade 2
9 042 (22%)
8 211 306 525 9 042 (23%)
MAIS 3+ The worst injury was of AIS grade 3 or more (MAIS 3+) which recently was defined as a „serious injury“ by the EU when looking for an internationally agreed definition for road traffic research.
27 147 (66%)
22 373 2 757 2 017 27 147 (66%)
Intensive care Patients who required intensive care due to their injuries (admission to ICU)
31 504 (77%)
27 626 2 834 1 044 31 504 (77%)
Deceased These patients died in the acute care hospital
3 554 ( 9%)
3 198 356 3 554 ( 9%)
Basic patient group This definition includes all MAIS 3+ patients. MAIS 2 patients were included only if they died or were treated on the intensive care unit. Patients also had to have valid age data.
33 374 (82%)
28 137 3 013 2 224 33 374 (82%)
ISS 16+ The definition ISS ≥ 16 (or > 15) is used in many scientific papers on trauma patients.
18 479 (45%)
14 847 2 189 1 443 18 479 (45%)
Life-threatening severe injury Injury severity (ISS ≥ 16) is combined with physiologi-cal consequences as done with the new ‘polytrauma’ definition (see Paffrath et al. 2014).
10 639 (26%)
8 785 1 070 784 10 639 (26%)
Polytrauma According to the new der „Berlin Definition“ two body regions need to be severely affected (MAIS 3+ in each), and one or more physiological problems are present (see p. 11, and Pape et al. 2014)
5 089 (12%)
4 379 385 325 5 089 (12%)

TraumaRegister DGU® - TR-DGU total 2.1
© 2017 Sektion NIS of DGU / AUC
2. Observed Mortality and Prognosis
Comparing the observed mortality of severely injured trauma patients with their prognosis is a central element of quality assessment in the TraumaRegister DGU®. Here the prognosis is derived from the newly developed RISC II prognostic score (Revised Injury Severity Classification, see Lefering et al. 2014). This score could be calculated for all primary admitted patients. The analysis on this page is limited to the basic patient group as defined on page 1.
Number of patients (basic patient group) documented in the last 10 years (2007-16): n = 210478 - among them, documented last year (2016): n = 33118 - among them, primary admitted cases (no transfer in; no early transfer out): n = 28137
Comparisons of outcome and prognosis will be performed in primary admitted patients only. For patients transferred in from another hospital (n=3013 in 2016) initial status from primary admission was missing; patients transferred out early (within 48 hours after admission; n=2224 in 2016) have no final outcome documented.
The mean age of the 28137 patients was 51.1 years, and 70% ware males. The mean ISS was 18.2 points. Of these patients 3152 died in hospital, which was 11.2% (95% confidence interval: 10.8 - 11.6). The risk of death prognosis based on RISC II 10.6%. You find these values in the figure below, where also your hospital results from previous years are presented together with the overall result in the registry. Details and definition of data quality are given on the following page 2.2 (see also page 8).
Your hospital Your hospital Your hospital TR-DGU TR-DGU 10 years 2015 2016 2016 10 years
No. of pat. (n): 176382 27770 28137 27 142 150 969 Data quality: ███ ███ ███ ███ ███
Legend to the figure:
The bars represent the observed mortality rate; percentages are given at the bottom of each bar. The predicted mortality rate based on RISC II is given as a vertical bar. This bar turns to grey or green in case that the observed redmortality is significantly lower (= better) or higher (= worse) than expected, respectively.
The interpretation of the results has to consider that these findings depend on statistical uncertainty. Therefore, the 95% confidence interval for the observed mortality rate is given as well (vertical line). The confidence interval describes a range of values which cover the true value with a high probability (95%). The more patients a value is based on, the narrower is the confidence interval. In case that the expected prognosis lies outside the confidence interval, it could be interpreted as a significant deviation (p<0.05).
If the observed mortality rate is based on less than 5 cases, the large confidence interval will not be presented.
11,7 11,3 11,2 11,2 11,7
11,4 10,8 10,6 10,6 11,4
0
5
10
15
20
25
30
35
Mo
rta
lity
[%]
0
5
10
15
20
25
30
35
TraumaRegister DGU® - TR-DGU gesamt 2.2
© 2017 Sektion NIS of DGU / AUC
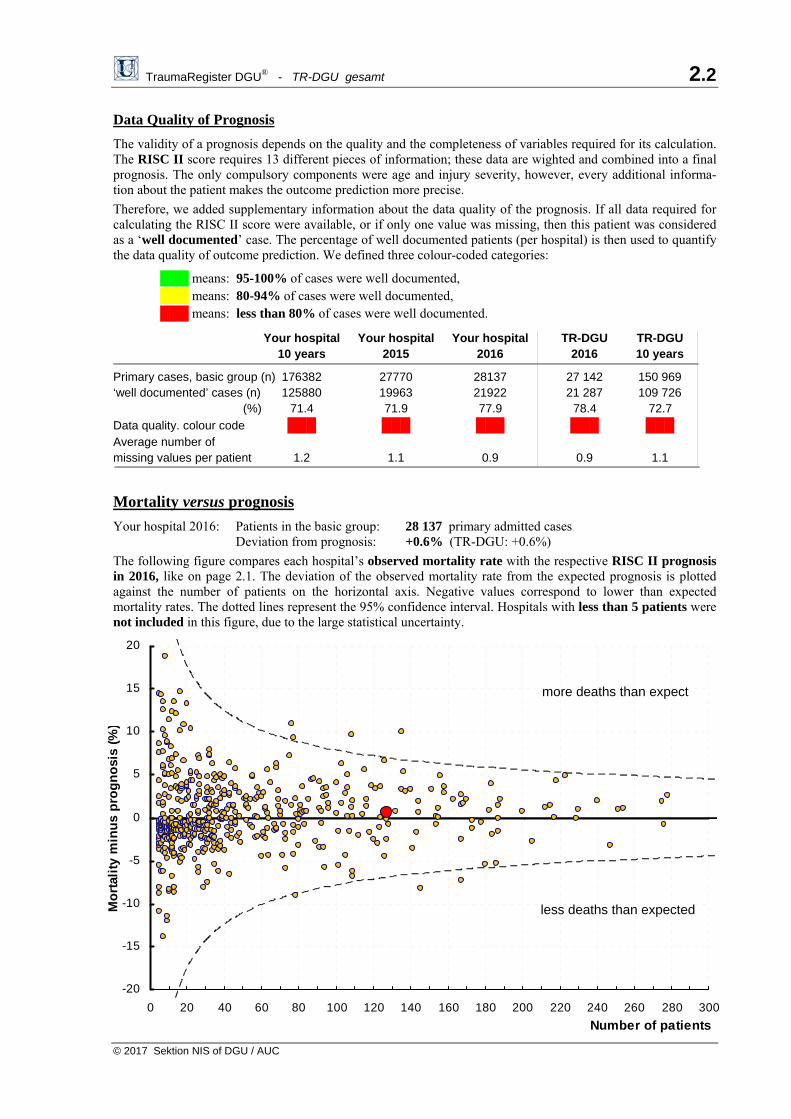
Data Quality of Prognosis
The validity of a prognosis depends on the quality and the completeness of variables required for its calculation. The RISC II score requires 13 different pieces of information; these data are wighted and combined into a final prognosis. The only compulsory components were age and injury severity, however, every additional informa-tion about the patient makes the outcome prediction more precise.
Therefore, we added supplementary information about the data quality of the prognosis. If all data required for calculating the RISC II score were available, or if only one value was missing, then this patient was considered as a ‘well documented’ case. The percentage of well documented patients (per hospital) is then used to quantify the data quality of outcome prediction. We defined three colour-coded categories:
███ means: 95-100% of cases were well documented, ███ means: 80-94% of cases were well documented, ███ means: less than 80% of cases were well documented.
Your hospital Your hospital Your hospital TR-DGU TR-DGU 10 years 2015 2016 2016 10 years
Primary cases, basic group (n) 176382 27770 28137 27 142 150 969 ‘well documented’ cases (n) 125880 19963 21922 21 287 109 726 (%) 71.4 71.9 77.9 78.4 72.7
Data quality. colour code ███ ███ ███ ███ ███ Average number of missing values per patient 1.2 1.1 0.9 0.9 1.1
Mortality versus prognosis
Your hospital 2016: Patients in the basic group: 28 137 primary admitted cases Deviation from prognosis: +0.6% (TR-DGU: +0.6%)
The following figure compares each hospital’s observed mortality rate with the respective RISC II prognosis in 2016, like on page 2.1. The deviation of the observed mortality rate from the expected prognosis is plotted against the number of patients on the horizontal axis. Negative values correspond to lower than expected mortality rates. The dotted lines represent the 95% confidence interval. Hospitals with less than 5 patients were not included in this figure, due to the large statistical uncertainty.
more deaths than expect
less deaths than expected
-20
-15
-10
-5
0
5
10
15
20
0 20 40 60 80 100 120 140 160 180 200 220 240 260 280 300
Number of patients
Mo
rtal
ity
min
us
pro
gn
osi
s (%
)

TraumaRegister DGU® TR-DGU gesamt 3
© 2017 Sektion NIS of DGU / AUC
3. Basic data from the last 3 years The results in this table refer to the basic patient group only excluding patients with minor injuries (see page 1). Attention: Results have to be interpreted with caution when the number of patients is low!
Your hospital TraumaRegister DGU®
10 years 2014 2015 2016 2016 10 years
Total no. of patients [n] 210478 31708 33118 33374 33 374 210 478
Primary adm. & treated [n] 176382 26741 27770 28137 28 137 176 382 Early transferred out [n] 13109 2084 2263 2224 2 224 13 109 All primary admissions [n] 189491 28825 30033 30361 30 361 189 491 From other hospital [n] 20987 2883 3085 3013 3 013 20 987
Patients
Mean age [years] 49.7 50.9 51.4 51.4 51.4 49.7
70 years or older [%] 24% 26% 26% 26% 26% 24%
Male patients [%] 71% 70% 69% 70% 70% 71%
Trauma
Blunt trauma [%] 96% 96% 96% 96% 96% 96%
Mean ISS [points] 19.4 18.3 18.4 18.6 18.6 19.4
ISS 16 [%] 58% 54% 54% 55% 55% 58%
Head injury (AIS head 3) [%] 39% 37% 37% 38% 38% 39%
Pre-hospital Care (only primary admissions)
Intubation [%] 27% 23% 22% 22% 22% 27%
Unconscious (GCS 8) [%] 19% 17% 17% 17% 17% 19%
Shock (BP 90 mmHg) [%] 11% 9% 9% 9% 9% 11%
Avg. amount of volume [ml] 753 658 655 653 653 753
Shock Room / ER (only primary admissions)
Whole body CT [%] 75% 76% 77% 79% 79% 75%
X-ray of thorax [%] 41% 38% 36% 33% 33% 41%
Blood transfusion [%] 10% 8% 8% 7% 7% 10%
Treatment in the Hospital
Operated patients 1) [%] 68% 68% 67% 58% 58% 68%
No. of op. if operated 1) 4) [n] 3.5 3.4 3.3 3.3 3.3 3.5
Treatment on ICU [%] 88% 87% 88% 88% 88% 88%
LOS on ICU 2) [days] 7.2 6.6 6.4 6.5 6.5 7.2
Intubated/ventilated 2) [%] 46% 40% 39% 39% 39% 46%
Days intubated 2) [days] 3.5 3.0 2.9 2.9 2.9 3.5
Outcome
LOS in hospital 3) [days] 17.8 16.8 15.9 16.2 16.2 17.8
Hospital mortality 3) [%] 11.0% 10.1% 10.5% 10.5% 10.5% 11.0%
Multiple organ failure1)3) [%] 22% 20% 20% 20% 20% 22%
Discharge to other hosp. [%] 17% 17% 18% 18% 18% 17%
1) not available in the reduced QM dataset 2) only ICU patients 3) without patients transferred out early 4) years with incomplete documentation excluded
TraumaRegister DGU® TR-DGU gesamt 4.1
© 2017 Sektion NIS der DGU / AUC
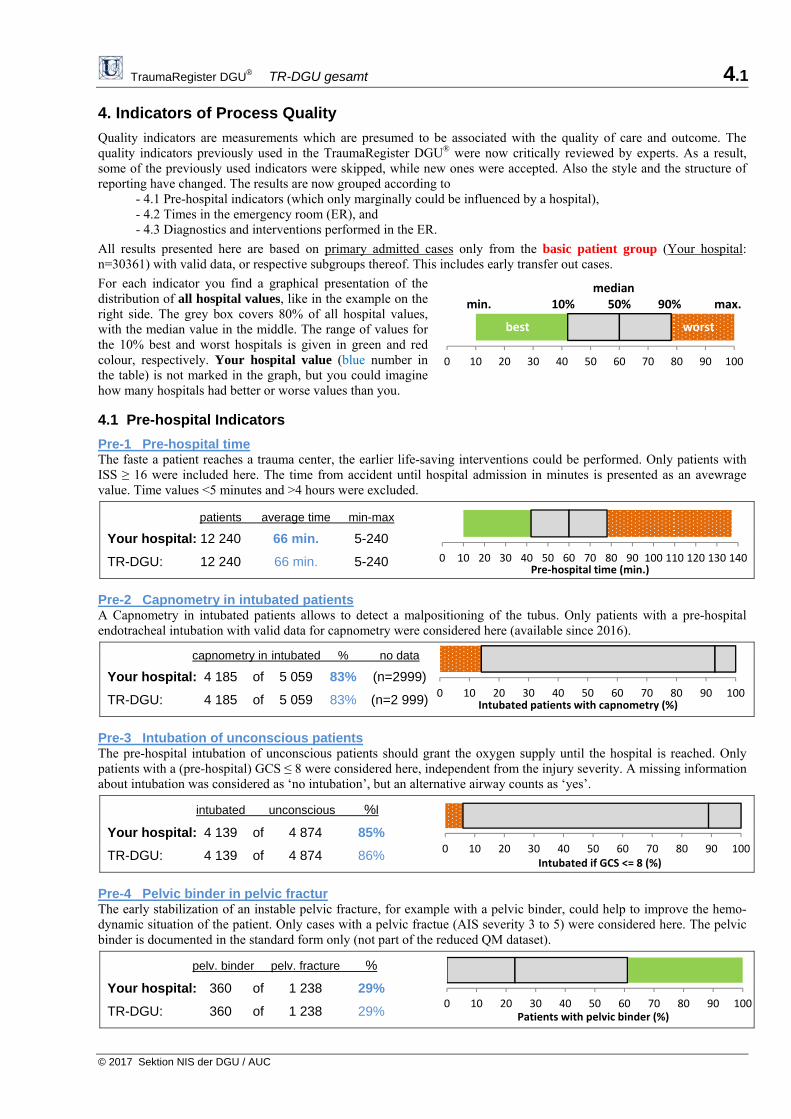
4. Indicators of Process Quality
Quality indicators are measurements which are presumed to be associated with the quality of care and outcome. The quality indicators previously used in the TraumaRegister DGU® were now critically reviewed by experts. As a result, some of the previously used indicators were skipped, while new ones were accepted. Also the style and the structure of reporting have changed. The results are now grouped according to - 4.1 Pre-hospital indicators (which only marginally could be influenced by a hospital), - 4.2 Times in the emergency room (ER), and - 4.3 Diagnostics and interventions performed in the ER.
All results presented here are based on primary admitted cases only from the basic patient group (Your hospital: n=30361) with valid data, or respective subgroups thereof. This includes early transfer out cases.
For each indicator you find a graphical presentation of the distribution of all hospital values, like in the example on the right side. The grey box covers 80% of all hospital values, with the median value in the middle. The range of values for the 10% best and worst hospitals is given in green and red colour, respectively. Your hospital value (blue number in the table) is not marked in the graph, but you could imagine how many hospitals had better or worse values than you.
4.1 Pre-hospital Indicators
Pre-1 Pre-hospital time The faste a patient reaches a trauma center, the earlier life-saving interventions could be performed. Only patients with ISS ≥ 16 were included here. The time from accident until hospital admission in minutes is presented as an avewrage value. Time values <5 minutes and >4 hours were excluded.
patients average time min-max
Your hospital: 12 240 66 min. 5-240
TR-DGU: 12 240 66 min. 5-240
Pre-2 Capnometry in intubated patients A Capnometry in intubated patients allows to detect a malpositioning of the tubus. Only patients with a pre-hospital endotracheal intubation with valid data for capnometry were considered here (available since 2016).
capnometry in intubated % no data
Your hospital: 4 185 of 5 059 83% (n=2999)
TR-DGU: 4 185 of 5 059 83% (n=2 999)
Pre-3 Intubation of unconscious patients The pre-hospital intubation of unconscious patients should grant the oxygen supply until the hospital is reached. Only patients with a (pre-hospital) GCS ≤ 8 were considered here, independent from the injury severity. A missing information about intubation was considered as ‘no intubation’, but an alternative airway counts as ‘yes’.
intubated unconscious %l
Your hospital: 4 139 of 4 874 85%
TR-DGU: 4 139 of 4 874 86%
Pre-4 Pelvic binder in pelvic fractur The early stabilization of an instable pelvic fracture, for example with a pelvic binder, could help to improve the hemo-dynamic situation of the patient. Only cases with a pelvic fractue (AIS severity 3 to 5) were considered here. The pelvic binder is documented in the standard form only (not part of the reduced QM dataset).
pelv. binder pelv. fracture %
Your hospital: 360 of 1 238 29%
TR-DGU: 360 of 1 238 29%
0 10 20 30 40 50 60 70 80 90 100 110 120 130 140Pre‐hospital time (min.)
0 10 20 30 40 50 60 70 80 90 100Intubated patients with capnometry (%)
0 10 20 30 40 50 60 70 80 90 100Intubated if GCS <= 8 (%)
0 10 20 30 40 50 60 70 80 90 100Patients with pelvic binder (%)
0 10 20 30 40 50 60 70 80 90 100
median min. 10% 50% 90% max.
best worst

TraumaRegister DGU® TR-DGU gesamt 4.2
© 2017 Sektion NIS der DGU / AUC
4.2 Times in the Emergency Room
ER-1 Time to whole-body CT when a whole-body CT was indicated, it should be performed without delay, in order to initiate subsequent interventions without loss of time. All patientes who received a whole-body CT were considered here. Times > 2 hours were excluded.
patients mean time min-max
Your hospital: 23 130 22 min. 1-120
TR-DGU: 23 130 22 min. 1-120
ER-2 Time to first emergency surgery Eight different emergency interventions were documented in TR-DGU (surgical liquor drain or brain decompression, laminectomy, thoracotomy, laparotomy, revascularisation, embolisation, and stabilisation of pelvis or extremities). All patients with at least one of these interventions were considered here. Times > 2 hours were excluded.
patients mean time min-max
Your hospital: 4 823 74 min. 1-120
TR-DGU: 4 823 74 min. 1-120
ER-3 Time to surgery in penetrating trauma Time to first surgical intervention (list of procedures, see ER-2 above) in patients with penetrating injuries (stabbing, gunshot, etc.). Times > 2 hours were excluded.
penetrating with surgery mean time
Your hospital: 1 183 446 64 min.
TR-DGU: 1 183 446 64 min.
ER-4 Time to surgery in patients with shock Time to first surgical intervention (list of procedures, see ER-2 above) in patients with shock, defined as systolic blod pressure ≤ 90 mmHg on admission. Times > 2 hours were excluded.
shock with surgery mean time
Your hospital: 2 275 701 67 min.
TR-DGU: 2 275 701 67 min.
ER-5 Time to start of blood transfusion If blood substitution is necessary this should be done as early as possible. All patiwents who received at least one unit of pRBC will be included here, if the time of first transfusion was documented. Times > 2 hours were excluded.
transfused with time mean time
Your hospital: 2 241 1456 51 min.
TR-DGU: 2 241 1 456 67 min.
ER-6 Time to surgical brain decompression In patients with intracranial bleeding after severe traumatic brain injury (TBI, AIS severity = 5) a surgical brain decompression is indicated. Only operated cases with a valid time to surgery (max. 2 hours) were considered here.
severe TBI time available mean time
Your hospital: 3 676 768 71 min.
TR-DGU: 3 676 768 71 min.
0 10 20 30 40 50 60 70 80 90 100 110 120Time to first emergency intervention (min.)
0 10 20 30 40 50 60 70 80 90 100 110 120Time to first emergency intervention (min.)
0 10 20 30 40 50 60 70 80 90 100Time to whole‐body CT (min.)
0 10 20 30 40 50 60 70 80 90 100 110 120Time to first emergency intervention (min.)
0 10 20 30 40 50 60 70 80 90 100 110 120Time to blood transfusion (min.)
0 10 20 30 40 50 60 70 80 90 100 110 120Time to surgical brain decompression (min.)
TraumaRegister DGU® TR-DGU gesamt 4.3
© 2017 Sektion NIS of DGU / AUC
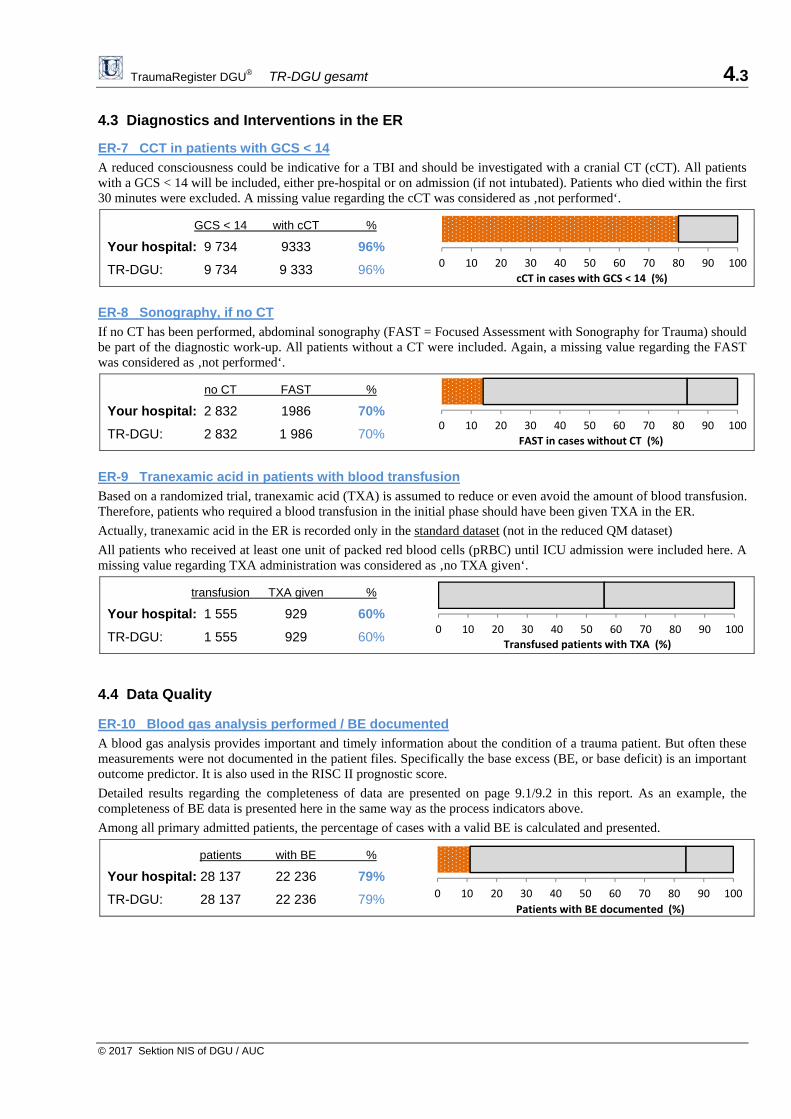
4.3 Diagnostics and Interventions in the ER
ER-7 CCT in patients with GCS < 14
A reduced consciousness could be indicative for a TBI and should be investigated with a cranial CT (cCT). All patients with a GCS < 14 will be included, either pre-hospital or on admission (if not intubated). Patients who died within the first 30 minutes were excluded. A missing value regarding the cCT was considered as ‚not performed‘.
GCS < 14 with cCT %
Your hospital: 9 734 9333 96%
TR-DGU: 9 734 9 333 96%
ER-8 Sonography, if no CT
If no CT has been performed, abdominal sonography (FAST = Focused Assessment with Sonography for Trauma) should be part of the diagnostic work-up. All patients without a CT were included. Again, a missing value regarding the FAST was considered as ‚not performed‘.
no CT FAST %
Your hospital: 2 832 1986 70%
TR-DGU: 2 832 1 986 70%
ER-9 Tranexamic acid in patients with blood transfusion
Based on a randomized trial, tranexamic acid (TXA) is assumed to reduce or even avoid the amount of blood transfusion. Therefore, patients who required a blood transfusion in the initial phase should have been given TXA in the ER.
Actually, tranexamic acid in the ER is recorded only in the standard dataset (not in the reduced QM dataset)
All patients who received at least one unit of packed red blood cells (pRBC) until ICU admission were included here. A missing value regarding TXA administration was considered as ‚no TXA given‘.
transfusion TXA given %
Your hospital: 1 555 929 60%
TR-DGU: 1 555 929 60%
4.4 Data Quality ER-10 Blood gas analysis performed / BE documented
A blood gas analysis provides important and timely information about the condition of a trauma patient. But often these measurements were not documented in the patient files. Specifically the base excess (BE, or base deficit) is an important outcome predictor. It is also used in the RISC II prognostic score.
Detailed results regarding the completeness of data are presented on page 9.1/9.2 in this report. As an example, the completeness of BE data is presented here in the same way as the process indicators above.
Among all primary admitted patients, the percentage of cases with a valid BE is calculated and presented.
patients with BE %
Your hospital: 28 137 22 236 79%
TR-DGU: 28 137 22 236 79%
0 10 20 30 40 50 60 70 80 90 100
cCT in cases with GCS < 14 (%)
0 10 20 30 40 50 60 70 80 90 100
FAST in cases without CT (%)
0 10 20 30 40 50 60 70 80 90 100
Transfused patients with TXA (%)
0 10 20 30 40 50 60 70 80 90 100
Patients with BE documented (%)
TraumaRegister DGU® TR-DGU gesamt 5
© 2016 Sektion NIS of DGU / AUC
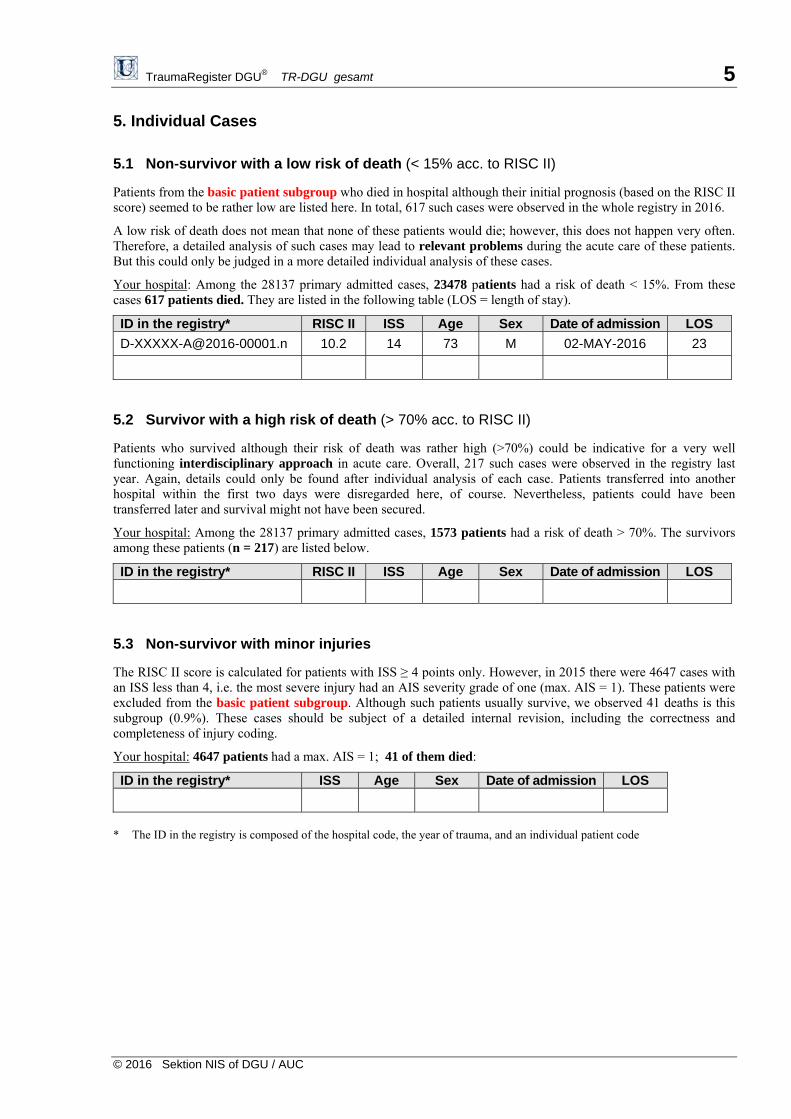
5. Individual Cases
5.1 Non-survivor with a low risk of death (< 15% acc. to RISC II)
Patients from the basic patient subgroup who died in hospital although their initial prognosis (based on the RISC II score) seemed to be rather low are listed here. In total, 617 such cases were observed in the whole registry in 2016.
A low risk of death does not mean that none of these patients would die; however, this does not happen very often. Therefore, a detailed analysis of such cases may lead to relevant problems during the acute care of these patients. But this could only be judged in a more detailed individual analysis of these cases.
Your hospital: Among the 28137 primary admitted cases, 23478 patients had a risk of death < 15%. From these cases 617 patients died. They are listed in the following table (LOS = length of stay).
ID in the registry* RISC II ISS Age Sex Date of admission LOS
[email protected] 10.2 14 73 M 02-MAY-2016 23
5.2 Survivor with a high risk of death (> 70% acc. to RISC II)
Patients who survived although their risk of death was rather high (>70%) could be indicative for a very well functioning interdisciplinary approach in acute care. Overall, 217 such cases were observed in the registry last year. Again, details could only be found after individual analysis of each case. Patients transferred into another hospital within the first two days were disregarded here, of course. Nevertheless, patients could have been transferred later and survival might not have been secured.
Your hospital: Among the 28137 primary admitted cases, 1573 patients had a risk of death > 70%. The survivors among these patients (n = 217) are listed below.
ID in the registry* RISC II ISS Age Sex Date of admission LOS
5.3 Non-survivor with minor injuries
The RISC II score is calculated for patients with ISS ≥ 4 points only. However, in 2015 there were 4647 cases with an ISS less than 4, i.e. the most severe injury had an AIS severity grade of one (max. AIS = 1). These patients were excluded from the basic patient subgroup. Although such patients usually survive, we observed 41 deaths is this subgroup (0.9%). These cases should be subject of a detailed internal revision, including the correctness and completeness of injury coding.
Your hospital: 4647 patients had a max. AIS = 1; 41 of them died:
ID in the registry* ISS Age Sex Date of admission LOS
* The ID in the registry is composed of the hospital code, the year of trauma, and an individual patient code
TraumaRegister DGU® TR-DGU gesamt 6.1
© 2016 Sektion NIS of DGU / AUC
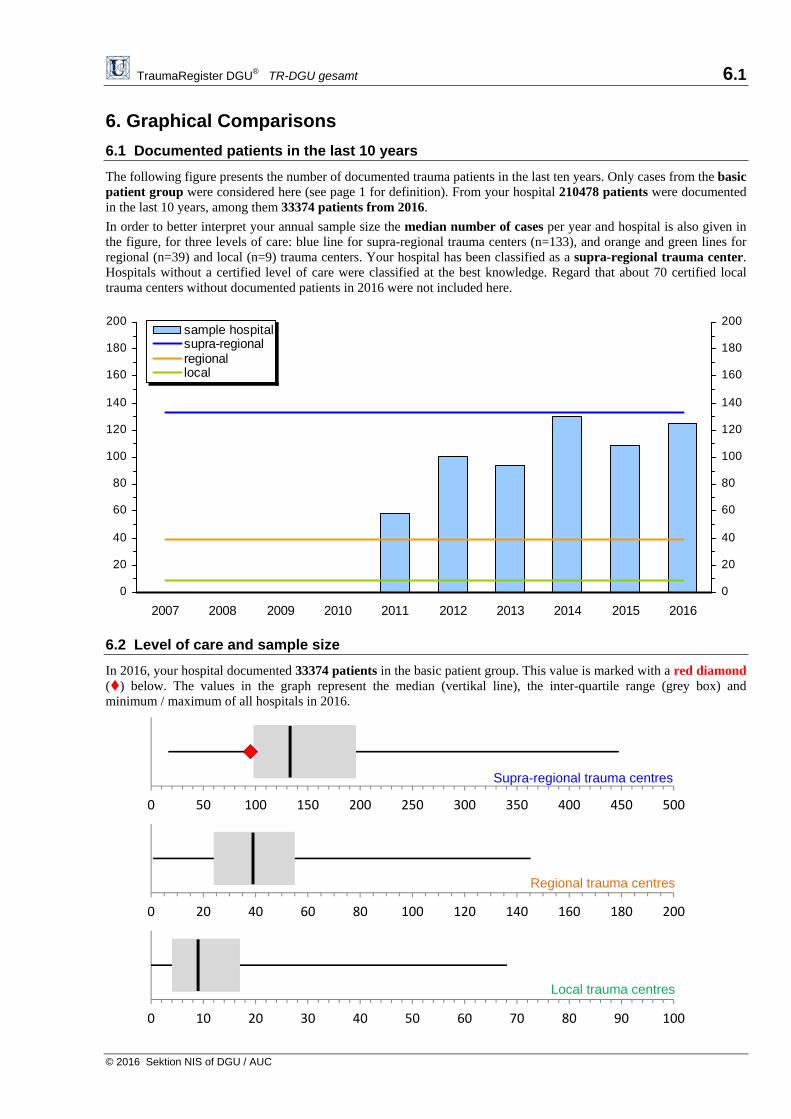
6. Graphical Comparisons
6.1 Documented patients in the last 10 years
The following figure presents the number of documented trauma patients in the last ten years. Only cases from the basic patient group were considered here (see page 1 for definition). From your hospital 210478 patients were documented in the last 10 years, among them 33374 patients from 2016.
In order to better interpret your annual sample size the median number of cases per year and hospital is also given in the figure, for three levels of care: blue line for supra-regional trauma centers (n=133), and orange and green lines for regional (n=39) and local (n=9) trauma centers. Your hospital has been classified as a supra-regional trauma center. Hospitals without a certified level of care were classified at the best knowledge. Regard that about 70 certified local trauma centers without documented patients in 2016 were not included here.
6.2 Level of care and sample size
In 2016, your hospital documented 33374 patients in the basic patient group. This value is marked with a red diamond () below. The values in the graph represent the median (vertikal line), the inter-quartile range (grey box) and minimum / maximum of all hospitals in 2016.
0 50 100 150 200 250 300 350 400 450 500
0 20 40 60 80 100 120 140 160 180 200
0 10 20 30 40 50 60 70 80 90 100
0
20
40
60
80
100
120
140
160
180
200
2007 2008 2009 2010 2011 2012 2013 2014 2015 2016
0
20
40
60
80
100
120
140
160
180
200sample hospitalsupra-regionalregionallocal
Supra-regional trauma centres
Regional trauma centres
Local trauma centres

TraumaRegister DGU® TR-DGU gesamt 6.2
© 2017 Sektion NIS der DGU / AUC
0
5
10
15
20
25
30
35
40
45
50
0
10
20
30
40
50
60
70
80
90
6.3 Graphical Comparisons with other Hospitals 2016
The following figures compare data of your hospital (from 2016) with respective data from all other hospitals in the TraumaRegister DGU®. Only cases from the basic patient subgroup will be considered (see page 1). Your hospital’s value is indicated as a red dot () if data from at least 3 patients were available. The horizontal line is the median value of all hospitals, and the broken lines are the 10% and 90% percentiles.
Mean Age (years) Your hospital: 51.4 years (33 374 patients) The median value of all 601 hospitals in 2016 (with at least 3 cases) was 52.2 years. Hospital Mortality (%) Your hospital: 11.3% (3 507 of 31 150 patients) Only primary admitted patients and those transferred in were considered here. Early transfers out (within 48 h) were excluded. The median mortality rate of all 579 hospitals in 2016 (with at least 3 cases) was 7.7%.

TraumaRegister DGU® TR-DGU gesamt 6.3
© 2017 Sektion NIS der DGU / AUC
0
10
20
30
40
50
60
70
80
90
100
110
120
0
5
10
15
20
25
30
35
0 5 10 15 20 25 30 35 40 45
Liegedauer (Tage)
ISS
Prehospital Time (mean time in min.) Your hospital: 63 Min. (23 135 patients)
Your hospital value is based on 23 135 of 30 361 primary admitted patients from the basic group with valid time points for both accident and hospital admission. Times below 5 minutes or above 4 hours were disregarded. The median value of all 583 hospitals (with 3 or more valid cases) in 2016 was 59 minutes. If there were less than 3 cases with valid data your hospital was not included in this figure.
5.4 Length of Stay and Injury Severity
This figure describes the association between length of stay (LOS) in hospital and injury severity (ISS). The mean value was calculated for survivors from the basic patient group. Patients transferred to another hospital (n=5 367) were excluded here. Hospitals with less than three valid cases were not included in this figure.
Your hospital 2016:
Your hospital value is based on 24 500 patients.
LOS: 17.4 days
ISS: 16.3 points
TR-DGU 2016:
Patients: 24 500
LOS: 17.4 days
ISS: 16.3 points
TraumaRegister DGU® TR-DGU total 7.1
© 2017 Sektion NIS of DGU / AUC
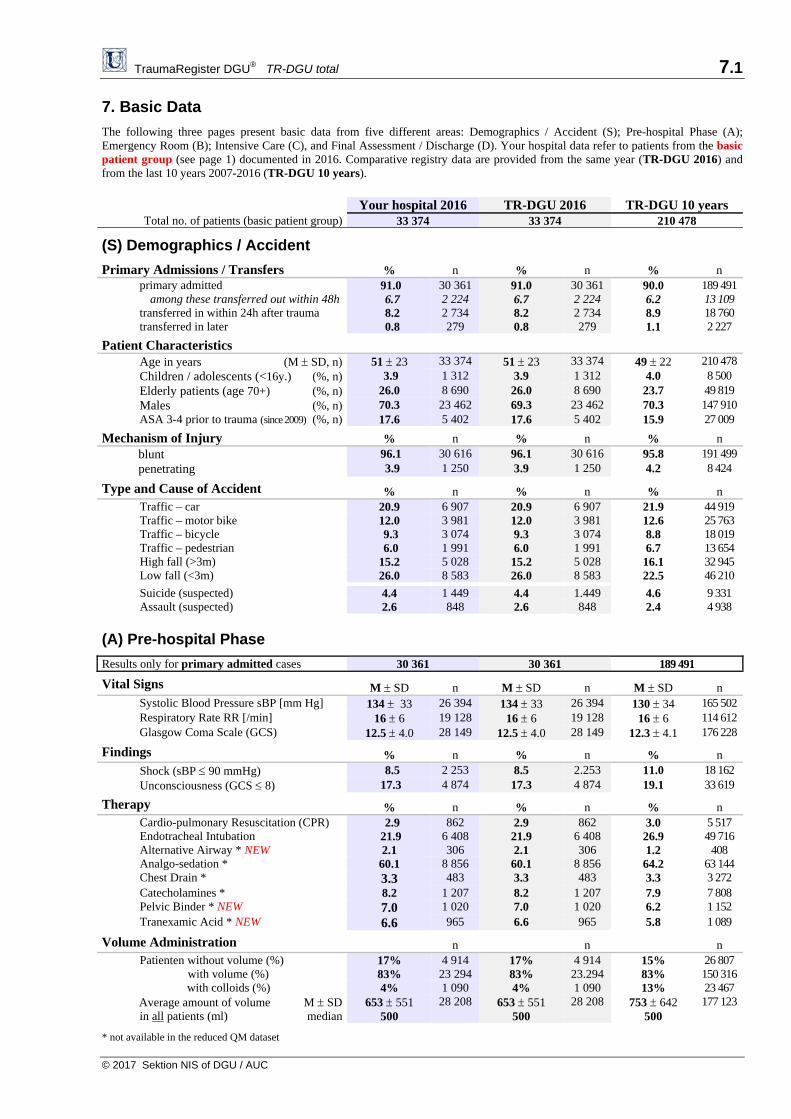
7. Basic Data
The following three pages present basic data from five different areas: Demographics / Accident (S); Pre-hospital Phase (A); Emergency Room (B); Intensive Care (C), and Final Assessment / Discharge (D). Your hospital data refer to patients from the basic patient group (see page 1) documented in 2016. Comparative registry data are provided from the same year (TR-DGU 2016) and from the last 10 years 2007-2016 (TR-DGU 10 years).
Your hospital 2016 TR-DGU 2016 TR-DGU 10 years Total no. of patients (basic patient group) 33 374 33 374 210 478
(S) Demographics / Accident
Primary Admissions / Transfers % n % n % n primary admitted among these transferred out within 48h transferred in within 24h after trauma transferred in later
91.0 6.7 8.2 0.8
30 3612 2242 734279
91.0 6.7 8.2 0.8
30 361 2 224 2 734 279
90.0 6.2 8.9 1.1
189 49113 10918 7602 227
Patient Characteristics Age in years (M SD, n) 51 23 33 374 51 23 33 374 49 22 210 478 Children / adolescents (<16y.) (%, n) 3.9 1 312 3.9 1 312 4.0 8 500 Elderly patients (age 70+) (%, n) 26.0 8 690 26.0 8 690 23.7 49 819 Males (%, n) 70.3 23 462 69.3 23 462 70.3 147 910 ASA 3-4 prior to trauma (since 2009) (%, n) 17.6 5 402 17.6 5 402 15.9 27 009
Mechanism of Injury % n % n % n blunt 96.1 30 616 96.1 30 616 95.8 191 499 penetrating 3.9 1 250 3.9 1 250 4.2 8 424
Type and Cause of Accident % n % n % n Traffic – car 20.9 6 907 20.9 6 907 21.9 44 919 Traffic – motor bike 12.0 3 981 12.0 3 981 12.6 25 763 Traffic – bicycle 9.3 3 074 9.3 3 074 8.8 18 019 Traffic – pedestrian 6.0 1 991 6.0 1 991 6.7 13 654 High fall (>3m) 15.2 5 028 15.2 5 028 16.1 32 945 Low fall (<3m) 26.0 8 583 26.0 8 583 22.5 46 210
Suicide (suspected) 4.4 1 449 4.4 1.449 4.6 9 331 Assault (suspected) 2.6 848 2.6 848 2.4 4 938
(A) Pre-hospital Phase
Results only for primary admitted cases 30 361 30 361 189 491
Vital Signs M SD n M SD n M SD n Systolic Blood Pressure sBP [mm Hg] 134 33 26 394 134 33 26 394 130 34 165 502 Respiratory Rate RR [/min] 16 6 19 128 16 6 19 128 16 6 114 612 Glasgow Coma Scale (GCS) 12.5 4.0 28 149 12.5 4.0 28 149 12.3 4.1 176 228
Findings % n % n % n Shock (sBP 90 mmHg) 8.5 2 253 8.5 2.253 11.0 18 162 Unconsciousness (GCS 8) 17.3 4 874 17.3 4 874 19.1 33 619
Therapy % n % n % n Cardio-pulmonary Resuscitation (CPR) 2.9 862 2.9 862 3.0 5 517 Endotracheal Intubation 21.9 6 408 21.9 6 408 26.9 49 716 Alternative Airway * NEW 2.1 306 2.1 306 1.2 408 Analgo-sedation * 60.1 8 856 60.1 8 856 64.2 63 144 Chest Drain * 3.3 483 3.3 483 3.3 3 272 Catecholamines * 8.2 1 207 8.2 1 207 7.9 7 808 Pelvic Binder * NEW 7.0 1 020 7.0 1 020 6.2 1 152 Tranexamic Acid * NEW 6.6 965 6.6 965 5.8 1 089
Volume Administration n n n Patienten without volume (%) with volume (%)
17% 83%
4 914 23 294
17% 83%
4 914 23.294
15% 83%
26 807 150 316
with colloids (%) 4% 1 090 4% 1 090 13% 23 467 Average amount of volume M SD
in all patients (ml) median653 551
500 28 208 653 551
500 28 208 753 642
500 177 123
* not available in the reduced QM dataset

TraumaRegister DGU® TR-DGU total 7.2
© 2017 Sektion NIS of DGU / AUC
Your hospital 2016 TR-DGU 2016 TR-DGU 10 years No. of patients 33 374 33 374 210 478
(B) Emergency Room
Results for primary admitted cases only n = 30 361 n = 30 361 n = 189 491
Transportation to hospital % n % n % n with helicopter 19.1% 5 785 19.1% 5 785 21.1% 39 974
Glasgow Coma Scale (GCS) M SD n M SD n M SD n if intubated on admission 3.2 1.4 3 786 3.2 1.4 3 786 3.2 1.3 29 751 if not intubated 13.7 2.6 10 280 13.7 2.6 10 280 13.7 2.5 61 585
Initial diagnostics % n % n % n sonography (FAST) 82.2% 24 959 82.2% 24 959 80.0% 151 622 X-ray of the thorax 33.2% 10 070 33.2% 10 070 40.8% 77 271 cranial CT (isolated or whole-body CT) 90.7% 27 529 90.7% 27 529 88.5% 167 765 whole-body CT 78.0% 23 677 78.0% 23 677 73.7% 139 736
Time in the ER M SD n M SD n M SD n sent to the opration room NEW % 24% 6 921 24% 6 921 25% 8 785 time in the ER [min] 74 59 6 065 74 59 6 065 74 59 7 567 transferred to the ICU NEW % 64% 18 217 64% 18 217 64% 22 700 time in the ER [min] 82 72 15 003 82 72 15 003 82 72 18 222
Bleeding and Transfusion % n % n % n pre-existing coagulopathy NEW 18% 4 217 18% 4 217 18% 5 284 systolic blood pressure 90 mmHg 8% 2 275 8% 2 275 9% 15 553 hemostasis therapy * 20% 2 793 20% 2 793 15% 12 002 administration of tranexamic acid * NEW 15% 2 128 15% 2 128 15% 2 551 ROTEM / thrombelastography * NEW 9% 1 067 9% 1 067 11% 6 335
patients with blood transfusion 7% 2 242 7% 2 242 10% 18 648 pRBC, if transfused (mean units) 5.1 5.1 6.0 FFP, if transfused (mean units) 3.2 3.2 2.0
Treatment in the ER % n % n % n cardio-pulmonary resuscitation (CPR) * 2% 363 2% 363 3% 2 903 chest drain * 10% 1 574 10% 1 574 12% 11 732 endotracheal intubation * NEW 15% 2 245 15% 2 245 19% 19 058
Initial laboratory values MW SD n MW SD n MW SD n base excess [mmol/l] - 1.8 4.5 23 746 - 1.8 4.5 23 746 - 2.0 4.7 128 753 hemoglobin [g/dl] 13.2 2.2 29 327 13.2 2.2 29 327 13.0 2.4 178 587 Int. Normalized Ratio, INR ** 1.20 0.50 28 315 1.20 0.50 28 315 1.20 0.60 170 652 Quick’s value [%] 87 21 27 554 87 21 27 554 86 22 167 481 temperature [°C] * 36.1 1.2 8 425 36.1 1.2 8 425 36.1 1.2 48 087
(C) Intensive Care Unit
Patients with intensive care therapy n = 29 275 (88%) n = 29 275 ( 88%) 184 127 (88%)
Treatment * % n % n % n hemostatic drugs * 15.1% 2 230 15.1% 2 230 16.4% 14 146 dialysis / hemofiltration * 2.2% 329 2.2% 329 2.4% 2 281 blood transfusion * within the first 48 h after admission 19.3% 3 119 19.3% 3 119 20.7% 21 691
mechan. ventilation / intubated 38.7% 11 322 38.7% 11 322 45.5% 83 713
Complications on ICU* % n % n % n organ failure * 33.7%. 5085 / 15073 33.7% 5 085 37.0% 35 979 multiple organ failure (MOF)* 20.0%. 3020 / 15073 20.0% 3 020 22.8% 21 588 sepsis* 6.7% 991 / 14778 6.7% 991 6.2% 5 905
Length of stay and ventilation M SD n M SD n M SD n length of intubation [days] 2.9 7.3
median 0 29 135 2.9 7.3
median 0 29 135 3.5 8.2
median 0 182 834
LOS on ICU [days] 6.5 10.0 median 2
29 275 6.5 10.0 median 2
29 275 7.2 10.8 median 3
184 111
* not available in the reduced QM dataset ** approximated from Quick’s value (PT) if not documented ICU = Intensiv Care Unit ER = Emergency Room LOS = Length of Stay CT = Computed Tomography M SD = mean and standard deviation

TraumaRegister DGU® TR-DGU gesamt 7.3
© 2017 Sektion NIS of DGU / AUC
Your hospital 2016 TR-DGU 2016 TR-DGU 10 years No. of patients (basic group) 33 374 33 374 210 478
(D) Discharge and Outcome
Diagnoses M n M n M n number of injuries per patient 4.5 4.5 4,6 patients with only one injury (%, n) 9.5% 3 180 9.5 3 180 9,5% 20 138
Operations % n % n % n patients with surgery 58.0% 17 523 58.0% 17 523 67,5% 82 658 no. of procedures if operated * [mean] 3.4 3.4 3,5
Thrombo-embolic Events* (MI; pulmonary embolism; DVT; stroke; etc.) % n % n % n patients with at least one event * 2.7% 437 2.7% 437 2,8% 2 845
Outcome (without early transfers out) % n % n % n survivor 88.7% 27 643 88.7% 27 643 88,3% 174 309 hospital mortality 11.3% 3 507 11.3% 3 507 11,7% 23 060 died within 30 days 10.8% 3 357 10.8% 3 357 11,2% 22 110 died within 24 hours 5.1% 1 580 5.1% 1 580 5,6% 10 973 died in the ER (no ICU) 1.4% 449 1.4% 449 1,7% 3 434
Transfer / Discharge (all patients) % n % n % n Survivor who were discharged and … 100% 29 867 100% 29 867 100% 187 352 transferred into another hospital 18.0% 5 367 17.6% 5 367 17,2% 32 446 among them early discharges (<48h) 7.4% 2 224 7.6% 2 224 7,0% 13 109 transferred into a rehabilitation center 17.2% 5 147 17.7% 5 147 21,5% 40 370 other destination 3.4% 1 014 3.4% 1 014 3,4% 6 366 sent home 61.4% 18 339 61.2% 18 339 57,7% 108 170
Condition at the time of discharge: Glasgow Outcome Scale (GOS) (without early transfers out) % n % n % n Patients with valid GOS 30 835 30 835 189 394 Surviving patients 100% 27 328 100% 27 328 100% 166 334 – good recovery 64.9% 17 740 67.3% 17 740 65,1% 108 280 – moderate disability 24.7% 6 758 23.1% 6 758 24,6% 40 976 – severe disability 8.9% 2 435 8.2% 2 435 8,7% 14 426 – persistant vegetative state 1.4% 395 1.4% 395 1,6% 2 652
Length of stay in hospital (all patients) M SD n M SD n M SD n All patients, mean 15.2 16.9 33 372 15.2 16.9 33 372 16,8 18,9 210 440 median 11 11 12 Only non-survivors 16.1 17.2 29 865 16.1 17.2 29 865 18,0 19,2 187 383 Only survivors 7.5 12.2 3 507 7.5 12.2 3 507 7,2 12,4 23 057 median survivors / non-survivors 11 / 3 11 / 3 13 / 3 Survivors transferred into a rehab. center 28.7 21.2 5 147 28.7 21.2 5 147 30,4 22,6 40 366 Survivors transferred into another hospital 10.5 14.4 5 367 10.5 14.4 5 367 11,0 15,5 32 442 Survivors sent home 13.9 14.2 18 337 13.9 14.2 18 337 15,2 16,3 108 146
Costs of treatment (without early transfers out; see footnote) € n € n € n Average costs per patient … all patients 14641 31 012 14 641 31 012 16 354 196 314 … only non-survivor 11164 3 478 11 164 3 478 11 283 22 837 … only survivor 15080 27 534 15 080 27 534 17 021 173 477 … only patients with ISS ≥ 16 19382 16 909 19 382 16 909 21 135 112 026
Sum of all costs 454 045 115 € 454 045 115 € 3 210 478 905 € Sum of all days in hospital 507 789 days 507 789 days 3 531 195 days Average costs per day 894.16 € 894.16 € 909.18 €
* not available in the reduced QM dataset M = mean
Treatment costs: The estimated treatment costs are based on data from 1002 German TR-DGU patients treated in 2007/08. For these patients a detailed cost analysis was available (Lefering et al. Unfallchirurg; online first). Assuming a cost increase of 2% per year the costs today would be 19% higher.

TraumaRegister DGU® TR-DGU total 8.1
© 2017 Sektion NIS of DGU / AUC
8. Subgroup Analyses
Summary results might not be helpful when looking for potential causes. Therfore, subgroup results of your hospital are presented on this page. Besides descriptive data about the patients and the process of care also hospital outcome and prognosis are presented here for each subgroup. In order to reduce the statistical uncertainty involved in subgroup analyses, patients from the last three years (2014-2016) were pooled together. Again, only patients from the basic patient group (see page 1) were considered here.
8.1 Subgroups within your hospital
All results in the following table refer to primary admitted cases from the basic patient group. Patients transferred in as well as those transferred out early (within 48h) are not considered here. There were a total of 82648 patients from your hospital in the last three years.
Primary patients3 years
Subgroups
No TBI
Combined trauma
Isolated TBI
Shock Severe injuries
Elderly
Defionition of subgroup Basic group
AIS head ≤ 1
head and body
AIS ≥ 2
AIS head ≥ 3 and AIS elsew. ≤ 1
syst. BP ≤ 90 on
admission
ISS ≥ 16 & at least one problem*
age 70 years
or more
No. of patients (basic group) n %
82 648100%
40 983 50%
31 014 38%
10 651 13%
6 146 7%
25 160 30%
20 971 25%
Patients Age [years] Males % ASA 3-4 %
50,9 70% 16%
48,3 71% 13%
51,4 69% 17%
59,5 65% 29%
51,0 69% 20%
59,3 66% 27%
79,8 55% 46%
Injuries ISS [points] Head injury (AIS≥3) % Thoracic injury (AIS≥3) % Abdominal injury (AIS≥3) %
18,1 34% 38% 9%
14,5 ---
43% 13%
22,7 56% 43% 8%
18,2
100% --- ---
30,2 47% 57% 23%
28,7 65% 51% 23%
18,8 46% 34% 5%
Pre-hospital care Pre-hospital time min. Intubation % Volume given [ml]
63
23% 661
61
12% 664
63
33% 706
64
34% 514
69
64% 1032
67
50% 802
64
22% 549
Emergency room Blood transfusion % Whole-body CT % CPR %
8% 90% 1%
8% 83% 1%
10% 96% 2%
3% 96% 1%
35% 85% 8%
18% 93% 4%
7% 88% 1%
Physiological problems* Age ≥ 70 % Shock (sBP ≤ 90) % Acidosis (BE<-6) % Coagulopathy % Unconsciousness (GCS 3-8) %
25% 25% 9% 11% 16%
19% 11% 7% 9% 4%
27% 15% 12% 14% 25%
44% 10% 9% 15% 34%
27%
100% 36% 32% 45%
47% 31% 24% 26% 44%
100% 12% 9% 21% 18%
Length of stay Treated on ICU n - Intubation (ICU) [days] - Days on ICU [days] Days in hospital [days]
74 132 2,9 6,5 16,0
35 565
1,3 4,2 16,0
28 929
4,0 7,7 16,7
9 638 3,5 6,5 13,6
5 259 7,1 11,9 19,9
22 925
6,5 11,4 20,0
18 428
3,2 7,0
15,8
Outcome and prognosis Non-survivor n Hospital mortality % RISC II prognosis %
9 128 11,0% 10,6%
1 920 4,7% 4,4%
4 425 14,3% 14,2%
2 783 26,1% 23,8%
2 289 37,2% 38,4%
7 646 30,4% 29,3%
5 064 24,1% 22,5%
* according to the definition of patients with severe life-threatening injuries from Paffrath et al. (Injury 2014); physiological problems were defined according to Pape et al. (J. Trauma 2014).
TraumaRegister DGU® TR-DGU gesamt 8.2
© 2017 Sektion NIS of DGU / AUC
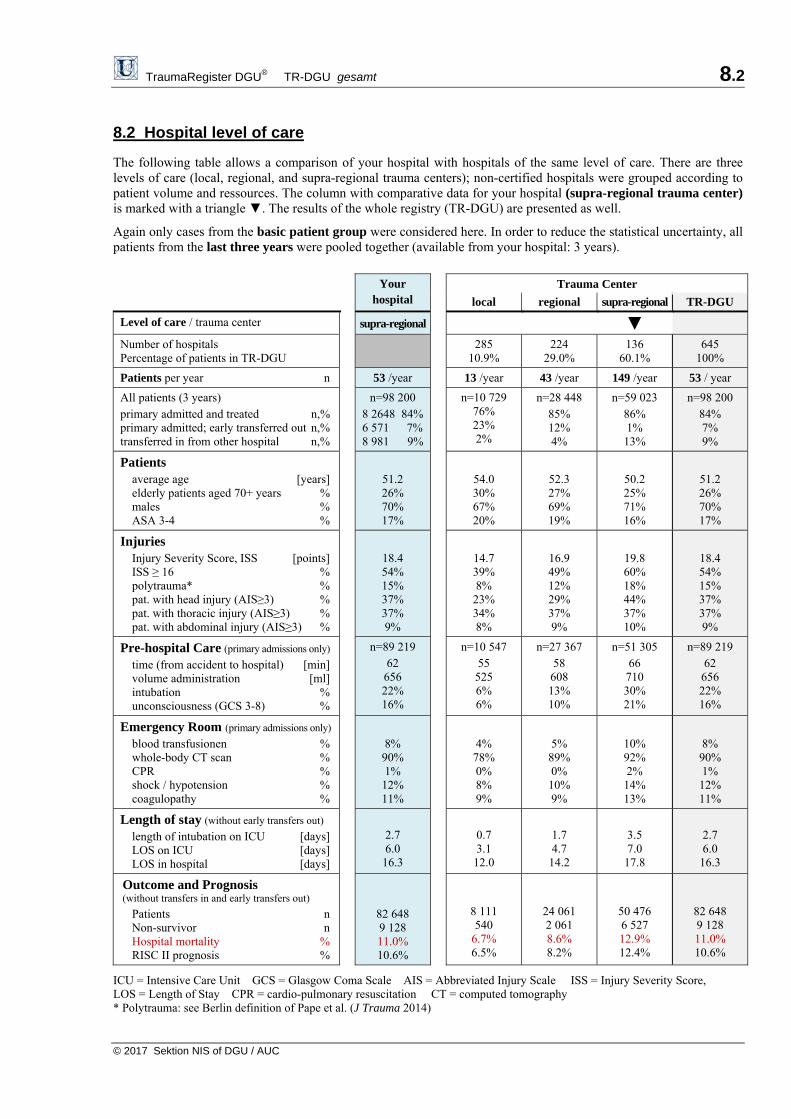
8.2 Hospital level of care
The following table allows a comparison of your hospital with hospitals of the same level of care. There are three levels of care (local, regional, and supra-regional trauma centers); non-certified hospitals were grouped according to patient volume and ressources. The column with comparative data for your hospital (supra-regional trauma center) is marked with a triangle ▼. The results of the whole registry (TR-DGU) are presented as well.
Again only cases from the basic patient group were considered here. In order to reduce the statistical uncertainty, all patients from the last three years were pooled together (available from your hospital: 3 years).
Your
hospital
Trauma Center
local regional supra-regional TR-DGU
Level of care / trauma center supra-regional ▼
Number of hospitals Percentage of patients in TR-DGU
285 10.9%
224 29.0%
136 60.1%
645 100%
Patients per year n 53 /year 13 /year 43 /year 149 /year 53 / year
All patients (3 years) primary admitted and treated n,%primary admitted; early transferred out n,%transferred in from other hospital n,%
n=98 200 8 2648 84%6 571 7%8 981 9%
n=10 729 76% 23% 2%
n=28 448 85% 12% 4%
n=59 023 86% 1% 13%
n=98 200 84% 7% 9%
Patients average age [years]elderly patients aged 70+ years %males %ASA 3-4 %
51.2 26% 70% 17%
54.0 30% 67% 20%
52.3 27% 69% 19%
50.2 25% 71% 16%
51.2 26% 70% 17%
Injuries Injury Severity Score, ISS [points]ISS ≥ 16 %polytrauma* %pat. with head injury (AIS≥3) %pat. with thoracic injury (AIS≥3) %pat. with abdominal injury (AIS≥3) %
18.4 54% 15% 37% 37% 9%
14.7 39% 8% 23% 34% 8%
16.9 49% 12% 29% 37% 9%
19.8 60% 18% 44% 37% 10%
18.4 54% 15% 37% 37% 9%
Pre-hospital Care (primary admissions only) time (from accident to hospital) [min]volume administration [ml]intubation %unconsciousness (GCS 3-8) %
n=89 219 62 656 22% 16%
n=10 547 55 525 6% 6%
n=27 367 58 608 13% 10%
n=51 305 66 710 30% 21%
n=89 219 62 656 22% 16%
Emergency Room (primary admissions only) blood transfusionen %whole-body CT scan %CPR %shock / hypotension %coagulopathy %
8% 90% 1% 12% 11%
4% 78% 0% 8% 9%
5% 89% 0% 10% 9%
10% 92% 2% 14% 13%
8% 90% 1% 12% 11%
Length of stay (without early transfers out) length of intubation on ICU [days]LOS on ICU [days] LOS in hospital [days]
2.7 6.0
16.3
0.7 3.1
12.0
1.7 4.7
14.2
3.5 7.0
17.8
2.7 6.0
16.3
Outcome and Prognosis (without transfers in and early transfers out)
Patients nNon-survivor nHospital mortality %RISC II prognosis %
82 648 9 128 11.0% 10.6%
8 111 540
6.7% 6.5%
24 061 2 061 8.6% 8.2%
50 476 6 527 12.9% 12.4%
82 648 9 128 11.0% 10.6%
ICU = Intensive Care Unit GCS = Glasgow Coma Scale AIS = Abbreviated Injury Scale ISS = Injury Severity Score, LOS = Length of Stay CPR = cardio-pulmonary resuscitation CT = computed tomography * Polytrauma: see Berlin definition of Pape et al. (J Trauma 2014)

TraumaRegister DGU® TR-DGU gesamt 9.1
© 2017 Sektion NIS of DGU / AUC
9. Data Quality and Completeness
9.1 Completeness of selected variables
Registries and audit reports could only be as good as the data they are based on. If a lot of patients have missing data in important variables then these patients have to be excluded from analysis, and results might be biased or even wrong. The following table describes the completeness rates (%) of several important variables, together with the number of patients with missing data (). The list of variables specifically contains the prognostic variables needed for the RISC II. As on the previous pages only cases from the basic patient group were considered here. Good completeness rates are indicated in green color ██ (96% or better), variables with moderate completeness are marked in yellow ██ (90-95%), and insufficient completeness (below 90%) is indicated in red ██. The categories for completeness are thresholds defined by experts; they were not derived from the data. The completeness rates of your hospital in 2016 are compared with your hospital’s data from the previous years (since 2007) and with actual overall data from the whole registry (TR-DGU 2016). Besides the rates also the number of patients with missing data is given, marked with the sign. including also cases with implausible data. Category (%) Your hospital
2016 Your hospital
2007-2015 TR-DGU
2016 Variable Importance
Pre-hospital data (A)
only primary admitted cases n=30 361 n=159 130 n=30 361
GCS RISC II requires the motor component; quality indicators use the GCS for the definition of cases
96+ 90-95 <90 93% 2212
██ 93% 11149
██ 93% 2212
██
Blood pressure
Initial blood pressure is important for validating the volume therapy and for the definition of shock
96+ 90-95 <90 87% 3967
██ 87% 20112
██ 87% 3967
██
Pupils* Pupil size and reactivity are relevant for prognosis (RISC II); will be required for all patients in future
96+ 90-95 <90 87% 3952
██ 91% 8360
██ 87% 3952
██
CPR Cardio-pulmonary resuscitation is seldom (3-4%) but highly predictive for outcome; required for RISC II
96+ 90-95 <90 91% 2786
██ 93% 11647
██ 91% 2768
██
Emergency room (B)
only primary admitted cases n=30 361 n=159 130 n=30 361
Time of admission
Required to calculate the time until diagnostics were performed 96+ 90-95 <90 99%
226 ██ 99%
2375 ██ 99%
226 ██
Blood pressure
BP on admission is used by RISC II as a prognostic variable; also needed for definition of shock
96+ 90-95 <90 94% 1753
██ 91% 14506
██ 94% 1753
██
Base excess Base excess is part of the RISC II and an independent prognostic factor 96+ 90-95 <90 78%
6631 ██ 66%
54227 ██ 78%
6631██
Coagulation The INR (or Quick’s value) is needed for the RISC II as coagulation marker 96+ 90-95 <90 93%
2046 ██ 89%
16793 ██ 93%
2046██
Hemoglobin Is part of the RISC II score as an indirect sign of relevant bleeding 96+ 90-95 <90 97%
1034 ██ 94%
9870 ██ 97%
1034██
Patients and Outcome
alle Patienten n=33 374 n=177 104 n=33 374
ASA Prior diseases are relevant for outcome prediction (RISC II); doc. since 2009 96+ 90-95 <90 92%
2649██ 79%
37873 ██ 92%
2649██
Surgical treatment*
A low rate of surgical patients could be based on incomplete documentation 70+ 50-69 <50 54% ██ 62% ██ 54% ██
GOS The Glasgow Outcome Scale (GOS) describes the patient’s condition at discharge or transfer
96+ 90-95 <90 98% 623
██ 94% 11293
██ 98% 623
██
Prozessdaten all patients n=33 374 n=177 104 n=33 374
Time point A timely documentation of cases is able to improve data quality
months from accident to start of documentation 3.7 mon. 4.5 mon. 3.7 mon.
Months from discharge until completion of documentation <3 3-4 5+ 4.7 ██ 5.5 ██ 4.7 ██
* the actual dataset revision includes pupil size / reactivity and surgical treatnment for all cases.

TraumaRegister DGU® TR-DGU gesamt 9.2
© 2016 Sektion NIS of DGU / AUC
9.2 Comparison of data quality among hospitals
Detailed completeness rates for different variables were presented on the previous page 9.1. In order to compare data quality among hospitals, a combined quality score has to be considered. This score was calculated from the following 10 variables: from the pre-hospital phase GCS, blood pressure, and CPR; from the emergency room phase the time of admission, blood pressure, base excess, hemoglobine, and coagulation (Quick’s value or INR); finally the patient’s prior health status (pre-injury ASA) and the GOS (Glasgow Outcome Scale) as outcome measure. All these variables were part of both the standard and the reduced QM dataset. The number of missing data points from all primary admitted trauma patients in the basic patient group were then added and compared to the theoretical maximum. This leads to an average completeness rate based on 10 different variables.
Your hospital2016
Your hospital 2007-2015
TR-DGU 2016 Data Completeness
Primary admitted patienten in the basic group n=30 361 159 130 30 361
Theoretical sum of all values 303 610 1 591 300 303 610
Sum of missing values 23 655 185 107 23 655
Average data completeness rate (%) based on 10 different measurements
92.2% 88.4% 92.2%
Graphical comparison with other hospitals The following figure summarizes the completeness data from all 645 hospitals who submitted cases in 2016. The value of your hospital is presented as a red diamond. The figure follows the idea of a box plot where the grey box ranging from 88.4 to 97.0 covers half of all hospital values. The vertical line within the box is the median hospital value (93.3%).
Development over time The following figure shows the development of data completeness in the last 8 years since 2009. The completeness rates were pooled separately for hospitals using the standard dataset and the reduced QM dataset.
35 40 45 50 55 60 65 70 75 80 85 90 95 100
60
65
70
75
80
85
90
95
100
2009 2010 2011 2012 2013 2014 2015 2016
Completeness of data (%
)
Standard dataset
QM dataset
TraumaRegister DGU® TR-DGU gesamt 10
© 2017 Sektion NIS of DGU / AUC
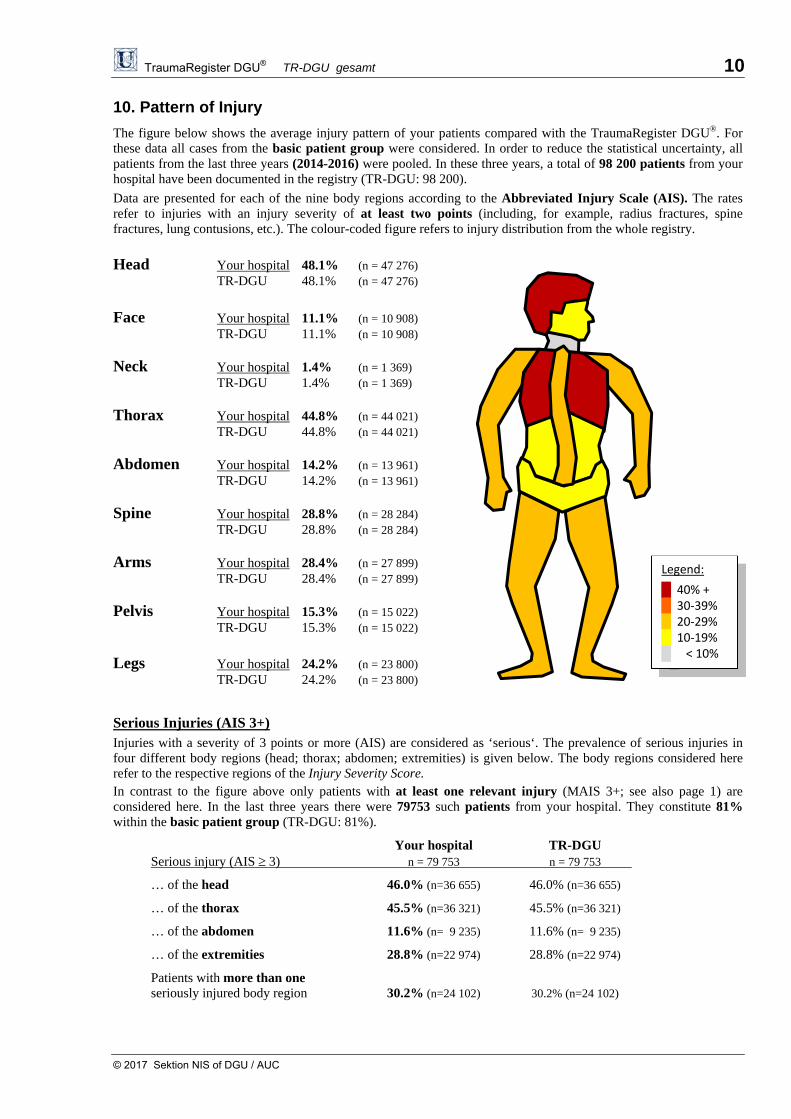
10. Pattern of Injury
The figure below shows the average injury pattern of your patients compared with the TraumaRegister DGU®. For these data all cases from the basic patient group were considered. In order to reduce the statistical uncertainty, all patients from the last three years (2014-2016) were pooled. In these three years, a total of 98 200 patients from your hospital have been documented in the registry (TR-DGU: 98 200).
Data are presented for each of the nine body regions according to the Abbreviated Injury Scale (AIS). The rates refer to injuries with an injury severity of at least two points (including, for example, radius fractures, spine fractures, lung contusions, etc.). The colour-coded figure refers to injury distribution from the whole registry.
Head Your hospital 48.1% (n = 47 276) TR-DGU 48.1% (n = 47 276)
Face Your hospital 11.1% (n = 10 908) TR-DGU 11.1% (n = 10 908) Neck Your hospital 1.4% (n = 1 369) TR-DGU 1.4% (n = 1 369) Thorax Your hospital 44.8% (n = 44 021) TR-DGU 44.8% (n = 44 021) Abdomen Your hospital 14.2% (n = 13 961) TR-DGU 14.2% (n = 13 961) Spine Your hospital 28.8% (n = 28 284) TR-DGU 28.8% (n = 28 284) Arms Your hospital 28.4% (n = 27 899) TR-DGU 28.4% (n = 27 899) Pelvis Your hospital 15.3% (n = 15 022) TR-DGU 15.3% (n = 15 022)
Legs Your hospital 24.2% (n = 23 800) TR-DGU 24.2% (n = 23 800)
Serious Injuries (AIS 3+) Injuries with a severity of 3 points or more (AIS) are considered as ‘serious‘. The prevalence of serious injuries in four different body regions (head; thorax; abdomen; extremities) is given below. The body regions considered here refer to the respective regions of the Injury Severity Score. In contrast to the figure above only patients with at least one relevant injury (MAIS 3+; see also page 1) are considered here. In the last three years there were 79753 such patients from your hospital. They constitute 81% within the basic patient group (TR-DGU: 81%).
Your hospital TR-DGU Serious injury (AIS 3) n = 79 753 n = 79 753
… of the head 46.0% (n=36 655) 46.0% (n=36 655)
… of the thorax 45.5% (n=36 321) 45.5% (n=36 321)
… of the abdomen 11.6% (n= 9 235) 11.6% (n= 9 235)
… of the extremities 28.8% (n=22 974) 28.8% (n=22 974)
Patients with more than one seriously injured body region 30.2% (n=24 102) 30.2% (n=24 102)
Legend:
█ 40% + █ 30‐39% █ 20‐29% █ 10‐19% █ < 10%
TraumaRegister DGU® Annual Report 2017 11.1
© 2017 Sektion NIS of DGU / AUC
11. General Results
Some results from the actual analysis of 2016 data from the TraumaRegister DGU® are of general interest. They will be presented here without reference to individual hospitals’ results.
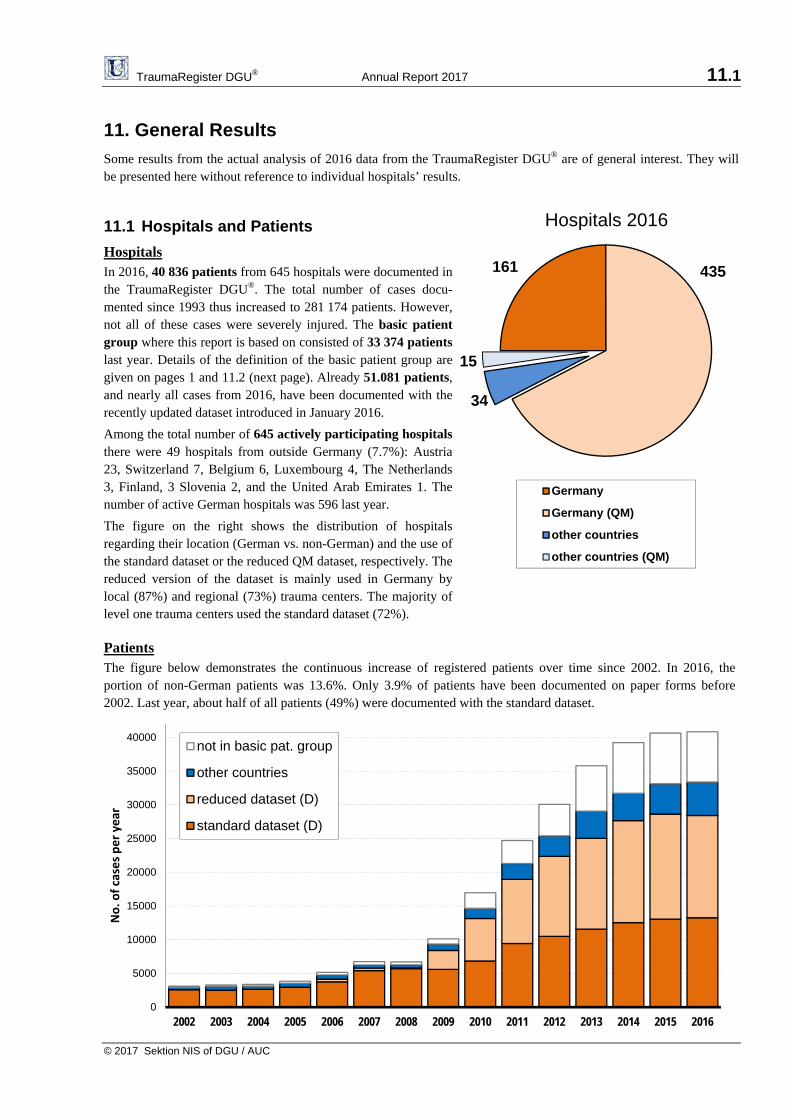
11.1 Hospitals and Patients
Hospitals In 2016, 40.836 patients from 645 hospitals were documented in the TraumaRegister DGU®. The total number of cases docu-mented since 1993 thus increased to 281.174 patients. However, not all of these cases were severely injured. The basic patient group where this report is based on consisted of 33.374 patients last year. Details of the definition of the basic patient group are given on pages 1 and 11.2 (next page). Already 51.081 patients, and nearly all cases from 2016, have been documented with the recently updated dataset introduced in January 2016.
Among the total number of 645 actively participating hospitals there were 49 hospitals from outside Germany (7.7%): Austria 23, Switzerland 7, Belgium 6, Luxembourg 4, The Netherlands 3, Finland, 3 Slovenia 2, and the United Arab Emirates 1. The number of active German hospitals was 596 last year.
The figure on the right shows the distribution of hospitals regarding their location (German vs. non-German) and the use of the standard dataset or the reduced QM dataset, respectively. The reduced version of the dataset is mainly used in Germany by local (87%) and regional (73%) trauma centers. The majority of level one trauma centers used the standard dataset (72%). Patients The figure below demonstrates the continuous increase of registered patients over time since 2002. In 2016, the portion of non-German patients was 13.6%. Only 3.9% of patients have been documented on paper forms before 2002. Last year, about half of all patients (49%) were documented with the standard dataset.
0
5000
10000
15000
20000
25000
30000
35000
40000
2002 2003 2004 2005 2006 2007 2008 2009 2010 2011 2012 2013 2014 2015 2016
No. o
f cases per year
not in basic pat. group
other countries
reduced dataset (D)
standard dataset (D)
161 435
34
15
Germany
Germany (QM)
other countries
other countries (QM)
Hospitals 2016
TraumaRegister DGU® Annual Report 2017 11.2
© 2017 Sektion NIS of DGU / AUC
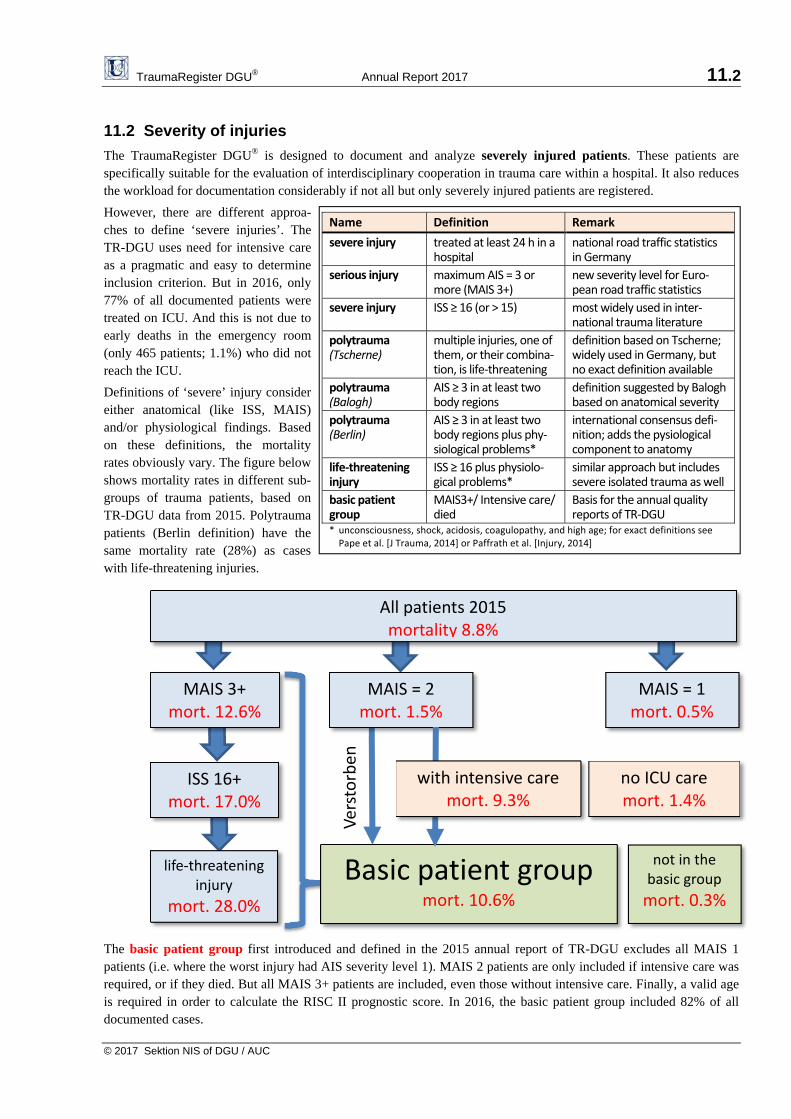
11.2 Severity of injuries
The TraumaRegister DGU® is designed to document and analyze severely injured patients. These patients are specifically suitable for the evaluation of interdisciplinary cooperation in trauma care within a hospital. It also reduces the workload for documentation considerably if not all but only severely injured patients are registered.
However, there are different approa-ches to define ‘severe injuries’. The TR-DGU uses need for intensive care as a pragmatic and easy to determine inclusion criterion. But in 2016, only 77% of all documented patients were treated on ICU. And this is not due to early deaths in the emergency room (only 465 patients; 1.1%) who did not reach the ICU.
Definitions of ‘severe’ injury consider either anatomical (like ISS, MAIS) and/or physiological findings. Based on these definitions, the mortality rates obviously vary. The figure below shows mortality rates in different sub-groups of trauma patients, based on TR-DGU data from 2015. Polytrauma patients (Berlin definition) have the same mortality rate (28%) as cases with life-threatening injuries.
The basic patient group first introduced and defined in the 2015 annual report of TR-DGU excludes all MAIS 1 patients (i.e. where the worst injury had AIS severity level 1). MAIS 2 patients are only included if intensive care was required, or if they died. But all MAIS 3+ patients are included, even those without intensive care. Finally, a valid age is required in order to calculate the RISC II prognostic score. In 2016, the basic patient group included 82% of all documented cases.
MAIS 3+ mort. 12.6%
All patients 2015mortality 8.8%
MAIS = 2mort. 1.5%
MAIS = 1mort. 0.5%
ISS 16+mort. 17.0%
life‐threatening injury
mort. 28.0%
not in the basic group
mort. 0.3%
Basic patient group mort. 10.6%
Ver
sto
rbe
n
no ICU caremort. 1.4%
with intensive care mort. 9.3%
Name Definition Remark
severe injury treated at least 24 h in a hospital
national road traffic statistics in Germany
serious injury maximum AIS = 3 or more (MAIS 3+)
new severity level for Euro‐pean road traffic statistics
severe injury ISS ≥ 16 (or > 15) most widely used in inter‐national trauma literature
polytrauma (Tscherne)
multiple injuries, one of them, or their combina‐tion, is life‐threatening
definition based on Tscherne; widely used in Germany, but no exact definition available
polytrauma (Balogh)
AIS ≥ 3 in at least two body regions
definition suggested by Balogh based on anatomical severity
polytrauma (Berlin)
AIS ≥ 3 in at least two body regions plus phy‐siological problems*
international consensus defi‐nition; adds the pysiological component to anatomy
life‐threatening injury
ISS ≥ 16 plus physiolo‐gical problems*
similar approach but includes severe isolated trauma as well
basic patient group
MAIS3+/ Intensive care/ died
Basis for the annual quality reports of TR‐DGU
* unconsciousness, shock, acidosis, coagulopathy, and high age; for exact definitions see Pape et al. [J Trauma, 2014] or Paffrath et al. [Injury, 2014]
TraumaRegister DGU® Annual Report 2017 11.3
© 2017 Sektion NIS of DGU / AUC
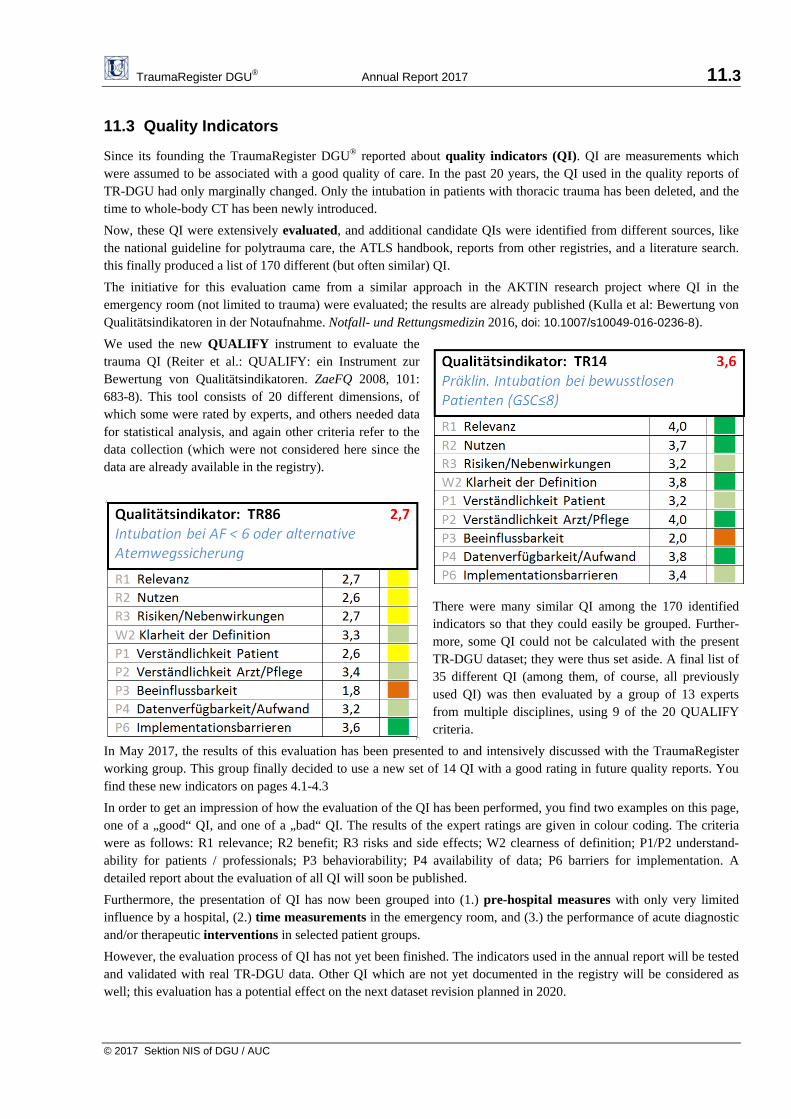
11.3 Quality Indicators
Since its founding the TraumaRegister DGU® reported about quality indicators (QI). QI are measurements which were assumed to be associated with a good quality of care. In the past 20 years, the QI used in the quality reports of TR-DGU had only marginally changed. Only the intubation in patients with thoracic trauma has been deleted, and the time to whole-body CT has been newly introduced.
Now, these QI were extensively evaluated, and additional candidate QIs were identified from different sources, like the national guideline for polytrauma care, the ATLS handbook, reports from other registries, and a literature search. this finally produced a list of 170 different (but often similar) QI.
The initiative for this evaluation came from a similar approach in the AKTIN research project where QI in the emergency room (not limited to trauma) were evaluated; the results are already published (Kulla et al: Bewertung von Qualitätsindikatoren in der Notaufnahme. Notfall- und Rettungsmedizin 2016, doi: 10.1007/s10049-016-0236-8).
We used the new QUALIFY instrument to evaluate the trauma QI (Reiter et al.: QUALIFY: ein Instrument zur Bewertung von Qualitätsindikatoren. ZaeFQ 2008, 101: 683-8). This tool consists of 20 different dimensions, of which some were rated by experts, and others needed data for statistical analysis, and again other criteria refer to the data collection (which were not considered here since the data are already available in the registry).
There were many similar QI among the 170 identified indicators so that they could easily be grouped. Further-more, some QI could not be calculated with the present TR-DGU dataset; they were thus set aside. A final list of 35 different QI (among them, of course, all previously used QI) was then evaluated by a group of 13 experts from multiple disciplines, using 9 of the 20 QUALIFY criteria.
In May 2017, the results of this evaluation has been presented to and intensively discussed with the TraumaRegister working group. This group finally decided to use a new set of 14 QI with a good rating in future quality reports. You find these new indicators on pages 4.1-4.3
In order to get an impression of how the evaluation of the QI has been performed, you find two examples on this page, one of a „good“ QI, and one of a „bad“ QI. The results of the expert ratings are given in colour coding. The criteria were as follows: R1 relevance; R2 benefit; R3 risks and side effects; W2 clearness of definition; P1/P2 understand-ability for patients / professionals; P3 behaviorability; P4 availability of data; P6 barriers for implementation. A detailed report about the evaluation of all QI will soon be published.
Furthermore, the presentation of QI has now been grouped into (1.) pre-hospital measures with only very limited influence by a hospital, (2.) time measurements in the emergency room, and (3.) the performance of acute diagnostic and/or therapeutic interventions in selected patient groups.
However, the evaluation process of QI has not yet been finished. The indicators used in the annual report will be tested and validated with real TR-DGU data. Other QI which are not yet documented in the registry will be considered as well; this evaluation has a potential effect on the next dataset revision planned in 2020.
TraumaRegister DGU® Annual Report 2017 12
© 2017 Sektion NIS of DGU / AUC
Copyright © 2017 Committee on Emergency Medicine, Intensive Care and Trauma Management of the German
Trauma Society (Sektion NIS) of the German Trauma Society (DGU, Deutschen Gesellschaft für Unfallchirurgie); Working Group on TraumaRegister (Chairmen: S. Huber-Wagner, Ch. Waydhas, R. Lefering, U. Schmucker)
and AUC - Academy of Trauma Surgery (Akademie der Unfallchirurgie GmbH)
Each publication or other public use of data from the TraumaRegister DGU® requires a prior approval by the Sektion NIS / AUC. Applications have to be sent to AUC (email: [email protected]).
Publications with data from the own hospital only do not fall under this publication guideline. Also data presented in the annual reports could be used for own publications, under the condition that the reference is mentioned.
Scientific analyses and publications with data from the TraumaRegister DGU® have to follow the actual publication guideline of the TraumaRegister DGU®. You will find this guideline on www.traumaregister-dgu.de. The term TraumaRegister DGU® is a reserved name. Imprint
Statistical analyses and preparation of the annual audit reports:
Rolf Lefering (IFOM) in cooperation with Ulrike Nienaber (AUC)
Address for correspondence:
Ulrike Nienaber Register and Research Coordination Academy of Trauma Surgery (AUC GmbH) Cologne Merheim Medical Center Ostmerheimer Str. 200, 51109 Cologne, Germany
Phone: +49 221 88 82 39 - 0 E-Mail: s u p p o r t - t r @ a u c - o n l i n e . d e
Prof. Dr. Rolf Lefering Institute for Research in Operative Medicine (IFOM) Faculty of Health, University Witten/Herdecke Ostmerheimer Str. 200 51109 Cologne, Germany
Phone: +49 221 98957-19 E-Mail: r o l f . l e f e r i n g @ u n i - w h . d e
Financial Disclosure:
The TraumaRegister DGU® receives fees from the participating hospitals collected by the AUC GmbH. The AUC GmbH, a 100% affiliate of the DGU (Deutsche Gesellschaft für Unfallchirurgie), also hosts the registry and is owner of the database. Hospitals certified as members of a German trauma network (TraumaNetzwerk DGU®) are obliged to participate in the TraumaRegister DGU®, all other hospitals participate voluntary.
In the past 10 years the registry received financial or other support from the following organizations and companies:
Private University Witten/Herdecke gGmbH and Cologne-Merheim Medical Centre (2005-2016) Novo Nordisk A/S, Bagsværd, Denmark (2003-2009) Sanofi Aventis Deutschland GmbH (2008)
Publikationen aus dem TraumaRegister DGU® 1
Publications from the TraumaRegister DGU®
Publications from the last three years (2015-2017), no abstracts; last update: August 2016
An extended list of publications from the TraumaRegister DGU® including also papers published previously is available on www.traumaregister-dgu.de.
[PDF] / [PDFprov] = this paper is available in PDF format / provisional PDF format.
The articles indicated with [PDF] could be provided to interested users on request if there is no direct access to the respective journal. In this case, please send an email to: [email protected] .
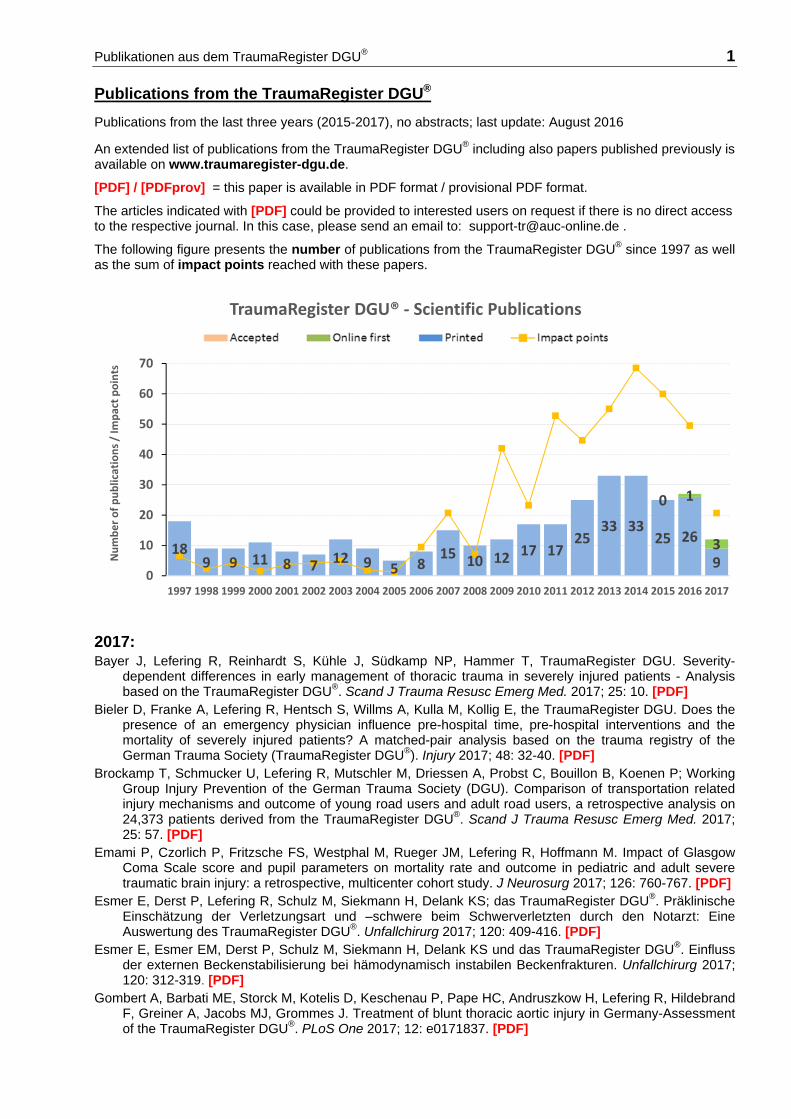
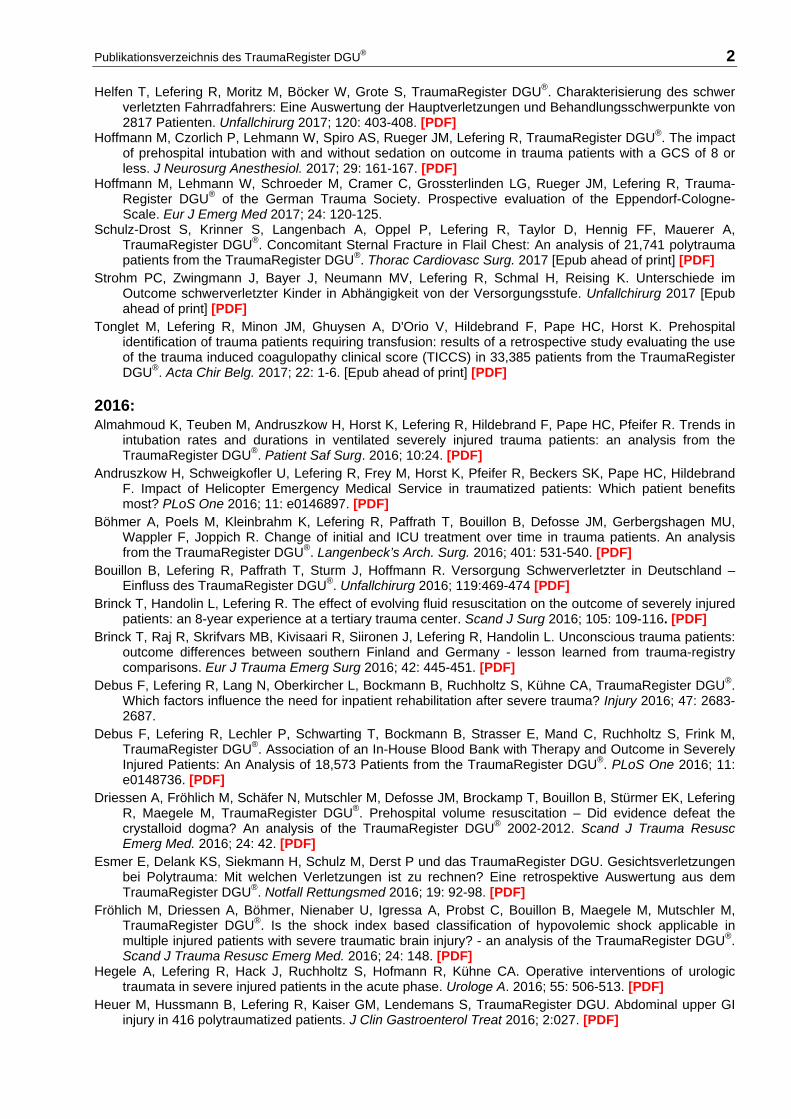
The following figure presents the number of publications from the TraumaRegister DGU® since 1997 as well as the sum of impact points reached with these papers.
2017: Bayer J, Lefering R, Reinhardt S, Kühle J, Südkamp NP, Hammer T, TraumaRegister DGU. Severity-
dependent differences in early management of thoracic trauma in severely injured patients - Analysis based on the TraumaRegister DGU®. Scand J Trauma Resusc Emerg Med. 2017; 25: 10. [PDF]
Bieler D, Franke A, Lefering R, Hentsch S, Willms A, Kulla M, Kollig E, the TraumaRegister DGU. Does the presence of an emergency physician influence pre-hospital time, pre-hospital interventions and the mortality of severely injured patients? A matched-pair analysis based on the trauma registry of the German Trauma Society (TraumaRegister DGU®). Injury 2017; 48: 32-40. [PDF]
Brockamp T, Schmucker U, Lefering R, Mutschler M, Driessen A, Probst C, Bouillon B, Koenen P; Working Group Injury Prevention of the German Trauma Society (DGU). Comparison of transportation related injury mechanisms and outcome of young road users and adult road users, a retrospective analysis on 24,373 patients derived from the TraumaRegister DGU®. Scand J Trauma Resusc Emerg Med. 2017; 25: 57. [PDF]
Emami P, Czorlich P, Fritzsche FS, Westphal M, Rueger JM, Lefering R, Hoffmann M. Impact of Glasgow Coma Scale score and pupil parameters on mortality rate and outcome in pediatric and adult severe traumatic brain injury: a retrospective, multicenter cohort study. J Neurosurg 2017; 126: 760-767. [PDF]
Esmer E, Derst P, Lefering R, Schulz M, Siekmann H, Delank KS; das TraumaRegister DGU®. Präklinische Einschätzung der Verletzungsart und –schwere beim Schwerverletzten durch den Notarzt: Eine Auswertung des TraumaRegister DGU®. Unfallchirurg 2017; 120: 409-416. [PDF]
Esmer E, Esmer EM, Derst P, Schulz M, Siekmann H, Delank KS und das TraumaRegister DGU®. Einfluss der externen Beckenstabilisierung bei hämodynamisch instabilen Beckenfrakturen. Unfallchirurg 2017; 120: 312-319. [PDF]
Gombert A, Barbati ME, Storck M, Kotelis D, Keschenau P, Pape HC, Andruszkow H, Lefering R, Hildebrand F, Greiner A, Jacobs MJ, Grommes J. Treatment of blunt thoracic aortic injury in Germany-Assessment of the TraumaRegister DGU®. PLoS One 2017; 12: e0171837. [PDF]
189 9 11 8 7 12 9 5 8
15 10 12 17 1725
33 3325 26
9
0 1
3
0
10
20
30
40
50
60
70
1997 1998 1999 2000 2001 2002 2003 2004 2005 2006 2007 2008 2009 2010 2011 2012 2013 2014 2015 2016 2017
Number of publications / Im
pact points
TraumaRegister DGU® ‐ Scientific Publications
Publikationsverzeichnis des TraumaRegister DGU® 2
Helfen T, Lefering R, Moritz M, Böcker W, Grote S, TraumaRegister DGU®. Charakterisierung des schwer verletzten Fahrradfahrers: Eine Auswertung der Hauptverletzungen und Behandlungsschwerpunkte von 2817 Patienten. Unfallchirurg 2017; 120: 403-408. [PDF]
Hoffmann M, Czorlich P, Lehmann W, Spiro AS, Rueger JM, Lefering R, TraumaRegister DGU®. The impact of prehospital intubation with and without sedation on outcome in trauma patients with a GCS of 8 or less. J Neurosurg Anesthesiol. 2017; 29: 161-167. [PDF]
Hoffmann M, Lehmann W, Schroeder M, Cramer C, Grossterlinden LG, Rueger JM, Lefering R, Trauma-Register DGU® of the German Trauma Society. Prospective evaluation of the Eppendorf-Cologne-Scale. Eur J Emerg Med 2017; 24: 120-125.
Schulz-Drost S, Krinner S, Langenbach A, Oppel P, Lefering R, Taylor D, Hennig FF, Mauerer A, TraumaRegister DGU®. Concomitant Sternal Fracture in Flail Chest: An analysis of 21,741 polytrauma patients from the TraumaRegister DGU®. Thorac Cardiovasc Surg. 2017 [Epub ahead of print] [PDF]
Strohm PC, Zwingmann J, Bayer J, Neumann MV, Lefering R, Schmal H, Reising K. Unterschiede im Outcome schwerverletzter Kinder in Abhängigkeit von der Versorgungsstufe. Unfallchirurg 2017 [Epub ahead of print] [PDF]
Tonglet M, Lefering R, Minon JM, Ghuysen A, D'Orio V, Hildebrand F, Pape HC, Horst K. Prehospital identification of trauma patients requiring transfusion: results of a retrospective study evaluating the use of the trauma induced coagulopathy clinical score (TICCS) in 33,385 patients from the TraumaRegister DGU®. Acta Chir Belg. 2017; 22: 1-6. [Epub ahead of print] [PDF]
2016: Almahmoud K, Teuben M, Andruszkow H, Horst K, Lefering R, Hildebrand F, Pape HC, Pfeifer R. Trends in
intubation rates and durations in ventilated severely injured trauma patients: an analysis from the TraumaRegister DGU®. Patient Saf Surg. 2016; 10:24. [PDF]
Andruszkow H, Schweigkofler U, Lefering R, Frey M, Horst K, Pfeifer R, Beckers SK, Pape HC, Hildebrand F. Impact of Helicopter Emergency Medical Service in traumatized patients: Which patient benefits most? PLoS One 2016; 11: e0146897. [PDF]
Böhmer A, Poels M, Kleinbrahm K, Lefering R, Paffrath T, Bouillon B, Defosse JM, Gerbergshagen MU, Wappler F, Joppich R. Change of initial and ICU treatment over time in trauma patients. An analysis from the TraumaRegister DGU®. Langenbeck’s Arch. Surg. 2016; 401: 531-540. [PDF]
Bouillon B, Lefering R, Paffrath T, Sturm J, Hoffmann R. Versorgung Schwerverletzter in Deutschland – Einfluss des TraumaRegister DGU®. Unfallchirurg 2016; 119:469-474 [PDF]
Brinck T, Handolin L, Lefering R. The effect of evolving fluid resuscitation on the outcome of severely injured patients: an 8-year experience at a tertiary trauma center. Scand J Surg 2016; 105: 109-116. [PDF]
Brinck T, Raj R, Skrifvars MB, Kivisaari R, Siironen J, Lefering R, Handolin L. Unconscious trauma patients: outcome differences between southern Finland and Germany - lesson learned from trauma-registry comparisons. Eur J Trauma Emerg Surg 2016; 42: 445-451. [PDF]
Debus F, Lefering R, Lang N, Oberkircher L, Bockmann B, Ruchholtz S, Kühne CA, TraumaRegister DGU®. Which factors influence the need for inpatient rehabilitation after severe trauma? Injury 2016; 47: 2683-2687.
Debus F, Lefering R, Lechler P, Schwarting T, Bockmann B, Strasser E, Mand C, Ruchholtz S, Frink M, TraumaRegister DGU®. Association of an In-House Blood Bank with Therapy and Outcome in Severely Injured Patients: An Analysis of 18,573 Patients from the TraumaRegister DGU®. PLoS One 2016; 11: e0148736. [PDF]
Driessen A, Fröhlich M, Schäfer N, Mutschler M, Defosse JM, Brockamp T, Bouillon B, Stürmer EK, Lefering R, Maegele M, TraumaRegister DGU®. Prehospital volume resuscitation – Did evidence defeat the crystalloid dogma? An analysis of the TraumaRegister DGU® 2002-2012. Scand J Trauma Resusc Emerg Med. 2016; 24: 42. [PDF]
Esmer E, Delank KS, Siekmann H, Schulz M, Derst P und das TraumaRegister DGU. Gesichtsverletzungen bei Polytrauma: Mit welchen Verletzungen ist zu rechnen? Eine retrospektive Auswertung aus dem TraumaRegister DGU®. Notfall Rettungsmed 2016; 19: 92-98. [PDF]
Fröhlich M, Driessen A, Böhmer, Nienaber U, Igressa A, Probst C, Bouillon B, Maegele M, Mutschler M, TraumaRegister DGU®. Is the shock index based classification of hypovolemic shock applicable in multiple injured patients with severe traumatic brain injury? - an analysis of the TraumaRegister DGU®. Scand J Trauma Resusc Emerg Med. 2016; 24: 148. [PDF]
Hegele A, Lefering R, Hack J, Ruchholtz S, Hofmann R, Kühne CA. Operative interventions of urologic traumata in severe injured patients in the acute phase. Urologe A. 2016; 55: 506-513. [PDF]
Heuer M, Hussmann B, Lefering R, Kaiser GM, Lendemans S, TraumaRegister DGU. Abdominal upper GI injury in 416 polytraumatized patients. J Clin Gastroenterol Treat 2016; 2:027. [PDF]
Publikationsverzeichnis des TraumaRegister DGU® 3
Hilbert-Carius P, Hofmann GO, Lefering R, Stuttmann R, Struck MF; TraumaRegister DGU®. Clinical presen-tation and blood gas analysis of multiple trauma patients for prediction of standard coagulation parameters at emergency department arrival. Anaesthesist 2016; 65: 274-280. [PDF]
Huber S, Crönlein M, von Matthey F, Hanschen M, Seidl F, Kirchhoff C, Biberthaler P, Lefering R, Huber-Wagner S, TraumaRegister DGU®. Effect of private versus emergency medical systems transportation in trauma patients in a mostly physician based system - a retrospective multicenter study based on the TraumaRegister DGU. Scand J Trauma Resusc Emerg Med 2016; 24: 60. [PDF]
Kulla M, Maier J, Bieler D, Lefering R, Hentsch S, Lampl L, Helm M. Zivile Explosionstraumata - ein unter-schätztes Problem? Ergebnisse einer retrospektiven Analyse aus dem TraumaRegister DGU®. Unfallchirurg 2016; 119: 843-853. [PDF]
Lech L, Jerkku T, Kanz KG, Wierer M, Mutschler W, Koeppel TA, Lefering R, Banafsche R. Bedeutung des Gefäßtraumas für die Schwerverletztenversorgung - Einfluss auf Verlauf und Mortalität. Zentralbl. Chir. 2016; 141: 526-532. [PDF]
Lefering R. Using data from registries like the TraumaRegister DGU® for effectiveness evaluations. Z Evid Fortbild Qual Gesundhwes. 2016; 112 Suppl 1: 11-15. [PDF]
Lefering R, Mahlke L, Franz D. The cost estimator in the TraumaRegister DGU. Unfallchirurg 2016 [Epub ahead of print].
Lustenberger T, Walcher F, Lefering R, Schweigkofler U, Wyen H, Marzi I, Wutzler S, TraumaRegister DGU®. The Reliability of the Pre-hospital physical examination of the pelvis: A retrospective, multicenter study. World J Surg. 2016; 40: 3073-3079. [PDF]
Schulz-Drost S, Oppel P, Grupp S, Krinner S, Langenbach A, Lefering R, Mauerer A. Knöcherne Verletzung der Brustwand beim Polytrauma: Inzidenz, Begleitverletzungen, Verlauf und Outcome. Unfallchirurg 2016; 119: 1023-1030. [PDF]
Wafaisade A, Lefering R, Bouillon B, Böhmer AB, Gäßler M, Ruppert M. Prehospital administration of tranexamic acid in trauma patiens. Crit Care 2016; 20: 143. [PDF]
Weber CD, Horst K, Lefering R, Hofman M, Dienstknecht T, Pape HC, FACS, TraumaRegister DGU. Major trauma in winter sports: an international trauma database analysis. Eur J Trauma Emerg Surg 2016; 42: 741-747. [PDF]
Weber CD, Lefering R, Dienstknecht T, Kobbe P, Sellei RM, Hildebrand F, Pape HC, TraumaRegister DGU®. Classification of soft-tissue injuries in open femur fractures: Relevant for systemic complications? J Trauma Acute Care Surg. 2016; 81: 824-833. [PDF]
Weuster M, Brück A, Lippross S, Menzdorf L, Fitschen-Oestern S, Behrendt P, Iden T, Höcker J, Lefering R, Seekamp A, Klüter T, TraumaRegister DGU®. Epidemiology of accidental hypothermia in polytrauma patients: An analysis of 15,230 patients of the TraumaRegister DGU®. J Trauma Acute Care Surg. 2016; 81: 905-912. [PDF]
Weuster M, Klueter T, Hofgaertner C, Beherndt P, Menzdrof L, Lefering R, Fitschen-Oestern S, Seekamp A, Lippross S, TraumaRegister DGU®. Epidemiology of cervical spine lesions in the multiply injured patient – recent data of the Traumaregister DGU®. World J Trauma Critical Care Med 2016; 4: 10-23. [PDF]
Zwingmann J, Lefering R, Feucht M, Südkamp NP, Strohm PC, Hammer T. Outcome and predictors for successful resuscitation in the emergency room of adult patients in traumatic cardiorespiratory arrest. Crit Care 2016; 20: 282. [PDF]
2015: Brinck T, Handolin L, Paffrath T, Lefering R. Trauma registry comparison: six-year results in trauma care in
Southern Finland and Germany. Eur J Trauma Emerg Surg 2015; 41: 509-516. [PDF] Burkhardt M, Nienaber U, Krause J, Pizanis A, Moersdorf P, Culemann U, Aghayev E, Paffrath T, Pohle-
mann T, Holstein JH, Beckenregister DGU, TraumaRegister DGU®. Das komplexe Beckentrauma. Matching des Beckenregisters DGU mit dem TraumaRegister DGU®. Unfallchirurg 2015; 118: 957-962. [PDF]
Debus F, Lefering R, Frink M, Kühne C, Mand C, Ruchholtz R. Das Polytrauma von Kindern und Jugend-lichen. Unfallchirurg 2015; 118: 432-38. [PDF]
Debus F, Lefering R, Frink M, Kühne CA, Mand C, Bücking B, Ruchholtz S, TraumaRegister DGU®. Anzahl der Schwerverletzten in Deutschland - eine retrospektive Analyse aus dem TraumaRegister DGU® der Deutschen Gesellschaft für Unfallchirurgie (DGU). Dtsch. Arztebl. 2015; 112: 823–829. [PDF] – siehe auch Erratum
Debus F, Lefering R, Frink M, Kühne CA, Mand C, Bücking B, Ruchholtz S. Numbers of Severely Injured Patients in Germany. Dtsch Arztebl Int. 2015; 112: 823-829. [PDF] – siehe auch Erratum
Delhey P, Huber S, Hanschen M, Häberle S, Trentzsch H, Deiler S, van Griensven M, Biberthaler P, Lefering R, Huber-Wagner S, TraumaRegister DGU®. Significance of traumatic macroamputation in severely injured patients - an analysis of the TraumaRegister DGU®. Shock 2015; 43: 233-237. [PDF]
Publikationsverzeichnis des TraumaRegister DGU® 4
Hanschen M, Kanz KG, Kirchhoff C, Khalil PN, Wierer M, van Griensven M, Laugwitz KL, Biberthaler P, Lefering R, Huber-Wagner S, TraumaRegister DGU®. Blunt cardiac injury in the severely injured - A retrospective multicentre study. PLOS ONE 2015; 10: e0131362. [PDF]
Heuer M, Hussmann B, Lefering R, Kaiser GM, Eicker C, Guckelberger O, Lendemanns S, TraumaRegister DGU®. Prehospital fluid management of abdominal organ trauma patients: a matched pair analysis. Langenbecks Arch Surg. 2015; 400: 371-379. [PDF]
Hilbert P, Hoffmann GO, Lefering R, Struck MF. Schockraumhämoglobin - Prädiktor für eine Gerinnungs-störung beim Traumapatienten. Unfallchirurg 2015; 118: 601-606. [PDF]
Hilbert-Carius P, Hofmann GO, Lefering R, Stuttmann R, Bucher M, Goebel P, Gronwald GH. Whole-body-CT in severely injured children. Results of retrospective, multicenter study with patients from the TraumaRegister DGU®. Klin Padiatr. 2015; 227: 206-212. [PDF prov.]
Hildebrand F, Lefering R, Andruszkow H, Zelle BA, Barkatali BM, Pape HC. Development of a scoring system based on conventional parameters to assess polytrauma patients: PolyTrauma Grading Score (PTGS). Injury 2015; 46 Suppl 4: 93-98. [PDF]
Horst K, Hildebrand F, Kobbe P, Pfeifer R, Lichte P, Andruszkow H, Lefering R, Pape HC. Detecting severe injuries of the upper body in multiple trauma patients. J Surg Research 2015; 199: 629-634. [PDF]
Hussmann B, Heuer M, Lefering R, Touma A, Schoeneberg C, Keitel J, Lendemans S. Prehospital Volume Therapy as an Independent Risk Factor after Trauma. BioMed Research International 2015; 2015: 354367. [PDF]
Lichte P, Kobbe P, Almahmoud K, Pfeifer R, Andruszkow H, Hildebrand F, Lefering R, Pape HC, Trauma-Register DGU®. Post-traumatic thrombo-embolic complications in polytrauma patients. Int Orthop 2015; 39: 947-954. [PDF prov.]
Lichte P, Andruszkow H, Kappe M, Horst K, Pishnamaz M, Hildebrand F, Lefering R, Pape HC, Kobbe P; TraumaRegister DGU®. Increased in-hospital mortality following severe head injury in young children: results from a nationwide trauma registry. Eur J Med Res. 2015; 20: 65. [PDF]
Raj R, Brinck T, Skrifvars MB, Kivisaari R, Siironen J, Lefering R, Handolin L. Validation of the revised injury severity classification score in patients with moderate-to-severe traumatic brain injury. Injury 2015; 46: 86-93. [PDF]
Reith G, Lefering R, Wafaisade A, Hensel KO, Paffrath T, Bouillon B, Probst C and TraumaRegister DGU®. Injury pattern, outcome and characteristics of severely injured pedestrian. Scand J Trauma Resusc Emerg Med 2015; 23: 56. [PDF]
Schweigkofler U, Reimertz C, Lefering R, Hoffmann R, TraumaRegister DGU®. Bedeutung der Luftrettung für die Schwerverletztenversorgung. Unfallchirurg 2015; 118: 240-244. [PDF]
Stephan K, Huber S, Häberle S, Kanz KG, Bühren V, van Griensven M, Meyer B, Biberthaler P, Lefering R, Huber-Wagner S; TraumaRegister DGU. Spinal cord injury-incidence, prognosis, and outcome: an analysis of the TraumaRegister DGU. Spine J. 2015; 15: 1994-2001. [PDF prov.]
Topp T, Lefering R, Lopez CL, Ruchholtz S, Ertel W, Kühne CA. Radiologic diagnostic procedures in severely injured patients - is only whole-body multislice computed tomography the answer? Int J Emerg Med 2015; 8: 3. [PDF]
Trentzsch H, Lefering R, Nienaber U, Kraft R, Faist E, Piltz S, TraumaRegister DGU®. The role of biological sex in severely traumatized patients on outcomes: A Matched-pair analysis. Ann Surg 2015; 261: 774-780. [PDF]
Wafaisade A, Paffrath A, Lefering R, Ludwig C, Fröhlich M, Mutschler M, Banerjee M, Bouillon B, Probst C and Section NIS. Patterns of early resuscitation associated with mortality after penetrating injuries. Br J Surg 2015; 102: 1220-1228. [PDF]
Wutzler S, Lefering R, Wafaisade A, Maegele M, Walcher F, Wyen H, Marzi I, Laurer H, TraumaRegister DGU®. Aggressive operative treatment of isolated blunt traumatic brain injury in the elderly is associated with favourable outcome Injury. Injury 2015; 46: 1706-1711. [PDF]
Zacher M, Kanz KG, Hanschen M, Häberle S, van Griensven M, Lefering R, Bühren V, Biberthaler P, Huber-Wagner S, TraumaRegister DGU®. Association between volume of severely injured patients and mortality in German trauma hospitals. Br J Surg 2015: 102: 1213-1219. [PDF]
Zwingmann J, Lefering R, TraumaRegister DGU, Bayer J, Reising K, Südkamp NP, Strohm PC. Outcome and risk factors in children after traumatic cardiac arrest and successful resuscitation. Resuscitation 2015; 96: 59-65. [PDF]
TraumaRegister DGU® Appendix: Abbreviations
© 2017 Sektion NIS of DGU / AUC
List of abbreviations used in the report
Abbreviations
AIS Abbreviated Injury Scale ASA American Society of Anaesthesiologists AUC AUC – Academy of Trauma Surgery (Akademie der Unfallchirurgie GmbH) BE Base Excess CT Computed tomography CCT Cranial computed tomography DGU German Trauma Society (Deutsche Gesellschaft für Unfallchirurgie) FFP Fresh Frozen Plasma GCS Glasgow Coma Scale GOS Glasgow Outcome Scale h Hour Hb Hemoglobine (or Haemoglobine) ICU Intensive Care Unit INR International Normalized Ratio ISS Injury Severity Score M Mean value MAIS Maximum AIS severity score min Minute ml Milliliter MOF Multiple Organ Failure NACA National Advisory Committee for Aeronautics NIS Committee on Emergency Medicine, Intensive Care and Trauma Management of the German Trauma Society (Sektion NIS of DGU) NISS New Injury Severity Score OP Operation OF Organ Failure PDF Portable Document Format pRBC Packed red blood cells PTT Partial thromboplastin time (in sec) QI Quality indicator QM Quality management RISC Revised Injury Severity Score (prognostic score) RISC II Revised Injury Severity Score, version II SAPS Simplified Acute Physiology Score sBP Systolic blood pressure sec Seconds SD Standard deviation SMR Standardized Mortality Ratio SOFA Sequential Organ Failure Assessment TBI Traumatic brain injury TPZ Thromboplastin timet; Quick’s value TR-DGU TraumaRegister DGU® TRISS Trauma and Injury Severity Score (prognostic score)