Embed Size (px)
Citation preview

ANNUAL REPORT 2017
A N N U A L R E P O R T
2017for the year ended March 31, 2017
0818_JSW_AR2017_FH.indd a-b0818_JSW_AR2017_FH.indd a-b 2017/09/14 16:072017/09/14 16:07

Contents
Forward-looking statements The performance forecasts included in this report are judgments
based on the information that was available to the JSW Group at the
time this report was prepared and the actual results may differ sig-
nificantly from these forecasts due to a variety of factors.
ProfileIn 1907, the Japanese government launched a joint venture for the purpose of domestic weapons pro-
duction in Muroran, Hokkaido—later to become a major steel manufacturing center—consisting of two
British firms (W.G. Armstrong and Vickers) and one Japanese company. That was the birth of The Japan
Steel Works, Ltd. (JSW).
After World War II, the company turned its sophisticated technologies and considerable experience
to meeting peacetime needs. Continuing to produce high-quality steel, it developed machinery making
use of this steel and endeavored to open up new business fields. In addition to heavy and chemical
industries such as electric power, steel, shipbuilding, and petrochemicals, the company broadened into
areas from automobiles to electrical machinery and information equipment, earning a worldwide repu-
tation as an integrated producer of steel materials and machinery.
Today, having grown into a comprehensive materials provider and manufacturer of mechatronics
products, JSW is meeting society’s needs at the forefront. In the steel and energy products business, we
are serving the needs of the energy industry in areas such as electrical power generation, oil refining,
natural gas, and wind power generation. In the industrial machinery products business, we supply
equipment for manufacturing and processing plastic materials, along with a diverse range of products
in areas from information technology to defense.
Financial Highlights (Consolidated)The Japan Steel Works, Ltd. and Consolidated Subsidiaries
Years ended March 31, 2017, 2016 and 2015
Millions of Yen
Thousands of
U.S. dollars
FY2014 FY2015 FY2016 FY2016
For the year
Net sales ¥194,674 ¥223,301 ¥212,469 $1,893,832
Operating income 7,517 14,423 12,340 109,992
Profi t (loss) attributable to owners of parent (5,327) (16,600) (4,968) (44,282)
At year-end
Total assets 319,667 293,138 275,315 2,454,007
Total net assets 138,234 111,340 107,587 958,971
Ratios
ROE −3.9% −13.5% –4.6%
Equity ratio 42.7% 37.5% 38.6%
Amounts per share (yen and U.S. dollars)
Profi t (loss) ¥(71.94) ¥(226.62) ¥(67.61) $(0.60)
Cash dividends applicable to the year 4.00 5.00 15.00 0.13
Notes 1: Amounts in U.S. dollars are presented solely for convenience and based on the rate of ¥112.19 = US$1.00, the rate of exchange on March 31, 2017. 2: The fi gures for 2015 have been revised due to changes in the fi nancial results. 3: The Company conducted a 1-for-5 reverse common stock split eff ective on October 1, 2016. For the sake of simplicity, the profi t (loss) per share in the table above are calculated using the number of shares after the reverse stock split.
01020408101214162022
2326325253
Financial Highlights (Consolidated)
Message from the President
Progress of JGP2017
Our Business Domains
Review of Operations
Special Feature
Research and Development
Corporate Governance
Environmental Management
Board of Directors, Audit & Supervisory Board Members and Executive Officers
Financial Section
Consolidated Financial Statements
Notes to Consolidated Financial Statements
Corporate Directory
Network
220,
653
8,28
1
111.
66
188,
719
5,52
7
74.5
8
194,
674
(5,3
27)
(4,9
68)
(71.
94)
223,
301
212,
469
(16,
600)
(226
.62)
(67.
61)
2012 (FY) (FY) (FY)2012 20122013 2013 20132014 2014 20142015 2015 20152016 2016 2016
240,000 20,000 120.0
180,000 10,000 60.0
120,000 0 0
60,000 −10,000 −60.0
0 −20,000 −240.0
Net Sales
Millions of yen
Profit (loss) attributableto owners of parentMillions of yen
Profit (loss)
Yen
01
Financia l H ighl ights (Consol idated)
0818_JSW_AR2017_FH.indd c-010818_JSW_AR2017_FH.indd c-01 2017/09/14 16:072017/09/14 16:07
Message from the President
Overview of Fiscal 2016Business performance
In fi scal 2016, ended March 31, 2017, overseas economies were aff ected by economic slowdown in China, stagnation in emerging nations stemming from falling commodity prices, and fi nancial turmoil following the United Kingdom’s decision to exit the European Union. Owing partly to buoyant eco-nomic sentiment following the U.S. presidential election, however, the world economy maintained an overall recovery tone. The Japanese economy also recovered moderately on the back of healthy corpo-rate earnings and improved worker recruitment and income conditions. With respect to the JSW Group’s operating environment, the Industrial Machinery Products Business segment performed well for the most part, thanks to increased demand for plastics machinery on the back of growing worldwide demand for plastic raw materials and plastic products, especially in the automotive sector. However, conditions remained diffi cult for the Steel and Energy Products Business segment, refl ecting a prolonged slump in demand for products used in nuclear power plants and the rise of manufacturers from emerging nations.
Fiscal 2016 was the second year of the Group’s medium-term management plan, titled JGP2017, which was formulated in May 2015 and covers the three-year period to fi scal 2017. The slogan of the plan is “Advancing toward Top Global & Niche Corporate Group,” and its aim is to achieve the top share at key points in customer value chains. During the year, we advanced our business activities according to three basic policies: (1) increase the profi tability of existing businesses, (2) foster new products and businesses and make them competitive as soon as possible, and (3) reinforce Group management and promote alliances. For the year, total orders amounted to ¥177,585 million (US$1,582 million), down 16.1% from the previous year. This was due to declines in orders generated by both the Steel and Energy Products Busi-ness and Industrial Machinery Products Business segments. Net sales fell 4.9%, to ¥212,469 million (US$1,893 million), due to lower sales in the Steel and Energy Products Business segment, which con-trasted with higher sales in the Industrial Machinery Products Business segment. Operating income fell 14.4%, to ¥12,340 million (US$109 million), and ordinary income was down 14.3%, to ¥12,111 million (US$107 million). For the year, we reported a loss attributable to owners of parent of ¥4,968 million (US$44 million), from ¥16,600 million (US$147 million) in the previous year. This was due to an impair-ment loss of ¥17,800 million (US$158 million) on fi xed assets owned by the Muroran Plant, arising from a prolonged delay in the recovery of the Steel and Energy Products Business segment’s operating per-formance, following an impairment loss of ¥35,400 million (US$315 million) in the previous fi scal year. Looking ahead, the world economy is expected to continue recovering moderately, driven by the U.S., European, and other industrialized economies. By contrast, various uncertain factors remain, such as declines in crude oil and other resource prices and fl uctuations in fi nancial markets impacted by political trends in Europe. In Japan, we expect the economy to remain on a moderate recovery path, but the outlook is unpredictable due to China’s slowdown, the eff ect of U.S. trade policies on exporting companies, and geopolitical risks in East Asia. Under these circumstances, the JSW Group’s Steel and Energy Products Business segment will con-tinue facing a diffi cult business environment amid a prolonged delay in demand recovery for electric power and nuclear power products. To achieve a return to profi tability, we will continue rebuilding our business foundation and fostering new businesses. In the Industrial Machinery Products Business seg-ment, we will expedite business expansion by pursuing growth opportunities, especially in China and other overseas markets. Our consolidated forecasts for fi scal 2017 are: total orders of ¥200.0 billion (US$1,782 million), net sales of ¥205.0 billion (US$1,827 million), operating income of ¥12.5 billion (US$111 million), ordinary income of ¥12.5 billion (US$111 million), and profi ts attributable to owners of parent of ¥8.0 billion (US$71 million).
We look forward to the renewed guidance and support of all shareholders.
June 2017
Naotaka MiyauchiRepresentative Director & President
0302
M essage f rom the Pres ident
0302
0818_JSW_AR2017_FH.indd 02-030818_JSW_AR2017_FH.indd 02-03 2017/09/14 16:072017/09/14 16:07

Progress of JGP2017 (JSW GROUP GROWTH PLAN FY2015-2017)
Corporate Vis ion
Steel and Energy Products Segment
Industrial Machinery Products Segment
Strict management control based on Action Plan (implement PDCA)
Basic Pol ic ies Numerical Targets
Policy 1
Policy 2
Policy 3
Defensive managementAchieve steady growth and prepare for renewed growth after JGP2017
Off ensive managementIdentify growth opportunities and accelerate business expansion
Renewed challenge: Net sales of ¥250 billion in FY 2020
Net Sales
¥194.6
FY2014
FY2015(Actual)
FY2015(Actual)
FY2016(Actual)
FY2016(Actual)
FY2017(Plan)
FY2017(Forecast)
FY2017(Plan)
FY2017(Forecast)
FY2020
FY2020
FY2017 FY2020
More than
¥220.0
More than
¥250.0
Increase profi tability of existing businesses• Pursue product & service diff erentiation• Strengthen total-cost competitiveness• Develop service & solution businesses• Reinforce initiatives in growth markets
Foster new products & businesses and make them competitive as soon as possible• Promote businesses based on
core management resources• Optimize timeframe and systems for
promoting new products & businesses
Reinforce Group management and promote alliances
Net Sales
¥74.8Operating Income
¥0.6
Net Sales
¥144.3Operating Income
¥12.3
Net Sales
¥51.2Operating Income
−¥2.7
Net Sales
¥159.3Operating Income
¥15.1
Net Sales
≧ ¥60.0Operating Income
≧ ¥0
Net Sales
≧ ¥45.2Operating Income
−¥1.1
Net Sales
≧ ¥158.0Operating Income
≧ ¥14.0
Net Sales
¥158.0Operating Income
¥15.0
Operating income
≧ ¥20.0ROA
≧ 4%ROE
≧ 10%
Operating income
¥7.5
* The ROE target has been revised upwards.
(Billions of yen)
(Billions of yen)
(Billions of yen)
Business restructuring
Continuousgrowth
• Expand new products
• Review unprofi table businesses
• Strengthen “profi table products”
• Secure volume of “operable products”
• Promote cost-reduction measures• Rationalize facilities
• Reallocate personnel
Review business domains
Expand business domainsPursue strategic investments
Reduce invested capital
Business Strategies
i
Operating income
≧ ¥13.0ROA
≧ 3%ROE
≧ 8%
• Expand sales of J-ADS series
• Expand thin-fi lm coating business
• Strengthen service businesses
• Acquired South Korea’s SM PLATEK
• Acquired “simultaneous biaxial stretching machine business” for fi lm and sheet manufacturing equipment
• Reinforce personnel
• Promote strategic alliances
• Reinforce production capacity at
Hiroshima and Yokohama Plants
“Advancing toward Top Global & Niche Corporate Group”Aiming to achieve top share at key points in customer value chains
0504
P R O G R E S S O F J G P 2017
0818_JSW_AR2017_FH.indd 04-050818_JSW_AR2017_FH.indd 04-05 2017/09/14 16:072017/09/14 16:07
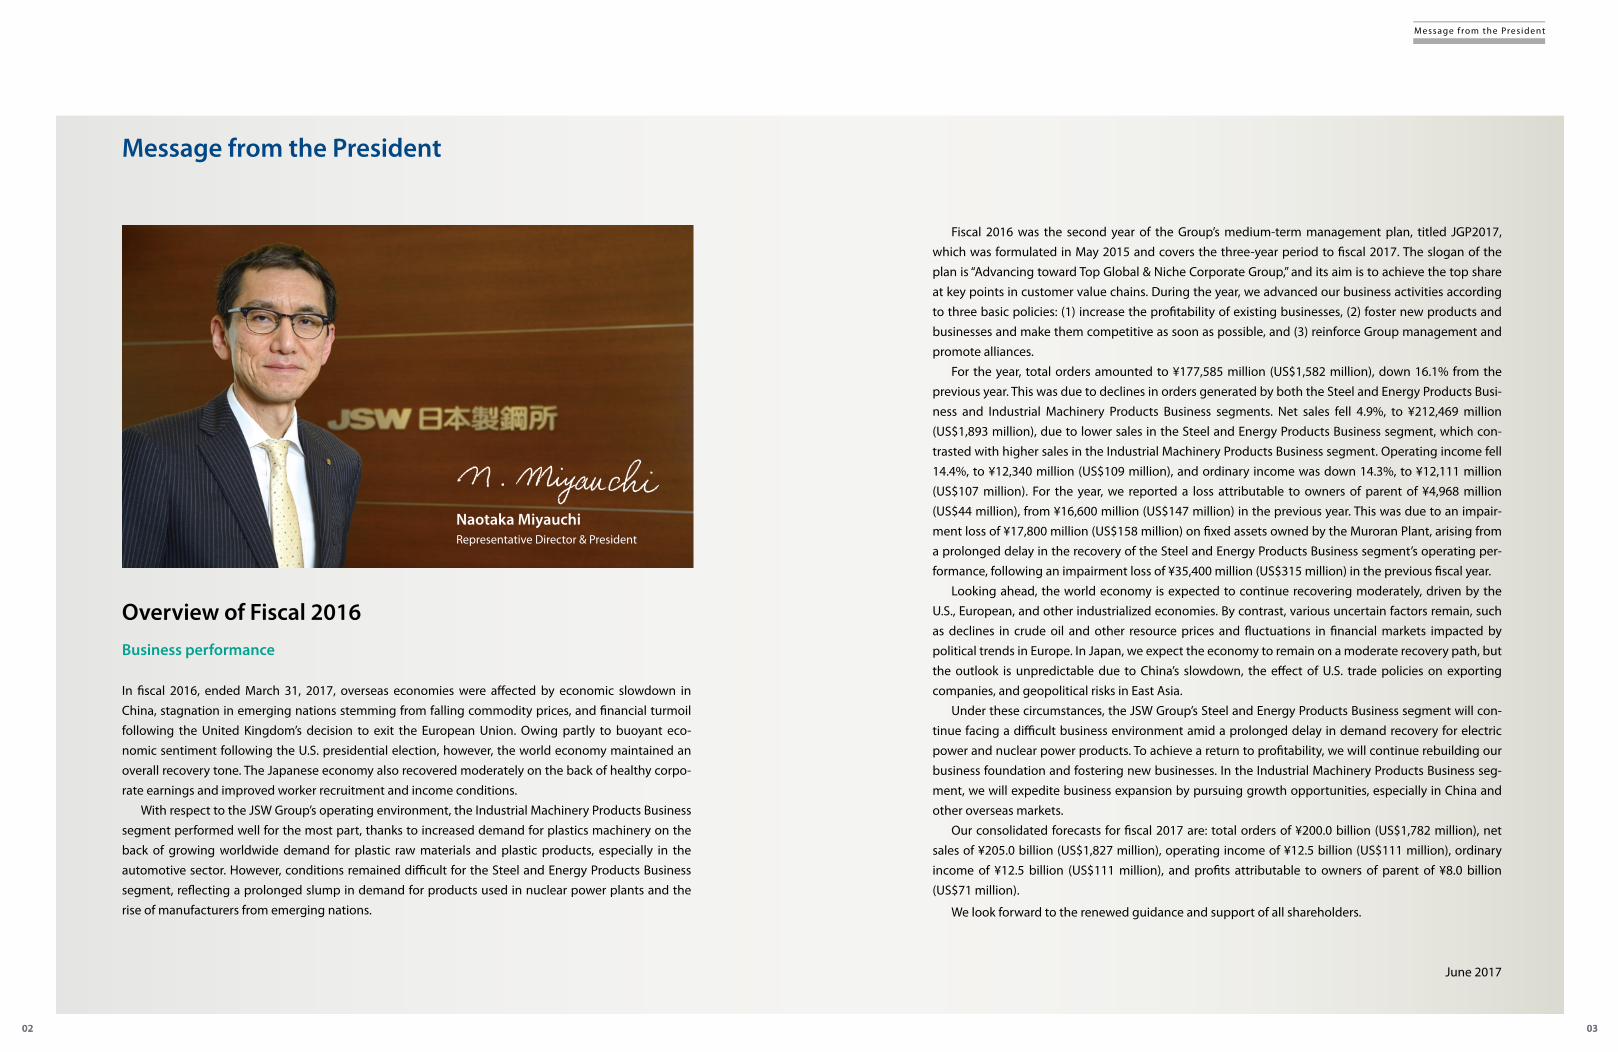
New fields and product groups of JSW Group Seek maximum synergistic benefi ts
JGP2017: Basic Strategies
Foster new produc ts and businesses and make them competit ive as soon as poss ible
Reinforce Group management and promote a l l iances
Developing operations in growth fi elds, primarily automotive, making the most of unique techniques
TELECOMMUNICATION, FPD, SENSOR
AIRCRAFT FIELD
NEW ENERGY
DEFENSE SYSTEMS
AUTOMOBILE
Low-pressure hydrogen storage tank
Laser annealing equipment
High-pressure hydrogen storage
Equipment applied laser technology
Manufacturing equipment for gallium nitride crystalsHydrogen station
Fine foam injection molding machines
New defense systems
Thin-fi lm deposition equip-ment for fl at panel display
Crystal device
Rubber manufacturing equipment
Aircraft components
Film processing equipment
CFRP processing equipment
Initiatives and Results from FY2015 to FY2016 Initiatives and Results from FY2015 to FY2016
Reinforce Group management Reallocation at Hiroshima Plant factory(commenced in FY2015 → completed in fi rst half of FY2016)
Continued to press ahead with Muroran Restructuring Project(improved production effi ciency, etc.)
Increased profi tability at affi liates(strengthened and expanded subsidiaries for external sales)
Made Meiki Co., Ltd. a wholly-owned subsidiary
Strengthened corporate governance(formulated and executed policy; strengthened the manage-ment of affi liates)
Promote alliancesFilm and sheet equipment
Acquired simultaneous biaxial stretching technologies
Compounding twin-screw extruders Acquired South Korea’s SM PLATEK Co., Ltd.
Molding machines Joint development of small machinery with Toyo Machinery & Metal Co., Ltd.(started to be sold in October 2016)
Large cast and forged steel products Alliance with India’s LTSSHF Joint venture with Brazil’s Gerdau (established in January 2017)
Increase profi tability of existing businesses
Foster new products and businesses and make them
competitive as soon as possible
Continue and strengthen furtherd strength Expand and evolve furtherand evolv
Reallocation at Hiroshima Plant factory and acquisition of the simultaneous biaxial stretching machine business have contributed greatly to the expansion of our Industrial Machinery Products Business. At the same time, we are working to improve the profi tability of affi liated companies to bolster consolidated revenue growth. Going forward, we will continue strengthening, expanding, and evolving these eff orts to maximize synergies.
0706
P R O G R E S S O F J G P 2017
0818_JSW_AR2017_FH.indd 06-070818_JSW_AR2017_FH.indd 06-07 2017/09/14 16:072017/09/14 16:07

Our Business Domains
The JSW Group comprises 49 subsidiaries (of which 32 are consolidated) and three affi liates (of which one is an
equity-method affi liate). Our operating domains are the Steel and Energy Products Business, the Industrial
Machinery Products Business, and the Real Estate and Other Businesses.
We maintain the Muroran, Hiroshima, and Yokohama plants. Our integrated lineup ranges from steel manufac-
turing to machinery.
Production encompasses steel casting and forging products (Muroran), steel plate and steel structures (Muroran),
wind turbines (Muroran), plastics machinery (Hiroshima and Yokohama), and other machinery (Muroran, Hiro-
shima, and Yokohama). We have responded to changes in the industrial structure by diversifying our businesses
and launching environmental businesses.
Steel and Energy Products Business
Business Lines Business Lines
Business Lines Business Lines
Business Lines
Industrial Machinery Products Business
Sales Composition
24%
Sales Composition
75%
At the Muroran Plant, which manufactures steel in electric furnaces, we pro-duce a broad range of cast products and steel ingots for forged products. In ingots for forgings, we have one of the world’s largest production capacities, of 670 tons. Our range of presses and hammers of various types and sizes, includ-ing two 14,000-ton hydraulic presses, ensures that we can deliver forgings in any needed shape. After undergoing heat treatment, machining and fi nishing, the cast, and forged steel products are used in the electric power generation industry (fossil fuel, hydroelectric and nuclear) as well as for steel-making, oil refi nery, and industrial machinery and facilities. In addition to being a leading global supplier of numerous extra-large cast and forged steel products, our plants produce a wide range of high-quality small and medium-sized steel cast and forged products.
At the Hiroshima Plant, we produce injection molding machines, pelletizers, twin-screw extruders, and fi lm and sheet manufacturing equipment. At the Yokohama Plant, we produce blow molding machines and spinning extruders. In injection molding machines, we off er a lineup of electrically driven machines, all of which feature both improved productivity and energy-saving standards along with enhanced basic performance and molding precision. In addition to conventional power regeneration technology, the new ADS Series delivers even better energy savings thanks to a revamp of its servo control. To respond to diversifying needs in these product markets, we have established a Technol-ogy Development Center within the Hiroshima Plant and engage in wide-rang-ing consultation with product users, enabling us to put in place an integrated development system to cope with changing demand, from plastic manufactur-ing to processing machinery.
At the Muroran Plant, which has one of Japan’s largest 4-thick plate reversing rolling mills, we can roll high-quality, extremely thick, wide, and long steel plates (maximum thickness: 350 millimeters, maximum width: 4.8 meters, max-imum length: 20 meters). Using advanced manufacturing technology we now mainly produce high-quality clad steel plates and clad steel pipes using clad steel plates. All of our products are used in a wide range of industrial applica-tions in Japan and overseas, giving this business a unique profi le. In addition, the Muroran Plant integrates the various forged steel products it manufactures and leverages the Company’s state-of-the-art welding technologies and facili-ties to produce very large welded structures, such as pressure vessels for oil refi neries and petrochemical plants, in an integrated process extending from raw materials to fi nished products. As a result, we are meeting demand both in Japan and overseas.
Supported by proprietary technologies and facilities at the Hiroshima, Yoko-hama, and Muroran plants, JSW produces industrial machinery for a wide range of demand, including defense equipment, power plant equipment, magnesium alloy injection molding machines, laser annealing systems, rolling stock parts, and environmental facilities.
The JSW Group entered the wind turbine system business in 2000. Leveraging state-of-the-art technologies, including permanent magnet synchronous gen-erators, we make low-noise wind turbine system equipment that excels in terms of function, performance, and reliability and is also environment-friendly. Going forward, we will provide high-quality services in an eff ort to increase customers’ capacity utilization rates.
Production and sale of products for power generation industries, steel-making, nuclear power-related equip-ment, die materials, and other areas
Production and sale of plastic injec-tion molding machines, plastic pro-duction and processing machinery (including pelletizers, compound extruders, fi lm and sheet manufac-turing equipment, etc.), and blow molding machines
Production and sale of products for oil refi ning, petrochemical, general chemical, and chemical machinery, as well as a wide range of pressure vessels, clad steel plates, clad steel pipes, extra-thick steel plates, and other areas
Production, sale and maintenance of compressors, hydraulic machines, machinery for the production of electronic components and displays (laser annealing systems, thin-fi lm coating machines, etc.), magnesium alloy injection molding machines, tightlock couplers and dampers, and defense equipment
Production, sale and maintenance of wind turbine system equipment
Steel Products
Steel Plates and Structures
Wind Turbines
Plastics Machinery
Other Machinery
“Improving customer satisfaction: Our services business”Drawing on its global network, the Company is advancing its wide-ranging service-related businesses, which include the maintenance and supply of components. In fi scal 2016, our service-related busi-nesses accounted for around 10% of consolidated net sales. To meet ever-increasing demand, we will continue upgrading our domestic and overseas service bases and expanding our operations. We also value communication with customers. By refl ecting their valuable feedback in the form of improved services, we enable customers to use our products with peace of mind, thus providing them with confi dence and satisfaction.
FY2016Net sales:
212.4billions of Yen
Services10%
0908
Our Business Domains
0818_JSW_AR2017_FH.indd 08-090818_JSW_AR2017_FH.indd 08-09 2017/09/14 16:082017/09/14 16:08

Review of Operations
Steel and Energy Products Business Industrial Machinery Products Business
Steel Products Sector
Steel Plates and Structures Sector
Wind Turbines Sector
Plastics Machinery Sector
Other Machinery Sector
57,1
28
126,
699
118,
38568
,418
135,
389
126,
363
39,7
85
19,5
00
167,
875
156,
204
144,
358
159,
378
2013 (FY) (FY) 2013 (FY) (FY)20132014 2014 20142015 2015 20152016 2016 2016
90,000 180,000 180,000
60,000 120,000 120,000
30,000 60,000 60,000
0 0 0
Orders ReceivedMillions of yen
Orders ReceivedMillions of yen
67,6
02
66,2
15 74,8
54
51,2
07
2013 2014 2015 2016
90,000
60,000
30,000
0
SalesMillions of yen
SalesMillions of yen
Shell fl ange used for pressure chamber for nuclear power plant
Polyolefi n extruder/pelletizer
Clad steel plate Large-size all-electric injection molding machine
J82-2.0D wind turbines system Magnesium alloy injection molding machine
Performance in Fiscal 2016
Total orders in the Steel and Energy Products Business amounted to ¥19,500
million (US$173 million), down 51.0% from the previous year. This was due
mainly to the cancellation of orders for wind power generation equipment,
as well as declining orders for electric and nuclear power plant products,
and for clad steel plates and pipes.
Sales in this segment fell 31.6%, to ¥51,207 million (US$456 million), due
to a recoil in sales of clad steel pipes following a surge in sales to large-scale
projects in the previous year.
Despite a decline in depreciation expenses, the segment posted an oper-
ating loss of ¥2,794 million (US$24 million), compared with operating
income of ¥699 million (US$6 million) in the previous year. This was due to
the fall in sales of clad steel pipes.
Performance in Fiscal 2016
Total orders in the Industrial Machinery Products Business declined 7.0%, to
¥156,204 million (US$1,392 million), due to a pullback in sales of laser
annealing equipment following a surge in sales to large-scale projects in the
previous year. This was despite an increase in sales of plastic production and
processing machinery.
Sales in this segment climbed 10.4%, to ¥159,378 million (US$1,420 mil-
lion), thanks to a solid performance by plastic production and processing
machinery, as well as increased sales of molding machines and laser anneal-
ing equipment.
Operating income jumped 22.5%, to ¥15,183 million (US$135 million),
benefi ting from higher segment sales and cost improvements.
1110
Review of Operat ions
0818_JSW_AR2017_FH.indd 10-110818_JSW_AR2017_FH.indd 10-11 2017/09/14 16:082017/09/14 16:08

S P E C I A L F E A T U R E
During the year, we began selling a fl exible compact hydrogen package (FCHP) for small-scale hydrogen stations, which will encourage the expansion of infrastructure to improve the supply of hydrogen required for the proliferation of fuel cell vehicles (FCVs). This FCHP is compact, consisting mainly of a pressure vessel and compressor, enabling it to be operated at hydrogen stations according to local needs and to be transported by truck. By promoting hydrogen infrastructure development, we will contribute to the developement of the hydrogen society.
Flexible compact hydrogen package (FCHP) for small-scale hydrogen stations
Flexible compact hydrogen package (FCHP) for small-scale hydrogen stations
Demand for fi lm and sheet equipment is strong, especially for use in manufacturing separator fi lms required for lithium-ion batteries installed in hybrid and electric vehicles. In fi scal 2016, we achieved record-high orders for our fi lm and sheet equipment, as we did in fi scal 2015. Moreover, we expect signifi cant demand to persist until around 2019, with steady growth to continue thereafter. In anticipation of this situation, we acted swiftly to increase production capacity at the Hiroshima Plant. A key feature of our equipment is that it can be tailored to specifi c manufacturing methods according to intended applica-tions, such as automobiles and smartphones. As a leading man-ufacturer in the industry, we will continue striving to further improve productivity.
Film and sheet equipment
Record-high orders for fi lm and sheet equipment
JSW held a private showing of its J-ADS Series of compact all-elec-tric injection molding machines (launched in October 2016), developed based on the concept of “maximum peace of mind for all customers.” Held at the Hiroshima Plant, it was the fi rst show-ing in Japan and introduced the latest Group technologies. Costs have been reduced thanks to a parts-sharing arrange-ment with Toyo Machinery & Metal Co., Ltd., a capital and busi-ness partner. In addition, J-ADS features the SYSCOM 5000i touch panel controller, which is popular in medium-sized machines, facilitating functional expansion through application develop-ment and compatibility with IoT technologies. Many customers were curious about the Group technologies and other facets of J-ADS. It was a signifi cant showcasing of our technological know-how, which generated a lot of positive interest and for which we have high expectations.
Private showing of compact all-electric injection molding machines (J-ADS Series)
Private showing
The Japanese railway system is highly regarded around the world for its safety and precision, and JSW’s couplers and draft gears are widely used in trains operated by Japan Railway and private railway companies. In luxury trains, which have been popular in recent years, our couplers and draft gears were adopted in “Train Suite Shiki-shima” operated by East Japan Railway Company (JR East) in eastern Japan and Hokkaido. This follows their addition to the “Seven Stars in Kyushu” cruise train running in Kyushu.
Train Suite Shiki-shima
JSW’s couplers and draft gears used by “Train Suite Shiki-shima” (following adoption by “Seven Stars in Kyushu”)
(Photo courtesy of East Japan Railway Company)
1312
S P E C I A L F E AT U R E
0818_JSW_AR2017_FH.indd 12-130818_JSW_AR2017_FH.indd 12-13 2017/09/14 16:082017/09/14 16:08
Research and Development
Research and development activities were almost
entirely funded by the Company during fi scal 2016. Com-
bined spending on research and development for the
Steel and Energy Products Business and the Industrial
Machinery Products Business amounted to ¥4,237 mil-
lion (US$37 million).
Seeking to become a “Top Global & Niche Corporate
Group”, we strive to develop new products and produc-
tion techniques using our proprietary technologies. To
bring these products and techniques to market as soon
as possible, we actively promote multidisciplinary and
technological tie-ups and joint development.
Our Research and Development Headquarters collab-
orates with business divisions and Group companies to
1) improve the capabilities, performance, and reliability
of core products; 2) develop off erings in new business
fi elds based on core and diff erentiated technologies; and
3) promote the development and commercialization of
new products through synergies with Group companies.
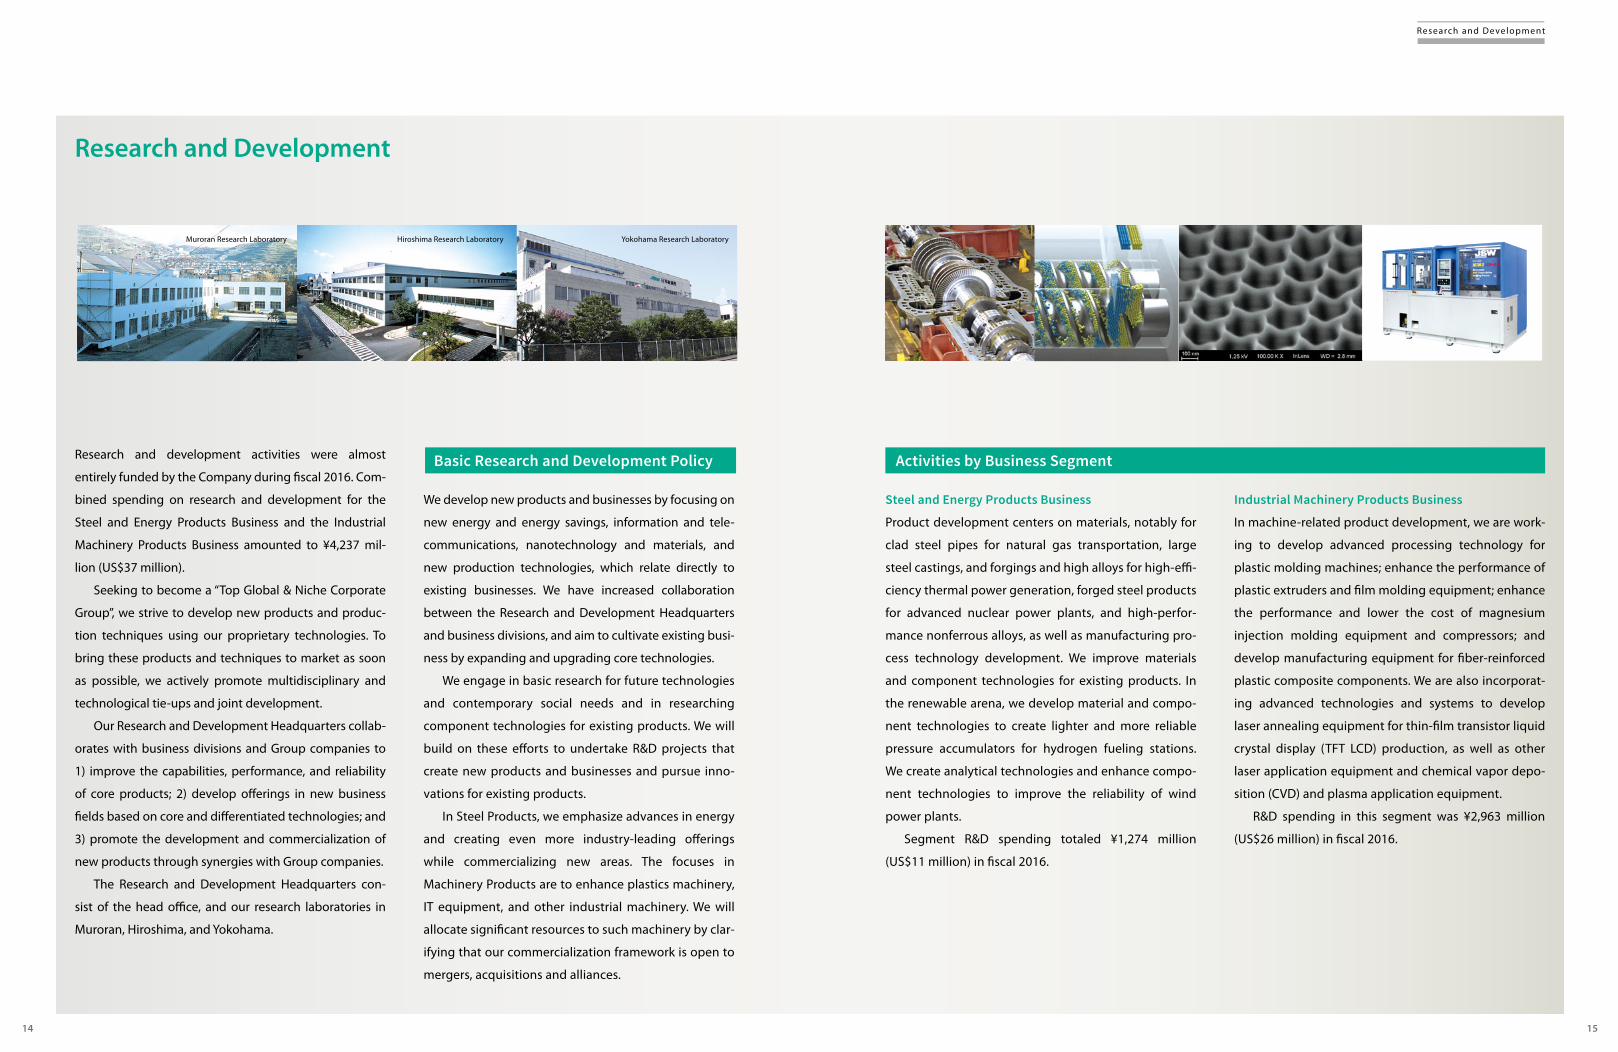
The Research and Development Headquarters con-
sist of the head offi ce, and our research laboratories in
Muroran, Hiroshima, and Yokohama.
Industrial Machinery Products Business
In machine-related product development, we are work-
ing to develop advanced processing technology for
plastic molding machines; enhance the performance of
plastic extruders and fi lm molding equipment; enhance
the performance and lower the cost of magnesium
injection molding equipment and compressors; and
develop manufacturing equipment for fi ber-reinforced
plastic composite components. We are also incorporat-
ing advanced technologies and systems to develop
laser annealing equipment for thin-fi lm transistor liquid
crystal display (TFT LCD) production, as well as other
laser application equipment and chemical vapor depo-
sition (CVD) and plasma application equipment.
R&D spending in this segment was ¥2,963 million
(US$26 million) in fi scal 2016.
Basic Research and Development Policy
We develop new products and businesses by focusing on
new energy and energy savings, information and tele-
communications, nanotechnology and materials, and
new production technologies, which relate directly to
existing businesses. We have increased collaboration
between the Research and Development Headquarters
and business divisions, and aim to cultivate existing busi-
ness by expanding and upgrading core technologies.
We engage in basic research for future technologies
and contemporary social needs and in researching
component technologies for existing products. We will
build on these eff orts to undertake R&D projects that
create new products and businesses and pursue inno-
vations for existing products.
In Steel Products, we emphasize advances in energy
and creating even more industry-leading off erings
while commercializing new areas. The focuses in
Machinery Products are to enhance plastics machinery,
IT equipment, and other industrial machinery. We will
allocate signifi cant resources to such machinery by clar-
ifying that our commercialization framework is open to
mergers, acquisitions and alliances.
Activities by Business Segment
Steel and Energy Products Business
Product development centers on materials, notably for
clad steel pipes for natural gas transportation, large
steel castings, and forgings and high alloys for high-effi -
ciency thermal power generation, forged steel products
for advanced nuclear power plants, and high-perfor-
mance nonferrous alloys, as well as manufacturing pro-
cess technology development. We improve materials
and component technologies for existing products. In
the renewable arena, we develop material and compo-
nent technologies to create lighter and more reliable
pressure accumulators for hydrogen fueling stations.
We create analytical technologies and enhance compo-
nent technologies to improve the reliability of wind
power plants.
Segment R&D spending totaled ¥1,274 million
(US$11 million) in fi scal 2016.
Muroran Research Laboratory Hiroshima Research Laboratory Yokohama Research Laboratory
1514
Research and Development
0818_JSW_AR2017_FH.indd 14-150818_JSW_AR2017_FH.indd 14-15 2017/09/14 16:082017/09/14 16:08
Corporate Governance
JSW recognizes that it must earn the trust of shareholders, customers, employees, and other stakeholders to aim to enhance enterprise value and thereby contribute to the economy and society as a whole. We therefore created a corporate governance setup that encompasses a management organization and framework to implement essential measures and pursues fair disclosure to ensure business transparency. On November 18, 2015, we formulated “Corporate Governance Policy of The Japan Steel Works, Ltd.” based resolution of the Board of Directors. The aim of the Policy is to clarify our basic stance, initiatives, and approach with respect to corporate governance. The Policy can be found at the following website: http://www.jsw.co.jp/en/guide/governance.html
controls, and its Internal Control Committee also meets as necessary. The Company is working to improve its internal control system in line with its Basic Policy on Internal Control Systems, adopted by the Board of Direc-tors, as described below.
1. Adhering to laws and regulations and the Articles of Incorporation relating to execution of duties by directors and employees
• At the Company, compliance extends beyond pre-venting fraud and adhering to laws and regulations and in-house rules. It also encompasses the fulfi ll-ment of broad social responsibilities and establish-ment of various compliance-related rules. The essence of its compliance activities centers on direc-tors and executive offi cers taking the lead and prac-ticing integrity and raising employee awareness of compliance issues through education and training.
• The Company established the Internal Audit Division to ensure that all of its corporate operations comply with all laws and regulations and in-house rules. The Division conducts regular and spot audits and submits the results of its audits to the president, and to other relevant parties as appropriate, including the Board of Directors, the Executive Board, the Management Coun-cil, and audit & supervisory board members.
• The Company has created multiple ways, including internal and external channels, for reporting and dis-cussing compliance-related problems uncovered by employees, based on a guarantee of protection for whistleblowers.
• In addition to its Corporate Code of Conduct, which opposes anti-social forces, the Company maintains an offi ce to share relevant information and spearhead tough measures to eliminate anti-social forces.
2. Safeguarding and managing information relating to execution of duties by directors
• The Company appoints a director or an executive offi -cer as the person responsible for safeguarding and managing information. Adhering to document and
information management rules and regulations, the Company stores and manages important information relating to the execution of duties by directors and executive offi cers as printed or digital records. This information includes the minutes of important meet-ings and written requests for approvals. Further, directors and audit & supervisory board members may review or copy this information as needed.
• The Company discloses fi nancial and important man-agement information in an appropriate and timely manner.
3. Rules on managing risk of losses • Directors, executive offi cers, and employees concur-
rently serving as general managers identify and evalu-ate risks arising in the course of business. They address these risks in keeping with regulations and the man-agement approval system. The Board of Directors and the Executive Board deliberate on key risks.
• The Company maintains risk management rules and a Companywide risk management system. Divisions overseeing risks in such areas as safety and hygiene, environmental management, information security, and export safety controls set up committees and create and administer rules for properly managing such risks throughout the Company. The Company also appoints a director or an executive offi cer as the person responsible for risk management. In collabo-ration with the Internal Audit Division, that person monitors the progress of risk management and reports to the Board of Directors or the Executive Board as appropriate.
• At all divisional headquarters, business units, and plants, the Company has risk managers who evaluate measures and identify daily risks. It also has a crisis management headquarters to handle critical situa-tions. Accordingly, the Company is prepared for both ordinary and emergency situations.
Overview of Corporate Governance Structure
We employ a statutory auditor system comprising eight directors, two of whom are independent, and four statu-tory auditors (hereafter, “audit & supervisory board mem-bers”), two of whom are external. The term of offi ce of directors is one year. We main-tain an executive offi cer system and separate decision-making and oversight from the executive functions of executive offi cers. The goal is to accelerate decision-mak-ing and enhance oversight and execution. In principle, the Board of Directors convenes once monthly to decide and report on important management issues, including basic operational policies and legally stipulated matters. Managing executive offi cers and above attend these meetings, positioning the Board as a vehicle for mutual oversight of directors and executive offi cers. The Executive Board—consisting of two representa-tive directors and other directors with executive responsi-bilities nominated by the president, two outside directors, and a audit & supervisory board member (chosen by rota-tion)—meets once a week to deliberate and decide on important management matters and important business execution decisions made by directors and executive offi -cers. The Strategy Council also discusses, reports on, and monitors overall operational matters. Our Management Council also convenes once monthly, in principle. Members include directors, audit & supervisory board members, divisional heads, plant gen-eral managers, headquarters managers, and others with executive responsibilities. This body’s tasks include
assessing the business environment and monitoring the progress of the Company’s business plan. Its goals are to share such knowledge throughout management and refl ect it in their decisions as well as to ensure risk man-agement and compliance. Audit & Supervisory Board comprises four audit & supervisory board members, two of whom are external as part-time. These members attend meetings of the Board of Directors, the Executive Board, the Management Coun-cil, and other important gatherings. In principle, they visit the Company’s plants and offi ces and major subsidiaries once every six months. The members receive divisional reports as necessary and exchange opinions with direc-tors and key employees. Based on these eff orts, the mem-bers express their views to management from an objective and neutral perspective, and exercise strict oversight with regard to the execution of directors’ duties. Seeking to ensure fairness and transparency of deci-sion-making processes related to executive nomination and remuneration, the Company established the Nomi-nation Advisory Committee and the Remuneration Advi-sory Committee. Consisting of fi ve members, including several outside executives, the committees serve as advi-sory bodies to the Board of Directors.
Status of Internal Control System
The Company recognizes the importance of its manage-ment responsibilities with respect to establishing and properly managing the necessary systems to ensure appropriate business operations. Based on this recogni-tion, it has set up a specialist unit to supervise internal
1716
Corporate Governance
0818_JSW_AR2017_FH.indd 16-170818_JSW_AR2017_FH.indd 16-17 2017/09/14 16:082017/09/14 16:08
4. Ensuring effi cient execution of duties by directors • The Company ensures rapid decision-making and
fl exible and effi cient business execution by having the president act as chief executive offi cer, with direc-tors overseeing key headquarters divisions and busi-ness units. Under this command and management structure, executive offi cers appointed by the Board of Directors perform the duties assigned to them. Directors and executive offi cers deliberate, decide, and report on important matters in meetings of the Board of Directors and the Executive Board.
• The Board of Directors formulates the medium-term management plan and annual business plans as Com-panywide objectives for directors, executive offi cers, and employees. Directors and executive offi cers plan and implement specifi c policies for reaching goals, segregating tasks in line with in-house rules. They also evaluate the results, review progress and submit peri-odic and spot reports to the Board of Directors, the Executive Board, and the Management Council.
5. Ensuring appropriate conduct at Group companies • The Company encourages Group subsidiaries to work
to establish and build Companywide internal controls according to JSW’s Vision, Management Philosophy, and Corporate Code of Conduct. The Company also supports Group subsidiaries to strive for effi cient business execution and autonomous management by ensuring proper division of duties and clarifi cation of decision-making authority based on their own in-house rules.
• The Company has formulated operational and man-agement rules for subsidiaries and defi ned the related management responsibilities and leadership structures. The Company maintains a system for reporting, notifying, and gathering information about subsidiary decisions on important matters and important facts. At the same time, the Company ensures that listed subsidiaries retain a degree of management autonomy.
• In addition to dispatching directors and audit & supervisory board members to Group subsidiaries, the Company ensures that subsidiaries comply with all laws and regulations and in-house rules by man-dating periodic and spot internal audits through rele-vant departments or the Internal Audit Division. It also audits operations directly and instructs subsid-iaries on internal control improvements.
• The Company supports the eff orts of Group subsid-iaries to establish systems to identify and evaluate risks according to division of duties determined inde pendently based on rules concerning risk management.
6. Appointing audit & supervisory board member assistants, securing their independence from direc-tors, and ensuring eff ectiveness of instructions given to them
• On request from audit & supervisory board members, the Company off ers employees as assistants. The Company seeks the opinions and consent of these members for appointments, dismissals, evaluations, and other personnel treatment regarding these assis-tants to secure their independence from directors and executive offi cers.
• The Company ensures that employees assigned as assistants can perform their duties according to the directions and instructions of audit & supervisory board members.
7. Reporting to audit & supervisory board members by directors and employees and preventing unfa-vorable treatment based on its content
• Audit & supervisory board members are guaranteed the opportunity to attend meetings of the Board of Directors, the Executive Board, the Management Council, and other managerial meetings that deliber-ate, decide, and report on important matters.
• Based on its management approval system, the Com-pany presents approval records to audit & supervisory board members. Audit & supervisory board members can at any time request reports from directors, executive
offi cers, and employees of the Company and Group subsidiaries. Also, persons who have received reports from directors, executive offi cers, and employees of the Company and Group subsidiaries can convey such reports to audit & supervisory board members.
• The Company guarantees that persons making reports to audit & supervisory board members are not subject to unfavorable treatment based on the content of such reports.
8. Policies on advance payment and compensation pertaining to costs and obligations incurred in exe-cution of duties by audit & supervisory board members
• The Company assumes responsibility for any neces-sary costs incurred in the execution of duties by audit & supervisory board members.
9. Ensuring eff ectiveness of audits conducted by audit & supervisory board members
• The Company encourages directors, executive offi -cers, and employees to recognize the importance and value of audits conducted by audit & supervisory board members and to accord them their fullest cooperation. These members can request assistance from the Internal Audit Division, other headquarters divisions, and all other divisions for auditing tasks.
• The Company enables audit & supervisory board members to collaborate closely with the accounting auditor and the Internal Audit Division.
• Audit & supervisory board members have the discre-tion to employ the services of legal advisors and other outside experts.
Ensuring reliable fi nancial reporting • The Company evaluates the eff ectiveness of internal
controls for fi nancial reports in keeping with basic policies for such controls. The Board of Directors and the Executive Board deliberate and report on the fi ndings of such evaluations.
Policy Regarding Large-Scale Purchase of Company Shares
At the meeting of the Board of Directors held on Septem-ber 10, 2007, the Company introduced “Measures against Large-Scale Share Acquisitions (takeover defense mea-sures),” which stipulate the procedures and rules to be followed and obeyed by any party seeking to purchase shares issued by the Company. Since then, the Company has amended part of the Takeover Defense Measures, which were updated following approval by shareholders at the 91st Annual General Meeting of Shareholders held on June 27, 2017.
10.
1918
Corporate Governance
0818_JSW_AR2017_FH.indd 18-190818_JSW_AR2017_FH.indd 18-19 2017/09/14 16:082017/09/14 16:08

Environmental Management
Fuel cells that generate electricity by causing hydrogen and oxygen to react chemically are attracting attention as an environ-mentally friendly energy source. Vehicles equipped with fuel cells allow signifi cant reductions in carbon dioxide and harmful gas emissions, making the ultimate “eco car,” the vehicle leveraging environmentally friendly energy. Since sales of fuel cell vehicles to the general public began in 2014, we have seen the establish-ment of hydrogen stations, which supply hydrogen for fuel cell vehicles, in various locations. With a history of hydrogen-related research and development covering more than 40 years, we have developed a steel pressure vessel for hydrogen storage, which plays a central role in the operation of hydrogen stations.
Steel pressure vessel for hydrogen stations (eco-car-related)
(1) We endeavor to increase the social value of our products in
terms of environmental protection, safety and hygiene.
(2) We will provide products and services that reduce environ-
mental loads by obtaining a clear grasp of environmental
needs and developing technologies.
President
Chief Environmental Management Supervisor/Environmental Management Committee Chairman(Director in charge of Environmental Management)
JSW Group companies EnvironmentalManagement Supervisors
(Company presidents)
JSW Group companies EnvironmentalManagement Supervisors
EnvironmentalManagement Committee
Affiliatedcompanies
Departments
JSW plants EnvironmentalManagement Plant Supervisors
(Plant general managers)
JSW plants Environmental Management Supervisors
Affiliatedcompanies
Departments
EnvironmentalSupervisoryCommittees
EnvironmentalSupervisoryCommittees
ISO 14001 Certifi cations of Business SitesBusiness Site Certifi cation Date Current Certifi cation Body
Muroran Plant December 18, 1998Lloyd’s Register Quality Assurance
Hiroshima Plant December 18, 1998Japan Quality Assurance Organization
Yokohama Plant September 4, 2006Lloyd’s Register Quality Assurance
Meiki Co., Ltd. March 4, 2005 ASR International Corporation
Fine Crystal Precision (S.Z.) Co., Ltd.
March 7, 2007 Intertek
NIKKO-YPK SHOJI CO., LTD.
February 7, 2005Japan Value-Added Certifi cation Co., Ltd.
INPUT MANUFACTURING OUTPUT
Materials• Metals
(including steel, non-ferrous metal)
• Plastics
• Rubber, timber, etc.
Steel and energy products• Forged steel components for nuclear power reactors
• Monobloc rotor shafts
• Turbine casings for thermal power generation
• Reactors for petroleum refi neries
• Clad steel plates/clad steel pipes
• Wind Turbines
Industrial machinery products• Twin-screw extruders
• Single-screw extruders
• Film and sheet equipment
• Electric servo drive molding machines
• Blow molding machines
• Magnesium alloy injection molding machines
• Excimer laser annealing systems
Waste emission volume 12,437 t
Recycling volume 73,602 t
Total waste volume86,039 t
Energy3,054 TJ
CO2 (from electric power and fuel)
192,635 t-CO2
CO2 (from domestic transportation)
2,343 t-CO2
Chemical substances(amounts emitted and transferred)
198 t
Waste water16.03 million m3
Chemical substances4,901 t
Water22.15 million m3
etc.86%of total
waste volume is recycled
As a responsible member of society, JSW regards operating in harmony with the environment as an important corporate responsibility. In our pursuit of production activities and environmental technolo-gies that respect environmental integrity, we engage in business activities that contribute to the eco-logically sustainable development of society.
Action Plan1. We aim to carry out environmental tasks in an organized way,
and to implement environmental preservation activities
continuously.
2. We will set appropriate objectives and targets for reducing the
burden our activities impose on the environment with con-
serving biodiversity.
3. We aim to provide society with products and services that
contribute to the preservation of the environment.
Environmental Management StructureThe Environmental Management Committee, headed by the
director in charge of environmental management, determines
matters such as annual environmental management policies and
programs of environmental activities for the whole company.
Each plant has its own Environmental Supervisory Committee,
which promotes environmental management activities and
works hand in hand with other Group companies including affi li-
ates to reduce the environmental impact of the Company’s
activities.
ISO 14001 Certifi cation ProgressThe Company’s Muroran, Hiroshima, and Yokohama plants and
its Group companies, Meiki Co., Ltd., Fine Crystal Precision (S.Z.)
Co., Ltd., and NIKKO-YPK SHOJI CO., LTD., have obtained certifi ca-
tion under ISO 14001, an international standard for environmen-
tal management systems.
We leverage third-party certifi cation bodies and internal
inspections to conduct checks at least once annually to ensure
that ISO 14001-certifi ed business sites are endeavoring to main-
tain and improve their environmental management systems.
The Company and Group companies have adhered strictly to
laws and ordinances, and there were again no violations in
fiscal 2016.
Business activities and environmental impactIn the process of manufacturing activities related to our core business sectors, steel and energy products business and industrial machin-
ery products business, the environmental impact status is shown below.
We measure both inputs (consumption of energy, water, and the like) and outputs (such as waste, carbon dioxide, and water resulting
from manufacturing processes), and use the data in our environmental improvement activities.
What is a steel pressure vessel?Hydrogen to be stored in fuel cell vehicles must be supplied at high pressure to enable long-distance trips with one fi lling. Therefore, in order to completely fi ll the tank with hydrogen in a short time period, the hydrogen station must use a steel pressure vessel to store hydrogen at high pressure beforehand. Deploying our technological expertise related to steel, we developed a highly durable and reliable steel pres-sure vessel for hydrogen storage. It can be used safely for long time periods, and even permits highly accurate safety inspections during operation.
ECO
2120
Environmental Management
0818_JSW_AR2017_FH.indd 20-210818_JSW_AR2017_FH.indd 20-21 2017/09/14 16:082017/09/14 16:08

Board of Directors,Audit & Supervisory Board Members and Executive Officers
Board of Directors and Audit & Supervisory Board Members
As of September 1, 2017
Representative Director & President
Naotaka Miyauchi
Representative Director & Executive Vice President
Yutaka Higashiizumi
Director, Senior Managing Executive Offi cer
Kenji Watanabe
Directors, Managing Executive Offi cers
Takashi ShibataMasao OshitaToshio Matsuo
Directors Motonobu Sato (Outside)Nobuo Mochida (Outside)
Audit & Supervisory Board Members
Yoshitomo TanakaAkira KadotaKazuya Jono (Outside)Itaru Masuda (Outside)
Organization
Executive Officers
As of September 1, 2017
Senior ManagingExecutive Offi cer
Yoshinao Ishibashi
Managing ExecutiveOffi cers
Hiroshi FujimuraToyohiko Kagawa
Senior Executive Offi cer Katsutoshi Orita
Executive Offi cers Junichiro Deguchi Kenji KikukawaTakashi IwamotoYoshitaka SatoToru NishiyamaShingo Mito
General Meeting of Shareholders Corporate Planning Office
Personnel Dept.
Secretary Office
General Affairs Dept.
Research & Development Headquarters
Laser & Plasma System Office
Wind Power Business Office
Steel Business Division
Machinery Business Division
Injection Molding Machinery Business Division
Ordnance Business Headquarters
Muroran Research Laboratory
Hiroshima Research Laboratory
Yokohama Research Laboratory
Finance & Accounting Dept.
Domestic Office
Muroran Plant
Overseas Office
Hiroshima Plant
Yokohama Plant
Board of Directors
President
Audit & Supervisory Board
Executive Board
Internal Auditors Office
Nomination Advisory Committee
Remuneration Advisory Committee
Financial Section
The Japan Steel Works, Ltd.
Six-Year SummaryYears ended March 31
Millions of yen
2012 2013 2014 2015 2016 2017
Consolidated
Net sales ¥221,368 ¥220,653 ¥188,719 ¥194,674 ¥223,301 ¥212,469
Profi t (loss) attributable to owners of parent 12,591 8,281 5,527 (5,327) (16,600) (4,968)
Total assets 325,653 303,970 293,139 319,667 293,138 275,315
Total net assets 128,613 134,368 139,268 138,234 111,340 107,587
Amounts per share (yen):
Profi t (loss) ¥151.65 ¥111.66 ¥74.58 ¥(71.94) ¥(226.62) ¥(67.61)
Non-Consolidated
Net sales ¥189,329 ¥184,312 ¥155,211 ¥153,455 ¥176,116 ¥166,722
Profi t (loss) 11,257 7,519 6,645 (5,658) (18,719) (8,260)
Total assets 302,550 277,086 267,241 291,793 263,112 242,353
Total net assets 116,255 120,866 127,416 124,381 97,107 88,837
Amounts per share (yen):
Profi t (loss) ¥169.63 ¥101.39 ¥89.67 ¥(76.41) ¥(255.55) ¥(112.40)
Cash dividends applicable to the year ¥10.00 ¥10.00 ¥5.00 ¥4.00 ¥5.00 ¥15.00
Note1: Amounts in U.S. dollars are presented solely for convenience and based on the rate of ¥112.19 = US$1.00, the rate of exchange on March 31, 2017.
2: The Company conducted a 1-for-5 reverse common stock split eff ective on October 1, 2016. For the sake of simplicity, the profi t (loss) per share in the
table above are calculated using the number of shares after the reverse stock split.
S ix-Year Summar y
Six-Year Summary
Financial Performance (Consolidated)
Consolidated Balance Sheet
Consolidated Statement of Income
Consolidated Statement of Comprehensive Income
Contents
23
24
26
28
29
30
31
32
51
Consolidated Statement of Changes in Net Assets
Consolidated Statement of Cash Flows
Notes to Consolidated Financial Statements
Independent Auditor’s Report
22 23
0825_JSW_AR2017_BH.indd 22-230825_JSW_AR2017_BH.indd 22-23 2017/09/14 16:092017/09/14 16:09
16,680
8,86
4
7,51
7
14,423
12,340
134,36
8
139,26
8
138,23
4
111,34
0
107,58
7
43.8 47.1
42.7
37.5
38.6
6.3
4.1
(3.9)
(13.5)
(4.6)
53,242
42,092
41,346 51
,341
52,453
23,735
11,549
11,580
19,721
12,023
52.3
49.1
48.4
55.1
115,47
2
92,752
94,256
122,99
6
108,89
351
.3
Operating Results
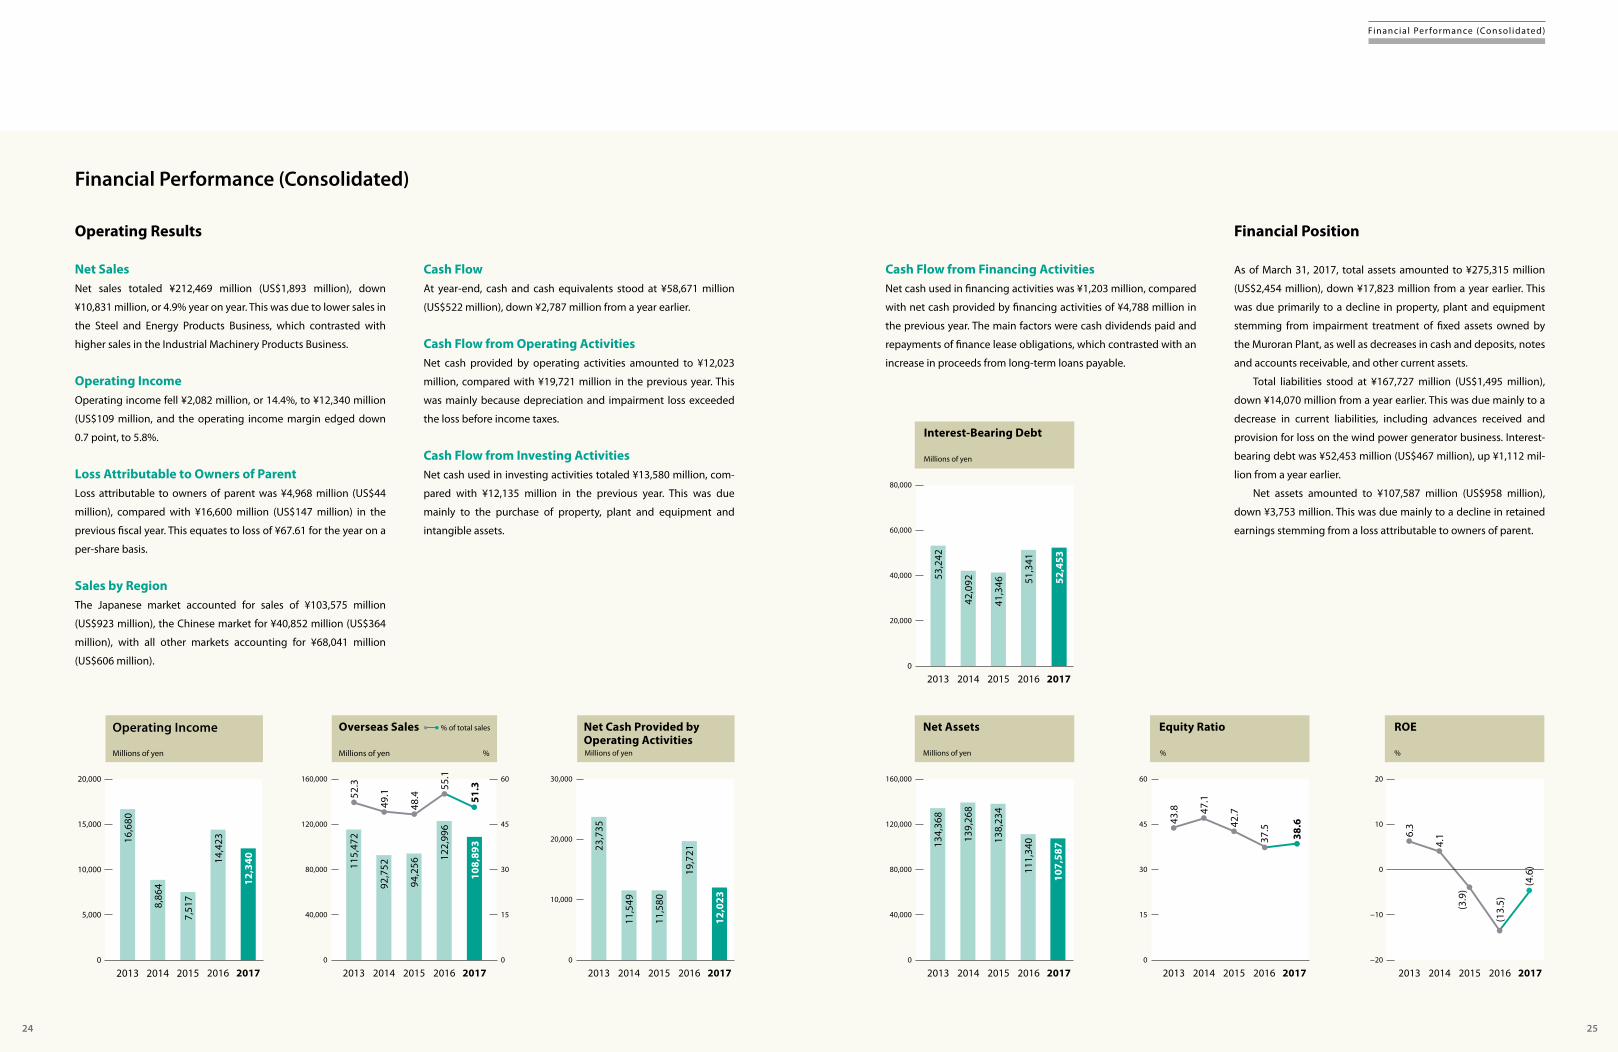
Net SalesNet sales totaled ¥212,469 million (US$1,893 million), down
¥10,831 million, or 4.9% year on year. This was due to lower sales in
the Steel and Energy Products Business, which contrasted with
higher sales in the Industrial Machinery Products Business.
Operating IncomeOperating income fell ¥2,082 million, or 14.4%, to ¥12,340 million
(US$109 million, and the operating income margin edged down
0.7 point, to 5.8%.
Loss Attributable to Owners of ParentLoss attributable to owners of parent was ¥4,968 million (US$44
million), compared with ¥16,600 million (US$147 million) in the
previous fi scal year. This equates to loss of ¥67.61 for the year on a
per-share basis.
Sales by RegionThe Japanese market accounted for sales of ¥103,575 million
(US$923 million), the Chinese market for ¥40,852 million (US$364
million), with all other markets accounting for ¥68,041 million
(US$606 million).
Cash FlowAt year-end, cash and cash equivalents stood at ¥58,671 million
(US$522 million), down ¥2,787 million from a year earlier.
Cash Flow from Operating ActivitiesNet cash provided by operating activities amounted to ¥12,023
million, compared with ¥19,721 million in the previous year. This
was mainly because depreciation and impairment loss exceeded
the loss before income taxes.
Cash Flow from Investing ActivitiesNet cash used in investing activities totaled ¥13,580 million, com-
pared with ¥12,135 million in the previous year. This was due
mainly to the purchase of property, plant and equipment and
intangible assets.
Cash Flow from Financing ActivitiesNet cash used in fi nancing activities was ¥1,203 million, compared
with net cash provided by fi nancing activities of ¥4,788 million in
the previous year. The main factors were cash dividends paid and
repayments of fi nance lease obligations, which contrasted with an
increase in proceeds from long-term loans payable.
Financial Position
As of March 31, 2017, total assets amounted to ¥275,315 million
(US$2,454 million), down ¥17,823 million from a year earlier. This
was due primarily to a decline in property, plant and equipment
stemming from impairment treatment of fi xed assets owned by
the Muroran Plant, as well as decreases in cash and deposits, notes
and accounts receivable, and other current assets.
Total liabilities stood at ¥167,727 million (US$1,495 million),
down ¥14,070 million from a year earlier. This was due mainly to a
decrease in current liabilities, including advances received and
provision for loss on the wind power generator business. Interest-
bearing debt was ¥52,453 million (US$467 million), up ¥1,112 mil-
lion from a year earlier.
Net assets amounted to ¥107,587 million (US$958 million),
down ¥3,753 million. This was due mainly to a decline in retained
earnings stemming from a loss attributable to owners of parent.
Financial Performance (Consolidated)
2013 2013 2013 2013
2013
201320132014 2014 2014 2014
2014
201420142015 2015 2015 2015
2015
201520152016 2016 2016 2016
2016
201620162017 2017 2017 2017
2017
20172017
160,000 6020,000
120,000 45 10
160,000 60 20
60,000
80,000
20,000
30,000
120,000 4515,000
80,000 30 0
40,000
10,000
80,000 3010,000
40,000 15 −10
20,000
40,000 15
0 0 0 −20
0
00 0
Operating Income
Millions of yen Millions of yen %
Net Assets Equity Ratio ROE
Interest-Bearing Debt
Millions of yen
Net Cash Provided by Operating ActivitiesMillions of yen Millions of yen
Overseas Sales % of total sales
Financia l Per formance (Consol idated)
% %
5,000
24 25
0825_JSW_AR2017_BH.indd 24-250825_JSW_AR2017_BH.indd 24-25 2017/09/14 16:092017/09/14 16:09
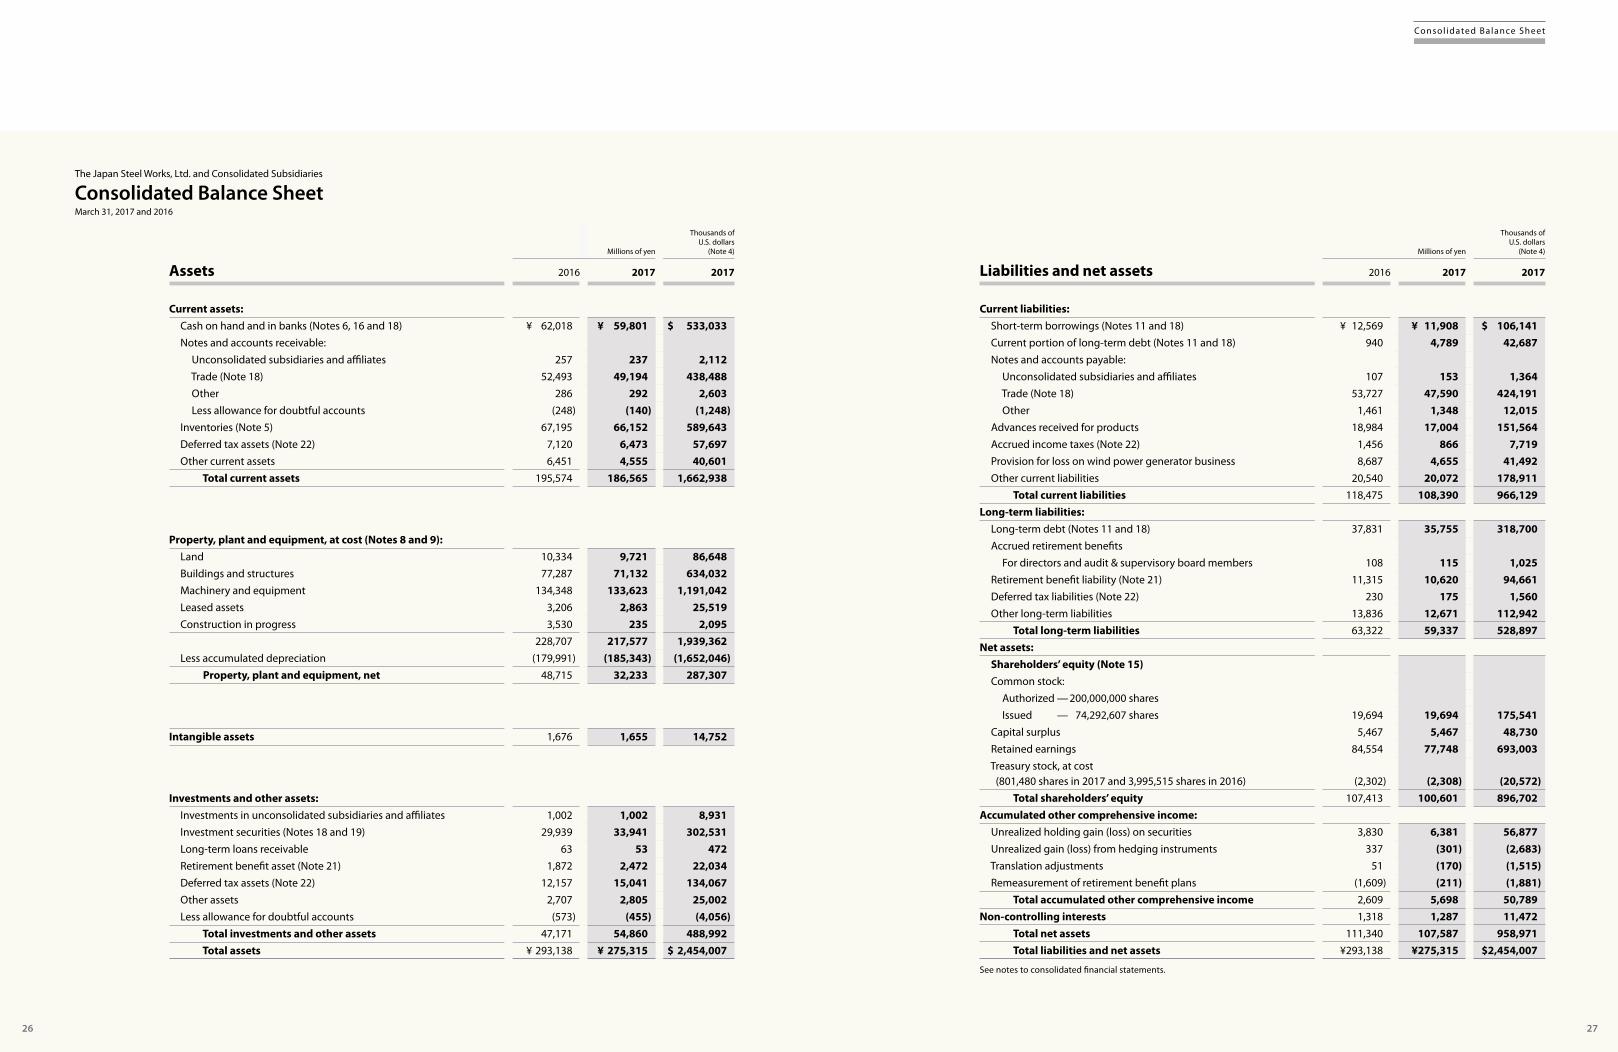
The Japan Steel Works, Ltd. and Consolidated Subsidiaries
Consolidated Balance SheetMarch 31, 2017 and 2016
Millions of yen
Thousands of U.S. dollars
(Note 4)
Assets 2016 2017 2017
Current assets: Cash on hand and in banks (Notes 6, 16 and 18) ¥ 62,018 ¥ 59,801 $ 533,033 Notes and accounts receivable: Unconsolidated subsidiaries and affi liates 257 237 2,112 Trade (Note 18) 52,493 49,194 438,488 Other 286 292 2,603 Less allowance for doubtful accounts (248) (140) (1,248) Inventories (Note 5) 67,195 66,152 589,643 Deferred tax assets (Note 22) 7,120 6,473 57,697 Other current assets 6,451 4,555 40,601 Total current assets 195,574 186,565 1,662,938
Property, plant and equipment, at cost (Notes 8 and 9): Land 10,334 9,721 86,648 Buildings and structures 77,287 71,132 634,032 Machinery and equipment 134,348 133,623 1,191,042 Leased assets 3,206 2,863 25,519 Construction in progress 3,530 235 2,095
228,707 217,577 1,939,362 Less accumulated depreciation (179,991) (185,343) (1,652,046) Property, plant and equipment, net 48,715 32,233 287,307
Intangible assets 1,676 1,655 14,752
Investments and other assets: Investments in unconsolidated subsidiaries and affi liates 1,002 1,002 8,931 Investment securities (Notes 18 and 19) 29,939 33,941 302,531 Long-term loans receivable 63 53 472 Retirement benefi t asset (Note 21) 1,872 2,472 22,034 Deferred tax assets (Note 22) 12,157 15,041 134,067 Other assets 2,707 2,805 25,002 Less allowance for doubtful accounts (573) (455) (4,056) Total investments and other assets 47,171 54,860 488,992 Total assets ¥ 293,138 ¥ 275,315 $ 2,454,007
Millions of yen
Thousands of U.S. dollars
(Note 4)
Liabilities and net assets 2016 2017 2017
Current liabilities: Short-term borrowings (Notes 11 and 18) ¥ 12,569 ¥ 11,908 $ 106,141 Current portion of long-term debt (Notes 11 and 18) 940 4,789 42,687 Notes and accounts payable: Unconsolidated subsidiaries and affi liates 107 153 1,364 Trade (Note 18) 53,727 47,590 424,191 Other 1,461 1,348 12,015 Advances received for products 18,984 17,004 151,564 Accrued income taxes (Note 22) 1,456 866 7,719 Provision for loss on wind power generator business 8,687 4,655 41,492 Other current liabilities 20,540 20,072 178,911 Total current liabilities 118,475 108,390 966,129Long-term liabilities: Long-term debt (Notes 11 and 18) 37,831 35,755 318,700 Accrued retirement benefi ts For directors and audit & supervisory board members 108 115 1,025 Retirement benefi t liability (Note 21) 11,315 10,620 94,661 Deferred tax liabilities (Note 22) 230 175 1,560 Other long-term liabilities 13,836 12,671 112,942 Total long-term liabilities 63,322 59,337 528,897Net assets: Shareholders’ equity (Note 15) Common stock: Authorized — 200,000,000 shares Issued — 74,292,607 shares 19,694 19,694 175,541 Capital surplus 5,467 5,467 48,730 Retained earnings 84,554 77,748 693,003 Treasury stock, at cost (801,480 shares in 2017 and 3,995,515 shares in 2016) (2,302) (2,308) (20,572) Total shareholders’ equity 107,413 100,601 896,702Accumulated other comprehensive income: Unrealized holding gain (loss) on securities 3,830 6,381 56,877 Unrealized gain (loss) from hedging instruments 337 (301) (2,683) Translation adjustments 51 (170) (1,515) Remeasurement of retirement benefi t plans (1,609) (211) (1,881) Total accumulated other comprehensive income 2,609 5,698 50,789Non-controlling interests 1,318 1,287 11,472 Total net assets 111,340 107,587 958,971 Total liabilities and net assets ¥293,138 ¥275,315 $2,454,007
See notes to consolidated fi nancial statements.
Consol idated Balance Sheet
26 27
0825_JSW_AR2017_BH.indd 26-270825_JSW_AR2017_BH.indd 26-27 2017/09/14 16:092017/09/14 16:09
The Japan Steel Works, Ltd. and Consolidated Subsidiaries
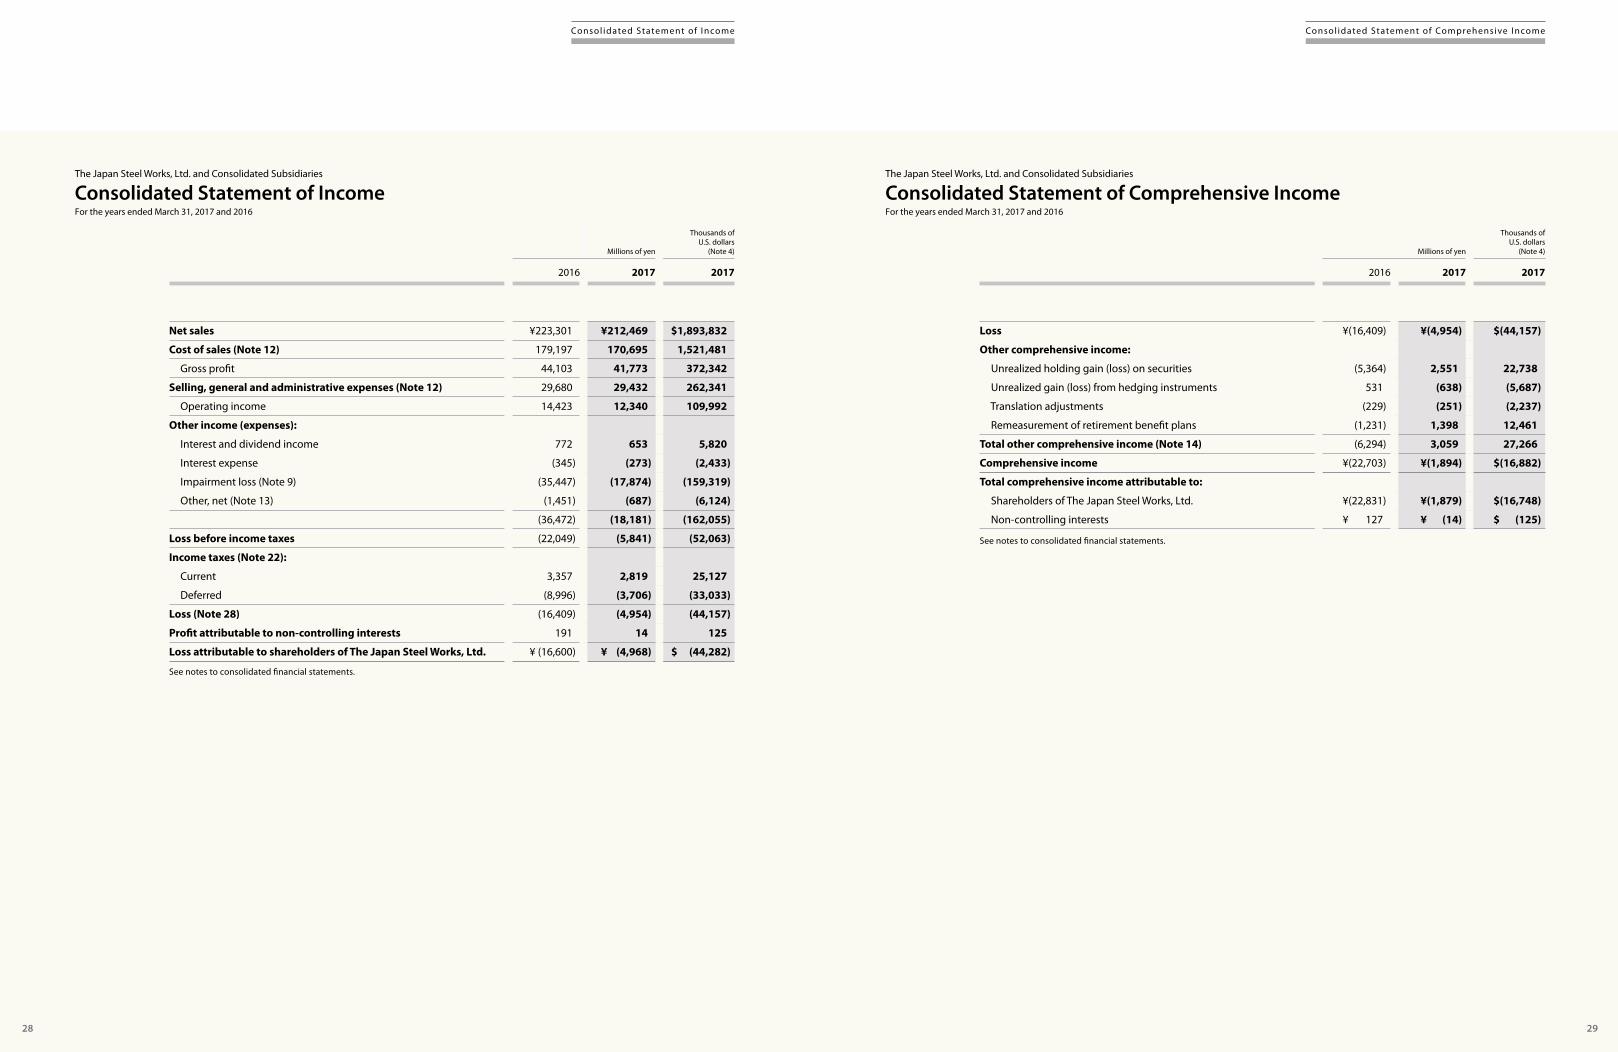
Consolidated Statement of IncomeFor the years ended March 31, 2017 and 2016
The Japan Steel Works, Ltd. and Consolidated Subsidiaries
Consolidated Statement of Comprehensive IncomeFor the years ended March 31, 2017 and 2016
Millions of yen
Thousands of U.S. dollars
(Note 4)
2016 2017 2017
Net sales ¥223,301 ¥212,469 $1,893,832
Cost of sales (Note 12) 179,197 170,695 1,521,481
Gross profi t 44,103 41,773 372,342
Selling, general and administrative expenses (Note 12) 29,680 29,432 262,341
Operating income 14,423 12,340 109,992
Other income (expenses):
Interest and dividend income 772 653 5,820
Interest expense (345) (273) (2,433)
Impairment loss (Note 9) (35,447) (17,874) (159,319)
Other, net (Note 13) (1,451) (687) (6,124)
(36,472) (18,181) (162,055)
Loss before income taxes (22,049) (5,841) (52,063)
Income taxes (Note 22):
Current 3,357 2,819 25,127
Deferred (8,996) (3,706) (33,033)
Loss (Note 28) (16,409) (4,954) (44,157)
Profi t attributable to non-controlling interests 191 14 125
Loss attributable to shareholders of The Japan Steel Works, Ltd. ¥ (16,600) ¥ (4,968) $ (44,282)
Millions of yen
Thousands of U.S. dollars
(Note 4)
2016 2017 2017
Loss ¥(16,409) ¥(4,954) $(44,157)
Other comprehensive income:
Unrealized holding gain (loss) on securities (5,364) 2,551 22,738
Unrealized gain (loss) from hedging instruments 531 (638) (5,687)
Translation adjustments (229) (251) (2,237)
Remeasurement of retirement benefi t plans (1,231) 1,398 12,461
Total other comprehensive income (Note 14) (6,294) 3,059 27,266
Comprehensive income ¥(22,703) ¥(1,894) $(16,882)
Total comprehensive income attributable to:
Shareholders of The Japan Steel Works, Ltd. ¥(22,831) ¥(1,879) $(16,748)
Non-controlling interests ¥ 127 ¥ (14) $ (125)
See notes to consolidated fi nancial statements.
See notes to consolidated fi nancial statements.
Consol idated Statement of Comprehensive I ncomeConsol idated Statement of I ncome
28 29
0825_JSW_AR2017_BH.indd 28-290825_JSW_AR2017_BH.indd 28-29 2017/09/14 16:092017/09/14 16:09

Millions of yen
Thousands of U.S. dollars
(Note 3)
2016 2017 2017
Operating activities Loss before income taxes ¥(22,049) ¥ (5,841) $ (52,063) Depreciation and amortization 10,843 8,058 71,825 Impairment loss 35,447 17,874 159,319 Interest and dividend income (772) (653) (5,820) Interest expense 345 273 2,433 Equity in losses of affi liates 0 0 0 Gain on sales of property, plant and equipment and intangible assets (112) (78) (695) Loss on disposal of tangible and intangible assets 892 150 1,337 Gain on sales of investment securities (54) — — Decrease in provision for loss on wind power generator business (4,515) (4,032) (35,939) Changes in operating assets and liabilities: Trade assets (Note 18) (11,637) (122) (1,087) Trade liabilities 11,557 (2,987) (26,624) Inventories (Note 5) 2,363 1,022 9,110 Other 122 1,393 12,416 Subtotal 22,431 15,056 134,201 Interest and dividends received 771 660 5,883 Interest paid (336) (273) (2,433) Income taxes paid (3,144) (3,420) (30,484) Net cash provided by operating activities 19,721 12,023 107,166Investing activities Investments into time deposits (964) (1,001) (8,922) Proceeds from withdrawal of time deposits 757 545 4,858 Increase in tangible and intangible assets (9,976) (13,348) (118,977) Decrease in tangible and intangible assets 322 131 1,168 Proceeds from sale of investment securities 839 0 0 Purchases of investment securities (11) (345) (3,075) Reimbursement of long-term deposits on contracts (378) (67) (597) Decrease in short-term loans receivable 0 0 0 Collection of long-term loans receivable 14 10 89 Payments for transfer of business (531) — — Purchase of investments in subsidiaries (2,293) — — Other 87 494 4,403 Net cash used in investing activities (12,135) (13,580) (121,045)Financing activities (Notes 11 and 18) Net increase (decrease) in short-term borrowings 313 (660) (5,883) Increase in long-term debt 30,900 2,308 20,572 Decrease in long-term debt (11,105) (320) (2,852) Redemption of bonds (10,000) — — Cash dividends paid (1,653) (1,837) (16,374) Acquisition of treasury stock (2,940) (5) (45) Repayments of fi nance lease obligations (724) (673) (5,999) Other (1) (16) (143) Net cash provided by (used in) fi nancing activities 4,788 (1,203) (10,723)Eff ect of exchange rate changes on cash and cash equivalents (68) (26) (232)(Decrease) increase in cash and cash equivalents 12,306 (2,787) (24,842)Cash and cash equivalents at beginning of the year 49,152 61,458 547,803Cash and cash equivalents at end of the year (Notes 16 and 18) ¥ 61,458 ¥ 58,671 $ 522,961
Millions of yenShareholders’ equity Accumulated other comprehensive income
Common stock
Capital surplus
Retained earnings
Treasury stock (Note 15)
Total shareholders’
equity
Unrealized holding gain
(loss) on securities
Unrealized gain (loss) from hedging
instrumentsTranslation
adjustments
Remeasurement benefi t plans adjustments
(Note 21)
Total accumulated
other comprehensive
incomeNon- controlling
interestTotal
net assets
Balance at April 1, 2015 ¥19,694 ¥5,425 ¥103,330 ¥ (731) ¥127,718 ¥ 9,195 ¥(194) ¥ 239 ¥ (399) ¥ 8,839 ¥1,676 ¥138,234Changes during the year Cash dividends paid (1,653) (1,653) (1,653) Loss attributable to shareholders of The Japan Steel Works, Ltd. (16,600) (16,600) (16,600) Purchase of shares of consolidated subsidiaries 45 45 45 Purchases of treasury stock (2,940) (2,940) (2,940) Disposal of treasury stock (525) 1,368 842 842 Transfer of loss on disposal of treasury shares 521 (521) — — Net changes in items other than those in shareholders’ equity (5,364) 531 (187) (1,210) (6,230) (358) (6,588)Total changes during the year — 41 (18,775) (1,571) (20,305) (5,364) 531 (187) (1,210) (6,230) (358) (26,894)Balance at March 31, 2016 ¥19,694 ¥5,467 ¥ 84,554 ¥(2,302) ¥107,413 ¥ 3,830 ¥ 337 ¥ 51 ¥(1,609) ¥ 2,609 ¥1,318 ¥111,340
Balance at April 1, 2016 ¥19,694 ¥5,467 ¥ 84,554 ¥(2,302) ¥107,413 ¥ 3,830 ¥ 337 ¥ 51 ¥(1,609) ¥ 2,609 ¥1,318 ¥111,340Changes during the year Cash dividends paid (1,837) (1,837) (1,837) Loss attributable to shareholders of The Japan Steel Works, Ltd. (4,968) (4,968) (4,968) Purchase of shares of consolidated subsidiaries — — Purchases of treasury stock (5) (5) (5) Disposal of treasury stock (0) 0 0 0 Transfer of loss on disposal of treasury shares 0 (0) — — Net changes in items other than those in shareholders’ equity 2,551 (638) (222) 1,398 3,089 (31) 3,058Total changes during the year — — (6,806) (5) (6,811) 2,551 (638) (222) 1,398 3,089 (31) (3,753)Balance at March 31, 2017 ¥19,694 ¥5,467 ¥ 77,748 ¥(2,308) ¥100,601 ¥ 6,381 ¥(301) ¥(170) ¥ (211) ¥ 5,698 ¥1,287 ¥107,587
Thousands of U.S. dollars (Note 4)Shareholders’ equity Accumulated other comprehensive income
Common stock
Capital surplus
Retained earnings
Treasury stock (Note 15)
Total shareholders’
equity
Unrealized holding gain
(loss) on securities
Unrealized gain (loss) from hedging
instrumentsTranslation
adjustments
Remeasurement benefi t plans adjustments
(Note 21)
Total accumulated
other comprehensive
incomeNon- controlling
interestTotal
net assets
Balance at April 1, 2016 $175,541 $48,730 $753,668 $(20,519) $957,420 $34,139 $ 3,004 $ 455 $(14,342) $23,255 $11,748 $992,424Changes during the year Cash dividends paid (16,374) (16,374) (16,374) Loss attributable to shareholders of The Japan Steel Works, Ltd. (44,282) (44,282) (44,282) Purchase of shares of consolidated subsidiaries — — Purchases of treasury stock (45) (45) (45) Disposal of treasury stock (0) 0 0 0 Transfer of loss on disposal of treasury shares 0 (0) — — Net changes in items other than those in shareholders’ equity 22,738 (5,687) (1,979) 12,461 27,534 (276) 27,257Total changes during the year — — (60,665) (45) (60,710) 22,738 (5,687) (1,979) 12,461 27,534 (276) (33,452)Balance at March 31, 2017 $175,541 $48,730 $693,003 $(20,572) $896,702 $56,877 $(2,683) $(1,515) $ (1,881) $50,789 $11,472 $958,971
The Japan Steel Works, Ltd. and Consolidated Subsidiaries
Consolidated Statement of Cash FlowsFor the years ended March 31, 2017 and 2016
The Japan Steel Works, Ltd. and Consolidated Subsidiaries
Consolidated Statement of Changes in Net AssetsFor the years ended March 31, 2017 and 2016
The accompanying notes are an integral part of these statements.
Consol idated Statement of Cash FlowsConsol idated Statement of Changes in Net Assets
See notes to consolidated fi nancial statements.
30 31
0825_JSW_AR2017_BH.indd 30-310825_JSW_AR2017_BH.indd 30-31 2017/09/14 16:092017/09/14 16:09
The Japan Steel Works, Ltd. and Consolidated Subsidiaries
Notes to Consolidated Financial Statements
1. Basis of PresentationThe Japan Steel Works, Ltd. (the “Company”) and its domestic sub-sidiaries maintain their books of account in conformity with the fi nancial accounting standards of Japan, and its foreign subsidiar-ies maintain their books of account in conformity with those of their respective countries of domicile. The accompanying consolidated fi nancial statements have been prepared in accordance with accounting principles generally accepted in Japan, which are diff erent in certain respects as to the application and disclosure requirements of IFRS, and have been compiled from the consolidated fi nancial statements prepared by the Company as required by the Financial Instruments and Exchange Law of Japan. As permitted by the Financial Instruments and Exchange Law of Japan, amounts of less than one million yen have been omitted. As a result, the totals shown in the accompanying consolidated fi nancial statements (both in yen and in U.S. dollars) do not necessarily agree with the sums of the individual amounts. Certain amounts in the prior year’s consolidated fi nancial statements have been reclassifi ed to conform to the current year’s presentation.
2. Summary of Signifi cant Accounting Policies(a) Principles of consolidation and accounting for investments
in unconsolidated subsidiaries and affi liatesThe accompanying consolidated fi nancial statements include the accounts of the Company and any signifi cant companies controlled directly or indirectly by the Company. Companies over which the Company exercises signifi cant infl uence in terms of their operating and fi nancial policies have been accounted for by the equity method. All signifi cant intercom-pany balances and transactions have been eliminated in consolidation. As of March 31, 2017, the numbers of consolidated subsidiar-ies, and subsidiaries and affi liates accounted for by the equity method were 32 and 1 (32 and 1 in 2016), respectively. Certain foreign subsidiaries are consolidated on the basis of fi scal periods ended December 31, which diff er from that of the Company. However, the necessary adjustments have been made if the eff ect of the diff erence is material. Investments in subsidiaries and affi liates which are neither consolidated nor accounted for by the equity method are carried at cost or less. Where there has been a permanent decline in the value of such investments, the Company has written them down. Diff erences between the cost and the underlying net equity at fair value of investments in consolidated subsidiaries and in com-panies accounted for by the equity method have been amortized by the straight-line method over fi ve years after acquisition and are included in selling, general and administrative expenses. (b) Foreign currency translationThe balance sheet accounts of the foreign consolidated subsidiar-ies are translated into yen at the rates of exchange in eff ect at the balance sheet date, except for the components of net assets excluding Non-controlling interests which are translated at their
historical exchange rates. Revenue and expense accounts are translated at the average rates of exchange in eff ect during the year. Diff erences arising from the translation are presented as translation adjustments and Non-controlling interests in the consolidated fi nancial statements. Revenue and expense items arising from transactions denomi-nated in foreign currencies are generally translated into yen at the rates of exchange in eff ect at the respective transaction dates. All monetary assets and liabilities denominated in foreign cur-rencies are translated into yen at the rates of exchange in eff ect at the balance sheet date and diff erences arising from the translation are included in the consolidated statements of income.
(c) Cash equivalentsShort-term investments with a maturity of three months or less when purchased which can easily be converted to cash and are subject to little risk of change in value are considered to be cash equivalents.
(d) InventoriesReal estate held for sale, fi nished products and work in process are stated at the lower of cost or net realizable value determined prin-cipally by the specifi c identifi cation method. Raw materials are stated at the lower of cost or replacement cost determined principally by the moving average method.
(e) Investment securitiesMarketable securities classifi ed as other securities are carried at fair value with changes in unrealized holding gain or loss, net of the applicable income taxes, included directly in net assets. Non- marketable securities classifi ed as other securities are carried at cost. Cost of securities sold is determined by the moving average method.
(f) Allowance for doubtful accountsThe allowance for doubtful accounts is provided for possible bad debts at an amount estimated based on the historical experience with bad debts on normal receivables plus an additional allow-ance for specifi c uncollectible amounts determined by reference to the collectability of individual doubtful accounts.
(g) Provision for warranties for completed constructionThe Company provides a provision for warranties for completed construction by estimating losses on possible future claims. (h) Provision for loss on construction contractsThe Company provides a provision for loss on construction con-tracts, which has not been delivered by the fi scal year end, by esti-mating the amount of total losses anticipated in the following fi scal year and thereafter to be incurred, when the amounts can be reasonably estimated.
(i) Provision for loss on wind power generator businessThe Company provides a provision for loss on wind power genera-tor business by estimating the amount of total losses caused by the defects of certain parts used in wind power generators.
(j) Property, plant and equipment and depreciationDepreciation of property, plant and equipment is calculated by the declining-balance method based on the estimated useful lives and the residual value determined by the Company, except for certain buildings which are depreciated by the straight-line method. Signifi cant renewals and additions are capitalized at cost. Maintenance and repairs are charged to profi t. The estimate useful lives of the assets are as follows: Buildings and structures: 6 to 65 years Machinery, equipment and vehicles: 3 to 20 years
(k) Leases and depreciationFinance lease transactions which do not stipulate the transfer of ownership of the leased assets to the lessee are accounted for as purchase and sales transactions. With regard to the depreciation method of leased assets, the straight-line method is applied using the lease period as the estimated useful life and a residual value of zero.
(l) Retirement benefi tThe retirement benefi t obligation for employees is attributed to each period by the benefi t formula method. Prior service cost is being amortized as incurred by the straight-line method over ten years, which is shorter than the average remaining years of service of the eligible employees. Actuarial gain or loss is amortized in the year following the year in which the gain or loss is recognized by the straight-line method over ten years, which is shorter than the average remaining years of service of the employees participating in the plans. Certain subsidiaries use a simplifi ed method in the calculation of their retirement benefi t obligation.
(m) Income taxesDeferred tax assets and liabilities have been recognized in the con-solidated balance sheets with respect to the diff erences between fi nancial reporting and the tax bases of the assets and liabilities, and are measured using the enacted tax rates and laws which will be in eff ect when the diff erences are expected to reverse. (n) Research and development expensesResearch and development expenses are charged to income when incurred.
(o) Revenue and cost recognitionRevenues on sales of products are generally recognized at the time of shipment. Revenues and costs, of which the percentage of completion can be reliably estimated, are recognized by the percentage- of-completion method. The percentage of completion is calculated at the cost incurred as a percentage of the estimated total cost. The completed-contract method is applied to contracts for which the percentage of completion cannot be reliably estimated.
(p) Derivative fi nancial instrumentsDerivative fi nancial instruments are carried at fair value. Gain or loss on derivatives designated as hedging instruments is deferred as a component of net assets until the loss or gain on the underly-ing hedged items is recognized. Foreign currency receivables and payables are translated at the applicable forward foreign exchange rates when certain conditions are met. In addition, the related interest diff erential paid or received under interest-rate swaps uti-lized as hedging instruments is recognized over the terms of the swap agreements as an adjustment to the interest expense of the underlying hedged items when certain conditions are met.
(q) Consumption taxAccounting treatment of consumption tax is the tax exclusion method.
(r) Provision for directors’ bonusesProvision for directors’ bonuses is provided based on estimated amounts to be paid in the subsequent period that are applicable to the current period.
(s) Provision for directors’ retirement benefi tsProvision for directors’ retirement benefi ts is provided based on estimated amounts determined by internal rules.
(t) Accounting changesThe Company’s domestic consolidated subsidiaries adopted “Practical Solution on a change in depreciation method due to Tax Reform 2016” (ASBJ PITF No.32, June 17, 2016) as a result of revi-sions to the Corporate Tax Act of Japan. Accordingly, the deprecia-tion method for both facilities attached to buildings and other non-building structures acquired on or after April 1, 2016 was changed from the declining-balance method to the straight-line method. The eff ect of this adoption on the accompanying consoli-dated fi nancial statements for the year ended March 31, 2017 is immaterial.
3. Additional InformationThe Company and its domestic consolidated subsidiaries adopted “Revised Implementation Guidance on Recoverability of Deferred Tax Assets” (ASBJ Guidance No. 26 of Mar 28, 2016) eff ective from April 1, 2016.
4. U.S. Dollar AmountsThe translation of yen amounts into U.S. dollars is included solely for convenience, as a matter of arithmetic computation only, at ¥112.19 = U.S.$1.00, the approximate rate of exchange prevailing on March 31, 2017. This translation should not be construed as a representation that all amounts shown could be converted into U.S. dollars at such rate.
Notes to Consol idated Financia l Statements
32 33
0825_JSW_AR2017_BH.indd 32-330825_JSW_AR2017_BH.indd 32-33 2017/09/14 16:092017/09/14 16:09

5. InventoriesInventories at March 31, 2017 and 2016 consisted of the following:
Millions of yenThousands of
U.S. dollars
2016 2017 2017
Real estate held for sale ¥ 283 ¥ 278 $ 2,478Finished products 1,703 2,080 18,540Work in process 58,878 58,037 517,310Raw materials and supplies 6,328 5,755 51,297Total ¥67,195 ¥66,152 $589,643
Work in process related to construction contracts of which a loss is anticipated to be incurred was off set with a provision for loss on construction contracts of ¥191 million ($1,702 thousand) at March 31, 2017 and ¥172 million at March 31, 2016.
6. Assets pledged as collateralThe assets pledged as collateral for issuance of Performance Bond at March 31, 2017 and 2016 were as follows:
Millions of yenThousands of
U.S. dollars
2016 2017 2017
Time deposit — ¥96 $856
Note: The assets pledged as collateral were no corresponding obligations at March 31, 2017.
7. DepreciationDepreciation expense on property, plant and equipment for the years ended March 31, 2017 and 2016 were as follows:
Millions of yenThousands of
U.S. dollars
2016 2017 2017
Depreciation expense ¥10,669 ¥7,858 $70,042
8. Advanced DepreciationAccumulated advanced depreciation related to government grants received has been deducted directly from the acquisition costs of certain tangible fi xed assets (plant, machinery and equip-ment). Such accumulated depreciation at March 31, 2017 and 2016 are summarized as follows:
Millions of yenThousands of
U.S. dollars
2016 2017 2017
Accumulated advanced depreciation expense ¥1,283 ¥1,298 $11,570
9. Impairment LossCurrent fi scal year (From April 1, 2016 to March 31, 2017)The Group recorded an impairment loss on the following groups of assets in the current fi scal year:
Use Asset type Location
Steel and Energy Products: Business assets
Buildings, structures, machinery and equipment, land, construction in progress, etc.
Muroran, Hokkaido
Steel and Energy Products:Business assets at investee subsidiary
Buildings, structures, machinery and equipment, land, etc.
Muroran, Hokkaido and Guangdong, China
(1) Grouping of assetsThe Company and its consolidated subsidiaries (hereinafter collectively known as the “Group”) determine whether to rec-ognize an impairment loss and measures the loss by grouping assets based on the smallest units used in management accounting that generate cash fl ows which are largely inde-pendent and whose revenue and expenditures are identifi ed on an ongoing basis. However, the Group determines whether to recognize impairment and measures the impairment on an individual asset basis if the asset is idle and not expected to be used in the future.
(2) Circumstances that led to the recognition of the impairment lossCarrying amounts of non-current assets were reduced to recoverable amounts and the reduced amounts were recog-nized in extraordinary losses as impairment loss because investment amounts were no longer expected to be recovered due to a decrease in profi tability. Breakdown of the impairment loss is as follows:
Buildings and structures ¥ 8,882 million $ 79,169 thousandMachinery, equipment and vehicles 6,761 60,264
Tools, furniture and fi xtures 352 3,138Land 576 5,134Leased assets (property, plant and equipment) 336 2,995
Construction in progress 898 8,004Leased assets (intangible assets) 8 71
Other (intangible assets) 57 508Total ¥17,874 $159,319
(3) Calculation method for recoverable amountsRecoverable amounts of the groups of assets are calculated at value in use. It is evaluated by memorandum value.
Prior fi scal year (From April 1, 2015 to March 31, 2016)The Group recorded an impairment loss on the following groups of assets in the prior fi scal year:
Use Asset type Location
Steel and Energy Products: Business assets
Buildings, structures, machinery and equipment, land, construction in progress, etc.
Muroran, Hokkaido
Steel and Energy Products:Business assets at investee subsidiary
Machinery and equipment, etc.
Muroran, Hokkaido and Guangdong, China
(1) Grouping of assetsThe Company and its consolidated subsidiaries (hereinafter collectively known as the “Group”) determine whether to rec-ognize an impairment loss and measures the loss by grouping assets based on the smallest units used in management accounting that generate cash fl ows which are largely inde-pendent and whose revenue and expenditures are identifi ed on an ongoing basis. However, the Group determines whether to recognize impairment and measures the impairment on an individual asset basis if the asset is idle and not expected to be used in the future.
(2) Circumstances that led to the recognition of the impairment lossCarrying amounts of non-current assets were reduced to recoverable amounts and the reduced amounts were recog-nized in extraordinary losses as impairment loss because investment amounts were no longer expected to be recovered due to a decrease in profi tability. Breakdown of the impairment loss is as follows:
Buildings and structures ¥19,744 millionMachinery, equipment and vehicles 10,764
Tools, furniture and fi xtures 401Land 770Leased assets (property, plant and equipment) 232
Construction in progress 3,439Leased assets (intangible assets) 16
Other (intangible assets) 79Total ¥35,447
(3) Calculation method for recoverable amountsRecoverable amounts of the groups of assets are calculated at value in use. Future cash fl ows are discounted at 7.52%.
10. Contingent LiabilitiesContingent liabilities at March 31, 2017 and 2016 consisted of the following:
Millions of yenThousands of
U.S. dollars
2016 2017 2017
As endorsers of trade notes receivable: Endorsed to other ¥ 75 ¥ 87 $ 775As guarantors of loans: Muroran Environmental
Plant Service Co., Ltd. 421 358 3,191 Obligation to guarantee
uncollected receivables of leasing companies 62 42 374
Gotsu Wind Power Co., Ltd 1,107 978 8,717
Employees and other 50 25 223
11. Short-Term Borrowings and Long-Term DebtAll short-term borrowings, with interest at annual rates ranging from 0.3073% to 1.4750% at March 31, 2017 and 0.3490% to 1.4750% at March 31, 2016, were unsecured. Long-term debt at March 31, 2017 and 2016 were as follows:
Millions of yenThousands of
U.S. dollars
2016 2017 2017
Loans from banks and insurance companies with interest at annual rates ranging from 0.0030% to 1.0960% ¥37,127 ¥39,116 $348,659
Less those maturing within one year (320) (4,215) (37,570)
Lease obligations 1,644 1,428 12,728Less those maturing within one year (620) (574) (5,116)
Long-term indebtedness refl ected in the consolidated balance sheets ¥37,831 ¥35,755 $318,700
Notes to Consol idated Financia l Statements
34 35
0825_JSW_AR2017_BH.indd 34-350825_JSW_AR2017_BH.indd 34-35 2017/09/14 16:092017/09/14 16:09

The aggregate annual maturities of long-term debt and lease obligations subsequent to March 31, 2017 are summarized as follows:
Millions of yenThousands of
U.S. dollars Millions of yenThousands of
U.S. dollars
Year ending March 31, Long-term loans Lease obligations
2018 ¥ 4,215 $ 37,570 ¥574 $5,1162019 132 1,177 400 3,5652020 60 535 274 2,4422021 5,000 44,567 131 1,1682022 1,800 16,044 40 3572023 and thereafter 27,908 248,757 7 62
12. Research and Development ExpensesResearch and development expenses included in manufacturing costs, and selling, general and administrative expenses for the years ended March 31, 2017 and 2016 were as follows:
Millions of yenThousands of
U.S. dollars
2016 2017 2017
Research and development expenses ¥4,292 ¥4,237 $37,766
13. Other Income (Expenses)—Other, NetThe details of “Other, net” in “Other income (expenses)” for the years ended March 31, 2017 and 2016 were as follows:
Millions of yenThousands of
U.S. dollars
2016 2017 2017
Foreign exchange loss ¥ (205) ¥ (91) $ (811)Equity in losses of affi liates (0) (0) (0)Gain on sales of property, plant and equipment 117 93 829
Gain on sales of investment securities 126 — —
Compensation expenses (23) (272) (2,424)Loss on sales or disposal of property, plant and equipment (892) (150) (1,337)
Other, net (573) (266) (2,371)Total ¥(1,451) ¥(687) $(6,124)
14. Other Comprehensive IncomeThe following table presents reclassifi cation adjustments and tax eff ects allocated to each component of other comprehensive income for the years ended March 31, 2017 and 2016:
Millions of yenThousands of
U.S. dollars
2016 2017 2017
Unrealized holding gain (loss) on securities: Amount arising during
the year ¥(8,031) ¥ 3,655 $32,579 Reclassifi cation
adjustments for gains and losses realized in net income 6 — —
The amount of unrealized holding gain (loss) on securities before tax eff ect (8,024) 3,655 32,579
Tax eff ect 2,660 (1,104) (9,840)Unrealized holding gain (loss) on securities (5,364) 2,551 22,738Unrealized gain (loss) from hedging instruments: Amount arising during
the year 774 (921) (8,209) Tax eff ect (242) 282 2,514Unrealized gain (loss) from hedging instruments 531 (638) (5,687)Translation adjustments: Amount arising during
the year (229) (251) (2,237)Translation adjustments (229) (251) (2,237)Remeasurement benefi ts plans adjustments: Amount arising during
the year (2,122) 1,023 9,118 Reclassifi cation
adjustments for gains and losses realized in net income 381 1,004 8,949
The amount of unrealized holding gain (loss) on securities before tax eff ect (1,741) 2,028 18,076
Tax eff ect 509 (629) (5,607)Remeasurement benefi ts plans adjustments (1,231) 1,398 12,461Total other comprehensive income ¥(6,294) ¥ 3,059 $27,266
15. Supplementary Information for Consolidated Statement of Changes in Net Assets
Year ended March 31, 2017(a) Information regarding the number and type of shares
issued and treasury stock:
Number of sharesYear ended March 31,
2016
Increase during
the year
Decrease during
the year
Year ended March 31,
2017
Shares issued: Common stock 371,463,036 — 297,170,429 74,292,607Treasury stock: Common stock (Note 1 and 2) 3,995,515 5,589 3,199,624 801,480
Notes: 1. Decrease of 297,170,429 ordinary shares held in shares was attributable to carry out the share consolidation at the ratio of 5 shares to 1 share eff ective, October 1, 2016.
2. Increase of 5,589 ordinary shares held in treasury was attributable to purchase of less than one share unit.
3. Decrease of 3,199,508 ordinary shares held in treasury was attributable to carry out the share consolidation at the ratio of 5 shares to 1 share eff ective, October 1, 2016, and sale of 116 shares resulting from the sale of shares to shareholders at their request.
(b) Dividends(i) Dividends paid to shareholders
Resolution: Annual general meeting of shareholders held on June 24, 2016
Type of shares: Common stock Total amount of dividends: ¥918 million ($8,183 thousand) Dividends per share: ¥2.5 ($0.022) Cut-off date: March 31, 2016 Eff ective date: June 27, 2016
Resolution: Meeting of Board of Directors held on November 7, 2016 Type of shares: Common stock Total amount of dividends: ¥918 million ($8,183 thousand) Dividends per share: ¥2.5 ($0.022) Cut-off date: September 30, 2016 Eff ective date: December 7, 2016
(ii) Dividends of which the cut-off date was in the year ended March 31, 2016, but the eff ective date is in the following fi scal year
Resolution: Annual general meeting of shareholders held on June 27, 2017 Type of shares: Common stock Total amount of dividends: ¥918 million ($8,183 thousand) Dividends per share: ¥12.5 ($0.111) Cut-off date: March 31, 2017 Eff ective date: June 28, 2017 Source of dividends: Retained earnings
Note: The Company carried out the share consolidation at the ratio of 5 shares to 1 share eff ective October 1, 2016. In accordance with this, cash dividends per share of which record date is March 31, 2017 is based on the share consolidation.
Year ended March 31, 2016(a) Information regarding the number and type of shares
issued and treasury stock:
Number of sharesYear endedMarch 31,
2015
Increase during
the year
Decrease during
the year
Year endedMarch 31,
2016
Shares issued: Common stock 371,463,036 — — 371,463,036Treasury stock: Common stock (Note 1 and 2) 1,192,297 5,177,789 2,374,571 3,995,515
Notes: 1. Increase of 5,177,789 ordinary shares held in treasury was attributable to purchase of 5,173,000 shares under a resolution approved at the Board of Directors meeting on May 26, 2015, purchase of 4,782 shares that was less than one share unit, and acquisition of 7 shares resulting from fractional shares arising from an exchange of shares in making Meiki Co.,Ltd. a wholly owned subsidiary of the Company.
2. Decrease of 2,374,571 ordinary shares held in treasury attributable to the distribution of 2,373,831 treasury shares resulting from the exchange of shares for making Meiki Co.,Ltd. a wholly owned subsidiary of the Company, and sale of 740 shares resulting from the sale of shares to shareholders at their request.
Notes to Consol idated Financia l Statements
36 37
0825_JSW_AR2017_BH.indd 36-370825_JSW_AR2017_BH.indd 36-37 2017/09/14 16:092017/09/14 16:09
(b) Dividends(i) Dividends paid to shareholders
Resolution: Annual general meeting of shareholders held on June 24, 2015
Type of shares: Common stock Total amount of dividends: ¥740 million Dividends per share: ¥2 Cut-off date: March 31, 2015 Eff ective date: June 25, 2015
Resolution: Meeting of Board of Directors held on November 2, 2015
Type of shares: Common stock Total amount of dividends: ¥912 million Dividends per share: ¥2.5 Cut-off date: September 30, 2015 Eff ective date: December 3, 2015
(ii) Dividends of which the cut-off date was in the year ended March 31, 2016, but the eff ective date is in the following fi scal year
Resolution: Annual general meeting of shareholders held on June 24, 2016
Type of shares: Common stock Total amount of dividends: ¥918 million Dividends per share: ¥2.5 Cut-off date: March 31, 2016 Eff ective date: June 27, 2016 Source of dividends: Retained earnings
16. Cash Flow Information(a) Cash and cash equivalentsThe reconciliation between cash and cash equivalents in the accompanying consolidated statements of cash fl ows and cash on hand and in banks in the accompanying consolidated balance sheets at March 31, 2017 and 2016 are summarized as follows:
Millions of yenThousands of
U.S. dollars
2016 2017 2017
Cash on hand and in banks in the consolidated balance sheet ¥62,018 ¥59,801 $533,033
Other current assets 322 189 1,685Time deposits with maturities of more than three months (881) (1,320) (11,766)
Cash and cash equivalents in the consolidated statement of cash fl ows ¥61,458 ¥58,671 $522,961
(b) Signifi cant transactions without cash fl owsAssets and liabilities corresponding to fi nance lease transactions that have been recorded by the Company and its domestic consolidated subsidiaries at March 31, 2017 and 2016 were as follows:
Millions of yenThousands of
U.S. dollars
2016 2017 2017
Lease assets ¥581 ¥438 $3,904Lease obligations 631 465 4,145
17. LeasesYear ended March 31, 2017Future minimum lease payments subsequent to March 31, 2017 under non-cancelable operating leases are summarized as follows:
Year ending March 31, Millions of yenThousands of
U.S. dollars
2018 ¥132 $1,1772019 and thereafter 195 1,738Total ¥327 $2,915
Year ended March 31, 2016Future minimum lease payments subsequent to March 31, 2016 under non-cancelable operating leases are summarized as follows:
Year ending March 31, Millions of yen
2017 ¥1862018 and thereafter 284Total ¥470
18. Financial InstrumentsOverview(a) Policy for fi nancial instrumentsIn consideration of plans for operations and capital investment, the Company and its consolidated subsidiaries (collectively, the “Group”) utilize funds provided by operating cash fl ows fi rst. The Group uses bond issuances and bank borrowings in order to raise additional funds, if needed. The Company manages temporary cash surpluses through low-risk fi nancial assets. The Company uses derivatives for the purpose of reducing risks and does not enter into derivative contracts for speculative or trading purposes.
(b) Types of fi nancial instruments and related riskTrade receivables – trade notes and accounts receivable – are exposed to credit risk in relation to customers. In addition, the Company is exposed to foreign currency exchange risk arising from receivables denominated in foreign currencies. The foreign currency exchange risks deriving from the trade receivables denominated in foreign currencies are hedged by forward foreign exchange contracts, if needed. Investment securities are exposed to market risk. These securities are mainly composed of the shares of common stock of companies with which the Company has business relationships. Trade payables – trade notes and accounts payable – have payment due dates within one year. Since the Company is exposed to foreign currency exchange risk arising from those payables denominated in foreign currencies, forward foreign exchange contracts are arranged to reduce the risk, if needed. Loans payable are used to raise funds mainly in connection with capital investments. The repayment dates of the long-term debts extend up to nine years from the balance sheet date. Long-term debt with variable interest rates is exposed to interest rate fl uctuation risk and foreign currency exchange risk. However, to reduce such risk and fi x the interest payments for long-term debt with variable rates, the Company utilizes interest rate swap transactions and interest-rate currency swaps as hedging instruments. Regarding derivatives, the Company enters into forward foreign exchange contracts to reduce the foreign currency exchange risk arising from the receivables and payables denomi-nated in foreign currencies. The Company also enters into interest rate swap transactions and interest-rate currency swaps to reduce the fl uctuation risk of interest payments for long-term debt with variable rates. Information regarding the method of hedge accounting, hedging instruments and hedged items, hedging policy, and the assessment of the eff ectiveness of hedging activities is found in Note 2 (p).
(c) Risk management for fi nancial instruments(i) Monitoring of credit risk (the risk that customers or
counterparties may default)In accordance with the internal policies of the Company for managing credit risk arising from receivables, each related division monitors credit worthiness of their main customers periodically, and monitors due dates and outstanding bal-ances by individual customer. In addition, the Company is making eff orts to identify and mitigate risks of bad debts from customers who are having fi nancial diffi culties. The consoli-dated subsidiaries also manage credit risk using the Company’s internal policies and methods. The Company also believes that the credit risk of deriva-tives is insignifi cant as it enters into derivative transactions only with fi nancial institutions which have a high credit-rating.
(ii) Monitoring of market risk (the risk arising from fl uctuations in foreign exchange rates, interest rates and others)For trade receivables and payables denominated in foreign currencies, the Company identifi es the foreign currency exchange risk for each currency on a monthly basis and enters into forward foreign exchange contracts to hedge such risk. In order to mitigate the interest rate risk for loans payable bear-ing interest at variable rates, the Company may also enter into interest rate swap transactions and interest-rate currency swaps. For investment securities, the Company periodically reviews the fair values of such fi nancial instruments and the fi nancial position of the issuers. In addition, the Company con-tinuously evaluates whether securities should be maintained taking into account their fair values and relationships with the issuers. In conducting derivative transactions, the division in charge of each derivative transaction follows the internal poli-cies, which set forth delegation of authority. Monthly reports including actual transaction data are submitted to top man-agement for their review. The consolidated subsidiaries also conduct derivative transactions using the Company’s internal policies.
(iii) Monitoring of liquidity risk (the risk that the Company may not be able to meet its obligations on scheduled due dates)Based on the report from each division, the Company prepares and updates its cash fl ow plans on a timely basis to manage liquidity risk. The consolidated subsidiaries manage the liquid-ity risk using cash fl ow plans and report to the Company periodically.
(d) Supplementary explanation of the estimated fair value of fi nancial instruments
The fair value of fi nancial instruments is based on their quoted market price, if available. When there is no available quoted mar-ket price, fair value is reasonably estimated. Since various assump-tions and factors are refl ected in estimating the fair value, diff erent assumptions and factors could result in diff erent fair value. In addi-tion, the notional amounts of derivatives in Note 18 Derivative Transactions are not necessarily indicative of the actual market risk involved in derivative transactions.
Notes to Consol idated Financia l Statements
38 39
0825_JSW_AR2017_BH.indd 38-390825_JSW_AR2017_BH.indd 38-39 2017/09/14 16:092017/09/14 16:09

Estimated Fair Value of Financial InstrumentsCarrying value of fi nancial instruments on the consolidated balance sheet as of March 31, 2017 and estimated fair value are shown in the following table. The following table does not include fi nancial instruments for which it is extremely diffi cult to determine the fair value (Please refer to Note (ii) below).
Year ended March 31, 2017
Millions of yen
Carrying amount
Estimated fair value Diff erence
Assets Cash on hand and in
banks ¥ 59,801 ¥ 59,801 ¥ — Trade notes and
accounts receivable 49,420 49,420 (0) Securities: Other securities 32,787 32,787 —Total assets ¥142,009 ¥142,009 ¥ (0)Liabilities Trade notes and
accounts payable ¥ 47,744 ¥ 47,744 ¥ — Short-term borrowings 11,908 11,908 — Current portion of
long-term debt 4,215 4,235 20 Long-term debt 34,901 35,385 484Total liabilities ¥ 98,768 ¥ 99,274 ¥505Derivatives (*) ¥ (472) ¥ (472) —
Thousands of U.S. dollars
Carrying amount
Estimated fair value Diff erence
Assets Cash on hand and in
banks $ 533,033 $ 533,033 $ — Trade notes and
accounts receivable 440,503 440,503 (0) Securities: Other securities 292,245 292,245 —Total assets $1,265,790 $1,265,790 $ (0)Liabilities Trade notes and
accounts payable $ 425,564 $ 425,564 $ — Short-term borrowings 106,141 106,141 — Current portion of
long-term debt 37,570 37,748 178 Long-term debt 311,088 315,402 4,314Total liabilities $ 880,364 $ 884,874 $4,501Derivatives (*) $ (4,207) $ (4,207) —
(*) The value of assets and liabilities arising from derivatives is shown at net value, with the amount in parentheses representing net liability position.
Year ended March 31, 2016
Millions of yen
Carrying amount
Estimated fair value Diff erence
Assets Cash on hand and in
banks ¥ 62,018 ¥ 62,018 ¥— Trade notes and
accounts receivable 52,738 52,738 (0) Securities: Other securities 29,121 29,121 —Total assets ¥143,878 ¥143,877 ¥ (0)Liabilities Trade notes and
accounts payable ¥ 53,835 ¥ 53,835 ¥— Short-term borrowings 12,569 12,569 — Current portion of
long-term debt 320 322 2 Long-term debt 36,807 36,881 73Total liabilities ¥103,531 ¥103,608 ¥76Derivatives (*) ¥ 486 ¥ 486 —
(*) The value of assets and liabilities arising from derivatives is shown at net value, with the amount in parentheses representing net liability position.
(i) Method to determine the estimated fair value of fi nancial instruments and other matters related to securities and derivative transactions
AssetsCash on hand and in banksThe carrying amount is used for bank deposits without maturi-ties, because the fair value approximates the carrying value. The fair value of time deposits in banks with maturities is cal-culated based on the present value of the total principal and interest discounted at a rate supposing a newly made deposit.Trade notes and accounts receivables The fair value is calculated by categories of the remaining periods of the receivables based on the present value using discount rates determined by the period to maturity and credit risk.SecuritiesThe carrying amount is used for other securities with maturi-ties, because the fair value approximates the carrying amount. Quoted market price is used for other securities.
LiabilitiesTrade notes and accounts payable and short-term borrowingsThe carrying amount is used for these items because the fair value approximates the carrying amount.Current portion of long-term debt and long-term debtThe fair values are calculated by applying a discount rate, based on the assumed interest rate if a similar new debt is issued, to the total of the principal and interest. The current portion of long-term debt and long-term debt with variable interest rates are subject to the special treatment of interest rate swaps or the integral treatment of interest rate currency swaps and is calculated by applying a discount rate, based on the assumed interest rate if a similar new debt is issued, to the total of the principal and interest including that of the interest rate swap.Derivative TransactionsPlease refer to Note 18, Derivative Transactions, of the notes to the consolidated fi nancial statements.
(ii) Financial instruments for which it is extremely diffi cult to determine the fair value
Millions of yenThousands of
U.S. dollars
2016 2017 2017
Unlisted stocks ¥1,217 ¥1,552 $13,834
Because the fair values of these fi nancial instruments are extremely diffi cult to determine, given that they do not have quoted market prices and future cash fl ows cannot be esti-mated, they are not included in “Securities” in the preceding table.
(iii) Redemption schedule for receivables and securities with maturities at March 31, 2017 and 2016.
Year ended March 31, 2017
Millions of yen
Due in one year
or less
Due after one year through
fi ve yearsDue after fi ve years
Cash on hand and in banks ¥ 59,801 ¥ — —Trade notes and accounts receivable 49,188 232 —Total ¥108,989 ¥232 —
Thousands of U.S. dollars
Due in one year
or less
Due after one year through
fi ve yearsDue after fi ve years
Cash on hand and in banks $533,033 $ — —Trade notes and accounts receivable 438,435 2,068 —Total $971,468 $2,068 —
Year ended March 31, 2016
Millions of yen
Due in one year
or less
Due after one year through
fi ve yearsDue after fi ve years
Cash on hand and in banks ¥ 62,018 ¥ — —Trade notes and accounts receivable 52,576 162 —Total ¥114,594 ¥162 —
(iv) The redemption schedule for long-term debt
Year ended March 31, 2017
Millions of yen
Long-term loans
Lease obligations
Due in 1 year or less ¥ 4,215 ¥574Due after 1 year through 2 years 132 400Due after 2 years through 3 years 60 274Due after 3 years through 4 years 5,000 131Due after 4 years through 5 years 1,800 40Due after 5 years 27,908 7
Long-term loans
Lease obligations
Due in 1 year or less $ 37,570 $5,116Due after 1 year through 2 years 1,177 3,565Due after 2 years through 3 years 535 2,442Due after 3 years through 4 years 44,567 1,168Due after 4 years through 5 years 16,044 357Due after 5 years 248,757 62
Notes to Consol idated Financia l Statements
40 41
0825_JSW_AR2017_BH.indd 40-410825_JSW_AR2017_BH.indd 40-41 2017/09/14 16:092017/09/14 16:09

Year ended March 31, 2016
Millions of yen
Long-term loans
Lease obligations
Due in 1 year or less ¥ 320 ¥620Due after 1 year through 2 years 3,175 482Due after 2 years through 3 years 1,092 306Due after 3 years through 4 years 40 181Due after 4 years through 5 years 5,000 49Due after 5 years 27,500 3
19. SecuritiesOther securities:
March 31, 2017
Millions of yen
Acquisition cost
Carrying amount
Unrealized gain (loss)
Carrying amount exceeding the acquisition cost:
Stocks ¥13,379 ¥24,189 ¥10,809Carrying amount not exceeding the acquisition cost:
Stocks 9,835 8,194 (1,640)Total ¥23,215 ¥32,384 ¥ 9,168
Thousands of U.S. dollars
Acquisition cost
Carrying amount
Unrealized gain (loss)
Carrying amount exceeding the acquisition cost:
Stocks $119,253 $215,607 $ 96,345Carrying amount not exceeding the acquisition cost:
Stocks 87,664 73,037 (14,618)Total $206,926 $288,653 $ 81,719
March 31, 2016
Millions of yen
Acquisition cost
Carrying amount
Unrealized gain (loss)
Carrying amount exceeding the acquisition cost:
Stocks ¥12,987 ¥21,432 ¥ 8,445Carrying amount not exceeding the acquisition cost:
Stocks 10,217 7,283 (2,934)Total ¥23,204 ¥28,716 ¥ 5,511
When their fair values have declined by 50% or more, impairment losses are recorded on those securities. When their fair values have declined by 30% up to 50%, impairment losses are recorded on those securities on an individual basis to the values considered to be recoverable.
20. Derivative Transactions(a) Derivatives not subject to hedge accounting
Year ended March 31, 2017None applicable
Year ended March 31, 2016None applicable
(b) Derivatives subject to hedge accountingThe contract amounts or the amount corresponding to principal as specifi ed by the contract as of the date of the closing of the con-solidated accounts is shown below by type of hedge accounting method.
(i) Currency-related transactionsYear ended March 31, 2017
Millions of yen
Hedge accounting method Type of derivative Principal items hedgedContract amount
Over one year Fair value
Allocation method Foreign exchange forward contracts Accounts receivableSell: U.S. dollars ¥13,716 ¥1,690 ¥(411)
Euros 689 174 6Thai baht 3 — (0)JPY 10 — (0)
Foreign exchange forward contracts Accounts payableBuy: U.S. dollars ¥ 82 ¥ 23 ¥ 0
Euros 272 — 0Sterling pound 359 236 (68)
Thousands of U.S. dollars
Hedge accounting method Type of derivative Principal items hedgedContract amount
Over one year Fair value
Allocation method Foreign exchange forward contracts Accounts receivableSell: U.S. dollars $122,257 $15,064 $(3,663)
Euros 6,141 1,551 53Thai baht 27 — (0)JPY 89 — (0)
Foreign exchange forward contracts Accounts payableBuy: U.S. dollars $ 731 $ 205 $ 0
Euros 2,424 — 0Sterling pound 3,200 2,104 (606)
Note: Calculation of fair value is based on the forward exchange rates.
Year ended March 31, 2016
Millions of yen
Hedge accounting method Type of derivative Principal items hedgedContract amount
Over one year Fair value
Allocation method Foreign exchange forward contracts Accounts receivableSell: U.S. dollars ¥13,805 ¥210 ¥587
Euros 715 158 17Sterling pound — — —
Foreign exchange forward contracts Accounts payableBuy: U.S. dollars ¥ 922 — ¥ (52)
Euros 388 — (21)Sterling pound 758 — (44)Swiss franc — — —
Note: Calculation of fair value is based on the forward exchange rates
Notes to Consol idated Financia l Statements
42 43
0825_JSW_AR2017_BH.indd 42-430825_JSW_AR2017_BH.indd 42-43 2017/09/14 16:092017/09/14 16:09

(ii) Interest-related transactions
Year ended March 31, 2017
Millions of yen
Hedge accounting method Type of derivative Principal items hedgedContract amount
Over one year Fair value
Special treatment for interest rate swaps
Receive/fl oating and pay/fi xed Long-term borrowings¥29,000 ¥25,000 (*)
Integral treatment for interest rate currency swaps: (Special treatment and allocation method)
Receivable USD and fl oating rate/ payable JPY and fi xed rate
Long-term borrowings
708 708 (*)
Thousands of U.S. dollars
Hedge accounting method Type of derivative Principal items hedgedContract amount
Over one year Fair value
Special treatment for interest rate swaps
Receive/fl oating and pay/fi xed Long-term borrowings$258,490 $222,836 (*)
Integral treatment for interest rate currency swaps: (Special treatment and allocation method)
Receivable USD and fl oating rate/ payable JPY and fi xed rate
Long-term borrowings
6,311 6,311 (*)
(*) Interest rate swaps subject to the special treatment for interest rate swaps and interest rate currency swaps subject to integral treatment for interest rate currency swaps are accounted for together with the long-term debt, accordingly the fair value of the interest rate swaps is included in the fair value of the corresponding long-term debt.
Note: Calculation of fair value is based on the stated price by fi nancial institutions.
Year ended March 31, 2016
Millions of yen
Hedge accounting method Type of derivative Principal items hedgedContract amount
Over one year Fair value
Special treatment for interest rate swaps
Receive/fl oating and pay/fi xed Long-term borrowings¥29,000 ¥29,000 (*)
(*) Since interest rate swap contracts accounted for by the special treatment for interest rate swaps are treated together with the long-term borrowings subject to hedging, the estimated fair value of such interest rate swap contracts is included in the estimated fair value of the corresponding long-term borrowings.
Note: Calculation of fair value is based on the stated price by fi nancial institutions.
The following table sets forth the funded status of the plans and the amounts recognized in the consolidated balance sheets as of March 31, 2017 and 2016 for the Company’s and the consolidated subsidiaries’ defi ned benefi t plans:
Millions of yenThousands of
U.S. dollars
2016 2017 2017
Funded retirement benefi t obligation ¥ 20,145 ¥ 19,201 $ 171,147
Plan assets at the value (15,769) (16,079) (143,319)4,375 3,121 27,819
Unfunded retirement benefi t obligation 5,067 5,026 44,799
Net liability for retirement benefi ts in the balance sheet 9,442 8,148 72,627
Retirement benefi t liability 11,315 10,620 94,661Retirement benefi t assets (1,872) (2,472) (22,034)Net liability for retirement benefi ts in the balance sheet ¥ 9,442 ¥ 8,148 $ 72,627
The components of retirement benefi t expense for the years ended March 31, 2017 and 2016 are as follows:
Millions of yenThousands of
U.S. dollars
2016 2017 2017
Service cost ¥1,030 ¥1,153 $10,277Interest cost 197 109 972Expected return on plan assets (322) (294) (2,621)
Amortization of actuarial gain and loss 397 1,019 9,083
Simplifi ed method for retirement benefi t expenses 702 646 5,758
Other 49 39 348Retirement benefi t expense ¥2,054 ¥2,673 $23,826
Notes to Consol idated Financia l Statements
21. Retirement Benefi t PlansThe Company and its consolidated subsidiaries have either funded or unfunded defi ned benefi t plans and/or defi ned contribution plans. The Company and its domestic consolidated subsidiaries have defi ned benefi t plans, i.e. lump-sum payment plans, defi ned
benefi t plans, welfare pension fund and tax-qualifi ed pension plans, covering substantially all employees who are entitled to lump-sum or annuity payments, the amounts of which are deter-mined by reference to their basic rates of pay, length of service, and the conditions under which termination occurs.
The changes in the retirement benefi t obligation for the years ended March 31, 2017 and 2016 are as follows:
Millions of yenThousands of
U.S. dollars
2016 2017 2017
Balance at the beginning of the year ¥20,489 ¥21,011 $187,281 Service cost 1,030 1,153 10,277 Interest cost 197 109 972 Actuarial gain and loss 1,097 (627) (5,589) Retirement benefi t paid (1,804) (1,518) (13,531)Balance at the end of the year ¥21,011 ¥20,128 $179,410
The changes in plan assets for the years ended March 31, 2017 and 2016 are as follows:
Millions of yenThousands of
U.S. dollars
2016 2017 2017
Balance at the beginning of the year ¥16,101 ¥14,729 $131,286
Expected return on plan assets 322 294 2,621 Actuarial gain and loss (1,025) 396 3,530 Contributions by the Company 422 467 4,163 Retirement benefi ts paid (1,091) (918) (8,183)Balance at the end the year ¥14,729 ¥14,969 $133,425
The changes in retirement benefi t liability accounted for using the simplifi ed method for the years ended March 31, 2017 and 2016 are as follows:
Millions of yenThousands of
U.S. dollars
2016 2017 2017
Balance at the beginning of the year ¥3,436 ¥3,161 $28,175 Retirement benefi t expenses 686 646 5,758 Retirement benefi t paid (757) (629) (5,607) Contributions (203) (187) (1,667)Balance at the end the year ¥3,161 ¥2,989 $26,642
44 45
0825_JSW_AR2017_BH.indd 44-450825_JSW_AR2017_BH.indd 44-45 2017/09/14 16:092017/09/14 16:09

The components of retirement benefi ts plans adjustments included in other comprehensive income (before tax eff ect) for the years ended March 31, 2017 and 2016 are as follows:
Millions of yenThousands of
U.S. dollars
2016 2017 2017
Actuarial gain and loss ¥(1,741) ¥2,028 $18,076Total ¥(1,741) ¥2,028 $18,076
The components of retirement benefi ts plans adjustments included in accumulated other comprehensive income (before tax eff ect) as of March 31, 2017 and 2016 are as follows:
Millions of yenThousands of
U.S. dollars
2016 2017 2017
Unrecognized actuarial gain and loss ¥(2,359) ¥(331) $(2,950)Total ¥(2,359) ¥(331) $(2,950)
The fair value of plan assets, by major category, as a percentage of total plan as of March 31, 2017 and 2016 as follows:
March 31, 2016 2017
Bonds 31% 30%Stocks 38 42Cash on hand and in banks 0 0General account 20 18Other 11 10Total 100% 100%
Retirement benefi t trust set for the lump-sum and corporate pen-sion plans accounts for 19% and 17% of the total plan assets, for the years ended March 31, 2017 and 2016, respectively.
The expected return on assets has been estimated based on the anticipated allocation to each asset class and the expected long-term returns on assets held in each category.
The assumptions used in accounting for the above plans are as follows:
March 31, 2016 2017
Discount rates 0.59% 0.68%Expected rates of return on plan assets 2.00 2.00
Contributions made to defi ned contribution plans for the years ended March 31, 2017 and 2016 were ¥59 million ($526 thousand) and ¥61 million, respectively.
22. Income TaxesThe signifi cant components of the Company’s deferred tax assets and liabilities at March 31, 2017 and 2016 were as follows:
Millions of yenThousands of
U.S. dollars
2016 2017 2017
Deferred tax assets: Accrued enterprise taxes ¥ 176 ¥ 138 $ 1,230 Accrued bonuses 951 912 8,129 Depreciation 1,081 685 6,106 Amortization of long-term prepaid expenses 105 105 936 Loss on revaluation of inventory items 1,018 1,036 9,234 Loss on revaluation of fi nancial instruments 193 194 1,729 Impairment loss 11,026 15,350 136,821 Retirement benefi t liability 4,921 4,363 38,889 Provision for warranties for completed construction 670 884 7,879 Provision for loss on construction contracts 390 911 8,120 Provision for loss on wind power generator business 2,667 1,429 12,737 Less allowance for doubtful accounts 216 155 1,382 Asset retirement obligations 393 400 3,565 Percentage-of- completion method 544 483 4,305 Tax loss carry forwards 2,217 2,327 20,742 Unrealized loss on investment securities 886 500 4,457 Deferred loss on hedges 100 172 1,533 Unrealized gain on intercompany transactions 720 677 6,034 Other 704 793 7,068 Gross deferred tax assets 28,986 31,525 280,997 Valuation allowance (4,194) (4,288) (38,221)Total deferred tax assets 24,792 27,236 242,767Deferred tax liabilities: Reserve for advanced depreciation 1,342 1,279 11,400 Reserve for special depreciation 181 51 455 Net defi ned benefi t asset 937 765 6,819 Disposal cost with asset retirement obligations 232 230 2,050 Unrealized gain on investment securities 2,579 3,298 29,397 Deferred gain on hedges 250 39 348 Other 221 232 2,068Total deferred tax liabilities 5,744 5,897 52,563Net deferred tax assets ¥19,048 ¥21,338 $190,195
The reconciliation between the eff ective tax rates refl ected in the consolidated statement of income and the statutory tax rates for the years ended March 31, 2017 and 2016 were as follows:
2016 2017
No reconciliation items are applicable for the year as the Company recorded net loss before income taxes
No reconciliation items are applicable for the year as the Company recorded net loss before income taxes
23. Business CombinationsNone applicable
24. Asset Retirement ObligationsThe following table presents the changes in asset retirement obli-gations for the years ended March 31, 2017 and 2016:
Millions of yenThousands of
U.S. dollars
2016 2017 2017
Balance at beginning of year ¥1,295 ¥1,307 $11,650Liabilities incurred due to the acquisition of property, plant and equipment — 16 143Accretion expense 21 21 187Liabilities settled (2) (23) (205)Other (6) (1) (9)Balance at end of year ¥1,307 ¥1,320 $11,766
Notes to Consol idated Financia l Statements
Millions of yen
Reportable segments
Year ended March 31, 2017
Steel and Energy
Products
Industrial Machinery Products
Real Estate and Other Businesses Total
Adjustmentsand
Eliminations Consolidated
Sales and operating income: Sales to third parties ¥51,207 ¥159,378 ¥ 1,883 ¥212,469 ¥ — ¥212,469 Intra-segment sales and transfers 5,551 858 3,751 10,161 (10,161) —Total sales 56,759 160,236 5,635 222,630 (10,161) 212,469Operating income ¥ (2,794) ¥ 15,183 ¥ 959 ¥ 13,349 ¥ (1,008) ¥ 12,340Assets, depreciation, and capital expenditures Total assets ¥37,561 ¥123,743 ¥11,878 ¥173,183 ¥102,131 ¥275,315 Depreciation and amortization 4,142 3,418 206 7,767 91 7,858 Capital expenditures 4,574 4,742 44 9,361 140 9,502
25. Investment and Rental PropertiesThe Company has omitted the disclosure of investment and rental properties due to immateriality for the years ended March 31, 2017 and 2016.
26. Segment InformationThe reportable segments of the Group are components for which discrete fi nancial information is available and whose operating results are regularly reviewed by the Executive Committee to make decisions about resource allocation and to assess performance. The Steel and Energy Products segment includes steel castings and forgings, steel plates, pressure vessels and steel structures. The Indus-trial Machinery Products segment includes injection molding machines, fi lm and sheet machinery, blow molding machines, magnesium injection molding machines, waste treatment equipment and manufacturing equipment for electronic products. The Real Estate and Other Businesses segment includes regional development.
46 47
0825_JSW_AR2017_BH.indd 46-470825_JSW_AR2017_BH.indd 46-47 2017/09/14 16:092017/09/14 16:09

Notes to Consol idated Financia l Statements
(a) Product and service information
Millions of yen
Year ended March 31, 2017
Steel and Energy
Products
Industrial Machinery Products
Real Estate and Other Businesses Total
Sales to third parties ¥51,207 ¥159,378 ¥1,883 ¥212,469
Thousands of U.S. dollars
Year ended March 31, 2017
Steel and Energy
Products
Industrial Machinery Products
Real Estate and Other Businesses Total
Sales to third parties $456,431 $1,420,608 $16,784 $1,893,832
Millions of yen
Year ended March 31, 2016
Steel and Energy
Products
Industrial Machinery Products
Real Estate and Other Businesses Total
Sales to third parties ¥74,854 ¥144,358 ¥4,087 ¥223,301
(b) Geographical information(i) Sales
Millions of yenThousands of
U.S. dollars
2016 2017 2017
Japan ¥100,304 ¥103,575 $ 923,211China 30,299 40,852 364,132Others 92,697 68,041 606,480Consolidated ¥223,301 ¥212,469 $1,893,832
Note: Net sales information above is based on customer location.
(ii) Tangible assetsThe Company has omitted the disclosure of tangible assets by country or region as of March 31, 2017 and 2016 because the amount of tangible assets in Japan accounted for more than 90% of the carrying amount in the consolidated balance sheet.
(c) Signifi cant customer informationThe Company has omitted the disclosure of signifi cant customer information for the years ended March 31, 2017 and 2016 because no individual customer accounted for more than 10% of net sales in the consolidated statement of income.
(d) Information on loss on impairment of fi xed assetsImpairment losses on fi xed assets by reportable segment for the years ended March 31, 2017 and 2016 are summarized as follows:
Millions of yen
Year ended March 31, 2017
Steel and Energy
Products
Industrial Machinery Products
Real Estate and Other Businesses Total
Impairment loss ¥17,874 — — ¥17,874
Thousands of U.S. dollars
Year ended March 31, 2017
Steel and Energy
Products
Industrial Machinery Products
Real Estate and Other Businesses Total
Impairment loss $159,319 — — $159,319
Millions of yen
Year ended March 31, 2016
Steel and Energy
Products
Industrial Machinery Products
Real Estate and Other Businesses Total
Impairment loss ¥35,447 — — ¥35,447
Thousands of U.S. dollars
Reportable segments
Year ended March 31, 2017
Steel and Energy
Products
Industrial Machinery Products
Real Estate and Other Businesses Total
Adjustmentsand
Eliminations Consolidated
Sales and operating income: Sales to third parties $456,431 $1,420,608 $ 16,784 $1,893,832 $ — $1,893,832 Intra-segment sales and transfers 49,479 7,648 33,434 90,570 (90,570) —Total sales 505,919 1,428,256 50,227 1,984,401 (90,570) 1,893,832Operating income $ (24,904) $ 135,333 $ 8,548 $ 118,986 $ (8,985) $ 109,992Assets, depreciation, and capital expenditures Total assets $334,798 $1,102,977 $105,874 $1,543,658 $910,340 $2,454,007 Depreciation and amortization 36,920 30,466 1,836 69,231 811 70,042 Capital expenditures 40,770 42,268 392 83,439 1,248 84,696
Notes: 1. Adjustments and eliminations for segment profi t of ¥1,008 million ($8,985 thousand) include elimination of inter-segment profi t on inventories and corporate general administration expense which are not allocable to a reportable segment.
2. Adjustments and eliminations for segment assets of ¥102,131 million ($910,340 thousand) include off set of inter-segment debt and credit, and corporate assets which are not allocable to a reportable segment.
3. Adjustments and eliminations for depreciation and amortization of ¥91 million ($811 thousand) include depreciation and amortization for corporate assets. Adjustments and eliminations for capital expenditures of ¥140 million ($1,248 thousand) include capital expenditures for corporate assets.
Millions of yen
Reportable segments
Year ended March 31, 2016
Steel and Energy
Products
Industrial Machinery Products
Real Estate and Other Businesses Total
Adjustmentsand
Eliminations Consolidated
Sales and operating income: Sales to third parties ¥74,854 ¥144,358 ¥ 4,087 ¥223,301 ¥ — ¥223,301 Intra-segment sales and transfers 4,684 1,883 3,362 9,930 (9,930) —Total sales 79,539 146,242 7,449 233,232 (9,930) 223,301Operating income ¥ 699 ¥ 12,391 ¥ 2,018 ¥ 15,109 ¥ (685) ¥ 14,423Assets, depreciation, and capital expenditures Total assets ¥60,256 ¥124,383 ¥12,055 ¥196,694 ¥96,443 ¥293,138 Depreciation and amortization 7,294 3,009 271 10,576 92 10,669 Capital expenditures 9,053 4,940 67 14,062 (51) 14,010
Notes: 1. Adjustments and eliminations for segment profi t of ¥685 million include elimination of inter-segment profi t on inventories and corporate general administration expense which are not allocable to a reportable segment.
2. Adjustments and eliminations for segment assets of ¥96,443 million include off set of inter-segment debt and credit, and corporate assets which are not allocable to a reportable segment.
3. Adjustments and eliminations for depreciation and amortization of ¥92 million include depreciation and amortization for corporate assets. Adjustments and eliminations for capital expenditures of ¥51 million include capital expenditures for corporate assets.
48 49
0825_JSW_AR2017_BH.indd 48-490825_JSW_AR2017_BH.indd 48-49 2017/09/14 16:092017/09/14 16:09

28. Amounts per ShareProfi t (loss) attributable to owners of parent per share is calculated based on the Profi t (loss) attributable to owners of parent available for distribution to shareholders of common stock and the weight-ed-average number of shares of common stock outstanding dur-ing the year. Net assets per share are calculated based on the number of shares of common stock outstanding at year end. Amounts per share at March 31, 2017 and 2016 and for the years then ended were as follows:
Yen U.S. dollars
2016 2017 2017
Profi t (loss) attributable to owners of parent ¥ (226.62) ¥ (67.61) $ (0.60)Net assets 1,497.04 1,446.44 12.89
Note: The Company carried out the share consolidation at the ratio of 5 shares to 1 share eff ective October 1, 2016. In accordance with this, net assets per share and profi t (loss) attributable to owners of parent per share are calcu-lated based on the assumption that the share consolidation had been carried out at the beginning of fi scal 2016.
29. Subsequent Events(Signifi cant subsequent events)
None applicable
I ndependent Auditor ’s Repor tNotes to Consol idated Financia l Statements
Independent Auditor’s Report
(e) Amortization and balance of goodwillThe following table presents the amortization and balance of neg-ative goodwill arising from business combinations on or prior to March 31, 2010 as of and for the years ended March 31, 2017 and 2016 by reportable segment:
Millions of yen
Year ended March 31, 2017
Steel and Energy
Products
Industrial Machinery Products
Real Estate and Other Businesses
Adjustments and
Eliminations Total
Amortization — ¥199 — — ¥199Balance as of March 31 — 657 — — 657
Thousands of U.S. dollars
Year ended March 31, 2017
Steel and Energy
Products
Industrial Machinery Products
Real Estate and Other Businesses
Adjustments and
Eliminations Total
Amortization — $1,774 — — $1,774Balance as of March 31 — 5,856 — — 5,856
Millions of yen
Year ended March 31, 2016
Steel and Energy
Products
Industrial Machinery Products
Real Estate and Other Businesses
Adjustments and
Eliminations Total
Amortization — ¥174 — — ¥174Balance as of March 31 — 912 — — 912
(f) Information on gain on negative goodwill
Year ended March 31, 2017None applicable
Year ended March 31, 2016None applicable
27. Shareholders’ EquityThe Corporation Law of Japan provides that an amount equal to 10% of the amount to be disbursed as distributions of capital surplus (other than the capital reserve) and retained earnings (other than the legal reserve) be transferred to the capital reserve and the legal reserve, respectively, until the sum of the capital reserve and the legal reserve equals 25% of the capital stock account. Such distributions can be made at any time by resolution of the meeting of shareholders, or by the Board of Directors if certain conditions are met.
50 51
0825_JSW_AR2017_BH.indd 50-510825_JSW_AR2017_BH.indd 50-51 2017/09/14 16:092017/09/14 16:09

Corporate Directory Network
Domestic
Overseas
Corporate Data
Trade Name The Japan Steel Works, Ltd.
Head Offi ce Gate City Ohsaki-West Tower,11-1, Osaki 1-chome,Shinagawa-ku, Tokyo, Japan
Foundation November 1, 1907
Paid-in Capital ¥19,694 million
Employees 2,266 (Consolidated 5,239)
Auditor Ernst & Young ShinNihon LLCHibiya Kokusai Bldg.,2-3, Uchisaiwai-cho 2-chome,Chiyoda-ku, Tokyo, Japan
(as of March 31, 2017)
Düsseldorf
Ansan (near Seoul)Detroit
New York
Houston
Corona (near Los Angeles)
Jakarta
SingaporeKuala Lumpur
BangkokHanoi
Gurgaon (near Delhi)
ShanghaiShenzhen
TaipeiHong Kong
Manila
Head Offi ceGate City Ohsaki-West Tower, 11-1, Osaki 1-chome, Shinagawa-ku, Tokyo 141-0032, JapanPhone: +81-3-5745-2001 Facsimile: +81-3-5745-2025
Nagoya Offi ceMitsui Sumitomo Kaijo Nagoya Shirakawa Bldg. 7F, 9-15, Sakae 2-chome, Naka-ku, Nagoya-shi, Aichi 460-0008, JapanPhone: +81-52-222-1271 Facsimile: +81-52-222-1275
Osaka Offi ceShinanobashi Mitsui Bldg., 11-7, Utsubohonmachi 1-chome, Nishi-ku, Osaka-shi, Osaka 550-0004, JapanPhone: +81-6-6446-2480 Facsimile: +81-6-6446-2488
Japan Steel Works America, Inc. Head Offi ce 379 Thornall Street, 5th Floor, Edison, NJ 08837, U.S.A. Phone: +1-212-490-2630 Facsimile: +1-212-490-2575 Detroit Offi ce 24387 Halstead Road Unit B, Farmington Hills, MI 48335, U.S.A. Phone: +1-248-536-0288 Facsimile: +1-212-490-2575 Houston Offi ce 9801 Westheimer Road, Suite 220 Houston, TX 77042, U.S.A. Phone: +1-713-588-1303 Facsimile: +1-713-588-1322
Japan Steel Works Europe GmbHFriedrichstr. 19, 40217 Düsseldorf, GermanyPhone: +49-211-3116660 Facsimile:+49-211-31166640
THE JAPAN STEEL WORKS (SINGAPORE) PTE. LTD.17, Gul Lane, Singapore 629413, Republic of SingaporePhone: +65-6861-4511 Facsimile: +65-6862-3166
JAPAN STEEL WORKS INDIA PRIVATE LIMITED611, Time Tower, MG Road, Sector 28, Gurgaon,Haryana, 122001, IndiaPhone: +91-124-469-4444 Facsimile: +91-124-469-4433
SM PLATEK CO., LTD.29, Cheomdan-ro, 181beon-gil, Danwon-gu, Ansan-si, Kyeonggi-do, KoreaPhone: +82-31-488-3401 Facsimile: +82-31-488-9982
JSW IT KOREA CO., LTD.1805, 6, Samseong-ro 96-gil, Gangnam-gu, Seoul, KoreaPhone: +82-2-2191-5294/5295 Facsimile: +82-2-2191-5296
JSW Plastics Machinery, Inc. Head Offi ce 555 South Promenade Ave., Unit 104 Corona, CA 92879, U.S.A. Phone: +1-951-898-0934 Facsimile: +1-951-898-1747 Chicago Offi ce 540 Capital Drive, Suite 130, Lake Zurich, IL 60047, U.S.A. Phone: +1-847-550-0704 Facsimile: +1-847-550-0725 Detroit Offi ce 24387 Halsted Road Unit B, Farmington Hills, MI 48335, U.S.A. Phone: +1-248-536-0288 Facsimile: +1-212-490-2575 Atlanta Offi ce 1395 S. Marietta Parkway, Bldg. 200, Suite 201, Marietta, GA 30067, U.S.A. Phone: +1-770-575-0383 Facsimile: +1-678-403-1846
JSW Plastics Machinery (Philippines) Inc.Unit 802 Alabang Business Tower 1216 Acacia Avenue, Madrigal Business Park, Alabang Muntinlupa City Metro Manila 1771, PhilippinesPhone: +63-2-478-2533/2534 Facsimile: +63-2-809-6221
Hiroshima Offi ce6-1, Funakoshi-Minami 1-chome, Aki-ku,Hiroshima-shi, Hiroshima 736-8602, JapanPhone: +81-82-822-0991 Facsimile: +81-82-822-0997
Fukuoka Offi ce23-2, Sakuragaoka 1-chome, Kasuga-shi, Fukuoka 816-0872, JapanPhone: +81-92-582-8111 Facsimile: +81-92-582-8124
PT. JSW Plastics Machinery IndonesiaGajah Building, Unit K Jl. Dr. Saharjo Raya No.111Tebet, Jakarta Selatan 12810, IndonesiaPhone: +62-21-8370-2536/2537 Facsimile: +62-21-829-8264
JSW Plastics Machinery (M) SDN. BHD. Head Offi ce D6-5-G Block D6, Pusat Perdagangan Dana, 1 Jalan PJU 1A/46, 47301 Petaling Jaya, Selangor Darul Ehsan, Malaysia Phone: +60-3-7842-6076 Facsimile: +60-3-7842-6078 Johor Offi ce No.207, Ground Floor Industry Center, Technovation Park UTM KM20, Jalan Pontian Lama, 81300 Skudai, Johor Bahru, Malaysia Phone: +60-7-554-3637 Facsimile: +60-7-554-3711
The Japan Steel Works (Thailand) Co.,Ltd.78/6 JST Building 4th Floor, Moo7, Kingkaew Road, Rachatewa, Bangplee, Samutprakarn 10540, ThailandPhone: +66-2-738-5272~6 Facsimile: +66-2-738-5277
JSW Plastics Machinery Vietnam Ltd. Head Offi ce Room 103, Techno-Center Thang Long Industrial Park, Kim Chung Commune, Dong Anh District, Hanoi, Vietnam Phone: +84-24-3951-6383 Facsimile: +84-24-3951-6384 Ho Chi Minh Offi ce G-Floor, DC Tower, 111D Ly Chinh thang Ward 7, Dist3, Ho Chi Minh, Vietnam Phone: +84-28-3526-1295 Facsimile: +84-28-3526-1296
JSW Plastics Machinery (H.K.) Co., Ltd. Room 907, Corporation Park, 11 On Lai Street, Shatin, New Territories, Hong KongPhone: +852-2648-0720 Facsimile:+852-2686-8204
JSW Plastics Machinery (TAIWAN) Corp. Head Offi ce 1F., No. 21, Dahu 1st Rd., Gueishan Shiang, Taoyuan, County 33373, Taiwan, R.O.C. Phone: +886-3-396-2102 Facsimile: +886-3-396-2104 Tainan Branch 15F-7, No.689-78, Xiaodong Rd., Yongkang City, Tainan County 71052, Taiwan, R.O.C. Phone: +886-6-311-4192 Facsimile: +886-6-311-4193
JSW Machinery Trading (Shanghai) Co., Ltd. Head Offi ce 28A, Strength Plaza, No.600-4 Tianshan Road, Shanghai, 200051, China Phone: +86-21-5206-7031/7032 Facsimile: +86-21-5206-7033 Beijin Branch Room 622, B Section, Xingfu Plaza, No.3, DongSanHuan North Road, Chaoyang District, Beijing, 100027, China Phone: +86-010-6590-8967 Facsimile: +86-010-6590-8968
Muroran Plant4, Chatsumachi, Muroran-shi,Hokkaido 051-8505, JapanPhone: +81-143-22-0143 Facsimile: +81-143-24-3440
Hiroshima Plant6-1, Funakoshi-Minami 1-chome, Aki-ku,Hiroshima-shi, Hiroshima 736-8602, JapanPhone: +81-82-822-3181 Facsimile: +81-82-285-2038
Yokohama Plant2-1, Fukuura 2-chome, Kanazawa-ku,Yokohama-shi, Kanagawa 236-0004, JapanPhone: +81-45-781-1111 Facsimile: +81-45-787-7200
Dalian Branch Room1055, Development Building, Rong Hui Road, Area No.9, Dalian Development District, Dalian Liaoning 116600, China Phone: +86-411-8761-0339 Facsimile: +86-411-8750-9182 Tianjin Branch Room 609, HaiHe Creative Center No. 5, JuXing Road No. 9, XianShuiGu Town, JinNan District, Tianjin, 300350 China Phone: +86-22-8538-5431 Facsimile: +86-22-8535-5431 Suzhou Branch C-219, Dong Chuang Technical Park, No. 216 Jinfeng Rd, Mudu, Wuzhong District, Suzhou, Jiansu 215101, China Phone: +86-512-6831-6246 Facsimile: +86-512-6831-6249
JSW Injection Machine Maintenance (Shenzhen) Co., Ltd.1F, YiBen Electronic & Business Industrial Park,NO.1063 Chaguang Road, Xili Town, Nanshan District, Shenzhen City, Guangdong Province, 518055, ChinaPhone: +86-755-8602-0930 Facsimile: +86-755-8602-0934
NINGBO TONGYONG PLASTIC MACHINERY MANUFACTURING CO., LTD.No.1 Zhuhan Industrial Zone Hengzhang Village ShiqiStreet Yinzhou District Ningbo 315155, ChinaPhone: +86-574-8821-7608 Facsimile: +86-574-8821-4801
JSW Machinery (Ningbo) Co., Ltd.No.1 Zhuhan Industrial Zone Hengzhang Village Shiqi Street Yinzhou District Ningbo 315155, ChinaPhone: +86-574-8823-6758 Facsimile: +86-574-8308-1589
YPK TRADING (HONG KONG) CO., Ltd.Flat C, 20/F, Young Ya Industrial Bldg., 381-389, Sha Tsui Road Tsuen Wan, N.T., Hong KongPhone: +852-3521-0437 Facsimile:+852-3905-7216
YPK Machine Trading (Shenzhen) Co., Ltd.Flat C, 10/F, Laifu Bldg., Fuyong Road, Baoan Shenzhen, Guangdong, 518103, ChinaPhone: +86-755-2733-2114 Facsimile: +86-755-2733-2106
Fine Crystal (H.K.) Co., Ltd.Room 903, 9/F Aitken Vanson Centre, 61 Hoi Yuen Road,Kwun Tong, Kowloon, Hong KongPhone: +852-2345-7485 Facsimile: +852-2357-9104
Fine Crystal Precision (S.Z.) Co., Ltd.No.14, Tong Fu Yu Industrial Zone, Long Tian She Qu, Keng Zi Ban Shi Chu, Ping Shan New District, Shenzhen, ChinaPhone: +86-755-8411-6005 Facsimile: +86-755-8411-5009
Stock Information
Authorized Shares 200,000,000 shares
Issued and Outstanding Shares 74,292,607 shares
Shareholders 24,719
Stock Listings Tokyo
Transfer Agent and Registrar Sumitomo Mitsui Trust Bank, Ltd.4-1, Marunouchi 1-chome, Chiyoda-ku,Tokyo, Japan
Major Shareholders (holding %)
The Master Trust Bank of Japan, Ltd. (Trust Account) 7.58%Japan Trustee Services Bank, Ltd. (Trust Account) 6.24%Mitsui Life Insurance Co., Ltd. 3.85%Sumitomo Mitsui Banking Corp. 2.99%BBH for the Advisor’s Inner Circle Fund II/Kopernik Glo All–cap Fund 2.53%Mitsui Sumitomo Insurance Co., Ltd. 2.40%Sumitomo Mitsui Trust Bank, Ltd. 2.22%Nippon Steel & Sumitomo Metal Corp. 1.78%Japan Trustee Services Bank, Ltd. (Trust Account 5) 1.73%State Street Bank and Trust Company 1.69% (as of March 31, 2017)
Note: The shareholding ratios are calculated after deducting 801,480 treasury shares from the total number of shares issued.
Classification of Shareholders by Percentage of Shares Held (As of March 31, 2017)
Number of Shares Issued
74,292,607shares
Securities Companies
2.73%
Individuals and Others
17.75%
Financial Institutions
38.41%
General Companies and Other
Corporations
15.31%
Foreign Corporations and Foreign Individuals
25.80%
52 53
0825_JSW_AR2017_BH.indd 52-530825_JSW_AR2017_BH.indd 52-53 2017/09/14 16:092017/09/14 16:09

ANNUAL REPORT 2017
A N N U A L R E P O R T
2017for the year ended March 31, 2017
0818_JSW_AR2017_FH.indd a-b0818_JSW_AR2017_FH.indd a-b 2017/09/14 16:072017/09/14 16:07