Embed Size (px)
Citation preview
ANNUAL REPORT 2017
COMMUNITY CAPITAL TRUST
CCM ALTERNATIVE INCOME FUND(THE “FUND”)
May 31, 2017

1
Dear Shareholder:
On behalf of the Board of Trustees of The Community Capital Trust, I am pleased to present the CCM Alternative Income Fund Annual Report to Shareholders for the year ended May 31, 2017.
The Fund celebrated its four-year anniversary and, during the one-year period end ed May 31, 2017, reached the majority of its goals, including low volatility, income of 3.0 to 4.0% above 3-month T-Bills, monthly distributions, and low correlation to the equity (S&P 500) market.
We applaud the disciplined and productive efforts of Community Capital Management, Inc., registered investment advisor to the Fund, and Badge Investment Partners LLC, sub-advisor to the Fund*, and we thank you, our shareholders.
Sincerely,
John TaylorChairman, Board of Trustees
* As of June 7, 2017 the employees of Badge Investment Partners LLC became employees of Community Capital Management, Inc. and the sub-advisory agreement was terminated.
2 CCM Alternative Income Fund
TABLE OF CONTENTSManager's Discussion & Analysis 3
Fund Profi le 4
Expenses 6
Schedule of Investments 7
Statement of Assets and Liabilities 16
Statement of Operations 17
Statements of Changes in Net Assets 18
Statement of Cash Flows 19
Financial Highlights 20
Notes to Financial Statements 21
Report of Independent Registered Public Accounting Firm 36
Notice to Shareholders 37
Trustees and Offi cers 38
Approval of Advisory and Sub-Advisory Agreements 41
3
MANAGER’S DISCUSSION & ANALYSIS
The Fund fi nished its fourth year of operation, continuing its focus on delivering monthly income with low volatility and low correlation to both bond and stock markets.
As of May 31, 2017, its 30-day SEC yield of 5.09% (4.77% unsubsidized 30-day yield) exceeded the Fund’s goal to produce income of 3-month T-Bills plus 4.0%. The Fund’s target correlation range of 0.0 to 0.5 to the S&P 500 was achieved. The Fund’s target correlation range of 0.0 to 0.5 to the Bloomberg Barclays Aggregate Bond Index (the “Agg”) was better than it’s goal at -0.11. In addition, the Fund’s standard deviation (volatility of returns) of 3.62% was within the range of its stated standard deviation goal of 2.0 to 4.0%. The Fund’s total return for the 12-month period ended May 31, 2017 was 3.41% as the equity market environment continues to be a headwind for value oriented and hedged strategies. For the same time period, the Citigroup 3-Month U.S. Treasury Bill Index was up 0.41%.
Rising rates, led by two Federal Reserve rate hikes and the belief that Trump’s policies would lead to infl ation, provided a tail wind for the portfolio’s interest rate hedged fi xed income holdings. The Fund’s beta (or the part of its returns that can be explained by the movement of the overall markets) was negative versus the bond market (-0.14 relative to the Agg). The Agg returned 1.58% for the 12-month period end ed May 31, 2017.
The S&P’s total return of 17.46% during the twelve-month period end ed May 31, 2017 was largely driven by multiple expansion within the growth sectors of the market and belief in Trump’s economic policies, which if realized would boost economic growth. Growth stocks outperformed value stocks by 4.63% (as measured by the S&P 500 Growth and Value Indices), which created a headwind for the Fund’s hedged equity holdings.
The portfolio management’s team focus on the Fund’s investment goals and objectives remains consistent: to deliver low volatility income and returns with a strong measure of capital preservation.Total return fi gures represent past performance and do not indicate future results. The investment return and principal value of an investment will fl uctuate so that an investor’s shares, when redeemed, may be worth more or less that their original cost. Current performance may be higher or lower than the total returns shown. Please call the Fund at 1-877-272-1977 to obtain the most recent month-end returns. Returns do not refl ect the deduction of taxes that a shareholder would pay on Fund distributions or the redemption of Fund shares.
This material represents an assessment of the market at a specifi c point in time and is not intended to be a forecast of future events or a guarantee of future results. This information should not be relied upon as research or investment advice.
Investing involves risk, including possible loss of principal.
The Fund is distributed by SEI Investments Distribution Co., which is not affi liated with Community Capital Management, Inc. or Badge Investment Partners.
4 CCM Alternative Income Fund
Fund Profi le May 31, 2017 (Unaudited)
Annual Total Returns
One Year Ended
May 31, 2017
Three Years Ended
May 31, 2017Inception to Date
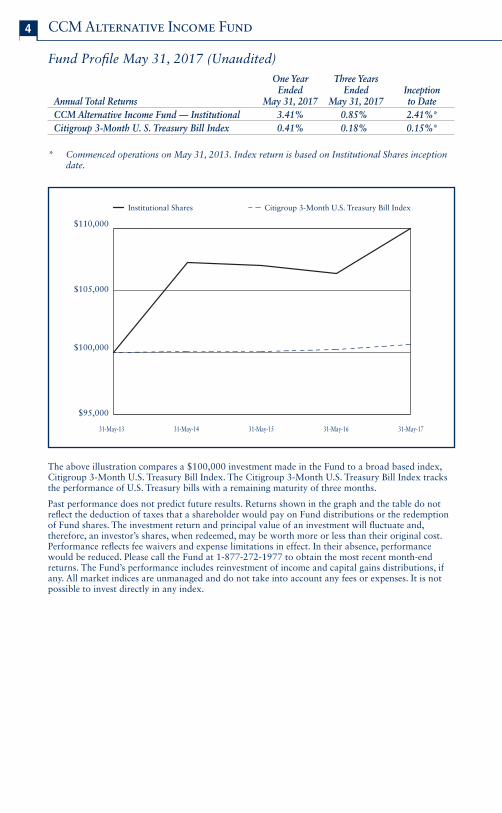
CCM Alternative Income Fund — Institutional 3.41% 0.85% 2.41%*Citigroup 3-Month U. S. Treasury Bill Index 0.41% 0.18% 0.15%*
* Commenced operations on May 31, 2013. Index return is based on Institutional Shares inception date.
31-May-13 31-May-14 31-May-15 31-May-17
Citigroup 3-Month U.S. Treasury Bill IndexInstitutional Shares
$95,000
$100,000
$105,000
$110,000
31-May-16
The above illustration compares a $100,000 investment made in the Fund to a broad based index, Citigroup 3-Month U.S. Treasury Bill Index. The Citigroup 3-Month U.S. Treasury Bill Index tracks the performance of U.S. Treasury bills with a remaining maturity of three months.
Past performance does not predict future results. Returns shown in the graph and the table do not refl ect the deduction of taxes that a shareholder would pay on Fund distributions or the redemption of Fund shares. The investment return and principal value of an investment will fl uctuate and, therefore, an investor’s shares, when redeemed, may be worth more or less than their original cost. Performance refl ects fee waivers and expense limitations in effect. In their absence, performance would be reduced. Please call the Fund at 1-877-272-1977 to obtain the most recent month-end returns. The Fund’s performance includes reinvestment of income and capital gains distributions, if any. All market indices are unmanaged and do not take into account any fees or expenses. It is not possible to invest directly in any index.
5
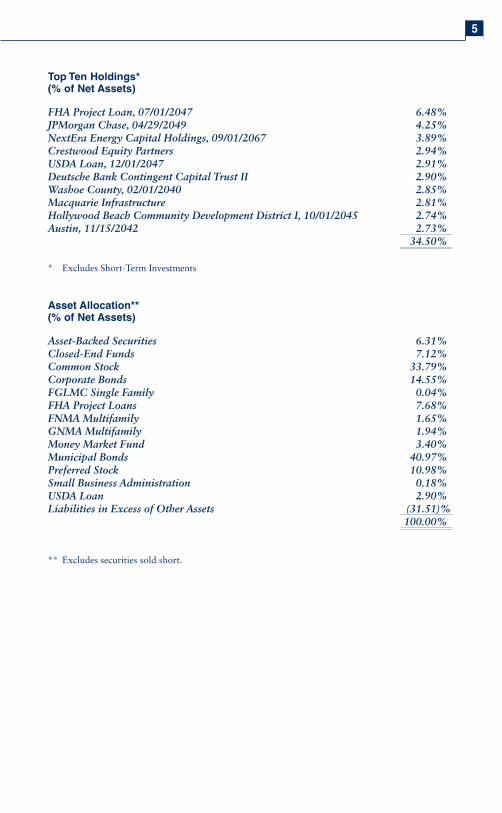
Top Ten Holdings*
(% of Net Assets)
FHA Project Loan, 07/01/2047 6.48%JPMorgan Chase, 04/29/2049 4.25%NextEra Energy Capital Holdings, 09/01/2067 3.89%Crestwood Equity Partners 2.94%USDA Loan, 12/01/2047 2.91%Deutsche Bank Contingent Capital Trust II 2.90%Washoe County, 02/01/2040 2.85%Macquarie Infrastructure 2.81%Hollywood Beach Community Development District I, 10/01/2045 2.74%Austin, 11/15/2042 2.73%
34.50%
* Excludes Short-Term Investments
Asset Allocation**
(% of Net Assets)
Asset-Backed Securities 6.31%Closed-End Funds 7.12%Common Stock 33.79%Corporate Bonds 14.55%FGLMC Single Family 0.04%FHA Project Loans 7.68%FNMA Multifamily 1.65%GNMA Multifamily 1.94%Money Market Fund 3.40%Municipal Bonds 40.97%Preferred Stock 10.98%Small Business Administration 0.18%USDA Loan 2.90%Liabilities in Excess of Other Assets (31.51)%
100.00%
** Excludes securities sold short.
6 CCM Alternative Income Fund
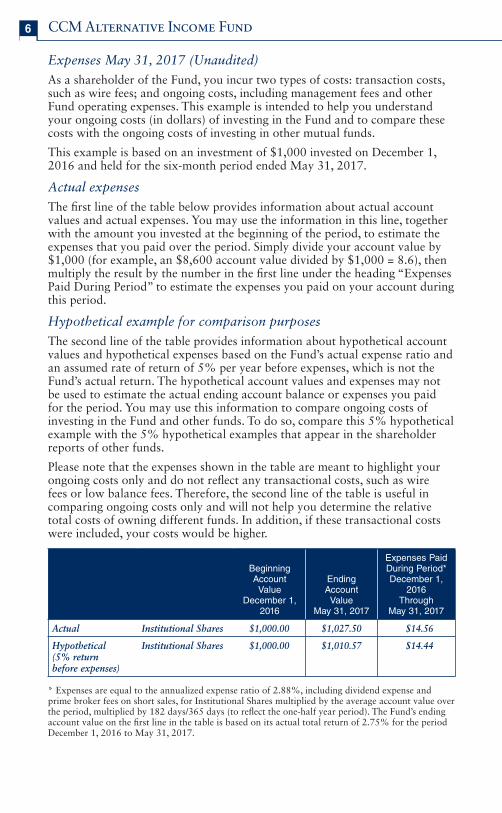
Expenses May 31, 2017 (Unaudited)
As a shareholder of the Fund, you incur two types of costs: transaction costs, such as wire fees; and ongoing costs, including management fees and other Fund operating expenses. This example is intended to help you understand your ongoing costs (in dollars) of investing in the Fund and to compare these costs with the ongoing costs of investing in other mutual funds.
This example is based on an investment of $1,000 invested on December 1, 2016 and held for the six-month period ended May 31, 2017.
Actual expenses
The fi rst line of the table below provides information about actual account values and actual expenses. You may use the information in this line, together with the amount you invested at the beginning of the period, to estimate the expenses that you paid over the period. Simply divide your account value by $1,000 (for example, an $8,600 account value divided by $1,000 = 8.6), then multiply the result by the number in the fi rst line under the heading “Expenses Paid During Period” to estimate the expenses you paid on your account during this period.
Hypothetical example for comparison purposes
The second line of the table provides information about hypothetical account values and hypothetical expenses based on the Fund’s actual expense ratio and an assumed rate of return of 5% per year before expenses, which is not the Fund’s actual return. The hypothetical account values and expenses may not be used to estimate the actual ending account balance or expenses you paid for the period. You may use this information to compare ongoing costs of investing in the Fund and other funds. To do so, compare this 5% hypothetical example with the 5% hypothetical examples that appear in the shareholder reports of other funds.
Please note that the expenses shown in the table are meant to highlight your ongoing costs only and do not refl ect any transactional costs, such as wire fees or low balance fees. Therefore, the second line of the table is useful in comparing ongoing costs only and will not help you determine the relative total costs of owning different funds. In addition, if these transactional costs were included, your costs would be higher.
Beginning Account Value
December 1, 2016
EndingAccountValue
May 31, 2017
Expenses Paid During Period* December 1,
2016Through
May 31, 2017
Actual Institutional Shares $1,000.00 $1,027.50 $14.56
Hypothetical(5% returnbefore expenses)
Institutional Shares $1,000.00 $1,010.57 $14.44
* Expenses are equal to the annualized expense ratio of 2.88%, including dividend expense and prime broker fees on short sales, for Institutional Shares multiplied by the average account value over the period, multiplied by 182 days/365 days (to refl ect the one-half year period). The Fund’s ending account value on the fi rst line in the table is based on its actual total return of 2.75% for the period December 1, 2016 to May 31, 2017.
The accompanying notes are an integral part of the financial statements.
7
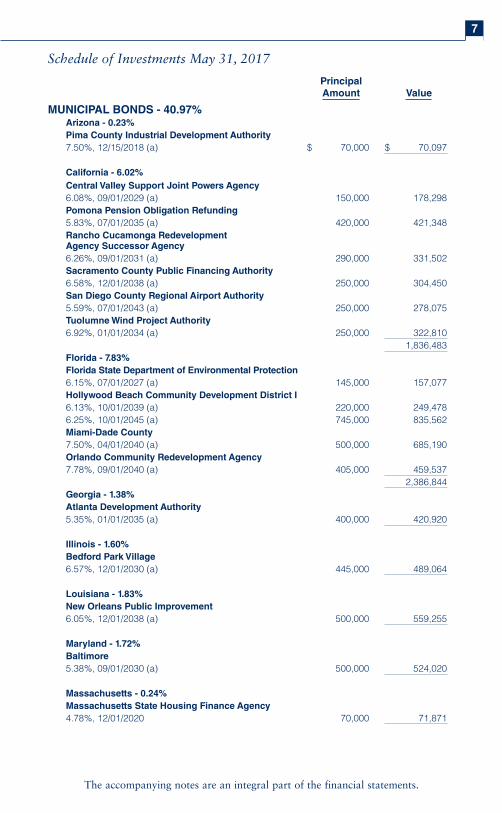
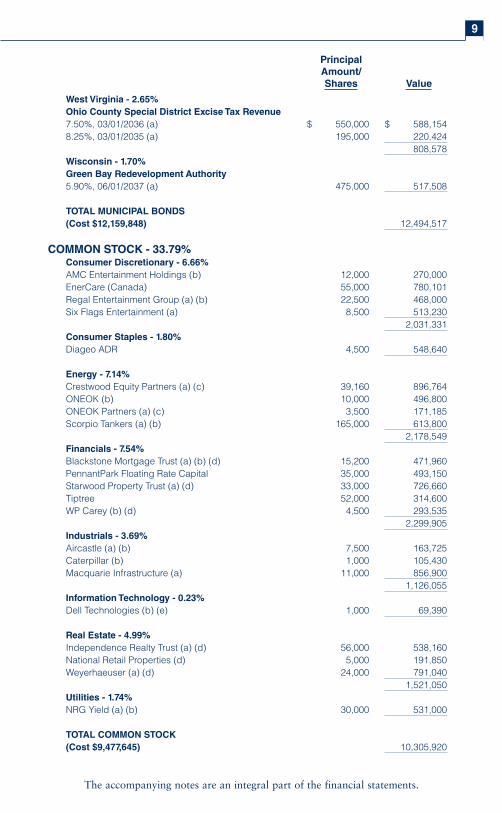
Schedule of Investments May 31, 2017
Principal
Amount Value
MUNICIPAL BONDS - 40.97%Arizona - 0.23%
Pima County Industrial Development Authority
7.50%, 12/15/2018 (a) $ 70,000 $ 70,097
California - 6.02%
Central Valley Support Joint Powers Agency
6.08%, 09/01/2029 (a) 150,000 178,298
Pomona Pension Obligation Refunding
5.83%, 07/01/2035 (a) 420,000 421,348
Rancho Cucamonga Redevelopment
Agency Successor Agency
6.26%, 09/01/2031 (a) 290,000 331,502
Sacramento County Public Financing Authority
6.58%, 12/01/2038 (a) 250,000 304,450
San Diego County Regional Airport Authority
5.59%, 07/01/2043 (a) 250,000 278,075
Tuolumne Wind Project Authority
6.92%, 01/01/2034 (a) 250,000 322,810
1,836,483
Florida - 7.83%
Florida State Department of Environmental Protection
6.15%, 07/01/2027 (a) 145,000 157,077
Hollywood Beach Community Development District I
6.13%, 10/01/2039 (a) 220,000 249,478
6.25%, 10/01/2045 (a) 745,000 835,562
Miami-Dade County
7.50%, 04/01/2040 (a) 500,000 685,190
Orlando Community Redevelopment Agency
7.78%, 09/01/2040 (a) 405,000 459,537
2,386,844
Georgia - 1.38%
Atlanta Development Authority
5.35%, 01/01/2035 (a) 400,000 420,920
Illinois - 1.60%
Bedford Park Village
6.57%, 12/01/2030 (a) 445,000 489,064
Louisiana - 1.83%
New Orleans Public Improvement
6.05%, 12/01/2038 (a) 500,000 559,255
Maryland - 1.72%
Baltimore
5.38%, 09/01/2030 (a) 500,000 524,020
Massachusetts - 0.24%
Massachusetts State Housing Finance Agency
4.78%, 12/01/2020 70,000 71,871
The accompanying notes are an integral part of the financial statements.
8 CCM Alternative Income Fund
Principal
Amount Value
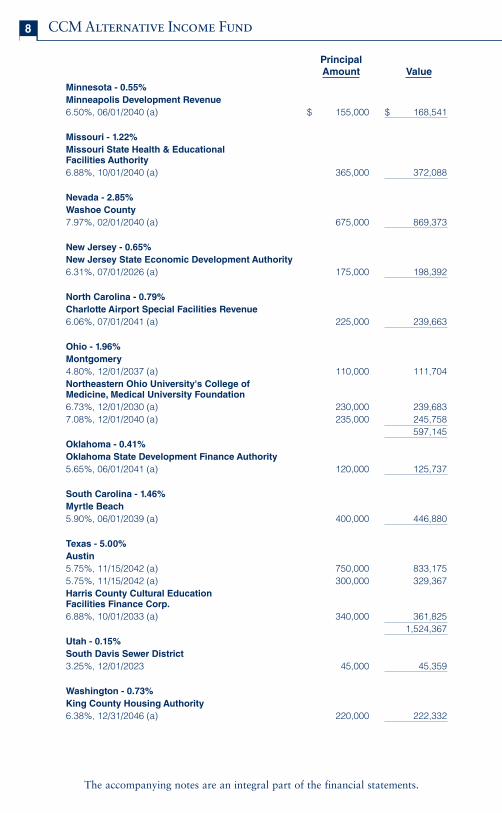
Minnesota - 0.55%
Minneapolis Development Revenue
6.50%, 06/01/2040 (a) $ 155,000 $ 168,541
Missouri - 1.22%
Missouri State Health & Educational
Facilities Authority
6.88%, 10/01/2040 (a) 365,000 372,088
Nevada - 2.85%
Washoe County
7.97%, 02/01/2040 (a) 675,000 869,373
New Jersey - 0.65%
New Jersey State Economic Development Authority
6.31%, 07/01/2026 (a) 175,000 198,392
North Carolina - 0.79%
Charlotte Airport Special Facilities Revenue
6.06%, 07/01/2041 (a) 225,000 239,663
Ohio - 1.96%
Montgomery
4.80%, 12/01/2037 (a) 110,000 111,704
Northeastern Ohio University's College of
Medicine, Medical University Foundation
6.73%, 12/01/2030 (a) 230,000 239,683
7.08%, 12/01/2040 (a) 235,000 245,758
597,145
Oklahoma - 0.41%
Oklahoma State Development Finance Authority
5.65%, 06/01/2041 (a) 120,000 125,737
South Carolina - 1.46%
Myrtle Beach
5.90%, 06/01/2039 (a) 400,000 446,880
Texas - 5.00%
Austin
5.75%, 11/15/2042 (a) 750,000 833,175
5.75%, 11/15/2042 (a) 300,000 329,367
Harris County Cultural Education
Facilities Finance Corp.
6.88%, 10/01/2033 (a) 340,000 361,825
1,524,367
Utah - 0.15%
South Davis Sewer District
3.25%, 12/01/2023 45,000 45,359
Washington - 0.73%
King County Housing Authority
6.38%, 12/31/2046 (a) 220,000 222,332
The accompanying notes are an integral part of the financial statements.
9
Principal
Amount/
Shares Value
West Virginia - 2.65%
Ohio County Special District Excise Tax Revenue
7.50%, 03/01/2036 (a) $ 550,000 $ 588,154
8.25%, 03/01/2035 (a) 195,000 220,424
808,578
Wisconsin - 1.70%
Green Bay Redevelopment Authority
5.90%, 06/01/2037 (a) 475,000 517,508
TOTAL MUNICIPAL BONDS
(Cost $12,159,848) 12,494,517
COMMON STOCK - 33.79%Consumer Discretionary - 6.66%
AMC Entertainment Holdings (b) 12,000 270,000
EnerCare (Canada) 55,000 780,101
Regal Entertainment Group (a) (b) 22,500 468,000
Six Flags Entertainment (a) 8,500 513,230
2,031,331
Consumer Staples - 1.80%
Diageo ADR 4,500 548,640
Energy - 7.14%
Crestwood Equity Partners (a) (c) 39,160 896,764
ONEOK (b) 10,000 496,800
ONEOK Partners (a) (c) 3,500 171,185
Scorpio Tankers (a) (b) 165,000 613,800
2,178,549
Financials - 7.54%
Blackstone Mortgage Trust (a) (b) (d) 15,200 471,960
PennantPark Floating Rate Capital 35,000 493,150
Starwood Property Trust (a) (d) 33,000 726,660
Tiptree 52,000 314,600
WP Carey (b) (d) 4,500 293,535
2,299,905
Industrials - 3.69%
Aircastle (a) (b) 7,500 163,725
Caterpillar (b) 1,000 105,430
Macquarie Infrastructure (a) 11,000 856,900
1,126,055
Information Technology - 0.23%
Dell Technologies (b) (e) 1,000 69,390
Real Estate - 4.99%
Independence Realty Trust (a) (d) 56,000 538,160
National Retail Properties (d) 5,000 191,850
Weyerhaeuser (a) (d) 24,000 791,040
1,521,050
Utilities - 1.74%
NRG Yield (a) (b) 30,000 531,000
TOTAL COMMON STOCK
(Cost $9,477,645) 10,305,920
The accompanying notes are an integral part of the financial statements.
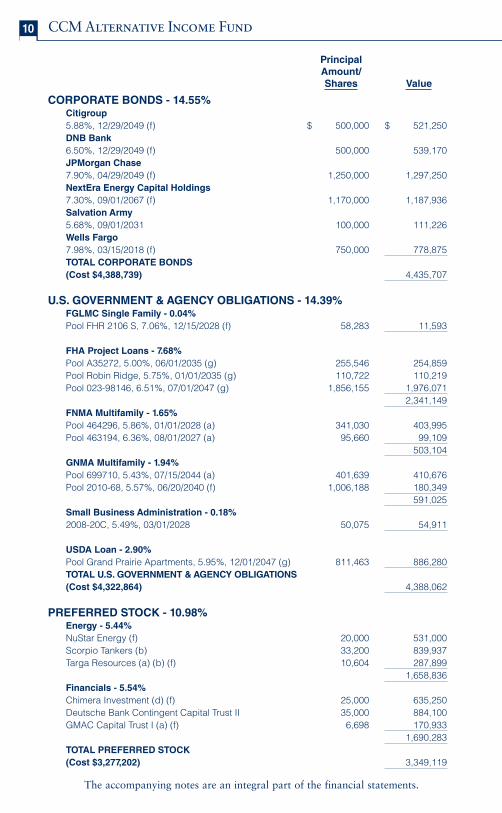
10 CCM Alternative Income Fund
Principal
Amount/
Shares Value
CORPORATE BONDS - 14.55%Citigroup
5.88%, 12/29/2049 (f) $ 500,000 $ 521,250
DNB Bank
6.50%, 12/29/2049 (f) 500,000 539,170
JPMorgan Chase
7.90%, 04/29/2049 (f) 1,250,000 1,297,250
NextEra Energy Capital Holdings
7.30%, 09/01/2067 (f) 1,170,000 1,187,936
Salvation Army
5.68%, 09/01/2031 100,000 111,226
Wells Fargo
7.98%, 03/15/2018 (f) 750,000 778,875
TOTAL CORPORATE BONDS
(Cost $4,388,739) 4,435,707
U.S. GOVERNMENT & AGENCY OBLIGATIONS - 14.39%FGLMC Single Family - 0.04%
Pool FHR 2106 S, 7.06%, 12/15/2028 (f) 58,283 11,593
FHA Project Loans - 7.68%
Pool A35272, 5.00%, 06/01/2035 (g) 255,546 254,859
Pool Robin Ridge, 5.75%, 01/01/2035 (g) 110,722 110,219
Pool 023-98146, 6.51%, 07/01/2047 (g) 1,856,155 1,976,071
2,341,149
FNMA Multifamily - 1.65%
Pool 464296, 5.86%, 01/01/2028 (a) 341,030 403,995
Pool 463194, 6.36%, 08/01/2027 (a) 95,660 99,109
503,104
GNMA Multifamily - 1.94%
Pool 699710, 5.43%, 07/15/2044 (a) 401,639 410,676
Pool 2010-68, 5.57%, 06/20/2040 (f) 1,006,188 180,349
591,025
Small Business Administration - 0.18%
2008-20C, 5.49%, 03/01/2028 50,075 54,911
USDA Loan - 2.90%
Pool Grand Prairie Apartments, 5.95%, 12/01/2047 (g) 811,463 886,280
TOTAL U.S. GOVERNMENT & AGENCY OBLIGATIONS
(Cost $4,322,864) 4,388,062
PREFERRED STOCK - 10.98%Energy - 5.44%
NuStar Energy (f) 20,000 531,000
Scorpio Tankers (b) 33,200 839,937
Targa Resources (a) (b) (f) 10,604 287,899
1,658,836
Financials - 5.54%
Chimera Investment (d) (f) 25,000 635,250
Deutsche Bank Contingent Capital Trust II 35,000 884,100
GMAC Capital Trust I (a) (f) 6,698 170,933
1,690,283
TOTAL PREFERRED STOCK
(Cost $3,277,202) 3,349,119
The accompanying notes are an integral part of the financial statements.
11
Shares/
Principal
Amount Value
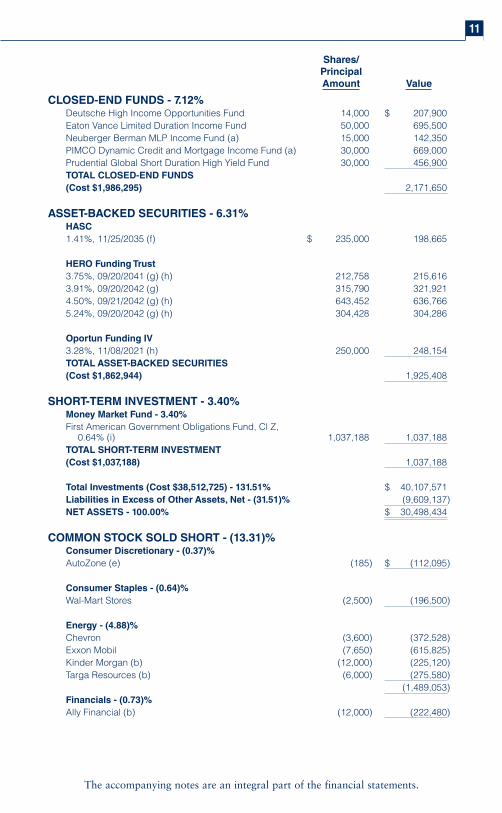
CLOSED-END FUNDS - 7.12%Deutsche High Income Opportunities Fund 14,000 $ 207,900
Eaton Vance Limited Duration Income Fund 50,000 695,500
Neuberger Berman MLP Income Fund (a) 15,000 142,350
PIMCO Dynamic Credit and Mortgage Income Fund (a) 30,000 669,000
Prudential Global Short Duration High Yield Fund 30,000 456,900
TOTAL CLOSED-END FUNDS
(Cost $1,986,295) 2,171,650
ASSET-BACKED SECURITIES - 6.31%HASC
1.41%, 11/25/2035 (f) $ 235,000 198,665
HERO Funding Trust
3.75%, 09/20/2041 (g) (h) 212,758 215,616
3.91%, 09/20/2042 (g) 315,790 321,921
4.50%, 09/21/2042 (g) (h) 643,452 636,766
5.24%, 09/20/2042 (g) (h) 304,428 304,286
Oportun Funding IV
3.28%, 11/08/2021 (h) 250,000 248,154
TOTAL ASSET-BACKED SECURITIES
(Cost $1,862,944) 1,925,408
SHORT-TERM INVESTMENT - 3.40%Money Market Fund - 3.40%
First American Government Obligations Fund, Cl Z,
0.64% (i) 1,037,188 1,037,188
TOTAL SHORT-TERM INVESTMENT
(Cost $1,037,188) 1,037,188
Total Investments (Cost $38,512,725) - 131.51% $ 40,107,571
Liabilities in Excess of Other Assets, Net - (31.51)% (9,609,137)
NET ASSETS - 100.00% $ 30,498,434
COMMON STOCK SOLD SHORT - (13.31)%Consumer Discretionary - (0.37)%
AutoZone (e) (185) $ (112,095)
Consumer Staples - (0.64)%
Wal-Mart Stores (2,500) (196,500)
Energy - (4.88)%
Chevron (3,600) (372,528)
Exxon Mobil (7,650) (615,825)
Kinder Morgan (b) (12,000) (225,120)
Targa Resources (b) (6,000) (275,580)
(1,489,053)
Financials - (0.73)%
Ally Financial (b) (12,000) (222,480)
The accompanying notes are an integral part of the financial statements.
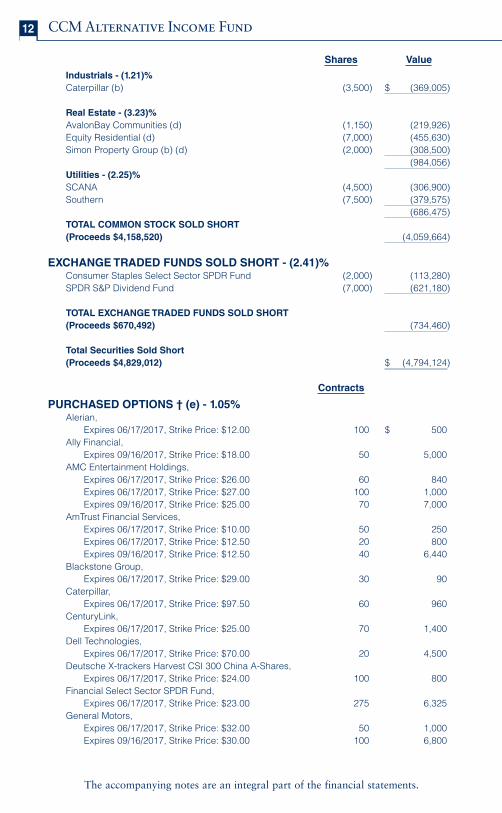
12 CCM Alternative Income Fund
Shares Value
Industrials - (1.21)%
Caterpillar (b) (3,500) $ (369,005)
Real Estate - (3.23)%
AvalonBay Communities (d) (1,150) (219,926)
Equity Residential (d) (7,000) (455,630)
Simon Property Group (b) (d) (2,000) (308,500)
(984,056)
Utilities - (2.25)%
SCANA (4,500) (306,900)
Southern (7,500) (379,575)
(686,475)
TOTAL COMMON STOCK SOLD SHORT
(Proceeds $4,158,520) (4,059,664)
EXCHANGE TRADED FUNDS SOLD SHORT - (2.41)%Consumer Staples Select Sector SPDR Fund (2,000) (113,280)
SPDR S&P Dividend Fund (7,000) (621,180)
TOTAL EXCHANGE TRADED FUNDS SOLD SHORT
(Proceeds $670,492) (734,460)
Total Securities Sold Short
(Proceeds $4,829,012) $ (4,794,124)
Contracts
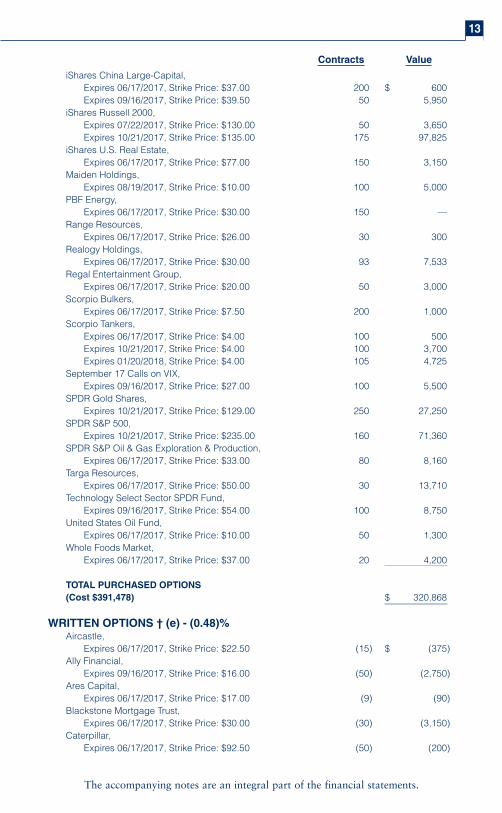
PURCHASED OPTIONS † (e) - 1.05%Alerian,
Expires 06/17/2017, Strike Price: $12.00 100 $ 500
Ally Financial,
Expires 09/16/2017, Strike Price: $18.00 50 5,000
AMC Entertainment Holdings,
Expires 06/17/2017, Strike Price: $26.00 60 840
Expires 06/17/2017, Strike Price: $27.00 100 1,000
Expires 09/16/2017, Strike Price: $25.00 70 7,000
AmTrust Financial Services,
Expires 06/17/2017, Strike Price: $10.00 50 250
Expires 06/17/2017, Strike Price: $12.50 20 800
Expires 09/16/2017, Strike Price: $12.50 40 6,440
Blackstone Group,
Expires 06/17/2017, Strike Price: $29.00 30 90
Caterpillar,
Expires 06/17/2017, Strike Price: $97.50 60 960
CenturyLink,
Expires 06/17/2017, Strike Price: $25.00 70 1,400
Dell Technologies,
Expires 06/17/2017, Strike Price: $70.00 20 4,500
Deutsche X-trackers Harvest CSI 300 China A-Shares,
Expires 06/17/2017, Strike Price: $24.00 100 800
Financial Select Sector SPDR Fund,
Expires 06/17/2017, Strike Price: $23.00 275 6,325
General Motors,
Expires 06/17/2017, Strike Price: $32.00 50 1,000
Expires 09/16/2017, Strike Price: $30.00 100 6,800
The accompanying notes are an integral part of the financial statements.
13
Contracts Value
iShares China Large-Capital,
Expires 06/17/2017, Strike Price: $37.00 200 $ 600
Expires 09/16/2017, Strike Price: $39.50 50 5,950
iShares Russell 2000,
Expires 07/22/2017, Strike Price: $130.00 50 3,650
Expires 10/21/2017, Strike Price: $135.00 175 97,825
iShares U.S. Real Estate,
Expires 06/17/2017, Strike Price: $77.00 150 3,150
Maiden Holdings,
Expires 08/19/2017, Strike Price: $10.00 100 5,000
PBF Energy,
Expires 06/17/2017, Strike Price: $30.00 150 —
Range Resources,
Expires 06/17/2017, Strike Price: $26.00 30 300
Realogy Holdings,
Expires 06/17/2017, Strike Price: $30.00 93 7,533
Regal Entertainment Group,
Expires 06/17/2017, Strike Price: $20.00 50 3,000
Scorpio Bulkers,
Expires 06/17/2017, Strike Price: $7.50 200 1,000
Scorpio Tankers,
Expires 06/17/2017, Strike Price: $4.00 100 500
Expires 10/21/2017, Strike Price: $4.00 100 3,700
Expires 01/20/2018, Strike Price: $4.00 105 4,725
September 17 Calls on VIX,
Expires 09/16/2017, Strike Price: $27.00 100 5,500
SPDR Gold Shares,
Expires 10/21/2017, Strike Price: $129.00 250 27,250
SPDR S&P 500,
Expires 10/21/2017, Strike Price: $235.00 160 71,360
SPDR S&P Oil & Gas Exploration & Production,
Expires 06/17/2017, Strike Price: $33.00 80 8,160
Targa Resources,
Expires 06/17/2017, Strike Price: $50.00 30 13,710
Technology Select Sector SPDR Fund,
Expires 09/16/2017, Strike Price: $54.00 100 8,750
United States Oil Fund,
Expires 06/17/2017, Strike Price: $10.00 50 1,300
Whole Foods Market,
Expires 06/17/2017, Strike Price: $37.00 20 4,200
TOTAL PURCHASED OPTIONS
(Cost $391,478) $ 320,868
WRITTEN OPTIONS † (e) - (0.48)%Aircastle,
Expires 06/17/2017, Strike Price: $22.50 (15) $ (375)
Ally Financial,
Expires 09/16/2017, Strike Price: $16.00 (50) (2,750)
Ares Capital,
Expires 06/17/2017, Strike Price: $17.00 (9) (90)
Blackstone Mortgage Trust,
Expires 06/17/2017, Strike Price: $30.00 (30) (3,150)
Caterpillar,
Expires 06/17/2017, Strike Price: $92.50 (50) (200)
The accompanying notes are an integral part of the financial statements.
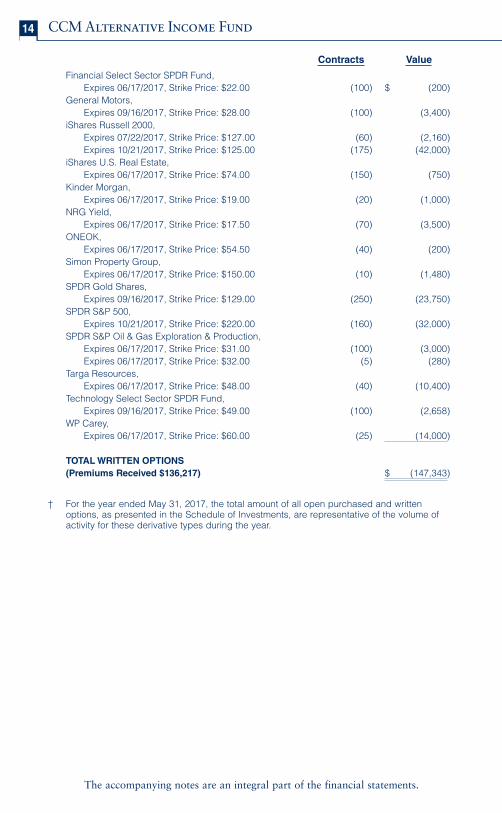
14 CCM Alternative Income Fund
Contracts Value
Financial Select Sector SPDR Fund,
Expires 06/17/2017, Strike Price: $22.00 (100) $ (200)
General Motors,
Expires 09/16/2017, Strike Price: $28.00 (100) (3,400)
iShares Russell 2000,
Expires 07/22/2017, Strike Price: $127.00 (60) (2,160)
Expires 10/21/2017, Strike Price: $125.00 (175) (42,000)
iShares U.S. Real Estate,
Expires 06/17/2017, Strike Price: $74.00 (150) (750)
Kinder Morgan,
Expires 06/17/2017, Strike Price: $19.00 (20) (1,000)
NRG Yield,
Expires 06/17/2017, Strike Price: $17.50 (70) (3,500)
ONEOK,
Expires 06/17/2017, Strike Price: $54.50 (40) (200)
Simon Property Group,
Expires 06/17/2017, Strike Price: $150.00 (10) (1,480)
SPDR Gold Shares,
Expires 09/16/2017, Strike Price: $129.00 (250) (23,750)
SPDR S&P 500,
Expires 10/21/2017, Strike Price: $220.00 (160) (32,000)
SPDR S&P Oil & Gas Exploration & Production,
Expires 06/17/2017, Strike Price: $31.00 (100) (3,000)
Expires 06/17/2017, Strike Price: $32.00 (5) (280)
Targa Resources,
Expires 06/17/2017, Strike Price: $48.00 (40) (10,400)
Technology Select Sector SPDR Fund,
Expires 09/16/2017, Strike Price: $49.00 (100) (2,658)
WP Carey,
Expires 06/17/2017, Strike Price: $60.00 (25) (14,000)
TOTAL WRITTEN OPTIONS
(Premiums Received $136,217) $ (147,343)
† For the year ended May 31, 2017, the total amount of all open purchased and written
options, as presented in the Schedule of Investments, are representative of the volume of
activity for these derivative types during the year.
The accompanying notes are an integral part of the financial statements.
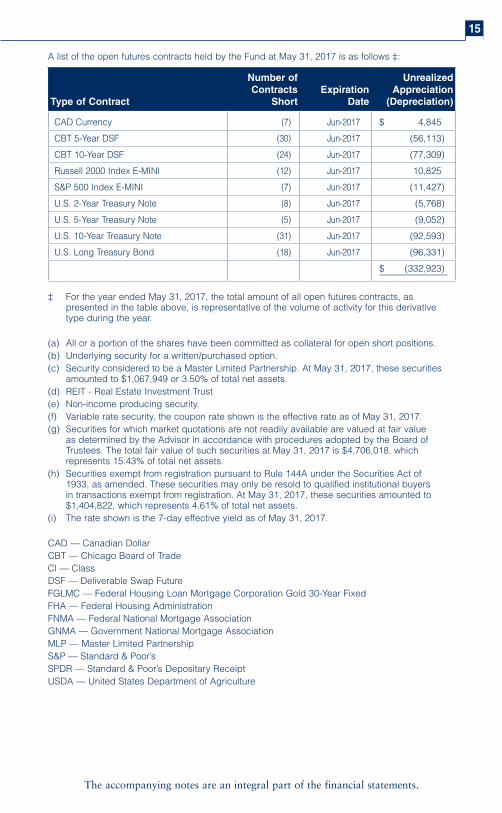
15
A list of the open futures contracts held by the Fund at May 31, 2017 is as follows ‡:
Type of Contract
Number of
Contracts
Short
Expiration
Date
Unrealized
Appreciation
(Depreciation)
CAD Currency (7) Jun-2017 $ 4,845
CBT 5-Year DSF (30) Jun-2017 (56,113)
CBT 10-Year DSF (24) Jun-2017 (77,309)
Russell 2000 Index E-MINI (12) Jun-2017 10,825
S&P 500 Index E-MINI (7) Jun-2017 (11,427)
U.S. 2-Year Treasury Note (8) Jun-2017 (5,768)
U.S. 5-Year Treasury Note (5) Jun-2017 (9,052)
U.S. 10-Year Treasury Note (31) Jun-2017 (92,593)
U.S. Long Treasury Bond (18) Jun-2017 (96,331)
$ (332,923)
‡ For the year ended May 31, 2017, the total amount of all open futures contracts, as
presented in the table above, is representative of the volume of activity for this derivative
type during the year.
(a) All or a portion of the shares have been committed as collateral for open short positions.
(b) Underlying security for a written/purchased option.
(c) Security considered to be a Master Limited Partnership. At May 31, 2017, these securities
amounted to $1,067,949 or 3.50% of total net assets.
(d) REIT - Real Estate Investment Trust
(e) Non-income producing security.
(f) Variable rate security, the coupon rate shown is the effective rate as of May 31, 2017.
(g) Securities for which market quotations are not readily available are valued at fair value
as determined by the Advisor in accordance with procedures adopted by the Board of
Trustees. The total fair value of such securities at May 31, 2017 is $4,706,018, which
represents 15.43% of total net assets.
(h) Securities exempt from registration pursuant to Rule 144A under the Securities Act of
1933, as amended. These securities may only be resold to qualified institutional buyers
in transactions exempt from registration. At May 31, 2017, these securities amounted to
$1,404,822, which represents 4.61% of total net assets.
(i) The rate shown is the 7-day effective yield as of May 31, 2017.
CAD — Canadian Dollar
CBT — Chicago Board of Trade
Cl — Class
DSF — Deliverable Swap Future
FGLMC — Federal Housing Loan Mortgage Corporation Gold 30-Year Fixed
FHA — Federal Housing Administration
FNMA — Federal National Mortgage Association
GNMA — Government National Mortgage Association
MLP — Master Limited Partnership
S&P — Standard & Poor’s
SPDR — Standard & Poor’s Depositary Receipt
USDA — United States Department of Agriculture
The accompanying notes are an integral part of the financial statements.
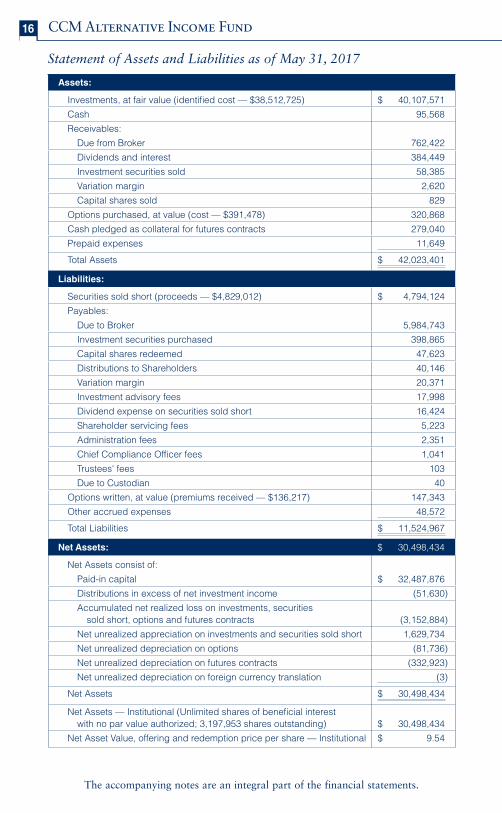
16 CCM Alternative Income Fund
Statement of Assets and Liabilities as of May 31, 2017
Assets:
Investments, at fair value (identifi ed cost — $38,512,725) $ 40,107,571
Cash 95,568
Receivables:
Due from Broker 762,422
Dividends and interest 384,449
Investment securities sold 58,385
Variation margin 2,620
Capital shares sold 829
Options purchased, at value (cost — $391,478) 320,868
Cash pledged as collateral for futures contracts 279,040
Prepaid expenses 11,649
Total Assets $ 42, 023,401
Liabilities:
Securities sold short (proceeds — $4,829,012) $ 4,794,124
Payables:
Due to Broker 5,984,743
Investment securities purchased 398,865
Capital shares redeemed 47,623
Distributions to Shareholders 40,146
Variation margin 20,371
Investment advisory fees 17,998
Dividend expense on securities sold short 16,424
Shareholder servicing fees 5,223
Administration fees 2,351
Chief Compliance Offi cer fees 1,041
Trustees' fees 103
Due to Custodian 40
Options written, at value (premiums received — $136,217) 147,343
Other accrued expenses 48,572
Total Liabilities $ 11, 524,967
Net Assets: $ 30,498,434
Net Assets consist of:
Paid-in capital $ 32, 487,876
Distributions in excess of net investment income (51,630)
Accumulated net realized loss on investments, securities
sold short, options and futures contracts (3, 152,884)
Net unrealized appreciation on investments and securities sold short 1,629,734
Net unrealized depreciation on options (81,736)
Net unrealized depreciation on futures contracts (332,923)
Net unrealized depreciation on foreign currency translation (3)
Net Assets $ 30,498,434
Net Assets — Institutional (Unlimited shares of benefi cial interest
with no par value authorized; 3,197,953 shares outstanding) $ 30,498,434
Net Asset Value, offering and redemption price per share — Institutional $ 9.54
The accompanying notes are an integral part of the financial statements.
17
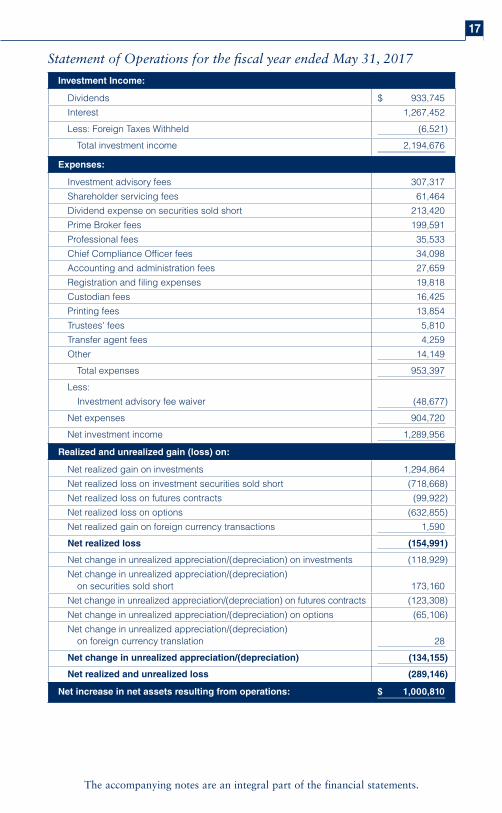
Statement of Operations for the fi scal year ended May 31, 2017
Investment Income:
Dividends $ 933,745
Interest 1,267,452
Less: Foreign Taxes Withheld (6,521)
Total investment income 2,194,676
Expenses:
Investment advisory fees 307,317
Shareholder servicing fees 61,464
Dividend expense on securities sold short 213,420
Prime Broker fees 199,591
Professional fees 35,533
Chief Compliance Offi cer fees 34,098
Accounting and administration fees 27,659
Registration and fi ling expenses 19,818
Custodian fees 16,425
Printing fees 13,854
Trustees' fees 5,810
Transfer agent fees 4,259
Other 14,149
Total expenses 953,397
Less:
Investment advisory fee waiver (48,677)
Net expenses 904,720
Net investment income 1,289,956
Realized and unrealized gain (loss) on:
Net realized gain on investments 1,294,864
Net realized loss on investment securities sold short (718,668)
Net realized loss on futures contracts (99,922)
Net realized loss on options (632,855)
Net realized gain on foreign currency transactions 1,590
Net realized loss (154,991)
Net change in unrealized appreciation/(depreciation) on investments (118,929)
Net change in unrealized appreciation/(depreciation)
on securities sold short 173,160
Net change in unrealized appreciation/(depreciation) on futures contracts (123,308)
Net change in unrealized appreciation/(depreciation) on options (65,106)
Net change in unrealized appreciation/(depreciation)
on foreign currency translation 28
Net change in unrealized appreciation/(depreciation) (134,155)
Net realized and unrealized loss (289,146)
Net increase in net assets resulting from operations: $ 1,000,810
The accompanying notes are an integral part of the financial statements.
18 CCM Alternative Income Fund
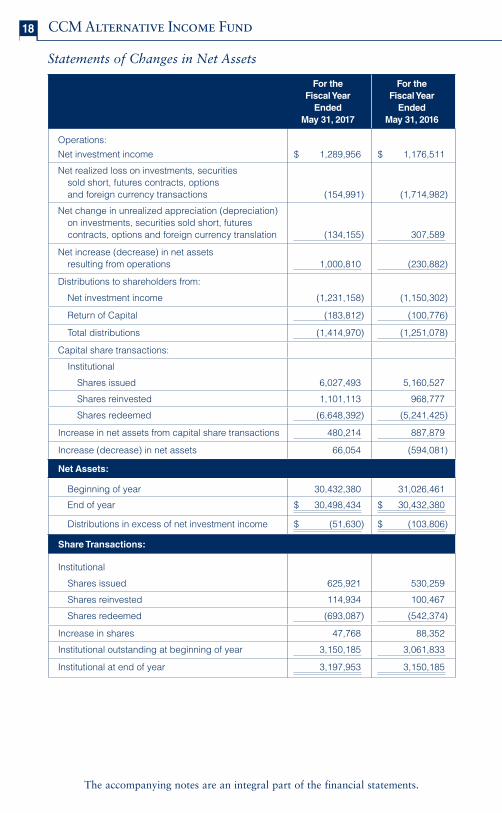
Statements of Changes in Net Assets
For the
Fiscal Year
Ended
May 31, 2017
For the
Fiscal Year
Ended
May 31, 2016
Operations:
Net investment income $ 1,289,956 $ 1,176,511
Net realized loss on investments, securities
sold short, futures contracts, options
and foreign currency transactions (154,991) (1,714,982)
Net change in unrealized appreciation (depreciation)
on investments, securities sold short, futures
contracts, options and foreign currency translation (134,155) 307,589
Net increase (decrease) in net assets
resulting from operations 1,000,810 (230,882)
Distributions to shareholders from:
Net investment income (1,23 1,158) (1,150,302)
Return of Capital (1 83,812) (100,776)
Total distributions (1,414,970) (1,251,078)
Capital share transactions:
Institutional
Shares issued 6,027,493 5,160,527
Shares reinvested 1,101,113 968,777
Shares redeemed (6,648,392) (5,241,425)
Increase in net assets from capital share transactions 480,214 887,879
Increase (decrease) in net assets 66,054 (594,081)
Net Assets:
Beginning of year 30,432,380 31,026,461
End of year $ 30,498,434 $ 30,432,380
Distributions in excess of net investment income $ (51,630) $ (103,806)
Share Transactions:
Institutional
Shares issued 625,921 530,259
Shares reinvested 114,934 100,467
Shares redeemed (693,087) (542,374)
Increase in shares 47,768 88,352
Institutional outstanding at beginning of year 3,150,185 3,061,833
Institutional at end of year 3,197,953 3,150,185
The accompanying notes are an integral part of the financial statements.
19
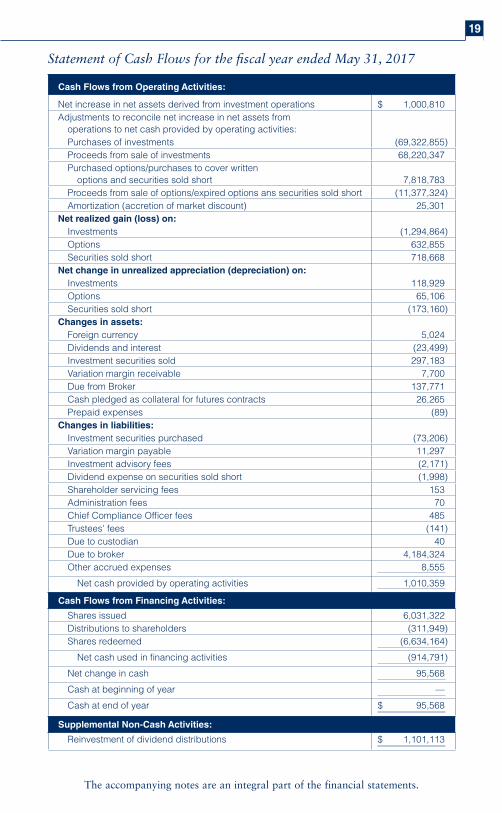
Statement of Cash Flows for the fi scal year ended May 31, 2017
Cash Flows from Operating Activities: Net increase in net assets derived from investment operations $ 1,000,810
Adjustments to reconcile net increase in net assets from
operations to net cash provided by operating activities:
Purchases of investments (69,322,855)
Proceeds from sale of investments 68,220,347
Purchased options/purchases to cover written
options and securities sold short 7,818,783
Proceeds from sale of options/expired options ans securities sold short (11,377,324)
Amortization (accretion of market discount) 25,301
Net realized gain (loss) on:
Investments (1,294,864)
Options 632,855
Securities sold short 718,668
Net change in unrealized appreciation (depreciation) on:
Investments 118,929
Options 65,106
Securities sold short (173,160)
Changes in assets:
Foreign currency 5,024
Dividends and interest (23,499)
Investment securities sold 297,183
Variation margin receivable 7,700
Due from Broker 137,771
Cash pledged as collateral for futures contracts 26,265
Prepaid expenses (89)
Changes in liabilities:
Investment securities purchased (73,206)
Variation margin payable 11,297
Investment advisory fees (2,171)
Dividend expense on securities sold short (1,998)
Shareholder servicing fees 153
Administration fees 70
Chief Compliance Offi cer fees 485
Trustees' fees (141)
Due to custodian 40
Due to broker 4,184,324
Other accrued expenses 8,555
Net cash provided by operating activities 1,010,359
Cash Flows from Financing Activities:
Shares issued 6,031,322
Distributions to shareholders ( 311,949)
Shares redeemed (6,634,164)
Net cash used in fi nancing activities (914,791)
Net change in cash 95,568
Cash at beginning of year —
Cash at end of year $ 95,568
Supplemental Non-Cash Activities:
Reinvestment of dividend distributions $ 1,101,113
The accompanying notes are an integral part of the financial statements.
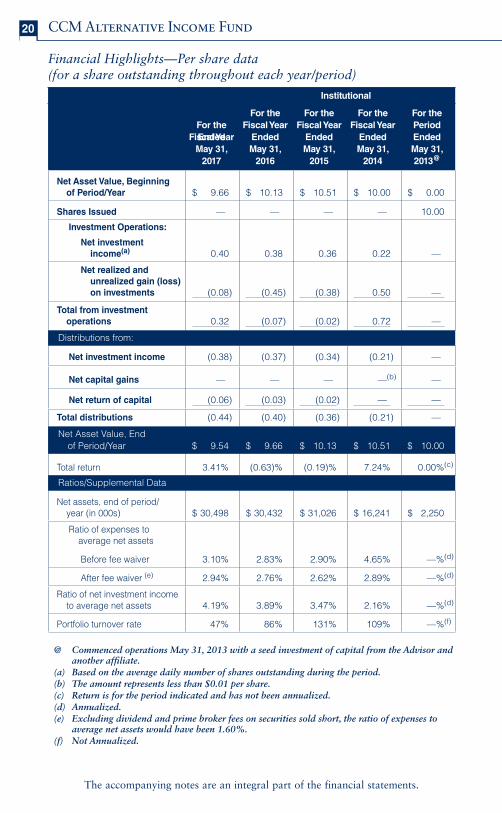
20 CCM Alternative Income Fund
Financial Highlights—Per share data (for a share outstanding throughout each year/period)
Institutional
For the
Fiscal Year Ended
May 31,
2017
For the
Fiscal Year
Ended
May 31,
2016
For the
Fiscal Year
Ended
May 31,
2015
For the
Fiscal Year
Ended
May 31,
2014
For the
Period
Ended
May 31,
2013@
Net Asset Value, Beginning
of Period/Year $ 9.66 $ 10.13 $ 10.51 $ 10.00 $ 0.00
Shares Issued — — — — 10.00
Investment Operations:
Net investment
income(a) 0.40 0.38 0.36 0.22 —
Net realized and
unrealized gain (loss)
on investments (0.0 8) (0.45) (0.38) 0.50 —
Total from investment
operations 0.3 2 (0.07) (0.02) 0.72 —
Distributions from:
Net investment income (0. 38) (0.37) (0.34) (0.21) —
Net capital gains — — — —(b) —
Net return of capital (0.06) (0.03) (0.02) — —
Total distributions (0.4 4) (0.40) (0.36) (0.21) —
Net Asset Value, End
of Period/Year $ 9.54 $ 9.66 $ 10.13 $ 10.51 $ 10.00
Total return 3.41% (0.63)% (0.19)% 7.24% 0.00%(c)
Ratios/Supplemental Data
Net assets, end of period/
year (in 000s) $ 30,498 $ 30,432 $ 31,026 $ 16,241 $ 2,250
Ratio of expenses to
average net assets
Before fee waiver 3.10% 2.83% 2.90% 4.65% —%(d)
After fee waiver (e) 2.94% 2.76% 2.62% 2.89% —%(d)
Ratio of net investment income
to average net assets 4.19% 3.89% 3.47% 2.16% —%(d)
Portfolio turnover rate 47% 86% 131% 109% —%(f)
@ Commenced operations May 31, 2013 with a seed investment of capital from the Advisor and another affi liate.
(a) Based on the average daily number of shares outstanding during the period. (b) The amount represents less than $0.01 per share.(c) Return is for the period indicated and has not been annualized. (d) Annualized.(e) Excluding dividend and prime broker fees on securities sold short, the ratio of expenses to
average net assets would have been 1.60%.(f) Not Annualized.
21
Notes to Financial Statements May 31, 2017
Note 1 – ORGANIZATION AND SIGNIFICANT ACCOUNTING POLICIESCommunity Capital Trust (the “Trust”) was organized as a Delaware business trust on January 15, 1999. The Trust is registered under the Investment Company Act of 1940, as amended (the “Act”), as an open-end management investment company and consists of two separate series. The fi nancial statements herein are those of the CCM Alternative Income Fund (the “Fund”). The Fund is classifi ed as a diversifi ed portfolio under the Act. The Fund offers one class of shares of benefi cial interest, which has been designated as Institutional Shares. The Fund commenced investment operations on May 31, 2013. Community Capital Management, Inc. (the “Advisor”) is the Fund’s investment advisor. The fi nancial statements of the remaining series of the Trust are not presented herein, but are presented separately. The assets of each series within the Trust are segregated, and a shareholder’s interest is limited to the series in which shares are held.
The Fund is an investment company in conformity with accounting principles generally accepted in the United States of America (“U.S. GAAP”). Therefore, the Fund follows the accounting and reporting guidance for investment companies. The following is a summary of signifi cant accounting policies consistently followed by the Fund in the preparation of its fi nancial statements. The policies are in conformity with U.S. GAAP for investment companies.
Security Valuation. Investments in securities traded on a national securities exchange are valued at the last reported bid price. Debt securities are valued by using market bid quotations or independent pricing services which use bid prices provided by market makers or estimates of values obtained from yield data relating to instruments or securities with similar characteristics. Options for which the primary market is a national securities exchange are valued at the last bid price on the exchange on which they are traded, or, in the absence of any sale, at the closing bid price. Options not traded on a national securities exchange are valued at the last quoted bid price. When market quotations are not readily available, securities and other assets are valued at fair value as determined by the Advisor and compared to independent third party sources for reasonableness. The Board of Trustees has approved the Fund’s valuation policies and procedures. Short-term obligations having a maturity of sixty (60) days or less at time of acquisition are valued at amortized cost (provided it is consistent with fair value) or original cost plus accrued interest.
At May 31, 2017, the Fund held securities that were fair valued by the Advisor in accordance with procedures approved by the Board of Trustees in the amount of $4,706,018.
The Fund may hold foreign securities that trade on weekends or other days when the Fund does not price its shares. Therefore, the value of such securities may change on days when shareholders will not be able to purchase or redeem shares.
In accordance with the authoritative guidance on fair value measurements and disclosure under U.S. GAAP, the Fund discloses the fair value of its investments in a hierarchy that prioritizes the inputs to evaluation techniques
22 CCM Alternative Income Fund
used to measure the fair value. The objective of a fair value measurement is to determine the price that would be received to sell an asset or paid to transfer a liability in an orderly transaction between willing market participants at the measurement date (an exit price). Accordingly, the fair value hierarchy gives the highest priority to quoted prices (unadjusted) in active markets for identical assets or liabilities (Level 1) and the lowest priority to unobservable inputs (Level 3). The three levels of the fair value hierarchy are described below:
• Level 1 — Unadjusted quoted prices in active markets for identical, unrestricted assets or liabilities that the Fund has the ability to access at the measurement date;
• Level 2 — Quoted prices which are not active, or inputs that are observable (either directly or indirectly) for substantially the full term of the asset or liability; and
• Level 3 — Prices, inputs or exotic modeling techniques which are both signifi cant to the fair value measurement and unobservable (supported by little or no market activity).
Investments are classifi ed within the level of the lowest signifi cant input considered in determining fair value. Investments classifi ed within Level 3 whose fair value measurement considers several inputs may include Level 1 or Level 2 inputs as components of the overall fair value measurement.
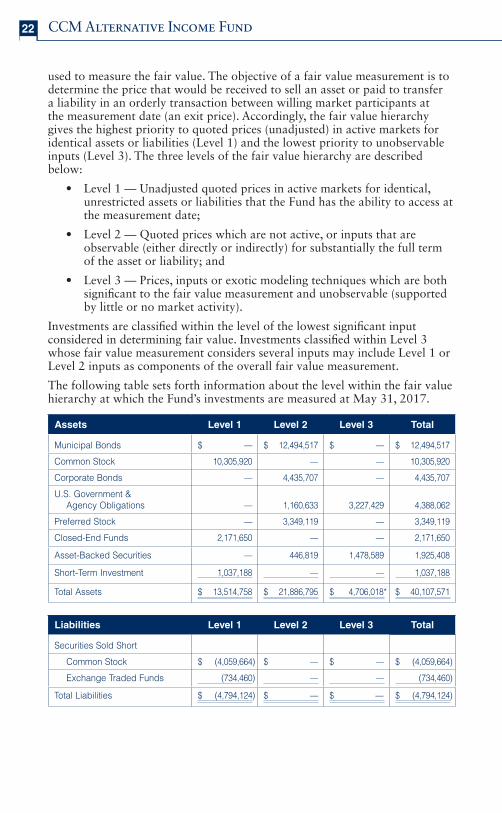
The following table sets forth information about the level within the fair value hierarchy at which the Fund’s investments are measured at May 31, 2017.
Assets Level 1 Level 2 Level 3 Total
Municipal Bonds $ — $ 12,494,517 $ — $ 12,494,517
Common Stock 10,305,920 — — 10,305,920
Corporate Bonds — 4,435,707 — 4,435,707
U.S. Government &
Agency Obligations — 1,160,633 3,227,429 4,388,062
Preferred Stock — 3,349,119 — 3,349,119
Closed-End Funds 2,171,650 — — 2,171,650
Asset-Backed Securities — 446,819 1,478,589 1,925,408
Short-Term Investment 1,037,188 — — 1,037,188
Total Assets $ 13,514,758 $ 21,886,795 $ 4,706,018* $ 40,107,571
Liabilities Level 1 Level 2 Level 3 Total
Securities Sold Short
Common Stock $ (4,059,664) $ — $ — $ (4,059,664)
Exchange Traded Funds (734,460) — — (734,460)
Total Liabilities $ (4,794,124) $ — $ — $ (4,794,124)
23
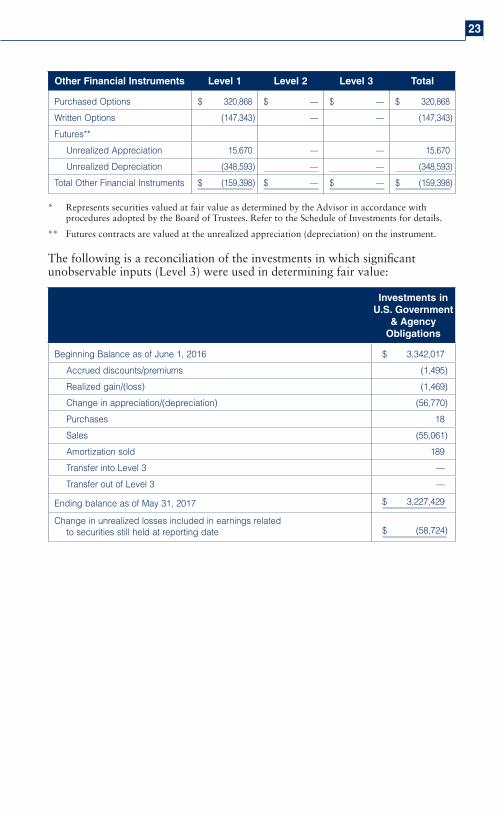
Other Financial Instruments Level 1 Level 2 Level 3 Total
Purchased Options $ 320,868 $ — $ — $ 320,868
Written Options (147,343) — — (147,343)
Futures**
Unrealized Appreciation 15,670 — — 15,670
Unrealized Depreciation (348,593) — — (348,593)
Total Other Financial Instruments $ (159,398) $ — $ — $ (159,398)
* Represents securities valued at fair value as determined by the Advisor in accordance with procedures adopted by the Board of Trustees. Refer to the Schedule of Investments for details.
** Futures contracts are valued at the unrealized appreciation (depreciation) on the instrument.
The following is a reconciliation of the investments in which signifi cant unobservable inputs (Level 3) were used in determining fair value:
Investments in
U.S. Government
& Agency
Obligations
Beginning Balance as of June 1, 2016 $ 3,342,017
Accrued discounts/premiums (1,495)
Realized gain/(loss) (1,469)
Change in appreciation/(depreciation) (56,770)
Purchases 18
Sales ( 55,061)
Amortization sold 189
Transfer into Level 3 —
Transfer out of Level 3 —
Ending balance as of May 31, 2017 $ 3,227,429
Change in unrealized losses included in earnings related
to securities still held at reporting date $ (58,724)
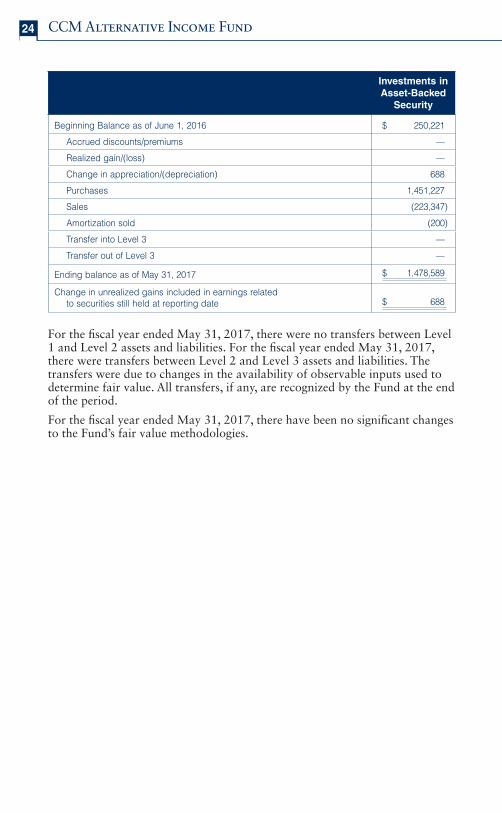
24 CCM Alternative Income Fund
Investments in
Asset-Backed
Security
Beginning Balance as of June 1, 2016 $ 250,221
Accrued discounts/premiums —
Realized gain/(loss) —
Change in appreciation/(depreciation) 688
Purchases 1,451,227
Sales (223,347)
Amortization sold (200)
Transfer into Level 3 —
Transfer out of Level 3 —
Ending balance as of May 31, 2017 $ 1,478,589
Change in unrealized gains included in earnings related
to securities still held at reporting date $ 688
For the fi scal year ended May 31, 2017, there were no transfers between Level 1 and Level 2 assets and liabilities. For the fi scal year ended May 31, 2017, there were transfers between Level 2 and Level 3 assets and liabilities. The transfers were due to changes in the availability of observable inputs used to determine fair value. All transfers, if any, are recognized by the Fund at the end of the period.
For the fi scal year ended May 31, 2017, there have been no signifi cant changes to the Fund’s fair value methodologies.
25
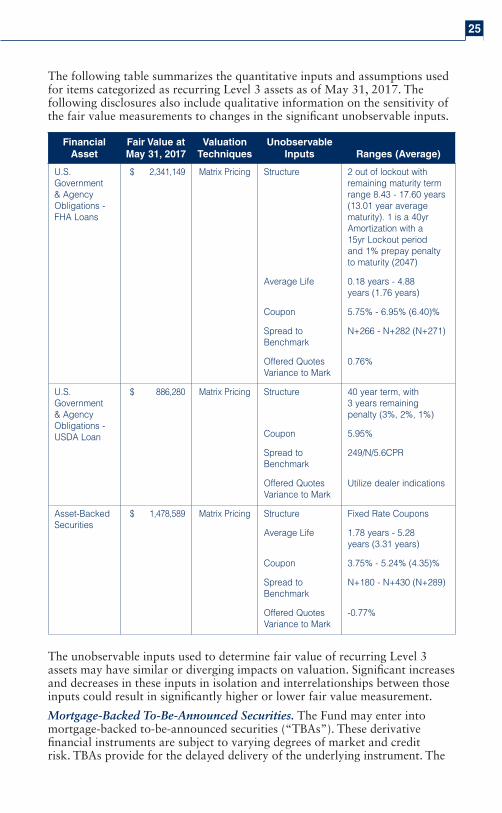
The following table summarizes the quantitative inputs and assumptions used for items categorized as recurring Level 3 assets as of May 31, 2017. The following disclosures also include qualitative information on the sensitivity of the fair value measurements to changes in the signifi cant unobservable inputs.
Financial
Asset
Fair Value at
May 31, 2017
Valuation
Techniques
Unobservable
Inputs Ranges (Average)
U.S.
Government
& Agency
Obligations -
FHA Loans
$ 2,341,149 Matrix Pricing Structure 2 out of lockout with
remaining maturity term
range 8.43 - 17.60 years
(13.01 year average
maturity). 1 is a 40yr
Amortization with a
15yr Lockout period
and 1% prepay penalty
to maturity (2047)
Average Life 0.18 years - 4.88
years (1.76 years)
Coupon 5.75% - 6.95% (6.40)%
Spread to
Benchmark
N+266 - N+282 (N+271)
Offered Quotes
Variance to Mark
0.76%
U.S.
Government
& Agency
Obligations -
USDA Loan
$ 886,280 Matrix Pricing Structure 40 year term, with
3 years remaining
penalty (3%, 2%, 1%)
Coupon 5.95%
Spread to
Benchmark
249/N/5.6CPR
Offered Quotes
Variance to Mark
Utilize dealer indications
Asset-Backed
Securities
$ 1,478,589 Matrix Pricing Structure Fixed Rate Coupons
Average Life 1.78 years - 5.28
years (3.31 years)
Coupon 3.75% - 5.24% (4.35)%
Spread to
Benchmark
N+180 - N+430 (N+289)
Offered Quotes
Variance to Mark
-0.77%
The unobservable inputs used to determine fair value of recurring Level 3 assets may have similar or diverging impacts on valuation. Signifi cant increases and decreases in these inputs in isolation and interrelationships between those inputs could result in signifi cantly higher or lower fair value measurement.
Mortgage-Backed To-Be-Announced Securities. The Fund may enter into mortgage-backed to-be-announced securities (“TBAs”). These derivative fi nancial instruments are subject to varying degrees of market and credit risk. TBAs provide for the delayed delivery of the underlying instrument. The
26 CCM Alternative Income Fund
contractual or notional amounts related to these fi nancial instruments adjusted for unrealized market valuation gains or losses are recorded on a trade date basis. The credit risk related to settlements is limited to the unrealized market valuation gains or losses recorded in the statement of operations. Market risk is substantially dependent upon the value of the underlying fi nancial instruments and is affected by market forces such as volatility and changes in interest rates.
Investment Income and Securities Transactions. Security transactions are accounted for on the date the securities are purchased or sold. Realized gains and losses on sales of investments are determined on the basis of the identifi ed cost for both fi nancial statement and federal income tax purposes. Dividend income is recognized on the ex-dividend date or as soon as information is available to the Fund. Interest income is recognized on an accrual basis.
Amortization and accretion are calculated using the effective interest method. Amortization of premiums and accretion of discounts are included in interest income.
Determination of Net Asset Value and Calculation of Expenses. In calculating the net asset value (“NAV”) per share of the Fund, investment income, realized and unrealized gains and losses, and expenses are allocated daily to each share based upon the proportion of net assets of each share.
Federal Income Taxes. It is the policy of the Fund to comply with all requirements of the Internal Revenue Code applicable to regulated investment companies and to distribute substantially all of its taxable income to its shareholders. Therefore, no Federal income tax provision is required.
The Fund evaluates tax positions taken or expected to be taken in the course of preparing the Fund’s tax returns to determine whether it is “more-likely-than-not” (i.e., greater than 50-percent) that each tax position will be sustained upon examination by a taxing authority based on the technical merits of the position. Tax positions deemed to meet the more-likely-than-not threshold are recorded as a tax benefi t in the current year. However, management’s conclusions regarding tax positions taken may be subject to review and adjustment at a later date based on factors including, but not limited to, examination by tax authorities (i.e., all open tax year ends, as applicable), on-going analysis of and changes to tax laws, regulations and interpretations thereof.
Distributions to Shareholders. Dividends from net investment income are declared and paid monthly and distributable net realized capital gains, if any, are declared and distributed at least annually. Distributions to shareholders are recorded on the ex-dividend date. Income and capital gain distributions are determined in accordance with income tax regulations, which may differ from U.S. GAAP.
Use of Estimates. In preparing fi nancial statements in conformity with U.S. GAAP, management makes estimates and assumptions that affect the reported amounts of assets and liabilities at the date of the fi nancial statements, as well as the reported amount of revenues and expenses during the reporting period. Actual results could differ from those estimates.
Securities Purchased on a Delayed Delivery Basis. The Fund may purchase securities on a delayed delivery basis, with payment and delivery scheduled for a future date. These transactions are subject to market fl uctuations and are
27
subject to the risk that the value at delivery may be more or less than the trade date purchase price. Although the Fund will generally purchase these securities with the intention of holding the securities, it may sell the securities before the settlement date. The Fund will set aside liquid assets, or engage in other appropriate measures, to cover its obligations with respect to these securities.
Futures Contracts. The Fund may use futures contracts for tactical hedging purposes as well as to enhance the Fund’s returns. Initial margin deposits of cash or securities are made upon entering into futures contracts. The contracts are marked to market daily and the resulting changes in value are accounted for as unrealized gains and losses. Variation margin payments are paid or received, depending upon whether unrealized gains or losses are incurred. When the contract is closed, the Fund records a realized gain or loss equal to the difference between the proceeds from (or cost of) the closing transaction and the amount invested in the contract.
Risks of entering into futures contracts include the possibility that there will be an imperfect price correlation between the futures and the underlying securities. Second, it is possible that a lack of liquidity for futures contracts could exist in the secondary market, resulting in an inability to close a position prior to its maturity date. Third, the futures contract involves the risk that the Fund could lose more than the original margin deposit required to initiate a futures transaction.
Finally, the risk exists that losses could exceed amounts disclosed on the Statement of Assets and Liabilities. Refer to the Fund’s Schedule of Investments for details regarding open futures contracts as of May 31, 2017.
Options Written/Purchased. The Fund may invest in fi nancial options contracts to add return or to hedge its existing portfolio securities, or securities that the Fund intends to purchase, against fl uctuations in fair value caused by changes in prevailing market interest rates. The option techniques utilized are to hedge against changes in interest rates, foreign currency exchange rates or securities’ prices in order to establish more defi nitely the effective return on securities or currencies held or intended to be acquired by the Fund, to reduce the volatility of the currency exposure associated with an investment in non-U.S. securities, or as an effi cient means of adjusting exposure to the bond, equity and currency markets and not for speculation. When the Fund writes or purchases an option, an amount equal to the premium received or paid by the Fund is recorded as a liability or an asset and is subsequently adjusted to the current market value of the option written or purchased. Premiums received or paid from writing or purchasing options which expire unexercised are treated by the Fund on the expiration date as realized gains. The difference between the premium and the amount paid or received on effecting a closing purchase or sale transaction, including brokerage commissions, is also treated as a realized gain or loss. If an option is exercised, the premium paid or received is added to the cost of the purchase or proceeds from the sale in determining whether the Fund has realized a gain or a loss.
The risk in writing a call option is that the Fund gives up the opportunity for profi t if the market price of the security increases. The risk in writing a put option is that the Fund may incur a loss if the market price of the security decreases and the option is exercised. The risk in purchasing an option is that the Fund pays a premium whether or not the option is exercised.
28 CCM Alternative Income Fund
The Fund also has the additional risk of being unable to enter into a closing transaction at an acceptable price if a liquid secondary market does not exist. Option contracts also involve the risk that they may not work as intended due to unanticipated developments in market conditions or other causes.
The Fund employed an active strategy of purchasing and writing options in accordance with its investment strategy. The cost of purchased options and the premiums received for written options that are presented in the Schedule of Investments are representative of the volume of activity during the fi scal year ended May 31, 2017.
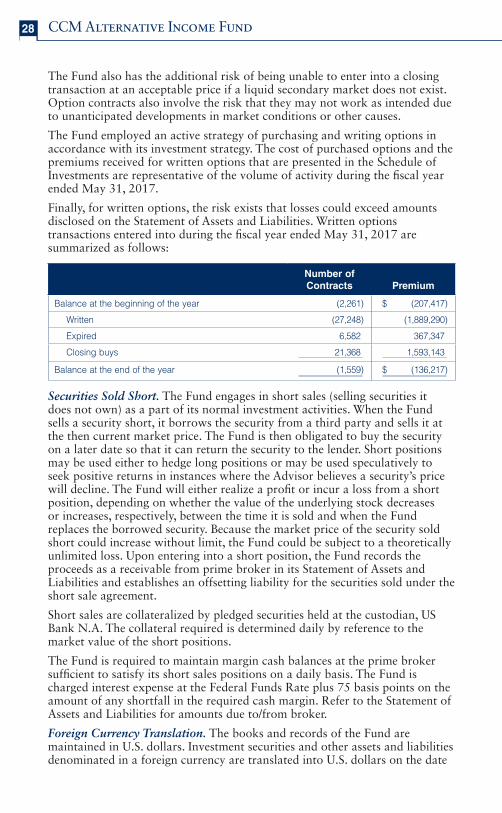
Finally, for written options, the risk exists that losses could exceed amounts disclosed on the Statement of Assets and Liabilities. Written options transactions entered into during the fi scal year ended May 31, 2017 are summarized as follows:
Number of
Contracts Premium
Balance at the beginning of the year (2,261) $ (207,417)
Written (27,248) (1,889,290)
Expired 6,582 367,347
Closing buys 21,368 1,593,143
Balance at the end of the year (1,559) $ (136,217)
Securities Sold Short. The Fund engages in short sales (selling securities it does not own) as a part of its normal investment activities. When the Fund sells a security short, it borrows the security from a third party and sells it at the then current market price. The Fund is then obligated to buy the security on a later date so that it can return the security to the lender. Short positions may be used either to hedge long positions or may be used speculatively to seek positive returns in instances where the Advisor believes a security’s price will decline. The Fund will either realize a profi t or incur a loss from a short position, depending on whether the value of the underlying stock decreases or increases, respectively, between the time it is sold and when the Fund replaces the borrowed security. Because the market price of the security sold short could increase without limit, the Fund could be subject to a theoretically unlimited loss. Upon entering into a short position, the Fund records the proceeds as a receivable from prime broker in its Statement of Assets and Liabilities and establishes an offsetting liability for the securities sold under the short sale agreement.
Short sales are collateralized by pledged securities held at the custodian, US Bank N.A. The collateral required is determined daily by reference to the market value of the short positions.
The Fund is required to maintain margin cash balances at the prime broker suffi cient to satisfy its short sales positions on a daily basis. The Fund is charged interest expense at the Federal Funds Rate plus 75 basis points on the amount of any shortfall in the required cash margin. Refer to the Statement of Assets and Liabilities for amounts due to/from broker.
Foreign Currency Translation. The books and records of the Fund are maintained in U.S. dollars. Investment securities and other assets and liabilities denominated in a foreign currency are translated into U.S. dollars on the date
29
of valuation. The Fund does not isolate that portion of realized or unrealized gains and losses resulting from changes in the foreign exchange rate from fl uctuations arising from changes in the market prices of the securities. These gains and losses are included in net realized and unrealized gains and losses on investments on the Statement of Operations. Net realized and unrealized gains and losses on foreign currency transactions represent net foreign exchange gains or losses from foreign currency exchange contracts, disposition of foreign currencies, currency gains or losses realized between trade and settlement dates on securities transactions and the difference between the amount of the investment income and foreign withholding taxes recorded on the Fund’s books and the U.S. dollar equivalent amounts actually received or paid.
Indemnifi cations. Under the Fund’s organizational documents, its offi cers and Trustees are indemnifi ed against certain liabilities arising out of the performance of their duties to the Fund. In the normal course of business, the Fund enters into contracts that contain a variety of representations that provide general indemnifi cations. The Fund’s maximum liability exposure under these arrangements is unknown, as future claims that have not yet occurred may be made against the Fund. However, based on experience, the Fund expects the risk of loss to be remote.
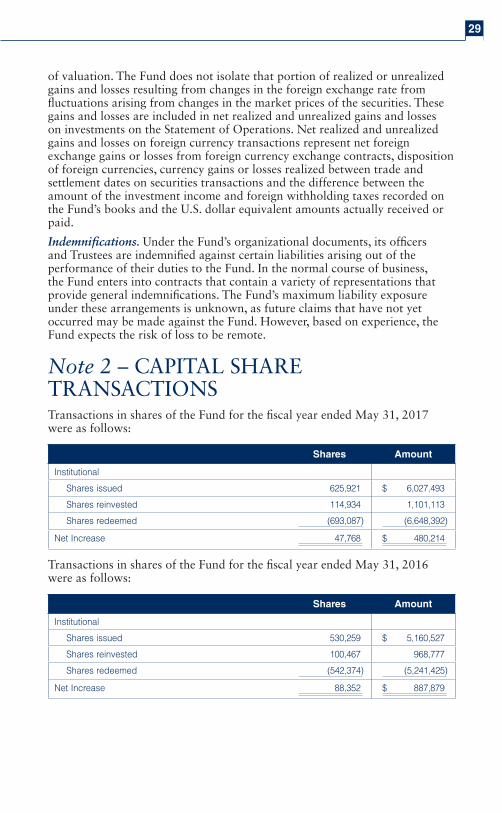
Note 2 – CAPITAL SHARE TRANSACTIONSTransactions in shares of the Fund for the fi scal year ended May 31, 2017 were as follows:
Shares Amount
Institutional
Shares issued 625,921 $ 6,027,493
Shares reinvested 114,934 1,101,113
Shares redeemed (693,087) (6,648,392)
Net Increase 47,768 $ 480,214
Transactions in shares of the Fund for the fi scal year ended May 31, 2016 were as follows:
Shares Amount
Institutional
Shares issued 530,259 $ 5,160,527
Shares reinvested 100,467 968,777
Shares redeemed (542,374) (5,241,425)
Net Increase 88,352 $ 887,879
30 CCM Alternative Income Fund
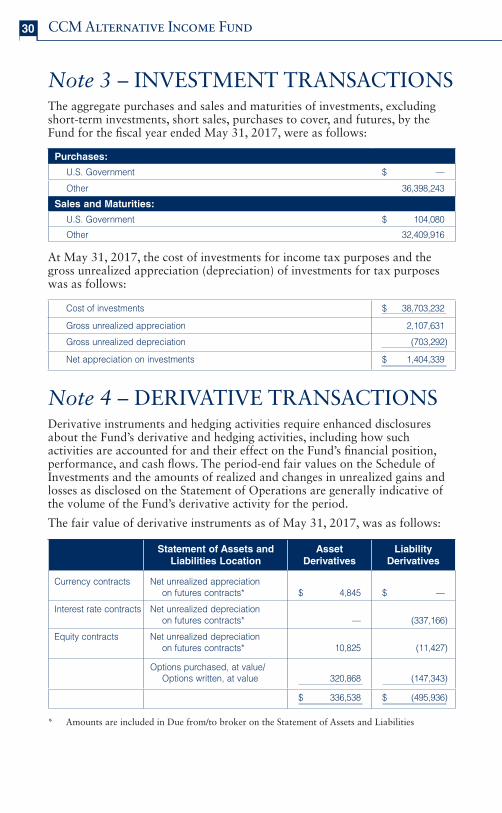
Note 3 – INVESTMENT TRANSACTIONSThe aggregate purchases and sales and maturities of investments, excluding short-term investments, short sales, purchases to cover, and futures, by the Fund for the fi scal year ended May 31, 2017, were as follows:
Purchases:
U.S. Government $ —
Other 36,398,243
Sales and Maturities:
U.S. Government $ 104,080
Other 32,409,916
At May 31, 2017, the cost of investments for income tax purposes and the gross unrealized appreciation (depreciation) of investments for tax purposes was as follows:
Cost of investments $ 38,7 03,232
Gross unrealized appreciation 2,107,631
Gross unrealized depreciation (7 03,292)
Net appreciation on investments $ 1, 404,339
Note 4 – DERIVATIVE TRANSACTIONSDerivative instruments and hedging activities require enhanced disclosures about the Fund’s derivative and hedging activities, including how such activities are accounted for and their effect on the Fund’s fi nancial position, performance, and cash fl ows. The period-end fair values on the Schedule of Investments and the amounts of realized and changes in unrealized gains and losses as disclosed on the Statement of Operations are generally indicative of the volume of the Fund’s derivative activity for the period.
The fair value of derivative instruments as of May 31, 2017, was as follows:
Statement of Assets and
Liabilities Location
Asset
Derivatives
Liability
Derivatives
Currency contracts Net unrealized appreciation
on futures contracts* $ 4,845 $ —
Interest rate contracts Net unrealized depreciation
on futures contracts* — (337,166)
Equity contracts Net unrealized depreciation
on futures contracts* 10,825 (11,427)
Options purchased, at value/
Options written, at value 320,868 (147,343)
$ 336,538 $ (495,936)
* Amounts are included in Due from/to broker on the Statement of Assets and Liabilities
31
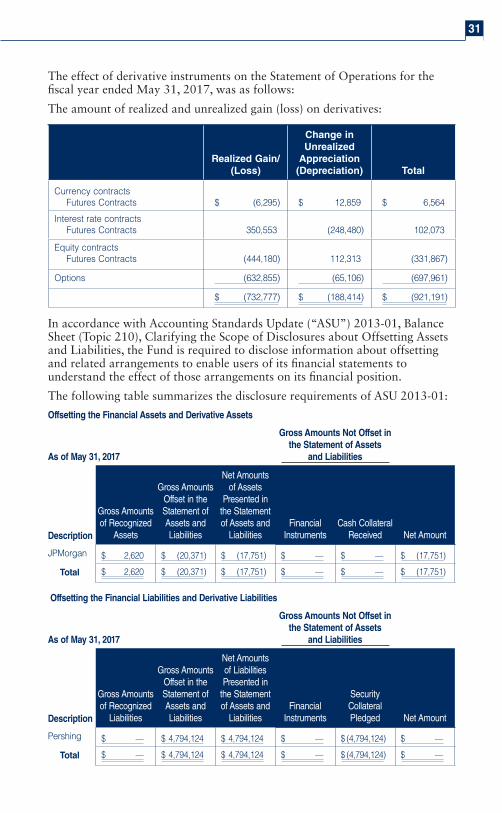
The effect of derivative instruments on the Statement of Operations for the fi scal year ended May 31, 2017, was as follows:
The amount of realized and unrealized gain (loss) on derivatives:
Realized Gain/
(Loss)
Change in
Unrealized
Appreciation
(Depreciation) Total
Currency contracts
Futures Contracts $ (6,295) $ 12,859 $ 6,564
Interest rate contracts
Futures Contracts 350,553 (248,480) 102,073
Equity contracts
Futures Contracts (444,180) 112,313 (331,867)
Options (632,855) (65,106) (697,961)
$ (732,777) $ (188,414) $ (921,191)
In accordance with Accounting Standards Update (“ASU”) 2013-01, Balance Sheet (Topic 210), Clarifying the Scope of Disclosures about Offsetting Assets and Liabilities, the Fund is required to disclose information about offsetting and related arrangements to enable users of its fi nancial statements to understand the effect of those arrangements on its fi nancial position.
The following table summarizes the disclosure requirements of ASU 2013-01:
Offsetting the Financial Assets and Derivative Assets
As of May 31, 2017
Gross Amounts Not Offset in
the Statement of Assets
and Liabilities
Description
Gross Amounts of Recognized
Assets
Gross Amounts Offset in the Statement of Assets and Liabilities
Net Amounts of Assets
Presented in the Statement of Assets and
LiabilitiesFinancial
InstrumentsCash Collateral
Received Net Amount
JPMorgan $ 2,620 $ (20,371) $ (17,751) $ — $ — $ (17,751)
Total $ 2,620 $ (20,371) $ (17,751) $ — $ — $ (17,751)
Offsetting the Financial Liabilities and Derivative Liabilities
As of May 31, 2017
Gross Amounts Not Offset in
the Statement of Assets
and Liabilities
Description
Gross Amounts of Recognized
Liabilities
Gross Amounts Offset in the Statement of Assets and Liabilities
Net Amounts of Liabilities Presented in
the Statement of Assets and
LiabilitiesFinancial
Instruments
Security Collateral Pledged Net Amount
Pershing $ — $ 4,794,124 $ 4,794,124 $ — $ (4,794,124) $ —
Total $ — $ 4,794,124 $ 4,794,124 $ — $ (4,794,124) $ —
32 CCM Alternative Income Fund
Note 5 – ADVISORY, SUB-ADVISORY AND SERVICE FEESThe Trust has entered into an Advisory Agreement with the Advisor to provide the Fund with investment management services. Pursuant to the Advisory Agreement, the Advisor is entitled to receive a fee, calculated daily, and paid monthly at the annual rate of 1.00% of the Fund’s average daily net assets. For the fi scal year ended May 31, 2017, the Advisor was entitled to receive advisory fees of $307,317.
The Board of Trustees of the Trust has approved Badge Investment Partners LLC (the “Sub-Advisor”) to provide sub-advisory services with respect to the Fund pursuant to a Sub-Advisory Agreement between the Advisor and Sub-Advisor. The Advisor pays the Sub-Advisor out of the advisory fee the Advisor receives for managing the Fund. The Advisor provides certain support services to the Sub-Advisor in return for a portion of the Sub-Advisor’s gross revenue. For the fi scal year ended May 31, 2017, the Advisor paid the Sub-Advisor $192,252 in sub-advisory fees.
The Trust has adopted a Services Plan with respect to the Fund’s Institutional Shares. Pursuant to the Services Plan, the Trust enters into servicing agreements with fi nancial institutions that agree to provide certain personal liaison and administrative support services to their customers who are the benefi cial owners of Institutional Shares of the Fund in consideration for payment of up to a maximum of 0.50% (comprised of up to 0.25% for personal liaison services and up to 0.25% for administrative support services) per year of the average daily net asset value of the Institutional Shares benefi cially owned by such customers. The Fund will limit fees to an aggregate fee of not more than 0.20% under the Services Plan for personal liaison and administrative support services through May 31, 2018. For the fi scal year ended May 31, 2017, the Fund incurred expenses under the Services Plan of $61,464.
The Advisor has contractually agreed to waive fees and reimburse expenses until September 30, 2017 to the extent total annualized expenses (excluding acquired fund fees and expenses and dividend expenses and prime broker fees on securities sold short) exceed 1.60% of the average daily net assets of the Institutional Shares. The Advisor waived $48,677 of these fees. The Advisor may not recoup waived fees and reimbursed expenses.
The President, Treasurer and Chief Compliance Offi cer of the Fund are affi liated with the Advisor.
Note 6 – DISTRIBUTIONS TO SHAREHOLDERSThe Fund has qualifi ed and intends to continue to qualify as a regulated investment company under Subchapter M of the Internal Revenue Code for federal income tax purposes and to distribute all of its taxable income and net capital gains. Accordingly, no provision has been made for federal income taxes.
33
Dividends from net investment income and distributions from net realized capital gains are determined in accordance with U.S. federal income tax regulations, which may differ from those amounts determined under U.S. GAAP. These book/tax differences are either temporary or permanent in nature. To the extent these differences are permanent, they are charged or credited to paid-in capital, undistributed net investment income or accumulated net realized gain, as appropriate, in the period that the differences arise.
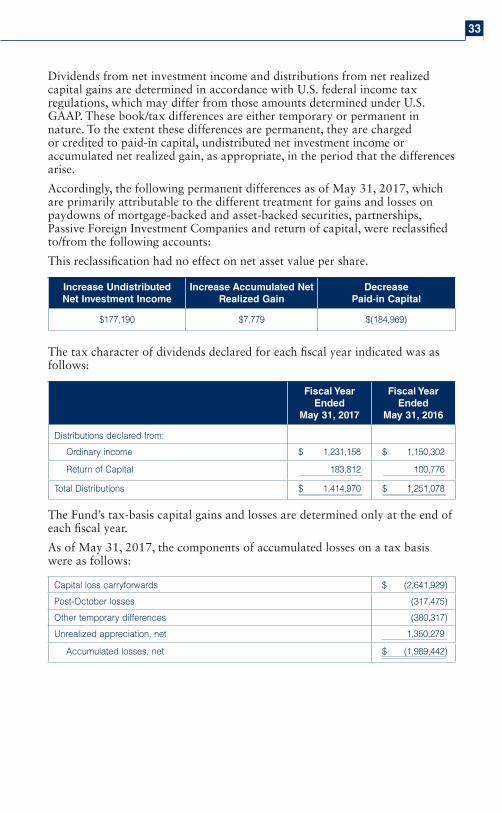
Accordingly, the following permanent differences as of May 31, 2017, which are primarily attributable to the different treatment for gains and losses on paydowns of mortgage-backed and asset-backed securities, partnerships, Passive Foreign Investment Companies and return of capital, were reclassifi ed to/from the following accounts:
This reclassifi cation had no effect on net asset value per share.
Increase Undistributed
Net Investment Income
Increase Accumulated Net
Realized Gain
Decrease
Paid-in Capital
$177,190 $ 7,779 $(18 4,969)
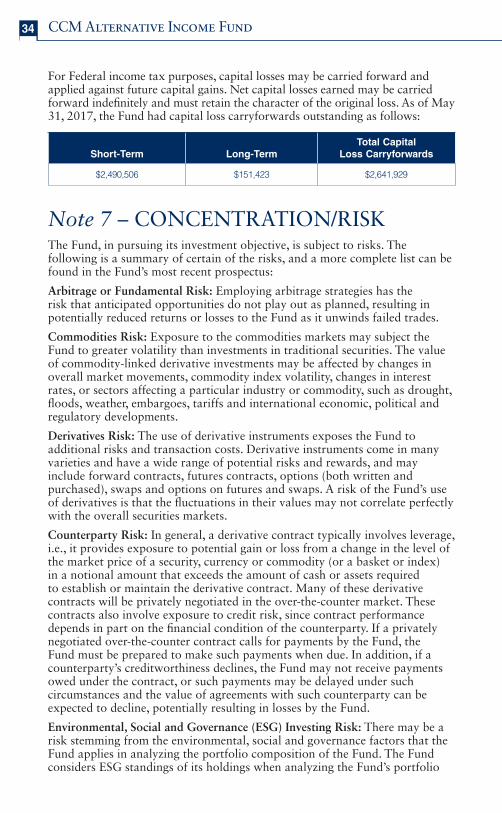
The tax character of dividends declared for each fi scal year indicated was as follows:
Fiscal Year
Ended
May 31, 2017
Fiscal Year
Ended
May 31, 2016
Distributions declared from:
Ordinary income $ 1,23 1,158 $ 1,150,302
Return of Capital 183,812 100,776
Total Distributions $ 1,414,970 $ 1,251,078
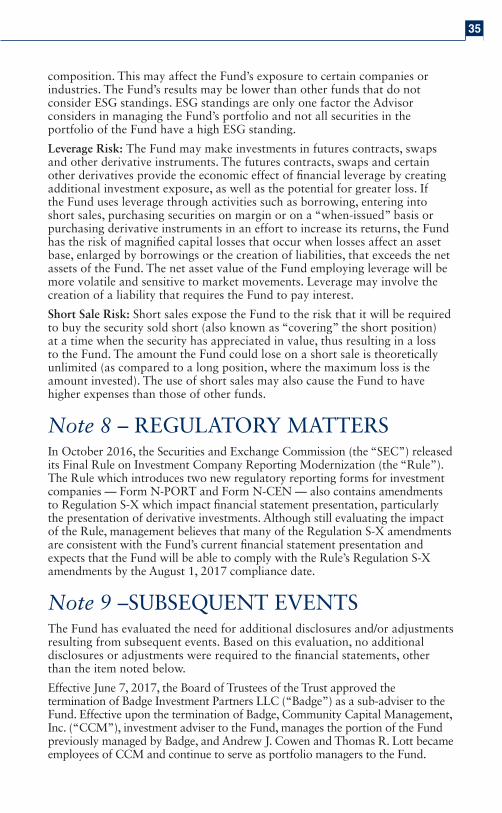
The Fund’s tax-basis capital gains and losses are determined only at the end of each fi scal year.
As of May 31, 2017, the components of accumulated losses on a tax basis were as follows:
Capital loss carryforwards $ (2,6 41,929)
Post-October losses ( 317,475)
Other temporary differences ( 380,317)
Unrealized appreciation, net 1,350,279
Accumulated losses, net $ (1,9 89,442)
34 CCM Alternative Income Fund
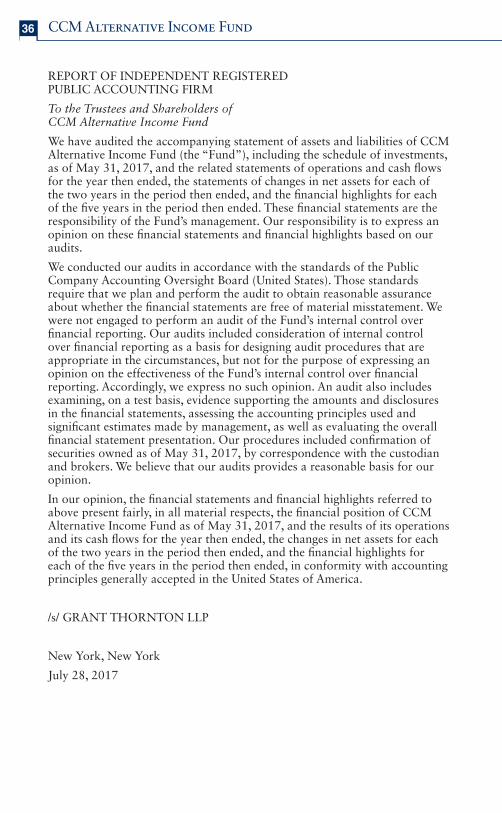
For Federal income tax purposes, capital losses may be carried forward and applied against future capital gains. Net capital losses earned may be carried forward indefi nitely and must retain the character of the original loss. As of May 31, 2017, the Fund had capital loss carryforwards outstanding as follows:
Short-Term Long-Term
Total Capital
Loss Carryforwards
$2, 4 90,506 $ 151,423 $2,64 1,929
Note 7 – CONCENTRATION/RISKThe Fund, in pursuing its investment objective, is subject to risks. The following is a summary of certain of the risks, and a more complete list can be found in the Fund’s most recent prospectus:
Arbitrage or Fundamental Risk: Employing arbitrage strategies has the risk that anticipated opportunities do not play out as planned, resulting in potentially reduced returns or losses to the Fund as it unwinds failed trades.
Commodities Risk: Exposure to the commodities markets may subject the Fund to greater volatility than investments in traditional securities. The value of commodity-linked derivative investments may be affected by changes in overall market movements, commodity index volatility, changes in interest rates, or sectors affecting a particular industry or commodity, such as drought, fl oods, weather, embargoes, tariffs and international economic, political and regulatory developments.
Derivatives Risk: The use of derivative instruments exposes the Fund to additional risks and transaction costs. Derivative instruments come in many varieties and have a wide range of potential risks and rewards, and may include forward contracts, futures contracts, options (both written and purchased), swaps and options on futures and swaps. A risk of the Fund’s use of derivatives is that the fl uctuations in their values may not correlate perfectly with the overall securities markets.
Counterparty Risk: In general, a derivative contract typically involves leverage, i.e., it provides exposure to potential gain or loss from a change in the level of the market price of a security, currency or commodity (or a basket or index) in a notional amount that exceeds the amount of cash or assets required to establish or maintain the derivative contract. Many of these derivative contracts will be privately negotiated in the over-the-counter market. These contracts also involve exposure to credit risk, since contract performance depends in part on the fi nancial condition of the counterparty. If a privately negotiated over-the-counter contract calls for payments by the Fund, the Fund must be prepared to make such payments when due. In addition, if a counterparty’s creditworthiness declines, the Fund may not receive payments owed under the contract, or such payments may be delayed under such circumstances and the value of agreements with such counterparty can be expected to decline, potentially resulting in losses by the Fund.
Environmental, Social and Governance (ESG) Investing Risk: There may be a risk stemming from the environmental, social and governance factors that the Fund applies in analyzing the portfolio composition of the Fund. The Fund considers ESG standings of its holdings when analyzing the Fund’s portfolio
35
composition. This may affect the Fund’s exposure to certain companies or industries. The Fund’s results may be lower than other funds that do not consider ESG standings. ESG standings are only one factor the Advisor considers in managing the Fund’s portfolio and not all securities in the portfolio of the Fund have a high ESG standing.
Leverage Risk: The Fund may make investments in futures contracts, swaps and other derivative instruments. The futures contracts, swaps and certain other derivatives provide the economic effect of fi nancial leverage by creating additional investment exposure, as well as the potential for greater loss. If the Fund uses leverage through activities such as borrowing, entering into short sales, purchasing securities on margin or on a “when-issued” basis or purchasing derivative instruments in an effort to increase its returns, the Fund has the risk of magnifi ed capital losses that occur when losses affect an asset base, enlarged by borrowings or the creation of liabilities, that exceeds the net assets of the Fund. The net asset value of the Fund employing leverage will be more volatile and sensitive to market movements. Leverage may involve the creation of a liability that requires the Fund to pay interest.
Short Sale Risk: Short sales expose the Fund to the risk that it will be required to buy the security sold short (also known as “covering” the short position) at a time when the security has appreciated in value, thus resulting in a loss to the Fund. The amount the Fund could lose on a short sale is theoretically unlimited (as compared to a long position, where the maximum loss is the amount invested). The use of short sales may also cause the Fund to have higher expenses than those of other funds.
Note 8 – REGULATORY MATTERSIn October 2016, the Securities and Exchange Commission (the “SEC”) released its Final Rule on Investment Company Reporting Modernization (the “Rule”). The Rule which introduces two new regulatory reporting forms for investment companies — Form N-PORT and Form N-CEN — also contains amendments to Regulation S-X which impact fi nancial statement presentation, particularly the presentation of derivative investments. Although still evaluating the impact of the Rule, management believes that many of the Regulation S-X amendments are consistent with the Fund’s current fi nancial statement presentation and expects that the Fund will be able to comply with the Rule’s Regulation S-X amendments by the August 1, 2017 compliance date.
Note 9 –SUBSEQUENT EVENTSThe Fund has evaluated the need for additional disclosures and/or adjustments resulting from subsequent events. Based on this evaluation, no additional disclosures or adjustments were required to the fi nancial statements, other than the item noted below.
Effective June 7, 2017, the Board of Trustees of the Trust approved the termination of Badge Investment Partners LLC (“Badge”) as a sub-adviser to the Fund. Effective upon the termination of Badge, Community Capital Management, Inc. (“CCM”), investment adviser to the Fund, manages the portion of the Fund previously managed by Badge, and Andrew J. Cowen and Thomas R. Lott became employees of CCM and continue to serve as portfolio managers to the Fund.
36 CCM Alternative Income Fund
REPORT OF INDEPENDENT REGISTERED PUBLIC ACCOUNTING FIRM
To the Trustees and Shareholders ofCCM Alternative Income Fund
We have audited the accompanying statement of assets and liabilities of CCM Alternative Income Fund (the “Fund”), including the schedule of investments, as of May 31, 2017, and the related statements of operations and cash fl ows for the year then ended, the statements of changes in net assets for each of the two years in the period then ended, and the fi nancial highlights for each of the fi ve years in the period then ended. These fi nancial statements are the responsibility of the Fund’s management. Our responsibility is to express an opinion on these fi nancial statements and fi nancial highlights based on our audits.
We conducted our audits in accordance with the standards of the Public Company Accounting Oversight Board (United States). Those standards require that we plan and perform the audit to obtain reasonable assurance about whether the fi nancial statements are free of material misstatement. We were not engaged to perform an audit of the Fund’s internal control over fi nancial reporting. Our audits included consideration of internal control over fi nancial reporting as a basis for designing audit procedures that are appropriate in the circumstances, but not for the purpose of expressing an opinion on the effectiveness of the Fund’s internal control over fi nancial reporting. Accordingly, we express no such opinion. An audit also includes examining, on a test basis, evidence supporting the amounts and disclosures in the fi nancial statements, assessing the accounting principles used and signifi cant estimates made by management, as well as evaluating the overall fi nancial statement presentation. Our procedures included confi rmation of securities owned as of May 31, 2017, by correspondence with the custodian and brokers. We believe that our audits provides a reasonable basis for our opinion.
In our opinion, the fi nancial statements and fi nancial highlights referred to above present fairly, in all material respects, the fi nancial position of CCM Alternative Income Fund as of May 31, 2017, and the results of its operations and its cash fl ows for the year then ended, the changes in net assets for each of the two years in the period then ended, and the fi nancial highlights for each of the fi ve years in the period then ended, in conformity with accounting principles generally accepted in the United States of America.
/s/ GRANT THORNTON LLP
New York, New York
July 28, 2017
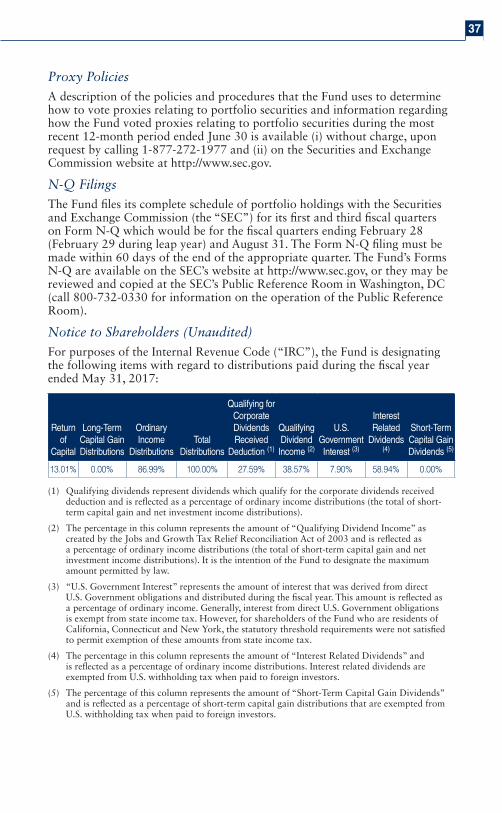
37
Proxy Policies
A description of the policies and procedures that the Fund uses to determine how to vote proxies relating to portfolio securities and information regarding how the Fund voted proxies relating to portfolio securities during the most recent 12-month period ended June 30 is available (i) without charge, upon request by calling 1-877-272-1977 and (ii) on the Securities and Exchange Commission website at http://www.sec.gov.
N-Q Filings
The Fund fi les its complete schedule of portfolio holdings with the Securities and Exchange Commission (the “SEC”) for its fi rst and third fi scal quarters on Form N-Q which would be for the fi scal quarters ending February 28 (February 29 during leap year) and August 31. The Form N-Q fi ling must be made within 60 days of the end of the appropriate quarter. The Fund’s Forms N-Q are available on the SEC’s website at http://www.sec.gov, or they may be reviewed and copied at the SEC’s Public Reference Room in Washington, DC (call 800-732-0330 for information on the operation of the Public Reference Room).
Notice to Shareholders (Unaudited)
For purposes of the Internal Revenue Code (“IRC”), the Fund is designating the following items with regard to distributions paid during the fi scal year ended May 31, 2017:
Return of
Capital
Long-Term Capital Gain Distributions
Ordinary Income
DistributionsTotal
Distributions
Qualifying for Corporate Dividends Received
Deduction (1)
Qualifying Dividend
Income (2)
U.S. Government Interest (3)
Interest Related
Dividends ( 4)
Short-Term Capital Gain Dividends (5)
13.01% 0.00% 8 6.99% 100.00% 27.5 9% 38. 57% 7.9 0% 5 8.94% 0.00%
(1) Qualifying dividends represent dividends which qualify for the corporate dividends received deduction and is refl ected as a percentage of ordinary income distributions (the total of short-term capital gain and net investment income distributions).
(2) The percentage in this column represents the amount of “Qualifying Dividend Income” as created by the Jobs and Growth Tax Relief Reconciliation Act of 2003 and is refl ected as a percentage of ordinary income distributions (the total of short-term capital gain and net investment income distributions). It is the intention of the Fund to designate the maximum amount permitted by law.
(3) “U.S. Government Interest” represents the amount of interest that was derived from direct U.S. Government obligations and distributed during the fi scal year. This amount is refl ected as a percentage of ordinary income. Generally, interest from direct U.S. Government obligations is exempt from state income tax. However, for shareholders of the Fund who are residents of California, Connecticut and New York, the statutory threshold requirements were not satisfi ed to permit exemption of these amounts from state income tax.
(4) The percentage in this column represents the amount of “Interest Related Dividends” and is refl ected as a percentage of ordinary income distributions. Interest related dividends are exempted from U.S. withholding tax when paid to foreign investors.
(5) The percentage of this column represents the amount of “Short-Term Capital Gain Dividends” and is refl ected as a percentage of short-term capital gain distributions that are exempted from U.S. withholding tax when paid to foreign investors.

38 CCM Alternative Income Fund
Trustees and Offi cers (Unaudited)
The business and affairs of the Trust are managed under the direction of the Trust’s Board of Trustees in accordance with the laws of the State of Delaware and the Trust’s Declaration of Trust. Information pertaining to the trustees and offi cers of the Trust is set forth below. Trustees who are not deemed to be “interested persons” of the Trust as defi ned in the 1940 Act are referred to as “Independent Trustees.” Trustees who are deemed to be “interested persons” of the Trust are referred to as “Interested Trustees.” The Fund’s Statement of Additional Information includes additional information about the Trustees and is available, without charge, upon request, by calling 1-877-272-1977.
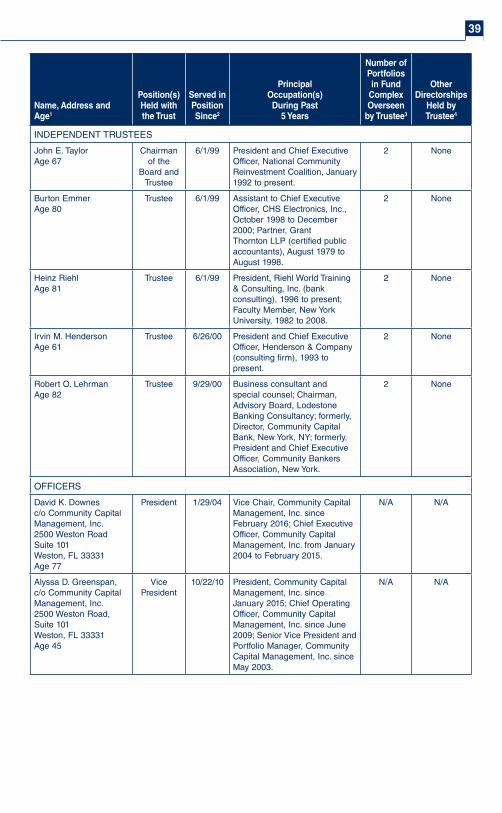
39
Name, Address and
Age1
Position(s)
Held with
the Trust
Served in
Position
Since2
Principal
Occupation(s)
During Past
5 Years
Number of
Portfolios
in Fund
Complex
Overseen
by Trustee3
Other
Directorships
Held by
Trustee4
INDEPENDENT TRUSTEES
John E. TaylorAge 67
Chairman of the
Board and Trustee
6/1/99 President and Chief Executive Officer, National Community Reinvestment Coalition, January 1992 to present.
2 None
Burton EmmerAge 80
Trustee 6/1/99 Assistant to Chief Executive Officer, CHS Electronics, Inc., October 1998 to December 2000; Partner, Grant Thornton LLP (certifi ed public accountants), August 1979 to August 1998.
2 None
Heinz RiehlAge 81
Trustee 6/1/99 President, Riehl World Training & Consulting, Inc. (bank consulting), 1996 to present; Faculty Member, New York University, 1982 to 2008.
2 None
Irvin M. HendersonAge 61
Trustee 6/26/00 President and Chief Executive Officer, Henderson & Company (consulting fi rm), 1993 to present.
2 None
Robert O. LehrmanAge 82
Trustee 9/29/00 Business consultant and special counsel; Chairman, Advisory Board, Lodestone Banking Consultancy; formerly, Director, Community Capital Bank, New York, NY; formerly, President and Chief Executive Officer, Community Bankers Association, New York.
2 None
OFFICERS
David K. Downesc/o Community Capital Management, Inc.2500 Weston Road Suite 101 Weston, FL 33331Age 77
President 1/29/04 Vice Chair, Community Capital Management, Inc. since February 2016; Chief Executive Officer, Community Capital Management, Inc. from January 2004 to February 2015.
N/A N/A
Alyssa D. Greenspan, c/o Community Capital Management, Inc.2500 Weston Road, Suite 101Weston, FL 33331 Age 45
Vice President
10/22/10 President, Community Capital Management, Inc. since January 2015; Chief Operating Officer, Community Capital Management, Inc. since June 2009; Senior Vice President and Portfolio Manager, Community Capital Management, Inc. since May 2003.
N/A N/A
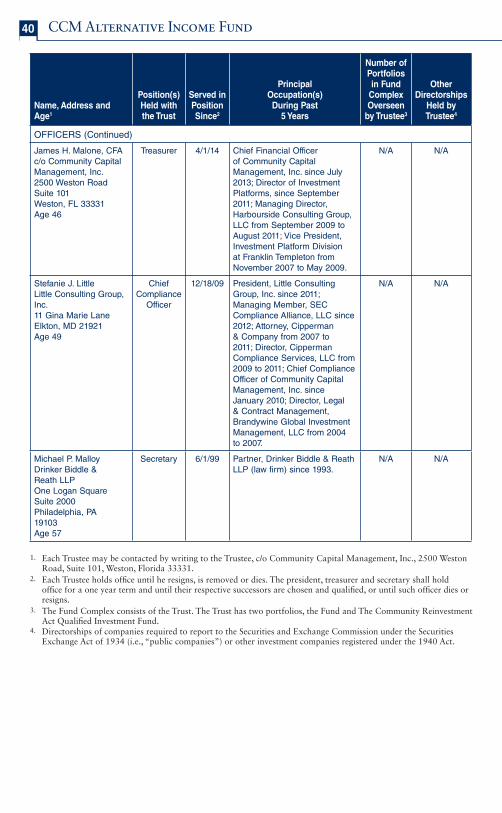
40 CCM Alternative Income Fund
Name, Address and
Age1
Position(s)
Held with
the Trust
Served in
Position
Since2
Principal
Occupation(s)
During Past
5 Years
Number of
Portfolios
in Fund
Complex
Overseen
by Trustee3
Other
Directorships
Held by
Trustee4
OFFICERS (Continued)
James H. Malone, CFA c/o Community Capital Management, Inc.2500 Weston Road Suite 101Weston, FL 33331 Age 46
Treasurer 4/1/14 Chief Financial Officer of Community Capital Management, Inc. since July 2013; Director of Investment Platforms, since September 2011; Managing Director, Harbourside Consulting Group, LLC from September 2009 to August 2011; Vice President, Investment Platform Division at Franklin Templeton from November 2007 to May 2009.
N/A N/A
Stefanie J. LittleLittle Consulting Group, Inc.11 Gina Marie LaneElkton, MD 21921Age 49
Chief Compliance
Officer
12/18/09 President, Little Consulting Group, Inc. since 2011; Managing Member, SEC Compliance Alliance, LLC since 2012; Attorney, Cipperman & Company from 2007 to 2011; Director, Cipperman Compliance Services, LLC from 2009 to 2011; Chief Compliance Officer of Community Capital Management, Inc. since January 2010; Director, Legal & Contract Management, Brandywine Global Investment Management, LLC from 2004 to 2007.
N/A N/A
Michael P. MalloyDrinker Biddle & Reath LLPOne Logan SquareSuite 2000Philadelphia, PA19103Age 57
Secretary 6/1/99 Partner, Drinker Biddle & Reath LLP (law fi rm) since 1993.
N/A N/A
1. Each Trustee may be contacted by writing to the Trustee, c/o Community Capital Management, Inc., 2500 Weston Road, Suite 101, Weston, Florida 33331.
2. Each Trustee holds offi ce until he resigns, is removed or dies. The president, treasurer and secretary shall hold offi ce for a one year term and until their respective successors are chosen and qualifi ed, or until such offi cer dies or resigns.
3. The Fund Complex consists of the Trust. The Trust has two portfolios, the Fund and The Community Reinvestment Act Qualifi ed Investment Fund.
4. Directorships of companies required to report to the Securities and Exchange Commission under the Securities Exchange Act of 1934 (i.e., “public companies”) or other investment companies registered under the 1940 Act.
41
Approval of Advisory and Sub-Advisory Agreements (Unaudited)
At a meeting held on April 27-28, 2017, the Board of Trustees of the Trust, including a majority of the Trustees who are not “interested persons” (as defi ned in the Investment Company Act of 1940, as amended (the “Independent Trustees”)), approved (1) the continuation of the Trust’s Advisory Agreement with the Advisor with respect to the CCM Alternative Income Fund (the “Fund”) and (2) the continuation of the Sub-Advisory Agreement between the Advisor and Sub-Advisor with respect to the Fund for an additional one-year period. The Advisor reviewed and responded to Trustees’ questions concerning the materials relating to the Advisory Agreement and Sub-Advisory Agreement, in particular, letters from the Advisor and Sub-Advisor responding to specifi c questions from the Trustees relating to the Advisory Agreement and Sub-Advisory Agreement. Among other things, those materials and the Advisor’s presentation covered: (i) the nature, extent and quality of the Advisor’s/Sub-Advisor’s services provided to the Fund; (ii) the experience and qualifi cations of the Advisor’s/Sub-Advisor’s personnel involved in the management of the Fund; (iii) the Advisor’s/Sub-Advisor’s investment philosophy and process; (iv) the Advisor’s/Sub-Advisor’s assets under management; (v) the current advisory/sub-advisory fee arrangement for the Fund and the Advisor’s separate account fees; (vi) the performance of the Fund and the advisory/sub-advisory fee and expenses as compared to other funds; (vii) the Advisor’s and Sub-Advisor’s fi nancial statements and profi tability; and (viii) other possible benefi ts to the Advisor/Sub-Advisor arising from its advisory/sub-advisory and other relationships with the Trust.
The Trustees then met in executive session with counsel to the Trust. The Trustees discussed the information that had been provided to them in connection with the continuation of the Advisory Agreement and Sub-Advisory Agreement, including the matters covered at the April 7, 2017 special meeting of the Board that had been called to review and discuss the materials and information the Board had requested from the Advisor and Sub-Advisor relating to the Advisory Agreement and Sub-Advisory Agreement. In connection with such continuation, counsel to the Trust reviewed his fi rm’s memorandum outlining the Trustees’ duties and responsibilities in connection with the continuation of the Advisory Agreement and Sub-Advisory Agreement. After further discussion concerning the continuation of the Advisory Agreement and Sub-Advisory Agreement, the Trustees, including a majority of the Independent Trustees, reached the following conclusions: (i) the Advisor and Sub-Advisor have the capabilities, resources and personnel necessary to manage the Fund; (ii) based on the services that the Advisor and Sub-Advisor would provide to the Fund under the Advisory Agreement and Sub-Advisory Agreement, respectively, and the expenses incurred by the Advisor and Sub-Advisor in the performance of such services, the compensation to be paid to the Advisor and Sub-Advisor was fair and equitable; (iii) the difference in management fees between the Fund and the separate accounts managed by the Advisor was reasonable in light of the differing service levels and portfolio management requirements; (iv) the Advisor’s and Sub-Advisor’s direct and indirect expenses in providing advisory and sub-advisory services to the Fund was reasonable; and (v) breakpoints were currently not relevant to the Fund given its asset size. Based upon such information as they considered necessary to the exercise of their reasonable business judgment, the Trustees, including all of the Independent Trustees, concluded that it was in the best interests of the Fund to continue the Advisory Agreement with the Advisor and the Sub-Advisory Agreement between the Advisor and Sub-Advisor with respect to the Fund for an additional one-year period.

THIS PAGE INTENTIONALLY LEFT BLANK.

THIS PAGE INTENTIONALLY LEFT BLANK.

THIS PAGE INTENTIONALLY LEFT BLANK.
Administrator and Transfer Agent:SEI Investments Global Funds ServicesOne Freedom Valley DriveOaks, PA 19456
Legal Counsel:Drinker Biddle & Reath LLPOne Logan SquareSuite 2000Philadelphia, PA 19103-6996
Independent Registered Public Accounting Firm:Grant Thornton LLP757 Third AvenueNew York, NY 10017
Custodian:U.S. Bank, National Association50 South 16th StreetSuite 200020th FloorEX-PA-WBSPPhiladelphia, PA 19102
Board of Trustees:John E. Taylor, Chairman of the Board of TrusteesBurton Emmer, TrusteeHeinz Riehl, TrusteeIrvin M. Henderson, TrusteeRobert O. Lehrman, Trustee
This report is intended for the Fund’s shareholders. It may not be distributed to prospective investors unless it is preceded by or accompanied by the Fund’s prospectus. An investor should read the prospectus carefully before investing or sending money. A prospectus may be obtained by calling the Fund at 1-877-272-1977.

2500 Weston Road Suite 101 Weston, FL 33331954-217-7999 Fax: 954-385-9299 Toll Free: 877-272-1977 www.ccminvests.com