Embed Size (px)
Citation preview
Annual Report 2016
We create solutions to unlock energy safely and sustainably for future generations.
Back to index
Page 2Introduction
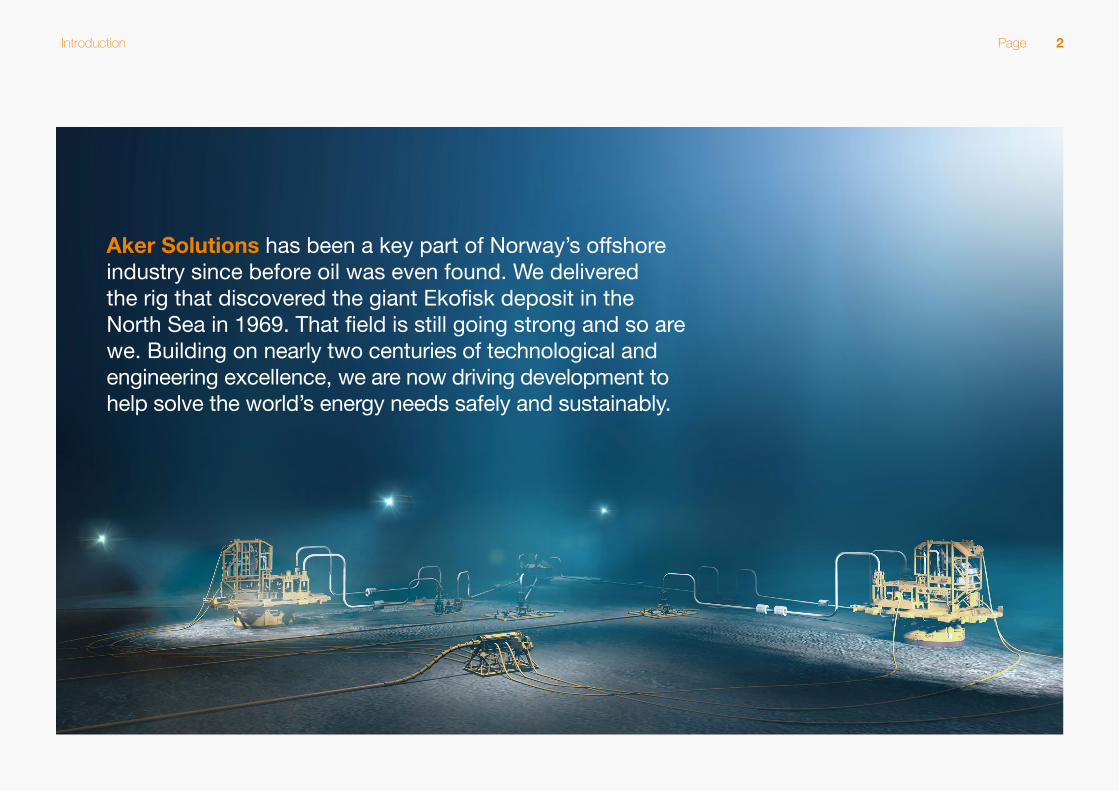
Aker Solutions has been a key part of Norway’s offshore industry since before oil was even found. We delivered the rig that discovered the giant Ekofisk deposit in the North Sea in 1969. That field is still going strong and so are we. Building on nearly two centuries of technological and engineering excellence, we are now driving development to help solve the world’s energy needs safely and sustainably.

Annual Report Index
Key Figures
Global Presence
Highlights 2016
CEO Introduction
Board of Directors’ Report
Consolidated Financial Statements
Parent Company Financial Statements
Auditor's Report
Alternative Performance Measures
2016 2015
Orders and resultsOrder backlog December 31 NOK mill 31,188 39,684
Order intake NOK mill 17,004 22,793
Revenue NOK mill 25,557 31,896
EBITDA NOK mill 1,929 1,841
EBITDA margin Percent 7.5% 5.8%
EBITDA margin ex. special items Percent 8.3% 8.3%
EBIT NOK mill 687 958
EBIT margin Percent 2.7% 3.0%
EBIT margin ex. special items Percent 5.3% 6.0%
Net profit NOK mill 152 383
Cashflow
Cashflow from operational activities NOK mill 312 1,934
Balance sheet
Net interest-bearing debt NOK mill 1,002 -301
Equity ratio Percent 29.8% 23.9%
Liquidity buffer NOK mill 7,480 8,862
Share
Share price December 31 NOK 41.37 30.30
Basic earnings per share NOK 0.21 1.44
Employees
Total employees December 31 Own employees 14,385 15,395
HSE
Lost time incident frequency Per million worked hours 0.30 0.49
Total recordable incident frequency Per million worked hours 1.30 1.34
Sick-leave rate Per million worked hours 2.75 2.83
Key Figures
Introduction

Back to index
Key Figures
Key Figures
8
7
6
5
4
3
2
1
2.5
2.0
1.5
1.0
0
0.5
0
Amounts in NOK billion and percent
EBIT (NOK billion)
EBIT and margin
EBIT margin (percent)
35
30
25
20
15
10
5
0
Amounts in NOK billion
Revenue
Revenue
60
50
40
30
20
10
0
Amounts in NOK billion
Order intake and backlog
Intake Backlog
2012 20142013 2015 20162012 20142013 2015 20162012 20142013 2015 2016

Back to index
Key Figures
Subsea
Field Design
Amounts in NOK billion
Amounts in NOK billion
Revenue
Revenue
Revenue
Revenue
20
15
10
5
0
8
10
12
14
6
4
2
0
987654321
1.4
1.2
1.0
0.8
0.6
0.4
0.2
0
1.81.61.41.21.00.80.60.4
0
0.20
Amounts in NOK billion and percent
Amounts in NOK billion and percent
EBIT (NOK billion)
EBIT NOK billion
EBIT and margin
EBIT and margin
2012 20142013 2015 2016
EBIT margin (percent)
EBIT margin (percent)
40
35
30
25
20
15
10
5
0
20181614121086420
Amounts in NOK billion
Amounts in NOK billion
Order intake and backlog
Order intake and backlog
Intake Backlog
Intake Backlog
2012 20142013 2015 2016
12
10
8
6
4
2
0
2012 20142013 2015 2016
2012 20142013 2015 20162012 20142013 2015 2016
2012 20142013 2015 2016

Back to index
Page 6Global Presence
Global PresenceMore than 14,000 employees in about 20 countries Norway
Asia PacificEurope
Africa
5,800
Manufacturing sitesAberdeenMobileHoustonTranbyMossPort KlangCuritiba
Service basesLuandaÅgotnesHoustonRio das OstrasLabuanKakinadaPerthAberdeenPointe-Noire
Engineering hubsOsloLondonKuala LumpurMumbai
Fabrication facilitiesEgersundÅgotnes
1,900Brazil
3,3002,600
200
North America
500
Figures in illustration show number of employees per region.

Back to index
Page 7Highlights 2016
Highlights 2016
Carbon CaptureAker Solutions carries out the world’s first test project for carbon capture at Norway’s largest waste-to-energy plant, successfully removing 90 percent of the CO2 from waste burned to create energy. The company’s carbon capture, utilization and storage technology is an important tool in reducing emissions and curtailing global warming.
Innovation and Technology Award The company wins Subsea UK’s innovation and technology award for its Vectus 6.0 subsea electronics module which improves performance and lowers risk at oil and gas installations on the seafloor.
ABB Cooperation Aker Solutions and ABB join forces to build on their combined strengths in subsea, power and automation technologies, bringing customers more effective, reliable and flexible oil and gas production solutions. Initial focus areas include developing subsea compression systems at lower costs and in less time.
Engineering Achievement The company wins an engineering achievement award at the OTC conference in Houston for its El-drive subsea electric actuators. These are more compact, effective and environmentally friendly than traditional hydraulic solutions.
Egypt The company in June secures an order valued at more than NOK 1 billion to deliver its longest-ever umbilicals system at the Zohr gas field offshore Egypt.
VietnamAker Solutions wins a contract from Idemitsu Oil and Gas to provide front-end engineering design work for the development of oil and gas resources in the Nam Con Son basin off Vietnam. This marks an expansion into a key new market for Aker Solutions.
Development Alliance Aker Solutions, Aker BP and Subsea 7 form a ‘one for all, all for one’ collaboration that marks a major shift in how an operator and its suppliers work together on Norwegian oil and gas developments.
BP ContractsAker Solutions secures several global framework agreements with BP, including in the engineering and subsea areas.
Lean SemiThe company introduces a new lighter weight and faster to deliver semisub mersible platform. The Lean Semi will help producers unlock marginal oil and gas fields in harsh environments across the globe.
Subsea Compression Aker Solutions and MAN Diesel & Turbo make progress in developing the next generation in subsea compression systems. The partnership says it expects to reduce the size and weight of such systems by at least 50 percent just a year after the world’s first subsea compression system went on stream at Statoil’s Åsgard field.
Reorganization Aker Solutions in November replaces its business area structure with five delivery centers: Customer Management, Front End, Products, Projects and Services. The new setup better reflects the company’s workflow from early engagement with customers to project execution and through to life-of-field services.
Brazil Aker Solutions opens a new state-of-the-art subsea manufacturing plant in Brazil and also secures a subsea services framework agreement with national oil and gas producer Petrobras. In December, the company buys 70 percent of Brazilian C.S.E. Mecânica e Instrumentação Ltda., building on a strategy to expand its services business internationally.

Page 8
Back to index
Aker Solutions made major progress in 2016 in becoming a leaner and more competitive company and promoting its aim of creating a more sustainable industry.
Encouraging Signs
CEO Introduction

Page 9
Back to index
We streamlined how we are organized, strengthening operations and taking big
steps to improve cost-efficiency. We delivered consistently on major projects
globally and increased our collaboration with other industry-leading companies to
find the best field development solutions.
We also had to make some tough decisions and let go of valued colleagues
because of the continued market decline. Together with the trade unions, we
ensured that this process was as fair and transparent as possible. We will continue
to be vigilant and do what is necessary to safeguard our company and future jobs.
Our business area structure was replaced with the following new delivery
centers: Customer Management, Front End, Products, Projects and Services.
These better reflect our workflow from early engagement with customers to project
execution and through to life-of-field services.
The new setup is driving leaner workflows and greater synergies and will
boost our standardization efforts and further speed up #thejourney program, which
targets cost-efficiency improvements of at least 30 percent by the end of this year.
It will propel growth in our services organization and help in the pursuit of more
international business.
Building on this strategy, we last year bought 70 percent of C.S.E. Mecânica
e Instrumentação, a Brazilian provider of maintenance, assembly, commissioning
and crane operation services. Through this we gain access to the country’s
expanding market for servicing existing oil and gas fields. I am pleased to say that
the process of integrating our two businesses is going well.
Our underlying margins were steady in 2016, aided by the cost-efficiency
efforts and strong project execution, even as the industrywide slowdown caused
a weakening of both our top and bottom lines. We had a solid financial position
with a liquidity buffer of 7.5 billion kroner at the end of the year. This gives us
good flexibility.
We won contracts in all parts of our business and built on our relationships
with major customers worldwide. This included global framework agreements
with BP for key business offerings, a major maintenance and modifications frame-
work agreement with ConocoPhillips in Norway and a subsea services agreement
with Petrobras in Brazil. We secured a record of more than 80
study awards last year, including for the Johan Sverdrup and
Johan Castberg projects, where we have worked closely with
the customer Statoil to significantly lower development costs.
About two-thirds of our project backlog is for outside Norway.
We built on our network of partnerships with companies
that are leaders in their fields, agreeing in April to collaborate
with ABB on subsea, power and automation technologies.
We also continued to partner in subsea with Baker Hughes,
MAN Diesel & Turbo, SBM Offshore and Saipem. These collabo-
rations close technology gaps in our portfolio, providing access to
the entire range of capabilities needed to develop fully-functioning
subsea production and processing systems.
We carried out the world’s first test project for carbon
capture at Norway’s largest waste-to-energy plant, success fully
removing 90 percent of the CO2 from waste burned to create
energy. Our carbon capture and storage technology is an important
tool in reducing emissions and curtailing global warming.
The safety and health of our employees is our first priority.
Tragically we lost four colleagues in a helicopter crash on April 29
that took the lives of all 13 people on board the flight off the coast
of Norway. We marshalled all of our resources to support the
Our underlying margins were steady in 2016, aided by cost-efficiency efforts and strong project execution
CEO Introduction

Page 10
Back to index
families and colleagues affected by this terrible accident. We also helped the author-
ities and operator in investigating its cause. It is crucial that we do everything in our
power as an industry to prevent such an accident from happening again.
As a member of the UN Global Compact, we are committed to its principles
and to responsible and sustainable business practices. We continue to strengthen
our anti-corruption efforts and there is a high priority in ensuring good corporate
governance. We seek to ensure equal opportunities and a work environment free
from discrimination.
The markets remain challenging, but there are some recovery signs. Oil
prices are off their lows and are seen stabilizing at a higher level in 2017. While
offshore investments are expected to remain subdued, the industry is moving out
of survival mode. Cost cuts, simplified field architecture and a deeper collaboration
have lowered the break-even on major projects. This is expected to help the industry
move forward with new investments. A strong pipeline of studies and tenders indi-
cates that prospective developments are looking more economically attractive. We
anticipate a slow acceleration of project sanctioning this year, particularly for brown-
field projects as the industry seeks to extract additional value from existing assets.
I am encouraged by these positive signs. But I am even more energized by
the way we are tackling the market challenges as we push ahead in pursuit of our
vision to be a leader in driving the sustainable development of our industry.
Luis Araujo
Chief Executive Officer
CEO Introduction

Page 11
Back to index
Board of Directors’ Report
Aker Solutions in 2016 took major steps in becoming an even more streamlined and effective business amid a challenging market.
Board of Directors’ Report

Page 12
Back to index
Board of Directors’ Report
Aker Solutions’ strategy builds on its vision of being a leader in forging a sustainable future for the global energy industry and the world it serves
The company introduced a new, leaner organizational model and made strong
progress with a global push to boost cost-efficiency by 30 percent by the end of
2017. It increased collaboration with other businesses on developing solutions for
a sustainable energy future.
OverviewBuilding on 175 years of technological and engineering excellence, Aker Solutions
is committed to finding solutions to safely and cost-effectively bring oil and gas discov-
eries into production, maximize recovery and minimize the environmental footprint.
The company provides products, systems and services ranging from concept
studies and front-end engineering to subsea production systems and services for
enhancing and extending the life of a field. The main customers are international,
national and independent oil and gas companies.
Aker Solutions employed more than 14,000 people in about 20 countries
at the end of 2016. The main office is in Fornebu, Norway. Aker Solutions ASA is
listed on the Oslo Stock Exchange.
Strategy and Organizational Development
Aker Solutions’ strategy builds on its vision of being a leader in forging a sustainable
future for the global energy industry and the world it serves. The company provides
customers the solutions they need to safely and sustainably develop, operate and
retire their assets. These efforts are reinforced through alliances with other leading
companies that seek to develop innovative and cost-effective solutions.
Significant organizational steps were taken in the last year to boost
Aker Solutions’ competitiveness, creating value for customers and shareholders.
The company replaced its business-area structure with five delivery centers that
are being fully implemented in 2017: Customer Management, Front End, Products,
Projects and Services. These better reflect the workflow from early customer
engagement to project execution and through life-of-field services. Each center is
supported by global functions in driving improved standards of performance. The
new setup is expected to generate greater synergies, enable a significant lift in
standardization and further speed up the global improvement
program, #thejourney. It will also facilitate a more coordinated
customer approach and boost growth of the international
services business.
Good progress was made in #thejourney program, which
targets an improvement in cost-efficiency of at least 30 percent
across the business by the end of 2017 compared with 2015
costs and work volumes. This equals potential annual savings
of at least NOK 9 billion. Aker Solutions is simplifying its work
methods, organizational set-up, geographic footprint and
products and services. This is giving leaner and more efficient
processes that will reduce overall costs on projects and products
while improving quality. A key focus is to build a culture of con-
tinuous improvement. The company had achieved 65 percent of
the total improvement target at the end of 2016.
Aker Solutions continued to build its network of partnerships
with companies that are leaders in their fields of expertise. The

Back to index
Page 13Board of Directors’ Report
company and ABB agreed in April to collaborate on subsea, power and automation
technologies to enable more effective, reliable and flexible oil and gas production
solutions. The collaboration is one of several formed since 2014 by Aker Solutions
and peers that also include Baker Hughes, MAN Diesel & Turbo, SBM Offshore and
Saipem. These partnerships span the entire subsea value chain from the reservoir
to the seabed and up to the topside. They close technology gaps in Aker Solutions’
portfolio, providing access to the full range of capabilities needed to develop
fully-functioning subsea production and processing systems. This is key to the
company’s subsea strategy.
Customer Focus
Aker Solutions seeks to provide the best service in the industry to its customers,
which include major integrated oil and gas companies, national oil companies and
independent exploration and production operators. Local marketing teams sup-
ported by the new customer management delivery center form a solid foundation
for understanding and engaging with customers. The company in 2016 continued
to sharpen its customer focus through targeted and proactive strategies where key
account managers worked together across the company’s full portfolio of offerings
to capitalize on business opportunities and strengthen customer relationships.
Aker Solutions’ collaboration with customers has been central to improving
the economics and overall performance associated with developing and produc-
ing oil and gas assets. Working closely with customers enables a more integrated
and holistic approach to establishing the most effective solutions across the full
develop ment and production lifecycle. In line with this rationale, Aker Solutions
formed a new alliance with Aker BP and Subsea 7. It combines Aker Solutions’
experience in front end engineering, modifications and subsea systems with
Subsea 7’s SURF capabilities and Aker BP’s exploration and production expertise.
This innovative way of addressing the challenges in the oil and gas industry
demonstrates Aker Solutions’ commitment to achieving its vision of sustainability.
The company will continue to pursue opportunities to engage and collaborate with
its customers with the aim of collectively driving forward industry performance.

Page 14
Back to index
Board of Directors’ Report
Where We OperateAker Solutions last year generated about two-thirds of its revenue from contracts
for delivery outside Norway, its single-largest market. The company operates in
about 20 countries, including Malaysia, Brunei, India and Australia in Asia Pacific
and Angola, Congo-Brazzaville and Nigeria in Sub-Saharan Africa. Aker Solutions
is also present in North America, with a particular focus on the Gulf of Mexico and
Atlantic Canada. The company also expanded its strong presence in Brazil by last
year acquiring 70 percent of Brazilian C.S.E. Mecânica e Instrumentação Ltda, a
provider of maintenance, assembly, commissioning and crane operation services
for offshore and onshore facilities. The purchase provides access to Brazil's
growing market for servicing existing oil and gas fields, building on a strategy to
expand the services business in key markets globally.
Market Outlook
Aker Solutions’ financial performance depends on activity in global oil and gas
markets, which is significantly affected by demand for oil and gas, price volatility
and changes in environmental requirements. The oil-services market remained
challenging in 2016 as exploration and production companies grappling with capital
constraints continued to curtail spending and postpone projects. Aker Solutions
met these challenges by reducing costs and streamlining its business to become
even more competitive. The company also engaged in increased
collaboration as industry participants intensified efforts to find the
most effective field development solutions.
The market outlook remains challenging, but there are
some signs of a recovery. Oil prices have come off their lows
and are seen stabilizing at a higher level in 2017, helping to
return some confidence to the sector. While offshore invest-
ments are expected to remain subdued, the industry is moving
out of survival mode and is now far better equipped to cope
with oil prices at current levels. Cost cuts are having an effect,
with the break-even coming down on projects amid efforts to
simplify field architecture and form more effective collaboration
models. This is expected to help the industry move forward with
new investments while a strong pipeline of studies and tenders
indicates that prospective developments are looking more eco-
nomically attractive. Aker Solutions anticipates a slow acceler-
ation of project sanctioning this year. This is especially true for
brownfield projects as the industry seeks to extract additional
value from existing assets and infrastructure
The underlying, long-term outlook remains positive.
Declining reserves and lower oil and gas production in many
parts of the world are expected to generate a need for investments
in developments and increased recovery from existing fields.
Aker Solutions is well placed in key regions to provide the capabili-
ties and technology to lower development costs, improve recovery
rates and reduce the industry’s environmental footprint.
Corporate Responsibility
Aker Solutions works proactively to ensure sustainability, integrity
and responsibility in its operations. Corporate responsibility at
Aker Solutions is about making good and sustainable business
Aker Solutions generated two-thirds of its revenue from contracts for delivery outside Norway in 2016

Back to index
Page 15Board of Directors’ Report
decisions that add value to the company, its stakeholders and society. Corporate
responsibility considerations are integrated in internal processes and business
operations and tailored to diverse local contexts and stakeholder expectations. The
company is a member of the United Nations Global Compact corporate sustain ability
initiative and is committed to its 10 principles. Aker Solutions has integrated a global
anti-corruption compliance program and is also a member of Trace International,
an international organization promoting transparency and anti-corruption. The
company’s commitment to human and labor rights is covered by the Global Frame-
work Agreement between Aker ASA and the Norwegian and international trade unions
Fellesforbundet, IndustriALL Global Union, NITO and Tekna. Aker Solutions reports
and communicates on corporate responsibility based on recommendations from
the Global Reporting Initiative (GRI). More information is available in the company’s
corporate responsibility report for 2016 on www.akersolutions.com/cr-reports.
Corporate Governance
Corporate governance is a framework of values, responsibilities and work processes
to control the business and ensure sustainable value creation for shareholders and
other stakeholders. The board of directors is responsible for ensuring sound gover-
nance at Aker Solutions. The audit committee supports the board in ensuring that
the company has internal procedures and systems in place for effective processes
based on the principles set out in the Norwegian Code of Practice for Corporate
Governance. More information on corporate governance is available in the corpo-
rate governance report for 2016 on www.akersolutions.com/corporate-governance.
Ethical and Political Risks
Aker Solutions could potentially become involved in unethical behavior, either directly
or through third parties or partners. The company has operations in countries
associated with high political, reputational and corruption risks. Risks of this kind
are managed through regular country analyses, mandatory awareness training,
compliance reviews and regular integrity due diligence.

Page 16
Back to index
Board of Directors’ Report
The company in 2016 strengthened its anti-corruption program, introducing a new
web-based whistleblowing tool and updating policies and procedures. This included
revising the qualification procedure for business partners to ensure a transparent
selection and approval process. Aker Solutions also introduced a centralized global
procedure for gifts and hospitality as well as a template for employees needing to
report conflict-of-interest situations. The company increased training of employees
across the business to boost awareness of and compliance with its ethical guidelines
and code of conduct.
Financial PerformanceAker Solutions presents its consolidated financial statements in accordance with
the International Financial Reporting Standards (IFRS) as adopted by the European
Union. All amounts except those in section 2.4 relate to the consolidated financial
statements for the group, since the parent company has very limited operations.
Consolidated Financial Results
Aker Solutions’ revenue declined to NOK 25.6 billion in 2016 from NOK 31.9 billion the
prior year amid a market slowdown. Earnings before interest and taxes (EBIT) fell to
NOK 687 million from NOK 958 million a year earlier, burdened by NOK 163 million in
costs for restructuring and reducing workforce capacity and NOK 82 million to cover
lease costs on vacated office space. Earnings were impacted by an unrealized gain of
NOK 44 million on non-qualifying hedges and NOK 10 million in other non-recurring
gains. Aker Solutions booked NOK 464 million in impairment charges on capitalized
research and development programs as well as machinery and equipment. Excluding
these special items EBIT fell to NOK 1.3 billion from NOK 1.9 billion a year earlier.
Interest income was NOK 65 million in 2016 compared with NOK 76 million
the previous year. Interest expenses rose to NOK 477 million from NOK 348 million
in 2015 because of an increase in borrowings. Aker Solutions hedges currency
risk for all significant project exposures. More than 80 percent of the value of the
hedging instru ments either qualify for hedge accounting or are hedges of separ-
ated embedded derivatives. Income before tax fell to NOK 273 million in 2016 from
NOK 685 million the year before. Income tax expenses were
NOK 121 million, down from NOK 302 million in 2015. This
corresponds to an effective tax rate of 44 percent, unchanged
from the year before. Net income after tax in 2016 was NOK 152
million compared with NOK 383 million the previous year.
Earnings per share were NOK 0.21 versus NOK 1.44 in 2015.
The board of directors has proposed that no dividend
payment be made for 2016. While Aker Solutions had a solid
financial position at the end of 2016, the board deems it prudent
to exercise caution amid a continued uncertain outlook for the oil
and gas industry. The company maintains its policy of paying a
dividend of between 30 and 50 percent of net profit over time.
Subsea Financial Results
The subsea business provides technologies and products, including
production systems, umbilicals and power cable systems.
The segment covers all phases of the life of fields, from concept
The company increased training of employees to boost awareness of and compliance with its ethical guidelines and code of conduct

Page 17
Back to index
Board of Directors’ Report
screening and design through manufacturing, installation and commissioning to
operational support and maintenance.
Subsea revenue declined to NOK 15 billion in 2016 from NOK 19.1 billion
the year before as demand for subsea services decreased, particularly in Norway.
This was partially offset by higher revenue from projects in Africa. The EBIT margin
narrowed to 2.3 percent from 5.5 percent a year earlier, affected by NOK 31 million
in costs for restructuring and reducing the workforce and NOK 441 million in
impair ment charges on capitalized research and development programs as well as
machinery and equipment. Excluding special items, the EBIT margin was 5.3 percent
compared with 7.1 percent a year earlier.
The full-year order intake was NOK 7.3 billion in 2016,
down from NOK 7.7 billion the prior year. The order backlog was
NOK 14.5 billion at the end of 2016 versus NOK 22.5 billion a
year earlier.
Field Design Financial ResultsThe field design area provides key services, products and tech-
nologies in field development, including engineering, project
management, fabrication and offshore construction services.
The segment consists of the engineering and maintenance,
modifications and operations (MMO) businesses.
Field Design revenue fell to NOK 10.7 billion in 2016 from
NOK 12.9 billion a year earlier, primarily because of a slowdown in
the Norwegian MMO market. This was partially offset by volumes
from international MMO operations, which represented about half
of MMO revenue in 2016. Field Design’s EBIT margin expanded
to 5.4 percent from 3.1 percent in 2015, helped by good project
execution, commercially beneficial close-outs of projects and
increased utilization of resources. It was negatively impacted
by NOK 62 million in restructuring costs and NOK 23 million in
impairments of technology. Excluding special items, the EBIT
margin was 6.2 percent in 2016 versus 5.2 percent in 2015.
The order intake fell to NOK 9.8 billion in the year from
NOK 15.3 billion in 2015. The order backlog was NOK 16.7 billion
at the end of 2016, down from NOK 17.2 billion a year earlier.
Cashflow
Consolidated cashflow from operating activities depends on a
number of factors, including progress on and delivery of projects,
changes in working capital and prepayments from customers.
Net cash from operating activities was NOK 312 million in 2016
Subsea Field Design
Amounts in NOK million 2016 2015 2016 2015
Operating revenue 14,996 19,101 10,670 12,920
EBITDA 1,417 1,778 730 543
EBITDA margin 9.5% 9.3% 6.8% 4.2%
EBITDA ex. special items 1,425 1,944 795 793
EBITDA margin ex. special items 9.5% 10.2% 7.4% 6.1%
EBIT 352 1,045 580 404
EBIT margin 2.3% 5.5% 5.4% 3.1%
EBIT ex. special items 800 1,357 667 672
EBIT margin ex. special items 5.3% 7.1% 6.2% 5.2%
NCOA 561 -472 -937 -861
Net capital employed 6,388 4,702 -359 -362
Order intake 7,283 7,660 9,831 15,263
Order backlog 14,500 22,476 16,711 17,235
Employees 5,407 7,449 8,664 7,772

Back to index
Page 18Board of Directors’ Report
compared with NOK 1.9 billion a year earlier. Net current operating assets were
negative NOK 904 million at the end of 2016 compared with negative NOK 1.6
billion a year earlier.
Working capital may fluctuate considerably due to large milestone pay-
ments on projects. Aker Solutions’ net cash outflow for investing activities was
NOK 1.2 billion in 2016, compared with NOK 1.3 billion a year earlier. This included
the acquisition of a 70 percent stake in the Brazilian company C.S.E. Mecânica e
Instrumentação Ltda. Investments in technology development and IT were NOK 297
million, compared with NOK 449 million a year earlier. Net cash outflow related to
financing activities was NOK 213 million, down from NOK 323 million in 2015. The
repayments and proceeds from borrowings mainly relates to Brazil.
Financial PositionAssets, Equity and Liability
Non-current assets totaled NOK 10.3 billion at the end of 2016, compared with
NOK 10.5 billion the year before. Goodwill and other intangible assets amounted
to NOK 5.6 billion, down from NOK 6.2 billion after impairment charges of
NOK 386 million were recognized during the year. The company had net inter-
est bearing debt of NOK 1 billion in 2016, compared with a net cash holding of
NOK 301 million the prior year. The net interest bearing debt consists of current
and non- current borrowings excluding cash and interest-bearing receivables. The
debt includes bond loans in the Norwegian market, bank loans with Nordic and inter-
national banks, local financing in Brazil and some smaller loan facilities between
group subsidiaries and local banks. The liquidity reserves were solid at the end
of the year with cash and bank deposits of NOK 2.5 billion, helped by customer pre-
payments on projects. Undrawn and committed long-term revolving bank credit
facilities were NOK 5 billion, giving a total liquidity buffer of NOK 7.5 billion. Capital
adequacy and liquidity were generally deemed solid at the end of 2016, putting the
company in a good position to meet challenges and opportunities over the next years.
The book value of equity including non-controlling interests was NOK 6.4
billion at the end of 2016, compared with NOK 6.6 billion a year earlier. The company’s

Page 19
Back to index
Board of Directors’ Report
equity ratio was 29.8 percent of the total balance sheet, up from 23.9 percent a
year earlier.
Parent Company Financial Statements
Aker Solutions ASA, the parent company of the Aker Solutions group, owns and
manages the group’s subsidiaries. Aker Solutions ASA has outsourced all company
functions to other companies within the group, mainly Aker Solutions Holding
AS. Assets and liabilities related to the corporate treasury function are held by
Aker Solutions ASA. Aker Solutions ASA had a net loss of NOK 199 million in 2016
compared with a net loss of NOK 211 million in 2015 mainly consisting of corporate
costs and interest expenses.
The parent company’s dividend policy is to pay shareholders 30 to 50 percent of
net profit as an annual dividend over time. The dividend will be paid in cash or
share buybacks or a combination of both. The board of directors proposed that no
dividend payment be made for 2016 as it was deemed prudent to exercise caution
amid an uncertain outlook for the oil and gas industry.
More information on the allocation of profits can be found in the income
statement of the parent company on page 100 of this report.
Going Concern
In accordance with the Norwegian Accounting Act, the board
confirms that the consolidated financial statement and parent
company financial statement have been prepared on the basis of
the going-concern assumption.
Research, Innovation and TechnologyAker Solutions builds on its strengths in key subsea and field
design markets through investment in research, innovation and
technology. The focus is to develop new concepts, technologies
and products that address challenges faced by our customers
while lowering costs. The offshore oil and gas industry is moving
into an era of declining production at maturing fields, increas-
ingly complex reservoirs, deeper waters and stricter regulation.
The research and development (R&D) portfolio involved
more than 20 main projects in 2016. Total R&D expenditure
was NOK 422 million, of which NOK 297 million was capitalized
and NOK 125 million was expensed. Aker Solutions recognized
NOK 386 million in impairment losses on capitalized research
and development. This was mainly related to technologies where
the market outlook worsened as a result of the downturn in the
oil and gas industry.
R&D is managed by the technology department. The
purpose is to share resources and aggregate best practice
and knowledge to ensure alignment with the company’s over-
all strategy.
R&D investments target four key areas: (1) subsea production
products, (2) new generation controls and automation systems, (3)
offshore greenfield developments and (4) offshore brownfield modifi-
cations to increase oil and gas recovery and extend field life.
Aker Solutions builds on its strengths in key subsea and field design markets through investment in research, innovation and technology

Page 20
Back to index
Board of Directors’ Report
These priorities and activities were all reflected in 2016 R&D portfolio invest-
ments, striking a balance between near-term project-driven product development,
medium-term feasibility studies and market-driven development and investments in
longer-term technologies.
New technology development is focused on cost reduction and profitability as
well as on elevating capabilities. Aker Solutions continued in 2016 to collaborate
with companies such as ABB, Baker Hughes and MAN Diesel & Turbo in developing
technologies and products to lower costs, increase recovery and minimize the environ-
mental footprint.
One example is POWERJump which was qualified for subsea deployment
in 2016. It is a fast-track and cost-effective boosting system that is particularly
well-suited to increasing production from fields with lower flow rates or individual
wells. It is built using proven technology from Baker Hughes and Aker Solutions
and complements and broadens the subsea boosting technology portfolio.
Another example is the development by Aker Solutions and MAN Diesel & Turbo
of the next generation in subsea compression systems, building on the success-
ful delivery in 2015 and subsequent strong operational performance of the world’s
first full-scale subsea gas compression system at the Åsgard field offshore Norway.
Together the two companies have developed a new compression design that will
reduce the weight and size by half for the same functionality to greatly reduce capital
expenditure and installation costs.
Aker Solutions last year also continued investing in early phases of technology
development, encouraging employees to come up with ideas and concepts to ensure a
steady stream of innovation for the technology and qualification pipeline. The company
engages with university researchers to develop competence and create technologies.
Health, Safety, Security and EnvironmentAker Solutions strives to safeguard the health, safety, security and environment
(HSSE) of its employees and to prevent all unfavorable incidents. The company
works continuously to prevent incidents that could harm personnel, material or
non-material assets through a companywide system that sets
the standard for HSSE management and leadership. Regular
audits shall uncover possible shortcomings so that countermea-
sures can be identified and initiated. The HSSE system works
as a framework for cross-organizational sharing and learning.
The company’s Just Care concept is a symbol for HSSE culture
and efforts and is backed by the principle that HSSE is the per-
sonal responsibility of every employee. Just Care will be further
developed in 2017 to ensure that HSSE remains a top priority.
Safety
Aker Solutions on April 29, 2016, lost three employees and a
contractor in a tragic helicopter crash off the coast of Bergen
in Norway. All 13 passengers were killed on the flight to Ber-
gen from the Statoil-operated Gullfaks B platform in the North
Sea when the helicopter’s main rotor head and mast suddenly
detached. Aker Solutions immediately mobilized its emergency
response team and has been providing support for next of kin
and employees affected by the accident. The company also
supported investigations by the Norwegian authorities and
operator into the cause of the accident.
Aker Solutions had 55 serious incidents in 2016, com-
pared with 53 the previous year. Of these, 12 involved personnel
injury, illness and the fatalities from the helicopter accident. A
total of 18 were related to environmental spills with the potential
for material damage and loss of reputation. There were also 17
near misses and 8 high-risk observations. The company investi-
gates all such incidents, near misses and observations to learn
and improve. Serious incidents largely stemmed from falling
objects, lifting operations, use of tools and equipment, work

Back to index
Page 21Board of Directors’ Report
at heights and pressure testing. In the second half of 2016, several employees in
Congo also contracted malaria. All cases were treated and the infected personnel
have recovered.
Several incidents involved people working for subcontractors, resulting in a
renewed effort to ensure that suppliers also adhere to and train personnel to follow
the company’s safety procedures. The total recordable injury frequency (TRIF) per
million working hours was 1.30 in 2016, down from 1.34 in 2015. The lost-time
injury frequency (LTIF) per million working hours was 0.3 in 2016, compared with
0.49 in 2015. The company targets a TRIF and LTIF of below 1.3 and 0.3, respec-
tively. The figures include subcontractors.
Health and Working Environment
Sick leave amounted to 2.75 percent of total working hours in 2016, compared
with 2.83 percent the prior year. Variations in national laws and practices make
it difficult to directly compare sick leave rates between countries. Rates for
Aker Solutions staff in Norway were low by national standards, but generally higher
than for employees in other countries.
The company works continuously to reduce sickleave. In Norway, many of
these efforts are led by Aker Care, a health initiative that was introduced in 2014.
Aker Care provides employees at major locations in Norway easy access to a
variety of in-house services from health personnel. The Aker Active initiative also
helped motivate staff to participate in physical activity and training.
Our efforts to reduce sick leave never cease, and in Norway, many of the
initiatives are led by Aker Care.
Security
As the global security environment has become more volatile, identifying and
analyzing security threats and implementing appropriate measures to protect
employees, clients and assets are major priorities for Aker Solutions. Since cultural
awareness is the cornerstone of any security operation, the company adheres to
the internat ional voluntary principles on security and human rights and has included

Page 22
Back to index
Board of Directors’ Report
these in the review process during security risk assessments at most locations.
The company opened a Global Security Operations Center in September 2016 to
monitor a number of locations worldwide and improve the response capabilities
for incidents. Research and development on the use of technical security is a major
contributor to cost-efficiency improvement processes. Security incidents in 2016
included armed robbery, burglaries, theft, fraud and threats. Several international
incidents, such as political unrest in Congo and an attempted coup d’état in
Turkey, also triggered responses and preventive measures.
Emergency Preparedness and Response
Aker Solutions continuously works to strengthen its emergency preparedness,
including strategic crisis management and methodology. The company in 2016 held
training sessions to improve employees’ emergency preparedness. Staff at both the
tactical and operational level demonstrated their capabilities in emergency response
drills, as well as during several real mobilizations of local emergency response teams.
Environment
Aker Solutions’ activities generally have limited direct impact on the environment.
One Aker Solutions employee performing maintenance work for a customer ac-
cidentally spilled 2,297 liters of diesel in the UK sector in 2016. The incident was
caused by an error during replacement of diesel filters, in which a drain valve was
accidently left open, spilling fuel through drains and a disposal system. The prob-
lem was detected and the pump was shut down. British authorities were notified
and, after an investigation, 29 measures were imposed to prevent similar incidents
in the future.
Aker Solutions works to protect the environment in two ways: First, by offering
products, systems and services that are environmentally safe and help reduce
the environmental footprint of customers’ operations, and second, by seeking to
reduce its own direct impact.
Aker Solutions’ total energy consumption, based on recorded use of oil, gas
and electricity, decreased to 109,122 megawatt hours (MWh) in 2016 from 126,750
MWh in 2015. Total carbon dioxide emissions were 22,133 tons
in 2016, down from 27,193 tons the year before.
Aker Solutions also focuses on waste reduction, which is
highly project dependent. The company in 2016 recorded total
waste of 7,690 tons, compared with 10,443 tons a year earlier.
A total 86 percent of the waste was sent for recycling, mainly
metal waste from the company’s production. Both the decrease
in energy usage and waste were mainly due to lower activity.
Safeguarding Diversity and Equal OpportunityAker Solutions had 14,385 own employees, representing nearly
80 nationalities, and 1,792 contract staff at the end of 2016.
Women made up about 20 percent of the workforce, excluding
contract staff. The employees’ diverse backgrounds and wide
range of skills are considered an asset for the company in a
competitive global environment.
Aker Solutions is committed to non-discrimination and
equal opportunity, regardless of gender, nationality or other
factors. It seeks to promote a balanced workforce through clear
requirements for diversity in recruitment and development of
individuals and programs supporting equal opportunity. An aim
of the 2016 reorgan ization was to ensure diversity of gender and
nationality in the new leadership structure.
Employees’ diverse backgrounds are considered an asset for the company in a competitive global environment

Page 23
Back to index
Board of Directors’ Report
The company seeks to enable local staff to move into management. This is
mandatory in some places under rules for local content and participation that promotes
job creation for natio nals. Local management teams work to promote, build and retain
local talent, ensuring legal compliance and securing long-term operations.
More information on diversity and equal opportunity is available in the
company’s 2016 corporate responsibility report.
Risk FactorsAker Solutions’ global operations and exposure to energy markets provide both
opportunities and risks that may affect the company’s operations, performance,
finances, reputation and share price.
The overall company performance is affected by project execution, service
delivery, customers’ behavior and market developments, including fluctuations in
energy prices. Results are also impacted by costs, both the company’s own and
those charged by suppliers, as well as customers’ ability to pay. Aker Solutions
is through its business exposed to legal, regulatory and political risks, such as
decisions on environmental regulation and international sanctions that impact supply
and demand, as well as risks associated with unethical and criminal behavior. The
company is exposed to financial market risks including changes in currency rates,
interest rates, tax, credit and counterparty risks, as well as risks associated with
access to and terms of financing.
Market Risk
The market situation and current outlook for the oil-services industry is considered
challenging in the short to medium term. The main factors that contribute to the
market risk include, but are not limited to:
Oil companies’ exploration, development, production, investment, modification
and maintenance activity. These factors are significantly affected by changes in
global demand, energy prices and environmental requirements
Local content requirements in countries of existing or planned
operations, legi slative restrictions or prohibitions on oil and
gas activities
Liabilities under environmental laws or regulations
Changes in market developments may lead to further capacity
adjustments and changes in the valuation of the company’s
assets and liabilities. This includes delivering on the company’s
reorganization targets, restructuring obligations, onerous
leases, impairments and increased credit risk impacting
the valuation of trade receivables. Aker Solutions may take
mitigating actions to increase flexibility in its operations, for
instance by driving down costs, adjusting capacity and driving
standardization and simplification. The company is focused
on improving agility, productivity and sustainability across the
business to enable the business to effectively adapt to industry
changes, particularly in how value is created and rewarded
across the value chain.
Operational Risk
Aker Solutions uses both reimbursable and fixed-price con-
tracts. Contracts that include fixed prices for all or parts of
the deliverables are exposed to potential cost overruns. The
projects often involve complex design and engineering as well
as significant procurement and manufacturing of equipment,
supplies and construction management. They may also require
development of new technology and solutions. There is at any
project phase a risk of delays that may hamper the company’s
ability to deliver on time and in accordance with a contract and
potentially harm Aker Solutions’ reputation, performance and

Page 24
Back to index
Board of Directors’ Report
finances. Factors that may have a material adverse effect on the business, results
of operations and finances of Aker Solutions include, but are not limited to:
Loss of business from a significant customer or failure to deliver a significant proj-
ect as agreed
Changes to the order backlog, which includes contracts that may be adjusted,
cancelled or suspended and consequently do not necessarily represent future
revenue
Uncertainty about future contract awards and their impact on future earnings and
profitability
Aker Solutions’ ability to compete effectively and maintain market positions and
sales volumes
Aker Solutions’ ability to effectively commercialize new technology
Technology or intellectual property disputes involving the company, its suppliers
or sub-suppliers which could increase or hamper Aker Solutions’ ability to deliver
products and services or limit its operational freedom
Partnerships, joint ventures and other types of cooperation that expose the
company to risks and uncertainties outside its control
Financial Risks
The objective of financial risk management is to control exposure to risk to increase
predictability of earnings and minimize potential adverse effects on financial perfor-
mance. Financial risk management and exposure are described in detail in note 22
and capital management is described in note 23. The main financial risks are:
Currency risk: Aker Solutions has international operations and is exposed to
currency risk on commercial transactions, assets and liabilities when payments
are denominated in a currency other than the respective functional currency of

Page 25
Back to index
Board of Directors’ Report
Credit risk: The credit risk related to customers’ ability to pay is assessed in the
bid phase and during execution of a project. The majority of the customers are
highly rated oil companies where the credit risk is considered to be limited. Risk
related to lower rated companies is monitored closely
Price risk: Aker Solutions is exposed to fluctuations in market prices which are
mitigated in the bid process by locking in committed prices with vendors or
through escalation clauses with customers
More information on financial risk factors is available in note 22.
Aker Solutions has company-wide policies, procedures and tools that identify
evaluate and respond to risks actively and systematically. The assessment,
definition, follow-up and implementation of adequate mitigating actions towards
the main risk factors are all integral parts of the overall governance of the company.
Aker Solutions apply a combination of risk management practices in order to effectively
manage the risk to the company such as: internal controls, scenario planning,
sensitivity analysis and audit management.
the subsidiary. The currency risk on all major contracts is hedged in the external
market. More than 80 percent of this either qualifies for hedge accounting or is
presented separately as embedded derivative hedges. Some jurisdictions may
also have restrictions on conversion to other currencies and transfer of cash out
of the country. The company takes mitigating actions to minimize the currency
exposure. These include multilateral agreements with banks, customers and
vendors on timing of payments to minimize the exposed cash balance
Liquidity risk: The corporate treasury department ensures sufficient flexibility in
funding by maintaining availability under committed credit lines. The company
monitors rolling weekly and monthly forecasts of the company’s liquidity reserve
based on expected cashflow
Interest rate risk: Aker Solutions’ interest rate risk stems from external borrowing
issued at variable rates. As the group has no significant interest-bearing
operating assets, operating income and operating cashflow are substantially
independent of changes in market interest rates
Fornebu, March 22, 2017Board of Directors of Aker Solutions ASA
Øyvind EriksenChairman
Anne DrinkwaterDeputy Chairman
Kjell Inge RøkkeDirector
Koosum KalyanDirector
Stuart FergusonDirector
Atle TeiglandDirector
Åsmund KnutsenDirector
Hilde KarlsenDirector
Luis AraujoChief Executive Officer

Page 26
Back to index
Consolidated Financial Statements
ConsolidatedFinancial StatementsAker Solutions Group December 31, 2016

Page 27
Back to index
Consolidated Financial Statements
Income StatementOther Comprehensive Income (OCI)Balance SheetCashflowEquity
GeneralNote 1 Company InformationNote 2 Basis of Preparation
PerformanceNote 3 RevenueNote 4 Operating SegmentsNote 5 Personnel ExpensesNote 6 Other Operating ExpensesNote 7 Finance Income and ExpensesNote 8 Earnings per Share and DividendsNote 9 Tax
AssetsNote 10 Property, Plant and EquipmentNote 11 Intangible AssetsNote 12 Impairment of AssetsNote 13 InventoriesNote 14 Trade and Other ReceivablesNote 15 Cash and Cash Equivalents
Liabilities and EquityNote 16 EquityNote 17 BorrowingsNote 18 Pension ObligationsNote 19 Operating LeasesNote 20 Provisions and Contingent LiabilitiesNote 21 Trade and Other Payables
Financial and Capital ManagementNote 22 Financial Risk Management and ExposuresNote 23 Capital ManagementNote 24 Derivative Financial InstrumentsNote 25 Financial Assets and Liabilities
Group Composition and Other InvestmentsNote 26 Aquisition of SubsidiariesNote 27 Acquisition of Non-Controlling Interests (NCI)Note 28 SubsidiariesNote 29 Other Investments
Related Parties and Audit FeesNote 30 Related PartiesNote 31 Management RemunerationNote 32 Audit Fees
The board and chief executive officer have today considered and approved the annual report and financial
statements for the Aker Solutions group and its parent company Aker Solutions ASA for the 2016 calendar
year ended on December 31, 2016.
This declaration is based on reports and statements from the chief executive officer, chief financial officer and
on the results of the group’s business as well as other essential information provided to the board to assess
the position of the parent company and group.
To the best of our knowledge:
the 2016 financial statements for the parent company and the group have been prepared in accordance with
all applicable accounting standards
the information provided in the financial statements gives a true and fair portrayal of the parent company’s
and the group’s assets, liabilities, financial position and results taken as a whole as of December 31, 2016
the board of directors’ report for the parent company and the group provides a true and fair overview of: the
development, performance and financial position of the parent company and the group taken as a whole,
and the most significant risks and uncertainties facing the parent company and the group
Fornebu, March 22, 2017Board of Directors of Aker Solutions ASA
Øyvind EriksenChairman
Anne DrinkwaterDeputy Chairman
Kjell Inge RøkkeDirector
Koosum KalyanDirector
Stuart FergusonDirector
Atle TeiglandDirector
Åsmund KnutsenDirector
Hilde KarlsenDirector
Luis AraujoChief Executive Officer
Declaration by the Board of Directors and Chief Executive Officer

Page 28
Back to index
Consolidated Financial Statements
Amounts in NOK million Note 2016 2015
Revenue 3, 4 25,557 31,896
Materials, goods and services -10,369 -12,979
Personnel expenses 5 -9,475 -11,750
Other operating expenses 6, 20 -3,784 -5,326
Operating expenses before depreciation, amortization and impairment -23,628 -30,055
Operating income before depreciation, amortization and impairment 1,929 1,841
Depreciation and amortization 10, 11 -778 -719
Impairment 10, 11, 12 -464 -163
Operating income 687 958
Interest income 7 65 76
Interest expenses 7 -477 -348
Net other financial items 7 -1 -1
Income before tax 273 685
Income tax 9 -121 -302
Net income 152 383
Net income attributable to:
Equity holders of the parent company 57 392
Non-controlling interests 28 95 -8
Net income 152 383
Earnings per share in NOK (basic and diluted) 8 0.21 1.44
Income StatementConsolidated statement for the year ended December 31
The subtotals and totals in some of the tables may not equal the sum of the amounts due to rounding.

Page 29
Back to index
Consolidated Financial Statements
Other Comprehensive Income (OCI)Consolidated statement for the year ended December 31
Amounts in NOK million Note 2016 2015
Net income 152 383
Other comprehensive income
Items that are or may be reclassified subsequently to profit or loss:
Cashflow hedges, effective portion of changes in fair value -81 -1,385
Cashflow hedges, reclassification to income statement 982 1,135
Cashflow hedges, deferred tax 9 -232 39
Translation differences - foreign operations -852 907
Total -183 696
Items that will not be reclassified to profit or loss:
Remeasurements of defined pension obligations 18 42 89
Remeasurements of defined pension obligations, deferred tax asset 9 -13 -21
Available-for-sale financial assets - net change in fair value 29 28 0
Other changes 14 -10
Total 70 58
Other comprehensive income (loss), net of tax -113 753
Total comprehensive income 38 1,137
Total comprehensive income (loss) attributable to:
Equity holders of the parent company -46 1,119
Non-controlling interests 84 17
Total comprehensive income 38 1,137

Page 30
Back to index
Consolidated Financial Statements
Balance SheetConsolidated statement as of December 31
Amounts in NOK million Note 2016 2015
Assets
Non-current assets
Property, plant and equipment 10,12 3,808 3,962
Intangible assets 11,12 5,647 6,207
Deferred tax assets 9 666 332
Other investments 22, 25, 29 75 13
Other non-current assets 25 90 23
Total non-current assets 10,287 10,537
Current assets
Current tax assets 242 118
Inventories 13 575 814
Trade and other receivables 14, 25 7,398 10,985
Derivative financial instruments 24, 25 93 1,295
Interest-bearing receivables 25 437 117
Cash and cash equivalents 15, 25 2,480 3,862
Total current assets 11,226 17,192
Total assets 21,512 27,729
Amounts in NOK million Note 2016 2015
Equity and liabilities
Equity
Share capital 16, 25 294 294
Treasury shares 16 -1 -1
Reserves 16 635 721
Retained earnings 5,350 5,382
Total equity attributable to the parent 6,278 6,397
Non-controlling interests 27, 28 138 234
Total equity 6,415 6,630
Non-current liabilities
Non-current borrowings 17 1,844 3,137
Pension obligations 18 540 572
Deferred tax liabilities 9 331 283
Other non-current liabilities 84 27
Total non-current liabilities 2,800 4,018
Current liabilities
Current tax liabilities 30 9
Current borrowings 17, 25 2,110 561
Provisions 20 1,087 1,294
Trade and other payables 21, 25, 30 8,002 12,222
Derivative financial instruments 24, 25 1,069 2,995
Total current liabilities 12,297 17,081
Total liabilities 15,097 21,099
Total equity and liabilities 21,512 27,729
Fornebu, March 22, 2017Board of Directors of Aker Solutions ASA
Øyvind EriksenChairman
Anne DrinkwaterDeputy Chairman
Kjell Inge RøkkeDirector
Koosum KalyanDirector
Stuart FergusonDirector
Atle TeiglandDirector
Åsmund KnutsenDirector
Hilde KarlsenDirector
Luis AraujoChief Executive Officer

Page 31
Back to index
Consolidated Financial Statements
CashflowConsolidated statement for the year ended December 31
Amounts in NOK million Note 2016 2015
Cashflow from operating activities
Net income 152 383
Adjustments for:
Income tax 9 121 302
Net interest cost 346 320
(Profit) loss on foreign currency forward contracts 7 67 -46
Depreciation, amortization and impairment 10, 11, 12 1,242 882
Other (profit) loss on disposals and non-cash effects -130 25
Net income after adjustments 1,799 1,866
Changes in operating assets and liabilities -483 1,022
Cash generated from operating activities 1,315 2,888
Interest paid -517 -288
Interest received 103 76
Income taxes paid -590 -742
Net cash from operating activities 312 1,934
Cashflow from investing activities
Acquisition of property, plant and equipment 10 -329 -841
Payments for capitalized development 11 -297 -449
Acquisition of subsidiaries, net of cash acquired 26 -210 -3
Proceeds from sale of property, plant and equipment 17 3
Interest-bearing loan to third-party -351 0
Other investing activities -16 -8
Net cash used in investing activities -1,186 -1,299
Amounts in NOK million Note 2016 2015
Cashflow from financing activities
Proceeds from borrowings 1,095 696
Repayment of borrowings -1,065 -598
Paid dividends including tax 8, 27 -34 -394
Acquisition of non-controlling interests -207 0
Net purchase of treasury shares and share purchase program
16 10 -6
Other financial activities -12 -21
Net cash from financing activities -213 -323
Effect of exchange rate changes on cash and bank deposits
-294 211
Net increase (decrease) in cash and bank deposits -1,382 522
Cash and cash equivalents at the beginning of the period 3,862 3,339
Cash and cash equivalents at the end of the period 15 2,480 3,862

Page 32
Back to index
Consolidated Financial Statements
Amounts in NOK million NoteShare
capital
Treasury share
reserve
Retained earnings
Hedging reserve
Translation reserve
Fair value reserve
Pension reserve
Equity attributable
to parent
Non- controlling
interests
Total equity
Equity as of January 1, 2015 294 -1 5,391 -1,076 1,117 -48 5,677 216 5,893
Net income 392 392 -8 383
Other comprehensive income -211 881 58 728 26 753
Total comprehensive income 392 -211 881 58 1,119 17 1,137
Dividends -394 -394 -394
Treasury shares 8 8 8
Employee share purchase program -14 -14 -14
Equity as of December 31, 2015 294 -1 5,382 -1,287 1,998 0 10 6,397 234 6,630
Net income 57 57 95 152
Other comprehensive income -17 669 -811 28 28 -103 -11 -114
Total comprehensive income 40 669 -811 28 28 -46 84 38
Treasury shares 10 10 10
Employee share purchase program -10 -10 -10
Change in non-controlling interests from dividend payments, incl tax 0 -34 -34
Change in non-controlling interests from acquisition of shares 27 -57 -57 -146 -204
Taxes on internal dividends -15 -15 -15
Equity as of December 31, 2016 294 -1 5,350 -618 1,187 28 38 6,278 138 6,415
EquityConsolidated statement of changes in equity

Page 33
Back to index
Consolidated Financial Statements
Note 1 Company Information
Aker Solutions is a global provider of products, systems and services to
the oil and gas industry. The group employs more than 14,000 people with
operations in over 20 countries across the world, with head office based in
Fornebu, Norway.
Aker Solutions ASA is a Norwegian limited liability company listed on the Oslo
Stock Exchange under the ticker AKSO. The consolidated financial statements of Aker
Solutions incorporate the financial statements of the company and its subsidiaries
collectively referred to as “the group” or “the company” and separately as group
companies. The parent company Aker ASA publishes consolidated financial state-
ments. The Resource Group TRG AS is the ultimate parent company of Aker Solutions
ASA.
Note 2 Basis of Preparation
Statement of ComplianceThe consolidated financial statements have been prepared in accordance with
International Financial Reporting Standards (IFRS) as approved by the European
Union, their interpretations adopted by the International Accounting Standards
Board (IASB) and the additional requirements of the Norwegian Accounting Act as
of December 31, 2016.
The consolidated financial statements were approved by the Board of Directors
and the chief executive officer (CEO). The consolidated financial
statements will be authorized at the Annual General Meeting
on April 20, 2017. Until this date the Board of Directors has the
authority to amend the financial statements.
Financial Reporting PrinciplesThe relevant financial reporting principles are described in each
note to the consolidated financial statements. Aker Solutions
focuses on describing the reporting within the IFRS framework
rather than repeating the actual text of the standard.
Basis of MeasurementThe consolidated balance sheet has been prepared on the
historical cost basis except for certain financial assets and
liabilities as presented in note 25 measured at fair value on each
reporting date. The financial information presented in Norwegian
Kroner (NOK) has been rounded to the nearest million (NOK million),
therefore the subtotals and totals in some tables may not equal
the sum of the amounts shown. Certain of the comparative
figures have been adjusted to conform to the presentation
adopted in the current year, including note 3 Revenue, note 4
Operating Segments, note 6 Other Operating Expenses, note 17
Borrowings and note 23 Capital Management. In addition, the
amount presented as NCI has been changed as described in
note 27 Acquisition of Non-Controlling Interest (NCI).
ConsolidationThe consolidated financial statements comprise the parent
company Aker Solutions ASA and its subsidiaries.
Intra-group balances and transactions, and any unrealized
gains and losses or income and expenses arising from intra-group
Notes to the Consolidated Financial StatementsFor the year ended December 31
Note 2 continues on next page

Page 34
Back to index
Consolidated Financial Statements
transactions, are eliminated in preparing the consolidated financial statements. Unre-
alized gains arising from transactions with associates are eliminated to the extent of
the group’s interest in the entity. Unrealized losses are eliminated in the same way as
unrealized gains, but only to the extent that there is no evidence of impairment.
Judgments and EstimatesThe preparation of consolidated financial statements in conformity with IFRS requires
management to make judgements, estimates and assumptions each reporting period
that affect the income statement and balance sheet. The accounting estimates will by
definition seldom precisely match actual results. The items where judgements and
estimates have been made are described in each of the following notes:
n Note 3 Revenuen Note 9 Taxn Note 10 Property, Plant and Equipmentn Note 11 Intangible Assetsn Note 12 Impairment of Assetsn Note 13 Inventoriesn Note 14 Trade and Other Receivables n Note 18 Pension Obligationsn Note 20 Provisionsn Note 26 Acquisition of Subsidiaries
New Financial Reporting Principles No significant new accounting principles have been adopted in 2016. The IASB has
issued three new standards that are expected to impact the financial reporting of
the company in the future. The expected impacts as described below may change
as clarifications are issued by the IASB or as practice develops in the industry.
IFRS 9 Financial Instruments
Effective in 2018
The standard will replace IAS 39 Financial Instruments Recognition and Measurement.
The standard includes revised guidance on classification and
measurement of financial instruments, including a new expected
credit loss model for calculating impairment on financial assets, and
new general hedge accounting requirements. The actual impact of
adopting IFRS 9 on the group’s consolidated financial statements
in 2018 is not known and cannot be reliably as it will depend on
the financial instruments the group holds and economic condi-
tions at that time as well as judgments made in the future.
The group has performed a preliminary assessment of the
potential impact of adoption of IFRS 9 and a more detailed review
of hedge accounting implications in particular will be carried out in
2017. Based on preliminary assessments, the group does not
anticipate significant impacts on its consolidated financial state-
ments of initial application of the new standard.
The following changes are expected to impact the reported
figures upon transition to IFRS 9:
n Around 80 percent of the group’s foreign currency hedges qualify
for hedge accounting under the current standard. The percentage
of qualifying hedges is expected to increase under IFRS 9 as the
hedge accounting model is more aligned with risk management,
including prospective testing and less restrictive requirements
on qualifying hedging instruments. This is expected to result in
less foreign currency effects reported under financial items. There
is also a possible change in timing of recognition of embedded
derivatives. The change is not expected to have material impact
on net profit; however assessment is on-going
n The effect of classification of financial instruments and the ex-
pected credit loss principle are not expected to have material
impact on the financial reporting, following the group’s cus-
tomer portfolioNote 2 continues on next page

Page 35
Back to index
Consolidated Financial Statements
n IFRS 9 requires more comprehensive disclosure than the current disclosure
requirements
The new standard for financial instruments was issued in July 2014 and will be
effective for accounting periods starting January 1, 2018. The group will not consider
early adoption of IFRS 9 until the standard has been endorsed by the EU.
IFRS 15 Revenue from Contracts with Customers
Effective in 2018
The new revenue standard will supersede the current revenue recognition guidance in
IAS 11 Construction Contracts and IAS 18 Revenue. IFRS 15 introduces a new five-
step model that applies to revenue arising from contracts with customers. The group
has initiated an implementation process to systematically analyze and evaluate the
application impact. The analysis of the application of IFRS 15 is still ongoing and more
detailed review of existing customer contracts will be carried out in 2017.
Based on the preliminary assessments, the new revenue recognition standard
is not expected to significantly change how the group recognizes revenue. The
progress-based measurement of revenue over time will still be the main method for the
construction contracts. The service contracts are still expected to be recognized over
time as services are delivered. The following changes are expected to impact the
reported figures upon transition to IFRS 15:
n The progress method for all construction contracts not completed by January 1,
2018, will be reassessed to ensure compliance with IFRS 15. The group does not
expect significant changes to the pattern of recognizing revenue as a result of this
assessment
n Variable consideration (such as bonuses and incentives) and change of scope (such
as variation orders and amendments) have a higher threshold for revenue recognition
in the new IFRS 15 than under the current IAS 11. This is only to a limited degree
expected to impact the financial figures, since the group is already
practicing a high threshold for including this type of revenue
n Waste cost has to be identified and expensed immediately,
and will not be considered as part of project cost recognized
according to progress as under the current IAS 11
n Tender cost is expected to be mainly expensed as incurred
under the new standard. The current IAS 11 requires that tender
costs are capitalized if award is considered to be probable
n IFRS 15 requires more comprehensive disclosures than the
current IAS 11 standard
n Other changes are currently not expected to be material.
However, this may change as clarifications are issued by the
IASB or as practice develops in the industry
The new revenue standard was issued in May 2015 and will be
effective for accounting periods starting January 1, 2018. On
transition to IFRS 15, the company will apply the new standard
retrospectively with the cumulative effect of initial application
recognized as an adjustment to the opening balance of retained
earnings as of January 1, 2018. Under this transition method,
the new standard will be applied retrospectively only to con-
tracts that are not completed by January 1, 2018. IFRS 15 was
endorsed by the EU in September 2016.
IFRS 16 Leasing
Effective in 2019
It is expected that the new standard for leasing will significantly
change how the group accounts for its lease contracts. Aker
Solutions has a significant number of lease contracts for land
Note 2 continues on next page

Page 36
Back to index
Consolidated Financial Statements
and buildings that are currently accounted for under IAS 17 as operating leases.
IFRS 16 eliminates the current dual accounting model when leasing assets, which
distinguishes between on-balance sheet finance leases and off-balance sheet
operating leases. Under the new standard, there will be a single on-balance sheet
model that is similar to current financial leases accounting. Only leases for small
items such as computers and office equipment may be exempt. The following
changes are expected to impact the reported figures upon transition to IFRS 16:
n Assets and liabilities in the group are expected to increase with an amount close
to the net present value of future lease payments
n Earnings before interest, taxes, depreciation and amortization (EBITDA) will
increase as the lease payments will be presented as depreciation and finance
cost rather than operating expenses
n Operating cashflow will increase and investing and financing cashflow will
decrease as the lease payments will no longer be considered as operational
The new standard for leases was issued in January 2016 and will be effective for
accounting periods starting January 1, 2019. IFRS 16 has not yet been endorsed
by the EU.
See note 19 for more information about lease commitments and lease expenses
Other new or revised accounting standards are not considered to have a material
impact on the Aker Solutions consolidated financial statements.

Page 37
Back to index
Consolidated Financial Statements
Note 3 Revenue
Construction contracts for the sale of subsea production equipment and
modifications of oil and gas installations account for more than half of the
revenue in Aker Solutions. These contracts typically last more than one year
and can be as long as five years. The total estimated contract revenue and
cost in construction contracts are critical financial reporting estimates that
may require significant management judgment. Aker Solutions also has ser-
vice contracts for engineering and maintenance of oil and gas installations.
These contracts are usually reimbursable with lower risk, but can include
lump sum elements and various incentive schemes with bonus and penalty
arrangements where management judgment is required. A limited portion of
the revenue relates to product sales and other revenue.
Financial Reporting PrinciplesConstruction Contracts
The construction contracts consist of engineering, procurement and construction
(EPC) contracts for manufacturing or modification of assets. Revenue and cost for
construction contracts is recognized using the stage of completion method. The
stage of completion method is determined by the method that best reflects the
work performed. Depending on the nature of the contract, the following two main
methods are used in order to determine progress:
n Technical completion
n Cost incurred of total cost
The compensation format in the construction contracts is lump sum, reimbursable
or a mix. The following principles are used:
n Options for additional scope of work are recognized when exercised by the buyer
n Variation orders for changes in the scope of work are recognized
when they are probable and can be measured reliably
n Incentive payments based on various key performance indicators
are included in contract revenue when the contract is sufficiently
advanced so it is probable that the specified performance targets
will be met, and the amounts can be measured reliably
n Disputed amounts and claims are only recognized when negoti-
ations have reached an advanced stage, customer acceptance
is probable and the amounts can be measured reliably
n When considered probable that liquidated damages (LD) will
be imposed, a corresponding reduction in project revenue is
recognized
Contract cost includes those that relate directly to the specific
contract and allocated cost that are attributable to general contract
activity. Tender cost is capitalized when it is probable that the
company will obtain the contract. The project management
team uses their experience from similar projects and develops
a detailed cost estimate based on the drawings and specifications
in the contract and the assumptions made in the tender phase.
The specific risks associated with the contract are estimated
and a risk contingency is included in the cost forecast based on
a probability weighting of the possible outcomes.
The estimation uncertainty during the early stages of a
construction contract is mitigated by a principle of not recogniz-
ing profit before the contract reaches 20 percent completion.
However, management can on a project-by-project basis give
approval of earlier profit recognition if cost estimates are
Note 3 continues on next page

Page 38
Back to index
Consolidated Financial Statements
considered reliable due to repeat projects, proven technology, proven execution
model or high level of committed cost. During execution, total forecasted revenue
and cost in addition to the stage of completion are updated each reporting date.
The full loss is recognized immediately when identified on loss-making contracts.
Service Contracts
Service contracts mainly consist of engineering services, subsea aftersales services
and maintenance frame agreements for oil and gas installations. The compensation
format is mainly reimbursable with incentive schemes and can include target sums
and lump sum elements. Service revenue is recognized in the period in which the
services are rendered or by using the stage of completion method. The stage of
completion is normally assessed based on the proportion of cost incurred for work
performed to date compared to the estimated total contract cost. Service revenue
is only recognized to the extent it is probable and the revenue, cost and the progress
can be measured reliably.
Product Sales
Product revenue is recognized when the significant risks and rewards have been
transferred to the buyer, usually upon delivery.
Other Income
Other income relates to rental income and gains and losses from sale of fixed assets.
Judgments and EstimatesIt can be challenging to estimate the expected revenue and cost in construction
and service contracts, in particular if the project is experiencing operational challenges.
The judgments and estimates in construction and service contracts are described
below.
Estimate of Total Contract Cost
The total contract cost can be judgmental and sensitive to changes, particularly
in lump sum construction contracts. Remaining project cost
depend on the ability to properly execute the engineering and
design phase, availability of skilled resources, manufacturing
capacity, productivity and quality factors, performance of sub-
contractors and sometimes also weather conditions. Experience,
systematic use of the project execution model and focus on
core competencies reduce, but do not eliminate, the risk that
cost estimates may change significantly.
Liquidated Damages (LD)
LDs are penalties for not achieving defined milestones. LDs are
common in construction contracts, but can also be present in
service contracts. If a project does not meet the defined milestone
in a contract, a provision reducing project revenue is made when
considered probable that an LD will be imposed. The estimated LD
provision is highly judgmental and based on experience with similar
LD situations and negotiations with customers.
Change of Scope (Variation Orders)
The construction and service contracts may have significant
changes in scope of work and variation orders are normally
agreed upfront. However, unapproved variation orders may be
included in the project revenue where recovery is assessed as
probable and the amount of revenue can be measured reliably.
Incentive Payments
Incentive payments are integral and significant parts of contract
revenue on many service contracts and may also exist on
construction contracts. Incentive payments include key per-
formance indicators, bonuses, target sum mechanisms and
productivity measures and can potentially both increase and
Note 3 continues on next page

Page 39
Back to index
Consolidated Financial Statements
decrease revenue. Incentive payments are generally included when there is a high
level of probability that the milestones or key performance indicators will be met.
There is a risk that the actual payment of incentives differs from the estimated
amount.
Construction Contracts and Service RevenueThe graph below presents the amounts of service and construction revenue per
operating segment.
Amounts in the Balance Sheet Relating to Construction and Service RevenueWork in Progress (WIP) on Construction Contracts
Work in progress (WIP) on construction contracts is presented
in the balance sheet as amounts due to or from customers.
The presentation of WIP as an asset or liability depends on the
financial status of the individual projects. All projects with a net
asset position are summarized and presented as amounts due
from customer. All projects with a net liability position are sum-
marized and presented as amounts due to customer. Advances
are presented separately as a liability as such advances represent
payments from customers in excess of the work performed.
16 000
10 000
4 000
14 000
8 000
2 000
12 000
6 000
0
Amounts in NOK million
2016 20162015
Subsea
Construction contract revenue
Service revenue
Field Design
2015
Amounts in NOK million 2016 2015
Amounts due from customers for construction work 1,103 2,365
Amounts due to customers for construction work -98 -1,037
Advances received from customers -2,411 -4,958
Construction contracts in progress, net position -1,406 -3,630
Cost incurred and recognized profits (less losses) from project start to period end
38,509 42,129
Note 3 continues on next page

Page 40
Back to index
Consolidated Financial Statements
Accrued and Deferred Revenue on Service Contracts
Service contracts where performed work exceeds invoiced amounts are presented
as trade and other receivables in the balance sheet. Service contracts where invoiced
amounts exceed work performed are presented as a trade and other payables in the
balance sheet.
Note 4 Operating Segments
Aker Solutions has two operating segments. Subsea pro-
vides production equipment and maintenance services to
the subsea market. Field Design provides offshore engineering
and maintenance services in addition to modifications.
The two operating segments Subsea and Field Design are
managed separately, have different strategies and risks and
offer different solutions to its customers. In November 2016,
there has been a major restructuring in the company that
will change the operating segments. The new structure will
be implemented for financial reporting purposes in 2017.
Financial Reporting PrinciplesOperating segments are components of the group regular-
ly reviewed by the chief operating decision maker to assess
performance and be able to allocate resources. The group’s
CEO (chief executive officer) is the chief decision maker in Aker
Solutions. The accounting principles of the operating segments
are the same as described in this annual report, except for
hedge accounting. When contract revenues and contract costs
are denominated in a foreign currency, the subsidiary hedges
the exposure against corporate treasury. Hedge accounting is
applied independently of whether the hedge qualifies for hedge
accounting in accordance with IFRS. The correction of the
non-qualifying hedges to secure that the consolidated financial
statements are in accordance with IFRS is made as an adjustment
at the corporate level and reported in the “other” segment. This
means that the group’s segment reporting reflects all hedges as
qualifying even though they may not qualify according to IFRS.
Amounts in NOK million 2016 2015
Accrued operating revenue from service contracts 1,337 2,032
Deferred revenue for service contracts -190 -162
Service contracts in progress, net position 1,147 1,870
See note 4 for more information about revenue per segment
See note 14 for more information about other receivables
See note 21 for more information about other payables
Note 4 continues on next page

Page 41
Back to index
Consolidated Financial Statements
SubseaSubsea offerings cover all phases of the life of subsea fields, from concept screening
and design through manufacturing, installation and commissioning to operational
support and maintenance services. Aker Solutions delivers both single subsea
equipment and complete subsea systems. The hardware deliveries are organized
as projects and include engineering, procurement and construction (EPC) and
often also installation and commissioning. The subsea systems include hardware
such as subsea trees, control systems, workover systems, tie-in and connection
systems, manifolds, umbilicals, power cables and compression systems. The market
for advanced and integrated subsea production system is continuesly developing
and combines hardware, subsea processing and the management of reservoir
performance into a full field concept. Lifecycle services on subsea installations
include maintenance, repairs and spares supply in addition to operational and
technical support.
Field DesignField Design provides engineering services on greenfield and brownfield developments
in addition to maintenance and modification services for oil and gas fields. The
engineering services include concept studies, front-end engineering and design
(FEED), field planning, detailed engineering, procurement services and construction
management services. The maintenance and modifications services include main-
tenance, modifications, asset integrity management (AIM) and hook-up services.
This operating segment includes two business areas in Aker Solutions that are
organized separately and provide individual management reporting to the CEO.
The business areas of Engineering (“ENG”) and Maintenance, Modifications and
Operations (“MMO”) are aggregated into the Field Design segment due to similar
commercial risks and operations in the same economic climate with the same
markets and customers. They also have similar operational characteristics as they
share resources and use the same type of KPI’s to monitor the business.
OtherThe “other” segment includes unallocated corporate costs,
onerous lease cost and the effect of hedges not qualifying for
hedge accounting. Lease decisions are taken by the corporate
center and onerous lease cost has for that reason been reported
in the “other” segment in the internal management reporting
Note 4 continues on next page

Page 42
Back to index
Consolidated Financial Statements
Segment Performance
Amounts in NOK million Note Subsea Field Design Total operating segments Other Intra-group elimination Total
Income statement
Construction revenue 11,694 1,465 13,159 -26 13,133
Services revenue 3,113 8,991 12,104 0 12,104
Products revenue 167 0 167 0 167
Other revenue 23 120 143 10 153
Total external revenue 14,997 10,576 25,573 -16 25,557
Inter-segment revenue -1 95 94 104 -198 0
Total revenue 14,996 10,670 25,667 88 -198 25,557
Operating income before depreciation, amortization and impairment 1,417 730 2,148 -219 1,929
Depreciation and amortization 10, 11 -625 -128 -753 -26 -778
Impairment 10, 11, 12 -441 -23 -464 0 -464
Operating income 352 580 931 -245 687
Assets
Current operating assets 6,128 2,455 8,583 204 -572 8,215
Non-current operating assets 6,983 2,346 9,329 181 9,510
Derivative financial instruments 724 6 730 -637 93
Operating assets 13,835 4,807 18,642 -252 -572 17,819
Liabilities
Current operating liabilities 5,567 3,391 8,958 732 -572 9,119
Non-current operating liabilities 109 400 509 31 540
Derivative financial instruments 1,118 32 1,150 -81 1,069
Operating liabilities 6,794 3,823 10,618 682 -572 10,728
Net current operating assets 561 -937 -376 -528 -904
Net capital employed 6,388 -359 6,029 2,364 8,393
Cashflow
Cashflow from operating activities -315 771 456 -145 312
Acquisition of property, plant and equipment 10 -297 -14 -311 -18 -329
Capitalized development 11 -277 -12 -288 -8 -297
Other key figures
Order intake (unaudited) 7,283 9,831 17,114 86 -196 17,004
Order backlog (unaudited) 14,500 16,711 31,211 0 -23 31,188
Own employees (unaudited) 5,407 8,664 14,071 314 14,385
2016
Note 4 continues on next page

Page 43
Back to index
Consolidated Financial Statements
Segment Performance (Continued)
Amounts in NOK million Note Subsea Field Design Total operating segments Other Intra-group elimination Total
Income statement
Construction revenue 14,703 1,709 16,412 123 16,535
Services revenue 4,181 10,846 15,026 9 15,035
Products revenue 227 0 227 0 227
Other revenue 1 58 59 40 98
Total external revenue 19,112 12,612 31,724 172 31,896
Inter-segment revenue -12 308 297 102 -398 0
Total revenue 19,101 12,920 32,021 273 -398 31,896
Operating income before depreciation, amortization and impairment 1,778 543 2,321 -480 1,841
Depreciation and amortization 10, 11 -588 -121 -709 -11 -719
Impairment 10, 11, 12 -145 -18 -163 0 -163
Operating income 1,045 404 1,449 -490 958
Assets
Current operating assets 9,211 2,878 12,089 164 -335 11,918
Non-current operating assets 7,727 2,239 9,967 205 10,172
Derivative financial instruments 2,512 1 2,513 -1,218 1,295
Operating assets 19,450 5,119 24,569 -849 -335 23,384
Liabilities
Current operating liabilities 9,682 3,739 13,421 439 -335 13,525
Non-current operating liabilities 126 420 546 25 572
Derivative financial instruments 3,569 25 3,594 -600 2,995
Operating liabilities 13,378 4,185 17,562 -135 -335 17,091
Net current operating assets -472 -861 -1,332 -275 -1,607
Net capital employed 4,702 -362 4,339 3,689 8,029
Cashflow
Cashflow from operating activities 1,307 1,178 2,485 -551 1,934
Acquisition of property, plant and equipment 10 -669 -26 -695 -146 -841
Capitalized development 11 -404 -39 -443 -7 -449
Other key figures
Order intake (unaudited) 7,660 15,263 22,923 287 -418 22,793Order backlog (unaudited) 22,476 17,235 39,712 0 -27 39,684
Own employees (unaudited) 7,449 7,772 15,221 174 15,395
2015
Note 4 continues on next page

Page 44
Back to index
Consolidated Financial Statements
Reconciliation of Information on Operating Segments to IFRS Measures
Major CustomersOne major customer represented 30.5 percent of total revenue in 2016, of which
NOK 7.5 billion (2015: NOK 6.2 billion) in Subsea and NOK 0.4 billion (2015:
NOK 0.4 billion) in Field Design. Another major customer represented 23.7 percent
of total revenue in 2016, of which NOK 1 billion (2015: NOK 2.4 billion) in Subsea
and NOK 5.1 billion (2015: NOK 4.8 billion) in Field Design. Aker Solutions has
long-term contracts with these two customers. Both customers are large interna-
tional oil companies.
Geographical InformationExternal revenue is presented on the basis of geographical location
of the selling company. Non-current segment assets and capital
expenditures are based on the geographical location of the
company owning the assets.Amounts in NOK million 2016 2015
Assets
Total operating segment assets 17,819 23,384
Deferred tax assets 666 332
Other investments 75 13
Current interest-bearing receivables 437 117
Cash and cash equivalents 2,480 3,862
Other 35 20
Total assets 21,512 27,729
Liabilities
Total operating segment liabilities 10,728 17,091
Tax-related liabilities 331 283
Net interest-bearing borrowings 3,954 3,698
Other non-current liabilities 84 27
Non interest-bearing liabilities 0 0
Total equity and liabilities 15,097 21,099
RevenueNon-current
operating assetsCapital expendi-ture fixed assets
Amounts in NOK million 2016 2015 2016 2015 2016 2015
Norway 13,626 16,263 4,033 4,497 34 201
UK 4,157 6,657 2,265 2,819 111 122
Angola 1,983 403 38 16 25 13
Brazil 1,679 2,280 1,480 962 83 411
Brunei 956 1,009 4 4 1 0
USA 929 2,662 643 649 31 32
Congo 707 535 17 22 1 3
Malaysia 601 1,014 516 566 26 4
Other countries 918 1,071 516 636 17 56
Total 25,557 31,896 9,510 10,172 329 841

Page 45
Back to index
Consolidated Financial Statements
Note 5 Personnel Expenses
Financial Reporting PrinciplesPersonnel expenses include wages, salaries, social security contributions, sick
leave, parental leave, price reduction in employee share purchase program and
other employee benefits. The benefits are recognized in the year in which the
associated services are rendered by the employees.
Personnel Expenses
Employee Share Purchase ProgramAker Solutions employees were invited to participate in a share purchase
program in 2016 whereby an employee could buy up to NOK 60,000 of
Aker Solutions shares at a 25 percent reduction of cost price in addition to a
discount of NOK 1,500. To encourage a long-term commitment to the company, a
three-year lock-in period was part of the arrangement. The total number of em-
ployees that participated in the program in 2016 totalled 901 compared to 1,479
in the prior year. The price reduction the employees receive upon purchase of the
shares is expensed as salary costs immediately. If allowed under local laws, the
shares purchased by each employee were funded by a loan provided by the local
Amounts in NOK million 2016 2015
Salaries and wages including holiday allowance 7,478 9,133
Social security contribution 945 1,158
Pension cost 542 586
Restructuring cost related to personnel 112 262
Other employee benefits 399 611
Personnel expenses 9,475 11,750
employer company. The loan is repaid by salary deductions over a
period of 12 months.
Loans to employees related to the share purchase program
amounted to NOK 25 million per December 31, 2016, compared
to NOK 40 million in the prior year.
Note 6 Other Operating Expenses
See note 19 for more information about operating leases
See note 32 for more information about audit fees
Amounts in NOK million 2016 2015
Rental and other cost for land and buildings 1,389 1,410
Office supplies 981 1,143
External consultants 311 404
Travel expenses 411 520
Insurance 111 185
Other expenses 581 1,664
Other operating expenses 3,784 5,326
See note 18 for more information about the pension cost and obligation
See note 20 for more information about restructuring provision related to
downsizing of personnel
See note 31 for more information about the

Page 46
Back to index
Consolidated Financial Statements
Note 7 Finance Income and Expenses
Financial Reporting PrinciplesInterest income and expenses include effects from using the effective interest rate
method where fees, interest paid, transaction costs and other premiums are
deferred and amortized over the life of the instrument. Effects from net present
value calculations of assets and liabilities are also included.
Foreign exchange gains and losses arise upon settlement of monetary assets
and liabilities that are not hedged. Foreign exchange gains and losses also include
the effects from translating monetary assets and liabilities denominated in foreign
currencies at the balance sheet date. The profit on foreign exchange forward contracts
include effects from derivatives that do not qualify for hedge accounting and embedded
derivatives in addition to the ineffective portion of qualifying hedges.
Financial Income and Expenses
Financial Reporting PrinciplesThe calculation of basic and diluted earnings per share is
based on the income attributable to ordinary shareholders and
a weighted average number of ordinary shares outstanding.
Treasury shares are not included in the weighted average number
of ordinary shares. Weighted average number of diluted and
ordinary shares is the same, as the company does not have
any diluted shares.
Earnings per Share (EPS)
DividendsThe board of directors has proposed that no dividend should be declared for 2016 as it is deemed prudent to exercise caution under the current market uncertainty in the oil and gas industry. This is the same as in the prior year.
Amounts in NOK million 2016 2015
Interest income 65 76
Interest expenses on financial liabilities measured at amortized cost -452 -330
Interest expenses on financial liabilities measured at fair value -26 -18
Interest expenses -477 -348
Capitalized interest cost 24 40
Net foreign exchange gain (loss) 26 -115
Profit (loss) on foreign currency forward contracts -67 46
Other finance income 25 30
Other financial expenses -9 -3
Net other financial items -1 -1
Net finance cost - 414 - 273
Note 8 Earnings per Share and Dividends
See note 16 for more information about share capital and treasury shares
See note 27 for more information about dividends to non-controlling interests
See note 24 for more information about derivative financial instruments
See note 25 for more information about financial assets and liabilities
Amounts in NOK million 2016 2015
Income attributable to ordinary shares (NOK million) 57 392
Weighted average number of issued ordinary shares for the year adjusted for treasury shares
270,916,252 271,287,405
Basic and diluted earnings per share (NOK) 0.21 1.44
Page 47
Back to index
Consolidated Financial Statements
Note 9 Tax Financial Reporting PrinciplesIncome tax in the income statement consists of current tax, effect of change in
deferred tax positions and withholding tax. Income tax is recognized in the income
statement except to the extent that it relates to items recognized directly in equity
or in other comprehensive income.
Current Tax
Current tax is the expected tax payable or receivable on the taxable income or loss
for the year, using tax rates enacted or substantially enacted at the reporting date
that will be paid during the next 12 months. Current tax also includes any adjust-
ment of taxes from previous years and taxes on dividends recognized in the year.
Deferred Tax
Deferred tax is recognized for temporary differences between the carrying amounts
of assets and liabilities for financial reporting and the amounts used for taxation
purposes. Deferred tax is measured at the tax rates expected to be applied to
temporary differences when they reverse, based on the laws that have been enacted
or substantively enacted by the reporting date. Deferred tax is not recognized for
goodwill identified in acquisitions. Deferred tax assets and liabilities are offset if
there is a legally enforceable right to offset current tax liabilities and assets, and
they relate to income taxes levied by the same tax authority. Deferred tax assets are
recognized for unused tax losses, tax credits and deductible temporary differences.
The deferred tax asset is only recognized to the extent it is considered probable
that future taxable profits will be available in order to utilize the credits.
Withholding Tax
Withholding tax and any related tax credits are generally recognized in the period
they are incurred. Withholding tax and related tax credits directly related to con-
struction contracts are recognized according to the stage of completion of the
construction contract, and follow the same recognition criteria
as the underlying construction contract.
Judgments and EstimatesThe group is subject to income taxes in numerous jurisdictions,
and judgment may be involved when determining the taxable
amounts. Tax authorities in different jurisdictions may challenge
calculation of taxes payable from prior periods. In particular,
management judgment is required when assessing the valuation of
unused losses, tax credits and other deferred tax assets which can
be complex. The recoverability is assessed by estimating taxable
profits in future years taking into consideration also expected
changes in temporary differences. The discounted amount from
these profits is compared to book value of the tax assets.
The estimate of future taxable profits is sensitive to
future market development for the products and services of Aker
Solutions. Forecasts are based on firm orders in the backlog
and identified prospects in addition to expected service revenue.
Changes in the assumptions related to the expected prospects
can have a significant impact on the forecasted cashflows.
Economic conditions may change and lead to a different conclusion
regarding recoverability, and such changes may affect future
reporting periods.
Note 9 continues on next page

Page 48
Back to index
Consolidated Financial Statements
Amounts in NOK million 2016 2015
Current income tax
Current year 358 481
Adjustments for prior years -2 -89
Total current income tax 356 393
Deferred income tax
Origination and reversal of temporary differences -228 -100
Write down of tax loss carry-forwards and deferred tax assets 46 48
Change in Norwegian tax rate from 27 to 25 percent -52 -39
Adjustment for prior periods 0 0
Total deferred income tax -235 -91
Total income tax 121 302
Amounts in NOK million 2016 2015
Cashflow hedges, deferred tax -232 39
Remeasurement of defined benefit pension plans -13 -31
Deferred tax charged to OCI -245 8
Taxes on dividends -15 0
Taxes on acquisition of NCI -34 0
Current tax charged to equity -49 0
Income Tax
Taxes in OCI and Equity
Note 9 continues on next page

Page 49
Back to index
Consolidated Financial Statements
Amounts in NOK million 2016 2015
Income before tax 273 685
Income tax when applying Norwegian tax rate of 25 percent (27 percent in 2015) 68 25.0% 185 27.0%
Tax effects of:
Differences in tax rates from 25 percent (27 percent in 2015) -31 -11.2% 95 13.9%
Non-deductible expenses 5 1.9% 4 0.6%
Additional withholding taxes 109 40.0% 114 16.6%
Current year effect of tax incentives -23 -8.5% -16 -2.4%
Prior year adjustments (current tax) -2 -0.7% -89 -12.9%
Deferred tax from write down (or reversal) of deferred tax assets (excluding tax loss) 46 16.7% 48 6.9%
Change in tax rates -52 -19.1% -39 -5.7%
Other 1 0.3% 0 -
Income tax and effective tax rate 121 44.2% 302 44.0%
Assets Liabilities Net
Amounts in NOK million 2016 2015 2016 2015 2016 2015
Property, plant and equipment 18 19 -107 -111 -89 -92
Pensions 112 136 0 0 112 136
Projects under construction 7 0 -1,451 -1,559 -1,444 -1,559
Tax loss carry-forwards 745 571 0 0 745 571
Intangible assets 6 4 -258 -291 -252 -286
Provisions 266 314 -8 -8 258 305
Derivatives 209 440 0 0 209 440
Other 855 581 -58 -47 797 534
Total before offsetting 2,218 2,066 -1,882 -2,016 335 49
Offsetting -1,552 -1,734 1,552 1,734 0 0
Total 666 332 -331 -283 335 49
Effective Tax RateThe table below reconciles the reported income tax expenses to the tax expenses if the tax rate of 25 percent in Norway was applied.
Recognized Deferred Tax Assets and Liabilities
Note 9 continues on next page

Page 50
Back to index
Consolidated Financial Statements
Amounts in NOK millionProperty, plant and
equipmentPensions
Projects under construction
Tax loss carry- forwards
Intangible assets
Provisions Derivatives Other Total
Balance as of January 1, 2015 -63 179 -1,462 399 -234 136 388 338 -319
Recognized in profit and loss -9 -11 -74 189 -42 182 12 -155 91
Recognized in other comprehensive income (OCI) 0 -31 0 0 0 0 39 0 8
Prepaid withholding tax 0 0 0 0 0 0 0 334 334
Currency translation differences -20 0 -23 -17 -9 -12 1 15 -66
Balance as of December 31, 2015 -92 136 -1,559 571 -286 305 440 534 49
Recognized in profit and loss 15 -9 91 169 24 -107 3 62 248
Recognized in other comprehensive income (OCI) 0 -13 0 0 0 0 -232 0 -245
Prepaid withholding tax 0 0 0 0 0 0 0 252 252
Additions through acquisition of subsidiaries -9 0 0 0 -12 0 0 -2 -23
Reclassification between categories 0 0 0 0 0 48 0 -48 0
Currency translation differences -3 -2 24 5 22 11 -2 -1 54
Balance as of December 31, 2016 -89 112 -1,444 745 -252 258 209 797 335
Amounts in NOK million Expiry within 5 years Expires 2021 and later Indefinite Total Unrecognized tax loss carry-forwards
Unrecognized other tax assets
Norway 0 0 1,951 1,951 0 0
Europe excluding Norway 361 22 51 434 374 0
North America 15 352 0 367 33 0
South America 0 0 429 429 0 0
Asia Pacific 1 0 87 89 89 3
Other 238 0 13 251 238 0
Total 615 374 2,531 3,520 735 3
Change in Net Recognized Deferred Tax Assets and Liabilities
Tax Loss Carry-Forwards and Unrecognized Deferred Tax Assets
The tax losses carried-forward relate to tax losses in previous years that can be used as tax credits in payable taxes in the future. The tax losses carried-forward recognized in the balance sheet are estimated to be used within 10 years.
See note 20 for information about contingent tax claims

Page 51
Back to index
Consolidated Financial Statements
Note 10 Property, Plant and Equipment
The majority of property, plant and equipment relate to
subsea manufacturing plants and service bases in Norway,
Brazil, Malaysia, the US and the UK. The new subsea
manufacturing plant in Brazil was opened in 2016. Fixed
assets also include furniture and fittings in office buildings.
Financial Reporting PrinciplesProperty, plant and equipment (PPE) are stated at cost less
accumulated depreciation and impairment losses. Components
of property, plant and equipment with different useful lives are
accounted for separately. Assets are mainly depreciated on a
straight-line basis over their expected economic lives as follows:n Machinery and equipment: 3-15 yearsn Buildings: 8-30 yearsn Sites: No depreciation
Borrowing costs are capitalized as part of the cost of the asset
when significant. The cost of self-constructed assets includes
the cost of materials, direct labor, production overheads and
borrowing cost.
Judgment and EstimatesJudgment is involved when determining the depreciation period
and when assessing impairment. Impairment is assessed for
individual assets and for cash generating units as a whole. The
impairment testing involves judgmental assumptions about future
market development, cashflows, determination of weighted aver-
age cost of capital (WACC), growth rate and other assumptions
that may change over time.
Amounts in NOK millionBuildings and sites
Machinery and equipment
Under construction
Total
Historical cost
Balance as of January 1, 2015 1,222 4,185 761 6,168
Additions 33 289 559 882
Transfer from assets under construction 93 329 -423 0
Disposals and scrapping -7 -66 0 -73
Currency translation differences 95 232 -85 242
Balance as of December 31, 2015 1,436 4,970 813 7,219
Additions 48 60 292 399
Transfer from assets under construction 635 294 -929 0
Additions through acquisition of subsidiaries 23 54 0 77
Disposal of subsidiaries 0 -10 0 -10
Disposals and scrapping -60 -152 0 -211
Currency translation differences 19 -77 40 -18
Balance as of December 31, 2016 2,102 5,138 216 7,456
Accumulated depreciation and impairment
Balance as of January 1, 2015 -316 -2,236 -13 -2,565
Depreciation for the year -73 -492 0 -565
Impairment -15 -12 0 -27
Disposals and scrapping 6 64 0 70
Currency translation differences -34 -135 -2 -171
Balance as of December 31, 2015 -431 -2,810 -16 -3,257
Depreciation for the year -83 -483 0 -567
Impairment 0 -78 0 -79
Disposal of subsidiaries 0 7 0 7
Disposals and scrapping 36 147 0 183
Currency translation differences 10 53 0 62
Balance as of December 31, 2016 -469 -3,164 -16 -3,648
Book value as of December 31, 2015 1,005 2,160 797 3,962
Book value as of December 31, 2016 1,633 1,974 200 3,808
Note 10 continues on next page

Page 52
Back to index
Consolidated Financial Statements
Borrowing CostAdditions include NOK 24 million of capitalized borrowing costs in 2016 with an average interest rate of 9.4 percent, compared to NOK 40 million in 2015 with an average interest rate of 8.4 percent. The capitalized borrowing costs mainly relate to the subsea manufacturing plant in Brazil that was completed in 2016. The borrowing cost will first be capitalized as asset under construction before the asset is ready for use and transferred to building and
sites.
CommitmentsAker Solutions has entered into contractual commitments for the acquisition of property, plant and equipment amounting to NOK 52 million as of December 31, 2016, of which NOK 48 million will expire in 2017. Contractual commitments were NOK 168 million
per December 31, 2015.
ImpairmentsImpairment losses for property, plant and equipment of NOK 79 million in 2016 relates to the Subsea operating segment. Impair-ment losses in 2015 of NOK 27 million relates to Subsea (NOK 21 million) and Field Design (NOK 6 million).
See note 12 for information about impairment testing
See note 17 for information about PPE being held as security for borrowings
See note 26 for information about acquisition of subsidiaries
Note 11 Intangible Assets
The research and development (R&D) programs in Aker Solutions are closely monitored in order to secure the desired technological achievements in time and at acceptable cost levels. R&D programs that meet certain criteria are capitalized and amortized over the expected useful life. Intangible assets also include goodwill and other assets identified in mergers and acquisitions in
addition to IT systems.
Financial Reporting PrinciplesCapitalized DevelopmentAll internal technology development programs are reviewed by the Corporate Invest-ment Committee before any costs are capitalized. The technology development in Aker Solutions is graded according to a Technology Readiness Level (TRL) consisting of eight phases. Research and development costs are expensed as incurred until a program has completed the concept phase. Development cost is only capitalized if the product or process is technically and commercially feasible and the business case shows a positive net present value. Capitalized development mainly includes internal labour costs in addition to materials for the development program. The capitalized development is normally amortized over five years on a straight-line basis, but some programs that have a clear differentiating offering and a longer economic benefit may be amortized up to seven years. For development projects in progress, a full impairment test is performed annually or when impairment indicators are identified.
GoodwillGoodwill represents the consideration paid in excess of identifiable assets and liabilities in business combinations. Goodwill has an indefinite useful life and is tested for impair-ment annually, or when impairment indicators are triggered.
OtherOther intangible assets includes IT systems and technology development acquired through business combinations.
Note 11 continues on next page

Page 53
Back to index
Consolidated Financial Statements
Judgments and EstimatesThe decision to capitalize a development program involves
management judgment. There are strict internal rules defining
what qualifies for capitalization, and the documentation of
the assessment is monitored centrally. Management makes
assessment of future market opportunities, ability to success-
fully achieve the desired technological solution and the time and
cost it takes to develop it. These factors may change over time.
Impairment indicators are assessed for individual development
projects, other intangible assets and for cash generating units
as a whole, including goodwill. Impairment testing is performed
when impairment indicators have been identified. In addition,
capitalized development programs that have not been completed
are subject to an annual impairment test. The impairment test
includes update of the business case, assessing status on technical
achievements and reviewing cost incurred compared to budget in
order to identify if any of the capitalized cost should be expensed.
The asset is written down to recoverable amount, if lower than book
value. The impairment testing involves judgmental assumptions
about future market development, cashflows, determination of
WACC, growth rate used for calculation of terminal value and other
assumptions that may change over time.
Research and Development ExpensesThe research and development expenses amounted to NOK
125 million in 2016 compared to NOK 211 million in 2015.
See note 12 for more information about impairment testing
See note 26 for more information about acquisition of subsidiaries
Amounts in NOK million Capitalized
development Goodwill Other Total
Historical cost
Balance as of January 1, 2015 1,845 3,972 243 6,060
Additions 431 0 17 449
Reclassification -56 0 56 0
Disposals 0 0 16 16
Currency translation differences 90 195 26 311
Balance as of December 31, 2015 2,310 4,166 359 6,836
Additions 278 0 19 297
Additions through business combinations
0 117 37 154
Disposals 0 -2 0 -2
Currency translation differences -116 -305 -34 -455
Balance as of December 31, 2016 2,472 3,976 381 6,829
Accumulated amortization and impairment
Balance as of January 1, 2015 -266 5 -35 -297
Amortization for the year -120 0 -35 -155
Impairment -89 0 -47 -136
Reclassification 25 0 -25 0
Disposals 0 0 -16 -16
Currency translation differences -19 -1 -6 -26
Balance as of December 31, 2015 -470 4 -164 -629
Amortization for the year -178 0 -34 -212
Impairment -386 0 0 -386
Disposals 0 0 0 0
Currency translation differences 26 2 16 44
Balance as of December 31, 2016 -1,007 6 -182 -1,182
Book value as of December 31, 2015 1,841 4,171 195 6,207
Book value as of December 31, 2016 1,465 3,983 199 5,647
Intangible Assets

Page 54
Back to index
Consolidated Financial Statements
Note 12 Impairment of Assets The challenging market conditions for the oil services companies have continued in 2016. All individual assets have been assessed for impairment, in addition to testing assets and goodwill as part of cash generating units. The impairment testing of the assets resulted in impairment losses of NOK 386 million for intangible assets and NOK 79 million for property, plant
and equipment in 2016.
Financial Reporting Principles Individual Assets
Individual intangible and fixed assets are assessed for impairment triggers every
quarter to identify assets that are damaged, no longer in use or will be disposed.
Capitalized development is assessed for impairment triggers every quarter to identify
development programs where the technological development or commercial
outlook for that specific technology is no longer feasible. Capitalized development
programs that have not been completed are subject to annual impairment test with
updates of the business case, assessing status on technical achievements and re-
viewing cost incurred compared to budget in order to identify if any of the capital-
ized cost should be expensed. The asset is written down to recoverable amount, if
lower than book value.
Assets in a Cash Generating Unit (CGU)
Impairment indicators are assessed for all assets as part of a cash generating unit
(CGU). A CGU represents the lowest level of independent revenue generated by
the assets, which is usually the lowest level where a separate market exists for
the output from the CGU. Impairment indicators are reviewed for all assets with
assessment of market conditions, technological development, change in order
backlog, change in discount rate and other elements that may impact the value of
the assets in the CGU. Assets are usually tested using the value-in-use approach
determined by discounting expected future cashflows. Impairment losses are
recognized for assets in CGUs where the recoverable amount is
lower than book value.
Goodwill
Groups of CGUs that include goodwill are tested for impairment
annually, or when impairment triggers have been identified. The
company does not have other assets than goodwill with indefinite
useful lives.
Judgments and EstimatesThe impairment testing of assets is by nature highly judgmental
as it includes estimates such as future expected cashflows,
discount rate and growth rate. In particular, future cashflows are
uncertain as they are impacted by market developments beyond
Aker Solutions control. The oil price impacts the investment levels
in capex and maintenance projects by the oil companies which in
turn impact the market in which Aker Solutions operate. Information
about sensitivities in the testing is given below.
Cash Generating Units (CGU)CGUs have been identified when testing fixed and intangible
assets and may represent a plant or a group of plants which are
deemed to produce independent cash inflows. CGUs have been
grouped together when testing goodwill and represent the busi-
ness areas of Aker Solutions (Subsea, Maintenance, Modification
and Operations and Engineering). Goodwill has been allocated to
business areas as this is the level where synergies are expected
and goodwill is monitored. For example, whereas goodwill is test-
ed on a Subsea business area level, the capitalized development
and property, plant and equipment in Subsea is tested separately
at CGU level for Norway/Africa, US, UK, Malaysia and Brazil.
Note 12 continues on next page

Page 55
Back to index
Consolidated Financial Statements
Cashflow Assumptions Expectations about the long-term oil prices are important when assessing the
future market development for the products and services of Aker Solutions. It has
been assumed that the downturn in the market will remain through 2017, with a
recovery in 2018. The long-term oil price per barrel has been estimated to gradually
increase to USD 70 in the terminal year. This assumption is particularly sensitive
in the current market conditions. Five year cashflows in the period 2017 to 2021
projected from the forecast and strategy process, approved by management in
2016, have been used as basis for the estimates of future cashflows. The fore-
casts are based on firm orders in the backlog and identified prospects in addition
to expected service revenue. Changes in the assumptions related to the expected
prospects can have a significant impact on the forecasted cashflows. The forecasted
cashflows used in the impairment tests reflect organic growth only. Other parameters in
the assessment are the mix of products and services, level of operating expenses
and capital expenditure for maintenance of the asset portfolio.
Discount and Growth Rate Estimated future cashflows are discounted to their present value using the weighted
average cost of capital (WACC), which is a post-tax discount rate. The WACC is
based on a risk free interest rate, a risk premium and average beta values of peers
within the subsea and field design market. A separate WACC has been calculated
for each of the CGUs taken into consideration country specific risk premiums and
long-term risk free interest rates. A growth rate has been used to calculate terminal
value after the five-year period.
Impairment Testing of Individual Assets When reviewing the individual capitalized development, certain development
programs were identified where the technology or commercial outlook no longer
justified the value, mainly as a result of the downturn in the oil service sector.
One smaller development program was identified and partially impaired due to the
fact that the design was not working as
intended. In total, NOK 363 million was impaired in the operating
segment for Subsea and NOK 23 million was impaired in Field
Design. The impairments were mainly related to development
projects in Norway and the UK. In addition, individual machines,
furniture and fittings were impaired in Subsea of NOK 79 million.
The total remaining book value of the assets that were partially
impaired was NOK 191 million per December 31, 2016.
The value-in use method was used for both fixed and
intangible assets. A WACC of 10.7 percent post tax was used
for the impairment testing in Norway and a WACC of 9.5 percent
post tax was used in the UK.
Impairment Testing of Assets in CGUsNo impairment losses were recognized as a result of the impairment
testing of assets in CGUs based on the value-in-use method.
Sensitivity analysis for change in future cash flows, growth
rate and WACC has been performed for the CGUs with limited
headroom in the impairment testing. A CGU in Brazil and in
the US had the least headroom resulting in additional sensitivity
testing. The results from the analysis support the conclusion
from the test that no impairment should be recognized. The
group is continuesly monitoring the market development and
will perform impairment testing if further impairment triggers are
identified.
Note 12 continues on next page

Page 56
Back to index
Consolidated Financial Statements
Amounts in NOK million 2016 2015
Subsea 2,546 2,862
Maintenance, Modifications and Operations (MMO) 977 849
Engineering 460 460
Total goodwill as of December 31 3,983 4,171
Impairment Testing of GoodwillThe goodwill in each of the three business areas identified as separate CGUs is
shown in the following table.
2016 2015
Amounts in NOK million Post-tax WACC Pre-tax WACC Post-tax WACC Pre-tax WACC
Subsea 10.0% 11.7% 8.6% 10.7%
Maintenance, Modifications and Operations (MMO)
9.6% 11.8% 8.9% 11.0%
Engineering 9.6% 11.7% 8.9% 11.3%
The annual average five year growth rate for revenue in the cashflow used for
impairment testing is 7.1 percent. A post-tax value in-use method was used, with
pre-tax rates calculated using an iterative method for illustration purposes only.
When determining the terminal value, a growth rate of 1.5 percent was used.
The annual impairment testing of goodwill did not result in any impairment losses.
Multiple sensitivity tests have been run to address the current uncertainty in
the oil service market. The impairment testing is sensitive to changes in the long-
term oil price which is likely to have an impact on the expected order intake. The
testing is also sensitive to changes in the discount rate, growth rates, the ability of
Aker Solutions to secure projects as estimated in the cashflow, product mix and
cost levels. Sensitivity testing of goodwill includes changing various assumptions
to consider other potential alternative market conditions. This includes changing
the discount rate and growth rate in addition to reducing the
expected cashflows in the future.
The recoverable amounts exceed book value for all
scenarios for all the CGUs in the goodwill impairment testing.
The asset base in the business areas for MMO and Engineering is
relatively low and the recoverable amount is significantly higher
than book values in these impairment tests. Subsea has a higher
asset base, but the recoverable amount is still higher than book
values in the impairment test. Due to the current market un-
certainties and the fact that Subsea has a significant goodwill
balance, sensitivities are included below.
The following table illustrates some of the key sensitivities and
how much they can change without triggering an impairment of
goodwill in Subsea.
Subsea
Amounts in NOK million 2016 2015
Highest post-tax WACC that can be used without resulting in impairment
13.6% 14.7%
Lowest growth rate that can be applied to the terminal value without resulting in impairment
-5.0% -10.0%
Highest reduction of free cashflows that can be used without resulting in impairment
-35.0% -52.0%
See note 10 for more information about property, plant and equipment
See note 11 for more information about intangible assets

Page 57
Back to index
Consolidated Financial Statements
Note 13 Inventories
Financial Reporting PrinciplesInventories are measured at the lower of cost and net realizable value. Net
realizable value is the estimated selling price in the ordinary course of business
less selling expenses and the estimated cost to complete the inventory. The cost of
inventories is based on the first-in first-out principle and includes expenditures for
bringing them to their existing location and condition.
Judgments and EstimatesThe assessment of obsolete and slow-moving inventory in order to determine
inventory write-downs is subject to management judgment. The selling price in the
market has to be estimated, and there is a risk that the actual selling price turns
out to be lower than the amount estimated by management.
There are no securities pledged over inventories.
Amounts in NOK million 2016 2015
Stock of raw materials 514 789
Goods under production 2 11
Finished goods 59 14
Total 575 814
Total inventories at cost 818 986
Inventory write-downs to net realizable value -244 -172
Total 575 814
Inventory write-down expenses in the period 129 115
Inventories

Page 58
Back to index
Consolidated Financial Statements
Note 14 Trade and Other Receivables
Financial Reporting PrinciplesTrade and other receivables are recognized at the original
invoiced amount, less an allowance for doubtful receivables.
The invoiced amount is considered to be approximately equal
to the value derived if the amortized cost method would have
been used.
Judgments and EstimatesJudgment is involved when determining the allowance for
doubtful receivables. The allowance is based on individual
assess ments of each customer and default risk in the industry
and the country in which the customer operates. The customers
of Aker Solutions are mainly large, international oil companies.
Trade and Other Receivables
Amounts in NOK million 2016 2015
Trade receivables 3,600 4,286
Trade receivables, related parties 111 121
Less provision for impairment of receivables -170 -143
Trade receivables, net 3,541 4,264
Advances to suppliers 156 232
Amounts due from customers for construction work 1,103 2,365
Accrued operating revenue from service contracts 1,337 2,032
Other receivables 1,260 2,091
Total 7,398 10,985
Amounts in NOK million 2016 2015
Balance as of January 1 -143 -40
Provisions made during the year -79 -109
Provisions used during the year 8 5
Provisions reversed during the year 23 12
Currency translation differences 21 -12
Balance as of December 31 -170 -143
Amounts in NOK million 2016 2015
Not overdue 2,599 3,549
Past due 0-30 days 611 297
Past due 31-90 days 136 195
Past due 91 days to one year 110 279
Past due more than one year 256 87
Total 3,711 4,407
Bad Debt Provision
Aging of Trade Receivables
See note 3 for more information about amounts due from customers for construction and service contracts
See note 22 for more information about credit risk
See note 30 for more information about receivables to related parties

Page 59
Back to index
Consolidated Financial Statements
See note 17 for more information about borrowings
See note 22 for more information about currency risk and the cash pool arrangement
See note 23 for more information about capital management
Note 15 Cash and Cash Equivalents
Financial Reporting PrinciplesCash and cash equivalents include cash on hand, demand
deposits held at banks and other short-term highly liquid
deposits with original maturity of three months or less.
Cash and Cash Equivalents
Available LiquidityAdditional undrawn committed non-current bank revolving
credit facilities amounted to NOK 5.0 billion, it was also NOK
5.0 billion in the prior period. Together with cash and cash
equivalents, this gives a total liquidity buffer of NOK 7.5 billion,
compared to NOK 8.9 billion in the prior period.
Amounts in NOK million 2016 2015
Cash pool 1,461 1,692
Other cash at banks 1,019 2,170
Total 2,480 3,862
Note 16 Equity
Share CapitalAker Solutions ASA was founded May 23, 2014 with a nominal share capital of
NOK 293,807,940 through the issuance of 272,044,389 shares. The total number of
outstanding shares is 272,044,389 at par value NOK 1.08 per share as of December 31,
2016. All issued shares are fully paid. Aker Solutions ASA has one class of shares,
ordinary shares, with equal rights for all shares. The holders of ordinary shares
are entitled to receive dividends and are entitled to one vote per share at general
meetings.
Treasury SharesThe group purchases its own shares (treasury shares) to meet the obligation under
the employee share purchase program. Repurchase of share capital is recognized
at cost as a reduction in equity and is classified as treasury shares. No gain or loss
is recognized in the income statement on the purchase or sale of the groups own
equity instruments.
Amounts in NOK million Number of shares Consideration
Treasury shares as of December 31, 2015 377,311 26
Purchase 1,072,847 29
Sale -938,357 -40
Treasury shares as of December 31, 2016 511,801 16
Hedging ReserveThe hedge reserve mainly relates to effects of currency cash flow hedges that are
not yet recognized in the income statement. The hedging effects are recognized
in the income statement according to the progress of the underlying construction
contract.
Note 16 continues on next page

Page 60
Back to index
Consolidated Financial Statements
Translation ReserveThe currency translation reserve includes foreign exchange
differences arising from the translation of the subsidiaries into
the presentation currency of the consolidated statements.
Pension ReserveThe defined benefit plan actuarial gains and losses reserve
includes remeasurement of the net defined benefit liability,
which comprise actuarial gains and losses and the return on
plan assets (excluding interest).
See note 2 for more information about currency translation of subsidiaries
See note 18 for more information about the pension obligation
See note 24 for more information about hedging
Note 17 Borrowings
Financial Reporting PrinciplesInterest-bearing borrowings are recognized initially at fair value less transaction
costs. Subsequent to initial recognition, interest-bearing borrowings are stated
at amortized cost with any difference between cost and redemption value being
recognized in the income statement over the period of the borrowings on an
effective interest basis.
Norwegian BondsThe group has issued two bonds in the Norwegian bond market denominated in
Norwegian Kroner. The bonds are issued based on a floating interest rate plus a
predefined margin. The bonds are issued with Norsk Tillitsmann as trustee and
the loan agreements are based on Norsk Tillitsmann’s standard loan agreement
for such bonds. The bonds are unsecured on a negative pledge basis and include
no dividend restrictions. All bonds issued are listed on the Oslo Stock Exchange.
Aker Solutions’ strategy is to have between 30-50 percent of borrowings at fixed
interest rates. To the extent that this is not reflected in the loan agreements, swap
transactions are entered into.
Note 17 continues on next page

Page 61
Back to index
Consolidated Financial Statements
Note 17 continues on next page
Amounts in NOK millionCurrency
Nominal currency value
Carrying amount (NOK) Interest rate
Fixed interest margin Interest coupon
Maturity date(mm/dd/yy) Interest terms
ISIN NO 0010647431 NOK 1,500 1,505 1.14% 4.25% 5.39% 06/06/17 Floating, 3M+fix margin
ISIN NO 0010661051 NOK 1,000 1,007 1.13% 4.20% 5.33% 10/09/19 Floating, 3M+fix margin
Total bonds1 2,512
Revolving credit facility (NOK 5,000 million)2 NOK 0 -20 1.05% 0.85% 1.90% 07/03/19 NIBOR + Margin3
Total credit facility -20
Brazilian Development Bank loans4 BRL 548 1,451 11.96% 0.00% 11.96% 2017-2022 Fixed, periodically
Brazilian Development Bank loans 1,451
Other borrowings 10
Total borrowings 3,954
Current borrowings 2,110
Non-current borrowings 1,844
Total borrowings 3,954
2016
Bonds and Borrowings
1) The carrying amount is calculated by reducing the nominal value of NOK 2,500 million (NOK 2,500 million in 2015) by total issue costs related to the new financing of NOK 7 million (NOK 11 million in 2015). Amount includes NOK 18 million of accrued interest related to the bonds (NOK 18 million in 2015).
2) The carrying amount includes fees for establishing the credit facility which is deferred according to the amortized cost method.3) The margin applicable to the facility is decided by a price grid based on the gearing ratio. Commitment fee is 35 percent of the margin.4) Brazilian loans consist of loans with interest rates ranging from 3.5 percent to 19 percent in 2016 (3.5 percent to 16.7 percent in 2015). The weighted average interest rate is used in the table and is calculated based on the contractual rates on the loans at
December 31 and does not include the effect of swap agreements.

Page 62
Back to index
Consolidated Financial Statements
2015
Bonds and Borrowings
Note 17 continues on next page
1) The carrying amount is calculated by reducing the nominal value of NOK 2,500 million (NOK 2,500 million in 2015) by total issue costs related to the new financing of NOK 7 million (NOK 11 million in 2015). Amount includes NOK 18 million of accrued interest related to the bonds (NOK 18 million in 2015).
2) The carrying amount includes fees for establishing the credit facility which is deferred according to the amortized cost method.3) The margin applicable to the facility is decided by a price grid based on the gearing ratio. Commitment fee is 35 percent of the margin.4) Brazilian loans consist of loans with interest rates ranging from 3.5 percent to 19 percent in 2016 (3.5 percent to 16.7 percent in 2015). The weighted average interest rate is used in the table and is calculated based on the contractual rates on the loans at
December 31 and does not include the effect of swap agreements.
Amounts in NOK millionCurrency
Nominal currency value
Carrying amount (NOK) Interest rate
Fixed interest margin Interest coupon
Maturity date(mm/dd/yy) Interest terms
ISIN NO 0010647431 NOK 1,500 1,502 1.15 % 4.25 % 5.40 % 06/06/17 Floating, 3M+fix margin
ISIN NO 0010661051 NOK 1,000 1,005 1.11 % 4.20 % 5.31 % 10/09/19 Floating, 3M+fix margin
Total bonds1 2,507
Revolving credit facility (NOK 5,000 million)2 NOK 0 -27 1.05 % 0.85 % 1.90 % 07/03/19 NIBOR + Margin3
Total credit facility -27
Brazilian Development Bank loans4 BRL 527 1,209 10.41 % 0.00 % 10.41 % 2016-2022 Fixed, periodically
Brazilian Development Bank loans 1,209
Other borrowings 9
Total borrowings 3,698
Current borrowings 561
Non-current borrowings 3,137
Total borrowings 3,698

Page 63
Back to index
Consolidated Financial Statements
Amounts in NOK million Carrying amount Total cashflow1 6 months and less 6-12 months 1-2 years 2-5 years More than 5 years
ISIN NO 0010647431 1,505 1,539 1,539 0 0 0 0
ISIN NO 0010661051 1,007 1,155 26 27 53 1,049 0
Total bonds 2,512 2,694 1,565 27 53 1,049 0
Revolving credit facility (NOK 5,000 million) -20 0 0 0 0 0 0
Brazilian Development Bank loans 1,451 1,801 86 658 499 113 445
Other loans 10 11 0 11 0 0 0
Total other loans 1,442 1,812 86 669 499 113 445
Total borrowings 3,954 4,506 1,651 696 552 1,162 445
Amounts in NOK million Carrying amount Total cashflow1 6 months and less 6-12 months 1-2 years 2-5 years More than 5 years
ISIN NO 0010647431 1,502 1,617 40 40 1,537 0 0
ISIN NO 0010661051 1,005 1,204 26 26 53 1,099 0
Total bonds 2,507 2,821 66 66 1,590 1,099 0
Revolving credit facility (NOK 5,000 million) -27 0 0 0 0 0 0
Brazilian Development Bank loans 1,209 1,502 102 518 111 509 262
Other loans 9 9 0 9 0 0 0
Total other loans 1,191 1,510 102 526 111 509 262
Total borrowings 3,698 4,331 168 592 1,701 1,608 262
2016
2015
Maturity of Bonds and Borrowings
1) The interest costs are calculated using either the last fixing rate known by year end (plus applicable margin) or the contractual fixed rate (when fixed rate debt).
Mortgages The group has no mortage liabilities in 2016. In 2015 there were NOK 5.7 million in
mortgage liabilities, which is secured by pledges on property, plant and equipment
with book values of NOK 4.6 million.
See note 23 for more information about capital management
See note 24 for more information about interest rate derivatives
See note 25 for more information about financial assets and liabilities

Page 64
Back to index
Consolidated Financial Statements
Note 18 Pension Obligations Financial Reporting Principles Aker Solutions operates several pension plans around the world. The most common
type of plan is the defined contribution plan, where Aker Solutions makes contributions
to the employee’s individual pension account. Aker Solutions still has some closed
defined benefit plans and impact of these are gradually reduced.
Defined Contribution Plans
A defined contribution plan is a type of retirement plan where the employer makes
contributions on a regular basis to the employees individual pension account. The
benefits received by the employee are based on the employer contributions and
gains or losses from investing the capital. Contributions to defined contribution
pension plans are recognized as an expense in the income statement as incurred.
Defined Benefit Plans
A defined benefit plan is a type of pension plan where the employer promises an
annual pension on retirement based on a percentage of the salary upon retirement
and the employee’s earnings history, years of service and age. The calculation of
defined benefit obligations is performed annually by a qualified actuary using the
projected unit credit method.
The defined benefit obligation is calculated separately for each plan by
discounting the estimated amount of future benefit that employees have earned in
the current and prior periods and deducting the fair value of any plan assets. The
change of the defined benefit obligation as a result of the change of assumptions
(actuarial gains and losses) and the return on plan assets are recognized immediately
in other comprehensive income. Net interest expense and other expenses related
to defined benefit plans are recognized in the income statement. When the benefits
of a plan are changed, settled or when a plan is curtailed, the change relating to
past service or the gain or loss on curtailment or settlement is recognized immediately
in the income statement.
Judgments and Estimates The present value of the pension obligations depends on a number
of factors determined on the basis of actuarial assumptions. These
assumptions include financial factors such as the discount rate,
expected salary growth, inflation and return on assets as well as
demographical factors concerning mortality, employee turnover,
disability and early retirement. Assumptions about all these
factors are based on the situation at the time the assessment
is made. However, it is reasonably certain that such factors will
change over long periods for which pension calculations are
made. Any changes in these assumptions will affect the calculated
pension obligations with immediate recognition in other compre-
hensive income.
Pension Plans in Norway The main pension arrangement in Norway is a general pension
plan organized by the Norwegian state providing a basic pension
entitlement to all tax payers. The additional pension plans which
all Norwegian employers are obliged to provide, represent limited
additional pension entitlements. The following pension plans
exist in Norway:
Defined Contribution Plan
All employees in Norway are offered participation in a defined
contribution plan. The annual contributions expensed for the
Norwegian plans were NOK 276 million in 2016. The estimated
contribution expected to be paid in 2017 is NOK 275 million.
Note 18 continues on next page

Page 65
Back to index
Consolidated Financial Statements
Defined Benefit Plan
The Norwegian companies in Aker Solutions closed the defined benefit plans in 2008.
Employees who were 58 years or older in 2008 are still members of the defined benefit
plan. This is a funded plan and represents most of the funded pension liability reported
in the tables below. The estimated contribution expected to be paid during 2017 is
NOK 61 million.
Compensation Plan
All employees in 2008 who had a calculated loss of more than NOK 1,000 per year
upon transition to the defined contribution plan were offered compensation. The
compensation amount will be adjusted annually in accordance with the adjustment
of the employees’ pensionable income, and accrued interest according to market
interest. If the employee leaves the company voluntarily before the age of 67 years,
the compensation amount will be reduced. This unfunded plan is classified and
accounted for as a defined benefit plan.
Tariff Based Pension Agreement (AFP)
Employees in Norway have a tariff based lifelong retirement arrangement (AFP) that
can be withdrawn from the age of 62 organized by the main labour unions and the
Norwegian state. The information required to estimate the pension obligation from
this defined benefit plan is not available from the plan administrator. Aker Solutions
therefore accounts for the plan as if it was a defined contribution plan.
Termination Benefits
Certain pension arrangements up until retirement has been given as part of
restructuring programs to achieve reduction of personnel. The cost in 2016 was
NOK 16 million.
Pension Plans Outside NorwayPension plans outside Norway are predominately defined
contrib ution plans. The annual contributions expensed for plans
outside Norway were NOK 181 million in 2016. The estimated
contributions expected to be paid in 2017 is NOK 137 million to
the plans outside Norway.
Total Pension Cost
Amounts in NOK million 2016 2015
Defined benefit plans 85 75
Defined contribution plans 457 511
Total 542 586
Note 18 continues on next page

Page 66
Back to index
Consolidated Financial Statements
Amounts in NOK million 2016 2015
Balance as of January 1 572 670
Current service and administration cost 71 60
Interest cost (income) 14 15
Included in income statement 85 75
Actuarial loss (gain) arising from demographic assumptions 116 0
Actuarial loss (gain) arising from financial assumptions -126 -79
Actuarial loss (gain) arising from experience adjustments -32 -10
Re-measurements loss (gain) included in OCI -42 -89
Contributions paid into the plan -70 -75
Benefits paid by the plan -34 -11
Reclassification from restructuring provision 28 0
Other movements 1 2
Other -75 -84
Balance as of December 31 540 572
Represented by:
Net funded liability 13 89
Net unfunded liability 527 483
Balance as of December 31 540 572
Movement in Pension ObligationsTables below relate to the movement in the pension obligation for defined benefit
plans. It is mainly the Norwegian entities that have defined benefit plans; other
defined benefit plans are insignificant.
Assets in the Defined Pension Plan
The equity securities are invested globally, and the value is
based on quoted price at the reporting date without any deduction
for estimated future selling cost. The majority of the bond
investment is in Norwegian municipalities and are assumed to
have a rating equal to AA, but there are very few official ratings
for these investments. The remaining bond investment is primarily
in the Norwegian market within bonds assumed to be of
“Investment Grade” quality. The majority of these investments
do not, however, have an official rating. The investment in funds
is mainly hedge funds that invests in listed securites and where
the value is based on quoted prices.
Amounts in NOK million 2016 2015
Equity securities 40 29
Bonds 1,114 1,184
Funds 94 47
Total plan assets at fair value 1,248 1,260
Note 18 continues on next page

Page 67
Back to index
Consolidated Financial Statements
2016 2015
Discount rate 2.50% 2.60%
Asset return 2.50% 2.60%
Salary progression 2.25% 2.50%
Pension indexation funded plans1 0.00% 0.75%
Mortality table K2013 K2013 BE
Life expectancy at age 65 for pensioners, males 22.4 21.3
Life expectancy at age 65 for pensioners, females 25.4 24.4
Actuarial AssumptionsThe information below relates only to Norwegian plans as these represent the
majority of the plans. The following were the principal actuarial assumptions at the
reporting date:
The discount rate is based on government bonds or high-quality corporate bonds
with maturities consistent with the terms of the obligations. The assumptions
used are in line with recommendations from the Norwegian Accounting Standards
Board.In Aker Solutions, a one percent increase of discount rate increases
the benefit obligation by only 9 percent. This is because the benefit
obligation in Aker Solutions consists mainly of pensioners and
employees over 60 years of age.
See note 5 for more information about personnel expenses
See note 31 for more information about pension arrangements for the management
Sensitivity AnalysisChanges at the reporting date to one of the relevant actuarial
assumptions, holding other assumptions constant, would have
changed the defined benefit obligation as of December 31,
2016 by the amounts shown below.
1) Pension indexation for unfunded plans is agreed invidually (0-8 percent).
Change net liability increase (+)/decrease (-)
Amounts in NOK million 2016 2015
Discount rate +1 percent -162 -234
Discount rate -1 percent 205 216
Expected rate of salary increase +1 percent 35 22
Expected rate of salary increase by -1 percent -31 -20
Expected rate of pension increase +1 percent 171 215
Expected rate of pension increase by -1 percent -137 -153

Page 68
Back to index
Consolidated Financial Statements
Amounts in NOK million Buildings, plants and sites Other Total
Minimum lease expense 844 10 854
Sub-lease income -125 0 -125
Total 719 10 729
Amounts in NOK million Buildings, plants and sites Other Total
Minimum lease expense 883 11 893
Sub-lease income -67 0 -67
Total 815 11 826
Note 19 Operating Leases
Financial Reporting PrinciplesOperating lease expenses are recognized in the income statement on a straight-
line basis over the term of the lease. Rent free periods and other lease incentives
received are recognized as an integral part of the total lease expense over the term
of the lease. The group does not have any financial leases. Sub-lease income is
recognized as operating revenue. The minimum lease payment includes the annual
rental as defined in the lease agreement, the effect of onerous lease provisions is
not included in the table below.
Lease Expenses and Sub-Lease Income Aker Solutions leases a number of production sites and office buildings worldwide.
The leases typically run for a period of 10-15 years, with an option to renew the lease
at market conditions. Other leasing contracts relate to IT and office equipment with
an average life of 3-5 years with no renewal option included in the contracts.
2016
2015
Minimum sub-lease payments to be received in the future are
shown in the table below and relate mainly to sub-lease of office
buildings.
Amounts in NOK million 2016 2015
Less than one year 820 867
Between one and five years 2,801 3,251
More than five years 4,357 4,975
Total 7,978 9,093
Amounts in NOK million 2016 2015
Less than one year -140 -65
Between one and five years -607 -157
More than five years -514 -24
Total -1,261 -247
See note 6 for more information about operating expenses for land and buildings
See note 20 for more information about onerous lease provisions
See note 30 for more information about leasing contracts with related parties
Lease CommitmentsFuture minimum lease payments for non-cancellable operating
leases are shown in the table below.

Page 69
Back to index
Consolidated Financial Statements
Amounts in NOK million Warranties Onerous contracts
Restructuring Other Total
Balance as of January 1, 2016 591 323 262 118 1,294
Provisions made during the year 172 111 112 68 463
Provisions used during the year -128 -139 -205 -38 -510
Provisions reversed during the year -34 -29 -28 -6 -98
Unwinding of discounting effect 0 10 0 0 10
Reclassification to pension obligations 0 0 -28 0 -28
Currency translation differences -27 -9 0 -7 -43
Balance as of December 31, 2016 573 267 112 135 1,087
Expected timing of payment as of December 31, 2016
Due within twelve months 154 119 112 57 442
Due after twelve months 419 148 0 78 645
Total 573 267 112 135 1,087
Note 20 Provisions and Contingent Liabilities
Financial Reporting PrinciplesA provision is a liability with uncertain timing and amount. Provisions are recog-nized when a cash outflow is considered probable, the amount can be reliably estimated and the obligation is a result of a past event. All provisions are presented
as short-term as they are part of the operating cycle.
A contingent liability is a possible obligation that arises from past events that typically depends on a future event outside of the company’s control, for example a court decision. A provision is made when it is considered as probable that a cash
outflow will take place, and the obligation can be measured reliably.
Judgments and EstimatesThe provisions are estimated based on a number of assumptions and are in nature highly judgmental. The various provisions with assumptions and estimation uncertain ties are discussed below.
WarrantiesThe provision for warranties relates to expected re-work and
improvements for products and services delivered to customers.
The warranty period is normally two to five years. The provision is
based on the historical average warranty expenses for each type
of contract and an assessment of the value of delivered products
and services currently in the warranty period. The provision can
also be a higher or lower amount following a specific evaluation
of the actual circumstances for each contract. The final warranty
cost may differ from the estimated warranty provision.
Onerous ContractsThe onerous contracts provision relates to separable parts of
leased office buildings that have been vacated or will be vacated
in the near future by Aker Solutions. Future lease commitments
and future expected sub-lease income have been discounted to
present value using a market rate of 6.1 percent. The provision is
sensitive to changes in the discount rate and assumptions relating
to the sub-lease period and the sub-lease revenue.
Restructuring ProvisionThe restructuring provision relates to capacity adjustments as
a result of the downturn in the oil services sector. Significant
decline in oil prices and current market conditions have resulted
in lower order intake, pressure on cost and necessary work-
force reductions. The restructuring provision relates to expected
employee costs for permanent and temporary redundancies
for first-half 2017. The provision has been estimated based on
assumptions of number of employees affected, salary levels,
notice period, idle time assumed during notice period and
severance pay. The provision is sensitive for changes in any of
these assumptions.
Note 20 continues on next page
Provisions

Page 70
Back to index
Consolidated Financial Statements
OtherOther provisions relate to other liabilities with uncertain timing or amount.
This includes provisions for leasehold dilapidations and US medical reserve.
Contingent LiabilitiesDisputes with customers are normally settled during the final negotiations with the
customer upon delivery and provided for in the projects accounts. However, given
the scope of the group’s worldwide construction and service operations there is a
risk that legal claims may arise in the future for deliveries where revenue has been
recognized in the past. Legal and tax claims are assessed on a regular basis.
Tax Claim in Brazil
The tax authorities in the state of Parana in Brazil has claimed the Aker Solutions
company in Brazil for approximately NOK 740 million (including penalties and
interests), stating that the conditions for the export exemption from ICMS are not
fulfilled. ICMS is a value added tax on sales and services related to the movement
of goods. It is managements’ opinion that, based on current law and practice, a
successful outcome in the administrative appeal system is regarded as likely.
The claim is regarded as a contingent liability since the possible outcome will be
confirmed by the occurrence of an uncertain future event (a potential court decision).
No provision has been made for this contingent liability since a cash outflow is not
considered probable, nor is it possible to establish a reliable estimate.
There are no other significant contingent liabilities where disclosure is required as
of December 31, 2016 (2015: nil).
See note 5 for more information about restructuring costs
See note 19 for more information about operating leases
See note 3 for more information about advances and amounts due to customers for
construction and service contracts
See note 30 for more information about receivables to related parties
Note 21 Trade and Other Payables
Financial Reporting PrinciplesTrade and other payables are recognized at the original invoiced
amount. The invoiced amount is considered to be approximately
equal to the value derived if the amortized cost method would
have been used.
Trade and Other Payables
Amounts in NOK million 2016 2015
Trade creditors1 964 1,517
Trade creditors, related parties 67 153
Amount due to customers for construction work 98 1,037
Advances received from customers 2,411 4,958
Accrued operating and financial costs 2,183 2,435
Deferred revenue for service contracts 190 162
Public duties and taxes 710 688
Other current liabilities 1,380 1,273
Total 8,002 12,222
1) Trade creditors include NOK 2 million (NOK 13 million in 2015) due after one year.

Page 71
Back to index
Consolidated Financial Statements
Note 22 Financial Risk Management and Exposures The objective of financial risk management is to manage and control financial risk exposures to increase the predictability of earnings and minimize potential adverse effects on the group’s financial performance. Aker Solutions uses derivatives to hedge currency risk exposures and aims to apply hedge accounting whenever possible in order to reduce the volatility resulting from the periodic market-to-market revaluation of financial instruments in the income statement. The company is also exposed to credit risk, liquidity risk
and price risk.
Risk management of financial risks is performed in every project and is the
responsi bility of the project manager. They cooperate with local finance managers
and corporate treasury to identify, evaluate and hedge financial risks under policies
approved by the board of directors. The group has well-established procedures for
overall risk management, as well as policies for the use of derivatives and financial
investments. There have not been any changes in these policies during the year.
Currency RiskThe group operates internationally and is exposed to currency risk on commercial trans-
actions, assets and liabilities and net investments in foreign operations. Commercial
transactions and assets and liabilities are subject to currency risk when payments
are denominated in a currency other than the respective functional currency of the
subsidiary. The group’s exposure to currency risk is primarily related to USD, EUR
and GBP. The group’s primary translation risk is related to USD, EUR, GBP and BRL.
Use of Currency Derivatives
The Aker Solutions’ policy requires business units to mitigate currency exposure
in all projects. Corporate treasury manages internal exposures by entering
into forward contracts or currency options with the financial market place. The
Aker Solutions group has a large number of contracts involving foreign currency
exposures and the currency risk policy has been well established for many years.
For segment reporting purposes, each business unit designates
all foreign currency hedge contracts with corporate treasury as
cashflow hedges or as hedges of separated embedded deriva-
tives. Corporate treasury enters into external foreign exchange
contracts separately for revenue and cost exposure. More than
80 percent of the value of the hedging instruments either qualify
for hedge accounting or are hedges of separated embedded
derivatives. Corporate treasury monitors hedges not qualifying
for hedge accounting and disqualification effects are reported
in the “other” segment. Currency exposure from investments in
foreign currencies is only hedged when specifically instructed
by management.
Exposure to Currency Risk
Corporate treasury is allowed to hold positions within an approved
trading mandate. The net exposure as of December 31 is shown
in the following table. Estimated forecasted cashflows in the
table are calculated based on the group’s hedge transactions
through corporate treasury, as these are considered to be the
best estimate of the currency exposure. The net exposure is
closely monitored by corporate treasury and reported on a daily
basis to management.
Note 22 continues on next page

Page 72
Back to index
Consolidated Financial Statements
2016 2015
Amounts in NOK million USD EUR GBP USD EUR GBP
Bank deposits -64 -40 -51 -23 -32 -79
Intercompany loans -76 -104 -1 -102 -91 28
Balance sheet exposure -140 -144 -52 -125 -123 -51
Forecasted receipts from customers 721 29 74 1,295 55 127
Forecasted payments to vendors -262 -99 -178 -331 -166 -305
Cashflow exposure 459 -70 -104 964 -111 -178
Forward exchange contracts -321 200 156 -837 236 229
Net exposure -2 -14 0 2 2 0
The currency exposure was within the trading mandate as of December 31, 2016
and 2015.
Sensitivity Analysis - Fair Value of Financial Instruments The impact on profit and equity from a 15 percent strengthening of EUR, USD and GBP against other currencies is shown below. A 15 percent weakening would have had the equal, but opposite effect. This sensitivity analysis shows the impact on financial instruments denominated in a foreign currency per December 31 and assumes that all other variables, in particular interest rates, remain constant. The analysis does not include the effect on future transactions (not invoiced as of December 31) or any effect from translation of subsidiaries.
The primary currency risk is the risk of reduced competitiveness
abroad in the case of a strengthened NOK. This risk relates to
future commercial contracts and is not included in the sensitivity
analysis.
Sensitivity Analysis - Currency Translation of Subsidiaries
A change in foreign currency rates will also impact the income
and balance sheet when translating the group companies into
the presentation currency which is NOK. The effect of change
in the various currencies will impact the group accounts in the
following manner:
Regulatory Restrictions
Different regulatory rules may put restrictions on free flow of cash
in some jurisdictions, including Angola and Nigeria. Although the
currency in these countries may not be fully convertible with other
currencies, mitigating actions have been taken in order to minimize
the currency exposure. These include multilateral agreements with
Note 22 continues on next page
2016 2015
Amounts in NOK million Profit (loss) before tax
Equity increase (decrease)
Profit (loss) before tax
Equity increase (decrease)
USD - 15 percent strengthening -186 -414 -437 -972
EUR - 15 percent strengthening 47 91 120 194
GBP - 15 percent strengthening 59 132 38 303
2016
Amounts in NOK millionRevenue increase
(decrease)
EBIT increase
(decrease)
Profit (loss) before
tax
Equity increase
(decrease)
USD - 15 percent strengthening
472 28 45 476
EUR - 15 percent strengthening
0 3 3 223
GBP - 15 percent strengthening
624 -21 -16 226
BRL - 15 percent strengthening
252 17 -7 165

Page 73
Back to index
Consolidated Financial Statements
banks, customers and vendors on timing of payments to minimize the exposed cash
balance. Aker Solutions will always strive to minimize cash balances and maximize
cash available for treasury. The cash in these countries amounted to NOK 94 million
as of December 31, 2016 compared to NOK 174 million in the prior year.
Interest Rate RiskBorrowings issued at variable rates expose the group to cashflow interest rate risk.
Borrowings issued at fixed rates do not affect profit and loss when held to maturity,
as these borrowings are measured at amortized cost.
As the group has no significant interest-bearing operating assets, operating
income and operating cashflow are substantially independent of changes in market
interest rates. At year-end, approximately 80 percent of NOK 2,500 million in bonds
was fixed for the duration of the bonds through interest rate swaps.
An increase of 100 basis points in interest rates during 2016 would have in-
creased (decreased) equity and profit and loss by the amounts shown on the table
below. This analysis assumes that all other variables, in particular foreign currency
rates, remain constant.
Interest Rates SensitivityA decrease of 100 basis points in interest rates during 2016 would have had the
equal but opposite effect on the amounts, on the basis that all other variables
remain constant.
Credit RiskCredit risk is the risk of financial losses if a customer or
counterp arty to financial receivables and financial instruments
fails to meet contractual obligations.
Investment Securities and Derivatives
Investment securities and derivatives are only traded against
approved banks. All approved banks are participants in the
Aker Solutions loan syndicate and have investment grade ratings.
Credit risk related to investment securities and derivatives is there-
fore considered to be insignificant.
Trade and Interest-Bearing Receivables
Assessment of credit risk related to customers and subcontractors
is an important requirement in the bid phase and throughout the
contract period. Such assessments are based on credit ratings,
income statement and balance sheet reviews and using credit
assessment tools available (e.g. Dun & Bradstreet). Revenues
are mainly related to large and long-term projects closely followed
up in terms of payments up front and in accordance with agreed
milestones. Normally, lack of payment is due to disagreements
related to project deliveries and is solved together with the
customer.
The credit risk has generally increased during the year
due to the downturn in the market. The majority of the customers
are highly rated oil companies where the credit risk is considered
to be limited. Risk related to lower rated companies is monitored
closely. The maximum exposure to credit risk at the reporting date
equals the book value of each category of financial assets. The
group does not hold collateral as security.
Note 22 continues on next page
2016 2015
Amounts in NOK million Profit (loss) before tax
Equity increase (decrease)1
Profit (loss) before tax
Equity increase (decrease)1
Interest on cash and cash equivalents 30 0 28 0
Interest on borrowings -41 0 -37 0
Effect of interest rate swap 20 21 20 40
Cashflow sensitivity (net) 10 21 11 40
1) Not including tax effect on hedge reserve or effects to equity that follow directly from the effects to profit and loss.

Page 74
Back to index
Consolidated Financial Statements
Liquidity RiskLiquidity risk is the risk that the group is unable to meet the obligations associated
with its financial liabilities. The group’s approach to managing liquidity is to ensure,
as far as possible, that it will always have sufficient liquidity reserves to meet its
liabilities when due.
Prudent liquidity risk management includes maintaining sufficient cash, the availability
of funding from an adequate amount of committed credit facilities and the ability
to close out market positions. Management monitors rolling weekly and monthly
forecasts of the group’s liquidity reserve on the basis of expected cashflow. Due
to the dynamic nature of the underlying businesses, corporate treasury maintains
flexibility in funding by maintaining availability under committed credit lines.
Note 22 continues on next page

Page 75
Back to index
Consolidated Financial Statements
Amounts in NOK million Book value Total cashflow1 6 months and less 6-12 months 1-2 years 2-5 years More than 5 years
Borrowings 3,954 4,506 1,651 696 552 1,162 445
Net derivative financial instruments 975 975 871 39 38 27 0
Trade and other payables 8,002 8,002 7,545 313 144 0 0
Total liabilities 12,930 13,483 10,067 1,048 734 1,188 445
Financial guarantees 8,824 1,547 280 225 2,474 4,298
Amounts in NOK million Book value Total cashflow1 6 months and less 6-12 months 1-2 years 2-5 years More than 5 years
Borrowings 3,698 4,331 168 592 1,701 1,608 262
Net derivative financial instruments 1,700 1,700 1,012 257 350 82 0
Trade and other payables 12,222 12,222 9,166 1,757 1,300 0 0
Total liabilities 17,620 18,253 10,345 2,605 3,351 1,690 262
Financial guarantees 6,913 636 486 724 1,586 3,481
2016
2015
Financial Liabilities and the Period in Which They Mature
1) Nominal currency value including interest.
Note 22 continues on next page

Page 76
Back to index
Consolidated Financial Statements
Cash Pool Arrangements
The group policy for the purpose of optimizing availability and flexibility of cash
within the group is to operate centrally managed cash pooling arrangements. Such
arrangements are either organized with a bank as a service provider, or as a part
of the operation of corporate treasury. An important condition for the participants
(business units) in such cash pooling arrangements is that the group as an owner
of such pools is financially viable and is able to prove its capability to service its
obligations concerning repayment of any net deposits made by business units. The
group policy is not applied in countries where local laws prohibit international cash
pool arrangements.
Price RiskThe group is exposed to fluctuations in market prices both in the investment port-
folio and in the operating businesses related to individual contracts. The units are
exposed to changes in market price for raw materials, equipment and development
in wages. This is managed in the bid process by locking in committed prices from
vendors as basis for offers to customers or through escalation clauses with customers.
GuaranteesThe group has provided the following guarantees on behalf of wholly owned
subsidiaries as of December 31 (all obligations are per date of issue):
n Non-financial parent company guarantees related to project performance on
behalf of group companies were NOK 45 billion (NOK 65 billion in 2015)
n Financial parent company indemnity guarantees for fulfillment of lease obligations,
credits and loans were NOK 4.5 billion (NOK 2.5 billion in 2015)
n Financial guarantees including counter guarantees for bank/surety bonds and
guarantees for pension obligations to employees were NOK 5.3 billion (NOK 4.4
billion in 2015)
Guarantee on Behalf of Akastor
Aker Solutions was demerged from Akastor in 2014, and parties
in a demerger have joint liability according to Norwegian law. If
an obligation that arose prior to the completion of the demerger
is not met by either party, the other party will have secondary
joint liability for such obligation. This statutory liability is unlimited
in time, but is limited in amount. The remaining value of the
financial guarantees where Aker Solutions has a secondary joint
liability was NOK 3 billion per December 31, 2016 compared to
NOK 3.6 billion per December 31, 2015.
See note 14 for more information about trade and other receivables
See note 15 for more information about cash and available credit facility
See note 17 for more information about borrowings
See note 21 for more information about trade and other payables
See note 24 for more information about derivatives

Page 77
Back to index
Consolidated Financial Statements
The objective of Aker Solutions’ capital management policy is to optimize the
capital structure to ensure sufficient and timely funding over time to finance its
activities at the lowest cost, in addition to investing in projects and businesses
which will increase the company’s return on capital employed over time.
Investment PolicyAker Solutions’ capital management is based on a rigorous investment selection
process which considers not only Aker Solutions’ weighted average cost of capital
and strategic orientation but also external factors such as market expectations and
extrinsic risk factors. This selection process is coupled with a centralized approval
process for all capital expenditures to be incurred by the group.
Funding PolicyLiquidity PlanningAker Solutions has a strong focus on its liquidity in order to meet its working capital
needs short-term and to ensure solvency for its financial obligations long-term. The
group’s internal guideline is to have a minimum liquidity reserve of NOK 3 billion,
including cash and undrawn committed credit facilities. As per December 31, 2016
this liquidity reserve amounted to NOK 7.5 billion and was composed of an undrawn
committed credit facility and bank deposits.
Funding of OperationsAker Solutions’ group funding policy states that all operating units will be funded
through corporate treasury. This ensures optimal availability and transfer of cash
within the group, better control of the group’s overall debt as well as discounted
funding for its operations. The group policy is not applied in countries where local
laws prohibit international cash pool arrangements, such as Brazil.
Aker Solutions emphasizes financial flexibility and steers its capital structure
accordingly to ensure a balance between liquidity risk and refinancing risk. In this
perspective, loans and other external borrowings are to be renegotiated well in
advance of their due date and the average term to maturity for
existing loans is to be at a minimum of two years.
Aker Solutions aims to have a diversified selection of
funding sources in order to reach the lowest possible cost of
capital. These funding sources include:
n the use of banks based on syndicated credit facilities or bilateral
agreements
n the issue of debt instruments on the Norwegian capital market
n the issue of debt instruments in foreign capital markets
Debt CovenantsAs per end of 2016, the capital structure of Aker Solutions was 37
percent from bank and export credit agency (ECA) debt and 63
percent from bonds issued in the Norwegian market. The group
monitors capital on the basis of gearing and interest coverage
ratios. The reported ratios are well within the requirements in the
loan agreements as shown in the table below.
Aker Solutions has the following debt covenants for the
revolving facility:n The company’s gearing ratio shall not exceed 3.5 and is calcu-
lated from the net interest-bearing debt to the adjusted EBITDA
n The company’s interest coverage ratio must not be less than
3.5, calculated from the adjusted EBITDA to net finance cost
Aker Solutions has the following debt covenant for the bonds:n The company’s gearing ratio shall not exceed 4.0 and is calculat-
ed from the gross interest bearing debt to the adjusted EBITDA
Note 23 continues on next page
Note 23 Capital Management

Page 78
Back to index
Consolidated Financial Statements
These guidelines aim to maintain a strong financial position for Aker Solutions, which
enables the company to comply with its covenants on existing debt and to maintain
satisfactory external credit rating to ensure reliable access to capital over time.
Gearing and Interest Coverage Ratios at December 31
See note 12 for more information about financial risk management
See note 17 for more information about borrowings
See note 24 for more information about interest rate derivatives
See note 25 for more information about financial assets and liabilities
Amounts in NOK million 2016 2015
Gearing ratios
Non-current interest-bearing debt 1,844 3,137
Current interest-bearing debt 2,110 561
Gross interest-bearing debt 3,954 3,698
Cash and cash equivalent -2,480 -3,862
Net interest-bearing debt 1,474 -164
EBITDA (Operating income before depreciation, amortization and impairment) 1,929 1,841
Restructuring and other special items as defined in the loan agreement 180 514
Adjusted EBITDA 2,109 2,355
Gross interest-bearing debt/adjusted EBITDA 1.9 1.6
Net interest-bearing debt/adjusted EBITDA 0.7 -0.1
Interest coverage
Adjusted EBITDA 2,109 2,355
Net interest expense as defined in the loan agreement 392 254
Adjusted EBITDA/Net finance cost 5.4 9.3
Note 24 Derivative Financial Instruments
The group has future cashflows to be settled in a foreign currency, and forward contracts are the most commonly used derivative to hedge such exposure. The policy states that all foreign exchange exposure is hedged, of which at least 80 percent shall be done back-to-back and qualify for hedge accounting or be hedges of separated embedded derivatives. The group may also use currency options for cashflows that are not firm and has certain interest rate swaps.
Financial Reporting PrinciplesCashflow Hedges of Foreign Currency
The hedged transactions in foreign currency subject to cashflow
hedge accounting are highly probable future transactions
expected to occur at various dates during the next one to four
years, depending on progress in the projects and firm commit-
ments. The derivatives are recognized initially and subsequently at
fair value in the balance sheet, and the effective portion of changes
in the fair value is recognized in other comprehensive income as a
hedge reserve.
Some hedged transactions do not qualify for hedge
accounting under IFRS, primarily because internal hedge trans-
actions are grouped and netted before external hedge trans-
actions are established. Both the derivatives and the foreign
exchange effects of the hedged receivable or payable will be
reported as financial income and expenses with corresponding
and opposite effects. The net foreign exchange gain or loss
therefore reflects the difference in timing between these two.
Note 24 continues on next page

Page 79
Back to index
Consolidated Financial Statements
Derivatives not qualifying for hedge accounting include derivatives used by
corporate treasury to hedge the residual exposure of the group as part of its risk
mandate. As of year-end 2016, these hedging instruments only include currency
forwards, currency options, interest swaps and foreign exchange swaps.
Hedge accounting is discontinued with immediate recognition in finance
income and expenses in the income statement when the hedge no longer qualifies
for hedge accounting, for example upon sale, expiration, termination or when a
forecasted transaction is no longer highly probable. The derivative financial instruments
are classified as current assets or liabilities as they are part of the operating cycle.
Foreign Currency as Embedded Derivatives
Embedded derivatives may exist in contracts with a currency other than the currency of
the contracting partners. The embedded derivative will under certain circumstances be
separated and recognized at fair value in the balance sheet and changes recognized in
the income statement. These entries will result in corresponding and opposite effects
compared to the hedging instrument. Aker Solutions applies the following separation
criteria for embedded derivatives. The embedded derivative needs to be separated if
the agreed payment is in a currency different from any of the major contract parties’
own functional currency, or that the contract currency is not considered to be
commonly used for the relevant economic environment defined as the countries
involved in the cross-border transaction.
Cashflow Hedges of Interest Rates
Hedge accounting is applied using the cashflow model for interest rate swaps
which means that gains and losses from floating to fixed interest rates as of
December 31, 2016 are recognized in the hedging reserve in equity and will be
continuesly released to the income statement until the bank borrowings are repaid.
This is achieved based on the periodic market-to-market revaluation of the interest
rate swaps whose fair value tends to reach zero upon maturity.
Note 24 continues on next page
Fair Values and Maturity The following table presents the fair value of the derivatives and
a maturity analysis of the derivatives undiscounted cashflows.
Given the Aker Solutions hedging policy and the assumption
that projects are cash neutral, this table also indicates when the
cashflows related to project expenses are expected to impact
profit and loss. The majority of project revenues are recognized in
accordance with IAS 11 using the stage of completion method.
This may result in differences between cashflow and revenue
recognition.

Page 80
Back to index
Consolidated Financial Statements
Amounts in NOK million Instruments at fair value Total cashflow1 6 months or less 6-12 months 1-2 years 2-5 years Over 5 years
Assets
Cashflow hedges 106 106 74 21 11 0 0
Fair value adjustments to hedged assets2 -58 -58 -41 -11 -6 0 0
Embedded derivatives in ordinary commercial contracts 14 14 4 3 6 1 0
Financial instruments not hedge accounted 32 32 32 0 0 0 0
Total financial instrument assets 94 94 70 13 11 1 0
Liabilities
Cashflow hedges -957 -957 -852 -50 -49 -6 0
Fair value adjustments to hedged liabilities2 -63 -63 -61 -2 0 0 0
Embedded derivatives in ordinary commercial contracts 0 0 0 0 0 0 0
Financial instruments not hedge accounted -16 -16 -16 0 0 0 0
Total forward foreign exchange contracts -1,036 -1,036 -929 -52 -49 -6 0
Cashflow hedges interest rate instruments -33 -33 -11 0 0 -21 0
Total financial instrument liabilities -1,069 -1,069 -941 -52 -49 -27 0
Net financial instruments -975 -975 -871 -39 -38 -27 0
2016
Note 24 continues on next page
1) Cashflows from matured derivatives are translated to NOK using the exchange rates on the balance sheet date.
2) Fair value of settled derivatives not yet booked in the income statement are recognized in balance sheet and will be reclassified to the income statement over the next years as the projects progress.

Page 81
Back to index
Consolidated Financial Statements
Amounts in NOK million Instruments at fair value Total cashflow1 6 months or less 6-12 months 1-2 years 2-5 years Over 5 years
Assets
Cashflow hedges 536 536 263 110 153 11 0
Fair value adjustments to hedged assets2 624 624 49 232 290 52 0
Embedded derivatives in ordinary commercial contracts 66 66 44 11 8 2 0
Currency derivatives not hedge accounted 70 70 66 0 4 0 0
Total financial instrument assets 1,295 1,295 422 354 455 65 0
Liabilities
Cashflow hedges -2,351 -2,351 -923 -592 -726 -110 0
Fair value adjustments to hedged liabilities2 -555 -555 -496 -19 -35 -5 0
Embedded derivatives in ordinary commercial contracts 0 0 0 0 0 0 0
Currency derivatives not hedge accounted -15 -15 -15 0 0 0 0
Total forward foreign exchange contracts -2,920 -2,920 -1,434 -611 -761 -114 0
Cashflow hedges interest rate instruments -75 -75 0 0 -43 -32 0
Total financial instrument liabilities -2,995 -2,995 -1,434 -611 -804 -146 0
Net financial instruments -1,700 -1,700 -1,012 -257 -350 -82 0
2015
Note 24 continues on next page
1) Cashflows from matured derivatives are translated to NOK using the exchange rates on the balance sheet date.
2) Fair value of settled derivatives not yet booked in the income statement are recognized in balance sheet and will be reclassified to the income statement over the next years as the projects progress.

Page 82
Back to index
Consolidated Financial Statements
2016 2015
Amounts in NOK millionFair value of all
hedging instrumentsRecognizedin
profit and lossDeferred in equity
(the hedge reserve)Fair value of all
hedging instrumentsRecognized in profit and loss
Deferred in equity (the hedge reserve)
Forward exchange contracts (cashflow hedges) -852 -615 -236 -1,814 -819 -995
Interest rate swaps -36 0 -36 -75 0 -75
Total -887 -615 -272 -1,889 -819 -1,070
Unsettled HedgesThe table below shows the unsettled cashflow hedges’ impact on profit and loss and equity (not adjusted for tax).
The purpose of the hedging instrument is to secure a situation where the hedged item and the hedging instrument together represent a predetermined value independent of fluctuations of exchange rates. Revenue and expenses on the underlying construction contracts are recognized in the income statement in accordance with progress. Conse-quently, negative NOK 615 million (negative NOK 819 million in 2015) of the value of the forward contracts have already impacted the income statement indirectly as revenues and expenses are recognized based on updated forecasts and progress. The negative NOK 236 million (negative NOK 995 million in 2015) that are currently recorded directly in the hedging reserve, will be reclassified to the income statement over the next years. The value of the interest swaps is attributable to changes in the interest swap curve for Norwegian Kroner during the period from inception of the hedge to the balance sheet date, excluding accrued interest rates of the swaps, tax and deferred settlements related to matured instruments.
Interest Rate SwapsAker Solutions has two bonds totalling NOK 2,500 million at floating interest rates out of which NOK 2,000 million are swapped to fixed interest. Floating interest is mainly tied to Inter-bank offered rates (NIBOR for NOK and LIBOR for other currencies).
See note 17 for more information about borrowings
See note 25 for more information about financial assets and liabilities

Page 83
Back to index
Consolidated Financial Statements
Financial Reporting PrinciplesFinancial assets and liabilities in the group consist of investments in other companies,
trade and other receivables, interest-bearing receivables, cash and cash equivalents,
trade and other payables, interest-bearing borrowings and equity. Financial assets and
liabilities are offset when there is a legally enforceable right to offset the recognized
amounts and there is an intention to settle on a net basis or realize the asset and settle
the liability simultaneously.
The Fair Value HierarchyFinancial instruments measured at fair value are classified by the levels in the fair
value hierarchy. All other financial instruments are classified by the main group of
instruments as defined in IAS 39. Both carrying amount and fair value are shown
for all financial instruments.
For financial instruments measured at fair value, the levels in the fair
value hierarchy are:
n Level 1: Fair values are based on prices quoted in an active market for identical
assets or liabilities
n Level 2: Fair values are based on price input other than quoted prices. Such prices
are derived from observable market transactions in an active market for identical
assets or liabilities. Level 2 includes currency or interest derivatives and interest
bonds, typically when the group uses forward prices on foreign exchange rates
or interest rates as inputs to valuation models
n Level 3: Fair values are based on unobservable input, mainly based on internal
assumptions used in the absence of quoted prices from an active market or other
observable price inputs
Note 25 Financial Assets and Liabilities
Note 25 continues on next page

Page 84
Back to index
Consolidated Financial Statements
Carrying value Fair value
Amounts in NOK millionFair value -
hedging instrumentsFinancial
assets at FVTPL1Loans and
receivablesAvailable
for saleFinancial
liabilities at FVTPL1Other financial
liabilities Total Level 1 Level 2 Level 3 Total
Other investments2 0 0 0 75 0 0 75 61 0 14 75
Non-current receivables 0 0 90 0 0 0 90 0 0 0 0
Trade and other receivables 0 0 7,398 0 0 0 7,398 0 0 0 0
Forward foreign exchange contract 93 0 0 0 0 0 93 0 93 0 93
Current interest-bearing receivables 0 87 351 0 0 0 437 87 0 0 87
Cash and cash equivalents 0 0 2,480 0 0 0 2,480 0 0 0 0
Financial assets 93 87 10,318 75 0 0 10,574 148 93 14 256
Non-current borrowings3 0 0 0 0 0 -1,844 -1,844 0 -1,856 0 -1,856
Other non-current liabilities 0 0 0 0 0 -17 -17 0 0 -17 -17
Current borrowings3 0 0 0 0 0 -2,110 -2,110 0 -2,128 0 -2,128
Deferred consideration 0 0 0 0 -76 0 -76 0 0 -76 -76
Trade and other payables 0 0 0 0 0 -8,002 -8,002 0 0 0 0
Forward foreign exchange contracts -1,036 0 0 0 0 0 -1,036 0 -1,036 0 -1,036
Interest rate instruments -33 0 0 0 0 0 -33 0 -33 0 -33
Financial liabilities -1,069 0 0 0 -76 -11,972 -13,117 0 -5,053 -93 -5,146
Financial Instruments as of December 31, 2016
1) FVTPL is short for fair value through profit and loss.2) All available for sale investments are designated as such upon initial recognition. Investments in level 1 consist of listed shared with quoted market prices, and investments in level 3 are shares where fair value cannot be measured reliably as the financial instrument is not
traded in an active market. The best estimate of fair value is initial purchase price.3) Fair value is quoted prices for the bonds noted on the Oslo Stock Exchange.
Note 25 continues on next page

Page 85
Back to index
Consolidated Financial Statements
Carrying value Fair value
Amounts in NOK millionFair value -
hedging instrumentsFinancial
assets at FVTPL1Loans and
receivablesAvailable
for saleFinancial
liabilities at FVTPL1Other financial
liabilities Total Level 1 Level 2 Level 3 Total
Other investments2 0 0 0 13 0 0 13 0 0 13 13
Non-current receivables 0 0 23 0 0 0 23 0 0 0 0
Trade and other receivables 0 0 10,985 0 0 0 10,985 0 0 0 0
Forward foreign exchange contract 1,295 0 0 0 0 0 1,295 0 1,295 0 1,295
Current interest-bearing receivables 0 117 0 0 0 0 117 117 0 0 117
Cash and cash equivalents 0 0 3,862 0 0 0 3,862 0 0 0 0
Financial assets 1,295 117 14,870 13 0 0 16,295 117 1,295 13 1,425
Non-current borrowings3 0 0 0 0 0 -3,137 -3,137 0 -3,076 0 -3,076
Other non-current liabilities 0 0 0 0 0 -10 -10 0 0 -10 -10
Current borrowings3 0 0 0 0 0 -561 -561 0 -561 0 -561
Deferred consideration 0 0 0 0 -16 0 -16 0 0 -16 -16
Trade and other payables 0 0 0 0 0 -12,222 -12,222 0 0 0 0
Forward foreign exchange contracts -2,916 0 0 0 0 0 -2,916 0 -2,916 0 -2,916
Interest rate instruments -78 0 0 0 0 0 -78 0 -78 0 -78
Financial liabilities -2,995 0 0 0 -16 -15,930 -18,941 0 -6,632 -26 -6,658
Financial Instruments as of December 31, 2015
1) FVTPL is short for fair value through profit and loss.2) All available for sale investments are designated as such upon initial recognition. Investments in level 1 consist of listed shared with quoted market prices, and investments in level 3 are shares where fair value cannot be measured reliably as the financial instrument is not
traded in an active market. The best estimate of fair value is initial purchase price.3) Fair value is quoted prices for the bonds noted on the Oslo Stock Exchange.
See note 14 for more information about trade and other receivables
See note 15 for more information about cash and cash equivalents
See note 17 for more information about borrowings
See note 21 for more information about trade and other payables
See note 29 for more information about other investments

Page 86
Back to index
Consolidated Financial Statements
Aker Solutions acquired C.S.E. Mecânica e Instrumentacâo Ltda (C.S.E.) on December 5, 2016 to gain access to Brazil’s growing market for servicing existing oil and gas fields. C.S.E. has approximately 2,300 employees and provides maintenance, assembly, commissioning and crane operation services at offshore and onshore facilities. The acquired business is part of the Field Design operating segment.
Financial Reporting PrinciplesThe fair value of the acquired assets and liabilities are included in the consolidated
financial statement from the date control is obtained. Goodwill is the difference
between the fair value of the consideration and the net assets acquired. When Aker
Solutions enters into put/call or forward contracts to acquire the remaining shares
in a subsidiary in cash as part of a business combination, the non-controlling inter-
ests (NCI) are derecognised and a liability is recognized for the present value of the
contingent consideration. Non-controlling interests and profits attributable to the
NCI are presented as attributable to Aker Solutions. The contingent consideration
is subsequently recognized at fair value and Aker Solutions has made an accounting
policy choice to recognize changes in the fair value of the liability in equity. Transaction
costs related to business combinations are expensed as incurred.
Judgments and EstimatesJudgment has been applied when assessing the fair value of the acquired assets
and liabilities (including WACC) and when determining the amortization period for
excess values. Various valuation techniques has been used in the purchase price
allocation, including a market approach and cost replacement approach for property,
plant and equipment and the excess earnings method for intangible assets. Manage-
ment judgment has also been applied when valuing the contingent consideration which
is based on estimates of future profits.
The AcquisitionOn October 20, 2016 Aker Solutions entered into an agreement
to acquire 70 percent of shares and voting rights of Brazilian
C.S.E Mecânica e Instrumentacâo Ltda ("C.S.E"). The acquisition
gives Aker Solutions access to Brazil's growing market for servicing
existing oil and gas fields. C.S.E had revenue of BRL 322 million
in 2015 and provides maintenance, assembly, commissioning
and crane operation services at offshore and onshore facilities.
The company headquartered in Pinhais in the Parana state has
approximately 2,300 employees primarily located at five service
facilities covering the country's different oil and gas basins.
Put and Call OptionsAker Solutions has a call option for all of the remaining 30
percent shares executable in 2019 while the sellers have a put
option for all of the remaining 30 percent shares exercisable in
2021. It is assumed that the call option will be exercised in 2019.
The cash payment upon exercising the options will be calculated
based on the 12 months EBITDA measured at a specific date in
2019. The contingent consideration is measured at present value
at the date of the aquisition by using the forcasted 12-month
EBITDA at the exercise-date in 2019 and a discount rate equal
to the implied internal rate of return in the business case for the
acquisition.
Purchase Price AllocationThe cost price of the acquisition includes the present value
of the contingent consideration at the time of the business
combination of NOK 67 million. Transaction costs related to
the acquisition of NOK 7 million have been recognised in other
Note 26 Acquisition of Subsidiaries
Note 26 continues on next page

Page 87
Back to index
Consolidated Financial Statements
Amounts in NOK million
Property, plant and equipment 77
Intangible assets 37
Trade receivables 82
Other current operating assets 103
Cash and cash equivalents 11
Deferred tax liabilities -23
Current operating liabilities -114
Non-current liabilities -1
Net assets acquired at fair value 172
Goodwill 117
Fair value acquired 288
Total consideration 288
Contingent consideration -67
Net cash consideration 221
Cash and cash equivalents acquired -11
Net cash outflow 210
Operating revenue in acquired subsidiary after acquisition 44
Profit for the period in acquired subsidiaries after acquisition -2
The trade receivables are estimated to have a fair value equal
to their gross carrying amount and hence no provision has been
made for uncollectable receivables. The goodwill relating to
C.S.E has not been tested for impairment in 2016 since the
acquisition and fair value assessment of the assets occurred
late in the year (December 5).
The information disclosed in the table is preliminary and
may be revised if new information related to the fair value of
acquired assets and liabilities becomes available within one
year of the acquisition date.
See note 28 for more information about subsidiaries
operating expenses in the income statement. Goodwill resulting from the transaction
is mainly attributable to the assembled workforce and expected synergies. The
report from the external valuation expert has not been finalized at the time of this
report, and the purchase price allocation presented below is preliminary.

Page 88
Back to index
Consolidated Financial Statements
Note 27 Acquisition of Non-Controlling Interest (NCI)
Acquisition of NCIIn October 2016, Aker Solutions increased its ownership in Aker Powergas Pvt Ltd
from 68.1 percent to 88.8 percent. The increase was structured through a treasury-
share buy-back in Aker Powergas Pvt Ltd from its NCIs with subsequent deletion of the
treasury shares. A change in the ownership without losing control is accounted for
as an equity transaction and no gain or loss is recognized in the income statement.
Prior to the share buy-back, the NCIs received a dividend payment of NOK 34
million (including taxes of NOK 6 million).
Impact on EquityThe carrying amount of Aker Powergas Pvt Ltd net assets in the consolidated financial
statements at the date of the acquisition was NOK 788 million. The group recognized
a decrease of NCI of NOK 184 million representing the book value of the net assets
related to the share buy-back and subsequent deletion of shares. The difference
between the paid consideration and taxes to the book values resulted in a decrease
of retained earnings of NOK 17 million and NCI of NOK 2 million as shown below.
Amounts in NOK million TotalAllocated
to majorityAllocated to
remaining NCI
Book value of the NCI acquired 184 164 20
Consideration paid to NCI -165 -147 -18
Tax payable on buyback of shares from NCI -38 -34 -4
Paid consideration and taxes in excess of book value -19 -17 -2
Book value of acquired NCI 0 -184
Re-allocation between majority and NCI -40 40
Net decrease of equity -57 -146
An amount of NOK 40 million has been re-allocated from
majority’s equity to the NCI in 2016, representing the NCI’s
share of equity of a subsidiary fully owned by Aker Powergas
Pvt Ltd. The share of this subsidiary has not previously been
allocated to the NCI. Comparative figures have not been
restated as the effect has not been considered material.
See note 28 for more information about NCIs

Page 89
Back to index
Consolidated Financial Statements
Financial Reporting PrinciplesThe consolidated statements include all entities controlled by
Aker Solutions ASA. Control exists when the company has the
power, directly or indirectly, to govern the financial and operating
policies of an entity so as to obtain benefits from its activities.
The financial statements of the subsidiaries are included in the
consolidated financial statements from the date control com-
mences until the date control ceases. Non-controlling interests
(NCIs) are measured on initial recognition at their portion of fair
values, and yearly earnings are allocated to the NCI according
to their ownership interest.
SubsidiariesAker Solutions has 50 subsidiaries in 24 countries at the reporting
date. The company acquired a new subsidiary in Brazil in 2016,
C.S.E Mecânica e Instrumentacâo Ltda. One subsidiary was
sold in 2016 (Aker Solutions AB) resulting in a loss of NOK 14
million presented as other revenue. Aker Solutions AS in Norway
is the only company that individually account for more than 10
percent of the revenue in the group and is considered material.
The group holds the majority of the shares in all subsidiaries
except two, see description below. Subsidiaries fully owned or
controlled by Aker Solutions as of December 31, 2016 are listed
below. If not stated otherwise, ownership equals the percentage
of voting shares.
Note 28 Subsidiaries Company Location Country Percent
Aker Solutions Enterprises LDA Luanda Angola 49
Aker Solutions Pty Ltd Perth Australia 100
Aker Solutions Azerbaijan LLC Baku Azerbaijan 100
Aker Solutions do Brasil Ltda Curitiba Brazil 100
C.S.E. Mecânica e Instrumentacâo Ltda Curitiba Brazil 70
Aker Solutions Sdn Bhd Kuala Belait Brunei 100
Aker Solutions Canada Inc Vancouver Canada 100
Aker Solutions Asset Integrity and Mgt. Canada Inc Newfoundland Canada 100
Aker Subsea (Shenzhen) Co. Ltd Shenzhen China 100
Aker Solutions Congo SA Point-Noire Congo 100
Aker Solutions Cyprus Ltd Limassol Cyprus 100
Aker Solutions SAS Paris France 100
Aker Solutions Ghana Ltd Adabraka Ghana 90
Aker Powergas Pvt Ltd Mumbai India 88.8
Aker Powergas Subsea Pvt Ltd Mumbai India 88.8
Aker Solutions Malaysia Sdn Bhd Kuala Lumpur Malaysia 100
Aker Solutions India Sdn Bhd Kuala Lumpur Malaysia 100
Aker Solutions APAC Sdn Bhd Shah Akam Malaysia 48
Aker Solutions Umbilical Asia Pasific Sdn Bhd Kuala Lumpur Malaysia 100
Aker Engingeering Malaysia Sdn Bhd Kuala Lumpur Malaysia 90
Aker Engineering International Sdn Bhd Kuala Lumpur Malaysia 100
Aker Solutions India Services Sdn Bhd Kuala Lumpur Malaysia 100
Aker Solutions India Operations Sdn Bhd Kuala Lumpur Malaysia 100
Aker Solutions de Mexico Mexico City Mexico 100
Aker Solutions Mozambique Ltda Maputo Mozambique 100
Note 28 continues on next page

Page 90
Back to index
Consolidated Financial Statements
Company Location Country Percent
Aker Solutions BV Zoetermeer Netherlands 100
Aker Solutions Nigeria Ltd Ikoyi-Lagos Nigeria 100
Aker Solutions Holding AS Fornebu Norway 100
Aker Solutions AS Fornebu Norway 100
Aker Installation FP AS Fornebu Norway 100
Aker Solutions Russia AS Fornebu Norway 100
Benestad Solutions AS Lierskogen Norway 100
KB eDesign AS Oslo Norway 100
Aker Operations AS Stavanger Norway 100
Aker Insurance Services AS Fornebu Norway 100
Aker Solutions Middle East AS Fornebu Norway 100
Aker Process Gulf Company Ltd Al-Khobar Saudia Arabia 100
Aker Solutions Saudi Arabia Co. Limited Dhahran Saudia Arabia 100
Aker Solutions Korea Co Ltd Geoje South Korea 100
K Water AB Ørnskjøldsvik Sweden 100
Aker Solutions Tanzania Ltd Dar es Salaam Tanzania 100
Aker Solutions Ltd Maidenhead UK 100
Aker Solutions Angola Ltd Maidenhead UK 100
Enovate Systems Ltd Aberdeen UK 100
Aker Engineering & Technology Ltd London UK 100
Aker Engineering Malaysia Ltd Leeds UK 100
Aker Offshore Partner Ltd London UK 100
International Design Engineering and Services Ltd Glasgow UK 100
Aker Solutions USA Corporation Houston USA 100
Aker Solutions Inc Houston USA 100
See note 26 for more information about acquisition of subsidiaries
See note 27 for more information about acquisition of non-controlling interest
Subsidiaries where Aker Solutions does not have the Majority of SharesAker Solutions has 49 percent of the shares in Aker Solutions
Enterprises LDA in Angola and 48 percent in Aker Solutions
APAC Sdn Bhd in Malaysia. Aker Solutions has control over
relevant activities through shareholders agreements. The sub-
sidiaries are fully consolidated and the non-controlling interest
share of profit and equity is presented in the income statement
and in the balance sheet.
Material Non-Controlling Interests (NCIs)The subsidiary Aker Solutions Enterprises LDA in Luanda, Angola
has a significant non-controlling interest (51percent). The table
below summarizes the financial information for the company,
before any intra-group eliminations.
Balance sheet 2016 2015
Non-current assets 67 39
Current assets 258 123
Current liabilities -226 -203
Net assets 98 -41
NCI's share of net assets 50 -21
Income statement 2016 2015
Revenue 1,766 362
Profit 136 -50
NCI's share of profit 70 -25

Page 91
Back to index
Consolidated Financial Statements
Note 29 Other Investments
Financial Reporting PrinciplesOther investments are those entities in which the group does not have significant
influence; usually entities were the group holds less than twenty percent of the
voting power. These investments are categorized as available-for-sale investments
measured at fair value with changes (other than impairment losses) recognized in
other comprehensive income (OCI) in equity. When the investments are sold, the
accumulated gain or loss in equity is reclassified to the income statement.
Available-for-Sale Investments
Quoted market prices are used to value investments in listed companies. Invest-
ments in shares that do not have quoted market prices are measured at cost, as
fair value cannot be measured reliably.
See note 25 for more information about financial assets and liabilities
Amounts in NOK million 2016 2015
Equity securities in unlisted companies, measured at cost 14 13
Equity securities in listed companies, measured at fair value 61 0
Available-for-sale investments 75 13
Note 30 Related Parties
Financial Reporting PrinciplesRelated party relationships are defined to be entities outside
the Aker Solutions group that are under control (either directly
or indirectly), joint control or significant influence by the owners
of Aker Solutions. Related parties are in a position to enter into
transactions with the company that would potentially not be
undertaken between unrelated parties. All transactions in the
Aker Solutions group with related parties have been based on
arm’s length terms.
Related Parties of Aker SolutionsThe largest shareholder of Aker Solutions is Aker Kværner
Holding AS which is controlled by Aker ASA (70 percent). Aker
ASA is controlled by The Resource Group TRG AS, a company
controlled by Kjell Inge Røkke. The Resource Group TRG AS
is the ultimate parent company of Aker Solutions ASA. In this
respect, all entities owned by Aker ASA and entities which Kjell
Inge Røkke and his close family controls through The Resource
Group TRG AS are considered related parties to Aker Solutions.
These entities include companies like Akastor, Kvaerner
and Aker BP and are referred to as Aker entities in this note.
Non-controlling interests with significant influence are also
considered as related parties.
Note 30 continues on next page

Page 92
Back to index
Consolidated Financial Statements
Transactions and Balances with Related Parties
The Major Related Parties Transactions Aker Solutions has several transactions with related parties on a recurring basis as part
of normal business and leases property from related parties. Below is a description of
the significant related party transactions and balances in 2016.
Shared Services and Hire of Personnel
Aker Solutions entered into a five-year contract with Frontica Business Solutions
(part of Akastor) in 2016 for IT services and consultancy projects as well as business
support services within HR, finance and procurement. The contract value is about
NOK 1-1.25 billion annually. Frontica Business Solutions was sold to Cognizant
on November 28, 2016 and is no longer a related party to Aker Solutions after this
date. Akastor is also providing staffing services with an estimated value up to
NOK 1 billion annually (depending on volume) through Frontica Advantage. On
January 6, 2017 Frontica Advantage was sold to NES Global Talent in exchange for
a minority shareholding in the combined entity. Frontica Advantage is no longer a
related party to Aker Solutions after this date. The total amount charged for these
services is NOK 2.3 billion in 2016 (NOK 3.6 billion in 2015).
Lease AgreementsAker Solutions leases several of its industrial buildings in Norway including Tranby,
Amounts in NOK million 2016 2015
Income statement
Operating revenues 770 1,372
Operating costs -2,665 -4,067
Balance sheet
Trade receivables 133 121
Non-current interest-bearing receivable 32 18
Trade payables -67 -153
Current interest-bearing loan -1 -1
Egersund and Ågotnes from companies owned by Aker Maritime Finance, a company fully owned by Kjell Inge Røkke. The rent rec-ognized in 2016 was NOK 81 million. Further, Aker Solutions agreed in 2016 to sub-lease offices in Stavanger, Norway, to Aker BP.
Commercial Contracts with Kvaerner and Aker BPAker Solutions both buys from and delivers services and products to Kvaerner through sub-contractor agreements. Aker Solutions holds agreements for delivery of equipment and services to Aker BP for various oil fields offshore Norway.
OtherOther agreements with related parties include:n Aker Solutions is a party to various agreements addressing com-
mercial separation issues between Akastor and Aker Solutions as a result of the demerger in 2014, including secondary joint liability for obligations existing in Akastor at the time of the demerger
n Aker Solutions contributed NOK 70 million in 2016 (NOK 75 million in 2015) to Aker Pensjonskasse, which is a fund estab-lished by Aker to manage the retirement plan for employees and retirees in Aker Solutions and other Aker companies
n A non-current interest-bearing loan has been granted to the non-controlling interest in Aker Solutions Enterprises LDA in Luanda, Angola of NOK 32 million per December 31, 2016 (NOK 18 million in 2015)
n Aker Solutions supported the group's union representative function with NOK 510,000 (same as prior year)
See note 14 for more information about trade and other receivables
See note 19 for more information about operating leases
See note 21 for more information about trade and other payables
See note 22 for more information about guarantee commitments for Akastor

Page 93
Back to index
Consolidated Financial Statements
Note 31 Management Remuneration
Board of DirectorsThe current Board of Directors has been elected by the general meeting to serve
for an appointment period starting on April 7, 2016 and ending on the date of the
2018 annual general meeting. Fees to the board of directors are approved by the
annual general meeting. The board held 10 meetings in 2016 with an average
attendance rate of 85 percent. In addition, certain matters were processed by
way of circulation of documents.
The audit committee held seven meetings in 2016 and comprise of
Anne Drinkwater (chairperson), Stuart Ferguson and Atle Teigland.
December 31, 2016 December 31, 2015 2016 2015
Number of shares owned1 Audit Committee fees Board fees2 Audit Committee fees Board fees
Øyvind Eriksen3 Chairman 0 0 0 600,000 0 600,000
Anne Drinkwater Deputy chairman 3,500 3,500 205,000 502,500 205,000 515,000
Kjell Inge Røkke3 0 0 0 340,000 0 340,000
Stuart Ferguson 0 0 115,000 390,000 115,000 415,000
Koosum Kalyan 0 0 0 402,500 0 415,000
Atle Teigland 8,751 7,328 115,000 170,000 115,000 170,000
Åsmund Knutsen 9,028 7,842 0 170,000 0 170,000
Hilde Karlsen 5,363 5,363 0 170,000 0 170,000
Total 26,642 24,033 435,000 2,745,000 435,000 2,795,000
The fees in the table below represent what is recognized as
expenses in the income statement based on expected fees
to be approved at the annual general meeting to be held in
April 2017. The directors did not receive any other fees except
for employee elected directors who have received salary as
employees. No agreements exist which entitle the directors to
any extraordinary compensation and no board members have
loans in the company.
1) The number of shares owned covers direct ownership of Aker Solutions ASA only and does not include Øyvind Eriksen’s and Kjell Inge Røkke’s indirect ownership.2) Board fees include an allowance of NOK 12,500 per meeting per physical attendance for board members residing outside the Nordic countries.3) The fee allocated to Øyvind Eriksen will be paid to Aker ASA and the fee allocated to Kjell Inge Røkke will be paid to The Resource Group TRG AS.
Note 31 continues on next page

Page 94
Back to index
Consolidated Financial Statements
Remuneration to the Executive Management TeamThe main purpose of the executive remuneration program is to encourage a strong
and sustainable performance-based culture, which supports growth in shareholder
value. The total remuneration to executives consists of a market based salary,
standard employee benefits, a variable pay program and a long term incentive plan.
The chief executive officer (CEO) and the executive management team participate in
the standard pension and insurance schemes applicable to all employees.
The variable pay program for the CEO is based on the annual performance
of the Aker Solutions ASA share price development above the combined average
share price development of the Philadelphia Oil Service Sector Index (PHLX) and
the Oslo Stock Exchange Benchmark Index (OSEBX). No payment is due to the CEO
unless the Aker Solutions ASA share price development exceeds the development of
these indexes. The maximum achievable payment is 66.7 percent of annual base salary.
The variable pay program for the other members of the executive manage-
ment team consists of two parts and is based on the achievement of company
financial results, the executive’s individual performance objectives and conditions
on continued employment. The variable pay is earned over a period of three years
and can potentially be up to 80 percent of base salary.
n The first part of the variable pay is earned during the first year and is based on
financial results and the executive’s individual performance objectives. The maximum
value of this part is 53.34 percent of base salary. The executives are paid 50 percent
of this variable pay after the first year, and 50 percent is deferred until after the third
year
n The second part is conditional on the basis that the executive is still employed
after three years, where the executive receives an additional 50 percent of the
variable pay as earned in the first year (maximum 26.66 percent of base salary)
Aker Solutions also has a share based program only offered to ex-
ecutives that started before January 1, 2016. This part is based on
the development of the Aker Solutions share price compared to the
Philadelphia Oil Service Sector Index (“PHLX”) and the Oslo Stock
Exchange Benchmark Index (“OSEBX”) after three years. The
maximum payment is 20 percent of basic salary and is dependent
on the executive still being employed at that time.
In addition, the executive management is from time
to time granted a discretionary variable pay. There were no
discretionary payments made in 2016 or 2015. The remuneration
to the executive management team in 2016 was according to
the guidelines of the company.
Note 31 continues on next page

Page 95
Back to index
Consolidated Financial Statements
Job title Period Base salary Variable pay1 Other benefits2 Total remunerationPension benefit earned/cost to
company3
Luis Araujo Chief Executive Officer Jan. 1 - Dec. 31 7,086,154 4,821,929 183,702 12,091,785 93,463
Svein Stoknes Chief Financial Officer Jan. 1 - Dec. 31 2,632,000 996,870 24,957 3,653,827 157,569
Dean Watson Chief Operating Officer Sep. 1 - Dec. 31 1,306,667 170,738 1,221,971 2,699,376 30,005
Mark Riding Executive Vice President Strategy Jan. 1 - Dec. 31 3,441,020 1,090,485 6,530 4,538,035 793,793
Valborg Lundegaard Executive Vice President Customer Management Jan. 1 - Dec. 31 2,900,992 1,290,622 38,034 4,229,647 246,824
Svenn Ivar Fure Executive Vice President Front End Nov. 1 - Dec. 31 373,427 131,417 1,831 506,674 19,370
Egil Bøyum Executive Vice President Products Nov. 1 - Dec. 31 455,606 110,087 1,627 567,320 40,821
Knut Sandvik Executive Vice President Projects Jan. 1 - Dec. 31 2,208,985 282,509 9,965 2,501,459 245,066
David Clark Executive Vice President Services Jan. 1 - Dec. 31 2,811,522 699,854 1,369,254 4,880,630 946,920
Alan Brunnen Head of Subsea Jan. 1 - Sep. 30 4,941,975 - 3,203,889 8,145,864 378,689
Per Harald Kongelf Regional Head of Norway Jan. 1 - Sep. 4 2,429,170 - 31,339 2,460,509 146,862
Tore Sjursen Head of Operational Improvements and Risk Mgt Jan. 1 - Oct. 31 2,204,462 774,196 24,270 3,002,928 197,366
Total 32,791,979 10,368,707 6,117,369 49,278,055 3,296,747
2016
1) Based on estimated variable pay earned during the year.2) Other benefits include membership in the standard employee benefit scheme and an additional executive group life and disability insurance, housing, relocation costs, children schooling costs, phone and broadband allowance, sign-on fee and severance payment.3) Pension benefits include the standard employee pension scheme, a pension compensation scheme (for transfer from benefit to contribution scheme), a disability pension scheme and certain management compensation for various pension schemes.
Note 31 continues on next page
The remuneration of the executive management team is shown in the table below.
The salary figures below represent expensed remuneration rather than what is paid
out in the period.

Page 96
Back to index
Consolidated Financial Statements
Job title Period Base salary Variable pay1 Other benefits2 Total remunerationPension benefit earned/cost to
company3
Luis Araujo Chief Executive Officer Jan. 1 - Dec. 31 7,086,154 0 1,030,914 8,117,068 87,320
Svein Stoknes Chief Financial Officer Jan. 1 - Dec. 31 2,632,000 1,155,874 25,562 3,813,436 146,874
Tore Sjursen Head of Operational Improvements and Risk Mgt Jan. 1 - Dec. 31 2,689,142 955,543 28,206 3,672,891 186,358
Mark Riding Chief Strategic Marketing Jan. 1 - Dec. 31 3,277,306 1,396,971 415,804 5,090,081 292,502
Valborg Lundegaard Head of Engineering Jan. 1 - Dec. 31 2,546,082 1,101,578 42,264 3,689,924 224,762
Knut Sandvik Head of MMO Apr. 1 - Dec. 31 1,595,946 765,851 7,318 2,369,115 152,212
Alan Brunnen Head of Subsea Jan. 1 - Dec. 31 4,488,163 1,987,671 12,708 6,488,542 883,943
David Clark Regional Head of Europe and Africa Sep. 21 - Dec. 31 844,442 172,542 926,461 1,943,445 188,305
Per Harald Kongelf Regional Head of Norway Jan. 1 - Dec. 31 2,985,295 1,239,157 38,722 4,263,174 203,924
David Currie Regional Head of UK Jan. 1 - Jan. 8 80,485 0 368,890 449,375 3,541
Erik Wiik Regional Head of North America Jan. 1 - Mar. 4 798,459 0 197,270 995,729 61,304
Total 29,023,474 8,775,187 3,094,119 40,892,780 2,431,045
2015
1) Based on estimated variable pay expensed during the year.2) Other benefits include membership in the standard employee benefit scheme and an additional executive group life and disability insurance, housing, relocation costs, international salary compensation, children schooling costs, auto allowance, phone and broadband
allowance, sign-on fee and severance payment.3) Pension benefits include the standard employee pension scheme, a pension compensation scheme (for transfer from benefit to contribution scheme), a disability pension scheme and certain management compensation for various pension schemes.
Note 31 continues on next page

Page 97
Back to index
Consolidated Financial Statements
Share-Based PaymentsThe development of the company’s share price is an element of the variable pay program. The accrual related to the long term incentive plan is estimated with the basis of the share price at year-end. The accrual consists of variable pay programs for three preceding years. The accrual for the long term incentive plan for the executive management team was nil as of December 31, 2016 (same as previous year). The company does not offer share option programs to executives or other employees.
Share Purchase Program for ManagementAker Solutions’ share purchase program for the executive managers is based on the general program for all employees, but with a higher maximum amount. In total 18 executives and senior managers participated in the separate management share program allowing eligible managers to purchase shares for an amount up to 25 percent of their base salary with a reduction of 25 percent on the share price. To encourage a long-term commitment to the company, a three-year lock-in period was part of the arrangement. Shares purchased under the management program were settled in cash by the participants.
The managers were also offered to participate in the ordinary share purchase program for employees where the shares purchased are funded by a loan from the employer company to each partici-pant. The outstanding loan balances related to the share purchase program are reported below. There are no other loans, securities or guarantees granted nor any advances, salary payment given to the executive management team members.
Shareholding and Termination AgreementsThe company practice standard employment contracts and standard terms and conditions regarding notice period and sever-ance pay for the CEO and the members of the executive manage-ment team. The below table sets out information of notice period and severance pay as well as loans and shareholding applicable to the current executive management team.
Job title Number of shares owned Outstanding loan balances in NOK1 Notice period Severance pay
Luis Araujo Chief Executive Officer 76,898 43,500 3 months 6 months
Svein Stoknes Chief Financial Officer 26,444 43,500 3 months 6 months
Dean Watson Chief Operating Officer 0 0 3 months 6 months
Mark Riding Executive Vice President Strategy 32,006 0 3 months 3 months
Valborg Lundegaard Executive Vice President Customer Management 5,185 0 3 months 6 months
Svenn Ivar Fure Executive Vice President Front End 61,008 43,500 3 months 6 months
Egil Bøyum Executive Vice President Products 4,198 0 6 months 3 months
Knut Sandvik Executive Vice President Projects 3,036 0 3 months 6 months
David Clark Executive Vice President Services 1,434 0 3 months 3 months
1) Loan amounts are to be repaid over 12 months by salary deductions.
See note 5 for more information about salaries and the share purchase program for employees
See note 18 for more information about pension arrangements

Page 98
Back to index
Consolidated Financial Statements
Note 32 Audit Fees
KPMG is the auditor of the group. The table below presents the audit fee expense.
Aker Solutions ASA Subsidiaries Total
Amounts in NOK million 2016 2015 2016 2015 2016 2015
Audit 4.3 1.7 12.1 13.3 16.4 15.0
Other assurance services 0.4 0.7 0.6 0.3 1.0 1.0
Tax services 0.0 0.0 2.0 3.3 2.0 3.3
Other non-audit services 0.4 0.0 0.3 0.8 0.7 0.8
Total 5.2 2.4 15.0 17.8 20.1 20.2

Page 99
Back to index
Parent Company Financial Statements
Parent CompanyFinancial StatementsAker Solutions ASA December 31, 2016

Page 100
Back to index
Income Statement Balance Sheet Cashflow
Note 1 Company Information Note 2 Operating Revenue and Expenses Note 3 Financial Income and Expenses Note 4 Tax Note 5 Investments in Group Companies Note 6 Shareholders’ Equity Note 7 Borrowings Note 8 Receivables abd Borrowings from Group Companies Note 9 Financial Risk Management and Financial Instruments Note 10 Guarantees Note 11 Related Parties Note 12 Shareholders
Amounts in NOK million Note 2016 2015
Operating revenues 2 30 23
Operating expenses 2 -99 -117
Operating loss -69 -94
Net financial expenses 3 -189 -188
Loss before tax -258 -282
Income tax 4 59 70
Net loss -199 -211
Net loss for the period distributed as follows:
Other equity -199 -211
Net loss -199 -211
Income StatementFor the year ended December 31
Parent Company Financial Statements

Page 101
Back to index
Parent Company Financial Statements
Balance SheetStatement as of December 31
Amounts in NOK million Note 2016 2015
Assets
Deferred tax asset 4 137 88
Investments in group companies 5 11,018 10,676
Non-current interest-bearing receivables from group companies 8 309 663
Other non-current interest-bearing receivables 2 2
Total non-current assets 11,465 11,429
Current interest-bearing receivables from group companies 8 36 341
Non-interest bearing receivables from group companies 8 38 67
Financial instruments 9 1,038 2,995
Other current receivables 3 0
Cash and cash equivalents 8 1,461 2,693
Total current assets 2,575 6,095
Total assets 14,041 17,524
Amounts in NOK million Note 2016 2015
Equity and liabilities
Issued capital 294 294
Other equity 3,007 3,165
Total equity 6 3,301 3,459
Non-current borrowings 7 975 2,462
Total non-current liabilities 975 2,462
Current borrowings 7 1,517 18
Current borrowings from group companies 8 7,157 8,581
Non interest-bearing liabilities from group companies 8 61 33
Financial instruments 9 1,017 2,929
Other current liabilities 13 42
Total current liabilities 9,765 11,603
Total liabilities 10,740 14,065
Total equity and liabilities 14,041 17,524
Fornebu, March 22, 2017Board of Directors of Aker Solutions ASA
Øyvind EriksenChairman
Anne DrinkwaterDeputy Chairman
Kjell Inge RøkkeDirector
Koosum KalyanDirector
Stuart FergusonDirector
Atle TeiglandDirector
Åsmund KnutsenDirector
Hilde KarlsenDirector
Luis AraujoChief Executive Officer

Page 102
Back to index
Parent Company Financial Statements
CashflowStatement for the year ended December 31
Amounts in NOK million 2016 2015
Loss before tax -258 -282
(Profit) loss on foreign currency forward contracts 44 -163
Changes in other operating assets and liabilities 78 -227
Net cash from operating activities -136 -672
Increase in investments in subsidiaries -342 0
Net cash used in investing activities -342 0
Payment of dividend 0 -394
Changes in borrowings to group companies 659 -211
Changes in borrowings from group companies -1,424 2,266
Proceeds from employees share purchase program 40 61
Repurchase of treasury shares -29 -74
Net cash from financing activities -754 1,648
Net increase (decrease) in cash and cash equivalents -1,232 976
Cash and cash equivalents at the beginning of the period 2,693 1,717
Cash and cash equivalents at the end of the period1 1,461 2,693
1)Unused credit facilities amounted to NOK 5,000 million as of December 31, 2016.
The cashflow statement has been prepared using the indirect method.

Page 103
Back to index
Parent Company Financial Statements
Note 1 Company InformationAker Solutions ASA is the parent company and owner of Aker Solutions Holding AS.
Aker Solutions ASA is domiciled in Norway and listed on the Oslo Stock Exchange.
The financial statements of the parent company are prepared in accordance with
Norwegian legislation and Norwegian Generally Accepted Accounting Principles.
Note 2 Operating Revenue and Expenses
RevenueOperating revenue comprises NOK 30 million in income from Parent Company
Guarantees (PCG). The PCGs are invoiced when the guarantees are issued, and
the revenue is recognized evenly over the lifetime of the guarantee.
ExpensesThere are no employees in Aker Solutions ASA and hence no personnel expenses.
Executive management and corporate staff are employed by other Aker Solutions
companies. Costs for their services as well as other parent company costs are
recharged proportionally to Aker Solutions ASA and presented as operating expenses.
Remuneration to and shareholding of managing director Luis Araujo is described in
note 31 Management Remuneration in the consolidated financial statements.
Audit fees to KPMG
Note 3 Financial Income and Expenses
Financial Reporting PrinciplesForeign Currency
Transactions in foreign currencies are translated at the exchange
rate at the date of the transaction. Monetary assets and liabilities
denominated in foreign currencies at the balance sheet date are
translated to the functional currency at the exchange rate on
that date.
Foreign Currency Derivatives
Subsidiaries have entered into financial derivative contracts with
the parent company to hedge their currency exposure. The parent
company uses derivatives from external banks to mitigate the
currency exposure from the financial derivative contracts with
the subsidiaries. The parent company does not engage in other
currency hedging activities. Aker Solutions ASA does not apply
hedge accounting and financial assets and liabilities related
to foreign currency contracts are measured at fair value with
changes recognized in the income statement.
Notes to the Parent Company Financial StatementsFor the year ended December 31
Amounts in NOK million 2016 2015
Audit fee 4.3 1.7
Other assurance services 0.4 0.7
Other non-audit services 0.4 0.0
Total 5.2 2.4
See note 10 for more information about guarantees
Note 3 continues on next page

Page 104
Back to index
Parent Company Financial Statements
Interest Rate Derivatives
In order to reduce the interest rate risk related to external borrowings, Aker Solutions
enters into interest swap agreements. The market value of interest rate swaps
classified as cashflow hedges (where the interest rate of the debt is switched from
floating to fixed interest rate) is accounted for directly against equity. The corre-
sponding interest payments are reflected in the profit and loss to neutralize potential
changes in interest levels.
The change in market values for arrangements where a fixed interes rate is
swapped to floating is recognized in the income statement as fair value hedges,
with a corresponding adjustment to the carrying amount of the liability.
Financial Income and Expense
Amounts in NOK million 2016 2015
Interest income from group companies 41 49
Interest expense to group companies -9 -16
Net interest income from group companies 31 33
External interest income 30 25
External interest expenses -259 -263
Net external interest expense -229 -238
Other financial expenses -2 -2
Foreign exchange loss -5,578 -4,507
Foreign exchange gain 5,589 4,526
Net other financial items 9 17
Net financial expense -188 -188
See note 7 for more information about borrowings
See note 9 for more information about financial risk management and financial instruments

Page 105
Back to index
Parent Company Financial Statements
Note 4 Tax
Financial Reporting PrinciplesTax expenses in the income statement comprise current tax
and changes in deferred tax. Deferred tax is calculated as 24
percent of temporary differences between accounting and tax
values as well as any tax losses carried forward at the year-end.
Net deferred tax assets are recognized only to the extent that it
is probable they will be utilized against future taxable profits.
Deferred Tax Asset and Tax Expenses
Effective Tax Rate
Amounts in NOK million 2016 2015
Calculation of taxable income
Loss before tax -258 -282
Change in timing differences 87 -146
Taxable income -171 -427
Positive and negative (-) temporary differences
Unrealized gain on forward exchange contracts 62 149
Interest rate swaps -32 -75
Tax loss carried forward -598 -428
Basis for deferred tax -569 -354
Deferred tax in income statement 129 70
Deferred tax in equity 8 19
Deferred tax asset 137 88
Income tax benefit
Origination and reversal of temporary differences 59 70
Total tax income 59 70
Amounts in NOK million 2016 2015
Loss before tax -258 -282
Income tax 25% (27% in 2015) 64 76
Change in tax rate from 25% to 24% (27% to 25% in 2015) -5 -6
Total tax income 59 70

Page 106
Back to index
Parent Company Financial Statements
Amounts in NOK millionRegistered
office Share capital
Number of shares
held
Percentage owner-
voting share
Book value
Aker Solutions Holding AS
Fornebu, Norway 3,582 30 100% 11,018
Total investments in group companies
11,018
Note 5 Investments in Group Companies
Financial Reporting PrinciplesInvestments in subsidiaries are measured at cost. The invest-
ments are written down to fair value when the impairment is not
considered to be temporary. Impairment losses are reversed if
the basis for the impairment is no longer present.
Dividends and other distributions are recognized as income
the same year as they are appropriated in the subsidiary. If the
distributed dividend in the subsidiary exceeds accumulated
profits in the ownership period, the payment is treated as a
reduction of the carrying value of the investment.
Investment in Group Companies
Note 6 Shareholders’ Equity
Financial Reporting PrinciplesRepurchase of share capital is recognized at cost as a reduction
in equity and is classified as treasury shares. No gain or loss is
recognized in the income statement on the purchase or sale of
the company’s own shares.
The board of directors has proposed that no dividend payment
be made for 2016 as it was deemed prudent to exercise caution
under the current market uncertainty in the oil and gas industry.
This is the same as in the prior year.
Amounts in NOK millionShare
capitalTreasury
sharesHedging reserve
Retained earnings
Total
Equity as of December 31, 2015 294 (56) 3,220 3,459
Shares issued to employees through share purchase program1 1 38 39
Share buy back2 -1 -28 -29
Loss for the period -198 -198
Cashflow hedge3 31 31
Equity as of December 31, 2016 294 0 -25 3,033 3,301
Shareholders’ Equity
See note 3 and note 9 for more information about the hedging reserve for interest rate
swap agreements
1) Aker Solutions subsidiaries operate a share purchase program for employees. The subsidiaries purchase shares from Aker Solutions ASA in order to settle obligations to the employees under the program. During 2016, a total of 938,357 shares were sold under the program.
2) A total of 1,072,847 treasury shares were acquired in the market in 2016. The number of treasury shares held by end of 2016 was 511,801. The shares are held for the purpose of future awards under the share purchase program for employees, as settlement in future corporate acquisitions or for other purposes as decided by the Board of Directors.
3) The value of interest swap agreements changing interest from floating to fixed is recognized directly in equity and will be released to income together with the corresponding interest expenses.

Page 107
Back to index
Parent Company Financial Statements
Note 7 Borrowings
Financial Reporting PrinciplesInterest-bearing borrowings are recognized initially at fair value less transaction
costs. Subsequent to initial recognition, interest-bearing borrowings are stated
at amortized cost with any difference between cost and redemption value being
recognized in the income statement. This is done over the period of the borrowings
on an effective interest basis.
Norwegian bondsAll bonds are denominated in Norwegian kroner and are issued in the Norwegian
bond market. The bonds are issued based on a floating interest rate plus a predefined
margin. The bonds are issued with Norsk Tillitsmann as trustee and the loan agree-
ments are based on Norsk Tillitsmann’s standard loan agreement for such bonds.
The bonds are unsecured on a negative pledge basis and include no dividend
restrictions. All bonds issued are listed on the Oslo Stock Exchange. The strategy
of Aker Solutions is to have between 30-50 percent of borrowings at fixed interest rates.
To the extent that this is not reflected in the loan agreements, swap transactions are
entered into.
Note 7 continues on next page

Page 108
Back to index
Parent Company Financial Statements
Amounts in NOK millionCurrency
Nominal currency value
Carrying amount (NOK) Interest rate
Fixed interest margin
Interest coupon
Maturity date(mm/dd/yy) Interest terms
ISIN NO 0010647431 NOK 1,500 1,505 1.14% 4.25% 5.39% 06/06/17 Floating, 3M+fix margin
ISIN NO 0010661051 NOK 1,000 1,007 1.13% 4.20% 5.33% 10/09/19 Floating, 3M+fix margin
Total bonds1 2,512
Revolving credit facility (NOK 5,000 million)2 NOK 0 -20 1.05% 0.85% 1.90% 07/03/19 NIBOR + Margin2
Total credit facility -20
Total borrowings 2,492
Current borrowings 1,517
Non-current borrowings 975
Total 2,492
2016
Bonds and Borrowings
1) The book value is calculated by reducing the nominal value of NOK 2,500 million by total issue costs related to the new financing of negative NOK 6 million. Accrued interest related to the bonds are included by NOK 18 million.2) The margin applicable to the facility is decided by a price grid based on the gearing ratio with 0.85 percent as the lowest margin (0.85 percent in 2015). A fee will be added to the margin for utilization of the facility. Commitment fee on unutilized facility is
35 percent of the applicable margin. Carrying amount includes deferred refinancing cost of negative NOK 20 million (NOK 27 million in 2015).
Note 7 continues on next page
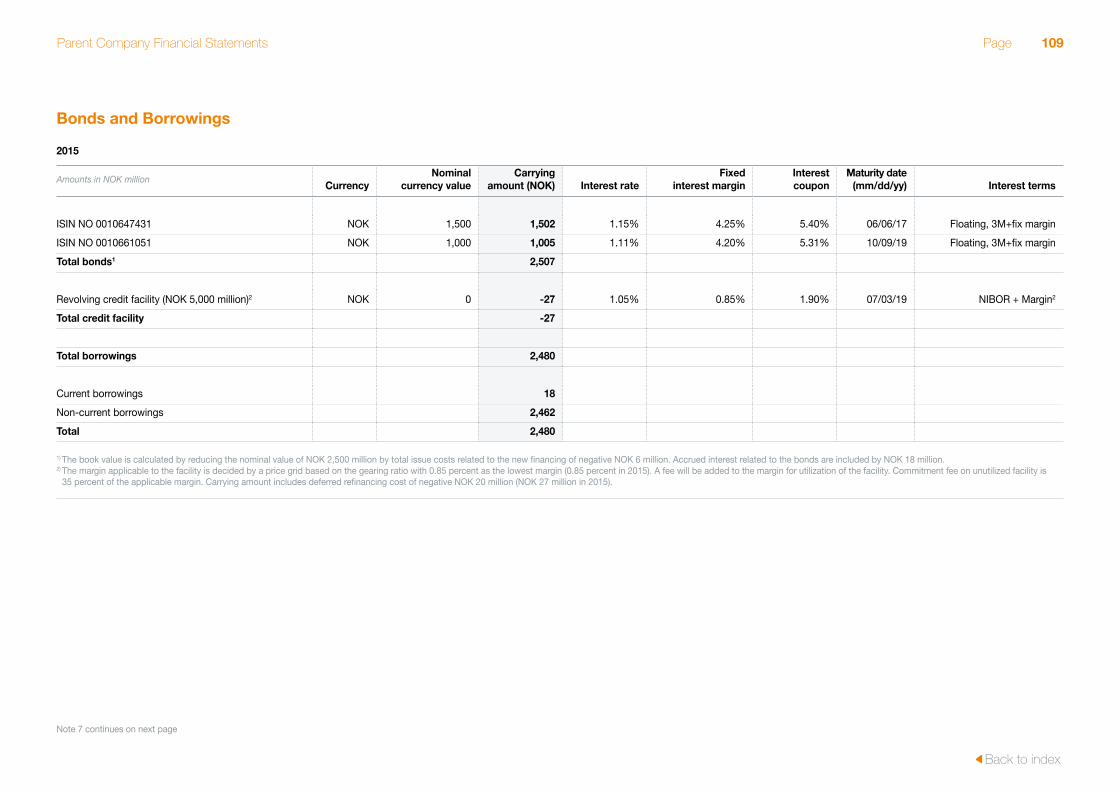
Page 109
Back to index
Parent Company Financial Statements
Amounts in NOK millionCurrency
Nominal currency value
Carrying amount (NOK) Interest rate
Fixed interest margin
Interest coupon
Maturity date(mm/dd/yy) Interest terms
ISIN NO 0010647431 NOK 1,500 1,502 1.15% 4.25% 5.40% 06/06/17 Floating, 3M+fix margin
ISIN NO 0010661051 NOK 1,000 1,005 1.11% 4.20% 5.31% 10/09/19 Floating, 3M+fix margin
Total bonds1 2,507
Revolving credit facility (NOK 5,000 million)2 NOK 0 -27 1.05% 0.85% 1.90% 07/03/19 NIBOR + Margin2
Total credit facility -27
Total borrowings 2,480
Current borrowings 18
Non-current borrowings 2,462
Total 2,480
2015
Bonds and Borrowings
1) The book value is calculated by reducing the nominal value of NOK 2,500 million by total issue costs related to the new financing of negative NOK 6 million. Accrued interest related to the bonds are included by NOK 18 million.2) The margin applicable to the facility is decided by a price grid based on the gearing ratio with 0.85 percent as the lowest margin (0.85 percent in 2015). A fee will be added to the margin for utilization of the facility. Commitment fee on unutilized facility is
35 percent of the applicable margin. Carrying amount includes deferred refinancing cost of negative NOK 20 million (NOK 27 million in 2015).
Note 7 continues on next page
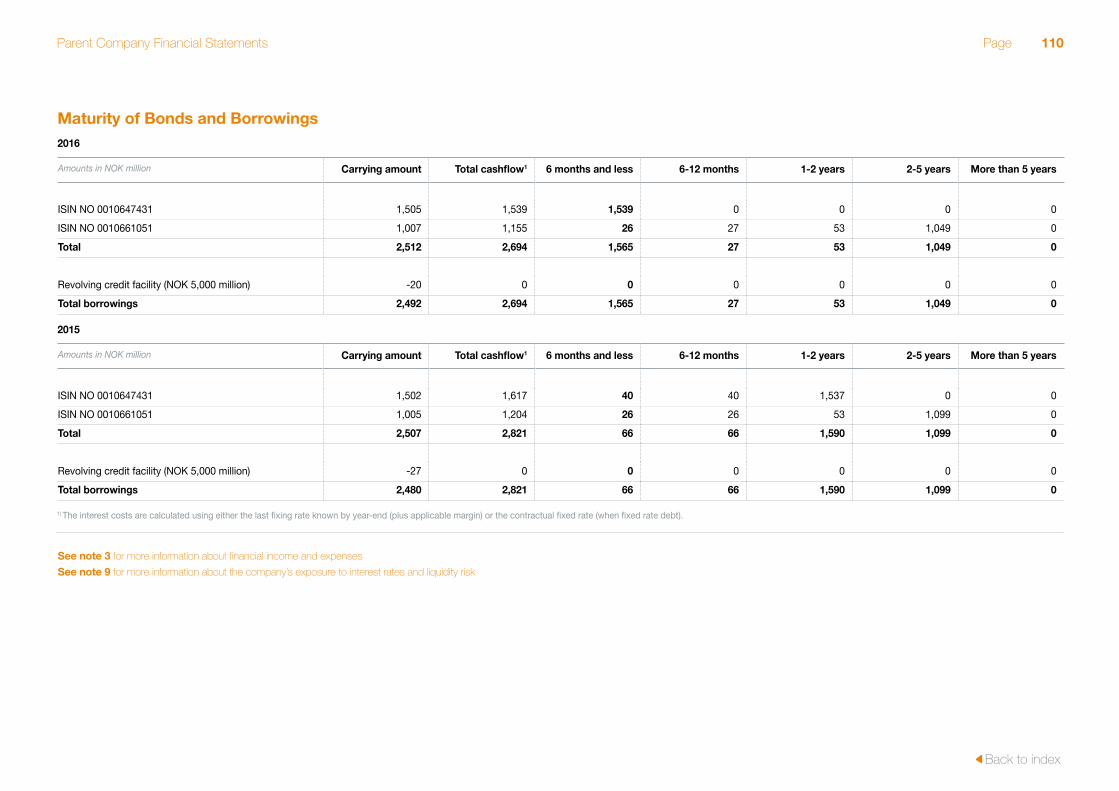
Page 110
Back to index
Parent Company Financial Statements
Amounts in NOK million Carrying amount Total cashflow1 6 months and less 6-12 months 1-2 years 2-5 years More than 5 years
ISIN NO 0010647431 1,505 1,539 1,539 0 0 0 0
ISIN NO 0010661051 1,007 1,155 26 27 53 1,049 0
Total 2,512 2,694 1,565 27 53 1,049 0
Revolving credit facility (NOK 5,000 million) -20 0 0 0 0 0 0
Total borrowings 2,492 2,694 1,565 27 53 1,049 0
Amounts in NOK million Carrying amount Total cashflow1 6 months and less 6-12 months 1-2 years 2-5 years More than 5 years
ISIN NO 0010647431 1,502 1,617 40 40 1,537 0 0
ISIN NO 0010661051 1,005 1,204 26 26 53 1,099 0
Total 2,507 2,821 66 66 1,590 1,099 0
Revolving credit facility (NOK 5,000 million) -27 0 0 0 0 0 0
Total borrowings 2,480 2,821 66 66 1,590 1,099 0
2016
2015
Maturity of Bonds and Borrowings
1) The interest costs are calculated using either the last fixing rate known by year-end (plus applicable margin) or the contractual fixed rate (when fixed rate debt).
See note 3 for more information about financial income and expenses
See note 9 for more information about the company’s exposure to interest rates and liquidity risk

Page 111
Back to index
Parent Company Financial Statements
Note 8 Receivables and Borrowings from Group Companies
Financial Reporting PrinciplesAssets and liabilities are presented as current when they are due within one year or they are part of the operating cycle. Other assets and liabilities are classified as non-current. Current assets are valued at the lowest of cost and fair value. Current liabilities are valued at nominal value at the time of recognition. Non-current receivables are measured at cost less impair-ment losses that are not considered to be temporary. Non-current liabilities are initially valued at transaction value less attributable transaction cost. Subsequent to initial recognition, interest-bearing non-current borrowings are measured at amortized cost with any difference between cost and redemption value being recognized in the income statement over the period of the borrowing on an effective interest basis. Trade and other receivables are recognized at the original invoiced amount less allowances for expected losses. Provision for expected losses is considered on an individual basis.
Receivables and Borrowings with Group CompaniesAker Solutions ASA is the owner of the cash pool system arrange-ments with DNB and Nordea. The cash pool systems cover a majority of the group geographically and assure good control and access to the group’s cash. Participation in the cash pool is vested in the group policy and decided by each company’s board of direc-tors and confirmed by a statement of participation. Certain entities in Brazil, Angola and other locations do not participate in the cash pool arrangements due to local restrictions. The participants in the cash pool system are joint and severally liable and it is therefore important that Aker Solutions as a group is financially viable. Any debit balance on a sub-account can be offset against any credit balance in the cash pool. Hence a debit balance on a
Amounts in NOK million 2016 2015
Group companies interest-bearing deposits in the cash pool system
4,556 5,139
Aker Solutions ASAs net borrowings in the cash pool system
-3,094 -3,448
Cash in cash pool system 1,461 1,692
Current interest-bearing receivables from group companies
36 341
Non-current interest-bearing receivables from group companies
309 663
Current interest-bearing borrowings from group companies
-7,157 -8,581
Net interest-bearing borrowings from group companies
-6,812 -7,577
Non-current interest-bearing receivables from group companies
38 67
Non-current interest-bearing borrowings from group companies
-1 -33
Net non interest-bearing receivables from group companies
37 33
Total net borrowings from group companies
-5,314 -5,852
sub-account represents a liability for Aker Solutions ASA and a credit balance on a sub-account a receivable for Aker Solutions ASA. The cash pool systems were showing a net balance of NOK 1,461 million per December 31, 2016. This amount is reported in Aker Solutions ASAs accounts as short-term borrowings from group companies and as cash in the cash pool system. Aker Solutions ASA is the group’s central treasury function and enters into borrowings and deposit agreements with group companies. Deposits and borrowings are agreed at market terms and are dependent on the group companies’ credit rating and the duration of the borrowings.
All current receivables and borrowings are due within one year.

Page 112
Back to index
Parent Company Financial Statements
Note 9 Financial Risk Management and Financial Instruments
Currency RiskAker Solutions ASA has entered into foreign exchange contracts with other entities in
the group in 2016 with a total value of approximately NOK 35 billion. Large contracts
are hedged back-to-back with external banks, while minor contracts are hedged based
on internal matching principles. Contracts hedged back to back with external banks
represent about 80 percent of the total group exposure, but are limited to a small
number of transactions. Aker Solutions ASA does not apply hedge accounting to any
of the currency derivatives. All financial assets and liabilities related to foreign exchange
contracts are revalued at fair value in respect to exchange rate movements each period.
The treasury function within Aker Solutions ASA also has a mandate to hold
limited positions in the currency and interest markets. The mandate has limits that are
strictly defined and is operated under a strict stop-loss regime. Open positions are
continuesly monitored on a mark to market basis.
The fair value of foreign exchange forward contracts and options is presented in the
table below.
2016 2015
Amounts in NOK million Assets Liabilities Assets Liabilities
Forward exchange contracts with group companies
924 -175 2,640 -874
Forward exchange contracts with external counterparts
113 -806 323 -1,945
Forward exchange options with external counterparts
1 -36 32 -110
Total 1,038 -1,017 2,995 -2,929
All instruments are booked at fair value as per December 31.
Note 9 continues on next page

Page 113
Back to index
Parent Company Financial Statements
2016 2015
Amounts in NOK million Assets Liabilities Assets Liabilities
Interest rate swaps - cashflow hedge (against equity) 0 -32 0 -75
Total 0 -32 0 -75
Credit RiskCredit risk relates to loans to subsidiaries, overdraft in the group cash pool, hedging contracts, guarantees to subsidiaries and deposits with external banks. Loans to subsidiaries are assessed by the internal credit committee. Loss provisions are made in situations of negative equity and where the company is not expected to be able to fulfil its loan obligations from future earnings. External deposits and forward contracts are placed according to a list of approved banks and primarily with banks where the company also has a borrowing relation.
The existence of netting agreements between Aker Solutions ASA and the related banks reduces the credit risk.
Liquidity RiskLiquidity risk relates to the risk that the company will not be able to meet its debt and guarantee obligations and is managed through maintaining sufficient cash and available credit facili-ties. The development in the group’s and thereby Aker Solutions ASA’s available liquidity is continuesly monitored through weekly and monthly cash forecasts, annual budgets and long-term planning.
See note 3 for more information about financial income and expenses
See note 7 for more information about borrowings
Interest Rate RiskInterest rate swaps are applied to achieve the internal policy that 30-50 percent of
the company’s gross external borrowing shall be at fixed interest rates, with duration
matching the remaining duration of the borrowing. Interest terms on the borrowing are
described in note 7 Borrowings. At year-end, approximately 80 percent of NOK 2,500
million in bonds was fixed for the duration of the bonds through interest rate swaps.
Hedge accounting is applied using the cashflow hedge accounting model.
That means gains and losses on interest rate swaps from floating to fixed interest rates
are recognized in the hedging reserve in equity. As of December 31, 2016 a net loss of
NOK 25 million (NOK 32 million before tax) is recognized in equity and will be
continuesly released to the income statement until the repayment of the borrowings
via the mark to market revaluation process.
The fair value of interest rate swaps is presented in the table below.

Page 114
Back to index
Parent Company Financial Statements
Note 10 Guarantees
Note 11 Related Parties
Amounts in NOK million 2016 2015
Parent company guarantees to group companies1 49,579 68,965
Counter guarantees for bank/surety bonds2 5,309 4,397
Total guarantee liabilities 54,887 73,362
Maturity of guarantee liabilities:
6 months and less 6,759 14,694
6-12 months 5,916 5,267
1-2 years 7,614 12,613
2-5 years 7,703 12,362
5 - years 26,896 28,425
Other services Note 2
Financial items Note 3
Investments Note 5
Cash pool Note 8
Receivables and borrowings Note 8
Foreign exchange contracts Note 9
Guarantees Note 10
See note 3 for more information about revenue from guarantees
1)Parent company guarantees to support subsidiaries in contractual obligations towards customers.2) Bank guarantees and surety bonds are issued on behalf of Aker Solutions subsidiaries, and counter indemnified by Aker Solutions ASA.
All transactions with related parties are entered into at market rates and in accordance with the arm’s length principle.
Transactions with subsidiaries and related parties are described on a line by line basis in the following notes:

Page 115
Back to index
Parent Company Financial Statements
Note 12 Shareholders
Company Nominee Number of shares held Ownership
Aker Kværner Holding AS 110,333,615 40.56%
Aker ASA 17,331,762 6.37%
Folketrygdfondet 12,331,732 4.53%
State Street Bank & Trust Company NOM 9,784,222 3.60%
Ferd AS 5,205,203 1.91%
Morgan Stanley & Co.LLC NOM 4,467,768 1.64%
JPMorgan Chase bank,NA London Nordea RE:NON-Traty NOM 4,363,716 1.60%
State Street Bank & Trust Company NOM 3,483,280 1.28%
Verdipapirfondet Alfred Berg Gamba 3,397,184 1.25%
J.P.Morgan Chase Bank N.A.London US RESIDENT NON NOM 3,224,752 1.19%
Company Nominee Number of shares held Ownership
Aker Kværner Holding AS 110,333,615 40.56 %
State Street Bank & Trust Company S/A SSB CLIENT NOM 17,965,839 6.60 %
Aker ASA 17,331,762 6.37 %
Folketrygdfondet 11,421,898 4.20 %
J.P. Morgan Chase NOM 7,617,901 2.80 %
State Street Bank & Trust Company A/C CLIENT NOM 5,419,338 1.99 %
Swedbank Robur Nordenfon 4,421,014 1.63 %
SIS SIX AG NOM 4,275,107 1.57 %
The Bank of New York BNYM SA/NV - BNY GCM NOM 4,046,537 1.49 %
Morgan Stanley & Co. MS & CO LLC MSCO CLI NOM 3,838,276 1.41 %
Clearstream Banking S.A NOM 3,227,683 1.19 %
The Bank of New York BNY Mellon NOM 3,128,243 1.15 %
2016
2015
Shareholders with more than 1 percent shareholding per December 31 are listed below

Page 116
Back to index
Auditor's Report
Report on the Audit of the Financial Statements
Opinion
We have audited the financial statements of Aker Solutions ASA. The financial
statements comprise:
• The financial statements of the parent company Aker Solutions ASA (the "Com-
pany"), which comprise the balance sheet as at 31 December 2016, the income
statement and cash flow statement for the year then ended, and notes to the
financial statements, including a summary of significant accounting policies, and
• The consolidated financial statements of Aker Solutions ASA and its subsidiaries
(the "Group"), which comprise the balance sheet at 31 December 2016, the
income statement and the statement of other comprehensive income, state-
ment of changes in equity, cash flow for the year then ended, and notes to the
financial statements, including a summary of significant accounting policies.
In our opinion:
• The financial statements are prepared in accordance with the law and regulations.
• The accompanying financial statements give a true and fair view of the financial
position of the Company as at 31 December 2016, and of its financial performance
and its cash flows for the year then ended in accordance with Norwegian
Accounting Act and accounting standards and practices generally accepted
in Norway ("NGAAP").
• The accompanying financial statements give a true and fair view of the financial
position of the Group as at 31 December 2016, and of its financial performance
and its cash flows for the year then ended in accordance with International
Financial Reporting Standards as adopted by the EU ("IFRS").
Basis for opinion
We conducted our audit in accordance with laws, regulations and auditing standards
and practices generally accepted in Norway, included International Standards on
Auditing ("ISAs"). Our responsibilities under those standards are further described in
the Auditor’s Responsibilities for the Audit of the Financial Statements section of our
report. We are independent of the Company and of the Group as required by laws
and regulations, and we have fulfilled our other ethical responsibilities in accordance
with these requirements. We believe that the audit evidence we have obtained is
sufficient and appropriate to provide a basis for our opinion.
Key audit matters
Key audit matters are those matters that, in our professional judgment, were of
most significance in our audit of the financial statements of the current period.
These matters were addressed in the context of our audit of the financial state-
ments as a whole, and in forming our opinion thereon, and we do not provide a
separate opinion on these matters.
Independent auditor's reportTo the Annual Shareholders' Meeting of Aker Solutions ASA
KPMG AS P.O. Box 7000 Majorstuen Sørkedalsveien 6 N-0306 Oslo
Telephone +47 04063Fax +47 22 60 96 01Internet www.kpmg.noEnterprise 935 174 627 MVA
KPMG AS, a Norwegian limited liability company and member firm of the KPMG network of independent member firms affiliated with KPMG Interna-tional Cooperative (“KPMG International”), a Swiss entity.
Statsautoriserte revisorer - medlemmer av Den norske Revisorforening
OsloAltaArendalBergenBodø
ElverumFinnsnes HamarHaugesundKnarvik
Kristiansand LarvikMo i Rana Molde Skien
SandefjordSandnessjøen StavangerStordStraume
Tromsø TrondheimTynsetTønsbergÅlesund
OFFICES IN:

Page 117
Back to index
Auditor's Report
How the matter was addressed in our audit
Our audit procedures in this area included, among others:
• Assessing management's process and results for identification and classification
of CGU's to ensure they were appropriate and in accordance with IAS 36;
• Evaluating management's assessment of impairment indicators;
• Where impairment indicators were identified or where impairment testing was
required, confirming, with assistance from our valuation specialists, that the models
used to calculate value in use are appropriate and mathematically accurate;
• Assessing the discount rates applied for each cash flow forecast;
• Challenging management on the timing of the cash flows;
• Evaluating the historical accuracy of management’s budgets and forecasts and
challenging management on the current year cash flow forecasts;
• Evaluating and challenging management on the growth assumptions in the
cash flow forecasts, forecast margins and order intake;
• Assessing the calculations and rationale supporting the impairment of tangible
and intangible assets; and
• Evaluating the adequacy and appropriateness of the disclosures in the finan-
cial statements related to the carrying value of intangible assets and property,
plant and equipment and the assumptions applied to the impairment testing.
Assessment of the carrying value of property, plant and equipment and intangible assetsRefer to note 10 Property, Plant and Equipment, note 11 Intangible Assets and note 12 Impairment of Assets
The key audit matter
The Group's operations are sensitive to certain factors including oil prices which
in turn impact the timing and nature of future capital expenditure on existing and
new oil fields and installations.
The economic environment, current long-term assumptions and the
Group's business plans indicate that impairment is a risk related to specific as-
sets, cash generating units and can also impact the assessment of impairment of
goodwill.
As of 31 December 2016, the Group has property, plant and equipment of
NOK 3 808 million, goodwill of NOK 3 983 million and other intangible assets of
NOK 1 664 million. The Group has recognized an impairment charge in 2016
associated with their property, plant and equipment and other intangible assets
of NOK 79 million and NOK 386 million respectively.

Page 118
Back to index
Auditor's Report
How the matter was addressed in our audit
Our audit procedures in this area included, among others:
• Evaluating management's process for assessing the stage of completion and
the method applied;
• Challenging management on estimated recovery of incentive payments, incentives
linked to key performance indicators and recognition of liquidated damages;
• Assessing the ability to recover amounts accrued under service contracts
compared to historical recovery rates and the assessments made by manage-
ment over the current balance;
• Challenging management on the estimate of cost to complete and the risk
assessment related to forecast cost;
• Evaluating the calculation of project revenue and cost and amounts due to and
from customers in relation to the stage of completion and forecasts; and
• Evaluating the adequacy and appropriateness of the disclosures in the fi-
nancial statements related to revenue from construction contracts and service
contracts.
Revenue and cost estimates related to construction contracts & service revenueRefer to note 3 Revenue and note 4 Operating Segments
The key audit matter
Accounting for long term projects and service contracts is considered to be a risk
area due to the significant judgement and estimation applied by management as well
as the degree of complexity of the contracts currently in the portfolio.
The key judgements and estimates applied by management include their
assessment of the stage of project completion as well as assessing the estimated
future contract revenue and cost outcomes. Revenue and cost outcomes factored
in managements forecasts include:
• incentive payments;
• key performance indicators;
• liquidated damages; and
• expected total cost to complete.
Additionally management exercises judgement in their assessment of the
recoverability of revenue accruals related to service contracts.
For the year ended 31 December 2016, the Group has recognized con-
struction revenue of NOK 13 133 million and service revenue of NOK 12 104
million.

Page 119
Back to index
Auditor's Report
How the matter was addressed in our audit
Our audit procedures in this area included, among others:
• Considering all leased locations in assessing the completeness of
management's estimate;
• Assessing the accuracy of lease obligation information used in management's
estimate;
• Challenging the inputs used in management's estimate and assessing the
reasonableness of significant assumptions such as vacancy periods, projected
utilization and estimated future cash flows by facility;
• Challenging the discount rate applied in the estimate and evaluating the
reasonableness with reference to market data;
• Evaluating the mathematical accuracy of calculations utilized in management's
valuation models; and
• Evaluating the adequacy and appropriateness of disclosures in the financial
statements related to onerous contract provisions.
Onerous contract provisionRefer to note 20 Provisions and Contingent Liabilities
The key audit matter
The onerous contract provision is considered to be a risk area as the Group is
committed to significant future lease payments. Following the downturn in the oil
and gas markets, there have been various downsizing activities in the business
leading to part or all of some leased buildings becoming vacant. The result of
which has caused the costs of certain contractual lease obligations to exceed
the economic benefits expected to be received.
The key judgements and estimates applied by management include the
calculation of the discount rate applied, the duration of sublease and vacancy
periods and sublease revenues.
As of 31 December 2016, the Group has recognized a provision for onerous
contracts of NOK 267 million.

Page 120
Back to index
Auditor's Report
How the matter was addressed in our audit
Our audit procedures in this area included, among others:
• Considering the restructuring plan, suggested number of employees and the
allocation across all relevant locations compared to the provision recognized;
• Assessing the accuracy of the data and assumptions used in management's
estimate compared to source data and the cost of previous restructuring
programs;
• Challenging the inputs used in management's estimate of significant assumptions
such as notice periods, settlement costs and legal fees, current salary levels and
pension assumptions;
• Evaluating the mathematical accuracy of calculations utilized in management's
models; and
• Evaluating the adequacy and appropriateness of disclosures in the financial
statements related to restructuring provisions.
Restructuring provisionRefer to note 20 Provisions and Contingent Liabilities
The key audit matter
The restructuring provision is considered to be a risk area as the estimated cost of
the restructuring program announced in December 2016 is subject to management
judgment.
Following the downturn in the oil and gas markets, there have been various
downsizing activities in the business leading to a decision to further reduce the work-
force across several locations in December 2016.
The key judgements and estimates applied by management are amongst
others the number and level of employees and the estimated incremental cost of
termination in each location based on local laws, regulations and local practice.
As of 31 December 2016, the Group has recognized a provision for restructur-
ing of NOK 112 million.

Page 121
Back to index
Auditor's Report
Other information
Management is responsible for the other information. The other information
comprises the information included in the Annual Report, with the exception of
the financial statements and the Independent auditor's report.
Our opinion on the financial statements does not cover the other informa-
tion and we do not express any form of assurance conclusion thereon, with the
exception of our report on Other Legal and Regulatory Requirements below.
In connection with our audit of the financial statements, our responsibility
is to read the other information and, in doing so, consider whether the other
information is materially inconsistent with the financial statements or our knowl-
edge obtained in the audit or otherwise appears to be materially misstated.
If, based on the work we have performed, we conclude that there is a ma-
terial misstatement of this other information, we are required to report that fact.
We have nothing to report in this regard.
Responsibilities of the Board of Directors and the Chief Executive
Officer for the Financial Statements
The Board of Directors and the Chief Executive Officer ("management") are
responsible for the preparation and fair presentation of the financial statements
of the Company in accordance with NGAAP, and for the preparation and fair
presentation of the financial statements of the Group in accordance with IFRS,
and for such internal control as management determines is necessary to enable
the preparation of financial statements that are free from material misstatement,
whether due to fraud or error.
In preparing the financial statements, management is responsible for assess-
ing the Company's and the Group's ability to continue as a going concern, disclos-
ing, as applicable, matters related to going concern. The financial statements of the
parent company use the going concern basis of accounting insofar as it is not likely
that the enterprise will cease operations. The financial statements of the Group use
the going concern basis of accounting unless management either intends to liqui-
date the Group or to cease operations, or has no realistic alternative but to do so.
Auditor's Responsibilities for the Audit of the Financial StatementsOur objectives are to obtain reasonable assurance about whether the financial
statements as a whole are free from material misstatement, whether due to fraud
or error, and to issue an auditor's report that includes our opinion. Reasonable
assurance is a high level of assurance, but is not a guarantee that an audit
conducted in accordance with laws, regulations, and auditing standards and
practices generally accepted in Norway, including ISAs, will always detect a
material misstatement when it exists. Misstatements can arise from fraud or
error and are considered material if, individually or in aggregate, they could
reasonably be expected to influence the economic decisions of users taken
on the basis of these financial statements.
As part of an audit in accordance with laws, regulations, and auditing stan-
dards and practices generally accepted in Norway, including ISAs, we exercise
professional judgment and maintain professional scepticism throughout the audit.
We also:
• Identify and assess the risks of material misstatement of the financial state-
ments, whether due to fraud or error. We design and perform audit procedures
responsive to those risks, and obtain audit evidence that is sufficient and ap-
propriate to provide a basis for our opinion. The risk of not detecting a material
misstatement resulting from fraud is higher than for one resulting from error, as
fraud may involve collusion, forgery, intentional omissions, misrepresentations,
or the override of internal control.
• Obtain an understanding of internal control relevant to the audit in order to
design audit procedures that are appropriate in the circumstances, but not for
the purpose of expressing an opinion on the effectiveness of the Company’s or
the Group's internal control.
• Evaluate the appropriateness of accounting policies used and the reasonableness
of accounting estimates and related disclosures made by management.
• Conclude on the appropriateness of management’s use of the going concern

Page 122
Back to index
Auditor's Report
basis of accounting and, based on the audit evidence obtained, whether a material
uncertainty exists related to events or conditions that may cast significant doubt
on the Company’s ability to continue as a going concern. If we conclude that a
material uncertainty exists, we are required to draw attention in our auditor’s report
to the related disclosures in the financial statements or, if such disclosures are in-
adequate, to modify our opinion. Our conclusions are based on the audit evidence
obtained up to the date of our auditor’s report. However, future events or conditions
may cause the Company to cease to continue as a going concern.
• Evaluate the overall presentation, structure and content of the financial statements,
including the disclosures, and whether the financial statements represent the
underlying transactions and events in a manner that achieves fair presentation.
• Obtain sufficient appropriate audit evidence regarding the financial information
of the entities or business activities within the Group to express an opinion on
the consolidated financial statements. We are responsible for the direction,
supervision and performance of the group audit. We remain solely responsible
for our audit opinion.
We communicate with the Board of Directors regarding, among other matters, the
planned scope and timing of the audit and significant audit findings, including any
significant deficiencies in internal control that we identify during our audit.
We also provide the Board of Directors with a statement that we have com-
plied with relevant ethical requirements regarding independence, and to communi-
cate with them all relationships and other matters that may reasonably be thought
to bear on our independence, and where applicable, related safeguards.
From the matters communicated with the Board of Directors, we deter-
mine those matters that were of most significance in the audit of the financial
statements of the current period and are therefore the key audit matters. We
describe these matters in our auditor's report unless law or regulation precludes
public disclosure about the matter or when, in extremely rare circumstances, we
determine that a matter should not be communicated in our report because
the adverse consequences of doing so would reasonably be expected to
outweigh the public interest benefits of such communication.
Report on Other Legal and Regulatory Requirements
Opinion on the Board of Directors' report
Based on our audit of the financial statements as described above, it is our
opinion that the information presented in the Board of Directors' report, including
the statements on corporate governance and corporate social responsibility,
concerning the financial statements and the going concern assumption is consistent
with the financial statements and complies with the law and regulations.
Opinion on Accounting Registration and Documentation
Based on our audit of the financial statements as described above, and control
procedures we have considered necessary in accordance with the International
Standard on Assurance Engagements 3000, «Assurance Engagements Other than
Audits or Reviews of Historical Financial Information», it is our opinion that manage-
ment has fulfilled its duty to produce a proper and clearly set out registration and
documentation of the Company's accounting information in accordance with the
law and bookkeeping standards and practices generally accepted in Norway.
Oslo, 22 March 2017KPMG AS
Julie Berg State Authorised Public Accountant

Page 123
Back to index
Alternative Performance Measures
Aker Solutions (the company) discloses alternative performance measures as a supplement to the financial statements prepared in accordance with IFRS.
Alternative Performance Measures

Page 124
Back to index
Alternative Performance Measures
Alternative performance measures are frequently used by securities
analysts, investors and other interested parties and they are meant
to provide an enhanced insight into the operations, financing and
future prospects of the company.
Profit MeasuresEBITDA and EBIT terms are presented as they are commonly used
by financial analysts and investors. Special items are excluded from
EBITDA and EBIT as alternative measures to provide enhanced
insight into the underlying financial development of the business
operations and to improve comparability between different periods.
EBITDA is short for earnings before interest, taxes, depreciation
and amortization. EBITDA corresponds to the “oper-
ating income before depreciation, amortization and
impairment” in the consolidated income statement.
EBIT is short for earnings before interest and taxes. EBIT
corresponds to “operating income” in the consoli-
dated income statement.
Margins such as EBITDA margin and EBIT margin is used to
compare relative profit between periods. EBITDA
margin and EBIT margin are calculated as EBITDA
or EBIT divided by revenue.
Special items may not be indicative of the ongoing operating
result or cash flows of the company. Profit measure
excluding special items are presented as alternative
measures to improve comparability of the underlying
business performance between the periods.
Special Items Impacting Revenue
Special Items Impacting EBITDA
Aker Solutions group
Subsea Field Design
Amounts in NOK million 2016 2015 2016 2015 2016 2015
Revenue 25,557 31,896 14,996 19,101 10,670 12,920
Non-qualifying hedges -"other" segment 26 -123
Gain/loss sale of PPE -36 -36
Other 12 12
Sum of special items ex. from revenue 2 -123 -24 0 0 0
Revenue ex. special items 25,559 31,772 14,972 19,101 10,670 12,920
Aker Solutions group
Subsea Field Design
Amounts in NOK million 2016 2015 2016 2015 2016 2015
EBITDA 1,929 1,841 1,417 1,778 730 543
Onerous lease cost 82 265 2
Restructuring cost 163 416 31 166 62 250
Non-qualifying hedges (44) 94
Gain/loss sale of PPE (36) (36)
Demerger and other costs 26 22 12
Sum of special items ex. from EBITDA 192 797 7 166 64 250
EBITDA ex. special items 2,121 2,638 1,425 1,944 795 793
EBITDA margin 7.5% 5.8% 9.5% 9.3% 6.8% 4.2%
EBITDA margin ex. special items 8.3% 8.3% 9.5% 10.2% 7.4% 6.1%

Page 125
Back to index
Alternative Performance Measures
Financing MeasuresAlternative financing and equity measures are presented as they are indicators of
the company’s ability to obtain financing and service its debts.
Net Current
Operating Assets
(NCOA)
Amounts in NOK million 2016 2015
Current tax asset 242 118
Inventory 575 814
Trade and other receivables 7,398 10,985
Current operating assets 8,215 11,918
Current tax liability -30 -9
Provisions -1,087 -1,294
Trade and other payables -8,002 -12,222
Current operating liabilities (9,119) (13,525)
Net current operating assets (NCOA) (904) (1,607)
is a measure of the working capital and consist of operat-
ing assets, current tax assets, current operating liabilities
and current tax liabilities.
Amounts in NOK million 2016 2015
Current borrowings 2,110 561
Non-current borrowings 1,844 3,137
Current interest-bearing receivables -437 -117
Non-current interest-bearing receivables1 -34 -20
Cash and cash equivalents -2,480 -3,862
Net interest-bearing debt 1,002 -301
is calculated as interest-bearing debt sub-
tracted by interestbearing receivables and
cash and cash equivalents.
Net Interest-
Bearing Debt
1)Non-current interest-bearing receivables are included in Other non-current assets in consolidated balance sheet.
Financing Measures continues on next page
Special Items Impacting EBIT
Aker Solutions group
Subsea Field Design
Amounts in NOK million 2016 2015 2016 2015 2016 2015
EBIT 687 958 352 1,045 580 404
Sum of special items excluded from EBITDA 192 797 7 166 64 250
Impairments 464 163 441 145 23 18
Sum of special items ex. from EBIT 656 960 449 312 87 268
EBIT ex. special items 1,343 1,918 800 1,357 667 672
EBIT margin 2.7% 3.0% 2.3% 5.5% 5.4% 3.1%
EBIT margin ex. special items 5.3% 6.0% 5.3% 7.1% 6.2% 5.2%
Equity Ratio is calculated as total equity divided by total assets.
Liquidity Buffer is a measure of available cash and is calculated
by adding together the cash and cash equiva-
lents and the unused credit facility.
Amounts in NOK million 2016 2015
Total equity 6,415 6,630
Total assets 21,512 27,729
Equity ratio 29.8% 23.9%
Amounts in NOK million 2016 2015
Cash and cash equivalents 2,480 3,862
Credit facility (unused) 5,000 5,000
Liquidity buffer 7,480 8,862

Page 126
Back to index
Alternative Performance Measures
Order Intake MeasuresOrder intake, order backlog and book-to-bill ratio are presented as alternative
performance measures as they are indicators of the company’s revenues and
operations in the future.
Order Intake includes new signed contracts in the period in addition to ex-
pansion of existing contracts. For construction contracts, the
order intake is based on the signed contract value excluding
potential options and change orders. For service contracts, the
order intake is based on the estimated value of firm periods in
the contracts.
Order Backlog represents the estimated value of remaining work on signed
contracts.
Amounts in NOK million 2016 2015
Property, plant and equipment 3,808 3,962
Intangible assets 5,647 6,207
Non-current receivables1 56 4
Non-current operating assets 9,510 10,172
Non-current operating liabilities (pension obligations) (540) (572)
Deferred tax assets 666 332
Other investments 75 13
Net current operating assets (NCOA) as defined above (904) (1,607)
Deferred tax liabilities (331) (283)
Other non-current liabilities (84) (27)
Net capital employed 8,393 8,029
is a measure of both short and long term tied up
capital related to ordinary business.
Net Capital
Employed
1) Non-current interest-bearing receivables are included in Other non-current assets in consolidated balance sheet.

Page 127
Back to index
Contact Information Aker Solutions ASA
Oksenøyveien 8, 1366 Lysaker
Postal address:
P.O. Box 169
NO-1325 Lysaker
Telephone:
+47 67 51 30 00
E-mail:
Web:
www.akersolutions.com
COPYRIGHT AND LEGAL NOTICE Copyright in all published material including photographs, drawings and images in this publica-
tion remains vested in Aker Solutions and third party contributors to this publication as appro-
priate. Accord ingly, neither the whole nor any part of this publication can be reproduced in any
form without express prior permission. Articles and opinions appearing in this publication do not
necessarily represent the views of Aker Solutions. While all steps have been taken to ensure the
accuracy of the published contents, Aker Solutions does not accept any responsibility for any
errors or resulting loss or damage whatsoever caused and readers have the responsibility to
thoroughly check these aspects for themselves. Enquiries about reproduction of content from
this publication should be directed to Aker Solutions.