Embed Size (px)
Citation preview

1
Calix Limited ABN 36 117 372 540
www.calix.com.au
ANNUAL REPORT 2016
For
per
sona
l use
onl
y

1
TABLE OF CONTENTS
Company at a glance 2
Corporate directory 7
Chairman’s and Managing Director’s message 8‐9
Directors’ report 10
Remuneration report 15
Auditor’s declaration of independence 17
Financial report
Financial statements 18
Notes to the financial statements 22
Auditor’s report 39
For
per
sona
l use
onl
y

2
Our company at a glance
Calix is a multi-award-winning Australian technology company that is developing new processes and materials to solve global challenges.
The core technology is a world-first, patented "kiln" built in Bacchus Marsh, Victoria that produces "mineral honeycomb" - very highly active minerals!
Calix is using these minerals, which are safe and environmentally friendly, to improve waste water treatment and phosphate removal, help protect sewer assets from corrosion, and help improve food production from aquaculture and agriculture without anti-biotics, fungicides and pesticides.
Calix's technology has also been adopted overseas, where we are working with some of the world's largest companies, governments and research institutions on CO2 capture.
Calix has moved strategically to commercialise its unique technology:
For
per
sona
l use
onl
y

3
The technology and its applications…
Calix's technology has been adopted in Europe, where we are working with some of the world's largest companies, governments and research institutions on CO2 capture.
Calix is using its nano-active minerals, which are safe and environmentally friendly, to improve waste water treatment and phosphate removal, help protect sewer assets from corrosion, and help improve food production from aquaculture and agriculture without anti-biotics, fungicides and pesticides.
…and we haven’t yet begun to explore the opportunities for other metal oxides, and in batteries, catalysts and 3D printing materials…
For
per
sona
l use
onl
y

4
Creating new materials, solving global challenges
WATER
The challenge is not about finding more water; it is about better managing and preserving the resources and infrastructure we have.
FOOD
By 2025, the global population will reach 8 billion people. Feeding an extra billion mouths within the next 12 years poses an unprecedented challenge to human ingenuity.
INFRASTRUCTURE
As the population grows, more people will need utilities and clean water, more goods will have to be transported, and more waste will need to be disposed of.
AIR
Fundamental changes are needed to reduce the amount of CO2 that we emit from industrial processes and energy generation in order to respond to the threat of climate change…
For
per
sona
l use
onl
y

5
Our Products
Our safe, environmentally friendly solution for H2S control & odour management.
Protecting sewer assets from sulphide corrosion.
For
per
sona
l use
onl
y

6
Revolutionary agricultural solution for increased yield, more efficient fertiliser usage, insect / pest management, and fungal control.
Enhanced magnesium hydroxide for water conditioning and yield improvement in aquaculture.
For
per
sona
l use
onl
y

7
CORPORATE DIRECTORY
DIRECTORS P J Turnbull – Chairman
Dr J A Hamilton
L A W O’Neill
D Zeiden
Dr P H Hodgson – Managing Director & CEO
Dr M G Sceats
SECRETARY D Charles
NOTICE OF GENERAL MEETING The annual general meeting of Calix Limited will be held at:‐
Calix Limited, 71 Rowsley Station Road, Maddingley, VIC 3340
Time – 10.00am
Date – 24 November 2016
PRINCIPAL PLACE OF BUSINESS Level 1, 9 Bridge Street
Pymble, NSW 2073
(02) 8199 7400
AUDITOR BDO
Level 11, 1 Margaret Street
Sydney, NSW 2000
SOLICITOR TO THE COMPANY Gilbert & Tobin
Level 37, 2 Park Street
Sydney, NSW 2000
WEBSITE www.calix.com.au
For
per
sona
l use
onl
y

8
CHAIRMAN’S MESSAGE I am pleased to present to you our Annual Report for the 2015 ‐16 financial year. Calix has continued to successfully build on its first operating cash positive result from last year, achieving over an 8‐fold increase in cash generation. Our focus on sales acceleration has delivered an 85 % year on year increase, a little short of our target to double this revenue, but a significant uplift nonetheless. Our partnering strategy has also been very successful, with the year delivering a global license deal on one of our high‐reactivity products, as well as a €12 million‐funded consortium to pilot Calix’s technology into the cement and lime industry in Europe. And, we have continued to innovate, with one new patent application on new applications of Calix’s technology. Our top strategic priority continues to be revenue acceleration. Our base water treatment business has faced stiff competition in Australia, but we have achieved over 40 % market share in our dosing application, continued to develop new markets and applications, and begun some targeted export activities. We will continue to compete very forcefully to win market share for our range of water treatment products across Australia and overseas. Our growing sales revenues have also been complemented by strong research grant income, with our technology successfully achieving significant grants both in Australia and overseas. Our international reputation, and recognition of the potential of our technology, was substantially boosted with the winning of €12m in funding from the European Union to pilot our technology in Europe, with some of the world’s largest cement, lime and engineering companies. Whilst we are very focussed on revenue growth, Calix continues to balance its resources well between the opportunities of today and tomorrow. Our R&D and partnering efforts have flourished, both internally and in collaboration with Australian universities and Institutions such as the University of NSW and Australian Synchrotron, as well as internationally with world leaders such as Imperial College and the Energy Research Centre of the Netherlands (ECN). We have continued to strengthen our technical potential to disrupt major markets. Sustainable water, agriculture, aquaculture, infrastructure, energy and health are strengthening mega‐trends that our technology plays strongly into. Our new website (www.calix.com.au) has distilled Calix’s current operations and future potential into these megatrends. The future success of the company rests with its people, and I continue to be very impressed and encouraged by the focus and dedication they have brought to execution of our strategy. I thank the whole team sincerely for their successful efforts over the last year noting that nearly all of our operational team are shareholders as well as employees. The Board has remained a cohesive and focussed team throughout the year and I would also like to thank them for their significant contribution. The only changes to the Board during the year was the resignation of the Sculptor Finance shareholder nominee Jonathon Lin. On behalf of the Board I sincerely thank Jonathon for his contribution, and also welcome their new appointee, David Zeiden, who has a very good understanding of Calix, to the Board. It is pleasing to see the company starting to deliver on near, medium, and longer‐term value. Next year should continue this pleasing trajectory and I look forward to working with the Board and Staff of Calix to deliver on‐going value growth. I would again like to take this opportunity to thank our valued shareholders for their continued support and belief in our future.
Peter Turnbull Chairman F
or p
erso
nal u
se o
nly

9
MANAGING DIRECTOR’S MESSAGE Firstly, I would like to join our Chairman Peter Turnbull in welcoming you to our Annual Report for the 2015‐2016 Financial Year. As Peter has outlined in his message, our strategy delivered pleasing growth during the financial year, and in particular our licensing, partnering and innovation activities were very strong. Our sales revenues were slightly below an ambitious target, however our grant and licensing income well exceeded targets and our overall revenue result was double last year’s, resulting in our very pleasing $2million operating cash result. As with the previous financial year, our short term strategy remained the relentless focus on growing the revenues and markets of various products made from our highly reactive Magnesium Hydroxide Liquid (MHL). Our water treatment MHL product; ACTI‐MagTM has successfully grown to about 40 % of the domestic market. In addition, it was pleasing to see new applications being developed for this product, with its unique ability to enhance water treatment biogas production for electricity being awarded an Australian Water Association Innovation Award and our case study paper being presented at 3 water conferences in Australia, New Zealand and Italy. Our “sprayed” MHL product, PROTECTA‐MagTM, has continued to grow with a 4‐year contract with Sydney Water achieved as well as a very successful product launch for our manhole application, with dozens of councils now using the product. Our aquaculture product, AQUA‐Cal+TM, was successfully trialled at two of the largest prawn companies in Malaysia, and regular sales have commenced for use in iron suppression, disease suppression and improved yield. Our agricultural foliar spray BOOSTER‐MagTM (name changed from SUPER‐Mag) is set for product launch in the Philippines following successful registration trials, and on‐going trialling around the world continue to reinforce the product’s potential as a safe, environmentally friendly but effective foliar fertiliser that also helps plants fight disease and mites. With the shift to cash‐flow positive operation last financial year, Calix has been able to focus on the expansion of our business outside of Australia. We have set up an office in Europe, with three new full‐time positions, both to support the development of our LEILAC project as well as assist with market entry for MHL product range. Having already established Calix in SE Asia and Europe, our focus over the coming year will look to market entry strategies for the Americas, Africa, India and China. We also continued to successfully raise Calix’s profile, with increasing recognition for our technology both in Australia and abroad. In October 2015, we won the Australian Technology Award – Agritech and the overall Australian Technology Company of the Year for our BOOSTER‐MagTM product. This year we were invited back to help judge this competition. In January 2015, we won an Australian Water Association Innovation Forum Award for our ACTI‐Mag product and launched our Low Emissions Intensity Lime and Cement (LEILAC) project on the back of €12million in European funding. In May, we were successful in our application for an AusIndustry Accelerating Commercialisation grant, to assist with the registration process for BOOSTER‐Mag in Australia. We also reached the second round of the Blue Economy Challenge for our AQUA‐Cal+ product, and as at October, 2016, we have reached the finals of the 2016 Premier’s NSW Export Awards. We were also very pleased to have our ISO9001 certification for the Development, Manufacture and Supply of Mineral Products renewed following a successful audit during the year. In addition to our focus on revenues, we have continued to find and exploit license opportunities for our technology to deliver value growth over the medium term. Our license and supply arrangement for Very High Surface Area Magnesium Oxide was extended to a global deal, with year on year exports growing over 8 times from FY1415 to FY1516. Our license and partnering pipeline continues to grow with world‐class potential partners interested in the various applications of our unique technology. Our longer term focus, on continuous innovation, continues to bear fruit with 1 new patent application and numerous local and international research partnerships established through the year. I would again like to sincerely thank the staff of Calix for their continued focus and enthusiastic execution of our strategy. Calix’s considerable potential is now being realised thanks to their efforts. I would also like to thank our shareholders for their continued support, and look forward to continuing to deliver on Calix’s very considerable potential.
Phil Hodgson Managing Director
For
per
sona
l use
onl
y
DIRECTORS REPORT
10
DIRECTORS REPORT The directors present their report on Calix Limited and its controlled entities (“the Group”) consisting of Calix Limited (“the Company”) and entities under its control as of, or during the year ended 30 June 2016. DIRECTORS The following persons were directors of the Company during the whole of the year ended 30 June 2016 and up to the date of the report, unless otherwise stated: P J Turnbull J A Hamilton L A W O’Neill P H Hodgson M G Sceats W Lan was a director up until his resignation on 7 October 2015. J H P Lin was a director from 8 October 2015 up until his resignation on 4 May 2016. D Zeiden was appointed as a director on 5 May 2016. INFORMATION ON DIRECTORS P J Turnbull - BCom, LLB, FCIS, FAICD (Non-executive chairman)
Experience
Mr. Turnbull is a company director with more than 25 years’ experience in commercial law, corporate governance and executive management. This experience includes group general counsel, company secretary, general manager and director of ASX Top 50 companies, regulatory authorities in Australia and Hong Kong, government owned and major not-for-profit Australian and global governance organisations. Mr. Turnbull was appointed to the board in 2010 and appointed Chairman in 2013. Mr Turnbull is a non-executive director of ASX listed Karoon Gas Australia Ltd. Special responsibilities Chairman of the board and audit and risk management committee Interest in shares and options 13,950,000 ordinary shares in Calix Limited Nil options or rights over ordinary shares in Calix Limited
J A Hamilton – B Chem, PhD (Non-executive director)
Experience
Dr. Hamilton has over 30 years’ experience in local and overseas energy industries including refining, petrochemicals, gas and LNG production covering roles in operations, project, commercial and marketing management. Previously, he was CEO of Exergen Pty Ltd, a low emission coal resource development company, and Director of NWS Ventures with Woodside Energy, overseeing Australia’s largest resource project, the North West Shelf project. Dr. Hamilton also holds non-executive directorships with Geodynamics Ltd. and DUET Group. Dr. Hamilton was appointed to the board in 2012. Special responsibilities Chairman of technology committee and member of audit & risk management committee Interest in shares and options 24,425,000 ordinary shares in Calix Limited Nil options or rights over ordinary shares in Calix Limited
L A W O’Neill – Bsc (Econ) Hons (Non-executive director)
Experience
Mr. O'Neill is a London-based director of DFB (Australia) Pty. Ltd, a Sydney based investment adviser and is also chairman of EP&F Capital Plc. He has worked in international securities and investment markets since 1981 in UK, Australia, USA and the Far East. During this time he has worked for Price Waterhouse & Co, Prudential-Bache Securities, Societe Generale (Australia) Securities and Rivkin Securities Limited. He is a director of, and/or investor in, a number of private and public companies in the UK, Australia, USA and Japan. Special responsibilities Nil Interest in shares and options 170,000 ordinary shares in Calix Limited Nil options or rights over ordinary shares in Calix Limited
For
per
sona
l use
onl
y

DIRECTORS REPORT
11
D Zeiden – (Non-executive director) Experience
Mr. Zeiden is Sculptor Finance Shareholder’s nominee to the Board of the Company. He is currently a Managing Director and General Counsel, Asia for Och-Ziff Capital Management Group, the investment manager of the Sculptor Finance Shareholders. Prior to joining Och-Ziff, Mr. Zeiden was an associate at two leading New York-based law firms, Paul Weiss Rifkind Wharton & Garrison and Debevoise & Plimpton, specializing in mergers & acquisitions and private equity transactions. Mr. Zeiden holds a B.A. from the University of Wisconsin-Madison and a J.D. from The UCLA School of Law. Mr. Zeiden is a member of the Bar of the State of New York. Special responsibilities Nil. Interest in shares and options Nil ordinary shares in Calix Limited Nil options or rights over ordinary shares in Calix Limited
P H Hodgson – BE, PhD (Managing director & CEO)
Experience
Phil Hodgson had a successful career with Shell, where for over 14 years he developed significant depth of experience across all key sectors of the downstream oil industry. During his time with Shell, Phil also held position of General Manager and Alternate Director of Fuelink Pty Ltd, a $700 million revenue, 300 - employee distribution and sales subsidiary. Phil has run his own consultancy business providing project development, commercial and M&A expertise to a number of industry sectors. From 2009 to 2012, Phil was the Managing Director of Jatenergy Limited, an ASX listed clean-technology business. Special responsibilities Managing Director & CEO, member of the technology committee Interest in shares and options 40,331,760 ordinary shares in Calix Limited Nil options or rights over ordinary shares in Calix Limited
M G Sceats – B.Sc (Hons 1st Class), PhD (Executive director & Chief Scientist)
Experience
Dr Mark Sceats is a qualified physical chemist with over 40 years’ experience. Mark has previously worked at the James Franck Institute at the University of Chicago, and as an Assistant Professor of the University of Rochester NY, USA, where he was awarded the Alfred P Sloan Fellowship for his work. Mark has published more than 140 academic papers in physical chemistry, and is the inventor of 25 patented inventions. Mark was awarded the M.A. Sargent Medal of the Institute of Engineers Australia and the Centenary Medal of the Commonwealth of Australia. He is a Fellow of the Australian Academy of Technological Sciences and Engineering, a Fellow of the Royal Australian Chemical Institute, and a Companion of the Institute of Engineers Australia. Mark was a co-founder of the Company. Special responsibilities Member of the technology committee Interest in shares and options 120,118,138 ordinary shares in Calix Limited Nil options or rights over ordinary shares in Calix Limited
COMPANY SECRETARY D Charles, B Com FCPA, is the Company Secretary and is also the Chief Financial Officer of Calix Limited.
For
per
sona
l use
onl
y
DIRECTORS REPORT
12
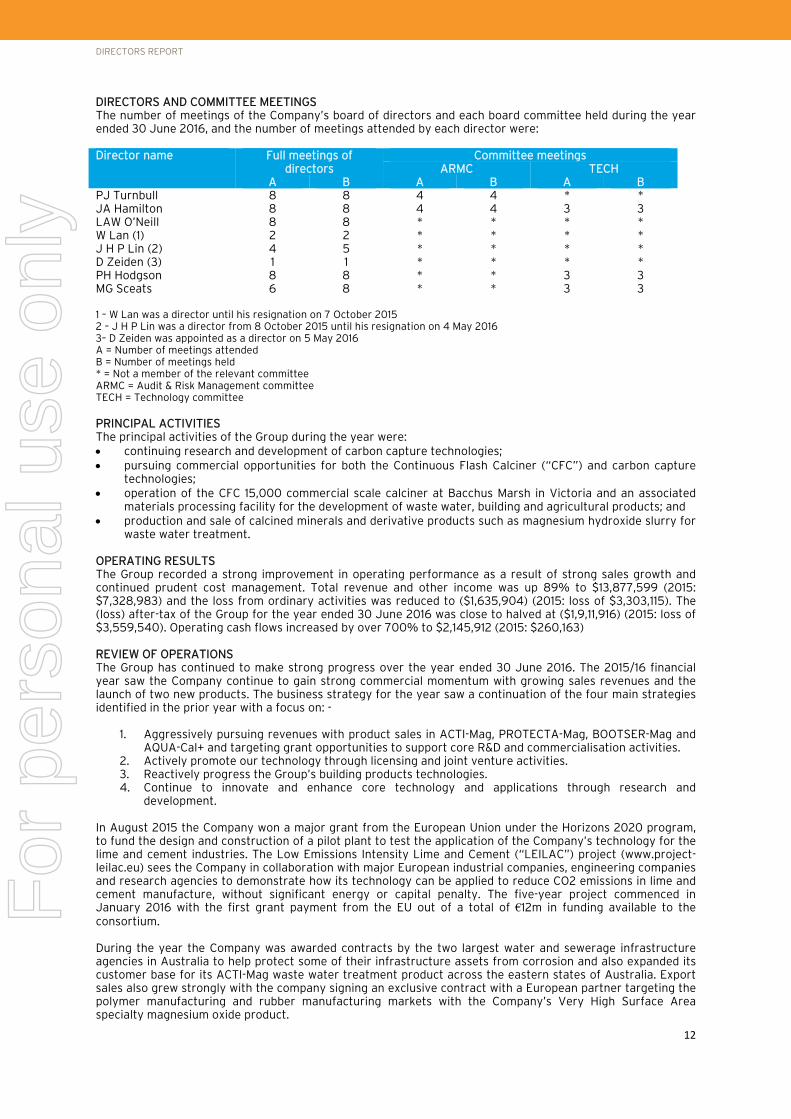
DIRECTORS AND COMMITTEE MEETINGS The number of meetings of the Company’s board of directors and each board committee held during the year ended 30 June 2016, and the number of meetings attended by each director were: Director name Full meetings of
directors Committee meetings
ARMC TECH A B A B A B
PJ Turnbull 8 8 4 4 * * JA Hamilton 8 8 4 4 3 3 LAW O’Neill 8 8 * * * * W Lan (1) 2 2 * * * * J H P Lin (2) 4 5 * * * * D Zeiden (3) 1 1 * * * * PH Hodgson 8 8 * * 3 3 MG Sceats 6 8 * * 3 3 1 – W Lan was a director until his resignation on 7 October 2015 2 – J H P Lin was a director from 8 October 2015 until his resignation on 4 May 2016 3– D Zeiden was appointed as a director on 5 May 2016 A = Number of meetings attended B = Number of meetings held * = Not a member of the relevant committee ARMC = Audit & Risk Management committee TECH = Technology committee PRINCIPAL ACTIVITIES The principal activities of the Group during the year were: continuing research and development of carbon capture technologies; pursuing commercial opportunities for both the Continuous Flash Calciner (“CFC”) and carbon capture
technologies; operation of the CFC 15,000 commercial scale calciner at Bacchus Marsh in Victoria and an associated
materials processing facility for the development of waste water, building and agricultural products; and production and sale of calcined minerals and derivative products such as magnesium hydroxide slurry for
waste water treatment. OPERATING RESULTS The Group recorded a strong improvement in operating performance as a result of strong sales growth and continued prudent cost management. Total revenue and other income was up 89% to $13,877,599 (2015: $7,328,983) and the loss from ordinary activities was reduced to ($1,635,904) (2015: loss of $3,303,115). The (loss) after-tax of the Group for the year ended 30 June 2016 was close to halved at ($1,9,11,916) (2015: loss of $3,559,540). Operating cash flows increased by over 700% to $2,145,912 (2015: $260,163) REVIEW OF OPERATIONS The Group has continued to make strong progress over the year ended 30 June 2016. The 2015/16 financial year saw the Company continue to gain strong commercial momentum with growing sales revenues and the launch of two new products. The business strategy for the year saw a continuation of the four main strategies identified in the prior year with a focus on: -
1. Aggressively pursuing revenues with product sales in ACTI-Mag, PROTECTA-Mag, BOOTSER-Mag and AQUA-Cal+ and targeting grant opportunities to support core R&D and commercialisation activities.
2. Actively promote our technology through licensing and joint venture activities. 3. Reactively progress the Group’s building products technologies. 4. Continue to innovate and enhance core technology and applications through research and
development. In August 2015 the Company won a major grant from the European Union under the Horizons 2020 program, to fund the design and construction of a pilot plant to test the application of the Company’s technology for the lime and cement industries. The Low Emissions Intensity Lime and Cement (“LEILAC”) project (www.project-leilac.eu) sees the Company in collaboration with major European industrial companies, engineering companies and research agencies to demonstrate how its technology can be applied to reduce CO2 emissions in lime and cement manufacture, without significant energy or capital penalty. The five-year project commenced in January 2016 with the first grant payment from the EU out of a total of €12m in funding available to the consortium. During the year the Company was awarded contracts by the two largest water and sewerage infrastructure agencies in Australia to help protect some of their infrastructure assets from corrosion and also expanded its customer base for its ACTI-Mag waste water treatment product across the eastern states of Australia. Export sales also grew strongly with the company signing an exclusive contract with a European partner targeting the polymer manufacturing and rubber manufacturing markets with the Company’s Very High Surface Area specialty magnesium oxide product.
For
per
sona
l use
onl
y

DIRECTORS REPORT
13
As a result of these and other sales successes, the Company grow its sales revenue by 78% to $3.45m. Total revenue and other income for the year grew by 89% to $13.88m. The Company achieved a number of other business development milestones including the expansion of its PROTECTA-mag business from vertical sewer assets in to man-hole and wet-well applications and also successfully trialling its AQUA-Cal+ product in a number of aquaculture applications in South East Asia. In May 2016 the Company was awarded an Accelerating Commercialisation grant of up to $950,000 from the Australian Government to assist with the commercialisation of its new BOOSTER-Mag product targeting the agricultural industry to enhance certain crop yields, improve insect/pest management and fungal control. The Company will be working to test efficacy of its product and gain product certification with this grant support over the next two years. In addition to commencing the LEILAC R&D project mentioned above, the Company continued its investment in strengthening its core technologies and also extended its intellectual property portfolio, with one new patent application filed during the year and had a number of its patent applications from prior years formally granted. Having achieved positive cash flow from operations in the prior financial year, the 2015/16 financial year saw a strong growth in operating cash generated and an overall increase in cash on hand at the year end. The staff headcount has increased with additional resources added in sales and business development, marketing, R&D and engineering. The Group now includes a small team of 4 staff based in Europe and the Company has 23 team members in Queensland, NSW and Victoria which is an increase in total head count of 6 over the prior financial year. FINANCIAL POSITION The Group held $1,877,390 in cash and cash equivalents at 30 June 2016 (2015: $722,464). The Group had a surplus of $2,613,567 of total current assets over total current liabilities (excluding deferred revenue). GOING CONCERN The financial report has been prepared on a going concern basis. The directors have formed this view based on a number of factors including: The directors believe the going concern basis of preparation of financial statements is appropriate based on the additional sources of income that have been secured since year end and the trading forecasts prepared for the company based on the ongoing increase in sales activity as the business continues to grow. The directors believe their strategies will ensure that the company is able to pay its debts as and when they fall due in the ordinary course of business. SIGNIFICANT CHANGES IN THE STATE OF AFFAIRS Other than the significant milestones as set out in the review of operations above, there were no significant changes in the state of affairs of the Group during the year. DIVIDENDS No dividends were paid or were payable during the year (2015: NIL). AFTER BALANCE DATE EVENTS On 7 October 2016 the Company received notice that an application for advanced finding and overseas research and development activities was approved by Innovation Australia. The finding is for three years to 2017/18. On 17 October 2016 4,000,000 warrants were exercised and 4,000,000 ordinary shares issued in accordance with the warrant terms and conditions. A further 12,000,000 warrants outstanding were unexercised and lapsed on 18 October 2016. Other than the item mentioned above, no other matters or circumstances have arisen since the end of the year which significantly affected, or may significantly affect, the operations of the Group, the results of those operations, or the state of affairs of the Group in future years. FUTURE DEVELOPMENT, PROSPECTS AND BUSINESS STRATEGIES Likely developments in operations and the expected results of those operations in future financial years have not been included in this report as the inclusion of such information is likely to result in unreasonable prejudice to the Group. ENVIRONMENTAL REGULATION The Group’s operations are subject to local, state and federal environmental legislation and regulations in both the testing and operational areas. The board of directors are responsible for the regular monitoring of environmental exposure and compliance with environmental regulations and are not aware of any breaches of these regulations during the year. The Group is committed to achieving a high standard of environmental performance.
For
per
sona
l use
onl
y

DIRECTORS REPORT
14
INDEMNIFICATION AND INSURANCE OF OFFICERS During or since the end of the financial year, the Company has given an indemnity by way of deed of indemnity to directors and senior management. The Company also paid a premium in relation to insuring the directors and other officers against liability incurred in their capacity as a director or officer. OPTIONS AND WARRANTS At the date of this report, there were no unissued ordinary shares of the Company under option and no unissued ordinary shares under warrant. On 17 October 2016 4,000,000 warrants were exercised and 4,000,000 ordinary shares issued in accordance with the warrant terms and conditions. A further 12,000,000 warrants outstanding were unexercised and lapsed on 18 October 2016. Refer to note 17 of the financial statements for further details of the warrants outstanding at balance date. For details of options issued to directors and executives as remuneration, refer to the Remuneration Report. PROCEEDINGS ON BEHALF OF COMPANY No person has applied to the Court under section 237 of the Corporations Act 2001 for leave to bring proceedings on behalf of the Group, or intervene in any proceedings to which the Group is a party, for the purpose of taking responsibility on behalf of the Group for all or any part of those proceedings. AUDITOR BDO East Coast Partnership continues in office in accordance with section 327 of the Corporations Act 2001. NON-AUDIT SERVICES The Group may decide to employ the auditor on assignments additional to their statutory audit duties where the auditor’s expertise and experience with the Company and/or Group are important. Amounts paid or payable to the auditors for non-audit services provided during the year are as follows: - Other assurance services $nil (2015: $nil), and Taxation services $nil (2015: $nil). The Company’s board has considered the position and is satisfied that the provision of the non-audit services is comparable with the general standard of independence for auditors imposed by the Corporations Act 2001. Directors are satisfied that the provision of non-audit services by the auditors, as set out below, did not compromise the auditor independence requirements of the Corporations Act 2001 for the following reasons: All non-audit services have been reviewed by the directors to ensure that they do not impact the
impartiality and objectivity of the audit; and None of the services undermine the general principles relating to auditor independence as set out in
APES 110 Code of Ethics for Professional Accountants. AUDITOR INDEPENDENCE A copy of the auditor’s independence declaration as required under section 307c of the Corporations Act 2001 is set out on page 17.
For
per
sona
l use
onl
y

DIRECTORS REPORT
15
REMUNERATION REPORT (UNAUDITED) This remuneration report sets out the remuneration information for the Group’s directors and other key management personnel (KMP). For the purposes of this report, KMP of the Group are defined as those persons having authority and responsibility for planning, directing and controlling major activities of the Company and the Group, directly or indirectly, including any director of the Company. The objectives of the Group’s remuneration policies are to align directors and key management personnel to the Group’s long-term interests and to ensure that remuneration structures are fair and competitive. The directors believe the current remuneration policies are appropriate and effective to attract and retain the best KMP to run and manage the Group. The director’s policies for determining the nature and amount of remuneration for directors and KMP of the Group are as follows: Non-executive director’s remuneration is approved by the board and shareholders. Non-executive
directors are remunerated at market rates for time, commitment and responsibilities. Remuneration is reviewed annually, based on market practice, duties and accountability. Independent external advice is sought when required. The maximum aggregate of fees that can be paid to non-executive directors is subject to approval by shareholders at the Annual General Meeting.
All KMP, including the CEO, receive a base salary which is based on factors such as length of service and experience. The board reviews KMP salary annually by reference to the Group’s performance, individual performance and comparable information from industry sectors.
KMP employees also receive a superannuation guarantee contribution, which is currently 9.50% and do not receive any other retirement benefits.
Details of the remuneration of the directors and the KMP of the Group are set out in the following tables:
30 June 2016 Short term benefits
Post-employment
benefits
Share-based payments
Total
$ $ $ $
Company directors P J Turnbull 80,000 - - 80,000W Lan - - - -J H P Lin - - - -D Zeiden - - - -J A Hamilton 34,151 - 44,250 78,401L A W O’Neill 80,000 - - 80,000P H Hodgson 216,768 21,575 - 238,343M G Sceats 276,016 1,077 95,750 372,843 686,935 22,652 140,000 849,587Other KMP of the Group D Charles (CFO) 231,387 23,601 - 254,988A C Okely (Divisional Manager) 199,720 25,833 - 225,553
431,107 49,434 - 480,541Total KMP Compensation 1,118,042 72,086 140,000 1,330,128
30 June 2015 Short term
benefits Post-
employment benefits
Share-based payments
Total
$ $ $ $
Company directors P J Turnbull 97,500 - - 97,500G M K Fong (to 29 June 2015) - - - -J A Hamilton 50,083 - - 50,083L A W O’Neill 14,222 - - 14,222P H Hodgson 226,000 16,517 - 242,517M G Sceats 223,157 11,635 - 234,792 610,962 28,152 - 639,114Other KMP of the Group D Charles (CFO) 192,667 14,490 - 207,157A C Okely (Divisional Manager) 209,333 19,167 - 228,500
402,000 33,657 - 435,657Total KMP Compensation 1,012,962 61,809 - 1,074,771
For
per
sona
l use
onl
y

DIRECTORS REPORT
16
During a prior year, the board established a share based payments scheme under which directors and employees could earn shares for achievement of short and long term goals. The Calix Employee Share Scheme Trust (“ESS”) was established to administer the scheme on behalf of the board. Pursuant to resolution of the board, 136,092,051 shares were issued to the Employee Share Scheme Trust at the time and were incorrectly brought to account in the Statement of Financial Performance at fair value (refer to note 34 for disclosure of the correction of this error). The accounting treatment of the ESS shares is now to expense the shares at fair value at the time they are awarded and vest to the participating directors and employees, rather than the establishment date of the ESS. During the 2015/16 financial year, certain KMP were allocated shares under the short term incentive scheme as a result of company performance for the 2014/15 financial year. These shares remain held within the ESS trust and have not been distributed to individuals as at the date of this report. The following shares have been allocated to KMP as a result of achieving the performance goals in the 2014/15 financial year with the corresponding expense being recorded and a reserve of $76,452 being raised in equity: -
Performance award for year ended 30 June 2015
Shares allocated within ESS Trust
(number)
Cash bonus $
Company directors P H Hodgson 1,875,000 -M G Sceats 1,133,332 11,333Other KMP of the Group D Charles (CFO) 862,500 -A C Okely (Divisional Manager) 937,500 -Total STI payment awarded to KMP
4,808,332 11,333
After balance date, the following shares have been allocated to KMP as a result of achieving the performance goals in the 2015/16 financial year with the corresponding expense being recorded and a reserve of $189,070 being raised in equity: -
Performance award for year ended 30 June 2016
STI component payable as
Shares allocated within ESS Trust
(number)*
STI component payable at the election of KMP as either shares or
cash or combination of both*
Share allocation (number)
Cash bonus $
Company directors
P H Hodgson 5,923,481 1,747,427 - M G Sceats 4,421,595 1,304,371 - Other KMP of the Group D Charles (CFO) 2,786,254 - 13,151 A C Okely (Divisional Manager) 3,028,534 - 14,295 Total STI payment awarded to KMP
16,159,864 3,051,798 27,446
* - All shares allocated to KMP remain held within the ESS Trust and have not been distributed to individuals as at the date of this report. For a portion of the STI payable for 2015/16, the KMP can choose between either cash or shares or a mixture of both. Service agreements The employment terms and conditions of KMP are formalised in contracts of employment or consulting arrangements. P Hodgson requires 6 months’ and, M G Sceats, D Charles and A C Okely require 3 months’ notice prior to termination of employment or consulting arrangement. Termination benefits for KMP are not payable in the event of gross misconduct unless otherwise indicated. Options holdings No KMP has options over ordinary shares and no KMP had options over ordinary shares in the prior year. This report is signed in accordance with a resolution of the board of directors.
P J Turnbull, Chairman Sydney 24 October 2016
For
per
sona
l use
onl
y

Level 11, 1 Margaret St Sydney NSW 2000 Australia
Tel: +61 2 9251 4100 Fax: +61 2 9240 9821 www.bdo.com.au
BDO East Coast Partnership ABN 83 236 985 726 is a member of a national association of independent entities which are all members of BDO Australia Ltd ABN 77 050 110 275, an Australian company limited by guarantee. BDO East Coast Partnership and BDO Australia Ltd are members of BDO International Ltd, a UK company limited by guarantee, and form part of the international BDO network of independent member firms. Liability limited by a scheme approved under Professional Standards Legislation, other than for the acts or omissions of financial services licensees.
DECLARATION OF INDEPENDENCE BY PAUL BULL TO THE DIRECTORS OF CALIX LIMITED
As lead auditor of Calix Limited for the year ended 30 June 2016, I declare that, to the best of my
knowledge and belief, there have been:
1. No contraventions of the auditor independence requirements of the Corporations Act 2001 in
relation to the audit; and
2. No contraventions of any applicable code of professional conduct in relation to the audit.
This declaration is in respect of Calix Limited and the entities it controlled during the period.
Paul Bull
Partner
BDO East Coast Partnership
Sydney, 24 October 2016
17
For
per
sona
l use
onl
y

FINANCIAL REPORT – CALIX LIMITED AND ITS CONTROLLED ENTITIES
18
CONSOLIDATED STATEMENT OF PROFIT OR LOSS AND OTHER COMPREHENSIVE INCOME For the year ended 30 June 2016
Note June 2016
$ Restated June 2015
$
Revenue & Other Income 3 13,877,599 7,328,983
Cost of Sales (2,791,185) (1,482,684)
Gross Profit 11,086,414 5,846,299
Employee benefits expenses (3,260,900) (3,311,961)
Directors fees (209,226) (169,245)
Depreciation & impairment expense 4 (4,448,443) (1,995,590)
Travel (335,033) (245,005)
Patent and trademark costs (178,424) (148,831)
Professional Advisors fees (141,268) (106,002)
Rental expense relating to operating leases (152,956) (211,233)
Research & development costs (3,386,182) (2,367,147)
Other expenditure (609,886) (594,400)
Total operating expenses (12,722,318) (9,149,414)
Loss from ordinary activities (1,635,904) (3,303,115)
Income tax expense 5 - -
Profit/(loss) from ordinary activities after income tax (1,635,904) (3,303,115)
Finance costs on borrowings (276,012) (256,425)
Net gain/(loss) from funding, derivative revaluation and goodwill impairment (1,911,916) (3,559,540)
Profit/(loss) after funding costs, derivative revaluation, goodwill impairment and income tax for the year
(1,911,916) (3,559,540)
Other comprehensive income
Items that may be reclassified to profit or loss:
Foreign currency translation (48,700) (1,026)
Total comprehensive income for the year (1,960,616) (3,560,566)
Total comprehensive income for the year is attributable to:
Owners of Calix Limited (1,954,902) (3,559,817)
Non-controlling interests (5,714) (749)
(1,960,616) (3,560,566)
Basic and diluted earnings per share (cents) 25 (0.01) (0.02)
The consolidated statement of profit or loss and other comprehensive income should be read in conjunction with the accompanying notes. Please refer to note 34 for details of the restatement of comparative.
For
per
sona
l use
onl
y

FINANCIAL REPORT – CALIX LIMITED AND ITS CONTROLLED ENTITIES
19
CONSOLIDATED STATEMENT OF FINANCIAL POSITION As at 30 June 2016
Note June 2016
$ Restated June 2015
$
ASSETS
Current assets
Cash and cash equivalents 6 1,877,390 722,464
Trade and other receivables 7 926,192 920,007
Inventory 8 38,598 25,306
Current tax assets 9 3,250,000 3,457,100
Total current assets 6,092,180 5,124,877
Non-current assets
Intangible assets 10 197,708 197,708
Property, plant and equipment 12 14,812,758 19,021,073
Investments accounted for using the equity method 11 41,270 41,270
Total non-current assets 15,051,736 19,260,051
Total assets 21,143,916 24,384,928
LIABILITIES
Current liabilities
Trade and other payables 13 1,478,613 1,973,137
Borrowings 14 2,000,000 3,000,000
Deferred revenue 16 1,140,000 -
Total current liabilities 4,618,613 4,973,137
Non-current liabilities
Borrowings 15 1,118,074 323,346
Deferred revenue 16 977,654 3,254,875
Derivative financial instruments 17 80,000 80,000
Total non-current liabilities 2,175,728 3,658,221
Total liabilities 6,794,341 8,631,358
NET ASSETS 14,349,575 15,753,570
EQUITY
Issued capital 18 21,036,817 20,758,276
Reserves 19 321,925 84,481
Retained earnings (7,009,708) (5,090,478)Capital and reserves attributable to the owners of Calix Limited 14,349,035 15,752,279
Non-controlling interests 540 1,291
TOTAL EQUITY 14,349,575 15,753,570
The consolidated statement of financial position should be read in conjunction with the accompanying notes. Please refer to note 34 for details of the restatement of comparative.
For
per
sona
l use
onl
y

FINANCIAL REPORT – CALIX LIMITED AND ITS CONTROLLED ENTITIES
20
CONSOLIDATED STATEMENT OF CASH FLOWS For the year ended 30 June 2016
Note June 2016
$ June 2015
$
Cash flows from operating activities
Receipts from customers 9,893,776 4,852,095
Payments to suppliers and employees (10,929,551) (7,852,320)
Interest received 3,633 12,543
Interest paid (276,012) (256,425)
Income tax benefit/GST received 3,454,066 3,504,270
Net cash provided by operating activities 21 2,145,912 260,163
Cash flows from investing activities
Purchases of property, plant and equipment (269,527) (1,307,962)
Proceeds from sales of assets - 88,090
Payments for investments in associates - (41,270)
Net cash used in investing activities (269,527) (1,261,142)
Cash flows from financing activities
Proceeds from issues of shares 278,541 114,713
Proceeds from/(repayments of) borrowings (1,000,000) 500,000
Net cash provided by financing activities (721,459) 614,713
Net increase/(decrease) in cash and cash equivalents 1,154,926 (386,266)
Cash and cash equivalents at the beginning of the year 722,464 1,108,730
Cash and cash equivalents at the end of the year 1,877,390 722,464
The consolidated statement of cash flows should be read in conjunction with the accompanying notes.
For
per
sona
l use
onl
y

FINANCIAL REPORT – CALIX LIMITED AND ITS CONTROLLED ENTITIES
21
CONSOLIDATED STATEMENT OF CHANGES IN EQUITY For the year ended 30 June 2016
Issued Capital Restated Reserves Retained Earnings
Restated Total Parent Entity
Interest Non-controlling
interest Restated Total
Balance at 1 July 2014
20,643,562
9,055
(1,529,912)
19,122,705
542
19,123,247
Net profit for the year after tax
-
-
(3,560,566)
(3,560,566)
(749)
(3,560,566)
Other comprehensive income for the year
Net movement in foreign currency translation reserve
-
(1,026)
-
(1,026)
-
(1,026)
Net movement in share based payment reserve
-
76,452
-
-
-
-
Total comprehensive income for the year
-
75,426 (3,560,566)
(3,485,140)
(749)
(3,485,889)
Transactions with owners
New issues of shares (net of transaction costs)
114,714
-
-
114,714
-
114,714
Non-controlling interests share of subsidiaries
-
-
-
-
1,498
1,498
Balance at 30 June 2015
20,758,276
84,481
(5,090,478)
15,752,279
1,291
15,753,570
Net profit for the year after tax
-
- (1,911,916)
(1,911,916) - (1,911,916)
Other comprehensive income for the year
Net movement in foreign currency translation reserve
-
(48,700)
-
(48,700) -
(48,700)
Net movement in share based payment reserve
-
189,070
-
189,070 -
189,070
Total comprehensive income for the year
-
140,370 (1,911,916)
(1,771,546)
-
(1,771,546)
Transactions with owners
New issues of shares (net of transaction costs)
278,541
-
-
278,541
-
278,541 Foreign currency adjustment to historical retained earnings
-
97,073
(7,313)
89,760
-
89,760
Non-controlling interests share of subsidiaries
-
-
-
-
(751)
(751)
Balance at 30 June 2016
21,036,817
321,924
(7,009,708)
14,349,034
540
14,349,574
The consolidated statement of changes in equity should be read in conjunction with the accompanying notes. Please refer to note 34 for details of the restatement of comparative.
For
per
sona
l use
onl
y

FINANCIAL REPORT – CALIX LIMITED AND ITS CONTROLLED ENTITIES
NOTES TO THE FINANCIAL REPORT For the year ended 30 June 2016
22
This financial report comprises the consolidated financial statements and notes of Calix Limited (“the Company”) and its controlled entities (“the Group").
1. SUMMARY OF SIGNIFICANT ACCOUNTING POLICIES
Basis of preparation The financial report is a general purpose financial report that has been prepared in accordance with Australian Accounting Standards – Reduced Disclosure Requirements (including Australian Accounting Interpretations) of the Australian Accounting Standards Board (AASB) and Corporations Act 2001 as appropriate for profit oriented entities.
The financial report has been prepared on an accrual basis and is based on historical costs, modified, where applicable by the measurement at fair value of selected non-current assets, financial assets and financial liabilities. Parent entity information In accordance with the Corporations Act 2001, these financial statements present the results of the consolidated entity only. Supplementary information about the parent entity is disclosed in note 31. (a) Principles of consolidation The consolidated financial statements incorporate the assets, liabilities and results of entities controlled by the Company at the end of the reporting period. A controlled entity is any entity over which the Company has the power to govern the financial and operating policies so as to obtain benefits from the entities activities. Control will generally exist when the parent owns, directly or indirectly through subsidiaries, more than half of the voting power of the entity. In assessing the power to govern, the existence and effect of holdings of actual and potential voting rights are considered. In preparing the consolidated financial statements, all inter-group balances and transactions between entities in the consolidated group, including any unrealised profits or losses have been eliminated on consolidation. Accounting policies of subsidiaries have been changed where necessary to ensure consistency with those adopted by the parent entity.
Non-controlling interests, being the equity in a subsidiary not attributable, directly or indirectly, to a parent, are shown separately within the equity section of the consolidated statement of financial position and consolidated statement of comprehensive income. The non-controlling interests in the net assets comprise their interest at their date of the original business combination and their shares of change in equity since that date.
(b) Going concern The consolidated operating loss for the year was $1.77 million. Notwithstanding this, the company generated strong growth in cash flows from operating activities for the year of $2.15 million, and had a net increase in cash balance of $1.15 million delivering a closing cash balance on $1.88 million. After balance date, the Company received its $3.25 million R&D tax rebate and received indicative interest on a new $3.0 million working capital facility with a group of lenders. The Group had net assets at 30 June 2016 of $14.35 million. Taking in to account the strong operating cash flow result, the directors believe the going concern basis of preparation of financial statements is appropriate based on the additional sources of income that have been secured since year end and the trading forecasts prepared for the company based on the ongoing increase in sales activity as the business becomes more established. The directors believe their strategies will ensure that the Company continues to be able to pay its debts as and when they fall due in the ordinary course of business.
(c) Business combinations Business combinations occur where an acquirer obtains control over one or more businesses and results in the consolidation of assets and liabilities. A business combination is accounted for by applying the acquisition method, unless it is a combination involving entities or businesses under common control. The acquisition method requires that for each business combination one of the combining entities must be identified as the acquirer (ie parent entity). The business combination will be accounted for as at the acquisition date, which is the date that control over the acquiree is obtained by the parent entity. At this date, the parent shall recognise, in the consolidated accounts, and subject to certain limited exceptions, the fair value of the identifiable assets acquired and liabilities assumed. In addition, contingent liabilities of the acquiree will be recognised where a present obligation has been incurred and its fair value can be reliably measured. The acquisition may result in the recognition of goodwill or a gain from a bargain purchase. The method adopted for the measurement of goodwill will impact on the measurement of any non-controlling interest to be recognised in the acquiree where less than 100% ownership interest is held in the acquiree. The acquisition date fair value of the consideration transferred for a business combination plus the acquisition date fair value of any previously held equity interest shall form the cost of the investment in the separate financial statements.
For
per
sona
l use
onl
y
FINANCIAL REPORT – CALIX LIMITED AND ITS CONTROLLED ENTITIES
NOTES TO THE FINANCIAL REPORT For the year ended 30 June 2016
23
Consideration may comprise the sum of the assets transferred by the acquirer, liabilities incurred by the acquirer to the former owners of the acquiree and the equity interest issued by the acquirer. Included in the measurement of consideration transferred is any asset or liability resulting from a contingent consideration arrangement. Any obligation incurred relating to contingent consideration is classified as either a financial liability or equity instrument, depending upon the nature of the arrangement. All transaction costs incurred in relation to the business combination are expensed to the consolidated income statement. (d) Associates
Associates are entities over which the consolidated entity has significant influence but not control or joint control. Investments in associates are accounted for in the consolidated financial statements using the equity method. Under the equity method, the share of the profits or losses of the associate is recognised in profit or loss and the share of the movements in equity is recognised in other comprehensive income. Investments in associates are carried in the statement of financial position at cost plus post-acquisition changes in the consolidated entity’s share of net assets of the associates. Dividends received or receivable from associates reduce the carrying amount of the investment. When the consolidated entity’s share of losses in an associate equals or exceeds its interest in the associate, including any unsecured long-term receivables, the consolidated entity does not recognise further losses, unless it has incurred obligations or made payments on behalf of the associate. (e) Income tax
The income tax expense/(benefit) for the year comprises current income tax expense/(benefit), research and development claim and deferred tax expense/(benefit). Current income tax expense charged to the profit or loss is the tax payable on taxable income calculated using applicable income tax rates enacted, or substantially enacted, as at the end of the reporting period together with the research and development claim submitted for the reporting period. Current tax liabilities/assets are therefore measured at the amounts expected to be paid to/recovered from the relevant taxation authority. Deferred income tax expense reflects movements in deferred tax asset and deferred tax liability balances during the year as well as unused tax losses. Current and deferred income tax expense/(benefit) is charged or credited directly to equity instead of the profit or loss when the tax relates to items that are credited or charged directly to equity.
Deferred tax assets and liabilities are ascertained based on temporary differences arising between the tax bases of assets and liabilities and their carrying amounts in the financial statements. Deferred tax assets also result where amounts have been fully expensed but future tax deductions are available.
No deferred income tax will be recognised from the initial recognition of an asset or liability, excluding a business combination, where there is no effect on accounting or taxable profit or loss. Deferred tax assets and liabilities are calculated at the tax rates that are expected to apply to the period when the asset is realised or the liability is settled, based on tax rates enacted or substantively enacted at the end of the reporting period. Their measurement also reflects the manner in which management expects to recover or settle the carrying amount of the related asset or liability. Deferred tax assets relating to temporary differences and unused tax losses are recognised only to the extent that is it probable that future taxable profit will be available against which the benefits of the deferred tax asset can be utilised. Where the temporary difference exists in relation to investments in subsidiaries, branches, associates and joint ventures, deferred tax assets and liabilities are not recognised where the timing of the reversal of the temporary difference can be controlled and it is not probable that the reversal will occur in the foreseeable future. Current tax assets and liabilities are offset where a legally enforceable right of set-off exists and it is intended that net settlement or simultaneous realisation and settlement of the respective asset and liability will occur. Deferred tax assets and liabilities are offset where a legally enforceable right of set-off exists, the deferred tax assets and liabilities related to income taxes levied by the same taxation authority on either the same taxable entity or different taxable entities where it is intended that the net settlement or simultaneous realisation and settlement of the respective asset and liability will occur in future periods in which significant amounts of deferred assets or liabilities are expected to be recovered or settled. (f) Fair value measurement When an asset or liability, financial or non-financial, is measured at fair value for recognition or disclosure purposes, the fair value is based on the price that would be received to sell an asset or paid to transfer a liability in an orderly transaction between market participants at the measurement date; and assumes that the transaction will take place either: in the principle market; or in the absence of a principal market, in the most advantageous market. Fair value is measured using the assumptions that market participants would use when pricing the asset or liability, assuming they act in their economic best interest. For non-financial assets, the fair value measurement is based on its highest and best use.
For
per
sona
l use
onl
y
FINANCIAL REPORT – CALIX LIMITED AND ITS CONTROLLED ENTITIES
NOTES TO THE FINANCIAL REPORT For the year ended 30 June 2016
24
Valuation techniques that are appropriate in the circumstances and for which sufficient data are available to measure fair value, are used, maximising the use of relevant observable inputs and minimising the use of unobservable inputs. Assets and liabilities measured at fair value are classified, into three levels, using a fair value hierarchy that reflects the significance of the inputs used in making the measurements. Classifications are reviewed each reporting date and transfers between levels are determined based on a reassessment of the lowest level input that is significant to the fair value measurement. For recurring and non-recurring fair value measurements, external valuers may be used when internal expertise is either not available or when the valuation is deemed to be significant. External valuers are selected based on market knowledge and reputation. Where there is a significant change in fair value of an asset or liability from one period to another, an analysis is undertaken, which includes a verification of the major inputs applied in the latest valuation and a comparison, where applicable, with external sources of data. (g) Property, plant & equipment
Each class of plant and equipment is carried at cost or fair value as indicated less, where applicable, any accumulated depreciation and impairment losses. Plant and equipment are measured on the cost basis less depreciation and impairment losses. The carrying amount of plant and equipment is reviewed annually by Directors to ensure it is not in excess of the recoverable amount from these assets. The recoverable amount is assessed on the basis of the expected net cash flows that will be received from the assets' employment and subsequent disposal. The expected net cash flows have been discounted to their present values in determining recoverable amounts. The cost of plant and equipment constructed includes the cost of materials, direct labour, borrowing costs and an appropriate proportion of fixed and variable overheads. Subsequent costs are included in the asset's carrying amount or recognised as a separate asset, as appropriate, only when it is probable that future economic benefits associated with the item will flow to the Group and the cost of the item can be measure reliably. All other repairs and maintenance expenses are charged to the income statements during the financial period in which they are incurred. Mining tenements and associated mineral resources:- The costs of acquiring mining tenements and associated mineral resources are capitalised as part of property plant and equipment and amortised over the estimated productive life of each applicable resource. Amortisation commences when extraction of the mineral resource commences.
(h) Depreciation The depreciable amount of fixed assets is calculated on a straight-line basis over the asset's useful life to the Group commencing from the time the asset is held ready for use. The depreciation rates used for each class for depreciable assets are:
Furniture and fittings - 10% Office equipment - 25% Software - 25% Commercial calciner equipment – 5%-
20% The assets' residual values and useful lives are reviewed, and adjusted if appropriate, at each reporting date. An asset's carrying amount is written down immediately to its recoverable amount if the asset's carrying amount is greater than its estimated recoverable amount. Gains and losses on disposal are determined by comparing proceeds with the carrying amount. These gains or losses are included in the statement of comprehensive income. When re-valued assets are sold, amounts included in the revaluation reserve relating to that asset are transferred to retained earnings. (i) Financial instruments Financial assets and financial liabilities are recognised when the entity becomes a party to the contractual provisions to the instrument. For financial assets, this is equivalent to the date that the Group commits itself to either the purchase or sale of the asset (i.e. trade date accounting is adopted). Financial instruments are initially measured at fair value plus transaction costs, except where the instrument is classified 'at fair value through profit or loss' in which case transaction costs are expensed to the statement of comprehensive income immediately. Classification and subsequent measurement a) Loans and receivables Loans and receivables are non-derivative financial asset with fixed or determinable payments that are not quoted in an active market and are subsequently measured at amortised cost. b) Financial liabilities Non-derivative financial liabilities (excluding financial guarantees) are measured at amortised cost. F
or p
erso
nal u
se o
nly

FINANCIAL REPORT – CALIX LIMITED AND ITS CONTROLLED ENTITIES
NOTES TO THE FINANCIAL REPORT For the year ended 30 June 2016
25
Derecognition Financial assets are derecognised where the contractual rights to receipt of cash flows expires or the asset is transferred to another party whereby the company no longer has any significant continuing involvement in the risks and benefits associated with the asset. Financial liabilities are derecognised where the related obligations are discharged, cancelled or expired. The difference between the carrying value of the financial liability, which is extinguished or transferred to another party and the fair value of consideration paid, including the transfer of non-cash assets or liabilities assumed, is recognised in profit or loss. (j) Impairment of assets At the end of each reporting period, the Group assesses whether there is any indication that any assets have been impaired. The assessment will include the consideration of external and internal sources of information including dividends received from subsidiaries, associated or jointly controlled entities deemed to be out of pre-acquisition profits. If such an indication exists, an impairment test is carried out on the asset by comparing the recoverable amount of the asset, being the higher of the asset's fair value less costs to sell and value in use, is compared to the asset's carrying value. An excess of the asset's carrying value over its recoverable amount is expensed to the statement of comprehensive income. Where it is not possible to estimate the recoverable amount of an individual asset, the Group estimates the recoverable amount of the cash-generating unit to which the asset belongs. Impairment testing is performed annually for goodwill and intangible assets with indefinite lives.
(k) Intangible assets Patent and trademarks Patents and trademarks are recognised at cost of acquisition. Patents and trademarks have a finite life and are carried at cost less any accumulated amortisation and any impairment losses. Research and development Expenditure during the research phase of a project is recognised as an expense when incurred. Development costs are capitalised only when technical feasibility studies identity that the projects will deliver future economic benefits and these benefits can be measured reliably. Development costs have a finite life and are amortised on a systematic basis matched to the future economic benefits over the useful life of the project.
(l) Current and non-current classification
Assets and liabilities are presented in the statement of financial position based on current and non-current classification.
An asset is current when: it is expected to be realised or intended to be sold or consumed in normal operating cycle; it is held primarily for the purpose of trading; it is expected to be realised within twelve months after the reporting period; or the asset is cash or cash equivalent unless restricted from being exchanged or used to settle a liability for at least twelve months after the reporting period. All other assets are classified as non-current. A liability is current when: it is expected to be settled in normal operating cycle; it is held primarily for the purpose of trading; it is due to be settled within twelve months after the reporting period; or there is no unconditional right to defer the settlement of the liability for at least twelve months after the reporting period. All other liabilities are classified as non-current. (m) Foreign currency transactions and balances Functional and presentation currency The functional currency of each of the Group's entities is measured using the currency of the primary economic environment in which that entity operates. The consolidated financial statements are presented in Australian Dollars which is the Group's functional and presentation currency. Transactions and balances Foreign currency transactions are translated into functional currency using the exchange rates prevailing at the date of transaction. Foreign currency monetary items are translated at the year-end exchange rate. Non-monetary items measured at historical cost continue to be carried at the exchange rate at the date of the transaction. Non-monetary items measured at fair value are reported at the exchange rate at the date when fair values were determined. Exchange differences arising on the translation of monetary items are recognised in the profit or loss, except where deferred in equity as a qualifying cash flow or net investment hedge. Exchange difference arising on translation of non-monetary items are recognised directly in equity to the extent that the gain or loss is directly recognised in equity, otherwise the exchange difference is recognised in the profit or loss. Group companies The financial results and position of foreign operations whose functional currency is different from the Group's presentation currency are translated as follows:
assets and liabilities are translated at year-end exchange rates prevailing at that reporting date
income and expense are translated at average exchange rates for the year; and
retained earnings are translated at the exchange rates prevailing at the date of the transaction.
For
per
sona
l use
onl
y

FINANCIAL REPORT – CALIX LIMITED AND ITS CONTROLLED ENTITIES
NOTES TO THE FINANCIAL REPORT For the year ended 30 June 2016
26
Exchange differences arising on translation of foreign operations are transferred directly to the Group's foreign currency translation reserve in the statement of financial position. These differences are also recognised in the statement of comprehensive income as other comprehensive income. The foreign currency reserve is recognised in profit or loss when the foreign operation is disposed of.
(n) Employee benefits
Provision is made for the Group's liability for employee benefits arising from services rendered by employees to balance date. Employee benefits that are expected to be settled within one year have been measured at the amounts expected to be paid when the liability is settled, plus related on-costs. Employee benefits payable later than one year have been measured at the present value of the estimated future cash outflows to be made for those benefits. In determining the liability, consideration is given to employee wage increases and the probability that the employee may satisfy vesting requirements. Those cash flows are discounted using market yields on national government bonds with terms to maturity that match the expected timing of cash flows. Short-term employee benefits Liabilities for wages and salaries, including non-monetary benefits, annual leave and long service leave expected to be settled within 12 months of the reporting date are recognised in current liabilities in respect of employees' services up to the reporting date and are measured at the amounts expected to be paid when the liabilities are settled. Other long-term employee benefits The liability for annual leave and long service leave not expected to be settled within 12 months of the reporting date are recognised in non-current liabilities, provided there is an unconditional right to defer settlement of the liability. The liability is measured as the present value of expected future payments to be made in respect of services provided by employees up to the reporting date using the projected unit credit method. Consideration is given to expected future wage and salary levels, experience of employee departures and periods of service. Expected future payments are discounted using market yields at the reporting date on national government bonds with terms to maturity and currency that match, as closely as possible, the estimated future cash outflows. Share-based payments Equity-settled share-based payments with employees and others providing similar services are measured at fair value of the equity instrument at the grant date. Further details on how the fair value of equity-settled share-based transactions has been determined can be found in note 24. The fair value determined at the grant date of the equity-settled share-based payments is expensed on a straight-line basis over the vesting period, based on the Company’s estimate of equity instruments that will eventually vest.
At each reporting date, the Company revised its estimate of the number of equity instruments expected to vest. The impact of the revision of the original estimates, if any, is recognized in profit or loss over the remaining vesting period, with corresponding adjustment to the employee option reserve. Equity-settled share-based transactions with other parties are measured at the fair value of the goods and services received, except where the fair value cannot be estimated reliably, in which case they are measured at the fair value of the equity instruments granted, measured at the date the entity obtains the goods or the counterparty renders the service. (o) Provisions Provisions are recognised when the Group has a legal or constructive obligation, as a result of past events, for which it is probable that an outflow of economic benefits will result and that outflow can be reliably measured. (p) Cash and cash equivalents Cash and cash equivalents include cash on hand, deposits held at call with banks, other short-term highly liquid investments with original maturities of three months or less, and bank overdrafts. Bank overdrafts are shown within short-term borrowings in current liabilities on the statement of financial position. (q) Revenue and other income Revenue is measured at the fair value of the consideration received or receivable after taking into account any trade discounts and volume rebates allowed. Sales revenue is recognised at the point of sale, which is when the customer has taken delivery of the goods, the risks and rewards are transferred to the customer and there is a valid sales contract. Interest revenue is recognised using the effective interest rate method, which for floating rate financial assets is the rate inherent in the instrument. Other revenue is recognised when it is received or when the right to receive payment is established. (r) Trade and other receivables Trade receivables are initially recognised at fair value and subsequently measured at amortised cost using the effective interest method, less any provision for impairment. Trade receivables are generally due for settlement within 30 days.
For
per
sona
l use
onl
y

FINANCIAL REPORT – CALIX LIMITED AND ITS CONTROLLED ENTITIES
NOTES TO THE FINANCIAL REPORT For the year ended 30 June 2016
27
Collectability of trade receivables is reviewed on an ongoing basis. Debts which are known to be uncollectable are written off by reducing the carrying amount directly. A provision for impairment of trade receivables is raised when there is objective evidence that the consolidated entity will not be able to collect all amounts due according to the original terms of the receivables. Significant financial difficulties of the debtor, probability that the debtor will enter bankruptcy or financial reorganisation and default or delinquency in payments (more than 60 days overdue) are considered indicators that the trade receivable may be impaired. The amount of the impairment allowance is the difference between the asset’s carrying amount and the present value of estimated future cash flows, discounted at the original effective interest rate. Cash flows relating to short-term receivables are not discounted if the effect of discounting is immaterial. Other receivables are recognised at amortised cost, less any provision for impairment.
(s) Trade and other payables Trade and other payables represent the liability outstanding at the end of the reporting period for goods and services received by the Group during the reporting period which remains unpaid. The balance is recognised as a current liability with the amount being normally paid with 30 days of recognition of the liability. (t) Borrowings Borrowings are initially recognised at fair value, net of transaction costs incurred. Borrowings are subsequently measured at amortised cost. Any difference between the proceeds and the redemption amount is recognised as profit or loss over the period of the borrowings using the effective interest rate method. The carrying amount of convertible bonds classified as borrowings is subject to re-estimation at each reporting date. In the event the consolidated entity revises its estimates of payments or receipts, the carrying amount of the borrowings is adjusted to reflect actual and revised estimated cash flows. The consolidated entity recalculates the carrying amount by computing the present value of estimated future cash flows at the convertible bonds original effective interest rate. The adjustment is recognised in profit or loss as income or expense. Where there is an unconditional right to defer the settlement of the liability for at least 12 months after the reporting date, the loans or borrowings are classified as non-current. (u) Finance costs Finance costs attributable to qualifying assets are capitalised as part of the asset. All other finance costs are expensed in the period in which they are incurred, including interest on convertible bonds.
(v) Derivative financial instruments Derivatives are initially recognised at fair value on the date a derivative contract is entered into and are subsequently measured at their fair value at the end of each reporting period. As the derivatives used do not qualify for hedge accounting, changes in their fair value are recognised in the profit or loss. Derivatives are classified as current or non-current depending on the expected period of realisation.
(w) Goods and services tax
Revenues, expense and assets are recognised net of the amount of GST, except where the amount of GST incurred is not recoverable from the Australian Tax Office. In these circumstances the GST is recognised as part of the cost of acquisition of the asset or as part of an item of the expense. Receivables and payables in the statement of financial position are shown inclusive of GST. Cash flows are presented in the cash flow statement on a gross basis, except for the GST component of investing and financing activities which are disclosed as operating cash flows.
(x) Comparative figures When required by the accounting standards, and/or for improved presentation purposes comparative figures have been adjusted to conform to changes in the presentation for the current year.
For
per
sona
l use
onl
y

FINANCIAL REPORT – CALIX LIMITED AND ITS CONTROLLED ENTITIES
NOTES TO THE FINANCIAL REPORT For the year ended 30 June 2016
28
(y) Critical accounting estimates and judgments
The directors evaluate estimates and judgements incorporated into the financial report based on historical knowledge and best available current information. Estimates assume a reasonable expectation of future events and are based on current trends and economic data, obtained both externally and within the Group.
Key estimates – valuation of derivatives The Group uses valuation techniques to estimate the fair value of certain types of derivative financial instruments. Information on the key assumptions used in estimating the fair values of these instruments is set out in note 18. Key estimates – estimation of useful lives of assets The consolidated entity determines the estimated useful lives and related depreciation and amortisation charges for its property, plant and equipment and finite life intangible assets. The useful lives could change significantly as a result of technical innovations or some other event. The depreciation and amortisation charge will increase where the useful lives are less than previously estimated lives, or technically obsolete or non-strategic assets that have been abandoned or sold will be written off or written down. Key estimates – employee benefits provision As discussed in note 1(n), the liability for employee benefits expected to be settled more than 12 months from the reporting date are recognised and measured at the present value of the estimated future cash flows to be made in respect of all employees at the reporting date. In determining the present value of the liability, estimates of attrition rates and pay increases through promotion and inflation have been taken into account. Key estimates - Impairment of non-financial assets other than goodwill and other indefinite life intangible assets The consolidated entity assesses impairment of non-financial assets other than goodwill and other indefinite life intangible assets at each reporting date by evaluating conditions specific to the consolidated entity and to the particular asset that may lead to impairment. If an impairment trigger exists, the recoverable amount of the asset is determined. This involves fair value less costs of disposal or value-in-use calculations, which incorporate a number of key estimates and assumptions.
Judgements – income tax, recovery of deferred tax assets and research and development claim. Deferred tax assets are recognised for deductible temporary differences and brought forward income tax losses only if the Group considers it is probable that future taxable amounts will be available to utilise those temporary differences and losses.
Judgement is required in determining the amount of income tax revenue relating to the research and development claim. There are certain transactions and calculations undertaken during the ordinary course of business for which the ultimate tax determination may be subject to change. The consolidated entity calculates its research and development claim based on the consolidated entity’s understanding of the tax law. Where the final outcome of these matters is different from the amounts that were initially recorded, such differences will impact the profit or loss in the year in which such determination is made. The consolidated entity is subject to income taxes in the jurisdictions in which it operates. Significant judgement is required in determining the provision for income tax. There are many transactions and calculations undertaken during the ordinary course of business for which the ultimate tax determination is uncertain. The consolidated entity recognises liabilities for anticipated tax audit issues based on the consolidated entity's current understanding of the tax law. Where the final tax outcome of these matters is different from the carrying amounts, such differences will impact the current and deferred tax provisions in the period in which such determination is made. Judgements – share-based payment transactions. The consolidated entity measures the cost of equity-settled transactions with employees by reference to the fair value of the equity instruments at the date at which they are granted. The fair value is determined by using either the Binomial or Black-Scholes model taking into account the terms and conditions upon which the instruments were granted. The accounting estimates and assumptions relating to equity-settled share-based payments would have no impact on the carrying amounts of assets and liabilities within the next annual reporting period but may impact profit or loss and equity. 2. SEGMENT INFORMATION The Group identifies its operating segments based on the internal reports that are reviewed and used by the executive management team (chief operating decision makers) in assessing performance and in determining the allocation of resources. At present, as reflected in internal reports, the Group operates in one segment being minerals processing and carbon capture.
For
per
sona
l use
onl
y

FINANCIAL REPORT – CALIX LIMITED AND ITS CONTROLLED ENTITIES
NOTES TO THE FINANCIAL REPORT For the year ended 30 June 2016
29
3. REVENUE AND OTHER INCOME June 2016
$ June 2015
$Revenue
Sales 3,447,630 1,936,487Other income
Grant income 6,963,127 1,801,808R&D rebate 3,276,361 3,457,100Interest income 3,633 12,543Other income 186,848 121,045
Total revenue and other income
13,877,599 7,328,983
4. EXPENSES
(Loss) before incomes tax includes the following specific expenses: - June 2016
$ June 2015
$Rental expense relating to operating leases 152,956 211,233 Depreciation expense 1,704,435 1,995,590Impairment expense 2,744,008 - 4,448,443 1,995,590
5. INCOME TAX Numerical reconciliation of income tax to prima facie tax payable: June 2016
$ June 2015
$Prima facie income tax (benefit) on loss from ordinary activities (30%)
(516,854) (1,044,926)
Tax effects of amounts which are not deductible (taxable) in calculating taxable income
Research & development claim
3,250,000 4,317,803
Sundry items 135,110 26,273Under provision of prior periods
(26,361) (35,259)
Share transaction costs of prior periods
(78,503) (258,748)
Unrealised exchange gain
36,330 (82,036)
Tax losses utilised (2,799,722) (2,923,107)Income tax attributable to the Group
- -
Tax losses Unused tax losses for which no deferred tax asset has been recognised 12,834,902 15,634,624Potential income tax benefit @ 30%
3,850,471 4,690,387
Unrecognised temporary differences Temporary differences not recognised 1,376,735 1,376,735Potential income tax benefit @ 30%
413,021 413,021
For
per
sona
l use
onl
y
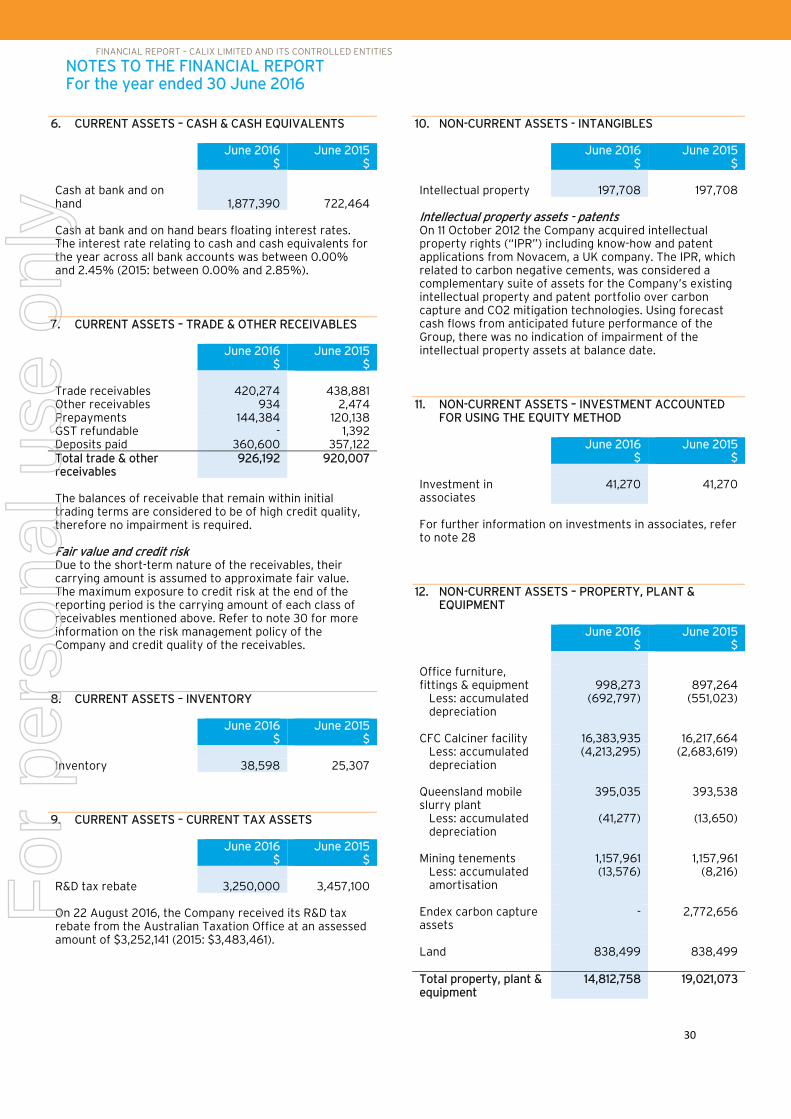
FINANCIAL REPORT – CALIX LIMITED AND ITS CONTROLLED ENTITIES
NOTES TO THE FINANCIAL REPORT For the year ended 30 June 2016
30
6. CURRENT ASSETS – CASH & CASH EQUIVALENTS June 2016
$ June 2015
$ Cash at bank and on hand 1,877,390 722,464 Cash at bank and on hand bears floating interest rates. The interest rate relating to cash and cash equivalents for the year across all bank accounts was between 0.00% and 2.45% (2015: between 0.00% and 2.85%).
7. CURRENT ASSETS – TRADE & OTHER RECEIVABLES June 2016
$ June 2015
$ Trade receivables 420,274 438,881Other receivables 934 2,474Prepayments 144,384 120,138GST refundable - 1,392Deposits paid 360,600 357,122Total trade & other receivables
926,192 920,007
The balances of receivable that remain within initial trading terms are considered to be of high credit quality, therefore no impairment is required. Fair value and credit risk Due to the short-term nature of the receivables, their carrying amount is assumed to approximate fair value. The maximum exposure to credit risk at the end of the reporting period is the carrying amount of each class of receivables mentioned above. Refer to note 30 for more information on the risk management policy of the Company and credit quality of the receivables.
8. CURRENT ASSETS – INVENTORY June 2016
$ June 2015
$ Inventory 38,598 25,307
9. CURRENT ASSETS – CURRENT TAX ASSETS June 2016
$ June 2015
$ R&D tax rebate 3,250,000 3,457,100 On 22 August 2016, the Company received its R&D tax rebate from the Australian Taxation Office at an assessed amount of $3,252,141 (2015: $3,483,461).
10. NON-CURRENT ASSETS - INTANGIBLES June 2016
$ June 2015
$ Intellectual property 197,708 197,708 Intellectual property assets - patents On 11 October 2012 the Company acquired intellectual property rights (“IPR”) including know-how and patent applications from Novacem, a UK company. The IPR, which related to carbon negative cements, was considered a complementary suite of assets for the Company’s existing intellectual property and patent portfolio over carbon capture and CO2 mitigation technologies. Using forecast cash flows from anticipated future performance of the Group, there was no indication of impairment of the intellectual property assets at balance date.
11. NON-CURRENT ASSETS – INVESTMENT ACCOUNTED FOR USING THE EQUITY METHOD
June 2016
$ June 2015
$ Investment in associates
41,270 41,270
For further information on investments in associates, refer to note 28
12. NON-CURRENT ASSETS – PROPERTY, PLANT & EQUIPMENT
June 2016
$ June 2015
$ Office furniture, fittings & equipment 998,273 897,264
Less: accumulated depreciation
(692,797) (551,023)
CFC Calciner facility 16,383,935 16,217,664
Less: accumulated depreciation
(4,213,295) (2,683,619)
Queensland mobile slurry plant
395,035 393,538
Less: accumulated depreciation
(41,277) (13,650)
Mining tenements 1,157,961 1,157,961
Less: accumulated amortisation
(13,576) (8,216)
Endex carbon capture assets
- 2,772,656
Land 838,499 838,499
Total property, plant & equipment
14,812,758 19,021,073
For
per
sona
l use
onl
y

FINANCIAL REPORT – CALIX LIMITED AND ITS CONTROLLED ENTITIES
NOTES TO THE FINANCIAL REPORT For the year ended 30 June 2016
31
Movement in the carrying amounts (dollars) for each class of plant and equipment between the beginning and the end of the year:
Office
furniture, fittings &
equipment $
CFC Calciner
facility
$
Queensland mobile
slurry plant
$
Mining tenements
$
Endex Carbon
Capture assets
$
Land
$
Total
$ Balance as at 30 June 2014 396,339 15,354,983 - 1,129,829 2,111,295 838,499 19,830,945 Additions 104,252 121,592 393,538 25,000 661,361 - 1,305,743Transfers - (122,316) - - - - (122,316)Depreciation expense (154,350) (1,820,216) (13,650) (5,084) - - (1,993,300)Balance as at 30 June 2015 346,241 13,534,044 379,887 1,149,745 2,772,656 838,499 19,021,072 Additions 101,009 166,271 1,497 - - - 268,777Depreciation expense (141,774) (1,529,675) (27,626) (5,360) - - (1,704,436)Impairment expense - - - - (2,744,008) - (2,744,008)Realised exchange rate adjustment
- - - - (28,648) - (28,648)
Balance as at 30 June 2016 305,476 12,170,640 353,758 1,144,385 - 838,499 14,812,758 Impairment expense – DECC Endex Carbon Capture assets. During the year, Millennium Generation Limited (“MGL”), a 65% owned subsidiary of the Company, was advised by UK’s Department of Energy and Climate Change (“DECC”) of plans to review its Carbon Capture and Storage (“CCS”) grant funding program. As a result of this decision and the ongoing policy uncertainty in the UK with respect to CCS technology, the board of MGL decided to discontinue further work on the DECC Endex Carbon Capture asset project. At the time this decision was taken, the Group accounts included a non-current asset associated with this project of $2,772,656 and had a deferred revenue non-current liability of $2,990,087. To reflect the decision to discontinue work on the project, the non-current asset was fully impaired resulting in an impairment expense of $2,772,656 and the deferred revenue was recognised in full in the statement of profit and loss.
For
per
sona
l use
onl
y
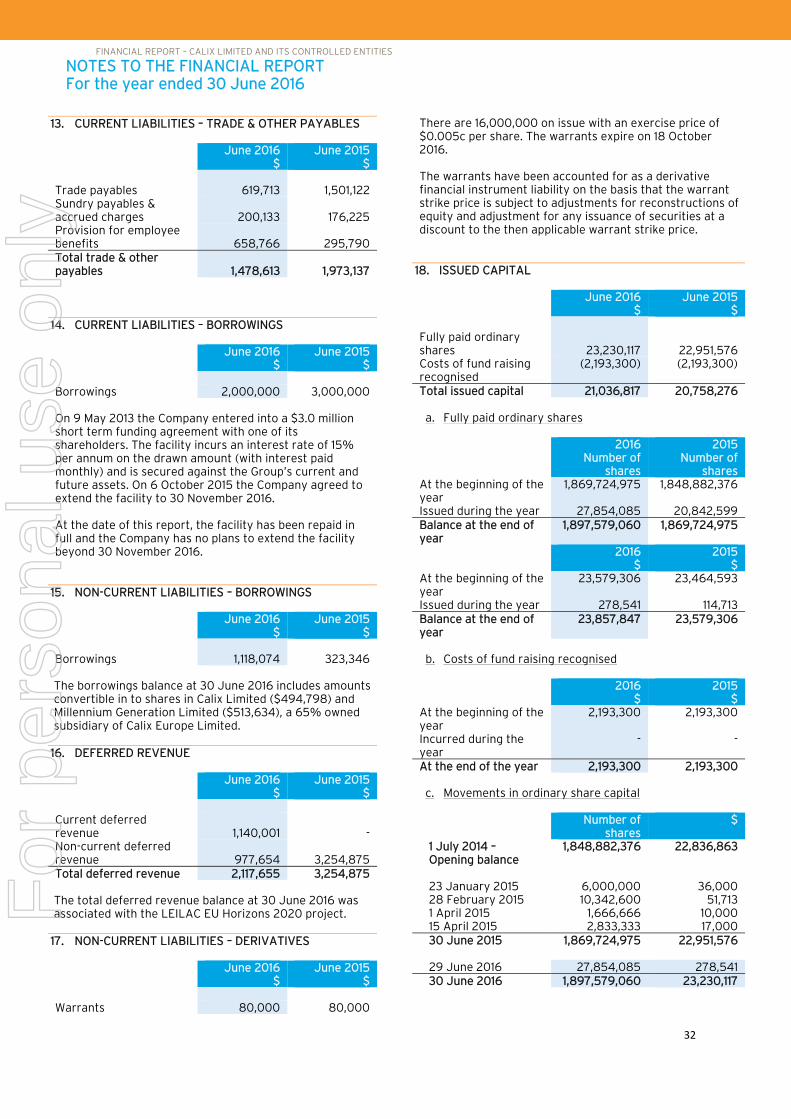
FINANCIAL REPORT – CALIX LIMITED AND ITS CONTROLLED ENTITIES
NOTES TO THE FINANCIAL REPORT For the year ended 30 June 2016
32
13. CURRENT LIABILITIES – TRADE & OTHER PAYABLES June 2016
$ June 2015
$ Trade payables 619,713 1,501,122Sundry payables & accrued charges 200,133 176,225Provision for employee benefits 658,766 295,790Total trade & other payables 1,478,613 1,973,137
14. CURRENT LIABILITIES – BORROWINGS June 2016
$ June 2015
$ Borrowings 2,000,000 3,000,000 On 9 May 2013 the Company entered into a $3.0 million short term funding agreement with one of its shareholders. The facility incurs an interest rate of 15% per annum on the drawn amount (with interest paid monthly) and is secured against the Group’s current and future assets. On 6 October 2015 the Company agreed to extend the facility to 30 November 2016. At the date of this report, the facility has been repaid in full and the Company has no plans to extend the facility beyond 30 November 2016.
15. NON-CURRENT LIABILITIES – BORROWINGS June 2016
$ June 2015
$ Borrowings 1,118,074 323,346 The borrowings balance at 30 June 2016 includes amounts convertible in to shares in Calix Limited ($494,798) and Millennium Generation Limited ($513,634), a 65% owned subsidiary of Calix Europe Limited.
16. DEFERRED REVENUE June 2016
$ June 2015
$ Current deferred revenue 1,140,001 -Non-current deferred revenue 977,654 3,254,875Total deferred revenue 2,117,655 3,254,875 The total deferred revenue balance at 30 June 2016 was associated with the LEILAC EU Horizons 2020 project.
17. NON-CURRENT LIABILITIES – DERIVATIVES June 2016
$ June 2015
$ Warrants 80,000 80,000
There are 16,000,000 on issue with an exercise price of $0.005c per share. The warrants expire on 18 October 2016. The warrants have been accounted for as a derivative financial instrument liability on the basis that the warrant strike price is subject to adjustments for reconstructions of equity and adjustment for any issuance of securities at a discount to the then applicable warrant strike price.
18. ISSUED CAPITAL June 2016
$ June 2015
$ Fully paid ordinary shares 23,230,117 22,951,576Costs of fund raising recognised
(2,193,300) (2,193,300)
Total issued capital 21,036,817 20,758,276 a. Fully paid ordinary shares
2016
Number of shares
2015Number of
sharesAt the beginning of the year
1,869,724,975 1,848,882,376
Issued during the year 27,854,085 20,842,599Balance at the end of year
1,897,579,060 1,869,724,975
2016 $
2015$
At the beginning of the year
23,579,306 23,464,593
Issued during the year 278,541 114,713Balance at the end of year
23,857,847 23,579,306
b. Costs of fund raising recognised
2016
$ 2015
$At the beginning of the year
2,193,300 2,193,300
Incurred during the year
- -
At the end of the year 2,193,300 2,193,300
c. Movements in ordinary share capital Number of
shares $
1 July 2014 – Opening balance
1,848,882,376 22,836,863
23 January 2015 6,000,000 36,00028 February 2015 10,342,600 51,7131 April 2015 1,666,666 10,00015 April 2015 2,833,333 17,00030 June 2015 1,869,724,975 22,951,576 29 June 2016 27,854,085 278,54130 June 2016 1,897,579,060 23,230,117
For
per
sona
l use
onl
y

FINANCIAL REPORT – CALIX LIMITED AND ITS CONTROLLED ENTITIES
NOTES TO THE FINANCIAL REPORT For the year ended 30 June 2016
33
d. Ordinary shares
Ordinary shares entitle the holder to participate in dividends and the proceeds on winding up of the Company in proportion to the number of and amounts paid on the shares held. On a show of hands, every holder of ordinary shares present at a meeting in person or by proxy, is entitled to one vote, and upon a poll each share is entitled to one vote. Ordinary shares have no par value and the Company does not have a limited amount of authorised capital.
19. RESERVES June 2016
$ June 2015
$ Foreign currency translation reserve 56,403 8,029Share-based payment reserve 265,522 76,452Total reserves 321,925 84,481 At the beginning of the year 84,481 9,055Revaluations made to foreign currency translation reserve made during the year 48,373 (1,206)Share-based payment expenses 189,070 76,452At the end of the year 321,925 84,481 The foreign currency translation reserve is used to recognise exchange difference arising from the translation of the financial statements of foreign operations to Australian Dollars. The share-based payment reserve is used to recognise the grant date fair value of shares issued and vested to employees and directors.
20. LEASING COMMITMENTS Operating leases June 2016
$ June 2015
$Minimum lease payments payable: - - not later than one year 195,117 60,000- later than one year but not later than five years 191,551 20,000Total operating lease commitments 386,668 80,000 After balance date, the Company entered into an operating lease over premises in Nerang in Queensland. The lease is for three years with an option to renew for a further three years. The premises will replace the Molendinar site as the location for Queensland based manufacturing operations.
Finance leases June 2016
$ June 2015
$Minimum lease payments payable: - -not later than one year 22,281 15,027-later than one year but not later than five years 109,763 65,792Total finance lease commitments
132,044 80,818
The present value of minimum lease payments associated with finance lease commitments is $110,411 (2015: 56,078). The net carrying amount at the end of the reporting period for motor vehicles subject to finance leases was $111,095 (2015: 56,213).
21. CASH FLOW INFORMATION Reconciliation of cash flows from operating activities with loss after income tax: June 2016
$ June 2015
$ (Loss) after income tax (1,722,846) (3,483,088) Depreciation & impairment expense
4,448,443 1,995,590
Changes in operating assets & liabilities
-(increase) in trade & other receivables
(6,185) (481,573)
-(increase) in inventory (13,392) (25,307)-decrease in current tax assets
207,100 42,900
-increase in trade & other payables
370,013 700,991
-increase/(decrease) in deferred revenue
(1,137,221) 1,510,647
Net cash provided by operating activities
2,145,912 260,161
22. AUDITORS REMUNERATION During the year the following fees were paid or payable for services provided by the auditor of the Group its related practices and non-related audit firms: - June 2016
$ June 2015
$ Audit & review of financial statements
38,500 38,500
Other assurance services
6,000 5,000
Total remuneration for services 44,500 43,500
23. KEY MANAGEMENT PERSONNEL (KMP) COMPENSATION
Information regarding the remuneration policies of the Group and KMP compensation can be found in the Remuneration Report section of the Director’s Report on page 16 of the Annual report.
For
per
sona
l use
onl
y

FINANCIAL REPORT – CALIX LIMITED AND ITS CONTROLLED ENTITIES
NOTES TO THE FINANCIAL REPORT For the year ended 30 June 2016
34
24. SHARE BASED PAYMENTS During the 2014 financial year, the board established a new share based payments scheme under which directors and employees may be issued shares for achievement of short and long term goals. The Calix Employee Share Scheme Trust (“ESS”) was established to administer the scheme on behalf of the board. 136,092,051 shares were issued to the ESS Trust in the 2014 financial year and were incorrectly brought to account in the Statement of Financial Performance at fair value (refer to note 34 for disclosure of the correction of this error). The accounting treatment of the ESS shares is now to expense the shares at fair value at the time they are awarded and vest to the participating directors and employees, rather than the establishment date of the ESS.
25. EARNINGS PER SHARE June 2016
$ June 2015
$ a. Earnings used to calculate basic EPS from continuing operations (1,722,846) (3,483,088) Number Numberb. Weighted average number of ordinary shares during the year used in calculating basic EPS 1,872,046,149 1,856,454,909
26. RELATED PARTY TRANSACTIONS Transactions between related parties are on normal commercial terms and conditions no more favourable to those available to other parties unless otherwise stated. a. Ultimate parent company Calix Limited acquired shares in Calix (Europe) Limited on 6 March 2009. As at 30 June 2016 Calix Limited had received loan funds from Calix (Europe) Limited to the amount of $1,067,491 (Loans to Calix (Europe) Limited in 2015: $84,072). Calix Limited acquired shares in Calix North America LLC on 25 November 2009. As at 30 June 2016 Calix Limited had loaned funds to Calix North America LLC to the amount of $3,607 (2015: $3,607). Calix Limited acquired shares in Calicoat Pty Limited in 2007. Calicoat has not traded since is its inception. As at 30 June 2016 Calix Limited had loaned funds to Calicoat Pty Limited to the amount of $1,157 (2015: $1,157). On 8 October 2012 Calix established MS Minerals as a wholly owned subsidiary. As at 30 June 2016 Calix Limited had loaned funds to the amount of $648,587 to MS Minerals (2015: $146,445). b. Key management personnel There have been no transactions with KMP (2015: NIL)
27. SUBSIDIARIES The consolidated financial statements incorporate the assets, liabilities and results of the following subsidiaries in accordance with the accounting policy described in note 1 (a): Subsidiaries Country of
incorporation %
owned2016
%owned
2015Calicoat Pty Ltd Australia 100% 100%MS Minerals Pty Ltd
Australia 100% 100%
Calix (Europe) Limited
UK 100% 100%
- Millennium Generation Limited
UK 65% 65%
Calix (North America) LLC
USA 100% 100%
Calix Technology Pty Ltd
Australia 100% 100%
28. INVESTMENTS IN ASSOCIATES & JOINT VENTURES On 24 April 2015 Calix Limited acquired 40% of the shares of Acti-Mag Asia Inc a Philippines Incorporated entity. The investment is accounted for using the Equity method. At 30 June 2016 the carrying value of the investment was $41,270. This represented the cash consideration paid for the shares. Acti-Mag Asia Inc was established to manufacture and distribute Magnesium Hydroxide slurries in the Philippines and other South East Asian markets. The slurries produced and the manufacturing processes used by Acti-Mag Asia Inc are based on technology licensed from Calix Limited. Acti-Mag Asia has an exclusive license to distribute the slurry products in the Philippines and a non-exclusive license for other South East Asian markets.
29. FAIR VALUE MEASUREMENT The following table details the Group’s assets and liabilities, measured or disclosed at fair value, using a three level hierarchy, based on the lowest level of input that is significant to the entire fair value measurement, being: Level 1: Quoted prices (unadjusted) in active markets for identical assets or liabilities that the entity can access at the measurement date Level 2: Inputs other than quoted prices included within Level 1 that are observable for the asset or liability, either directly or indirectly Level 3: Unobservable inputs for the asset or liability 2016 Level 1
$Level 2
$ Level 3
$Total
$Assets - - - -Liabilities - - 80,000 80,000 2015 Assets - - - -Liabilities - - 80,000 80,000
For
per
sona
l use
onl
y
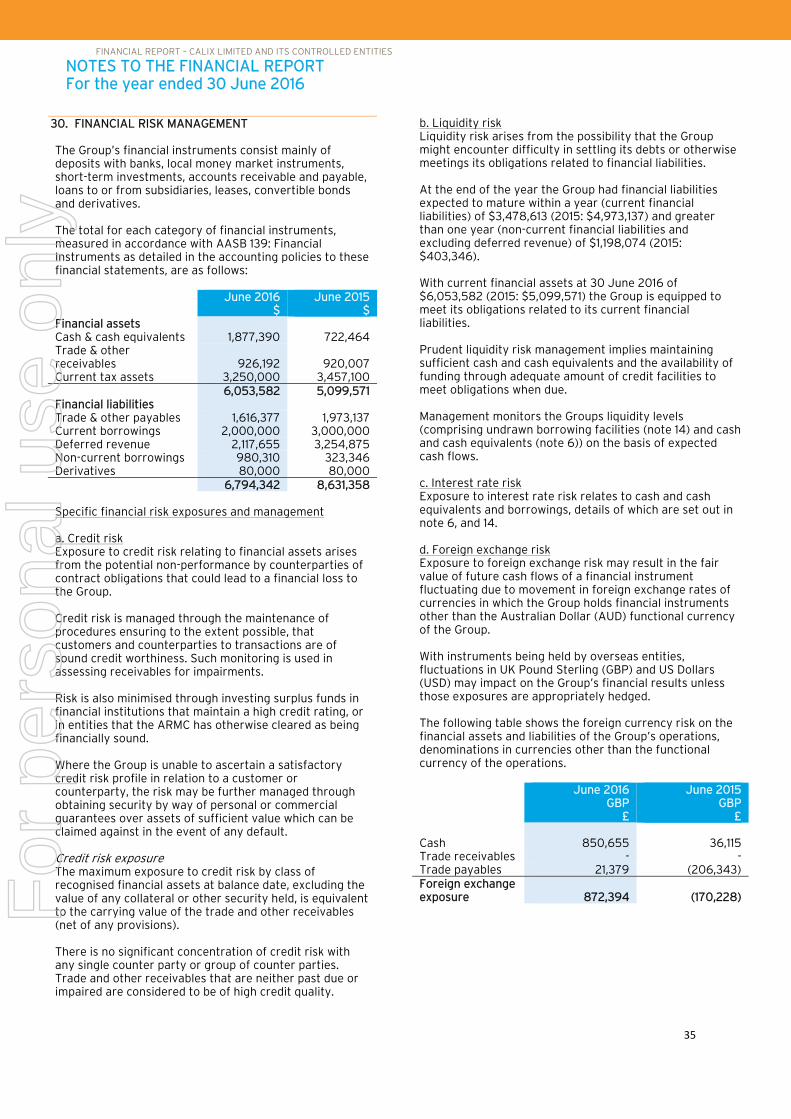
FINANCIAL REPORT – CALIX LIMITED AND ITS CONTROLLED ENTITIES
NOTES TO THE FINANCIAL REPORT For the year ended 30 June 2016
35
30. FINANCIAL RISK MANAGEMENT The Group’s financial instruments consist mainly of deposits with banks, local money market instruments, short-term investments, accounts receivable and payable, loans to or from subsidiaries, leases, convertible bonds and derivatives. The total for each category of financial instruments, measured in accordance with AASB 139: Financial Instruments as detailed in the accounting policies to these financial statements, are as follows: June 2016
$ June 2015
$Financial assets Cash & cash equivalents 1,877,390 722,464Trade & other receivables 926,192 920,007Current tax assets 3,250,000 3,457,100 6,053,582 5,099,571Financial liabilities Trade & other payables 1,616,377 1,973,137Current borrowings 2,000,000 3,000,000Deferred revenue 2,117,655 3,254,875Non-current borrowings 980,310 323,346Derivatives 80,000 80,000 6,794,342 8,631,358 Specific financial risk exposures and management a. Credit risk Exposure to credit risk relating to financial assets arises from the potential non-performance by counterparties of contract obligations that could lead to a financial loss to the Group. Credit risk is managed through the maintenance of procedures ensuring to the extent possible, that customers and counterparties to transactions are of sound credit worthiness. Such monitoring is used in assessing receivables for impairments. Risk is also minimised through investing surplus funds in financial institutions that maintain a high credit rating, or in entities that the ARMC has otherwise cleared as being financially sound. Where the Group is unable to ascertain a satisfactory credit risk profile in relation to a customer or counterparty, the risk may be further managed through obtaining security by way of personal or commercial guarantees over assets of sufficient value which can be claimed against in the event of any default. Credit risk exposure The maximum exposure to credit risk by class of recognised financial assets at balance date, excluding the value of any collateral or other security held, is equivalent to the carrying value of the trade and other receivables (net of any provisions). There is no significant concentration of credit risk with any single counter party or group of counter parties. Trade and other receivables that are neither past due or impaired are considered to be of high credit quality.
b. Liquidity risk Liquidity risk arises from the possibility that the Group might encounter difficulty in settling its debts or otherwise meetings its obligations related to financial liabilities. At the end of the year the Group had financial liabilities expected to mature within a year (current financial liabilities) of $3,478,613 (2015: $4,973,137) and greater than one year (non-current financial liabilities and excluding deferred revenue) of $1,198,074 (2015: $403,346). With current financial assets at 30 June 2016 of $6,053,582 (2015: $5,099,571) the Group is equipped to meet its obligations related to its current financial liabilities. Prudent liquidity risk management implies maintaining sufficient cash and cash equivalents and the availability of funding through adequate amount of credit facilities to meet obligations when due. Management monitors the Groups liquidity levels (comprising undrawn borrowing facilities (note 14) and cash and cash equivalents (note 6)) on the basis of expected cash flows. c. Interest rate risk Exposure to interest rate risk relates to cash and cash equivalents and borrowings, details of which are set out in note 6, and 14. d. Foreign exchange risk Exposure to foreign exchange risk may result in the fair value of future cash flows of a financial instrument fluctuating due to movement in foreign exchange rates of currencies in which the Group holds financial instruments other than the Australian Dollar (AUD) functional currency of the Group. With instruments being held by overseas entities, fluctuations in UK Pound Sterling (GBP) and US Dollars (USD) may impact on the Group’s financial results unless those exposures are appropriately hedged. The following table shows the foreign currency risk on the financial assets and liabilities of the Group’s operations, denominations in currencies other than the functional currency of the operations. June 2016
GBP £
June 2015GBP
£ Cash 850,655 36,115Trade receivables - -Trade payables 21,379 (206,343)Foreign exchange exposure 872,394 (170,228)
For
per
sona
l use
onl
y

FINANCIAL REPORT – CALIX LIMITED AND ITS CONTROLLED ENTITIES
NOTES TO THE FINANCIAL REPORT For the year ended 30 June 2016
36
e. Sensitivity analysis The table below illustrates the sensitivity of the Group’s exposures to changes in GBP. The table indicates the impact on how profit and equity values reported at balance date would have been affected by changes in the relevant risk variable that management considers to be reasonably possible. June 2016
$ June 2015
$ +/- 5% in AUD/GBP 153,473 (34,017)
f. Net fair value Fair values are those amounts at which an asset could be exchanged, or a liability settled between knowledgeable willing parties in arm’s length transactions. Cash and cash equivalents, trade and other receivables and trade and other payables are short-term instruments in nature whose carrying amount is equivalent to fair value. The fair value of derivative financial instruments is determined using valuation techniques. Details of the measurement and valuation are outlined in note 17.
31. PARENT ENTITY FINANCIAL INFORMATION The individual financial statements for the parent entity show the following aggregate amounts: June 2016
$ June 2015
$ Current assets 6,329,407 5,843,578Total assets 20,252,743 22,237,063Current liabilities 4,854,584 4,239,271Total liabilities 5,401,260 4,642,616 Equity Issued capital 21,664,547 21,386,006Reserves - -Retained earnings (5,745,573) (3,791,559) 15,918,974 17,594,447 Profit/(loss) for the year (1,924,218) (1,689,047) Total comprehensive income/(loss) for the year (1,924,218) (1,689,047)
32. CONTINGENT LIABILITIES There are no known contingent liabilities.
33. AFTER BALANCE DATE EVENTS On 7 October 2016 the Company received notice that an application for advanced finding and overseas research and development activities was approved by Innovation Australia. The finding is for three years to 2017/18. On 17 October 2016 4,000,000 warrants were exercised and 4,000,000 ordinary shares issued in accordance with the warrant terms and conditions. A further 12,000,000 outstanding warrants were unexercised and lapsed on 18 October 2016. No matters or circumstances have arisen since the end of the year which significantly affected, or may significantly affect, the operations of the Group, the results of those operations, or the state of affairs of the Group in future years.
34. ERROR IN RESPECT TO SHARE BASED PAYMENTS During the current financial year, it came to the attention of the directors, that the Group’s accounting treatment for the recognition of share based payment transactions on the Company Employee Share Scheme was incorrectly recognised in the 2013/14 financial years with the entire benefit recognised as vested and expensed. The transaction in 2013/14 was recorded at the time to which the shares were issued to the ESS Trust, however under the requirements of the Australian Accounting Standards the shares are not deemed to have vested until the ESS Trust is directed by the Board to issue the shares to the employees once they have met the conditions of their performance requirements. The Company has issued shares to participants of the ESS in both the 2014/15 and 2015/16 financial years where the Board agreed that the participants had met the vesting requirements set out in the scheme. The performance awards approved by the Board during the 2014/15 and 2015/16 financial years which create a vesting event are detailed as follows: - Performance awards for the year: - Shares issued
Number Fair value of
shares awarded$
2015 ESS issues to KMP 4,808,332 76,452 2016 ESS issues to KMP 16,159,864 189,070
For
per
sona
l use
onl
y

FINANCIAL REPORT – CALIX LIMITED AND ITS CONTROLLED ENTITIES
NOTES TO THE FINANCIAL REPORT For the year ended 30 June 2016
37
The following summaries the impact of amending the accounting treatment for the share based payments contained within the ESS trust. Principally the adjustment is amending the timing of the vesting of the shares within the ESS trust from the date of transfer to the trust to the date where the employee or director is entitled to receive shares held by the trust and are approved by the Board.
2014 year unadjusted
$
Adjustment to 30 June 2014
$
Adjustment to 30 June 2015
$
Entries for 30 June 2016
$
Share based payments expense 627,731 - 76,452 189,070 Total comprehensive profit/(loss) for the year
7,037,032 7,664,763 3,559,540 1,960,616
Total assets 25,075,818 25,075,818 24,384,929 21,143,916Total liabilities (5,952,571) (5,952,571) (8,631,359) (6,794,342)Net assets 19,123,247 19,123,247 15,753,570 14,349,574 Issued capital 21,271,293 20,643,562 20,758,276 21,036,817Other reserves 9,055 9,055 8,029 56,402Share based payment reserves - - 76,452 265,523Retained earnings (2,157,643) (1,529,912) (5,090,478) (7,009,708)Non-controlling interest 542 542 1,291 540Total contributed equity 19,123,247 19,123,247 15,753,570 14,349,574
For
per
sona
l use
onl
y
FINANCIAL REPORT – CALIX LIMITED AND ITS CONTROLLED ENTITIES
NOTES TO THE FINANCIAL REPORT For the year ended 30 June 2016
38
DIRECTORS’ DECLARATION
In the directors’ opinion: 1. the financial statements and notes set out on page 18 to 37 are in accordance with the Corporations Act 2001,
including: a. complying with Accounting Standards Reduced Disclosure Requirements, the Corporations Regulations 2001
and other mandatory professional reporting requirements, and b. giving a true and fair view of the consolidated entity’s financial position as at 30 June 2016 and of its
performance for the financial year ended on that date, and 2. there are reasonable grounds to believe that the Company will be able to pay its debts as and when they become
due and payable. This declaration is made in accordance with a resolution of the directors.
P J Turnbull Chairman Sydney 24 October 2016
For
per
sona
l use
onl
y

Level 11, 1 Margaret St Sydney NSW 2000 Australia
Tel: +61 2 9251 4100 Fax: +61 2 9240 9821 www.bdo.com.au
BDO East Coast Partnership ABN 83 236 985 726 is a member of a national association of independent entities which are all members of BDO Australia Ltd ABN 77 050 110 275, an Australian company limited by guarantee. BDO East Coast Partnership and BDO Australia Ltd are members of BDO International Ltd, a UK company limited by guarantee, and form part of the international BDO network of independent member firms. Liability limited by a scheme approved under Professional Standards Legislation, other than for the acts or omissions of financial services licensees.
INDEPENDENT AUDITOR’S REPORT
To the members of Calix Limited
Report on the Financial Report
We have audited the accompanying financial report of Calix Limited, which comprises the consolidated
statement of financial position as at 30 June 2016, the consolidated statement of profit or loss and
other comprehensive income, the consolidated statement of changes in equity and the consolidated
statement of cash flows for the year then ended, notes comprising a summary of significant accounting
policies and other explanatory information, and the directors’ declaration of the consolidated entity
comprising the company and the entities it controlled at the year’s end or from time to time during the
financial year.
Directors’ Responsibility for the Financial Report
The directors of the company are responsible for the preparation of the financial report that gives a
true and fair view in accordance with Australian Accounting Standards – Reduced Disclosure
Requirements and the Corporations Act 2001 and for such internal control as the directors determine is
necessary to enable the preparation of the financial report that gives a true and fair view and is free
from material misstatement, whether due to fraud or error.
Auditor’s Responsibility
Our responsibility is to express an opinion on the financial report based on our audit. We conducted our
audit in accordance with Australian Auditing Standards. Those standards require that we comply with
relevant ethical requirements relating to audit engagements and plan and perform the audit to obtain
reasonable assurance about whether the financial report is free from material misstatement.
An audit involves performing procedures to obtain audit evidence about the amounts and disclosures in
the financial report. The procedures selected depend on the auditor’s judgement, including the
assessment of the risks of material misstatement of the financial report, whether due to fraud or error.
In making those risk assessments, the auditor considers internal control relevant to the company’s
preparation of the financial report that gives a true and fair view in order to design audit procedures
that are appropriate in the circumstances, but not for the purpose of expressing an opinion on the
effectiveness of the company’s internal control. An audit also includes evaluating the appropriateness
of accounting policies used and the reasonableness of accounting estimates made by the directors, as
well as evaluating the overall presentation of the financial report.
We believe that the audit evidence we have obtained is sufficient and appropriate to provide a basis
for our audit opinion.
39
For
per
sona
l use
onl
y

Independence
In conducting our audit, we have complied with the independence requirements of the Corporations
Act 2001. We confirm that the independence declaration required by the Corporations Act 2001, which
has been given to the directors of Calix Limited, would be in the same terms if given to the directors as
at the time of this auditor’s report.
Opinion
In our opinion the financial report of Calix Limited is in accordance with the Corporations Act 2001,
including:
(a) giving a true and fair view of the consolidated entity’s financial position as at 30 June 2016 and of
its performance for the year ended on that date; and
(b) complying with Australian Accounting Standards – Reduced Disclosure Requirements and the
Corporations Regulations 2001.
BDO East Coast Partnership
Paul Bull
Partner
Sydney, 24 October 2016
40
For
per
sona
l use
onl
y

CALIX Limited
Level 1, 9 Bridge Street Pymble NSW 2073
AUSTRALIA
+61 2 8199 7400 [email protected] www.calix.com.au
Calix Share Registry: +61 2 8280 7090
For
per
sona
l use
onl
y


![CM Plant Reports · CALIX C7 CALIX E7-20 CALIX PON CABINET FEEDER FIBER MDI] SPLITTER PEDESTAL POLE Plant Order Plant Type Other Other O …](https://img.pdfslide.us/doc/110x75/5b7b2b487f8b9a004b8c232b/cm-plant-reports-calix-c7-calix-e7-20-calix-pon-cabinet-feeder-fiber-mdi-splitter.jpg)


![Development of Calix[4]arene-Functionalized](https://img.pdfslide.us/doc/110x75/61ab1bfbbc68120d180622ab/development-of-calix4arene-functionalized-.jpg)