Embed Size (px)
Citation preview

Annual Report 2016
Financial Information

1 on
Terumo Corporation Annual Report 2016 Financial Information
Consolidated Balance Sheets Terumo Corporation and subsidiaries March 31, 2016 and 2015
Millions of yen
Assets 2016 2015
Current Assets: Cash and deposits (Notes 2 and 18) ············································································ ¥ 149,672 ¥ 129,679 Notes and accounts receivable—trade (Note 18) ··························································· 104,426 104,944 Less: allowance for doubtful accounts ············································································ (1,390) (1,458)
Notes and accounts receivable—trade, net ·································································· 103,035 103,485 Marketable securities (Notes 2, 4 and 18) ····································································· 50,000 Inventories (Note 3) ··································································································· 96,454 101,472 Deferred tax assets (Note 8) ······················································································· 14,963 13,949 Other current assets (Note 18 and 19) ·········································································· 10,621 13,871
Total current assets ···························································································· 374,746 412,458
Property, Plant and Equipment:
Land ·························································································································· 23,297 22,023 Buildings and structures ······························································································· 167,612 161,029 Machinery, equipment and vehicles ··············································································· 233,310 220,685 Other equipment and furniture ······················································································ 43,683 42,422 Leased assets ············································································································ 2,141 2,182 Construction in progress ······························································································ 21,417 39,029
491,463 487,373 Less: accumulated depreciation ···················································································· (315,668) (308,877)
Net property, plant and equipment (Note 22) ······················································ 175,794 178,496
Investments and Other Assets:
Investment securities, including investments in unconsolidated subsidiaries and affiliates (Notes 4 and 18) ·········································· 37,724 45,461
Goodwill (Note 22) ····································································································· 143,707 166,990 Customer relationships ································································································ 90,750 103,217 Deferred tax assets (Note 8) ······················································································· 3,436 259 Retirement benefit assets (Note 7) ··············································································· 6,786 Other assets ··············································································································· 75,524 78,402
Total investments and other assets ······································································· 351,143 401,118
Total Assets ············································································································ ¥ 901,685 ¥ 992,073
See accompanying notes to consolidated financial statements.
2 on
Terumo Corporation Annual Report 2016 Financial Information
Millions of yen
Liabilities and Net Assets 2016 2015
Current Liabilities: Short-term debt (Notes 5 and 18) ···················································································· ¥ 61 ¥ 364
Current portion of long-term debt (Notes 5 and 18) ····························································· 19,839 5,417
Current portion of bonds payable (Notes 6 and 18) ····························································· 40,000
Notes and accounts payable—trade (Note 18) ··································································· 36,294 38,484
Lease obligations ·········································································································· 256 208
Income taxes payable (Note 8) ······················································································· 9,778 19,714
Accrued expenses ········································································································· 35,555 35,841
Other current liabilities (Notes 8, 18 and 19) ······································································ 27,049 29,916
Total current liabilities ······················································································· 168,835 129,947
Non-current Liabilities: Bonds payable (Notes 6 and 18) ····················································································· 40,000
Convertible bonds with subscription rights to shares (Notes 6 and 18) ···································· 100,184 100,233
Long-term debt (Notes 5 and 18) ···················································································· 58,873 79,141
Lease obligations ·········································································································· 286 278
Retirement benefit liabilities (Note 7) ··············································································· 8,656 7,020
Provision for directors’ retirement benefits ·········································································· 66 66
Asset retirement obligations ···························································································· 230 233
Deferred tax liabilities (Note 8) ······················································································· 45,079 50,013
Other non-current liabilities ······························································································ 7,925 11,615
Total non-current liabilities ······················································································ 221,304 288,602
Total liabilities ······································································································ 390,140 418,550
Contingencies (Note 20)
Net Assets (Note 15):
Capital stock ················································································································ 38,716 38,716
Authorized 1,519,000,000 shares in 2016 and 2015.
Issued 379,760,520 shares in 2016 and 2015.
Capital surplus ·············································································································· 50,928 52,103
Retained earnings ········································································································· 419,573 383,317
Less: treasury stock, at cost (Note 14) ············································································· (64,040) (3,035)
Total shareholders’ equity ······················································································ 445,178 471,102
Unrealized gains (losses) on available-for-sale securities, net of taxes ····································· 16,308 16,910
Deferred gains (losses) on hedges, net of taxes ·································································· (13)
Foreign currency translation adjustments ··········································································· 63,182 89,043
Accumulated adjustments for retirement benefits, net of taxes (Note 7) ·································· (13,403) (3,611)
Total accumulated other comprehensive income ························································· 66,074 102,341
Stock subscription rights ································································································· 183 78
Non-controlling interests ································································································· 109
Total net assets ···································································································· 511,544 573,523
Total Liabilities and Net Assets ················································································· ¥ 901,685 ¥ 992,073
See accompanying notes to consolidated financial statements.
3 on
Terumo Corporation Annual Report 2016 Financial Information
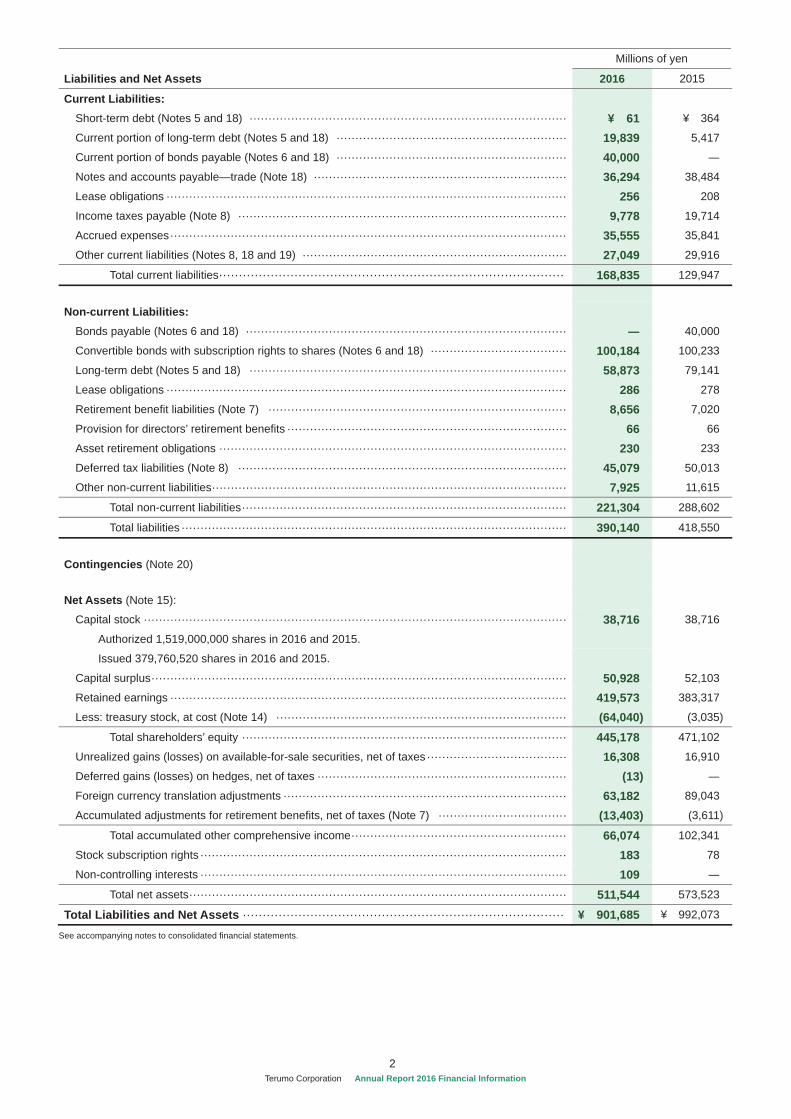
Consolidated Statements of Income Terumo Corporation and subsidiaries Years ended March 31, 2016 and 2015
Millions of yen
2016 2015
Net Sales ················································································································· ¥ 525,026 ¥ 489,506 Cost of Sales ··········································································································· 240,125 233,480
Gross profit ········································································································ 284,900 256,025 Selling, General and Administrative Expenses (Notes 9 and 10) ··········································· 203,197 188,569
Operating income ································································································ 81,703 67,456 Other Income (Expenses):
Interest and dividend income ························································································· 942 932 Royalty income ············································································································ 209 200 Equity in earnings (losses) of affiliates ············································································· 328 (65)Gain on sales of property, plant and equipment (Note 11) ················································· 4,917 692 Gain on sales of investment securities ············································································ 793 559 Subsidy income ··········································································································· 1,783 Gain on adjustment of accounts payable ········································································· 2,030 Interest expense ·········································································································· (1,395) (1,254)Foreign exchange gains (losses) ·················································································· (7,485) 6,598 Loss on disposal of inventories ······················································································ (82) (267)Structural reform-related expenses ················································································· (222) (797)Loss on disposal of property, plant and equipment (Note 12) ············································ (895) (1,160)Impairment loss (Note 13) ···························································································· (1,010) (1,625)Settlement package ······································································································ (1,656) Loss on liquidation of subsidiaries ·················································································· (102) (597)Restructuring loss ········································································································ (5,607)Loss on liquidation of businesses ··················································································· (974)Other, net ···················································································································· (907) (2,071)
(4,782) (3,409)
Income before income taxes ···················································································· 76,920 64,046 Income Taxes (Note 8):
Current ······················································································································· 27,718 29,954 Deferred ····················································································································· (1,427) (4,378)
26,290 25,575
Profit ···························································································································· 50,630 38,470
Loss attributable to non-controlling interests ···································································· (46) Profit attributable to owners of parent ·············································································· ¥ 50,676 ¥ 38,470
Yen
Earnings per Common Stock: Basic ·························································································································· ¥135.14 ¥101.33
Diluted ························································································································ 126.36 99.12
Cash Dividends per Common Stock ··········································································· ¥39.00 ¥30.50 See accompanying notes to consolidated financial statements.
4 on
Terumo Corporation Annual Report 2016 Financial Information
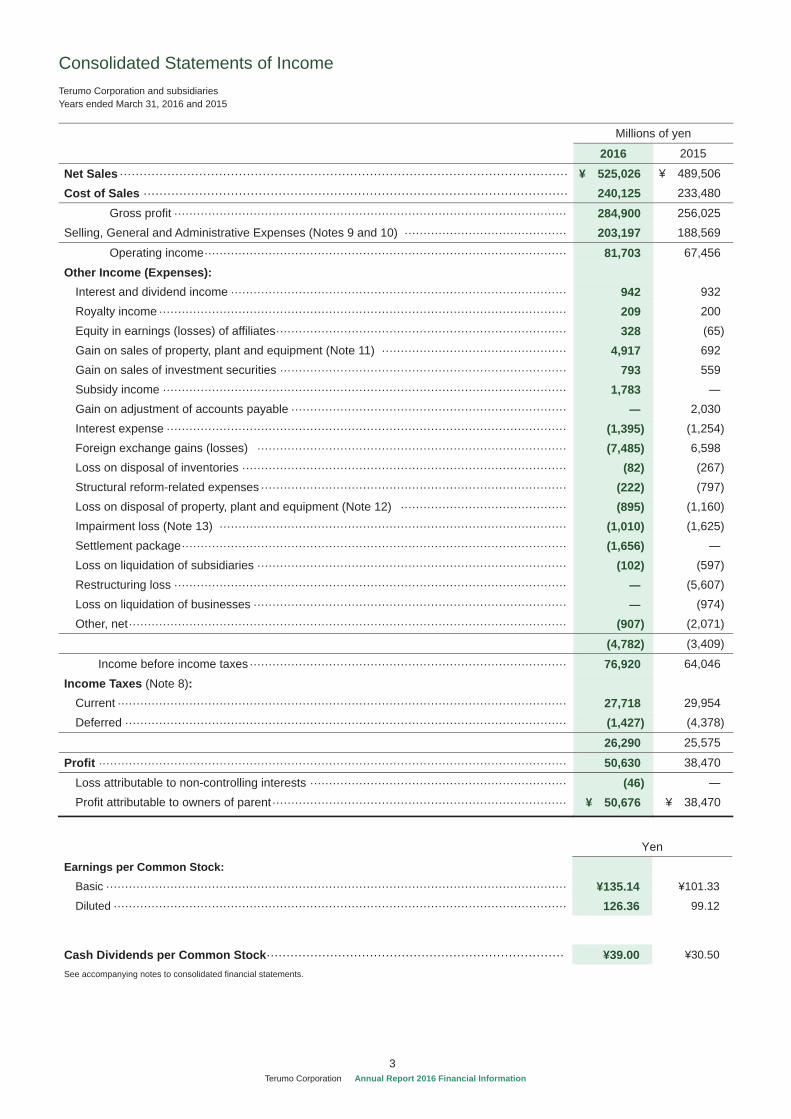
Consolidated Statements of Comprehensive Income Terumo Corporation and subsidiaries Years ended March 31, 2016 and 2015
Millions of yen 2016 2015
Profit ···························································································································· ¥ 50,630 ¥ 38,470 Other Comprehensive Income:
Unrealized gains (losses) on available-for-sale securities, net of taxes ································ (602) 5,640 Deferred gains (losses) on hedges, net of taxes ······························································· (15) 2 Foreign currency translation adjustments········································································· (25,864) 45,665 Adjustments for retirement benefits, net of taxes ······························································ (9,792) (795)Share of other comprehensive income of affiliates accounted for using the equity method, net of taxes ········································································ 2 1
Total other comprehensive income (Note 23) ····································································· (36,272) 50,515
Comprehensive Income ································································································· ¥ 14,358 ¥ 88,986
Comprehensive Income attributable to: Millions of yen
Owners of parent ·········································································································· ¥ 14,408 ¥ 88,986
Non-controlling interests ································································································· (50) See accompanying notes to consolidated financial statements.
5 on
Terumo Corporation Annual Report 2016 Financial Information
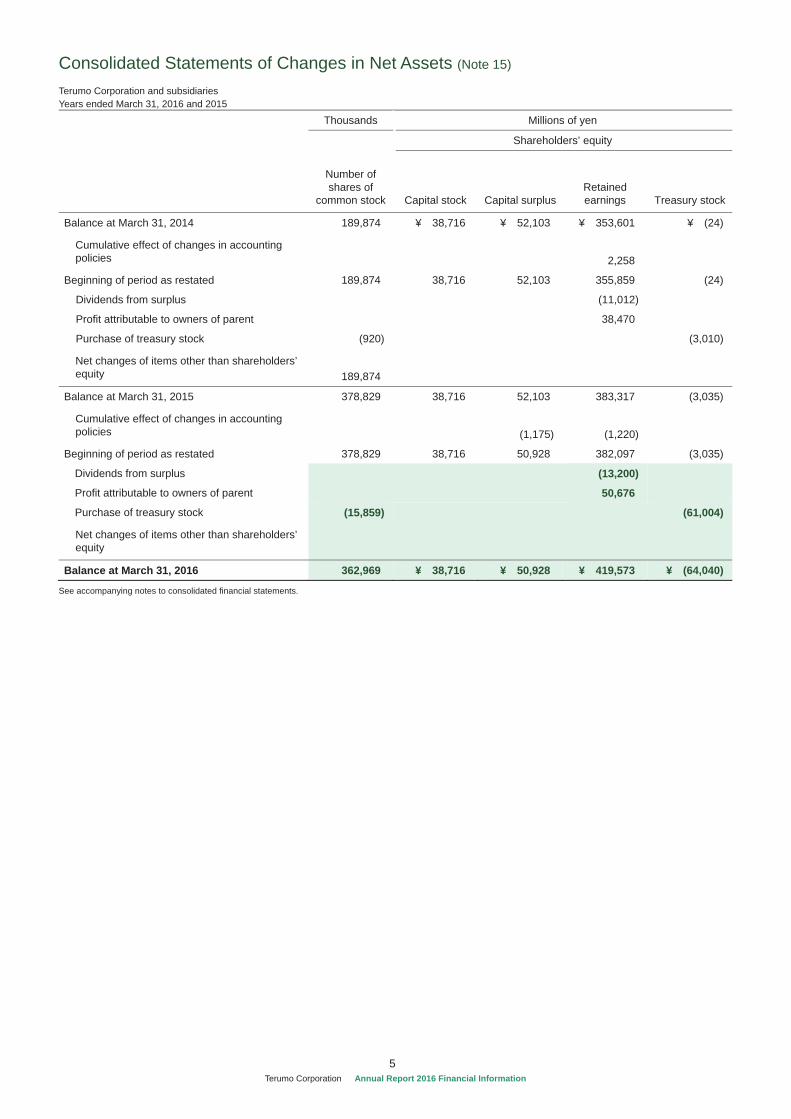
Consolidated Statements of Changes in Net Assets (Note 15) Terumo Corporation and subsidiaries Years ended March 31, 2016 and 2015
Thousands Millions of yen
Shareholders’ equity
Number of shares of
common stock Capital stock Capital surplusRetained earnings Treasury stock
Balance at March 31, 2014 189,874 ¥ 38,716 ¥ 52,103 ¥ 353,601 ¥ (24)
Cumulative effect of changes in accounting policies 2,258
Beginning of period as restated 189,874 38,716 52,103 355,859 (24)
Dividends from surplus (11,012)
Profit attributable to owners of parent 38,470
Purchase of treasury stock (920) (3,010)
Net changes of items other than shareholders’ equity 189,874
Balance at March 31, 2015 378,829 38,716 52,103 383,317 (3,035)
Cumulative effect of changes in accounting policies (1,175) (1,220)
Beginning of period as restated 378,829 38,716 50,928 382,097 (3,035)
Dividends from surplus (13,200)
Profit attributable to owners of parent 50,676
Purchase of treasury stock (15,859) (61,004)
Net changes of items other than shareholders’ equity
Balance at March 31, 2016 362,969 ¥ 38,716 ¥ 50,928 ¥ 419,573 ¥ (64,040)
See accompanying notes to consolidated financial statements.
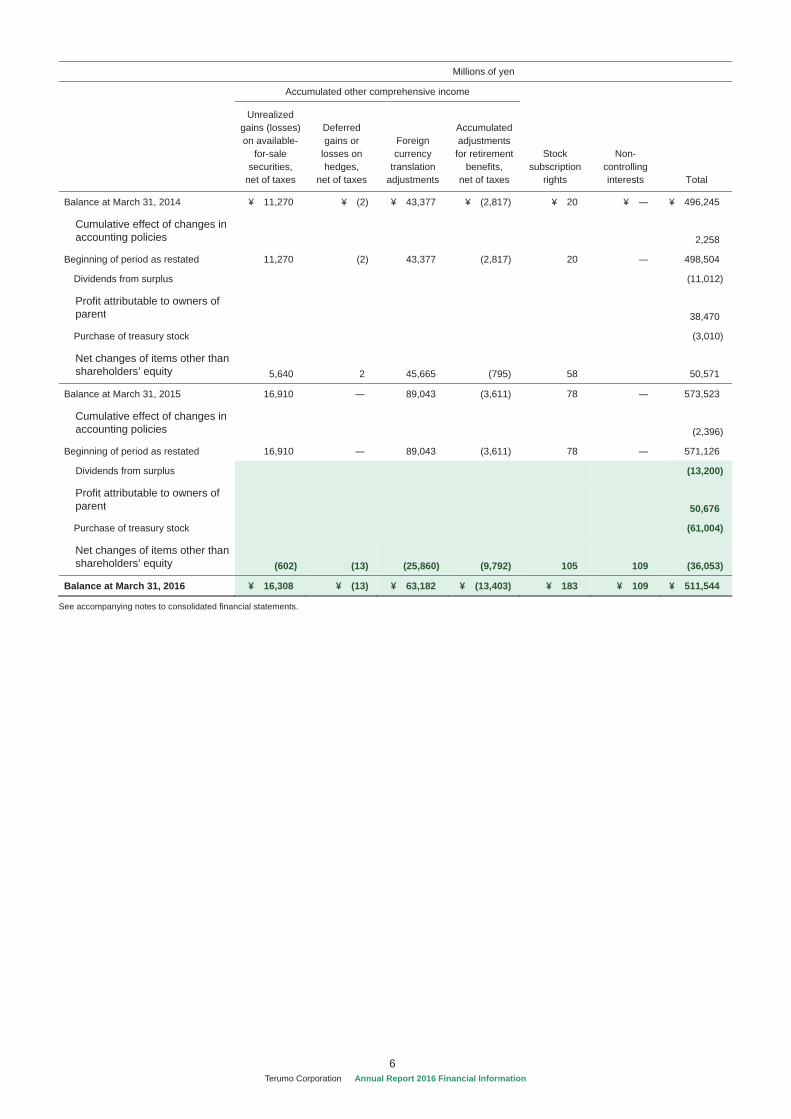
6 on
Terumo Corporation Annual Report 2016 Financial Information
Millions of yen
Accumulated other comprehensive income
Unrealized gains (losses) on available-
for-sale securities,
net of taxes
Deferred gains or
losses on hedges,
net of taxes
Foreign currency
translation adjustments
Accumulated adjustments for retirement
benefits, net of taxes
Stock subscription
rights
Non-controlling interests Total
Balance at March 31, 2014 ¥ 11,270 ¥ (2) ¥ 43,377 ¥ (2,817) ¥ 20 ¥ ¥ 496,245
Cumulative effect of changes in accounting policies
2,258
Beginning of period as restated 11,270 (2) 43,377 (2,817) 20 498,504
Dividends from surplus (11,012)
Profit attributable to owners of parent
38,470
Purchase of treasury stock (3,010)
Net changes of items other than shareholders’ equity 5,640 2 45,665 (795) 58 50,571
Balance at March 31, 2015 16,910 89,043 (3,611) 78 573,523
Cumulative effect of changes in accounting policies
(2,396)
Beginning of period as restated 16,910 89,043 (3,611) 78 571,126
Dividends from surplus (13,200)
Profit attributable to owners of parent
50,676
Purchase of treasury stock (61,004)
Net changes of items other than shareholders’ equity (602) (13) (25,860) (9,792) 105 109 (36,053)
Balance at March 31, 2016 ¥ 16,308 ¥ (13) ¥ 63,182 ¥ (13,403) ¥ 183 ¥ 109 ¥ 511,544
See accompanying notes to consolidated financial statements.

7 on
Terumo Corporation Annual Report 2016 Financial Information
Consolidated Statements of Cash Flows Terumo Corporation and subsidiaries Years ended March 31, 2016 and 2015
Millions of yen
2016 2015
Net Cash Provided by (Used in) Operating Activities Income before income taxes ···························································································· ¥ 76,920 ¥ 64,046
Depreciation and amortization ·························································································· 33,679 30,363
Impairment loss ············································································································ 1,010 1,625
Amortization of goodwill ·································································································· 10,995 10,329
Equity in losses (earnings) of affiliates ··············································································· (328) 65
Decrease (increase) in retirement benefit assets ································································· (6,890) 1,135
Increase (decrease) in retirement benefit liabilities ······························································· (220) (215)
Increase (decrease) in allowance for doubtful accounts ························································ (22) 14
Increase (decrease) in provision for directors’ bonuses ························································· 28 32
Interest and dividend income ··························································································· (942) (932)
Interest expense ··········································································································· 1,395 1,254
Foreign exchange losses (gains) ···················································································· 4,321 (4,483)
Structural reform-related expenses ··················································································· 222 797
Gain on sales of property, plant and equipment ··································································· (4,917) (692)
Loss on disposal of property, plant and equipment ······························································· 895 1,160
Loss (gain) on sales of investment securities ······································································ (793) (559)
Subsidy income ············································································································ (1,783)
Gain on adjustment of accounts payable ············································································ (2,030)
Settlement package ······································································································· 1,656
Loss on liquidation of subsidiaries ···················································································· 102 597
Restructuring loss ········································································································· 5,607
Loss on liquidation of businesses ····················································································· 974
Decrease (increase) in notes and accounts receivable—trade ················································ (3,138) 1,317
Decrease (increase) in inventories ···················································································· 398 (1,241)
Increase (decrease) in notes and accounts payable—trade ··················································· (1,492) (801)
Other, net ···················································································································· 5,583 (2,242)
Subtotal ············································································································· 116,679 106,121
Interest and dividend income received ··············································································· 1,751 1,165
Interest expenses paid ··································································································· (1,445) (1,282)
Income taxes paid ········································································································· (36,451) (31,001)
Payments for structural reform-related expenses ································································· (409) (382)
Subsidy income received ································································································ 1,783
Payments for loss on liquidation of subsidiaries ··································································· (83) (565)
Payments for restructuring loss ························································································ (1,390) (515)
Payments for loss on liquidation of businesses ···································································· (132) (179)
Payments for information system failure ············································································· (250)
Net cash provided by (used in) operating activities ······················································ 80,303 73,110
Net Cash Provided by (Used in) Investing Activities Payments for time deposits ····························································································· (1,766) (1,201)
Proceeds from withdrawal of time deposits ········································································· 1,796 1,505
Purchase of property, plant and equipment ········································································· (28,209) (37,342)
Proceeds from sales of property, plant and equipment ·························································· 5,135 1,168
Purchase of intangible assets ·························································································· (4,703) (3,683)
Purchase of investment securities ···················································································· (3,505) (429)

8 on
Terumo Corporation Annual Report 2016 Financial Information
Proceeds from sales of investment securities ······································································ 10,802 1,434
Collection of lease deposits ····························································································· 39 459
Payments for acquisition of businesses ············································································· (54)
Other, net ···················································································································· (3,082) (2,276)
Net cash provided by (used in) investing activities ······················································ (23,495) (40,421)
Net Cash Provided by (Used in) Financing Activities
Proceeds from short-term debt ························································································· 257
Repayments of short-term debt ························································································ (298) (202)
Proceeds from long-term debt ·························································································· 3,018
Repayments of long-term debt ························································································· (5,416) (4,963)
Proceeds from issuance of bonds with subscription rights to shares ········································ 100,250
Redemption of bonds ····································································································· (40,000)
Proceeds from share issuance to non-controlling interests ····················································· 181
Repayments of finance lease obligations ··········································································· (197) (214)
Purchase of treasury stock ······························································································ (61,004) (3,010)
Cash dividends paid ······································································································ (13,200) (11,012)
Net cash provided by (used in) financing activities ······················································ (79,936) 44,121
Effect of Exchange Rate Changes on Cash and Cash Equivalents ········································ (6,606) 7,353
Net Increase in Cash and Cash Equivalents ······································································· (29,734) 84,164
Cash and Cash Equivalents at Beginning of the Year ·························································· 176,662 92,498
Cash and Cash Equivalents at End of the Year (Note 2) ····················································· ¥ 146,927 ¥ 176,662
See accompanying notes to consolidated financial statements.
9 on
Terumo Corporation Annual Report 2016 Financial Information
NOTES TO CONSOLIDATED FINANCIAL STATEMENTS Terumo Corporation and subsidiaries
1. SUMMARY OF SIGNIFICANT ACCOUNTING POLICIES
(a) Basis of Presenting Consolidated Financial Statements Terumo Corporation (the “Company”) and domestic subsidiaries
maintain their official accounting records in Japanese yen and in
accordance with the provisions set forth in the Japanese Financial
Instruments and Exchange Act and its related accounting regulations,
and in conformity with accounting principles generally accepted in
Japan (“Japanese GAAP”), which are different in certain respects as
to application and disclosure requirements of International Financial
Reporting Standards. The accounts of consolidated overseas
subsidiaries are prepared in accordance with either International
Financial Reporting Standards or U.S. generally accepted
accounting principles, with adjustments on consolidation for four
specified items as applicable.
The accompanying consolidated financial statements have been
reformatted and translated into English (with some expanded
descriptions) from the consolidated financial statements of the
Company prepared in accordance with Japanese GAAP and filed
with the appropriate Local Finance Bureau of the Ministry of Finance
as required by the Japanese Financial Instruments and Exchange
Act. Some supplementary information included in the statutory
Japanese language consolidated financial statements is not
presented in the accompanying consolidated financial statements.
(b) Principles of Consolidation The consolidated financial statements include the accounts of the
Company and subsidiaries, except for immaterial subsidiaries. All
significant intercompany balances, transactions and unrealized
profits have been eliminated in consolidation. Investments in
affiliated companies and the immaterial subsidiaries not consolidated
are stated at their underlying net equity value.
Assets and liabilities of subsidiaries are valued at their full fair
value, including a portion, if any, attributable to non-controlling
interests, at the time the Company acquires control of the respective
subsidiary.
(c) Foreign Currency Translation All short-term and long-term assets and liabilities denominated in
foreign currencies are translated into Japanese yen at the exchange
rates as of the balance sheet date.
Revenue and expense denominated in foreign currencies are
translated into Japanese yen at their respective spot rates.
The balance sheet accounts of consolidated foreign subsidiaries
are translated into Japanese yen at exchange rates as of the balance
sheet date except for shareholders’ equity, which is translated at
historical rates. Differences arising from such translations are shown
as “Foreign currency translation adjustments” in a separate
component of net assets in the consolidated balance sheets.
Revenue and expense accounts of consolidated foreign
subsidiaries are translated into Japanese yen at annual average
exchange rates.
(d) Cash and Cash Equivalents The Company considers cash and deposits, which can be
withdrawn on demand without diminution of principal and with
original maturities of three months or less, to be cash and cash
equivalents.
(e) Investments The accounting standards for financial instruments require the
Company to classify its securities into one of the following four
categories: trading, held-to-maturity, available-for-sale securities or
investments in unconsolidated subsidiaries and affiliates. All of the
Company's securities are classified as held-to-maturity securities,
available-for-sale securities or investments in unconsolidated
subsidiaries or affiliates and included in investment securities in the
consolidated balance sheets.
In accordance with the accounting standards for financial
instruments, available-for-sale securities with a market value are
carried at market value. The difference, net of tax, between the
acquisition cost and the carrying value of available-for-sale securities,
including unrealized gains and losses, is recognized in “Unrealized
gains (losses) on available-for-sale securities” in a separate
component of net assets in the consolidated balance sheets.
Available-for-sale securities without a market value are principally
carried at cost. The cost of available-for sale securities sold is
principally computed based on the moving average method.
(f) Inventories Inventories are stated at cost, principally using the average
method. Inventories are written down to their net realizable value
when there is evidence of deterioration in value.
(g) Property, Plant and Equipment Property, plant and equipment are stated at cost. Routine
maintenance and repairs and minor replacement costs are charged
to expenses as incurred. Depreciation is computed by the straight-
line depreciation method based on the following estimated useful
lives:
Buildings and structures: 3–60 years
Machinery, equipment and vehicles : 4–15 years
(h) Allowance for Doubtful Accounts Allowance for doubtful accounts is provided to cover probable
losses on notes and accounts receivable due to customer defaults at
an estimated amount based on past collection experience for current
receivables, and individual account by account analysis for specific
10 A
Terumo Corporation Annual Report 2016 Financial Information
overdue receivables.
(i) Goodwill Goodwill, which represents the excess cost over the fair value of
the net assets acquired at acquisition dates of investments in
subsidiaries, is principally amortized over 10–20 years, which is the
expected period to be benefited.
(j) Intangible assets Intangible assets are amortized on a straight-line basis. Customer
relationships are mainly amortized over 20 years which is the
estimated useful life.
(k) Income Taxes Income taxes are accounted for under the asset and liability
method. Deferred tax assets and liabilities are recognized for the
future tax consequences attributable to differences between the
financial statement carrying amounts of existing assets and liabilities
and their respective tax bases and operating loss and tax credit
carry-forwards. Deferred tax assets and liabilities are measured
using enacted tax rates expected to apply to taxable income in the
years in which those temporary differences are expected to be
recovered or settled. The effect on deferred tax assets and liabilities
of a change in tax rates is recognized in income in the period that
includes the enactment date.
(l) Retirement Benefits The Company and certain subsidiaries have contributory and non-
contributory defined benefit plans for employees that provide for
pension or lump-sum benefit payments. In calculating retirement
benefit obligations, the Company and subsidiaries allocate the
projected retirement benefits to the period through the expected
retirement period based on the benefit formula basis.
Prior service cost is amortized by the straight-line method over a
period within the average remaining service years of employees
(mainly 10 years) at the time of recognition. Actuarial gain and loss
is amortized by the straight-line method over a period within the
average remaining service years of employees (mainly 10 years) at
the time of recognition, beginning from the fiscal year following the
respective fiscal year of recognition.
The Company decided to abolish the directors’ retirement benefit
program on April 20, 2006. The payment of retirement benefits
estimated on the abolished program according to the length of
service of eligible directors and audit and supervisory board
members through June 29, 2006 was approved at the Annual
General Meeting of Shareholders for the year ended March 2006
which was held on June 29, 2006. The payments will be made at the
time of each eligible person’s retirement.
(m) Leases Assets held under finance leases, except for certain immaterial
leases, are capitalized and depreciated over the lease terms.
(n) Derivatives and Hedge Accounting
The Company, in general, adopts the deferral method of hedge
accounting. Interest rate swaps that meet certain criteria are
accounted for under the special method provided by the accounting
standards as if the interest rates under the interest rate swaps were
originally applied to underlying borrowings.
Derivative financial instruments held by the Company and
subsidiaries include forward exchange contracts and interest rate
swap contracts. Forward exchange contracts are utilized to hedge
risks arising from changes in foreign exchange risk of monetary
assets and liabilities and forecast transactions denominated in
foreign currencies. Interest-rate swaps are utilized to manage
interest-rate risk of long-term debt.
Derivatives are stated at fair value.
The Company has developed a hedging policy to control various
aspects of derivative transactions, including authorization levels and
transaction volumes. Based on this policy, the Company hedges,
within certain limits, risks arising from changes in foreign currency
exchange rates and interest rates. The Company reviews the
effectiveness of all hedging instruments to take account of the
cumulative cash flows and any changes in the market.
The Company evaluates hedge effectiveness by comparing the
cumulative changes in cash flows from hedged items and
corresponding changes in hedging derivative instruments every half
year. With respect to interest rate swaps under the special method,
the evaluation of hedge effectiveness is omitted.
(o) Appropriation of Retained Earnings Under the Japanese Corporate Law, the appropriation of retained
earnings with respect to a given financial period is made by
resolution of the shareholders at a general meeting held subsequent
to the end of such financial period. The accounts for that period do
not, therefore, reflect such appropriation.
(p) Consumption Taxes Transactions subject to consumption taxes are recorded at
amounts exclusive of consumption taxes.
(q) Earnings and Cash Dividends per Common Stock Basic earnings per common stock is computed by dividing
earnings available to common shareholders by the weighted-
average number of common shares outstanding during the year.
Diluted earnings per common stock is computed similarly to the
basic earnings per common stock except that the average of
common shares outstanding is increased by the number of additional
common shares that would have been outstanding had potentially
dilutive common shares been issued.
Cash dividends per common stock are presented on an accruals
basis and include dividends to be approved after the balance sheet
date, but applicable to the year then ended.
(r) Research and Development Expenses Research and development expenses are charged to income
when incurred.

11 A
Terumo Corporation Annual Report 2016 Financial Information
(s) Reclassifications Certain prior year amounts have been reclassified to conform to
the current year presentation.
(t) Solution on Unification of Accounting Policies Applied to Foreign Subsidiaries for Consolidated Financial Statements
ASBJ PITF No. 18 requires that accounting policies and
procedures applied by a parent company and subsidiaries to similar
transactions and events under similar circumstances should, in
principle, be unified for the preparation of the consolidated financial
statements. PITF No. 18, however, as a tentative measure, allows a
parent company to prepare consolidated financial statements using
foreign subsidiaries’ financial statements prepared in accordance
with either International Financial Reporting Standards or U.S.
generally accepted accounting principles. In this case, adjustments
for the following four items are required in the consolidation process
so that their impact on profit is accounted for in accordance with
Japanese GAAP unless the impact is not material.
(i) Goodwill not subject to amortization
(ii) Actuarial gains and losses of defined-benefit retirement plans
recognized outside profit or loss
(iii) Capitalized expenditures for research and development
activities
(iv) Fair value measurement of investment properties, and
revaluation of property, plant and equipment and intangible assets
(u) Accounting Periods of Consolidated Subsidiaries The year end consolidated balance sheet date is March 31.
Among the consolidated subsidiaries, Terumo Medical Products
(Hangzhou) Co., Ltd., Terumo Medical (Shanghai) Co., Ltd. and
TERUMO (China) Holdings Co., Ltd. have a year end balance sheet
date of December 31, which is different from the year end
consolidated balance sheet date. Financial statements of these
subsidiaries for consolidation purposes were prepared as of the
consolidated balance sheet date.
(v) Application of Accounting Standards regarding Business Combinations
The “Revised Accounting Standard for Business Combinations”
(ASBJ Statement No.21, September 13, 2013; hereinafter the
“Business Combinations Accounting Standard”), “Revised
Accounting Standard for Consolidated Financial Statements” (ASBJ
Statement No.22, September 13, 2013; hereinafter the
“Consolidation Accounting Standard”), “Revised Accounting
Standard for Business Divestitures” (ASBJ Statement No.7,
September 13, 2013; hereinafter the “Business Divestitures
Accounting Standard”) and other standards have been applied from
the year ended March 31, 2016. Accordingly, the accounting method
has been changed such that the difference associated with changes
in equity in subsidiaries remaining under the control of the Company
is recorded as capital surplus, and acquisition-related costs are
recorded as expenses for the fiscal year in which the costs are
incurred. For business combinations implemented on or after the
beginning of the year ended March 31, 2016, the accounting method
has been changed to reflect the adjustments to the allocated amount
of acquisition costs on the finalization of provisional accounting
treatment in the consolidated financial statements for the period
containing the date of the business combinations.
In addition, the Company has changed the presentation of net
income and the term of “minority interests” has been changed to
“non-controlling interests”. To reflect these changes in presentation,
the consolidated financial statements for the years ended March 31,
2016 and 2015 have been reclassified.
With respect to application of the Accounting Standards regarding
Business Combinations, the transitional treatment as prescribed in
article 58-2 (3) of the Business Combinations Accounting Standard,
article 44-5 (3) of the Consolidation Accounting Standard and article
57-4 (3) of the Business Divestitures Accounting Standard was
applied. The cumulative impact of the retroactive application of the
new accounting policies over all past periods at the beginning of the
year ended March 31, 2016 was reflected in capital surplus and
retained earnings.
As a result of this change, as of the beginning of the year ended
March 31, 2016, goodwill, capital surplus and retained earnings
decreased by 3,135 million yen, 1,175 million yen and 1,220 million
yen, respectively. Additionally operating income, ordinary income,
and income before income taxes for the year ended March 31, 2016
each increased by 188 million yen.
Reflecting the cumulative impact on net assets at the beginning of
the year ended March 31, 2016, in the consolidated statement of
changes in net assets, capital surplus at the beginning of the year
decreased by 1,175 million yen and retained earnings at the
beginning of the year decreased by 1,220 million yen.
In addition, net assets per common stock as of March 31, 2016
decreased by 6.08 yen and basic earnings per common stock and
diluted earnings per common stock for the year ended March 31,
2016 increased by 0.50 yen and 0.47 yen, respectively.
(w) New Accounting Pronouncements “Revised Implementation Guidance on Recoverability of Deferred
Tax Assets” (ASBJ Guidance No. 26, March 28, 2016 (hereinafter,
“Guidance No.26”)
(1) Overview
Following the framework in Auditing Committee Report No. 66
“Audit Treatment regarding the Judgment of Recoverability of
Deferred Tax Assets”, which prescribes estimation of deferred tax
assets according to the classification of the entity by one of five types,
the following treatments were changed as necessary:
1. Treatment for an entity that does not meet any of the criteria in
types 1 to 5;
2. Criteria for types 2 and 3;
3. Treatment for deductible temporary differences which an entity
classified as type 2 is unable to schedule;
12 A
Terumo Corporation Annual Report 2016 Financial Information
4. Treatment for the period which an entity classified as type 3 is
able to reasonably estimate with respect to future taxable
income before consideration of taxable or deductible temporary
differences that exist at the end of the current fiscal year; and
5. Treatment when an entity classified as type 4 also meets the
criteria for type 2 or 3.
(2) Effective date
Effective from the beginning of the fiscal year ending March 31,
2017
(3) Effects of application of the Guidance
The Company and its consolidated domestic subsidiaries are
currently in the process of determining the effects of the new
guidance on the consolidated financial statements.
13 A
Terumo Corporation Annual Report 2016 Financial Information
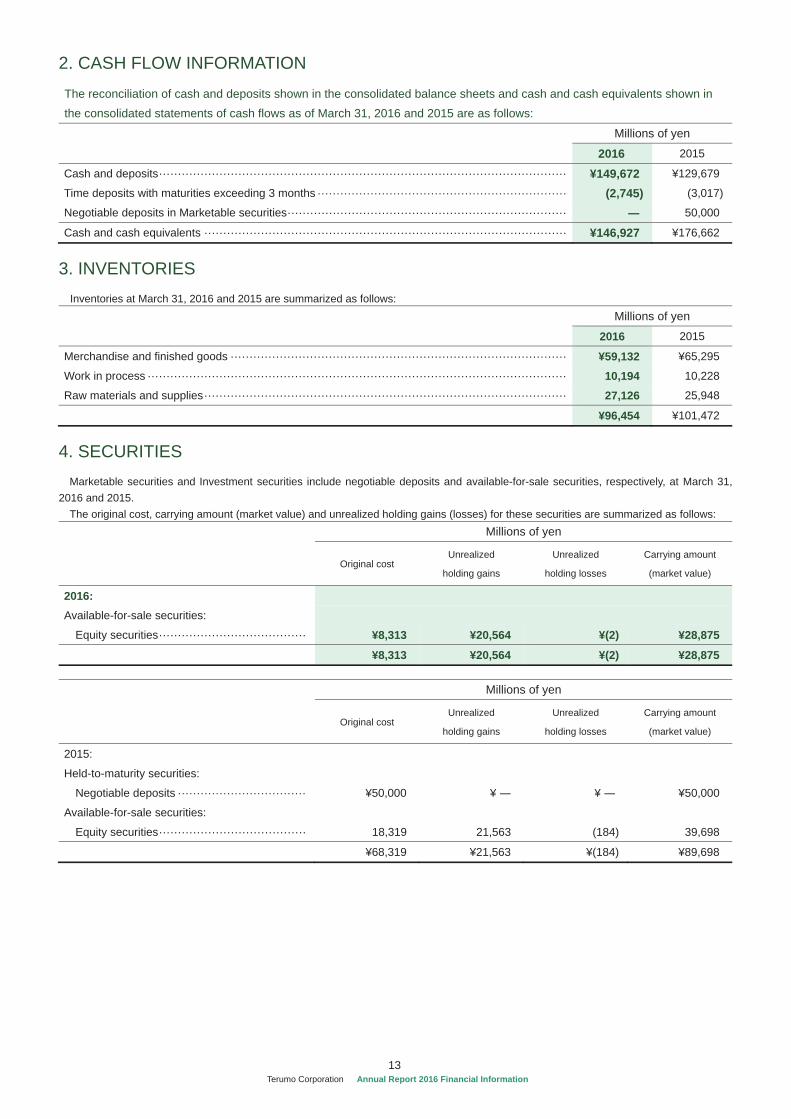
2. CASH FLOW INFORMATION
The reconciliation of cash and deposits shown in the consolidated balance sheets and cash and cash equivalents shown in the consolidated statements of cash flows as of March 31, 2016 and 2015 are as follows:
Millions of yen
2016 2015
Cash and deposits ············································································································ ¥149,672 ¥129,679
Time deposits with maturities exceeding 3 months ·································································· (2,745) (3,017)
Negotiable deposits in Marketable securities ·········································································· 50,000
Cash and cash equivalents ································································································ ¥146,927 ¥176,662
3. INVENTORIES Inventories at March 31, 2016 and 2015 are summarized as follows: Millions of yen
2016 2015
Merchandise and finished goods ························································································· ¥59,132 ¥65,295
Work in process ··············································································································· 10,194 10,228
Raw materials and supplies ································································································ 27,126 25,948
¥96,454 ¥101,472
4. SECURITIES Marketable securities and Investment securities include negotiable deposits and available-for-sale securities, respectively, at March 31,
2016 and 2015. The original cost, carrying amount (market value) and unrealized holding gains (losses) for these securities are summarized as follows: Millions of yen
Original cost
Unrealized
holding gains
Unrealized
holding losses
Carrying amount
(market value)
2016: Available-for-sale securities:
Equity securities ······································· ¥8,313 ¥20,564 ¥(2) ¥28,875
¥8,313 ¥20,564 ¥(2) ¥28,875
Millions of yen
Original cost
Unrealized
holding gains
Unrealized
holding losses
Carrying amount
(market value)
2015:
Held-to-maturity securities:
Negotiable deposits ·································· ¥50,000 ¥ ¥ ¥50,000
Available-for-sale securities:
Equity securities ······································· 18,319 21,563 (184) 39,698
¥68,319 ¥21,563 ¥(184) ¥89,698

14 A
Terumo Corporation Annual Report 2016 Financial Information
Realized gains and losses on investment securities which were sold in the years ended March 31, 2016 and 2015 were as follows:
Millions of yen
Sales price Realized gains Realized losses
2016:
Equity securities ··································································· ¥10,802 ¥793 ¥ ¥10,802 ¥793 ¥
Millions of yen
Sales price Realized gains Realized losses
2015:
Equity securities ··································································· ¥1,434 ¥559 ¥
¥1,434 ¥559 ¥
The balances of investments in unconsolidated subsidiaries and affiliates at March 31, 2016 and 2015 were ¥4,939 million and
¥3,513 million, respectively.
15 A
Terumo Corporation Annual Report 2016 Financial Information
5. SHORT-TERM DEBT AND LONG-TERM DEBT Short-term debt at March 31, 2016 included unsecured bank
borrowings in the amount of ¥61 million. The weighted-average
interest rates applicable to the bank borrowings was 12.3% at
March 31, 2016.
As is customary in Japan, short-term debt is made under general
agreements which provide that security and guarantees for present
and future indebtedness will be given upon request of the banks,
and that the banks have the right to offset cash deposits against
obligations that have become due or, in the event of default, against
all obligations due to the banks.
There is no committed line of credit as of March 31, 2016 and 2015. Long-term debt at March 31, 2016 and 2015 is summarized as follows:
Millions of yen
2016 Unsecured loans, principally from banks:
Due 2017, weighted-average interest rate of 1.03% ·············································································· ¥19,839 Due 2018 to 2024, weighted-average interest rate of 1.24% ··································································· 58,873
Total long-term debt ··························································································································· ¥78,713
Millions of yen
2015
Unsecured loans, principally from banks:
Due 2016, weighted-average interest rate of 1.86% ·············································································· ¥5,417
Due 2017 to 2019, weighted-average interest rate of 1.23% ··································································· 79,141
Total long-term debt ······························································································································· ¥84,558
The aggregate annual maturities of long-term debt at March 31, 2016 are as follows:
Year Ending March 31 Millions of yen
2017 ············································································································································ ¥19,839 2018 ············································································································································ 7,887 2019 ············································································································································ 47,887 2020 ············································································································································ 2021 ············································································································································ 2022 and thereafter ························································································································ 3,098
¥78,713

16 A
Terumo Corporation Annual Report 2016 Financial Information
6. BONDS PAYABLE The Company has issued the following bonds:
Millions of yen
Issuance date Interest rate Security Maturity date 2016 2015
4th series unsecured straight bonds March
2, 2012 0.504% Unsecured
March
2, 2017 ¥40,000 ¥40,000
Convertible bonds with subscription rights to shares (maturing in 2019)
December
4, 2014
Unsecured
December
4, 2019 50,184 50,233
Convertible bonds with subscription rights to shares (maturing in 2021)
December
4, 2014 Unsecured
December
6, 2021 50,000 50,000
The aggregate annual maturities of unsecured straight bonds at March 31, 2016 is as follows:
Year Ending March 31 Millions of yen
2017 ··············································································································································· ¥40,000 2018 ··············································································································································· 2019 ··············································································································································· 2020 ··············································································································································· 2021 ··············································································································································· 2022 and thereafter ··························································································································
¥40,000 The aggregate annual maturities of convertible bonds with subscription rights to shares at March 31, 2016 is as follows:
Year Ending March 31 Millions of yen
2017 ··············································································································································· ¥ 2018 ··············································································································································· 2019 ··············································································································································· 2020 ··············································································································································· 50,000 2021 ··············································································································································· 2022 and thereafter ··························································································································· 50,000 ¥100,000
17 A
Terumo Corporation Annual Report 2016 Financial Information
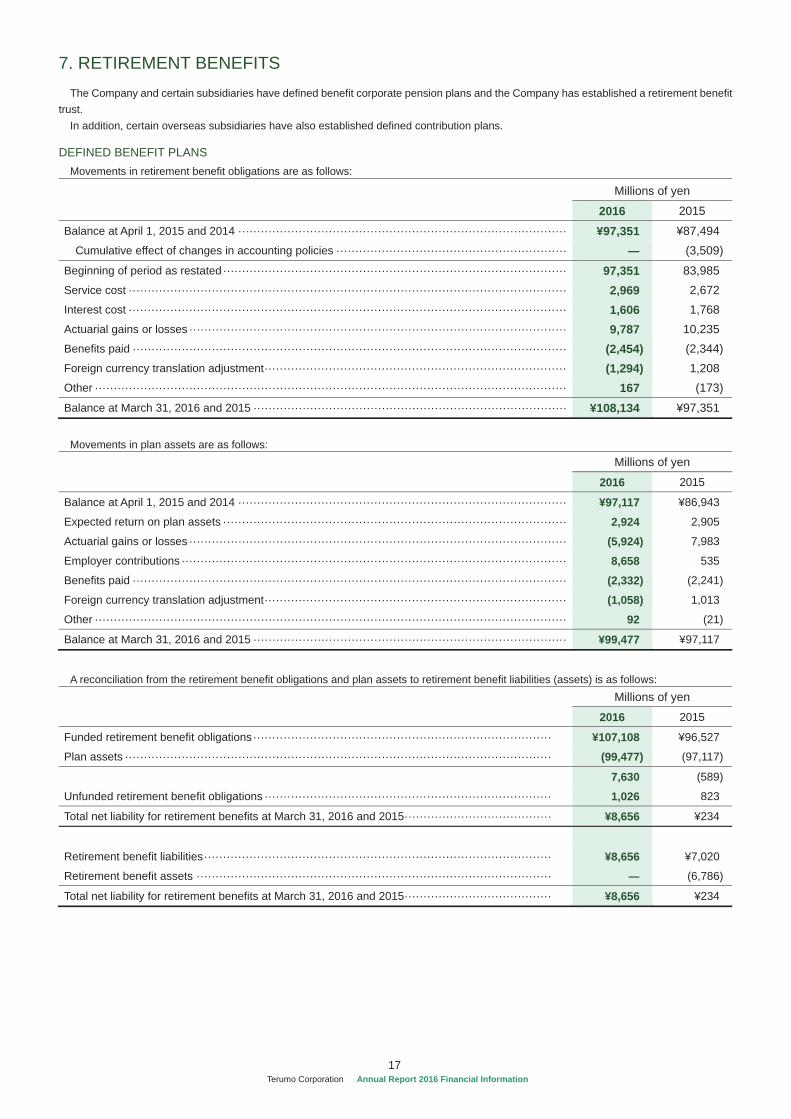
7. RETIREMENT BENEFITS The Company and certain subsidiaries have defined benefit corporate pension plans and the Company has established a retirement benefit
trust. In addition, certain overseas subsidiaries have also established defined contribution plans.
DEFINED BENEFIT PLANS Movements in retirement benefit obligations are as follows:
Millions of yen
2016 2015
Balance at April 1, 2015 and 2014 ······················································································· ¥97,351 ¥87,494 Cumulative effect of changes in accounting policies ····························································· (3,509)
Beginning of period as restated ··························································································· 97,351 83,985 Service cost ···················································································································· 2,969 2,672 Interest cost ···················································································································· 1,606 1,768 Actuarial gains or losses ···································································································· 9,787 10,235 Benefits paid ··················································································································· (2,454) (2,344)Foreign currency translation adjustment ················································································ (1,294) 1,208 Other ····························································································································· 167 (173)
Balance at March 31, 2016 and 2015 ··················································································· ¥108,134 ¥97,351
Movements in plan assets are as follows:
Millions of yen
2016 2015
Balance at April 1, 2015 and 2014 ······················································································· ¥97,117 ¥86,943
Expected return on plan assets ··························································································· 2,924 2,905
Actuarial gains or losses ···································································································· (5,924) 7,983
Employer contributions ······································································································ 8,658 535
Benefits paid ··················································································································· (2,332) (2,241)
Foreign currency translation adjustment ················································································ (1,058) 1,013
Other ····························································································································· 92 (21)
Balance at March 31, 2016 and 2015 ··················································································· ¥99,477 ¥97,117
A reconciliation from the retirement benefit obligations and plan assets to retirement benefit liabilities (assets) is as follows:
Millions of yen
2016 2015
Funded retirement benefit obligations ··············································································· ¥107,108 ¥96,527
Plan assets ················································································································· (99,477) (97,117)
7,630 (589)
Unfunded retirement benefit obligations ············································································ 1,026 823
Total net liability for retirement benefits at March 31, 2016 and 2015 ······································· ¥8,656 ¥234
Retirement benefit liabilities ···························································································· ¥8,656 ¥7,020
Retirement benefit assets ······························································································ (6,786)
Total net liability for retirement benefits at March 31, 2016 and 2015 ······································· ¥8,656 ¥234

18 A
Terumo Corporation Annual Report 2016 Financial Information
Retirement benefit costs consisted of the following: Millions of yen
2016 2015
Service cost ···················································································································· ¥2,969 ¥2,672
Interest cost ···················································································································· 1,606 1,768
Expected return on plan assets ··························································································· (2,924) (2,905)
Net actuarial gains or losses amortization ············································································· 1,452 1,348
Past service costs amortization ··························································································· (150) (150)
Other ····························································································································· 95
Total retirement benefit costs for the year ended March 31, 2016 and 2015 ································· ¥2,954 ¥2,829
The pre-tax amount recognized in adjustments for retirement benefits consisted of the following:
Millions of yen
2016 2015
Past service costs ············································································································ ¥150 ¥150
Net actuarial gains or losses ······························································································· 13,998 991
Total balance at March 31, 2016 and 2015 ············································································ ¥14,148 ¥1,141
The pre-tax amount recognized in Accumulated adjustments for retirement benefits consisted of the following:
Millions of yen
2016 2015
Past service costs that are yet to be recognized ····································································· ¥825 ¥975
Net actuarial gains or losses that are yet to be recognized ························································ (20,503) (6,504)
Total balance at March 31, 2016 and 2015 ············································································ ¥(19,678) ¥(5,529)
A breakdown of plan assets by category is as follows:
2016 2015
Bonds ···························································································································· 55% 50%
Equity securities ··············································································································· 40 41
Cash and cash equivalents ································································································ 0 3
Other ····························································································································· 5 6
Total ····························································································································· 100% 100%
16% and 14% of the total plan assets were held by a retirement benefit trust established to cover the corporate pension plan benefits at March 31, 2016 and 2015, respectively.
Current and target asset allocations and historical and expected returns on various categories of plan assets have been considered in determining the long-term expected rate of return.
The principal actuarial assumptions at March 31, 2016 and 2015 are as follows:
2016 2015
Discount rate ··················································································································· 1.2% 1.5%
Long-term expected rate of return ························································································ 3.0 3.0
DEFINED CONTRIBUTION PLANS Certain overseas subsidiaries have defined contribution plans, which provide retirement benefits for their employees who meet certain
eligibility requirements. Contributions made to those plans for the year ended March 31, 2016 and 2015 were ¥2,818 million and ¥2,473 million, respectively.

19 A
Terumo Corporation Annual Report 2016 Financial Information
8. INCOME TAXES Income taxes comprise corporation tax, prefectural and municipal inhabitants taxes and enterprise tax, which in the aggregate resulted in a
statutory tax rate of 33.1% and 35.6% for the years ended March 31, 2016 and 2015, respectively. The difference between the Japanese statutory income tax rate and the effective income tax rate for the year ended March 31, 2016 is not
presented because the difference is less than 5% of the statutory tax rate. A reconciliation between the Japanese statutory income tax rate and the effective income tax rate calculated as a percentage of income before income taxes for the year ended March 31, 2015 is as follows:
Millions of yen
2015
Japanese statutory income tax rate ······································································································· 35.6%
Increase (decrease) in income taxes resulting from: Expenses not deductible for tax purposes ··························································································· 0.6
Dividend income, non-taxable ··········································································································· (0.2)
Income of foreign subsidiaries taxed at different rate to Japanese statutory tax rate ····································· (1.7)
Amortization of goodwill ··················································································································· 5.7
R&D tax credit ······························································································································· (2.5)
Valuation allowance ························································································································ (0.5)
Changes in tax rates ······················································································································· 1.4
Deferred tax effect on unrealized profit in inventories ············································································· 0.9
Other ··········································································································································· 0.6
Effective income tax rate after adoption of tax-effect accounting ································································· 39.9%
The tax effects of temporary differences and net operating loss carryforwards that give rise to significant portions of the deferred tax assets and deferred tax liabilities at March 31, 2016 and 2015 are presented below:
Millions of yen
2016 2015
Deferred tax assets:
Retirement benefit liabilities ····························································································· ¥10,088 ¥6,810
Research and development expenses ··············································································· 1,282 1,045
Unrealized profit in inventories and property, plant and equipment ·········································· 4,743 3,953
Accrued expenses ········································································································· 7,323 7,553
Impairment loss ············································································································ 4,244 4,905
Loss on valuation of investment securities ······································································· 2,542 2,695
Inventories ················································································································ 2,346 2,060
Net operating loss carryforwards ··················································································· 3,589 2,392
Other ·························································································································· 2,450 3,748
Total gross deferred tax assets ···························································································· 38,611 35,165
Less: valuation allowance ·································································································· (5,259) (6,345)
Net deferred tax assets ····································································································· 33,351 28,819
Deferred tax liabilities: ·····································································································
Gain on contribution of securities to retirement benefit trust ··················································· (1,479) (1,562)
Intangible assets ········································································································ (48,753) (55,853)
Unrealized gains (losses) on available-for-sale securities ··················································· (4,084) (4,376)
Other ·························································································································· (5,769) (2,938)
Total gross deferred tax liabilities ························································································· (60,087) (64,730)
Net deferred tax liabilities ··································································································· ¥(26,735) ¥(35,910)
Deferred tax liabilities-current included in “Other current liabilities” were ¥56 million and ¥105 million as of March 31, 2016 and 2015,
respectively.Adjustment of deferred tax assets and liabilities due to enacted changes in tax laws and rates
On March 29, 2016, amendments to the Japanese tax regulations were enacted into law. Based on the amendments, the statutory income
tax rates utilized for the measurement of deferred tax assets and liabilities expected to be settled or realized from April 1, 2016 to March 31,
2018 and on or after April 1, 2018 were changed from 32.3% to 30.9% and 30.6%, respectively, as of March 31, 2016.
20 A
Terumo Corporation Annual Report 2016 Financial Information
Due to these changes in statutory income tax rates, net deferred tax liabilities (after deducting deferred tax assets), deferred income tax
expense and unrealized gains on available-for-sale securities, net of taxes increased by ¥373 million, ¥320 million and ¥218 million,
respectively, and accumulated adjustments for retirement benefits, net of taxes decreased by ¥270 million.
9. SELLING, GENERAL AND ADMINISTRATIVE EXPENSES Significant components of selling, general and administrative expenses for the years ended March 31, 2016 and 2015 are as follows: Millions of yen
2016 2015
Promotion and advertising expenses ···················································································· ¥17,177 ¥ 15,972
Salaries and allowances ···································································································· 76,045 70,504
Freight and packing expenses ···························································································· 10,995 11,035
Research and development expenses ·················································································· 33,147 29,360
Depreciation and amortization ····························································································· 27,537 25,070
10. RESEARCH AND DEVELOPMENT EXPENSES Research and development expenses charged to income for the years ended March 31, 2016 and 2015 were ¥33,147 million and ¥29,360
million, respectively.
11. GAIN ON SALES OF PROPERTY, PLANT AND EQUIPMENT A breakdown of gain on sales of property, plant and equipment is as follows: Millions of yen
2016 2015
Buildings and structures ···································································································· ¥237 ¥ 166
Machinery, equipment and vehicles ······················································································ 172 291
Land ······························································································································ 4,473 175
Other ····························································································································· 33 59
¥4,917 ¥692
12. LOSS ON DISPOSAL OF PROPERTY, PLANT AND EQUIPMENT A breakdown of loss on disposal of property, plant and equipment is as follows: Millions of yen
2016 2015
Buildings and structures ···································································································· ¥88 ¥162
Machinery, equipment and vehicles ······················································································ 138 722
Construction in progress ···································································································· 72 160
Other ····························································································································· 595 115
¥895 ¥1,160
21 A
Terumo Corporation Annual Report 2016 Financial Information
13. IMPAIRMENT LOSSThe Company and subsidiaries group their fixed assets by the
smallest identifiable operating unit for which its performance is
continuously monitored, within the Cardiac and Vascular Company
segment, General Hospital Company segment, or Blood
Management Company segment. Idle assets and assets to be
disposed of due to termination of operations or businesses are
grouped on an individual asset-by-asset basis.
Assets belonging to the Headquarters and R&D center, company
housing and dormitories are included in common assets due to the
fact that they do not generate separately identifiable cash flows.
The Company and subsidiaries assessed fixed assets for
possible impairment on the basis of the above asset groups. In
the year ended March 31, 2016 and 2015, since the profitability or
utility which was originally expected of certain asset groups
deteriorated, their carrying amounts were reduced to the
respective recoverable amounts. As a result, the Company and
subsidiaries recognized a total of ¥876 million and ¥1,625 million
in impairment loss on the following groups of assets for the years
ended March 31, 2016 and 2015, respectively. In the year ended
March 31, 2016, the former Fukuoka branch became idle due to
relocation and the assets were determined to be sold. As a result,
the asset carrying amounts were reduced to the recoverable
amounts.:
Use Location Classification
2016: Cardiac and Vascular Company Manufacturing facilities
Michigan, U.S.A. and others
Machinery, equipment and vehicles, Construction in progress and other assets
Idle assets Fukuoka Prefecture, Japan
Buildings and structures, and Land
Breakdown of impairment loss for the asset groups by fixed asset type is as follows (millions of yen):
Cardiac and Vascular Company / Manufacturing facilities and others ¥876 (Construction in progress ¥601, Machinery, equipment and vehicles ¥207, Buildings and structures ¥43, Other ¥23) Idle assets ¥134 (Land ¥115, Buildings and structures¥18)
With respect to the asset groups within the Cardiac and Vascular Company segment, the recoverable amounts of buildings and land were
measured at net selling prices based on a third party's appraisal, and the recoverable amounts of all other assets were deemed to be zero. The recoverable amount was computed using the net selling price based on the estimated price if sold.
Use Location Classification
2015: Cardiac and Vascular Company Manufacturing facilities
Michigan, U.S.A. and others Machinery, equipment and vehicles, Construction in progress and other assets
Breakdown of impairment loss for the asset groups by fixed asset type is as follows (millions of yen):
Cardiac and Vascular Company / Manufacturing facilities and others ¥1,625 (Construction in progress ¥622, Other assets (Investments and Other Assets) ¥373, Machinery, equipment and vehicles ¥322, Goodwill ¥54, Other ¥251)
With respect to the asset groups within the Cardiac and Vascular Company segment, the recoverable amounts of buildings and land were
measured at net selling prices based on a third party's appraisal, and the recoverable amounts of all other assets were deemed to be zero.

22 A
Terumo Corporation Annual Report 2016 Financial Information
14. TREASURY STOCK At March 31, 2016 and 2015, the Company held 16,790
thousand and 931 thousand shares of treasury stock for an
aggregate cost of ¥64,040 million and ¥3,035 million, respectively.
The annual shareholders’ meeting held on June 29, 2004 approved
a change to the Company's Articles of Incorporation so that the
Company may acquire its common stock to be held in treasury
based on decision by the Board of Directors.
15. NET ASSETS Under the Japanese Corporate Law (“the Law”) and related
regulations, the entire amount paid for new shares is required to be
designated as capital stock. However, a company may, by a
resolution of the Board of Directors, designate an amount not
exceeding one-half of the price of the new shares as additional
paid-in capital, which is included in capital surplus. In cases where
a dividend distribution of surplus is made, the smaller of an amount
equal to 10% of the dividend or the excess, if any, of 25% of capital
stock over the total of additional paid-in capital and legal earnings
reserve must be set aside as additional paid-in capital or legal
earnings reserve. Legal earnings reserve is included in retained
earnings in the accompanying consolidated balance sheets. Under
the Law, legal earnings reserve and additional paid-in capital could
be used to eliminate or reduce a deficit and capitalized by a
resolution of the shareholders’ meeting. Additional paid-in capital
and legal earnings reserve may not be distributed as dividends.
Under the Law, however, on condition that the total amount of legal
earnings reserve and additional paid-in capital remain equal to or
exceed 25% of common stock, they are available for distribution by
resolution of the shareholders’ meeting. Under the Law, all
additional paid-in capital and all legal earnings reserve may be
transferred to other capital surplus and retained earnings which are
potentially available for dividends.
The maximum amount that the Company can distribute as
dividends is calculated based on the non-consolidated financial
statements of the Company in accordance with the Law and related
regulations.
Terumo Corporation executed a two-for-one stock split of its common shares effective April 1, 2014. The total number and periodic changes in the number of share subscription rights of convertible bonds with subscription rights to shares for
the year ended March 31, 2016 are summarized as follows:
Item Convertible bond-type bonds with subscription rights to shares (maturing in 2019)
Convertible bond-type bonds with subscription rights to shares (maturing in 2021)
Class of stock Common stock Common stock
(Thousands of shares) (Thousands of shares)
Balance at March 31, 2015 12,843 12,843
Increase
Decrease
Balance at March 31, 2016 12,843 12,843
23 A
Terumo Corporation Annual Report 2016 Financial Information
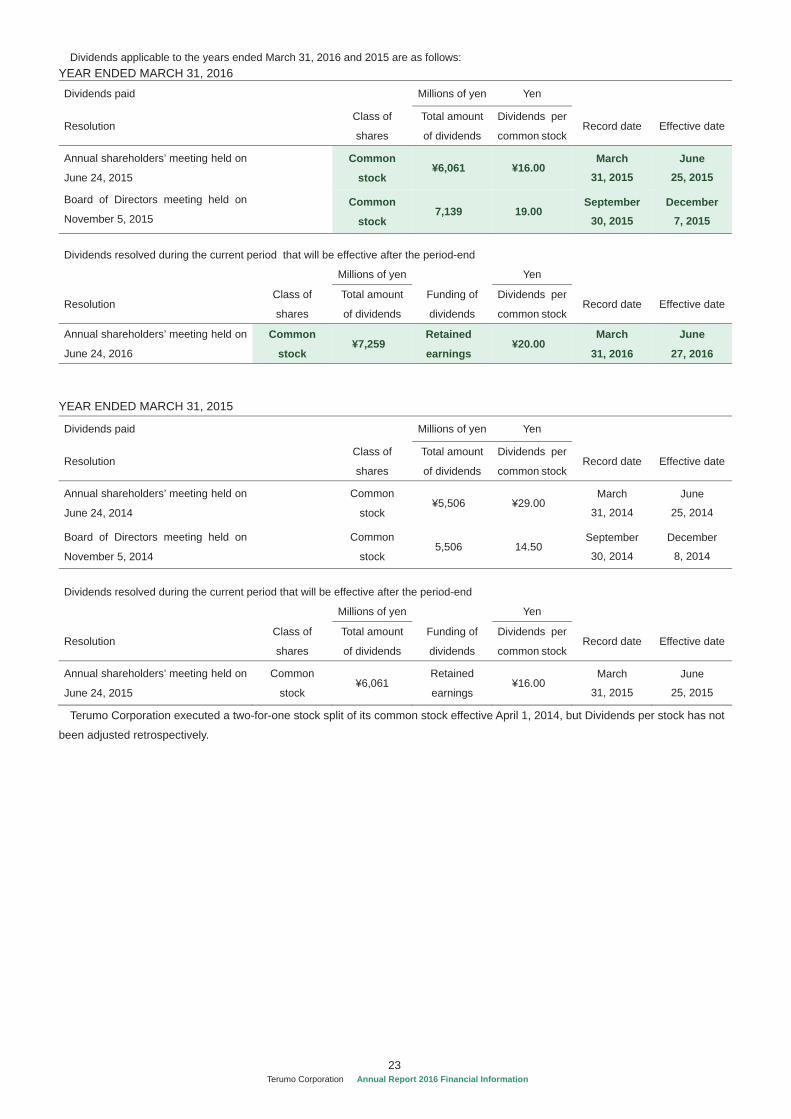
Dividends applicable to the years ended March 31, 2016 and 2015 are as follows: YEAR ENDED MARCH 31, 2016
Dividends paid Millions of yen Yen
Resolution
Class of
shares
Total amount
of dividends
Dividends per
common stockRecord date Effective date
Annual shareholders’ meeting held on
June 24, 2015
Common
stock ¥6,061 ¥16.00
March 31, 2015
June 25, 2015
Board of Directors meeting held on
November 5, 2015
Common
stock 7,139 19.00
September 30, 2015
December 7, 2015
Dividends resolved during the current period that will be effective after the period-end Millions of yen Yen
Resolution Class of
shares
Total amount
of dividends
Funding of
dividends
Dividends per
common stockRecord date Effective date
Annual shareholders’ meeting held on
June 24, 2016
Common
stock ¥7,259
Retained
earnings ¥20.00
March
31, 2016
June
27, 2016
YEAR ENDED MARCH 31, 2015
Dividends paid
Millions of yen Yen
Resolution Class of
shares
Total amount
of dividends
Dividends per
common stockRecord date Effective date
Annual shareholders’ meeting held on
June 24, 2014
Common
stock ¥5,506 ¥29.00
March
31, 2014
June
25, 2014
Board of Directors meeting held on
November 5, 2014
Common
stock 5,506 14.50
September
30, 2014
December
8, 2014
Dividends resolved during the current period that will be effective after the period-end
Millions of yen Yen
Resolution Class of
shares
Total amount
of dividends
Funding of
dividends
Dividends per
common stockRecord date Effective date
Annual shareholders’ meeting held on
June 24, 2015
Common
stock ¥6,061
Retained
earnings ¥16.00
March
31, 2015
June
25, 2015
Terumo Corporation executed a two-for-one stock split of its common stock effective April 1, 2014, but Dividends per stock has not
been adjusted retrospectively.
24 A
Terumo Corporation Annual Report 2016 Financial Information
16. STOCK OPTIONS Stock options outstanding as of March 31, 2016 are as follows:
Stock Options Grantees Number of
Options Granted
Date of Grant
Exercise Price
Exercise Period
(Shares) (Yen)
2013 Stock Options 7 directors 6 employees 47,542
Aug 22, 2013 ¥1
From Aug 23, 2013 to Aug 22, 2043
2014 Stock Options 9 directors 26 employees
55,350 Aug
27, 2014 ¥1
From Aug 28, 2014 to Aug 27, 2044
2015 Stock Options 10 directors 26 employees
52,102 Aug
25, 2015 ¥1
From Aug 26, 2015 to Aug 25, 2045
The stock option activity for the year ended March 31, 2016 is as follows:
2013 Stock Option 2014 Stock Option
(Shares) (Shares) Non-vested Outstanding at March 31, 2015 ··········································· 47,542 55,350
Granted ······································································ Canceled ···································································· Vested ········································································
Outstanding at March 31, 2016 ············································ 47,542 55,350 Exercise price ···································································· ¥1 ¥1Average stock price at exercise ············································ Fair value at grant date ······················································ ¥4,180 ¥4,610
2015 Stock Option
(Shares) Non-vested Outstanding at March 31, 2015 ···········································
Granted ······································································ 52,102 Canceled ···································································· Vested ········································································
Outstanding at March 31, 2016 ············································ 52,102 Exercise price ···································································· ¥1 Average stock price at exercise ············································ Fair value at grant date ······················································ ¥5,616
Terumo Corporation executed a two-for-one stock split of its common shares effective April 1, 2014. The number of shares relating to the 2013 Stock Options were adjusted retrospectively to reflect the effect of the stock split.
ASSUMPTIONS USED TO MEASURE FAIR VALUE OF 2015 STOCK OPTIONS Valuation method: ·················································································· Black - Scholes option pricing modelVolatility of stock price: ··········································································· 31.48%Estimated remaining outstanding period: ··················································· 11.3 yearsEstimated annual dividend (Yen): ····························································· ¥30.5 per common stockRisk-free interest rate: ············································································ 0.47%
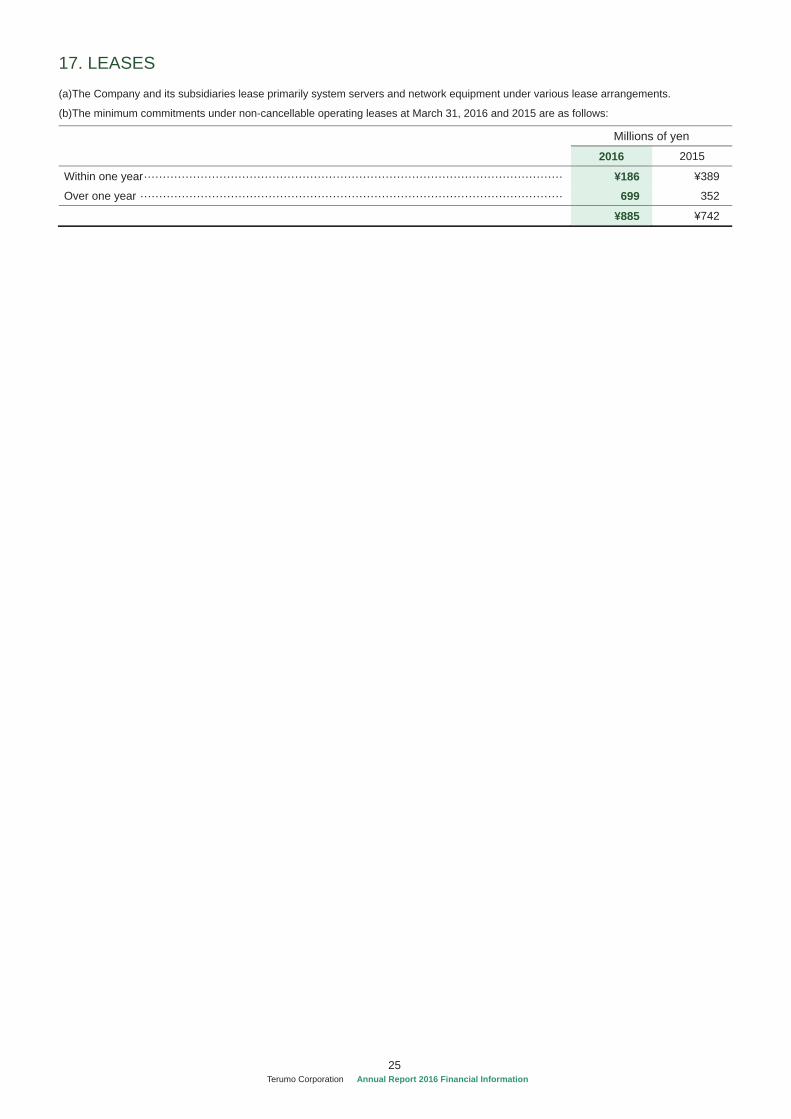
25 A
Terumo Corporation Annual Report 2016 Financial Information
17. LEASES (a)The Company and its subsidiaries lease primarily system servers and network equipment under various lease arrangements.
(b)The minimum commitments under non-cancellable operating leases at March 31, 2016 and 2015 are as follows:
Millions of yen
2016 2015
Within one year ··············································································································· ¥186 ¥389
Over one year ················································································································ 699 352
¥885 ¥742

26 A
Terumo Corporation Annual Report 2016 Financial Information
18. FINANCIAL INSTRUMENTS
1. Qualitative information on financial instruments
(A) POLICIES FOR USE OF FINANCIAL INSTRUMENTS The Company and subsidiaries secure funds through bank
borrowings and issuance of bonds. Direct and indirect finance is
managed effectively based on capital investment plans to operate
the business of manufacturing and marketing medical equipment
and healthcare products, considering changes in the business
environment. Excess cash is temporarily invested in a portfolio that
emphasizes the safety of principal. The Company and subsidiaries
enter into derivative transactions for the purpose of hedging their
exposures to foreign exchange fluctuations and interest rate
fluctuations, and not for speculative purposes.
(B) DESCRIPTION OF FINANCIAL INSTRUMENTS AND THEIR EXPOSURE TO RISKS
Trade receivables, including notes and accounts receivable, are
exposed to customer credit risk, and trade receivables in foreign
currencies are also affected by foreign exchange rate fluctuations.
The Company and subsidiaries utilize forward exchange contracts
and foreign-currency denominated payables to hedge their
exposures to foreign exchange fluctuations related to foreign-
currency denominated trade receivables. Securities consist of
negotiable deposits deposited in financial institutions which are
highly creditworthy, and, accordingly, are exposed to no or little
counterparty credit risk. Investment securities mainly consist of
the shares of business partners held for business and capital
alliances, and are exposed to the risk of stock price fluctuations.
Most trade payables, including notes and accounts payable, have
a short maturity of one year or less. While a portion of trade
payables arising from imports of raw materials are denominated in
foreign currencies, the amount of such foreign-currency
denominated trade payables is within the balance of accounts
receivable denominated in the same foreign currencies.
Long-term debt and bonds payable were issued to finance a part
of the acquisition price of CaridianBCT Holding Corp. in a previous
period and capital expenditure for property, plant, and equipment.
Long-term debt with variable interest rates is exposed to the risk of
interest rate fluctuations, and interest rate swaps are used for
certain long-term debt in order to hedge this risk. A part of long-
term debt is denominated in foreign currencies, and is therefore
exposed to a foreign currency rate fluctuation risk.
The Company enters into forward exchange contracts to hedge
against the risk of fluctuations in foreign currency exchange rates
associated with certain trade receivables and payables in foreign
currencies and forecast transactions in foreign currencies, and
interest rate swaps to hedge against the risk of fluctuations in
interest rates associated with debt with variable interest. For more
information on the use of hedge accounting, including hedging
instruments, hedged items and hedge policy, and the evaluation of
hedge effectiveness, please refer to “1. Summary of Significant
Accounting Policies” (n) Derivatives and Hedge Accounting.
(C) POLICIES AND PROCEDURES FOR MANAGING THE RISKS ASSOCIATED WITH FINANCIAL INSTRUMENTS
i. Management of Credit Risk
The Company regularly monitors customer accounts under its
receivable management process by managing the balances and
due dates of each customer, identifying early signs of potential
collection issues due to customers’ deteriorated financial condition,
and reviewing the adequacy of collateral in order to prevent default
losses. Each of the Company’s consolidated subsidiaries has a
similar receivable management process in place.
The Company limits counterparties to its derivative transactions
to financial institutions which are highly creditworthy and,
accordingly, is exposed to no or little counterparty credit risk.
ii. Management of Market Risk
The Company and certain subsidiaries utilize forward exchange
contracts for the purpose of hedging their exposures to exchange
rate fluctuations arising from trade receivables and payables in
foreign currencies and forecast transactions in foreign currencies,
which are analyzed on a monthly basis by currency. The Company
utilizes interest rate swaps for the purpose of hedging its exposures
to interest rate fluctuations arising from long-term debt with variable
interest.
For investment securities, the Company regularly monitors their
fair value and the issuers’ financial condition. Securities other than
those held to maturity are continuously reviewed regarding their
retention by considering the relationship with business partners.
The Company enters into derivative transactions under the
corporate derivative management policy, which prescribes the
authority and limitations on derivative transactions. In accordance
with the policy, the Treasury Department executes and records
derivative transactions and reconciles balances with the
counterparties. The results of forward exchange transactions are
reported monthly to the director in charge of the Treasury
Department and the Board of Directors. The same management
process is implemented by subsidiaries of the Company.
iii. Management of Funding and Liquidity Risk
The Treasury Department performs liquidity risk management by
forecasting and updating the Company’s cash flow plan according
to reports from each Department of the Company.
(D) SUPPLEMENTAL INFORMATION ON FAIR VALUES The fair value of financial instruments is estimated based on
quoted market prices as well as amounts calculated using a
reasonable valuation technique when there is no available market
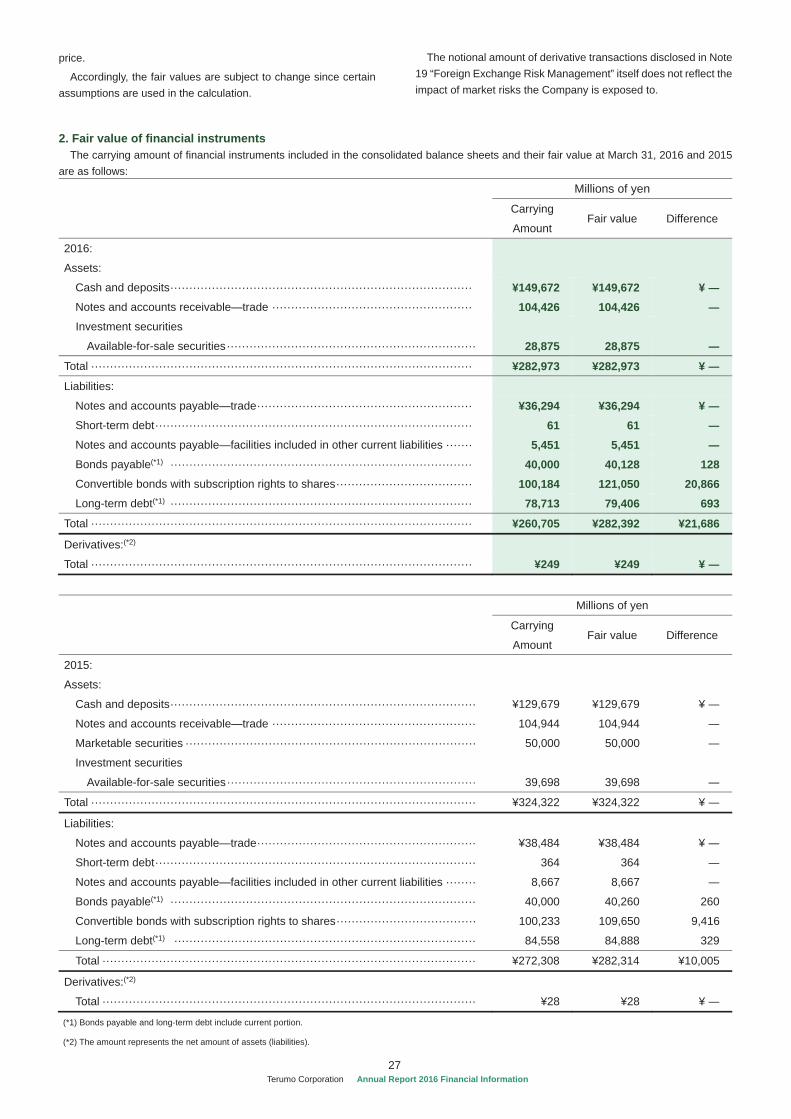
27 A
Terumo Corporation Annual Report 2016 Financial Information
price.
Accordingly, the fair values are subject to change since certain assumptions are used in the calculation.
The notional amount of derivative transactions disclosed in Note 19 “Foreign Exchange Risk Management” itself does not reflect the impact of market risks the Company is exposed to.
2. Fair value of financial instruments The carrying amount of financial instruments included in the consolidated balance sheets and their fair value at March 31, 2016 and 2015
are as follows: Millions of yen
Carrying
Amount Fair value Difference
2016:
Assets:
Cash and deposits ················································································ ¥149,672 ¥149,672 ¥ Notes and accounts receivable—trade ····················································· 104,426 104,426 Investment securities
Available-for-sale securities ·································································· 28,875 28,875
Total ····································································································· ¥282,973 ¥282,973 ¥
Liabilities:
Notes and accounts payable—trade ························································· ¥36,294 ¥36,294 ¥ Short-term debt ···················································································· 61 61 Notes and accounts payable—facilities included in other current liabilities ······· 5,451 5,451 Bonds payable(*1) ················································································ 40,000 40,128 128 Convertible bonds with subscription rights to shares ···································· 100,184 121,050 20,866 Long-term debt(*1) ················································································ 78,713 79,406 693
Total ····································································································· ¥260,705 ¥282,392 ¥21,686
Derivatives:(*2) Total ····································································································· ¥249 ¥249 ¥
Millions of yen
Carrying
Amount Fair value Difference
2015:
Assets:
Cash and deposits ················································································· ¥129,679 ¥129,679 ¥
Notes and accounts receivable—trade ······················································ 104,944 104,944
Marketable securities ············································································· 50,000 50,000
Investment securities
Available-for-sale securities ·································································· 39,698 39,698
Total ······································································································ ¥324,322 ¥324,322 ¥
Liabilities:
Notes and accounts payable—trade ·························································· ¥38,484 ¥38,484 ¥
Short-term debt ····················································································· 364 364
Notes and accounts payable—facilities included in other current liabilities ········ 8,667 8,667
Bonds payable(*1) ················································································· 40,000 40,260 260
Convertible bonds with subscription rights to shares ····································· 100,233 109,650 9,416
Long-term debt(*1) ················································································ 84,558 84,888 329
Total ··································································································· ¥272,308 ¥282,314 ¥10,005
Derivatives:(*2)
Total ··································································································· ¥28 ¥28 ¥
(*1) Bonds payable and long-term debt include current portion.
(*2) The amount represents the net amount of assets (liabilities).
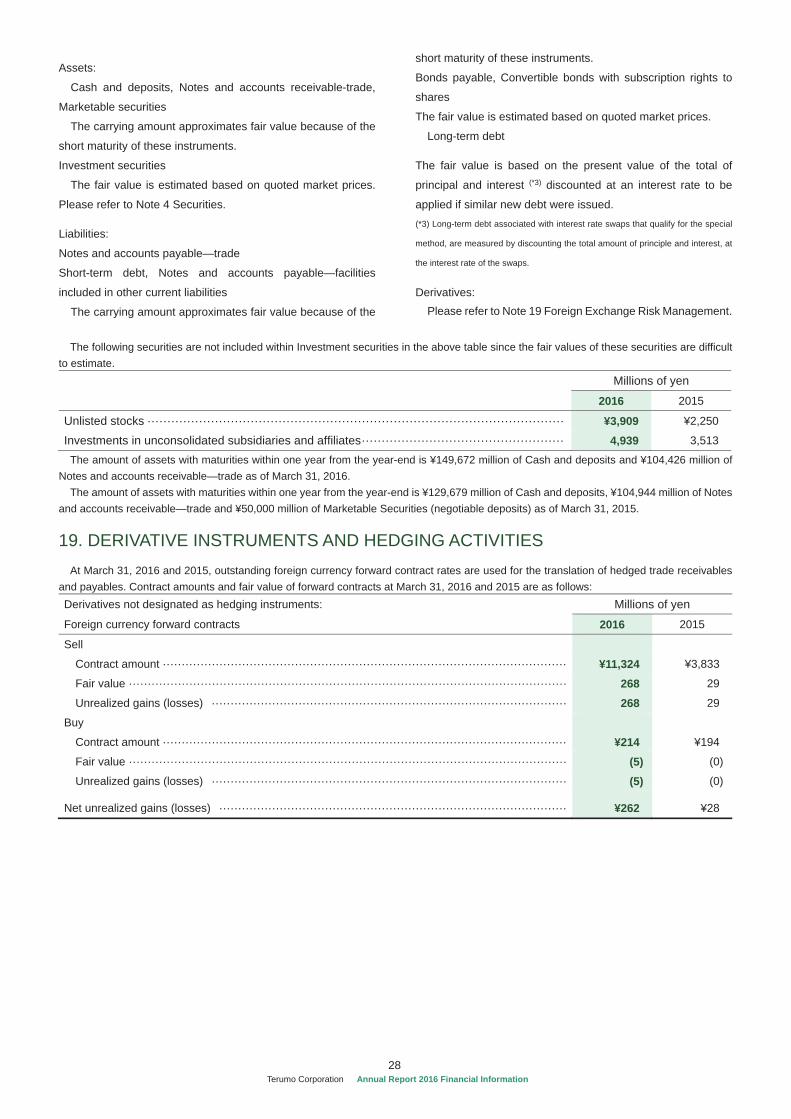
28 A
Terumo Corporation Annual Report 2016 Financial Information
Assets:
Cash and deposits, Notes and accounts receivable-trade,
Marketable securities
The carrying amount approximates fair value because of the
short maturity of these instruments.
Investment securities
The fair value is estimated based on quoted market prices.
Please refer to Note 4 Securities.
Liabilities:
Notes and accounts payable—trade
Short-term debt, Notes and accounts payable—facilities
included in other current liabilities
The carrying amount approximates fair value because of the
short maturity of these instruments.
Bonds payable, Convertible bonds with subscription rights to
shares
The fair value is estimated based on quoted market prices.
Long-term debt
The fair value is based on the present value of the total of
principal and interest (*3) discounted at an interest rate to be
applied if similar new debt were issued. (*3) Long-term debt associated with interest rate swaps that qualify for the special
method, are measured by discounting the total amount of principle and interest, at
the interest rate of the swaps.
Derivatives: Please refer to Note 19 Foreign Exchange Risk Management.
The following securities are not included within Investment securities in the above table since the fair values of these securities are difficult
to estimate. Millions of yen
2016 2015
Unlisted stocks ········································································································· ¥3,909 ¥2,250
Investments in unconsolidated subsidiaries and affiliates ··················································· 4,939 3,513
The amount of assets with maturities within one year from the year-end is ¥149,672 million of Cash and deposits and ¥104,426 million of Notes and accounts receivable—trade as of March 31, 2016.
The amount of assets with maturities within one year from the year-end is ¥129,679 million of Cash and deposits, ¥104,944 million of Notes and accounts receivable—trade and ¥50,000 million of Marketable Securities (negotiable deposits) as of March 31, 2015.
19. DERIVATIVE INSTRUMENTS AND HEDGING ACTIVITIES At March 31, 2016 and 2015, outstanding foreign currency forward contract rates are used for the translation of hedged trade receivables
and payables. Contract amounts and fair value of forward contracts at March 31, 2016 and 2015 are as follows: Derivatives not designated as hedging instruments: Millions of yen
Foreign currency forward contracts 2016 2015
Sell
Contract amount ··········································································································· ¥11,324 ¥3,833
Fair value ···················································································································· 268 29
Unrealized gains (losses) ······························································································ 268 29
Buy
Contract amount ··········································································································· ¥214 ¥194
Fair value ···················································································································· (5) (0)
Unrealized gains (losses) ······························································································ (5) (0)
Net unrealized gains (losses) ···························································································· ¥262 ¥28

29 A
Terumo Corporation Annual Report 2016 Financial Information
Derivatives designated as qualified hedging instruments: Millions of yen
Foreign currency forward contracts 2016 2015
Sell Contract amount ·········································································································· ¥6,831 ¥ Fair value ···················································································································· (13)
Buy Contract amount ·········································································································· ¥ ¥ Fair value ····················································································································
Total fair value ················································································································ ¥(13) ¥
Derivatives designated as qualified hedging instruments: Millions of yen
Interest rate swaps 2016 2015
Notional amount ··········································································································· ¥20,000 ¥20,000 Fair value (*1) (*1)
(*1) Interest rate swap contracts are accounted for as part of long-term debt. Therefore, the estimated fair value of the contracts is included in the fair value of the underlying
long-term debt.
20. CONTINGENCIES The Company and subsidiaries had no significant contingent liabilities at March 31, 2016 and 2015.
21. SUBSEQUENT EVENTS (a) Issuance of bonds Terumo Corporation issued unsecured straight bonds with a payment date of April 19, 2016 upon a resolution of the Board of Directors on
April 5, 2016. The terms and conditions are as follows: Terumo Corporation Series 5 Unsecured Straight Bonds (with inter-bond parri passu clause) (5-year Bonds)
1. Total amount of issue : 10 billion yen 2. Issue price : 100% of the principal amount 3. Interest rate : 0.080% per annum 4. Payment date : April 19, 2016 5. Maturity : April 19, 2021 6. Redemption : Lump-sum redemption at maturity 7. Use of funds : The funds will be used for repayment of the loan which will become due in February 2017
and a part of the redemption of corporate bonds. Terumo Corporation Series 6 Unsecured Straight Bonds (with inter-bond parri passu clause) (7-year Bonds)
1. Total amount of issue : 10 billion yen 2. Issue price : 100% of the principal amount 3. Interest rate : 0.170% per annum 4. Payment date : April 19, 2016 5. Maturity : April 19, 2023 6. Redemption : Lump-sum redemption at maturity 7. Use of funds : The funds will be used for repayment of the loan which will become due in February, 2017
and a part of the redemption of corporate bonds. Terumo Corporation Series 7 Unsecured Straight Bonds (with inter-bond parri passu clause) (10-year Bonds)
1. Total amount of issue : 10 billion yen 2. Issue price : 100% of the principal amount 3. Interest rate : 0.240% per annum 4. Payment date : April 19, 2016 5. Maturity : April 19, 2026 6. Redemption : Lump-sum redemption at maturity 7. Use of funds : The funds will be used for repayment of the loan which will become due in February 2017
and a part of the redemption of corporate bonds.
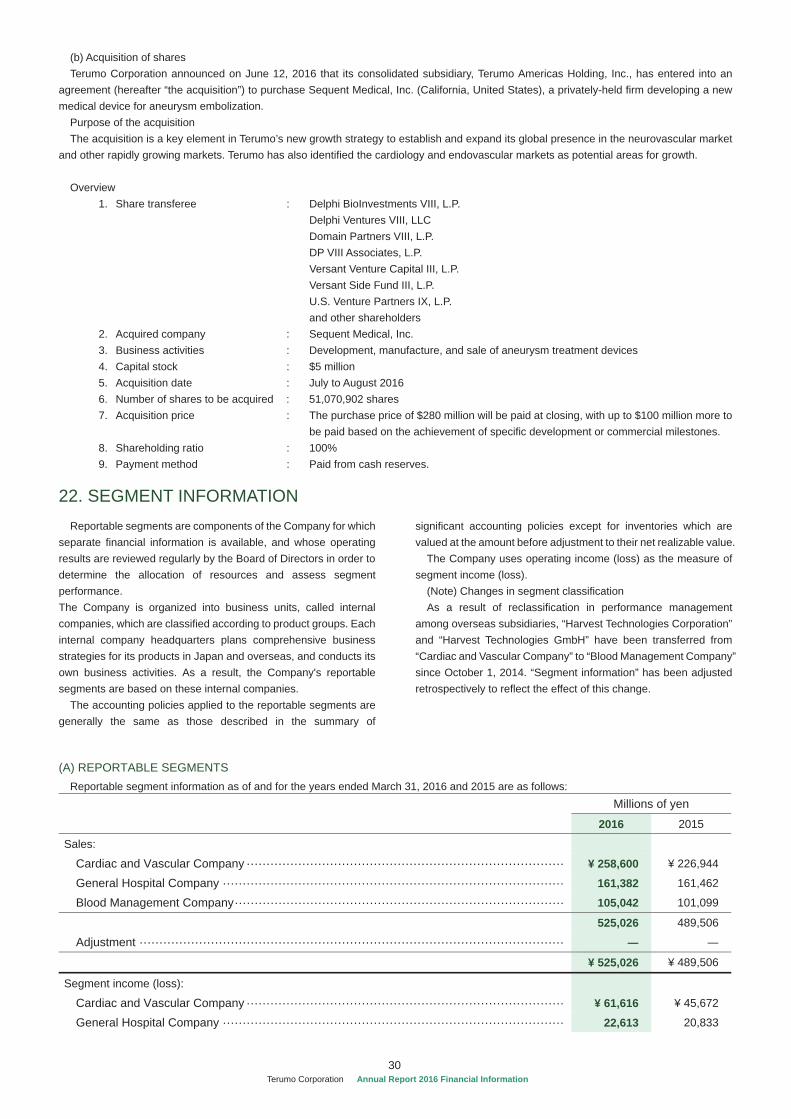
30 A
Terumo Corporation Annual Report 2016 Financial Information
(b) Acquisition of shares Terumo Corporation announced on June 12, 2016 that its consolidated subsidiary, Terumo Americas Holding, Inc., has entered into an
agreement (hereafter “the acquisition”) to purchase Sequent Medical, Inc. (California, United States), a privately-held firm developing a new medical device for aneurysm embolization.
Purpose of the acquisition The acquisition is a key element in Terumo’s new growth strategy to establish and expand its global presence in the neurovascular market
and other rapidly growing markets. Terumo has also identified the cardiology and endovascular markets as potential areas for growth. Overview
1. Share transferee : Delphi BioInvestments VIII, L.P. Delphi Ventures VIII, LLC Domain Partners VIII, L.P. DP VIII Associates, L.P. Versant Venture Capital III, L.P. Versant Side Fund III, L.P. U.S. Venture Partners IX, L.P. and other shareholders
2. Acquired company : Sequent Medical, Inc. 3. Business activities : Development, manufacture, and sale of aneurysm treatment devices 4. Capital stock : $5 million 5. Acquisition date : July to August 2016 6. Number of shares to be acquired : 51,070,902 shares 7. Acquisition price : The purchase price of $280 million will be paid at closing, with up to $100 million more to
be paid based on the achievement of specific development or commercial milestones. 8. Shareholding ratio : 100% 9. Payment method : Paid from cash reserves.
22. SEGMENT INFORMATIONReportable segments are components of the Company for which
separate financial information is available, and whose operating results are reviewed regularly by the Board of Directors in order to determine the allocation of resources and assess segment performance. The Company is organized into business units, called internal companies, which are classified according to product groups. Each internal company headquarters plans comprehensive business strategies for its products in Japan and overseas, and conducts its own business activities. As a result, the Company's reportable segments are based on these internal companies.
The accounting policies applied to the reportable segments are generally the same as those described in the summary of
significant accounting policies except for inventories which are valued at the amount before adjustment to their net realizable value.
The Company uses operating income (loss) as the measure of segment income (loss).
(Note) Changes in segment classification As a result of reclassification in performance management
among overseas subsidiaries, “Harvest Technologies Corporation” and “Harvest Technologies GmbH” have been transferred from “Cardiac and Vascular Company” to “Blood Management Company” since October 1, 2014. “Segment information” has been adjusted retrospectively to reflect the effect of this change.
(A) REPORTABLE SEGMENTS Reportable segment information as of and for the years ended March 31, 2016 and 2015 are as follows: Millions of yen
2016 2015
Sales:
Cardiac and Vascular Company ················································································ ¥ 258,600 ¥ 226,944
General Hospital Company ······················································································ 161,382 161,462
Blood Management Company ··················································································· 105,042 101,099
525,026 489,506
Adjustment ···········································································································
¥ 525,026 ¥ 489,506
Segment income (loss):
Cardiac and Vascular Company ················································································ ¥ 61,616 ¥ 45,672
General Hospital Company ······················································································ 22,613 20,833
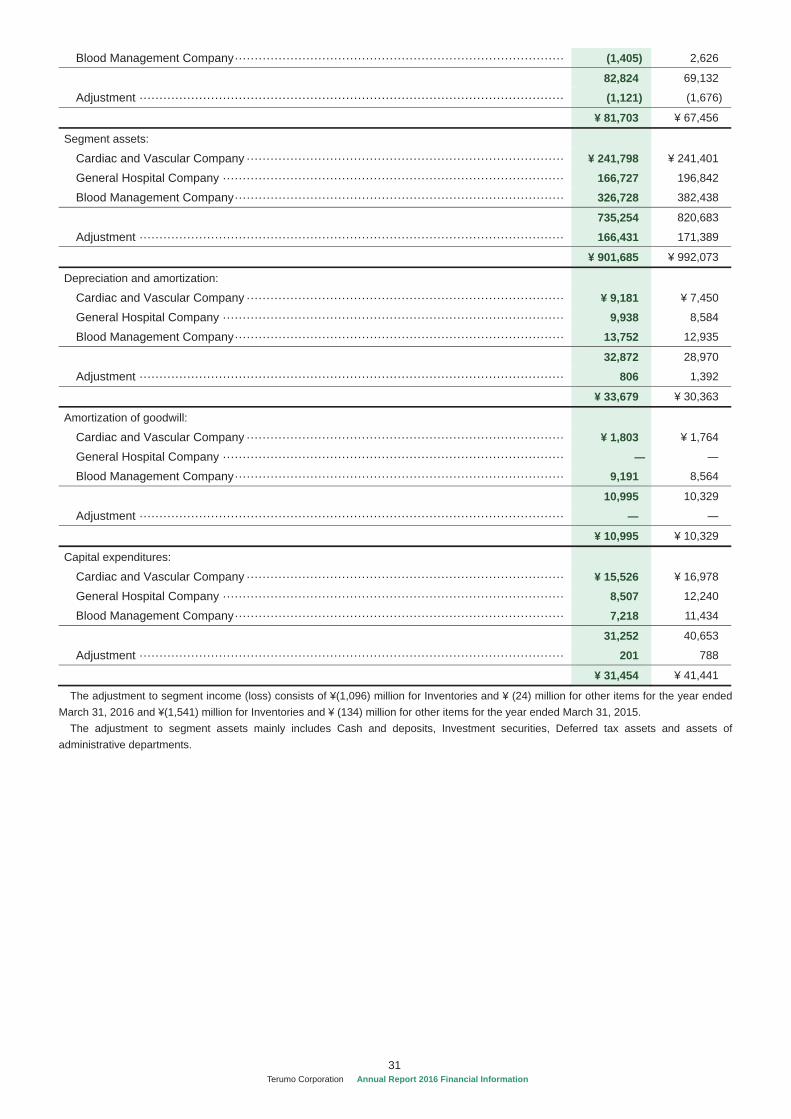
31 A
Terumo Corporation Annual Report 2016 Financial Information
Blood Management Company ··················································································· (1,405) 2,626
82,824 69,132
Adjustment ··········································································································· (1,121) (1,676)
¥ 81,703 ¥ 67,456
Segment assets:
Cardiac and Vascular Company ················································································ ¥ 241,798 ¥ 241,401
General Hospital Company ······················································································ 166,727 196,842
Blood Management Company ··················································································· 326,728 382,438
735,254 820,683
Adjustment ··········································································································· 166,431 171,389
¥ 901,685 ¥ 992,073
Depreciation and amortization:
Cardiac and Vascular Company ················································································ ¥ 9,181 ¥ 7,450
General Hospital Company ······················································································ 9,938 8,584
Blood Management Company ··················································································· 13,752 12,935
32,872 28,970
Adjustment ··········································································································· 806 1,392
¥ 33,679 ¥ 30,363
Amortization of goodwill:
Cardiac and Vascular Company ················································································ ¥ 1,803 ¥ 1,764
General Hospital Company ······················································································
Blood Management Company ··················································································· 9,191 8,564
10,995 10,329
Adjustment ···········································································································
¥ 10,995 ¥ 10,329
Capital expenditures:
Cardiac and Vascular Company ················································································ ¥ 15,526 ¥ 16,978
General Hospital Company ······················································································ 8,507 12,240
Blood Management Company ··················································································· 7,218 11,434
31,252 40,653
Adjustment ··········································································································· 201 788
¥ 31,454 ¥ 41,441
The adjustment to segment income (loss) consists of ¥(1,096) million for Inventories and ¥ (24) million for other items for the year ended March 31, 2016 and ¥(1,541) million for Inventories and ¥ (134) million for other items for the year ended March 31, 2015.
The adjustment to segment assets mainly includes Cash and deposits, Investment securities, Deferred tax assets and assets of administrative departments.
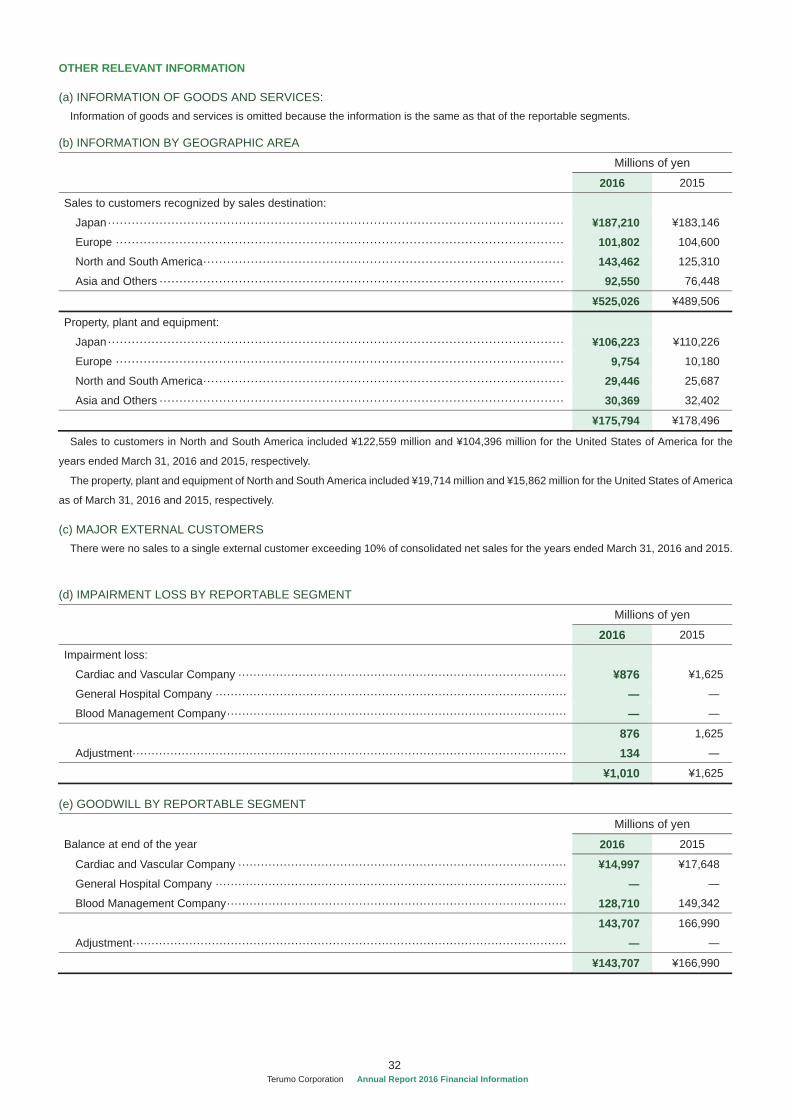
32 A
Terumo Corporation Annual Report 2016 Financial Information
OTHER RELEVANT INFORMATION
(a) INFORMATION OF GOODS AND SERVICES: Information of goods and services is omitted because the information is the same as that of the reportable segments.
(b) INFORMATION BY GEOGRAPHIC AREA
Millions of yen
2016 2015
Sales to customers recognized by sales destination:
Japan ··················································································································· ¥187,210 ¥183,146
Europe ················································································································· 101,802 104,600
North and South America ··························································································· 143,462 125,310
Asia and Others ······································································································ 92,550 76,448 ¥525,026 ¥489,506
Property, plant and equipment:
Japan ··················································································································· ¥106,223 ¥110,226
Europe ················································································································· 9,754 10,180
North and South America ··························································································· 29,446 25,687
Asia and Others ······································································································ 30,369 32,402
¥175,794 ¥178,496
Sales to customers in North and South America included ¥122,559 million and ¥104,396 million for the United States of America for the
years ended March 31, 2016 and 2015, respectively.
The property, plant and equipment of North and South America included ¥19,714 million and ¥15,862 million for the United States of America
as of March 31, 2016 and 2015, respectively.
(c) MAJOR EXTERNAL CUSTOMERS There were no sales to a single external customer exceeding 10% of consolidated net sales for the years ended March 31, 2016 and 2015.
(d) IMPAIRMENT LOSS BY REPORTABLE SEGMENT
Millions of yen
2016 2015
Impairment loss:
Cardiac and Vascular Company ······················································································· ¥876 ¥1,625
General Hospital Company ·····························································································
Blood Management Company ··························································································
876 1,625
Adjustment··················································································································· 134
¥1,010 ¥1,625
(e) GOODWILL BY REPORTABLE SEGMENT
Millions of yen
Balance at end of the year 2016 2015
Cardiac and Vascular Company ······················································································· ¥14,997 ¥17,648
General Hospital Company ·····························································································
Blood Management Company ·························································································· 128,710 149,342 143,707 166,990
Adjustment···················································································································
¥143,707 ¥166,990
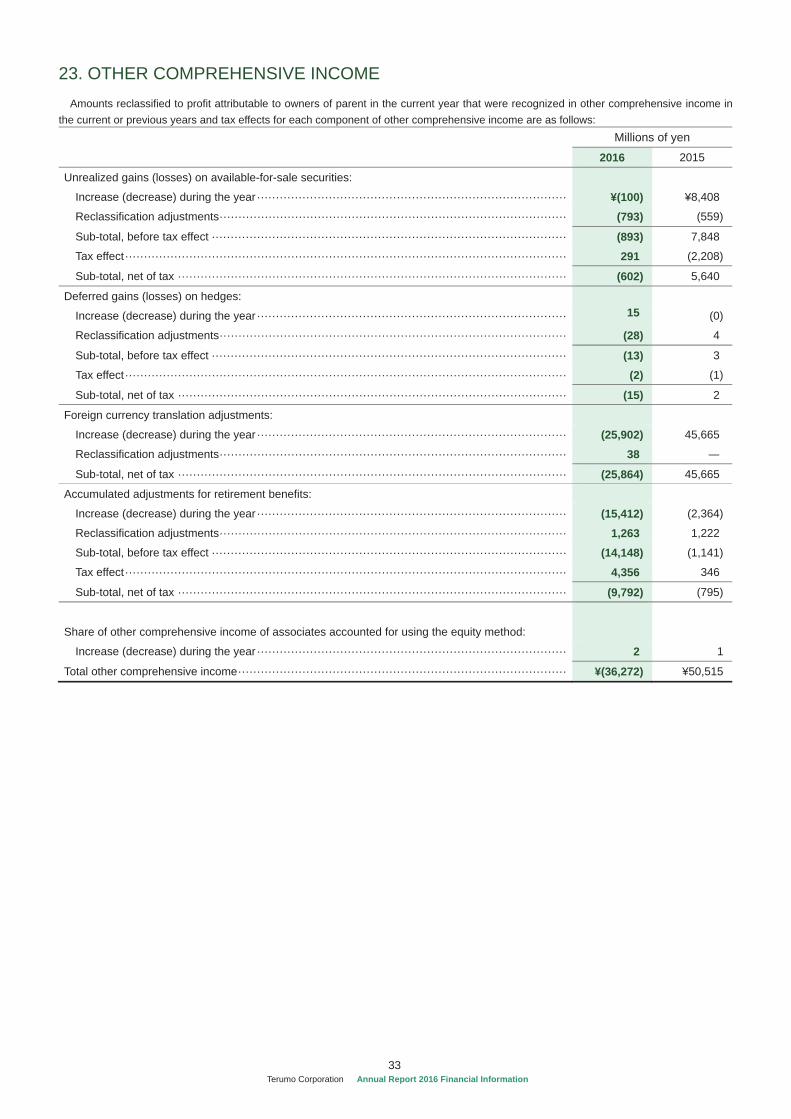
33 A
Terumo Corporation Annual Report 2016 Financial Information
23. OTHER COMPREHENSIVE INCOME Amounts reclassified to profit attributable to owners of parent in the current year that were recognized in other comprehensive income in
the current or previous years and tax effects for each component of other comprehensive income are as follows: Millions of yen
2016 2015
Unrealized gains (losses) on available-for-sale securities:
Increase (decrease) during the year ·················································································· ¥(100) ¥8,408
Reclassification adjustments ···························································································· (793) (559)
Sub-total, before tax effect ······························································································ (893) 7,848
Tax effect ····················································································································· 291 (2,208)
Sub-total, net of tax ······································································································· (602) 5,640
Deferred gains (losses) on hedges:
Increase (decrease) during the year ·················································································· 15 (0)
Reclassification adjustments ···························································································· (28) 4
Sub-total, before tax effect ······························································································ (13) 3
Tax effect ····················································································································· (2) (1)
Sub-total, net of tax ······································································································· (15) 2
Foreign currency translation adjustments:
Increase (decrease) during the year ·················································································· (25,902) 45,665
Reclassification adjustments ···························································································· 38
Sub-total, net of tax ······································································································· (25,864) 45,665
Accumulated adjustments for retirement benefits:
Increase (decrease) during the year ·················································································· (15,412) (2,364)
Reclassification adjustments ···························································································· 1,263 1,222
Sub-total, before tax effect ······························································································ (14,148) (1,141)
Tax effect ····················································································································· 4,356 346
Sub-total, net of tax ······································································································· (9,792) (795)
Share of other comprehensive income of associates accounted for using the equity method:
Increase (decrease) during the year ·················································································· 2 1
Total other comprehensive income ······················································································· ¥(36,272) ¥50,515
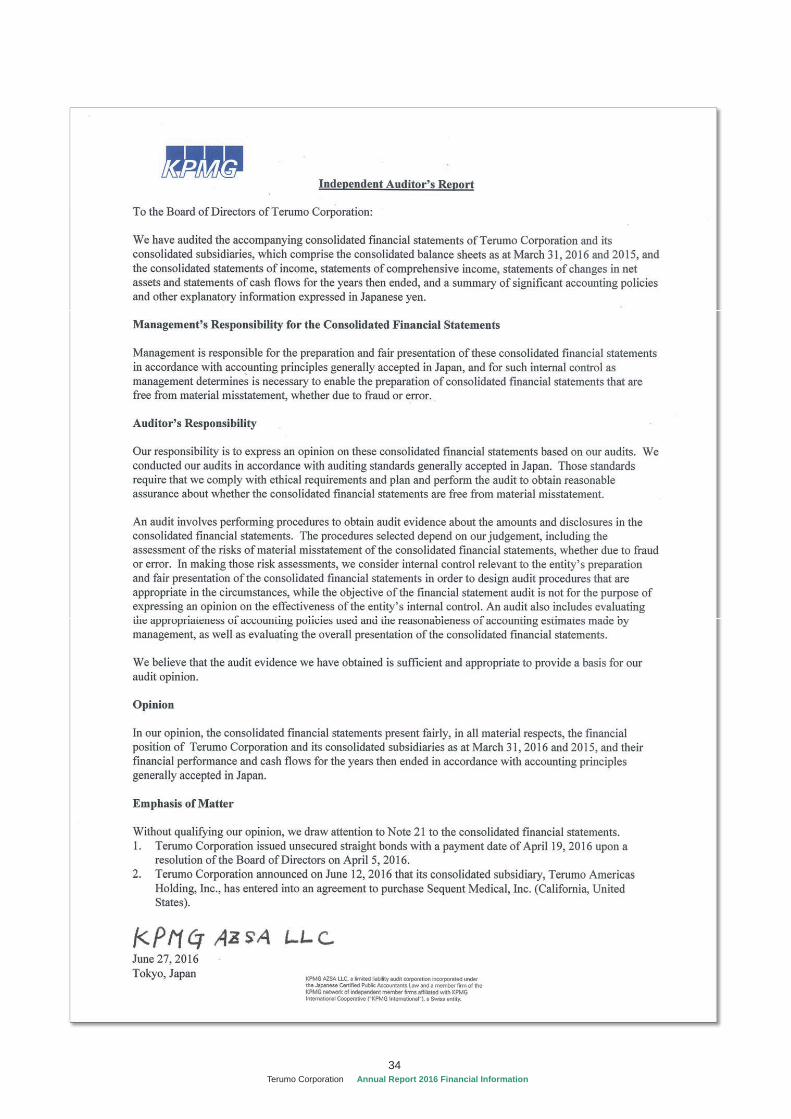
34 A
Terumo Corporation Annual Report 2016 Financial Information
1 A
Terumo Corporation Annual Report 2016 Financial Information
<Appendix> Segment Information
(Unaudited)
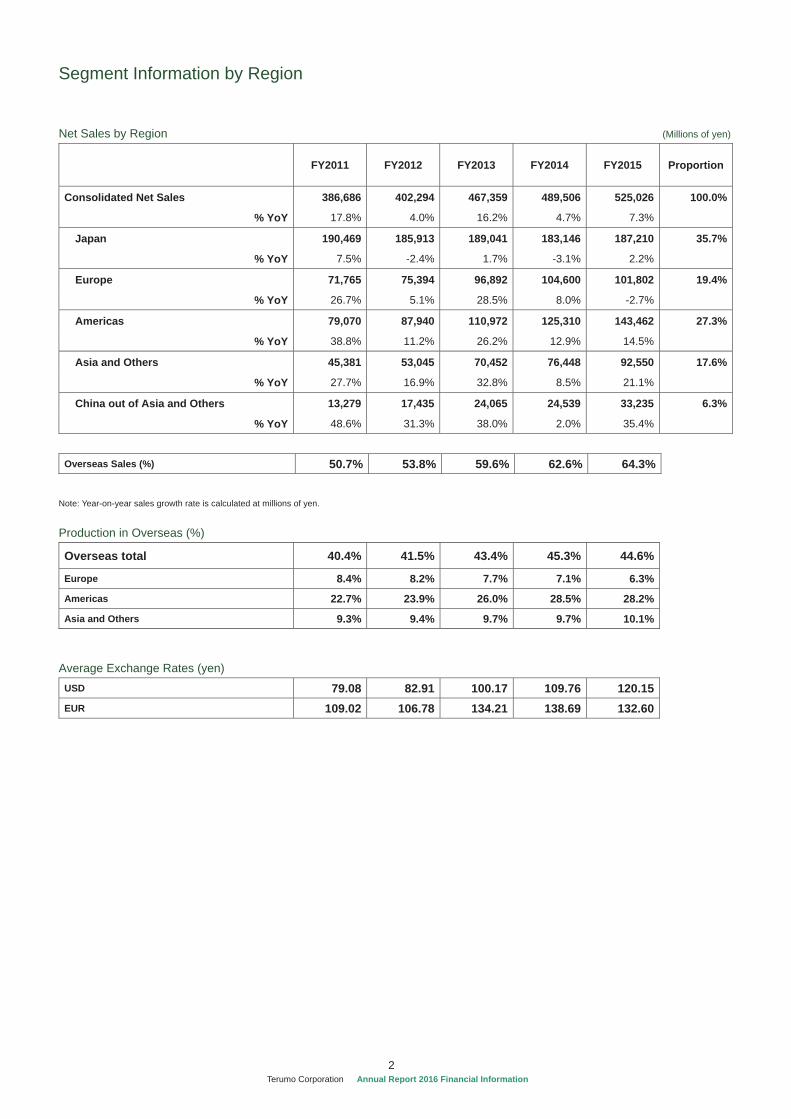
2 A
Terumo Corporation Annual Report 2016 Financial Information
Segment Information by Region
Net Sales by Region (Millions of yen)
FY2011 FY2012 FY2013 FY2014 FY2015 Proportion
Consolidated Net Sales 386,686 402,294 467,359 489,506 525,026 100.0%
% YoY 17.8% 4.0% 16.2% 4.7% 7.3%
Japan 190,469 185,913 189,041 183,146 187,210 35.7%
% YoY 7.5% -2.4% 1.7% -3.1% 2.2%
Europe 71,765 75,394 96,892 104,600 101,802 19.4%
% YoY 26.7% 5.1% 28.5% 8.0% -2.7%
Americas 79,070 87,940 110,972 125,310 143,462 27.3%
% YoY 38.8% 11.2% 26.2% 12.9% 14.5%
Asia and Others 45,381 53,045 70,452 76,448 92,550 17.6%
% YoY 27.7% 16.9% 32.8% 8.5% 21.1%
China out of Asia and Others 13,279 17,435 24,065 24,539 33,235 6.3%
% YoY 48.6% 31.3% 38.0% 2.0% 35.4%
Overseas Sales (%) 50.7% 53.8% 59.6% 62.6% 64.3% Note: Year-on-year sales growth rate is calculated at millions of yen.
Production in Overseas (%)
Overseas total 40.4% 41.5% 43.4% 45.3% 44.6%
Europe 8.4% 8.2% 7.7% 7.1% 6.3%
Americas 22.7% 23.9% 26.0% 28.5% 28.2%
Asia and Others 9.3% 9.4% 9.7% 9.7% 10.1%
Average Exchange Rates (yen) USD 79.08 82.91 100.17 109.76 120.15 EUR 109.02 106.78 134.21 138.69 132.60
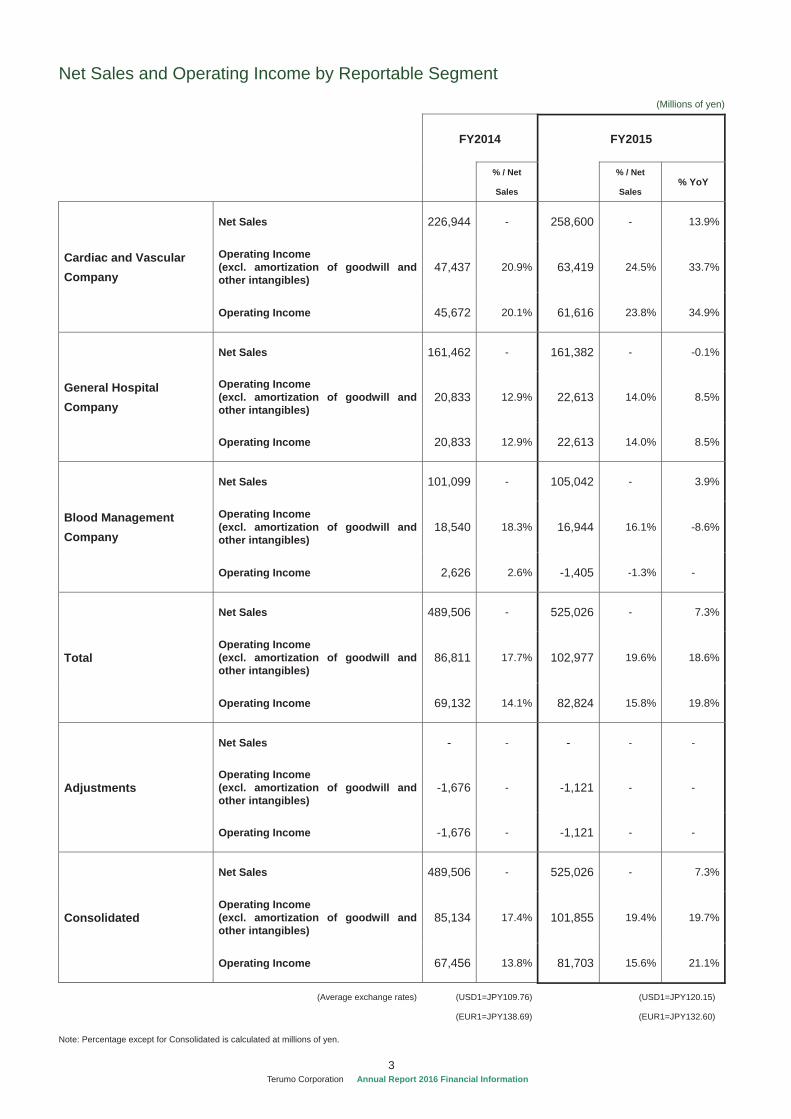
3 A
Terumo Corporation Annual Report 2016 Financial Information
Net Sales and Operating Income by Reportable Segment (Millions of yen)
FY2014 FY2015
% / Net
Sales
% / Net
Sales % YoY
Cardiac and Vascular Company
Net Sales 226,944 - 258,600 - 13.9%
Operating Income (excl. amortization of goodwill and other intangibles)
47,437 20.9% 63,419 24.5% 33.7%
Operating Income 45,672 20.1% 61,616 23.8% 34.9%
General Hospital Company
Net Sales 161,462 - 161,382 - -0.1%
Operating Income (excl. amortization of goodwill and other intangibles)
20,833 12.9% 22,613 14.0% 8.5%
Operating Income 20,833 12.9% 22,613 14.0% 8.5%
Blood Management Company
Net Sales 101,099 - 105,042 - 3.9%
Operating Income (excl. amortization of goodwill and other intangibles)
18,540 18.3% 16,944 16.1% -8.6%
Operating Income 2,626 2.6% -1,405 -1.3% -
Total
Net Sales 489,506 - 525,026 - 7.3%
Operating Income (excl. amortization of goodwill and other intangibles)
86,811 17.7% 102,977 19.6% 18.6%
Operating Income 69,132 14.1% 82,824 15.8% 19.8%
Adjustments
Net Sales - - - - -
Operating Income (excl. amortization of goodwill and other intangibles)
-1,676 - -1,121 - -
Operating Income -1,676 - -1,121 - -
Consolidated
Net Sales 489,506 - 525,026 - 7.3%
Operating Income (excl. amortization of goodwill and other intangibles)
85,134 17.4% 101,855 19.4% 19.7%
Operating Income 67,456 13.8% 81,703 15.6% 21.1%
(Average exchange rates) (USD1=JPY109.76) (USD1=JPY120.15)
(EUR1=JPY138.69) (EUR1=JPY132.60)
Note: Percentage except for Consolidated is calculated at millions of yen.
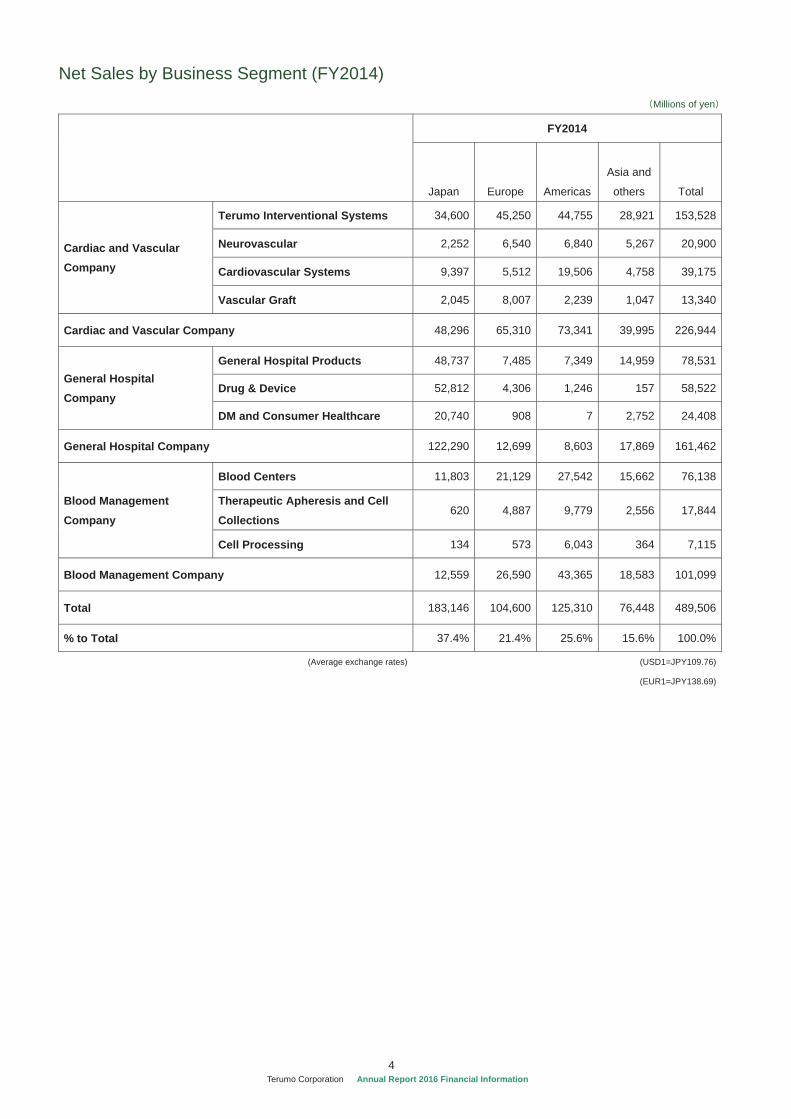
4 A
Terumo Corporation Annual Report 2016 Financial Information
Net Sales by Business Segment (FY2014) Millions of yen
FY2014
Japan
Europe
Americas
Asia and
others Total
Cardiac and Vascular Company
Terumo Interventional Systems 34,600 45,250 44,755 28,921 153,528
Neurovascular 2,252 6,540 6,840 5,267 20,900
Cardiovascular Systems 9,397 5,512 19,506 4,758 39,175
Vascular Graft 2,045 8,007 2,239 1,047 13,340
Cardiac and Vascular Company 48,296 65,310 73,341 39,995 226,944
General Hospital Company
General Hospital Products 48,737 7,485 7,349 14,959 78,531
Drug & Device 52,812 4,306 1,246 157 58,522
DM and Consumer Healthcare 20,740 908 7 2,752 24,408
General Hospital Company 122,290 12,699 8,603 17,869 161,462
Blood Management Company
Blood Centers 11,803 21,129 27,542 15,662 76,138
Therapeutic Apheresis and Cell Collections
620 4,887 9,779 2,556 17,844
Cell Processing 134 573 6,043 364 7,115
Blood Management Company 12,559 26,590 43,365 18,583 101,099
Total 183,146 104,600 125,310 76,448 489,506
% to Total 37.4% 21.4% 25.6% 15.6% 100.0%
(Average exchange rates)
(USD1=JPY109.76)
(EUR1=JPY138.69)

5 A
Terumo Corporation Annual Report 2016 Financial Information
Net Sales by Business Segment (FY2015) Millions of yen
FY2015
Japan
Europe
Americas
Asia and
others Total
Cardiac and Vascular Company
Terumo Interventional Systems 37,102 45,992 56,211 37,306 176,613
Neurovascular 2,489 7,277 9,022 7,511 26,301
Cardiovascular Systems 9,882 5,491 21,438 4,998 41,810
Vascular Graft 2,079 7,923 2,721 1,150 13,875
Cardiac and Vascular Company 51,554 66,684 89,394 50,967 258,600
General Hospital Company
General Hospital Products 49,896 4,469 6,832 16,504 77,702
Drug & Device 52,838 3,843 1,487 180 58,350
DM and Consumer Healthcare 21,443 961 10 2,913 25,329
General Hospital Company 124,178 9,275 8,330 19,598 161,382
Blood Management Company
Blood Centers 10,680 20,333 26,839 18,599 76,453
Therapeutic Apheresis and Cell Collections
680 4,728 11,949 2,923 20,282
Cell Processing 115 780 6,948 462 8,306
Blood Management Company 11,477 25,842 45,737 21,985 105,042
Total 187,210 101,802 143,462 92,550 525,026
% to Total 35.7% 19.4% 27.3% 17.6% 100.0%
(Average exchange rates)
(USD1=JPY120.15)
(EUR1=JPY132.60)

© Terumo Corporation September 2016Tokyo Opera City Tower, 3-20-2 Nishi-Shinjuku, Shinjuku-ku, Tokyo 163-1450, JapanTokyo Of�ce