Embed Size (px)
Citation preview

ANNUAL REPORT
2016

Curtin University Annual Report 2016
Cover image:
1. The vibrant interior of the newly-completed Building 410, which will
accommodate Curtin’s first cohort of medical students, is anything but
clinical.
2. Curtin University St Georges Terrace is a major boost to the University’s
stakeholder engagement in the city centre.
3. Professor Phil Bland’s Desert Fireball Network and citizen science project
Fireballs in the Sky, were hugely successful in 2016.
We’re making tomorrow better.
Curtin strives to meet global challenges by supporting practical
research and teaching that addresses issues and creates
solutions for healthy, sustainable and successful societies.
Curtin’s goal is to benefit the community locally, nationally and
internationally, today and into the future.
Help us make tomorrow better, together.
Curtin University Foundation
give.curtin.edu.au
CURTIN UNIVERSITY FOUNDATION 2016 ANNUAL REPORT
ANNUAL REPORT
2016
Curtin University professor and eminent botanist Professor Kingsley Dixon was named WA Scientist of the Year at the 2016 Premier’s Science Awards in recognition of his efforts in conservation science, restoration ecology and plant science.

Curtin University Annual Report 2016 1
STATEMENT OF COMPLIANCE
The Honourable Sue Ellery MLC
Minister for Education and Training
Level 13, Dumas House
2 Havelock Street
WEST PERTH WA 6005
Dear Minister
In accordance with section 61 of the Financial Management Act 2006, we hereby submit for your information and presentation to
Parliament the Annual Report of Curtin University of Technology for the year ended 31 December 2016.
The Annual Report has been prepared in accordance with the provisions of the Financial Management Act 2006.
Yours sincerely
Colin Beckett Deborah Terry AO
Chancellor Vice-Chancellor
On behalf of the University Council Dated this 22nd day of March 2017
CONTENTS
Statement of compliance ............................................................................................................. 1
About Curtin .................................................................................................................................. 2
Curtin locations ............................................................................................................................. 3
Chancellor’s foreword ................................................................................................................... 4
Vice-Chancellor’s report ............................................................................................................... 6
Vision, mission and values .......................................................................................................... 8
Strategic plan 2013-2017 ............................................................................................................ 9
Report on performance ...............................................................................................................10
Strategic theme 1: People and culture ......................................................................................................................... 10
Strategic theme 2: Research .......................................................................................................................................... 13
Strategic theme 3: Teaching and learning ................................................................................................................... 16
Strategic theme 4: Engagement and impact ............................................................................................................... 20
Report on operations ..................................................................................................................26
Governance of the University ....................................................................................................... 26
Administrative structure ............................................................................................................... 32
Staffing matters ............................................................................................................................. 34
Significant issues and trends ...................................................................................................... 36
Other disclosures and legal requirements .................................................................................. 38
Curtin key statistics....................................................................................................................44
Independent Auditor’s Report ....................................................................................................46
Financial Report 2016 .................................................................................................................50
Curtin’s key performance indicators .......................................................................................108

Curtin University Annual Report 2016 Curtin University Annual Report 20162 3
ABOUT CURTIN CURTIN LOCATIONS
Curtin University is Western Australia’s largest university, with
52,994 enrolled students in 2016. Of these, approximately 31
per cent were international students, and more than 2,405 were
research students.
Established in 1986, the University takes its name from the influential and widely
respected former Prime Minister of Australia, John Curtin, and continues to embrace his
philosophy to “look ever forward”, instilling a culture of innovation in its teaching and
research, and inspiring staff and students to make tomorrow better.
Curtin is a globally focused institution that offers a wide range of undergraduate and
postgraduate courses in business, humanities, health sciences, resources, engineering
and related sciences. A culturally diverse university, Curtin fosters tolerance and
encourages the development of the individual. A combination of first-rate resources,
staff and technology makes Curtin a major contributor to tertiary education, both within
Australia and internationally.
The University’s main campus is in the suburb of Bentley, six kilometres south of the
centre of Perth, Western Australia’s capital city. Curtin has two additional metropolitan
campuses and regional campuses in Kalgoorlie and Margaret River. Curtin also has
campuses in Malaysia and Singapore.
The University’s educational and research programs are divided across five teaching
areas. Each teaching area equips its graduates with the knowledge, skills and industry
experience needed to excel in their chosen profession:
• Faculty of Health Sciences
• Faculty of Humanities
• Faculty of Science and Engineering.
• Curtin Business School
• Centre for Aboriginal Studies
Curtin is a leading research institution, known for its strength in minerals and energy,
data analytics and emerging technologies, health sciences, astronomy, sustainable
development and agriculture.
Curtin has close links with business, industry, government and the community, and its
courses have a strong practical focus, with many involving work experience components.
As a result, Curtin graduates are more desirable to employers, with skills that enable
them to make a genuine and positive influence in a continuously changing world.
Curtin University is a trademark of Curtin University of Technology, a body corporate
established under the Curtin University of Technology Act 1966, an Act of the Western
Australian Parliament. It is domiciled in Australia.
Under the Universities Legislation Amendment Act 2016, effective 2 January 2017 the
University was formally renamed “Curtin University”. The Curtin University of Technology
Act 1966 is now also to be cited as the Curtin University Act 1966.
The University is not an incorporated company under the Corporations Act 2001.
Therefore, it does not have an Australian Company Number, nor does it have a
Certificate of Incorporation.
curtin.edu.au
BENTLEY
Kent Street, BENTLEY WA 6102
Postal address: GPO Box U1987, PERTH WA 6845
curtin.edu.au
PERTH CITY
Graduate School of Business
78 Murray Street, PERTH WA 6000
Curtin Law School
57 Murray Street, PERTH WA 6000
Curtin University St Georges Terrace
139 St Georges Tce Perth, WA 6000
KALGOORLIE
Curtin Western Australian School of Mines (WASM)
Egan Street, KALGOORLIE WA 6430
(WASM is also located at the Bentley Campus)
MARGARET RIVER
Margaret River Education Centre
272 Bussell Highway, MARGARET RIVER WA 6285
MALAYSIA
Curtin Sarawak
Senadin, MIRI, SARAWAK, MALAYSIA
curtin.edu.my
SINGAPORE
Curtin Singapore
90 and 92 Jalan Rajah, SINGAPORE 329162
curtin.edu.sg

Curtin University Annual Report 20164 5Curtin University Annual Report 2016
CHANCELLOR’S FOREWORD
Our journey as a university has played a
significant role in the development of higher
education in Australia. When we began as the
Western Australian Institute of Technology (WAIT)
in 1967 we challenged traditional notions of what
an institute of technology should be, introducing a
broad range of courses and establishing research
centres in engineering and science. It didn’t take
us long to become synonymous with innovation.
Over the years, our pioneering spirit has seen us lead the way in
many areas including Indigenous and international education.
And today, almost fifty years on, our essential character hasn’t
changed.
Since the WAIT days our presence has expanded far beyond the
boundaries of the Bentley Campus. Our commitment to the
Kalgoorlie Campus of the WA School of Mines remains strong
as evidenced by recent investments in laboratory facilities, the
library and Agricola College. This year, I was privileged to open
the new Engineering and Science building at our campus in Miri,
Malaysia. In Perth, we took possession of two of Perth’s oldest
heritage listed buildings: the former Old Perth Boy’s School
on St Georges Terrace and 57 Murray Street. Curtin University
St Georges Terrace will serve as a hub for community and
stakeholder engagement, while 57 Murray Street houses the new
Curtin Law School.
Essential to future innovation is our Greater Curtin vision; a place
where businesses and entrepreneurs can exchange knowledge, a
place where creative relationships are forged between colleagues,
and a place where companies, the community and our students
can share a unique opportunity for innovation and creativity,
with long-term benefits for the people of Western Australia.
The infrastructure to support this vision is underway with the
completion of the striking Curtin Medical School and Main Street
in 2016.
We embrace the vast opportunities of the digital age, to provide
education that’s more accessible and more engaging than
ever before. In 2015 we joined with some of the world’s elite
universities to offer free, online courses via the edX platform,
created by Harvard and MIT. In 2016 we expanded our edX
offerings and improved the digital delivery of our degree
courses. Together with immersive simulations and visualisation
technologies in our physical classrooms, we’re creating
memorable learning experiences and preparing students for the
jobs of the future.
Our research capability and output has also increased
significantly in the past 50 years. We have attracted talented
researchers to Curtin to augment our cadre of research
academics, improved research facilities and forged numerous
international research partnerships. We have subsequently
increased our annual volume of high-quality research
publications by an order of magnitude. Nature named Curtin
the most collaborative university in Australia in 2016, based on
the number of co-authored papers published. The publisher also
ranked Curtin in the top 100 of the world’s leading institutions
for growth in high-quality science, and the third-fastest ‘rising
star’ in research in Asia Pacific, which is testament to Curtin’s
continued focus on strengthening its research culture.
I acknowledge the individual achievements of some of
Curtin’s eminent researchers in 2016. In April, Curtin organic
geochemist Professor Kliti Grice was awarded the coveted 2016
Gibb Maitland Medal in recognition of her work in organic and
isotope geochemistry, and for her substantial and sustained
contributions to the resources sector in Western Australia and
internationally.
In August, Curtin botanist Professor Kingsley Dixon was named
2016 WA Scientist of the Year at the Premier’s Science Awards
in recognition of his efforts in conservation science, restoration
ecology and plant science. At the same awards, citizen science
project Fireballs in the Sky, led by planetary geologist Professor
Phil Bland, was named Chevron Science Engagement Initiative of
the Year. The project subsequently received the 2016 Eureka Prize
for Innovation in Citizen Science. Congratulations to these award
winners and to the long list of Curtin staff who have achieved
notable success in 2016.
In an environment of intense international competition and
lingering uncertainty in regards to federal funding of higher
education, having a solid plan for the future is of the utmost
importance. In November we published a new strategic plan for
2017-2020, which serves as a roadmap as we seek to position
ourselves as a leading global university. I invite you to read the
plan which is available on the Curtin website.
In 2017 we will reflect on our 50 years as an institution but we
will also begin a new chapter in our journey with the opening of
the Curtin Medical School. Continuing the University’s tradition
of service to the community, it will place strong emphasis on
primary care and will prepare graduates to work in rural and
remote WA, where there is an acute shortage of doctors. The
opening of the school marks the first time in our state’s history
that undergraduates can study toward a degree in medicine.
Curtin Medical School follows the Curtin Law School, which
launched in 2013. These are the latest examples of our evolution
as a university, and a broadening of scope beyond the technical
degrees we were once known for. This broadening was the reason
for dropping our trading name Curtin University of Technology in
favour of Curtin University in 2010.
In 2016 that name change was finally enshrined in legislation,
with the passing of the Universities Amendment Act 2016
in October. The result of ten years of negotiation, the Act
acknowledges the changing face of WA’s universities, introducing
several common amendments to their respective enabling acts.
Significantly, it allows Curtin to use its land for commercial
purposes, paving the way for the next exciting chapter of the
Greater Curtin project.
I thank the University Council for their significant contribution
in 2016 and Professor Terry for her strong leadership as Vice-
Chancellor. Finally, I would like to thank all Curtin staff for their
commitment to the University which, at 50, has never looked
better.
Colin Beckett
Chancellor
Curtin University Annual Report 20166 7
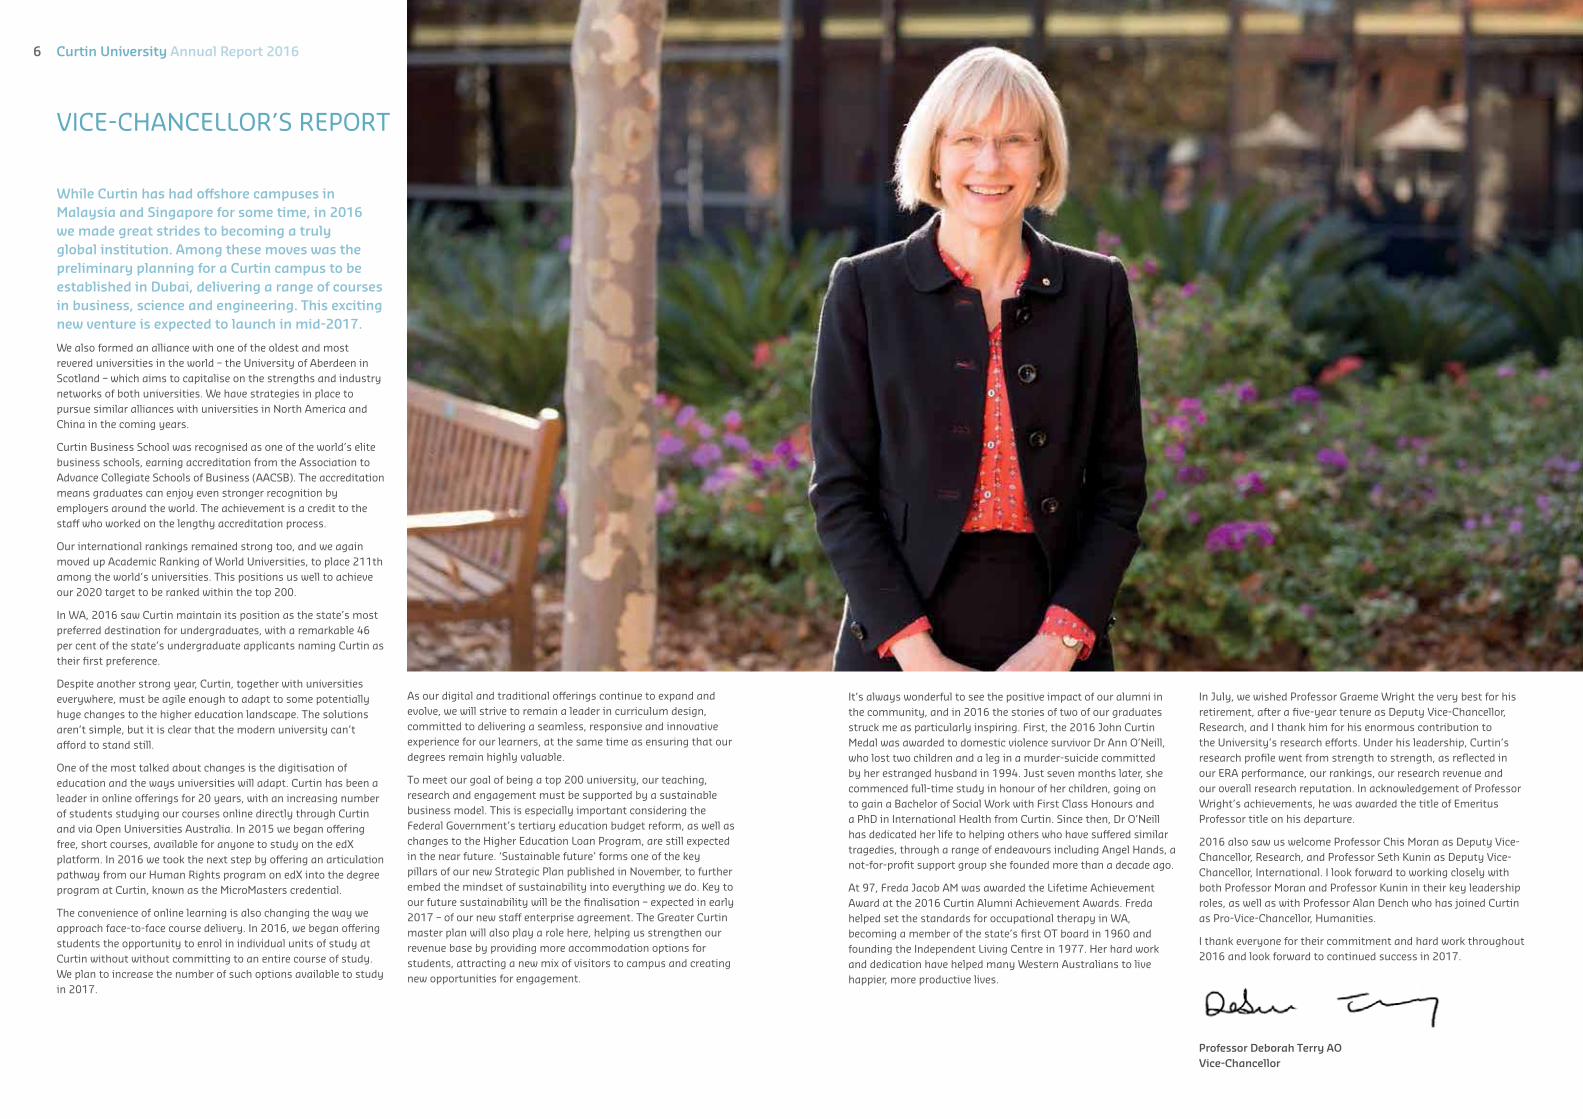
VICE-CHANCELLOR’S REPORT
While Curtin has had offshore campuses in
Malaysia and Singapore for some time, in 2016
we made great strides to becoming a truly
global institution. Among these moves was the
preliminary planning for a Curtin campus to be
established in Dubai, delivering a range of courses
in business, science and engineering. This exciting
new venture is expected to launch in mid-2017.
We also formed an alliance with one of the oldest and most
revered universities in the world – the University of Aberdeen in
Scotland – which aims to capitalise on the strengths and industry
networks of both universities. We have strategies in place to
pursue similar alliances with universities in North America and
China in the coming years.
Curtin Business School was recognised as one of the world’s elite
business schools, earning accreditation from the Association to
Advance Collegiate Schools of Business (AACSB). The accreditation
means graduates can enjoy even stronger recognition by
employers around the world. The achievement is a credit to the
staff who worked on the lengthy accreditation process.
Our international rankings remained strong too, and we again
moved up Academic Ranking of World Universities, to place 211th
among the world’s universities. This positions us well to achieve
our 2020 target to be ranked within the top 200.
In WA, 2016 saw Curtin maintain its position as the state’s most
preferred destination for undergraduates, with a remarkable 46
per cent of the state’s undergraduate applicants naming Curtin as
their first preference.
Despite another strong year, Curtin, together with universities
everywhere, must be agile enough to adapt to some potentially
huge changes to the higher education landscape. The solutions
aren’t simple, but it is clear that the modern university can’t
afford to stand still.
One of the most talked about changes is the digitisation of
education and the ways universities will adapt. Curtin has been a
leader in online offerings for 20 years, with an increasing number
of students studying our courses online directly through Curtin
and via Open Universities Australia. In 2015 we began offering
free, short courses, available for anyone to study on the edX
platform. In 2016 we took the next step by offering an articulation
pathway from our Human Rights program on edX into the degree
program at Curtin, known as the MicroMasters credential.
The convenience of online learning is also changing the way we
approach face-to-face course delivery. In 2016, we began offering
students the opportunity to enrol in individual units of study at
Curtin without without committing to an entire course of study.
We plan to increase the number of such options available to study
in 2017.
As our digital and traditional offerings continue to expand and
evolve, we will strive to remain a leader in curriculum design,
committed to delivering a seamless, responsive and innovative
experience for our learners, at the same time as ensuring that our
degrees remain highly valuable.
To meet our goal of being a top 200 university, our teaching,
research and engagement must be supported by a sustainable
business model. This is especially important considering the
Federal Government’s tertiary education budget reform, as well as
changes to the Higher Education Loan Program, are still expected
in the near future. ‘Sustainable future’ forms one of the key
pillars of our new Strategic Plan published in November, to further
embed the mindset of sustainability into everything we do. Key to
our future sustainability will be the finalisation – expected in early
2017 – of our new staff enterprise agreement. The Greater Curtin
master plan will also play a role here, helping us strengthen our
revenue base by providing more accommodation options for
students, attracting a new mix of visitors to campus and creating
new opportunities for engagement.
CCuCCuCuCuCCuCuCuCuuCuuCuCuuuurtrrtrtrtrtrrtttrrtinnininiin UUUUUUUUUUUUUUUUUUUnnnnniniiinniininnnnnnnn vvvveveeeevevvvevvverrrrssrsrrrssssrssssrrsrssrsssr ittiiititttittttttttiiiiiityyyyyyyyyyy AAAAAAAAAnnAAnAAnAnAAAnAnAnAnnAnAAAA nunununununualalalalalaaaaaa RRRRRRRRRRRRRRReeeeeeppppppeeppppeeeeeeeeeeppppepppppepppppppppoooorororororooooororororoooroororooo ttttttt 200002002002020002020202202020202000001661616161616161616161616 777777777
It’s always wonderful to see the positive impact of our alumni in
the community, and in 2016 the stories of two of our graduates
struck me as particularly inspiring. First, the 2016 John Curtin
Medal was awarded to domestic violence survivor Dr Ann O’Neill,
who lost two children and a leg in a murder-suicide committed
by her estranged husband in 1994. Just seven months later, she
commenced full-time study in honour of her children, going on
to gain a Bachelor of Social Work with First Class Honours and
a PhD in International Health from Curtin. Since then, Dr O’Neill
has dedicated her life to helping others who have suffered similar
tragedies, through a range of endeavours including Angel Hands, a
not-for-profit support group she founded more than a decade ago.
At 97, Freda Jacob AM was awarded the Lifetime Achievement
Award at the 2016 Curtin Alumni Achievement Awards. Freda
helped set the standards for occupational therapy in WA,
becoming a member of the state’s first OT board in 1960 and
founding the Independent Living Centre in 1977. Her hard work
and dedication have helped many Western Australians to live
happier, more productive lives.
In July, we wished Professor Graeme Wright the very best for his
retirement, after a five-year tenure as Deputy Vice-Chancellor,
Research, and I thank him for his enormous contribution to
the University’s research efforts. Under his leadership, Curtin’s
research profile went from strength to strength, as reflected in
our ERA performance, our rankings, our research revenue and
our overall research reputation. In acknowledgement of Professor
Wright’s achievements, he was awarded the title of Emeritus
Professor title on his departure.
2016 also saw us welcome Professor Chis Moran as Deputy Vice-
Chancellor, Research, and Professor Seth Kunin as Deputy Vice-
Chancellor, International. I look forward to working closely with
both Professor Moran and Professor Kunin in their key leadership
roles, as well as with Professor Alan Dench who has joined Curtin
as Pro-Vice-Chancellor, Humanities.
I thank everyone for their commitment and hard work throughout
2016 and look forward to continued success in 2017.
Professor Deborah Terry AO
Vice-Chancellor
Curtin University Annual Report 2016

Curtin University Annual Report 2016 Curtin University Annual Report 20168 9
VISION, MISSION AND VALUES STRATEGIC PLAN 2013-2017
Curtin’s 2013-2017 strategic plan was approved by the University Council in December 2012 and was
officially launched in February 2013. Capitalising on the outcomes achieved in the previous plan, the
2013-2017 strategic plan presents an ambitious goal to align with the University’s vision, positioning
Curtin on the international stage as a leader in the provision of quality teaching and research.
The University’s mission is to effect change through world-class research and teaching focused on making a real difference.
Curtin’s values underpin all activities, and the University has begun to further strengthen this values based culture.
Curtin is pursuing its vision and mission in a climate of aggressive global competition, rapidly changing technology,
financial uncertainty and a new government agenda. The new strategic plan addresses these major opportunities and
challenges to support the University’s ongoing sustainability. It details a series of strategic objectives presented under four
themes:
2030 VISION
A recognised global leader in research, education and
engagement.
Curtin University is a vibrant and globally engaged institution.
We are innovative in our thinking and we have a track record of
embracing change. Our graduates are highly sought after by
industry and our alumni community comprises leaders all over
the world. We celebrate diversity, have a strong commitment
to social justice and pride ourselves on offering a rich campus
life for our students and our staff.
We will continue to transform our learning environments
in order to leverage the opportunities afforded by new
technologies, aiming to deliver high quality learning outcomes
irrespective of mode of delivery. Our goal is to ensure that our
graduates are career capable, well-rounded individuals who
reflect the University’s values and signature behaviours and
are proud Curtin ambassadors.
Our recent success in research has underpinned our
improvements in international university rankings. We will
seek to retain our areas of strength, at the same time as
pursuing emerging areas of research capability. By embracing
a culture of innovation, we will provide commercialisation and
entrepreneurship opportunities for our staff and students,
ensuring that we play a key role in helping to drive the
knowledge-based industries of the future.
Developing a clear and comprehensive global strategy,
strengthened by deep international partnerships and
alliances, will enhance our ambition to be a genuinely global
university. At the same time, we will not weaken our resolve
to deliver impact in education and research for the benefit of
our local communities. On our Bentley campus, the Greater
Curtin development will play a critical role in helping us to
further intensify our linkages with industry, business and
the broader community. At the same time, on our Malaysian
campus, investments in new biotechnology and engineering
infrastructure will create fresh opportunities for collaborative,
research and industry engagement.
MISSION
Transform lives and communities through education and
research.
2020 POSITIONING
Secure our position as a leading global university; in the top
200 internationally and the top 10 nationally.
CURTIN VALUES
Building on a foundation of integrity and respect, and through
courage, we will achieve excellence and have an impact on the
communities we serve.
The University upholds the
philosophy of its namesake,
former Prime Minister of Australia,
John Curtin, who said:
“The great university …
should look ever forward;
for it the past should be
but a preparation for the
greater days to be.”
The strategic plan provides a framework for the development of major initiatives within enabling and faculty plans which are all subject
to an annual review process that provides for the re-examination of plans in light of the progress in implementation and changes in the
environment. The ‘2016 Report on Performance’ section of this annual report presents Curtin’s major achievements for the year and
underscores the momentum the University has achieved in moving towards its vision.
The 2013-2017 strategic plan was retired at the end of 2016. Council had agreed in 2015 that work on a new strategic plan should be
brought forward given significant changes in the market environment which required Curtin to consider new strategies. Consequently,
work was undertaken throughout 2016 to develop Curtin’s strategic plan for 2017 to 2020. Council approved the new plan at its
meeting on 14 September 2016; the new plan was launched in December 2016. The plan addresses the major opportunities and
challenges presented by the rapidly changing and highly competitive higher education market, and will ensure the ongoing success and
sustainability of the University.
PEOPLE AND CULTURE
Curtin will:
• Evolve as an agile, responsive and versatile
organisation, committed to leadership,
innovation and excellence
• Excel through dynamic staff with shared
values and a common purpose
• Engage students and staff as partners in
a flexible, inspiring and technologically
advanced environment.
TEACHING AND LEARNING
Curtin will:
• Lead in innovative education globally
• Provide a richly interactive and personalised
learning experience
• Provide opportunity for graduates, equipping
them with skills for the future.
RESEARCH
Curtin will:
• Strengthen as a research-intensive university
• Attract and retain iconic scholars to
undertake world leading research in areas of
global significance
• Change lives in Western Australia, the nation
and the world through high-impact research.
ENGAGEMENT AND IMPACT
Curtin will:
• Address the major challenges facing society
and meet the needs of the communities we
serve
• Expand its international outreach with
globally relevant networks and partnerships
in both teaching and research
• Change the world and its workforce through
our research and our graduates.

Curtin University Annual Report 2016 Curtin University Annual Report 201610 11
REPORT ON PERFORMANCE
STRATEGIC THEME 1: PEOPLE AND CULTURE
Curtin will:
• evolve as an agile, responsive and versatile
organisation, committed to leadership, innovation and
excellence
• excel through dynamic staff with shared values and a
common purpose
• engage students and staff as partners in a flexible,
inspiring and technologically advanced environment.
Measures of success for the People and Culture stream
of our 2013-17 Strategic Plan are expressed across four
components: Performance, Satisfaction, Health and Safety
and Diversity and Equity.
Many outcomes across this strategic theme
showed progress in 2016 as the University
continued to embed a values-led approach to
supporting all staff through a broad range of
programs and activities across Curtin.
Evolving as an organisation
• Following our Pulse Check climate survey in 2015 efforts
on improving the satisfaction and engagement of staff were
focused at a local level with many areas across the university
committing to a broad range of interventions and strategies
ahead of a more comprehensive survey in 2017. More than
50 facilitated interventions were undertaken across Curtin to
improve the capacity and capability of schools and areas to
respond to the survey in a proactive way.
• Employment opportunities within the University’s
comprehensive Reconciliation Action Plan continue to
receive significant attention. The proportion of staff who
self-identified as Aboriginal or Torres Strait Islander was 1.58
per cent this year, reflecting an increasing trend and is the
highest participation rate in the last five years. A key focus
in 2016 was the alignment of efforts in attracting higher
numbers of Indigenous staff while also increasing retention,
and employability outcomes, for students. Our inaugural
Indigenous Student Placement Program was conducted this
year in an effort to commence building a pipeline of students
who might otherwise not have considered a career in the
Higher Education sector. The program was piloted in the
semester break and of the eight students in the first cohort, six
of them were offered, and accepted, additional employment
opportunities across the University following the program.
• Curtin implemented the Indigenous Cultural Capabilities
Framework to promote an understanding of Indigenous
culture, knowledge and history. The three tiers involve Ways
of Working as an introduction to Aboriginal society and
culture; a cultural development program where staff members
participate in on-country visits; and an extended three or
four day cultural immersion visit to a culturally significant
Indigenous site.
• 2016 saw the establishment of the Gender Equity Working
Group as a fourth stream of the Strengthening Our Culture
initiative together with the assessment teams in each faculty
that will collectively focus on longer term strategies for
change. A key element of the working group’s activities is
a significant effort toward achieving external accreditation
from the Science in Australia Gender Equity (SAGE) initiative
program which among other outcomes will position Curtin
well to embed transformative actions to improve the
promotion and retention of women and gender minorities
both within the STEMM streams and more broadly.
• Significant work was undertaken to more fully understand
and reduce our gender pay gap internally and externally.
In partnership with the Workplace Gender Equality Agency
the Bankwest Curtin Economics Centre proudly released the
Gender Equity Insights 2016 Inside Australia’s Gender Pay
Gap report.
• A career development program for women, Trajectory, was
piloted across the University. The program will continue into
2017 with an emphasis on increasing the pipeline of women
who apply and succeed in promotion to Academic Level E.
A particularly pleasing outcome from the 2016 Academic
Promotion round was the increased rate of both application
and successful advancement of women. Fifty per cent of
applicants at Levels C, D and E were women and 84 per cent of
those women were successful in gaining promotion.
• Work began on Akari, a new Curriculum Management
System to replace paper-based processes. This significant
development will provide a single accessible repository
for curriculum information and automation of University
curriculum approval processes.
• The Assessment Quality Process was streamlined in 2016
and a new interactive dashboard was developed. Trends
show a high level of engagement from staff and improving
performance against standards.
• Curtin has taken a leadership role to address the challenge of
academic integrity. The University hosted a state-wide forum
on contract cheating. The full day event included a keynote
presentation by leading UK expert Dr Thomas Lancaster.
• Our primary Enterprise Agreement reached its nominal expiry
in 2016 and negotiations took place throughout the second
half of the year and are anticipated to conclude next year.
• Curtin successfully transitioned to the Federal Government’s
Simplified Student Visa Processing. Various initiatives were
introduced to meet the new requirements, including more
detailed risk assessment of applications from regions deemed
as having a heightened risk of not achieving recruitment or
admissions goals.
• A review of the Collaborative Education Services
(International) (CES) Policy and Procedures was undertaken
to align, in 2017, with the cycle of school reviews. In addition,
the CES was aligned with the new Higher Educations Standard
Framework (Threshold Standards) 2015 that take effect in
January 2017.
• Curtin’s Bentley campus underwent an audit in May for the
ongoing maintenance of ISO 9001:9008 accreditation to
cover the systems and procedures in relation to the quality
assurance for onshore processes and procedures, and offshore
partner contract development. The audit presented positive
findings. A revised standard, ISO 9001:2015, was introduced
and the majority of work was completed for transitioning
from ISO 9001:2008 to ISO 9001:2015. In addition to this,
the Curtin Singapore and Sarawak campuses retained their
ISO accreditation status during 2016 following an audit by
external certifiers.
• The number of academic staff with doctoral qualifications
was 77 per cent across each of the five academic staffing
levels A–E. This was slightly higher than in 2015 (76.5 per
cent) and a pleasing outcome against a target of 73 per cent.
Curtin remains comparable overall with the national average
of 76.1 per cent for Australian universities.
Working with the best
• At the 2016 Premier’s Science Awards, Professor Kingsley
Dixon was named WA Scientist of the Year in recognition
of his efforts in conservation science, restoration ecology
and plant science. At the same awards, Fireballs in the Sky,
led by Curtin researcher Professor Phil Bland, received the
Chevron Science Engagement Initiative of the Year. Professor
Zheng-Xiang Li was recognised as a finalist for WA Scientist
of the Year, and Dr Kaiming Bi and Dr Jun Li were finalists
for the Woodside Early Career Scientist of the Year. Fireballs
in the Sky also won the Australian Museum Eureka Prize for
Innovation in Citizen Science.
Professor Phil Bland’s Fireballs in the Sky initiative picked up two major science awards in 2016.

Curtin University Annual Report 2016 Curtin University Annual Report 201612 13
REPORT ON PERFORMANCE (CONTINUED)
• Professor Simon Cook was awarded the inaugural Premier’s
Agriculture and Food Fellow to lead a research team in WA to
develop the state’s capabilities in big data and agriculture.
• A number of Curtin’s academic staff were recognised for their
excellence and leadership in teaching through the awarding
of various national awards, citations and fellowships. At the
Australian Awards for University Teaching, Curtin was the
only university to win four of the 30 awards allocated, which
is testament to the quality of our academic staff.
• Health Sciences student Kate Tonta’s work as a facilitator for
Curtin’s UniPASS (Peer-assisted Study Sessions) program was
recognised with an outstanding new PASS leader award.
• Professor David Gibson from Curtin Learning and Teaching
was named the inaugural United Nations Educational,
Scientific and Cultural Organisation (UNESCO) Chair for Data
Science in Higher Education. The six year appointment will
link data science to solving real-world problems in education,
with the goal of transforming higher education to benefit
future students.
• Curtin appointed Professor Seth Kunin as its new Deputy
Vice-Chancellor, International in April 2016. Professor
Kunin was previously Vice-Principal, Internationalisation,
at the University of Aberdeen. Prior to this, he was Pro Vice-
Chancellor (Arts and Humanities) and Executive Dean (Arts
and Humanities) at Durham University. Professor Kunin has
extensive experience in the international domain, having led
the University of Aberdeen’s very successful international
strategy for two years, which included overseeing the
development of a campus in South Korea and establishing
significant collaborations with overseas universities,
organisations and governments.
• Professor Chris Moran joined Curtin in August 2016 as
Deputy Vice-Chancellor, Research. Professor Moran was
previously Professor and Director, Sustainable Minerals
Institute at The University of Queensland – a position he held
since 2007. Prior to that, he was Founding Director, Centre for
Coal Seam Gas (UQ) and Founding Director, Centre for Water
in the Minerals Industry (UQ). Across a 16 year career with
CSIRO, he held a range of leadership roles, including heading
the team that developed the Water for a Healthy Country
Flagship Program. Professor Moran’s expertise and experience
will help Curtin continue to build its research profile.
• Professor Alan Dench was appointed Pro Vice-Chancellor of
Humanities in August 2016. Professor Dench was previously
the Dean of Graduate Research and Postdoctoral Training
and a Professor of Linguistics at The University of Western
Australia. He is also a recipient of a 2016 Vincent Fairfax
Fellowship in Ethical Leadership.
• Professor Joseli Macedo was appointed the new Head of
School of Built Environment in August 2016. Professor
Macedo has had more than 20 years international higher
education experience and her funded research portfolio totals
$1.1 million.
Engaging students and staff
• Curtin’s staff community continues to provide transformative
support to student scholarships and other valuable programs.
Collectively, staff and Council members gave more than
$124,000 in 2016 through Give to Change, the University’s
staff giving program. While the focus of the program is on
student scholarship and hardship funds, staff also contributed
to the John Curtin Gallery, health research, sustainability and
Curtin FM.
• Significant work was undertaken this year to improve the
efficiency and personalisation of the on-boarding experience
for people joining the University. Process improvements are
estimated to have reduced effort by more than 12,000 hours
per annum and a new Welcome to Curtin induction program
has achieved very positive feedback from new staff.
• Agent management was enhanced through an overhaul
of and agent training manuals and the launch of an agent
online portal. This will include marketing materials for agents
including faculty presentations and specific print material
that can be downloaded for agents to use.
• A well-received Global Recruitment Forum with a separate
Marketing Hackathon were held in November. This included
participation by Curtin Recruitment Service Provider global
network staff, faculty, international campuses and Curtin
International staff.
• New communication channels, such as webinars, were
introduced to prospective students from selected countries
allowing them to speak to an agent to learn more about
studying at Curtin and life in Perth.
LOOKING FORWARD
Our 2017-2020 strategic plan is underpinned by a new People
and Culture enabling plan.
The focus for the next horizon will be creating a global,
collaborative and connected workforce; embedding a culture of
innovation through empowering our staff at all levels to strive for
excellence; strengthening values-based leadership and improving
gender and Indigenous equity.
Key initiatives will include examining our existing structures;
adjusting the balance between transactive and transformative
work; refining our approaches to talent acquisition; improving
decision making through the use of data analytics; reviewing our
reward and recognition systems; improving gender balance and
advancing Indigenous recognition and reconciliation.
STRATEGIC THEME 2: RESEARCH
Curtin will:
• be a research-intensive university
• attract iconic scholars to undertake world leading
research in areas of global significance
• change lives in WA, the nation and the region through
high-impact research.
This theme is principally supported by initiatives
contained in the Research Enabling Plan 2013-2017,
which provides the framework for the University to
progress against its objectives.
In 2016 Curtin continued to consolidate its place
as a research intensive university, progressing
toward the 2030 vision of being a recognised
international leader in research and education.
The many successes Curtin achieved in 2016 are
testament to the quality and impact of Curtin’s
research.
A growing reputation for research
• Curtin’s positioning as a leading research institution
increased significantly as demonstrated by a jump of 100
band points in 2016 according to the Academic Ranking of
World Universities (ARWU). Curtin’s positioning increased
from the 301-400 band in 2014 to the 201-300 band in 2016.
Detailed modelling of these results indicates Curtin is placed
211 worldwide, and in the top ten nationally demonstrating
Curtin’s competitive edge as a research ranked University.
• The Nature Publishing Group released the 2016 Nature
Index that measures an institution’s contributions to
high-quality papers published in a group of leading natural
science journals. Curtin is recognised as one of the top
500 universities in the world, and in the top ten Australian
universities. Based on 2015 data, Curtin excelled in the
area of Earth and Environmental Sciences and Chemistry,
while the largest number of publications (171 articles) was
in the Physical Sciences. Collaborative research between
Curtin and The University of Western Australia was the most
successful Australian collaboration, ranked first of all bilateral
collaborations in Australia. Curtin’s top ten collaborators
consisted of seven Australian universities, one Australian
research organisation (CSIRO), and two institutions from
China – the Chinese Academy of Sciences and Nanjing
University of Technology. Curtin was also identified as the
fastest improving Australian institution and the third fastest
internationally.
Curtin’s new $46 million agriculture research facility opened in December.

Curtin University Annual Report 2016 Curtin University Annual Report 201614 15
REPORT ON PERFORMANCE (CONTINUED)
• Curtin’s leadership of the Murchison Widefield Array (MWA)
radio telescope, as part of the development of the Square
Kilometer Array, continues to deliver significant outcomes. In
2016 the MWA produced the GaLactic and Extragalactic All-
sky MWA (GLEAM) survey, the largest survey of the sky using
radio frequencies ever to be completed.
• In the 2016 Australian Competitive Grant funding schemes,
Curtin was awarded $3.9 million from the National Health
and Medical Research Council and $6.8 million Australian
Research Council. This success was complemented by the
number of successful grants led by other organisations with
which Curtin was a partner organisation, demonstrating
Curtin’s commitment to collaborative research.
• Curtin signed a landmark agreement with Gekko Systems,
a world technical leader in gold processing and low-energy
mining solutions, for the commercial application of a new
initiative Carbon Scout to help gold mine operators optimise
process plant efficiency and reduce gold losses. Development
of the Carbon Scout at Curtin was supported through the
Accelerating Commercialisation program funded by the
Australian Government’s Department of Industry, Science and
Innovation.
• 307 Curtin students completed a higher degree by research
in 2017.
Changing lives in WA, the nation and the region
• Agriculture research, in collaboration with the Grains
Research Development Corporation and Curtin’s Centre
for Crop and Disease Management (CCDM), continued to
prosper with $6 million injected into the program in 2016.
In December, Curtin’s new $46 million agriculture research
facility was opened by Western Australian Minister for
Agriculture and Food, The Honourable Mark Lewis. This state-
of-the-art facility will enable CCDM to continue its work in
crop genetics, fungicide resistance and farming systems to
reduce the $1.5 billion annual impact of crop disease on the
Australian agricultural sector.
• The partnership between Bankwest and Curtin through
the Bankwest-Curtin Economics Centre continues to be
successful with the centre awarded the Ashley Goldsworthy
Award for Sustained Collaboration between Business and
Tertiary Education, by the Business/Higher Education
Round Table. A number of reports were launched in 2016 on
important issues affecting Western Australia including the
economy, agriculture and agribusiness. Furthermore, a 2016
report on gender equity demonstrates the centre’s broadening
focus into socio-economic issues.
• Curtin continues to lead the way in engagement with industry
to solve industry-identified problems by participation in
the Cooperative Research Centres (CRC) program. Current
participation includes:
• CRC for Contamination Assessment and Remediation of the
Environment to develop technology and guidelines for the
assessment and clean-up of contamination
• CRC for Greenhouse Gas Technologies to develop options for
future zero carbon emissions
• CRC for Living with Autism Spectrum Disorder focusing on
an approach to diagnosis, education and adult life
• CRC Remote Economic Participation to deliver solutions to
economic challenges faced in remote Australia
• CRC for Spatial Information to address issues of national
importance in the spatial information area
• Deep Exploration Technologies CRC for research into deep
mineral deposits
• Low Carbon Living to lower carbon emissions in the built
environment
• Lowitja Institute to support Aboriginal and Torres Strait
Islander health researchers
• Wound Management Innovation CRC for research into
wound healing and prevention.
• The operations of the Cisco Internet of Everything
Innovation Centre (CIIC) strengthened Curtin’s position
as a leader in industry collaborative research by applying
new technologies for the enhancement of businesses and
industries of the future, including delivering innovative
solutions to commercial problems. The centre facilitated
meetings and workshops with over 80 companies and
government agencies keen to utilise the facility and hosting
of short term student project activities. As part of the
collaboration, Cisco Senior Vice-President and Security and
Trust Officer, Mr John Stewart, committed to significant
student internships to assist in progressing projects, and
establishment of a 100GB link from the Murchison Radio
Observatory to the CIIC to enable development of remote
correlation software for remote telescopes. The CIIC was also
expanded through the establishment of a Sydney node.
• Curtin partnered with the Australian Renewable Energy
Agency in a multi-million dollar, Curtin-led project that aims
to provide scalable and generalisable governance models
for shared ownership of solar photovoltaics and storage
in medium density housing developments. The research
will be piloted in 50 housing units in the White Gum Valley
development near Fremantle, and will aim to show how solar
technology can be implemented and utilised in apartment
housing. The project will address the energy system design
as well as the legal aspects of shared solar technology for
developers, owners, tenants, strata bodies and utilities.
The project is being led by Professor Greg Morrison, Curtin
University Sustainability Policy Institute.
LOOKING FORWARD
Curtin’s new Strategic Plan 2017-2020 focuses on continuing
to strengthen key partnerships, focusing on strengths in
interdisciplinary research and industry engagement to build on
the global innovation agenda. Curtin is well placed to continue its
journey as a world leading research institution through a strong
research agenda into the future, building on the successes of
research in recent years.

Curtin University Annual Report 2016 Curtin University Annual Report 201616 17
REPORT ON PERFORMANCE (CONTINUED)
STRATEGIC THEME 3: TEACHING AND LEARNING
Curtin will:
• lead in innovative education globally
• provide a richly interactive and personalised learning
experience
• provide opportunity for graduates, equipping them
with skills for the future.
Curtin’s teaching and learning objectives are underpinned
by the Teaching, Learning and Student Experience Plan
2013-2017.
The university placed strong emphasis on
ensuring the Curtin student experience is
memorable, convenient and engaging.
A global leader in innovative education
• Curtin Business School was recognised as an elite global
business school through accreditation by the Association to
Advance Collegiate Schools of Business. This is awarded
to institutions that meet strict standards of quality and
excellence and is the longest standing, most recognised form
of professional accreditation business programs can earn.
• Curtin’s Medical School received accreditation by the
Australian Medical Council. In support of the new Medical
School, an innovative new teaching and learning building
was opened at Bentley. The building is an exciting addition
to the campus and the cornerstone of the Greater Curtin
development.
• Curtin’s Exercise, Sport and Rehabilitation Science course was
accredited by the Australian peak body, Exercise and Sports
Science Australia. The accreditation means that graduates
can now be recognised as exercise scientists, providing them
with greater opportunities in the exercise and sports industry.
• eVALUate is Curtin’s online system for gathering and
reporting students’ perceptions of their learning experiences.
For the first time in a decade Curtin achieved more than 80
per cent agreement on all survey items in first semester.
An interactive, personalised educational experience
• Improvements to the orientation period have been effective in
welcoming and supporting new students to Curtin. A range of
new types of communication were implemented including the
‘First 24 Hours’ suite of videos published in seven languages.
• Facebook Live was piloted with ‘Connect Four’ during the first
four weeks of second semester. A panel of experts addressed
common student concerns on topics ranging from enrolment,
to financial advice and study skills.
• Installation of a customer relationship management system
has led to a number of enhancements in data integration and
case management of students at risk in the Student Services
and Student Experience areas.
• Elsie, Curtin’s mobile study assistant, was used by more
than 18,000 students. Most recent developments include
a customisable feed of news and events; summary of
assessments; and a library feature providing information on
loans and outstanding fines.
• Curtin Connect is bringing together services and support
functions for students from across the University into a
single, convenient central location. The refurbishment is
due to be completed in May 2017 and will house Curtin’s
Student Services, Support Services, Future Students, Curtin
International and the Graduate Research School.
• Activity in the University Library continues to increase
despite the growth in digital resources. The Robertson Library
welcomed its two millionth walk-in visitor for the year in mid-
November, the first time this statistic has been achieved.
• Curtin offered six MOOCs on edX in 2016, with topics covering
the business of mining, digital marketing, environmental
studies and analytics in the classroom. To date, Curtin’s
MOOCs have attracted over 100,000 learners.
• In collaboration with edX, Curtin became one of only 14
universities globally to launch a MicroMasters in Human
Rights. Students passing the required courses receive an
edX credential which is recognised towards a master degree.
Curtin also partnered with prestigious US university MIT, to
accept applications from MIT’s Supply Chain MicroMasters
students.
Improvements to student orientation in 2016, including multilingual ‘First 24 Hours’ videos, are helping ensure new students make a great start at Curtin

Curtin University Annual Report 2016 Curtin University Annual Report 201618 19
REPORT ON PERFORMANCE (CONTINUED)
• Game-based learning was embedded into traditional
curriculum with a new feature of the Challenge Platform
which integrates with Blackboard, Curtin’s learning
management system. Curtin Challenge was further developed
to include new team functions that allow students to form
teams and to judge their work as well as the work of others.
• Curtin’s UniReady Program continued to be a popular
choice for students wishing to gain entry through alternative
pathways. UniReady students who complete their first year
of undergraduate study perform, based on their semester
weighted average, at approximately the same level as
students who enter on a 75 ATAR score.
• Curtin’s Centre for Aboriginal Studies and Faculty of Health
Sciences developed the Indigenous Pre-Medicine and Health
Sciences Enabling Course which will be first offered in
2017. The program is open to Indigenous and Torres Strait
Islander students who did not complete an ATAR but who are
interested in medicine or health sciences degrees.
• Student Services moved to a cashless operating
environment meaning all student tuition and incidental
payments are completed electronically. One of the major aims
of the initiative was greater flexibility as the online facility
allows users to perform their transactions anywhere and at
any time.
Equipping the workforce of tomorrow
• In 2016, there were 24,000 student engagements in a
Curtin leadership program, exceeding 2015 numbers. The
John Curtin Weekend is the most extensive opportunity
for students to engage in volunteer projects. This year, it
ran over six consecutive weekends and spanned 40 different
regional towns and metropolitan sites across WA; engaging
400 students from Perth and 320 from Curtin’s Sarawak and
Singapore campuses.
• Through the John Curtin Leadership Academy, 59 Curtin
students partnered with ten not-for-profit organisations to
complete a broad range of community projects. The students
helped raise over $235,000, produced two promotional videos,
developed marketing materials and social media campaigns,
hosted numerous events and generated over 200 mobile
phone app ideas.
• Curtin Accelerate is an ongoing program that provides
support to Curtin students, staff or graduates to get an
innovative business idea off the ground. The program
provides support and guidance needed to commercialise
ideas. StoreKat, Fit Out, Mud & Musk, Sciosity and Rate my
Space were the focus of the program in 2016. Teams were
showcased at a final event hosted at the St Georges Terrace
location to an audience of industry and investors. StoreKat,
an on line market place for storage space, was chosen to
represent Curtin at a national demonstration day led by
Curtin in collaboration with Knowledge Commercialisation
Australia and Google.
LOOKING FORWARD
The University will continue its focus on providing flexible and
digitally enhanced learning experiences that are individually
rewarding and supported by academic rigour and Curtin’s
reputation for innovation and quality.
We will also continue to leverage our growing global presence
and recognised leadership to collaborate with some of the most
elite higher education institutions in the world, offering a Curtin
education to learners across the globe.
Curtin Business School was recognised among the world’s elite, receiving accreditation by the Association to Advance Collegiate Schools of Business.

Curtin University Annual Report 2016 Curtin University Annual Report 201620 21
REPORT ON PERFORMANCE (CONTINUED)
A partnership with Hockey Australia provided an outreach opportunity to international students, particularly in India.
STRATEGIC THEME 4: ENGAGEMENT AND IMPACT
Curtin will:
• address the major challenges facing society and meet
the needs of the communities we serve
• expand its international outreach with globally
relevant networks and partnerships in both teaching
and research
• change the world and its workforce through our
research and our graduates.
Our networks and partnerships with industry,
government and academia around the world
broadened and strengthened in 2016. There was
a particular emphasis on innovation, with several
Curtin-developed ideas having an impact in the
global marketplace.
Serving the community
• Curtin’s Humans of Curtin campaign was awarded a 2016
Australian Marketing Institute Award in the Corporate
Social Responsibility category, and a Marketing Award for
Outstanding Contribution to Multiculturalism at the 2016
WA Multicultural Recognition Awards. Humans of Curtin is a
multi-platform project that showcases members of the Curtin
community and their personal stories, to promote positive
conversations around issues of diversity and inclusion, and
highlight the variety of reasons why people choose to pursue
higher education.
• Curtin’s alumni community pledged more than $6 million in
future bequests to support student scholarships in a diverse
range of areas such as physiotherapy, medical science and
international development.
• With its WAIT Alumni Scholarships Campaign, a committed
group of WAIT alumni worked tirelessly to raise more than
$1 million for student scholarships, with plans to double this
amount in 2017.
• Curtin played an active leadership role in increasing
educational opportunities for high school teaching staff
and promising youth. In 2016, a High Achieving Student
Strategy was implemented and there are now more than 14
schools, public and private, committed to Curtin’s Innovative
Schools Consortium.
• Curtin had the opportunity to engage, as the education
partner, for the STEAM Ahead – Arcadia Australia
Community Open Days. The event supported creativity,
inspired students and promoted learning through science,
technology, engineering, arts and mathematics.
• An all-female group of 33 education and engineering students,
‘the STEMinists’ mentored Western Australian primary school
girls throughout 2016 in workshops known as makerspaces,
collaborating on creative activities which incorporate STEM
learning.
• Curtin’s strong relationship with BHP Billiton continued with
a review of the scholarship offer, engagement of BHP scholars
into the business and an enhanced marketing campaign
showcasing their support.
• A two year partnership with Hockey Australia was developed,
providing an outreach opportunity to international students,
particularly in India. A partnership with the Fremantle
Football Club facilitated similar international student
engagement. The subsequent formation of the AFL Women’s
competition will offer further impactful learning opportunities
for students.
• Curtin Stadium proudly hosted the 2016 Australian
University Games in September 2016. 368 student athletes
represented Curtin, competing in 29 different sports against
7,000 other students. Curtin placed 9th out of 41 universities
across Australia.
• The contribution of Curtin alumni was recognised at the
annual Alumni Achievement Awards in November, with 18
graduates recognised for achievements in their careers and
in the community. The Lifetime Achievement Award was
presented to Ms Freda Jacob, who helped set the standards for
the occupational therapy industry in Western Australia and
has left a monumental legacy in her field.
• Curtin’s Row AHEAD program was a finalist in the 2016/17
WA Sport and Recreation Industry Awards in the Commitment
to Participation category. Row AHEAD, run in conjunction
with Clontarf Aboriginal College, was one of three programs
recognised in this category, primarily for its innovative
approach to increasing community participation in sport.
• Curtin signed an MOU with the Southern Aboriginal
Corporation and the Bringing Them Home Committee that
will provide opportunities for students to undertake practice-
based learning for credit toward their degrees, at the former
mission sites of Carrolup/Marribank and Wandering Brook.
• During NAIDOC Week the University signed a memorandum
of understanding with Wakuthuni Aboriginal Corporation,
Gumala Aboriginal Corporation and Ashburton Aboriginal
Corporation. It will assist in developing sustainable and
culturally sensitive livelihood solutions to ensure future
economic development of the Wakuthuni community in the
Pilbara.

Curtin University Annual Report 2016 Curtin University Annual Report 201622 23
REPORT ON PERFORMANCE (CONTINUED)
Changing the world through our research and graduates
• Established in 2014 as a start-up company based on research
conducted at Curtin, ePAT Technology is now trading on the
Australian Stock Exchange. ePAT analyses facial expressions
for indicators of pain, making better pain management and
improved quality of life possible. The technology also won the
2016 Perth Convention Bureau Travel Award at WA Innovator
of the Year.
• The OzAPP Awards again received strong interest from those
developing mobile, cloud and web based applications around
Australia and South East Asia. The final pitching now runs
as part of a week-long technology based festival, West Tech
Fest, which has evolved under Curtin’s leadership. The event,
significantly supported by the City of Perth aim to foster
dialogue and collaboration between innovators, researchers,
investors and industry, while further stimulating innovative
tech developments in WA and the Asia Pacific region.
• Curtin start up, iCetana, was recognised at the CRC
Association annual conference as one of the Science Meets
Business Top 25 Australian Research and Development Spin-
off Companies. iCetana sells video analytics software that
increases the effectiveness of installed video infrastructure
and security controls rooms. The product is used by
Curtin security and has been rolled out internationally in
Universities, public transit authorities, shopping malls and
other large site management applications.
• Three Curtin programs were selected to participate in ON
Prime, a national innovation accelerator program run by
CSIRO to assist research teams to develop their work for
market. The successful Curtin programs are: Biometric Market
Research Laboratory, Exoskeleton Robotic Finger Orthosis
and Virtual Training for Health and Aged Care. The teams
will participate in an eight-week program hosted at the Cisco
Internet of Everything Centre.
• Curtin’s Remote Sensing and Satellite Research Group
will be collaborating with 55 scientists from 30 countries
who will work on 22 research projects for the Antarctic
Circumnavigation Expedition (ACE). The three-month
scientific expedition aboard the Akademik Treshnikov, a
Russian research vessel, will fully circumnavigate Antarctica
to measure the impact of climate change and pollution in the
Southern Ocean.
• Curtin ran a masterclass for entrepreneurs in 2016,
drawing on the network of its Entrepreneur in Residence,
Adjunct Professor Bill Tai. Other presenters included Susi Mai,
founder of Xtreme Tech Challenge, an international start up
competition with Sir Richard Branson as the patron, Paul
Herz, a senior operations executive responsible for Apple’s
display technology, Melanie Perkins, CEO of Canva, the world’s
fastest growing digital design platform, and Katarina Roth,
who has built a highly successful information technology
platform consultancy. The event was a sellout and received
very positive feedback from the audience of entrepreneurs,
developers, researchers and students.
• The 2016 Curtin Commercial Innovation Awards showcased
the latest commercially relevant technologies being
developed at Curtin and attracted 300 attendees from
industry, government and the investment community. The
overall winner was Shutdown Maintenance Optimisation
developed by Associate Professor Ryan Loxton – a clever use
of algorithms for creating economical shutdown schedules for
mining operations.
• The annual John Curtin Prime Ministerial Library Lecture
was delivered by Melbourne broadcaster, anthropologist and
writer, Sally Warhaft and introduced by the Library’s Patron,
Hon Julia Gillard. The lecture was held the week prior to the
Federal election and titled “Curtin’s Call: What our 14th Prime
Minister would make of the Federal election campaign”.
• A team of three Curtin law students won the Asia Pacific
Regional Round of the 2016 Manfred Lachs Space Law Moot
Court Competition in India, the first time in ten years that an
Australian team has triumphed.
Expanding our international networks
• Curtin continued to offer quality courses in collaboration
with partners in China, Singapore, Malaysia, Mauritius,
Vietnam and Sri Lanka. A new initiative in Dubai, potentially
commencing in 2017, will further strengthen Curtin’s global
position. Progression of possible alliance opportunities with
The University of Aberdeen and other institutions were also
investigated.
• In preparation for the Curtin Dubai Campus offering Bachelor
courses in 2017, a foundation program was developed in
partnership with the Transnational Academic Group Dubai
to help to ensure the successful recruitment and preparation
of students into Curtin programs.
• Curtin University and Nanjing University in China
recently signed a memorandum of understanding for
the establishment of the Sino-Australia Collaborative
Innovation Alliance. The alliance will deliver research and
innovation on “Megaproject Management in the Era of
Internet + and Big Data” and will be driven by industry needs.
Joining Curtin and Nanjing are four prestigious universities
that will also be core members of the alliance including
Tongji University, Harbin Institute of Technology, Huazhong
University of Science and Technology, and Shanghai Jiao Tong
University.
• As at December 2016, 59 new international agreements
had been signed, including articulation agreements,
MOUs, sponsored student agreements, and student and
staff exchange agreements. These agreements focused
on collaborative research, student exchange and student
recruitment pathways through articulation to Curtin
campuses.
• The formation of the DuPont Innovation Award agreement
saw DuPont sponsoring a Curtin Business School innovation
award which included a generous cash prize and a visit to
DuPont’s New Innovation and Business Hub in Singapore for
the winning research project.
• In the 2016 New Colombo Plan funding round, grants
totalling $471,000 were awarded to 109 students to
undertake industry internships, semester long exchange,
study tours and clinical placements in the region. Two Curtin
students - Georgia Ivers and Jesse Tucek - were awarded
the prestigious New Colombo Plan Scholarship, awarded
to Australian undergraduate students who demonstrate
academic excellence and leadership skills.
• Curtin continued to actively engage with the American
Chamber of Commerce, Australian British Chamber of
Commerce, French Australian Chamber of Commerce,
CCIWA and Committee for Perth. This engagement was
enhanced through Curtin’s new facilities at St Georges
Terrace, Perth.
• Numbers of articulating students to Curtin declined by 19
per cent from 2015 to 2016, mainly attributed to declines
from Chinese and Indonesian partners. A new China strategy
was implemented in 2016 with the appointment of a
specialist Regional Dean China, Dr Henry Li.
Curtin students Jesse Tucek (second from left) and Georgia Ivers (second from right) received the prestigious New Colombo Plan Scholarship from Foreign Minister Julie Bishop (centre). Joining them are Alison Johnson from Curtin’s Department of Mobility and Sponsorship Development (far left) and Pratul Awasthi, Curtin’s 2014 New Colombo Plan Scholar (far right)

Curtin University Annual Report 2016 Curtin University Annual Report 201624 25
REPORT ON PERFORMANCE (CONTINUED)
• Curtin enrolled 751 sponsored students in 2016, a decline
from 963 in 2015. Changes to major sponsor programs such
as the Australia Awards Scholarships saw a decrease in this
cohort, however Curtin continues to receive positive feedback
from sponsored students and the Australian government for
the management of this prestigious scholarship program.
The largest cohort of sponsored students other than Australia
Award students continues to be the Saudi Arabian Cultural
Mission.
• Curtin continued to be a leading destination for students
sponsored under the Brazilian Science without Borders
program. In 2016 there were 145 students, slightly up from
the 2015 enrolment of 140 students. A key component of
their program is an internship or work integrated learning
experience over the summer period. All participating students
were successfully placed in 2016.
• In 2016, 150 Curtin students participated in full semester
outbound student exchange opportunities. Curtin continued
to provide travel grants to assist students who participated in
student exchange programs.
• Curtin College continued to be the major pathway provider
for international students on-campus in Perth, with 478
students transferring from this pathway in 2016; 93 per
cent of the total Curtin College cohort articulated to Curtin
in 2016. Recent increases in pre-university pathway visa
applications indicate that this pathway will continue to be
a significant source of onshore international enrolments.
In 2016, the college had its largest intake of students since
2011. Enrolments in Commerce, Engineering and Health
Sciences are strong. College pass rates compare favourably
with Curtin Bentley and Curtin Singapore. Reports from Curtin
show Curtin College graduates’ semester weighted averages
compare favourably with the wider Curtin cohort.
• In August, Curtin English successfully renewed its National
ELICOS Accreditation Scheme quality assurance without
any recommended changes to implement. The site reviewer’s
report was overwhelmingly positive.
• A total of 769 students graduated from Curtin’s onshore
English Language Bridging onshore program in 2016, which
represents a growth of 62 per cent on the equivalent figure
for 2015. This was boosted by a significant Brazilian cohort
through Science Without Borders and major growth from
India. There were 287 commencements in the offshore English
Language Bridging program in 2016. The pass rate of those
students completing the offshore program was over 90 per
cent.
• Curtin English developed an innovative new model, whereby
the lower levels of general English will be delivered by a
partner organisation before students transfer into Curtin
English for the final stages of their English program. The
process of selecting a partner is currently underway. This is
expected to improve profitability and sustainability and result
in an attractive offer for our students.
• Curtin continued to dominate the Western Australian market
in international enrolments. In 2016, 8,509 international
students were enrolled onshore at Curtin – an increase of 2.5
per cent on the previous year. This is despite WA’s share of
nationwide international enrolments falling from 11.2 per
cent to 6.8 per cent since 2002.
• 2016 was a positive year towards further consolidating
Curtin’s position in Malaysia. The new Science and
Engineering building at the Sarawak campus was officially
opened by the Chancellor and Vice-Chancellor in October and
precedes a comprehensive upgrade of facilities over the next
five years.
• The number of PhD students at Sarawak exceeded the 2016
target of 100 with approximately 120 students enrolled or
intending to commence their studies.
• Dr Beena Giridharan was appointed Deputy Pro Vice-
Chancellor at Curtin Sarawak.
• At Curtin Singapore, the ISO 9001 re-certification audit
was undertaken in 2016 with no non-conformities detected.
Singapore’s ISO 9001 certification will continue until
September 2018 at which time conversion to the new ISO
9001 (2015) version will be undertaken.
• The closure of the Sydney campus was well managed, with
valuable assistance from the staff in Sydney to ensure that
students continue to receive support during the teachout
process. The emphasis throughout was to ensure the students
were not disadvantaged in completing their degree and the
process and effort from staff situated at Sydney and Bentley
has been commendable in achieving this outcome.
LOOKING FORWARD
We will take engagement with our government, industry and
corporate partners to a new level. Leveraging our recently
expanded city presence will be critical, as will a focus on ensuring
that we are seen as a collaborative and accessible partner of
choice, both locally and internationally.
More broadly, our goal is to ensure that our reputation and profile
aligns with our strengths and our achievements. We will use our
50 year anniversary in 2017 to secure our position globally. At
the same time, we are committed to having clear and sustainable
strategies in place to deliver benefits to regional Western
Australia.
Beyond the anniversary, it is important that we build our capacity
to engage with our alumni in ways that will engender their
ongoing loyalty and support.
Curtin took possession of two of Perth’s oldest inner-city premises: 57 Murray Street and the former Perth Boys School on St Georges Terrace. Leveraging our expanded presence in the city will be critical to our continued success.

Curtin University Annual Report 2016 Curtin University Annual Report 201626 27
REPORT ON OPERATIONS
GOVERNANCE OF THE UNIVERSITY
The Council is the governing body of the University and its
powers are set out in the Curtin University Act 1966 (WA). It has
the management and control of the property and affairs of the
University and may do all such acts and things as it may think
best calculated to promote the interests of the University.
Council met on eight occasions in 2016, including one meeting
held at Kalgoorlie.
A Council Retreat was conducted on 8 October 2016 on the
strategic positioning of the University.
At its meeting on 7 December 2016, Council elected Ms Sue
Wilson to the position of Pro Chancellor for a new term that is to
commence on 4 March 2017 and is due to cease on 3 March 2020.
Key governance-related activities considered by Council in 2016
included:
• approval of the following:
• Key performance indicators for assessing the Vice-
Chancellor’s performance in 2016
• Establishment of a Dubai Campus
• Procurement process for Stage One of Greater Curtin
• Budget for 2017
• Various honorary awards
• Amendments to University Rules re Executive Manager
Titles
• Amendments to Student Guild Regulations
• University Strategic Plan 2017-2020
• noting reports on the following:
• University’s performance against key performance
indicators, measures and targets identified in the Strategic
Plan 2013–2017
• Strategic Risk
• Alumni relations
• Financial management
• Investment Performance
• Square Kilometre Array
• Pawsey Supercomputing Centre
• Disability Access and Inclusion Plan
• Operations of the Kalgoorlie Campus in 2015
• Performance of the Curtin University Foundation in 2015
• Health, Safety and Emergency Management
• Equal Employment Opportunity
• Integrity and Standards
• Application of the Common Seal
To inform and enhance Council’s role in shaping the strategic
direction of the University, a series of strategic conversations
and portfolio presentations were undertaken in 2016 as part of
Council’s meeting program.
Strategic conversations included:
• Indigenous outcomes
• Greater Curtin and sustainability
• University Strategic Plan - stakeholder engagement
• Academic Governance
• International strategy
Portfolio presentations included:
• Humanities
• Health Sciences
• Curtin Business School
• Learning and Teaching
Properly constituted committees help Council to meet its
broad responsibilities by enabling matters to be appropriately
scrutinised prior to coming before Council for resolution.
The current standing committees established by resolution of
Council are the:
• Executive Committee
• Finance Committee
• Audit and Compliance Committee
• Legislative Committee
Special purpose committees established by resolution of Council
include:
• Health and Safety Due Diligence Committee
• Curtin Student Advisory Forum
The Academic Board is also a committee of Council and forms
part of the overall governance framework of the University. The
Academic Board is responsible to Council for helping to ensure
the academic quality and integrity of the University’s operations
as an academic institution. The Academic Board is also assisted
in the performance of its responsibilities by the following sub-
committees:
• Academic Board Executive
• Academic Services Committee
• Courses Committee
• University Graduate Studies Committee
• University Teaching and Learning Committee
• University Research and Development Committee
The procurement process for Stage One of Greater Curtin was approved by Council in 2016.

Curtin University Annual Report 2016 Curtin University Annual Report 201628 29
REPORT ON OPERATIONS (CONTINUED)
MEMBERS OF COUNCIL FOR 2016 (AS AT 31 DECEMBER 2016)
Members appointed by Governor in Council Commenced Terminated Due to expire
Mr Kim Bridge BBus (WACAE)
15/11/2014 15/11/2011
Current 14/11/2014
14/11/2017
Ms Cathryn Carver BBus (Curtin)
11/11/2014 14/09/2016
Dr Andrew Crane BSc Hons (Hatfield) PhD (Portsmouth) AMP (Harvard) FAICD
1/4/2015 Current 31/3/2018
Mr Alex Jones BSc (Melb) MBA (UNSW)
1/4/2015 Current 31/3/2018
Mr Michael Lishman BA BJuris LLB (UWA) LLM (Melb)
1/4/2016 1/4/2013
20/4/2010
Current 31/5/2016 31/3/2013
31/3/2019
Dr Michael Stanford CitWA MB BS (UNSW) MBA (MacqU) Grad Cert LCC (ACU) FAFPHM FAIM FAICD
2/12/2014 13/12/2011
2/12/2008
Current 1/12/2014 1/12/2011
2/12/2017
Member nominated by Minister for Education and Training
Ms Sue Wilson BJuris LLB (UWA) FAICD FGIA
3/5/2016 3/5/2013
Current 2/5/2016
3/3/2017*
Member who is the Chief Executive Officer
Professor Deborah Terry AO BA (ANU) PhD (ANU) FASSA FAPS
17/2/2014 Current Ex-officio
Members elected by full-time academic staff Commenced Terminated Due to expire
Professor Dale Pinto PhD (Melb) M Tax (Hons) (Sydney) CPA FTIA AFAIM FTMA MAICD
22/8/2014 Current 31/3/2017
Professor Glennda Scully BCom (Melb) MAcc (UWA) PhD (UWA) FCA
1/4/2016 1/4/2013
Current 31/3/2016
31/3/2019
Member elected by full-time salaried (general) staff Commenced Terminated Due to expire
Mr Andrew McLean BA(Hons)(Curtin) AFATEM
18/6/2016 Current 17/6/2019
Mr Andy Sharp B Arch (Canberra) MBA (Curtin)
18/6/2013 17/6/2016
Members elected by students Commenced Terminated Due to expire
Mr Liam O’Neill 13/4/2016 Current 12/4/2017
Mr Jason Giancono 13/4/2015 12/4/2016
Ms Noni Elliott Hobbs 13/4/2016 Current 12/4/2017
Ms Saraya Martin 13/4/2015 12/4/2016
Co-opted Members Commenced Terminated Due to expire
Mr Colin Beckett MA (Cantab) MICE (Chancellor from 1/01/2013)
1/1/20161/4/2013
Current31/12/2015
31/12/2018
Previously appointed by the Governor 19/10/2010 – 31/3/2013
Mr Steve Scudamore BA Hons, MA (Oxon), FCA, SF Fin, FAICD
1/4/2014 1/4/2011
Current 31/3/2014
31/3/2017
Mr Gene Tilbrook BSc DipComp MBA (UWA) AMP (Harvard) FAICD
1/4/2015 1/4/2012 1/4/2009
Current 31/3/2015 31/3/2012
31/3/2018
Member elected by Academic Board Commenced Terminated Due to expire
Associate Professor Linley Lord DBA (Curtin) Postgrad Dip Bus (Human Resource Development) (Curtin) BSc (UWA)
1/4/2016 1/4/2014 1/4/2012
Current 31/3/2016 31/3/2014
31/3/2018
* The term of office is required to cease on the 60th day after the day on which the Universities Legislation Amendment Act 2016 came
into operation, that is, 2 January 2017.

Curtin University Annual Report 2016 Curtin University Annual Report 201630 31
REPORT ON OPERATIONS (CONTINUED)
ADVANCEMENT
STEERING
COMMITTEE
DISABILITY
ACCESS AND
INCLUSION
COMMITTEE
COUNCIL
KALGOORLIE
CAMPUS
COUNCIL
CURTIN
FOUNDATION
BOARD
CURTIN
STUDENT
ADVISORY
FORUM
FINANCE
COMMITTEEVICE-CHANCELLOR
LEGISLATIVE
COMMITTEE
EXECUTIVE COMMITTEE
AUDIT AND
COMPLIANCE
COMMITTEE
STUDENTSERVICES AND
AMENITIES FEESEXPENDITURE
ADVISORYCOMMITTEE
CURTIN
INDIGENOUS
POLICY
COMMITTEE
UNIVERSITY
HEALTH
AND SAFETY
COMMITTEE
HEALTH AND SAFETY DUE DILIGENCE
COMMITTEE
HONORARY AWARDS
NOMINATIONS COMMITTEE
JOHN CURTINGALLERY
ADVISORY BOARD
CURTIN ABORIGINAL AND TORRES
STRAIT ISLANDER ADVISORY
COMMITTEE
ACADEMIC
BOARD
COURSES
COMMITTEE
ACADEMIC
BOARD
EXECUTIVE
UNIVERSITY
GRADUATE
STUDIES
COMMITTEE
UNIVERSITY TEACHING
AND LEARNING COMMITTEE
ACADEMIC
SERVICES
COMMITTEE
INTERNATIONAL
COMMITTEE
UNIVERSITY RESEARCH AND DEVELOPMENT
COMMITTEE
PLANNING AND
MANAGEMENT
COMMITTEE
COMMITTEE STRUCTURE (AS AT 31 DECEMBER 2016)MEMBERS OF COUNCIL
Back row from left to right: Liam O’Neill, Dr Michael Stanford, Dr Andy Crane, Gene Tilbrook, Steve Scudamore, Alex Jones
Front row from left to right: Andrew McLean, Noni Elliott Hobbs, Professor Deborah Terry AO (Vice-Chancellor), Colin Beckett (Chancellor), Sue Wilson (Pro Chancellor), Professor Dale Pinto, Associate Professor Linley Lord, Professor Glennda Scully
Absent: Michael Lishman

Curtin University Annual Report 2016 Curtin University Annual Report 201632 33
ORGANISATIONAL CHART
REPORT ON OPERATIONS (CONTINUED)
ASSOCIATE PROVOST
DIRECTOR, INTEGRITY AND
STANDARDS UNIT
PROVOST
PRO VICE-CHANCELLOR,CURTIN BUSINESS
SCHOOL
PRO VICE-CHANCELLOR,
FACULTY OF SCIENCE& ENGINEERING
PRO VICE-CHANCELLOR,FACULTY OF HEALTH
SCIENCES
PRO VICE-CHANCELLOR,
FACULTY OFHUMANITIES
CHIEF STRATEGYOFFICER
PRO VICE-CHANCELLOR
& PRESIDENT, SARAWAK
PRO VICE-CHANCELLOR
& PRESIDENT, SINGAPORE
DEPUTYVICE-CHANCELLOR,
RESEARCH
ASSOCIATE DEPUTYVICE-CHANCELLOR,
RESEARCH
ASSOCIATE DEPUTYVICE-CHANCELLOR,
RESEARCH TRAINING
DIRECTOR,ENERGY RESEARCH
INITIATIVES
DIRECTOR,STRATEGIC PROJECTS
DIRECTOR, IPCOMMERCIALISATION
DIRECTOR,RESEARCH &
DEVELOPMENT
VICE-CHANCELLOR
DEPUTYVICE-CHANCELLOR,
ACADEMIC
ASSOCIATE DEPUTYVICE-CHANCELLOR,
LEARNING & TEACHING
CHIEF STUDENT SERVICES OFFICER
UNIVERSITY LIBRARIAN
DIRECTOR, CORPORATE VALUES
& EQUITY
DIRECTOR,CENTRE FOR
ABORIGINAL STUDIES
DIRECTOR,SUPPORT SERVICES
ACADEMIC REGISTRAR
DEPUTYVICE-CHANCELLOR,
INTERNATIONAL
ASSOCIATE DEPUTY VICE-CHANCELLOR,
INTERNATIONAL
DIRECTOR,CURTIN ENGLISH
DIRECTOR, CURTIN INTERNATIONAL
CHIEF OPERATING OFFICER
CHIEF FINANCIALOFFICER
CHIEF INFORMATIONOFFICER
DIRECTOR,PROPERTIES,FACILITIES &
DEVELOPMENT
DIRECTOR,PEOPLE AND
CULTURE
DIRECTOR,LEGAL &
COMPLIANCE
DIRECTOR,HEALTH, SAFETY AND EMERGENCY
MANAGEMENT
DIRECTOR,RISK MANAGEMENT
DIRECTOR,SECRETARIAT &
COUNCIL SECRETARY
VICE-PRESIDENT,CORPORATERELATIONS
CHIEF MARKETINGOFFICER
DIRECTOR,STRATEGIC
COMMUNICATIONS
DIRECTOR,EXTERNALRELATIONS
DIRECTOR,PUBLIC
RELATIONS
DIRECTOR,ADVANCEMENT
DIRECTOR,STRATEGIC
ENGAGEMENT
ADMINISTRATIVE STRUCTURE
Vice-Chancellor Professor Deborah Terry AO
Provost Professor John Cordery
Deputy Vice-Chancellor, Academic Professor Jill Downie
Deputy Vice-Chancellor, InternationalProfessor Seth Kunin (commenced 1 April 2016) Associate Professor Simon Leunig (Acting)
Deputy Vice-Chancellor, ResearchProfessor Chris Moran (commenced 1 August 2016)Professor Graeme Wright (Retired)
Chief Operating Officer Mr Ian Callahan
Vice-President, Corporate Relations Ms Valerie Raubenheimer
Pro Vice-Chancellor, Curtin Business School Professor Tony Travaglione
Pro Vice-Chancellor, Health Sciences Professor Michael Berndt
Pro Vice-Chancellor, Humanities Professor Alan Dench (commenced 1 August 2016)Associate Professor Stephen Mickler (Acting)
Pro Vice-Chancellor, Science and Engineering Professor Andris Stelbovics
Pro Vice-Chancellor and President, Curtin Sarawak Professor James Mienczakowski
Pro Vice-Chancellor and President, Curtin Singapore Professor Robert Evans
Chief Financial Officer Mr David Menarry
Chief Strategy Officer Mr Marco Schultheis

Curtin University Annual Report 2016 Curtin University Annual Report 201634 35
REPORT ON OPERATIONS (CONTINUED)
STAFFING MATTERS
STAFF SUMMARY
FTE of academic and professional/general staff as at 31 March 2016 (excluding hourly paid/casual staff)
Continuing/ permanent
Fixed term/ temporary Total
Academic staff 830.3 642.5 1,472.8
Professional & general staff 1,481.3 473.4 1,954.7
Total 2,311.6 1,115.9 3,427.5
STAFFING POLICIES AND INITIATIVES
Two new staffing Procedures were approved in 2016, the Family and Domestic Violence Leave and Support Procedures and the Titles for
University Position Procedures. The Titles for University Position Policy was rescinded.
The Academic Freedom Policy was renamed the Intellectual Freedom Policy and updated for relevancy and to reference all staff and
students.
ONBOARDING
A new approach to onboarding staff at Curtin was implemented with a new online system providing a personalised contract to all new
starters. The system also provides line managers with analytics on onboarding and recruitment processes.
WELCOME TO CURTIN
A new corporate induction, Welcome to Curtin, was implemented for all new fixed term and continuing academic and professional and
general staff. The induction program enhances the new starter experience and is intended to connect, inspire and motivate. The Welcome
to Curtin was complemented by informal afternoon teas with the Vice-Chancellor on the three month anniversary of new staff.
INDUSTRIAL RELATIONS
Negotiations for replacement enterprise agreements between Curtin University, unions and individual bargaining representatives
commenced in April 2016.
While traditional ways of delivering academic services will remain relevant, new products, digital delivery methods and a growing
focus on the delivery of Curtin qualifications to the international market will necessitate that alternative approaches to organising and
delivering academic services are available. Creating cost effective alternatives to operate in conjunction with traditional academic work
patterns is a cornerstone of the bargaining approach by Curtin.
HEALTH, SAFETY AND EMERGENCY MANAGEMENT
2016 REPORTABLE KEY PERFORMANCE INDICATORS
Actual results
TargetComment on resultMeasure 2014 2015 2016
Number of fatalities 0 0 0 0 Meets target
* Lost time injury/disease (LTI/D) incidence rate* 0.44 0.29 0.45 0 or 10% improvement
No improvement compared to 2015, however consistent with previous years
**Lost time injury/disease (LTI/D) severity rate** 0 0 0 0 or 10% improvement
Meets target and consistent with past 2 years
***Percentage of injured workers returned to work within***:
Greater than or equal to
80% return to work within
26 weeks
Exceeds target. 100% of staff returned to work within 26 weeks
(i) 13 weeks 61% 75% 79%
(ii) 26 weeks 83% 91.67% 100%
Percentage of managers trained in occupational safety, health and injury management responsibilities
60% 67% 73% Greater than or equal to
80%
Some improvement compared to 2015
* Lost Time Injury Incidence Rate: # of LTI/Ds
x 100# of employees (FTE)
** Lost Time Injury Severity Rate calculation: # of injuries ≥ 60 days
# of LTI/Ds x100
*** Return to Work (RTW) Within 13 / 26 Weeks:# of LTI/Ds with a RTW outcome within 13 / 26 weeks
x 100# of LTI/Ds reported
HEALTH AND SAFETY
The University, through its Council members and senior
executives, is committed to providing and maintaining high
standards of occupational health and safety in the workplace.
This is achieved, in consultation with staff and safety and
health representatives, through such mechanisms as Area/
Faculty Health and Safety Sub-Committees and the overarching
University Health and Safety Committee, with the aim to
continually improve our safe work practices and processes.
The 2016 Health, Safety and Emergency Management (HSEM)
Plan focused on strategies to deliver long term sustainable health
and safety performance in all areas, with key objectives for 2016
successfully achieved, including:
• WorkSafe Plan Accreditation – Curtin undertook a WorkSafe
Plan audit resulting in a Gold Certificate of Achievement being
awarded to the University by our state regulator WorkSafe
WA, for demonstrating a best practice approach to health and
safety management across all of our WA campuses.
• Launch of Curtin’s new Hazard And Risk Management
software (CHARM) – a more user-friendly system that allows
greater visibility and reporting capabilities at the user end.
• Other achievements included completion of a Curtin wide
Chemical Management Plan and associated documentation;
development and review of various HSEM procedures and
guidelines; conduct of emergency management exercises
with internal and external stakeholders and combat agencies;
participation in the 2016 National Safe Work Month, including
the ‘CU Safe Expo’, various HSEM activities, demonstrations
and seminars run over the month of October.

Curtin University Annual Report 2016 Curtin University Annual Report 201636 37
REPORT ON OPERATIONS (CONTINUED)
WORKERS’ COMPENSATION AND INJURY MANAGEMENT
The University continues to provide a dedicated service to
assist staff return to work following injuries or illness through
its early intervention Injury Management Service, recently re-
named Curtin’s Corporate Wellness Team. The name change
reflects a continued focus on best practice injury management
for both work related and non-compensable conditions along
with proactive wellness interventions whilst continuing to
ensure the University meets its obligations under the Workers’
Compensation and Injury Management Act 1981.
Curtin’s Wellness Program for staff resides within this team
function and provides lead indicators for health and safety
measures captured in order to monitor and measure the
effectiveness of any preventative strategies. This proactive
approach to injury and illness enables area specific injury
prevention projects across Curtin to target positive health
and safety outcomes. The Corporate Wellness team continues
to provide specialist services for the provision of reasonable
workplace adjustment for staff with Disability and expert Human
Factors and Ergonomic advice related to manual handling and job
design.
SIGNIFICANT ISSUES AND TRENDS
EFFECT OF ECONOMIC AND OTHER FACTORS
Following from the change in Coalition leadership in 2016, the
Australian tertiary sector awaits direction regarding the national
higher education policy and funding agenda. The continued delay
in the implementation of the Federal Government’s policy reforms
including the intended, but as yet unlegislated, aim to reduce
higher education funding by 20 per cent, has resulted in financial
pressure and continued uncertainty for the sector overall. The
Government has signalled a focus on enhancing quality and
transparency within the sector, as evidenced by a recent review
into higher education admissions policies and its increasing focus
on demonstrating graduate employability. In addition to these
pressures, the sector is impacted by market trends including:
changing demographics of the student population; unprecedented
competition for students nationally and globally, exacerbated by
the rise of private providers in Australia; the continued expansion
and influence of disruptive technologies on learning and teaching
approaches; and changes in the scope, nature and funding of
research.
The National Innovation and Science Agenda (NISA) launched
in December 2015 and the proposed 2016 National Research
Infrastructure Roadmap, released for comment in December
2016, demonstrates a national commitment to research and
innovation. A key measure within the NISA is the introduction of a
national engagement and impact assessment which will examine
how universities are translating their research into economic,
social and other benefits as well as fostering collaboration
between universities, industry and other end-users. Curtin is
well-placed in research translation and knowledge exchange and
has a number of exemplary programs such as the Cisco Internet
of Everything Innovation Centre (CIIC), co-founded by CISCO,
Curtin and Woodside Energy Ltd, which won the Best Creative
Engagement Strategy at the Knowledge Commercialisation
Australasia (KCA) Research Commercialisation Awards in 2016.
While competition for Federal research funding is expected to
tighten in coming years, two new initiatives of the Australian
Research Council will be of benefit to Curtin’s research strengths.
The ARC Statement of Support for Interdisciplinary Research in
2016 will increase opportunities for interdisciplinary research
in the National Competitive Grant Program (NCGP) and the
implementation of continuous application, rather than fixed
term dates of application, for Linkage Projects will assist Curtin
researchers and their partners in timely grant application, review
and award. Curtin researchers received $10 million in research
funds for 2016 projects that range from philosophical ethology
to atomic collisions research. Curtin also received $6 million in
National Health and Medical Research Council (NHMRC) funding
for 2016 projects.
Western Australia’s transition from construction-driven growth
to broader drivers of economic activity has resulted in lower
enrolments in some disciplines. The state has also experienced a
higher unemployment rate which has impacted on employment
opportunities for new graduates in some fields. Research
investment by industry has also been affected by the transition
away from resource-based investment.
The ‘half-year cohort’ created in 2002 when the school starting
age changed saw a decline in 2015 of the number of applications
by WA school leavers to the Tertiary Institutions Service Centre
(TISC) of 32 per cent and a subsequent 9 per cent decline in
enrolments at Curtin. The half-year cohort is no longer a factor in
enrolment intake in WA from 2016, but will have some pipeline
impact on total enrolments for the next three years. With the end
of the half-year cohort, applications to TISC in 2016 increased by
56 per cent from 2015 or compared to applications prior to the
half-year cohort, applications increased by 6 per cent. Curtin’s
commencing enrolments for 2016 saw a 5 per cent increase from
2015, but down by 4 per cent from 2014.
Curtin leads the state in the percentage of TISC first preferences,
taking 46 per cent of the market share for the 2016 cohort. The
University continues to attract a growing number of higher
achieving applicants – 24 per cent of commencing students have
ATAR scores at 95 or above.
International onshore student enrolments in Western Australia
appear to be returning to growth after a period of decline,
although there is an evident need for a coordinated international
education strategy for the state in line with the recently released
National Strategy for International Education. Nevertheless,
Curtin’s onshore commencements have been steady, and the
University’s offshore enrolment continues to grow, particularly at
our Sarawak campus and in programs delivered in Mauritius.
While Curtin is impacted by the aforementioned challenges, the
University has maintained a competitive position in the market
and 2016 was a very successful year for Curtin in terms of our
global positioning.
The prestigious Nature Index which examines the high-quality
research output of universities and institutions ranked Curtin at
358 in the world and 9 nationally in 2016, up from 423 in 2015
and 10 in 2015.
Curtin was also ranked at 94 in the world and 3 nationally in the
Nature Index Rising Stars Top 100 for growth in high-quality
science, with Nature Index noting that “Curtin is the fastest
moving and most collaborative of Australian universities”. Curtin’s
top ten collaborators include seven other Australian universities,
the CSIRO, the Chinese Academy of Science, and Nanjing
University of Technology.
Curtin continues to rise in the prestigious Academic Rankings of
Universities (ARWU) and is now positioned 211 in the world and
10 in Australia, up from 270 in the world and 11 nationally in
2015. The University’s steady growth in this ranking enables us
to pursue collaborations with other highly ranked universities.
Curtin’s positioning within the top 10 Australian universities
on all of the major research-based global rankings reflects a
concerted effort by the University to be more research intensive.
Changes to the legal environment affecting the University
in 2016
The following summary refers to significant legislative changes
that apply to the University.
COMMONWEALTH LEGISLATION
Amendments to the Australian Consumer Law affect new or
renewed contracts entered into on and from 12 November
2016 which meet four criteria. This update is relevant to Curtin
University as some of the contracts entered into are with small
businesses and Curtin University will have to take care to avoid
potentially unfair contract terms.
WESTERN AUSTRALIAN LEGISLATION
The Universities Legislation Amendment Act 2016 passed both
Houses of the WA Parliament in October 2016 and received royal
assent on 19 October 2016. All provisions were proclaimed to
come into operation on 2 January 2017, except those provisions
which relate to the remuneration of members of the University
Council and Kalgoorlie Campus Council which come into operation
on 1 October 2017.
The purpose of the Amendment Act was to amend the Curtin
University of Technology Act 1966, and the enabling Acts of the
other WA universities. The amendments relating to Curtin include
the renaming of the University to “Curtin University”; the size,
composition and remuneration of Council; the form, functions
and composition of the Kalgoorlie Campus Council; delegation
arrangements; filling of casual vacancies; nomenclature of
university officers; inclusion of gender neutral language;
borrowing powers; commercial activities including the use and
development of Curtin’s land for commercial purposes; the tabling
and disallowance of statutes; arrangements regarding the setting,
collection and distribution of the student amenities and services
fees and the maximum penalty for a by-law infringement.
The Curtin University of Technology Act 1966 is now also cited as
the Curtin University Act 1966.

Curtin University Annual Report 2016 Curtin University Annual Report 201638 39
REPORT ON OPERATIONS (CONTINUED)
OTHER DISCLOSURES AND LEGAL REQUIREMENTS
ACT OF GRACE PAYMENTS
Under the University’s policy on Act of Grace Payment, Curtin
undertakes to report through its Annual Report all Act of Grace
payments made in each financial year. In 2016 no Act of Grace
payments were made.
ADVERTISING – ELECTORAL ACT 1907
Under section 175ZE of the Electoral Act 1907, the University
is required to disclose expenditure for advertising agencies,
market research organisations, polling organisations, direct mail
organisations and media advertising organisation costs.
For 2016 the following costs were recorded against
these items:
Sum of GST exclusive amount $
Advertising Agencies 2,715,746
Campaign -
Non Campaign 2,715,746
Market research organisations 176,950
Media advertising organisations 2,948,107
Grand Total 5,840,803
CAPITAL WORKS
Greater Curtin Stage One
Curtin has a goal of transforming the physical Bentley campus
into a new knowledge cluster based on the agglomeration
of research, students and industry. Greater Curtin is a
transformational project aimed at delivering long-term benefit
to Curtin University and all Western Australians by catalysing
important urban development focused on the University’s
mission.
In 2016, a procurement process was launched to seek private
sector consortia to finance, design, deliver and operate the initial
components of Greater Curtin Stage One. Components of this
stage include student accommodation, academic and industry
facilities, public transport hub, retail and other supporting
infrastructure.
Road and services infrastructure to support the Greater Curtin
Stage One development began in January 2016 and will be
completed in early 2017.
Building 410 Curtin Medical School and teaching facilities
Building 410 was completed in mid 2016. The facility offers a
comprehensive range of state of the art learning and teaching
facilities. While the building will be utilised by a wide variety of
students, it will be the home base for Curtin Medical School.
Building 304 research facilities (agriculture)
Construction is complete for Building 304 which provides Physical
Containment Level 2 (PC2) and Quarantine Containment Level
3 (QC3) laboratories and research facilities to support Curtin’s
research activities with a particular focus on agriculture and
grains research.
Kalgoorlie Campus student housing (Agricola College)
The project to replace the existing student housing at Kalgoorlie
with the construction of facilities accommodating 180 new beds
and 48 refurbished beds is near completion with full occupancy
planned for early 2017. To meet the constraints of the regional
location, innovative modular construction has been successfully
implemented.
The anticipated total cost is $32 million with $21.5 million being
contributed from Royalties for Regions funding.
Curtin Connect – Student Engagement in buildings 101,
102 and 103
This project will create a cutting edge, technology-enabled,
single stop for face to face services for students and prospective
students. The facility will be completed mid 2017.
Refurbishment
In 2016 a variety of refurbishment programs were undertaken.
This included the strategic projects in the CBD (Curtin Law School
and Old Perth Boys city hub) and a range of projects to support
the growth in research programs. The majority of this program
provided facilities for the Faculty of Science and Engineering,
reflecting their success in initiating new research programs.
Midland Campus (Health)
In May 2015, the Federal Government announced it had
given its approval for a Curtin University Medical School. This
announcement was supported by the State Government who
committed to provide Curtin University with $22 million and land
for a facility based in Midland to house activities of the new Curtin
Medical School and other University programs where appropriate.
This project is now in the planning phase with a completion date
forecast for 2019.
DISABILITY ACCESS AND INCLUSION PLAN (DAIP) OUTCOMES
In 2016 Curtin commenced the final year of its DAIP 2012-2017
which will finish on 30 June 2017. Good progress was made on
long term initiatives and major projects such as investigating the
process to benchmark the DAIP against other WA universities,
now to be undertaken in second semester 2017. Properties,
Facilities and Development commenced benchmarking its facility
management process against the Tertiary Education Facilities
Management Association Accessibility rating.
In collaboration with the Disability Services Commission, housing
industry and the Liveable Housing Project, Curtin has developed
academic AV material regarding universal design in the built
environment with final completion of all material due March
2017.
Wide cross-campus discussions regarding the use of universal
design principles in Curtin’s facilities, programs and services
occurred throughout 2016, with agreement to use a universal
design approach to Curtin’s access and inclusion initiatives in the
next DAIP.
The five year DAIP 2012-2017 review and draft report was
completed and the review findings used to prepare the draft three
year plan, DAIP 2017-2020. Both are due for lodgement with the
Disability Services Commission by 30 June 2017. Curtin made
progress in all strategies pertaining to the seven DAIP mandated
outcomes and met all external progress reporting requirements
in 2016.
Outcome 1: People with disabilities will have the same
opportunities as other people to access the services of,
and events organised by, Curtin.
Curtin’s commitment to the inclusion of people with intellectual
disability on campus and the Disability Services Commission’s
state-wide Count Me In strategy continues with goodwill and
support from academic staff. Resolving enrolment, assessment
and award issues will continue in 2017.
Norton Gold Fields, partnering with the Curtin Specialist
Mentoring Program to support students on the autism spectrum,
generously contributed to a dedicated social space (Norton Gold
Fields Common Room) for Bentley campus students. Curtin
has experienced an increase in enrolments of these students
consequent to such initiatives.
To improve student access to academic programs, an IT
accessibility audit of student computer labs was completed and
25 Sonoscent Audio Notetaker software licences were purchased
for use by students with learning difficulties.
Equity Room improvements in the Robertson Library were
completed and the new accessible web site is now live.
Discussions to make the DAIP more student-friendly began
between the Student Guild, Disability Services and Digital Services
- Student Experience.
Outcome 2: People with disabilities will have the same
opportunities as other people to access Curtin’s buildings
and facilities
The inaugural Curtin Physical Access Plan and Universal Design
Guidelines - Built Environment were completed. These are a first
for Australian universities. The guidelines will inform Curtin
contractors about Curtin’s building standards.
The Curtin Wayfinding Strategy project was briefed and will
include physical and digital wayfinding, and directives for
physical planning structures, spaces and the environment with
completion due January 2017.
Building 108 emergency egress project was completed, providing
a model for possible future situations. Resolution involved the
person with disability most affected, community agencies (St
John’s Ambulance), Curtin staff (training) and a teaching and
learning opportunity for occupational therapy students.
An accessible parking and transport strategy, Mobility at Curtin,
was completed in December 2016, with implementation over five
years.
Outcome 3: People with disabilities receive information
from Curtin in a format that will allow them to access the
information as readily as other people are able to access
it.
Curtin’s Transforming Curtin IT program Web Toolkit overhaul,
to update online information, Curtin web developers and content
authors, was completed. A web accessibility training course for
all Curtin Information Technology Service (CITS) developers was
conducted on-campus by Vision Australia in November 2016.
Universal Design Guidelines - Teaching & Learning, based on the
inaugural UDG-Built Environment, are scheduled for development
in 2017.
Outcome 4: People with disabilities receive the same level
and quality of service from Curtin staff as other people
receive from Curtin staff
The staff online Disability Awareness module was workshopped in
2016, for delivery in 2017.
Two Counselling & Disability Services staff – Counsellor and
Disability Advisor – are based part-time in the Centre for
Aboriginal Studies.
Outcome 5: People with disabilities will have the same
opportunities as other people to make complaints to
Curtin
Curtin’s Integrity Standards Unit continued discussions with
WA Deaf Society regarding an Auslan translation on the Curtin
website to enable people with hearing difficulties to access our
complaint portal.

Curtin University Annual Report 2016 Curtin University Annual Report 201640 41
REPORT ON OPERATIONS (CONTINUED)
Outcome 6: People with disabilities will have the same
opportunities as other people to participate in any public
consultation by Curtin
The draft Curtin Guidelines for Accessible Public Consultation
was reviewed and the Office of Strategy and Planning Market
Intelligence Research website includes reference to alternative
format requirements when planning research and surveys.
A variety of alternative consultation formats were used in the five
year review of DAIP 2012-2017.
Outcome 7: People with disabilities will have the
same opportunities as other people to participate in
employment at Curtin (voluntary Curtin Outcome).
The research project regarding appropriate development
opportunities for staff with disability to meet longer-term plans
for career development was completed.
ENVIRONMENTAL SUSTAINABILITY
Biodiversity
Curtin aims to provide a safe and healthy environment for
our students, staff and the community whilst minimising our
environmental impact.
Key initiatives include the implementation of the University’s
Black Cockatoo Action Plan 2016-2018 and the Urban Forest
Action Plan 2014-2020. To improve the food source for the black
cockatoo, Curtin University has installed a variety of mature tree
and tube stock of high priority feeding trees. In 2016, 420 tube
stock and 110 mature trees were planted, while 13 existing trees
were transplanted.
Green Star Communities
In February 2015, Curtin was awarded Australia’s first 5-Star
Green Star-Communities rating from the Green Building
Council of Australia (GBCA). The 5-Star rating, which equates to
‘Australian Excellence’ was earned after the University Master
Plan was assessed against benchmarks for governance and
innovation, design excellence, environmental sustainability,
economic prosperity and liveability.
In 2016, in preparation for recertification, the focus was on
documenting sustainability-related activities across the
University. More than one hundred current initiatives have been
documented.
Energy management
Curtin has a strong focus on energy efficiency to reduce both
greenhouse emissions and energy costs. During 2016 Curtin
implemented an Energy Management Plan aimed at better
understanding our environmental impact. Key initiatives include
the completion of the electricity sub-metering program and
implementation of an innovative Energy and Water Monitoring
system across every building at the Bentley Campus to track and
manage resource use and improve asset performance.
To achieve the best possible energy efficiencies, we continually
review past projects and identify opportunities for new facilities.
For instance, building 410 includes a 50 kW photovoltaic system,
solar hot water, LED lighting and high performance glazing.
Other strategies are aimed at improving indoor air quality
through higher ventilation rates and low-formaldehyde and low-
VOC finishes. In addition, the project achieved our 90 per cent
construction waste recycling target.
Water efficiency
As a major potable and ground water consumer, the University
reviews its Water Efficiency Management Plan annually to find
new ways to save money in water and sewerage charges while
reducing consumption.
Water efficient water fixtures and toilets are installed in all new
buildings and refurbishment, and landscaping is undertaken
using water wise plantings. A 50 kL grey water recycling system
is now being trialled in Building 410.
INSURANCE
An indemnity agreement was entered into between the University
and the directors and officers named in this report. Under
the agreement, the University has agreed to indemnify those
directors and officers against any claim to the extent allowed by
the law, for any expenses or costs which may arise as a result of
work performed in their respective capacities.
During 2016 the University paid a premium in respect of
a contract of insurance for the directors and officers of the
University and all related bodies corporate, against liabilities
incurred in acting in such capacities, to the extent permitted
under the Corporations Act 2001. The contract prohibits the
disclosure of the nature of the liabilities and/or the amount of the
premium.
MARKETING AND COMMUNICATION ACTIVITIES
The University ended the year with a record 48.8 per cent of
Western Australia’s undergraduate applicants choosing Curtin
as their preferred destination for 2017, compared to UWA (25
per cent), Murdoch (14.7 per cent) and ECU (11.1 per cent). This
continues Curtin’s upward trajectory in terms of market share,
and is an indication that our marketing and communication
activity resonating with this key market.
University Marketing adopted a more personalised approach
to digital marketing in 2016, with the implementation of
automation software Marketo in October. The system enables
tailored communication to prospective students in Curtin’s
database, based on their interests and level of education. The
system was successfully piloted with prospective postgraduates
in 2016, and it will be expanded to the prospective undergraduate
market in 2017. It is hoped that the approach will increase
engagement across all segments and safeguard Curtin’s strong
market position over coming years.
A significant portion of the Curtin website was updated in July,
to a new streamlined, design that is responsive across multiple
devices, and a re-thought navigation structure, to provide the
University’s visitors with a more intuitive online experience.
The Curtin homepage is a key communication tool for the
University, receiving more than 2.2 million visits each year. These
improvements were a milestone in a larger program of works,
which will see improvements to our online course catalogue,
research promotion and networking, and staff portal in 2017.
PRICING POLICIES ON OUTPUTS PROVIDED
Fees are charged in accordance with Australian Government
guidelines and University policy.
Students in Commonwealth-supported places are required to
contribute towards the cost of their education. The student
contribution amount is calculated for each study period from
their student load and the annual contribution amounts that
apply for that year. In common with most universities, Curtin
charges the maximum student contribution amount permitted by
legislation.
Tuition fees for other students are determined by taking into
account a number of factors, such as cost of delivery, ‘market’
factors and legislative requirements.
Approved fees are published online at fees.curtin.edu.au.
A new-look website will provide a better online experience for millions of web visitors each year.

Curtin University Annual Report 2016 Curtin University Annual Report 201642 43
REPORT ON OPERATIONS (CONTINUED)
RECORDKEEPING – COMPLIANCE WITH THE STATE RECORDS ACT 2000 (WA)
Curtin University (Curtin) is committed to the reliable and
systematic management of its documents and records in
accordance with good practice standards. As Curtin was
established under an Act of the Parliament of Western Australia,
it is also subject to the provisions of the State Records Act 2000
(WA) (Act). In accordance with this Act, Curtin works under an
approved Recordkeeping Plan (RKP). The RKP contains timelines
and responsibilities for improving recordkeeping practices at
Curtin. The Records & Information Management (RIM) team
develops policies, processes, training and tools to assist staff to
meet the requirements of the plan.
Significant improvements and developments:
• Work continued at the Western Australian School of Mines in
Kalgoorlie on capturing and recording archival and historical
material in various formats, including the completion of an
oral history project.
• Enhancements were made to the Curtin Records and
Information System to improve functionality and efficiency.
• Various records and information management resources were
reviewed and updated (including advice with regards to using
cloud services)
• Curtin’s Privacy Statement was also revised in 2016.
Ongoing Records and Information Management Training:
• Training was made available for all staff on Creating and
Keeping Records; Sentencing, Retention and Disposal of
Information as well as Managing Email. Training on how
to use the Curtin Records and Information System and
the Contracts and Agreements Register was also provided.
Customised training to areas on managing records within file
shares was also provided.
• Over 1300 staff completed the online information
management awareness training in 2016. All staff are
required to complete this training within two months of
starting at Curtin, and are required to repeat the training after
three years.
• Information and awareness raising activities in relation to
Privacy and Freedom of Information responsibilities were
provided to staff.
• Feedback is sought from attendees and all training is reviewed
regularly.
RISK MANAGEMENT
Curtin’s Risk Management Framework consists of the Risk
Management Policy, Risk Management Procedures and Risk
Reference Tables that specify the University’s Risk Appetite set by
Council. The policy sets Curtin’s tone and tolerance to accepting
risk, as it contains Curtin’s risk appetite and agreed risk-aware
behaviours.
During 2016, there were four key areas of focus:
• Culture – Curtin maintained a strong focus on strengthening
its culture. Risk Management participated in the
Strengthening our Culture Steering Committee, Working
Groups as well as nominating a culture representative
from the team. Culture is an important pillar of Curtin’s
Risk Management Framework and to this end, the Risk
Management Policy contains four risk aware behaviours
aligned to Curtin’s desired culture, namely:
• Tone from the top – the University community values
risk and will proactively integrate risk aware behaviours
into University business or activities, and will embed the
University’s risk assessment and treatment processes
where required.
• Continuous disclosure –
i. The University community will communicate bad
news (concerns) and good news (opportunities) on
time to the relevant manager.
ii. Managers will listen to, and respond appropriately
to, concerns or opportunities, and the University
community will be encouraged to speak openly and
honestly.
iii. Managers will monitor risk and will disclose risks
identified as approaching or exceeding Curtin’s risk
appetite.
• Prudent decision making – policies, delegations, processes
and procedures will reflect the degree of risk, empowering
agility and innovation. Decisions will be timely and
prudent, based on relevant information.
• Single line accountability – individual staff will be held to
account for the success of activities, projects or functions,
even when working in groups or teams. Staff will be
appropriately empowered to deliver agreed outcomes
within the University’s risk appetite.
Additionally Curtin has a risk appetite and various risk tools to
assist staff and students make prudent decisions. Significant
work was undertaken enhancing and embedding fieldwork risk
tools. Curtin now has an enterprise wide framework for fieldwork
with risk management incorporated. Curtin has over 20 000
fieldwork placements annually in support of Work Integrated
Learning, co-curricular and research activities, giving our students
enhanced local and global learning experiences and opportunities.
Embedding risk management thinking in everyday activities is
fundamental to building a risk aware culture. An external desktop
review of the fieldwork risk framework provided guidance for
future improvements. However the review noted that Curtin
University is working towards establishing international best
practice processes and resources to professionally train and
support students and staff at the university who work off-site as
part of their activities at the university
• Strategy - New technologies, new competitors and overall
market disruption in the delivery of higher education globally
has the potential to impact Curtin. Accordingly, Curtin’s
risk profile, disruption scenarios and a risk issues map were
updated alongside development of the 2017-2020 strategy.
A revised risk profile will be finalised in early 2017 in support
of delivery of the 2017-2020 strategy incorporating key risk
indicators for each strategic risk.
• Systems – Work has been underway to examine system
solutions for enterprise risk management and business
continuity. Given the size and complexity of Curtin’s global
operations, adoption of an enterprise wide system integrated
with other governance processes including planning, will
reduce the administrative burden on the front line managers
ideally using one process to deliver many outcomes.
• Assurance – Following an external review of the internal
audit function in 2016, it was agreed to move to a co-sourced
model for internal audit delivery. The revised model will
provide access to global expertise and subject matter experts
across higher education and other industries to align with
the global footprint of the University. In addition, the internal
audit function has joined with Risk Management to become
Risk and Assurance, incorporating sound controls to maintain
independence and objectivity.
SENIOR OFFICER DISCLOSURES
The senior officers of the University have declared:
• They do not hold (as a nominee or beneficially) any shares in
any subsidiary body of the University; and
• They (or a firm of which they are a member, or an entity
in which they have a substantial interest) do not hold any
interests in any existing or proposed contracts with the
University, or subsidiary, related or affiliated body of the
University.
STRATEGIC PROCUREMENT
Curtin continues to deliver improved commercial processes,
practices and systems through a strategic procurement
approach. Contracts have been executed in many separate
expenditure categories, achieving substantial savings. Strategic
supplier–relationship management is used to maximise
opportunities from commercial relationships, for added value and
innovation.
SUBSIDIARY BODIES
From time to time, the University invests in companies that
are set up for the purposes of commercialising intellectual
property. For a short period after the companies are established,
the University may be in the position whereby it has control
of the company, in which case the company may be regarded
as a subsidiary of the University. However, in these cases the
University’s interest in the company is not financially material
and will be diluted in time through investment from third parties.
At 31 December 2016, the University had no subsidiaries.
VOLUNTARY CODE OF BEST PRACTICE FOR THE GOVERNANCE OF AUSTRALIAN UNIVERSITIES
At its meeting on 7 December 2011, Council adopted the
Voluntary Code of Best Practice for the Governance of Australian
Universities as a best practice governance benchmark. A
compliance report for 2016 was noted by Council at its meeting
on15 February 2016. The University complies with all 14
protocols.

0
10,000
20,000
30,000
40,000
50,000
60,000
2012 2013 2014 2015
Curtin Enrolments by Citizenship
Domestic International Onshore International O shore
2016
0
15,000
30,000
45,000
60,000
75,000
2012 2013 2014 2015
Total Curtin Enrolments
Curtin Award Courses Students Non-Award OUA Students
2016
0
10,000
20,000
30,000
40,000
50,000
60,000
2012 2013 2014 2015
Curtin Enrolments by Course Level
Undergraduate Postgraduate Coursework
Non-Award Postgraduate Research
2016
Curtin University Annual Report 201644
22,000
24,000
26,000
28,000
30,000
2012 2013 2014 2015
Curtin Female Enrolments
2016
Curtin University Annual Report 2016 45
* Students who have multiple enrolments or a change of citizenship during the year are counted multiple times therefore the sum of the categories does not necessarily equal the overall total enrolment. Includes students from all campuses. Data reported is consistent with the HEIMS data collection with the exception of non Commonwealth Supported OUA students who are not reported to government.
# Staff figures are calculated as the full-time equivalent of continuing and fixed term staff captured as at 31 March, plus the full-time equivalent of casual staff as at 31 December. An estimate of casual staff is reported for 2016, while the prior year published in the 2015 Annual Report has now been updated with actual casual staff data. Includes staff from Bentley and WA campuses only.
0
2,000
4,000
6,000
8,000
10,000
12,000
2012 2013 2014 2015
Curtin Award Completions by Course Level
Undergraduate Postgraduate Coursework
Postgraduate Research
2016
0
2,000
6,000
2012 2013 2014 2015
Curtin Sta (Full-Time Equivalent) Academic Professional
4,000
2016
380
400
420
440
460
2012 2013 2014 2015
Curtin Indigenous Australian Enrolments
2016
0
1,000
2,000
3,000
4,000
5,000
6,000
2012 2013 2014 2015
Curtin Low SES Enrolments
2016
CURTIN KEY STATISTICS
2012 2013 2014 2015 2016
CURTIN ENROLMENT
Headcount 64,042 61,724 60,762 59,942 58,217
CURTIN ENROLMENT EXCLUDING NON-AWARD OPEN UNIVERSITIES AUSTRALIA (OUA) STUDENTS *
Headcount 50,106 51,595 53,617 53,611 52,994
Attendance: Full-time ratio 69% 68% 68% 69% 69%
Course Level
Postgraduate Research 2,329 2,306 2,396 2,457 2,405
Postgraduate Coursework 8,522 8,597 8,579 8,485 8,020
Undergraduate 37,303 38,362 39,825 39,722 39,474
Non-Award 2,638 3,071 3,814 3,923 4,023
Broad Field of Education
Agriculture, Environmental and Related Studies
219 197 212 208 209
Architecture and Building 2,268 2,309 2,366 2,317 2,330
Creative Arts 1,390 1,064 988 962 930
Education 4,231 4,675 4,531 4,324 4,272
Engineering and Related Technologies
6,484 6,541 6,965 6,996 6,978
Health 8,617 9,313 9,788 9,456 9,507
Information Technology 871 718 600 468 408
Management and Commerce 15,300 14,407 14,373 14,063 13,304
Natural and Physical Sciences 3,262 3,693 3,809 4,183 4,415
Society and Culture 7,626 8,894 10,486 10,956 11,030
Non-Award 819 886 900 847 804
DEMOGRAPHY AND EQUITY
Student Citizenship
Domestic Students 32,823 35,229 37,218 36,192 36,326
International Students studying in Australia
9,267 8,742 8,656 8,733 8,509
from : China (%) 32% 32% 30% 28% 25%
India (%) 2% 3% 4% 7% 13%
Malaysia (%) 15% 14% 13% 12% 12%
Indonesia (%) 7% 7% 6% 6% 5%
Singapore (%) 5% 5% 4% 4% 4%
2012 2013 2014 2015 2016
International Students studying outside Australia
8,016 7,818 7,926 7,745 6,912
from : Malaysia (%) 38% 37% 37% 40% 45%
Mauritius (%) 13% 14% 15% 17% 19%
Singapore (%) 19% 20% 18% 15% 11%
Hong Kong (%) 8% 8% 9% 7% 5%
China (%) 3% 3% 4% 4% 4%
Gender
Female Students 27,925 29,121 29,887 29,573 29,057
Female Proportion 56% 56% 56% 55% 55%
Indigenous Australian Students 440 410 431 427 445
Low Socio-Economic Status (SES) Students
4,451 4,959 5,469 5,563 5,754
AWARD COMPLETIONS
Total Curtin Completions 11,473 11,267 10,919 10,835 11,025
Course Level
Postgraduate Research 250 284 299 294 307
Postgraduate Coursework 3,320 3,178 2,994 3,146 3,153
Undergraduate 7,903 7,805 7,626 7,395 7,565
STAFF (FULL-TIME EQUIVALENT) #
Total Curtin Staff 3,771 3,950 3,987 4,019 4,160
Work Function
Academic 1,791 1,828 1,831 1,841 1,909
Teaching 606 612 613 700 724
Research 262 279 361 426 491
Teaching and Research 784 798 720 623 610
Other 139 138 137 92 84
Professional 1,980 2,122 2,156 2,178 2,251
Curtin University Annual Report 2016 Curtin University Annual Report 201646 47
INDEPENDENT AUDITOR’S REPORT

Curtin University Annual Report 2016 Curtin University Annual Report 201648 49
INDEPENDENT AUDITOR’S REPORT (CONTINUED)

Curtin University Annual Report 2016 51Curtin University Annual Report 201650
CERTIFICATIONS
CERTIFICATION OF THE FINANCIAL STATEMENTS
The accompanying financial statements of Curtin University of Technology have been prepared in compliance with the relevant
provisions of the Financial Management Act 2006 from proper accounts and records to present fairly the financial transactions
for the financial year ended 31 December 2016 and the financial position as at 31 December 2016.
At the date of signing, we are not aware of any circumstances which would render any particulars included in the financial
statements misleading or inaccurate.
Colin Beckett Deborah Terry AO David Menarry
Chancellor Vice-Chancellor Chief Finance Officer
Dated this 22nd day of March 2017
CERTIFICATION OF THE FINANCIAL STATEMENTS REQUIRED BY THE DEPARTMENT OF EDUCATION AND TRAINING
We declare that the amount of Australian Government financial assistance expended during the financial year ended
31 December 2016 was for the purpose(s) for which it was intended and that Curtin University of Technology has complied
with applicable legislation, contracts, agreements and program guidelines in making expenditure.
Curtin University of Technology charged Student Services and Amenities Fees strictly in accordance with the Higher Education
Support Act 2003 and the Administration Guidelines made under the Act. Revenue from the fee was spent strictly in accordance
with the Act and only on services and amenities specified in subsection 19-38(4) of the Act.
Colin Beckett Deborah Terry AO
Chancellor Vice-Chancellor
Dated this 22nd day of March 2017
FINANCIAL REPORT 2016
Certifications ...............................................................................................................................51
Statement of Comprehensive Income .......................................................................................52
Statement of Financial Position ................................................................................................53
Statement of Changes in Equity ................................................................................................54
Statement of Cash Flows ............................................................................................................55
Report by the Members of the University Council ..................................................................103

Curtin University Annual Report 2016 Curtin University Annual Report 201652 53
STATEMENT OF FINANCIAL POSITIONas at 31 December 2016
Note 2016 $’000
2015 $’000
ASSETS
Current Assets
Cash and cash equivalents:
Unrestricted 19(a) 26,804 41,239
Restricted 19(b) 1,960 1,919
Receivables 20 28,058 26,981
Inventories 21 89 91
Other financial assets:
Unrestricted 22 450 887
Restricted 23 125,957 121,258
Other non-financial assets 24 29,616 35,967
Total Current Assets 212,934 228,342
Non-Current Assets
Receivables 20 57,525 60,573
Other financial assets – unrestricted 22 349,154 384,378
Other non-financial assets 24 3,790 4,012
Property, plant and equipment 25 974,767 880,113
Total Non-Current Assets 1,385,236 1,329,076
Total Assets 1,598,170 1,557,418
LIABILITIES
Current Liabilities
Trade and other payables 26 22,732 14,972
Borrowings 27 1,881 1,761
Provisions 28 71,873 70,034
Other liabilities 29 75,504 88,617
Total Current Liabilities 171,990 175,384
Non-Current Liabilities
Borrowings 27 52,595 54,475
Provisions 28 88,791 89,611
Total Non-Current Liabilities 141,386 144,086
Total Liabilities 313,376 319,470
Net Assets 1,284,794 1,237,948
EQUITY
Reserves 30 149,959 138,934
Retained earnings 30 1,134,835 1,099,014
Total Equity 1,284,794 1,237,948
The Statement of Financial Position should be read in conjunction with the accompanying notes.
STATEMENT OF COMPREHENSIVE INCOMEfor the year ended 31 December 2016
Note 2016 $’000
2015 $’000
Revenue from Continuing Operations
Australian Government financial assistance:
Australian Government grants 4 347,448 338,278
HELP – Australian Government payments 4 171,452 167,762
State and Local Government financial assistance 5 23,356 18,476
HECS-HELP – student payments 25,182 23,188
Fees and charges 6 227,153 223,152
Investment revenue 7 31,857 33,073
Royalties, trademarks and licences 8 30,139 46,475
Consultancy and contracts 9 30,487 30,981
Other revenue 10 28,070 28,613
Total Revenue from Continuing Operations 915,144 909,998
Net (loss)/gain on disposal of non-current assets 16 (48) (492)
Total Income from Continuing Operations 915,096 909,506
Expenses from Continuing Operations
Employee related expenses 11 546,004 509,457
Depreciation and amortisation 12 55,535 48,439
Repairs and maintenance 13 14,266 14,531
Borrowing costs 14 3,723 3,840
Impairment of assets 15 1,207 95
Deferred superannuation expense 11/44(b) 344 379
Other expenses 17 255,944 270,812
Total Expenses from Continuing Operations 877,023 847,553
Net result for the Year 38,073 61,953
Other Comprehensive Income
Items that may be reclassifed to profit or loss:
Net investment revaluation gain/(loss) 30(a) 8,773 1 ,449
Total Comprehensive Income 46,846 63,402
The Statement of Comprehensive Income should be read in conjunction with the accompanying notes.

Curtin University Annual Report 2016 Curtin University Annual Report 201654 55
Note2016
$’0002015
$’000
CASH FLOWS FROM OPERATING ACTIVITIES
Receipts
Australian Government grants received 4(g) 520,339 505,853
State and Local Government financial assistance 23,356 18,476
HECS-HELP – student payments 25,182 23,188
Fees and charges 230,645 224,627
Royalties, trademarks and licences 29,839 46,475
Consultancy and contract research 30,591 31,350
Interest received 1,318 2,049
Dividends received - 1,795
Distributions received 26,525 28,486
Other 7,088 11,479
GST refunds received 22,558 17,616
Payments
Payments for employee benefits (547,633) (507,279)
Payments to suppliers (275,688) (280,312)
Interest and other costs of finance paid (4,179) (3,757)
Net cash provided by/(used in) operating activities 41(b) 89,941 120,046
CASH FLOWS FROM INVESTING ACTIVITIES
Payments for property, plant and equipment (147,579) (133,069)
Proceeds on sale of property, plant and equipment 54 65
Payments for investments - -
Proceeds on redemption of investments 44,948 20,005
Net cash provided by/(used in) investing activities (102,577) (112,999)
CASH FLOWS FROM FINANCING ACTIVITIES
Repayment of borrowings (1,758) (1,878)
Proceeds from borrowings - -
Net cash provided by/(used in) financing activities (1,758) (1,878)
Net increase/(decrease) in cash and cash equivalents (14,394) 5,169
Cash and cash equivalents at the beginning of the financial year 43,158 37,989
Cash and cash equivalents at the end of the financial year 41(a) 28,764 43,158
STATEMENT OF CASH FLOWSfor the year ended 31 December 2016
The Statement of Cash Flows should be read in conjunction with the accompanying notes.
Note
Reserves
$’000
Retained Earnings
$’000
Total Equity $’000
Balance at 1 January 2015 127,266 1,047,280 1,174,546
Net result for the year - 61,953 61,953
Other comprehensive income for the year 30(a) 1,449 - 1,449
Transfers from retained earnings 30(b) 34,488 (34,488) -
Transfers to retained earnings 30(b) (24,269) 24,269 -
Balance at 31 December 2015 30 138,934 1,099,014 1,237,948
Net result for the year - 38,073 38,073
Other comprehensive income for the year 30(a) 8,773 - 8,773
Transfers from retained earnings 30(b) 32,943 (32,943) -
Transfers to retained earnings 30(b) (30,691) 30,691 -
Balance at 31 December 2016 30 149,959 1,134,835 1,284,794
STATEMENT OF CHANGES IN EQUITYfor the year ended 31 December 2016
The Statement of Changes in Equity should be read in conjunction with the accompanying notes.

Curtin University Annual Report 2016 Curtin University Annual Report 201656 57
1 SUMMARY OF SIGNIFICANT ACCOUNTING POLICIES
The principal accounting policies adopted in the preparation of the financial report are set out below. These policies have been consistently applied to all the years presented, unless otherwise stated.
The principal address of Curtin University of Technology is Kent Street, Bentley WA 6102.
(a) Basis of preparation
This general purpose financial report has been prepared in accordance with Australian Accounting Standards, other authoritative pronouncements of the Australian Accounting Standards Board (AASB), the requirements of the Department of Education and Training, applicable sections of the Financial Management Act 2006 and applicable Western Australian government Treasurer’s Instructions.
The financial statements and notes thereto comply with Australian Accounting Standards, some of which contain requirements specific to not-for-profit entities that are inconsistent with International Financial Reporting Standards requirements.
Date of authorisation for issueThe financial statements were authorised for issue by the members of the University Council on 22 March 2017.
Historical cost conventionThe financial statements have been prepared under the historical cost convention except for certain financial assets which are reported at fair value (refer Note 33).
Accrual basis of accountingThe financial statements, except for cash flow information, are prepared using the accrual basis of accounting.
Critical accounting estimatesThe preparation of financial statements in conformity with Australian Accounting Standards requires the use of certain critical accounting estimates. It also requires management to exercise its judgement in the process of applying the University’s accounting policies. The estimates and underlying assumptions are reviewed on an ongoing basis. The areas involving a higher degree of judgement or complexity, or areas where assumptions and estimates are significant to the financial statements, are disclosed in Note 2.
The financial report is presented in Australian dollars and all values are rounded to the nearest thousand dollars ($’000).
(b) Not-for-profit status
For the purpose of the application of Australian Accounting Standards and Interpretations, the University is considered to be a not-for-profit entity.
(c) Principles of consolidation
Consolidated financial statements are prepared by combining the financial statements of all entities that comprise the consolidated entity, being the University (the parent entity) and any controlled entities, in accordance with AASB 127 “Consolidated and Separate Financial Statements” and modified by Treasurer’s Instruction 1105 “Consolidated Financial Statements”.
Consolidated financial statements are not required as there are no material controlled entities.
(d) Revenue recognition
Revenue is measured at the fair value of the consideration received or receivable. Amounts disclosed as revenue are net of returns, trade allowances, rebates and amounts collected on behalf of third parties.
The University recognises revenue when the amount of revenue can be reliably measured, it is probable that the future economic benefits will flow to the University and specific criteria have been met.
Student feesStudent fees are recognised when the University has provided the service(s) to the student.
Notes To The Financial Statements (continued)for the year ended 31 December 2016
1 SUMMARY OF SIGNIFICANT ACCOUNTING POLICIES (continued)
Commonwealth supported student incomeIncome for Commonwealth Supported students is recognised when the University has provided the service(s) to the student.
Research incomeResearch grants from government are recognised as revenue when the University obtains control over the asset comprising the contributions. When the University does not have control of the contribution, does not have the right to receive the contribution or, in the case of reciprocal grants, has not fulfilled grant conditions, the grant contribution is treated as deferred income as a liability in the Statement of Financial Position.
Reciprocal research income from other entities is recognised as revenue when the University has provided the service to the customer. Non-reciprocal research income from other entities is recognised as revenue when the University obtains control over the asset comprising the contributions.
Unspent non-reciprocal research grant funds at the end of each financial year are recognised by way of a Research Grants Reserve (refer Note 30(b)). This reserve is released as expenditure is incurred.
Other government grantsOther grants from government are recognised as revenue when the University obtains control over the asset comprising the contributions. When the University does not have control over the contribution, does not have the right to receive the contribution or, in the case of reciprocal grants, has not fulfilled grant conditions, the grant contribution is treated as deferred income as a liability in the Statement of Financial Position.
Consultancy feesConsultancy fees are recognised as revenue when the University has provided the service(s) to the customer.
RoyaltiesRevenue from royalties is recognised when the University has provided the service(s) to the customer through their use of the University’s intellectual property.
Other contributions revenueDonations, gifts and other non-reciprocal contributions are recognised as revenue when the University obtains control over the assets comprising the contributions.
Contributions of assets are recognised at their fair value. Contributions of services are only recognised when a fair value can be reliably determined and the services would be purchased if not donated.
(e) Property, plant and equipment
All property, plant and equipment with a cost of greater than $5,000 (excluding GST) is recorded as a non-current asset at cost, less subsequent depreciation and impairment.
Borrowing costs that are directly attributable to the acquisition, construction or production of an asset that necessarily takes a substantial period of time to get ready for its intended use or sale are capitalised as part of the cost of that asset.
Assets acquired at no cost or for nominal consideration are initially recognised at their fair value at the date of acquisition.
Gains and losses on disposals are determined by comparing the disposal proceeds with the carrying amount and are included in the Statement of Comprehensive Income.
(f) Depreciation of non-current assets
All non-current assets having a limited useful life are depreciated or amortised over their estimated useful lives, in a manner which reflects the consumption of their future economic benefits.
NOTES TO THE FINANCIAL STATEMENTSfor the year ended 31 December 2016

Curtin University Annual Report 2016 Curtin University Annual Report 201658 59
1 SUMMARY OF SIGNIFICANT ACCOUNTING POLICIES (continued)
Depreciation is calculated on a straight-line basis from the time the asset becomes available for use. Estimated useful lives are as follows:
• Land .....................................................Not depreciated
• Buildings .............................................Lower of 50 years or remaining useful life
• Infrastructure .....................................Lower of 50 years or remaining useful life
• Leasehold land ...................................Lower of 50 years or remaining lease period
• Computing equipment .....................3 to 5 years
• Other equipment and furniture .......8 years
• Motor vehicles ....................................5 years
• Library collection ...............................10 years
• Works of art .......................................Not depreciated
Land and works of art controlled by the University are classified as non-current assets. They are anticipated to have indeterminate useful lives since their service potential is not, in any material sense, consumed. As such, no amount for depreciation is recognised.
Assets’ residual values and useful lives are reviewed, and adjusted if appropriate, at each reporting date.
In 2016 a new asset category, Infrastructure, was created to better reflect the nature of relevant assets. 2015 comparative data has been adjusted accordingly.
(g) Impairment of property, plant and equipment
Where the recoverable amount of an asset is less than its carrying amount, the carrying amount is reduced to the recoverable amount. That reduction is an impairment loss, which is recognised as an expense to the Statement of Comprehensive Income. In most cases recoverable amount is based on “value in use” and is determined as the depreciated replacement cost of the asset.
(h) Intangible assets
An intangible asset shall be recognised if, and only if:
(i) it is probable that expected future economic benefits are attributable to the asset and will flow to the University; and(ii) the cost of the asset can be measured reliably.
Intangible assets are recognised when the ongoing benefit to the University has been demonstrated and a useful life established.
(i) Leases
In accordance with AASB 117 “Leases”, leased assets classified as “finance leases” are recognised as assets. The amount initially brought to account as an asset is the present value of minimum lease payments. An equivalent finance lease liability is brought to account at the same time.
Finance leased assets are amortised on a straight-line basis over the estimated useful life of the asset.
Finance lease payments are allocated between interest expense and reduction of lease liability over the term of the lease. The interest expense is determined by applying the interest rate implicit in the lease to the outstanding lease liability at the beginning of each lease payment period.
Operating lease payments are recognised as an expense in the Statement of Comprehensive Income on a basis which reflects the pattern in which economic benefits from the leased asset are consumed.
(j) Inventories
Inventories are valued at the lower of cost and net realisable value. Costs are assigned by the method most appropriate to each particular class of inventory, with the majority being measured on a weighted average cost basis.
Notes To The Financial Statements (continued)for the year ended 31 December 2016
1 SUMMARY OF SIGNIFICANT ACCOUNTING POLICIES (continued)
(k) Receivables
Current accounts receivable are recognised at nominal amounts receivable as they are due for settlement no more than 30 days from the date of recognition. Non-current accounts receivable are recognised at fair value.
Collectibility of receivables is reviewed on an ongoing basis. Debts which are known to be uncollectible are written-off as bad debts. A provision for impaired receivables is raised when there is objective evidence that the University may not be able to collect the debt.
(l) Investments
In accordance with AASB 139 “Financial Instruments” investments, other than unlisted shares, are classified as available-for-sale and gains and losses arising from changes in fair value are recognised directly in other comprehensive income until the security is disposed of or is determined to be impaired, at which time the cumulative gain or loss previously recognised in equity is transferred to the Net Result for the period.
Any decline in the fair value of previously impaired available-for-sale investments is to be recognised in the Net Result for the period. Any increase in the fair value of previously impaired available-for-sale debt investments is to be recognised in the Net Result for the period to the extent of the initial impairment and thereafter taken to the Investments Revaluation Reserve. Any increase in the fair value of previously impaired available-for-sale equity investments is to be recognised in the Investment Revaluation Reserve in Equity.
Included within unlisted shares are investments in a number of unlisted companies which were established to commercialise intellectual property. Where a fair value cannot be reliably ascertained, unlisted shares are stated at historical cost unless there has been a permanent diminution in value, in which event a recoverable amount write-down is made. The University’s associates (refer Note 37) have not been equity accounted for in the University’s financial statements because they are not considered material.
Interest revenue and other investment income is recognised when earned.
(m) Joint research activities
The University participates in a number of joint research activities, such as Cooperative Research Centres. The University recognises within its financial statements: the assets that it controls, the liabilities that it incurs, the expenses that it incurs and its share of the income that it earns from the joint research activities.
(n) Loans receivable
Loans receivable are initially recognised at fair value, net of transaction costs incurred. Loans are subsequently measured at amortised cost.
Loans receivable are classified as current assets unless the counterparty has an unconditional right to defer settlement of the asset for at least 12 months after the reporting date, in which case they are classified as non-current.
(o) Payables
Payables, including accruals (expenses incurred but not yet billed), are recognised when the University becomes obliged to make future payments as a result of a purchase of assets or services received. Payables are generally settled within a 30 day term.
(p) Borrowings
Borrowings are initially recognised at fair value, net of transaction costs incurred. Borrowings are subsequently measured at amortised cost.
Borrowings are removed from the Statement of Financial Position when the obligation specified in the contract is discharged, cancelled or expired. The difference between the carrying amount of a financial liability that has been extinguished or transferred to another party and the consideration paid, including any non-cash assets transferred or liabilities assumed, is recognised in other income or other expenses.
Borrowings are classified as current liabilities unless the University has an unconditional right to defer settlement of the liability for at least 12 months after the reporting date, in which case they are classified as non-current.
Notes To The Financial Statements (continued)for the year ended 31 December 2016

Curtin University Annual Report 2016 Curtin University Annual Report 201660 61
1 SUMMARY OF SIGNIFICANT ACCOUNTING POLICIES (continued)
(q) Employee benefits
Annual leaveThis benefit is recognised at the reporting date in respect of employees’ service up to that date and is measured at the amounts expected to be paid when the liabilities are settled, including anniversary increments and anticipated salary increases. Annual leave that is not expected to be settled wholly within 12 months after the end of the reporting period and is therefore considered to be ‘other long-term employee benefits’. The provision for annual leave is classified as a current liability as the University does not have an unconditional right to defer settlement of the liability for at least 12 months after the end of the reporting period.
Long service leaveLong service leave is not expected to be settled wholly within 12 months after the end of the reporting period. When assessing expected future payments, consideration is given to expected future wage and salary levels, experience of employee departures and periods of service. Expected future payments are discounted using market yields at the reporting date on national government bonds with terms to maturity and currency that match, as closely as possible, the estimated future cash outflows.
Unconditional long service leave provisions are classified as current liabilities as the University does not have an unconditional right to defer settlement of the liability for at least 12 months after the reporting date.
The liability for conditional long service leave expected to be settled more than 12 months from the reporting date is recognised in the provision for employee benefits as a non-current liability and is measured at the present value of expected future payments to be made in respect of services provided by employees up to the reporting date.
SuperannuationThe University contributes to a number of superannuation schemes including both defined contribution and defined benefit schemes.
Payments to defined contribution schemes are charged as an expense as they fall due. The University’s obligation is limited to these contributions.
Defined benefit schemes provide a defined lump sum benefit to scheme members based on years of service and final average salary. A defined benefit liability is included in the Statement of Financial Position equal to the present value of the defined benefit obligation at the reporting date (less any past service costs not yet recognised) less the fair value of Scheme assets at the reporting date.
The cost of providing benefits is determined using the projected unit credit method, with actuarial valuations being carried out on an annual basis. Actuarial gains and losses are recognised in other comprehensive income. Where appropriate the University has adopted the multi employer provisions of AASB 119 “Employee Benefits”. This is currently relevant to the Unisuper Defined Benefit scheme.
Unfunded superannuationAn arrangement exists between the Commonwealth Government and the Western Australian Government to meet the unfunded liability for the University’s beneficiaries of the State Superannuation Schemes on an emerging cost basis. The unfunded liabilities have been recognised in the Statement of Financial Position under Provisions, with a corresponding asset recognised under Receivables. The recognition of both the asset and the liability concurrently does not affect the year end net asset position of the University. The liability and equivalent receivable are measured actuarially on an annual basis.
Termination benefitsTermination benefits are payable when employment is terminated before the normal retirement date, or when an employee accepts an offer of benefits in exchange for the termination of employment. The University recognises termination benefits either when it can no longer withdraw the offer of those benefits or when it has recognised costs for restructuring within the scope of AASB137 “Provisions, Contingent Liabilities and Contingent Assets” when it is demonstrably committed to terminating the employment of current employees according to a detailed formal plan without possibility of withdrawal.
Notes To The Financial Statements (continued)for the year ended 31 December 2016
1 SUMMARY OF SIGNIFICANT ACCOUNTING POLICIES (continued)
Accrued or prepaid salariesAccrued salaries represent the amount due to staff but unpaid at the end of the financial period, as the end of the last pay period for that financial year does not always coincide with the end of the financial period. The University considers that the nominal carrying amount approximates net fair value.
If the payroll is paid on a date prior to the end of the financial year, the amount prepaid which overlaps the year end is treated as a current asset.
(r) Foreign currency
Transactions denominated in a foreign currency are translated at the rates in existence at the dates of the transactions. Foreign currency monetary items, which can include cash, receivables and payables, are translated at exchange rates current at the reporting date. Exchange gains and losses are brought to account in the Net Result.
(s) Taxes
Income taxCurtin University of Technology is exempt from income tax as per Subdivision 50-B of the Income Tax Assessment Act 1997.
Goods and services tax (GST)Revenue, expenses and assets are recognised net of the amount of GST except:
• Where the GST incurred on a purchase of goods and services is not recoverable from the taxation authority, then the GST is recognised as part of the cost of acquisition or as part of the expense item as applicable; and
• Receivables and payables are stated with the amount of GST included.
The net amount of GST recoverable from, or payable to, the taxation authority is included as part of receivables or payables in the Statement of Financial Position.
Cash flows are included in the Statement of Cash Flows on a gross basis. The GST component of cash flows arising from investing activities, which is recoverable from or payable to the taxation authority, is classified as an operating cash flow.
Fringe benefits taxThe University is liable to pay Fringe Benefits Tax, and it is included in ‘Other Expenses’ in the Statement of Comprehensive Income.
Payroll taxThe University is liable to pay Payroll Tax, and it is included in ‘Employee related expenses’ in the Statement of Comprehensive Income.
(t) Other expenses
Borrowing costsBorrowing costs are recognised on an accrual basis.
Borrowing costs for qualifying assets are capitalised net of any investment income earned on the unexpended portion of the borrowings. Other borrowing costs are expensed when incurred.
Repairs and maintenanceAll repairs and maintenance expenditure is charged to the Statement of Comprehensive Income during the financial period in which it is incurred.
Research and developmentResearch and development costs, other than costs that meet the criteria for recognition as an intangible asset arising from development, are expensed to the Statement of Comprehensive Income as incurred.
(u) Comparative figures
Comparative figures have been, where appropriate, reclassified so as to be comparable with the figures presented in the current financial year.
Notes To The Financial Statements (continued)for the year ended 31 December 2016

Curtin University Annual Report 2016 Curtin University Annual Report 201662 63
1 SUMMARY OF SIGNIFICANT ACCOUNTING POLICIES (continued)
(v) Fair value
The University measures and recognises Available-for-sale financial assets at fair value on a recurring basis.
Fair value measurement of investments and other financial assets are based on quoted prices in an active market. If the market for a financial asset is not active (including unlisted securities), the University establishes fair value by using valuation techniques that maximise the use of relevant data. These include reference to the estimated price in an orderly transaction that would take place between market participants at the measurement date. Other valuation techniques used are the cost approach and the income approach based on the characteristics of the asset and the assumptions made by market participants.
(w) Externally operated campuses
The University provides its educational services through a number of campuses and other locations. The three campuses outside of Western Australia are managed and operated by third parties through contractual arrangements with the University. The University has no ownership or financial interest in these third party companies other than by way of the contractual arrangements.
OPERATOR CAMPUS
Colleges of Business and Technology (NSW) Pty Ltd (100% subsidiary of Navitas Limited)
Sydney1, New South Wales, Australia
Curtin Education Centre Pte Ltd (90% subsidiary of Navitas Limited)
Singapore
Curtin (Malaysia) Sdn Bhd Miri, Sarawak, Malaysia
1 The University’s Sydney campus is scheduled for closure in early 2017.
(x) New Accounting Standards and Interpretations
A number of new Accounting Standards and Interpretations have been published that are not mandatory for the 31 December 2016 reporting period. There is no early adoption of these Standards.
The University’s assessment of the new Standards and Interpretations that have been finalised is that there is no significant impact to the University’s financial statements for future reporting periods, except for the following new standards, the impacts for which have yet to be quantified:
• AASB 9 - Financial Instruments• AASB 15 - Revenue from Contracts with Customers• AASB 16 - Leases
Notes To The Financial Statements (continued)for the year ended 31 December 2016
Notes To The Financial Statements (continued)for the year ended 31 December 2016
2 CRITICAL ACCOUNTING ESTIMATES AND JUDGEMENTS
Estimates and judgements are continually evaluated based on historical experience and other factors, including expectations of future events that are believed to be reasonable under the circumstances.
(a) Critical accounting estimates and assumptions
The key assumptions made concerning the future, and other key sources of estimating uncertainty at the reporting date that have a significant risk of causing a material adjustment to the carrying amounts of assets and liabilities within the next financial year are:
• Superannuation benefits and associated assets/liabilities;• Discount and cost escalation rates used in estimating non-current provisions – discount rates are based on
market yields on government bonds;• Assessing impairment of assets including receivables, property, plant and equipment and investments; and• Estimating useful lives of non-current assets - the useful life reflects the consumption of the assets’ future
economic benefits.
(b) Critical judgements in applying the University’s accounting policies
The judgements that have been made in the process of applying accounting policies that have the most significant effect on the amounts recognised in the financial report include:
• Estimating the useful life of key assets;• Impairment of property, plant and equipment;• Impairment of receivables; and• Impairment of other financial assets (including investments).
3 DISAGGREGATED INFORMATION
Revenue Results1 Assets
2016$’000
2015$’000
2016$’000
2015$’000
2016$’000
2015$’000
Geographical
Australia 897,448 889,849 22,440 47,224 1,598,170 1,557,418
Asia 14,587 16,913 12,565 11,521 - -
Other 3,109 3,236 3,068 3,208 - -
Total 915,144 909,998 38,073 61,953 1,598,170 1,557,418
1 Results reflect revenue earned and expenses incurred in the geographical segments. Expenses are incurred in Australia for activities outside Australia and the net results for those activities do not reflect those expenses.

Curtin University Annual Report 2016 Curtin University Annual Report 201664 65
Notes To The Financial Statements (continued)for the year ended 31 December 2016
Note 2016 $’000
2015 $’000
4 AUSTRALIAN GOVERNMENT FINANCIAL ASSISTANCE INCLUDING AUSTRALIAN GOVERNMENT LOANS PROGRAMS (HELP)
(a) Commonwealth Grants Scheme (CGS) and Other Grants 45(a)
Commonwealth Grants Scheme 247,666 236,141
Indigenous Support Program 1,138 1,192
Disability Support Program 150 112
Partnership and Participation Program 5,407 6,536
Total Commonwealth Grants Scheme and Other Grants 254,361 243,981
(b) Higher Education Loan Programs 45(b)
HECS-HELP 144,428 139,838
FEE-HELP 24,785 25,326
SA-HELP 2,239 2,598
Total Higher Education Loan Programs 171,452 167,762
(c) Scholarships 45(c)
Australian Postgraduate Awards 7,217 7,001
Indigenous Access Scholarships 39 (4)
International Postgraduate Research Scholarships 568 540
Commonwealth Education Costs Scholarships 38 87
Commonwealth Accommodation Scholarships 21 28
Total Scholarships 7,883 7,652
(d) EDUCATION Research 45(d)
Joint Research Engagement Program 9,263 9,403
JRE Engineering Cadetship 156 154
Sustainable Research Excellence in Universities 3,039 2,302
Research Training Scheme 16,964 16,556
Research Infrastructure Block Grants 4,063 3,264
Total EDUCATION Research Grants 33,485 31,679
(e) Australian Research Council (ARC)
(i) Discovery 45(e)(i)
Project 7,002 7,109
Fellowships 2,472 3,265
Total Discovery 9,474 10,374
(ii) Linkages 45(e)(ii)
Infrastructure 1,539 631
Projects 3,494 3,771
Total Linkages 5,033 4,402
(iii) Centres 45(e)(iii)
Centres 939 452
Others 69 90
Total Centres 1,008 542
Total ARC 15,515 15,318
Notes To The Financial Statements (continued)for the year ended 31 December 2016
Note 2016 $’000
2015 $’000
4 AUSTRALIAN GOVERNMENT FINANCIAL ASSISTANCE INCLUDING AUSTRALIAN GOVERNMENT LOANS PROGRAMS (HELP) (continued)
(f) Other Australian Government Financial Assistance
Non-capital
CRC Cooperative Research Centres Funding 6,230 6,416
CSIRO Flagship Collaborative Research Program 220 2,830
National Drug Law Enforcement Research Fund - (17)
NHMRC Grants 5,642 4,303
Other Commonwealth Research Income 13,508 13,677
Other Teaching Grants 594 502
Other Commonwealth Grants 8,248 10,736
Research Funds from Other Universities 1,354 699
35,796 39,146
Capital
CRC Cooperative Research Centres Funding 14 -
NHMRC Grants 18 24
Other Commonwealth Research Income 39 478
Other Commonwealth Grants 325 -
Research Funds from Other Universities 12 -
408 502
Total Other Australian Government Financial Assistance 36,204 39,648
Total Australian Government Financial Assistance 518,900 506,040
Reconciliation
Australian Government grants [a+c+d+e+f] 347,448 338,278
HECS-HELP payments 144,428 139,838
FEE-HELP payments 24,785 25,326
SA-HELP payments 2,239 2,598
171,452 167,762
Total Australian Government Financial Assistance 518,900 506,040
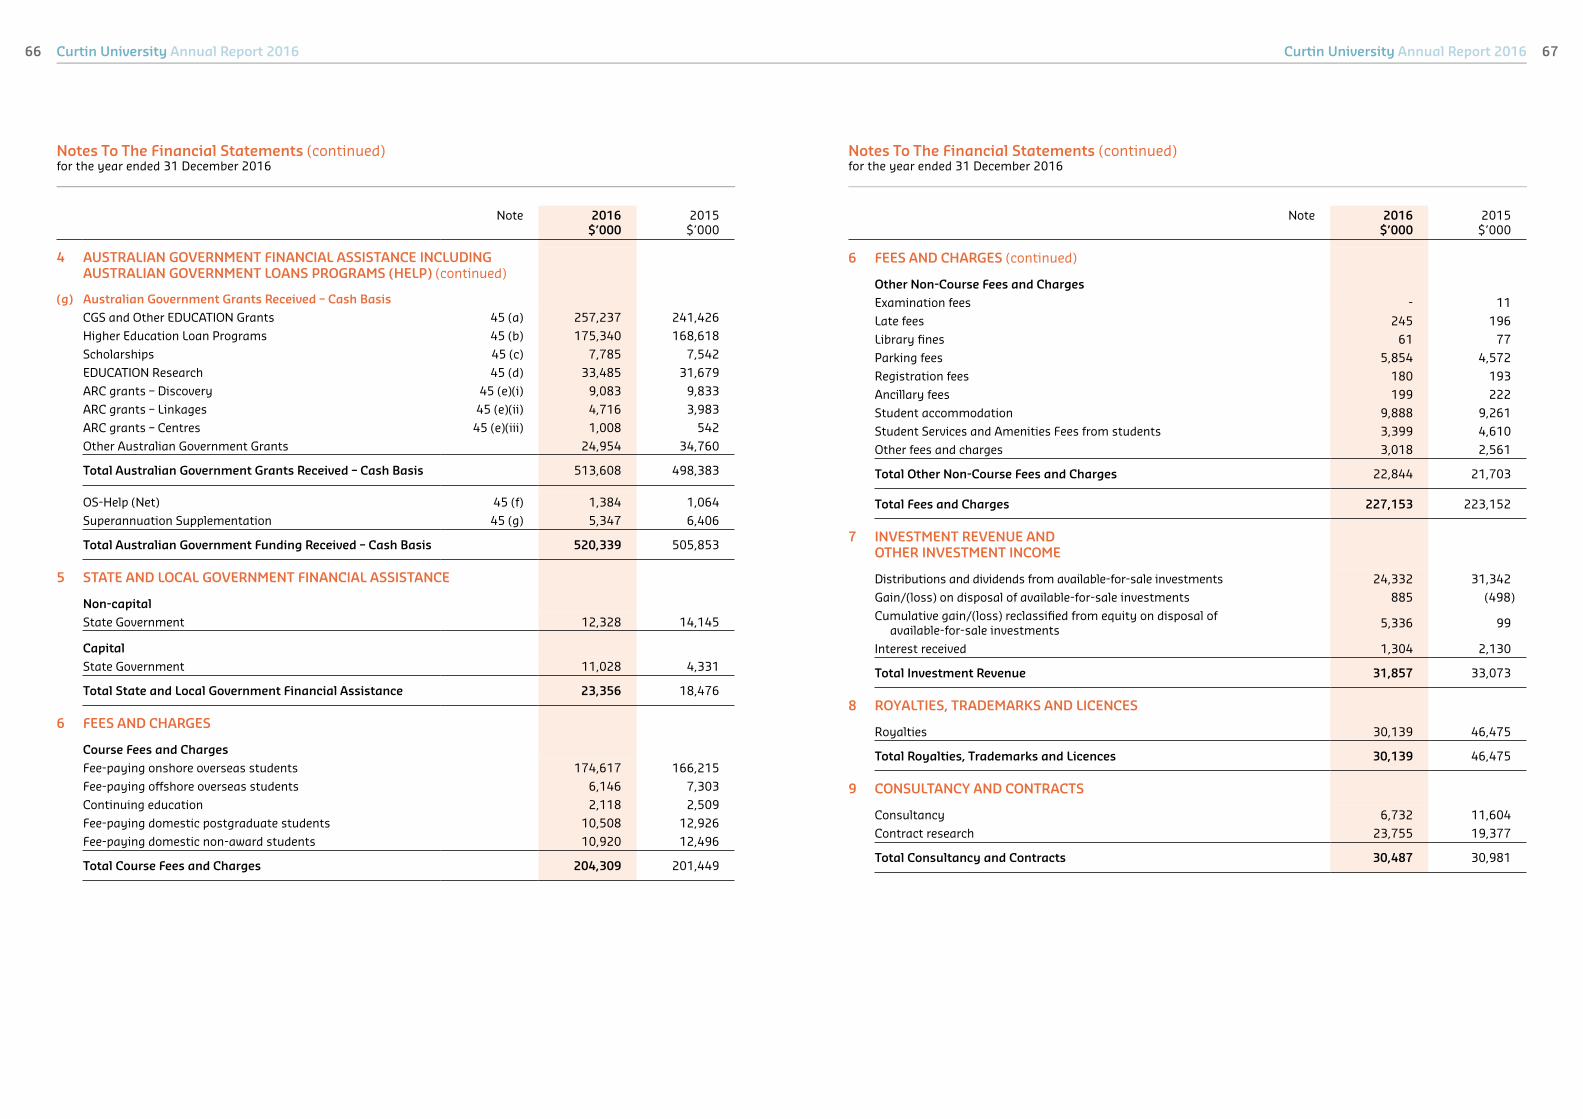
Curtin University Annual Report 2016 Curtin University Annual Report 201666 67
Note 2016 $’000
2015 $’000
4 AUSTRALIAN GOVERNMENT FINANCIAL ASSISTANCE INCLUDING AUSTRALIAN GOVERNMENT LOANS PROGRAMS (HELP) (continued)
(g) Australian Government Grants Received – Cash Basis
CGS and Other EDUCATION Grants 45 (a) 257,237 241,426
Higher Education Loan Programs 45 (b) 175,340 168,618
Scholarships 45 (c) 7,785 7,542
EDUCATION Research 45 (d) 33,485 31,679
ARC grants – Discovery 45 (e)(i) 9,083 9,833
ARC grants – Linkages 45 (e)(ii) 4,716 3,983
ARC grants – Centres 45 (e)(iii) 1,008 542
Other Australian Government Grants 24,954 34,760
Total Australian Government Grants Received – Cash Basis 513,608 498,383
OS-Help (Net) 45 (f) 1,384 1,064
Superannuation Supplementation 45 (g) 5,347 6,406
Total Australian Government Funding Received – Cash Basis 520,339 505,853
5 STATE AND LOCAL GOVERNMENT FINANCIAL ASSISTANCE
Non-capital
State Government 12,328 14,145
Capital
State Government 11,028 4,331
Total State and Local Government Financial Assistance 23,356 18,476
6 FEES AND CHARGES
Course Fees and Charges
Fee-paying onshore overseas students 174,617 166,215
Fee-paying offshore overseas students 6,146 7,303
Continuing education 2,118 2,509
Fee-paying domestic postgraduate students 10,508 12,926
Fee-paying domestic non-award students 10,920 12,496
Total Course Fees and Charges 204,309 201,449
Notes To The Financial Statements (continued)for the year ended 31 December 2016
Note 2016 $’000
2015 $’000
6 FEES AND CHARGES (continued)
Other Non-Course Fees and Charges
Examination fees - 11
Late fees 245 196
Library fines 61 77
Parking fees 5,854 4,572
Registration fees 180 193
Ancillary fees 199 222
Student accommodation 9,888 9,261
Student Services and Amenities Fees from students 3,399 4,610
Other fees and charges 3,018 2,561
Total Other Non-Course Fees and Charges 22,844 21,703
Total Fees and Charges 227,153 223,152
7 INVESTMENT REVENUE AND OTHER INVESTMENT INCOME
Distributions and dividends from available-for-sale investments 24,332 31,342
Gain/(loss) on disposal of available-for-sale investments 885 (498)
Cumulative gain/(loss) reclassified from equity on disposal of available-for-sale investments
5,336 99
Interest received 1,304 2,130
Total Investment Revenue 31,857 33,073
8 ROYALTIES, TRADEMARKS AND LICENCES
Royalties 30,139 46,475
Total Royalties, Trademarks and Licences 30,139 46,475
9 CONSULTANCY AND CONTRACTS
Consultancy 6,732 11,604
Contract research 23,755 19,377
Total Consultancy and Contracts 30,487 30,981
Notes To The Financial Statements (continued)for the year ended 31 December 2016
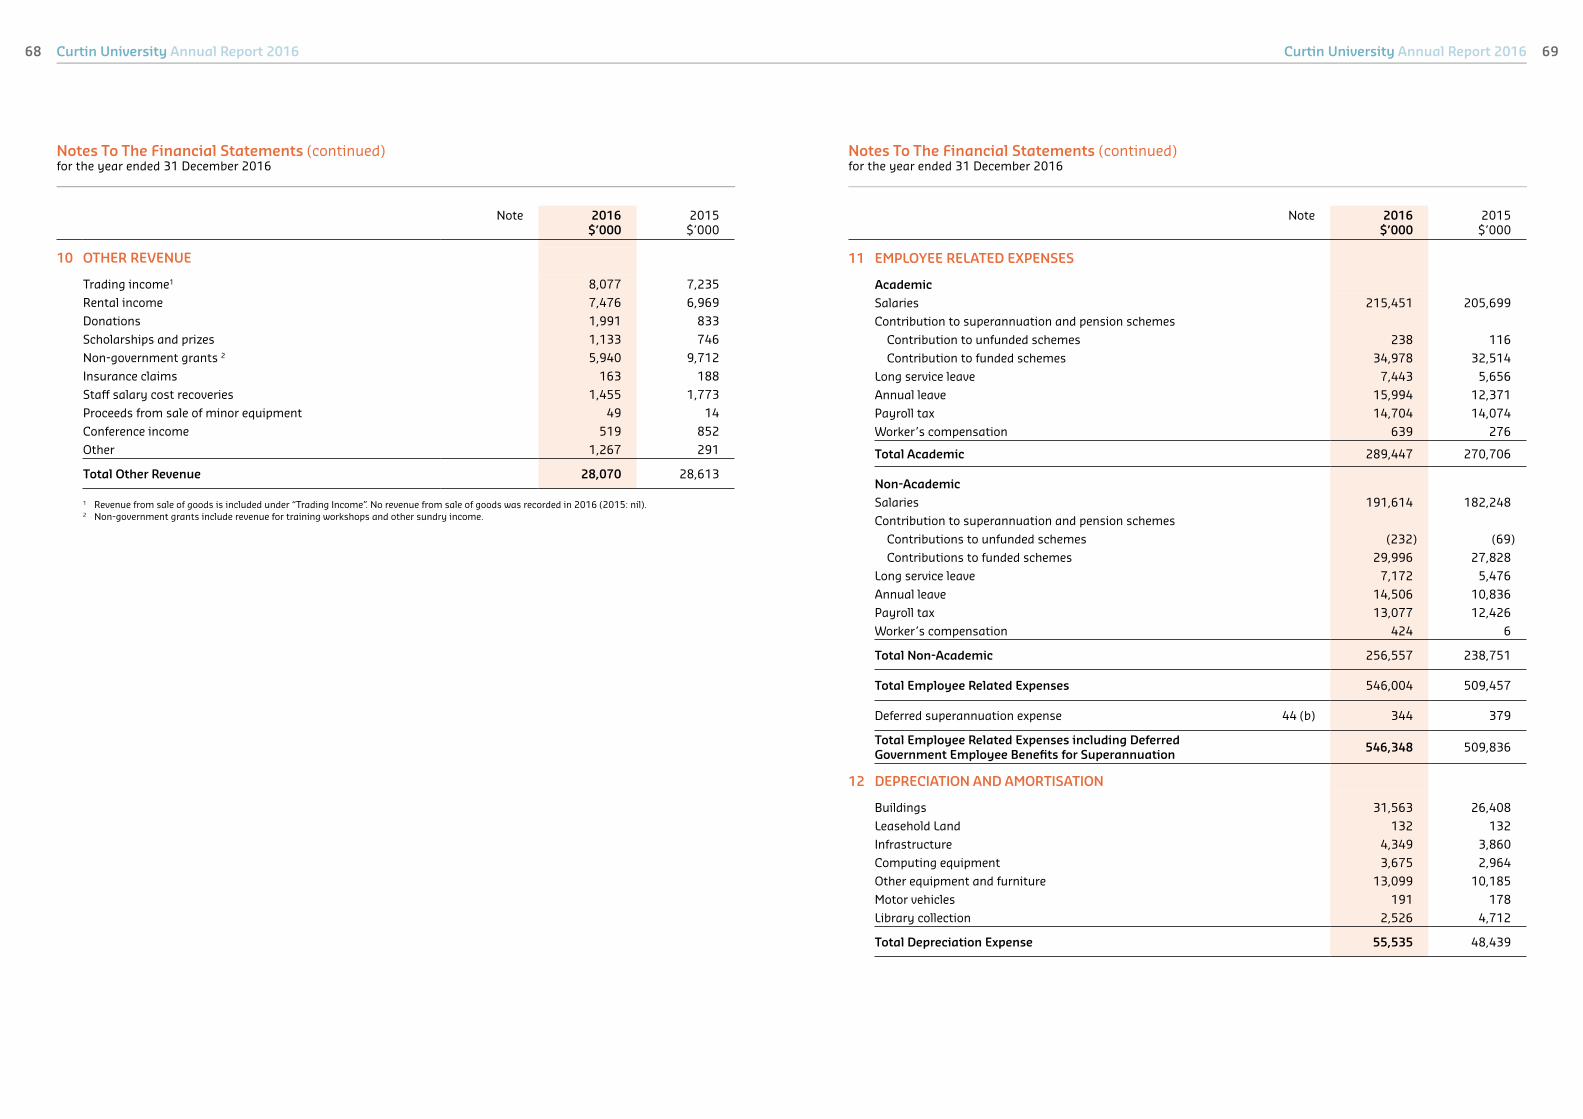
Curtin University Annual Report 2016 Curtin University Annual Report 201668 69
Note 2016 $’000
2015 $’000
10 OTHER REVENUE
Trading income1 8,077 7,235
Rental income 7,476 6,969
Donations 1,991 833
Scholarships and prizes 1,133 746
Non-government grants 2 5,940 9,712
Insurance claims 163 188
Staff salary cost recoveries 1,455 1,773
Proceeds from sale of minor equipment 49 14
Conference income 519 852
Other 1,267 291
Total Other Revenue 28,070 28,613
1 Revenue from sale of goods is included under “Trading Income”. No revenue from sale of goods was recorded in 2016 (2015: nil).2 Non-government grants include revenue for training workshops and other sundry income.
Notes To The Financial Statements (continued)for the year ended 31 December 2016
Note 2016 $’000
2015 $’000
11 EMPLOYEE RELATED EXPENSES
Academic
Salaries 215,451 205,699
Contribution to superannuation and pension schemes
Contribution to unfunded schemes 238 116
Contribution to funded schemes 34,978 32,514
Long service leave 7,443 5,656
Annual leave 15,994 12,371
Payroll tax 14,704 14,074
Worker’s compensation 639 276
Total Academic 289,447 270,706
Non-Academic
Salaries 191,614 182,248
Contribution to superannuation and pension schemes
Contributions to unfunded schemes (232) (69)
Contributions to funded schemes 29,996 27,828
Long service leave 7,172 5,476
Annual leave 14,506 10,836
Payroll tax 13,077 12,426
Worker’s compensation 424 6
Total Non-Academic 256,557 238,751
Total Employee Related Expenses 546,004 509,457
Deferred superannuation expense 44 (b) 344 379
Total Employee Related Expenses including Deferred Government Employee Benefits for Superannuation
546,348 509,836
12 DEPRECIATION AND AMORTISATION
Buildings 31,563 26,408
Leasehold Land 132 132
Infrastructure 4,349 3,860
Computing equipment 3,675 2,964
Other equipment and furniture 13,099 10,185
Motor vehicles 191 178
Library collection 2,526 4,712
Total Depreciation Expense 55,535 48,439
Notes To The Financial Statements (continued)for the year ended 31 December 2016

Curtin University Annual Report 2016 Curtin University Annual Report 201670 71
Note 2016 $’000
2015 $’000
13 REPAIRS AND MAINTENANCE
Building repairs 6,349 4,733
General infrastructure maintenance 6,589 8,341
Parks and gardens 1,328 1,457
Total Repairs and Maintenance 14,266 14,531
14 BORROWING COSTS
Interest on borrowings 3,723 3,840
Less: Amount capitalised - -
Total Borrowing Costs 3,723 3,840
15 IMPAIRMENT OF ASSETS
Bad debts written off/(recoveries) 28 (6)
Movement in provision for impaired receivables 796 188
Net impairment /(impairment reversal) of other financial assets
383 (87)
Total Impairment of Assets 1,207 95
16 NET LOSS/(GAIN) ON DISPOSAL OF NON-CURRENT ASSETS
Carrying amount of disposed non-current assets
Property, plant and equipment 102 557
Proceeds from disposal of non-current assets
Property, plant and equipment (54) (65)
Net Loss/(Gain) on Disposal of Non-Current Assets 48 492
Notes To The Financial Statements (continued)for the year ended 31 December 2016
Note 2016 $’000
2015 $’000
17 OTHER EXPENSES
Advertising, marketing and promotional 6,047 6,531
Agency staff costs 8,993 9,932
Books 4,621 4,820
Computer peripherals and parts 23,274 20,707
Consumables 12,010 14,085
Contract work 46,276 49,968
Exchange rate (gains)/losses 769 (194)
Fees and commissions 25,310 24,668
Financial assistance provided/research support 3,228 3,919
Graduations 907 969
Hospitality 3,427 3,802
Insurance 3,924 2,983
Inventory used and sold 468 1,004
Lease and rental 4,664 4,874
Non-capitalised equipment 6,224 5,963
Occupational health, safety and welfare 557 501
Partner service fees 6,658 18,616
Postage and courier 1,087 1,029
Publications 688 532
Scholarships, grants and prizes 49,623 46,273
Security 701 508
Staff development and training 4,566 4,620
Staff recruitment 1,493 2,052
Subscriptions 6,016 7,809
Telecommunications 1,784 2,367
Travel 16,183 14,581
Utilities and cleaning 13,820 15,022
Other 2,626 2,871
Total Other Expenses 255,944 270,812
18 DISCONTINUED OPERATIONS
There were no discontinued operations in 2016. In 2015 the University announced that its Sydney campus would close in 2017. The net result and net cash flows of the Sydney campus are not disclosed separately because they are not significant to the University’s financial results.
Notes To The Financial Statements (continued)for the year ended 31 December 2016

Curtin University Annual Report 2016 Curtin University Annual Report 201672 73
Note 2016 $’000
2015 $’000
19 CASH AND CASH EQUIVALENTS
(a) Cash and Cash Equivalents – Unrestricted
Cash at bank and on hand 1 26,804 34,115
Fixed Term Deposits 2 - 7,124
Total Cash and Cash Equivalents – Unrestricted 26,804 41,239
(b) Cash and Cash Equivalents – Restricted
Trust cash at bank 1 40 105
Trust Fixed Term Deposit 2 1,920 1,814
Total Cash and Cash Equivalents – Restricted 1,960 1,919
Total Cash and Cash Equivalents 28,764 43,158
1 Cash on hand is non-interest bearing. Cash at bank is subject to variable interest rates (refer Note 31). 2 Deposits are interest bearing at variable interest rates (refer Note 31). These deposits have an average maturity of 42 Days (2015: 78 days).
20 RECEIVABLES
Current
Student receivables 10,245 6,914
Less: Provision for impaired receivables (2,001) (1,213)
8,244 5,701
General receivables 15,942 17,453
Less: Provision for impaired receivables (177) (169)
15,765 17,284
Deferred government contribution for superannuation 44(b) 4,049 3,996
Total Current 28,058 26,981
Non-Current
Deferred government contribution for superannuation 44(b) 57,525 60,573
Total Receivables 85,583 87,554
Impaired receivables
As at 31 December 2016, current receivables for student fees with a nominal value of $2.001 million (2015: $1.213 million) were impaired. The amount of the provision was $2.001 million (2015: $1.213 million).
The ageing of these receivables is as follows:
Less than 12 months 351 3
Greater than 12 months 1,650 1,210
2,001 1,213
Notes To The Financial Statements (continued)for the year ended 31 December 2016
Note 2016 $’000
2015 $’000
20 RECEIVABLES (continued)
As at 31 December 2016, current receivables for student fees of $3.460 million (2015: $2.243 million) were past due date but not impaired.
The ageing of these receivables is as follows:
Less than 12 months 3,460 2,243
Greater than 12 months - -
3,460 2,243
Movements in the provision for impaired student fees receivables are as follows:
Balance at start of year 1,213 979
Provision for impairment recognised during the year 832 236
Receivables written-off during the year as uncollectible (44) (2)
Unused amount reversed - -
Balance at end of year 2,001 1,213
As at 31 December 2016, current general receivables with a nominal value of $0.177 million (2015: $0.169 million) were impaired.
The ageing of these receivables is as follows:
Less than 12 months 22 16
Greater than 12 months 155 153
177 169
As at 31 December 2016, current general receivables of $11.371 million (2015: $10.701 million) were past due date but not impaired.
The ageing of these receivables is as follows:
Less than 12 months 11,371 10,701
Greater than 12 months - -
11,371 10,701
Movements in the provision for impaired general receivables are as follows:
Balance at start of year 169 215
Receivables written-off during the year as uncollectible - -
Provision for impairment recognised during the year 177 -
Unused amount reversed (169) (46)
Balance at end of year 177 169
Notes To The Financial Statements (continued)for the year ended 31 December 2016

Curtin University Annual Report 2016 Curtin University Annual Report 201674 75
Note 2016 $’000
2015 $’000
21 INVENTORIES
Inventories not held for resale:
General stores 89 91
Total Inventories 89 91
22 OTHER FINANCIAL ASSETS – UNRESTRICTED
Current
Loans receivable
Other loans 450 887
Total Current Other Financial Assets 450 887
Non-Current
Available-for-Sale
Funds under management 336,291 373,343
Unlisted shares and warrants 12,863 11,035
Total Non-Current Other Financial Assets 349,154 384,377
Total Other Financial Assets – Unrestricted 349,604 385,264
23 OTHER FINANCIAL ASSETS – RESTRICTED
Current Available-for-Sale
Restricted funds under management
Research activities 88,202 85,950
Donations and prizes 30,517 28,422
Trusts 7,238 6,886
Total Restricted Funds Under Management (at fair value) 125,957 121,258
Total Restricted Other Financial Assets 125,957 121,258
Restricted funds are held as cash (refer Note 19(b)) or invested as managed funds.
All available-for-sale financial assets are denominated in Australian currency. For an analysis of the credit risk and sensitivity of available-for-sale financial assets to price and interest rate risk, refer to Note 31.
24 OTHER NON-FINANCIAL ASSETS
Current
Prepayments 25,304 24,432
Accrued income 4,312 11,535
Total Current Other Non-Financial Assets 29,616 35,967
Non-Current
Prepayments 3,790 4,012
Total Non-Current Other Non-Financial Assets 3,790 4,012
Total Other Non-Financial Assets 33,406 39,979
Notes To The Financial Statements (continued)for the year ended 31 December 2016
Note 2016 $’000
2015 $’000
25 PROPERTY, PLANT AND EQUIPMENT
Land ¹
At cost 78,998 78,998
Accumulated impairment - -
78,998 78,998
Buildings
At cost 851,916 733,923
Accumulated depreciation and impairment (239,648) (208,272)
612,268 525,651
Infrastructure
At cost 117,984 110,382
Accumulated depreciation and impairment (29,580) (25,231)
88,404 85,151
Leasehold land
At cost 4,654 4,654
Accumulated depreciation (1,745) (1,612)
2,909 3,042
Work in progress
At cost 85,980 93,196
Computing equipment
At cost 27,193 19,684
Accumulated depreciation (17,166) (13,491)
10,027 6,193
Other equipment and furniture
At cost 144,916 128,369
Accumulated depreciation (83,925) (72,181)
60,991 56,188
Motor vehicles
At cost 1,276 1,341
Accumulated depreciation (952) (899)
324 442
Library collections
At cost 29,293 23,345
Accumulated depreciation (7,238) (4,712)
22,055 18,633
Works of art
At cost 12,811 12,619
Total Property, Plant and Equipment 974,767 880,113
¹ Parts of the sites upon which the University is located at, in particular the Bentley and Kalgoorlie campuses, are vested in the University by the government of Western Australia.
Notes To The Financial Statements (continued)for the year ended 31 December 2016

Curtin University Annual Report 2016 77Curtin University Annual Report 201676
25
P
RO
PE
RT
Y, P
LAN
T A
ND
EQ
UIP
ME
NT
(co
nti
nu
ed)
Rec
on
cili
ati
on
s o
f th
e ca
rry
ing
am
ou
nts
of
pro
per
ty, p
lan
t a
nd
eq
uip
men
t a
t th
e b
egin
nin
g a
nd
en
d o
f th
e cu
rren
t fi
na
nci
al y
ear
are
set
ou
t b
elo
w.
No
tes
To
Th
e F
ina
nci
al
Sta
tem
en
ts (
con
tin
ued
)fo
r th
e y
ear
end
ed 3
1 D
ecem
ber
20
16
20
16
Lan
d
$’0
00
Bu
ild
ing
s
$’0
00
Infr
ast
ruct
ure
1
$’0
00
Lea
seh
old
lan
d
$’0
00
Wo
rk in
pro
gre
ss
$’0
00
Co
mp
uti
ng
equ
ipm
ent
$’0
00
Oth
er
equ
ipm
ent
an
d
furn
itu
re
$’0
00
Mo
tor
veh
icle
s
$’0
00
Lib
rary
colle
ctio
n
$’0
00
Wo
rks
of
art
$’0
00
To
tal
$’0
00
Ca
rry
ing
am
ou
nt
at
sta
rt o
f y
ear
78
,99
8
52
5,6
51
8
5,1
51
3
,04
2
93
,19
6
6,1
93
5
6,1
88
4
42
1
8,6
33
1
2,6
19
8
80
,11
3
Ad
dit
ion
s -
3
45
-
-
1
24
,62
0
7,0
59
1
2,1
24
9
2
5,9
48
1
03
1
50
,29
1
Co
st o
f d
isp
osa
ls -
(
20
0)
-
(1
) -
-
(
1,4
12
) (
15
7)
-
(1
3)
(1
,78
3)
Acc
um
ula
ted
dep
reci
ati
on
on
d
isp
osa
ls -
1
88
-
-
-
-
1
,35
5
13
8
-
-
1,6
81
Tra
nsf
ers
in/(
ou
t) -
1
17
,84
7
7,6
02
-
(
13
1,8
36
) 4
50
5
,83
5
-
-
10
2
-
Dep
reci
ati
on
ch
arg
e -
(
31
,56
3)
(4
,34
9)
(1
32
) -
(
3,6
75
) (
13
,09
9)
(1
91
) (
2,5
26
) -
(
55
,53
5)
Ca
rry
ing
am
ou
nt
at
en
d o
f y
ea
r 7
8,9
98
6
12
,26
8
88
,40
4
2,9
09
8
5,9
80
1
0,0
27
6
0,9
91
3
24
2
2,0
55
1
2,8
11
9
74
,76
7
20
15
Ca
rry
ing
am
ou
nt
at
sta
rt o
f y
ear
78
,99
8
49
9,3
92
8
1,4
42
3
,17
4
49
,19
5
6,4
05
4
9,5
29
4
74
1
8,0
67
1
2,5
50
7
99
,22
6
Ad
dit
ion
s -
2
05
-
-
1
11
,47
4
2,3
76
1
0,3
34
1
46
5
,27
8
70
1
29
,88
3
Co
st o
f d
isp
osa
ls -
(
1,4
74
) -
-
-
(
21
) (
1,0
74
) (
12
2)
(6
,62
4)
(1
) (
9,3
16
)
Acc
um
ula
ted
dep
reci
ati
on
on
d
isp
osa
ls -
9
79
-
-
-
2
1
1,0
13
1
22
6
,62
4
-
8,7
59
Tra
nsf
ers
in/(
ou
t) -
5
2,9
57
7
,56
9
-
(6
7,4
73
) 3
76
6
,57
1
-
-
-
-
Dep
reci
ati
on
ch
arg
e -
(
26
,40
8)
(3
,86
0)
(1
32
) -
(
2,9
64
) (
10
,18
5)
(1
78
) (
4,7
12
) -
(
48
,43
9)
Ca
rry
ing
am
ou
nt
at
end
of
yea
r 7
8,9
98
5
25
,65
1
85
,15
1
3,0
42
9
3,1
96
6
,19
3
56
,18
8
44
2
18
,63
3
12
,61
9
88
0,1
13
1 In
20
16
a n
ew a
sset
ca
teg
ory
, In
fra
stru
ctu
re, w
as
crea
ted
to
bet
ter
refl
ect
the
na
ture
of
rele
van
t a
sset
s. 2
01
5 c
om
pa
rati
ve d
ata
ha
s b
een
ad
just
ed a
cco
rdin
gly
.
Notes To The Financial Statements (continued)for the year ended 31 December 2016
Note 2016 $’000
2015 $’000
26 TRADE AND OTHER PAYABLES
Current
Total Payables 22,732 14,972
27 BORROWINGS
Current
Interest bearing Treasury loans 1,881 1,761
Non-Current
Interest bearing Treasury loans 52,595 54,475
Total Borrowings 54,476 56,236
Treasury Loans
The University has the following loans with the WA Treasury Corporation:
Principal outstanding
Average Interest
rate
Maturity date
2016
$’000
2015
$’000
Muresk Campus housing
– fixed rate interest only quarterly repayments with the loan principal to be repaid at date of maturity
6.50% 15.07.2018 2,050 2,050
Bentley Campus housing
– fixed rate interest only quarterly repayments with the loan principal to be repaid at date of maturity
7.05% 15.01.2018 16,800 16,800
Chemistry Centre of WA building
– monthly principal and fixed rate interest repayments 6.77% 01.07.2029 31,982 33,542
– monthly principal and fixed rate interest repayments 5.11% 01.07.2029 3,644 3,844
Total Treasury Loans 54,476 56,236

Curtin University Annual Report 2016 Curtin University Annual Report 201678 79
Notes To The Financial Statements (continued)for the year ended 31 December 2016
Note 2016 $’000
2015 $’000
27 BORROWINGS (continued)
Financing facilities available
At reporting date, the following financing facilities had been negotiated and were available:
Total facilities:
– Treasury Loans 54,476 56,236
Facilities used at reporting date:
– Treasury Loans 54,476 56,236
Facilities unused at reporting date:
– Treasury Loans - -
Assets pledged as security
The University has not pledged any assets as security against the borrowings. The loans are secured by a State Government Treasurer’s Guarantee.
2016 2015
Carrying Amount
$’000
Fair Value$’000
Carrying Amount
$’000
Fair Value
$’000
Muresk Campus housing
– fixed rate interest only quarterly repayments with the loan principal to be repaid at date of maturity
2,050 2,216 2,050 2,283
Bentley Campus housing
– fixed rate interest only quarterly repayments with the loan principal to be repaid at date of maturity
16,800 17,947 16,800 18,608
Chemistry Centre of WA building
– monthly principal and fixed rate interest repayments 31,982 39,018 33,542 41,114
– monthly principal and fixed rate interest repayments 3,644 4,065 3,844 4,283
Total Treasury Loans 54,476 63,246 56,236 66,288
Fair valueThe carrying amounts and fair values of borrowings at balance date are:
The fair value of the loans have been prepared assuming hypothetical settlement dates of 31 December 2016 and 31 December 2015.
Notes To The Financial Statements (continued)for the year ended 31 December 2016
Note 2016 $’000
2015 $’000
28 PROVISIONS
Employee benefits provisions
Current provisions expected to be settled within 12 months
Annual leave 30,390 30,204
Long service leave 21,086 19,637
Employment on-costs 3,346 3,239
Redundancy costs 1,474 3,551
Defined benefit obligation
– Deferred employee benefits for unfunded superannuation 44(b) 4,049 3,996
– Other University pension liabilities 44(a) 120 113
60,465 60,740
Current provisions expected to be settled after more than 12 months
Annual leave 2,210 1,902
Long service leave 7,861 5,643
Employment on-costs 655 491
Redundancy costs 682 1,258
11,408 9,294
Total Current Provisions 71,873 70,034
Non-Current
Employee benefits provisions
Long service leave 28,753 26,546
Employment on-costs 1,869 1,726
Defined benefit obligation
– Deferred employee benefits for unfunded superannuation 44(b) 57,525 60,573
– Other University pension liabilities 44(a) 644 766
Total Non-Current Provisions 88,791 89,611
Total Provisions 160,664 159,645

Curtin University Annual Report 2016 Curtin University Annual Report 201680 81
Notes To The Financial Statements (continued)for the year ended 31 December 2016
Note 2016 $’000
2015 $’000
28 PROVISIONS (continued)
Movements in Other Provisions
Movements in each class of provision during the financial year, other than employee benefits, are set out below:
Employment on-costs provision
Balance at beginning of year 5,456 5,591
Addition/(reduction) in provisions recognised 2,899 2,239
Reduction arising from payments (2,485) (2,374)
Balance at end of year 5,870 5,456
Redundancy costs provision
Balance at beginning of year 4,809 4,064
Addition/(reduction) in provisions recognised (1,874) 1,654
Reduction arising from payments (779) (909)
Balance at end of year 2,156 4,809
29 OTHER LIABILITIES
Current
Income received in advance 46,428 43,349
Accrued expenses 19,878 36,485
Monies held in trust 9,198 8,783
Total Other Liabilities 75,504 88,617
30 EQUITY
Reserves
Investments revaluation reserve 30(a) 61,757 52,984
Research grants reserve 30(b) 88,202 85,950
Total Reserves 149,959 138,934
Retained earnings 1,134,835 1,099,014
Notes To The Financial Statements (continued)for the year ended 31 December 2016
Note 2016 $’000
2015 $’000
30 EQUITY (continued)
(a) Investments revaluation reserve
The investments revaluation reserve arises on the revaluation of available-for-sale financial assets. Where a revalued financial asset is sold, that portion of the reserve which relates to that financial asset and is effectively realised, is recognised in the Net Result. Where a revalued financial asset is impaired, the portion of the reserve which relates to that financial asset is transferred to the Net Result.
Movement in reserve
Balance at beginning of year 52,984 51,535
Unrealised valuation gain/(loss) 14,492 1,276
Realised (gain)/loss on sale of financial assets (5,336) 250
Impairment reversal/(impairment) of financial assets (383) (77)
Movement for the year 8,773 1,449
Balance at end of year 61,757 52,984
(b) Research grants reserve
Non-reciprocal research grants are required by Accounting Standards to be recognised as income when the University obtains control over the asset comprising the contributions. This reserve is provided for the balance of unspent research grants at the end of each financial year.
Balance at beginning of year 85,950 75,731
Transfer to reserves 32,943 34,488
Transfers from reserves (30,691) (24,269)
Balance at end of year 88,202 85,950

Curtin University Annual Report 2016 Curtin University Annual Report 201682 83
Notes To The Financial Statements (continued)for the year ended 31 December 2016
31 FINANCIAL INSTRUMENTS
Weighted Average Effective Interest
Rate%
Non- interest bearing
$’000
Variable interest
rate
$’000
Fixed interest
rate
$’000
Total Carrying Amount
$’000
Maturity Profile
Foreign Exchange Risk Sensitivity 2 Interest Rate Risk Sensitivity Price Risk Sensitivity 3
Credit Risk
$’000
-10% +10% -200 bps +200 bps -15% +15%
Less than 1 year
$’000
1-5 years
$’000
More than
5 years$’000
Net Result
$’000
OtherEquity
$’000
Net Result
$’000
OtherEquity
$’000
Net Result
$’000
OtherEquity
$’000
Net Result
$’000
OtherEquity
$’000
Net Result
$’000
OtherEquity
$’000
Net Result
$’000
OtherEquity
$’000
2016
Financial Assets
Cash and cash equivalents 1.55% 1 28,763 - 28,764 28,764 - - - - - - (996) - 996 - - - - - -
Receivables - 24,009 - - 24,009 24,009 - - - - - - - - - - - - - - 24,009
Loans receivable - 450 - - 450 450 - - - - - - - - - - - - - - 450
Unlisted securities (unrestricted) - 12,863 - - 12,863 - 12,863 - - - - - - - - - - - - - -
Funds under management (unrestricted)1,4 - 334,324 1,967 - 336,291 - 3,683 332,608 - 4,067 - (4,067) - - - - (466) (49,981) 24 50,423 1,967
Funds under management (restricted)4 - 125,957 - - 125,957 - - 125,957 - - - - - - - - (175) (18,720) 9 18,886 -
Total Financial Assets 497,604 30,730 - 528,334 53,223 16,546 458,565 - 4,067 - (4,067) (996) - 996 - (641) (68,701) 33 69,309 26,426
Financial Liabilities
Payables 22,732 - - 22,732 22,732 - - - - - - - - - - - - - - -
Borrowings 6.73% - - 54,476 54,476 1,881 27,740 24,855 - - - - - - - - - - - - -
Total Financial Liabilities 22,732 - 54,476 77,208 24,613 27,740 24,855 - - - - - - - - - - - - -
2015
Financial Assets
Cash and cash equivalents 2.17% 5 43,153 - 43,158 43,158 - - - - - - (1,451) - 1,451 - - - - - -
Receivables - 22,985 - - 22,985 22,985 - - - - - - - - - - - - - - 22,985
Loans receivable - 887 - - 887 887 - - - - - - - - - - - - - - 887
Unlisted securities (unrestricted) - 11,035 - - 11,035 - 11,035 - - - - - - - - - - - - - -
Funds under management (unrestricted)1,4 - 371,431 1,912 - 373,343 - 3,601 369,742 - 4,661 - (4,661) - - - - (1,129) (54,874) 66 55,937 1,912
Funds under management (restricted)4 - 121,258 - - 121,258 - - 121,258 - - - - - - - - (367) (17,822) 21 18,168 -
Total Financial Assets 527,601 45,065 - 572,666 67,030 14,636 491,000 - 4,661 - (4,661) (1,451) - 1,451 - (1,496) (72,696) 87 74,105 25,784
Financial Liabilities
Payables - 14,972 - - 14,972 14,972 - - - - - - - - - - - - - - -
Borrowings 6.73% - - 56,236 56,236 1,761 27,174 27,301 - - - - - - - - - - - - -
Total Financial Liabilities 14,972 - 56,236 71,208 16,733 27,174 27,301 - - - - - - - - - - - - -
¹ Funds under management mainly comprise investments in unit based funds. Credit risk exposure relates only to funds under management not in unit-based funds.
2 A positive number indicates an increase in operating surplus and equity where the Australian dollar weakens against the foreign currency.3 Net Result would not be affected if prices increased by 15% as the equity investments are classified as available-for-sale with gains recognised directly in
equity. However, Net Result would be affected if prices decreased by 15% with further decreases in value of previously impaired available–for–sale assets recognised in the Net Result.
4 Funds under management in unit-based funds receive income by way of distributions and do not attract interest.

Curtin University Annual Report 2016 Curtin University Annual Report 201684 85
Notes To The Financial Statements (continued)for the year ended 31 December 2016
32 FINANCIAL RISK MANAGEMENT
Financial instruments held by the University are cash and cash equivalents, receivables, available-for-sale financial assets, borrowings and payables. The University has exposure to financial risks. The University’s overall risk management program focuses on managing the risks identified below.
(a) Market Risk
Market risk is the risk that the fair value or future cash flows of financial instruments will fluctuate because of changes in market prices. Components of market risk to which the University is exposed are:
(i) Interest Rate RiskThe University is exposed to interest rate risk from its use of interest bearing financial assets and liabilities. Non-derivative interest bearing assets are predominantly short term liquid assets, i.e. cash, cash deposits, interest-bearing loans advanced and some funds under management. The University’s main interest rate liability risk arises from borrowings issued at fixed rates, which give exposure to fair value interest rate risk, and from borrowings at a variable interest rate, which give rise to cash flow interest rate risk. The University manages its borrowings in accordance with targeted interest rate, liquidity and debt portfolio maturity profiles. Notes 27 and 31 provide further detail.
Note 31 details the University’s sensitivity to a 200 basis point increase or decrease in interest rates assuming the change took place at the beginning of the financial year and held constant throughout the reporting period. There is no significant exposure to interest rate risks.
(ii) Foreign Currency RiskThe University is exposed to foreign currency risk when income from overseas operations, such as royalties and offshore partner fees, is received in foreign currency.
The University manages this risk by conducting its contracts and business in Australian dollars where it is commercially practical to do so. Furthermore, the University seeks to hedge any material, highly probable, foreign currency transactions by way of permitted instruments with appropriate counterparties. The University does not undertake speculative positions on movements in foreign currency exchange rates.
The University holds available-for-sale investments whose underlying assets include some investments denominated in foreign currency which are unhedged.
At 31 December 2016, the University held no foreign currency forward exchange contracts.
(iii) Price RiskPrice risk arises when there is a possibility of decline in the value of investments. It refers to the risk that the value of an investment will fluctuate due to changes in market prices. Investments include unlisted securities and funds under management. Note 31 details the University’s sensitivity to a 15% increase or decrease in prices at reporting date on its funds under management. At reporting date, if the inputs to valuation of funds under management had been 15% higher, Equity would have been $69.309 million (2015: $74.105 million) higher and the Net Result would have been $0.033 million (2015: $0.087 million) higher due to the reversal of previously impaired available-for-sale debt investments. However, if the inputs to the valuation of the funds under management had been 15% lower, the devaluation would have reduced the Equity Reserve by $68.701 million (2015: $72.696 million) and the impairment loss that would have been recognised through the Net Result on previously impaired assets would have been $0.641 million (2015: $1.496 million).
The University’s sensitivity to price risk has decreased over the period due to reduced equity investments held.
Notes To The Financial Statements (continued)for the year ended 31 December 2016
32 FINANCIAL RISK MANAGEMENT (continued)
(b) Credit Risk
Credit risk is the risk that a contracting entity will not complete its obligations under a financial instrument resulting in a financial loss to the University. The University has exposure to credit risk and financial loss on financial assets included in the Statement of Financial Position, comprising receivables, and other financial assets.
Procedures are in place to minimise exposure to credit risk associated with students and other debtors. The credit risk on funds under management and derivative financial instruments is limited as the counterparties are generally either with banks or investment grade fund managers. For an analysis of credit risk of the University refer to Note 31.
The University’s funds under management subject to credit risk has reduced and certain zero coupon bonds held are endowed with capital protection mechanisms. At reporting date, some previously impaired available-for-sale debt investments increased in value resulting in reversal of impairments to the Net Result of $0.055 million (2015: $0.087 million).
(c) Liquidity Risk
Liquidity risk refers to the risk of financial loss to the University as a result of insufficient funds being available to meet its short and long term liabilities.
The University manages liquidity risk by maintaining adequate cash and cash equivalent balances, monitoring forecast and actual cash flows and matching the maturity profiles of financial assets and liabilities.
33 FAIR VALUE
(a) Fair Value Measurements
The fair values of financial assets and financial liabilities shown in Note 31 are determined as follows:
• Due to the short-term nature of current receivables and payables, their carrying value is assumed to approximate fair value and, based on credit history, it is expected that the receivables that are neither past due date nor impaired will be received when due.
• Available-for-sale equity financial assets are traded on an active market. Hence, the fair value of these investments is based on quoted market prices at the reporting date (Level 1). The fair value of available-for-sale debt financial assets are determined based on market prices of financial assets with similar maturity and risk profiles due to the illiquidity of these financial assets (Level 2).
• Unlisted shares are not traded on an active market and are measured at cost which is assumed to approximate fair value, except where an unobservable input can be measured reliably.
• The fair value of loans to related entities are estimated for disclosure purposes by discounting the future contractual cash flows at the University’s weighted average interest rate of cash and cash equivalents.
• The fair value of borrowings is based on cash flows discounted using borrowing rates provided by the Western Australian Treasury Corporation. The rates vary between 5% to 7% depending on the purpose of the borrowing (2015: 5% to 7%). The fair value of the borrowings equals the carrying amount including additional charges and adjustments provided by the Western Australian Treasury Corporation, had the University terminated the loans at 31 December of each year.

Curtin University Annual Report 2016 Curtin University Annual Report 201686 87
2016 2015 2016 2015 2016 Fair Value Hierarchy 2015 Fair Value Hierarchy
Carrying amount
$’000
Carrying amount
$’000
Fair value$’000
Fair value$’000
Level 1
$’000
Level 2
$’000
Level 3
$’000
Level 1
$’000
Level 2
$’000
Level 3
$’000
Financial Assets
Cash and cash equivalents 28,764 43,158 28,764 43,158 - - - - - -
Receivables 24,009 22,985 24,009 22,985 - - - - - -
Loans advanced 450 887 443 869 - - - - - -
Unlisted securities (unrestricted)
12,863 11,035 12,863 11,035 - - 12,863 - - 11,035
Funds under management (unrestricted)
336,291 373,343 336,291 373,343 334,324 1,967 - 371,431 1,912 -
Funds under management (restricted)
125,957 121,258 125,957 121,258 125,957 - - 121,258 - -
Total Financial Assets 528,334 572,666 528,327 572,648 460,281 1,967 12,863 492,689 1,912 11,035
Financial Liabilities
Payables 22,732 14,972 22,732 14,972 - - - - - -
Borrowings 54,476 56,236 63,246 66,288 63,246 - - 66,288 - -
Total Financial Liabilities 77,208 71,208 85,978 81,260 63,246 - - 66,288 - -
33 FAIR VALUE (continued)
(b) Fair Value Hierarchy
(c) Valuation Techniques
The Fair Value Hierarchy reflects the following level of inputs used in measuring the fair value of financial assets and financial liabilities:
Level 1: The fair value of assets and liabilities are determined based on quoted market prices (unadjusted) in active markets for identical assets or liabilities. The fair valuation of borrowings is primarily based on the net present value of the borrowing using the variable rate for lending at year end. Where the variable rate is lower than the fixed rate, the fair value is greater than the face value.
Level 2: The fair value of assets and liabilities have been determined from inputs other than quoted prices that are observable for the asset or liability, either directly (i.e. as prices) or indirectly (derived from prices); this includes directly held fixed income securities of the University (classified as Funds under Management) being derived from observable market data;
Level 3: Inputs for the Assets or Liabilities that are not based on observable market data.
Notes To The Financial Statements (continued)for the year ended 31 December 2016
Notes To The Financial Statements (continued)for the year ended 31 December 2016
34 REMUNERATION OF MEMBERS OF THE ACCOUNTABLE AUTHORITY AND SENIOR OFFICERS
(a) Remuneration of Members of the Accountable Authority
Names of Persons who were Members of the Accountable Authority during the financial year
For the purposes of the Financial Management Act 2006, the University Council is the Accountable Authority of the University.
Members appointed by Governor in CouncilMr Kim BridgeMs Cathryn Carver (ceased 14 September 2016)
Dr Andrew CraneMr Alex JonesMr Michael LishmanDr Michael Stanford
Member nominated by the Minister for Education and TrainingMs Sue Wilson
Member who is the Chief Executive OfficerProfessor Deborah Terry, Vice-Chancellor
Members elected by full-time academic staffProfessor Dale PintoProfessor Glennda Scully
Member elected by full-time general staffMr Andy Sharp (ceased 17 June 2016)
Mr Andrew McLean (commenced 18 June 2016)
Co-opted MembersMr Colin Beckett, ChancellorMr Steve ScudamoreMr Gene Tilbrook
Members who are members of bodies that represent the interests of the University in places other than the University’s principal campusVacant
Member who is a member of the Academic Board elected by and from the Academic BoardAssociate Professor Linley Lord
Members elected by studentsMs Noni Elliott Hobbs (elected 13 April 2016)
Mr Jason Giancono (ceased 12 April 2016)
Ms Saraya Martin (ceased 12 April 2016)
Mr Liam O’Neill (elected 13 April 2016)
2016$’000
2015$’000
Unlisted securities (unrestricted)
Opening Balance 11,035 1,837
Acquisitions - -
Impairment - -
Recognised in profit or loss - -
Recognised in other comprehensive income 1,828 9,198
Closing Balance 12,863 11,035
The gain included in other comprehensive income relates to the revaluation of unlisted securities, determined by an independent valuer, based on observable inputs and an unobservable input (discount factor of 30%), reported within the Investments revaluation reserve.
The University’s sensitivity to a 5% increase or decrease in the unobservable input on discount factor at reporting date would result in a decrease or increase in other comprehensive income by $0.130 million respectively.
33 FAIR VALUE (continued)
(d) Fair Value Measurement Using Significant Unobservable Inputs (Level 3)

Curtin University Annual Report 2016 Curtin University Annual Report 201688 89
Notes To The Financial Statements (continued)for the year ended 31 December 2016
34 REMUNERATION OF MEMBERS OF THE ACCOUNTABLE AUTHORITY AND SENIOR OFFICERS (continued)
Remuneration of Members of the Accountable AuthorityThe number of Members of the Accountable Authority whose total fees, salaries, superannuation and other benefits for the financial year, fall within the following bands were:
2016 Number
2015 Number
Nil – $10,000 5 6
$10,001 – $20,000 2 3
$20,001 – $30,000 2 1
$30,001 – $40,000 4 3
$80,001 – $90,000 1 1
$90,001 - $100,000 1 -
$130,001 - $140,000 1 -
$180,001 – $190,000 - 1
$190,001 - $200,000 1 -
$230,001 - $240,000 1 -
$240,001 - $250,000 - 1
$250,001 – $260,000 - 1
$270,001 - $280,000 1 1
$780,001- $790,000 - 1
$810,001- $820,000 1 -
2016 2015
$’000 $’000
Aggregate Remuneration of Members of the Accountable Authority(a) 2,081 2,015
(a) Includes accrued leave
(b) Remuneration of Senior Officers
The number of Senior Officers other than Senior Officers reported as Members of the Accountable Authority, whose total of fees, salaries, superannuation and other benefits for the financial year, fall within the following bands were:
2016 Number
2015Number
Nil - $10,000 1 1
100,001 - 110,000 2 -
$140,001 - $150,000 1 -
$150,001 - $160,000 1 -
$190,001 - $200,000 - 1
$220,001 - $230,000 1 -
$240,001 - $250,000 - 1
$250,001 - $260,000 - 1
$260,001 - $270,000 - 1
$280,001 - $290,000 2 -
$290,001 - $300,000 - 1
$320,001 - $330,000 1 -
$330,001 - $340,000 1 -
Notes To The Financial Statements (continued)for the year ended 31 December 2016
34 REMUNERATION OF MEMBERS OF THE ACCOUNTABLE AUTHORITY AND SENIOR OFFICERS (continued)
2016 Number
2015Number
$350,001 - $360,000 - 1
$360,001 - $370,000 - 1
$370,001 - $380,000 - 2
$380,001 - $390,000 - 1
$390,001 - $400,000 - 2
$400,001 - $410,000 4 1
$410,001 - $420,000 - 1
$420,001 - $430,000 1 -
$450,001 - $460,000 - 1
$460,001 - $470,000 2 1
$490,001 - $500,000 1 -
2016$’000
2015$’000
Aggregate Remuneration of Senior Officers(a) 5,442 5,643
(a) Includes accrued leave
35 REMUNERATION OF AUDITORS
During the year, the following fees (excluding GST) were payable for services provided by the auditor of the University and non-related audit firms:
2016$’000
2015$’000
(a) Audit and review of the Financial Statements
Fees paid to the Office of the Auditor General 284 281
(b) Other audit and assurance services1
Fees paid to the Office of the Auditor General 14 14
Australian Government - Department of Agriculture 3 -
Casilli Holdings Pty Ltd 17 22
Council of Ambulance Authorities Inc 4 3
Independent Appraisal 1 -
Nexia Edwards Marshall 10 -
Quantum Assurance - 8
SAI Global Limited 5 4
JMG Building Surveyors - 6
Western Australian QUA - 1
Daff Biosec - 1
Total fees paid for other audit services 54 62
Total Remuneration of Auditors 338 343
1 Other audit and assurance services are related to compliance audits and research project audits.

Curtin University Annual Report 2016 Curtin University Annual Report 201690 91
Notes To The Financial Statements (continued)for the year ended 31 December 2016
36 RELATED PARTIES
Transactions with specified Accountable Authority and Senior Officers
(a) Accountable Authority and Senior Officers’ remuneration and retirement benefits
Details of remuneration and retirement benefits are disclosed in Note 34.
(b) Other transactions with specified Accountable Authority, Senior Officers and Related Parties
University Council members, or their related entities, may conduct transactions with the University that occur within a normal employee, customer or supplier relationship on terms and conditions that are no more favourable than those with which it is reasonable to expect the University to adopt if it was dealing at arm’s length in similar circumstances.
These transactions include the following and have been quantified below where the transactions are considered likely to be of interest to users of these financial statements:
37 JOINT OPERATIONS AND ASSOCIATES
Companies
Details of the University’s significant associates at 31 December 2016 are listed below.
Transaction Type Related party2016
$’0002015$’000
Purchases Curtin Student Guild 4,370 4,620
Revenue Curtin Student Guild 808 2,382
Receivable at 31 December Curtin Student Guild 1,159 2,086
Payable at 31 December Curtin Student Guild - 7
(c) Loans to Related Parties
Balance at beginning of year 887 788
Loans advanced - 99
Loans repayment received - -
Loans impaired (437) -
Interest charged - -
Interest received - -
Balance at end of year 450 887
The University invests in a number of unlisted companies which are established to commercialise intellectual property. Loans were advanced to some of these entities.
Carrying value of Investment
Equity holding
Name of entity Country of incorporation2016
$’0002015$’000
2016%
2015%
Associates
HiSeis Pty Ltd Australia 275 275 44 44
iCetana Pty Ltd Australia 600 600 39 39
Renergi Pty Ltd1 Australia 1 1 48 48
¹ A loan of $0.450 million is disclosed within Note 36(c).
Notes To The Financial Statements (continued)for the year ended 31 December 2016
38 CONTINGENT LIABILITIES AND CONTINGENT ASSETS
(a) Contingent Liabilities
Legal ActionsThe University is exposed to legal actions that arise in the course of the University’s normal operations. The University does not believe that these legal actions, if successful, would result in material loss. There are no other contingent liabilities.
(b) Contingent Assets
The University had no contingent assets at the reporting date.
39 COMMITMENTS2016
$’0002015$’000
(a) Capital commitments
Capital expenditure contracted for at the reporting date but not recognised as liabilities is as follows:
Property, Plant and Equipment
Within one year 11,719 80,656
Between one and five years - 11,748
Later than five years - -
Total Capital Commitments 11,719 92,404
(b) Lease commitments
Operating leases
A lease is classified as an operating lease if it does not transfer substantially all the risks and rewards incidental to ownership. Operating leases at the University are related to computer leases, network leases, motor vehicle leases and building leases.
Commitments for minimum lease payments in relation to non-cancellable operating leases are payable as follows:
Within one year 10,069 11,108
Between one and five years 16,041 21,434
Later than five years 55,419 64,599
Total future minimum lease payments 81,529 97,141
(c) Other expenditure commitments
Commitments in relation to purchase orders are payable as follows:
Within one year 24,920 20,205
(d) Loans commitment to related parties
Loans committed at the reporting date but not recognised as liabilities are as follows:
Within one year - -
Between one and five years - -
Later than five years - -
Total loans commitment to related parties - -
All the above commitments are inclusive of GST where applicable.

Curtin University Annual Report 2016 Curtin University Annual Report 201692 93
Notes To The Financial Statements (continued)for the year ended 31 December 2016
41 NOTES TO THE STATEMENT OF CASH FLOWS
2016$’000
2015$’000
(a) Reconciliation to cash
Cash at the end of the year as shown in the Statement of Cash Flows is reconciled to the related items in the Statement of Financial Position as follows:
Unrestricted cash and cash equivalents (Note 19(a)) 26,804 41,239
Restricted cash and cash equivalents (Note 19(b)) 1,960 1,919
Balance as per Statement of Cash Flows 28,764 43,158
(b) Reconciliation of net result to net cash provided by operating activities
Net result for the year 38,073 61,953
Depreciation expense 55,535 48,439
Net loss/(gain) on disposal of non-current assets 48 492
Impairment of assets 1,207 95
Other non-cash items (8,311) 3,566
Net exchange differences - (194)
Changes in assets and liabilities:
(Increase)/decrease in receivables 1,148 3,748
(Increase)/decrease in inventories 2 7
(Increase)/decrease in other current assets 6,573 (6,434)
Increase/(decrease) in trade and other payables 7,760 (2,234)
Increase/(decrease) in provisions 1,019 (5,064)
Increase/(decrease) in other current liabilities (13,113) 15,672
Net cash provided by/(used in) operating activities 89,941 120,046
42 NON-CASH FINANCING AND INVESTING ACTIVITIES
During the year, the University received and re-invested non-cash distributions net of fees from the available-for-sale investments of $0.201 million (2015: $0.038 million). The investment revenue was not reflected in the Statement of Cash Flows.
40 EVENTS OCCURING AFTER REPORTING DATE
A number of amendments to the University’s enabling legislation became effective as of 2 January 2017. Included in those amendments is a change in the University’s name from Curtin University of Technology to Curtin University. The name change is part of an important shift to strengthen and clarify Curtin’s brand.
Notes To The Financial Statements (continued)for the year ended 31 December 2016
43 SUPPLEMENTARY FINANCIAL INFORMATION
2016$’000
2015$’000
Write-Offs
Public property written off by the Minister during the financial year - -
Losses Through Theft, Defaults and Other Causes
Losses of public moneys and, public and other property through theft or default - -
Amounts recovered - -
44 DEFINED BENEFIT SUPERANNUATION PLANS
(a) Curtin University pension obligations
Until 30 June 2006, a group of former employees was entitled, on retirement, death or disablement, to defined benefits under the Curtin University Superannuation Scheme. In some circumstances the scheme provided pension benefits. All members of the Scheme had retired, and had either received a pension or were entitled to receive a pension at a future date under certain circumstances. The scheme was wound up on 30 June 2006. Some former members of the wound-up Scheme entered into a contractual relationship direct with the University. The University now provides benefits to those individuals, consistent with their entitlements under the wound-up scheme. The University meets the benefits directly as they fall due.
2016$’000
2015$’000
Reconciliation of the Present Value of the Defined Benefit Obligation
Present value of defined benefit obligations at beginning of the year 879 917
Current service cost - -
Interest cost 25 29
Actuarial loss/(gain) (32) 33
Benefits paid (108) (100)
Present value of defined benefit obligations at end of the year 764 879
Reconciliation of the Fair Value of Assets
Fair value of assets at beginning of the year - -
Employer contributions 108 100
Benefits paid (108) (100)
Fair value of assets at end of the year - -
Reconciliation of the Assets and Liabilities Recognised in the Statement of Financial Position
Present value of defined benefit obligation 764 879
Fair value of assets - -
Net liability 764 879
Liability recognised in the Statement of Financial Position as:
Current 120 113
Non-current 644 766
764 879
Expense Recognised in the Statement of Comprehensive Income
Interest cost 25 29
Actuarial loss/(gain) (32) 33
Superannuation expense/(benefit) (7) 62
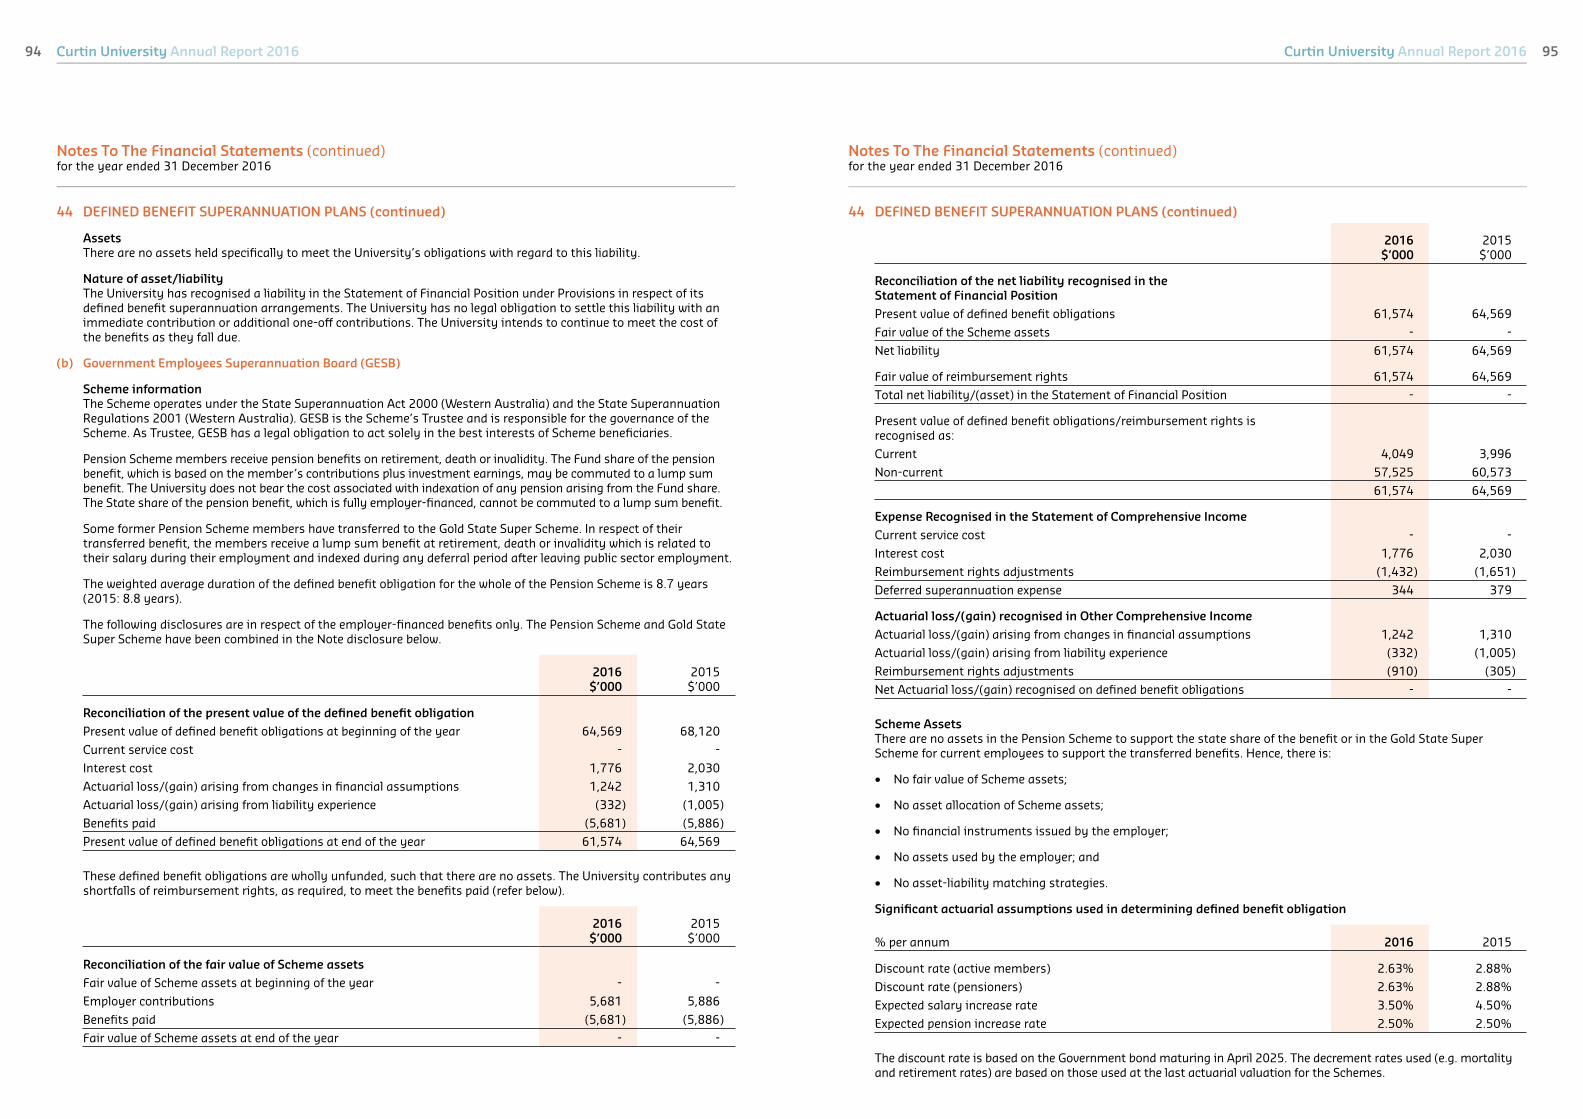
Curtin University Annual Report 2016 Curtin University Annual Report 201694 95
Notes To The Financial Statements (continued)for the year ended 31 December 2016
44 DEFINED BENEFIT SUPERANNUATION PLANS (continued)
AssetsThere are no assets held specifically to meet the University’s obligations with regard to this liability.
Nature of asset/liabilityThe University has recognised a liability in the Statement of Financial Position under Provisions in respect of its defined benefit superannuation arrangements. The University has no legal obligation to settle this liability with an immediate contribution or additional one-off contributions. The University intends to continue to meet the cost of the benefits as they fall due.
(b) Government Employees Superannuation Board (GESB)
Scheme informationThe Scheme operates under the State Superannuation Act 2000 (Western Australia) and the State Superannuation Regulations 2001 (Western Australia). GESB is the Scheme’s Trustee and is responsible for the governance of the Scheme. As Trustee, GESB has a legal obligation to act solely in the best interests of Scheme beneficiaries.
Pension Scheme members receive pension benefits on retirement, death or invalidity. The Fund share of the pension benefit, which is based on the member’s contributions plus investment earnings, may be commuted to a lump sum benefit. The University does not bear the cost associated with indexation of any pension arising from the Fund share. The State share of the pension benefit, which is fully employer-financed, cannot be commuted to a lump sum benefit.
Some former Pension Scheme members have transferred to the Gold State Super Scheme. In respect of their transferred benefit, the members receive a lump sum benefit at retirement, death or invalidity which is related to their salary during their employment and indexed during any deferral period after leaving public sector employment.
The weighted average duration of the defined benefit obligation for the whole of the Pension Scheme is 8.7 years (2015: 8.8 years).
The following disclosures are in respect of the employer-financed benefits only. The Pension Scheme and Gold State Super Scheme have been combined in the Note disclosure below.
2016$’000
2015$’000
Reconciliation of the present value of the defined benefit obligation
Present value of defined benefit obligations at beginning of the year 64,569 68,120
Current service cost - -
Interest cost 1,776 2,030
Actuarial loss/(gain) arising from changes in financial assumptions 1,242 1,310
Actuarial loss/(gain) arising from liability experience (332) (1,005)
Benefits paid (5,681) (5,886)
Present value of defined benefit obligations at end of the year 61,574 64,569
These defined benefit obligations are wholly unfunded, such that there are no assets. The University contributes any shortfalls of reimbursement rights, as required, to meet the benefits paid (refer below).
2016$’000
2015$’000
Reconciliation of the fair value of Scheme assets
Fair value of Scheme assets at beginning of the year - -
Employer contributions 5,681 5,886
Benefits paid (5,681) (5,886)
Fair value of Scheme assets at end of the year - -
Notes To The Financial Statements (continued)for the year ended 31 December 2016
2016$’000
2015$’000
Reconciliation of the net liability recognised in the Statement of Financial Position
Present value of defined benefit obligations 61,574 64,569
Fair value of the Scheme assets - -
Net liability 61,574 64,569
Fair value of reimbursement rights 61,574 64,569
Total net liability/(asset) in the Statement of Financial Position - -
Present value of defined benefit obligations/reimbursement rights is recognised as:
Current 4,049 3,996
Non-current 57,525 60,573
61,574 64,569
Expense Recognised in the Statement of Comprehensive Income
Current service cost - -
Interest cost 1,776 2,030
Reimbursement rights adjustments (1,432) (1,651)
Deferred superannuation expense 344 379
Actuarial loss/(gain) recognised in Other Comprehensive Income
Actuarial loss/(gain) arising from changes in financial assumptions 1,242 1,310
Actuarial loss/(gain) arising from liability experience (332) (1,005)
Reimbursement rights adjustments (910) (305)
Net Actuarial loss/(gain) recognised on defined benefit obligations - -
Scheme AssetsThere are no assets in the Pension Scheme to support the state share of the benefit or in the Gold State Super Scheme for current employees to support the transferred benefits. Hence, there is:
• No fair value of Scheme assets;
• No asset allocation of Scheme assets;
• No financial instruments issued by the employer;
• No assets used by the employer; and
• No asset-liability matching strategies.
Significant actuarial assumptions used in determining defined benefit obligation
% per annum 2016 2015
Discount rate (active members) 2.63% 2.88%
Discount rate (pensioners) 2.63% 2.88%
Expected salary increase rate 3.50% 4.50%
Expected pension increase rate 2.50% 2.50%
The discount rate is based on the Government bond maturing in April 2025. The decrement rates used (e.g. mortality and retirement rates) are based on those used at the last actuarial valuation for the Schemes.
44 DEFINED BENEFIT SUPERANNUATION PLANS (continued)

Curtin University Annual Report 201696
Notes To The Financial Statements (continued)for the year ended 31 December 2016
44 DEFINED BENEFIT SUPERANNUATION PLANS (continued)
2016$’000
2015$’000
2014$’000
2013 $’000
2012$’000
Historical Information
Present value of defined benefit obligation 61,574 64,569 68,120 64,261 73,586
Fair value of Scheme assets - - - - -
Deficit in Scheme assets 61,574 64,569 68,120 64,261 73,586
Experience adjustments (gain)/loss - Scheme assets - - - - -
Experience adjustments (gain)/loss - Scheme liabilities (332) (1,005) 2,017 921 (1,591)
The experience adjustment for scheme liabilities represents the actuarial loss/(gain) due to a change in the liabilities arising from the Scheme’s experience (e.g. membership movements, unit entitlements) but excludes the effect of the changes in assumptions (e.g. movements in the bond rate and changes in pensioner mortality assumptions).
2017$’000
2016$’000
Expected ContributionsExpected employer contributions 5,594 5,773
Nature of asset/liabilityThe University has recognised a liability in the Statement of Financial Position under Provisions in respect of its defined benefit superannuation arrangements (refer Note 28).
An arrangement exists between the Australian Government and the Government of Western Australia to meet the unfunded liability for beneficiaries of the State Superannuation Schemes on an emerging cost basis. Accordingly, a corresponding asset is recognised under Receivables for the reimbursement rights (refer Note 20).
The recognition of both the asset and the liability consequently do not affect the year end net asset position of the University, therefore no sensitivity analysis is relevant.
(c) Unisuper Defined Benefit Plan
Scheme informationThe UniSuper Defined Benefit Plan (DBP) is a multi-employer defined benefit plan under superannuation law. However, it is considered to be a multi-employer defined contribution plan under the Accounting Standard AASB 119 - Employee Benefits. This is because, where there are or may be insufficient funds to provide benefits payable, the Trustee must reduce the benefits payable on a fair and equitable basis. The employer’s legal or constructive obligation is limited to the amount that it agrees to contribute to the funds and the actuarial and investment risks rest with the employee.
(d) Superannuation employer contributions
Employer contributions for all superannuation plans of $64.980 million (2015: $60.389 million) were charged as an expense under employee benefits (refer Note 11) as they fell due.
Curtin University Annual Report 2016 97
No
tes
To
Th
e F
ina
nci
al
Sta
tem
en
ts (
con
tin
ued
)fo
r th
e y
ear
end
ed 3
1 D
ecem
ber
20
16
45
AC
QU
ITT
AL
OF
AU
ST
RA
LIA
N G
OV
ER
NM
EN
T F
INA
NC
IAL
AS
SIS
TA
NC
E
(a)
Ed
uca
tio
n –
CG
S a
nd
Oth
er
Ed
uca
tio
n G
ran
ts Co
mm
on
wea
lth
G
ran
ts S
chem
e1
Ind
igen
ou
s S
up
po
rt
Pro
gra
mD
isa
bil
ity
Su
pp
ort
P
rog
ram
Pa
rtn
ersh
ip &
P
art
icip
ati
on
P
rog
ram
2T
ota
l
20
16
$’0
00
20
15
$’0
00
20
16
$’0
00
20
15
$’0
00
20
16
$’0
00
20
15
$’0
00
20
16
$’0
00
20
15
$’0
00
20
16
$’0
00
20
15
$’0
00
Fin
an
cia
l ass
ista
nce
rec
eive
d in
CA
SH
d
uri
ng
th
e re
po
rtin
g p
erio
d 2
51
,38
9
23
4,4
95
1
,13
8
1,1
92
1
50
1
12
4
,56
0
5,6
27
2
57
,23
7
24
1,4
26
Net
acc
rua
l ad
just
men
ts (
3,7
23
) 1
,64
6
-
-
-
-
84
7
90
9
(2
,87
6)
2,5
55
Rev
enu
e fo
r th
e p
erio
d 2
47
,66
6
23
6,1
41
1
,13
8
1,1
92
1
50
1
12
5
,40
7
6,5
36
2
54
,36
1
24
3,9
81
Su
rplu
s/(d
efici
t) f
rom
th
e p
revi
ou
s y
ear
-
-
-
-
(3
00
) (
12
3)
3,4
69
2
,34
2
3,1
69
2
,21
9
To
tal r
even
ue
incl
ud
ing
acc
rued
rev
enu
e 2
47
,66
6
23
6,1
41
1
,13
8
1,1
92
(
15
0)
(1
1)
8,8
76
8
,87
8
25
7,5
30
2
46
,20
0
Less
exp
ense
s in
clu
din
g a
ccru
ed e
xpen
ses
(2
47
,66
6)
(23
6,1
41
) (
1,1
38
) (
1,1
92
) (
37
1)
(2
89
) (
4,3
65
) (
5,4
09
) (
25
3,5
40
) (
24
3,0
31
)
Su
rplu
s/(d
efici
t) f
or
rep
ort
ing
per
iod
-
-
-
-
(5
21
) (
30
0)
4,5
11
3
,46
9
3,9
90
3
,16
9
1 I
ncl
ud
es t
he
ba
sic
CG
S g
ran
t a
mo
un
t, C
GS
– R
egio
na
l Lo
ad
ing
, CG
S –
En
ab
ling
Lo
ad
ing
, Ma
ths
an
d S
cien
ce T
ran
siti
on
Lo
ad
ing
an
d F
ull
Fee
Pla
ces
Tra
nsi
tio
n L
oa
din
g.
2 In
clu
des
Eq
uit
y S
up
po
rt P
rog
ram
.

Curtin University Annual Report 201698N
ote
s T
o T
he
Fin
an
cia
l S
tate
me
nts
(co
nti
nu
ed)
for
the
yea
r en
ded
31
Dec
emb
er 2
01
6
45
AC
QU
ITT
AL
OF
AU
ST
RA
LIA
N G
OV
ER
NM
EN
T F
INA
NC
IAL
AS
SIS
TA
NC
E (
con
tin
ued
)
(b)
Hig
he
r E
du
cati
on
Lo
an
Pro
gra
ms
(exc
l O
S-H
ELP
)
HE
CS
-HE
LPFE
E-H
ELP
3S
A-H
ELP
To
tal
20
16
$’0
00
20
15
$’0
00
20
16
$’0
00
20
15
$’0
00
20
16
$’0
00
20
15
$’0
00
20
16
$’0
00
20
15
$’0
00
Fin
an
cia
l ass
ista
nce
rec
eive
d in
CA
SH
du
rin
g t
he
rep
ort
ing
per
iod
14
8,7
91
1
40
,23
0
24
,23
5
25
,98
2
2,3
14
2
,40
6
17
5,3
40
1
68
,61
8
Net
acc
rua
l ad
just
men
ts (
4,3
63
) (
39
2)
55
0
(6
56
) (
75
) 1
92
(
3,8
88
) (
85
6)
Rev
enu
e fo
r th
e p
erio
d 1
44
,42
8
13
9,8
38
2
4,7
85
2
5,3
26
2
,23
9
2,5
98
1
71
,45
2
16
7,7
62
Su
rplu
s/(d
efici
t) f
rom
th
e p
revi
ou
s y
ear
-
-
-
-
-
-
-
-
To
tal r
even
ue
incl
ud
ing
acc
rued
rev
enu
e 1
44
,42
8
13
9,8
38
2
4,7
85
2
5,3
26
2
,23
9
2,5
98
1
71
,45
2
16
7,7
62
Less
exp
ense
s in
clu
din
g a
ccru
ed e
xpen
ses
(14
4,4
28
)(1
39
,83
8)
(24
,78
5)
(25
,32
6)
(2
,23
9)
(2
,59
8)
(1
71
,45
2)
(1
67
,76
2)
Su
rplu
s/(d
efici
t) f
or
rep
ort
ing
per
iod
-
-
-
-
-
-
-
-
3 P
rog
ram
is in
res
pec
t o
f FE
E-H
ELP
fo
r H
igh
er E
du
cati
on
on
ly a
nd
exc
lud
es f
un
ds
rece
ived
in r
esp
ect
of
VE
T F
EE
-HE
LP.
Curtin University Annual Report 2016 99
No
tes
To
Th
e F
ina
nci
al
Sta
tem
en
ts (
con
tin
ued
)fo
r th
e y
ear
end
ed 3
1 D
ecem
ber
20
16
45
AC
QU
ITT
AL
OF
AU
ST
RA
LIA
N G
OV
ER
NM
EN
T F
INA
NC
IAL
AS
SIS
TA
NC
E (
con
tin
ued
)
(c)
Sch
ola
rsh
ips
Au
stra
lia
nP
ost
gra
du
ate
A
wa
rds
Ind
igen
ou
s A
cces
s S
cho
lars
hip
s
Inte
rna
tio
na
l P
ost
gra
du
ate
R
esea
rch
S
cho
lars
hip
s
Co
mm
on
wea
lth
E
du
cati
on
Co
sts
Sch
ola
rsh
ips
4
Co
mm
on
wea
lth
A
cco
mm
od
ati
on
S
cho
lars
hip
s 4
To
tal
20
16
$’0
00
20
15
$’0
00
20
16
$’0
00
20
15
$’0
00
20
16
$’0
00
20
15
$’0
00
20
16
$’0
00
20
15
$’0
00
20
16
$’0
00
20
15
$’0
00
20
16
$’0
00
20
15
$’0
00
Fin
an
cia
l ass
ista
nce
rec
eive
d/
(ref
un
ded
) in
CA
SH
du
rin
g t
he
rep
ort
ing
per
iod
7,2
17
7
,00
1
-
-
56
8
54
0
-
1
-
-
7,7
85
7
,54
2
Net
acc
rua
l ad
just
men
ts -
-
3
9
(4
) -
-
3
8
86
2
1
28
9
8
11
0
Rev
enu
e fo
r th
e p
erio
d 7
,21
7
7,0
01
3
9
(4
) 5
68
5
40
3
8
87
2
1
28
7
,88
3
7,6
52
Su
rplu
s/(d
efici
t) f
rom
th
e p
revi
ou
s y
ear
(7
91
) (
78
1)
-
-
(1
,21
9)
(8
28
) -
-
-
-
(2
,01
0)
(1,6
09
)
To
tal r
even
ue
incl
ud
ing
a
ccru
ed r
even
ue
6,4
26
6
,22
0
39
(
4)
(6
51
) (
28
8)
38
8
7
21
2
8
5,8
73
6
,04
3
Less
exp
ense
s in
clu
din
g
acc
rued
exp
ense
s (
7,4
56
) (
7,0
11
) (
39
) 4
(
96
4)
(9
31
) (
38
) (
87
) (
21
) (
28
)(8
,51
8)
(8,0
53
)
Su
rplu
s/(d
efici
t) f
or
re
po
rtin
g p
erio
d (
1,0
30
) (
79
1)
-
-
(1
,61
5)
(1
,21
9)
-
-
-
-
(2,6
45
) (
2,0
10
)
4 I
ncl
ud
es G
ran
dfa
ther
ed S
cho
lars
hip
s, N
ati
on
al P
rio
rity
an
d N
ati
on
al A
cco
mm
od
ati
on
Pri
ori
ty S
cho
lars
hip
s a
nd
Ind
igen
ou
s S
cho
lars
hip
(IC
EC
S, I
EC
EC
S, I
CA
S
an
d IE
CA
S)
resp
ecti
vely
.

Curtin University Annual Report 2016100N
ote
s T
o T
he
Fin
an
cia
l S
tate
me
nts
(co
nti
nu
ed)
for
the
yea
r en
ded
31
Dec
emb
er 2
01
6
45
AC
QU
ITT
AL
OF
AU
ST
RA
LIA
N G
OV
ER
NM
EN
T F
INA
NC
IAL
AS
SIS
TA
NC
E (
con
tin
ued
)
(d)
Ed
uca
tio
n R
ese
arc
h
Join
t R
esea
rch
E
ng
ag
emen
t JR
E E
ng
inee
rin
g
Ca
det
ship
Su
sta
ina
ble
R
esea
rch
Exc
elle
nce
in
Un
iver
siti
esR
esea
rch
Tra
inin
g
Sch
eme
Res
earc
h
Infr
ast
ruct
ure
Blo
ck
Gra
nts
To
tal
20
16
$’0
00
20
15
$’0
00
20
16
$’0
00
20
15
$’0
00
20
16
$’0
00
20
15
$’0
00
20
16
$’0
00
20
15
$’0
00
20
16
$’0
00
20
15
$’0
00
20
16
$’0
00
20
15
$’0
00
Fin
an
cia
l ass
ista
nce
re
ceiv
ed in
CA
SH
du
rin
g t
he
rep
ort
ing
per
iod
9,2
63
9
,40
3
15
6
15
4
3,0
39
2
,30
2
16
,96
4
16
,55
6
4,0
63
3
,26
4
33
,48
5
31
,67
9
Net
acc
rua
l ad
just
men
ts -
-
-
-
-
-
-
-
-
-
-
-
Rev
enu
e fo
r th
e p
erio
d 9
,26
3
9,4
03
1
56
1
54
3
,03
9
2,3
02
1
6,9
64
1
6,5
56
4
,06
3
3,2
64
3
3,4
85
3
1,6
79
Su
rplu
s/(d
efici
t) f
rom
th
e p
revi
ou
s y
ear
-
-
-
-
(3
17
) (
31
7)
-
-
-
-
(3
17
) (
31
7)
To
tal r
even
ue
incl
ud
ing
a
ccru
ed r
even
ue
9,2
63
9
,40
3
15
6
15
4
2,7
22
1
,98
5
16
,96
4
16
,55
6
4,0
63
3
,26
4
33
,16
8
31
,36
2
Less
exp
ense
s in
clu
din
g
acc
rued
exp
ense
s (
9,2
63
) (
9,4
03
) (
15
6)
(1
54
) (
3,0
39
) (
2,3
02
) (
16
,96
4)
(1
6,5
56
) (
4,0
63
) (
3,2
64
) (
33
,48
5)
(3
1,6
79
)
Su
rplu
s/(d
efici
t) f
or
re
po
rtin
g p
erio
d -
-
-
-
(
31
7)
(3
17
) -
-
-
-
(
31
7)
(3
17
)
(e)
Au
stra
lia
n R
ese
arc
h C
ou
nci
l G
ran
ts
(i)
Dis
cove
ry
Pro
ject
s Fe
llow
ship
s 5
To
tal
20
16
$’0
00
20
15
$’0
00
20
16
$’0
00
20
15
$’0
00
20
16
$’0
00
20
15
$’0
00
Fin
an
cia
l ass
ista
nce
rec
eive
d in
CA
SH
du
rin
g t
he
rep
ort
ing
per
iod
6,6
11
6
,56
8
2,4
72
3
,26
5
9,0
83
9
,83
3
Net
acc
rua
l ad
just
men
ts 3
91
5
41
-
-
3
91
5
41
Rev
enu
e fo
r th
e p
erio
d 7
,00
2
7,1
09
2
,47
2
3,2
65
9
,47
4
10
,37
4
Su
rplu
s/(d
efici
t) f
rom
th
e p
revi
ou
s y
ear
89
8
44
2
,81
2
3,1
26
2
,90
1
3,9
70
To
tal r
even
ue
incl
ud
ing
acc
rued
rev
enu
e 7
,09
1
7,9
53
5
,28
4
6,3
91
1
2,3
75
1
4,3
44
Less
exp
ense
s in
clu
din
g a
ccru
ed e
xpen
ses
(6
,98
4)
(7
,86
4)
(3
,11
5)
(3
,57
9)
(1
0,0
99
) (
11
,44
3)
Su
rplu
s/(d
efici
t) f
or
rep
ort
ing
per
iod
10
7
89
2
,16
9
2,8
12
2
,27
6
2,9
01
5 In
clu
des
Ea
rly
Ca
reer
Res
earc
her
Aw
ard
Curtin University Annual Report 2016 101
45
AC
QU
ITT
AL
OF
AU
ST
RA
LIA
N G
OV
ER
NM
EN
T F
INA
NC
IAL
AS
SIS
TA
NC
E (
con
tin
ued
)
(e)
Au
stra
lia
n R
ese
arc
h C
ou
nci
l G
ran
ts (
con
tin
ued
)
(ii)
Lin
ka
ge
s
Infr
ast
ruct
ure
P
roje
cts
To
tal
20
16
$’0
00
20
15
$’0
00
20
16
$’0
00
20
15
$’0
00
20
16
$’0
00
20
15
$’0
00
Fin
an
cia
l ass
ista
nce
rec
eive
d in
CA
SH
du
rin
g t
he
rep
ort
ing
per
iod
1,3
20
5
60
3
,39
6
3,4
23
4
,71
6
3,9
83
N
et a
ccru
al a
dju
stm
ents
21
9
71
9
8
34
8
31
7
41
9
Rev
enu
e fo
r th
e p
erio
d 1
,53
9
63
1
3,4
94
3
,77
1
5,0
33
4
,40
2
Su
rplu
s/(d
efici
t) f
rom
th
e p
revi
ou
s y
ear
53
1
96
4
(3
95
) (
85
4)
13
6
11
0
To
tal r
even
ue
incl
ud
ing
acc
rued
rev
enu
e 2
,07
0
1,5
95
3
,09
9
2,9
17
5
,16
9
4,5
12
Less
exp
ense
s in
clu
din
g a
ccru
ed e
xpen
ses
(2
,64
3)
(1
,06
4)
(2
,93
1)
(3
,31
2)
(5
,57
4)
(4
,37
6)
Su
rplu
s/(d
efici
t) f
or
rep
ort
ing
per
iod
(5
73
) 5
31
1
68
(
39
5)
(4
05
) 1
36
(iii
)C
en
tre
s
Cen
tres
Oth
erT
ota
l2
01
6$
’00
02
01
5$
’00
02
01
6$
’00
02
01
5$
’00
02
01
6$
’00
02
01
5$
’00
0
Fin
an
cia
l ass
ista
nce
rec
eive
d in
CA
SH
du
rin
g t
he
rep
ort
ing
per
iod
93
9
45
2
69
9
0
1,0
08
5
42
Net
acc
rua
l ad
just
men
ts -
-
-
-
-
-
Rev
enu
e fo
r th
e p
erio
d 9
39
4
52
6
9
90
1
,00
8
54
2
Su
rplu
s/(d
efici
t) f
rom
th
e p
revi
ou
s y
ear
16
1
15
9
(2
33
) 7
4
(7
2)
23
3
To
tal r
even
ue
incl
ud
ing
acc
rued
rev
enu
e 1
,10
0
61
1
(1
64
) 1
64
9
36
7
75
Less
exp
ense
s in
clu
din
g a
ccru
ed e
xpen
ses
(1
,14
1)
(4
50
) (
28
4)
(3
97
) (
1,4
25
) (
84
7)
Su
rplu
s/(d
efici
t) f
or
rep
ort
ing
per
iod
(4
1)
16
1
(4
48
) (
23
3)
(4
89
) (
72
)
No
tes
To
Th
e F
ina
nci
al
Sta
tem
en
ts (
con
tin
ued
)fo
r th
e y
ear
end
ed 3
1 D
ecem
ber
20
16

Curtin University Annual Report 2016 103Curtin University Annual Report 2016102
45
AC
QU
ITT
AL
OF
AU
ST
RA
LIA
N G
OV
ER
NM
EN
T F
INA
NC
IAL
AS
SIS
TA
NC
E (
con
tin
ued
)
2
01
6$
’00
02
01
5$
’00
0
(f)
OS
-HE
LP
Ca
sh r
ecei
ved
du
rin
g t
he
rep
ort
ing
per
iod
1,3
84
1
,06
4
Ca
sh s
pen
t d
uri
ng
th
e re
po
rtin
g p
erio
d (
1,3
84
) (
1,0
64
)
Net
ca
sh r
ecei
ved
-
-
Ca
sh s
urp
lus/
(defi
cit)
fro
m t
he
pre
vio
us
per
iod
-
-
Ca
sh s
urp
lus/
(defi
cit)
fo
r th
e re
po
rtin
g p
erio
d -
-
(g)
Hig
he
r E
du
cati
on
Su
pe
ran
nu
ati
on
Pro
gra
m
Ca
sh r
ecei
ved
du
rin
g t
he
rep
ort
ing
per
iod
5,3
47
6
,40
6
Un
iver
sity
co
ntr
ibu
tio
n in
res
pec
t o
f cu
rren
t em
plo
yee
s 3
44
3
79
Ca
sh a
vail
ab
le 5
,69
1
6,7
85
Ca
sh s
urp
lus/
(defi
cit)
fro
m t
he
pre
vio
us
per
iod
27
7
23
4
Ca
sh a
vail
ab
le f
or
curr
ent
per
iod
5,9
68
7
,01
9
Co
ntr
ibu
tio
ns
to s
pec
ified
defi
ned
ben
efit
fun
ds
(5
,91
0)
(6
,74
2)
Ca
sh s
urp
lus/
(defi
cit)
fo
r th
e re
po
rtin
g p
erio
d 5
8
27
7
(h)
Stu
de
nt
Se
rvic
es
an
d A
me
nit
ies
Fee
Un
spen
t/(o
vers
pen
t) r
even
ue
fro
m p
revi
ou
s p
erio
d 4
29
6
82
SA
-HE
LP r
even
ue
earn
ed 2
,23
9
2,5
98
Stu
den
t S
ervi
ces
an
d A
men
itie
s Fe
es d
irec
t fr
om
stu
den
ts 3
,39
9
4,6
10
To
tal r
even
ue
exp
end
ab
le in
per
iod
6,0
67
7
,89
0
Stu
den
t S
ervi
ces
exp
ense
s d
uri
ng
per
iod
(5
,58
2)
(7
,46
1)
Un
spen
t/(o
vers
pen
t) S
tud
ent
Ser
vice
s R
even
ue
48
5
42
9
No
tes
To
Th
e F
ina
nci
al
Sta
tem
en
ts (
con
tin
ued
)fo
r th
e y
ear
end
ed 3
1 D
ecem
ber
20
16
REPORT BY THE MEMBERS OF THE UNIVERSITY COUNCIL
The members of the University Council present their report for the year ended 31 December 2016.
MEMBERS
The following persons were members of the Council of Curtin University of Technology during the year ended 31 December 2016:
Members appointed by Governor in CouncilMr Kim BridgeMs Cathryn Carver (ceased 14 September 2016)Dr Andrew CraneMr Alex JonesMr Michael LishmanDr Michael Stanford
Member nominated by the Minister for Education and TrainingMs Sue Wilson, Pro Chancellor
Member who is the Chief Executive OfficerProfessor Deborah Terry AO, Vice-Chancellor
Co-opted MembersMr Colin Beckett, ChancellorMr Steve ScudamoreMr Gene Tilbrook
Members elected by full-time academic staffProfessor Dale PintoProfessor Glennda Scully
Members elected by the Alumni AssociationVacant
Member elected by full-time general staff Mr Andy Sharp (ceased 17 June 2016)Mr Andrew McLean (commenced 18 June 2016)
Members who are members of bodies that represent the interests of the University in places other than the University’s principal campusVacant
Member who is a member of the Academic Board elected by and from the Academic BoardAssociate Professor Linley Lord
Members elected by students Ms Noni Elliott Hobbs (elected 13 April 2016)Mr Jason Giancono (ceased 12 April 2016)Ms Saraya Martin (ceased 12 April 2016)Mr Liam O’Neill (elected 13 April 2016)

Curtin University Annual Report 2016 Curtin University Annual Report 2016104 105
Report by the Members of the University Council (continued)
Meetings of Members The number of meetings of the University Council and of each committee of Council held during the year ended 31 December 2016, and the number of meetings attended by each member were:
MEMBERSCOUNCIL MEETINGS
MEETINGS OF COMMITTEES1
AUDIT & COMPLIANCE EXECUTIVE FINANCE HEALTH & SAFETY DUE DILIGENCE LEGISLATIVE2
ATTENDED HELD ATTENDED HELD ATTENDED HELD ATTENDED HELD ATTENDED HELD ATTENDED HELD
Mr Colin Beckett, Chancellor3 8 8 6 8 3 3
Mr Kim Bridge 6 8 4 7
Ms Cathryn Carver 2 6 3 6
Dr Andrew Crane 5 8 5 8
Ms Noni Elliott Hobbs 6 6
Professor Paul Fairall (co-opted)
1 1
Mr Jason Giancono 2 2
Mr Beth Gordon (co-opted) 1 2
Mr Damian Gordon (co-opted) 1 2
Mr Alex Jones 7 8 8 8
Mr Michael Lishman 4 8 8 8 1 3 1 1
Assoc Prof Linley Lord 7 8 6 8
Ms Saraya Martin 1 2
Mr Andrew McLean 3 3
Mr Liam O’Neill 6 6
Professor Dale Pinto 6 8 1 1
Mr Steve Scudamore4 7 8 8 8 7 8 1 1
Prof Glennda Scully 6 8 4 4
Mr Andy Sharp 5 5 2 2
Dr Michael Stanford 5 8 9 9
Professor Deborah Terry AO4 8 8 8 8 8 8 9 9 1 1
Mr Gene Tilbrook 6 8 5 8 9 9
Ms Sue Wilson, Pro Chancellor3 7 8 8 8 8 8
1 The number of meetings held represents the number of regular and special meetings held during the time a member was a member of the Council or a committee of Council during the year. The number of meetings held does not include matters considered by circular resolution by Council or respective committees, and site visits conducted by the Health and Safety Due Diligence Committee.
2 The Legislative Committee only meets when necessary
3 Also a member of the Curtin University of Technology Foundation Board4 Also a member of the Curtin University of Technology Foundation Board and Kalgoorlie Campus Council

Curtin University Annual Report 2016 Curtin University Annual Report 2016106 107
Principal activitiesDuring the year, the principal and continuing activities of the University are:
(a) to provide courses of study appropriate to a university, and other tertiary courses, and to aid the advancement, development and practical application of knowledge;
(b) to encourage and participate in the development and improvement of tertiary education whether on a full or part-time basis; and
(c) to encourage and undertake research and to aid directly or indirectly the application of science and technology to industry.
No significant changes in the nature of the activities of the University occurred during the year.
Review of operations The net operating result for the year ended 31 December 2016 was $38.073 million (2015: $61.953 million).
The operations of the University during the financial year are reviewed in the following accompanying sections of the Annual Report:
• Chancellor's Foreword
• Vice-Chancellor's Report
• Report on Operations
• 2016 Activity Highlights
Significant changes in the State of Affairs No significant changes in the University's state of affairs occurred during the year.
Matters subsequent to the end of the financial yearA number of amendments to the University’s enabling legislation became effective as of 2 January 2017. Included in those amendments is a change in the University’s name from Curtin University of Technology to Curtin University. The name change is part of an important shift to strengthen and clarify Curtin’s brand. No other events have occurred since balance date that are likely to have a material impact on the financial report of the University.
Likely developments and expected results of operationsThe University will continue to further its objectives, consistent with the principal activities outlined above. To provide further detail would result in unreasonable prejudice.
Environmental regulationThe members of the University Council are not aware of any breaches of environmental regulations.
Relevant legislation that Curtin is subject to includes:
• Environmental Protection Act 1986 (WA)
• Environmental Protection Regulations 1987
• Environmental Protection (Controlled Waste) Regulations 2004
• Environmental Protection (Noise) Regulations 1997
• Environmental Protection (Unauthorised Discharges) Regulations 2004
• Contaminated Sites Act 2003 (WA)
• National Greenhouse and Energy Reporting Act 2007 (Cth)
• National Greenhouse and Energy Reporting Regulations 2008
The University is committed to protecting, preserving as well as improving the environment in which the University operates.
Report by the Members of the University Council (continued)
Insurance of Members of Council and OfficersThe University provides Directors and Officers Liability and Employers Practices Insurance and Supplementary Legal Expenses Cover through contracts with external insurance providers. The cover applies to members of Council and Officers of the University.
Proceedings on behalf of Curtin University of TechnologyNo material legal proceedings were initiated by the University during 2016.
This report is made in accordance with a resolution of the members of the University Council.
Colin BeckettChancellor
Curtin University, Bentley, Perth, WA
Dated this 22nd day of March 2017
Report by the Members of the University Council (continued)

Curtin University Annual Report 2016 Curtin University Annual Report 2016108 109
CURTIN’S KEY PERFORMANCE INDICATORS
Certification ...............................................................................................................................109
Introduction ...............................................................................................................................110
Teaching and Research ............................................................................................................111
People and Culture ....................................................................................................................116
Engagement and Impact ..........................................................................................................120
Financial Security .....................................................................................................................122
CERTIFICATION OF KEY PERFORMANCE INDICATORS
We hereby certify that the performance indicators are based on proper records, are relevant and appropriate for assisting users to access Curtin University of Technology’s performance, and fairly represent the performance of Curtin University of Technology for the financial year ended 31 December 2016.
Colin Beckett Deborah Terry AOChancellor Vice-Chancellor
On behalf of the University Council
Dated this 22nd day of March 2017

Curtin University Annual Report 2016 111Curtin University Annual Report 2016110
CURTIN ANNUAL REPORT 2016 KEY PERFORMANCE INDICATORS
Curtin’s mission statement: To change minds, lives and the world through leadership, innovation and excellence in teaching and research
reflects the University’s purpose and overarching outcome. To achieve its mission, the University assesses performance across a series
of outcome components and key performance indicators related to: demand for Curtin courses, experience of its students and the
reputation of its graduates; research outputs; performance of its academic workforce; and the efficiency of its teaching and learning
activities. These are set out in a balanced scorecard framework over four interdependent themes to provide a holistic and balanced
view of the University’s performance. The selection of indicators reflect those that are designed to demonstrate progress towards
achieving targets as outlined in the Curtin Strategic Plan (2013-2017) and Enabling Plans. Performance indicators are classified as either
effectiveness or efficiency.
A summary of the Outcome Components and Key Performance Indicators is presented below:
B. PEOPLE AND CULTURE
Outcome Component
Key Performance Indicator
4. Performance
To enhance performance of Curtin’s academic workforce
4.1 with doctoral qualifications
4.2 Research income
5. Satisfaction
To be recognised as an employer of choice
5.1 satisfaction (Your Voice survey)
6. Diversity and Equity
To meet social and equal employment opportunity objectives
6.1 participation rate
6.2 balance
C. ENGAGEMENT AND IMPACT
Outcome Component
Key Performance Indicator
7. Graduate Reputation
To have Curtin graduate employment rates ranked No1 in WA
7.1 Domestic graduate employment rates
8. Alumni Engagement
To connect with Curtin graduates
8.1 Alumni survey
9. International Reputation
To improve Curtin’s reputation for quality research and graduates
9.1 QSWUR Global Academic Survey and Global Employer Survey scores
CURTIN VISION 2030
A recognised international leader in research and education
MISSION
To change minds, lives and the world through leadership, innovation and excellence in
teaching and research
D. FINANCIAL SECURITY
Outcome Component Key Performance Indicator
10. Financial Sustainability
To provide an excellent learning experience that is financially sustainable
10.1 Teaching & learning expenditure per equivalent full-time student load(Efficiency)
10.2
A. TEACHING AND RESEARCH
Outcome Component Key Performance Indicator
1. Student Demand and Quality
To monitor student cohorts who choose to study at Curtin
1.1 Curtin market share of WA university students
2. Student Experience
experience and equip them with skills for the future
2.1 Overall course satisfaction (CEQ)
2.2 Retention rate of undergraduate students
3. Research Reputation and Outcomes
To enhance Curtin’s research performance and recognition as an international leader in research and education
3.1
3.2
3.3 Total research income (HERDC Cat 1- 4)
Net operating results (Effectiveness)
A. TEACHING AND RESEARCH
Outcome Component: 1. Student Demand and Quality
Monitoring the market share of total commencements provides an assessment of strength of student demand across all student
cohorts. Tertiary Institutions Service Centre (TISC) first preferences indicate WA domestic student demand for Curtin undergraduate
courses and the share of high Australian Tertiary Admission Rank (ATAR) (above 95%) enrolment indicates the calibre of domestic
undergraduate students enrolling into Curtin courses. Taken together, the measures reflect the value and reputation of Curtin courses in
the WA university sector.
Key Performance Indicator: 1.1 Curtin market share of WA university students – commencing enrolments and TISC domestic undergraduate applicants
Classification: Effectiveness measure
Benchmark gauge: Comparison of Curtin’s market share against previous years reflects the growth/changes in demand for Curtin
courses and the quality of its domestic undergraduate students.
Total Commencements is the per cent of all commencing students (undergraduates, postgraduates and others) enrolled at one of the
five universities in Western Australia as measured with data published by the Department of Education and Training (DET), Canberra.
TISC First Preferences measure Curtin market share in first preferences received through the TISC. TISC is operated by the four major
public universities in Western Australia to facilitate domestic undergraduate applications. The University of Notre Dame (UND) is a
private institution and hence does not utilise TISC but considers direct entry for all student applications.
Commencements with ATAR ≥95 is the per cent of TISC and non-TISC (UND) applicants with a high ATAR score (≥95) that enrolled at one
of the five major universities in Western Australia. An imputed enrolment is calculated for the University of Notre Dame based on the
TISC application data.
Performance in 2016 has fallen short of target and 2015 performance. Curtin has been approaching market share saturation and growth
in market share is showing signs of slowing. Initiatives launched in 2016, such as the Curtin Medical School, are expected to enhance
market share outcomes. Data for 2016 Total Commencements is not yet available.
*Benchmark data for 2016 are not available for Total Commencements due to timing of data collection and release by DET.
Total Commencements
TISC First Preferences
Commencements with ATAR ≥95
2013 36.8% 40.6% 19.5%
2014 37.8% 44.9% 24.2%
2015 37.7% 46.0% 25.4%
2016* 45.5% 23.6%
2016 Target 40.8% 48.0% 26.0%
0%
10%
20%
30%
40%
50%
Curtin Market Share of WA University Students
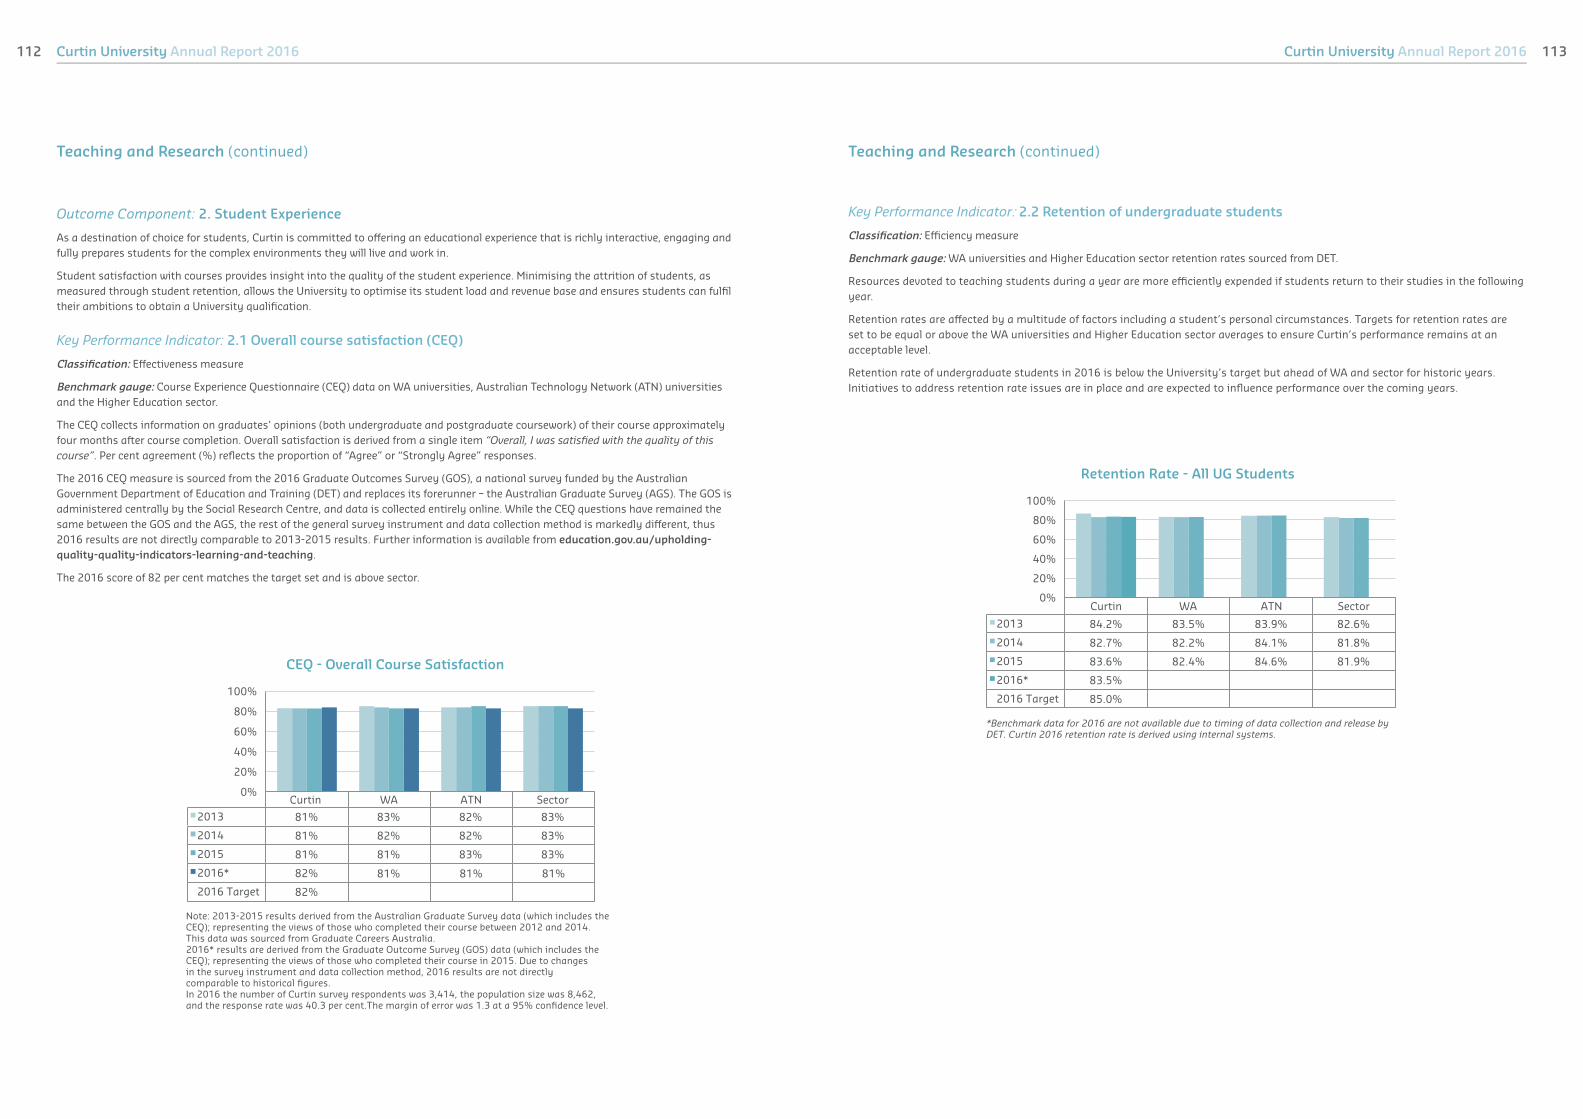
Curtin University Annual Report 2016 Curtin University Annual Report 2016112 113
Note: 2013-2015 results derived from the Australian Graduate Survey data (which includes theCEQ); representing the views of those who completed their course between 2012 and 2014.This data was sourced from Graduate Careers Australia.2016* results are derived from the Graduate Outcome Survey (GOS) data (which includes theCEQ); representing the views of those who completed their course in 2015. Due to changesin the survey instrument and data collection method, 2016 results are not directlycomparable to historical figures.In 2016 the number of Curtin survey respondents was 3,414, the population size was 8,462,and the response rate was 40.3 per cent.The margin of error was 1.3 at a 95% confidence level.
Curtin WA ATN Sector
2013 81% 83% 82% 83%
2014 81% 82% 82% 83%
2015 81% 81% 83% 83%
2016* 82%
2016 Target 82%
0%
20%
40%
60%
80%
100%
CEQ - Overall Course Satisfaction
81% 81% 81%
Outcome Component: 2. Student Experience
As a destination of choice for students, Curtin is committed to offering an educational experience that is richly interactive, engaging and
fully prepares students for the complex environments they will live and work in.
Student satisfaction with courses provides insight into the quality of the student experience. Minimising the attrition of students, as
measured through student retention, allows the University to optimise its student load and revenue base and ensures students can fulfil
their ambitions to obtain a University qualification.
Key Performance Indicator: 2.1 Overall course satisfaction (CEQ)
Classification: Effectiveness measure
Benchmark gauge: Course Experience Questionnaire (CEQ) data on WA universities, Australian Technology Network (ATN) universities
and the Higher Education sector.
The CEQ collects information on graduates’ opinions (both undergraduate and postgraduate coursework) of their course approximately
four months after course completion. Overall satisfaction is derived from a single item “Overall, I was satisfied with the quality of this
course”. Per cent agreement (%) reflects the proportion of “Agree” or “Strongly Agree” responses.
The 2016 CEQ measure is sourced from the 2016 Graduate Outcomes Survey (GOS), a national survey funded by the Australian
Government Department of Education and Training (DET) and replaces its forerunner – the Australian Graduate Survey (AGS). The GOS is
administered centrally by the Social Research Centre, and data is collected entirely online. While the CEQ questions have remained the
same between the GOS and the AGS, the rest of the general survey instrument and data collection method is markedly different, thus
2016 results are not directly comparable to 2013-2015 results. Further information is available from education.gov.au/upholding-
quality-quality-indicators-learning-and-teaching.
The 2016 score of 82 per cent matches the target set and is above sector.
Teaching and Research (continued)
*Benchmark data for 2016 are not available due to timing of data collection and release by
DET. Curtin 2016 retention rate is derived using internal systems.
Curtin WA ATN Sector
2013 84.2% 83.5% 83.9% 82.6%
2014 82.7% 82.2% 84.1% 81.8%
2015 83.6% 82.4% 84.6% 81.9%
2016* 83.5%
2016 Target 85.0%
0%
20%
40%
60%
80%
100%
Retention Rate - All UG Students
Teaching and Research (continued)
Key Performance Indicator: 2.2 Retention of undergraduate students
Classification: Efficiency measure
Benchmark gauge: WA universities and Higher Education sector retention rates sourced from DET.
Resources devoted to teaching students during a year are more efficiently expended if students return to their studies in the following
year.
Retention rates are affected by a multitude of factors including a student’s personal circumstances. Targets for retention rates are
set to be equal or above the WA universities and Higher Education sector averages to ensure Curtin’s performance remains at an
acceptable level.
Retention rate of undergraduate students in 2016 is below the University’s target but ahead of WA and sector for historic years.
Initiatives to address retention rate issues are in place and are expected to influence performance over the coming years.

Curtin University Annual Report 2016 Curtin University Annual Report 2016114 115
Key Performance Indicator: 3.2 Excellence in Research for Australia (ERA) results
Classification: Effectiveness measure
Benchmark gauge: ERA rating by the Australian Research Council (ARC). Comparison with previous years’ ratings reflects progress and
development of research at Curtin.
ERA is Australia’s national research evaluation framework. It provides a comprehensive quality evaluation of all research produced in
Australian universities against national and international benchmarks. ERA is based on expert review informed by a range of indicators
and metrics with ratings assigned using Field of Research (FoR) codes within an institution based on the Australia and New Zealand
Standard Classification. Data for ERA is submitted at the four-digit FoR level which categorises a broad subject area or research
discipline at a more detailed level.
There is no ERA rating in 2016, the next round will be conducted in 2018. In 2015, Curtin was assessed on 50 four-digit level FoRs and
awarded ‘5s’ (well-above world-standard) for 9 fields and ‘4s’ (above world standard) for 17 fields, the top two of a five-point rating scale.
Curtin met and exceeded its set targets for 2015 ERA outcomes.
ERA Results
2010 2012 2015 2015 Target
5s 2 2 9 4
4s 5 12 17 16
Outcome Component: 3. Research Reputation and Outcomes
To be a leading international university, Curtin must have strong research performance.
The prestige of being ranked within the Academic Ranking of World Universities (ARWU) and Excellence in Research Australia (ERA)
provides significant research, partnership and marketing opportunities. The measures reflect credible, external evaluations. Research
income is an indicator of the University’s ability to attract research funding in a competitive environment and provides a proxy measure
for national and international research reputation.
Key Performance Indicator: 3.1 The Academic Ranking of World Universities (ARWU) ranking
Classification: Effectiveness measure
Benchmark gauge: ARWU ranking data by Centre for World-Class Universities of Shanghai Ranking Consultancy. Rise in rank indicates
the progress of Curtin in attaining leadership in research and education.
The ARWU uses six objective indicators to rank world universities, including the number of alumni and staff winning Nobel Prizes
and Fields Medals, the number of highly cited researchers selected by Thomson Reuters, the number of papers published in Nature
and Science journals, the number of papers indexed in Science Citation Index-Expanded and Social Science Citation Index, and the per
capita academic performance of an institution. More than 1,200 universities are ranked by ARWU and the best 500 are published on
the web.
Curtin is estimated to rank 211 in the world in 2016, a very significant improvement in rank. Among the Australian universities, it has
obtained a position in the top 10 nationally.
Note: 2013-2016 estimated ranks are calculated by Curtin’s Office of Strategy and Planning using publicly available scores and a factored calculation.
ARWU Ranking
2013 2014 2015 2016 2016 Target
World Rank 401-500 301-400 201-300 201-300 250-280
Estimated World Rank 427= 303= 270 211
National Rank 17-19 10-18 9-11 9-14 10-16
Estimated National Rank 17= 10= 11 10
Teaching and Research (continued)
Key Performance Indicator: 3.3 Total research income (HERDC Cat 1-4)
Classification: Effectiveness measure
Benchmark gauge: Australian Technology Network (ATN) Universities and All Australian Universities National Rank sourced from DET
higher education research data collection (HERDC) data.
Research income consists of four HERDC categories:
• Category 1 - Australian Competitive Grants
• Category 2 - Other Public Sector Funds
• Category 3 - Industry and Other Funds
• Category 4 - Cooperative Research Centre Funds
Curtin has set a target to increase research income by 100 per cent over 2013-2017 in order to secure its position as a top 10 university
in Australia.
Research performance outcomes are being targeted through strategic support for grant proposals, recruitment of high performing
researchers, and improved success in ARC fellowship and grant programs. These strategies are delivering improved research income
performance.
As the DET data are reported with a year lag, benchmark data is only available up to 2015. In that year, Curtin’s research income was
above the average ATN universities and continued to rank 12th among 41 Australian universities.
Total Research Income (HERDC Cat 1-4)
2013 2014 2015 2015 Target 2016 target
Curtin* $72.4m $80.5m $87.5m $83.0m $90.0m
Average ATN Universities* $65.2m $70.5m $73.1m
All Australian Universities Rank* 12 12 12
*Data for 2016 are not available due to timing of data collection and release by DET.
Teaching and Research (continued)
Note: The ERA process is conducted every 3 years. A pilot round was held in 2010.

Curtin University Annual Report 2016 Curtin University Annual Report 2016116 117
*Benchmark data for 2016 are not available due to timing of data collection and release by AHEIA.Curtin 2016 percentage is derived using internal systems.Note: Data for Curtin and benchmarks are sourced from the latest report provided by AHEIA
Curtin ATN Avg Aus Avg
2013 68.0% 71.1% 70.4%
2014 73.4% 74.8% 71.9%
2015 76.6% 76.0% 76.1%
2016* 77.0%
2016 Target 73.0%
0%
20%
40%
60%
80%
100%
Academic Staff with Doctoral Qualifications
B. PEOPLE AND CULTURE
Outcome Component: 4. Performance
To improve student experience and Curtin’s research performance, the University is focused on improving the performance of its
academic workforce. Academic staff qualifications are a significant lead indicator of Curtin’s capacity to achieve its strategic goals in
teaching and research.
To be a leading international university Curtin must have strong research cohort. The University’s ability to attract research funding in a
competitive environment and performance of the research cohort is measured by research income per research full time equivalent (FTE).
Key Performance Indicator: 4.1 Academic staff with doctoral qualifications
Classification: Effectiveness measure
Benchmark gauge: ATN and Australian sector averages are calculated based on universities that participate in the HR Benchmarking
Program compiled by the Australian Higher Education Industrial Association (AHEIA).
Curtin’s percentage of academic staff with doctoral qualifications in 2016 of 77.0% has exceeded target and benchmark figures for prior
year. Benchmark data for 2016 are not published yet.
Outcome Component: 5. Satisfaction
Curtin has adopted a staff satisfaction target that takes it towards being recognised as an employer of choice. The University actively
seeks feedback from staff through the YourVoice Staff Satisfaction Survey.
Key Performance Indicator: 5.1 Overall staff satisfaction (YourVoice survey)
Classification: Effectiveness measure
Benchmark gauge: “ATN and Group of Eight (Go8)”, “All Universities” and “All Industries” data compiled by the Voice Project Agency that
conducted this survey for Curtin. The Go8 is an alliance of eight research-intensive Australian universities.
The YourVoice survey is conducted biennially and the indicator is derived from the mean of responses to three statements: “My work
gives me a feeling of personal accomplishment”; “I like the kind of work I do” and “Overall, I am satisfied with my job”.
2016 results are not available as there was no survey conducted in 2016. However the survey has been scheduled to March 2017 so as to
ensure that the results can be fully disseminated and acted upon within the calendar year; also the March date will provide sufficient time
to facilitate the involvement of staff at Curtin’s offshore campuses. Results for this measure will be reported to University Council in 2017.
The latest available result is from the 2014 survey and the satisfaction outcome of 82 per cent exceeded target and also met/exceeded
two out of three benchmark results.
Key Performance Indicator: 4.2 Research income per research staff FTE
Classification: Efficiency measure
Benchmark gauge: ATN and Australian universities figures derived from DET HERDC publication.
Increased productivity is being addressed through targeting of higher value research grants and contracts, and timely contract
management through the Office of Research and Development.
Research Income comprises HERDC income (categories 1-4) and the research cohort consists of staff FTE who perform the functions of
“research” or “teaching and research”, in academic or professional roles. In 2015, there has been a 19 per cent growth in research income
per research FTE and the target is met. Curtin is ahead of the ATN average and its national rank has improved.
Research Income (HERDC Cat 1-4) per Research Staff FTE
2013 2014 2015 2015 Target 2016 Target
Curtin* $63,860 $71,328 $84,592 $80,150 $93,775
Average ATN Universities* $56,460 $61,269 $63,182
National Rank* 16 13 11
*Data for 2016 are not available due to timing of research income data and staff data collections and release by DET.
People and Culture (continued)
Your Voice – Job Satisfaction (% Fav)
2010 2012 2014 2016 2016 Target
Curtin 79% 80% 82% na 80%
ATN and Go8* na na 83% na
All Universities 79% 80% 82% na
All Industry 69% 69% 70% na
*Data for ATN and Go8 is a new comparison category from 2014. In 2014 the number of survey responses was 2,920, the population size was 4,357 and the response rate was 67 per cent. The margin of error was 1.0 at a 95% confidence level. In 2010 and 2012, only continuing and fixed-term staff were surveyed. In 2014, professional casual staff and academic sessional staff were also included in the survey.
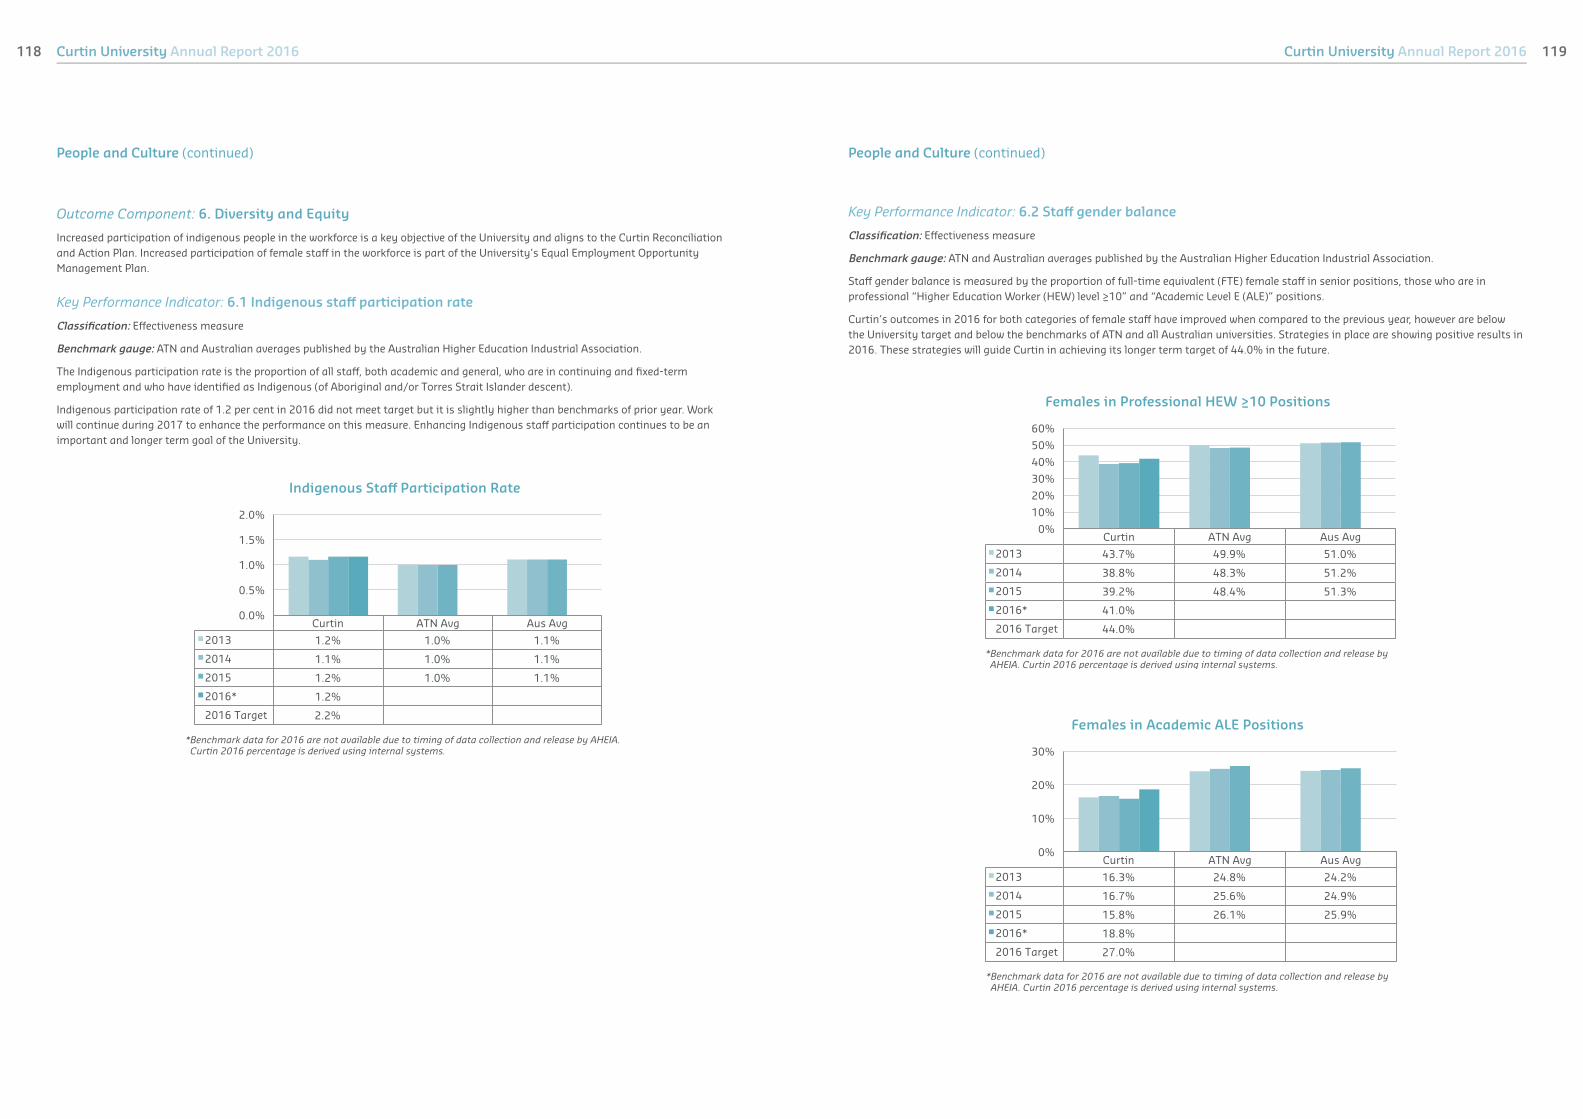
Curtin University Annual Report 2016 Curtin University Annual Report 2016118 119
*Benchmark data for 2016 are not available due to timing of data collection and release by AHEIA.Curtin 2016 percentage is derived using internal systems.
Curtin ATN Avg Aus Avg
2013 1.2% 1.0% 1.1%
2014 1.1% 1.0% 1.1%
2015 1.2% 1.0% 1.1%
2016* 1.2%
2016 Target 2.2%
0.0%
0.5%
1.0%
1.5%
2.0%
Indigenous Staff Participation Rate
Outcome Component: 6. Diversity and Equity
Increased participation of indigenous people in the workforce is a key objective of the University and aligns to the Curtin Reconciliation
and Action Plan. Increased participation of female staff in the workforce is part of the University’s Equal Employment Opportunity
Management Plan.
Key Performance Indicator: 6.1 Indigenous staff participation rate
Classification: Effectiveness measure
Benchmark gauge: ATN and Australian averages published by the Australian Higher Education Industrial Association.
The Indigenous participation rate is the proportion of all staff, both academic and general, who are in continuing and fixed-term
employment and who have identified as Indigenous (of Aboriginal and/or Torres Strait Islander descent).
Indigenous participation rate of 1.2 per cent in 2016 did not meet target but it is slightly higher than benchmarks of prior year. Work
will continue during 2017 to enhance the performance on this measure. Enhancing Indigenous staff participation continues to be an
important and longer term goal of the University.
People and Culture (continued)
*Benchmark data for 2016 are not available due to timing of data collection and release byAHEIA. Curtin 2016 percentage is derived using internal systems.
Curtin ATN Avg Aus Avg
2013 43.7% 49.9% 51.0%
2014 38.8% 48.3% 51.2%
2015 39.2% 48.4% 51.3%
2016* 41.0%
2016 Target 44.0%
0%
10%
20%
30%
40%
50%
60%
Females in Professional HEW ≥10 Positions
Key Performance Indicator: 6.2 Staff gender balance
Classification: Effectiveness measure
Benchmark gauge: ATN and Australian averages published by the Australian Higher Education Industrial Association.
Staff gender balance is measured by the proportion of full-time equivalent (FTE) female staff in senior positions, those who are in
professional “Higher Education Worker (HEW) level ≥10” and “Academic Level E (ALE)” positions.
Curtin’s outcomes in 2016 for both categories of female staff have improved when compared to the previous year, however are below
the University target and below the benchmarks of ATN and all Australian universities. Strategies in place are showing positive results in
2016. These strategies will guide Curtin in achieving its longer term target of 44.0% in the future.
*Benchmark data for 2016 are not available due to timing of data collection and release byAHEIA. Curtin 2016 percentage is derived using internal systems.
Curtin ATN Avg Aus Avg
2013 16.3% 24.8% 24.2%
2014 16.7% 25.6% 24.9%
2015 15.8% 26.1% 25.9%
2016* 18.8%
2016 Target 27.0%
0%
10%
20%
30%
Females in Academic ALE Positions
People and Culture (continued)

Curtin University Annual Report 2016 Curtin University Annual Report 2016120 121
C. ENGAGEMENT AND IMPACT
Outcome Component: 7. Graduate Reputation
Curtin aspires to have the highest graduate employment rates in Western Australia. The vision for Teaching and Learning is to be
‘sought after by students’ and ‘sought after by employers’. Measuring the employment rate of graduates indicates the reputation of
Curtin graduates with industry as well as a secondary measure of Curtin’s reputation. It should be noted that graduate employment
rates are affected by external factors such as economic conditions and labour market cycles.
Key Performance Indicator: 7.1 Domestic graduate employment rates
Classification: Effectiveness measure
Benchmark gauge: : National Graduate Destination Survey Ranking (institutions with >300 survey respondents) published by Graduate
Careers Australia.
As with the CEQ measure, the 2016 employment rate is sourced from the Graduate Outcomes Survey (GOS), while the 2013-2015 results
has been sourced from the Australian Graduate Survey (AGS). Although the GOS and its forerunner the AGS both collect labour market
outcome information, the data collection method and labour market questions are different. Consequently, 2016 forms a new time
series and is not directly comparable to 2013-2015 results. Further information is available from education.gov.au/upholding-quality-
quality-indicators-learning-and-teaching.
Results show that Curtin’s domestic graduate employment rate, including casual employment, is 88.6 per cent in 2016. Curtin ranks 3rd
within Western Australia and 23rd nationally.
Domestic Graduate Employment Rates
2013 2014 2015 2016* 2016 Target
Curtin Employment Rate 91.8% 88.80% 89.3% 88.6%
National Employment Rate 90.6% 90.2% 90.3% 88.7%
Western Australian Ranking 2= 3 4 3 2
National Ranking 13 (n=42) 30 (n=42) 33 (n=39) 23 (n=38)
Note: 2013-2015 results derived from Graduate Destinations Survey (GDS 2013-15) data; representing the views of those who completed their course between 2012 and 2014..* 2016 results are derived from Graduate Outcome Survey (GOS 2016) data; representing the views of those who completed their course in 2015. Due to changes in the survey instrument and data collection method, 2016 results are not directly comparable to historical figures. In 2016, the number of domestic Curtin survey respondents was 2,977, the domestic Curtin graduate population size was 6,433, and the response rate was 46.3 per cent. The margin of error was 1.32 at a 95% confidence level.
Outcome Component: 8. Alumni Engagement
Maintaining relationships with Alumni supports advocacy for the University and ensures global Alumni networks are fostered. The
annual Alumni survey measures the affinity of Alumni towards Curtin using a Net Promoter Score (NPS).
Key Performance Indicator: 8.1 Alumni survey
Classification: Effectiveness measure
Benchmark gauge: Since this is an internal survey, there is no comparable benchmark.
As part of the annual Curtin Alumni Survey, alumni are asked to rate the question “How likely would you be to recommend Curtin as a
university to your family, colleagues or friends?” on a 0-10 likelihood scale. Responses are grouped according to their score on a scale
of 0-10: Promoters (9-10); Passives (7-8); and Detractors (0-6). The NPS is then derived by taking the percentage of Detractors from the
percentage of Promoters.
2016 results are not available. Work is currently underway to develop a more robust Alumni engagement measure for the Strategic Plan
2017-2020. For this reason, a decision was made not to undertake the 2016 Alumni Survey.
In 2015, NPS of 48 shows a noticeable increase compared to previous years and has exceeded target.
Outcome Component: 9. International Reputation
Curtin aims to grow its reputation for quality research and graduates. Improving academic and employer survey scores in comparison to
other Australian universities will demonstrate the University’s increased performance in the higher education and industry sectors.
Key Performance Indicator: 9.1 QSWUR Global Academic Survey and Global Employer Survey scores
Classification: Effectiveness measure
Benchmark gauge: Comparison with all Australian universities in the QSWUR survey ranks.
The QS World University Ranking (QSWUR) uses responses from two global surveys as part of their ranking metrics. The Global Academic
Survey is the basis for the Academic Reputation indicator, worth 40% of an institution’s total score, and the Global Employer Survey is
the basis for the Employer Reputation indicator, worth 10% of an institution’s total score.
In 2016, Curtin ranks 17th among Australian universities in the Academic Survey and has failed to meet target. For the Global Employer
Survey, Curtin’s 16th position is one below target. A total of 35 Australian universities were ranked in QSWUR in 2016.
Net Promoter Score (NPS) of the Curtin Alumni Survey Results
2013 2014 2015 2016
nPositive (7-10)* NPS n
Positive (7-10)* NPS n
Positive (7-10)* NPS n
Positive (7-10)* NPS
Actual 906 85% 28 1,164 92% 42 2,820 91% 48 na na na
Target 28 29 na
Note: In 2015, the number of responses was 2,820, the population size was 84,956**, and the response rate was 3.3 per cent. The margin of error was 1.04 at a 95% confidence level.* Proportion of respondents who gave the question a rating of 7, 8, 9 or 10.** The population only includes Alumni for which Curtin has current contact details. A significant proportion of Alumni who graduated prior to 2000 are not included in the population as Curtin does not have current email addresses for these graduates.
Engagement and Impact (continued)
Curtin Rank in Australia in the QSWUR Global Academic Survey
and Global Employer Survey Scores
2013 2014 2015 2016 2016 Target
Academic 14 16 15 17 14
Employer 14 17 17 16 15

Curtin University Annual Report 2016122
Outcome Component: 10. Financial Sustainability
To provide an excellent learning experience that is financially sustainable.
Key Performance Indicator: 10.1 Teaching and learning (T&L) expenditure per equivalent full-time student load (EFTSL)
Classification: Efficiency measure
Benchmark gauge: This indicator is an internal measure and there is no comparable data for benchmarking.
Due to the changing nature of business models for course delivery, e.g. development of Massive Open Online Courses (MOOCs) and other
online offerings, a target for this measure has not been set.
T&L expenditure relates to the teaching of Curtin’s programs. Utilising the measure of average cost of teaching per EFTSL provides an
indicator of efficiency. It is important to note that average expenditure per EFTSL is largely dependent on the mix of disciplines taught
by an institution. Curtin’s high representation of laboratory-based courses raises relative service delivery costs, as does the delivery of
regional higher education programs in locations such as Kalgoorlie and Margaret River.
D. FINANCIAL SECURITY
Teaching and Learning Expenditure per Student EFTSL
2013 2014 2015 2016
T&L Expenditure ($’000) $605,914 $627,778 $639,978 $633,110
EFTSL 38,056 38,525 38,506 37,537
T&L Expenditure per EFTSL $15,922 $16,295 $16,620 $16,866
Key Performance Indicator: 10.2 Net operating results
Classification: Effectiveness measure
Benchmark gauge: This indicator is an internal measure and there is no comparable data for benchmarking. No targets have been
published due to the commercially sensitive nature of this measure.
Net Operating Result (revenue minus expenses from continuing operations) is the key measure of Curtin’s financial sustainability. The
University aims to maintain a net operating surplus in order to retain reserves for investment in development and to buffer against financial
volatility.
Net Operating Results (dollars and percentage of total revenue)
2013 2014 2015 2016
Net Operating Result ($’m) $62.4 $49.7 $62.0 $38.1
Percentage of total revenue from continuing operations
7.3% 5.6% 6.8% 4.2%

Curtin University
Kent Street Bentley 6102
GPO Box U1987 Perth WA 6845
Tel: +61 8 9266 9266
CRICOS Provider Code 00301J
© Curtin University 2017
curtin.edu.au
CONTACT:
Disclaimer
Information in this publication is correct at the time of printing but may be subject to change. This material does not purport to constitute legal or professional advice. Curtin accepts no responsibility for and makes no representations, whether express or implied, as to the accuracy or reliability in any respect of any material in this publication. Except to the extent mandated otherwise by legislation, Curtin does not accept responsibility for the consequences of any reliance which may be placed on this material by any person. Curtin will not be liable to you or to any other person for any loss or damage (including direct, consequential or economic loss or damage) however caused and whether by negligence or otherwise which may result directly or indirectly from the use of this publication.
Copyright information
Except as permitted by the Copyright Act 1968 this material may not be reproduced, stored or transmitted without the permission of the copyright owner. All enquiries must be directed to Curtin University.
This publication is available in alternative formats on request. 2546CORP