Embed Size (px)
Citation preview
Annual Report 2016
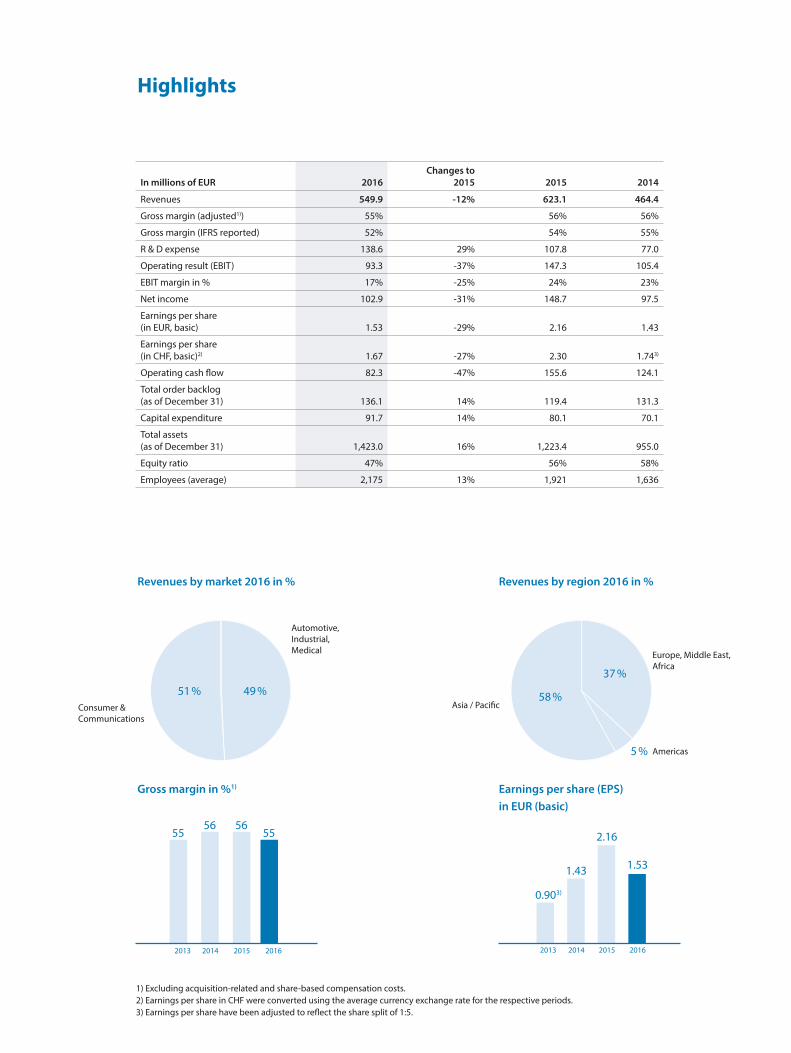
Revenues by market 2016 in %
Highlights
Gross margin in %1)
Asia / Pacific
Americas
Europe, Middle East, Africa
Revenues by region 2016 in %
Earnings per share (EPS) in EUR (basic)
2013 20162014 2015
55 5556 56
0.903)
1.43
2.16
1.53
2013 2014 2015 2016
Consumer &Communications
Automotive,Industrial,Medical
64 %
36 %
1) Excluding acquisition-related and share-based compensation costs.2) Earnings per share in CHF were converted using the average currency exchange rate for the respective periods. 3) Earnings per share have been adjusted to reflect the share split of 1:5.
In millions of EUR 2016Changes to
2015 2015 2014
Revenues 549.9 -12% 623.1 464.4
Gross margin (adjusted1)) 55% 56% 56%
Gross margin (IFRS reported) 52% 54% 55%
R & D expense 138.6 29% 107.8 77.0
Operating result (EBIT) 93.3 -37% 147.3 105.4
EBIT margin in % 17% -25% 24% 23%
Net income 102.9 -31% 148.7 97.5
Earnings per share (in EUR, basic) 1.53 -29% 2.16 1.43
Earnings per share (in CHF, basic)2) 1.67 -27% 2.30 1.743)
Operating cash flow 82.3 -47% 155.6 124.1
Total order backlog (as of December 31) 136.1 14% 119.4 131.3
Capital expenditure 91.7 14% 80.1 70.1
Total assets (as of December 31) 1,423.0 16% 1,223.4 955.0
Equity ratio 47% 56% 58%
Employees (average) 2,175 13% 1,921 1,636
65 %
35 %49 %51 % 58 %
37 %
5 %
3
4
Contents
Preface by the Management Board ...................................................................................................... 6Preface by the Supervisory Board .......................................................................................................10
Our Company ..............................................................................................................12
Our Company ..............................................................................................................................................14Our Business ................................................................................................................................................18Our Global Network .................................................................................................................................21
Investor Relations and Corporate Governance ...............................................22
Investor Relations ......................................................................................................................................24Executive Bodies ........................................................................................................................................26Corporate Governance ............................................................................................................................27
Financial Information ...............................................................................................36
Group Management Report 2016 .......................................................................................................38Consolidated Income Statement acc. to IFRS from January 1, 2016 until December 31, 2016 ......................................................52Consolidated Statement of Comprehensive Income acc. to IFRS from January 1, 2016 until December 31, 2016 ......................................................53Consolidated Balance Sheet acc. to IFRS as of December 31, 2016 ..................................................................................................54Consolidated Statement of Cash Flows acc. to IFRS from January 1, 2016 until December 31, 2016 ......................................................55Consolidated Statement of Changes in Shareholders’ Equity acc. to IFRS from January 1, 2016 until December 31, 2016 ......................................................56Notes to the Consolidated Financial Statements ..........................................................................57Independent Auditor’s Report ........................................................................................................... 118
Glossary ...................................................................................................................................................... 125
5
6
Preface by the Management Board
Dear shareholders, customers and employees, ladies and gentlemen
2016 was a year of transformation for ams.
In March, Alexander Everke took over the CEO position as planned following his appointment to the Management Board in October 2015. Kirk Laney moved to a strategist role focusing on ams’ position in emerging sensor technologies and has retired from the Management Board in March of this year. We thank Kirk Laney for his outstanding contribution to the development of our business over the last five years.
We defined a new corporate strategy for ams last year with the goal to build the global leader in sensor solutions. We are focusing on true leadership in the four fast-growing sensing markets for optical, imaging, environmental and audio sensing. Here we want to offer best-in-class performance per sensor area in a diversified business with a balanced portfolio. We have combined these goals with clear finan-cial targets for 30% revenue growth (CAGR) in the years to 2019 and a 30% EBIT margin (adj.) from 2019 onwards, however, our revenue growth target is currently under upward revision.
The most important development for ams in 2016 and major step in implementing our strategy was the acquisition of Heptagon, a worldwide leader in micro-optics and optical sensing with a focus on high performance optical packaging. The long-term strategic transaction created the clear global leader in optical sensing which significantly boosts our competitive position in our largest business area. Com-bining market-leading technology in optical sensors and optical packaging we now have an excellent platform for leadership in the large emerging market of 3D optical sensing and can pursue aggressive roadmaps for new optical sensing applications. Numerous synergies from ams and Heptagon capabili-ties will enable us to drive innovative solutions across our sensing focus areas and end markets.
As part of the active management of our technology portfolio, we also acquired strategically important businesses in gas and environmental sensing (CCMOSS), spectral sensing with an industrial focus (MAZeT) and digital noise cancellation IP (Incus) last year. We successfully divested our wireless busi-ness for NFC and RFID reader applications in 2016 retaining relevant wireless IP to support the expected adoption of wireless sensor solutions. Active portfolio management will continue to play a key role in our strategy going forward.
7
Our consumer and communications business provided the most significant revenue contribution again last year with light sensor products remaining the largest product area for the group. We are the world-wide market leader in advanced light sensors and our mobile device light sensor solutions are found in numerous high volume devices by leading smartphone and consumer OEMs. We expanded our optical sensor portfolio last year and recorded strong market traction including designs at new customers. Other areas including audio solutions for MEMS microphones and ambient noise cancellation also per-formed well in 2016 and created new growth opportunities for ams.
Our automotive, industrial, and medical businesses developed positively in 2016 and according to ex-pectations. Our strong technology base including newly acquired IP and a broad global customer base allowed us to improve market penetration. The industrial business for industrial and factory automati-on, building control, and industrial sensing showed solid results in light of limited business momentum last year. Our imaging product lines developed broadly in line with expectations. The medical business which focuses on medical imaging for computed tomography, digital X-ray, and mammography per-formed well in 2016 and gained new customers in Asia for future programs. We recorded another year of solid growth in our automotive business where we offer sensor solutions for safety, position measu-rement, level control and other applications. We see ams well positioned for the ongoing expansion of sensing and new sensor systems in vehicles.
ams maintains high levels of investment in R&D and increased R&D resources again in 2016, mainly as a result of acquisitions. Our production model combines in-house capacity and strong manufacturing partners into a high volume platform supporting our market success. Our internal capacity was fully utilized in 2016 while we successfully completed planned expansion investments in wafer fabrication and optical layer deposition. We also defined a cost-attractive path for higher outsourced wafer volu-mes with our technology manufacturing partners to prepare ams for the growth opportunities we see. We remain committed to responsible business practices, and implemented further energy efficiency measures last year.
Based on our current dividend policy we will propose a dividend of EUR 0.30 per share or 25% of the net result for 2016. Our financial position remains very solid and is supported by our cash-generative business model enabling attractive profitability.
8
The Supervisory Board offered constructive support for our activities and backed our strategic decisions last year. We would like to thank our customers, partners, shareholders and, above all, the people of ams whose creativity, energy, ingenuity and commitment are the building blocks of our worldwide success.
We expect our expanded business to show meaningful growth in 2017 as we implement our target of 30% annual revenue growth rate for the years 2017-2019. In combination with Heptagon we see the clear potential for new growth opportunities across all end markets in the coming years. We will con-centrate on leadership in our sensing focus areas to drive differentiation and make ams the worldwide leader in sensor solutions.
Alexander EverkeCEO
Dr. Thomas StockmeierCOO
Michael Wachsler-MarkowitschCFO
9
10
Preface by the Supervisory Board
Dear shareholders
In 2016, despite major efforts undertaken in a slightly declining market, the ams group did not succeed in repeating the outstanding financial results achieved in the year before. Over the past year, ams’ revenues and earnings did not meet our own expectations. The medium and long-term prospects of ams never-theless remain very positive, and have continued to improve due to the consistent further development of the strategic direction of the company, and its implementation through operative targets and results. Under the leadership of our new CEO, Alexander Everke, we have focussed our highly-regarded sensor solutions and sensor technologies on growth markets and applications in optical, imaging, environmental and audio sensing. At the same time, we have applied our internal resources combined with acquisitions to enhance our expertise in the growing market for sensor systems.
The headlines about the semiconductor industry revolve around ever bigger corporate takeovers and mergers aimed at satisfying expectations for growth and profitability. We are deliberately embarking in a different direction. The acquisitions of 2016 have been conducive to achieving the strategic goal of making us the market-leader for complete sensing systems in our selected target markets, and to moving away from being solely a supplier of individual sensor ICs. In this context, the ability to offer the complete value chain as a one-stop supplier will be a decisive competitive advantage for ams.
Over the previous year, we strengthened the management team with the addition of industry specialists of various nationalities, who possess a broad range of technical and commercial experience and skills. This created an additional significant basis for the successful implementation of our strategy. Them joining confirmed the attractiveness of ams as a rapidly growing, profitable sensor specialist.
Kirk Laney retired from ams’ management team at the end of March this year. As General Manager of our optical sensor business and later as CEO of the ams group, Kirk played a defining role in ams’ move to-wards sensor solutions. We would like to thank Kirk Laney for his strong and successful commitment to the development of ams, and we wish him all the best for the next, somewhat more tranquil, stage of his life. The Supervisory Board has also undergone a change with the election by the shareholders of Kin Wah Loh to succeed Jerry Rogers on the Board. We also thank Jerry Rogers for his contribution to the development of ams. In the past years we benefited from his wide-ranging experience as a specialist in the semicon-ductor industry. In Mr Loh, ams has gained an internationally experienced senior executive, well-known in the semiconductor industry. Through his appointment we demonstrate the importance of the Asian markets for ams’ future development also in the Supervisory Board.
The constructive partnership between the Management and Supervisory Boards continued in 2016 and focused on implementing the corporate goals and our transformation into a solutions provider. The Management Board provided regular, comprehensive written and verbal information detailing the
11
ongoing performance of the business, the implementation of the strategic objectives and the financial situation of the group. The Supervisory Board held six meetings comprehensively fulfilling its tasks and duties. In collaboration with the Management Board and on its own the Supervisory Board accomplished its agenda also by way of its committees, which once again were an important element of the Super-visory Board‘s activities. Further information on the work of the committees can be found in the Corporate Governance section of this report. In addition, we conducted intensive discussions on current issues with the Management Board at monthly Executive Committee meetings. Once again, in 2016 the Supervisory Board completed a self-evaluation process for assessing its work and decision-making.
The strategic focus and its organisational implementation, the acquisitions and their integration, as well as challenging, technically ground-breaking customer and technology projects, together with an ambitious investment program, all demanded outstanding efforts from the Management Board, the management team and ams’ employees in Europe, the U.S. and Asia in 2016. These tasks were performed in the interests of the shareholders, the customers and the employees of ams. The Supervisory Board would like to thank everyone involved for their extraordinary dedication, which will provide the foundation for the further, positive development of our company.
On behalf of the Supervisory Board
Hans Jörg KaltenbrunnerChairman of the Supervisory Board

12
Our Company
13
14
Our Company
Our Vision
For ams, “Sensing is Life” and our passion is in creating sensor solutions that make devices and technology smarter, safer, more environmentally friendly and easier to use. We are shaping the world
with sensor solutions, leading the way in forging continuous connections between people and technology, and envisioning a seamless experience between the two.
Our Company & Strategy
ams’ sensor solutions and sensor ICs are at the heart of the products and technologies that define our world today – from smartphones and mobile devices to smart homes and buildings, industrial automation, medical technology and connected vehicles. Leading manufacturers around the globe rely on our sensing expertise for advanced system designs. Our solutions excel in applications requiring extreme precision, dynamic range, high sensitivity, and low power consumption in small form factors.
In 2016, we set forth a bold corporate strategy to be the global leader in sensor solutions in four fast growing areas: Optical, Imaging, Environmental and Audio sensing. These areas now represent the four pillars of our business, and we have taken decisive steps to build true leadership in these high-value markets.
We actively manage a focused technology and pro-duct portfolio around these four sensing areas to drive differentiation as the key factor for sustained leadership. Executing our roadmap towards our vision makes ams an ever-stronger player in the global semiconductor industry – to benefit our customers, shareholders, suppliers, and employees.
In each of our four focus areas we strive to offer industry-leading performance to our customers
by providing complete sensor solutions, so OEMs can rely on one trusted vendor for their techno-logy needs. We are driving integration of sensor technologies into monolithically integrated solu-tions or multi-sensor modules. These multi-sensor solutions – also called sensors hubs – may include hardware, state-of-the-art sensor algorithms, sensor fusion software and application software. By offering complete solutions, we help the industry move forward and create strategic advantages for customers. We empower OEMs to deliver differen-tiated products that change and improve lives, and enable exciting new end-user experiences.
To build global leadership in optical, imaging, environmental and audio sensing, we completed a series of strategic acquisitions in 2016. The addition of Heptagon, the global leader in micro-optics and high-performance optical packaging, stands out as a transforming event for our company making ams the clear worldwide leader in optical sensing. Furthermore, the acquisition of CCMOSS created a leadership position in gas sensing for the environ-mental sensor market, and the addition of MAZeT enhanced ams’ reach in spectral optical sensing. Finally, the acquisition of Incus Laboratories broadened our offering in active noise cancellation technologies.
15
16
Our Talent
ams recognizes the company’s workforce as its greatest asset and the key driver of ams’ global suc-cess. We embrace a wide range of highly creative, innovative, and unconventional thinkers, helping us attract and retain the best and brightest talent in the industry. Our culture is designed for pushing boundaries, empowering our workforce while
holding them accountable. We demand integrity in everything we do, and expect our team to be loyal, trustworthy, authentic and true role models. Diversity is valued across ams and the commit-ment and effort of every staff member contributes to our achievements in a competitive worldwide marketplace.
Manufacturing
ams’ flexible manufacturing concept combines internal and external wafer production capacity and in-house test at internal manufacturing sites in Austria and the Philippines. In 2016, we signifi-cantly expanded our optical filter layer deposition capacity for industry-leading optical sensor solu-tions. We also defined a robust path for expanding
wafer volumes with our technology manufacturing partners to support expected growth in the coming years. Through our acquisition of Heptagon we added high-volume manufacturing capabi-lities for differentiated packaging techno logy in Singapore where we are completing a major expansion of manufacturing capacity.
Our Company
17
Corporate Responsibility
Ethical, professional practices and environmental responsibility principles guide how ams conducts its business. Our company code of conduct is a binding set of principles and procedures for all ams staff safeguarding consistent, responsible, and accountable corporate activity across all business functions.
We are a member of the UN Global Compact, the world’s largest corporate initiative for responsib-le business and sustainability. With more than 10,000 participants in 130 countries, the UN Global Compact is committed to human rights, labor standards, environmental protection, and anti- corruption measures.
We remain firm in our commitment of protecting the environment and the sustainability of resour-ces, and strive to reduce our carbon emissions footprint globally. We are deploying state-of-the-art technologies designed to decrease our electric and natural gas consumption. Supporting these efforts, ams’ internal production sites in Austria and the Philippines are certified per the Environ mental Management System DIN EN ISO 14001. Our emissions footprint information is published within the framework of the Carbon Disclosure Project, an international initiative for corporate disclosure of environmental information.
18
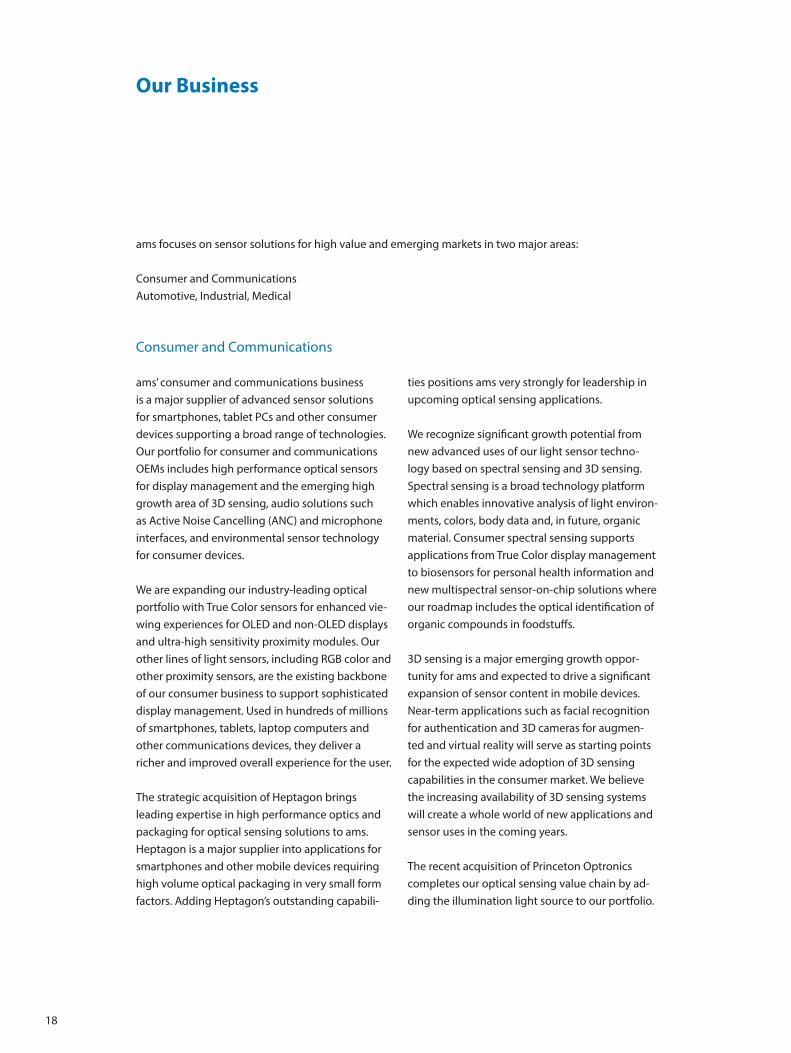
Our Business
ams focuses on sensor solutions for high value and emerging markets in two major areas:
Consumer and CommunicationsAutomotive, Industrial, Medical
Consumer and Communications
ams’ consumer and communications business is a major supplier of advanced sensor solutions for smartphones, tablet PCs and other consumer devices supporting a broad range of technologies. Our portfolio for consumer and communications OEMs includes high performance optical sensors for display management and the emerging high growth area of 3D sensing, audio solutions such as Active Noise Cancelling (ANC) and microphone interfaces, and environmental sensor technology for consumer devices. We are expanding our industry-leading optical portfolio with True Color sensors for enhanced vie-wing experiences for OLED and non-OLED displays and ultra-high sensitivity proximity modules. Our other lines of light sensors, including RGB color and other proximity sensors, are the existing backbone of our consumer business to support sophisticated display management. Used in hundreds of millions of smartphones, tablets, laptop computers and other communications devices, they deliver a richer and improved overall experience for the user.
The strategic acquisition of Heptagon brings leading expertise in high performance optics and packaging for optical sensing solutions to ams. Heptagon is a major supplier into applications for smartphones and other mobile devices requiring high volume optical packaging in very small form factors. Adding Heptagon’s outstanding capabili-
ties positions ams very strongly for leadership in upcoming optical sensing applications.
We recognize significant growth potential from new advanced uses of our light sensor techno-logy based on spectral sensing and 3D sensing. Spectral sensing is a broad technology platform which enables innovative analysis of light environ-ments, colors, body data and, in future, organic material. Consumer spectral sensing supports applications from True Color display management to biosensors for personal health information and new multispectral sensor-on-chip solutions where our roadmap includes the optical identification of organic compounds in foodstuffs.
3D sensing is a major emerging growth oppor-tunity for ams and expected to drive a significant expansion of sensor content in mobile devices. Near-term applications such as facial recognition for authentication and 3D cameras for augmen-ted and virtual reality will serve as starting points for the expected wide adoption of 3D sensing capabilities in the consumer market. We believe the increasing availability of 3D sensing systems will create a whole world of new applications and sensor uses in the coming years.
The recent acquisition of Princeton Optronics completes our optical sensing value chain by ad-ding the illumination light source to our portfolio.
19
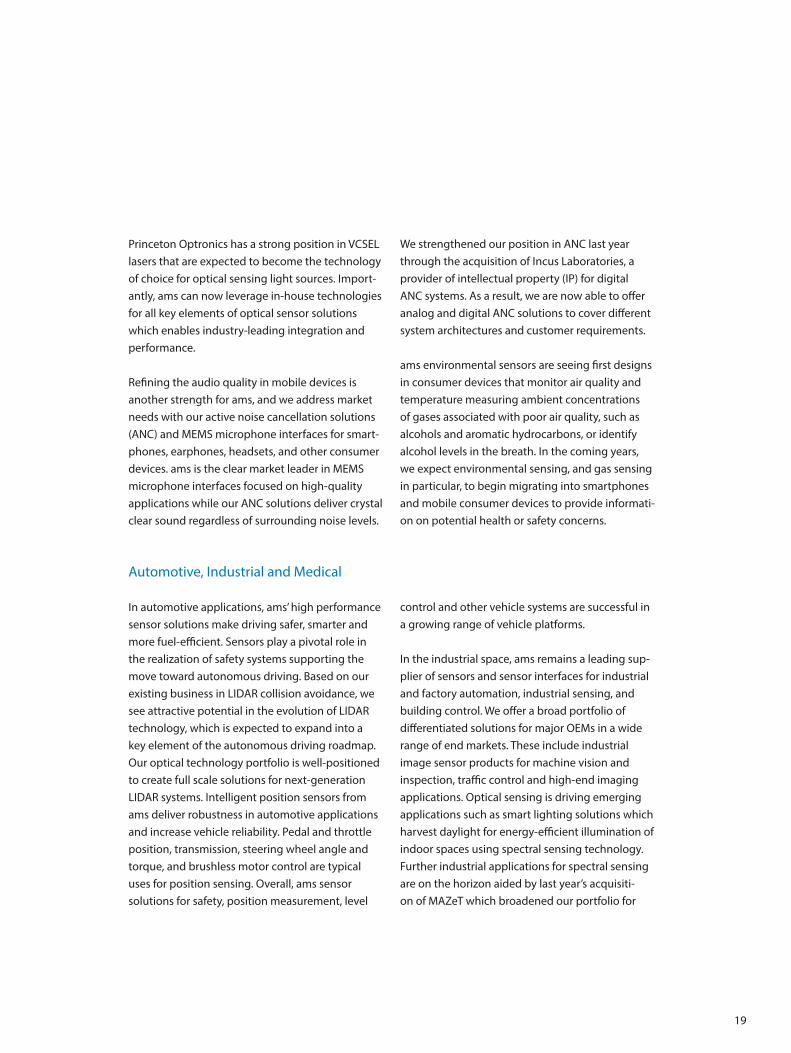
Princeton Optronics has a strong position in VCSEL lasers that are expected to become the technology of choice for optical sensing light sources. Import-antly, ams can now leverage in-house technologies for all key elements of optical sensor solutions which enables industry-leading integration and performance.
Refining the audio quality in mobile devices is another strength for ams, and we address market needs with our active noise cancellation solutions (ANC) and MEMS microphone interfaces for smart-phones, earphones, headsets, and other consumer devices. ams is the clear market leader in MEMS microphone interfaces focused on high-quality applications while our ANC solutions deliver crystal clear sound regardless of surrounding noise levels.
We strengthened our position in ANC last year through the acquisition of Incus Laboratories, a provider of intellectual property (IP) for digital ANC systems. As a result, we are now able to offer analog and digital ANC solutions to cover different system architectures and customer requirements.
ams environmental sensors are seeing first designs in consumer devices that monitor air quality and temperature measuring ambient concentrations of gases associated with poor air quality, such as alcohols and aromatic hydrocarbons, or identify alcohol levels in the breath. In the coming years, we expect environmental sensing, and gas sensing in particular, to begin migrating into smartphones and mobile consumer devices to provide informati-on on potential health or safety concerns.
Automotive, Industrial and Medical
In automotive applications, ams’ high performance sensor solutions make driving safer, smarter and more fuel-efficient. Sensors play a pivotal role in the realization of safety systems supporting the move toward autonomous driving. Based on our existing business in LIDAR collision avoidance, we see attractive potential in the evolution of LIDAR technology, which is expected to expand into a key element of the autonomous driving roadmap. Our optical technology portfolio is well-positioned to create full scale solutions for next-generation LIDAR systems. Intelligent position sensors from ams deliver robustness in automotive applications and increase vehicle reliability. Pedal and throttle position, transmission, steering wheel angle and torque, and brushless motor control are typical uses for position sensing. Overall, ams sensor solutions for safety, position measurement, level
control and other vehicle systems are successful in a growing range of vehicle platforms.
In the industrial space, ams remains a leading sup-plier of sensors and sensor interfaces for industrial and factory automation, industrial sensing, and building control. We offer a broad portfolio of differentiated solutions for major OEMs in a wide range of end markets. These include industrial image sensor products for machine vision and inspection, traffic control and high-end imaging applications. Optical sensing is driving emerging applications such as smart lighting solutions which harvest daylight for energy-efficient illumination of indoor spaces using spectral sensing technology. Further industrial applications for spectral sensing are on the horizon aided by last year’s acquisiti-on of MAZeT which broadened our portfolio for
20
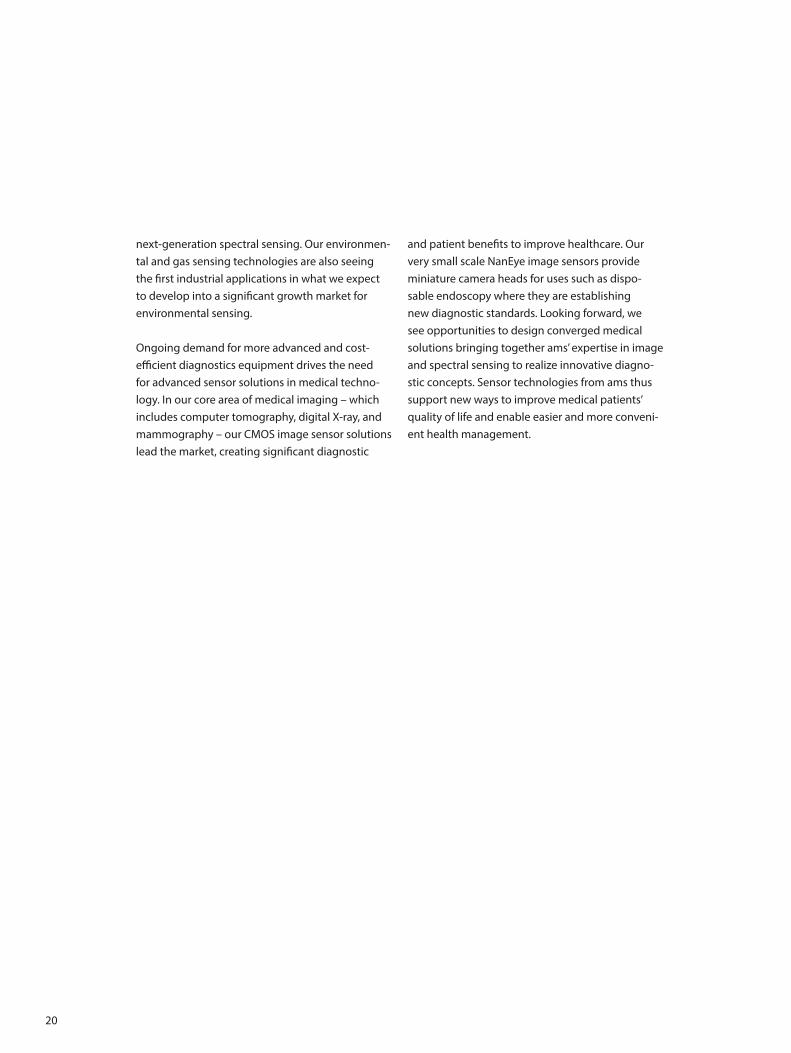
next-generation spectral sensing. Our environmen-tal and gas sensing technologies are also seeing the first industrial applications in what we expect to develop into a significant growth market for environmental sensing.
Ongoing demand for more advanced and cost- efficient diagnostics equipment drives the need for advanced sensor solutions in medical techno-logy. In our core area of medical imaging – which includes computer tomography, digital X-ray, and mammography – our CMOS image sensor solutions lead the market, creating significant diagnostic
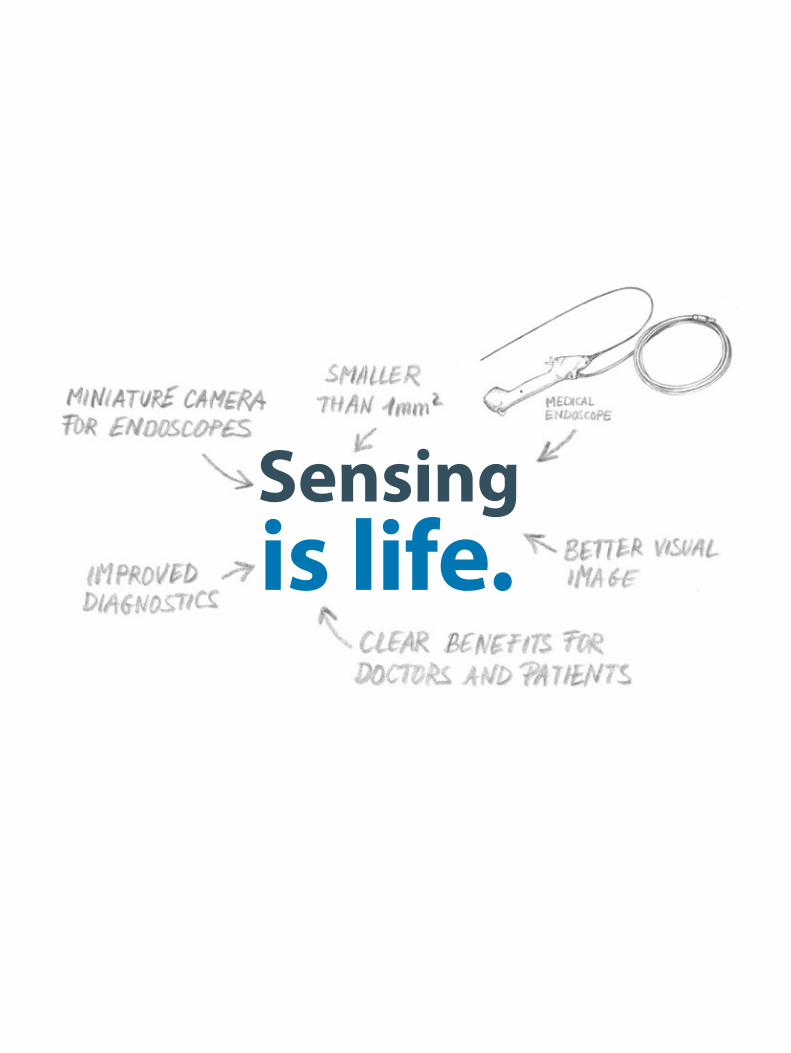
and patient benefits to improve healthcare. Our very small scale NanEye image sensors provide miniature camera heads for uses such as dispo-sable endoscopy where they are establishing new diagnostic standards. Looking forward, we see opportunities to design converged medical solutions bringing together ams’ expertise in image and spectral sensing to realize innovative diagno-stic concepts. Sensor technologies from ams thus support new ways to improve medical patients’ quality of life and enable easier and more conveni-ent health management.
21
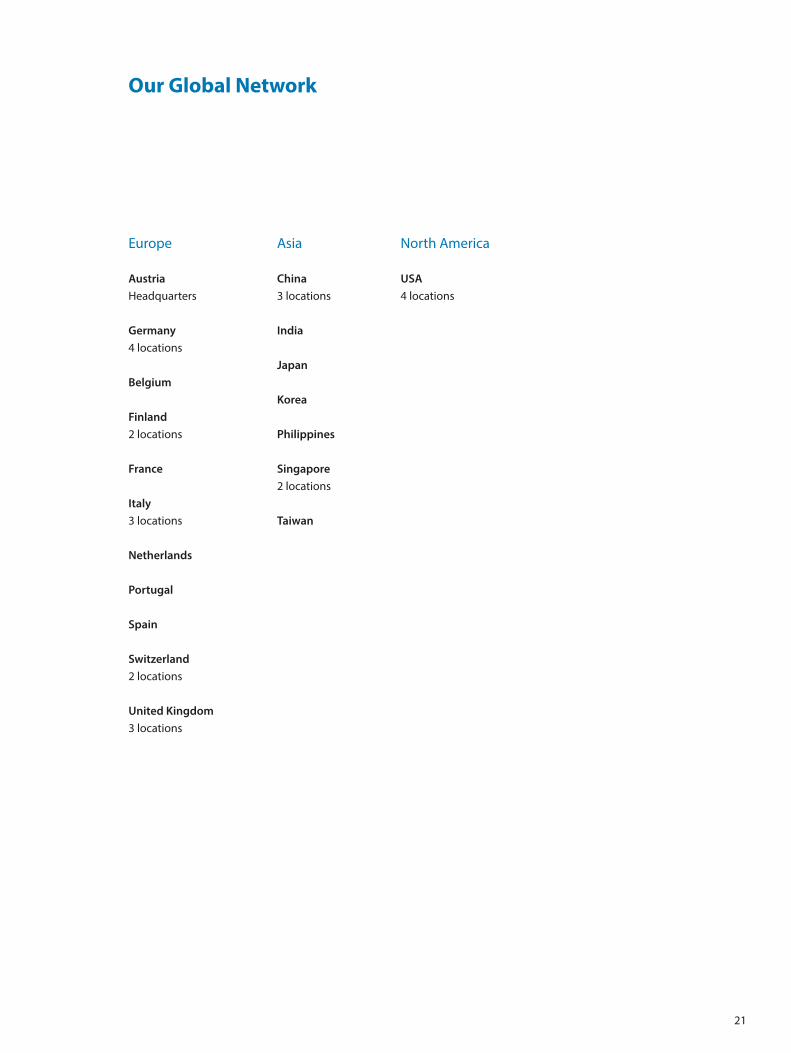
Our Global Network
Europe
AustriaHeadquarters
Germany4 locations
Belgium
Finland2 locations
France
Italy3 locations
Netherlands
Portugal
Spain
Switzerland2 locations
United Kingdom3 locations
Asia
China3 locations
India
Japan
Korea
Philippines
Singapore2 locations
Taiwan
North America
USA4 locations
22
Investor Relations and Corporate Governance
24
Investor Relations
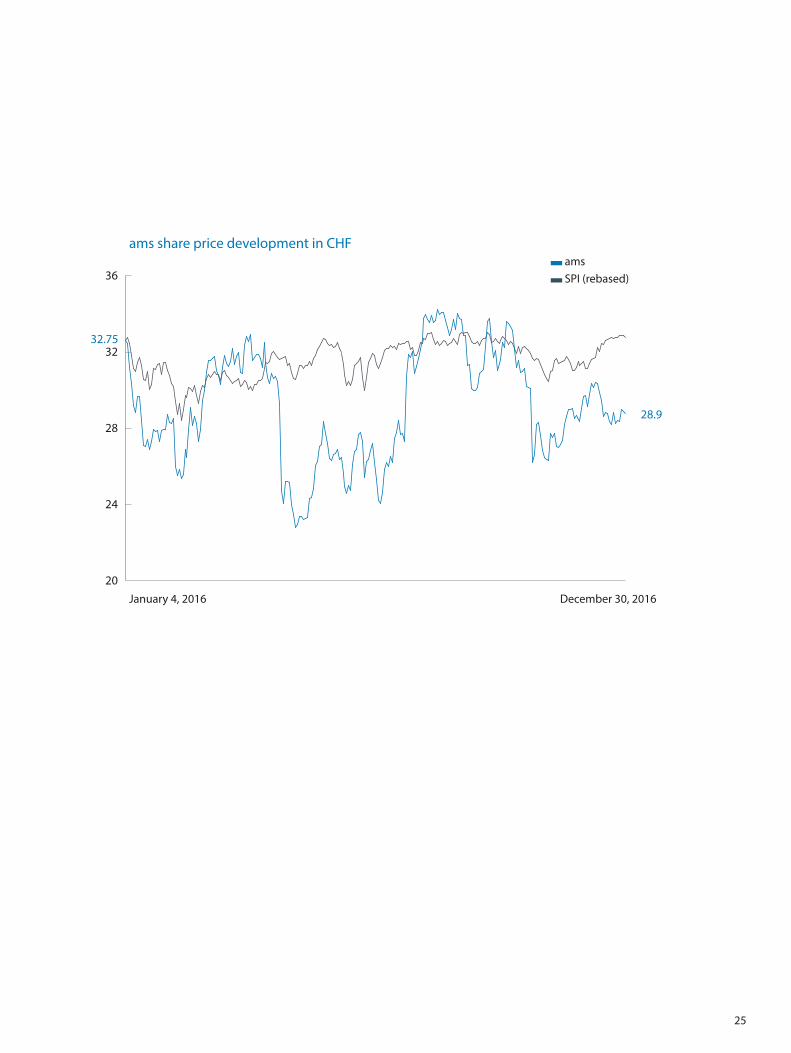
The ams share offers attractive potential for value appreciation as ams expects continued growth for its business and implements its focused sensor solutions strategy. The ams share recorded a mixed performance in 2016 with a volatile share price development in the first half given weakness in consumer end markets, followed by a positive trend in the third quarter. After the announcement of the Heptagon transaction the share price imme-diately reflected the dilutive effect of the announ-ced capital increase for a portion of the transaction consideration. The ams share partially recovered from this impact until year end as the advantages of the transaction began to be recognized. Overall, the ams share ended the year around 12% lower compared to the beginning of the year which includes the effect from the announced capital increase.
ams currently follows a dividend policy outlining a payout ratio of 25% of the annual net result. The Management Board will therefore propose a dividend of EUR 0.30 for the fiscal year 2016 reflec-ting the development of ams’ business (EUR 0.51 for fiscal year 2015). ams intends to continue to distribute dividends in the coming years based on the further positive development of its business.
ams also operates a share buyback scheme under which the company bought back 4,017,500 shares last year, equivalent to 5.5% of total issued shares at year end 2016. A major portion of these treasury shares has been utilized as consideration in the Heptagon transaction which closed in January 2017 while shares may also be used to cover em-ployee long-term incentive plans.
At the Annual General Meeting in June 2016, all agenda items subject to a vote were approved with an overwhelming majority.
ams continued to expand its investor relations ac-tivities in 2016, based on its quarterly reports and regular presentations to analysts, press, and insti-tutional investors. Besides increased investor road show activities in financial hubs across Europe, the U.S., Canada, and – for the first time – Asia, ams at-tended a number of investor conferences in Europe and the U.S.. Investor relations activities in North America were a particular focus in 2016 and helped improve the visibility of the ams share. Financial re-ports, press releases, and additional information on the ams share are available in the “Investor” section of the company website www.ams.com.
Share details
ISIN AT0000A18XM4Securities code 24924656Ticker symbol AMS (SIX Swiss Exchange)Reuters / Bloomberg AMS.S / AMS SW
25
ams share price development in CHF
32.75
28.9
20
24
28
32
36 ams SPI (rebased)
January 4, 2016 December 30, 2016
26
Executive Bodies
Management Board
Alexander Everke (CEO, since March 1, 2016)Kirk S. Laney (CEO, until February 29, 2016 / Chief Strategist Sensor Solutions, until March 31, 2017)Michael Wachsler-Markowitsch (CFO) Dr. Thomas Stockmeier (COO)
Supervisory Board
Guido Klestil (Honorary Chairman)Hans Jörg Kaltenbrunner (Chairman)Prof. Dr. Siegfried Selberherr (Deputy Chairman)Gerald Rogers (Deputy Chairman, until June 2, 2016)Michael Grimm Klaus IfflandJacob Jacobsson Kin Wah Loh (since June 2, 2016)Johann Eitner (employee representative)Andreas Pein (employee representative, since February 8, 2016)Vida Uhde-Djefroudi (employee representative, until February 7, 2017)Günter Kneffel (employee representative, until February 8, 2016 and since February 7, 2017)
27
Corporate Governance
As an Austrian company listed in Switzerland, ams AG (“ams”) is subject to the compulsory regulations of the SIX Swiss Exchange’s directive con-cerning information on corporate governance (“Swiss Corporate Govern-ance Directive”). The Swiss Corporate Governance Directive is available at https://www.six-exchange-regulation.com/dam/downloads/regula-tion/admission-manual/directives/06_16-DCG_en.pdf. This chapter also contains the Corporate Governance report information according to the stipulations of Austrian law.
In this context, ams points out that Austrian Corporate Law differs from the Swiss model in terms of the structure of its corporate bodies, their duties and their accountability. Hereinafter, the Austrian terms for the corporate bodies will be used. Corporations that are not constituted according to the Swiss Code of Obligations are required correspondingly to meet the regulations of the Swiss Corporate Governance Directive, which is formulated in close correspondence with the Swiss Code of Ob-ligations. Consequently there follows a brief description of the particular features of the Austrian organizational structure:
– The Management Board is responsible for company management and representation of the company; it holds the monopoly on company management and representation. It is not subject to instructions by the shareholders or the Supervisory Board, acting rather on its own respon-sibility and without instructions. Where the Swiss Corporate Governance Directive calls for information on the Executive Board, corresponding de-tails on the Management Board are provided. Nevertheless, the function of the Management Board does not correspond exactly with that of the Swiss Executive Board.
– The Supervisory Board is in charge of appointing and dismissing the Management Board and, in particular, supervising it. Furthermore, specific legal transactions also require the Supervisory Board’s approval. Where the Swiss Corporate Governance Directive calls for information on the Administrative Board corresponding details on the Supervisory Board are provided. Nevertheless, the function of the Supervisory Board does not correspond exactly with that of the Swiss Administrative Board.
– The Annual General Meeting, functioning as the supreme means of decision-making body for a company, is responsible for appointing and dismissing the members of the Supervisory Board and the appointment of the auditor. Where the Swiss Corporate Governance Directive calls for information on the General Meeting corresponding details on the Annu-al General Meeting are provided. The Swiss and Austrian legal systems differ with regard to these two institutions.
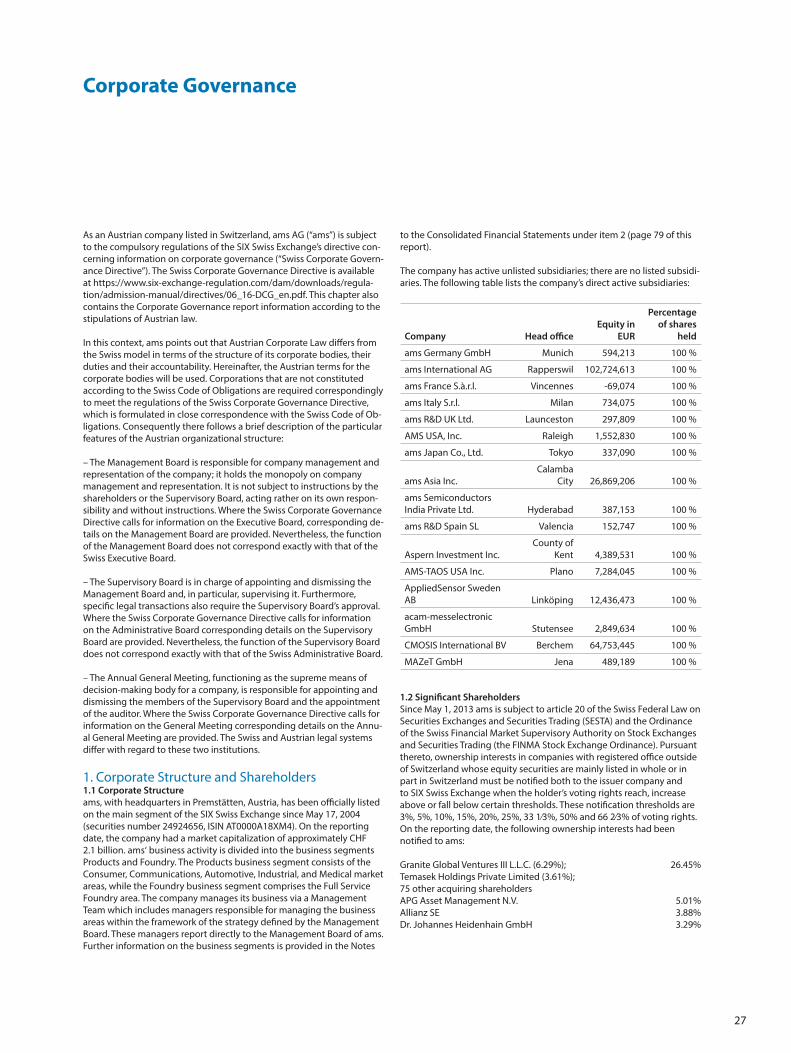
1. Corporate Structure and Shareholders 1.1 Corporate Structure ams, with headquarters in Premstätten, Austria, has been officially listed on the main segment of the SIX Swiss Exchange since May 17, 2004 (securities number 24924656, ISIN AT0000A18XM4). On the reporting date, the company had a market capitalization of approximately CHF 2.1 billion. ams‘ business activity is divided into the business segments Products and Foundry. The Products business segment consists of the Consumer, Communications, Automotive, Industrial, and Medical market areas, while the Foundry business segment comprises the Full Service Foundry area. The company manages its business via a Management Team which includes managers responsible for managing the business areas within the framework of the strategy defined by the Management Board. These managers report directly to the Management Board of ams. Further information on the business segments is provided in the Notes
to the Consolidated Financial Statements under item 2 (page 79 of this report).
The company has active unlisted subsidiaries; there are no listed subsidi-aries. The following table lists the company’s direct active subsidiaries:
Company Head office Equity in
EUR
Percentage of shares
held
ams Germany GmbH Munich 594,213 100 %
ams International AG Rapperswil 102,724,613 100 %
ams France S.à.r.l. Vincennes -69,074 100 %
ams Italy S.r.l. Milan 734,075 100 %
ams R&D UK Ltd. Launceston 297,809 100 %
AMS USA, Inc. Raleigh 1,552,830 100 %
ams Japan Co., Ltd. Tokyo 337,090 100 %
ams Asia Inc. Calamba
City 26,869,206 100 %
ams Semiconductors India Private Ltd. Hyderabad 387,153 100 %
ams R&D Spain SL Valencia 152,747 100 %
Aspern Investment Inc. County of
Kent 4,389,531 100 %
AMS-TAOS USA Inc. Plano 7,284,045 100 %
AppliedSensor Sweden AB Linköping 12,436,473 100 %
acam-messelectronic GmbH Stutensee 2,849,634 100 %
CMOSIS International BV Berchem 64,753,445 100 %
MAZeT GmbH Jena 489,189 100 %
1.2 Significant Shareholders Since May 1, 2013 ams is subject to article 20 of the Swiss Federal Law on Securities Exchanges and Securities Trading (SESTA) and the Ordinance of the Swiss Financial Market Supervisory Authority on Stock Exchanges and Securities Trading (the FINMA Stock Exchange Ordinance). Pursuant thereto, ownership interests in companies with registered office outside of Switzerland whose equity securities are mainly listed in whole or in part in Switzerland must be notified both to the issuer company and to SIX Swiss Exchange when the holder’s voting rights reach, increase above or fall below certain thresholds. These notification thresholds are 3%, 5%, 10%, 15%, 20%, 25%, 33 1⁄3%, 50% and 66 2⁄3% of voting rights. On the reporting date, the following ownership interests had been notified to ams:
Granite Global Ventures III L.L.C. (6.29%); 26.45% Temasek Holdings Private Limited (3.61%); 75 other acquiring shareholders APG Asset Management N.V. 5.01%Allianz SE 3.88%Dr. Johannes Heidenhain GmbH 3.29%
28
Information on significant shareholders or groups of shareholders filed with ams and the Disclosure Office of SIX Swiss Exchange in accordance with article 20 SESTA can also be viewed on the Disclosure Office‘s publication platform at https://www.six-exchange-regulation.com/en/home/publications/significant-shareholders.html
1.3 Cross Shareholding No cross shareholdings exist at this time.
2. Capital Structure 2.1 Capital As of December 31, 2016, ams’ ordinary capital amounted to nominally EUR 73,408,545.00, divided up into 73,408,545 no-par-value shares with a calculated nominal value of EUR 1.00 per share (Articles of Association available at http://ams.com/eng/Investor/Corporate-Governance).
2.2 Authorized and Conditional Capital in Particular (the figures shown below reflect the situation at the time of authoriza-tion)(Articles of Association available at http://ams.com/eng/Investor/Cor-porate-Governance)
Authorized Capital In June 2016, the management board was authorized upon cancel-lation of the existing authorized capital (authorized capital 2012) to increase – if required in several tranches - the share capital by up to EUR 11,011,281.00 by issuing up to 11,011,281 new shares (no-par value shares) against cash and/or contribution in kind and to determine, in agreement with the Supervisory Board, the terms of issue and further details of the implementation of the capital increase (authorized capital 2016).
Conditional Capital In May 2005, the Annual General Meeting authorized the Management Board to increase the share capital by EUR 2,398,203.53 by issuing 990,000 new bearer shares (4,950,000 shares calculated when reflecting the stock split in 2014) for cash to provide cover for stock options granted to staff members and senior executives in the company and its subsidiaries, excluding the subscription rights of existing shareholders. The terms of issue were based on the provisions of the stock option plan approved by the Management Board on April 22, 2005 (Stock Op-tion Plan 2005 / SOP 2005). This plan provided for the issue of a total of 990,000 options over a period of four years. According to the conditions of SOP 2005, options forfeited back to the company could be re-issued until the end of the plan period. One option entitled the bearer to buy one share in the company. 20% of the options issued can be exercised a year after issue at the earliest and the remainder in 20% installments for each further year after issue at the earliest. The options’ strike price was calculated from the average market price of the ams share over the three months prior to granting of the stock options, minus a discount of 25%. Differing from the practice in previous years, the options issued in 2012 were immediately exercisable at 60% at grant date and in the amount of 20% on the first and second anniversary of grant date. The options were non-transferable. The last possible exercise date was June 30, 2015, therefore this stock option plan ended on June 30, 2015.The Management Board was authorized in June 2015 to conditionally increase the share capital pursuant to § 159 paragraph 2 sub-par 3 Austrian Stock Corporation Act (AktG) in a manner that the share capital is increased up to EUR 5,000,000 by issuance of up to 5,000,000 no-par
bearer shares (no-par value shares) for the purpose of granting stock options to employees, officers and directors of the Company and any company affiliated within the scope of the Performance Stock Unit Plan (PSP) 2014-2029. The issue price is calculated based on the stock ex-change price before granting of the respective stock options, whereup-on the issue price in any case is at least the amount of the share capital attributable to each no-par share. The Supervisory Board is authorized to decide changes in the Articles of Association resulting from the conditional capital increase. The other terms of issue are based on the provisions of the Long Term Incentive Plan (LTIP 2014) approved by the Management Board on October 17, 2014 which is the alternative name adopted for the PSP 2014-2029. Each option under the plan granted entitles each participant to purchase one share of the Company. The available options were to be granted during the year 2014 for the first time after prior resolution by the LTIP committee. All options granted must be exercised by October 17, 2024. The exercise price for the new shares is EUR 1.00. Issuance of the options is subject to the following criteria: a) approval of the plan by the annual general meeting – this was fulfilled by the authorization in June 2015 described above – ; b) exercisability of 50% of the options depends on an increase of earnings per share measured over a period of three years compared to the earn-ings per share of the year prior to the respective grant; c) exercisability of the remaining 50% of the options depends on the comparison of total shareholder return over a period of three years to a defined bench-mark group of semiconductor companies. The earliest date for exercise of options is three years after grant and the LTIP committee’s decision about fulfilment of the above criteria. Additional information on the plan is available on page 74 of this report.
2.3 Changes in Capital In total, the ams Group‘s shareholders‘ equity amounted to EUR 555.76 million as of December 31, 2014, EUR 681.21 million as of December 31, 2015; and EUR 667.56 million as of December 31, 2016. Information about the changes in shareholders’ equity over the last two reporting years is provided in the section entitled “Consolidated Statement of Changes in Shareholders‘ Equity according to IFRS from January 1, 2016 until December 31, 2016” in the financial section of this Annual Report (page 56).
2.4 Shares and Participation Certificates On the date of reporting, ams’ share capital consisted of 73,408,545 common no-par-value shares issued to bearer with a calculated nomi-nal value of EUR 1.00 per share. Every bearer of a common share has the right to vote and is entitled to receive dividends; there are no preferen-tial rights. All shares are equal in terms of the company’s residual assets; all capital was paid in. There are no participation certificates.
2.5 Profit Sharing Certificates There are no profit sharing certificates.
2.6 Restrictions on Transferability and Nominee Registration The company only has bearer shares outstanding. There are no restric-tions on transferability or corporate rules on nominee registration.
2.7 Convertible Bonds and Option Plan A Stock Option Plan (SOP 2009) was approved at the Annual General Meeting of April 2, 2009. Under the terms of SOP 2009, over a period of 4 years a total not exceeding 5,500,000 options on no-par compa-ny shares was to be granted, corresponding to around 10 % of the
29
company’s capital at the time of approval. Every option granted entitles the participant to purchase a no-par share in ams. Exercise of options is possible annually to the extent of 25% on the days of the first, second, third and fourth anniversaries of granting, i.e. in four equal tranches. The preferential price of the options is calculated from the average stock market price over the 3 months prior to granting of the stock options. All options granted must be exercised by June 30, 2017. Differ-ing from the practice in previous years, the options issued in 2013 vest to the extent of 33% on the first, second and third anniversary of the grant for 50% of the granted options. The earliest date for exercising the other 50% of the granted options is the third anniversary of the options grant date depending on the achievement of the following criteria: (i) The benchmark growth of the market (sales growth of the analog semiconductor market as published by WSTS) has to be surpassed in the period 2013-2015 with stable gross margins (not to be lower than in 2012; adjusted for extraordinary impacts related to a positive long-term development of the business such as e.g. acquisition costs or financing costs). If this does not apply to the whole period but only to single calendar years, a quota of one third of the exercisability for the relevant year has to be taken into account. (ii) Over the period 2013-2015 an increase of earnings per share has to be achieved. If this does not apply to the whole period but only to single calendar years (provided that earnings per share are not lower than in 2012), a quota of one third of the exercisability for the relevant year has to be taken into account.In connection with the acquisition of TAOS Inc., the company com-mitted to grant options to certain employees of TAOS Inc. by issuing a Stock Option Plan, which – as far as legally possible - matches the number of options and the option plan which has been granted to those employees under the TAOS Inc. - „Equity Incentive Plan 2000”. To fulfill this obligation, the management board of ams adopted a new Stock Option Plan 2011 (SOP 2011), which the company‘s Supervisory Board approved on July 9, 2011. The SOP 2011 comprises unvested op-tions and vested options. Each option granted entitles each employee to purchase one share of the company. For holders of unvested options the exercise price equals the original exercise price under the TAOS Inc. plan. This price is in the range of USD 0.19 and USD 3.96. Certain employees of TAOS Inc., who held a small number of TAOS Inc. shares („small Shareholders“), were granted exercisable options for shares of the Company as compensation for shares of TAOS Inc. held by them prior to the transaction (vested options). The option exercise price for these options is CHF 8.27 which is the average of the market price of the shares of the company on the SIX Swiss Exchange within 30 days following the date of grant of options. The term of the unvested options will remain unchanged compared to the original TAOS Inc. plan. The options will expire between September 3, 2017 and June 8, 2021. The options of the Small Shareholders expire ten years after the date of issuance, therefore on July 12, 2021.
The Supervisory and Management Boards decided to adopt a new Stock Option Plan (SOP 2013) on August 28, 2013. The SOP 2013 comprises a maximum of 2,000,000 options, of which (i) up to 1,575,000 options may be granted to employees and executive employees and (ii) up to 235,000 options may be granted to the Chairman of the Management Board / Chief Executive Officer and up to 190,000 options may be granted to the Chief Financial Officer. This corresponds to 2.8% of the nominal capital of the Company at that time. Each option entitles the relevant employee, executive employee and/or managing director (collectively „Participants“) to acquire one no-par value ordinary share of ams. The available options were to be granted during the year 2013 after prior resolution by the SOP committee. All options granted must
be exercised by June 30, 2021.The exercise price for the new shares corresponds to the average strike price within the last three months be-fore the granting of the stock options. For 50% of the granted options, options can be exercised to the extent of 33% of the grant on the first, second and third anniversary of the options grant date at the earliest. For the other 50% of the granted options, the earliest date for exercis-ing is the third anniversary of the options grant date depending on the achievement of the following criteria: (i) The benchmark growth of the market (sales growth of the analog semiconductor market as published by WSTS) has to be surpassed in the period 2013-2015 with stable gross margins (not to be lower than in 2012; adjusted for extraordinary im-pacts related to a positive long-term development of the business such as e.g. acquisition costs or financing costs). If this does not apply to the whole period but only to single calendar years, a quota of one third of the exercisability for the relevant year has to be taken into account. (ii) Over the period 2013-2015 an increase of earnings per share has to be achieved. If this does not apply to the whole period but only to single calendar years (provided that earnings per share are not lower than in 2012), a quota of one third of the exercisability for the relevant year has to be taken into account. In total, 1,571,005 options were distributed from SOP 2013.
The Management Board decided to adopt a new Long Term Incentive Plan (LTIP 2014) on October 17, 2014. The LTIP 2014 comprises a maxi-mum of 5,124,940 options. This corresponds to approximately 7% of the share capital of the Company at the time. Each option granted entitles each participant to purchase one share of the Company. The available options were to be granted during the year 2014 for the first time after prior resolution by the LTIP committee. All options granted must be exercised by October 17, 2024. The exercise price for the new shares is EUR 1.00. Issuance of the options is subject to the following criteria: a) approval of the plan by the annual general meeting; b) exercisability of 50% of the options depends on an increase of earnings per share measured over a period of three years compared to the earnings per share of the year prior to the respective grant; c) exercisability of the remaining 50% of the options depends on the comparison of total shareholder return over a period of three years to a defined benchmark group of semiconductor companies. The earliest date for exercise of op-tions is three years after grant and the LTIP committee’s decision about fulfilment of the above criteria. In 2016, 795,550 options from LTIP 2014 were granted to employees and management of the company (2015: 510,090 options).
3. Supervisory Board On the reporting date, the company’s Supervisory Board was composed of nine members, of whom three were employee representatives. The members were not employed as members of the company’s or a subsidiary’s management board and are therefore non-executive. The company’s Articles of Association are available at http://ams.com/eng/Investor/Corporate-Governance.
3.1 / 3.2/ 3.3 / 3.4 Members of the Supervisory Board, Other Activi-ties, Vested Interests, Cross-Involvement, Election and Terms of Office Insofar as nothing to the contrary is mentioned below, no material activities, vested interests or cross-involvements exist regarding the members of the Supervisory Board. Under the Corporate Governance Directive and the relevant comment by SIX Swiss Exchange, activities and vested interests are only indicated in listed Swiss and foreign organizations or ones that operate in the same or a related industry
30
sector as the company. The information below shows committee mem-berships as of the reporting date.
Hans Jörg Kaltenbrunner (Chairman), born in 1957, Austrian citizen. Member of the Supervisory Board since 2009, Chairman since 2013. Re-elected in 2014, current term of office until 2018. Having studied at the Vienna University of Business and Economics, Hans Jörg Kalten-brunner began his professional career at the Austrian Trade Delegation in Taipei, Taiwan as Deputy Trade Delegate in 1982. From 1985-1994, he assumed management positions at the Hong Kong branch and in the asset management group of Creditanstalt-Bankverein. Following appointments to the management boards of RHI AG and Austria Mikro Systeme AG, he has been a partner of Andlinger & Company since 2002 and has served as a member of management and supervisory boards of international industrial companies in this capacity.
Prof. Dr. Siegfried Selberherr (Vice Chairman), born in 1955, Austrian citizen. Member of the Supervisory Board since 2001, Vice Chairman since 2001. Re-elected in 2014, current term of office until 2018. After completing his studies in Electrical Engineering, Prof. Selberherr earned a doctorate in Technical Sciences. He has been a full professor at the Institute of Microelectronics at Vienna University of Technology since 1988 and was Dean of the Faculty of Electrical Engineering and Infor-mation Technology from 1998 to 2005. Prof. Selberherr is internationally recognized for his research in microelectronics, particularly in the field of technology computer-aided design (TCAD), and advises several international semiconductor companies.
Klaus Iffland, born in 1956, German citizen. Member of the Supervisory Board since 2006. Re-elected in 2014, current term of office until 2018. Having graduated in Mechanical Engineering and Business Studies, Klaus Iffland held executive positions at Audi AG in production, devel-opment, and purchasing, and was head of purchasing from 1996. Since 2002 he has held executive positions at Magna International, a leading worldwide automotive supplier, first as a member of the management board of Magna Steyr Fahrzeugtechnik, then as President of Intier Automotive Europe and Magna Closures, VP Purchasing at Magna In-ternational Europe and VP Procurement & Supply at Magna Steyr. Since 2008 he is VP Global Purchasing Magna International Europe; in July 2011 he additionally assumed responsibility for Magna Logistics Europe and joined the Management Board of Magna Europe.
Michael Grimm, born in 1960, German citizen. Member of the Su-pervisory Board since 2009. Re-elected in 2014, current term of office until 2018. Michael Grimm studied Management at the University of Frankfurt and worked as a tax consultant and auditor at Arthur Andersen Wirtschaftsprüfungsgesellschaft, lately as partner and head of the Leipzig office. From 1997 until 2001 he was at Hoechst AG with responsibility for group accounts and was involved in the transforma-tion of Hoechst AG into Aventis. From 2002 until 2005 Michael Grimm was director of finance, accounting and investments at Grohe Water Technology AG & Co. KG, then Managing Director of Triton Beteiligungs-beratung GmbH, an investment company with holdings in medi-um-sized companies in Germany and Sweden. Since 2008 he has been Commercial Director of Dr. Johannes Heidenhain GmbH.
Jacob Jacobsson, born in 1953, Swedish and U.S. citizen. Member of the Supervisory Board since 2011. Re-elected in 2016, current term of office until 2019. Jacob Jacobsson has held CEO positions at Blaze DFM, Inc., Forte Design Systems and SCS Corporation, and executive
positions at Xilinx Inc., Cadence Design Systems, and Daisy Systems. He has served on the board of directors at Actel Corp., and currently serves on the boards of a number of privately-held companies in the United States and Europe. He was a member of the board of directors for TAOS Inc. since 2003. Prior to his management career, Jacob Jacobsson was active in the fields of IC design and automated design of semiconductor chips. He holds M.S. degrees in Computer Science and Electrical Engi-neering from the Royal Institute of Technology (KTH, Stockholm) and a B.A. degree from the University of Stockholm.
Kin Wah Loh, born in 1954, Malaysian citizen. Member of the Superviso-ry Board since 2016, current term of office until 2019. Kin Wah Loh has over 35 years of management experience in world leading semiconduc-tor enterprises. He was formerly Executive Vice President, Global Sales and Marketing of NXP Semiconductors; President and Chief Executive Officer of Qimonda AG, and Executive Vice President, Communication Group of Infineon Technologies AG. He is currently Managing Partner of Beijing Jianguang Asset Management Co., Member of the Management Board of Ampleon B.V., and Member of the Supervisory Board of BESI B.V. Kin Wah Loh holds an Honors degree in Chemical Engineering from the University of Malaya, Kuala Lumpur, and a postgraduate certified diploma in accounting and finance from ACCA (UK).
Johann C. Eitner (Employee Representative), born in 1957, Austrian cit-izen. Member of the Supervisory Board since 1994. Re-elected in 2014, current term of office until 2019. Chairman of the Workers’ Council and Employee Representative on the Supervisory Board since 1994. During his more than 35-year career, Johann Eitner has been employed as an electrician in various positions and, since 1984, as supervisor in the mask lithography department at ams. He was trained as an electrician.
Günter Kneffel (Employee Representative), born in 1968, Austrian citi-zen. Member of the Supervisory Board since March 1999 until January 2016. Re-elected in 2017, current term of office until 2019. Chairman of the Employee Council and Employee Representative on the Supervisory Board from 1999 until 2016 and since 2017. After completing his studies in RF Engineering and Electronics, Günter Kneffel gained more than 15 years of professional experience as a process engineer for photolithog-raphy and graduated in law in 2010 (Magister der Rechtswissenschaf-ten).
Vida Uhde-Djefroudi (Employee Representative), born in 1959, Austri-an citizen. Member of the Supervisory Board from 2012 until November 2014 and since March 2015 with term of office until 2019, retired from Supervisory Board in 2017. Member of the Employee Council since 2003. Vida Uhde-Djefroudi studied at Graz University of Technology and received a degree in Electrical Engineering. She joined ams in 1994 as an analog circuit designer and has been focusing on high voltage design since 2003.
Andreas Pein (Employee Representative), born in 1964, Austrian citizen. Member of the Supervisory Board since February 2016, current term of office until 2019. Member of the Employee Council since 1998 and Chairman of the Employee Council from February 2016 to August 2016. Andreas Pein joined the company in 1986 as a data preparation technician in the mask lithography department. In 2002, he moved to the IT department where he worked as an automation engineer. He is currently working as a technician in the IT operations team.
31
Unless decided otherwise by the Annual General Meeting, election proposals for members of the Supervisory Board are for three years, i.e. until the end of the Annual General Meeting that decides on their dis-charge for the second business year after the election. For this purpose, the business year in which they were elected is not included in the calculation. Individual election or election as a group are both possible under the Articles of Association (available at http://ams.com/eng/Investor/Corporate-Governance) and the Austrian Stock Corporation Act. The Articles of Association do not stipulate any staggering of the Supervisory Board members’ terms of office.
3.5 Internal Organization 3.5.1 Allocation of tasks in the Supervisory Board Both the Management Board and the Supervisory Board have rules of procedure. The Supervisory Board has a Chairman and a Vice Chairman. The Supervisory Board can appoint one or more committees from its midst for the purpose of preparing its negotiations and resolutions or monitoring the implementation of its resolutions. The Supervisory Board of ams has formed the following committees: Compensation Committee, Audit Committee, Nomination Committee and Emergency Committee.
3.5.2 Members list, tasks and area of responsibility for all committees of the Supervisory Board
The information below shows committee memberships as of the reporting date.
– Compensation Committee The Compensation Committee is responsible for negotiating and passing resolutions on the relationship between the company and the members of the Management Board except resolutions on appoint-ments and dismissals of members of the Management Board (signing, adaption and termination of the employment contracts for members and remuneration for the Management Board, etc.) The members of this committee are Hans-Jörg Kaltenbrunner (Chairman) and Prof. Siegfried Selberherr.
– Audit Committee The Audit Committee is, amongst other matters, in charge of examining the annual financial statements, the management report and the proposal on the appropriation of profits, preparing the reports to be submitted to the Annual General Meeting and discussing the audit report with the auditor. The members of this committee are Michael Grimm (Chairman), Jacob Jacobsson, Hans-Jörg Kaltenbrunner, Johann C. Eitner, and Andreas Pein.
– Nomination Committee The Nomination Committee is responsible for preparing proposals to the Supervisory Board regarding appointments to executive positions that become available on the Management Board, strategies for succes-sion planning and proposals to the Annual General Meeting regarding appointments to positions that become available on the Supervisory Board. The members of this committee are Hans-Jörg Kaltenbrunner (Chairman), Prof. Siegfried Selberherr, Jacob Jacobsson, Johann C. Eitner, and Vida Uhde-Djefroudi.
– Emergency Committee The Emergency Committee was set up to discuss the affairs of the Su-pervisory Board in cases of imminent danger (“danger in delay”) and, if
the situation absolutely requires it, to decide on them. The members of this committee are Hans-Jörg Kaltenbrunner (Chairman), Prof. Siegfried Selberherr, Klaus Iffland, Johann C. Eitner, and Vida Uhde-Djefroudi.
3.5.3 Working procedures of the Supervisory Board and its commit-tees The meetings of the Supervisory Board (SB) are presided over by the Chairman and, in his absence, by a Vice Chairman. Resolutions are passed by simple majority of the votes cast. In case of equality of votes, the Chairman’s vote is decisive. The SB is entitled to request written re-ports on corporate affairs and managerial issues from the Management Board at any time. In principle, the Management Board also attends the SB meetings. Unless the chairman of the meeting decides otherwise the Management Board is merely granted an advisory vote. 10 days in advance of a SB meeting, the members of the SB receive the meeting agenda, which has been aligned with the Chairman, and extensive information on the agenda items. The members of the SB can pose questions to the Management Board and request additional informa-tion via an internal communications tool. In the SB meeting the Man-agement Board provides details on the development of the business including human resources, on the financial performance and on the progress of longer-term technical and commercial projects. Extensive time is allocated to discussions with the Management Board and within the SB. In accordance with the Management Board by-laws resolutions on investments, acquisitions and other proposals by the Management Board are a further important element of each SB meeting.
The SB committees are entitled to adopt a resolution which is binding for the Supervisory Board only in cases where the committee has been granted such decision-making power by the Supervisory Board in advance. The Supervisory Board appoints a committee member as Committee Chairman and an additional committee member as the Chairman’s deputy. Committee resolutions are passed by simple majority of the votes cast. In case of equality of votes, the Committee Chairman’s vote is decisive.
The Supervisory Board normally convenes five times a year. During the past year, the Supervisory Board convened a total of seven times with the Supervisory Board meetings lasting an average of around six hours. The Compensation Committee convened a total of three times with sessions lasting an average of around one hour. The Audit Commit-tee convened a total of five times with sessions lasting an average of around one hour. The Nomination Committee convened a total of two times with sessions lasting an average of around one hour. The Emer-gency Committee did not convene. With the exception of one member missing one meeting for health reasons and one member missing one meeting due to another commitment all members attended all meet-ings of the Supervisory Board and its Committees.
3.6 Definition of Area of Responsibility The Management Board of ams acts on its own responsibility and is not subject to instructions from the shareholders or the Supervisory Board. Specific legal transactions individually listed in the Austrian Stock Cor-poration Act require approval by the Supervisory Board. Amongst other responsibilities including succession planning and nomination and compensation of Board members, the Supervisory Board supervises the business conduct of the Management Board. This includes discussing regular updates on the company’s financial and business develop-ment internally and with the Management Board and approving the company’s budget for the following year. The Management Board clears
32
the company’s strategic orientation with the Supervisory Board and discusses the status of strategy implementation with the Supervisory Board at regular intervals.
3.7 Information and Control Instruments vis-à-vis the Management Board The company possesses a Risk Management System, a Management Information System (MIS) and an internal audit function. Within the framework of the Risk Management System, recognizable risks in numerous areas of the company are compiled and assessed at least twice a year. Further details on the Risk Management System are given in item 8 of the Group Management Report. The principal results are subsequently evaluated by the Management Board and brought to the attention of the Supervisory Board. The company’s MIS compiles a multitude of performance indicators from various areas of the company as well as comprehensive financial information and promptly makes them available to management as processed files in electronic form. The Supervisory Board receives monthly and quarterly reports based on information from the MIS. The internal audit function compiles four au-dit reports per year which are made available to the Supervisory Board and cover specific areas of audit jointly defined by the Management and Supervisory Boards.
4. Management Board 4.1 / 4.2 Members of the Management Board, Other Activities and Vested Interests Insofar as nothing to the contrary is mentioned below, no material activities or vested interests exist regarding the members of the Man-agement Board.
Alexander Everke, born in 1963, German citizen. Member of the Man-agement Board since October 2015 and Chairman of the Management Board since March 2016. Contract term until 2018. Alexander Everke started his career in the semiconductor industry in 1991 with Siemens as Marketing Manager and Director. In 1996 he joined the Siemens spinoff Infineon as Vice President Sales responsible for the Memory Products Division. In 2001 he became Senior Vice President Sales responsible for the Global Sales Organization of Infineon with an annual revenue of EUR 7.2 billion. His final position with Infineon was Senior Vice President and General Manager for the Chip Card & Security ICs Business Unit before joining NXP Semiconductor UK as General Man-ager in 2006. In 2007 Alexander Everke became a Member of the NXP Management Team and served as Executive Vice President and General Manager for the Business Units Multimarket Semiconductors, High Performance Mixed Signal and Infrastructure & Industrial reporting in all roles directly to the CEO of NXP Semiconductor. Alexander Everke holds a Master diploma in Electrical Engineering and a Master degree in Business Administration.
Kirk S. Laney, born in 1957, U.S. citizen. Chairman of the Management Board from May 2013 until February 2016, Member of the Management Board since March 2016, retired from Management Board in 2017. Kirk Laney began his 30-year semiconductor industry career in 1980 when he joined the Linear Products Group at Texas Instruments where he became Operations Manager for the Optoelectronics Business Unit in 1993. In 1998, under a technology license, Kirk Laney and five colleagues spun off the Optoelectronic Products Group into Texas Advanced Optoelectronic Solutions, Inc. (TAOS) which he led from a niche market provider to a worldwide leader and technology innovator of opto-sensor solutions. Kirk Laney served as CEO of TAOS since its
foundation and headed ams’ opto-sensor and lighting business as Executive Vice President following ams’ acquisition of TAOS in 2011. Kirk Laney holds a Bachelor of Science degree in Physics from Midwestern State University and four patents in opto-electronic packaging.
Michael Wachsler-Markowitsch, born in 1968, Austrian citizen. Mem-ber of the Management Board responsible for finance since February 2004. Contract term until 2019. He has been with ams since 2001, hold-ing the position of Chief Financial Officer (CFO) since 2003. During his more than 20-year career, Michael Wachsler-Markowitsch was finance director of Ahead Communications AG and worked as a consultant and auditor for international mandates at KPMG Austria. He has extensive experience in accounting, corporate finance and tax consultancy. Mi-chael Wachsler-Markowitsch studied Business Administration at Vienna University of Business and Economics (Magister degree) and founded Dynaconsult GmbH, an IT consulting firm, during the same period. He is member of the Management Board of the Styrian Federation of Indus-try and heads the representative body for the electrical and electronics industries at the Styrian Chamber of Commerce.
Dr. Thomas Stockmeier, born in 1958, German citizen. Member of the Management Board responsible for operations since October 2014. Contract term until 2017. He joined ams in April 2013 as Executive Vice President and General Manager of the Industrial & Medical business. In July 2014, he was appointed Executive Vice President and General Man-ager of the Division Sensors and Sensor Interfaces as well as Corporate Technology. Dr. Thomas Stockmeier has 29 years of broad experience in the electronics industry, gained with ABB in Switzerland and the U.S. where he spent 13 years holding various positions in R&D and man-agement. Before joining ams, he worked at SEMIKRON for 13 years as Member of the Management Board and Chief Technology Officer (CTO) responsible for R&D, Operations, and Quality. Dr. Thomas Stockmeier received a Diploma Degree in Material Science and a Doctorate Degree in Electrical Engineering from the University of Erlangen-Nuremberg.
4.3 Management Contracts There are currently no management contracts.
5. Compensation, Shareholdings and Loans 5.1 Content and Method of Determining Compensation and Share Ownership Programs The Annual General Meeting is in charge of determining the remuner-ation of the company’s Supervisory Board. A shareholder may submit a proposal for resolution to the Annual General Meeting.
The remuneration of the individual Management Board members is determined annually by the Compensation Committee and the share ownership programs of the individual Management Board members by the Supervisory Board Chairman and its Vice Chairman in consultation with the employee representative members of the Supervisory Board. The Management Board members do not have a right to attend these meetings of Compensation Committee and of the Supervisory Board’s Chairman and its Vice Chairman. The Supervisory Board is informed about the developments in this process. No external advisors were consulted in this process in the period under review.
The amount of the annual variable part of the Management Board remuneration is determined according to the fulfillment of annually determined performance targets for the members of the Management
33
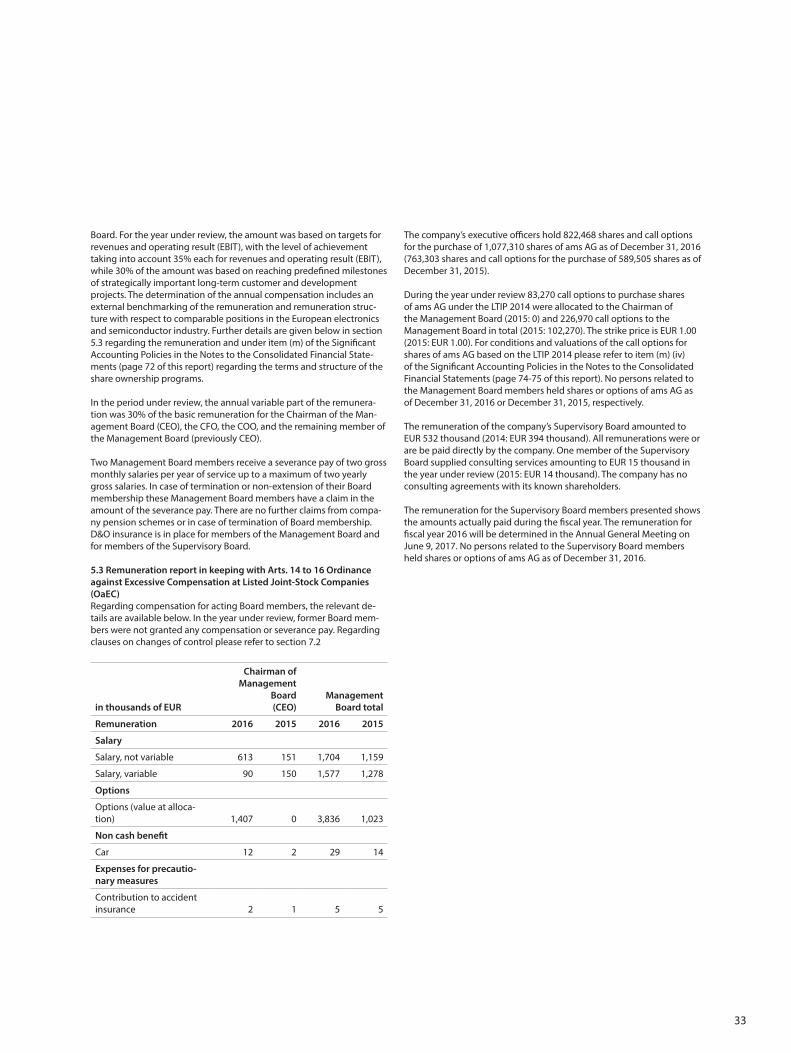
Board. For the year under review, the amount was based on targets for revenues and operating result (EBIT), with the level of achievement taking into account 35% each for revenues and operating result (EBIT), while 30% of the amount was based on reaching predefined milestones of strategically important long-term customer and development projects. The determination of the annual compensation includes an external benchmarking of the remuneration and remuneration struc-ture with respect to comparable positions in the European electronics and semiconductor industry. Further details are given below in section 5.3 regarding the remuneration and under item (m) of the Significant Accounting Policies in the Notes to the Consolidated Financial State-ments (page 72 of this report) regarding the terms and structure of the share ownership programs.
In the period under review, the annual variable part of the remunera-tion was 30% of the basic remuneration for the Chairman of the Man-agement Board (CEO), the CFO, the COO, and the remaining member of the Management Board (previously CEO).
Two Management Board members receive a severance pay of two gross monthly salaries per year of service up to a maximum of two yearly gross salaries. In case of termination or non-extension of their Board membership these Management Board members have a claim in the amount of the severance pay. There are no further claims from compa-ny pension schemes or in case of termination of Board membership. D&O insurance is in place for members of the Management Board and for members of the Supervisory Board.
5.3 Remuneration report in keeping with Arts. 14 to 16 Ordinance against Excessive Compensation at Listed Joint-Stock Companies (OaEC)Regarding compensation for acting Board members, the relevant de-tails are available below. In the year under review, former Board mem-bers were not granted any compensation or severance pay. Regarding clauses on changes of control please refer to section 7.2
in thousands of EUR
Chairman of Management
Board (CEO)
Management Board total
Remuneration 2016 2015 2016 2015
Salary
Salary, not variable 613 151 1,704 1,159
Salary, variable 90 150 1,577 1,278
Options
Options (value at alloca-tion) 1,407 0 3,836 1,023
Non cash benefit
Car 12 2 29 14
Expenses for precautio-nary measures
Contribution to accident insurance 2 1 5 5
The company’s executive officers hold 822,468 shares and call options for the purchase of 1,077,310 shares of ams AG as of December 31, 2016 (763,303 shares and call options for the purchase of 589,505 shares as of December 31, 2015).
During the year under review 83,270 call options to purchase shares of ams AG under the LTIP 2014 were allocated to the Chairman of the Management Board (2015: 0) and 226,970 call options to the Management Board in total (2015: 102,270). The strike price is EUR 1.00 (2015: EUR 1.00). For conditions and valuations of the call options for shares of ams AG based on the LTIP 2014 please refer to item (m) (iv) of the Significant Accounting Policies in the Notes to the Consolidated Financial Statements (page 74-75 of this report). No persons related to the Management Board members held shares or options of ams AG as of December 31, 2016 or December 31, 2015, respectively.
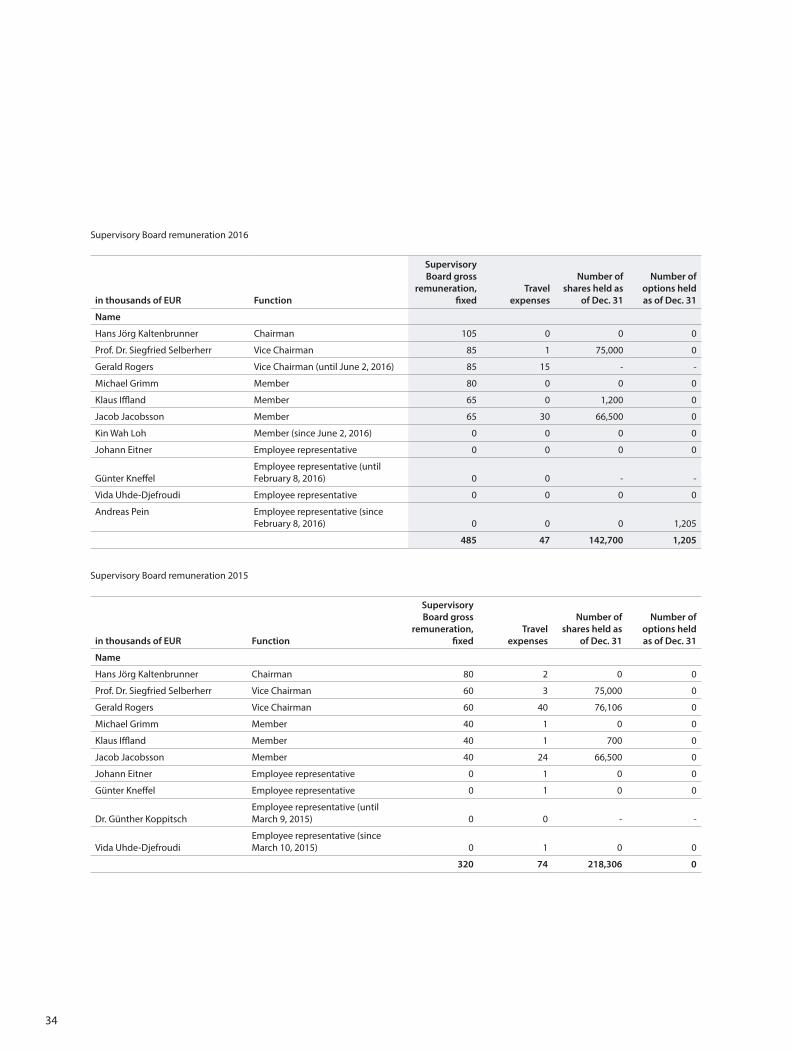
The remuneration of the company’s Supervisory Board amounted to EUR 532 thousand (2014: EUR 394 thousand). All remunerations were or are be paid directly by the company. One member of the Supervisory Board supplied consulting services amounting to EUR 15 thousand in the year under review (2015: EUR 14 thousand). The company has no consulting agreements with its known shareholders.
The remuneration for the Supervisory Board members presented shows the amounts actually paid during the fiscal year. The remuneration for fiscal year 2016 will be determined in the Annual General Meeting on June 9, 2017. No persons related to the Supervisory Board members held shares or options of ams AG as of December 31, 2016.
34
Supervisory Board remuneration 2016
in thousands of EUR Function
Supervisory Board gross
remuneration, fixed
Travel expenses
Number of shares held as
of Dec. 31
Number of options held as of Dec. 31
Name
Hans Jörg Kaltenbrunner Chairman 105 0 0 0
Prof. Dr. Siegfried Selberherr Vice Chairman 85 1 75,000 0
Gerald Rogers Vice Chairman (until June 2, 2016) 85 15 - -
Michael Grimm Member 80 0 0 0
Klaus Iffland Member 65 0 1,200 0
Jacob Jacobsson Member 65 30 66,500 0
Kin Wah Loh Member (since June 2, 2016) 0 0 0 0
Johann Eitner Employee representative 0 0 0 0
Günter KneffelEmployee representative (until February 8, 2016) 0 0 - -
Vida Uhde-Djefroudi Employee representative 0 0 0 0
Andreas Pein Employee representative (since February 8, 2016) 0 0 0 1,205
485 47 142,700 1,205
Supervisory Board remuneration 2015
in thousands of EUR Function
Supervisory Board gross
remuneration, fixed
Travel expenses
Number of shares held as
of Dec. 31
Number of options held as of Dec. 31
Name
Hans Jörg Kaltenbrunner Chairman 80 2 0 0
Prof. Dr. Siegfried Selberherr Vice Chairman 60 3 75,000 0
Gerald Rogers Vice Chairman 60 40 76,106 0
Michael Grimm Member 40 1 0 0
Klaus Iffland Member 40 1 700 0
Jacob Jacobsson Member 40 24 66,500 0
Johann Eitner Employee representative 0 1 0 0
Günter Kneffel Employee representative 0 1 0 0
Dr. Günther KoppitschEmployee representative (until March 9, 2015) 0 0 - -
Vida Uhde-DjefroudiEmployee representative (since March 10, 2015) 0 1 0 0
320 74 218,306 0
35
6. Shareholders’ Right of Participation 6.1 Voting Rights and Representation Restrictions All shareholders of ams hold common bearer shares. Every share enti-tles its bearer to one vote at the Annual General Meeting. There are no voting right restrictions. Voting by proxy is only possible with a written power of attorney which remains with the company.
6.2 Statutory Quorums The resolutions passed by the Annual General Meeting require the majority of the votes cast (simple majority) insofar as the Austrian Stock Corporation Act or the Articles of Association do not foresee a larger majority or additional requirements. ams’ Articles of Association do not call for a higher number of votes than those required by the Austrian Stock Corporation Act.
6.3 Convocation of the Annual General Meeting Pursuant to the Austrian Stock Corporation Act, the Annual General Meeting is convened by the Management Board. In accordance with the company’s Articles of Association, the Annual General Meeting shall be convened at least 28 days prior to the appointed date. The convoca-tion is published in the “Wiener Zeitung” and announced in “Finanz & Wirtschaft”.
6.4 Agenda In compliance with the Austrian Stock Corporation Act, the agenda pro-posed for the Annual General Meeting shall be published in connection with the convocation of said meeting. Within 21 days prior to the date of the Annual General Meeting, a minority of 5% of the ordinary capital may demand that the agenda of a previously convened Annual General Meeting shall be supplemented. Those proposing must have been in possession of the shares for at least three months prior to making their proposal.
6.5 Inscriptions into the Share Register The company only has bearer shares outstanding and therefore does not keep a share register.
7. Changes of Control and Defense Measures 7.1 Duty to Make a Public Offer Since ams is an Austrian corporation mainly listed in Switzerland, the regulations of the Swiss Federal Law on Securities Exchanges and Securities Trading (SESTA) regarding public takeover offers apply at the reporting date. Under article 32 para. 1 SESTA, anyone acquiring equity securities with 33 1/3% or more of all voting rights must mandatorily make a public tender offer. The Articles of Association of ams (available at http://ams.com/eng/Investor/Corporate-Governance) contain neither an opting-up clause (in other words, they do not raise this percentage threshold) nor an opting-out clause (i.e., they do not waive the requirement of a tender offer). At the same time, the regulations of Austrian takeover law relating to offer obligations do not apply to ams.
7.2 Clauses on Changes of ControlAt the reporting date, no clauses on changes of control existed in agreements or plans involving members of the Supervisory Board, the Management Board or other members of management.
8. Auditors 8.1 Duration of the Mandate and Term of Office of the Lead Auditor The existing auditing mandate was assumed by KPMG Alpen-Treuhand GmbH, now KPMG Austria GmbH, Wirtschaftsprüfungs- und Steuerber-
atungsgesellschaft, Vienna, in 2005. Its election as auditor for the year under review was confirmed at the Annual General Meeting on June 2, 2016. The audit partner responsible for this mandate, Mag. Helmut Kerschbaumer, took office for the first time for fiscal year 2015.
8.2 Auditing Fees The auditing firm charged auditing fees amounting to EUR 160,000.00 during the year under review.
8.3 Additional Fees The auditing firm charged fees for additional consulting services amounting to EUR 91,721.37 during the year under review.
8.4 Supervisory and Control Instruments Pertaining to the Audit The auditor reports to the Supervisory Board‘s Audit Committee both orally and in writing on a regular basis, typically several times over the course of the year. In the period under review, the auditor reported in five Audit Committee meetings, which were held in January, March, April, October, and December 2016, and attended one Supervisory Board meeting.
The auditor is monitored and evaluated by the Supervisory Board’s Au-dit Committee at regular intervals. The auditor is selected on the basis of a tendering process that takes a catalog of criteria into account. The auditor‘s remuneration is checked regularly against prevailing market fees. The lead auditor for the company rotates every five years.
9. Information Policy ams is committed to an open and transparent information policy towards the stakeholders. Important information on the development of business and the share price (reports, financial information and share price data) is available on the company website www.ams.com in the section “Investor”. The financial calendar is available at http://www.ams.com/eng/Investor/Investor-Calendar. The company‘s ad-hoc publi-cations are available at www.ams.com/eng/Investor/Financial-News/Ad-hoc and can be subscribed via www.ams.com/eng/Investor/Inves-tor-Contact/Subscribe. Share-price-influencing events are published promptly through the media and on the website. ams issues quarterly reports regarding the development of its business. The publications are made available in electronic form at http://www.ams.com/eng/Inves-tor/Financial-Reports. The Annual Report may also be made available in a printed version. For the company‘s contact details, refer to the publishing information at the end of the Annual Report (page 126 of this report).
Advancement of Women ams is committed to facilitating the career development of women in management positions and to increasing the share of women in its workforce over the medium term. However, as a highly technical company in a high-tech industry it remains difficult for ams to increase the ratio of women in management positions in Austria as well as internationally. The share of women in management positions (except Management Board members) was 13% in fiscal year 2016 (16% in fiscal year 2015), while the overall share of women in the company’s work-force was 27% last year. According to its Code of Conduct, ams refrains from any form of discrimination based on, for example, race, religion, political affiliation, and in particular gender.
36
Financial Information
Group Management Report 2016 ........................................................................................................................................... 38Consolidated Income Statement acc. to IFRS from January 1, 2016 until December 31, 2016 .......................................................................................... 52Consolidated Statement of Comprehensive Income acc. to IFRS from January 1, 2016 until December 31, 2016 .......................................................................................... 53Consolidated Balance Sheet acc. to IFRS as of December 31, 2016 ...................................................................................................................................... 54Consolidated Statement of Cash Flows acc. to IFRS from January 1, 2016 until December 31, 2016 .......................................................................................... 55Consolidated Statement of Changes in Shareholders’ Equity acc. to IFRS from January 1, 2016 until December 31, 2016 .......................................................................................... 56Notes to the Consolidated Financial Statements .............................................................................................................. 57Independent Auditor’s Report ................................................................................................................................................118
37
38
Group Management Report 2016
1) Source: WSTS, December 2016
1. Overview of the Economic Environment and the Past Financial Year
The global semiconductor sector showed a mixed development in 2016 and was influenced by an in-creasingly volatile macroeconomic environment in key regions. Total sales of the global semiconductor industry increased slightly by 1.1% to USD 338.9bn in 2016, while market volume had decreased by 0.2% in 2015 to USD 335.1bn. The relevant market segment for ams, analog semiconductors, grew 5.8% to USD 47.8bn in 2016 (previous year: USD 45.3bn).1
Continuous innovation based on more than 35 years of experience in analog semiconductors and sensors makes ams a leading supplier of advanced sensor and analog IC solutions. Through its world-wide network ams has a strong presence in the re-levant markets in Europe, Asia, and North America as more than 8,000 customers globally rely on ams’ expertise in sensing.
ams defined a focused strategy around leadership in the fast-growing markets for optical, imaging, environmental and audio sensing last year. As the company started to implement this strategy through active management of its technology portfolio, 2016 was an expected year of transfor-mation for ams.
Taking a significant strategic step forward, ams announced the acquisition of Heptagon last year. Heptagon is a global leader in micro-optics and optical sensing solutions with particular expertise in high performance optical packaging. Adding Heptagon’s capabilities positions ams strongly for leadership in upcoming optical sensing applications including spectral sensing, time-of-flight technology, and 3D sensing. The Heptagon
business offers a substantial existing development pipeline and major opportunities to combine ams’ and Heptagon technologies into industry-leading optical solutions. ams therefore expects the Hept-agon business to enable new growth prospects for the group in the coming years.
ams’ business segment Products comprises the markets Consumer & Communications and Auto-motive, Industrial, Medical.
ams’ Consumer & Communications Business which is a major supplier of advanced sensor and analog solutions for smartphones, tablet PCs and other consumer devices recorded a solid performance in 2016. ams’ optical sensor product lines again provided the largest share of group revenues in 2016 while ams fortified its position as worldwide market leader in advanced light sensors.
ams continued to supply a broad range of leading smartphone and consumer OEMs with mobile device light sensor solutions last year. ams’ high performance color, ambient light and proximity sensors and modules are found in a wide spectrum of high volume consumer devices globally. ams was able to broaden its portfolio of mobile optical sensor solutions last year and recorded strong mar-ket traction including designs at new customers. In combination with Heptagon, ams sees itself extremely well positioned to capture significant value in new optical sensing solutions from this year onwards. ams expects technologies such as true color, spectral sensing, 3D sensing and new imaging-related applications to offer substantial growth opportunities for the group.
39
In audio solutions, the MEMS microphone interface product line performed well again last year with ams’ market leadership resulting in continued very high volumes. An increasing adoption of active noise cancellation (ANC) offers attractive poten-tial for higher ams content in consumer devices through bundled accessories. ams acquired Incus, a provider of intellectual property (IP) for digital active noise cancellation, in 2016 to broaden the company’s technology reach in ANC.
ams successfully divested its wireless business for NFC and RFID reader applications last year as part of its strategic portfolio alignment. ams retained relevant wireless IP to support the expected ad-option of wireless sensor solutions in multiple end markets.
ams’ Industrial, Medical and Automotive Businesses developed positively in 2016 in line with expecta-tions. ams was able to improve its market penet-ration given a strong technology base including newly acquired IP, a wide range of end markets, and a broad base of customers worldwide.
ams’ Industrial Business performed well last year, however, business momentum remained limited throughout the year amid signs of end market and macroeconomic uncertainty. As a leading global supplier of sensors and sensor interfaces for indus-trial and factory automation, building control, and industrial sensing, ams offers a broad portfolio of differentiated solutions for major OEMs and a wide range of applications. Imaging product lines gene-rally developed in line with expectations last year with an attractive pipeline going forward driven by new applications.
Implementing its strategic approach, ams acqui-red CCMOSS, a world leader in gas and IR sensor technologies, and MAZeT, an important techno-
logy player in spectral sensing with an industrial focus, last year. The addition of CCMOSS creates a complete value chain offering for integrated gas sensors propelling ams into a leadership position in gas sensing for a variety of applications. MAZeT broadens ams’ portfolio for next generation spectral sensors concentrating on new industrial opportunities. Both transactions added future growth potential in new markets and innovative applications.
ams’ Medical Business recorded attractive results in 2016 demonstrating ams’ sector-specific sensing expertise. This development was mainly driven by the core area of Medical Imaging for computed tomography (CT), digital X-ray, and mammography. As the market leader in high resolution imaging solutions ams ramped a new OEM last year and gained additional imaging customers in Asia for fu-ture programs. ams therefore broadened its market reach and continues to advance diagnostic, patient and cost benefits in medical imaging.
The company’s Automotive Business showed another year of solid growth in 2016 given a supportive demand environment and the ongoing expansion of sensing content in vehicles. ams’ high performance sensor solutions for safety, position measurement, level control and other applica-tions are successful in a growing range of vehicle platforms. Focusing on its sensing strengths, ams is well positioned to benefit from the trend towards new automotive sensor systems. ams sees attrac-tive mid-term potential in the evolution of optical sensor technologies which are expected to support the autonomous driving roadmap.
ams’ business segment Foundry which manufac-tures analog and mixed-signal ICs for customers in specialty processes again recorded a positive performance in 2016 and contributed attractively
40
to the company’s results. The business segment is positioned as a full service provider offering a broad spectrum of services from design support to final test and holds a leading market position as an analog foundry for specialty processes.
Preparing for expected business growth in the future, ams made further investments last year to increase production capacity at the company’s headquarters and successfully concluded the
expansion of optical filter layer deposition capacity. Due to significant delays outside of ams’ control ams decided to withdraw from the envisaged project to operate a wafer fabrication facility to be built by the State of New York (USA). At the same time, ams has defined a robust, cost-attractive path for expanding outsourced wafer volumes with its technology manufacturing partners to support its growth ambitions for the coming years.
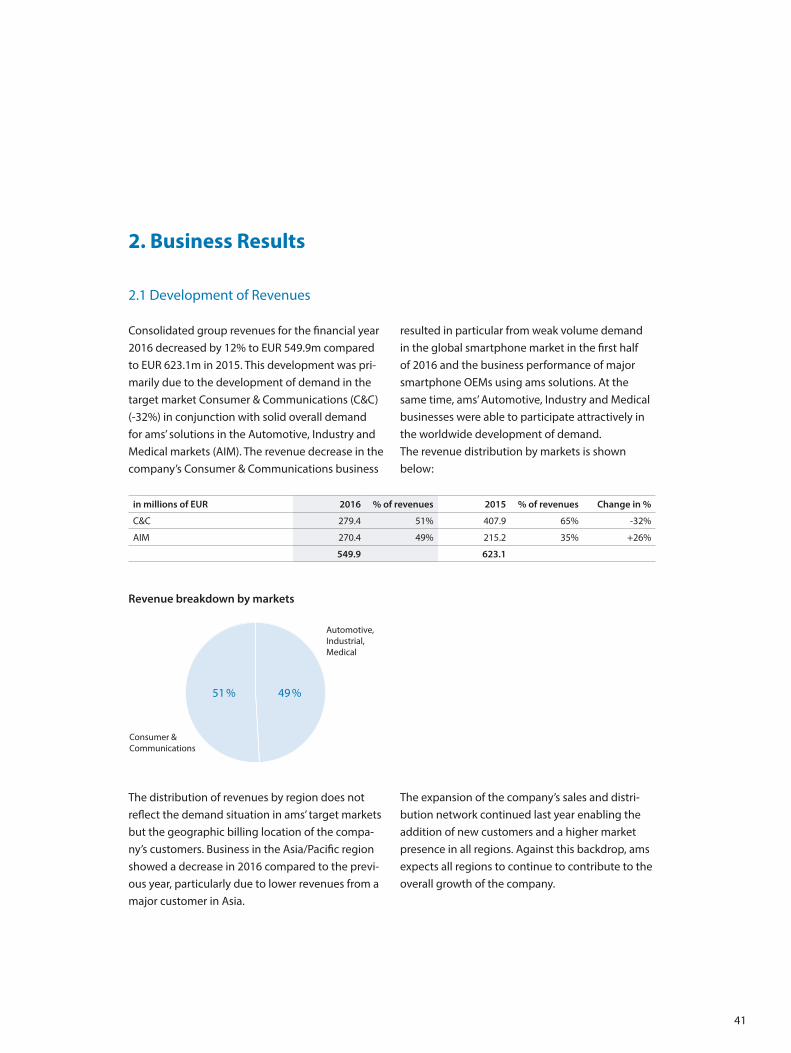
41
2. Business Results
2.1 Development of Revenues
Consolidated group revenues for the financial year 2016 decreased by 12% to EUR 549.9m compared to EUR 623.1m in 2015. This development was pri-marily due to the development of demand in the target market Consumer & Communications (C&C) (-32%) in conjunction with solid overall demand for ams’ solutions in the Automotive, Industry and Medical markets (AIM). The revenue decrease in the company’s Consumer & Communications business
resulted in particular from weak volume demand in the global smartphone market in the first half of 2016 and the business performance of major smartphone OEMs using ams solutions. At the same time, ams’ Automotive, Industry and Medical businesses were able to participate attractively in the worldwide development of demand.The revenue distribution by markets is shown below:
in millions of EUR 2016 % of revenues 2015 % of revenues Change in %
C&C 279.4 51% 407.9 65% -32%
AIM 270.4 49% 215.2 35% +26%
549.9 623.1
The distribution of revenues by region does not reflect the demand situation in ams’ target markets but the geographic billing location of the compa-ny’s customers. Business in the Asia/Pacific region showed a decrease in 2016 compared to the previ-ous year, particularly due to lower revenues from a major customer in Asia.
The expansion of the company’s sales and distri-bution network continued last year enabling the addition of new customers and a higher market presence in all regions. Against this backdrop, ams expects all regions to continue to contribute to the overall growth of the company.
Revenue breakdown by markets
Consumer &Communications
Automotive,Industrial,Medical
49 %51 %
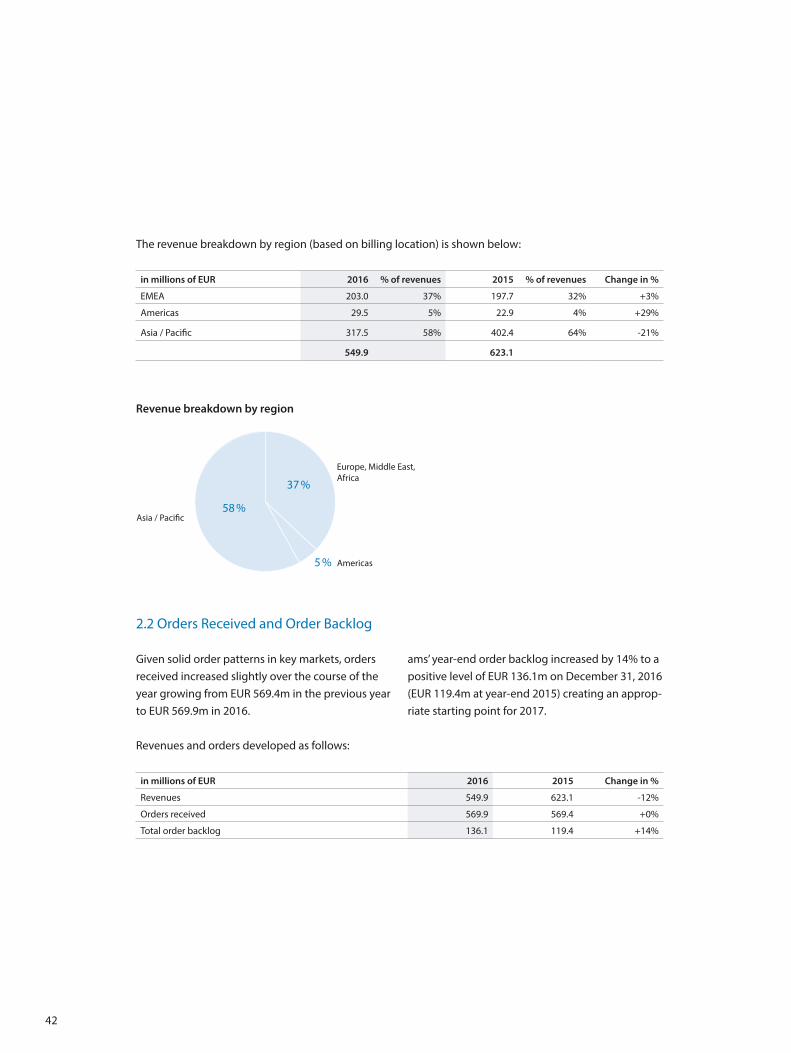
42
The revenue breakdown by region (based on billing location) is shown below:
in millions of EUR 2016 % of revenues 2015 % of revenues Change in %
EMEA 203.0 37% 197.7 32% +3%
Americas 29.5 5% 22.9 4% +29%
Asia / Pacific 317.5 58% 402.4 64% -21%
549.9 623.1
2.2 Orders Received and Order Backlog
Given solid order patterns in key markets, orders received increased slightly over the course of the year growing from EUR 569.4m in the previous year to EUR 569.9m in 2016.
ams’ year-end order backlog increased by 14% to a positive level of EUR 136.1m on December 31, 2016 (EUR 119.4m at year-end 2015) creating an approp-riate starting point for 2017.
Revenues and orders developed as follows:
in millions of EUR 2016 2015 Change in %
Revenues 549.9 623.1 -12%
Orders received 569.9 569.4 +0%
Total order backlog 136.1 119.4 +14%
Revenue breakdown by region
Asia / Pacific
Americas
Europe, Middle East, Africa
58 %
37 %
5 %
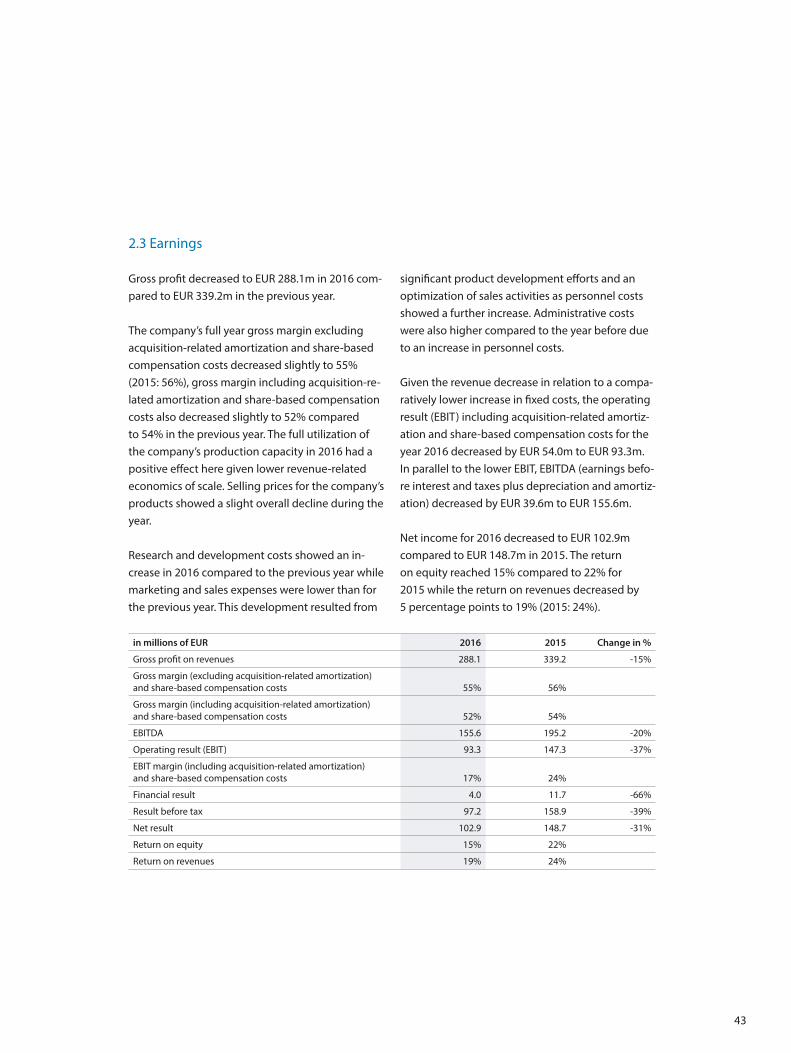
43
2.3 Earnings
Gross profit decreased to EUR 288.1m in 2016 com-pared to EUR 339.2m in the previous year.
The company’s full year gross margin excluding acquisition-related amortization and share-based compensation costs decreased slightly to 55% (2015: 56%), gross margin including acquisition-re-lated amortization and share-based compensation costs also decreased slightly to 52% compared to 54% in the previous year. The full utilization of the company’s production capacity in 2016 had a positive effect here given lower revenue-related economics of scale. Selling prices for the company’s products showed a slight overall decline during the year.
Research and development costs showed an in-crease in 2016 compared to the previous year while marketing and sales expenses were lower than for the previous year. This development resulted from
significant product development efforts and an optimization of sales activities as personnel costs showed a further increase. Administrative costs were also higher compared to the year before due to an increase in personnel costs.
Given the revenue decrease in relation to a compa-ratively lower increase in fixed costs, the operating result (EBIT) including acquisition-related amortiz-ation and share-based compensation costs for the year 2016 decreased by EUR 54.0m to EUR 93.3m. In parallel to the lower EBIT, EBITDA (earnings befo-re interest and taxes plus depreciation and amortiz-ation) decreased by EUR 39.6m to EUR 155.6m.
Net income for 2016 decreased to EUR 102.9m compared to EUR 148.7m in 2015. The return on equity reached 15% compared to 22% for 2015 while the return on revenues decreased by 5 percentage points to 19% (2015: 24%).
in millions of EUR 2016 2015 Change in %
Gross profit on revenues 288.1 339.2 -15%
Gross margin (excluding acquisition-related amortization) and share-based compensation costs 55% 56%
Gross margin (including acquisition-related amortization) and share-based compensation costs 52% 54%
EBITDA 155.6 195.2 -20%
Operating result (EBIT) 93.3 147.3 -37%
EBIT margin (including acquisition-related amortization) and share-based compensation costs 17% 24%
Financial result 4.0 11.7 -66%
Result before tax 97.2 158.9 -39%
Net result 102.9 148.7 -31%
Return on equity 15% 22%
Return on revenues 19% 24%
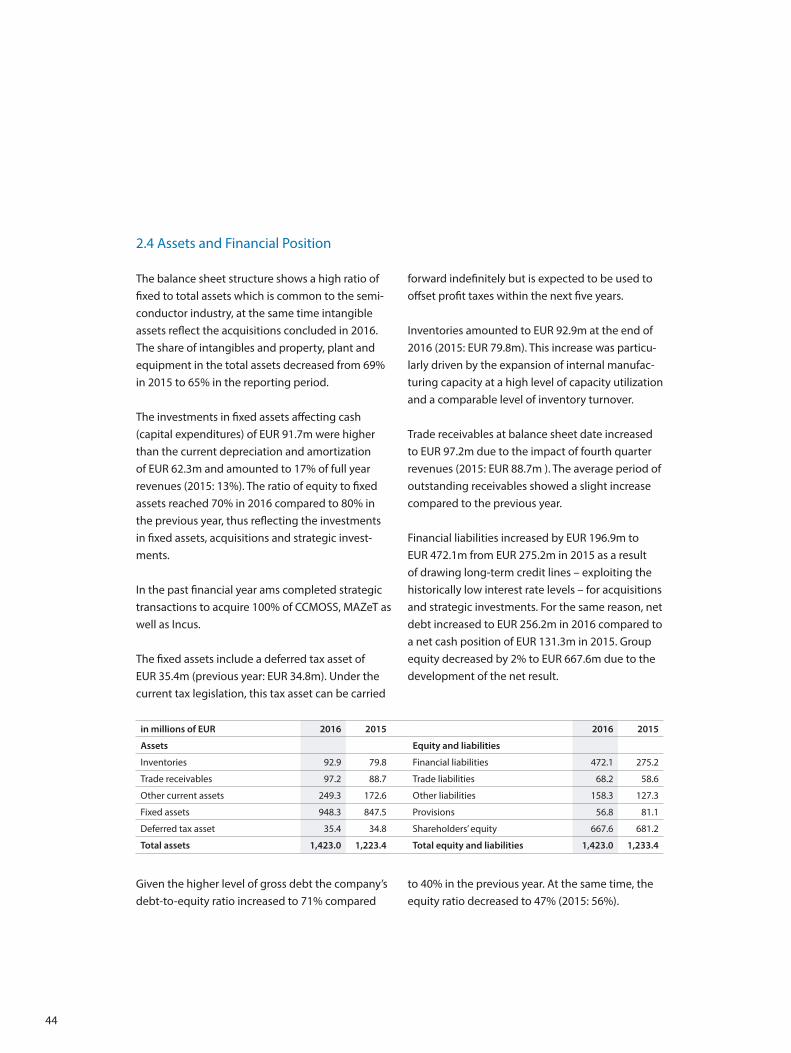
44
2.4 Assets and Financial Position
The balance sheet structure shows a high ratio of fixed to total assets which is common to the semi-conductor industry, at the same time intangible assets reflect the acquisitions concluded in 2016. The share of intangibles and property, plant and equipment in the total assets decreased from 69% in 2015 to 65% in the reporting period.
The investments in fixed assets affecting cash (capital expenditures) of EUR 91.7m were higher than the current depreciation and amortization of EUR 62.3m and amounted to 17% of full year revenues (2015: 13%). The ratio of equity to fixed assets reached 70% in 2016 compared to 80% in the previous year, thus reflecting the investments in fixed assets, acquisitions and strategic invest-ments.
In the past financial year ams completed strategic transactions to acquire 100% of CCMOSS, MAZeT as well as Incus.
The fixed assets include a deferred tax asset of EUR 35.4m (previous year: EUR 34.8m). Under the current tax legislation, this tax asset can be carried
forward indefinitely but is expected to be used to offset profit taxes within the next five years.
Inventories amounted to EUR 92.9m at the end of 2016 (2015: EUR 79.8m). This increase was particu-larly driven by the expansion of internal manufac-turing capacity at a high level of capacity utilization and a comparable level of inventory turnover.
Trade receivables at balance sheet date increased to EUR 97.2m due to the impact of fourth quarter revenues (2015: EUR 88.7m ). The average period of outstanding receivables showed a slight increase compared to the previous year.
Financial liabilities increased by EUR 196.9m to EUR 472.1m from EUR 275.2m in 2015 as a result of drawing long-term credit lines – exploiting the historically low interest rate levels – for acquisitions and strategic investments. For the same reason, net debt increased to EUR 256.2m in 2016 compared to a net cash position of EUR 131.3m in 2015. Group equity decreased by 2% to EUR 667.6m due to the development of the net result.
in millions of EUR 2016 2015 2016 2015
Assets Equity and liabilities
Inventories 92.9 79.8 Financial liabilities 472.1 275.2
Trade receivables 97.2 88.7 Trade liabilities 68.2 58.6
Other current assets 249.3 172.6 Other liabilities 158.3 127.3
Fixed assets 948.3 847.5 Provisions 56.8 81.1
Deferred tax asset 35.4 34.8 Shareholders’ equity 667.6 681.2
Total assets 1,423.0 1,223.4 Total equity and liabilities 1,423.0 1,233.4
Given the higher level of gross debt the company’s debt-to-equity ratio increased to 71% compared
to 40% in the previous year. At the same time, the equity ratio decreased to 47% (2015: 56%).
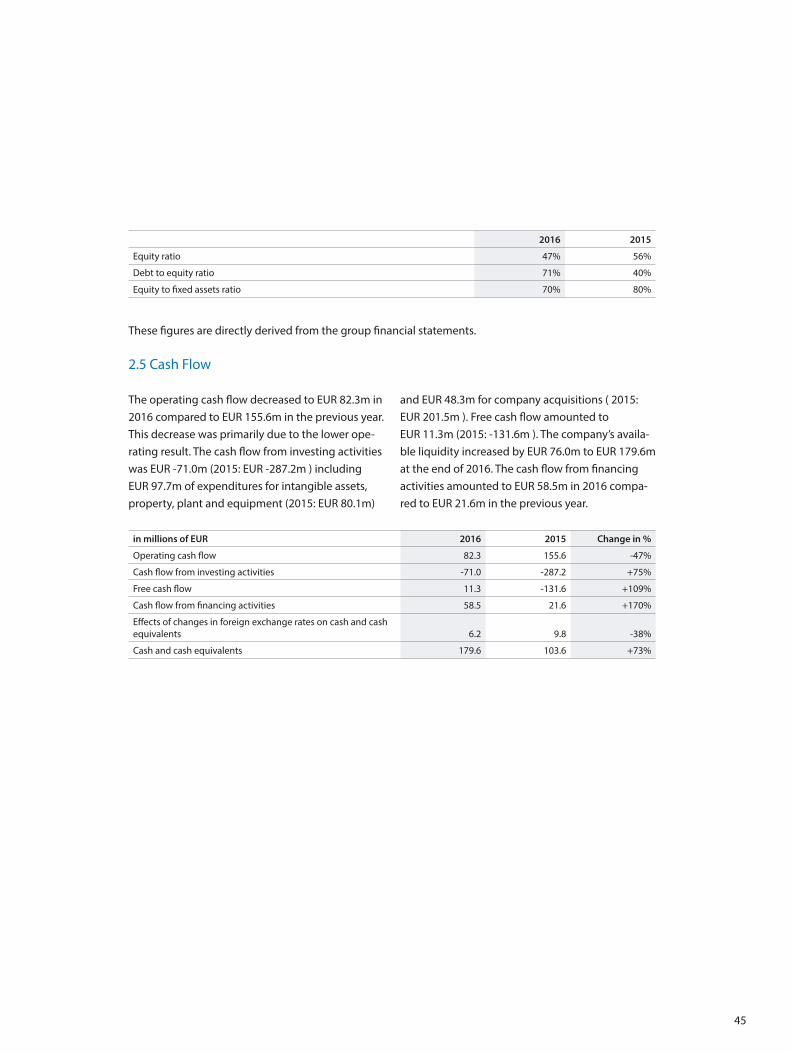
45
2016 2015
Equity ratio 47% 56%
Debt to equity ratio 71% 40%
Equity to fixed assets ratio 70% 80%
These figures are directly derived from the group financial statements.
2.5 Cash Flow
The operating cash flow decreased to EUR 82.3m in 2016 compared to EUR 155.6m in the previous year. This decrease was primarily due to the lower ope-rating result. The cash flow from investing activities was EUR -71.0m (2015: EUR -287.2m ) including EUR 97.7m of expenditures for intangible assets, property, plant and equipment (2015: EUR 80.1m)
and EUR 48.3m for company acquisitions ( 2015: EUR 201.5m ). Free cash flow amounted to EUR 11.3m (2015: -131.6m ). The company’s availa-ble liquidity increased by EUR 76.0m to EUR 179.6m at the end of 2016. The cash flow from financing activities amounted to EUR 58.5m in 2016 compa-red to EUR 21.6m in the previous year.
in millions of EUR 2016 2015 Change in %
Operating cash flow 82.3 155.6 -47%
Cash flow from investing activities -71.0 -287.2 +75%
Free cash flow 11.3 -131.6 +109%
Cash flow from financing activities 58.5 21.6 +170%
Effects of changes in foreign exchange rates on cash and cash equivalents 6.2 9.8 -38%
Cash and cash equivalents 179.6 103.6 +73%
46
3. Research and Development
ams’ technological leadership in the design and manufacture of high performance sensor solutions and analog ICs is based on more than 30 years of intensive research and development activities. In order to secure and strengthen its leading position, the company makes significant investments in research and development on a continuous basis. Research and development expenses amounted to EUR 138.6m last year (25% of revenues) compared to EUR 107.8m in the year before (17% of revenu-es). Research and development activities mainly
comprised sensor solutions, sensors and sensor in-terfaces for the company’s core markets regarding product development as well as the development of specialty variants of CMOS and SiGe processes. The average number of employees in research and development was 677 in 2016 (2015: 548).
ams’ R&D activities again allowed the filing of a large number of international patents and the pub-lication of numerous papers in international specia-list journals and at trade conferences last year.
4. Purchasing and Manufacturing
In purchasing, ams was able to reduce the cost of raw materials and assembly services slightly last year which had a positive effect on the gross profit margin. Given continuously rising personnel costs the cost pressures in manufacturing nevertheless remain high.
Internal production capacity was fully utilized throughout the year 2016. As a consequence, the average capacity utilization across all manufactu-ring areas was 100% over the reporting period. Any unabsorbed fixed costs have been recorded in the income statement.
Gross margin excluding acquisition-related amortization and share based compensation costs decreased slightly to 55% compared to 56% in 2015, gross margin including acquisition-related amortization decreased as well slightly to 52% from 54% in the previous year. This relatively stable de-velopment was mainly due to product mix effects and a high capacity utilization in manufacturing.
Given the positive demand environment for its products ams expects another year of very high capacity utilization for 2017.
47
5. Employees
On average, ams had 2,175 employees in 2016 (2015: 1,921) of which 1,111 worked at the compa-ny headquarters in Premstätten (2015: 1,040 ). The increase of 253 employees comprises the addition of 128 employees in research and development, 49 employees in production and 75 employees in General and Administration.
ams recognizes its responsibility as an important employer in the region. The company again offered a wide range of internal and external training and development opportunities for all employees last year and provided training positions for apprenti-ces.
ams attempts to retain its employees with the help of a long-term remuneration model. A profit sharing program for all ams employees augments
the existing employee stock option and incentive programs by way of an attractive direct compo-nent. The profit sharing program expresses ams’ belief that the company’s employees are its most important success factor and honors every emplo-yee’s contribution to ams’ success.
Owing to the earnings in 2016, the total amount for distribution which depends on the operating profit before taxes in relation to full year revenues (EBT margin) decreased significantly and totals EUR 1.7m for 2016 (2015: EUR 15.7m).
Moreover, active internal and employee communi-cations as well as regular employee events which form a company tradition serve to ensure the employees’ identification with the company.
6. Environment
Acting responsibly towards the environment is a basic principle for ams in all business operations. ams is dedicated meeting the highest environmen-tal standards as well as using resources and the en-vironment conservatively. ams has therefore been certified to ISO 14001:2004 for a number of years.
Sustainability as well as efforts to preserve en-vironmental resources and reduce energy costs and carbon dioxide emissions are major concerns for ams which have been supported by a range of activities for many years. Based on a thorough
analysis of ams’ carbon dioxide emission sources in 2009, measures to achieve further reductions in carbon dioxide emissions are being defined each subsequent year.
ams also submits information on its carbon dioxide emissions to the Carbon Disclosure Project, a global transparency initiative which has created the world’s largest freely available database of corporate carbon dioxide emissions.
48
7. Subsidiaries and Branch Facilities
ams currently has subsidiaries in Switzerland, Italy, Germany, France, Belgium, the United Kingdom, Spain, Portugal, Sweden, the U.S., the Cayman Is-lands, the Philippines, China, Japan, Korea, Slovenia and India. The subsidiaries in the USA, Switzerland, Italy, Spain, Belgium, Portugal and the United Kingdom, Slovenia, Germany, Japan and India carry out development, marketing and sales activities, while the subsidiaries in France and China are ac-tive in marketing and sales and technical support. The subsidiary in the Philippines is responsible for
production activities in testing, while the subsidi-ary in Korea is responsible for sales and assembly in the region. Branch facilities exist in Hong Kong, Singapore and Taiwan.
Principal shareholdings: The investment in New Scale Technologies, Inc., Victor, New York (USA), remained unchanged at 34.5%. New Scale Tech-nologies develops piezo-based miniature motor technologies and licenses products and technolo-gies to industrial partners.
8. Risk Management
Operating on a global basis, the ams Group is expo-sed to a variety of risks that are inextricably linked to business activities. In order to identify, evaluate and counteract these risks in a timely manner, ams has developed and implemented tight internal risk management systems. This risk management sys-tem was implemented and benchmarked against best practices in conjunction with the company’s auditors. The risk management process in place re-quires the business units to constantly monitor and
evaluate risks. Regular risk reports are prepared for the management board and supervisory board. This ensures that major risks are identified and counteraction can be taken at an early stage.
The internal audit function complements the risk management process. In close alignment with the supervisory board’s audit committee it aims to analyze internal processes and if necessary propose improvements.
Business Interruption Risk
The company’s state-of-the-art 200mm manufactu-ring facility went into operation in 2002. Although 12 years old the facility is regarded as compara-tively new by semiconductor industry standards. Therefore the risk of breakdowns or prolonged downtime is relatively low. In addition, this risk is being minimized further by preventive main-
tenance activities. The business interruption risk is additionally insured for the replacement price and against loss of earnings for 18 months. ams’ insurer, FM Global, has awarded the company – as one of a select number of semiconductor manufacturers – the HPR (highly protected risk) status.
49
Financial Risks
Risk management is handled centrally by the treasury department in accordance with guidelines issued by the management board. These detailed internal guidelines regulate responsibility and acti-
on parameters for the areas affected. The treasury department evaluates and hedges financial risks in close cooperation with the business units.
Receivables and Credit Risk
ams operates a strict credit policy. The creditwort-hiness of existing customers is constantly checked and new customers undergo a credit evaluation. Under ams’ treasury and risk management policy, investments in liquid securities and transactions
involving derivative financial instruments are only carried out with financial institutions that have high credit ratings. As of the balance sheet date there were no significant concentrations of credit risk.
Interest Rate Risk
Interest rate risk – the possible fluctuation in value of financial instruments due to changes in market interest rates – arises in relation to medium and long-term receivables and payables (especially borrowings). ams’ treasury policy ensures that part of the interest rate risk is reduced by fixed-in-terest borrowings. On the liability side, 42% of all amounts owed to financial institutions are at fixed
rates. Of the remaining borrowings on a floating rate basis (58%), 37% will be repaid over the next two years. The remaining floating rate borrowings undergo continual checks with regard to the interest rate risk. On the asset side, the interest rate risks are primarily attached to time deposits and securities in current assets that are tied to the market interest rate.
Foreign Exchange Risk
Financial transactions in the semiconductor in-dustry are predominantly carried out in US dollars. To hedge the currency risk, all transaction and conversion risks are constantly monitored. Within the group, cash flow streams in the same currency are offset (netting). Currency fluctuations during
foreign currency transactions mainly concern the US dollar. From the company’s point of view, due to the extreme volatility in the currency markets, it is not possible to engage in economically feasible, efficient, and low risk currency hedges.
50
Product Liability and Quality Risk
The products manufactured by ams are integrated into complex electronic systems. Faults or functio-nal defects in the products produced by ams may have a direct or indirect effect on the property, health or life of third parties. The company is not in a position to reduce or exclude its liability towards consumers or third parties in sales agreements. Every product that leaves the company undergoes
several qualified checks regarding quality and function. In spite of quality control systems certi-fied to ISO/TS 16949, ISO/TS 13485, ISO 9001 und ISO 14001, product defects may occur and possibly only show up after installation and use of the finis-hed products. Although this risk has been approp-riately insured, quality problems could negatively impact ams’ assets, financial and earnings position.
Patent Infringement Risk
ams manufactures complex ICs using various process technologies, line widths and production facilities. Like industry competitors, the company constantly has to develop these technologies further. Should ams infringe any existing patents while consistently monitoring processes, pro-
duction methods, and design blocks protected under patent law as well as related comprehensive licensing, this may negatively impact the assets, financial and earnings position of the company as well as the ams share price.
9. Outlook
Despite prevailing uncertainties about the de-velopment of the world economy, global industrial production and private consumption in the current year, ams expects its business to resume growth in 2017 based on the market launch of new advanced sensor and analog solutions and the production ramp-up of various design-wins.
For the analog segment of the worldwide semicon-ductor industry market researchers assume market volume to expand further in 2017 and currently expect year-on-year growth in the middle sing-le-digit percentage range (WSTS, February 2017) In contrast, ams expresses its confidence at this time to achieve a revenue growth rate above the expec-ted market growth rate for the current year. ams expects gross profit margin for the year 2017 to
remain high and foresees a positive development of the operating and net result in the current year despite further increases in research and develop-ment as well as sales and marketing expenses.
However, should global semiconductor demand and the macroeconomic environment develop unfavorably in 2017 and/or the US dollar show notable weakness, ams would experience a mea-ningful impact on the development of its business and earnings.
ams’ outstanding expertise in sensor and analog solutions and its clear strategy of focusing on key sensing markets offer significant growth oppor-tunities for the company. These include a range of new and upcoming applications in smartphones
51
and other mobile devices as well as the rapidly increasing use of advanced sensor technologies in automotive, industrial, and medical applications. In this context, the expansion of the company’s
business with key accounts, a stronger penetration of its worldwide customer base and a continued leadership position in its target markets remain mid-term strategic priorities for ams.
10. Other Information
Regarding information concerning equity and investments please refer to the notes of the financial state-ments.
Premstätten, February 27, 2017
Michael Wachsler-Markowitsch
Member of the Management Board
CFO
Alexander Everke
Chairman of the Management Board
CEO
Dr. Thomas Stockmeier
Member of the Management Board
COO
Kirk S. Laney
Member of the Management Board
CSO
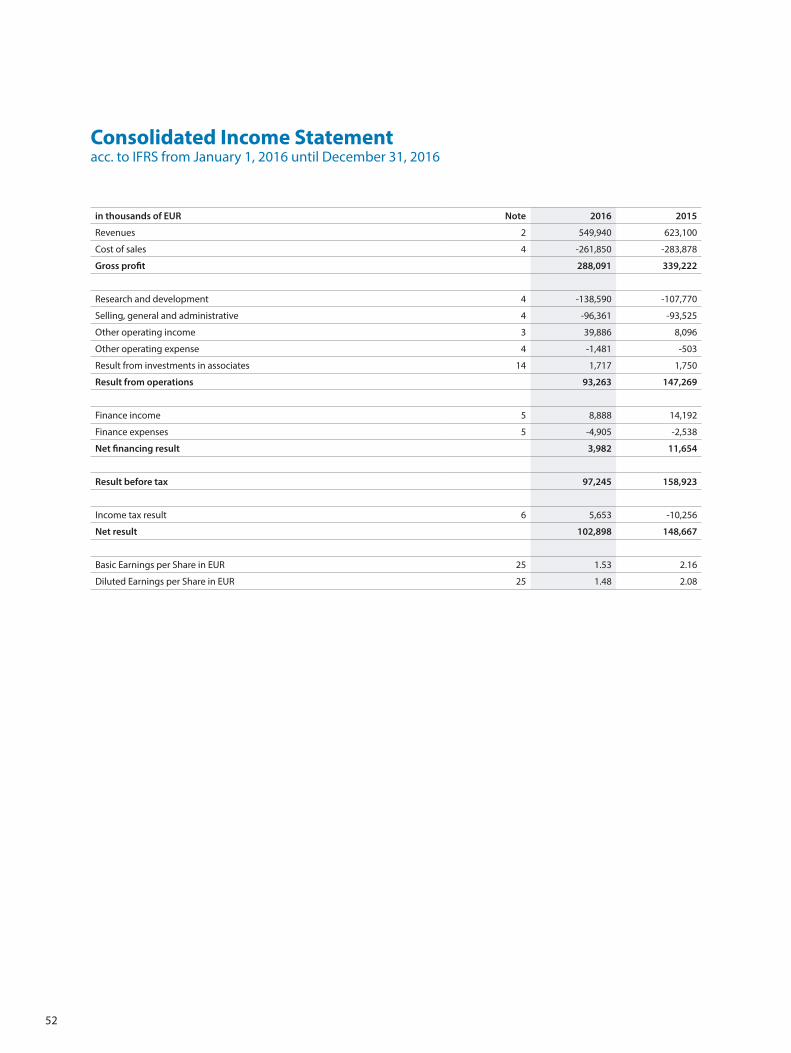
52
Consolidated Income Statement acc. to IFRS from January 1, 2016 until December 31, 2016
in thousands of EUR Note 2016 2015
Revenues 2 549,940 623,100
Cost of sales 4 -261,850 -283,878
Gross profit 288,091 339,222
Research and development 4 -138,590 -107,770
Selling, general and administrative 4 -96,361 -93,525
Other operating income 3 39,886 8,096
Other operating expense 4 -1,481 -503
Result from investments in associates 14 1,717 1,750
Result from operations 93,263 147,269
Finance income 5 8,888 14,192
Finance expenses 5 -4,905 -2,538
Net financing result 3,982 11,654
Result before tax 97,245 158,923
Income tax result 6 5,653 -10,256
Net result 102,898 148,667
Basic Earnings per Share in EUR 25 1.53 2.16
Diluted Earnings per Share in EUR 25 1.48 2.08
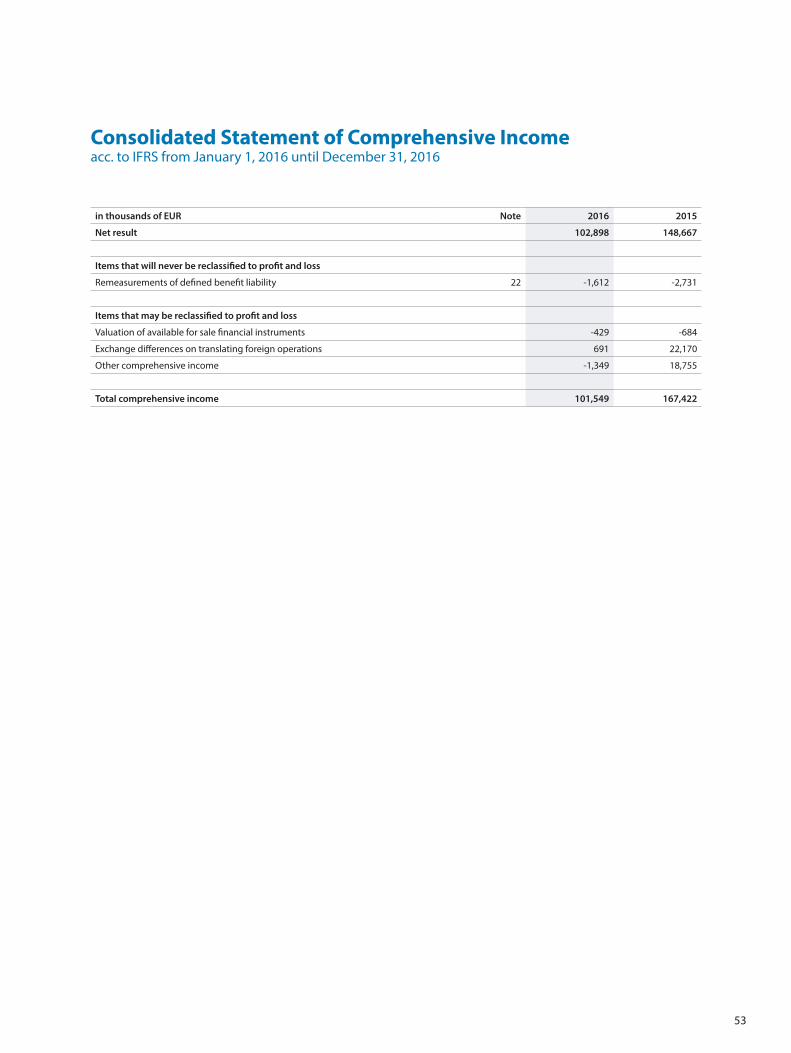
53
Consolidated Statement of Comprehensive Income acc. to IFRS from January 1, 2016 until December 31, 2016
in thousands of EUR Note 2016 2015
Net result 102,898 148,667
Items that will never be reclassified to profit and loss
Remeasurements of defined benefit liability 22 -1,612 -2,731
Items that may be reclassified to profit and loss
Valuation of available for sale financial instruments -429 -684
Exchange differences on translating foreign operations 691 22,170
Other comprehensive income -1,349 18,755
Total comprehensive income 101,549 167,422
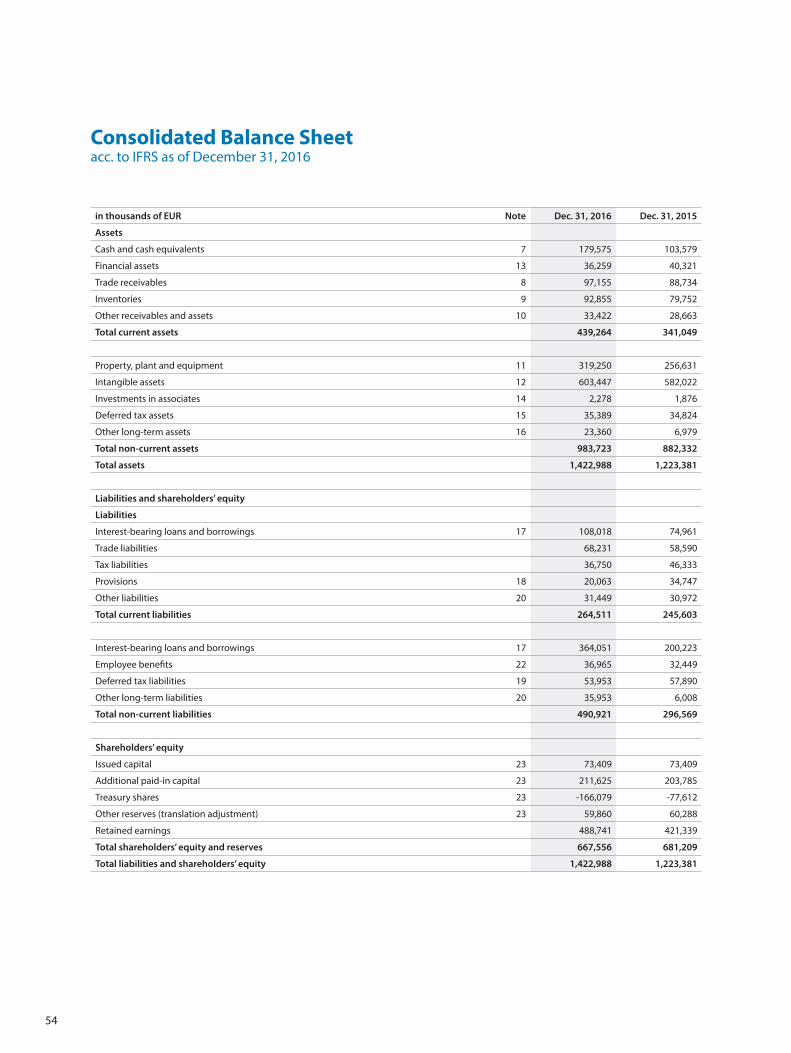
54
Consolidated Balance Sheet acc. to IFRS as of December 31, 2016
in thousands of EUR Note Dec. 31, 2016 Dec. 31, 2015
Assets
Cash and cash equivalents 7 179,575 103,579
Financial assets 13 36,259 40,321
Trade receivables 8 97,155 88,734
Inventories 9 92,855 79,752
Other receivables and assets 10 33,422 28,663
Total current assets 439,264 341,049
Property, plant and equipment 11 319,250 256,631
Intangible assets 12 603,447 582,022
Investments in associates 14 2,278 1,876
Deferred tax assets 15 35,389 34,824
Other long-term assets 16 23,360 6,979
Total non-current assets 983,723 882,332
Total assets 1,422,988 1,223,381
Liabilities and shareholders’ equity
Liabilities
Interest-bearing loans and borrowings 17 108,018 74,961
Trade liabilities 68,231 58,590
Tax liabilities 36,750 46,333
Provisions 18 20,063 34,747
Other liabilities 20 31,449 30,972
Total current liabilities 264,511 245,603
Interest-bearing loans and borrowings 17 364,051 200,223
Employee benefits 22 36,965 32,449
Deferred tax liabilities 19 53,953 57,890
Other long-term liabilities 20 35,953 6,008
Total non-current liabilities 490,921 296,569
Shareholders’ equity
Issued capital 23 73,409 73,409
Additional paid-in capital 23 211,625 203,785
Treasury shares 23 -166,079 -77,612
Other reserves (translation adjustment) 23 59,860 60,288
Retained earnings 488,741 421,339
Total shareholders’ equity and reserves 667,556 681,209
Total liabilities and shareholders’ equity 1,422,988 1,223,381
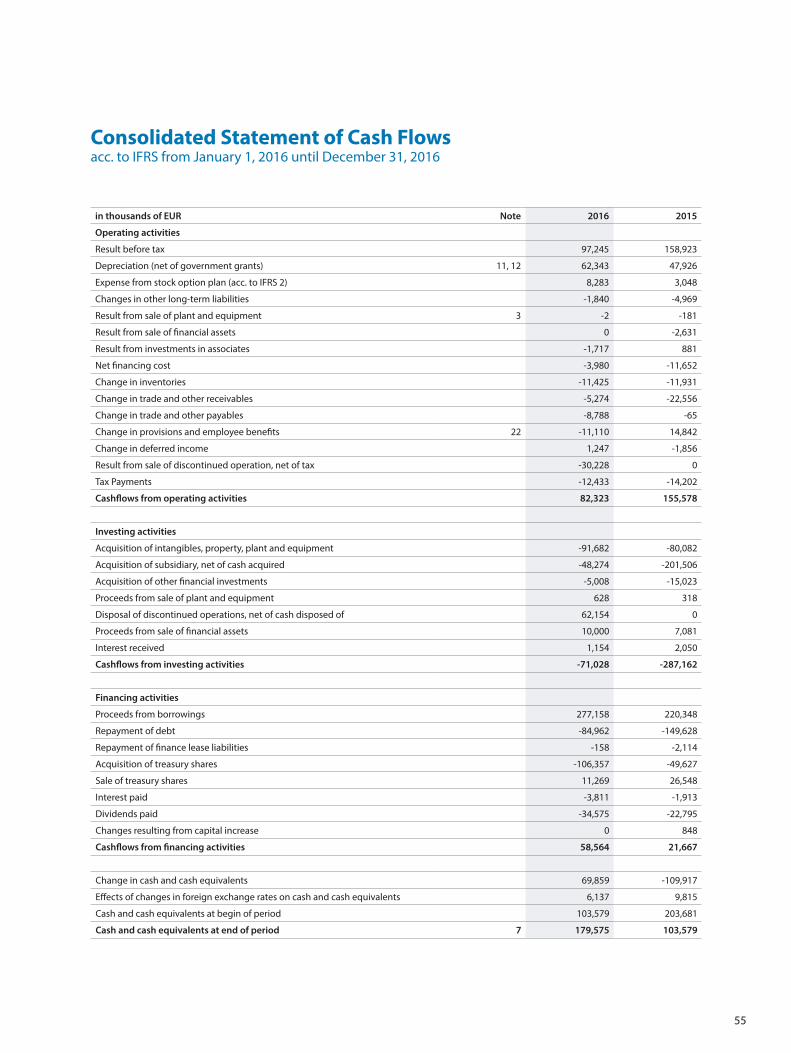
55
Consolidated Statement of Cash Flows acc. to IFRS from January 1, 2016 until December 31, 2016
in thousands of EUR Note 2016 2015
Operating activities
Result before tax 97,245 158,923
Depreciation (net of government grants) 11, 12 62,343 47,926
Expense from stock option plan (acc. to IFRS 2) 8,283 3,048
Changes in other long-term liabilities -1,840 -4,969
Result from sale of plant and equipment 3 -2 -181
Result from sale of financial assets 0 -2,631
Result from investments in associates -1,717 881
Net financing cost -3,980 -11,652
Change in inventories -11,425 -11,931
Change in trade and other receivables -5,274 -22,556
Change in trade and other payables -8,788 -65
Change in provisions and employee benefits 22 -11,110 14,842
Change in deferred income 1,247 -1,856
Result from sale of discontinued operation, net of tax -30,228 0
Tax Payments -12,433 -14,202
Cashflows from operating activities 82,323 155,578
Investing activities
Acquisition of intangibles, property, plant and equipment -91,682 -80,082
Acquisition of subsidiary, net of cash acquired -48,274 -201,506
Acquisition of other financial investments -5,008 -15,023
Proceeds from sale of plant and equipment 628 318
Disposal of discontinued operations, net of cash disposed of 62,154 0
Proceeds from sale of financial assets 10,000 7,081
Interest received 1,154 2,050
Cashflows from investing activities -71,028 -287,162
Financing activities
Proceeds from borrowings 277,158 220,348
Repayment of debt -84,962 -149,628
Repayment of finance lease liabilities -158 -2,114
Acquisition of treasury shares -106,357 -49,627
Sale of treasury shares 11,269 26,548
Interest paid -3,811 -1,913
Dividends paid -34,575 -22,795
Changes resulting from capital increase 0 848
Cashflows from financing activities 58,564 21,667
Change in cash and cash equivalents 69,859 -109,917
Effects of changes in foreign exchange rates on cash and cash equivalents 6,137 9,815
Cash and cash equivalents at begin of period 103,579 203,681
Cash and cash equivalents at end of period 7 179,575 103,579
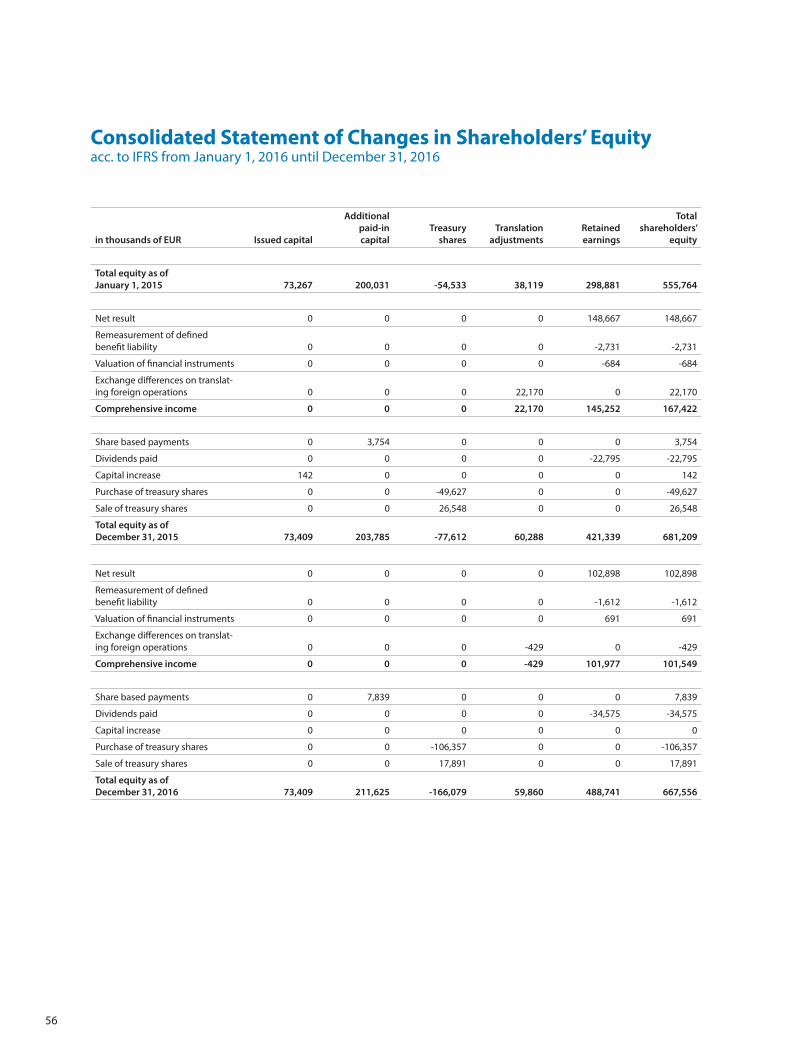
56
Consolidated Statement of Changes in Shareholders’ Equity acc. to IFRS from January 1, 2016 until December 31, 2016
in thousands of EUR Issued capital
Additional paid-in capital
Treasury shares
Translation adjustments
Retained earnings
Total shareholders’
equity
Total equity as of January 1, 2015 73,267 200,031 -54,533 38,119 298,881 555,764
Net result 0 0 0 0 148,667 148,667
Remeasurement of defined benefit liability 0 0 0 0 -2,731 -2,731
Valuation of financial instruments 0 0 0 0 -684 -684
Exchange differences on translat-ing foreign operations 0 0 0 22,170 0 22,170
Comprehensive income 0 0 0 22,170 145,252 167,422
Share based payments 0 3,754 0 0 0 3,754
Dividends paid 0 0 0 0 -22,795 -22,795
Capital increase 142 0 0 0 0 142
Purchase of treasury shares 0 0 -49,627 0 0 -49,627
Sale of treasury shares 0 0 26,548 0 0 26,548
Total equity as of December 31, 2015 73,409 203,785 -77,612 60,288 421,339 681,209
Net result 0 0 0 0 102,898 102,898
Remeasurement of defined benefit liability 0 0 0 0 -1,612 -1,612
Valuation of financial instruments 0 0 0 0 691 691
Exchange differences on translat-ing foreign operations 0 0 0 -429 0 -429
Comprehensive income 0 0 0 -429 101,977 101,549
Share based payments 0 7,839 0 0 0 7,839
Dividends paid 0 0 0 0 -34,575 -34,575
Capital increase 0 0 0 0 0 0
Purchase of treasury shares 0 0 -106,357 0 0 -106,357
Sale of treasury shares 0 0 17,891 0 0 17,891
Total equity as of December 31, 2016 73,409 211,625 -166,079 59,860 488,741 667,556
57
Significant accounting policies
ams AG (“the Company”) is a company located in 8141 Premstätten, Austria. The Company is a global leader in the design, manufacture and sale of high performance analog and analog intensive mixed signal integrated circuits. The consolidated financial statements for the year ended Decem-ber 31, 2015 represent the parent company ams
AG and its subsidiaries (together referred to as the “Group”).
On February 27, 2017 the consolidated financial statements according to IFRS as per December 31, 2017 were completed and released for approval by the Supervisory Board.
(a) Statement of Compliance
The consolidated financial statements comply with International Financial Reporting Standards as issued by the International Accounting Standards Board (IASB) and all obligatory interpretations as issued by the International Financial Interpreta-tions Committee. Furthermore these consolidated financial statements are in accordance with the International Financial Reporting Standards as to
be applied in the European Union as per the busi-ness year 2016, as well as additional requirements relating to §245a UGB.
New or amended standards and interpretations that have been applied for the first time during the business year:
Standard Content Initial application IASB1) Initial application EU2)
Amended standards and interpretations:
Amendment to IAS 19Defined Benefit Plans: Employee Contribution July 1, 2014 February 1, 20152)
Amendment to IFRS 11Acquisition of an interest in a joint operation January 1, 2016 January 1, 2016
Amendments to IAS 16 and IAS 38
Acceptable Methods of de-preciation and amortisation January 1, 2016 January 1, 2016
Amendments to IAS 16 and IAS 41 Agriculture: Bearer Plants January 1, 2016 January 1, 2016
Amendments to IAS 27Equity Method in Separate Financial Statements January 1, 2016 January 1, 2016
Annual improvements (2012-2014 cycle) Various January 1, 2016 January 1, 2016
Amendment to IAS 1 Disclosure Initative January 1, 2016 January 1, 2016
Amendments to IFRS 10, IFRS 12 and IAS 28
Consolidation – Investment entities January 1, 2016 January 1, 2016
Annual improvements (2010-2012 cycle) Various July 1, 2014 February 1, 20152)
Notes to the Consolidated Financial Statements
1) Standards to be applied for financial years which begin on or after the effective date according to the respective pronouncements of the International Accounting Standards Board.
2) The IFRS are to be applied for business years that begin on or after the effective date according to the respective EU regulation.
58
Amendment to IAS 19: Defined Benefit Plans: Employee Contribution
The amendments to IAS 19 clarify the requirements that relate how contributions from employees or third parties that are linked to service should be attributed to periods of service. In addition, it per-
mits practical measures to facilitate if the amount of the contributions is independent of the number of years of service
Annual Improvements (2010-2012 cycle)
During this project seven standards were amend-ed. Existing regulations should be clarified by adapting the wording of single IFRS standards. Additionally, the amendments did have an effect
on the notes. The amendments affected the stand-ards IFRS 2, IFRS 3, IFRS 8, IFRS 13, IAS 16, IAS 24 and IAS 38.
Amendment to IFRS 11: Acquisition of an Interest in a Joint Operation
The amendments clarify that the acquirer of an in-terest in a joint operation in which the activity con-stitutes a business, as defined in IFRS 3, is required to apply all principles for business combinations
accounting according to IFRS 3 and other IFRSs with the exception of those principles that conflict with the guidance in IFRS 11.
Amendments to IAS 16 and IAS 38: Acceptable Methods of Depreciation and Amortisation
The amendments clarify acceptable methods of depreciation of property, plant and equipment and amortisation of intangible assets. Depreciation should reflect the expected pattern of consump-tion of the future economic benefits of the asset. Therefore the IASB has clarified that a depreci-ation of property, plant and equipment based
on revenues generated as a proportion of total expected revenues during the assets useful life is not appropriate. Multiple factors influence revenue and not all of these are related to the way the asset is used or consumed, e.g. changes in sales volumes and prices and inflation.
Amendments to IFRS 10, 12 and IAS 28: Investment Entities
The standard clarifies questions relating to the exception of applying mandatory consolidation acc
to IFRS 10, when the parent company qualifies as investment entity.
59
Annual Improvements (2012-2014 cycle)
During this project four standards were amended. Existing regulations should be clarified by adapting the wording of single IFRS standards. The amend-ments affected the standards IFRS 5, IFRS 7, IAS 19
and IAS 34. The amendments are effective for an-nual periods beginning on or after January 1, 2016, but can be applied earlier.
Amendments to IAS 1: Disclosure Initiative
The amendments aim at clarifying to preparers reports that notes have to be presented only, if their content is not marginally. This explicit is also valid for minimum-requests of IFRS. The amend-ments also clarify that the notes do not need to be presented in model structure, that an entity’s
share of other comprehensive income of equi-ty-accounted associates and joint ventures should be presented in the income statement, and an aggregation or disaggregation of single line items have to be specified in the balance sheet and the income statement.
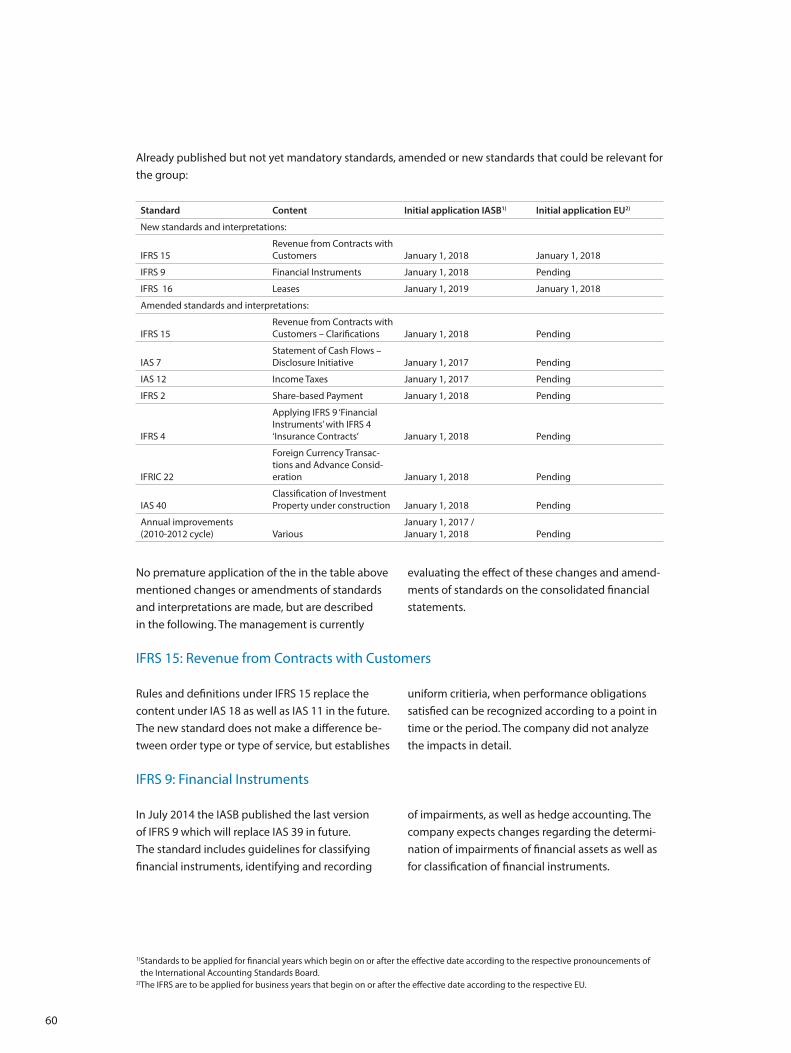
60
Already published but not yet mandatory standards, amended or new standards that could be relevant for the group:
Standard Content Initial application IASB1) Initial application EU2)
New standards and interpretations:
IFRS 15Revenue from Contracts with Customers January 1, 2018 January 1, 2018
IFRS 9 Financial Instruments January 1, 2018 Pending
IFRS 16 Leases January 1, 2019 January 1, 2018
Amended standards and interpretations:
IFRS 15Revenue from Contracts with Customers – Clarifications January 1, 2018 Pending
IAS 7Statement of Cash Flows – Disclosure Initiative January 1, 2017 Pending
IAS 12 Income Taxes January 1, 2017 Pending
IFRS 2 Share-based Payment January 1, 2018 Pending
IFRS 4
Applying IFRS 9 ‘Financial Instruments’ with IFRS 4 ‘Insurance Contracts’ January 1, 2018 Pending
IFRIC 22
Foreign Currency Transac-tions and Advance Consid-eration January 1, 2018 Pending
IAS 40Classification of Investment Property under construction January 1, 2018 Pending
Annual improvements (2010-2012 cycle) Various
January 1, 2017 / January 1, 2018 Pending
No premature application of the in the table above mentioned changes or amendments of standards and interpretations are made, but are described in the following. The management is currently
evaluating the effect of these changes and amend-ments of standards on the consolidated financial statements.
IFRS 15: Revenue from Contracts with Customers
Rules and definitions under IFRS 15 replace the content under IAS 18 as well as IAS 11 in the future. The new standard does not make a difference be-tween order type or type of service, but establishes
uniform critieria, when performance obligations satisfied can be recognized according to a point in time or the period. The company did not analyze the impacts in detail.
IFRS 9: Financial Instruments
In July 2014 the IASB published the last version of IFRS 9 which will replace IAS 39 in future. The standard includes guidelines for classifying financial instruments, identifying and recording
of impairments, as well as hedge accounting. The company expects changes regarding the determi-nation of impairments of financial assets as well as for classification of financial instruments.
1) Standards to be applied for financial years which begin on or after the effective date according to the respective pronouncements of the International Accounting Standards Board.
2) The IFRS are to be applied for business years that begin on or after the effective date according to the respective EU.
61
IFRS 16: Leasing
The final version of IFRS 16 was issued in January 2016. The main idea is to recognize all leasing rela-tionships and their related assets and liabilities in the balance sheet. Therefore the differentiation un-der IAS 17 between finance and operating leasing
is not necessary anymore. Due to initial application of IFRS 16 the company expects a balance-sheet extension, especially due to recognition of assets and liabilities resulting from operating leasing.
Amendment to IAS 7 – Statemtent of Cash Flows Disclosure Initiative
The International Accounting Standards Board (IASB) has published amendments to IAS 7 ‘State-ment of Cash Flows’ on April 11, 2016. The amend-ments in Disclosure Initiative (Amendments to IAS 7) come with the objective that entities shall pro-vide disclosures to evaluate changes in liabilities.According to the amendments entities need to dis-close information about changes of such financial liabilities, whose inflows and outflows are shown under cashflow from financing activities in the
statement of cash flows. Related financial assets have to be included in the disclosures. Disclosed should be:
- changes from financing cash flows; - changes arising from obtaining or losing control
of subsidiaries or other businesses; - the effect of changes in foreign exchange rates; - changes in fair values; and - other changes
Amendment to IAS 12 – Income taxes – Recognition of Deferred Tax Assets for Unrealised Losses
On January 19, 2016 the amendment to IAS 12 Income Taxes has been published. The amendment clarifies how provision of IAS 12 should be applied
related to the recognition of deferred tax assets resulting from debt instruments acquired at fair value.
Amendment to IFRS 15 – Revenue from Contracts with Customers – Clarifications
The amendments do not change the underlying principles of the standard, they should just clarify. It clarifies identifying performance obligations, prin-cipal versus agent considerations for the entity and
whether income from a licence grant is realized at a point in time or over time. Additionally several transition reliefs have been introduced.
Amendment to IFRS 2 – Sharebased payments – and Measurement of Share-based Payment Transactions
On June 20, 2016 the IASB published the amend-ment to IFRS share based payments. The changes related to specific areas where due to lack of speci-
fications diversity in practice occurred. The changes have to be applied for business years starting on or after January 1, 2018.
62
Amendment to IFRS 4 – Insurance Contracts
On September 12, 2016 amendments to IFRS 4 Insurance contracts have been published. These amendments concern a first application of IFRS 4 for insurers. As IFRS 9 and the new standard for
insurance contracts have different dates of coming into force, for the transition period higher volatili-ties in results would occur as well as higher costs of transition.
(b) Basis of Preparation
The financial statements are presented in EUR and rounded to the nearest thousand. The use of automated calculation systems may lead to round-ing differences in totals of rounded amounts and percentages.
The consolidated financial statements have been prepared on the historical cost basis except for the following material items in the statement of financial positions:
- Available-for-sale financial assets measured at fair value
- Derivative financial instruments are stated at their fair value
- Employee benefits: fair value of the defined bene-fit liability (or asset)
- Share-based payments: fair value
(c) Basis of Consolidation
(i) SubsidiariesSubsidiaries are all operative enterprises controlled by the Company. Control exists when the Company is exposed to (has rights to) variable returns from its involvement with the investee, and has the abil-ity to affect those returns through its power over the subsidiary. The financial statements of the sub-sidiaries are included in the consolidated financial statements from the date that control commences until the date that control ceases. Audits of major subsidiaries were carried out locally.
The accounts of the subsidiary company AMS R&D UK Limited, Cambridge CMOS Sensors Limited and Incus Laboratories Limited have not been audited. All members agree to the exemption in accordance with section 479A of the UK Companies Act 2006.
(ii) Business combinationsThe acquisition method is used for all business combinations, as soon as the Company obtained control. The value of the consideration transferred as well as the identifiable assets acquired and the liabilities assumed are generally measured at fair value. If the fair value is higher than the assets ac-quired a goodwill is indicated. An impairment test under IAS 36 has to be performed annually. A profit resulting from an acquisition below market value is accounted in the income statement in the period occurred. Acquisition related costs are recognized in profit or loss immediately. All contingent con-sideration are recognized at fair value, subsequent changes are recognized in profit or loss.
On June 17, 2016 the Group obtained control over Cambridge CMOS Sensors Ltd, Great Britain (CCMOSS).
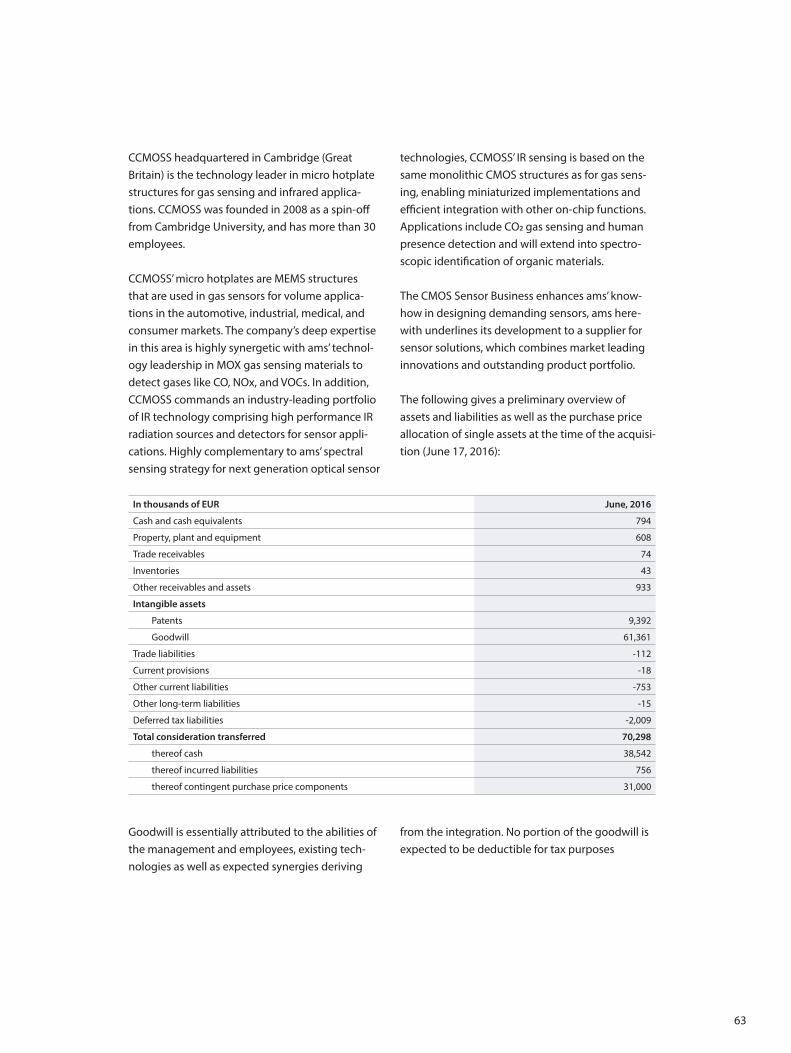
63
CCMOSS headquartered in Cambridge (Great Britain) is the technology leader in micro hotplate structures for gas sensing and infrared applica-tions. CCMOSS was founded in 2008 as a spin-off from Cambridge University, and has more than 30 employees.
CCMOSS’ micro hotplates are MEMS structures that are used in gas sensors for volume applica-tions in the automotive, industrial, medical, and consumer markets. The company’s deep expertise in this area is highly synergetic with ams’ technol-ogy leadership in MOX gas sensing materials to detect gases like CO, NOx, and VOCs. In addition, CCMOSS commands an industry-leading portfolio of IR technology comprising high performance IR radiation sources and detectors for sensor appli-cations. Highly complementary to ams’ spectral sensing strategy for next generation optical sensor
technologies, CCMOSS’ IR sensing is based on the same monolithic CMOS structures as for gas sens-ing, enabling miniaturized implementations and efficient integration with other on-chip functions. Applications include CO2 gas sensing and human presence detection and will extend into spectro-scopic identification of organic materials.
The CMOS Sensor Business enhances ams’ know-how in designing demanding sensors, ams here-with underlines its development to a supplier for sensor solutions, which combines market leading innovations and outstanding product portfolio.
The following gives a preliminary overview of assets and liabilities as well as the purchase price allocation of single assets at the time of the acquisi-tion (June 17, 2016):
In thousands of EUR June, 2016
Cash and cash equivalents 794
Property, plant and equipment 608
Trade receivables 74
Inventories 43
Other receivables and assets 933
Intangible assets
Patents 9,392
Goodwill 61,361
Trade liabilities -112
Current provisions -18
Other current liabilities -753
Other long-term liabilities -15
Deferred tax liabilities -2,009
Total consideration transferred 70,298
thereof cash 38,542
thereof incurred liabilities 756
thereof contingent purchase price components 31,000
Goodwill is essentially attributed to the abilities of the management and employees, existing tech-nologies as well as expected synergies deriving
from the integration. No portion of the goodwill is expected to be deductible for tax purposes
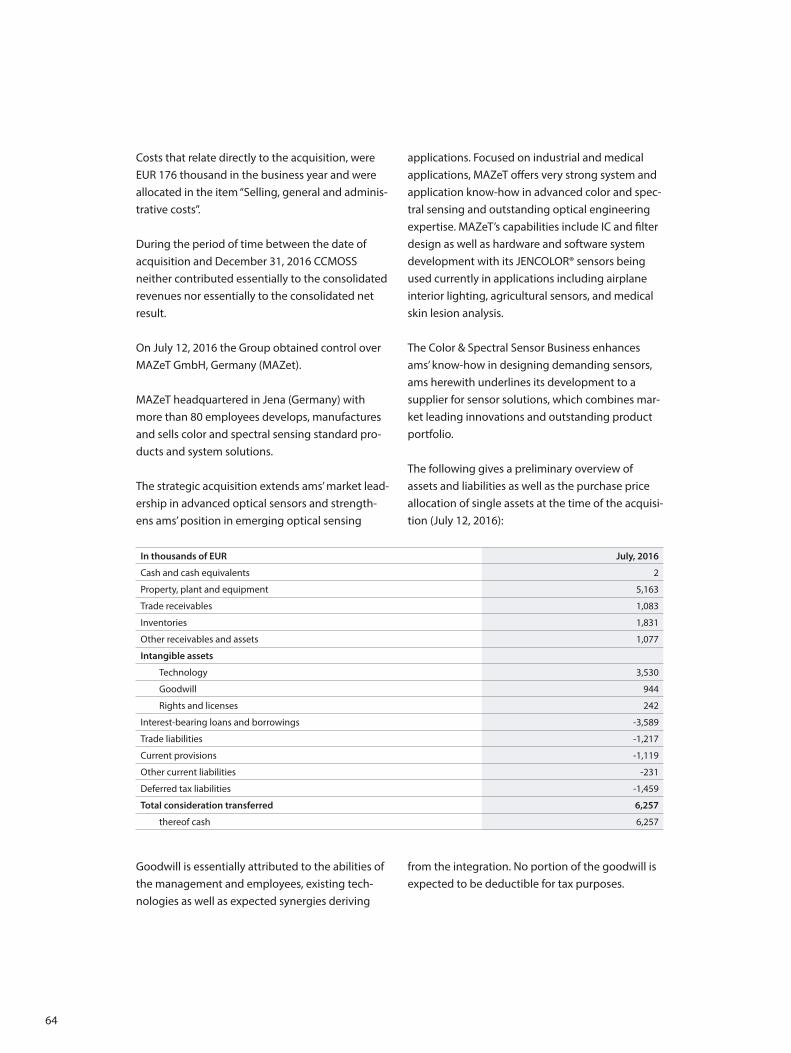
64
Costs that relate directly to the acquisition, were EUR 176 thousand in the business year and were allocated in the item “Selling, general and adminis-trative costs”.
During the period of time between the date of acquisition and December 31, 2016 CCMOSS neither contributed essentially to the consolidated revenues nor essentially to the consolidated net result.
On July 12, 2016 the Group obtained control over MAZeT GmbH, Germany (MAZet).
MAZeT headquartered in Jena (Germany) with more than 80 employees develops, manufactures and sells color and spectral sensing standard pro-ducts and system solutions.
The strategic acquisition extends ams’ market lead-ership in advanced optical sensors and strength-ens ams’ position in emerging optical sensing
applications. Focused on industrial and medical applications, MAZeT offers very strong system and application know-how in advanced color and spec-tral sensing and outstanding optical engineering expertise. MAZeT’s capabilities include IC and filter design as well as hardware and software system development with its JENCOLOR® sensors being used currently in applications including airplane interior lighting, agricultural sensors, and medical skin lesion analysis.
The Color & Spectral Sensor Business enhances ams’ know-how in designing demanding sensors, ams herewith underlines its development to a supplier for sensor solutions, which combines mar-ket leading innovations and outstanding product portfolio.
The following gives a preliminary overview of assets and liabilities as well as the purchase price allocation of single assets at the time of the acquisi-tion (July 12, 2016):
In thousands of EUR July, 2016
Cash and cash equivalents 2
Property, plant and equipment 5,163
Trade receivables 1,083
Inventories 1,831
Other receivables and assets 1,077
Intangible assets
Technology 3,530
Goodwill 944
Rights and licenses 242
Interest-bearing loans and borrowings -3,589
Trade liabilities -1,217
Current provisions -1,119
Other current liabilities -231
Deferred tax liabilities -1,459
Total consideration transferred 6,257
thereof cash 6,257
Goodwill is essentially attributed to the abilities of the management and employees, existing tech-nologies as well as expected synergies deriving
from the integration. No portion of the goodwill is expected to be deductible for tax purposes.
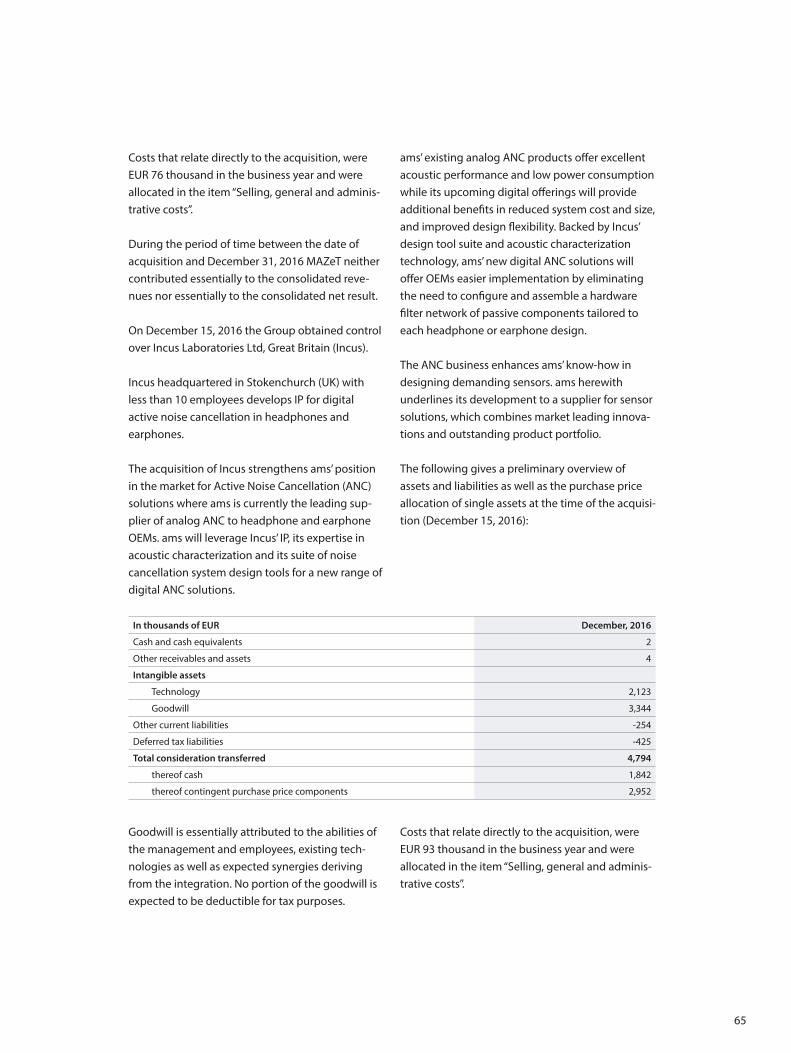
65
Costs that relate directly to the acquisition, were EUR 76 thousand in the business year and were allocated in the item “Selling, general and adminis-trative costs”.
During the period of time between the date of acquisition and December 31, 2016 MAZeT neither contributed essentially to the consolidated reve-nues nor essentially to the consolidated net result.
On December 15, 2016 the Group obtained control over Incus Laboratories Ltd, Great Britain (Incus).
Incus headquartered in Stokenchurch (UK) with less than 10 employees develops IP for digital active noise cancellation in headphones and earphones.
The acquisition of Incus strengthens ams’ position in the market for Active Noise Cancellation (ANC) solutions where ams is currently the leading sup-plier of analog ANC to headphone and earphone OEMs. ams will leverage Incus’ IP, its expertise in acoustic characterization and its suite of noise cancellation system design tools for a new range of digital ANC solutions.
ams’ existing analog ANC products offer excellent acoustic performance and low power consumption while its upcoming digital offerings will provide additional benefits in reduced system cost and size, and improved design flexibility. Backed by Incus’ design tool suite and acoustic characterization technology, ams’ new digital ANC solutions will offer OEMs easier implementation by eliminating the need to configure and assemble a hardware filter network of passive components tailored to each headphone or earphone design.
The ANC business enhances ams’ know-how in designing demanding sensors. ams herewith underlines its development to a supplier for sensor solutions, which combines market leading innova-tions and outstanding product portfolio.
The following gives a preliminary overview of assets and liabilities as well as the purchase price allocation of single assets at the time of the acquisi-tion (December 15, 2016):
In thousands of EUR December, 2016
Cash and cash equivalents 2
Other receivables and assets 4
Intangible assets
Technology 2,123
Goodwill 3,344
Other current liabilities -254
Deferred tax liabilities -425
Total consideration transferred 4,794
thereof cash 1,842
thereof contingent purchase price components 2,952
Goodwill is essentially attributed to the abilities of the management and employees, existing tech-nologies as well as expected synergies deriving from the integration. No portion of the goodwill is expected to be deductible for tax purposes.
Costs that relate directly to the acquisition, were EUR 93 thousand in the business year and were allocated in the item “Selling, general and adminis-trative costs”.
66
During the period of time between the date of acquisition and December 31, 2016 Incus neither contributed essentially to the consolidated reve-nues nor essentially to the consolidated net result.
On December 4, 2015 the Group obtained control over CMOSIS International NV, Belgium und its subsidiaries.
During the business year 2016 the purchase price allocation has been finalized which lead to a subsequent adjustment of the net assets trans-fered. Therefore the goodwill decreased from EUR 131,176 thousand to EUR 130,560 thousand.
(iii) Transactions eliminated on consolidationIntra-group balances and transactions, and any re-sults from intra-group transactions, are eliminated in preparing the consolidated financial statements.
(iv) Loss of controlWhen the Group loses control over a subsidiary, it derecognizes the assets and liabilities of the subsidiary, and any related non-controlling interest and other components of equity. Any resulting gain or loss is recognized in profit or loss. Any inter-est retained in the former subsidiary is measured at fair value when control is lost.
(v) Investments in associatesInvestments in associates are accounted using the equity method if the company has a significant influence on the investee (associate), but without control or joint control, and the concerned compa-nies are material to present a true and fair view of the financial statements.
Under the equity method, on initial recognition the investment in an associate or a joint venture are recognized at cost including all transaction costs. After the initial recognition the consolidated profit or loss includes the share of the profit or loss of the investee until the significant influence ceas-es. If there are any indications that an investment may be impaired and the carrying amount is less than the recoverable amount an impairment loss has to be recognized as an expense. If a favorable change of the recoverable amount occurs, a rever-sal of the recognized impairment loss is possible in future.
(vi) Sale of discontinued operationIn July 2016 the Group has signed an agreement to divest NFC and RFID reader IP, technologies and product lines to STMicroelectronics (NYSE: STM) for an up-front cash consideration of USD 79.3m (approx. EUR 71.5m) plus a substantial deferred earn-out consideration contingent on future results of up to USD 37 million (approx. EUR 33.4m). The transaction is part of ams’ ongoing efforts to actively manage its portfolio of technologies with a clear focus on implementing its sensor solutions strategy. The divestment comprises ams’ NFC assets, including NFC front-end and antenna boost solutions, and integrated HF/UHF RFID reader assets. ams will retain its NFC/RFID wireless tags business and related IP and plans to create wireless sensor solutions for IoT applications combining NFC and RFID connectivity interfaces with its port-folio of sensors.
67
(d) Foreign Currency
(i) Foreign currency transactionsTransactions in foreign currencies are translated into EUR at the average foreign exchange rate at the date of the transaction. Foreign exchange rate differences are recognized in the income state-ment.
Monetary assets and liabilities denominated in foreign currencies at the balance sheet date are translated into EUR at the foreign exchange rate at that date and provided from the ECB (European Central Bank).
(ii) Financial statements of economic independ-ent foreign entitiesThe functional currency of the mother company is the Euro (EUR). The functional currency of entities domiciled outside the EUR zone is their respective domestic currency.
Accordingly, the assets and liabilities of these en-tities including goodwill from subsidiaries outside the Eurozone are translated into EUR at the average foreign exchange rates at the balance sheet date. Revenues and expenses of foreign entities are
translated into EUR at the average foreign ex-change rates of the year. Translation differences are recognized directly within other comprehensive income.
In the case of loss of control the cumulative amount in the translation reserve related to that foreign operation is reclassified to profit or loss as part of the gain or loss on disposal.
(iii) Hedges of a net investment in a foreign operationIf settlement of a monetary item receivable from or payable to a foreign operation is neither planned nor likely to occur in the foreseeable future, then foreign currency differences arising from such item form part of the net investment in the foreign oper-ation. Accordingly such differences are recognized in OCI and accumulated in the translation reserve.
In the case of loss of control the cumulative amount in the translation reserve related to that foreign operation is reclassified to profit or loss as part of the gain or loss on disposal.
(e) Property, Plant and Equipment
(i) Owned assetsItems of property, plant and equipment are stated at cost less accumulated depreciation and impair-ment losses and net of related government grants. The cost of internally generated assets includes the cost of materials, direct labor, directly attributable proportion of production overheads and borrow-ing costs for qualified assets.
(ii) Leased assetsLeases in terms of which the Group assumes substantially all the risks and rewards of ownership are classified as finance leases. Property, plant and equipment recorded by way of finance leases is stated at an amount at the lower of its fair value and the present value of the minimum lease pay-ments at the inception of the lease, less accumulat-ed depreciation and impairment losses. Minimum
68
lease payments should be appointed between the finance charge and the reduction of the outstand-ing liability. The leasing costs are distributed over the term of the lease so that the interest rate for the remaining liability remains constant over the period.
Assets arising under other lease agreements are classified as operating leasing and are not rec-ognized in the balance sheet. Operating lease payments should be recognized as an expense in the income statement over the lease term on a straight-line basis. Incentives for the agreement should be recognized as a reduction of the rental expenses over the lease term.
(iii) DepreciationDepreciation on property, plant and equipment is charged to the income statement on a straight-line basis over the estimated useful life of the assets. Land is not depreciated. The estimated useful life is as follows:
Buildings 15 – 33 yearsPlants, technical equipment and machines 4 – 12 yearsOther equipment 4 – 10 years
Due to the application of the cost of sales method the annual depreciation is distributed over all cost positions.
(f ) Intangible Assets
(i) Intangible assets acquired by the GroupIntangible assets, which are acquired by the Group, are stated at cost less accumulated amortization and impairment losses. The goodwill arising out of business combinations are recognized at cost less accumulated impairment losses.
(ii) AmortizationAmortization of intangible assets is charged to the income statement on a straight-line basis over the estimated useful economic life of the assets, unless it is not an intangible asset with indefinite useful lives (goodwill). The estimated useful life is as follows:
Patent and Licenses 5 years Customer base and technology 7 – 18 years
Due to the application of the cost of sales method the annual depreciation is distributed over all cost positions. All intangible assets have a limited useful economic life.
(iii) Research and DevelopmentExpenditures on research activities, expecting to gain new scientific or technical knowledge and understanding, are expensed as incurred and are recognized as expenses for Research and Develop-ment.
Development expenditures are capitalized only if the expenditure can be measured reliably the product or process is technical and commercially feasible, future economic benefits are probable and the Company intends to and has sufficient resources to complete development and to use or sell the asset. Otherwise it is recognized in profit or loss as incurred. Subsequent to initial recognition, development expenditure is measured at cost less accumulated amortization and any accumulated impairment loss. In the business year 2015 the criteria for capitalization of development costs were met for the first time. Therefore the group recognized development costs in amount of EUR 8.099 thousand (2015: EUR 4.079 thousand) as addition to the intangible assets.
69
(g) Primary Financial Instruments
(i) Recognition and MeasurementNon-derivative financial instruments are classified into following measurement categories by the group:
- Available-for-sale financial assets- Held-for-trading- Financial assets at fair value through profit or loss- Loans and receivables- Financial liabilities at (amortized) costs
The Group recognizes non-derivative financial instruments at value date.
Available-for-sale financial assets are recognized at fair value including any directly attributable transaction costs and are recognized under the item financial instruments in the balance sheet item “Financial assets”. Subsequent to initial recog-nition, they are measured at fair value and changes therein, other than impairment losses are recog-nized in other comprehensive income and directly in equity. When these assets are derecognized, the gain or loss accumulated in equity is reclassified to profit or loss. In the business year 2016 valuation effects amounting to EUR +691 thousand (2015: EUR -684 thousand) have been recognized in other result.
Financial instruments classified as Held-for-Trading and the performances are constantly monitored and are recognized at fair value through profit or loss.
Loans and receivables are recognized at fair value at initial recognition and further at amortized costs
including impairment losses. Whereby resulting gains or losses have to be recognized in the profit and loss statement. Loans and receivables are rec-ognized in the balance sheet items “Trade receiva-bles”, and sometimes “Other receivables and assets” or “Other assets”.
Non-derivative financial liabilities are included in the balance sheet items “Interest-bearing loans and borrowings”, “Trade liabilities” and sometimes “Other liabilities” and “Other long-term liabilities” and are measured at amortized costs minus direct-ly attributable transaction costs. For non-current financial liabilities the effective interest method is used.
Further information is given in the notes to single balance sheet items.
(ii) ImpairmentAn entity is required to assess at each balance sheet date whether there is any objective evidence of impairment for all primary financial assets, which are not classified as held-for-trading or designat-ed at fair value. An impairment loss or reversal of impairment is recognized pursuant to the relevant valuation group. Evidence of impairment may include indications like the failure or default of a debtor, the disappearance of an active market for shares or observable data indicating a notable decrease in expected cash flows from a specific group. An objective evidence indicator for the impairment of equity instruments is a significant or longer lasting decline of the fair value. The compa-ny defines a decline of 20% as significant and nine months as longer lasting.
70
(h) Derivative Financial Instruments
Interest swaps were used by the Group to reduce the interest rate risk from financial financing and investing activities as well as to optimize the financial result during the business year. Due to the fact that not all criteria for hedge accounting under IAS 39 are met the Group does not apply hedge accounting. Derivative financial instruments are recognized at cost (equal to the fair value) on initial recognition. Directly attributable transaction costs are recognized in profit or loss. At further
recognition derivative financial instruments are accounted for at fair value. Resulting changes are recognized in profit or loss. Positive market values are shown in the balance sheet item “Other receiv-ables and assets” whereby negative market values are reported under the line item “Other liabilities”. As of December 31, 2016 the company has not been involved as a contractual party for derivative financial instruments.
(i) Inventories
Inventories are stated at the lower of cost and net realizable value. Net realizable value is the estimat-ed selling price in the ordinary course of business, less the estimated costs of completion and selling expense.
The cost of inventories is based on the moving average price formula and includes expenditures
incurred in their acquisition as well as bringing them to their existing location and condition. For manufactured inventories and work in progress, cost includes an appropriate share of overhead based on normal operating capacity.
(j) Equity
Issued capital is the fully paid-in capital of ordinary shares (bearer shares). If shares are repurchased the value is recognized as own shares.
Directly attributable costs regarding issue or repurchasing of shares are, considering tax effects,
deducted from equity (retained earnings). If treas-ury shares are sold later or issued again, the income including any difference to the carrying amount has to be recognized in equity (retained earnings).
(k) Impairment of Non-Financial Assets
At each balance sheet date the Group is required to assess whether there is any objective evidence of impairment. Therefore assets are grouped at the lowest levels for which there are separately identifiable cash flows (cash-generating units), that are largely independent of cash inflows from either assets or cash-generating units. Goodwill acquired
in a business combination shall be allocated to each of the cash-generating units or groups of cash-generating units that are expected to benefit from the synergies of the combination. If there is an indication of a value impairment the recoverable amount of the asset or cash-generating unit is de-termined. At each balance sheet date the recover-
71
able amount of intangible assets with an indefinite useful life and intangible assets not yet available for use is estimated. An impairment loss shall be recognized if the carrying amount of the asset or cash-generating unit, to which independent results can be attributed, exceeds the recoverable amount. An impairment loss is recognized in profit or loss.
(i) Calculation of recoverable amountThe recoverable amount is the higher value of their fair value less transaction costs or as the present value of expected future cash flows and value in use. In assessing value in use, the estimated future cash flows are discounted to their present value using a pre-tax discount rate that reflects current market rates of the time value of money and the risks specific to the asset. For assets that do not generate cash inflows largely independent of those from other assets, the recoverable amount is determined for the cash-generating unit to
which the asset belongs. Goodwill acquired in a business combination shall be allocated to each of the cash-generating units, or groups of cash-gen-erating units, that is expected to benefit from the synergies of the combination.
(ii) Reversals of impairmentAn impairment loss recognized for an asset shall be reversed if there has been a change in the estimates used to determine the asset’s recover-able amount. An impairment loss recognized for goodwill shall not be reversed.
An impairment loss is only reversed to the extent that the asset’s carrying amount does not exceed the carrying amount that would have been deter-mined, net of depreciation or amortization, if no impairment loss had been recognized, when they are classified as held for sale.
(l) Non-Current Assets Held for Sale
Non-current assets or disposal groups, including assets and liabilities, are classified as held for sale if its carrying amount will be recovered principally through a sale rather than through continuing use. These non-current assets or disposal groups are recognized at the lower of its carrying amount and fair value less cost to sell. On initial recognition an
impairment loss or reversal has to be recognized in the profit or loss. As soon as the intangible asset or property, plant and equipment are classified as held for sale they are no longer depreciated or amortized. Investments in associates are no longer recognized with the equity method.
(m) Employee Benefits
(i) Defined benefit plansAccording to Austrian labor regulations, employees who joined the Company prior to December 31, 2002, are entitled to receive severance payments – depending on the job tenure - equal to a multiple of their monthly compensation, which comprises fixed plus variable amounts such as overtime and bonus payments. Maximum severance is equal to a multiple of twelve times the eligible monthly
compensation. All employees of the Swiss com-panies are covered by pension funds at pension fund providers, with benefit contributions made by employers and employees. Because employers and employees are charged a “restructuring contribu-tion” in the event that the fund does not have suf-ficient assets to cover the employees’ entitlements, IAS 19 identifies this system as a defined benefit plan. The obligation for such severance payments is
72
measured using the projected unit credit method. The discount rate is the yield at the balance sheet date on AAA credit-rated bonds that have matu-rity dates approximating the terms of the Group’s obligations. Life expectancy is calculated accord-ing to the respective country’s mortality tables. Remeasurements of the defined benefit liability are recognized in other comprehensive income.
(ii) Defined contribution plansFor all Austrian based employees who entered into an employment contract after December 31, 2002, the Company is obliged to contribute 1.53 % of their monthly remuneration to an employee ben-efit fund. There is no additional obligation for the Company. Therefore, this plan constitutes a defined contribution plan. Contributions are recognized as an expense in the income statement as incurred. There are no further obligations for the Company.
(iii) Other long-term employee benefitsAll Austrian employees under the collective agree-ment are eligible for jubilee payments. Under this plan, eligible employees receive a cash payment af-ter a specified service period. This payment equals one to three months salary, depending on the number of years of service. The amount recognized as a liability from this compensation is measured using the projected unit credit method. Actuarial assumptions are identical to those applied for defined benefit plans. All actuarial gains and losses are recognized immediately.
(iv) Stock Option PlanThe stock options issued to employees are recog-nized at fair value of the single option at the grant date. The determined value of the options will be spread over the period until vesting. The amount recognized as expense is adjusted, if expectations regarding the settlement of service conditions and independent performance conditions change, in such a way as recognized expenses are based on the options, which fulfill the service conditions and
the independent performance conditions at the end of the vesting period respectively. The fair val-ues for market condition based stock option plans are determined on the grant date including these conditions; an adjustment of occurring differences between expected and actual results is not being recognized.
The options were measured based on option-pric-ing models. The interpretation of market infor-mation necessary for the estimation of market values also requires a certain degree of subjective judgement. The expected volatilities were extrap-olated from the historical stock-exchange price of the ams share (source: Bloomberg). This can result in a difference between the figures shown here and values subsequently realized on the marketplace.
The shareholders approved a further Stock Option Plan (SOP 2009) in the annual general meeting on April 2, 2009.
Within the SOP 2009 a total of up to 5,500,000 options of no-par-value shares may be issued over 4 years. This reflects 10% of the issued capital at the time of approval. The SOP 2009 is administered by the SOP Committee. The Committee may define terms for allocation and exercise of the options. It is envisaged to grant the options during a 4-year-pro-gram. One option entitles the holder to receive one no-par-value share of ams AG. The options may be exercised during each of the next succeeding four years on the first, second, third and fourth anniver-sary of the grant date to the maximum extent of twenty-five percent (25%) of the total number of shares covered thereby (vesting period). The strike price for each tranche will be defined based on a 3month average price of the ams share prior to the grant date. All granted options under the Stock Option Plan 2009 must be exercised prior to June 30, 2017. Any options reverted to the company can be issued under the options of the SOP 2009 until the end of the term.
73
No options (SOP 2009) were granted to employees and executives of the company in the business year 2016 (2015: no options (SOP 2009) were granted).
In connection with the acquisition of TAOS, the Company has committed to grant options to cer-tain employees of TAOS – by issuing a Stock Option Plan, which – as far as legally possible - matches the number of options and the option plan which has been granted to those employees under the TAOS - “Equity Incentive Plan 2000”. To fulfil this obligation, the management board of ams AG has adopted a new Stock Option Plan 2011 (SOP 2011), which the company’s Supervisory Board approved on July 9, 2011.
Each option granted entitles each employee to purchase one share of the company. For holders of unvested options the exercise price equals the original exercise price under the TAOS plan. This price is in the range of USD 0.19 and USD 3.96.
Certain employees of TAOS, who held a small number of TAOS shares (“Small Shareholders”), were granted exercisable options for shares of the Company as compensation for shares of TAOS held by them prior to the transaction (vested options). The option exercise price for these options is CHF 8.27 which is the average of the market price of the shares of the Company on the SIX Swiss Ex-change within 30 days following the date of grant of options.
The term of the unvested options will remain unchanged compared to the original TAOS plan. The options will expire between September 3, 2017 and June 8, 2021.
The options of the Small Shareholders expire ten years after the date of issuance, therefore on July 12, 2021.
The management board has decided to adopt a new Stock Option Plan (SOP 2013) on August 28, 2013.
The SOP 2013 comprises a maximum of 2,000,000 options, of which (i) up to 1,575,000 options may be granted to employees and executive employ-ees and (ii) up to 235,000 options may be granted to the Chief Executive Officer and up to 190,000 options may be granted to the Chief Financial Of-ficer of the management board. This corresponds to 2.8% of the nominal capital of the Company at that time. Each option entitles the participants to acquire one no-par value ordinary share of ams AG. The available options shall be granted during the year 2013 after prior resolution by the SOP commit-tee. All options granted can only be exercised by June, 30 2021. The exercise price for the new shares corresponds to the average strike price within the last three months before the granting of the stock options.
Regarding the earliest date of exercise for exer-cising 50% of the granted options, these vest to the extent of 33% on the first, second and third anniversary of the granting.
The earliest date for exercising the other 50% granted options is the third anniversary of the op-tions grant date depending on the achievements of the following criteria:
(i) The benchmark growth of the market (sales growth of the analog semiconductor market as published by WSTS) has to be surpassed in the period 2013-2015 with stable gross margins (not less than in 2012; adjusted for extraordinary time impacts in relation with a positive, long lasting development of the business like e.g. acquisition costs, financing costs etc.). If this does not apply to the whole period but to single calendar years, 1/3 of exercisability for the relevant year has to be taken into account.
(ii) Over the period 2013-2015 an increase of earn-ings per share has to be achieved. If this does not apply to the whole period but to single calendar years (not less than in the year 2012), an aliquot of
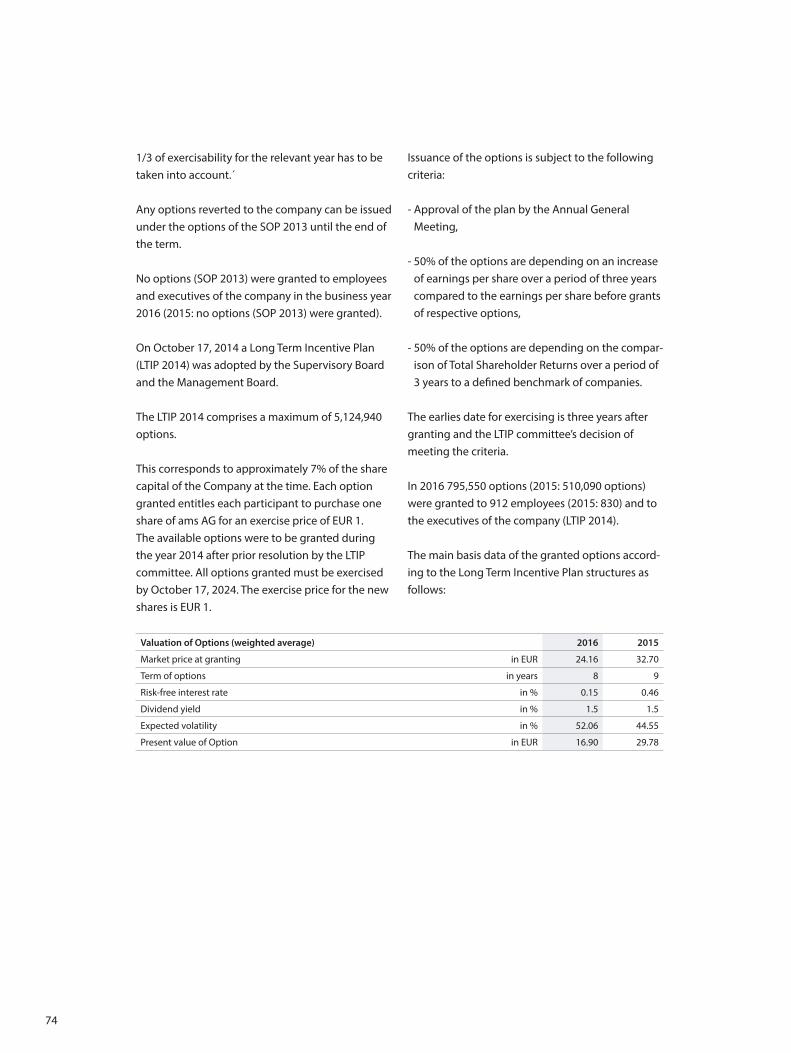
74
1/3 of exercisability for the relevant year has to be taken into account.´
Any options reverted to the company can be issued under the options of the SOP 2013 until the end of the term.
No options (SOP 2013) were granted to employees and executives of the company in the business year 2016 (2015: no options (SOP 2013) were granted).
On October 17, 2014 a Long Term Incentive Plan (LTIP 2014) was adopted by the Supervisory Board and the Management Board.
The LTIP 2014 comprises a maximum of 5,124,940 options.
This corresponds to approximately 7% of the share capital of the Company at the time. Each option granted entitles each participant to purchase one share of ams AG for an exercise price of EUR 1. The available options were to be granted during the year 2014 after prior resolution by the LTIP committee. All options granted must be exercised by October 17, 2024. The exercise price for the new shares is EUR 1.
Issuance of the options is subject to the following criteria:
- Approval of the plan by the Annual General Meeting,
- 50% of the options are depending on an increase of earnings per share over a period of three years compared to the earnings per share before grants of respective options,
- 50% of the options are depending on the compar-ison of Total Shareholder Returns over a period of 3 years to a defined benchmark of companies.
The earlies date for exercising is three years after granting and the LTIP committee’s decision of meeting the criteria.
In 2016 795,550 options (2015: 510,090 options) were granted to 912 employees (2015: 830) and to the executives of the company (LTIP 2014).
The main basis data of the granted options accord-ing to the Long Term Incentive Plan structures as follows:
Valuation of Options (weighted average) 2016 2015
Market price at granting in EUR 24.16 32.70
Term of options in years 8 9
Risk-free interest rate in % 0.15 0.46
Dividend yield in % 1.5 1.5
Expected volatility in % 52.06 44.55
Present value of Option in EUR 16.90 29.78
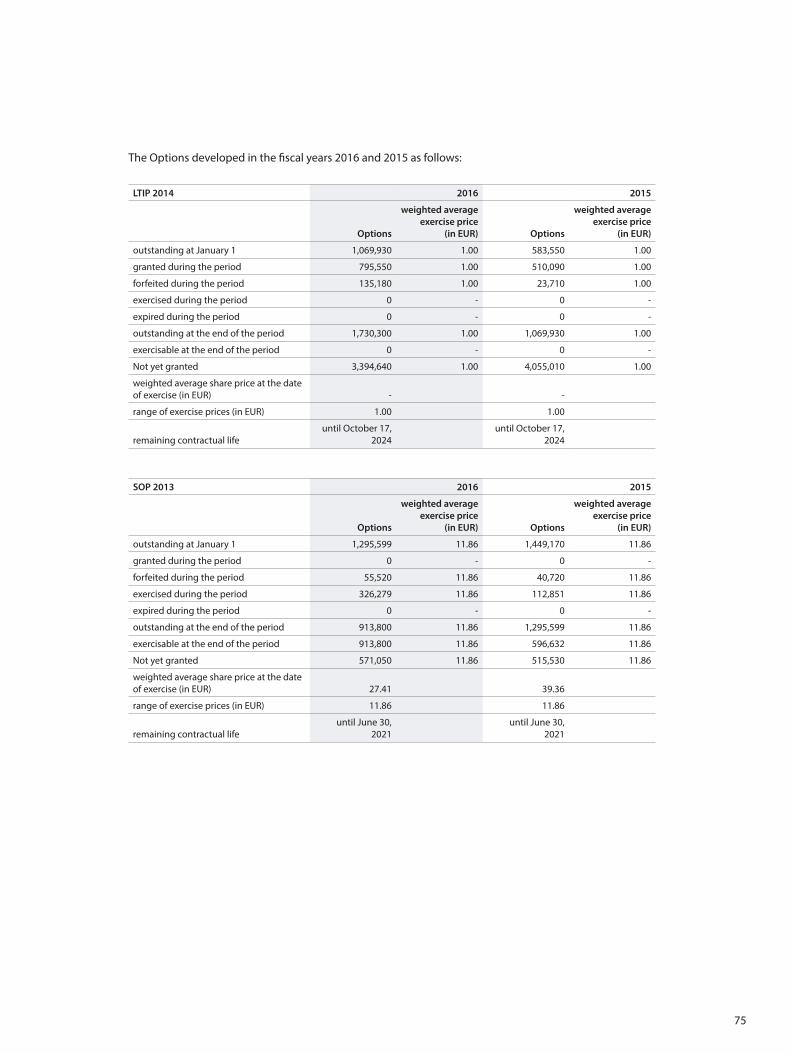
75
The Options developed in the fiscal years 2016 and 2015 as follows:
LTIP 2014 2016 2015
Options
weighted average exercise price
(in EUR) Options
weighted average exercise price
(in EUR)
outstanding at January 1 1,069,930 1.00 583,550 1.00
granted during the period 795,550 1.00 510,090 1.00
forfeited during the period 135,180 1.00 23,710 1.00
exercised during the period 0 - 0 -
expired during the period 0 - 0 -
outstanding at the end of the period 1,730,300 1.00 1,069,930 1.00
exercisable at the end of the period 0 - 0 -
Not yet granted 3,394,640 1.00 4,055,010 1.00
weighted average share price at the date of exercise (in EUR) - -
range of exercise prices (in EUR) 1.00 1.00
remaining contractual lifeuntil October 17,
2024until October 17,
2024
SOP 2013 2016 2015
Options
weighted average exercise price
(in EUR) Options
weighted average exercise price
(in EUR)
outstanding at January 1 1,295,599 11.86 1,449,170 11.86
granted during the period 0 - 0 -
forfeited during the period 55,520 11.86 40,720 11.86
exercised during the period 326,279 11.86 112,851 11.86
expired during the period 0 - 0 -
outstanding at the end of the period 913,800 11.86 1,295,599 11.86
exercisable at the end of the period 913,800 11.86 596,632 11.86
Not yet granted 571,050 11.86 515,530 11.86
weighted average share price at the date of exercise (in EUR) 27.41 39.36
range of exercise prices (in EUR) 11.86 11.86
remaining contractual lifeuntil June 30,
2021until June 30,
2021
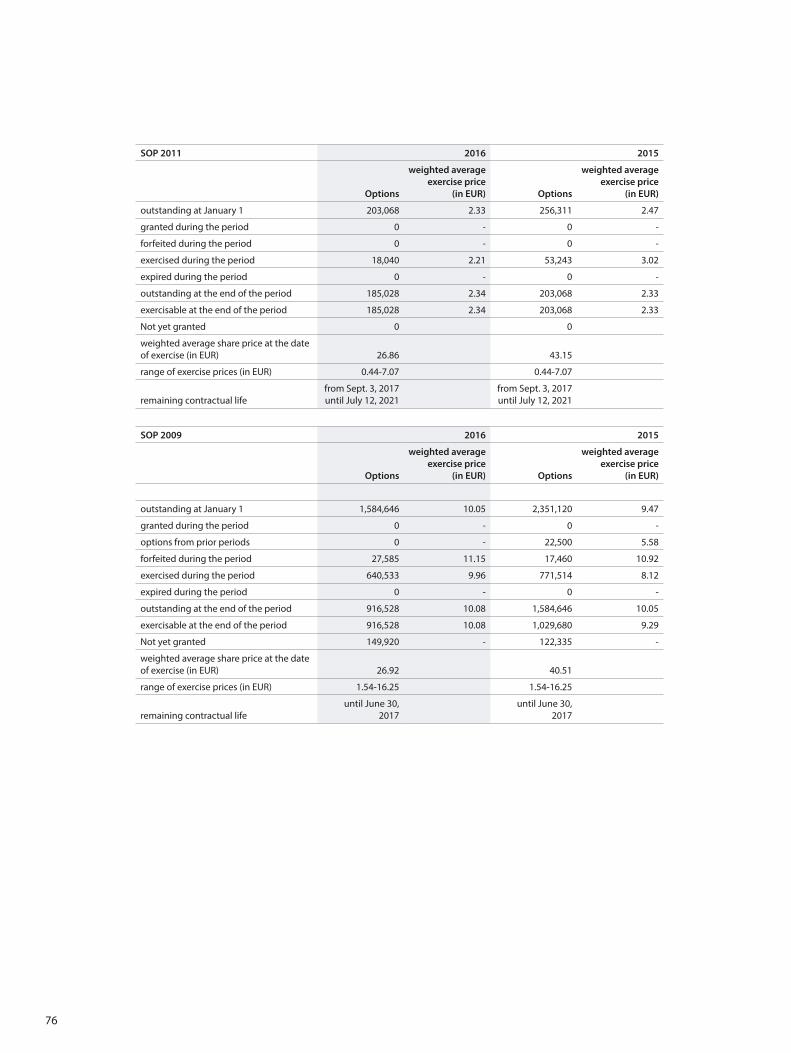
76
SOP 2011 2016 2015
Options
weighted average exercise price
(in EUR) Options
weighted average exercise price
(in EUR)
outstanding at January 1 203,068 2.33 256,311 2.47
granted during the period 0 - 0 -
forfeited during the period 0 - 0 -
exercised during the period 18,040 2.21 53,243 3.02
expired during the period 0 - 0 -
outstanding at the end of the period 185,028 2.34 203,068 2.33
exercisable at the end of the period 185,028 2.34 203,068 2.33
Not yet granted 0 0
weighted average share price at the date of exercise (in EUR) 26.86 43.15
range of exercise prices (in EUR) 0.44-7.07 0.44-7.07
remaining contractual lifefrom Sept. 3, 2017 until July 12, 2021
from Sept. 3, 2017 until July 12, 2021
SOP 2009 2016 2015
Options
weighted average exercise price
(in EUR) Options
weighted average exercise price
(in EUR)
outstanding at January 1 1,584,646 10.05 2,351,120 9.47
granted during the period 0 - 0 -
options from prior periods 0 - 22,500 5.58
forfeited during the period 27,585 11.15 17,460 10.92
exercised during the period 640,533 9.96 771,514 8.12
expired during the period 0 - 0 -
outstanding at the end of the period 916,528 10.08 1,584,646 10.05
exercisable at the end of the period 916,528 10.08 1,029,680 9.29
Not yet granted 149,920 - 122,335 -
weighted average share price at the date of exercise (in EUR) 26.92 40.51
range of exercise prices (in EUR) 1.54-16.25 1.54-16.25
remaining contractual lifeuntil June 30,
2017until June 30,
2017
77
(n) Provisions
A provision is recognized on the balance sheet when the Group has a legal or constructive obligation as a result of a past event, and it is probable that an outflow of economic benefits will be required to settle the obligation. If the effect is material, provisions are determined by discounting the expected future cash flows at a pre-tax rate that reflects current market assessments of the time value of money and, where appropriate, the risks specific to the liability.
(i) WarrantiesA provision for warranties is recognized when a warranty claim is received from a customer. The amount recognized is the best estimate of the expenditure required to settle the claim based on historical experience.
(ii) Onerous contractsA provision for onerous contracts is recognized when the expected benefits to be derived by the Group from a contract are lower than the una-voidable cost of meeting its obligations under the contract.
(o) Trade and Other Payables
Trade and other payables are stated at amortized historical cost.
(p) Revenue
Revenue from the sale of goods is recognized in the income statement when the significant risks and rewards of ownership have been transferred to the buyer.
Revenues from services rendered is recognized in the income statement in proportion to the stage
of completion of the transaction at the balance sheet date. No revenue is recognized if there are significant uncertainties regarding recovery of the consideration due, associated costs or the possible return of goods.
(q) Government Grants
During the business year 2016 government grant was provided as R&D subsidy and R&D premium. The R&D premium is recognized as income under the item research- and development expenses.
The R&D subsidy is recognized as other operating income. If the grants are related to capitalized project costs they are according to the net method deducted from the initial costs.
(r) Construction Contracts
Construction contracts are recognized as services rendered but not yet chargeable in the balance sheet item “Inventory” and measured at occurred costs less process billings and recognized losses.
Contract revenue includes the amount of revenue agreed and, if it is more likely than not that they will result in revenue and they are capable of being reliably measured. Contract costs are recognized
78
when they arise, unless they form an asset that is connected with the completion of the order. As the result of construction contracts cannot be estimated reliably a partial-realization is not appropriate. An expected loss on the contract shall
be recognized as expense immediately. If partial billings and recognized losses exceed occurred costs the value should be recognized as deferred income. Advanced payments from customers are recognized as deferred liability.
(s) Net Financing Cost
Net financing costs comprise interest payable on borrowings, interest receivable on funds invested and dividend income, foreign exchange gains and losses, and gains and losses on derivative financial instruments related to financing activities.
Interest income is recognized in the income state-ment as it accrues, taking into account the asset’s effective yield. Dividend income is recognized in
the income statement on the date that the divi-dend is declared.
All interest and other costs incurred in connection with borrowings are expensed as incurred as part of net financing cost. The interest expense com-ponent of finance lease payments is recognized in the income statement using the effective interest method.
(t) Income Tax
Income tax on the profit for the year comprises current and deferred tax. Income tax is recognized in the income statement except to the extent that it relates to items recognized directly within equity or income taxes directly related to acquisitions.
(i) Current taxCurrent tax is the expected tax payable on taxable income for the year, using tax rates enacted at the balance sheet date and all adaptions concerning earlier years.
(ii) Deferred taxDeferred tax is accounted for using the balance sheet liability method, providing for temporary dif-ferences between the carrying amounts of assets and liabilities for IFRS financial reporting purposes
and the amounts used for tax purposes as well as for tax assets existing at the balance sheet date. Deferred tax assets and liabilities for temporary differences relating to investments in subsidiaries to the extent that they will probably not reverse in the foreseeable future are not recognized.
The amount of deferred tax provided is based on the expected manner of realization or settlement of the carrying amount of assets and liabilities, using tax rates enacted or substantially enacted at the balance sheet date.
A deferred tax asset is only recognized, when it is probable based on current planning, that during the next 5 years future taxable results can be used against unused tax losses and unused tax credits.
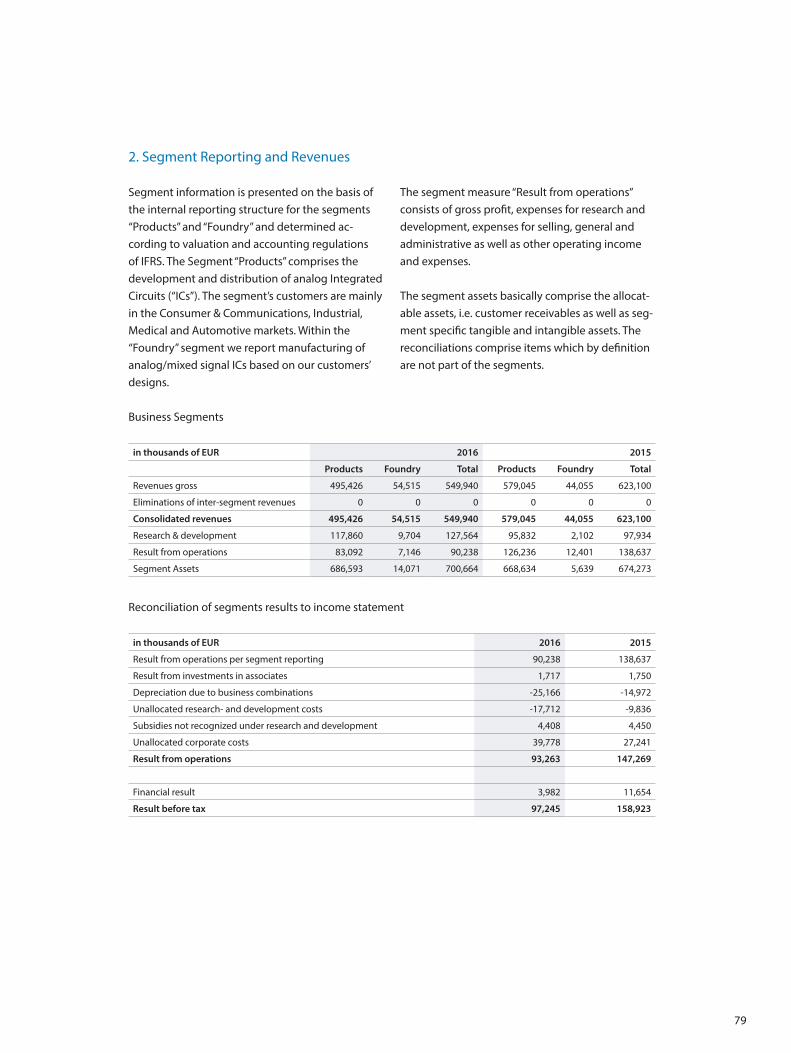
79
2. Segment Reporting and Revenues
Segment information is presented on the basis of the internal reporting structure for the segments “Products” and “Foundry” and determined ac-cording to valuation and accounting regulations of IFRS. The Segment “Products” comprises the development and distribution of analog Integrated Circuits (“ICs”). The segment’s customers are mainly in the Consumer & Communications, Industrial, Medical and Automotive markets. Within the “Foundry” segment we report manufacturing of analog/mixed signal ICs based on our customers’ designs.
The segment measure “Result from operations” consists of gross profit, expenses for research and development, expenses for selling, general and administrative as well as other operating income and expenses.
The segment assets basically comprise the allocat-able assets, i.e. customer receivables as well as seg-ment specific tangible and intangible assets. The reconciliations comprise items which by definition are not part of the segments.
Business Segments
in thousands of EUR 2016 2015
Products Foundry Total Products Foundry Total
Revenues gross 495,426 54,515 549,940 579,045 44,055 623,100
Eliminations of inter-segment revenues 0 0 0 0 0 0
Consolidated revenues 495,426 54,515 549,940 579,045 44,055 623,100
Research & development 117,860 9,704 127,564 95,832 2,102 97,934
Result from operations 83,092 7,146 90,238 126,236 12,401 138,637
Segment Assets 686,593 14,071 700,664 668,634 5,639 674,273
Reconciliation of segments results to income statement
in thousands of EUR 2016 2015
Result from operations per segment reporting 90,238 138,637
Result from investments in associates 1,717 1,750
Depreciation due to business combinations -25,166 -14,972
Unallocated research- and development costs -17,712 -9,836
Subsidies not recognized under research and development 4,408 4,450
Unallocated corporate costs 39,778 27,241
Result from operations 93,263 147,269
Financial result 3,982 11,654
Result before tax 97,245 158,923
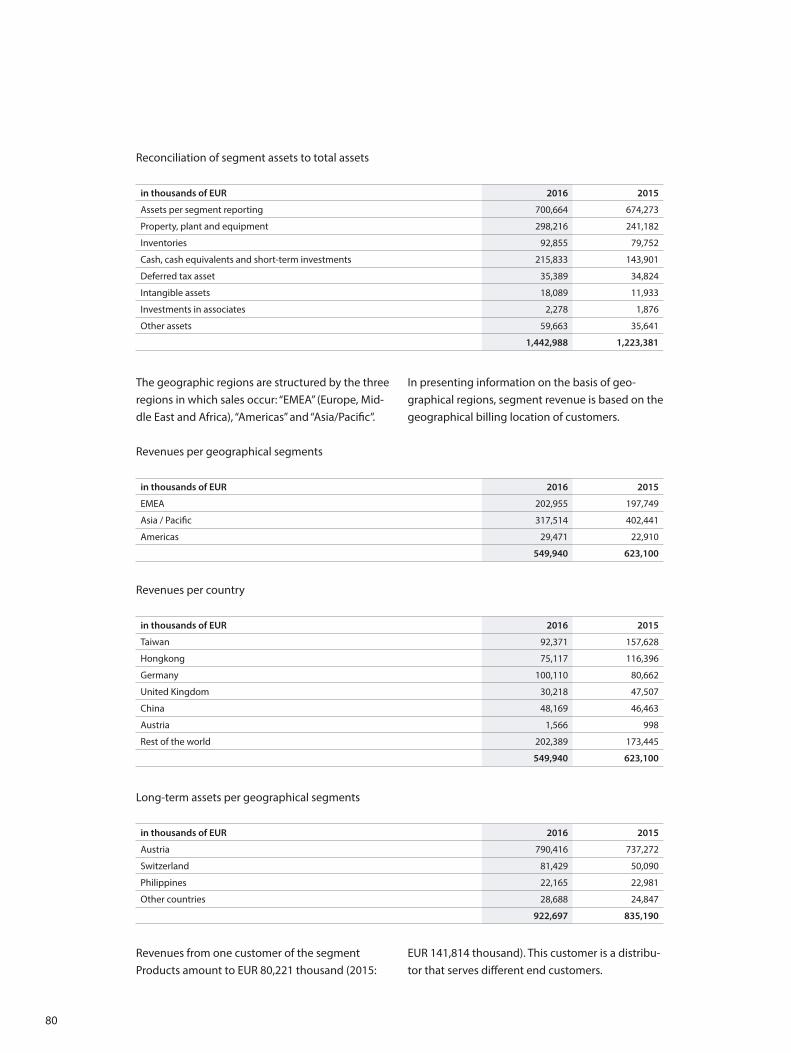
80
Reconciliation of segment assets to total assets
in thousands of EUR 2016 2015
Assets per segment reporting 700,664 674,273
Property, plant and equipment 298,216 241,182
Inventories 92,855 79,752
Cash, cash equivalents and short-term investments 215,833 143,901
Deferred tax asset 35,389 34,824
Intangible assets 18,089 11,933
Investments in associates 2,278 1,876
Other assets 59,663 35,641
1,442,988 1,223,381
The geographic regions are structured by the three regions in which sales occur: “EMEA” (Europe, Mid-dle East and Africa), “Americas” and “Asia/Pacific”.
In presenting information on the basis of geo-graphical regions, segment revenue is based on the geographical billing location of customers.
Revenues per geographical segments
in thousands of EUR 2016 2015
EMEA 202,955 197,749
Asia / Pacific 317,514 402,441
Americas 29,471 22,910
549,940 623,100
Revenues per country
in thousands of EUR 2016 2015
Taiwan 92,371 157,628
Hongkong 75,117 116,396
Germany 100,110 80,662
United Kingdom 30,218 47,507
China 48,169 46,463
Austria 1,566 998
Rest of the world 202,389 173,445
549,940 623,100
Long-term assets per geographical segments
in thousands of EUR 2016 2015
Austria 790,416 737,272
Switzerland 81,429 50,090
Philippines 22,165 22,981
Other countries 28,688 24,847
922,697 835,190
Revenues from one customer of the segment Products amount to EUR 80,221 thousand (2015:
EUR 141,814 thousand). This customer is a distribu-tor that serves different end customers.
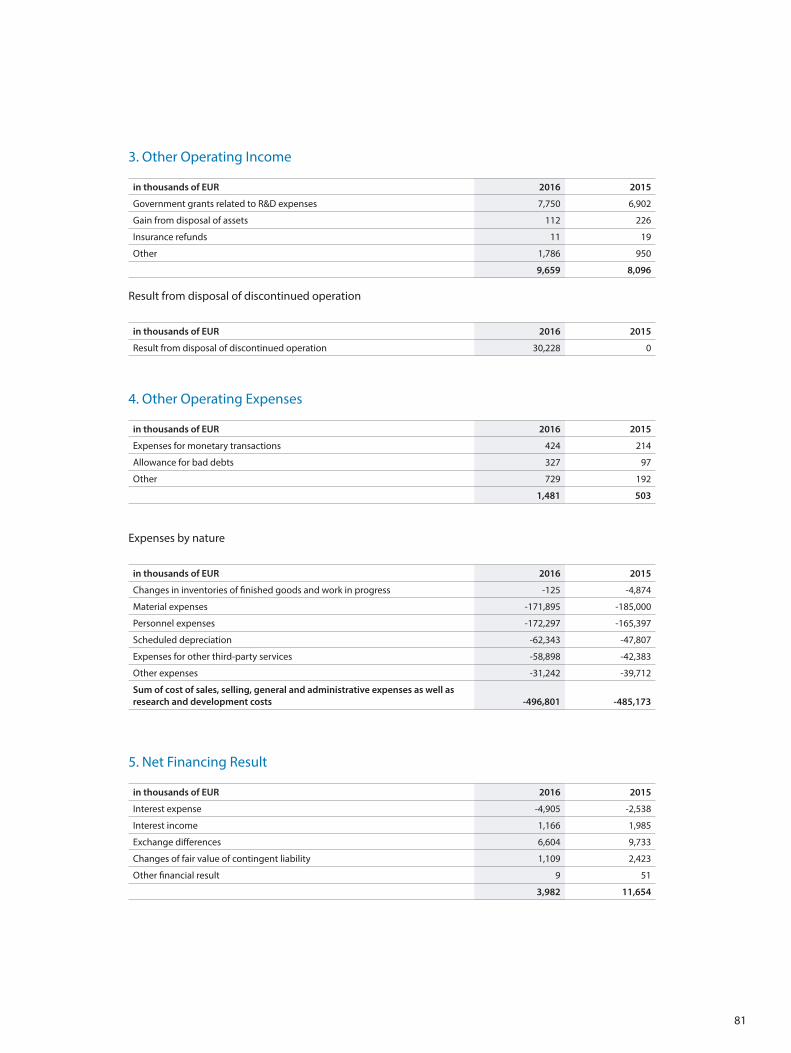
81
3. Other Operating Income
in thousands of EUR 2016 2015
Government grants related to R&D expenses 7,750 6,902
Gain from disposal of assets 112 226
Insurance refunds 11 19
Other 1,786 950
9,659 8,096
Result from disposal of discontinued operation
in thousands of EUR 2016 2015
Result from disposal of discontinued operation 30,228 0
4. Other Operating Expenses
in thousands of EUR 2016 2015
Expenses for monetary transactions 424 214
Allowance for bad debts 327 97
Other 729 192
1,481 503
Expenses by nature
in thousands of EUR 2016 2015
Changes in inventories of finished goods and work in progress -125 -4,874
Material expenses -171,895 -185,000
Personnel expenses -172,297 -165,397
Scheduled depreciation -62,343 -47,807
Expenses for other third-party services -58,898 -42,383
Other expenses -31,242 -39,712
Sum of cost of sales, selling, general and administrative expenses as well as research and development costs -496,801 -485,173
5. Net Financing Result
in thousands of EUR 2016 2015
Interest expense -4,905 -2,538
Interest income 1,166 1,985
Exchange differences 6,604 9,733
Changes of fair value of contingent liability 1,109 2,423
Other financial result 9 51
3,982 11,654
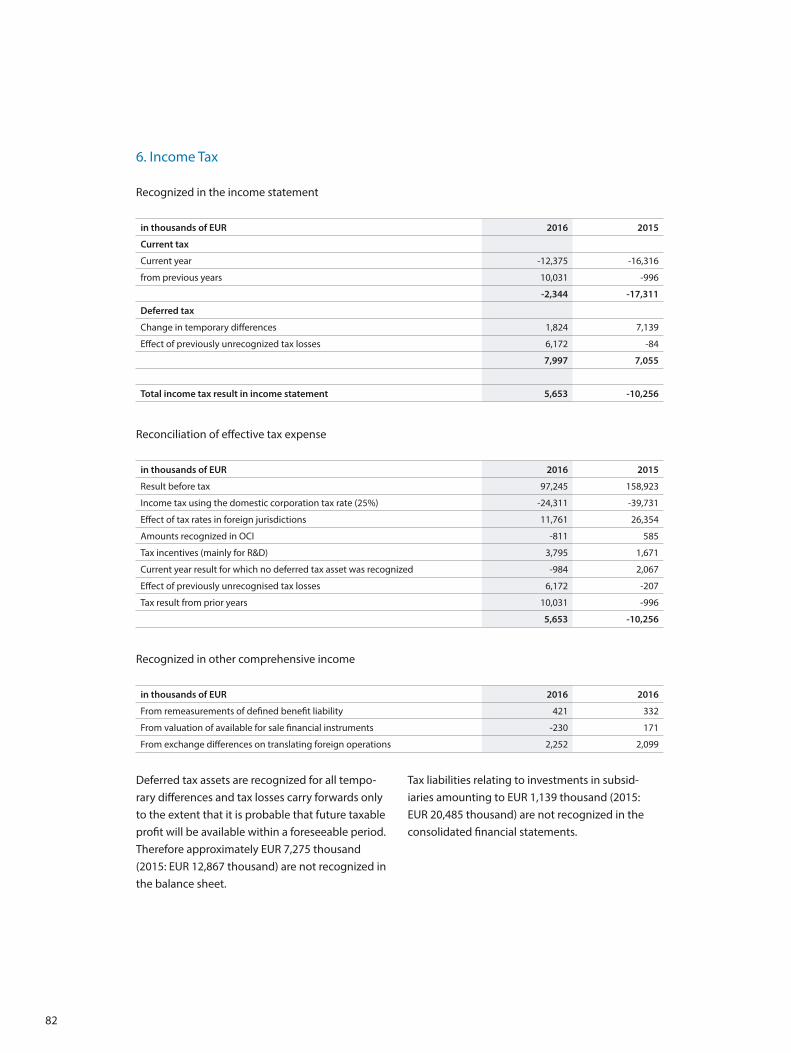
82
6. Income Tax
Recognized in the income statement
in thousands of EUR 2016 2015
Current tax
Current year -12,375 -16,316
from previous years 10,031 -996
-2,344 -17,311
Deferred tax
Change in temporary differences 1,824 7,139
Effect of previously unrecognized tax losses 6,172 -84
7,997 7,055
Total income tax result in income statement 5,653 -10,256
Reconciliation of effective tax expense
in thousands of EUR 2016 2015
Result before tax 97,245 158,923
Income tax using the domestic corporation tax rate (25%) -24,311 -39,731
Effect of tax rates in foreign jurisdictions 11,761 26,354
Amounts recognized in OCI -811 585
Tax incentives (mainly for R&D) 3,795 1,671
Current year result for which no deferred tax asset was recognized -984 2,067
Effect of previously unrecognised tax losses 6,172 -207
Tax result from prior years 10,031 -996
5,653 -10,256
Recognized in other comprehensive income
in thousands of EUR 2016 2016
From remeasurements of defined benefit liability 421 332
From valuation of available for sale financial instruments -230 171
From exchange differences on translating foreign operations 2,252 2,099
Deferred tax assets are recognized for all tempo-rary differences and tax losses carry forwards only to the extent that it is probable that future taxable profit will be available within a foreseeable period. Therefore approximately EUR 7,275 thousand (2015: EUR 12,867 thousand) are not recognized in the balance sheet.
Tax liabilities relating to investments in subsid-iaries amounting to EUR 1,139 thousand (2015: EUR 20,485 thousand) are not recognized in the consolidated financial statements.
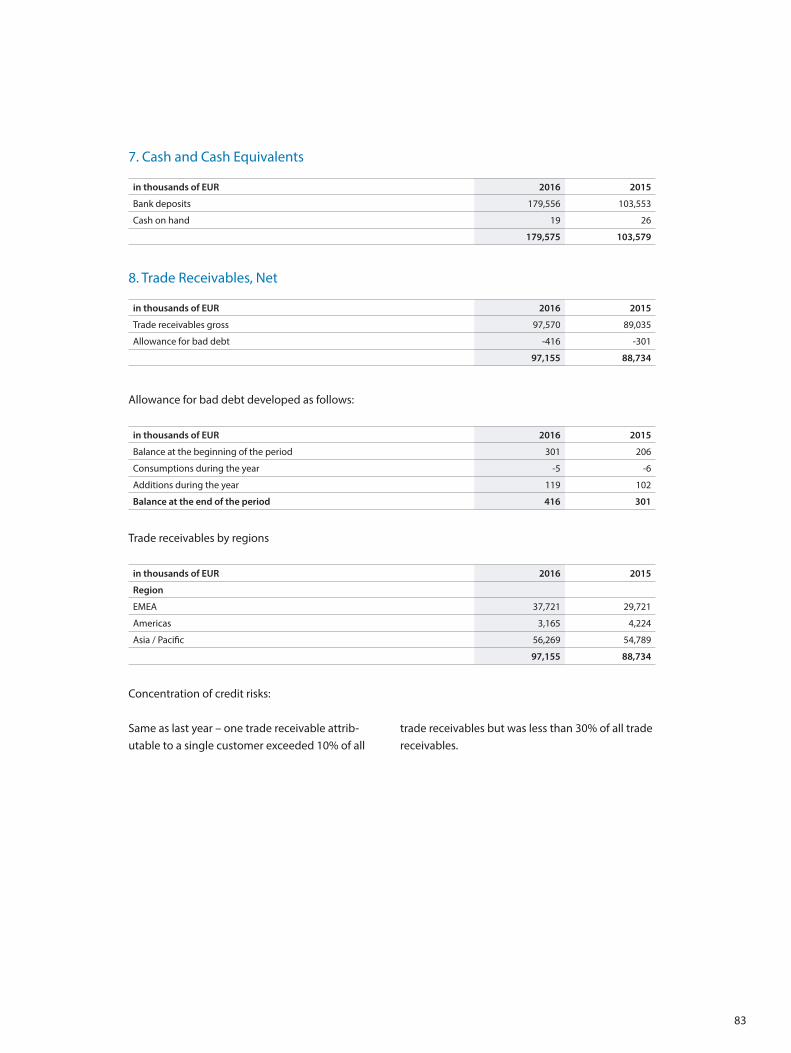
83
7. Cash and Cash Equivalents
in thousands of EUR 2016 2015
Bank deposits 179,556 103,553
Cash on hand 19 26
179,575 103,579
8. Trade Receivables, Net
in thousands of EUR 2016 2015
Trade receivables gross 97,570 89,035
Allowance for bad debt -416 -301
97,155 88,734
Allowance for bad debt developed as follows:
in thousands of EUR 2016 2015
Balance at the beginning of the period 301 206
Consumptions during the year -5 -6
Additions during the year 119 102
Balance at the end of the period 416 301
Trade receivables by regions
in thousands of EUR 2016 2015
Region
EMEA 37,721 29,721
Americas 3,165 4,224
Asia / Pacific 56,269 54,789
97,155 88,734
Concentration of credit risks:
Same as last year – one trade receivable attrib-utable to a single customer exceeded 10% of all
trade receivables but was less than 30% of all trade receivables.
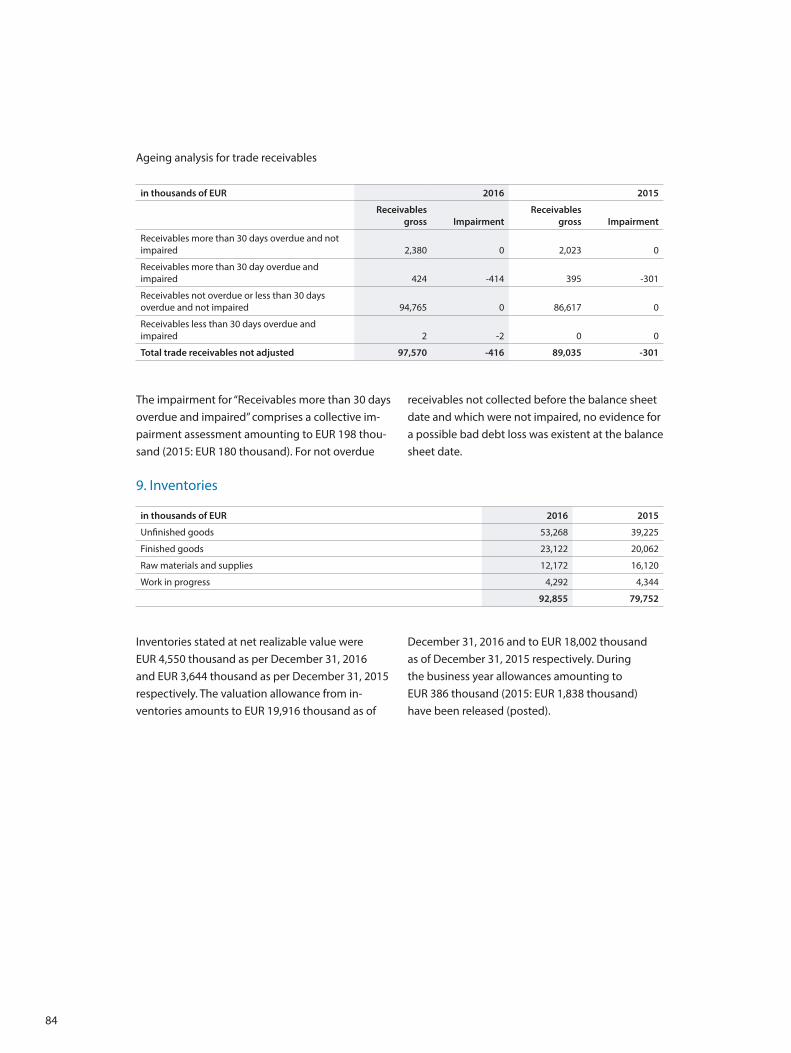
84
Ageing analysis for trade receivables
in thousands of EUR 2016 2015
Receivablesgross Impairment
Receivablesgross Impairment
Receivables more than 30 days overdue and not impaired 2,380 0 2,023 0
Receivables more than 30 day overdue and impaired 424 -414 395 -301
Receivables not overdue or less than 30 days overdue and not impaired 94,765 0 86,617 0
Receivables less than 30 days overdue and impaired 2 -2 0 0
Total trade receivables not adjusted 97,570 -416 89,035 -301
The impairment for “Receivables more than 30 days overdue and impaired” comprises a collective im-pairment assessment amounting to EUR 198 thou-sand (2015: EUR 180 thousand). For not overdue
receivables not collected before the balance sheet date and which were not impaired, no evidence for a possible bad debt loss was existent at the balance sheet date.
9. Inventories
in thousands of EUR 2016 2015
Unfinished goods 53,268 39,225
Finished goods 23,122 20,062
Raw materials and supplies 12,172 16,120
Work in progress 4,292 4,344
92,855 79,752
Inventories stated at net realizable value were EUR 4,550 thousand as per December 31, 2016 and EUR 3,644 thousand as per December 31, 2015 respectively. The valuation allowance from in-ventories amounts to EUR 19,916 thousand as of
December 31, 2016 and to EUR 18,002 thousand as of December 31, 2015 respectively. During the business year allowances amounting to EUR 386 thousand (2015: EUR 1,838 thousand) have been released (posted).
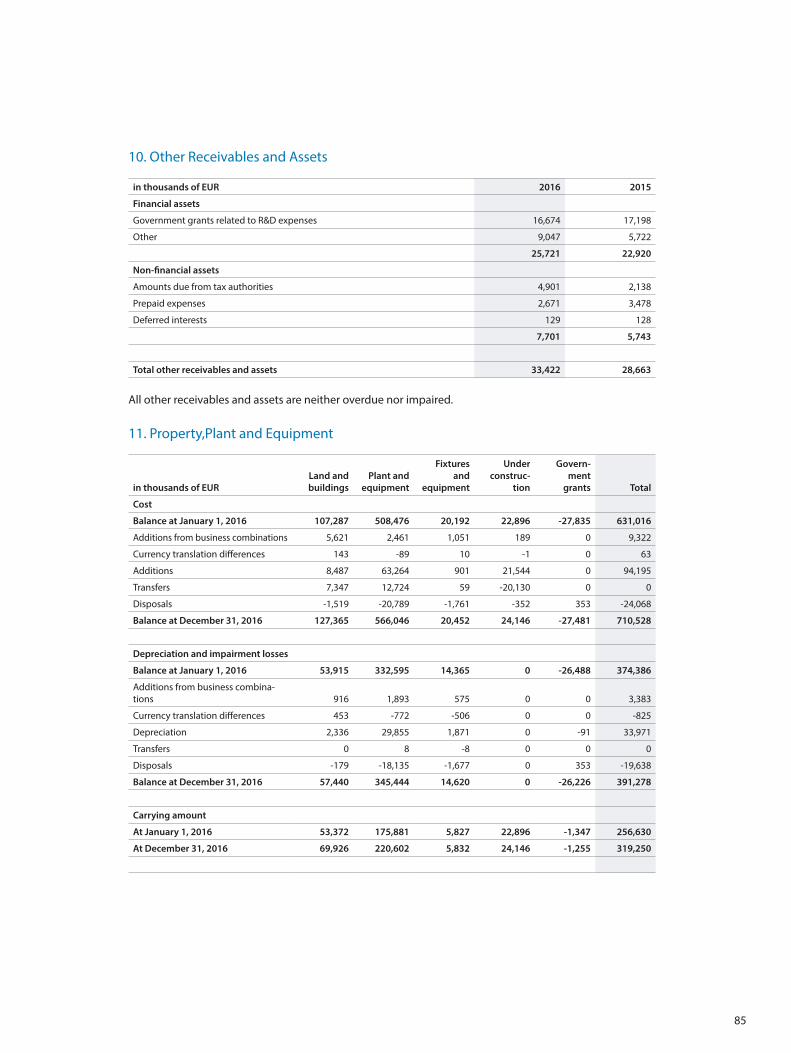
85
10. Other Receivables and Assets
in thousands of EUR 2016 2015
Financial assets
Government grants related to R&D expenses 16,674 17,198
Other 9,047 5,722
25,721 22,920
Non-financial assets
Amounts due from tax authorities 4,901 2,138
Prepaid expenses 2,671 3,478
Deferred interests 129 128
7,701 5,743
Total other receivables and assets 33,422 28,663
All other receivables and assets are neither overdue nor impaired.
11. Property,Plant and Equipment
in thousands of EURLand and buildings
Plant and equipment
Fixtures and
equipment
Under construc-
tion
Govern-ment
grants Total
Cost
Balance at January 1, 2016 107,287 508,476 20,192 22,896 -27,835 631,016
Additions from business combinations 5,621 2,461 1,051 189 0 9,322
Currency translation differences 143 -89 10 -1 0 63
Additions 8,487 63,264 901 21,544 0 94,195
Transfers 7,347 12,724 59 -20,130 0 0
Disposals -1,519 -20,789 -1,761 -352 353 -24,068
Balance at December 31, 2016 127,365 566,046 20,452 24,146 -27,481 710,528
Depreciation and impairment losses
Balance at January 1, 2016 53,915 332,595 14,365 0 -26,488 374,386
Additions from business combina-tions 916 1,893 575 0 0 3,383
Currency translation differences 453 -772 -506 0 0 -825
Depreciation 2,336 29,855 1,871 0 -91 33,971
Transfers 0 8 -8 0 0 0
Disposals -179 -18,135 -1,677 0 353 -19,638
Balance at December 31, 2016 57,440 345,444 14,620 0 -26,226 391,278
Carrying amount
At January 1, 2016 53,372 175,881 5,827 22,896 -1,347 256,630
At December 31, 2016 69,926 220,602 5,832 24,146 -1,255 319,250
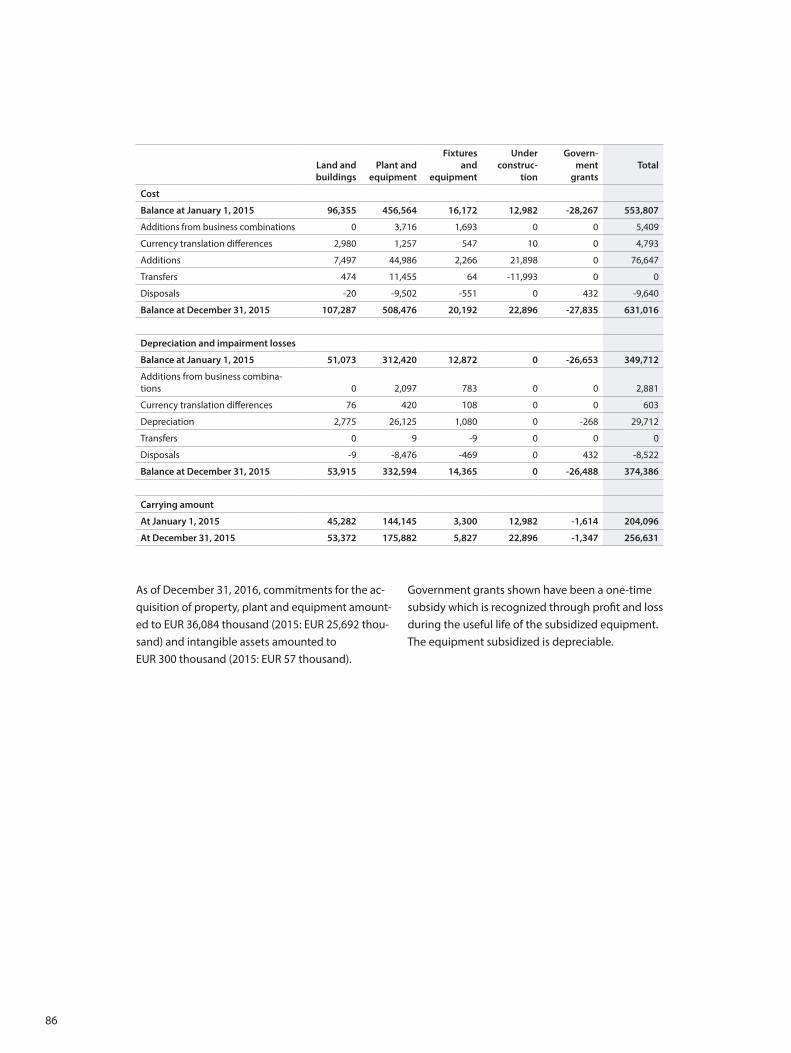
86
Land and buildings
Plant and equipment
Fixtures and
equipment
Under construc-
tion
Govern-ment
grantsTotal
Cost
Balance at January 1, 2015 96,355 456,564 16,172 12,982 -28,267 553,807
Additions from business combinations 0 3,716 1,693 0 0 5,409
Currency translation differences 2,980 1,257 547 10 0 4,793
Additions 7,497 44,986 2,266 21,898 0 76,647
Transfers 474 11,455 64 -11,993 0 0
Disposals -20 -9,502 -551 0 432 -9,640
Balance at December 31, 2015 107,287 508,476 20,192 22,896 -27,835 631,016
Depreciation and impairment losses
Balance at January 1, 2015 51,073 312,420 12,872 0 -26,653 349,712
Additions from business combina-tions 0 2,097 783 0 0 2,881
Currency translation differences 76 420 108 0 0 603
Depreciation 2,775 26,125 1,080 0 -268 29,712
Transfers 0 9 -9 0 0 0
Disposals -9 -8,476 -469 0 432 -8,522
Balance at December 31, 2015 53,915 332,594 14,365 0 -26,488 374,386
Carrying amount
At January 1, 2015 45,282 144,145 3,300 12,982 -1,614 204,096
At December 31, 2015 53,372 175,882 5,827 22,896 -1,347 256,631
As of December 31, 2016, commitments for the ac-quisition of property, plant and equipment amount-ed to EUR 36,084 thousand (2015: EUR 25,692 thou-sand) and intangible assets amounted to EUR 300 thousand (2015: EUR 57 thousand).
Government grants shown have been a one-time subsidy which is recognized through profit and loss during the useful life of the subsidized equipment. The equipment subsidized is depreciable.
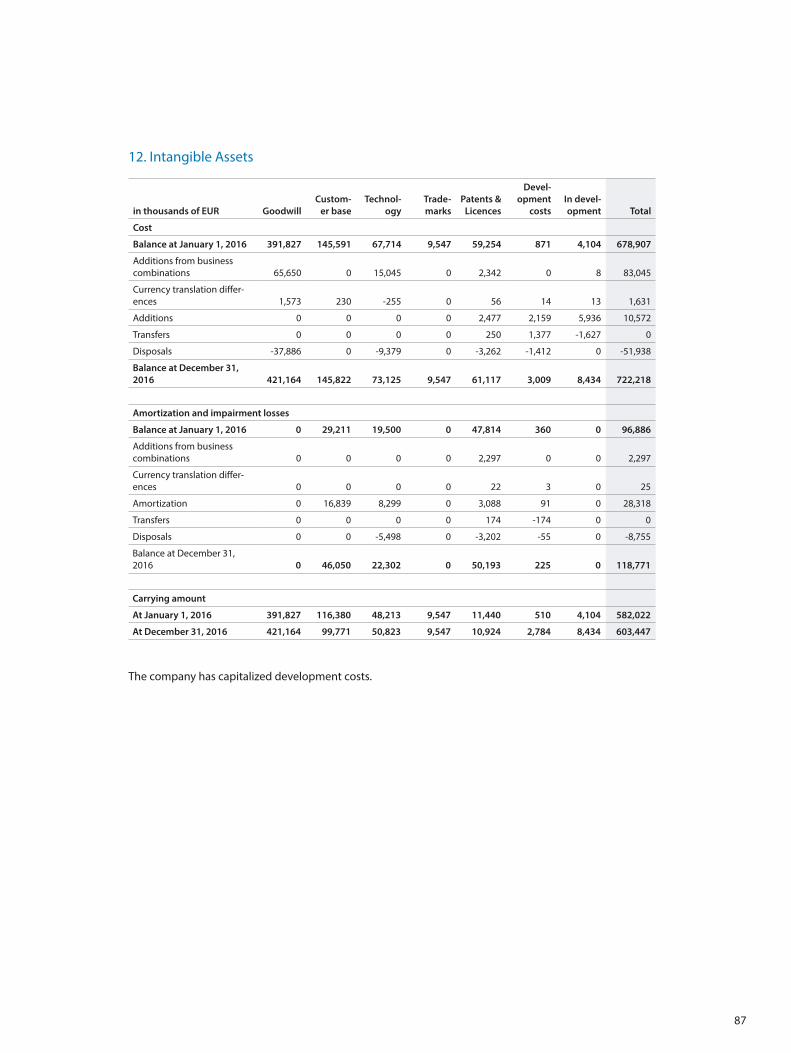
87
12. Intangible Assets
in thousands of EUR GoodwillCustom-
er baseTechnol-
ogyTrade-marks
Patents & Licences
Devel-opment
costsIn devel-opment Total
Cost
Balance at January 1, 2016 391,827 145,591 67,714 9,547 59,254 871 4,104 678,907
Additions from business combinations 65,650 0 15,045 0 2,342 0 8 83,045
Currency translation differ-ences 1,573 230 -255 0 56 14 13 1,631
Additions 0 0 0 0 2,477 2,159 5,936 10,572
Transfers 0 0 0 0 250 1,377 -1,627 0
Disposals -37,886 0 -9,379 0 -3,262 -1,412 0 -51,938
Balance at December 31, 2016 421,164 145,822 73,125 9,547 61,117 3,009 8,434 722,218
Amortization and impairment losses
Balance at January 1, 2016 0 29,211 19,500 0 47,814 360 0 96,886
Additions from business combinations 0 0 0 0 2,297 0 0 2,297
Currency translation differ-ences 0 0 0 0 22 3 0 25
Amortization 0 16,839 8,299 0 3,088 91 0 28,318
Transfers 0 0 0 0 174 -174 0 0
Disposals 0 0 -5,498 0 -3,202 -55 0 -8,755
Balance at December 31, 2016 0 46,050 22,302 0 50,193 225 0 118,771
Carrying amount
At January 1, 2016 391,827 116,380 48,213 9,547 11,440 510 4,104 582,022
At December 31, 2016 421,164 99,771 50,823 9,547 10,924 2,784 8,434 603,447
The company has capitalized development costs.
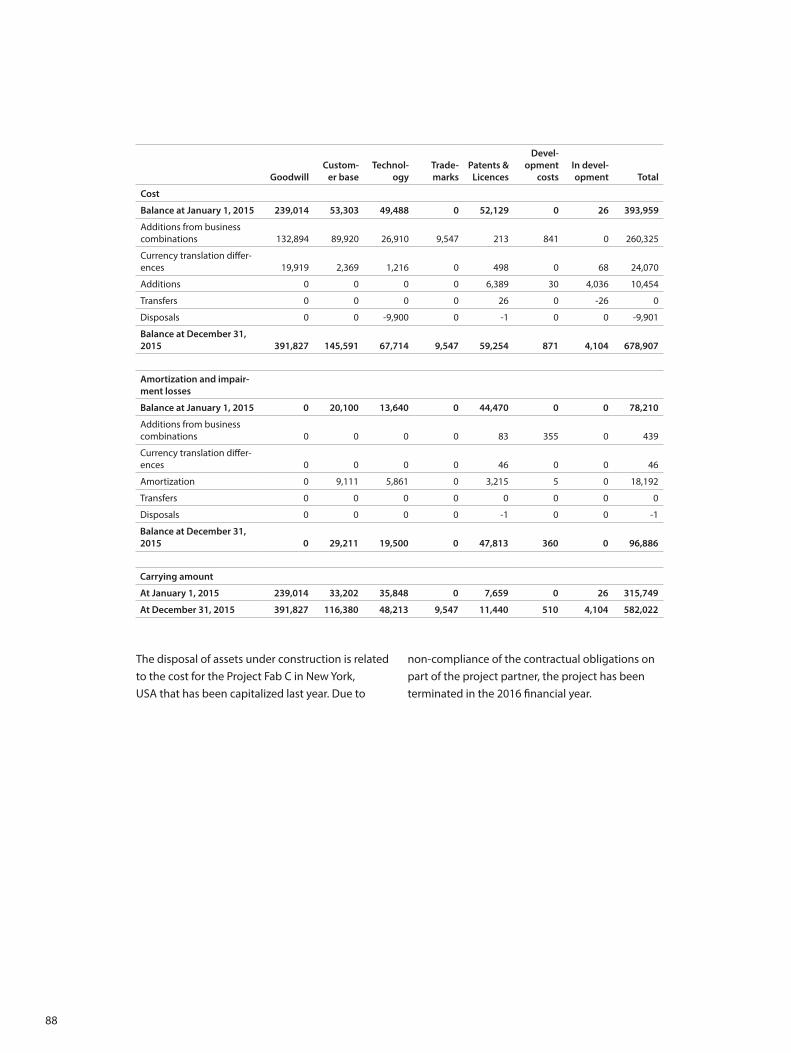
88
GoodwillCustom-
er baseTechnol-
ogyTrade-marks
Patents & Licences
Devel-opment
costsIn devel-opment Total
Cost
Balance at January 1, 2015 239,014 53,303 49,488 0 52,129 0 26 393,959
Additions from business combinations 132,894 89,920 26,910 9,547 213 841 0 260,325
Currency translation differ-ences 19,919 2,369 1,216 0 498 0 68 24,070
Additions 0 0 0 0 6,389 30 4,036 10,454
Transfers 0 0 0 0 26 0 -26 0
Disposals 0 0 -9,900 0 -1 0 0 -9,901
Balance at December 31, 2015 391,827 145,591 67,714 9,547 59,254 871 4,104 678,907
Amortization and impair-ment losses
Balance at January 1, 2015 0 20,100 13,640 0 44,470 0 0 78,210
Additions from business combinations 0 0 0 0 83 355 0 439
Currency translation differ-ences 0 0 0 0 46 0 0 46
Amortization 0 9,111 5,861 0 3,215 5 0 18,192
Transfers 0 0 0 0 0 0 0 0
Disposals 0 0 0 0 -1 0 0 -1
Balance at December 31, 2015 0 29,211 19,500 0 47,813 360 0 96,886
Carrying amount
At January 1, 2015 239,014 33,202 35,848 0 7,659 0 26 315,749
At December 31, 2015 391,827 116,380 48,213 9,547 11,440 510 4,104 582,022
The disposal of assets under construction is related to the cost for the Project Fab C in New York, USA that has been capitalized last year. Due to
non-compliance of the contractual obligations on part of the project partner, the project has been terminated in the 2016 financial year.
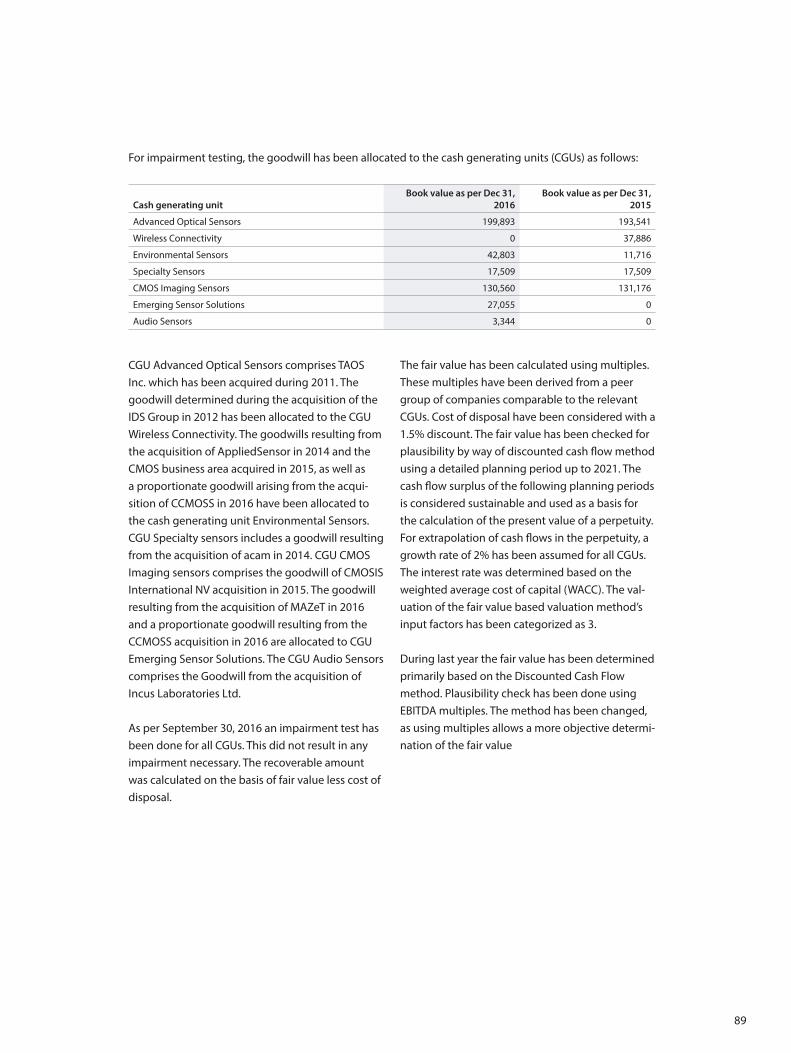
89
For impairment testing, the goodwill has been allocated to the cash generating units (CGUs) as follows:
Cash generating unitBook value as per Dec 31,
2016Book value as per Dec 31,
2015
Advanced Optical Sensors 199,893 193,541
Wireless Connectivity 0 37,886
Environmental Sensors 42,803 11,716
Specialty Sensors 17,509 17,509
CMOS Imaging Sensors 130,560 131,176
Emerging Sensor Solutions 27,055 0
Audio Sensors 3,344 0
CGU Advanced Optical Sensors comprises TAOS Inc. which has been acquired during 2011. The goodwill determined during the acquisition of the IDS Group in 2012 has been allocated to the CGU Wireless Connectivity. The goodwills resulting from the acquisition of AppliedSensor in 2014 and the CMOS business area acquired in 2015, as well as a proportionate goodwill arising from the acqui-sition of CCMOSS in 2016 have been allocated to the cash generating unit Environmental Sensors. CGU Specialty sensors includes a goodwill resulting from the acquisition of acam in 2014. CGU CMOS Imaging sensors comprises the goodwill of CMOSIS International NV acquisition in 2015. The goodwill resulting from the acquisition of MAZeT in 2016 and a proportionate goodwill resulting from the CCMOSS acquisition in 2016 are allocated to CGU Emerging Sensor Solutions. The CGU Audio Sensors comprises the Goodwill from the acquisition of Incus Laboratories Ltd.
As per September 30, 2016 an impairment test has been done for all CGUs. This did not result in any impairment necessary. The recoverable amount was calculated on the basis of fair value less cost of disposal.
The fair value has been calculated using multiples. These multiples have been derived from a peer group of companies comparable to the relevant CGUs. Cost of disposal have been considered with a 1.5% discount. The fair value has been checked for plausibility by way of discounted cash flow method using a detailed planning period up to 2021. The cash flow surplus of the following planning periods is considered sustainable and used as a basis for the calculation of the present value of a perpetuity. For extrapolation of cash flows in the perpetuity, a growth rate of 2% has been assumed for all CGUs. The interest rate was determined based on the weighted average cost of capital (WACC). The val-uation of the fair value based valuation method’s input factors has been categorized as 3.
During last year the fair value has been determined primarily based on the Discounted Cash Flow method. Plausibility check has been done using EBITDA multiples. The method has been changed, as using multiples allows a more objective determi-nation of the fair value
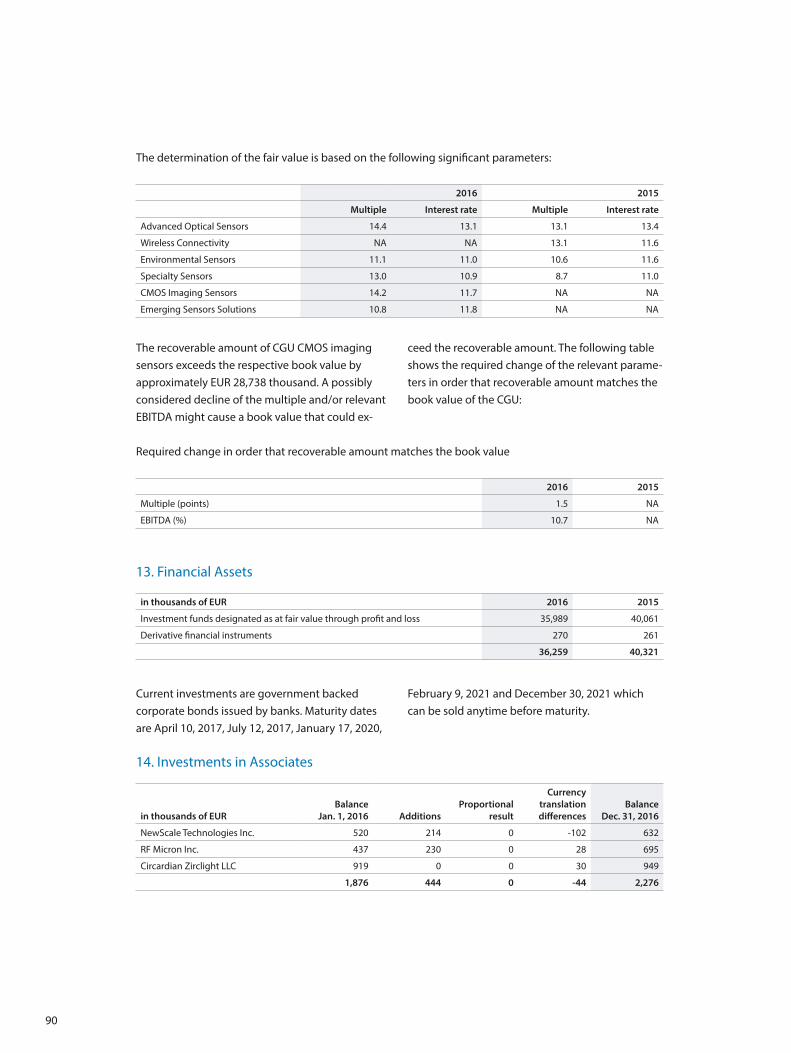
90
The determination of the fair value is based on the following significant parameters:
2016 2015
Multiple Interest rate Multiple Interest rate
Advanced Optical Sensors 14.4 13.1 13.1 13.4
Wireless Connectivity NA NA 13.1 11.6
Environmental Sensors 11.1 11.0 10.6 11.6
Specialty Sensors 13.0 10.9 8.7 11.0
CMOS Imaging Sensors 14.2 11.7 NA NA
Emerging Sensors Solutions 10.8 11.8 NA NA
The recoverable amount of CGU CMOS imaging sensors exceeds the respective book value by approximately EUR 28,738 thousand. A possibly considered decline of the multiple and/or relevant EBITDA might cause a book value that could ex-
ceed the recoverable amount. The following table shows the required change of the relevant parame-ters in order that recoverable amount matches the book value of the CGU:
Required change in order that recoverable amount matches the book value
2016 2015
Multiple (points) 1.5 NA
EBITDA (%) 10.7 NA
13. Financial Assets
in thousands of EUR 2016 2015
Investment funds designated as at fair value through profit and loss 35,989 40,061
Derivative financial instruments 270 261
36,259 40,321
Current investments are government backed corporate bonds issued by banks. Maturity dates are April 10, 2017, July 12, 2017, January 17, 2020,
February 9, 2021 and December 30, 2021 which can be sold anytime before maturity.
14. Investments in Associates
in thousands of EURBalance
Jan. 1, 2016 AdditionsProportional
result
Currency translation differences
Balance Dec. 31, 2016
NewScale Technologies Inc. 520 214 0 -102 632
RF Micron Inc. 437 230 0 28 695
Circardian Zirclight LLC 919 0 0 30 949
1,876 444 0 -44 2,276
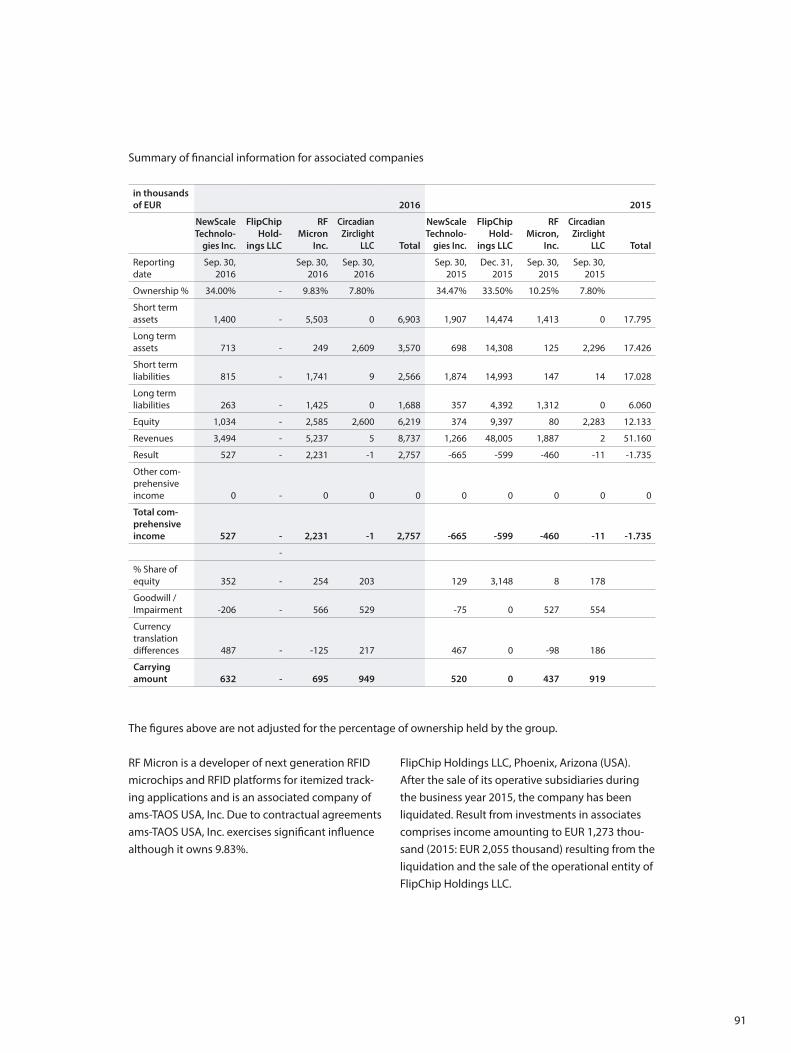
91
Summary of financial information for associated companies
in thousands of EUR 2016 2015
NewScale Technolo-
gies Inc.
FlipChip Hold-
ings LLC
RF Micron
Inc.
Circadian Zirclight
LLC Total
NewScale Technolo-
gies Inc.
FlipChip Hold-
ings LLC
RF Micron,
Inc.
Circadian Zirclight
LLC Total
Reporting date
Sep. 30, 2016
Sep. 30, 2016
Sep. 30, 2016
Sep. 30, 2015
Dec. 31, 2015
Sep. 30, 2015
Sep. 30, 2015
Ownership % 34.00% - 9.83% 7.80% 34.47% 33.50% 10.25% 7.80%
Short term assets 1,400 - 5,503 0 6,903 1,907 14,474 1,413 0 17.795
Long term assets 713 - 249 2,609 3,570 698 14,308 125 2,296 17.426
Short term liabilities 815 - 1,741 9 2,566 1,874 14,993 147 14 17.028
Long term liabilities 263 - 1,425 0 1,688 357 4,392 1,312 0 6.060
Equity 1,034 - 2,585 2,600 6,219 374 9,397 80 2,283 12.133
Revenues 3,494 - 5,237 5 8,737 1,266 48,005 1,887 2 51.160
Result 527 - 2,231 -1 2,757 -665 -599 -460 -11 -1.735
Other com-prehensive income 0 - 0 0 0 0 0 0 0 0
Total com-prehensive income 527 - 2,231 -1 2,757 -665 -599 -460 -11 -1.735
-
% Share of equity 352 - 254 203 129 3,148 8 178
Goodwill / Impairment -206 - 566 529 -75 0 527 554
Currency translation differences 487 - -125 217 467 0 -98 186
Carrying amount 632 - 695 949 520 0 437 919
The figures above are not adjusted for the percentage of ownership held by the group.
RF Micron is a developer of next generation RFID microchips and RFID platforms for itemized track-ing applications and is an associated company of ams-TAOS USA, Inc. Due to contractual agreements ams-TAOS USA, Inc. exercises significant influence although it owns 9.83%.
FlipChip Holdings LLC, Phoenix, Arizona (USA). After the sale of its operative subsidiaries during the business year 2015, the company has been liquidated. Result from investments in associates comprises income amounting to EUR 1,273 thou-sand (2015: EUR 2,055 thousand) resulting from the liquidation and the sale of the operational entity of FlipChip Holdings LLC.
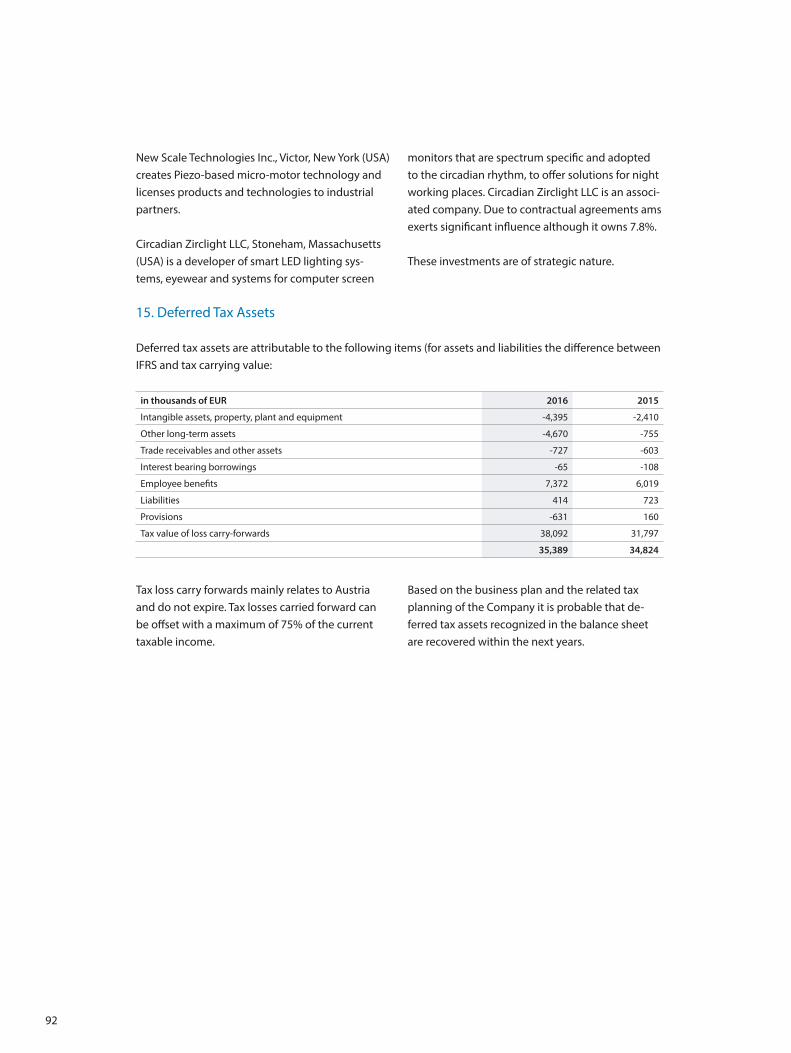
92
New Scale Technologies Inc., Victor, New York (USA) creates Piezo-based micro-motor technology and licenses products and technologies to industrial partners.
Circadian Zirclight LLC, Stoneham, Massachusetts (USA) is a developer of smart LED lighting sys-tems, eyewear and systems for computer screen
monitors that are spectrum specific and adopted to the circadian rhythm, to offer solutions for night working places. Circadian Zirclight LLC is an associ-ated company. Due to contractual agreements ams exerts significant influence although it owns 7.8%. These investments are of strategic nature.
15. Deferred Tax Assets
Deferred tax assets are attributable to the following items (for assets and liabilities the difference between IFRS and tax carrying value:
in thousands of EUR 2016 2015
Intangible assets, property, plant and equipment -4,395 -2,410
Other long-term assets -4,670 -755
Trade receivables and other assets -727 -603
Interest bearing borrowings -65 -108
Employee benefits 7,372 6,019
Liabilities 414 723
Provisions -631 160
Tax value of loss carry-forwards 38,092 31,797
35,389 34,824
Tax loss carry forwards mainly relates to Austria and do not expire. Tax losses carried forward can be offset with a maximum of 75% of the current taxable income.
Based on the business plan and the related tax planning of the Company it is probable that de-ferred tax assets recognized in the balance sheet are recovered within the next years.
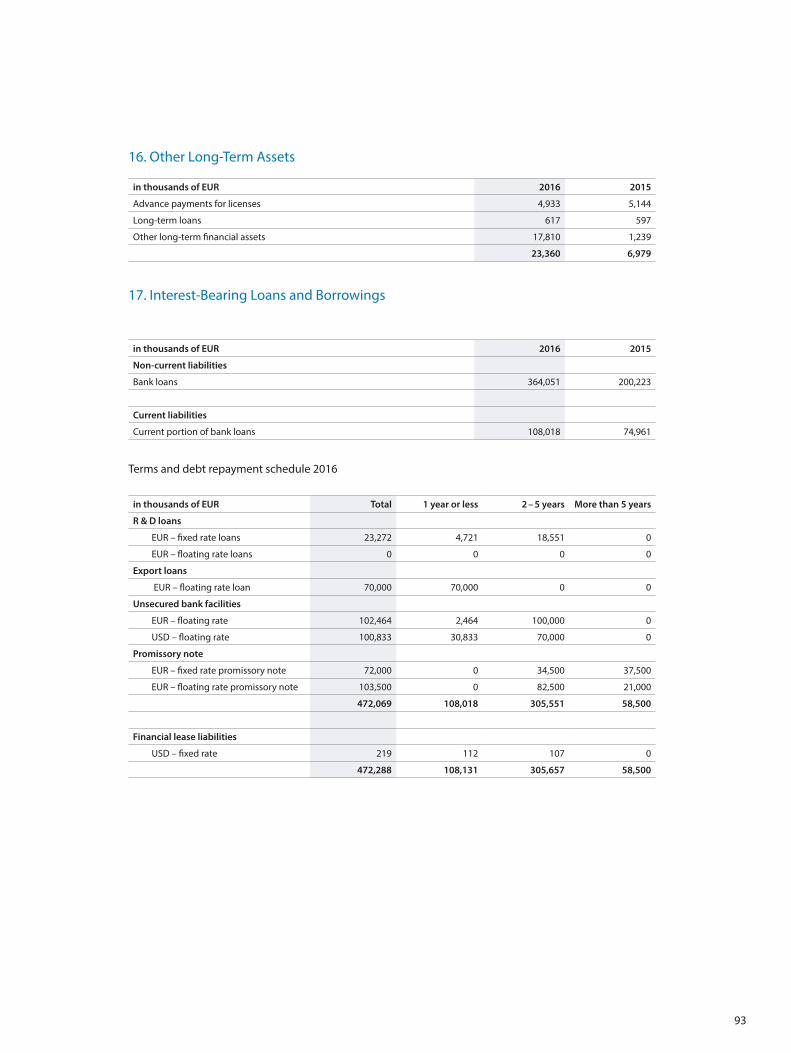
93
16. Other Long-Term Assets
in thousands of EUR 2016 2015
Advance payments for licenses 4,933 5,144
Long-term loans 617 597
Other long-term financial assets 17,810 1,239
23,360 6,979
17. Interest-Bearing Loans and Borrowings
in thousands of EUR 2016 2015
Non-current liabilities
Bank loans 364,051 200,223
Current liabilities
Current portion of bank loans 108,018 74,961
Terms and debt repayment schedule 2016
in thousands of EUR Total 1 year or less 2 – 5 years More than 5 years
R & D loans
EUR – fixed rate loans 23,272 4,721 18,551 0
EUR – floating rate loans 0 0 0 0
Export loans
EUR – floating rate loan 70,000 70,000 0 0
Unsecured bank facilities
EUR – floating rate 102,464 2,464 100,000 0
USD – floating rate 100,833 30,833 70,000 0
Promissory note
EUR – fixed rate promissory note 72,000 0 34,500 37,500
EUR – floating rate promissory note 103,500 0 82,500 21,000
472,069 108,018 305,551 58,500
Financial lease liabilities
USD – fixed rate 219 112 107 0
472,288 108,131 305,657 58,500
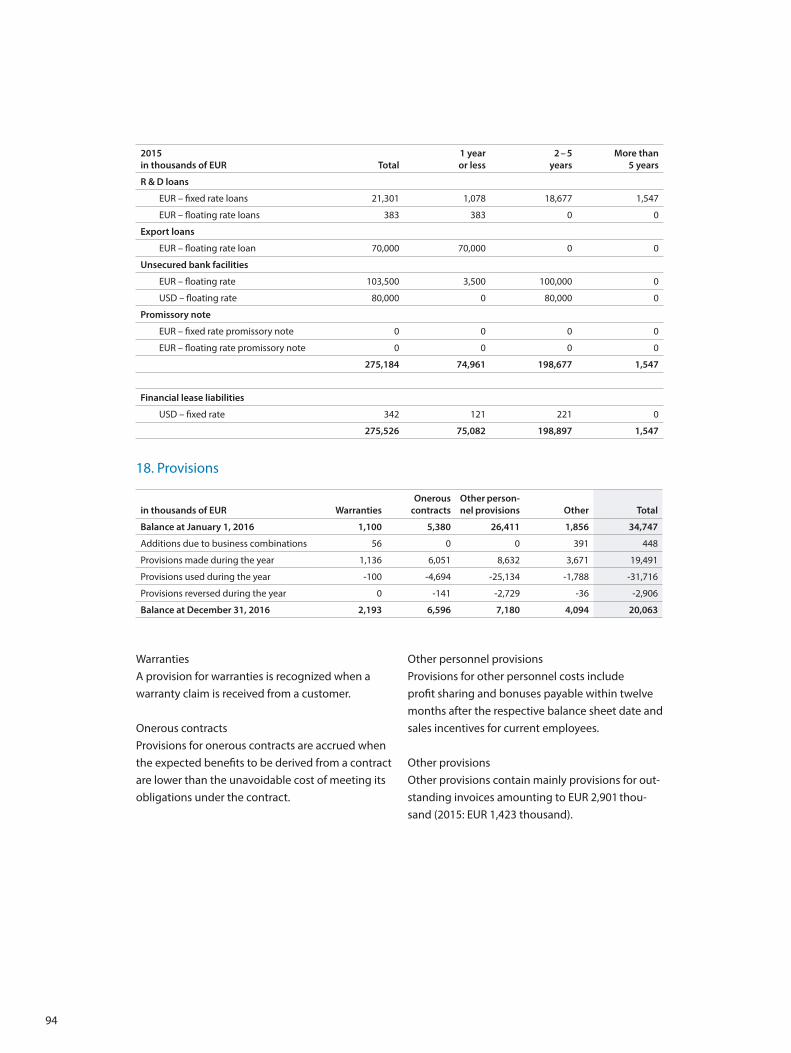
94
2015 in thousands of EUR Total
1 year or less
2 – 5years
More than 5 years
R & D loans
EUR – fixed rate loans 21,301 1,078 18,677 1,547
EUR – floating rate loans 383 383 0 0
Export loans
EUR – floating rate loan 70,000 70,000 0 0
Unsecured bank facilities
EUR – floating rate 103,500 3,500 100,000 0
USD – floating rate 80,000 0 80,000 0
Promissory note
EUR – fixed rate promissory note 0 0 0 0
EUR – floating rate promissory note 0 0 0 0
275,184 74,961 198,677 1,547
Financial lease liabilities
USD – fixed rate 342 121 221 0
275,526 75,082 198,897 1,547
18. Provisions
in thousands of EUR WarrantiesOnerous
contractsOther person-nel provisions Other Total
Balance at January 1, 2016 1,100 5,380 26,411 1,856 34,747
Additions due to business combinations 56 0 0 391 448
Provisions made during the year 1,136 6,051 8,632 3,671 19,491
Provisions used during the year -100 -4,694 -25,134 -1,788 -31,716
Provisions reversed during the year 0 -141 -2,729 -36 -2,906
Balance at December 31, 2016 2,193 6,596 7,180 4,094 20,063
WarrantiesA provision for warranties is recognized when a warranty claim is received from a customer.
Onerous contractsProvisions for onerous contracts are accrued when the expected benefits to be derived from a contract are lower than the unavoidable cost of meeting its obligations under the contract.
Other personnel provisionsProvisions for other personnel costs include profit sharing and bonuses payable within twelve months after the respective balance sheet date and sales incentives for current employees.
Other provisionsOther provisions contain mainly provisions for out-standing invoices amounting to EUR 2,901 thou-sand (2015: EUR 1,423 thousand).
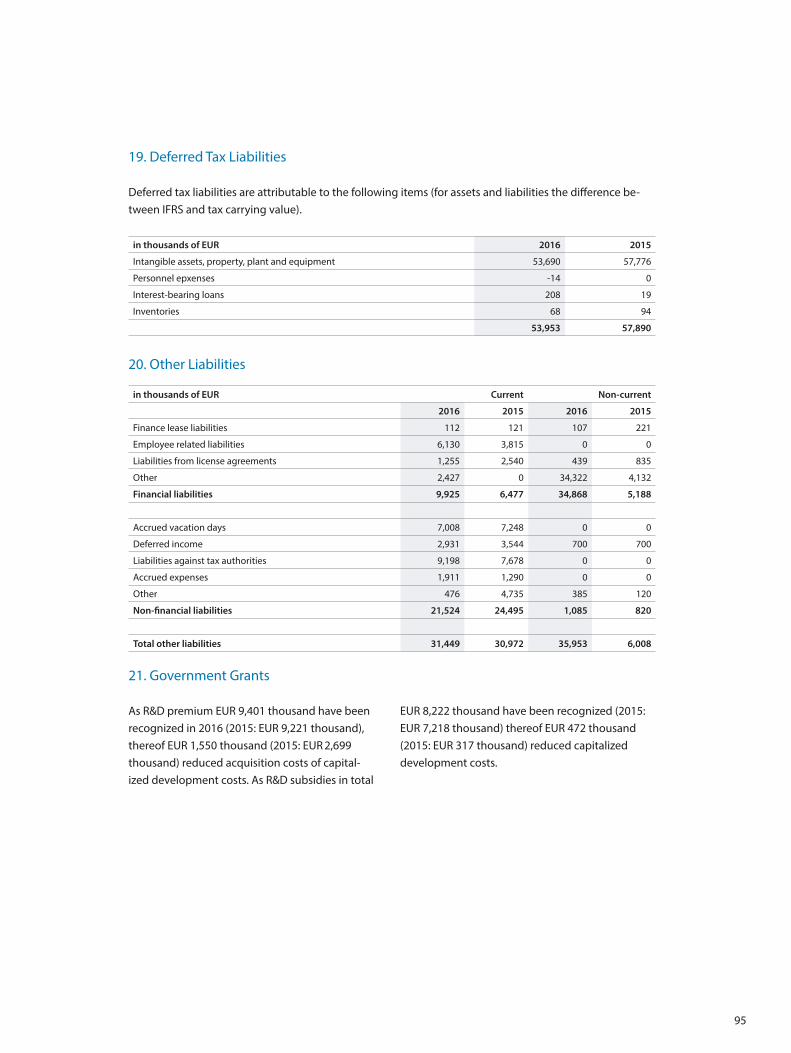
95
19. Deferred Tax Liabilities
Deferred tax liabilities are attributable to the following items (for assets and liabilities the difference be-tween IFRS and tax carrying value).
in thousands of EUR 2016 2015
Intangible assets, property, plant and equipment 53,690 57,776
Personnel epxenses -14 0
Interest-bearing loans 208 19
Inventories 68 94
53,953 57,890
20. Other Liabilities
in thousands of EUR Current Non-current
2016 2015 2016 2015
Finance lease liabilities 112 121 107 221
Employee related liabilities 6,130 3,815 0 0
Liabilities from license agreements 1,255 2,540 439 835
Other 2,427 0 34,322 4,132
Financial liabilities 9,925 6,477 34,868 5,188
Accrued vacation days 7,008 7,248 0 0
Deferred income 2,931 3,544 700 700
Liabilities against tax authorities 9,198 7,678 0 0
Accrued expenses 1,911 1,290 0 0
Other 476 4,735 385 120
Non-financial liabilities 21,524 24,495 1,085 820
Total other liabilities 31,449 30,972 35,953 6,008
21. Government Grants
As R&D premium EUR 9,401 thousand have been recognized in 2016 (2015: EUR 9,221 thousand), thereof EUR 1,550 thousand (2015: EUR 2,699 thousand) reduced acquisition costs of capital-ized development costs. As R&D subsidies in total
EUR 8,222 thousand have been recognized (2015: EUR 7,218 thousand) thereof EUR 472 thousand (2015: EUR 317 thousand) reduced capitalized development costs.
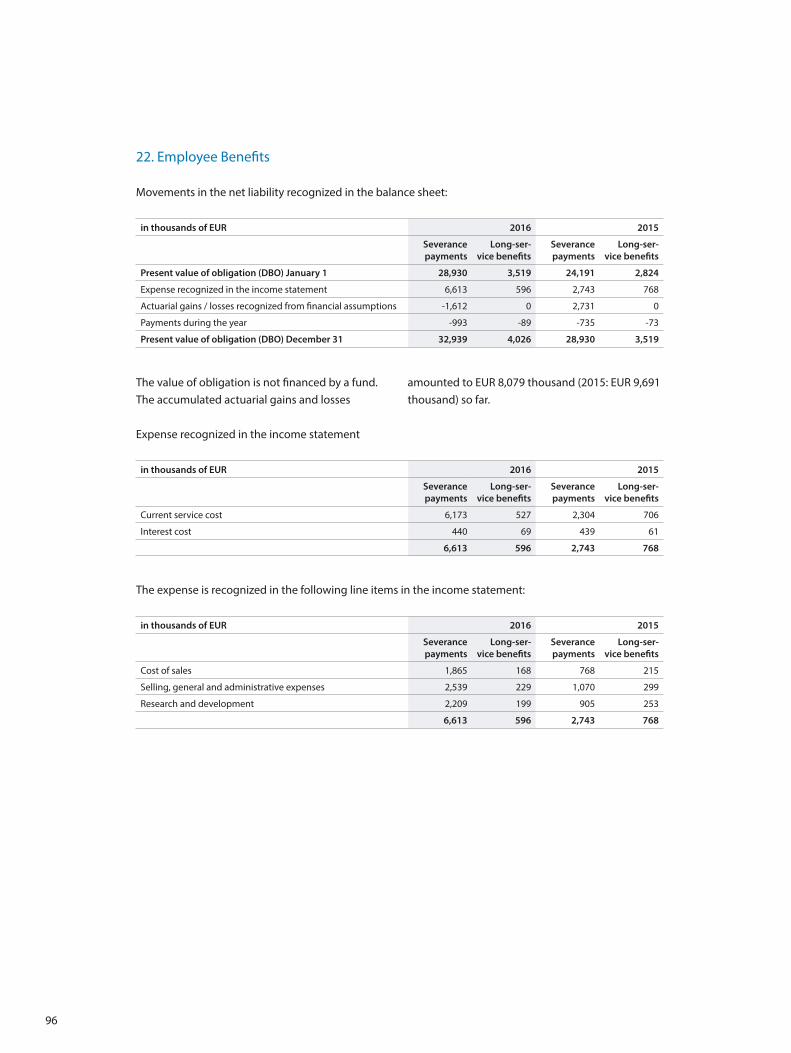
96
22. Employee Benefits
Movements in the net liability recognized in the balance sheet:
in thousands of EUR 2016 2015
Severance payments
Long-ser-vice benefits
Severance payments
Long-ser-vice benefits
Present value of obligation (DBO) January 1 28,930 3,519 24,191 2,824
Expense recognized in the income statement 6,613 596 2,743 768
Actuarial gains / losses recognized from financial assumptions -1,612 0 2,731 0
Payments during the year -993 -89 -735 -73
Present value of obligation (DBO) December 31 32,939 4,026 28,930 3,519
The value of obligation is not financed by a fund.The accumulated actuarial gains and losses
amounted to EUR 8,079 thousand (2015: EUR 9,691 thousand) so far.
Expense recognized in the income statement
in thousands of EUR 2016 2015
Severance payments
Long-ser-vice benefits
Severance payments
Long-ser-vice benefits
Current service cost 6,173 527 2,304 706
Interest cost 440 69 439 61
6,613 596 2,743 768
The expense is recognized in the following line items in the income statement:
in thousands of EUR 2016 2015
Severance payments
Long-ser-vice benefits
Severance payments
Long-ser-vice benefits
Cost of sales 1,865 168 768 215
Selling, general and administrative expenses 2,539 229 1,070 299
Research and development 2,209 199 905 253
6,613 596 2,743 768
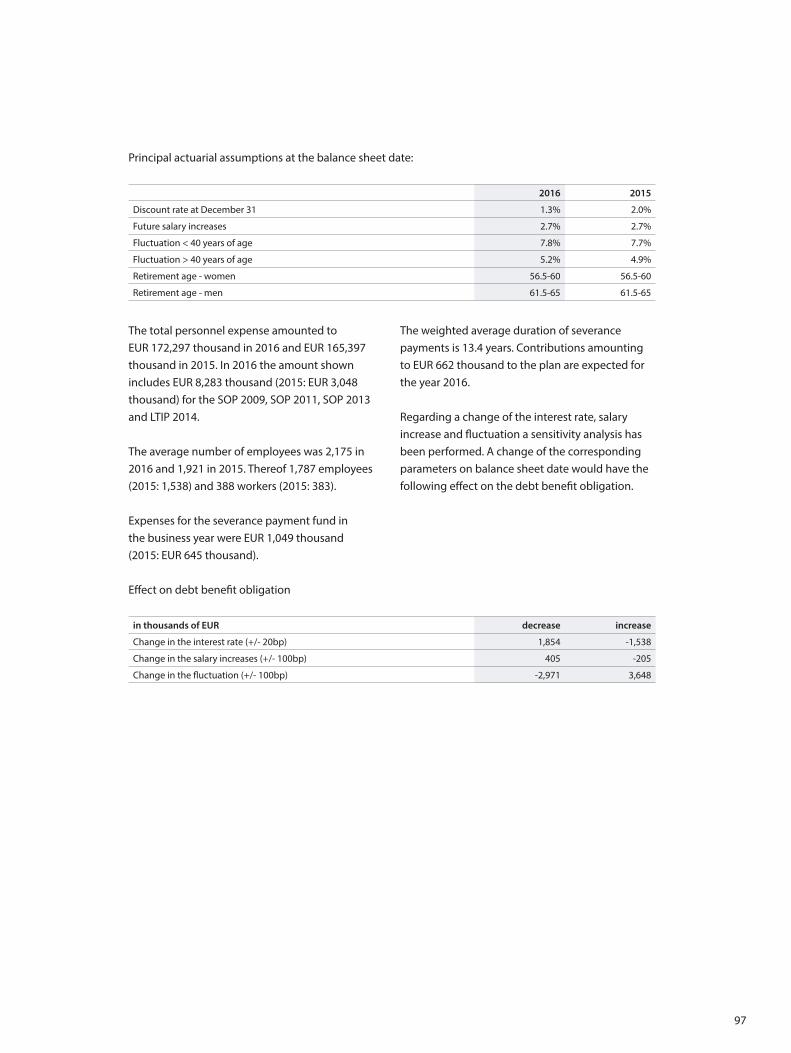
97
Principal actuarial assumptions at the balance sheet date:
2016 2015
Discount rate at December 31 1.3% 2.0%
Future salary increases 2.7% 2.7%
Fluctuation < 40 years of age 7.8% 7.7%
Fluctuation > 40 years of age 5.2% 4.9%
Retirement age - women 56.5-60 56.5-60
Retirement age - men 61.5-65 61.5-65
The total personnel expense amounted to EUR 172,297 thousand in 2016 and EUR 165,397 thousand in 2015. In 2016 the amount shown includes EUR 8,283 thousand (2015: EUR 3,048 thousand) for the SOP 2009, SOP 2011, SOP 2013 and LTIP 2014.
The average number of employees was 2,175 in 2016 and 1,921 in 2015. Thereof 1,787 employees (2015: 1,538) and 388 workers (2015: 383).
Expenses for the severance payment fund in the business year were EUR 1,049 thousand (2015: EUR 645 thousand).
The weighted average duration of severance payments is 13.4 years. Contributions amounting to EUR 662 thousand to the plan are expected for the year 2016.
Regarding a change of the interest rate, salary increase and fluctuation a sensitivity analysis has been performed. A change of the corresponding parameters on balance sheet date would have the following effect on the debt benefit obligation.
Effect on debt benefit obligation
in thousands of EUR decrease increase
Change in the interest rate (+/- 20bp) 1,854 -1,538
Change in the salary increases (+/- 100bp) 405 -205
Change in the fluctuation (+/- 100bp) -2,971 3,648
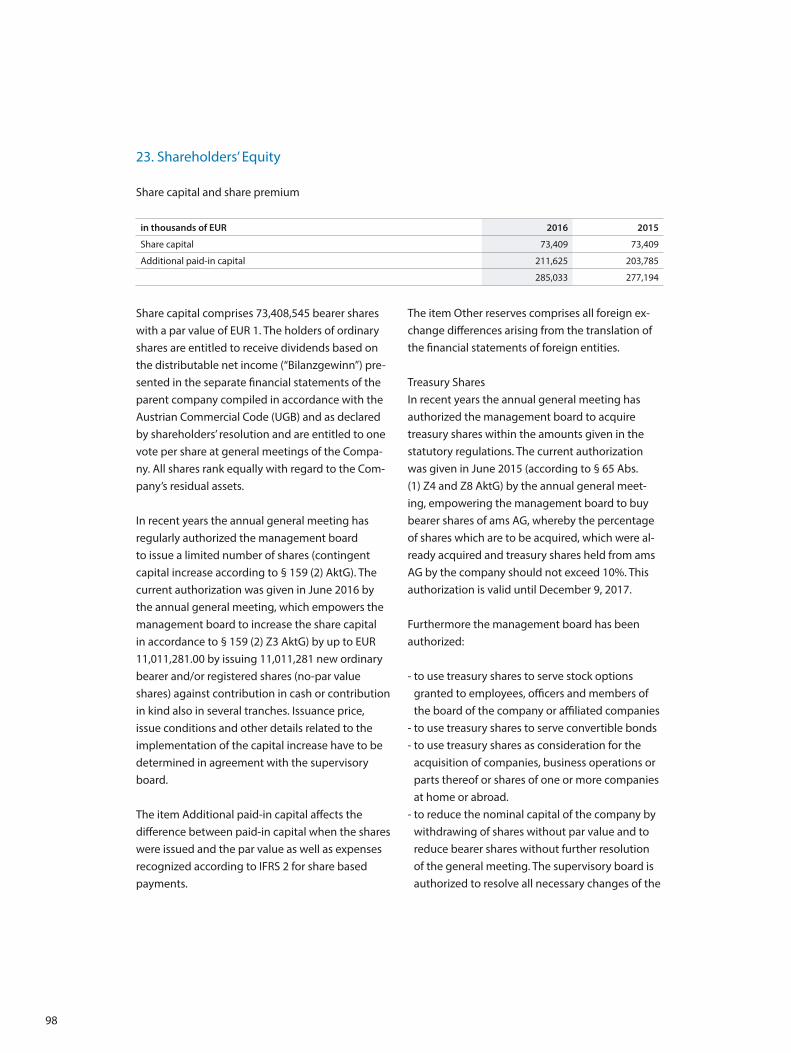
98
23. Shareholders’ Equity
Share capital and share premium
in thousands of EUR 2016 2015
Share capital 73,409 73,409
Additional paid-in capital 211,625 203,785
285,033 277,194
Share capital comprises 73,408,545 bearer shares with a par value of EUR 1. The holders of ordinary shares are entitled to receive dividends based on the distributable net income (“Bilanzgewinn”) pre-sented in the separate financial statements of the parent company compiled in accordance with the Austrian Commercial Code (UGB) and as declared by shareholders’ resolution and are entitled to one vote per share at general meetings of the Compa-ny. All shares rank equally with regard to the Com-pany’s residual assets.
In recent years the annual general meeting has regularly authorized the management board to issue a limited number of shares (contingent capital increase according to § 159 (2) AktG). The current authorization was given in June 2016 by the annual general meeting, which empowers the management board to increase the share capital in accordance to § 159 (2) Z3 AktG) by up to EUR 11,011,281.00 by issuing 11,011,281 new ordinary bearer and/or registered shares (no-par value shares) against contribution in cash or contribution in kind also in several tranches. Issuance price, issue conditions and other details related to the implementation of the capital increase have to be determined in agreement with the supervisory board.
The item Additional paid-in capital affects the difference between paid-in capital when the shares were issued and the par value as well as expenses recognized according to IFRS 2 for share based payments.
The item Other reserves comprises all foreign ex-change differences arising from the translation of the financial statements of foreign entities.
Treasury SharesIn recent years the annual general meeting has authorized the management board to acquire treasury shares within the amounts given in the statutory regulations. The current authorization was given in June 2015 (according to § 65 Abs. (1) Z4 and Z8 AktG) by the annual general meet-ing, empowering the management board to buy bearer shares of ams AG, whereby the percentage of shares which are to be acquired, which were al-ready acquired and treasury shares held from ams AG by the company should not exceed 10%. This authorization is valid until December 9, 2017.
Furthermore the management board has been authorized:
- to use treasury shares to serve stock options granted to employees, officers and members of the board of the company or affiliated companies
- to use treasury shares to serve convertible bonds- to use treasury shares as consideration for the
acquisition of companies, business operations or parts thereof or shares of one or more companies at home or abroad.
- to reduce the nominal capital of the company by withdrawing of shares without par value and to reduce bearer shares without further resolution of the general meeting. The supervisory board is authorized to resolve all necessary changes of the
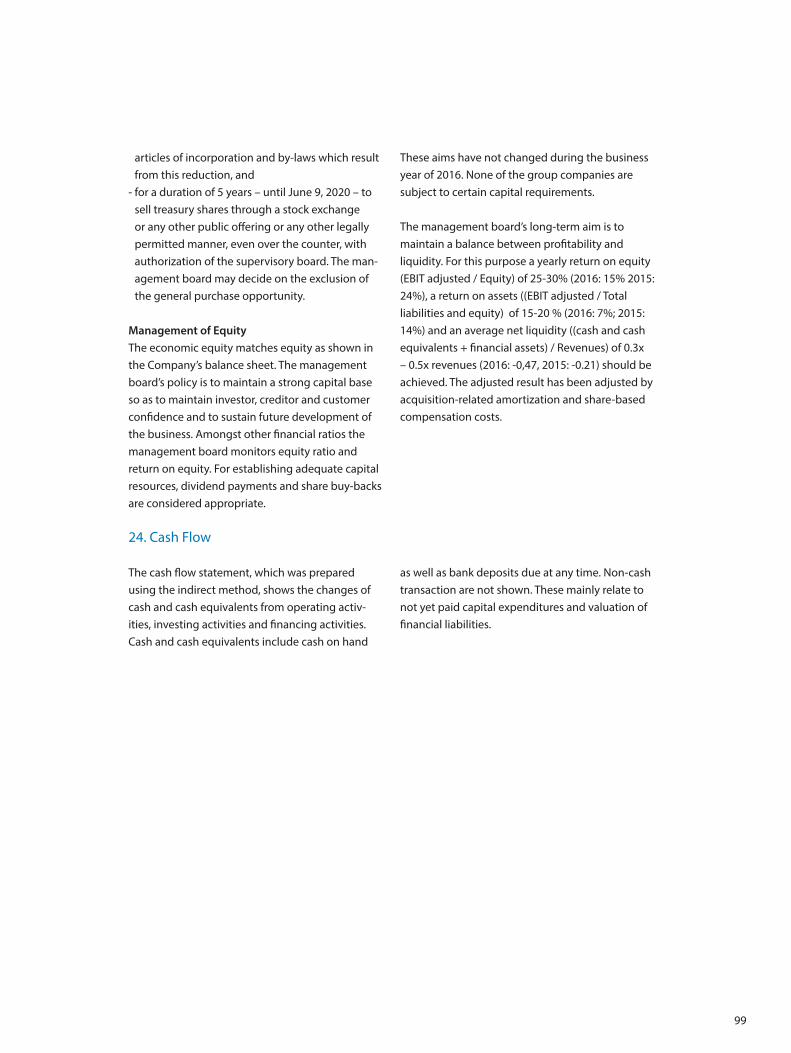
99
articles of incorporation and by-laws which result from this reduction, and
- for a duration of 5 years – until June 9, 2020 – to sell treasury shares through a stock exchange or any other public offering or any other legally permitted manner, even over the counter, with authorization of the supervisory board. The man-agement board may decide on the exclusion of the general purchase opportunity.
Management of EquityThe economic equity matches equity as shown in the Company’s balance sheet. The management board’s policy is to maintain a strong capital base so as to maintain investor, creditor and customer confidence and to sustain future development of the business. Amongst other financial ratios the management board monitors equity ratio and return on equity. For establishing adequate capital resources, dividend payments and share buy-backs are considered appropriate.
These aims have not changed during the business year of 2016. None of the group companies are subject to certain capital requirements.
The management board’s long-term aim is to maintain a balance between profitability and liquidity. For this purpose a yearly return on equity (EBIT adjusted / Equity) of 25-30% (2016: 15% 2015: 24%), a return on assets ((EBIT adjusted / Total liabilities and equity) of 15-20 % (2016: 7%; 2015: 14%) and an average net liquidity ((cash and cash equivalents + financial assets) / Revenues) of 0.3x – 0.5x revenues (2016: -0,47, 2015: -0.21) should be achieved. The adjusted result has been adjusted by acquisition-related amortization and share-based compensation costs.
24. Cash Flow
The cash flow statement, which was prepared using the indirect method, shows the changes of cash and cash equivalents from operating activ-ities, investing activities and financing activities. Cash and cash equivalents include cash on hand
as well as bank deposits due at any time. Non-cash transaction are not shown. These mainly relate to not yet paid capital expenditures and valuation of financial liabilities.
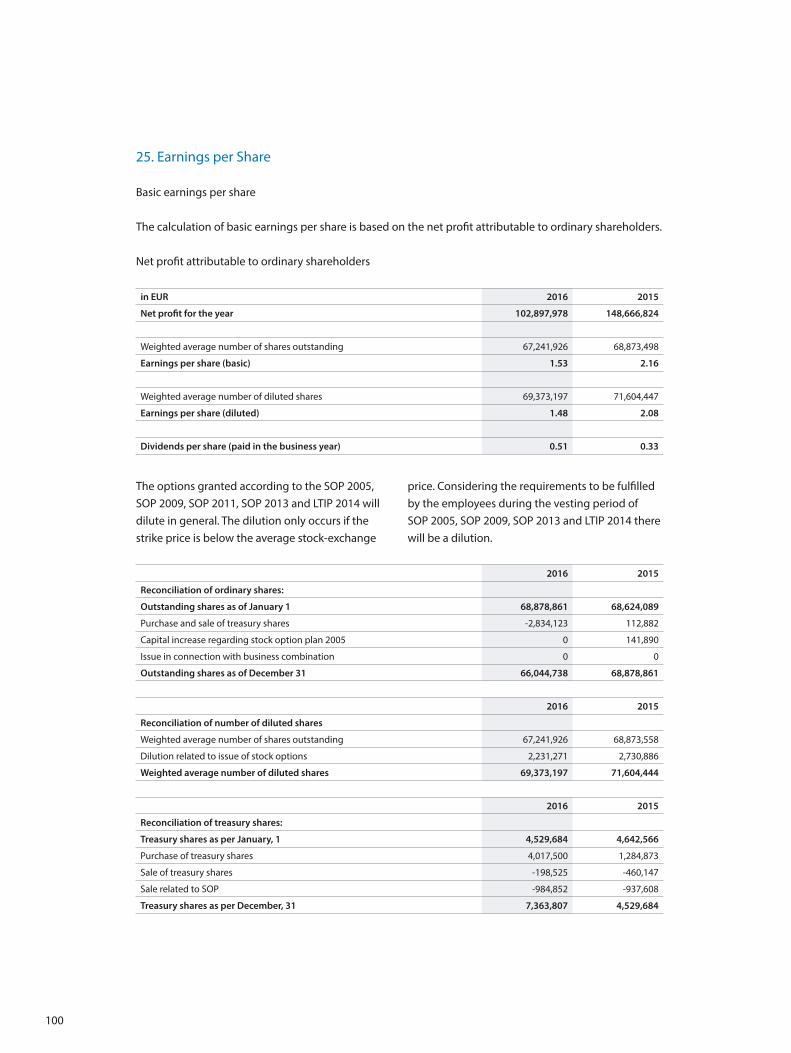
100
25. Earnings per Share
Basic earnings per share
The calculation of basic earnings per share is based on the net profit attributable to ordinary shareholders.
Net profit attributable to ordinary shareholders
in EUR 2016 2015
Net profit for the year 102,897,978 148,666,824
Weighted average number of shares outstanding 67,241,926 68,873,498
Earnings per share (basic) 1.53 2.16
Weighted average number of diluted shares 69,373,197 71,604,447
Earnings per share (diluted) 1.48 2.08
Dividends per share (paid in the business year) 0.51 0.33
The options granted according to the SOP 2005, SOP 2009, SOP 2011, SOP 2013 and LTIP 2014 will dilute in general. The dilution only occurs if the strike price is below the average stock-exchange
price. Considering the requirements to be fulfilled by the employees during the vesting period of SOP 2005, SOP 2009, SOP 2013 and LTIP 2014 there will be a dilution.
2016 2015
Reconciliation of ordinary shares:
Outstanding shares as of January 1 68,878,861 68,624,089
Purchase and sale of treasury shares -2,834,123 112,882
Capital increase regarding stock option plan 2005 0 141,890
Issue in connection with business combination 0 0
Outstanding shares as of December 31 66,044,738 68,878,861
2016 2015
Reconciliation of number of diluted shares
Weighted average number of shares outstanding 67,241,926 68,873,558
Dilution related to issue of stock options 2,231,271 2,730,886
Weighted average number of diluted shares 69,373,197 71,604,444
2016 2015
Reconciliation of treasury shares:
Treasury shares as per January, 1 4,529,684 4,642,566
Purchase of treasury shares 4,017,500 1,284,873
Sale of treasury shares -198,525 -460,147
Sale related to SOP -984,852 -937,608
Treasury shares as per December, 31 7,363,807 4,529,684
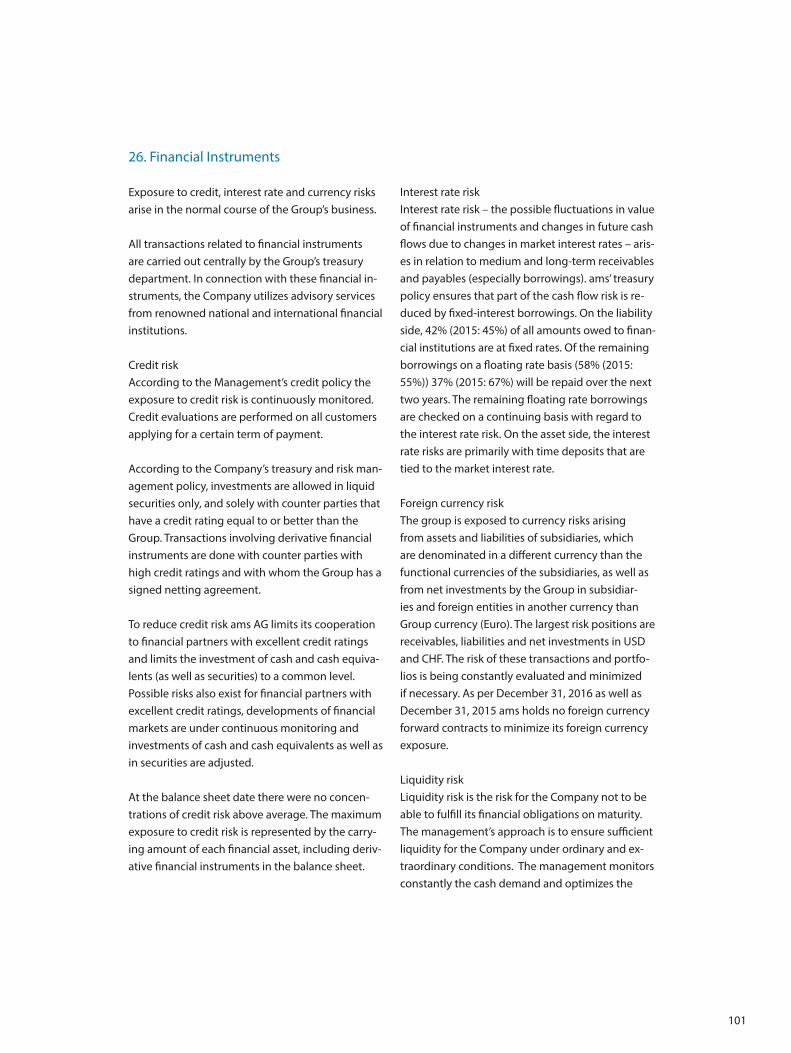
101
26. Financial Instruments
Exposure to credit, interest rate and currency risks arise in the normal course of the Group’s business.
All transactions related to financial instruments are carried out centrally by the Group’s treasury department. In connection with these financial in-struments, the Company utilizes advisory services from renowned national and international financial institutions.
Credit riskAccording to the Management’s credit policy the exposure to credit risk is continuously monitored. Credit evaluations are performed on all customers applying for a certain term of payment.
According to the Company’s treasury and risk man-agement policy, investments are allowed in liquid securities only, and solely with counter parties that have a credit rating equal to or better than the Group. Transactions involving derivative financial instruments are done with counter parties with high credit ratings and with whom the Group has a signed netting agreement.
To reduce credit risk ams AG limits its cooperation to financial partners with excellent credit ratings and limits the investment of cash and cash equiva-lents (as well as securities) to a common level.Possible risks also exist for financial partners with excellent credit ratings, developments of financial markets are under continuous monitoring and investments of cash and cash equivalents as well as in securities are adjusted.
At the balance sheet date there were no concen-trations of credit risk above average. The maximum exposure to credit risk is represented by the carry-ing amount of each financial asset, including deriv-ative financial instruments in the balance sheet.
Interest rate riskInterest rate risk – the possible fluctuations in value of financial instruments and changes in future cash flows due to changes in market interest rates – aris-es in relation to medium and long-term receivables and payables (especially borrowings). ams’ treasury policy ensures that part of the cash flow risk is re-duced by fixed-interest borrowings. On the liability side, 42% (2015: 45%) of all amounts owed to finan-cial institutions are at fixed rates. Of the remaining borrowings on a floating rate basis (58% (2015: 55%)) 37% (2015: 67%) will be repaid over the next two years. The remaining floating rate borrowings are checked on a continuing basis with regard to the interest rate risk. On the asset side, the interest rate risks are primarily with time deposits that are tied to the market interest rate.
Foreign currency riskThe group is exposed to currency risks arising from assets and liabilities of subsidiaries, which are denominated in a different currency than the functional currencies of the subsidiaries, as well as from net investments by the Group in subsidiar-ies and foreign entities in another currency than Group currency (Euro). The largest risk positions are receivables, liabilities and net investments in USD and CHF. The risk of these transactions and portfo-lios is being constantly evaluated and minimized if necessary. As per December 31, 2016 as well as December 31, 2015 ams holds no foreign currency forward contracts to minimize its foreign currency exposure.
Liquidity riskLiquidity risk is the risk for the Company not to be able to fulfill its financial obligations on maturity. The management’s approach is to ensure sufficient liquidity for the Company under ordinary and ex-traordinary conditions. The management monitors constantly the cash demand and optimizes the
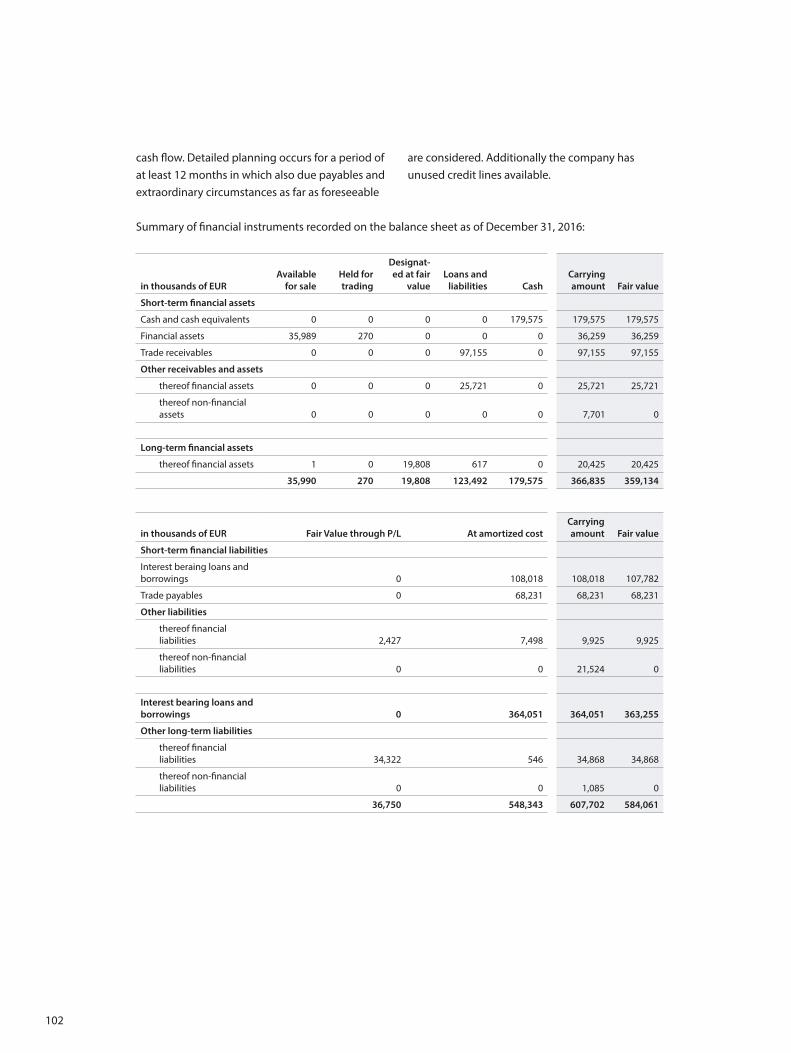
102
cash flow. Detailed planning occurs for a period of at least 12 months in which also due payables and extraordinary circumstances as far as foreseeable
are considered. Additionally the company has unused credit lines available.
Summary of financial instruments recorded on the balance sheet as of December 31, 2016:
in thousands of EURAvailable
for saleHeld for trading
Designat-ed at fair
valueLoans and
liabilities CashCarrying amount Fair value
Short-term financial assets
Cash and cash equivalents 0 0 0 0 179,575 179,575 179,575
Financial assets 35,989 270 0 0 0 36,259 36,259
Trade receivables 0 0 0 97,155 0 97,155 97,155
Other receivables and assets
thereof financial assets 0 0 0 25,721 0 25,721 25,721
thereof non-financial assets 0 0 0 0 0 7,701 0
Long-term financial assets
thereof financial assets 1 0 19,808 617 0 20,425 20,425
35,990 270 19,808 123,492 179,575 366,835 359,134
in thousands of EUR Fair Value through P/L At amortized costCarrying amount Fair value
Short-term financial liabilities
Interest beraing loans and borrowings 0 108,018 108,018 107,782
Trade payables 0 68,231 68,231 68,231
Other liabilities
thereof financial liabilities 2,427 7,498 9,925 9,925
thereof non-financial liabilities 0 0 21,524 0
Interest bearing loans and borrowings 0 364,051 364,051 363,255
Other long-term liabilities
thereof financial liabilities 34,322 546 34,868 34,868
thereof non-financial liabilities 0 0 1,085 0
36,750 548,343 607,702 584,061
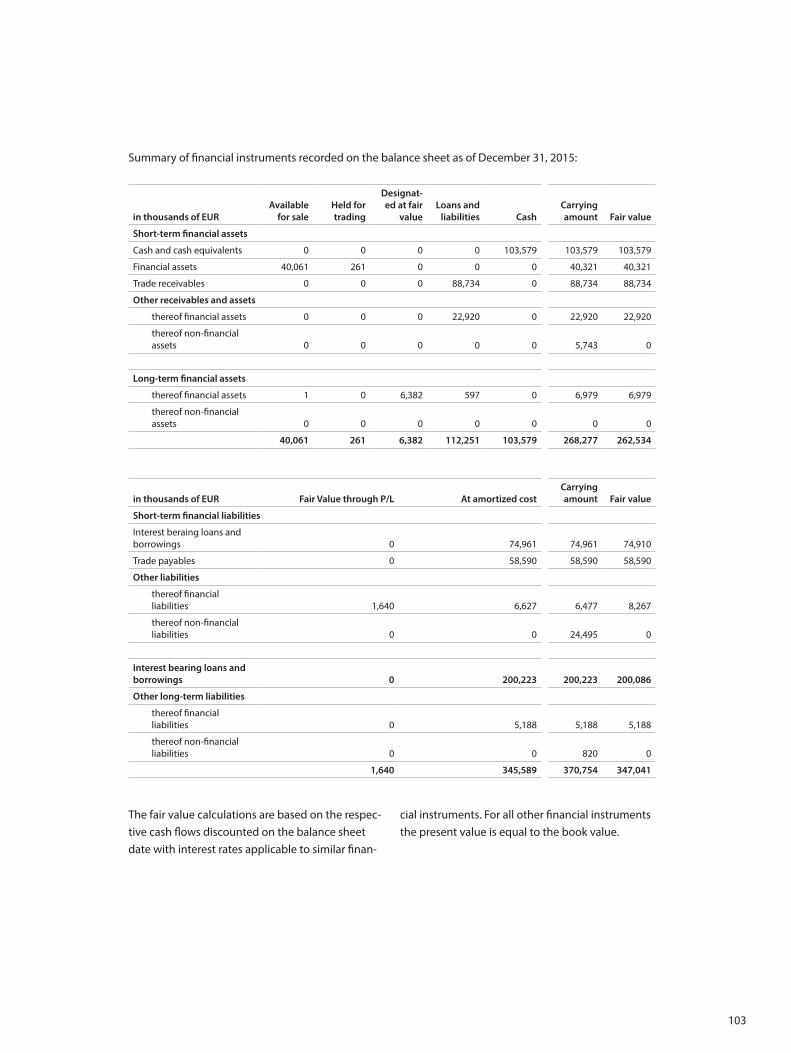
103
Summary of financial instruments recorded on the balance sheet as of December 31, 2015:
in thousands of EURAvailable
for saleHeld for trading
Designat-ed at fair
valueLoans and
liabilities CashCarrying amount Fair value
Short-term financial assets
Cash and cash equivalents 0 0 0 0 103,579 103,579 103,579
Financial assets 40,061 261 0 0 0 40,321 40,321
Trade receivables 0 0 0 88,734 0 88,734 88,734
Other receivables and assets
thereof financial assets 0 0 0 22,920 0 22,920 22,920
thereof non-financial assets 0 0 0 0 0 5,743 0
Long-term financial assets
thereof financial assets 1 0 6,382 597 0 6,979 6,979
thereof non-financial assets 0 0 0 0 0 0 0
40,061 261 6,382 112,251 103,579 268,277 262,534
in thousands of EUR Fair Value through P/L At amortized costCarrying amount Fair value
Short-term financial liabilities
Interest beraing loans and borrowings 0 74,961 74,961 74,910
Trade payables 0 58,590 58,590 58,590
Other liabilities
thereof financial liabilities 1,640 6,627 6,477 8,267
thereof non-financial liabilities 0 0 24,495 0
Interest bearing loans and borrowings 0 200,223 200,223 200,086
Other long-term liabilities
thereof financial liabilities 0 5,188 5,188 5,188
thereof non-financial liabilities 0 0 820 0
1,640 345,589 370,754 347,041
The fair value calculations are based on the respec-tive cash flows discounted on the balance sheet date with interest rates applicable to similar finan-
cial instruments. For all other financial instruments the present value is equal to the book value.
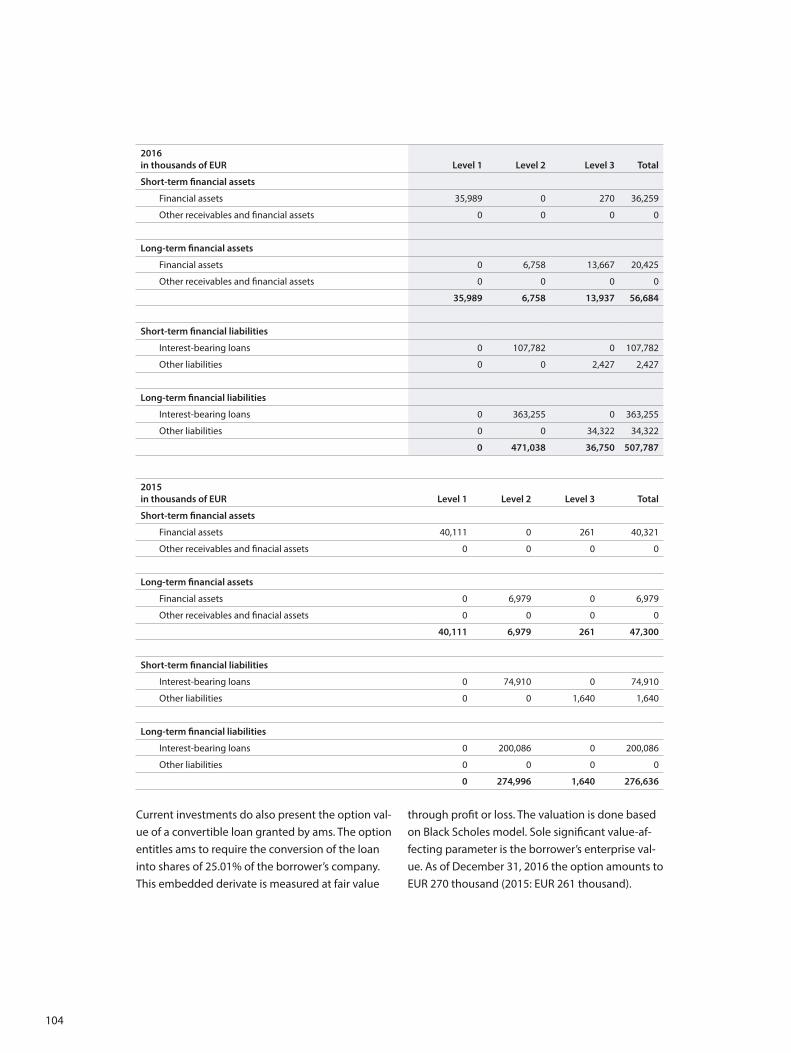
104
2016 in thousands of EUR Level 1 Level 2 Level 3 Total
Short-term financial assets
Financial assets 35,989 0 270 36,259
Other receivables and financial assets 0 0 0 0
Long-term financial assets
Financial assets 0 6,758 13,667 20,425
Other receivables and financial assets 0 0 0 0
35,989 6,758 13,937 56,684
Short-term financial liabilities
Interest-bearing loans 0 107,782 0 107,782
Other liabilities 0 0 2,427 2,427
Long-term financial liabilities
Interest-bearing loans 0 363,255 0 363,255
Other liabilities 0 0 34,322 34,322
0 471,038 36,750 507,787
2015in thousands of EUR Level 1 Level 2 Level 3 Total
Short-term financial assets
Financial assets 40,111 0 261 40,321
Other receivables and finacial assets 0 0 0 0
Long-term financial assets
Financial assets 0 6,979 0 6,979
Other receivables and finacial assets 0 0 0 0
40,111 6,979 261 47,300
Short-term financial liabilities
Interest-bearing loans 0 74,910 0 74,910
Other liabilities 0 0 1,640 1,640
Long-term financial liabilities
Interest-bearing loans 0 200,086 0 200,086
Other liabilities 0 0 0 0
0 274,996 1,640 276,636
Current investments do also present the option val-ue of a convertible loan granted by ams. The option entitles ams to require the conversion of the loan into shares of 25.01% of the borrower’s company. This embedded derivate is measured at fair value
through profit or loss. The valuation is done based on Black Scholes model. Sole significant value-af-fecting parameter is the borrower’s enterprise val-ue. As of December 31, 2016 the option amounts to EUR 270 thousand (2015: EUR 261 thousand).
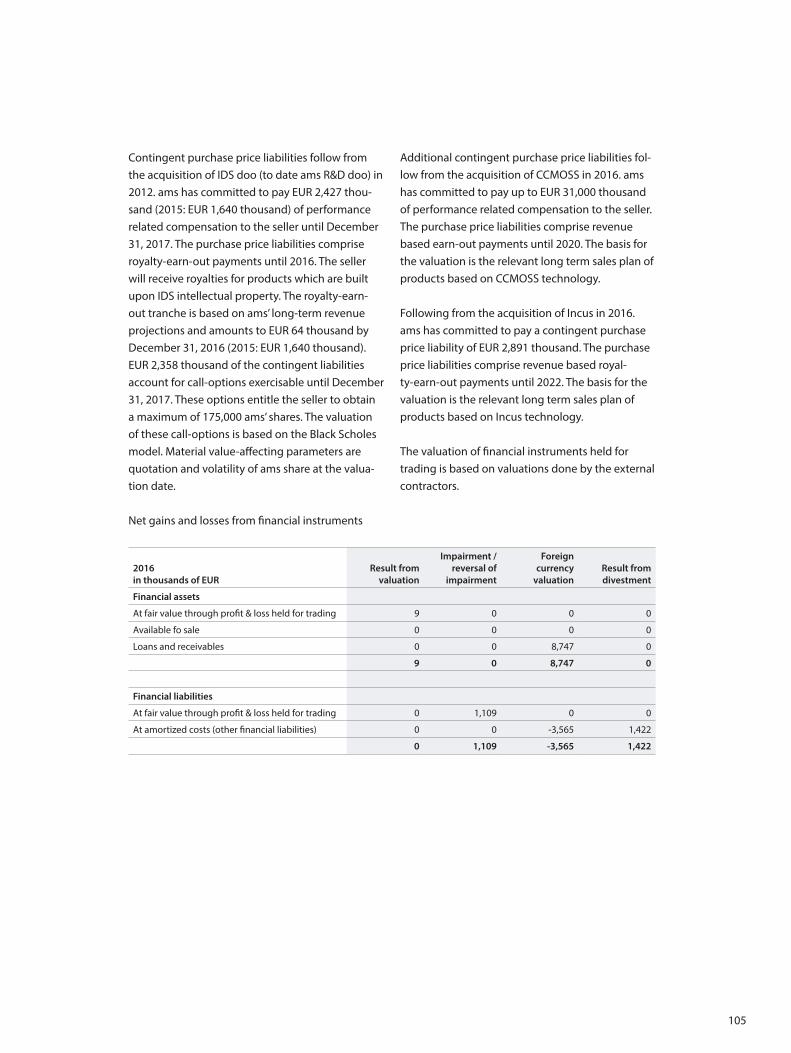
105
Contingent purchase price liabilities follow from the acquisition of IDS doo (to date ams R&D doo) in 2012. ams has committed to pay EUR 2,427 thou-sand (2015: EUR 1,640 thousand) of performance related compensation to the seller until December 31, 2017. The purchase price liabilities comprise royalty-earn-out payments until 2016. The seller will receive royalties for products which are built upon IDS intellectual property. The royalty- earn-out tranche is based on ams’ long-term revenue projections and amounts to EUR 64 thousand by December 31, 2016 (2015: EUR 1,640 thousand). EUR 2,358 thousand of the contingent liabilities account for call-options exercisable until December 31, 2017. These options entitle the seller to obtain a maximum of 175,000 ams’ shares. The valuation of these call-options is based on the Black Scholes model. Material value-affecting parameters are quotation and volatility of ams share at the valua-tion date.
Additional contingent purchase price liabilities fol-low from the acquisition of CCMOSS in 2016. ams has committed to pay up to EUR 31,000 thousand of performance related compensation to the seller. The purchase price liabilities comprise revenue based earn-out payments until 2020. The basis for the valuation is the relevant long term sales plan of products based on CCMOSS technology.
Following from the acquisition of Incus in 2016. ams has committed to pay a contingent purchase price liability of EUR 2,891 thousand. The purchase price liabilities comprise revenue based royal-ty-earn-out payments until 2022. The basis for the valuation is the relevant long term sales plan of products based on Incus technology.
The valuation of financial instruments held for trading is based on valuations done by the external contractors.
Net gains and losses from financial instruments
2016in thousands of EUR
Result from valuation
Impairment / reversal of
impairment
Foreign currency
valuationResult from divestment
Financial assets
At fair value through profit & loss held for trading 9 0 0 0
Available fo sale 0 0 0 0
Loans and receivables 0 0 8,747 0
9 0 8,747 0
Financial liabilities
At fair value through profit & loss held for trading 0 1,109 0 0
At amortized costs (other financial liabilities) 0 0 -3,565 1,422
0 1,109 -3,565 1,422
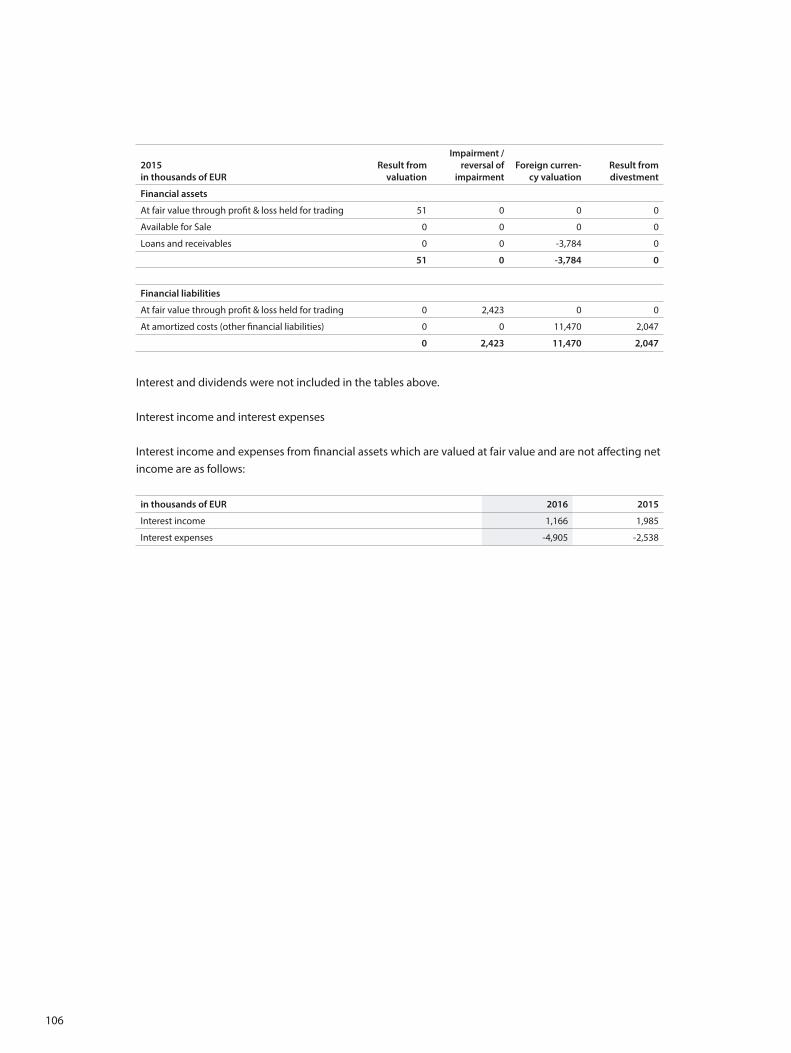
106
2015in thousands of EUR
Result from valuation
Impairment / reversal of
impairmentForeign curren-
cy valuationResult from divestment
Financial assets
At fair value through profit & loss held for trading 51 0 0 0
Available for Sale 0 0 0 0
Loans and receivables 0 0 -3,784 0
51 0 -3,784 0
Financial liabilities
At fair value through profit & loss held for trading 0 2,423 0 0
At amortized costs (other financial liabilities) 0 0 11,470 2,047
0 2,423 11,470 2,047
Interest and dividends were not included in the tables above.
Interest income and interest expenses
Interest income and expenses from financial assets which are valued at fair value and are not affecting net income are as follows:
in thousands of EUR 2016 2015
Interest income 1,166 1,985
Interest expenses -4,905 -2,538
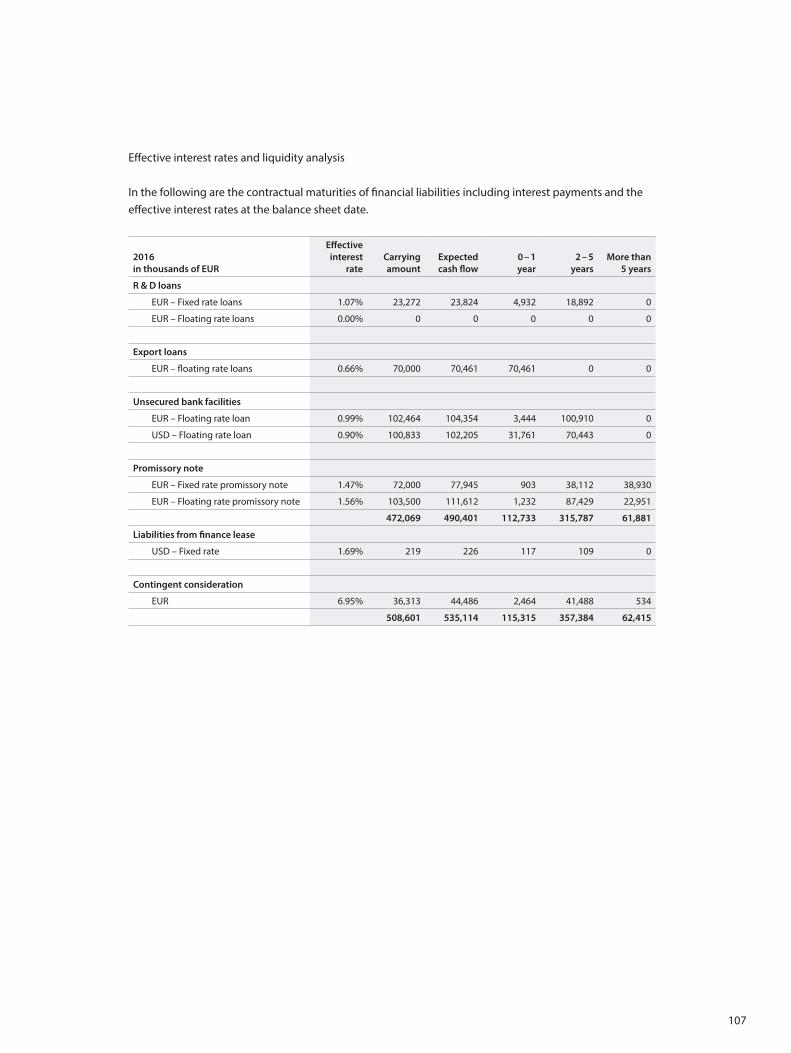
107
Effective interest rates and liquidity analysis
In the following are the contractual maturities of financial liabilities including interest payments and the effective interest rates at the balance sheet date.
2016 in thousands of EUR
Effective interest
rateCarrying amount
Expected cash flow
0 – 1year
2 – 5years
More than5 years
R & D loans
EUR – Fixed rate loans 1.07% 23,272 23,824 4,932 18,892 0
EUR – Floating rate loans 0.00% 0 0 0 0 0
Export loans
EUR – floating rate loans 0.66% 70,000 70,461 70,461 0 0
Unsecured bank facilities
EUR – Floating rate loan 0.99% 102,464 104,354 3,444 100,910 0
USD – Floating rate loan 0.90% 100,833 102,205 31,761 70,443 0
Promissory note
EUR – Fixed rate promissory note 1.47% 72,000 77,945 903 38,112 38,930
EUR – Floating rate promissory note 1.56% 103,500 111,612 1,232 87,429 22,951
472,069 490,401 112,733 315,787 61,881
Liabilities from finance lease
USD – Fixed rate 1.69% 219 226 117 109 0
Contingent consideration
EUR 6.95% 36,313 44,486 2,464 41,488 534
508,601 535,114 115,315 357,384 62,415
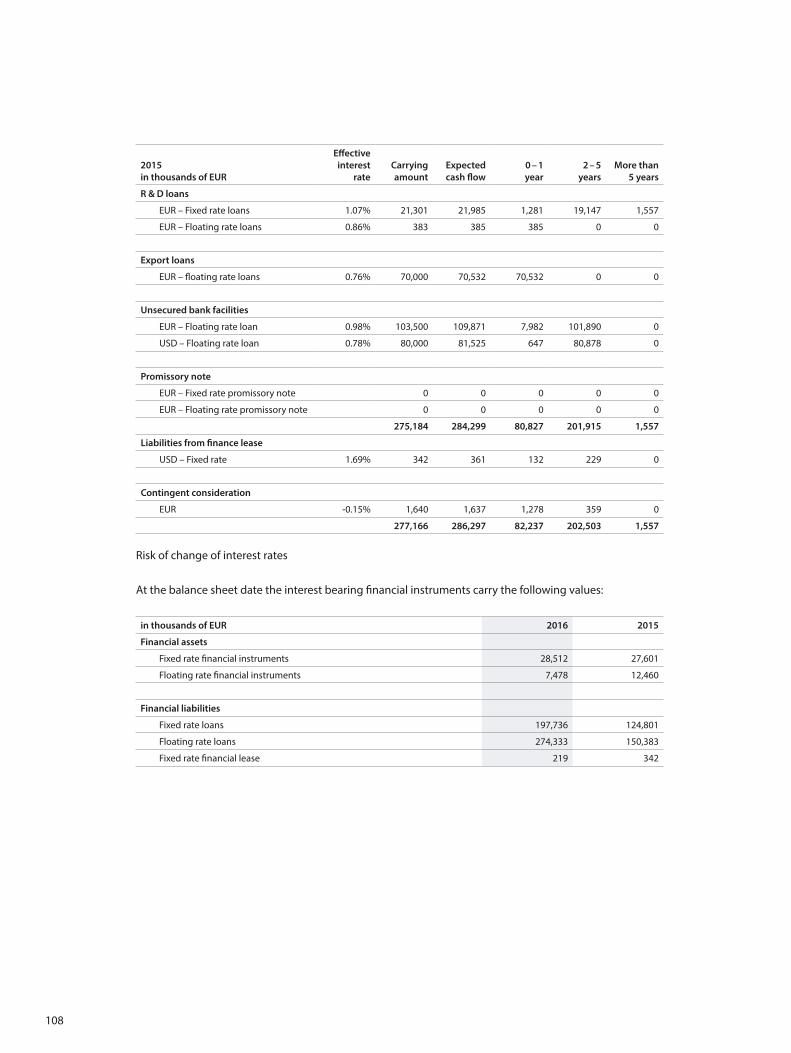
108
2015 in thousands of EUR
Effective interest
rateCarrying amount
Expected cash flow
0 – 1year
2 – 5years
More than5 years
R & D loans
EUR – Fixed rate loans 1.07% 21,301 21,985 1,281 19,147 1,557
EUR – Floating rate loans 0.86% 383 385 385 0 0
Export loans
EUR – floating rate loans 0.76% 70,000 70,532 70,532 0 0
Unsecured bank facilities
EUR – Floating rate loan 0.98% 103,500 109,871 7,982 101,890 0
USD – Floating rate loan 0.78% 80,000 81,525 647 80,878 0
Promissory note
EUR – Fixed rate promissory note 0 0 0 0 0
EUR – Floating rate promissory note 0 0 0 0 0
275,184 284,299 80,827 201,915 1,557
Liabilities from finance lease
USD – Fixed rate 1.69% 342 361 132 229 0
Contingent consideration
EUR -0.15% 1,640 1,637 1,278 359 0
277,166 286,297 82,237 202,503 1,557
Risk of change of interest rates
At the balance sheet date the interest bearing financial instruments carry the following values:
in thousands of EUR 2016 2015
Financial assets
Fixed rate financial instruments 28,512 27,601
Floating rate financial instruments 7,478 12,460
Financial liabilities
Fixed rate loans 197,736 124,801
Floating rate loans 274,333 150,383
Fixed rate financial lease 219 342
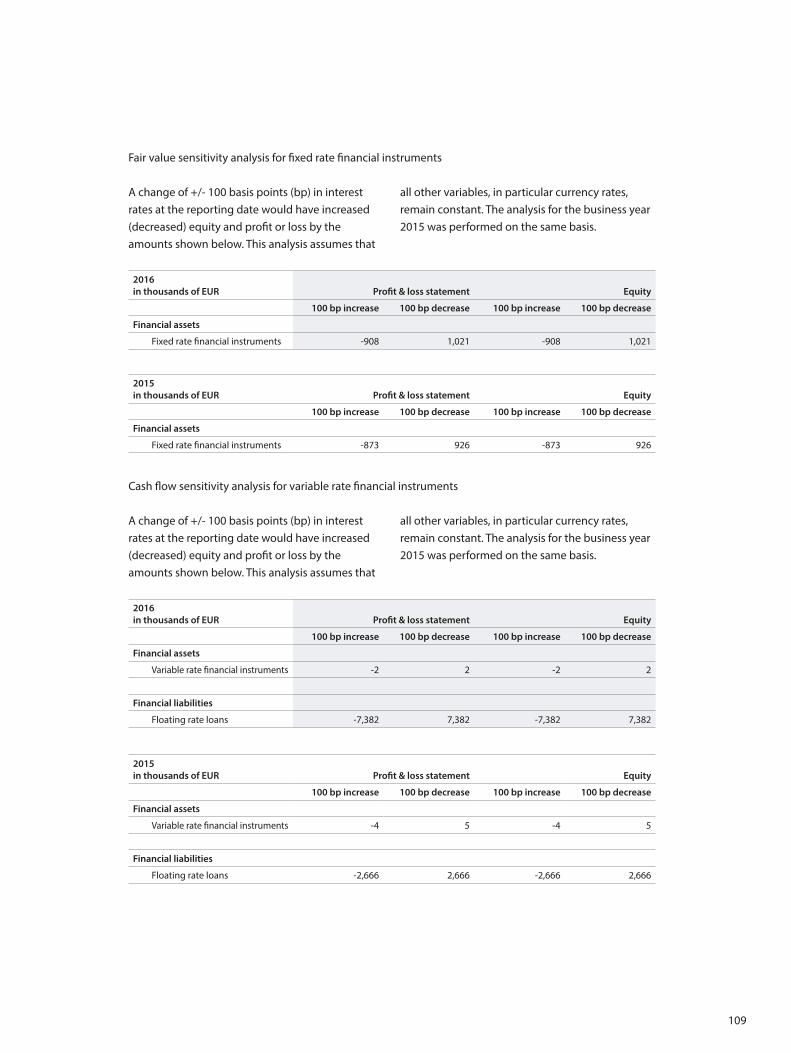
109
Fair value sensitivity analysis for fixed rate financial instruments
A change of +/- 100 basis points (bp) in interest rates at the reporting date would have increased (decreased) equity and profit or loss by the amounts shown below. This analysis assumes that
all other variables, in particular currency rates, remain constant. The analysis for the business year 2015 was performed on the same basis.
2016 in thousands of EUR Profit & loss statement Equity
100 bp increase 100 bp decrease 100 bp increase 100 bp decrease
Financial assets
Fixed rate financial instruments -908 1,021 -908 1,021
2015in thousands of EUR Profit & loss statement Equity
100 bp increase 100 bp decrease 100 bp increase 100 bp decrease
Financial assets
Fixed rate financial instruments -873 926 -873 926
Cash flow sensitivity analysis for variable rate financial instruments
A change of +/- 100 basis points (bp) in interest rates at the reporting date would have increased (decreased) equity and profit or loss by the amounts shown below. This analysis assumes that
all other variables, in particular currency rates, remain constant. The analysis for the business year 2015 was performed on the same basis.
2016 in thousands of EUR Profit & loss statement Equity
100 bp increase 100 bp decrease 100 bp increase 100 bp decrease
Financial assets
Variable rate financial instruments -2 2 -2 2
Financial liabilities
Floating rate loans -7,382 7,382 -7,382 7,382
2015 in thousands of EUR Profit & loss statement Equity
100 bp increase 100 bp decrease 100 bp increase 100 bp decrease
Financial assets
Variable rate financial instruments -4 5 -4 5
Financial liabilities
Floating rate loans -2,666 2,666 -2,666 2,666
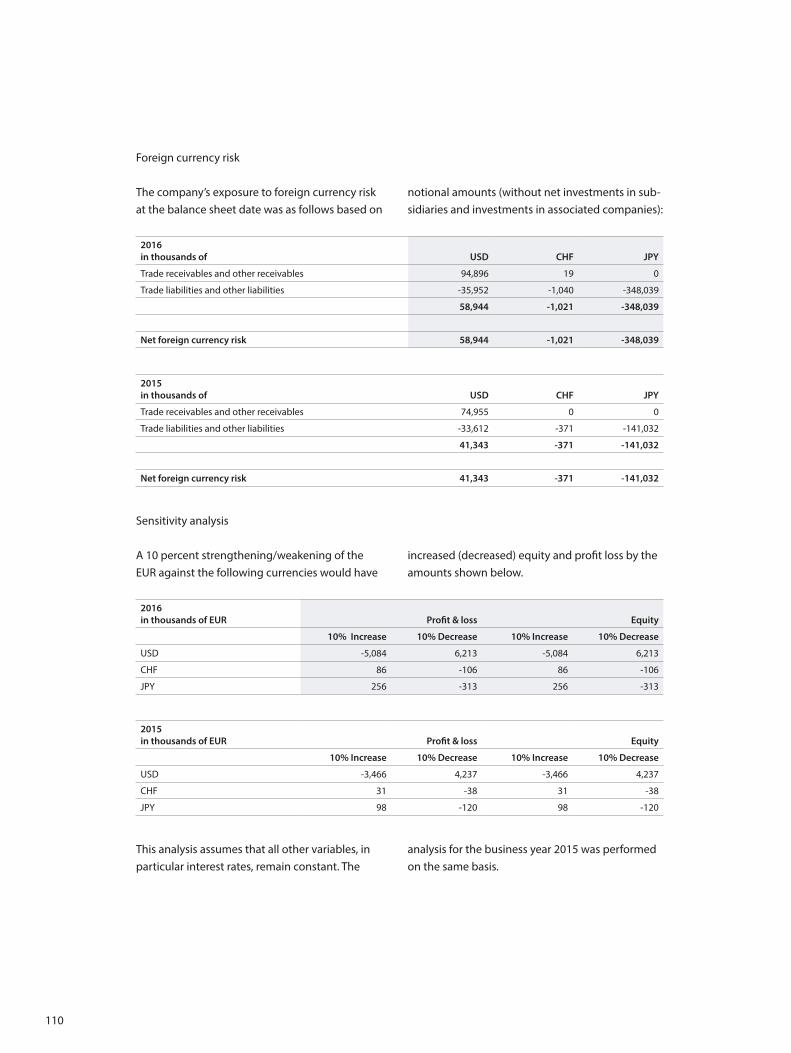
110
Foreign currency risk
The company’s exposure to foreign currency risk at the balance sheet date was as follows based on
notional amounts (without net investments in sub-sidiaries and investments in associated companies):
2016in thousands of USD CHF JPY
Trade receivables and other receivables 94,896 19 0
Trade liabilities and other liabilities -35,952 -1,040 -348,039
58,944 -1,021 -348,039
Net foreign currency risk 58,944 -1,021 -348,039
2015in thousands of USD CHF JPY
Trade receivables and other receivables 74,955 0 0
Trade liabilities and other liabilities -33,612 -371 -141,032
41,343 -371 -141,032
Net foreign currency risk 41,343 -371 -141,032
Sensitivity analysis
A 10 percent strengthening/weakening of the EUR against the following currencies would have
increased (decreased) equity and profit loss by the amounts shown below.
2016 in thousands of EUR Profit & loss Equity
10% Increase 10% Decrease 10% Increase 10% Decrease
USD -5,084 6,213 -5,084 6,213
CHF 86 -106 86 -106
JPY 256 -313 256 -313
2015 in thousands of EUR Profit & loss Equity
10% Increase 10% Decrease 10% Increase 10% Decrease
USD -3,466 4,237 -3,466 4,237
CHF 31 -38 31 -38
JPY 98 -120 98 -120
This analysis assumes that all other variables, in particular interest rates, remain constant. The
analysis for the business year 2015 was performed on the same basis.
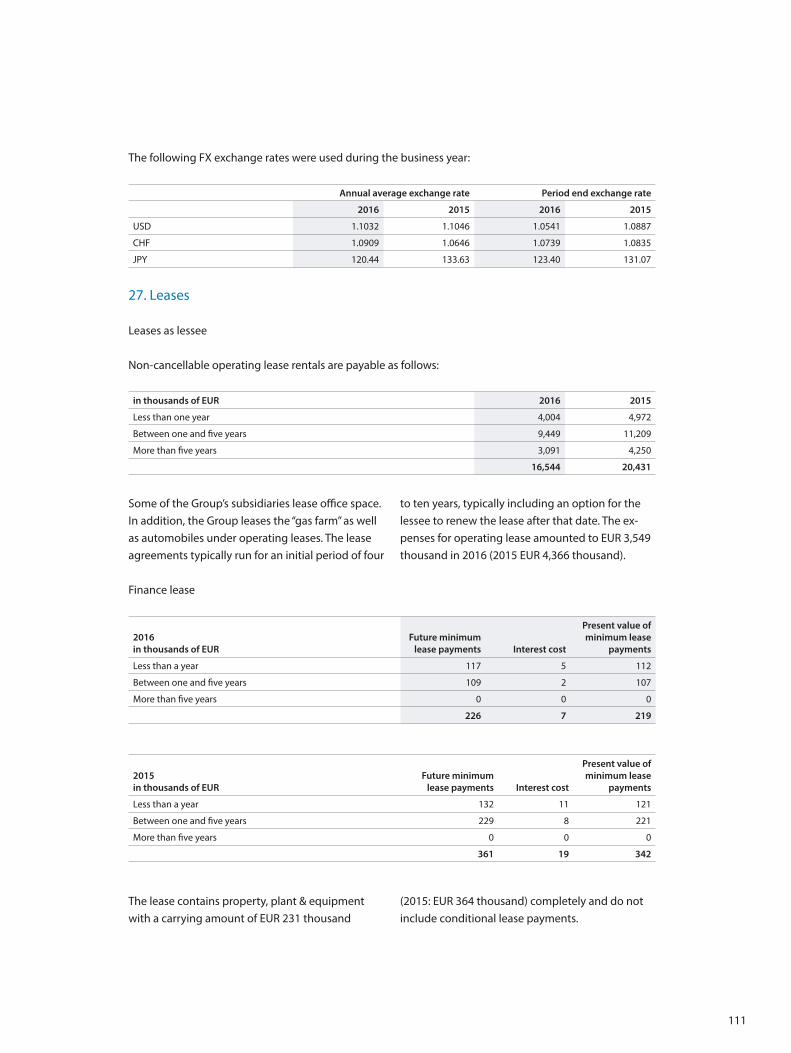
111
The following FX exchange rates were used during the business year:
Annual average exchange rate Period end exchange rate
2016 2015 2016 2015
USD 1.1032 1.1046 1.0541 1.0887
CHF 1.0909 1.0646 1.0739 1.0835
JPY 120.44 133.63 123.40 131.07
27. Leases
Leases as lessee
Non-cancellable operating lease rentals are payable as follows:
in thousands of EUR 2016 2015
Less than one year 4,004 4,972
Between one and five years 9,449 11,209
More than five years 3,091 4,250
16,544 20,431
Some of the Group’s subsidiaries lease office space. In addition, the Group leases the “gas farm” as well as automobiles under operating leases. The lease agreements typically run for an initial period of four
to ten years, typically including an option for the lessee to renew the lease after that date. The ex-penses for operating lease amounted to EUR 3,549 thousand in 2016 (2015 EUR 4,366 thousand).
Finance lease
2016 in thousands of EUR
Future minimum lease payments Interest cost
Present value of minimum lease
payments
Less than a year 117 5 112
Between one and five years 109 2 107
More than five years 0 0 0
226 7 219
2015 in thousands of EUR
Future minimum lease payments Interest cost
Present value of minimum lease
payments
Less than a year 132 11 121
Between one and five years 229 8 221
More than five years 0 0 0
361 19 342
The lease contains property, plant & equipment with a carrying amount of EUR 231 thousand
(2015: EUR 364 thousand) completely and do not include conditional lease payments.
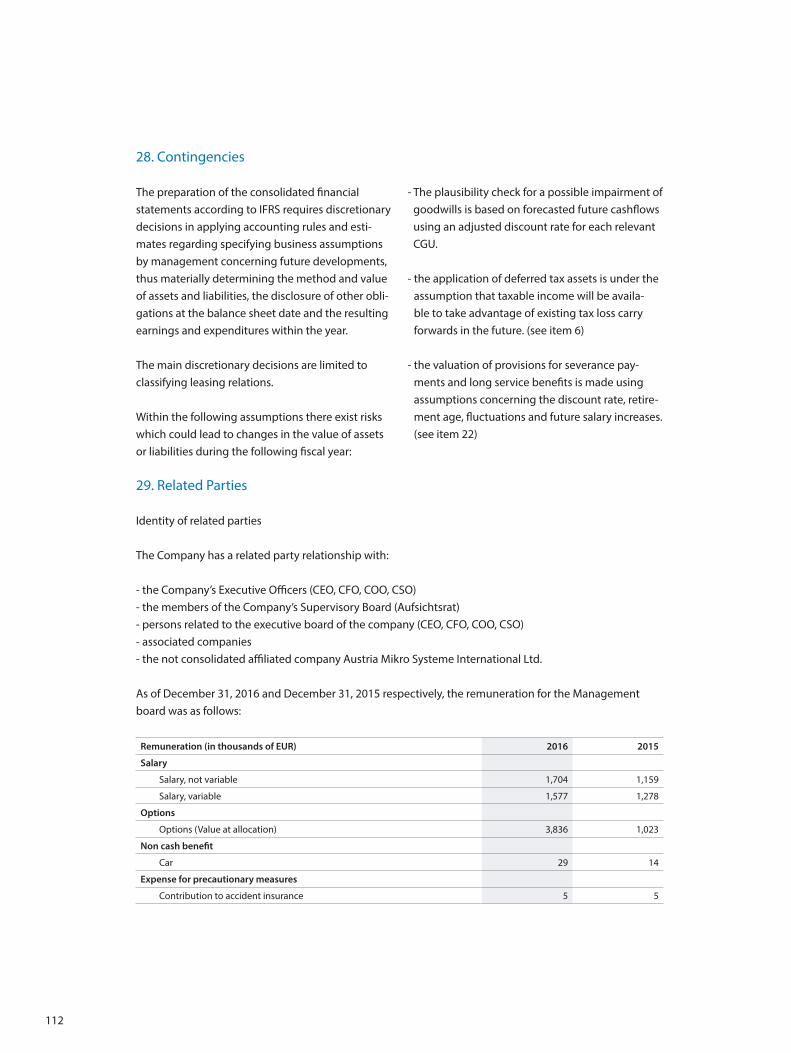
112
28. Contingencies
The preparation of the consolidated financial statements according to IFRS requires discretionary decisions in applying accounting rules and esti-mates regarding specifying business assumptions by management concerning future developments, thus materially determining the method and value of assets and liabilities, the disclosure of other obli-gations at the balance sheet date and the resulting earnings and expenditures within the year.
The main discretionary decisions are limited to classifying leasing relations.
Within the following assumptions there exist risks which could lead to changes in the value of assets or liabilities during the following fiscal year:
- The plausibility check for a possible impairment of goodwills is based on forecasted future cashflows using an adjusted discount rate for each relevant CGU.
- the application of deferred tax assets is under the assumption that taxable income will be availa-ble to take advantage of existing tax loss carry forwards in the future. (see item 6)
- the valuation of provisions for severance pay-ments and long service benefits is made using assumptions concerning the discount rate, retire-ment age, fluctuations and future salary increases. (see item 22)
29. Related Parties
Identity of related parties
The Company has a related party relationship with:
- the Company’s Executive Officers (CEO, CFO, COO, CSO)- the members of the Company’s Supervisory Board (Aufsichtsrat)- persons related to the executive board of the company (CEO, CFO, COO, CSO)- associated companies- the not consolidated affiliated company Austria Mikro Systeme International Ltd.
As of December 31, 2016 and December 31, 2015 respectively, the remuneration for the Management board was as follows:
Remuneration (in thousands of EUR) 2016 2015
Salary
Salary, not variable 1,704 1,159
Salary, variable 1,577 1,278
Options
Options (Value at allocation) 3,836 1,023
Non cash benefit
Car 29 14
Expense for precautionary measures
Contribution to accident insurance 5 5
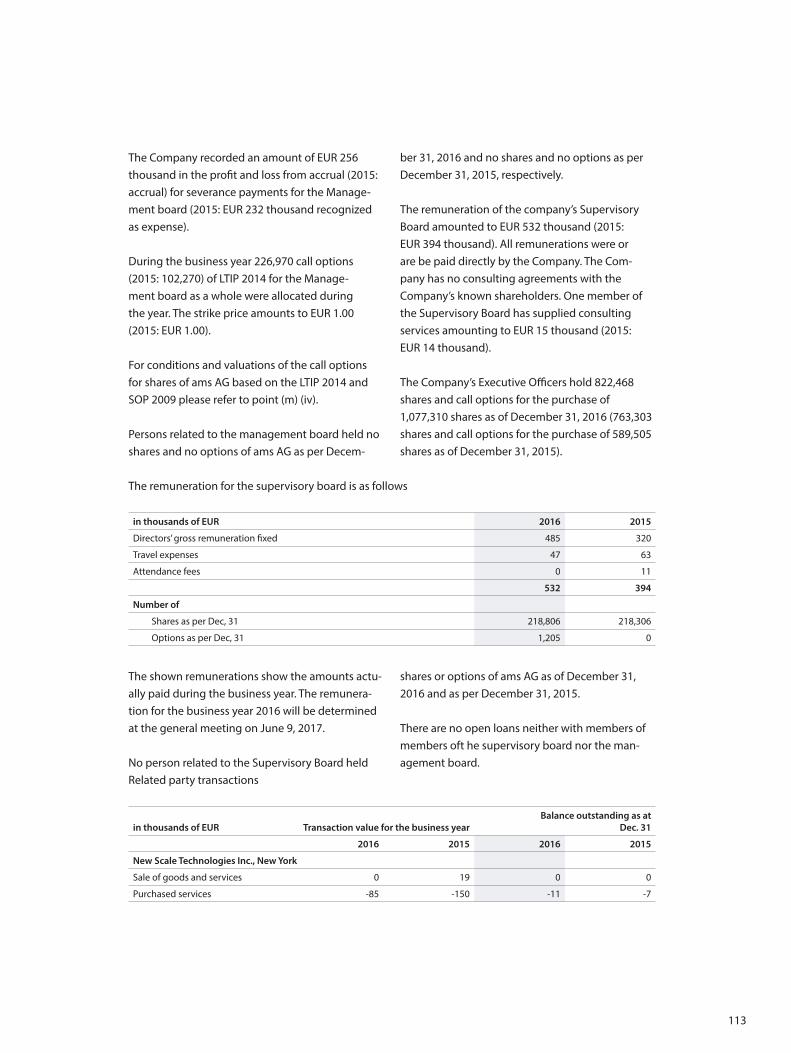
113
The Company recorded an amount of EUR 256 thousand in the profit and loss from accrual (2015: accrual) for severance payments for the Manage-ment board (2015: EUR 232 thousand recognized as expense).
During the business year 226,970 call options (2015: 102,270) of LTIP 2014 for the Manage-ment board as a whole were allocated during the year. The strike price amounts to EUR 1.00 (2015: EUR 1.00).
For conditions and valuations of the call options for shares of ams AG based on the LTIP 2014 and SOP 2009 please refer to point (m) (iv).
Persons related to the management board held no shares and no options of ams AG as per Decem-
ber 31, 2016 and no shares and no options as per December 31, 2015, respectively.
The remuneration of the company’s Supervisory Board amounted to EUR 532 thousand (2015: EUR 394 thousand). All remunerations were or are be paid directly by the Company. The Com-pany has no consulting agreements with the Company’s known shareholders. One member of the Supervisory Board has supplied consulting services amounting to EUR 15 thousand (2015: EUR 14 thousand).
The Company’s Executive Officers hold 822,468 shares and call options for the purchase of 1,077,310 shares as of December 31, 2016 (763,303 shares and call options for the purchase of 589,505 shares as of December 31, 2015).
The remuneration for the supervisory board is as follows
in thousands of EUR 2016 2015
Directors’ gross remuneration fixed 485 320
Travel expenses 47 63
Attendance fees 0 11
532 394
Number of
Shares as per Dec, 31 218,806 218,306
Options as per Dec, 31 1,205 0
The shown remunerations show the amounts actu-ally paid during the business year. The remunera-tion for the business year 2016 will be determined at the general meeting on June 9, 2017.
No person related to the Supervisory Board held
shares or options of ams AG as of December 31, 2016 and as per December 31, 2015.
There are no open loans neither with members of members oft he supervisory board nor the man-agement board.
Related party transactions
in thousands of EUR Transaction value for the business yearBalance outstanding as at
Dec. 31
2016 2015 2016 2015
New Scale Technologies Inc., New York
Sale of goods and services 0 19 0 0
Purchased services -85 -150 -11 -7
114
Identity of associated companies:
New Scale Technologies Inc., Victor, New York (USA): Creates disruptively small motion systems. Based on its patented micro-motor technology, New Scale Technlogy Inc. invents, manufactures and sells miniature ultrasonic motors and integrated positioning systems.
RFMicron Inc., Austin, Texas (USA):The company is a developer of next generation RFID Micro Chips and platforms for itemized tracking applications.
These investements are of strategic nature.
30. Contingencies
There are no contingencies (2015: EUR 600 thousand) (see item 14)
Contingent liabilities amount to EUR 481 thousand (2015: EUR 493 thousand).
31. Remuneration for the Auditors
The expense for the auditor’s remuneration for the audit of the financial statements and annual consolidated financial statements 2015 amounted
to EUR 160,000.00. For other consultancy services EUR 91,721.37 have been expensed.
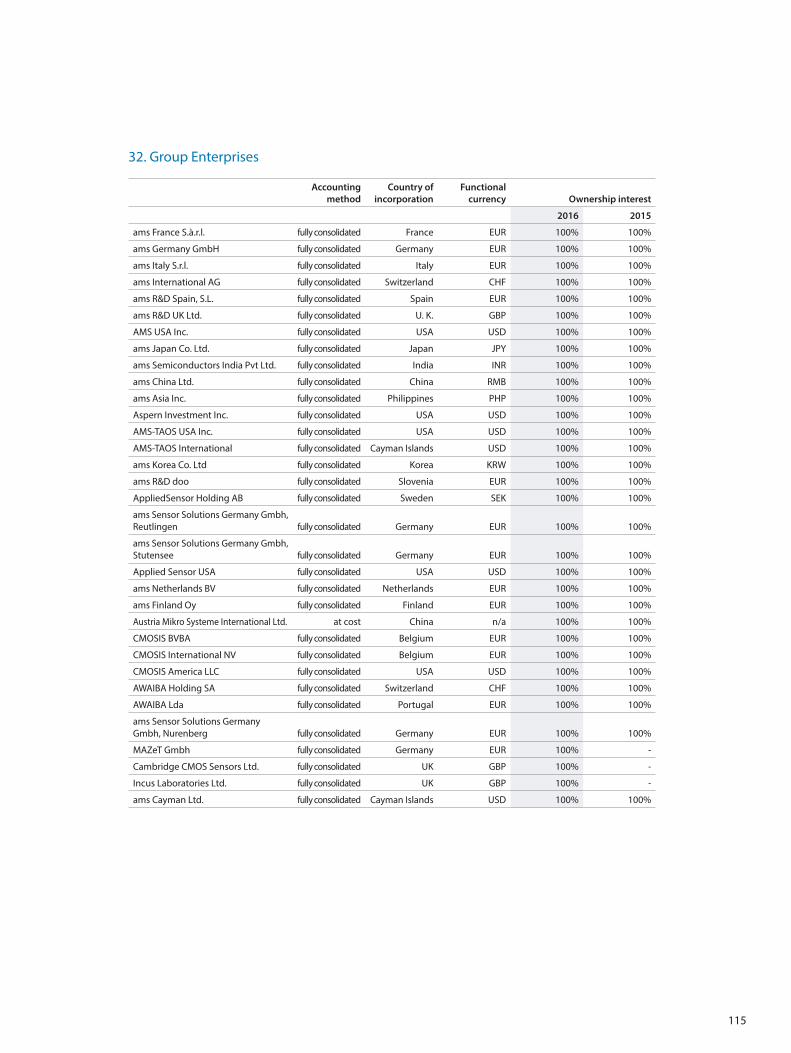
115
32. Group Enterprises
Accounting method
Country of incorporation
Functional currency Ownership interest
2016 2015
ams France S.à.r.l. fully consolidated France EUR 100% 100%
ams Germany GmbH fully consolidated Germany EUR 100% 100%
ams Italy S.r.l. fully consolidated Italy EUR 100% 100%
ams International AG fully consolidated Switzerland CHF 100% 100%
ams R&D Spain, S.L. fully consolidated Spain EUR 100% 100%
ams R&D UK Ltd. fully consolidated U. K. GBP 100% 100%
AMS USA Inc. fully consolidated USA USD 100% 100%
ams Japan Co. Ltd. fully consolidated Japan JPY 100% 100%
ams Semiconductors India Pvt Ltd. fully consolidated India INR 100% 100%
ams China Ltd. fully consolidated China RMB 100% 100%
ams Asia Inc. fully consolidated Philippines PHP 100% 100%
Aspern Investment Inc. fully consolidated USA USD 100% 100%
AMS-TAOS USA Inc. fully consolidated USA USD 100% 100%
AMS-TAOS International fully consolidated Cayman Islands USD 100% 100%
ams Korea Co. Ltd fully consolidated Korea KRW 100% 100%
ams R&D doo fully consolidated Slovenia EUR 100% 100%
AppliedSensor Holding AB fully consolidated Sweden SEK 100% 100%
ams Sensor Solutions Germany Gmbh, Reutlingen fully consolidated Germany EUR 100% 100%
ams Sensor Solutions Germany Gmbh, Stutensee fully consolidated Germany EUR 100% 100%
Applied Sensor USA fully consolidated USA USD 100% 100%
ams Netherlands BV fully consolidated Netherlands EUR 100% 100%
ams Finland Oy fully consolidated Finland EUR 100% 100%
Austria Mikro Systeme International Ltd. at cost China n/a 100% 100%
CMOSIS BVBA fully consolidated Belgium EUR 100% 100%
CMOSIS International NV fully consolidated Belgium EUR 100% 100%
CMOSIS America LLC fully consolidated USA USD 100% 100%
AWAIBA Holding SA fully consolidated Switzerland CHF 100% 100%
AWAIBA Lda fully consolidated Portugal EUR 100% 100%
ams Sensor Solutions Germany Gmbh, Nurenberg fully consolidated Germany EUR 100% 100%
MAZeT Gmbh fully consolidated Germany EUR 100% -
Cambridge CMOS Sensors Ltd. fully consolidated UK GBP 100% -
Incus Laboratories Ltd. fully consolidated UK GBP 100% -
ams Cayman Ltd. fully consolidated Cayman Islands USD 100% 100%
116
Michael Wachsler-Markowitsch
Management Board MemberCFO
33. Events after the Balance Sheet Date
On January 24, 2017 the Company completed the transaction to acquire 100% of the shares in Hepta-gon and the related capital increase of 11,011,281 new shares from authorized capital excluding subscription rights. Heptagon is the worldwide leader in high performance optical packaging and
micro-optics. The upfront consideration for the transaction includes approximately USD 64 million in cash, 5,450,586 ams shares from currently held treasury shares as well as 11,011,281 new shares from authorized capital.
Unterpremstätten, February 27, 2017
Alexander Everke
Management Board MemberCEO
Dr. Thomas Stockmeier
Management Board MemberCOO
Kirk S. Laney
Management Board MemberCSO

117
118
Auditor’s Report
Report on the Consolidated Financial Statements
Audit OpinionWe have audited the consolidated financial state-ments of ams AG, Premstätten and its subsidiaries (the Group which comprise the consolidated balance sheet as at 31 December 2016, the consol-idated statement of comprehensive income, the consolidated statement of cash flows and the con-solidated statement of changes in equity for the year then ended, and the notes to the consolidated financial statements. In our opinion, the consolidated financial state-ments present fairly, in all material respects, the consolidated financial position of the Group as of 31 December 2016, and its consolidated financial performance and consolidated cash flows for the year then ended in accordance with International Financial Reporting Standards as issued by the International Accounting Standards Board and as adopted by the EU (IFRS).
Basis for our OpinionWe conducted our audit in accordance with Austrian Standards on Auditing. These standards require the audit to be conducted in accordance with International Standards on Auditing (ISA). Our responsibilities pursuant to these rules and standards are described in the “Auditors’ Responsi-bility” section of our report. We are independent of the audited entity within the meaning of Austrian commercial law and professional regulations, and have fulfilled our other responsibilities under those relevant ethical requirements. We believe that the audit evidence we have obtained is sufficient and appropriate to provide a basis for our audit opinion.
Key Audit MattersKey audit matters are those matters that, in our professional judgment, were of most significance in our audit of the consolidated financial statements. Our audit procedures relating to these matters were designed in the context of our audit of the consolidated financial statements as a whole. Our opinion on the consolidated financial statements is not modified with respect to any of the key audit matters described below, and we do not express an opinion on these individual matters.
Transactions / M&ARefer to notes section 1.d)
Risk for the Financial Statementsams AG frequently engages in acquisitions and disposals of business components. In 2016, ams AG disposed of major parts of the Wireless Connectivity Business and acquired three entities, Cambridge CMOS Sensors Ltd, MAZeT GmbH and Incus Laboratories Ltd. Proceeds from disposal of the Wireless Connectivity Business amounted to EUR 62,2 million, of which EUR 12,9 million are con-tingent on future operating results of the compo-nent disposed. The acquisition costs for the newly acquired entities are EUR 81,4 million, thereof EUR 34,0 million contingent consideration, resulting in an increase in goodwill of EUR 68,2 million.
Accounting for disposals and acquisitions requires the application of complex accounting policies (IFRS 3) and involves significant judgments and assumptions. For the financial statements, this leads to the risk that methods used for acquisition accounting, especially the allocation of acquisition cost to assets acquired and liabilities assumed, are
119
not in accordance with IFRS 3, assumptions and other inputs involved in required valuations are not reasonably estimated or disposals are not recog-nized at the right point of time or at the correct amount in the financial statements.
Our responseWith respect to the accounting for the transactions, we have read the relevant parts of the purchase/sale agreements, obtained an understanding of the deal structure and assessed whether the accounting treatment in accordance with IFRS 3 has been appropriately applied. This comprises the judgement whether the entity acquired constitutes a business and whether the acquisition date has been properly determined.
We have evaluated the determination of the contingent parts of sales and purchase consider-ations, tested the valuations used for the alloca-tion of acquisition cost and underlying valuation assumptions for reasonableness and re-performed the calculation of goodwill. In addition we have as-sessed whether the disclosures in the notes to the financial statements are in line with the require-ments of IFRS 3.
Valuation of GoodwillRefer to notes section 12
Risk for the Financial StatementsUnder IFRSs, the Company is required to test the amount of goodwill for impairment, annually and if there is a triggering event for testing. At December 31, 2016, goodwill amounted to EUR 421 million.Goodwill impairment tests require the application of an appropriate assessment process and the defi-nition of significant assumptions and other inputs. In particular, there is a risk that
- Cash generating units (CGU) are not properly defined,
- Methods used for impairment testing are not in accordance with IAS 36 or
- Assumptions and other inputs not reasonably estimated.
Our responseOur audit procedures included, amongst others, the involvement of our own valuation expert to assist us in evaluating the methodologies and assumptions used by the Company, in particular those relating to the determination of multiples and discount rates in the plausibility check. We have evaluated the sales and margin projections used in the plausibility check based on information available for each CGU, and assessed the historical accuracy of management’s estimates by comparing plans for prior periods with the actual results.
We also assessed the adequacy and completeness of the disclosures in Note 12 Goodwill.
Accounting for Income Tax PositionsRefer to notes section 6, 15 and 19
Risk for the Financial Statementsams AG’s business activities are located in a large number of legislations spread over virtually all are-as of the world. Consequently, the Group is subject to various different tax jurisdictions and resulting obligations. In addition, the relevant financial re-porting standards, especially IAS 12 Income Taxes, contain comprehensive rules that require estimates on future developments and involve a high degree of complexity in their application.
This may lead to a situation where current or de-ferred taxes are not correctly determined, existing
120
tax obligations are not properly recognized and tax risks are not appropriately assessed, or tax receivables and deferred tax assets cannot be used. For the financial statements, there is a risk of tax liabilities or provisions being omitted or understat-ed or of tax receivables or deferred tax assets being overstated.
Our responseWe have tested the completeness and accuracy of the amounts reported for current and deferred tax. In this area our audit procedures included, amongst others, assessment of correspondence with the relevant tax authorities and obtaining information and confirmations from the Group’s external tax advisors. Based on this information we have obtained an understanding about the tax sta-tus of ams AG and significant group components.We have involved our tax specialists to assist us in assessing whether current taxes and corresponding tax liabilities are complete, accurate and reasona-bly valued. Deferred taxes recognized in the con-solidated financial statements have been evaluated by us with respect to their agreement with IAS 12 and mathematical accuracy. In order to confirm the valuation of deferred tax assets we have reviewed the respective tax planning, underlying assump-tions and forward-looking estimates.
We also assessed the disclosures included in the notes to the financial statements as to their accura-cy and completeness
Revenue recognitionRefer to notes section 2
Risk for the Financial Statementsams AG recognizes revenue from the sale of its products when the risks and rewards of the un-
derlying products have been transferred to the re-spective customer based on agreed delivery terms (Incoterms). Revenue for contracts with customers that involve the development of products (con-struction contracts) is recognized at the contract’s completion, because the outcome of the contract cannot be reliably estimated.
For the financial statements there is a risk that, in particular,
- Revenue cut off errors may lead to revenues being recognized in the wrong period,
- Amounts which do not constitute revenue are recognized as revenue due to fraud or error
- Rights of customers, especially return rights not properly considered.
Our responseBased on underlying documents and inquiries of sales and accounting personnel, we have obtained an understanding of all significant classes of sales transactions. Based on this understanding we have assessed whether the Company’s revenue recogni-tion policies are in accordance with IFRS account-ing standards.
We have tested, on a sample basis, the effective-ness of the company’s internal controls over the correct timing of revenue recognition. This includ-ed the test of relevant automated IT application controls by our own IT expert.
In order to obtain audit evidence on the existence on revenue transactions we have requested written confirmations from customers, above all from major customers, on a sample basis. For situations where the responses showed differences or where we were not able to obtain a response in time,
121
we have confirmed the existence of the respec-tive receivables and revenues by means of other evidence, such as delivery documents or payments received.
For revenue recognized during the last days of the business year, we have verified, based on fright documents, whether the required conditions for revenue recognition were met. In addition, we have vouched credit notes issued after the balance sheet date and have evaluated whether there are indica-tions that revenues recognized in the business year need to be reversed.
Management’s Responsibility and Responsibility of the Audit Committee for the Consolidated Financial Statements The Company’s management is responsible for the preparation and fair presentation of these consolidated financial statements in accordance with International Financial Reporting Standards (IFRSs) as issued by the International Accounting Standards Board and as adopted by the EU, and the additional requirements pursuant to Section 245a UGB (Austrian Commercial Code) and for such internal control as management determines is necessary to enable the preparation of consolidat-ed financial statements that are free from material misstatement, whether due to fraud or error.Management is also responsible for assessing the Group’s ability to continue as a going concern, and, where appropriate, to disclose matters that are relevant to the Group’s ability to continue as a going concern and to apply the going concern assumption in its financial reporting, except in circumstances in which liquidation of the Group or closure of operations is planned or cases in which such measures appear unavoidable.
The audit committee is responsible for overseeing the Group’s financial reporting process.
Auditors’ Responsibility Our aim is to obtain reasonable assurance about whether the consolidated financial statements as a whole are free of material misstatements, whether due to fraud or error, and to issue an audit report that includes our opinion. Reasonable assurance represents a high degree of assurance, but provides no guarantee that an audit conducted in accord-ance with Austrian Standards on Auditing, which require the audit to be performed in accordance with ISA, will always detect a material misstate-ment when it exists. Misstatements may result from fraud or error and are considered material if they could, individually or in the aggregate, reasonably be expected to influence the economic decisions of users taken on the basis of these consolidated financial statements.
As part of an audit in accordance with Austrian Standards on Auditing, which require the audit to be performed in accordance with ISA, we exercise professional judgment and retain professional skepticism throughout the audit.
Moreover:- We identify and assess the risks of material mis-
statement of the consolidated financial state-ments, whether due to fraud or error, we plan and perform procedures to address such risks and obtain sufficient and appropriate audit evidence to serve as a basis for our audit opinion. The risk that material misstatements due to fraud remain undetected is higher than that of material mis-statements due to error, since fraud may include collusion, forgery, intentional omissions, mislead-ing representation or override of internal control.
122
- We obtain an understanding of internal control relevant to the audit in order to design audit procedures that are appropriate in the circum-stances, but not for the purpose of expressing an opinion on the effectiveness of the entity’s internal control.
- We evaluate the appropriateness of accounting policies used and the reasonableness of account-ing estimates as well as related disclosures made by management.
- We conclude on the appropriateness of manage-ment’s use of the going concern assumption and, based on the audit evidence obtained, whether a material uncertainty exists related to events or conditions that may cast significant doubt on the entity’s ability to continue as a going concern. In case we conclude that there is a material uncer-tainty about the entity’s ability to continue as a going concern, we are required to draw attention to the respective note in the financial statements in our audit report or, in case such disclosures are not appropriate, to modify our audit opinion. We conclude based on the audit evidence obtained until the date of our audit report. Future events or conditions however may result in the Company departing from the going concern assumption.
- We evaluate the overall presentation, structure and content of the consolidated financial state-ments, including the disclosures, and whether the consolidated financial statements represent the underlying transactions and events in a manner that achieves fair presentation.
- We obtain sufficient appropriate audit evidence regarding the financial information of the entities
and business activities within the Group to express an opinion on the consolidated financial statements. We are responsible for the direc-tion, supervision and performance of the group audit. We remain solely responsible for our audit opinion.
- We communicate with the audit committee re-garding, among other matters, the planned scope and timing of our audit as well as significant findings including any significant deficiencies in internal control that we identify in the course of our audit.
- We report to the audit committee that we have complied with the relevant professional require-ments in respect of our independence and that we will report any relationships and other events that could reasonably affect our independence and, where appropriate, related measures taken to ensure our independence.
- From the matters communicated with the audit committee we determine those matters that re-quired significant auditor attention in performing the audit and which are therefore key audit mat-ters. We describe these key audit matters in our audit report except in the circumstances where laws or other legal regulations forbid publication of such matter or in very rare cases, we determine that a matter should not be included in our audit report because the negative effects of such com-munication are reasonably expected to outweigh its benefits for the public interest.
123
Report on Other Legal Requirements
Group Management ReportIn accordance with the Austrian Commercial Code the group management report is to be audited as to whether it is consistent with the consolidated financial statements and as to whether it has been prepared in accordance with legal requirements.
The legal representatives of the Company are responsible for the preparation of the group man-agement report in accordance with the Austrian Commercial Code.
We have conducted our audit in accordance with generally accepted standards on the audit of group management reports as applied in Austria.
OpinionIn our opinion, the group management report has been prepared in accordance with legal require-ments and is consistent with the consolidated financial statements. The disclosures pursuant to Section 243a UGB (Austrian Commercial Code) are appropriate.
StatementBased on our knowledge gained in the course of the audit of the consolidated financial statements and the understanding of the Group and its envi-ronment, we did not note any material misstate-ments in the group management report.
Other InformationThe legal representatives of the Company are re-sponsible for other information. Other information comprises all information provided in the annual report, with the exception of the consolidated fi-nancial statements, the group management report, and the auditor’s report thereon. We expect the annual report to be provided to us after the date of the opinion.
Our opinion on the consolidated financial state-ments does not cover other information, and we will not provide any kind of assurance on it.
In conjunction with our audit, it is our responsi-bility to read this other information as soon as it becomes available, and to assess whether it contains any material inconsistencies with the con-solidated financial statements and our knowledge gained during our audit, or any apparent material misstatement of fact.
124
Engagement PartnerThe engagement partner is Mr Helmut Kerschbaumer.
Vienna, 27 February 2017
KPMG Austria GmbH Wirtschaftsprüfungs- und Steuerberatungsgesellschaft
signed by:
Mag. Helmut Kerschbaumer Wirtschaftsprüfer
(Austrian Chartered Accountant)
This report is a translation of the original report in German, which is solely valid. Publication of the consolidated financial statements together with our auditor’s opinion may only be made if the consolidated financial statements and the group management report are identical with the audited version attached to this report. Section 281 Section 2 UGB (Austrian Commercial Code) applies.
125
Glossary
3D sensing Sensing technologies incorporating the acquisition of depth information to capture image or spatial data in three dimensions
CMOS Complementary metal-oxide-semiconductor; a widely used technology for constructing integrated circuits (ICs)
Internet of Things (IoT) Network of physical objects fitted with electronics in-cluding sensors and network connections that enables these objects to collect and exchange data for remote sensing and control
MEMS microphone Microphone based on a pressure-sensitive diaphragm etched into a silicon wafer as a microelectro-mechanical structure, also called silicon microphone
NFC Near Field Communication; wireless technology for secure short-distance data transmission
126
Imprint
ams AGInvestor RelationsMoritz M. GmeinerTobelbader Strasse 308141 Premstaetten AustriaTelefon +43 3136 500-31211Fax +43 3136 [email protected]
All images and graphs © ams AG All information is subject to misprints and typographical errors.
Illustrations: Tanja AranovychDesign and layout: Rubikon Werbeagentur, Graz (www.rubikon.at)
This report has been printed on Munken Polar 130g and 300g which is FSC certified.

www.ams.com