Embed Size (px)
Citation preview

ATLAS.COM.MT
i
ANNUAL REPORT & AUDITED FINANCIAL STATEMENTS - 2016
atlas.com.mt
Annual Report 2016

ANNUAL REPORT & AUDITED FINANCIAL STATEMENTS - 2016 ATLAS.COM.MT
ii
atlas.com.mtCover Image by Mark MalliaMark Mallia was the featured artist for the Atlas Calendar 2017

ATLAS.COM.MT
1
ANNUAL REPORT & AUDITED FINANCIAL STATEMENTS - 2016
Atlas Insurance PCC LimitedAnnual Report & Audited Financial Statements31 December 2016
2016

ANNUAL REPORT & AUDITED FINANCIAL STATEMENTS - 2016 ATLAS.COM.MT
2
→ OUR VISION
The Atlas Group will be recognised as trusted, long term suppliers of insurance and financial services in Malta and overseas and will provide security and value to all stakeholders with a purpose beyond profit.
→ OUR MISSION
Atlas fosters a respectful environment between staff, clients, intermediaries and suppliers that empowers our people to build on their skills and training to develop and provide innovative, personalised, top quality products while ensuring the consistent delivery of our service promise to exceed our clients’ expectations.
→ OUR CORE VALUES
• Creating value for all stakeholders,• Empowerment and innovation,• Commitment to service,• Passion,• Respect

ATLAS.COM.MT
3
ANNUAL REPORT & AUDITED FINANCIAL STATEMENTS - 2016
→ CONTENTS Chairman’s Statement 4
Chief Executive Officer’s Report 6
Board Members & Board/Executive Committees 8
Offices & branches, Cells and Professional services 9
Corporate Social Responsibility Highlights 10
Directors’ Report 12
Corporate governance - Statement of Compliance 14
Independent Auditor’s Report 18
Profit and Loss Account 21
Statement of Comprehensive Income 22
Balance Sheet 23
Statement of Changes in Equity 24
Statement of Cash Flows 26
Notes to the Financial Statements 28

ANNUAL REPORT & AUDITED FINANCIAL STATEMENTS - 2016 ATLAS.COM.MT
4
2016 has been a particularly challenging year for the Company and despite an increase in claims, the results for Atlas Insurance PCC showed satisfactory performance with increases in revenues and a containment of costs.
We have continued to distinguish ourselves by enhancing the customer experience, strengthening our retail distribution channels and developing further our technology aided services. We have sought to improve efficiency while ensuring that regulations and risk standards are effectively implemented.
→ Economic EnvironmentThe Maltese economy continued to perform well, although the rate of growth was lower than that of the previous year. The gross domestic product grew by 5.0% in real terms. Unemployment has gone down further from 2015 and is now at 4.2%. Total employment has continued to rise and in 2016 increased by 3.1% over 2015. Household consumption rose by 4.2% over the previous year. The annual inflation rate has remained low with a rate of 1.0%. The current account of the balance of payments stood at €783 million (7.9% of the gross domestic product) while the capital account stood at €79 million.
Gross value added of financial and insurance activities increased by 9.4% to €598 million, thereby growing at a faster pace than the rest of the economy. This sector was reported to have employed just over 9,000 persons in 2016, an increase of 5.1% over the previous year.
The local insurance market still presents a number of challenges largely as a result of poor technical results in motor business.
→ Financial ResultsThe total assets of the Company stood at €97.2 million at the end of December 2016, up from €90.0 million the previous year. Net assets increased from €32.7 to €35.4 million. This increase in net assets was nearly all attributable to the Core. A part of this improvement in net assets was generated by the Company’s operations while another important contributor was the revaluation of its office premises and investment properties.
Gross premiums written by the Core have increased by 6.5% in 2016 over 2015 to €23.6 million. Total premiums written by the Company went down by €2.0 million to €42.8 million because of a decrease in premiums written by the Cells. The balance on the Technical Account for the Core decreased to €2.4 million while the balance on the Technical Account of the Cells increased to €2.4 million. The total balance increased to €4.8 million.
Operating expenses remained tightly managed and increased marginally to €2.6 million during 2016.
The investment income accruing to the Core policyholders and shareholders, net of investment costs, for the year experienced a sharp drop in the light of developments in local and international financial markets. It decreased to €1.7 million.
Profit before tax accruing to the Core decreased to €3.0 million while profit before tax for the PCC as a whole decreased minimally to €5.5 million from €5.9 million. Earnings per share for the Core shareholders amounted to €0.92, and the return on capital employed for the PCC as a whole stood at 15.1%.
Dividends amounting to €1.25 million were paid to the Core shareholders in 2016. An interim dividend was proposed by the Board of Directors and paid to the Core shareholders amounting to €0.6 million in February 2017 and at the forthcoming Annual General Meeting, a final dividend of €0.6 million after tax is being proposed by the directors to the Core shareholders. Interim dividends to cell shareholders were also proposed to be paid in February 2017 amounting to €0.49m.
I am pleased to report that, as in past years, the Company continues to show a strong balance sheet which maintains high levels of capital surplus over regulatory requirements. The capital ratio stood at 2.68 times the capital requirement for the Core as on 31 December 2016. Under Solvency II regulation, periodic tests to the Balance Sheet to ensure capital adequacy under the new regime were also carried out and this continues to be well above the Solvency II Capital Requirements.
→ Management and staffOur management and staff have risen to the occasion in the face of the challenges presented in 2016. They continually demonstrate the Atlas values in their work as they seek to exceed our customers’ and shareholders’ expectations. The team led by the CEO, Michael Gatt, has shown great dedication and commitment to maintain the position of prestige that the Company has achieved in the insurance sector. On behalf of the Board, I thank them for their tremendous commitment and the results they have delivered.
The Board has worked closely with the management team to develop the appropriate business strategy for the Company in the light of current circumstances and in assessing and managing risks in line with regulatory requirements.
Chairman’s Statement
ATLAS.COM.MT
5
ANNUAL REPORT & AUDITED FINANCIAL STATEMENTS - 2016
→ Regulatory EnvironmentYears of preparation have come to fruition with EU’s Solvency II regime finally coming into force on 1 January 2016. Our protected cells have particularly benefited from the governance and reporting efficiencies. Enhancements in these areas were extended across the Atlas Group in line with new group supervision requirements. This included widening the scope of the own risk solvency assessment process, which the board actively steers and uses in strategic planning. The board has also established an ongoing relationship with the Company’s actuaries.
Thanks to ongoing investments in business intelligence technology, the Group was able to complete more efficiently and accurately the new extensive quarterly and annual regulatory reporting templates.
The risk appetite statement, which is frequently reviewed, was also extended to cover the Group. The status is reviewed at least quarterly by the Board, Risk and Compliance Committee, and the management team.
The Group actively participates in industry responses to consultation papers and preparing for various new pieces of legislation and regulation which will come into force in 2018 and beyond.
As we have done in the evolving Solvency II environment, we will endeavour to find opportunities to exploit in the ever developing regulatory environment.
→ Board of DirectorsThe Board of Directors has continued to adopt best practice in corporate governance, while evaluating its performance on an annual basis. There has been constant communication between the non-executive directors and the executive directors.
During 2016, the Board has continued to work closely with the Executive Committee in the formulation of business strategy and risk appetite parameters as well as the Own Risks and Solvency Assessment.
Board members also chair four committees, set up to enhance the corporate governance structure. These four committees are the Audit Committee, the Risk and Compliance Committee, the Remuneration, Nominations and Related Parties Transactions Committee and the Investments Committee. The charters of the various committees as well as the various policies of the company are formally reviewed annually to ensure that these policies reflect best practice.
→ Our Contribution to SocietyCorporate social responsibility (CSR) is a business approach that contributes to sustainable development by delivering economic, social and environmental benefits to all stakeholders. It is difficult to be on the forefront on all aspects of CSR and the Group strategy in this area has been to focus our efforts primarily on our contribution to the nation’s health. We continue to believe that as key stakeholders, our staff should be fully involved in our CSR efforts and the promotion of health, sport and fitness. Where possible the Group involves staff members in events or projects it sponsors and supports and staff are actively encouraged to suggest areas of focus. During 2016 we continued with our internal programmes including various fitness related programmes to staff as well as a blood donation drive. We increased our support of the Pink October breast cancer awareness campaign and sponsored the Motor Cycle ride and to support the launch of our new iCycle policy we also supported the Alive Charity Foundation and the Life Cycle Challenge .
We continued to support the University of Malta Saħħtek initiative, a major health and wellbeing study and again held an information session for clients and staff in connection with the sponsorship. Other related initiatives included the continuing support of both Melita FC and of Pitch 22, a web application developed to assist youth and amateur football clubs to improve communication with players and parents.
During 2016 the Group also sponsored Fondazzjoni Patrimonju Malti as well as Young Enterprise, organisations which we believe enrich our culture and future.
→ OutlookThe challenges posed in 2016 are likely to remain in 2017 and beyond. We will remain focused on improving the performance of the Group and to continue exploiting new opportunities. The great talent and professionalism present in Atlas augurs well for the future and remains a great strength in taking it forward.
On behalf of the Board of Directors I thank the customers for their patronage and their continued trust in the Atlas brand. I also thank the shareholders for the trust they have shown in the Board and their invaluable support.
Lawrence ZammitChairman

ANNUAL REPORT & AUDITED FINANCIAL STATEMENTS - 2016 ATLAS.COM.MT
6
→ OverviewThe operating environment in 2016 remained challenging characterised unfortunately by continued losses in the motor class of business as well as lower investment returns in comparison to what we have been accustomed to in the recent past. Notwithstanding, our underlying fundamentals remain strong and performance was satisfactory with gross premiums written by the Core increasing by 6.5%. When taking into consideration the health premiums written through our fully owned subsidiary Atlas Healthcare Insurance Agency Ltd (AHIAL) premiums grew by 7.3%. The combined gross written premiums reported for the year reached a record high of €32.1 million. In addition a further €19.2 million of gross premiums were written in the cells thereby reaching an overall premium of €51.3 million. The financial results of the Company reflect only the dividend income from AHIAL.
Generally, the Maltese economy performed well and the outlook remains favourable. New investment projects, increased labour market participation and strong services exports should be the primary drivers of growth. Real GDP growth in 2016 reached 5%.
Our distribution network has contributed to the overall growth of the Company. We currently have nine branches evenly spread throughout Malta besides our two offices in Ta’ Xbiex and we will be further expanding our network soon by opening a tenth branch in Zebbug. We are proud to have Tied Insurance Intermediaries with their own offices which may be small in number but relevant in contribution. Our Tied Insurance Insurance Intermediary network complements our branch network and, as strategic partners, they support and help us to achieve our long term growth objectives. In 2016 we further strengthened our relationship with the leading brokers on the island and continued to work closely with them as we have done for a great number of years.
→ PerformanceAtlas Insurance PCC Ltd reported a profit before tax for the Core of €3.0 million for the year ended 31 December 2016. This represents a decrease of €1.0m or 25% on the previous year. Profit after tax at €2.2 million was also down on the previous year’s €2.6 million.
The cells produced a profit before tax of €2.5 million, an increase of 32.5% on the previous year’s profits resulting in a total profit before tax for the Core and the cells combined of €5.5 million and a net profit after tax of €3.7 million compared to €3.8 million in 2015.
2016 results were once again negatively impacted by poor motor results. With the ever increasing number of cars and motor cycles on the road, we are experiencing an increase in claims both in frequency and also in severity, most of all in the number of bodily injury claims and fatalities which have increased significantly over the last two years. This has resulted in a combined loss ratio of 108.7% in 2016 albeit an improvement on the previous year’s 122.2%. We have been addressing the situation over the past two years by adjusting premiums to reflect today’s reality and we will continue to do so until the motor class of business is self-sustainable. We seek to get optimum value on repair and parts replacement costs and at the same time we give due attention and importance to the quality of repairs so that cars are safer when they are back on the road after an accident.
The remaining classes of business generally performed satisfactorily despite having experienced some large material damage and liability losses in 2016. This is reflected in the higher combined loss ratio of 82.7% compared to 73.9% in 2015.
Gross operating expenses were slightly reduced to 26.7% of earned premiums.
The uncertainty and then the eventual surprise victories at the polls for Brexit and Donald Trump caused volatility in the markets throughout 2016 and this had a negative effect on our investment returns which fell very much short of the previous year’s strong performance. The drop in investment income was partly mitigated by a positive revaluation of our real estate property.
With Solvency II having come into effect on 1 January 2016, we continued to enhance our own risk solvency assessment (ORSA) and risk management processes that were extended across the Atlas Group and are now fully engrained in our business planning. A robust and resilient risk culture helps ensure all significant uncertainties are consistently and effectively managed within our risk appetite enabling our board and management to take decisions with more risk-based information. Our latest assessments also continue to confirm that we maintain substantial surplus funds over European capital requirements which will be reported on in our Solvency and Financial Condition Report (SFCR).
Ever-changing regulations can be considered the norm these days. We aim to turn such challenges into opportunities. For example we saw Solvency II as an opportunity to expand our international business with protected cells as we allow their owners to benefit from substantial cost burden sharing and reduced capital requirements versus standalone alternatives. Our expertise in this area was recently recognized when we won European Captive Services Awards’ Best Cell Captive Initiative. And now Brexit presents new opportunities to provide solutions to UK and Gibraltarian captives and insurers wishing to ensure continued access to the single market. Where otherwise regulation could be a barrier to entry for start-ups including insuretechs, Atlas is enabling such new entrants into the insurance market catalysing innovation and growing our knowledge and talent pool in the process.
Chief Executive Officer’s Report

ATLAS.COM.MT
7
ANNUAL REPORT & AUDITED FINANCIAL STATEMENTS - 2016
Our investment in IT continues to extend into various areas of our operations including Customer Relationship Management, Finance, Compliance and IS Security. With increasing human resources and claims costs, investment in IT to enhance automation and enhance the client experience is paramount. Further IT investment was necessary to integrate our new vehicle damage estimation system. Our investment in business intelligence and dashboards is proving to be extremely helpful in providing real time information in the SII environment and our new cash management system which is being deployed this year will further enhance our internal controls system.
Further investment in property has given our clients an all-weather facility for surveying of lightly damaged cars at our Head Office which has proven to be very popular. We continue to upgrade our main client facing areas and investment in PV panels has also continued during the period.
Throughout 2016, the employment market continued to be dominated by the job seeker, with excellent national employment figures which challenged employers across all sectors. Continuing to actively position ourselves as employers of choice in the industry, we are pleased to say that our retention rate was still very acceptable, with our over-5-year retention rising to 63% and retaining our rate of qualified staff at 58%.
As a people driven organisation in an environment characterised by rapid change all round, we focused on utilising our resources, both human and technological, to work smarter and create more employee and therefore client engagement. Our efforts in H.R. concentrated on recruitment, talent management, training, and increasing our work life balance through initiatives that focused on more flexible working hours and reducing commute times. We recognise that organisational agility through our people is a determining factor of success now and in the future.
→ OutlookThe local economy continues to perform well and the outlook remains cautiously favourable. The premium growth in the last two years has been significantly more than in prior years so it will be very challenging to maintain this level of growth. We will ensure that we price our products at reasonable levels and are ready to sacrifice market share particularly in the loss making class of motor insurance. This will, in the long run, enable us to continue to deliver an optimal service to all our claimants when most needed.
The Company is mindful of the need to focus on changes that are happening in the international insurance industry coupled with the requirements of the ever evolving regulatory changes which we must take on board and adopt to our own advantage.
I would like to thank our customers and intermediaries for the trust they have shown in Atlas throughout the years. I would also like to thank management and staff, the Executive Committee and Board of Directors for their support and dedication in 2016.
Michael GattManaging Director
and CEO
‘As a people driven
organisation,
we focused on
utilising our
resources to work
smarter and create
more employee
engagement and
therefore client
engagement.’

ANNUAL REPORT & AUDITED FINANCIAL STATEMENTS - 2016 ATLAS.COM.MT
8
Board Members & Board/Executive Committees
Board of DirectorsLawrence Zammit MA (Econ) – Chairman
Franco Azzopardi MSc (Leicester) FIA CPA – Non Executive
André Camilleri LLD, Dip Econ & Ind Law (Milan) – Non Executive
Catherine Calleja BA (Hons.) ACII – Executive and Company Secretary
Michael Gatt – Managing and CEO
Philip Micallef – Non Executive
Matthew von Brockdorff FCII – Deputy Managing
Audit CommitteeFranco Azzopardi MSc (Leicester) FIA CPA – Chairman
Philip Micallef BSc (Eng), MIEE, C Eng, Eur Ing, MBA. (Warwick)
Lawrence Zammit MA (Econ)
Risk and Compliance CommitteeAndré Camilleri LLD, Dip Econ & Ind Law (Milan) – Chairman
Franco Azzopardi MSc (Leicester) FIA CPA
Catherine Calleja BA(Hons) ACII
Philip Micallef BSc (Eng), MIEE, C Eng, Eur Ing, MBA. (Warwick)
Matthew von Brockdorff FCII
Remuneration, Nominations and Related Parties CommitteeLawrence Zammit MA (Econ) – Chairman
André Camilleri LLD, Dip Econ & Ind Law (Milan)
Philip Micallef BSc (Eng), MIEE, C Eng, Eur Ing, MBA. (Warwick)
Investments CommitteeLawrence Zammit MA (Econ) – Chairman
Franco Azzopardi MSc (Leicester) FIA CPA
John P Bonett
André Camilleri LLD, Dip Econ & Ind Law (Milan)
Mark CamilleriMichael Gatt
Executive CommitteeMichael Gatt – Chairman
Catherine Calleja BA (Hons) ACII
Mark CamilleriRobert MicallefDavid Mifsud FCII
Ian-Edward Stafrace MSc (Risk Management) CFIRM FCII PIOR
Matthew von Brockdorff FCII
Protected Cells CommitteeMichael Gatt – Chairman
John P BonettCatherine Calleja BA(Hons) ACII
Mark CamilleriDavid Mifsud FCII
Ian-Edward Stafrace MSc (Risk Management) CFIRM FCII PIOR
Matthew von Brockdorff FCII

ATLAS.COM.MT
9
ANNUAL REPORT & AUDITED FINANCIAL STATEMENTS - 2016
Professional Services
ActuariesKPMG
AuditorsPricewaterhouseCoopers
Compliance and Internal Audit Office/Atlas Healthcare, Insurance Agency and Ark Insurance Management PCC officesAbate Rigord Street,Ta’ Xbiex XBX 1121
Paola Regional OfficeValletta Road,Paola PLA 1517
Qormi BranchTriq Manwel Dimech,Qormi QRM 9061
SkyParks BranchMalta International Airport, Luqa LQA 3290
Bormla Branch55, Gavino Gulia Square,Bormla BML 1800
St Paul’s Bay Branch2, Toni Bajada Street,St Paul’s Bay SPB 3227
Head Office48-50, Ta’ Xbiex Seafront,Ta’ Xbiex XBX 1021
Rabat Branch45, Vjal il-Haddiem,Rabat RBT 1769
Offices &Branches,Cells & Professional Services
BankersAPS Bank LimitedBanif Bank (Malta) LimitedBank of Valletta plcHSBC Bank Malta plcLombard Bank Malta plcBarclays Bank plc
Cells
Perfecthome Cell
Travelodge Cell
Ocado Cell
TVIS Cell
Amplifon Cell
Gemini Cell
L’AMIE Cell
Investment ManagersBOV Asset Management LimitedJesmond Mizzi FinancialAdvisors LimitedRizzo Farrugia & Co(Stockbrokers) Limited
Legal AdvisorsGanado & AssociatesMamo TCV AdvocatesSD AdvocatesVella Zammit McKeon
Birkirkara Branch1, Psaila Street,Birkirkara BKR 9070
Mosta Branch94, Constitution Street,Mosta MST 9055
San Gwann BranchNaxxar Road c/w,Bernardette Street,San Gwann SGN 9030

ANNUAL REPORT & AUDITED FINANCIAL STATEMENTS - 2016 ATLAS.COM.MT
10
The CEO with the European Captive Services Awards’ Best Cell Captive Initiative Award and (from left) the Chief Underwriting Officer, the Chief Risk Officer and the Group Chief Financial Officer
Atlas Blood Donation Drive
Pitch 22 tournament
Pictorial highlights

ATLAS.COM.MT
11
ANNUAL REPORT & AUDITED FINANCIAL STATEMENTS - 2016
Atlas Insurance PCC LimitedAnnual Report & Audited Financial Statements31 December 2016
2016

ANNUAL REPORT & AUDITED FINANCIAL STATEMENTS - 2016 ATLAS.COM.MT
12
Directors’ ReportThe directors present their report and the audited financial statements for the year ended 31 December 2016.
Principal activitiesThe principal activities of the Company consist of the business of insurance. The Company is licensed as a cell company to write general business in terms of Article 7 of the Insurance Business Act (Cap.403) by the Malta Financial Services Authority in accordance with the Companies Act (Cell Companies carrying on business of insurance) Regulations, 2004.
Review of the businessThe Board of Directors reports that the Company registered satisfactory results for 2016 for both the Non-Cellular shareholders (Core) and the Cellular shareholders with the PCC reporting continued important results. A good return arising from the Core’s investment portfolio bolstered reasonably good technical results. The Company registered an aggregate net profit before tax for the year of €5.5m (2015: €5.9m) and a net profit after tax of €3.7m (2015: €3.8m). Profits accruing to the non-cellular shareholders amounted to €3.0m(2015: €4.1m) before taxation.
CoreThe Board of Directors’ objective remains that of consolidating balance sheet reserves with an end to safeguarding Policyholder interest, balanced with its dividend distribution policy. In this regard the relatively conservative underwriting and reinsurance policies as well as a prudent dividend policy applied by the Board continue to work toward this objective and consistently produce profitability as well as growing the Company’s reserves and consolidating its balance sheet strength. The Core’s regulated solvency position as at 31 December 2016 stood at 268% of the minimum Solvency requirement. Results of the financial year under review continue to be impacted by poor motor technical performance, largely due to the number of bodily injury claims and fatalities which have increased significantly over the last two years. This resulted in a combined loss ratio of 108.7% albeit an improvement on the previous year’s loss ratio. This situation has been addressed over the past two years by considering increased reinsurance protection and adjusting premiums to reflect today’s reality. Early results for 2017 are in fact indicative of positive reduced losses for the class of business. During the financial year under review the Company continued to increase premium income with important growth being registered in all classes of business. The Core premium written portfolio increased by 6.5%, a result which combines well with a good return on the investment portfolio of 5.8%. In the coming financial year, the Company expects to continue to grow in both the core local business as well as internationally through the protected cell operation. It will continue to focus on improving the profitability of the motor account, the prudent management of core operating costs and will continue with its cautious investment strategy. Besides operating through its Ta’Xbiex Offices the Company also operates through nine branches strategically spread throughout the Island in servicing its clients. During 2017 the Company will also be setting up a tenth branch in Zebbug.
CellularThe operating cells have continued to contribute to the Company’s aggregated profitability. Such portion ofprofitability accrues to cell shareholders.
During the year, the cells carried on operations registering continued positive results with a combined profit before tax at €2.5m (2015: €1.9m) and after tax at €1.6m (2015: €1.2m) accruing to the cell shareholders.
Principal risks and uncertaintiesThe Board is confident that it addresses a full inventory of the risks the Company’s administration and operations face through its risk management structures. The mitigation for the principal risks are disclosed under note 3 of these accounts which impact is reported under notes 15, 16 and 22.
Core assets, cellular assets and share capitalThe core assets comprise the assets of the Company which are non-cellular assets relating to the core operation. The assets of Atlas Insurance PCC Limited are either core assets or cellular assets. The assets attributable to a cell comprise assets represented by the proceeds of cell share capital, reserves and other assets attributable to the cell.
SubsidiariesThe Company fully owns two licensed subsidiaries Atlas Healthcare Insurance Agency Limited, agents for AXA PPP healthcare Limited and Ark Insurance Management PCC Limited, a licensed insurance manager and protected cell company.
It is the Company’s declared financial policy to direct its subsidiaries’ reserves within its own financial management processes and for this reason, directs its subsidiaries to upstream excess financial resources over those required under regulation, while preserving their regulated financial positions.
Atlas Healthcare’s increased growth and profitability has continued to contribute to the Company’s success during the period under review through increased dividend income. The agency’s net asset value totaled €924,165 as on 31 December 2016, which result is in an excess

ATLAS.COM.MT
13
ANNUAL REPORT & AUDITED FINANCIAL STATEMENTS - 2016
over regulated financial resources requirements under the Insurance Intermediaries Act. Ark Insurance Management PCC Limited also saw an increase in its profitability through increased insurance management activity. This subsidiary too manages its financial resources in excess of that under regulation for its enrollment under the Insurance Intermediaries Act. The net asset value of the insurance manager is reported as on 31 December 2016 at €74,958.
Board of DirectorsThe directors of the Company who held office during the year were: Lawrence Zammit M.A. (Econ.) – Chairman Franco Azzopardi M.Sc. (Leicester), F.I.A. , C.P.A. – Non Executive André Camilleri LL.D, Dip. Econ. & Ind. Law (Milan) – Non Executive Catherine Calleja B.A.(Hons.), A.C.I.I. – Executive and Company Secretary Michael Gatt – Managing and Chief Executive Officer Philip Micallef B.Sc.(Eng.), M.I.E.E., C.Eng., Eur. Ing., M.B.A. (Warwick) – Non Executive Matthew von Brockdorff FCII – Deputy Managing
The current directors have expressed their willingness to remain in office.
Results and dividendsThe profit and loss account is set out on pages 21 and 22. During 2016 Ordinary dividends of €1,205,000 net of tax were declared. Furthermore, on 25 January 2017, the Board approved the payment of a net interim dividend of €600,000 to the non-cellular shareholders and, on 22 February 2017, the payments of net interim dividends of €490,300 to two of its cellular shareholders. The directors propose the payment of a final dividend of €615,000 net of tax to the non-cellular shareholders.
Statement of directors’ responsibilities for the financial statementsThe directors are required by the Maltese Insurance Business Act (Cap.403) and the Maltese Companies Act (Cap.386) to prepare financial statements which give a true and fair view of the state of affairs of the Company as at the end of each financial period and of the profit or loss for that period.
In preparing the financial statements, the directors are responsible for:
• ensuring that the financial statements have been drawn up in accordance with International Financial Reporting Standards as adopted by the EU; • selecting and applying appropriate accounting policies; • making accounting estimates that are reasonable in the circumstances; • ensuring that the financial statements are prepared on the going concern basis unless it is inappropriate to presume that the Company will continue in business as a going concern.
The directors are also responsible for designing, implementing and maintaining internal control as the directors determine is necessary to enable the preparation of financial statements that are free from material misstatement, whether due to fraud or error, and that comply with the Maltese Insurance Business Act (Cap.403) and with the Maltese Companies Act (Cap.386). They are also responsible for safeguarding the assets of the Company and hence for taking reasonable steps for the prevention and detection of fraud and other irregularities. In terms of the Companies Act (Cell companies carrying on business of insurance) Regulations, 2010, the directors are responsible to keep separate accounts and records as may be necessary to evidence the assets and liabilities of each cell as distinct and separate from the assets and liabilities of other cells in the same Company.
The financial statements of Atlas Insurance PCC Limited for the year ended 31 December 2016 are included in the Annual Report 2016, which is published in hard-copy printed form and may be made available on the Company’s website. The directors are responsible for the maintenance and integrity of the Annual Report on the website in view of their responsibility for the controls over, and the security of, the website. Access to information published on the Company’s website is available in other countries and jurisdictions, where legislation governing the preparation and dissemination of financial statements may differ from requirements or practice in Malta.
AuditorsPricewaterhouseCoopers have expressed willingness to continue in office as auditors of the Company and a resolution proposing their reappointment will be put to the forthcoming Annual General Meeting.
Registered office:47-50 Ta’ Xbiex Seafront,Ta’ Xbiex,Malta17 May 2017
On behalf of the Board
Lawrence ZammitChairman
Michael GattManaging Director and CEO

ANNUAL REPORT & AUDITED FINANCIAL STATEMENTS - 2016 ATLAS.COM.MT
14
Corporate Governance – Statement of ComplianceAtlas Insurance PCC Limited adopts the Malta Financial Services Authority (MFSA) Corporate Governance Guidelines for Public Interest Companies. As a licensed insurance undertaking it is also regulated by various rules issued under the Insurance Business Act (Cap 403) and is guided in this area by other international models of best practice.
The BoardThe Board of Directors is composed of a majority of four Independent Non-Executive Directors (NEDs) and three Executive Directors one of whom is the CEO of the Group and Managing Director of the Company, The board is appointed at the Annual General Meeting as per the Memorandum and Articles of Association of the Company. Non-executive board members are chosen for their diverse and complementary backgrounds in the fields of law and regulation, risk, finance and accounting, international business, human resources management and Information technology.
It is felt that the number of Board members and composition of the Board is the right mix for the size and complexity of the Company. As required by the Insurance Business Act, the Board of Directors is ultimately responsible for the compliance by the Company with the Act, regulations, and Insurance Rules issued thereunder.
The independent Non-Executive Chairman promotes a culture of openness and debate and is responsible for effective communication with shareholders. Together with the three other independent NEDs, he provides constructive challenge and help in the development of the strategy of the Company. Through the various committee structures, NEDs are in a position to scrutinise management performance in meeting strategic objectives and satisfy themselves on the integrity of the financial information and the internal controls system. The Board of Directors also communicates regularly with members of the Executive Committee of the Company and several joint sessions are scheduled throughout the year to discuss strategy, the ORSA, the Actuarial Function Report and for professional development.
The Chairman’s main role is to ensure that the board focuses on ongoing development and determination of the Company’s strategy and overall commercial objectives, indeed on what is best for the Company. While creating and maintaining the right conditions for constructive discussion and involvement of all directors, the Chairman must ensure that the board’s annual objectives are met. The Chairman focuses the board’s attention on matters relating to strategy, risk, performance, value creation, accountability and matters which may arise which are of concern to members of the board or of management. To this end he sets the agenda, in collaboration with the Company Secretary, to ensure that the board is focused on these issues and is furnished with enough timely information and key performance indicators to be well prepared for the individual items of discussion.
The Senior Independent Director’s role is to provide a sounding board for the Chairman, be a trusted intermediary for NEDs and be available to address the concerns of shareholders or indeed members of staff through the Group’s Raising a Concern (Whistleblowing) policy. He is also responsible for the board evaluation process which is carried out on an annual basis during the last quarter of the year and followed up by a discussion, the outcomes of which are input into board objectives for the following year.
The separation of roles of the independent Chairman and the CEO creates a clearly accepted division of responsibilities in the leadership of the Company ensuring a balance of power and authority. The CEO is ultimately responsible and answerable to the board for the achievement of the Company’s objectives and the realisation of the Company strategy. Other Executive Directors, being the Deputy Managing Director and Group Company Secretary, bring further elements of balance and extra information to the board. The CEO also chairs the Executive Committee made up of the three executive directors, the Chief Underwriting Officer, the Group Chief Financial Officer, the Chief Commercial Officer and the Chief Risk Officer.
Board and Board Committee meetings are scheduled prior to the start of the year. During 2016, the board met eight times but the board was also convened sometimes together with the Executive Committee to discuss various relevant matters as described above.
It should also be noted that under Solvency II Group Supervision rules, Atlas Holdings, as the ultimate parent insurance holding company of the Group, has had to identify the undertaking responsible for fulfilling the governance requirements for the Group, and Atlas Insurance was appointed the responsible undertaking for group supervision. An extensive review of policies and procedures and workings of the various key functions has been undertaken to ensure that the board and its committees have an effective overview of the Group.
After each board meeting and well in advance of the next meeting, minutes that faithfully record attendance, issues discussed and resolutions are circulated.
Board and Executive CommitteesThe Board of Directors has established the Audit Committee, the Remuneration, Nominations and Related Parties Committee, the Risk and Compliance Committee, the Investment Committee, the Protected Cells Committee and the Executive Committee. Members of these committees are appointed by the Board of Directors. The Board has delegated specific responsibilities to these committees, and it may, from time to time, establish other committees. Members of these committees are listed on page 8. These committees have charters which are set and annually reviewed by the board. Committee meeting progress and matters arising from minutes of meetings are regularly discussed at board level. The two executive committees, being the Executive and Protected Cells Committees, are chaired by the CEO, while the Audit, Remuneration and Risk Management committees are chaired by NEDs.
AuditThe Audit Committee met five times during the period under review. The committee, chaired by Mr Franco Azzopardi who is considered competent by the board in this field as having the relevant qualifications in accounting and/or auditing, is composed entirely of independent NEDs. Other members of the committee are Mr Lawrence Zammit and Mr Philip Micallef.

ATLAS.COM.MT
15
ANNUAL REPORT & AUDITED FINANCIAL STATEMENTS - 2016
The committee oversees the financial reporting and internal controls processes of the Group, the audits of the Group’s financial statements, the performance of the accounting firm engaged as the Group’s auditor to prepare and issue an audit report on the financial statements of the various Group companies. It also reviews and assesses the qualitative aspects of financial reporting to shareholders and meets with external auditors as and when required. The committee also exercises final approval on the appointment or discharge of the auditors and pre-approves any permitted non-audit services to be performed by the auditors.
The Audit Committee also has oversight of the internal audit function including the setting of risk based annual Internal Audit plans. It also reviews the internal audit function’s performance relative to the plan. Regular liaison with the Risk function and indeed the collaboration with the Risk and Compliance committee enables Internal Audit to function according to priorities aligned with the Company’s top risks and risk appetite.
The Committee appoints the Internal Auditor and reviews findings from the Internal Auditor’s work and management’s response thereto. It also assesses the effectiveness of the function as a whole and benchmarks the function’s activities against recognised standards and Solvency II expectations. The Internal Audit function is independent from the operations of the Company and, through the Audit committee and its Chairman, has direct access to the Board of Directors. Mr Martin Gauci, as the Internal Auditor during the year under review, together with the Assistant Internal Auditor, Mr Ivan Distefano, regularly made presentations to the Audit Committee and attended relevant meetings.
During 2016, Mr Ivan Distefano was judged by the Committee to be well prepared to take over Mr Gauci’s responsibilities in 2017. After receiving MFSA approval for the appointment, Mr Distefano has taken over the position of Internal Auditor. The Committee Chairman meets the Internal Auditor regularly outside the formal Audit Committee meetings to give guidance and receive feedback, and is very much involved in his professional development. Other key senior executives are also invited to appropriate meetings of the Committee. During 2017 it is expected that oversight of Related Party Transactions will be transferred to this Committee.
Remuneration, Nominations and Related PartiesThe Remuneration, Nominations and Related Parties Committee, also composed entirely of independent NEDs, met three times during 2016. Mr Lawrence Zammit chairs the committee and is considered by the board to have very relevant experience for this position. Dr André Camilleri, the Senior Independent Director, and Mr Philip Micallef are the other two NEDs on the Committee. Executive Directors attend meetings by invitation as and when required.
The committee’s role is to determine and agree with the board the remuneration of the Chief Executive, Executive Directors, members of the Executive Committee and the Internal Auditor. It also reviews the ongoing effectiveness of the Group’s remuneration policy and approves the design of and determines targets for any performance related pay schemes operated by the Group. The committee also approves annual payments made under this policy. It also ensures that the salary levels established by the Group are regularly benchmarked against the industry and that all provisions regarding disclosure of remuneration are fulfilled.
In terms of article 8(1) of the Insurance Business Act and more specifically as per Insurance Rulebook’s Chapter 2: Fit and Proper Criteria, Notification and Assessment, the Group ensures that all persons who effectively run the undertaking or have other key functions are at all times ‘fit and proper’ persons. The committee has been assigned the responsibility for overseeing the continuing fitness and properness of such persons and oversees this process on an ongoing basis.
The committee identifies nominees qualified to fill board vacancies for recommendation to the board and shareholders, as well as assessing their independence and relevant fitness and properness. It also reviews senior succession planning issues. The committee currently proposes to the board the related party transaction policy of the Company, receives reports on any related party transactions and approves any transactions which it is required to approve under the policy. As stated above, it is expected that the committee will relinquish these responsibilities during 2017 to the Audit Committee.
Risk and ComplianceThis committee’s primary objectives are to ensure that appropriate risk management and compliance frameworks are consistently implemented across the Group. During the period under review, Dr André Camilleri took over the chair of the committee as the designated director for oversight of the risk management system as required for regulatory purposes.
The committee, together with the Chief Risk Officer, Mr Ian-Edward Stafrace, coordinates, facilitates and has oversight of the risk management function including the development of the risk management policy and methodology as well as the Group’s risk appetite and future risk strategy and governing policies. The committee also carries out risk management at corporate level, monitoring developments in the Group’s policies, strategy, operations, and environment that may significantly affect uncertainties faced by the organisation.
The committee will continue to develop its role in evolving the methodology and assumptions underlying the models for determining the Group’s economic and regulatory capital requirements including the ORSA (Own Risk and Solvency Assessment) process. It reviews quarterly status reports on the Company’s risk appetite in the major risk categories, provided by the Chief Risk Officer as well as regular reports relating to the various risk areas of accountability assigned across the organisation. The committee also involves itself in areas of new developments such as cyber security and data protection.
Monitoring and reviewing the formalised Risk Management systems to ensure they are operating appropriately and effectively including when taking major strategic decisions, the Committee also reports and monitors any significant incidents, including near-misses and the appropriateness of subsequent management responses, both in the core and for cells. It also has oversight of the Compliance function through the Group Compliance Officer, Ms Elaine Scerri. It ensures that the Group continues to maintain its systems to ensure regulatory compliance and readiness for anticipated regulatory changes including the review of MFSA consultation papers. The Group Compliance Officer is also active on an industry level representing the sector with the MFSA. The Committee also reviews the training programme to ascertain that training in the various areas of regulatory compliance is regularly carried out for new and existing staff members as well

ANNUAL REPORT & AUDITED FINANCIAL STATEMENTS - 2016 ATLAS.COM.MT
16
as the Company’s tied insurance intermediaries. Regular reporting on compliance with the various areas of legislation assigned across the organisation is also made to the Committee using a ‘traffic lights’ system.
Mr Franco Azzopardi, Mr Philip Micallef, Mr Matthew von Brockdorff and Ms Catherine Calleja continued to form part of the Committee, which met four times during 2016. The Chief Risk Officer and Group Compliance Officer are regularly invited to the meetings to present detailed reports. Senior management members such as the Group Information Systems Manager, or other relevant third parties are also sometimes invited to review various aspects of internal controls.
InvestmentThe committee has been appointed by the Board of Directors to take responsibility for assisting the board in setting the Investment Policy and ensuring that the investment of the Company funds allocated by the Board of Directors is conducted in accordance with the Investment Policy. The Committee acts in accordance with the Prudent Person Principle as stipulated in Chapter 5 of the Insurance Rule Book –Valuation of Assets and Liabilities Technical Provisions, Own Funds, Solvency Capital Requirement, Minimum Capital Requirement and Investment Rules.
The committee also sets investment parameters, mandates with discretionary managers, and asset allocations in line with Investment Policy, Asset Liability Management Policy and the Board’s Risk Appetite Statement. It may also recommend changes to the board in respect of the Asset Liability Management Policy and Risk Appetite statement relating to relevant risks.
The recommendation of discretionary managers to manage the investment portfolio is also a function of this committee. It also reviews the performance of such managers. Detailed reports of the performance of such managers are provided to investment committee members on a monthly basis. Any investments made in excess of their mandate are always subject to the Board’s Risk Appetite or with the Board’s exceptional approval.
During the year under review, Mr Lawrence Zammit was the Chair of the committee while members included Dr André Camilleri, Mr Franco Azzopardi and Mr Michael Gatt, CEO, as directors on the committee. The Group CFO, Mr Mark Camilleri and Mr John Bonett are also appointed as additional members. Ms Elaine Scerri, Group Compliance Officer acts as secretary to the committee which met four times in the year under review. The Company’s discretionary investment managers are regularly asked to address the Committee and report on their performance.
Protected CellsThe Protected Cells Committee proposes policy and broad guidelines in relation to the identification of markets for cell business as well as underwriting policy in relation to the acceptance of protected cells within the Company. The committee has oversight over the operational and financial progress of each cell, including its solvency and any impact or potential impact on core solvency. It also ensures that regular cell inspections occur and, where applicable, oversees relationships with cell managers.
The committee reports to the board on a regular basis and reviews new cell applications including appropriate due diligence enquiries, cell agreements and other critical outsourcing agreements. Before accepting engagement, the committee presents a detailed proposal to the board in order to seek approval to proceed with applications to the MFSA.
The committee is chaired by the Chief Executive Officer of the Company and met four times during 2016. The Chief Underwriting Officer and Group Chief Financial Officer, as representatives of the committee, form part of the Cell Committees of the relative cells, which also review risk management and compliance issues relating to cells together with cell owners and managers. The committee is delegated with the responsibility to approving charters and membership of the said Cell Committees which are central to the positive ongoing relationship with cell shareholders.
Apart from the Chairman, the committee is composed of the two other Executive Directors of the Company as well as the Chief Underwriting Officer, the Chief Risk Officer and the Group Chief Financial Officer as well as Mr John Bonett.
Executive Committee
This committee is responsible for implementing the strategy of the Company which involves development of business plans and detailed budgets on an annual basis to achieve the key strategic goals developed with the Board of Directors. It is also heavily involved in policy development and change in various areas of the Group including human resources development and talent management, sales and marketing, information systems planning and the consideration of new business opportunities.
Chaired by the CEO, the committee is made up of the three Executive Directors and the Group Chief Financial Officer, the Chief Underwriting Officer, the Chief Commercial Officer and the Chief Risk Officer. Minutes of the EXCO meetings are copied to board members and matters arising regularly discussed.
Relations with Shareholders
In the interests of good governance, the Group ensures dialogue between the board and shareholders based on the mutual understanding of objectives. The level of disclosure with these important stakeholders within the Group continues to be in excess of statutory requirements under the Companies Act. During the Annual General Meeting, besides the statutory business as laid down in the memorandum and articles of the Company, information on group performance is presented.

ATLAS.COM.MT
17
ANNUAL REPORT & AUDITED FINANCIAL STATEMENTS - 2016
Atlas Holdings Limited, the shareholder of the non-cell shares (‘core shareholder’), in Atlas Insurance PCC Limited, appoints the directors of the company. Mr Lawrence Zammit is also Chairman of the Atlas Holdings Board and this structure ensures that both boards are kept aware of the priorities of the ultimate core shareholders.
Communication with cell shareholders is also ongoing with regular meetings through the individual cell committees and regular reports to the board of any issues as well as financial and solvency performance of the cells.
Directors’ and Officers’ Liability Insurance
Directors and officers of the Group are covered by Directors and Officers Liability insurance purchased by the Group. Atlas Healthcare Insurance Agency and Ark Insurance Management PCC Limited as subsidiaries of the Company and other fellow subsidiaries of Atlas Holdings are also covered by the same policy
Approved by the Board of Directors on 17 May 2017 and signed on its behalf by:
Lawrence ZammitChairman
Michael GattManaging Director and CEO

ANNUAL REPORT & AUDITED FINANCIAL STATEMENTS - 2016 ATLAS.COM.MT
18
Independent auditor’s report To the Shareholders of Atlas Insurance PCC Limited
Report on the audit of the financial statements
Our opinion• Atlas Insurance PCC Limited’s financial statements give a true and fair view of the company’s financial position as at 31 December 2016, and of the company’s financial performance and cash flows for the year then ended in accordance with International Financial Reporting Standards (‘IFRSs’) as adopted by the EU; and• The financial statements have been prepared in accordance with the requirements of the Maltese Companies Act (Cap. 386).
What we have auditedAtlas Insurance PPC Limited’s financial statements, set out on pages 21 to 81 comprise:
• the balance sheet as at 31 December 2016;• the profit and loss account and the statement of comprehensive income for the year then ended; • the statement of changes in equity for the year then ended; • the statement of cash flows for the year then ended; and • the notes to the financial statements, which include a summary of significant accounting policies.
Basis for opinionWe conducted our audit in accordance with International Standards on Auditing (ISAs). Our responsibilities under those standards are further described in the Auditor’s Responsibilities for the Audit of the Financial Statements section of our report. We believe that the audit evidence we have obtained is sufficient and appropriate to provide a basis for our opinion.
IndependenceWe are independent of the company in accordance with the International Ethics Standards Board for Accountants’ Code of Ethics for Professional Accountants (IESBA Code) together with the ethical requirements of the Accountancy Profession (Code of Ethics for Warrant Holders) Directive issued in terms of the Accountancy Profession Act (Cap. 281) that are relevant to our audit of the financial statements in Malta. We have fulfilled our other ethical responsibilities in accordance with the IESBA Code.
Other informationThe directors are responsible for the other information. The other information comprises the Directors’ report and Corporate Governance – Statement of Compliance (but does not include the financial statements and our auditor’s report thereon), which we obtained prior to the date of this auditor’s report, and the Chairman’s Statement and the Chief Executive Officer’s Report, which are expected to be made available to us after that date.
Our opinion on the financial statements does not cover the other information, including the directors’ report. In connection with our audit of the financial statements, our responsibility is to read the other information identified above and, in doing so, consider whether the other information is materially inconsistent with the financial statements or our knowledge obtained in the audit, or otherwise appears to be materially misstated.
With respect to the directors’ report, we also considered whether the directors’ report includes the disclosures required by Article 177 of the Maltese Companies Act (Cap. 386).

ATLAS.COM.MT
19
ANNUAL REPORT & AUDITED FINANCIAL STATEMENTS - 2016
Independent auditor’s report - Continued To the Shareholders of Atlas Insurance PCC LimitedBased on the work we have performed, in our opinion: • The information given in the directors’ report for the financial year for which the financial statements are prepared is consistent with the financial statements; and• the directors’ report has been prepared in accordance with the Maltese Companies Act (Cap. 386).
In addition, in light of the knowledge and understanding of the company and its environment obtained in the course of the audit, we are required to report if we have identified material misstatements in the directors’ report and other information that we obtained prior to the date of this auditor’s report. We have nothing to report in this regard.
When we read the Chairman’s Statement and the Chief Executive Officer’s Report, if we conclude that there is a material misstatement therein, we are required to communicate the matter in accordance with International Standards on Auditing.
Responsibilities of the directors for the financial statementsThe directors are responsible for the preparation of financial statements that give a true and fair view in accordance with IFRSs as adopted by the EU and the requirements of the Maltese Companies Act (Cap. 386), and for such internal control as the directors determine is necessary to enable the preparation of financial statements that are free from material misstatement, whether due to fraud or error.
In preparing the financial statements, the directors are responsible for assessing the company’s ability to continue as a going concern, disclosing, as applicable, matters related to going concern and using the going concern basis of accounting unless the directors either intend to liquidate the company or to cease operations, or have no realistic alternative but to do so.
Auditor’s responsibilities for the audit of the financial statementsOur objectives are to obtain reasonable assurance about whether the financial statements as a whole are free from material misstatement, whether due to fraud or error, and to issue an auditor’s report that includes our opinion. Reasonable assurance is a high level of assurance, but is not a guarantee that an audit conducted in accordance with ISAs will always detect a material misstatement when it exists. Misstatements can arise from fraud or error and are considered material if, individually or in the aggregate, they could reasonably be expected to influence the economic decisions of users taken on the basis of these financial statements.
As part of an audit in accordance with ISAs, we exercise professional judgement and maintain professional scepticism throughout the audit. We also:
• Identify and assess the risks of material misstatement of the financial statements, whether due to fraud or error, design and perform audit procedures responsive to those risks, and obtain audit evidence that is sufficient and appropriate to provide a basis for our opinion. The risk of not detecting a material misstatement resulting from fraud is higher than for one resulting from error, as fraud may involve collusion, forgery, intentional omissions, misrepresentations, or the override of internal control.
• Obtain an understanding of internal control relevant to the audit in order to design audit procedures that are appropriate in the circumstances, but not for the purpose of expressing an opinion on the effectiveness of the company’s internal control.
• Evaluate the appropriateness of accounting policies used and the reasonableness of accounting estimates and related disclosures made by the directors.
• Conclude on the appropriateness of the directors’ use of the going concern basis of accounting and, based on the audit evidence obtained, whether a material uncertainty exists related to events or conditions that may cast significant doubt on the company’s ability to continue as a going concern. If we conclude that a material uncertainty exists, we are required to draw attention in our auditor’s report to the related disclosures in the financial statements or, if such disclosures are inadequate, to modify our opinion. Our conclusions are based on the audit evidence obtained up to the date of our auditor’s report. However, future events or conditions may cause the company to cease to continue as a going concern.
• Evaluate the overall presentation, structure and content of the financial statements, including the disclosures, and whether the financial statements represent the underlying transactions and events in a manner that achieves fair presentation.
We communicate with those charged with governance regarding, among other matters, the planned scope and timing of the audit and significant audit findings, including any significant deficiencies in internal control that we identify during our audit.

ANNUAL REPORT & AUDITED FINANCIAL STATEMENTS - 2016 ATLAS.COM.MT
20
Independent auditor’s report - ContinuedTo the Shareholders of Atlas Insurance PCC Limited
Report on other legal and regulatory requirementsOther matters on which we are required to report by exceptionWe also have responsibilities under the Maltese Companies Act (Cap. 386) to report to you if, in our opinion:
• Adequate accounting records have not been kept, or that returns adequate for our audit have not been received from branches not visited by us.• The financial statements are not in agreement with the accounting records and returns. • We have not received all the information and explanations we require for our audit. • Certain disclosures of directors’ remuneration specified by law are not made in the financial statements, giving the required particulars in our report.
We have nothing to report to you in respect of these responsibilities.
Simon Flynn17 May 2017
PricewaterhouseCoopers78, Mill Street Qormi Malta
ATLAS.COM.MT
21
ANNUAL REPORT & AUDITED FINANCIAL STATEMENTS - 2016
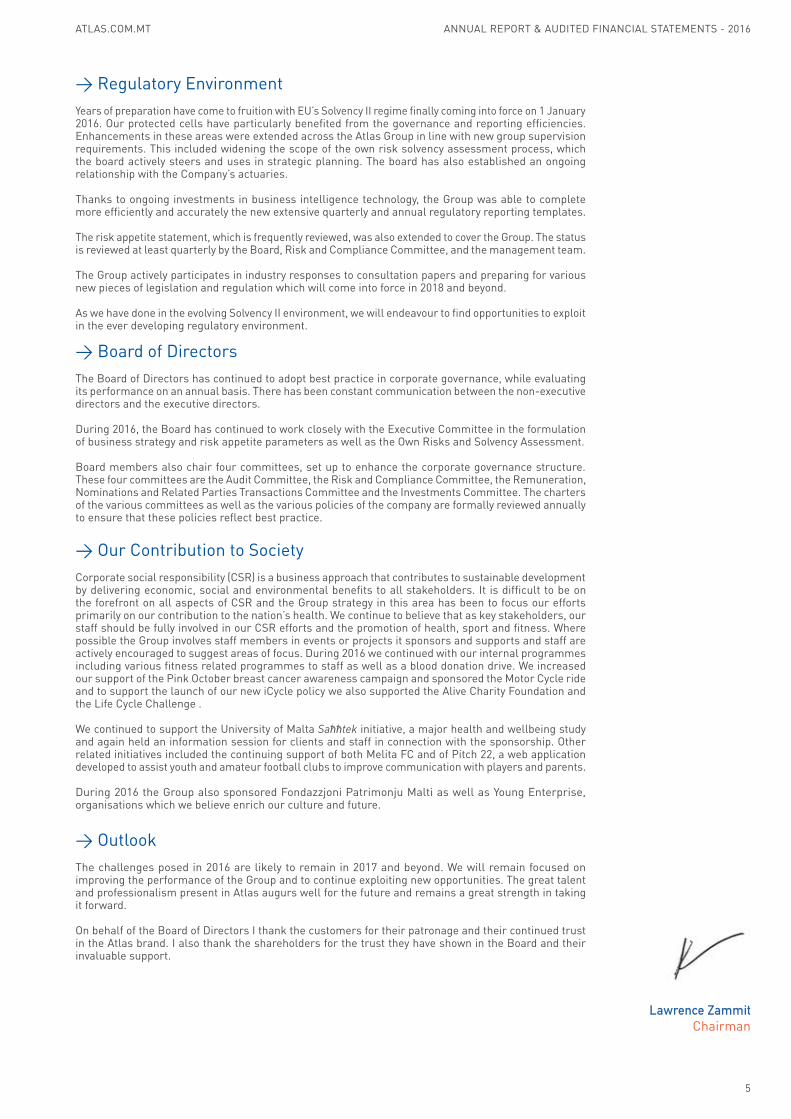
Profit and loss accountTechnical account - General businessYear ended 31 December
Earned premiums, netof reinsurance
Gross premiums written 4 23,573,516 22,127,732 19,233,050 22,706,228 42,806,566 44,833,960
Outward reinsurance premiums (9,997,552) (9,426,721) (911,941) (963,626) (10,909,493) (10,390,347)
Net premiums written 13,575,964 12,701,011 18,321,109 21,742,602 31,897,073 34,443,613
Change in the provision for unearned premiums
- gross amount 22(548,141) (891,669) (1,421,170) (1,358,109) (1,969,311) (2,249,778)
- reinsurers’ share 22 198,313 449,340 114,844 164,333 313,157 613,673
(349,828) (442,329) (1,306,326) (1,193,776) (1,656,154) (1,636,105)
Earned premiums, netof reinsurance 13,226,136 12,258,682 17,014,783 20,548,826 30,240,919 32,807,508
Allocated investment return transferred from the non-technical account 6 962,065 1,658,679 2,457 2,995 964,522 16,616,674
Total technical income 14,188,201 13,917,361 17,017,240 20,551,821 31,205,441 34,469,182
Claims incurred, netof reinsurance
Claims paid - gross amount 9,359,271 12,154,055 7,265,231 5,374,787 16,624,502 17,528,842- reinsurers’ share 22 (1,854,609) (4,117,742) (1,505,285) (314, 635) (3,359,894) (4,432,377)
7,504,662 8,036,313 5,759,946 5,060,152 13,264,608 13,096,465
Change in the provision for claims
- gross amount 22 2,589,631 742,646 808,483 7,797,559 3,398,114 8,540,205
- reinsurers’ share 22 (883,882) (145,684) 14,595 (7,092,526) (869,287) (7,238,210)
1,705,749 596,962 823,078 705,033 2,528,827 1,301,995
Claims incurred, net of reinsurance 9,210,411 8,633,275 6,583,024 5,765,185 15,793,435 14,398,460
Net operating expenses 5 2,565,295 2,404,351 8,009,775 12,947,846 10,575,070 15,352,197
Total technical charges 11,775,706 11,037,626 14,592,799 18,713,031 26,368,505 29,750,657
Balance on the technical account for general business (page 22) 2,412,495 2,879,735 2,424,441 1,838,790 4,836,936 4,718,525
2016 2015 2016 2015 2016 2015
Core Cells Total
Notes € € €€ € €

ANNUAL REPORT & AUDITED FINANCIAL STATEMENTS - 2016 ATLAS.COM.MT
22
Profit and loss accountNon-technical accountYear ended 31 December
Balance on technical account– general business (page 21) 2,412,495 2,879,735 2,424,441 1,838,790 4,836,936 4,718,525
Investment income 6 1,973,701 3,333,061 82,705 80,892 2,056,406 3,413,953
Investment expenses and charges 6 (257,257) (353,571) (1,391) (23,501) (258,648) (377,072)
Allocated investment returntransferred to the general business
Technical account 6(962,065) (1,658,679) (2,457) (2,995) (964,522) (1,661,674)
Administrative expenses 7 (142,284) (142,153) (38,609) (33,334) (180,893) (175,487)
Profit before tax 3,024,590 4,058,393 2,464,689 1,859,852 5,489,279 5,918,245
Tax expense 9 (837,783) (1,458,943) (908,265) (682,178) (1,746,048) (2,141,121)
Profit for the year 2,186,807 2,599,450 1,556,424 1,177,674 3,743,231 3,777,124
Statement of comprehensive income
Profit for the year 2,186,807 2,599,450 1,556,424 1,177,674 3,743,231 3,777,124
Other comprehensive income:Items that will not be reclassified to profit or lossNet reporting currency differencesarising on translation from functional currency to presentation currency 21 - - (1,405,851) 390,636 (1,405,851) 390,636
Revaluation surplus 21 1,603,965 - - - 1,603,965 -
Movement in deferred tax relatingto property, plant and equipment 17 (113,054) 3,840 - - (113,054) 3,840
Total other comprehensive income, net of tax 1,490,911 3,840 (1,405,851) 390,636 85,060 394,476
Total comprehensive income for the year 3,677,718 2,603,290 150,573 1,568,310 3,828,291 4,171,600
Items disclosed in the statement above are disclosed net of tax. The income tax relating to each component is disclosed in Notes 9 and 17.
The notes on pages 28 to 81 are an integral part of these financial statements.
2016 2015 2016 2015 2016 2015
Core Cells Total
Notes € € €€ € €
2016 2015 2016 2015 2016 2015
Core Cells Total
Notes € € €€ € €

ATLAS.COM.MT
23
ANNUAL REPORT & AUDITED FINANCIAL STATEMENTS - 2016
Balance sheetas at 31 December
Core Cells Total
Notes 2016 2015 2016 2015 2016 2015
€ € € € € €
ASSETSIntangible assets 12 31,908 52,383 - - 31,908 52,383
Tangible assets: - land, buildings and improvements 13 5,250,408 3,901,460 - - 5,250,408 3,901,460 - plant and equipment 13 604,604 660,407 - - 604,604 660,407
Investments: - land and buildings 14 3,549,950 2,778,108 - - 3,549,950 2,778,108 - investment in subsidiaries 15 698,000 698,000 - - 698,000 698,000 - other financial investments 16 27,637,868 24,387,751 5,486,652 5,179,104 33,124,520 29,566,855Reinsurers’ share of technical Provisions 22 8,861,188 7,778,993 13,896,983 15,910,183 22,758,171 23,689,176Deferred acquisition costs 18 790,940 749,708 295,261 228,162 1,086,201 977,870
Receivables: - debtors arising out of direct
insurance operations 19 3,526,012 3,419,683 - - 3,526,012 3,419,683 - receivables from reinsurers 19 - - - - - - - other debtors 19 448,796 603,649 4,458,275 4,849,617 4,907,071 5,453,266Taxation recoverable 524,891 101,851 - - 524,891 101,851Prepayments and accrued income 19 178,766 289,034 144,963 138,431 323,729 427,465Cash and cash equivalents 26 4,569,286 5,060,422 16,257,808 13,187,248 20,827,094 18,247,670
Total assets 56,672,617 50,481,449 40,539,942 39,492,745 97,212,559 89,974,194
EQUITYCapital and reservesShare capital 20 8,198,000 8,198,000 8,106,509 8,106,509 16,304,509 16,304,509Other reserves 21 2,468,119 977,208 (520,418) 885,433 1,947,701 1,862,641Profit and loss account 21 13,944,341 12,962,534 3,174,780 1,618,356 17,119,121 14,580,890
Total equity 24,610,460 22,137,742 10,760,871 10,610,298 35,371,331 32,748,040
LIABILITIESTechnical provisions 22 26,193,399 22,902,202 24,236,490 24,965,651 50,429,889 47,867,853
Payables: - borrowings 23 45,225 6,337 - - 45,225 6,337 - creditors arising out of direct insurance operations 24 1,034,091 1,102,715 645,700 440,790 1,679,791 1,543,505 - creditors arising out of
reinsurance operations 24 - - 144,881 150,965 144,881 150,965 - balances payable to reinsurers 24 1,151,836 963,205 1,100,964 794,501 2,252,800 1,757,706 - other creditors 24 95,208 128,237 1,913,375 957,688 2,008,583 1,085,925Deferred taxation 17 1,489,173 1,258,781 - - 1,489,173 1,258,781Taxation payable - - 1,564,353 1,417,649 1,564,353 1,417,649Accruals and deferred income 24 2,053,225 1,982,230 173,308 155,203 2,226,533 2,137,433
Total liabilities 32,062,157 28,343,707 29,779,071 28,882,447 61,841,228 57,226,154
Total equity and liabilities 56,672,617 50,481,449 40,539,942 39,492,745 97,212,559 89,974,194
The notes on pages 28 to 81 are an integral part of these financial statements.
The financial statements on pages 21 to 81 were authorised for issue by the board on 17 May 2017 and were signed on its behalf by:
Lawrence ZammitChairman
Michael GattManaging Director and CEO

ANNUAL REPORT & AUDITED FINANCIAL STATEMENTS - 2016 ATLAS.COM.MT
24
Balance at 1 January 2016 8,198,000 977,208 12,962,534 22,137,742 8,106,509 885,433 1,618,356 10,610,298 16,304,509 1,862,641 14,580,890 32,748,040
Comprehensive income
Profit for the year - - 2,186,807 2,186,807 - - 1,556,424 1,556,424 - - 3,743,231 3,743,231
Other comprehensive incomeNet reporting currency differences arising on currency 21 - - - - - (1,405,851) - (1,405,851) - (1,405,851) - (1,405,851)
Fair value gains - 1,603,965 - 1,603,965 - - - - - 1,603,965 - 1,603,965
Movement in deferred tax relating to prop-erty, plant and equipment 21 - (113,054) - (113,054) - - - - - (113,054) - (113,054)
Total other comprehensive Income - 1,490,911 - 1,490,911 - (1,405,851) - (1,405,851) - 85,060 - 85,060
Total comprehensive income - 1,490,911 2,186,807 3,677,718 - (1,405,851) 1,556,424 150,573 - 85,060 3,743,231 3,828,291
Transactions with owners
Dividends 11 - - (1,205,000) (1,205,000) - - - - - - (1,205,000) (1,205,000)
Total transactions with owners - - (1,205,000) (1,205,000) - - - - - - (1,205,000) (1,205,000)
Balance at 31December 2016 8,198,000 2,468,119 13,944,341 24,610,460 8,106,509 (520,418) 3,174,780 10,760,871 16,304,509 1,947,701 17,119,121 35,371,331
The notes on pages 28 to 81 are an integral part of these financial statements.
Statement of changes in equity
Core Cells Total
Notes Share capital Other reservesProfit and loss
account Total Share capital Other reservesProfit and loss
account Total Share capital Other reservesProfit and loss
account Total
€ € € € € € € € € € € €
Balance at 1 January 2015 8,198,000 973,368 11,613,084 20,784,452 4,710,132 499,157 3,016,978 8,226,267 12,908,132 1,472,525 14,630,062 29,010,719
Comprehensive income
Profit for the year - - 2,599,450 2,599,450 - - 1,177,674 1,177,674 - - 3,777,124 3,777,124
Other comprehensive incomeNet reporting currency differences arising on translation from functional currency to presentation currency 21 - - - - - 390,636 - 390,636 - 390,636 - 390,636
Movement in deferred tax relating to proper-ty, plant and equipment 21 - 3,840 - 3,840 - - - - - 3,840 - 3,840
Total other comprehensive Income - 3,840 - 3,840 - 390,636 - 390,636 - 394,476 - 394,476
Total comprehensive income - 3,840 2,599,450 2,603,290 - 390,636 1,177,674 1,568,310 - 394,476 3,777,124 4,171,600
Transactions with ownersIncrease in share capital 20 - - - - 2,479,127 - - 2,479,127 2,479,127 - - 2,479,127Decrease in share capital 20 - - - - (133,750) - 133,750 - (133,750) - 133,750 -Issue of cell shares on incorporation 20 - - - - 1,051,000 - - 1,051,000 1,051,000 - - 1,051,000Assignment of reserves 21 - - - - - (4,360) 4,360 - - (4,360) 4,360 -Dividends 11 - - (1,250,000) (1,250,000) - - (2,714,406) (2,714,406) - - (3,964,406) (3,964,406)
Total transactions with owners - - (1,250,000) (1,250,000) 3,396,377 (4,360) (2,576,296) 815,721 3,396,377 (4,360) (3,826,296) (434,279)
Balance at 31 December 2015 8,198,000 977,208 12,962,534 22,137,742 8,106,509 885,433 1,618,356 10,610,298 16,304,509 1,862,641 14,580,890 32,748,040

ATLAS.COM.MT
25
ANNUAL REPORT & AUDITED FINANCIAL STATEMENTS - 2016
Balance at 1 January 2016 8,198,000 977,208 12,962,534 22,137,742 8,106,509 885,433 1,618,356 10,610,298 16,304,509 1,862,641 14,580,890 32,748,040
Comprehensive income
Profit for the year - - 2,186,807 2,186,807 - - 1,556,424 1,556,424 - - 3,743,231 3,743,231
Other comprehensive incomeNet reporting currency differences arising on currency 21 - - - - - (1,405,851) - (1,405,851) - (1,405,851) - (1,405,851)
Fair value gains - 1,603,965 - 1,603,965 - - - - - 1,603,965 - 1,603,965
Movement in deferred tax relating to prop-erty, plant and equipment 21 - (113,054) - (113,054) - - - - - (113,054) - (113,054)
Total other comprehensive Income - 1,490,911 - 1,490,911 - (1,405,851) - (1,405,851) - 85,060 - 85,060
Total comprehensive income - 1,490,911 2,186,807 3,677,718 - (1,405,851) 1,556,424 150,573 - 85,060 3,743,231 3,828,291
Transactions with owners
Dividends 11 - - (1,205,000) (1,205,000) - - - - - - (1,205,000) (1,205,000)
Total transactions with owners - - (1,205,000) (1,205,000) - - - - - - (1,205,000) (1,205,000)
Balance at 31December 2016 8,198,000 2,468,119 13,944,341 24,610,460 8,106,509 (520,418) 3,174,780 10,760,871 16,304,509 1,947,701 17,119,121 35,371,331
The notes on pages 28 to 81 are an integral part of these financial statements.
Core Cells Total
Notes Share capital Other reservesProfit and loss
account Total Share capital Other reservesProfit and loss
account Total Share capital Other reservesProfit and loss
account Total
€ € € € € € € € € € € €
Balance at 1 January 2015 8,198,000 973,368 11,613,084 20,784,452 4,710,132 499,157 3,016,978 8,226,267 12,908,132 1,472,525 14,630,062 29,010,719
Comprehensive income
Profit for the year - - 2,599,450 2,599,450 - - 1,177,674 1,177,674 - - 3,777,124 3,777,124
Other comprehensive incomeNet reporting currency differences arising on translation from functional currency to presentation currency 21 - - - - - 390,636 - 390,636 - 390,636 - 390,636
Movement in deferred tax relating to proper-ty, plant and equipment 21 - 3,840 - 3,840 - - - - - 3,840 - 3,840
Total other comprehensive Income - 3,840 - 3,840 - 390,636 - 390,636 - 394,476 - 394,476
Total comprehensive income - 3,840 2,599,450 2,603,290 - 390,636 1,177,674 1,568,310 - 394,476 3,777,124 4,171,600
Transactions with ownersIncrease in share capital 20 - - - - 2,479,127 - - 2,479,127 2,479,127 - - 2,479,127Decrease in share capital 20 - - - - (133,750) - 133,750 - (133,750) - 133,750 -Issue of cell shares on incorporation 20 - - - - 1,051,000 - - 1,051,000 1,051,000 - - 1,051,000Assignment of reserves 21 - - - - - (4,360) 4,360 - - (4,360) 4,360 -Dividends 11 - - (1,250,000) (1,250,000) - - (2,714,406) (2,714,406) - - (3,964,406) (3,964,406)
Total transactions with owners - - (1,250,000) (1,250,000) 3,396,377 (4,360) (2,576,296) 815,721 3,396,377 (4,360) (3,826,296) (434,279)
Balance at 31 December 2015 8,198,000 977,208 12,962,534 22,137,742 8,106,509 885,433 1,618,356 10,610,298 16,304,509 1,862,641 14,580,890 32,748,040

ANNUAL REPORT & AUDITED FINANCIAL STATEMENTS - 2016 ATLAS.COM.MT
26
Statement of cash flowsYear ended 31 December
Core Cells Total
Notes 2016 2015 2016 2015 2016 2015
€ € € € € €
Cash flows from operating activities
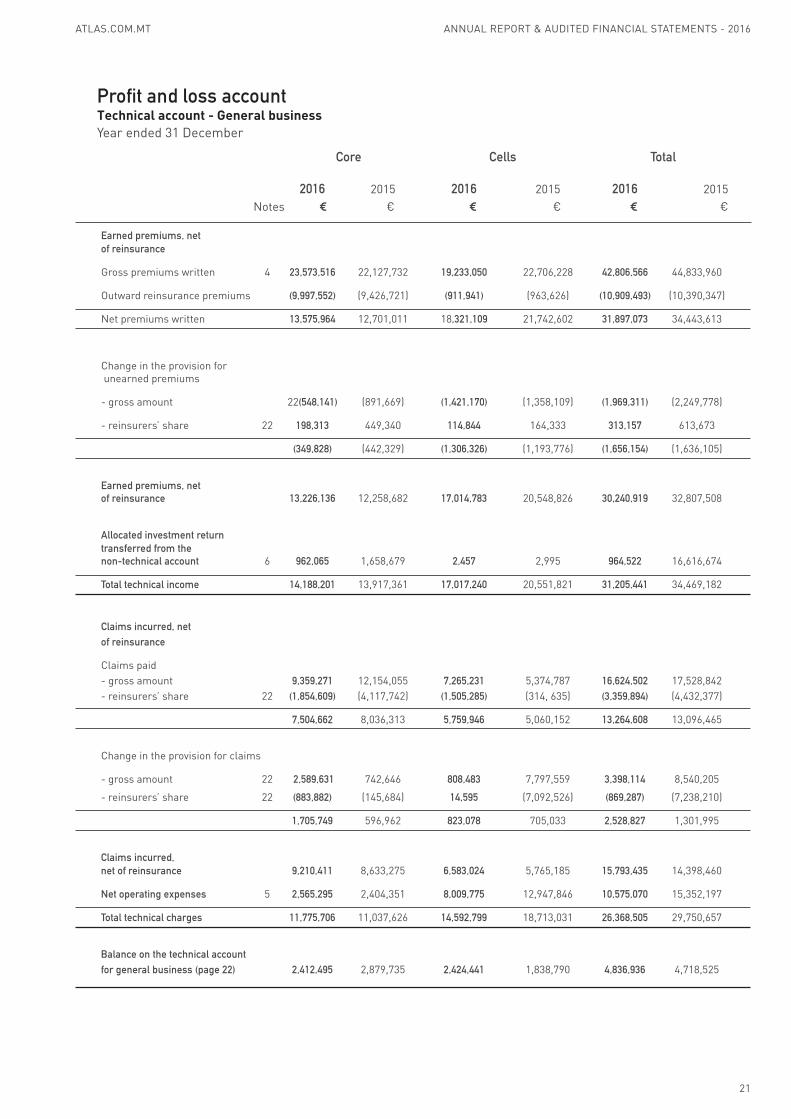
Cash generated from operations 25 1,914,648 5,051,749 6,053,003 5,473,356 7,967,651 10,525,105
Income tax paid (961,170) (1,034,328) (761,561) (945,750) (1,722,731) (1,980,078)
Net cash generated from operating activities 953,478 4,017,421 5,291,442 4,527,606 6,244,920 8,545,027
Cash flows from investing activities
Purchase of property, plant and equipment (278,368) (534,554) - - (278,368) (534,554)
Disposal of property, plant and equipment 18,800 3,250 - - 18,800 3,250
Purchase of investment property - (833) - - - (833)
Net cash (used in) investing activities (259,568) (532,137) - - (259,568) (532,137)
Cash flows from financing activitiesDividends paid (1,205,000) (1,250,000) - (2,714,406) (1,205,000) (3,964,406)
Issue of share capital - - - 3,530,127 - 3,530,127
Net cash (used in)/generated from financing activities (1,205,000) (1,250,000) - 815,721 (1,205,000) (434,279)
Movement in cash and cash equivalents (511,090) 2,235,284 5,291,442 5,343,327 4,780,352 7,578,611
Cash and cash equivalents at beginning of year 5,054,085 2,814,065 13,187,248 6,484,542 18,241,333 9,298,607
Exchange (losses)/gains on cash and cash equivalents (18,934) 4,736 (2,220,882) 1,359,379 (2,239,816) 1,364,115
Cash and cash equivalents at end of year 26 4,524,061 5,054,085 16,257,808 13,187,248 20,781,869 18,241,333
The notes on pages 28 to 81 are an integral part of these financial statements.
ATLAS.COM.MT
27
ANNUAL REPORT & AUDITED FINANCIAL STATEMENTS - 2016
Statement of cash flowsYear ended 31 December
Core Cells Total
Notes 2016 2015 2016 2015 2016 2015
€ € € € € €
Cash flows from operating activities
Cash generated from operations 25 1,914,648 5,051,749 6,053,003 5,473,356 7,967,651 10,525,105
Income tax paid (961,170) (1,034,328) (761,561) (945,750) (1,722,731) (1,980,078)
Net cash generated from operating activities 953,478 4,017,421 5,291,442 4,527,606 6,244,920 8,545,027
Cash flows from investing activities
Purchase of property, plant and equipment (278,368) (534,554) - - (278,368) (534,554)
Disposal of property, plant and equipment 18,800 3,250 - - 18,800 3,250
Purchase of investment property - (833) - - - (833)
Net cash (used in) investing activities (259,568) (532,137) - - (259,568) (532,137)
Cash flows from financing activitiesDividends paid (1,205,000) (1,250,000) - (2,714,406) (1,205,000) (3,964,406)
Issue of share capital - - - 3,530,127 - 3,530,127
Net cash (used in)/generated from financing activities (1,205,000) (1,250,000) - 815,721 (1,205,000) (434,279)
Movement in cash and cash equivalents (511,090) 2,235,284 5,291,442 5,343,327 4,780,352 7,578,611
Cash and cash equivalents at beginning of year 5,054,085 2,814,065 13,187,248 6,484,542 18,241,333 9,298,607
Exchange (losses)/gains on cash and cash equivalents (18,934) 4,736 (2,220,882) 1,359,379 (2,239,816) 1,364,115
Cash and cash equivalents at end of year 26 4,524,061 5,054,085 16,257,808 13,187,248 20,781,869 18,241,333
The notes on pages 28 to 81 are an integral part of these financial statements.

ANNUAL REPORT & AUDITED FINANCIAL STATEMENTS - 2016 ATLAS.COM.MT
28
Notes to the financial statements1. Summary of significant accounting policies
The principal accounting policies adopted in the preparation of these financial statements are set out below. These policies have been consistently applied to all the years presented, unless otherwise stated.
1.1 Basis of preparation
These financial statements are prepared in accordance with International Financial Reporting Standards (IFRSs) as adopted by the EU as modified by Article 174 of the Maltese Companies Act (Cap.386) and in accordance with the requirements of the said Act and the requirements of the Maltese Insurance Business Act, 1998. Atlas Holdings Limited (Note 30) prepares consolidated financial statements as required by the Maltese Companies Act (Cap.386) and these are delivered to the Registrar of Companies in Malta in terms of Article 174 (2) (e). Accordingly, Atlas Insurance PCC Limited is exempt from the preparation of consolidated financial statements by virtue of Article 174 of the Companies Act, 1995.
The financial statements of Atlas Insurance PCC Limited include the financial performance and financial position of the Core operation together with the operations of the Cells.
As at 31 December 2016, the Company had seven Cells, the Perfecthome Cell, the Travelodge Cell, the Ocado Cell, the TVIS Cell, the Amplifon Cell, the Gemini Cell and the L’Amie Cell referred to in these financial statements as Cell 1, Cell 2, Cell 4, Cell 7, Cell 8, Cell 9 and Cell 10 respectively. The Totemic Cell 2, referred to as Cell 6 in these financial statements, was wound up through a share capital reduction as authorised by the Malta Financial Services Authority on 29 December 2015. The Company maintains separate accounts for each Cell. Cellular assets and liabilities are separate and separately identifiable from Core and Cellular assets attributable to other Cells. Separate balance sheets, profit and loss accounts and statements of comprehensive income, changes in equity and cash flows have accordingly been prepared for the Cells.
The financial statements are prepared under the historical cost convention as modified by the fair valuation of Land and buildings - investment property, Land and buildings – property, plant and equipment, and financial assets at fair value through profit or loss.
The balance sheet is organised in increasing order of liquidity, with additional disclosures on the current or non-current nature of the Company’s assets and liabilities provided within the notes to the financial statements.
The preparation of financial statements in conformity with IFRSs requires the use of certain critical accounting estimates. It also requires directors to exercise their judgement in the process of applying the Company’s accounting policies. The areas involving a higher degree of judgement or complexity, or areas where assumptions and estimates are significant to the financial statements, are disclosed in Note 2.
Standards, interpretations and amendments to published standards effective in 2016
In 2016, the Company adopted new standards, amendments and interpretations to existing standards that are mandatory for the Company’s accounting period beginning on 1 January 2016. The adoption of these revisions to the requirements of IFRSs as adopted by the EU did not result in substantial changes to the Company’s accounting policies.

ATLAS.COM.MT
29
ANNUAL REPORT & AUDITED FINANCIAL STATEMENTS - 2016
1. Summary of significant accounting policies – continued
1.1 Basis of preparation – continued
Standards, interpretations and amendments to published standards that are not yet effective
Certain new standards, amendments and interpretations to existing standards have been published by the date of authorisation for issue of these financial statements but are mandatory for the Company’s accounting periods beginning after 1 January 2016. The Company has not early adopted these revisions to the requirements of IFRSs as adopted by the EU and the Company’s directors are of the opinion that, with the exception of the below pronouncements, there are no requirements that will have a possible significant impact on the Company’s financial statements in the period of initial application. IFRS 9, ‘Financial instruments’, addresses the classification, measurement and de-recognition of financial assets and financial liabilities. The complete version of IFRS 9 was issued in July 2014. It replaces the guidance in IAS 39 that relates to the classification and measurement of financial instruments. IFRS 9 retains but simplifies the mixed measurement model and establishes three primary measurement categories for financial assets: amortised cost, fair value through other comprehensive income and fair value through profit or loss. The basis of classification depends on the entity’s business model and the contractual cash flow characteristics of the financial asset. Investments in equity instruments are required to be measured at fair value through profit or loss with the irrevocable option at inception to present changes in fair value in other comprehensive income not recycling. The new expected credit losses model replaces the incurred loss impairment model used in IAS 39. For financial liabilities there were no changes to classification and measurement except for the recognition of changes in own credit risk in other comprehensive income, for liabilities designated at fair value through profit or loss.
As the activities of the company are predominantly connected with insurance, the company intends to apply the temporary exemption from IFRS 9, subject to EU endorsement.
IFRS 15, ‘Revenue from contracts with customers’ deals with revenue recognition and establishes principles for reporting useful information to users of financial statements about the nature, amount, timing and uncertainty of revenue and cash flows arising from an entity’s contracts with customers. Revenue is recognised when a customer obtains control of a good or service and thus has the ability to direct the use and obtain the benefits from the good or service. The standard replaces IAS 18 ‘Revenue’ and IAS 11 ‘Construction contracts’ and related interpretations.
1.2 Revenue recognition
Revenue comprises the fair value for services and is recognised as follows:
(a) Rendering of services
Premium recognition is described in accounting policy 1.15 dealing with insurance contracts.
(b) Interest income
Interest income from financial assets not classified as fair value through profit or loss is recognised using the effective interest method.
(c) Dividend income
Dividend income is recognised when the right to receive payment is established.

ANNUAL REPORT & AUDITED FINANCIAL STATEMENTS - 2016 ATLAS.COM.MT
30
1. Summary of significant accounting policies – continued
1.2 Revenue recognition - continued
(d) Rental income
Rental income from investment property is accounted for on an accruals basis in accordance with the substance of the relevant lease agreements.
1.3 Investment return
Investment return comprises investment income including fair value movements, interest income, dividends and rental income, and is net of investment expenses, charges and interest. Dividends are recorded on the date when the shareholder’s right to receive income is established. Interest and expenses are accounted for on an accruals basis.
Investment return is initially recorded in the non-technical account. A transfer is made from the non-technical account to the general business technical account of the actual investment return on investments supporting the insurance net technical provisions.
1.4 Foreign currencies
(a) Functional and presentation currency
Items included in these financial statements are measured using the currency of the primary economic environment in which the entity operates (‘the functional currency’). The euro is the Core’s functional and the Company’s presentation currency.
(b) Transactions and balances
Foreign currency transactions are translated into the functional currency using the exchange rates prevailing at the dates of the transactions. Foreign exchange gains and losses resulting from the settlement of such transactions and from the translation at year-end exchange rates of monetary assets and liabilities denominated in foreign currencies are recognised in the profit and loss account.
All foreign exchange gains and losses are presented in the profit and loss account within ‘investment return’.
The results and the financial position of the cells are translated from GBP ‘the functional currency’ into euro ‘the presentation currency’ as follows:
(i) assets and liabilities for each balance sheet presented are translated at the closing rate at the date of that balance sheet; and
(ii) income and expenses for each profit and loss account are translated at average exchange rates.
All resulting exchange differences are recognised as a component of equity and are accounted for in the functional currency exchange reserve (Note 21).
ATLAS.COM.MT
31
ANNUAL REPORT & AUDITED FINANCIAL STATEMENTS - 2016
1. Summary of significant accounting policies – continued
1.5 Intangible assets
(a) Customer relationships
Acquired customer relationships are shown at historical cost. Customer relationships have an indefinite useful life.
(b) Computer software
Acquired computer software is capitalised on the basis of the costs incurred to acquire and bring to use the specific software. These costs are amortised using the straight-line method over their useful lives, not exceeding a period of three years.
All costs associated with maintaining computer software programmes are recognised as an expense as incurred.
1.6 Tangible assets - Property, plant and equipment
Tangible fixed assets comprising land and buildings, computer equipment and furniture and fittings are initially recorded at cost. Land and buildings included within property, plant and equipment are subsequently shown at fair value, based on valuations by the directors after seeking due professional advice, less subsequent depreciation. Valuations are carried out on a regular basis such that the carrying amount of property does not differ materially from that which would be determined using fair values at the balance sheet date. All other tangible fixed assets are stated at historical cost less depreciation.
Increases in the carrying amount arising on revaluation are credited to other comprehensive income and shown as revaluation reserve in shareholders’ equity. Decreases that offset previous increases of the same asset are charged in other comprehensive income and debited against the revaluation reserve directly in equity; all other decreases are charged to the profit and loss account.
Depreciation is calculated on the straight line method to write off the cost of the assets to their residual values over their estimated useful life as follows:
%
Buildings 1Improvement to leasehold premises 10Furniture, equipment and motor vehicles 10 - 20
Freehold land is not depreciated.
Gains and losses on disposal of tangible fixed assets are determined by reference to their carrying amount and are taken into account in determining operating profit. On disposal of a revalued asset, amounts in the revaluation reserve relating to that asset are transferred to retained earnings.
Where the carrying amount of an asset is greater than its estimated recoverable amount, it is written down immediately to its recoverable amount.

ANNUAL REPORT & AUDITED FINANCIAL STATEMENTS - 2016 ATLAS.COM.MT
32
1. Summary of significant accounting policies – continued
1.7 Land and buildings - Investment property
Property that is held for long-term rental yields or for capital appreciation or both, and that is not occupied by the Company, is classified as investment property. Investment property comprises freehold buildings.
Investment property is measured initially at its cost, including related transaction costs. After initial recognition, investment property is carried at fair value. Fair value is based on active market prices, adjusted, if necessary, for any difference in the nature, location or condition of the specific asset. If this information is not available, the Company uses alternative valuation methods such as recent prices on less active markets or discounted cash flow projections. These valuations are reviewed annually by the directors after seeking professional advice.
The fair value of investment property reflects, among other things, rental income from current leases and assumptions about rental income from future leases in the light of current market conditions. The fair value also reflects, on a similar basis, any cash outflows that could be expected in respect of the property.
Subsequent expenditure is charged to the asset’s carrying amount only when it is probable that future economic benefits associated with the item will flow to the Company and the cost of the item can be measured reliably. All other repairs and maintenance costs are charged to the profit and loss account during the financial period in which they are incurred. Changes in fair values are recorded in the profit and loss account.
Gains or losses on disposal are determined by comparing proceeds with carrying amount and are included in the profit and loss account.
If an investment property becomes owner-occupied, it is reclassified as property, plant and equipment, and its fair value at the date of reclassification becomes its cost for subsequent accounting purposes.
1.8 Investment in subsidiaries
Investment in subsidiaries is accounted for at cost less impairment. The results of the subsidiary undertakings are reflected in the Company’s financial statements only to the extent of dividends receivable.
On disposal of an investment, the difference between the net disposal proceeds and the carrying amount is charged or credited to the profit and loss account.
1.9 Financial assets
The Company classifies its financial assets in the following categories: financial assets at fair value through profit or loss and loans and receivables. The classification depends on the purpose for which the investments were acquired. The directors determine the appropriate classification of the investments at the time of purchase and re-evaluate such designation at every reporting date.

ATLAS.COM.MT
33
ANNUAL REPORT & AUDITED FINANCIAL STATEMENTS - 2016
1. Summary of significant accounting policies – continued
1.9 Financial assets - continued
1.9.1 Classification
(a) Financial assets at fair value through profit or loss
Financial assets are designated at inception as fair value through profit or loss, if they are part of a group of investments that are managed on a portfolio basis, and whose performance is evaluated and reported internally on fair value basis to the Board in accordance with a documented investment strategy.
(b) Loans and receivables
Loans and receivables are non-derivative financial assets with fixed or determinable payments that are not quoted in an active market, other than those that the Company intends to sell in the short term or that it has designated as fair value through profit or loss. They include, inter alia, deposits held with credit or financial institutions, debtors and cash and cash equivalents.
1.9.2 Recognition and measurement
All purchases and sales of investments are recognised on the trade date, which is the date that the Company commits to purchase and sell the asset. Investments are initially recognised at fair value plus, in the case of all financial assets not carried at fair value through profit or loss, transaction costs that are directly attributable to their acquisition. Financial assets are derecognised when the rights to receive cash flows from the financial assets have expired or have been transferred and the Company has also transferred substantially all risks and rewards of ownership.
Financial assets at fair value through profit or loss are subsequently carried at fair value. Loans and receivables are carried at amortised cost using the effective interest method, less any provision for impairment. Realised and unrealised gains and losses arising from changes in fair value of the ‘financial assets at fair value through profit or loss’ category are included in the profit and loss account in the period in which they arise.
The fair values of quoted investments and units in collective investment schemes are based on quoted market prices at the reporting date. If the market for an investment is not active, the Company establishes fair value by using valuation techniques. Equity securities for which the fair value cannot be measured reliably are recognised at cost less impairment.
On disposal, the difference between the net disposal proceeds and the carrying amount is included in the net profit or loss for the period.
1.10 Impairment of assets
(a) Impairment of financial assets carried at amortised cost
The Company assesses at each reporting date whether there is objective evidence that a financial asset or group of financial assets is impaired. A financial asset or group of financial assets is impaired and impairment losses are incurred only if there is objective evidence of impairment as a result of one or more events that have occurred after the initial recognition of the asset (a ‘loss event’) and that loss event or events have an impact on the estimated future cash flows of the financial asset or group of financial assets that can be reliably estimated.

ANNUAL REPORT & AUDITED FINANCIAL STATEMENTS - 2016 ATLAS.COM.MT
34
1. Summary of significant accounting policies – continued
1.10 Impairment of assets – continued
(a) Impairment of financial assets carried at amortised cost - continued
Objective evidence that a financial asset or group of assets is impaired includes observable data that comes to the attention of the Company about the following events:
(i) significant financial difficulty of the issuer or debtor;(ii) a breach of contract, such as default or delinquency in payments;(iii) it becoming probable that the issuer or debtor will enter bankruptcy or other financial reorganisation; and(iv) observable data indicating that there is a measurable decrease in the estimated future cash flow from a group of financial
assets since the initial recognition of those assets, although the decrease cannot yet be identified with the individual financial assets in the group.
The Company first assesses whether objective evidence of impairment exists individually for financial assets that are individually significant. If the Company determines that no objective evidence of impairment exists for an individually-assessed financial asset, whether significant or not, it includes the asset in a group of financial assets with similar credit risk characteristics and collectively assesses them for impairment. Assets that are assessed individually for impairment and for which an impairment loss is or continues to be recognised are not included in a collective assessment of impairment.
If there is objective evidence that an impairment loss has been incurred on loans and receivables carried at amortised cost, the amount of the loss is measured as the difference between the asset’s carrying amount and the present value of estimated future cash flows discounted at the financial asset’s original effective interest rate. The carrying amount of the asset is reduced through the use of an allowance account and the amount of the loss is recognised in the profit and loss account.
If in a subsequent period, the amount of the impairment loss decreases and the decrease can be related objectively to an event occurring after the impairment was recognised (such as improved credit rating), the previously recognised impairment loss is reversed by adjusting the allowance account. The amount of the reversal is recognised in the profit and loss account.
(b) Impairment of other non-financial assets
Assets that have an indefinite useful life, such as customer relationships, are not subject to amortisation and are tested annually for impairment. Assets that are subject to amortisation or depreciation are reviewed for impairment whenever events or changes in circumstances indicate that the carrying amount may not be recoverable. An impairment loss is recognised for the amount by which the asset’s carrying amount exceeds its recoverable amount. The recoverable amount is the higher of an asset’s fair value less costs to sell and value in use.
For the purposes of assessing impairment, assets are grouped at the lowest levels for which there are separately identifiable cash flows (cash-generating units).

ATLAS.COM.MT
35
ANNUAL REPORT & AUDITED FINANCIAL STATEMENTS - 2016
1. Summary of significant accounting policies – continued
1.11 Operating leases
Assets leased out under operating leases are included as investment property in the balance sheet. Rental income is recognised in the profit and loss account over the period of the lease to which it relates.
1.12 Cash and cash equivalents
For the purposes of the statement of cash flows, cash and cash equivalents comprise cash in hand and deposits held at call with banks, net of bank overdrafts, and other short-term highly liquid investments with original maturities of three months or less. In the balance sheet, bank overdrafts are included in borrowings.
1.13 Share capital
Ordinary shares are classified as equity. Incremental costs directly attributable to the issue of new ordinary shares are shown in equity as a deduction, net of tax, from the proceeds.
1.14 Current and deferred tax
The tax expense for the period comprises current and deferred tax. Tax is recognised in profit or loss, except to the extent that it relates to items recognised in other comprehensive income or directly in equity. In this case, the tax is also recognised in other comprehensive income or directly in equity, respectively.
The current income tax charge is calculated on the basis of the tax laws enacted or substantively enacted at the balance sheet date.
Deferred tax is recognised, using the liability method, on temporary differences arising between the tax bases of assets and liabilities and their carrying amounts in the financial statements. However, deferred tax liabilities are not recognised if they arise from the initial recognition of goodwill; deferred tax is not accounted for if it arises from initial recognition of an asset or liability in a transaction other than a business combination that at the time of the transaction affects neither accounting nor taxable profit or loss. Deferred tax is determined using tax rates (and laws) that have been enacted or substantially enacted by the balance sheet date and are expected to apply when the related deferred tax asset is realised or the deferred tax liability is settled.
Deferred tax assets are recognised only to the extent that future taxable profit will be available such that realisation of the related tax benefit is probable.
Deferred tax assets and liabilities are offset when there is a legally enforceable right to offset current tax assets against current tax liabilities.

ANNUAL REPORT & AUDITED FINANCIAL STATEMENTS - 2016 ATLAS.COM.MT
36
1. Summary of significant accounting policies – continued
1.15 Insurance contracts – classification
The Company issues contracts that transfer significant insurance risk and that are classified as insurance contracts. As a general guideline, the Company defines as significant insurance risk the possibility of having to compensate the policyholder if a specified uncertain future event (the insured event) adversely affects the policyholder.
Insurance contracts – General business
The results for direct business are determined on an annual basis whereby the incurred cost of claims, commissions and related expenses are charged against the earned proportion of premiums, net of reinsurance, as follows:
(i) Premiums earned relate to business incepted during the year together with any differences between the booked premiums for prior years and thus previously accrued, less cancellations.
(ii) Unearned premiums represent the proportion of premiums written in the year that relate to unexpired terms of policies in force at the balance sheet date, calculated on a time apportionment basis.
(iii) Commissions and other acquisition costs that vary with and are related to securing new contracts and renewing existing contracts are deferred over the period in which the related premiums are earned. These are capitalised and are shown as deferred acquisition costs (“DAC”) in the balance sheet. DAC is amortised over the term of the policies as the premium is earned. All other costs are recognised as expenses when incurred.
(iv) Claims incurred comprise claims and related expenses paid in the year and changes in the provision for outstanding claims, including provisions for claims incurred but not reported (“IBNR”) and related expenses, together with any other adjustments to claims from previous years. Where applicable, deductions are made for salvage and other recoveries.
(v) Provision is made at the year-end for the estimated cost of claims incurred but not settled at the balance sheet date, including the cost of claims incurred but not yet reported to the Company. The estimated cost of claims includes expenses to be incurred in settling claims and a deduction for the expected value of salvage and other recoveries. The Company takes all reasonable steps to ensure that it has appropriate information regarding its claims exposures. However, given the uncertainty in establishing claims provisions, it is likely that the final outcome will prove to be different from the original liability established. Liabilities for unpaid claims are estimated using the input of assessments for individual cases reported to the Company and statistical analyses for the claims incurred but not reported. The Company does not discount its liabilities for unpaid claims.
The estimation of claims IBNR is generally subject to a greater degree of uncertainty than the estimation of the cost of settling claims already notified to the Company, where more information about the claim event is generally available.
(vi) Provision in the form of an unexpired risk provision will be made for any deficiencies arising when unearned premiums, net of associated acquisition costs, are insufficient to meet expected claims and expenses after taking into account future investment return on the investments supporting the unearned premiums provision and unexpired risks provision. The expected claims are calculated having regard to events that have occurred prior to the balance sheet date.

ATLAS.COM.MT
37
ANNUAL REPORT & AUDITED FINANCIAL STATEMENTS - 2016
1. Summary of significant accounting policies – continued
1.15 Insurance contracts – classification – continued
Reinsurance contracts held
Contracts entered into by the Company with reinsurers under which the Company is compensated for losses on one or more contracts issued by the Company and that meet the classification requirements for insurance contracts are classified as reinsurance contracts held. Insurance contracts entered into by the Company under which the contract holder is another insurer (inwards reinsurance) are included with insurance contracts.
The benefits to which the Company is entitled under its reinsurance contracts held are recognised as reinsurance assets. These assets consist of short-term balances due from reinsurers (classified within receivables), as well as longer term receivables (classified within reinsurers’ share of technical provisions) that are dependent on the expected claims and benefits arising under the related reinsured insurance contracts. Amounts recoverable from or due to reinsurers are measured consistently with the amounts associated with the reinsured insurance contracts and in accordance with the terms of each reinsurance contract. Reinsurance liabilities are primarily premiums payable for reinsurance contracts and are recognised as an expense on an accruals basis.
The Company assesses its reinsurance assets for impairment on a regular basis. If there is objective evidence that the reinsurance asset is impaired, the Company reduces the carrying amount of the reinsurance asset to its recoverable amount and recognises that impairment loss in the profit and loss account. The Company gathers the objective evidence that a reinsurance asset is impaired using the same process adopted for financial assets held at amortised cost. The impairment loss is also calculated following the same method used for these financial assets.
Receivables and payables related to insurance contracts
Receivables and payables are recognised when due. These include amounts due to and from agents, brokers and policyholders.
If there is objective evidence that an insurance receivable is impaired, the Company reduces the carrying amount of the insurance receivable accordingly and recognises that impairment loss in the profit and loss account. The Company gathers the objective evidence that an insurance receivable is impaired using the same process adopted for financial assets held at amortised cost. The impairment loss is calculated following the same method used for these financial assets.
1.16 Provisions
Provisions for legal claims are recognised when the Company has a present legal or constructive obligation as a result of past events, it is probable that an outflow of resources will be required to settle the obligation, and the amount has been reliably estimated. Provisions are not recognised for future operating losses.
Provisions are measured at the present value of the expenditures expected to be required to settle the obligation using a pre-tax rate that reflects current market assessments of the time value of money and the risks specific to the obligation. The increase in the provision due to passage of time is recognised as interest expense.

ANNUAL REPORT & AUDITED FINANCIAL STATEMENTS - 2016 ATLAS.COM.MT
38
1. Summary of significant accounting policies – continued
1.17 Borrowings
Borrowings are recognised initially at fair value, net of transaction costs incurred. Borrowings are subsequently stated at amortised cost; any difference between the proceeds (net of transaction costs) and the redemption value is recognised in the profit and loss account over the period of the borrowings using the effective interest method.
Borrowings are classified as current liabilities unless the Company has an unconditional right to defer settlement of the liability for at least 12 months from the end of the reporting period.
1.18 Offsetting financial instruments
Financial assets and liabilities are offset and the net amount reported in the statement of financial position when there is a legally enforceable right to set off the recognised amounts and there is an intention to settle on a net basis, or realise the asset and settle the liability simultaneously.
1.19 Dividend distribution
Dividends on ordinary shares or on cell shares are recognised in equity in the period in which they are declared by the directors or approved by the Company’s shareholders.
2. Critical accounting estimates and judgements in applying accounting policies
The estimation of the ultimate liability arising from claims made under insurance contracts is the Company’s most critical accounting estimate.
Provision is made as and when claims are notified for the estimated cost of claims. This estimate will include expenses to be incurred in settling the claim. All provisions for claims incurred but not settled by balance sheet date are carried forward to the following financial period. Given the uncertainty in establishing claims provisions, it is possible that the final outcome may prove to be different from the original liability estimated.
In reporting claims incurred and balance sheet provisions the Company takes all reasonable steps to curtail any future deviations in establishing its liabilities by ensuring that it has appropriate information regarding its claims exposures and related future liabilities from the outset, the results of which are elaborated in the claims cost progression tables disclosed in Note 22.
The Company believes that the liability arising from claims under insurance contracts is adequately reserved as at the financial year end.

ATLAS.COM.MT
39
ANNUAL REPORT & AUDITED FINANCIAL STATEMENTS - 2016
3. Management of insurance and financial risk
3.1 Insurance risk
The Company issues contracts that transfer the insurance risk of the Company’s clients. This section summarises these risks and how the Company manages them.
The risk under any one insurance contract is the uncertainty of whether the insured will sustain the contingency insured against. If that happens, then further uncertainty lies in how many times this can happen and how much it will cost, i.e. the frequency and severity of resultant claims.
Insurance risk is by its nature random and unpredictable. Consequently the Company writes portfolios of risk with the intention of taking refuge within the theory of probability (large numbers) and thus being able to correctly construct pricing of its insurance contracts.
The risk the Company faces however remains that actual claims incurred exceed the amounts of such provisions since the frequency and severity incurred exceed the estimated ones.
Insurance events, due to their random nature, can vary in severity and frequency from year to year. However the larger the portfolio involved, the lower the deviation from estimates which is why the Company endeavours to acquire growth in areas of insurance risk which it deems attractive.
Another method used to mitigate random deviations is that of diversification in portfolio characteristics. Atlas Insurance PCC Limited is not unduly dependant on one class or sector of business and in fact is deemed to be privileged with a balanced mix of various classes of Motor, Liability, Marine, Miscellaneous Accident, Property and Travel and Personal Accident. Likewise the Company’s portfolio is evenly spread between personal lines and commercial lines business.
The Company has a rather even geographical spread of property risks within the Maltese isles and is well spread among the various sectors of commerce e.g. tourism and hotel accommodation; manufacture; services and it is not unduly dependent on one sector alone.
Once again this diversification ensures that the type and amount of risks presented are spread out without there being undue concentrations in one area alone.
During the year the Company did not license any new cells but Gemini Cell, L’Amie Cell, PerfectHome Cell, Travelodge Cell, Ocado Cell, Amplifon Cell and TVIS Cell carried on business during the year in accordance with their licence conditions.
The insurance business written by the Gemini Cell emanates from Belgium and the Netherlands and that of L’Amie Cell relates to risks situated in Austria. The reinsurance business written by Amplifon Cell relates to risks originally written in the Netherlands. The other cells all write property, accident, sickness, motor, general liability and motor liability and miscellaneous financial risks in the United Kingdom. The property risks are equally well-spread geographically. The cells’ results are amply reflected in these financial statements.

ANNUAL REPORT & AUDITED FINANCIAL STATEMENTS - 2016 ATLAS.COM.MT
40
3. Management of insurance and financial risk – continued
3.1 Insurance risk – continued
3.1.1 Frequency and severity of claims
Motor and liability
The danger is that competition restrains average premium growth while the frequency and severity of claims may be seriously affected by:
(i) the long lifetime which motor and other liability claims tend to have and which can lead to negative effects of inflation on claim amounts;
(ii) changes in traffic management and density and the increased presence of more vulnerable road users;(iii) increased court awards arising from increased sensitivity of courts to the plight of accident victims spurred also by EU
directives and “pro-victim” court/legislative tendencies in other EU jurisdictions; and(iv) increased responsibilities of employers and business owners in the light of health and safety and consumer legislation; and(v) the latent effect of disease claims on the employers liability and products liability portfolio(vi) the effect of inflation on motor repair costs(vii) the effect of natural hazards affecting comprehensive motor results.
The Company’s 2016 gross motor result remained affected by the continued spike in the frequency of bodily injury losses and underlying attritional losses on motor own damage.
The review of Maltese law on civil damages in tort is not yet concluded and no untoward trends have been observed in legal judgements in the interim.
Property
The October windstorm had a relatively minor effect of performance and no other extreme weather “catastrophe” events of note occurred. However, the gross property result was impacted by a large engineering loss in September.
Miscellaneous accident, and personal accident and travel
The nature of claims on Money, Glass, Goods in Transit and Fidelity relate very much to the prevalence of crime in Malta and the 2016 year showed no extraordinary experience in this respect. Travel as a class had a relatively uneventful year.
Marine
The marine account tends to produce regular patterns of claim frequency though years of increased frequency can arise owing to particular localised problems and the windstorm of October did have some impact on the marine hull result.
Miscellaneous Financial Risk
Risk carried by the Company and managed under this class of business did not materially impact the results of the Company and the risk profiles do not pose any threat to the Company’s core capital.

ATLAS.COM.MT
41
ANNUAL REPORT & AUDITED FINANCIAL STATEMENTS - 2016
3. Management of insurance and financial risk – continued
3.1 Insurance risk – continued
3.1.1 Frequency and severity of claims – continued
The Company manages all the above via:
(a) underwriting strategy,(b) adequate reinsurance arrangements, and(c) proactive claims handling
(a) Underwriting strategy
The Company follows strict risk acceptance selection processes and only accepts risks that possess characteristics which the Company feels will lead to low or average frequency and severity of losses. This criteria applies across all classes and for this purpose the Company uses underwriting guidelines and sets limits on the overall retention of the risks it writes.
The Company inserts certain exclusions in its contracts to enforce underwriting criteria. For example, in the context of liability exposures, the Company applies asbestos liabilities exclusions on all liability policies.
The Company closely scrutinises the business activities of its client base to determine any undue exposure to long-term industrial disease claims and to assist in this process and that of analysing other potential exposures, the Company views several property, accident and liability risks first hand via its policy of risk surveying (in-house and external).
The Company also has a regular renewal analysis and reserves the right to reassess each contract based on its claims experience and any other changes in material information. The majority of the marine cargo account is based on open covers. Thorough controls on each marine open cover are carried out regularly ensuring that performance is acceptable.
Malta’s storm and flood exposure is localised in particular areas of flash flood exposure. With the Company’s pre-risk survey strategy and with the added knowledge of flood-prone areas, the Company filters the incoming new business portfolio or alternatively manages the risk of storm.
The Company, as a standard, applies limits on all motor and liability policies. The only area of unlimited liability is that of Motor EU use (in line with legislation in certain countries).
The Company’s internal underwriting authority limits mean that authority to bind is delegated in a controlled manner. The Company’s branches likewise follow and are subject to specific underwriting limitations beyond which they must seek head office approval.
The risks underwritten by the Company may also be in the form of reinsurance contracts issued on a proportional basis whereby it assumes a portion of the risk which the ceding insurance undertakings undertake with their direct clients.

ANNUAL REPORT & AUDITED FINANCIAL STATEMENTS - 2016 ATLAS.COM.MT
42
3. Management of insurance and financial risk – continued
3.1 Insurance risk – continued
3.1.1 Frequency and severity of claims – continued
(b) Reinsurance
The Company places its reinsurance programme with overseas reinsurers who all meet the financial approval of the local regulator. It is generally the Company’s policy for reinsurance to be placed in the Lloyd’s market or with listed multinational reinsurance companies whose credit rating is not less than A-. The portfolio programme is a mix of proportional and non-proportional protection which also includes protection from industrial disease losses incurred but not reported during the years prior to the portfolio transfers in 2004 and 2005 from AXA Insurance plc to the Company.
The Company’s decision on the type of reinsurance obtained, the level of retention and the width of cover are recommended by the Company’s own technical personnel in collaboration with overseas consultants and the board of directors approves the reinsurance programme on an annual basis.
The effectiveness of reinsurance protection in place for the Company have worked towards reducing the impact of net retained losses for the year by the Company.
(c) Claims techniques
Claims are handled and reserved on a claim by claim basis.
The Company employs in-house specialised claims personnel. In addition to having in place authority levels for its staff to negotiate claims, it also employs a panel of external loss adjusters and technical experts who are regularly utilised in the Company’s quest for sound and equitable claim handling.
The Company has a policy of analysing claims progressions and thus determines if reserving policies adopted in the past have been successful. This procedure has pre-dated the setting up of the Company as an underwriter and the Company in fact tracks claims which were incurred in years during which the Company formerly acted as an agent for overseas principals.
The Company actively pursues early settlement of all claims to reduce exposure to unpredictable developments and equally the Company maintains a proactive system that ensures that timely action is taken on all claims and reviews are carried out when required. This is particularly important in the context of motor and liability claims. In the context of reserving active use is made of a panel of legal advisors and full acquaintance is made with courtroom developments by our specialist claims team headed by the claims director.

ATLAS.COM.MT
43
ANNUAL REPORT & AUDITED FINANCIAL STATEMENTS - 2016
3. Management of insurance and financial risk – continued
3.1 Insurance risk – continued
3.1.2 Sources of uncertainty in estimation of future claims payments
Owing to the fact that liability claims are normally payable on a claims occurrence basis, a claim is payable if the accident occurred in the year of insurance even if the damage is manifest long afterwards. This is accentuated in the context of employers’ liability claims where cover is provided on a loss caused basis. Therefore not only can known liability claims take longer to be settled owing to lengthy court proceedings and the like, but claims can take long to be registered. This is why known claims outstanding provisions must be adequately increased by a provision for IBNR (incurred but not reported) claims.
Therefore when estimating the cost due to be paid in future the Company looks at:
(i) the monetary provision necessary for pending non-liability claims based on the latest available facts and estimates
(ii) the monetary provision for the future payment of claims for bodily injuries to employees or third party victims of accidents. This is based on the accepted basis of:
(a) loss of future earnings as a result of disability percentages along with estimated rehabilitation expenses; (b) an element of direct damages; and (c) costs of settlement including legal and other fees and court expenses; and
(iii) to the above provisions for known reported claims, the Company adds an IBNR provision with particular emphasis on the motor and liability class.
The Company also makes a provision for the unexpired period of cover of policies running at the time of the balance sheet date.
Like all claims, large claims are assessed on a case by case basis and accurately analysed, and Atlas will take pessimistic scenarios based on legal precedent (of particular relevance to motor and liability class) and similar cases. The Company will also note current trends.
The Company takes care to ensure it is in possession of knowledge on all bodily injury claims notified and carries out active reviews of the larger/more serious bodily injury cases on motor and liability classes.
IBNR percentages are taken as a factor on outstanding claims provision and are arrived at on the basis of an annual historical analyses of different classes’ performance vis-a-vis actual IBNR experienced since 2005.
Uncertainty on the estimation of claim payments on property classes is considerably lower than that on motor and liability classes. The same can be said of personal accident, travel and miscellaneous accident.
Uncertainty in general is reduced by ensuring thorough knowledge of the circumstances and extent of losses reported; and through the use of medical and loss assessors and adjusters to ensure correct reserving.
A high degree of certainty on marine claims is achieved via collection of survey evidence and value documentation.

ANNUAL REPORT & AUDITED FINANCIAL STATEMENTS - 2016 ATLAS.COM.MT
44
3. Management of insurance and financial risk – continued
3.2 Financial risk management
The Company is exposed to financial risk through its financial assets and liabilities, reinsurance assets and insurance liabilities. The key financial risk is that the proceeds from its financial assets would not be sufficient to fund the obligations arising from its insurance contracts and investing activity. The most important components of the Company’s financial risk are market risk (cash flow and fair value interest rate risk, equity price risk and currency risk), credit risk and liquidity risk. These risks mainly arise on open positions in interest rate, debt and equity products, and currency exposures, which are all subject to market movements.
The Company’s investment strategy reflects its profile of liabilities to ensure that sufficient assets of appropriate nature, term and liquidity enable it to meet the liabilities as they become due.
3.2.1 Market risk
(a) Cash flow and fair value interest rate risk
In general, the Company is exposed to risk associated with the effects of fluctuations in the prevailing levels of market interest rates. Financial instruments issued at variable rates expose the Company to cash flow interest rate risk. Financial instruments issued at fixed rates expose the Company to fair value interest rate risk. The Company holds investments mostly in equity and debt securities. Debt securities are subject to interest rate risk.
Fair value interest rate risk is the risk that the relative value of a security will worsen due to an interest rate increase. Interest rate risk is mitigated through the distribution of fixed interest investments over a range of maturity dates. Moreover, the Company’s asset allocation policy limits the amount of investment in any one asset or towards any one counterparty. Notes 16 and 26 incorporate interest rate and maturity information with respect to the Company’s assets.
The total assets and liabilities subject to interest rate risk are the following:
2016 2015€ €
Assets at floating interest rates - bank balances 20,271,506 17,866,469Assets at fixed interest rates
- Listed debt securities 7,716,979 13,905,885 - Deposits with banks or financial institutions 265,000 830,854 - Amounts owed from related parties 4,146,326 4,261,338
32,399,811 36,864,546
Liabilities at floating interest rates - bank balance overdrawn 45,225 6,337
Bank and other borrowing facilities are not commonly availed of and the directors traditionally sanction the use of such facilities for short-term operational cash flow bridging as and when the requirement arises. The exposure to interest rate risk in respect of borrowings is accordingly not material.

ATLAS.COM.MT
45
ANNUAL REPORT & AUDITED FINANCIAL STATEMENTS - 2016
3. Management of insurance and financial risk – continued
3.2 Financial risk management – continued
3.2.1 Market risk – continued
(a) Cash flow and fair value interest rate risk - continued
Deposits with banks or financial institutions potentially expose the Company to fair value interest rate risk. However, since these instruments are not fair valued, a change in interest rates will not have an effect on profit or loss or other comprehensive income. Cash at bank subject to floating interest rates expose the Company to cash flow interest rate risk.
The sensitivity analysis for interest rate risk illustrates how changes in the fair value or future cash flows of a financial instrument will fluctuate because of changes in market interest rates at the reporting date.
At 31 December 2016 the Company was mainly exposed to fair value interest rate risk on listed fixed interest rate debt securities. If interest rates at that date would have been 50 basis points (2015: 50 basis points) lower with all other variables held constant, pre-tax profit for the year would have been €270,752 higher (2015: €473,323 higher). An increase of 50 basis points (2015: 50 basis points), with all other variables held constant, would have resulted in pre-tax profits being €266,120 lower (2015: €470,338 lower). Up to the end of the reporting period the Company did not have any hedging policy with respect to interest rate risk on other financial instruments as exposure to such risks was not deemed to be significant by the directors.
(b) Equity price risk
The Company is exposed to market price risk on its equity investments. These investments are subject to stock market volatility and the value can decline significantly in response to adverse political, market or economic developments. The Company reduces this risk by diversifying its investments in different countries and in different sectors.
The Company’s investment portfolio is overseen by the Investment Committee that meets on a regular basis in order to review the position of its investments and to plan its investment strategy in accordance with established guidelines. Investment decisions are taken on the basis of an Investment Policy approved by the Board. The Investment Policy includes benchmarks and guidelines on various aspects of portfolio management, including currency, instrument, rating, localisation, concentration and maturity. It is periodically reviewed by the Investment Committee and, subject to Board approval, amended as necessary so as to reflect the Company’s overall investment objective, which is principally the preservation of capital and liabilities.
The total assets subject to equity price risk are the following:
Core Cells Total
2016 2015 2016 2015 2016 2015
€ € € € € €
Assets subject to equity price risk
Equity securities 16,394,510 4,198,164 - - 16,394,510 4,198,164Units in unit trusts 3,017,491 5,887,661 1,584,214 482,953 4,601,705 6,370,614
19,412,001 10,085,825 1,584,214 482,953 20,996,215 10,568,778

ANNUAL REPORT & AUDITED FINANCIAL STATEMENTS - 2016 ATLAS.COM.MT
46
3. Management of insurance and financial risk – continued
3.2 Financial risk management – continued
3.2.1 Market risk - continued
(b) Equity price risk - continued
The sensitivity for equity price risk illustrates how changes in the fair value of equity securities will fluctuate because of changes in market prices, whether those changes are caused by factors specific to the individual equity issuer, or factors affecting all similar equity traded in the market. The sensitivity for equity price risk is derived based on global equity returns, assuming that currency exposures are hedged. A 10% positive or negative movement in equity prices is considered to be an appropriate benchmark for sensitivity purposes. An increase or a decrease of 10% (2015: 10%) in equity prices, with all other variables held constant, would result in an impact on the Core pre-tax profit for the year of €1,941,200 (2015: €1,008,583). An increase or a decrease of 10% (2015: 10%) in equity prices, with all other variables held constant, would result in an impact on the Cells pre-tax profit for the year of €158,421 (2015: €48,295).
(c) Currency risk
Currency risk relates to the risk of fluctuations in the value of financial instruments and assets and liabilities due to changes in exchange rates. The Company may experience losses arising from a decrease in values of its assets held in foreign currency or an increase in value of its technical reserves denominated in foreign currencies. The board of directors implements a policy of currency matching rules thus minimising the Company’s exposure to such risk.
As the Company’s technical reserves arising from its core operation are wholly denominated in euro due to the fact that all insurance policies are written in euro, funds covering such liabilities are largely invested in euro instruments.
Similarly, in managing its cells, the Company applies the same currency matching policy by identifying the currency in which cellular technical provisions arise and as such administers a balance of matched assets.
In an effort to maximise return on investment the board directs its investments committees to prudently apply a certain degree of flexibility which is limited to the extent of not compromising the Company’s financial strength in matching its liabilities, primarily its insurance technical provisions.
At 31 December 2016, foreign currency exposure, principally comprising a mix of US Dollar and UK Pound, amounted to €1,887,686 (2015: €2,233,059). If the above currencies had weakened or strengthened by 15% against the euro with all other variables held constant, pre-tax profit for the year would have been lower by €333,121 (2015: €394,069) or higher by €246,220 (2015: €291,269).

ATLAS.COM.MT
47
ANNUAL REPORT & AUDITED FINANCIAL STATEMENTS - 2016
3. Management of insurance and financial risk – continued
3.2 Financial risk management - continued
3.2.2 Credit risk
The Company is exposed to credit risk, that risk of loss due to a counterparty being unable to pay amounts in full when due. The following are the areas where credit risk is identified:
(i) reinsurers’ share of insurance technical provisions;(ii) amounts due from reinsurers in respect of claims already paid;(iii) amounts due from insurance contract holders;(iv) amounts due from insurance intermediaries; and(v) investments and cash and cash equivalents.
Limits of authority and segregation of duties in the granting of credit are in place to maintain objectivity, independence and control over new and existing lending exposures.
The credit risk management team assesses the creditworthiness of all reinsurers, intermediaries and customers by using credit grade references provided by rating agencies, and other publicly available financial information. Where this information is not available, detailed analysis is carried out by investigating both financial strength and market repute. The Company experiences a low level of bad debts and concentration of credit risk with respect to debts is limited due to the large number of customers comprising the Company’s debtor base.
Routine reviews of payment history and the status of any ongoing negotiations with counterparties is carried out by the credit risk management in order to detect any deterioration in the creditworthiness of individual counterparties.
While reinsurance is used to manage insurance risk, this does not discharge the Company’s liability as primary insurer. If a reinsurer fails to pay a claim for any reason, the Company remains liable for the payment to the policyholder. The creditworthiness of reinsurers is considered by the directors on an ongoing basis by reviewing their financial strength within the terms of their credit ratings as stated in Note 3.1.1 (b).
The Company is also exposed to credit risk for its investments and its cash at bank. The Company’s cash is placed with quality financial institutions. Credit risk in respect of investments is not considered by the directors to be significant in view of the credit standing of the issuers.
The Investment Committee takes account of the credit risk inherent in the Company’s investment portfolio by adopting similar cautious practices in identifying investment opportunities and monitoring portfolio performance. The investment instruments acquired are highly rated by the internationally-renowned credit rating agencies like Moody’s and Standard and Poor’s. The policy adopted by the investment committee is that of directing most of the funds available for investment to A-rated securities and deposits. There are certain instances whereby the committee may opt for placing these funds in B-rated securities only once the circumstances of such an opportunity are fully assessed and are beneficial to the performance of the investment portfolio.
Credit risk in relation to cells is not considered to be significant as a substantial amount of the receivables is due from related parties.

ANNUAL REPORT & AUDITED FINANCIAL STATEMENTS - 2016 ATLAS.COM.MT
48
3. Management of insurance and financial risk – continued
3.2 Financial risk management – continued
3.2.2 Credit risk – continued
The following table illustrates the assets that expose the Company to credit risk as at the balance sheet date and includes the Standard & Poor’s (or equivalent) composite rating, when available. Financial assets that are not rated principally comprise locally traded bonds on the Malta Stock Exchange, debtors and certain deposits with local bank institutions for which no international rating is available.
Assets bearing credit risk at the end of the reporting period, split up between Core and Cell operations are analysed as follows:
As at 31 December 2016
AAA to AA A to A- BBB to B Not rated A to A- Not ratedCore Core Core Core Cells Cells Total
€ € € € € € €
Investments
Debt securities - listed fixed interest rate 1,002,216 2,475,317 1,194,214 3,054,232 - - 7,716,979
Deposits with banks or financial institutions - - 265,000 - - - 265,000
1,002,216 2,475,317 1,459,214 3,054,232 - - 7,981,979
Loans and receivables
Discounted securities to cell owners - - - - - 3,902,438 3,902,438Debtors and prepayments and accrued income - - - 4,153,574 - 4,603,238 8,756,812
Cash equivalents - 11,661 2,504,726 1,497,311 6,084,852 10,172,956 20,271,506
- 11,661 2,504,726 5,650,885 6,084,852 18,678,632 32,930,756
Reinsurers’ share of technical provisions 7,206,298 1,633,830 - 21,060 13,896,983 - 22,758,171
Total assets bearing credit risk 8,208,514 4,120,808 3,963,940 8,717,177 19,981,835 18,678,632 63,670,906

ATLAS.COM.MT
49
ANNUAL REPORT & AUDITED FINANCIAL STATEMENTS - 2016
3. Management of insurance and financial risk – continued
3.2 Financial risk management – continued
3.2.2 Credit risk – continued
As at 31 December 2015
AAA to AA A to A- BBB to B Not rated A to A- Not ratedCore Core Core Core Cells Cells Total
€ € € € € € €
Investments
Debt securities - listed fixed interest rate 824,386 5,879,113 2,509,084 4,693,302 - - 13,905,885
Deposits with banks or financial institutions - - 350,000 - - 480,854 830,854
824,386 5,879,113 2,859,084 4,693,302 - 480,854 14,736,739
Loans and receivables
Amounts receivable from related parties - - - 46,041 - - 46,041
Discounted securities to cell owners - - - - - 4,215,297 4,215,297
Debtors and prepayments and accrued income - - - 4,312,366 - 4,988,048 9,300,414
Cash equivalents - - 2,673,853 2,005,368 5,439,723 7,747,525 17,866,469
- - 2,673,853 6,363,775 5,439,723 16,950,870 31,428,221
Reinsurers’ share of technical provisions 3,258,777 4,520,216 - - 15,910,183 - 23,689,176
Total assets bearing credit risk 4,083,163 10,399,329 5,532,937 11,057,077 21,349,906 17,431,724 69,854,136
3.2.3 Liquidity risk
The Company’s exposure to liquidity risk arises from the eventuality that the frequency or severity of claims are greater than estimated. Liquidity risk is the risk that cash may not be available to pay obligations when due at a reasonable cost.
The directors do not consider this risk as significant given the nature of the Company’s financial assets and liabilities. The Company’s financial assets are considered to be readily realisable as they consist of local and foreign securities listed on recognised stock markets and deposits held with first-class-rated credit institutions. Moreover, the Company ensures that a reasonable level of funds is available at any point in time for unexpected large claims and the Company may also resort to an overdraft facility which provides a short-term means of finance.
The table below analyses the Company’s financial liabilities (gross of reinsurers’ share of claims outstanding (Note 22) into relevant maturity groupings based on the remaining period at the balance sheet date to the contractual maturity date. The amounts disclosed in the table are the contractual undiscounted cash outflows.
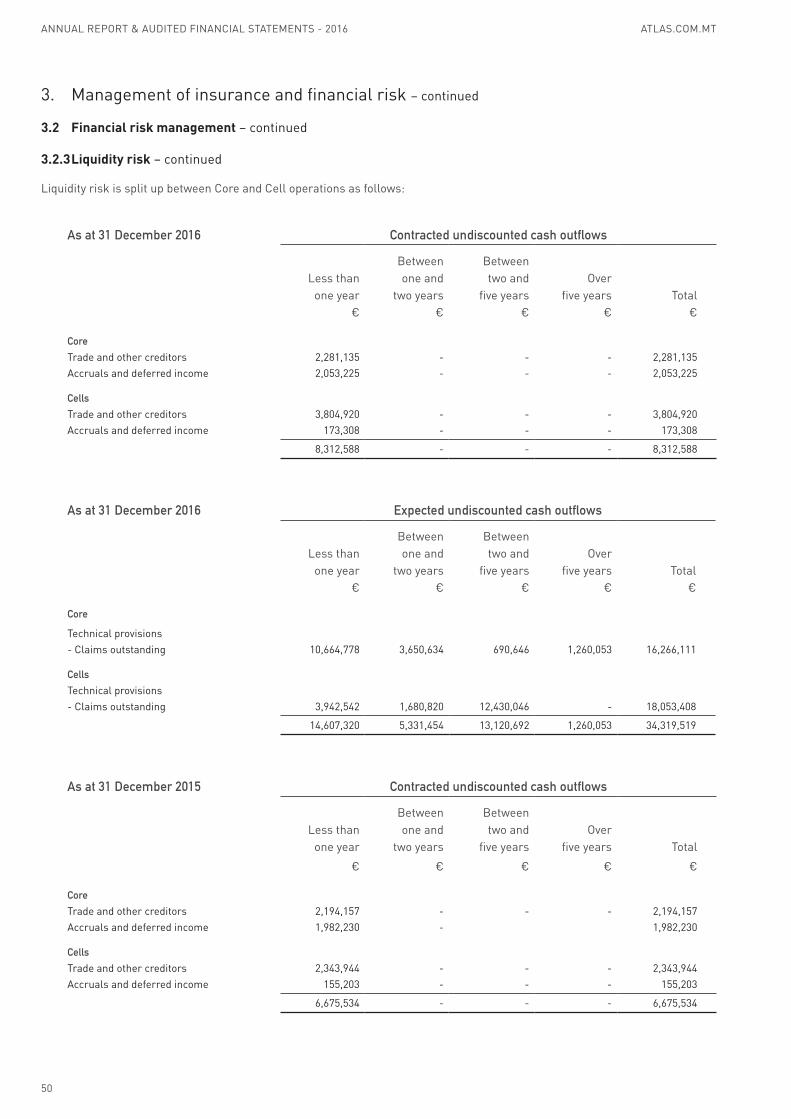
ANNUAL REPORT & AUDITED FINANCIAL STATEMENTS - 2016 ATLAS.COM.MT
50
3. Management of insurance and financial risk – continued
3.2 Financial risk management – continued
3.2.3 Liquidity risk – continued
Liquidity risk is split up between Core and Cell operations as follows:
As at 31 December 2016 Contracted undiscounted cash outflows
Between BetweenLess than one and two and Over
one year two years five years five years Total€ € € € €
CoreTrade and other creditors 2,281,135 - - - 2,281,135Accruals and deferred income 2,053,225 - - - 2,053,225
CellsTrade and other creditors 3,804,920 - - - 3,804,920Accruals and deferred income 173,308 - - - 173,308
8,312,588 - - - 8,312,588
As at 31 December 2016 Expected undiscounted cash outflows
Between BetweenLess than one and two and Over
one year two years five years five years Total€ € € € €
Core
Technical provisions - Claims outstanding 10,664,778 3,650,634 690,646 1,260,053 16,266,111
CellsTechnical provisions - Claims outstanding 3,942,542 1,680,820 12,430,046 - 18,053,408
14,607,320 5,331,454 13,120,692 1,260,053 34,319,519
As at 31 December 2015 Contracted undiscounted cash outflows
Between BetweenLess than one and two and Over
one year two years five years five years Total
€ € € € €
CoreTrade and other creditors 2,194,157 - - - 2,194,157Accruals and deferred income 1,982,230 - 1,982,230
CellsTrade and other creditors 2,343,944 - - - 2,343,944Accruals and deferred income 155,203 - - - 155,203
6,675,534 - - - 6,675,534

ATLAS.COM.MT
51
ANNUAL REPORT & AUDITED FINANCIAL STATEMENTS - 2016
3. Management of insurance and financial risk – continued
3.2 Financial risk management - continued
3.2.3 Liquidity risk - continued
As at 31 December 2015 Expected undiscounted cash outflows
Between BetweenLess than one and two and Over
one year two years five years five years Total€ € € € €
CoreTechnical provisions - Claims outstanding 8,492,636 2,809,415 1,386,816 834,188 13,523,055
CellsTechnical provisions - Claims outstanding 3,165,447 955,916 15,708,608 - 19,829,971
11,658,083 3,765,331 17,095,424 834,188 33,353,026
3.3 Fair value estimation
The table below analyses financial instruments carried at fair value, by valuation method. The different levels have been defined as follows:
• Quoted prices (unadjusted) in active markets for identical assets or liabilities (level 1).• Inputs other than quoted prices included within level 1 that are observable for the asset or liability, either directly (that is, as prices) or indirectly (that is, derived from prices) (level 2).• Inputs for the asset or liability that are not based on observable market data (that is, unobservable inputs) (level 3).
The following table presents the Company’s assets and liabilities that are measured at fair value at 31 December 2016 and 2015:
Core Cells Total
2016 2015 2016 2015 2016 2015Level 1 Level 1 Level 1
€ € € € € €
AssetsFinancial assets at fair value through profit or loss
- Equity securities and units in unit trusts 19,412,001 10,085,825 1,584,214 482,953 20,996,215 10,568,778- Debt securities 7,716,979 13,905,885 - - 7,716,979 13,905,885
Total assets 27,128,980 23,991,710 1,584,214 482,953 28,713,194 24,474,663
The fair value of financial instruments traded in active markets is based on quoted market prices at the balance sheet date. A market is regarded as active if quoted prices are readily and regularly available from an exchange, dealer, broker, industry group, pricing service, or regulatory agency, and those prices represent actual and regularly occurring market transactions on an arm’s length basis. The quoted market price used for financial assets held by the Company is the current bid price. These instruments are included in level 1. At 31 December 2016 and 2015, the carrying amount of the Company’s other financial assets and liabilities approximate their fair value in view of their short-term maturity.
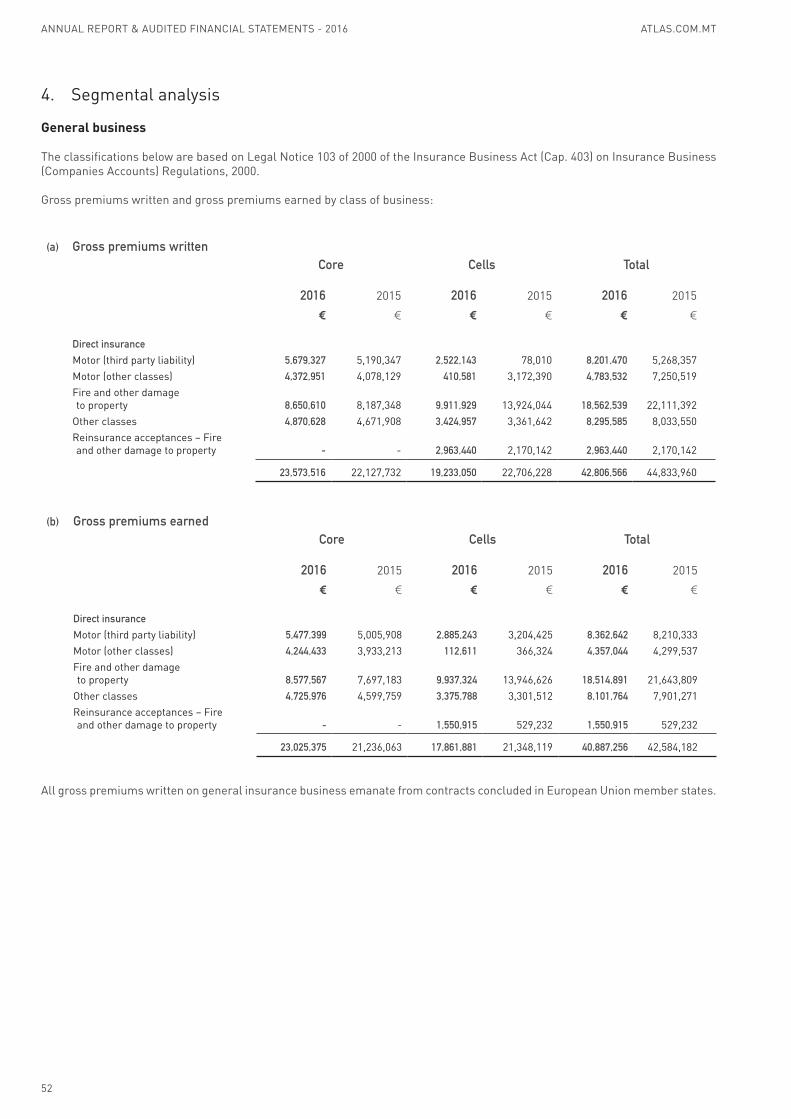
ANNUAL REPORT & AUDITED FINANCIAL STATEMENTS - 2016 ATLAS.COM.MT
52
4. Segmental analysis
General business
The classifications below are based on Legal Notice 103 of 2000 of the Insurance Business Act (Cap. 403) on Insurance Business (Companies Accounts) Regulations, 2000.
Gross premiums written and gross premiums earned by class of business:
(a) Gross premiums writtenCore Cells Total
2016 2015 2016 2015 2016 2015
€ € € € € €
Direct insuranceMotor (third party liability) 5,679,327 5,190,347 2,522,143 78,010 8,201,470 5,268,357Motor (other classes) 4,372,951 4,078,129 410,581 3,172,390 4,783,532 7,250,519Fire and other damage to property 8,650,610 8,187,348 9,911,929 13,924,044 18,562,539 22,111,392
Other classes 4,870,628 4,671,908 3,424,957 3,361,642 8,295,585 8,033,550Reinsurance acceptances – Fire and other damage to property - - 2,963,440 2,170,142 2,963,440 2,170,142
23,573,516 22,127,732 19,233,050 22,706,228 42,806,566 44,833,960
(b) Gross premiums earnedCore Cells Total
2016 2015 2016 2015 2016 2015
€ € € € € €
Direct insuranceMotor (third party liability) 5,477,399 5,005,908 2,885,243 3,204,425 8,362,642 8,210,333Motor (other classes) 4,244,433 3,933,213 112,611 366,324 4,357,044 4,299,537Fire and other damage to property 8,577,567 7,697,183 9,937,324 13,946,626 18,514,891 21,643,809
Other classes 4,725,976 4,599,759 3,375,788 3,301,512 8,101,764 7,901,271Reinsurance acceptances – Fire and other damage to property - - 1,550,915 529,232 1,550,915 529,232
23,025,375 21,236,063 17,861,881 21,348,119 40,887,256 42,584,182
All gross premiums written on general insurance business emanate from contracts concluded in European Union member states.

ATLAS.COM.MT
53
ANNUAL REPORT & AUDITED FINANCIAL STATEMENTS - 2016
4. Segmental analysis – continued
Gross claims incurred, gross operating expenses and reinsurance balance by class of business:
(c) Gross claims incurredCore Cells Total
2016 2015 2016 2015 2016 2015
€ € € € € €
Direct insuranceMotor (third party liability) 5,531,493 4,527,697 3,195,529 9,234,285 8,727,022 13,761,982Motor (other classes) 2,996,569 3,579,192 311,384 142,153 3,307,953 3,721,345Fire and other damage to property 1,932,966 3,943,599 2,075,197 1,993,414 4,008,163 5,937,013
Other classes 1,487,874 846,213 1,774,356 1,440,832 3,262,230 2,287,045Reinsurance acceptances – Fire and other damage to property - - 717,249 361,662 717,249 361,662
11,948,902 12,896,701 8,073,715 13,172,346 20,022,617 26,069,047
(d) Gross operating expensesCore Cells Total
2016 2015 2016 2015 2016 2015
€ € € € € €
Direct insuranceMotor (third party liability) 1,531,559 1,655,227 173,818 218,093 1,705,377 1,873,320Motor (other classes) 1,179,535 1,223,277 26,479 15,750 1,206,014 1,239,027Fire and other damage to property 2,201,247 1,785,857 6,422,582 11,233,558 8,623,829 13,019,415
Other classes 1,239,176 1,141,413 1,263,872 1,397,055 2,503,048 2,538,468Reinsurance acceptances – Fire and other damage to property - - 123,740 83,390 123,740 83,390
6,151,517 5,805,774 8,010,491 12,947,846 14,162,008 18,753,620
(e) Reinsurance balanceCore Cells Total
2016 2015 2016 2015 2016 2015
€ € € € € €
Direct insuranceMotor (third party liability) (672,031) (35,342) (735,033) (6,683,015) (1,407,064) (6,718,357)Motor (other classes) - (27,768) (17,446) 74,485 (17,446) 46,717Fire and other damage to property 3,174,311 566,708 1,030 40 3,175,341 566,748
Other classes 973,009 808,934 57,141 605 1,030,150 809,539
3,475,289 1,312,532 (694,308) (6,607,885) 2,780,981 (5,295,353)
The reinsurance balance represents the credit to the technical account from the aggregate of all items relating to reinsurance outwards.

ANNUAL REPORT & AUDITED FINANCIAL STATEMENTS - 2016 ATLAS.COM.MT
54
5. Net operating expenses
Core Cells Total
2016 2015 2016 2015 2016 2015
€ € € € € €
Acquisition costs 3,407,803 3,151,438 7,221,124 12,250,825 10,628,927 15,402,263Change in deferred acquisition costs (Note 18) (41,232) (18,488) (84,190) (100,484) (125,422) (118,972)
Administrative expenses 3,166,035 3,082,790 530,081 487,955 3,696,116 3,570,745Reinsurance commission earned (3,586,222) (3,401,423) (716) (17) (3,586,938) (3,401,440)Other net technical (income)/expense (381,089) (409,966) 343,476 309,567 (37,613) (100,399)
2,565,295 2,404,351 8,009,775 12,947,846 10,575,070 15,352,197
Total commissions included in acquisition costs and accounted for in the financial period amounted to €1,878,178 in respect of the core operations (2015: €1,793,332) and €7,221,124 in respect of the cell operations (2015: €12,250,825).
6. Investment return
Investment incomeCore Cells Total
2016 2015 2016 2015 2016 2015
€ € € € € €
Interest receivable from financial assets that are not at fair value through profit or loss 645 2,709 69,462 80,892 70,107 83,601
Net gains from financial assets at fair value through profit or loss:
- dividend income 124,898 249,880 - - 124,898 249,880- net fair value gains 650,167 2,508,991 - - 650,167 2,508,991Dividend from subsidiary undertaking 523,077 461,538 - - 523,077 461,538Fair value gains on investment property 559,992 - - - 559,992 -
Exchange differences - 4,736 13,243 - 13,243 4,736Rental income from investment property 114,922 105,207 - - 114,922 105,207
1,973,701 3,333,061 82,705 80,892 2,056,406 3,413,953
Investment expenses and chargesCore Cells Total
2016 2015 2016 2015 2016 2015
€ € € € € €
Interest expense and charges for financial liabilities that are not at fair value through profit or loss 85,622 78,069 1,391 3,196 87,013 81,265
Investment expenses 152,699 275,502 - - 152,699 275,502Exchange differences 18,936 - - 20,305 18,936 20,305
257,257 353,571 1,391 23,501 258,648 377,072
Total investment return 1,716,444 2,979,490 81,314 57,391 1,797,758 3,036,881
Allocated investment return transferred to:
general business technical account 962,065 1,658,679 2,457 2,995 964,522 1,661,674 non-technical account 754,379 1,320,811 78,857 54,396 833,236 1,375,207

ATLAS.COM.MT
55
ANNUAL REPORT & AUDITED FINANCIAL STATEMENTS - 2016
7. Expenses by nature
Core Cells Total
2016 2015 2016 2015 2016 2015
€ € € € € €
Employee benefit expense and directors’ fees 2,833,681 2,719,755 - - 2,833,681 2,719,755
Commissions payable 1,878,188 1,793,332 7,221,124 12,250,825 9,099,312 14,044,157Change in deferred acquisition costs (41,232) (18,488) (84,190) (100,484) (125,422) (118,972)
Reinsurance commissions earned (3,586,222) (3,401,423) (716) (17) (3,586,938) (3,401,440)
Amortisation of intangible assets (Note 12) 14,569 27,378 - - 14,569 27,378
Impairment of intangible assets 46,040 - - - 46,040 -Depreciation of property, plant and equipment (Note 13) 383,242 370,600 - - 383,242 370,600
Profit on disposal of fixed assets - - - - - -Auditor’s fees 46,040 40,555 35,080 35,850 81,120 76,405Other expenses 1,133,273 1,014,795 877,086 795,006 2,010,359 1,809,801
Total operating and administrative expenses 2,707,579 2,546,504 8,048,384 12,981,180 10,755,963 15,527,684
Allocated to:
Technical account 2,565,295 2,404,351 8,009,775 12,947,846 10,575,070 15,352,197Non-technical account 142,284 142,153 38,609 33,334 180,893 175,487
Auditor’s fees
Fees charged by the auditor for services rendered during the financial years ended 31 December 2016 and 2015 relate to the following:
2016 2015€ €
Annual statutory audit 69,000 61,840Other assurance services - 6,000Tax advisory 12,120 8,565
81,120 76,405

ANNUAL REPORT & AUDITED FINANCIAL STATEMENTS - 2016 ATLAS.COM.MT
56
8. Employee benefit expense
2016 2015€ €
Salaries and related costs (including directors’ salaries) 3,521,539 3,487,610Social security costs 217,492 206,397
3,739,031 3,694,007Inter-company payroll charge (226,863) (238,962)
3,512,168 3,455,045
The average number of persons employed during the year was:
2016 2015
Directors 7 7Managerial 15 15Clerical 103 98
125 120
9. Tax expense
Core Cells Total
2016 2015 2016 2015 2016 2015
€ € € € € €
Current tax expense 752,095 1,057,342 908,265 682,178 1,660,360 1,739,520Deferred tax charge (Note 17) 100,566 402,836 - - 100,566 402,836
Over provision in previous years (14,878) (1,235) - - (14,878) (1,235)
837,783 1,458,943 908,265 682,178 1,746,048 2,141,121
The tax on the Company’s profit before tax differs from the theoretical amount that would arise using the basic tax rate as follows:
2016 2015€ €
Profit before tax 5,489,279 5,918,245
Tax on profit at 35% 1,921,248 2,071,386Tax effect of: Differences due to the application of Flat Rate Foreign Tax Credit (25,864) (60,038)
Income subject to reduced rates of tax (237,201) (7,309) Expenses not deductible for tax purposes 29,286 46,350 Over provision in previous years (14,878) (1,235)Unrecognised temporary differences 45,623 18,036 Other movements 27,834 73,931
Tax charge in the accounts 1,746,048 2,141,121

ATLAS.COM.MT
57
ANNUAL REPORT & AUDITED FINANCIAL STATEMENTS - 2016
10. Directors’ emoluments
2016 2015€ €
Directors’ fees 76,833 77,194Salaries and other emoluments 354,136 344,456
430,969 421,650
During the year, benefits in kind valued at €18,873 (2015: €25,937) were provided to the directors.
11. Dividends declared
2016 2015€ €
To the ordinary shareholders:Net 1,205,000 1,250,000
Dividends per ordinary share 0.37 0.38
To the cell shareholders:Cell 1 - 2,354,339
Cell 4 - 222,004
Cell 7 - 138,063
Net - 2,714,406
Dividends per preference share
Cell 1 - 1.61
Cell 4 - 0.20
Cell 7 - 0.34
Total dividends 1,205,000 3,964,406
On 25 January 2017, the Board approved the payment of a net interim dividend of €600,000 to the non-cellular shareholders and, on 22 February 2017, the payments of net interim dividends of €490,300 to two of its cellular shareholders.
At the forthcoming Annual General Meeting a net dividend in respect of 2017 amounting to €615,000 is to be presented for shareholders’ approval.
These financial statements do not recognise these dividends paid and proposed during 2017, which will be accounted for in shareholders’ equity as an apportionment of retained earnings in the year ending 31 December 2017.

ANNUAL REPORT & AUDITED FINANCIAL STATEMENTS - 2016 ATLAS.COM.MT
58
12. Intangible assets
Customer relationships
Computer Software Total
€ € €
At 1 January 2015Cost 194,735 521,666 716,401Accumulated amortisation and impairment (194,735) (451,649) (646,384)
Net book amount - 70,017 70,017
Year ended 31 December 2015Opening net book amount - 70,017 70,017Additions - 9,744 9,744Amortisation charge - (27,378) (27,378)
Closing net book amount - 52,383 52,383
At 31 December 2015Cost 194,735 531,410 726,145Accumulated amortisation and impairment (194,735) (479,027) (673,762)
Net book amount - 52,383 52,383
Year ended 31 December 2016Opening net book amount - 52,383 52,383Disposals - (5,906) (5,906)Amortisation charge - (14,569) (14,569)
Closing net book amount - 31,908 31,908
At 31 December 2016Cost 194,735 525,504 720,239Accumulated amortisation and impairment (194,735) (493,596) (688,331)
Net book amount - 31,908 31,908

ATLAS.COM.MT
59
ANNUAL REPORT & AUDITED FINANCIAL STATEMENTS - 2016
13. Property, plant and equipment
Land and buildings
Improvements to leasehold
premises
Furniture, equipment and motor
vehicles Total€ € € €
At 1 January 2015 Cost or revaluation 3,200,721 1,258,320 3,331,170 7,790,211Accumulated depreciation - (683,589) (2,698,967) (3,382,556)
Net book amount 3,200,721 574,731 632,203 4,407,655
Year ended 31 December 2015Opening net book amount 3,200,721 574,731 632,203 4,407,655Additions - 282,401 242,411 524,812Disposals - - (40,106) (40,106)Depreciation charge (34,101) (122,292) (214,207) (370,600)Depreciation released on disposal - - 40,106 40,106
Closing net book amount 3,166,620 734,840 660,407 4,561,867
At 31 December 2015Cost or revaluation 3,200,721 1,540,721 3,533,475 8,274,917Accumulated depreciation (34,101) (805,881) (2,873,068) (3,713,050)
Net book amount 3,166,620 734,840 660,407 4,561,867
Year ended 31 December 2016Opening net book amount 3,166,620 734,840 660,407 4,561,867Additions - 118,520 165,752 284,272Fair value increases 1,603,965 - - 1,603,965Reclassification to Investment Property (211,850) - - (211,850)Disposals - - (50,469) (50,469)Depreciation charge (33,558) (128,129) (221,555) (383,242)Depreciation released on disposal - - 50,469 50,469
Closing net book amount 4,525,177 725,231 604,604 5,855,012
At 31 December 2016Cost or revaluation 4,558,735 1,659,241 3,648,758 9,866,734Accumulated depreciation (33,558) (934,010) (3,044,154) (4,011,722)
Net book amount 4,525,177 725,231 604,604 5,855,012
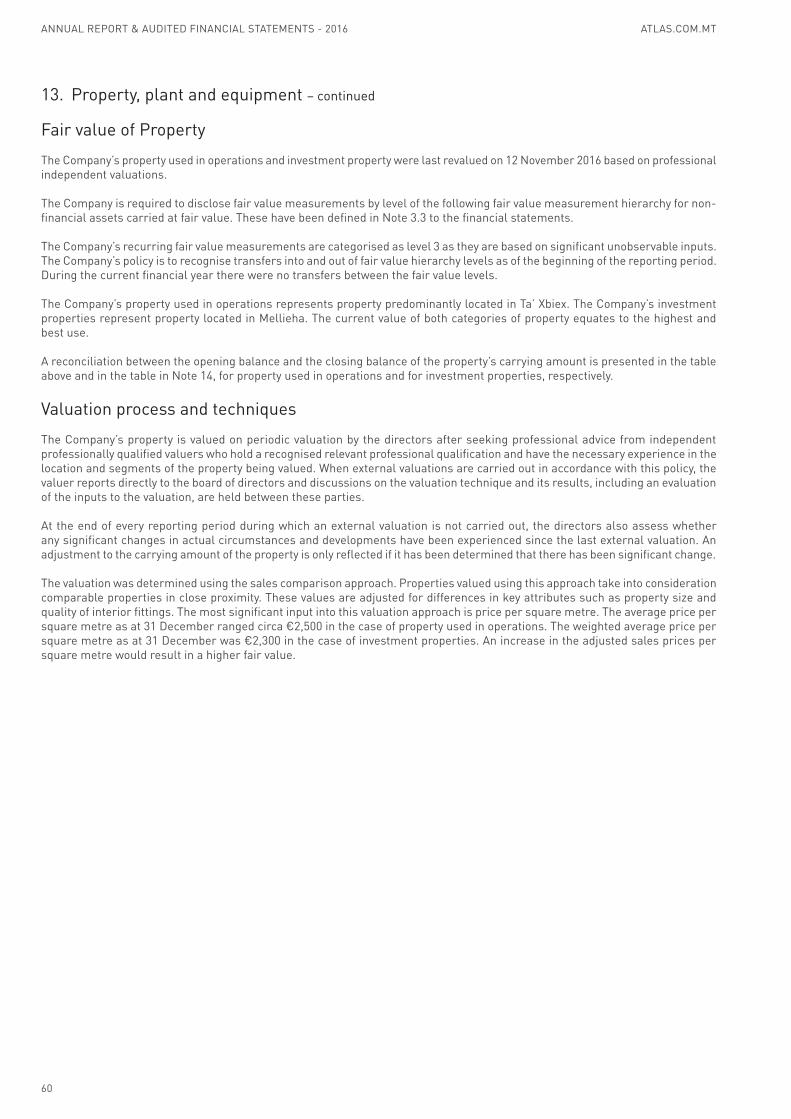
ANNUAL REPORT & AUDITED FINANCIAL STATEMENTS - 2016 ATLAS.COM.MT
60
13. Property, plant and equipment – continued
Fair value of Property
The Company’s property used in operations and investment property were last revalued on 12 November 2016 based on professional independent valuations.
The Company is required to disclose fair value measurements by level of the following fair value measurement hierarchy for non-financial assets carried at fair value. These have been defined in Note 3.3 to the financial statements.
The Company’s recurring fair value measurements are categorised as level 3 as they are based on significant unobservable inputs. The Company’s policy is to recognise transfers into and out of fair value hierarchy levels as of the beginning of the reporting period. During the current financial year there were no transfers between the fair value levels.
The Company’s property used in operations represents property predominantly located in Ta’ Xbiex. The Company’s investment properties represent property located in Mellieha. The current value of both categories of property equates to the highest and best use.
A reconciliation between the opening balance and the closing balance of the property’s carrying amount is presented in the table above and in the table in Note 14, for property used in operations and for investment properties, respectively.
Valuation process and techniques
The Company’s property is valued on periodic valuation by the directors after seeking professional advice from independent professionally qualified valuers who hold a recognised relevant professional qualification and have the necessary experience in the location and segments of the property being valued. When external valuations are carried out in accordance with this policy, the valuer reports directly to the board of directors and discussions on the valuation technique and its results, including an evaluation of the inputs to the valuation, are held between these parties.
At the end of every reporting period during which an external valuation is not carried out, the directors also assess whether any significant changes in actual circumstances and developments have been experienced since the last external valuation. An adjustment to the carrying amount of the property is only reflected if it has been determined that there has been significant change.
The valuation was determined using the sales comparison approach. Properties valued using this approach take into consideration comparable properties in close proximity. These values are adjusted for differences in key attributes such as property size and quality of interior fittings. The most significant input into this valuation approach is price per square metre. The average price per square metre as at 31 December ranged circa €2,500 in the case of property used in operations. The weighted average price per square metre as at 31 December was €2,300 in the case of investment properties. An increase in the adjusted sales prices per square metre would result in a higher fair value.

ATLAS.COM.MT
61
ANNUAL REPORT & AUDITED FINANCIAL STATEMENTS - 2016
13. Property, plant and equipment – continued
Valuation process and techniques – continued
If the land and buildings were stated on the historical cost basis, the amounts would be as follows:
2016 2015€ €
Cost 4,973,536 2,644,340Accumulated depreciation (311,937) (278,379)
Net book amount 4,661,599 2,365,961
14. Land and buildings – investment property
2016 2015€ €
Year ended 31 DecemberAt beginning of year 2,778,108 2,777,275Reclassification from Property, Plant and Equipment 211,850 -Fair value increases 559,992 -Additions - 833
At end of year 3,549,950 2,778,108
At 31 DecemberCost and net book amount 3,549,950 2,778,108
The valuation process and techniques are included under Note 13.
If the investment property was stated on the historical cost basis, the amounts would be as follows:
2016 2015€ €
Cost 3,549,950 2,778,108Accumulated depreciation (146,289) (110,789)
Net book amount 3,403,661 2,667,319
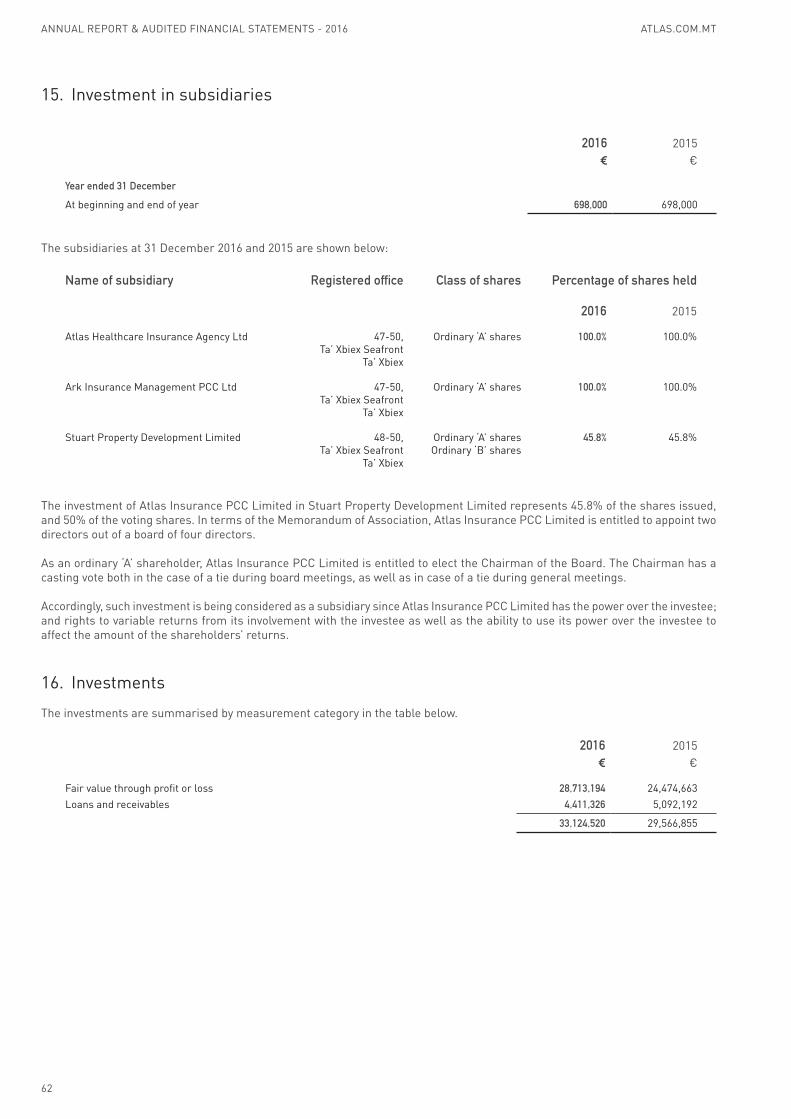
ANNUAL REPORT & AUDITED FINANCIAL STATEMENTS - 2016 ATLAS.COM.MT
62
15. Investment in subsidiaries
2016 2015€ €
Year ended 31 December
At beginning and end of year 698,000 698,000
The subsidiaries at 31 December 2016 and 2015 are shown below:
Name of subsidiary Registered office Class of shares Percentage of shares held
2016 2015
Atlas Healthcare Insurance Agency Ltd 47-50, Ta’ Xbiex Seafront
Ta’ Xbiex
Ordinary ‘A’ shares 100.0% 100.0%
Ark Insurance Management PCC Ltd 47-50, Ta’ Xbiex Seafront
Ta’ Xbiex
Ordinary ‘A’ shares 100.0% 100.0%
Stuart Property Development Limited 48-50, Ta’ Xbiex Seafront
Ta’ Xbiex
Ordinary ‘A’ sharesOrdinary ‘B’ shares
45.8% 45.8%
The investment of Atlas Insurance PCC Limited in Stuart Property Development Limited represents 45.8% of the shares issued, and 50% of the voting shares. In terms of the Memorandum of Association, Atlas Insurance PCC Limited is entitled to appoint two directors out of a board of four directors.
As an ordinary ‘A’ shareholder, Atlas Insurance PCC Limited is entitled to elect the Chairman of the Board. The Chairman has a casting vote both in the case of a tie during board meetings, as well as in case of a tie during general meetings.
Accordingly, such investment is being considered as a subsidiary since Atlas Insurance PCC Limited has the power over the investee; and rights to variable returns from its involvement with the investee as well as the ability to use its power over the investee to affect the amount of the shareholders’ returns.
16. Investments
The investments are summarised by measurement category in the table below.
2016 2015€ €
Fair value through profit or loss 28,713,194 24,474,663Loans and receivables 4,411,326 5,092,192
33,124,520 29,566,855

ATLAS.COM.MT
63
ANNUAL REPORT & AUDITED FINANCIAL STATEMENTS - 2016
16. Investments – continued
(a) Investments at fair value through profit or loss
Core Cells Total
2016 2015 2016 2015 2016 2015€ € € € € €
At 31 DecemberEquity securities and units in unit trusts 19,412,001 10,085,825 1,584,214 482,953 20,996,215 10,568,778
Debt securities – listed fixed interest rate 7,716,979 13,905,885 - - 7,716,979 13,905,885
Total investments at fair value through profit or loss 27,128,980 23,991,710 1,584,214 482,953 28,713,194 24,474,663
Equity securities and units in unit trusts are classified as non-current. During the year the Company invested €13m as seed capital in the Merill Total Return Income Fund following a transfer of existing investments held under a discretionary management agreement.
Maturity of fixed income debt securities:
2016 2015€ €
Within 1 year 103,000 204,910Between 1 and 2 years 691,235 777,798Between 2 and 5 years 1,594,955 3,812,233Over 5 years 5,327,789 9,110,944
7,716,979 13,905,885
Weighted average effective interest rate 3.69% 4.19%
The movements for the year are summarised as follows:
Core Cells Total
2016 2015 2016 2015 2016 2015€ € € € € €
Year ended 31 DecemberAt beginning of year 23,991,710 23,667,746 482,953 453,263 24,474,663 24,121,009Additions 7,931,233 8,352,839 1,163,705 - 9,094,938 8,352,839Disposals (5,102,112) (9,893,811) - - (5,102,112) (9,893,811)Fair value gains 308,149 1,864,936 - - 308,149 1,864,936Other movements - - (62,444) 29,690 (62,444) 29,690
At end of year 27,128,980 23,991,710 1,584,214 482,953 28,713,194 24,474,663
As at 31 DecemberCost 24,410,886 21,466,342 1,593,345 429,640 26,004,231 21,895,982Accumulated net fair value gains 2,718,094 2,525,368 (9,131) 53,313 2,708,963 2,578,681
27,128,980 23,991,710 1,584,214 482,953 28,713,194 24,474,663

ANNUAL REPORT & AUDITED FINANCIAL STATEMENTS - 2016 ATLAS.COM.MT
64
16. Investments – continued
(b) Loans and receivables
2016 2015€ €
At 31 December Deposits with banks or financial institutions (i) 265,000 830,854
Discounted securities (ii) 3,902,438 4,215,297
Loan to subsidiary company (iii) - 46,041
Loan to parent company (iv) 243,888 -
4,411,326 5,092,192
( i ) Deposits with banks or financial institutions
Core Cells Total
2016 2015 2016 2015 2016 2015€ € € € € €
Within 3 months 265,000 350,000 - 480,854 265,000 830,854
The deposits with banks or financial institutions earn interest as follows:
2016 2015€ €
At fixed rates 265,000 830,854
Weighted average effective interest rate 0.1% 0.1%
( ii ) Discounted securities
These consist of discounted securities issued by related parties which are not subject to interest, were issued at a discount and are redeemable at par upon maturity. No guarantees have been given or received in respect of these notes and the amounts outstanding will be settled in cash. Details for their redemption dates and values and effective interest rates are as follows:
As at 31 December 2016Value in
Original Redemption Redemption Effective Balancenote value date value interest rate Sheet
% €
Redemption period calculated from the balance sheet date:
Within one year Cell 1 GBP2,929,364 15/11/2017 GBP2,982,439 0.18 3,429,246 Cell 2 GBP399,740 30/09/2017 GBP411,178 0.20 473,192
3,902,438

ATLAS.COM.MT
65
ANNUAL REPORT & AUDITED FINANCIAL STATEMENTS - 2016
16. Investments – continued
(b) Loans and receivables - continued
( ii ) Discounted securities - continued
As at 31 December 2015Value in
Original Redemption Redemption Effective Balancenote value date value interest rate Sheet
% €
Redemption period calculated
from the balance sheet date:
Within one year Cell 1 GBP2,832,510 15/01/2016 GBP2,836,400 0.13 3,673,489 Cell 2 GBP390,878 31/12/2015 GBP397,660 1.71 541,808
4,215,297
( iii ) Loan to subsidiary company
The loan to subsidiary company is classified as non-current. The amount is stated net of a provision for impairment of €221,224 (2015: €175,183).
( iv ) Loan to parent company
The loan to the parent Company is an interest free loan. The amount is €243,888 (2015: Nil).
17. Deferred taxation
2016 2015€ €
Year ended 31 DecemberAt beginning of year (1,258,781) (859,785)Charged to other comprehensive income (Note 21) (129,826) 3,840Charged to profit and loss account (Note 9) (100,566) (402,836)
At end of year (1,489,173) (1,258,781)
The total deferred tax liability is not expected to fall due within 12 months.
Deferred taxes are calculated on all temporary differences under the liability method using a principal tax rate of 35% (2015: 35%) with the exception of investment property and freehold and other property, for which deferred taxes are calculated using a tax rate of 8% or 10% of the carrying amount (2015: 8% or 10%) depending on acquisition dates.

ANNUAL REPORT & AUDITED FINANCIAL STATEMENTS - 2016 ATLAS.COM.MT
66
17. Deferred taxation – continued
The balance at 31 December represents temporary differences on:
2016 2015€ €
Revaluation of land and buildings (249,862) (120,036)Revaluation of investment property (289,075) -Temporary differences on: - Financial investments at fair value through profit or loss (894,752) (975,317) - Fixed assets (79,942) (187,886) - Provisions 24,458 24,458
(1,489,173) (1,258,781)
Movements in deferred tax arising on revaluation of land and buildings are accounted for in Other comprehensive income. All other temporary differences are accounted for in the profit and loss account. Deferred income taxes and liabilities are offset when there is a legally enforceable right to set-off under the Malta Income Tax regime.
18. Deferred acquisition costs
Core Cells Total
2016 2015 2016 2015 2016 2015€ € € € € €
Year ended 31 DecemberAt beginning of year 749,708 731,220 228,162 119,334 977,870 850,554Net amount credited to profit and loss account (Note 5) 41,232 18,488 84,190 100,484 125,422 118,972Exchange differences resulting from translation to presentation currency - - (17,091) 8,344 (17,091) 8,344
At end of year 790,940 749,708 295,261 228,162 1,086,201 977,870
Current portion 790,940 749,708 295,261 228,162 1,086,201 977,870

ATLAS.COM.MT
67
ANNUAL REPORT & AUDITED FINANCIAL STATEMENTS - 2016
19. Debtors and prepayments and accrued income
Core Cells Total
2016 2015 2016 2015 2016 2015€ € € € € €
Debtors arising from direct Insurance operationsDue from policyholders 1,436,558 1,756,743 - - 1,436,558 1,756,743
Due from agents, brokers & intermediaries 2,089,454 1,662,940 - - 2,089,454 1,662,940
3,526,012 3,419,683 - - 3,526,012 3,419,683
Other debtorsReceivable from parent 95,561 88,648 - - 95,561 88,648Receivable from subsidiaries 62,170 150,912 - - 62,170 150,912Receivable from fellow subsidiaries 181 170,898 - - 181 170,898Receivable from related parties 81,965 225 3,933,995 4,167,053 4,015,960 4,167,278Amounts owed by directors/ shareholders - 488 - - - 488Other debtors 208,919 192,478 524,280 682,564 733,199 875,042
448,796 603,649 4,458,275 4,849,617 4,907,071 5,453,266
Prepayments and accrued incomePrepayments 72,227 84,659 144,963 138,431 217,190 223,090Accrued interest 106,539 204,375 - - 106,539 204,375
178,766 289,034 144,963 138,431 323,729 427,465Total debtors and prepayments and accrued income 4,153,574 4,312,366 4,603,238 4,988,048 8,756,812 9,300,414
Current portion 4,153,574 4,312,366 4,603,238 4,988,048 8,756,812 9,300,414
Core debtors are presented net of an allowance for impairment of €69,881 (2015: €69,881). As at 31 December 2016, total debtors amounting to €3,122,673 (2015: €3,013,427) were fully performing, whereas debtors amounting to €852,134 (2015: €1,009,905) were past due but not impaired. These dues related to a number of independent parties for whom there is no recent history of significant default. The ageing analysis of amounts past due but not impaired is as follows:
2016 2015
€ €
Up to 3 months 620,197 664,5623 to 9 months 118,431 274,174More than 9 months 113,506 71,169
852,134 1,009,905
Receivables from group undertakings and related parties are unsecured, interest free and repayable on demand.

ANNUAL REPORT & AUDITED FINANCIAL STATEMENTS - 2016 ATLAS.COM.MT
68
20. Share capital
2016 2015
€ €
Authorised share capital:
4,997,000 ‘A’ ordinary voting shares of €2.50 each 12,492,500 12,492,500
3,000 ‘B’ cumulative preference shares of €2.50 each 7,500 7,500
6,000,000 cell shares of €2.50 each 15,000,000 15,000,000
27,500,000 27,500,000
CoreIssued and fully paid up share capital:
3,276,200 ‘A’ ordinary voting shares of €2.50 each 8,190,500 8,190,500
3,000 ‘B’ cumulative preference shares of €2.50 each 7,500 7,500
8,198,000 8,198,000
CellsCell 1 Issued and 100% paid up share capital: 1,466,240 cell shares 3,665,600 3,665,600Cell 2 Issued and 80% paid up share capital: 155,000 cell shares 310,000 310,000Cell 4 Issued and 50% (2014: 85.5%) paid up share capital: 1,121,377 cell shares 1,401,721 1,401,721Cell 7 Issued and 67.5% paid up share capital: 401,815 cell shares 678,063 678,063Cell 8 Issued and 44.5% paid up share capital: 900,000 cell shares 1,000,125 1,000,125Cell 9 Issued and 55% paid up share capital: 328,000 cell shares 451,000 451,000Cell 10 Issued and 100% paid up share capital: 240,000 cell shares 600,000 600,000
8,106,509 8,106,509
Total share capital 16,304,509 16,304,509
All cell shares have a nominal value of €2.50 each.
On 10 November 2015 the cell shares were converted from non-participating redeemable preference shares to non-participating ordinary shares.
In terms of resolution dated 14 April 2015, the authorised share capital of the Company was increased to €27,500,000 in the form of an additional 3,000,000 cell shares of €2.50 each.
In terms of a resolution dated 18 December 2015, the shareholders of the Company resolved to redenominate the 503,980 cell shares of €2.50 each 85.5% paid up to 861,806 cell shares of €2.50 each 50% fully paid up by the issue of a further 357,826 cell shares of €2.50 each 50% paid up in relation to Cell 4.
In terms of a resolution dated 22 September 2015, the issued share capital of the Company was increased by 4,000 cell shares of €2.50 each fully paid up in relation to Cell 6. Following the closure and winding up of Cell 6 in terms of an extraordinary resolution dated 25 September 2015, the issued share capital was reduced by the cancellation of 53,500 cell shares of €2.50 each, fully paid up. Such cancellation became effective on 29 December 2015.
During 2015, the shareholders of the various cells resolved the following resolutions relating to increases in cell shares:
Cell Resolution date Nature of increase Nominal value Paid up
Cell 1 18 December 2015 Issue of 390,460 cell shares €2.50 Fully paid upCell 4 14 April 2015 Issue of 412,000 cell shares €2.50 Fully paid upCell 4 18 December 2015 Issue of 259,571 cell shares €2.50 50% paid upCell 7 18 December 2015 Issue of 81,815 cell shares €2.50 67.5% paid upCell 9 29 September 2015 Issue of 328,000 cell shares €2.50 55% paid upCell 10 18 November 2015 Issue of 240,000 cell shares €2.50 Fully paid up

ATLAS.COM.MT
69
ANNUAL REPORT & AUDITED FINANCIAL STATEMENTS - 2016
21. Reserves
Core Cells Total
2016 2015 2016 2015 2016 2015€ € € € € €
Revaluation reserve 2,266,577 775,666 - - 2,266,577 775,666Functional currency exchange reserve - - (520,418) 885,433 (520,418) 885,433General reserve 201,542 201,542 - - 201,542 201,542
Total other reserves 2,468,119 977,208 (520,418) 885,433 1,947,701 1,862,641
Revaluation reserveCore
2016 2015
€ €
Year ended 31 December At beginning of year 775,666 771,826Revaluation increase on land and buildings (Note 13) 1,603,965 -Movement in deferred tax relating to property, plant and equipment (Note 17) (129,826) 3,840Transfer from subsidiary 16,772 -
At end of year 2,266,577 775,666
Functional currency exchange reserveCells
2016 2015
€ €
Year ended 31 DecemberAt beginning of year 885,433 499,157Exchange differences resulting from translation to presentation currency (1,405,851) 386,276
At end of year (520,418) 885,433
The movements during the year are accounted for in other comprehensive income. The amounts gross of tax do not differ from the net amounts.
Revaluation reserve represents the revaluation surplus on freehold and other property, net of deferred tax.
Functional currency exchange reserve represents movements in the exchange to the reporting currency of those assets and liabilities held by cellular operations in the currency it operates in, the functional currency.
The directors consider other reserves to be non-distributable.

ANNUAL REPORT & AUDITED FINANCIAL STATEMENTS - 2016 ATLAS.COM.MT
70
21. Reserves – continued
Profit and loss account
2016 2015
€ €
Core 14,318,644 12,962,534
CellsCell 1 1,524,987 501,183Cell 2 317,038 413,806Cell 4 513,971 471,219Cell 7 380,989 240,308Cell 8 504,283 48,450Cell 9 23,704 (34,704)Cell 10 (90,192) (21,906)
3,174,780 1,618,356
Total profit and loss account 17,493,424 14,580,890
The profit and loss account balance represents the amount available for dividend distribution to the respective shareholders, except any amount that is not distributable in terms of the solvency capital requirements under the Insurance Business (Assets and Liabilities), Regulations 2007 and any amount that is not distributable under the Maltese Companies Act (Cap.386), as it represents unrealised profits.

ATLAS.COM.MT
71
ANNUAL REPORT & AUDITED FINANCIAL STATEMENTS - 2016
22. Technical provisions and reinsurance assets
Gross technical provisions Core Cells Total
2016 2015 2016 2015 2016 2015€ € € € € €
Claims reported and loss adjustment expenses 14,949,470 12,407,684 15,068,395 16,757,593 30,017,865 29,165,277Claims incurred but not reported 1,316,641 1,115,371 2,985,013 3,072,378 4,301,654 4,187,749Unearned premiums 9,927,288 9,379,147 6,183,082 5,135,680 16,110,370 14,514,827
Total insurance liabilities, gross 26,193,399 22,902,202 24,236,490 24,965,651 50,429,889 47,867,853
Reinsurers’ share of technical provisionsClaims reported and loss adjustment expenses 4,399,530 3,570,755 13,063,393 15,107,618 17,462,923 18,678,373Claims incurred but not reported 370,920 315,813 - - 370,920 315,813Unearned premiums 4,090,738 3,892,425 833,590 802,565 4,924,328 4,694,990
Total reinsurers’ share of insurance liabilities 8,861,188 7,778,993 13,896,983 15,910,183 22,758,171 23,689,176
Net technical provisionsClaims reported and loss adjustment expenses 10,549,940 8,836,929 2,005,002 1,649,975 12,554,942 10,486,904Claims incurred but not reported 945,721 799,558 2,985,013 3,072,378 3,930,734 3,871,936Unearned premiums 5,836,550 5,486,722 5,349,492 4,333,115 11,186,042 9,819,837
17,332,211 15,123,209 10,339,507 9,055,468 27,671,718 24,178,677
Maturity information related to claims outstanding and claims incurred but not reported is presented in Note 3.2.3. Unearned premium is current in nature.
The Company recognises liabilities arising from its operations, and specifically identifies those arising from premium written and claims incurred, while also establishing recoverability from reinsurers.
The Company uses various techniques in estimating liabilities arising from claims. A component of these estimation techniques is usually the estimation of the cost of notified but not paid claims. In estimating the cost of these the Company has regard to the claim circumstance as reported, any information available from loss adjusters and information on the cost of settling claims with similar characteristics in previous periods. Large claims impacting each relevant business class are generally assessed separately, being measured on a case by case basis or projected separately in order to allow for the possible distortive effect of the development and incidence of these large claims.
The estimation of claims incurred but not reported (IBNR) is generally subject to a greater degree of uncertainty than the estimation of the cost of settling claims already notified to the Company, where more information about the claim event is generally available. Claims IBNR may often not be apparent to the insured until several years after the event. In calculating the estimate cost of unpaid claims the Company uses statistical analyses of historical experience in order to identify the IBNR component to be added to its known claims reserves. The basic assumption that the development pattern of the current claims will be consistent with past experience is also complemented with allowance for changes or uncertainties which may create distortions in the underlying statistics or which might cause the cost of unsettled claims to increase or reduce when compared with the cost of previously settled claims.
Unearned premium reserves are formulated on a 365ths time apportionment basis of calculation. This method of calculation proves to be most accurate in identifying arising liabilities at the time of Balance Sheet reporting. These liabilities are reflective of that amount of premium remaining unearned on an individual policy basis, aggregated to determine the Company’s total liability at any point in time.
Provision is also made for any deficiencies arising when unearned premiums, net of associated acquisition costs, are insufficient to meet expected claims and expenses after taking into account future investment return on the investments supporting the unearned premiums provision and unexpired risks provision. The expected claims are calculated having regard to events that have occurred prior to the balance sheet date.
The risk and claim profile of the Company do not indicate any conditions or variables that are likely to impact significantly upon the Company’s cash flow. During the year there were no significant changes required in the assumptions used to estimate the ultimate cost of claims.

ANNUAL REPORT & AUDITED FINANCIAL STATEMENTS - 2016 ATLAS.COM.MT
72
22. Technical provisions and reinsurance assets – continued
The reasonableness of the estimation processes on claims is monitored using claims’ cost progression tables. These are reproduced below:
Estimate of the ultimate Gross claims costs for the Core:
2007 2008 2009 2010 2011 2012 2013 2014 2015 2016 Total€ € € € € € € € € € €
- at end of reporting year 8,047,207 7,990,595 10,233,170 10,031,590 8,302,389 9,790,944 10,344,366 11,283,117 15,231,792 14,400,164 105,655,335
- one year later 7,611,020 7,164,318 9,374,647 9,005,458 7,276,342 8,583,139 9,373,332 9,022,726 13,446,678
- two years later 7,090,024 6,907,429 8,673,410 8,345,563 6,581,449 8,062,640 8,761,064 8,015,028
- three years later 6,420,626 6,827,888 8,389,139 7,882,614 6,138,583 7,686,076 8,553,785
- four years later 6,395,977 7,011,852 8,320,524 8,018,995 6,014,570 7,585,657
- five years later 6,436,422 6,734,033 8,238,753 7,923,623 5,938,102
- six years later 6,414,682 6,699,496 8,276,002 7,884,434
- seven years later 6,404,881 6,777,428 8,369,496
- eight years later 6,398,177 6,816,249
- nine years later 6,461,575
Current estimates of : Cumulative claims 6,461,575 6,816,249 8,369,496 7,884,434 5,938,102 7,585,657 8,553,785 8,015,028 13,446,678 14,400,164 87,471,168 Cumulative payments to date (6,191,808) (6,572,630) (7,950,987) (7,870,362) (5,877,212) (7,335,359) (7,899,937) (7,340,704) (10,520,082) (4,627,853) (72,186,934)
Liability recognised in the balance sheet 269,767 243,620 418,509 14,072 60,889 250,299 653,848 674,323 2,926,596 9,772,311 15,284,234
Reserve in respect of prior years 981,877
Total reserve included in the balance sheet 16,266,111
Estimate of the ultimate Net claims costs for the Core:
2007 2008 2009 2010 2011 2012 2013 2014 2015 2016 Total€ € € € € € € € € € €
- at end of reporting year 5,411,727 5,738,975 6,478,050 6,736,170 6,822,148 7,278,905 8,039,367 7,768,761 9,431,033 10,106,850 73,811,986- one year later 4,983,702 5,244,482 5,806,238 5,993,703 5,964,826 6,476,751 7,258,996 6,881,159 8,675,037- two years later 4,570,697 5,094,412 5,259,385 5,678,373 5,494,455 6,056,331 6,642,433 6,357,253- three years later 4,486,886 5,033,480 5,027,885 5,328,498 5,088,202 5,808,076 6,470,996- four years later 4,483,513 5,131,648 4,998,718 5,470,410 4,971,888 5,736,542- five years later 4,520,014 4,945,626 4,929,275 5,378,238 4,892,818 - six years later 4,497,787 4,916,553 5,026,195 5,340,697- seven years later 4,487,480 4,957,882 5,123,822- eight years later 4,484,735 5,007,246- nine years later 4,551,464
Current estimates of : Cumulative claims 4,551,464 5,007,246 5,123,822 5,340,697 4,892,818 5,736,542 6,470,996 6,357,253 8,675,037 10,106,850 62,262,725 Cumulative payments to date (4,284,480) (4,777,629) (4,788,656) (5,328,436) (4,833,233) (5,535,792) (5,931,887) (5,768,939) (6,501,309) (3,928,828) (51,679,189)
Liability recognised in the balance sheet 266,984 229,617 335,166 12,261 59,585 200,750 539,109 588,314 2,173,728 6,178,022 10,583,536Reserve in respect of prior years 912,125
Total reserve included in the balance sheet 11,495,661

ATLAS.COM.MT
73
ANNUAL REPORT & AUDITED FINANCIAL STATEMENTS - 2016
22. Technical provisions and reinsurance assets – continued
The reasonableness of the estimation processes on claims is monitored using claims’ cost progression tables. These are reproduced below:
Estimate of the ultimate Gross claims costs for the Core:
2007 2008 2009 2010 2011 2012 2013 2014 2015 2016 Total€ € € € € € € € € € €
- at end of reporting year 8,047,207 7,990,595 10,233,170 10,031,590 8,302,389 9,790,944 10,344,366 11,283,117 15,231,792 14,400,164 105,655,335
- one year later 7,611,020 7,164,318 9,374,647 9,005,458 7,276,342 8,583,139 9,373,332 9,022,726 13,446,678
- two years later 7,090,024 6,907,429 8,673,410 8,345,563 6,581,449 8,062,640 8,761,064 8,015,028
- three years later 6,420,626 6,827,888 8,389,139 7,882,614 6,138,583 7,686,076 8,553,785
- four years later 6,395,977 7,011,852 8,320,524 8,018,995 6,014,570 7,585,657
- five years later 6,436,422 6,734,033 8,238,753 7,923,623 5,938,102
- six years later 6,414,682 6,699,496 8,276,002 7,884,434
- seven years later 6,404,881 6,777,428 8,369,496
- eight years later 6,398,177 6,816,249
- nine years later 6,461,575
Current estimates of : Cumulative claims 6,461,575 6,816,249 8,369,496 7,884,434 5,938,102 7,585,657 8,553,785 8,015,028 13,446,678 14,400,164 87,471,168 Cumulative payments to date (6,191,808) (6,572,630) (7,950,987) (7,870,362) (5,877,212) (7,335,359) (7,899,937) (7,340,704) (10,520,082) (4,627,853) (72,186,934)
Liability recognised in the balance sheet 269,767 243,620 418,509 14,072 60,889 250,299 653,848 674,323 2,926,596 9,772,311 15,284,234
Reserve in respect of prior years 981,877
Total reserve included in the balance sheet 16,266,111
Estimate of the ultimate Net claims costs for the Core:
2007 2008 2009 2010 2011 2012 2013 2014 2015 2016 Total€ € € € € € € € € € €
- at end of reporting year 5,411,727 5,738,975 6,478,050 6,736,170 6,822,148 7,278,905 8,039,367 7,768,761 9,431,033 10,106,850 73,811,986- one year later 4,983,702 5,244,482 5,806,238 5,993,703 5,964,826 6,476,751 7,258,996 6,881,159 8,675,037- two years later 4,570,697 5,094,412 5,259,385 5,678,373 5,494,455 6,056,331 6,642,433 6,357,253- three years later 4,486,886 5,033,480 5,027,885 5,328,498 5,088,202 5,808,076 6,470,996- four years later 4,483,513 5,131,648 4,998,718 5,470,410 4,971,888 5,736,542- five years later 4,520,014 4,945,626 4,929,275 5,378,238 4,892,818 - six years later 4,497,787 4,916,553 5,026,195 5,340,697- seven years later 4,487,480 4,957,882 5,123,822- eight years later 4,484,735 5,007,246- nine years later 4,551,464
Current estimates of : Cumulative claims 4,551,464 5,007,246 5,123,822 5,340,697 4,892,818 5,736,542 6,470,996 6,357,253 8,675,037 10,106,850 62,262,725 Cumulative payments to date (4,284,480) (4,777,629) (4,788,656) (5,328,436) (4,833,233) (5,535,792) (5,931,887) (5,768,939) (6,501,309) (3,928,828) (51,679,189)
Liability recognised in the balance sheet 266,984 229,617 335,166 12,261 59,585 200,750 539,109 588,314 2,173,728 6,178,022 10,583,536Reserve in respect of prior years 912,125
Total reserve included in the balance sheet 11,495,661

ANNUAL REPORT & AUDITED FINANCIAL STATEMENTS - 2016 ATLAS.COM.MT
74
22. Technical provisions and reinsurance assets – continued
Estimate of the ultimate Gross claims costs for the Cells:
2008 2009 2010 2011 2012 2013 2014 2015 2016 TotalCells € € € € € € € € € €
- at end of reporting year 6,608 436,538 750,960 2,097,027 2,128,125 10,125,682 4,535,651 6,775,987 8,388,631 35,245,209- one year later 10,596 422,616 876,294 1,921,989 1,929,797 10,664,268 4,479,656 7,038,815 27,344,032- two years later 10,596 422,616 655,087 1,640,648 1,938,163 18,018,955 4,427,930 27,113,996- three years later 10,596 422,616 676,499 1,681,901 1,747,566 15,834,488 20,373,666- four years later 10,596 422,616 675,860 1,636,471 1,653,096 4,398,639- five years later 10,596 422,616 635,644 1,612,358 2,681,214- six years later 10,596 422,616 613,987 1,047,199- seven years later 10,596 422,616 433,212- eight years later 10,596 10,596Current estimates of: Cumulative claims 10,596 422,616 613,987 1,612,358 1,653,096 15,834,488 4,427,930 7,038,815 8,388,631 40,002,517 Cumulative payments to date (10,352) (421,954) (645,603) (1,643,617) (1,636,357) (4,033,212) (3,800,137) (4,792,409) (4,354,783) (21,338,424) Other movements (244) (662) 32,492 93,676 8,114 123,646 (210,815) (565,586) (91,306) (610,685)
Liability recognised in the balance sheet - - 876 62,417 24,853 11,924,922 416,978 1,680,820 3,942,542 18,053,408
Estimate of the ultimate Net claims costs for the Cells:
2008 2009 2010 2011 2012 2013 2014 2015 2016 TotalCells € € € € € € € € € €
- at end of reporting year 6,608 436,538 750,960 2,097,027 2,128,125 2,895,624 4,536,006 6,775,987 6,987,056 26,613,931- one year later 10,596 422,616 876,294 1,921,989 1,929,797 2,886,026 4,479,656 6,977,881 19,504,855- two years later 10,596 422,616 655,087 1,640,648 1,938,399 2,911,341 4,427,930 12,006,617- three years later 10,596 422,616 676,499 1,681,934 1,747,566 2,592,339 7,131,650- four years later 10,596 422,616 675,860 1,636,471 1,653,096 4,398,639- five years later 10,596 422,616 635,644 1,612,358 2,681,214- six years later 10,596 422,616 613,987 1,047,199- seven years later 10,596 422,616 433,212- eight years later 10,596 10,596Current estimates of: Cumulative claims 10,596 422,616 613,987 1,612,358 1,653,096 2,592,339 4,427,930 6,977,881 6,987,056 25,297,859 Cumulative payments to date (10,352) (421,954) (645,603) (1,643,617) (1,636,357) (2,391,947) (3,800,137) (4,792,409) (4,354,783) (19,697,159) Other movements (244) (662) 32,492 93,676 8,114 123,646 (210,815) (565,586) (91,306) (610,685)
Liability recognised in the balance sheet - - 876 62,417 24,853 324,038 416,978 1,619,886 2,540,967 4,990,015

ATLAS.COM.MT
75
ANNUAL REPORT & AUDITED FINANCIAL STATEMENTS - 2016
22. Technical provisions and reinsurance assets – continued
Estimate of the ultimate Gross claims costs for the Cells:
2008 2009 2010 2011 2012 2013 2014 2015 2016 TotalCells € € € € € € € € € €
- at end of reporting year 6,608 436,538 750,960 2,097,027 2,128,125 10,125,682 4,535,651 6,775,987 8,388,631 35,245,209- one year later 10,596 422,616 876,294 1,921,989 1,929,797 10,664,268 4,479,656 7,038,815 27,344,032- two years later 10,596 422,616 655,087 1,640,648 1,938,163 18,018,955 4,427,930 27,113,996- three years later 10,596 422,616 676,499 1,681,901 1,747,566 15,834,488 20,373,666- four years later 10,596 422,616 675,860 1,636,471 1,653,096 4,398,639- five years later 10,596 422,616 635,644 1,612,358 2,681,214- six years later 10,596 422,616 613,987 1,047,199- seven years later 10,596 422,616 433,212- eight years later 10,596 10,596Current estimates of: Cumulative claims 10,596 422,616 613,987 1,612,358 1,653,096 15,834,488 4,427,930 7,038,815 8,388,631 40,002,517 Cumulative payments to date (10,352) (421,954) (645,603) (1,643,617) (1,636,357) (4,033,212) (3,800,137) (4,792,409) (4,354,783) (21,338,424) Other movements (244) (662) 32,492 93,676 8,114 123,646 (210,815) (565,586) (91,306) (610,685)
Liability recognised in the balance sheet - - 876 62,417 24,853 11,924,922 416,978 1,680,820 3,942,542 18,053,408
Estimate of the ultimate Net claims costs for the Cells:
2008 2009 2010 2011 2012 2013 2014 2015 2016 TotalCells € € € € € € € € € €
- at end of reporting year 6,608 436,538 750,960 2,097,027 2,128,125 2,895,624 4,536,006 6,775,987 6,987,056 26,613,931- one year later 10,596 422,616 876,294 1,921,989 1,929,797 2,886,026 4,479,656 6,977,881 19,504,855- two years later 10,596 422,616 655,087 1,640,648 1,938,399 2,911,341 4,427,930 12,006,617- three years later 10,596 422,616 676,499 1,681,934 1,747,566 2,592,339 7,131,650- four years later 10,596 422,616 675,860 1,636,471 1,653,096 4,398,639- five years later 10,596 422,616 635,644 1,612,358 2,681,214- six years later 10,596 422,616 613,987 1,047,199- seven years later 10,596 422,616 433,212- eight years later 10,596 10,596Current estimates of: Cumulative claims 10,596 422,616 613,987 1,612,358 1,653,096 2,592,339 4,427,930 6,977,881 6,987,056 25,297,859 Cumulative payments to date (10,352) (421,954) (645,603) (1,643,617) (1,636,357) (2,391,947) (3,800,137) (4,792,409) (4,354,783) (19,697,159) Other movements (244) (662) 32,492 93,676 8,114 123,646 (210,815) (565,586) (91,306) (610,685)
Liability recognised in the balance sheet - - 876 62,417 24,853 324,038 416,978 1,619,886 2,540,967 4,990,015

ANNUAL REPORT & AUDITED FINANCIAL STATEMENTS - 2016 ATLAS.COM.MT
76
22. Technical provisions and reinsurance assets – continued
(a) Claims and loss adjustment expenses - Core
Year ended 31 December 2016 Year ended 31 December 2015
Gross Reinsurance Net Gross Reinsurance Net€ € € € € €
Notified claims still out-standing 12,407,684 (3,570,755) 8,836,929 11,483,839 (3,310,096) 8,173,743
Incurred but not reported 1,115,371 (315,813) 799,558 1,296,570 (430,788) 865,782
Total at beginning of year 13,523,055 (3,886,568) 9,636,487 12,780,409 (3,740,884) 9,039,525Increase in liabilities:- arising from current year claims 14,400,164 (4,293,314) 10,106,850 15,231,792 (5,800,759) 9,431,033
- arising from prior year claims (3,058,963) 1,554,823 (1,504,140) (3,141,117) 1,537,333 (1,603,784)
Claims settled during the year (8,598,145) 1,854,609 (6,743,536) (11,348,029) 4,117,742 (7,230,287)
Total at end of year 16,266,111 (4,770,450) 11,495,661 13,523,055 (3,886,568) 9,636,487
Notified claims still out-standing 14,949,470 (4,399,530) 10,549,940 12,407,684 (3,570,755) 8,836,929
Incurred but not reported 1,316,641 (370,920) 945,721 1,115,371 (315,813) 799,558
Total at end of year 16,266,111 (4,770,450) 11,495,661 13,523,055 (3,886,568) 9,636,487
(a) Claims and loss adjustment expenses - Cells
Year ended 31 December 2016 Year ended 31 December 2015
Gross Reinsurance Net Gross Reinsurance Net€ € € € € €
Notified claims still out-standing 16,757,593 (15,107,618) 1,649,975 9,219,280 (7,778,628) 1,440,652
Incurred but not reported 3,072,378 - 3,072,378 1,731,862 - 1,731,862
Total at beginning of year 19,829,971 (15,107,618) 4,722,353 10,951,142 (7,778,628) 3,172,514Increase in liabilities:- arising from current year claims 8,388,631 (1,401,575) 6,987,056 6,775,987 - 6,775,987
- arising from prior year claims (314,917) (89,115) (404,032) 7,347,506 (7,329,372) 18,134
Claims settled during the year (7,265,231) 1,505,285 (5,759,946) (5,374,787) 314,635 (5,060,152)
Other movements (2,585,046) 2,029,630 (555,416) 130,123 (314,253) 184,130
Total at end of year 18,053,408 (13,063,393) 4,990,015 19,829,971 (15,107,618) 4,722,353
Notified claims still out-standing 15,068,395 (13,063,393) 2,005,002 16,757,593 (15,107,618) 1,649,975
Incurred but not reported 2,985,013 - 2,985,013 3,072,378 - 3,072,378
Total at end of year 18,053,408 (13,063,393) 4,990,015 19,829,971 (15,107,618) 4,722,353

ATLAS.COM.MT
77
ANNUAL REPORT & AUDITED FINANCIAL STATEMENTS - 2016
22. Technical provisions and reinsurance assets – continued
(b) Gross and Net unearned premiums - Core
Year ended 31 December 2016 Year ended 31 December 2015
Gross Reinsurance Net Gross Reinsurance Net€ € € € € €
At beginning of year 9,379,147 (3,892,425) 5,486,722 8,487,478 (3,443,085) 5,044,393Net charge/(credit) to profit and loss 548,141 (198,313) 349,828 891,669 (449,340) 442,329
At end of year 9,927,288 (4,090,738) 5,836,550 9,379,147 (3,892,425) 5,486,722
(b) Gross and Net unearned premiums - Cells
Year ended 31 December 2016 Year ended 31 December 2015
Gross Reinsurance Net Gross Reinsurance Net€ € € € € €
At beginning of year 5,135,680 (802,565) 4,333,115 3,499,498 (589,447) 2,910,051Net charge/(credit) to profit and loss 1,421,170 (114,844) 1,306,326 1,358,109 (164,333) 1,193,776Other movements (373,768) 83,819 (289,949) 278,073 (48,785) 229,288
At end of year 6,183,082 (833,590) 5,349,492 5,135,680 (802,565) 4,333,115
23. Borrowings
2016 2015
€ €
Bank balance overdrawn (Note 26) 45,225 6,337
The Company has the following undrawn borrowing facilities:
2016 2015
€ €
Floating rate and expiring within one year 903,736 964,933

ANNUAL REPORT & AUDITED FINANCIAL STATEMENTS - 2016 ATLAS.COM.MT
78
24. Creditors and accruals and deferred income
Core Cells Total
2016 2015 2016 2015 2016 2015€ € € € € €
Creditors arising out of direct insurance operationsTrade creditors 1,034,091 1,102,715 645,700 440,790 1,679,791 1,543,505Payable to reinsurers 1,151,836 963,205 1,100,964 794,501 2,252,800 1,757,706
2,185,927 2,065,920 1,746,664 1,235,291 3,932,591 3,301,211
Creditors arising out of reinsurance operations - - 144,881 150,965 144,881 150,965
Other creditorsPayable to related parties - 39,977 1,913,375 957,688 1,913,375 997,665Other creditors 95,208 88,260 - - 95,208 88,260
95,208 128,237 1,913,375 957,688 2,008,583 1,085,925
Accruals and deferred income 2,053,225 1,982,230 173,308 155,203 2,226,533 2,137,433
Total creditors and accruals and deferred income 4,334,360 4,176,387 3,978,228 2,499,147 8,312,588 6,675,534
Current portion 4,334,360 4,176,387 3,978,228 2,499,147 8,312,588 6,675,534
Amounts payable to related parties are interest free, unsecured and repayable on demand.
25. Cash generated from operations
Core Cells Total
2016 2015 2016 2015 2016 2015€ € € € € €
Insurance premiums received 23,467,187 22,272,469 19,233,050 22,706,228 42,700,237 44,978,697Reinsurance premiums paid (9,877,545) (9,279,756) (911,941) (963,626) (10,789,486) (10,243,382)Claims paid (9,359,271) (12,154,055) (7,265,231) (5,374,787) (16,624,502) (17,528,842)Reinsurance claims received 1,854,609 4,117,742 1,505,285 314,635 3,359,894 4,432,377Commission and other income 3,657,217 3,535,653 18,105 16,490 3,675,322 3,552,143Cash paid to employees, related parties and other suppliers for services and goods (5,859,858) (5,955,874) (6,286,788) (11,724,153) (12,146,646) (17,680,027)Interest received 440,498 654,712 68,071 77,696 508,569 732,408Dividends received 464,898 549,880 - - 464,898 549,880Rental Income 114,922 105,207 - - 114,922 105,207Net (purchase)/disposal of operating assets: - loans and receivables (158,888) (335,202) (307,548) 420,873 (466,436) 85,671 - financial assets at fair value through profit or loss (2,829,121) 1,540,973 - - (2,829,121) 1,540,973
Cash generated from operations 1,914,648 5,051,749 6,053,003 5,473,356 7,967,651 10,525,105

ATLAS.COM.MT
79
ANNUAL REPORT & AUDITED FINANCIAL STATEMENTS - 2016
26. Cash and cash equivalents
For the purpose of the statement of cash flows, the year end cash and cash equivalents comprise the following:
Core Cells Total
2016 2015 2016 2015 2016 2015€ € € € € €
Cash at bank and in hand 1,970,536 1,610,806 16,257,808 13,187,248 18,228,344 14,798,054Held with investment managers 2,598,750 3,449,616 - - 2,598,750 3,449,616Bank balance overdrawn (45,225) (6,337) - - (45,225) (6,337)
At end of year 4,524,061 5,054,085 16,257,808 13,187,248 20,781,869 18,241,333
The weighted average interest rate on interest bearing bank balances as at year-end was 0.04% p.a. (2015: 0.04% p.a.). Included in cash at bank and in hand is an amount of €600,000 that is restricted in use (2015: €55,608).
27. Related party transactionsAll companies forming part of the Atlas Group of Companies are considered by the directors to be related parties since these companies are ultimately owned and controlled by Atlas Holdings Limited.
The following transactions were carried out by the Company with related parties:
2016 2015
€ €
Income
Fellow subsidiaries:Payroll costs charged 232 37,020
Subsidiaries: Payroll costs charged 204,773 181,316
Other related entities: Payroll costs charged 21,858 20,626
Dividend receivable from subsidiary is disclosed Note 6. Dividends payable to the parent company are disclosed in Note 11.
2016 2015
€ €
ExpenditureFellow subsidiaries:Commissions 322 55,797Other related entities:Management fees 12,679 103,632
In relation to cells, companies ultimately owned and controlled by the Cell owners are considered as related parties in connection with the respective cells. As part of the ordinary course of business, the cells transact business with related parties including the collection of premiums, settlement of claims and payment of commissions.
Year end balances owed by or to group undertakings and other related parties are disclosed in Notes 19 and 24 to these financial statements respectively.
Key management personnel compensation, consisting of directors’ remuneration, has been disclosed in Note 10 to these financial statements.
ANNUAL REPORT & AUDITED FINANCIAL STATEMENTS - 2016 ATLAS.COM.MT
80
28. Capital management
As from 1 January 2016, the Company was subject to the requirements of the EU Solvency II.
The Company has established the following capital management objectives, policies and approach to managing the risks that affect its capital position: • To comply with the obligations to maintain positive solvency position based on the requirements under regulation;• To ensure sufficient capital funding in order that the Company may continue as a going concern;• To safeguard the interests of policy holders arising from the Company’s contractual obligations;• To provide adequate returns for shareholders; and• To ensure that shareholder and other stakeholder interests are safeguarded at all times.
In order to maintain or adjust the capital structure, the Company may issue new shares or capitalise contributions received from its shareholders. The Company is required to hold regulatory capital for its insurance business in compliance with the rules issued by the Malta Financial Services Authority (MFSA). The minimum capital requirement must be maintained at all times throughout the year. The Company monitors its capital level on a regular basis, by ensuring that sufficient assets are maintained to match insurance liabilities and to provide solvency cover.
The company defines capital as the excess of assets over liabilities as valued in accordance with the respective regulatory requirements.
Any transactions that may affect the Company’s solvency position are immediately reported to the directors and shareholders for resolution, prior to notifying MFSA. Any potential shortfall in capital requirements necessitates the development of a recovery plan with a list of possible actions.
As at 31 December 2015 the Company was in full compliance with Solvency I requirements, having capital in excess of the required minimum set by the Regulator.
As from 1 January 2016, the Company was subject to the requirements of the EU Solvency II directive. The Solvency II regime establishes a new set of EU-wide capital requirements, risk management and disclosure standards. The Company must hold eligible own funds to cover the solvency capital requirement (SCR) and eligible basic own funds to cover the minimum capital requirement (MCR). The SCR shall be calculated either in accordance with the standard formula or using a full or partial internal model (PIM) as approved by the Regulator. The Company must immediately inform the Regulator where it observes that its SCR or MCR are no longer complied with or where there is risk of non-compliance in the following six months for SCR and three months for MCR. The Company opted for the standard formula under the Solvency II regime to calculate the SCR as the assumptions underlying the standard formula are considered to be a good fit for the Company’s risk profile. At 31 December 2016, the Company’s eligible own funds adequately covered the required SCR amounting to €23,508,108 (unaudited).
The Company was compliant with its regulatory capital requirements throughout the financial year.
Liabilities arising from cell operations
In terms of Legal Notice 412 of 2007 of the Companies Act, (Cell Companies carrying on business of insurance), where any liability arises which is attributable to a particular cell of a cell company –
(a) the cellular assets attributable to that cell shall be primarily used to satisfy the liability;(b) the Company’s core assets shall be secondarily used to satisfy the liability, provided that the cellular assets attributable to
the relevant cell have been exhausted; and (c) any cellular assets not attributable to the relevant cell shall not be used to satisfy the liability.
The Company has taken the following safeguards in this respect:
(a) if the assets of the Cell are at any time insufficient to meet any payments, liabilities or obligations due or about to become due by the Cell, the Company shall notify the Cell owners in writing and the Cell owners shall ensure forthwith that the Cell is adequately funded to meet all payments, liabilities or other obligations due or becoming due by the cell.
(b) in the event that the Cellular Assets of the Cell are exhausted, the Cell Owner agrees to indemnify the Company for any assets paid or otherwise transferred to creditors of the Cell asset of the non-cellular assets of the Company.

ATLAS.COM.MT
81
ANNUAL REPORT & AUDITED FINANCIAL STATEMENTS - 2016
29. Operating lease commitments
As at year-end the Company had commitments under non-cancellable operating leases where the Company is the lessee. These arrangements relate to leasing of a number of branches in difference locations.
The future aggregate minimum lease payments under non-cancellable operating leases are as follows:
2016 2015
€ €
Not later than 1 year 40,889 44,882Later than 1 year and not later than 5 years 72,221 97,780
113,110 142,662
During the current year, operating lease payments in respect of cancellable and non-cancellable leases amounting to €100,123 (2015: €82,708) were recognised as an operating expense in profit or loss.
30. Statutory information
Atlas Insurance PCC Limited is a limited liability company and is incorporated in Malta. The immediate and ultimate parent company of Atlas Insurance PCC Limited is Atlas Holdings Limited, a company registered in Malta, with its registered address at 47-50, Ta’ Xbiex Seafront, Ta’ Xbiex, which prepares consolidated financial statements.
31. Comparative information
Comparative figures disclosed in the main components of these financial statements have been reclassified to conform with current year’s disclosure for the purpose of fairer presentation.


ANNUAL REPORT & AUDITED FINANCIAL STATEMENTS - 2016 ATLAS.COM.MT
84
Atlas Insurance PCC LimitedRegistered Office 48-50 Ta' Xbiex Seafront,Ta' Xbiex XBX 1021, MaltaTel: (+356) 23 435 363 Fax: (+356) 21 344 [email protected]
Atlas Insurance PCC Limited is a Cell Company authorised by Malta Financial Services Authority to carry on general insurance business.
atlas.com.mt