Embed Size (px)
Citation preview

ANNUAL REPORT
2016

Abanka is synonymous with excellence in financial services. Our values bring us together and guide us in our work. They lead us in the pursuit of our mission and the achievement of our vision:
to become Slovenia’s number one bank of choice for our customers, employees and investors.
A clear view towards our objectives.
INTRODUCTION
A B A N K A G R O U P Annual Report 2016
3
CONTENTS BUSINESS REPORT 5
FINANCIAL HIGHLIGHTS AND PERFORMANCE INDICATORS ................................................................................................ 6
FINANCIAL HIGHLIGHTS AND PERFORMANCE INDICATORS – THE ABANKA GROUP....................................................... 6 FINANCIAL HIGHLIGHTS AND PERFORMANCE INDICATORS – ABANKA ............................................................................ 7
MANAGEMENT ............................................................................................................................................................................ 11
MANAGEMENT BOARD OF THE BANK .................................................................................................................................. 11 Report of the Management Board ........................................................................................................................................ 12
SUPERVISORY BOARD .......................................................................................................................................................... 14 Report of the Supervisory Board .......................................................................................................................................... 15
PRESENTATION OF THE GROUP AND ITS ENVIRONMENT ................................................................................................... 18
ABOUT THE BANK................................................................................................................................................................... 18 SERVICES OF THE BANK ....................................................................................................................................................... 19 BANK PROFILE ....................................................................................................................................................................... 20 ABOUT THE GROUP ............................................................................................................................................................... 20
Activities of Subsidiaries ...................................................................................................................................................... 21 ABANKA'S STRATEGY ............................................................................................................................................................ 24
Abanka's Mission and Vision ................................................................................................................................................ 24 FINANCIAL PLAN FOR 2017 ................................................................................................................................................... 25 MAJOR BUSINESS EVENTS IN 2016 AND 2017 ..................................................................................................................... 26
Major Business Events in 2016 ............................................................................................................................................ 26 Major Business Events after the Date of the Statement of Financial Position ...................................................................... 28
THE ECONOMIC AND BANKING ENVIRONMENT IN 2016 AND OUTLOOK FOR 2017 ......................................................... 29 The Economic Environment in 2016 .................................................................................................................................... 29 Banking Environment in 2016 .............................................................................................................................................. 30 Outlook for 2017 .................................................................................................................................................................. 30
FINANCIAL RESULTS OF THE GROUP AND THE BANK ........................................................................................................ 32
PERFORMANCE AS VIEWED THROUGH THE INCOME STATEMENT ................................................................................. 32 PERFORMANCE AS VIEWED THROUGH THE STATEMENT OF FINANCIAL POSITION ..................................................... 34 PERFORMANCE OF THE GROUP IN 2016 ............................................................................................................................. 36
Corporate Banking ............................................................................................................................................................... 36 Retail Banking ...................................................................................................................................................................... 39 Operations with Other Banks ............................................................................................................................................... 41 Securities ............................................................................................................................................................................. 42 Equity Investments ............................................................................................................................................................... 43 Payment Transactions ......................................................................................................................................................... 43 Card and ATM Operations ................................................................................................................................................... 43 Investment Brokerage and Precious Metals ......................................................................................................................... 44 AIII Mutual Pension Fund ..................................................................................................................................................... 45 Custody and Administrative Services ................................................................................................................................... 45 Bancassurance .................................................................................................................................................................... 45 Total Equity and Ownership Structure .................................................................................................................................. 46
THE BANK'S DEVELOPMENT .................................................................................................................................................... 49
DEVELOPMENT AND MARKETING COMMUNICATIONS IN 2016 ......................................................................................... 49 Corporate banking................................................................................................................................................................ 49 Retail Banking ...................................................................................................................................................................... 50 Financial Markets ................................................................................................................................................................. 51
DEVELOPMENT, AND MARKETING COMMUNICATIONS IN 2017 ........................................................................................ 52
CORPORATE GOVERNANCE STATEMENT ............................................................................................................................. 53
RISK MANAGEMENT .................................................................................................................................................................. 62
CREDIT RISK ........................................................................................................................................................................... 63 OPERATIONAL RISK ............................................................................................................................................................... 65 MARKET RISK ......................................................................................................................................................................... 66 INTEREST RATE RISK ............................................................................................................................................................ 67 LIQUIDITY RISK AND THE ILAAP PROCESS ......................................................................................................................... 68 THE ICAAP PROCESS ............................................................................................................................................................ 70
A B A N K A G R O U P Annual Report 2016
4
STATEMENT OF THE MANAGEMENT BOARD AND THE SUPERVISORY BOARD ON THE ADEQUACY OF RISK MANAGEMENT IN ABANKA AND THE ABANKA GROUP ....................................................................................................... 71
STATEMENT OF THE MANAGEMENT BOARD AND THE SUPERVISORY BOARD ON THE RISKS OF ABANKA AND THE ABANKA GROUP ....................................................................................................................................................... 72
ORGANISATION AND PROCESSES .......................................................................................................................................... 74
ORGANISATIONAL CHART AS AT 31 DECEMBER 2016 ....................................................................................................... 74 PROJECTS PLANNED FOR 2017............................................................................................................................................ 75
EMPLOYEES ............................................................................................................................................................................... 76
PERSONNEL POLICY AND THE EDUCATIONAL STRUCTURE OF EMPLOYEES ................................................................ 76 POLICY ON ASSESSMENT OF PROFESSIONAL COMPETENCE AND ADEQUACY ........................................................... 77 STAFF TRAINING AND DEVELOPMENT ................................................................................................................................ 78 STAFF REMUNERATION ........................................................................................................................................................ 79 DEVELOPMENT OF THE ORGANISATIONAL CULTURE ...................................................................................................... 79 REMUNERATION POLICY ...................................................................................................................................................... 80
INFORMATION TECHNOLOGY .................................................................................................................................................. 81
SUSTAINABLE DEVELOPMENT AND CORPORATE SOCIAL RESPONSIBILITY .................................................................. 83
ECONOMIC DEVELOPMENT .................................................................................................................................................. 83 SOCIAL DEVELOPMENT ........................................................................................................................................................ 84
Internal Communication ....................................................................................................................................................... 84 Communication with the Media ............................................................................................................................................ 84 Sponsorships and Donations ............................................................................................................................................... 85
PROTECTION OF THE ENVIRONMENT ................................................................................................................................. 85
INTERNAL AUDIT ........................................................................................................................................................................ 86
SENIOR MANAGEMENT ............................................................................................................................................................. 87
BRANCH NETWORK ................................................................................................................................................................... 88
FINANCIAL REPORT 90
STATEMENT OF MANAGEMENT'S RESPONSIBILITIES ......................................................................................................... 91
FINANCIAL STATEMENTS ......................................................................................................................................................... 92
NOTES TO THE FINANCIAL STATEMENTS ............................................................................................................................ 108
INDEPENDENT AUDITOR'S REPORT ...................................................................................................................................... 232
The Abanka Group Annual Report 2016 is a translation of the original Abanka Group Annual Report 2016 issued in Slovene.
This translation is provided for reference purpose only.

BUSINESS REPORT
Searching for unique and exceptional paths.We make useful changes and search for the best solutions. Through technological innovation and improved business processes, we are developing contemporary and interesting services tailored to the needs of our clients. Innovation is our strength, while excellence sets the standard for our superior execution. We build long-term respect, trust and cooperation through sound partnerships.
A B A N K A G R O U P Annual Report 2016
6
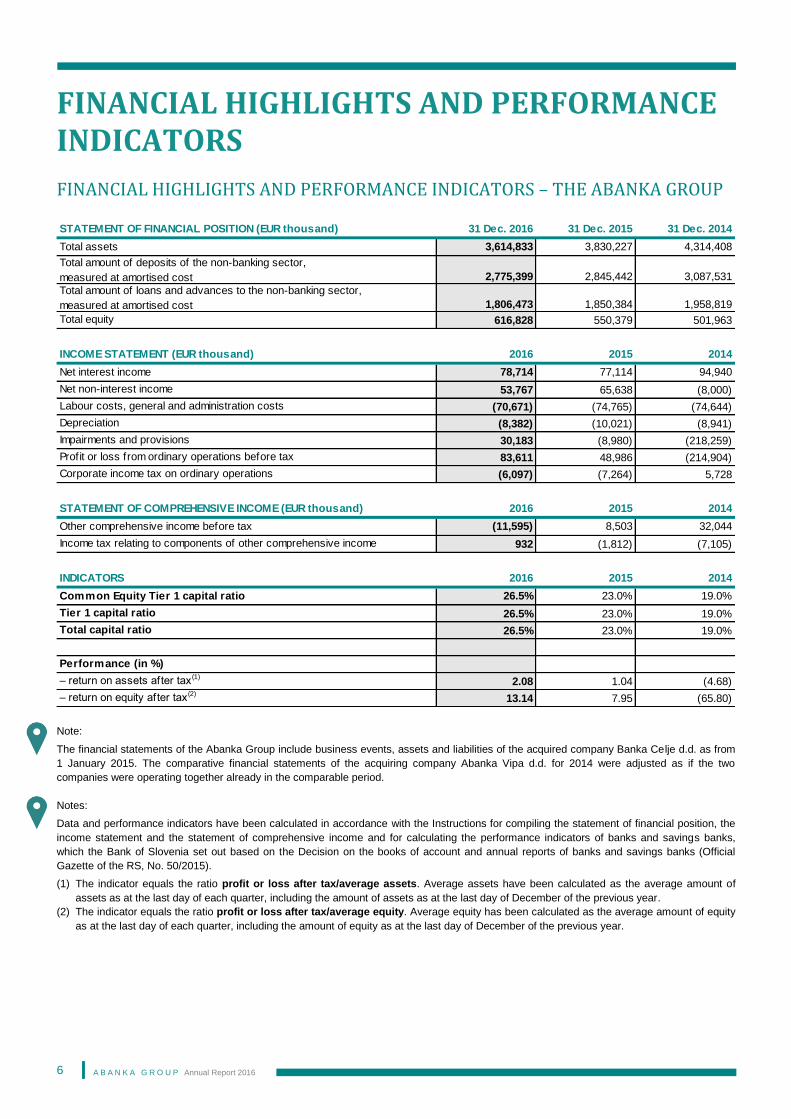
FINANCIAL HIGHLIGHTS AND PERFORMANCE INDICATORS
FINANCIAL HIGHLIGHTS AND PERFORMANCE INDICATORS – THE ABANKA GROUP
Note:
The financial statements of the Abanka Group include business events, assets and liabilities of the acquired company Banka Celje d.d. as from
1 January 2015. The comparative financial statements of the acquiring company Abanka Vipa d.d. for 2014 were adjusted as if the two
companies were operating together already in the comparable period.
Notes:
Data and performance indicators have been calculated in accordance with the Instructions for compiling the statement of financial position, the
income statement and the statement of comprehensive income and for calculating the performance indicators of banks and savings banks,
which the Bank of Slovenia set out based on the Decision on the books of account and annual reports of banks and savings banks (Official
Gazette of the RS, No. 50/2015).
(1) The indicator equals the ratio profit or loss after tax/average assets. Average assets have been calculated as the average amount of
assets as at the last day of each quarter, including the amount of assets as at the last day of December of the previous year.
(2) The indicator equals the ratio profit or loss after tax/average equity. Average equity has been calculated as the average amount of equity
as at the last day of each quarter, including the amount of equity as at the last day of December of the previous year.
31 Dec. 2016 31 Dec. 2015 31 Dec. 2014
3,614,833 3,830,227 4,314,408
2,775,399 2,845,442 3,087,531
1,806,473 1,850,384 1,958,819
616,828 550,379 501,963
2016 2015 2014
78,714 77,114 94,940
53,767 65,638 (8,000)
(70,671) (74,765) (74,644)
(8,382) (10,021) (8,941)
30,183 (8,980) (218,259)
83,611 48,986 (214,904)
(6,097) (7,264) 5,728
2016 2015 2014
(11,595) 8,503 32,044
932 (1,812) (7,105)
2016 2015 2014
26.5% 23.0% 19.0%
26.5% 23.0% 19.0%
26.5% 23.0% 19.0%
2.08 1.04 (4.68)
13.14 7.95 (65.80)
– return on assets after tax (1)
– return on equity after tax(2)
Performance (in %)
STATEMENT OF COMPREHENSIVE INCOME (EUR thousand)
Other comprehensive income before tax
Income tax relating to components of other comprehensive income
INDICATORS
Total capital ratio
Common Equity Tier 1 capital ratio
Tier 1 capital ratio
Corporate income tax on ordinary operations
Total equity
INCOME STATEMENT (EUR thousand)
Net interest income
Net non-interest income
Labour costs, general and administration costs
Depreciation
Impairments and provisions
Profit or loss from ordinary operations before tax
Total amount of loans and advances to the non-banking sector,
measured at amortised cost
STATEMENT OF FINANCIAL POSITION (EUR thousand)
Total assets
Total amount of deposits of the non-banking sector,
measured at amortised cost
A B A N K A G R O U P Annual Report 2016
7
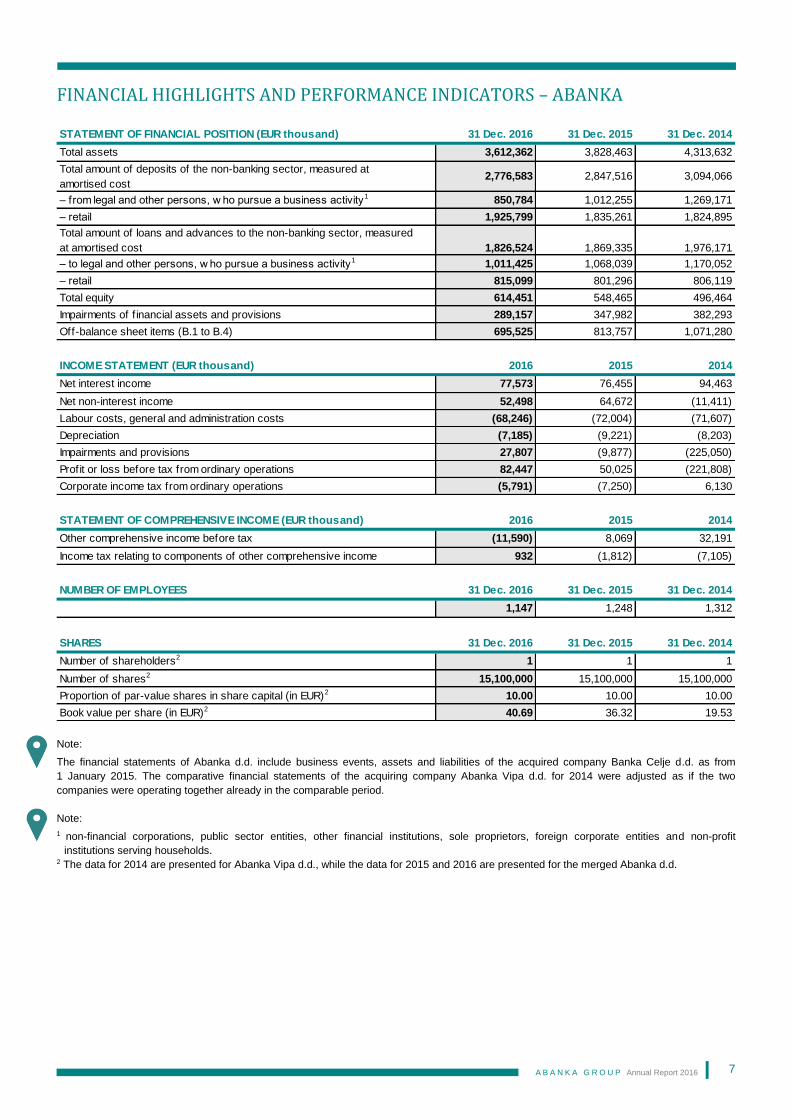
FINANCIAL HIGHLIGHTS AND PERFORMANCE INDICATORS – ABANKA
Note:
The financial statements of Abanka d.d. include business events, assets and liabilities of the acquired company Banka Celje d.d. as from
1 January 2015. The comparative financial statements of the acquiring company Abanka Vipa d.d. for 2014 were adjusted as if the two
companies were operating together already in the comparable period.
Note:
1 non-financial corporations, public sector entities, other financial institutions, sole proprietors, foreign corporate entities and non-profit
institutions serving households. 2 The data for 2014 are presented for Abanka Vipa d.d., while the data for 2015 and 2016 are presented for the merged Abanka d.d.
31 Dec. 2016 31 Dec. 2015 31 Dec. 2014
Total assets 3,612,362 3,828,463 4,313,632
Total amount of deposits of the non-banking sector, measured at
amortised cost 2,776,583 2,847,516 3,094,066
– from legal and other persons, w ho pursue a business activity1 850,784 1,012,255 1,269,171
– retail 1,925,799 1,835,261 1,824,895
Total amount of loans and advances to the non-banking sector, measured
at amortised cost 1,826,524 1,869,335 1,976,171
– to legal and other persons, w ho pursue a business activity1 1,011,425 1,068,039 1,170,052
– retail 815,099 801,296 806,119
Total equity 614,451 548,465 496,464
Impairments of f inancial assets and provisions 289,157 347,982 382,293
Off-balance sheet items (B.1 to B.4) 695,525 813,757 1,071,280
2016 2015 2014
Net interest income 77,573 76,455 94,463
Net non-interest income 52,498 64,672 (11,411)
Labour costs, general and administration costs (68,246) (72,004) (71,607)
Depreciation (7,185) (9,221) (8,203)
Impairments and provisions 27,807 (9,877) (225,050)
Profit or loss before tax from ordinary operations 82,447 50,025 (221,808)
Corporate income tax from ordinary operations (5,791) (7,250) 6,130
2016 2015 2014
Other comprehensive income before tax (11,590) 8,069 32,191
Income tax relating to components of other comprehensive income 932 (1,812) (7,105)
31 Dec. 2016 31 Dec. 2015 31 Dec. 2014
1,147 1,248 1,312
31 Dec. 2016 31 Dec. 2015 31 Dec. 2014
Number of shareholders2 1 1 1
Number of shares2 15,100,000 15,100,000 15,100,000
Proportion of par-value shares in share capital (in EUR)2 10.00 10.00 10.00
Book value per share (in EUR)2 40.69 36.32 19.53
NUMBER OF EMPLOYEES
STATEMENT OF FINANCIAL POSITION (EUR thousand)
INCOME STATEMENT (EUR thousand)
STATEMENT OF COMPREHENSIVE INCOME (EUR thousand)
SHARES
A B A N K A G R O U P Annual Report 2016
8
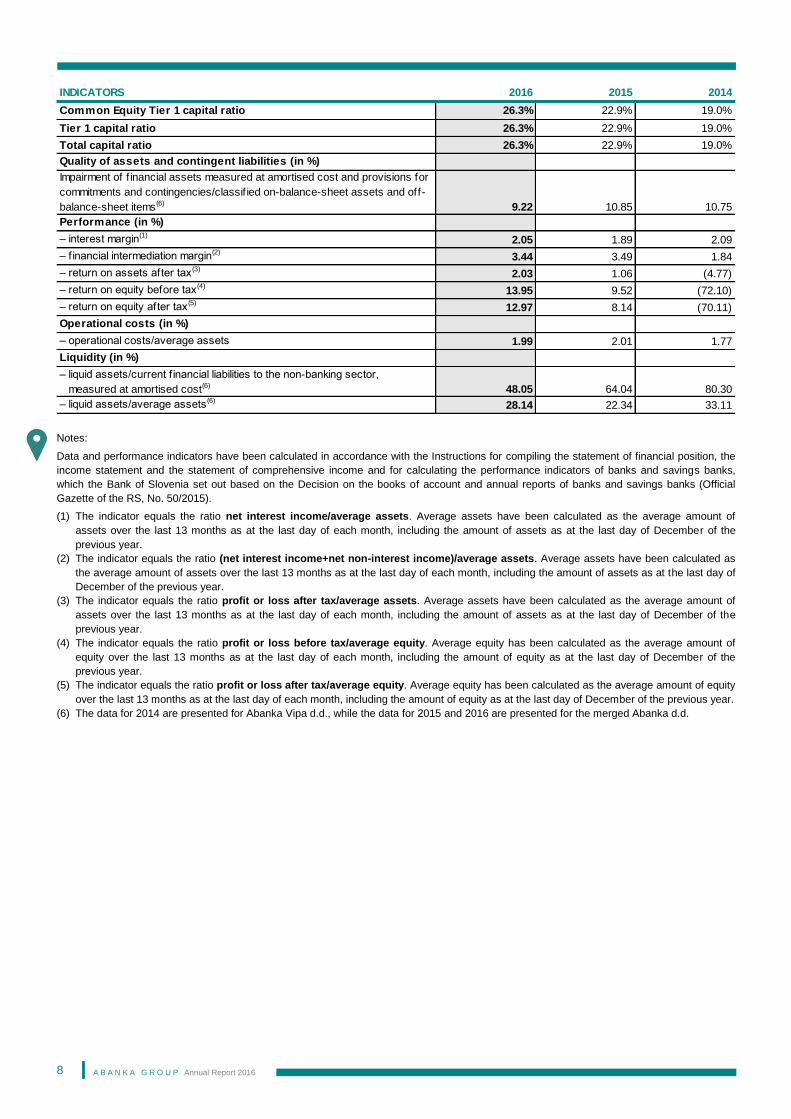
Notes:
Data and performance indicators have been calculated in accordance with the Instructions for compiling the statement of financial position, the
income statement and the statement of comprehensive income and for calculating the performance indicators of banks and savings banks,
which the Bank of Slovenia set out based on the Decision on the books of account and annual reports of banks and savings banks (Official
Gazette of the RS, No. 50/2015).
(1) The indicator equals the ratio net interest income/average assets. Average assets have been calculated as the average amount of
assets over the last 13 months as at the last day of each month, including the amount of assets as at the last day of December of the
previous year.
(2) The indicator equals the ratio (net interest income+net non-interest income)/average assets. Average assets have been calculated as
the average amount of assets over the last 13 months as at the last day of each month, including the amount of assets as at the last day of
December of the previous year.
(3) The indicator equals the ratio profit or loss after tax/average assets. Average assets have been calculated as the average amount of
assets over the last 13 months as at the last day of each month, including the amount of assets as at the last day of December of the
previous year.
(4) The indicator equals the ratio profit or loss before tax/average equity. Average equity has been calculated as the average amount of
equity over the last 13 months as at the last day of each month, including the amount of equity as at the last day of December of the
previous year.
(5) The indicator equals the ratio profit or loss after tax/average equity. Average equity has been calculated as the average amount of equity
over the last 13 months as at the last day of each month, including the amount of equity as at the last day of December of the previous year.
(6) The data for 2014 are presented for Abanka Vipa d.d., while the data for 2015 and 2016 are presented for the merged Abanka d.d.
2016 2015 2014
26.3% 22.9% 19.0%
Tier 1 capital ratio 26.3% 22.9% 19.0%
Total capital ratio 26.3% 22.9% 19.0%
9.22 10.85 10.75
2.05 1.89 2.09
3.44 3.49 1.84
2.03 1.06 (4.77)
13.95 9.52 (72.10)
12.97 8.14 (70.11)
1.99 2.01 1.77
48.05 64.04 80.30
28.14 22.34 33.11
Impairment of f inancial assets measured at amortised cost and provisions for
commitments and contingencies/classif ied on-balance-sheet assets and off-
balance-sheet items(6)
INDICATORS
Common Equity Tier 1 capital ratio
Quality of assets and contingent liabilities (in %)
Performance (in %)
– interest margin(1)
– financial intermediation margin(2)
– return on assets after tax(3)
– return on equity before tax(4)
– return on equity after tax(5)
Operational costs (in %)
– operational costs/average assets
Liquidity (in %)
– liquid assets/current f inancial liabilities to the non-banking sector,
measured at amortised cost(6)
– liquid assets/average assets (6)
A B A N K A G R O U P Annual Report 2016
9
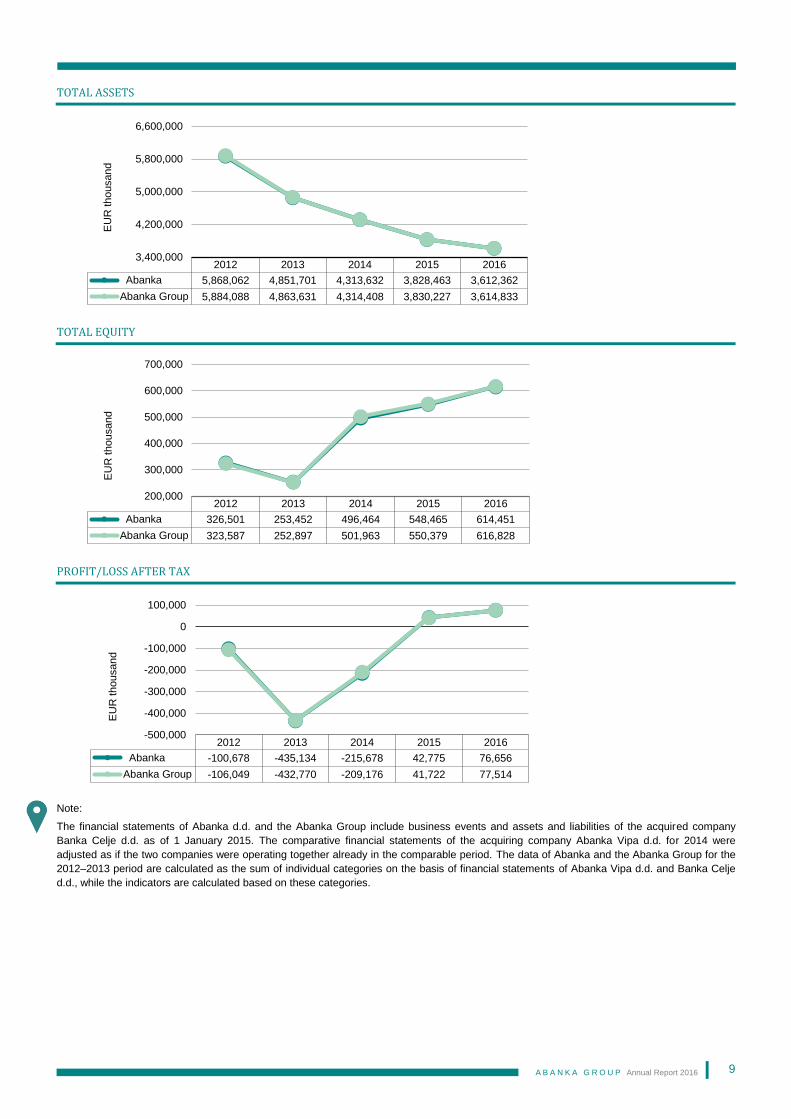
TOTAL ASSETS
TOTAL EQUITY
PROFIT/LOSS AFTER TAX
Note:
The financial statements of Abanka d.d. and the Abanka Group include business events and assets and liabilities of the acquired company
Banka Celje d.d. as of 1 January 2015. The comparative financial statements of the acquiring company Abanka Vipa d.d. for 2014 were
adjusted as if the two companies were operating together already in the comparable period. The data of Abanka and the Abanka Group for the
2012–2013 period are calculated as the sum of individual categories on the basis of financial statements of Abanka Vipa d.d. and Banka Celje
d.d., while the indicators are calculated based on these categories.
2012 2013 2014 2015 2016
Abanka 5,868,062 4,851,701 4,313,632 3,828,463 3,612,362
Abanka Group 5,884,088 4,863,631 4,314,408 3,830,227 3,614,833
3,400,000
4,200,000
5,000,000
5,800,000
6,600,000
EU
R thousand
2012 2013 2014 2015 2016
Abanka 326,501 253,452 496,464 548,465 614,451
Abanka Group 323,587 252,897 501,963 550,379 616,828
200,000
300,000
400,000
500,000
600,000
700,000
EU
R thousand
2012 2013 2014 2015 2016
Abanka -100,678 -435,134 -215,678 42,775 76,656
Abanka Group -106,049 -432,770 -209,176 41,722 77,514
-500,000
-400,000
-300,000
-200,000
-100,000
0
100,000
EU
R thousand
A B A N K A G R O U P Annual Report 2016
10
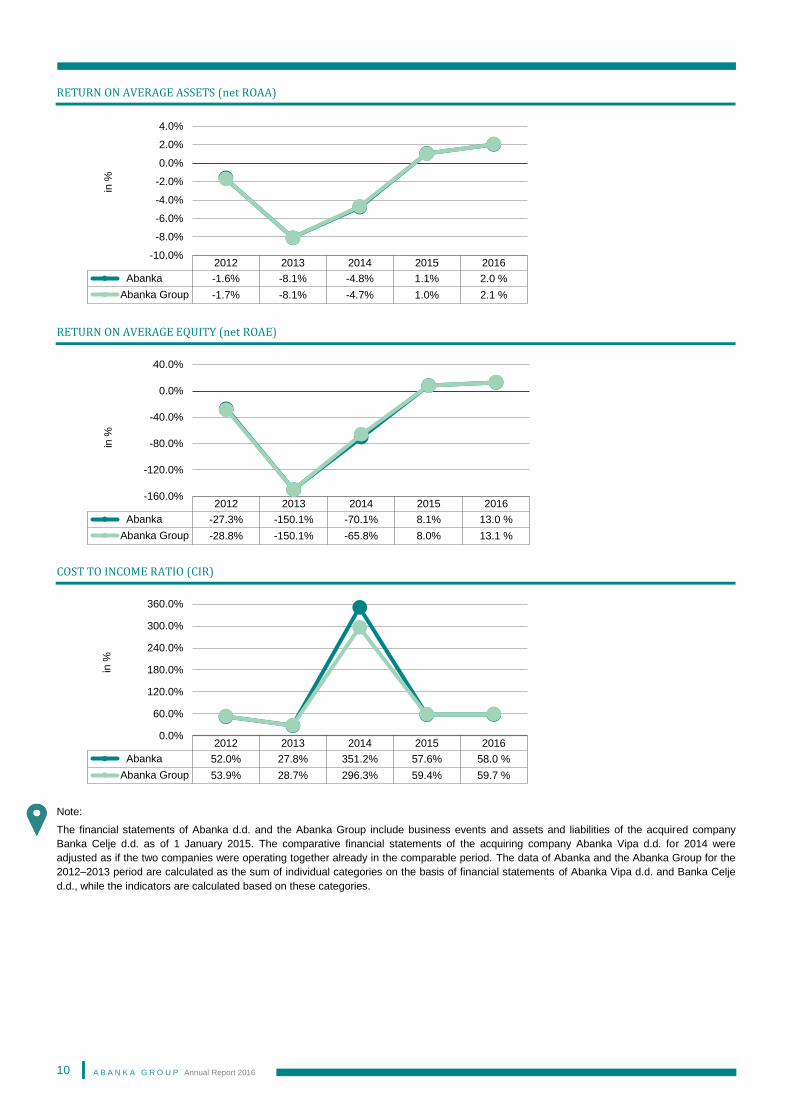
RETURN ON AVERAGE ASSETS (net ROAA)
RETURN ON AVERAGE EQUITY (net ROAE)
COST TO INCOME RATIO (CIR)
Note:
The financial statements of Abanka d.d. and the Abanka Group include business events and assets and liabilities of the acquired company
Banka Celje d.d. as of 1 January 2015. The comparative financial statements of the acquiring company Abanka Vipa d.d. for 2014 were
adjusted as if the two companies were operating together already in the comparable period. The data of Abanka and the Abanka Group for the
2012–2013 period are calculated as the sum of individual categories on the basis of financial statements of Abanka Vipa d.d. and Banka Celje
d.d., while the indicators are calculated based on these categories.
2012 2013 2014 2015 2016
Abanka -1.6% -8.1% -4.8% 1.1% 2.0 %
Abanka Group -1.7% -8.1% -4.7% 1.0% 2.1 %
-10.0%
-8.0%
-6.0%
-4.0%
-2.0%
0.0%
2.0%
4.0%
in %
2012 2013 2014 2015 2016
Abanka -27.3% -150.1% -70.1% 8.1% 13.0 %
Abanka Group -28.8% -150.1% -65.8% 8.0% 13.1 %
-160.0%
-120.0%
-80.0%
-40.0%
0.0%
40.0%
in %
2012 2013 2014 2015 2016
Abanka 52.0% 27.8% 351.2% 57.6% 58.0 %
Abanka Group 53.9% 28.7% 296.3% 59.4% 59.7 %
0.0%
60.0%
120.0%
180.0%
240.0%
300.0%
360.0%
in %

A B A N K A G R O U P Annual Report 2016
11
MANAGEMENT
MANAGEMENT BOARD OF THE BANK
Management Board
Aleksander VOZEL
Member of the Management Board
Matej GOLOB MATZELE
Member of the Management Board
Jože LENIČ
President of the Management Board
A B A N K A G R O U P Annual Report 2016
12
Report of the Management Board
Honourable business partners and colleagues of the Abanka Group,
In 2016, by taking into account several one-off events, Abanka generated a net profit of EUR 76.7 million, thereby continuing its
story of success, which began on 5 October 2015 through the merger with Banka Celje. Customer confidence has been
strengthened, also by providing a considerably expanded range of services. Regardless of the operational merger, the Bank
primarily focused on the customers, which was in line with the vision of becoming the best bank according to the choice of
customers, employees and investors.
In the low interest rate and in a highly competitive environment, Abanka’s net interest income was by 1.5% higher compared to
2015, while operating expenses were lower by 7.1%. As at the reporting date, total assets of Abanka amounted to EUR 3.6
billion. The Bank maintains high liquidity and capital strength, as indicated by the total capital ratio of 26.3% as at the 2016 year-
end. The latter is also confirmed by the results of supervisory stress tests, in which Abanka was included from March to October
2016 as one of the four European banks.
In 2016, the Bank followed the key strategic programmes from the medium-term Strategy of Abanka d.d. for the 2016–2019
Period, which included continued integration of both banks, acceleration of digital transformation, loan process optimisation and
staff renewal.
Abanka is the leading Slovene bank in custody services for investment funds and the only bank offering administrative services.
In addition, the Bank not only holds high market shares in payment services and SEPA direct debits but is also actively engaged
in bullion trading. Abanka provides high quality and competitive insurance services in partnership with Zavarovalnica Triglav and
sells mutual funds in cooperation with Triglav Skladi. Excellent relationships are developed with all customer segments.
In 2016, the Bank sought solutions for simplifying and accelerating the main processes, which also have an impact on service
quality. Optimisation of the organisational structure continued so as to centralise support functions, ensure more efficient
customer servicing. In line with the strategic guideline of the Bank, much attention was devoted to the development of modern
sales channels. The Abamobi com mobile bank application for corporate customers was upgraded to enable payment
transactions and checking of deposit and loan balances, in addition to providing fast, simple and secure banking services. For
better communication with corporate customers, the feature of receiving and sending messages to the Bank was added to the
mobile bank application. Apart from that, the Abamobi mobile bank application for retail customers was upgraded, further
improving user experience. An important element in the digital transformation of Abanka is a state-of-the-art website. User
experience was upgraded by observing the latest trends and international standards in user experience design and by adjusting
the website for mobile devices through responsive web design.
In the context of cashless operations, the Bank offers its customers a range of card services. The Visa business card was
redesigned to bring it closer to the users and cards that allow contactless payment started to be issued. The signing of
agreements using a signature pad (ePero application) was made available to customers in order to accelerate the conclusion of
agreements and automate the agreement archiving process. In the second half of 2016, the loan process optimisation was
launched in order to improve client servicing. As of July, a redesigned application for the sale of credit, guarantee and deposit
operations to legal persons has been in use. With many years of experience in trade finance and a high level of professionalism,
the Bank is aware of the significance of choosing an appropriate hedging insurance for a particular customer. Therefore,
when giving advice focus is on the target choice and preparation of individual hedging instruments tailored to the needs of
individual customers.
Abanka actively sold its treasury products, which resulted mainly in higher business volume with regard to the spot purchase
and sale of foreign currencies and higher demand for derivatives for hedging against foreign exchange risks and interest rate
risk. The Bank was also successful in acquiring customers due to the abolition of registry accounts kept by KDD. The
management of the debt securities portfolio included in the banking book demanded the Bank to continue to apply a
conservative and prudent investment policy, i.e. investing in investment-grade, highly liquid bonds.
To become a cost-effective and profitable bank, in 2017 Abanka will continue to focus on retail banking, small and medium-
sized enterprises and key customers with significant non-interest income. The Bank effectively manages risks, executes the
projects aimed at increasing cost-effectiveness and optimisation of the loan process, develops new products and services, and
creates a stimulating environment for employees by maintaining a good organisational climate and through employee
commitment, which will not only result in profitable, safe and stable operations but also boost the reputation of the Bank in the
eyes of investors. In parallel, the Bank strengthens business relationships with customers and upgrades the existing
relationships through a personal, individual approach, quality services and quick responsiveness. The Bank’s ultimate goal
remains a satisfied and loyal customer, who is provided a wide range of banking and insurance products in a simple and
A B A N K A G R O U P Annual Report 2016
13
modern way. Abanka actively pursues digitisation of banking services as well as upgrades the functionality of the electronic and
mobile channels and its website www.abanka.si. Customers will continue to be provided simple, cost-effective and time-saving
access to the banking services through e-channels, which may be used anywhere and anytime. The Bank will continue to
upgrade and market modern services, such as the Abamobi com mobile bank, Abasms for corporate customers and the Abanet
com online bank.
Abanka accomplishes its mission of “UNITING WITH EXCELLENCE IN FINANCIAL SERVICES” through its values and core
competencies and/or comparative advantages. The Bank gazed into the past, present and future at the 2016 Abanka Day,
where the values governing the Bank’s operations were presented in detail. Abanka strives for excellence in all segments and
builds new value chains by forming partnerships with both customers and employees. Innovation is key in the development of
services, sales channels and processes. In business operations, the focus is on responsible and professional execution in
accordance with the arrangements. Abanka’s relationships are based on friendliness to the customers, employees and all
other stakeholders.
Our core competences are a strong customer-focused culture and awareness of customer importance, economical and
prudent approach to costs, innovation, and high willingness of employees to face new challenges, entrepreneurship and
expertise based on experience. The Bank is constantly in search of improvements contributing to a better quality of services in
all business segments. In 2016, a new way of acquiring innovative ideas was established by organising Abathon, which will be
further developed and upgraded.
Abanka is a modern universal commercial bank with a clear vision of the future and the development of advanced banking
services. The strong capital base, the continued restructuring of both the Bank and the Group and the implementation of the set
strategic objectives will enable safe, reliable and profitable operations of the Bank also in 2017, thereby making the Bank more
attractive to investors. Abanka is a bank of friendly people devoted to excellence in business, services and personal relations.
Abanka pursues its business objectives in cooperation with you, our loyal business partners, our highly qualified and motivated
employees and with the support of our shareholder.
The Management Board thanks all colleagues for their contribution to excellent business results in 2016, to our business
partners for good cooperation, to our customers for their trust and to the shareholder for its support. In 2017, Abanka continues
to follow its vision of becoming the best bank according to the choice of customers, employees and investors.
Management Board
Matej GOLOB MATZELE
Member of the Management Board
Aleksander VOZEL
Member of the Management Board
Jože LENIČ
President of the Management Board
A B A N K A G R O U P Annual Report 2016
14
SUPERVISORY BOARD
As at 31 December 2016
Marko GARBAJS SIJ d.d., Business Analyst
MAG PROJEKTI, svetovanje in financiranje projektov d.o.o., Director
Melita MALGAJ Slovenski državni holding d.d., Director of Economy Management Department
Hit d.d., external member of the Investment and Disinvestment Committee
Blaž ŠTERK The Interenergo Group (Interenergo, energetski inženiring, d.o.o. Ljubljana, Authorised
Officer; Interenergo d.o.o., Zagreb, Director; PLC Interenergo d.o.o., Belgrade, Director;
Interenergo d.o.o. – Kosova sh.p.k., Director)
RSG Kapital, upravljanje tveganega kapitala d.o.o., Member of the Supervisory Board
Alenka VRHOVNIK TEŽAK VTT d.o.o., Authorised Officer and Financial Adviser
Court Expert in Economics – Finance
Rok PIVK Zavarovalnica Triglav d.d., Executive Director of Finance
Salnal d.o.o., Director
Triglav, upravljanje nepremičnin, d.d., Chairman of the Supervisory Board
Skupna pokojninska družba d.d., Member of the Supervisory Board
Vid LESKOVEC Leskovec Law Firm, Director
A B A N K A G R O U P Annual Report 2016
15
Report of the Supervisory Board
As at 31 December 2016, the Supervisory Board of Abanka was composed of six members. In 2016, the composition of the
Supervisory Board changed. In early 2016, the Supervisory Board was composed of Janko Gedrih as its Chairman, Marko
Garbajs as its Vice Chairman and Andrej Slapar, Blaž Šterk, Melita Malgaj, Matjaž Trebše and Alenka Vrhovnik Težak as its
members. On 9 February 2016, Janko Gedrih, the Chairman of Abanka’s Supervisory Board, resigned as a Supervisory Board
member. As a result, on 25 February 2016 Marko Garbajs, Vice Chairman of the Supervisory Board, was appointed Chairman
of the Supervisory Board, whilst Melita Malgaj, Member of the Supervisory Board, was appointed Vice Chairman of the
Supervisory Board of Abanka d.d.
The 33rd General Meeting of Shareholders, held on 13 May 2016, appointed the following Supervisory Board members: Rok
Pivk, with a term of office starting on 13 May 2016, and Vid Leskovec, with a term of office starting on 31 May 2016, (on 30 May
2016 the term of office of Andrej Slapar, the Supervisory Board Member expired).
On 8 August 2016, Matjaž Trebše, Member of Abanka’s Supervisory Board, resigned as a Supervisory Board Member.
As at the reporting date, the Supervisory Board was composed of Marko Garbajs as the Chairman of the Supervisory Board,
Melita Malgaj Vice Chairman and Blaž Šterk, Alenka Vrhovnik Težak, Rok Pivk and Vid Leskovec its members. The Banking Act
specifically and in detail stipulates the conditions and requirements for supervisory board members of banks and does not
prohibit members who have an economic, personal or other close relationship with bank's major shareholders or their
Management Board from serving as Supervisory Board members. In cases when the Supervisory Board discusses issues
related to a member of the Supervisory Board and/or persons linked to members of the Supervisory Board, the latter are
regularly excluded from the discussion and voting on those issues, with the Chairman of the Supervisory Board paying special
attention to the exclusion of these members. In case the Chairman is excluded, the session is chaired by the Vice Chairman.
Any such exclusion is entered into the minutes.
The Supervisory Board had four committees:
As at the reporting date, the Audit Committee had the following composition: Blaž Šterk as Chairman, and Melita Malgaj,
Rok Pivk and Alenka Vrhovnik Težak as members. As at 31 December 2015, the Committee was composed of: Blaž Šterk as
Chairman, and Matjaž Trebše, Marko Garbajs and Melita Malgaj as members. The composition of the Committee changed
over the course of the year. In the reporting period, Marko Garbajs was replaced by Rok Pivk as Committee Member. From
1 June 2016 to 8 August 2016, the Audit Committee thus had the following composition: Blaž Šterk as its Chairman and
Matjaž Trebše, Melita Malgaj and Rok Pivk as its members. Following the resignation of Matjaž Trebše as the Member of the
Supervisory Board on 8 August 2016, the Audit Committee was composed of three members in the period from 9 August 2016
to 24 August 2016. On 25 August 2016, Alenka Vrhovnik Težak became the Audit Committee member. The Audit Committee
held eight meetings in and one correspondence meeting in 2016. The main purpose of the Audit Committee is to assist the
Supervisory Board in discharging its supervision duties regarding the reliability of financial statements, financial reports and
other financial information that the Bank provides to its shareholders and other members of the public concerning the
qualifications, effectiveness and independence of the external auditor, the operation of the internal audit function and
compliance of the Bank with the applicable legal and regulatory requirements.
As at the reporting date, the Human Resource Committee had the following composition: Marko Garbajs its Chairman and
Melita Malgaj and Vid Leskovec its members. As at the 2015 year-end, the Committee was composed of the following
members: Janko Gedrih as its Chairman and Andrej Slapar and Melita Malgaj as its members. In 2016, the Committee
composition changed. On 9 February 2016, Janko Gedrih resigned as the Supervisory Board Member. Consequently, as from
25 February 2016, the Human Resource Committee was chaired by Marko Garbajs, whilst on 30 May 2016 the term of office
of a Supervisory Board Member Andrej Slapar ended. On 31 May 2016, Vid Leskovec thus became the Committee member.
In the reporting period, the Committee had six meetings and held one correspondence one. The main purpose of the Human
Resource Committee is to support the Supervisory Board in the execution of their supervisory responsibilities with respect to
personnel issues involving the Management Board and the Supervisory Board membership. As at the reporting date, the Compensation Committee had the following composition: Marko Garbajs as its Chairman and
Alenka Vrhovnik Težak and Vid Leskovec its members. As at the 2015 year-end, the Committee was composed of the
following members: Andrej Slapar served as its Chairman and Alenka Vrhovnik Težak and Matjaž Trebše as its members. In
2016, the Committee composition changed. On 30 May 2016, the term of office of Andrej Slapar as the Supervisory Board
Member ended. As a result, on 31 May 2016 Vid Leskovec joined the Committee as a member, while Matjaž Trebše served as
its Chairman until his resignation on 8 August 2016. Since 25 August 2016, the Chairman of the Compensation Committee
was Marko Garbajs. The Committee held four meetings in 2016. The main purpose of the Compensation Committee is to
support the Supervisory Board in the execution of their supervisory responsibilities with respect to taking decisions on
remuneration, including those having an impact on the risks and risk management of the Bank.
A B A N K A G R O U P Annual Report 2016
16
As at 31 December 2016, the Risk Management and Asset Liability Management Committee had the following
composition: Alenka Vrhovnik Težak served as its Chairman and Marko Garbajs, Blaž Šterk and Rok Pivk as its members. As
at the 2015 year-end, the Committee was composed of the following members: Marko Garbajs as its Chairman and Janko
Gedrih, Alenka Vrhovnik Težak and Blaž Šterk as its members. In 2016, the Committee composition changed. As of 9
February 2016, following the resignation of Janko Gedrih, the Committee had only three members. Since 31 May 2016, the
Committee was composed of the following members: Alenka Vrhovnik Težak as its Chairman and Marko Garbajs, Blaž Šterk
and Rok Pivk its members. In 2016, the Committee held seven meetings. The main purpose of the Committee is to support
the Supervisory Board in the execution of its supervisory responsibilities with respect to taking decisions related to the risk
management function, the risk profile and the control of asset liability management in the Bank.
With the exception of the above-stated committees, the Supervisory Board has no other division of duties among its members.
All the members submitted their signed statements of independence to the Supervisory Board in accordance with the Corporate
Governance Code, which are published on the official website of the Bank.
The self-assessment results of the Supervisory Board in 2016 were positive and adequate. The assessment of the Supervisory
Board's work included the proposed activities for the elimination of any identified deficiencies. The professional quali fications,
knowledge and experience of the Supervisory Board members cover a broad spectrum of expertise in finance, audit,
supervision, law and other fields. The organisation and functioning of Board members as a team is effective as they facilitate the
ongoing monitoring and supervision of the Bank's operations as well as initiatives and guidelines for its development. The
Supervisory Board's self-assessment results positively affected and encouraged its work and confirmed that the Board had
properly performed its activities.
Review of the Supervisory Board's activities in 2016
The Supervisory Board oversees the management of the Bank's business operations. In accordance with the competencies and
obligations defined in the Banking Act, the Companies Act, the Decision on Internal Governance, the Management Body and
the Adequate Internal Capital Assessment Procedure for Banks and Savings Banks and the Articles of Association of the Bank,
the Supervisory Board operated pursuant to the principles of modern corporate governance and thus, through its supervisory
function, contributed to the efficiency and transparency of the Bank's operations. At its sessions, the Supervisory Board
regularly took note of the Bank’s financial operations and the risk management activities, focusing mainly on the Bank's capital,
credit, liquidity and interest rate risks. At its sessions, the Supervisory Board members actively participated in discussions and
initiated debates particularly in relation to the financial operations of Abanka and the Abanka Group, risk management, and the
ICAAP and ILAAP processes. The Supervisory Board approved the Annual Plan of Abanka and the Abanka Group for 2017,
including the financial plans up to 2019. The Supervisory Board adopted the training programme for Supervisory Board
members for 2017.
In 2016, the Supervisory Board held one correspondence session in its initial composition: Janko Gedrih as its Chairman, Marko
Garbajs as its Vice Chairman and Andrej Slapar, Blaž Šterk, Melita Malgaj, Matjaž Trebše and Alenka Vrhovnik Težak as its
members. After Janko Gedrih resigned as the Chairman of the Supervisory Board, the Supervisory Board held four regular
sessions and two correspondence ones in the following composition: Marko Garbajs its Chairman, Melita Malgaj its Vice
Chairman and Andrej Slapar, Blaž Šterk, Matjaž Trebše and Alenka Vrhovnik Težak its members. All members of the
Management and Supervisory Boards were present at all regular sessions of the Supervisory Board, except for Andrej Slapar,
who was not present at the 21st regular session held on 21st April 2016 for legitimate reasons.
In the reporting year, the Supervisory Board held one regular session and two correspondence ones in the following
composition: Marko Garbajs as its Chairman, Melita Malgaj as its Vice Chairman and Blaž Šterk, Matjaž Trebše, Alenka
Vrhovnik Težak, Rok Pivk and Vid Leskovec as its members. Following the resignation of Matjaž Trebše, the Supervisory Board
composed of Marko Garbajs as Chairman, Melita Malgaj as Vice Chairman and Blaž Šterk, Alenka Vrhovnik Težak, Rok Pivk
and Vid Leskovec as its members held four sessions. All members of the Management Board were present at all regular
sessions of the Supervisory Board.
In line with Abanka’s commitments made to the European Commission (State aid SA.38522 2014/N Slovenia, Restructuring aid
for Banka Celje/Abanka) by the Republic of Slovenia upon the approval of state aid to the Bank, a representative of KPMG,
poslovno svetovanje, d.o.o. regularly attended the Supervisory Board sessions as a Monitoring Trustee.
The Supervisory Board's regular sessions lasted 32 hours and 11 minutes in total, which is 3% less than in 2015 (33:10).
At its sessions in 2016, the Supervisory Board:
approved and adopted the audited Annual Report of Abanka for 2015, including the auditor’s report by Deloitte Revizija d.o.o. ,
and adopted the Corporate Governance Statement for 2015;
A B A N K A G R O U P Annual Report 2016
17
took note of the resignation letter of Janko Gedrih, the Chairman of Abanka’s Supervisory Board, to resign as a Supervisory
Board Member of Abanka as at 9 February 2016; appointed Marko Garbajs as the Supervisory Board Chairman and Melita
Malgaj its Vice Chairman on 25 February 2016; took note of the resignation letter of Matjaž Trebše as a member of the Supervisory Board of the Abanka as at 8 August 2016; took note of reports on the implementation of the commitments, made to the European Commission; adopted the Strategy of Abanka d.d. for the 2016-2019 period;
discussed reports on financial operations of Abanka and the Abanka Group in 2015 and 2016;
took note of and approved the credit limits;
approved the Abanka Group Recovery Plan;
took note of and discussed the largest non-performing exposures;
discussed the ICAAP and ILAAP processes and took note of the findings and results of the ICAAP and ILAAP processes;
discussed comprehensive reports on the risks of Abanka’s and/or the Abanka Group’s operations (including the Risk
Management Strategy of the Abanka Group);
regularly took note of the Comprehensive Assessment Project carried out by the European Central Bank in 2016;
approved the proposed agenda of the 33rd General Meeting of Shareholders of Abanka held on 13 May 2016; proposed to the General Meeting of Shareholders to appoint two new members of the Supervisory Board (before the
appointment of new Supervisory Board members at the General Meeting of Shareholders held on 13 May 2016, the Bank
performed the fit and proper assessment of the candidates for the members of the Supervisory Board in accordance with the
Banking Act (ZBan-2));
gave consent to the appointment of the internal auditor;
discussed the Annual Internal Audit Report for 2015 and gave its opinion thereto, discussed internal audit reports for the first
six months of 2016, approved the Internal Audit Department Work Plan for 2017 and the framework strategic plan for the
2018–2019 period;
approved the Annual Plan of Abanka and the Abanka Group for 2017, including the financial plans up to 2019; on 15 December 2016 took note of the resignation letter of Aleksander Vozel, Member of the Management Board; discussed other issues related to the operations of the Bank and the Group.
Based on up-to-date materials prepared by the Management Board, reports made by specialised in-house departments and its
own findings, the Supervisory Board responsibly monitored the Bank's operations and the work of the Internal Audit Department,
also supervising the management of the Bank. In addition, the Supervisory Board required from the Management Board to take
appropriate measures and implement activities aimed at improving the performance of the Bank and reducing the risks. The
Supervisory Board considers its cooperation with the Management Board good; the Management Board reported on all relevant
circumstances in a timely and complete manner, provided answers to the questions received, and duly discharged the duties
imposed by the Supervisory Board. The Supervisory Board concluded that its regular and comprehensive monitoring of
Abanka’s operations, its guidance towards the best possible decisions in a particular situation, coupled with appropriate
supervision of the Bank’s governance, contributed to safe and stable operations of the Bank and excellent business results.
Annual Report for 2016
At its session on 13 April 2017, the Supervisory Board discussed the 2016 Annual Report of Abanka, including the audit report
by Deloitte Revizija d.o.o. Cooperation with the audit company was of high quality; the auditors responsible took part in the
sessions of the Supervisory Board and the Audit Committee and participated in resolving the outstanding issues. The
Supervisory Board confirmed that the Annual Report is a true and fair presentation of the Bank’s and the Group’s position, gives
a comprehensive view of operations in 2016 and thus complements the information they received during the financial year.
Comparing the Annual Report with the audited financial statements for the 2016 financial year, the Supervisory Board
established that the financial results presented in the Annual Report match the audit report. In its opinion, the Supervisory
Board, together with the Management Board, fulfilled all their legal requirements for the 2016 financial year.
The Supervisory Board hereby establishes that the certified external auditor, in their report, issued a positive opinion of the
financial statements, which present a true and fair view of the Bank's and the Group’s financial position in all material aspects.
The Supervisory Board has no comments on the audit report by Deloitte Revizija d.o.o. and believes the Bank's and the Group’s
operations in 2016 were carried out in accordance with the applicable legal requirements. Based on its insights into the Bank's
operations during the year and following a careful examination of the audited Annual Report and the positive opinion issued by
the certified auditor in their audit report, the Supervisory Board hereby without objections approves and adopts the Annual
Report of Abanka for the 2016 financial year.
Marko GARBAJS
Chairman of the Supervisory Board
A B A N K A G R O U P Annual Report 2016
18
PRESENTATION OF THE GROUP AND ITS ENVIRONMENT
ABOUT THE BANK
Abanka Vipa d.d. is a bank with a long tradition in the Slovene banking sector. The origins of Abanka date back to 1955, when
the bank operated as a branch of the Yugoslav Bank for Foreign Trade. In 1977, the branch was renamed Jugobanka –
Temeljna banka Ljubljana. Abanka began using its current name on 1 January 1990, when it was reorganised as a public limited
company. On 31 December 2002, Banka Vipa merged with Abanka. Since then, the Bank has operated under the name Abanka
Vipa d.d., abbreviated to Abanka d.d. The shares of Abanka were listed on the Ljubljana Stock Exchange from October 2008 to
December 2013, when on the basis of the Decision of the Bank of Slovenia on Extraordinary Measures, all qualified liabilities of
the Bank on 18 December 2013 ceased in full. On 18 December 2013, the Republic of Slovenia subscribed and fully paid in all
15,000,000 shares newly issued by Abanka, and thereby became the 100% owner of the Bank. On 8 October 2014, the
Republic of Slovenia paid in another 100,000 new shares. On 5 October 2015, Banka Celje d.d., established in 1864 when Celje
Municipal Savings Bank was founded, was merged with Abanka Vipa d.d. in line with the commitment made to the European
Commission. Since that date, the merged bank has operated under the name Abanka d.d. As at 31 December 2016, Abanka’s
market share in terms of total assets was 9.7%.
Abanka is a universal bank with authorisation to provide all banking and other financial services. Through its extensive network
of 58 branches across Slovenia, e-banking, advisory services and a personal approach, the Bank provides integrated financial
services, ranging from traditional banking and bancassurance to investment banking. Moreover, Abanka has gained
international reputation. In interbank operations, it uses a network of correspondent banks across the globe to provide quality
customer services relating to international payment transactions.
The subsidiaries Aleasing d.o.o. and Anepremičnine d.o.o. complement Abanka’s offering by providing leasing services and
trading in own real property.
9.7% Abanka's market share as at the 2016 year-end
A B A N K A G R O U P Annual Report 2016
19
SERVICES OF THE BANK
As at 31 December 2016 Abanka was authorised to provide the following mutually recognised financial services under Article 5
of the Banking Act (ZBan-2):
SERVICE LICENCE ISSUED
1. Acceptance of deposits and other repayable funds; YES
2. Lending including, inter alia:
– consumer loans,
– mortgage loans,
– factoring, with or without recourse,
– financing of commercial transactions (including forfeiting);
YES
YES
YES
YES
3. Financial leasing: leasing of assets for a period which is approximately the same as the life
expectancy of the leased assets, where the lessee derives most benefit from the use of the
leased assets and assumes total transaction risk; NO
4. Payment services YES
5. Issuance and administering of payment instruments (e.g. travellers’ cheques
and bankers’ drafts insofar as this service is not covered by previous point); YES
6. Issuance of guarantees and other commitments; YES
7. Trading for own account or for the account of customers in:
– money market instruments,
– foreign exchange, including currency exchange transactions,
– financial futures and options,
– exchange and interest-rate instruments,
– transferable securities;
YES
YES
YES
YES
YES
YES
8. Participation in the issuance of securities and services related to such issues; YES
9. Advice and services related to mergers and acquisitions of undertakings; YES
10. Money intermediation on inter-bank markets; NO
11. Advice on portfolio management; YES
12. Safekeeping of securities and other services related to the safekeeping
of securities; YES
13. Credit reference services: collection, analysis and provision of information
on creditworthiness; YES
14. Renting of safe deposit boxes; YES
15. Investment services and operations and ancillary investment services in accordance with the
Financial Instruments Market Act. YES
Abanka is also authorised to provide the following other financial services under Article 6 of the Banking Act (ZBan-2):
SERVICE LICENCE ISSUED
1. Insurance brokerage in accordance with the law governing the insurance business; YES
2. Payment system management services in accordance with the Payment Transactions Act (ZPlaP); NO
3. Pension fund management in accordance with the law governing pension and disability
insurance; NO
4. Custodian services provided according to the Investment Funds and Management
Companies Act; YES
5. Credit brokerage in consumer and other loans; NO
6. Finance leasing brokerage and administrative services for investment funds. YES
A B A N K A G R O U P Annual Report 2016
20
BANK PROFILE
Abanka is entered in the Companies Register kept by the District Court in Ljubljana under registration no. 1/02828/00.
Registered office: Slovenska cesta 58, 1517 Ljubljana
Transaction account: SI56 0100 0000 0500 021
SWIFT: ABANSI2X
Tax number: 68297530
VAT identification number: SI68297530
Company registration number: 5026024
Share capital: EUR 151,000,000.00
Telephone: (+386 1) 47 18 100
Fax: (+386 1) 43 25 165
Website: http://www.abanka.si
E-mail: [email protected]
ABOUT THE GROUP
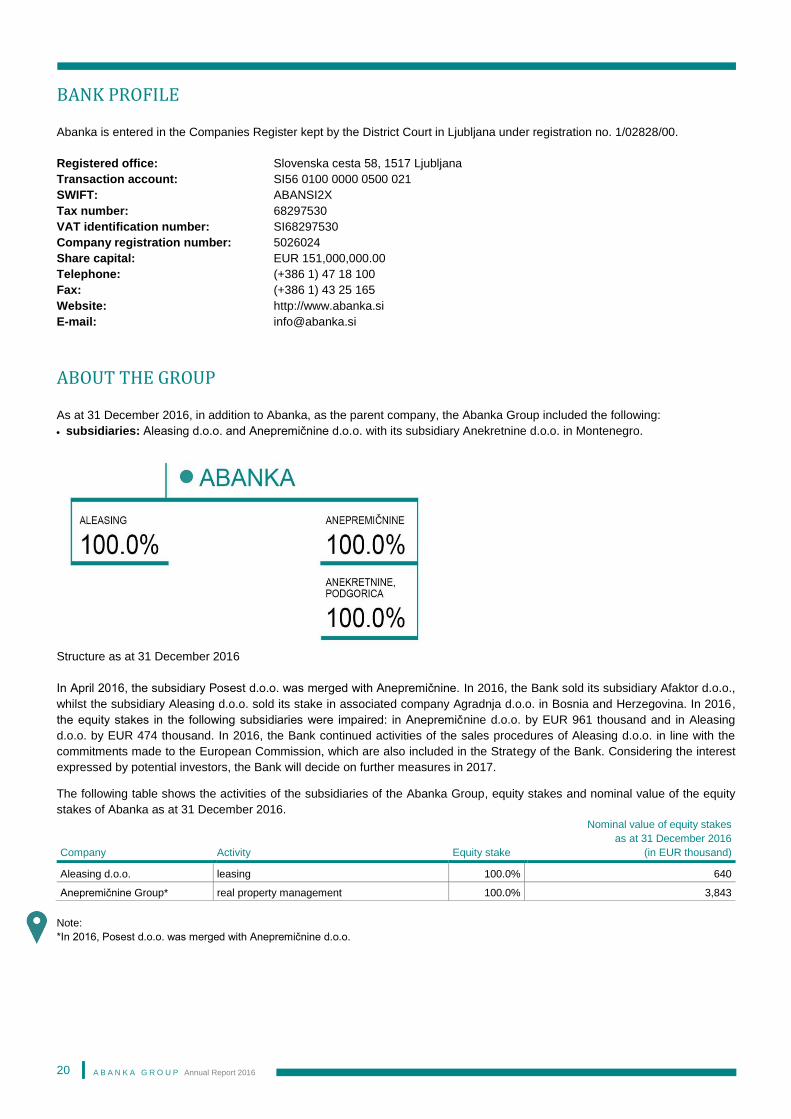
As at 31 December 2016, in addition to Abanka, as the parent company, the Abanka Group included the following:
subsidiaries: Aleasing d.o.o. and Anepremičnine d.o.o. with its subsidiary Anekretnine d.o.o. in Montenegro.
Structure as at 31 December 2016
In April 2016, the subsidiary Posest d.o.o. was merged with Anepremičnine. In 2016, the Bank sold its subsidiary Afaktor d.o.o.,
whilst the subsidiary Aleasing d.o.o. sold its stake in associated company Agradnja d.o.o. in Bosnia and Herzegovina. In 2016,
the equity stakes in the following subsidiaries were impaired: in Anepremičnine d.o.o. by EUR 961 thousand and in Aleasing
d.o.o. by EUR 474 thousand. In 2016, the Bank continued activities of the sales procedures of Aleasing d.o.o. in line with the
commitments made to the European Commission, which are also included in the Strategy of the Bank. Considering the interest
expressed by potential investors, the Bank will decide on further measures in 2017.
The following table shows the activities of the subsidiaries of the Abanka Group, equity stakes and nominal value of the equity
stakes of Abanka as at 31 December 2016.
Company Activity Equity stake
Nominal value of equity stakes
as at 31 December 2016
(in EUR thousand)
Aleasing d.o.o. leasing 100.0% 640
Anepremičnine Group* real property management 100.0% 3,843
Note:
*In 2016, Posest d.o.o. was merged with Anepremičnine d.o.o.
A B A N K A G R O U P Annual Report 2016
21
In 2016, the nominal value of Abanka’s equity stake in Anepremičnine d.o.o. increased from EUR 3,152 thousand as at the
2015 year-end to EUR 3,843 thousand as at 31 December 2016 (as the result of the merger of Posest d.o.o. in 2016 in the
amount of EUR 1,652 thousand and an impairment of EUR 961 thousand), whilst in Aleasing d.o.o. it decreased from
EUR 1,114 thousand as at the 2015 year-end to EUR 640 thousand as at the reporting date due to the impairment of
EUR 474 thousand. In 2016 the Bank sold its subsidiary Afaktor d.o.o. Its book value stood at EUR 106 thousand as at
31 December 2015.
Activities of Subsidiaries
Anepremičnine Group
The company, which was entered in the Companies Register on 31 May 2013, was established by assuming a portion of assets
from Aleasing d.o.o. On the day the demerger was entered in the Companies Register, the new company assumed a portion
of the assets of the transferring company, Aleasing d.o.o., and as its successor entered all legal relations concerning the
demerged assets, previously held by Aleasing d.o.o. Its core business is trading in own real property, with its headquarters
in Ljubljana.
At the 2016 year-end, Gregor Žvipelj was the Director of Anepremičnine d.o.o. The Supervisory Board was composed of
Davorin Leskovar, Chairman and Peter Jančič, member and Dejan Grum, member. On 19 December 2016, Peter Jančič was
appointed member of the Supervisory Board to replace Gregor Hudobivnik; furthermore, on 25 January 2017, he was appointed
Vice Chairman of the Supervisory Board.
Anepremičnine performs the full range of real property portfolio management activities, which include conducting the sales
procedures, leasing and selling real properties, analysing real property development projects, construction and completion of
projects, acquiring new real property portfolio in the market or via spin-offs, selling to third parties, optimising real property
management and governance of subsidiaries abroad. It has an efficient system of real property sale and lease and actively
participates in the brokerage of real property pledged as collateral to the bank. The company sells its non-residential property at
public auctions or through invitations to submit binding or non-binding offers (tendering).
An important segment of the company’s activities is the provision of support services, particularly real property appraisal both for
the Bank and the Bank’s customers, supervision of the eligible use of funds, marketability analysis, real property marketing,
asset management for the Bank-owned real property and advisory services.
The company was established with an aim to centralise real property management at the Abanka Group level, to optimise the
real property portfolio and to manage it more efficiently. The company’s main task is to manage the real property portfolio in a
more uniform, transparent and predictable manner that will enable value maximisation and adequate profitability. If necessary, it
participates in the completion of unfinished projects as an investor.
Anepremičnine is closely involved in the part of the process of real property business of the Abanka Group which relates to
commercial transactions. This entails acquisition of real property within the Group, property selling, development, investment,
attracting tenants, real property management, divestment and operational marketing of real property. In the reporting year,
Anepremičnine either sold or leased many residential and commercial real properties for its own account and provided estate
agency services, thereby achieving the key objectives set for 2016.
In April 2016, Anepremičnine acquired Posest, podjetje za trgovino, inženiring in posredovanje d.o.o. (hereinafter: Posest),
which ceased to exist as an independent legal entity, whilst all its assets and liabilities were transferred to Anepremičnine as its
acquiring company. Banka Celje established Posest d.o.o. on 6 September 1991 with its headquarters in Celje. Due to the
merger of Banka Celje with Abanka, Posest was 100% owned by Abanka d.d. as at the 2015 year-end. It operated in Slovenia,
although in 2015 some appraisals were made abroad, i.e. in Croatia, Serbia and Bosnia and Herzegovina. The core activities of
the company until the merger were: marketing of real property owned by the company and the Bank, real property and
equipment appraisal, supervision of bank loans extended for special purposes, assistance in collecting the debts of the Bank
that are more difficult to recover, real property leasing, engineering of own and other real properties and advisory services
related to financing of real property development projects. Until the merger the company was managed by Davorin Zavasnik
and the Supervisory Board was composed of Davorin Leskovar as its Chairman, Gregor Žvipelj its Vice Chairman and Bojan
Zadravec as its member.
A B A N K A G R O U P Annual Report 2016
22
The operations of the Anepremičnine Group are geographically limited to Slovenia and Montenegro, where in Podgorica in 2014
Anepremičnine d.o.o. founded its subsidiary Anekretnine d.o.o. As at the reporting date, the subsidiary was managed by
Director Slobodan Radović and had no Supervisory Board. According to the forecast of the European Commission1, economic
growth was expected to reach 2.6% in 2016 while general government debt would stand at 65.5% of potential GDP as at the
2016 year-end. Over the next two years, economic growth of Montenegro is projected to slightly increase, i.e. by 3.7% in 2017
and by 3.1% in 2018. According to the European Commission, general government debt of Montenegro will slightly rise as it is
expected to reach 70.3% of GDP in 2017 and 73.3% of GDP in 2018.
Aleasing d.o.o.
Aleasing, financiranje, svetovanje, trženje d.o.o. (short company name: Aleasing d.o.o.) started its operations on 11 February
2000 under the name of Eurofin leasing. After Abanka Vipa d.d. became its majority owner, Eurofin leasing was renamed
Aleasing on 1 April 2004. The merger by acquisition of Vogo leasing d.o.o. from Šempeter pri Gorici by Aleasing took place on
1 July 2009. Aleasing, as the acquiring company, entered all legal transactions, in which Vogo leasing had been involved, as its
legal successor, operating on the Slovene market from 1990.
Currently, it is 100% owned by Abanka with its headquarters in Ljubljana and two business units in Celje and Šempeter pri
Gorici. In 2012, the company relocated its headquarters from Celje to Ljubljana. The company had one associated company in
Sarajevo in Bosnia and Herzegovina, i.e. a 49% equity stake in Agradnja d.o.o., which was sold in 2016.
The leasing products provided by Aleasing complement the range of products and services provided by the Abanka Group. This
company operates in a relatively narrow and highly specialised market niche. The main products are financial leasing of real
property and movables and operating leasing of vehicles. Within the framework of its core business, the company is proactive in
selling insurance services. Operations of Aleasing were made compliant with the Abanka Group's policies and strategic
guidelines and its commitments to the European Commission, which means that in 2016 the company neither borrowed
additional money nor increased its total assets.
The company is led by Director Nikolaj Fišer. The three members of the Supervisory Board supervise and manage the
company, which had the following composition as at the 2016 year-end: Davorin Leskovar its Chairman, Jure Poljšak and Peter
Jančič its members. In 2016, the composition of the Supervisory Board changed as on 20 December 2016 Gregor Hudobivnik,
Vice Chairman of the Supervisory Board, was replaced by Peter Jančič, member of the Supervisory Board. Jure Poljšak was
appointed Vice Chairman of the Supervisory Board on 24 January 2017. There were no significant changes in the ownership
and management of the company.
Due to the limitations on the volume of its operations, Aleasing is unable to utilise its potential and exploit the opportunities
resulting from higher demand for financial services due to the winding-up of certain other leasing companies and the revival of
the economy. As a result of adjusting the business strategy to a smaller volume of new business, the operations of the company
are focused on the financing of vehicles and equipment. Particular attention is paid to deepening cooperation with its strategic
business partners and development of services. It offers fleet management services in cooperation with an outsourced provider.
Fleet management services are suitable for companies which only want to use company vehicles, without having to care for
their maintenance, insurance, registration and the like. Aleasing sells these services to large companies with an extensive
vehicle fleet and the highest credit rating.
In order to achieve the set objectives, Aleasing pays great attention to streamlining its business processes, risk management,
finding synergies within the Abanka Group and to identifying its comparative advantages. The objectives of the company are
aimed at achieving high interest rates on leased funds, safety of investments and cost effectiveness of its operations.
In line with the commitments made to the European Commission, Abanka is carrying out the sales process of Aleasing.
Employees of the company are intensively involved in the sales activities in order to ensure credible and transparent information
on the operations to the potential buyers. The procedures are being implemented in accordance with the time schedule,
according to which the sale will be completed in 2017.
1 European Economic Forecast Winter 2017, February 2017. Luxembourg: Publications Office of the European Union, 2017.
A B A N K A G R O U P Annual Report 2016
23
Agradnja d.o.o.
In October 2016, Aleasing d.o.o. sold its stake in the associated company Agradnja d.o.o. Agradnja d.o.o., an engineering,
construction and real property company based in Sarajevo, was established in 2008 with an aim to build a commercial and
residential complex in Sarajevo. In the first half of 2013, Agradnja became an associated company of the subsidiary Aleasing. A
joint venture agreement was concluded at the same time. Until the sale of the company in October 2016, the ownership
structure of the company was as follows: Aleasing d.o.o. (49%) and ASA Finance d.d. (51%). Until the company was sold, it was
led by Director Sanin Granov. The company had no supervisory board.
Afaktor d.o.o.
Afaktor, finančna družba za faktoring d.o.o. (hereinafter: Afaktor or Company), established in March 1993, was 100% owned by
Abanka until 14 December 2016. The company's registered office is in Ljubljana. RI-NA d.o.o. was established by SKB banka
d.d. in 1993. In 1998, it was renamed to SKB faktor, finančna družba za faktoring d.o.o. Ljubljana. Since the beginning of 1999,
the company specialised in factoring and was 100% owned by SKB banka d.d. In 2002, Abanka acquired the company and
changed its name to Afaktor, finančna družba za faktoring d.o.o., Ljubljana. On 14 December 2016, Abanka concluded an
agreement to sell the 100% stake in the said company with the German factoring company A.B.S. Global Factoring AG. After
the acquisition, the company changed its name and has been operating under the name A.B.S. Factoring d.o.o.
Until 31 March 2016 the company was managed by Matjaž Kaštrun, whereas since 1 April 2016 the company has been
managed by Bojan Šuštar. Until the sale, the company’s Supervisory Board comprised of Davorin Leskovar as its Chairman,
Gregor Hudobivnik as its Vice Chairman and Bojan Zadravec as its member.
The core activities of Afaktor d.o.o. were:
domestic and international factoring, with or without recourse;
purchase of receivables arising from sales of goods and services;
financing commercial transactions and lending.
Afaktor was established as a specialised financial company offering factoring services on the Slovene market. Following a
capital increase in 2007 and after joining Factors Chain International (FCI), a global network of leading factoring companies,
Afaktor started to provide international factoring services alongside the domestic factoring. In line with the strategy of expansion
to the markets of South-East Europe, Afaktor founded a subsidiary in Belgrade in 2007 and another one in Zagreb in April 2010.
In view of the revised strategy of the Bank in 2012, Afaktor consequently amended its strategy of expansion to the markets of
South-East Europe and began to withdraw from the Croatian and Serbian markets. The subsidiary in Croatia stopped operating
in 2013 and the subsidiary in Serbia suspended its operations in the first half of 2014. Withdrawal from the markets in Serbia
and Croatia was completed with the sale of both subsidiaries by September 2015.
In 2016 the company operated to a limited extent. Due to the commitments made to the European Commission, Abanka was
required to sell or wind down the subsidiary. Considering the fact that there were no eligible buyers in the sales process, Abanka
adopted the programme of orderly and gradual winding down. During the implementation of the programme and additional
activities of the company, the strategic investor (A.B.S. Global Factoring AG) expressed an interest in acquiring a stake in the
company. Following successful negotiations, Abanka sold its 100% stake. After the ownership change and under a new name,
the company re-established its operations.
A B A N K A G R O U P Annual Report 2016
24
ABANKA'S STRATEGY
In 2016, the Bank followed the strategic guidelines as set out in the medium-term Strategy of Abanka d.d. for the 2016–2019
Period, approved by the Supervisory Board on 25 February 2016. The Strategy was drawn up on the basis of the restructuring
plan and the information on the economic environment and future forecasts available at that time. It includes the Group's vision,
mission, key strategic guidelines and financial projections including the actions required for the achievement of the strategic
objectives, honouring the commitments of the European Commission.
Abanka's Mission and Vision
The Abanka’s mission is UNITING WITH EXCELLENCE IN FINANCIAL SERVICES and is known as the BANK OF FRIENDLY
PEOPLE. Abanka accomplishes this mission through its values, core competencies and comparative advantages.
Abanka’s performs with excellence in all segments and forms partnerships with internal and external partners, with whom new
value chains are built. Special attention is paid to innovation in the development of services, sales channels and processes. The focus is on execution, which means responsible and consistent performance of tasks in accordance with the agreements. Abanka’s relationships are based on friendliness to the customers, employees and all other stakeholders.
The key strategic guidelines of the merged bank include:
making the Bank more attractive to investors and obtaining an adequate credit rating; operational merger of both banks and unification of the culture of operation;
strengthening the retail and SME operations;
servicing key major customers by providing a comprehensive range of banking products;
quick and efficient introduction of advanced technological and process solutions;
becoming the most popular employer in the industry.
The Bank has comparative advantages in the following key areas: a high degree of availability and responsiveness for key customers and natural persons;
knowing our customers and building long-term relationships;
the leading position in individual service segments (payment transactions, custodial services, bancassurance, card operations,
Abatočka, trade finance, etc.);
the leading position in the introduction of innovative banking products.
Abanka operates on the Slovene market, which is characterised by extremely fierce banking and non-banking competition. In
line with its vision for 2019, Abanka is committed to become THE FIRST BANK IN SLOVENIA ACCORDING TO THE CHOICE
OF CUSTOMERS, EMPLOYEES AND INVESTORS.
The following main strategic programmes were developed: operational merger,
acceleration of digital transformation,
loan process optimisation and
reorganisation of the staffing structure.
Abanka is confident that by continuously searching for the best implementing solutions it will introduce and implement additional
strategic programmes, projects and activities by 2019.
The Abanka’s mission is UNITING WITH
EXCELLENCE IN FINANCIAL SERVICES and
is known as the BANK OF FRIENDLY PEOPLE.
THE FIRST BANK IN SLOVENIA ACCORDING
TO THE CHOICE OF CUSTOMERS,
EMPLOYEES AND INVESTORS.
A B A N K A G R O U P Annual Report 2016
25
FINANCIAL PLAN FOR 2017
The financial plan for 2017 was prepared in autumn 2016 based on macroeconomic forecasts and expectations available at that
time, in line with the restrictions arising from the commitments made to the European Commission at the Group level. The
Annual Plan of Abanka and the Abanka Group for 2017, including the financial plans up to 2019, were approved by the
Supervisory Board in December 2016.
Abanka’s main goals in 2017 will again include retail banking, the SME segment and key customers with significant non-interest
income. The Bank will focus on improving risk management by strengthening the culture of awareness of all employees about
the importance of effective risk management as well as on implementing the projects aimed at increasing cost-effectiveness.
Moreover, the Bank will create a stimulating environment for employees by maintaining a good organisational climate and
through employee commitment and continue with the loan process optimisation, which will not only enable profitable, safe and
stable operations but also enhance the Bank’s reputation among investors. In parallel, measures aimed at boosting customer
business will be implemented in line with the vision of becoming the best bank according to the choice of customers, employees
and investors.
Total assets will decrease in 2017 due to the commitments made to the European Commission, while operating expenses will
also experience a significant drop. In 2017, both the Group and the Bank are expected to generate a profit.
Total assets will decrease in 2017 due to the
commitments made to the European Commission,
while operating expenses will also experience
a significant drop. In 2017, both the Group and
the Bank are expected to generate a profit.
A B A N K A G R O U P Annual Report 2016
26
MAJOR BUSINESS EVENTS IN 2016 AND 2017
Major Business Events in 2016
Major business events in 2016 included:
The change in the status of Abanka d.d. from a less important bank to an important bank:
– The European Central Bank changed the status of Abanka d.d. from a less important bank to an important bank as of
1 January 2016.
The change in the status of Abanka d.d. in accordance with the Financial Instruments Market Act (ZTFI):
– As of 16 February 2016 Abanka d.d. is no longer a public limited company in accordance with Article 99 of the ZTFI, as the
BCE15 bond of Banka Celje fell due on 15 February 2016.
A comprehensive assessment of the Bank:
– In 2016 Abanka passed the comprehensive assessment, under both the baseline and adverse scenarios.
– The European Central Bank performed comprehensive assessments also in 2016. The comprehensive assessment in
Abanka was conducted from March to October 2016, which consisted of an asset quality review (AQR) and stress tests.
The threshold of the Common Equity Tier 1 capital ratio (CET1 ratio) for the baseline scenario was 8.0% and Abanka
achieved 23.8%. The threshold of the Common Equity Tier 1 capital ratio (CET1 ratio) for the adverse scenario was 5.5%
and Abanka achieved 10.0%.
Changes to the Management Board:
– In December 2016, Aleksander Vozel resigned as a Management Board Member, who served as a Management Board
member until 31 March 2017.
Changes to the Supervisory Board:
– In early 2016, the Supervisory Board was composed of seven members: Janko Gedrih as its Chairman, Marko Garbajs as
its Vice Chairman, and Andrej Slapar, Blaž Šterk, Melita Malgaj, Matjaž Trebše and Alenka Vrhovnik Težak as its members.
– On 9 February 2016, Janko Gedrih, the Chairman of Abanka’s Supervisory Board, resigned as a Supervisory Board
Member.
– On 25 February 2016, Marko Garbajs, Vice Chairman of the Supervisory Board, was appointed Chairman of the
Supervisory Board.
– On 25 February 2016, Melita Malgaj, Member of the Supervisory Board, was appointed Vice Chairman of the Supervisory
Board.
– The 33rd General Meeting of Shareholders, held on 13 May 2016, appointed the following Supervisory Board members:
Rok Pivk, with a term of office starting on 13 May 2016, and Vid Leskovec, with a term of office starting on 31 May 2016 (on
30 May 2016 the term of office of Andrej Slapar, a Supervisory Board Member, expired).
– On 8 August 2016, Matjaž Trebše, Member of Abanka’s Supervisory Board, resigned as a Supervisory Board Member.
Changes to the Supervisory Board committees:
– As at the 2015 year-end, the Audit Committee was composed of the following members: Blaž Šterk as Chairman, and
Matjaž Trebše, Marko Garbajs and Melita Malgaj as members. The composition of the Committee changed over the course
of the year. In the reporting period, Marko Garbajs was replaced by Rok Pivk as Committee Member. From 1 June 2016 to
8 August 2016, the Audit Committee thus had the following composition: Blaž Šterk as its Chairman and Matjaž Trebše,
Melita Malgaj and Rok Pivk as its members. Following the resignation of Matjaž Trebše as the Member of the Supervisory
Board on 8 August 2016, the Audit Committee was composed of only three members in the period from 9 August 2016 to
24 August 2016. Since 25 August 2016, Alenka Vrhovnik Težak joined the Audit Committee as its member along with Blaž
Šterk as the Chairman and Melita Malgaj and Rok Pivk as its members.
– As at the 2015 year-end, the Compensation Committee comprised: Andrej Slapar served as its Chairman and Alenka
Vrhovnik Težak and Matjaž Trebše as its members. In 2016, the composition of the Committee changed. On 30 May 2016,
the term of office of Andrej Slapar as a Supervisory Board Member ended. As a result, Vid Leskovec joined the Committee
as its member on 31 May 2016. Matjaž Trebše served as its Chairman until his resignation on 8 August 2016. Since
25 August 2016 onwards, the Chairman of the Compensation Committee was Marko Garbajs. As at the 2016 year-end, the
Compensation Committee comprised: Matjaž Trebše as its Chairman and Alenka Vrhovnik Težak and Vid Leskovec as
its members.
A B A N K A G R O U P Annual Report 2016
27
– As at the 2015 year-end, the Human Resource Committee comprised: Janko Gedrih as its Chairman and Andrej Slapar
and Melita Malgaj as its members. In 2016, the Committee composition changed. On 9 February 2016, Janko Gedrih
resigned as a Supervisory Board Member. Consequently, as of 25 February 2016, the Human Resource Committee was
chaired by Marko Garbajs. On 30 May 2016 the term of office of the Supervisory Board Member Andrej Slapar ended, and
on 31 May 2016 Vid Leskovec became the new member of the Human Resource Committee. As at the 2016 year-end, the
Committee was composed of the following members: Marko Garbajs as its Chairman and Melita Malgaj and Vid Leskovec
as its members.
– As at 31 December 2015, the Risk Management and Asset Liability Management Committee had the following
composition: Marko Garbajs served as its Chairman and Janko Gedrih, Alenka Vrhovnik Težak and Blaž Šterk as its
members. In 2016, the composition of the Committee changed. As of 9 February 2016, following the resignation of Janko
Gedrih, the Committee had only three members. Since 31 May 2016, the Committee has been composed of the following
members: Alenka Vrhovnik Težak as its Chairman and Marko Garbajs, Blaž Šterk and Rok Pivk as its members.
Credit ratings by Moody's Investors Service:
– On 10 February 2016, the credit rating agency Moody's Investors Service confirmed Abanka's long term local- and foreign-
currency deposit ratings of B3 with a stable outlook, as well as Abanka's BCA (baseline credit assessment) of caa1.
– On 4 August 2016, the credit rating agency Moody's Investors Service assigned the status “Review for Upgrade” to
Abanka's B3 long-term local- and foreign-currency deposit ratings and caa1 BCA (baseline credit assessment).
– On 25 October 2016, the credit rating agency Moody's Investors Service upgraded Abanka's long term local- and foreign-
currency deposit ratings from B3 to Ba3 with a positive outlook, as well as Abanka's BCA (baseline credit assessment) from
caa1 to b2.
Credit rating by Fitch Ratings:
– On 12 May 2016, the international rating agency Fitch Ratings upgraded Abanka's Long-Term Issuer Default Rating from
BB– to BB and assigned it a stable outlook. Abanka's Viability Rating was also upgraded from bb– to bb. Other bank ratings
remain unchanged: Short-Term IDR at B, Support Rating at 5 and Support Rating Floor at “No Floor”. The Agency’s
higher Long-Term Issuer Default Rating and Viability Rating of the Bank are based on the improved credit portfolio of the
Bank, improved capital adequacy ratios, high liquidity reserves and an appropriate structure of sources
of funding, in addition to the improved environment in which the Bank operates and further restructuring of the
corporate accounts.
The activities related to the subsidiaries of the Abanka Group:
– In 2016, the merger process of Posest d.o.o. with Anepremičnine d.o.o. began. Based on the Decision of the District Court
of Ljubljana dated 18 April 2016, Posest, podjetje za trgovino, inženiring in posredovanje d.o.o. was merged to the acquiring
company Anepremičnine trgovanje z lastnimi nepremičninami d.o.o. The merger was executed under the formal status
change procedure as a simplified merger. Upon its entry into the Companies Register, Posest d.o.o. ceased to exist as an
independent legal entity, whilst all its assets and liabilities were transferred to Anepremičnine d.o.o. as its acquiring
company.
– In 2016, the Bank continued the sales procedures of the subsidiaries Afaktor d.o.o., and Aleasing d.o.o. in line with the
commitments made to the European Commission, which are also included in the Strategy of the Bank. In May 2016,
Abanka announced the beginning of the sale of Aleasing’s equity stake in Agradnja d.o.o. and the sale of receivables from
Agradnja, whilst end of June it announced the start of the procedure to find a strategic investor to purchase the 100% stake
and the entire lending exposure of its subsidiaries Aleasing d.o.o. and Afaktor d.o.o.
– In October 2016, the activities relating to the sale of Agradnja d.o.o. in Sarajevo were completed.
– On 14 December 2016, Abanka completed the sales procedure of its subsidiary Afaktor d.o.o., Ljubljana by selling it to A.
B.S. Global Factoring, Germany.
The transfer of activities of AIII mutual pension fund to Banka Koper d.d.:
– In January 2016, Abanka signed an agreement on the merger of AIII mutual pension fund (hereinafter: AIII VPS) with Banka
Koper’s Open-ended mutual pension fund (hereinafter: OVPS). On 7 June 2016, AIII VPS was merged with Banka Koper’s
Open-ended mutual pension fund and the insured of AIII VPS have become the insured of OVPS, while AIII VPS ceased
to exist.
A B A N K A G R O U P Annual Report 2016
28
Major Business Events after the Date of the Statement of Financial Position
The following business events occurred after the reporting period:
Changes to the Supervisory Board:
– At the 34th General Meeting of Shareholders held on 28 February 2017, Dejan Kaisersberger was appointed a new
Supervisory Board member for a four-year term of office, commencing on 28 February 2017. He also sits on the Audit
Committee and the Risk Monitoring and Asset Liability Management Committee as of 13 March 2017.
Changes to the Management Board:
– On 13 March 2017, the Supervisory Board appointed Matevž Slapničar a new Management Board member, whose term of
office will begin after he obtains an authorisation to serve on the Management Board.
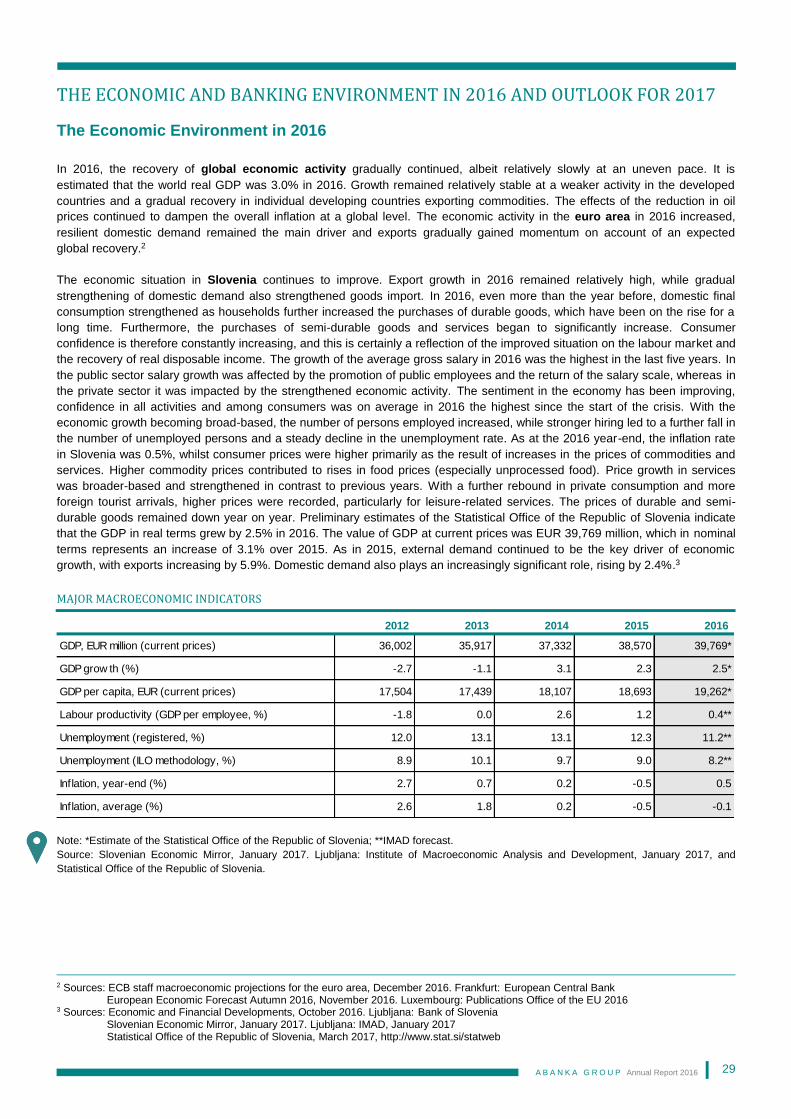
A B A N K A G R O U P Annual Report 2016
29
THE ECONOMIC AND BANKING ENVIRONMENT IN 2016 AND OUTLOOK FOR 2017
The Economic Environment in 2016
In 2016, the recovery of global economic activity gradually continued, albeit relatively slowly at an uneven pace. It is
estimated that the world real GDP was 3.0% in 2016. Growth remained relatively stable at a weaker activity in the developed
countries and a gradual recovery in individual developing countries exporting commodities. The effects of the reduction in oil
prices continued to dampen the overall inflation at a global level. The economic activity in the euro area in 2016 increased,
resilient domestic demand remained the main driver and exports gradually gained momentum on account of an expected
global recovery.2
The economic situation in Slovenia continues to improve. Export growth in 2016 remained relatively high, while gradual
strengthening of domestic demand also strengthened goods import. In 2016, even more than the year before, domestic final
consumption strengthened as households further increased the purchases of durable goods, which have been on the rise for a
long time. Furthermore, the purchases of semi-durable goods and services began to significantly increase. Consumer
confidence is therefore constantly increasing, and this is certainly a reflection of the improved situation on the labour market and
the recovery of real disposable income. The growth of the average gross salary in 2016 was the highest in the last five years. In
the public sector salary growth was affected by the promotion of public employees and the return of the salary scale, whereas in
the private sector it was impacted by the strengthened economic activity. The sentiment in the economy has been improving,
confidence in all activities and among consumers was on average in 2016 the highest since the start of the crisis. With the
economic growth becoming broad-based, the number of persons employed increased, while stronger hiring led to a further fall in
the number of unemployed persons and a steady decline in the unemployment rate. As at the 2016 year-end, the inflation rate
in Slovenia was 0.5%, whilst consumer prices were higher primarily as the result of increases in the prices of commodities and
services. Higher commodity prices contributed to rises in food prices (especially unprocessed food). Price growth in services
was broader-based and strengthened in contrast to previous years. With a further rebound in private consumption and more
foreign tourist arrivals, higher prices were recorded, particularly for leisure-related services. The prices of durable and semi-
durable goods remained down year on year. Preliminary estimates of the Statistical Office of the Republic of Slovenia indicate
that the GDP in real terms grew by 2.5% in 2016. The value of GDP at current prices was EUR 39,769 million, which in nominal
terms represents an increase of 3.1% over 2015. As in 2015, external demand continued to be the key driver of economic
growth, with exports increasing by 5.9%. Domestic demand also plays an increasingly significant role, rising by 2.4%.3
MAJOR MACROECONOMIC INDICATORS
Note: *Estimate of the Statistical Office of the Republic of Slovenia; **IMAD forecast.
Source: Slovenian Economic Mirror, January 2017. Ljubljana: Institute of Macroeconomic Analysis and Development, January 2017, and
Statistical Office of the Republic of Slovenia.
2 Sources: ECB staff macroeconomic projections for the euro area, December 2016. Frankfurt: European Central Bank
European Economic Forecast Autumn 2016, November 2016. Luxembourg: Publications Office of the EU 2016 3 Sources: Economic and Financial Developments, October 2016. Ljubljana: Bank of Slovenia
Slovenian Economic Mirror, January 2017. Ljubljana: IMAD, January 2017 Statistical Office of the Republic of Slovenia, March 2017, http://www.stat.si/statweb
2012 2013 2014 2015 2016
GDP, EUR million (current prices) 36,002 35,917 37,332 38,570 39,769*
GDP grow th (%) -2.7 -1.1 3.1 2.3 2.5*
GDP per capita, EUR (current prices) 17,504 17,439 18,107 18,693 19,262*
Labour productivity (GDP per employee, %) -1.8 0.0 2.6 1.2 0.4**
Unemployment (registered, %) 12.0 13.1 13.1 12.3 11.2**
Unemployment (ILO methodology, %) 8.9 10.1 9.7 9.0 8.2**
Inflation, year-end (%) 2.7 0.7 0.2 -0.5 0.5
Inflation, average (%) 2.6 1.8 0.2 -0.5 -0.1
A B A N K A G R O U P Annual Report 2016
30
Banking Environment in 2016
The economic recovery in the euro area in 2016 continued. Low interest rates and the effects of the ECB’s non-standard
monetary policy measures continued to support money and credit dynamics. Banks passed on their favourable funding
conditions in the form of lower lending rates and eased credit standards, thereby supporting further increase in loan demand by
firms and households. Increasing loan demand was driven by a variety of factors, including the low general level of interest
rates, financing needs for mergers and acquisitions and favourable housing market prospects. The saving ratio in the euro area
is estimated to have increased since mid-2015, most likely because households saved part of the oil price-related income
windfalls. This effect is expected to be temporary, and its unwinding is projected to imply a decline in the saving ratio.4
In 2016, total assets continued to decline in the Slovene banking sector, with a reduction in external borrowing, which makes up
a diminishing proportion of bank funding, and a contraction in credit activity. The credit activity was mostly influenced by the
contraction of corporate lending, while household lending slightly strengthened. The banks again decreased liabilities to the rest
of the world, which represented a little more than one tenth of total assets (almost 40% before the crisis). Deposits by the non-
banking sector are increasing in importance in bank funding. Their volume continued to grow in 2016, while at the same time the
contraction of the balance sheet means that their proportion is also increasing. The trend of improvement in the banks’ credit
portfolio is continuing. The favourable economic situation has also contributed to the improvement in portfolio quality via higher
repayment rates on existing debts and a smaller increase in new non-performing claims. The banking system operated at a
profit in 2016. The lower level of credit risk, the release of impairments and provisions and the solid increase in non-interest
income were the decisive factors in 2016 in the relatively high bank profitability. The banks are nevertheless exposed to
relatively strong income pressures in the wake of the sustained contraction in loans and the falls not only in interest rates but
also in returns on securities in the low interest rate environment. The banking system’s capital adequacy further improved in
2016 and the banks met their capital requirements with the highest-quality capital.5
According to the Bank of Slovenia and the Institute for Macroeconomic Analysis and Development of the Republic of Slovenia
(hereinafter: IMAD)6, both demand and supply were the reasons for the low credit activity. The banks’ offering was limited
primarily as they were very cautious and were not prepared to take additional risks due to the relatively slow reduction in the
share of non-performing claims. The banks were cautious in lending to enterprises because it was estimated that their
creditworthiness, despite the improvements, was still relatively low. Bank loans remained the most important form of household
borrowing. Although the volume is not yet significant, housing loans recorded gentle growth for three years, and in 2016 a
recovery in consumer loans was discernible due to the more favourable economic situation. Higher growth in housing loans was
affected by the reduced lending interest rates, the continued low indebtedness of households and lower prices of real property.
Outlook for 2017
Global economic activity is expected to continue to strengthen. According to the estimates of international institutions, world
real GDP is projected at 3.4% or 3.5% in 2017 and slightly higher in 2018 (3.5–3.7%). The effects of the reduction in oil prices
continue to dampen the overall inflation at a global level, but the global inflation is expected to gradually increase. The economic
recovery of the euro area is expected to continue at a moderate but steady pace. The expected global recovery and resilient
domestic demand, supported by the very accommodative monetary policy stance, past progress made in deleveraging across
sectors and a continued improvement in the labour market are projected to sustain the recovery. In annual terms, euro area real
GDP is expected to grow by 1.7% in 2017 and by 1.6% in 2018 and 2019. Domestic demand in the euro area is projected to
continue to strengthen. Corporate profitability should continue to promote a recovery in investment. Sustained employment
gains, improved bank lending conditions and still relatively low oil prices are expected to support private consumption. The euro
area labour markets continue to recover. In the coming years, inflation in the euro area is projected to significantly increase from
0.2% in 2016 to 1.3% in 2017, 1.5% in 2018 and 1.7% in 2019.7
4 Sources: ECB Economic Bulletin, Issue 6/2016, September 2016. Frankfurt: European Central Bank
ECB staff macroeconomic projections for the euro area, December 2016. Frankfurt: European Central Bank 5 Sources: Economic and Financial Developments, October 2016. Ljubljana: Bank of Slovenia
Internal calculations of the Bank 6 Sources: Economic and Financial Developments, October 2016. Ljubljana: Bank of Slovenia
Autumn Forecast of Economic Trends 2016, September 2016, Ljubljana: Institute of Macroeconomic Analysis and Development 7 Sources: ECB staff macroeconomic projections for the euro area, December 2016. Frankfurt: European Central Bank
European Economic Forecast Autumn 2016, November 2016. Luxembourg: Publications Office of the EU 2016 ECB staff macroeconomic projections for the euro area, September 2016. Frankfurt: European Central Bank
A B A N K A G R O U P Annual Report 2016
31
The European Central Bank (hereinafter: the ECB) expects the key interest rates to remain at the current or lower level for an
even longer period and much longer than the net purchases of securities will last. Regarding non-standard monetary policy
measures, the ECB decided to continue its purchases under the asset purchase programme (APP) at the current monthly pace
of EUR 80 billion until the end of March 2017. From April 2017, the net asset purchases are intended to continue at a monthly
pace of EUR 60 billion until the end of December 2017 and in any case until the Governing Council sees a sustained adjustment
in the path of inflation consistent with its inflation aim.8 The ECB estimates that residential investment in the euro area will
continue to expand. The projected acceleration of nominal disposable income and very low mortgage rates are expected to
support a sustained recovery of residential investment. Moreover, business investment in the euro area is expected to show
further growth due to a number of positive factors.9
Economic growth forecasts for Slovenia remain favourable, as it is expected that economic growth will be stable and above the
euro area average in the medium term. According to the forecasts of international and domestic institutions10, GDP growth in
Slovenia is projected to be between 1.8% and 2.9% in 2017 and between 1.6% and 2.6% in 2018. GDP growth dynamics will be
marked primarily by government investment related to the absorption of EU funds. Exports will continue to remain the key driver
of economic activity. Economic growth is becoming broad-based as the contribution of domestic consumption gradually rises.
Household consumption is therefore expected to significantly increase in the future, with a marked improvement in labour
market conditions and a high level of consumer confidence. Owing to the continued recovery of the real property market, a
steady rebound in housing investment growth and further growth in investment in machinery and equipment are expected.
According to IMAD, the corporate sector in Slovenia is expected to rebound; however, despite the fact that the conditions for an
increase in bank loans will improve as the banking system continues to remain stable, non-banking and internal sources of
funding will play an increasingly important role in financing the economy. Small and medium-sized enterprises, in particular, still
find it difficult to obtain funding as they have limited access to non-banking sources of funding. In addition to the further recovery
of the economy, higher employer confidence in economic growth and the increased use of flexible forms of employment will also
contribute to employment growth. Nominal growth in average salary will gradually rise in the private sector. In addition to strong
business performance, salary growth will also be underpinned by a considerable decline in unemployment. Although consumer
prices will rise in the 2017–2019 period, inflation will remain relatively low (below 2%). On average, consumer prices remained
unchanged, mainly due to the influence of the low oil prices. Given the assumed growth in import prices for oil and commodities
over the next two years, rises in energy prices are expected, as well as a slightly higher rate of core inflation owing to a rebound
in domestic consumption and a gradual closing of the output gap.11
8 Source: A press release of the European Central Bank, Monetary Policy Decisions, December 2016
https://www.ecb.europa.eu/press/pr/date/2016/html/pr161208.en.html 9 Source: ECB Economic Bulletin, Issue 6/2016, September 2016. Frankfurt: European Central Bank 10 Institute of Macroeconomic Analysis and Development (IMAD), Bank of Slovenia (BS), European Commission (EC), International Monetary
Fund (IMF), Organisation for Economic Co-operation and Development (OECD) 11 Sources: Autumn Forecast of Economic Trends 2016, September 2016. Ljubljana: Institute of Macroeconomic Analysis and Development Macroeconomic Projections for Slovenia, December 2016. Ljubljana: Bank of Slovenia
A B A N K A G R O U P Annual Report 2016
32
FINANCIAL RESULTS OF THE GROUP AND THE BANK
The consolidated financial statements of the Abanka Group for 2016 include the subsidiaries Aleasing and the Anepremičnine
Group, alongside Abanka as the parent bank.
The consolidated financial statements of the Abanka Group for 2015 include the subsidiaries Afaktor, Aleasing and the
Anepremičnine Group, alongside Abanka as the parent bank. Participation in the associate Agradnja of the subsidiary Aleasing
was also consolidated under the equity method. With the acquisition of Banka Celje, its subsidiary Posest also became part of
the Abanka Group; however, after obtaining an authorisation of the Bank of Slovenia, Posest was excluded from the scope of
prudential consolidation due to its negligible importance with respect to prudential supervision goals. The subsidiary Posest
d.o.o. was not included in the consolidated financial statements of the Abanka Group, as it did not have a significant impact on a
true and fair view of the Group’s financial situation. Total assets of Posest in the amount of EUR 13.6 mi llion as at the end of
2015 represented 0.36% of total assets of the Bank, while its business volume has been decreasing since 2012. In 2016, the
company was merged with Anepremičnine and ceased to exist as an independent legal entity.
PERFORMANCE AS VIEWED THROUGH THE INCOME STATEMENT
In 2016, the Abanka Group posted a profit before tax of EUR 83,611 thousand, which was EUR 34,625 thousand more over
2015, whilst consolidated profit after tax amounted to EUR 77,514 thousand (2015: EUR 41,722 thousand). In 2016, Abanka
posted a profit before tax of EUR 82,447 thousand, which was reflected in a 14.0% return on equity, having increased by
64.8% over 2015. The Bank generated a net profit of EUR 76,656, which represents an increase of EUR 33,881 over 2015.
In the reporting period, return on equity after tax was 13.0%, while in the corresponding period of the preceding year it
was 8.1%.
In 2016, the Abanka Group recorded interest income of EUR 91,541 thousand, down by 18.2% over the previous year. The
Group’s interest expenses amounted to EUR 12,827 thousand or 63.1% less than in 2015. The Abanka Group’s net interest
income was EUR 78,714 thousand or 2.1% above the amount reported for 2015.
Abanka's interest income in 2016 was EUR 90,404 thousand, having decreased by 18.7% compared to the preceding year,
whilst its interest expenses equalled EUR 12,831 thousand or 63.1% less compared to 2015. Abanka's net interest income
amounted to EUR 77,573 thousand, which was 1.5% more than the 2015 level of EUR 76,455 thousand. Both interest income
and interest expenses fell due to lower average interest rates and a lower volume of operations; however, an increase in net
interest was recorded primarily as the result of a higher drop in interest rates on primary sources of funding. In 2016, Abanka’s
market share of net interest accounted for 11.6%, whilst the interest margin was 2.05%.
For 2016 the Abanka Group posted EUR 38,874 thousand in net fee and commission income or 7.2% less than the year
before. In 2016, Abanka posted EUR 38,948 thousand in net fee and commission income or also 7.2% less than in 2015. On
contrast, its market share increased from 12.5% in 2015 to 12.6% in 2016. The bulk of net fee and commission income was
generated by payment and card transactions.
Other net non-interest income (excluding net fee and commission income) of the Abanka Group in 2016 amounted to EUR
14,893 thousand, whereas in 2015 it equalled EUR 23,763 thousand. Other net non-interest income (excluding net fee and
commission income) of Abanka in 2016 totalled EUR 13,550 thousand, which was 40.3% lower compared to 2015, amounting
to EUR 22,695 thousand. A profit generated by the sale of Visa Europe Limited to Visa Inc. accounted for EUR 9,910 thousand
of total other non-interest income. In 2015, other net non-interest income was a result of several one-off business events.
12.6% market share of Abanka in net fee and commission income in 2016
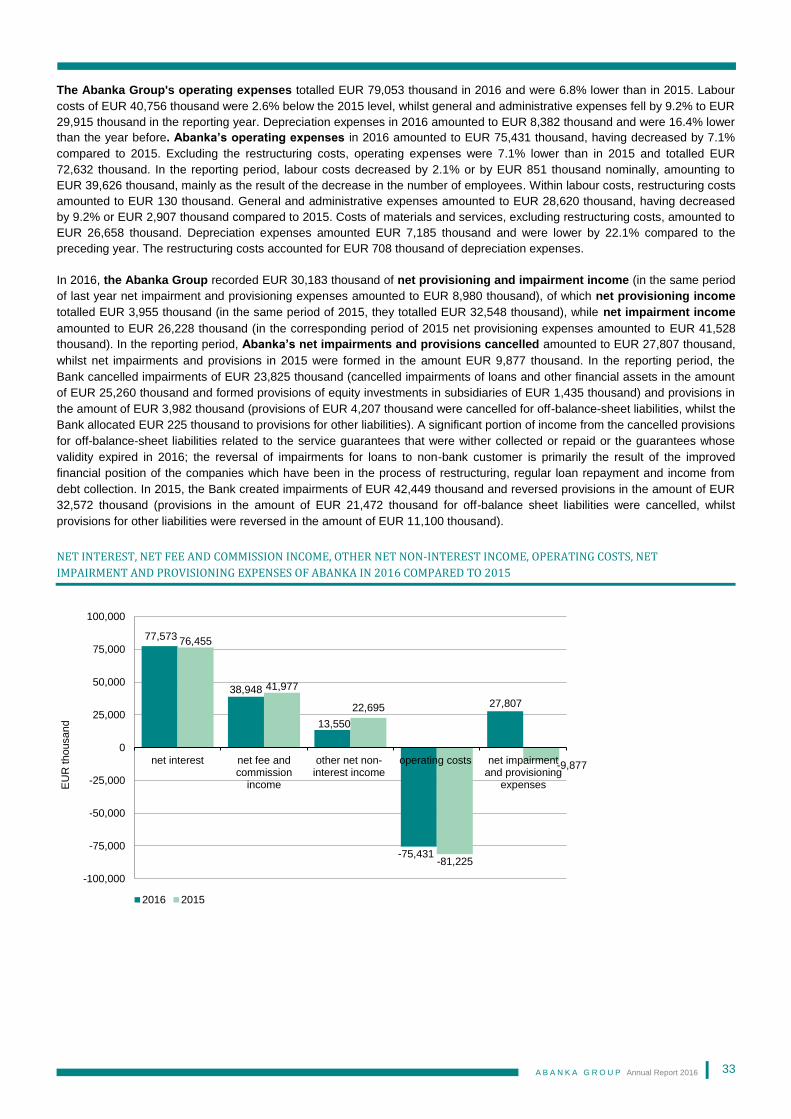
A B A N K A G R O U P Annual Report 2016
33
The Abanka Group's operating expenses totalled EUR 79,053 thousand in 2016 and were 6.8% lower than in 2015. Labour
costs of EUR 40,756 thousand were 2.6% below the 2015 level, whilst general and administrative expenses fell by 9.2% to EUR
29,915 thousand in the reporting year. Depreciation expenses in 2016 amounted to EUR 8,382 thousand and were 16.4% lower
than the year before. Abanka’s operating expenses in 2016 amounted to EUR 75,431 thousand, having decreased by 7.1%
compared to 2015. Excluding the restructuring costs, operating expenses were 7.1% lower than in 2015 and totalled EUR
72,632 thousand. In the reporting period, labour costs decreased by 2.1% or by EUR 851 thousand nominally, amounting to
EUR 39,626 thousand, mainly as the result of the decrease in the number of employees. Within labour costs, restructuring costs
amounted to EUR 130 thousand. General and administrative expenses amounted to EUR 28,620 thousand, having decreased
by 9.2% or EUR 2,907 thousand compared to 2015. Costs of materials and services, excluding restructuring costs, amounted to
EUR 26,658 thousand. Depreciation expenses amounted EUR 7,185 thousand and were lower by 22.1% compared to the
preceding year. The restructuring costs accounted for EUR 708 thousand of depreciation expenses.
In 2016, the Abanka Group recorded EUR 30,183 thousand of net provisioning and impairment income (in the same period
of last year net impairment and provisioning expenses amounted to EUR 8,980 thousand), of which net provisioning income
totalled EUR 3,955 thousand (in the same period of 2015, they totalled EUR 32,548 thousand), while net impairment income
amounted to EUR 26,228 thousand (in the corresponding period of 2015 net provisioning expenses amounted to EUR 41,528
thousand). In the reporting period, Abanka’s net impairments and provisions cancelled amounted to EUR 27,807 thousand,
whilst net impairments and provisions in 2015 were formed in the amount EUR 9,877 thousand. In the reporting period, the
Bank cancelled impairments of EUR 23,825 thousand (cancelled impairments of loans and other financial assets in the amount
of EUR 25,260 thousand and formed provisions of equity investments in subsidiaries of EUR 1,435 thousand) and provisions in
the amount of EUR 3,982 thousand (provisions of EUR 4,207 thousand were cancelled for off-balance-sheet liabilities, whilst the
Bank allocated EUR 225 thousand to provisions for other liabilities). A significant portion of income from the cancelled provisions
for off-balance-sheet liabilities related to the service guarantees that were wither collected or repaid or the guarantees whose
validity expired in 2016; the reversal of impairments for loans to non-bank customer is primarily the result of the improved
financial position of the companies which have been in the process of restructuring, regular loan repayment and income from
debt collection. In 2015, the Bank created impairments of EUR 42,449 thousand and reversed provisions in the amount of EUR
32,572 thousand (provisions in the amount of EUR 21,472 thousand for off-balance sheet liabilities were cancelled, whilst
provisions for other liabilities were reversed in the amount of EUR 11,100 thousand).
77,573
38,948
13,550
-75,431
27,807
76,455
41,977
22,695
-81,225
-9,877
-100,000
-75,000
-50,000
-25,000
0
25,000
50,000
75,000
100,000
net interest net fee andcommission
income
other net non-interest income
operating costs net impairmentand provisioning
expensesEU
R thousand
2016 2015
NET INTEREST, NET FEE AND COMMISSION INCOME, OTHER NET NON-INTEREST INCOME, OPERATING COSTS, NET
IMPAIRMENT AND PROVISIONING EXPENSES OF ABANKA IN 2016 COMPARED TO 2015
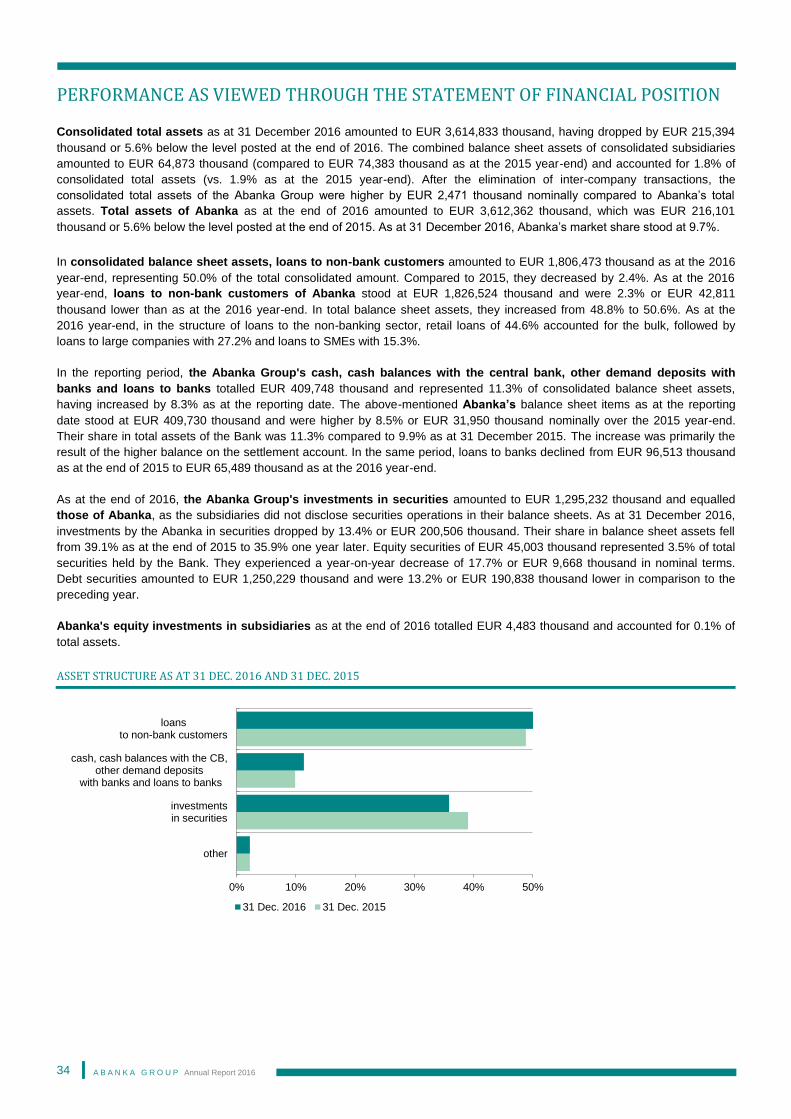
A B A N K A G R O U P Annual Report 2016
34
PERFORMANCE AS VIEWED THROUGH THE STATEMENT OF FINANCIAL POSITION
Consolidated total assets as at 31 December 2016 amounted to EUR 3,614,833 thousand, having dropped by EUR 215,394
thousand or 5.6% below the level posted at the end of 2016. The combined balance sheet assets of consolidated subsidiaries
amounted to EUR 64,873 thousand (compared to EUR 74,383 thousand as at the 2015 year-end) and accounted for 1.8% of
consolidated total assets (vs. 1.9% as at the 2015 year-end). After the elimination of inter-company transactions, the
consolidated total assets of the Abanka Group were higher by EUR 2,471 thousand nominally compared to Abanka’s total
assets. Total assets of Abanka as at the end of 2016 amounted to EUR 3,612,362 thousand, which was EUR 216,101
thousand or 5.6% below the level posted at the end of 2015. As at 31 December 2016, Abanka’s market share stood at 9.7%.
In consolidated balance sheet assets, loans to non-bank customers amounted to EUR 1,806,473 thousand as at the 2016
year-end, representing 50.0% of the total consolidated amount. Compared to 2015, they decreased by 2.4%. As at the 2016
year-end, loans to non-bank customers of Abanka stood at EUR 1,826,524 thousand and were 2.3% or EUR 42,811
thousand lower than as at the 2016 year-end. In total balance sheet assets, they increased from 48.8% to 50.6%. As at the
2016 year-end, in the structure of loans to the non-banking sector, retail loans of 44.6% accounted for the bulk, followed by
loans to large companies with 27.2% and loans to SMEs with 15.3%.
In the reporting period, the Abanka Group's cash, cash balances with the central bank, other demand deposits with
banks and loans to banks totalled EUR 409,748 thousand and represented 11.3% of consolidated balance sheet assets,
having increased by 8.3% as at the reporting date. The above-mentioned Abanka’s balance sheet items as at the reporting
date stood at EUR 409,730 thousand and were higher by 8.5% or EUR 31,950 thousand nominally over the 2015 year-end.
Their share in total assets of the Bank was 11.3% compared to 9.9% as at 31 December 2015. The increase was primarily the
result of the higher balance on the settlement account. In the same period, loans to banks declined from EUR 96,513 thousand
as at the end of 2015 to EUR 65,489 thousand as at the 2016 year-end.
As at the end of 2016, the Abanka Group's investments in securities amounted to EUR 1,295,232 thousand and equalled
those of Abanka, as the subsidiaries did not disclose securities operations in their balance sheets. As at 31 December 2016,
investments by the Abanka in securities dropped by 13.4% or EUR 200,506 thousand. Their share in balance sheet assets fell
from 39.1% as at the end of 2015 to 35.9% one year later. Equity securities of EUR 45,003 thousand represented 3.5% of total
securities held by the Bank. They experienced a year-on-year decrease of 17.7% or EUR 9,668 thousand in nominal terms.
Debt securities amounted to EUR 1,250,229 thousand and were 13.2% or EUR 190,838 thousand lower in comparison to the
preceding year.
Abanka's equity investments in subsidiaries as at the end of 2016 totalled EUR 4,483 thousand and accounted for 0.1% of
total assets.
ASSET STRUCTURE AS AT 31 DEC. 2016 AND 31 DEC. 2015
0% 10% 20% 30% 40% 50%
other
investmentsin securities
cash, cash balances with the CB,other demand deposits
with banks and loans to banks
loansto non-bank customers
31 Dec. 2016 31 Dec. 2015
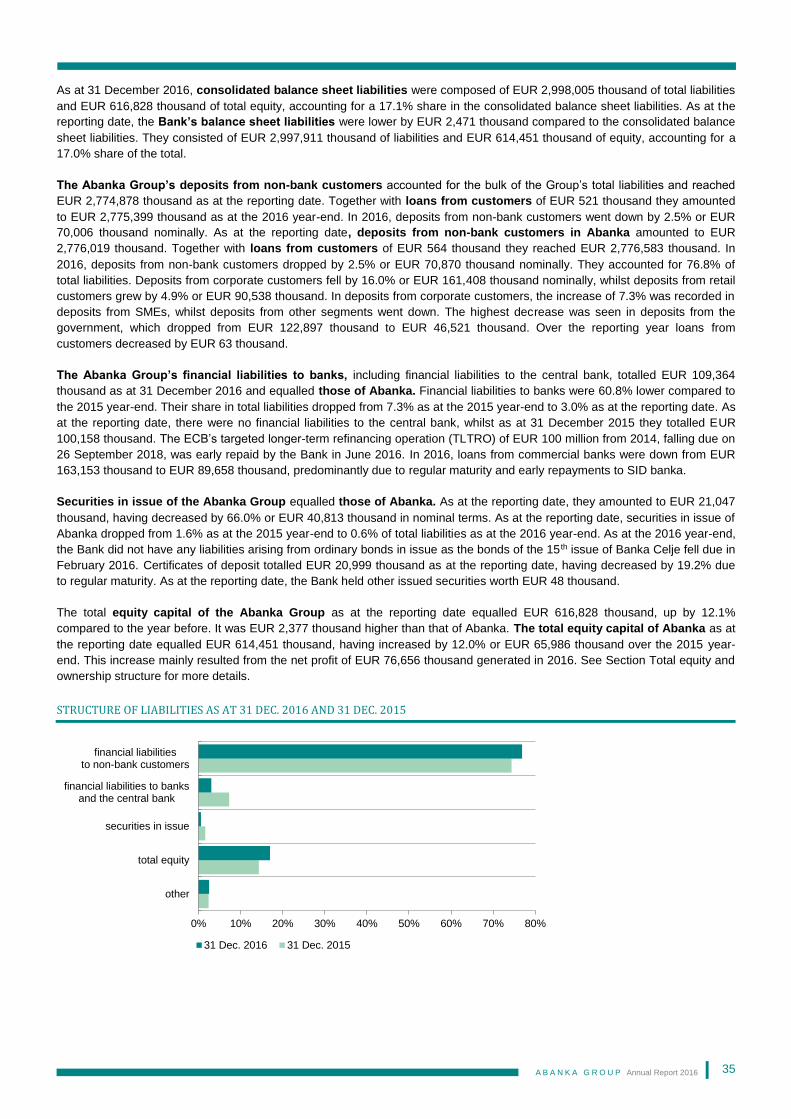
A B A N K A G R O U P Annual Report 2016
35
As at 31 December 2016, consolidated balance sheet liabilities were composed of EUR 2,998,005 thousand of total liabilities
and EUR 616,828 thousand of total equity, accounting for a 17.1% share in the consolidated balance sheet liabilities. As at the
reporting date, the Bank’s balance sheet liabilities were lower by EUR 2,471 thousand compared to the consolidated balance
sheet liabilities. They consisted of EUR 2,997,911 thousand of liabilities and EUR 614,451 thousand of equity, accounting for a
17.0% share of the total.
The Abanka Group’s deposits from non-bank customers accounted for the bulk of the Group’s total liabilities and reached
EUR 2,774,878 thousand as at the reporting date. Together with loans from customers of EUR 521 thousand they amounted
to EUR 2,775,399 thousand as at the 2016 year-end. In 2016, deposits from non-bank customers went down by 2.5% or EUR
70,006 thousand nominally. As at the reporting date, deposits from non-bank customers in Abanka amounted to EUR
2,776,019 thousand. Together with loans from customers of EUR 564 thousand they reached EUR 2,776,583 thousand. In
2016, deposits from non-bank customers dropped by 2.5% or EUR 70,870 thousand nominally. They accounted for 76.8% of
total liabilities. Deposits from corporate customers fell by 16.0% or EUR 161,408 thousand nominally, whilst deposits from retail
customers grew by 4.9% or EUR 90,538 thousand. In deposits from corporate customers, the increase of 7.3% was recorded in
deposits from SMEs, whilst deposits from other segments went down. The highest decrease was seen in deposits from the
government, which dropped from EUR 122,897 thousand to EUR 46,521 thousand. Over the reporting year loans from
customers decreased by EUR 63 thousand.
The Abanka Group’s financial liabilities to banks, including financial liabilities to the central bank, totalled EUR 109,364
thousand as at 31 December 2016 and equalled those of Abanka. Financial liabilities to banks were 60.8% lower compared to
the 2015 year-end. Their share in total liabilities dropped from 7.3% as at the 2015 year-end to 3.0% as at the reporting date. As
at the reporting date, there were no financial liabilities to the central bank, whilst as at 31 December 2015 they totalled EUR
100,158 thousand. The ECB’s targeted longer-term refinancing operation (TLTRO) of EUR 100 million from 2014, falling due on
26 September 2018, was early repaid by the Bank in June 2016. In 2016, loans from commercial banks were down from EUR
163,153 thousand to EUR 89,658 thousand, predominantly due to regular maturity and early repayments to SID banka.
Securities in issue of the Abanka Group equalled those of Abanka. As at the reporting date, they amounted to EUR 21,047
thousand, having decreased by 66.0% or EUR 40,813 thousand in nominal terms. As at the reporting date, securities in issue of
Abanka dropped from 1.6% as at the 2015 year-end to 0.6% of total liabilities as at the 2016 year-end. As at the 2016 year-end,
the Bank did not have any liabilities arising from ordinary bonds in issue as the bonds of the 15 th issue of Banka Celje fell due in
February 2016. Certificates of deposit totalled EUR 20,999 thousand as at the reporting date, having decreased by 19.2% due
to regular maturity. As at the reporting date, the Bank held other issued securities worth EUR 48 thousand.
The total equity capital of the Abanka Group as at the reporting date equalled EUR 616,828 thousand, up by 12.1%
compared to the year before. It was EUR 2,377 thousand higher than that of Abanka. The total equity capital of Abanka as at
the reporting date equalled EUR 614,451 thousand, having increased by 12.0% or EUR 65,986 thousand over the 2015 year-
end. This increase mainly resulted from the net profit of EUR 76,656 thousand generated in 2016. See Section Total equity and
ownership structure for more details.
STRUCTURE OF LIABILITIES AS AT 31 DEC. 2016 AND 31 DEC. 2015
0% 10% 20% 30% 40% 50% 60% 70% 80%
other
total equity
securities in issue
financial liabilities to banksand the central bank
financial liabilitiesto non-bank customers
31 Dec. 2016 31 Dec. 2015
A B A N K A G R O U P Annual Report 2016
36
PERFORMANCE OF THE GROUP IN 2016
Corporate Banking
Business operations in 2016 were marked by a distinct trend of declining interest rates as the result of the ECB measures and
the improved liquidity situation in Slovenia. The latter had a significant impact on the reduction of lending and deposit interest
rates. It should be pointed out that in 2016 the deleveraging trend of the economy continued, which also affected the demand
structure. The current situation is particularly reflected in excess liquidity and the relatively high available assets of enterprises
in the short-term and highly liquid investments. Based on the measures taken, the Bank is in a better position to support the
economy in terms of long-term funding of projects. Exporters continue to be at the forefront of the more active customer
segments. Companies continue to demand primarily working capital financing; however, an increasing number of cases was
recorded where customers sought funding for investments, which they either already realised (especially in the last quarter) or
planned for 2017.
In addition to the aforementioned specific liquidity situation, the reporting year was marked by considerable commitment of
employees to retain customers and ensure an effective migration of customers from Banka Celje to Abanka. Customer
migration was successfully completed within the planned timeframe, as the Bank managed to retain the vast majority of
customers despite the tight competitive situation. The realisation in 2016 is a good starting point for further activities. Therefore,
the Bank will continue to strengthen business relationships with customers and upgrade the existing relationships through a
personal, individual approach, placing greater emphasis on quality services and quick responsiveness. The ultimate goal
remains a satisfied and loyal customer.
A special focus is placed on the credit rating of customers so as to increase the volume of business of customers with the A and
B credit ratings, particularly by providing new project funding for the previously mentioned customers, carefully monitoring the
existing portfolio and gradually reducing the exposure of customers with a poor credit rating.
Additional attention is paid to mutual cooperation. The number of products per customer has been and will continue to be
increased as this is further increasing non-interest income. Targeted marketing is directed at increasing the volume of payment
transactions, documentary operations and the number of points of sale equipped with Abanka’s POS terminals (ACQ), the issue
of new business cards and marketing of online and mobile banking.
The SME segment continues to remain the strategic segment of the Bank. To this end, the Bank adapted its activities and set
the following goals reflecting its values:
recruitment of additional staff to ensure quality monitoring of the customer portfolio and further strengthen the individual
approach to finding a solution;
ongoing training so as to provide top-quality services;
retaining the existing and acquiring new customers;
improved portfolio quality;
integrated customer management and increased number of products per customer.
Abanka looks optimistically towards 2017. The loan portfolio of the SME segment is planned to grow with the help of the
redesigned loan process and additional staff, focusing on the acquisition of new customers. Cooperation with the existing
customers will be reviewed on an individual basis and further strengthened.
Economic growth and greater export-orientation of Slovene companies also affected customer demand for trade finance. In this
respect, the customers do not limit themselves only to transactions with the existing business partners. In an effort to enter into
transactions with new business partners, the scope of business is expanded to include more distant and demanding markets,
where the use of trade finance instruments for hedging is particularly important. With many years of experience in trade finance
and a high level of professionalism, the Bank is aware of the significance of choosing an appropriate hedging insurance for a
particular customer. Therefore, when giving advice focus is on the target choice and preparation of individual hedging
instruments tailored to the needs of individual customers. In view of the positive responses to the presentation of trade finance
last year, this form of cooperation with customers was actively continued throughout 2016. Presentations were organised for
both the existing and new customers, while special attention was devoted to individual presentations with an emphasis on
specific cases, which customers face in the course of their business. On the basis of the positive experience of customers who
conduct business with import letters of credit via the Abacom e-channel, which allows not only an easy and quick exchange of
data but also monitoring of execution of a transaction, this distribution channel was effectively marketed in the reporting period.
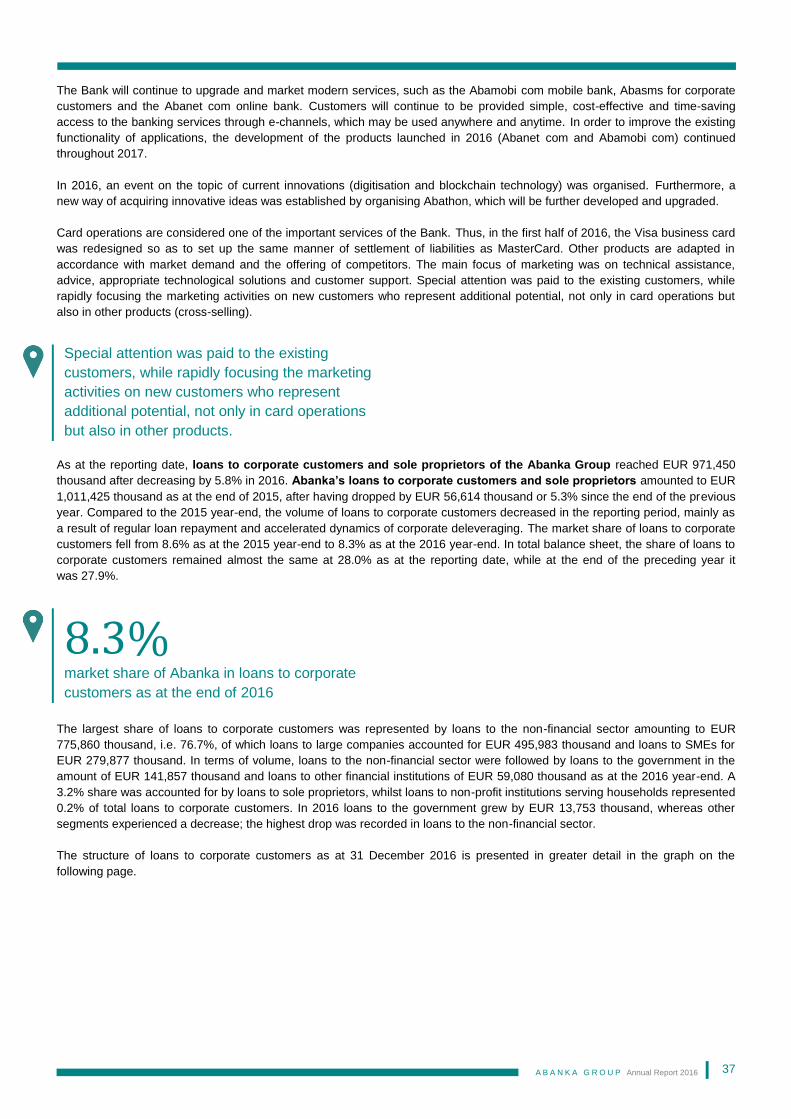
A B A N K A G R O U P Annual Report 2016
37
The Bank will continue to upgrade and market modern services, such as the Abamobi com mobile bank, Abasms for corporate
customers and the Abanet com online bank. Customers will continue to be provided simple, cost-effective and time-saving
access to the banking services through e-channels, which may be used anywhere and anytime. In order to improve the existing
functionality of applications, the development of the products launched in 2016 (Abanet com and Abamobi com) continued
throughout 2017.
In 2016, an event on the topic of current innovations (digitisation and blockchain technology) was organised. Furthermore, a
new way of acquiring innovative ideas was established by organising Abathon, which will be further developed and upgraded.
Card operations are considered one of the important services of the Bank. Thus, in the first half of 2016, the Visa business card
was redesigned so as to set up the same manner of settlement of liabilities as MasterCard. Other products are adapted in
accordance with market demand and the offering of competitors. The main focus of marketing was on technical assistance,
advice, appropriate technological solutions and customer support. Special attention was paid to the existing customers, while
rapidly focusing the marketing activities on new customers who represent additional potential, not only in card operations but
also in other products (cross-selling).
As at the reporting date, loans to corporate customers and sole proprietors of the Abanka Group reached EUR 971,450
thousand after decreasing by 5.8% in 2016. Abanka’s loans to corporate customers and sole proprietors amounted to EUR
1,011,425 thousand as at the end of 2015, after having dropped by EUR 56,614 thousand or 5.3% since the end of the previous
year. Compared to the 2015 year-end, the volume of loans to corporate customers decreased in the reporting period, mainly as
a result of regular loan repayment and accelerated dynamics of corporate deleveraging. The market share of loans to corporate
customers fell from 8.6% as at the 2015 year-end to 8.3% as at the 2016 year-end. In total balance sheet, the share of loans to
corporate customers remained almost the same at 28.0% as at the reporting date, while at the end of the preceding year it
was 27.9%.
The largest share of loans to corporate customers was represented by loans to the non-financial sector amounting to EUR
775,860 thousand, i.e. 76.7%, of which loans to large companies accounted for EUR 495,983 thousand and loans to SMEs for
EUR 279,877 thousand. In terms of volume, loans to the non-financial sector were followed by loans to the government in the
amount of EUR 141,857 thousand and loans to other financial institutions of EUR 59,080 thousand as at the 2016 year-end. A
3.2% share was accounted for by loans to sole proprietors, whilst loans to non-profit institutions serving households represented
0.2% of total loans to corporate customers. In 2016 loans to the government grew by EUR 13,753 thousand, whereas other
segments experienced a decrease; the highest drop was recorded in loans to the non-financial sector.
The structure of loans to corporate customers as at 31 December 2016 is presented in greater detail in the graph on the
following page.
Special attention was paid to the existing
customers, while rapidly focusing the marketing
activities on new customers who represent
additional potential, not only in card operations
but also in other products.
8.3% market share of Abanka in loans to corporate
customers as at the end of 2016
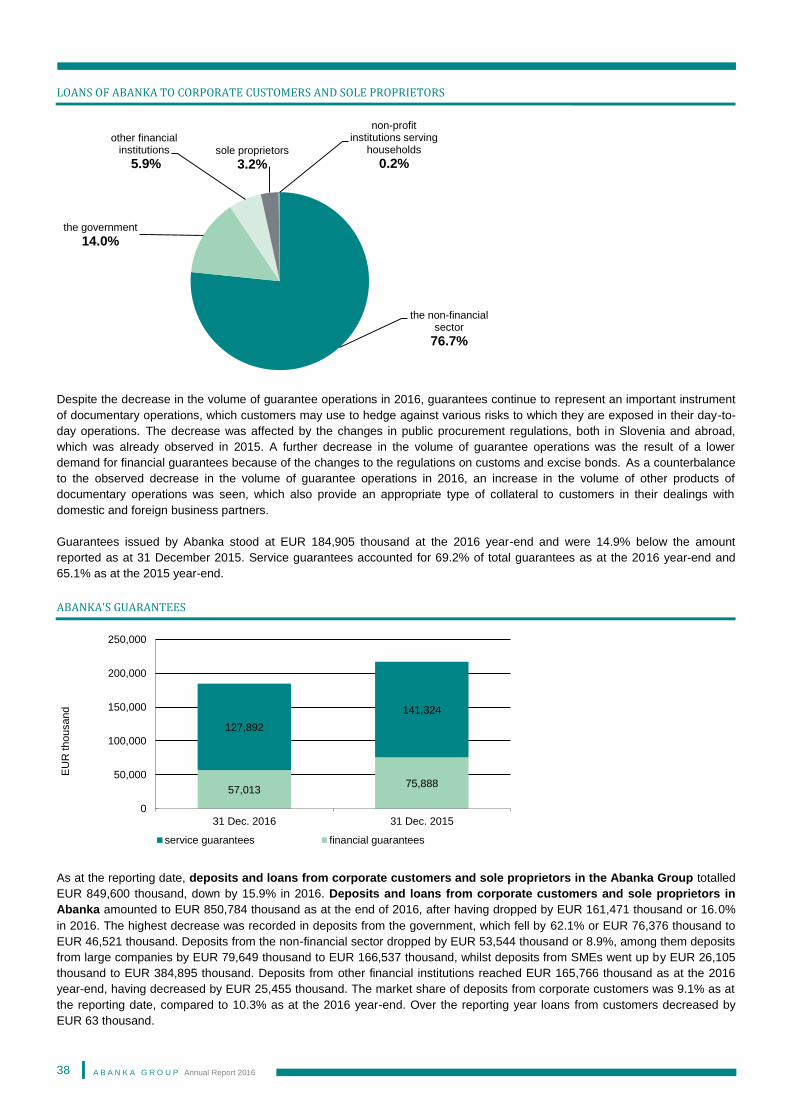
A B A N K A G R O U P Annual Report 2016
38
LOANS OF ABANKA TO CORPORATE CUSTOMERS AND SOLE PROPRIETORS
Despite the decrease in the volume of guarantee operations in 2016, guarantees continue to represent an important instrument
of documentary operations, which customers may use to hedge against various risks to which they are exposed in their day-to-
day operations. The decrease was affected by the changes in public procurement regulations, both in Slovenia and abroad,
which was already observed in 2015. A further decrease in the volume of guarantee operations was the result of a lower
demand for financial guarantees because of the changes to the regulations on customs and excise bonds. As a counterbalance
to the observed decrease in the volume of guarantee operations in 2016, an increase in the volume of other products of
documentary operations was seen, which also provide an appropriate type of collateral to customers in their dealings with
domestic and foreign business partners.
Guarantees issued by Abanka stood at EUR 184,905 thousand at the 2016 year-end and were 14.9% below the amount
reported as at 31 December 2015. Service guarantees accounted for 69.2% of total guarantees as at the 2016 year-end and
65.1% as at the 2015 year-end.
ABANKA'S GUARANTEES
As at the reporting date, deposits and loans from corporate customers and sole proprietors in the Abanka Group totalled
EUR 849,600 thousand, down by 15.9% in 2016. Deposits and loans from corporate customers and sole proprietors in
Abanka amounted to EUR 850,784 thousand as at the end of 2016, after having dropped by EUR 161,471 thousand or 16.0%
in 2016. The highest decrease was recorded in deposits from the government, which fell by 62.1% or EUR 76,376 thousand to
EUR 46,521 thousand. Deposits from the non-financial sector dropped by EUR 53,544 thousand or 8.9%, among them deposits
from large companies by EUR 79,649 thousand to EUR 166,537 thousand, whilst deposits from SMEs went up by EUR 26,105
thousand to EUR 384,895 thousand. Deposits from other financial institutions reached EUR 165,766 thousand as at the 2016
year-end, having decreased by EUR 25,455 thousand. The market share of deposits from corporate customers was 9.1% as at
the reporting date, compared to 10.3% as at the 2016 year-end. Over the reporting year loans from customers decreased by
EUR 63 thousand.
the non-financial sector
76.7%
the government
14.0%
other financial institutions
5.9%sole proprietors
3.2%
non-profit institutions serving
households
0.2%
57,01375,888
127,892
141,324
0
50,000
100,000
150,000
200,000
250,000
31 Dec. 2016 31 Dec. 2015
EU
R thousand
service guarantees financial guarantees
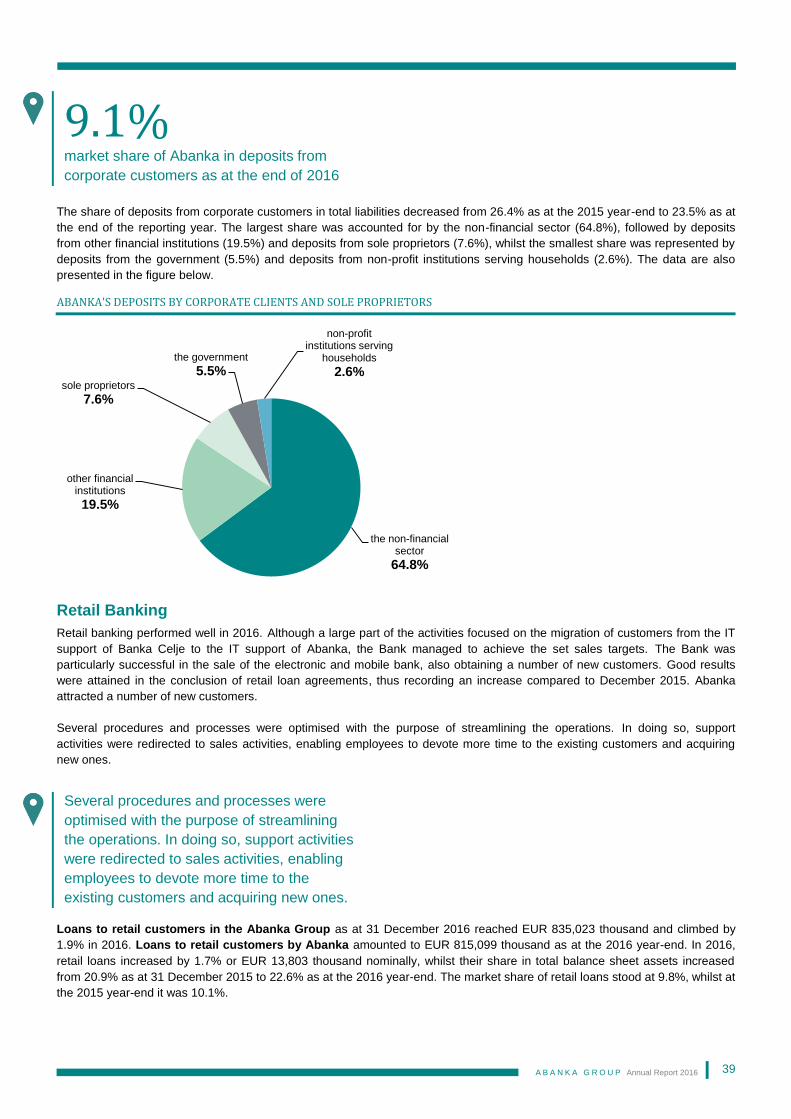
A B A N K A G R O U P Annual Report 2016
39
The share of deposits from corporate customers in total liabilities decreased from 26.4% as at the 2015 year-end to 23.5% as at
the end of the reporting year. The largest share was accounted for by the non-financial sector (64.8%), followed by deposits
from other financial institutions (19.5%) and deposits from sole proprietors (7.6%), whilst the smallest share was represented by
deposits from the government (5.5%) and deposits from non-profit institutions serving households (2.6%). The data are also
presented in the figure below.
ABANKA'S DEPOSITS BY CORPORATE CLIENTS AND SOLE PROPRIETORS
Retail Banking
Retail banking performed well in 2016. Although a large part of the activities focused on the migration of customers from the IT
support of Banka Celje to the IT support of Abanka, the Bank managed to achieve the set sales targets. The Bank was
particularly successful in the sale of the electronic and mobile bank, also obtaining a number of new customers. Good results
were attained in the conclusion of retail loan agreements, thus recording an increase compared to December 2015. Abanka
attracted a number of new customers.
Several procedures and processes were optimised with the purpose of streamlining the operations. In doing so, support
activities were redirected to sales activities, enabling employees to devote more time to the existing customers and acquiring
new ones.
Loans to retail customers in the Abanka Group as at 31 December 2016 reached EUR 835,023 thousand and climbed by
1.9% in 2016. Loans to retail customers by Abanka amounted to EUR 815,099 thousand as at the 2016 year-end. In 2016,
retail loans increased by 1.7% or EUR 13,803 thousand nominally, whilst their share in total balance sheet assets increased
from 20.9% as at 31 December 2015 to 22.6% as at the 2016 year-end. The market share of retail loans stood at 9.8%, whilst at
the 2015 year-end it was 10.1%.
the non-financial sector
64.8%
other financial institutions
19.5%
sole proprietors
7.6%
the government
5.5%
non-profit institutions serving
households
2.6%
9.1% market share of Abanka in deposits from
corporate customers as at the end of 2016
Several procedures and processes were
optimised with the purpose of streamlining
the operations. In doing so, support activities
were redirected to sales activities, enabling
employees to devote more time to the
existing customers and acquiring new ones.
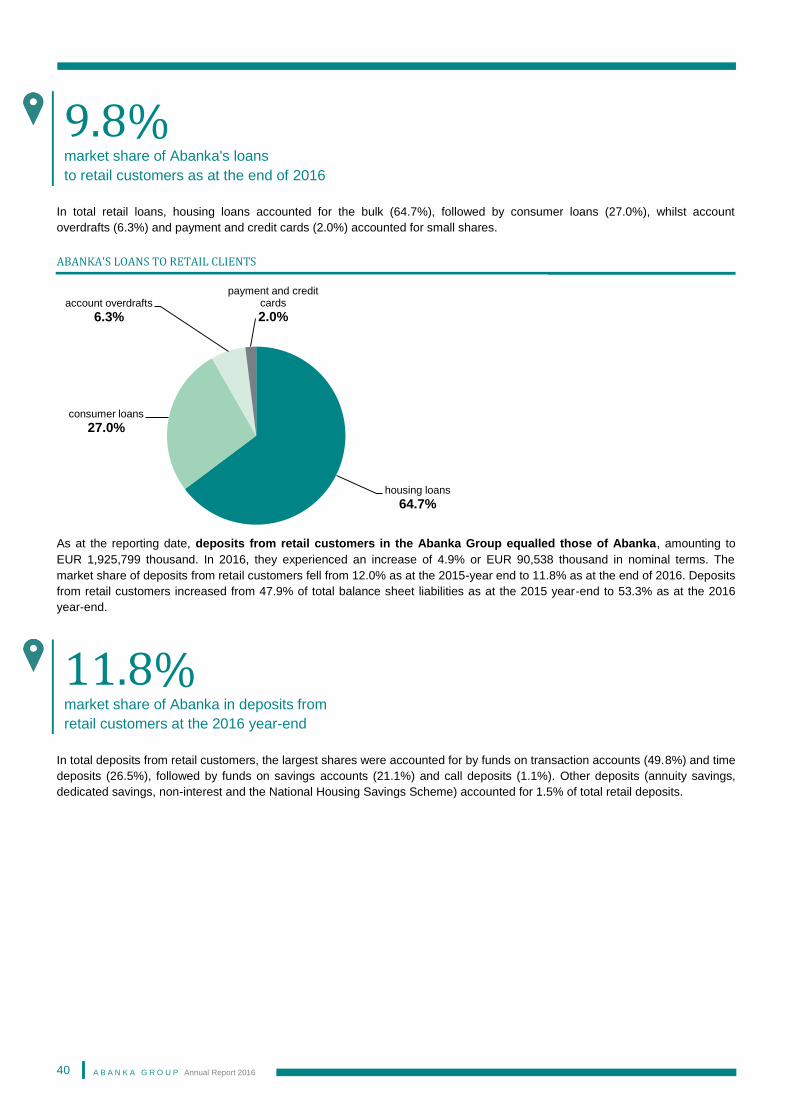
A B A N K A G R O U P Annual Report 2016
40
In total retail loans, housing loans accounted for the bulk (64.7%), followed by consumer loans (27.0%), whilst account
overdrafts (6.3%) and payment and credit cards (2.0%) accounted for small shares.
ABANKA'S LOANS TO RETAIL CLIENTS
As at the reporting date, deposits from retail customers in the Abanka Group equalled those of Abanka, amounting to
EUR 1,925,799 thousand. In 2016, they experienced an increase of 4.9% or EUR 90,538 thousand in nominal terms. The
market share of deposits from retail customers fell from 12.0% as at the 2015-year end to 11.8% as at the end of 2016. Deposits
from retail customers increased from 47.9% of total balance sheet liabilities as at the 2015 year-end to 53.3% as at the 2016
year-end.
In total deposits from retail customers, the largest shares were accounted for by funds on transaction accounts (49.8%) and time
deposits (26.5%), followed by funds on savings accounts (21.1%) and call deposits (1.1%). Other deposits (annuity savings,
dedicated savings, non-interest and the National Housing Savings Scheme) accounted for 1.5% of total retail deposits.
housing loans
64.7%
consumer loans
27.0%
account overdrafts
6.3%
payment and credit cards
2.0%
9.8% market share of Abanka's loans
to retail customers as at the end of 2016
11.8% market share of Abanka in deposits from
retail customers at the 2016 year-end
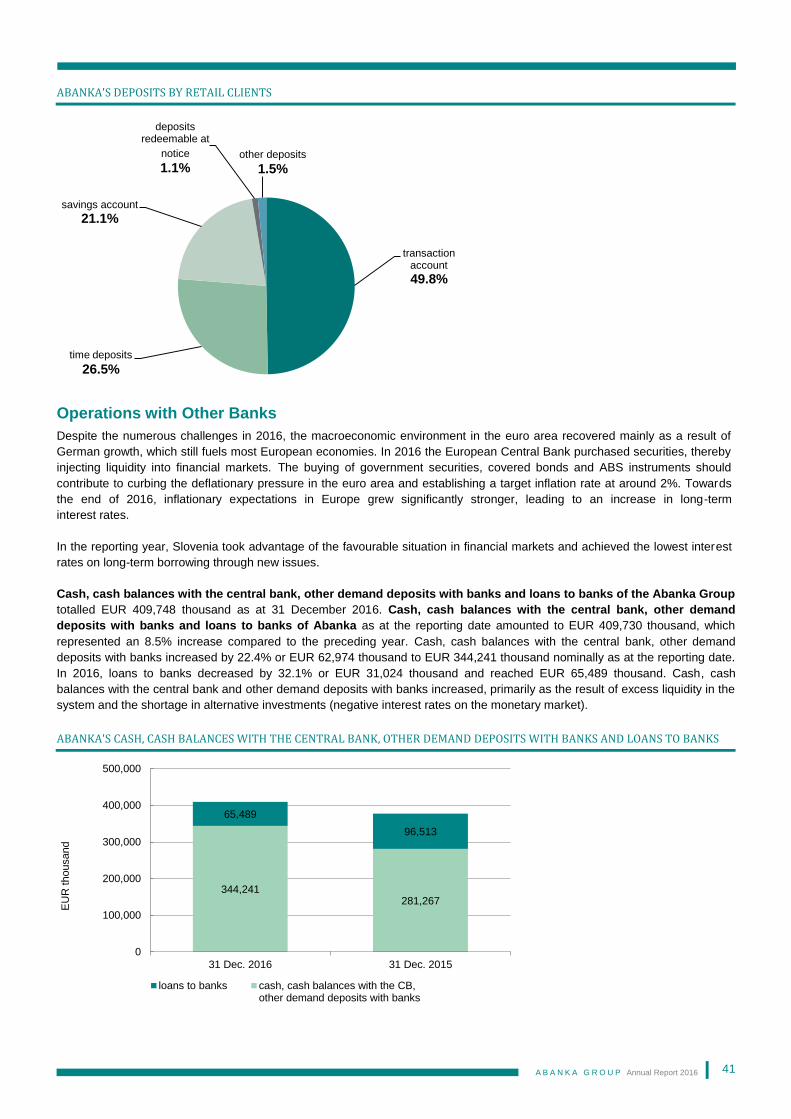
A B A N K A G R O U P Annual Report 2016
41
ABANKA'S DEPOSITS BY RETAIL CLIENTS
Operations with Other Banks
Despite the numerous challenges in 2016, the macroeconomic environment in the euro area recovered mainly as a result of
German growth, which still fuels most European economies. In 2016 the European Central Bank purchased securities, thereby
injecting liquidity into financial markets. The buying of government securities, covered bonds and ABS instruments should
contribute to curbing the deflationary pressure in the euro area and establishing a target inflation rate at around 2%. Towards
the end of 2016, inflationary expectations in Europe grew significantly stronger, leading to an increase in long-term
interest rates.
In the reporting year, Slovenia took advantage of the favourable situation in financial markets and achieved the lowest interest
rates on long-term borrowing through new issues.
Cash, cash balances with the central bank, other demand deposits with banks and loans to banks of the Abanka Group
totalled EUR 409,748 thousand as at 31 December 2016. Cash, cash balances with the central bank, other demand
deposits with banks and loans to banks of Abanka as at the reporting date amounted to EUR 409,730 thousand, which
represented an 8.5% increase compared to the preceding year. Cash, cash balances with the central bank, other demand
deposits with banks increased by 22.4% or EUR 62,974 thousand to EUR 344,241 thousand nominally as at the reporting date.
In 2016, loans to banks decreased by 32.1% or EUR 31,024 thousand and reached EUR 65,489 thousand. Cash, cash
balances with the central bank and other demand deposits with banks increased, primarily as the result of excess liquidity in the
system and the shortage in alternative investments (negative interest rates on the monetary market).
ABANKA'S CASH, CASH BALANCES WITH THE CENTRAL BANK, OTHER DEMAND DEPOSITS WITH BANKS AND LOANS TO BANKS
transaction account
49.8%
time deposits
26.5%
savings account
21.1%
deposits redeemable at
notice
1.1%other deposits
1.5%
344,241281,267
65,489
96,513
0
100,000
200,000
300,000
400,000
500,000
31 Dec. 2016 31 Dec. 2015
EU
R thousand
loans to banks cash, cash balances with the CB,other demand deposits with banks
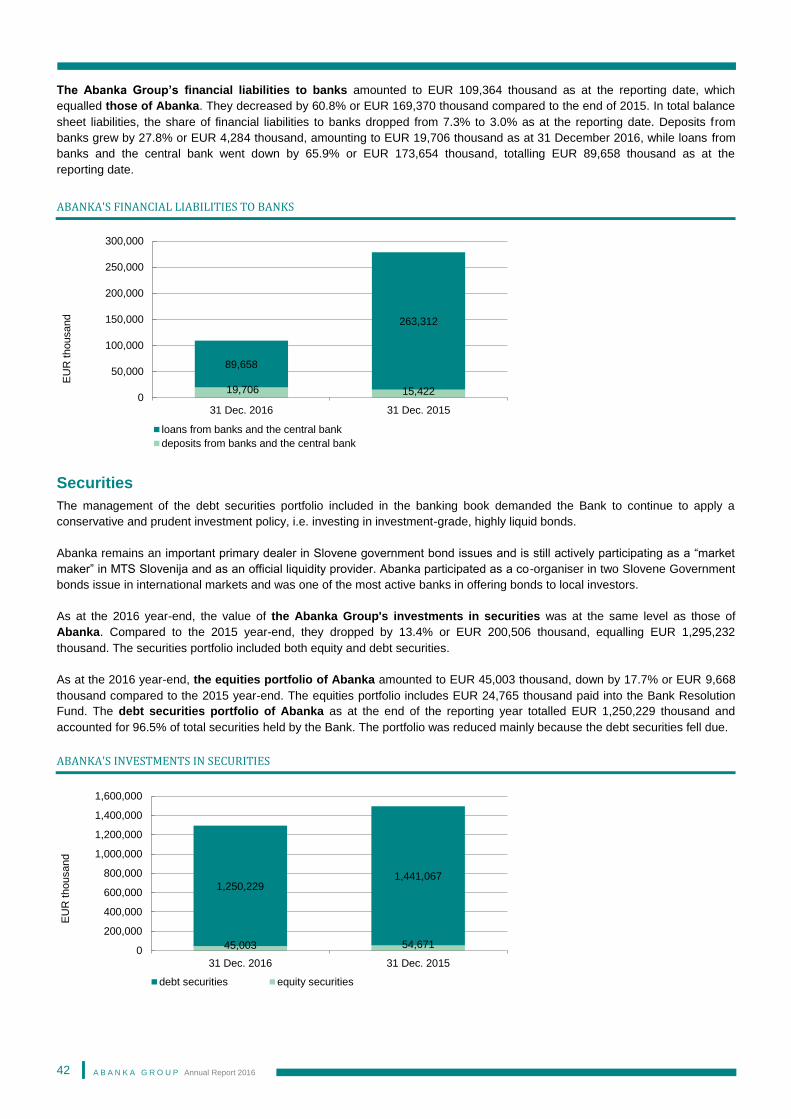
A B A N K A G R O U P Annual Report 2016
42
The Abanka Group’s financial liabilities to banks amounted to EUR 109,364 thousand as at the reporting date, which
equalled those of Abanka. They decreased by 60.8% or EUR 169,370 thousand compared to the end of 2015. In total balance
sheet liabilities, the share of financial liabilities to banks dropped from 7.3% to 3.0% as at the reporting date. Deposits from
banks grew by 27.8% or EUR 4,284 thousand, amounting to EUR 19,706 thousand as at 31 December 2016, while loans from
banks and the central bank went down by 65.9% or EUR 173,654 thousand, totalling EUR 89,658 thousand as at the
reporting date.
ABANKA'S FINANCIAL LIABILITIES TO BANKS
Securities
The management of the debt securities portfolio included in the banking book demanded the Bank to continue to apply a
conservative and prudent investment policy, i.e. investing in investment-grade, highly liquid bonds.
Abanka remains an important primary dealer in Slovene government bond issues and is still actively participating as a “market
maker” in MTS Slovenija and as an official liquidity provider. Abanka participated as a co-organiser in two Slovene Government
bonds issue in international markets and was one of the most active banks in offering bonds to local investors.
As at the 2016 year-end, the value of the Abanka Group's investments in securities was at the same level as those of
Abanka. Compared to the 2015 year-end, they dropped by 13.4% or EUR 200,506 thousand, equalling EUR 1,295,232
thousand. The securities portfolio included both equity and debt securities.
As at the 2016 year-end, the equities portfolio of Abanka amounted to EUR 45,003 thousand, down by 17.7% or EUR 9,668
thousand compared to the 2015 year-end. The equities portfolio includes EUR 24,765 thousand paid into the Bank Resolution
Fund. The debt securities portfolio of Abanka as at the end of the reporting year totalled EUR 1,250,229 thousand and
accounted for 96.5% of total securities held by the Bank. The portfolio was reduced mainly because the debt securities fell due.
ABANKA'S INVESTMENTS IN SECURITIES
19,706 15,422
89,658
263,312
0
50,000
100,000
150,000
200,000
250,000
300,000
31 Dec. 2016 31 Dec. 2015
EU
R thousand
loans from banks and the central bank
deposits from banks and the central bank
45,003 54,671
1,250,2291,441,067
0
200,000
400,000
600,000
800,000
1,000,000
1,200,000
1,400,000
1,600,000
31 Dec. 2016 31 Dec. 2015
EU
R thousand
debt securities equity securities
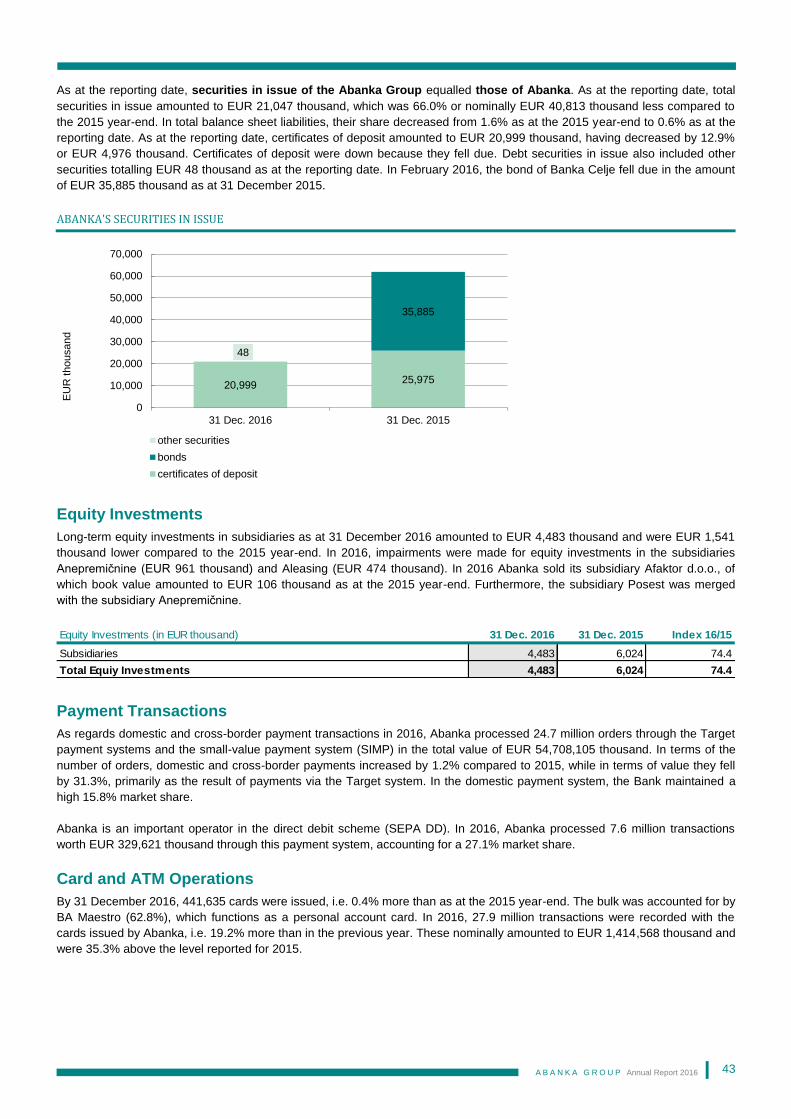
A B A N K A G R O U P Annual Report 2016
43
As at the reporting date, securities in issue of the Abanka Group equalled those of Abanka. As at the reporting date, total
securities in issue amounted to EUR 21,047 thousand, which was 66.0% or nominally EUR 40,813 thousand less compared to
the 2015 year-end. In total balance sheet liabilities, their share decreased from 1.6% as at the 2015 year-end to 0.6% as at the
reporting date. As at the reporting date, certificates of deposit amounted to EUR 20,999 thousand, having decreased by 12.9%
or EUR 4,976 thousand. Certificates of deposit were down because they fell due. Debt securities in issue also included other
securities totalling EUR 48 thousand as at the reporting date. In February 2016, the bond of Banka Celje fell due in the amount
of EUR 35,885 thousand as at 31 December 2015.
ABANKA'S SECURITIES IN ISSUE
Equity Investments
Long-term equity investments in subsidiaries as at 31 December 2016 amounted to EUR 4,483 thousand and were EUR 1,541
thousand lower compared to the 2015 year-end. In 2016, impairments were made for equity investments in the subsidiaries
Anepremičnine (EUR 961 thousand) and Aleasing (EUR 474 thousand). In 2016 Abanka sold its subsidiary Afaktor d.o.o., of
which book value amounted to EUR 106 thousand as at the 2015 year-end. Furthermore, the subsidiary Posest was merged
with the subsidiary Anepremičnine.
Payment Transactions
As regards domestic and cross-border payment transactions in 2016, Abanka processed 24.7 million orders through the Target
payment systems and the small-value payment system (SIMP) in the total value of EUR 54,708,105 thousand. In terms of the
number of orders, domestic and cross-border payments increased by 1.2% compared to 2015, while in terms of value they fell
by 31.3%, primarily as the result of payments via the Target system. In the domestic payment system, the Bank maintained a
high 15.8% market share.
Abanka is an important operator in the direct debit scheme (SEPA DD). In 2016, Abanka processed 7.6 million transactions
worth EUR 329,621 thousand through this payment system, accounting for a 27.1% market share.
Card and ATM Operations
By 31 December 2016, 441,635 cards were issued, i.e. 0.4% more than as at the 2015 year-end. The bulk was accounted for by
BA Maestro (62.8%), which functions as a personal account card. In 2016, 27.9 million transactions were recorded with the
cards issued by Abanka, i.e. 19.2% more than in the previous year. These nominally amounted to EUR 1,414,568 thousand and
were 35.3% above the level reported for 2015.
20,99925,975
35,885
48
0
10,000
20,000
30,000
40,000
50,000
60,000
70,000
31 Dec. 2016 31 Dec. 2015
EU
R thousand
other securities
bonds
certificates of deposit
Equity Investments (in EUR thousand) 31 Dec. 2016 31 Dec. 2015 Index 16/15
Subsidiaries 4,483 6,024 74.4
Total Equiy Investments 4,483 6,024 74.4
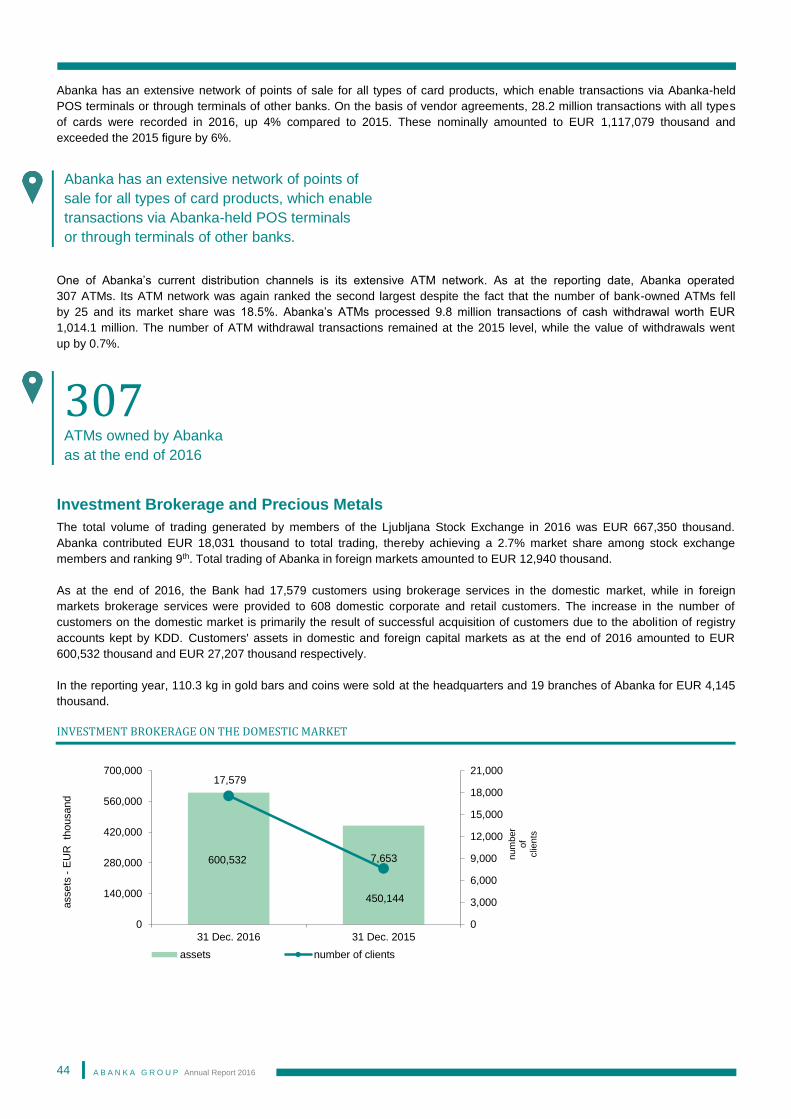
A B A N K A G R O U P Annual Report 2016
44
Abanka has an extensive network of points of sale for all types of card products, which enable transactions via Abanka-held
POS terminals or through terminals of other banks. On the basis of vendor agreements, 28.2 million transactions with all types
of cards were recorded in 2016, up 4% compared to 2015. These nominally amounted to EUR 1,117,079 thousand and
exceeded the 2015 figure by 6%.
One of Abanka’s current distribution channels is its extensive ATM network. As at the reporting date, Abanka operated
307 ATMs. Its ATM network was again ranked the second largest despite the fact that the number of bank-owned ATMs fell
by 25 and its market share was 18.5%. Abanka’s ATMs processed 9.8 million transactions of cash withdrawal worth EUR
1,014.1 million. The number of ATM withdrawal transactions remained at the 2015 level, while the value of withdrawals went
up by 0.7%.
Investment Brokerage and Precious Metals
The total volume of trading generated by members of the Ljubljana Stock Exchange in 2016 was EUR 667,350 thousand.
Abanka contributed EUR 18,031 thousand to total trading, thereby achieving a 2.7% market share among stock exchange
members and ranking 9th. Total trading of Abanka in foreign markets amounted to EUR 12,940 thousand.
As at the end of 2016, the Bank had 17,579 customers using brokerage services in the domestic market, while in foreign
markets brokerage services were provided to 608 domestic corporate and retail customers. The increase in the number of
customers on the domestic market is primarily the result of successful acquisition of customers due to the abolition of registry
accounts kept by KDD. Customers' assets in domestic and foreign capital markets as at the end of 2016 amounted to EUR
600,532 thousand and EUR 27,207 thousand respectively.
In the reporting year, 110.3 kg in gold bars and coins were sold at the headquarters and 19 branches of Abanka for EUR 4,145
thousand.
INVESTMENT BROKERAGE ON THE DOMESTIC MARKET
600,532
450,144
17,579
7,653
0
3,000
6,000
9,000
12,000
15,000
18,000
21,000
0
140,000
280,000
420,000
560,000
700,000
31 Dec. 2016 31 Dec. 2015
num
ber
of
clie
nts
assets
-E
UR
th
ousand
assets number of clients
Abanka has an extensive network of points of
sale for all types of card products, which enable
transactions via Abanka-held POS terminals
or through terminals of other banks.
307 ATMs owned by Abanka
as at the end of 2016
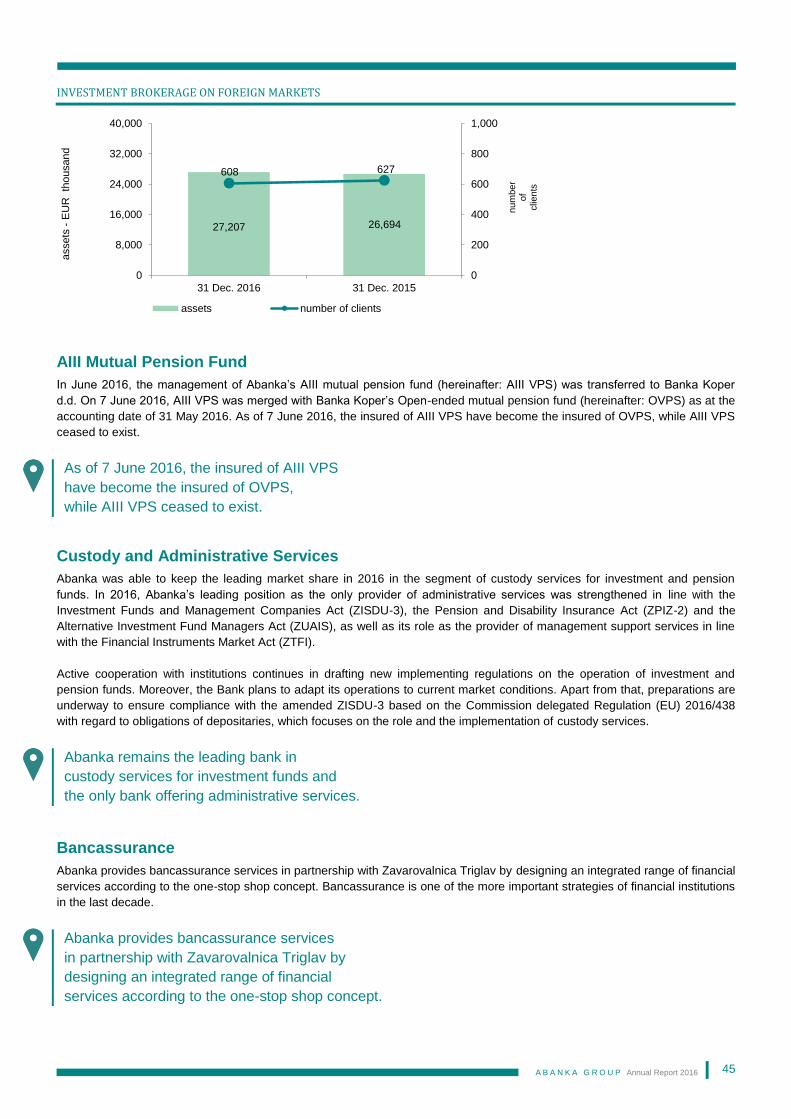
A B A N K A G R O U P Annual Report 2016
45
INVESTMENT BROKERAGE ON FOREIGN MARKETS
AIII Mutual Pension Fund
In June 2016, the management of Abanka’s AIII mutual pension fund (hereinafter: AIII VPS) was transferred to Banka Koper
d.d. On 7 June 2016, AIII VPS was merged with Banka Koper’s Open-ended mutual pension fund (hereinafter: OVPS) as at the
accounting date of 31 May 2016. As of 7 June 2016, the insured of AIII VPS have become the insured of OVPS, while AIII VPS
ceased to exist.
Custody and Administrative Services
Abanka was able to keep the leading market share in 2016 in the segment of custody services for investment and pension
funds. In 2016, Abanka’s leading position as the only provider of administrative services was strengthened in line with the
Investment Funds and Management Companies Act (ZISDU-3), the Pension and Disability Insurance Act (ZPIZ-2) and the
Alternative Investment Fund Managers Act (ZUAIS), as well as its role as the provider of management support services in line
with the Financial Instruments Market Act (ZTFI).
Active cooperation with institutions continues in drafting new implementing regulations on the operation of investment and
pension funds. Moreover, the Bank plans to adapt its operations to current market conditions. Apart from that, preparations are
underway to ensure compliance with the amended ZISDU-3 based on the Commission delegated Regulation (EU) 2016/438
with regard to obligations of depositaries, which focuses on the role and the implementation of custody services.
Bancassurance
Abanka provides bancassurance services in partnership with Zavarovalnica Triglav by designing an integrated range of financial
services according to the one-stop shop concept. Bancassurance is one of the more important strategies of financial institutions
in the last decade.
27,207 26,694
608 627
0
200
400
600
800
1,000
0
8,000
16,000
24,000
32,000
40,000
31 Dec. 2016 31 Dec. 2015
nu
mb
er
of
clie
nts
assets
-E
UR
th
ousand
assets number of clients
As of 7 June 2016, the insured of AIII VPS
have become the insured of OVPS,
while AIII VPS ceased to exist.
Abanka remains the leading bank in
custody services for investment funds and
the only bank offering administrative services.
Abanka provides bancassurance services
in partnership with Zavarovalnica Triglav by
designing an integrated range of financial
services according to the one-stop shop concept.
A B A N K A G R O U P Annual Report 2016
46
Abanka has acted as a broker in the insurance market since November 2003. In conjunction with Zavarovalnica Triglav, it offers
the following bancassurance products:
accident insurance as a supplementary facility for holders of Aračun accounts, Premium personal accounts and Akeš
personal accounts (the first bancassurance product);
endowment life insurance, a type of insurance where the investment risk is carried by the insurer;
unit-linked life insurance, which combines life insurance and investment linked to the unit prices of selected mutual funds
and the investment fund of Zavarovalnica Triglav;
single premium unit-linked life insurance, which combines life insurance and investment elements, linked to the unit prices
of selected mutual funds, with the insurance premium being paid in a lump sum when the policy is taken out;
supplemental health insurance, which is a type of voluntary health insurance available to holders of personal and savings
accounts with Abanka who are covered by compulsory health insurance and obliged to make supplementary payments;
various types of risk life insurance without investment elements; throughout the duration of the insurance policy, the sum
insured remains the same;
mortgage life insurance, which is taken out in combination with a mortgage, housing or consumer loan (with a term above 2
years) and provides a diminishing pay-out in the event of death, with the pay-out reaching zero when the policy expires;
ABAFLEKS investment insurance – ABAFLEKS investment insurance for adults and FLEKS investment insurance for
young people; these products are a combination of life insurance and investment linked to investment funds; the
policyholders assume the investment risk but at the same time have a choice among different investment strategies (financial
objectives strategy related to funds);
ABC life insurance, which is in essence similar to all unit-linked life insurance products, but offers lower premiums and an
open-ended term of insurance;
supplementary loss of employment insurance for borrowers taking a mortgage, housing or consumer loan;
card insurance of personal account holders is designed for the holders of ordinary or Premium personal accounts with
Abanka and their authorised signatories;
Triglav package home insurance, which is a type of property insurance;
Triglav zaščita life insurance, which is a type of insurance against death, full and permanent incapacity for work in serious
conditions due to an accident or illness.
Total Equity and Ownership Structure
As at 31 December 2016, the total equity capital of the Abanka Group amounted to EUR 616,828 thousand, whilst that of
Abanka equalled EUR 614,451 thousand. In 2016, the total equity capital of Abanka experienced a year-on-year increase of
12.0% or EUR 65,986 thousand in nominal terms. This increase resulted from a net profit of EUR 76,656 thousand less other
comprehensive income after tax of EUR 10,658 thousand and actuarial recalculations of provisions for post-employment
benefits of EUR 12 thousand. As at the reporting date, the Bank's total equity capital accounted for 17.0% of total balance sheet
liabilities, while in 2015 it was lower at 14.3%.
At the 33rd regular General Meeting of Shareholders held on 13 May 2016, the shareholder was informed that the accumulated
profit for 2015 totalled EUR 22,099,974.59, consisting of the remaining net profit for 2015 of EUR 19,248,861.18 and profit
brought forward from previous business years in the amount of EUR 2,851,113.41. The General Meeting of Shareholders
concluded that the accumulated profit in the amount EUR 22,099,974.59 will remain undistributed until further notice as
retained earnings.
As at the reporting date, Abanka's accumulated other comprehensive income amounted to EUR 42,466 thousand (a
decrease of EUR 10,658 thousand compared to 2015), reserves from profit equalled EUR 47,448 thousand (an increase of
EUR 26,915 thousand) and retained profit totalled EUR 91,078 thousand (an increase of net profit of EUR 76,656 thousand, a
decrease of EUR 19,249 thousand for the allocation of retained profit to reserves from profit, a decrease of EUR 7,666 thousand
for the allocation of net profit to reserves from profit and a decrease of EUR 12 thousand for the allocation to actuarial
recalculations of provisions for post-employment benefits).
The audited share book value was EUR 40.69 as at 31 December 2016, based on 15,100,000 shares (31 December 2015: EUR
36.32). It was calculated as the ratio of all capital components, including net profit for the reporting period, to the number of
shares subscribed as at the reporting date.
A B A N K A G R O U P Annual Report 2016
47
The Bank’s share capital amounted to EUR 151,000 thousand as at the reporting date. On 18 December 2013, the Republic of
Slovenia subscribed and fully paid up all 15,000,000 shares (ABKS) newly issued by Abanka, and thereby became its 100%
owner, holding 15,000,000 ordinary registered no-par value shares with voting rights attached. On 25 September 2014, based
on a relevant decision of the European Commission, the Government of the Republic of Slovenia was able to finally adopt its
decision on measures for strengthening the stability of Abanka, which also included the second round of the capital increase of
EUR 243,000 thousand. On 3 October 2014, the General Meeting of Shareholders of Abanka passed a resolution to increase
the share capital through the in-kind contribution of the Republic of Slovenia in bonds totalling EUR 242,999,943.49 and through
the cash contribution of EUR 56.51. In accordance with the resolution passed by the 29th General Meeting of Shareholders of
Abanka on 8 October 2014, the Republic of Slovenia paid in 100,000 new shares amounting to EUR 243,000 thousand. The
share capital increase of EUR 1,000,000.00 was entered in the Companies Register on 10 October 2014. The share capital of
Abanka amounts to EUR 151,000,000.00 and is divided into 15,100,000 ordinary no-par value registered shares wholly owned
by the Republic of Slovenia. On 5 October 2015, Banka Celje d.d., established in 1864 when Celje Municipal Savings Bank was
founded, was merged with Abanka Vipa d.d. in line with the commitment made to the European Commission. After the merger
of Banka Celje, the share capital of Abanka remained unchanged in the amount of EUR 151,000 thousand, while the share
capital of Banka Celje was transferred to the share premium of Abanka, amounting to EUR 282,459 thousand as at the 2015
year-end, which remained unchanged in 2016. The corresponding amount per no-par value share in the share capital was EUR
10.00 as at the end of 2016.
On 16 December 2014, Banka Celje received the Decision on Extraordinary Measures of the Bank of Slovenia, based on which
additional capital was provided to the Bank. The existing share capital of Banka Celje in the amount of EUR 16,980 thousand
was therefore first reduced to EUR 0 on 16 December 2014, after which it was increased by EUR 190 million. All qualified
liabilities of the bank incurred up to the issue date of the Decision and consisting of share capital and subordinated financial
instruments ceased in full. After reducing it to EUR 0, the share capital was increased by EUR 50 million and share premium by
EUR 140 million, while the Republic of Slovenia became the sole owner of the bank. The share capital of the bank, which
amounted to EUR 50 million after the increase, was divided into 5 million new ordinary no-par value shares. The corresponding
amount per no-par value share was EUR 10 and the issue value per share was EUR 38. One half of the capital increase was
realised through cash contributions and the other half through the bonds of the Republic of Slovenia.
THE SHAREHOLDER OF THE BANK
With regard to transparency of financial relations between public authorities and bodies of self-governing local
communities and public undertakings, Abanka is not required to settle the operating loss and ensure the capital because in
2016 the Bank generated a profit of EUR 76,656 thousand.
Issue of shares and capital increase - Abanka
Prior to the enforcement of the 1999 Book Entry Securities Act, three issues of 3,162,362 bonds were placed amounting to EUR
13,196,302.79. Thereafter, the following capital increase operation ensued (excluding the capital increase in 2002 with 536,038
shares following the merger by acquisition of Banka Vipa d.d.): in 2001 with 337,638 shares amounting to EUR 5,752,695.52; in
2003 with 763,962 shares totalling EUR 15,206,554.58; in 2005 with 700,000 shares amounting to EUR 26,289,434.15; and in
2008 with 1,700,000 shares totalling EUR 102,000,000.00.
At the 26th General Meeting of Shareholders held on 8 April 2013, reduction of the Bank’s share capital was approved, so that
the share capital of the Bank, which on 8 April 2013 amounted to EUR 30,045,067.60 and was divided into 7,200,000 ordinary
registered no-par value shares, was reduced through a simplified procedure by EUR 22,845,067.60; after reduction the share
capital amounted to EUR 7,200,000.00. This reduction was carried out in order to cover part of the loss for 2012 in the amount
of EUR 22,845,067.60 charged to the Bank’s share capital. The simplified reduction of the Bank’s share capital was entered in
the Companies Register on 21 May 2013.
Before 17 December 2013 (i.e. the date when the Bank of Slovenia issued the relevant decision), the share capital of Abanka
totalled EUR 7,200,000.00 and was divided into 7,200,000 ordinary, freely transferable, no-par value shares with the ABKN
ticker symbol, of which 7,198,874 were in dematerialised (book entry) form and 1,126 in materialised form, the latter not yet
submitted to KDD. The voting rights were attached to 4,676,340 shares. In January 2011, the voting rights attached to
2,513,321 shares owned by Zavarovalnica Triglav d.d., HIT d.d., SOD d.d. and Mobitel d.d. were suspended in accordance with
the decision issued by the Securities Market Agency. The share issue was fully paid up.
Number of
shares
Holding
in %
Number of
shares
Holding
in %
The Republic of Slov enia 15,100,000 100.0 The Republic of Slov enia 15,100,000 100.0
31 Dec. 2016 31 Dec. 2015
A B A N K A G R O U P Annual Report 2016
48
According to the Decision of the Bank of Slovenia on Extraordinary Measures, dated 17 December 2013, as of 18 December
2013 all qualified liabilities of Abanka Vipa d.d. fully ceased, including the share capital comprising all the shares of Abanka Vipa
d.d. with the ABKN ticker symbol. On the same day, respective entries were made in the Companies Register and, as a result,
the above-mentioned shares were stricken off the Central Securities Depository of securities issued in dematerialised form and
kept by KDD.
Simultaneously with the reduction of the share capital of Abanka Vipa d.d. to zero, on 18 December 2013, in accordance with
the Decision of the Bank of Slovenia on Extraordinary Measures, dated 17 December 2013, and the Decision of the Bank of
Slovenia Approving the Share Capital Increase of Abanka Vipa d.d., dated 18 December 2013, the Bank’s capital share was
increased to EUR 150,000,000 through the issue of 15,000,000 new ordinary registered no-par value voting shares. On the
same day, respective entries were made in the Companies Register and, as a result, the above-mentioned shares were entered
in the Central Securities Depository of securities issued in dematerialised form. After 18 December 2013, the share capital of
Abanka Vipa d.d. was divided into 15,000,000 new shares with voting rights attached. After the subscription of new ABKS
shares, the Republic of Slovenia held 15,000,000 ABKS shares, which was 100% of all issued shares of Abanka Vipa d.d. In
accordance with the resolution passed by the 29th General Meeting of Shareholders on 3 October 2014, the Republic of
Slovenia paid in 100,000 new shares amounting to EUR 243,000 thousand on 8 October 2014. The share capital increase of
EUR 1,000,000.00 was entered in the Companies Register on 10 October 2014. After the increase, the share capital of
Abanka amounted to EUR 151,000,000.00 and was divided into 15,100,000 ordinary no-par value registered shares wholly
owned by the Republic of Slovenia.
Issue of shares and capital increase – Banka Celje
Before the capital increase in 2008, the share capital of the bank consisted of 422,123 no-par value registered shares issued in
dematerialised form and entered in the Central Securities Depository of securities issued in dematerialised form. The shares
included 80% ordinary shares with voting rights attached and 20% preference shares.
At the 23rd regular General Meeting of Shareholders held on 22 May 2008, the Management Board of the bank was granted the
authorisation to increase the share capital by issuing new shares within the next five years. As the amount of the authorised
capital may not exceed half of the share capital at the time when authorisation is given, this represented 211,061 shares. The
new shares can only be issued with the approval of the Supervisory Board of the bank. In October 2008, the share capital of the
bank was increased from the authorised capital by selling 86,506 shares at the total issue value of EUR 35 million. The bank
sold 69,205 ordinary shares at a price of EUR 413 per share and 17,301 preference shares at a price of EUR 371 per share. After the capital increase, the share capital of the bank was divided into 508,629 no-par value shares.
No new shares were issued from the authorised capital in the following years. At the General Meeting of Shareholders held in
October 2012, a resolution was passed, revoking the preferential rights of all issued preference shares and converting them into
ordinary shares.
Following the capital increase through state aid on 16 December 2014, the share capital of the bank was divided into 5,000,000
ordinary registered no-par value shares issued in dematerialised form. All the shares that represented a qualified liability of the
first order prior to the capital increase, i.e. all 508,629 ordinary no-par value shares, were cancelled as of the date of the capital
increase. Through the capital increase the Republic of Slovenia became the sole owner of the bank.
A B A N K A G R O U P Annual Report 2016
49
THE BANK'S DEVELOPMENT
DEVELOPMENT AND MARKETING COMMUNICATIONS IN 2016
Corporate banking
In line with the strategic guideline of the Bank, much attention was devoted to the development of modern sales channels. The
Abamobi com mobile bank application was upgraded to enable payment transactions and an overview of deposits and loans, in
addition to the existing, well-established functionalities (overview of transactions, remote signing). For better communication with
corporate customers, the function “Sporočila” (“Messages” – receiving and sending of messages to the Bank) was added to the
mobile bank application. In March, Abasms com, a new service for business users, was introduced. By sending a text message,
the service notifies the user of any changes on their business account and business cards, both at home and abroad.
In the first half of 2016, the Visa business card was redesigned to bring it closer to its users. In June, the Bank began to issue
payment cards that allow contactless payment.
In 2016, the Bank has continued to seek solutions for simplifying and accelerating the main processes, which also have an
impact on service quality. In the second half of 2016, the loan process optimisation was launched. As of July, a redesigned
application for the sale of credit, guarantee and deposit operations to legal persons has been in use.
A diverse range of banking services is provided not only by creating own special offerings but also through special offers
provided in cooperation with business partners (SID Bank, municipalities and others). In 2016, Abanka introduced the overdraft
facility without a maturity date and a liquidity loan for large and medium-sized enterprises – “hot money". For all new customers,
a welcome package (a business package for legal entities and a business package for sole proprietors) was prepared.
The first six months of 2016 were also marked by activities related to the merger of Banka Celje with Abanka. Business
accounts were renumbered and the corresponding products were replaced with Abanka’s products (business cards, online
banking, etc.). The contact centre provided to the customers of the former Banka Celje information in relation to the Bank’s
products and technical assistance in using the new online banking service.
In 2016, nine business events primarily for micro-enterprises were organised throughout Slovenia. In autumn 2016, the main
event for all corporate customers was held in Ljubljana. The current banking content was well presented at a number of other
business events organised for legal entities by other organisations across Slovenia (Family Entrepreneurship, many regional
and local events held by Regional Chambers of Craft and Small Business, MOS (International Trade and Business Fair), etc.).
Marketing for corporate customers was implemented through various forms of direct marketing, focusing on electronic
marketing, telemarketing and web marketing. To this end, the content of Abanka’s electronic bulletin for corporate customers
(eBilten) was very helpful, with three editions published in 2016.
In March, Abasms com, a new service for
business users, was introduced. By sending
a text message, the service notifies the user
of any changes on their business account
and business cards, both at home and abroad.
A B A N K A G R O U P Annual Report 2016
50
Retail Banking
In 2016, the Abamobi mobile bank service for retail customers was upgraded so as to further improve the user experience. In
doing so, Google Analytics was added, the “Scan and Pay” component was upgraded, the indicator for rejected tasks was
introduced, and the options to open an authorisation in the review of orders in PDF format and to enter and review contact
information were added.
For the purpose of cashless operations, the Bank offers its customers a range of card services. The signing of agreements via a
signature pad (the ePero application) was enabled in order to accelerate the conclusion of agreements and automate the
agreement archiving process. In June 2016, the Bank began to issue the first payment cards that allow contactless payment.
Apart from that, alternative forms of saving were offered to savers. In the reporting period, Abanka continued to sell insurance
services in cooperation with Zavarovalnica Triglav so as to provide high quality and competitive insurance services and with
Triglav Skladi d.o.o. in the sale of mutual funds. A special bundled product continued to be provided – an undedicated deposit
and an investment in a selected mutual fund.
In September, in order to meet the regulatory requirements, the Bank introduced a basic account designed for users who do not
have or are in the phase of closing their personal account and for the recipients of financial social assistance who do not have
an account opened with Abanka.
Across all channels, in the online and mobile banking services and in the application for counter operations, automatic input of
the BIC code was enabled based on the entered IBAN code for cross-border payments. The retail loan application continued to
be developed and the option to create an annex to an agreement was added.
A welcome package was prepared for new customers, Aračun users, retired persons, small businesses and entrepreneurs,
enabling them more favourable banking operations. The range of favourable housing and consumer loans was maintained. The
package of benefits Apaket Podjetnik (Apaket Entrepreneur) was designed for entrepreneurs and sole proprietors.
In 2016, the activities related to the operational merger of Banka Celje with Abanka continued. The operational merger of
systems for personal accounts, including the corresponding products, was completed. The contact centre provided to the
customers of the former Banka Celje information in relation to the Bank’s products and technical assistance in using the new
online banking service.
Through effective and modern marketing communications in 2016, the activities continued which were aimed at consolidating
the position of Abanka as a modern, innovative and technologically advanced bank. Moreover, the visibility of Abanka service
brands was enhanced and Abanka was ranked among the top three banks. Particular attention was paid to effective marketing
of card operations and Abamobi mobile banking. The same customer segment was the target audience of the pre-summer
marketing campaign, when before the summer holidays the focus was on the key banking services, which come handy during a
vacation and should be taken care of before the departure. Abanka's main e-news (eNovice) was intended especially for
these customers.
Marketing activities were targeted at different target groups. Pre-school children continued to be addressed primarily by the
hedgehog mascot Abanka Ježek, elementary school children and their parents were the target group of the Akeš junior brand,
while students were effectively targeted through Akeš, the brand for young people. The youngest children were entertained by
the hedgehog mascot Ježek at a number of family events organised across Slovenia. In 2016, through puppet shows shown in
kindergartens, more than 1,300 children and their teachers were educated about basic banking. For the third consecutive year,
Abanka sponsored Cici vesela šola for pre-school children and Vesela šola for elementary school children.
For the acquisition of elementary school personal accounts, two effective marketing campaigns were carried out in 2016. The
activities relating to the national competition in logic, which is also sponsored by Abanka, were intended for elementary
school children.
In June 2016, the Bank began to
issue the first payment cards that
allow contactless payment.
A B A N K A G R O U P Annual Report 2016
51
In 2016, two comprehensive marketing activities were targeted at pupils and students, inviting them to open a personal account
for young people. In the youth segment Abanka's Facebook profile remained most popular. In addition, direct communication
with young people was carried out through the most favourite communication channels – e-mail and text messages. Apart from
Abanka’s own marketing activities, the Akeš brand and Abanka are brought closer to young people via participation in selected
events, e.g. competitions in logic for secondary school pupils, Fanfara – the main marketing event for students. In the youth
segment, Abanka maintained the highest net promoter score (NPS).
Part of the marketing activities was also devoted to the most loyal, more mature population by presenting the benefits of Aračun
senior personal account for pensioners at the Festival for the Third Life Period and in a couple of publications in key
printed media.
Through an individual customer approach and premium private banking, the segment of more demanding customers was
targeted by more direct, personal, discrete marketing activities, which resulted in higher customer satisfaction generated by
gratitude and rewarding customer loyalty.
In all of the before marketing activities in 2016, all the available internal communication channels were also used.
As of December 2016, up-to-date information is available to customers at Abanka’s fully redesigned website, on the two active
Facebook profiles (Abanka and Akeš) and Abanka’s LinkedIn profile.
Financial Markets
In 2016, in terms of liquidity management, the Treasury Division:
continued with the centralised operational liquidity management process and upgraded the software for monitoring the
planned and realised cash flows;
continued the management of secondary liquidity reserves and provided for an adequate level and structure of the banking
book.
In operations with customers, all treasury products were proactively marketed in 2016. A significant increase in business volume
was recorded with regard to the spot purchase and sale of foreign currencies. The increased volatility of exchange rates also
resulted in higher demand for derivatives for hedging against foreign exchange risks. A growing number of customers is opting
for flexible forward transactions, since they allow for simple management of foreign currency cash flows while also providing
efficient protection from foreign exchange risk.
As a result of extremely low euro interest rates in 2016, the demand for derivatives for hedging against interest rate risk was
slightly revived. The Bank expanded the range of customers involved in the purchase and sale of debt securities; it was also
actively engaged in the new issue of treasury bills and bonds of the Republic of Slovenia in domestic and international markets.
In 2016, Abanka acquired new customers, maintained good business relations with existing customers and consolidated the
visibility of its treasury products. This was confirmed by the good attendance of corporate customers at the 9 th traditional
treasury event held in October in Ljubljana.
Abanka remains an important primary dealer in Slovene government bonds and treasury bills. In both the domestic and foreign
markets, it operates as the official market maker for MTS Slovenia together with 15 large foreign banks, dealing in 14
government bonds of the Republic of Slovenia. In the most recent international bond issue and the domestic issue of treasury
bills, Abanka played an active role as a co-organiser and achieved a high market share in the local market.
In 2016, the abolishment of the registry accounts kept by KDD took place. To this end, the Bank created a special offer, which
was recognised as such by approximately 10,000 new customers of brokerage services.
Abanka remains an important
primary dealer in Slovene
government bonds and treasury bills.
A B A N K A G R O U P Annual Report 2016
52
DEVELOPMENT, AND MARKETING COMMUNICATIONS IN 2017
In 2017, product development will follow both the development of new technologies and systems and the strategic guidelines of
the Bank. Particular emphasis will be on the development of digital channels – online and mobile banking. The Bank will
continue to seek possibilities for process optimisation.
In 2017, the existing good practices will continue to be implemented, while adding even more modern and efficient marketing
techniques. The Bank will further consolidate the visibility of product brands and promote the sale of these services in order to
contribute to higher satisfaction of both retail and corporate customers in all segments. The marketing activities will be aimed at
promoting services among the existing customers as well as at acquiring new customers.
A number of marketing and advertising campaigns will be prepared and implemented. Apart from that, new banking products
and services will be presented not only at the events organised by Abanka but also at other events.
In 2017, the Bank will maintain its presence on key social media, striving for the highest possible net promoter score. The main
web portal will be kept up-to-date and both electronic bulletins for customers will continue to be published.
In 2017, product development will follow
both the development of new technologies
and systems and the strategic guidelines of
the Bank. Particular emphasis will be on
the development of digital channels – online
and mobile banking. The Bank will continue
to seek possibilities for process optimisation.
A B A N K A G R O U P Annual Report 2016
53
CORPORATE GOVERNANCE STATEMENT
To achieve a high level of transparency in governance, Abanka d.d. includes a corporate governance statement in its business
report in accordance with the fifth paragraph of Article 70 of the Companies Act.
Abanka d.d. implements its internal governance arrangements, including corporate governance, in accordance with the
applicable legislation of the Republic of Slovenia, particularly the provisions of the Banking Act (ZBan-2) on internal governance
arrangements in Section 3.4 (Governance System of a Bank) and Section 6 (Internal Governance Arrangements and Internal
Capital Adequacy), the latter in the part relating to the requirements which apply to a bank or to the members of the
management body, in addition to taking into account the regulations referred to in the second paragraph of Article 9 of the
Banking Act (ZBan-2). Apart from that, the Bank adheres to the Decision on Internal Governance, the Management Body and
the Adequate Internal Capital Assessment Procedure for Banks and Savings Banks and the relevant EBA guidelines on the
assessment of the suitability of members of the management body and key function holders as well as the guidelines on
remuneration policies and practices. Furthermore, the Bank seeks to follow non-mandatory recommendations from the letter of
the Bank of Slovenia (ref. 38.20-0288/15-TR of 23 October 2015) to the maximum possible extent.
Abanka d.d. is a state-owned company and not a public company within the meaning of the Financial Instruments Market Act. In
2016, the Bank complied with the legal requirements on the governance of a bank, including the reference codes and
recommendations set out in the Statement of Compliance with the Corporate Governance Code.
Statement of Compliance with the Corporate Governance Codes
The Management and Supervisory Boards declare that in its work and operations in 2016 Abanka d.d. observed the corporate
governance recommendations as set out in:
Corporate Governance Code adopted by the Ljubljana Stock Exchange d.d., Ljubljana, the Association of Supervisory Board
Members of Slovenia and the Managers’ Association of Slovenia on 8 December 2009. The Code is available on the website
of the Ljubljana Stock Exchange at http://www.ljse.si in Slovene and English;
Corporate Governance Code for Companies with Capital Assets of the State adopted by Slovenski državni holding d.d.
on 19 December 2014 and revised on 2 March 2016 and the Recommendations and Expectations of the Slovenian
Sovereign Holding (Slovenski državni holding d.d.) adopted in February 2016. Both codes are published on the website
www.sdh.si.
Individual deviations from the provisions of the codes and recommendations, including a statement of reasons and presentation
of appropriate alternative practices, are disclosed below. The reasons for a different practice lie primarily in specific
characteristics related to the ownership structure and industry or activities of the company.
a) Corporate Governance Code
Code provision 4.2: Abanka is of the view that providing information to the public via its sole shareholder – the Republic of
Slovenia about their investment policy is primarily at the shareholder’s discretion, in line with the regulations governing capital
assets of the State. No encouragement by Abanka can specifically influence its shareholder's decision to inform the public.
Code provision 20.4: Considering the fact that the Bank was a public company only until February 2016 and is 100% owned by
one shareholder, it ensured transparency of its operations to the investor in such a way that it timely and appropriately informed
the investor about accounting, financial and non-financial information, enabling it to assess the situation and the impact of a
particular business event on the price of the security.
b) Corporate Governance Code for Companies with Capital Assets of the State
Code provision 6.1: The Supervisory Board performs its function of supervision of the Bank’s operations and its management
in compliance with the law and the Articles of Association. In 2016, the Bank began to draw up the documents relevant for the
preparation of a timely and effective succession plan for the members of the management bodies. In January 2017, the
Supervisory Board adopted the abovementioned documents.
A B A N K A G R O U P Annual Report 2016
54
Code provision 10.2.1: Corporate integrity system
The Bank's guiding principle is lawful, professional, ethical, safe and diligent business, which it implements by complying with
the applicable regulations, standards, codes, best practices and other rules of the financial and banking sector. In order to
ensure a stable governance arrangement, the management body adopted the Code of Business Ethics. The Code not only sets
the standard of Abanka’s corporate culture based on its corporate values but also defines the conduct of the members of the
management body and other employees in business or personal relations with the customers, co-workers, shareholders,
business partners and the natural and social environment (the stakeholders). The corporate integrity system consists of the rules of conduct, arising from the Code and defining the management of various
types of risks such as the risk of unlawful operations, conduct contrary to the interests at all levels of decision-making and
operation, the different types of fraud, employee harassment and mobbing, money laundering and terrorist financing, abuse of
all kinds of confidential information, non-transparent and inappropriate selection of outsourcers, improper handling of
consumers, market abuse, inadequate information about the performance and other.
The compliance function is integrated into the corporate integrity system so as to develop and implement the compliance
programme, including the provision of advisory services and training and the identification, monitoring and assessment of risks
in this area. On the basis of the self-assessment, the general annual assessment on the state of corporate integrity was made. All employees are familiar with the Code of Business Ethics; it is published on the intranet portal and on the website of the Bank. Employees can report any detected violations to their superiors or using the internal electronic reporting system (to report
infringement, loss events or incidents). The Bank ensures any employee submitting such a report that no retaliatory measures
will be taken against them as a result.
c) Recommendations and Expectations of the Slovenian Sovereign Holding
Recommendation No. 5: Attainment of quality and excellence in the operations of companies/groups
The Bank performs a range of activities to determine, assess, manage and monitor the quality of its operations in various
segments. The Code of Ethics constitutes the basis for improving the corporate culture of the Bank, thereby achieving business
excellence and quality. The activities aimed at improving the quality of operations include verification of customer satisfaction
(analyses on the basis of received complaints, loss events and other incidents, checking the service level among organisational
units) and care for employee satisfaction (measurement of the organisational climate, management staff assessment, a Family-
Friendly Enterprise certificate, concern for employee safety and health, monitoring of staff turnover, monitoring of reported
infringements and irregularities, promotion and rewarding of promoters of the Bank’s values and innovative ideas), professional
training and acquisition of leadership skills. By ensuring adequate staffing in IT area, the quality and security of information
systems is properly managed. Moreover, qualified internal control functions contribute to higher quality of the Bank’s operat ions
through their activities.
The governance policy and practices of Abanka are publicly accessible on its website at http://www.abanka.si/.
Main characteristics of the internal control and risk management systems in financial reporting
The Bank manages all types of material risks in accordance with the adopted Risk Management Strategy and in line with the
risk management policies by risk type. The Bank’s internal control system encompasses regular internal controls, including
control policies and procedures implemented by the front office, middle office and back office, and independent internal control
functions (risk management, compliance, internal audit).
The main objective of internal controls in the management of risks arising from financial reporting is to ensure reliability or
credibility, accuracy, integrity, completeness and timeliness of accounting data, appropriate separation of powers and duties in
accounting procedures, professional and efficient performance of tasks, operations in accordance with the applicable
regulations and internal rules and fair disclosure of accounting data in internal and external reports.
Monitoring the effectiveness of risk hedging methods arising from accounting reporting and risk reduction is a process based on
an internal control system consisting of internal controls (particularly the work procedures, granting and exercise of powers
and responsibilities, and reporting). The activities of the Internal Audit Department and compliance activities are also part of
the system.
Information required under items 3, 4, 6, 8 and 9 of paragraph 6 of Article 70 of the Companies Act
The structure of the company’s share capital, including all securities, as defined by the act governing takeovers
As at the reporting date, the share capital of Abanka amounted to EUR 151,000,000.00 and was divided into 15,100,000
ordinary no-par value registered shares wholly owned by the Republic of Slovenia. Abanka has only one class of shares
without any restrictions on their transferability. Each ordinary share carries one vote at the General Meeting of Shareholders
unless stipulated otherwise by the Articles of Association or the law (no voting right).
A B A N K A G R O U P Annual Report 2016
55
Significant direct or indirect ownership of securities in terms of achieving a qualifying holding as defined by the act
governing takeovers
As at the reporting date, the Republic of Slovenia was the 100% owner of all the Bank’s shares.
Special controlling rights
None of the Bank's shareholders have special controlling rights.
Voting right restrictions
According to the Articles of Association, voting rights are not restricted to a certain holding or to a minimum number of shares.
Detailed information on the exercise of voting rights is contained in Section Functioning of the General Meeting of
Shareholders, its key competencies, description of shareholders' voting rights and the manner in which they are exercised,
which is part of this statement. The Bank is unaware of any agreements according to which the financial rights attached to securities are through the
involvement of the Bank separated from the rights attached to the holding of such securities.
Rules on the appointment or replacement of members of the management or supervisory bodies and amendments to
the Articles of Association
The rules on the appointment or replacement of members of the management or supervisory bodies are presented in the
section "Composition and functioning of management or supervisory bodies and their committees", which is part of this
statement.
The rules regarding amendments to the Articles of Association are disclosed in the section "Functioning of the General
Meeting of Shareholders, its key competencies, description of shareholders' voting rights and the manner in which they are
exercised", which is part of this statement.
Authorisations of the management, especially share purchase and share issuing options
The Management Board of the Bank is not authorised to issue or purchase shares or issue authorised capital.
Functioning of the General Meeting of Shareholders, its key competencies, description of shareholders'
voting rights and the manner in which they are exercised
The General Meeting of Shareholders consists of the Bank's shareholders. The General Meeting of Shareholders decides on
the following matters: distribution of the accumulated profit on the proposal of the Management and Supervisory Boards;
approval of the Annual Report should the Supervisory Board fail to approve the Annual Report or should the Management and
Supervisory Boards leave it to the General Meeting of Shareholders to decide on the approval of the Annual Report; the Annual
Internal Audit Report, including the opinion of the Supervisory Board; adoption of and amendments to the Articles of
Association; measures to increase or decrease the share capital, excluding those which, in line with the Articles of Association,
fall within the competence of the Management Board; the winding-up of the Bank and status-related changes; appointment and
dismissal of Supervisory Board members; a vote of no confidence in the Management Board; granting discharge to members of
the Management and Supervisory Boards; appointment of the auditor; the Rules of Procedure of the General Meeting of
Shareholders and other matters determined by the Articles of Association and by the law.
The General Meeting of Shareholders is convened at least once a year by the Management Board. It can also be convened by
the Supervisory Board. In addition, shareholders holding a total of one-twentieth of the share capital may require that a General
Meeting of Shareholders be convened.
The Management Board convenes the General Meeting of Shareholders at least thirty days prior to the General Meeting of
Shareholders by publishing the notice convening the General Meeting, its agenda and draft resolutions in the manner provided
by the law and the Articles of Association. The material necessary for making decisions at the General Meeting, including draft
resolutions, must be available to the shareholders at the Bank’s premises from the publication of the notice convening the
General Meeting. In 2016, the Articles of Association were amended by adding the provision that if all shareholders of the Bank are present or
represented at the General Meeting of Shareholders, the General Meeting of the Shareholders may take decisions without
prejudice to the provisions of the law or the Articles of Association concerning the content, date and publication of the not ice
convening the General Meeting, the provisions relating to the deadlines and publication of amendments to the agenda of the
General Meeting and the provisions on the majority required for the Management Board of the Bank to take a decision on the
convocation of the General Meeting of Shareholders.
Only the shareholders holding ordinary shares who were entered in the Share Register no later than by the end of the fourth day
before the date of the General Meeting of Shareholders and who announced their attendance to the Management Board no later
than by the end of the fourth day prior to the date of the General Meeting are entitled to participate in and vote at the
General Meeting of Shareholders. Shareholders may exercise their rights at the General Meeting of Shareholders in person or
through a proxy.
A B A N K A G R O U P Annual Report 2016
56
Each ordinary share carries one vote at the General Meeting of Shareholders unless stipulated otherwise by the Articles of
Association or the law (no voting right). The Bank has not issued any shares with restricted voting rights. The General Meeting
of Shareholders adopts decisions by the majority of votes cast, unless otherwise stipulated by the Articles of Association or by
the law. A three-quarters majority of the represented share capital is required for the General Meeting of Shareholders to adopt
decisions on increasing or decreasing the capital, amendments to the Articles of Association, the denial of pre-emption rights to
purchase shares in increasing the share capital, the winding-up of the Bank, status-related changes of the Bank, the dismissal
of a Supervisory Board member and a vote of no confidence in the Management Board.
At the 33rd regular General Meeting of Shareholders held on 13 May 2016, the shareholder took note of the Annual Report of
Abanka for 2015 and the remuneration of the Management and Supervisory Board members for 2015. Moreover, the
shareholder was informed that the accumulated profit for 2015 totalled EUR 22,099,974.59, consisting of the remaining net
profit for 2015 of EUR 19,248,861.18 and profit brought forward from previous business years in the amount of EUR
2,851,113.41. The General Meeting of Shareholders concluded that the accumulated profit in the amount EUR 22,099,974.59
will remain undistributed until further notice as retained earnings. The General Meeting granted a discharge to the Management
and Supervisory Board members and adopted the Annual Internal Audit Report of Abanka d.d. for 2015, including the opinion of
the Supervisory Board. The General Meeting of Shareholders took note of the resignation of Janko Gedrih as of 9 February
2016, and consequently the termination of his term of office as a member and Chairman of the Supervisory Board. The General
Meeting further took note that on 30 May 2016 the term of office of Andrej Slapar as a member of the Supervisory Board would
expire. The General Meeting appointed Rok Pivk a member of the Supervisory Board of Abanka d.d. for a four-year term,
beginning on 13 May 2016, and Vid Leskovec a member of the Supervisory Board of Abanka d.d. for a four-year term,
beginning on 31 May 2016. Moreover, the General Meeting of Shareholders adopted the following amendments to the Articles
of Association of Abanka d.d.: (i) Article 25 was amended with the provisions on the admissibility of decisions made by the
General Meeting of Shareholders without prejudice to the provisions of the law and the Articles of Association regarding the
convocation of the General Meeting if all shareholders are present or represented at the General Meeting of Shareholders; (ii )
Article 33 was amended with the provisions on the notice period of a member of the Supervisory Board who resigns from the
function and on the resignation of a member of the Supervisory Board without a notice period in the case of objectively justi fied
reasons; (iii) the sixth indent of Article 35 was amended to stipulate that the Supervisory Board shall give the Management
Board its approval to defining the annual work plan of the Internal Audit Department; (iv) the provision in Article 44.a was
amended to read that a member of the Management Board shall immediately inform the Supervisory Board of the
circumstances due to which a potential conflict of interest may arise; (v) the first paragraph of Article 48 was amended with the
provision that the Supervisory Board shall decide on the rights and obligations included in the agreement of a Management
Board member; (vi) the existing second paragraph of Article 48 was deleted; the existing third paragraph became the second
paragraph, which as of now stipulates that the members of the Management Board may be entitled to profit-sharing in the
amount set by the General Meeting of Shareholders if so provided by the management body remuneration policy adopted by the
Supervisory Board, which informs the General Meeting of Shareholders thereof, or by the General Meeting of Shareholders; (vii)
in Article 53 the phrase “in accordance with the annual programme” was replaced by “in accordance with the annual work plan”.
Composition and functioning of management or supervisory bodies and their committees/commissions
Abanka uses a two-tier management system. The Bank is run by the Management Board, whose work is supervised by the
Supervisory Board. The governance of the Bank is based on the applicable legal regulations, the Articles of Association, internal
documents, generally accepted business practices, the Corporate Governance Code and the Corporate Governance Code for
Companies with Capital Assets of the State and the Recommendations and Expectations of the Slovenian Sovereign Holding
(with certain exceptions and differences disclosed in the Statement of Compliance with the Corporate Governance Code).
Management Board
The Management Board runs the Bank's operations independently, for which it is fully responsible. In legal transactions, the
Bank is always jointly represented by two members of the Management Board who are entitled to sign on its behalf. The
Management Board is appointed and dismissed by the Supervisory Board. The Management Board has at least two and no
more than five members, of whom one acts as its President. The number of Management Board members is determined by the
Supervisory Board. The President and members of the Management Board are appointed for a five-year term with the possibility
of reappointment. The Management Board reports to the Supervisory Board in accordance with the applicable regulations.
Each member of the Management Board has one vote. The decisions of the Management Board are adopted by a majority vote
of all members. Where a vote is equal, the President holds the deciding vote. By a special decision adopted unanimously, the
Management Board may authorise each of the Management Board members to take decisions on individual matters and
transactions relating to the Bank’s current operations at their own discretion.
A B A N K A G R O U P Annual Report 2016
57
If a member of the Management Board is appointed director or if their function in other companies and organisations has ended,
they are required to immediately inform in writing the Bank, the Supervisory Board and the Bank of Slovenia or the European
Central Bank.
A member of the Management Board is obligated to notify the Supervisory Board of the circumstances due to which a potential
conflict of interest may arise with respect to the performance of the function of a Management Board member and of other
circumstances that could affect the fulfilment of the conditions for the appointment as a Management Board member in line with
the Banking Act, including any significant change which affects or could affect the Bank’s assessment as to their suitability as a
Management Board member.
In 2016, the Management Board was composed of Jože Lenič as its President and Aleksander Vozel and Matej Golob Matzele
as its members.
The Management Board is responsible for the establishment and implementation of such an internal governance arrangement
of the Bank, which will enable efficient and prudent management of the Bank based on clearly defined powers and duties as
well as policies and measures for the prevention of conflicts of interest. The Management Board is fully responsible for the
operations of the Bank and its risk management, including (i) the approval of strategic objectives of the Bank, adoption and
regular review of the risk appetite and management strategy and internal governance arrangement; (ii) ensuring the integrity of
the accounting and financial reporting systems, including financial and operational control as well as compliance with the
applicable regulations and standards; (iii) monitoring of information disclosure procedures and procedures for notification of
competent authorities and other stakeholders; and (iv) effective supervision of senior management. Furthermore, the
Management Board regularly monitors and assesses the effectiveness of the internal governance arrangement, takes
appropriate measures to eliminate any identified deficiencies, and informs and reports to the Supervisory Board.
A member of the Management Board must satisfy the statutory conditions for performing the function of a Management Board
member throughout their entire term of office as well as (i) act with due skill and care and in particular ensure that the
Management Board acts in line with the Banking Act; (ii) act honestly, fairly and independently so as to effectively evaluate and
assess senior management decisions related to the management of the Bank; (iii) act in accordance with the highest ethical
standards of governance, including the prevention of conflicts of interests; and (iv) devote sufficient time to effectively perform
the function of a Management Board member.
Apart from that, a member of the Management Board has to ensure that the Bank operates in accordance with the general rules
and regulations governing the performance of services and transactions provided by the Bank as well as any regulations issued
on the basis thereof.
The Rules of Procedure of the Management Board stipulate the methods of its work, and distribute the areas of work and tasks
among its members. The Management Board assigns individual organisational units of the Bank to its members and makes
them responsible for their management and co-ordination.
The Management Board may transfer certain decision-making rights to collective decision-making bodies. The number and
type of bodies is determined in the Rules on organisation, while the scope of authorisations is defined by the Management
Board in a decision. The following bodies assist the Management Board in its work:
Assets and Liabilities Management Committee
The Committee manages the Bank's liquidity, currency and interest risks, capital and capital adequacy, sets internal transfer
rates, approves special terms and conditions for certain customers, as well as sets interest rates and a tariff charge system
applicable to customers. As a rule, the Committee meets once a month. As at the end of 2016, the Committee had eight
members. The Management Board appoints the Chairman, Vice Chairman and members of the Committee. The Committee
members are appointed from among the Bank’s employees with special authorisations.
Assets and Liabilities Management Commission
This Commission decides on special terms and conditions for certain customers and sets interest rates and a tariff charge
system for customers. As a rule, the Commission has regular meetings once a week. The Management Board appoints the
Chairman, Vice Chairman and members of the Commission. The Commission members are appointed from among the Bank’s
employees with special authorisations. At the end of 2016, the Commission had seven members.
The Bank’s Credit Committee
With regard to investment management, the Credit Committee decides on borrowings to customers, credit limits for
transactions with derivatives and repo transactions, decides on accepting syndicated loan agent services, project financing
and other financial services, discusses financial restructuring plans or loan restructuring proposals and risk management
reports, monitors how individual decision-making authorisations are exercised by the employees with special authorisations
A B A N K A G R O U P Annual Report 2016
58
and other employees as set out in the Management Board decisions regarding individual authorisations, monitors the
implementation and realisation of internal resolutions of the body, decides on other matters and discusses other reports.
The Credit Committee is authorised to decide on the abovementioned investments if they have not been decided on in the
framework of individual or Credit Commission authorisations or the Loan Watch Committee, within exposure limits to
individuals or groups of related parties and other exposure limits set by the Bank, taking into account statutory limitations and
the commitments made to the European Commission within the framework of the Bank’s restructuring plan. Regular meetings
of the Committee are convened once a week, whereas extraordinary meetings are held when necessary. The meetings can be
held by correspondence. The composition of the Committee is determined by the Management Board. As at the end of 2016,
the Committee had five members.
Liquidity Commission
The Commission designs the current liquidity, exchange and interest policies of the Bank. Regular meetings of the
Commission are usually convened daily, whereas extraordinary meetings are held when necessary. The meetings can be held
by correspondence. The Bank’s Management Board adopts a decision on the Commission’s composition, appointing its
members and substitutes. As at the 2016 year-end, the Commission had ten members.
Risk Management Committee and Operational Risk Commission
The Risk Management Committee monitors, steers and controls risk management of the Bank. Furthermore, the Committee
assesses the appropriateness of the Risk Management Strategy, its related policies and methodologies and the recovery plan,
monitors exposure to credit, market and operational risks, takes appropriate measures, manages other risks, discusses and
approves the limit systems and the limits, monitors the implementation of restrictions designed to manage liquidity, currency,
interest rate and market risks as well as exposure to foreign countries, individual activities and banks, monitors capital
requirements, discusses the results of calculations of internal assessment of the capital requirements, the capital level and the
related ratios, and takes appropriate measures. The Committee checks the adequacy of the selected risk indicators and risk-
bearing capacity indicators and confirms them, defines the importance of business activities for the needs of the Bank’s risk
profile assessment, adopts measures to modify the risk profile and to increase the risk-bearing capacity, and performs other
activities in the context of the ICAAP process and risk management in general. Regular meetings of the Committee are
convened once a month, whereas extraordinary meetings are held when necessary. The meetings can be held by
correspondence. The composition of the Committee is determined by the Management Board. As at the end of 2016, the
Committee had ten members.
The Operational Risk Commission is a working body of the Risk Management Committee. It is responsible for the
development of the operational risk management system, it monitors the implementation of the operational risk management
policy, it discusses reports on loss events and incidents as well as all the elements of operational risk, it reports to the
Committee on important findings and proposes measures to eliminate the causes of their occurrence, it monitors the
implementation of measures and reports to the Committee thereon.
Loan Watch Committee
The Committee decides on the Bank’s investments classified as non-performing, investments whose trustee is the
Investments Under Scrutiny Department and investments determined by the Credit Committee. Furthermore, the Committee
decides on borrowings to customers (including bilateral and syndicated loans) and accepting syndicated loan agent services,
project financing and other financial services, discusses financial restructuring plans, recovery plans, loan restructuring
proposals, proposals to initiate insolvency proceedings and the reports of the Investments Under Scrutiny Department,
monitors the implementation and realisation of internal decisions, decides on other matters and discusses other reports.
Regular meetings of the Committee are convened once a week, whereas extraordinary meetings are held when necessary.
The meetings can be held by correspondence. The composition of the Committee is determined by the Management Board.
As at the end of 2016, the Committee had five members.
Development Committee
The Committee is a collective decision-making body in charge of directing and supervising the management of development
activities aimed at achieving the strategic objectives of the Bank. The Development Committee holds regular monthly
meetings. The composition of the Committee is determined by the Management Board. As at the end of 2016, the Committee
had eleven members.
Commission for the Treatment of High-Risk Customers in Terms of Money Laundering and Terrorist Financing
Prevention
The Commission for the Treatment of High-Risk Customers in Terms of Money Laundering and Terrorist Financing Prevention
discusses cases of high-risk customers in order to take appropriate measures to ensure their conduct is in compliance with the
applicable laws and to adopt measures for a comprehensive management of all types of risks to which the Bank is exposed or
A B A N K A G R O U P Annual Report 2016
59
would be exposed when dealing with such customers. The composition of the Commission is determined by the Management
Board. The Committee’s meetings are held when necessary. As at the 2016 year-end, the Commission had six members.
Purchasing Commission
The Purchasing Commission is responsible for transparent conclusion of transactions related to the procurement of goods and
services based on previously set and appropriately balanced selection criteria as well as on the basis of obtained comparable
offers, which is the responsibility of the relevant departments of the Bank. The composition of the Commission is determined
by the Management Board. At the end of 2016, the Commission had three members.
Supervisory Board
The Supervisory Board oversees the management of the Bank's business operations. It consists of seven members, who are
appointed and dismissed by the General Meeting of Shareholders. Two thirds of the Supervisory Board members must be
independent experts. Independent persons are those who are not or have not been employed by the Slovene Government
within the last 24 months since their appointment to the Supervisory Board, or who have not performed a senior or managerial
function in any Slovene political party within the last 24 months. Any natural person fulfilling the relevant requirements and for
whom no restrictions were stipulated in the act regulating banking, the act regulating companies and other applicable
regulations may be appointed to the Supervisory Board. The members of the Supervisory Board are appointed for a four-year
term with the possibility of reappointment.
The Supervisory Board is responsible for the following: deciding on the appointment and dismissal of Management Board
members and their remuneration; deciding on granting loans to Management Board members, authorised officers and other
persons stipulated by law; approving the agreements between Supervisory Board members and the Bank; adopting and
monitoring the implementation of general remuneration policy principles; deciding on granting loans to Supervisory Board
members; reviewing and providing a written opinion on the Annual Report, including the auditor’s report, and the profit
distribution to the General Meeting of Shareholders in accordance with the second paragraph of Article 282 of the Companies
Act (ZGD-1); approving the Annual Report; reviewing and providing opinions on financial and other reports by the Management
Board; supervising the adequacy of internal control procedures and the effectiveness of the internal audit department; proposing
nominees for the Supervisory Board to the General Meeting of Shareholders; submitting proposals to the General Meeting of
Shareholders for the appointment of an auditor; proposing profit distribution to the General Meeting of Shareholders together
with the Management Board; providing an opinion on the annual internal audit report to the General Meeting of Shareholders;
reporting on the annual audit and auditing costs of the Bank to the General Meeting of Shareholders; discussing the findings of
the Bank of Slovenia or the European Central Bank (ECB) if the ECB exercises the powers and duties of the supervision over
the Bank in line with the EU regulations governing banking, as well as findings of other supervisory bodies in the bank
supervision procedure; tax supervisory findings and other supervisory bodies in the bank supervision procedure; approving the
operations of the Bank if such approval is required in the Articles of Association; deciding on amendments to the Articles of
Association but only to the extent so as to adjust the wording of the Articles of Association to validly adopted decisions; adopting
its own Rules of Procedure; and other competencies determined by the law or the Articles of Association.
The Supervisory Board gives its approval to the Management Board’s long-term capital investments in other legal entities
exceeding 1% of the bank capital, which is the sum of Tier 1 and Tier 2 capital in accordance with the applicable regulations;
strategic business alliances; the Bank's corporate policy; the Bank's financial plan; organisation of an internal control system;
the annual work plan of the Internal Audit Department; rules of the Internal Audit Department; conclusion of any legal transaction
that, in consideration of the overall exposure of the Bank, would result in the Bank's large exposure to an individual customer;
conclusion of any legal transaction due to which a large exposure of the Bank to an individual customer would equal or exceed
10% or every further 5% eligible capital of the Bank in line with the act regulating banking, which is the sum of Tier 1 and Tier 2
capital in accordance with the applicable regulations; conclusion of any legal transaction which would result in the Bank's
exposure to the members of the Management Board and/or the Supervisory Board, authorised officers of the Bank and parties
related to these persons; conclusion of any transactions with persons in a special relationship with the Bank in line with the act
regulating banking; dismissal of the head of the risk management department; appointment and dismissal of the head of the
internal audit department; write-off of receivables over EUR 1 million a year to an individual person or persons who are
considered a group of related persons in line with the act regulating banking; raising loans; issuing bonds or subordinated debt
instruments for every such assumed liability exceeding 25% of the book-value capital as well as to other matters stipulated by
the law or the Articles of Association.
The Supervisory Board adopts resolutions at its sessions. The work of the Supervisory Board is performed in accordance with
the Rules of Procedure of the Supervisory Board. The quorum of the Supervisory Board is constituted if a majority of members
is present at a session. Decisions are adopted according to the majority of votes cast. Where a vote is equal, the Chairman shall
hold the deciding vote.

A B A N K A G R O U P Annual Report 2016
60
As at 31 December 2016, the Supervisory Board of Abanka d.d. was made up of the following members: Marko Garbajs, Chairman, term starting on 4 October 2014; Melita Malgaj, Vice Chairman, term starting on 2 October 2015; Blaž Šterk, Member, term starting on 4 October 2014; Alenka Vrhovnik Težak, Member, term starting on 8 October 2015;
Rok Pivk, Member, term starting on 13 May 2016;
Vid Leskovec, Member, term starting on 31 May 2016.
In 2016, the terms of office of the following members ended: Janko Gedrih (resignation), Andrej Slapar (expiry) and Matjaž
Trebše (resignation). In the reporting year, the Supervisory Board held nine sessions and five correspondence sessions.
Supervisory Board Committees
The Supervisory Board forms committees as its consultative bodies. In line with the act regulating banking, the Bank set up four
committees consisting of only the members of the Supervisory Board, whilst their manner of organisation and operation is
governed by the applicable rules of procedure.
In 2016, the Audit Committee was composed of the following members:
– from 1 January to 31 May 2016: Blaž Šterk as its Chairman, and Marko Garbajs, Matjaž Trebše and Melita Malgaj as its
members;
– from 1 June to 8 August 2016: Blaž Šterk as its Chairman, and Matjaž Trebše, Melita Malgaj and Rok Pivk as its members;
– from 9 August to 24 August 2016: Blaž Šterk as its Chairman, and Melita Malgaj and Rok Pivk as its members;
– from 25 August 2016 onwards: Blaž Šterk as its Chairman, and Melita Malgaj, Rok Pivk and Alenka Vrhovnik Težak as its
members. The main purpose of the Audit Committee is to support the Supervisory Board in the execution of their supervisory duties related
to the supervision of the organisation and efficiency of operations, putting emphasis on the quality and appropriateness of the
risk management system and the internal control system with respect to financial reporting, compliance with the regulations and
internal documents of the Bank, compliance of internal auditing, and adherence to the Code of Business Ethics and to the
procedures for assessing the external auditor’s independence. The Committee promotes transparent reporting and an efficient
governance system of the banking group and creates added value by giving independent and impartial assurances to the
Supervisory Board. The Committee held eight meetings and one correspondence meeting in 2016.
In 2016, the Compensation Committee had the following composition:
– from 1 January to 30 May 2016: Andrej Slapar as its Chairman and Alenka Vrhovnik Težak and Matjaž Trebše as its
members;
– from 31 May to 8 August 2016: Matjaž Trebše was as its Chairman and Alenka Vrhovnik Težak and Vid Leskovec were its
members;
– from 9 August to 24 August 2016: Alenka Vrhovnik Težak and Vid Leskovec as its members;
– from 25 August 2016 onwards: Marko Garbajs as its Chairman and Alenka Vrhovnik Težak and Vid Leskovec as its
members. The main purpose of the Compensation Committee is to support the Supervisory Board in the execution of their supervisory
duties in relation to preparing decisions on remuneration, including those having an impact on the risks and risk management of
the Bank. The Committee held four meetings in 2016.
In 2016, the Human Resource Committee had the following composition:
– from 1 January to 9 February 2016: Janko Gedrih as its Chairman, and Andrej Slapar and Melita Malgaj as its members;
– from 10 February to 25 February 2016: Andrej Slapar and Melita Malgaj as its members;
– from 25 February to 30 May 2016: Marko Garbajs as its Chairman, and Andrej Slapar and Melita Malgaj as its members;
– from 31 May 2016 onwards: Marko Garbajs as its Chairman, and Melita Malgaj and Vid Leskovec as its members.
The main purpose of the Committee is to support the Supervisory Board in the execution of their supervisory duties with respect
to staffing issues involving the Management Board and the Supervisory Board membership. The Committee held six meetings
and one correspondence meeting in 2016.
A B A N K A G R O U P Annual Report 2016
61
In the reporting period, the Risk Monitoring and Asset Liability Management Committee had the following composition:
– from 1 January to 9 February 2016: Marko Garbajs as its Chairman, and Janko Gedrih, Alenka Vrhovnik Težak and Blaž
Šterk as its members;
– from 10 February to 30 May 2016: Marko Garbajs as its Chairman and Alenka Vrhovnik Težak and Blaž Šterk as its
members;
– from 31 May 2016 onwards: Alenka Vrhovnik Težak as its Chairman, and Marko Garbajs, Blaž Šterk and Rok Pivk as its
members.
The main purpose of the Committee is to support the Supervisory Board in the execution of its supervisory duties with respect to
taking decisions related to the risk management function, the risk profile and the control of asset liability management in the
Bank. In 2016, the Committee met seven times.
Abanka d.d. is committed to further strengthen its corporate governance and raise the corporate culture.
Ljubljana, 23 February 2017
Management Board Supervisory Board
Jože LENIČ
President of the Management Board
Marko GARBAJS
Chairman of the Supervisory Board
Aleksander VOZEL
Member of the Management Board
Matej GOLOB MATZELE
Member of the Management Board
A B A N K A G R O U P Annual Report 2016
62
RISK MANAGEMENT
The operations of Abanka in 2016 were directed towards the implementation of further activities relating to the merger with
Banka Celje and the improvement of the risk management process. Abanka upgraded the rating system for corporate customer
classification, the group loss assessment methodology and the limit system, the rating methodology for banks and debt
securities issued by institutions, the methodology for calculating the upper exposure limit for banks, the ICAAP process and the
Recovery Plan. The central project during the reporting period was the performance of the activities necessary in the context of
the projects “AQR and stress tests” and “IFRS 9” as well as continued activities for the implementation of the Bank of Sloven ia
guidelines on the calculation of default and loss rates. Apart from that, the early warning system for increased credit risk and
upgraded IT support for collateral management were introduced.
Abanka was identified as a systemically important bank and was included in a comprehensive assessment performed by the
ECB. The Bank passed the comprehensive assessment, under both the baseline and adverse scenarios.
In 2016, the Risk Management Strategy was revised to take into account the guidelines included in the Restructuring Plan of
the Bank, the Business Plan of the Bank for the 2017–2019 Period and the commitments made to the European Commission
regarding risk management.
In terms of risk management, the Abanka Group set clear objectives, which are achieved by establishing appropriate
procedures through key processes and a clear segregation of duties and powers. The Risk Management Strategy objectives are
as follows:
• to ensure an effective risk management process while implementing the set business policy and financial plan;
• to define the risk appetite of the Group;
• to identify and appropriately manage all major risks;
• to define clear lines of duties and responsibilities throughout the risk management process within the Group;
• to optimise the risk and return ratio;
• risk management that allows achieving financial objectives even in adverse operating conditions.
In order to achieve the set objectives, the Abanka Group adopted the following risk management principles:
• building the risk management culture and continually improving risk management processes as the key business elements,
• defining clear lines of duties and responsibilities throughout the risk management process,
• ensuring efficient risk management infrastructure to support business growth and development plans.
In the Risk Management Strategy, special attention was paid to the risk appetite and the risk management culture. The Bank is
aware that business decisions have to be aimed at ensuring long-term sustainable and profitable operations and maintaining an
adequate capital level with regard to the level of assumed risk. This means that bank divisions need to be able to realise their
ambitions without going against the interests of investors, customers, employees and the public at large. In line with the Risk
Management Strategy, the Bank makes a risk profile assessment and a risk-bearing capacity assessment at least twice a year.
The testing of the impact of extraordinary circumstances at the Group level is an important part of strategic planning of the risk-
bearing capacity, as it provides information on whether the financial position of the Group could withstand the impact of
extraordinary, but likely events.
With its active risk management and an adequate capital level, Abanka’s strategic objective is to obtain and retain the credit
rating in an investment grade.
The Risk Management Department, an organisational unit independent from the front office, is in charge of the risk management
function. The Risk Management Department is responsible for the development and use of risk management techniques
(identification, measurement/assessment, control and monitoring/reporting) at the Group level in the most reliable, integrated,
systemic, transparent and comprehensible manner. It is also responsible for raising awareness about the importance of risk
management for the long-term stability and safety of the Group's operations within the scope of the key risk-bearing capacity
indicators as set in the risk management strategy.
With its active risk management and
an adequate capital level, Abanka’s
strategic objective is to obtain and retain
the credit rating in an investment grade.
A B A N K A G R O U P Annual Report 2016
63
The activities of the Risk Management Division in 2016 and the achieved results are presented in detail below. In 2017, the
activities of the Division will primarily focus on upgrading the internal rating system related to credit risk (stand-alone risk) and
the operational risk management system. Special attention will be paid to model risk and conduct risk, while taking into account
the precautionary principle and diversification of the portfolio of financial instruments. Moreover, the internal capital adequacy
assessment process (ICAAP) and stress testing will be upgraded. Furthermore, the Bank will redesign the processes and
methodologies relating to the disclosure of financial instruments and the calculation of credit risk losses as the result of the
transition to IFRS 9, which will enter into force on 1 January 2018.
CREDIT RISK
Credit risk is the most important risk in the Abanka Group and represents a risk that a debtor or counterparty will cause a loss to
the Group by failing to discharge an obligation. Apart from default risk, it includes concentration risk, the risk of less effective
credit protection (residual risk), country risk, dilution risk, foreign currency lending risk, ownership interest risk, downgrade risk
and shadow banking risk. The Group identified the following risks as material risks: default risk or counterparty default risk,
concentration risk and residual risk.
The main objective of credit risk management in the Abanka Group is to achieve and maintain such quality and diversification of
the credit portfolio, which provides for stable and sound operations, while achieving the target returns and capital adequacy, as
set out in the Risk Management Strategy. To achieve this objective, procedures for credit risk exposure monitoring and loss
prevention were set up.
The Abanka Group established the credit risk management process, which includes: credit risk identification,
measurement/assessment, monitoring, management and reporting procedures. In credit risk management, various credit risk
mitigation tools are used, such as: the limit system, credit collateral, master netting agreements, financial covenants and other
contractual provisions in credit agreements.
Exposure to credit risk depends on the following three credit risk components:
a debtor’s default probability reflected in their credit rating,
the loss or recovery ratio on defaulted obligations,
the amount of exposure in the case of a default.
The Group uses the expected loss as a measure of credit risk. When calculating the expected loss, the credit portfolio risk
assessment, amount and quality of collateral and exposure maturity are taken into account as well as the risk characteristics of
various types of exposure. In credit risk assessment, the volume and concentration of assets are taken into account in addition
to asset quality.
In 2016, the shares of C, D and E loans in the Group's credit portfolio, excluding exposures to banks, decreased compared to
the previous year. The reasons for the decrease are continued activities related to the collection of non-performing loans, the
restructuring of corporate loans which have a business model and a sufficient cash flow for future loan repayment, the
implementation of activities connected to the early warning system (EWS) for increased credit risk and a selective approach in
the approval of new loans to companies for financing their ordinary course of business or investments.
Trends in the shares of CDE and DE loans in the Group's credit portfolio, excluding exposures to banks, are presented in the
graph on the following page.
The main objective of credit risk management
in the Abanka Group is to achieve and
maintain such quality and diversification of
the credit portfolio, which provides for stable
and sound operations, while achieving the
target returns and capital adequacy, as set
out in the Risk Management Strategy.
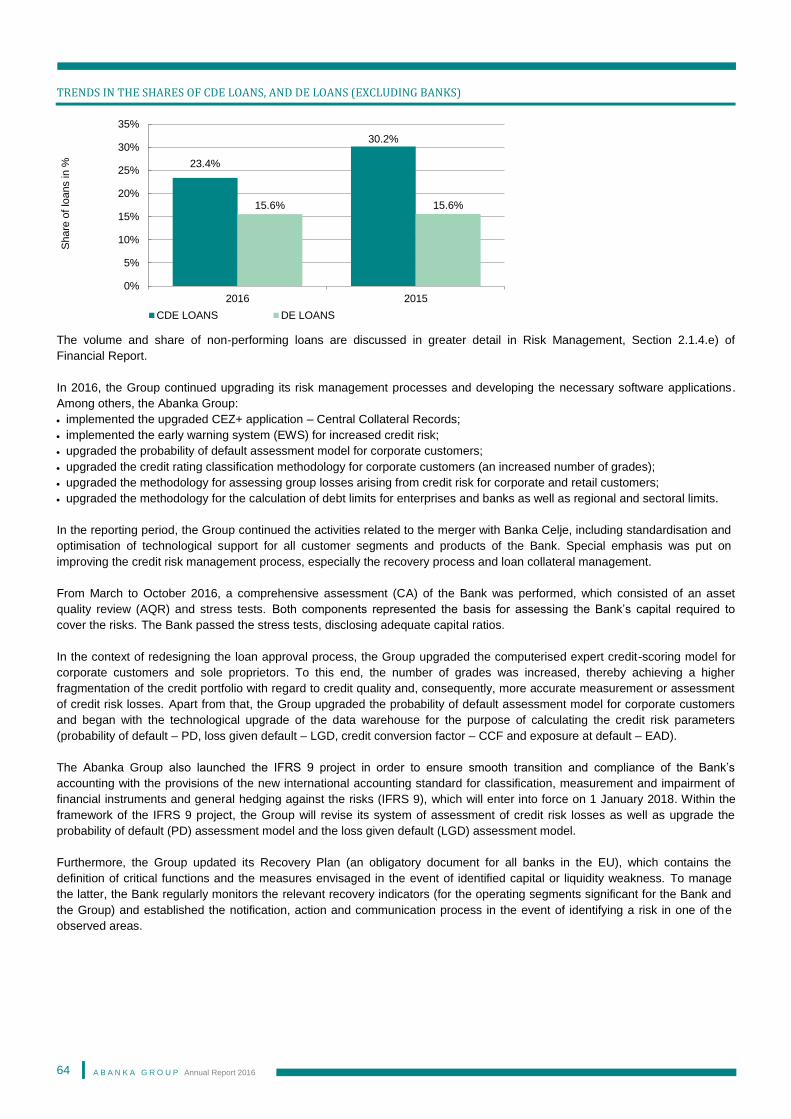
A B A N K A G R O U P Annual Report 2016
64
TRENDS IN THE SHARES OF CDE LOANS, AND DE LOANS (EXCLUDING BANKS)
The volume and share of non-performing loans are discussed in greater detail in Risk Management, Section 2.1.4.e) of
Financial Report.
In 2016, the Group continued upgrading its risk management processes and developing the necessary software applications.
Among others, the Abanka Group:
implemented the upgraded CEZ+ application – Central Collateral Records;
implemented the early warning system (EWS) for increased credit risk;
upgraded the probability of default assessment model for corporate customers;
upgraded the credit rating classification methodology for corporate customers (an increased number of grades);
upgraded the methodology for assessing group losses arising from credit risk for corporate and retail customers;
upgraded the methodology for the calculation of debt limits for enterprises and banks as well as regional and sectoral limits.
In the reporting period, the Group continued the activities related to the merger with Banka Celje, including standardisation and
optimisation of technological support for all customer segments and products of the Bank. Special emphasis was put on
improving the credit risk management process, especially the recovery process and loan collateral management.
From March to October 2016, a comprehensive assessment (CA) of the Bank was performed, which consisted of an asset
quality review (AQR) and stress tests. Both components represented the basis for assessing the Bank’s capital required to
cover the risks. The Bank passed the stress tests, disclosing adequate capital ratios.
In the context of redesigning the loan approval process, the Group upgraded the computerised expert credit-scoring model for
corporate customers and sole proprietors. To this end, the number of grades was increased, thereby achieving a higher
fragmentation of the credit portfolio with regard to credit quality and, consequently, more accurate measurement or assessment
of credit risk losses. Apart from that, the Group upgraded the probability of default assessment model for corporate customers
and began with the technological upgrade of the data warehouse for the purpose of calculating the credit risk parameters
(probability of default – PD, loss given default – LGD, credit conversion factor – CCF and exposure at default – EAD).
The Abanka Group also launched the IFRS 9 project in order to ensure smooth transition and compliance of the Bank’s
accounting with the provisions of the new international accounting standard for classification, measurement and impairment of
financial instruments and general hedging against the risks (IFRS 9), which will enter into force on 1 January 2018. Within the
framework of the IFRS 9 project, the Group will revise its system of assessment of credit risk losses as well as upgrade the
probability of default (PD) assessment model and the loss given default (LGD) assessment model.
Furthermore, the Group updated its Recovery Plan (an obligatory document for all banks in the EU), which contains the
definition of critical functions and the measures envisaged in the event of identified capital or liquidity weakness. To manage
the latter, the Bank regularly monitors the relevant recovery indicators (for the operating segments significant for the Bank and
the Group) and established the notification, action and communication process in the event of identifying a risk in one of the
observed areas.
23.4%
30.2%
15.6% 15.6%
0%
5%
10%
15%
20%
25%
30%
35%
2016 2015
Share
of
loans in %
CDE LOANS DE LOANS
A B A N K A G R O U P Annual Report 2016
65
In 2017, the Group will continue with the activities on the IFRS 9 project, the implementation of the Bank of Slovenia guidelines
on the calculation of default and loss rates and the upgrading of the EWS process. The focus will be on credit portfolio
optimisation, including the acceptance of adequate forms of collateral, which should not only optimise the capital requirements
but also improve the collectability of due receivables.
Great attention will be devoted to the implementation of the probability of default assessment model, the establishment of IT
support and internal processes that will allow the collection of data required to calculate credit parameters (PD and LGD), the
updating of the methodology for assessing group percentage losses arising from credit risk, the redesign of the loan approval
process, the upgrade of individual limit systems as well as to the improvement of the credit portfolio monitoring information
system and the credit risk reporting system.
OPERATIONAL RISK
Operational risk is the risk of loss resulting from inadequate or failed internal processes, people and systems or from
external events, and includes legal risk. The definition additionally includes model risk, conduct risk and outsourcing risk, but
excludes strategic risk and reputational risk. However, the realisation of operational risk may, as a consequence, impair the
Bank's reputation.
The Group regularly identifies and assesses the operational risk exposure, while also taking stock of preventive and corrective
measures in case of potential loss events. The system of reporting the occurrence of loss events and other incidents in the
Abanka Group involves the entire staff and enables a quick reaction in the event of problems, as the Management Board and
senior management are involved in such reporting if necessary. The occurrence and frequency of loss events – financial, non-
financial and contingent, which are in the broadest sense called incidents – are quarterly discussed by both the Operational
Risk Committee, responsible for the development of the operational risk management system, and the Risk Management
Committee, which is a collective decision-making body responsible for monitoring, directing and controlling operational risk
management. The Risk Management Committee is promptly informed of all significant operational risks and major losses. It
monitors the operational risk exposure and takes the necessary risk management measures, monitors their implementation and
discusses operational risk profiles (assessed, realised, targeted).
In 2016, the Abanka Group upgraded the management system of loss events and other incidents. An analysis of loss events
occurred in 2016 indicated that the human factor was the main source of losses arising from operational risk, followed by the
losses arising from external environmental factors. Action plans were prepared for all significant types of loss events, aimed at
their prevention or reducing the likelihood of their occurrence, including the persons in charge and the deadlines.
Implementation of measures is regularly monitored.
In 2016, the Group assessed the potential exposure to operational risk, both excluding and including the control environment
assessment.
Abanka has prepared business continuity plans and disaster recovery plans, which are regularly updated and tested.
In 2017, the Group will actively continue to upgrade the operational risk management system, placing emphasis on quick risk
identification, prevention of the most recent outstanding risks, fraud risk management and extraordinary events that might
jeopardise the business continuity of the Bank. Special attention will be paid to model risk and conduct risk. In the future, risk
analyses will be prepared using new software support, which will improve the efficiency of operational risk management.
Abanka has prepared business continuity
plans and disaster recovery plans, which
are regularly updated and tested.
A B A N K A G R O U P Annual Report 2016
66
MARKET RISK
Market risk is the risk of loss due to the unfavourable movement of market prices. It is caused by an adverse movement of risk
factors, including interest rates, exchange rates, credit spreads, the prices of shares, commodity/gold prices and other important
factors. The Group separately monitors its market risk exposure to financial instruments according to its trading and banking
books. Market risk primarily arises from the activities performed in the Treasury Department and the Investment Banking
Department.
The main purpose of market risk management is to achieve a balance between the return and the acceptable risk level, taking
into account the Group's risk appetite and risk-bearing capacity, macroeconomic environment factors, abiding by legal
restrictions and the corporate policy in force. In the Group, trading units generating risk are operationally and organisationally
separated from the Risk Management Department, the middle office and the back office. The Management Board authorised the
Risk Management Committee to approve market risk exposure limits.
Market risk is regularly measured and assessed by means of stress testing and sensitivity analyses, which enable estimating
the likelihood of a potential event's occurrence and the level of its consequences. The Management Board, senior management
and the Supervisory Board are regularly informed of the market risk analyses results.
In 2016, the Group continued its policy of limited trading in financial instruments. Trading in equity financial instruments was
banned, whilst trading in debt financial instruments for own account was mainly limited to primary dealing in the government
bonds of the Republic of Slovenia and active maintenance of this bond market. Trading in derivatives was limited to foreign
exchange and interest rate financial instruments requested by customers (mostly corporates) for the purpose of hedging against
interest rate and currency risks.
The banking book portfolio includes both equity and debt securities, which are not held for trading. The banking book equity
portfolio includes only the strategic positions of the Bank and positions obtained from collateral foreclosure or debt-to-equity
swaps. The size of the debt securities portfolio of the banking book, serving as an asset and liability management tool,
decreased in 2016 by EUR 191 million, amounting to EUR 1,250 million as at the 2016 year-end.
To measure market risks, the Group applies Value at Risk (VaR): a quantitative measure used for assessing potential loss in the
value of a position caused by adverse risk factor changes over a given future period at a given level of confidence in normal
market conditions. The Group calculates VaR for debt financial instruments based on a historical simulation at a 95% to 99%
confidence level and with a 10-day holding period. At a 99% confidence level, with a 10-day holding period and under the
assumption of normal market conditions, the Group could not have incurred more than EUR 28 thousand of loss from trading in
debt financial instruments as at the 2016 year-end.
A limit system is the basic tool for effective market risk management, which arises from the Group’s appetite to bear market risk.
The Group has established a limit system, including credit and position limits, stop loss limits, market rate compliance limits,
VaR limits and limits per single authorised person. In setting limits in the trading and banking books of financial instruments, the
Abanka Group follows the principles of prudence and increased portfolio diversification to minimise the exposure to credit and
market risks.
In 2016, the limit systems restricting the Bank’s market risk exposure remained unchanged. Trading in derivatives was based on
the back-to-back trading policy. Trading in derivatives with other companies was mostly performed only to hedge positions
against interest and currency risks. Trading in more complex derivatives was not allowed.
The Group plans to maintain a low appetite for market risk in the future through restrictive limit systems for high liquidity of the
Bank’s trading portfolio, debt financial instruments of high credit quality and effective portfolio diversification. A potential threat is
the possibility that portfolios will deteriorate and expand due to the possible realisation of collaterals in lending operations or due
to potential debt-to-equity swaps, which will increase the market risk exposure. A potential increased exposure of the Group to
market risk can also be caused by a counterparty’s failure to meet its obligations from transactions in derivatives, which the
Group is closing with high-street European banks.
A limit system is the basic tool for effective
market risk management, which arises from
the Group’s appetite to bear market risk.
A B A N K A G R O U P Annual Report 2016
67
INTEREST RATE RISK
Interest rate risk is the risk arising from the exposure to unfavourable changes in levels of market interest rates. Fluctuations in
the levels of prevailing market interest rates have an impact on the value of financial instruments and the future cash flows. As a
consequence of these changes, interest margins and profits change as well.
For interest rate risk management, an effective interest rate risk management process is in place, which keeps risks at an
acceptable level. Interest rate risk is identified, measured, managed, controlled and monitored in line with the interest rate risk
management policy. In terms of organisation, interest rate risk limitation and control are separated from operational interest rate
risk management and the fulfilment of requirements.
The interest rate risk arising from trading is monitored within the framework of monitoring market risks. The interest rate risk
arising from the banking book is measured through interest rate gaps and regular balance sheet interest rate sensitivity
analyses. Interest gaps indicate the difference between the cash flows of interest rate sensitive assets and interest rate sensitive
liabilities by an individual time bucket, whereas interest rate sensitivity analyses, taking into account various scenarios and
forecasts, measure the impact of potential changes in interest rates and other factors on the economic value of the capital and
the net interest income of the Bank. The extent of interest rate risk is restricted by a limit system and different scenarios are
given for measuring the impact of yield curve changes on interest rate risk. The basis risk, arising from various types of
reference interest rates, is also taken into account when interest rate risk is measured. Stress tests are regularly performed.
In 2016, the euro area continued to record moderate economic growth, however the decision of Great Britain to leave the EU
caused further uncertainty. The situation in the labour market has been improving, but euro area growth is expected to remain
only moderate. The ECB continued to implement the non-standard measures within the quantitative easing programme. The
purchases under the APP are expected to continue at the monthly pace of EUR 80 billion until the end of March 2017, whereas
from April 2017 onwards the monthly purchases will again be EUR 60 billion. The programme is intended to last until the end of
December 2017, or until the ECB sees a sustained adjustment in the path of inflation consistent with its inflation aim. With
respect to the monetary policy, the ECB reduced the interest rate on the main refinancing operations to 0.00% and the deposit
facility rate to –0.40%. Moreover, the ECB introduced negative interest rates on the targeted longer-term refinancing operations
(TLTRO). Interest rates are expected to remain at such low levels for quite some time, which for banks represents new risks in
finding an adequate return. In 2016 the reference interest rates further decreased, remaining in negative territory even for a
prolonged period of time.
The Abanka Group continuously adjusted its interest rate policy to the conditions in domestic and international markets as well
as balanced its interest rate position. In the current year, the interest rate risk exposure of the Abanka Group was regularly
monitored, however the existing market situation requires detailed monitoring and control of the interest rate risk.
The graph on the following page shows interest gaps by time bucket at the end of 2016 in comparison to the 2015 year-end.
For interest rate risk management,
an effective interest rate risk management
process is in place, which keeps risks at
an acceptable level.
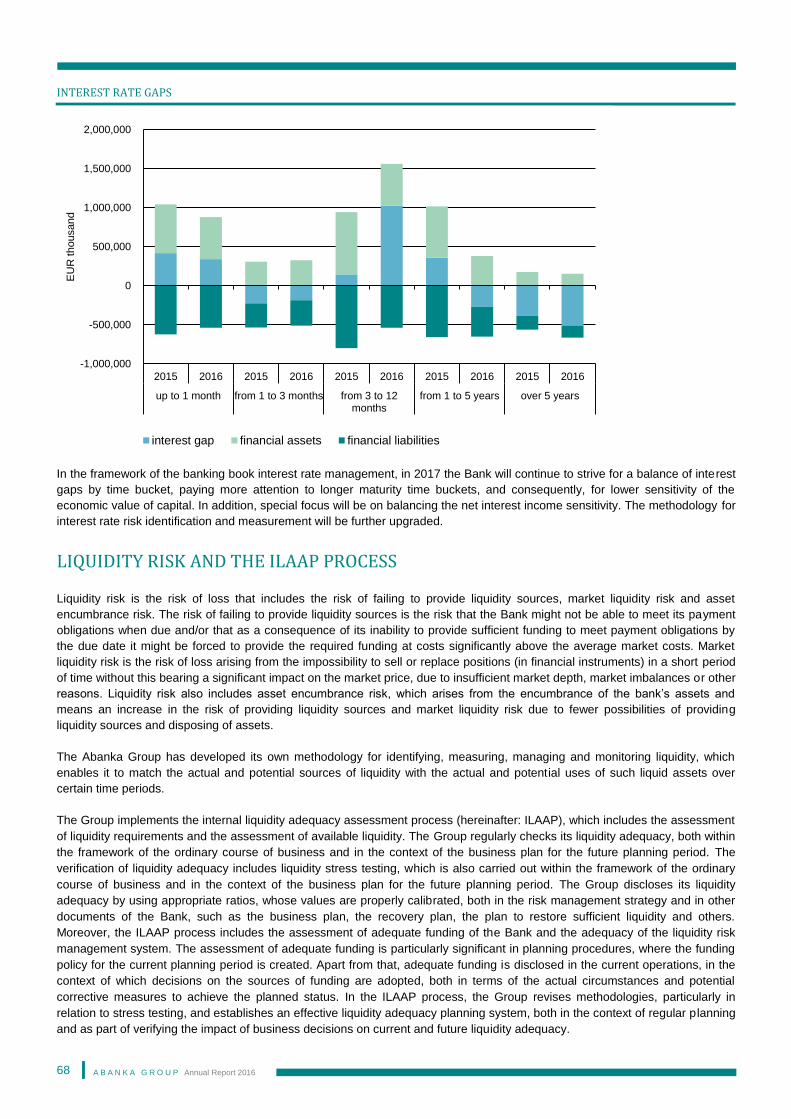
A B A N K A G R O U P Annual Report 2016
68
INTEREST RATE GAPS
In the framework of the banking book interest rate management, in 2017 the Bank will continue to strive for a balance of interest
gaps by time bucket, paying more attention to longer maturity time buckets, and consequently, for lower sensitivity of the
economic value of capital. In addition, special focus will be on balancing the net interest income sensitivity. The methodology for
interest rate risk identification and measurement will be further upgraded.
LIQUIDITY RISK AND THE ILAAP PROCESS
Liquidity risk is the risk of loss that includes the risk of failing to provide liquidity sources, market liquidity risk and asset
encumbrance risk. The risk of failing to provide liquidity sources is the risk that the Bank might not be able to meet its payment
obligations when due and/or that as a consequence of its inability to provide sufficient funding to meet payment obligations by
the due date it might be forced to provide the required funding at costs significantly above the average market costs. Market
liquidity risk is the risk of loss arising from the impossibility to sell or replace positions (in financial instruments) in a short period
of time without this bearing a significant impact on the market price, due to insufficient market depth, market imbalances or other
reasons. Liquidity risk also includes asset encumbrance risk, which arises from the encumbrance of the bank’s assets and
means an increase in the risk of providing liquidity sources and market liquidity risk due to fewer possibilities of providing
liquidity sources and disposing of assets.
The Abanka Group has developed its own methodology for identifying, measuring, managing and monitoring liquidity, which
enables it to match the actual and potential sources of liquidity with the actual and potential uses of such liquid assets over
certain time periods.
The Group implements the internal liquidity adequacy assessment process (hereinafter: ILAAP), which includes the assessment
of liquidity requirements and the assessment of available liquidity. The Group regularly checks its liquidity adequacy, both within
the framework of the ordinary course of business and in the context of the business plan for the future planning period. The
verification of liquidity adequacy includes liquidity stress testing, which is also carried out within the framework of the ordinary
course of business and in the context of the business plan for the future planning period. The Group discloses its liquidity
adequacy by using appropriate ratios, whose values are properly calibrated, both in the risk management strategy and in other
documents of the Bank, such as the business plan, the recovery plan, the plan to restore sufficient liquidity and others.
Moreover, the ILAAP process includes the assessment of adequate funding of the Bank and the adequacy of the liquidity risk
management system. The assessment of adequate funding is particularly significant in planning procedures, where the funding
policy for the current planning period is created. Apart from that, adequate funding is disclosed in the current operations, in the
context of which decisions on the sources of funding are adopted, both in terms of the actual circumstances and potential
corrective measures to achieve the planned status. In the ILAAP process, the Group revises methodologies, particularly in
relation to stress testing, and establishes an effective liquidity adequacy planning system, both in the context of regular planning
and as part of verifying the impact of business decisions on current and future liquidity adequacy.
-1,000,000
-500,000
0
500,000
1,000,000
1,500,000
2,000,000
2015 2016 2015 2016 2015 2016 2015 2016 2015 2016
up to 1 month from 1 to 3 months from 3 to 12months
from 1 to 5 years over 5 years
EU
R thousand
interest gap financial assets financial liabilities
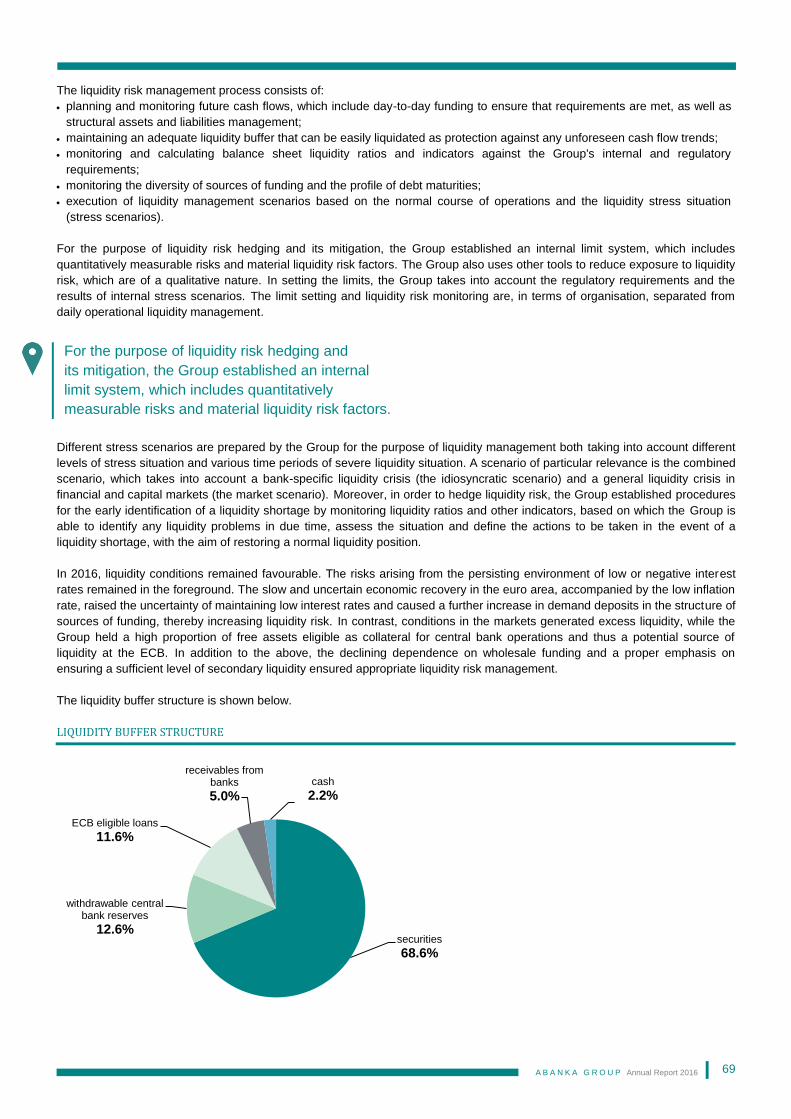
A B A N K A G R O U P Annual Report 2016
69
The liquidity risk management process consists of:
planning and monitoring future cash flows, which include day-to-day funding to ensure that requirements are met, as well as
structural assets and liabilities management;
maintaining an adequate liquidity buffer that can be easily liquidated as protection against any unforeseen cash flow trends;
monitoring and calculating balance sheet liquidity ratios and indicators against the Group's internal and regulatory
requirements;
monitoring the diversity of sources of funding and the profile of debt maturities;
execution of liquidity management scenarios based on the normal course of operations and the liquidity stress situation
(stress scenarios).
For the purpose of liquidity risk hedging and its mitigation, the Group established an internal limit system, which includes
quantitatively measurable risks and material liquidity risk factors. The Group also uses other tools to reduce exposure to liquidity
risk, which are of a qualitative nature. In setting the limits, the Group takes into account the regulatory requirements and the
results of internal stress scenarios. The limit setting and liquidity risk monitoring are, in terms of organisation, separated from
daily operational liquidity management.
Different stress scenarios are prepared by the Group for the purpose of liquidity management both taking into account different
levels of stress situation and various time periods of severe liquidity situation. A scenario of particular relevance is the combined
scenario, which takes into account a bank-specific liquidity crisis (the idiosyncratic scenario) and a general liquidity crisis in
financial and capital markets (the market scenario). Moreover, in order to hedge liquidity risk, the Group established procedures
for the early identification of a liquidity shortage by monitoring liquidity ratios and other indicators, based on which the Group is
able to identify any liquidity problems in due time, assess the situation and define the actions to be taken in the event of a
liquidity shortage, with the aim of restoring a normal liquidity position.
In 2016, liquidity conditions remained favourable. The risks arising from the persisting environment of low or negative interest
rates remained in the foreground. The slow and uncertain economic recovery in the euro area, accompanied by the low inflation
rate, raised the uncertainty of maintaining low interest rates and caused a further increase in demand deposits in the structure of
sources of funding, thereby increasing liquidity risk. In contrast, conditions in the markets generated excess liquidity, while the
Group held a high proportion of free assets eligible as collateral for central bank operations and thus a potential source of
liquidity at the ECB. In addition to the above, the declining dependence on wholesale funding and a proper emphasis on
ensuring a sufficient level of secondary liquidity ensured appropriate liquidity risk management.
The liquidity buffer structure is shown below.
LIQUIDITY BUFFER STRUCTURE
securities
68.6%
withdrawable central bank reserves
12.6%
ECB eligible loans
11.6%
receivables from banks
5.0%cash
2.2%
For the purpose of liquidity risk hedging and
its mitigation, the Group established an internal
limit system, which includes quantitatively
measurable risks and material liquidity risk factors.
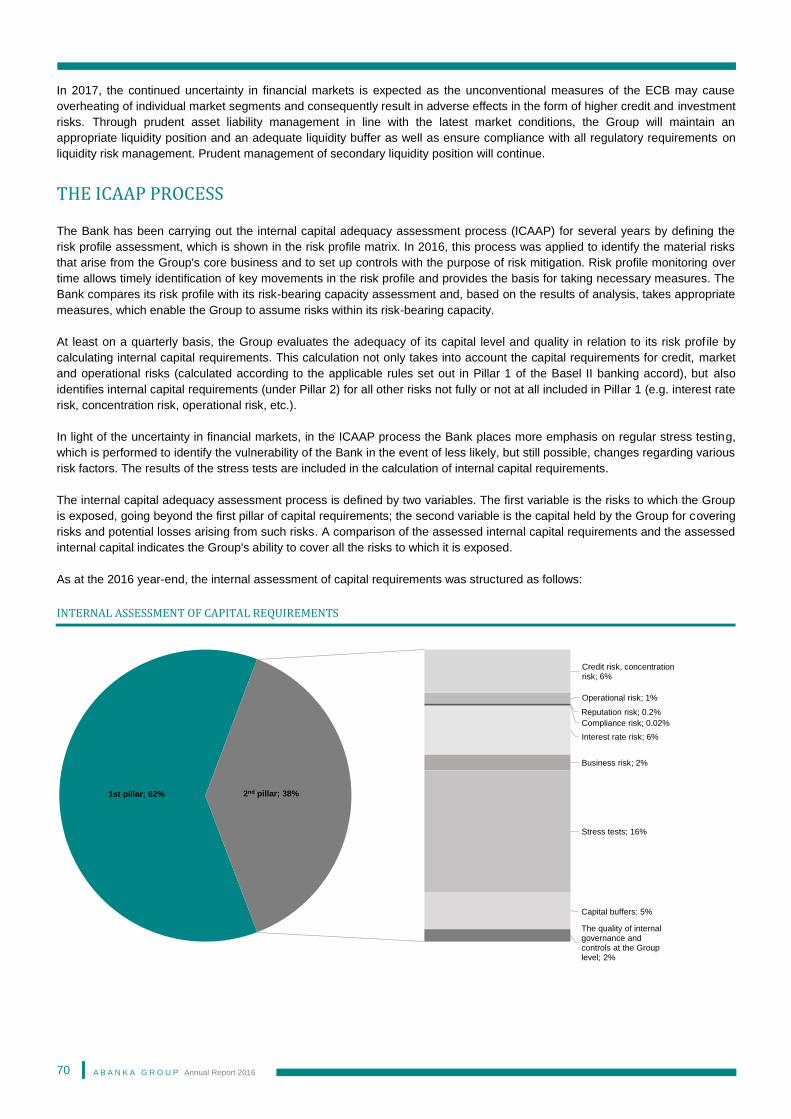
A B A N K A G R O U P Annual Report 2016
70
In 2017, the continued uncertainty in financial markets is expected as the unconventional measures of the ECB may cause
overheating of individual market segments and consequently result in adverse effects in the form of higher credit and investment
risks. Through prudent asset liability management in line with the latest market conditions, the Group will maintain an
appropriate liquidity position and an adequate liquidity buffer as well as ensure compliance with all regulatory requirements on
liquidity risk management. Prudent management of secondary liquidity position will continue.
THE ICAAP PROCESS
The Bank has been carrying out the internal capital adequacy assessment process (ICAAP) for several years by defining the
risk profile assessment, which is shown in the risk profile matrix. In 2016, this process was applied to identify the material risks
that arise from the Group's core business and to set up controls with the purpose of risk mitigation. Risk profile monitoring over
time allows timely identification of key movements in the risk profile and provides the basis for taking necessary measures. The
Bank compares its risk profile with its risk-bearing capacity assessment and, based on the results of analysis, takes appropriate
measures, which enable the Group to assume risks within its risk-bearing capacity.
At least on a quarterly basis, the Group evaluates the adequacy of its capital level and quality in relation to its risk prof ile by
calculating internal capital requirements. This calculation not only takes into account the capital requirements for credit, market
and operational risks (calculated according to the applicable rules set out in Pillar 1 of the Basel II banking accord), but also
identifies internal capital requirements (under Pillar 2) for all other risks not fully or not at all included in Pillar 1 (e.g. interest rate
risk, concentration risk, operational risk, etc.).
In light of the uncertainty in financial markets, in the ICAAP process the Bank places more emphasis on regular stress testing,
which is performed to identify the vulnerability of the Bank in the event of less likely, but still possible, changes regarding various
risk factors. The results of the stress tests are included in the calculation of internal capital requirements.
The internal capital adequacy assessment process is defined by two variables. The first variable is the risks to which the Group
is exposed, going beyond the first pillar of capital requirements; the second variable is the capital held by the Group for covering
risks and potential losses arising from such risks. A comparison of the assessed internal capital requirements and the assessed
internal capital indicates the Group's ability to cover all the risks to which it is exposed.
As at the 2016 year-end, the internal assessment of capital requirements was structured as follows:
INTERNAL ASSESSMENT OF CAPITAL REQUIREMENTS
1st pillar; 62%
Credit risk, concentration risk; 6%
Operational risk; 1%
Reputation risk; 0.2%
Compliance risk; 0.02%
Interest rate risk; 6%
Business risk; 2%
Stress tests; 16%
Capital buffers; 5%
The quality of internal governance and controls at the Group level; 2%
2nd pillar; 38%
A B A N K A G R O U P Annual Report 2016
71
STATEMENT OF THE MANAGEMENT BOARD AND THE SUPERVISORY BOARD ON THE ADEQUACY OF RISK MANAGEMENT IN ABANKA AND THE ABANKA GROUP
The Management Board is responsible to set up an appropriate risk management system and a financial and internal control
system in Abanka and the Abanka Group.
The Supervisory Board together with the Audit Committee, the Risk Management and Asset Liability Management Committee
and the Compensation Committee monitors the implementation of the Risk Management Strategy. Through its supervision, it
contributes to the establishment and implementation of not only an adequate and stable risk management system but also an
appropriate internal control system in Abanka and the Abanka Group.
Both the Management Board and the Supervisory Board assess that based on their risk profile and the adopted business
strategy Abanka and the Abanka Group have an appropriate risk management system, which enables the implementation of the
adopted Risk Management Strategy.
Ljubljana, 23 February 2017
Management Board Supervisory Board
Jože LENIČ
President of the Management Board
Marko GARBAJS
Chairman of the Supervisory Board
Aleksander VOZEL
Member of the Management Board
Matej GOLOB MATZELE
Member of the Management Board
A B A N K A G R O U P Annual Report 2016
72
STATEMENT OF THE MANAGEMENT BOARD AND THE SUPERVISORY BOARD ON THE RISKS OF ABANKA AND THE ABANKA GROUP
Abanka and the Abanka Group achieve strategic objectives based on the pre-defined risk appetite. The aim of the risk appetite
is to manage the acceptable level of profitability and the capital and liquidity adequacy of Abanka and the Abanka Group within
the limits laid down by the Supervisory Board, which are in line with the commitments made to the European Commission.
The risk appetite is limited so as to ensure that Abanka and the Abanka Group are operating at a satisfactory profit and maintain
adequate capital and liquidity levels also in extraordinary circumstances. Setting the risk appetite limits represents an important
part of the decision-making process. The ongoing risk monitoring and reporting process in Abanka and the Abanka Group
enables to take timely action at pre-set limits before reaching the upper tolerance limit. Risk management involves the entire
senior management, who participates in all relevant meetings and committees where decisions on risk management are taken.
Within the framework of the Supervisory Board, the Risk Monitoring and Asset Liability Management Committee was setup,
whose work particularly focuses on risk management.
Abanka and the Abanka Group monitor and assess all the risks on the basis of a risk matrix (part of the Risk Management
Strategy), which includes the definitions, scope, persons in charge and designation of (im)materiality. Special emphasis is put
on careful management of all material risks, including: credit risk, liquidity risk, interest rate risk, capital risk, currency risk,
market risk, profitability risk and operational risk.
The Management Board set and the Supervisory Board approved the risk appetite, defined by key indicators determining the
acceptable risk by a particular risk category. The credit risk appetite of Abanka and the Abanka Group is moderate, which
means that a more conservative credit risk management policy will be followed in the context of a prudent credit process.
In line with the above, the following guidelines will be observed:
focusing on the domestic market;
strengthening the retail and SME business;
investing in less risky debtors (defined by the internal credit rating scale) and limiting the exposures associated with a very
high risk;
ensuring credit portfolio diversification at the exposure level of individual borrowers, groups of related parties and industries;
strong emphasis on an appropriate form, size and quality of collateral;
maintaining an adequate level of liquidity reserves and liquidity ratios as defined in the applicable risk management strategy.
Monitoring of the risk profile of both the Bank and the Group is based on twelve key ratios (indicators), of which the main five,
including their thresholds, are presented below:
Common Equity Tier 1 (CET1) ratio – over 18%
the share of non-performing loans (NPLs) – under 15%
net interest margin (NIM) – over 1.8%
liquidity coverage ratio (LCR) – over 150%
loan-to-deposit ratio (LTD) – under 90%.
To provide a comprehensive presentation of the Bank’s risk profile, the values of the ratios are presented in the business part
(Section Financial Highlights and Performance Indicators) and the accounting part of the Annual Report of Abanka (Sections
Risk Management and Capital Management).
Abanka and the Abanka Group have clearly defined risk appetite limits through the limit systems (regional and sectoral limits,
individual credit limits, limits for trading and transactions with financial instruments of the banking book, limits for liquidity,
currency and interest rate risk management). In line with the implementation of the Group’s Strategy and the commitments
made to the European Commission, risk-adjusted pricing is used for corporate loans.
A B A N K A G R O U P Annual Report 2016
73
Risk assessment is conducted in the context of both the internal capital adequacy assessment process (ICAAP) and the internal
liquidity adequacy assessment process (ILAAP). The assessment of the required capital and liquidity levels is performed on a
quarterly basis and is regularly presented to the Bank’s bodies (the Risk Management Committee, the ALCO, the Management
Board, the Supervisory Board and its Committee).
The risk management systems in Abanka and the Abanka Group are appropriate and consistent with both the Business
Strategy and the Risk Management Strategy, which is based on the defined key risk management indicators.
Ljubljana, 23 February 2017
Management Board Supervisory Board
Jože LENIČ
President of the Management Board
Marko GARBAJS
Chairman of the Supervisory Board
Aleksander VOZEL
Member of the Management Board
Matej GOLOB MATZELE
Member of the Management Board
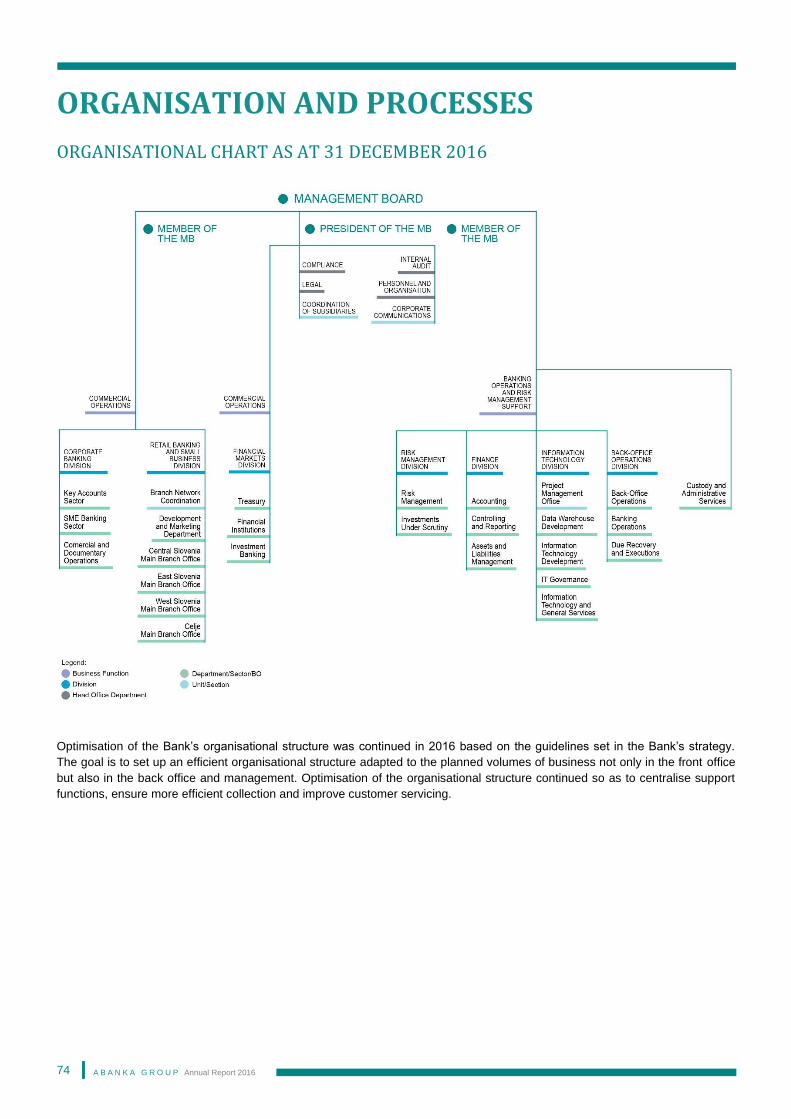
A B A N K A G R O U P Annual Report 2016
74
ORGANISATION AND PROCESSES
ORGANISATIONAL CHART AS AT 31 DECEMBER 2016
Optimisation of the Bank’s organisational structure was continued in 2016 based on the guidelines set in the Bank’s strategy.
The goal is to set up an efficient organisational structure adapted to the planned volumes of business not only in the front office
but also in the back office and management. Optimisation of the organisational structure continued so as to centralise support
functions, ensure more efficient collection and improve customer servicing.
A B A N K A G R O U P Annual Report 2016
75
PROJECTS PLANNED FOR 2017
In 2017, the highest priority will continue to be given to the projects connected to the operational merger or the establishment of
joint information support in the merged bank, placing particular emphasis on achieving the synergies related thereto. In the
context of the already established “Trojane D2” programme, the implementation of all projects will not only continue but will also
be completed in 2017:
migration of transaction accounts of retail and corporate customers; redesign of the “IRC naložbe” information system and data migration;
upgrade of retail loans and data migration; upgrade of retail deposits and data migration; data warehouse development.
Considering the demanding and extensive changes resulting in the introduction of the IFRS 9 standard, the establishment of a
uniform data platform for finance and risks and the advantages brought by such an approach, the Bank plans to introduce a
programme of projects, which will include the following projects:
adjustment of processes and IT support to the requirements of the new IFRS 9 standard,
provision of a time series of historical data necessary for modelling and
upgrade of the asset-liability management (ALM) software and implementation of Basel interest-rate risk standards (IRRBB).
In 2017, the programme will be implemented with the highest priority.
In accordance with the strategy of the Bank, in 2017 high priority will be given to the projects from the strategic programme of
accelerating digital transformation:
continued development of mobile banking and electronic channels for both retail and corporate customers,
completion of website redesign,
continued introduction of the comprehensive and multi-channel customer relationship management (CRM) system,
development of a customer loyalty programme,
development of support for instant payments and others.
Apart from this, Abanka will implement the projects aimed at significantly increasing its cost-effectiveness and improving its risk
management systems:
continued development of software support for a more efficient collection process,
further upgrade of software support for more efficient monitoring of receivables,
upgrade of software support for credit transactions with corporate customers based on the anticipated changes in the lending
process,
replacement of investment banking software,
redesign of software support for recording and keeping the statutory data on cash transactions in line with the Prevention of
Money Laundering and Terrorist Financing Act,
adjustment of IT support to the introduction of the UPN order with a QR code,
redesign of the Boniteta application, etc.
Within the framework of line duties, all other systems will continue to be developed in accordance with regulatory requirements
and current needs of the Bank's operations.
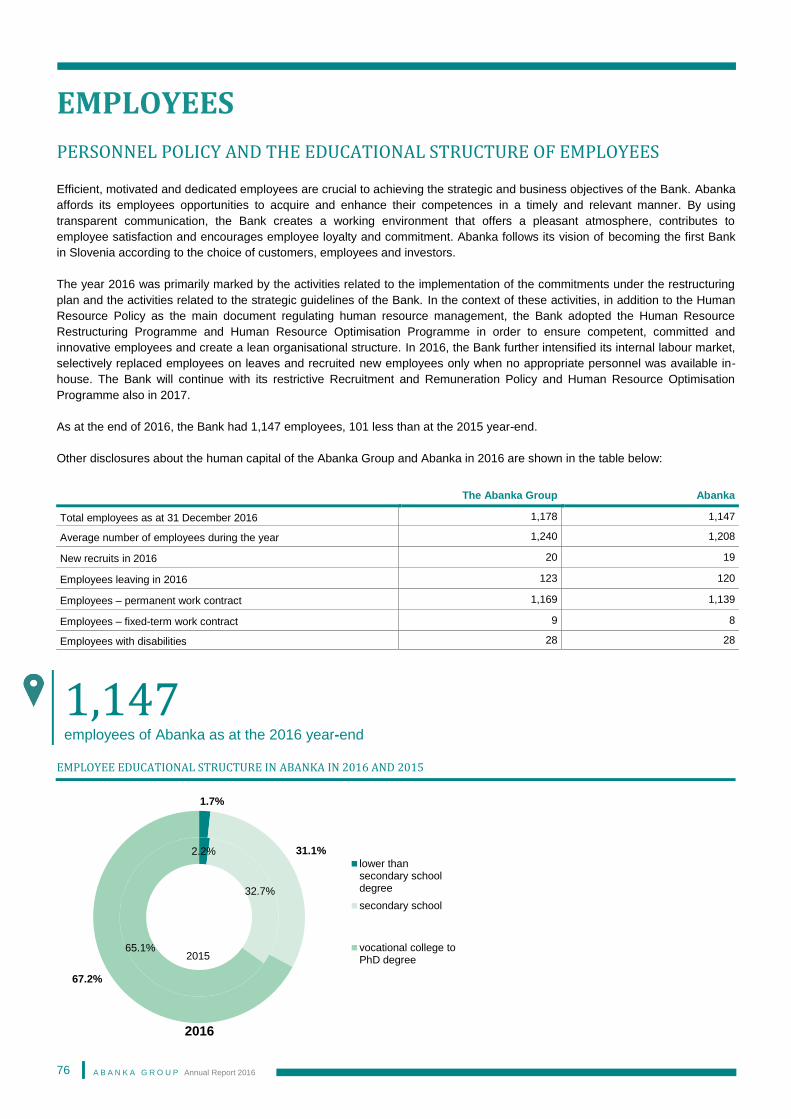
A B A N K A G R O U P Annual Report 2016
76
EMPLOYEES
PERSONNEL POLICY AND THE EDUCATIONAL STRUCTURE OF EMPLOYEES
Efficient, motivated and dedicated employees are crucial to achieving the strategic and business objectives of the Bank. Abanka
affords its employees opportunities to acquire and enhance their competences in a timely and relevant manner. By using
transparent communication, the Bank creates a working environment that offers a pleasant atmosphere, contributes to
employee satisfaction and encourages employee loyalty and commitment. Abanka follows its vision of becoming the first Bank
in Slovenia according to the choice of customers, employees and investors.
The year 2016 was primarily marked by the activities related to the implementation of the commitments under the restructuring
plan and the activities related to the strategic guidelines of the Bank. In the context of these activities, in addition to the Human
Resource Policy as the main document regulating human resource management, the Bank adopted the Human Resource
Restructuring Programme and Human Resource Optimisation Programme in order to ensure competent, committed and
innovative employees and create a lean organisational structure. In 2016, the Bank further intensified its internal labour market,
selectively replaced employees on leaves and recruited new employees only when no appropriate personnel was available in-
house. The Bank will continue with its restrictive Recruitment and Remuneration Policy and Human Resource Optimisation
Programme also in 2017.
As at the end of 2016, the Bank had 1,147 employees, 101 less than at the 2015 year-end.
Other disclosures about the human capital of the Abanka Group and Abanka in 2016 are shown in the table below:
EMPLOYEE EDUCATIONAL STRUCTURE IN ABANKA IN 2016 AND 2015
2.2%
32.7%
65.1%
1.7%
31.1%
67.2%
lower thansecondary schooldegree
secondary school
vocational college toPhD degree
2016
2015
The Abanka Group Abanka
Total employees as at 31 December 2016 1,178 1,147
Average number of employees during the year 1,240 1,208
New recruits in 2016 20 19
Employees leaving in 2016 123 120
Employees – permanent work contract 1,169 1,139
Employees – fixed-term work contract 9 8
Employees with disabilities 28 28
1,147 employees of Abanka as at the 2016 year-end
A B A N K A G R O U P Annual Report 2016
77
POLICY ON ASSESSMENT OF PROFESSIONAL COMPETENCE AND ADEQUACY
In accordance with the Banking Act and the related regulations and guidelines issued by the European Banking Authority
(hereinafter: EBA), the Bank formulated two policies: the Policy on Assessment of the Suitability of Management and
Supervisory Board Members and the Policy on Assessment of the Suitability of Key Function Holders.
The Policy on Assessment of the Suitability of Management and Supervisory Board Members was established so as to
define the qualities required by the person who is a candidate for performing the function of a Management Board or
Supervisory Board member and the qualities required by the person who already performs the function of a Management Board
or Supervisory Board member. In defining the necessary qualities of a Management Board or Supervisory Board member, the
Bank adheres to the "fit & proper” principle.
Criteria for the assessment of suitability The assessment of suitability is made based on the criteria (defined in a policy) regarding the scope and nature of work
experience required to perform a managerial and supervisory function, reputation, ethical integrity and the ability for constructive
cooperation in governance and supervision. In the assessment of experience, a wide range of knowledge (theoretical and
practical), skills and experience are taken into account, including the nature and complexity of the function for which a member
is a candidate or to which they have been appointed. In line with the policy, at least university education and five years of work
experience in a managerial function are required, in addition to knowing at least one foreign language. A study programme will
be deemed appropriate if, in terms of content, it is related to banking and finance, economics, administrative sciences, financial
regulations, or mathematical and statistical knowledge (the conditions for the performance of an individual function).
With respect to the criteria regarding the ability for constructive cooperation in governance, the diversity of the required
knowledge and experience in the context of the management body will be considered, including appropriate representation of
both genders, while also taking into account each member’s contribution to the heterogeneity, complementary expertise and
delegation of duties within the management body.
The policy defines the key guidelines for the appointment and assessment of suitability of candidates or members of the
management body, both in terms of professional competence, knowledge, skills, experience and the conditions required for the
performance of the functions as well as in terms of time devoted to the function, including the definition of personal
characteristics (reputation). These criteria will also be considered in the appointment of members of Supervisory Board
committees.
Considering the abovementioned criteria, the composition of both the Supervisory Board and the Management Board of the
Bank is evident from the information published on the Bank’s website.
The Human Resource Committee, which was set up as a working body of the Supervisory Board, once a year or upon any
substantial change in circumstances prepares an assessment of the suitability of the Management Board and Supervisory
Board members as well as of the Management Board and Supervisory Board as the bodies of the Bank. This is a documented
assessment of suitability of every candidate for a Management Board or Supervisory Board member or the members already
performing these functions, which includes reputation, experience and management. The assessment is made based on
predetermined procedures and criteria in line with the Policy on Assessment of the Suitability of Management and Supervisory
Board Members.
In line with the law and the implementation of this Policy, the Supervisory Board of the Bank discussed and approved the
suitability assessments also in December 2016.
In defining the required characteristics of
the members of the Management or the
Supervisory Board, the Bank follows the
“fit and proper principle”, aiming to appoint
independent persons who manage and
supervise the operations of the Bank in
a fair, responsible and professional manner
and who are appropriately engaged themselves.
A B A N K A G R O U P Annual Report 2016
78
The Policy on Assessment of the Suitability of Key Function Holders in the Abanka Group was established so as to
define the qualities required by the person who is a candidate for holding a key function in the Abanka Group and the qualities
required by the person who already holds a key function in the Abanka Group. The key function holders are those employees
whose work tasks and activities have a material impact on the operations and reputation of the Bank. These posts are defined in
greater detail in the Policy. In defining the necessary qualities of the employee, the Bank adheres to the "fit & proper” principle.
The employee suitability assessment, which is a documented assessment of suitability of every candidate, is made during the
selection process of a new employee or in the process of verifying compliance with the conditions of this Policy of existing
employees due to changed circumstances or potential reappointment to the same or other key function. The suitability
assessment of key function holders is made based on predetermined procedures and criteria in accordance with this Policy.
At least once a year, a periodic report is produced and presented to both the Human Resource Committee and the Supervisory
Board of the Bank on the implementation of this Policy. In line with the law and the implementation of this Policy, the
Supervisory Board of the Bank discussed the report on the execution of this Policy also in 2016.
STAFF TRAINING AND DEVELOPMENT
Investment in education and training is the best investment for the future success of the Bank. Education and training needs
arise not only from individual needs related to the professional and personal development of employees but also from business
needs related to the business strategy of the Bank; all needs were met to the maximum possible extent.
The key activities in education and training were aimed at the acquisition of relevant know-how and skills mainly required by
business priorities, which employees obtained through in-house and external training. External training was provided by hiring
recognised external experts, whereas in-house training was based on the transfer of know-how and skills among co-workers.
In 2016, systematic training of leaders was continued with a view to obtaining the relevant leadership competencies, placing
emphasis on corporate culture and values with the aim of unifying the organisational culture in the merged bank. The leaders
were trained to acquire and enhance their leadership skills, motivation to target achievement, responsibility at work, foster
mutual trust and motivate other employees, as well as to improve communication with employees at all management levels. The
360-degree feedback was utilised to assess the management team of the Bank so as to obtain information on the factors
affecting their productivity and the productivity of the team they lead.
In order to ensure relevant professional qualifications, in 2016 employees participated in different training and education
programmes in various fields such as management, banking and financial operations, introduction of new products and software
support, foreign languages and other statutory training courses. A special emphasis was placed on training in marketing and
sales, negotiations and loan process redesign. An increasing number of education and training programmes are carried out as
e-learning.
In 2016, the number of employees included in education and training amounted to 1,135, i.e. 98.95%. The average number of
education/training hours per employee was 23.25, and 44.35 hours for managerial staff.
As in previous years, work study of the employees selected in an internal call was co-financed in 2016.
Abanka follows the development of its employees systematically, by using various tools, including annual appraisal
interviews, which have been conducted in Abanka since 2000. It is also ensured that managers and employees are
appropriately qualified and prepared for quality execution of interviews. Based on the annual interview, plans for achieving the
objectives are prepared and employee development plans are outlined.
Employee development is one of the most important human resource functions that positively affects both the performance and
employees of the Bank. In the context of employee development, the Bank provides for appropriate induction training and
employees’ professional and personal development. In filling the vacancies, priority is given to existing employees, thereby
enabling their advancement and at the same time carrying out in-house staff restructuring.
In-house training is based on the transfer
of know-how and skills among co-workers.

A B A N K A G R O U P Annual Report 2016
79
Identification and management of key staff is an important part of the Human Resource Policy which has a large impact on the
performance of the Bank and its competitive advantage. Key staff management provides an opportunity for the employees to
have a successful career, while their visibility and development bring greater added value and give a reason to retain high-
quality staff. Key staff of the Bank include almost 10% of employees.
STAFF REMUNERATION
Employees who achieve above-average results at work can be rewarded through a performance-related bonus in accordance
with the Promotion and Remuneration Rules. The Bank set up appropriate remuneration schemes, separately also for rewarding
the front office staff.
Every year, jubilarians (the employees who have continuously worked in the Bank for 10, 20, 30 or 40 years) and selected
best front office staff and employees from middle and back office are rewarded. In 2016, the ambassadors of Abanka’s
values were selected for the first time.
In the reporting year, promotions based on criteria stipulated in the Promotion and Remuneration Rules were limited in line with
the Human Resource Policy, but nevertheless partly carried out in mid-2016.
The Bank has a scholarship system for the children of deceased employees, and in 2016 company scholarships were
re-established. The company scholarship concept was adopted and an invitation to apply for a company scholarship for the
field of information technology was published.
Accident insurance for posts with increased risk exposure is provided to employees at the work posts exposed to risks defined
in the Safety Declaration and Risk Assessment.
DEVELOPMENT OF THE ORGANISATIONAL CULTURE
Abanka’s organisational culture is based on promoting the Bank as a successful and most desirable employer.
The Bank's values and organisational culture are enhanced through different activities. Great care is taken to provide for
professional and personal development of employees, as only skilled, satisfied and committed employees contribute to
successful performance.
By rewarding the jubilees and giving recognition to those employees who deserve it, loyalty and commitment to the Bank are
built. In 2016, the entire process of selecting the best front office employee and the best colleague was revised and upgraded
with the awarding of titles of the ambassadors of Abanka’s values.
In the context of the organisational culture, an employee satisfaction and commitment survey was conducted in order to further
boost satisfaction and improve mutual relations in the workplace.
The employees who find themselves in financial or social hardship receive solidarity assistance.
Taking into account the abilities of the work process, Abanka implements measures designed to help its staff reconcile their
professional and family life within the framework of the "Family Friendly Company" certificate. In 2016, lovely presents were
given to the parents (Abančniki) of newborns.
Considerable effort is devoted to having a constructive dialogue with both unions. Moreover, the sports club and the
mountaineering society of the Bank enable the employees to actively spend their free time.
Employees who achieve above-average
results at work can be rewarded through
a performance-related bonus.
The selection of the best front office
employee and the best colleague was
expanded to include the awarding of
titles of the ambassadors of Abanka’s values.
A B A N K A G R O U P Annual Report 2016
80
REMUNERATION POLICY
Since the end of 2011, Abanka regulated its remuneration policy pursuant to the Banking Act and the regulations arising from
this Act as well as any other applicable legislation. As the Bank is subject to the special legislation for the companies in which
the Republic of Slovenia, directly or indirectly, holds a majority stake and due to the commitments made to the European
Commission under the restructuring plan, remuneration is also regulated in line with this legislation.
The bodies in charge of the formulation, implementation and control of the remuneration policy are the Management Board, the
Compensation Committee as a professional body of the Supervisory Board and the Supervisory Board. Furthermore,
independent control functions within the Bank participate in the creation, control and assessment of adequacy of the
remuneration policy. Once a year, the Bank reports on the implementation of the remuneration policy to the Compensation
Committee and the Supervisory Board as part of a periodic report; such a report was given in November 2016.
The remuneration policy of the Bank is based on the balance between remuneration and prudent risk-taking. The Bank ensures
that through appropriate ratios between the fixed and the variable remuneration component of employees whose work is of a
specific nature, whereby the total remuneration of an employee may not significantly depend on the variable component. The
remuneration policy and the relevant internal rules of the Bank regulate the ratios between the fixed and the variable component
of managers' salaries, the mode of payment of the managers' variable remuneration component, and the period of deferred and
retained variable remuneration of managers.
Abanka defined that "employees whose work is of a specific nature"12 include the Management Board, the Executive Directors
of Divisions, the authorised representative of the Management Board, Director of the Risk Management Department, Director of
the Internal Audit Department, Head of Compliance Office, Head of Legal Office, Director of the Human Resource and
Organisation Department and Director of the Investments Under Scrutiny Department. The employees whose work is of a
specific nature are defined based on qualitative and quantitative criteria of the remuneration policy. The remuneration policy of
Abanka is in compliance with the Bank's mission, the business strategy of the Bank, its risk management strategy, its corporate
culture, the values of the Bank and its set goals. The remuneration policy and practice are strictly focused on the fulfilment of the
Bank's business strategy objectives and adjusted to the risk profile of the Bank and its risk-taking ability.
Remuneration on the basis of manager employment agreements with a variable remuneration component is linked to the
fulfilment of objectives, measures and criteria in compliance with the Bank's strategy and business plan. The amount of variable
remuneration for the employees whose work is of a specific nature also depends on their contribution to achieving high
professional and ethical standards of the Bank and a positive attitude toward the internal controls, based on which a strong
organisational culture is built. The amount of variable remuneration can increase by surpassing the concrete business and
financial goals. Such a remuneration policy provides performance incentives, while simultaneously containing corrective
measures in case of critical deviations from the set goals. Appropriately set decision-taking processes and implemented
business policies shall prevent any generation of improper risks in the business operations of the Bank.
The variable component of the remuneration of the Management Board and senior management depends on the conditions and
criteria of the Bank's performance.
12 Employees whose work tasks and activities could have a material impact on the bank’s risk profile.
The remuneration policy of the Bank
is based on the balance between
remuneration and prudent risk-taking.
A B A N K A G R O U P Annual Report 2016
81
INFORMATION TECHNOLOGY
The Information Technology Division is in charge of the development and management of the information system, information
technology management and general services in Abanka. Its role is to develop IT solutions and manage highly available,
integrated, safe and user-friendly IT services so as to provide constant and reliable information and technological support at
minimum cost and with maximum reliability. Moreover, the Information Technology Division is in charge of maintaining the real
property of the Bank, facilitating investments and general services, and ensuring security of the IT system.
The core of Abanka’s information system is developed and maintained in-house, whereas the sub-systems that do not interact
directly with the core are developed externally or already developed solutions are purchased. External development is actively
managed and attention is paid that the IT solutions are compliant with the concepts, technologies and standards of the Bank.
In own software solution development, a great deal of effort was put in the activities related to the operational merger of
Abanka and Banka Celje. The key objectives for 2016 were the migration of retail and corporate accounts to Abanka’s
information system, the upgrade of Abanka’s data warehouse with an analytical platform, which was developed in Banka Celje,
and submission of several reports for the Bank of Slovenia created using this platform. The key milestones in both of these
projects were achieved. Data migration will continue in 2017 with the aim of transferring all transactions from the former Banka
Celje’s information system to Abanka’s information system so that in 2017 the applications of Banka Celje will cease to be used.
In 2016, software solutions were focused on the development and introduction of modern IT concepts. The key objective of
the changes is to establish a flexible information system that will support the omni-channel approach and will be based on the
service architecture. The AIDO (the online Abanka integrated work environment) framework continued to be developed, into
which newly developed web applications are being integrated. In the context of this framework, the Bank continued to develop a
uniform customer approach system, created new software support for collateral management, the financial commitments
module and software support for the redesigned collection process. New process support for corporate sales was introduced.
Furthermore, the Bank continued to introduce the software solution development processes based on the continuous
development/integration concept. The plan to establish a catalogue of computerised business processes and exposure of
individual processes through interfaces (APIs) was created, in addition to the introduction of the application programming
interface (API) management system.
An important part of development was directed towards the projects focusing on the acceleration of digital transformation. Activities are underway in various areas. The mobile and online banking services for retail and corporate customers were
upgraded, Abanka’s website was redesigned, a system for digital marketing via e-mail was introduced and the information
support for the contact centre was replaced. The information system is being adapted to the needs of integration with the CRM
system, whose introduction is foreseen in 2017.
With respect to business rules, advanced concepts continued to be introduced by upgrading the procedures for capturing and
recording business rules, introducing complex business rules and through the establishment of procedures for the verification of
business rule integrity. The transition to a higher version of the business rule management system was made.
In outsourced software development, in 2016 the preparations began for the replacement of software support for investment
banking, which will be completed in 2017. In the context of the preparations for the implementation of the project relating to the
replacement of the asset-liability management software and the project for the introduction of changes brought by IFRS 9, it was
decided that it was reasonable to establish a uniform data platform for finance and risk assessment or to find an external
solution that would work on a common data platform. Both projects will be executed in 2017.
The key objectives for 2016 were the migration
of retail and corporate accounts to Abanka’s
information system, the upgrade of Abanka’s
data warehouse with an analytical platform,
which was developed in Banka Celje, and
submission of several reports for the Bank
of Slovenia created using this platform.
A B A N K A G R O U P Annual Report 2016
82
In information system protection and security, in 2016 Abanka continued with e-training courses for employees, regularly
carried out IT risk analyses and risk analyses in subsidiaries, as well as participated in IT audits and inspections. Controls over
the functioning of security mechanisms were extended and the Division participated in the planning and implementation of IT
system security modifications and incident management. Other tasks of promotion and IT security improvement included
cooperation with external institutions (the Bank Association of Slovenia), associations (ISACA, the Slovenian Institute of
Auditors) and other banks. Special attention was devoted to the testing of security settings by using vulnerability and penetration
tests. Abanka continued to develop the audit trail management system, the user identity management system and the security
management system.
In 2016, the greater part of resources allocated to the development of the banking data warehouse (BDW) was devoted to the
merger of data warehouses. The team also had to participate in various other projects of the Bank, especially by providing the
necessary data from the data warehouse. Apart from that, new rating grades were introduced and several new reports (for
guarantees, LCR, etc.) were created.
In IT management, the reporting year was marked by the activities relating to the consolidation and optimisation of the solutions
and technologies used in the merged bank. In accordance with the business needs and the consequent increase in data
quantity, the data storage systems were adapted and the database servers were upgraded so that the infrastructure is capable
of handling the increased volume of transactions in the information system as the result of the merger of both banks. Obsolete
computer equipment was replaced and the peripheral equipment of end-users was unified. The required adjustments and
upgrades of the wired network were made and the wireless network was setup in branch offices. The central control system and
terminal servers were upgraded and the new remote access system was established. The system for recording the sessions of
computer system access was introduced, which is used to supervise the outsourcers. The Division also participated in other
projects undertaken by the Bank and its subsidiaries. In addition, both the system and application software of servers,
workstations and communication equipment were regularly updated. As every year, in 2016 the business continuity tests
were performed.
In technical support and general services, in 2016 the focus was on internal user assistance requests, data processing and
system operation control, installations of new hardware and software, including new ATMs, installations and maintenance of
other equipment, assistance in the relocation of employees due to reorganisation, office building maintenance, refurbishment
projects for business premises and post room management.
Physical and technical protection of the Bank was also provided. In accordance with the investment plan, technical and
mechanical protection systems were partly upgraded in order to ensure complete and adequate technical protection of property
and people in the Bank. The good practice of regular employee training will continue, paying special attention to ongoing
training on how to act in the event of a robbery or burglary.
A B A N K A G R O U P Annual Report 2016
83
SUSTAINABLE DEVELOPMENT AND CORPORATE SOCIAL RESPONSIBILITY
ECONOMIC DEVELOPMENT
As a modern universal commercial bank with a clear vision of the future and a focus on the development of advanced banking
services, Abanka remains customer-oriented, committed to excellent financial services and sustainable development
commitments. The Bank is aware of its important role on the path towards a new era of sustainability and progress. In business
development, Abanka endeavours to combine business requirements with the principles of sustainable development as well as
utilise the power of its human and financial capital in order to connect its customers and partners so as to enable them to take
full advantage of new sustainable environmental economics. Transition to an environmentally sustainable economy will affect us
all, directly or indirectly. The Bank is aware that future business success will increasingly depend on the ability of economic
entities to adapt their business to global climate changes and challenges brought by these changes.
As an important bank in the Slovene banking system, Abanka strives to support sustainable development and to create potential
for business performance and economic growth in various ways:
As “the bank of friendly people”, Abanka strengthens the confidence and satisfaction of our customers. The Bank strives to
cater to the financial needs of its customers and aims to promote the business of successful innovative companies, which
have a vision, develop renewable sources of energy and create new environmentally friendly jobs.
Customer-tailored innovative banking products are constantly developed and upgraded. The Bank pays attention to the ideas
of the community at large and organises innovative and creative (ABATHON HACKATHON) gatherings for individuals and
teams with innovative ideas. Abanka strives to provide services tailored to customer needs, which facilitate their banking
operations and increase their performance (e.g. development and upgrade of online banking, mobile banking upgrades,
Abanka website, the opening of new Abatočka points of sale for executing money orders, etc.).
As a retail and corporate bank, Abanka offers a range of products and services tailored to specific customer segments,
provides advice to customers on a whole range of environmentally friendly products and services, such as ecological loans
promoting energy savings, as well as various electronic invoicing options and digital conclusion of agreements available on
Abanet, etc.
As a company with a strong presence in the social environment of Slovenia, Abanka is forging innovative partnerships with
governmental and non-governmental organisations to preserve natural resources, while promoting greater energy efficiency
and environmental responsibility.
Abanka obtains sources of funds in order to promote competition and global entrepreneurship as well as to finance projects
and investments in infrastructure, the environment, and regional and social development.
Abanka has always made every effort to execute its operations in an environmentally responsible manner by:
– carefully separating waste (e.g. separate collection of ink cartridges, waste paper, separate waste collection in the premises
of the Bank etc.);
– optimising paper use (e.g. electronic archiving, business process computerising – streamlining the paper-based processes
in the Bank, encouraging the customers to use electronic bank statements and modern banking channels, etc.);
– continuously implementing various measures for achieving savings in energy (e.g. investing in better insulation in buildings
and greater energy efficiency of lighting, heating);
– reducing the costs of other office supplies.
In business development, Abanka endeavours
to combine business requirements with the
principles of sustainable development as well as
utilise the power of its human and financial capital
in order to connect its customers and partners so
as to enable them to take full advantage of
new sustainable environmental economics.
A B A N K A G R O U P Annual Report 2016
84
Abanka is aware that the path to sustainable development is not without obstacles. One of the important challenges is global
climate change. The necessary transition from the existing technologies based on fossil fuels to clean technologies based on
renewable resources that do not pollute the environment will be multifaceted and involve everybody in one way or another.
Abanka has recognised its commitment to this transformation in its business strategy. The Bank is focused on upwards and
finding synergies that help take advantage of the existing financial opportunities and create new ones for an environmentally
and economically healthy future.
SOCIAL DEVELOPMENT
Internal Communication
Through responsible and ethical communication with its employees, Abanka supports the attainment of its business objectives
and operations in compliance with the guidelines and values laid down in the Bank’s strategy. In 2016, Abanka devoted even
greater attention to internal communication, particularly to the transfer of its values to the employees. Obtaining the confidence
and commitment of employees is an important task for all parties involved, as during the merger process of both banks the
employees were exposed to major changes. In order to achieve greater employee commitment and to make it easier for the
employees to cope with the changes, the values of the new bank were communicated through systematic communication.
Activities were aimed at raising the awareness about the importance of the values written in the strategy. In the first half of
2016, the new Code of Business Ethics was prepared for the employees, which explains in detail the importance of the Bank’s
values. Later in the year, several events on the topic of Abanka’s values were organised.
A user satisfaction survey regarding internal communication was conducted, followed by the proposals for upgrading internal
communication. In 2016, four editions of the internal newspaper Pogled od znotraj (View from the Inside) were issued, which
started to be published in the HTML format. In addition to news, several expert articles were published and a few colleagues
were presented through interviews.
Communication with the Media
Information provided by the media affects the information of the public at large as well as the formation of opinions and views.
The public image of Abanka is also presented through cooperation with the journalists. In 2016, a number of questions from the
press were related to the Bank’s products from all lines of business. The most important source of corporate information is the
legally required disclosure of information on the websites of Ljubljana Stock Exchange and of Abanka.
Publications in various media are followed on a daily basis via clipping, while an in-depth assessment of publications is made on
a semi-annual and annual basis through a media presence analysis. On the basis of the analysis, corporate communication is
planned and certain reputational risk parameters are assessed. In the reporting year, fewer negative publications were seen
compared to the previous year.
Activities were aimed at raising
the awareness about the importance
of the values written in the strategy. In
the first half of 2016, the new Code of
Business Ethics was prepared for the
employees, which explains in detail the
importance of the Bank’s values.
Publications in various media are followed
on a daily basis via clipping, while an in-depth
assessment of publications is made on a semi-annual
and annual basis through a media presence analysis.
A B A N K A G R O U P Annual Report 2016
85
Sponsorships and Donations
Integration into the broader environment is important for successful performance, qualitative development and progress of the
Bank, which is why Abanka is included in the social environment in a proactive and responsible manner. Abanka realises the
mission and values of its operations and implements its vision of a long-term relationship through its sponsorship and donation
programme. In line with its vision and strategy, the Bank invests in the environment in which it operates. The Bank supports
sports and culture through sponsorships, participates in charity events and is engaged in social activities, because it is aware
that the effectiveness and efficiency of operations also depend on the support of the environment and the confidence of other
interested parties. Socially disadvantaged children received their traditional New Year’s humanitarian presents also in 2016.
PROTECTION OF THE ENVIRONMENT
Abanka is aware of the impact its operations have on the environment and supports the principles of sustainable development.
In terms of technical equipment, for many years the Bank has been striving to ensure appropriate working conditions by
installing air conditioning systems with energy recovery. They use environmentally sound technologies for cooling, heating and
ventilation and thus ensure high efficiency and reduced energy consumption. All of Abanka's premises are being fitted with
energy-efficient lighting, which further contributes towards a more rational use of electricity. Already in the planning phase of
refurbishments and renovations of existing buildings or in the case of new constructions, appropriate materials are selected
(suitable glass panes, insulation, etc.). Modernisation projects and investments in new and more modern equipment for heating,
cooling and ventilation are made in compliance with the annual investment plan. In choosing new equipment, not only price but
also technical adequacy and environmental acceptability are taken into account.
Strong emphasis is placed on training and raising employee awareness about the rational use of the cooling/heating systems,
which along with computer hardware are the largest consumers of electricity in the Bank. To this end, instructions have
been issued. They include practical advice and guidelines for employees and define the rational use of air conditioning and
ventilation systems.
In the purchase of materials, the Bank ensures that they are environmentally safe, whilst waste is collected separately. The
Bank cooperates with the companies that have introduced the highest ISO and EMAS quality standards. Moreover, waste paper
and ink cartridges are collected and a central heating control system was installed for more rational energy consumption.
Socially disadvantaged children
received their traditional New Year’s
humanitarian presents also in 2016.
In the purchase of materials, the Bank
ensures that they are environmentally
safe, whilst waste is collected separately.
The bank cooperates with the companies
that have introduced the highest ISO and
EMAS quality standards. Moreover, waste
paper and ink cartridges are collected and
a central heating control system was installed
for more rational energy consumption.
A B A N K A G R O U P Annual Report 2016
86
INTERNAL AUDIT
To perform the internal audit control function, the Internal Audit Department (hereinafter: the IAD) was established as an
independent organisational unit, which is functionally and organisationally separated from other units and is directly
subordinated to the Management Board of the Bank. The IAD regularly reports about its work, audit findings and the
implementation of recommendations also to the Audit Committee and/or the Supervisory Board. The Internal Audit Department
operates in accordance with the Banking Act, the International Standards for the Professional Practice of Internal Auditing, the
Code of Professional Ethics for Internal Auditors and the Code of Internal Auditing Principles. The work of the IAD as a whole is
regulated by the Rules on the Internal Audit Department, which are adopted by the Management Board with the approval of the
Supervisory Board. The operating procedures of the internal audit activity are defined in greater detail in the Manual on
Internal Auditing.
The IAD provides to the management body, the Audit Committee and senior management an independent assessment of the
quality and efficiency of internal management, including the risk management and internal control systems and processes, and
thereby contributes not only to improving the performance and achievement of the Bank’s objectives but also to strengthening
risk management and internal governance. The IAD carries out its mission by performing internal audits of riskier areas and
providing advisory services in line with the IAD’s annual plan and the strategic work plan. Both plans are based on the risk
analysis and regulatory requirements and are approved by the Management Board with the consent of the Supervisory Board.
In 2016, the IAD conducted 17 regular internal audits, concentrating on riskier or regulatory mandatory areas: internal
governance arrangements and risk management, execution of internal controls in retail and corporate lending, including early
collection and non-performing exposure (NPE) management, IT management, the merger project, mobile banking, trade in
financial instruments, administrative and custody services, documentary operations, arrangements of money laundering
prevention, the calculation process of minimum capital requirements, the internal capital adequacy assessment process
(ICAAP), reporting to the management body on the monitoring of compliance with the business strategy, the remuneration
system, monitoring of the fulfilment of commitments made to the European Commission under the restructuring plan, the VISA
security requirements and disclosures under Part Eight of the CRR.
In addition to internal auditing and advisory services, the IAD’s employees devoted a considerable amount of their time to the
monitoring of the implementation of recommendations made in audits. Furthermore, the Internal Audit Department coordinated
the preparation of replies to the regulator’s queries. With a view to ensuring and improving the quality of the IAD’s performance,
the internal documents on the operation of the internal audit function were revised, the internal auditing procedures following the
merger of both banks were unified and upgraded, a self-assessment of the IAD’s quality was made, and continuous education
and training of internal auditors was provided for.
As at 31 December 2016, the Internal Audit Department including the Head of Department had 10 internal auditors. The internal
auditors have an in-depth knowledge of the field and the banking processes and hold the following titles and/or licences:
certified internal auditor, auditor, certified information systems auditor, certified auditor, ACCA13 and CISA14.
13 ACCA stands for Association of Chartered Certified Accountants. 14 CISA stands for Certified Information Systems Auditor.
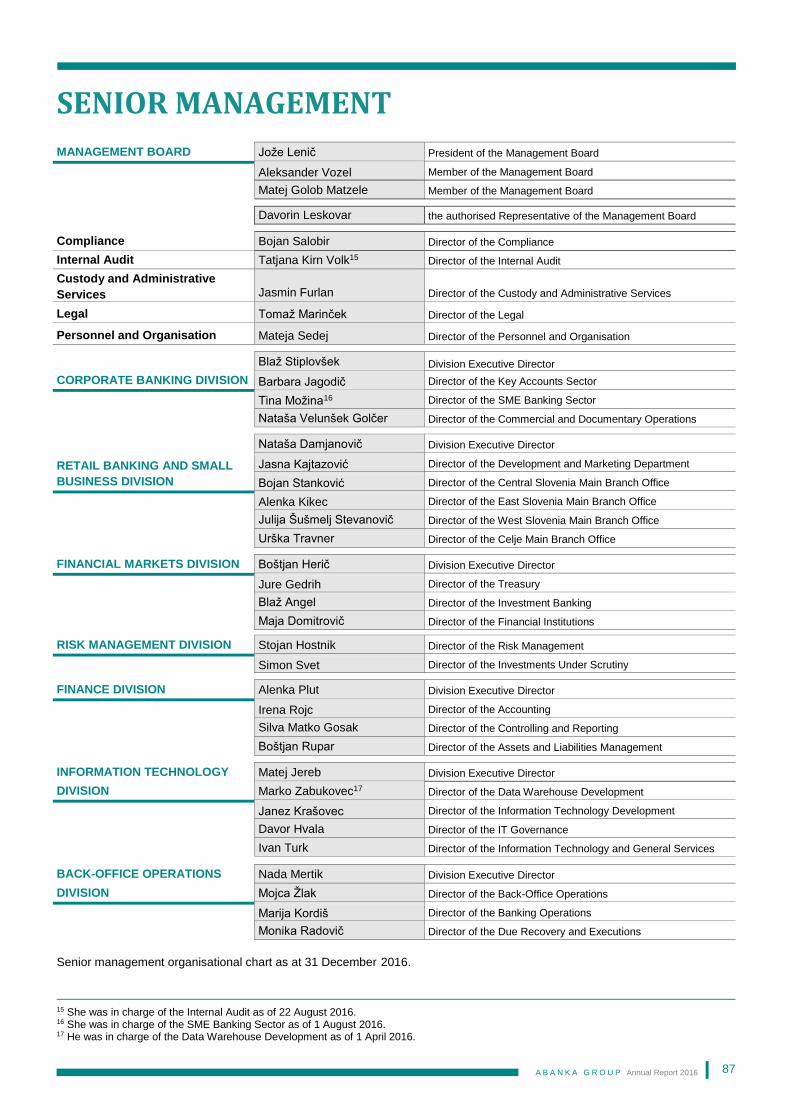
A B A N K A G R O U P Annual Report 2016
87
SENIOR MANAGEMENT
MANAGEMENT BOARD Jože Lenič President of the Management Board
Aleksander Vozel Member of the Management Board
Matej Golob Matzele Member of the Management Board
Davorin Leskovar the authorised Representative of the Management Board
Compliance Bojan Salobir Director of the Compliance
Internal Audit Tatjana Kirn Volk15 Director of the Internal Audit
Custody and Administrative
Services Jasmin Furlan Director of the Custody and Administrative Services
Legal Tomaž Marinček Director of the Legal
Personnel and Organisation Mateja Sedej Director of the Personnel and Organisation
CORPORATE BANKING DIVISION
Blaž Stiplovšek Division Executive Director
Barbara Jagodič Director of the Key Accounts Sector
Tina Možina16 Director of the SME Banking Sector
Nataša Velunšek Golčer Director of the Commercial and Documentary Operations
RETAIL BANKING AND SMALL
BUSINESS DIVISION
Nataša Damjanovič Division Executive Director
Jasna Kajtazović Director of the Development and Marketing Department
Bojan Stanković Director of the Central Slovenia Main Branch Office
Alenka Kikec Director of the East Slovenia Main Branch Office
Julija Šušmelj Stevanovič Director of the West Slovenia Main Branch Office
Urška Travner Director of the Celje Main Branch Office
FINANCIAL MARKETS DIVISION Boštjan Herič Division Executive Director
Jure Gedrih Director of the Treasury
Blaž Angel Director of the Investment Banking
Maja Domitrovič Director of the Financial Institutions
RISK MANAGEMENT DIVISION Stojan Hostnik Director of the Risk Management
Simon Svet Director of the Investments Under Scrutiny
FINANCE DIVISION Alenka Plut Division Executive Director
Irena Rojc Director of the Accounting
Silva Matko Gosak Director of the Controlling and Reporting
Boštjan Rupar Director of the Assets and Liabilities Management
INFORMATION TECHNOLOGY Matej Jereb Division Executive Director
DIVISION Marko Zabukovec17 Director of the Data Warehouse Development
Janez Krašovec Director of the Information Technology Development
Davor Hvala Director of the IT Governance
Ivan Turk Director of the Information Technology and General Services
BACK-OFFICE OPERATIONS Nada Mertik Division Executive Director
DIVISION Mojca Žlak Director of the Back-Office Operations
Marija Kordiš Director of the Banking Operations
Monika Radovič Director of the Due Recovery and Executions
Senior management organisational chart as at 31 December 2016.
15 She was in charge of the Internal Audit as of 22 August 2016. 16 She was in charge of the SME Banking Sector as of 1 August 2016. 17 He was in charge of the Data Warehouse Development as of 1 April 2016.
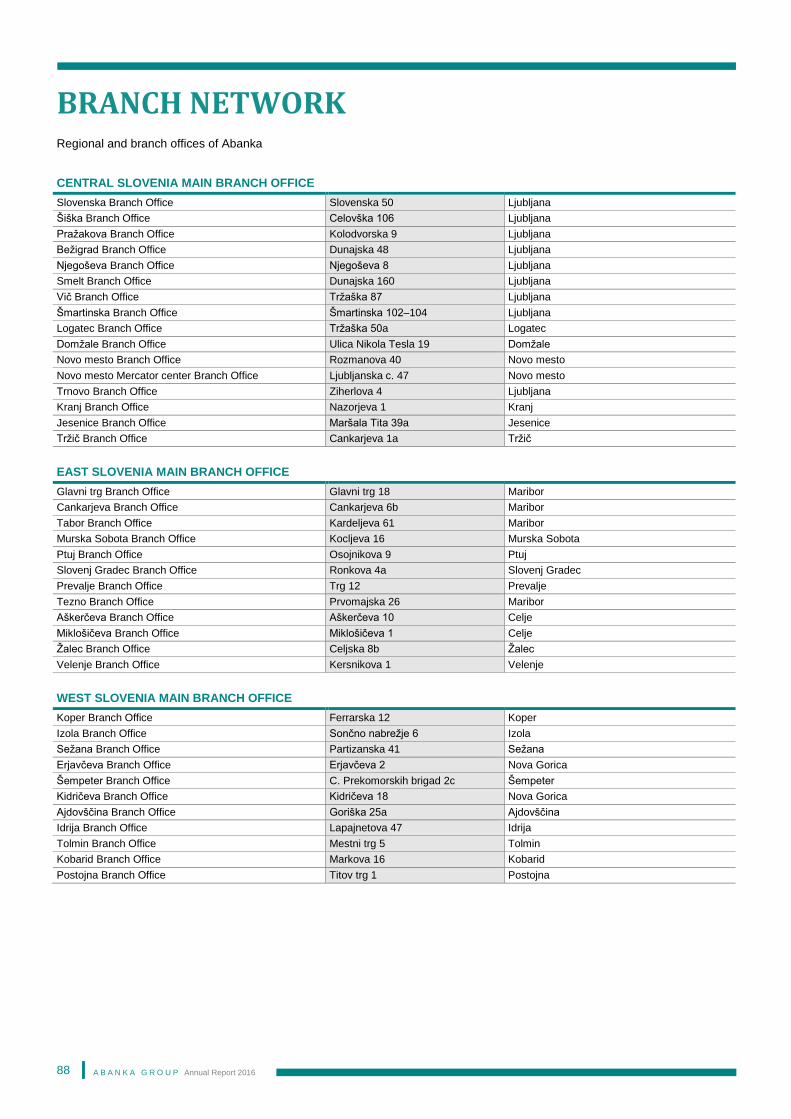
A B A N K A G R O U P Annual Report 2016
88
BRANCH NETWORK
Regional and branch offices of Abanka
CENTRAL SLOVENIA MAIN BRANCH OFFICE
Slovenska Branch Office Slovenska 50 Ljubljana
Šiška Branch Office Celovška 106 Ljubljana
Pražakova Branch Office Kolodvorska 9 Ljubljana
Bežigrad Branch Office Dunajska 48 Ljubljana
Njegoševa Branch Office Njegoševa 8 Ljubljana
Smelt Branch Office Dunajska 160 Ljubljana
Vič Branch Office Tržaška 87 Ljubljana
Šmartinska Branch Office Šmartinska 102–104 Ljubljana
Logatec Branch Office Tržaška 50a Logatec
Domžale Branch Office Ulica Nikola Tesla 19 Domžale
Novo mesto Branch Office Rozmanova 40 Novo mesto
Novo mesto Mercator center Branch Office Ljubljanska c. 47 Novo mesto
Trnovo Branch Office Ziherlova 4 Ljubljana
Kranj Branch Office Nazorjeva 1 Kranj
Jesenice Branch Office Maršala Tita 39a Jesenice
Tržič Branch Office Cankarjeva 1a Tržič
EAST SLOVENIA MAIN BRANCH OFFICE
Glavni trg Branch Office Glavni trg 18 Maribor
Cankarjeva Branch Office Cankarjeva 6b Maribor
Tabor Branch Office Kardeljeva 61 Maribor
Murska Sobota Branch Office Kocljeva 16 Murska Sobota
Ptuj Branch Office Osojnikova 9 Ptuj
Slovenj Gradec Branch Office Ronkova 4a Slovenj Gradec
Prevalje Branch Office Trg 12 Prevalje
Tezno Branch Office Prvomajska 26 Maribor
Aškerčeva Branch Office Aškerčeva 10 Celje
Miklošičeva Branch Office Miklošičeva 1 Celje
Žalec Branch Office Celjska 8b Žalec
Velenje Branch Office Kersnikova 1 Velenje
WEST SLOVENIA MAIN BRANCH OFFICE
Koper Branch Office Ferrarska 12 Koper
Izola Branch Office Sončno nabrežje 6 Izola
Sežana Branch Office Partizanska 41 Sežana
Erjavčeva Branch Office Erjavčeva 2 Nova Gorica
Šempeter Branch Office C. Prekomorskih brigad 2c Šempeter
Kidričeva Branch Office Kidričeva 18 Nova Gorica
Ajdovščina Branch Office Goriška 25a Ajdovščina
Idrija Branch Office Lapajnetova 47 Idrija
Tolmin Branch Office Mestni trg 5 Tolmin
Kobarid Branch Office Markova 16 Kobarid
Postojna Branch Office Titov trg 1 Postojna
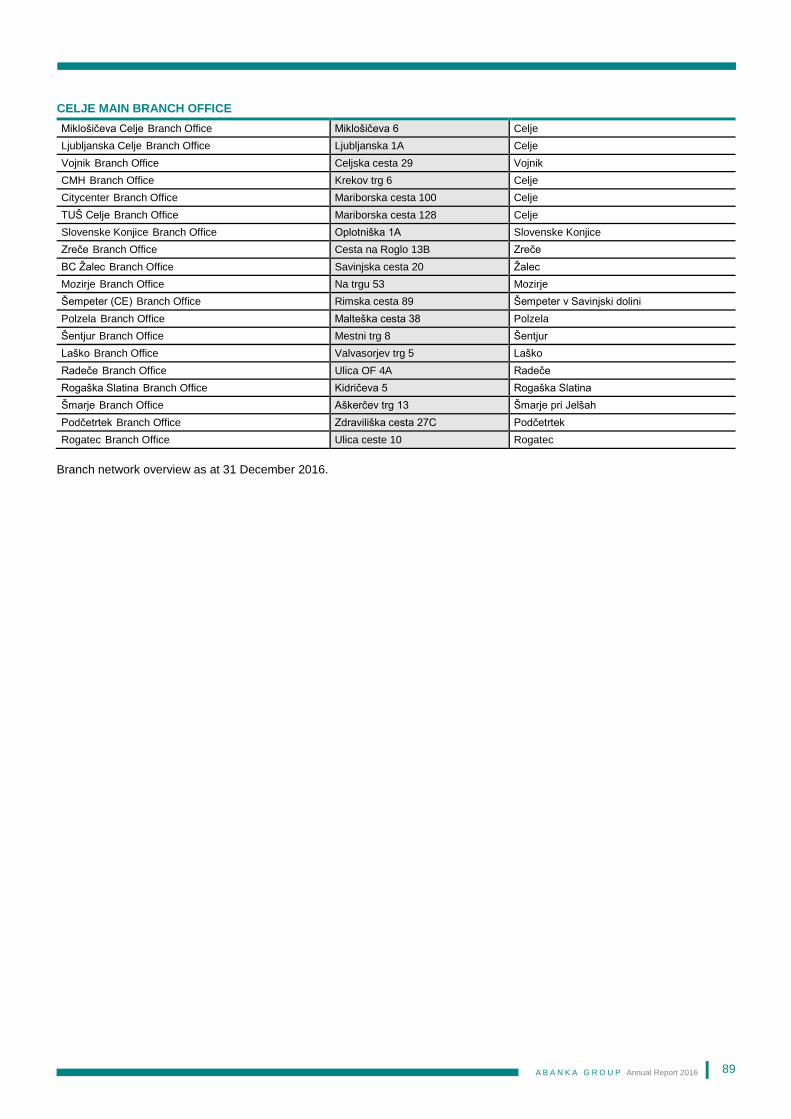
A B A N K A G R O U P Annual Report 2016
89
CELJE MAIN BRANCH OFFICE
Miklošičeva Celje Branch Office Miklošičeva 6 Celje
Ljubljanska Celje Branch Office Ljubljanska 1A Celje
Vojnik Branch Office Celjska cesta 29 Vojnik
CMH Branch Office Krekov trg 6 Celje
Citycenter Branch Office Mariborska cesta 100 Celje
TUŠ Celje Branch Office Mariborska cesta 128 Celje
Slovenske Konjice Branch Office Oplotniška 1A Slovenske Konjice
Zreče Branch Office Cesta na Roglo 13B Zreče
BC Žalec Branch Office Savinjska cesta 20 Žalec
Mozirje Branch Office Na trgu 53 Mozirje
Šempeter (CE) Branch Office Rimska cesta 89 Šempeter v Savinjski dolini
Polzela Branch Office Malteška cesta 38 Polzela
Šentjur Branch Office Mestni trg 8 Šentjur
Laško Branch Office Valvasorjev trg 5 Laško
Radeče Branch Office Ulica OF 4A Radeče
Rogaška Slatina Branch Office Kidričeva 5 Rogaška Slatina
Šmarje Branch Office Aškerčev trg 13 Šmarje pri Jelšah
Podčetrtek Branch Office Zdraviliška cesta 27C Podčetrtek
Rogatec Branch Office Ulica ceste 10 Rogatec
Branch network overview as at 31 December 2016.

FINANCIAL REPORT
A bank of friendly people. Always and above all.We are defined and guided by much, but by friendliness above all. Friendliness is much more than a kind word to a co-worker or a smile for a client; it is woven into everything we do and everything we are. Friendliness is our best-known trait, and we are proud to be the best possible reflection of that word.
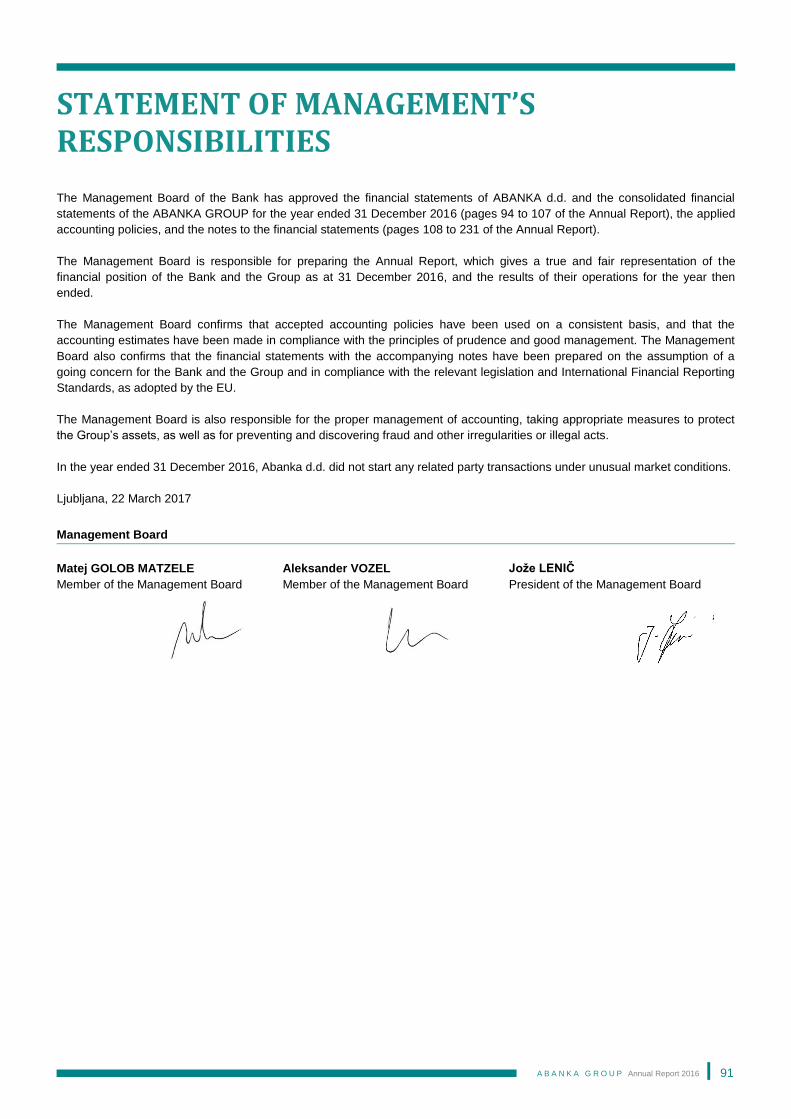
A B A N K A G R O U P Annual Report 2016
91
STATEMENT OF MANAGEMENT’S RESPONSIBILITIES
The Management Board of the Bank has approved the financial statements of ABANKA d.d. and the consolidated financial
statements of the ABANKA GROUP for the year ended 31 December 2016 (pages 94 to 107 of the Annual Report), the applied
accounting policies, and the notes to the financial statements (pages 108 to 231 of the Annual Report).
The Management Board is responsible for preparing the Annual Report, which gives a true and fair representation of the
financial position of the Bank and the Group as at 31 December 2016, and the results of their operations for the year then
ended.
The Management Board confirms that accepted accounting policies have been used on a consistent basis, and that the
accounting estimates have been made in compliance with the principles of prudence and good management. The Management
Board also confirms that the financial statements with the accompanying notes have been prepared on the assumption of a
going concern for the Bank and the Group and in compliance with the relevant legislation and International Financial Reporting
Standards, as adopted by the EU.
The Management Board is also responsible for the proper management of accounting, taking appropriate measures to protect
the Group’s assets, as well as for preventing and discovering fraud and other irregularities or illegal acts.
In the year ended 31 December 2016, Abanka d.d. did not start any related party transactions under unusual market conditions.
Ljubljana, 22 March 2017
Management Board
Matej GOLOB MATZELE
Member of the Management Board
Aleksander VOZEL
Member of the Management Board
Jože LENIČ
President of the Management Board
A B A N K A G R O U P Annual Report 2016
92
FINANCIAL STATEMENTS
INDEX TO THE FINANCIAL STATEMENTS
NOTE PAGE
INCOME STATEMENT OF ABANKA D.D. .................................................................................................................................. 94
STATEMENT OF COMPREHENSIVE INCOME OF ABANKA D.D. ............................................................................................ 95
STATEMENT OF FINANCIAL POSITION OF ABANKA D.D. ..................................................................................................... 96
STATEMENT OF CHANGES IN EQUITY OF ABANKA D.D. ...................................................................................................... 98
CASH FLOW STATEMENT OF ABANKA D.D. ........................................................................................................................... 99
CONSOLIDATED INCOME STATEMENT OF THE ABANKA GROUP .................................................................................... 101
CONSOLIDATED STATEMENT OF COMPREHENSIVE INCOME OF THE ABANKA GROUP .............................................. 102
CONSOLIDATED STATEMENT OF FINANCIAL POSITION OF THE ABANKA GROUP ....................................................... 103
CONSOLIDATED STATEMENT OF CHANGES IN EQUITY OF THE ABANKA GROUP ........................................................ 105
CONSOLIDATED CASH FLOW STATEMENT OF THE ABANKA GROUP ............................................................................. 106
NOTES TO THE FINANCIAL STATEMENTS ............................................................................................................................ 108
1 SUMMARY OF SIGNIFICANT ACCOUNTING POLICIES ...................................................................................................... 108
1.1 BASIS OF PREPARATION ....................................................................................................................................................... 108
1.2 CONSOLIDATION .................................................................................................................................................................. 112
1.3 SEGMENT REPORTING .......................................................................................................................................................... 113
1.4 FOREIGN CURRENCY TRANSLATION ........................................................................................................................................ 113
1.5 FINANCIAL ASSETS AND FINANCIAL LIABILITIES ......................................................................................................................... 114
1.6 OFFSETTING FINANCIAL INSTRUMENTS ................................................................................................................................... 115
1.7 DERIVATIVE FINANCIAL INSTRUMENTS AND HEDGE ACCOUNTING................................................................................................ 116
1.8 INTEREST INCOME AND EXPENSES ......................................................................................................................................... 116
1.9 FEE AND COMMISSION INCOME AND EXPENSES ........................................................................................................................ 117
1.10 DIVIDEND INCOME .............................................................................................................................................................. 117
1.11 IMPAIRMENT OF FINANCIAL ASSETS ...................................................................................................................................... 117
1.12 PROPERTY AND EQUIPMENT, INTANGIBLE ASSETS, INVESTMENT PROPERTY AND NON-CURRENT ASSETS HELD FOR SALE ............... 120
1.13 IMPAIRMENT OF INVESTMENTS IN SUBSIDIARIES AND ASSOCIATES ............................................................................................ 121
1.14 LEASES ............................................................................................................................................................................ 121
1.15 CASH AND CASH EQUIVALENTS ............................................................................................................................................ 121
1.16 PROVISIONS ...................................................................................................................................................................... 122
1.17 FINANCIAL GUARANTEE CONTRACTS .................................................................................................................................... 122
1.18 EMPLOYEE BENEFITS ......................................................................................................................................................... 122
1.19 TAXATION ......................................................................................................................................................................... 122
1.20 SHARE CAPITAL ................................................................................................................................................................. 123
1.21 MANAGED FUNDS .............................................................................................................................................................. 123
1.22 SALE AND REPURCHASE AGREEMENTS ................................................................................................................................. 123
1.23 PRECIOUS METALS ............................................................................................................................................................. 123
1.24 COMPARATIVES ................................................................................................................................................................. 123
1.25 INFORMATION IN THE NOTES TO THE FINANCIAL STATEMENTS .................................................................................................. 123
2 RISK MANAGEMENT ............................................................................................................................................................. 124
2.1 CREDIT RISK ....................................................................................................................................................................... 126
2.2 MARKET RISK ...................................................................................................................................................................... 141
2.3 LIQUIDITY RISK .................................................................................................................................................................... 151
2.4 CAPITAL MANAGEMENT ......................................................................................................................................................... 160
2.5 OPERATIONAL RISK MANAGEMENT ......................................................................................................................................... 176
A B A N K A G R O U P Annual Report 2016
93
3 CRITICAL ACCOUNTING ESTIMATES AND JUDGEMENTS IN APPLYING ACCOUNTING POLICIES ............................ 178
4 SEGMENT ANALYSES........................................................................................................................................................... 187
5 NET INTEREST INCOME ........................................................................................................................................................ 192
6 DIVIDEND INCOME ................................................................................................................................................................ 192
7 NET FEE AND COMMISSION INCOME ................................................................................................................................. 193
8 REALISED GAINS/LOSSES ON FINANCIAL ASSETS AND LIABILITIES NOT MEASURED
AT FAIR VALUE THROUGH PROFIT OR LOSS ................................................................................................................... 193
9 NET GAINS/LOSSES ON FINANCIAL ASSETS AND LIABILITIES HELD FOR TRADING ................................................. 194
10 FAIR VALUE ADJUSTMENTS IN HEDGE ACCOUNTING .................................................................................................. 194
11 NET OTHER OPERATING EXPENSES ................................................................................................................................ 194
12 ADMINISTRATIVE EXPENSES ............................................................................................................................................ 195
13 DEPRECIATION AND AMORTISATION .............................................................................................................................. 195
14 PROVISIONS ........................................................................................................................................................................ 196
15 IMPAIRMENT ........................................................................................................................................................................ 196
16 INCOME TAX ........................................................................................................................................................................ 197
17 CASH, CASH BALANCES WITH THE CENTRAL BANK AND OTHER DEMAND DEPOSITS WITH BANKS .................. 198
18 FINANCIAL ASSETS AND LIABILITIES HELD FOR TRADING AND HEDGING DERIVATIVES ...................................... 198
19 FINANCIAL ASSETS DESIGNATED AT FAIR VALUE THROUGH PROFIT OR LOSS ..................................................... 200
20 AVAILABLE-FOR-SALE FINANCIAL ASSETS ................................................................................................................... 201
21 LOANS TO BANKS............................................................................................................................................................... 202
22 LOANS TO NON-BANK CUSTOMERS ................................................................................................................................ 203
23 OTHER FINANCIAL ASSETS ............................................................................................................................................... 204
24 HELD-TO-MATURITY INVESTMENTS ................................................................................................................................. 205
25 PROPERTY AND EQUIPMENT, INTANGIBLE ASSETS, INVESTMENT PROPERTY AND
NON-CURRENT ASSETS HELD FOR SALE ....................................................................................................................... 206
26 INVESTMENTS IN SUBSIDIARIES AND ASSOCIATES ..................................................................................................... 208
27 OTHER ASSETS ................................................................................................................................................................... 210
28 PLEDGED ASSETS .............................................................................................................................................................. 210
29 DEPOSITS AND LOANS FROM BANKS AND THE CENTRAL BANK ............................................................................... 211
30 DEPOSITS FROM NON-BANK CUSTOMERS ..................................................................................................................... 212
31 DEBT SECURITIES ISSUED ................................................................................................................................................ 212
32 OTHER FINANCIAL LIABILITIES......................................................................................................................................... 213
33 PROVISIONS ........................................................................................................................................................................ 213
34 DEFERRED INCOME TAX .................................................................................................................................................... 214
35 SHARE CAPITAL, SHARE PREMIUM, ACCUMULATED OTHER COMPREHENSIVE INCOME
AND RESERVES FROM PROFIT ......................................................................................................................................... 216
36 DISTRIBUTABLE PROFIT .................................................................................................................................................... 217
37 CASH FLOW STATEMENT .................................................................................................................................................. 217
38 COMMITMENTS AND CONTINGENCIES ............................................................................................................................ 218
39 LEASES ................................................................................................................................................................................ 220
40 TRANSACTIONS IN THE NAME AND FOR THE ACCOUNT OF THIRD PARTIES ........................................................... 221
41 MANAGED FUNDS ............................................................................................................................................................... 222
42 RELATED-PARTY TRANSACTIONS ................................................................................................................................... 222
43 EVENTS AFTER THE REPORTING DATE .......................................................................................................................... 231
NOTE PAGE
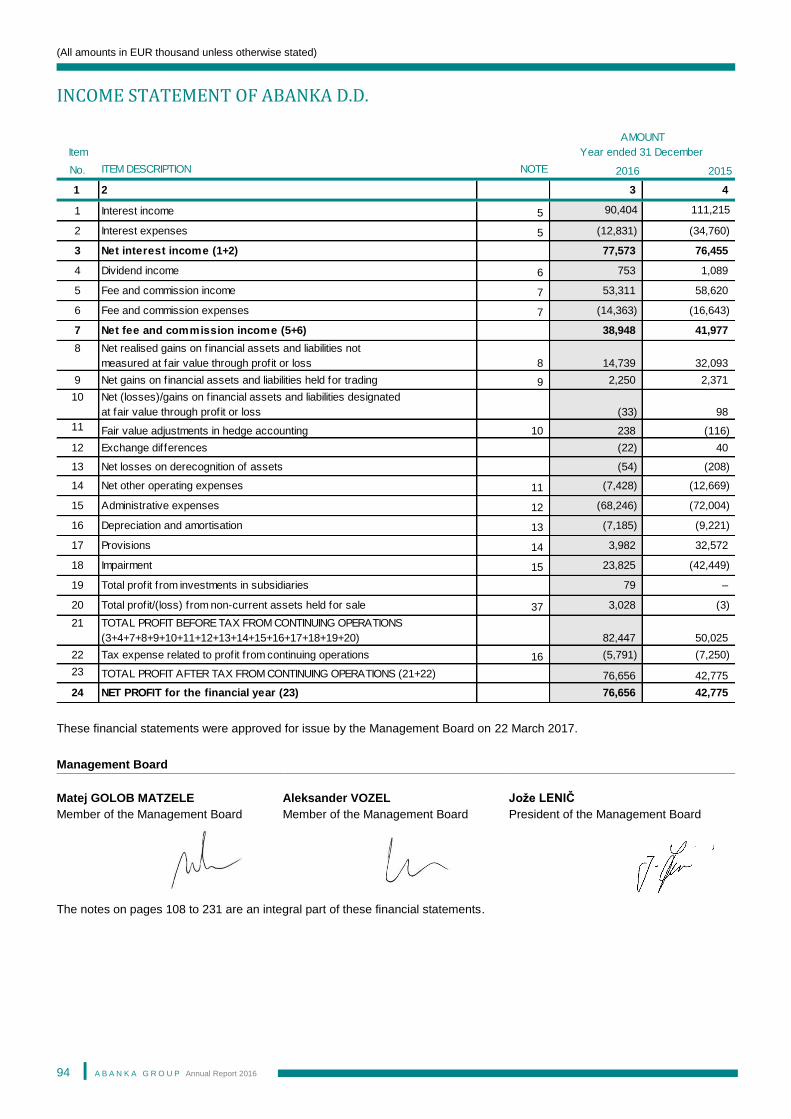
(All amounts in EUR thousand unless otherwise stated)
A B A N K A G R O U P Annual Report 2016
94
INCOME STATEMENT OF ABANKA D.D.
These financial statements were approved for issue by the Management Board on 22 March 2017.
Management Board
Matej GOLOB MATZELE
Member of the Management Board
Aleksander VOZEL
Member of the Management Board
Jože LENIČ
President of the Management Board
The notes on pages 108 to 231 are an integral part of these financial statements.
Item
No. ITEM DESCRIPTION NOTE 2016 2015
1 2 3 4
1 Interest income 5
2 Interest expenses 5 (12,831) (34,760)
3 Net interest income (1+2) 77,573 76,455
4 Dividend income 6 753 1,089
5 Fee and commission income 7 53,311 58,620
6 Fee and commission expenses 7 (14,363) (16,643)
7 Net fee and commission income (5+6) 38,948 41,977
8 Net realised gains on f inancial assets and liabilities not
measured at fair value through profit or loss 8 14,739 32,093
9 Net gains on f inancial assets and liabilities held for trading 9 2,250 2,371
10 Net (losses)/gains on f inancial assets and liabilities designated
at fair value through profit or loss (33) 98
11 Fair value adjustments in hedge accounting 10 238 (116)
12 Exchange differences (22) 40
13 Net losses on derecognition of assets (54) (208)
14 Net other operating expenses 11 (7,428) (12,669)
15 Administrative expenses 12 (68,246) (72,004)
16 Depreciation and amortisation 13 (7,185) (9,221)
17 Provisions 14 3,982 32,572
18 Impairment 15 23,825 (42,449)
19 Total profit from investments in subsidiaries 79 –
20 Total profit/(loss) from non-current assets held for sale 37 3,028 (3)
21 TOTAL PROFIT BEFORE TAX FROM CONTINUING OPERATIONS
(3+4+7+8+9+10+11+12+13+14+15+16+17+18+19+20) 82,447 50,025
22 Tax expense related to profit from continuing operations 16 (5,791) (7,250)
23 TOTAL PROFIT AFTER TAX FROM CONTINUING OPERATIONS (21+22) 76,656 42,775
24 NET PROFIT for the financial year (23) 76,656 42,775
Year ended 31 December
90,404 111,215
AMOUNT
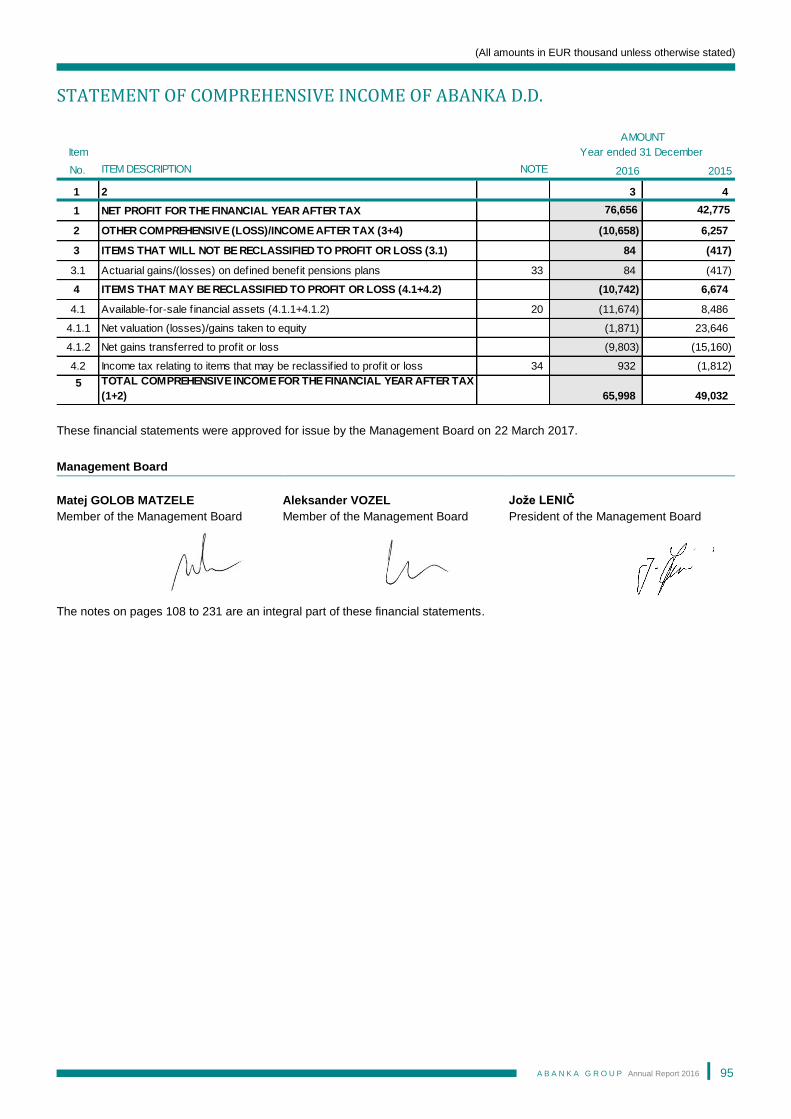
(All amounts in EUR thousand unless otherwise stated)
A B A N K A G R O U P Annual Report 2016
95
STATEMENT OF COMPREHENSIVE INCOME OF ABANKA D.D.
These financial statements were approved for issue by the Management Board on 22 March 2017.
Management Board
Matej GOLOB MATZELE
Member of the Management Board
Aleksander VOZEL
Member of the Management Board
Jože LENIČ
President of the Management Board
The notes on pages 108 to 231 are an integral part of these financial statements.
Item
No. ITEM DESCRIPTION NOTE 2016 2015
1 2 3 4
1 NET PROFIT FOR THE FINANCIAL YEAR AFTER TAX
2 OTHER COMPREHENSIVE (LOSS)/INCOME AFTER TAX (3+4) (10,658) 6,257
3 ITEMS THAT WILL NOT BE RECLASSIFIED TO PROFIT OR LOSS (3.1) 84 (417)
3.1 Actuarial gains/(losses) on defined benefit pensions plans 33 84 (417)
4 ITEMS THAT MAY BE RECLASSIFIED TO PROFIT OR LOSS (4.1+4.2) (10,742) 6,674
4.1 Available-for-sale f inancial assets (4.1.1+4.1.2) 20 (11,674) 8,486
4.1.1 Net valuation (losses)/gains taken to equity (1,871) 23,646
4.1.2 Net gains transferred to profit or loss (9,803) (15,160)
4.2 Income tax relating to items that may be reclassif ied to profit or loss 34 932 (1,812)
5 TOTAL COMPREHENSIVE INCOME FOR THE FINANCIAL YEAR AFTER TAX
(1+2) 65,998 49,032
76,656 42,775
AMOUNT
Year ended 31 December
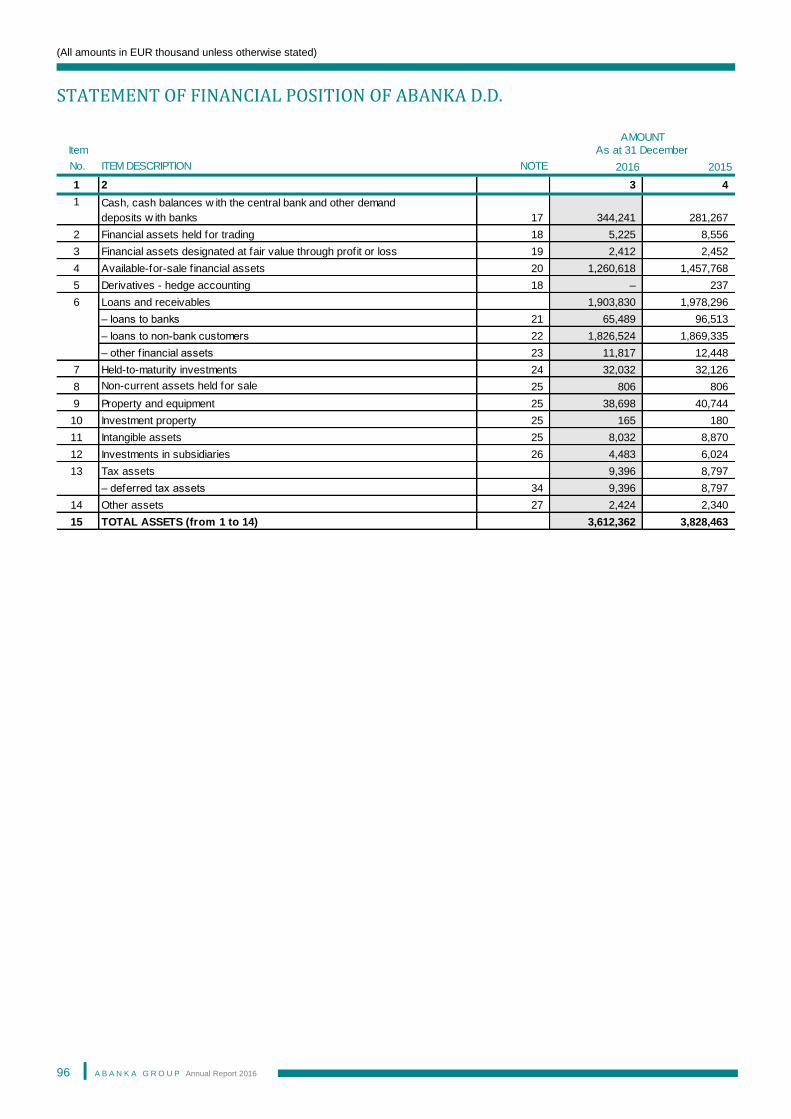
(All amounts in EUR thousand unless otherwise stated)
A B A N K A G R O U P Annual Report 2016
96
STATEMENT OF FINANCIAL POSITION OF ABANKA D.D.
Item
No. ITEM DESCRIPTION NOTE 2016 2015
1 2 3 4
1 Cash, cash balances w ith the central bank and other demand
deposits w ith banks 17 344,241 281,267
2 Financial assets held for trading 18 5,225 8,556
3 Financial assets designated at fair value through profit or loss 19 2,412 2,452
4 Available-for-sale f inancial assets 20 1,260,618 1,457,768
5 Derivatives - hedge accounting 18 – 237
6 Loans and receivables 1,903,830 1,978,296
– loans to banks 21 65,489 96,513
– loans to non-bank customers 22 1,826,524 1,869,335
– other f inancial assets 23 11,817 12,448
7 Held-to-maturity investments 24 32,032 32,126
8 Non-current assets held for sale 25 806 806
9 Property and equipment 25 38,698 40,744
10 Investment property 25 165 180
11 Intangible assets 25 8,032 8,870
12 Investments in subsidiaries 26 4,483 6,024
13 Tax assets 9,396 8,797
– deferred tax assets 34 9,396 8,797
14 Other assets 27 2,424 2,340
15 TOTAL ASSETS (from 1 to 14) 3,612,362 3,828,463
As at 31 December
AMOUNT
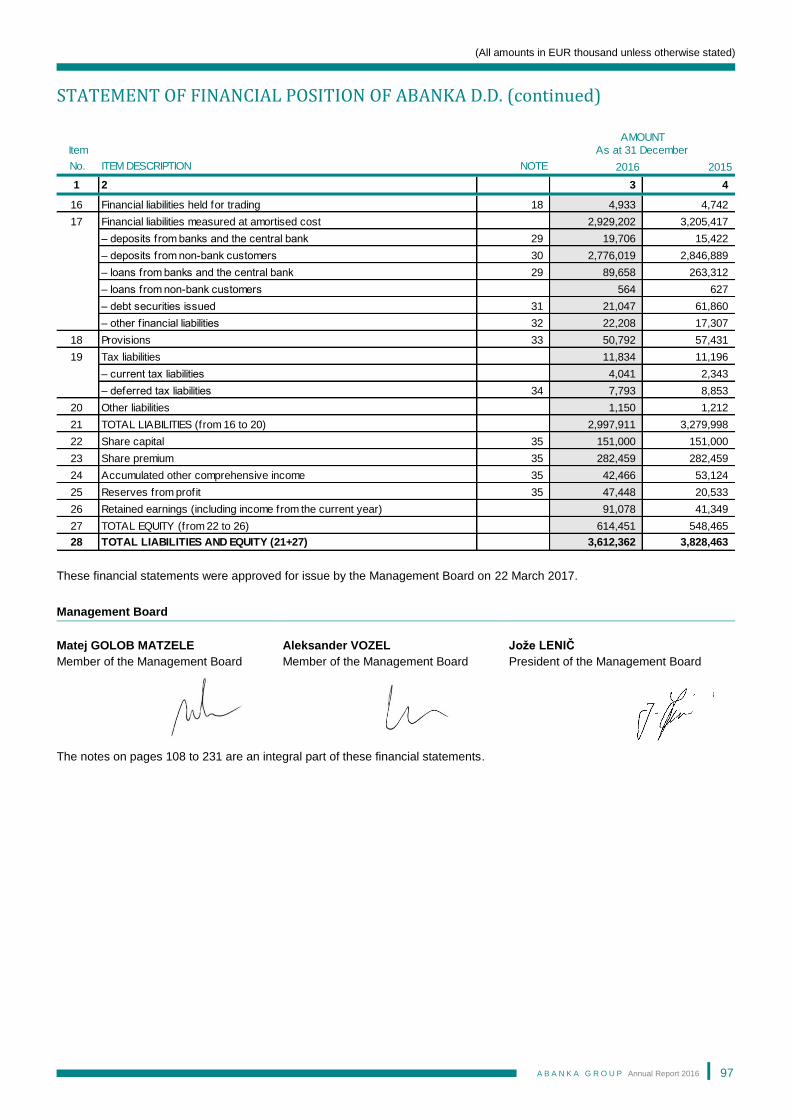
(All amounts in EUR thousand unless otherwise stated)
A B A N K A G R O U P Annual Report 2016
97
STATEMENT OF FINANCIAL POSITION OF ABANKA D.D. (continued)
These financial statements were approved for issue by the Management Board on 22 March 2017.
Management Board
Matej GOLOB MATZELE
Member of the Management Board
Aleksander VOZEL
Member of the Management Board
Jože LENIČ
President of the Management Board
The notes on pages 108 to 231 are an integral part of these financial statements.
Item
No. ITEM DESCRIPTION NOTE 2016 2015
1 2 3 4
16 Financial liabilities held for trading 18 4,933 4,742
17 Financial liabilities measured at amortised cost 2,929,202 3,205,417
– deposits from banks and the central bank 29 19,706 15,422
– deposits from non-bank customers 30 2,776,019 2,846,889
– loans from banks and the central bank 29 89,658 263,312
– loans from non-bank customers 564 627
– debt securities issued 31 21,047 61,860
– other f inancial liabilities 32 22,208 17,307
18 Provisions 33 50,792 57,431
19 Tax liabilities 11,834 11,196
– current tax liabilities 4,041 2,343
– deferred tax liabilities 34 7,793 8,853
20 Other liabilities 1,150 1,212
21 TOTAL LIABILITIES (from 16 to 20) 2,997,911 3,279,998
22 Share capital 35 151,000 151,000
23 Share premium 35 282,459 282,459
24 Accumulated other comprehensive income 35 42,466 53,124
25 Reserves from profit 35 47,448 20,533
26 Retained earnings (including income from the current year) 91,078 41,349
27 TOTAL EQUITY (from 22 to 26) 614,451 548,465
28 TOTAL LIABILITIES AND EQUITY (21+27) 3,612,362 3,828,463
As at 31 December
AMOUNT
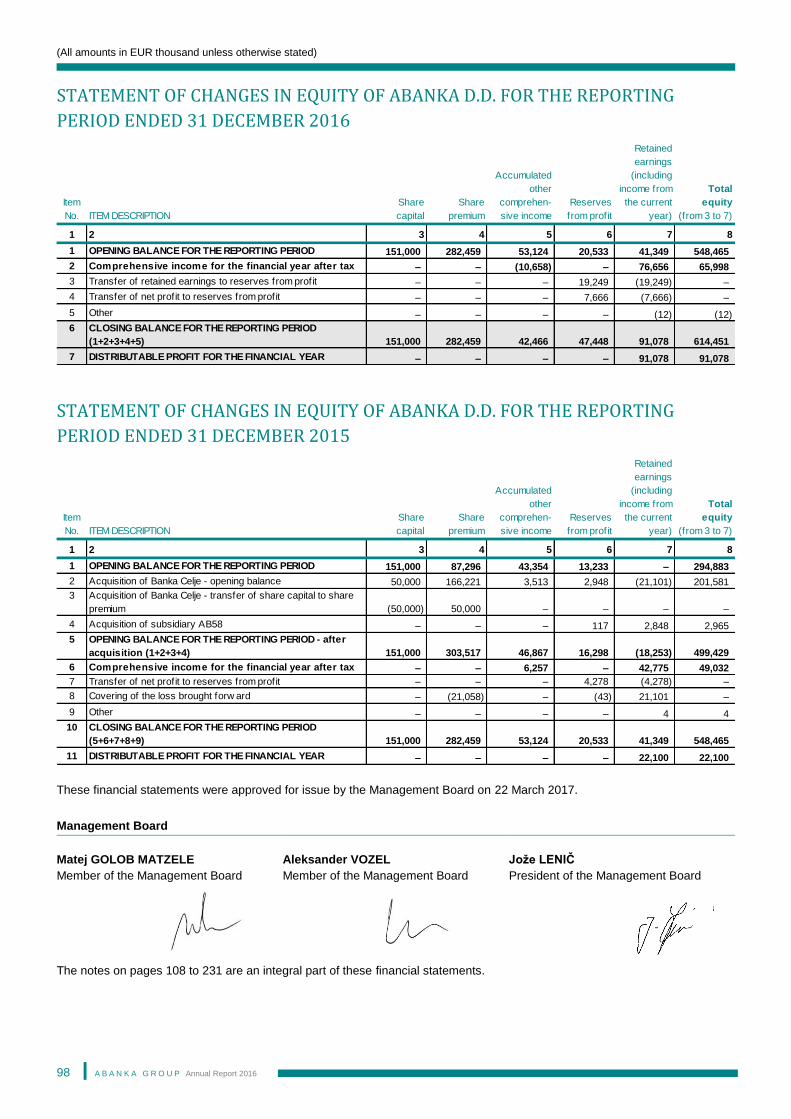
(All amounts in EUR thousand unless otherwise stated)
A B A N K A G R O U P Annual Report 2016
98
STATEMENT OF CHANGES IN EQUITY OF ABANKA D.D. FOR THE REPORTING
PERIOD ENDED 31 DECEMBER 2016
STATEMENT OF CHANGES IN EQUITY OF ABANKA D.D. FOR THE REPORTING
PERIOD ENDED 31 DECEMBER 2015
These financial statements were approved for issue by the Management Board on 22 March 2017.
Management Board
Matej GOLOB MATZELE
Member of the Management Board
Aleksander VOZEL
Member of the Management Board
Jože LENIČ
President of the Management Board
The notes on pages 108 to 231 are an integral part of these financial statements.
Item
No. ITEM DESCRIPTION
Share
capital
Share
premium
Accumulated
other
comprehen-
sive income
Reserves
from profit
Retained
earnings
(including
income from
the current
year)
Total
equity
(from 3 to 7)
1 2 3 4 5 6 7 8
1 OPENING BALANCE FOR THE REPORTING PERIOD 151,000 282,459 53,124 20,533 41,349 548,465
2 Comprehensive income for the financial year after tax – – (10,658) – 76,656 65,998
3 Transfer of retained earnings to reserves from profit – – – 19,249 (19,249) –
4 Transfer of net profit to reserves from profit – – – 7,666 (7,666) –
5 Other – – – – (12) (12)
6 CLOSING BALANCE FOR THE REPORTING PERIOD
(1+2+3+4+5) 151,000 282,459 42,466 47,448 91,078 614,451
7 DISTRIBUTABLE PROFIT FOR THE FINANCIAL YEAR – – – – 91,078 91,078
Item
No. ITEM DESCRIPTION
Share
capital
Share
premium
Accumulated
other
comprehen-
sive income
Reserves
from profit
Retained
earnings
(including
income from
the current
year)
Total
equity
(from 3 to 7)
1 2 3 4 5 6 7 8
1 OPENING BALANCE FOR THE REPORTING PERIOD 151,000 87,296 43,354 13,233 – 294,883
2 Acquisition of Banka Celje - opening balance 50,000 166,221 3,513 2,948 (21,101) 201,581
3 Acquisition of Banka Celje - transfer of share capital to share
premium (50,000) 50,000 – – – –
4 Acquisition of subsidiary AB58 – – – 117 2,848 2,965
5 OPENING BALANCE FOR THE REPORTING PERIOD - after
acquisition (1+2+3+4) 151,000 303,517 46,867 16,298 (18,253) 499,429
6 Comprehensive income for the financial year after tax – – 6,257 – 42,775 49,032
7 Transfer of net profit to reserves from profit – – – 4,278 (4,278) –
8 Covering of the loss brought forw ard – (21,058) – (43) 21,101 –
9 Other – – – – 4 4
10 CLOSING BALANCE FOR THE REPORTING PERIOD
(5+6+7+8+9) 151,000 282,459 53,124 20,533 41,349 548,465
11 DISTRIBUTABLE PROFIT FOR THE FINANCIAL YEAR – – – – 22,100 22,100
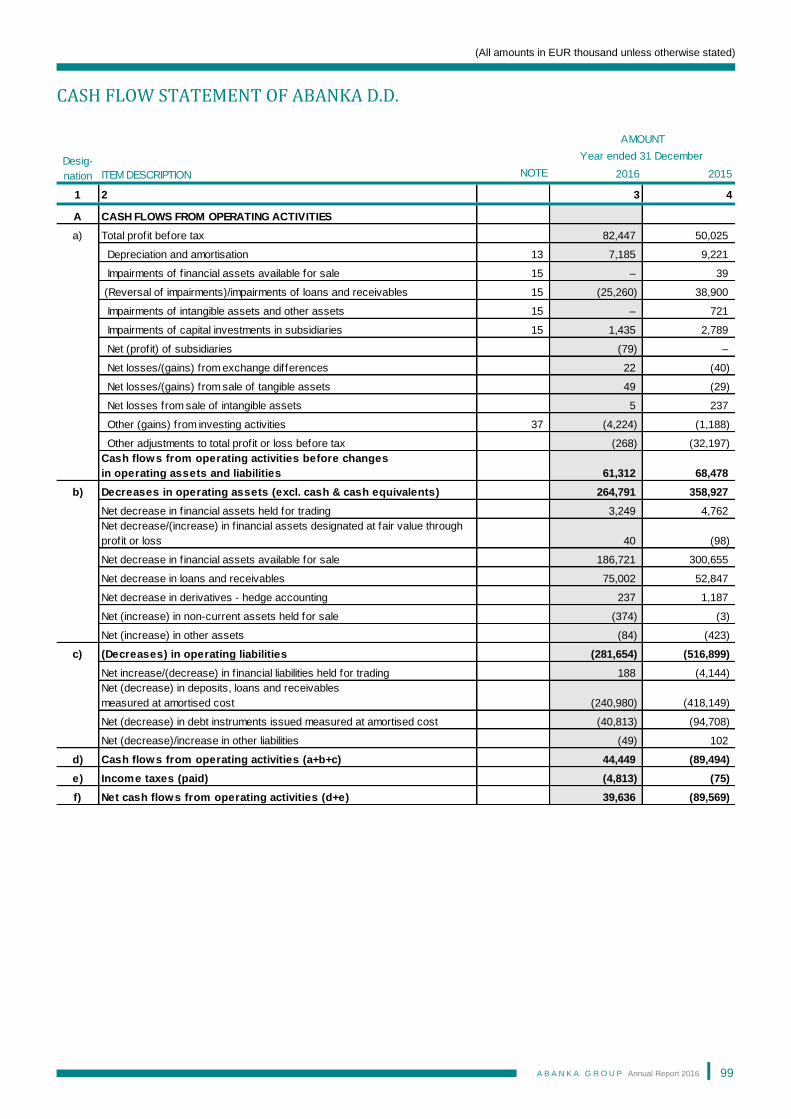
(All amounts in EUR thousand unless otherwise stated)
A B A N K A G R O U P Annual Report 2016
99
CASH FLOW STATEMENT OF ABANKA D.D.
ITEM DESCRIPTION NOTE 2016 2015
1 2 3 4
A CASH FLOWS FROM OPERATING ACTIVITIES
a) Total profit before tax 82,447 50,025
Depreciation and amortisation 13 7,185 9,221
Impairments of f inancial assets available for sale 15 – 39
(Reversal of impairments)/impairments of loans and receivables 15 (25,260) 38,900
Impairments of intangible assets and other assets 15 – 721
Impairments of capital investments in subsidiaries 15 1,435 2,789
Net (profit) of subsidiaries (79) –
Net losses/(gains) from exchange differences 22 (40)
Net losses/(gains) from sale of tangible assets 49 (29)
Net losses from sale of intangible assets 5 237
Other (gains) from investing activities 37 (4,224) (1,188)
Other adjustments to total profit or loss before tax (268) (32,197)
Cash flows from operating activities before changes
in operating assets and liabilities 61,312 68,478
b) Decreases in operating assets (excl. cash & cash equivalents) 264,791 358,927
Net decrease in f inancial assets held for trading 3,249 4,762
Net decrease/(increase) in f inancial assets designated at fair value through
profit or loss 40 (98)
Net decrease in f inancial assets available for sale 186,721 300,655
Net decrease in loans and receivables 75,002 52,847
Net decrease in derivatives - hedge accounting 237 1,187
Net (increase) in non-current assets held for sale (374) (3)
Net (increase) in other assets (84) (423)
c) (Decreases) in operating liabilities (281,654) (516,899)
Net increase/(decrease) in f inancial liabilities held for trading 188 (4,144)
Net (decrease) in deposits, loans and receivables
measured at amortised cost (240,980) (418,149)
Net (decrease) in debt instruments issued measured at amortised cost (40,813) (94,708)
Net (decrease)/increase in other liabilities (49) 102
d) Cash flows from operating activities (a+b+c) 44,449 (89,494)
e) Income taxes (paid) (4,813) (75)
f) Net cash flows from operating activities (d+e) 39,636 (89,569)
AMOUNT
Year ended 31 DecemberDesig-
nation
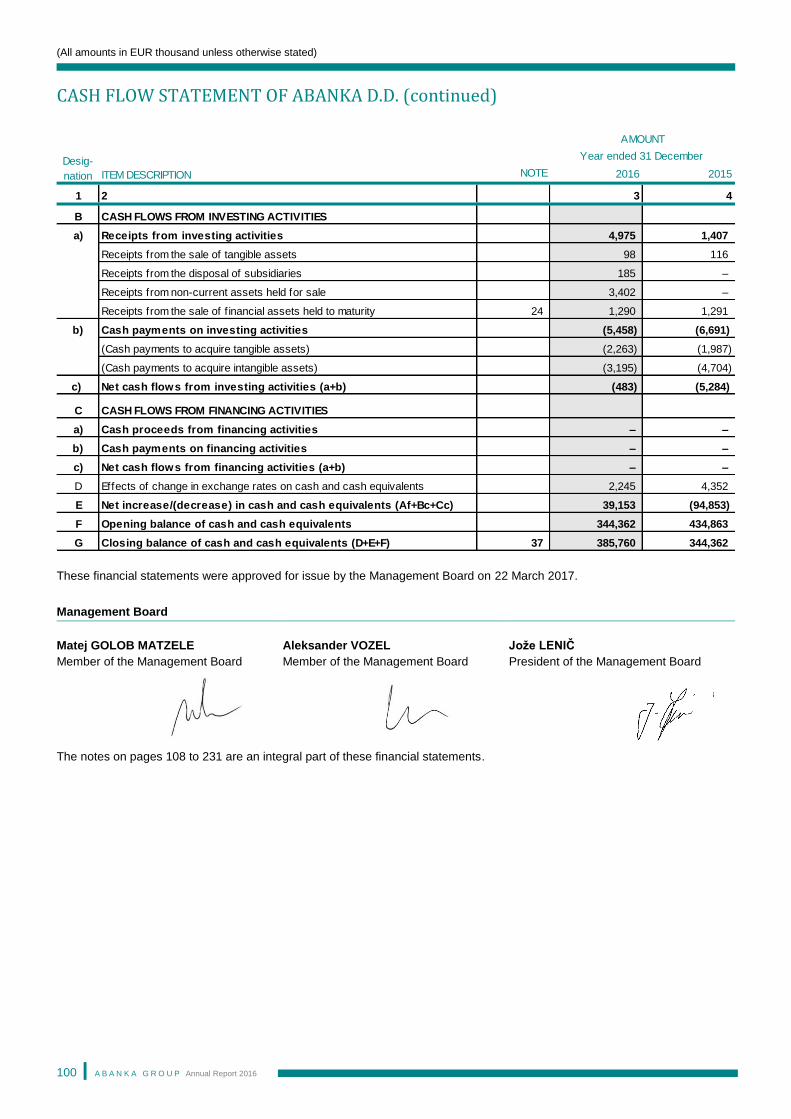
(All amounts in EUR thousand unless otherwise stated)
A B A N K A G R O U P Annual Report 2016
100
CASH FLOW STATEMENT OF ABANKA D.D. (continued)
These financial statements were approved for issue by the Management Board on 22 March 2017.
Management Board
Matej GOLOB MATZELE
Member of the Management Board
Aleksander VOZEL
Member of the Management Board
Jože LENIČ
President of the Management Board
The notes on pages 108 to 231 are an integral part of these financial statements.
ITEM DESCRIPTION NOTE 2016 2015
1 2 3 4
B CASH FLOWS FROM INVESTING ACTIVITIES
a) Receipts from investing activities 4,975 1,407
Receipts from the sale of tangible assets 98 116
Receipts from the disposal of subsidiaries 185 –
Receipts from non-current assets held for sale 3,402 –
Receipts from the sale of f inancial assets held to maturity 24 1,290 1,291
b) Cash payments on investing activities (5,458) (6,691)
(Cash payments to acquire tangible assets) (2,263) (1,987)
(Cash payments to acquire intangible assets) (3,195) (4,704)
c) Net cash flows from investing activities (a+b) (483) (5,284)
C CASH FLOWS FROM FINANCING ACTIVITIES
a) Cash proceeds from financing activities – –
b) Cash payments on financing activities – –
c) Net cash flows from financing activities (a+b) – –
D Effects of change in exchange rates on cash and cash equivalents 2,245 4,352
E Net increase/(decrease) in cash and cash equivalents (Af+Bc+Cc) 39,153 (94,853)
F Opening balance of cash and cash equivalents 344,362 434,863
G Closing balance of cash and cash equivalents (D+E+F) 37 385,760 344,362
AMOUNT
Year ended 31 DecemberDesig-
nation
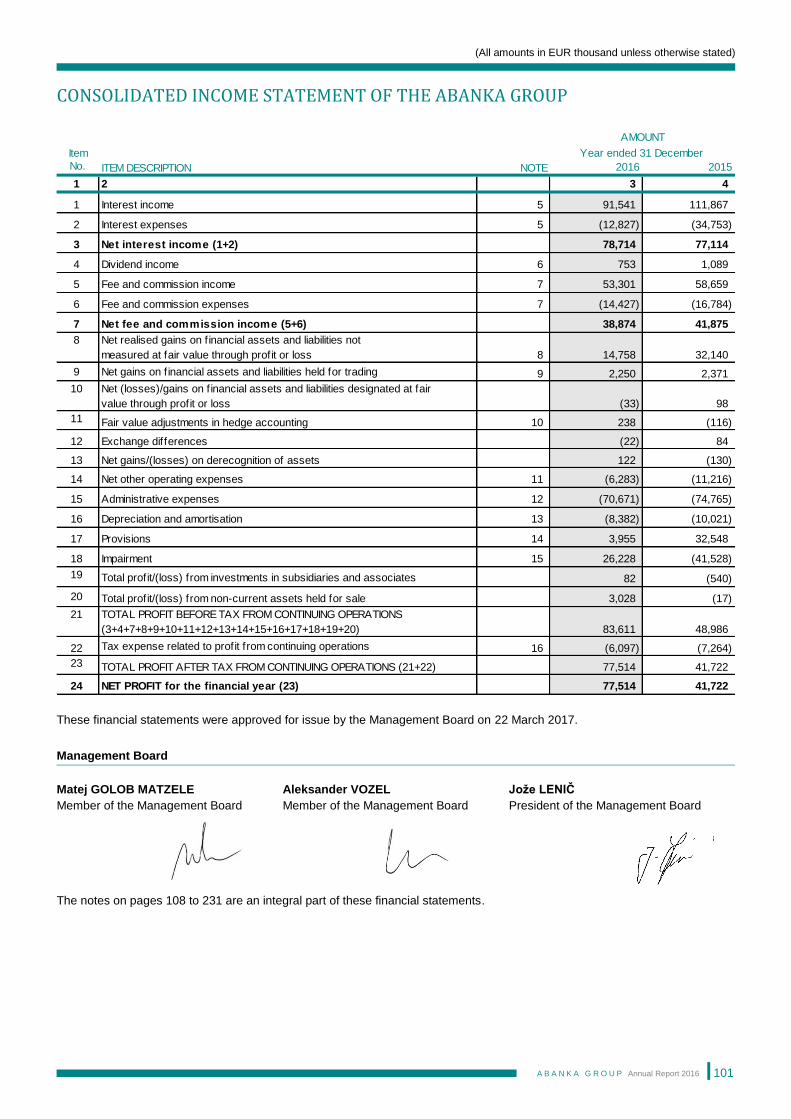
(All amounts in EUR thousand unless otherwise stated)
A B A N K A G R O U P Annual Report 2016
101
CONSOLIDATED INCOME STATEMENT OF THE ABANKA GROUP
These financial statements were approved for issue by the Management Board on 22 March 2017.
Management Board
Matej GOLOB MATZELE
Member of the Management Board
Aleksander VOZEL
Member of the Management Board
Jože LENIČ
President of the Management Board
The notes on pages 108 to 231 are an integral part of these financial statements.
Item
No. ITEM DESCRIPTION NOTE 2016 2015
1 2 3 4
1 Interest income 5 91,541 111,867
2 Interest expenses 5 (12,827) (34,753)
3 Net interest income (1+2) 78,714 77,114
4 Dividend income 6 753 1,089
5 Fee and commission income 7 53,301 58,659
6 Fee and commission expenses 7 (14,427) (16,784)
7 Net fee and commission income (5+6) 38,874 41,875
8 Net realised gains on f inancial assets and liabilities not
measured at fair value through profit or loss 8 14,758 32,140
9 Net gains on f inancial assets and liabilities held for trading 9 2,250 2,371
10 Net (losses)/gains on f inancial assets and liabilities designated at fair
value through profit or loss (33) 98
11 Fair value adjustments in hedge accounting 10 238 (116)
12 Exchange differences (22) 84
13 Net gains/(losses) on derecognition of assets 122 (130)
14 Net other operating expenses 11 (6,283) (11,216)
15 Administrative expenses 12 (70,671) (74,765)
16 Depreciation and amortisation 13 (8,382) (10,021)
17 Provisions 14 3,955 32,548
18 Impairment 15 26,228 (41,528)
19 Total profit/(loss) from investments in subsidiaries and associates 82 (540)
20 Total profit/(loss) from non-current assets held for sale 3,028 (17)
21 TOTAL PROFIT BEFORE TAX FROM CONTINUING OPERATIONS
(3+4+7+8+9+10+11+12+13+14+15+16+17+18+19+20) 83,611 48,986
22 Tax expense related to profit from continuing operations 16 (6,097) (7,264)
23 TOTAL PROFIT AFTER TAX FROM CONTINUING OPERATIONS (21+22) 77,514 41,722
24 NET PROFIT for the financial year (23) 77,514 41,722
Year ended 31 December
AMOUNT
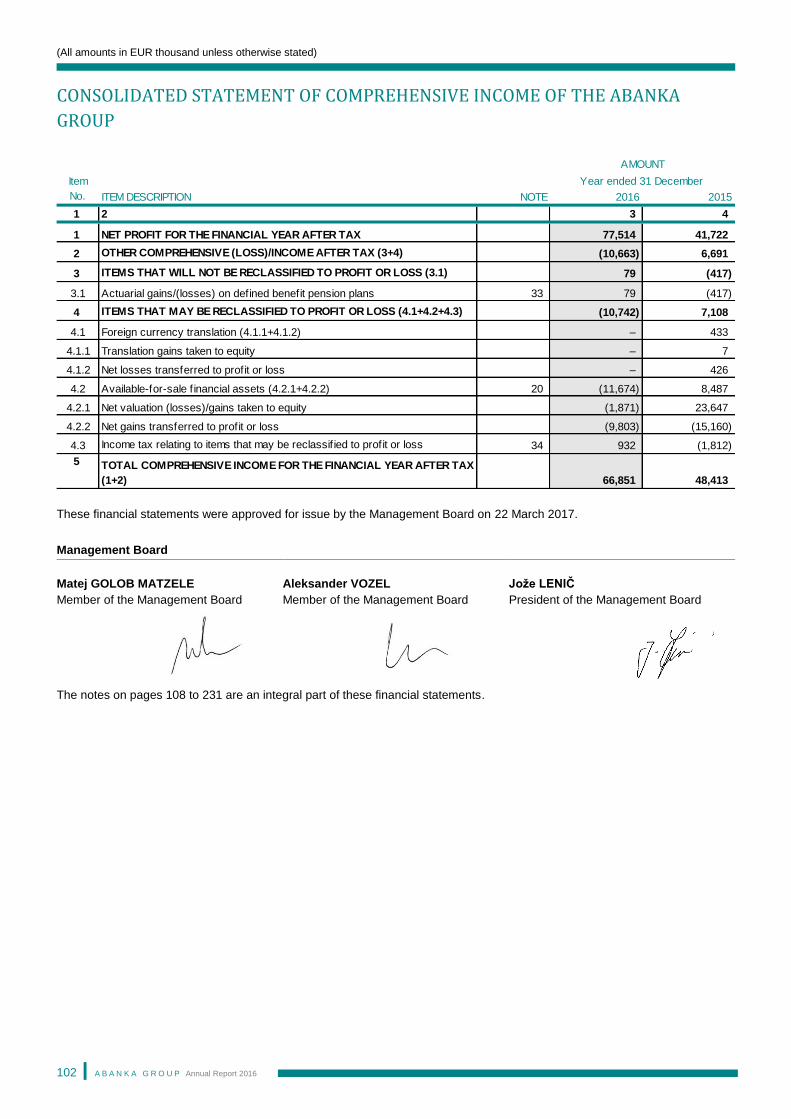
(All amounts in EUR thousand unless otherwise stated)
A B A N K A G R O U P Annual Report 2016
102
CONSOLIDATED STATEMENT OF COMPREHENSIVE INCOME OF THE ABANKA
GROUP
These financial statements were approved for issue by the Management Board on 22 March 2017.
Management Board
Matej GOLOB MATZELE
Member of the Management Board
Aleksander VOZEL
Member of the Management Board
Jože LENIČ
President of the Management Board
The notes on pages 108 to 231 are an integral part of these financial statements.
Item
No. ITEM DESCRIPTION NOTE 2016 2015
1 2 3 4
1 NET PROFIT FOR THE FINANCIAL YEAR AFTER TAX 77,514 41,722
2 OTHER COMPREHENSIVE (LOSS)/INCOME AFTER TAX (3+4) (10,663) 6,691
3 ITEMS THAT WILL NOT BE RECLASSIFIED TO PROFIT OR LOSS (3.1) 79 (417)
3.1 Actuarial gains/(losses) on defined benefit pension plans 33 79 (417)
4 ITEMS THAT MAY BE RECLASSIFIED TO PROFIT OR LOSS (4.1+4.2+4.3) (10,742) 7,108
4.1 Foreign currency translation (4.1.1+4.1.2) – 433
4.1.1 Translation gains taken to equity – 7
4.1.2 Net losses transferred to profit or loss – 426
4.2 Available-for-sale f inancial assets (4.2.1+4.2.2) 20 (11,674) 8,487
4.2.1 Net valuation (losses)/gains taken to equity (1,871) 23,647
4.2.2 Net gains transferred to profit or loss (9,803) (15,160)
4.3 Income tax relating to items that may be reclassif ied to profit or loss 34 932 (1,812)
AMOUNT
5 TOTAL COMPREHENSIVE INCOME FOR THE FINANCIAL YEAR AFTER TAX
(1+2) 66,851 48,413
Year ended 31 December
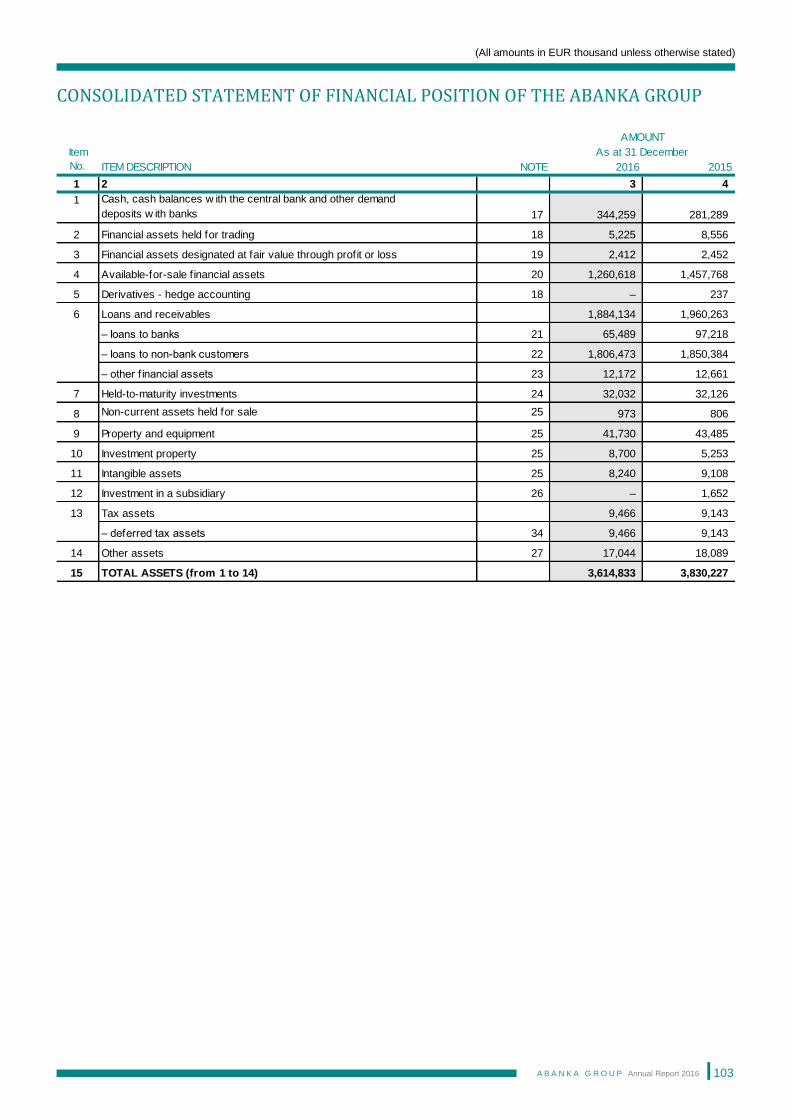
(All amounts in EUR thousand unless otherwise stated)
A B A N K A G R O U P Annual Report 2016
103
CONSOLIDATED STATEMENT OF FINANCIAL POSITION OF THE ABANKA GROUP
Item
No. ITEM DESCRIPTION NOTE 2016 2015
1 2 3 4
1 Cash, cash balances w ith the central bank and other demand
deposits w ith banks 17 344,259 281,289
2 Financial assets held for trading 18 5,225 8,556
3 Financial assets designated at fair value through profit or loss 19 2,412 2,452
4 Available-for-sale f inancial assets 20 1,260,618 1,457,768
5 Derivatives - hedge accounting 18 – 237
6 Loans and receivables 1,884,134 1,960,263
– loans to banks 21 65,489 97,218
– loans to non-bank customers 22 1,806,473 1,850,384
– other f inancial assets 23 12,172 12,661
7 Held-to-maturity investments 24 32,032 32,126
8 Non-current assets held for sale 25 973 806
9 Property and equipment 25 41,730 43,485
10 Investment property 25 8,700 5,253
11 Intangible assets 25 8,240 9,108
12 Investment in a subsidiary 26 – 1,652
13 Tax assets 9,466 9,143
– deferred tax assets 34 9,466 9,143
14 Other assets 27 17,044 18,089
15 TOTAL ASSETS (from 1 to 14) 3,614,833 3,830,227
As at 31 December
AMOUNT
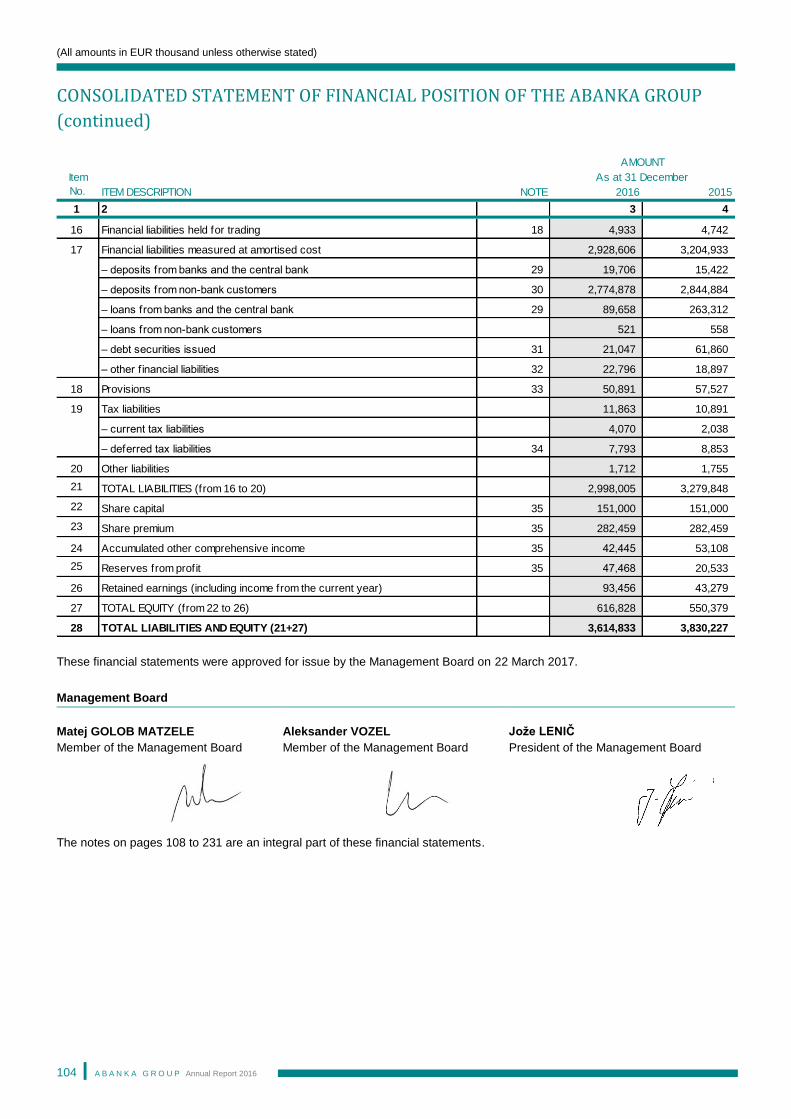
(All amounts in EUR thousand unless otherwise stated)
A B A N K A G R O U P Annual Report 2016
104
CONSOLIDATED STATEMENT OF FINANCIAL POSITION OF THE ABANKA GROUP
(continued)
These financial statements were approved for issue by the Management Board on 22 March 2017.
Management Board
Matej GOLOB MATZELE
Member of the Management Board
Aleksander VOZEL
Member of the Management Board
Jože LENIČ
President of the Management Board
The notes on pages 108 to 231 are an integral part of these financial statements.
Item
No. ITEM DESCRIPTION NOTE 2016 2015
1 2 3 4
16 Financial liabilities held for trading 18 4,933 4,742
17 Financial liabilities measured at amortised cost 2,928,606 3,204,933
– deposits from banks and the central bank 29 19,706 15,422
– deposits from non-bank customers 30 2,774,878 2,844,884
– loans from banks and the central bank 29 89,658 263,312
– loans from non-bank customers 521 558
– debt securities issued 31 21,047 61,860
– other f inancial liabilities 32 22,796 18,897
18 Provisions 33 50,891 57,527
19 Tax liabilities 11,863 10,891
– current tax liabilities 4,070 2,038
– deferred tax liabilities 34 7,793 8,853
20 Other liabilities 1,712 1,755
21 TOTAL LIABILITIES (from 16 to 20) 2,998,005 3,279,848
22 Share capital 35 151,000 151,000
23 Share premium 35 282,459 282,459
24 Accumulated other comprehensive income 35 42,445 53,108
25 Reserves from profit 35 47,468 20,533
26 Retained earnings (including income from the current year) 93,456 43,279
27 TOTAL EQUITY (from 22 to 26) 616,828 550,379
28 TOTAL LIABILITIES AND EQUITY (21+27) 3,614,833 3,830,227
As at 31 December
AMOUNT
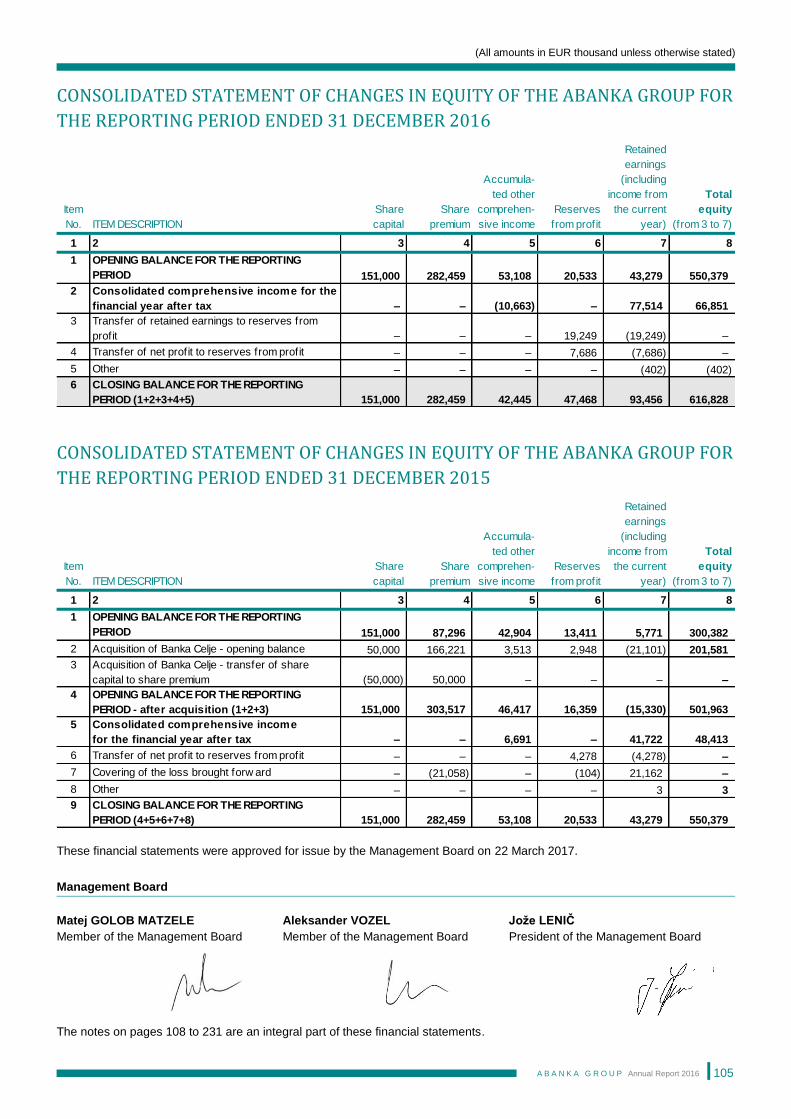
(All amounts in EUR thousand unless otherwise stated)
A B A N K A G R O U P Annual Report 2016
105
CONSOLIDATED STATEMENT OF CHANGES IN EQUITY OF THE ABANKA GROUP FOR
THE REPORTING PERIOD ENDED 31 DECEMBER 2016
CONSOLIDATED STATEMENT OF CHANGES IN EQUITY OF THE ABANKA GROUP FOR
THE REPORTING PERIOD ENDED 31 DECEMBER 2015
These financial statements were approved for issue by the Management Board on 22 March 2017.
Management Board
Matej GOLOB MATZELE
Member of the Management Board
Aleksander VOZEL
Member of the Management Board
Jože LENIČ
President of the Management Board
The notes on pages 108 to 231 are an integral part of these financial statements.
Item
No. ITEM DESCRIPTION
Share
capital
Share
premium
Accumula-
ted other
comprehen-
sive income
Reserves
from profit
Retained
earnings
(including
income from
the current
year)
Total
equity
(from 3 to 7)
1 2 3 4 5 6 7 8
1 OPENING BALANCE FOR THE REPORTING
PERIOD 151,000 282,459 53,108 20,533 43,279 550,379
2 Consolidated comprehensive income for the
financial year after tax – – (10,663) – 77,514 66,851
3 Transfer of retained earnings to reserves from
profit – – – 19,249 (19,249) –
4 Transfer of net profit to reserves from profit – – – 7,686 (7,686) –
5 Other – – – – (402) (402)
6 CLOSING BALANCE FOR THE REPORTING
PERIOD (1+2+3+4+5) 151,000 282,459 42,445 47,468 93,456 616,828
Item
No. ITEM DESCRIPTION
Share
capital
Share
premium
Accumula-
ted other
comprehen-
sive income
Reserves
from profit
Retained
earnings
(including
income from
the current
year)
Total
equity
(from 3 to 7)
1 2 3 4 5 6 7 8
1 OPENING BALANCE FOR THE REPORTING
PERIOD 151,000 87,296 42,904 13,411 5,771 300,382
2 Acquisition of Banka Celje - opening balance 50,000 166,221 3,513 2,948 (21,101) 201,581
3 Acquisition of Banka Celje - transfer of share
capital to share premium (50,000) 50,000 – – – –
4 OPENING BALANCE FOR THE REPORTING
PERIOD - after acquisition (1+2+3) 151,000 303,517 46,417 16,359 (15,330) 501,963
5 Consolidated comprehensive income
for the financial year after tax – – 6,691 – 41,722 48,413
6 Transfer of net profit to reserves from profit – – – 4,278 (4,278) –
7 Covering of the loss brought forw ard – (21,058) – (104) 21,162 –
8 Other – – – – 3 3
9 CLOSING BALANCE FOR THE REPORTING
PERIOD (4+5+6+7+8) 151,000 282,459 53,108 20,533 43,279 550,379
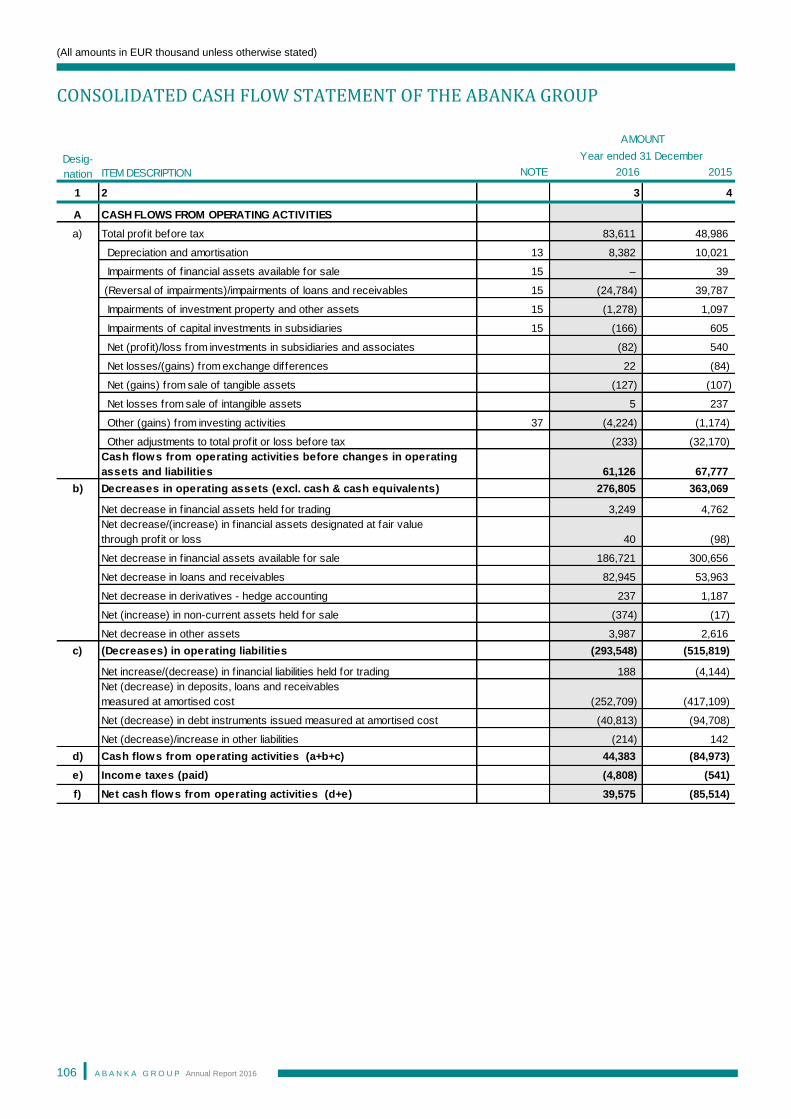
(All amounts in EUR thousand unless otherwise stated)
A B A N K A G R O U P Annual Report 2016
106
CONSOLIDATED CASH FLOW STATEMENT OF THE ABANKA GROUP
ITEM DESCRIPTION NOTE 2016 2015
1 2 3 4
A CASH FLOWS FROM OPERATING ACTIVITIES
a) Total profit before tax 83,611 48,986
Depreciation and amortisation 13 8,382 10,021
Impairments of f inancial assets available for sale 15 – 39
(Reversal of impairments)/impairments of loans and receivables 15 (24,784) 39,787
Impairments of investment property and other assets 15 (1,278) 1,097
Impairments of capital investments in subsidiaries 15 (166) 605
Net (profit)/loss from investments in subsidiaries and associates (82) 540
Net losses/(gains) from exchange differences 22 (84)
Net (gains) from sale of tangible assets (127) (107)
Net losses from sale of intangible assets 5 237
Other (gains) from investing activities 37 (4,224) (1,174)
Other adjustments to total profit or loss before tax (233) (32,170)
Cash flows from operating activities before changes in operating
assets and liabilities 61,126 67,777
b) Decreases in operating assets (excl. cash & cash equivalents) 276,805 363,069
Net decrease in f inancial assets held for trading 3,249 4,762
Net decrease/(increase) in f inancial assets designated at fair value
through profit or loss 40 (98)
Net decrease in f inancial assets available for sale 186,721 300,656
Net decrease in loans and receivables 82,945 53,963
Net decrease in derivatives - hedge accounting 237 1,187
Net (increase) in non-current assets held for sale (374) (17)
Net decrease in other assets 3,987 2,616
c) (Decreases) in operating liabilities (293,548) (515,819)
Net increase/(decrease) in f inancial liabilities held for trading 188 (4,144)
Net (decrease) in deposits, loans and receivables
measured at amortised cost (252,709) (417,109)
Net (decrease) in debt instruments issued measured at amortised cost (40,813) (94,708)
Net (decrease)/increase in other liabilities (214) 142
d) Cash flows from operating activities (a+b+c) 44,383 (84,973)
e) Income taxes (paid) (4,808) (541)
f) Net cash flows from operating activities (d+e) 39,575 (85,514)
Desig-
nation
AMOUNT
Year ended 31 December
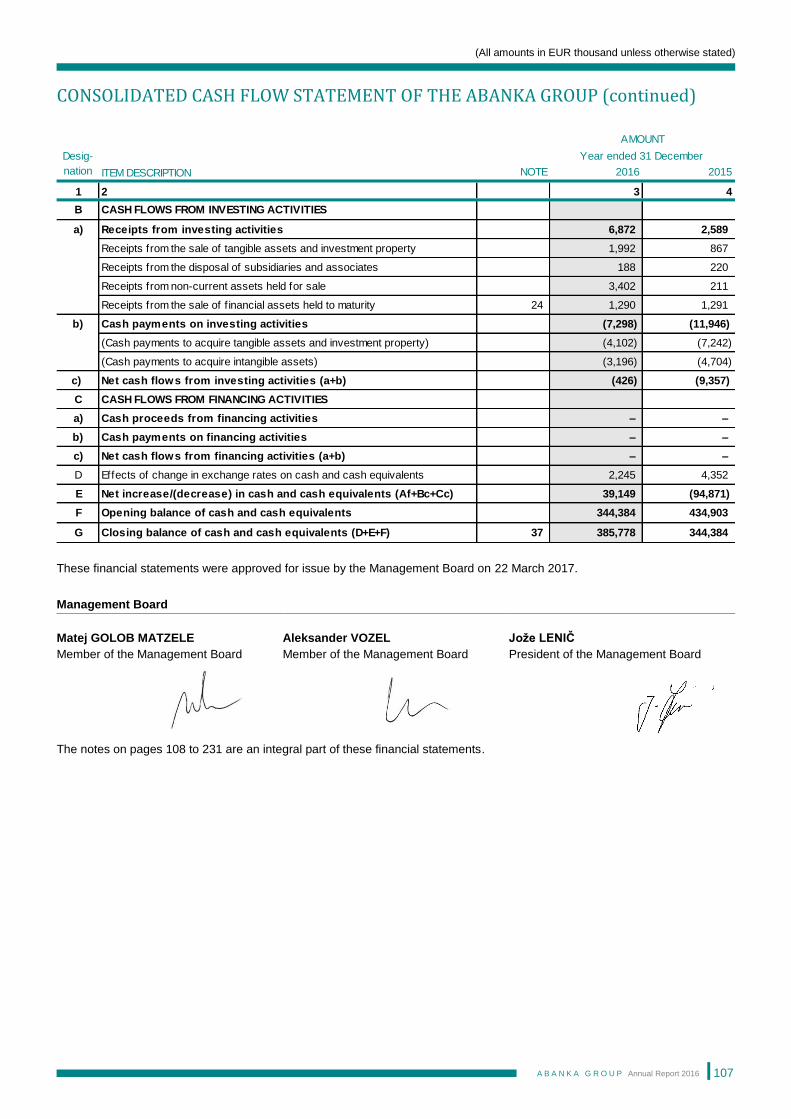
(All amounts in EUR thousand unless otherwise stated)
A B A N K A G R O U P Annual Report 2016
107
CONSOLIDATED CASH FLOW STATEMENT OF THE ABANKA GROUP (continued)
These financial statements were approved for issue by the Management Board on 22 March 2017.
Management Board
Matej GOLOB MATZELE
Member of the Management Board
Aleksander VOZEL
Member of the Management Board
Jože LENIČ
President of the Management Board
The notes on pages 108 to 231 are an integral part of these financial statements.
ITEM DESCRIPTION NOTE 2016 2015
1 2 3 4
B CASH FLOWS FROM INVESTING ACTIVITIES
a) Receipts from investing activities 6,872 2,589
Receipts from the sale of tangible assets and investment property 1,992 867
Receipts from the disposal of subsidiaries and associates 188 220
Receipts from non-current assets held for sale 3,402 211
Receipts from the sale of f inancial assets held to maturity 24 1,290 1,291
b) Cash payments on investing activities (7,298) (11,946)
(Cash payments to acquire tangible assets and investment property) (4,102) (7,242)
(Cash payments to acquire intangible assets) (3,196) (4,704)
c) Net cash flows from investing activities (a+b) (426) (9,357)
C CASH FLOWS FROM FINANCING ACTIVITIES
a) Cash proceeds from financing activities – –
b) Cash payments on financing activities – –
c) Net cash flows from financing activities (a+b) – –
D Effects of change in exchange rates on cash and cash equivalents 2,245 4,352
E Net increase/(decrease) in cash and cash equivalents (Af+Bc+Cc) 39,149 (94,871)
F Opening balance of cash and cash equivalents 344,384 434,903
G Closing balance of cash and cash equivalents (D+E+F) 37 385,778 344,384
Year ended 31 DecemberDesig-
nation
AMOUNT
(All amounts in EUR thousand unless otherwise stated)
A B A N K A G R O U P Annual Report 2016
108
NOTES TO THE FINANCIAL STATEMENTS
1 SUMMARY OF SIGNIFICANT ACCOUNTING POLICIES
Separate and consolidated financial statements were compiled in accordance with the basic accounting policies defined
hereinafter.
Reporting entity
Abanka d.d. is headquartered in Slovenia. The consolidated financial statements of the Bank as at and for the year ended
31 December 2016 comprise the Bank and its subsidiaries (together referred to as the “Group” and individually as “Group
entities”). The Group is primarily involved in corporate, retail and investment banking.
1.1 Basis of preparation
(a) Basis of preparation
Accepted accounting policies have been used on a consistent basis, and the accounting estimates have been made in
compliance with the principles of prudence and good management. The Management Board confirms that the financial
statements and the accompanying notes have been prepared on the assumption of a going concern for the Bank and the Group
for the period of assessment, being twelve months from the date of approval of these financial statements and in compliance
with the relevant legislation and International Financial Reporting Standards, as adopted by the EU.
These statutory financial statements are prepared for the purpose of compliance with legal requirements. The Bank is legally
required to obtain an independent audit of these financial statements. The scope of that audit is limited to an audit of general
purpose statutory financial statements to fulfill the legal requirement for audit of statutory financial statements. The audit scope
comprehends the statutory financial statements taken as a whole and does not provide assurance on any individual line item,
account or transaction. The audited financial statements are not intended for use by any party for the purposes of decision
making concerning any ownership, financing or any other specific transactions relating to the Bank. Accordingly, users of the
audited statutory financial statements should not rely exclusively on the financial statements and should undertake other
procedures before making decisions.
(b) Statement of compliance
The financial statements of the Bank and the consolidated financial statements have been prepared in accordance with
International Financial Reporting Standards (IFRS), as adopted by the EU.
The scope of information and notes included in the Group’s Annual Report and the breakdown of financial statements are also
prescribed in the Companies Act and in the Regulation on the Books of Account and Annual Reports of Banks and Savings
Banks issued by the Bank of Slovenia.
(c) Basis of measurement
The financial statements of the Bank and the consolidated financial statements have been prepared on the historical cost basis,
except for the following material items in the statement of financial position:
• derivative financial instruments are measured at fair value;
• financial instruments at fair value through profit or loss are measured at fair value;
• available-for-sale financial assets are measured at fair value.
(d) Functional and presentation currency
The financial statements of the Bank and the consolidated financial statements are presented in euros, which is the Bank’s
functional currency. All financial information presented in euros has been rounded to the nearest thousand unless
otherwise stated.
(e) Use of estimates and judgements The preparation of the financial statements in conformity with IFRS as adopted by the EU requires management to make
judgements, estimates and assumptions that affect the application of accounting policies and the reported amounts of assets,
liabilities, income and expenses. Actual results may differ from these estimates.
(All amounts in EUR thousand unless otherwise stated)
NOTES TO THE FINANCIAL STATEMENTS (continued)
A B A N K A G R O U P Annual Report 2016
109
Estimates and underlying assumptions are reviewed on an on-going basis. Revisions to accounting estimates are recognised in
the period in which the estimates are revised and in any future periods affected.
Information on critical judgements in applying accounting policies that have the most significant effect on the amounts
recognised in the financial statements is included in Note 3 Critical accounting estimates and judgments in applying
accounting policies.
(f) Standards and interpretations effective in the current period
The following standards, amendments to the existing standards and interpretations issued by the International Accounting
Standards Board (IASB) and adopted by the EU are effective for the current period:
• Amendments to IFRS 10 “Consolidated Financial Statements”, IFRS 12 “Disclosure of Interests in Other Entities” and IAS 28
“Investments in Associates and Joint Ventures” - Investment Entities: Applying the Consolidation Exception - adopted by the
EU on 22 September 2016 (effective for annual periods beginning on or after 1 January 2016);
• Amendments to IFRS 11 “Joint Arrangements” – Accounting for Acquisitions of Interests in Joint Operations - adopted by the
EU on 24 November 2015 (effective for annual periods beginning on or after 1 January 2016);
• Amendments to IAS 1 “Presentation of Financial Statements” – Disclosure Initiative - adopted by the EU on 18 December
2015 (effective for annual periods beginning on or after 1 January 2016);
• Amendments to IAS 16 “Property, Plant and Equipment” and IAS 38 “Intangible Assets” – Clarification of Acceptable Methods
of Depreciation and Amortisation - adopted by the EU on 2 December 2015 (effective for annual periods beginning on or after
1 January 2016);
• Amendments to IAS 19 “Employee Benefits” – Defined Benefit Plans: Employee Contributions - adopted by the EU on 17
December 2014 (effective for annual periods beginning on or after 1 February 2015);
• Amendments to IAS 27 “Separate Financial Statements” – Equity Method in Separate Financial Statements - adopted by the
EU on 18 December 2015 (effective for annual periods beginning on or after 1 January 2016);
• Amendments to various standards “Improvements to IFRSs (cycle 2010-2012)” resulting from the annual improvement project
of IFRS (IFRS 2, IFRS 3, IFRS 8, IFRS 13, IAS 16, IAS 24 and IAS 38) primarily with a view to removing inconsistencies and
clarifying wording - adopted by the EU on 17 December 2014 (amendments are to be applied for annual periods beginning on
or after 1 February 2015);
• Amendments to various standards “Improvements to IFRSs (cycle 2012-2014)” resulting from the annual improvement project
of IFRS (IFRS 5, IFRS 7, IAS 19 and IAS 34) primarily with a view to removing inconsistencies and clarifying wording -
adopted by the EU on 15 December 2015 (amendments are to be applied for annual periods beginning on or after
1 January 2016).
The adoption of these amendments to the existing standards and interpretation has not led to any changes in the Group’s
accounting policies.
(g) Standards, interpretations and amendments issued but not yet effective
Among the standards issued by the International Accounting Standards Board but which the Group has not started to apply
early, IFRS 9 – Financial Instruments (effective for annual periods beginning on or after 1 January 2018) is the most significant
for the Group in terms of financial statements.
The implementation of IFRS 9
IFRS 9 “Financial Instruments” issued on 24 July 2014 is the IASB's replacement of IAS 39 Financial Instruments: Recognition
and Measurement. IFRS 9 includes requirements for recognition and measurement, impairment, derecognition and general
hedge accounting.
Classification and Measurement - IFRS 9 introduces a new approach for the classification of financial assets, which is driven by
cash flow characteristics and the business model in which an asset is held. This single approach replaces existing requirements
under IAS 39. The new model also results in a single impairment model being applied to all financial instruments.
Impairment - IFRS 9 has introduced a new, expected-loss impairment model that will require more timely recognition of
expected credit losses. Specifically, the new Standard requires entities to account for expected credit losses from when financial
instruments are first recognised and to recognise full lifetime expected losses on a more timely basis.
(All amounts in EUR thousand unless otherwise stated)
NOTES TO THE FINANCIAL STATEMENTS (continued)
A B A N K A G R O U P Annual Report 2016
110
Hedge accounting - IFRS 9 introduces a substantially modified hedge accounting model, particularly for companies that are
exposed to product risk (hedged non-financial items). The new model represents a significant overhaul of hedge accounting that
aligns the accounting treatment with risk management activities.
Own credit risk - IFRS 9 removes the volatility in profit or loss that was caused by changes in the credit risk of liabilities elected
to be measured at fair value. This change in accounting means that gains caused by the deterioration of an entity’s own credi t
risk on such liabilities are no longer recognised in profit or loss.
Key requirements of IFRS 9 are:
All recognised financial assets that are within the scope of IFRS 9 are required to be subsequently measured at amortised cost
or fair value. Debt instruments that are held within a business model whose objective is to collect the contractual cash flows,
and that have contractual cash flows that are solely payments of principal and interest on the principal outstanding are
measured at amortised cost at the end of subsequent accounting periods. Debt instruments that are held within a business
model whose objective is achieved both by collecting contractual cash flows and selling financial assets, and that have
contractual terms that give rise on specified dates to cash flows that are solely payments of principal and interest on the
principal amount outstanding, are generally measured at FVTOCI. All other debt instruments and equity instruments are
measured at their fair value at the end of subsequent accounting periods. In addition, under IFRS 9, entities may make an
irrevocable election to present subsequent changes in the fair value of an equity instrument (that is not held for trading nor
contingent consideration recognised by an acquirer in a business combination to which IFRS 3 applies) in other comprehensive
income, with only dividend income recognised in profit or loss. With regard to the measurement of financial liabilities designated
as at fair value through profit or loss, IFRS 9 requires that the amount of change in the fair value of a financial liability that is
attributable to changes in the credit risk of that liability is presented in other comprehensive income, unless the recognition of
such changes in other comprehensive income would create or enlarge an accounting mismatch in profit or loss. Changes in fair
value attributable to a financial liability's credit risk are not subsequently reclassified to profit or loss.
In relation to the impairment of financial assets, IFRS 9 requires an expected credit loss model, as opposed to an incurred credit
loss model under IAS 39. The expected credit loss model requires an entity to account for expected credit losses and changes
in those expected credit losses at each reporting date to reflect changes in credit risk since initial recognition. In other words, it
is no longer necessary for a credit event to have occurred before credit losses are recognised.
The new general hedge accounting requirements retain the three types of hedge accounting mechanisms currently available in
IAS 39. Under IFRS 9, greater flexibility has been introduced to the types of transactions eligible for hedge accounting,
specifically broadening the types of instruments that qualify for hedging instruments and the types of risk components of non-
financial items that are eligible for hedge accounting. In addition, the effectiveness test has been overhauled and replaced with
the principle of an ‘economic relationship’. Retrospective assessment of hedge effectiveness is also no longer required.
Enhanced disclosure requirements regarding an entity’s risk management activities have also been introduced.
In 2016, the Group launched the IFRS 9 implementation project. With the help of an external consultant, a gap analysis was
prepared as well as the content request of implementation. The project phases completed in 2016 included:
• the gap analysis between the existing situation and the IFRS requirements;
• the initial estimate of the transition impact;
• determination of the business model and procedures for filling the gaps in classification and measurement;
• determination of the characteristics of the contractual cash flows and the introduction of the SPPI test;
• concept and development of the model for the calculation of expected credit losses.
In 2017, the Group started developing and adapting IT systems to the requirements of the new standard.
According to IFRS 9, the Bank will be obliged to recognise a loss allowance for expected credit loss, which constitutes a
significant change compared to the currently valid IAS 39 that requires the recognition of incurred losses in financial statements.
IFRS 9 introduces the identification and management of three different stages in the life cycle of any financial asset:
• a financial asset is assigned to Stage 1 upon initial recognition and remains in Stage 1 until a significant increase in credit risk
has been identified. Impairment is calculated on the basis of 12-month expected credit losses;
• a financial asset is classified as Stage 2 once a significant increase of credit risk has been detected and remains in Stage 2
until a default event has occurred. Impairment is calculated on the basis of lifetime expected credit losses;
(All amounts in EUR thousand unless otherwise stated)
NOTES TO THE FINANCIAL STATEMENTS (continued)
A B A N K A G R O U P Annual Report 2016
111
• a financial asset is classified as Stage 3 if there is objective evidence of impairment or if a default event has occurred.
Impairment is calculated on the basis of lifetime expected credit losses or assessed based on the discounted value of
expected repayment (cash flows) including the expected proceeds from the realisation of collateral (individual impairment
calculation).
The Bank has defined triggers for the transition or re-classification of financial assets between the stages for individual debtor
segments, which include:
• credit rating,
• threshold number of days past due,
• restructuring of financial assets,
• watch list,
• significant past-due liabilities of debtor and past-due financial asset.
Expected losses will be calculated on the basis of the Probability of Default (PD), Loss Given Default (LGD) and Exposure at
Default (EAD). The calculated credit parameters (PD and LGD) will be adjusted to macroeconomic forecasts.
Loans and those debt securities held in the banking book, which are not intended to regulate operational, current liquidity but to
collect contractual cash flows, will be classified by the Group into the business model whose objective is to hold the financial
asset to collect the contractual cash flows (valued at amortised cost).
The Group's business model of assets held for the purpose of both collecting contractual cash flows and selling financial assets
(valued at fair value through equity) will consist of debt securities held in the banking book, which are intended to regulate
operational, current liquidity and are, as a rule, more liquid, high quality and less exposed to credit risk and a part of non-
performing loans destined for sale according to the Group’s strategy.
At initial recognition of the debt securities classified into the above-mentioned models, the Group will be obliged to check
whether their cash flows include only the repayment of the principal and interest.
In the other business model (valued through profit or loss), the Group will include the following:
• instruments obtained for hedging of other positions,
• structured products, which were recognised at fair value through profit or loss even as at the 2016 year-end,
• securities held for trading,
• equity securities, for which the option of irrevocable election of measurement through equity will not be selected at initial
recognition.
In the other business model (the option of irrevocable election of valuation through equity), the Group will include the following:
• equity securities that are complementary to the principal activity of the Bank (of strategic nature for the Bank) and
• equity securities that support the principal activity of the Bank (of infrastructure nature for the Bank) and are currently
classified as available-for-sale financial assets.
The business models are based on the Bank’s business decisions in accordance with IFRS 8.
The Group has presented only qualitative information, since no reliable assessment of the quantitative impacts could be made
as at 31 December 2016, because the final methodology for the calculation of expected credit losses and related risk
parameters had not been confirmed.
• IFRS 15 “Revenue from Contracts with Customers” and amendments to IFRS 15 “Effective date of IFRS 15” - adopted by the
EU on 22 September 2016 (effective for annual periods beginning on or after 1 January 2018)
The Group estimates that the introduction of IFRS 15 in the initial application period will not have a material impact on the
Group's financial statements.
(h) New Standards and amendments to the existing standards issued by IASB but not yet adopted by the EU
• IFRS 14 “Regulatory Deferral Accounts” (effective for annual periods beginning on or after 1 January 2016) - the European
Commission has decided not to launch the endorsement process of this interim standard and to wait for the final standard;
(All amounts in EUR thousand unless otherwise stated)
NOTES TO THE FINANCIAL STATEMENTS (continued)
A B A N K A G R O U P Annual Report 2016
112
• IFRS 16 “Leases” (effective for annual periods beginning on or after 1 January 2019);
• Amendments to IFRS 2 “Share-based Payment” - Classification and Measurement of Share-based Payment Transactions
(effective for annual periods beginning on or after 1 January 2018);
• Amendments to IFRS 4 “Insurance Contracts” - Applying IFRS 9 Financial Instruments with IFRS 4 Insurance Contracts
(effective for annual periods beginning on or after 1 January 2018 or when IFRS 9 “Financial Instruments” is applied for the
first time);
• Amendments to IFRS 10 “Consolidated Financial Statements” and IAS 28 “Investments in Associates and Joint Ventures” -
Sale or Contribution of Assets between an Investor and its Associate or Joint Venture and further amendments (effective date
deferred indefinitely until the research project on the equity method has been concluded);
• Amendments to IFRS 15 “Revenue from Contracts with Customers” - Clarifications to IFRS 15 Revenue from Contracts with
Customers (effective for annual periods beginning on or after 1 January 2018);
• Amendments to IAS 7 “Statement of Cash Flows” - Disclosure Initiative (effective for annual periods beginning on or after
1 January 2017);
• Amendments to IAS 12 “Income Taxes” - Recognition of Deferred Tax Assets for Unrealised Losses (effective for annual
periods beginning on or after 1 January 2017);
• Amendments to IAS 40 “Investment Property” - Transfers of Investment Property (effective for annual periods beginning on or
after 1 January 2018);
• Amendments to various standards “Improvements to IFRSs (cycle 2014-2016)” resulting from the annual improvement project
of IFRS (IFRS 1, IFRS 12 and IAS 28) primarily with a view to removing inconsistencies and clarifying wording (amendments
to IFRS 12 are to be applied for annual periods beginning on or after 1 January 2017 and amendments to IFRS 1 and IAS 28
are to be applied for annual periods beginning on or after 1 January 2018);
• IFRIC 22 “Foreign Currency Transactions and Advance Consideration” (effective for annual periods beginning on or after
1 January 2018).
The Group estimates that the introduction of these accounting standards and changes to the existing standards in the initial
application period will not have a material impact on the Group's financial statements.
• Hedge accounting (part of IFRS 9) for a portfolio of financial assets and liabilities whose principles have not been adopted by
the EU remains unregulated. The Group estimates that the application of hedge accounting to a portfolio of financial assets or
liabilities pursuant to IAS 39: “Financial Instruments: Recognition and Measurement” would not significantly impact the
financial statements, if applied as at the balance sheet date.
1.2 Consolidation
(a) Subsidiaries
Subsidiaries are all entities over which the Group has control. The Group controls an entity when the Group is exposed to, or
has rights to, variable returns from its involvement with the entity and has the ability to affect those returns through its power
over the entity. The existence and effect of potential voting rights that are currently exercisable or convertible are considered
when assessing whether the Group controls another entity. Subsidiaries are fully consolidated from the date on which control is
transferred to the Group. They are deconsolidated from the date on which control ceases.
Inter-company transactions, balances and unrealised gains on transactions between group companies are eliminated.
Unrealised losses are also eliminated unless the transaction provides evidence of the impairment of the asset transferred.
In the separate financial statements of the Bank, investments in subsidiaries are measured at cost.
In 2016, the subsidiary Afaktor d.o.o. has been excluded from the consolidated financial statements of the Abanka Group, as
the company had no significant impact on the true and fair view of the financial position of the Group.
(b) Associates
Associates are all entities in which the Group has between 20% and 50% of the voting rights and over which the Group has
significant influence, but does not control. In the consolidated financial statements, investments in associates are accounted for
by the equity method of accounting and are initially recognised at cost. The Group’s investment in associates includes goodwill
(net of any accumulated impairment loss) identified upon acquisition.
(All amounts in EUR thousand unless otherwise stated)
NOTES TO THE FINANCIAL STATEMENTS (continued)
A B A N K A G R O U P Annual Report 2016
113
The Group’s share of the post-acquisition profits or losses of associates is recognised in the consolidated income statement,
and its share of post-acquisition movements in other comprehensive income is recognised in other comprehensive income. The
cumulative post-acquisition movements are adjusted against the carrying amount of the investment.
Unrealised gains on transactions between the Group and its associates are eliminated to the extent of the Group’s interest in
the associates; unrealised losses are also eliminated, unless the transaction provides evidence of an impairment of the asset
transferred. When the Group’s share of losses in an associate equals or exceeds its interest in the associate, the Group does
not recognise further losses unless the Group has incurred obligations or made payments on behalf of the associate.
In the separate financial statements of the Bank, investments in associates are measured at cost.
1.3 Segment reporting
Operating segments are reported in a manner consistent with the internal reporting provided to the Management Board of the
Bank.
In accordance with IFRS 8, the Group has the following business segments: retail banking, corporate banking and financial
markets. Additional information is disclosed in Note 4 Segment Analyses.
1.4 Foreign currency translation
The functional currency of each of the Group’s consolidated entities is the currency of the primary economic environment in
which the entity operates. The functional and presentation currency of the Bank and its subsidiaries in Slovenia and Montenegro
is the euro.
(a) Transactions and balances
Foreign currency transactions are translated into the respective functional currency of the operation, using the spot exchange
rates as at the date of the transaction. Monetary assets and liabilities denominated in foreign currencies at the reporting date
are retranslated into the functional currency at the ECB reference rate as at that date. Foreign exchange gains and losses on
monetary items are the difference between amortised cost in the functional currency at the beginning of the period, adjusted for
effective interest and payments during the period, and the amortised cost in foreign currency translated at the spot exchange
rate as at the end of the period. Non-monetary assets and liabilities denominated in foreign currencies that are measured at fair
value are retranslated into the functional currency at the spot exchange rate as at the date that fair value was determined.
Foreign currency differences arising from retranslation are recognised in profit or loss, except for differences arising from the
retranslation of available-for-sale equity instruments that are recognised directly in other comprehensive income. Non-monetary
assets and liabilities that are measured in terms of the historical cost in a foreign currency are translated using the exchange
rate as at the date of the transaction.
(b) Foreign operations
The assets and liabilities of foreign operations, including goodwill and fair value adjustments arising on acquisition, are
translated into euros at spot exchange rates at the reporting date. The income and expenses of foreign operations are
translated into euros at spot exchange rates as at the dates of the transactions.
Foreign currency differences on the translation of foreign operations are recognised in other comprehensive income in the
translation reserve, which is part of the accumulated other comprehensive income. However, if the operation is not wholly
owned, the relevant proportional share of the difference is instead allocated to the non-controlling interest. When a foreign
operation is disposed of, the relevant amount in the translation reserve is transferred to profit or loss upon disposal. When the
Group disposes of only part of its interest in a subsidiary that includes a foreign operation, whilst retaining control, the relevant
proportion of the cumulative amount is reattributed to non-controlling interests. When the Group disposes of only part of its
investment in an associate that includes a foreign operation, whilst retaining significant influence, the relevant proportion of the
cumulative amount is reclassified to profit or loss.
Foreign exchange gains or losses arising from a monetary item receivable from or payable to a foreign operation, the settlement
of which is neither planned nor likely to occur in the foreseeable future and which in substance is considered to form part of the
net investment in the foreign operation, are recognised in other comprehensive income in the translation reserve, which is part
of the accumulated other comprehensive income.
(All amounts in EUR thousand unless otherwise stated)
NOTES TO THE FINANCIAL STATEMENTS (continued)
A B A N K A G R O U P Annual Report 2016
114
1.5 Financial assets and financial liabilities
The Group initially recognises loans and receivables, given deposits and debt securities isued on the date that they originate.
Regular purchases and sales of other financial assets are recognised on the trade date at which the Group commits to
purchasing and selling the asset.
A financial asset is initially measured at fair value; plus, for an item not at fair value through profit or loss, transaction costs that
are directly attributable to its acquisition.
The Group derecognises a financial asset when the contractual rights to the cash flows from the financial asset expire, when it
transfers the rights to receive the contractual cash flows on the financial asset in a transaction in which substantially all the risks
and rewards of ownership of the financial asset are transferred or with the write-off. Any interest in transferred financial assets
that is created or retained by the Group is recognised as a separate asset in the statement of financial position. Upon the de-
recognition of a financial asset, the difference between the carrying amount of the asset and the sum of the consideration
received and the cumulative gain or loss that had been recognised in other comprehensive income is recognised in profit
or loss.
The Group classifies its financial assets into the following categories: financial assets at fair value through profit or loss; loans;
held-to-maturity investments; and available-for-sale financial assets. Management determines the classification of its
investments at initial recognition. Reclassifications after initial recognition are also possible under certain circumstances.
Borrowings are recognised initially at the fair value net of transaction costs incurred. Borrowings are subsequently stated at
amortised cost; any difference between the proceeds net of transaction costs and the redemption value is recognised in the
income statement over the period of the borrowings using the effective interest method.
If the Group purchases its own debt, it is removed from the statement of financial position and the difference between the
carrying amount of the liability and the consideration paid is included in realised gains and losses on financial assets and
liabilities not measured at fair value through profit or loss.
Deposits from banks, the central bank and non-bank customers are measured at amortised cost.
(a) Financial assets and liabilities at fair value through profit or loss
This category has two sub-categories: held-for-trading financial assets and those designated at fair value through profit or loss
at inception.
A financial asset is classified as held-for-trading if it is acquired or incurred principally for the purpose of selling or repurchasing
in the near term, or if it is part of a portfolio of identified financial instruments that are managed together and for which there is
evidence of a recent actual pattern of short-term profit-taking. Derivatives are also categorised as held-for-trading, unless they
are designated as hedging instruments.
Financial assets and financial liabilities are designated at fair value through profit or loss when:
• doing so significantly reduces measurement inconsistencies that would arise if the related instruments were classified in
different groups of financial instruments and therefore valued differently; or
• financial instruments containing one or more embedded derivatives that significantly modify the cash flows are designated at
fair value through profit or loss; or
• certain instruments, such as equity investments, which are managed and evaluated on a fair value basis in accordance with a
documented risk management or investment strategy and reported to key management personnel on that basis, are
designated at fair value through profit or loss.
Interest income and expenses, and dividend income on financial assets at fair value through profit or loss are included in “Net
interest income” or “Dividend income”, respectively.
(All amounts in EUR thousand unless otherwise stated)
NOTES TO THE FINANCIAL STATEMENTS (continued)
A B A N K A G R O U P Annual Report 2016
115
(b) Loans
Loans are non-derivative financial assets with fixed or determinable payments that are not quoted in an active market, other
than: (a) those that the entity intends to sell immediately or in the short term, which are classified as held-for-trading and those
that the entity designates at fair value through profit or loss upon initial recognition; (b) those that the entity designates as
available for sale upon initial recognition; or (c) those for which the holder may not substantially recover all of its initial
investment, other than because of credit deterioration.
(c) Held-to-maturity financial assets
Held-to-maturity investments are non-derivative financial assets with fixed or determinable payments and fixed maturities for
which the Group’s management has the positive intention and ability to hold to maturity. If the Group were to sell other than an
insignificant amount of held-to-maturity assets, the entire category would be reclassified as available-for-sale.
(d) Available-for-sale financial assets
Available-for-sale financial assets are those non-derivative financial assets that are designated as available for sale or are not
classified as loans, held-to-maturity investments or financial assets at fair value through profit or loss.
Available-for-sale financial assets can be reclassified to the loans category if they can be classified as loans at the moment of
reclassification, and the Group has the ability and intent to hold the financial asset for the foreseeable future or until maturity.
Amortised cost measurement
Loans and held-to-maturity investments are carried at amortised cost using the effective interest method. This method is
explained in Note 1.8 Interest income and expenses.
Fair value measurement
Available-for-sale financial assets and financial assets at fair value through profit or loss are subsequently carried at fair value.
Gains and losses arising from changes in the fair value of the “financial assets at fair value through profit or loss” category are
included in the income statement in the period in which they arise. Interest earned whilst holding trading securities is reported as
interest income. Gains and losses arising from changes in the fair value of available-for-sale financial assets are recognised
directly in other comprehensive income, until the financial asset is derecognised or impaired. At this time, the cumulative gain or
loss previously recognised in other comprehensive income is recognised in profit or loss. Gains and losses from foreign
exchange differences of equity securities are recognised within fair value changes in other comprehensive income. Interest
calculated using the effective interest method and foreign currency gains and losses on monetary assets classified as available-
for-sale are recognised in the income statement. Financial assets, for which no market transactions or market information
are available and for which the Group has decided not to measure fair value using alternative valuation methods due to
the immateriality of an individual or cumulative position of such assets, are measured using the cost model (average
purchase price).
Fair value measurement, valuation methods and the assumptions applied are additionally disclosed in Note 3(d). The fair value
hierarchy is described and disclosed in the same note.
Impairment of financial assets is described in Note 1.11.
1.6 Offsetting financial instruments
Financial assets and liabilities are offset, and the net amount is reported in the statement of financial position when there is a
legally enforceable right to offset the recognised amounts, and there is an intention to settle on a net basis, or realise the asset
and settle the liability simultaneously. The ISDA (International Swaps and Derivatives Association) and similar master netting
arrangements do not meet the criteria for offsetting in the statement of financial position. This is because they create for the
parties to the agreement a right of set-off of recognised amounts that is enforceable only following an event of default,
insolvency or bankruptcy of the Group or the counterparties or following other predetermined events. In addition, the Group and
its counterparties do not intend to settle on a net basis or to realise the assets and settle the liabilities simultaneously.
(All amounts in EUR thousand unless otherwise stated)
NOTES TO THE FINANCIAL STATEMENTS (continued)
A B A N K A G R O U P Annual Report 2016
116
1.7 Derivative financial instruments and hedge accounting
Derivatives are initially recognised at fair value on the date on which a derivative contract is entered into and are subsequently
re-measured at their fair value. Fair values are obtained from quoted market prices in active markets, including recent market
transactions and valuation techniques, including discounted cash flow models and options pricing models, as appropriate. All
derivatives are carried as assets when the fair value is positive and as liabilities when the fair value is negative.
The best evidence of the fair value of a derivative at initial recognition is the transaction price (i.e. the fair value of the
consideration given or received).
Derivatives of the Group are classified as held-for-trading and held for hedging purposes (Note 18).
The method of recognising the resulting fair value gain or loss depends on whether the derivative is designated as a hedging
instrument, and if so, the nature of the item being hedged. The Group uses derivatives to hedge the fair value of recognised
assets and liabilities.
Hedge accounting is used provided certain criteria are met. When a hedge is introduced, a formal document is prepared,
describing the relationship between hedged items and hedging instruments, as well as its risk management purpose and
strategy and the valuation methodology. The Group also documents the effectiveness assessment of hedging instruments at
exposure to changes in the fair value of a hedged instrument, which are attributable to hedging. The Group assesses the
effectiveness of a hedge at its inception and then on an ongoing basis during the duration of the hedge, where the hedge
effectiveness must always fall within a range of 80 to 125 percent.
Changes in the fair value of derivatives that are designated and qualify as fair value hedges are recognised in the income
statement, together with any changes in the fair value of the hedged asset or liability that are attributable to the hedged risk.
Effective changes in fair value of hedging instruments and the related hedged items are reflected in the income statement under
’’Fair value adjustments in hedge accounting’’.
If the hedge no longer meets the criteria for hedge accounting, the adjustment to the carrying amount of a hedged item for which
the effective interest method is used is transferred to profit or loss over the period to maturity. The adjustment in the carrying
amount of the hedged equity investment is included in operating profit at the moment of sale.
Individual derivative financial instruments that provide effective economic hedges which, however, do not qualify for hedge
accounting under the specific accounting rules, are treated as derivatives held for trading. Changes in the fair value of those
derivative instruments are recognised immediately in the income statement under “Net gains/(losses) on financial assets and
liabilities held for trading”.
Past due receivables from derivatives held for trading remain recorded under the same item of financial assets (derivatives) and
are not reclassified under other receivables. When objective evidence of the possible impairment of derivative financial assets
due to credit risk exists, the Group assesses the impairment loss and recognises it in the valuation of the derivative.
1.8 Interest income and expenses
Interest income and expenses for all interest-bearing financial instruments are recognised within “interest income” and “interest
expenses” in the income statement, using the effective interest method.
The effective interest method is a method of calculating the amortised cost of a financial asset or a financial liability and of
allocating the interest income or interest expense over the relevant period. The effective interest rate is the rate that exactly
discounts estimated future cash payments or receipts through the expected life of the financial instrument or, when appropriate,
a shorter period to the net carrying amount of the financial asset or financial liability. When calculating the effective interest rate,
the Group estimates cash flows considering all contractual terms of the financial instrument (for example, prepayment options)
but does not consider future credit losses. The calculation includes all fees and points paid or received between parties to the
contract that are an integral part of the effective interest rate, transaction costs and all other premiums or discounts.
(All amounts in EUR thousand unless otherwise stated)
NOTES TO THE FINANCIAL STATEMENTS (continued)
A B A N K A G R O U P Annual Report 2016
117
Once a financial asset or a group of similar financial assets has been written down as a result of an impairment loss,
interest income is recognised using the interest rate used to discount the future cash flows for the purpose of measuring the
impairment loss.
1.9 Fee and commission income and expenses
Fees and commissions received are generally recognised on an accrual basis when the service has been provided. Loan
commitment fees for loans that are likely to be drawn down are deferred (together with related direct cost) and recognised as an
adjustment to the effective interest rate on the loan. Loan syndication fees are recognised as revenue when the syndication has
been completed, and the Group has retained no part of the loan package for itself or has retained a part at the same effective
interest rate as the other participants. Commissions and fees arising from negotiating or participating in the negotiation of a
transaction for a third party (e.g. the arrangement of the acquisition of shares or other securities or the purchase or sale of
businesses) are recognised upon completion of the underlying transaction. Portfolio and other management advisory and
service fees are recognised based on the applicable service contracts, usually on a time-apportioned basis. Asset management
fees related to investment funds are recognised rateably over the period in which the service is provided. The same principle is
applied for custody services that are continuously provided over an extended period of time. Performance-linked fees or fee
components are recognised when the performance criteria are fulfilled.
Fees and commissions paid that are mostly related to payment transactions are recognised as the Group’s expenses as
they arise.
1.10 Dividend income
Dividends are recognised in the income statement when the entity’s right to receive payment is established.
1.11 Impairment of financial assets
(a) Assets carried at amortised cost
At each reporting date, the Group assesses whether there is objective evidence that a financial asset or group of financial assets is
impaired. Impairment losses are recognised if there is objective evidence of impairment of a financial asset as a result of one or
more events that occurred after the initial recognition of the asset and have an impact on the future cash flows that can be reliably
estimated. The Group first estimates whether there is impartial evidence of the impairment or possibility of loss, such as:
significant financial difficulties for the debtor; an actual breach of contract (such as a failure to pay interest, the principal, fees
and commissions); restructuring of financial assets; the existence or probability of bankruptcy or financial reorganisation; a
measurable decline in the projected cash flows of a group of financial assets from the initial recognition of those assets, even
though the decline cannot yet be allocated to individual assets in the group, including negative changes when settling debts in
the group of financial assets, or national or local economic conditions associated with the failure to settle financial assets in
the group.
The Group first assesses whether objective evidence of impairment exists for individually significant financial assets. If the Group
determines that no objective evidence of impairment exists for an individually significant financial asset, such asset is included in a
group of financial assets exposed to similar credit risks. The group of financial assets is then examined for signs of impairment. The
assets that have been individually assessed for impairment and for which any signs of impairment loss have been established are
excluded from a collective assessment of impairment.
If there is objective evidence that an impairment loss on a loan or held-to-maturity financial asset has been incurred, the amount of
the impairment loss is measured as the difference between the asset’s carrying amount and the present value of estimated future
cash flows, including estimated cash flows from collateral foreclosure, less the costs for obtaining and selling collateral, discounted
at the effective interest rate or contractual interest rate which does not substantially differ from the effective interest rate. The
carrying amount of the asset is reduced through the use of an allowance account and the amount of the loss is recognised in the
income statement. If a loan or held-to-maturity financial asset has a variable interest rate, the discount rate for measuring any
impairment loss is the current effective interest rate determined under the contract. Alternatively, the impairment of a financial asset
carried at amortised cost may be measured at the asset’s fair value, using a market price.
(All amounts in EUR thousand unless otherwise stated)
NOTES TO THE FINANCIAL STATEMENTS (continued)
A B A N K A G R O U P Annual Report 2016
118
When assessing collective impairments, financial assets are grouped on the basis of similar credit risk characteristics that indicate
the debtor’s ability to pay all amounts due according to the contractual terms. Such homogenous groups are formed according to
the following criteria: the type of debtor; the debtor’s credit rating; stability of the debtor’s operations; the credit rating of the financial
asset; the type of collateral.
In 2016, the Bank upgraded the methodology for the collective loss assessment of exposures to corporate and retail customers. By
expanding the number of credit rating grades, under the new methodology collective percentage losses for corporate customers
were calculated for each grade (A1, A2, A3, B1, B2, B3, C1, C2, D and E) and not for a particular credit rating group (A, B, C, D
and E). Default rates were calculated on the basis of average annual non-weighted transition matrix by grade, while loss rates were
calculated on the basis of the information on the amount of exposure to defaulting customers and the collateral; the deductible
proportions and the expected term of realisation were set based on the Bank of Slovenia guidelines on the calculation of default
and loss rates, with the exception of deductible proportions for real property and the insurer’s guarantee, which were estimated by
the Bank itself.
The calculation of collective percentage losses for retail customers is based on the default rates, which are calculated on the basis
of annual non-weighted transition matrix by grade as in the previous year; the loss rate is, in accordance with the new methodology,
calculated based on the information on the amount of exposure to defaulting customers and collateral. The deductible proportions
and the expected term of realisation are set in accordance with the Bank of Slovenia guidelines on the calculation of default and
loss rates, with the exception of deductible proportions for real property and the insurer’s guarantee. Apart from that, exposures to
retail customers, which are classified into the E group and for which repayment or partial repayment is expected, were impaired at
the level of collective percentage loss which applies to the E group; exposures to retail customers, which are classified into the E
group and for which full repayment is not expected, were 100% impaired.
As the result of the revised methodology for the collective loss assessment of exposures to corporate and retail customers, the
collectively assessed impairments and provisions decreased by EUR 1.3 million.
Exposures to companies are grouped according to the credit rating of individual debtor. Credit risk loss is calculated for any
individual group of companies on the basis of the average non-weighted transition matrix and calculated average debt un-recovery
rate of defaulters. The average non-weighted transition matrix, composed of annual non-weighted transition matrices, sets out the
probability of debtor transfers from one credit group to another credit group over one year. Past experiences with losses and factors
indicating the current state are taken into account when evaluating losses.
Exposures to individuals are grouped according to the credit rating of the financial assets. Classification of the financial assets of
individuals is mainly based on objective criteria, such as the regularity of settling liabilities to the Group. Credit risk loss is calculated
for any individual group of financial assets on the basis of the average default probability (non-weighted transition matrices) and the
estimated debt un-recovery rate of defaulters.
Percentages of loss from credit risk for the collectively assessed financial assets of companies and individuals are calculated once
per year or during the year if there are significant changes in circumstances within the Group and/or in the market.
Non-risky balance sheet items are not assessed for impairments. The following exposures are not impaired:
• exposures secured with best-quality collateral;
• performance guarantees (principal values only) with very low realisation risk, where the probability of non-realisation is higher
than the probability of realisation;
• exposures to banks and governments with no unbiased evidence for impairment or possible credit risk loss;
• exposures to companies arising from payment transactions where the debtor settles them on the next business day.
The Group regularly checks the methodology and assumptions used when assessing losses. The assessment of loss must be
brought into line with changed circumstances, both in the Group and in the market, or with changes in legislation.
(All amounts in EUR thousand unless otherwise stated)
NOTES TO THE FINANCIAL STATEMENTS (continued)
A B A N K A G R O U P Annual Report 2016
119
If the Bank, in its debt collection process, assesses that a financial asset measured at amortised cost will not be recovered and the
criteria stipulated in Article 20 of the Regulation on the Assessment of Credit Risk Losses of Banks and Savings Banks are fulfilled:
• for an uncollateralised financial asset arising from a loan agreement or an exercised off-balance contingent liability defaulted
on by the borrower for over 1 year;
• for a financial asset arising from a loan agreement or an exercised off-balance contingent liability secured by real estate
collateral, if the debtor is more than 4 years in arrears with repayment or the Bank has not received any payments from
foreclosed property sales during this period;
• for an uncollateralised financial asset arising from a loan agreement or an exercised off-balance contingent liability where the
borrower is in bankruptcy proceedings;
• for a financial asset where, by approval of compulsory settlement, the Bank’s right to claim payment from the borrower in judicial
or other proceedings has expired and up to the amount to which that right has expired;
or the conditions for derecognition of that asset in the statement of financial position have been fulfilled, the Bank, in accordance
with that Article, writes it off through the use of the previously established allowance account and keeps it on off-balance-sheet
records until the legal basis for concluding the collection process has been obtained. In cases when the criteria stipulated in the
second paragraph of Article 20 of the Regulation on the Assessment of Credit Risk Losses of Banks and Savings Banks are not
fulfilled, the Bank may nevertheless write off a financial asset and keep it on off-balance-sheet records, provided that the asset
recovery is in the final stage as regulated by the Financial Operations, Insolvency Proceedings and Compulsory Winding-up Act or
the asset is subject to enforcement proceedings, or provided that the Bank has a reasonable expectation based on available
information and past experience that no more than 10 percent of the outstanding contract value will be recovered.
If, in a subsequent period, the amount of the impairment loss decreases and the decrease can be related objectively to an event
occurring after the impairment was recognised (such as an improvement in the debtor’s credit rating), the previously recognised
impairment loss is reversed by adjusting the allowance for impairment. The amount of the reversal is recognised in the income
statement in impairment losses.
Renegotiated loans
Renegotiated loans are defined in Section 2 Risk Management (Note 2.1.4 d).
In accordance with IFRS, the Bank restructures financial assets based on their adjusted value.
(b) Assets carried at fair value
At each reporting date, the Group assesses whether there is objective evidence that a financial asset or group of financial assets is
impaired. The Group carries out an assessment of whether there is objective evidence of impairment of the equity and debt
instruments classified as available-for-sale financial assets, whose accumulated other comprehensive income is negative (deficit).
Evidence for impairment of an available-for-sale equity investment includes information about any significant adverse changes that
have taken place in the technological, market, economic or legal environments in which the issuer of the equity instrument operates
which indicate that the cost of the investment in the equity instrument may not be recovered. A significant or prolonged decline in
the fair value of an investment in an equity instrument below its cost is also regarded by the Group as objective evidence of
impairment. During the period of significant or prolonged decline in the fair value, the Group continuously recognises a loss in
accumulated other comprehensive income in relation to the relevant equity security.
The key indicator for debt securities impairment is the issuer’s performance, i.e. its credit rating and the breach of contractual
obligations. If there is objective evidence of impairment of an available-for-sale debt instrument, such an instrument has to
be impaired.
Upon the impairment of available-for-sale financial assets, the amount of the cumulative revaluation loss (difference between the
current fair value and the acquisition cost for equity instruments or amortised cost for debt instruments), recognised directly in
equity, is removed from equity and recognised in profit or loss.
Impairment losses recognised in the income statement on equity instruments are not reversed through the income statement. If, in
a subsequent period, the fair value of a debt instrument classified as available-for-sale increases, and the increase can be
objectively related to an event occurring after the impairment loss was recognised in profit or loss, the impairment loss is reversed
through the income statement.
(All amounts in EUR thousand unless otherwise stated)
NOTES TO THE FINANCIAL STATEMENTS (continued)
A B A N K A G R O U P Annual Report 2016
120
1.12 Property and equipment, intangible assets, investment property and non-current
assets held for sale
Land and buildings mainly comprise investments in branches and offices. All property and equipment is stated at the historical cost
less depreciation and impairment loss. The historical cost includes expenditure that is directly attributable to the acquisition of
the items.
Subsequent costs are included in the asset’s carrying amount or are recognised as a separate asset, as appropriate, only when it is
probable that future economic benefits associated with the item will flow to the Group and the cost of the item can be measured
reliably. All other repairs and maintenance are charged to administrative expenses during the financial period in which they
are incurred.
The Group includes licences and software among its intangible assets. Intangible assets are valued at historical cost upon initial
recognition. Subsequent valuation is made using the historical cost model. All intangible assets have finite useful lives. In line
with the historical cost model, intangible assets are recorded at the historical cost less amortisation and the accumulated
impairment loss.
Investment property includes land and buildings leased out under an operating lease. Investment property is valued at the historical
cost upon initial recognition. Subsequent valuation is made using the historical cost model, as made for property and equipment.
The same accounting treatment that applies to property and equipment is applied to investment property.
Land is not depreciated. Depreciation of other assets is calculated using the straight-line method to allocate their cost less their
residual values over their estimated useful lives as follows:
2016 2015
Buildings 2–6% 2–6%
Equipment 14–20% 14–20%
Computers 10–50% 10–50%
Intangible assets 9–50% 9–50%
The residual values and useful lives of assets are reviewed at least once a year or as needed and adjusted accordingly.
Intangible assets are reviewed for impairment whenever events or changes in circumstances indicate that the carrying amount
may not be recoverable. Property and equipment are reviewed for impairment at least once a year. Where the carrying amount
of an asset is greater than its estimated recoverable amount, it is written down immediately to its recoverable amount. Gains
and losses on the disposal of property and equipment are determined by comparing proceeds with carrying amount and are
included in gains and losses upon the de-recognition of assets other than those held for sale in the income statement.
Non-current assets classified as held for sale are measured at the lower of the carrying amount and fair value less costs to sell.
Non-current assets are classified as held for sale if their carrying amount is to be recovered through a sales transaction rather
than through continued use. This condition is regarded as being met only when the sale is highly probable and the asset is
available for immediate sale in its present condition, subject to terms that are usual and customary for the sale of such assets.
Management must be committed to the sale and must actively market the property for sale at a price that is reasonable in
relation to the current fair value. The sale should be expected to qualify for recognition as a completed sale within one year of
the date of classification.
The property and equipment received by the Group following foreclosure due to unpaid past-due receivables are disclosed as
inventory. If such property and equipment are leased by the Group under an operating lease, they are recognised as
investment property.
(All amounts in EUR thousand unless otherwise stated)
NOTES TO THE FINANCIAL STATEMENTS (continued)
A B A N K A G R O U P Annual Report 2016
121
1.13 Impairment of investments in subsidiaries and associates
In line with IAS 36, when assessing the impairment of investments in subsidiaries and associates, the Group reviews not only
objective evidence of impairment, but also any indication that an investment in a subsidiary or associate may be impaired. In
addition to indications from external and internal sources of information, the Group takes into account other indications of possible
impairment, such as underperformance, or the decision of a company’s management to wind the company up.
If there is objective evidence or an indication that an investment in a subsidiary or associate may be impaired, according to IAS 36
the Group calculates the impairment amount as being the difference between the carrying amount of the investment and its
recoverable amount. The recoverable amount is that which is found to be higher following a comparison of an investment’s:
• fair value less costs to sell; or
• value in use, which equals the present value of the future cash flows expected to arise from this investment, discounted at the
current market rate of return on a similar financial asset.
If any of these amounts exceeds the carrying value, the financial asset is not impaired, and the other amount need not be
assessed. If expected future cash flows cannot be estimated to calculate the value in use, the Group calculates the necessary
impairments using the net asset value method (the asset accumulation method), or as the difference between the carrying amount
of a financial asset and the equity book value of the company into which the Group has invested, and does so by reference to its
proportional share in equity.
At each reporting date, an assessment is made as to whether previous impairments of non-financial assets may be reversed.
1.14 Leases
A group company is the lessor
A lease is classified as a finance lease if it transfers all the substantial risks and rewards incidental to ownership. A lease is
classified as an operating lease if it does not transfer all the substantial risks and rewards incidental to ownership.
When assets are held subject to a finance lease, the present value of the lease payments is recognised as a receivable. The
difference between the gross receivable and the present value of the receivable is treated as unearned finance income. Lease
income is recognised over the term of the lease using the net investment method (before tax), which reflects a constant periodic
rate of return.
Lease income from operating leases is recognised in income on a straight-line basis over the lease term. Costs, including
depreciation, incurred in earning the lease income are recognised as costs. Initial direct costs incurred by lessors in negotiating
and arranging an operating lease are added to the carrying amount of the leased asset and recognised as costs over the lease
term on the same basis as the lease income.
A group company is the lessee
The leases entered into by the Group are primarily operating leases. The Group rents business premises, equipment, cars and
locations for cash machines. The total payments made under operating leases are charged to administrative expenses. When an
operating lease is terminated before the lease period has expired, any payment required to be made to the lessor by way of penalty
is recognised as a cost in the period in which termination takes place.
1.15 Cash and cash equivalents
For the purposes of the cash flow statement, cash and cash equivalents comprise balances with less than three months maturity
from the date of acquisition, including cash and non-restricted balances with the central bank, amounts due from other banks and
ECB eligible securities held for trading, designated at fair value through profit or loss and available-for-sale.
(All amounts in EUR thousand unless otherwise stated)
NOTES TO THE FINANCIAL STATEMENTS (continued)
A B A N K A G R O U P Annual Report 2016
122
1.16 Provisions
Provisions are recognised when the Group has a present legal or constructive obligation as a result of past events; when it is more
likely than not that an outflow of resources embodying economic benefits will be required to settle the obligation, and a reliable
estimate of the amount of the obligation can be made.
Provisions are measured at the present value of the expenditures expected to be required to settle the obligation using a pre-tax
rate that reflects current market assessments of the time value of money and the risks specific to the obligation. The increase in
the provision due to the passage of time is recognised as an interest expense.
1.17 Financial guarantee contracts
Financial guarantee contracts are contracts that require the issuer to make specified payments to reimburse the holder for a loss it
incurs, because a specified debtor fails to make payments when due in accordance with the terms of a debt instrument. Such
financial guarantees are given to banks, financial institutions and other bodies on behalf of customers to secure loans, overdrafts
and other banking facilities.
Financial guarantees are initially recognised in the financial statements at fair value on the date the guarantee was given.
Subsequent to initial recognition, the Group’s liabilities under such guarantees are measured at the higher of the initial
measurement, less amortisation calculated to recognise the fee income earned on a straight line basis over the life of the guarantee
and contingent liability or provision in accordance with IAS 37, which presents the best estimate of the expenditure required to
settle any financial obligation existing as at the statement of financial position date. These estimates are determined based on the
experience of similar transactions and a history of past losses, supplemented by the judgment of management.
Any increase in the liability relating to guarantees is recorded in the income statement under provision charges.
1.18 Employee benefits
The Group provides benefits to employees as a legal obligation, including jubilee benefits and retirement bonuses. Employee
benefits are included in staff costs and provisions for employee benefits. The Group sets aside such provisions based on actuarial
calculations. The major assumptions used in these calculations are the following: the discount rate, the number of employees
eligible for benefits, the rate of labour turnover and the average annual salary growth.
Employees retire once they meet the requirements of the old-age pension scheme and achieve the required years of service in
accordance with the relevant Slovene legislation. At that time (if they meet certain conditions) they become eligible for full
retirement benefits. Furthermore, pursuant to the collective agreement, employees are also entitled to jubilee payments.
Defined contributions to state social security are deducted each month from the payroll, expensed as incurred and included in
administrative expenses.
1.19 Taxation
Taxation is provided for in the financial statements in accordance with the Slovene legislation currently in force. The charge for
taxation in the income statement for the year comprises current tax and changes in deferred tax. Current tax is calculated on the
basis of the taxable profit for the year using the tax rates in effect at the statement of financial position date.
Deferred income tax is provided in full, using the liability method, on temporary differences arising between the tax basis of
assets and liabilities and their carrying amounts in the financial statements. Deferred income tax is determined using tax rates
(and laws) that have been enacted or substantially enacted by the statement of financial position date, and are expected to
apply when the related deferred income tax asset is realised, or the deferred income tax liability is settled.
The Group has created deferred taxes on the temporary differences arising from the impairment of tangible and intangible
assets, from different depreciation rates for accounting and tax purposes, from the revaluation and impairment of available-for-
sale securities, from the impairment of equity investments, from provisions created for employee benefits, from restructuring
provisions, from the impairment of loans and receivables in subsidiaries and from tax losses carried forward.
(All amounts in EUR thousand unless otherwise stated)
NOTES TO THE FINANCIAL STATEMENTS (continued)
A B A N K A G R O U P Annual Report 2016
123
Deferred tax assets are recognised to the extent that it is probable that future taxable profit will be available, against which the
temporary differences can be utilised. Current income tax payable on profits, based on the applicable tax law in each
jurisdiction, is recognised as an expense in the period in which profits arise. The tax effects of income tax losses available for
carrying forward are recognised as an asset when it is probable that future taxable profits will be available, against which these
losses can be utilised.
Deferred tax related to the fair value re-measurement of available-for-sale investments, which is charged or credited directly to
other comprehensive income, is also credited or charged directly to other comprehensive income and subsequently (upon de-
recognition or impairment) recognised in the income statement, together with the deferred gain or loss.
1.20 Share capital
(a) Share issue costs
Incremental costs directly attributable to the issue of new shares or to the acquisition of a business are shown in equity as a
deduction, net of tax, from the proceeds.
(b) Dividends on ordinary shares
Dividends on ordinary shares are recognised in equity in the period in which they are approved by the Bank’s shareholders.
1.21 Managed funds
Asset management was one of the services the Group offered to its customers. Assets under management are not included in
the statement of financial position of the Group. Clients are charged fees for asset management services, which are itemised in
Note 40. In compliance with the Slovene legislation, Note 40 additionally includes fees charged to customers for the
acceptance, transmission and execution of orders, management and custody of financial instruments, itemised assets
and liabilities per customer account which the Group uses to account for customers’ financial assets arising from
brokered transactions.
1.22 Sale and repurchase agreements
Securities sold subject to repurchase agreements (“repos”) are classified in the financial statements as held-for-trading financial
assets, available-for-sale financial assets or held-to-maturity financial assets, even though the transferee has the right by
contract or custom to sell or re-pledge them as collateral. The counterparty financial liability is included in loans from banks and
the central bank or loans from non-bank customers. Securities purchased under agreements to resell (“reverse repos”) are
recorded as loans to banks or non-bank customers, as appropriate. The difference between the sale and repurchase price is
treated as interest and accrued over the life of the agreements using the effective interest method. Securities lent to
counterparties are also retained in the financial statements.
1.23 Precious metals
The Group carries precious metals among other assets. Although precious metals are not considered to be financial assets,
they are recognised, measured and derecognised in compliance with IAS 39. This means that the stock of precious metals held
for trading is measured at fair value through profit or loss. Gains and losses from the valuation and sales are recognised in net
other operating income or expenses.
1.24 Comparatives
Due to changes in the underlying methodology of the fair value hierarchy, the Group has adjusted the comparative data in the
table showing the valuation methodology for financial instrument measured at fair value (Note 3(d)).
1.25 Information in the notes to the financial statements
Disclosures in the notes to the financial statements are presented for the Bank and for the Group separately. In the cases of
completely identical information for the Bank and the Group, only information for the Group is presented. Notes 2, 3 and 4 are
prepared on a consolidated basis, as there are no significant differences between the Bank and the Group.
(All amounts in EUR thousand unless otherwise stated)
NOTES TO THE FINANCIAL STATEMENTS (continued)
A B A N K A G R O U P Annual Report 2016
124
2 RISK MANAGEMENT Effective risk management is one of the cornerstones of the safe and stable operations of the Group and its strategic
development. Within this framework, the Group promotes good practices and applies the general standards of risk
management. The management, supervisory bodies and senior management of the Bank actively participate in risk
management processes. The risk management function is independent from operational functions. The Supervisory Board
approves the risk management strategy, strategic decisions and accompanying policies and monitors the efficancy and
adequacy of the risk management system at the Group level. The Group is exposed daily to various risks in its operations,
which can be broadly divided into credit risk, market risk, interest rate risk, foreign exchange risk, liquidity risk, operational risk,
capital risk, business risk and reputational risk. The ability to manage and appropriately control risks has a direct impact on the
Group’s long-term stability and performance. Therefore, the Group pays heightened attention to the risk management function,
which includes risk identification, risk measurement or assessment, risk control, risk monitoring and risk reporting procedures.
The risk profile of the Group is monitored through key risk-bearing capacity indicators.
This chapter discusses the management of individual types of risks in the Group. In addition to these, the Group’s operations
may also be affected by other risks that are not yet recognised as significant by the Group, or which are insignificant at present
but could grow in significance in the future. Risk management is disclosed only on a consolidated basis, as there are no
significant differences between the Bank and the Group in the treatment of individual risks.
In the reporting period, the Group was engaged in further activities related to the merger with Banka Celje and focused on
enhancing its risk management process. The key focus areas of the Group were the activities related to the implementation of
the projects “IFRS 9” (transition to a new international reporting standard for the classification, valuation and impairment of
financial instruments and general hedge accounting that will become applicable on 1 January 2018) and the comprehensive
assessment of the Bank, including the asset quality review (AQR) and stress tests.
The Abanka Group has been classified as a systemically important bank and has been subject to a comprehensive
assessment by the European Central Bank (ECB). Abanka has successfully passed the evaluation, in both the baseline and the
adverse scenarios.
In 2016, the Risk Management Strategy was revised to take into account the guidelines included in the restructuring plan of the
Bank and the plan of operations of the merged bank for the period 2017–2019, as well as the commitments made to the
European Commission regarding risk management.
The Group updated its Recovery Plan (an obligatory document for all banks in the EU), which contains the definition of critical
functions and the measures envisaged in the event of an identified capital or liquidity weakness.
Credit risk represents the Group's major risk exposure, while also remaining the most significant system risk in the banking
industry in 2016, despite the fact that bad debt recovery has led to gradual stabilisation.
Significant attention was paid to improving credit risk management procedures, both in terms of assessing customer credit rating
assignment and approving credit exposure as well as in terms of monitoring, recovery and hedging processes. The Group
continued activities related to the implementation of the Bank of Slovenia guidelines on the calculation of default and loss rates.
The process of assessing customer credit rating has been enhanced by virtue of an improved credit classification methodology
for companies (increased number of credit classes); by upgrading the methodology for the collective assessment of credit
losses; and by overhauling the expert model underlying the credit assessment of companies and sole traders and the model
underlying the assessment of the probability of default (PD) for companies. The Group has implemented an upgraded
application for the central collateral records, introduced a system for the early detection of increased credit risk and started an
overhaul of the data warehouse related to the calculation of credit risk parameters. In order to improve the efficiency of the risk
exposure approval process, the Group has upgraded the methodology for the calculation of exposure limits to companies and
banks and exposure limits for individual portfolios, countries and sectors.
In 2016, the Group maintained its conservative approach to assuming market risk. In general, the year 2016 was marked by
high volatility of stock exchange indices. In the beginning of the year, the main causes of uncertainty were China's decision to
devalue its currency and the sharp drop of oil prices; in mid-June 2016 came the UK referendum and the decision to leave the
EU, followed by the election in the USA. The strengthening of the global economy was primarily reflected in the growth of stock
(All amounts in EUR thousand unless otherwise stated)
NOTES TO THE FINANCIAL STATEMENTS (continued)
A B A N K A G R O U P Annual Report 2016
125
market indices in developed markets. Slovenia also recorded a positive economic growth rate in 2016. The return to maturity on
10-year government bonds of the Republic of Slovenia stood at 0.8 percent at 2016 year-end. The growth of stock indices on
the Ljubljana stock exchange was higher than that of most European indices; at the annual value, the SBITOP index increased
in value by more than 3 percent.
The Group managed its appetite for market risk by implementing a limit system in its trading in financial instruments. The Group
primarily trades in government bonds of the Republic of Slovenia, acting as market maker for the sovereign bond market, and in
derivatives aimed at hedging client risks, while trading in equity securities was not allowed. The value-at-risk (Var) of the debt
security portfolio calculated using the historical simulation method at 99% confidence level and a 10-day holding period stood at
EUR 2.2 million at the 2016 year-end.
Liquidity conditions remained favourable throughout 2016. Due to ECB measures, surplus liquidity on international financial
markets was mostly reflected in further interest rate falls. Deposit interest rates in the banking industry recorded a further
decrease. The Group’s balance of deposits by retail and corporate clients remained stable, while the share of sight deposits
increased, mostly as a result of low interest rates.
In the reporting year, the Group complied with the regulatory requirements for the category one liquidity ratio and amount of
required reserves, recording an average category one liquidity ratio of 1.66 in 2016. The Group duly reported on both the
liquidity coverage ratio (LCR) that stood at 5.52 at the 2016 year-end and the net stable funding ratio (NSFR). Information on
encumbered and unencumbered assets was also reported. This type of reporting has been introduced in order to standardise
liquidity maintenance requirements within the European Monetary Union.
As mentioned, moderate economic growth in the euro area continued in 2016. Purchasing sovereign and corporate bonds of
Eurozone countries, the ECB continued with its expansionary monetary policy aimed at increasing the liquidity of the banking
system and stimulating the supply of credit. Monthly purchases of securities under the current programme are expected to
remain at EUR 80 billion until March 2017 and continue at EUR 60 billion as of April 2017. The programme is planned to
continue until the end of December 2017 or until the ECB is satisfied that the inflation rate is approaching the target value. In the
field of monetary policy, the ECB reduced the benchmark financing rate to 0.00 percent and the deposit rate to -0.40 percent.
Reference interest rates continued to decrease in 2016 and are in negative figures, even for longer terms. In view of the
low/negative interest rates, the Bank’s exposure to interest risk is particularly significant; meanwhile, the period of low/negative
interest rates also presents the bank with new challenges in terms of generating income.
The Abanka Group continuously adapted its interest rate policy to developments in the domestic and foreign markets and
adjusted its interest rate position accordingly. The exposure of the Abanka Group to interest risk measured in terms of the effect
of interest rate changes on the economic value of equity and on net interest income reduced somewhat in 2016. However,
interest risk remains a significant risk in periods of low interest rates and must be subject to continuous monitoring and control.
In the area of operational risk management, the Group implemented regular preventive activities aimed at reducing the
possibility of loss events and incidents as well as corrective measures aimed at minimising the recurrence of such events and
incidents. A database of loss events and operational risk related incidents that occurred in 2016 was compiled, revealing that
the majority of operational losses were due to the human factor. In 2016, the Group focused its attention on the sources of
operational risk that proved to be most significant in the recent period. In 2016, Abanka prepared an assessment of its exposure
to operational risk and updated most of its business continuity plans.
Within the framework of the Internal Capital Adequacy Assessment Process (ICAAP), the Group upgraded the existing methods
for calculating the internal assessments of capital requirements; continued to regularly monitor its risk profile and evaluated its
risk-bearing capacity; designed and developed methodologies for calculating the impact of stress test scenarios; and calculated
the amount of its internal assessment of capital and internal assessment of capital requirements for all important types of r isks
on a quarterly basis. As at 31 December 2016, the Group recorded a surplus of capital over the total capital requirement
(including the total SREP capital requirement) of EUR 243 million.
(All amounts in EUR thousand unless otherwise stated)
NOTES TO THE FINANCIAL STATEMENTS (continued)
A B A N K A G R O U P Annual Report 2016
126
2.1 Credit risk
Credit risk is the risk that a debtor or counterparty will cause a financial loss for the Group by failing to discharge an obligation.
This risk represents the potential unwillingness or inability of the debtor to fully meet its contractual obligations within the agreed
period and/or amount. In addition to default risk and counterparty risk, credit risk also includes: concentration risk, residual risk,
country risk, dilution risk of purchased receivables, risk associated with foreign currency loans, participation risk, credit rating
risk and shadow banking risk.
Concentration risk is the risk of a loss arising from being overexposed to a single individual, groups of related parties and parties
connected by common risk factors, such as the same economic sector, geographical area or transactions of the same type.
Concentration risk also arises from using credit protection.
Residual risk is the risk of less effective credit protection than expected.
Country risk is the risk of a loss arising from lending to borrowers in foreign countries. It is linked to the economic, social and
political environment of the debtor country. Specific kinds of country risk include transfer risk and sovereign risk. Transfer risk
exists when a debtor's obligation is not denominated in a local currency. Sovereign risk arises from the default of a foreign
sovereign entity acting as a debtor.
Dilution risk is the risk that the amount of receivables to which the Group is entitled might be reduced due to successful
objections by the debtor arising from the legal relationship with the previous creditor that gave rise to such receivables.
The risk associated with foreign currency loans is the current or future risk to the Bank’s profit and equity arising from foreign currency loans granted to unhedged borrowers. Participation risk refers to the risk of loss arising from capital investments in equity stakes, including stakes in subsidiaries and the Bank Resolution Fund. Credit rating risk refers to the risk of loss due to the downgrading of a client or receivable. Shadow banking risk refers to the risk of loss arising from exposure to entities engaged in shadow banking activities outside the regulated framework, namely: • taking deposits and other repayable funds, • financial leasing, • issuing of guarantees and warranties and incurring liabilities, • participation in securities issues and the provision of services related to such issues, • money brokering.
Credit risk arises in all areas of banking involving risk-bearing balance sheet asset items and risk-bearing off-balance sheet
items. Credit risk is the most important risk in the Group’s operations and, therefore, is given high priority by the management.
2.1.1 The credit risk management process
The main objective of credit risk management is to achieve and maintain the quality and diversification of the credit portfolio
that provides for stable and sound operations and enables the achievement of the target level of profitability as well as capital
adequacy as set out in the risk management strategy. The strategy and policy of credit risk assumption and management
complies with general credit risk management standards, best banking practices and own experience. Moreover, this defines
the goals to be pursued by the Group during its operations, which include effective credit processes, early identification of
increased credit risk, efficient bad debt recovery, intensive resolving of non-performing loans, development of a model approach
to credit portfolio management, execution of procedures for accepting and management of credit collaterals and consideration
of profitability per transaction upon credit approval, including appropriate compensation for assumed risks.
The credit risk management process includes the identification, measurement, control and monitoring of credit risk, including
reporting credit risks to which the Group is or might be exposed in its operations.
(All amounts in EUR thousand unless otherwise stated)
NOTES TO THE FINANCIAL STATEMENTS (continued)
A B A N K A G R O U P Annual Report 2016
127
Credit risk is managed at the level of individual transactions and debtors, as well as at the level of the overall credit portfolio.
The Group has an established structure and organisation of appropriate functions for credit risk management. The
Management Board and senior management are responsible for efficient credit risk management. The Management Board
transferred some of its competencies in this area to senior management and collective decision-making bodies (the Risk
Management Committee, the Credit Committee, the Committee for Special Loan Treatment, the Assets and Liabilities
Committee, the Assets and Liabilities Commission). Within the scope of its powers, the Loan Recovery and Restructuring
Department not only processes problem loans but is also closely involved in their recovery in collaboration with experts from
other departments. The credit risk management function is coordinated at the Group level so as to provide compliance and
maximise standardisation in all subsidiaries.
The Group has clearly delimited competencies and tasks between commercial divisions and the Risk Management Division,
which is organisationally independent of the front-end units (where credit risk is assumed). Furthermore, competencies and
tasks are also clearly delimited between commercial units and the back office, including management.
The extent and features of internal reporting on credit risk allow an appropriate flow of information up and down-stream, as
well as between organisational units. This enables timely decision-making at all managerial levels of the Group with regard to
measures for mitigating credit risk and for monitoring the results of these measures. There is an established practice of
producing periodic and, when appropriate, extraordinary reports on assumed credit risk. The Risk Management Committee, the
Management Board, the Risk Management and Assets Liability Management Commission and the Supervisory Board discuss
and review at least quarterly comprehensive risk reports focusing primarily on credit risk.
2.1.1.1 Credit risk measurement
a) Loans
The Group's exposure to credit risk depends on the following three credit risk components: exposure amount, a debtor’s default
probability reflected in its credit rating, and the recovery ratio on defaulted obligations, which is dependent on collateral and
debt collection.
The Group has set up its own internal methodologies for measuring credit risk, which serve as the basis for the process of
classifying borrowers and exposures into credit rating categories: A, B, C, D and E, in accordance with the Regulation on the
assessment of credit risk losses of banks and savings banks issued by the Bank of Slovenia.
Credit rating A denotes the lowest credit risk and is assigned to borrowers with the highest creditworthiness, those who are
assessed as being able to regularly settle their liabilities when they fall due. Credit rating B is assigned to borrowers whose
financial position is somewhat weaker, yet the Group does not expect any significant difficulties in them being able to service
their obligations. Credit rating C is assigned to borrowers who are either undercapitalised or who lack sufficient long-term
sources of funds to finance long-term investments, whose cash flows have been ascertained to be insufficient for the regular
settlement of all due liabilities. However, their past-due liabilities to the Group do not exceed 90 days and no material credit-
related economic losses wtih these borrowers are foreseen. Credit rating D is assigned to borrowers to whom the Group’s
exposures are treated as non-performing, who are insolvent or undergoing rehabilitation or compulsory settlement and for whom
the Group consider that they are unlikely to pay their credit obligations in full, but it can be reasonably expected that their loans
will be repaid, at least in part. Credit rating E denotes the highest credit risk and is also assigned to borrowers to whom the
Group’s exposures are treated as non-performing, but the Group considers that the borrowers are highly unlikely to pay their
credit obligations or does not expect any repayment at all. Country risk is also taken into account when assigning credit ratings
to foreign borrowers.
Companies are ranked in ten credit classes (credit grades A and B have three credit sub-grades, credit grade C has two).The
assignment of credit ratings to customers and exposures is based on quantitative and qualitative criteria, such as an assessment
of the borrowers’ financial position, the ability to provide sufficient cash flow for future debt servicing, the borrower’s loan
servicing track record, and the quality and amount of credit protection.
The Group also performs its own credit risk analyses of foreign banks and countries, taking into account inter alia credit ratings
and credit reports by credit rating agencies, as well as export credit agencies’ ratings in the case of country credit risk analyses.
(All amounts in EUR thousand unless otherwise stated)
NOTES TO THE FINANCIAL STATEMENTS (continued)
A B A N K A G R O U P Annual Report 2016
128
Prior to credit approval, all debtors must be classified into the appropriate rating category. Throughout the duration of the legal
relationship underlying credit exposure, the Group monitors the borrower’s operations and the quality of credit protection. The
Group also regularly evaluates the level of expected credit losses and creates the necessary impairments and provisions in
accordance with the International Financial Reporting Standards.
b) Debt securities
Credit risk arising from investments in debt securities is managed by a limit system in accordance with provisions of the Banking
Act, which is based on internal and external ratings (Fitch Ratings and Moody's Investors Service) of securities and their
issuers. The limit system ensures investments mostly in debt securities of high credit quality. Investing in debt securities issued
by foreign issuers without an external credit rating is not allowed. The Group has established a limit system which bans
investments in subordinated and structured debt financial instruments.
c) Credit-related commitments and contingent liabilities
Credit-related commitments and contingent liabilities represent guarantees, letters of credit and undrawn portions of granted
loans, overdrafts and credit lines. The primary purpose of these instruments is to ensure that funds are available to a customer
when required. Guarantees and standby letters of credit, which are written undertakings by the Group to pay in the event of the
customer’s default on its obligations to a third party, potentially carry the same credit risk for the Group as loans. Credit-related
commitments and contingent liabilities represent potential credit risk for the Group. The same methodology as for loans is used
to measure the credit risk arising from these instruments.
d) Derivatives
In case of derivative instruments, which are traded over-the-counter (OTC), the Group is exposed to counterparty credit risk, i.e.
the risk that the counterparty may not fulfil their underlying contractual payment obligations. Counterparty credit risk from
positions in derivatives equals the credit exposure value of these transactions. The exposure on a specific transaction is
calculated as the sum of the current market value of the transaction and potential credit exposure.
The Group avoids transactions involving counterparties with lower credit ratings. For transactions that involve counterparties
with such a credit rating, the Group insists on adequate collateral.
2.1.1.2 Credit risk mitigation
a) Credit limits
The Group mitigates credit risk by setting and monitoring credit limits at the level of individual borrowers or counterparties and
groups of related counterparties. Structural limits are also established for industries, geographical regions and for specific
products within the credit limits for banks. The system of credit limits is also the basic tool for the successful management of the
credit risk arising from positions in debt securities, derivatives, REPO and reverse transactions. Credit risk exposure limits
ensure that the Group’s credit portfolio is adequately diversified.
Credit limits are set and monitored according to internal methodologies. The Risk Management Department proposes credit
limits, taking into account the limits prescribed by law. Credit limits are approved by the Risk Management Committee, the
Credit Committee or by duly authorised employees, depending on the type of credit limit. Exposure limits (so-called gross limits
and limits after exemptions) are set for every exposure to an individual customer or a group of connected clients whose gross
direct or indirect exposure equals or exceeds 10% (and every further 5%) of the capital of the Bank or Group or is very likely to
reach or exceed 10% (and every further 5%) of the capital of the Bank or Group in the near future. Large exposure limits are
also set for every exposure to entities with a special relationship with the Bank, which are subject to previous approval by the
Supervisory Board.
The Group complies with regulatory requirements on the maximum exposure to individual clients or a group of related parties
(after taking into account impairments and provisions as well as regulatory exemptions and the effect of eligible credit
protection) which is set at 25% of the Group's regulatory capital.
b) Credit protection (collateral and guarantees)
In addition to the risk limit system, the Group also requires credit protection in order to reduce credit risk. A credit protection
policy was developed for this purpose, defining the types of funded and unfunded credit protection that the Group accepts, as
well as the procedures for assessing and monitoring the adequacy and value of credit protection. The most common forms of
credit protection are real-estate collateral and guarantees.
(All amounts in EUR thousand unless otherwise stated)
NOTES TO THE FINANCIAL STATEMENTS (continued)
A B A N K A G R O U P Annual Report 2016
129
As funded credit protection, the Group primarily accepts collateral in the form of real estate, other physical collateral,
receivables, cash on deposit held by a credit institution, and securities. As unfunded credit protection, the Group mainly accepts
joint and several guarantees from corporate and retail customers, guarantees of the Republic of Slovenia, and guarantees
issued by insurance companies and banks.
In granting credit, most important for the Group is a borrower's creditworthiness, enabling the settlement of all obligations, whilst
accepted credit protection serves as a secondary source of loan repayment. The quality of collateral and the loan-to-value ratio
required by the Group depend on a borrower’s credit rating and loan maturity. Credit protection instruments (CRM techniques)
mitigate credit risk losses, improve the recovery of past-due receivables and decrease capital requirements on the condition
they are compliant with minimum requirements in terms of their adequacy defined in banking regulation.
The Group mitigates credit risk by applying credit protection, but this may simultaneously trigger or increase other risks (such as
legal risk, operational risk, liquidity risk or market risk); therefore, the Group pays due attention to residual risk in applying credit
protection. This risk arises, for example, when the property provided as collateral is overvalued or when the liquidation of the
collateral in reasonable time is either problematic or implausible.
c) Master netting agreements
The Group further reduces its exposure to credit risk by entering into master netting agreements that cover repurchase
transactions, OTC derivatives contracts and other capital market instruments. These transactions can be carried out only with
the counterparties who have concluded master netting agreements with the Group. These arrangements are usually settled on
a gross basis, but in the case of a default they are settled on a net basis.
d) Financial covenants and other contractual provisions in credit agreements
The Group additionally mitigates credit risk exposure by including financial covenants and other contractual provisions in credit
agreements. Financial covenants consist of a set of financial categories or financial ratios that a borrower must maintain at an
agreed level throughout the term of the loan. They most often refer to the funding structure and income statement.
2.1.1.3 Credit risk management in extreme situations
The Group performs activities to reduce credit risk and mitigate the impact of extreme situations on its operations. The
Supervisory Board is regularly informed of the course of developments.
In a difficult economic and financial situation, the Group adapts its credit policy and takes measures based on stricter credit
standards.
2.1.2 Impairment and provisioning policies
In accordance with the International Financial Reporting Standards, the Group regularly assesses whether there is objective
evidence of financial asset impairment or possible losses from off-the-balance-sheet commitments and contingencies, defined in
Chapter 1.11 Impairment of financial assets. Where there is objective evidence of impairment or possible losses, the Group
creates impairments of financial assets or provisions for off-the-balance-sheet commitments and contingencies on the basis of
an individual or collective assessment. For the purpose of assessing the credit risk losses, the Group individually assesses its
significant exposures to corporate customers where there is objective evidence of impairment or the possibility of a loss.
Individual impairments of financial assets are calculated as the difference between the carrying amount and recoverable
amount. The latter is calculated by discounting estimated future cash flows, which include cash flows from the foreclosure of
collateral, if certain required conditions are met.
For the purpose of calculating collective impairments, homogenous groups of debtors are formed according to similar credit risk
characteristics that reflect the debtor’s ability to meet its contractual obligations. The Group estimates the impairments and
provisions for any homogenous groups of exposures on the basis of available historical default data and credit losses.
The structure of loans and the average impairment rates for the internal credit classes are shown below.
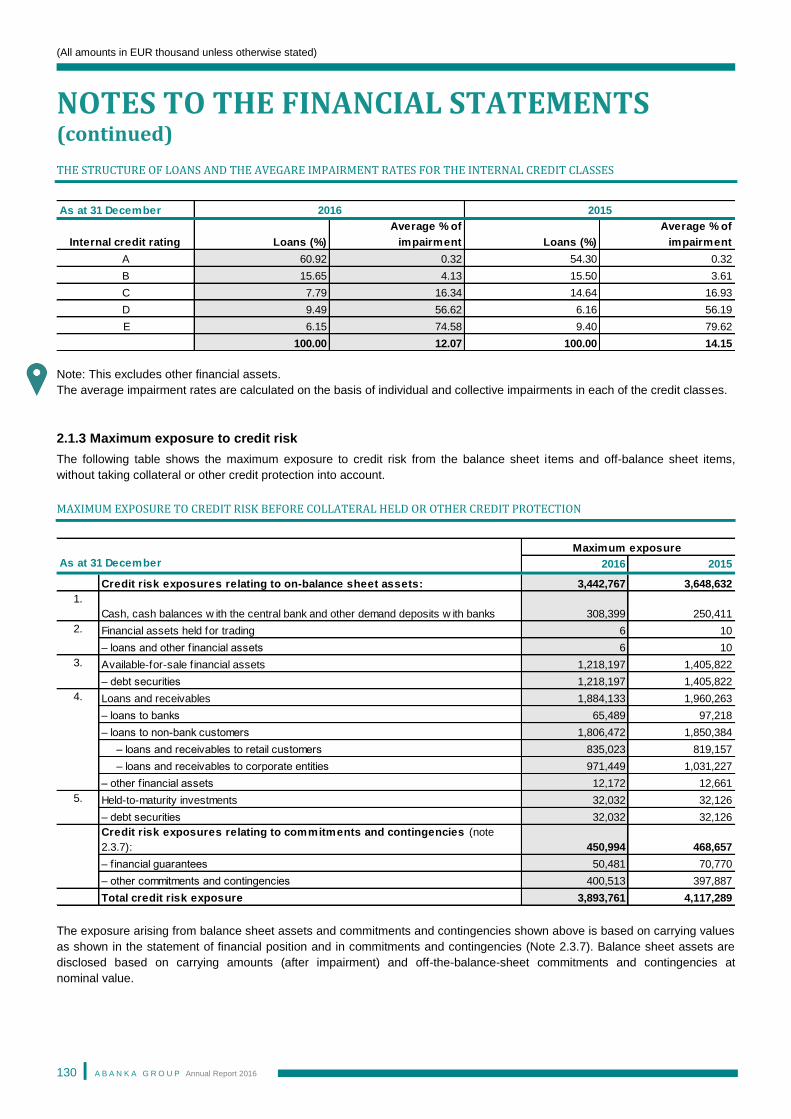
(All amounts in EUR thousand unless otherwise stated)
NOTES TO THE FINANCIAL STATEMENTS (continued)
A B A N K A G R O U P Annual Report 2016
130
THE STRUCTURE OF LOANS AND THE AVEGARE IMPAIRMENT RATES FOR THE INTERNAL CREDIT CLASSES
Note: This excludes other financial assets.
The average impairment rates are calculated on the basis of individual and collective impairments in each of the credit classes.
2.1.3 Maximum exposure to credit risk
The following table shows the maximum exposure to credit risk from the balance sheet items and off-balance sheet items,
without taking collateral or other credit protection into account.
MAXIMUM EXPOSURE TO CREDIT RISK BEFORE COLLATERAL HELD OR OTHER CREDIT PROTECTION
The exposure arising from balance sheet assets and commitments and contingencies shown above is based on carrying values
as shown in the statement of financial position and in commitments and contingencies (Note 2.3.7). Balance sheet assets are
disclosed based on carrying amounts (after impairment) and off-the-balance-sheet commitments and contingencies at
nominal value.
As at 31 December
Internal credit rating Loans (%)
Average % of
impairment Loans (%)
Average % of
impairment
A 60.92 0.32 54.30 0.32
B 15.65 4.13 15.50 3.61
C 7.79 16.34 14.64 16.93
D 9.49 56.62 6.16 56.19
E 6.15 74.58 9.40 79.62
100.00 12.07 100.00 14.15
2016 2015
2016 2015
Credit risk exposures relating to on-balance sheet assets: 3,442,767 3,648,632
1.
Cash, cash balances w ith the central bank and other demand deposits w ith banks 308,399 250,411
2. Financial assets held for trading 6 10
– loans and other f inancial assets 6 10
3. Available-for-sale f inancial assets 1,218,197 1,405,822
– debt securities 1,218,197 1,405,822
4. Loans and receivables 1,884,133 1,960,263
– loans to banks 65,489 97,218
– loans to non-bank customers 1,806,472 1,850,384
– loans and receivables to retail customers 835,023 819,157
– loans and receivables to corporate entities 971,449 1,031,227
– other f inancial assets 12,172 12,661
5. Held-to-maturity investments 32,032 32,126
– debt securities 32,032 32,126
Credit risk exposures relating to commitments and contingencies (note
2.3.7): 450,994 468,657
– financial guarantees 50,481 70,770
– other commitments and contingencies 400,513 397,887
Total credit risk exposure 3,893,761 4,117,289
Maximum exposure
As at 31 December
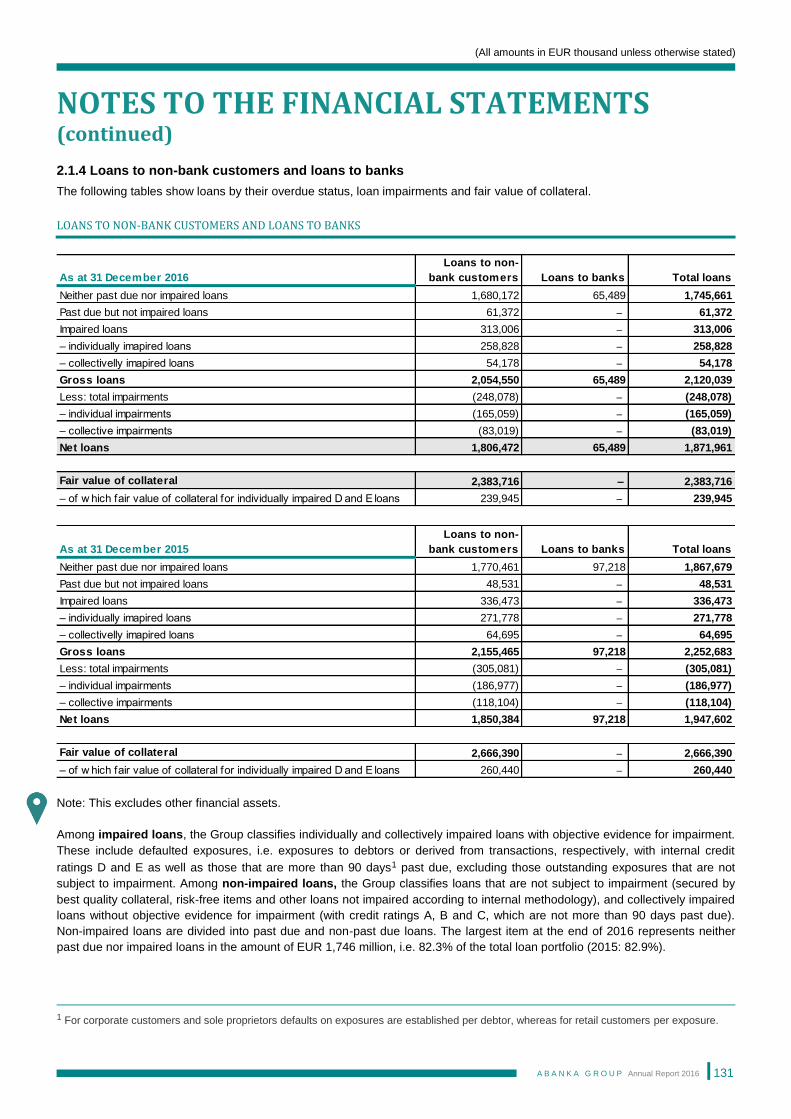
(All amounts in EUR thousand unless otherwise stated)
NOTES TO THE FINANCIAL STATEMENTS (continued)
A B A N K A G R O U P Annual Report 2016
131
2.1.4 Loans to non-bank customers and loans to banks
The following tables show loans by their overdue status, loan impairments and fair value of collateral.
LOANS TO NON-BANK CUSTOMERS AND LOANS TO BANKS
Note: This excludes other financial assets.
Among impaired loans, the Group classifies individually and collectively impaired loans with objective evidence for impairment.
These include defaulted exposures, i.e. exposures to debtors or derived from transactions, respectively, with internal credit
ratings D and E as well as those that are more than 90 days1 past due, excluding those outstanding exposures that are not
subject to impairment. Among non-impaired loans, the Group classifies loans that are not subject to impairment (secured by
best quality collateral, risk-free items and other loans not impaired according to internal methodology), and collectively impaired
loans without objective evidence for impairment (with credit ratings A, B and C, which are not more than 90 days past due).
Non-impaired loans are divided into past due and non-past due loans. The largest item at the end of 2016 represents neither
past due nor impaired loans in the amount of EUR 1,746 million, i.e. 82.3% of the total loan portfolio (2015: 82.9%).
1 For corporate customers and sole proprietors defaults on exposures are established per debtor, whereas for retail customers per exposure.
As at 31 December 2016
Loans to non-
bank customers Loans to banks Total loans
Neither past due nor impaired loans 1,680,172 65,489 1,745,661
Past due but not impaired loans 61,372 – 61,372
Impaired loans 313,006 – 313,006
– individually imapired loans 258,828 – 258,828
– collectivelly imapired loans 54,178 – 54,178
Gross loans 2,054,550 65,489 2,120,039
Less: total impairments (248,078) – (248,078)
– individual impairments (165,059) – (165,059)
– collective impairments (83,019) – (83,019)
Net loans 1,806,472 65,489 1,871,961
Fair value of collateral 2,383,716 – 2,383,716
– of w hich fair value of collateral for individually impaired D and E loans 239,945 – 239,945
As at 31 December 2015
Loans to non-
bank customers Loans to banks Total loans
Neither past due nor impaired loans 1,770,461 97,218 1,867,679
Past due but not impaired loans 48,531 – 48,531
Impaired loans 336,473 – 336,473
– individually imapired loans 271,778 – 271,778
– collectivelly imapired loans 64,695 – 64,695
Gross loans 2,155,465 97,218 2,252,683
Less: total impairments (305,081) – (305,081)
– individual impairments (186,977) – (186,977)
– collective impairments (118,104) – (118,104)
Net loans 1,850,384 97,218 1,947,602
Fair value of collateral 2,666,390 – 2,666,390
– of w hich fair value of collateral for individually impaired D and E loans 260,440 – 260,440
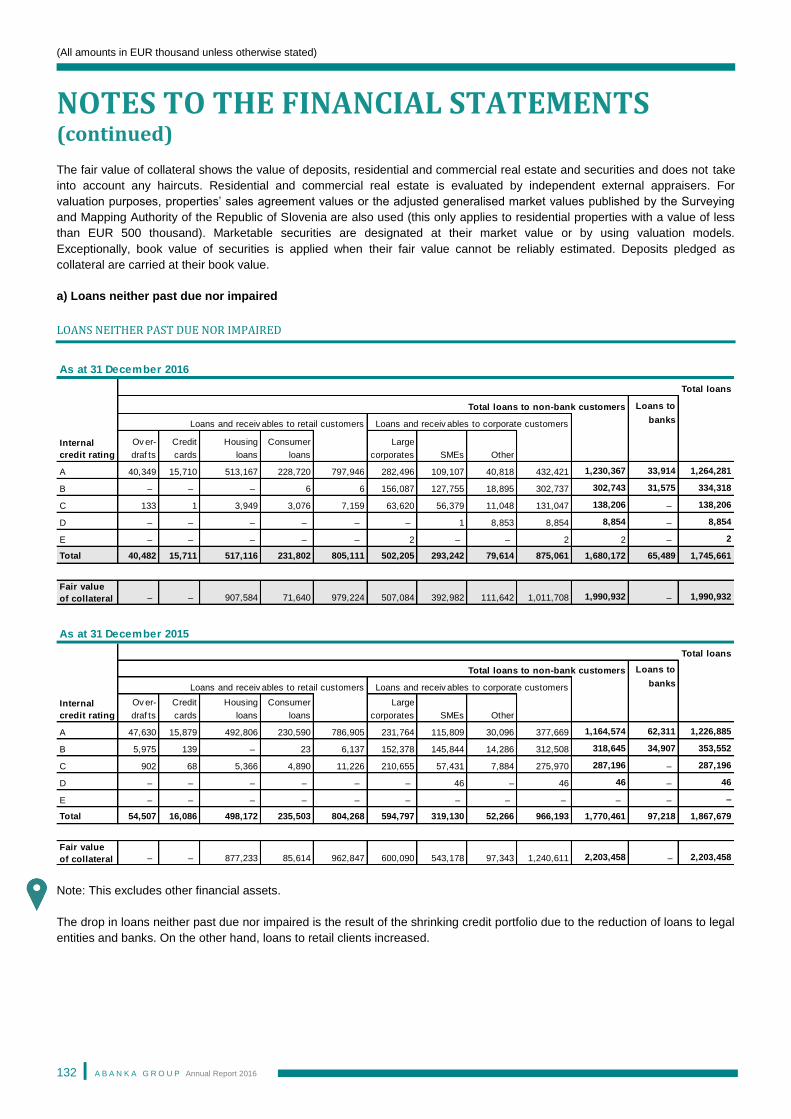
(All amounts in EUR thousand unless otherwise stated)
NOTES TO THE FINANCIAL STATEMENTS (continued)
A B A N K A G R O U P Annual Report 2016
132
The fair value of collateral shows the value of deposits, residential and commercial real estate and securities and does not take
into account any haircuts. Residential and commercial real estate is evaluated by independent external appraisers. For
valuation purposes, properties’ sales agreement values or the adjusted generalised market values published by the Surveying
and Mapping Authority of the Republic of Slovenia are also used (this only applies to residential properties with a value of less
than EUR 500 thousand). Marketable securities are designated at their market value or by using valuation models.
Exceptionally, book value of securities is applied when their fair value cannot be reliably estimated. Deposits pledged as
collateral are carried at their book value.
a) Loans neither past due nor impaired
LOANS NEITHER PAST DUE NOR IMPAIRED
Note: This excludes other financial assets.
The drop in loans neither past due nor impaired is the result of the shrinking credit portfolio due to the reduction of loans to legal
entities and banks. On the other hand, loans to retail clients increased.
Loans to
banks
Ov er-
draf ts
Credit
cards
Housing
loans
Consumer
loans
Large
corporates SMEs Other
A 40,349 15,710 513,167 228,720 797,946 282,496 109,107 40,818 432,421 1,230,367 33,914 1,264,281
B – – – 6 6 156,087 127,755 18,895 302,737 302,743 31,575 334,318
C 133 1 3,949 3,076 7,159 63,620 56,379 11,048 131,047 138,206 – 138,206
D – – – – – – 1 8,853 8,854 8,854 – 8,854
E – – – – – 2 – – 2 2 – 2
Total 40,482 15,711 517,116 231,802 805,111 502,205 293,242 79,614 875,061 1,680,172 65,489 1,745,661
Fair value
of collateral – – 907,584 71,640 979,224 507,084 392,982 111,642 1,011,708 1,990,932 – 1,990,932
Loans to
banks
Ov er-
draf ts
Credit
cards
Housing
loans
Consumer
loans
Large
corporates SMEs Other
A 47,630 15,879 492,806 230,590 786,905 231,764 115,809 30,096 377,669 1,164,574 62,311 1,226,885
B 5,975 139 – 23 6,137 152,378 145,844 14,286 312,508 318,645 34,907 353,552
C 902 68 5,366 4,890 11,226 210,655 57,431 7,884 275,970 287,196 – 287,196
D – – – – – – 46 – 46 46 – 46
E – – – – – – – – – – – –
Total 54,507 16,086 498,172 235,503 804,268 594,797 319,130 52,266 966,193 1,770,461 97,218 1,867,679
Fair value
of collateral – – 877,233 85,614 962,847 600,090 543,178 97,343 1,240,611 2,203,458 – 2,203,458
As at 31 December 2015
Total loans
Total loans to non-bank customers
Loans and receiv ables to retail customers Loans and receiv ables to corporate customers
Internal
credit rating
As at 31 December 2016
Total loans
Total loans to non-bank customers
Internal
credit rating
Loans and receiv ables to retail customers Loans and receiv ables to corporate customers
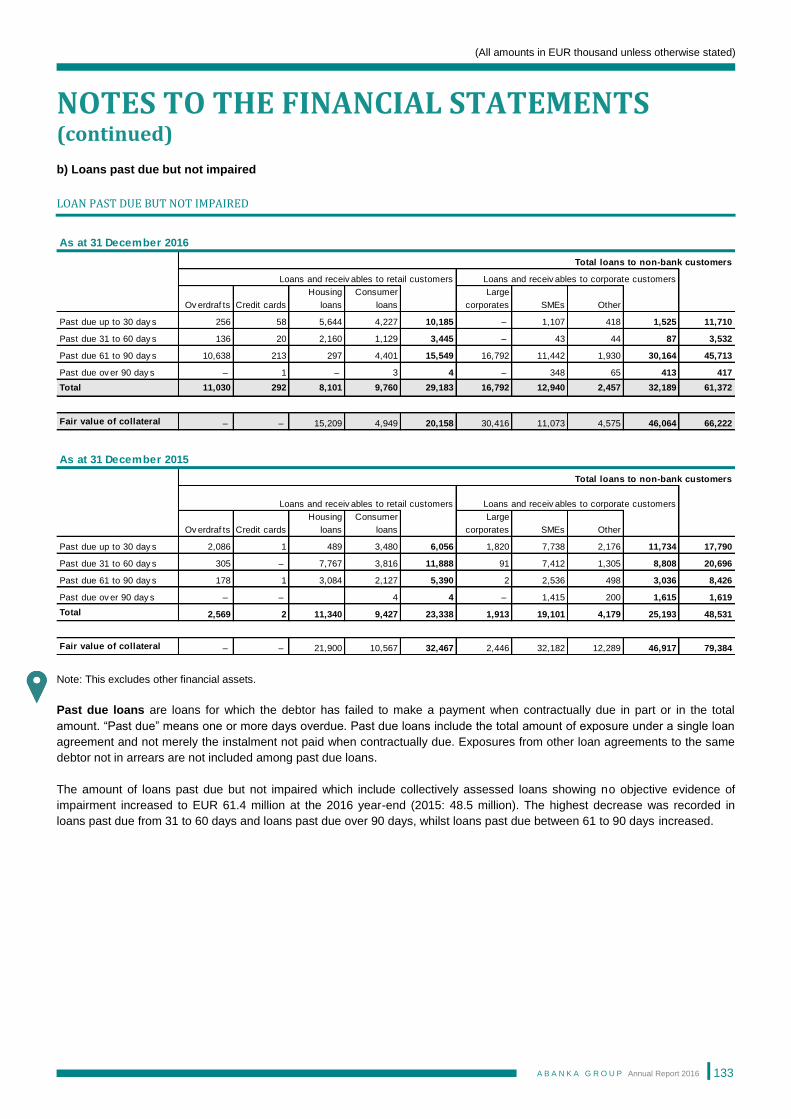
(All amounts in EUR thousand unless otherwise stated)
NOTES TO THE FINANCIAL STATEMENTS (continued)
A B A N K A G R O U P Annual Report 2016
133
b) Loans past due but not impaired
LOAN PAST DUE BUT NOT IMPAIRED
Note: This excludes other financial assets.
Past due loans are loans for which the debtor has failed to make a payment when contractually due in part or in the total
amount. “Past due” means one or more days overdue. Past due loans include the total amount of exposure under a single loan
agreement and not merely the instalment not paid when contractually due. Exposures from other loan agreements to the same
debtor not in arrears are not included among past due loans.
The amount of loans past due but not impaired which include collectively assessed loans showing no objective evidence of
impairment increased to EUR 61.4 million at the 2016 year-end (2015: 48.5 million). The highest decrease was recorded in
loans past due from 31 to 60 days and loans past due over 90 days, whilst loans past due between 61 to 90 days increased.
Ov erdraf ts Credit cards
Housing
loans
Consumer
loans
Large
corporates SMEs Other
Past due up to 30 day s 256 58 5,644 4,227 10,185 – 1,107 418 1,525 11,710
Past due 31 to 60 day s 136 20 2,160 1,129 3,445 – 43 44 87 3,532
Past due 61 to 90 day s 10,638 213 297 4,401 15,549 16,792 11,442 1,930 30,164 45,713
Past due ov er 90 day s – 1 – 3 4 – 348 65 413 417
Total 11,030 292 8,101 9,760 29,183 16,792 12,940 2,457 32,189 61,372
Fair value of collateral – – 15,209 4,949 20,158 30,416 11,073 4,575 46,064 66,222
Ov erdraf ts Credit cards
Housing
loans
Consumer
loans
Large
corporates SMEs Other
Past due up to 30 day s 2,086 1 489 3,480 6,056 1,820 7,738 2,176 11,734 17,790
Past due 31 to 60 day s 305 – 7,767 3,816 11,888 91 7,412 1,305 8,808 20,696
Past due 61 to 90 day s 178 1 3,084 2,127 5,390 2 2,536 498 3,036 8,426
Past due ov er 90 day s – – 4 4 – 1,415 200 1,615 1,619
Total 2,569 2 11,340 9,427 23,338 1,913 19,101 4,179 25,193 48,531
Fair value of collateral – – 21,900 10,567 32,467 2,446 32,182 12,289 46,917 79,384
Loans and receiv ables to retail customers
Total loans to non-bank customers
Loans and receiv ables to corporate customers
As at 31 December 2016
Total loans to non-bank customers
Loans and receiv ables to retail customers Loans and receiv ables to corporate customers
As at 31 December 2015
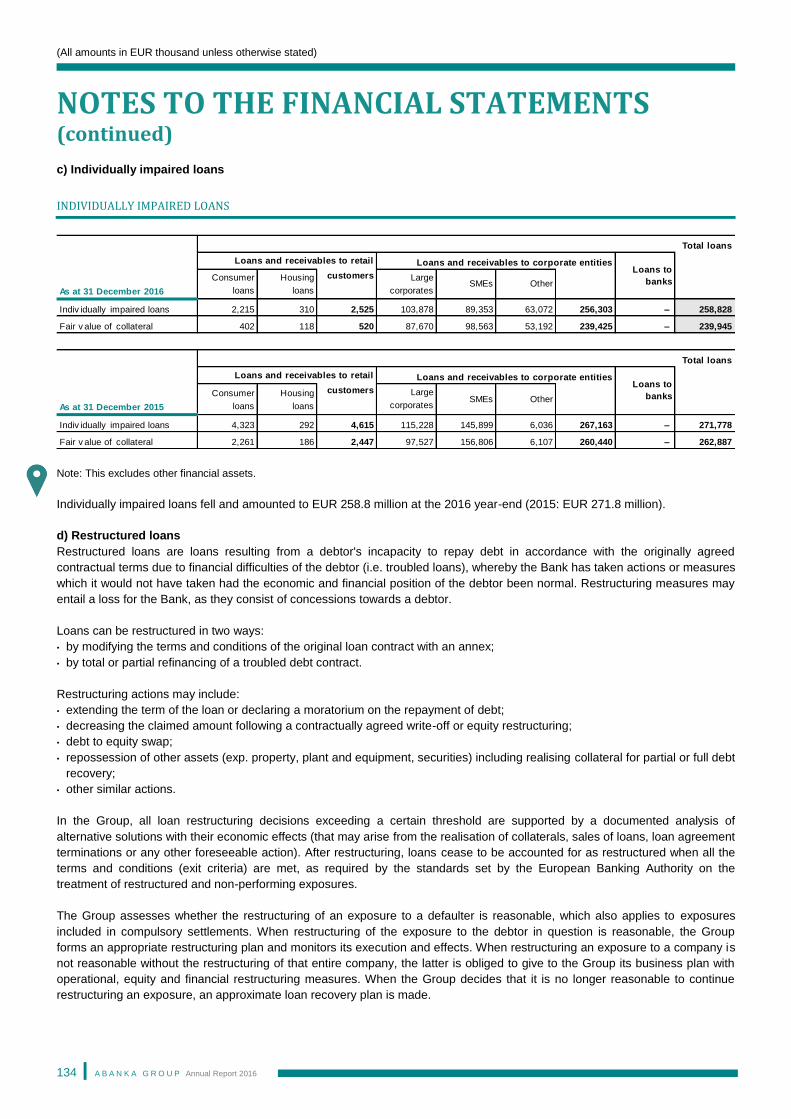
(All amounts in EUR thousand unless otherwise stated)
NOTES TO THE FINANCIAL STATEMENTS (continued)
A B A N K A G R O U P Annual Report 2016
134
c) Individually impaired loans
INDIVIDUALLY IMPAIRED LOANS
Note: This excludes other financial assets.
Individually impaired loans fell and amounted to EUR 258.8 million at the 2016 year-end (2015: EUR 271.8 million).
d) Restructured loans
Restructured loans are loans resulting from a debtor's incapacity to repay debt in accordance with the originally agreed
contractual terms due to financial difficulties of the debtor (i.e. troubled loans), whereby the Bank has taken actions or measures
which it would not have taken had the economic and financial position of the debtor been normal. Restructuring measures may
entail a loss for the Bank, as they consist of concessions towards a debtor.
Loans can be restructured in two ways:
• by modifying the terms and conditions of the original loan contract with an annex;
• by total or partial refinancing of a troubled debt contract.
Restructuring actions may include:
• extending the term of the loan or declaring a moratorium on the repayment of debt;
• decreasing the claimed amount following a contractually agreed write-off or equity restructuring;
• debt to equity swap;
• repossession of other assets (exp. property, plant and equipment, securities) including realising collateral for partial or full debt
recovery;
• other similar actions.
In the Group, all loan restructuring decisions exceeding a certain threshold are supported by a documented analysis of
alternative solutions with their economic effects (that may arise from the realisation of collaterals, sales of loans, loan agreement
terminations or any other foreseeable action). After restructuring, loans cease to be accounted for as restructured when all the
terms and conditions (exit criteria) are met, as required by the standards set by the European Banking Authority on the
treatment of restructured and non-performing exposures.
The Group assesses whether the restructuring of an exposure to a defaulter is reasonable, which also applies to exposures
included in compulsory settlements. When restructuring of the exposure to the debtor in question is reasonable, the Group
forms an appropriate restructuring plan and monitors its execution and effects. When restructuring an exposure to a company is
not reasonable without the restructuring of that entire company, the latter is obliged to give to the Group its business plan with
operational, equity and financial restructuring measures. When the Group decides that it is no longer reasonable to continue
restructuring an exposure, an approximate loan recovery plan is made.
As at 31 December 2016
Consumer
loans
Housing
loans
customers Large
corporatesSMEs Other
Indiv idually impaired loans 2,215 310 2,525 103,878 89,353 63,072 256,303 – 258,828
Fair v alue of collateral 402 118 520 87,670 98,563 53,192 239,425 – 239,945
As at 31 December 2015
Consumer
loans
Housing
loans
customers Large
corporatesSMEs Other
Indiv idually impaired loans 4,323 292 4,615 115,228 145,899 6,036 267,163 – 271,778
Fair v alue of collateral 2,261 186 2,447 97,527 156,806 6,107 260,440 – 262,887
Total loans
Loans and receivables to retail Loans and receivables to corporate entitiesLoans to
banks
Loans to
banks
Total loans
Loans and receivables to corporate entitiesLoans and receivables to retail
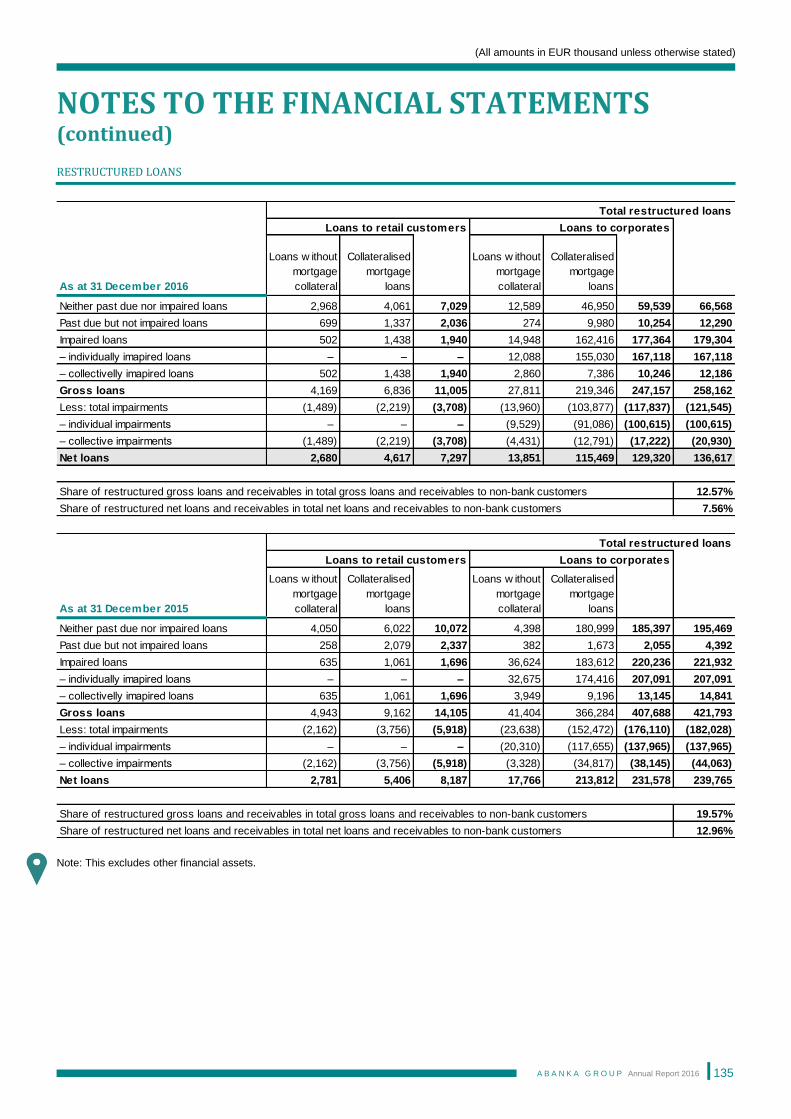
(All amounts in EUR thousand unless otherwise stated)
NOTES TO THE FINANCIAL STATEMENTS (continued)
A B A N K A G R O U P Annual Report 2016
135
RESTRUCTURED LOANS
Note: This excludes other financial assets.
Loans to retail customers Loans to corporates
As at 31 December 2016
Loans w ithout
mortgage
collateral
Collateralised
mortgage
loans
Loans w ithout
mortgage
collateral
Collateralised
mortgage
loans
Neither past due nor impaired loans 2,968 4,061 7,029 12,589 46,950 59,539 66,568
Past due but not impaired loans 699 1,337 2,036 274 9,980 10,254 12,290
Impaired loans 502 1,438 1,940 14,948 162,416 177,364 179,304
– individually imapired loans – – – 12,088 155,030 167,118 167,118
– collectivelly imapired loans 502 1,438 1,940 2,860 7,386 10,246 12,186
Gross loans 4,169 6,836 11,005 27,811 219,346 247,157 258,162
Less: total impairments (1,489) (2,219) (3,708) (13,960) (103,877) (117,837) (121,545)
– individual impairments – – – (9,529) (91,086) (100,615) (100,615)
– collective impairments (1,489) (2,219) (3,708) (4,431) (12,791) (17,222) (20,930)
Net loans 2,680 4,617 7,297 13,851 115,469 129,320 136,617
12.57%
7.56%
Loans to retail customers Loans to corporates
As at 31 December 2015
Loans w ithout
mortgage
collateral
Collateralised
mortgage
loans
Loans w ithout
mortgage
collateral
Collateralised
mortgage
loans
Neither past due nor impaired loans 4,050 6,022 10,072 4,398 180,999 185,397 195,469
Past due but not impaired loans 258 2,079 2,337 382 1,673 2,055 4,392
Impaired loans 635 1,061 1,696 36,624 183,612 220,236 221,932
– individually imapired loans – – – 32,675 174,416 207,091 207,091
– collectivelly imapired loans 635 1,061 1,696 3,949 9,196 13,145 14,841
Gross loans 4,943 9,162 14,105 41,404 366,284 407,688 421,793
Less: total impairments (2,162) (3,756) (5,918) (23,638) (152,472) (176,110) (182,028)
– individual impairments – – – (20,310) (117,655) (137,965) (137,965)
– collective impairments (2,162) (3,756) (5,918) (3,328) (34,817) (38,145) (44,063)
Net loans 2,781 5,406 8,187 17,766 213,812 231,578 239,765
19.57%
12.96%
Total restructured loans
Share of restructured gross loans and receivables in total gross loans and receivables to non-bank customers
Share of restructured net loans and receivables in total net loans and receivables to non-bank customers
Total restructured loans
Share of restructured gross loans and receivables in total gross loans and receivables to non-bank customers
Share of restructured net loans and receivables in total net loans and receivables to non-bank customers
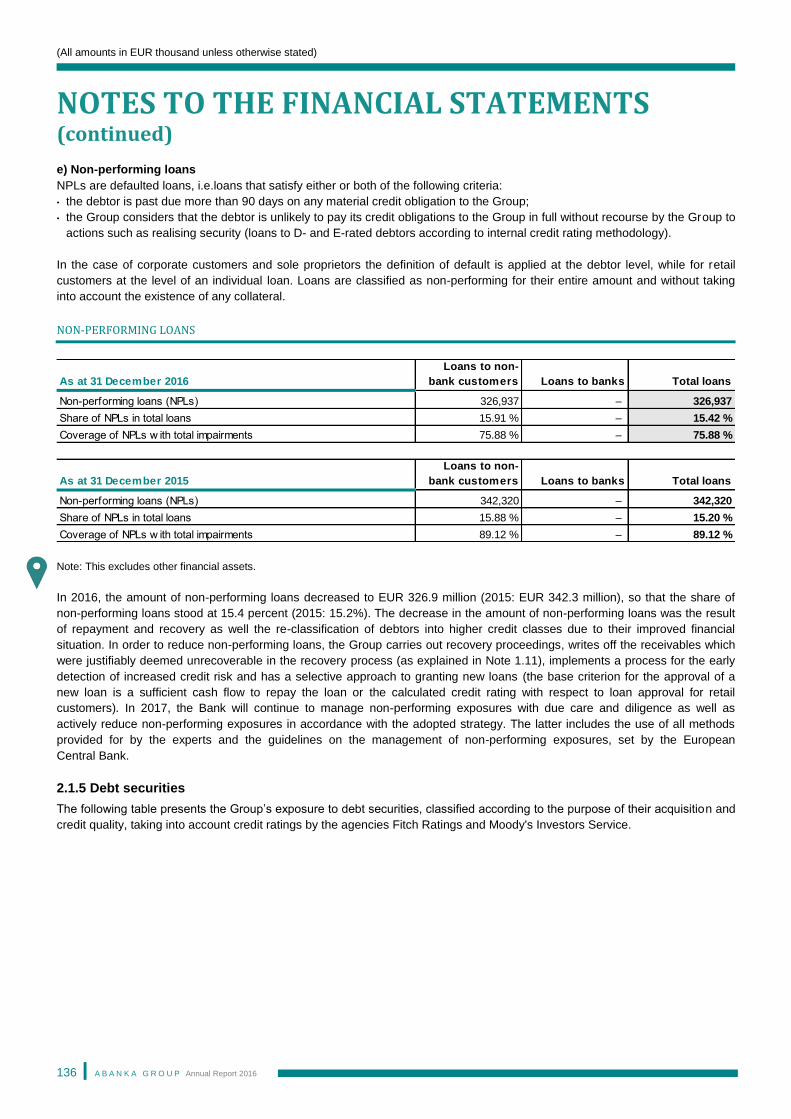
(All amounts in EUR thousand unless otherwise stated)
NOTES TO THE FINANCIAL STATEMENTS (continued)
A B A N K A G R O U P Annual Report 2016
136
e) Non-performing loans
NPLs are defaulted loans, i.e.loans that satisfy either or both of the following criteria:
• the debtor is past due more than 90 days on any material credit obligation to the Group;
• the Group considers that the debtor is unlikely to pay its credit obligations to the Group in full without recourse by the Group to
actions such as realising security (loans to D- and E-rated debtors according to internal credit rating methodology).
In the case of corporate customers and sole proprietors the definition of default is applied at the debtor level, while for retail
customers at the level of an individual loan. Loans are classified as non-performing for their entire amount and without taking
into account the existence of any collateral.
NON-PERFORMING LOANS
Note: This excludes other financial assets.
In 2016, the amount of non-performing loans decreased to EUR 326.9 million (2015: EUR 342.3 million), so that the share of
non-performing loans stood at 15.4 percent (2015: 15.2%). The decrease in the amount of non-performing loans was the result
of repayment and recovery as well the re-classification of debtors into higher credit classes due to their improved financial
situation. In order to reduce non-performing loans, the Group carries out recovery proceedings, writes off the receivables which
were justifiably deemed unrecoverable in the recovery process (as explained in Note 1.11), implements a process for the early
detection of increased credit risk and has a selective approach to granting new loans (the base criterion for the approval of a
new loan is a sufficient cash flow to repay the loan or the calculated credit rating with respect to loan approval for retail
customers). In 2017, the Bank will continue to manage non-performing exposures with due care and diligence as well as
actively reduce non-performing exposures in accordance with the adopted strategy. The latter includes the use of all methods
provided for by the experts and the guidelines on the management of non-performing exposures, set by the European
Central Bank.
2.1.5 Debt securities
The following table presents the Group’s exposure to debt securities, classified according to the purpose of their acquisition and
credit quality, taking into account credit ratings by the agencies Fitch Ratings and Moody's Investors Service.
As at 31 December 2016
Loans to non-
bank customers Loans to banks Total loans
Non-performing loans (NPLs) 326,937 – 326,937
Share of NPLs in total loans 15.91 % – 15.42 %
Coverage of NPLs w ith total impairments 75.88 % – 75.88 %
As at 31 December 2015
Loans to non-
bank customers Loans to banks Total loans
Non-performing loans (NPLs) 342,320 – 342,320
Share of NPLs in total loans 15.88 % – 15.20 %
Coverage of NPLs w ith total impairments 89.12 % – 89.12 %
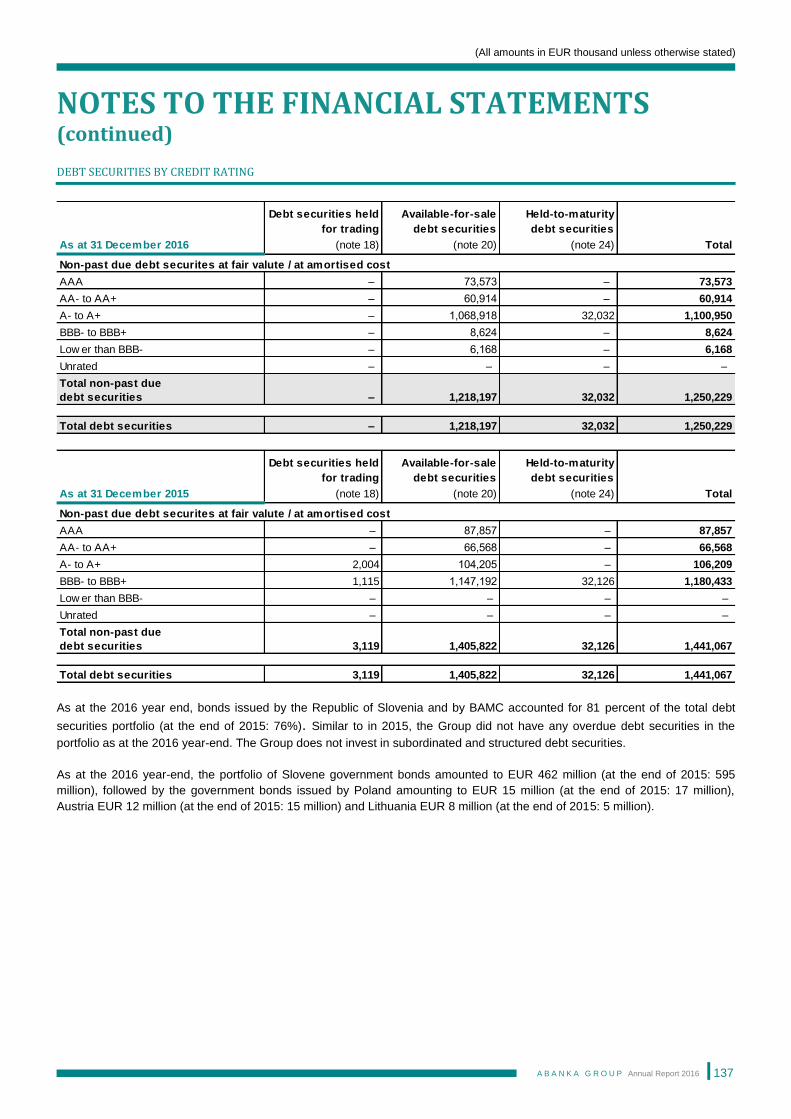
(All amounts in EUR thousand unless otherwise stated)
NOTES TO THE FINANCIAL STATEMENTS (continued)
A B A N K A G R O U P Annual Report 2016
137
DEBT SECURITIES BY CREDIT RATING
As at the 2016 year end, bonds issued by the Republic of Slovenia and by BAMC accounted for 81 percent of the total debt
securities portfolio (at the end of 2015: 76%). Similar to in 2015, the Group did not have any overdue debt securities in the
portfolio as at the 2016 year-end. The Group does not invest in subordinated and structured debt securities.
As at the 2016 year-end, the portfolio of Slovene government bonds amounted to EUR 462 million (at the end of 2015: 595
million), followed by the government bonds issued by Poland amounting to EUR 15 million (at the end of 2015: 17 million),
Austria EUR 12 million (at the end of 2015: 15 million) and Lithuania EUR 8 million (at the end of 2015: 5 million).
Debt securities held
for trading
Available-for-sale
debt securities
Held-to-maturity
debt securities
As at 31 December 2016 (note 18) (note 20) (note 24) Total
Non-past due debt securites at fair valute / at amortised cost
AAA – 73,573 – 73,573
AA- to AA+ – 60,914 – 60,914
A- to A+ – 1,068,918 32,032 1,100,950
BBB- to BBB+ – 8,624 – 8,624
Low er than BBB- – 6,168 – 6,168
Unrated – – – –
Total non-past due
debt securities – 1,218,197 32,032 1,250,229
Total debt securities – 1,218,197 32,032 1,250,229
Debt securities held
for trading
Available-for-sale
debt securities
Held-to-maturity
debt securities
As at 31 December 2015 (note 18) (note 20) (note 24) Total
Non-past due debt securites at fair valute / at amortised cost
AAA – 87,857 – 87,857
AA- to AA+ – 66,568 – 66,568
A- to A+ 2,004 104,205 – 106,209
BBB- to BBB+ 1,115 1,147,192 32,126 1,180,433
Low er than BBB- – – – –
Unrated – – – –
Total non-past due
debt securities 3,119 1,405,822 32,126 1,441,067
Total debt securities 3,119 1,405,822 32,126 1,441,067
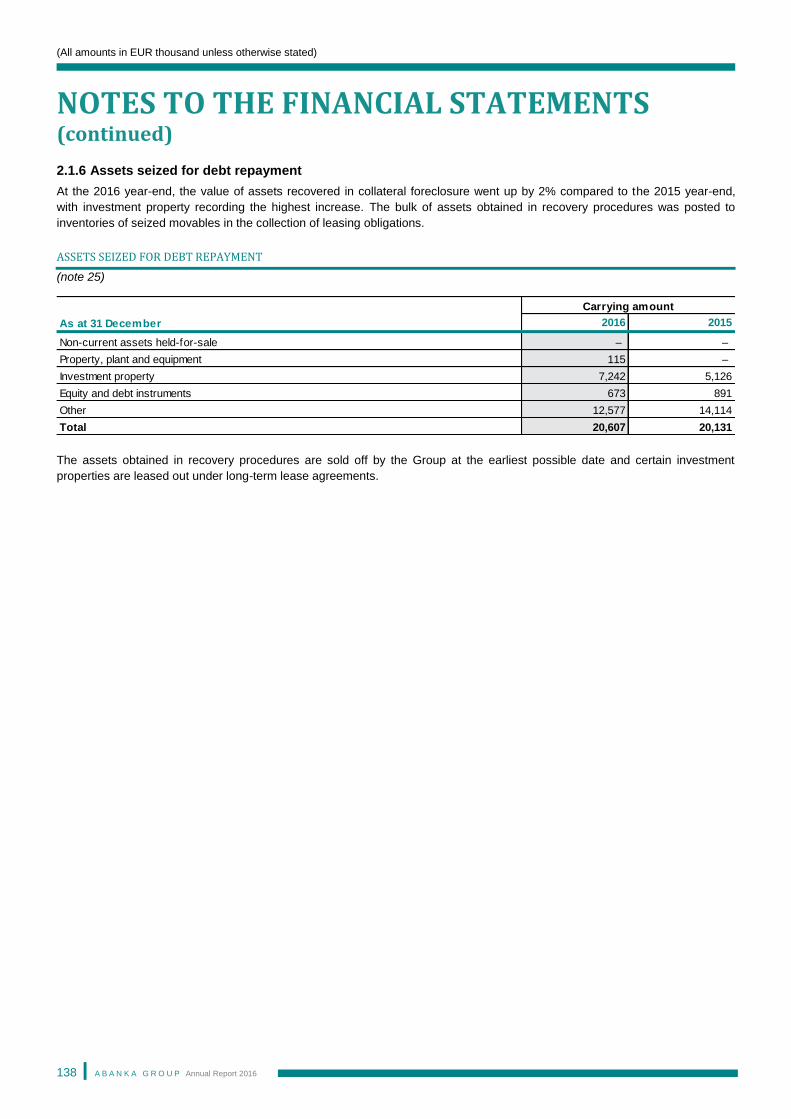
(All amounts in EUR thousand unless otherwise stated)
NOTES TO THE FINANCIAL STATEMENTS (continued)
A B A N K A G R O U P Annual Report 2016
138
2.1.6 Assets seized for debt repayment
At the 2016 year-end, the value of assets recovered in collateral foreclosure went up by 2% compared to the 2015 year-end,
with investment property recording the highest increase. The bulk of assets obtained in recovery procedures was posted to
inventories of seized movables in the collection of leasing obligations.
ASSETS SEIZED FOR DEBT REPAYMENT
(note 25)
The assets obtained in recovery procedures are sold off by the Group at the earliest possible date and certain investment
properties are leased out under long-term lease agreements.
As at 31 December 2016 2015
Non-current assets held-for-sale – –
Property, plant and equipment 115 –
Investment property 7,242 5,126
Equity and debt instruments 673 891
Other 12,577 14,114
Total 20,607 20,131
Carrying amount
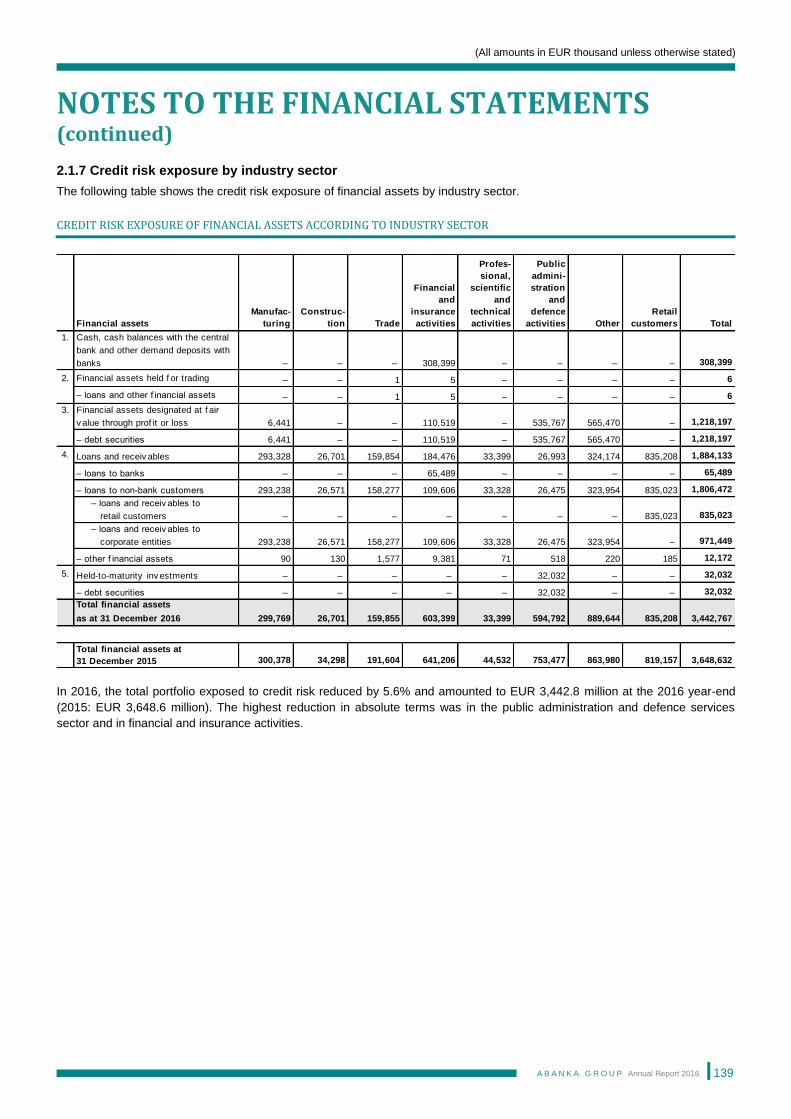
(All amounts in EUR thousand unless otherwise stated)
NOTES TO THE FINANCIAL STATEMENTS (continued)
A B A N K A G R O U P Annual Report 2016
139
2.1.7 Credit risk exposure by industry sector
The following table shows the credit risk exposure of financial assets by industry sector.
CREDIT RISK EXPOSURE OF FINANCIAL ASSETS ACCORDING TO INDUSTRY SECTOR
In 2016, the total portfolio exposed to credit risk reduced by 5.6% and amounted to EUR 3,442.8 million at the 2016 year-end
(2015: EUR 3,648.6 million). The highest reduction in absolute terms was in the public administration and defence services
sector and in financial and insurance activities.
Financial assets
Manufac-
turing
Construc-
tion Trade
Financial
and
insurance
activities
Profes-
sional,
scientific
and
technical
activities
Public
admini-
stration
and
defence
activities Other
Retail
customers Total
1. Cash, cash balances with the central
bank and other demand deposits with
banks – – – 308,399 – – – – 308,399
2. Financial assets held f or trading – – 1 5 – – – – 6
– loans and other f inancial assets – – 1 5 – – – – 6
3. Financial assets designated at f air
v alue through prof it or loss 6,441 – – 110,519 – 535,767 565,470 – 1,218,197
– debt securities 6,441 – – 110,519 – 535,767 565,470 – 1,218,197
4. Loans and receiv ables 293,328 26,701 159,854 184,476 33,399 26,993 324,174 835,208 1,884,133
– loans to banks – – – 65,489 – – – – 65,489
– loans to non-bank customers 293,238 26,571 158,277 109,606 33,328 26,475 323,954 835,023 1,806,472
– loans and receiv ables to
retail customers – – – – – – – 835,023 835,023
– loans and receiv ables to
corporate entities 293,238 26,571 158,277 109,606 33,328 26,475 323,954 – 971,449
– other f inancial assets 90 130 1,577 9,381 71 518 220 185 12,172
5. Held-to-maturity inv estments – – – – – 32,032 – – 32,032
– debt securities – – – – – 32,032 – – 32,032
Total financial assets
as at 31 December 2016 299,769 26,701 159,855 603,399 33,399 594,792 889,644 835,208 3,442,767
Total financial assets at
31 December 2015 300,378 34,298 191,604 641,206 44,532 753,477 863,980 819,157 3,648,632
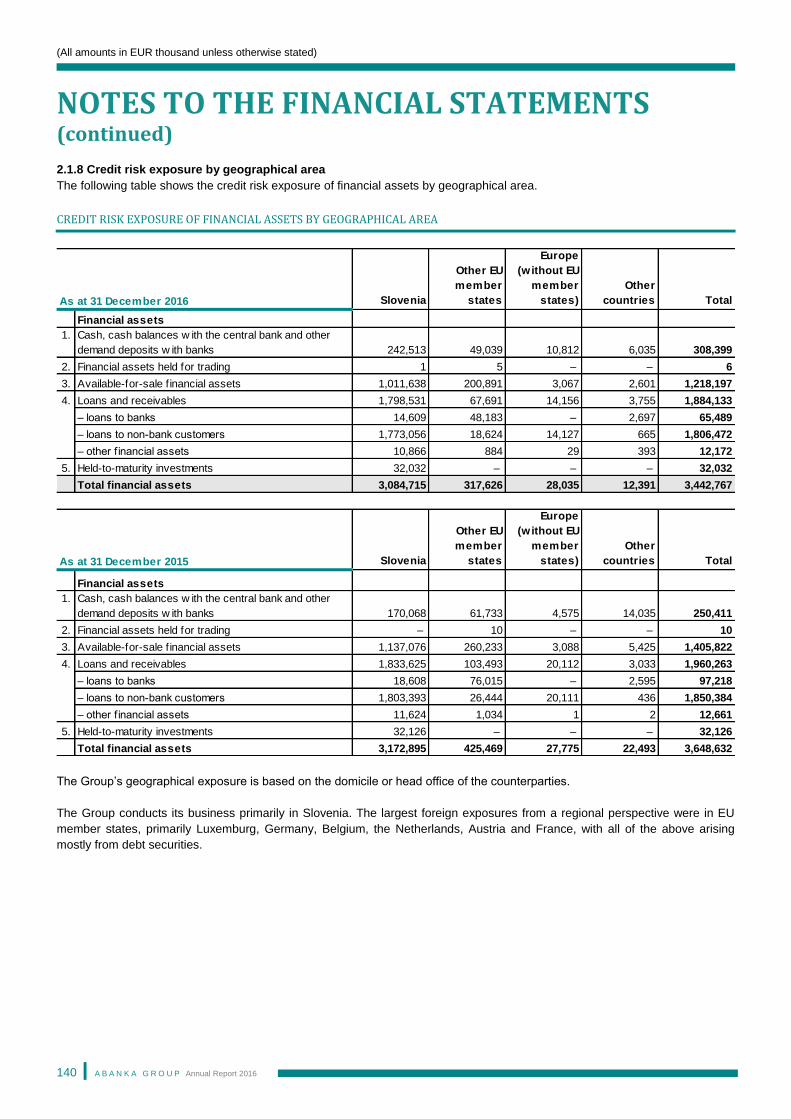
(All amounts in EUR thousand unless otherwise stated)
NOTES TO THE FINANCIAL STATEMENTS (continued)
A B A N K A G R O U P Annual Report 2016
140
2.1.8 Credit risk exposure by geographical area
The following table shows the credit risk exposure of financial assets by geographical area.
CREDIT RISK EXPOSURE OF FINANCIAL ASSETS BY GEOGRAPHICAL AREA
The Group’s geographical exposure is based on the domicile or head office of the counterparties.
The Group conducts its business primarily in Slovenia. The largest foreign exposures from a regional perspective were in EU
member states, primarily Luxemburg, Germany, Belgium, the Netherlands, Austria and France, with all of the above arising
mostly from debt securities.
Slovenia
Other EU
member
states
Europe
(without EU
member
states)
Other
countries Total
Financial assets
1. Cash, cash balances w ith the central bank and other
demand deposits w ith banks 242,513 49,039 10,812 6,035 308,399
2. Financial assets held for trading 1 5 – – 6
3. Available-for-sale f inancial assets 1,011,638 200,891 3,067 2,601 1,218,197
4. Loans and receivables 1,798,531 67,691 14,156 3,755 1,884,133
– loans to banks 14,609 48,183 – 2,697 65,489
– loans to non-bank customers 1,773,056 18,624 14,127 665 1,806,472
– other f inancial assets 10,866 884 29 393 12,172
5. Held-to-maturity investments 32,032 – – – 32,032
Total financial assets 3,084,715 317,626 28,035 12,391 3,442,767
Slovenia
Other EU
member
states
Europe
(without EU
member
states)
Other
countries Total
Financial assets
1. Cash, cash balances w ith the central bank and other
demand deposits w ith banks 170,068 61,733 4,575 14,035 250,411
2. Financial assets held for trading – 10 – – 10
3. Available-for-sale f inancial assets 1,137,076 260,233 3,088 5,425 1,405,822
4. Loans and receivables 1,833,625 103,493 20,112 3,033 1,960,263
– loans to banks 18,608 76,015 – 2,595 97,218
– loans to non-bank customers 1,803,393 26,444 20,111 436 1,850,384
– other f inancial assets 11,624 1,034 1 2 12,661
5. Held-to-maturity investments 32,126 – – – 32,126
Total financial assets 3,172,895 425,469 27,775 22,493 3,648,632
As at 31 December 2016
As at 31 December 2015
(All amounts in EUR thousand unless otherwise stated)
NOTES TO THE FINANCIAL STATEMENTS (continued)
A B A N K A G R O U P Annual Report 2016
141
2.2 Market risk
Market risk is the uncertainty that an adverse change in risk factors, including interest rates, exchange rates, credit spreads,
prices of financial instruments, commodity prices and other relevant parameters, may unfavourably affect the value of a financial
instrument and/or consequently lead to a loss.
The Group monitors its market risk exposure in its trading and banking books. Market risks primarily arise from activities
performed in treasury and the investment banking departments. The trading book positions include mainly positions in equity
and debt instruments that the Group intends to sell at a profit in the short term. Part of the trading book also consists of financial
derivatives that the Group sells to its customers to hedge against interest rate and foreign exchange risk. These positions are
closed according to the Group’s back-to-back policy. In the reporting period, the trading book on average stood at EUR 3.2
million which is two times higher compared to the 2015 average trading volume. The average trading volume in debt securities
increased. The banking book positions include positions in debt instruments, foreign exchange instruments and financial
derivatives held for asset and liability management purposes of the Bank, equity instruments (acquired through collateral
foreclosures and/or debt to equity swaps) and strategic positions. On average, in 2016 the banking book amounted to EUR
1,373 million, mainly from debt financial instruments.
2.2.1 Market risk management process
The market risk management strategy is based on the Group’s market risk-bearing capacity, the existing and expected
market conditions, realised and projected financial data, regulations in force and the existing risk management systems. In the
reporting period, the Group traded in debt financial instruments on a limited scale, while trading in equity financial instruments
for own account was not allowed. The Group’s trading in derivative financial instruments is based on a policy of back-to-back
trading and the involvement of counterparties with higher credit ratings. Such trades are concluded mostly to hedge against
financial risks.
The purpose of the market risk management process is to minimise losses from positions in trading and banking books.
Simultaneously, it takes into account business policies, balance sheet structure, capital adequacy and opportunities in capital
markets. The Group aspires to achieve the most favourable ratio between generated return and assumed risk and it manages
market risk pursuant to the Market Risk Policy of the Group.
The market risk management process comprises:
procedures of market risk identification, measurement/assessment, monitoring, control, and
internal reporting on market risk.
Identification procedures are used to define existing and potential risks that arise from trading and banking book positions. Risks
and a risk management process must be defined before launching new services or entering new markets. The Trading Strategy,
which presents potential risks and the way in which they will be managed, is formulated on an annual basis and approved by the
Supervisory Board.
The system of limits for trading in financial instruments allows market risk appetite to be kept at low levels. This system also
requires investing in highly liquid positions whilst maintaining an adequate risk diversification. The Risk Management
Department sets a limit system primarily based on the Group’s market risk appetite and capital adequacy. The limit
system includes credit and position limits, stop loss limits, market rates compliance limits, VaR limits and limits per single
authorised person.
The Group has also established a system of limits for debt financial instruments in the banking book through which it
implements its policy of investing in bonds of high credit quality pledgeable as collateral to the European Central Bank, while
following the goal of credit diversification and maximum loss limitation.
The structure and organisation of appropriate functions for market risk management is the responsibility of the
Management Board and senior management. The Management Board has authorised the Risk Management Committee to
approve market risk exposure limits.
(All amounts in EUR thousand unless otherwise stated)
NOTES TO THE FINANCIAL STATEMENTS (continued)
A B A N K A G R O U P Annual Report 2016
142
The competencies and responsibilities are clearly delimited between trading units (treasury, investment banking), the back
office, the middle office and the Risk Management Department, which is organisationally independent of the units that assume
market risk.
The extent and features of internal reporting: The middle office is responsible for the daily calculating of exposures from
financial instruments in trading and in the banking book and reporting to the Management Board, senior management, trading
units and the Risk Management Department. Quarterly reports on market risk exposure, the utilisation of limits, the size of
Value-at-Risk and stress-testing results for trading and the banking book are presented to the Management Board. The
Supervisory Board discusses and reviews a report on the Group’s exposure to various types of risks, including market risk, on at
least a quarterly basis.
2.2.1.1 Market risk measurement techniques
Market risk measurement techniques comprise risk analyses and validation. This includes assessing the possible frequency
of a potential event and the size of its consequences. Market risk is regularly measured by:
the Value-at-Risk method (i.e. VaR);
stress testing;
sensitivity analysis; and
calculating market risk capital requirements, using the standardised approach.
The Group is aware of the limitations of the VaR method in cases of extreme market conditions, which is why the Group
performs stress testing as a supplement to VaR. Stress testing assesses potential impacts of extraordinary, yet plausible,
events in financial markets on the value of financial instruments.
Market risk is also measured with sensitivity analyses to determine the impact of changes in different risk factors and their
influence on the Group’s profit and equity levels.
2.2.1.2 Market risk mitigation
An adequate limit system, in line with the conservative market risk policy, is the basic tool of effective risk management. For the
purpose of hedging and reducing market risk, a system of trading limits is in place alongside a system of limits on the banking
book operations with debt financial instruments. The market risk regime is implemented on a daily basis through systems of
limits and clear guidelines on responsibilities and competencies in assuming risk.
For the main part of trading in derivative financial instruments, exposures to position risk, interest rate risk and currency risk are
reduced by pursuing a back-to-back policy. Market risks are hedged by counter-transactions.
2.2.1.3 VaR of debt securities
Value-at-risk assessment (VaR assessment) is a quantitative measure used for assessing potential loss in the value of positions
caused by adverse risk factor changes over a given future period at a given confidence level. The Group calculates value-at-risk
(VaR) by applying the historical simulation approach and in compliance with the standards set by the Bank of Slovenia. The
model assumes the following:
• a 10-day holding period, meaning that within 10 days all the positions included in the calculation can be liquidated, i.e. sold off.
This assumption does not necessarily always hold true for all positions, i.e. not in a period of general illiquidity of financial
markets. Expanding the daily VaR to a longer period is based on the assumption of a static portfolio;
• a 1-year observation period, meaning that the most recent year should sufficiently reflect the market situation changes that
influence the business of the Group. In fact, historical data do not necessarily represent a good indicator of potential future risk
factors. This is especially true in periods of extreme market conditions;
• a 99% level of confidence, meaning that on any one day of one hundred trading days the Group would suffer a loss from
trading activity exceeding the calculated value. The amount of such excessive losses cannot be measured with VaR.
Measuring VaR shows that the Group’s potential loss on one day out of one hundred trading days will at least be equal to the
calculated VaR on an individual trading day, under the assumption that positions can be sold over the following 10-day period.
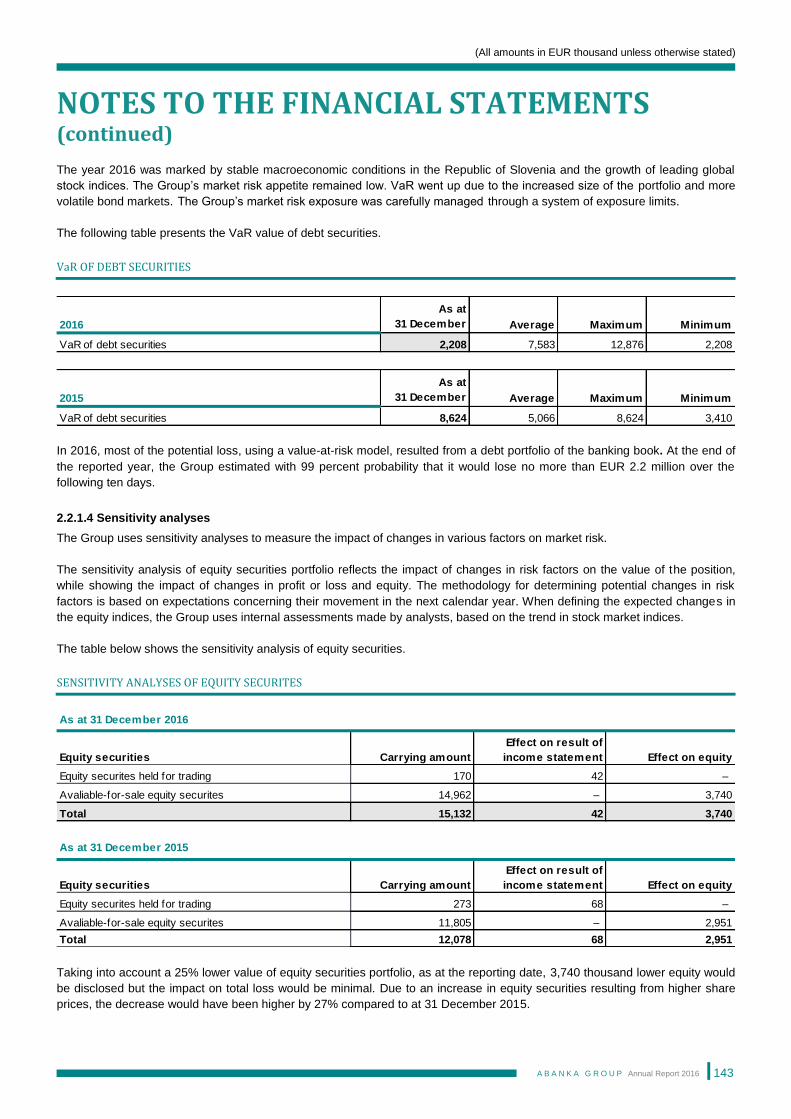
(All amounts in EUR thousand unless otherwise stated)
NOTES TO THE FINANCIAL STATEMENTS (continued)
A B A N K A G R O U P Annual Report 2016
143
The year 2016 was marked by stable macroeconomic conditions in the Republic of Slovenia and the growth of leading global
stock indices. The Group’s market risk appetite remained low. VaR went up due to the increased size of the portfolio and more
volatile bond markets. The Group’s market risk exposure was carefully managed through a system of exposure limits.
The following table presents the VaR value of debt securities.
VaR OF DEBT SECURITIES
In 2016, most of the potential loss, using a value-at-risk model, resulted from a debt portfolio of the banking book. At the end of
the reported year, the Group estimated with 99 percent probability that it would lose no more than EUR 2.2 million over the
following ten days.
2.2.1.4 Sensitivity analyses
The Group uses sensitivity analyses to measure the impact of changes in various factors on market risk.
The sensitivity analysis of equity securities portfolio reflects the impact of changes in risk factors on the value of the position,
while showing the impact of changes in profit or loss and equity. The methodology for determining potential changes in risk
factors is based on expectations concerning their movement in the next calendar year. When defining the expected changes in
the equity indices, the Group uses internal assessments made by analysts, based on the trend in stock market indices.
The table below shows the sensitivity analysis of equity securities.
SENSITIVITY ANALYSES OF EQUITY SECURITES
Taking into account a 25% lower value of equity securities portfolio, as at the reporting date, 3,740 thousand lower equity would
be disclosed but the impact on total loss would be minimal. Due to an increase in equity securities resulting from higher share
prices, the decrease would have been higher by 27% compared to at 31 December 2015.
2016
As at
31 December Average Maximum Minimum
VaR of debt securities 2,208 7,583 12,876 2,208
2015
As at
31 December Average Maximum Minimum
VaR of debt securities 8,624 5,066 8,624 3,410
As at 31 December 2016
Equity securities Carrying amount
Effect on result of
income statement Effect on equity
Equity securites held for trading 170 42 –
Avaliable-for-sale equity securites 14,962 – 3,740
Total 15,132 42 3,740
As at 31 December 2015
Equity securities Carrying amount
Effect on result of
income statement Effect on equity
Equity securites held for trading 273 68 –
Avaliable-for-sale equity securites 11,805 – 2,951
Total 12,078 68 2,951
(All amounts in EUR thousand unless otherwise stated)
NOTES TO THE FINANCIAL STATEMENTS (continued)
A B A N K A G R O U P Annual Report 2016
144
The impact of interest rate changes on net interest income and economic value of capital based on the sensitivity analysis is
shown in Section 2.2.3.2.
2.2.2 Foreign exchange risk
Foreign exchange risk is the risk that the fair value or future cash flows of a financial instrument will fluctuate because of
changes in foreign exchange rates.
2.2.2.1 Foreign exchange risk management process
The foreign exchange risk strategy focuses on risk exposure in accordance with set limits and the Group’s risk capacity in
view of its income and capital adequacy. Foreign exchange risk is identified, measured, controlled and monitored in line with the
Group’s established foreign exchange risk management policy. The foreign exchange risk management process is based on
the procedures for identifying, measuring, monitoring and managing foreign exchange risk and includes internal reporting.
The structure and organisation of appropriate functions for foreign exchange risk management are set out in the
relevant policy. The adequacy of the strategy, policies and limit system of foreign exchange risk management is monitored by
the Risk Management Committee. The implementation of the relevant policy is monitored and controlled by the Assets and
Liabilities Management Committee; foreign exchange risk management is the responsibility of the Assets and Liabilities
Management Department, whereas the Treasury Department and other divisions are in charge of the operationalisation of
policies and guidelines.
The extent and features of internal reporting: it is an established practice to produce daily reports on foreign exchange
exposures, including daily calculations of maximum potential losses arising from net foreign exchange positions. Regular
monthly reports on foreign exchange exposures are also produced for the Assets and Liability Committee. The Supervisory
Board quarterly discusses and reviews a report on a Group’s exposure to various types of risks, including foreign exchange risk.
The foreign exchange measurement system covers the daily monitoring of net foreign exchange positions per currency and
currency groups, as well as the daily calculation of maximum loss limits associated with foreign exchange risk by using the
Value-at-Risk method. Foreign exchange risk is measured and assessed in accordance with internal methodology. This defines
the stress testing used by the Group to evaluate potential losses resulting from foreign exchange rate fluctuations.
The Group hedges and reduces foreign exchange rate risk, since fluctuations in the prevailing foreign currency exchange
rates have an impact on its financial position and cash flows. In 2016, the gaps between foreign currency inflows and outflows,
which mostly arose from payment transactions, were managed by arbitrage. These exposures associated with financial
instruments in foreign currencies were low and well within the set limits.
The following table presents the Group’s foreign exchange risk exposure and includes the Group’s financial instruments at their
carrying amounts by currency.
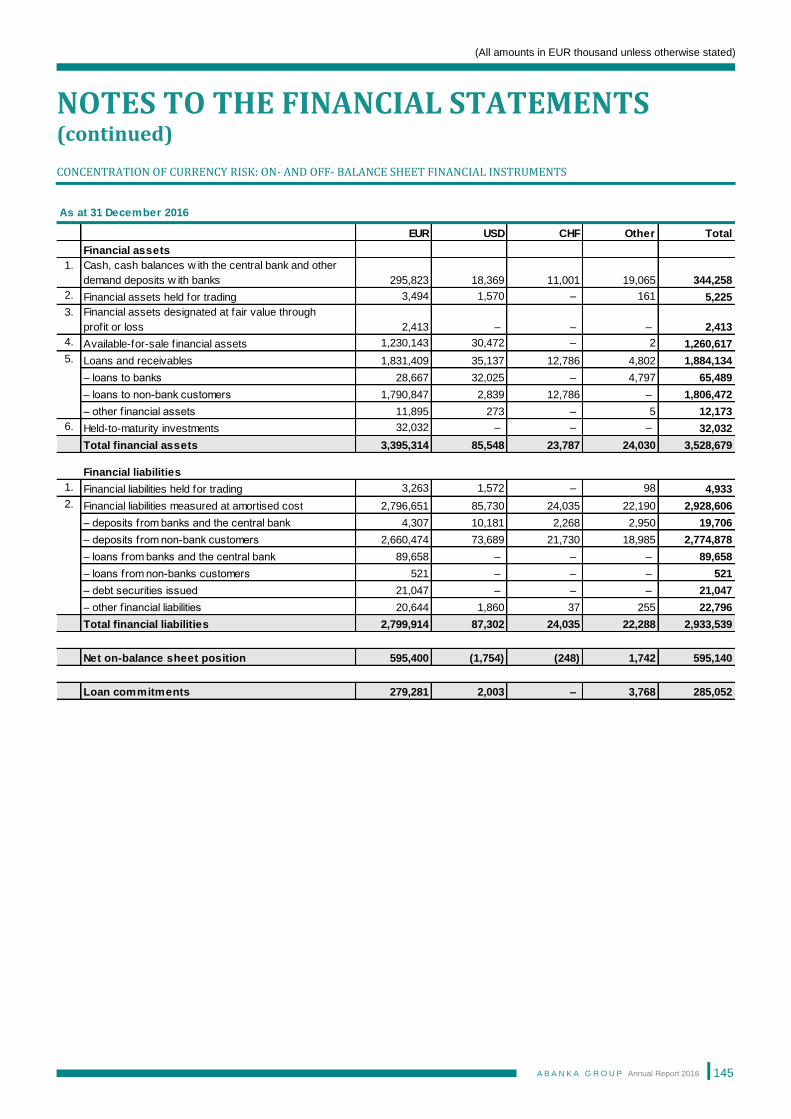
(All amounts in EUR thousand unless otherwise stated)
NOTES TO THE FINANCIAL STATEMENTS (continued)
A B A N K A G R O U P Annual Report 2016
145
CONCENTRATION OF CURRENCY RISK: ON- AND OFF- BALANCE SHEET FINANCIAL INSTRUMENTS
As at 31 December 2016
EUR USD CHF Other Total
Financial assets
1. Cash, cash balances w ith the central bank and other
demand deposits w ith banks 295,823 18,369 11,001 19,065 344,258
2. Financial assets held for trading 3,494 1,570 – 161 5,225
3. Financial assets designated at fair value through
profit or loss 2,413 – – – 2,413
4. Available-for-sale f inancial assets 1,230,143 30,472 – 2 1,260,617
5. Loans and receivables 1,831,409 35,137 12,786 4,802 1,884,134
– loans to banks 28,667 32,025 – 4,797 65,489
– loans to non-bank customers 1,790,847 2,839 12,786 – 1,806,472
– other f inancial assets 11,895 273 – 5 12,173
6. Held-to-maturity investments 32,032 – – – 32,032
Total financial assets 3,395,314 85,548 23,787 24,030 3,528,679
Financial liabilities
1. Financial liabilities held for trading 3,263 1,572 – 98 4,933
2. Financial liabilities measured at amortised cost 2,796,651 85,730 24,035 22,190 2,928,606
– deposits from banks and the central bank 4,307 10,181 2,268 2,950 19,706
– deposits from non-bank customers 2,660,474 73,689 21,730 18,985 2,774,878
– loans from banks and the central bank 89,658 – – – 89,658
– loans from non-banks customers 521 – – – 521
– debt securities issued 21,047 – – – 21,047
– other f inancial liabilities 20,644 1,860 37 255 22,796
Total financial liabilities 2,799,914 87,302 24,035 22,288 2,933,539
Net on-balance sheet position 595,400 (1,754) (248) 1,742 595,140
Loan commitments 279,281 2,003 – 3,768 285,052
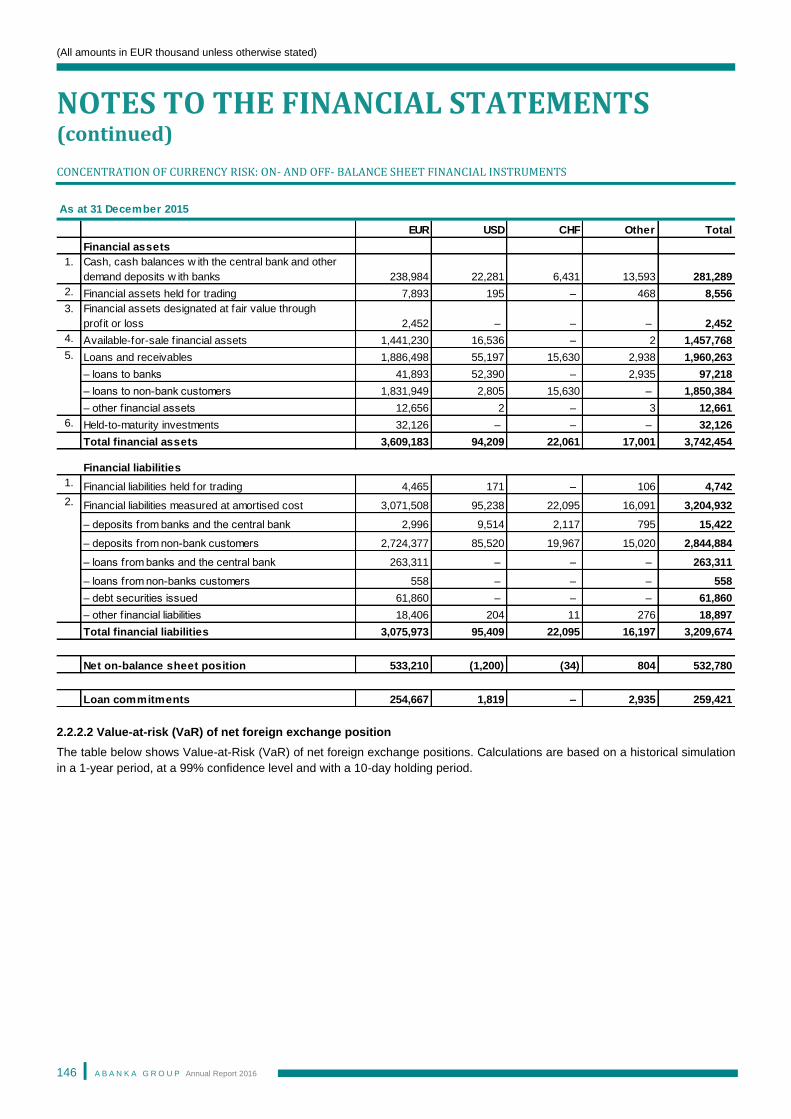
(All amounts in EUR thousand unless otherwise stated)
NOTES TO THE FINANCIAL STATEMENTS (continued)
A B A N K A G R O U P Annual Report 2016
146
CONCENTRATION OF CURRENCY RISK: ON- AND OFF- BALANCE SHEET FINANCIAL INSTRUMENTS
2.2.2.2 Value-at-risk (VaR) of net foreign exchange position
The table below shows Value-at-Risk (VaR) of net foreign exchange positions. Calculations are based on a historical simulation
in a 1-year period, at a 99% confidence level and with a 10-day holding period.
As at 31 December 2015
EUR USD CHF Other Total
Financial assets
1. Cash, cash balances w ith the central bank and other
demand deposits w ith banks 238,984 22,281 6,431 13,593 281,289
2. Financial assets held for trading 7,893 195 – 468 8,556
3. Financial assets designated at fair value through
profit or loss 2,452 – – – 2,452
4. Available-for-sale f inancial assets 1,441,230 16,536 – 2 1,457,768
5. Loans and receivables 1,886,498 55,197 15,630 2,938 1,960,263
– loans to banks 41,893 52,390 – 2,935 97,218
– loans to non-bank customers 1,831,949 2,805 15,630 – 1,850,384
– other f inancial assets 12,656 2 – 3 12,661
6. Held-to-maturity investments 32,126 – – – 32,126
Total financial assets 3,609,183 94,209 22,061 17,001 3,742,454
Financial liabilities
1. Financial liabilities held for trading 4,465 171 – 106 4,742
2. Financial liabilities measured at amortised cost 3,071,508 95,238 22,095 16,091 3,204,932
– deposits from banks and the central bank 2,996 9,514 2,117 795 15,422
– deposits from non-bank customers 2,724,377 85,520 19,967 15,020 2,844,884
– loans from banks and the central bank 263,311 – – – 263,311
– loans from non-banks customers 558 – – – 558
– debt securities issued 61,860 – – – 61,860
– other f inancial liabilities 18,406 204 11 276 18,897
Total financial liabilities 3,075,973 95,409 22,095 16,197 3,209,674
Net on-balance sheet position 533,210 (1,200) (34) 804 532,780
Loan commitments 254,667 1,819 – 2,935 259,421
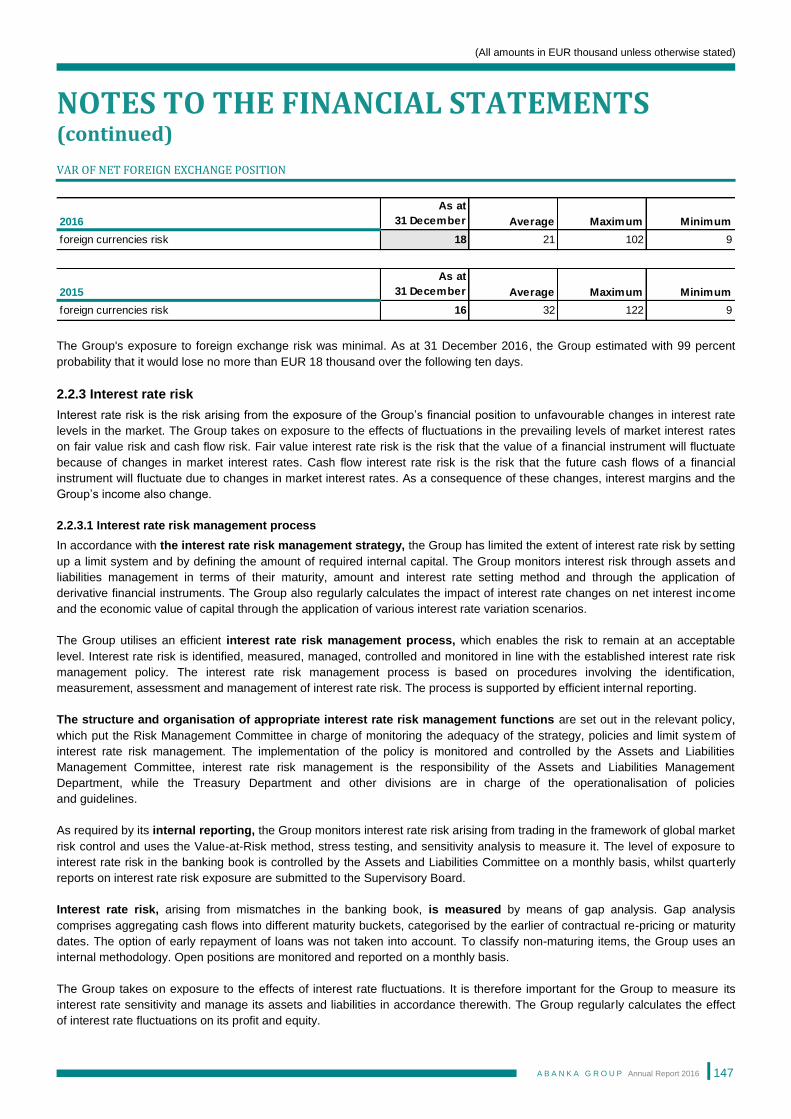
(All amounts in EUR thousand unless otherwise stated)
NOTES TO THE FINANCIAL STATEMENTS (continued)
A B A N K A G R O U P Annual Report 2016
147
VAR OF NET FOREIGN EXCHANGE POSITION
The Group's exposure to foreign exchange risk was minimal. As at 31 December 2016, the Group estimated with 99 percent
probability that it would lose no more than EUR 18 thousand over the following ten days.
2.2.3 Interest rate risk
Interest rate risk is the risk arising from the exposure of the Group’s financial position to unfavourab le changes in interest rate
levels in the market. The Group takes on exposure to the effects of fluctuations in the prevailing levels of market interest rates
on fair value risk and cash flow risk. Fair value interest rate risk is the risk that the value of a financial instrument will fluctuate
because of changes in market interest rates. Cash flow interest rate risk is the risk that the future cash flows of a financial
instrument will fluctuate due to changes in market interest rates. As a consequence of these changes, interest margins and the
Group’s income also change.
2.2.3.1 Interest rate risk management process
In accordance with the interest rate risk management strategy, the Group has limited the extent of interest rate risk by setting
up a limit system and by defining the amount of required internal capital. The Group monitors interest risk through assets and
liabilities management in terms of their maturity, amount and interest rate setting method and through the application of
derivative financial instruments. The Group also regularly calculates the impact of interest rate changes on net interest income
and the economic value of capital through the application of various interest rate variation scenarios.
The Group utilises an efficient interest rate risk management process, which enables the risk to remain at an acceptable
level. Interest rate risk is identified, measured, managed, controlled and monitored in line with the established interest rate risk
management policy. The interest rate risk management process is based on procedures involving the identification,
measurement, assessment and management of interest rate risk. The process is supported by efficient internal reporting.
The structure and organisation of appropriate interest rate risk management functions are set out in the relevant policy,
which put the Risk Management Committee in charge of monitoring the adequacy of the strategy, policies and limit system of
interest rate risk management. The implementation of the policy is monitored and controlled by the Assets and Liabilities
Management Committee, interest rate risk management is the responsibility of the Assets and Liabilities Management
Department, while the Treasury Department and other divisions are in charge of the operationalisation of policies
and guidelines.
As required by its internal reporting, the Group monitors interest rate risk arising from trading in the framework of global market
risk control and uses the Value-at-Risk method, stress testing, and sensitivity analysis to measure it. The level of exposure to
interest rate risk in the banking book is controlled by the Assets and Liabilities Committee on a monthly basis, whilst quarterly
reports on interest rate risk exposure are submitted to the Supervisory Board.
Interest rate risk, arising from mismatches in the banking book, is measured by means of gap analysis. Gap analysis
comprises aggregating cash flows into different maturity buckets, categorised by the earlier of contractual re-pricing or maturity
dates. The option of early repayment of loans was not taken into account. To classify non-maturing items, the Group uses an
internal methodology. Open positions are monitored and reported on a monthly basis.
The Group takes on exposure to the effects of interest rate fluctuations. It is therefore important for the Group to measure its
interest rate sensitivity and manage its assets and liabilities in accordance therewith. The Group regularly calculates the effect
of interest rate fluctuations on its profit and equity.
2016
As at
31 December Average Maximum Minimum
foreign currencies risk 18 21 102 9
2015
As at
31 December Average Maximum Minimum
foreign currencies risk 16 32 122 9
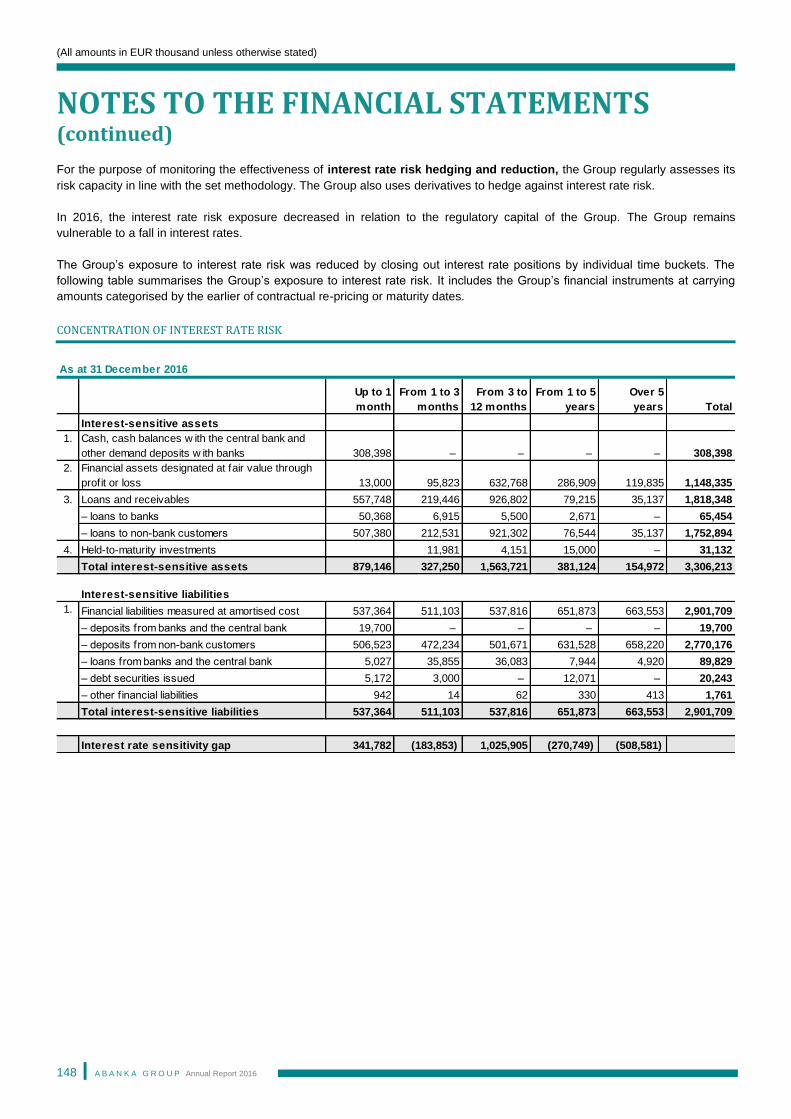
(All amounts in EUR thousand unless otherwise stated)
NOTES TO THE FINANCIAL STATEMENTS (continued)
A B A N K A G R O U P Annual Report 2016
148
For the purpose of monitoring the effectiveness of interest rate risk hedging and reduction, the Group regularly assesses its
risk capacity in line with the set methodology. The Group also uses derivatives to hedge against interest rate risk.
In 2016, the interest rate risk exposure decreased in relation to the regulatory capital of the Group. The Group remains
vulnerable to a fall in interest rates.
The Group’s exposure to interest rate risk was reduced by closing out interest rate positions by individual time buckets. The
following table summarises the Group’s exposure to interest rate risk. It includes the Group’s financial instruments at carrying
amounts categorised by the earlier of contractual re-pricing or maturity dates.
CONCENTRATION OF INTEREST RATE RISK
Up to 1
month
From 1 to 3
months
From 3 to
12 months
From 1 to 5
years
Over 5
years Total
Interest-sensitive assets
1. Cash, cash balances w ith the central bank and
other demand deposits w ith banks 308,398 – – – – 308,398
2. Financial assets designated at fair value through
profit or loss 13,000 95,823 632,768 286,909 119,835 1,148,335
3. Loans and receivables 557,748 219,446 926,802 79,215 35,137 1,818,348
– loans to banks 50,368 6,915 5,500 2,671 – 65,454
– loans to non-bank customers 507,380 212,531 921,302 76,544 35,137 1,752,894
4. Held-to-maturity investments 11,981 4,151 15,000 – 31,132
Total interest-sensitive assets 879,146 327,250 1,563,721 381,124 154,972 3,306,213
Interest-sensitive liabilities
1. Financial liabilities measured at amortised cost 537,364 511,103 537,816 651,873 663,553 2,901,709
– deposits from banks and the central bank 19,700 – – – – 19,700
– deposits from non-bank customers 506,523 472,234 501,671 631,528 658,220 2,770,176
– loans from banks and the central bank 5,027 35,855 36,083 7,944 4,920 89,829
– debt securities issued 5,172 3,000 – 12,071 – 20,243
– other f inancial liabilities 942 14 62 330 413 1,761
Total interest-sensitive liabilities 537,364 511,103 537,816 651,873 663,553 2,901,709
Interest rate sensitivity gap 341,782 (183,853) 1,025,905 (270,749) (508,581)
As at 31 December 2016
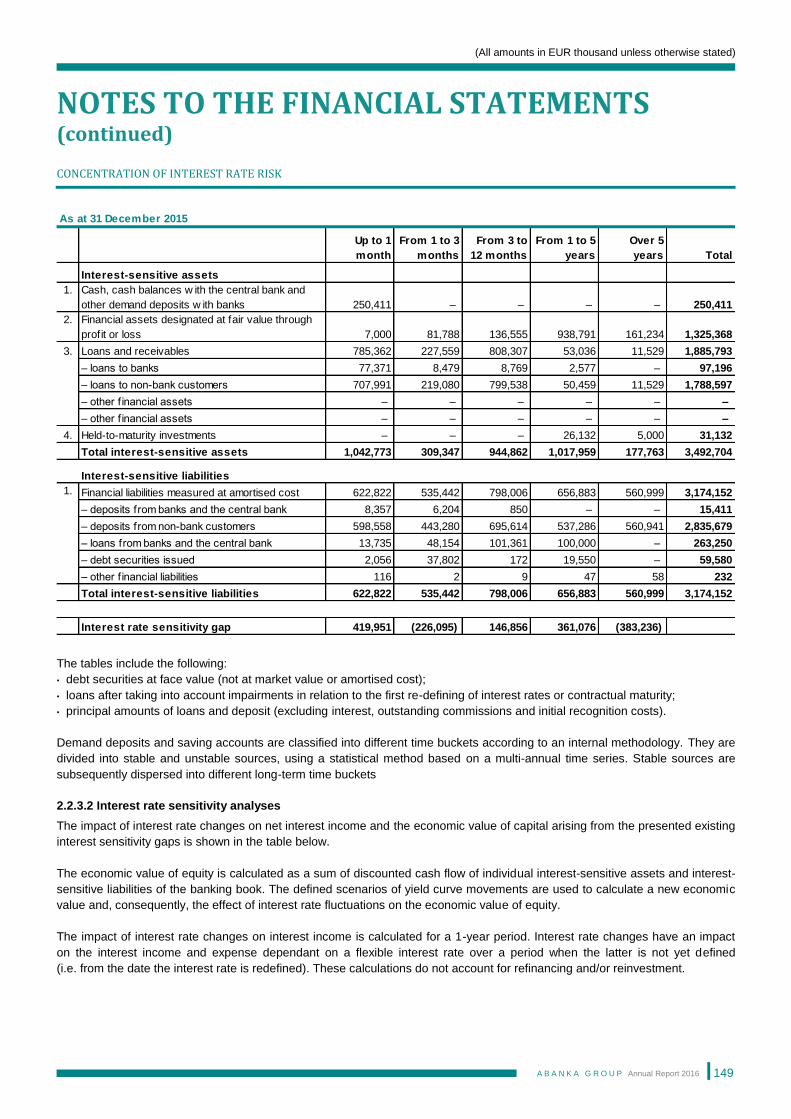
(All amounts in EUR thousand unless otherwise stated)
NOTES TO THE FINANCIAL STATEMENTS (continued)
A B A N K A G R O U P Annual Report 2016
149
CONCENTRATION OF INTEREST RATE RISK
The tables include the following:
• debt securities at face value (not at market value or amortised cost);
• loans after taking into account impairments in relation to the first re-defining of interest rates or contractual maturity;
• principal amounts of loans and deposit (excluding interest, outstanding commissions and initial recognition costs).
Demand deposits and saving accounts are classified into different time buckets according to an internal methodology. They are
divided into stable and unstable sources, using a statistical method based on a multi-annual time series. Stable sources are
subsequently dispersed into different long-term time buckets
2.2.3.2 Interest rate sensitivity analyses
The impact of interest rate changes on net interest income and the economic value of capital arising from the presented existing
interest sensitivity gaps is shown in the table below.
The economic value of equity is calculated as a sum of discounted cash flow of individual interest-sensitive assets and interest-
sensitive liabilities of the banking book. The defined scenarios of yield curve movements are used to calculate a new economic
value and, consequently, the effect of interest rate fluctuations on the economic value of equity.
The impact of interest rate changes on interest income is calculated for a 1-year period. Interest rate changes have an impact
on the interest income and expense dependant on a flexible interest rate over a period when the latter is not yet defined
(i.e. from the date the interest rate is redefined). These calculations do not account for refinancing and/or reinvestment.
Up to 1
month
From 1 to 3
months
From 3 to
12 months
From 1 to 5
years
Over 5
years Total
Interest-sensitive assets
1. Cash, cash balances w ith the central bank and
other demand deposits w ith banks 250,411 – – – – 250,411
2. Financial assets designated at fair value through
profit or loss 7,000 81,788 136,555 938,791 161,234 1,325,368
3. Loans and receivables 785,362 227,559 808,307 53,036 11,529 1,885,793
– loans to banks 77,371 8,479 8,769 2,577 – 97,196
– loans to non-bank customers 707,991 219,080 799,538 50,459 11,529 1,788,597
– other f inancial assets – – – – – –
– other f inancial assets – – – – – –
4. Held-to-maturity investments – – – 26,132 5,000 31,132
Total interest-sensitive assets 1,042,773 309,347 944,862 1,017,959 177,763 3,492,704
Interest-sensitive liabilities
1. Financial liabilities measured at amortised cost 622,822 535,442 798,006 656,883 560,999 3,174,152
– deposits from banks and the central bank 8,357 6,204 850 – – 15,411
– deposits from non-bank customers 598,558 443,280 695,614 537,286 560,941 2,835,679
– loans from banks and the central bank 13,735 48,154 101,361 100,000 – 263,250
– debt securities issued 2,056 37,802 172 19,550 – 59,580
– other f inancial liabilities 116 2 9 47 58 232
Total interest-sensitive liabilities 622,822 535,442 798,006 656,883 560,999 3,174,152
Interest rate sensitivity gap 419,951 (226,095) 146,856 361,076 (383,236)
As at 31 December 2015
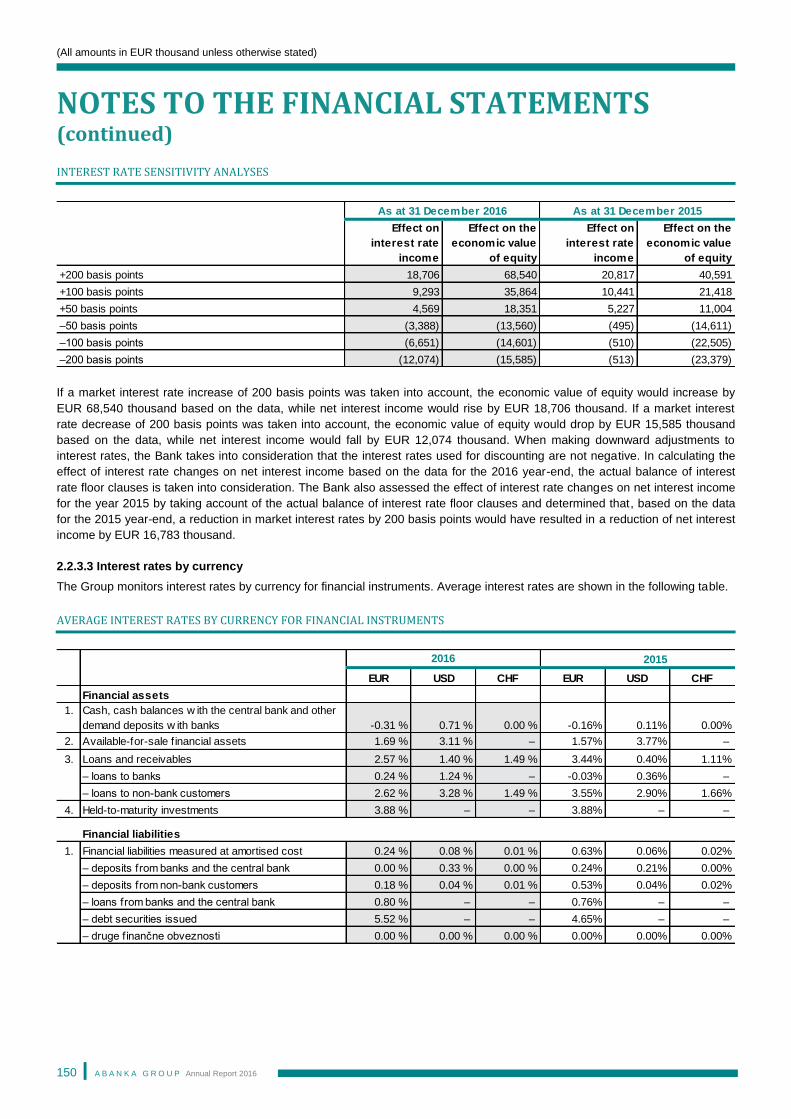
(All amounts in EUR thousand unless otherwise stated)
NOTES TO THE FINANCIAL STATEMENTS (continued)
A B A N K A G R O U P Annual Report 2016
150
INTEREST RATE SENSITIVITY ANALYSES
If a market interest rate increase of 200 basis points was taken into account, the economic value of equity would increase by
EUR 68,540 thousand based on the data, while net interest income would rise by EUR 18,706 thousand. If a market interest
rate decrease of 200 basis points was taken into account, the economic value of equity would drop by EUR 15,585 thousand
based on the data, while net interest income would fall by EUR 12,074 thousand. When making downward adjustments to
interest rates, the Bank takes into consideration that the interest rates used for discounting are not negative. In calculating the
effect of interest rate changes on net interest income based on the data for the 2016 year-end, the actual balance of interest
rate floor clauses is taken into consideration. The Bank also assessed the effect of interest rate changes on net interest income
for the year 2015 by taking account of the actual balance of interest rate floor clauses and determined that, based on the data
for the 2015 year-end, a reduction in market interest rates by 200 basis points would have resulted in a reduction of net interest
income by EUR 16,783 thousand.
2.2.3.3 Interest rates by currency
The Group monitors interest rates by currency for financial instruments. Average interest rates are shown in the following table.
AVERAGE INTEREST RATES BY CURRENCY FOR FINANCIAL INSTRUMENTS
Effect on
interest rate
income
Effect on the
economic value
of equity
Effect on
interest rate
income
Effect on the
economic value
of equity
+200 basis points 18,706 68,540 20,817 40,591
+100 basis points 9,293 35,864 10,441 21,418
+50 basis points 4,569 18,351 5,227 11,004
–50 basis points (3,388) (13,560) (495) (14,611)
–100 basis points (6,651) (14,601) (510) (22,505)
–200 basis points (12,074) (15,585) (513) (23,379)
As at 31 December 2016 As at 31 December 2015
2016 2015
EUR USD CHF EUR USD CHF
Financial assets
1. Cash, cash balances w ith the central bank and other
demand deposits w ith banks -0.31 % 0.71 % 0.00 % -0.16% 0.11% 0.00%
2. Available-for-sale f inancial assets 1.69 % 3.11 % – 1.57% 3.77% –
3. Loans and receivables 2.57 % 1.40 % 1.49 % 3.44% 0.40% 1.11%
– loans to banks 0.24 % 1.24 % – -0.03% 0.36% –
– loans to non-bank customers 2.62 % 3.28 % 1.49 % 3.55% 2.90% 1.66%
4. Held-to-maturity investments 3.88 % – – 3.88% – –
Financial liabilities
1. Financial liabilities measured at amortised cost 0.24 % 0.08 % 0.01 % 0.63% 0.06% 0.02%
– deposits from banks and the central bank 0.00 % 0.33 % 0.00 % 0.24% 0.21% 0.00%
– deposits from non-bank customers 0.18 % 0.04 % 0.01 % 0.53% 0.04% 0.02%
– loans from banks and the central bank 0.80 % – – 0.76% – –
– debt securities issued 5.52 % – – 4.65% – –
– druge finančne obveznosti 0.00 % 0.00 % 0.00 % 0.00% 0.00% 0.00%
(All amounts in EUR thousand unless otherwise stated)
NOTES TO THE FINANCIAL STATEMENTS (continued)
A B A N K A G R O U P Annual Report 2016
151
2.3 Liquidity risk
Liquidity risk is the risk that includes the risk of failing to provide liquidity sources, market liquidity risk and asset encumbrance
risk.
The risk of failing to provide liquidity sources is the risk that the Group might not be able to meet its payment obligations when
due, and/or that as a consequence of its inability to provide sufficient funding to meet payment obligations by the due date, the
Group might be forced to provide the required funding at costs significantly above usual.
Market liquidity risk is the risk of loss arising from the impossibility of selling or replacing positions (in financial instruments) in a
short period of time without this bearing a significant impact on the market price, due to insufficient market depth, market
imbalances or other reasons.
The asset encumbrance risk is the risk arising from the encumbrance of the bank’s assets and means an increase in the risk of
providing liquidity sources and market liquidity risk due to fewer possibilities of providing liquidity sources and disposing of
assets. Any decrease in the value of encumbered assets as a result of market factors and the related demand for additional
coverage further increases this risk.
2.3.1 Liquidity risk management process
The liquidity risk management strategy is based on prudent and stable operations, and includes the careful management of
assets and liabilities (both on and off-balance sheet) as well as a balanced borrowing strategy, which enables the Group to meet
its financial obligations as they fall due.
The Group provides for the appropriate volume and structure of the liquidity buffer, taking into account the risk related to procuring liquidity sources, market liquidity risk and asset encumbrance risk.
The liquidity risk management process follows the established liquidity risk management policy. This process includes
implementation procedures and rules on measures for identifying, assessing, monitoring, reporting on and minimising
risk exposure.
The liquidity risk management process consists of:
• integrated planning and monitoring future cash flows, which include day-to-day funding, with a view to ensuring that
requirements are met and sources are replenished as they mature;
• maintaining an appropriate volume of the liquidity buffer, i.e. a portfolio of highly liquid assets that can be easily liquidated and
serve as protection against unforeseen cash flow developments;
• assessing market liquidity risk;
• monitoring and calculating liquidity indicators in line with the requirements of the Abanka Group and regulatory requirements;
• monitoring the diversity of financing sources and the profile of outstanding liabilities;
• running liquidity management scenarios for the normal course of business and for extraordinary liquidity requirements (stress
scenarios);
• monitoring the liquidity position of the banking system and the national economy;
• adopting adequate liquidity policies in view of the given circumstances; and
• establishing an adequate relationship between the costs, benefits and risks involved in providing liquidity.
The structure and organisation of appropriate functions for liquidity risk management are set out in the relevant policy.
The adequacy of the strategy, policies and limit system of liquidity risk management is monitored by the Risk Management
Committee. The implementation of the relevant policy is jointly controlled by the Assets and Liabilities Management Committee
and the Liquidity Commission, liquidity risk management lies within the competence of the Treasury Department and the Assets
and Liabilities Management Department, whilst the Treasury Department and other divisions are in charge of the
operationalisation of policies and guidelines.
(All amounts in EUR thousand unless otherwise stated)
NOTES TO THE FINANCIAL STATEMENTS (continued)
A B A N K A G R O U P Annual Report 2016
152
Internal reporting takes the form of cash flow measurement and projections for the next day, week and month, as these are
key periods for operational liquidity management. Furthermore, liquidity measurements for longer periods are carried out to
monitor liquidity exposure in those periods, and to manage emergency liquidity situation. The starting point for those projections
is the contractual maturity of financial liabilities, the expected recovery date of financial assets and the assessment of the
expected movement of unstable sources. Liquidity risk exposure is followed and controlled by the Liquidity Committee on a daily
basis and by the Assets and Liabilities Committee on a monthly basis. The Supervisory Board discusses a quarterly report on
the Group’s exposure to various types of risks, including liquidity risk.
2.3.1.1 Liquidity risk measurement
The procedures for measuring liquidity risk include quality and quantity assessments for risk measurement. The Group has
developed its own methods for establishing, measuring, managing and monitoring liquidity, which enable matching of the actual
and potential liquid funds to the actual and potential use of such funds over certain time periods. The Group evaluates the
adequacy of liquid assets and their availability. When an assessment of liquidity is made, the Group primarily takes into account
the possibility of obtaining liquidity in the short run on the basis of these funds. The Group also monitors the distribution of costs,
benefits and risks involved in providing liquidity. An internal methodology has been developed for this purpose, which covers
important assets and liability items, off-balance items and all liquidity maintenance costs. This methodology is regularly
upgraded by the Group.
The Group also regularly upgrades its methodology for assessing expected cash flows. The discrepancy between the expected
and contractual cash flows is evaluated using assumptions, which are based on historical data. The Group regularly verifies the
adequacy and accuracy of these assumptions.
The Group implements the internal liquidity adequacy assessment process (ILAAP). The key aim of the ILAAP process is
ensuring that the Bank has sufficient short-term and mid-term liquidity available both under normal and stress conditions. The
ILAAP process includes the assessment of liquidity requirements and the assessment of available liquidity. The Bank regularly
checks its liquidity adequacy, both within the framework of the ordinary course of business and in the context of the business
plan for the future planning period. The verification of liquidity adequacy also includes liquidity stress testing for pre-defined
stress situations of varying severity.
2.3.1.2 Liquidity risk mitigation
With the aim of hedging and reducing liquidity risk, the Group implements prudent assets and liabilities management, which is
the foundation of stable operations; therefore, the following objectives are pursued:
• the ability to fulfil all obligations related to balance-sheet and off-balance-sheet outflows in the short term;
• minimizing the costs of maintaining liquidity; • foreseeing the occurrence of extraordinary liquidity conditions and implementing the adopted action plan for re-establishing
appropriate liquidity in the event that such extraordinary conditions materialise.
In order to reduce the liquidity risk, the Group established a limit system, which includes compliance with regulatory
requirements and internally defined limits as well as monitoring of target structural liquidity indicators. In 2016, the Group slightly
adapted its limit system requirements by changing the threshold levels of certain liquidity indicators.
For the purpose of liquidity risk hedging, The Group applies a methodology for identifying and measuring liquidity risk and
maintains an action plan for the re-establishment of appropriate liquidity. The Group is hedged against liquidity risk by virtue of
diligent and effective liquidity buffer management and the availability of adequate sources of funding, which are kept as diverse
as possible. The Group also adequately addresses liquidity risk in its Recovery Plan.
In order to monitor the effectiveness of hedging and minimise liquidity risk, the Group regularly assesses its risk capacity in
accordance with the established methodology.
2.3.1.3 Liquidity management scenarios in extreme situations
The Group prepares various liquidity scenarios in extreme situations with the aim of identifying potential weaknesses and
vulnerabilities in its liquidity position. These scenarios assume worsened liquidity conditions due to a weaker financial position of
the Bank and a diminished reputation domestically and internationally. Moreover, the Group prepares scenarios assuming
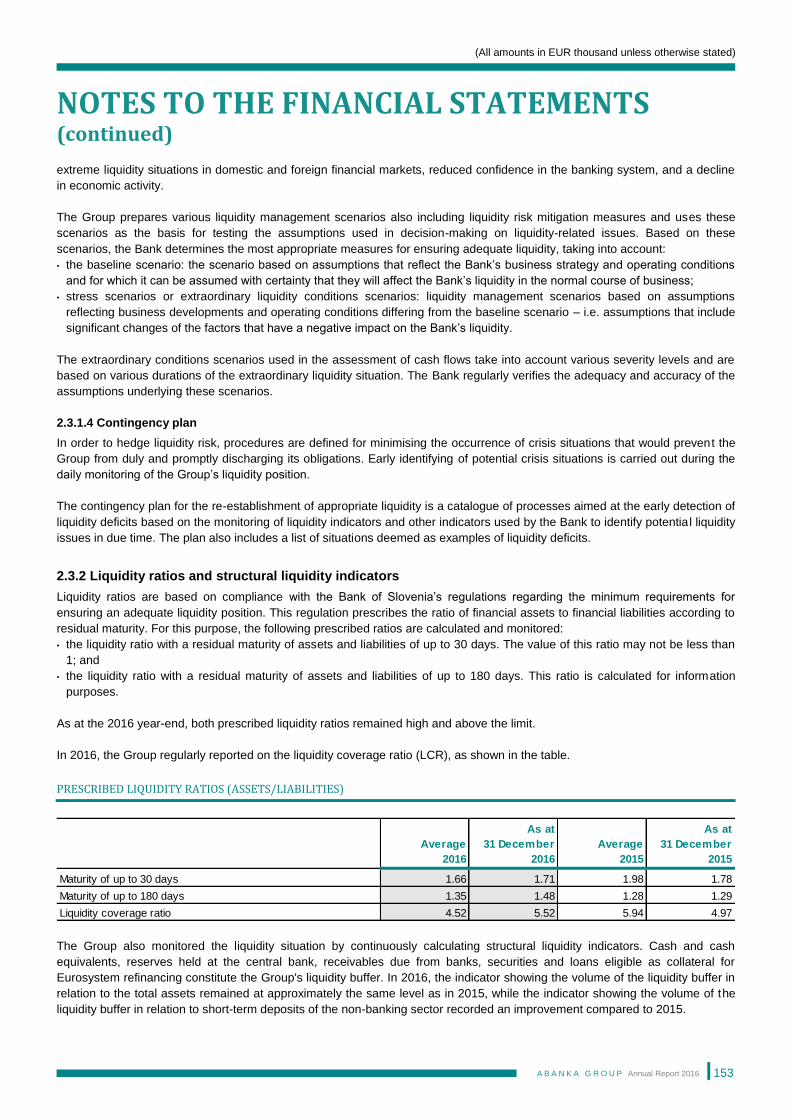
(All amounts in EUR thousand unless otherwise stated)
NOTES TO THE FINANCIAL STATEMENTS (continued)
A B A N K A G R O U P Annual Report 2016
153
extreme liquidity situations in domestic and foreign financial markets, reduced confidence in the banking system, and a decline
in economic activity.
The Group prepares various liquidity management scenarios also including liquidity risk mitigation measures and uses these
scenarios as the basis for testing the assumptions used in decision-making on liquidity-related issues. Based on these
scenarios, the Bank determines the most appropriate measures for ensuring adequate liquidity, taking into account:
• the baseline scenario: the scenario based on assumptions that reflect the Bank’s business strategy and operating conditions
and for which it can be assumed with certainty that they will affect the Bank’s liquidity in the normal course of business;
• stress scenarios or extraordinary liquidity conditions scenarios: liquidity management scenarios based on assumptions
reflecting business developments and operating conditions differing from the baseline scenario – i.e. assumptions that include
significant changes of the factors that have a negative impact on the Bank’s liquidity.
The extraordinary conditions scenarios used in the assessment of cash flows take into account various severity levels and are
based on various durations of the extraordinary liquidity situation. The Bank regularly verifies the adequacy and accuracy of the
assumptions underlying these scenarios.
2.3.1.4 Contingency plan
In order to hedge liquidity risk, procedures are defined for minimising the occurrence of crisis situations that would prevent the
Group from duly and promptly discharging its obligations. Early identifying of potential crisis situations is carried out during the
daily monitoring of the Group’s liquidity position.
The contingency plan for the re-establishment of appropriate liquidity is a catalogue of processes aimed at the early detection of
liquidity deficits based on the monitoring of liquidity indicators and other indicators used by the Bank to identify potential liquidity
issues in due time. The plan also includes a list of situations deemed as examples of liquidity deficits.
2.3.2 Liquidity ratios and structural liquidity indicators
Liquidity ratios are based on compliance with the Bank of Slovenia’s regulations regarding the minimum requirements for
ensuring an adequate liquidity position. This regulation prescribes the ratio of financial assets to financial liabilities according to
residual maturity. For this purpose, the following prescribed ratios are calculated and monitored:
• the liquidity ratio with a residual maturity of assets and liabilities of up to 30 days. The value of this ratio may not be less than
1; and
• the liquidity ratio with a residual maturity of assets and liabilities of up to 180 days. This ratio is calculated for information
purposes.
As at the 2016 year-end, both prescribed liquidity ratios remained high and above the limit.
In 2016, the Group regularly reported on the liquidity coverage ratio (LCR), as shown in the table.
PRESCRIBED LIQUIDITY RATIOS (ASSETS/LIABILITIES)
The Group also monitored the liquidity situation by continuously calculating structural liquidity indicators. Cash and cash
equivalents, reserves held at the central bank, receivables due from banks, securities and loans eligible as collateral for
Eurosystem refinancing constitute the Group's liquidity buffer. In 2016, the indicator showing the volume of the liquidity buffer in
relation to the total assets remained at approximately the same level as in 2015, while the indicator showing the volume of the
liquidity buffer in relation to short-term deposits of the non-banking sector recorded an improvement compared to 2015.
Average
2016
As at
31 December
2016
Average
2015
As at
31 December
2015
Maturity of up to 30 days 1.66 1.71 1.98 1.78
Maturity of up to 180 days 1.35 1.48 1.28 1.29
Liquidity coverage ratio 4.52 5.52 5.94 4.97
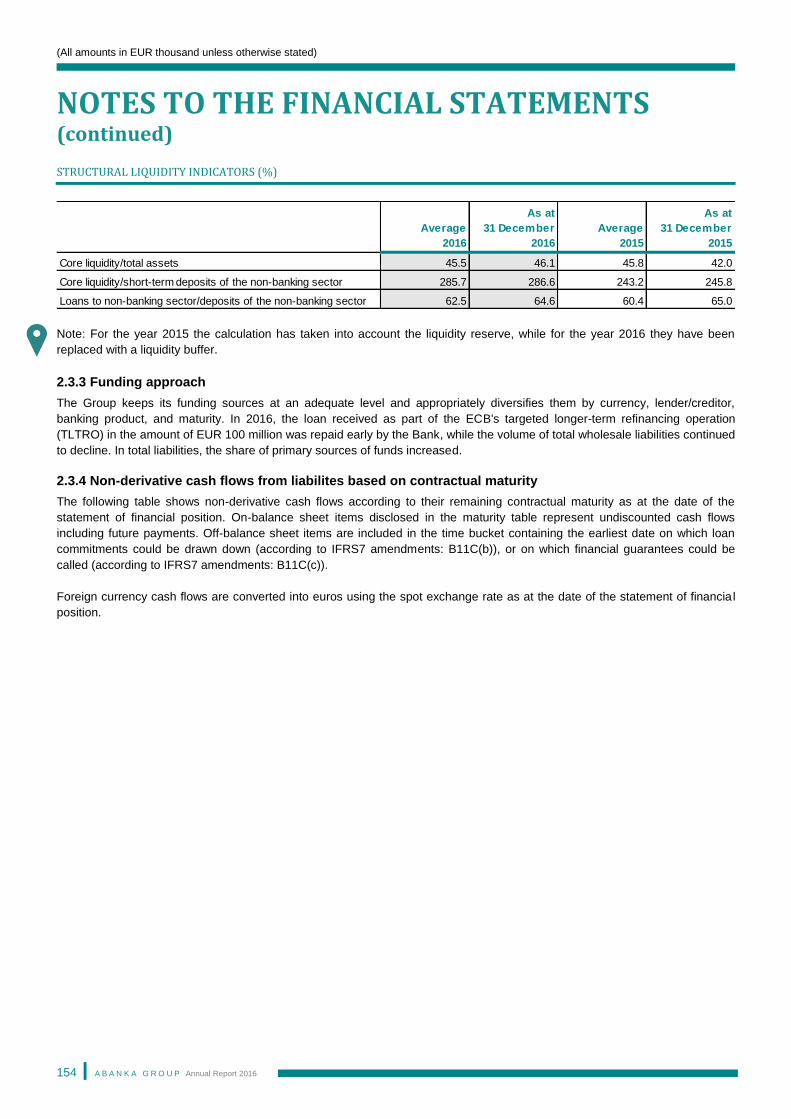
(All amounts in EUR thousand unless otherwise stated)
NOTES TO THE FINANCIAL STATEMENTS (continued)
A B A N K A G R O U P Annual Report 2016
154
STRUCTURAL LIQUIDITY INDICATORS (%)
Note: For the year 2015 the calculation has taken into account the liquidity reserve, while for the year 2016 they have been
replaced with a liquidity buffer.
2.3.3 Funding approach
The Group keeps its funding sources at an adequate level and appropriately diversifies them by currency, lender/creditor,
banking product, and maturity. In 2016, the loan received as part of the ECB's targeted longer-term refinancing operation
(TLTRO) in the amount of EUR 100 million was repaid early by the Bank, while the volume of total wholesale liabilities continued
to decline. In total liabilities, the share of primary sources of funds increased.
2.3.4 Non-derivative cash flows from liabilites based on contractual maturity
The following table shows non-derivative cash flows according to their remaining contractual maturity as at the date of the
statement of financial position. On-balance sheet items disclosed in the maturity table represent undiscounted cash flows
including future payments. Off-balance sheet items are included in the time bucket containing the earliest date on which loan
commitments could be drawn down (according to IFRS7 amendments: B11C(b)), or on which financial guarantees could be
called (according to IFRS7 amendments: B11C(c)).
Foreign currency cash flows are converted into euros using the spot exchange rate as at the date of the statement of financial
position.
Average
2016
As at
31 December
2016
Average
2015
As at
31 December
2015
Core liquidity/total assets 45.5 46.1 45.8 42.0
Core liquidity/short-term deposits of the non-banking sector 285.7 286.6 243.2 245.8
Loans to non-banking sector/deposits of the non-banking sector 62.5 64.6 60.4 65.0
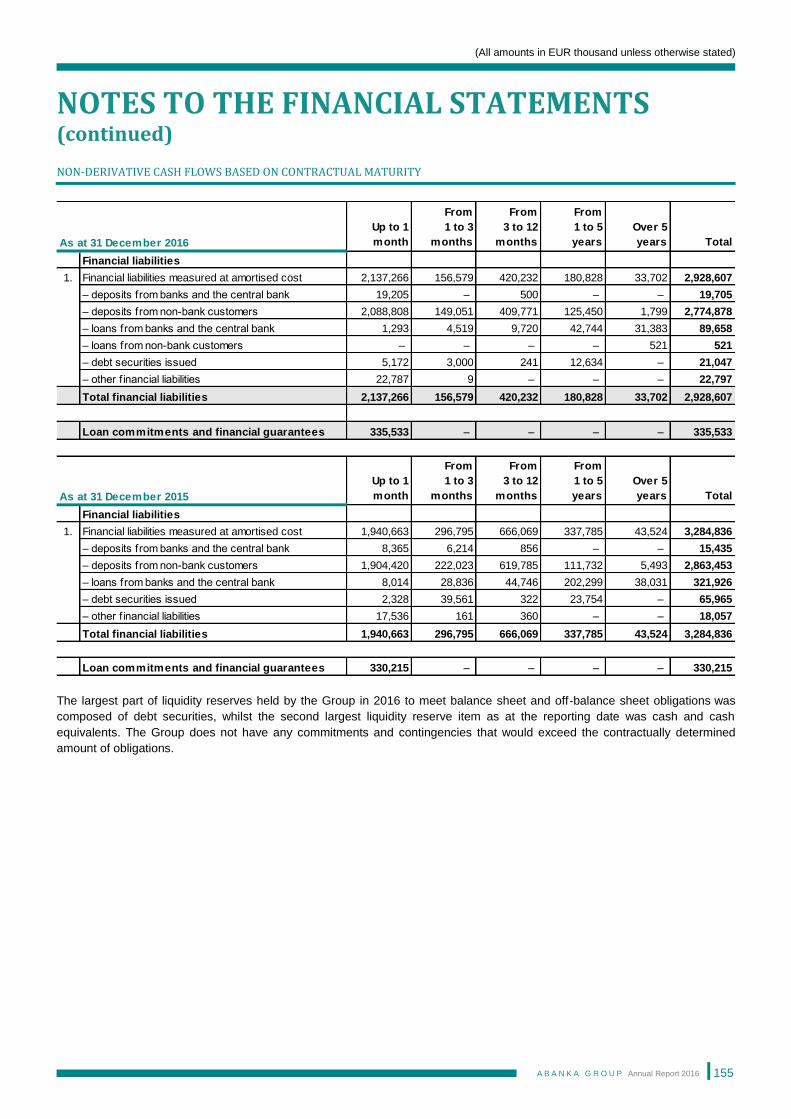
(All amounts in EUR thousand unless otherwise stated)
NOTES TO THE FINANCIAL STATEMENTS (continued)
A B A N K A G R O U P Annual Report 2016
155
NON-DERIVATIVE CASH FLOWS BASED ON CONTRACTUAL MATURITY
The largest part of liquidity reserves held by the Group in 2016 to meet balance sheet and off-balance sheet obligations was
composed of debt securities, whilst the second largest liquidity reserve item as at the reporting date was cash and cash
equivalents. The Group does not have any commitments and contingencies that would exceed the contractually determined
amount of obligations.
Up to 1
month
From
1 to 3
months
From
3 to 12
months
From
1 to 5
years
Over 5
years Total
Financial liabilities
1. Financial liabilities measured at amortised cost 2,137,266 156,579 420,232 180,828 33,702 2,928,607
– deposits from banks and the central bank 19,205 – 500 – – 19,705
– deposits from non-bank customers 2,088,808 149,051 409,771 125,450 1,799 2,774,878
– loans from banks and the central bank 1,293 4,519 9,720 42,744 31,383 89,658
– loans from non-bank customers – – – – 521 521
– debt securities issued 5,172 3,000 241 12,634 – 21,047
– other f inancial liabilities 22,787 9 – – – 22,797
Total financial liabilities 2,137,266 156,579 420,232 180,828 33,702 2,928,607
Loan commitments and financial guarantees 335,533 – – – – 335,533
Up to 1
month
From
1 to 3
months
From
3 to 12
months
From
1 to 5
years
Over 5
years Total
Financial liabilities
1. Financial liabilities measured at amortised cost 1,940,663 296,795 666,069 337,785 43,524 3,284,836
– deposits from banks and the central bank 8,365 6,214 856 – – 15,435
– deposits from non-bank customers 1,904,420 222,023 619,785 111,732 5,493 2,863,453
– loans from banks and the central bank 8,014 28,836 44,746 202,299 38,031 321,926
– debt securities issued 2,328 39,561 322 23,754 – 65,965
– other f inancial liabilities 17,536 161 360 – – 18,057
Total financial liabilities 1,940,663 296,795 666,069 337,785 43,524 3,284,836
Loan commitments and financial guarantees 330,215 – – – – 330,215
As at 31 December 2015
As at 31 December 2016
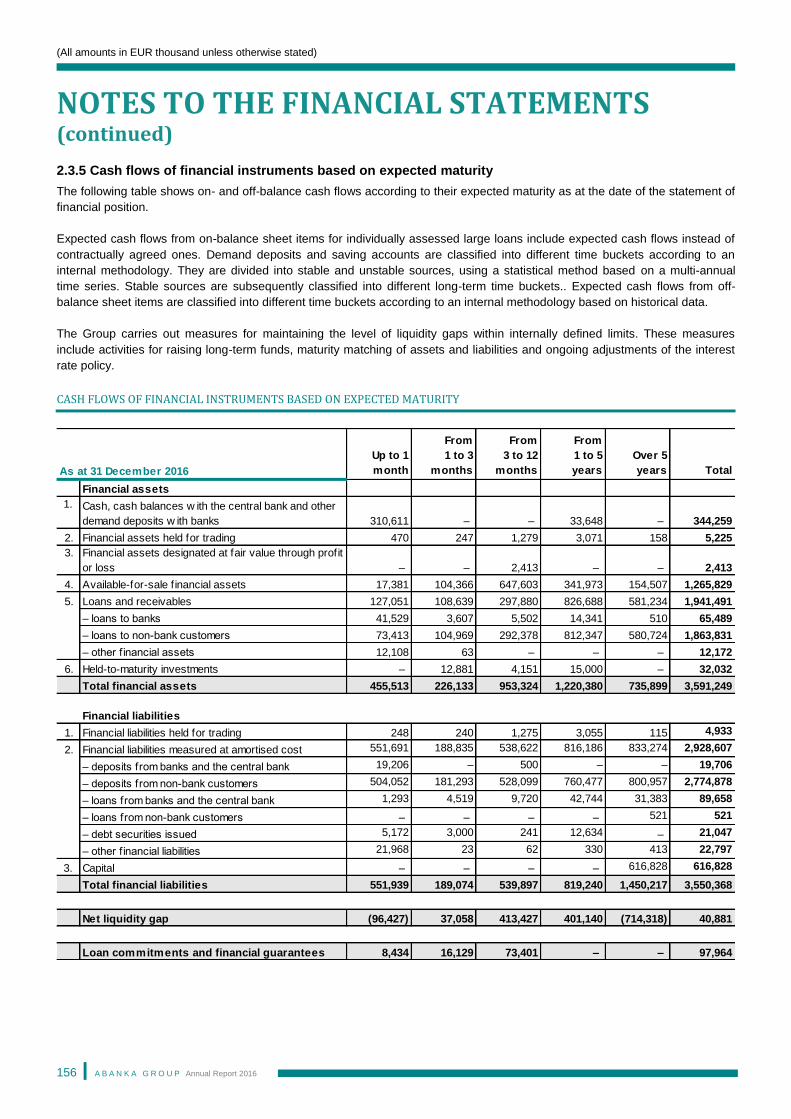
(All amounts in EUR thousand unless otherwise stated)
NOTES TO THE FINANCIAL STATEMENTS (continued)
A B A N K A G R O U P Annual Report 2016
156
2.3.5 Cash flows of financial instruments based on expected maturity
The following table shows on- and off-balance cash flows according to their expected maturity as at the date of the statement of
financial position.
Expected cash flows from on-balance sheet items for individually assessed large loans include expected cash flows instead of
contractually agreed ones. Demand deposits and saving accounts are classified into different time buckets according to an
internal methodology. They are divided into stable and unstable sources, using a statistical method based on a multi-annual
time series. Stable sources are subsequently classified into different long-term time buckets.. Expected cash flows from off-
balance sheet items are classified into different time buckets according to an internal methodology based on historical data.
The Group carries out measures for maintaining the level of liquidity gaps within internally defined limits. These measures
include activities for raising long-term funds, maturity matching of assets and liabilities and ongoing adjustments of the interest
rate policy.
CASH FLOWS OF FINANCIAL INSTRUMENTS BASED ON EXPECTED MATURITY
Up to 1
month
From
1 to 3
months
From
3 to 12
months
From
1 to 5
years
Over 5
years Total
Financial assets
1. Cash, cash balances w ith the central bank and other
demand deposits w ith banks 310,611 – – 33,648 – 344,259
2. Financial assets held for trading 470 247 1,279 3,071 158 5,225
3. Financial assets designated at fair value through profit
or loss – – 2,413 – – 2,413
4. Available-for-sale f inancial assets 17,381 104,366 647,603 341,973 154,507 1,265,829
5. Loans and receivables 127,051 108,639 297,880 826,688 581,234 1,941,491
– loans to banks 41,529 3,607 5,502 14,341 510 65,489
– loans to non-bank customers 73,413 104,969 292,378 812,347 580,724 1,863,831
– other f inancial assets 12,108 63 – – – 12,172
6. Held-to-maturity investments – 12,881 4,151 15,000 – 32,032
Total financial assets 455,513 226,133 953,324 1,220,380 735,899 3,591,249
Financial liabilities
1. Financial liabilities held for trading 248 240 1,275 3,055 115 4,933
2. Financial liabilities measured at amortised cost 551,691 188,835 538,622 816,186 833,274 2,928,607
– deposits from banks and the central bank 19,206 – 500 – – 19,706
– deposits from non-bank customers 504,052 181,293 528,099 760,477 800,957 2,774,878
– loans from banks and the central bank 1,293 4,519 9,720 42,744 31,383 89,658
– loans from non-bank customers – – – – 521 521
– debt securities issued 5,172 3,000 241 12,634 – 21,047
– other f inancial liabilities 21,968 23 62 330 413 22,797
3. Capital – – – – 616,828 616,828
Total financial liabilities 551,939 189,074 539,897 819,240 1,450,217 3,550,368
Net liquidity gap (96,427) 37,058 413,427 401,140 (714,318) 40,881
Loan commitments and financial guarantees 8,434 16,129 73,401 – – 97,964
As at 31 December 2016
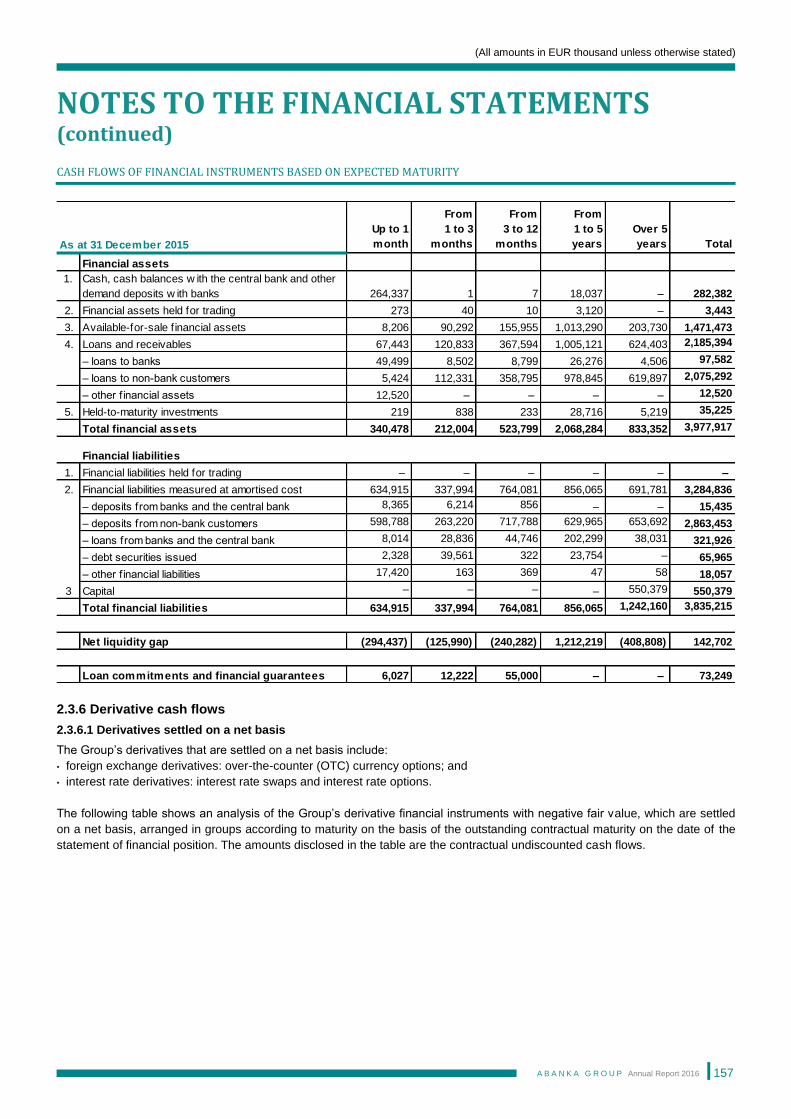
(All amounts in EUR thousand unless otherwise stated)
NOTES TO THE FINANCIAL STATEMENTS (continued)
A B A N K A G R O U P Annual Report 2016
157
CASH FLOWS OF FINANCIAL INSTRUMENTS BASED ON EXPECTED MATURITY
2.3.6 Derivative cash flows
2.3.6.1 Derivatives settled on a net basis
The Group’s derivatives that are settled on a net basis include:
• foreign exchange derivatives: over-the-counter (OTC) currency options; and
• interest rate derivatives: interest rate swaps and interest rate options.
The following table shows an analysis of the Group’s derivative financial instruments with negative fair value, which are settled
on a net basis, arranged in groups according to maturity on the basis of the outstanding contractual maturity on the date of the
statement of financial position. The amounts disclosed in the table are the contractual undiscounted cash flows.
Up to 1
month
From
1 to 3
months
From
3 to 12
months
From
1 to 5
years
Over 5
years Total
Financial assets
1. Cash, cash balances w ith the central bank and other
demand deposits w ith banks 264,337 1 7 18,037 – 282,382
2. Financial assets held for trading 273 40 10 3,120 – 3,443
3. Available-for-sale f inancial assets 8,206 90,292 155,955 1,013,290 203,730 1,471,473
4. Loans and receivables 67,443 120,833 367,594 1,005,121 624,403 2,185,394
– loans to banks 49,499 8,502 8,799 26,276 4,506 97,582
– loans to non-bank customers 5,424 112,331 358,795 978,845 619,897 2,075,292
– other f inancial assets 12,520 – – – – 12,520
5. Held-to-maturity investments 219 838 233 28,716 5,219 35,225
Total financial assets 340,478 212,004 523,799 2,068,284 833,352 3,977,917
Financial liabilities
1. Financial liabilities held for trading – – – – – –
2. Financial liabilities measured at amortised cost 634,915 337,994 764,081 856,065 691,781 3,284,836
– deposits from banks and the central bank 8,365 6,214 856 – – 15,435
– deposits from non-bank customers 598,788 263,220 717,788 629,965 653,692 2,863,453
– loans from banks and the central bank 8,014 28,836 44,746 202,299 38,031 321,926
– debt securities issued 2,328 39,561 322 23,754 – 65,965
– other f inancial liabilities 17,420 163 369 47 58 18,057
3 Capital – – – – 550,379 550,379
Total financial liabilities 634,915 337,994 764,081 856,065 1,242,160 3,835,215
Net liquidity gap (294,437) (125,990) (240,282) 1,212,219 (408,808) 142,702
Loan commitments and financial guarantees 6,027 12,222 55,000 – – 73,249
As at 31 December 2015
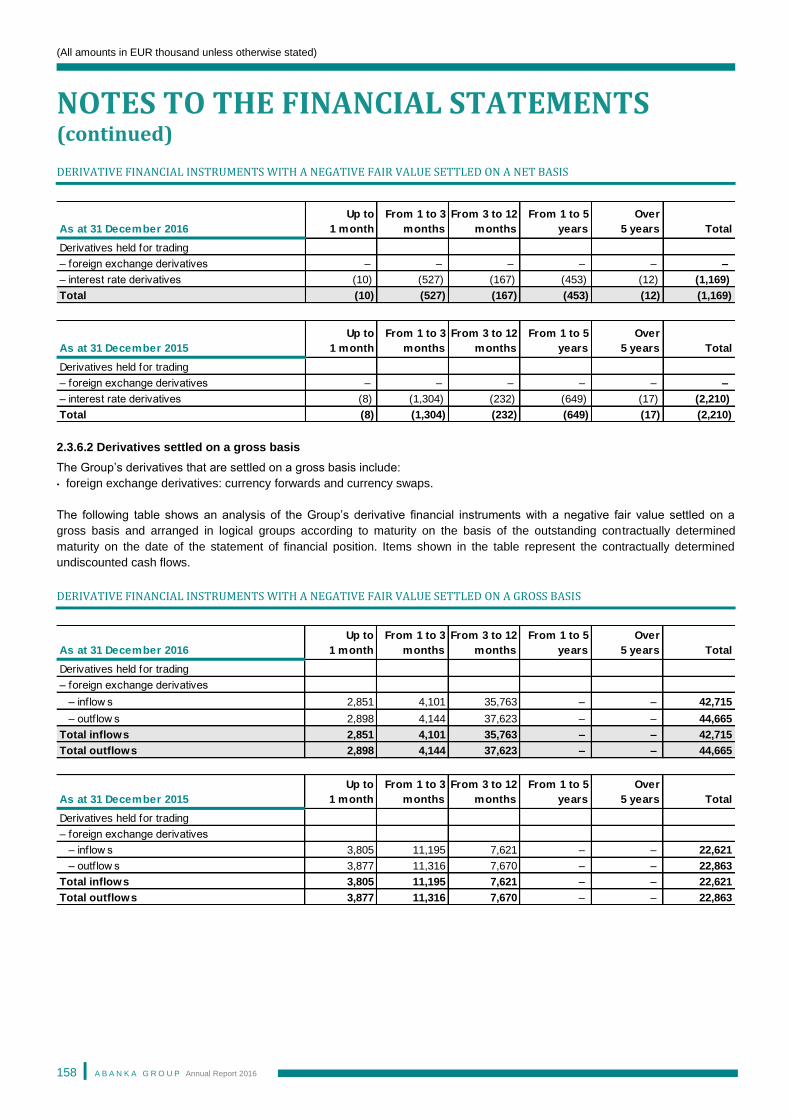
(All amounts in EUR thousand unless otherwise stated)
NOTES TO THE FINANCIAL STATEMENTS (continued)
A B A N K A G R O U P Annual Report 2016
158
DERIVATIVE FINANCIAL INSTRUMENTS WITH A NEGATIVE FAIR VALUE SETTLED ON A NET BASIS
2.3.6.2 Derivatives settled on a gross basis
The Group’s derivatives that are settled on a gross basis include:
• foreign exchange derivatives: currency forwards and currency swaps.
The following table shows an analysis of the Group’s derivative financial instruments with a negative fair value settled on a
gross basis and arranged in logical groups according to maturity on the basis of the outstanding contractually determined
maturity on the date of the statement of financial position. Items shown in the table represent the contractually determined
undiscounted cash flows.
DERIVATIVE FINANCIAL INSTRUMENTS WITH A NEGATIVE FAIR VALUE SETTLED ON A GROSS BASIS
As at 31 December 2016
Up to
1 month
From 1 to 3
months
From 3 to 12
months
From 1 to 5
years
Over
5 years Total
Derivatives held for trading
– foreign exchange derivatives – – – – – –
– interest rate derivatives (10) (527) (167) (453) (12) (1,169)
Total (10) (527) (167) (453) (12) (1,169)
As at 31 December 2015
Up to
1 month
From 1 to 3
months
From 3 to 12
months
From 1 to 5
years
Over
5 years Total
Derivatives held for trading
– foreign exchange derivatives – – – – – –
– interest rate derivatives (8) (1,304) (232) (649) (17) (2,210)
Total (8) (1,304) (232) (649) (17) (2,210)
As at 31 December 2016
Up to
1 month
From 1 to 3
months
From 3 to 12
months
From 1 to 5
years
Over
5 years Total
Derivatives held for trading
– foreign exchange derivatives
– inflow s 2,851 4,101 35,763 – – 42,715
– outf low s 2,898 4,144 37,623 – – 44,665
Total inflows 2,851 4,101 35,763 – – 42,715
Total outflows 2,898 4,144 37,623 – – 44,665
As at 31 December 2015
Up to
1 month
From 1 to 3
months
From 3 to 12
months
From 1 to 5
years
Over
5 years Total
Derivatives held for trading
– foreign exchange derivatives
– inflow s 3,805 11,195 7,621 – – 22,621
– outf low s 3,877 11,316 7,670 – – 22,863
Total inflows 3,805 11,195 7,621 – – 22,621
Total outflows 3,877 11,316 7,670 – – 22,863
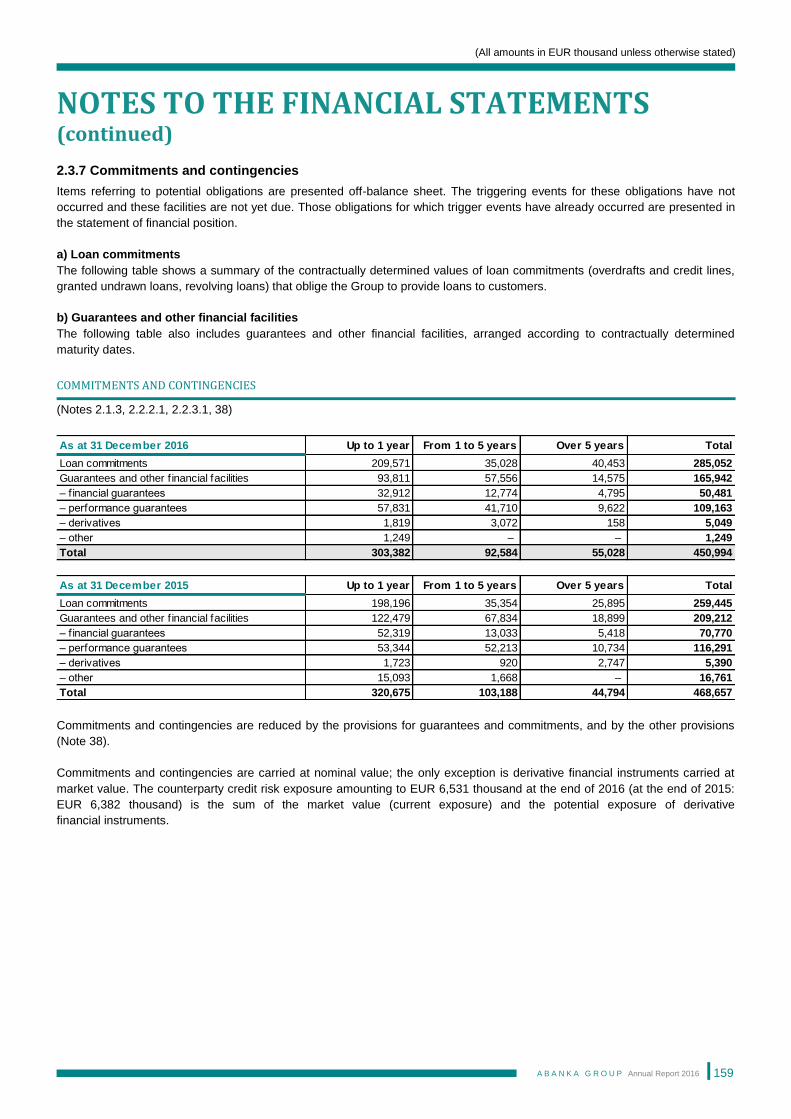
(All amounts in EUR thousand unless otherwise stated)
NOTES TO THE FINANCIAL STATEMENTS (continued)
A B A N K A G R O U P Annual Report 2016
159
2.3.7 Commitments and contingencies
Items referring to potential obligations are presented off-balance sheet. The triggering events for these obligations have not
occurred and these facilities are not yet due. Those obligations for which trigger events have already occurred are presented in
the statement of financial position.
a) Loan commitments
The following table shows a summary of the contractually determined values of loan commitments (overdrafts and credit lines,
granted undrawn loans, revolving loans) that oblige the Group to provide loans to customers.
b) Guarantees and other financial facilities
The following table also includes guarantees and other financial facilities, arranged according to contractually determined
maturity dates.
COMMITMENTS AND CONTINGENCIES
(Notes 2.1.3, 2.2.2.1, 2.2.3.1, 38)
Commitments and contingencies are reduced by the provisions for guarantees and commitments, and by the other provisions
(Note 38).
Commitments and contingencies are carried at nominal value; the only exception is derivative financial instruments carried at
market value. The counterparty credit risk exposure amounting to EUR 6,531 thousand at the end of 2016 (at the end of 2015:
EUR 6,382 thousand) is the sum of the market value (current exposure) and the potential exposure of derivative
financial instruments.
As at 31 December 2016 Up to 1 year From 1 to 5 years Over 5 years Total
Loan commitments 209,571 35,028 40,453 285,052
Guarantees and other f inancial facilities 93,811 57,556 14,575 165,942
– financial guarantees 32,912 12,774 4,795 50,481
– performance guarantees 57,831 41,710 9,622 109,163
– derivatives 1,819 3,072 158 5,049
– other 1,249 – – 1,249
Total 303,382 92,584 55,028 450,994
As at 31 December 2015 Up to 1 year From 1 to 5 years Over 5 years Total
Loan commitments 198,196 35,354 25,895 259,445
Guarantees and other f inancial facilities 122,479 67,834 18,899 209,212
– financial guarantees 52,319 13,033 5,418 70,770
– performance guarantees 53,344 52,213 10,734 116,291
– derivatives 1,723 920 2,747 5,390
– other 15,093 1,668 – 16,761
Total 320,675 103,188 44,794 468,657
(All amounts in EUR thousand unless otherwise stated)
NOTES TO THE FINANCIAL STATEMENTS (continued)
A B A N K A G R O U P Annual Report 2016
160
2.4 Capital management
Capital management comprises monitoring the level of capital, capital adequacy ratios, drafting guidelines for achieving the
planned capital adequacy ratios and following the implementation of measures aimed at keeping at least minimum capital
adequacy ratios in compliance with the respective business policy of the Group.
The management and supervisory bodies regularly monitor and assess the effectiveness of the capital management system.
The Group calculates its regulatory capital and capital adequacy at least quarterly.
The Group’s capital must be at least equal the total sum of minimum capital requirements at all times.
2.4.1 Regulatory capital and capital adequacy
The regulatory capital of the Group is calculated on the basis of the Group’s consolidated financial statements in accordance
with the Part Two of Regulation (EU) No 575/2013. The Group’s regulatory capital calculation takes into account capital
components, prudential filters and deductible items. In calculating the capital adequacy and capital requirements of the Group,
the Part Three of Regulation (EU) No 575/2013 is applied.
Regulatory capital includes Tier 1 capital and Tier 2 capital. The Tier 1 capital of the Group consists of the sum of the Common
Equity Tier 1 capital and Additional Tier 1 capital of the Group. The Regulation (EU) No. 575/2013 stipulates the application of
three ratios:
• a Common Equity Tier 1 capital ratio of at least 4.5%,
• a Tier 1 capital ratio of at least 6% and
• a total capital ratio of at least 8%.
Disclosures related to own funds are laid down in Article 437 of Regulation (EU) No 575/2013 and, with regard to disclosure of
own funds set out in the implementing technical standards contained in Commission Implementing Regulation (EU) No
1423/2013. The disclosure related to own funds also includes transitional provisions of Article 492 of Regulation (EU) No
575/2013, prescribing additional information that has to be disclosed for the period from 1 January 2014 to 31 December 2021.
The following table shows regulatory capital components and capital adequacy ratios.
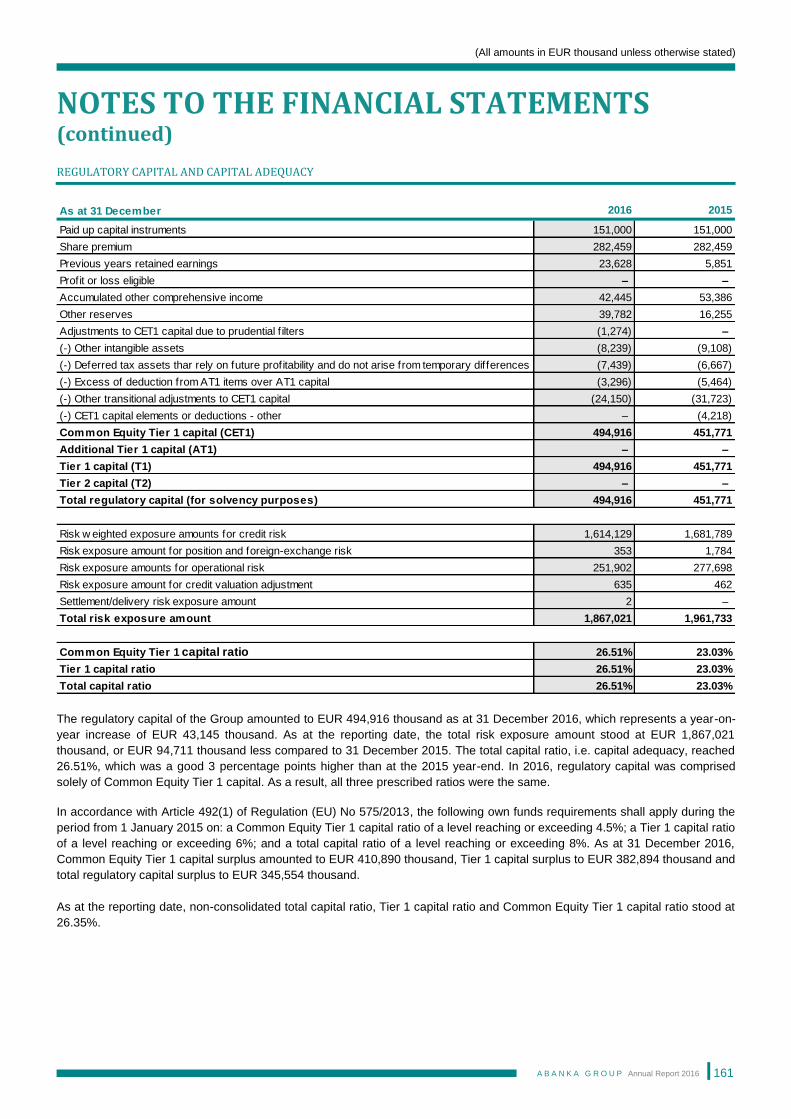
(All amounts in EUR thousand unless otherwise stated)
NOTES TO THE FINANCIAL STATEMENTS (continued)
A B A N K A G R O U P Annual Report 2016
161
REGULATORY CAPITAL AND CAPITAL ADEQUACY
The regulatory capital of the Group amounted to EUR 494,916 thousand as at 31 December 2016, which represents a year-on-
year increase of EUR 43,145 thousand. As at the reporting date, the total risk exposure amount stood at EUR 1,867,021
thousand, or EUR 94,711 thousand less compared to 31 December 2015. The total capital ratio, i.e. capital adequacy, reached
26.51%, which was a good 3 percentage points higher than at the 2015 year-end. In 2016, regulatory capital was comprised
solely of Common Equity Tier 1 capital. As a result, all three prescribed ratios were the same.
In accordance with Article 492(1) of Regulation (EU) No 575/2013, the following own funds requirements shall apply during the
period from 1 January 2015 on: a Common Equity Tier 1 capital ratio of a level reaching or exceeding 4.5%; a Tier 1 capital ratio
of a level reaching or exceeding 6%; and a total capital ratio of a level reaching or exceeding 8%. As at 31 December 2016,
Common Equity Tier 1 capital surplus amounted to EUR 410,890 thousand, Tier 1 capital surplus to EUR 382,894 thousand and
total regulatory capital surplus to EUR 345,554 thousand.
As at the reporting date, non-consolidated total capital ratio, Tier 1 capital ratio and Common Equity Tier 1 capital ratio stood at
26.35%.
As at 31 December 2016 2015
Paid up capital instruments 151,000 151,000
Share premium 282,459 282,459
Previous years retained earnings 23,628 5,851
Profit or loss eligible – –
Accumulated other comprehensive income 42,445 53,386
Other reserves 39,782 16,255
Adjustments to CET1 capital due to prudential f ilters (1,274) –
(-) Other intangible assets (8,239) (9,108)
(-) Deferred tax assets thar rely on future profitability and do not arise from temporary differences (7,439) (6,667)
(-) Excess of deduction from AT1 items over AT1 capital (3,296) (5,464)
(-) Other transitional adjustments to CET1 capital (24,150) (31,723)
(-) CET1 capital elements or deductions - other – (4,218)
Common Equity Tier 1 capital (CET1) 494,916 451,771
Additional Tier 1 capital (AT1) – –
Tier 1 capital (T1) 494,916 451,771
Tier 2 capital (T2) – –
Total regulatory capital (for solvency purposes) 494,916 451,771
Risk w eighted exposure amounts for credit risk 1,614,129 1,681,789
Risk exposure amount for position and foreign-exchange risk 353 1,784
Risk exposure amounts for operational risk 251,902 277,698
Risk exposure amount for credit valuation adjustment 635 462
Settlement/delivery risk exposure amount 2 –
Total risk exposure amount 1,867,021 1,961,733
Common Equity Tier 1 capital ratio 26.51% 23.03%
Tier 1 capital ratio 26.51% 23.03%
Total capital ratio 26.51% 23.03%
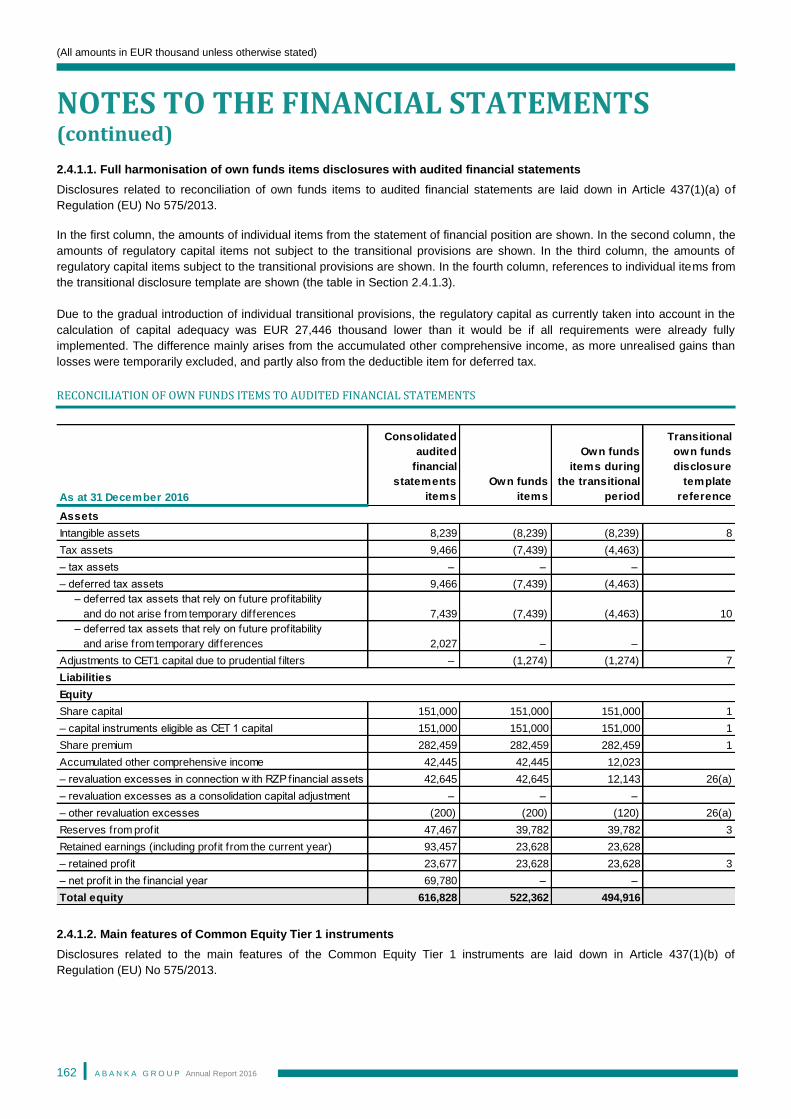
(All amounts in EUR thousand unless otherwise stated)
NOTES TO THE FINANCIAL STATEMENTS (continued)
A B A N K A G R O U P Annual Report 2016
162
2.4.1.1. Full harmonisation of own funds items disclosures with audited financial statements
Disclosures related to reconciliation of own funds items to audited financial statements are laid down in Article 437(1)(a) of
Regulation (EU) No 575/2013.
In the first column, the amounts of individual items from the statement of financial position are shown. In the second column, the
amounts of regulatory capital items not subject to the transitional provisions are shown. In the third column, the amounts of
regulatory capital items subject to the transitional provisions are shown. In the fourth column, references to individual items from
the transitional disclosure template are shown (the table in Section 2.4.1.3).
Due to the gradual introduction of individual transitional provisions, the regulatory capital as currently taken into account in the
calculation of capital adequacy was EUR 27,446 thousand lower than it would be if all requirements were already fully
implemented. The difference mainly arises from the accumulated other comprehensive income, as more unrealised gains than
losses were temporarily excluded, and partly also from the deductible item for deferred tax.
RECONCILIATION OF OWN FUNDS ITEMS TO AUDITED FINANCIAL STATEMENTS
2.4.1.2. Main features of Common Equity Tier 1 instruments
Disclosures related to the main features of the Common Equity Tier 1 instruments are laid down in Article 437(1)(b) of
Regulation (EU) No 575/2013.
As at 31 December 2016
Consolidated
audited
financial
statements
items
Own funds
items
Own funds
items during
the transitional
period
Transitional
own funds
disclosure
template
reference
Intangible assets 8,239 (8,239) (8,239) 8
Tax assets 9,466 (7,439) (4,463)
– tax assets – – –
– deferred tax assets 9,466 (7,439) (4,463)
– deferred tax assets that rely on future profitability
and do not arise from temporary differences 7,439 (7,439) (4,463) 10
– deferred tax assets that rely on future profitability
and arise from temporary differences 2,027 – –
Adjustments to CET1 capital due to prudential f ilters – (1,274) (1,274) 7
Share capital 151,000 151,000 151,000 1
– capital instruments eligible as CET 1 capital 151,000 151,000 151,000 1
Share premium 282,459 282,459 282,459 1
Accumulated other comprehensive income 42,445 42,445 12,023
– revaluation excesses in connection w ith RZP financial assets 42,645 42,645 12,143 26(a)
– revaluation excesses as a consolidation capital adjustment – – –
– other revaluation excesses (200) (200) (120) 26(a)
Reserves from profit 47,467 39,782 39,782 3
Retained earnings (including profit from the current year) 93,457 23,628 23,628
– retained profit 23,677 23,628 23,628 3
– net profit in the f inancial year 69,780 – –
Total equity 616,828 522,362 494,916
Assets
Liabilities
Equity
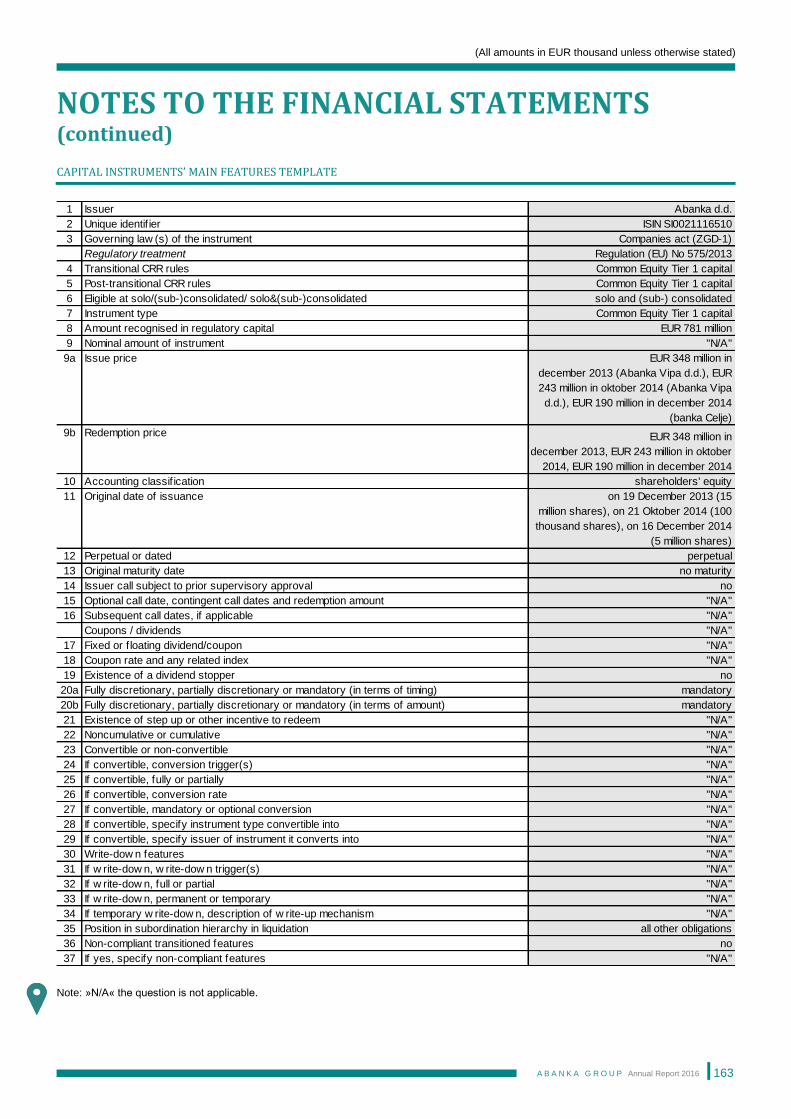
(All amounts in EUR thousand unless otherwise stated)
NOTES TO THE FINANCIAL STATEMENTS (continued)
A B A N K A G R O U P Annual Report 2016
163
CAPITAL INSTRUMENTS’ MAIN FEATURES TEMPLATE
Note: »N/A« the question is not applicable.
1 Issuer Abanka d.d.
2 Unique identif ier ISIN SI0021116510
3 Governing law (s) of the instrument Companies act (ZGD-1)
Regulatory treatment Regulation (EU) No 575/2013
4 Transitional CRR rules Common Equity Tier 1 capital
5 Post-transitional CRR rules Common Equity Tier 1 capital
6 Eligible at solo/(sub-)consolidated/ solo&(sub-)consolidated solo and (sub-) consolidated
7 Instrument type Common Equity Tier 1 capital
8 Amount recognised in regulatory capital EUR 781 million
9 Nominal amount of instrument "N/A"
9a Issue price EUR 348 million in
december 2013 (Abanka Vipa d.d.), EUR
243 million in oktober 2014 (Abanka Vipa
d.d.), EUR 190 million in december 2014
(banka Celje)
9b Redemption price EUR 348 million in
december 2013, EUR 243 million in oktober
2014, EUR 190 million in december 2014
10 Accounting classif ication shareholders' equity
11 Original date of issuance on 19 December 2013 (15
million shares), on 21 Oktober 2014 (100
thousand shares), on 16 December 2014
(5 million shares)
12 Perpetual or dated perpetual
13 Original maturity date no maturity
14 Issuer call subject to prior supervisory approval no
15 Optional call date, contingent call dates and redemption amount "N/A"
16 Subsequent call dates, if applicable "N/A"
Coupons / dividends "N/A"
17 Fixed or f loating dividend/coupon "N/A"
18 Coupon rate and any related index "N/A"
19 Existence of a dividend stopper no
20a Fully discretionary, partially discretionary or mandatory (in terms of timing) mandatory
20b Fully discretionary, partially discretionary or mandatory (in terms of amount) mandatory
21 Existence of step up or other incentive to redeem "N/A"
22 Noncumulative or cumulative "N/A"
23 Convertible or non-convertible "N/A"
24 If convertible, conversion trigger(s) "N/A"
25 If convertible, fully or partially "N/A"
26 If convertible, conversion rate "N/A"
27 If convertible, mandatory or optional conversion "N/A"
28 If convertible, specify instrument type convertible into "N/A"
29 If convertible, specify issuer of instrument it converts into "N/A"
30 Write-dow n features "N/A"
31 If w rite-dow n, w rite-dow n trigger(s) "N/A"
32 If w rite-dow n, full or partial "N/A"
33 If w rite-dow n, permanent or temporary "N/A"
34 If temporary w rite-dow n, description of w rite-up mechanism "N/A"
35 Position in subordination hierarchy in liquidation all other obligations
36 Non-compliant transitioned features no
37 If yes, specify non-compliant features "N/A"
(All amounts in EUR thousand unless otherwise stated)
NOTES TO THE FINANCIAL STATEMENTS (continued)
A B A N K A G R O U P Annual Report 2016
164
2.4.1.3. Disclosure of own funds – the nature and amounts of specific capital items
Disclosures relating to the information about the capital are laid down in Article 492(3) of Regulation (EU) No 575/2013 and the
Commission Implementing Regulation (EU) No 1423/2013 (Annex VI – Transitional own funds disclosure template).
In the first column, the amounts subject to the transitional provisions are shown. In the third column, the amounts not subject to
the transitional provisions are shown.
Due to the gradual introduction of individual transitional provisions, the regulatory capital as currently taken into account in the
calculation of capital adequacy was EUR 27,446 thousand lower than it would be if all requirements were already fully
implemented. The difference mainly arises from the accumulated other comprehensive income, as more unrealised gains than
losses were temporarily excluded, and partly also from the deductible item for deferred tax.
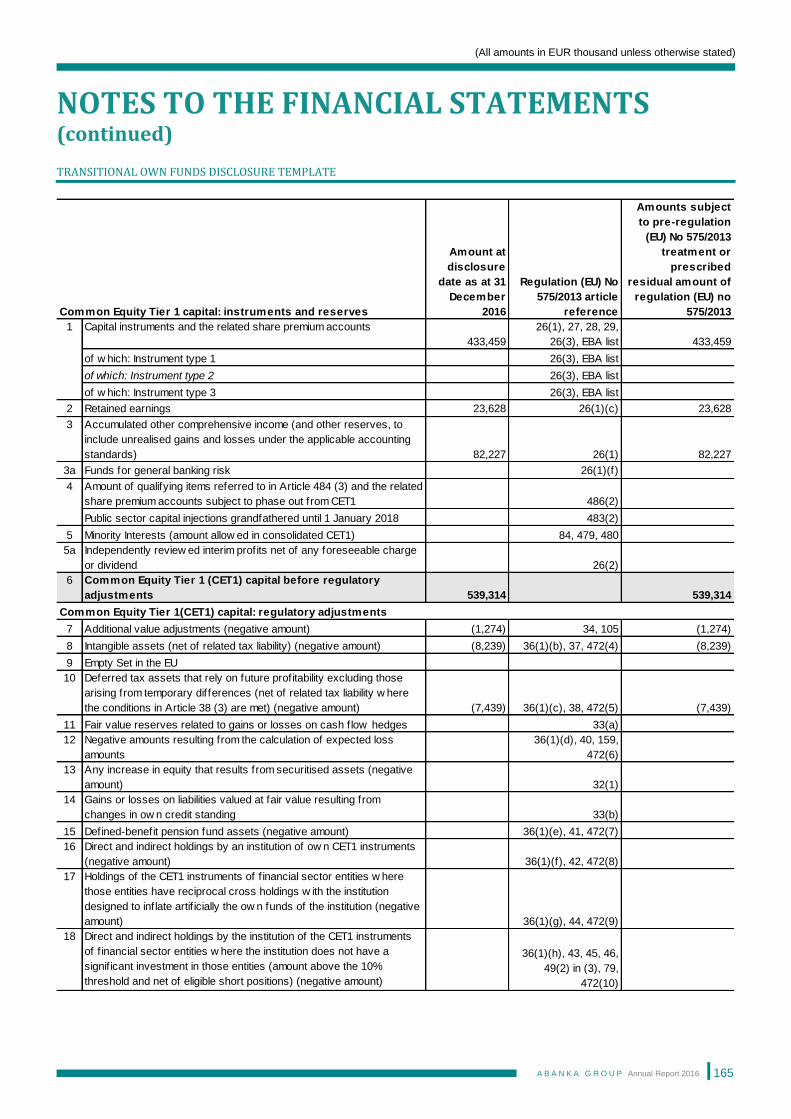
(All amounts in EUR thousand unless otherwise stated)
NOTES TO THE FINANCIAL STATEMENTS (continued)
A B A N K A G R O U P Annual Report 2016
165
TRANSITIONAL OWN FUNDS DISCLOSURE TEMPLATE
Amount at
disclosure
date as at 31
December
2016
Regulation (EU) No
575/2013 article
reference
Amounts subject
to pre-regulation
(EU) No 575/2013
treatment or
prescribed
residual amount of
regulation (EU) no
575/2013
1 Capital instruments and the related share premium accounts
433,459
26(1), 27, 28, 29,
26(3), EBA list 433,459
of w hich: Instrument type 1 26(3), EBA list
of which: Instrument type 2 26(3), EBA list
of w hich: Instrument type 3 26(3), EBA list
2 Retained earnings 23,628 26(1)(c) 23,628
3 Accumulated other comprehensive income (and other reserves, to
include unrealised gains and losses under the applicable accounting
standards) 82,227 26(1) 82,227
3a Funds for general banking risk 26(1)(f)
4 Amount of qualifying items referred to in Article 484 (3) and the related
share premium accounts subject to phase out from CET1 486(2)
Public sector capital injections grandfathered until 1 January 2018 483(2)
5 Minority Interests (amount allow ed in consolidated CET1) 84, 479, 480
5a Independently review ed interim profits net of any foreseeable charge
or dividend 26(2)
6 Common Equity Tier 1 (CET1) capital before regulatory
adjustments 539,314 539,314
7 Additional value adjustments (negative amount) (1,274) 34, 105 (1,274)
8 Intangible assets (net of related tax liability) (negative amount) (8,239) 36(1)(b), 37, 472(4) (8,239)
9 Empty Set in the EU
10 Deferred tax assets that rely on future profitability excluding those
arising from temporary differences (net of related tax liability w here
the conditions in Article 38 (3) are met) (negative amount) (7,439) 36(1)(c), 38, 472(5) (7,439)
11 Fair value reserves related to gains or losses on cash f low hedges 33(a)
12 Negative amounts resulting from the calculation of expected loss
amounts
36(1)(d), 40, 159,
472(6)
13 Any increase in equity that results from securitised assets (negative
amount) 32(1)
14 Gains or losses on liabilities valued at fair value resulting from
changes in ow n credit standing 33(b)
15 Defined-benefit pension fund assets (negative amount) 36(1)(e), 41, 472(7)
16 Direct and indirect holdings by an institution of ow n CET1 instruments
(negative amount) 36(1)(f), 42, 472(8)
17 Holdings of the CET1 instruments of f inancial sector entities w here
those entities have reciprocal cross holdings w ith the institution
designed to inflate artif icially the ow n funds of the institution (negative
amount) 36(1)(g), 44, 472(9)
18 Direct and indirect holdings by the institution of the CET1 instruments
of f inancial sector entities w here the institution does not have a
signif icant investment in those entities (amount above the 10%
threshold and net of eligible short positions) (negative amount)
36(1)(h), 43, 45, 46,
49(2) in (3), 79,
472(10)
Common Equity Tier 1 capital: instruments and reserves
Common Equity Tier 1(CET1) capital: regulatory adjustments
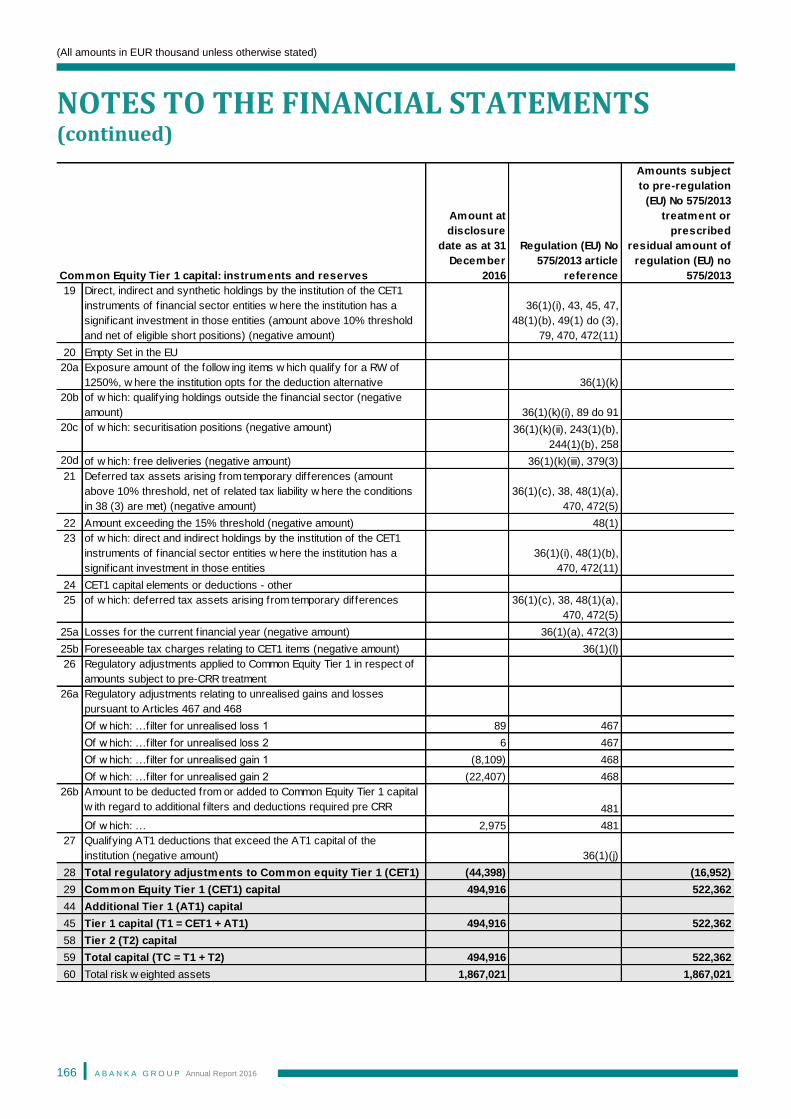
(All amounts in EUR thousand unless otherwise stated)
NOTES TO THE FINANCIAL STATEMENTS (continued)
A B A N K A G R O U P Annual Report 2016
166
Amount at
disclosure
date as at 31
December
2016
Regulation (EU) No
575/2013 article
reference
Amounts subject
to pre-regulation
(EU) No 575/2013
treatment or
prescribed
residual amount of
regulation (EU) no
575/2013
19 Direct, indirect and synthetic holdings by the institution of the CET1
instruments of f inancial sector entities w here the institution has a
signif icant investment in those entities (amount above 10% threshold
and net of eligible short positions) (negative amount)
36(1)(i), 43, 45, 47,
48(1)(b), 49(1) do (3),
79, 470, 472(11)
20 Empty Set in the EU
20a Exposure amount of the follow ing items w hich qualify for a RW of
1250%, w here the institution opts for the deduction alternative 36(1)(k)
20b of w hich: qualifying holdings outside the f inancial sector (negative
amount) 36(1)(k)(i), 89 do 91
20c of w hich: securitisation positions (negative amount) 36(1)(k)(ii), 243(1)(b),
244(1)(b), 258
20d of w hich: free deliveries (negative amount) 36(1)(k)(iii), 379(3)
21 Deferred tax assets arising from temporary differences (amount
above 10% threshold, net of related tax liability w here the conditions
in 38 (3) are met) (negative amount)
36(1)(c), 38, 48(1)(a),
470, 472(5)
22 Amount exceeding the 15% threshold (negative amount) 48(1)
23 of w hich: direct and indirect holdings by the institution of the CET1
instruments of f inancial sector entities w here the institution has a
signif icant investment in those entities
36(1)(i), 48(1)(b),
470, 472(11)
24 CET1 capital elements or deductions - other
25 of w hich: deferred tax assets arising from temporary differences 36(1)(c), 38, 48(1)(a),
470, 472(5)
25a Losses for the current f inancial year (negative amount) 36(1)(a), 472(3)
25b Foreseeable tax charges relating to CET1 items (negative amount) 36(1)(l)
26 Regulatory adjustments applied to Common Equity Tier 1 in respect of
amounts subject to pre-CRR treatment
26a Regulatory adjustments relating to unrealised gains and losses
pursuant to Articles 467 and 468
Of w hich: …filter for unrealised loss 1 89 467
Of w hich: …filter for unrealised loss 2 6 467
Of w hich: …filter for unrealised gain 1 (8,109) 468
Of w hich: …filter for unrealised gain 2 (22,407) 468
26b Amount to be deducted from or added to Common Equity Tier 1 capital
w ith regard to additional f ilters and deductions required pre CRR 481
Of w hich: … 2,975 481
27 Qualifying AT1 deductions that exceed the AT1 capital of the
institution (negative amount) 36(1)(j)
28 Total regulatory adjustments to Common equity Tier 1 (CET1) (44,398) (16,952)
29 Common Equity Tier 1 (CET1) capital 494,916 522,362
44 Additional Tier 1 (AT1) capital
45 Tier 1 capital (T1 = CET1 + AT1) 494,916 522,362
58 Tier 2 (T2) capital
59 Total capital (TC = T1 + T2) 494,916 522,362
60 Total risk w eighted assets 1,867,021 1,867,021
Common Equity Tier 1 capital: instruments and reserves
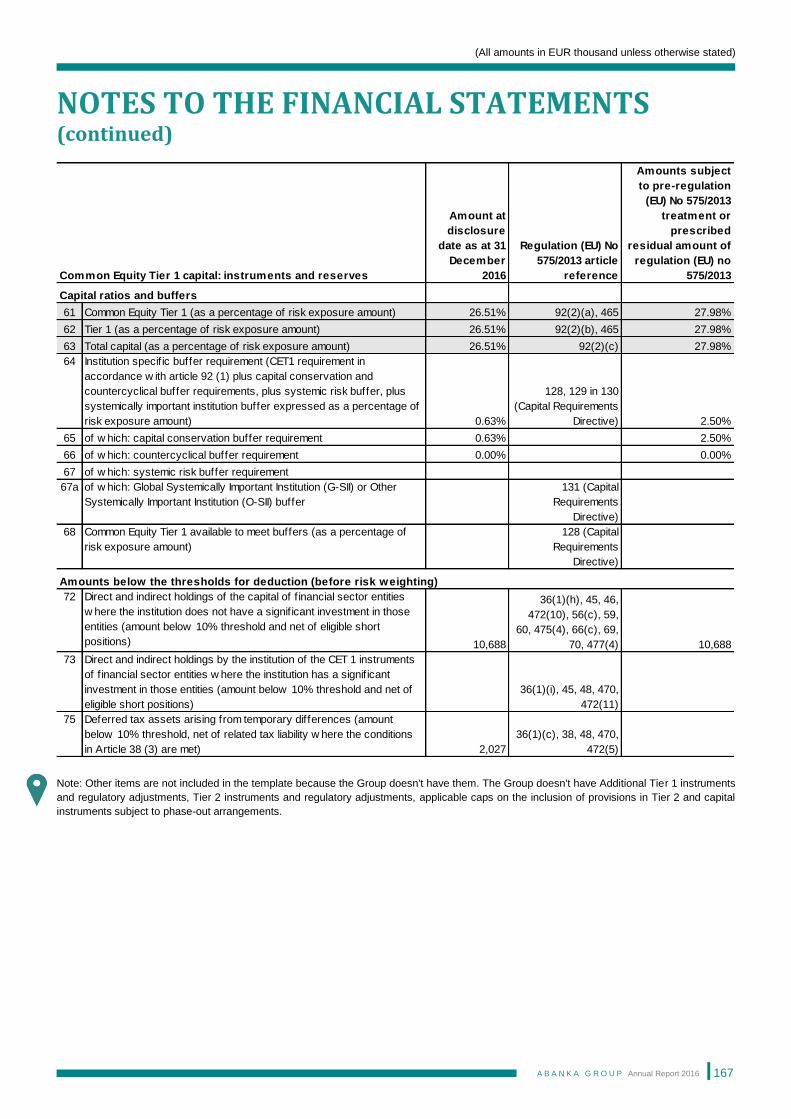
(All amounts in EUR thousand unless otherwise stated)
NOTES TO THE FINANCIAL STATEMENTS (continued)
A B A N K A G R O U P Annual Report 2016
167
Note: Other items are not included in the template because the Group doesn't have them. The Group doesn't have Additional Tier 1 instruments
and regulatory adjustments, Tier 2 instruments and regulatory adjustments, applicable caps on the inclusion of provisions in Tier 2 and capital
instruments subject to phase-out arrangements.
Amount at
disclosure
date as at 31
December
2016
Regulation (EU) No
575/2013 article
reference
Amounts subject
to pre-regulation
(EU) No 575/2013
treatment or
prescribed
residual amount of
regulation (EU) no
575/2013
Capital ratios and buffers
61 Common Equity Tier 1 (as a percentage of risk exposure amount) 26.51% 92(2)(a), 465 27.98%
62 Tier 1 (as a percentage of risk exposure amount) 26.51% 92(2)(b), 465 27.98%
63 Total capital (as a percentage of risk exposure amount) 26.51% 92(2)(c) 27.98%
64 Institution specif ic buffer requirement (CET1 requirement in
accordance w ith article 92 (1) plus capital conservation and
countercyclical buffer requirements, plus systemic risk buffer, plus
systemically important institution buffer expressed as a percentage of
risk exposure amount) 0.63%
128, 129 in 130
(Capital Requirements
Directive) 2.50%
65 of w hich: capital conservation buffer requirement 0.63% 2.50%
66 of w hich: countercyclical buffer requirement 0.00% 0.00%
67 of w hich: systemic risk buffer requirement
67a of w hich: Global Systemically Important Institution (G-SII) or Other
Systemically Important Institution (O-SII) buffer
131 (Capital
Requirements
Directive)
68 Common Equity Tier 1 available to meet buffers (as a percentage of
risk exposure amount)
128 (Capital
Requirements
Directive)
Amounts below the thresholds for deduction (before risk weighting)
72 Direct and indirect holdings of the capital of f inancial sector entities
w here the institution does not have a signif icant investment in those
entities (amount below 10% threshold and net of eligible short
positions) 10,688
36(1)(h), 45, 46,
472(10), 56(c), 59,
60, 475(4), 66(c), 69,
70, 477(4) 10,688
73 Direct and indirect holdings by the institution of the CET 1 instruments
of f inancial sector entities w here the institution has a signif icant
investment in those entities (amount below 10% threshold and net of
eligible short positions)
36(1)(i), 45, 48, 470,
472(11)
75 Deferred tax assets arising from temporary differences (amount
below 10% threshold, net of related tax liability w here the conditions
in Article 38 (3) are met) 2,027
36(1)(c), 38, 48, 470,
472(5)
Common Equity Tier 1 capital: instruments and reserves
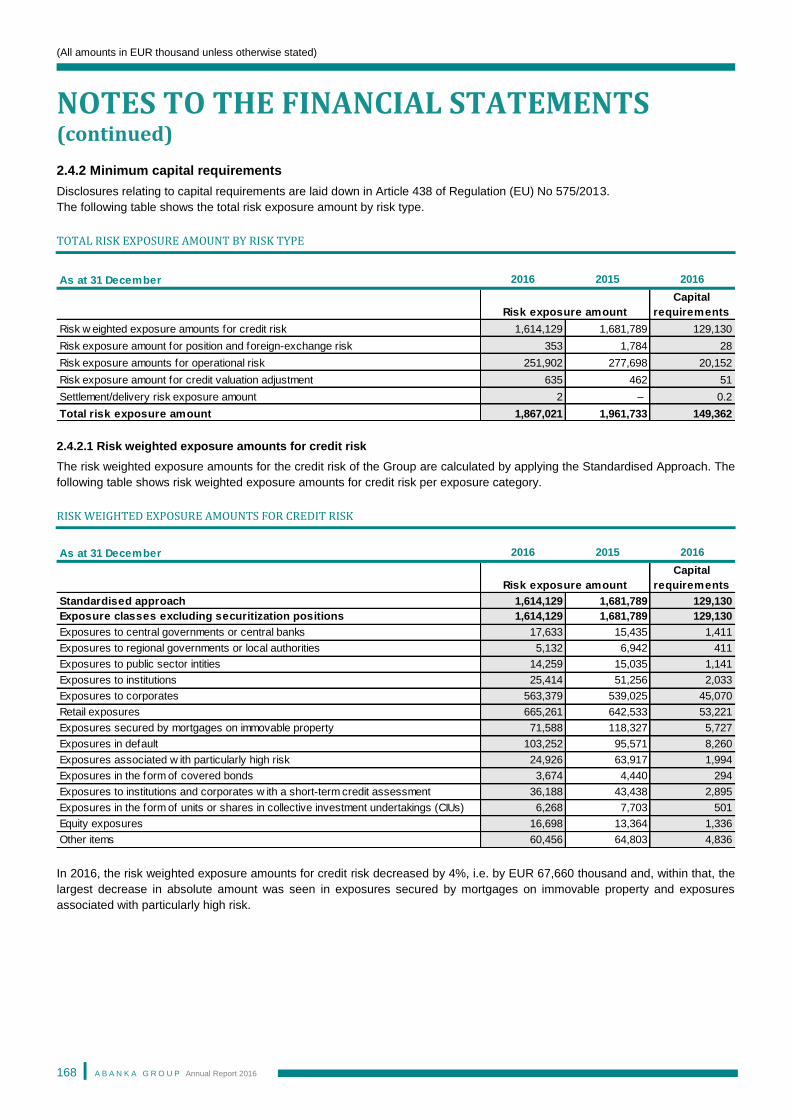
(All amounts in EUR thousand unless otherwise stated)
NOTES TO THE FINANCIAL STATEMENTS (continued)
A B A N K A G R O U P Annual Report 2016
168
2.4.2 Minimum capital requirements
Disclosures relating to capital requirements are laid down in Article 438 of Regulation (EU) No 575/2013.
The following table shows the total risk exposure amount by risk type.
TOTAL RISK EXPOSURE AMOUNT BY RISK TYPE
2.4.2.1 Risk weighted exposure amounts for credit risk
The risk weighted exposure amounts for the credit risk of the Group are calculated by applying the Standardised Approach. The
following table shows risk weighted exposure amounts for credit risk per exposure category.
RISK WEIGHTED EXPOSURE AMOUNTS FOR CREDIT RISK
In 2016, the risk weighted exposure amounts for credit risk decreased by 4%, i.e. by EUR 67,660 thousand and, within that, the
largest decrease in absolute amount was seen in exposures secured by mortgages on immovable property and exposures
associated with particularly high risk.
As at 31 December 2016 2015 2016
Capital
requirements
Risk w eighted exposure amounts for credit risk 1,614,129 1,681,789 129,130
Risk exposure amount for position and foreign-exchange risk 353 1,784 28
Risk exposure amounts for operational risk 251,902 277,698 20,152
Risk exposure amount for credit valuation adjustment 635 462 51
Settlement/delivery risk exposure amount 2 – 0.2
Total risk exposure amount 1,867,021 1,961,733 149,362
Risk exposure amount
As at 31 December 2016 2015 2016
Capital
requirements
Standardised approach 1,614,129 1,681,789 129,130
Exposure classes excluding securitization positions 1,614,129 1,681,789 129,130
Exposures to central governments or central banks 17,633 15,435 1,411
Exposures to regional governments or local authorities 5,132 6,942 411
Exposures to public sector intities 14,259 15,035 1,141
Exposures to institutions 25,414 51,256 2,033
Exposures to corporates 563,379 539,025 45,070
Retail exposures 665,261 642,533 53,221
Exposures secured by mortgages on immovable property 71,588 118,327 5,727
Exposures in default 103,252 95,571 8,260
Exposures associated w ith particularly high risk 24,926 63,917 1,994
Exposures in the form of covered bonds 3,674 4,440 294
Exposures to institutions and corporates w ith a short-term credit assessment 36,188 43,438 2,895
Exposures in the form of units or shares in collective investment undertakings (CIUs) 6,268 7,703 501
Equity exposures 16,698 13,364 1,336
Other items 60,456 64,803 4,836
Risk exposure amount
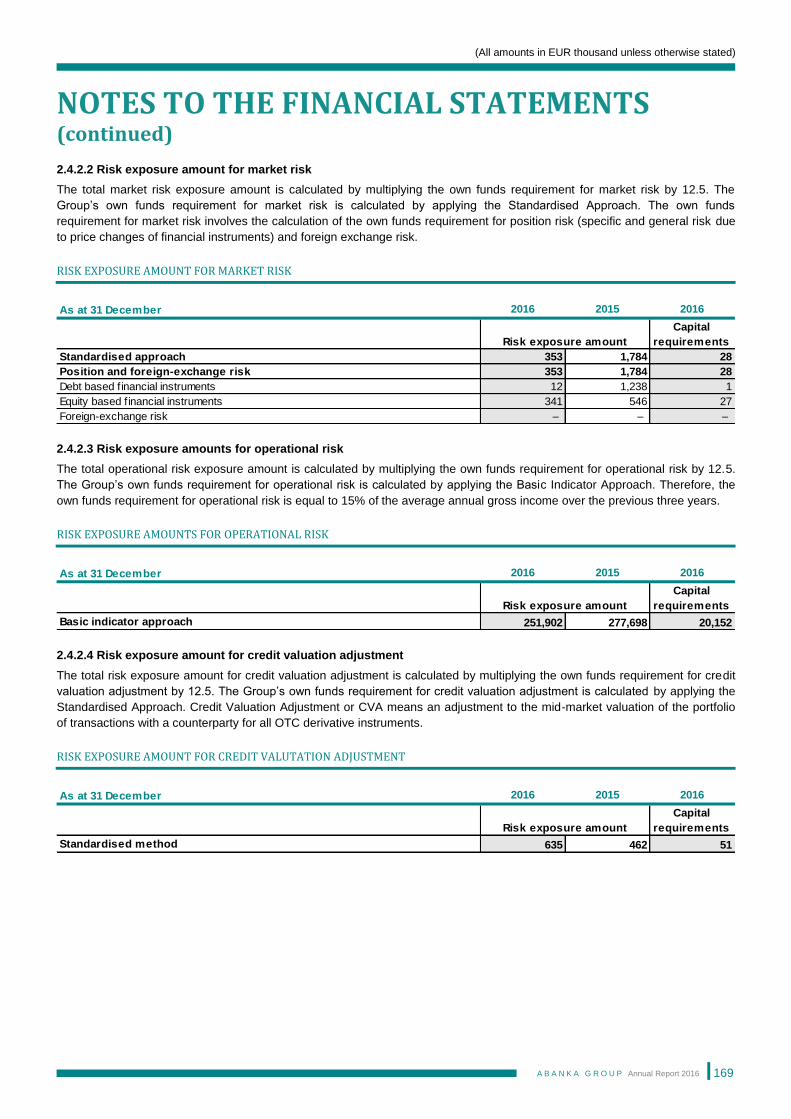
(All amounts in EUR thousand unless otherwise stated)
NOTES TO THE FINANCIAL STATEMENTS (continued)
A B A N K A G R O U P Annual Report 2016
169
2.4.2.2 Risk exposure amount for market risk
The total market risk exposure amount is calculated by multiplying the own funds requirement for market risk by 12.5. The
Group’s own funds requirement for market risk is calculated by applying the Standardised Approach. The own funds
requirement for market risk involves the calculation of the own funds requirement for position risk (specific and general risk due
to price changes of financial instruments) and foreign exchange risk.
RISK EXPOSURE AMOUNT FOR MARKET RISK
2.4.2.3 Risk exposure amounts for operational risk
The total operational risk exposure amount is calculated by multiplying the own funds requirement for operational risk by 12.5.
The Group’s own funds requirement for operational risk is calculated by applying the Basic Indicator Approach. Therefore, the
own funds requirement for operational risk is equal to 15% of the average annual gross income over the previous three years.
RISK EXPOSURE AMOUNTS FOR OPERATIONAL RISK
2.4.2.4 Risk exposure amount for credit valuation adjustment
The total risk exposure amount for credit valuation adjustment is calculated by multiplying the own funds requirement for credit
valuation adjustment by 12.5. The Group’s own funds requirement for credit valuation adjustment is calculated by applying the
Standardised Approach. Credit Valuation Adjustment or CVA means an adjustment to the mid-market valuation of the portfolio
of transactions with a counterparty for all OTC derivative instruments.
RISK EXPOSURE AMOUNT FOR CREDIT VALUTATION ADJUSTMENT
As at 31 December 2016 2015 2016
Capital
requirements
Standardised approach 353 1,784 28
Position and foreign-exchange risk 353 1,784 28
Debt based financial instruments 12 1,238 1
Equity based financial instruments 341 546 27
Foreign-exchange risk – – –
Risk exposure amount
As at 31 December 2016 2015 2016
Capital
requirements
Basic indicator approach 251,902 277,698 20,152
Risk exposure amount
As at 31 December 2016 2015 2016
Capital
requirements
Standardised method 635 462 51
Risk exposure amount
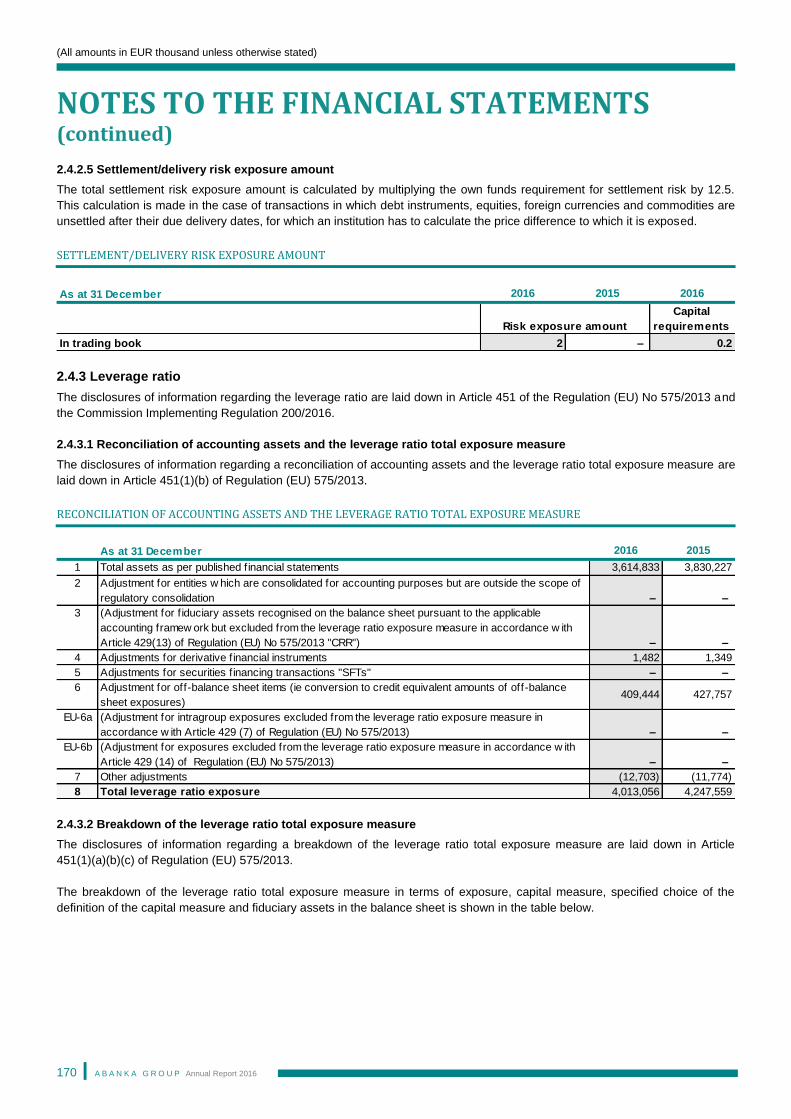
(All amounts in EUR thousand unless otherwise stated)
NOTES TO THE FINANCIAL STATEMENTS (continued)
A B A N K A G R O U P Annual Report 2016
170
2.4.2.5 Settlement/delivery risk exposure amount
The total settlement risk exposure amount is calculated by multiplying the own funds requirement for settlement risk by 12.5.
This calculation is made in the case of transactions in which debt instruments, equities, foreign currencies and commodities are
unsettled after their due delivery dates, for which an institution has to calculate the price difference to which it is exposed.
SETTLEMENT/DELIVERY RISK EXPOSURE AMOUNT
2.4.3 Leverage ratio
The disclosures of information regarding the leverage ratio are laid down in Article 451 of the Regulation (EU) No 575/2013 and
the Commission Implementing Regulation 200/2016.
2.4.3.1 Reconciliation of accounting assets and the leverage ratio total exposure measure
The disclosures of information regarding a reconciliation of accounting assets and the leverage ratio total exposure measure are
laid down in Article 451(1)(b) of Regulation (EU) 575/2013.
RECONCILIATION OF ACCOUNTING ASSETS AND THE LEVERAGE RATIO TOTAL EXPOSURE MEASURE
2.4.3.2 Breakdown of the leverage ratio total exposure measure
The disclosures of information regarding a breakdown of the leverage ratio total exposure measure are laid down in Article
451(1)(a)(b)(c) of Regulation (EU) 575/2013.
The breakdown of the leverage ratio total exposure measure in terms of exposure, capital measure, specified choice of the
definition of the capital measure and fiduciary assets in the balance sheet is shown in the table below.
As at 31 December 2016 2015 2016
Capital
requirements
In trading book 2 – 0.2
Risk exposure amount
As at 31 December 2016 2015
1 Total assets as per published financial statements 3,614,833 3,830,227
2 Adjustment for entities w hich are consolidated for accounting purposes but are outside the scope of
regulatory consolidation – –
3 (Adjustment for f iduciary assets recognised on the balance sheet pursuant to the applicable
accounting framew ork but excluded from the leverage ratio exposure measure in accordance w ith
Article 429(13) of Regulation (EU) No 575/2013 "CRR") – –
4 Adjustments for derivative f inancial instruments 1,482 1,349
5 Adjustments for securities f inancing transactions "SFTs" – –
6 Adjustment for off-balance sheet items (ie conversion to credit equivalent amounts of off-balance
sheet exposures)409,444 427,757
EU-6a (Adjustment for intragroup exposures excluded from the leverage ratio exposure measure in
accordance w ith Article 429 (7) of Regulation (EU) No 575/2013) – –
EU-6b (Adjustment for exposures excluded from the leverage ratio exposure measure in accordance w ith
Article 429 (14) of Regulation (EU) No 575/2013) – –
7 Other adjustments (12,703) (11,774)
8 Total leverage ratio exposure 4,013,056 4,247,559
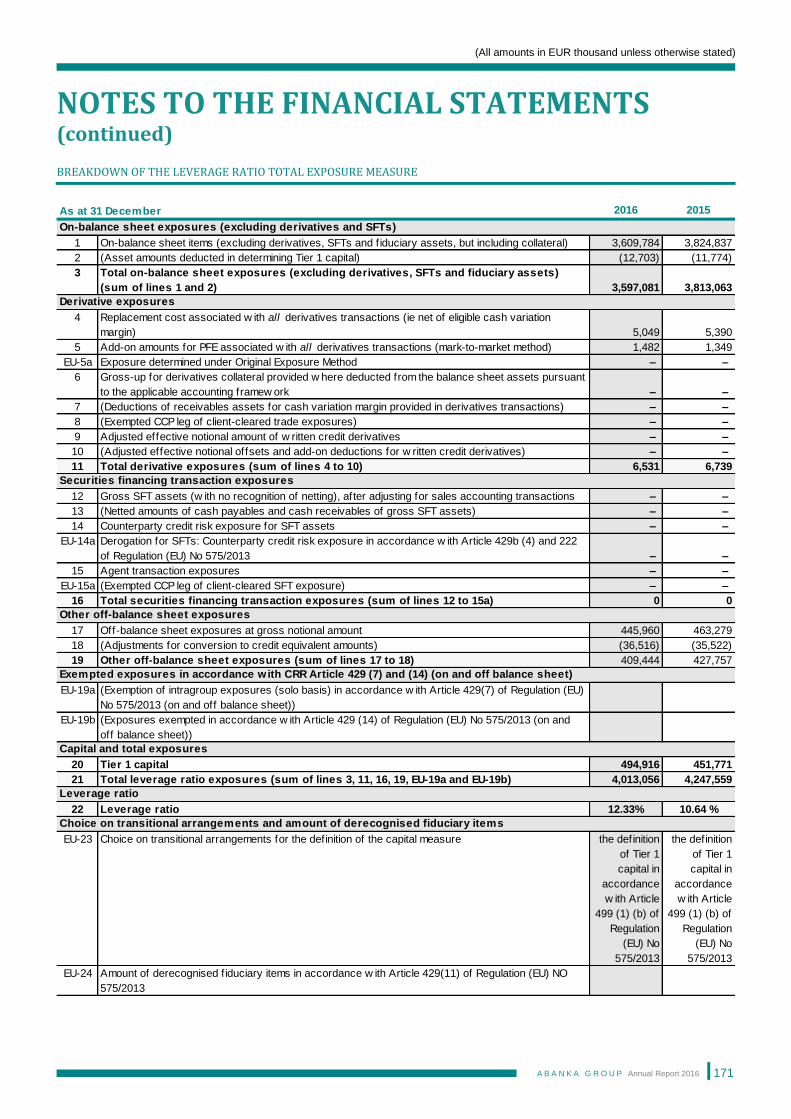
(All amounts in EUR thousand unless otherwise stated)
NOTES TO THE FINANCIAL STATEMENTS (continued)
A B A N K A G R O U P Annual Report 2016
171
BREAKDOWN OF THE LEVERAGE RATIO TOTAL EXPOSURE MEASURE
2016 2015
1 On-balance sheet items (excluding derivatives, SFTs and f iduciary assets, but including collateral) 3,609,784 3,824,837
2 (Asset amounts deducted in determining Tier 1 capital) (12,703) (11,774)
3 Total on-balance sheet exposures (excluding derivatives, SFTs and fiduciary assets)
(sum of lines 1 and 2) 3,597,081 3,813,063
4 Replacement cost associated w ith all derivatives transactions (ie net of eligible cash variation
margin) 5,049 5,390
5 Add-on amounts for PFE associated w ith all derivatives transactions (mark-to-market method) 1,482 1,349
EU-5a Exposure determined under Original Exposure Method – –
6 Gross-up for derivatives collateral provided w here deducted from the balance sheet assets pursuant
to the applicable accounting framew ork – –
7 (Deductions of receivables assets for cash variation margin provided in derivatives transactions) – –
8 (Exempted CCP leg of client-cleared trade exposures) – –
9 Adjusted effective notional amount of w ritten credit derivatives – –
10 (Adjusted effective notional offsets and add-on deductions for w ritten credit derivatives) – –
11 Total derivative exposures (sum of lines 4 to 10) 6,531 6,739
12 Gross SFT assets (w ith no recognition of netting), after adjusting for sales accounting transactions – –
13 (Netted amounts of cash payables and cash receivables of gross SFT assets) – –
14 Counterparty credit risk exposure for SFT assets – –
EU-14a Derogation for SFTs: Counterparty credit risk exposure in accordance w ith Article 429b (4) and 222
of Regulation (EU) No 575/2013 – –
15 Agent transaction exposures – –
EU-15a (Exempted CCP leg of client-cleared SFT exposure) – –
16 Total securities financing transaction exposures (sum of lines 12 to 15a) 0 0
17 Off-balance sheet exposures at gross notional amount 445,960 463,279
18 (Adjustments for conversion to credit equivalent amounts) (36,516) (35,522)
19 Other off-balance sheet exposures (sum of lines 17 to 18) 409,444 427,757
EU-19a (Exemption of intragroup exposures (solo basis) in accordance w ith Article 429(7) of Regulation (EU)
No 575/2013 (on and off balance sheet))
EU-19b (Exposures exempted in accordance w ith Article 429 (14) of Regulation (EU) No 575/2013 (on and
off balance sheet))
20 Tier 1 capital 494,916 451,771
21 Total leverage ratio exposures (sum of lines 3, 11, 16, 19, EU-19a and EU-19b) 4,013,056 4,247,559
22 Leverage ratio 12.33% 10.64 %
EU-23 Choice on transitional arrangements for the definition of the capital measure the definition
of Tier 1
capital in
accordance
w ith Article
499 (1) (b) of
Regulation
(EU) No
575/2013
the definition
of Tier 1
capital in
accordance
w ith Article
499 (1) (b) of
Regulation
(EU) No
575/2013
EU-24 Amount of derecognised f iduciary items in accordance w ith Article 429(11) of Regulation (EU) NO
575/2013
On-balance sheet exposures (excluding derivatives and SFTs)
Derivative exposures
Securities financing transaction exposures
Other off-balance sheet exposures
Exempted exposures in accordance with CRR Article 429 (7) and (14) (on and off balance sheet)
Capital and total exposures
Leverage ratio
Choice on transitional arrangements and amount of derecognised fiduciary items
As at 31 December
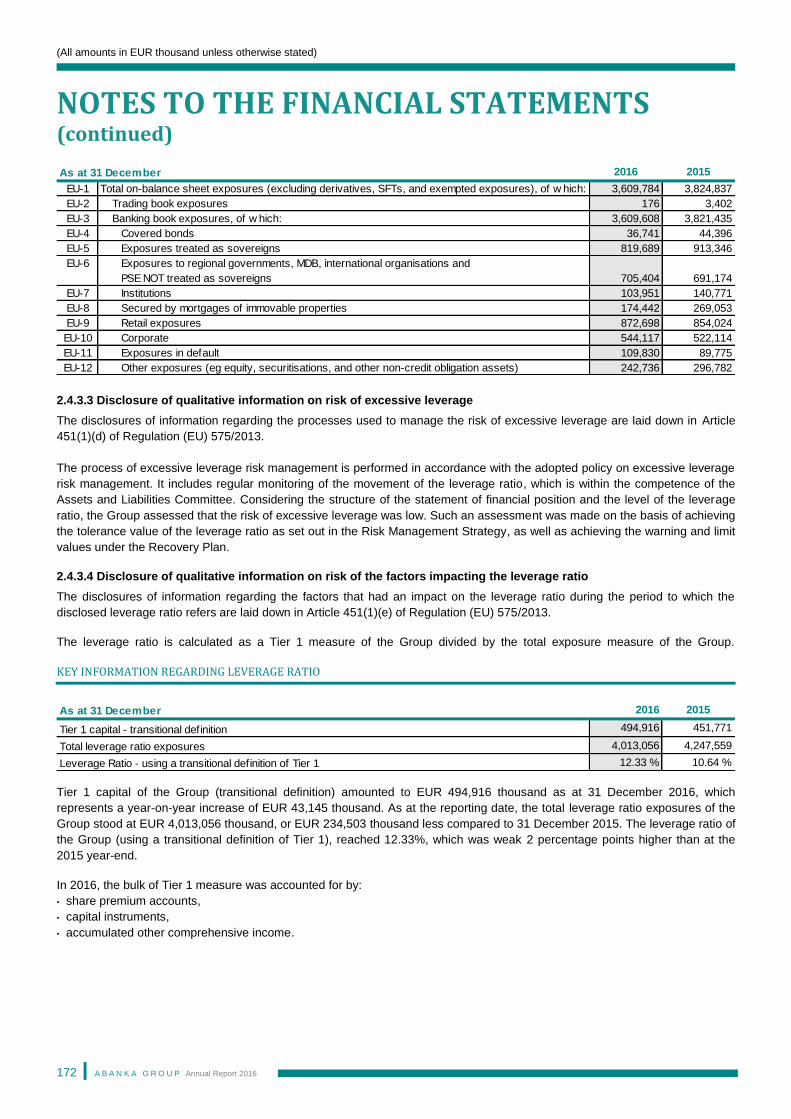
(All amounts in EUR thousand unless otherwise stated)
NOTES TO THE FINANCIAL STATEMENTS (continued)
A B A N K A G R O U P Annual Report 2016
172
2.4.3.3 Disclosure of qualitative information on risk of excessive leverage
The disclosures of information regarding the processes used to manage the risk of excessive leverage are laid down in Article
451(1)(d) of Regulation (EU) 575/2013.
The process of excessive leverage risk management is performed in accordance with the adopted policy on excessive leverage
risk management. It includes regular monitoring of the movement of the leverage ratio, which is within the competence of the
Assets and Liabilities Committee. Considering the structure of the statement of financial position and the level of the leverage
ratio, the Group assessed that the risk of excessive leverage was low. Such an assessment was made on the basis of achieving
the tolerance value of the leverage ratio as set out in the Risk Management Strategy, as well as achieving the warning and limit
values under the Recovery Plan.
2.4.3.4 Disclosure of qualitative information on risk of the factors impacting the leverage ratio
The disclosures of information regarding the factors that had an impact on the leverage ratio during the period to which the
disclosed leverage ratio refers are laid down in Article 451(1)(e) of Regulation (EU) 575/2013.
The leverage ratio is calculated as a Tier 1 measure of the Group divided by the total exposure measure of the Group.
KEY INFORMATION REGARDING LEVERAGE RATIO
Tier 1 capital of the Group (transitional definition) amounted to EUR 494,916 thousand as at 31 December 2016, which
represents a year-on-year increase of EUR 43,145 thousand. As at the reporting date, the total leverage ratio exposures of the
Group stood at EUR 4,013,056 thousand, or EUR 234,503 thousand less compared to 31 December 2015. The leverage ratio of
the Group (using a transitional definition of Tier 1), reached 12.33%, which was weak 2 percentage points higher than at the
2015 year-end.
In 2016, the bulk of Tier 1 measure was accounted for by:
• share premium accounts,
• capital instruments,
• accumulated other comprehensive income.
2016 2015
EU-1 Total on-balance sheet exposures (excluding derivatives, SFTs, and exempted exposures), of w hich: 3,609,784 3,824,837
EU-2 Trading book exposures 176 3,402
EU-3 Banking book exposures, of w hich: 3,609,608 3,821,435
EU-4 Covered bonds 36,741 44,396
EU-5 Exposures treated as sovereigns 819,689 913,346
EU-6 Exposures to regional governments, MDB, international organisations and
PSE NOT treated as sovereigns 705,404 691,174
EU-7 Institutions 103,951 140,771
EU-8 Secured by mortgages of immovable properties 174,442 269,053
EU-9 Retail exposures 872,698 854,024
EU-10 Corporate 544,117 522,114
EU-11 Exposures in default 109,830 89,775
EU-12 Other exposures (eg equity, securitisations, and other non-credit obligation assets) 242,736 296,782
As at 31 December
2016 2015
494,916 451,771
4,013,056 4,247,559
12.33 % 10.64 %
As at 31 December
Tier 1 capital - transitional definition
Total leverage ratio exposures
Leverage Ratio - using a transitional definition of Tier 1
(All amounts in EUR thousand unless otherwise stated)
NOTES TO THE FINANCIAL STATEMENTS (continued)
A B A N K A G R O U P Annual Report 2016
173
Due to higher Common Equity Tier 1 items and lower reductions from Common Equity Tier 1 items, the Tier 1 measure
improved in 2016 compared to 2015, positively impacting the level of the leverage ratio.
In the reporting period, the bulk of leverage ratio total exposure measure was accounted for by:
• retail exposures,
• exposures to central governments,
• exposures to regional governments and public sector entities,
• exposures to corporates.
Due to lower amounts of exposures secured by mortgages on immovable property and exposures to central governments, the
leverage ratio total exposure measure decreased in 2016 compared to 2015, which had a positive impact on the level of the
leverage ratio.
2.4.4 Capital buffers
The disclosures of information regarding capital buffers are laid down in Article 440 of Regulation (EU) 575/2013 and the
Commission Delegated Regulation (EU) 2015/1555.
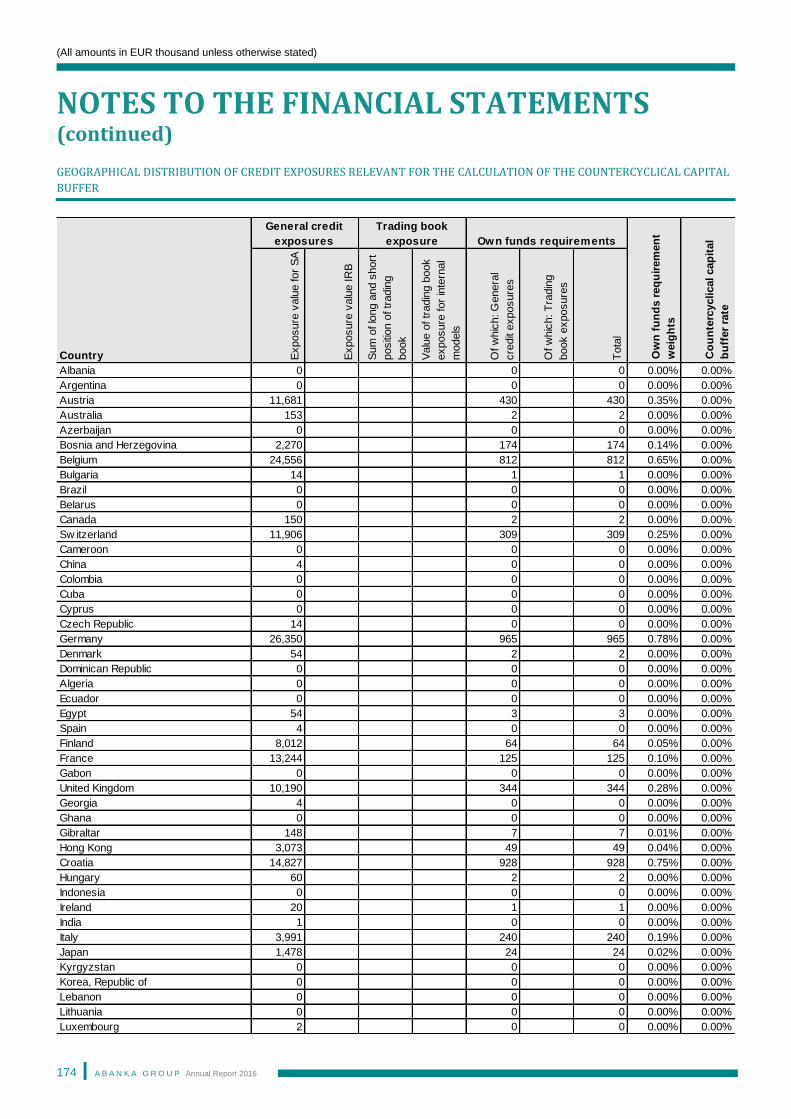
(All amounts in EUR thousand unless otherwise stated)
NOTES TO THE FINANCIAL STATEMENTS (continued)
A B A N K A G R O U P Annual Report 2016
174
GEOGRAPHICAL DISTRIBUTION OF CREDIT EXPOSURES RELEVANT FOR THE CALCULATION OF THE COUNTERCYCLICAL CAPITAL
BUFFER
Exposure
valu
e for
SA
Exposure
valu
e IR
B
Sum
of lo
ng a
nd s
hort
positi
on o
f tr
adin
g
book
Valu
e o
f tr
adin
g b
ook
exposure
for
inte
rnal
models
Of w
hic
h: G
enera
l
cre
dit
exposure
s
Of w
hic
h: T
radin
g
book e
xposure
s
Tota
l
Albania 0 0 0 0.00% 0.00%
Argentina 0 0 0 0.00% 0.00%
Austria 11,681 430 430 0.35% 0.00%
Australia 153 2 2 0.00% 0.00%
Azerbaijan 0 0 0 0.00% 0.00%
Bosnia and Herzegovina 2,270 174 174 0.14% 0.00%
Belgium 24,556 812 812 0.65% 0.00%
Bulgaria 14 1 1 0.00% 0.00%
Brazil 0 0 0 0.00% 0.00%
Belarus 0 0 0 0.00% 0.00%
Canada 150 2 2 0.00% 0.00%
Sw itzerland 11,906 309 309 0.25% 0.00%
Cameroon 0 0 0 0.00% 0.00%
China 4 0 0 0.00% 0.00%
Colombia 0 0 0 0.00% 0.00%
Cuba 0 0 0 0.00% 0.00%
Cyprus 0 0 0 0.00% 0.00%
Czech Republic 14 0 0 0.00% 0.00%
Germany 26,350 965 965 0.78% 0.00%
Denmark 54 2 2 0.00% 0.00%
Dominican Republic 0 0 0 0.00% 0.00%
Algeria 0 0 0 0.00% 0.00%
Ecuador 0 0 0 0.00% 0.00%
Egypt 54 3 3 0.00% 0.00%
Spain 4 0 0 0.00% 0.00%
Finland 8,012 64 64 0.05% 0.00%
France 13,244 125 125 0.10% 0.00%
Gabon 0 0 0 0.00% 0.00%
United Kingdom 10,190 344 344 0.28% 0.00%
Georgia 4 0 0 0.00% 0.00%
Ghana 0 0 0 0.00% 0.00%
Gibraltar 148 7 7 0.01% 0.00%
Hong Kong 3,073 49 49 0.04% 0.00%
Croatia 14,827 928 928 0.75% 0.00%
Hungary 60 2 2 0.00% 0.00%
Indonesia 0 0 0 0.00% 0.00%
Ireland 20 1 1 0.00% 0.00%
India 1 0 0 0.00% 0.00%
Italy 3,991 240 240 0.19% 0.00%
Japan 1,478 24 24 0.02% 0.00%
Kyrgyzstan 0 0 0 0.00% 0.00%
Korea, Republic of 0 0 0 0.00% 0.00%
Lebanon 0 0 0 0.00% 0.00%
Lithuania 0 0 0 0.00% 0.00%
Luxembourg 2 0 0 0.00% 0.00%
Ow
n f
un
ds r
eq
uir
em
en
t
weig
hts
Co
un
terc
yclical cap
ital
bu
ffer
rate
Country
General credit
exposures
Trading book
exposure Own funds requirements
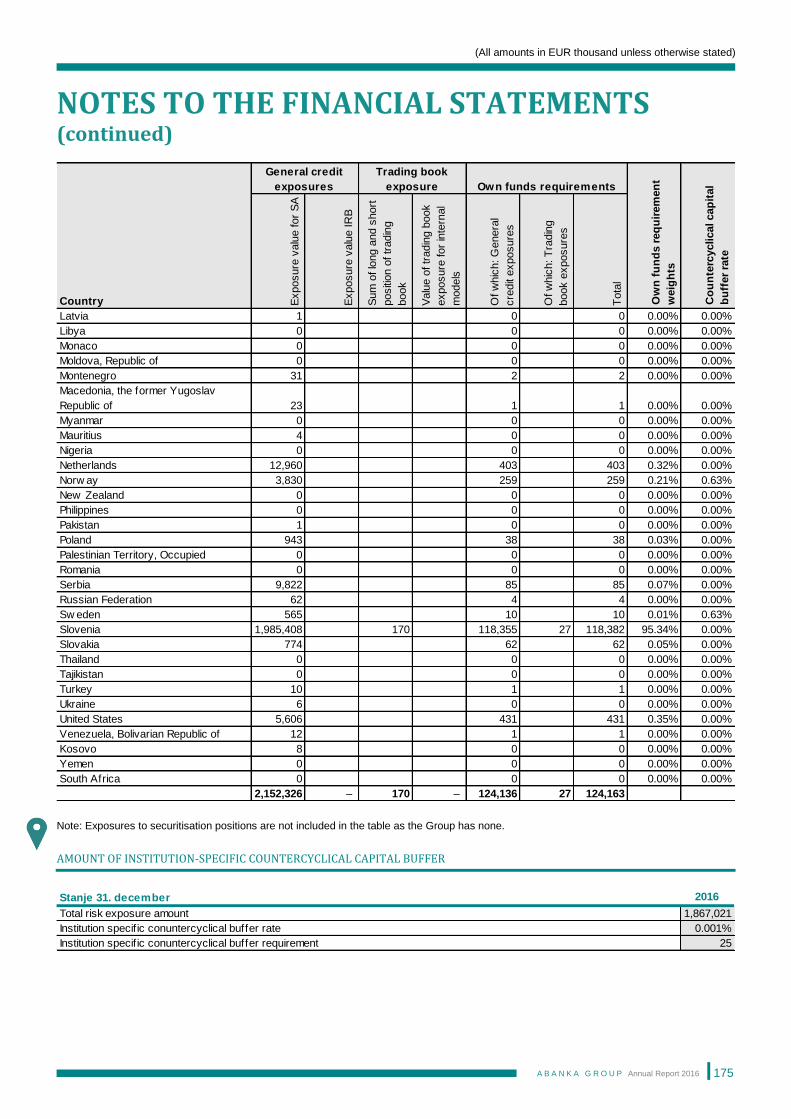
(All amounts in EUR thousand unless otherwise stated)
NOTES TO THE FINANCIAL STATEMENTS (continued)
A B A N K A G R O U P Annual Report 2016
175
Note: Exposures to securitisation positions are not included in the table as the Group has none.
AMOUNT OF INSTITUTION-SPECIFIC COUNTERCYCLICAL CAPITAL BUFFER
Exposure
valu
e for
SA
Exposure
valu
e IR
B
Sum
of lo
ng a
nd s
hort
positi
on o
f tr
adin
g
book
Valu
e o
f tr
adin
g b
ook
exposure
for
inte
rnal
models
Of w
hic
h: G
enera
l
cre
dit
exposure
s
Of w
hic
h: T
radin
g
book e
xposure
s
Tota
l
Latvia 1 0 0 0.00% 0.00%
Libya 0 0 0 0.00% 0.00%
Monaco 0 0 0 0.00% 0.00%
Moldova, Republic of 0 0 0 0.00% 0.00%
Montenegro 31 2 2 0.00% 0.00%
Macedonia, the former Yugoslav
Republic of 23 1 1 0.00% 0.00%
Myanmar 0 0 0 0.00% 0.00%
Mauritius 4 0 0 0.00% 0.00%
Nigeria 0 0 0 0.00% 0.00%
Netherlands 12,960 403 403 0.32% 0.00%
Norw ay 3,830 259 259 0.21% 0.63%
New Zealand 0 0 0 0.00% 0.00%
Philippines 0 0 0 0.00% 0.00%
Pakistan 1 0 0 0.00% 0.00%
Poland 943 38 38 0.03% 0.00%
Palestinian Territory, Occupied 0 0 0 0.00% 0.00%
Romania 0 0 0 0.00% 0.00%
Serbia 9,822 85 85 0.07% 0.00%
Russian Federation 62 4 4 0.00% 0.00%
Sw eden 565 10 10 0.01% 0.63%
Slovenia 1,985,408 170 118,355 27 118,382 95.34% 0.00%
Slovakia 774 62 62 0.05% 0.00%
Thailand 0 0 0 0.00% 0.00%
Tajikistan 0 0 0 0.00% 0.00%
Turkey 10 1 1 0.00% 0.00%
Ukraine 6 0 0 0.00% 0.00%
United States 5,606 431 431 0.35% 0.00%
Venezuela, Bolivarian Republic of 12 1 1 0.00% 0.00%
Kosovo 8 0 0 0.00% 0.00%
Yemen 0 0 0 0.00% 0.00%
South Africa 0 0 0 0.00% 0.00%
2,152,326 – 170 – 124,136 27 124,163
Ow
n f
un
ds r
eq
uir
em
en
t
weig
hts
Co
un
terc
yclical cap
ital
bu
ffer
rate
Country
General credit
exposures
Trading book
exposure Own funds requirements
2016
1,867,021
0.001%
25
Stanje 31. december
Institution specific conuntercyclical buffer rate
Institution specific conuntercyclical buffer requirement
Total risk exposure amount
(All amounts in EUR thousand unless otherwise stated)
NOTES TO THE FINANCIAL STATEMENTS (continued)
A B A N K A G R O U P Annual Report 2016
176
2.4.5 Indicators of global systemic importance
The disclosures of information regarding the indicators of global systemic importance are laid down in Article 441 of Regulation
(EU) 575/2013 and the Commission Implementing Regulation (EU) 2016/818.
Institutions identified as G-SIIs disclose the values of the indicators of global systemic importance on an annual basis. Abanka
d.d. is not defined as a G-SII bank.
2.4.6 Internal capital adequacy assessment process
The internal capital adequacy assessment process is defined by two variables. The first variable represents the risks to which
the Group is exposed, going beyond the first pillar of capital requirements, while the second variable is the capital held by the
Group for covering risks and potential losses arising from such risks. A comparison of the internal assessment of capital
requirements and the internal assessment of capital indicates the Group's ability to cover all risks to which it is exposed.
Within the framework of the Internal Capital Adequacy Assessment Process (ICAAP), the Group upgraded existing methods for
calculating the internal assessments of capital requirements; continued to regularly monitor its risk profile and evaluated risk-
bearing capacity; set up and performed stress tests; and calculated the amount of its internal assessment of capital and internal
assessment of capital requirements for all important types of risks on a quarterly basis. The findings of the ICAAP process are
included in regular quarterly reports on the results of the Internal Capital Adequacy Assessment Process, which is
communicated to the members of the Management Board, the members of the Risk Management Committee, consisting of
senior management of the Bank, the members of the Risk Monitoring and Asset Liability Management Committee and the
Supervisory Board members.
As at 31 December 2016, the consolidated total capital ratio, Common Equity Tier 1 ratio and Additional Tier 1 capital ratio were
at 26.51% (non-consolidated 26.35%). In accordance with Regulation (EU) No 575/2013, the following own funds requirements
shall apply in the period from 1 January 2015 on: a Common Equity Tier 1 capital ratio at 4.5% or higher; a Tier 1 capital ratio at
6% or higher; and a total capital ratio at 8% or higher. As at 31 December 2016, the Group's capital adequacy ratios were above
the legally required levels. According to stress scenarios by the Bank of Slovenia the expected consolidated capital adequacy
ratio was 13.5% and the expected Common Equity Tier 1 capital ratio equalled 10.8%. As at the reporting date, the Group's
capital adequacy ratios were above the levels required by the Bank of Slovenia.
2.5 Operational risk management
Operational risk is the risk of loss resulting from inadequate or failed internal processes, people and systems or from external
events. The definition includes legal risk, model risk and outsourcing risk, but excludes strategic risk and reputational risk.
However, the realisation of operational risk may, as a consequence, compromise the Group’s reputation.
2.5.1 Operational risk management process
The operational risk strategy and management processes are set out in the Operational Risk Management Policy. In 2016,
the Group continued with the activities formulated in the Policy, which was updated in 2016 with current amendments. The
accompanying internal instructions were brought in line with the amended Policy, in order to involve all operational risk
management steps and define the Group’s appetite and tolerance for operational risk.
The objective of the operational risk management process is to establish procedures for reducing risk and limiting the
occurrence of losses from operational risk as well as to actively plan and implement measures aimed at reducing the frequency
and severity of loss events.
The operational risk management process includes:
• procedures of operational risk identification, measurement/assessment, monitoring (controlling) and mitigation;
• operational risk internal reporting.
(All amounts in EUR thousand unless otherwise stated)
NOTES TO THE FINANCIAL STATEMENTS (continued)
A B A N K A G R O U P Annual Report 2016
177
The Group regularly identifies and qualitatively assesses operational risk exposure, whilst also taking stock of preventive and
corrective measures in the case that potential loss events occur. The system of operational risk internal reporting in the Group
involves the entire staff and enables a quick reaction in the event of problems, since the Management Board and senior
management are involved in such reporting. If necessary, after each loss event, additional measures are to be taken, and
holders and implementation deadlines are to be set in order to prevent or reduce the possibility of reoccurrence, and with the
aim of improving operational risk management. Risk Management Department monitors the implementation of measures and
reports to the Risk Management Committee.
The structure and organisation of appropriate operational risk management in the Group involves employees at all levels
with different responsibilities and duties. Operational risk management and risk mitigation measures are decentralised and take
place in all organisational units. The Risk Management Department is in charge of coordinating the operational risk
management function.
Working within the Group are the Operational Risk Commission, which is responsible for the development of the operational risk
management system, and the Risk Management Committee, which is a collective decision-making body responsible for
directing and controlling operational risk management. The latter includes all senior managers and is chaired by a member of
the Management Board.
For the purpose of operational risk internal reporting, the Group uses an application developed in-house for recording loss
events. The recording application enables the recording of loss events (also anonymously). In the framework of loss event
reporting, the Group also collects information on legal risk. The risk management policy and processes are applied to legal r isk
in the same manner as other operational risk categories. The Group manages the legal risk arising from legal actions against
the Group in the same manner as other legal risks, i.e. by prudent and careful consideration of each case (if not outsourced)
and/or cautious selection of lawyers (if outsourced) to allow for quality representation of the Group. The Risk Management
Department is responsible for the preparation of summary quarterly reports on loss events, which are discussed by the
Operational Risk Commission and the Risk Management Committee. The Committee discusses major loss events in greater
detail, takes appropriate measures as they occur and monitors implementation of these measures. It also investigates all
operational risk profiles (assessed, realised, targeted) by organisational units and at the Group level. Moreover, the
Management Board and senior management are promptly informed of all major loss events. The Supervisory Board discusses
quarterly reports on exposure to various risks, including operational risk.
2.5.1.1 Operational risk mitigation
The operational risk measurement system includes operational risk identification and assessment and/or measurement
through the recording of potential loss events. For each identified potential loss event, the probability of its occurrence and the
seriousness of the consequences resulting from its occurrence are assessed.For assessment purposes a qualitative approach
is taken. Existing controls for reducing loss event occurrence have to be defined for each recorded potential loss event. For
significant loss events preventive measures, holders and implementation deadlines are also defined.
2.5.1.2. Operational risk mitigation
The Group carries out activities within the framework of operational risk hedging and reduction, which are based on the
identification, measurement, assessment, monitoring and internal reporting on operational risk. In addition, the Group performs
activities to mitigate the consequences of occurred loss events. The implementation of these activities is the responsibility of
individual organisational units. An analysis of the loss events which occurred during the last year was performed, indicating that
the human factor was the main source of losses arising from operational risks. Therefore, the Group is continuously introducing
measures for constant risk mitigation.
The Group has developed business continuity plans and disaster recovery plans, which are regularly updated, upgraded
and tested.
(All amounts in EUR thousand unless otherwise stated)
NOTES TO THE FINANCIAL STATEMENTS (continued)
A B A N K A G R O U P Annual Report 2016
178
3 CRITICAL ACCOUNTING ESTIMATES AND JUDGEMENTS IN APPLYING
ACCOUNTING POLICIES
The Group makes estimates and assumptions that affect the reported amounts of assets and liabilities within the next financial
year. Estimates and judgements are continually evaluated and based on historical experience and other factors, including
expectations of future events that are believed to be reasonable given the circumstances.
(a) Impairment losses on loans and advances
The Group constantly monitors the quality of its credit portfolio and assesses credit risk losses. In determining whether an
impairment loss should be recorded in the income statement, the Group makes judgements as to whether there is any
observable data indicating a measurable decrease in the estimated future cash flows from a portfolio of loans, before the
decrease can be identified with an individual loan in that portfolio. This evidence may include observable data indicating a
decline in the solvency of debtors, or a deterioration in economic conditions that correlates with defaults on assets in the group
of loans. Future cash flows are estimated on the basis of historical loss experience for assets with credit risk characteristics and
objective evidence of impairment similar to those in the group. Individual assessments of losses arising from credit risk are
made on the basis of projected future cash flows, taking into account all relevant information regarding the financial position and
payment status of the debtor. Cash flow projections are verified by the Risk Management Department. Minor exposures,
including loans to individuals, are collectively assessed. The methodology and assumptions used for estimating both the amount
and timing of future cash flows are reviewed regularly to reduce any differences between loss estimates and actual
loss experience.
The Group regularly measures the impact of the deterioration of the credit portfolio on the basis of the amount of credit risk
losses, on profit or loss, as well as on regulatory capital and the capital adequacy ratio of the Group. It employs sensitivity
analyses to provide additional information on potential credit risk losses and necessary impairments of financial assets. Two of
the analyses used to determine the impact of credit portfolio deterioration on the amount of credit risk loss are presented below.
The first sensitivity analysis assumes that 2% of A, B, C and D loans are downgraded by one credit rating category. Based on
data at the end of 2016, credit risk losses would increase by 2.2% (2015: 2.3%) or EUR 6 million (2015: EUR 7.5 million). The
second sensitivity analysis was conducted in accordance with the assumption that 1% of A, B and C loans are downgraded by
one credit rating category, 1% of these loans are downgraded by two credit rating categories and 2% of D-rated loans are
downgraded by one credit rating category. The result of this sensitivity analysis has shown that, based on data at the end of
2016, credit risk losses would rise by 3.9% (2015: 3.9%) or EUR 10.5 million (2015: EUR 12.9 million).
(b) Impairment of available-for-sale equity investments
The Group determines that available-for-sale equity investments are impaired when there has been a significant or prolonged
decline in their fair value below their cost.
In addition, the Group estimates the usual fluctuation in share prices. Impairment may also be appropriate when there is
evidence of deterioration in the financial health of the investee, industry and sector performance, changes in technology and
operational and financing cash flows. In 2016, this category contained no securities with a fair value lower than the cost.
(All amounts in EUR thousand unless otherwise stated)
NOTES TO THE FINANCIAL STATEMENTS (continued)
A B A N K A G R O U P Annual Report 2016
179
(c) Held-to-maturity investments
The Group follows the IAS 39 guidance on classifying non-derivative financial assets with fixed or determinable payments and
fixed maturity as held-to-maturity. This classification requires significant judgement. In making this judgement, the Bank
evaluates its intention and ability to hold such investments to maturity. If the Bank fails to keep these investments to maturity
other than for the specific circumstances (e.g. selling an insignificant amount close to maturity) the Bank is required to reclassify
the entire category as available-for-sale. The investments would therefore be measured at fair value and not at amortised cost.
If all held-to-maturity investments were to be so reclassified, the carrying value would increase by EUR 1,948 thousand (2015: a
EUR 2,754 thousand increase), with a corresponding entry in accumulated other comprehensive income in equity.
(d) Fair value of financial assets and liabilities
Financial instruments carried at fair value
Fair value is defined as the price achieved on the sale of an asset or paid to transfer a liability in an orderly transaction in the
principal (or, if not existent, in the most advantageous) market under current market conditions between participants at the
measurement date. Such a definition of price requires the market participants to be independent and unrelated, informed and
capable, willing and not forced to enter into a transaction.
When measuring fair value, it is assumed that an asset or liability is exchanged in an orderly transaction between market
participants under current market conditions at the measurement date, whether or not the price can be directly observed or
estimated by applying other valuation techniques.
Fair value hierarchy
In line with IFRS 13, the Group categorises financial instruments into three fair value levels based on the nature of inputs used
to determine fair value. Higher levels contain financial instruments whose fair value was measured by using directly observable
inputs (directly observable prices). Financial instruments, for which the fair value was also measured by using unobservable
inputs, are categorised into lower fair value levels. The level of inputs having the strongest impact on determining the fair value
of a financial instrument is taken into consideration. In cases where several types of inputs impact the determination of fair
value, the lowest level in the hierarchy of inputs is used.
• Level 1: The Group categorises financial instruments, for which the fair value was measured through direct price observation
at markets for identical financial instruments, to which the Group had access at the measurement date, into fair value Level 1.
Debt instruments must meet the detailed liquidity criteria stipulated in internal acts, while equity instruments listed on the
Ljubljana Stock Exchange are required to comply with the liquidity rules determined by the Ljubljana Stock Exchange.
• Level 2: The Group categorises financial instruments, for which the fair value was measured through direct price observation
at markets for similar financial instruments, into fair value Level 2. The Group categorises debt instruments into fair value level
2 if the fair value was measured using the direct observation of quoted prices by third parties (e.g. BGN, BVAL, etc.). In
addition, the Group categorises into fair value level 2 those financial instruments whose fair value was measured using inputs
which make it impossible to categorise a financial instrument into fair value Level 1, whilst the inputs are accessible at the
market and indirectly indicate the market conditions, or are derived from observable market prices or from observable quoted
prices for equal financial instruments from market participants or third parties, provided orderly transaction pricing and a
binding quote of a third party.
• Level 3: The Group categorises financial instruments, for which the fair value was measured using unobservable inputs, into
fair value Level 3. Unobservable inputs comprise assumptions and anticipations. In using this valuation technique, the Group
forms assumptions and anticipations in compliance with other market participants. In addition, the Group categorises into fair
value Level 3 the financial instruments whose fair value was measured by using insufficient or unknown inputs in applying the
selected valuation technique and those financial instruments whose fair value was measured on the basis of third party quoted
prices that do not indicate an orderly transaction or a binding quote of a third party. Equity securities and equity holdings for
which the fair value was measured using internal valuation methods are also classified into fair value level 3.
(All amounts in EUR thousand unless otherwise stated)
NOTES TO THE FINANCIAL STATEMENTS (continued)
A B A N K A G R O U P Annual Report 2016
180
Valuation techniques for financial instruments measured at fair value
Valuation techniques used in the measurement of fair value encourage maximising the use of relevant observable inputs and
minimising the use of unobservable inputs. The markets where inputs for the valuation of financial instruments can be observed
include organised exchange markets, dealer markets, brokered markets and principal-to-principal markets.
The Group measures the fair value of financial instruments by using directly observable market prices for identical assets or
liabilities, accessible to the Group at the measurement date. As a rule, in such cases the Group makes use of closing market
prices on the valuation cut-off date. The Group may further use quoted prices provided by market participants or third parties to
measure the fair value of financial instruments, provided that inputs stem from orderly transaction pricing and constitute a
binding quote of a third party. In case of several quotations, the Group may use the most favourable quotation.
If directly observable market prices for identical assets or liabilities are not available and, at the same, there are no quoted
prices available from market participants or third parties (provided orderly transaction pricing, and a binding quote of a third
party, or when the Group estimates that there is no active market for a financial instrument), a market approach or an income
approach valuation technique is used to determine fair value.
The fair value of equity securities for which there is no active market, or no market price is available, is mainly determined using
a yield-based valuation technique, namely the discounted cash flow method. When a sufficient number of similar listed
companies exists, the Group uses a market-based valuation method, namely the method of similar listed companies.
The valuation of debt securities is based on a market-based valuation method using the method of similar companies.
Valuation of derivatives is based on discounting the expected future cash flows estimated on the basis of market information,
such as interest rates and exchange rates. The Group applies the Garman-Kohlhagen model for the valuation of European-style
currency options, and the Barone-Adesi and Whaley model for American currency options valuation. The Blacks model is used
for the valuation of interest options.
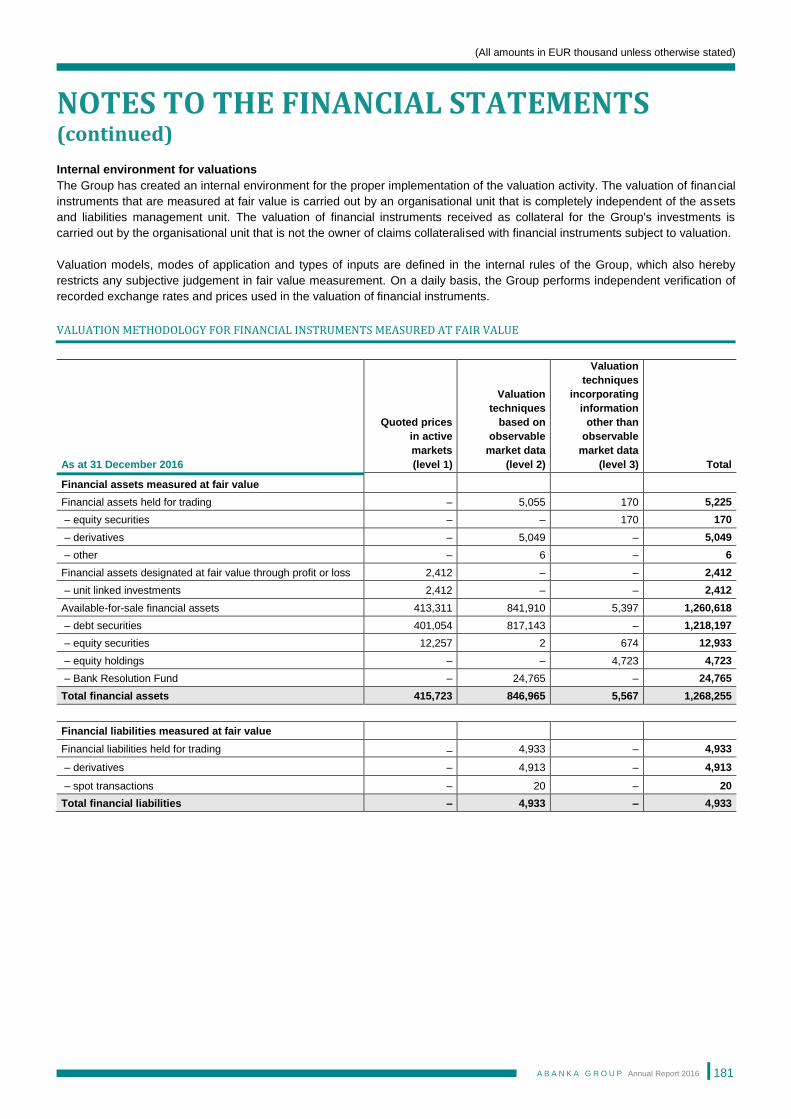
(All amounts in EUR thousand unless otherwise stated)
NOTES TO THE FINANCIAL STATEMENTS (continued)
A B A N K A G R O U P Annual Report 2016
181
Internal environment for valuations
The Group has created an internal environment for the proper implementation of the valuation activity. The valuation of financial
instruments that are measured at fair value is carried out by an organisational unit that is completely independent of the assets
and liabilities management unit. The valuation of financial instruments received as collateral for the Group's investments is
carried out by the organisational unit that is not the owner of claims collateralised with financial instruments subject to valuation.
Valuation models, modes of application and types of inputs are defined in the internal rules of the Group, which also hereby
restricts any subjective judgement in fair value measurement. On a daily basis, the Group performs independent verification of
recorded exchange rates and prices used in the valuation of financial instruments.
VALUATION METHODOLOGY FOR FINANCIAL INSTRUMENTS MEASURED AT FAIR VALUE
As at 31 December 2016
Quoted prices
in active
markets
(level 1)
Valuation
techniques
based on
observable
market data
(level 2)
Valuation
techniques
incorporating
information
other than
observable
market data
(level 3) Total
Financial assets measured at fair value
Financial assets held for trading – 5,055 170 5,225
– equity securities – – 170 170
– derivatives – 5,049 – 5,049
– other – 6 – 6
Financial assets designated at fair value through profit or loss 2,412 – – 2,412
– unit linked investments 2,412 – – 2,412
Available-for-sale financial assets 413,311 841,910 5,397 1,260,618
– debt securities 401,054 817,143 – 1,218,197
– equity securities 12,257 2 674 12,933
– equity holdings – – 4,723 4,723
– Bank Resolution Fund – 24,765 – 24,765
Total financial assets 415,723 846,965 5,567 1,268,255
Financial liabilities measured at fair value
Financial liabilities held for trading – 4,933 – 4,933
– derivatives – 4,913 – 4,913
– spot transactions – 20 – 20
Total financial liabilities – 4,933 – 4,933
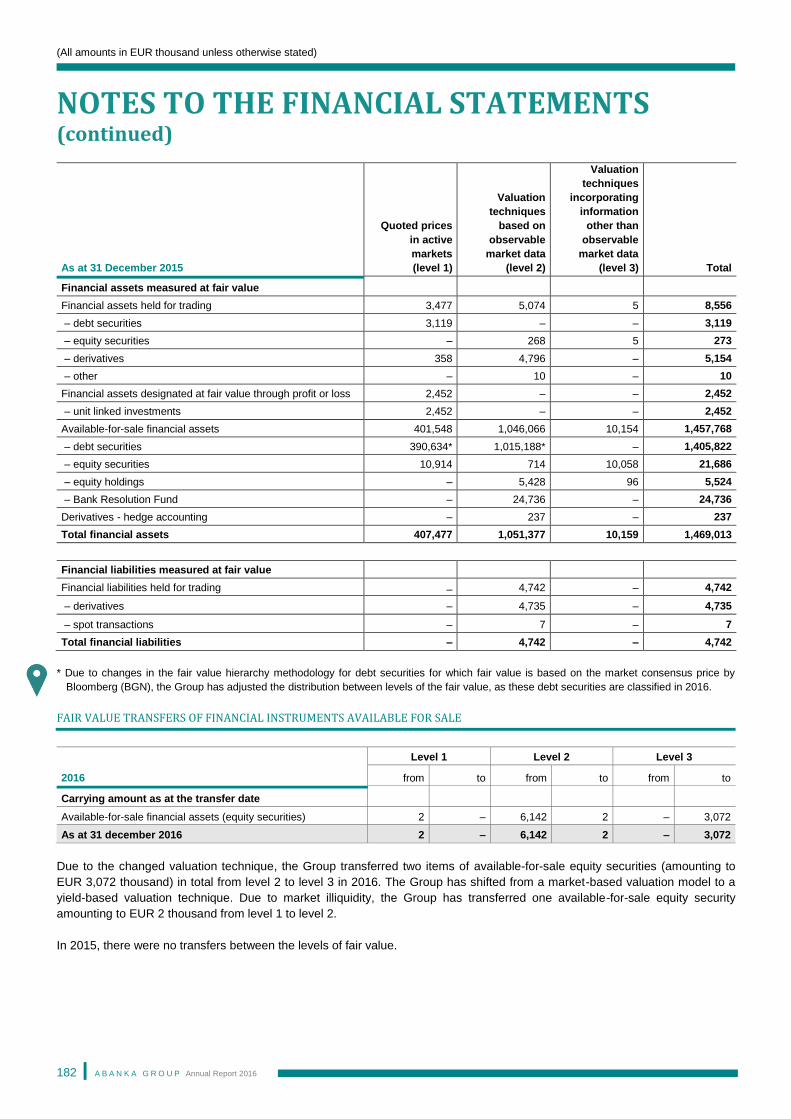
(All amounts in EUR thousand unless otherwise stated)
NOTES TO THE FINANCIAL STATEMENTS (continued)
A B A N K A G R O U P Annual Report 2016
182
As at 31 December 2015
Quoted prices
in active
markets
(level 1)
Valuation
techniques
based on
observable
market data
(level 2)
Valuation
techniques
incorporating
information
other than
observable
market data
(level 3) Total
Financial assets measured at fair value
Financial assets held for trading 3,477 5,074 5 8,556
– debt securities 3,119 – – 3,119
– equity securities – 268 5 273
– derivatives 358 4,796 – 5,154
– other – 10 – 10
Financial assets designated at fair value through profit or loss 2,452 – – 2,452
– unit linked investments 2,452 – – 2,452
Available-for-sale financial assets 401,548 1,046,066 10,154 1,457,768
– debt securities 390,634* 1,015,188* – 1,405,822
– equity securities 10,914 714 10,058 21,686
– equity holdings – 5,428 96 5,524
– Bank Resolution Fund – 24,736 – 24,736
Derivatives - hedge accounting – 237 – 237
Total financial assets 407,477 1,051,377 10,159 1,469,013
Financial liabilities measured at fair value
Financial liabilities held for trading – 4,742 – 4,742
– derivatives – 4,735 – 4,735
– spot transactions – 7 – 7
Total financial liabilities – 4,742 – 4,742
* Due to changes in the fair value hierarchy methodology for debt securities for which fair value is based on the market consensus price by
Bloomberg (BGN), the Group has adjusted the distribution between levels of the fair value, as these debt securities are classified in 2016.
FAIR VALUE TRANSFERS OF FINANCIAL INSTRUMENTS AVAILABLE FOR SALE
2016
Level 1 Level 2 Level 3
from to from to from to
Carrying amount as at the transfer date
Available-for-sale financial assets (equity securities) 2 – 6,142 2 – 3,072
As at 31 december 2016 2 – 6,142 2 – 3,072
Due to the changed valuation technique, the Group transferred two items of available-for-sale equity securities (amounting to
EUR 3,072 thousand) in total from level 2 to level 3 in 2016. The Group has shifted from a market-based valuation model to a
yield-based valuation technique. Due to market illiquidity, the Group has transferred one available-for-sale equity security
amounting to EUR 2 thousand from level 1 to level 2.
In 2015, there were no transfers between the levels of fair value.
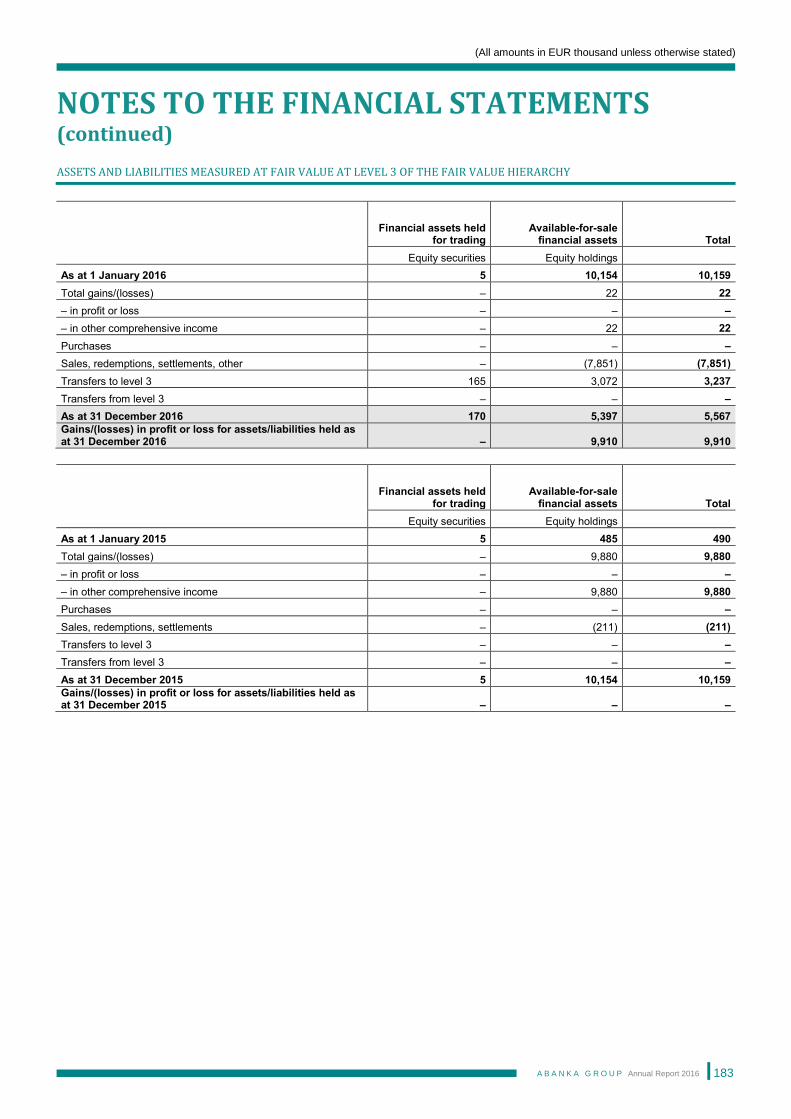
(All amounts in EUR thousand unless otherwise stated)
NOTES TO THE FINANCIAL STATEMENTS (continued)
A B A N K A G R O U P Annual Report 2016
183
ASSETS AND LIABILITIES MEASURED AT FAIR VALUE AT LEVEL 3 OF THE FAIR VALUE HIERARCHY
Financial assets held for trading
Available-for-sale financial assets Total
Equity securities Equity holdings
As at 1 January 2016 5 10,154 10,159
Total gains/(losses) – 22 22
– in profit or loss – – –
– in other comprehensive income – 22 22
Purchases – – –
Sales, redemptions, settlements, other – (7,851) (7,851)
Transfers to level 3 165 3,072 3,237
Transfers from level 3 – – –
As at 31 December 2016 170 5,397 5,567
Gains/(losses) in profit or loss for assets/liabilities held as at 31 December 2016 – 9,910 9,910
Financial assets held for trading
Available-for-sale financial assets Total
Equity securities Equity holdings
As at 1 January 2015 5 485 490
Total gains/(losses) – 9,880 9,880
– in profit or loss – – –
– in other comprehensive income – 9,880 9,880
Purchases – – –
Sales, redemptions, settlements – (211) (211)
Transfers to level 3 – – –
Transfers from level 3 – – –
As at 31 December 2015 5 10,154 10,159
Gains/(losses) in profit or loss for assets/liabilities held as at 31 December 2015 – – –
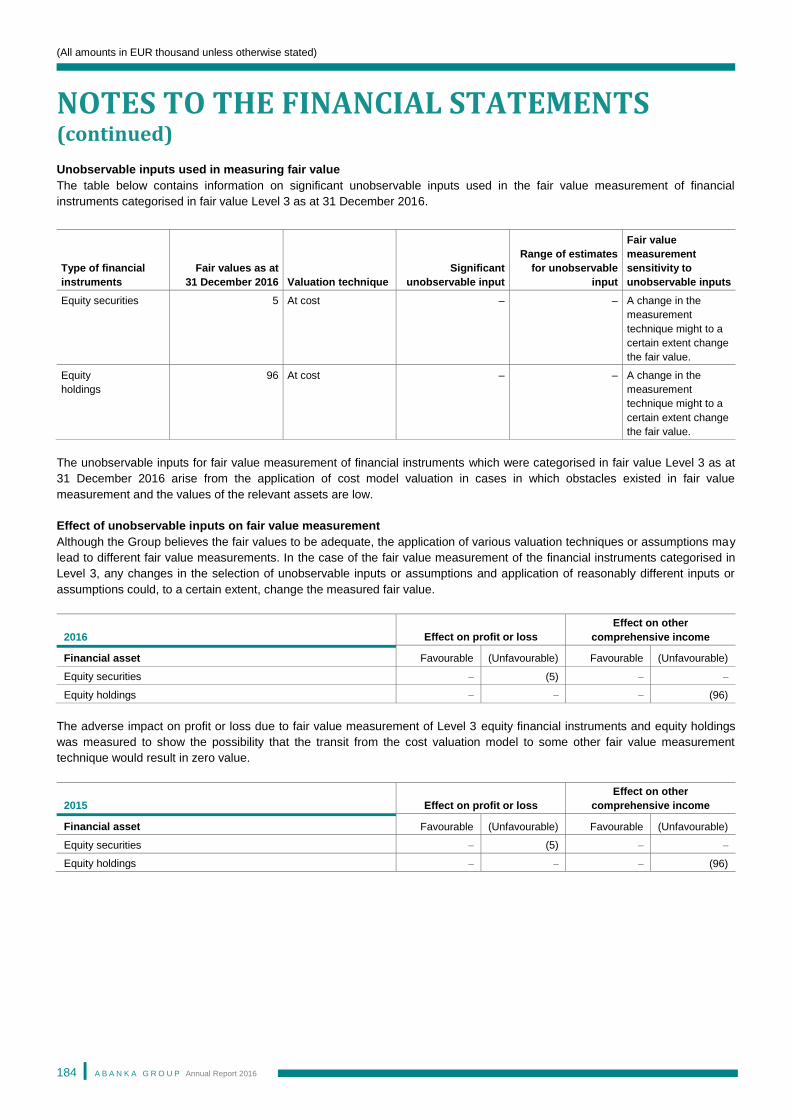
(All amounts in EUR thousand unless otherwise stated)
NOTES TO THE FINANCIAL STATEMENTS (continued)
A B A N K A G R O U P Annual Report 2016
184
Unobservable inputs used in measuring fair value
The table below contains information on significant unobservable inputs used in the fair value measurement of financial
instruments categorised in fair value Level 3 as at 31 December 2016.
Type of financial
instruments
Fair values as at
31 December 2016 Valuation technique
Significant
unobservable input
Range of estimates
for unobservable
input
Fair value
measurement
sensitivity to
unobservable inputs
Equity securities 5 At cost – – A change in the
measurement
technique might to a
certain extent change
the fair value.
Equity
holdings
96 At cost – – A change in the
measurement
technique might to a
certain extent change
the fair value.
The unobservable inputs for fair value measurement of financial instruments which were categorised in fair value Level 3 as at
31 December 2016 arise from the application of cost model valuation in cases in which obstacles existed in fair value
measurement and the values of the relevant assets are low.
Effect of unobservable inputs on fair value measurement
Although the Group believes the fair values to be adequate, the application of various valuation techniques or assumptions may
lead to different fair value measurements. In the case of the fair value measurement of the financial instruments categorised in
Level 3, any changes in the selection of unobservable inputs or assumptions and application of reasonably different inputs or
assumptions could, to a certain extent, change the measured fair value.
2016 Effect on profit or loss
Effect on other
comprehensive income
Financial asset Favourable (Unfavourable) Favourable (Unfavourable)
Equity securities – (5) – –
Equity holdings – – – (96)
The adverse impact on profit or loss due to fair value measurement of Level 3 equity financial instruments and equity holdings
was measured to show the possibility that the transit from the cost valuation model to some other fair value measurement
technique would result in zero value.
2015 Effect on profit or loss
Effect on other
comprehensive income
Financial asset Favourable (Unfavourable) Favourable (Unfavourable)
Equity securities – (5) – –
Equity holdings – – – (96)
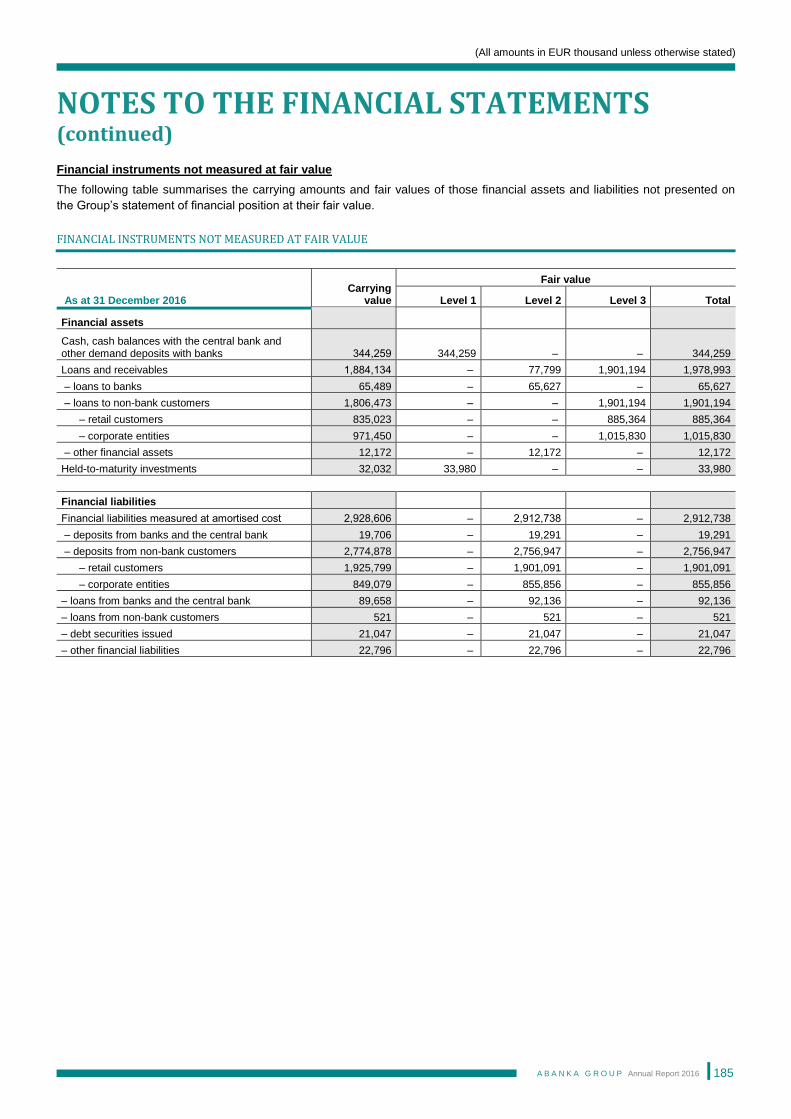
(All amounts in EUR thousand unless otherwise stated)
NOTES TO THE FINANCIAL STATEMENTS (continued)
A B A N K A G R O U P Annual Report 2016
185
Financial instruments not measured at fair value
The following table summarises the carrying amounts and fair values of those financial assets and liabilities not presented on
the Group’s statement of financial position at their fair value.
FINANCIAL INSTRUMENTS NOT MEASURED AT FAIR VALUE
As at 31 December 2016 Carrying
value
Fair value
Level 1 Level 2 Level 3 Total
Financial assets
Cash, cash balances with the central bank and other demand deposits with banks 344,259 344,259 – – 344,259
Loans and receivables 1,884,134 – 77,799 1,901,194 1,978,993
– loans to banks 65,489 – 65,627 – 65,627
– loans to non-bank customers 1,806,473 – – 1,901,194 1,901,194
– retail customers 835,023 – – 885,364 885,364
– corporate entities 971,450 – – 1,015,830 1,015,830
– other financial assets 12,172 – 12,172 – 12,172
Held-to-maturity investments 32,032 33,980 – – 33,980
Financial liabilities
Financial liabilities measured at amortised cost 2,928,606 – 2,912,738 – 2,912,738
– deposits from banks and the central bank 19,706 – 19,291 – 19,291
– deposits from non-bank customers 2,774,878 – 2,756,947 – 2,756,947
– retail customers 1,925,799 – 1,901,091 – 1,901,091
– corporate entities 849,079 – 855,856 – 855,856
– loans from banks and the central bank 89,658 – 92,136 – 92,136
– loans from non-bank customers 521 – 521 – 521
– debt securities issued 21,047 – 21,047 – 21,047
– other financial liabilities 22,796 – 22,796 – 22,796
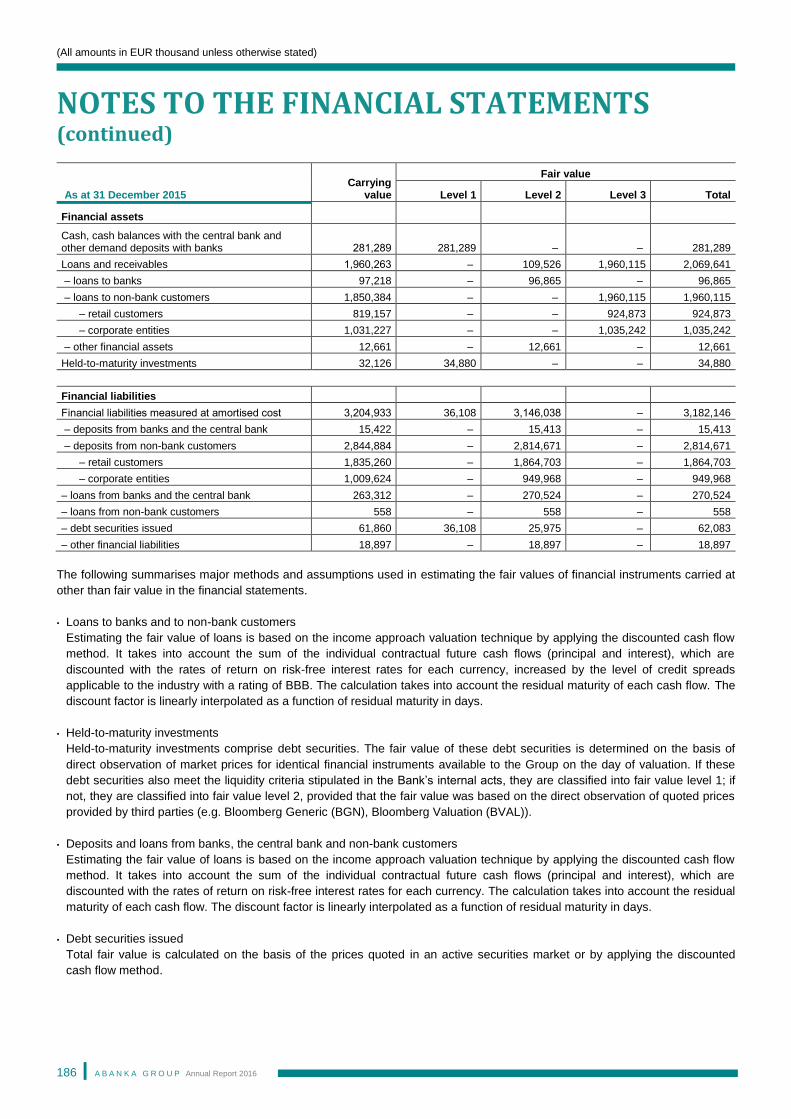
(All amounts in EUR thousand unless otherwise stated)
NOTES TO THE FINANCIAL STATEMENTS (continued)
A B A N K A G R O U P Annual Report 2016
186
As at 31 December 2015 Carrying
value
Fair value
Level 1 Level 2 Level 3 Total
Financial assets
Cash, cash balances with the central bank and other demand deposits with banks 281,289 281,289 – – 281,289
Loans and receivables 1,960,263 – 109,526 1,960,115 2,069,641
– loans to banks 97,218 – 96,865 – 96,865
– loans to non-bank customers 1,850,384 – – 1,960,115 1,960,115
– retail customers 819,157 – – 924,873 924,873
– corporate entities 1,031,227 – – 1,035,242 1,035,242
– other financial assets 12,661 – 12,661 – 12,661
Held-to-maturity investments 32,126 34,880 – – 34,880
Financial liabilities
Financial liabilities measured at amortised cost 3,204,933 36,108 3,146,038 – 3,182,146
– deposits from banks and the central bank 15,422 – 15,413 – 15,413
– deposits from non-bank customers 2,844,884 – 2,814,671 – 2,814,671
– retail customers 1,835,260 – 1,864,703 – 1,864,703
– corporate entities 1,009,624 – 949,968 – 949,968
– loans from banks and the central bank 263,312 – 270,524 – 270,524
– loans from non-bank customers 558 – 558 – 558
– debt securities issued 61,860 36,108 25,975 – 62,083
– other financial liabilities 18,897 – 18,897 – 18,897
The following summarises major methods and assumptions used in estimating the fair values of financial instruments carried at
other than fair value in the financial statements.
• Loans to banks and to non-bank customers
Estimating the fair value of loans is based on the income approach valuation technique by applying the discounted cash flow
method. It takes into account the sum of the individual contractual future cash flows (principal and interest), which are
discounted with the rates of return on risk-free interest rates for each currency, increased by the level of credit spreads
applicable to the industry with a rating of BBB. The calculation takes into account the residual maturity of each cash flow. The
discount factor is linearly interpolated as a function of residual maturity in days.
• Held-to-maturity investments
Held-to-maturity investments comprise debt securities. The fair value of these debt securities is determined on the basis of
direct observation of market prices for identical financial instruments available to the Group on the day of valuation. If these
debt securities also meet the liquidity criteria stipulated in the Bank’s internal acts, they are classified into fair value level 1; if
not, they are classified into fair value level 2, provided that the fair value was based on the direct observation of quoted prices
provided by third parties (e.g. Bloomberg Generic (BGN), Bloomberg Valuation (BVAL)).
• Deposits and loans from banks, the central bank and non-bank customers
Estimating the fair value of loans is based on the income approach valuation technique by applying the discounted cash flow
method. It takes into account the sum of the individual contractual future cash flows (principal and interest), which are
discounted with the rates of return on risk-free interest rates for each currency. The calculation takes into account the residual
maturity of each cash flow. The discount factor is linearly interpolated as a function of residual maturity in days.
• Debt securities issued
Total fair value is calculated on the basis of the prices quoted in an active securities market or by applying the discounted
cash flow method.
(All amounts in EUR thousand unless otherwise stated)
NOTES TO THE FINANCIAL STATEMENTS (continued)
A B A N K A G R O U P Annual Report 2016
187
4 SEGMENT ANALYSES
(a) By business segment
The Group provides services in three business segments:
• Retail banking – incorporating personal accounts (of residents and non-residents), savings accounts, domestic and foreign
currency fixed-term deposits, annuity and dedicated savings, online banking, mobile banking, AbaSMS mobile service, loans,
account overdrafts, insurance services, funds, payment cards, Abacent, gold bullion, safe deposit boxes, MoneyGram, “design
your own card” (Oblikuj si kartico!), payment transactions and payment instruments, e-account;
• Corporate banking – incorporating transaction accounts, account overdrafts, loans and deposits with different terms, payment
cards, certificates of deposit, documentary operations, guarantees, letters of credit, payment transactions and payment
instruments, Abatočka, cash management, Abakredit, e-account, online banking, mobile banking, on-line payment service,
AbaSMS mobile service; and
• Financial markets – incorporating trading with financial instruments, liquidity management, investment banking and inter-bank
operations.
The “Other” segment includes the activities of the Group that relate to custody and administrative services, activities of
subsidiaries (leasing, factoring and other activities), the impact of inter-company transactions and the valuation of associates in
the consolidated statements.
For the purpose of intra-company accounting, transactions between segments were treated on the basis of an agreed and
harmonised set of transfer instruments to account for the transfers of various effects (internal transfers/allocation of indirect
costs by business segment, debiting overheads to commercial segments, internal transfers of earnings between business
segments).
Liabilities, interest expenses and other non-interest expenses from financing were allocated to those business segments that
generated them.
Assets and liabilities by business segment represent a majority of the statement of financial position assets and liabilities, but
they exclude tax receivables that are disclosed at the group level and not allocated to business segments.
Business segment results depend on the system of opportunity interest rates, which is based on alternative/opportunity interest
rates applied to interest-bearing assets and liabilities items, aimed at establishing opportunity income and expenses. This
serves as a basis for calculating opportunity interest margins for individual segments of assets (as the difference between
earned income and opportunity income) as well as opportunity interest margins for individual segments of liabilities (as the
difference between opportunity expenses and incurred expenses). This is also the basis for establishing positive and negative
opportunity interest margins and consequently positive or negative contributions to the performance of individual
business segments.
Business segments are reported to the Management Board of the Bank.
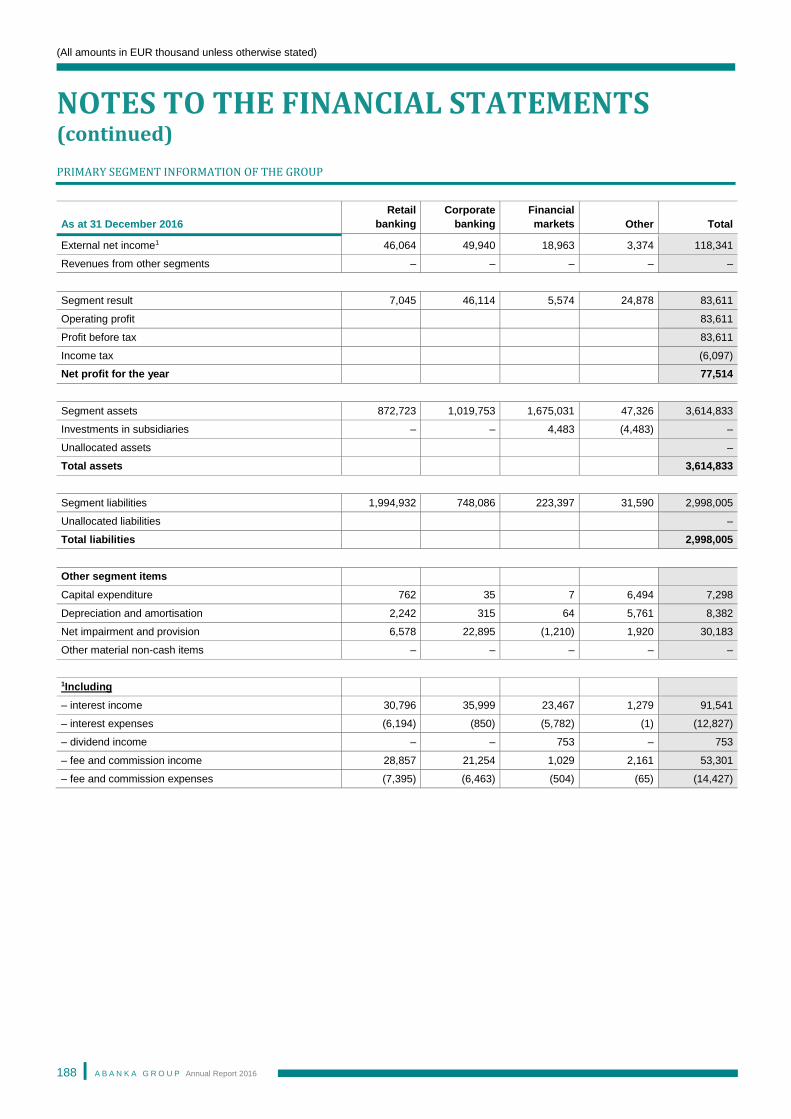
(All amounts in EUR thousand unless otherwise stated)
NOTES TO THE FINANCIAL STATEMENTS (continued)
A B A N K A G R O U P Annual Report 2016
188
PRIMARY SEGMENT INFORMATION OF THE GROUP
As at 31 December 2016
Retail
banking
Corporate
banking
Financial
markets Other Total
External net income1 46,064 49,940 18,963 3,374 118,341
Revenues from other segments – – – – –
Segment result 7,045 46,114 5,574 24,878 83,611
Operating profit 83,611
Profit before tax 83,611
Income tax (6,097)
Net profit for the year 77,514
Segment assets 872,723 1,019,753 1,675,031 47,326 3,614,833
Investments in subsidiaries – – 4,483 (4,483) –
Unallocated assets –
Total assets 3,614,833
Segment liabilities 1,994,932 748,086 223,397 31,590 2,998,005
Unallocated liabilities –
Total liabilities 2,998,005
Other segment items
Capital expenditure 762 35 7 6,494 7,298
Depreciation and amortisation 2,242 315 64 5,761 8,382
Net impairment and provision 6,578 22,895 (1,210) 1,920 30,183
Other material non-cash items – – – – –
1Including
– interest income 30,796 35,999 23,467 1,279 91,541
– interest expenses (6,194) (850) (5,782) (1) (12,827)
– dividend income – – 753 – 753
– fee and commission income 28,857 21,254 1,029 2,161 53,301
– fee and commission expenses (7,395) (6,463) (504) (65) (14,427)
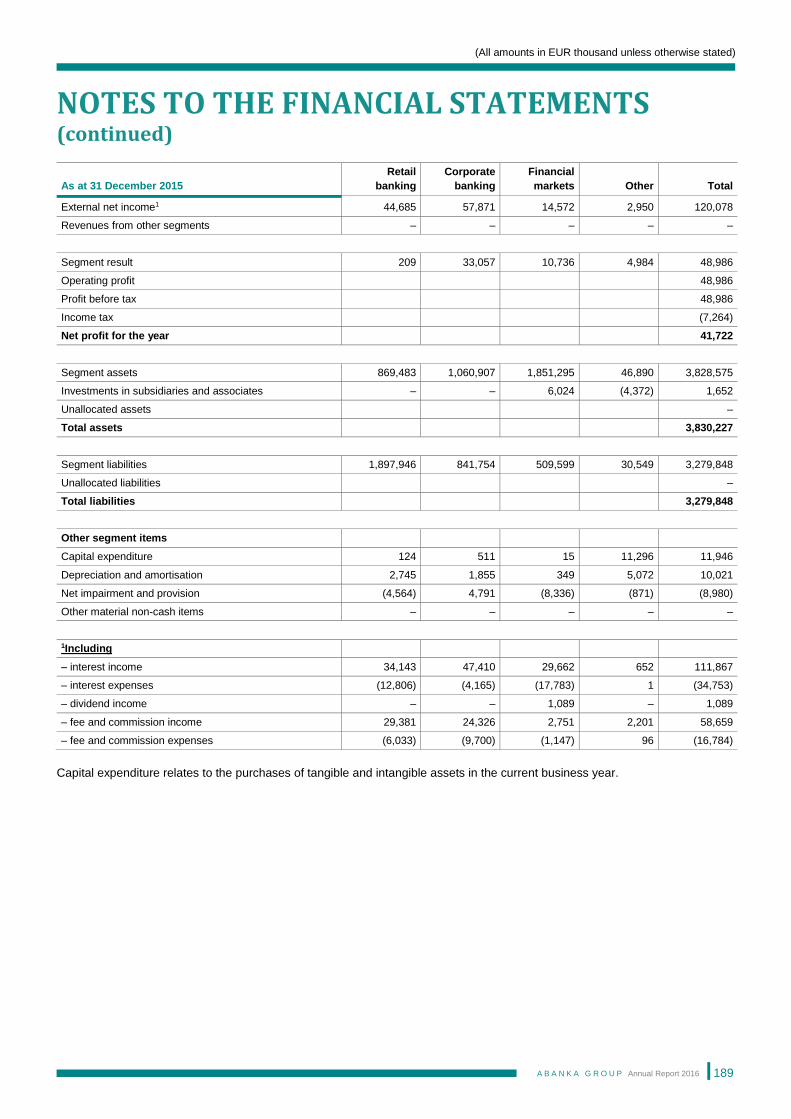
(All amounts in EUR thousand unless otherwise stated)
NOTES TO THE FINANCIAL STATEMENTS (continued)
A B A N K A G R O U P Annual Report 2016
189
As at 31 December 2015
Retail
banking
Corporate
banking
Financial
markets Other Total
External net income1 44,685 57,871 14,572 2,950 120,078
Revenues from other segments – – – – –
Segment result 209 33,057 10,736 4,984 48,986
Operating profit 48,986
Profit before tax 48,986
Income tax (7,264)
Net profit for the year 41,722
Segment assets 869,483 1,060,907 1,851,295 46,890 3,828,575
Investments in subsidiaries and associates – – 6,024 (4,372) 1,652
Unallocated assets –
Total assets 3,830,227
Segment liabilities 1,897,946 841,754 509,599 30,549 3,279,848
Unallocated liabilities –
Total liabilities 3,279,848
Other segment items
Capital expenditure 124 511 15 11,296 11,946
Depreciation and amortisation 2,745 1,855 349 5,072 10,021
Net impairment and provision (4,564) 4,791 (8,336) (871) (8,980)
Other material non-cash items – – – – –
1Including
– interest income 34,143 47,410 29,662 652 111,867
– interest expenses (12,806) (4,165) (17,783) 1 (34,753)
– dividend income – – 1,089 – 1,089
– fee and commission income 29,381 24,326 2,751 2,201 58,659
– fee and commission expenses (6,033) (9,700) (1,147) 96 (16,784)
Capital expenditure relates to the purchases of tangible and intangible assets in the current business year.
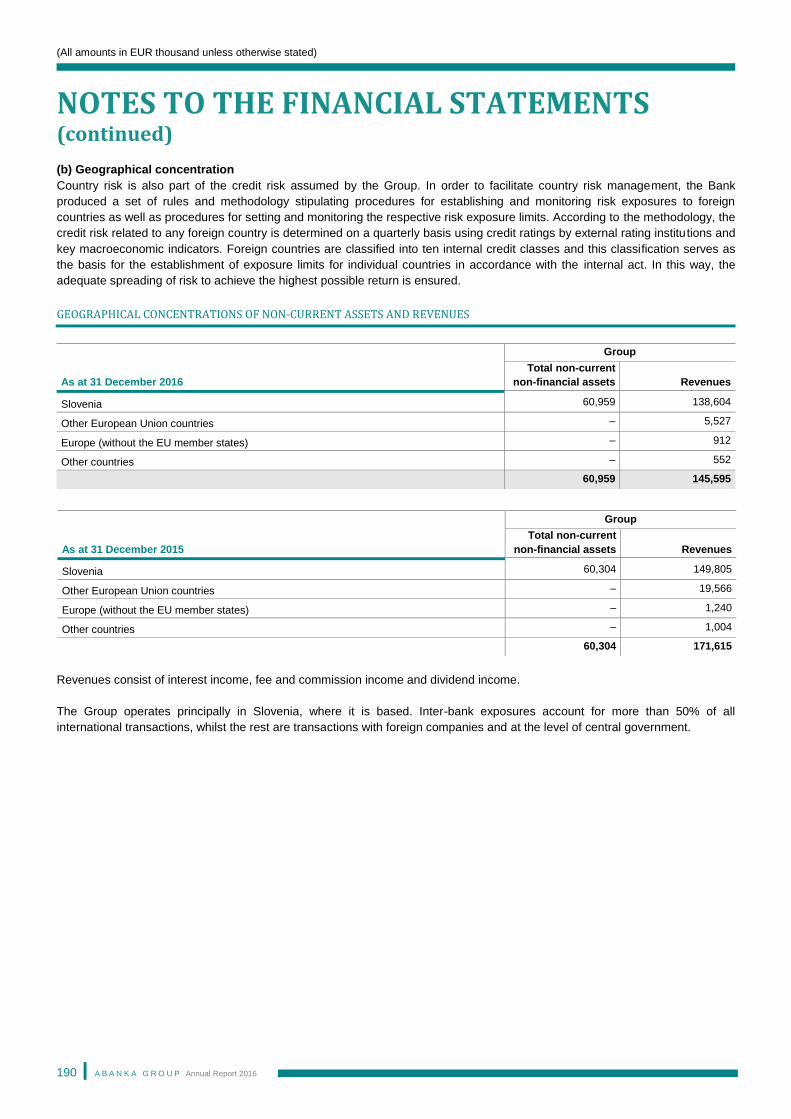
(All amounts in EUR thousand unless otherwise stated)
NOTES TO THE FINANCIAL STATEMENTS (continued)
A B A N K A G R O U P Annual Report 2016
190
(b) Geographical concentration
Country risk is also part of the credit risk assumed by the Group. In order to facilitate country risk management, the Bank
produced a set of rules and methodology stipulating procedures for establishing and monitoring risk exposures to foreign
countries as well as procedures for setting and monitoring the respective risk exposure limits. According to the methodology, the
credit risk related to any foreign country is determined on a quarterly basis using credit ratings by external rating institutions and
key macroeconomic indicators. Foreign countries are classified into ten internal credit classes and this classification serves as
the basis for the establishment of exposure limits for individual countries in accordance with the internal act. In this way, the
adequate spreading of risk to achieve the highest possible return is ensured.
GEOGRAPHICAL CONCENTRATIONS OF NON-CURRENT ASSETS AND REVENUES
Revenues consist of interest income, fee and commission income and dividend income.
The Group operates principally in Slovenia, where it is based. Inter-bank exposures account for more than 50% of all
international transactions, whilst the rest are transactions with foreign companies and at the level of central government.
Group
As at 31 December 2016
Total non-current
non-financial assets
Revenues
Slovenia 60,959 138,604
Other European Union countries – 5,527
Europe (without the EU member states) – 912
Other countries – 552
60,959 145,595
Group
As at 31 December 2015
Total non-current
non-financial assets
Revenues
Slovenia 60,304 149,805
Other European Union countries – 19,566
Europe (without the EU member states) – 1,240
Other countries – 1,004
60,304 171,615
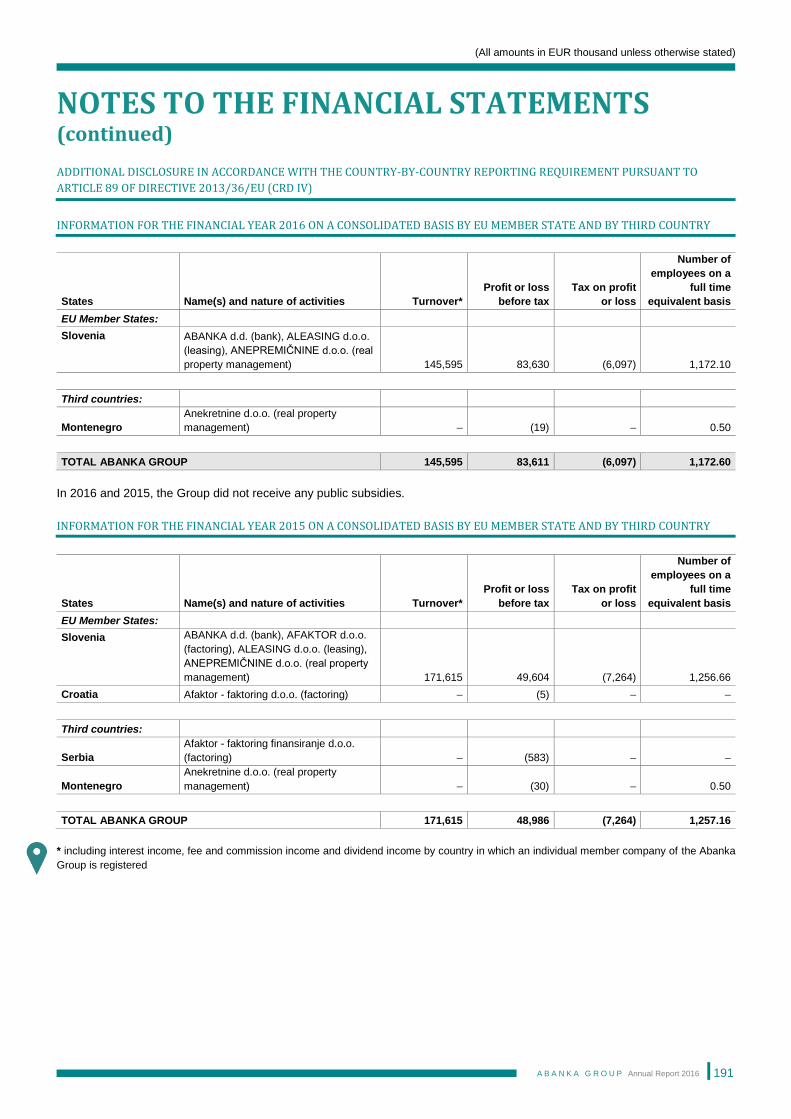
(All amounts in EUR thousand unless otherwise stated)
NOTES TO THE FINANCIAL STATEMENTS (continued)
A B A N K A G R O U P Annual Report 2016
191
ADDITIONAL DISCLOSURE IN ACCORDANCE WITH THE COUNTRY-BY-COUNTRY REPORTING REQUIREMENT PURSUANT TO
ARTICLE 89 OF DIRECTIVE 2013/36/EU (CRD IV)
INFORMATION FOR THE FINANCIAL YEAR 2016 ON A CONSOLIDATED BASIS BY EU MEMBER STATE AND BY THIRD COUNTRY
States Name(s) and nature of activities Turnover*
Profit or loss
before tax
Tax on profit
or loss
Number of
employees on a
full time
equivalent basis
EU Member States:
Slovenia ABANKA d.d. (bank), ALEASING d.o.o.
(leasing), ANEPREMIČNINE d.o.o. (real
property management) 145,595 83,630 (6,097) 1,172.10
Third countries:
Montenegro
Anekretnine d.o.o. (real property
management) – (19) – 0.50
TOTAL ABANKA GROUP 145,595 83,611 (6,097) 1,172.60
In 2016 and 2015, the Group did not receive any public subsidies.
INFORMATION FOR THE FINANCIAL YEAR 2015 ON A CONSOLIDATED BASIS BY EU MEMBER STATE AND BY THIRD COUNTRY
States Name(s) and nature of activities Turnover*
Profit or loss
before tax
Tax on profit
or loss
Number of
employees on a
full time
equivalent basis
EU Member States:
Slovenia ABANKA d.d. (bank), AFAKTOR d.o.o.
(factoring), ALEASING d.o.o. (leasing),
ANEPREMIČNINE d.o.o. (real property
management) 171,615 49,604 (7,264) 1,256.66
Croatia Afaktor - faktoring d.o.o. (factoring) – (5) – –
Third countries:
Serbia
Afaktor - faktoring finansiranje d.o.o.
(factoring) – (583) – –
Montenegro
Anekretnine d.o.o. (real property
management) – (30) – 0.50
TOTAL ABANKA GROUP 171,615 48,986 (7,264) 1,257.16
* including interest income, fee and commission income and dividend income by country in which an individual member company of the Abanka
Group is registered
(All amounts in EUR thousand unless otherwise stated)
NOTES TO THE FINANCIAL STATEMENTS (continued)
A B A N K A G R O U P Annual Report 2016
192
5 NET INTEREST INCOME
Abanka Group
2016 2015 2016 2015
Interest income
Loans and advances 67,344 81,666 68,481 82,318
– to banks 366 113 366 113
– to customers 66,978 81,553 68,115 82,205
Available-for-sale securities 20,609 23,094 20,609 23,094
Financial assets held to maturity 1,196 1,191 1,196 1,191
Financial assets held for trading 1,154 4,016 1,154 4,016
Derivatives - hedge accounting – 1,190 – 1,190
Other assets 101 58 101 58
90,404 111,215 91,541 111,867
Interest expenses
Deposits 8,029 21,648 8,029 21,648
– from banks 56 30 56 30
– from customers 7,973 21,618 7,973 21,618
Debt securities issued 1,318 4,326 1,318 4,326
Financial liabilities held for trading 1,113 3,936 1,113 3,936
Derivatives - hedge accounting – 7 – 7
Loans from banks and the central bank 1,347 4,378 1,347 4,378
Other liabilities 1,024 465 1,020 458
12,831 34,760 12,827 34,753
Net interest income 77,573 76,455 78,714 77,114
In 2016, interest income accrued on impaired financial assets of the Group amounted to EUR 1,787 thousand (2015: EUR 2,158
thousand).
6 DIVIDEND INCOME
Group
2016 2015
Held-for-trading securities 14 10
Available-for-sale securities 739 1,079
753 1,089
(All amounts in EUR thousand unless otherwise stated)
NOTES TO THE FINANCIAL STATEMENTS (continued)
A B A N K A G R O U P Annual Report 2016
193
7 NET FEE AND COMMISSION INCOME
BREAKDOWN BY TYPE OF TRANSACTION:
Abanka Group
2016 2015 2016 2015
Fee and commission income
Payment transactions 19,145 20,270 19,145 20,268
Transaction account management 6,660 7,593 6,650 7,580
Card and ATM operations 18,968 20,946 18,968 20,946
Lending operations and guarantees granted 4,455 5,283 4,450 5,279
Other services 4,083 4,528 4,088 4,586
53,311 58,620 53,301 58,659
Fee and commission expenses
Payment transactions 2,278 2,429 2,279 2,431
Card and ATM operations 11,442 13,486 11,442 13,486
Other services 643 728 706 867
14,363 16,643 14,427 16,784
Net fee and commission income 38,948 41,977 38,874 41,875
8 REALISED GAINS/LOSSES ON FINANCIAL ASSETS AND LIABILITIES NOT
MEASURED AT FAIR VALUE THROUGH PROFIT OR LOSS
Abanka Group
2016 2015 2016 2015
Net realised gains from available-for-sale financial assets 10,063 17,356 10,063 17,356
Realised losses from loans and other financial assets and liabilities (13) (132) (13) (132)
Realised gains from loans and other financial assets and liabilities 4,689 14,869 4,708 14,916
14,739 32,093 14,758 32,140
When Visa Europe Limited was sold to Visa Inc., Abanka as a Principal Member of Visa Europe Limited was entitled to a
participating share and newly issued Class C preference shares of Visa Inc., thus earning a profit of EUR 9,910 thousand in
June 2016.
Realised gains from loans in 2015 in the amount of EUR 9,714 thousand referred to the repayment of loans of ASA Aleasing.
(All amounts in EUR thousand unless otherwise stated)
NOTES TO THE FINANCIAL STATEMENTS (continued)
A B A N K A G R O U P Annual Report 2016
194
9 NET GAINS/LOSSES ON FINANCIAL ASSETS AND LIABILITIES HELD FOR TRADING
Group
2016 2015
Foreign exchange transaction gains 1,309 2,150
Net losses from derivatives – (323)
Realised gains from debt securities 1,044 535
Unrealised (losses)/gains from trading securities (103) 9
2,250 2,371
10 FAIR VALUE ADJUSTMENTS IN HEDGE ACCOUNTING
Group
2016 2015
Net profit from hedged instruments 238 999
Net loss from hedging derivatives – (1,115)
238 (116)
The transaction related to fair value hedging matured in February 2016 (Note 18).
11 NET OTHER OPERATING EXPENSES
Abanka Group
2016 2015 2016 2015
Other operating income
– income from non-banking services 7 6 7 6
– income from sale of vehicles, real estate and other – – 1,774 1,783
– other operating income 1,312 1,189 2,219 1,478
1,319 1,195 4,000 3,267
Other operating expenses
– financial services tax (4,465) (4,947) (4,502) (4,983)
– other taxes, contributions and other duties (28) (60) (44) (85)
– membership fees and similar (113) (160) (118) (173)
– Single Resolution Fund (SRF) (825) (2,998) (825) (2,998)
– other operating expenses (3,316) (5,699) (4,794) (6,244)
(8,747) (13,864) (10,283) (14,483)
Net other operating expenses (7,428) (12,669) (6,283) (11,216)
(All amounts in EUR thousand unless otherwise stated)
NOTES TO THE FINANCIAL STATEMENTS (continued)
A B A N K A G R O U P Annual Report 2016
195
12 ADMINISTRATIVE EXPENSES
Abanka Group
2016 2015 2016 2015
Staff costs 39,626 40,477 40,756 41,834
– gross salaries 34,514 35,324 35,490 36,489
– social security costs 2,139 2,246 2,201 2,323
– pension costs 2,759 2,665 2,843 2,776
– provisions for employee benefits (Note 33) 214 242 222 246
Professional services 15,444 17,198 16,280 18,101
Advertising and marketing 2,028 2,498 2,125 2,549
Other administrative expenses 2,659 2,525 2,742 2,585
IT and software costs 6,655 7,247 6,655 7,295
Rent payable 1,202 1,419 1,295 1,567
Other costs 632 640 818 834
68,246 72,004 70,671 74,765
Abanka Group
Amount spent1 for the auditor of the annual report: 2016 2015 2016 2015
– auditing of the annual report 139 77 156 98
– other assurance services – – – –
– other non-auditing services 32 2 35 2
– tax advisory services – – – –
171 79 191 100
1 Include amounts paid in each reporting year. 2 Compared to the previous year, the amount spent for auditing of the annual report is higher due to the different dynamics of payments.
Within the administrative expenses in 2016, EUR 2,091 thousand referred to costs of restructuring of the Bank and EUR 2,063
thousand to costs of restructuring of the Group (2015: EUR 2,568 thousand).
13 DEPRECIATION AND AMORTISATION
Abanka Group
Note 2016 2015 2016 2015
Property and equipment 25 4,149 4,624 4,933 5,240
Investment property 25 15 126 384 224
Intangible assets 25 3,021 4,471 3,065 4,557
7,185 9,221 8,382 10,021
Within the depreciation and amortisation costs in 2016, EUR 708 thousand referred to costs of restructuring (2015: EUR 471
thousand).
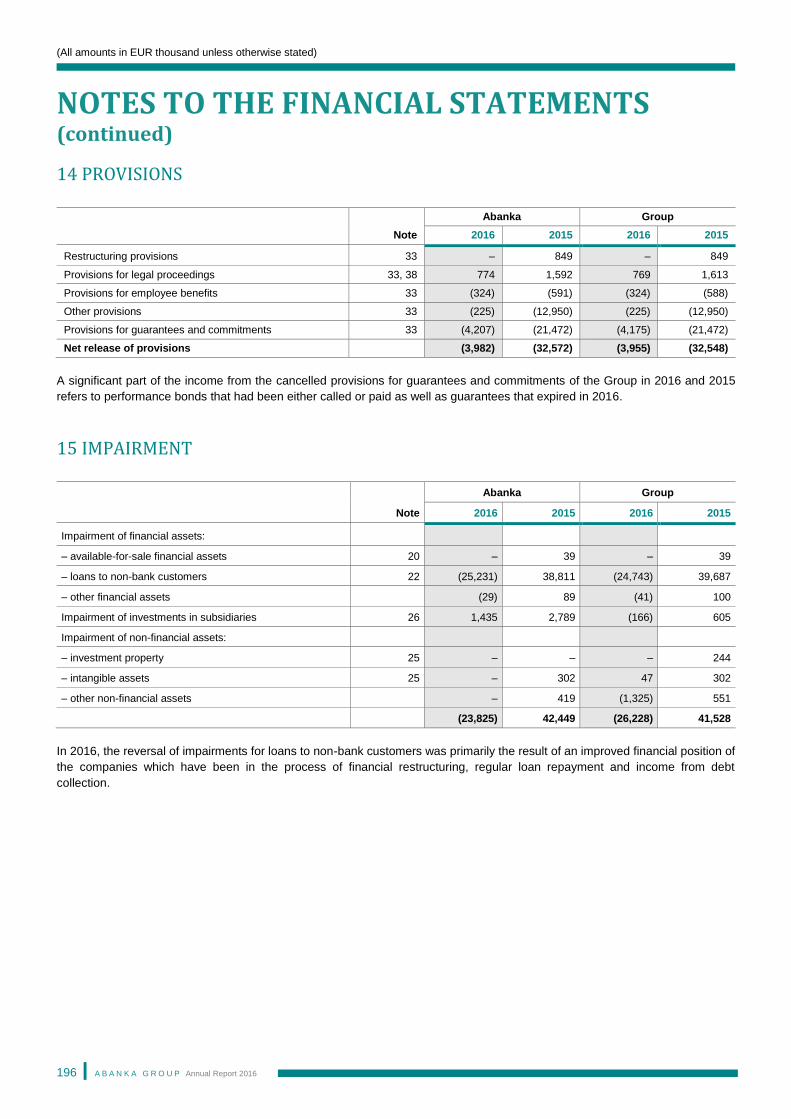
(All amounts in EUR thousand unless otherwise stated)
NOTES TO THE FINANCIAL STATEMENTS (continued)
A B A N K A G R O U P Annual Report 2016
196
14 PROVISIONS
Abanka Group
Note 2016 2015 2016 2015
Restructuring provisions 33 – 849 – 849
Provisions for legal proceedings 33, 38 774 1,592 769 1,613
Provisions for employee benefits 33 (324) (591) (324) (588)
Other provisions 33 (225) (12,950) (225) (12,950)
Provisions for guarantees and commitments 33 (4,207) (21,472) (4,175) (21,472)
Net release of provisions (3,982) (32,572) (3,955) (32,548)
A significant part of the income from the cancelled provisions for guarantees and commitments of the Group in 2016 and 2015
refers to performance bonds that had been either called or paid as well as guarantees that expired in 2016.
15 IMPAIRMENT
Abanka Group
Note 2016 2015 2016 2015
Impairment of financial assets:
– available-for-sale financial assets 20 – 39 – 39
– loans to non-bank customers 22 (25,231) 38,811 (24,743) 39,687
– other financial assets (29) 89 (41) 100
Impairment of investments in subsidiaries 26 1,435 2,789 (166) 605
Impairment of non-financial assets:
– investment property 25 – – – 244
– intangible assets 25 – 302 47 302
– other non-financial assets – 419 (1,325) 551
(23,825) 42,449 (26,228) 41,528
In 2016, the reversal of impairments for loans to non-bank customers was primarily the result of an improved financial position of
the companies which have been in the process of financial restructuring, regular loan repayment and income from debt
collection.
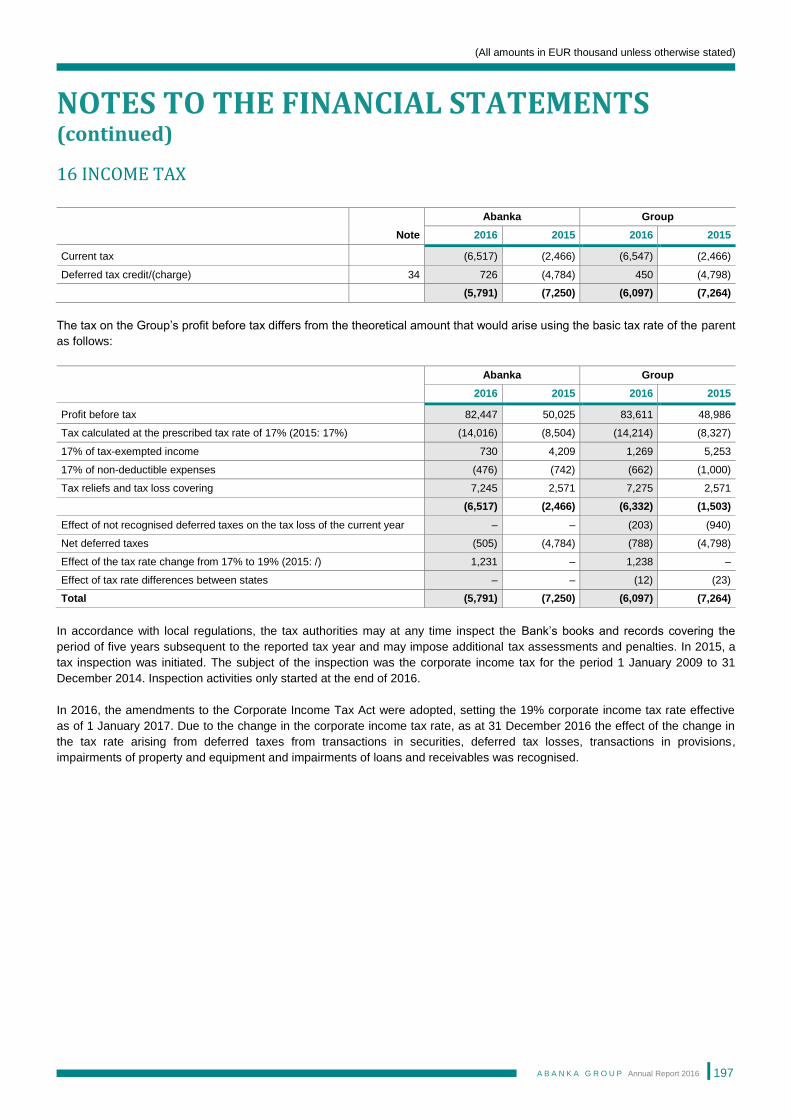
(All amounts in EUR thousand unless otherwise stated)
NOTES TO THE FINANCIAL STATEMENTS (continued)
A B A N K A G R O U P Annual Report 2016
197
16 INCOME TAX
Abanka Group
Note 2016 2015 2016 2015
Current tax (6,517) (2,466) (6,547) (2,466)
Deferred tax credit/(charge) 34 726 (4,784) 450 (4,798)
(5,791) (7,250) (6,097) (7,264)
The tax on the Group’s profit before tax differs from the theoretical amount that would arise using the basic tax rate of the parent
as follows:
Abanka Group
2016 2015 2016 2015
Profit before tax 82,447 50,025 83,611 48,986
Tax calculated at the prescribed tax rate of 17% (2015: 17%) (14,016) (8,504) (14,214) (8,327)
17% of tax-exempted income 730 4,209 1,269 5,253
17% of non-deductible expenses (476) (742) (662) (1,000)
Tax reliefs and tax loss covering 7,245 2,571 7,275 2,571
(6,517) (2,466) (6,332) (1,503)
Effect of not recognised deferred taxes on the tax loss of the current year – – (203) (940)
Net deferred taxes (505) (4,784) (788) (4,798)
Effect of the tax rate change from 17% to 19% (2015: /) 1,231 – 1,238 –
Effect of tax rate differences between states – – (12) (23)
Total (5,791) (7,250) (6,097) (7,264)
In accordance with local regulations, the tax authorities may at any time inspect the Bank’s books and records covering the
period of five years subsequent to the reported tax year and may impose additional tax assessments and penalties. In 2015, a
tax inspection was initiated. The subject of the inspection was the corporate income tax for the period 1 January 2009 to 31
December 2014. Inspection activities only started at the end of 2016.
In 2016, the amendments to the Corporate Income Tax Act were adopted, setting the 19% corporate income tax rate effective
as of 1 January 2017. Due to the change in the corporate income tax rate, as at 31 December 2016 the effect of the change in
the tax rate arising from deferred taxes from transactions in securities, deferred tax losses, transactions in provisions,
impairments of property and equipment and impairments of loans and receivables was recognised.
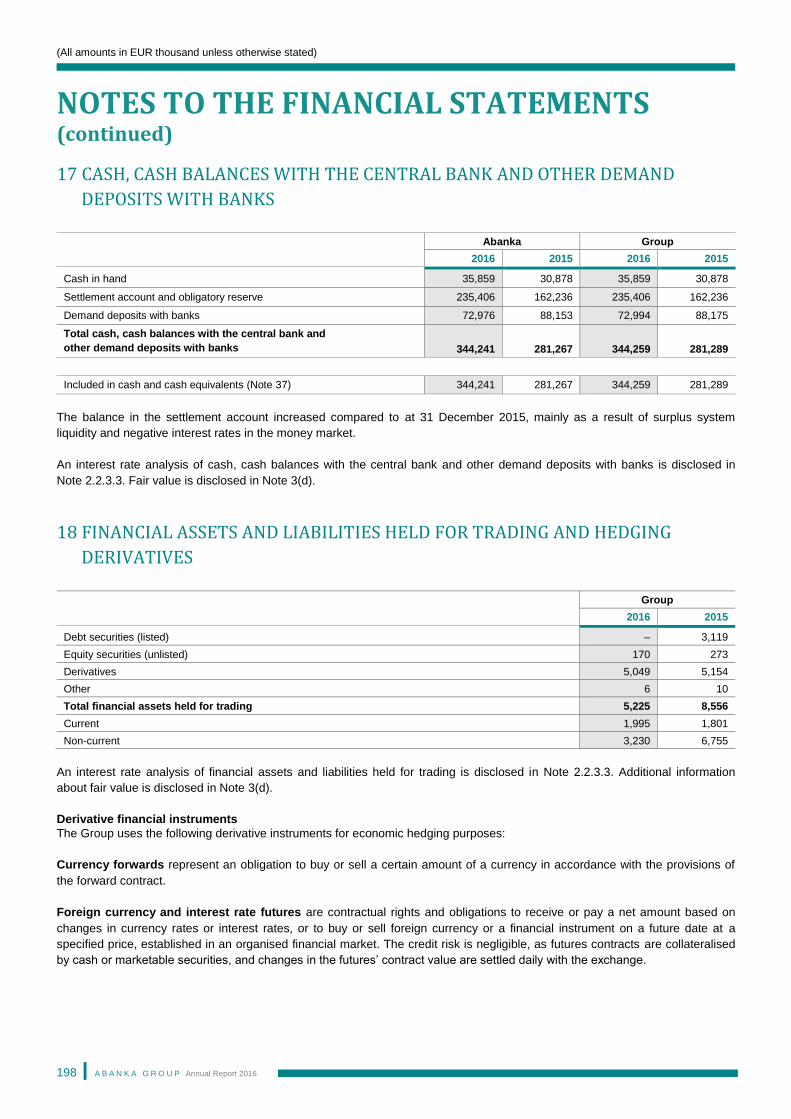
(All amounts in EUR thousand unless otherwise stated)
NOTES TO THE FINANCIAL STATEMENTS (continued)
A B A N K A G R O U P Annual Report 2016
198
17 CASH, CASH BALANCES WITH THE CENTRAL BANK AND OTHER DEMAND
DEPOSITS WITH BANKS
Abanka Group
2016 2015 2016 2015
Cash in hand 35,859 30,878 35,859 30,878
Settlement account and obligatory reserve 235,406 162,236 235,406 162,236
Demand deposits with banks 72,976 88,153 72,994 88,175
Total cash, cash balances with the central bank and
other demand deposits with banks 344,241 281,267 344,259 281,289
Included in cash and cash equivalents (Note 37) 344,241 281,267 344,259 281,289
The balance in the settlement account increased compared to at 31 December 2015, mainly as a result of surplus system
liquidity and negative interest rates in the money market.
An interest rate analysis of cash, cash balances with the central bank and other demand deposits with banks is disclosed in
Note 2.2.3.3. Fair value is disclosed in Note 3(d).
18 FINANCIAL ASSETS AND LIABILITIES HELD FOR TRADING AND HEDGING
DERIVATIVES
Group
2016 2015
Debt securities (listed) – 3,119
Equity securities (unlisted) 170 273
Derivatives 5,049 5,154
Other 6 10
Total financial assets held for trading 5,225 8,556
Current 1,995 1,801
Non-current 3,230 6,755
An interest rate analysis of financial assets and liabilities held for trading is disclosed in Note 2.2.3.3. Additional information
about fair value is disclosed in Note 3(d).
Derivative financial instruments
The Group uses the following derivative instruments for economic hedging purposes:
Currency forwards represent an obligation to buy or sell a certain amount of a currency in accordance with the provisions of
the forward contract.
Foreign currency and interest rate futures are contractual rights and obligations to receive or pay a net amount based on
changes in currency rates or interest rates, or to buy or sell foreign currency or a financial instrument on a future date at a
specified price, established in an organised financial market. The credit risk is negligible, as futures contracts are collateralised
by cash or marketable securities, and changes in the futures’ contract value are settled daily with the exchange.
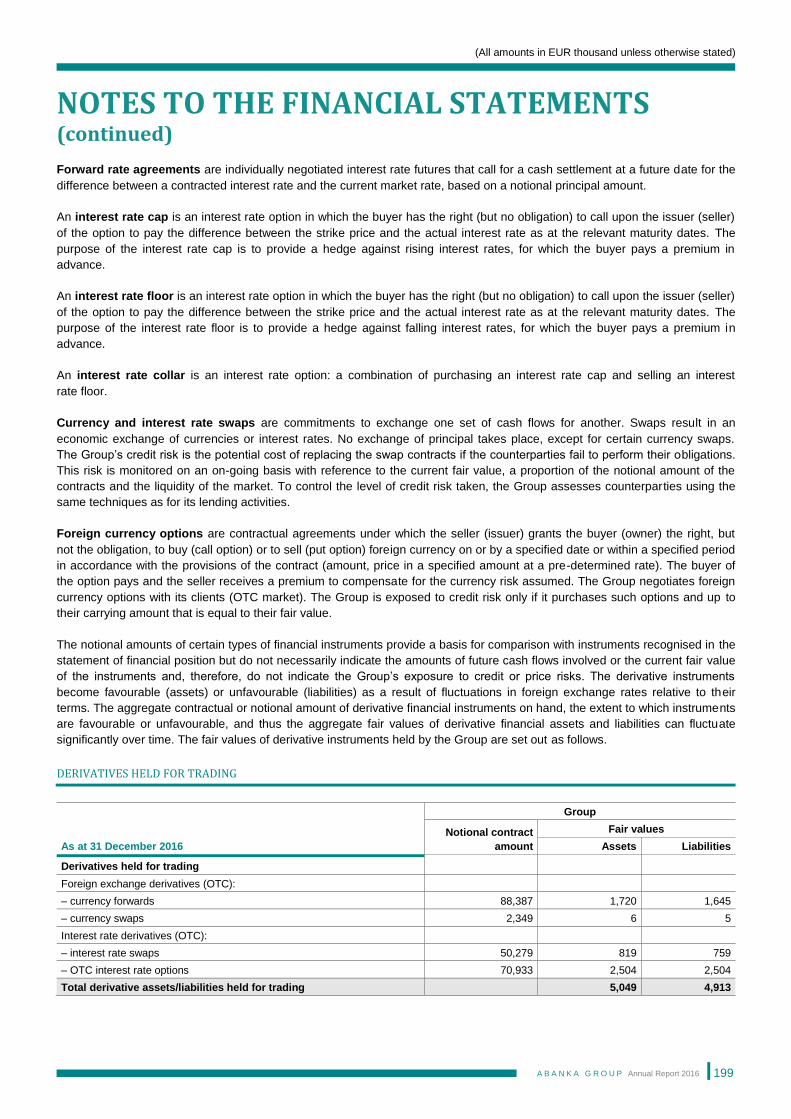
(All amounts in EUR thousand unless otherwise stated)
NOTES TO THE FINANCIAL STATEMENTS (continued)
A B A N K A G R O U P Annual Report 2016
199
Forward rate agreements are individually negotiated interest rate futures that call for a cash settlement at a future date for the
difference between a contracted interest rate and the current market rate, based on a notional principal amount.
An interest rate cap is an interest rate option in which the buyer has the right (but no obligation) to call upon the issuer (seller)
of the option to pay the difference between the strike price and the actual interest rate as at the relevant maturity dates. The
purpose of the interest rate cap is to provide a hedge against rising interest rates, for which the buyer pays a premium in
advance.
An interest rate floor is an interest rate option in which the buyer has the right (but no obligation) to call upon the issuer (seller)
of the option to pay the difference between the strike price and the actual interest rate as at the relevant maturity dates. The
purpose of the interest rate floor is to provide a hedge against falling interest rates, for which the buyer pays a premium in
advance.
An interest rate collar is an interest rate option: a combination of purchasing an interest rate cap and selling an interest
rate floor.
Currency and interest rate swaps are commitments to exchange one set of cash flows for another. Swaps result in an
economic exchange of currencies or interest rates. No exchange of principal takes place, except for certain currency swaps.
The Group’s credit risk is the potential cost of replacing the swap contracts if the counterparties fail to perform their obligations.
This risk is monitored on an on-going basis with reference to the current fair value, a proportion of the notional amount of the
contracts and the liquidity of the market. To control the level of credit risk taken, the Group assesses counterparties using the
same techniques as for its lending activities.
Foreign currency options are contractual agreements under which the seller (issuer) grants the buyer (owner) the right, but
not the obligation, to buy (call option) or to sell (put option) foreign currency on or by a specified date or within a specified period
in accordance with the provisions of the contract (amount, price in a specified amount at a pre-determined rate). The buyer of
the option pays and the seller receives a premium to compensate for the currency risk assumed. The Group negotiates foreign
currency options with its clients (OTC market). The Group is exposed to credit risk only if it purchases such options and up to
their carrying amount that is equal to their fair value.
The notional amounts of certain types of financial instruments provide a basis for comparison with instruments recognised in the
statement of financial position but do not necessarily indicate the amounts of future cash flows involved or the current fair value
of the instruments and, therefore, do not indicate the Group’s exposure to credit or price risks. The derivative instruments
become favourable (assets) or unfavourable (liabilities) as a result of fluctuations in foreign exchange rates relative to their
terms. The aggregate contractual or notional amount of derivative financial instruments on hand, the extent to which instruments
are favourable or unfavourable, and thus the aggregate fair values of derivative financial assets and liabilities can fluctuate
significantly over time. The fair values of derivative instruments held by the Group are set out as follows.
DERIVATIVES HELD FOR TRADING
Group
Notional contract
amount
Fair values
As at 31 December 2016 Assets Liabilities
Derivatives held for trading
Foreign exchange derivatives (OTC):
– currency forwards 88,387 1,720 1,645
– currency swaps 2,349 6 5
Interest rate derivatives (OTC):
– interest rate swaps 50,279 819 759
– OTC interest rate options 70,933 2,504 2,504
Total derivative assets/liabilities held for trading 5,049 4,913
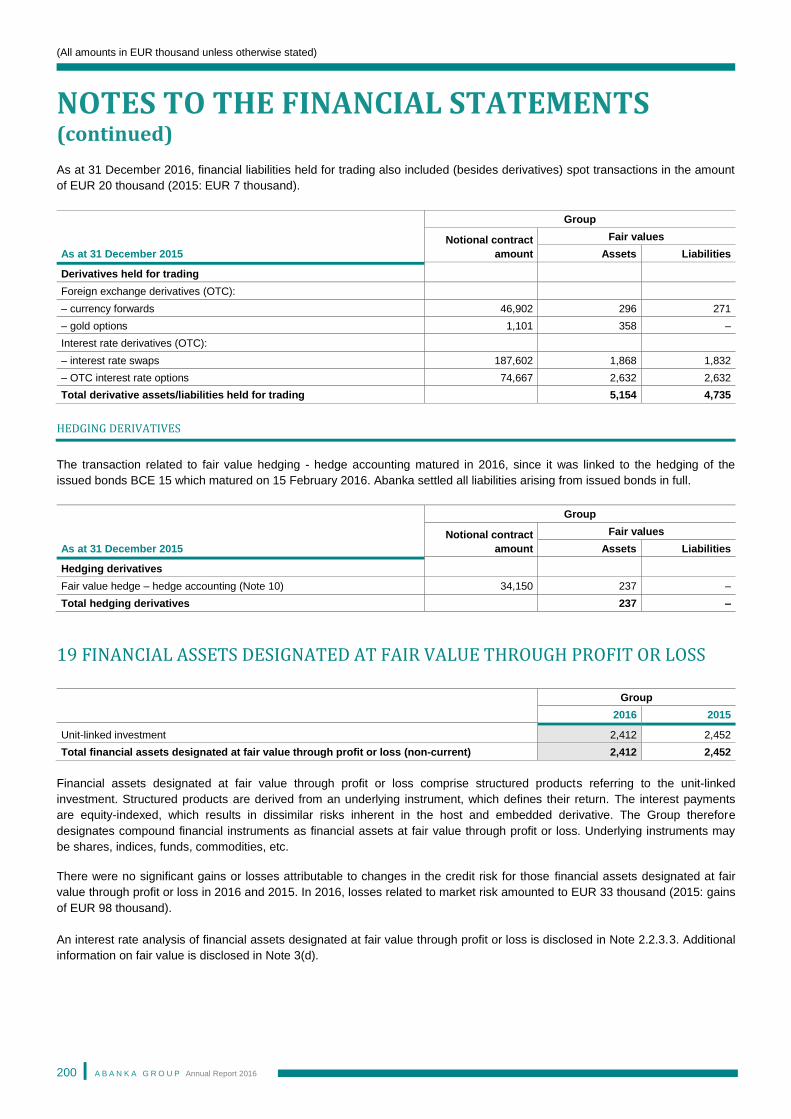
(All amounts in EUR thousand unless otherwise stated)
NOTES TO THE FINANCIAL STATEMENTS (continued)
A B A N K A G R O U P Annual Report 2016
200
As at 31 December 2016, financial liabilities held for trading also included (besides derivatives) spot transactions in the amount
of EUR 20 thousand (2015: EUR 7 thousand).
Group
Notional contract
amount
Fair values
As at 31 December 2015 Assets Liabilities
Derivatives held for trading
Foreign exchange derivatives (OTC):
– currency forwards 46,902 296 271
– gold options 1,101 358 –
Interest rate derivatives (OTC):
– interest rate swaps 187,602 1,868 1,832
– OTC interest rate options 74,667 2,632 2,632
Total derivative assets/liabilities held for trading 5,154 4,735
HEDGING DERIVATIVES
The transaction related to fair value hedging - hedge accounting matured in 2016, since it was linked to the hedging of the
issued bonds BCE 15 which matured on 15 February 2016. Abanka settled all liabilities arising from issued bonds in full.
Group
Notional contract
amount
Fair values
As at 31 December 2015 Assets Liabilities
Hedging derivatives
Fair value hedge – hedge accounting (Note 10) 34,150 237 –
Total hedging derivatives 237 –
19 FINANCIAL ASSETS DESIGNATED AT FAIR VALUE THROUGH PROFIT OR LOSS
Group
2016 2015
Unit-linked investment 2,412 2,452
Total financial assets designated at fair value through profit or loss (non-current) 2,412 2,452
Financial assets designated at fair value through profit or loss comprise structured products referring to the unit-linked
investment. Structured products are derived from an underlying instrument, which defines their return. The interest payments
are equity-indexed, which results in dissimilar risks inherent in the host and embedded derivative. The Group therefore
designates compound financial instruments as financial assets at fair value through profit or loss. Underlying instruments may
be shares, indices, funds, commodities, etc.
There were no significant gains or losses attributable to changes in the credit risk for those financial assets designated at fair
value through profit or loss in 2016 and 2015. In 2016, losses related to market risk amounted to EUR 33 thousand (2015: gains
of EUR 98 thousand).
An interest rate analysis of financial assets designated at fair value through profit or loss is disclosed in Note 2.2.3.3. Additional
information on fair value is disclosed in Note 3(d).
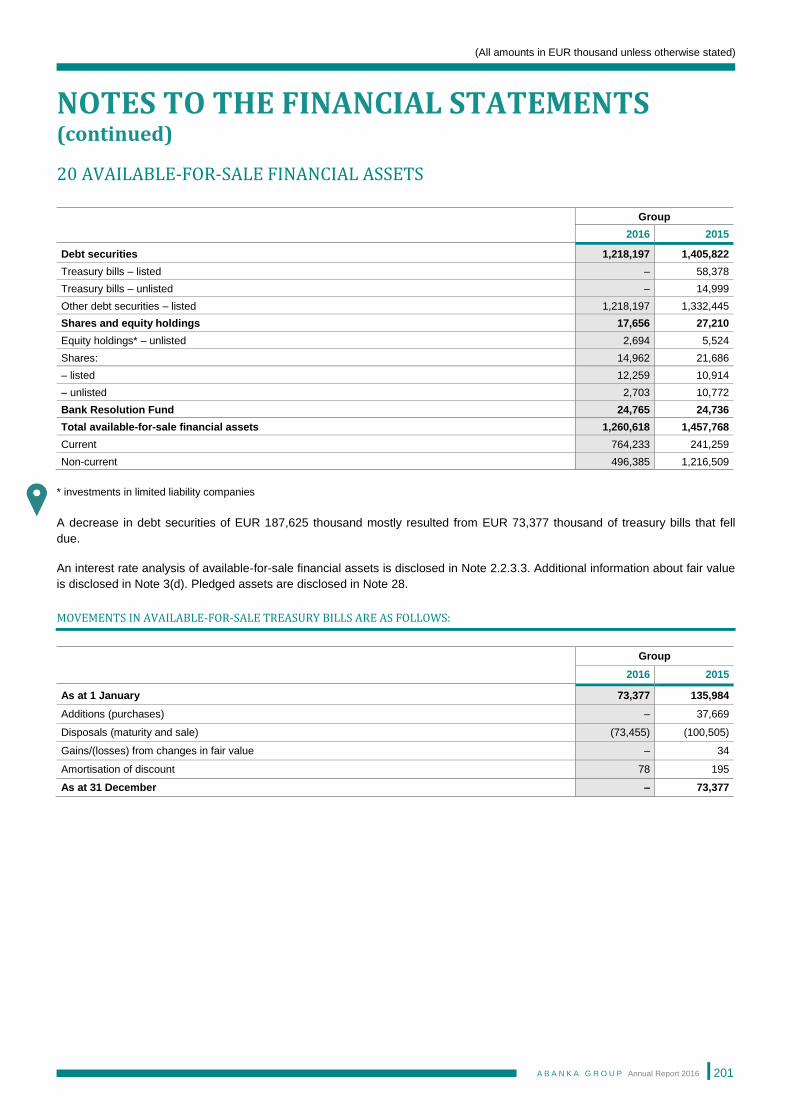
(All amounts in EUR thousand unless otherwise stated)
NOTES TO THE FINANCIAL STATEMENTS (continued)
A B A N K A G R O U P Annual Report 2016
201
20 AVAILABLE-FOR-SALE FINANCIAL ASSETS
Group
2016 2015
Debt securities 1,218,197 1,405,822
Treasury bills – listed – 58,378
Treasury bills – unlisted – 14,999
Other debt securities – listed 1,218,197 1,332,445
Shares and equity holdings 17,656 27,210
Equity holdings* – unlisted 2,694 5,524
Shares: 14,962 21,686
– listed 12,259 10,914
– unlisted 2,703 10,772
Bank Resolution Fund 24,765 24,736
Total available-for-sale financial assets 1,260,618 1,457,768
Current 764,233 241,259
Non-current 496,385 1,216,509
* investments in limited liability companies
A decrease in debt securities of EUR 187,625 thousand mostly resulted from EUR 73,377 thousand of treasury bills that fell
due.
An interest rate analysis of available-for-sale financial assets is disclosed in Note 2.2.3.3. Additional information about fair value
is disclosed in Note 3(d). Pledged assets are disclosed in Note 28.
MOVEMENTS IN AVAILABLE-FOR-SALE TREASURY BILLS ARE AS FOLLOWS:
Group
2016 2015
As at 1 January 73,377 135,984
Additions (purchases) – 37,669
Disposals (maturity and sale) (73,455) (100,505)
Gains/(losses) from changes in fair value – 34
Amortisation of discount 78 195
As at 31 December – 73,377
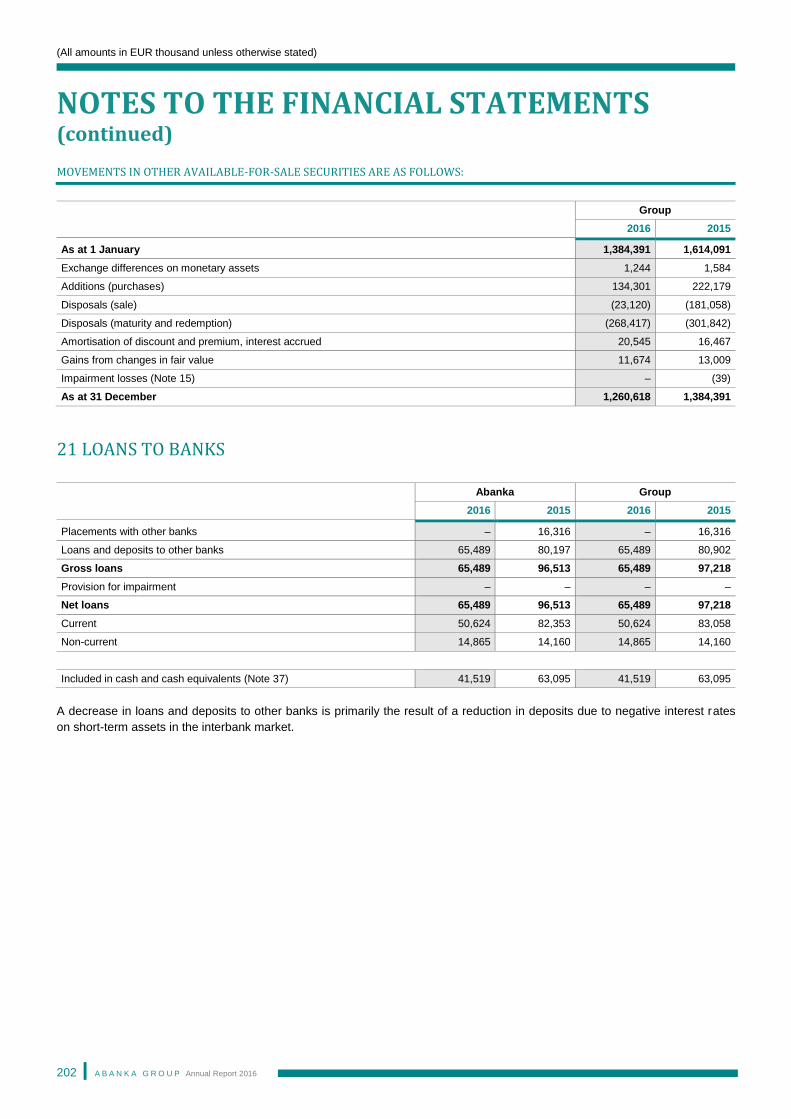
(All amounts in EUR thousand unless otherwise stated)
NOTES TO THE FINANCIAL STATEMENTS (continued)
A B A N K A G R O U P Annual Report 2016
202
MOVEMENTS IN OTHER AVAILABLE-FOR-SALE SECURITIES ARE AS FOLLOWS:
Group
2016 2015
As at 1 January 1,384,391 1,614,091
Exchange differences on monetary assets 1,244 1,584
Additions (purchases) 134,301 222,179
Disposals (sale) (23,120) (181,058)
Disposals (maturity and redemption) (268,417) (301,842)
Amortisation of discount and premium, interest accrued 20,545 16,467
Gains from changes in fair value 11,674 13,009
Impairment losses (Note 15) – (39)
As at 31 December 1,260,618 1,384,391
21 LOANS TO BANKS
Abanka Group
2016 2015 2016 2015
Placements with other banks – 16,316 – 16,316
Loans and deposits to other banks 65,489 80,197 65,489 80,902
Gross loans 65,489 96,513 65,489 97,218
Provision for impairment – – – –
Net loans 65,489 96,513 65,489 97,218
Current 50,624 82,353 50,624 83,058
Non-current 14,865 14,160 14,865 14,160
Included in cash and cash equivalents (Note 37) 41,519 63,095 41,519 63,095
A decrease in loans and deposits to other banks is primarily the result of a reduction in deposits due to negative interest rates
on short-term assets in the interbank market.
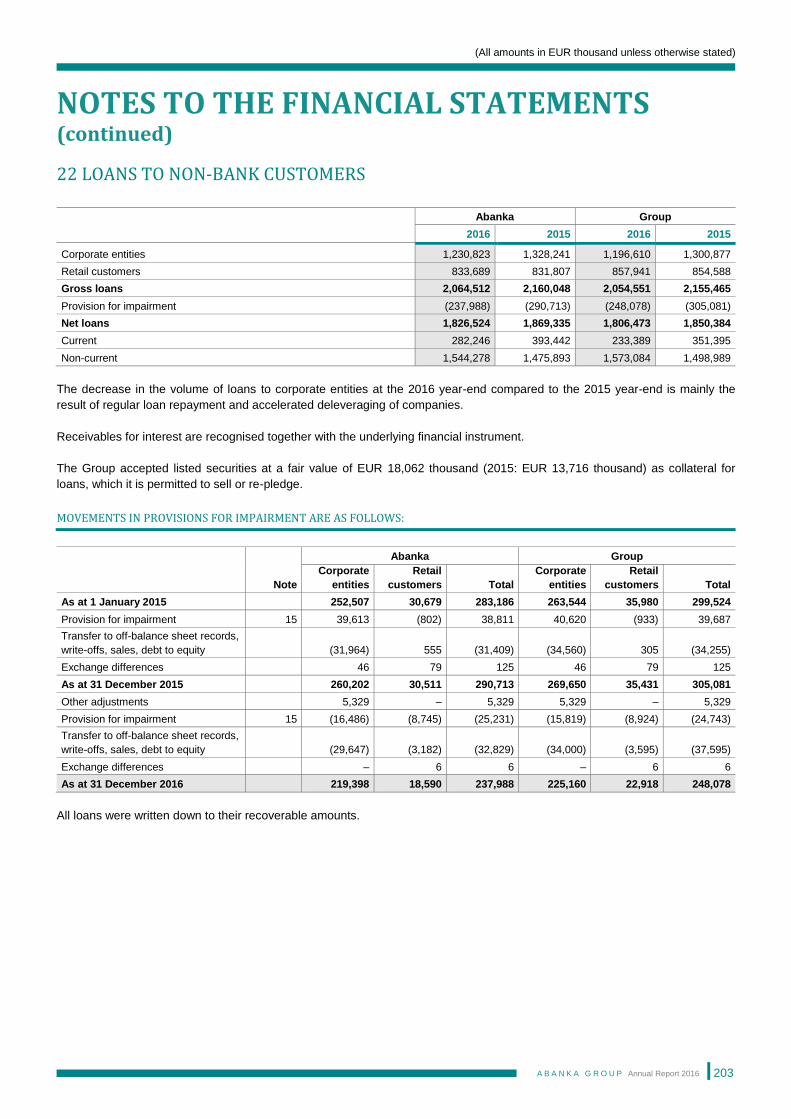
(All amounts in EUR thousand unless otherwise stated)
NOTES TO THE FINANCIAL STATEMENTS (continued)
A B A N K A G R O U P Annual Report 2016
203
22 LOANS TO NON-BANK CUSTOMERS
Abanka Group
2016 2015 2016 2015
Corporate entities 1,230,823 1,328,241 1,196,610 1,300,877
Retail customers 833,689 831,807 857,941 854,588
Gross loans 2,064,512 2,160,048 2,054,551 2,155,465
Provision for impairment (237,988) (290,713) (248,078) (305,081)
Net loans 1,826,524 1,869,335 1,806,473 1,850,384
Current 282,246 393,442 233,389 351,395
Non-current 1,544,278 1,475,893 1,573,084 1,498,989
The decrease in the volume of loans to corporate entities at the 2016 year-end compared to the 2015 year-end is mainly the
result of regular loan repayment and accelerated deleveraging of companies.
Receivables for interest are recognised together with the underlying financial instrument.
The Group accepted listed securities at a fair value of EUR 18,062 thousand (2015: EUR 13,716 thousand) as collateral for
loans, which it is permitted to sell or re-pledge.
MOVEMENTS IN PROVISIONS FOR IMPAIRMENT ARE AS FOLLOWS:
Abanka Group
Note
Corporate
entities
Retail
customers Total
Corporate
entities
Retail
customers Total
As at 1 January 2015 252,507 30,679 283,186 263,544 35,980 299,524
Provision for impairment 15 39,613 (802) 38,811 40,620 (933) 39,687
Transfer to off-balance sheet records,
write-offs, sales, debt to equity (31,964) 555 (31,409) (34,560) 305 (34,255)
Exchange differences 46 79 125 46 79 125
As at 31 December 2015 260,202 30,511 290,713 269,650 35,431 305,081
Other adjustments 5,329 – 5,329 5,329 – 5,329
Provision for impairment 15 (16,486) (8,745) (25,231) (15,819) (8,924) (24,743)
Transfer to off-balance sheet records,
write-offs, sales, debt to equity (29,647) (3,182) (32,829) (34,000) (3,595) (37,595)
Exchange differences – 6 6 – 6 6
As at 31 December 2016 219,398 18,590 237,988 225,160 22,918 248,078
All loans were written down to their recoverable amounts.
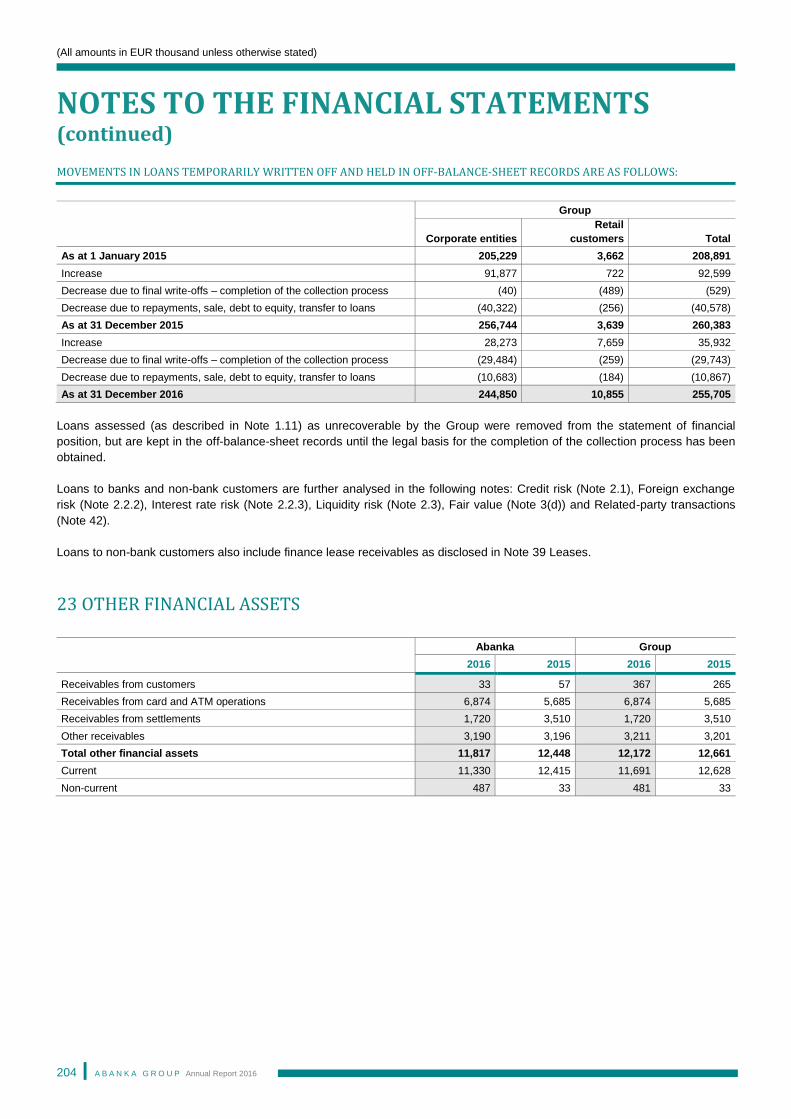
(All amounts in EUR thousand unless otherwise stated)
NOTES TO THE FINANCIAL STATEMENTS (continued)
A B A N K A G R O U P Annual Report 2016
204
MOVEMENTS IN LOANS TEMPORARILY WRITTEN OFF AND HELD IN OFF-BALANCE-SHEET RECORDS ARE AS FOLLOWS:
Group
Corporate entities
Retail
customers Total
As at 1 January 2015 205,229 3,662 208,891
Increase 91,877 722 92,599
Decrease due to final write-offs – completion of the collection process (40) (489) (529)
Decrease due to repayments, sale, debt to equity, transfer to loans (40,322) (256) (40,578)
As at 31 December 2015 256,744 3,639 260,383
Increase 28,273 7,659 35,932
Decrease due to final write-offs – completion of the collection process (29,484) (259) (29,743)
Decrease due to repayments, sale, debt to equity, transfer to loans (10,683) (184) (10,867)
As at 31 December 2016 244,850 10,855 255,705
Loans assessed (as described in Note 1.11) as unrecoverable by the Group were removed from the statement of financial
position, but are kept in the off-balance-sheet records until the legal basis for the completion of the collection process has been
obtained.
Loans to banks and non-bank customers are further analysed in the following notes: Credit risk (Note 2.1), Foreign exchange
risk (Note 2.2.2), Interest rate risk (Note 2.2.3), Liquidity risk (Note 2.3), Fair value (Note 3(d)) and Related-party transactions
(Note 42).
Loans to non-bank customers also include finance lease receivables as disclosed in Note 39 Leases.
23 OTHER FINANCIAL ASSETS
Abanka Group
2016 2015 2016 2015
Receivables from customers 33 57 367 265
Receivables from card and ATM operations 6,874 5,685 6,874 5,685
Receivables from settlements 1,720 3,510 1,720 3,510
Other receivables 3,190 3,196 3,211 3,201
Total other financial assets 11,817 12,448 12,172 12,661
Current 11,330 12,415 11,691 12,628
Non-current 487 33 481 33
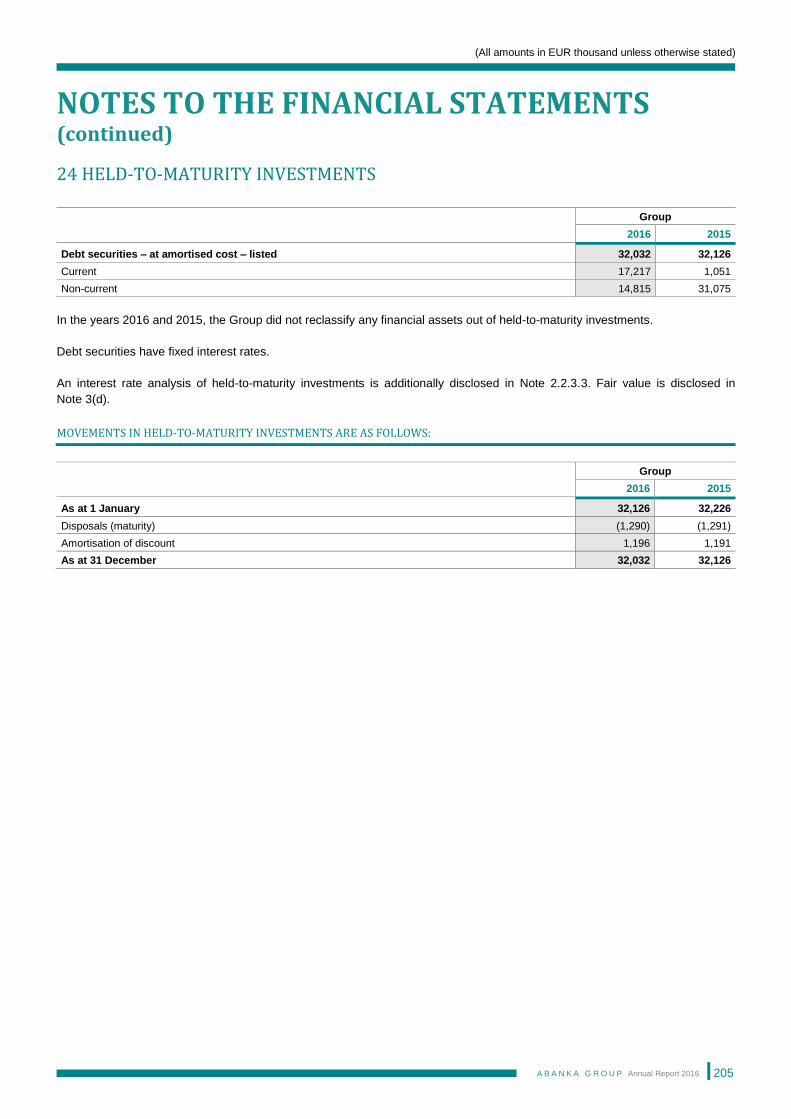
(All amounts in EUR thousand unless otherwise stated)
NOTES TO THE FINANCIAL STATEMENTS (continued)
A B A N K A G R O U P Annual Report 2016
205
24 HELD-TO-MATURITY INVESTMENTS
Group
2016 2015
Debt securities – at amortised cost – listed 32,032 32,126
Current 17,217 1,051
Non-current 14,815 31,075
In the years 2016 and 2015, the Group did not reclassify any financial assets out of held-to-maturity investments.
Debt securities have fixed interest rates.
An interest rate analysis of held-to-maturity investments is additionally disclosed in Note 2.2.3.3. Fair value is disclosed in
Note 3(d).
MOVEMENTS IN HELD-TO-MATURITY INVESTMENTS ARE AS FOLLOWS:
Group
2016 2015
As at 1 January 32,126 32,226
Disposals (maturity) (1,290) (1,291)
Amortisation of discount 1,196 1,191
As at 31 December 32,032 32,126
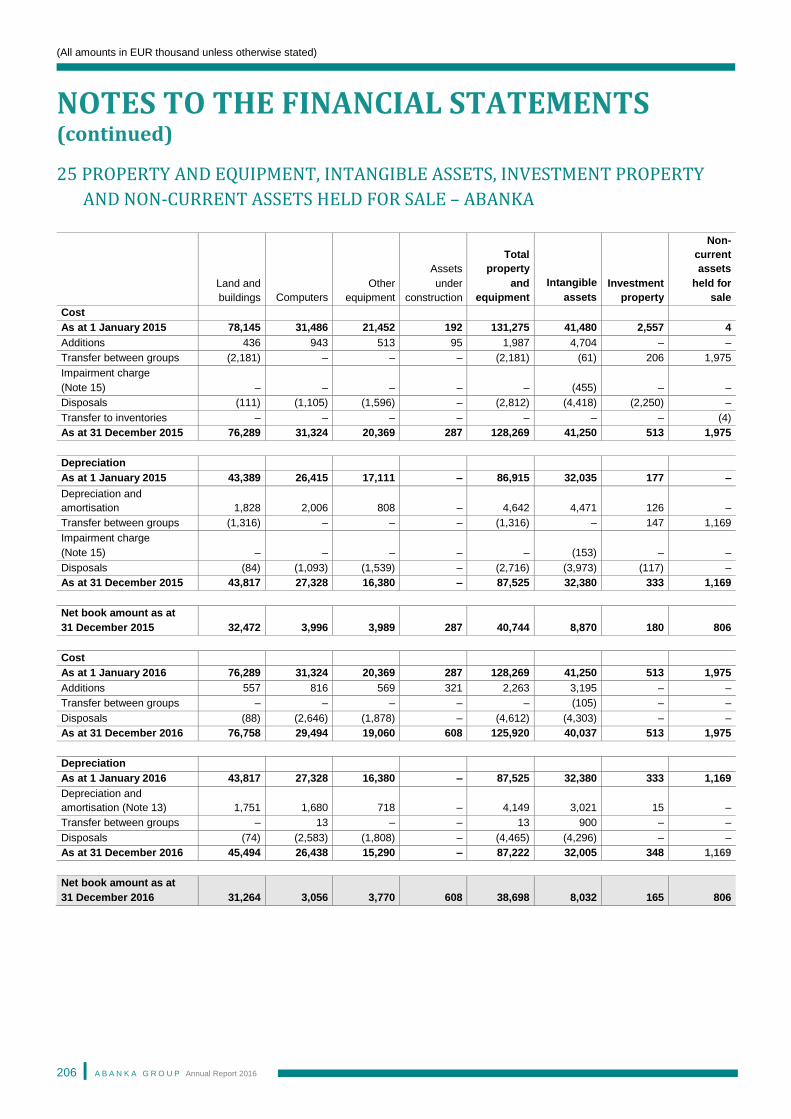
(All amounts in EUR thousand unless otherwise stated)
NOTES TO THE FINANCIAL STATEMENTS (continued)
A B A N K A G R O U P Annual Report 2016
206
25 PROPERTY AND EQUIPMENT, INTANGIBLE ASSETS, INVESTMENT PROPERTY
AND NON-CURRENT ASSETS HELD FOR SALE – ABANKA
Land and
buildings
Computers
Other
equipment
Assets
under
construction
Total
property
and
equipment
Intangible
assets
Investment
property
Non-
current
assets
held for
sale
Cost
As at 1 January 2015 78,145 31,486 21,452 192 131,275 41,480 2,557 4
Additions 436 943 513 95 1,987 4,704 – –
Transfer between groups (2,181) – – – (2,181) (61) 206 1,975
Impairment charge
(Note 15) – – – – – (455) – –
Disposals (111) (1,105) (1,596) – (2,812) (4,418) (2,250) –
Transfer to inventories – – – – – – – (4)
As at 31 December 2015 76,289 31,324 20,369 287 128,269 41,250 513 1,975
Depreciation
As at 1 January 2015 43,389 26,415 17,111 – 86,915 32,035 177 –
Depreciation and
amortisation 1,828 2,006 808
– 4,642 4,471 126
–
Transfer between groups (1,316) – – – (1,316) – 147 1,169
Impairment charge
(Note 15) – – – – – (153) – –
Disposals (84) (1,093) (1,539) – (2,716) (3,973) (117) –
As at 31 December 2015 43,817 27,328 16,380 – 87,525 32,380 333 1,169
Net book amount as at
31 December 2015 32,472 3,996 3,989 287 40,744 8,870 180 806
Cost
As at 1 January 2016 76,289 31,324 20,369 287 128,269 41,250 513 1,975
Additions 557 816 569 321 2,263 3,195 – –
Transfer between groups – – – – – (105) – –
Disposals (88) (2,646) (1,878) – (4,612) (4,303) – –
As at 31 December 2016 76,758 29,494 19,060 608 125,920 40,037 513 1,975
Depreciation
As at 1 January 2016 43,817 27,328 16,380 – 87,525 32,380 333 1,169
Depreciation and
amortisation (Note 13) 1,751 1,680 718 – 4,149 3,021 15 –
Transfer between groups – 13 – – 13 900 – –
Disposals (74) (2,583) (1,808) – (4,465) (4,296) – –
As at 31 December 2016 45,494 26,438 15,290 – 87,222 32,005 348 1,169
Net book amount as at
31 December 2016 31,264 3,056 3,770 608 38,698 8,032 165 806
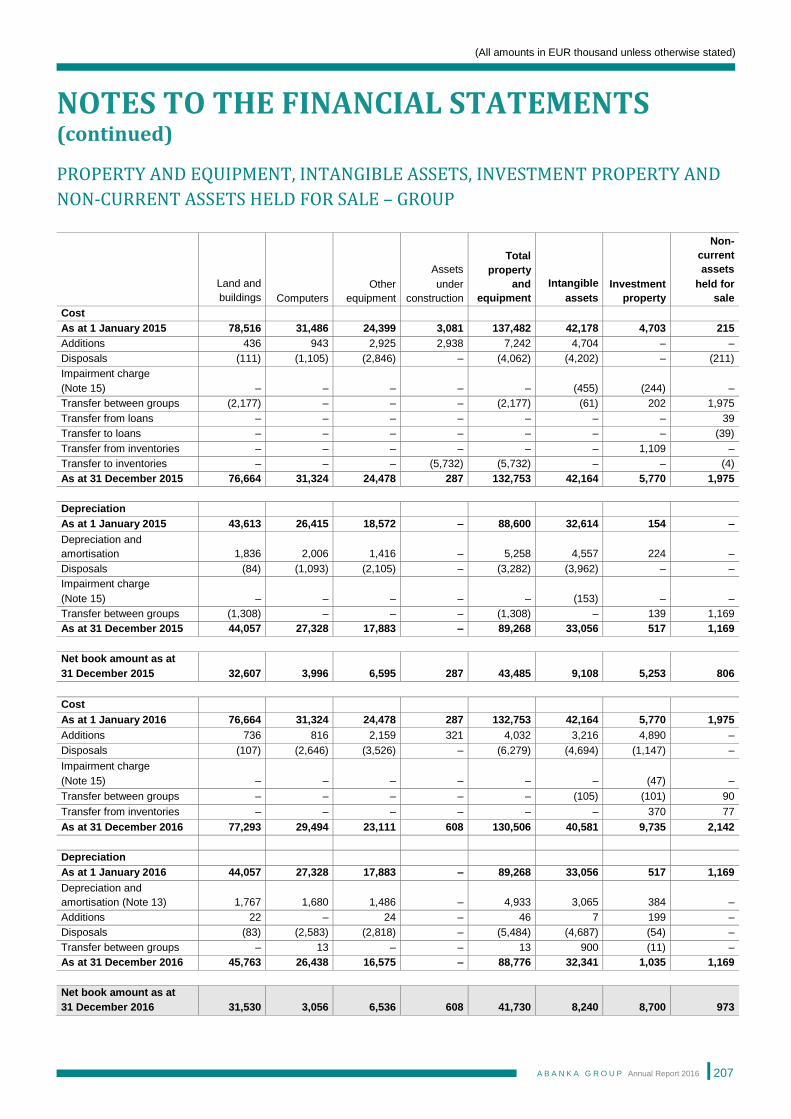
(All amounts in EUR thousand unless otherwise stated)
NOTES TO THE FINANCIAL STATEMENTS (continued)
A B A N K A G R O U P Annual Report 2016
207
PROPERTY AND EQUIPMENT, INTANGIBLE ASSETS, INVESTMENT PROPERTY AND
NON-CURRENT ASSETS HELD FOR SALE – GROUP
Land and
buildings
Computers
Other
equipment
Assets
under
construction
Total
property
and
equipment
Intangible
assets
Investment
property
Non-
current
assets
held for
sale
Cost
As at 1 January 2015 78,516 31,486 24,399 3,081 137,482 42,178 4,703 215
Additions 436 943 2,925 2,938 7,242 4,704 – –
Disposals (111) (1,105) (2,846) – (4,062) (4,202) – (211)
Impairment charge
(Note 15) – – – – – (455) (244) –
Transfer between groups (2,177) – – – (2,177) (61) 202 1,975
Transfer from loans – – – – – – – 39
Transfer to loans – – – – – – – (39)
Transfer from inventories – – – – – – 1,109 –
Transfer to inventories – – – (5,732) (5,732) – – (4)
As at 31 December 2015 76,664 31,324 24,478 287 132,753 42,164 5,770 1,975
Depreciation
As at 1 January 2015 43,613 26,415 18,572 – 88,600 32,614 154 –
Depreciation and
amortisation 1,836 2,006 1,416
– 5,258 4,557 224
–
Disposals (84) (1,093) (2,105) – (3,282) (3,962) – –
Impairment charge
(Note 15) – – – – – (153) – –
Transfer between groups (1,308) – – – (1,308) – 139 1,169
As at 31 December 2015 44,057 27,328 17,883 – 89,268 33,056 517 1,169
Net book amount as at
31 December 2015
32,607
3,996
6,595
287
43,485
9,108
5,253
806
Cost
As at 1 January 2016 76,664 31,324 24,478 287 132,753 42,164 5,770 1,975
Additions 736 816 2,159 321 4,032 3,216 4,890 –
Disposals (107) (2,646) (3,526) – (6,279) (4,694) (1,147) –
Impairment charge
(Note 15) – – – – – – (47) –
Transfer between groups – – – – – (105) (101) 90
Transfer from inventories – – – – – – 370 77
As at 31 December 2016 77,293 29,494 23,111 608 130,506 40,581 9,735 2,142
Depreciation
As at 1 January 2016 44,057 27,328 17,883 – 89,268 33,056 517 1,169
Depreciation and
amortisation (Note 13) 1,767 1,680 1,486
– 4,933 3,065 384
–
Additions 22 – 24 – 46 7 199 –
Disposals (83) (2,583) (2,818) – (5,484) (4,687) (54) –
Transfer between groups – 13 – – 13 900 (11) –
As at 31 December 2016 45,763 26,438 16,575 – 88,776 32,341 1,035 1,169
Net book amount as at
31 December 2016 31,530 3,056 6,536 608 41,730 8,240 8,700 973
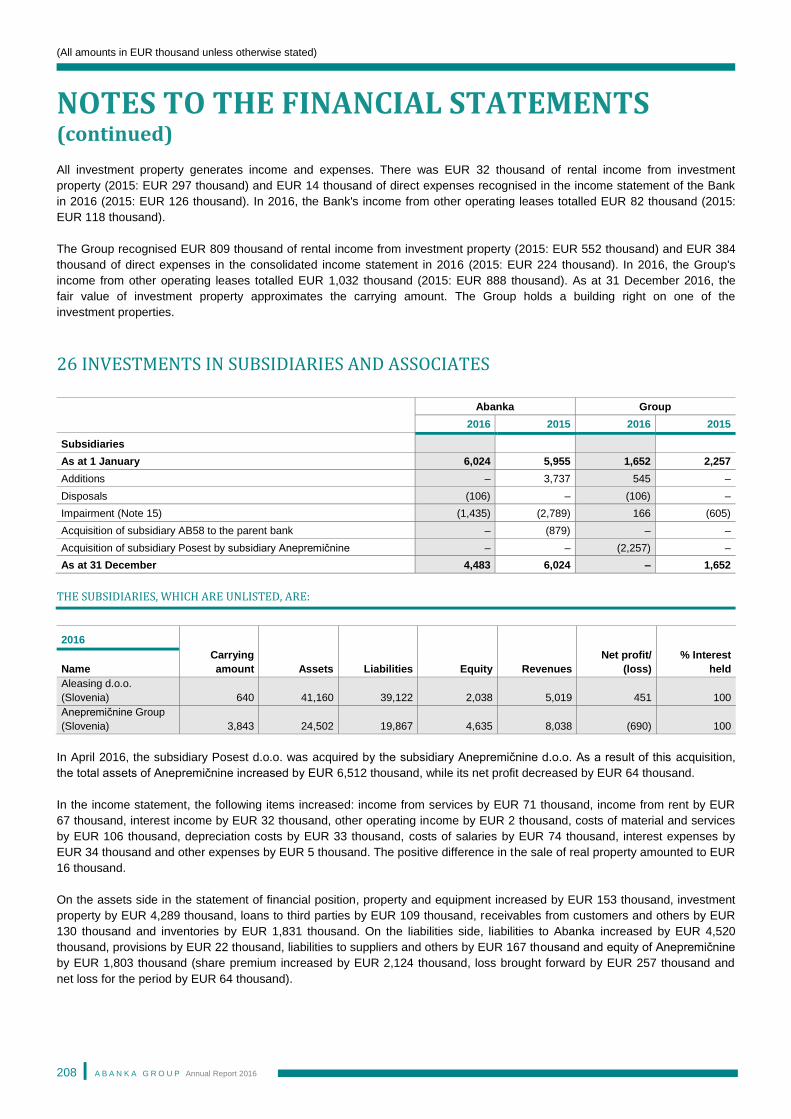
(All amounts in EUR thousand unless otherwise stated)
NOTES TO THE FINANCIAL STATEMENTS (continued)
A B A N K A G R O U P Annual Report 2016
208
All investment property generates income and expenses. There was EUR 32 thousand of rental income from investment
property (2015: EUR 297 thousand) and EUR 14 thousand of direct expenses recognised in the income statement of the Bank
in 2016 (2015: EUR 126 thousand). In 2016, the Bank's income from other operating leases totalled EUR 82 thousand (2015:
EUR 118 thousand).
The Group recognised EUR 809 thousand of rental income from investment property (2015: EUR 552 thousand) and EUR 384
thousand of direct expenses in the consolidated income statement in 2016 (2015: EUR 224 thousand). In 2016, the Group's
income from other operating leases totalled EUR 1,032 thousand (2015: EUR 888 thousand). As at 31 December 2016, the
fair value of investment property approximates the carrying amount. The Group holds a building right on one of the
investment properties.
26 INVESTMENTS IN SUBSIDIARIES AND ASSOCIATES
Abanka Group
2016 2015 2016 2015
Subsidiaries
As at 1 January 6,024 5,955 1,652 2,257
Additions – 3,737 545 –
Disposals (106) – (106) –
Impairment (Note 15) (1,435) (2,789) 166 (605)
Acquisition of subsidiary AB58 to the parent bank – (879) – –
Acquisition of subsidiary Posest by subsidiary Anepremičnine – – (2,257) –
As at 31 December 4,483 6,024 – 1,652
THE SUBSIDIARIES, WHICH ARE UNLISTED, ARE:
2016
Carrying
amount Assets Liabilities Equity Revenues
Net profit/
(loss)
% Interest
held Name
Aleasing d.o.o.
(Slovenia) 640 41,160 39,122 2,038 5,019 451 100
Anepremičnine Group
(Slovenia) 3,843 24,502 19,867 4,635 8,038 (690) 100
In April 2016, the subsidiary Posest d.o.o. was acquired by the subsidiary Anepremičnine d.o.o. As a result of this acquisition,
the total assets of Anepremičnine increased by EUR 6,512 thousand, while its net profit decreased by EUR 64 thousand.
In the income statement, the following items increased: income from services by EUR 71 thousand, income from rent by EUR
67 thousand, interest income by EUR 32 thousand, other operating income by EUR 2 thousand, costs of material and services
by EUR 106 thousand, depreciation costs by EUR 33 thousand, costs of salaries by EUR 74 thousand, interest expenses by
EUR 34 thousand and other expenses by EUR 5 thousand. The positive difference in the sale of real property amounted to EUR
16 thousand.
On the assets side in the statement of financial position, property and equipment increased by EUR 153 thousand, investment
property by EUR 4,289 thousand, loans to third parties by EUR 109 thousand, receivables from customers and others by EUR
130 thousand and inventories by EUR 1,831 thousand. On the liabilities side, liabilities to Abanka increased by EUR 4,520
thousand, provisions by EUR 22 thousand, liabilities to suppliers and others by EUR 167 thousand and equity of Anepremičnine
by EUR 1,803 thousand (share premium increased by EUR 2,124 thousand, loss brought forward by EUR 257 thousand and
net loss for the period by EUR 64 thousand).
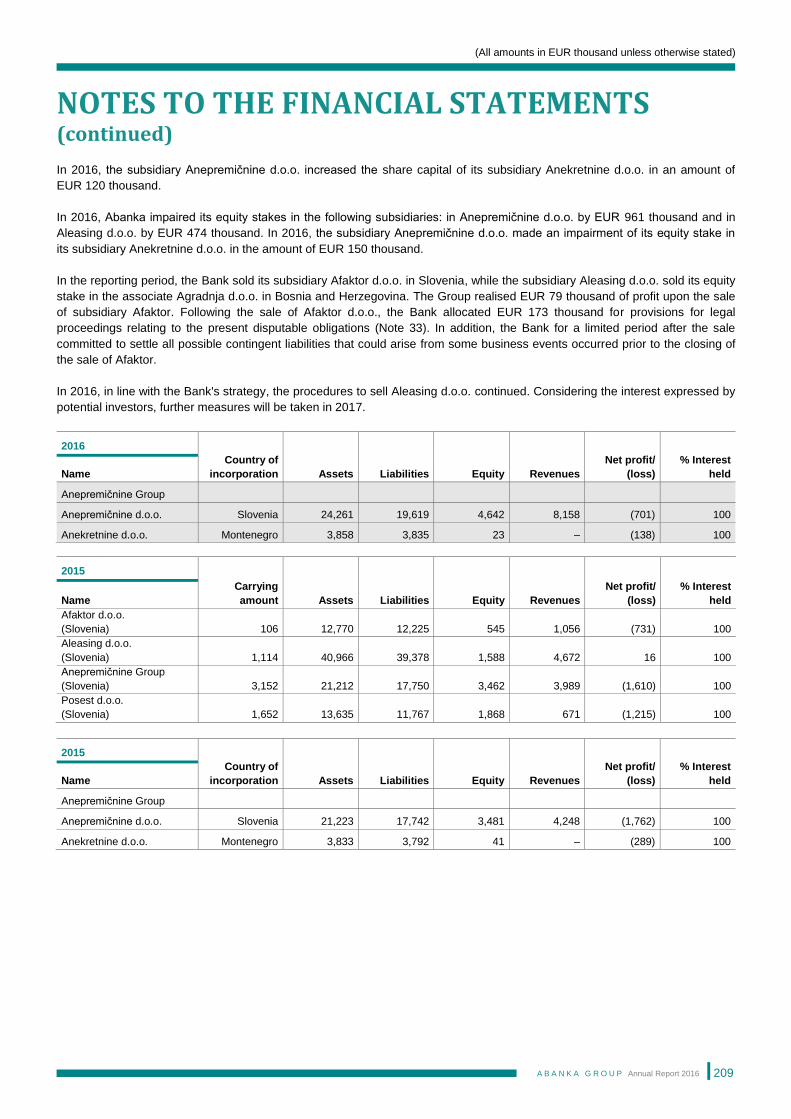
(All amounts in EUR thousand unless otherwise stated)
NOTES TO THE FINANCIAL STATEMENTS (continued)
A B A N K A G R O U P Annual Report 2016
209
In 2016, the subsidiary Anepremičnine d.o.o. increased the share capital of its subsidiary Anekretnine d.o.o. in an amount of
EUR 120 thousand.
In 2016, Abanka impaired its equity stakes in the following subsidiaries: in Anepremičnine d.o.o. by EUR 961 thousand and in
Aleasing d.o.o. by EUR 474 thousand. In 2016, the subsidiary Anepremičnine d.o.o. made an impairment of its equity stake in
its subsidiary Anekretnine d.o.o. in the amount of EUR 150 thousand.
In the reporting period, the Bank sold its subsidiary Afaktor d.o.o. in Slovenia, while the subsidiary Aleasing d.o.o. sold its equity
stake in the associate Agradnja d.o.o. in Bosnia and Herzegovina. The Group realised EUR 79 thousand of profit upon the sale
of subsidiary Afaktor. Following the sale of Afaktor d.o.o., the Bank allocated EUR 173 thousand for provisions for legal
proceedings relating to the present disputable obligations (Note 33). In addition, the Bank for a limited period after the sale
committed to settle all possible contingent liabilities that could arise from some business events occurred prior to the closing of
the sale of Afaktor.
In 2016, in line with the Bank's strategy, the procedures to sell Aleasing d.o.o. continued. Considering the interest expressed by
potential investors, further measures will be taken in 2017.
2016
Country of
incorporation Assets Liabilities Equity Revenues
Net profit/
(loss)
% Interest
held Name
Anepremičnine Group
Anepremičnine d.o.o. Slovenia 24,261 19,619 4,642 8,158 (701) 100
Anekretnine d.o.o. Montenegro 3,858 3,835 23 – (138) 100
2015
Carrying
amount Assets Liabilities Equity Revenues
Net profit/
(loss)
% Interest
held Name
Afaktor d.o.o.
(Slovenia) 106 12,770 12,225 545 1,056 (731) 100
Aleasing d.o.o.
(Slovenia) 1,114 40,966 39,378 1,588 4,672 16 100
Anepremičnine Group
(Slovenia) 3,152 21,212 17,750 3,462 3,989 (1,610) 100
Posest d.o.o.
(Slovenia) 1,652 13,635 11,767 1,868 671 (1,215) 100
2015
Country of
incorporation Assets Liabilities Equity Revenues
Net profit/
(loss)
% Interest
held Name
Anepremičnine Group
Anepremičnine d.o.o. Slovenia 21,223 17,742 3,481 4,248 (1,762) 100
Anekretnine d.o.o. Montenegro 3,833 3,792 41 – (289) 100
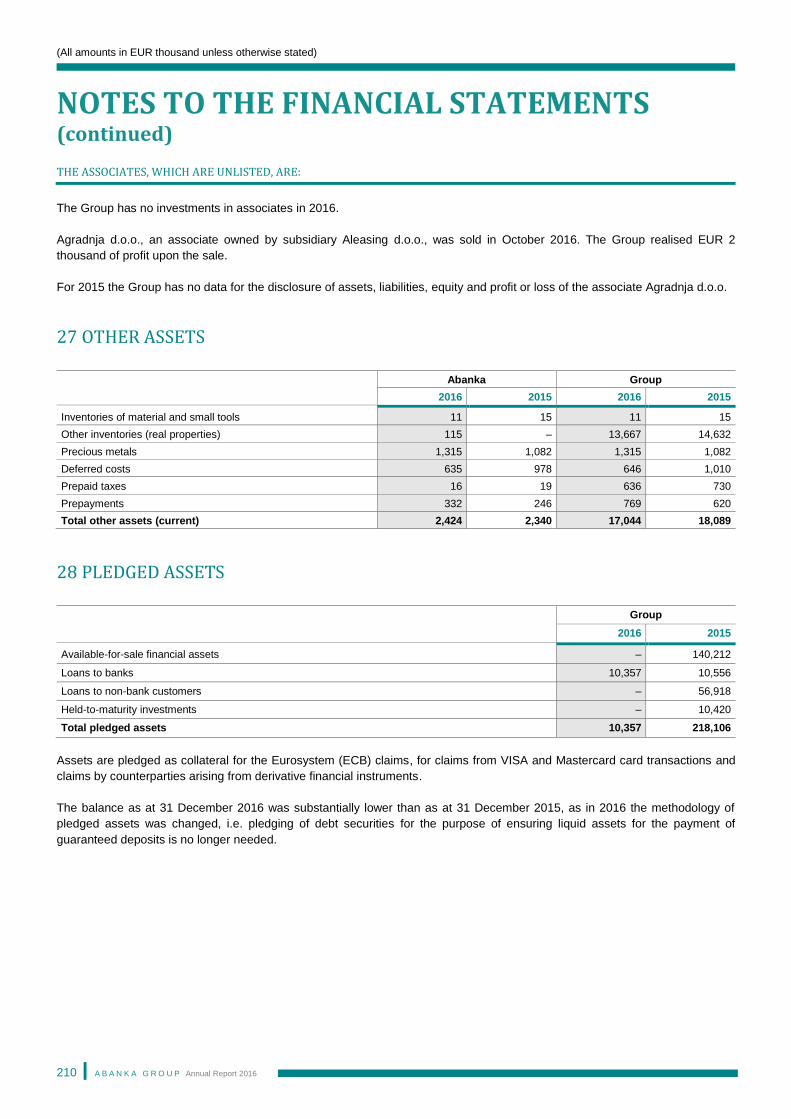
(All amounts in EUR thousand unless otherwise stated)
NOTES TO THE FINANCIAL STATEMENTS (continued)
A B A N K A G R O U P Annual Report 2016
210
THE ASSOCIATES, WHICH ARE UNLISTED, ARE:
The Group has no investments in associates in 2016.
Agradnja d.o.o., an associate owned by subsidiary Aleasing d.o.o., was sold in October 2016. The Group realised EUR 2
thousand of profit upon the sale.
For 2015 the Group has no data for the disclosure of assets, liabilities, equity and profit or loss of the associate Agradnja d.o.o.
27 OTHER ASSETS
Abanka Group
2016 2015 2016 2015
Inventories of material and small tools 11 15 11 15
Other inventories (real properties) 115 – 13,667 14,632
Precious metals 1,315 1,082 1,315 1,082
Deferred costs 635 978 646 1,010
Prepaid taxes 16 19 636 730
Prepayments 332 246 769 620
Total other assets (current) 2,424 2,340 17,044 18,089
28 PLEDGED ASSETS
Group
2016 2015
Available-for-sale financial assets – 140,212
Loans to banks 10,357 10,556
Loans to non-bank customers – 56,918
Held-to-maturity investments – 10,420
Total pledged assets 10,357 218,106
Assets are pledged as collateral for the Eurosystem (ECB) claims, for claims from VISA and Mastercard card transactions and
claims by counterparties arising from derivative financial instruments.
The balance as at 31 December 2016 was substantially lower than as at 31 December 2015, as in 2016 the methodology of
pledged assets was changed, i.e. pledging of debt securities for the purpose of ensuring liquid assets for the payment of
guaranteed deposits is no longer needed.
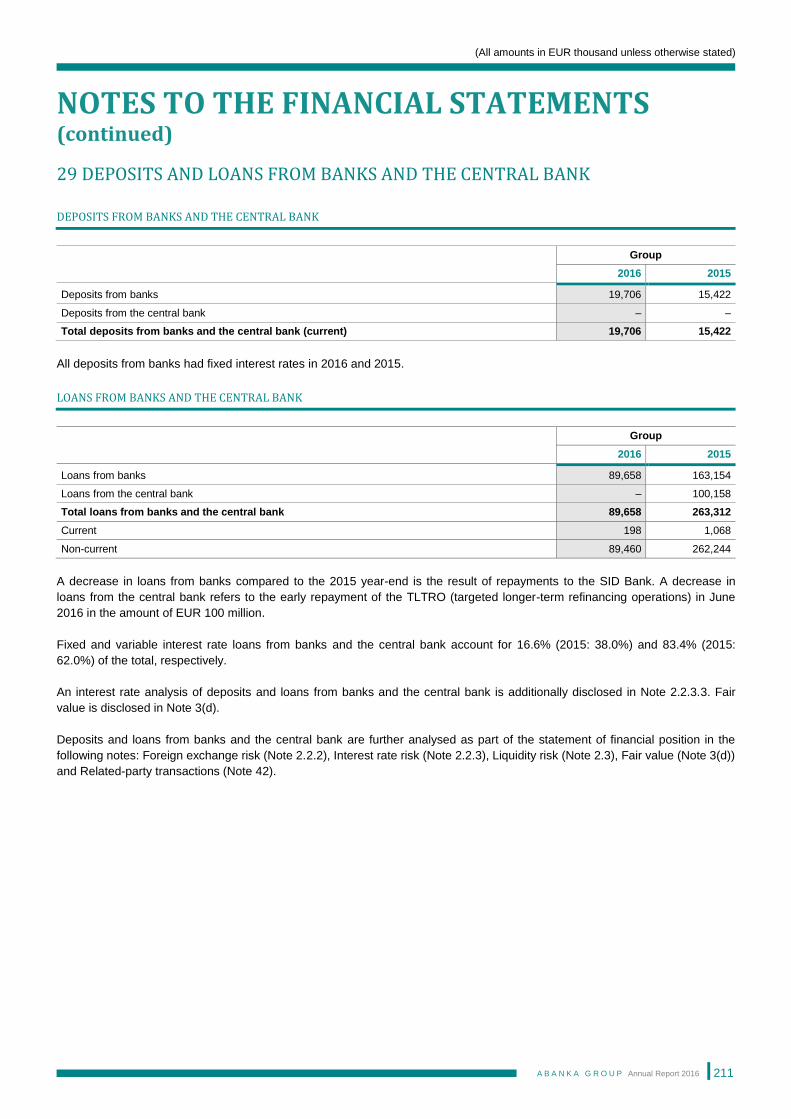
(All amounts in EUR thousand unless otherwise stated)
NOTES TO THE FINANCIAL STATEMENTS (continued)
A B A N K A G R O U P Annual Report 2016
211
29 DEPOSITS AND LOANS FROM BANKS AND THE CENTRAL BANK
DEPOSITS FROM BANKS AND THE CENTRAL BANK
Group
2016 2015
Deposits from banks 19,706 15,422
Deposits from the central bank – –
Total deposits from banks and the central bank (current) 19,706 15,422
All deposits from banks had fixed interest rates in 2016 and 2015.
LOANS FROM BANKS AND THE CENTRAL BANK
Group
2016 2015
Loans from banks 89,658 163,154
Loans from the central bank – 100,158
Total loans from banks and the central bank 89,658 263,312
Current 198 1,068
Non-current 89,460 262,244
A decrease in loans from banks compared to the 2015 year-end is the result of repayments to the SID Bank. A decrease in
loans from the central bank refers to the early repayment of the TLTRO (targeted longer-term refinancing operations) in June
2016 in the amount of EUR 100 million.
Fixed and variable interest rate loans from banks and the central bank account for 16.6% (2015: 38.0%) and 83.4% (2015:
62.0%) of the total, respectively.
An interest rate analysis of deposits and loans from banks and the central bank is additionally disclosed in Note 2.2.3.3. Fair
value is disclosed in Note 3(d).
Deposits and loans from banks and the central bank are further analysed as part of the statement of financial position in the
following notes: Foreign exchange risk (Note 2.2.2), Interest rate risk (Note 2.2.3), Liquidity risk (Note 2.3), Fair value (Note 3(d))
and Related-party transactions (Note 42).
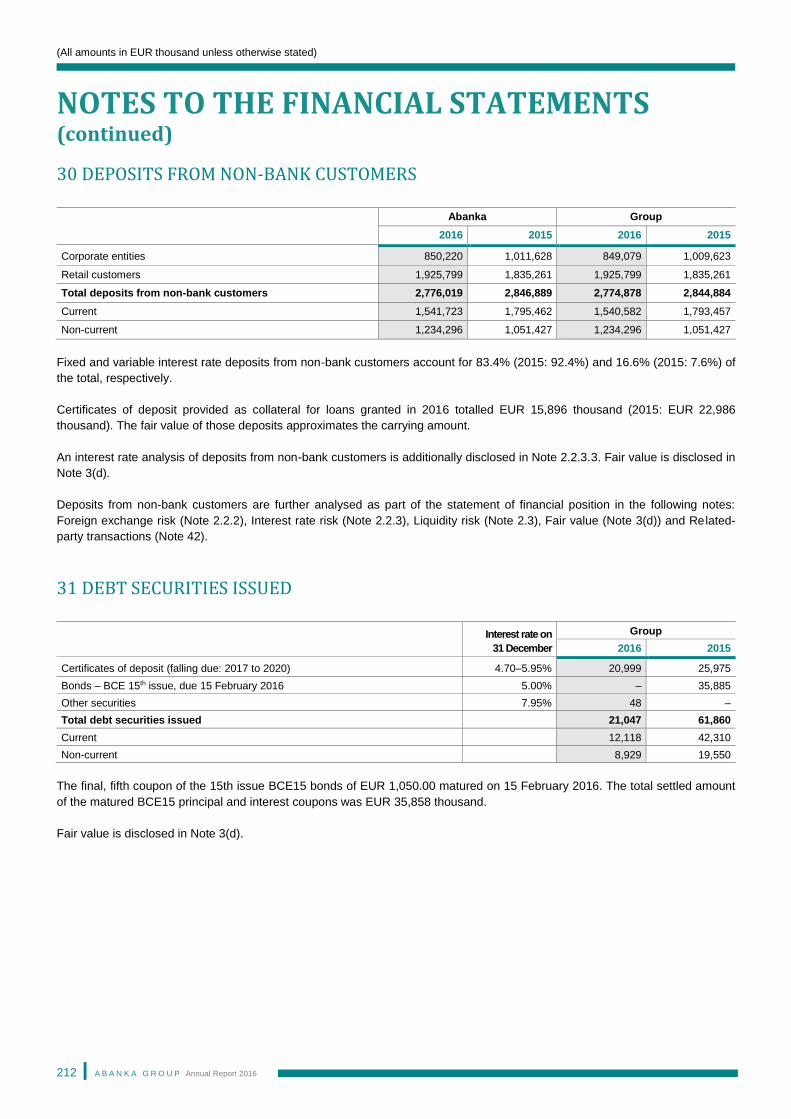
(All amounts in EUR thousand unless otherwise stated)
NOTES TO THE FINANCIAL STATEMENTS (continued)
A B A N K A G R O U P Annual Report 2016
212
30 DEPOSITS FROM NON-BANK CUSTOMERS
Abanka Group
2016 2015 2016 2015
Corporate entities 850,220 1,011,628 849,079 1,009,623
Retail customers 1,925,799 1,835,261 1,925,799 1,835,261
Total deposits from non-bank customers 2,776,019 2,846,889 2,774,878 2,844,884
Current 1,541,723 1,795,462 1,540,582 1,793,457
Non-current 1,234,296 1,051,427 1,234,296 1,051,427
Fixed and variable interest rate deposits from non-bank customers account for 83.4% (2015: 92.4%) and 16.6% (2015: 7.6%) of
the total, respectively.
Certificates of deposit provided as collateral for loans granted in 2016 totalled EUR 15,896 thousand (2015: EUR 22,986
thousand). The fair value of those deposits approximates the carrying amount.
An interest rate analysis of deposits from non-bank customers is additionally disclosed in Note 2.2.3.3. Fair value is disclosed in
Note 3(d).
Deposits from non-bank customers are further analysed as part of the statement of financial position in the following notes:
Foreign exchange risk (Note 2.2.2), Interest rate risk (Note 2.2.3), Liquidity risk (Note 2.3), Fair value (Note 3(d)) and Related-
party transactions (Note 42).
31 DEBT SECURITIES ISSUED
Interest rate on
31 December
Group
2016 2015
Certificates of deposit (falling due: 2017 to 2020) 4.70–5.95% 20,999 25,975
Bonds – BCE 15th issue, due 15 February 2016 5.00% – 35,885
Other securities 7.95% 48 –
Total debt securities issued 21,047 61,860
Current 12,118 42,310
Non-current 8,929 19,550
The final, fifth coupon of the 15th issue BCE15 bonds of EUR 1,050.00 matured on 15 February 2016. The total settled amount
of the matured BCE15 principal and interest coupons was EUR 35,858 thousand.
Fair value is disclosed in Note 3(d).
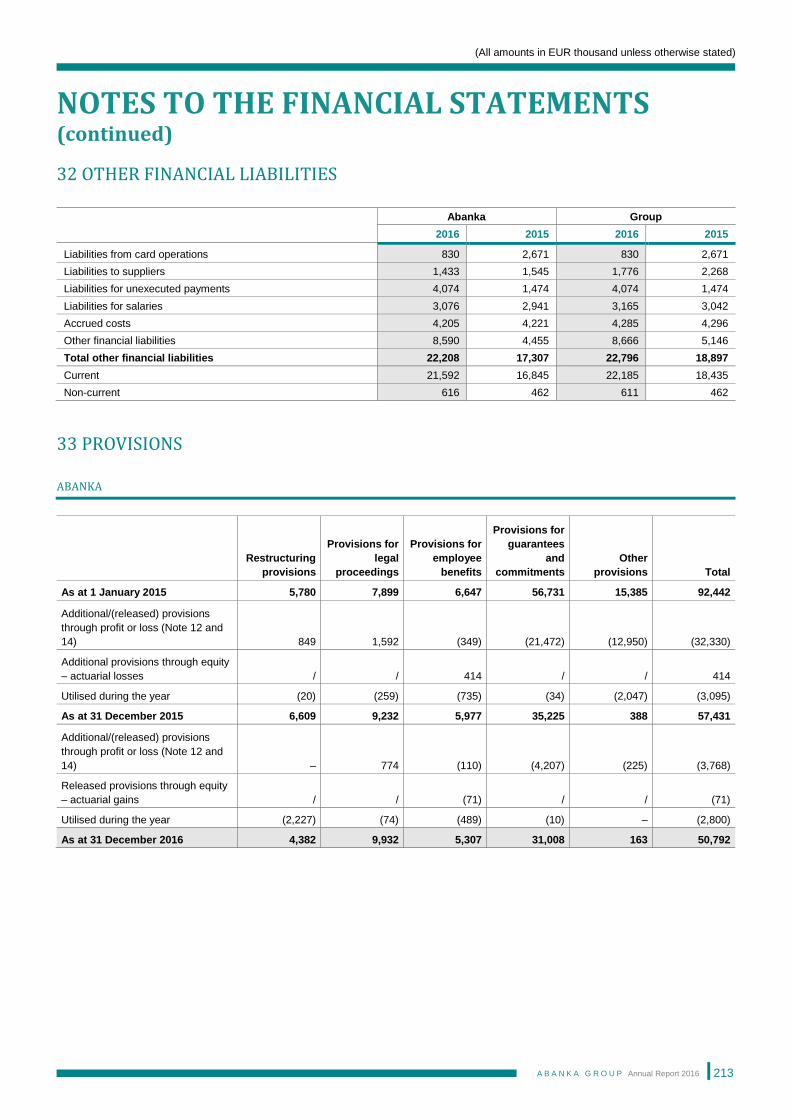
(All amounts in EUR thousand unless otherwise stated)
NOTES TO THE FINANCIAL STATEMENTS (continued)
A B A N K A G R O U P Annual Report 2016
213
32 OTHER FINANCIAL LIABILITIES
Abanka Group
2016 2015 2016 2015
Liabilities from card operations 830 2,671 830 2,671
Liabilities to suppliers 1,433 1,545 1,776 2,268
Liabilities for unexecuted payments 4,074 1,474 4,074 1,474
Liabilities for salaries 3,076 2,941 3,165 3,042
Accrued costs 4,205 4,221 4,285 4,296
Other financial liabilities 8,590 4,455 8,666 5,146
Total other financial liabilities 22,208 17,307 22,796 18,897
Current 21,592 16,845 22,185 18,435
Non-current 616 462 611 462
33 PROVISIONS
ABANKA
Restructuring
provisions
Provisions for
legal
proceedings
Provisions for
employee
benefits
Provisions for
guarantees
and
commitments
Other
provisions Total
As at 1 January 2015 5,780 7,899 6,647 56,731 15,385 92,442
Additional/(released) provisions
through profit or loss (Note 12 and
14) 849 1,592 (349) (21,472) (12,950) (32,330)
Additional provisions through equity
– actuarial losses / / 414 / / 414
Utilised during the year (20) (259) (735) (34) (2,047) (3,095)
As at 31 December 2015 6,609 9,232 5,977 35,225 388 57,431
Additional/(released) provisions
through profit or loss (Note 12 and
14) – 774 (110) (4,207) (225) (3,768)
Released provisions through equity
– actuarial gains / / (71) / / (71)
Utilised during the year (2,227) (74) (489) (10) – (2,800)
As at 31 December 2016 4,382 9,932 5,307 31,008 163 50,792
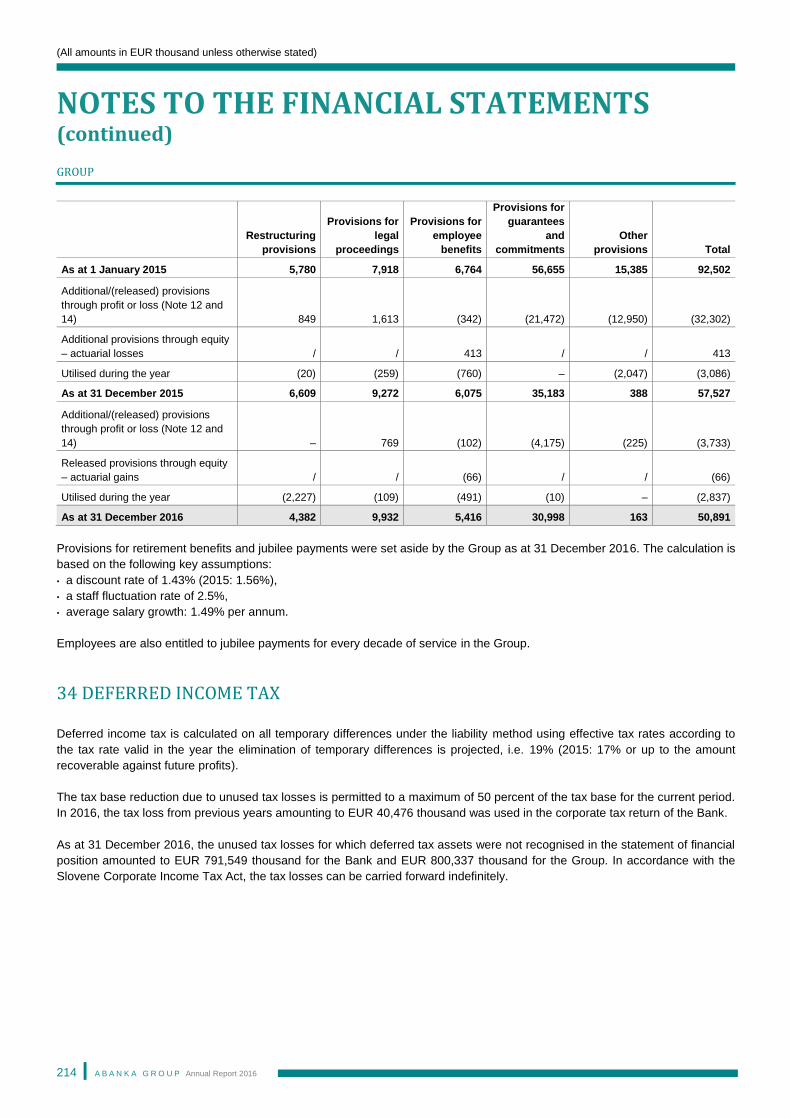
(All amounts in EUR thousand unless otherwise stated)
NOTES TO THE FINANCIAL STATEMENTS (continued)
A B A N K A G R O U P Annual Report 2016
214
GROUP
Restructuring
provisions
Provisions for
legal
proceedings
Provisions for
employee
benefits
Provisions for
guarantees
and
commitments
Other
provisions Total
As at 1 January 2015 5,780 7,918 6,764 56,655 15,385 92,502
Additional/(released) provisions
through profit or loss (Note 12 and
14) 849 1,613 (342) (21,472) (12,950) (32,302)
Additional provisions through equity
– actuarial losses / / 413 / / 413
Utilised during the year (20) (259) (760) – (2,047) (3,086)
As at 31 December 2015 6,609 9,272 6,075 35,183 388 57,527
Additional/(released) provisions
through profit or loss (Note 12 and
14) – 769 (102) (4,175) (225) (3,733)
Released provisions through equity
– actuarial gains / / (66) / / (66)
Utilised during the year (2,227) (109) (491) (10) – (2,837)
As at 31 December 2016 4,382 9,932 5,416 30,998 163 50,891
Provisions for retirement benefits and jubilee payments were set aside by the Group as at 31 December 2016. The calculation is
based on the following key assumptions:
• a discount rate of 1.43% (2015: 1.56%),
• a staff fluctuation rate of 2.5%,
• average salary growth: 1.49% per annum.
Employees are also entitled to jubilee payments for every decade of service in the Group.
34 DEFERRED INCOME TAX
Deferred income tax is calculated on all temporary differences under the liability method using effective tax rates according to
the tax rate valid in the year the elimination of temporary differences is projected, i.e. 19% (2015: 17% or up to the amount
recoverable against future profits).
The tax base reduction due to unused tax losses is permitted to a maximum of 50 percent of the tax base for the current period.
In 2016, the tax loss from previous years amounting to EUR 40,476 thousand was used in the corporate tax return of the Bank.
As at 31 December 2016, the unused tax losses for which deferred tax assets were not recognised in the statement of financial
position amounted to EUR 791,549 thousand for the Bank and EUR 800,337 thousand for the Group. In accordance with the
Slovene Corporate Income Tax Act, the tax losses can be carried forward indefinitely.
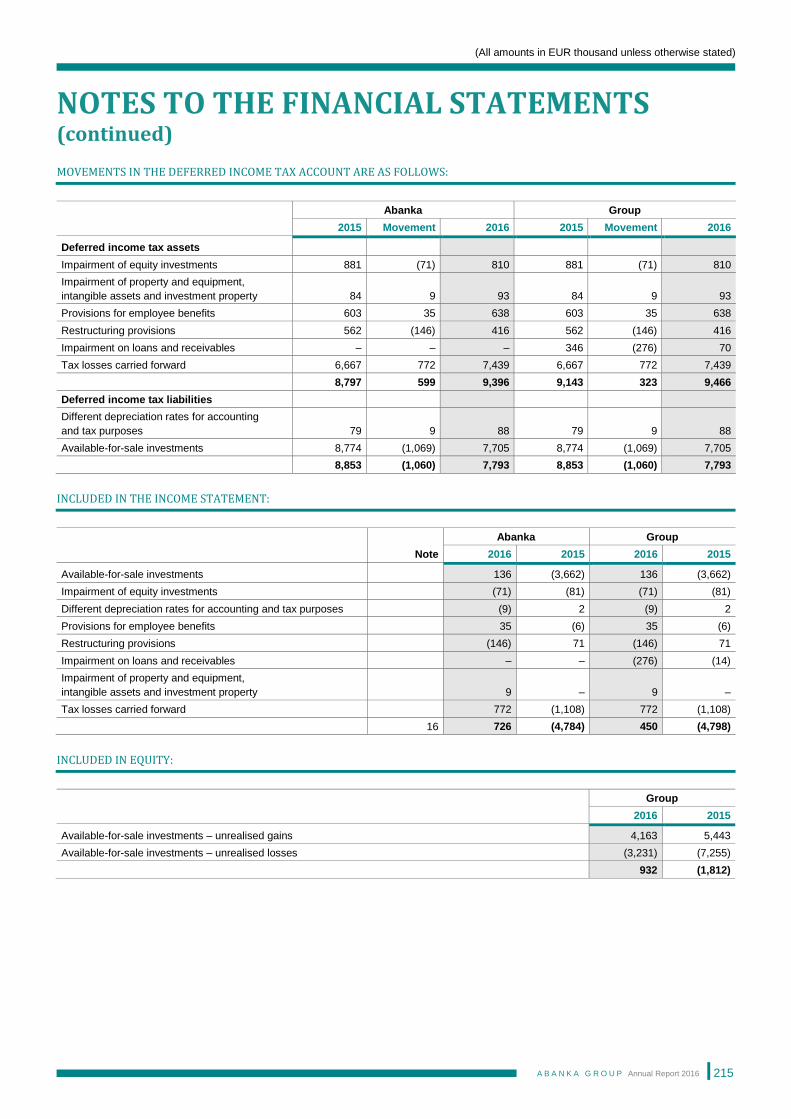
(All amounts in EUR thousand unless otherwise stated)
NOTES TO THE FINANCIAL STATEMENTS (continued)
A B A N K A G R O U P Annual Report 2016
215
MOVEMENTS IN THE DEFERRED INCOME TAX ACCOUNT ARE AS FOLLOWS:
Abanka Group
2015 Movement 2016 2015 Movement 2016
Deferred income tax assets
Impairment of equity investments 881 (71) 810 881 (71) 810
Impairment of property and equipment,
intangible assets and investment property 84 9 93 84 9 93
Provisions for employee benefits 603 35 638 603 35 638
Restructuring provisions 562 (146) 416 562 (146) 416
Impairment on loans and receivables – – – 346 (276) 70
Tax losses carried forward 6,667 772 7,439 6,667 772 7,439
8,797 599 9,396 9,143 323 9,466
Deferred income tax liabilities
Different depreciation rates for accounting
and tax purposes 79 9 88 79 9 88
Available-for-sale investments 8,774 (1,069) 7,705 8,774 (1,069) 7,705
8,853 (1,060) 7,793 8,853 (1,060) 7,793
INCLUDED IN THE INCOME STATEMENT:
Abanka Group
Note 2016 2015 2016 2015
Available-for-sale investments 136 (3,662) 136 (3,662)
Impairment of equity investments (71) (81) (71) (81)
Different depreciation rates for accounting and tax purposes (9) 2 (9) 2
Provisions for employee benefits 35 (6) 35 (6)
Restructuring provisions (146) 71 (146) 71
Impairment on loans and receivables – – (276) (14)
Impairment of property and equipment,
intangible assets and investment property 9 – 9 –
Tax losses carried forward 772 (1,108) 772 (1,108)
16 726 (4,784) 450 (4,798)
INCLUDED IN EQUITY:
Group
2016 2015
Available-for-sale investments – unrealised gains 4,163 5,443
Available-for-sale investments – unrealised losses (3,231) (7,255)
932 (1,812)
(All amounts in EUR thousand unless otherwise stated)
NOTES TO THE FINANCIAL STATEMENTS (continued)
A B A N K A G R O U P Annual Report 2016
216
35 SHARE CAPITAL, SHARE PREMIUM, ACCUMULATED OTHER COMPREHENSIVE
INCOME AND RESERVES FROM PROFIT
2016 Share 2015 Share
The Republic of Slovenia 100% The Republic of Slovenia 100%
MOVEMENTS IN SHARE CAPITAL:
Number of
shares Total
As at 1 January 2015 15,100,000 151,000
Acquisition of Banka Celje d.d. / 50,000
Acquisition of Banka Celje d.d. – transfer of share capital to share premium / (50,000)
As at 1 January 2015 – adjusted after acquisition 15,100,000 151,000
As at 31 December 2015 and 31 December 2016 15,100,000 151,000
MOVEMENTS IN SHARE PREMIUM:
2016 2015
As at 1 January 282,459 87,296
Acquisition of Banka Celje d.d. – opening balance / 166,221
Acquisition of Banka Celje d.d. – transfer of share capital to share premium / 50,000
As at 1 January – adjusted after acquisition 282,459 303,517
Covering of the loss brought forward – (21,058)
As at 31 December 282,459 282,459
The amounts of the share capital and share premium are equal for the Bank and the Group.
Accumulated other comprehensive income of the Bank amounted to EUR 42,466 thousand (2015: EUR 53,124 thousand)
arising from the valuation of financial assets available for sale of EUR 42,644 thousand (2015: EUR 53,386 thousand) and
actuarial losses on provisions for retirement benefits of EUR 178 thousand (2015: actuarial losses of EUR 262 thousand).
Accumulated other comprehensive income of the Group to the amount of EUR 42,445 thousand (2015: EUR 53,108 thousand)
refers to the valuation of available-for-sale financial assets, which totalled EUR 42,644 thousand (2015: EUR 53,386 thousand)
and actuarial losses on provisions for retirement benefits to the amount of EUR 199 thousand (2015: actuarial losses of EUR
278 thousand).
Reserves from profit include legal reserves, statutory reserves and other reserves from profit. In the past, the Group created
legal reserves in accordance with the Companies Act.
(All amounts in EUR thousand unless otherwise stated)
NOTES TO THE FINANCIAL STATEMENTS (continued)
A B A N K A G R O U P Annual Report 2016
217
RESERVES FROM PROFIT
Abanka Group
2016 2015 2016 2015
Legal reserves 16,213 16,213 16,233 16,213
Statutory reserves 11,943 4,278 11,943 4,278
Other reserves from profit 19,292 42 19,292 42
Total reserves from profit 47,448 20,533 47,468 20,533
Share premium, legal and statutory reserves may be used for covering loss after tax for the year, if it cannot be covered from
retained earnings or other reserves from profit.
36 DISTRIBUTABLE PROFIT
Abanka
2016 2015
Net profit from the current year 76,656 42,775
Distribution of net profit from the current year:
– for statutory reserves (7,665) (4,278)
– for other reserves from profit – (19,249)
Retained earnings 22,087 2,852
Distributable profit 91,078 22,100
The allocation of distributable profit is subject to a decision by the Bank’s Annual General Meeting.
37 CASH FLOW STATEMENT
The indirect method was used to prepare the cash flow statement.
CASH AND CASH EQUIVALENTS
Abanka Group
2016 2015 2016 2015
Cash, cash balances with the central bank and other demand
deposits with banks (Note 1.15 and 17) 344,241 281,267 344,259 281,289
Loans to banks (Note 1.15 and 21) 41,519 63,095 41,519 63,095
385,760 344,362 385,778 344,384
(All amounts in EUR thousand unless otherwise stated)
NOTES TO THE FINANCIAL STATEMENTS (continued)
A B A N K A G R O U P Annual Report 2016
218
CASH FLOWS FROM INTEREST AND DIVIDENDS
Abanka Group
2016 2015 2016 2015
Interest paid 17,034 42,701 17,034 42,701
Interest received 108,566 125,222 111,436 128,270
Dividends received 753 1,089 753 1,089
OTHER ITEMS IN THE CASH FLOW STATEMENT
Other gains from investing activities totalling EUR 4,224 thousand relate to held-to-maturity investments (EUR 1,196 thousand)
and non-current assets held for sale (EUR 3,028 thousand). In 2016, the Group received EUR 3,402 thousand in cash from the
successful restructuring of a large company and the sale of this investment, disclosed under non-current assets held for sale,
and thus earned profit in the amount of EUR 3,028 thousand.
38 COMMITMENTS AND CONTINGENCIES
a) Legal proceedings
As at 31 December 2016, the Group and the Bank are involved as defendants in several judicial proceedings and other
disputes. The total amount of pecuniary claims filed against the Bank on the reporting date stands at EUR 25,226 thousand
excluding default interest (as at 31 December 2015: EUR 13,148 thousand) and against the Group EUR 25,629 thousand (as at
31 December 2015: EUR 13,602 thousand). Based on the assessment of the likely outcome of disputes, respective provisions
were made (Note 33).
In the field of intellectual property rights, the Bank is involved in several disputes brought against it by ABANCA
CORPORACION BANCARIA S.A. from Spain, who is seeking the annulment of two international brands ABANKA no. 860 632
and no. 860 561. Proceedings have been initiated in Spain, Portugal, France, the United Kingdom, Germany and Switzerland,
with the claimant opposing the use of the abovementioned brands in these countries. Proceedings are at various stages and
are pending.
b) Credit-related commitments
The primary purpose of these instruments is to ensure that funds are available to customers upon request. Guarantees and
standby letters of credit (which represent irrevocable assurances that the Group will make payments in the event that a
customer cannot meet their obligations to third parties) carry the same credit risk as loans, documentary and commercial letters
of credit (which are written undertakings by the Group on behalf of a customer authorising a third party to draw drafts on the
Group up to a stipulated amount under specific terms and conditions) are collateralised by the underlying shipments of goods to
which they relate, or cash deposits, and therefore carry less risk than direct borrowing. Cash requirements under guarantees
and standby letters of credit are considerably lower than the amount of the commitment, because the Group does not generally
expect the third party to draw the funds under the agreement.
Commitments to extend credit represent unused portions of authorisations to extend credit in the form of loans, guarantees or
letters of credit. With respect to credit risk on commitments to extend credit, the Group is potentially exposed to a loss in an
amount equal to the total unused commitments. However, the likely amount of loss is less than the total unused commitments,
since most commitments to extend credit are contingent upon customers maintaining specific credit standards.
Whilst there is some credit risk associated with the remainder of commitments, the risk is viewed as modest, since it results from
the possibility of unused portions of loan authorisations being drawn by the customer and, secondly, from these drawings
subsequently not being repaid when due. The Group monitors the term to maturity of credit commitments, because long-term
commitments generally involve greater credit risk than short-term ones. The total outstanding contractual amount of credit
commitments to extend credit does not necessarily represent future cash requirements, since many of these commitments may
expire or terminate without being funded.
(All amounts in EUR thousand unless otherwise stated)
NOTES TO THE FINANCIAL STATEMENTS (continued)
A B A N K A G R O U P Annual Report 2016
219
The following table indicates the contractual amounts of the Bank’s and the Group’s guarantees and commitments to extend
credit to customers.
GUARANTEES AND COMMITMENTS
Abanka Group
Note 2016 2015 2016 2015
Performance bonds 127,892 141,324 127,761 141,316
Financial guarantees 57,013 75,888 57,013 75,888
Loan commitments 292,238 261,954 290,896 263,958
Derivatives 5,049 5,391 5,049 5,391
Other 1,437 17,450 1,437 17,450
483,629 502,007 482,156 504,003
Provisions: 33
– provisions for guarantees and commitments (31,008) (35,225) (30,998) (35,183)
– other provisions
– national housing savings scheme (NHSS) (163) (163) (163) (163)
– other – (225) – (225)
452,458 466,394 450,995 468,432
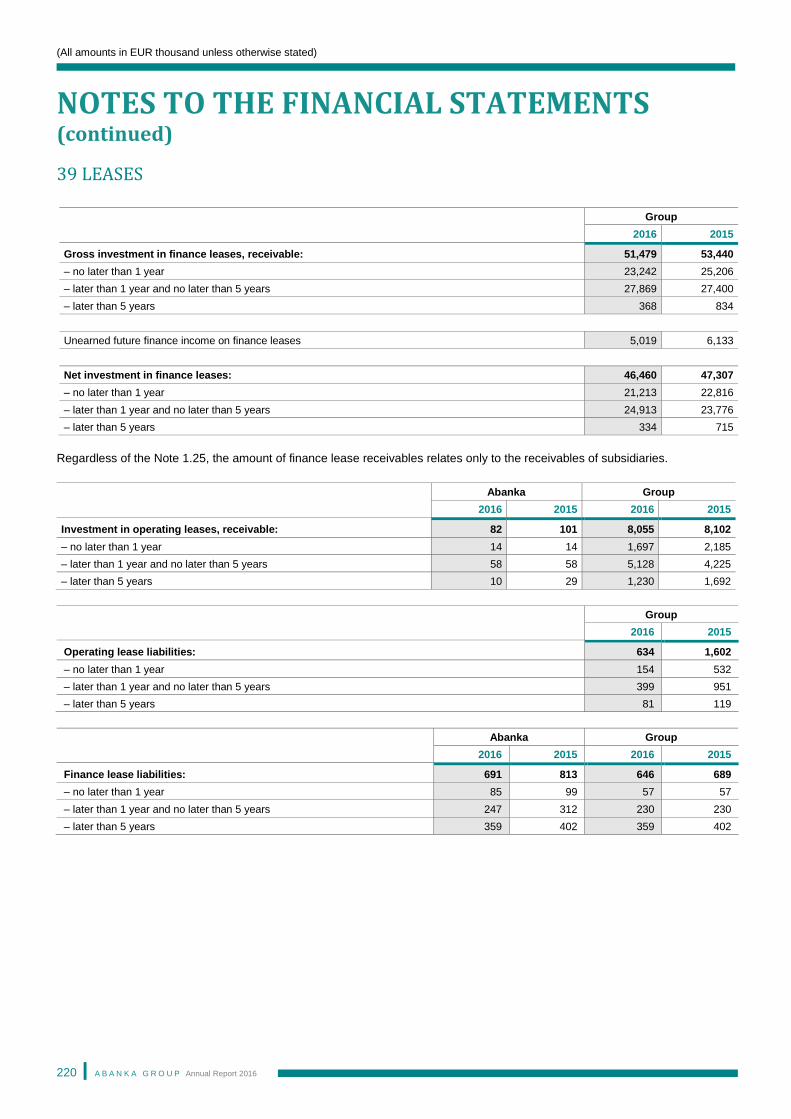
(All amounts in EUR thousand unless otherwise stated)
NOTES TO THE FINANCIAL STATEMENTS (continued)
A B A N K A G R O U P Annual Report 2016
220
39 LEASES
Group
2016 2015
Gross investment in finance leases, receivable: 51,479 53,440
– no later than 1 year 23,242 25,206
– later than 1 year and no later than 5 years 27,869 27,400
– later than 5 years 368 834
Unearned future finance income on finance leases 5,019 6,133
Net investment in finance leases: 46,460 47,307
– no later than 1 year 21,213 22,816
– later than 1 year and no later than 5 years 24,913 23,776
– later than 5 years 334 715
Regardless of the Note 1.25, the amount of finance lease receivables relates only to the receivables of subsidiaries.
Abanka Group
2016 2015 2016 2015
Investment in operating leases, receivable: 82 101 8,055 8,102
– no later than 1 year 14 14 1,697 2,185
– later than 1 year and no later than 5 years 58 58 5,128 4,225
– later than 5 years 10 29 1,230 1,692
Group
2016 2015
Operating lease liabilities: 634 1,602
– no later than 1 year 154 532
– later than 1 year and no later than 5 years 399 951
– later than 5 years 81 119
Abanka Group
2016 2015 2016 2015
Finance lease liabilities: 691 813 646 689
– no later than 1 year 85 99 57 57
– later than 1 year and no later than 5 years 247 312 230 230
– later than 5 years 359 402 359 402
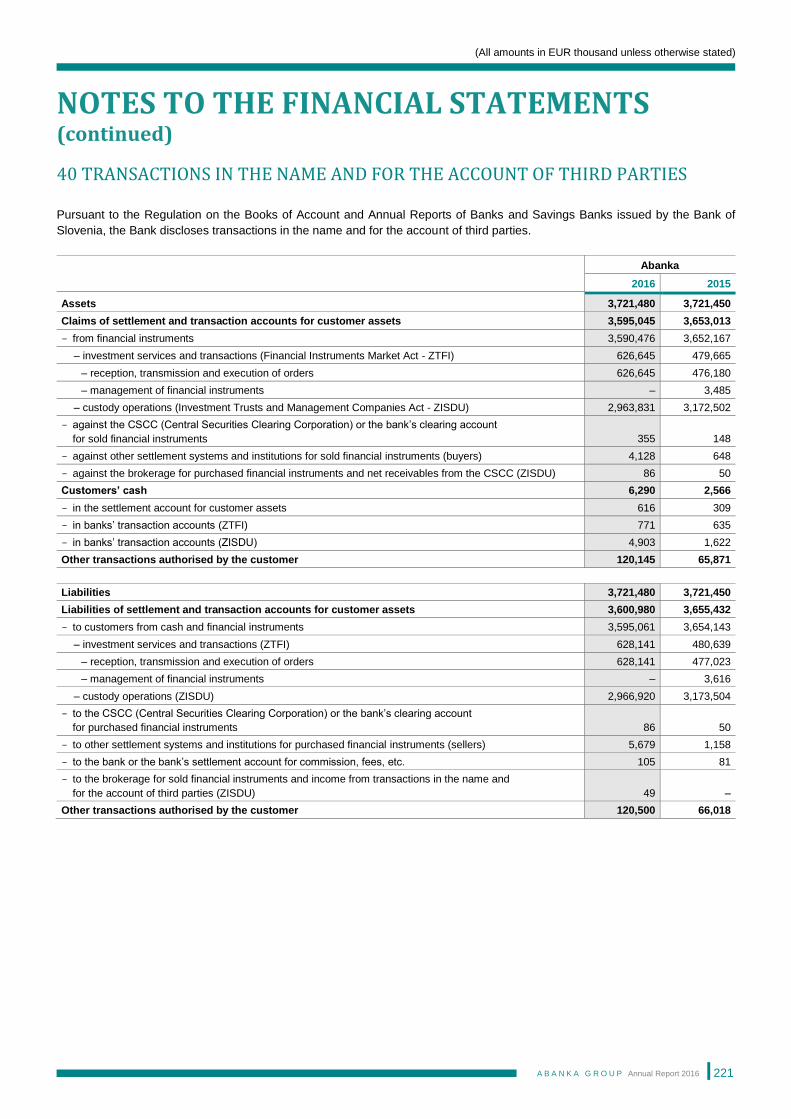
(All amounts in EUR thousand unless otherwise stated)
NOTES TO THE FINANCIAL STATEMENTS (continued)
A B A N K A G R O U P Annual Report 2016
221
40 TRANSACTIONS IN THE NAME AND FOR THE ACCOUNT OF THIRD PARTIES
Pursuant to the Regulation on the Books of Account and Annual Reports of Banks and Savings Banks issued by the Bank of
Slovenia, the Bank discloses transactions in the name and for the account of third parties.
Abanka
2016 2015
Assets 3,721,480 3,721,450
Claims of settlement and transaction accounts for customer assets 3,595,045 3,653,013
- from financial instruments 3,590,476 3,652,167
– investment services and transactions (Financial Instruments Market Act - ZTFI) 626,645 479,665
– reception, transmission and execution of orders 626,645 476,180
– management of financial instruments – 3,485
– custody operations (Investment Trusts and Management Companies Act - ZISDU) 2,963,831 3,172,502
- against the CSCC (Central Securities Clearing Corporation) or the bank’s clearing account
for sold financial instruments 355 148
- against other settlement systems and institutions for sold financial instruments (buyers) 4,128 648
- against the brokerage for purchased financial instruments and net receivables from the CSCC (ZISDU) 86 50
Customers’ cash 6,290 2,566
- in the settlement account for customer assets 616 309
- in banks’ transaction accounts (ZTFI) 771 635
- in banks’ transaction accounts (ZISDU) 4,903 1,622
Other transactions authorised by the customer 120,145 65,871
Liabilities 3,721,480 3,721,450
Liabilities of settlement and transaction accounts for customer assets 3,600,980 3,655,432
- to customers from cash and financial instruments 3,595,061 3,654,143
– investment services and transactions (ZTFI) 628,141 480,639
– reception, transmission and execution of orders 628,141 477,023
– management of financial instruments – 3,616
– custody operations (ZISDU) 2,966,920 3,173,504
- to the CSCC (Central Securities Clearing Corporation) or the bank’s clearing account
for purchased financial instruments 86 50
- to other settlement systems and institutions for purchased financial instruments (sellers) 5,679 1,158
- to the bank or the bank’s settlement account for commission, fees, etc. 105 81
- to the brokerage for sold financial instruments and income from transactions in the name and
for the account of third parties (ZISDU) 49 –
Other transactions authorised by the customer 120,500 66,018
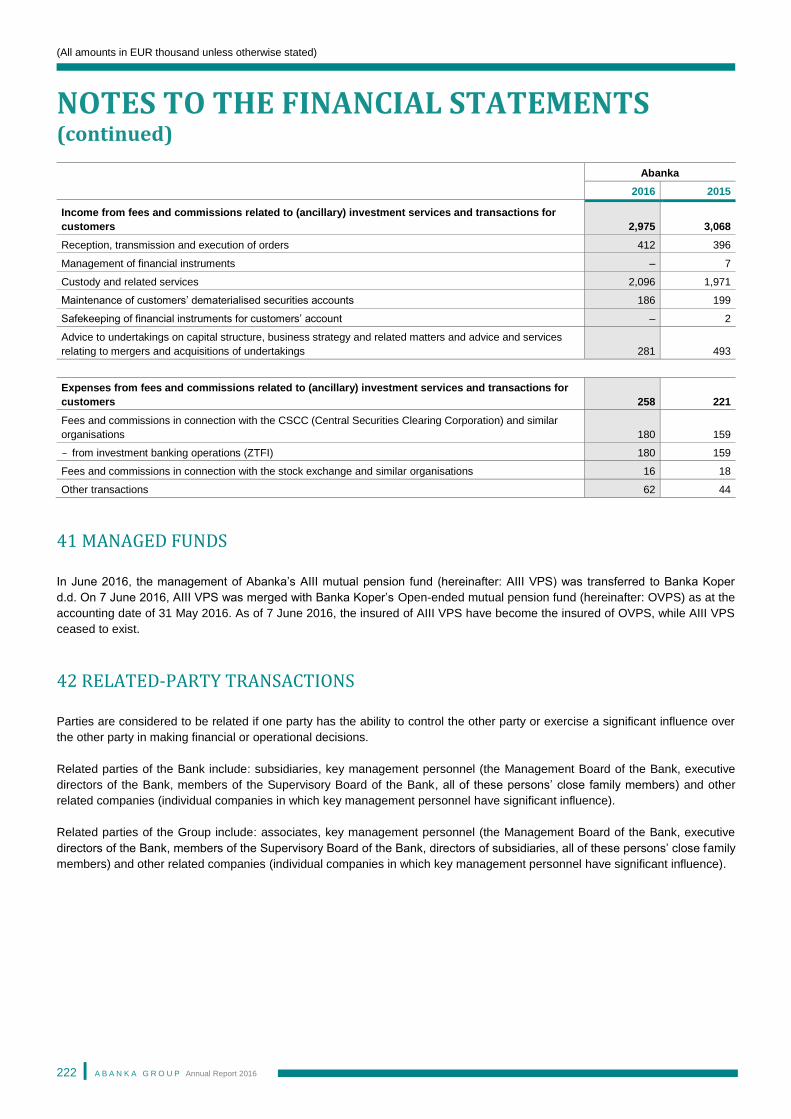
(All amounts in EUR thousand unless otherwise stated)
NOTES TO THE FINANCIAL STATEMENTS (continued)
A B A N K A G R O U P Annual Report 2016
222
Abanka
2016 2015
Income from fees and commissions related to (ancillary) investment services and transactions for
customers 2,975 3,068
Reception, transmission and execution of orders 412 396
Management of financial instruments – 7
Custody and related services 2,096 1,971
Maintenance of customers’ dematerialised securities accounts 186 199
Safekeeping of financial instruments for customers’ account – 2
Advice to undertakings on capital structure, business strategy and related matters and advice and services
relating to mergers and acquisitions of undertakings 281 493
Expenses from fees and commissions related to (ancillary) investment services and transactions for
customers 258 221
Fees and commissions in connection with the CSCC (Central Securities Clearing Corporation) and similar
organisations 180 159
- from investment banking operations (ZTFI) 180 159
Fees and commissions in connection with the stock exchange and similar organisations 16 18
Other transactions 62 44
41 MANAGED FUNDS
In June 2016, the management of Abanka’s AIII mutual pension fund (hereinafter: AIII VPS) was transferred to Banka Koper
d.d. On 7 June 2016, AIII VPS was merged with Banka Koper’s Open-ended mutual pension fund (hereinafter: OVPS) as at the
accounting date of 31 May 2016. As of 7 June 2016, the insured of AIII VPS have become the insured of OVPS, while AIII VPS
ceased to exist.
42 RELATED-PARTY TRANSACTIONS
Parties are considered to be related if one party has the ability to control the other party or exercise a significant influence over
the other party in making financial or operational decisions.
Related parties of the Bank include: subsidiaries, key management personnel (the Management Board of the Bank, executive
directors of the Bank, members of the Supervisory Board of the Bank, all of these persons’ close family members) and other
related companies (individual companies in which key management personnel have significant influence).
Related parties of the Group include: associates, key management personnel (the Management Board of the Bank, executive
directors of the Bank, members of the Supervisory Board of the Bank, directors of subsidiaries, all of these persons’ close family
members) and other related companies (individual companies in which key management personnel have significant influence).
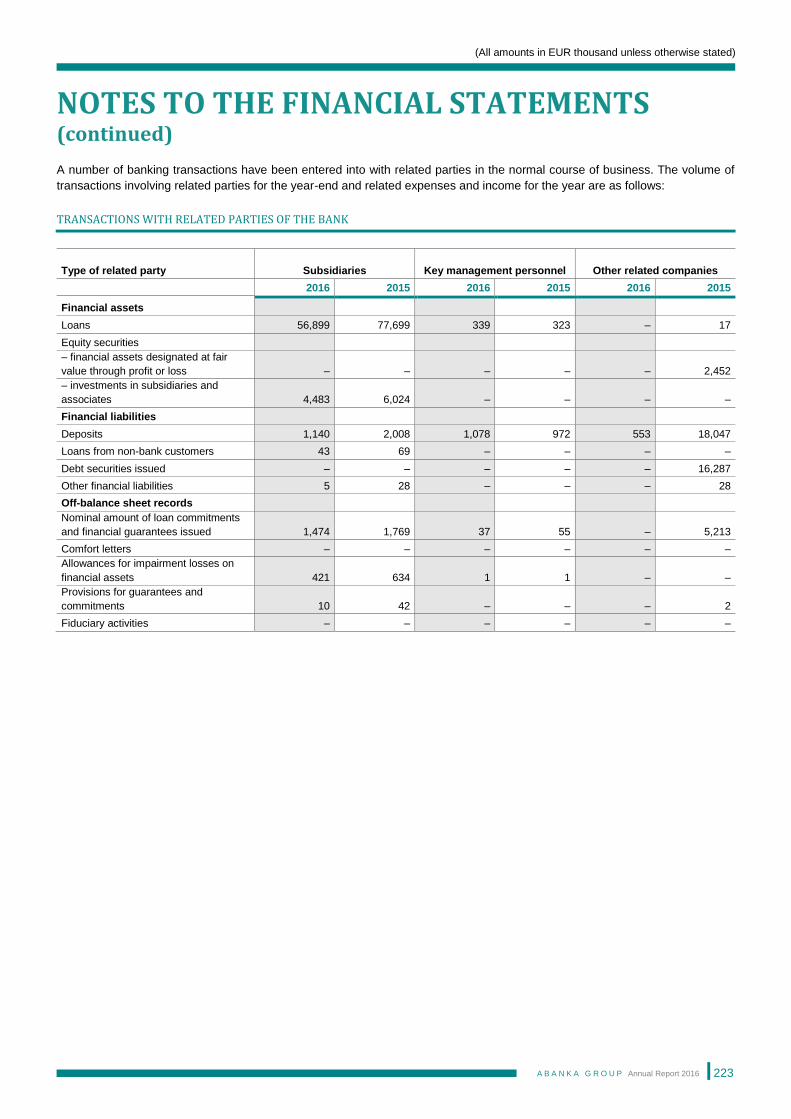
(All amounts in EUR thousand unless otherwise stated)
NOTES TO THE FINANCIAL STATEMENTS (continued)
A B A N K A G R O U P Annual Report 2016
223
A number of banking transactions have been entered into with related parties in the normal course of business. The volume of
transactions involving related parties for the year-end and related expenses and income for the year are as follows:
TRANSACTIONS WITH RELATED PARTIES OF THE BANK
Type of related party Subsidiaries Key management personnel Other related companies
2016 2015 2016 2015 2016 2015
Financial assets
Loans 56,899 77,699 339 323 – 17
Equity securities
– financial assets designated at fair
value through profit or loss – – – – – 2,452
– investments in subsidiaries and
associates 4,483 6,024 – – – –
Financial liabilities
Deposits 1,140 2,008 1,078 972 553 18,047
Loans from non-bank customers 43 69 – – – –
Debt securities issued – – – – – 16,287
Other financial liabilities 5 28 – – – 28
Off-balance sheet records
Nominal amount of loan commitments
and financial guarantees issued 1,474 1,769 37 55 – 5,213
Comfort letters – – – – – –
Allowances for impairment losses on
financial assets 421 634 1 1 – –
Provisions for guarantees and
commitments 10 42 – – – 2
Fiduciary activities – – – – – –
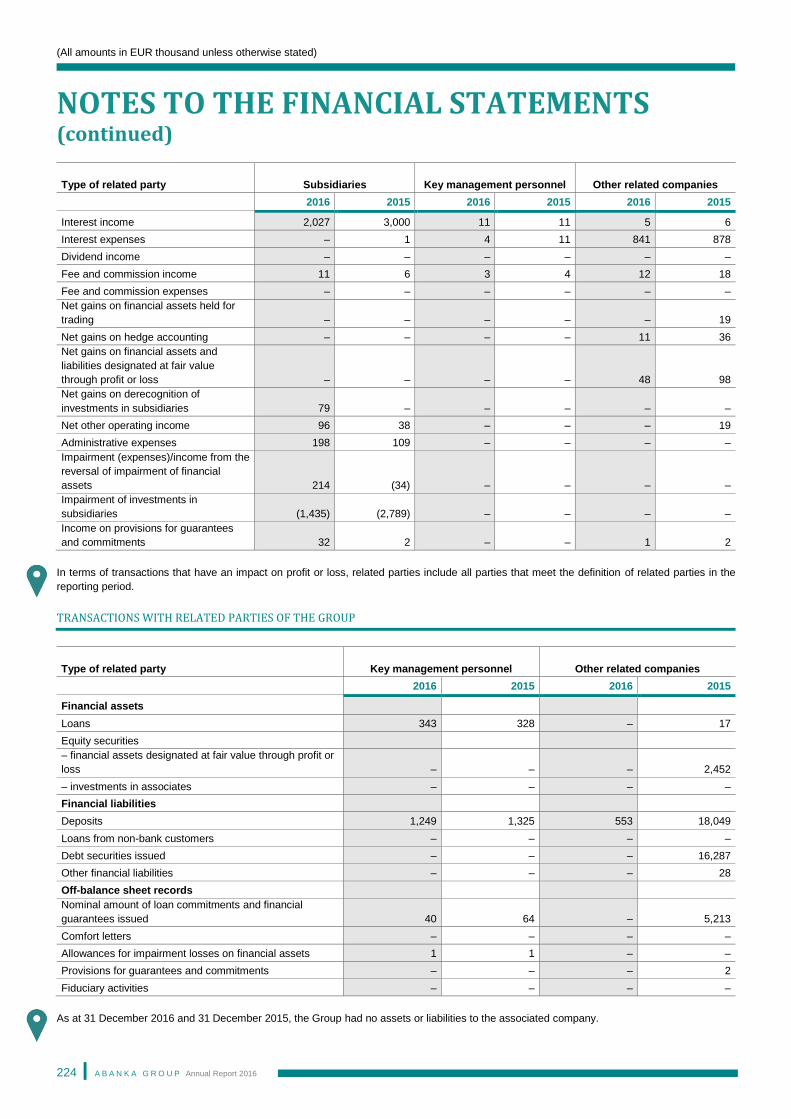
(All amounts in EUR thousand unless otherwise stated)
NOTES TO THE FINANCIAL STATEMENTS (continued)
A B A N K A G R O U P Annual Report 2016
224
Type of related party Subsidiaries Key management personnel Other related companies
2016 2015 2016 2015 2016 2015
Interest income 2,027 3,000 11 11 5 6
Interest expenses – 1 4 11 841 878
Dividend income – – – – – –
Fee and commission income 11 6 3 4 12 18
Fee and commission expenses – – – – – –
Net gains on financial assets held for
trading – – – – – 19
Net gains on hedge accounting – – – – 11 36
Net gains on financial assets and
liabilities designated at fair value
through profit or loss – – – – 48 98
Net gains on derecognition of
investments in subsidiaries 79 – – – – –
Net other operating income 96 38 – – – 19
Administrative expenses 198 109 – – – –
Impairment (expenses)/income from the
reversal of impairment of financial
assets 214 (34) – – – –
Impairment of investments in
subsidiaries (1,435) (2,789) – – – –
Income on provisions for guarantees
and commitments 32 2 – – 1 2
In terms of transactions that have an impact on profit or loss, related parties include all parties that meet the definition of related parties in the
reporting period.
TRANSACTIONS WITH RELATED PARTIES OF THE GROUP
Type of related party Key management personnel Other related companies
2016 2015 2016 2015
Financial assets
Loans 343 328 – 17
Equity securities
– financial assets designated at fair value through profit or
loss – – – 2,452
– investments in associates – – – –
Financial liabilities
Deposits 1,249 1,325 553 18,049
Loans from non-bank customers – – – –
Debt securities issued – – – 16,287
Other financial liabilities – – – 28
Off-balance sheet records
Nominal amount of loan commitments and financial
guarantees issued 40 64 – 5,213
Comfort letters – – – –
Allowances for impairment losses on financial assets 1 1 – –
Provisions for guarantees and commitments – – – 2
Fiduciary activities – – – –
As at 31 December 2016 and 31 December 2015, the Group had no assets or liabilities to the associated company.
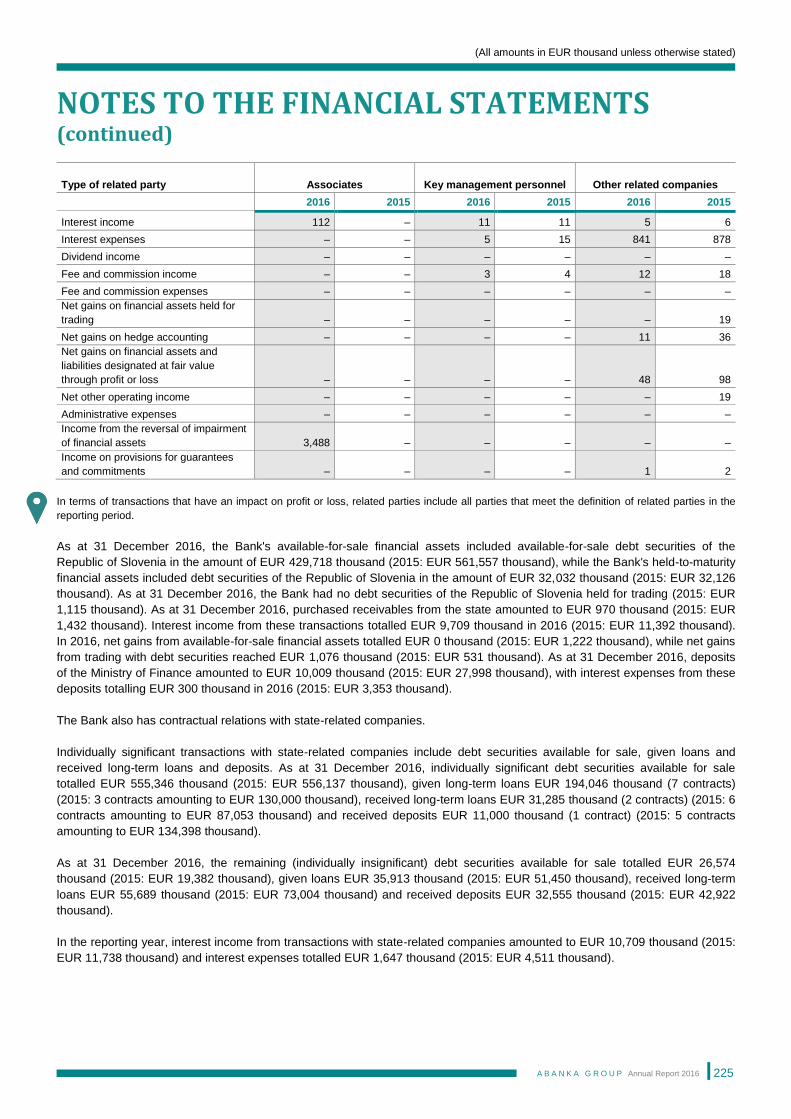
(All amounts in EUR thousand unless otherwise stated)
NOTES TO THE FINANCIAL STATEMENTS (continued)
A B A N K A G R O U P Annual Report 2016
225
Type of related party Associates Key management personnel Other related companies
2016 2015 2016 2015 2016 2015
Interest income 112 – 11 11 5 6
Interest expenses – – 5 15 841 878
Dividend income – – – – – –
Fee and commission income – – 3 4 12 18
Fee and commission expenses – – – – – –
Net gains on financial assets held for
trading – – – – – 19
Net gains on hedge accounting – – – – 11 36
Net gains on financial assets and
liabilities designated at fair value
through profit or loss – – – – 48 98
Net other operating income – – – – – 19
Administrative expenses – – – – – –
Income from the reversal of impairment
of financial assets 3,488 – – – – –
Income on provisions for guarantees
and commitments – – – – 1 2
In terms of transactions that have an impact on profit or loss, related parties include all parties that meet the definition of related parties in the
reporting period.
As at 31 December 2016, the Bank's available-for-sale financial assets included available-for-sale debt securities of the
Republic of Slovenia in the amount of EUR 429,718 thousand (2015: EUR 561,557 thousand), while the Bank's held-to-maturity
financial assets included debt securities of the Republic of Slovenia in the amount of EUR 32,032 thousand (2015: EUR 32,126
thousand). As at 31 December 2016, the Bank had no debt securities of the Republic of Slovenia held for trading (2015: EUR
1,115 thousand). As at 31 December 2016, purchased receivables from the state amounted to EUR 970 thousand (2015: EUR
1,432 thousand). Interest income from these transactions totalled EUR 9,709 thousand in 2016 (2015: EUR 11,392 thousand).
In 2016, net gains from available-for-sale financial assets totalled EUR 0 thousand (2015: EUR 1,222 thousand), while net gains
from trading with debt securities reached EUR 1,076 thousand (2015: EUR 531 thousand). As at 31 December 2016, deposits
of the Ministry of Finance amounted to EUR 10,009 thousand (2015: EUR 27,998 thousand), with interest expenses from these
deposits totalling EUR 300 thousand in 2016 (2015: EUR 3,353 thousand).
The Bank also has contractual relations with state-related companies.
Individually significant transactions with state-related companies include debt securities available for sale, given loans and
received long-term loans and deposits. As at 31 December 2016, individually significant debt securities available for sale
totalled EUR 555,346 thousand (2015: EUR 556,137 thousand), given long-term loans EUR 194,046 thousand (7 contracts)
(2015: 3 contracts amounting to EUR 130,000 thousand), received long-term loans EUR 31,285 thousand (2 contracts) (2015: 6
contracts amounting to EUR 87,053 thousand) and received deposits EUR 11,000 thousand (1 contract) (2015: 5 contracts
amounting to EUR 134,398 thousand).
As at 31 December 2016, the remaining (individually insignificant) debt securities available for sale totalled EUR 26,574
thousand (2015: EUR 19,382 thousand), given loans EUR 35,913 thousand (2015: EUR 51,450 thousand), received long-term
loans EUR 55,689 thousand (2015: EUR 73,004 thousand) and received deposits EUR 32,555 thousand (2015: EUR 42,922
thousand).
In the reporting year, interest income from transactions with state-related companies amounted to EUR 10,709 thousand (2015:
EUR 11,738 thousand) and interest expenses totalled EUR 1,647 thousand (2015: EUR 4,511 thousand).
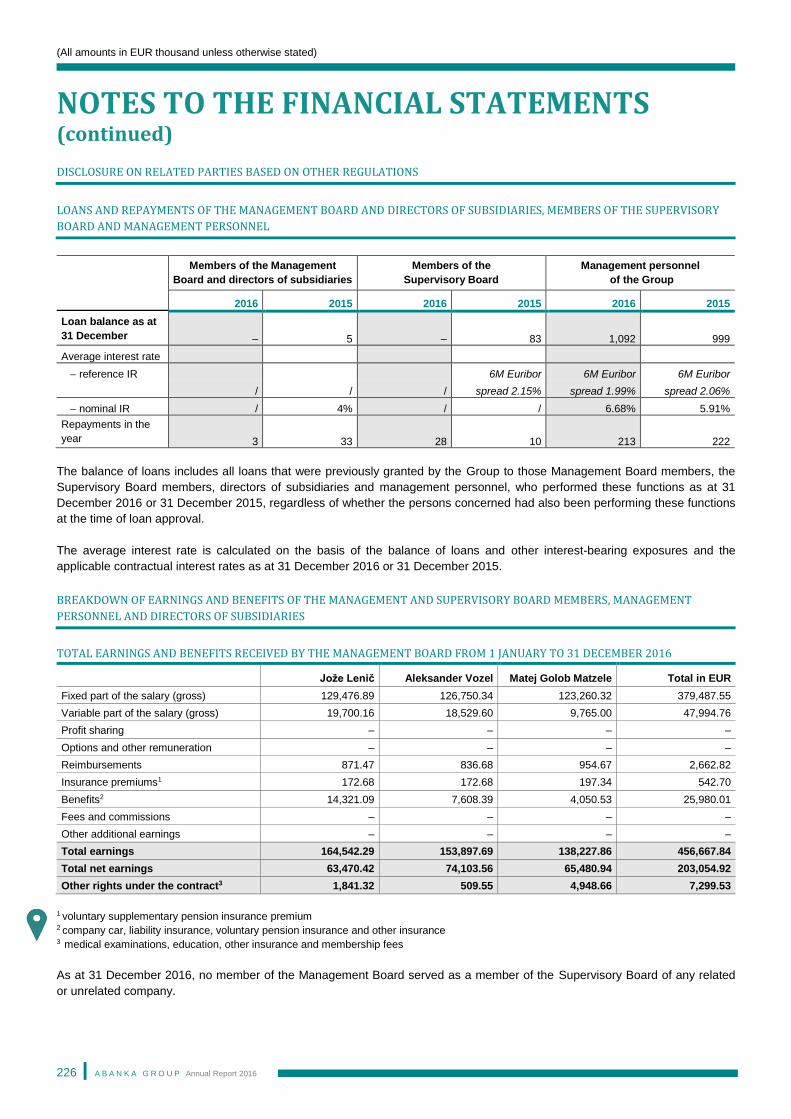
(All amounts in EUR thousand unless otherwise stated)
NOTES TO THE FINANCIAL STATEMENTS (continued)
A B A N K A G R O U P Annual Report 2016
226
DISCLOSURE ON RELATED PARTIES BASED ON OTHER REGULATIONS
LOANS AND REPAYMENTS OF THE MANAGEMENT BOARD AND DIRECTORS OF SUBSIDIARIES, MEMBERS OF THE SUPERVISORY
BOARD AND MANAGEMENT PERSONNEL
Members of the Management
Board and directors of subsidiaries
Members of the
Supervisory Board
Management personnel
of the Group
2016 2015 2016 2015 2016 2015
Loan balance as at
31 December – 5 – 83 1,092 999
Average interest rate
reference IR
6M Euribor 6M Euribor 6M Euribor
/ / / spread 2.15% spread 1.99% spread 2.06%
nominal IR / 4% / / 6.68% 5.91%
Repayments in the
year 3 33 28 10 213 222
The balance of loans includes all loans that were previously granted by the Group to those Management Board members, the
Supervisory Board members, directors of subsidiaries and management personnel, who performed these functions as at 31
December 2016 or 31 December 2015, regardless of whether the persons concerned had also been performing these functions
at the time of loan approval.
The average interest rate is calculated on the basis of the balance of loans and other interest-bearing exposures and the
applicable contractual interest rates as at 31 December 2016 or 31 December 2015.
BREAKDOWN OF EARNINGS AND BENEFITS OF THE MANAGEMENT AND SUPERVISORY BOARD MEMBERS, MANAGEMENT
PERSONNEL AND DIRECTORS OF SUBSIDIARIES
TOTAL EARNINGS AND BENEFITS RECEIVED BY THE MANAGEMENT BOARD FROM 1 JANUARY TO 31 DECEMBER 2016
Jože Lenič Aleksander Vozel Matej Golob Matzele Total in EUR
Fixed part of the salary (gross) 129,476.89 126,750.34 123,260.32 379,487.55
Variable part of the salary (gross) 19,700.16 18,529.60 9,765.00 47,994.76
Profit sharing – – – –
Options and other remuneration – – – –
Reimbursements 871.47 836.68 954.67 2,662.82
Insurance premiums1 172.68 172.68 197.34 542.70
Benefits2 14,321.09 7,608.39 4,050.53 25,980.01
Fees and commissions – – – –
Other additional earnings – – – –
Total earnings 164,542.29 153,897.69 138,227.86 456,667.84
Total net earnings 63,470.42 74,103.56 65,480.94 203,054.92
Other rights under the contract3 1,841.32 509.55 4,948.66 7,299.53
1 voluntary supplementary pension insurance premium 2 company car, liability insurance, voluntary pension insurance and other insurance 3 medical examinations, education, other insurance and membership fees
As at 31 December 2016, no member of the Management Board served as a member of the Supervisory Board of any related
or unrelated company.
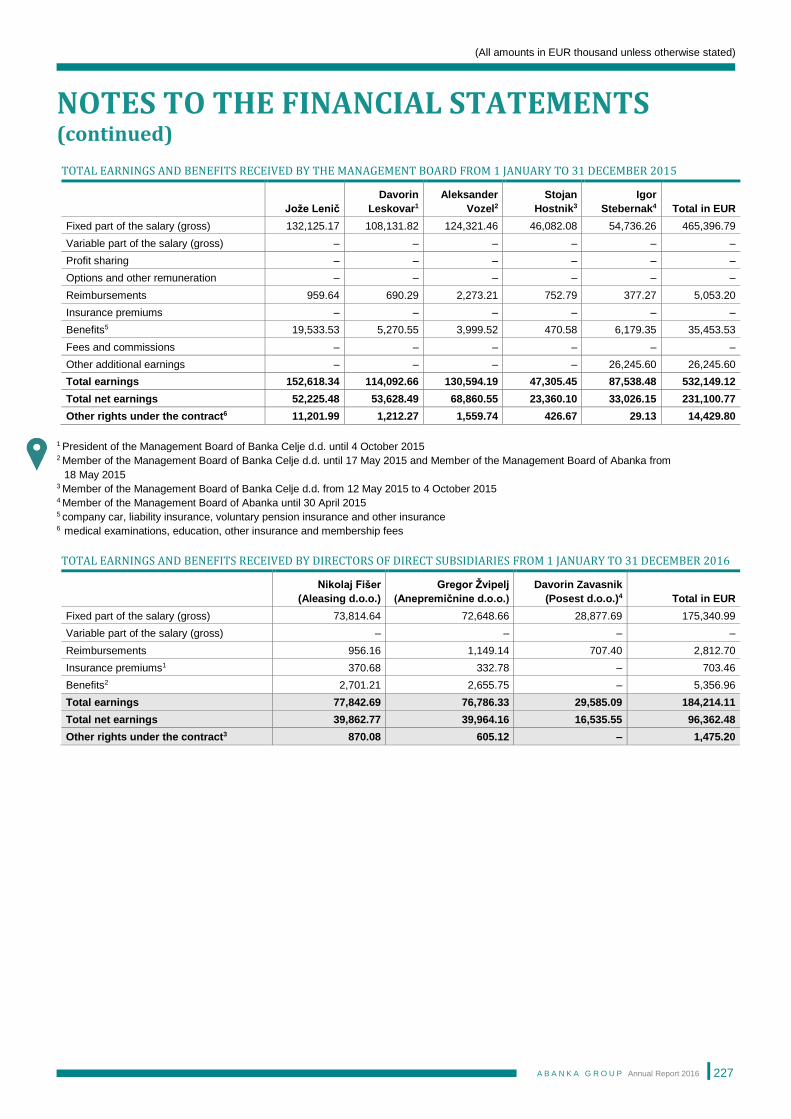
(All amounts in EUR thousand unless otherwise stated)
NOTES TO THE FINANCIAL STATEMENTS (continued)
A B A N K A G R O U P Annual Report 2016
227
TOTAL EARNINGS AND BENEFITS RECEIVED BY THE MANAGEMENT BOARD FROM 1 JANUARY TO 31 DECEMBER 2015
Jože Lenič
Davorin
Leskovar1
Aleksander
Vozel2
Stojan
Hostnik3
Igor
Stebernak4 Total in EUR
Fixed part of the salary (gross) 132,125.17 108,131.82 124,321.46 46,082.08 54,736.26 465,396.79
Variable part of the salary (gross) – – – – – –
Profit sharing – – – – – –
Options and other remuneration – – – – – –
Reimbursements 959.64 690.29 2,273.21 752.79 377.27 5,053.20
Insurance premiums – – – – – –
Benefits5 19,533.53 5,270.55 3,999.52 470.58 6,179.35 35,453.53
Fees and commissions – – – – – –
Other additional earnings – – – – 26,245.60 26,245.60
Total earnings 152,618.34 114,092.66 130,594.19 47,305.45 87,538.48 532,149.12
Total net earnings 52,225.48 53,628.49 68,860.55 23,360.10 33,026.15 231,100.77
Other rights under the contract6 11,201.99 1,212.27 1,559.74 426.67 29.13 14,429.80
1 President of the Management Board of Banka Celje d.d. until 4 October 2015 2 Member of the Management Board of Banka Celje d.d. until 17 May 2015 and Member of the Management Board of Abanka from
18 May 2015 3 Member of the Management Board of Banka Celje d.d. from 12 May 2015 to 4 October 2015 4 Member of the Management Board of Abanka until 30 April 2015 5 company car, liability insurance, voluntary pension insurance and other insurance 6 medical examinations, education, other insurance and membership fees
TOTAL EARNINGS AND BENEFITS RECEIVED BY DIRECTORS OF DIRECT SUBSIDIARIES FROM 1 JANUARY TO 31 DECEMBER 2016
Nikolaj Fišer
(Aleasing d.o.o.)
Gregor Žvipelj
(Anepremičnine d.o.o.)
Davorin Zavasnik
(Posest d.o.o.)4 Total in EUR
Fixed part of the salary (gross) 73,814.64 72,648.66 28,877.69 175,340.99
Variable part of the salary (gross) – – – –
Reimbursements 956.16 1,149.14 707.40 2,812.70
Insurance premiums1 370.68 332.78 – 703.46
Benefits2 2,701.21 2,655.75 – 5,356.96
Total earnings 77,842.69 76,786.33 29,585.09 184,214.11
Total net earnings 39,862.77 39,964.16 16,535.55 96,362.48
Other rights under the contract3 870.08 605.12 – 1,475.20
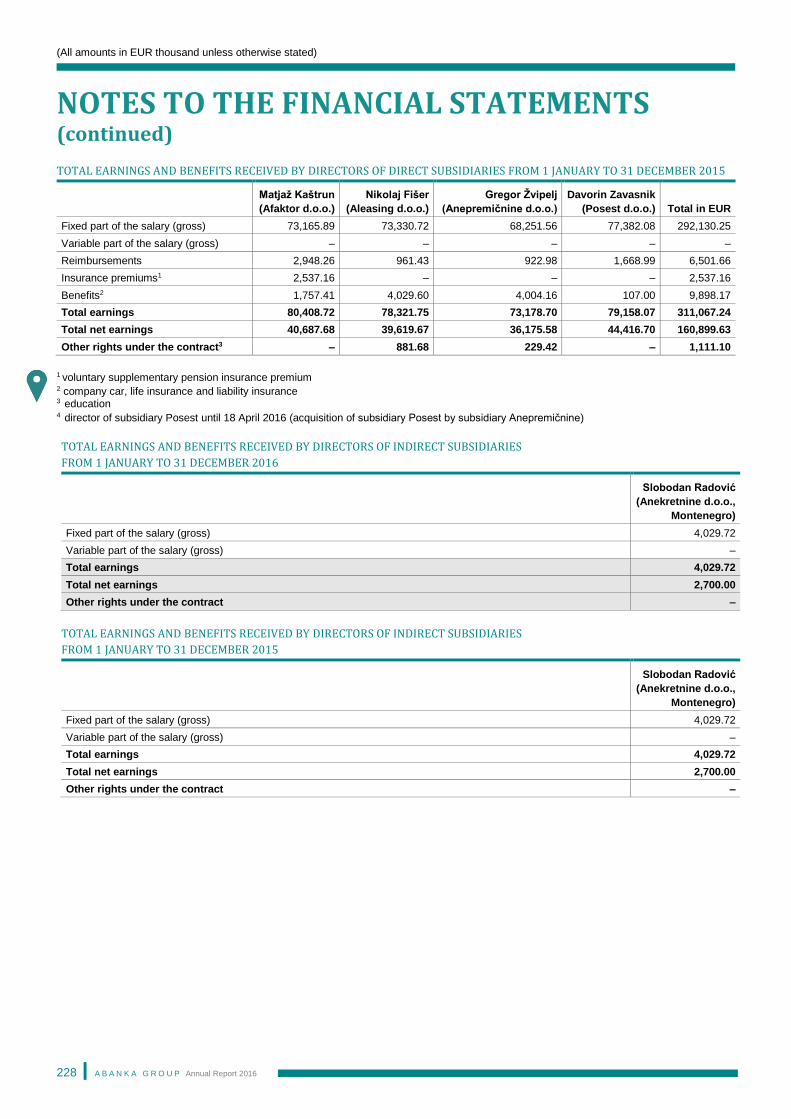
(All amounts in EUR thousand unless otherwise stated)
NOTES TO THE FINANCIAL STATEMENTS (continued)
A B A N K A G R O U P Annual Report 2016
228
TOTAL EARNINGS AND BENEFITS RECEIVED BY DIRECTORS OF DIRECT SUBSIDIARIES FROM 1 JANUARY TO 31 DECEMBER 2015
Matjaž Kaštrun
(Afaktor d.o.o.)
Nikolaj Fišer
(Aleasing d.o.o.)
Gregor Žvipelj
(Anepremičnine d.o.o.)
Davorin Zavasnik
(Posest d.o.o.) Total in EUR
Fixed part of the salary (gross) 73,165.89 73,330.72 68,251.56 77,382.08 292,130.25
Variable part of the salary (gross) – – – – –
Reimbursements 2,948.26 961.43 922.98 1,668.99 6,501.66
Insurance premiums1 2,537.16 – – – 2,537.16
Benefits2 1,757.41 4,029.60 4,004.16 107.00 9,898.17
Total earnings 80,408.72 78,321.75 73,178.70 79,158.07 311,067.24
Total net earnings 40,687.68 39,619.67 36,175.58 44,416.70 160,899.63
Other rights under the contract3 – 881.68 229.42 – 1,111.10
1 voluntary supplementary pension insurance premium 2 company car, life insurance and liability insurance 3 education 4 director of subsidiary Posest until 18 April 2016 (acquisition of subsidiary Posest by subsidiary Anepremičnine)
TOTAL EARNINGS AND BENEFITS RECEIVED BY DIRECTORS OF INDIRECT SUBSIDIARIES
FROM 1 JANUARY TO 31 DECEMBER 2016
Slobodan Radović
(Anekretnine d.o.o.,
Montenegro)
Fixed part of the salary (gross) 4,029.72
Variable part of the salary (gross) –
Total earnings 4,029.72
Total net earnings 2,700.00
Other rights under the contract –
TOTAL EARNINGS AND BENEFITS RECEIVED BY DIRECTORS OF INDIRECT SUBSIDIARIES
FROM 1 JANUARY TO 31 DECEMBER 2015
Slobodan Radović
(Anekretnine d.o.o.,
Montenegro)
Fixed part of the salary (gross) 4,029.72
Variable part of the salary (gross) –
Total earnings 4,029.72
Total net earnings 2,700.00
Other rights under the contract –
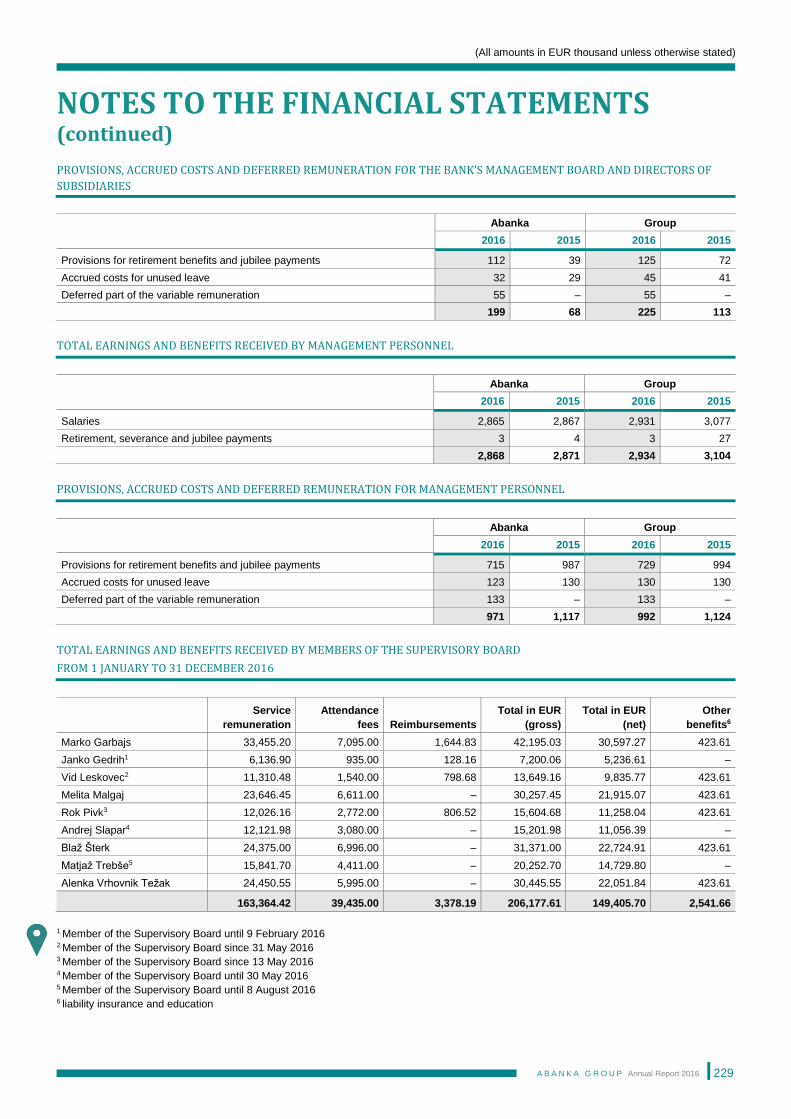
(All amounts in EUR thousand unless otherwise stated)
NOTES TO THE FINANCIAL STATEMENTS (continued)
A B A N K A G R O U P Annual Report 2016
229
PROVISIONS, ACCRUED COSTS AND DEFERRED REMUNERATION FOR THE BANK’S MANAGEMENT BOARD AND DIRECTORS OF
SUBSIDIARIES
Abanka Group
2016 2015 2016 2015
Provisions for retirement benefits and jubilee payments 112 39 125 72
Accrued costs for unused leave 32 29 45 41
Deferred part of the variable remuneration 55 – 55 –
199 68 225 113
TOTAL EARNINGS AND BENEFITS RECEIVED BY MANAGEMENT PERSONNEL
Abanka Group
2016 2015 2016 2015
Salaries 2,865 2,867 2,931 3,077
Retirement, severance and jubilee payments 3 4 3 27
2,868 2,871 2,934 3,104
PROVISIONS, ACCRUED COSTS AND DEFERRED REMUNERATION FOR MANAGEMENT PERSONNEL
Abanka Group
2016 2015 2016 2015
Provisions for retirement benefits and jubilee payments 715 987 729 994
Accrued costs for unused leave 123 130 130 130
Deferred part of the variable remuneration 133 – 133 –
971 1,117 992 1,124
TOTAL EARNINGS AND BENEFITS RECEIVED BY MEMBERS OF THE SUPERVISORY BOARD
FROM 1 JANUARY TO 31 DECEMBER 2016
Service
remuneration
Attendance
fees Reimbursements
Total in EUR
(gross)
Total in EUR
(net)
Other
benefits6
Marko Garbajs 33,455.20 7,095.00 1,644.83 42,195.03 30,597.27 423.61
Janko Gedrih1 6,136.90 935.00 128.16 7,200.06 5,236.61 –
Vid Leskovec2 11,310.48 1,540.00 798.68 13,649.16 9,835.77 423.61
Melita Malgaj 23,646.45 6,611.00 – 30,257.45 21,915.07 423.61
Rok Pivk3 12,026.16 2,772.00 806.52 15,604.68 11,258.04 423.61
Andrej Slapar4 12,121.98 3,080.00 – 15,201.98 11,056.39 –
Blaž Šterk 24,375.00 6,996.00 – 31,371.00 22,724.91 423.61
Matjaž Trebše5 15,841.70 4,411.00 – 20,252.70 14,729.80 –
Alenka Vrhovnik Težak 24,450.55 5,995.00 – 30,445.55 22,051.84 423.61
163,364.42 39,435.00 3,378.19 206,177.61 149,405.70 2,541.66
1 Member of the Supervisory Board until 9 February 2016 2 Member of the Supervisory Board since 31 May 2016 3 Member of the Supervisory Board since 13 May 2016 4 Member of the Supervisory Board until 30 May 2016 5 Member of the Supervisory Board until 8 August 2016 6 liability insurance and education
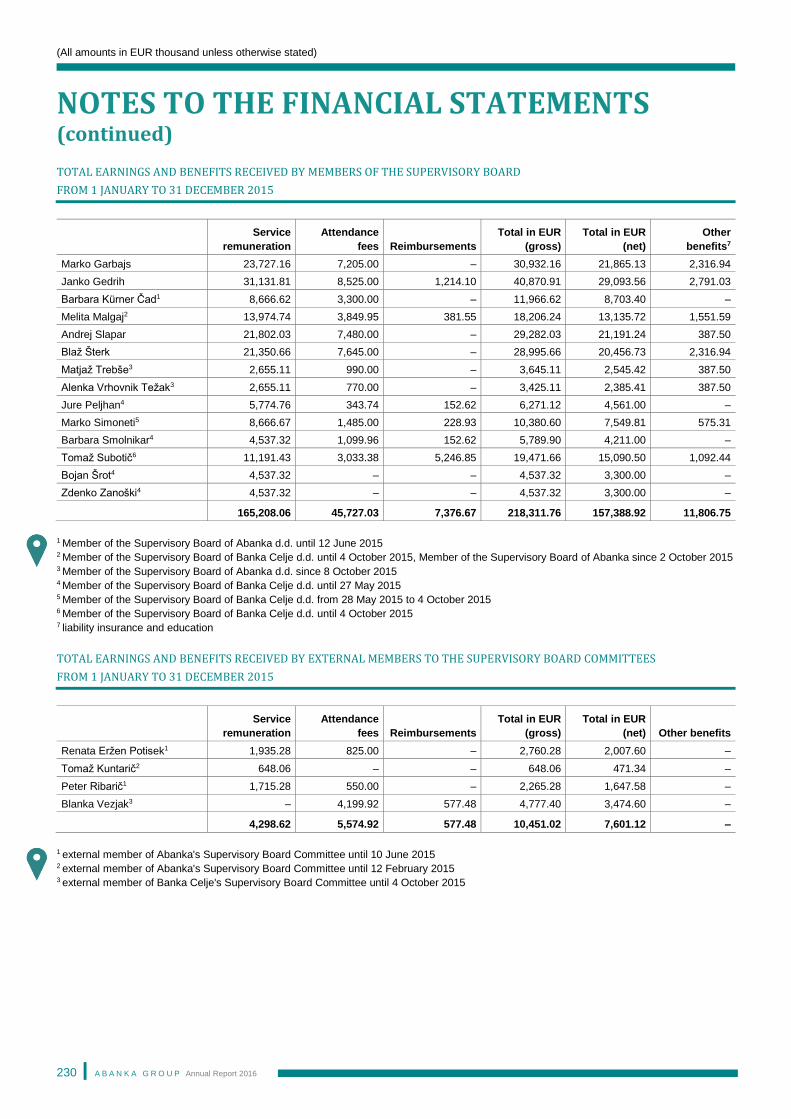
(All amounts in EUR thousand unless otherwise stated)
NOTES TO THE FINANCIAL STATEMENTS (continued)
A B A N K A G R O U P Annual Report 2016
230
TOTAL EARNINGS AND BENEFITS RECEIVED BY MEMBERS OF THE SUPERVISORY BOARD
FROM 1 JANUARY TO 31 DECEMBER 2015
Service
remuneration
Attendance
fees Reimbursements
Total in EUR
(gross)
Total in EUR
(net)
Other
benefits7
Marko Garbajs 23,727.16 7,205.00 – 30,932.16 21,865.13 2,316.94
Janko Gedrih 31,131.81 8,525.00 1,214.10 40,870.91 29,093.56 2,791.03
Barbara Kürner Čad1 8,666.62 3,300.00 – 11,966.62 8,703.40 –
Melita Malgaj2 13,974.74 3,849.95 381.55 18,206.24 13,135.72 1,551.59
Andrej Slapar 21,802.03 7,480.00 – 29,282.03 21,191.24 387.50
Blaž Šterk 21,350.66 7,645.00 – 28,995.66 20,456.73 2,316.94
Matjaž Trebše3 2,655.11 990.00 – 3,645.11 2,545.42 387.50
Alenka Vrhovnik Težak3 2,655.11 770.00 – 3,425.11 2,385.41 387.50
Jure Peljhan4 5,774.76 343.74 152.62 6,271.12 4,561.00 –
Marko Simoneti5 8,666.67 1,485.00 228.93 10,380.60 7,549.81 575.31
Barbara Smolnikar4 4,537.32 1,099.96 152.62 5,789.90 4,211.00 –
Tomaž Subotič6 11,191.43 3,033.38 5,246.85 19,471.66 15,090.50 1,092.44
Bojan Šrot4 4,537.32 – – 4,537.32 3,300.00 –
Zdenko Zanoški4 4,537.32 – – 4,537.32 3,300.00 –
165,208.06 45,727.03 7,376.67 218,311.76 157,388.92 11,806.75
1 Member of the Supervisory Board of Abanka d.d. until 12 June 2015 2 Member of the Supervisory Board of Banka Celje d.d. until 4 October 2015, Member of the Supervisory Board of Abanka since 2 October 2015 3 Member of the Supervisory Board of Abanka d.d. since 8 October 2015 4 Member of the Supervisory Board of Banka Celje d.d. until 27 May 2015 5 Member of the Supervisory Board of Banka Celje d.d. from 28 May 2015 to 4 October 2015 6 Member of the Supervisory Board of Banka Celje d.d. until 4 October 2015 7 liability insurance and education
TOTAL EARNINGS AND BENEFITS RECEIVED BY EXTERNAL MEMBERS TO THE SUPERVISORY BOARD COMMITTEES
FROM 1 JANUARY TO 31 DECEMBER 2015
Service
remuneration
Attendance
fees Reimbursements
Total in EUR
(gross)
Total in EUR
(net) Other benefits
Renata Eržen Potisek1 1,935.28 825.00 – 2,760.28 2,007.60 –
Tomaž Kuntarič2 648.06 – – 648.06 471.34 –
Peter Ribarič1 1,715.28 550.00 – 2,265.28 1,647.58 –
Blanka Vezjak3 – 4,199.92 577.48 4,777.40 3,474.60 –
4,298.62 5,574.92 577.48 10,451.02 7,601.12 –
1 external member of Abanka's Supervisory Board Committee until 10 June 2015 2 external member of Abanka's Supervisory Board Committee until 12 February 2015 3 external member of Banka Celje's Supervisory Board Committee until 4 October 2015
(All amounts in EUR thousand unless otherwise stated)
NOTES TO THE FINANCIAL STATEMENTS (continued)
A B A N K A G R O U P Annual Report 2016
231
43 EVENTS AFTER THE REPORTING DATE
There were no events after the reporting period that might have an impact on business decisions of the Report's users made on
the presented financial statements.
A B A N K A G R O U P Annual Report 2016
232
INDEPENDENT AUDITOR’S REPORT
A B A N K A G R O U P Annual Report 2016
233
A B A N K A G R O U P Annual Report 2016
234
A B A N K A G R O U P Annual Report 2016
235
A B A N K A G R O U P Annual Report 2016
236
A B A N K A G R O U P Annual Report 2016
237

Abanka d.d.Slovenska cesta 581517 LjubljanaBusiness account: SI56 0100 0000 0500 021 VAT number: SI68297530 Registration number: 5026024Tel.: +386 1 47 18100Fax: +386 1 43 25165www.abanka.siEmail: [email protected]
Published by: Abanka d.d.Editing: Corporate CommunicationsExpert advisorsBusiness report: Silva Matko Gosak and Mojca Mlinar Fekonja Financial report: Irena Rojc, Teja Šuster and Bisera Podjavoršek Risk management: Stojan Hostnik, Nataša Tkalec Goršek and Majda Klemenčič
Production: PD 8 d.o.o.Title pages design: Poanta d.o.o. Translation and language editing: Ago d.o.o., Amidas d.o.o.Photograph of Management Board: Igor Škafar Layout: Matejka StrašekApril 2017