Embed Size (px)
Citation preview
Annual Report2016-17
In this Annual Report, we have disclosed forward-looking information to enable investors to comprehend our prospects and take investment decisions. This report and other statements – written and oral – that we periodically make contain forward-looking statements that set out anticipated results based on the management’s plans and assumptions. We have tried wherever possible to identify such statements by using words such as ‘anticipate’, ‘estimate’, ‘expects’, ‘projects’, ‘intends’, ‘plans’, ‘believes’, and words of similar substance in connection with any discussion of future performance. We cannot guarantee that these forward-looking statements will be realised, although we believe we have been prudent in assumptions. The achievements of results are subject to risks, uncertainties, and even inaccurate assumptions. Should known or unknown risks or uncertainties materialise, or should underlying assumptions prove inaccurate, actual results could vary materially from those anticipated, estimated, or projected. Readers should keep this in mind. We undertake no obligation to publicly update any forward-looking statements, whether as a result of new information, future events or otherwise.
FORWARD-LOOKING STATEMENTS
For more details visit: http://www.visasteel.com
Vision & Values 02Financial and Operational Highlights 03Raw Material 04Operations 06Marketing 08Chairman’s Insights 10Vice Chairman & Managing Director’s Message 12Board of Directors 14Corporate Social Responsibility 16
COMPANY OVERVIEW
01-17
Standalone 72Consolidated 14472-218
FINANCIAL STATEMENTS 3
Report of the Directors 18Management Discussion and Analysis 50Report on Corporate Governance 5618-71
GOVERNANCE REPORTS 2
1
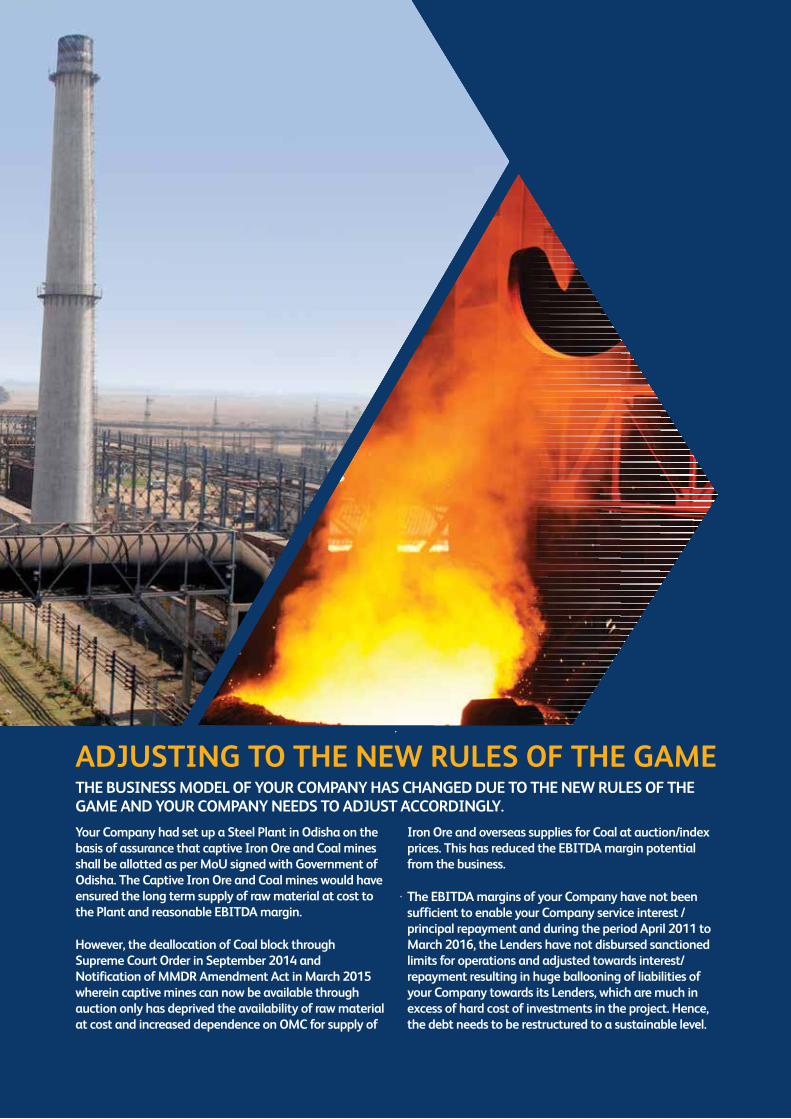
ADJUSTING TO THE NEW RULES OF THE GAMETHE BUSINESS MODEL OF YOUR COMPANY HAS CHANGED DUE TO THE NEW RULES OF THE GAME AND YOUR COMPANY NEEDS TO ADJUST ACCORDINGLY.
Your Company had set up a Steel Plant in Odisha on the basis of assurance that captive Iron Ore and Coal mines shall be allotted as per MoU signed with Government of Odisha. The Captive Iron Ore and Coal mines would have ensured the long term supply of raw material at cost to the Plant and reasonable EBITDA margin.
However, the deallocation of Coal block through Supreme Court Order in September 2014 and Notification of MMDR Amendment Act in March 2015 wherein captive mines can now be available through auction only has deprived the availability of raw material at cost and increased dependence on OMC for supply of
Iron Ore and overseas supplies for Coal at auction/index prices. This has reduced the EBITDA margin potential from the business.
The EBITDA margins of your Company have not been sufficient to enable your Company service interest / principal repayment and during the period April 2011 to March 2016, the Lenders have not disbursed sanctioned limits for operations and adjusted towards interest/repayment resulting in huge ballooning of liabilities of your Company towards its Lenders, which are much in excess of hard cost of investments in the project. Hence, the debt needs to be restructured to a sustainable level.
2 A nnu a l Repor t 2016-17
VISA STEEL VISION & VALUES
VISA STEEL VISION & VALUES | FINANCIAL AND OPERATIONAL PERFORMANCE
Vision Create long term shareholder value through value addition of natural resources
Registered OfficeBhubaneswar
Corporate OfficeKolkata
ListingYour Company has been listed on National Stock Exchange of India Limited and Bombay Stock Exchange Limited
ValuesTransparency
We are transparent and honest in our profession to all our stakeholders
Team Work
We work together as a team to benefit from our complementary strengths
Passion
We are passionately committed to delivering excellence in performance
Attitude
We demonstrate ownership in our attitude to create sustainable value for shareholders
Governance
We are committed to best standards of safety, corporate social responsibility and corporate governance
3VI S A S T EEL LT D.
COMPANY OVERVIEW FINANCIAL STATEMENTSGOVERNANCE REPORTS
FINANCIAL AND OPERATIONAL PERFORMANCE
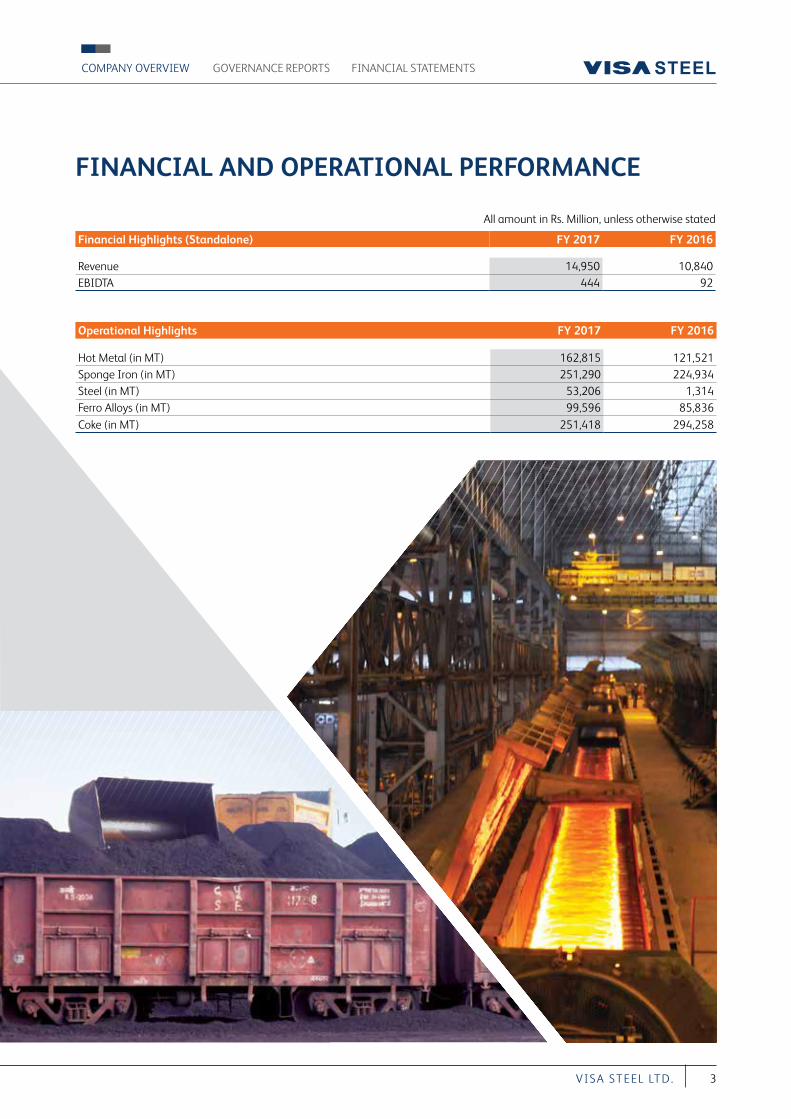
All amount in Rs. Million, unless otherwise stated
Financial Highlights (Standalone) FY 2017 FY 2016
Revenue 14,950 10,840 EBIDTA 444 92
Operational Highlights FY 2017 FY 2016
Hot Metal (in MT) 162,815 121,521 Sponge Iron (in MT) 251,290 224,934 Steel (in MT) 53,206 1,314 Ferro Alloys (in MT) 99,596 85,836 Coke (in MT) 251,418 294,258
4 A nnu a l Repor t 2016-17
RAW MATERIAL
RAW MATERIAL
5VI S A S T EEL LT D.
COMPANY OVERVIEW FINANCIAL STATEMENTSGOVERNANCE REPORTS
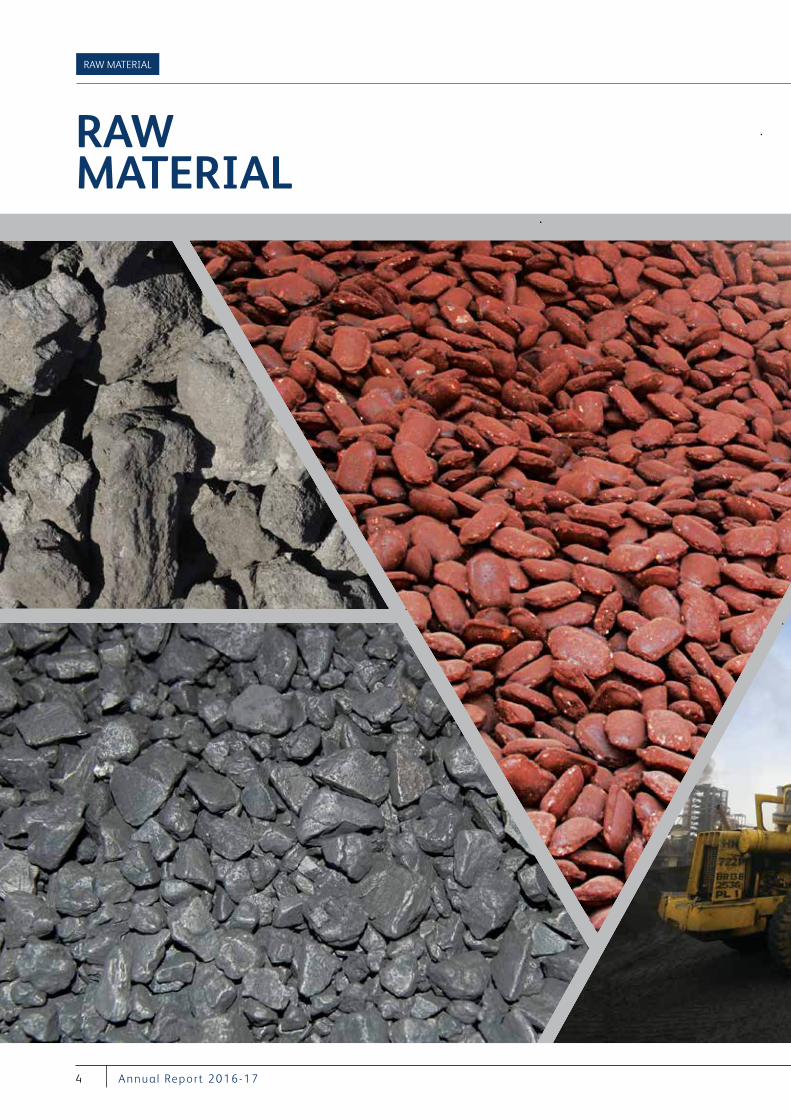
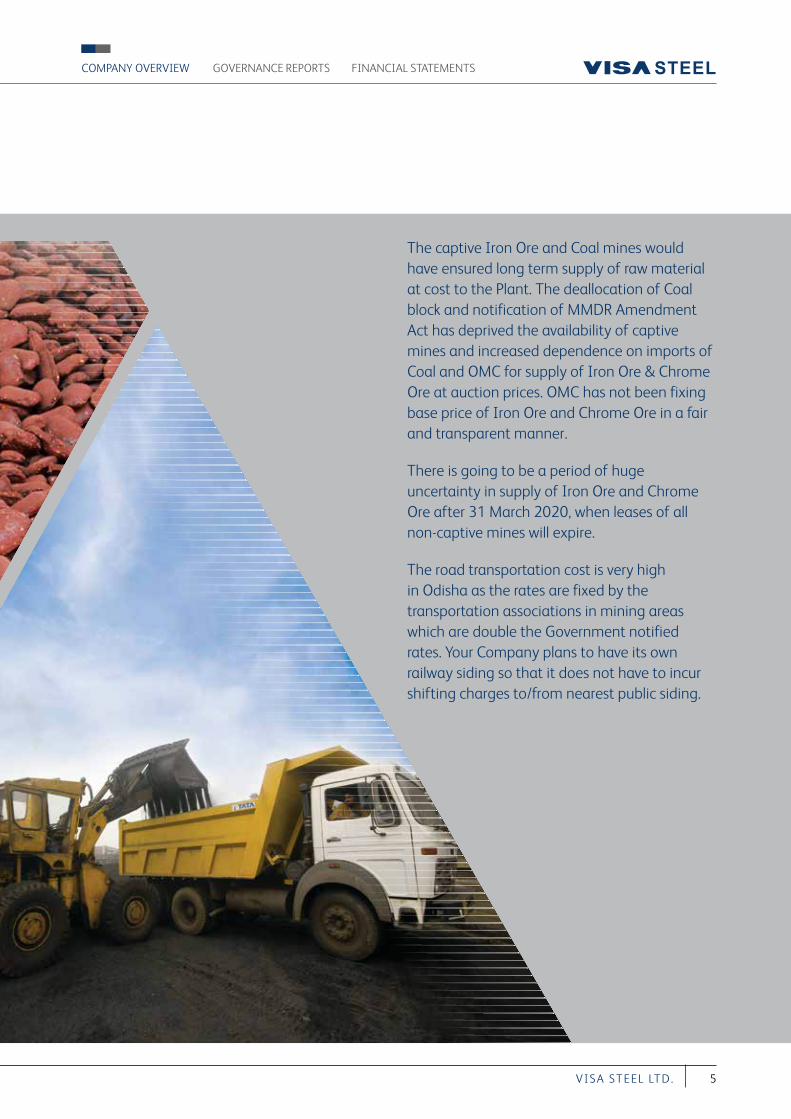
The captive Iron Ore and Coal mines would have ensured long term supply of raw material at cost to the Plant. The deallocation of Coal block and notification of MMDR Amendment Act has deprived the availability of captive mines and increased dependence on imports of Coal and OMC for supply of Iron Ore & Chrome Ore at auction prices. OMC has not been fixing base price of Iron Ore and Chrome Ore in a fair and transparent manner.
There is going to be a period of huge uncertainty in supply of Iron Ore and Chrome Ore after 31 March 2020, when leases of all non-captive mines will expire.
The road transportation cost is very high in Odisha as the rates are fixed by the transportation associations in mining areas which are double the Government notified rates. Your Company plans to have its own railway siding so that it does not have to incur shifting charges to/from nearest public siding.
6 A nnu a l Repor t 2016-17
OPERATIONS
OPERATIONS
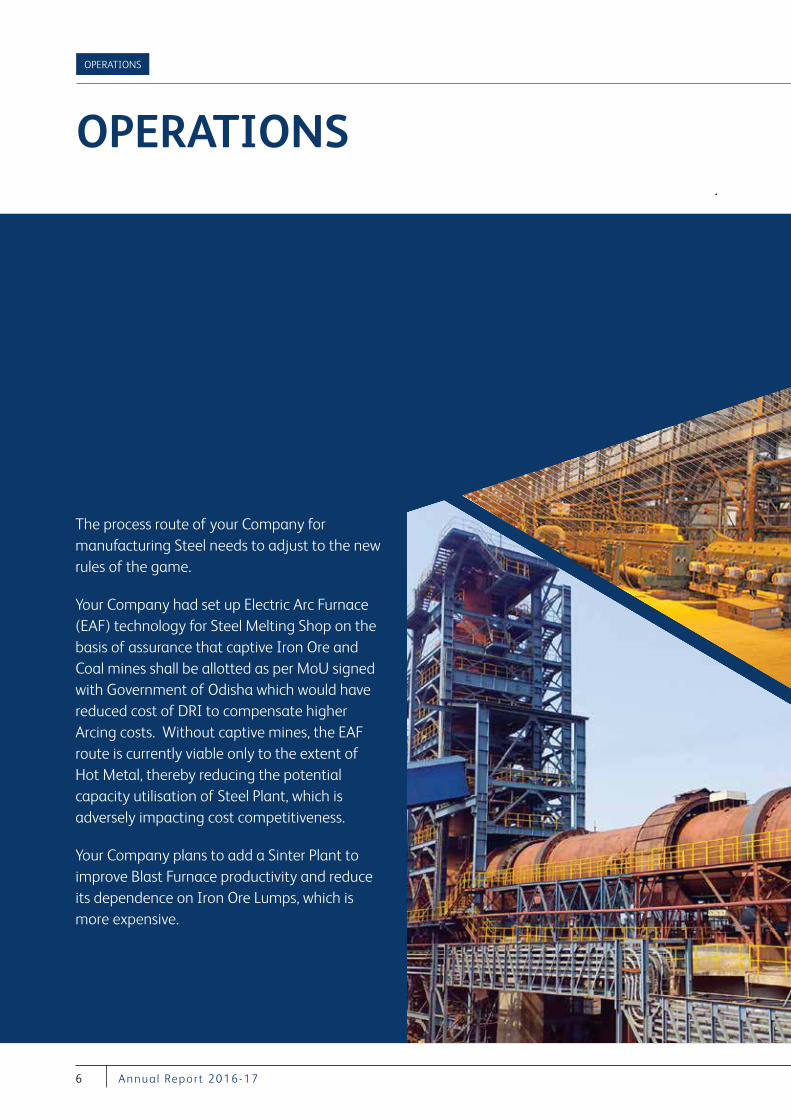
The process route of your Company for manufacturing Steel needs to adjust to the new rules of the game.
Your Company had set up Electric Arc Furnace (EAF) technology for Steel Melting Shop on the basis of assurance that captive Iron Ore and Coal mines shall be allotted as per MoU signed with Government of Odisha which would have reduced cost of DRI to compensate higher Arcing costs. Without captive mines, the EAF route is currently viable only to the extent of Hot Metal, thereby reducing the potential capacity utilisation of Steel Plant, which is adversely impacting cost competitiveness.
Your Company plans to add a Sinter Plant to improve Blast Furnace productivity and reduce its dependence on Iron Ore Lumps, which is more expensive.
7VI S A S T EEL LT D.
COMPANY OVERVIEW FINANCIAL STATEMENTSGOVERNANCE REPORTS
8 A nnu a l Repor t 2016-17
MARKETING
MARKETING
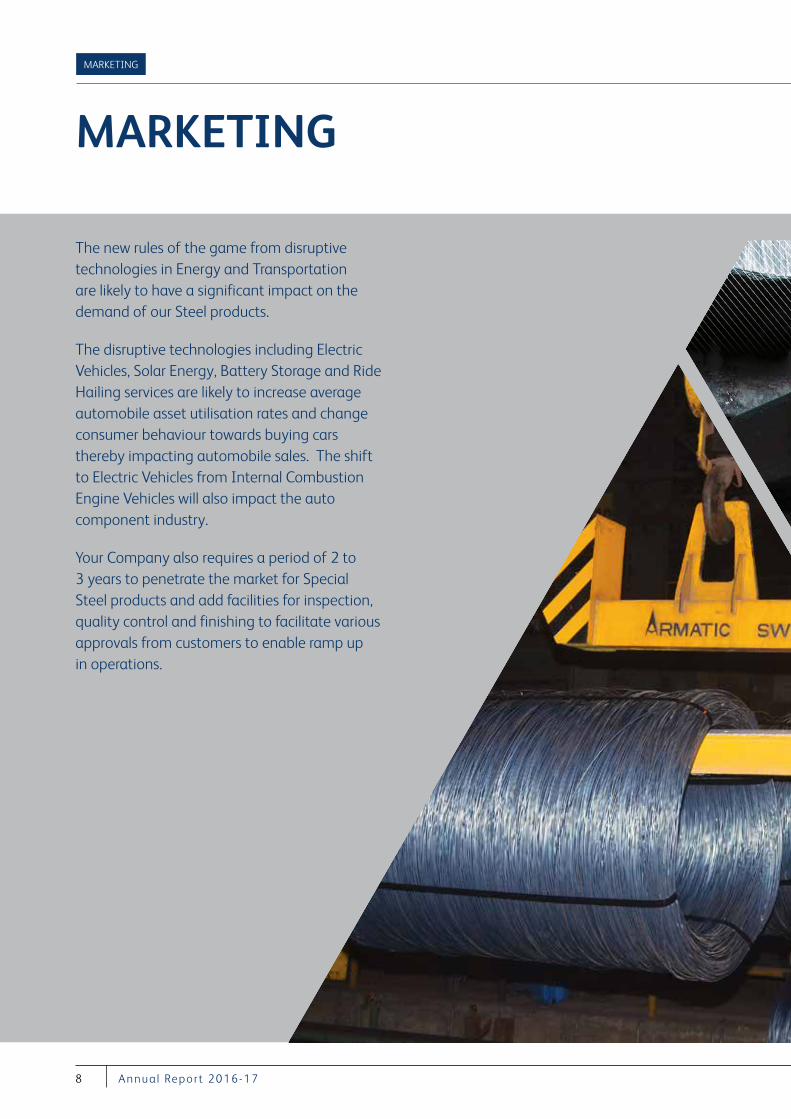
The new rules of the game from disruptive technologies in Energy and Transportation are likely to have a significant impact on the demand of our Steel products.
The disruptive technologies including Electric Vehicles, Solar Energy, Battery Storage and Ride Hailing services are likely to increase average automobile asset utilisation rates and change consumer behaviour towards buying cars thereby impacting automobile sales. The shift to Electric Vehicles from Internal Combustion Engine Vehicles will also impact the auto component industry.
Your Company also requires a period of 2 to 3 years to penetrate the market for Special Steel products and add facilities for inspection, quality control and finishing to facilitate various approvals from customers to enable ramp up in operations.
9VI S A S T EEL LT D.
COMPANY OVERVIEW FINANCIAL STATEMENTSGOVERNANCE REPORTS
10 A nnu a l Repor t 2016-17
CHAIRMAN’S INSIGHTS
CHAIRMAN’S INSIGHTS
Vishambhar Saran, Chairman
DEAR SHAREHOLDERS,The financial year 2016-17 has witnessed landmark reforms by the Government of India including Demonetisation announced on 8 November 2016, Banking Sector reforms and the passing of Insolvency & Bankruptcy Code 2016 and implementation of GST from 1 July 2017. These measures have temporarily affected the economic growth and demand for finished products of your Company, but is a positive step for organised Steel producers like your Company and is expected to benefit your Company in the long term. The operations of your Company improved in 2016-17 due to improvement in availability of raw material and imposition of anti-dumping duties. The amalgamation of VISA BAO Limited with your Company has also been completed consequent to which Baosteel, China holds 5% stake in your Company.
For the year ended 31 March 2017, your Company’s standalone revenues increased from Rs.10,840 million in FY 2015-16 to Rs.14,950 million in FY 2016-17 and EBITDA from Rs. 92 million in FY 2015-16 to Rs. 444 million in FY 2016-17. Your Company’s margins have been low due to high prices of vital raw material at index/auction price with no captive mines and the demand and prices for your Company’s finished products also being weak due to slowdown in economy.
SPECIAL STEEL BUSINESSThe production of Steel from Steel Melt Shop and Rolling Mill units resumed in Q2 of FY 2016-17 but the EBITDA margins remain negative. The focus is to gradually ramp up production of Special Steel products and develop/penetrate the market by getting various approvals from end users.
Your Company is putting thrust on Steel marketing and in this regard, your Company has opened a stockyard in Faridabad for efficient distribution of Steel products and to penetrate North India market. Your Company has also strengthened the Steel Marketing team with presence in Chennai, Bangalore, Ludhiana and Rajkot.
FERRO ALLOYS BUSINESSDuring the year under review, one additional Ferro Chrome Furnace has been completed and the Long Term Linkage quantity for Chrome Ore from OMC has been increased. Your Company has also started sourcing Chrome Ore from Misrilal Mines. However, a period of huge uncertainty in supply of Chrome Ore is likely after 31 March 2020, when leases of all non-captive mines will expire.
COKE BUSINESSThe Coke Business being operated through VISA SunCoke Limited (a joint venture between VISA Steel Limited and SunCoke Energy, USA, in which your Company holds 51% stake and SunCoke Energy holds 49% stake) has been adversely affected due to sluggish demand for Coke in the domestic market and pressure of cheap imports even after imposition of anti-dumping duty. Australian Coking Coal prices have witnessed sharp increase and a lot of volatility thus making Coke manufacturing based on the domestic Coke prices unviable at times. The production of the Coke had to be kept at low levels at times because of non-availability of Coking Coal at viable prices.
THE INDUSTRY The Steel industry globally continues to suffer from huge overcapacity in China, although some measures have
For the year ended 31 March 2017, your Company’s standalone revenues increased from Rs.10,840 million in FY 2015-16 to Rs.14,950 million in FY 2016-17 and EBITDA from Rs. 92 million in FY 2015-16 to Rs. 444 million in FY 2016-17.
11VI S A S T EEL LT D.
COMPANY OVERVIEW FINANCIAL STATEMENTSGOVERNANCE REPORTS
been taken to close Induction Furnaces in China. However, Steel production in China remains at above 800 million TPA run rate, which seems to be at its peak and needs to reduce significantly going forward. There is also concern about slowdown in demand after the Chinese elections.
India has increased its Steel capacity to 126 million tonne in FY 2016-17 with production of approx. 98 million tonne. India is poised to become the 2nd largest Steel producer in the World with expected production of 105 million tonne in 2017-18 and 110 million tonne in 2018-19. The National Steel Policy of the Government of India announced in May 2017 aspires to achieve 300 million tonne of Steel making capacity by 2030 and seeks to increase consumption of Steel in major segments of infrastructure, automobiles, housing etc. It seeks to enhance domestic Steel consumption and ensure high quality Steel production and create a technologically advanced and globally competitive Steel industry.
VISION & STRATEGYYour Company is committed to its vision to emerge as an efficient producer of Special Steel Long products, High Carbon Ferro Chrome and Metallurgical Coke. Your Company is focused on increasing capacity utilisation for all Units, reducing cost and improving operational efficiencies, raising funds for working capital and restructuring loan to a sustainable level.
OUTLOOKThe Government of India is giving a thrust to the manufacturing sector through the “Make in India” Campaign and your Company is ready to benefit from this opportunity. However,
the emergence of various disruptive technologies in the automobile sector is an area of concern and will remain a challenge going forward.
I would like to place on record my sincere appreciation and gratitude to the entire team of VISA Steel Group for their relentless commitment inspite of the challenging business environment. I am grateful to the members of the Board of your Company for their invaluable guidance and contribution and acknowledge the support of all shareholders. I would also like to convey my sincere thanks to all the stakeholders, Lenders, suppliers, customers, employee and Government officials etc. for their valued support as we navigate through these challenging times for the Steel Sector and I hope to continue to receive your support in the future.
Warm Regards,
Vishambhar Saran Chairman
Your Company is committed to its vision to emerge as an efficient producer of Special Steel Long Products, High Carbon Ferro Chrome and Metallurgical Coke. Your Company is focused on increasing capacity utilisation for all Units, reducing cost and improving operational efficiencies, raising funds for working capital and restructuring loan to a sustainable level.
12 A nnu a l Repor t 2016-17
DEAR SHAREHOLDERS,Your Company has set up economically viable manufacturing assets for production of Special Steel, Ferro Alloys and Metallurgical Coke at Kalinganagar in Odisha. Your Company’s financial and operational performances have improved in FY 2016-17 with the improvement in availability of raw material and imposition of anti-dumping duties. However, the high and volatile prices of vital raw materials, delay in restructuring of debt to a sustainable level, and weak demand and prices for finished products remain key challenges.
RAW MATERIALYour Company has been adversely impacted by high prices of Iron Ore and Chrome Ore due to lack of fair and transparent mechanism for discovery of floor price during OMC e-auction. OMC needs to fix the floor price of Iron Ore & Chrome Ore in a transparent manner, preferably on cost plus basis, and which allows reasonable margin for OMC and the Steel & Ferro Alloy Companies.
OPERATIONSYour Company’s production from Blast Furnace has increased to 162,815 MT in FY 2016-17 from 121,521 MT in FY 2015-16, a YoY growth of 33.98%, DRI/Sponge Iron production has increased to 251,290 MT in FY 2016-17 from 224,934 MT in FY 2015-16, a YoY growth of 11.72%. The Steel Melt Shop & Rolling Mill resumed operations in Q2 FY 2016-17 and the production of Steel was 53,206 MT in FY 2016-17.
Your Company’s production from Ferro Alloys has increased to 99,596 MT in FY 2016-17 from 85,836 MT in FY 2015-16, a YoY growth of 16%.
The production of metallurgical Coke in FY 2016-17 was 251,418 MT compared to 294,258 MT in FY 2015-16.
MARKETINGYour Company has strengthened its Steel Marketing team across India and opened a stockyard in Faridabad for penetrating its products in North India market. The Demonetisation announced by the Government of India on 8 November 2016 and the implementation of Goods & Service Tax with effect from 1 July 2017 has temporarily affected demand of Steel products and the market remains weak due to sharp decline in credit growth and capex.
FINANCEThe EBITDA margins of your Company have not been sufficient to enable service interest/principal repayment and whilst the principal term loan is only approx. Rs. 1,190 Crores, during the period April 2011 to March 2016, the Lenders have charged approx. Rs. 2,320 Crores on account of interest/repayment whereas EBITDA was only approx. Rs. 100 Crores resulting in huge ballooning of liabilities of your Company towards its lenders, which are much in excess of hard cost of investments in the project. Hence, the debt needs to be restructured to a sustainable level.
The amalgamation of VISA Bao Limited with your Company has been completed and consequently, Baosteel has been issued 5% stake in your Company. Your Company is also in discussions with Baosteel and other investors to acquire additional stake in your Company to infuse funds as working capital and enable restructuring of debt to a sustainable level.
VICE CHAIRMAN & MANAGINGDIRECTOR’S MESSAGE
VICE CHAIRMAN & MANAGING DIRECTOR’S MESSAGE
Vishal Agarwal, VC & MD
Your Company’s production from Blast Furnace has increased to 162,815 MT in FY 2016-17 from 121,521 MT in FY 2015-16, a YoY growth of 33.98%, DRI/Sponge Iron has increased to 251,290 MT in FY 2016-17 from 224,934 MT in FY 2015-16, a YoY growth of 11.72%. Steel Melt Shop and Rolling Mill resumed operations in Q2 FY 2016-17 and the production of Steel was 53,206 MT in FY 2016-17.
13VI S A S T EEL LT D.
COMPANY OVERVIEW FINANCIAL STATEMENTSGOVERNANCE REPORTS
As per RBI Press Release dated 13 June 2017, Internal Advisory Committee (IAC) has recommended that accounts with exposure below Rs. 5,000 Crore – Lenders should finalise Resolution Plan within six months, i.e., by 13 December 2017. Your Company has submitted a Debt Resolution Plan to Lenders and has requested Lenders to finalise the Debt Resolution Plan through JLF at the earliest.
HUMAN RESOURCE Your Company recognises its employees as its most important assets. We improve our team building and encourage family bonding through various employee engagement social activities. Your Company has formulated a detailed Code of Conduct in order to practice ethical behaviour and is committed to creating a healthy work environment that enables employees to work without fear of prejudice, gender bias, sexual harassment and all forms of intimidation or exploitation.
CORPORATE SOCIAL RESPONSIBILITYWe acknowledge our role and responsibility as a corporate citizen. In line with our core business philosophy, concern for Health, Safety and Environment continue to be one of our key priorities. As a responsible corporate, your Company is focused on the happiness of people living in its larger neighbouring communities. Your Company’s CSR team has directed its community development work in the areas of education, healthcare, rural development, sports & culture and your Company wishes to continue its support and focus on these issues. The team has taken special initiatives to promote
“Swachhata Hi Seva” movement on Gandhi Jayanti and distribute Diyas to under privileged families during Diwali.
I would like to convey my sincere thanks to all the stakeholders including shareholders, Lenders, suppliers, customers, Government officials and employees for their valued support.
With warm regards & best wishes,
Vishal Agarwal Vice Chairman & MD
The amalgamation of VISA BAO Limited with your Company has been completed and consequently, Baosteel has been issued 5% stake in your Company.
14 A nnu a l Repor t 2016-17
BOARD OF DIRECTORS
BOARD OF DIRECTORS
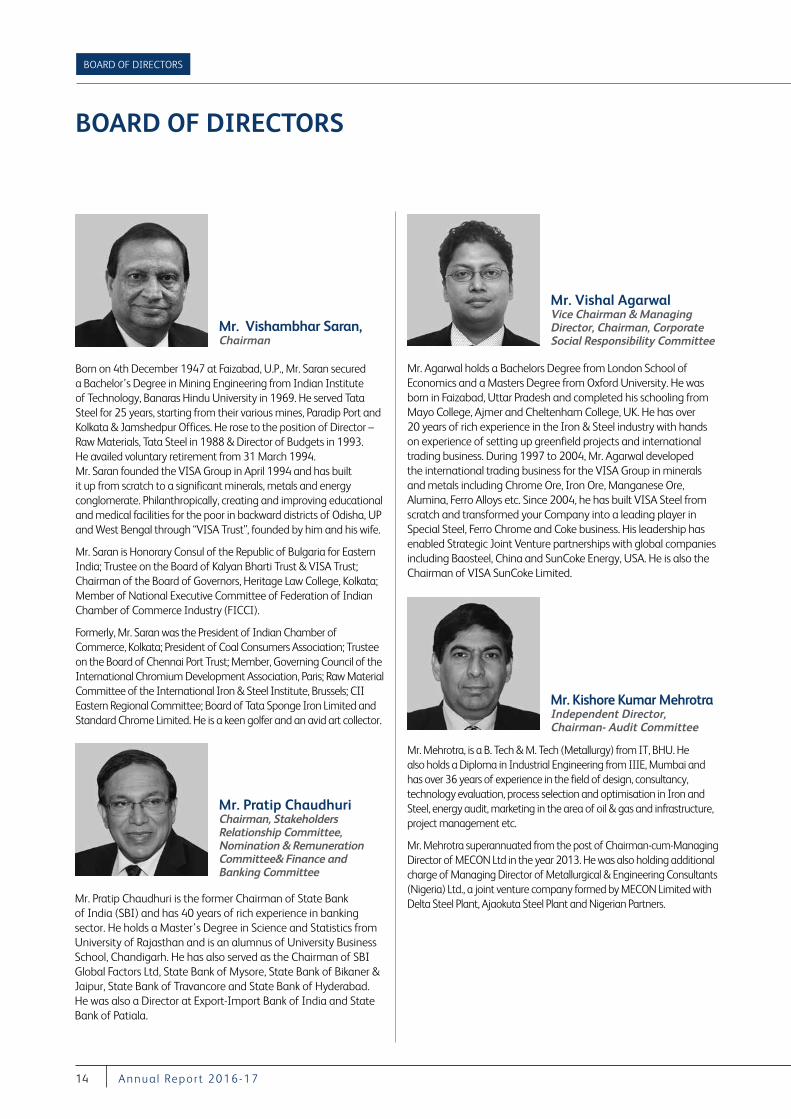
Mr. Pratip Chaudhuri is the former Chairman of State Bank of India (SBI) and has 40 years of rich experience in banking sector. He holds a Master’s Degree in Science and Statistics from University of Rajasthan and is an alumnus of University Business School, Chandigarh. He has also served as the Chairman of SBI Global Factors Ltd, State Bank of Mysore, State Bank of Bikaner & Jaipur, State Bank of Travancore and State Bank of Hyderabad. He was also a Director at Export-Import Bank of India and State Bank of Patiala.
Mr. Pratip ChaudhuriChairman, Stakeholders Relationship Committee, Nomination & Remuneration Committee& Finance and Banking Committee
Mr. Agarwal holds a Bachelors Degree from London School of Economics and a Masters Degree from Oxford University. He was born in Faizabad, Uttar Pradesh and completed his schooling from Mayo College, Ajmer and Cheltenham College, UK. He has over 20 years of rich experience in the Iron & Steel industry with hands on experience of setting up greenfield projects and international trading business. During 1997 to 2004, Mr. Agarwal developed the international trading business for the VISA Group in minerals and metals including Chrome Ore, Iron Ore, Manganese Ore, Alumina, Ferro Alloys etc. Since 2004, he has built VISA Steel from scratch and transformed your Company into a leading player in Special Steel, Ferro Chrome and Coke business. His leadership has enabled Strategic Joint Venture partnerships with global companies including Baosteel, China and SunCoke Energy, USA. He is also the Chairman of VISA SunCoke Limited.
Mr. Vishal AgarwalVice Chairman & Managing Director, Chairman, Corporate Social Responsibility Committee
Born on 4th December 1947 at Faizabad, U.P., Mr. Saran secured a Bachelor’s Degree in Mining Engineering from Indian Institute of Technology, Banaras Hindu University in 1969. He served Tata Steel for 25 years, starting from their various mines, Paradip Port and Kolkata & Jamshedpur Offices. He rose to the position of Director – Raw Materials, Tata Steel in 1988 & Director of Budgets in 1993. He availed voluntary retirement from 31 March 1994. Mr. Saran founded the VISA Group in April 1994 and has built it up from scratch to a significant minerals, metals and energy conglomerate. Philanthropically, creating and improving educational and medical facilities for the poor in backward districts of Odisha, UP and West Bengal through “VISA Trust”, founded by him and his wife.
Mr. Saran is Honorary Consul of the Republic of Bulgaria for Eastern India; Trustee on the Board of Kalyan Bharti Trust & VISA Trust; Chairman of the Board of Governors, Heritage Law College, Kolkata; Member of National Executive Committee of Federation of Indian Chamber of Commerce Industry (FICCI).
Formerly, Mr. Saran was the President of Indian Chamber of Commerce, Kolkata; President of Coal Consumers Association; Trustee on the Board of Chennai Port Trust; Member, Governing Council of the International Chromium Development Association, Paris; Raw Material Committee of the International Iron & Steel Institute, Brussels; CII Eastern Regional Committee; Board of Tata Sponge Iron Limited and Standard Chrome Limited. He is a keen golfer and an avid art collector.
Mr. Vishambhar Saran, Chairman
Mr. Mehrotra, is a B. Tech & M. Tech (Metallurgy) from IT, BHU. He also holds a Diploma in Industrial Engineering from IIIE, Mumbai and has over 36 years of experience in the field of design, consultancy, technology evaluation, process selection and optimisation in Iron and Steel, energy audit, marketing in the area of oil & gas and infrastructure, project management etc.
Mr. Mehrotra superannuated from the post of Chairman-cum-Managing Director of MECON Ltd in the year 2013. He was also holding additional charge of Managing Director of Metallurgical & Engineering Consultants (Nigeria) Ltd., a joint venture company formed by MECON Limited with Delta Steel Plant, Ajaokuta Steel Plant and Nigerian Partners.
Mr. Kishore Kumar MehrotraIndependent Director, Chairman- Audit Committee
15VI S A S T EEL LT D.
COMPANY OVERVIEW FINANCIAL STATEMENTSGOVERNANCE REPORTS
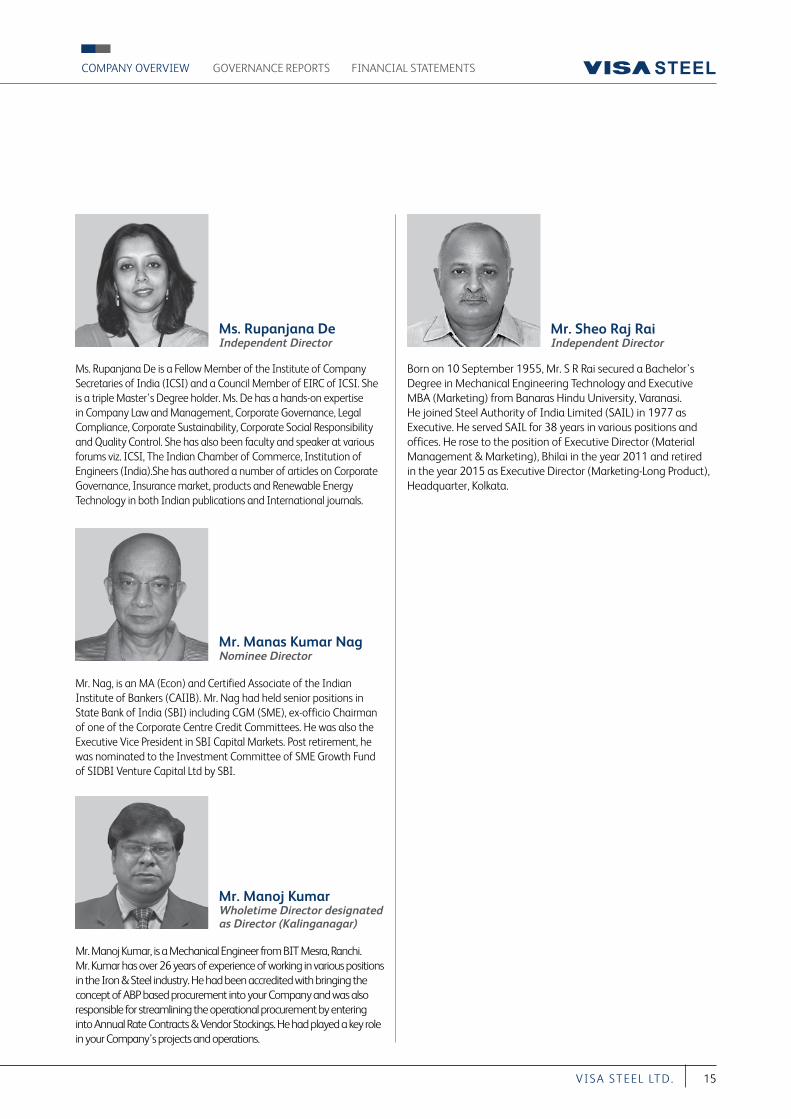
Ms. Rupanjana De is a Fellow Member of the Institute of Company Secretaries of India (ICSI) and a Council Member of EIRC of ICSI. She is a triple Master’s Degree holder. Ms. De has a hands-on expertise in Company Law and Management, Corporate Governance, Legal Compliance, Corporate Sustainability, Corporate Social Responsibility and Quality Control. She has also been faculty and speaker at various forums viz. ICSI, The Indian Chamber of Commerce, Institution of Engineers (India).She has authored a number of articles on Corporate Governance, Insurance market, products and Renewable Energy Technology in both Indian publications and International journals.
Ms. Rupanjana De Independent Director
Born on 10 September 1955, Mr. S R Rai secured a Bachelor’s Degree in Mechanical Engineering Technology and Executive MBA (Marketing) from Banaras Hindu University, Varanasi. He joined Steel Authority of India Limited (SAIL) in 1977 as Executive. He served SAIL for 38 years in various positions and offices. He rose to the position of Executive Director (Material Management & Marketing), Bhilai in the year 2011 and retired in the year 2015 as Executive Director (Marketing-Long Product), Headquarter, Kolkata.
Mr. Sheo Raj RaiIndependent Director
Mr. Nag, is an MA (Econ) and Certified Associate of the Indian Institute of Bankers (CAIIB). Mr. Nag had held senior positions in State Bank of India (SBI) including CGM (SME), ex-officio Chairman of one of the Corporate Centre Credit Committees. He was also the Executive Vice President in SBI Capital Markets. Post retirement, he was nominated to the Investment Committee of SME Growth Fund of SIDBI Venture Capital Ltd by SBI.
Mr. Manas Kumar NagNominee Director
Mr. Manoj Kumar, is a Mechanical Engineer from BIT Mesra, Ranchi. Mr. Kumar has over 26 years of experience of working in various positions in the Iron & Steel industry. He had been accredited with bringing the concept of ABP based procurement into your Company and was also responsible for streamlining the operational procurement by entering into Annual Rate Contracts & Vendor Stockings. He had played a key role in your Company’s projects and operations.
Mr. Manoj KumarWholetime Director designated as Director (Kalinganagar)
16 A nnu a l Repor t 2016-17
CORPORATE SOCIAL RESPONSIBILITY
CORPORATE SOCIAL RESPONSIBILITY
17VI S A S T EEL LT D.
COMPANY OVERVIEW FINANCIAL STATEMENTSGOVERNANCE REPORTS
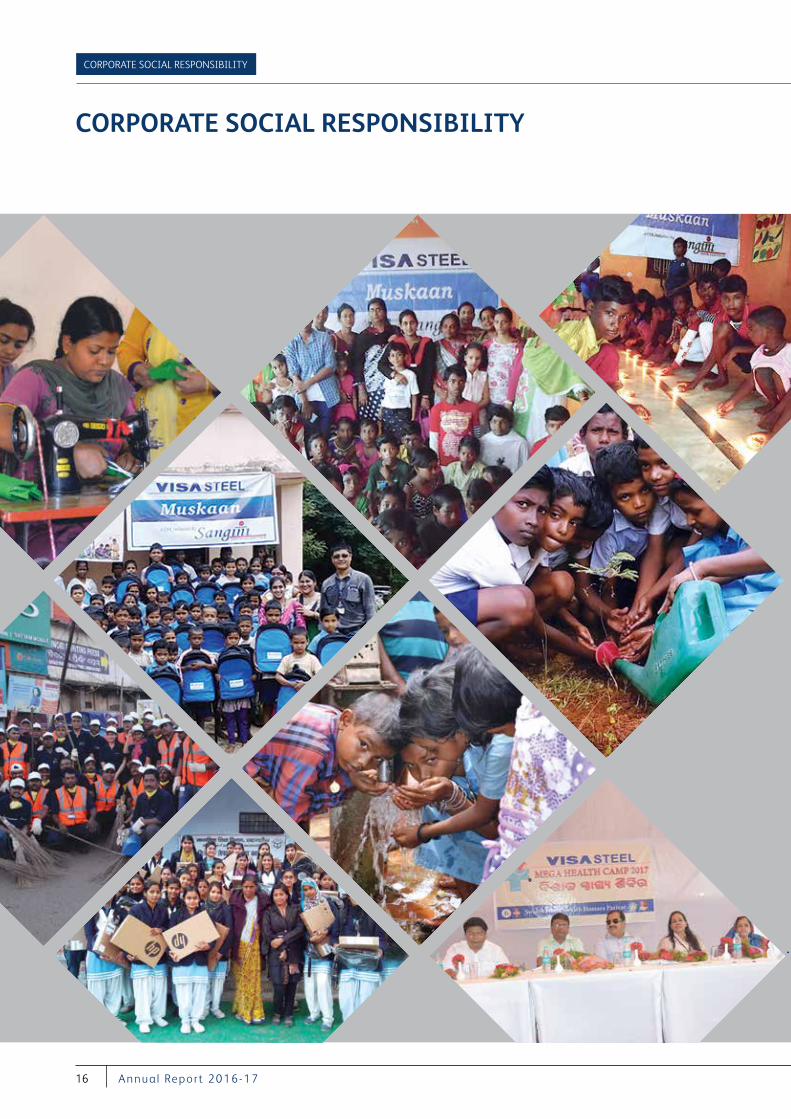
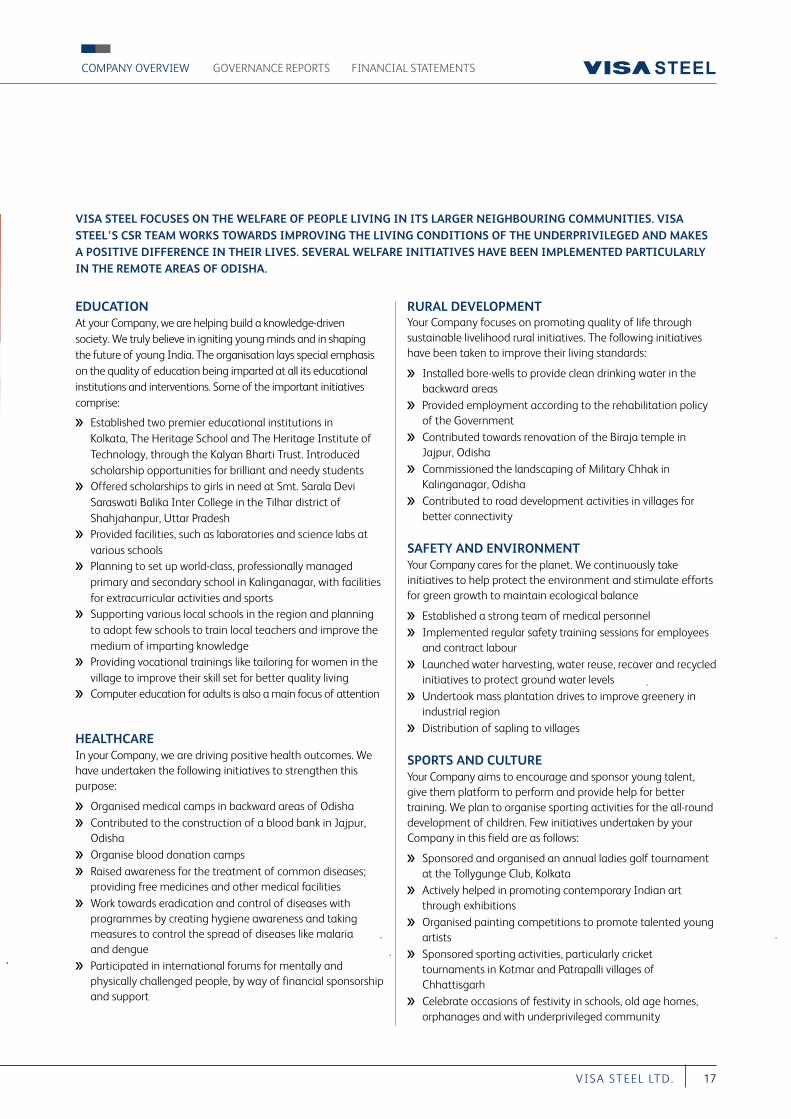
VISA STEEL FOCUSES ON THE WELFARE OF PEOPLE LIVING IN ITS LARGER NEIGHBOURING COMMUNITIES. VISA STEEL’S CSR TEAM WORKS TOWARDS IMPROVING THE LIVING CONDITIONS OF THE UNDERPRIVILEGED AND MAKES A POSITIVE DIFFERENCE IN THEIR LIVES. SEVERAL WELFARE INITIATIVES HAVE BEEN IMPLEMENTED PARTICULARLY IN THE REMOTE AREAS OF ODISHA.
EDUCATIONAt your Company, we are helping build a knowledge-driven society. We truly believe in igniting young minds and in shaping the future of young India. The organisation lays special emphasis on the quality of education being imparted at all its educational institutions and interventions. Some of the important initiatives comprise:
Established two premier educational institutions in Kolkata, The Heritage School and The Heritage Institute of Technology, through the Kalyan Bharti Trust. Introduced scholarship opportunities for brilliant and needy students
Offered scholarships to girls in need at Smt. Sarala Devi Saraswati Balika Inter College in the Tilhar district of Shahjahanpur, Uttar Pradesh
Provided facilities, such as laboratories and science labs at various schools
Planning to set up world-class, professionally managed primary and secondary school in Kalinganagar, with facilities for extracurricular activities and sports
Supporting various local schools in the region and planning to adopt few schools to train local teachers and improve the medium of imparting knowledge
Providing vocational trainings like tailoring for women in the village to improve their skill set for better quality living
Computer education for adults is also a main focus of attention
HEALTHCAREIn your Company, we are driving positive health outcomes. We have undertaken the following initiatives to strengthen this purpose:
Organised medical camps in backward areas of Odisha Contributed to the construction of a blood bank in Jajpur,
Odisha Organise blood donation camps Raised awareness for the treatment of common diseases;
providing free medicines and other medical facilities Work towards eradication and control of diseases with
programmes by creating hygiene awareness and taking measures to control the spread of diseases like malaria and dengue
Participated in international forums for mentally and physically challenged people, by way of financial sponsorship and support
RURAL DEVELOPMENTYour Company focuses on promoting quality of life through sustainable livelihood rural initiatives. The following initiatives have been taken to improve their living standards:
Installed bore-wells to provide clean drinking water in the backward areas
Provided employment according to the rehabilitation policy of the Government
Contributed towards renovation of the Biraja temple in Jajpur, Odisha
Commissioned the landscaping of Military Chhak in Kalinganagar, Odisha
Contributed to road development activities in villages for better connectivity
SAFETY AND ENVIRONMENTYour Company cares for the planet. We continuously take initiatives to help protect the environment and stimulate efforts for green growth to maintain ecological balance
Established a strong team of medical personnel Implemented regular safety training sessions for employees
and contract labour Launched water harvesting, water reuse, recover and recycled
initiatives to protect ground water levels Undertook mass plantation drives to improve greenery in
industrial region Distribution of sapling to villages
SPORTS AND CULTUREYour Company aims to encourage and sponsor young talent, give them platform to perform and provide help for better training. We plan to organise sporting activities for the all-round development of children. Few initiatives undertaken by your Company in this field are as follows:
Sponsored and organised an annual ladies golf tournament at the Tollygunge Club, Kolkata
Actively helped in promoting contemporary Indian art through exhibitions
Organised painting competitions to promote talented young artists
Sponsored sporting activities, particularly cricket tournaments in Kotmar and Patrapalli villages of Chhattisgarh
Celebrate occasions of festivity in schools, old age homes, orphanages and with underprivileged community
REPORT OF THE DIRECTORS
18 A nnu a l Repor t 2016-17
REPORT OF THE DIRECTORS
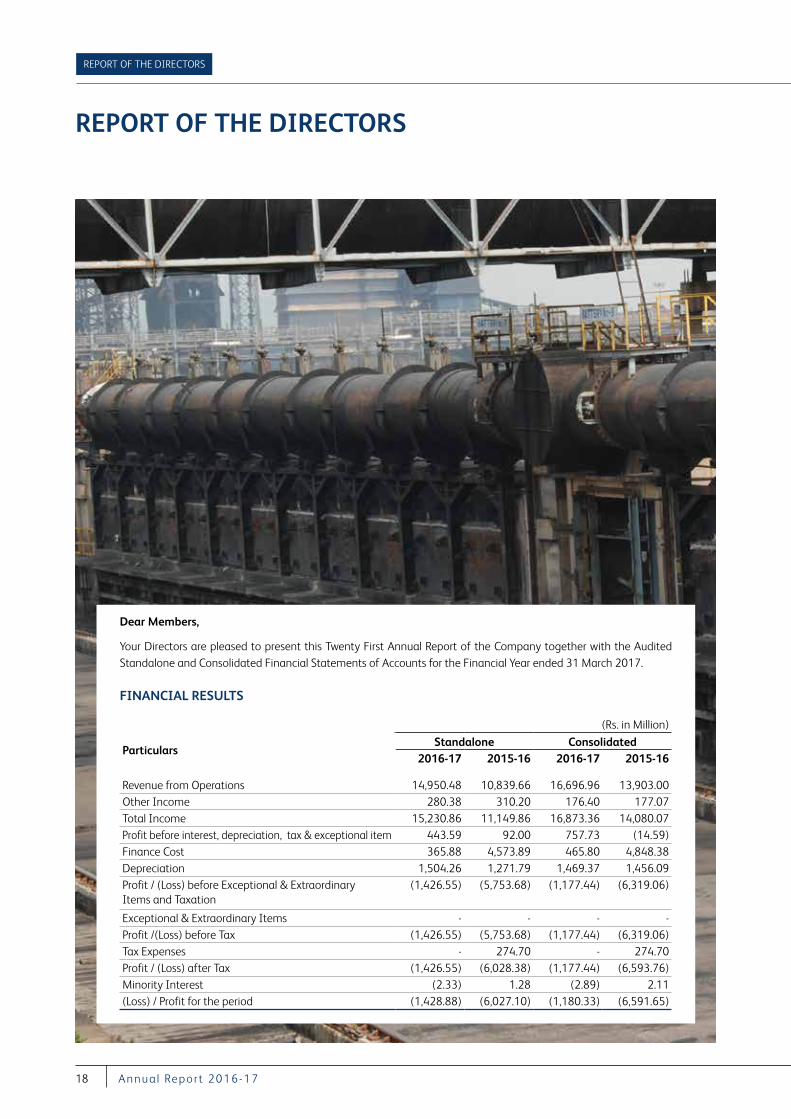
Dear Members,
Your Directors are pleased to present this Twenty First Annual Report of the Company together with the Audited Standalone and Consolidated Financial Statements of Accounts for the Financial Year ended 31 March 2017.
FINANCIAL RESULTS
(Rs. in Million)
ParticularsStandalone Consolidated
2016-17 2015-16 2016-17 2015-16
Revenue from Operations 14,950.48 10,839.66 16,696.96 13,903.00 Other Income 280.38 310.20 176.40 177.07 Total Income 15,230.86 11,149.86 16,873.36 14,080.07 Profit before interest, depreciation, tax & exceptional item 443.59 92.00 757.73 (14.59)Finance Cost 365.88 4,573.89 465.80 4,848.38 Depreciation 1,504.26 1,271.79 1,469.37 1,456.09 Profit / (Loss) before Exceptional & Extraordinary Items and Taxation
(1,426.55) (5,753.68) (1,177.44) (6,319.06)
Exceptional & Extraordinary Items - - - - Profit /(Loss) before Tax (1,426.55) (5,753.68) (1,177.44) (6,319.06)Tax Expenses - 274.70 - 274.70 Profit / (Loss) after Tax (1,426.55) (6,028.38) (1,177.44) (6,593.76)Minority Interest (2.33) 1.28 (2.89) 2.11 (Loss) / Profit for the period (1,428.88) (6,027.10) (1,180.33) (6,591.65)
FINANCIAL STATEMENTSCOMPANY OVERVIEW GOVERNANCE REPORTS
19VI S A S T EEL LT D.
OPERATIONSThe standalone and consolidated Revenue of your Company stood at Rs.14,950.48 million and Rs. 16,696.96 million respectively for the FY 2016-17. The standalone and consolidated profit before interest, depreciation, tax and exceptional item is Rs. 443.59 million and Rs. 757.73 million respectively during the FY 2016-17. The growth in Revenues is mainly due to higher production and sales volume from its units.
The Blast Furnace produced 162,815 Metric Tonne (MT) Hot Metal as compared to 121,521 MT in the previous year. The DRI Plant produced 251,290 MT Sponge Iron as compared to 224,934 MT in the previous year. The Steel production was 53,206 MT.
The Ferro Alloys Plant produced 99,596 MT compared to 85,836 MT in the previous year.
VISA SunCoke Limited (VSCL) had a production of Coke of 251,418 MT during the year, compared to 294,258 MT in the previous year.
During the year under review, your Company’s operational performance improved due to improvement in the availability of raw material and imposition of anti-dumping duties. Your Company has been facing challenges arising out of high prices and sharp fluctuation in prices of its vital raw materials and dependence on OMC for Iron Ore and Chrome Ore at auction prices. Your Company is gradually ramping up its Special Steel production due to working capital constraints and as it requires time for customer approvals to penetrate the market
Debt RestructuringYour Company has been under financial stress since 2011-12 due to various external factors beyond the control of the Company and its management, which amongst others, include (i) failure of the State Government of Odisha to fulfill its obligation under the MoU executed with your Company for grant of Captive Iron Ore Mine, which has deprived your Company of assured supply of consistent quality iron ore at a reasonable cost, (ii) de-allocation of Coal Block by Ministry of Coal and Hon’ble Supreme Court judgement dated 24 September 2014, which has deprived your Company of assured supply of consistent quality coal at a reasonable cost, (iii) non-availability of Iron Ore & Chrome Ore at viable prices due to closure of Mines following the investigations by Shah Commission which commenced sometime in 2011 and the Hon’ble Supreme Court judgment dated 16 May 2014, (iv) dumping of Steel products by overseas manufacturers resulting in sharp drop in prices, (v) non-disbursement of sanctioned loans by lenders for plant operations and adjustment of
sanctioned facilities with interest / principal repayment falling due over time, which resulted in complete depletion of working capital of your Company, (vi) high cost of logistics for transportation of raw materials as these rates are fixed by Associations at rates much above the Government notified rates, etc.
Consequently, EBITDA margins of your Company have not been sufficient to enable service interest / principal repayment since 2011-12 and whilst the principal term loan is only approx. Rs. 1,190 Crores, the lenders have adjusted non-disbursed sanctioned limits for operations and sanctioned limits with principal & interest repayment resulting in huge ballooning of liabilities of your Company towards its lenders, which are much in excess of hard cost of investments in the project. Hence, the debt needs to be restructured to a sustainable level and in this regard, Lenders have appointed MECON to prepare a TEV Report.
Your Company has been taking support of operational creditors to continue Plant operations so that Plant does not shutdown and is having large overdue outstanding payments to operational creditors.
As per RBI press release dated 13 June 2017, the Internal Advisory Committee (IAC) has recommended that the accounts with exposure below Rs. 5,000 Crore, the lenders should finalise resolution plan within six months (i.e., by 13 December 2017). Your Company has submitted a Debt Resolution Plan to lenders and has requested lenders to finalise the Debt Resolution Plan through Joint Lenders Forum within 13 December 2017.
FUTURE OUTLOOKIndia has increased its Steel capacity to 126 MT in FY 2016-17 with production of approx. 98 MT. India is poised to become second largest Steel producer in the world with expected production of 105 MT in FY 2017-18 and 110 MT in FY 2018-19. The National Steel Policy approved by the Government of India on 3 May 2017, aspires to achieve 300 MT of Steel making capacity by 2030 and seek to increase consumption of Steel in major segments of infrastructure, automobiles, housing etc. It seeks to enhance Domestic Steel consumption and ensure high quality Steel production and create a technologically advanced and globally competitive Steel Industry.
Your Company is committed to its vision to emerge as an efficient producer of Special Steel Long products, Ferro Chrome and Coke. Your Company is focused on increasing capacity utilization of all Units, reducing cost and improving operational efficiency, raising funds for working capital and restructuring loan to a sustainable level.
REPORT OF THE DIRECTORS
20 A nnu a l Repor t 2016-17
Going forward, your Company expects to adjust to the new rules of the game which shall improve future performance of your Company.
DIVIDENDIn view of the loss incurred by your Company, your Directors have not recommended any dividend for the FY ended 31 March 2017.
TRANSFER TO RESERVES In view of losses incurred by your Company during the year, no amount has been transferred to the General Reserve for the FY ended 31 March 2017.
CHANGE IN NATURE OF BUSINESSDuring the year under review, there has been no change in the nature of business of your Company.
TRANSFER TO INVESTOR EDUCATION AND PROTECTION FUND (IEPF)During the year under review, your Company was not required to transfer any amount to the Investor Education and Protection Fund. Subsequent to the end of FY 2016-17, your Company had transferred Rs. 378,532/- to the Investor Education and Protection Fund lying in the Unpaid/ Unclaimed Dividend Account FY 2009-10.
SHARE CAPITALYour Company’s paid up equity share capital remained at Rs.1,100,000,000 (Rupees One Hundred Ten Crores only) comprising of 110,000,000 equity shares of Rs. 10/- each. There was no change in the Company’s share capital during the year under review. Subsequent to the year end, the Company has allotted 57,89,500 equity shares of Rs. 10 each to Baosteel Resources Co. Ltd, China pursuant to the Order dated 12 October 2017 passed by the Hon’ble National Company Law Tribunal, Kolkata Bench approving the Scheme of Amalgamation of VISA BAO Limited (Subsidiary Company) with the Company.
SHIFTING OF REGISTERED OFFICE OF THE COMPANYDuring the year under review, the Members of the Company had approved Shifting of the Registered Office of the Company from the State of Odisha to the State of West Bengal. Consequently an application was filed by the Company before the Hon’ble Regional Director, Eastern Region, Ministry of Corporate Affairs, Kolkata.
Subsequent to the end of FY 2016-17, your Directors decided to withdraw the application for Shifting of Registered Office of the
Company due to immense inconvenience to the stakeholders of the Company. The withdrawal of application was allowed by the Hon’ble Regional Director, Eastern Director, Ministry of Corporate Affairs, Kolkata vide its Order dated 3 August 2017.
TRANSFER OF SPECIAL STEEL BUSINESS The Board of Directors of the Company had approved a Scheme of Arrangement under Sections 391 to 394 of the Companies Act, 1956, between the Company and VISA Special Steel Limited (VSSL), a subsidiary of the Company, and their respective shareholders and creditors, which inter alia, envisages transfer of Special Steel Business (comprising of Blast Furnace, DRI Plant, Steel Melt Shop and Rolling Mill) of the Company with all its assets and liabilities, into VSSL. The Appointed Date of the Scheme is 1 April 2013 or such other date as may be fixed or approved by the Hon’ble High Court of Judicature of Orissa at Cuttack. The Scheme has been approved by the members of the Company at the Court Convened Meeting (CCM) held on 10 June 2014. Subsequent to the approval of the members, a petition was filed before the Hon’ble High Court of Orissa on 25 June 2014. Lender’s approval was received on 31 December 2014. The matter is being heard in High Court of Orissa and decision is awaited. Meanwhile, the Board of Directors of the Company noted that due to the violations of terms by one of the lenders (HUDCO) and undue delay in the approval of the Scheme, the Company had lost the opportunity to induct investor and infuse funds in VISA Special Steel Limited and hence decided to withdraw the Company’s Application pending with Hon’ble High Court of Orissa at Cuttack as the very purpose for which the Scheme was filed in June 2014 has been defeated due to delay in sanction of the Scheme.
AMALGAMATION OF VISA BAO LIMITEDThe Board of Directors & Lenders of VISA BAO Limited (VBL) and your Company has approved Scheme of Amalgamation of VBL with your Company.
Pursuant to the notification of the Ministry of Corporate Affairs, all matters related to amalgamation, merger, de-merger shall be dealt by the jurisdictional National Company Law Tribunal (NCLT). Your Company had filed an application before the National Company Law Tribunal, Kolkata Bench in March 2017 and the application was admitted by the Hon’ble NCLT in April 2017 and approved vide order dated 12 October 2017 passed by the Hon’ble NCLT. Subsequent to amalgamation, 57,89,500 equity shares of Rs. 10 each of the Company have been allotted to Baosteel Resources Co. Ltd, China (Baosteel). Baosteel now holds 5% of the equity shares of the Company.
FINANCIAL STATEMENTSCOMPANY OVERVIEW GOVERNANCE REPORTS
21VI S A S T EEL LT D.
AMALGAMATION OF KALINGANAGAR SPECIAL STEEL PRIVATE LIMITEDThe Board of Directors of the Company had approved a Scheme of Amalgamation under Section 391 to 394 of the Companies Act, 1956, between the Company and Kalinganagar Special Steel Private Limited, a subsidiary of the Company and their respective shareholders and creditors. The appointed date of the Scheme is 31 March 2014 or such other date as may be fixed or approved by the Hon’ble High Court of Judicature of Orissa at Cuttack. The matter is being heard in High Court of Orissa and decision is awaited.
SUBSIDIARIESAs on 31 March 2017, the Company has seven subsidiaries including indirect subsidiaries namely, VISA BAO Limited, VISA SunCoke Limited, Ghotaringa Minerals Limited, Kalinganagar Special Steel Private Limited, Kalinganagar Chrome Private Limited, VISA Ferro Chrome Limited and VISA Special Steel Limited:
(i) VISA BAO Limited (VBL) is a Joint Venture between the Company and Baosteel Resources Co. Ltd. (Baosteel), China. VBL is setting up a Ferro Chrome Plant with 4 Submerged Arc Furnaces at Kalinganagar in Odisha of which 2 furnaces were commissioned in the month of June 2013. The remaining two furnaces are expected to be completed, one each before 31 March 2017 and during FY 2017-18, respectively. The Company holds 65 percent stake in VBL and Baosteel, one of the leading Steel Companies in the world, holds the balance 35 percent stake.
Pursuant to the Order dated 12 October 2017 passed by the Hon’ble National Company Law Tribunal, Kolkata Bench, VISA BAO Limited stands amalgamated with the Company with effect from 17 October 2017.
(ii) VISA SunCoke Limited (VSCL) is a Joint Venture with Sun Coke Europe Holding B.V. (SunCoke), in which the Company holds 51 percent stake and SunCoke holds remaining 49 percent stake. The joint venture comprises of 400,000 MTPA Heat Recovery Coke Plant and associated
Steam Generation Units at Kalinganagar in Odisha. The joint venture provides great opportunity for VSCL to leverage its operating and technological expertise to serve customers across India with the highest quality coke.
(iii) Ghotaringa Minerals Limited (GML) is a Joint Venture between the Company and Orissa Industries Limited (ORIND).
(iv) Kalinganagar Special Steel Private Limited, a wholly owned subsidiary, was incorporated on 27 May 2013.
(v) Kalinganagar Chrome Private Limited, a wholly owned subsidiary, was incorporated on 1 July 2013.
(vi) VISA Ferro Chrome Limited (VFCL), a step down subsidiary was incorporated on 26 July 2013. VFCL is a wholly owned subsidiary of Kalinganagar Special Steel Private Limited.
(vii) VISA Special Steel Limited (VSSL), a step down subsidiary incorporated on 27 July 2012 and is a wholly owned subsidiary of VISA Ferro Chrome Limited.
The Consolidated Financial Statement presented by the Company includes financial information of its subsidiaries prepared in compliance with applicable Accounting Standards. A statement containing the salient features of the financial statement of the Company’s subsidiaries in the prescribed form AOC-1 pursuant to first proviso to Section 129(3) of the Companies Act, 2013 read with the Companies (Accounts) Rules, 2014 is annexed separately to the financial statements.
The Annual Accounts of the Subsidiary Companies will be made available to the shareholders of the aforesaid subsidiaries and the Company as and when they demand and will also be kept for inspection by any investor at the registered office of the Company and these subsidiaries. The financial statements of the Company and its subsidiaries are also available on the website of the Company.
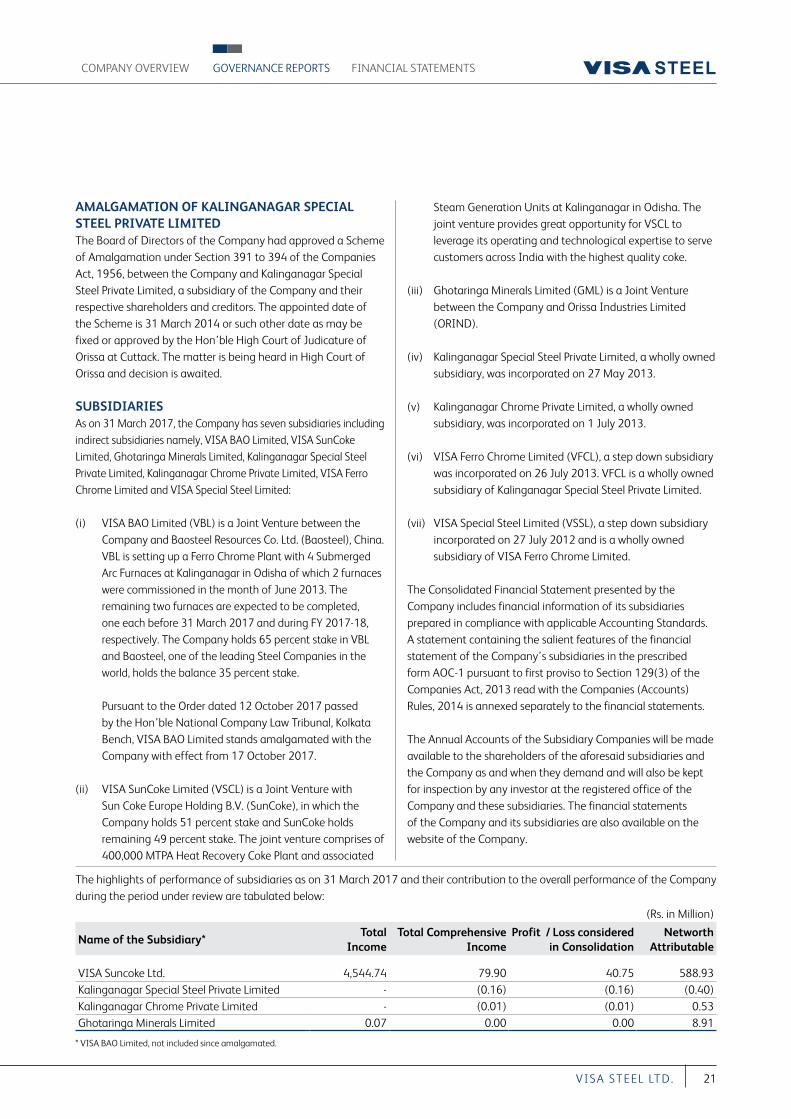
The highlights of performance of subsidiaries as on 31 March 2017 and their contribution to the overall performance of the Company during the period under review are tabulated below:
(Rs. in Million)
Name of the Subsidiary*Total
IncomeTotal Comprehensive
IncomeProfit / Loss considered
in ConsolidationNetworth
Attributable
VISA Suncoke Ltd. 4,544.74 79.90 40.75 588.93Kalinganagar Special Steel Private Limited - (0.16) (0.16) (0.40)Kalinganagar Chrome Private Limited - (0.01) (0.01) 0.53Ghotaringa Minerals Limited 0.07 0.00 0.00 8.91
* VISA BAO Limited, not included since amalgamated.
REPORT OF THE DIRECTORS
22 A nnu a l Repor t 2016-17
EXTENSION OF DATE FOR HOLDING ANNUAL GENERAL MEETING OF THE COMPANYIn accordance with provisions of Section 96 read with Section 129 of the Companies Act, 2013, the Annual General Meeting (AGM) of the Company for the FY ended 31 March 2017, was due to be held on or before 30 September 2017. The Company approached the Registrar of Companies, Orissa to extend time by three months for holding the Annual General Meeting so that necessary effect could be given to the Scheme of Amalgamation between the Company and VISA BAO Limited on its sanction by the Hon’ble National Company Law Tribunal, Kolkata Bench and to complete the preparation of financial statements of the Company after giving effect to the Scheme. Necessary approval to hold the Annual General Meeting for the FY 2016-17 up to 31 December 2017 was granted by the Registrar of Companies, Orissa.
BOARD MEETINGSThe Board met 4 times during the year, the details of which are given in the Corporate Governance Report that forms part of the Annual Report. The intervening gap between the meetings was within the period prescribed under the Companies Act, 2013 and the SEBI (Listing Obligations and Disclosure Requirements) Regulations, 2015 (“Listing Regulations”).
Further, the Independent Directors at their meeting, reviewed the performance of the Board, Chairman of the Board and of Non Independent Directors, as required under the Act and the Listing Agreement.
The Independent Directors at their meeting also assessed the quality, quantity and timelines of flow of information between the Company Management and the Board of Directors of the Company.
DIRECTORS AND KEY MANAGERIAL PERSONNELDirectors In accordance with the provisions of Section 152 of the Companies Act, 2013 and in terms with the Articles of Association of the Company, Mr. Manoj Kumar, Whole time Director designated as Director (Kalinganagar) (DIN: 06823891), retires by rotation at the forthcoming Annual General Meeting and being eligible offers himself for re-appointment. The Board recommends for his re-appointment.
Mr. Debi Prasad Bagchi (DIN 00061648), Mr. Pratip Chaudhuri (DIN 00915201), Mr. Kishore Kumar Mehrotra (DIN 02894045), Ms. Puja Sondhi (DIN 06592082) and Ms. Ramya Hariharan (DIN 06958511) have given declarations confirming that they meet with the criteria of independence as prescribed both under sub-section (6) of Section 149 of the Companies
Act, 2013 and under Regulation 17 of the Listing Regulations. Ms. Gauri Rasgotra (DIN 06862334), Independent Woman Director resigned w.e.f. 27 July 2016. Mr. Shiv Dayal Kapoor (DIN 00043634) resigned as an Independent Director w.e.f 4 November 2016 due to health reasons.
Mr. Manas Kumar Nag (DIN 02058292) continues as Nominee Director (Nominee of State Bank of India).
Mr. Manoj Kumar Digga (DIN 01090626) resigned as the Whole time Director designated as Director (Finance) & Chief Financial Officer of the Company w.e.f. 18 January 2017. However, he continues to be the Chief Financial Officer of the Company.
Mr. Manoj Kumar (DIN 06823891) continues to be the Whole time Director designated as Director (Kalinganagar) of the Company for a period of 3 (three) years w.e.f. 15 September 2015. His remuneration was revised w.e.f 10 February 2017, subject to the approval of the shareholders of the Company in the ensuing Annual general Meeting of the Company. Details of the remuneration have been disclosed in the Notice of the Annual General Meeting dated 9 November 2017.
Subsequent to the year end, Mr Debi Prasad Bagchi (DIN 00061648) had resigned as the Independent Director w.e.f 21 April 2017, Ms. Puja Sondhi (DIN: 06592082) had resigned as the Independent Woman Director w.e.f 9 May 2017. Ms. Ramya Hariharan (DIN: 06928511) was appointed as the Additional Independent Woman Director w.e.f 19 May 2017 to hold office up to the ensuing Annual General Meeting. Ms. Hariharan resigned w.e.f 26 August 2017 due to increasing professional commitments. Mr. Sheo Raj Rai (DIN: 07902184) was appointed as the Additional Independent Director w.e.f 8 August 2017 and Ms. Rupanjana De (DIN 01560140) was appointed as Additional Independent Woman director w.e.f 26 August 2017. Mr Rai and Ms. De hold office up to the ensuing Annual General Meeting.
Brief resume of the above Directors, nature of their expertise in their specific functional areas, details of directorships in other Companies and the chairmanship / membership of committees of the Board, as stipulated under Regulation 17 of the SEBI (Listing Obligations and Disclosure Requirements) Regulations 2015, are given in the Notice for the ensuing Annual General Meeting.
Key Managerial PersonnelMr. Vishambhar Saran is responsible for Chief Executive functions of the of the Company in addition to being the Whole time Director designated as the Chairman, Mr. Vishal Agarwal acts as Deputy Chief Executive Officer in addition to being the
FINANCIAL STATEMENTSCOMPANY OVERVIEW GOVERNANCE REPORTS
23VI S A S T EEL LT D.
Vice Chairman & Managing Director and Mr. Manoj Kumar, acts as Chief Operating Officer in addition to being the Whole time Director designated as Director (Kalinagnagar).
During the year, Mr. Keshav Sadani resigned as the Company Secretary and Compliance Officer of the Company with effect from 25 June 2016 and Mr. Sudhir Kumar Banthiya was appointed as the Company Secretary and Compliance Officer of the Company w.e.f 13 September 2016. Mr. Manoj Kumar Digga continues to be the Chief Financial Officer of the Company.
BOARD EVALUATIONThe Board carried out an annual performance evaluation of its own performance, the individual Directors as well as the Board Committees, in due compliance with the provisions of the Companies Act, 2013 and the Listing Regulations. The performance evaluation of the Independent Directors was carried by the entire Board and performance evaluation of the Chairman and Non Independent Directors was carried out by the Independent Directors.
The Board evaluation was carried out in accordance with the criteria laid down in the Nomination and Remuneration policy of the Company.
DIRECTORS’ RESPONSIBILITY STATEMENTIn terms of the provisions of Section 134(5) of the Companies Act, 2013, your Directors to the best of their knowledge and ability confirm:
(a) that in the preparation of the annual accounts, the applicable accounting standards had been followed along with proper explanation relating to material departures;
(b) that the Directors have selected such accounting policies and applied them consistently and made judgments and estimates that are reasonable and prudent so as to give a true and fair view of the state of affairs of the Company as at 31 March 2017 and of the loss of the Company for that period;
(c) that proper and sufficient care for the maintenance of adequate accounting records in accordance with the provisions of the Companies Act, 2013, for safeguarding the assets of the Company and for preventing and detecting fraud and other irregularities;
(d) that the annual accounts had been prepared on a going concern basis;
(e) that the directors have laid down internal financial controls to be followed by the Company and that such internal financial controls are adequate and were operating effectively; and
(f) that proper systems have been devised to ensure compliance with the provisions of all applicable laws and that such systems were adequate and operating effectively.
AUDIT COMMITTEEThe Audit Committee comprises of 3 (three) Non-Executive Independent Directors. As on date, Mr. Kishore Kumar Mehrotra is the Chairman of the Audit Committee. The members of the Committee possess adequate knowledge of Accounts, Audit and Finance, among others. The composition of the Audit Committee meets the requirements as per Section 177 of the Companies Act, 2013 and of and is detailed in the Corporate Governance Report forming part of this Annual Report.
All recommendations made by the Audit Committee during the FY 2016-17 were accepted by the Board of Directors of the Company.
CEO / CFO CERTIFICATION As required under SEBI (Listing Obligations and Disclosure Requirements), Regulations 2015, Mr. Vishal Agarwal, Vice Chairman & Managing Director and Mr. Manoj Kumar Digga, Chief Financial Officer of the Company have certified to the Board regarding the Financial Statements for the year ended 31 March 2017, which is annexed to this report.
AUDITORSStatutory Auditors and Auditors ReportThe members of the Company had, at the 18th Annual General Meeting of the members of the Company held on 24 December 2014, approved the appointment of M/s. Lovelock & Lewes, Chartered Accountants as Statutory Auditors of the Company to hold office from the conclusion of that Annual General Meeting till the conclusion of 21st Annual General Meeting, subject to ratification by members at every Annual General Meeting.
Accordingly, it is proposed to appoint M/s. Singhi & Co., Chartered Accountants (FRN 302049E), as Statutory Auditors of the Company from the conclusion of the ensuing Annual General Meeting till the Annual General Meeting of the Company to be held in the year 2022.
In compliance with Section 139 and other applicable provisions of the Companies Act, 2013, the Company has obtained a written consent from the Auditors and also a certificate to the
REPORT OF THE DIRECTORS
24 A nnu a l Repor t 2016-17
effect that their appointment, if ratified, would be in accordance with the conditions prescribed under the Act.
The para-wise management response to the qualifications / observations made in the Independent Auditors Report is stated as under:
1. Attention is drawn to para 9 of the Independent Auditors Report regarding Basis for Qualified Opinion. The clarification of the same is provided in Note No. 18D of the Accounts of the Standalone Accounts.
2. Attention is drawn to para 11(a) of the Independent Auditors Report regarding Emphasis of Matter. The clarification of the same is provided in Note No. 40 of the Accounts of the Standalone Accounts.
3. Attention is drawn to para 11(b) and (c) of the Independent Auditors Report regarding Emphasis of Matter. The clarification of the same is provided in Note No. 48 of the Accounts of the Standalone Accounts.
4. As regards para (iii) (b) and (c) of the Annexure to the Independent Auditors Report, your Directors report that Ghotaringa Minerals Limited, a subsidiary of the Company could not pay the interest of Rs. 2.74 million as at Balance Sheet date. The Board of Directors of the Company had extended the tenure of repayment up to May 2018.
5. The Auditors observation in para viii of the Annexure to the Auditors report regarding dues to financial institution and banks aggregating Rs 17,271.94 million as mentioned in Note 18E were due to severe liquidity crisis being faced by the Company on account of continued cash losses incurred.
Internal AuditorsIn terms of the provisions of Section 138 of the Companies Act, 2013 M/s. L B Jha & Company, an Independent Chartered Accountants were appointed as Internal Auditors of the Company for FY 2017-18. The Audit Committee in consultation with the Internal Auditors formulates the scope, functioning, periodicity and methodology for conducting the Internal Audit. The Audit Committee, inter alia, reviews the Internal Audit Report.
Secretarial AuditorsPursuant to Section 204 of the Companies Act, 2013 and The Companies (Appointment and Remuneration of Managerial Personnel) Rules, 2014, the Board of Directors of the Company had appointed M/s. M K B & Associates, Practicing Company
Secretaries, as its Secretarial Auditor to undertake the Secretarial Audit for FY 2016-17. The report of the Secretarial Auditor in specified form MR-3 is annexed herewith as Annexure I and forms part of this report. The report does not contain any observation or qualification or adverse remarks.
The Board has re-appointed M/s. M K B & Associates, Practicing Company Secretaries, as Secretarial Auditors of the Company for the financial year 2017-18.
Cost AuditorsAs per Section 148 of the Companies Act, 2013, the Board of Directors has appointed, M/s. DGM & Associates, (Registration No.00038), Cost Accountants, Kolkata as Cost Auditors of the Company, to carry out the cost audit of the products (Pig Iron & Pig Scrap, Ferro Chrome and Sponge Iron) manufactured by the Company for the FY ending 31 March 2018.
The Cost Audit Report for FY 2016-17 has been filed under XBRL mode within the due date of filing.
RISK MANAGEMENTThe speed and degree of changes in the global economy and the increasingly complex interplay of factors influencing the business makes Risk Management an inevitable exercise and to cater to the same, your Company has identified major focus areas for risk management to ensure organisational objectives are achieved and has a robust policy along with well-defined and dynamic structure and proactive approach to assess, monitor and mitigate risks associated with the business.
SIGNIFICANT AND MATERIAL ORDERS PASSED BY THE REGULATORS / COURTSThere are no significant material orders passed by the Regulators / Courts which would impact the going concern status of your Company and its future operations.
INTERNAL CONTROL SYSTEMYour Company has adequate system of internal control procedures commensurate with its size and the nature of business. The internal control systems of the Company are monitored and evaluated by the Internal Auditors and their audit reports are periodically reviewed by the Audit Committee of the Board of Directors of the Company.
Your Company manages and monitors the various risks and uncertainties that can have adverse impact on the Company’s business. Your Company is giving major thrust in developing and strengthening its internal audit so that risk threat can be mitigated.
FINANCIAL STATEMENTSCOMPANY OVERVIEW GOVERNANCE REPORTS
25VI S A S T EEL LT D.
RELATED PARTY TRANSACTIONSAll Related Party Transactions entered into during FY 2016-17 were on arm’s length basis and also in the ordinary course of business. No Related Party Transactions were made by the Company with Promoters, Directors, Key Managerial Personnel or other designated persons during FY 2016-17 except those reported.
All Related Party Transactions were placed before the Audit Committee for approval. Prior Omnibus Approval of the Audit Committee was obtained on a yearly basis for the transactions which were of foreseen and repetitive in nature. The transactions entered into pursuant to the Omnibus Approval so granted were audited and a statement giving details of all Related Party Transactions was placed before the Audit Committee for its approval on a quarterly basis. The policy on Related Party Transactions as approved by the Board is uploaded on the Company’s website at www.visasteel.com.
Information on transaction with Related Parties is given in Form AOC-2, Annexure II and the same forms part of this report.
None of the Directors or KMP has any pecuniary relationships or transactions vis-à-vis the Company during FY 2016-17.
PARTICULARS OF CONSERVATION OF ENERGY, TECHNOLOGY ABSORPTION AND FOREIGN EXCHANGE EARNINGS AND OUTGOInformation pursuant to Section 134(3)(m) of the Companies Act, 2013 read with the Companies (Accounts) Rules, 2014 in respect of Conservation of Energy and Technology Absorption and Foreign Exchange Earnings and Outgo is given in Annexure III forming part of this report.
PARTICULARS OF LOANS, GUARANTEES OR INVESTMENTSDetails of loans, guarantees and investments covered under the provisions of Section 186 of the Companies Act, 2013 are given in the notes to the financial statements.
HUMAN RESOURCESThe Company places significant emphasis on recruitment, training & development of human resources, which assumes utmost significance in achievement of corporate objectives. The Company integrates employee growth with organizational growth in a seamless manner through empowerment and by offering a challenging workplace aimed towards realisation of organisational goals. To this effect, your Company has a training center at its Plant for knowledge-sharing and imparting need based training to its employees. The Company also has in place
a Performance Management System in SAP for performance appraisal of the employees. To ensure accommodation, hospitality and other facilities for its employees, the Company has set up a modern guest house at Kalinganagar.
PARTICULARS OF EMPLOYEES AND OTHER ADDITIONAL INFORMATIONThe information required under Section 197(12) of the Companies Act, 2013, read with Rule 5(2) & 5(3) of the Companies (Appointment and Remuneration of Managerial Personnel) Rules, 2014 (the Rules) are set out in Annexure IV to this Report. However, as per the provisions of Section 136 of the Companies Act, 2013, the Annual Report excluding the aforesaid information is being sent to all the members of the Company and others entitled thereto. Any member interested in obtaining a copy of the statement may write to the Company.
The disclosure pertaining to remuneration of Directors, Key Managerial Personnel and Employees as required under Section 197(12) of the Act read with Rule 5(1) of the Rules are provided in Annexure IVB to this report.
EMPLOYEES STOCK OPTIONThe Company has an ESOP Scheme in place titled Employee Stock Option Scheme 2010 (ESOP Scheme 2010), for permanent employees including any Director, whether whole-time or otherwise, of the Company, its subsidiaries and the Holding Company to be administered by the Nomination and Remuneration Committee of the Board of Directors of the Company. ESOP Scheme 2010 provides an incentive to attract, retain and reward the employees and enable them to participate in future growth and financial success of the Company. Each option confers a right upon the employee to apply for one equity share of the Company.
During the year under review, NIL Stock Options have vested with the specified employees of the Company and its subsidiary (ies) under the ESOP Scheme 2010 and 128,750 Stock Options have lapsed till 31 March 2017. As on 31 March 2017, none of the Options have been exercised.
The particulars with regard to ESOP scheme as on 31 March 2017, as required to be disclosed pursuant to the provisions of Rule 12(9) of the Companies (Share Capital & Debentures) Rules, 2014 are set out in Annexure V to this report.
A Certificate from the Statutory Auditors with regard to the implementation of ESOP Scheme 2010 would be placed at the forthcoming Annual General Meeting.
REPORT OF THE DIRECTORS
26 A nnu a l Repor t 2016-17
DEPOSITSThe Company has not accepted or renewed any deposits during the year under review.
CONSOLIDATED FINANCIAL STATEMENTIn terms of SEBI (Listing Obligations and Disclosure Requirements), Regulations 2015 Consolidated Financial Statement, confirming to Indian Accounting Standard 110 issued by the Institute of Chartered Accountants of India, is attached as a part of the Annual Report.
CORPORATE GOVERNANCE The Company is committed in maintaining the highest standards of Corporate Governance and adheres to the stipulations prescribed under Regulations 17-23 of the Listing Regulations. A Report on Corporate Governance & Shareholder Information together with the Auditors’ Certificate thereon is annexed as part of the Annual Report.
MANAGEMENT DISCUSSION & ANALYSISA detailed analysis of the Industry and Company Outlook, Company’s operations, project review, risk management, strategic initiatives and financial review & analysis, as stipulated under SEBI (Listing Obligations and Disclosure Requirements), Regulations 2015 is presented under a separate section titled “Management Discussion and Analysis” forming part of the Annual Report.
EXTRACT OF THE ANNUAL RETURNThe details forming part of the extract of the Annual Return in Form MGT 9 as per provisions of Companies Act, 2013 and rules thereto is annexed to this report as Annexure VI.
VIGIL MECHANISM (WHISTLE BLOWER POLICY)The Company has a Vigil Mechanism / Whistle Blower Policy to deal with instances of fraud and mismanagement, if any. The policy provides for adequate safeguards against victimization of employees and / or Directors and also provides for direct access to the Chairman of the Audit Committee. The Policy is uploaded on the website of the Company at www.visasteel.com.
CORPORATE SOCIAL RESPONSIBILITY POLICY The Corporate Social Responsibility (CSR) policy recommended by the Corporate Social Responsibility Committee had been approved by the Board of Directors. Detailed annexure as per Companies (CSR Policy) Rules, 2014 is attached as Annexure VII. The CSR policy is available on the website of the Company www.visasteel.com and is also attached to this report as Annexure VIII.
During the year, the CSR initiatives undertaken by the Company, although not mandatory under Section 135 of the Act read with Companies (Corporate Social Responsibility Policy) Rules 2014, are detailed in the Annual Report.
NOMINATION AND REMUNERATION POLICYIn terms of the requirement of Section 178 of the Companies Act, 2013, on the recommendation of the Nomination and Remuneration Committee, the Board has approved the Remuneration policy of the Company. The Remuneration policy is attached to the Board’s Report as Annexure IX.
DISCLOSURE AS PER THE SEXUAL HARASSMENT OF WOMEN AT WORKPLACE (PREVENTION, PROHIBITION AND REDRESSAL) ACT, 2013The Company has zero tolerance towards sexual harassment at the workplace and has adopted a policy on prevention, prohibition and redressal of sexual harassment at workplace in line with the provisions of the Sexual Harassment of Women at Workplace (Prevention, Prohibition and Redressal) Act, 2013 and the Rules thereunder. The Company has not received any complaint of sexual harassment during the FY 2016-17.
ACKNOWLEDGEMENTYour Directors record their sincere appreciation for the assistance, support and guidance provided by banks, financial institutions, customers, suppliers, regulatory & government authorities, project & other business associates and stakeholders. The Directors also commend the continuing commitment and dedication of the employees at all levels which has been critical for the Company’s growth. The Directors look forward to their continued support in future.
Your Directors value your involvement as shareholders and look forward to your continuing support.
For and on behalf of the Board
Vishal AgarwalVice Chairman & Managing Director,
(DIN 00121539)
Kolkata Manoj Kumar 9 November 2017 Wholetime Director designated as
Director (Kalinganagar) (DIN 06823891)
FINANCIAL STATEMENTSCOMPANY OVERVIEW GOVERNANCE REPORTS
27VI S A S T EEL LT D.
Annexure I
FORM NO. MR-3SECRETARIAL AUDIT REPORTFor The Financial Year ended 31st March, 2017[Pursuant to Section 204(1) of the Companies Act, 2013 and Rule No.9 of the Companies (Appointment and Remuneration of Managerial Personnel) Rules, 2014]
ToThe Members,VISA STEEL LIMITED
We have conducted the secretarial audit of the compliance of applicable statutory provisions and the adherence to good corporate practices by VISA STEEL LIMITED (hereinafter called “the Company”). Secretarial Audit was conducted in a manner that provided us a reasonable basis for evaluating the corporate conducts/statutory compliances and expressing our opinion thereon.
The Company’s Management is responsible for preparation and maintenance of secretarial and other records and for devising proper systems to ensure compliance with the provisions of applicable laws and Regulations.
Based on our verification of the books, papers, minute books, forms and returns filed and other records maintained by the Company and also the information provided by the Company, its officers, agents and authorized representatives during the conduct of secretarial audit, we hereby report that in our opinion, the Company has, during the audit period covering the Financial Year ended on 31st March, 2017, generally complied with the statutory provisions listed hereunder and also that the Company has proper Board processes and compliance mechanism in place to the extent, in the manner and subject to the reporting made hereinafter:
We have examined the books, papers, minute books, forms and returns filed and other records maintained by the Company for the Financial Year ended on 31st March, 2017, to the extent applicable, according to the provisions of:
i) The Companies Act, 2013 (the Act) and the rules made thereunder;
ii) The Securities Contracts (Regulation) Act, 1956 and Rules made thereunder;
iii) The Depositories Act, 1996 and Regulations and Bye-laws framed thereunder;
iv) The Foreign Exchange Management Act, 1999 and the Rules and Regulations made thereunder to the extent of Foreign Direct Investment, Overseas Direct Investment and External Commercial Borrowings;
v) The Regulations and Guidelines prescribed under the Securities & Exchange Board of India Act, 1992 (“SEBI Act”) or by SEBI, to the extent applicable:
a) The Securities & Exchange Board of India (Substantial Acquisition of Shares and Takeover) Regulations, 2011
b) The Securities & Exchange Board of India (Prohibition of Insider Trading) Regulations 2015
c) The Securities & Exchange Board of India (Issue of Capital and Disclosure Requirements) Regulations, 2009
d) The Securities and Exchange Board of India (Share Based Employee Benefits) Regulations, 2014
e) The Securities & Exchange Board of India (Issue and listing of Debt securities) Regulations, 2008
f) The Securities & Exchange Board of India (Registrars to an Issue and Share Transfer Agents) Regulations, 1993
g) The Securities & Exchange Board of India (Delisting of Equity Shares) Regulations, 2009
h) The Securities & Exchange Board of India (Buyback of Securities) Regulations, 1998
vi) Other than fiscal, labour and environmental laws which are generally applicable to all manufacturing companies, the following laws/acts are also, inter alia, applicable to the Company:
a) The Legal Metrology Act, 2009 and Rules made there under
b) The Orissa Electricity (Duty) Act, 1961 and Rules made there under
c) The Static And Mobile Pressure Vessels (Unfired) Rules, 1981
d) The Gas Cylinder Rules, 2004
REPORT OF THE DIRECTORS
28 A nnu a l Repor t 2016-17
e) The Petroleum Act, 1934 and Rules made there under
f) The Environment (Protection) Act, 1986
g) The Air( Prevention and Control of Pollution) Act, 1981
h) Orissa Air (Prevention & Control Of Pollution) Rules, 1983
We have also examined compliance with the applicable clauses of the following:a) The Secretarial Standards issued by The Institute of
Company Secretaries of India.
b) Provisions of the Securities and Exchange Board of India (Listing Obligations and Disclosure Requirements) Regulations, 2015.
During the period under review the Company has generally complied with the provisions of the Act, Rules, Regulations, Guidelines, Standards, etc. mentioned above.
We further report thata) The Board of Directors of the Company is duly constituted
with proper balance of Executive Directors, Non Executive Directors and Independent Directors. The changes in the composition of the Board of Directors that took place during the period under review were carried out in compliance with the provisions of the Act.
b) Adequate notice is given to all directors to schedule the Board Meetings, agenda and detailed notes on agenda were sent at least seven days in advance, and a system exists for seeking and obtaining further information and clarifications on the agenda items before the meeting and for meaningful participation at the meeting.
c) None of the directors in any meeting dissented on any resolution and hence there was no instance of recording any dissenting member’s view in the minutes.
We further report that there are adequate systems and processes in the Company commensurate with the size and operations of the Company to monitor and ensure compliance with applicable laws, rules, regulations and guidelines.
We further report that during the period under audit, the Company has passed the following special resolutions:
a) Shifting of the registered office of the Company from the state of Odisha to the state of West Bengal pursuant to Section 13(4) of the Companies Act, 2013.
b) Approval of related party transactions under section 188 and other applicable provisions, if any, of the Companies Act, 2013 read with Rules made there under.
We further report that three Schemes of Arrangement pursuant to Section 391/394 of the Companies Act, 1956 and corresponding sections of Companies Act, 2013, involving the Company were filed and are pending adjudication before the Hon’ble High Court, Orissa/the National Company Law Tribunal, Kolkata Bench:
(a) The Company Petition being CP No. 17 of 2014 which, inter alia, envisages transfer of Special Steel undertaking of the Company with all its assets and liabilities, into VISA Special Steel Limited, the Appointed Date of the Scheme being 1st April, 2013. The Board of Directors of the Company, in its meeting held on 26th May 2017, has decided to withdraw the Company Petition.
(b) The Company Petition being CP no. 110 of 2014 which, inter alia, envisages amalgamation of Kalinganagar Special Steel Private Limited with the Company, the Appointed Date of the Scheme being 31st March, 2014.
(c) The Company Petition being CP No. 24 of 2016 which, inter alia, envisages amalgamation of VISA BAO Limited with the Company, the Appointed Date of the Scheme being 1st April, 2015.
We further report that during the audit period there are no specific events/actions which have any major bearing on Company’s affairs.
This report is to be read with our letter of even date which is annexed as Annexure – I, which forms an integral part of this report.
For MKB & AssociatesCompany Secretaries
Raj Kumar Banthia(Partner)
ACS no. 17190Date: 6 October 2017 COP no. 18428Place: Kolkata FRN: P2010WB042700
FINANCIAL STATEMENTSCOMPANY OVERVIEW GOVERNANCE REPORTS
29VI S A S T EEL LT D.
Annexure I
ToThe Members,VISA STEEL LIMITED
Our report of even date is to be read along with this letter.1. It is management’s responsibility to identify the Laws, Rules, Regulations, Guidelines and Directions which are applicable to the
Company depending upon the industry in which it operates and to comply and maintain those records with same in letter and in spirit. Our responsibility is to express an opinion on those records based on our audit.
2. We have followed the audit practices and process as were appropriate to obtain reasonable assurance about the correctness of the contents of the secretarial records. The verification was done on test basis to ensure that correct facts are reflected in secretarial records. We believe that the process and practices we followed provide a reasonable basis for our opinion.
3. We have not verified the correctness and appropriateness of financial records and Books of Accounts of the Company.
4. Wherever required, we have obtained the Management’s Representation about the compliance of Laws, Rules, Regulations, Guidelines and Directions and happening events, etc.
5. The Secretarial Audit Report is neither an assurance as to the future viability of the Company nor of the efficacy or effectiveness with which the management has conducted the affairs of the Company.
For MKB & AssociatesCompany Secretaries
Raj Kumar Banthia(Partner)
ACS no. 17190Date: 6 October 2017 COP no. 18428Place: Kolkata FRN: P2010WB042700
REPORT OF THE DIRECTORS
30 A nnu a l Repor t 2016-17
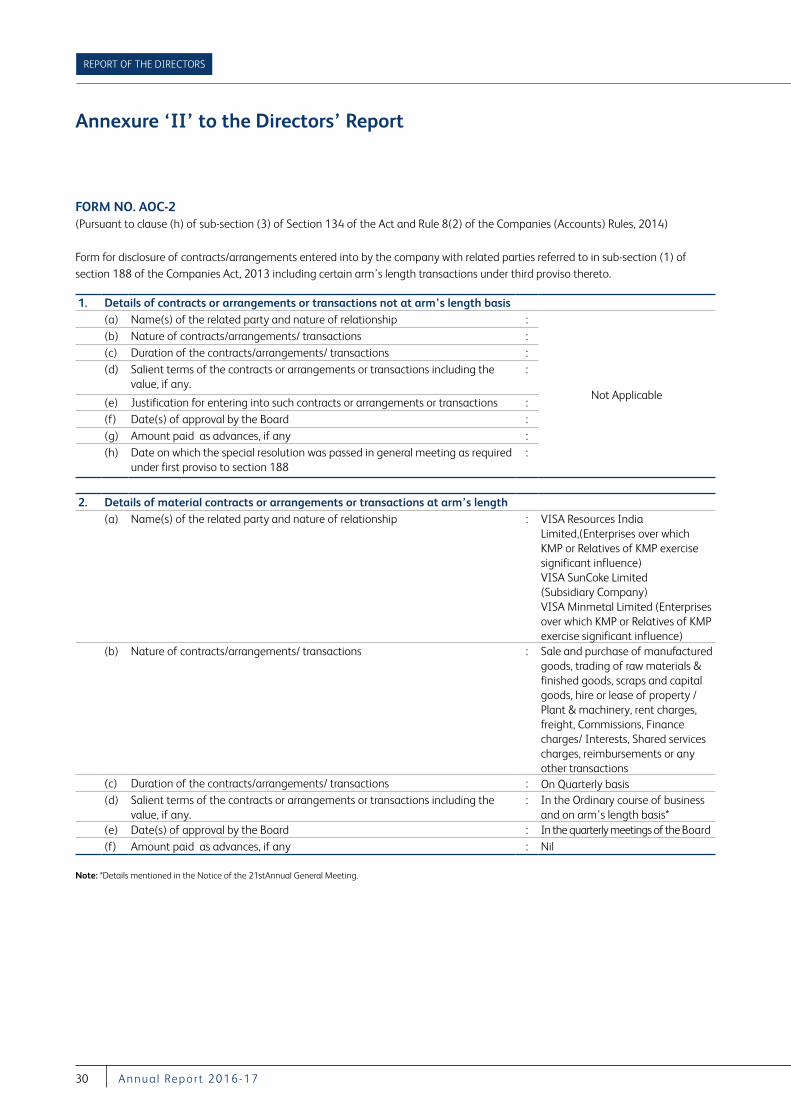
Annexure ‘II’ to the Directors’ Report
FORM NO. AOC-2(Pursuant to clause (h) of sub-section (3) of Section 134 of the Act and Rule 8(2) of the Companies (Accounts) Rules, 2014)
Form for disclosure of contracts/arrangements entered into by the company with related parties referred to in sub-section (1) of section 188 of the Companies Act, 2013 including certain arm’s length transactions under third proviso thereto.
1. Details of contracts or arrangements or transactions not at arm’s length basis(a) Name(s) of the related party and nature of relationship :
Not Applicable
(b) Nature of contracts/arrangements/ transactions :(c) Duration of the contracts/arrangements/ transactions :(d) Salient terms of the contracts or arrangements or transactions including the
value, if any.:
(e) Justification for entering into such contracts or arrangements or transactions :(f) Date(s) of approval by the Board :(g) Amount paid as advances, if any :(h) Date on which the special resolution was passed in general meeting as required
under first proviso to section 188:
2. Details of material contracts or arrangements or transactions at arm’s length(a) Name(s) of the related party and nature of relationship : VISA Resources India
Limited,(Enterprises over which KMP or Relatives of KMP exercise significant influence)VISA SunCoke Limited (Subsidiary Company)VISA Minmetal Limited (Enterprises over which KMP or Relatives of KMP exercise significant influence)
(b) Nature of contracts/arrangements/ transactions : Sale and purchase of manufactured goods, trading of raw materials & finished goods, scraps and capital goods, hire or lease of property / Plant & machinery, rent charges, freight, Commissions, Finance charges/ Interests, Shared services charges, reimbursements or any other transactions
(c) Duration of the contracts/arrangements/ transactions : On Quarterly basis(d) Salient terms of the contracts or arrangements or transactions including the
value, if any.: In the Ordinary course of business
and on arm’s length basis*(e) Date(s) of approval by the Board : In the quarterly meetings of the Board(f) Amount paid as advances, if any : Nil
Note: *Details mentioned in the Notice of the 21stAnnual General Meeting.
FINANCIAL STATEMENTSCOMPANY OVERVIEW GOVERNANCE REPORTS
31VI S A S T EEL LT D.
Annexure ‘III’ to the Report of the Directors
Particulars of Energy Conservation, Technology Absorption and Foreign Exchange Earnings and Outgo required under Companies (Accounts) rules, 2014
A. CONSERVATION OF ENERGY i. Steps taken or impact on conservation of energy
and utilising alternate sources of energy 1. Installation of leak proof gas before stack
flaring of Blast furnace has enabled for utilization of 10000 NM3/hr in Blast Furnace WHRB boiler resulting in increase in steam and further power by 0.8 MW/Hr.
2. Installation of de-dust firing system in ABC of both Kiln for Increasing of 1 MW power from DRI WHRB Boiler 1 & 2
3. Re-orientation of sidewall panel for O2 lance with lance holder side wall panels will reduce stickers inside the furnace and improved the efficiency of usage of oxygen in EAF.
4. In EAF at SMS, consumable door lance is replaced with water cooled supersonic door lance enabling in proper utilization of oxygen and minimization of lancing pipes.
5. Utilization of coke fines in form of coke briquette in Ferrochrome furnace enables to reduces equivalent amount of fixed carbon though prime coke.
6. Utilization of waste Char from DRI kiln process (Approx- 30,628 T) in CFBC Boiler as fuel.
7. Installation of new designed vortex in CFBC Boiler to maintain overall flue gas flow and reduction in specific coal consumption.
8. Overall descaling of condenser due to which specific steam consumption of steam and heat rate of turbine has been improved.
Proposals, if any, being implemented for reduction in consumption of energy:
1. Installation of stave cooling system at Blast furnace to enhance refractory lining life by 2 years instead of 8 months and also to prevent production loss and extra coke consumption during erosion of refractory lining.
2. Installation of Pulverize coal injection system with oxygen enrichment in Blast Furnace which will enable us to reduce coke consumption and equivalent increase in production.
3. Fuel Emulsification system being installed for use of mixture of water and furnace oil in Reheating Furnace of Rolling Mill. In this process a mixture of water and chemicals is
mixed in a tank and fed to the FO line through a pump to be used in the furnace. This will help in reducing Furnace Oil consumption. The system will be put on trial in the next rolling campaign.
The above system will result in energy saving by reduction in FO consumption by 8-10%. It will also prevent carbon deposition in burner nozzle, which will improve efficiency
4. Heating of tundish at caster of SMS by LPG instead of HSD to reduce fuel consumption and also heating duration.
5. Replacement of 25 % of infrastructure light from 70 W to 12-20 W LED to reduce energy consumption.
Capital Investment on Energy Conservation Equipment’s: Rs. Nil
B. TECHNOLOGY ABSORPTION i. Efforts made towards technology adsorption a) Erection of EAF canopy sheeting inside the
shop to ensure proper suction of dust emitting during hot metal pouring in EAF.
b) Modification of LRF inlet extraction system and addition of delta in LRF roof leading for proper suction of flue gas.
c) Installation of load cell in EAF ladle car enables the operation people to know exact amount of metal tapped, quantity of Hot heel balance at furnace and better control over chemistry calculation.
ii. Benefits derived: a) By doing this overall suction of smoke is being
done and helps safe operation during pouring of hot metal in EAF.
b) Increase life of Booster fan shaft and bearing housing and 100 % suction of hot gas from LRF.
c) Enables in better monitoring during tapping, hot heel in furnace and control over chemistry of metal.
Future plan of action a) Installation of pollution control measures like
dust extraction system at DRI, Blast Furnace and Ferrochrome, Slurry handling system at Blast Furnace and Fume extraction system at cast house of Blast furnace to provide 100 %
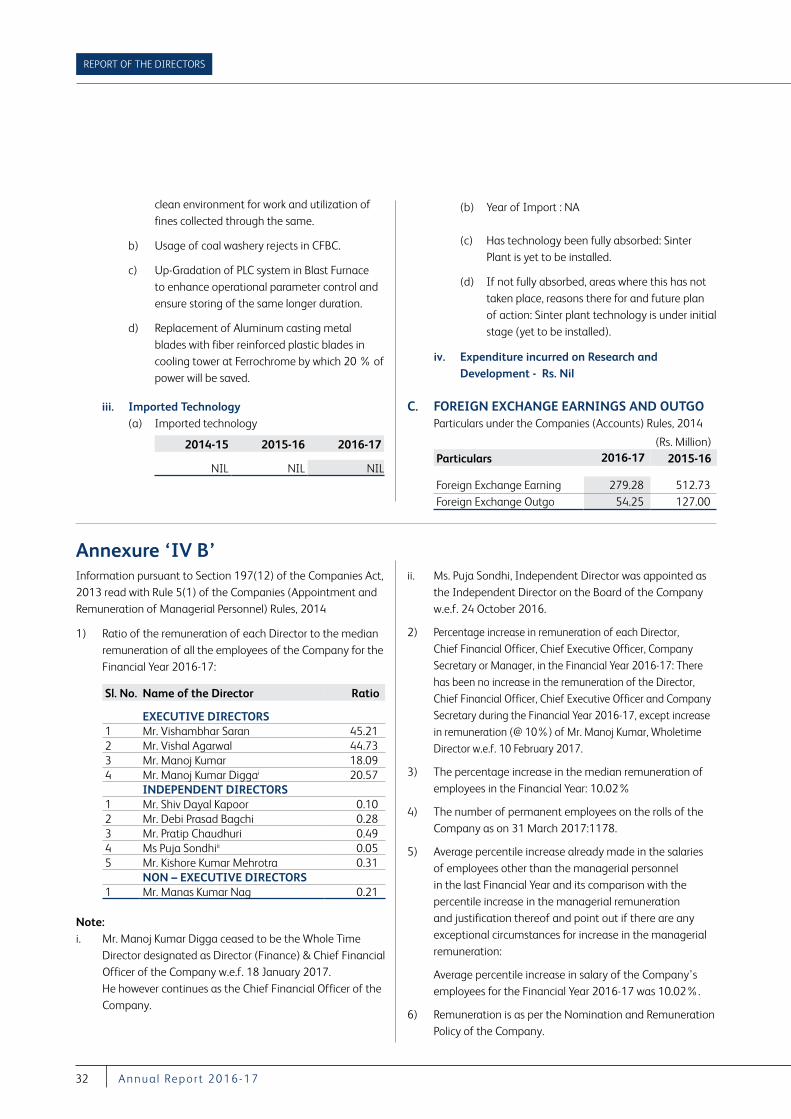
REPORT OF THE DIRECTORS
32 A nnu a l Repor t 2016-17
clean environment for work and utilization of fines collected through the same.
b) Usage of coal washery rejects in CFBC.
c) Up-Gradation of PLC system in Blast Furnace to enhance operational parameter control and ensure storing of the same longer duration.
d) Replacement of Aluminum casting metal blades with fiber reinforced plastic blades in cooling tower at Ferrochrome by which 20 % of power will be saved.
iii. Imported Technology (a) Imported technology
2014-15 2015-16 2016-17
NIL NIL NIL
(b) Year of Import : NA
(c) Has technology been fully absorbed: Sinter Plant is yet to be installed.
(d) If not fully absorbed, areas where this has not taken place, reasons there for and future plan of action: Sinter plant technology is under initial stage (yet to be installed).
iv. Expenditure incurred on Research and Development - Rs. Nil
C. FOREIGN EXCHANGE EARNINGS AND OUTGO Particulars under the Companies (Accounts) Rules, 2014
(Rs. Million)Particulars 2016-17 2015-16
Foreign Exchange Earning 279.28 512.73Foreign Exchange Outgo 54.25 127.00
Annexure ‘IV B’Information pursuant to Section 197(12) of the Companies Act, 2013 read with Rule 5(1) of the Companies (Appointment and Remuneration of Managerial Personnel) Rules, 2014
1) Ratio of the remuneration of each Director to the median remuneration of all the employees of the Company for the Financial Year 2016-17:
Sl. No. Name of the Director Ratio
EXECUTIVE DIRECTORS1 Mr. Vishambhar Saran 45.212 Mr. Vishal Agarwal 44.733 Mr. Manoj Kumar 18.094 Mr. Manoj Kumar Diggai 20.57
INDEPENDENT DIRECTORS1 Mr. Shiv Dayal Kapoor 0.102 Mr. Debi Prasad Bagchi 0.283 Mr. Pratip Chaudhuri 0.494 Ms Puja Sondhiii 0.055 Mr. Kishore Kumar Mehrotra 0.31
NON – EXECUTIVE DIRECTORS1 Mr. Manas Kumar Nag 0.21
Note:i. Mr. Manoj Kumar Digga ceased to be the Whole Time
Director designated as Director (Finance) & Chief Financial Officer of the Company w.e.f. 18 January 2017. He however continues as the Chief Financial Officer of the Company.
ii. Ms. Puja Sondhi, Independent Director was appointed as the Independent Director on the Board of the Company w.e.f. 24 October 2016.
2) Percentage increase in remuneration of each Director, Chief Financial Officer, Chief Executive Officer, Company Secretary or Manager, in the Financial Year 2016-17: There has been no increase in the remuneration of the Director, Chief Financial Officer, Chief Executive Officer and Company Secretary during the Financial Year 2016-17, except increase in remuneration (@ 10%) of Mr. Manoj Kumar, Wholetime Director w.e.f. 10 February 2017.
3) The percentage increase in the median remuneration of employees in the Financial Year: 10.02%
4) The number of permanent employees on the rolls of the Company as on 31 March 2017:1178.
5) Average percentile increase already made in the salaries of employees other than the managerial personnel in the last Financial Year and its comparison with the percentile increase in the managerial remuneration and justification thereof and point out if there are any exceptional circumstances for increase in the managerial remuneration:
Average percentile increase in salary of the Company’s employees for the Financial Year 2016-17 was 10.02%.
6) Remuneration is as per the Nomination and Remuneration Policy of the Company.
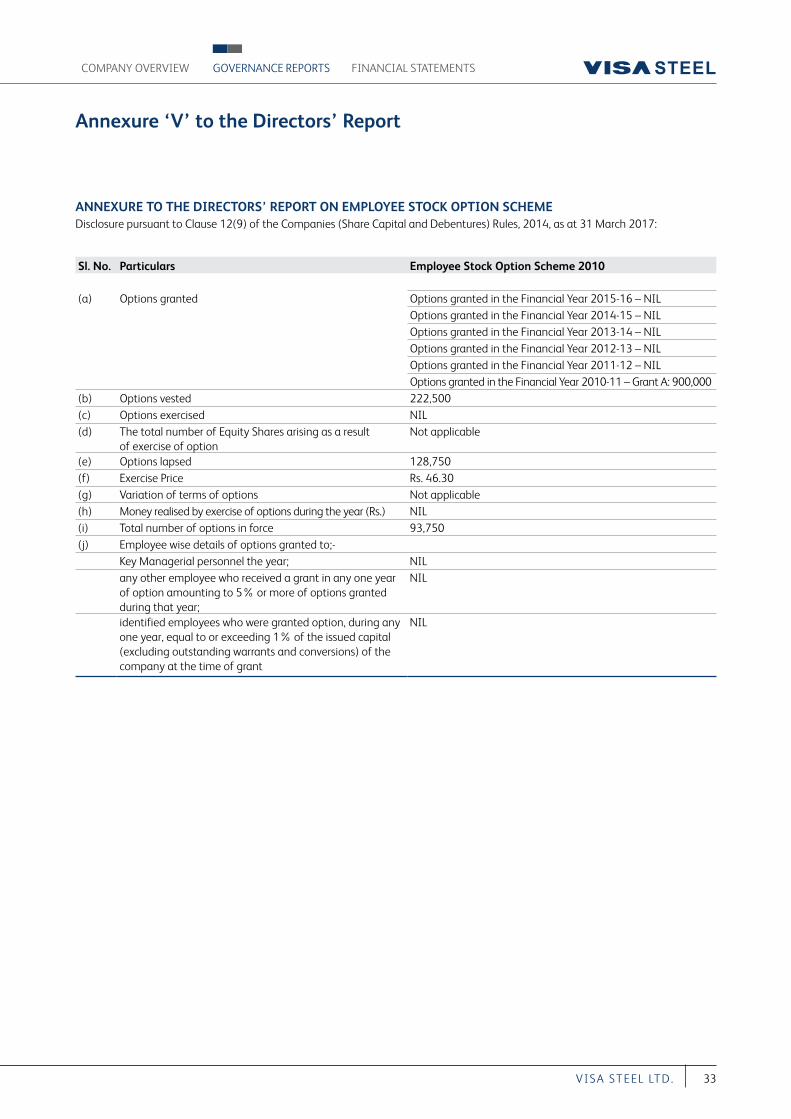
FINANCIAL STATEMENTSCOMPANY OVERVIEW GOVERNANCE REPORTS
33VI S A S T EEL LT D.
Annexure ‘V’ to the Directors’ Report
ANNEXURE TO THE DIRECTORS’ REPORT ON EMPLOYEE STOCK OPTION SCHEMEDisclosure pursuant to Clause 12(9) of the Companies (Share Capital and Debentures) Rules, 2014, as at 31 March 2017:
Sl. No. Particulars Empl oyee Stock Option Scheme 2010
(a) Options granted Options granted in the Financial Year 2015-16 – NILOptions granted in the Financial Year 2014-15 – NILOptions granted in the Financial Year 2013-14 – NILOptions granted in the Financial Year 2012-13 – NILOptions granted in the Financial Year 2011-12 – NILOptions granted in the Financial Year 2010-11 – Grant A: 900,000
(b) Options vested 222,500(c) Options exercised NIL(d) The total number of Equity Shares arising as a result
of exercise of optionNot applicable
(e) Options lapsed 128,750(f) Exercise Price Rs. 46.30(g) Variation of terms of options Not applicable (h) Money realised by exercise of options during the year (Rs.) NIL(i) Total number of options in force 93,750(j) Employee wise details of options granted to;-
Key Managerial personnel the year; NILany other employee who received a grant in any one year of option amounting to 5% or more of options granted during that year;
NIL
identified employees who were granted option, during any one year, equal to or exceeding 1% of the issued capital (excluding outstanding warrants and conversions) of the company at the time of grant
NIL
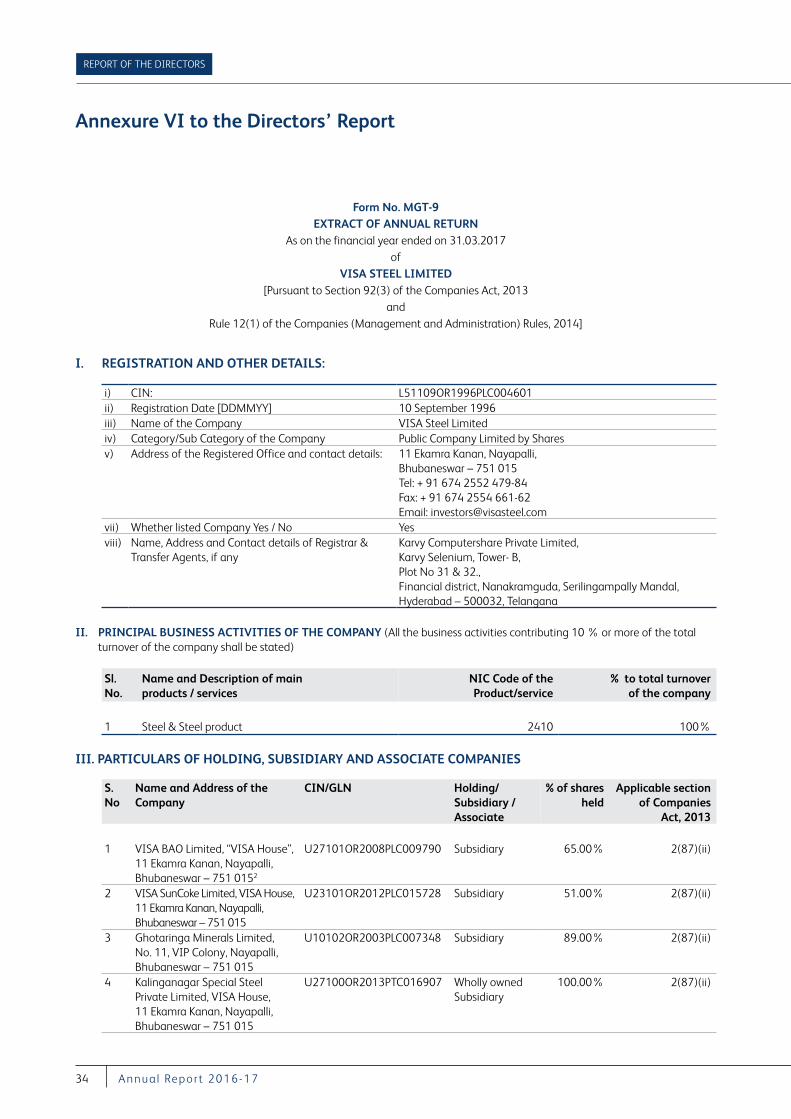
REPORT OF THE DIRECTORS
34 A nnu a l Repor t 2016-17
Annexure VI to the Directors’ Report
Form No. MGT-9EXTRACT OF ANNUAL RETURN
As on the financial year ended on 31.03.2017of
VISA STEEL LIMITED[Pursuant to Section 92(3) of the Companies Act, 2013
andRule 12(1) of the Companies (Management and Administration) Rules, 2014]
I. REGISTRATION AND OTHER DETAILS:
i) CIN: L51109OR1996PLC004601ii) Registration Date [DDMMYY] 10 September 1996iii) Name of the Company VISA Steel Limitediv) Category/Sub Category of the Company Public Company Limited by Sharesv) Address of the Registered Office and contact details: 11 Ekamra Kanan, Nayapalli,
Bhubaneswar – 751 015Tel: + 91 674 2552 479-84Fax: + 91 674 2554 661-62Email: [email protected]
vii) Whether listed Company Yes / No Yesviii) Name, Address and Contact details of Registrar &
Transfer Agents, if anyKarvy Computershare Private Limited, Karvy Selenium, Tower- B, Plot No 31 & 32.,Financial district, Nanakramguda, Serilingampally Mandal, Hyderabad – 500032, Telangana
II. PRINCIPAL BUSINESS ACTIVITIES OF THE COMPANY (All the business activities contributing 10 % or more of the total turnover of the company shall be stated)
Sl. No.
Name and Description of main products / services
NIC Code of the Product/service
% to total turnover of the company
1 Steel & Steel product 2410 100%
III. PARTICULARS OF HOLDING, SUBSIDIARY AND ASSOCIATE COMPANIES
S. No
Name and Address of the Company
CIN/GLN Holding/ Subsidiary / Associate
% of shares held
Applicable section of Companies
Act, 2013
1 VISA BAO Limited, “VISA House”, 11 Ekamra Kanan, Nayapalli, Bhubaneswar – 751 0152
U27101OR2008PLC009790 Subsidiary 65.00% 2(87)(ii)
2 VISA SunCoke Limited, VISA House, 11 Ekamra Kanan, Nayapalli, Bhubaneswar – 751 015
U23101OR2012PLC015728 Subsidiary 51.00% 2(87)(ii)
3 Ghotaringa Minerals Limited, No. 11, VIP Colony, Nayapalli, Bhubaneswar – 751 015
U10102OR2003PLC007348 Subsidiary 89.00% 2(87)(ii)
4 Kalinganagar Special Steel Private Limited, VISA House, 11 Ekamra Kanan, Nayapalli, Bhubaneswar – 751 015
U27100OR2013PTC016907 Wholly owned Subsidiary
100.00% 2(87)(ii)
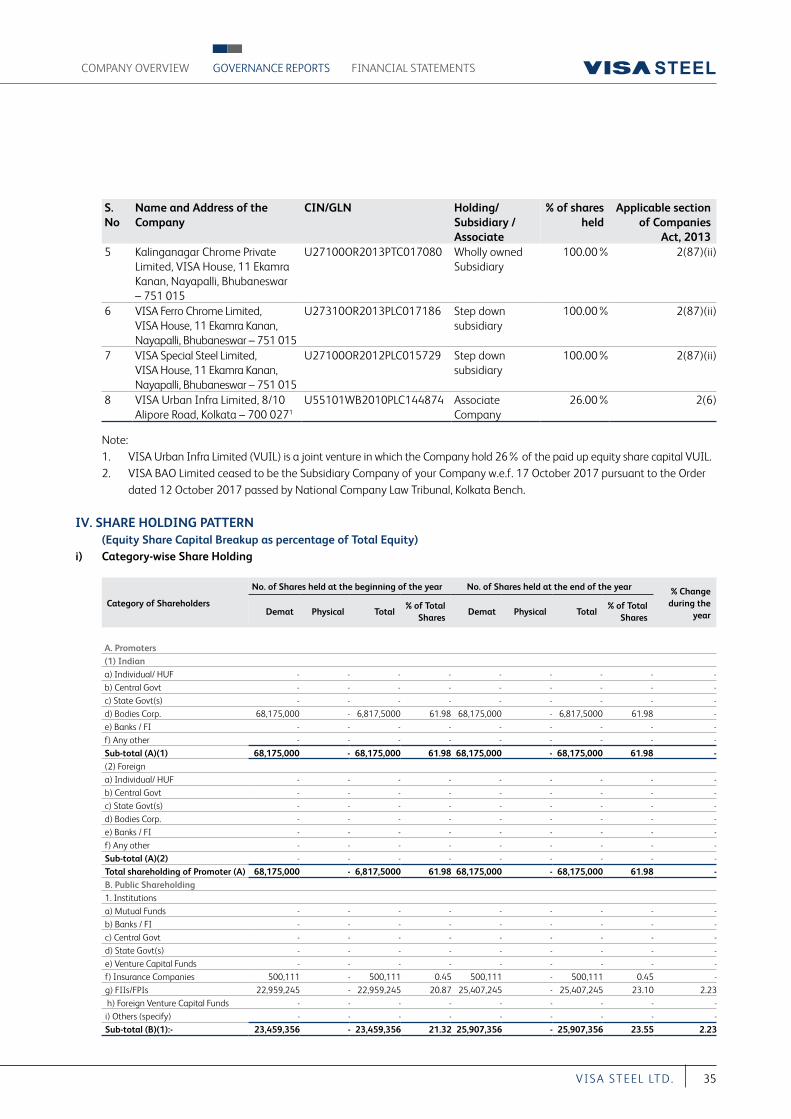
FINANCIAL STATEMENTSCOMPANY OVERVIEW GOVERNANCE REPORTS
35VI S A S T EEL LT D.
S. No
Name and Address of the Company
CIN/GLN Holding/ Subsidiary / Associate
% of shares held
Applicable section of Companies
Act, 20135 Kalinganagar Chrome Private
Limited, VISA House, 11 Ekamra Kanan, Nayapalli, Bhubaneswar – 751 015
U27100OR2013PTC017080 Wholly owned Subsidiary
100.00% 2(87)(ii)
6 VISA Ferro Chrome Limited, VISA House, 11 Ekamra Kanan, Nayapalli, Bhubaneswar – 751 015
U27310OR2013PLC017186 Step down subsidiary
100.00% 2(87)(ii)
7 VISA Special Steel Limited, VISA House, 11 Ekamra Kanan, Nayapalli, Bhubaneswar – 751 015
U27100OR2012PLC015729 Step down subsidiary
100.00% 2(87)(ii)
8 VISA Urban Infra Limited, 8/10 Alipore Road, Kolkata – 700 0271
U55101WB2010PLC144874 Associate Company
26.00% 2(6)
Note: 1. VISA Urban Infra Limited (VUIL) is a joint venture in which the Company hold 26% of the paid up equity share capital VUIL. 2. VISA BAO Limited ceased to be the Subsidiary Company of your Company w.e.f. 17 October 2017 pursuant to the Order
dated 12 October 2017 passed by National Company Law Tribunal, Kolkata Bench.
IV. SHARE HOLDING PATTERN (Equity Share Capital Breakup as percentage of Total Equity)i) Category-wise Share Holding
Category of Shareholders
No. of Shares held at the beginning of the year No. of Shares held at the end of the year % Change during the
year Demat Physical Total% of Total
SharesDemat Physical Total
% of Total Shares
A. Promoters (1) Indiana) Individual/ HUF - - - - - - - - -b) Central Govt - - - - - - - - -c) State Govt(s) - - - - - - - - -d) Bodies Corp. 68,175,000 - 6,817,5000 61.98 68,175,000 - 6,817,5000 61.98 -e) Banks / FI - - - - - - - - -f) Any other - - - - - - - - -Sub-total (A)(1) 68,175,000 - 68,175,000 61.98 68,175,000 - 68,175,000 61.98 -(2) Foreigna) Individual/ HUF - - - - - - - - -b) Central Govt - - - - - - - - -c) State Govt(s) - - - - - - - - -d) Bodies Corp. - - - - - - - - -e) Banks / FI - - - - - - - - -f) Any other - - - - - - - - -Sub-total (A)(2) - - - - - - - - -Total shareholding of Promoter (A) 68,175,000 - 6,817,5000 61.98 68,175,000 - 68,175,000 61.98 -B. Public Shareholding1. Institutionsa) Mutual Funds - - - - - - - - -b) Banks / FI - - - - - - - - -c) Central Govt - - - - - - - - -d) State Govt(s) - - - - - - - - -e) Venture Capital Funds - - - - - - - - -f) Insurance Companies 500,111 - 500,111 0.45 500,111 - 500,111 0.45 -g) FIIs/FPIs 22,959,245 - 22,959,245 20.87 25,407,245 - 25,407,245 23.10 2.23 h) Foreign Venture Capital Funds - - - - - - - - -i) Others (specify) - - - - - - - - -Sub-total (B)(1):- 23,459,356 - 23,459,356 21.32 25,907,356 - 25,907,356 23.55 2.23
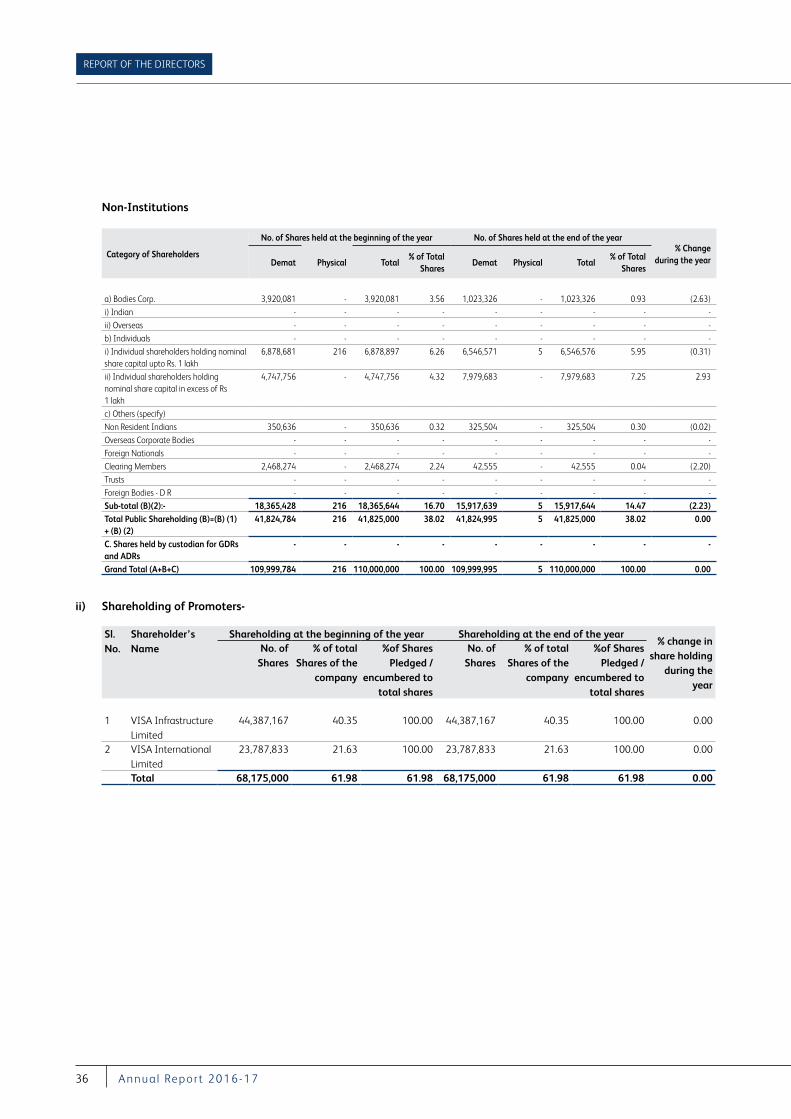
REPORT OF THE DIRECTORS
36 A nnu a l Repor t 2016-17
Non-Institutions
Category of Shareholders
No. of Shares held at the beginning of the year No. of Shares held at the end of the year% Change
during the year Demat Physical Total% of Total
SharesDemat Physical Total
% of Total Shares
a) Bodies Corp. 3,920,081 - 3,920,081 3.56 1,023,326 - 1,023,326 0.93 (2.63)i) Indian - - - - - - - - -ii) Overseas - - - - - - - - -b) Individuals - - - - - - - - -i) Individual shareholders holding nominal share capital upto Rs. 1 lakh
6,878,681 216 6,878,897 6.26 6,546,571 5 6,546,576 5.95 (0.31)
ii) Individual shareholders holding nominal share capital in excess of Rs 1 lakh
4,747,756 - 4,747,756 4.32 7,979,683 - 7,979,683 7.25 2.93
c) Others (specify)Non Resident Indians 350,636 - 350,636 0.32 325,504 - 325,504 0.30 (0.02)Overseas Corporate Bodies - - - - - - - - -Foreign Nationals - - - - - - - - -Clearing Members 2,468,274 - 2,468,274 2.24 42,555 - 42,555 0.04 (2.20)Trusts - - - - - - - - -Foreign Bodies - D R - - - - - - - - -Sub-total (B)(2):- 18,365,428 216 18,365,644 16.70 15,917,639 5 15,917,644 14.47 (2.23)Total Public Shareholding (B)=(B) (1) + (B) (2)
41,824,784 216 41,825,000 38.02 41,824,995 5 41,825,000 38.02 0.00
C. Shares held by custodian for GDRs and ADRs
- - - - - - - - -
Grand Total (A+B+C) 109,999,784 216 110,000,000 100.00 109,999,995 5 110,000,000 100.00 0.00
ii) Shareholding of Promoters-
Sl. No.
Shareholder’s Name
Shareholding at the beginning of the year Shareholding at the end of the year% change in
share holding during the
year
No. of Shares
% of total Shares of the
company
%of Shares Pledged /
encumbered to total shares
No. of Shares
% of total Shares of the
company
%of Shares Pledged /
encumbered to total shares
1 VISA Infrastructure Limited
44,387,167 40.35 100.00 44,387,167 40.35 100.00 0.00
2 VISA International Limited
23,787,833 21.63 100.00 23,787,833 21.63 100.00 0.00
Total 68,175,000 61.98 61.98 68,175,000 61.98 61.98 0.00
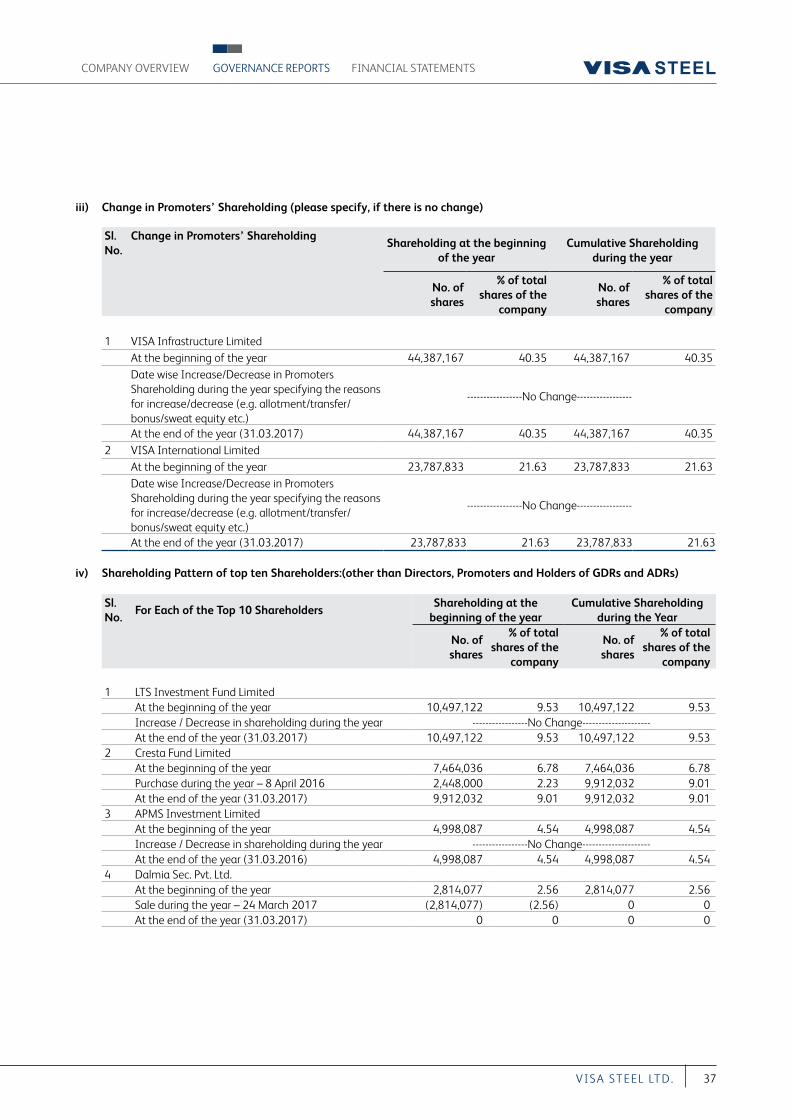
FINANCIAL STATEMENTSCOMPANY OVERVIEW GOVERNANCE REPORTS
37VI S A S T EEL LT D.
iii) Change in Promoters’ Shareholding (please specify, if there is no change)
Sl. No.
Change in Promoters’ ShareholdingShareholding at the beginning
of the yearCumulative Shareholding
during the year
No. of shares
% of totalshares of the
company
No. of shares
% of totalshares of the
company
1 VISA Infrastructure LimitedAt the beginning of the year 44,387,167 40.35 44,387,167 40.35Date wise Increase/Decrease in Promoters Shareholding during the year specifying the reasons for increase/decrease (e.g. allotment/transfer/bonus/sweat equity etc.)
-----------------No Change-----------------
At the end of the year (31.03.2017) 44,387,167 40.35 44,387,167 40.352 VISA International Limited
At the beginning of the year 23,787,833 21.63 23,787,833 21.63Date wise Increase/Decrease in Promoters Shareholding during the year specifying the reasons for increase/decrease (e.g. allotment/transfer/bonus/sweat equity etc.)
-----------------No Change-----------------
At the end of the year (31.03.2017) 23,787,833 21.63 23,787,833 21.63
iv) Shareholding Pattern of top ten Shareholders:(other than Directors, Promoters and Holders of GDRs and ADRs)
Sl. No.
For Each of the Top 10 ShareholdersShareholding at the
beginning of the yearCumulative Shareholding
during the Year
No. of shares
% of totalshares of the
company
No. of shares
% of totalshares of the
company
1 LTS Investment Fund LimitedAt the beginning of the year 10,497,122 9.53 10,497,122 9.53Increase / Decrease in shareholding during the year -----------------No Change---------------------At the end of the year (31.03.2017) 10,497,122 9.53 10,497,122 9.53
2 Cresta Fund LimitedAt the beginning of the year 7,464,036 6.78 7,464,036 6.78Purchase during the year – 8 April 2016 2,448,000 2.23 9,912,032 9.01At the end of the year (31.03.2017) 9,912,032 9.01 9,912,032 9.01
3 APMS Investment LimitedAt the beginning of the year 4,998,087 4.54 4,998,087 4.54Increase / Decrease in shareholding during the year -----------------No Change--------------------- At the end of the year (31.03.2016) 4,998,087 4.54 4,998,087 4.54
4 Dalmia Sec. Pvt. Ltd.At the beginning of the year 2,814,077 2.56 2,814,077 2.56Sale during the year – 24 March 2017 (2,814,077) (2.56) 0 0At the end of the year (31.03.2017) 0 0 0 0
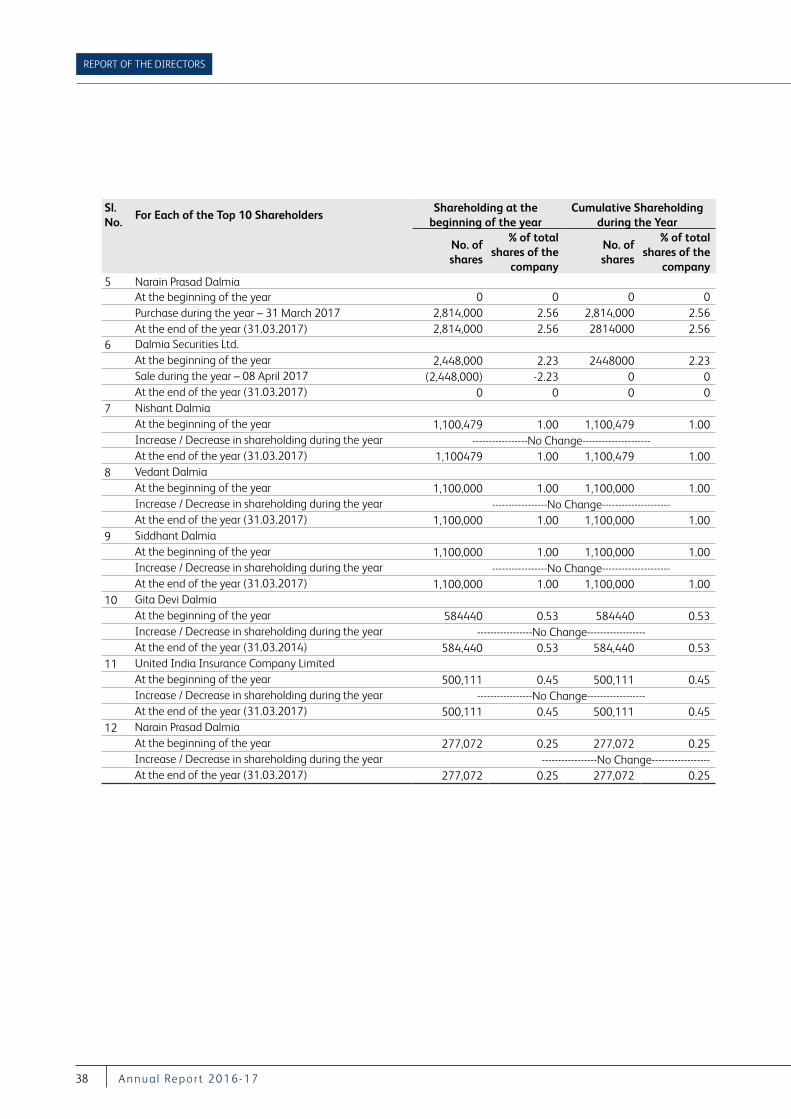
REPORT OF THE DIRECTORS
38 A nnu a l Repor t 2016-17
Sl. No.
For Each of the Top 10 ShareholdersShareholding at the
beginning of the yearCumulative Shareholding
during the Year
No. of shares
% of totalshares of the
company
No. of shares
% of totalshares of the
company5 Narain Prasad Dalmia
At the beginning of the year 0 0 0 0Purchase during the year – 31 March 2017 2,814,000 2.56 2,814,000 2.56At the end of the year (31.03.2017) 2,814,000 2.56 2814000 2.56
6 Dalmia Securities Ltd.At the beginning of the year 2,448,000 2.23 2448000 2.23Sale during the year – 08 April 2017 (2,448,000) -2.23 0 0At the end of the year (31.03.2017) 0 0 0 0
7 Nishant DalmiaAt the beginning of the year 1,100,479 1.00 1,100,479 1.00Increase / Decrease in shareholding during the year -----------------No Change---------------------At the end of the year (31.03.2017) 1,100479 1.00 1,100,479 1.00
8 Vedant DalmiaAt the beginning of the year 1,100,000 1.00 1,100,000 1.00Increase / Decrease in shareholding during the year -----------------No Change---------------------At the end of the year (31.03.2017) 1,100,000 1.00 1,100,000 1.00
9 Siddhant DalmiaAt the beginning of the year 1,100,000 1.00 1,100,000 1.00Increase / Decrease in shareholding during the year -----------------No Change---------------------At the end of the year (31.03.2017) 1,100,000 1.00 1,100,000 1.00
10 Gita Devi DalmiaAt the beginning of the year 584440 0.53 584440 0.53Increase / Decrease in shareholding during the year -----------------No Change------------------At the end of the year (31.03.2014) 584,440 0.53 584,440 0.53
11 United India Insurance Company LimitedAt the beginning of the year 500,111 0.45 500,111 0.45Increase / Decrease in shareholding during the year -----------------No Change------------------At the end of the year (31.03.2017) 500,111 0.45 500,111 0.45
12 Narain Prasad DalmiaAt the beginning of the year 277,072 0.25 277,072 0.25Increase / Decrease in shareholding during the year -----------------No Change------------------At the end of the year (31.03.2017) 277,072 0.25 277,072 0.25
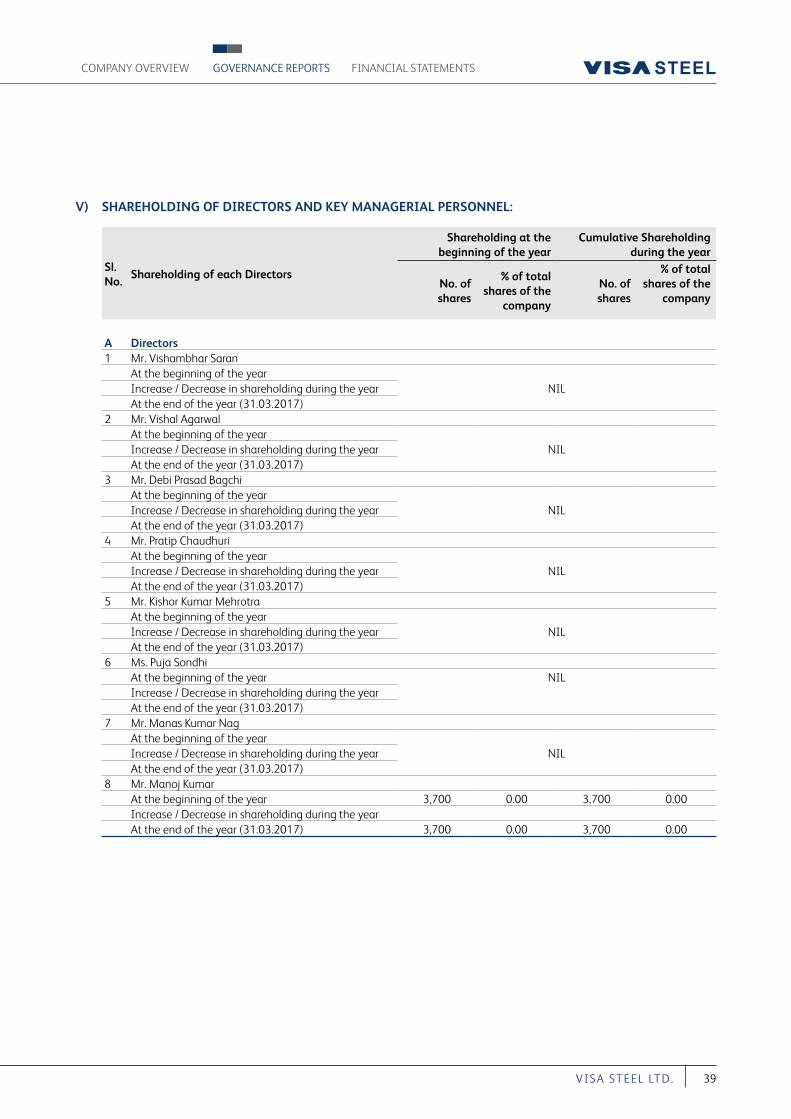
FINANCIAL STATEMENTSCOMPANY OVERVIEW GOVERNANCE REPORTS
39VI S A S T EEL LT D.
V) SHAREHOLDING OF DIRECTORS AND KEY MANAGERIAL PERSONNEL:
Sl. No.
Shareholding of each Directors
Shareholding at the beginning of the year
Cumulative Shareholding during the year
No. of shares
% of totalshares of the
company
No. of shares
% of totalshares of the
company
A Directors1 Mr. Vishambhar Saran
At the beginning of the yearNILIncrease / Decrease in shareholding during the year
At the end of the year (31.03.2017)2 Mr. Vishal Agarwal
At the beginning of the yearNILIncrease / Decrease in shareholding during the year
At the end of the year (31.03.2017)3 Mr. Debi Prasad Bagchi
At the beginning of the yearNILIncrease / Decrease in shareholding during the year
At the end of the year (31.03.2017)4 Mr. Pratip Chaudhuri
At the beginning of the yearNILIncrease / Decrease in shareholding during the year
At the end of the year (31.03.2017)5 Mr. Kishor Kumar Mehrotra
At the beginning of the yearNILIncrease / Decrease in shareholding during the year
At the end of the year (31.03.2017)6 Ms. Puja Sondhi
At the beginning of the year NILIncrease / Decrease in shareholding during the yearAt the end of the year (31.03.2017)
7 Mr. Manas Kumar NagAt the beginning of the year
NILIncrease / Decrease in shareholding during the yearAt the end of the year (31.03.2017)
8 Mr. Manoj KumarAt the beginning of the year 3,700 0.00 3,700 0.00Increase / Decrease in shareholding during the yearAt the end of the year (31.03.2017) 3,700 0.00 3,700 0.00
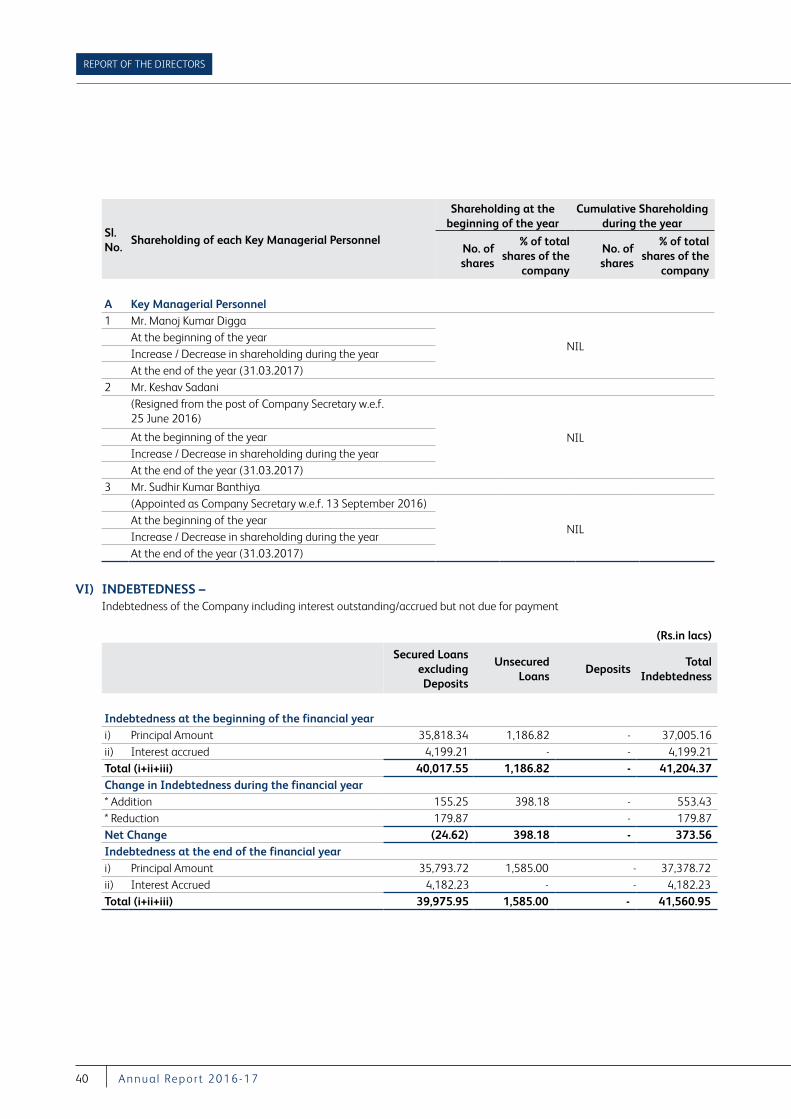
REPORT OF THE DIRECTORS
40 A nnu a l Repor t 2016-17
Sl. No.
Shareholding of each Key Managerial Personnel
Shareholding at the beginning of the year
Cumulative Shareholding during the year
No. of shares
% of totalshares of the
company
No. of shares
% of totalshares of the
company
A Key Managerial Personnel1 Mr. Manoj Kumar Digga
NILAt the beginning of the yearIncrease / Decrease in shareholding during the yearAt the end of the year (31.03.2017)
2 Mr. Keshav Sadani(Resigned from the post of Company Secretary w.e.f. 25 June 2016)
NILAt the beginning of the yearIncrease / Decrease in shareholding during the yearAt the end of the year (31.03.2017)
3 Mr. Sudhir Kumar Banthiya(Appointed as Company Secretary w.e.f. 13 September 2016)
NILAt the beginning of the yearIncrease / Decrease in shareholding during the yearAt the end of the year (31.03.2017)
VI) INDEBTEDNESS – Indebtedness of the Company including interest outstanding/accrued but not due for payment
(Rs.in lacs)
Secured Loans
excluding Deposits
Unsecured Loans
DepositsTotal
Indebtedness
Indebtedness at the beginning of the financial yeari) Principal Amount 35,818.34 1,186.82 - 37,005.16 ii) Interest accrued 4,199.21 - - 4,199.21 Total (i+ii+iii) 40,017.55 1,186.82 - 41,204.37 Change in Indebtedness during the financial year* Addition 155.25 398.18 - 553.43 * Reduction 179.87 - 179.87 Net Change (24.62) 398.18 - 373.56 Indebtedness at the end of the financial yeari) Principal Amount 35,793.72 1,585.00 - 37,378.72 ii) Interest Accrued 4,182.23 - - 4,182.23 Total (i+ii+iii) 39,975.95 1,585.00 - 41,560.95
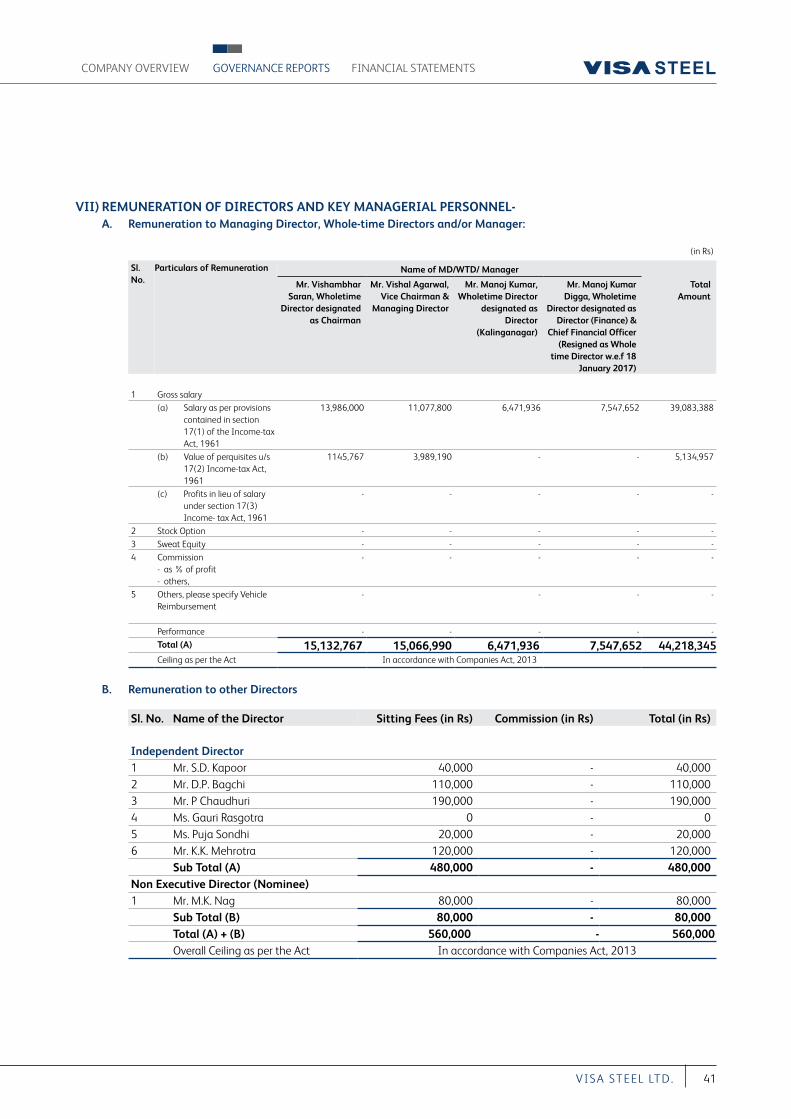
FINANCIAL STATEMENTSCOMPANY OVERVIEW GOVERNANCE REPORTS
41VI S A S T EEL LT D.
VII) REMUNERATION OF DIRECTORS AND KEY MANAGERIAL PERSONNEL- A. Remuneration to Managing Director, Whole-time Directors and/or Manager:
(in Rs)
Sl. No.
Particulars of Remuneration Name of MD/WTD/ Manager
Mr. Vishambhar Saran, Wholetime
Director designated as Chairman
Mr. Vishal Agarwal, Vice Chairman &
Managing Director
Mr. Manoj Kumar, Wholetime Director
designated as Director
(Kalinganagar)
Mr. Manoj Kumar Digga, Wholetime
Director designated as Director (Finance) &
Chief Financial Officer (Resigned as Whole
time Director w.e.f 18 January 2017)
Total Amount
1 Gross salary(a) Salary as per provisions
contained in section 17(1) of the Income-tax Act, 1961
13,986,000 11,077,800 6,471,936 7,547,652 39,083,388
(b) Value of perquisites u/s 17(2) Income-tax Act, 1961
1145,767 3,989,190 - - 5,134,957
(c) Profits in lieu of salary under section 17(3) Income- tax Act, 1961
- - - - -
2 Stock Option - - - - -3 Sweat Equity - - - - -4 Commission
- as % of profit- others,
- - - - -
5 Others, please specify Vehicle Reimbursement
- - - -
Performance - - - - -Total (A) 15,132,767 15,066,990 6,471,936 7,547,652 44,218,345Ceiling as per the Act In accordance with Companies Act, 2013
B. Remuneration to other Directors
Sl. No. Name of the Director Sitting Fees (in Rs) Commission (in Rs) Total (in Rs)
Independent Director1 Mr. S.D. Kapoor 40,000 - 40,0002 Mr. D.P. Bagchi 110,000 - 110,0003 Mr. P Chaudhuri 190,000 - 190,0004 Ms. Gauri Rasgotra 0 - 05 Ms. Puja Sondhi 20,000 - 20,0006 Mr. K.K. Mehrotra 120,000 - 120,000
Sub Total (A) 480,000 - 480,000Non Executive Director (Nominee)1 Mr. M.K. Nag 80,000 - 80,000
Sub Total (B) 80,000 - 80,000Total (A) + (B) 560,000 - 560,000Overall Ceiling as per the Act In accordance with Companies Act, 2013
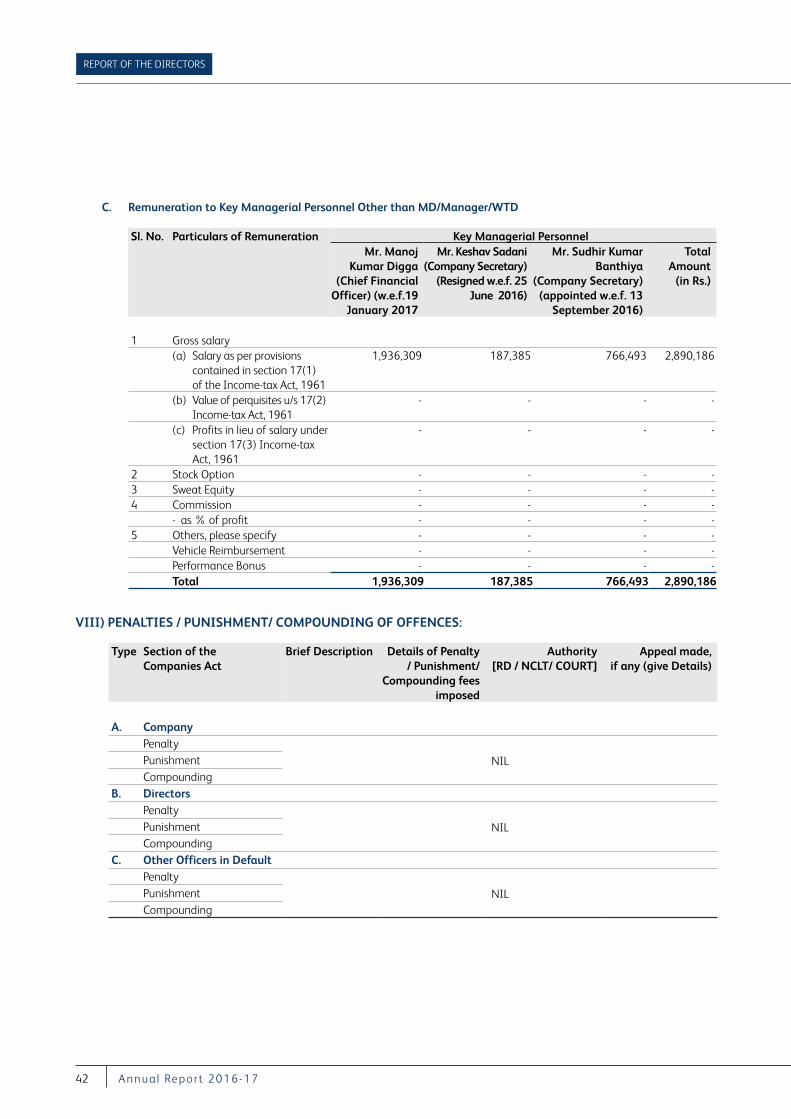
REPORT OF THE DIRECTORS
42 A nnu a l Repor t 2016-17
C. Remuneration to Key Managerial Personnel Other than MD/Manager/WTD
Sl. No. Particulars of Remuneration Key Managerial PersonnelMr. Manoj
Kumar Digga (Chief Financial
Officer) (w.e.f.19 January 2017
Mr. Keshav Sadani (Company Secretary)
(Resigned w.e.f. 25 June 2016)
Mr. Sudhir Kumar Banthiya
(Company Secretary) (appointed w.e.f. 13
September 2016)
Total Amount
(in Rs.)
1 Gross salary(a) Salary as per provisions
contained in section 17(1) of the Income-tax Act, 1961
1,936,309 187,385 766,493 2,890,186
(b) Value of perquisites u/s 17(2) Income-tax Act, 1961
- - - -
(c) Profits in lieu of salary under section 17(3) Income-tax Act, 1961
- - - -
2 Stock Option - - - -3 Sweat Equity - - - -4 Commission - - - -
- as % of profit - - - -5 Others, please specify - - - -
Vehicle Reimbursement - - - -Performance Bonus - - - -Total 1,936,309 187,385 766,493 2,890,186
VIII) PENALTIES / PUNISHMENT/ COMPOUNDING OF OFFENCES:
Type Section of the Companies Act
Brief Description Details of Penalty / Punishment/
Compounding fees imposed
Authority[RD / NCLT/ COURT]
Appeal made,if any (give Details)
A. CompanyPenalty
NILPunishmentCompounding
B. DirectorsPenalty
NILPunishmentCompounding
C. Other Officers in DefaultPenalty
NILPunishmentCompounding
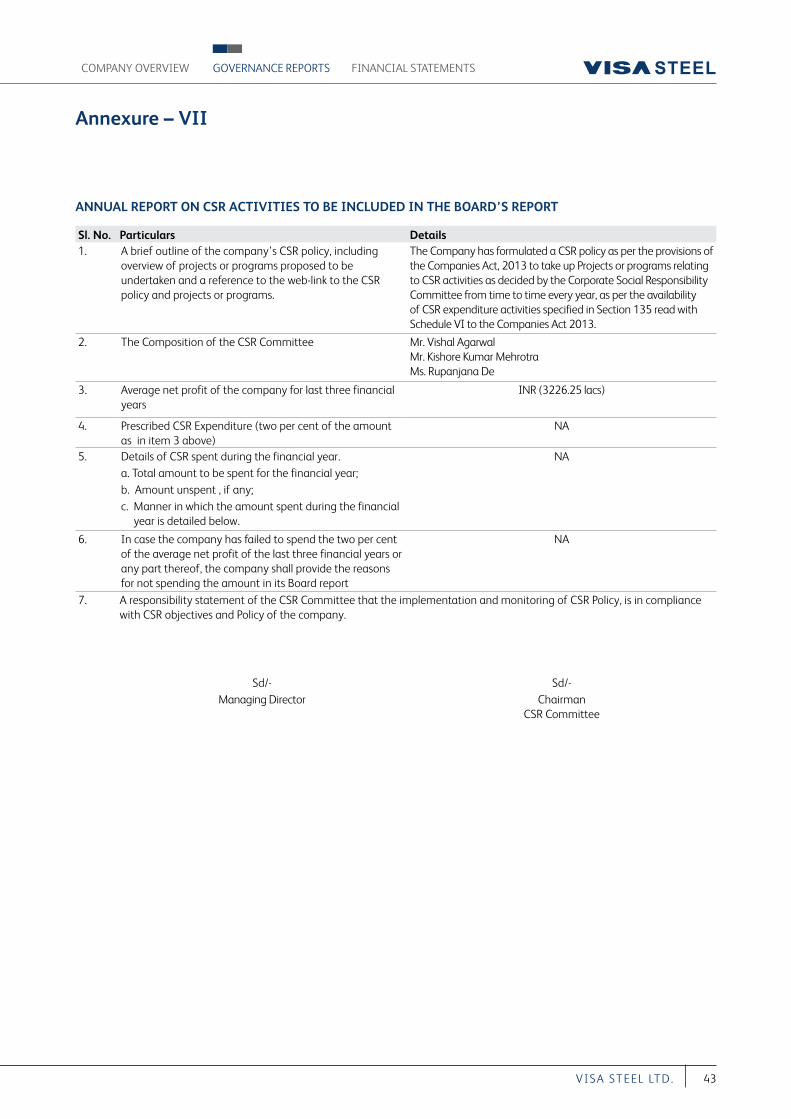
FINANCIAL STATEMENTSCOMPANY OVERVIEW GOVERNANCE REPORTS
43VI S A S T EEL LT D.
Annexure – VII
ANNUAL REPORT ON CSR ACTIVITIES TO BE INCLUDED IN THE BOARD’S REPORT
Sl. No. Particulars Details1. A brief outline of the company’s CSR policy, including
overview of projects or programs proposed to be undertaken and a reference to the web-link to the CSR policy and projects or programs.
The Company has formulated a CSR policy as per the provisions of the Companies Act, 2013 to take up Projects or programs relating to CSR activities as decided by the Corporate Social Responsibility Committee from time to time every year, as per the availability of CSR expenditure activities specified in Section 135 read with Schedule VI to the Companies Act 2013.
2. The Composition of the CSR Committee Mr. Vishal AgarwalMr. Kishore Kumar MehrotraMs. Rupanjana De
3. Average net profit of the company for last three financial years
INR (3226.25 lacs)
4. Prescribed CSR Expenditure (two per cent of the amount as in item 3 above)
NA
5. Details of CSR spent during the financial year. NAa. Total amount to be spent for the financial year;b. Amount unspent , if any;c. Manner in which the amount spent during the financial
year is detailed below.
6. In case the company has failed to spend the two per cent of the average net profit of the last three financial years or any part thereof, the company shall provide the reasons for not spending the amount in its Board report
NA
7. A responsibility statement of the CSR Committee that the implementation and monitoring of CSR Policy, is in compliance with CSR objectives and Policy of the company.
Sd/- Sd/-Managing Director Chairman
CSR Committee
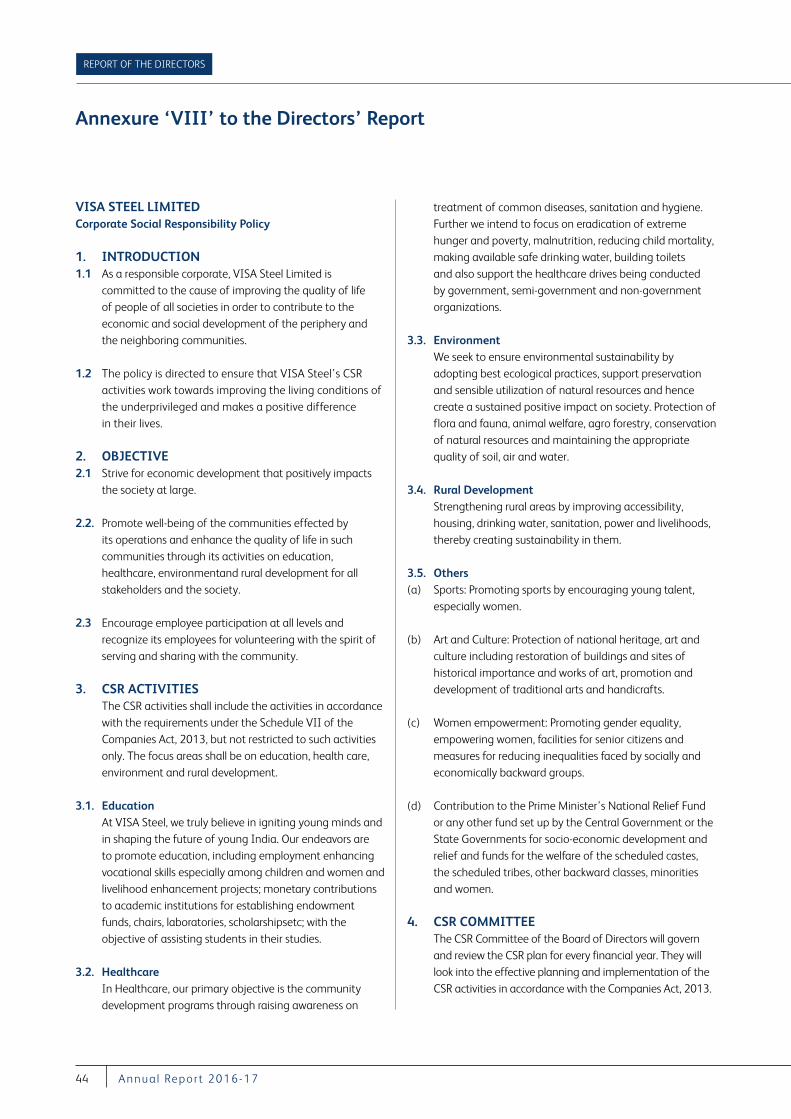
REPORT OF THE DIRECTORS
44 A nnu a l Repor t 2016-17
Annexure ‘VIII’ to the Directors’ Report
VISA STEEL LIMITEDCorporate Social Responsibility Policy
1. INTRODUCTION 1.1 As a responsible corporate, VISA Steel Limited is
committed to the cause of improving the quality of life of people of all societies in order to contribute to the economic and social development of the periphery and the neighboring communities.
1.2 The policy is directed to ensure that VISA Steel’s CSR activities work towards improving the living conditions of the underprivileged and makes a positive difference in their lives.
2. OBJECTIVE2.1 Strive for economic development that positively impacts
the society at large.
2.2. Promote well-being of the communities effected by its operations and enhance the quality of life in such communities through its activities on education, healthcare, environmentand rural development for all stakeholders and the society.
2.3 Encourage employee participation at all levels and recognize its employees for volunteering with the spirit of serving and sharing with the community.
3. CSR ACTIVITIES The CSR activities shall include the activities in accordance
with the requirements under the Schedule VII of the Companies Act, 2013, but not restricted to such activities only. The focus areas shall be on education, health care, environment and rural development.
3.1. Education At VISA Steel, we truly believe in igniting young minds and
in shaping the future of young India. Our endeavors are to promote education, including employment enhancing vocational skills especially among children and women and livelihood enhancement projects; monetary contributions to academic institutions for establishing endowment funds, chairs, laboratories, scholarshipsetc; with the objective of assisting students in their studies.
3.2. Healthcare In Healthcare, our primary objective is the community
development programs through raising awareness on
treatment of common diseases, sanitation and hygiene. Further we intend to focus on eradication of extreme hunger and poverty, malnutrition, reducing child mortality, making available safe drinking water, building toilets and also support the healthcare drives being conducted by government, semi-government and non-government organizations.
3.3. Environment We seek to ensure environmental sustainability by
adopting best ecological practices, support preservation and sensible utilization of natural resources and hence create a sustained positive impact on society. Protection of flora and fauna, animal welfare, agro forestry, conservation of natural resources and maintaining the appropriate quality of soil, air and water.
3.4. Rural Development Strengthening rural areas by improving accessibility,
housing, drinking water, sanitation, power and livelihoods, thereby creating sustainability in them.
3.5. Others(a) Sports: Promoting sports by encouraging young talent,
especially women.
(b) Art and Culture: Protection of national heritage, art and culture including restoration of buildings and sites of historical importance and works of art, promotion and development of traditional arts and handicrafts.
(c) Women empowerment: Promoting gender equality, empowering women, facilities for senior citizens and measures for reducing inequalities faced by socially and economically backward groups.
(d) Contribution to the Prime Minister’s National Relief Fund or any other fund set up by the Central Government or the State Governments for socio-economic development and relief and funds for the welfare of the scheduled castes, the scheduled tribes, other backward classes, minorities and women.
4. CSR COMMITTEE The CSR Committee of the Board of Directors will govern
and review the CSR plan for every financial year. They will look into the effective planning and implementation of the CSR activities in accordance with the Companies Act, 2013.
FINANCIAL STATEMENTSCOMPANY OVERVIEW GOVERNANCE REPORTS
45VI S A S T EEL LT D.
The composition of the CSR Committee of the Board shall be as follows:
(a). Mr. Vishal Agarwal - Chairman (b). Mr. Kishore Kumar Mehortra - Member (c). Ms. Rupanjana De - Member
The responsibility of the CSR Committee shall include: (a) Formulate and recommend to the Board of Directors,
the CSR Policy and indicating activities to be undertaken.
(b) Recommend the amount of expenditure for the CSR activities; and
(c) Monitor the CSR activities from time to time.
The responsibility of the Board of Directors of the Company shall include:
(a) Approve the CSR policy of the Company and disclose contents of the policy in its report and also place it on the Company’s website, as prescribed
(b) Ensure that the activities included in the CSR Policy of the Company are undertaken by the Company
The Company’s CSR Executive Committee chaired by Ms. Bhawna Agarwal, President(CSR & Corporate Communication) and comprising of Senior Management Team shall periodically review the activities and monitor achievements against targets as per annual CSR Plan.
The Company’s CSR Working Committee shall work under the guidance of the CSR Executive Committee and ensure implementation of the CSR activities and maintain ground level connectivity with the local communities.
CSR BUDGET4.1 An annual CSR budget as per the Companies Act, 2013
will be allocated by the CSR Committee for CSR activities. The Company shall allocate budget and spend in every Financial Year atleast 2% of the average net profit of the Company made during the three immediate preceding financial years, calculated in accordance with the relevant Sections of the Companies Act, 2013 read with Companies (Corporate Social Responsibility Policy) Rules, 2014.
4.2 The Company shall give preference to the local area and areas around it where it operates, for spending the amount earmarked for CSR activities.
4.3 If the Company fails to spend the allocated fund; the Board shall, in its report, specify the reasons for not spending the amount.
4.4 Any surplus arising out of the CSR Projects or Programs or activities shall not form part of the business profit of the Company.
5 CRITERIA FOR IDENTIFYING PROJECTS AND NGO’S
5.1 The Company attempts to identify the needs of communities, plan projects and facilitate their implementation to help in social economic development. Our activities are set with targets to promote the principles of inclusive growth and equitable development through which the members of society can participate and benefit from the growth.
5.2 While identifying the projects all efforts will be made to the extent possible to define the Project objectives, Implementation schedules with impact on society, results and its usefulness.
5.3 While identifying Projects the Company shall also identify the external agency (NGO) who would execute the said Project. These NGOs / Agencies must have a permanent office in India and should be registered society under Societies’ Registration Act / Public Trust Act/ not for profit Company under Section 8 of the Companies Act, 2013 (erstwhile Section 25 of the Companies Act, 1956) with valid Income-tax Exemption Certificate.
6 RESPONSIBILITY STATEMENT The CSR Committee will issue a responsibility statement
that the CSR activities are in compliance with CSR Policy of the Company duly signed by the Chairman of the CSR Committee. The Responsibility statement shall be included in the Annual Report of the Company.
Note: (a) The Policy comes into effect from 31 March 2015.
(b) This CSR policy document will be reviewed from time to time and any changes, if necessary, will be approved by the CSR Committee of the Board.
REPORT OF THE DIRECTORS
46 A nnu a l Repor t 2016-17
Annexure ‘IX’ to the Directors’ Report
Nomination and Remuneration Policy
1. PREAMBLE This Nomination and Remuneration Policy (“Policy”)
has been formulated inter-alia for nomination and remuneration of Directors, Key Managerial Personnel and Senior Management by the Nomination and Remuneration Committee and approved by the Board of Directors, in accordance with the requirements of the provisions of Section 178 of the Companies Act, 2013 and Securities and Exchange Board of India (Listing Obligations & Disclosure Requirements) Regulations, 2015, as amended.
2. DEFINITIONS AND INTERPRETATIONS2.1. Unless the context requires otherwise, capitalized terms
used in this Policy shall have the following meanings:
“Board” means the collective body of the Directors of the Company.
“The Committee” means the Nomination and Remuneration Committee of the Board of Directors of the Company as constituted or reconstituted from time to time in accordance with the applicable provisions of the Companies Act, 2013 and the Listing Regulations.
“The Company” means VISA Steel Limited.
“Director” means a Director of the Company.
“Independent Director” means a Director appointed in accordance with Section 149(6) of the Companies Act, 2013 and Listing Regulations.
“Key Managerial Personnel” or “KMP” means
(i) the Chief Executive Officer or the Managing Director or the Manager;
(ii) the Whole-time director; (iii) the Chief Financial Officer; (iv) the Company Secretary; and (v) the such other officer as may be prescribed.
“Listing Regulations” shall mean the Securities and Exchange Board of India (Listing Obligations & Disclosure Requirements) Regulations, 2015 (erstwhile Listing Agreement executed between the Company and the relevant Stock Exchange(s), as amended from time to time;
“Other Employees” means all the employees other than the Directors, KMPs and the Senior Management Personnel.
“Senior Management Personnel or Senior Management” means all personnel of the Company who are one level below the Board, viz., Executive Directors, Presidents, Senior Vice Presidents, Vice Presidents, Chief Financial Officer, Company Secretary, General Managers and all other executives having similar or equivalent rank in the Company in the Company including all Functional heads and any other person who the Board may include within the definition of senior management.
2.2. Unless the context otherwise requires, words and expressions used in this Policy and not defined herein but defined in the Companies Act, 2013 or the Rules made thereunder (as may be amended from time to time) or the Listing Regulations shall have the meaning respectively assigned to them in the Companies Act, 2013 the Rules made thereunder or the Listing Regulation, as the case may be.
3. OBJECTIVES OF THIS POLICY3.1. The key objective of this Policy of VISA Steel Limited
(“the Company”) is to provide a framework that allows for competitive and fair rewards for the achievement of key deliverables and also aligns with practice in the industry and shareholders’ expectations.
3.2. The objectives of this Policy include the following:
3.2.1. to lay down criteria for identifying persons who are qualified to become Directors and who may be appointed in Senior Management or KMP of the Company;
3.2.2. to lay down the terms and conditions in relation to the appointment of Directors, Senior Management Personnel or KMP and recommend to the Board the appointment and removal of Directors, Senior Management Personnel or KMP;
3.2.3. to lay down criteria to carry out evaluation of every Director’s performance;
3.2.4. to formulate criteria for determining qualification, positive attributes and Independence of a Director;
3.2.5. to determine the composition and level of remuneration, including reward linked with the performance, which is reasonable and sufficient to attract, retain and motivate Directors, KMP, Senior Management Personnel and other Employees to work towards the long term growth and success of the Company;
FINANCIAL STATEMENTSCOMPANY OVERVIEW GOVERNANCE REPORTS
47VI S A S T EEL LT D.
3.2.6. to devise a policy on the diversity of the Board; and
3.2.7. to assist the Board with developing a succession plan for the Board.
4. GENERAL4.1. This Policy shall be applicable to all Directors, KMP and
Senior Management Personnel of the Company.
5. MATTERS TO BE DEALT WITH, PERUSED AND RECOMMENDED TO THE BOARD BY THE NOMINATION AND REMUNERATION COMMITTEE
5.1. The Committee shall inter alia:5.1.1. identify persons who are qualified to become Director(s),
KMP and Senior Management Personnel of the Company;
5.1.2. recommend to the Board, appointment and removal of Director(s) of the Company and carry out evaluation of every Director’s performance;
5.1.3. formulate criteria for determining qualification, positive attributes and independence of Directors;
5.1.4. formulate a criteria for evaluation of Independent Director(s) and the Board;
5.1.5. make recommendations to the Board with respect to incentive compensation plans for Executive Director(s) and remuneration of Non-Executive Director(s);
5.1.6. review the annual performance of Executive and Non-Executive Director(s);
5.1.7. assist the Board in the establishment and implementation of an appropriate performance evaluation / self-assessment process for the Members of the Board and the Committees;
5.1.8. perform review and evaluation, of the performance of the Members of the Board and the Committee Members, at least annually;
5.1.9. periodically review the composition and duties of the Company’s Board Committees and recommend any changes in these committees to the Board;
5.1.10. devise a policy on Board diversity;
5.1.11. carry out any other responsibilities and duties delegated to it by the Board from time to time;
5.1.12. carry out additional functions and adopt additional policies and procedures as may be required or appropriate in light of changing business, legislative, regulatory, legal or other conditions.
5.2. QUALIFICATIONS5.2.1. Criteria for identifying persons who are qualified to be
appointed as Directors / KMP / Senior Management Personnel of the Company:
5.2.1.1. Directors Section 164 of the Companies Act, 2013 provides for
the disqualifications for appointment of any person to become Director of any Company. Any person who in the opinion of the Board is not disqualified to become a Director, and in the opinion of the Board, possesses the ability, integrity and relevant expertise and experience, can be appointed as Director of the Company.
5.2.1.2. Independent Directors For appointing any person as an Independent Director
he/she should possess qualifications as mentioned in (A) the Companies Act, 2013 and the Rules made thereunder (including but not limited to Section 149 of the Companies Act, 2013 and Rule 5 of The Companies (Appointment and Qualification of Directors) Rules, 2014); and (B) the Listing Regulations.
5.2.1.3. Senior Management Personnel and KMP The Company shall have an Organogram displaying
positions of Senior Management and KMP with the minimum qualifications and experience requirements for each positions which commensurate with the size of its business and the nature and complexity of its operations.
6. POLICY FOR APPOINTMENT OF DIRECTOR, KMP, SENIOR MANAGEMENT AND OTHER EMPLOYEES, THEIR EVALUATION AND RETIREMENT & REMOVAL
6.1. Appointment criteria and qualifications6.1.1 The Committee shall identify and ascertain the integrity,
qualification, expertise and experience of the person for appointment as Director (including Independent Directors), KMP or at Senior Management and recommend to the Board his / her appointment.
REPORT OF THE DIRECTORS
48 A nnu a l Repor t 2016-17
6.1.2 Such person should possess adequate qualification, expertise and experience for the position he / she is considered for appointment. The Committee has discretion to decide whether qualification, expertise and experience possessed by a person are sufficient / satisfactory for the concerned position.
6.1.3 The Company shall not appoint or continue the employment of any person as Whole-time Director who has attained the age of seventy years. Provided that the term of the person holding this position may be extended beyond the age of seventy years with the approval of shareholders by passing a special resolution. The explanatory statement annexed to the notice convening the meeting for this purpose shall indicate the justification for extension of appointment beyond seventy years.
6.2. Term / Tenure:6.2.1. Managing Director/ Whole-time Director: The Company shall appoint or re-appoint any person as
its Executive Chairman, Managing Director or Executive Director for a term not exceeding five years at a time.
6.2.2. Independent Director:6.2.2.1. An Independent Director shall hold office for a maximum
term up to five consecutive years on the Board and will be eligible for re-appointment on passing of a special resolution by the Company and disclosure of such appointment in the Board’s report.
6.2.2.2. No Independent Director shall hold office for more than two consecutive terms of maximum five years each, but such Independent Director shall be eligible for appointment after expiry of three years of ceasing to become an Independent Director. Provided that an Independent Director shall not, during the said period of three years, be appointed in or be associated with the Company in any other capacity, either directly or indirectly. However, if a person who has already served as an Independent Director for 5 years or more in the Company as on 1st October, 2014 or such other date as may be determined by the Committee as per regulatory requirement, he / she shall be eligible for appointment for one more term of 5 years only.
6.2.3. At the time of appointment of Directors (including Independent Directors), it should be ensured that the persons proposed to be appointed as Directors (including
Independent Directors) do not hold Directorship exceeding the maximum number of directorships a person can hold as per applicable laws.
6.3. Evaluation: The Committee shall carry out evaluation of
performance of every Director, KMP and Senior Management Personnel at regular interval (yearly).
6.3.1. Evaluation of directors: In terms of Section 149 of the Companies Act, 2013
read with Schedule IV of the said Act, states that the Independent Directors shall at its separate meeting review performance of Non-Independent Directors and the Board as a whole and the performance evaluation of Independent Directors shall be done by the entire Board of Directors excluding the Director being evaluated.
6.3.2. Evaluation of KMP and Senior Management Personnel Criteria for evaluating performance of KMP and Senior
Management Personnel shall be as per the Company’s Policy.
6.4. Removal Subject to the provisions of applicable laws, the
Committee may recommend, to the Board, with reasons recorded in writing, removal of a Director, KMP and Senior Management Personnel.
6.5. Retirement The Director, KMP and Senior Management Personnel
shall retire as per the applicable provisions of the Companies Act, 2013 and the prevailing policy of the Company. The Board will have the discretion to retain the Director, KMP, Senior Management Personnel in the same position / remuneration or otherwise even after attaining the retirement age, for the benefit of the Company.
7. POLICY RELATING TO THE REMUNERATION FOR THE WHOLE-TIME DIRECTOR, KMP AND SENIOR MANAGEMENT PERSONNEL
7.1. This Policy aims to strike a balance between fixed and incentive pay reflecting short and long term performance objectives appropriate to the working of the Company.
7.2. The remuneration / compensation / commission etc. to the Whole-time Director/Managing Director, KMP and Senior Management Personnel will be determined by the Committee and recommended to the Board for approval
FINANCIAL STATEMENTSCOMPANY OVERVIEW GOVERNANCE REPORTS
49VI S A S T EEL LT D.
based on factors and parameters that the Committee considers relevant. While determining the remuneration / compensation / commission etc, the Committee shall ensure that:
7.2.1. the level and composition of remuneration is reasonable and sufficient to attract, retain and motivate directors of the quality required to run the company successfully; and
7.2.2. there exists a clear relationship between remuneration and performance and that such relationship meets appropriate performance benchmarks.
7.3. The remuneration / compensation / commission etc. shall be in accordance the provisions of applicable laws, including the Companies Act, 2013 and the Rules made thereunder.
7.4. The remuneration and commission to be paid to the Directors/ KMP/ Senior Management shall be in accordance with the percentage/ slabs/ conditions laid down in the Articles of Association of the Company (if any) and as per the provisions of the applicable laws.
7.5. Where any insurance is taken by the Company on behalf of its Whole-time Director/Managing Director, KMP and Senior Management Personnel for indemnifying them against any liability, the premium paid on such insurance shall not be treated as part of the remuneration payable to any such personnel. Provided that if such person is proved to be guilty, the premium paid on such insurance shall be treated as part of the remuneration.
7.6. Remuneration to Non- Executive / Independent Director:
7.6.1. Remuneration / Commission: The remuneration / commission shall be fixed as per
the slabs and conditions mentioned in the Articles of Association of the Company and the Companies Act, 2013 and the rules made thereunder.
7.6.2. Sitting Fees: The Non- Executive / Independent Director may receive
remuneration by way of fees for attending meetings of Board or Committee thereof, as may be decided by the Board. Provided that the amount of such fees shall not exceed limits prescribed by the Central Government from time to time.
7.6.3. Commission: Commission may be paid, whenever applicable, within
the monetary limit approved by shareholders, subject to the limit not exceeding 1% of the profits of the Company computed as per the applicable provisions of the Companies Act, 2013.
7.6.4. Stock Options: An Independent Director shall not be entitled to any
stock option of the Company.
8. DISCLOSURE OF INFORMATION Disclosures required under applicable laws regarding the
remuneration paid by the Company shall be made in the financial statements of the Company.
9. AMENDMENT Any change in this Policy shall, on recommendation of
the Committee, be approved by the Board of Directors of the Company. The Board of Directors shall have the right to withdraw and / or amend any part of this Policy or the entire Policy, at any time, as it deems fit, or from time to time, and the decision of the Board in this respect shall be final and binding.
10. IMPLEMENTATION AND REVIEW The Committee is responsible for the monitoring,
implementation and review of this Policy. The Committee shall provide recommendations to the Board as to how to effectively structure and facilitate a remuneration strategy, which will meet the needs of the Company. The Board shall review the (i) contents of and (ii) compliance with this Policy at regular interval.
MANAGEMENT DISCUSSION AND ANALYSIS
50 A nnu a l Repor t 2016-17
MANAGEMENT DISCUSSION AND ANALYSIS
OVERVIEWDuring the FY 2016-17, the financial and operational performance of your Company has improved in comparison to the previous year with the improvement in availability of raw material and imposition of anti-dumping duties. During FY 2016-17, your Company has registered standalone Revenue of Rs. 14,950.48 million and EBITDA of Rs. 443.59 million.
INDUSTRY STRUCTURE AND DEVELOPMENTSIndustry OverviewThe Steel industry globally continues to suffer from huge overcapacity in China, although some measures have been taken to close Induction Furnaces in China. However, Steel production in China remains at above 800 million TPA run rate which seems to be at its
peak and needs to reduce significantly going forward. There is also concern about slowdown in demand after the Chinese elections.
India has increased its Steel capacity to 126 million tonnes in FY 2016-17 with production of approx. 98 million tonne. India is poised to become the second largest Steel producer in the World with expected production of 105 million tonne in 2017-18 and 110 million tonne in 2018-19. The National Steel Policy of the Government of India announced in May 2017 aspires to achieve 300 million tonne of Steel making capacity by 2030 and seeks to increase consumption of Steel in major segments of infrastructure, automobiles, housing etc. It seeks to enhance domestic Steel consumption and ensure high quality Steel production and create a technologically advanced and globally competitive Steel industry.
FINANCIAL STATEMENTSCOMPANY OVERVIEW GOVERNANCE REPORTS
51VI S A S T EEL LT D.
India’s Ferro Chrome industry, with 1 million TPA production, contributes 9% of the 11 million tonnes global Ferro Chrome output. India exports ~50% of its annual Ferro Chrome output. Similarly, India’s 3 million TPA Chrome Ore production forms 9% of global Chrome Ore production. There is going to be a period of huge uncertainty in supply of Chrome Ore after 31 March 2020 when leases of all non-captive mines will expire.
Demand for Coke from Blast Furnaces was weak due to financial stress in the Steel Sector and cheap imports of Coke from China, inspite of the imposition of anti-dumping duty on Chinese Coke. The Australian Coking Coal prices have witnessed sharp increase and a lot of volatility thus making Coke manufacturing based on the domestic Coke prices unviable at times.
Company OverviewYour Company has established economically viable manufacturing assets for production of Special Steel, Ferro Alloys and Metallurgical Coke at Kalinganagar in Odisha.
BUSINESS REVIEW Your Company is engaged in the business of manufacturing of value added products including Pig Iron, Sponge Iron, Special Steel Bars & Wire Rods and Ferro Alloys.
During the year under review, your Company’s operational performances have improved due to improvement in availability of raw material and imposition of anti-dumping duties. Your Company plans to increase the production from Steel Melt Shop and Rolling Mill by putting thrust on Steel marketing. Your Company has strengthened its marketing team with presence in Ludhiana, Chennai, Bangalore and Rajkot and opened a stockyard in Faridabad for efficient distribution of Special Steel products and penetrating the North India market. The Government has also taken steps to provide remedial measures to protect the Indian Steel Sector from external threat of dumping and uniform trade.
Products(a) Ferro Alloys The production of Ferro Chrome increased to 99,596 MT
in FY 2016-17 from 85,836 MT in FY 2015-16. The main raw material for Ferro Chrome is Chrome Ore & Chrome Concentrates which is being sourced mainly from OMC & Misrilal Mines. Ferro Chrome produced by your Company is sold to various Special and Stainless Steel Plants in India and globally.
(b) Special Steel Production of Blast Furnace increased to 162,815 MT in
2016-17 from 121,521 MT in 2015-16. The production of Sponge Iron increased to 251,290 MT in 2016-17 from 224,934 MT in 2015-16.
The main raw material for Hot metal / Pig Iron is Iron Ore procured mainly from OMC and Metallurgical Coke procured mainly from VISA SunCoke Limited and for DRI/Sponge Iron Plant is Iron Ore procured mainly from OMC and Thermal Coal procured through imports from South Africa.
The Steel Melt Shop & Rolling Mill resumed operations in Q2 FY 2016-17 and the production of Steel was 53,206 MT in FY 2016-17 and is being gradually ramped up.
STRATEGIC INITIATIVESAmalgamation of VISA BAO LimitedThe Board of Directors & Lenders of VISA BAO Limited (VBL) and your Company has approved Scheme of Amalgamation of VBL with your Company.
Pursuant to the notification of the Ministry of Corporate Affairs, all matters related to amalgamation, merger, de-merger shall be dealt by the jurisdictional National Company Law Tribunal (NCLT). Your Company had filed an application before the National Company Law Tribunal, Kolkata Bench in March 2017 and the application was admitted by the Hon’ble NCLT in April 2017 and approved vide order dated 12 October 2017 passed by the Hon’ble NCLT. Subsequent to amalgamation, 5,789,500 equity shares of Rs. 10 each of the Company have been allotted to Baosteel Resources Co. Ltd, China (Baosteel). Baosteel now holds 5% of the equity shares in your Company.
Joint Venture with SunCoke The Coke Business and its associated steam generation units is being operated through Company’s subsidiary - VISA SunCoke Limited, a joint venture between VISA Steel Limited and SunCoke Energy, USA, in which your Company holds 51% stake and SunCoke Energy holds remaining 49% stake.
The Coke plant is equipped with highly advanced Chinese technology with Stamp Charging facility, along with waste heat recovery facility from flue gases, wherein the four waste heat recovery boilers produce steam for generating power.
MANAGEMENT DISCUSSION AND ANALYSIS
52 A nnu a l Repor t 2016-17
Production of Coke was 251,418 MT in FY 2016-17 from 294,258 MT in 2015-16 in VISA SunCoke Limited.
Coking Coal, the primary raw material for producing Coke, was imported from Australia. Coke was partly consumed in the Blast Furnace of your Company and partly sold in the market.
OPPORTUNITIES AND THREATSOpportunitiesIndia is the world’s third-largest producer of Crude Steel and is expected to move to the second position soon consequent to the government’s thrust on infrastructure creation and urban development. India’s per capita Steel consumption of 60 kg is one-fourth of the global average of 220 kg (China 500kg). India has favourable demographic factors, which will result in higher demand for Steel products.
The Government of India is giving a thrust to the manufacturing sector through the “Make in India” Campaign and your Company shall benefit from this opportunity.
ThreatsDue to global over capacity, mainly in China and the high production run rate of above 800 million tonnes, the Steel business environment remains extremely challenging. Due to low demand, non-availability of vital raw material at viable prices, shortage of working capital and delay in debt resolution of the Steel Companies, the Steel Sector in India remains under stress. There is going to be a period of huge uncertainty in supply of Iron Ore and Chrome Ore after 31 March 2020 when leases of all non-captive mines will expire.
The disruptive technologies including Electric Vehicles, Solar Energy, Battery Storage and Ride Hailing services are likely to increase average automobile asset utilisation rates and change consumer behaviour towards buying Cars thereby impacting automobile sales. The shift to Electric Vehicles from Internal Combustion Engine Vehicles will also impact the auto component industry. These factors shall impact demand for Steel products.
The long-term competitiveness of the Steel Industry in India will depend on the cost of doing business including regulatory costs, logistics costs for inbound and outbound transportation of raw material and finished goods, finance costs as also the availability of energy at competitive costs. We have seen significant increase in levies, duties and regulatory costs in the mining sector in India in the recent years and also high interest rates and infrastructural challenges especially in logistics. The port and rail infrastructure also needs to be upgraded. The majority of the ports, mines and railways have inadequate and
low capacity bulk handling facility. The congested road networks connecting Steel Plants to mines and ports lead to delays in supply and delivery of raw materials like Iron Ore, Chrome Ore and Coking Coal.
However, your Company is determined to face these challenges in the Steel Industry going forward by adjusting to the new rules of the game for the industry.
RISK MANAGEMENTThe volatility in the global economy and the increasingly complex interplay of factors influencing a more globally integrated Steel business makes Risk Management an inevitable exercise and to cater to the same, your Company has identified major focus areas for risk management to ensure organisational objectives are achieved and has a well-defined and dynamic structure and proactive approach to assess, monitor and mitigate risks associated with these areas, briefly enumerated below:
a) Operations – Timely and cost-effective raw material supply is critical to growth. Fluctuations in the price and availability of key raw materials, non-availability of working capital and commercial changes such as domestic duties / taxes on raw materials have an impact on the operations. Moreover, the stocks are also subject to the other foreseeable risks. Necessary coverage has been taken in the form of a comprehensive Industrial All Risk (IAR) policy which covers plant, machinery, buildings (with contents), tools and equipment and stocks (raw materials, stores and spares and finished goods) against fire, allied perils and all other foreseeable risks. The policy also covers loss of profit to the business arising from any accidental event. Your Company also has coverage in form of a Sales Turnover policy which provides all-risk transit insurance cover to the finished goods produced and sold by your Company and also covers transit of all the incoming raw materials.
b) Foreign Exchange – Your Company deals in foreign exchange in imports of raw materials and exports of finished products. A comprehensive forex policy has been formulated for managing its foreign exchange exposure.
c) Systems – Your Company has implemented SAP, the leading software for Enterprise Resource Planning, to integrate its operations and to use best business and commercial practices.
d) Statutory compliances – Procedure is in place for periodical reporting of compliance of statutory obligations and is reported to the Board of Directors at its Meetings.
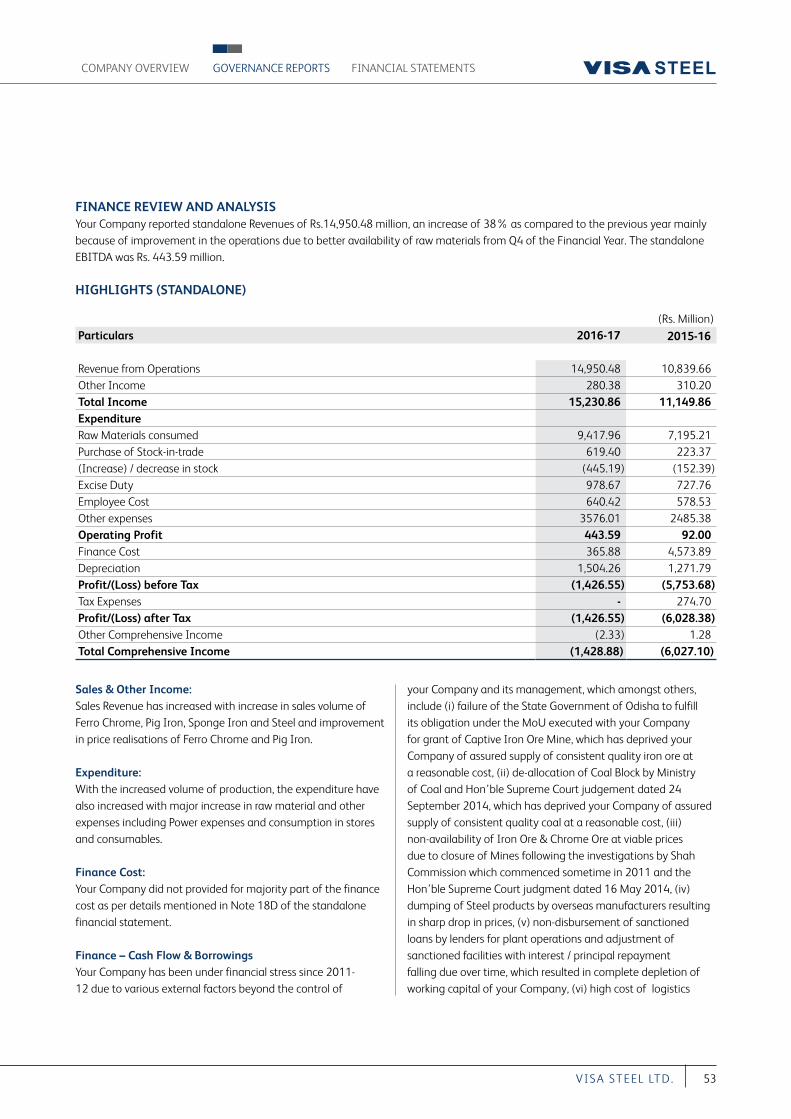
FINANCIAL STATEMENTSCOMPANY OVERVIEW GOVERNANCE REPORTS
53VI S A S T EEL LT D.
FINANCE REVIEW AND ANALYSISYour Company reported standalone Revenues of Rs.14,950.48 million, an increase of 38% as compared to the previous year mainly because of improvement in the operations due to better availability of raw materials from Q4 of the Financial Year. The standalone EBITDA was Rs. 443.59 million.
HIGHLIGHTS (STANDALONE)
(Rs. Million)Particulars 2016-17 2015-16
Revenue from Operations 14,950.48 10,839.66Other Income 280.38 310.20Total Income 15,230.86 11,149.86ExpenditureRaw Materials consumed 9,417.96 7,195.21Purchase of Stock-in-trade 619.40 223.37(Increase) / decrease in stock (445.19) (152.39)Excise Duty 978.67 727.76Employee Cost 640.42 578.53Other expenses 3576.01 2485.38Operating Profit 443.59 92.00Finance Cost 365.88 4,573.89Depreciation 1,504.26 1,271.79Profit/(Loss) before Tax (1,426.55) (5,753.68)Tax Expenses - 274.70Profit/(Loss) after Tax (1,426.55) (6,028.38)Other Comprehensive Income (2.33) 1.28Total Comprehensive Income (1,428.88) (6,027.10)
Sales & Other Income: Sales Revenue has increased with increase in sales volume of Ferro Chrome, Pig Iron, Sponge Iron and Steel and improvement in price realisations of Ferro Chrome and Pig Iron.
Expenditure: With the increased volume of production, the expenditure have also increased with major increase in raw material and other expenses including Power expenses and consumption in stores and consumables.
Finance Cost: Your Company did not provided for majority part of the finance cost as per details mentioned in Note 18D of the standalone financial statement.
Finance – Cash Flow & BorrowingsYour Company has been under financial stress since 2011-12 due to various external factors beyond the control of
your Company and its management, which amongst others, include (i) failure of the State Government of Odisha to fulfill its obligation under the MoU executed with your Company for grant of Captive Iron Ore Mine, which has deprived your Company of assured supply of consistent quality iron ore at a reasonable cost, (ii) de-allocation of Coal Block by Ministry of Coal and Hon’ble Supreme Court judgement dated 24 September 2014, which has deprived your Company of assured supply of consistent quality coal at a reasonable cost, (iii) non-availability of Iron Ore & Chrome Ore at viable prices due to closure of Mines following the investigations by Shah Commission which commenced sometime in 2011 and the Hon’ble Supreme Court judgment dated 16 May 2014, (iv) dumping of Steel products by overseas manufacturers resulting in sharp drop in prices, (v) non-disbursement of sanctioned loans by lenders for plant operations and adjustment of sanctioned facilities with interest / principal repayment falling due over time, which resulted in complete depletion of working capital of your Company, (vi) high cost of logistics
MANAGEMENT DISCUSSION AND ANALYSIS
54 A nnu a l Repor t 2016-17
for transportation of raw materials as these rates are fixed by Associations at rates much above the Government notified rates, etc.
Consequently, EBITDA margins of your Company have not been sufficient to enable your Company service interest / principal repayment, and whilst the principal term loan is only approx. Rs. 1,190 Crores, during the period April 2011 to March 2016, the lenders have not disbursed sanctioned limits for operations and adjusted / charged approx. Rs. 2,320 Crores on account of interest/repayment whereas EBITDA was only approx. Rs. 100 Crores resulting in huge ballooning of liabilities of your Company towards its lenders, which are much in excess of hard cost of investments in the project. Hence, the debt needs to be restructured to a sustainable level and in this regard, Lenders have appointed MECON to prepare a TEV Report.
Your Company has been taking support of operational creditors to continue Plant operations so that Plant does not shutdown and is having large overdue outstanding payments to operational creditors.
The amalgamation of VISA BAO Limited with your Company has been completed and consequently, Baosteel has been issued 5% stake in your Company. Your Company is also in discussions with Baosteel and other investors to acquire additional stake in your Company to infuse funds as working capital and enable restructuring of debt to a sustainable level.
Your Company is continuing to make efforts required to ramp up operations, raise funds from potential investors for working capital and restructure the loan to a sustainable level.
DEVELOPMENTS IN HUMAN RESOURCES & INDUSTRIAL RELATIONSYour Company has formulated a detailed Code of Conduct in order to practice ethical behaviour and sound conduct to establish the principles that guide our daily actions. Ethical conduct is the cornerstone of how your Company does business. Your Company is committed to creating a healthy work environment that enables employees to work without fear of prejudice, gender bias, sexual harassment and all forms of intimidation or exploitation. It is committed to provide a work environment that ensures every employee is treated with dignity and respect.
Your Company recognizes Human Resource as its most important assets and is constantly engaged in enriching the value and developing competencies of Human Resources through various development & training programmes. We improve our team building and encourage family bonding through various employee engagement social activities.
The total number of employees in your Company, including those inducted as trainees in your Company, as on 31 March 2017 was 1178.
INTERNAL CONTROL AND SYSTEMSYour Company has in place detailed and well spelt internal control systems, which commensurate with the size and nature of its operations and periodic audits are conducted in various disciplines to ensure adherence to the same. During the year, M/s. L. B. Jha, Internal Auditor of your Company had independently evaluated the adequacy and efficacy of the audit controls. The direct reporting of the Internal Auditor to the Audit Committee of the Board ensures independence of the audit and compliance functions. The Internal Auditor regularly report to the Audit Committee on their observations on your Company’s processes, systems and procedures ascertained during the course of their audit. Your Company has also appointed Cost Auditors for the cost audit of its manufactured products and the Cost Auditors also report to the Audit Committee on their observations. Your Company has appointed BSR & Co., a member firm of KPMG to report on arms length pricing policy and its compliance with the Companies Act, SEBI Regulations on related party transaction. Concerted efforts towards stabilisation of SAP have also contributed to tightening of control systems. Your Company has been able to adapt adequately to this ERP package and is placed to derive significant benefits from the same. Emphasis is placed on adequacy, reliability and accuracy of dissemination of financial data and information. Compliance issues are given utmost importance and reported regularly to the Board.
Your Company has been accredited with the ISO 9001 certification. It shows commitment to quality, customers, and a willingness to work towards improving efficiency. It has also been accredited with the ISO/TS 16949:2009 certification. The ISO/TS 16949 is obligatory for all steel manufacturers to sell their products to the automotive industry. ISO/TS 16949:2009 has given your Company a global standing as a reputable
FINANCIAL STATEMENTSCOMPANY OVERVIEW GOVERNANCE REPORTS
55VI S A S T EEL LT D.
supplier, improved risk management, ability to win more business and subsequently a wider spectrum of customer base.
Your Company has an adequate internal financial controls system over financial reporting were operating effectively as at 31 March 2017 which has been audited and certified by the Statutory Auditor.
CORPORATE SOCIAL RESPONSIBILITYAs a responsible corporate, your Company is focused on the happiness of people living in its larger neighboring communities. Your Company’s CSR team has directed its community development work in the areas of education, healthcare, rural development, sports & culture and your Company wishes to continue its support and focus on these issues. The team has taken special initiatives to promote “Swachhata Hi Seva” movement on Gandhi Jayanti and distribute Diyas to under privileged families during Diwali.
HEALTH AND SAFETYYour Company endeavors to be one of the most respected enterprises across the world in terms of providing a safe work place to its employees, contractors and other stakeholders. The management is making every possible effort to ensure that its employees and contractors adopt, practice and enjoy world class health and safety standards.
OUTLOOK The Government of India is giving a thrust to the manufacturing sector through the “Make in India” Campaign and your Company is well poised to take advantage of the growth in the demand for Special Steel products, Ferro Alloys and Coke. However, the uncertainty in supply of Iron Ore and Chrome Ore after 31 March 2020 when leases of all non-captive mines will expire, and emergence of various disruptive technologies in the Automobile Sector are an area of concern and will remain a challenge going forward.
CAUTIONARY STATEMENTStatements in this “Management Discussion & Analysis” describing the Company’s objectives, projections, estimates, expectations or predictions may be ‘forward looking statements’ within the meaning of applicable securities laws and regulations. Actual results could differ materially from those expressed or implied. Important factors that could make a difference to the Company’s operations include global and Indian demand supply conditions, finished goods prices, input availability and prices, cyclical demand and pricing in the Company’s principal markets, changes in Government regulations, tax regimes, economic developments within India and the countries within which the Company conducts business and other factors such as litigation and labour negotiations.
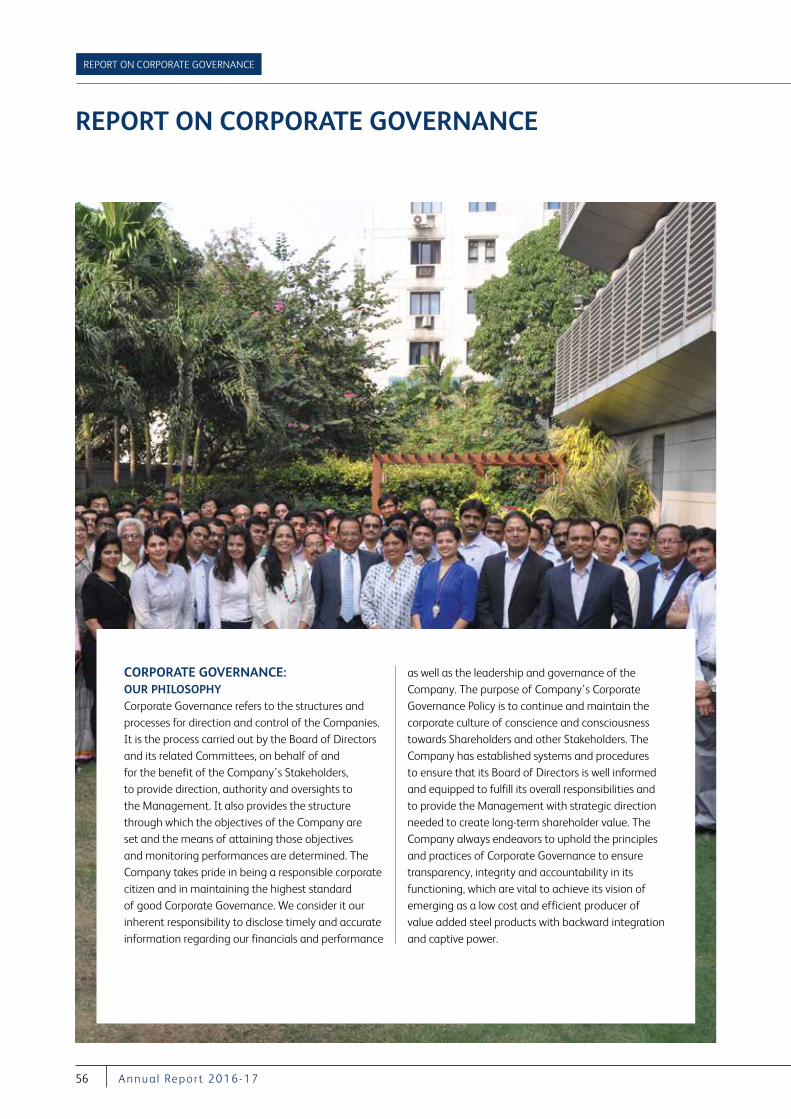
REPORT ON CORPORATE GOVERNANCE
56 A nnu a l Repor t 2016-17
CORPORATE GOVERNANCE: OUR PHILOSOPHY Corporate Governance refers to the structures and processes for direction and control of the Companies. It is the process carried out by the Board of Directors and its related Committees, on behalf of and for the benefit of the Company’s Stakeholders, to provide direction, authority and oversights to the Management. It also provides the structure through which the objectives of the Company are set and the means of attaining those objectives and monitoring performances are determined. The Company takes pride in being a responsible corporate citizen and in maintaining the highest standard of good Corporate Governance. We consider it our inherent responsibility to disclose timely and accurate information regarding our financials and performance
as well as the leadership and governance of the Company. The purpose of Company’s Corporate Governance Policy is to continue and maintain the corporate culture of conscience and consciousness towards Shareholders and other Stakeholders. The Company has established systems and procedures to ensure that its Board of Directors is well informed and equipped to fulfill its overall responsibilities and to provide the Management with strategic direction needed to create long-term shareholder value. The Company always endeavors to uphold the principles and practices of Corporate Governance to ensure transparency, integrity and accountability in its functioning, which are vital to achieve its vision of emerging as a low cost and efficient producer of value added steel products with backward integration and captive power.
REPORT ON CORPORATE GOVERNANCE
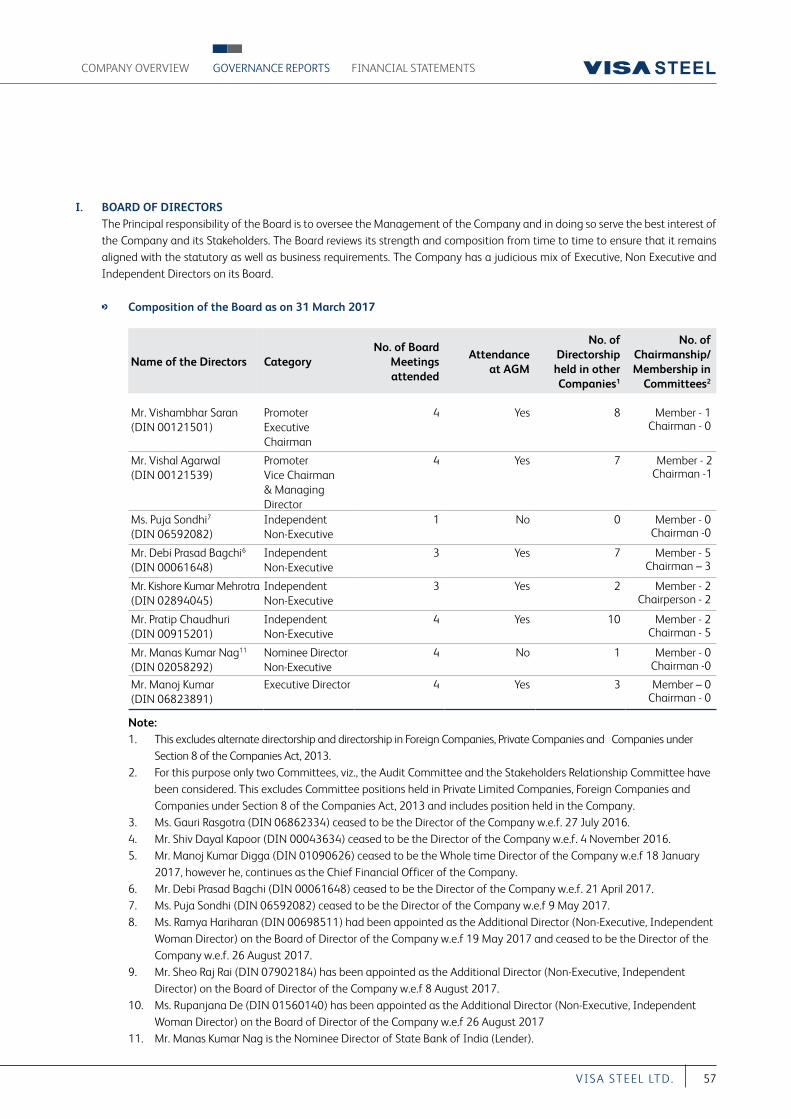
COMPANY OVERVIEW FINANCIAL STATEMENTSGOVERNANCE REPORTS
57VI S A S T EEL LT D.
I. BOARD OF DIRECTORS The Principal responsibility of the Board is to oversee the Management of the Company and in doing so serve the best interest of
the Company and its Stakeholders. The Board reviews its strength and composition from time to time to ensure that it remains aligned with the statutory as well as business requirements. The Company has a judicious mix of Executive, Non Executive and Independent Directors on its Board.
Composition of the Board as on 31 March 2017
Name of the Directors CategoryNo. of Board
Meetings attended
Attendance at AGM
No. of Directorship held in other Companies1
No. of Chairmanship/ Membership in
Committees2
Mr. Vishambhar Saran (DIN 00121501)
Promoter Executive Chairman
4 Yes 8 Member - 1Chairman - 0
Mr. Vishal Agarwal (DIN 00121539)
Promoter Vice Chairman & Managing Director
4 Yes 7 Member - 2 Chairman -1
Ms. Puja Sondhi7
(DIN 06592082)Independent Non-Executive
1 No 0 Member - 0Chairman -0
Mr. Debi Prasad Bagchi6
(DIN 00061648)Independent Non-Executive
3 Yes 7 Member - 5Chairman – 3
Mr. Kishore Kumar Mehrotra(DIN 02894045)
Independent Non-Executive
3 Yes 2 Member - 2Chairperson - 2
Mr. Pratip Chaudhuri(DIN 00915201)
Independent Non-Executive
4 Yes 10 Member - 2Chairman - 5
Mr. Manas Kumar Nag11
(DIN 02058292)Nominee DirectorNon-Executive
4 No 1 Member - 0Chairman -0
Mr. Manoj Kumar(DIN 06823891)
Executive Director 4 Yes 3 Member – 0Chairman - 0
Note: 1. This excludes alternate directorship and directorship in Foreign Companies, Private Companies and Companies under
Section 8 of the Companies Act, 2013. 2. For this purpose only two Committees, viz., the Audit Committee and the Stakeholders Relationship Committee have
been considered. This excludes Committee positions held in Private Limited Companies, Foreign Companies and Companies under Section 8 of the Companies Act, 2013 and includes position held in the Company.
3. Ms. Gauri Rasgotra (DIN 06862334) ceased to be the Director of the Company w.e.f. 27 July 2016. 4. Mr. Shiv Dayal Kapoor (DIN 00043634) ceased to be the Director of the Company w.e.f. 4 November 2016. 5. Mr. Manoj Kumar Digga (DIN 01090626) ceased to be the Whole time Director of the Company w.e.f 18 January
2017, however he, continues as the Chief Financial Officer of the Company. 6. Mr. Debi Prasad Bagchi (DIN 00061648) ceased to be the Director of the Company w.e.f. 21 April 2017. 7. Ms. Puja Sondhi (DIN 06592082) ceased to be the Director of the Company w.e.f 9 May 2017. 8. Ms. Ramya Hariharan (DIN 00698511) had been appointed as the Additional Director (Non-Executive, Independent
Woman Director) on the Board of Director of the Company w.e.f 19 May 2017 and ceased to be the Director of the Company w.e.f. 26 August 2017.
9. Mr. Sheo Raj Rai (DIN 07902184) has been appointed as the Additional Director (Non-Executive, Independent Director) on the Board of Director of the Company w.e.f 8 August 2017.
10. Ms. Rupanjana De (DIN 01560140) has been appointed as the Additional Director (Non-Executive, Independent Woman Director) on the Board of Director of the Company w.e.f 26 August 2017
11. Mr. Manas Kumar Nag is the Nominee Director of State Bank of India (Lender).
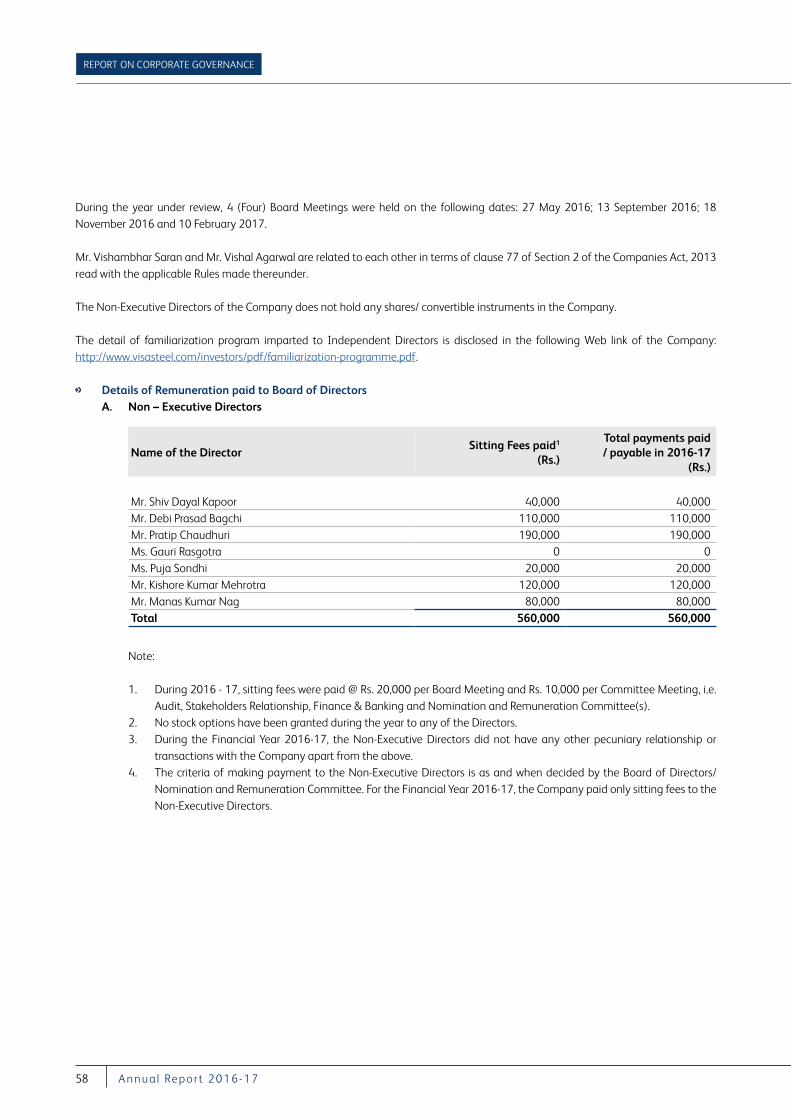
REPORT ON CORPORATE GOVERNANCE
58 A nnu a l Repor t 2016-17
During the year under review, 4 (Four) Board Meetings were held on the following dates: 27 May 2016; 13 September 2016; 18 November 2016 and 10 February 2017.
Mr. Vishambhar Saran and Mr. Vishal Agarwal are related to each other in terms of clause 77 of Section 2 of the Companies Act, 2013 read with the applicable Rules made thereunder.
The Non-Executive Directors of the Company does not hold any shares/ convertible instruments in the Company.
The detail of familiarization program imparted to Independent Directors is disclosed in the following Web link of the Company: http://www.visasteel.com/investors/pdf/familiarization-programme.pdf.
Details of Remuneration paid to Board of Directors A. Non – Executive Directors
Name of the DirectorSitting Fees paid1
(Rs.)
Total payments paid / payable in 2016-17
(Rs.)
Mr. Shiv Dayal Kapoor 40,000 40,000Mr. Debi Prasad Bagchi 110,000 110,000Mr. Pratip Chaudhuri 190,000 190,000Ms. Gauri Rasgotra 0 0Ms. Puja Sondhi 20,000 20,000Mr. Kishore Kumar Mehrotra 120,000 120,000Mr. Manas Kumar Nag 80,000 80,000Total 560,000 560,000
Note:
1. During 2016 - 17, sitting fees were paid @ Rs. 20,000 per Board Meeting and Rs. 10,000 per Committee Meeting, i.e. Audit, Stakeholders Relationship, Finance & Banking and Nomination and Remuneration Committee(s).
2. No stock options have been granted during the year to any of the Directors. 3. During the Financial Year 2016-17, the Non-Executive Directors did not have any other pecuniary relationship or
transactions with the Company apart from the above. 4. The criteria of making payment to the Non-Executive Directors is as and when decided by the Board of Directors/
Nomination and Remuneration Committee. For the Financial Year 2016-17, the Company paid only sitting fees to the Non-Executive Directors.
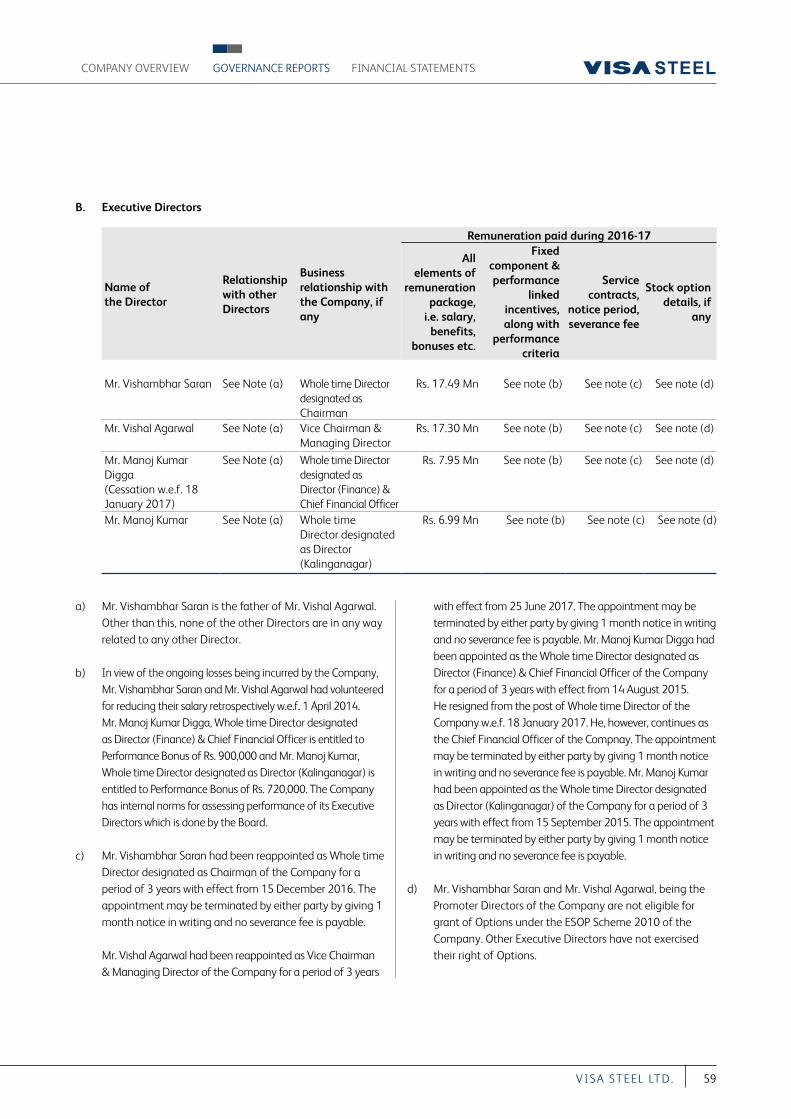
COMPANY OVERVIEW FINANCIAL STATEMENTSGOVERNANCE REPORTS
59VI S A S T EEL LT D.
a) Mr. Vishambhar Saran is the father of Mr. Vishal Agarwal. Other than this, none of the other Directors are in any way related to any other Director.
b) In view of the ongoing losses being incurred by the Company, Mr. Vishambhar Saran and Mr. Vishal Agarwal had volunteered for reducing their salary retrospectively w.e.f. 1 April 2014. Mr. Manoj Kumar Digga, Whole time Director designated as Director (Finance) & Chief Financial Officer is entitled to Performance Bonus of Rs. 900,000 and Mr. Manoj Kumar, Whole time Director designated as Director (Kalinganagar) is entitled to Performance Bonus of Rs. 720,000. The Company has internal norms for assessing performance of its Executive Directors which is done by the Board.
c) Mr. Vishambhar Saran had been reappointed as Whole time Director designated as Chairman of the Company for a period of 3 years with effect from 15 December 2016. The appointment may be terminated by either party by giving 1 month notice in writing and no severance fee is payable.
Mr. Vishal Agarwal had been reappointed as Vice Chairman & Managing Director of the Company for a period of 3 years
with effect from 25 June 2017. The appointment may be terminated by either party by giving 1 month notice in writing and no severance fee is payable. Mr. Manoj Kumar Digga had been appointed as the Whole time Director designated as Director (Finance) & Chief Financial Officer of the Company for a period of 3 years with effect from 14 August 2015. He resigned from the post of Whole time Director of the Company w.e.f. 18 January 2017. He, however, continues as the Chief Financial Officer of the Compnay. The appointment may be terminated by either party by giving 1 month notice in writing and no severance fee is payable. Mr. Manoj Kumar had been appointed as the Whole time Director designated as Director (Kalinganagar) of the Company for a period of 3 years with effect from 15 September 2015. The appointment may be terminated by either party by giving 1 month notice in writing and no severance fee is payable.
d) Mr. Vishambhar Saran and Mr. Vishal Agarwal, being the Promoter Directors of the Company are not eligible for grant of Options under the ESOP Scheme 2010 of the Company. Other Executive Directors have not exercised their right of Options.
B. Executive Directors
Name of the Director
Relationship with other Directors
Business relationship with the Company, if any
Remuneration paid during 2016-17
All elements of
remuneration package,
i.e. salary, benefits,
bonuses etc.
Fixed component & performance
linked incentives, along with
performance criteria
Service contracts,
notice period, severance fee
Stock option details, if
any
Mr. Vishambhar Saran See Note (a) Whole time Director designated asChairman
Rs. 17.49 Mn See note (b) See note (c) See note (d)
Mr. Vishal Agarwal See Note (a) Vice Chairman & Managing Director
Rs. 17.30 Mn See note (b) See note (c) See note (d)
Mr. Manoj Kumar Digga(Cessation w.e.f. 18 January 2017)
See Note (a) Whole time Director designated as Director (Finance) & Chief Financial Officer
Rs. 7.95 Mn See note (b) See note (c) See note (d)
Mr. Manoj Kumar See Note (a) Whole time Director designated as Director (Kalinganagar)
Rs. 6.99 Mn See note (b) See note (c) See note (d)
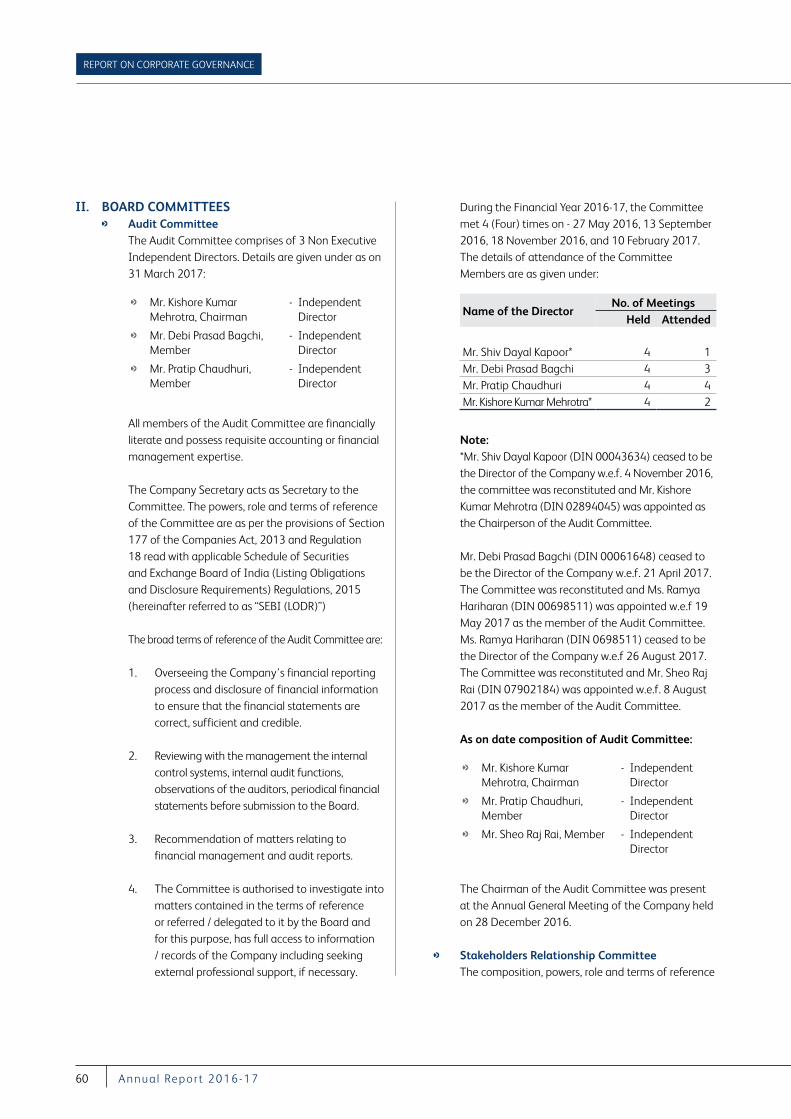
REPORT ON CORPORATE GOVERNANCE
60 A nnu a l Repor t 2016-17
II. BOARD COMMITTEES Audit Committee The Audit Committee comprises of 3 Non Executive
Independent Directors. Details are given under as on 31 March 2017:
Mr. Kishore Kumar Mehrotra, Chairman
- Independent Director
Mr. Debi Prasad Bagchi, Member
- Independent Director
Mr. Pratip Chaudhuri, Member
- Independent Director
All members of the Audit Committee are financially literate and possess requisite accounting or financial management expertise.
The Company Secretary acts as Secretary to the Committee. The powers, role and terms of reference of the Committee are as per the provisions of Section 177 of the Companies Act, 2013 and Regulation 18 read with applicable Schedule of Securities and Exchange Board of India (Listing Obligations and Disclosure Requirements) Regulations, 2015 (hereinafter referred to as “SEBI (LODR)”)
The broad terms of reference of the Audit Committee are:
1. Overseeing the Company’s financial reporting process and disclosure of financial information to ensure that the financial statements are correct, sufficient and credible.
2. Reviewing with the management the internal control systems, internal audit functions, observations of the auditors, periodical financial statements before submission to the Board.
3. Recommendation of matters relating to financial management and audit reports.
4. The Committee is authorised to investigate into matters contained in the terms of reference or referred / delegated to it by the Board and for this purpose, has full access to information / records of the Company including seeking external professional support, if necessary.
During the Financial Year 2016-17, the Committee met 4 (Four) times on - 27 May 2016, 13 September 2016, 18 November 2016, and 10 February 2017. The details of attendance of the Committee Members are as given under:
Name of the DirectorNo. of Meetings
Held Attended
Mr. Shiv Dayal Kapoor* 4 1Mr. Debi Prasad Bagchi 4 3Mr. Pratip Chaudhuri 4 4Mr. Kishore Kumar Mehrotra* 4 2
Note: *Mr. Shiv Dayal Kapoor (DIN 00043634) ceased to be the Director of the Company w.e.f. 4 November 2016, the committee was reconstituted and Mr. Kishore Kumar Mehrotra (DIN 02894045) was appointed as the Chairperson of the Audit Committee.
Mr. Debi Prasad Bagchi (DIN 00061648) ceased to be the Director of the Company w.e.f. 21 April 2017. The Committee was reconstituted and Ms. Ramya Hariharan (DIN 00698511) was appointed w.e.f 19 May 2017 as the member of the Audit Committee. Ms. Ramya Hariharan (DIN 0698511) ceased to be the Director of the Company w.e.f 26 August 2017. The Committee was reconstituted and Mr. Sheo Raj Rai (DIN 07902184) was appointed w.e.f. 8 August 2017 as the member of the Audit Committee.
As on date composition of Audit Committee:
Mr. Kishore Kumar Mehrotra, Chairman
- Independent Director
Mr. Pratip Chaudhuri, Member
- Independent Director
Mr. Sheo Raj Rai, Member - Independent Director
The Chairman of the Audit Committee was present at the Annual General Meeting of the Company held on 28 December 2016.
Stakeholders Relationship Committee The composition, powers, role and terms of reference
COMPANY OVERVIEW FINANCIAL STATEMENTSGOVERNANCE REPORTS
61VI S A S T EEL LT D.
of the Committee are as per the provisions of Section 178 of the Companies Act, 2013 and Regulation 20 read with applicable Schedule of SEBI (LODR).
The Stakeholders Relationship Committee comprises of the following Directors as on 31 March 2017:
Mr. Pratip Chaudhuri, Chairman
- Independent Director
Mr. Vishal Agarwal, Member
- Vice Chairman & Managing Director
Mr. Kishore Kumar Mehrotra, Member
- Independent Director
The primary function of the Committee is to consider and resolve the grievances of the stakeholders of the Company, including complaints relating to transfer and transmission of securities, non-receipt of dividends and such other grievances as may be raised by the security holders from time to time. As on 31 March 2017, 100% of the Company’s shares are in dematerialised form and the shares are compulsorily traded on the Stock Exchanges in the dematerialised form.
Mr. Keshav Sadani, Company Secretary, acted as the Compliance Officer of the Company who resigned w.e.f. 25 June 2016. Mr. Manoj Kumar Digga was appointed as the Compliance Officer of the Company w.e.f. 25 June 2016. Thereafter, Mr. Sudhir Kumar Banthiya, Company Secretary is acting as the Compliance Officer of the Company w.e.f. 13 September 2016.
Particulars StatusNumber of shareholders’ complaints received so far
3
Number of shareholders’ complaints not solved to the satisfaction of shareholders
NIL
Number of shareholders’ pending complaints
NIL
Nomination and Remuneration Committee The composition, powers, role and terms of reference of the Committee are are as per the provisions of Section 178 of the Companies Act, 2013 and Regulation 19 read with applicable Schedule of SEBI (LODR).
The Committee comprises of the following Directors as on 31 March 2017:
Mr. Pratip Chaudhuri, Chairman
- Independent Director
Mr. Debi Prasad Bagchi, Member
- Independent Director
Mr. Kishore Kumar Mehrotra, Member
- Independent Director
The role and terms of reference of the Nomination and Remuneration Committee, inter alia, includes the following:
to lay down criteria for identifying persons who are qualified to become Directors and who may be appointed in Senior Management or KMP of the Company;
to lay down the terms and conditions in relation to the appointment of Directors, Senior Management Personnel or KMP and recommend to the Board the appointment and removal of Directors, Senior Management Personnel or KMP;
to lay down criteria to carry out evaluation of every Director’s performance;
to formulate criteria for determining qualification, positive attributes and Independence of a Director;
to determine the composition and level of remuneration, including reward linked with the performance, which is reasonable and sufficient to attract, retain and motivate Directors, KMP and Senior Management Personnel to work towards the long term growth and success of the Company;
to devise a policy on the diversity of the Board; and
to assist the Board with developing a succession plan for the Board.
REPORT ON CORPORATE GOVERNANCE
62 A nnu a l Repor t 2016-17
During the Financial Year 2016-17, the Committee met 2 (Two) times on 18 November 2016 and 10 February 2017. The details of attendance by the Committee members are as given under:
Name of the DirectorNo. of Meetings
Held Attended
Mr. Pratip Chaudhari 2 2Mr. Debi Prasad Bagchi 2 2Mr. Kishore Kumar Mehrotra 2 2
Note:Mr. Debi Prasad Bagchi (DIN 00061648) ceased to be the Director w.e.f. 21 April 2017. The Committee was reconstituted and Ms. Ramya Hariharan (DIN 0698511) was appointed w.e.f 19 May 2017 as the member of the Nomination and Remuneration Committee.
Ms. Ramya Hariharan (DIN 0698511) ceased to be the Director of the Company w.e.f 26 August 2017. The Committee was reconstituted and Ms. Rupanjana De (DIN 01560140) was appointed w.e.f. 26 August 2017 as the member of the Nomination and Remuneration Committee.
As on date composition of Nomination and Remuneration Committee:
Mr. Pratip Chaudhuri, Chairman
- Independent Director
Mr. Kishore Kumar Mehrotra, Member
- Independent Director
Ms. Rupanjana De, Member - Independent Director
Performance evaluation criteria The Company has in place a Remuneration Policy adopted in terms of the provisions of the Companies Act, 2013. The Board of Directors carried out an annual evaluation of its own performance and that of its Committees and individual Directors including the criteria of independence of the Independent Directors, in line with the Remuneration Policy,
requirements of the Companies Act, 2013 and SEBI (LODR). The Remuneration Policy of the Company forms part of the Board’s Report.
The Nomination and Remuneration Committee also reviewed the performance of the individual Directors. A separate Meeting of the Independent Directors of the Company was also held, wherein, the Independent Directors evaluated the performance of the Board as a whole and non - Independent Directors of the Company.
Corporate Social Responsibility Committee In terms of Section 135 of the Companies Act, 2013, the Board on 26 September 2014, constituted a Corporate Social Responsibility (CSR) Committee to monitor the CSR Policy of the Company and the activities included in the Policy.
The Committee comprises of the following Directors as on 31 March 2017:
Mr. Vishal Agarwal, Chairman
- Vice Chairman & Managing Director
Mr. Kishore Kumar Mehrotra, Member
- Independent Director
Ms. Puja Sondhi, Member - Independent Director
The CSR Policy is available on the website of the Company (www.visasteel.com) and also forms part of the Board’s Report.
Note:Ms. Puja Sondhi (DIN 06592082) ceased to be the Director of the Company w.e.f. 9 May 2017. The Committee was reconstituted and Ms. Ramya Hariharan (DIN 00698511) was appointed w.e.f. 19 May 2017 as the member of the Corporate Social Responsibility Committee.
Ms. Ramya Hariharan (DIN 00698511) ceased to be the Director of the Company w.e.f 26 August 2017 and Ms. Rupanjana De (DIN 01560140) was appointed w.e.f 26 August 2017 as the member of the Corporate Social Responsibility Committee.
COMPANY OVERVIEW FINANCIAL STATEMENTSGOVERNANCE REPORTS
63VI S A S T EEL LT D.
As on date composition of Corporate Social Responsibility Committee:
Mr. Vishal Agarwal, Chairman
- Vice Chairman & Managing Director
Mr. Kishore Kumar Mehrotra, Member
- Independent Director
Ms. Rupanjan De, Member - Independent Director
During the Financial Year 2016-17, no Meeting of the Committee was held. The CSR initiatives undertaken by the Company, although not mandatory under Section 135 of the Act read with applicable Rules made thereunder, are detailed in the Annual Report.
Finance & Banking Committee In addition to the above Committees, your Company
has a Finance & Banking Committee with powers to approve strategies, plans, policies and actions related to corporate finance.
The Committee comprises of the following Directors as on 31 March 2017:
Mr. Pratip Chaudhuri, Chairman
- Independent Director
Mr. Vishal Agarwal, Member
- Vice Chairman & Managing Director
Ms. Puja Sondhi, Member - Independent Director
Note:Ms. Puja Sondhi (DIN 06592082) ceased to be the Director of the Company w.e.f. 9 May 2017, the committee was reconstituted and Ms. Ramya Hariharan (DIN 0698511) was appointed w.e.f 19 May 2017 as the member of the Finance & Banking Committee.
Ms. Ramya Hariharan (DIN 00698511) ceased to be the Director of the Company w.e.f 26 August 2017 and Ms. Rupanjana De (DIN 01560140) was appointed w.e.f 26 August 2017 as the member of the Finance & Banking Committee.
During the Financial Year 2016-17, the Committee met once on 27 May 2016 which was attended by all the members of the Committee.
As on date composition of Finance & Banking Committee
Mr. Pratip Chaudhuri, Chairman
- Independent Director
Mr. Vishal Agarwal, Member
- Vice Chairman & Managing Director
Ms. Rupanjana De, Member
- Independent Director
III. SUBSIDIARY COMPANIES The Company has 7 (Seven) subsidiaries including indirect
subsidiaries, as on 31 March 2017: VISA BAO Limited (VBL) VISA SunCoke Limited (VSCL) Kalinganagar Special Steel Private Limited VISA Ferro Chrome Limited VISA Special Steel Limited Ghotaringa Minerals Limited Kalinganagar Chrome Private Limited
Under the definition of SEBI (LODR) VBL and VSCL are “material subsidiary” of your Company.
During the year under review, the following has been duly complied with in accordance with the provisions of the SEBI (LODR) Regulation, 2015:
REPORT ON CORPORATE GOVERNANCE
64 A nnu a l Repor t 2016-17
Mr. Shiv Dayal Kapoor was also an Independent Director on the Board of Director of VBL and VSCL till 4 November 2016. Thereafter, Mr. Kishore Kumar Mehrotra, an Independent Director on the Board of Directors of the Company was also an Independent Director on the Board of Directors of VBL and VSCL.
The Audit Committee reviewed the Financial Statements and in particular, the investments made by the unlisted subsidiary companies.
The Minutes of the Board Meetings as well as statements of all significant transactions of the unlisted subsidiary companies were placed before the Board of Directors of the Company for their review.
The Company had formulated a Policy for Determining Material Subsidiaries and the same is available on the Company’s website at: www.visasteel.com.
Means of communication
Quarterly results - Posted on our website www.visasteel.comNewspapers normally published in - One English Language National Daily
One daily published in Oriya LanguageAny website, where displayed - www.visasteel.comWhether it displays official news releases - YesPresentation to investors / analysts - Available as and when madeWhether Shareholder Information Report forms part of the Annual Report - Yes
The Annual Report containing, inter alia, Audited Standalone and Consolidated Financial Statements, Reports of the Auditors and Directors, Chairman’s Statement, Management Discussion and Analysis Report and other important information is circulated to the members and displayed on the Company’s website.
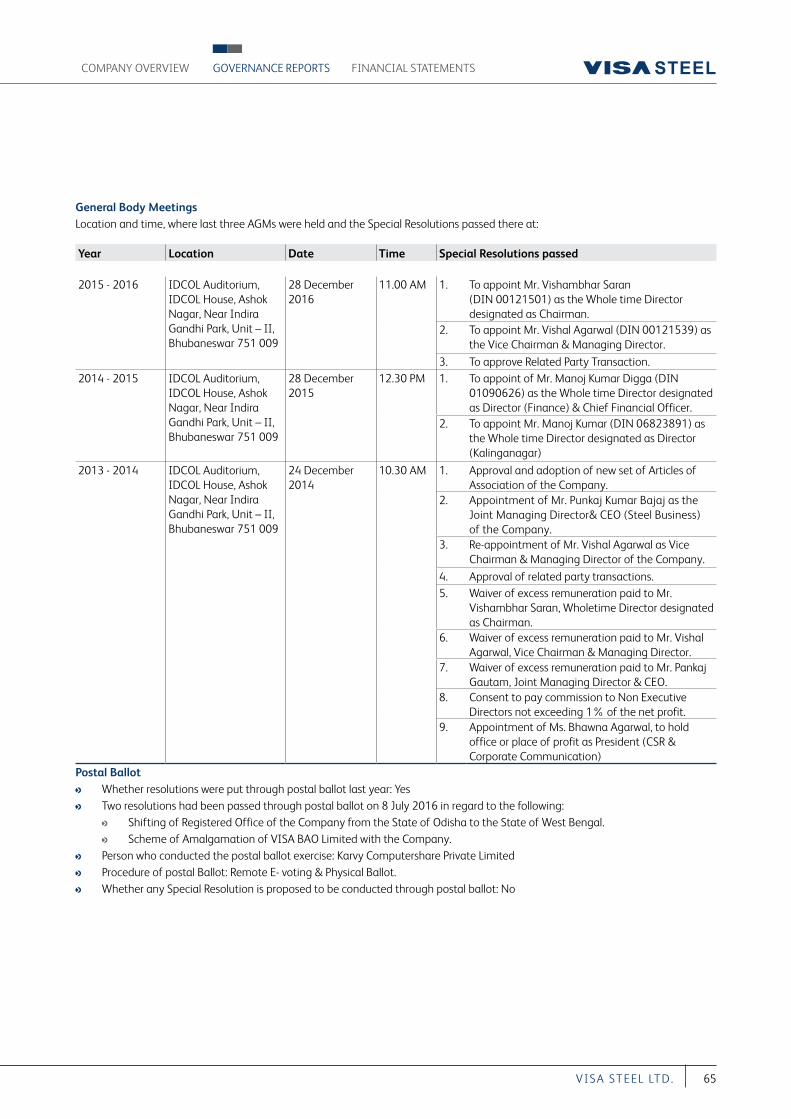
COMPANY OVERVIEW FINANCIAL STATEMENTSGOVERNANCE REPORTS
65VI S A S T EEL LT D.
General Body MeetingsLocation and time, where last three AGMs were held and the Special Resolutions passed there at:
Year Location Date Time Special Resolutions passed
2015 - 2016 IDCOL Auditorium, IDCOL House, Ashok Nagar, Near Indira Gandhi Park, Unit – II, Bhubaneswar 751 009
28 December 2016
11.00 AM 1. To appoint Mr. Vishambhar Saran (DIN 00121501) as the Whole time Director designated as Chairman.
2. To appoint Mr. Vishal Agarwal (DIN 00121539) as the Vice Chairman & Managing Director.
3. To approve Related Party Transaction.2014 - 2015 IDCOL Auditorium,
IDCOL House, Ashok Nagar, Near Indira Gandhi Park, Unit – II, Bhubaneswar 751 009
28 December 2015
12.30 PM 1. To appoint of Mr. Manoj Kumar Digga (DIN 01090626) as the Whole time Director designated as Director (Finance) & Chief Financial Officer.
2. To appoint Mr. Manoj Kumar (DIN 06823891) as the Whole time Director designated as Director (Kalinganagar)
2013 - 2014 IDCOL Auditorium, IDCOL House, Ashok Nagar, Near Indira Gandhi Park, Unit – II, Bhubaneswar 751 009
24 December 2014
10.30 AM 1. Approval and adoption of new set of Articles of Association of the Company.
2. Appointment of Mr. Punkaj Kumar Bajaj as the Joint Managing Director& CEO (Steel Business) of the Company.
3. Re-appointment of Mr. Vishal Agarwal as Vice Chairman & Managing Director of the Company.
4. Approval of related party transactions.5. Waiver of excess remuneration paid to Mr.
Vishambhar Saran, Wholetime Director designated as Chairman.
6. Waiver of excess remuneration paid to Mr. Vishal Agarwal, Vice Chairman & Managing Director.
7. Waiver of excess remuneration paid to Mr. Pankaj Gautam, Joint Managing Director & CEO.
8. Consent to pay commission to Non Executive Directors not exceeding 1% of the net profit.
9. Appointment of Ms. Bhawna Agarwal, to hold office or place of profit as President (CSR & Corporate Communication)
Postal Ballot Whether resolutions were put through postal ballot last year: Yes Two resolutions had been passed through postal ballot on 8 July 2016 in regard to the following:
Shifting of Registered Office of the Company from the State of Odisha to the State of West Bengal. Scheme of Amalgamation of VISA BAO Limited with the Company.
Person who conducted the postal ballot exercise: Karvy Computershare Private Limited Procedure of postal Ballot: Remote E- voting & Physical Ballot. Whether any Special Resolution is proposed to be conducted through postal ballot: No
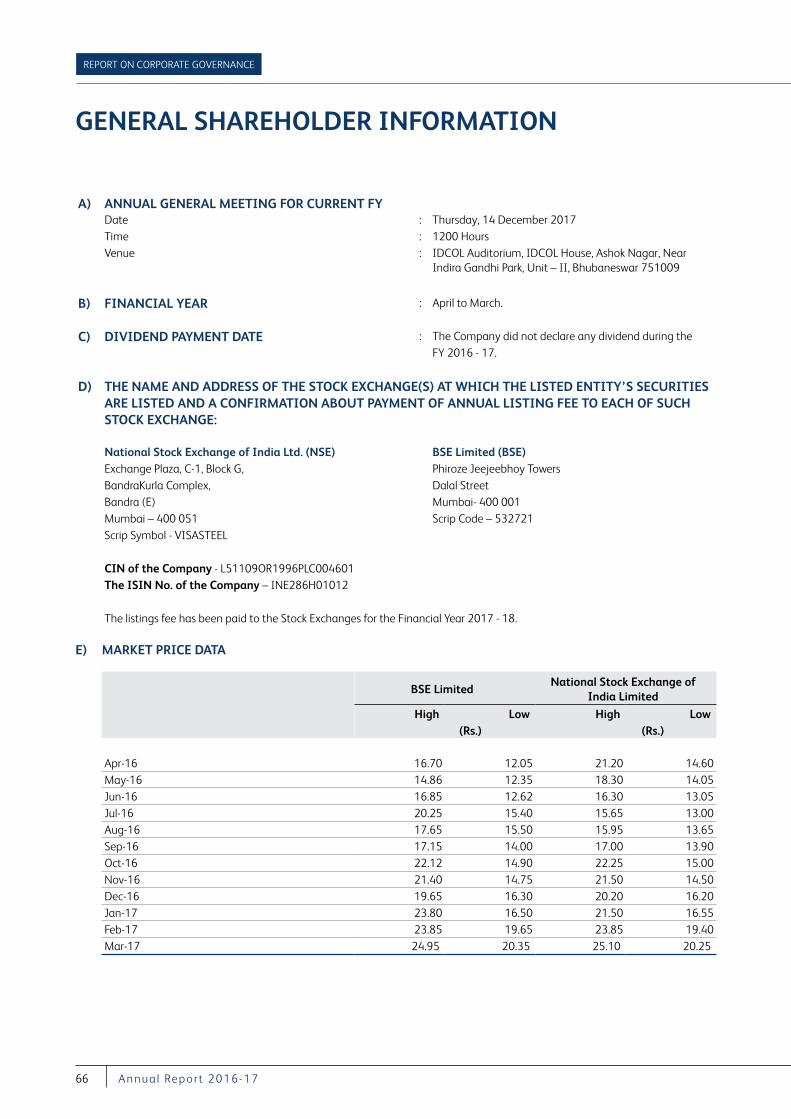
REPORT ON CORPORATE GOVERNANCE
66 A nnu a l Repor t 2016-17
GENERAL SHAREHOLDER INFORMATION
A) ANNUAL GENERAL MEETING FOR CURRENT FYDate : Thursday, 14 December 2017Time : 1200 HoursVenue : IDCOL Auditorium, IDCOL House, Ashok Nagar, Near
Indira Gandhi Park, Unit – II, Bhubaneswar 751009
B) FINANCIAL YEAR : April to March.
C) DIVIDEND PAYMENT DATE : The Company did not declare any dividend during the FY 2016 - 17.
D) THE NAME AND ADDRESS OF THE STOCK EXCHANGE(S) AT WHICH THE LISTED ENTITY’S SECURITIES ARE LISTED AND A CONFIRMATION ABOUT PAYMENT OF ANNUAL LISTING FEE TO EACH OF SUCH STOCK EXCHANGE:
National Stock Exchange of India Ltd. (NSE) BSE Limited (BSE)Exchange Plaza, C-1, Block G, Phiroze Jeejeebhoy TowersBandraKurla Complex, Dalal StreetBandra (E) Mumbai- 400 001Mumbai – 400 051 Scrip Code – 532721Scrip Symbol - VISASTEEL
CIN of the Company - L51109OR1996PLC004601The ISIN No. of the Company – INE286H01012
The listings fee has been paid to the Stock Exchanges for the Financial Year 2017 - 18.
E) MARKET PRICE DATA
BSE LimitedNational Stock Exchange of
India Limited
High Low High Low (Rs.) (Rs.)
Apr-16 16.70 12.05 21.20 14.60May-16 14.86 12.35 18.30 14.05Jun-16 16.85 12.62 16.30 13.05Jul-16 20.25 15.40 15.65 13.00Aug-16 17.65 15.50 15.95 13.65Sep-16 17.15 14.00 17.00 13.90Oct-16 22.12 14.90 22.25 15.00Nov-16 21.40 14.75 21.50 14.50Dec-16 19.65 16.30 20.20 16.20Jan-17 23.80 16.50 21.50 16.55Feb-17 23.85 19.65 23.85 19.40Mar-17 24.95 20.35 25.10 20.25
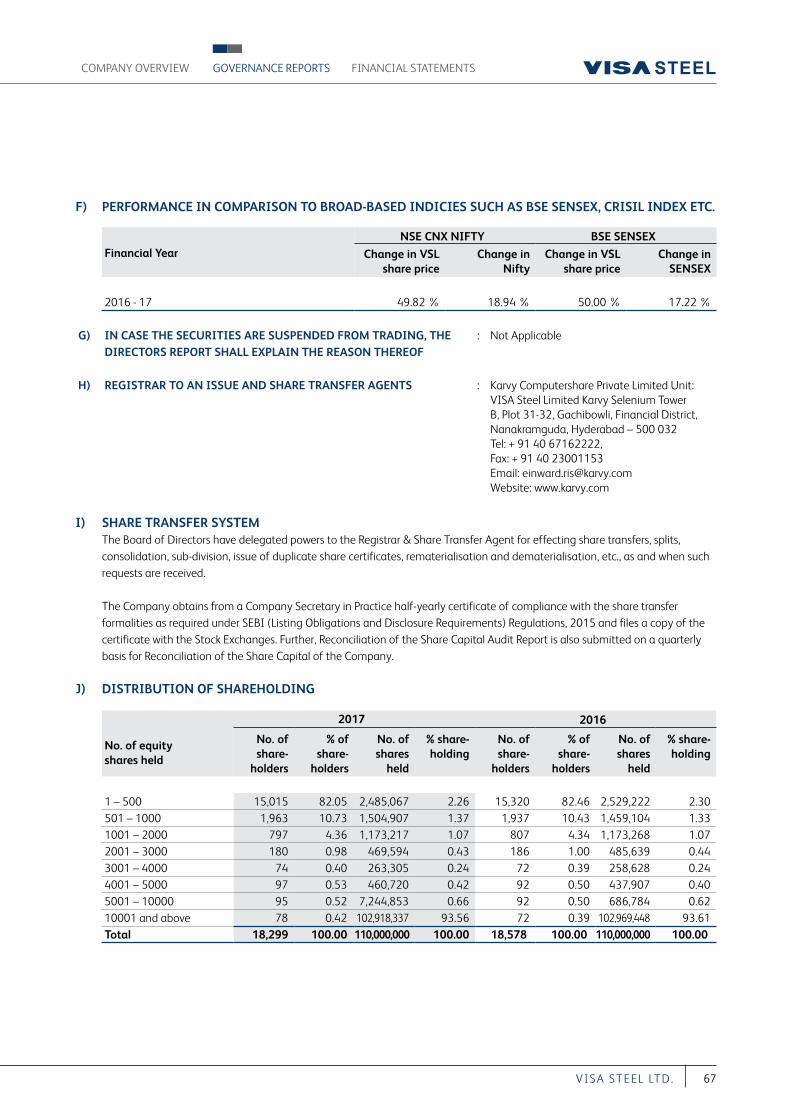
COMPANY OVERVIEW FINANCIAL STATEMENTSGOVERNANCE REPORTS
67VI S A S T EEL LT D.
F) PERFORMANCE IN COMPARISON TO BROAD-BASED INDICIES SUCH AS BSE SENSEX, CRISIL INDEX ETC.
Financial YearNSE CNX NIFTY BSE SENSEX
Change in VSL share price
Change in Nifty
Change in VSL share price
Change in SENSEX
2016 - 17 49.82 % 18.94 % 50.00 % 17.22 %
G) IN CASE THE SECURITIES ARE SUSPENDED FROM TRADING, THE DIRECTORS REPORT SHALL EXPLAIN THE REASON THEREOF
: Not Applicable
H) REGISTRAR TO AN ISSUE AND SHARE TRANSFER AGENTS : Karvy Computershare Private Limited Unit: VISA Steel Limited Karvy Selenium Tower B, Plot 31-32, Gachibowli, Financial District, Nanakramguda, Hyderabad – 500 032Tel: + 91 40 67162222, Fax: + 91 40 23001153 Email: [email protected]: www.karvy.com
I) SHARE TRANSFER SYSTEM The Board of Directors have delegated powers to the Registrar & Share Transfer Agent for effecting share transfers, splits,
consolidation, sub-division, issue of duplicate share certificates, rematerialisation and dematerialisation, etc., as and when such requests are received.
The Company obtains from a Company Secretary in Practice half-yearly certificate of compliance with the share transfer formalities as required under SEBI (Listing Obligations and Disclosure Requirements) Regulations, 2015 and files a copy of the certificate with the Stock Exchanges. Further, Reconciliation of the Share Capital Audit Report is also submitted on a quarterly basis for Reconciliation of the Share Capital of the Company.
J) DISTRIBUTION OF SHAREHOLDING
2017 2016
No. of equity shares held
No. of share-
holders
% of share-
holders
No. of shares
held
% share-holding
No. of share-
holders
% of share-
holders
No. of shares
held
% share-holding
1 – 500 15,015 82.05 2,485,067 2.26 15,320 82.46 2,529,222 2.30501 – 1000 1,963 10.73 1,504,907 1.37 1,937 10.43 1,459,104 1.331001 – 2000 797 4.36 1,173,217 1.07 807 4.34 1,173,268 1.072001 – 3000 180 0.98 469,594 0.43 186 1.00 485,639 0.443001 – 4000 74 0.40 263,305 0.24 72 0.39 258,628 0.244001 – 5000 97 0.53 460,720 0.42 92 0.50 437,907 0.405001 – 10000 95 0.52 7,244,853 0.66 92 0.50 686,784 0.6210001 and above 78 0.42 102,918,337 93.56 72 0.39 102,969,448 93.61Total 18,299 100.00 110,000,000 100.00 18,578 100.00 110,000,000 100.00
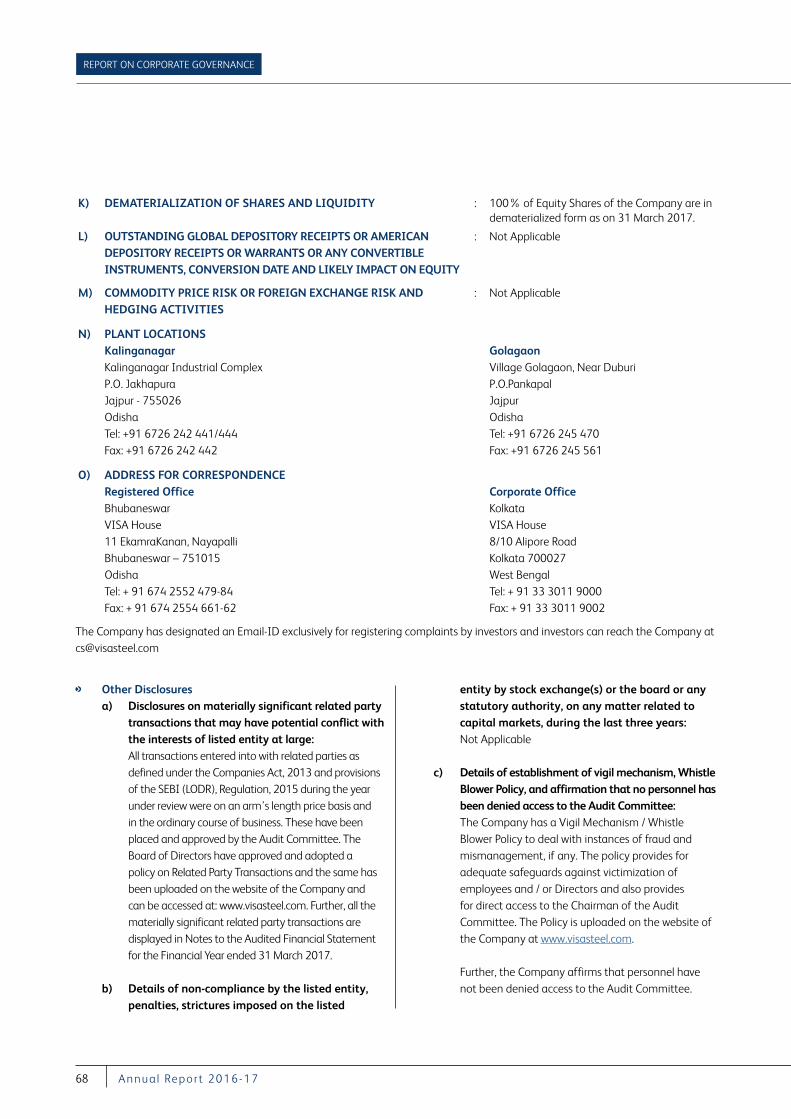
REPORT ON CORPORATE GOVERNANCE
68 A nnu a l Repor t 2016-17
K) DEMATERIALIZATION OF SHARES AND LIQUIDITY : 100% of Equity Shares of the Company are in dematerialized form as on 31 March 2017.
L) OUTSTANDING GLOBAL DEPOSITORY RECEIPTS OR AMERICAN DEPOSITORY RECEIPTS OR WARRANTS OR ANY CONVERTIBLE INSTRUMENTS, CONVERSION DATE AND LIKELY IMPACT ON EQUITY
: Not Applicable
M) COMMODITY PRICE RISK OR FOREIGN EXCHANGE RISK AND HEDGING ACTIVITIES
: Not Applicable
N) PLANT LOCATIONSKalinganagar GolagaonKalinganagar Industrial Complex Village Golagaon, Near DuburiP.O. Jakhapura P.O.PankapalJajpur - 755026 JajpurOdisha Odisha Tel: +91 6726 242 441/444 Tel: +91 6726 245 470Fax: +91 6726 242 442 Fax: +91 6726 245 561
O) ADDRESS FOR CORRESPONDENCERegistered Office Corporate OfficeBhubaneswar KolkataVISA House VISA House11 EkamraKanan, Nayapalli 8/10 Alipore RoadBhubaneswar – 751015 Kolkata 700027Odisha West BengalTel: + 91 674 2552 479-84 Tel: + 91 33 3011 9000Fax: + 91 674 2554 661-62 Fax: + 91 33 3011 9002
The Company has designated an Email-ID exclusively for registering complaints by investors and investors can reach the Company at [email protected]
Other Disclosures a) Disclosures on materially significant related party
transactions that may have potential conflict with the interests of listed entity at large:
All transactions entered into with related parties as defined under the Companies Act, 2013 and provisions of the SEBI (LODR), Regulation, 2015 during the year under review were on an arm’s length price basis and in the ordinary course of business. These have been placed and approved by the Audit Committee. The Board of Directors have approved and adopted a policy on Related Party Transactions and the same has been uploaded on the website of the Company and can be accessed at: www.visasteel.com. Further, all the materially significant related party transactions are displayed in Notes to the Audited Financial Statement for the Financial Year ended 31 March 2017.
b) Details of non-compliance by the listed entity, penalties, strictures imposed on the listed
entity by stock exchange(s) or the board or any statutory authority, on any matter related to capital markets, during the last three years:
Not Applicable
c) Details of establishment of vigil mechanism, Whistle Blower Policy, and affirmation that no personnel has been denied access to the Audit Committee:
The Company has a Vigil Mechanism / Whistle Blower Policy to deal with instances of fraud and mismanagement, if any. The policy provides for adequate safeguards against victimization of employees and / or Directors and also provides for direct access to the Chairman of the Audit Committee. The Policy is uploaded on the website of the Company at www.visasteel.com.
Further, the Company affirms that personnel have not been denied access to the Audit Committee.
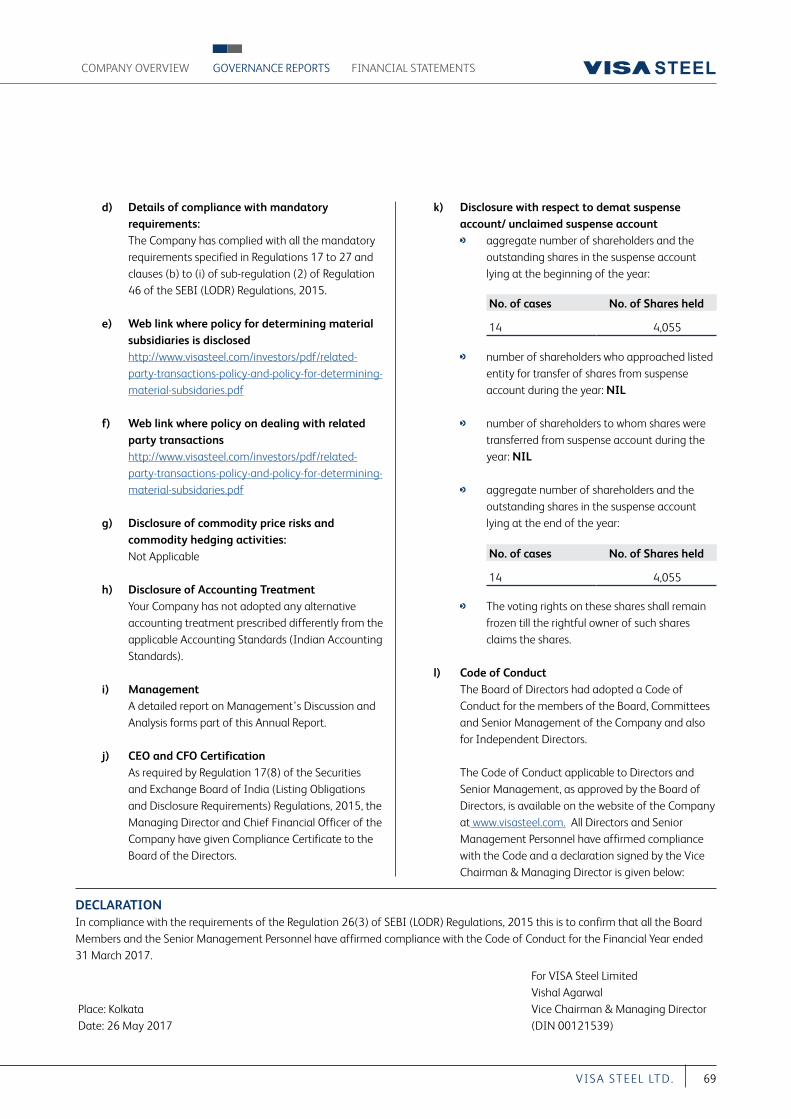
COMPANY OVERVIEW FINANCIAL STATEMENTSGOVERNANCE REPORTS
69VI S A S T EEL LT D.
d) Details of compliance with mandatory requirements:
The Company has complied with all the mandatory requirements specified in Regulations 17 to 27 and clauses (b) to (i) of sub-regulation (2) of Regulation 46 of the SEBI (LODR) Regulations, 2015.
e) Web link where policy for determining material subsidiaries is disclosed
http://www.visasteel.com/investors/pdf/related-party-transactions-policy-and-policy-for-determining-material-subsidaries.pdf
f) Web link where policy on dealing with related party transactions
http://www.visasteel.com/investors/pdf/related-party-transactions-policy-and-policy-for-determining-material-subsidaries.pdf
g) Disclosure of commodity price risks and commodity hedging activities:
Not Applicable
h) Disclosure of Accounting Treatment Your Company has not adopted any alternative
accounting treatment prescribed differently from the applicable Accounting Standards (Indian Accounting Standards).
i) Management A detailed report on Management’s Discussion and
Analysis forms part of this Annual Report.
j) CEO and CFO Certification As required by Regulation 17(8) of the Securities
and Exchange Board of India (Listing Obligations and Disclosure Requirements) Regulations, 2015, the Managing Director and Chief Financial Officer of the Company have given Compliance Certificate to the Board of the Directors.
k) Disclosure with respect to demat suspense account/ unclaimed suspense account
aggregate number of shareholders and the outstanding shares in the suspense account lying at the beginning of the year:
No. of cases No. of Shares held
14 4,055
number of shareholders who approached listed entity for transfer of shares from suspense account during the year: NIL
number of shareholders to whom shares were transferred from suspense account during the year: NIL
aggregate number of shareholders and the outstanding shares in the suspense account lying at the end of the year:
No. of cases No. of Shares held
14 4,055
The voting rights on these shares shall remain frozen till the rightful owner of such shares claims the shares.
l) Code of Conduct The Board of Directors had adopted a Code of
Conduct for the members of the Board, Committees and Senior Management of the Company and also for Independent Directors.
The Code of Conduct applicable to Directors and Senior Management, as approved by the Board of Directors, is available on the website of the Company at www.visasteel.com. All Directors and Senior Management Personnel have affirmed compliance with the Code and a declaration signed by the Vice Chairman & Managing Director is given below:
DECLARATIONIn compliance with the requirements of the Regulation 26(3) of SEBI (LODR) Regulations, 2015 this is to confirm that all the Board Members and the Senior Management Personnel have affirmed compliance with the Code of Conduct for the Financial Year ended 31 March 2017.
For VISA Steel LimitedVishal Agarwal
Place: Kolkata Vice Chairman & Managing DirectorDate: 26 May 2017 (DIN 00121539)
REPORT ON CORPORATE GOVERNANCE
70 A nnu a l Repor t 2016-17
ADOPTION AND COMPLIANCE OF DISCRETIONARY/NON MANDATORY REQUIREMENTS: The Board The Company has an Executive Chairman and the expenses of his office incurred during the performance of his duties is borne
by the Company.
Shareholders Rights The Company’s quarterly and half yearly results are published in the newspapers, sent to Exchange(s) where the shares of the
Company are listed and also uploaded on its website www.visasteel.com. Therefore no individual communication is sent to Shareholders on the quarterly and half yearly financial results. However, the Company furnishes the quarterly and half yearly results on receipt of a request from the Shareholders.
Modified opinion in Audit Report The modified opinion in the Independent Audit Report in the Financial Statement for the Financial Year 2016 – 17 forms
integral part of this Annual Report. Refer page no. 73 for details.
Separate posts of chairperson and chief executive officer The Company has separate post of Chairman and Managing Director.
Reporting of Internal Auditor The Internal Auditor Reports directly to the Audit Committee.
AUDITORS’ CERTIFICATE REGARDING COMPLIANCE OF CONDITIONS OF CORPORATE GOVERNANCE
To the Members of VISA Steel Limited
We have examined the compliance of conditions of Corporate Governance by VISA Steel Limited, for the year ended March 31, 2017 as stipulated in Regulations 17, 18, 19, 20, 21, 22, 23, 24, 25, 26, 27 and clauses (b) to (i) of sub-regulation (2) of Regulation 46 and para C , D and E of Schedule V of the Securities and Exchange Board of India (Listing Obligations and Disclosure Requirements) Regulations, 2015 (collectively referred to as “SEBI Listing Regulations, 2015).
The compliance of conditions of Corporate Governance is the responsibility of the Company’s management. Our examination was carried out in accordance with the Guidance Note on Certification of Corporate Governance, issued by the Institute of Chartered Accountants of India and was limited to procedures and implementation thereof, adopted by the Company for ensuring the compliance of the conditions of Corporate Governance. It is neither an audit nor an expression of opinion on the financial statements of the Company.
In our opinion and to the best of our information and according to the explanations given to us, we certify that the Company has complied with the conditions of Corporate Governance as stipulated in the SEBI Listing Regulations, 2015.
We state that such compliance is neither an assurance as to the future viability of the Company nor the efficiency or effectiveness with which the management has conducted the affairs of the Company.
For and on behalf of Lovelock & Lewes
Chartered Accountants
Place: KolkataDate: November 9, 2017
Pradip LawPartner
Membership No: 51790
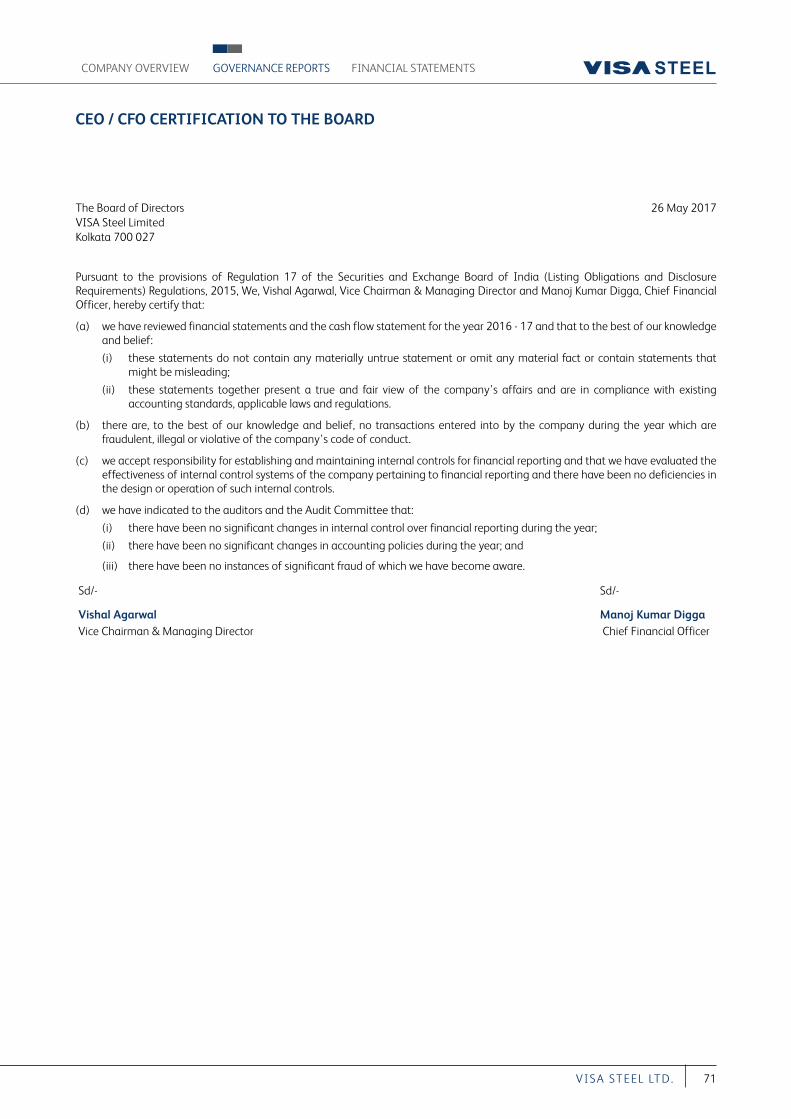
COMPANY OVERVIEW FINANCIAL STATEMENTSGOVERNANCE REPORTS
71VI S A S T EEL LT D.
The Board of DirectorsVISA Steel LimitedKolkata 700 027
26 May 2017
Pursuant to the provisions of Regulation 17 of the Securities and Exchange Board of India (Listing Obligations and Disclosure Requirements) Regulations, 2015, We, Vishal Agarwal, Vice Chairman & Managing Director and Manoj Kumar Digga, Chief Financial Officer, hereby certify that:
(a) we have reviewed financial statements and the cash flow statement for the year 2016 - 17 and that to the best of our knowledge and belief:
(i) these statements do not contain any materially untrue statement or omit any material fact or contain statements that might be misleading;
(ii) these statements together present a true and fair view of the company’s affairs and are in compliance with existing accounting standards, applicable laws and regulations.
(b) there are, to the best of our knowledge and belief, no transactions entered into by the company during the year which are fraudulent, illegal or violative of the company’s code of conduct.
(c) we accept responsibility for establishing and maintaining internal controls for financial reporting and that we have evaluated the effectiveness of internal control systems of the company pertaining to financial reporting and there have been no deficiencies in the design or operation of such internal controls.
(d) we have indicated to the auditors and the Audit Committee that:
(i) there have been no significant changes in internal control over financial reporting during the year;
(ii) there have been no significant changes in accounting policies during the year; and
(iii) there have been no instances of significant fraud of which we have become aware.
Sd/- Sd/-
Vishal Agarwal Manoj Kumar DiggaVice Chairman & Managing Director Chief Financial Officer
CEO / CFO CERTIFICATION TO THE BOARD
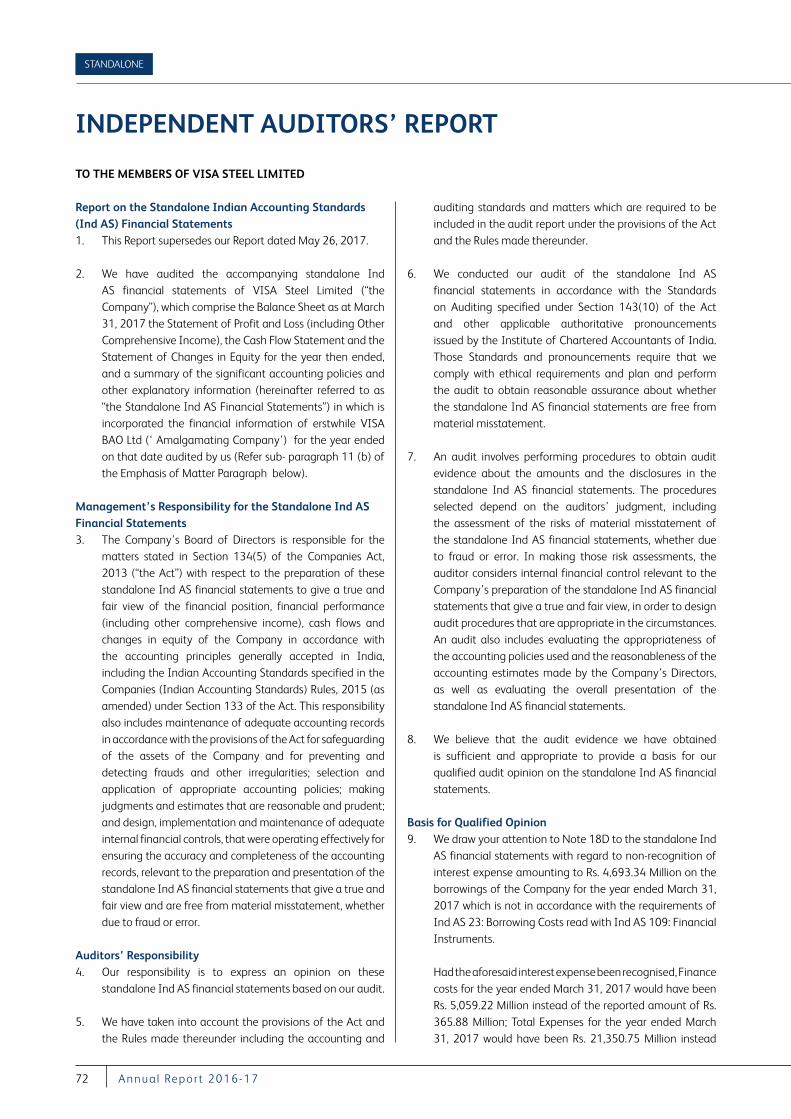
72 A nnu a l Repor t 2016-17
STANDALONE
INDEPENDENT AUDITORS’ REPORT
TO THE MEMBERS OF VISA STEEL LIMITED
Report on the Standalone Indian Accounting Standards (Ind AS) Financial Statements1. This Report supersedes our Report dated May 26, 2017.
2. We have audited the accompanying standalone Ind AS financial statements of VISA Steel Limited (“the Company”), which comprise the Balance Sheet as at March 31, 2017 the Statement of Profit and Loss (including Other Comprehensive Income), the Cash Flow Statement and the Statement of Changes in Equity for the year then ended, and a summary of the significant accounting policies and other explanatory information (hereinafter referred to as “the Standalone Ind AS Financial Statements”) in which is incorporated the financial information of erstwhile VISA BAO Ltd (‘ Amalgamating Company’) for the year ended on that date audited by us (Refer sub- paragraph 11 (b) of the Emphasis of Matter Paragraph below).
Management’s Responsibility for the Standalone Ind AS Financial Statements3. The Company’s Board of Directors is responsible for the
matters stated in Section 134(5) of the Companies Act, 2013 (“the Act”) with respect to the preparation of these standalone Ind AS financial statements to give a true and fair view of the financial position, financial performance (including other comprehensive income), cash flows and changes in equity of the Company in accordance with the accounting principles generally accepted in India, including the Indian Accounting Standards specified in the Companies (Indian Accounting Standards) Rules, 2015 (as amended) under Section 133 of the Act. This responsibility also includes maintenance of adequate accounting records in accordance with the provisions of the Act for safeguarding of the assets of the Company and for preventing and detecting frauds and other irregularities; selection and application of appropriate accounting policies; making judgments and estimates that are reasonable and prudent; and design, implementation and maintenance of adequate internal financial controls, that were operating effectively for ensuring the accuracy and completeness of the accounting records, relevant to the preparation and presentation of the standalone Ind AS financial statements that give a true and fair view and are free from material misstatement, whether due to fraud or error.
Auditors’ Responsibility4. Our responsibility is to express an opinion on these
standalone Ind AS financial statements based on our audit.
5. We have taken into account the provisions of the Act and the Rules made thereunder including the accounting and
auditing standards and matters which are required to be included in the audit report under the provisions of the Act and the Rules made thereunder.
6. We conducted our audit of the standalone Ind AS financial statements in accordance with the Standards on Auditing specified under Section 143(10) of the Act and other applicable authoritative pronouncements issued by the Institute of Chartered Accountants of India. Those Standards and pronouncements require that we comply with ethical requirements and plan and perform the audit to obtain reasonable assurance about whether the standalone Ind AS financial statements are free from material misstatement.
7. An audit involves performing procedures to obtain audit evidence about the amounts and the disclosures in the standalone Ind AS financial statements. The procedures selected depend on the auditors’ judgment, including the assessment of the risks of material misstatement of the standalone Ind AS financial statements, whether due to fraud or error. In making those risk assessments, the auditor considers internal financial control relevant to the Company’s preparation of the standalone Ind AS financial statements that give a true and fair view, in order to design audit procedures that are appropriate in the circumstances. An audit also includes evaluating the appropriateness of the accounting policies used and the reasonableness of the accounting estimates made by the Company’s Directors, as well as evaluating the overall presentation of the standalone Ind AS financial statements.
8. We believe that the audit evidence we have obtained is sufficient and appropriate to provide a basis for our qualified audit opinion on the standalone Ind AS financial statements.
Basis for Qualified Opinion9. We draw your attention to Note 18D to the standalone Ind
AS financial statements with regard to non-recognition of interest expense amounting to Rs. 4,693.34 Million on the borrowings of the Company for the year ended March 31, 2017 which is not in accordance with the requirements of Ind AS 23: Borrowing Costs read with Ind AS 109: Financial Instruments.
Had the aforesaid interest expense been recognised, Finance costs for the year ended March 31, 2017 would have been Rs. 5,059.22 Million instead of the reported amount of Rs. 365.88 Million; Total Expenses for the year ended March 31, 2017 would have been Rs. 21,350.75 Million instead
73VI S A S T EEL LT D.
COMPANY OVERVIEW FINANCIAL STATEMENTSGOVERNANCE REPORTS
INDEPENDENT AUDITORS’ REPORT
of Rs. 16,657.41 Million; Loss before exceptional items and tax for the year ended March 31, 2017 would have been Rs. 6,119.89 Million instead of the reported amount of Rs. 1,426.55 Million; Loss before tax for the year ended March 31, 2017 would have been Rs. 6,119.89 Million instead of the reported amount of Rs. 1,426.55 Million; Net Loss after tax for the year ended March 31, 2017 would have been Rs. 6,119.89 Million instead of the reported amount of Rs. 1,426.55 Million; Total Comprehensive Income for year ended March 31, 2017 would have been Rs. (6,122.22) Million instead of the reported amount of Rs. (1,428.88) Million and Loss Per Share for the year ended March 31, 2017 would have been Rs. 55.64 instead of the reported amount of Rs. 12.97. Other Equity and Other Current Financial Liabilities as at March 31, 2017 would have been Rs. (12,330.55) Million and Rs. 18,501.61 Million instead of the reported amount of Rs. (7,637.21) Million and Rs. 13,808.27 Million respectively.
Qualified Opinion10. In our opinion and to the best of our information and
according to the explanations given to us, the aforesaid standalone Ind AS financial statements give the information required by the Act in the manner so required and except for the effect of matter referred to in paragraph 9 above, give a true and fair view in conformity with the accounting principles generally accepted in India, of the state of affairs of the Company as at March 31, 2017, its total comprehensive income (comprising loss and other comprehensive income), its cash flows and the changes in equity for the year ended on that date.
Emphasis of Matter11. We draw attention to the following matters: (a) Note 40 to the standalone Ind AS financial
statements, regarding the preparation of the same on going concern basis. The Company has incurred a net loss during the year ended March 31, 2017 and, as of that date, the Company’s current liabilities exceeds its current assets and the Company’s net worth has been eroded as at the balance sheet date. These conditions along with other matters as set forth in the aforesaid Note, indicate the existence of a material uncertainty that may cast significant doubt about the Company’s ability to continue as a going concern.
(b) We draw attention to Note 48 to the standalone Ind AS financial statements which describes the basis for revision of the standalone Ind AS financial statements consequent to the merger of the Amalgamating Company with the Company, pursuant to a Scheme
of Amalgamation sanctioned by the National Company Law Tribunal (“NCLT”) vide its order dated October 12, 2017 (the “Scheme”). We further report that, our audit procedures on the subsequent events in so far as it relates to the revision to the standalone Ind AS financial statements (as amended) are restricted solely to the aforesaid matter relating to the Scheme and no effect have been given for any other events, if any, occurring after May 26, 2017 (being the date on which the standalone Ind AS financial statements were first approved by the Board of Directors of the Company and reported upon by us by our report of that date).
(c) Note 48 to the standalone financial statements relating to accounting for amalgamation of VISA BAO Limited (the “Transferor Company”) with the Company in accordance with the Scheme. As specified in the said Scheme, the Company has recorded net assets of the Transferor Company at their respective fair values. This accounting treatment is not in accordance with the pooling of interest method as prescribed under Ind AS 103 - Business Combinations with respect to accounting for business combinations of entities under common control.
Our opinion is not qualified in respect of these matters.
Other Matter12. The financial information of the Company for the year
ended March 31, 2016 and the transition date opening balance sheet as at April 1, 2015 included in these standalone Ind AS financial statements, are based on the previously issued statutory financial statements for the years ended March 31, 2016 and March 31, 2015 prepared in accordance with the Companies (Accounting Standards) Rules, 2006 (as amended) which were audited by us, on which we expressed an unmodified opinion dated May 27, 2016 and modified opinion dated May 29, 2015 respectively. The adjustments to those financial statements for the differences in accounting principles adopted by the Company on transition to the Ind AS have been audited by us.
Our opinion is not qualified in respect of this matter.
Report on Other Legal and Regulatory Requirements13. As required by the Companies (Auditor’s Report) Order,
2016, issued by the Central Government of India in terms of sub-section (11) of Section 143 of the Act (“the Order”),
74 A nnu a l Repor t 2016-17
STANDALONE
and on the basis of such checks of the books and records of the Company as we considered appropriate and according to the information and explanations given to us, we give in the Annexure B a statement on the matters specified in paragraphs 3 and 4 of the Order.
14. As required by Section 143 (3) of the Act, we report that: (a) We have sought and obtained all the information and
explanations which to the best of our knowledge and belief were necessary for the purposes of our audit.
(b) In our opinion, except for the matter referred to in paragraph 9 above, proper books of account as required by law have been kept by the Company so far as it appears from our examination of those books.
(c) The Balance Sheet, the Statement of Profit and Loss (including other comprehensive income), the Cash Flow Statement and the Statement of Changes in Equity dealt with by this Report are in agreement with the books of account.
(d) In our opinion, except for the matter referred to in paragraph 9 above, the aforesaid standalone Ind AS financial statements comply with the Indian Accounting Standards specified under Section 133 of the Act.
(d) The matter mentioned in paragraph 11(a) above, in our opinion, may have an adverse effect on the functioning of the Company.
(f) On the basis of the written representations received from the directors as on March 31, 2017 taken on record by the Board of Directors, none of the directors is disqualified as on March 31, 2017 from being appointed as a director in terms of Section 164 (2) of the Act.
(g) With reference to maintenance of accounts and other matters connected therewith, reference is drawn to our comment in paragraph 14 (b) above.
(h) With respect to the adequacy of the internal financial controls over financial reporting of the Company and the operating effectiveness of such controls, refer to our separate Report in Annexure A.
(i) With respect to the other matters to be included in the Auditors’ Report in accordance with Rule 11 of the Companies (Audit and Auditors) Rules, 2014, in our opinion and to the best of our knowledge and belief and according to the information and explanations given to us:
i. The Company has disclosed the impact, if any, of pending litigations as at March 31, 2017 on its financial position in its standalone Ind AS financial statements – Refer Note 39;
ii. The Company has long-term contracts including derivative contracts as at March 31, 2017 for which there were no material foreseeable losses;
iii. There were no amounts which were required to be transferred to the Investor Education and Protection Fund by the Company during the year ended March 31, 2017;
iv. The Company has provided requisite disclosures in the standalone Ind AS financial statements as to holdings as well as dealings in Specified Bank Notes during the period from November 8, 2016 to December 30, 2016. Based on audit procedures and relying on the management representation we report that the disclosures are in accordance with books of account maintained by the Company and as produced to us by the Management – Refer Note 41.
For Lovelock & LewesFirm Registration Number: 301056E
Chartered Accountants
Pradip LawKolkata PartnerNovember 9, 2017 Membership Number 51790
INDEPENDENT AUDITORS’ REPORT
75VI S A S T EEL LT D.
COMPANY OVERVIEW FINANCIAL STATEMENTSGOVERNANCE REPORTS
ANNEXURE A TO INDEPENDENT AUDITORS’ REPORT
Report on the Internal Financial Controls under Clause (i) of Sub-section 3 of Section 143 of the Act1. This Report supersedes our Report dated May 26, 2017.
2. We have audited the internal financial controls over financial reporting of VISA Steel Limited (“the Company”) as of March 31, 2017, in conjunction with our audit of the standalone Ind AS financial statements of the Company for the year ended on that date.
Management’s Responsibility for Internal Financial Controls3. The Company’s Management is responsible for establishing
and maintaining internal financial controls based on the internal control over financial reporting criteria established by the Company considering the essential components of internal control stated in the Guidance Note on Audit of Internal Financial Controls Over Financial Reporting issued by the Institute of Chartered Accountants of India (ICAI). These responsibilities include the design, implementation and maintenance of adequate internal financial controls that were operating effectively for ensuring the orderly and efficient conduct of its business, including adherence to company’s policies, the safeguarding of its assets, the prevention and detection of frauds and errors, the accuracy and completeness of the accounting records, and the timely preparation of reliable financial information, as required under the Act.
Auditors’ Responsibility4. Our responsibility is to express an opinion on the Company’s
internal financial controls over financial reporting based on our audit. We conducted our audit in accordance with the Guidance Note on Audit of Internal Financial Controls Over Financial Reporting (the “Guidance Note”) and the Standards on Auditing deemed to be prescribed under Section 143(10) of the Act to the extent applicable to an audit of internal financial controls, both applicable to an audit of internal financial controls and both issued by the ICAI. Those Standards and the Guidance Note require that we comply with ethical requirements and plan and perform the audit to obtain reasonable assurance about whether adequate internal financial controls over financial reporting was established and maintained and if such controls operated effectively in all material respects.
5. Our audit involves performing procedures to obtain audit evidence about the adequacy of the internal financial controls system over financial reporting and their operating effectiveness. Our audit of internal financial controls over financial reporting included obtaining an understanding of internal financial controls over financial reporting, assessing the risk that a material weakness exists, and testing and evaluating the design and operating effectiveness of internal control based on the assessed risk. The procedures selected depend on the auditor’s judgement, including the assessment of the risks of material misstatement of the standalone Ind AS financial statements, whether due to fraud or error.
6. We believe that the audit evidence we have obtained is sufficient and appropriate to provide a basis for our qualified audit opinion on the Company’s internal financial controls system over financial reporting.
Meaning of Internal Financial Controls Over Financial Reporting7. A company’s internal financial control over financial
reporting is a process designed to provide reasonable assurance regarding the reliability of financial reporting and the preparation of financial statements for external purposes in accordance with generally accepted accounting principles. A company’s internal financial control over financial reporting includes those policies and procedures that (1) pertain to the maintenance of records that, in reasonable detail, accurately and fairly reflect the transactions and dispositions of the assets of the company; (2) provide reasonable assurance that transactions are recorded as necessary to permit preparation of financial statements in accordance with generally accepted accounting principles, and that receipts and expenditures of the company are being made only in accordance with authorisations of management and directors of the company; and (3) provide reasonable assurance regarding prevention or timely detection of unauthorised acquisition, use, or disposition of the company’s assets that could have a material effect on the financial statements.
Inherent Limitations of Internal Financial Controls Over Financial Reporting8. Because of the inherent limitations of internal financial
controls over financial reporting, including the possibility
Referred to in paragraph 14 (h) of the Independent Auditors’ Report of even date to the members of VISA Steel Limited on the standalone Ind AS financial statements for the year ended March 31, 2017
76 A nnu a l Repor t 2016-17
STANDALONE
of collusion or improper management override of controls, material misstatements due to error or fraud may occur and not be detected. Also, projections of any evaluation of the internal financial controls over financial reporting to future periods are subject to the risk that the internal financial control over financial reporting may become inadequate because of changes in conditions, or that the degree of compliance with the policies or procedures may deteriorate.
Basis for Qualified opinion9. According to the information and explanations given to us
and based on our audit, the following material weakness has been identified in the operating effectiveness of the Company’s internal financial controls over financial reporting as at March 31, 2017:
The Company’s internal financial controls relating to application of appropriate policies and procedures that provide reasonable assurance that transactions are recorded as necessary to permit preparation of financial statements in accordance with generally accepted accounting principles were were not operating effectively which resulted in non-recognition of interest expense as indicated in Note 18D to the standalone Ind AS financial statements.
10. A ‘material weakness’ is a deficiency, or a combination of deficiencies, in internal financial control over financial reporting, such that there is a reasonable possibility that a material misstatement of the company’s annual or interim financial statements will not be prevented or detected on a timely basis.
Qualified opinion11. In our opinion, the Company has, in all material respects, an
adequate internal financial controls system over financial reporting and except for the effects of the material weakness described in the Basis for Qualified Opinion paragraph above, such internal financial controls over financial reporting were operating effectively as at March 31, 2017, based on the internal control over financial reporting criteria established by the Company considering the essential components of internal control stated in the
Guidance Note on Audit of Internal Financial Controls Over Financial Reporting issued by the Institute of Chartered Accountants of India.
12. We have considered the material weakness identified and reported above in determining the nature, timing, and extent of audit tests applied in our audit of the standalone Ind AS financial statements of the Company for the year ended March 31, 2017, and the material weakness does not affect our opinion on the standalone Ind AS financial statements of the Company.
Emphasis of Matter13. We draw attention to Note 48 to the standalone Ind AS
financial statements which describes the basis for revision of the standalone Ind AS financial statements consequent to the amalgamation of Visa BAO Limited, an erstwhile subsidiary of the Company with the Company, pursuant to a Scheme of Amalgamation sanctioned by the National Company Law Tribunal (“NCLT”) vide its order dated October 12, 2017 and filed with the Registrar of Companies on October 17, 2017 (the “Scheme”). We further report that, our audit procedures on the subsequent events in so far as it relates to the revision to the standalone Ind AS financial statements (as amended) with respect to the adequacy and operating effectiveness of internal financial controls over financial reporting therein are restricted solely to the aforesaid matter relating to the Scheme and no effect have been given for any other events, if any, occurring after May 26, 2017 (being the date on which the standalone Ind AS financial statements were first approved by the Board of Directors of the Company and reported upon by us by our report of that date).
Our opinion is not modified in respect of this matter.
For Lovelock & LewesFirm Registration Number: 301056E
Chartered Accountants
Pradip LawKolkata PartnerNovember 9, 2017 Membership Number 51790
ANNEXURE A TO INDEPENDENT AUDITORS’ REPORT
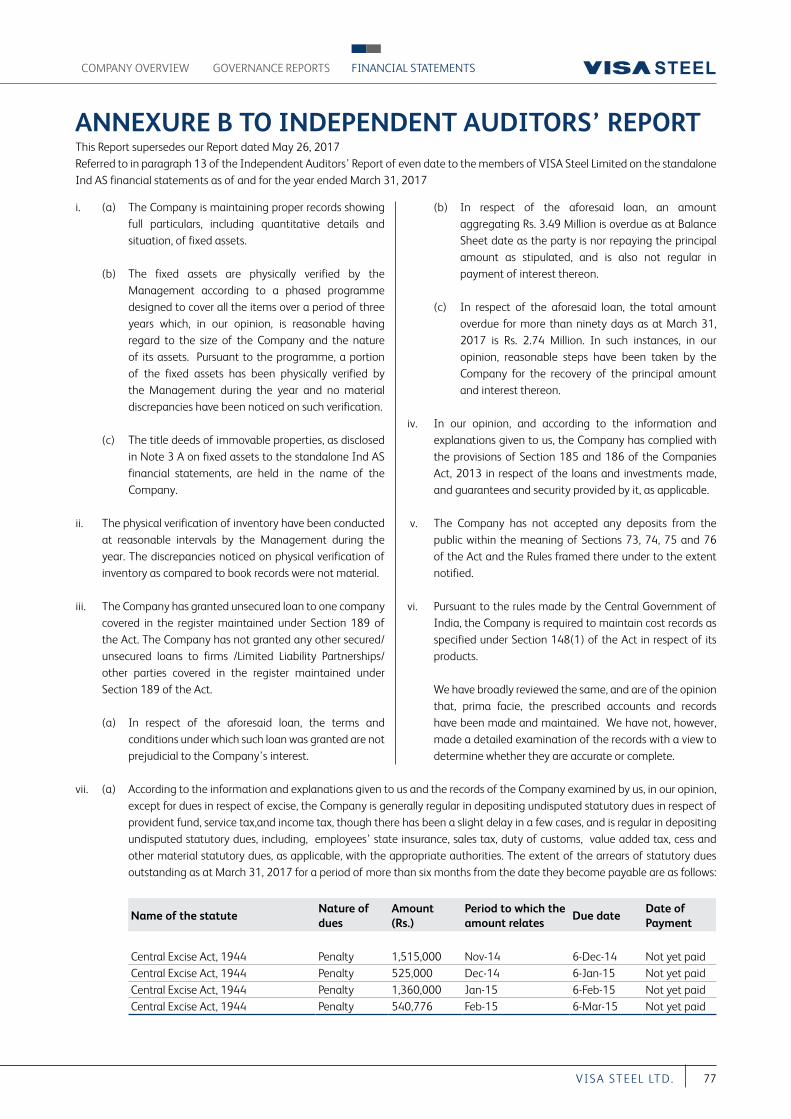
77VI S A S T EEL LT D.
COMPANY OVERVIEW FINANCIAL STATEMENTSGOVERNANCE REPORTS
ANNEXURE B TO INDEPENDENT AUDITORS’ REPORT
i. (a) The Company is maintaining proper records showing full particulars, including quantitative details and situation, of fixed assets.
(b) The fixed assets are physically verified by the Management according to a phased programme designed to cover all the items over a period of three years which, in our opinion, is reasonable having regard to the size of the Company and the nature of its assets. Pursuant to the programme, a portion of the fixed assets has been physically verified by the Management during the year and no material discrepancies have been noticed on such verification.
(c) The title deeds of immovable properties, as disclosed in Note 3 A on fixed assets to the standalone Ind AS financial statements, are held in the name of the Company.
ii. The physical verification of inventory have been conducted at reasonable intervals by the Management during the year. The discrepancies noticed on physical verification of inventory as compared to book records were not material.
iii. The Company has granted unsecured loan to one company covered in the register maintained under Section 189 of the Act. The Company has not granted any other secured/unsecured loans to firms /Limited Liability Partnerships/ other parties covered in the register maintained under Section 189 of the Act.
(a) In respect of the aforesaid loan, the terms and conditions under which such loan was granted are not prejudicial to the Company’s interest.
(b) In respect of the aforesaid loan, an amount aggregating Rs. 3.49 Million is overdue as at Balance Sheet date as the party is nor repaying the principal amount as stipulated, and is also not regular in payment of interest thereon.
(c) In respect of the aforesaid loan, the total amount overdue for more than ninety days as at March 31, 2017 is Rs. 2.74 Million. In such instances, in our opinion, reasonable steps have been taken by the Company for the recovery of the principal amount and interest thereon.
iv. In our opinion, and according to the information and explanations given to us, the Company has complied with the provisions of Section 185 and 186 of the Companies Act, 2013 in respect of the loans and investments made, and guarantees and security provided by it, as applicable.
v. The Company has not accepted any deposits from the public within the meaning of Sections 73, 74, 75 and 76 of the Act and the Rules framed there under to the extent notified.
vi. Pursuant to the rules made by the Central Government of India, the Company is required to maintain cost records as specified under Section 148(1) of the Act in respect of its products.
We have broadly reviewed the same, and are of the opinion that, prima facie, the prescribed accounts and records have been made and maintained. We have not, however, made a detailed examination of the records with a view to determine whether they are accurate or complete.
This Report supersedes our Report dated May 26, 2017Referred to in paragraph 13 of the Independent Auditors’ Report of even date to the members of VISA Steel Limited on the standalone Ind AS financial statements as of and for the year ended March 31, 2017
vii. (a) According to the information and explanations given to us and the records of the Company examined by us, in our opinion, except for dues in respect of excise, the Company is generally regular in depositing undisputed statutory dues in respect of provident fund, service tax,and income tax, though there has been a slight delay in a few cases, and is regular in depositing undisputed statutory dues, including, employees’ state insurance, sales tax, duty of customs, value added tax, cess and other material statutory dues, as applicable, with the appropriate authorities. The extent of the arrears of statutory dues outstanding as at March 31, 2017 for a period of more than six months from the date they become payable are as follows:
Name of the statuteNature of dues
Amount (Rs.)
Period to which the amount relates
Due dateDate of Payment
Central Excise Act, 1944 Penalty 1,515,000 Nov-14 6-Dec-14 Not yet paidCentral Excise Act, 1944 Penalty 525,000 Dec-14 6-Jan-15 Not yet paidCentral Excise Act, 1944 Penalty 1,360,000 Jan-15 6-Feb-15 Not yet paidCentral Excise Act, 1944 Penalty 540,776 Feb-15 6-Mar-15 Not yet paid
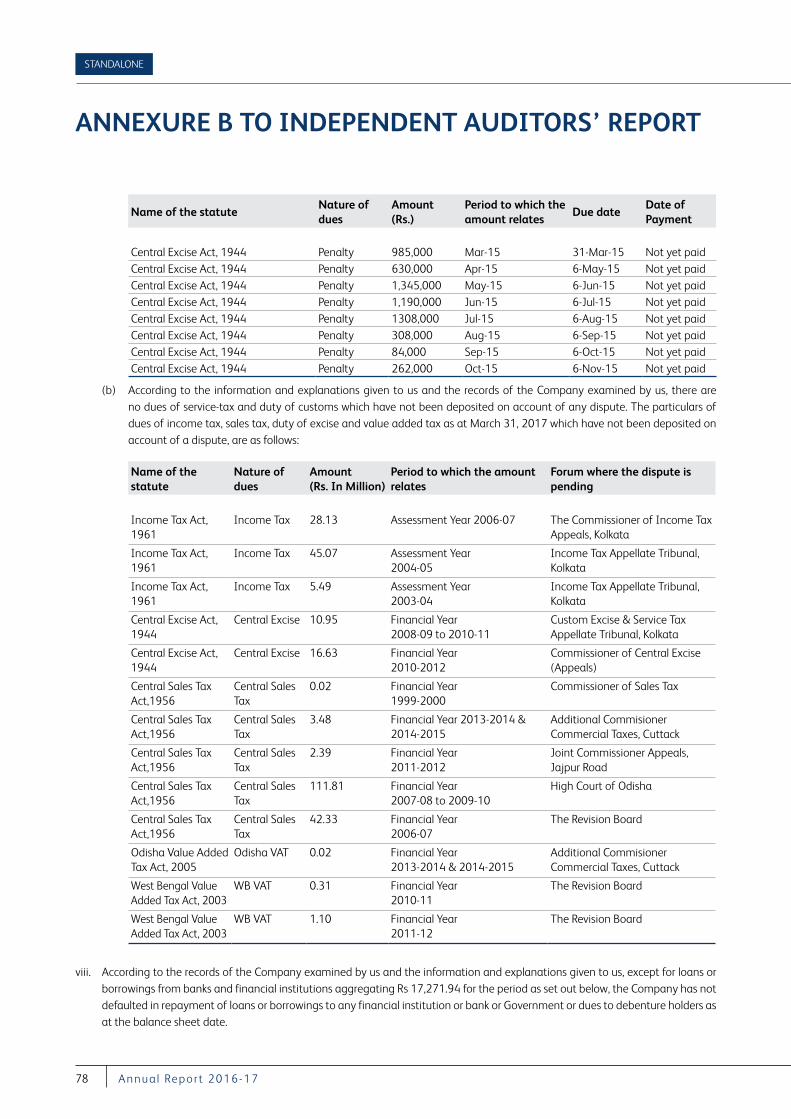
78 A nnu a l Repor t 2016-17
STANDALONE
Name of the statute
Nature of dues
Amount(Rs. In Million)
Period to which the amount relates
Forum where the dispute is pending
Income Tax Act, 1961
Income Tax 28.13 Assessment Year 2006-07 The Commissioner of Income Tax Appeals, Kolkata
Income Tax Act, 1961
Income Tax 45.07 Assessment Year 2004-05
Income Tax Appellate Tribunal, Kolkata
Income Tax Act, 1961
Income Tax 5.49 Assessment Year 2003-04
Income Tax Appellate Tribunal, Kolkata
Central Excise Act, 1944
Central Excise 10.95 Financial Year2008-09 to 2010-11
Custom Excise & Service Tax Appellate Tribunal, Kolkata
Central Excise Act, 1944
Central Excise 16.63 Financial Year2010-2012
Commissioner of Central Excise (Appeals)
Central Sales Tax Act,1956
Central Sales Tax
0.02 Financial Year1999-2000
Commissioner of Sales Tax
Central Sales Tax Act,1956
Central Sales Tax
3.48 Financial Year 2013-2014 & 2014-2015
Additional Commisioner Commercial Taxes, Cuttack
Central Sales Tax Act,1956
Central Sales Tax
2.39 Financial Year2011-2012
Joint Commissioner Appeals, Jajpur Road
Central Sales Tax Act,1956
Central Sales Tax
111.81 Financial Year2007-08 to 2009-10
High Court of Odisha
Central Sales Tax Act,1956
Central Sales Tax
42.33 Financial Year2006-07
The Revision Board
Odisha Value Added Tax Act, 2005
Odisha VAT 0.02 Financial Year2013-2014 & 2014-2015
Additional Commisioner Commercial Taxes, Cuttack
West Bengal Value Added Tax Act, 2003
WB VAT 0.31 Financial Year2010-11
The Revision Board
West Bengal Value Added Tax Act, 2003
WB VAT 1.10 Financial Year2011-12
The Revision Board
viii. According to the records of the Company examined by us and the information and explanations given to us, except for loans or borrowings from banks and financial institutions aggregating Rs 17,271.94 for the period as set out below, the Company has not defaulted in repayment of loans or borrowings to any financial institution or bank or Government or dues to debenture holders as at the balance sheet date.
ANNEXURE B TO INDEPENDENT AUDITORS’ REPORT
Name of the statuteNature of dues
Amount (Rs.)
Period to which the amount relates
Due dateDate of Payment
Central Excise Act, 1944 Penalty 985,000 Mar-15 31-Mar-15 Not yet paidCentral Excise Act, 1944 Penalty 630,000 Apr-15 6-May-15 Not yet paidCentral Excise Act, 1944 Penalty 1,345,000 May-15 6-Jun-15 Not yet paidCentral Excise Act, 1944 Penalty 1,190,000 Jun-15 6-Jul-15 Not yet paidCentral Excise Act, 1944 Penalty 1308,000 Jul-15 6-Aug-15 Not yet paidCentral Excise Act, 1944 Penalty 308,000 Aug-15 6-Sep-15 Not yet paidCentral Excise Act, 1944 Penalty 84,000 Sep-15 6-Oct-15 Not yet paidCentral Excise Act, 1944 Penalty 262,000 Oct-15 6-Nov-15 Not yet paid
(b) According to the information and explanations given to us and the records of the Company examined by us, there are no dues of service-tax and duty of customs which have not been deposited on account of any dispute. The particulars of dues of income tax, sales tax, duty of excise and value added tax as at March 31, 2017 which have not been deposited on account of a dispute, are as follows:
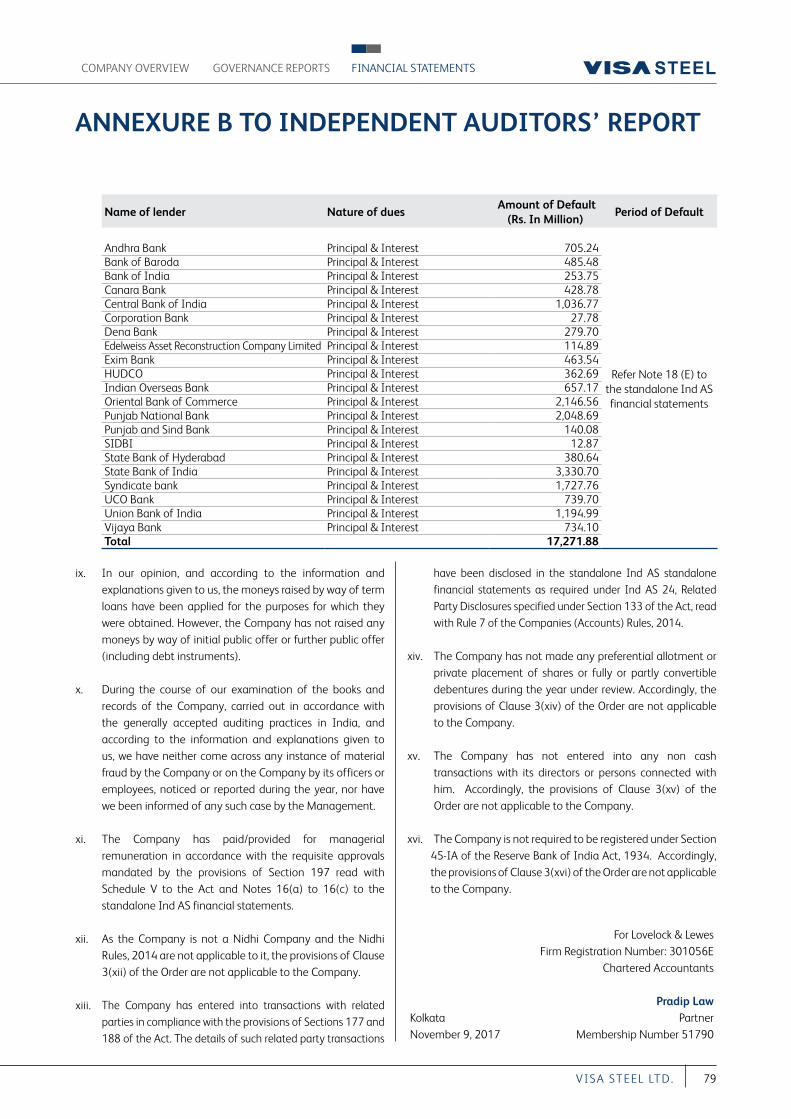
79VI S A S T EEL LT D.
COMPANY OVERVIEW FINANCIAL STATEMENTSGOVERNANCE REPORTS
Name of lender Nature of dues Amount of Default
(Rs. In Million) Period of Default
Andhra Bank Principal & Interest 705.24
Refer Note 18 (E) to the standalone Ind AS financial statements
Bank of Baroda Principal & Interest 485.48 Bank of India Principal & Interest 253.75 Canara Bank Principal & Interest 428.78 Central Bank of India Principal & Interest 1,036.77 Corporation Bank Principal & Interest 27.78 Dena Bank Principal & Interest 279.70 Edelweiss Asset Reconstruction Company Limited Principal & Interest 114.89 Exim Bank Principal & Interest 463.54 HUDCO Principal & Interest 362.69 Indian Overseas Bank Principal & Interest 657.17 Oriental Bank of Commerce Principal & Interest 2,146.56 Punjab National Bank Principal & Interest 2,048.69 Punjab and Sind Bank Principal & Interest 140.08 SIDBI Principal & Interest 12.87 State Bank of Hyderabad Principal & Interest 380.64 State Bank of India Principal & Interest 3,330.70 Syndicate bank Principal & Interest 1,727.76 UCO Bank Principal & Interest 739.70 Union Bank of India Principal & Interest 1,194.99 Vijaya Bank Principal & Interest 734.10 Total 17,271.88
ix. In our opinion, and according to the information and explanations given to us, the moneys raised by way of term loans have been applied for the purposes for which they were obtained. However, the Company has not raised any moneys by way of initial public offer or further public offer (including debt instruments).
x. During the course of our examination of the books and records of the Company, carried out in accordance with the generally accepted auditing practices in India, and according to the information and explanations given to us, we have neither come across any instance of material fraud by the Company or on the Company by its officers or employees, noticed or reported during the year, nor have we been informed of any such case by the Management.
xi. The Company has paid/provided for managerial remuneration in accordance with the requisite approvals mandated by the provisions of Section 197 read with Schedule V to the Act and Notes 16(a) to 16(c) to the standalone Ind AS financial statements.
xii. As the Company is not a Nidhi Company and the Nidhi Rules, 2014 are not applicable to it, the provisions of Clause 3(xii) of the Order are not applicable to the Company.
xiii. The Company has entered into transactions with related parties in compliance with the provisions of Sections 177 and 188 of the Act. The details of such related party transactions
have been disclosed in the standalone Ind AS standalone financial statements as required under Ind AS 24, Related Party Disclosures specified under Section 133 of the Act, read with Rule 7 of the Companies (Accounts) Rules, 2014.
xiv. The Company has not made any preferential allotment or private placement of shares or fully or partly convertible debentures during the year under review. Accordingly, the provisions of Clause 3(xiv) of the Order are not applicable to the Company.
xv. The Company has not entered into any non cash transactions with its directors or persons connected with him. Accordingly, the provisions of Clause 3(xv) of the Order are not applicable to the Company.
xvi. The Company is not required to be registered under Section 45-IA of the Reserve Bank of India Act, 1934. Accordingly, the provisions of Clause 3(xvi) of the Order are not applicable to the Company.
For Lovelock & LewesFirm Registration Number: 301056E
Chartered Accountants
Pradip LawKolkata PartnerNovember 9, 2017 Membership Number 51790
ANNEXURE B TO INDEPENDENT AUDITORS’ REPORT
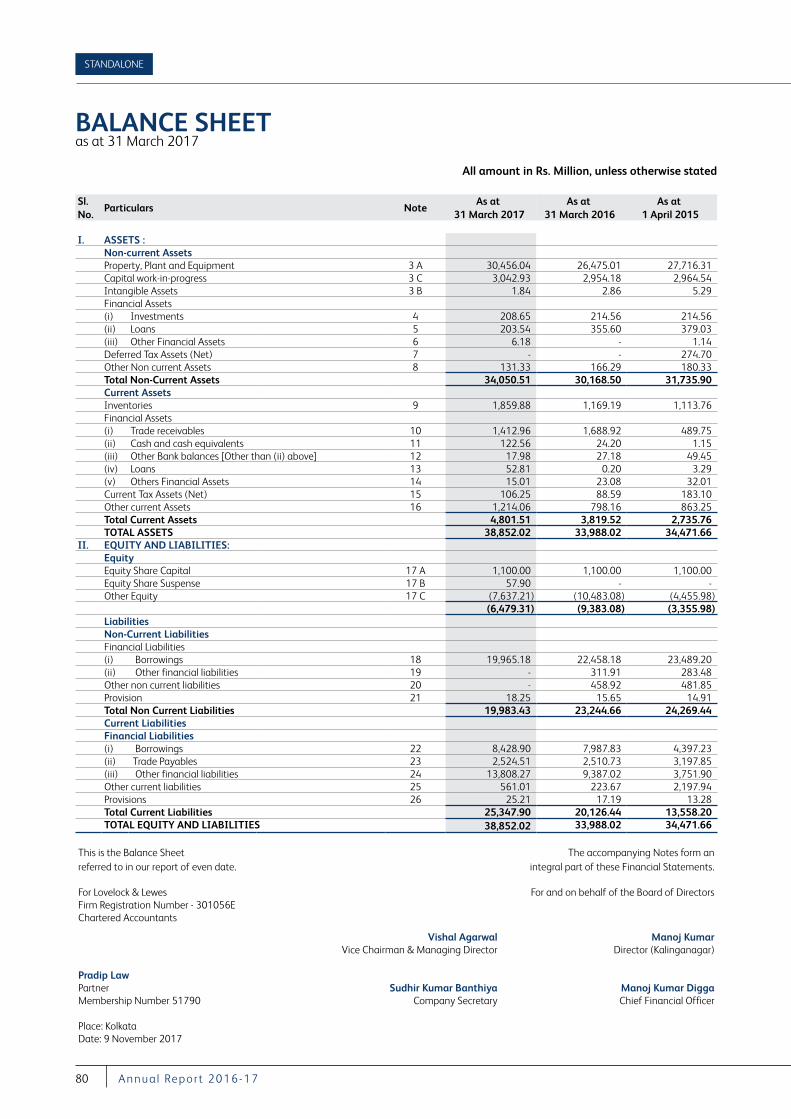
STANDALONE
80 A nnu a l Repor t 2016-17
BALANCE SHEETas at 31 March 2017
Sl. No.
Particulars NoteAs at
31 March 2017 As at
31 March 2016As at
1 April 2015
I. ASSETS :Non-current AssetsProperty, Plant and Equipment 3 A 30,456.04 26,475.01 27,716.31 Capital work-in-progress 3 C 3,042.93 2,954.18 2,964.54 Intangible Assets 3 B 1.84 2.86 5.29 Financial Assets(i) Investments 4 208.65 214.56 214.56 (ii) Loans 5 203.54 355.60 379.03 (iii) Other Financial Assets 6 6.18 - 1.14 Deferred Tax Assets (Net) 7 - - 274.70 Other Non current Assets 8 131.33 166.29 180.33 Total Non-Current Assets 34,050.51 30,168.50 31,735.90 Current AssetsInventories 9 1,859.88 1,169.19 1,113.76 Financial Assets(i) Trade receivables 10 1,412.96 1,688.92 489.75 (ii) Cash and cash equivalents 11 122.56 24.20 1.15 (iii) Other Bank balances [Other than (ii) above] 12 17.98 27.18 49.45 (iv) Loans 13 52.81 0.20 3.29 (v) Others Financial Assets 14 15.01 23.08 32.01 Current Tax Assets (Net) 15 106.25 88.59 183.10 Other current Assets 16 1,214.06 798.16 863.25 Total Current Assets 4,801.51 3,819.52 2,735.76 TOTAL ASSETS 38,852.02 33,988.02 34,471.66
II. EQUITY AND LIABILITIES:Equity Equity Share Capital 17 A 1,100.00 1,100.00 1,100.00 Equity Share Suspense 17 B 57.90 - -Other Equity 17 C (7,637.21) (10,483.08) (4,455.98)
(6,479.31) (9,383.08) (3,355.98)LiabilitiesNon-Current LiabilitiesFinancial Liabilities(i) Borrowings 18 19,965.18 22,458.18 23,489.20 (ii) Other financial liabilities 19 - 311.91 283.48 Other non current liabilities 20 - 458.92 481.85 Provision 21 18.25 15.65 14.91 Total Non Current Liabilities 19,983.43 23,244.66 24,269.44 Current LiabilitiesFinancial Liabilities(i) Borrowings 22 8,428.90 7,987.83 4,397.23 (ii) Trade Payables 23 2,524.51 2,510.73 3,197.85 (iii) Other financial liabilities 24 13,808.27 9,387.02 3,751.90 Other current liabilities 25 561.01 223.67 2,197.94 Provisions 26 25.21 17.19 13.28 Total Current Liabilities 25,347.90 20,126.44 13,558.20 TOTAL EQUITY AND LIABILITIES 38,852.02 33,988.02 34,471.66
This is the Balance Sheet The accompanying Notes form an referred to in our report of even date. integral part of these Financial Statements.
For Lovelock & Lewes For and on behalf of the Board of Directors Firm Registration Number - 301056EChartered Accountants
Vishal Agarwal Manoj Kumar Vice Chairman & Managing Director Director (Kalinganagar)
Pradip LawPartner Sudhir Kumar Banthiya Manoj Kumar Digga Membership Number 51790 Company Secretary Chief Financial Officer
Place: KolkataDate: 9 November 2017
All amount in Rs. Million, unless otherwise stated
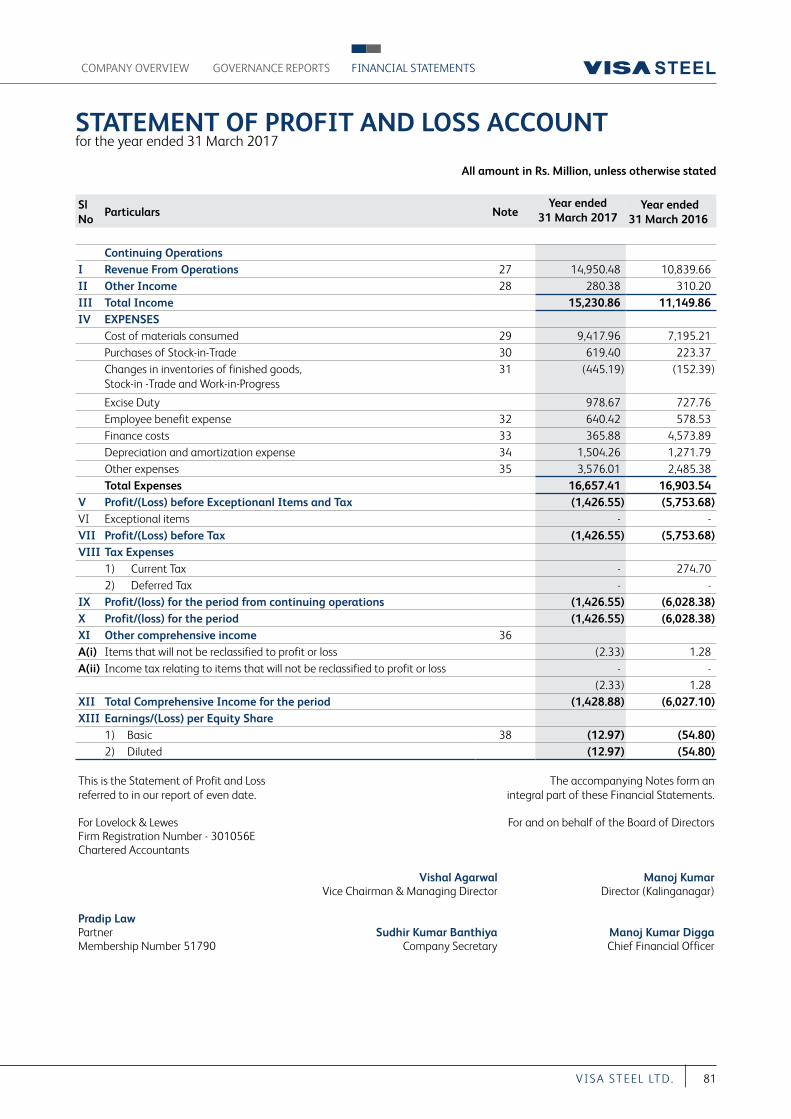
COMPANY OVERVIEW FINANCIAL STATEMENTSGOVERNANCE REPORTS
81VI S A S T EEL LT D.
Sl No
Particulars NoteYear ended
31 March 2017 Year ended
31 March 2016
Continuing OperationsI Revenue From Operations 27 14,950.48 10,839.66 II Other Income 28 280.38 310.20 III Total Income 15,230.86 11,149.86 IV EXPENSES
Cost of materials consumed 29 9,417.96 7,195.21 Purchases of Stock-in-Trade 30 619.40 223.37 Changes in inventories of finished goods, Stock-in -Trade and Work-in-Progress
31 (445.19) (152.39)
Excise Duty 978.67 727.76 Employee benefit expense 32 640.42 578.53 Finance costs 33 365.88 4,573.89 Depreciation and amortization expense 34 1,504.26 1,271.79 Other expenses 35 3,576.01 2,485.38 Total Expenses 16,657.41 16,903.54
V Profit/(Loss) before Exceptionanl Items and Tax (1,426.55) (5,753.68)VI Exceptional items - - VII Profit/(Loss) before Tax (1,426.55) (5,753.68)VIII Tax Expenses
1) Current Tax - 274.70 2) Deferred Tax - -
IX Profit/(loss) for the period from continuing operations (1,426.55) (6,028.38)X Profit/(loss) for the period (1,426.55) (6,028.38)XI Other comprehensive income 36A(i) Items that will not be reclassified to profit or loss (2.33) 1.28 A(ii) Income tax relating to items that will not be reclassified to profit or loss - -
(2.33) 1.28 XII Total Comprehensive Income for the period (1,428.88) (6,027.10)XIII Earnings/(Loss) per Equity Share
1) Basic 38 (12.97) (54.80)2) Diluted (12.97) (54.80)
This is the Statement of Profit and Loss The accompanying Notes form an referred to in our report of even date. integral part of these Financial Statements.
For Lovelock & Lewes For and on behalf of the Board of Directors Firm Registration Number - 301056EChartered Accountants
Vishal Agarwal Manoj Kumar Vice Chairman & Managing Director Director (Kalinganagar)
Pradip LawPartner Sudhir Kumar Banthiya Manoj Kumar Digga Membership Number 51790 Company Secretary Chief Financial Officer
STATEMENT OF PROFIT AND LOSS ACCOUNT for the year ended 31 March 2017
All amount in Rs. Million, unless otherwise stated
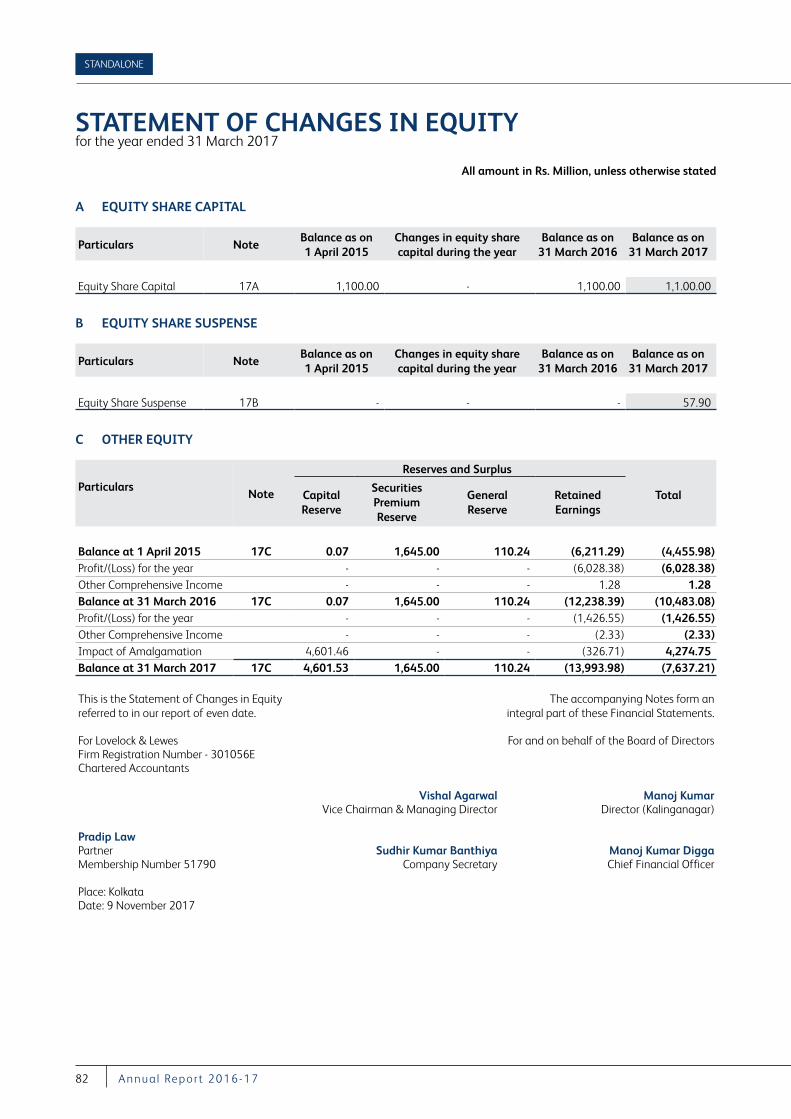
STANDALONE
82 A nnu a l Repor t 2016-17
A EQUITY SHARE CAPITAL
Particulars Note Balance as on 1 April 2015
Changes in equity share capital during the year
Balance as on 31 March 2016
Balance as on 31 March 2017
Equity Share Capital 17A 1,100.00 - 1,100.00 1,1.00.00
B EQUITY SHARE SUSPENSE
Particulars NoteBalance as on 1 April 2015
Changes in equity share capital during the year
Balance as on 31 March 2016
Balance as on 31 March 2017
Equity Share Suspense 17B - - - 57.90
C OTHER EQUITY
Particulars Note
Reserves and Surplus
Capital Reserve
Securities Premium Reserve
General Reserve
Retained Earnings
Total
Balance at 1 April 2015 17C 0.07 1,645.00 110.24 (6,211.29) (4,455.98)Profit/(Loss) for the year - - - (6,028.38) (6,028.38)Other Comprehensive Income - - - 1.28 1.28Balance at 31 March 2016 17C 0.07 1,645.00 110.24 (12,238.39) (10,483.08)Profit/(Loss) for the year - - - (1,426.55) (1,426.55)Other Comprehensive Income - - - (2.33) (2.33)Impact of Amalgamation 4,601.46 - - (326.71) 4,274.75 Balance at 31 March 2017 17C 4,601.53 1,645.00 110.24 (13,993.98) (7,637.21)
This is the Statement of Changes in Equity The accompanying Notes form an referred to in our report of even date. integral part of these Financial Statements.
For Lovelock & Lewes For and on behalf of the Board of Directors Firm Registration Number - 301056EChartered Accountants
Vishal Agarwal Manoj Kumar Vice Chairman & Managing Director Director (Kalinganagar)
Pradip LawPartner Sudhir Kumar Banthiya Manoj Kumar Digga Membership Number 51790 Company Secretary Chief Financial Officer
Place: KolkataDate: 9 November 2017
STATEMENT OF CHANGES IN EQUITY for the year ended 31 March 2017
All amount in Rs. Million, unless otherwise stated
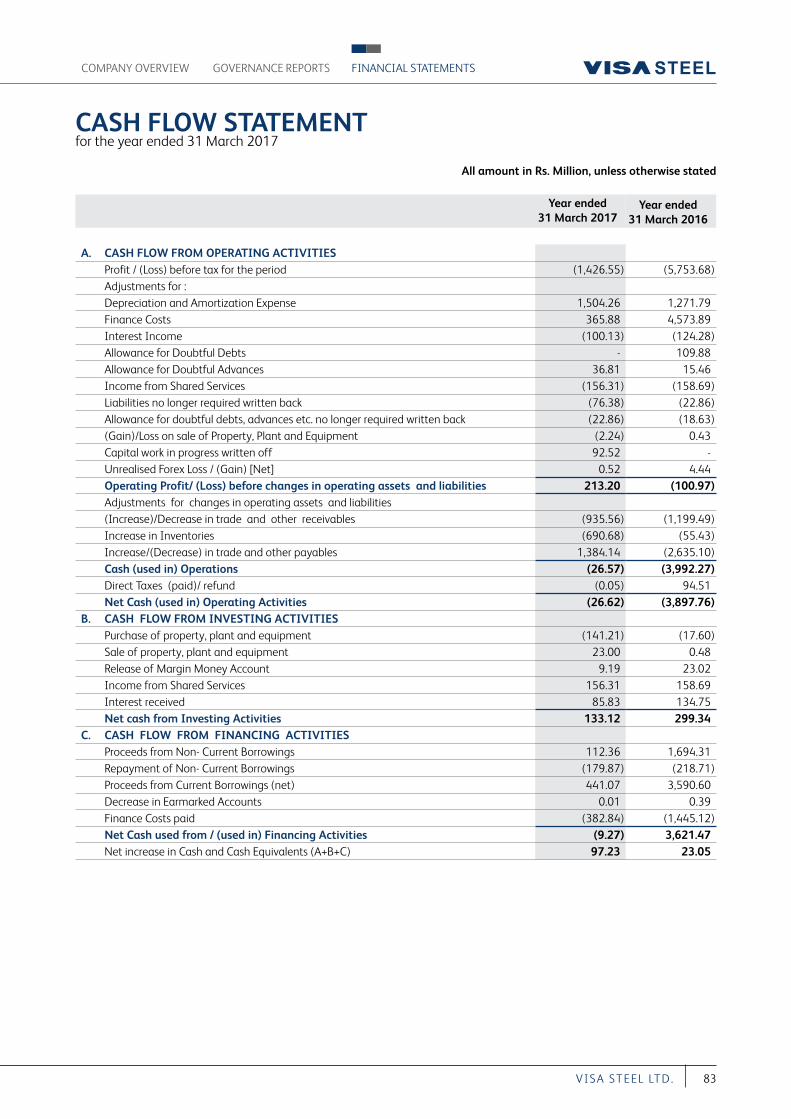
COMPANY OVERVIEW FINANCIAL STATEMENTSGOVERNANCE REPORTS
83VI S A S T EEL LT D.
Year ended 31 March 2017
Year ended 31 March 2016
A. CASH FLOW FROM OPERATING ACTIVITIES Profit / (Loss) before tax for the period (1,426.55) (5,753.68)Adjustments for :Depreciation and Amortization Expense 1,504.26 1,271.79 Finance Costs 365.88 4,573.89 Interest Income (100.13) (124.28)Allowance for Doubtful Debts - 109.88 Allowance for Doubtful Advances 36.81 15.46 Income from Shared Services (156.31) (158.69)Liabilities no longer required written back (76.38) (22.86)Allowance for doubtful debts, advances etc. no longer required written back (22.86) (18.63)(Gain)/Loss on sale of Property, Plant and Equipment (2.24) 0.43 Capital work in progress written off 92.52 -Unrealised Forex Loss / (Gain) [Net] 0.52 4.44 Operating Profit/ (Loss) before changes in operating assets and liabilities 213.20 (100.97)Adjustments for changes in operating assets and liabilities (Increase)/Decrease in trade and other receivables (935.56) (1,199.49)Increase in Inventories (690.68) (55.43)Increase/(Decrease) in trade and other payables 1,384.14 (2,635.10)Cash (used in) Operations (26.57) (3,992.27)Direct Taxes (paid)/ refund (0.05) 94.51 Net Cash (used in) Operating Activities (26.62) (3,897.76)
B. CASH FLOW FROM INVESTING ACTIVITIES Purchase of property, plant and equipment (141.21) (17.60)Sale of property, plant and equipment 23.00 0.48 Release of Margin Money Account 9.19 23.02 Income from Shared Services 156.31 158.69 Interest received 85.83 134.75 Net cash from Investing Activities 133.12 299.34
C. CASH FLOW FROM FINANCING ACTIVITIES Proceeds from Non- Current Borrowings 112.36 1,694.31 Repayment of Non- Current Borrowings (179.87) (218.71)Proceeds from Current Borrowings (net) 441.07 3,590.60 Decrease in Earmarked Accounts 0.01 0.39 Finance Costs paid (382.84) (1,445.12)Net Cash used from / (used in) Financing Activities (9.27) 3,621.47 Net increase in Cash and Cash Equivalents (A+B+C) 97.23 23.05
CASH FLOW STATEMENT for the year ended 31 March 2017
All amount in Rs. Million, unless otherwise stated
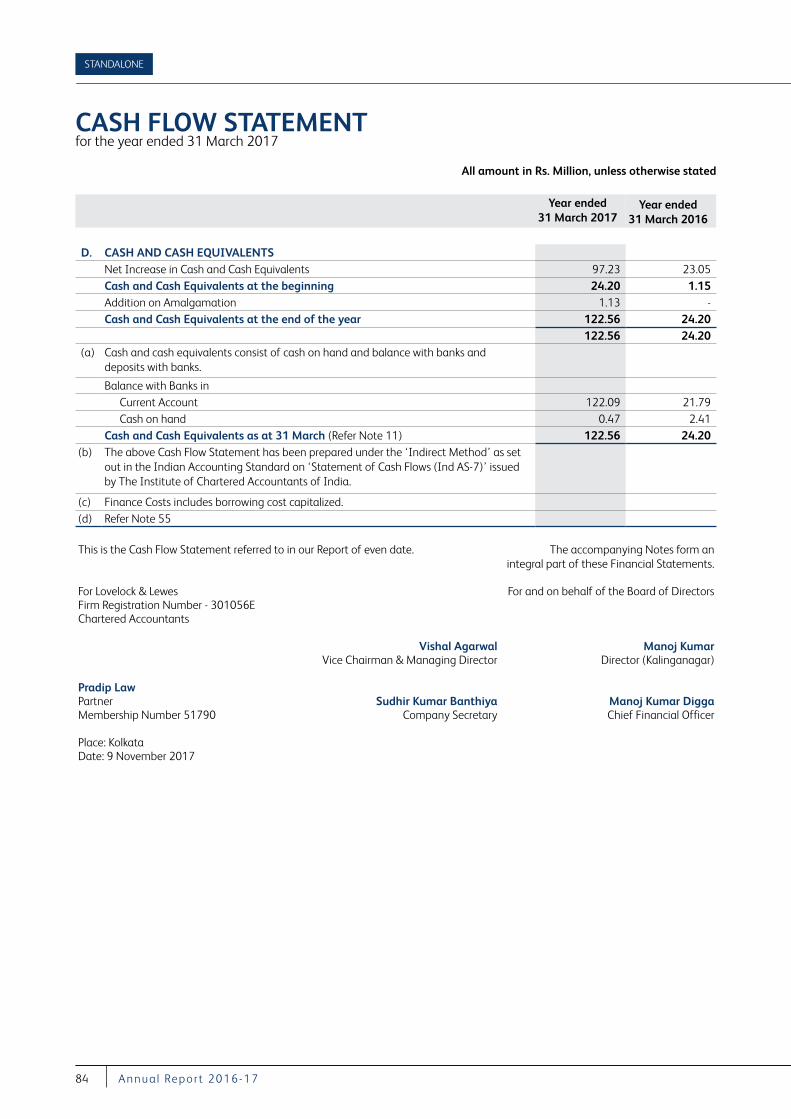
STANDALONE
84 A nnu a l Repor t 2016-17
Year ended 31 March 2017
Year ended 31 March 2016
D. CASH AND CASH EQUIVALENTS Net Increase in Cash and Cash Equivalents 97.23 23.05 Cash and Cash Equivalents at the beginning 24.20 1.15 Addition on Amalgamation 1.13 -Cash and Cash Equivalents at the end of the year 122.56 24.20
122.56 24.20 (a) Cash and cash equivalents consist of cash on hand and balance with banks and
deposits with banks.
Balance with Banks inCurrent Account 122.09 21.79 Cash on hand 0.47 2.41
Cash and Cash Equivalents as at 31 March (Refer Note 11) 122.56 24.20 (b) The above Cash Flow Statement has been prepared under the ‘Indirect Method’ as set
out in the Indian Accounting Standard on ‘Statement of Cash Flows (Ind AS-7)’ issued by The Institute of Chartered Accountants of India.
(c) Finance Costs includes borrowing cost capitalized.(d) Refer Note 55
This is the Cash Flow Statement referred to in our Report of even date. The accompanying Notes form an integral part of these Financial Statements.
For Lovelock & Lewes For and on behalf of the Board of Directors Firm Registration Number - 301056EChartered Accountants
Vishal Agarwal Manoj Kumar Vice Chairman & Managing Director Director (Kalinganagar)
Pradip LawPartner Sudhir Kumar Banthiya Manoj Kumar Digga Membership Number 51790 Company Secretary Chief Financial Officer
Place: KolkataDate: 9 November 2017
CASH FLOW STATEMENT for the year ended 31 March 2017
All amount in Rs. Million, unless otherwise stated
COMPANY OVERVIEW FINANCIAL STATEMENTSGOVERNANCE REPORTS
85VI S A S T EEL LT D.
SIGNIFICANT ACCOUNTING POLICIES AND NOTES TO THE FINANCIAL STATEMENTS
1 Corporate Information VISA Steel Limited (“VSL” or “the Company”) is engaged
in the manufacturing of Iron and Steel products including Pig Iron, Sponge Iron, Special Steel and High Carbon Ferro Chrome with captive power plant incorporated on 10 September, 1996, VSL has its registered office at Bhubaneswar and Corporate Office in Kolkata with manufacturing facilities at Kalinganagar and Golagaon both in Odisha and branch offices across India. VSL is a Public Limited Company with its shares listed on BSE Limited (BSE) and National Stock Exchange of India Limited (NSE). Pursuant to the scheme of Amalgamation (“the Scheme”), VISA Bao Limited (“VBL”), an erstwhile subsidiary company, amalgamated with the Comapany. (Refer Note-48)
2 Basis of preparation of financial statements, significant accounting policies and critical estimates & judgements
2.1 Basis of preparation of financial statements2.1.1 Compliance with Ind AS These financial statements have been prepared
to comply in all material aspects with Indian Accounting Standards (“Ind AS”) notified under the Companies (Indian Accounting Standards) Rules, 2015 [As amended] notified under Section 133 of the Companies Act, 2013 (the Act) and other relevant provisions of the Act, to the extent applicable. The financial statements upto the year ended 31 March 2016, were prepared in accordance with the accounting standards notified under the Companies (Accounting Standard) Rules, 2006 (as amended) and other relevant provisions of the Act. This Note provides a list of the significant accounting policies adopted in the preparation of these standalone financial statements. These policies have been consistently applied to all the years presented, unless otherwise stated. These financial statements are the first financial statements of the Company under Ind AS. An explanation of how the transition from previous GAAP to Ind AS has affected the Company’s financial position, financial performance and cash flows is given in Note 47.
2.1.2 Historical cost convention The financial statements have been prepared on the
historical cost convention and on accrual basis except for the following:
- certain financial assets and liabilities including derivative
instruments measured at fair value - defined benefit plans - plan assets measured at fair value - share-based payments
2.1.3 Current versus non-current classification The Company presents assets and liabilities in the balance
sheet based on current/ non-current classification. An asset is current when it is:
Expected to be realised or intended to be sold or consumed in normal operating cycle
Held primarily for the purpose of trading
Expected to be realised within twelve months after the reporting period, or
Cash or cash equivalent unless restricted from being exchanged or used to settle a liability for at least twelve months after the reporting period
All other assets are classified as non-current. A liability is current when:
It is expected to be settled in normal operating cycle
It is held primarily for the purpose of trading
It is due to be settled within twelve months after the reporting period, or
There is no unconditional right to defer the settlement of the liability for at least twelve months after the reporting period.
The Company classifies all other liabilities as non-current.
2.2 Summary of significant accounting policies2.2.1 Financial instruments2.2.1.1 A financial instrument is a contract that gives rise to a
financial asset of one entity and a financial liability or equity instrument of another entity.
Financial asset i) Classification and measurement Classification The Company classifies its financial assets, other than
investments in subsidiaries and joint venture in the following measurement categories:
1) those to be measured subsequently at fair value
All amount in Rs. Million, unless otherwise stated
STANDALONE
86 A nnu a l Repor t 2016-17
(either through other comprehensive income, or through profit or loss), and
2) those measured at amortised cost. The classification depends on the Company’s
business model for managing the financial assets and the contractual terms of the cash flows. For assets measured at fair value, gains and losses will either be recorded in profit or loss or other comprehensive income. For investments in debt instruments, this will depend on the business model in which the investment is held. For investments in equity instruments, this will depend on whether the Company has made an irrevocable election at the time of initial recognition to account for the equity investment at fair value through other comprehensive income. The Company reclassifies debt investments when and only when its business model for managing those assets changes.
Measurement At initial recognition, all financial assets are measured
initially at fair value plus, in the case of financial assets not recorded at fair value through profit or loss, transaction costs that are attributable to the acquisition of the financial asset. Transaction costs of financial assets carried at fair value through profit or loss are expensed in profit or loss. Purchase or sales of financial assets that require delivery of assets within a time frame established by regulation or convention in the market place (regular way trade) are recognised on trade date.
Debt instruments Subsequent measurement of debt instruments depends
on the Company’s business model for managing the asset and the cash flow characteristics of the asset. There is only one measurement category into which the Company classifies its debt instruments as follows: Amortised cost: Assets that are held for collection of contractual cash flows where those cash flows represent solely payments of principal and interest are measured at amortised cost. A gain or loss on a debt investment that is subsequently measured at amortised cost and is not part of a hedging relationship is recognised in profit or loss when the asset is derecognised or impaired. Interest income from these financial assets is included in finance
income using the effective interest rate method.
Trade receivables Trade receivables are recognised initially at fair
value and subsequently measured at amortised cost using the effective interest method, less provision for impairment.
Cash and cash equivalents For the purpose of presentation in the statement of
cash flows, cash and cash equivalents includes cash on hand, deposits held at call with financial institutions, other short-term, highly liquid investments with original maturities of three months or less that are readily convertible to known amounts of cash and which are subject to an insignificant risk of changes in value, and bank overdrafts which are repayable on demand and form an integral part of an entity’s cash management system. Other bank overdrafts are shown within borrowings in current liabilities in the balance sheet.
ii) Impairment of financial assets The Company assesses on a forward looking basis
the expected credit losses associated with its assets carried at amortised cost. The impairment methodology applied depends on whether there has been a significant increase in credit risk. Note 52 details how the Company determines whether there has been a significant increase in credit risk. For trade receivables only, the Company applies the simplified approach permitted by Ind AS 109 Financial Instruments, which requires expected lifetime losses to be recognised from initial recognition of the receivables.
iii) Derecognition of financial assets A financial asset (or, where applicable, a part of a
financial asset or part of a group of similar financial assets) is primarily derecognised when:
The rights to receive cash flows from the financial asset have been transferred, or
The Company retains the contractual rights to receive the cash flows of the financial asset but assumes a contractual obligation to pay the cash flows to one or more recipients.
SIGNIFICANT ACCOUNTING POLICIES AND NOTES TO THE FINANCIAL STATEMENTS
All amount in Rs. Million, unless otherwise stated
COMPANY OVERVIEW FINANCIAL STATEMENTSGOVERNANCE REPORTS
87VI S A S T EEL LT D.
When the Company has transferred an asset, it evaluates whether it has transferred substantially all risks and rewards of ownership of the financial asset. In such cases, the financial asset is derecognised. When the Company has not transferred substantially all the risks and rewards of ownership of a financial asset, the financial asset is not derecognised. When the Company has neither transferred a financial asset nor retains substantially all risks and rewards of ownership of the financial asset, the financial asset is derecognised if the Company has not retained control of the financial asset. When the Company retains control of the financial asset, the asset is continued to be recognised to the extent of continuing involvement of the asset.
iv) Income recognition Interest income from debt instruments is recognised
using the effective interest rate method. The effective interest rate is the rate that exactly discounts estimated future cash receipts through the expected life of the financial asset to the gross carrying amount of a financial asset. When calculating the effective interest rate, the Company estimates the expected cash flows by considering all the contractual terms of the financial instrument (for example, prepayment, extension, call and similar options) but does not consider the expected credit losses. Dividends are recognised in profit or loss only when the right to receive payment is established, it is probable that the economic benefits associated with the dividend will flow to the Company, and the amount of the dividend can be measured reliably.”
2.2.1.2 Financial liabilities i) Initial recognition and measurement Financial liabilities are classified, at initial recognition,
as financial liabilities at fair value through profit or loss and amortised cost, as appropriate.
All financial liabilities are recognised initially at fair value and, in the case of loans and borrowings and payables, net of directly attributable transaction costs. The Company’s financial liabilities includes trade and other payables and loans and borrowings including bank overdrafts.
ii) Subsequent measurement The measurement of financial liabilities depends on
their classification, as described below:
Financial liabilities at fair value through profit or loss include financial liabilities held for trading and financial liabilities designated upon initial recognition as at fair value through profit or loss. This category also includes derivative financial instruments entered into by the Company that are not designated as hedging instruments in hedge relationships as defined by Ind-AS 109. Gains or losses on liabilities held for trading are recognised in the profit or loss.
Financial liabilities designated upon initial recognition at fair value through profit or loss are designated at the initial date of recognition, and only if the criteria in Ind-AS 109 are satisfied. For liabilities designated as Fair Value Through Profit or Loss, fair value gains/ losses attributable to changes in own credit risk are recognized in Other Comprehensive Income. These gains/loss are not subsequently transferred to statement of profit or loss. However, the Company may transfer the cumulative gain or loss within equity. All other changes in fair value of such liability are recognised in the statement of profit or loss.
Loans and Borrowings Borrowings are initially recognized at fair value,
net of transaction costs incurred. Borrowings are subsequently measured at amortised cost. Any difference between the proceeds (net of transaction costs) and the redemption amount is recognised in the statement of profit and loss over the period of the borrowings using the effective interest method. Fees paid on the establishment of loan facilities are recognised as transaction costs of the loan to the extent that it is probable that some or all of the facility will be drawn down. In this case, the fee is deferred until the draw down occurs. To the extent there is no evidence that it is probable that some or all of the facility will be drawn down, the fee is capitalized as a prepayment for liquidity services and amortised over the period of the facility to which it relates. Borrowings are removed from the balance sheet when the obligation specified in the contract is discharged, cancelled or expired.
SIGNIFICANT ACCOUNTING POLICIES AND NOTES TO THE FINANCIAL STATEMENTS
All amount in Rs. Million, unless otherwise stated
STANDALONE
88 A nnu a l Repor t 2016-17
Trade and other payables These amount represent liabilities for goods and
services provided to the Company prior to the end of the financial year which are unpaid. Trade and other payables are classifed as current liabilities unless payments is not due for payment within 12 months after the reporting period. They are recognised initially at their fair value and subsequently measured at amortized cost model.
ii) Derecognition of financial liabilities A financial liability is derecognised when the obligation
under the liability is discharged or cancelled or expires. When an existing financial liability is replaced by another from the same lender on substantially different terms, or the terms of an existing liability are substantially modified, such an exchange or modification is treated as the derecognition of the original liability and the recognition of a new liability. The difference in the respective carrying amounts is recognised in profit or loss.
2.2.1.3 Derivatives Derivatives are initially recognised at fair value on the date
a derivative contract is entered into and are subsequently re-measured to their fair value at the end of each reporting period. The Company uses derivative financial instruments such as forward currency contracts to hedge its foreign currency risks which are not designated as hedges. Such derivative financial instruments are recognised at fair value. Derivatives are carried as financial assets when the fair value is positive and as financial liabilities when the fair value is negative. Gains or losses arising from such fair valuation of such derivatives is recognised as income or expense through profit or loss.
2.2.1.4 Offsetting of financial instrument Financial assets and financial liabilities are offset and the
net amount is reported in the balance sheet where there is an enforceable legal right to offset the recognised amounts and there is an intention to settle on a net basis or to realise the assets and settle the liabilities simultaneously.The legally enforceable right must not be contingent on future events and must be enforceable in the normal course of business and in the event of default, insolvency or bankruptcy of the Company or the counterparty.
2.2.1.5 Investments in subsidiaries and joint venture Investments in subsidiaries and joint ventures are carried
at cost less accumulated impairment loss, if any. Where
an indication of impairment exists, the carrying amount of the investment is assessed and written down immediately to its recoverable amount. On disposal of investments in subsidiaries and joint ventures, the difference between net disposal proceeds and the carrying amounts is recognised in the statement of profit and loss.
Transition to Ind AS On the date of transition to Ind AS i.e. 1 April 2015, the
Company has elected to use fair value of its investments in certain subsidiaries on the transition date as deemed cost, while in case of investments in other subsidiaries and joint ventures, carrying amount of such investments under the previous GAAP has been used as deemed cost.
2.2.2 Property, plant and equipment Freehold land is carried at historical cost. All other items
of property, plant and equipment are carried at historical cost less accumulated depreciation and accumulated impairment loss, if any. Historical cost includes expenditure that is directly attributable to the acquisition of the items. Subsequent costs are included in the asset’s carrying amount or recognized as a separate asset, as appropriate, only when it is probable that future economic benefits associated with the item will flow to the Company and the cost of the item can be measured reliably. The carrying amount of any component accounted for as a separate asset is derecognised when replaced. All other repairs and maintenance are charged to profit or loss during the reporting period in which they are incurred. Gains and losses on disposals are determined by comparing proceeds with carrying amount. These are included in the statement of profit and loss within other income/expenses.
Transition to Ind AS On transition to Ind AS, the Company has elected to
continue with the carrying value of all of its property, plant and equipment recognised as at 1 April 2015 measured as per the previous GAAP and use that carrying value as the deemed cost of the property, plant and equipment
Depreciation methods, estimated useful lives and residual values
Depreciation including amortization where applicable is provided on pro-rata basis under Straight Line Method (SLM) over the estimated useful lives of the assets as specified in Schedule II to the Companies Act, 2013 (‘the Act’), which are also supported by technical assessment carried out by the Company other than the following:
SIGNIFICANT ACCOUNTING POLICIES AND NOTES TO THE FINANCIAL STATEMENTS
All amount in Rs. Million, unless otherwise stated
COMPANY OVERVIEW FINANCIAL STATEMENTSGOVERNANCE REPORTS
89VI S A S T EEL LT D.
- Leasehold assets(Buildings and Plant and Machinery) which are jointly held are amortized over the period of lease i.e, 6 to10 years, being lower than the useful lives specified in Schedule II to the Act for similar assets.
- Furnace refractories are depreciated over useful life of 5-6 years based on technical assessment carried out by the Company - Leasehold land is amortized over the period of lease
Items of spare parts, stand-by equipment and servicing equipment which meet the definition of property, plant and equipment are capitalized and depreciated under SLM on pro-rata basis at the rates specified therein. Other spare parts are carried as inventory and recognized in the income statement on consumption. The property, plant and equipment acquired under finance leases is depreciated over the asset’s useful life or over the shorter of the asset’s useful life and the lease term if there is no reasonable certainty that the Company will obtain ownership at the end of the lease term.
Residual value: The residual values are not more than 5% of the original cost of the assets. The useful lives, residual values and method of depreciation of property plant and equipment are reviewed and adjusted, if appropriate at the end of each reporting period.
2.2.3 Intangible assets Intangible assets (Computer Software) are carried at
cost less accumulated amortisation and accumulated impairment loss, if any. Computer Software for internal use, which is primarily acquired, is capitalised. Subsequent costs associated with maintaining such software are recognised as expense as incurred. Cost of Software includes licenses fees and cost of implementation, system integration services etc. where applicable.
Transition to Ind AS On transition to Ind AS, the Company has elected to
continue with the carrying value of all of its intangible assets (Computer Software) recognised as at 1 April 2015 measured as per the previous GAAP and use that carrying value as the deemed cost of such intangible assets.
Amortisation The Company amortises intangible assets (Computer
Software) with a finite useful life using the straight line method over a period of 3 years .
2.2.4 Impairment of non financial assets The Company assesses, at each reporting date, whether
there is an indication that an asset may be impaired. If any indication exists, or when annual impairment testing for an asset is required, the Company estimates the asset’s recoverable amount. An asset’s recoverable amount is the higher of an asset’s or Cash Generating Unit’s (CGU) fair value less costs of disposal and its value in use. Recoverable amount is determined for an individual asset, unless the asset does not generate cash inflows that are largely independent of those from other assets. An impairment loss is recognised for the amount by which the asset’s carrying amount exceeds its recoverable amount. Non- financial assets other than goodwill that suffered an impairment are reviewed for possible reversal of the impairment at the end of each reporting period. In assessing value in use, the estimated future cash flows are discounted to their present value using a pre-tax discount rate that reflects current market assessments of the time value of money and the risks specific to the asset. In determining fair value less costs of disposal, recent market transactions are taken into account. If no such transactions can be identified, an appropriate valuation model is used.
The Company bases its impairment calculation on detailed budgets and forecast calculations, which are prepared separately for each of the Company’s CGUs to which the individual assets are allocated. These budgets and forecast calculations generally cover a period of five years. For longer periods, a long term growth rate is calculated and applied to project future cash flows after the fifth year.
Impairment losses of continuing operations, including impairment on inventories, are recognised in profit or loss section of the statement of profit and loss, except for properties previously revalued with the revaluation taken to OCI. For such properties, the impairment is recognised in OCI up to the amount of any previous revaluation.
2.2.5 Leases The determination of whether an arrangement is
(or contains) a lease is based on the substance of the arrangement at the inception of the lease. The arrangement is, or contains, a lease if fulfilment of the arrangement is dependent on the use of a specific asset or assets and the arrangement conveys a right to use the asset or assets, even if that right is not explicitly specified in an arrangement.
SIGNIFICANT ACCOUNTING POLICIES AND NOTES TO THE FINANCIAL STATEMENTS
All amount in Rs. Million, unless otherwise stated
STANDALONE
90 A nnu a l Repor t 2016-17
For arrangements entered into prior to 1 April 2015, the date of inception is deemed to be 1 April 2015 in accordance with Ind-AS 101, First-time Adoption of Indian Accounting Standard.
As a lessee A lease is classified at the inception date as a finance lease
or an operating lease. A lease that transfers substantially all the risks and rewards incidental to ownership to the Company is classified as a finance lease. Leases in which a significant portion of the risks and rewards of ownership are retained by the lessor are classified as operating leases.
Finance leases are capitalised at the inception date at fair value of the leased property or, if lower, at the present value of the minimum lease payments. The corresponding rental obligations, net of finance charges, are included in the borrowings or other financial liabilities as appropriate Lease payments are apportioned between finance charges and reduction of the lease liability so as to achieve a constant rate of interest on the remaining balance of the liability. Finance charges are recognised in finance costs in the statement of profit and loss. Contingent rents are charged as expenses in the period in which they are incurred.
A leased asset is depreciated over the useful life of the asset. However, if there is no reasonable certainty that the Company will obtain ownership by the end of the lease term, the asset is depreciated over the shorter of the estimated useful life of the asset and the lease term.
Operating lease payments are recognised as an expense in the statement of profit and loss on a straight-line basis over the lease term unless the payments are structured to increase in line with expected general inflation to compensate for the lessor’s expected inflationary cost increases.
As a lessor Leases in which the Company does not transfer substantially
all the risks and rewards of ownership of an asset are classified as operating leases. Lease income from operating leases is recognised as income on a straight-line basis over the lease term unless the receipts are structured to increase in line with expected general inflation to compensate for the expected inflationary cost increases. Initial direct costs incurred in negotiating and arranging an operating lease are added to the carrying amount of the leased asset and
recognised over the lease term on the same basis as rental income. Contingent rents are recognised as income in the period in which they are earned.
Leases are classified as finance leases when substantially all of the risks and rewards incidental to legal ownership transfer from the Company to the lessee. Amounts due from lessees under finance leases are recorded as receivables at the inception of the lease as the Company’s net investment in the lease. Lease payment receivable is treated by the lessor as repayment of principal and finance income to reimburse and reward the lessor for its investment and services. Initial direct costs incurred in negotiating and arranging a lease are included in the initial measurement of the finance lease receivable and reduce the amount of income recognised over the lease term. Finance lease income is allocated to accounting periods so as to reflect a constant periodic rate of return on the net investment outstanding in respect of the lease.
2.2.6 Capital work-in-progress The items of property, plant and equipment which are not
yet ready for use are disclosed as Capital work-in-progress and are carried at historical cost.
Transition to Ind AS On transition to Ind AS, the Company has elected to
continue with the carrying value of all items of capital work-in-progress recognised as at 1st April, 2015 measured as per the previous GAAP and use that carrying value as the deemed cost of such items of capital work-in-progress.
2.2.7 Inventories Raw materials and stores, work in progress, traded and
finished goods are stated at the lower of cost and net realisable value. Cost of raw materials and traded goods comprises cost of purchases. Cost of work-in progress and finished goods comprises direct materials, direct labour and an appropriate proportion of variable and fixed overhead expenditure, the latter being allocated on the basis of normal operating capacity. Cost of inventories also include all other costs incurred in bringing the inventories to their present location and condition. Costs are assigned to individual items of inventory on the basis of weighted average basis. Costs of purchased inventory are determined after deducting rebates, CENVAT Credits and discounts. Net realisable value is the estimated selling price in the ordinary course of business less the estimated costs of completion and the estimated costs necessary to make the sale.
SIGNIFICANT ACCOUNTING POLICIES AND NOTES TO THE FINANCIAL STATEMENTS
All amount in Rs. Million, unless otherwise stated
COMPANY OVERVIEW FINANCIAL STATEMENTSGOVERNANCE REPORTS
91VI S A S T EEL LT D.
SIGNIFICANT ACCOUNTING POLICIES AND NOTES TO THE FINANCIAL STATEMENTS
2.2.8 Provisions and Contingent Liabilities Provisions are recognised when the Company has a
present legal or constructive obligation as a result of past events, it is probable that an outflow of resources will be required to settle the obligation and the amount can be reliably estimated. Provisions are not recognised for future operating losses.
Provisions are measured at the present value of management’s best estimate of the expenditure required to settle the present obligation at the end of the reporting period. The discount rate used to determine the present value is a pre-tax rate that reflects current market assessments of the time value of money and the risks specific to the liability. The increase in the provision due to the passage of time is recognised as interest expense. However contingent liabilities are not considered. Contingent liabilities are disclosed when there is a possible obligation arising from past events, the existence of which will be confirmed only by the occurrence or non occurrence of one or more uncertain future events not wholly within the control of the Company or a present obligation that arises from past events where it is either not probable that an outflow of resources will be required to settle or a reliable estimate of the amount cannot be made.
2.2.9 Revenue recognition Revenue is measured at the fair value of the consideration
received or receivable. Amounts disclosed as revenue are inclusive of excise duty and net of returns, trade discounts, rebates, Value Added Tax and amounts collected on behalf of third parties.
The Company recognises revenue when the amount of revenue can be reliably measured, it is probable that future economic benefits will flow to the Company and specific criteria have been met for each of the Company’s activities as described below. The Company bases its estimates on historical results, taking into consideration the type of customer, the type of transaction and the specifics of each arrangement.
Sale of Goods : Revenue from the sale of goods is recognised when all the following conditions are satisfied:
the Company has transferred to the buyer the significant risks and rewards of ownership of the goods;
the Company retains neither continuing managerial involvement to the degree usually associated with ownership nor effective control over the goods sold;
the amount of revenue can be measured reliably;
it is probable that the economic benefits associated with the transaction will flow to the Company; and
the costs incurred or to be incurred in respect of the transaction can be measured reliably.
Sale of Services : Sales are recognised upon the rendering of services and are recognised net of service tax.
All other items are recognised on accrual basis.
2.2.10 Income Tax The income tax expense or credit for the period is the tax
payable on the current period’s taxable income based on the applicable income tax rate for each jurisdiction adjusted by changes in deferred tax assets and liabilities attributable to temporary differences and to unused tax losses. The current income tax charge is calculated on the basis of the tax laws enacted or substantively enacted at the end of the reporting period. Management periodically evaluates positions taken in tax returns with respect to situations in which applicable tax regulation is subject to interpretation. It establishes provisions where appropriate on the basis of amounts expected to be paid to the tax authorities. Deferred income tax is provided in full, using the liability method, on temporary differences arising between the tax bases of assets and liabilities and their carrying amounts in the seperate financial statements. However, deferred tax liabilities are not recognised if they arise from the initial recognition of goodwill. Deferred income tax is also not accounted for if it arises from initial recognition of an asset or liability in a transaction other than a business combination that at the time of the transaction affects neither accounting profit nor taxable profit (tax loss). Deferred income tax is determined using tax rates (and laws) that have been enacted or substantially enacted by the end of the reporting period and are expected to apply when the related deferred income tax asset is realised or the deferred income tax liability is settled. Deferred tax assets are recognised for all deductible temporary differences and unused tax losses only if it is
All amount in Rs. Million, unless otherwise stated
STANDALONE
92 A nnu a l Repor t 2016-17
probable that future taxable amounts will be available to utilise those temporary differences and loss
Deferred tax assets and liabilities are offset when there is a legally enforceable right to offset current tax assets and liabilities and when the deferred tax balances relate to the same taxation authority. Current tax assets and tax liabilities are offset where the Company has a legally enforceable right to offset and intends either to settle on a net basis, or to realise the asset and settle the liability simultaneously.
Current and deferred tax is recognised in profit or loss, except to the extent that it relates to items recognised in other comprehensive income or directly in equity. In this case, the tax is also recognised in other comprehensive income or directly in equity, respectively.
2.2.11 Employee benefits Short-term obligations Liabilities for wages and salaries, including non-monetary
benefits that are expected to be settled wholly within 12 months after the end of the period in which the employees render the related service are recognized in respect of employees services up to the end of the reporting period and are measured at the amounts expected to be paid when the liabilities are settled. The liabilities are presented as current employee benefit obligations in the balance sheet
Other long-term employee benefit obligations The liabilities for earned leave and sick leave are not
expected to be settled wholly within 12 months after the end of the period in which the employees render the related service. They are therefore measured as the present value of expected future payments to be made in respect of services provided by employees up to the end of the reporting period on government bonds using the projected unit credit method. The benefits are discounted using the market yields at the end of the reporting period that have terms approximating to the terms of the related obligation. Remeasurements as a result of experience adjustments and changes in actuarial assumptions are recognised in profit or loss.
The obligations are presented as current liabilities in the balance sheet if the Company does not have an unconditional right to defer settlement for at least twelve months after the reporting period, regardless of when the actual settlement is expected to occur.
Post-employment obligations The Company operates the following post-employment
schemes:
(a) defined benefit plans such as gratuity and (b) defined contribution plans such as provident fund.
Defined benefit plan The liability or asset recognised in the balance sheet in
respect of defined benefit gratuity plans is the present value of the defined benefit obligation at the end of the reporting period less the fair value of plan assets. The defined benefit obligation is calculated annually by actuaries using the projected unit credit method.
The present value of the defined benefit obligation is determined by discounting the estimated future cash outflows by reference to market yields at the end of the reporting period on government bonds that have terms approximating to the terms of the related obligation.
The net interest cost is calculated by applying the discount rate to the net balance of the defined benefit obligation and the fair value of plan assets. This cost is included in employee benefit expense in the statement of profit and loss.
Remeasurement gains and losses arising from experience adjustments and changes in actuarial assumptions are recognised in the period in which they occur, directly in other comprehensive income. They are included in retained earnings in the statement of changes in equity and in the balance sheet.
Changes in the present value of the defined benefit obligation resulting from plan amendments or curtailments are recognised immediately in profit or loss as past service cost.
Defined contribution plans The Company pays provident fund contributions to publicly
administered provident funds as per local regulations. The Company has no further payment obligations once the contributions have been paid. The contributions are accounted for as defined contribution plans and the contributions are recognised as employee benefit expense when they are due. Prepaid contributions are recognised as an asset to the extent that a cash refund or a reduction in the future payments is available.
SIGNIFICANT ACCOUNTING POLICIES AND NOTES TO THE FINANCIAL STATEMENTS
All amount in Rs. Million, unless otherwise stated
COMPANY OVERVIEW FINANCIAL STATEMENTSGOVERNANCE REPORTS
93VI S A S T EEL LT D.
Share-based payments Share-based compensation benefits are provided to
employees via the Employee Stock Option Scheme 2010. The fair value of options granted under the Employee Stock Option Scheme 2010 is recognised as an employee benefits expense with a corresponding increase in equity. The total amount to be expensed is determined by reference to the fair value of the options granted:
- including any market performance conditions (e.g., the Company’s share price)
- excluding the impact of any service and non-market performance vesting conditions (e.g. profitability, sales growth targets and retaining an employee of the Company over a specified time period), and
- including the impact of any non-vesting conditions (e.g. the requirement for employees to save or hold shares for a specific period of time).
The total expense is recognised over the vesting period, which is the period over which all of the specified vesting conditions are to be satisfied. At the end of each period, the Company revises its estimates of the number of options that are expected to vest based on the non-market vesting and service conditions. It recognises the impact of the revision to original estimates, if any, in profit or loss, with a corresponding adjustment to equity.
2.2.12 Foreign currency transactions The Company’s financial statements are presented in
Indian Rupee which is also the functional currency.
Foreign currency transactions are translated into the functional currency using the exchange rates at the dates of the transactions. Foreign exchange gains and losses resulting from the settlement of such transactions and from the translation of monetary assets and liabilities denominated in foreign currencies at year end exchange rates are generally recognised in profit or loss.
Foreign exchange differences regarded as an adjustment to borrowing costs are presented in the statement of profit and loss, within finance costs. All other foreign exchange gains and losses are presented in the statement of profit and loss on a net basis within other income/expenses. Non-monetary items that are measured at fair value in a foreign currency are translated using the exchange rates at the date when the fair value was determined.
Translation differences on assets and liabilities carried at fair value are reported as part of the fair value gain or loss.
2.2.13 Borrowing costs General and specific borrowing costs that are directly
attributable to the acquisition, construction or production of a qualifying asset are capitalised during the period of time that is required to complete and prepare the asset for its intended use or sale. Qualifying assets are assets that necessarily take a substantial period of time to get ready for their intended use or sale.
Other borrowing costs are expensed in the period in which they are incurred.
2.2.14 Earnings Per Share Basic Earning Per Share is calculated by dividing the profit
for the year attributable to equity holders(or owners) of the Company by the weighted average number of equity shares outstanding during the year.
Diluted Earning Per Share is calculated by dividing the profit attributable to equity holders (or owners) of the Company by the weighted average number of equity shares outstanding during the year plus the weighted average number of equity shares that would be issued on conversion of all the dilutive potential equity shares into equity shares.
2.2.15 Segment Reporting Operating segments are reported in a manner consistent
with the internal reporting provided to the chief operating decision maker. Refer note 46 for details on segment information presented. Chief operating decision making group consists of the Executive Chairman, Vice Chairman & Managing Director, the CFO and the Director(Kalinganagar).
2.3 Critical estimates and judgements The preparation of financial statements requires the
use of accounting estimates which, by definition, will seldom equal the actual results. Managment also needs to excerise judgement in applying the Company’s accounting policies.
This Note provides an overview of the areas that involved a higher degree of judgement or complexity, and of items which are more likely to be materially adjusted due to estimates and assumptions turning out to be different than those originally assessed. Detailed information about each of these estimates and judgements is included in relevant notes
SIGNIFICANT ACCOUNTING POLICIES AND NOTES TO THE FINANCIAL STATEMENTS
All amount in Rs. Million, unless otherwise stated
STANDALONE
94 A nnu a l Repor t 2016-17
together with information about the basis of calculation for each affected line item in the financial statements.
The areas involving critical estimates or judgements are: Estimated useful lives of property, plant and equipment and intangible assets - Notes 2.2.2 and 2.2.3
Estimation of defined benefit obligation - Note 32 Estimation of fair values of contingent liabilities - Note 39A Impairment of trade receivables - Note 52 Estimation of Finance cost - Note 18 D, Estimation of provision for unsalable/obsolete inventories
- Note 9 Recognition of deferred tax assets for carried forward
losses and current tax assets - Note 7 and 15 Estimates and judgements are continually evaluated.
They are based on historical experience and other factors, including expectations of future events that may have a financial impact on the Company and that are believed to be reasonable under the circumstances.
2.4 Standards issued but not yet effective In March 2017, the Ministry of Corporate Affairs
issued the Companies (Indian Accounting Standards) (Amendments) Rules, 2017, notifying amendments to the following Indian Accounting Standards which will be applicable to the Company with effect from 1 April 2017
(a) Ind AS 7, ‘Statement of Cash Flows’ (b) Ind AS 102, ‘Share based Payments’
Amendments to Ind AS 7 The amendments to Ind AS 7 requires the entities
to provide disclosures that enable users of financial statements to evaluate changes in liabilities arising from financing activities, including both changes arising from cash flows and non-cash changes, suggesting inclusion of a reconciliation between the opening and closing balances in the balance sheet for liabilities arising from financing activities, to meet the disclosure requirement.
Amendments to Ind AS 102 The amendments to Ind AS 102 addresses three
classification and measurement issues. These relate to measurement of cash-settled awards, modification of cash-settled awards and equity-settled awards that include a ‘net settlement’ feature in respect of withholding taxes. The Company intends to adopt these amendments when it becomes effective. Further, the Company is in the process of assessing the possible impact of aforesaid amendments in its financial statements.
SIGNIFICANT ACCOUNTING POLICIES AND NOTES TO THE FINANCIAL STATEMENTS
All amount in Rs. Million, unless otherwise stated
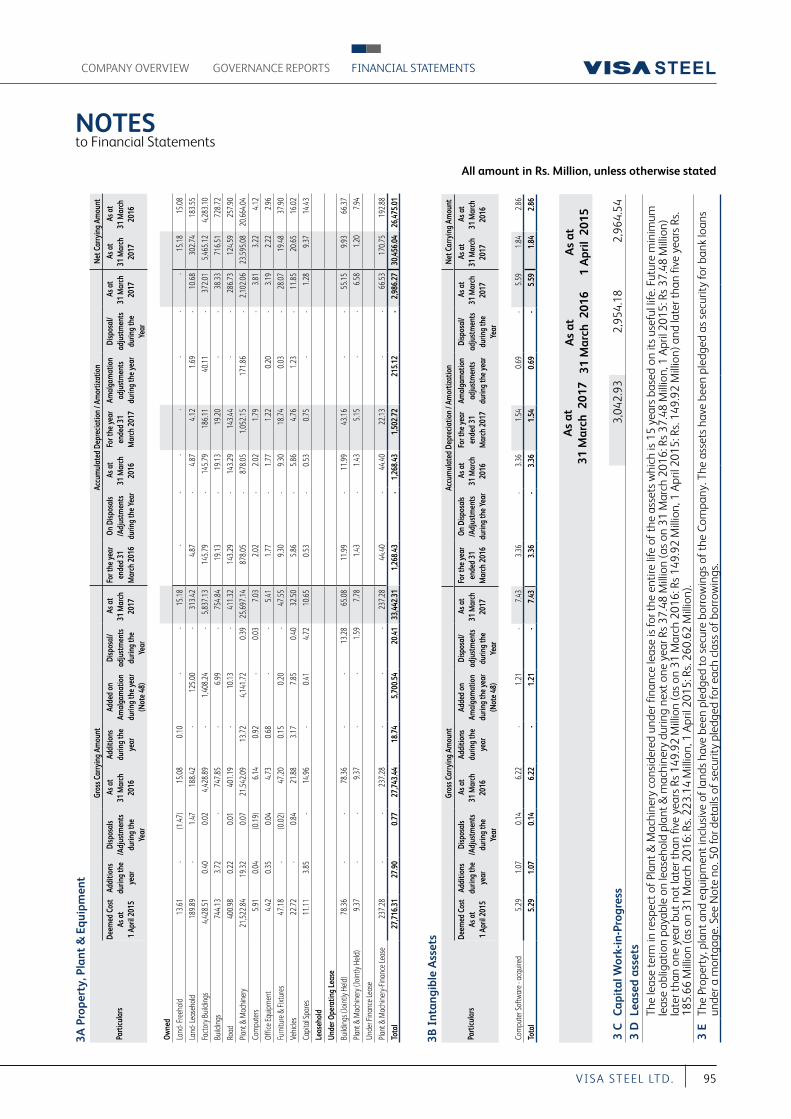
NOTES to Financial Statements
All amount in Rs. Million, unless otherwise stated
COMPANY OVERVIEW FINANCIAL STATEMENTSGOVERNANCE REPORTS
95VI S A S T EEL LT D.
3A P
rope
rty,
Pla
nt &
Equ
ipm
ent
Part
icula
rs
Gros
s Car
ryin
g Am
ount
Accu
mul
ated
Dep
recia
tion
/ Am
ortiz
atio
nN
et C
arry
ing
Amou
nt
Deem
ed C
ost
As a
t 1
April
201
5
Addi
tions
du
ring
the
year
Disp
osal
s /A
djus
tmen
ts
durin
g th
e Ye
ar
As a
t
31
Mar
ch
2016
Addi
tions
du
ring
the
year
Adde
d on
Am
alga
mat
ion
durin
g th
e ye
ar
(Not
e 48
)
Disp
osal
/ ad
just
men
ts
durin
g th
e Ye
ar
As a
t
31
Mar
ch
2017
For t
he y
ear
ende
d 31
M
arch
201
6
On D
ispos
als
/Adj
ustm
ents
du
ring
the
Year
As a
t
31
Mar
ch
2016
For t
he y
ear
ende
d 31
M
arch
201
7
Amal
gam
atio
n ad
just
men
ts
durin
g th
e ye
ar
Disp
osal
/ ad
just
men
ts
durin
g th
e Ye
ar
As a
t
31
Mar
ch
2017
As a
t
31
Mar
ch
2017
As a
t
31
Mar
ch
2016
Owne
d
Land
- Fre
ehol
d 1
3.61
-
(1.4
7) 1
5.08
0
.10
- -
15.
18
- -
- -
- -
- 1
5.18
1
5.08
Land
- Lea
seho
ld
189
.89
- 1
.47
188
.42
- 1
25.0
0 -
313
.42
4.8
7 -
4.8
7 4
.12
1.6
9 -
10.
68
302
.74
183
.55
Fact
ory B
uild
ings
4
,428
.51
0.4
0 0
.02
4,4
28.8
9 -
1,4
08.2
4 -
5,8
37.1
3 1
45.7
9 -
145
.79
186
.11
40.
11
- 3
72.0
1 5
,465
.12
4,2
83.1
0
Build
ings
7
44.1
3 3
.72
- 7
47.8
5 -
6.9
9 -
754
.84
19.
13
- 1
9.13
1
9.20
-
- 3
8.33
7
16.5
1 7
28.7
2
Road
4
00.9
8 0
.22
0.0
1 4
01.1
9 -
10.
13
- 4
11.3
2 1
43.2
9 -
143
.29
143
.44
- -
286
.73
124
.59
257
.90
Plant
& M
achi
nery
2
1,52
2.84
1
9.32
0
.07
21,
542.
09
13.
72
4,1
41.7
2 0
.39
25,
697.
14
878
.05
- 8
78.0
5 1
,052
.15
171
.86
- 2
,102
.06
23,
595.
08
20,
664.
04
Com
pute
rs 5
.91
0.0
4 (0
.19)
6.1
4 0
.92
- 0
.03
7.0
3 2
.02
- 2
.02
1.7
9 -
3.8
1 3
.22
4.1
2
Offic
e Equ
ipm
ent
4.4
2 0
.35
0.0
4 4
.73
0.6
8 -
- 5
.41
1.7
7 -
1.7
7 1
.22
0.2
0 -
3.1
9 2
.22
2.9
6
Furn
iture
& Fi
xtur
es
47.
18
- (0
.02)
47.
20
0.1
5 0
.20
- 4
7.55
9
.30
- 9
.30
18.
74
0.0
3 -
28.
07
19.
48
37.
90
Vehi
cles
22.
72
- 0
.84
21.
88
3.1
7 7
.85
0.4
0 3
2.50
5
.86
- 5
.86
4.7
6 1
.23
- 1
1.85
2
0.65
1
6.02
Capi
tal S
pare
s 1
1.11
3
.85
- 1
4.96
-
0.4
1 4
.72
10.
65
0.5
3 -
0.5
3 0
.75
--
1.2
8 9
.37
14.
43
Leas
ehol
d
Und
er O
pera
ting
Leas
e
Build
ings
(Joi
ntly
Held
) 7
8.36
-
- 7
8.36
-
- 1
3.28
6
5.08
1
1.99
-
11.
99
43.
16
--
55.
15
9.9
3 6
6.37
Plant
& M
achi
nery
(Joi
ntly
Held
) 9
.37
- -
9.3
7 -
- 1
.59
7.7
8 1
.43
- 1
.43
5.1
5 -
- 6
.58
1.2
0 7
.94
Unde
r Fin
ance
Leas
e
Plant
& M
achi
nery
-Fin
ance
Leas
e 2
37.2
8 -
- 2
37.2
8 -
- -
237
.28
44.
40
- 4
4.40
2
2.13
-
- 6
6.53
1
70.7
5 1
92.8
8
Tota
l 2
7,71
6.31
2
7.90
0
.77
27,
743.
44
18.
74
5,7
00.5
4 2
0.41
3
3,44
2.31
1
,268
.43
- 1
,268
.43
1,5
02.7
2 2
15.1
2 -
2,9
86.2
7 3
0,45
6.04
2
6,47
5.01
3B I
ntan
gibl
e A
sset
s
Part
icula
rs
Gros
s Car
ryin
g Am
ount
Accu
mul
ated
Dep
recia
tion
/ Am
ortiz
atio
nN
et C
arry
ing
Amou
nt
Deem
ed C
ost
As a
t 1
April
201
5
Addi
tions
du
ring
the
year
Disp
osal
s /A
djus
tmen
ts
durin
g th
e Ye
ar
As a
t
31
Mar
ch
2016
Addi
tions
du
ring
the
year
Adde
d on
Am
alga
mat
ion
durin
g th
e ye
ar
(Not
e 48
)
Disp
osal
/ ad
just
men
ts
durin
g th
e Ye
ar
As a
t
31
Mar
ch
2017
For t
he y
ear
ende
d 31
M
arch
201
6
On D
ispos
als
/Adj
ustm
ents
du
ring
the
Year
As a
t
31
Mar
ch
2016
For t
he y
ear
ende
d 31
M
arch
201
7
Amal
gam
atio
n ad
just
men
ts
durin
g th
e ye
ar
Disp
osal
/ ad
just
men
ts
durin
g th
e Ye
ar
As a
t
31
Mar
ch
2017
As a
t
31
Mar
ch
2017
As a
t
31
Mar
ch
2016
Com
pute
r Sof
twar
e - a
cqui
red
5.2
9 1
.07
0.1
4 6
.22
- 1
.21
- 7
.43
3.3
6 -
3.3
6 1
.54
0.6
9 -
5.5
9 1
.84
2.8
6
Tota
l 5
.29
1.0
7 0
.14
6.2
2 -
1.2
1 -
7.4
3 3
.36
- 3
.36
1.5
4 0
.69
- 5
.59
1.8
4 2
.86
As
at
31 M
arch
201
7A
s at
31
Mar
ch 2
016
As
at
1 A
pril
201
5
3 C
Cap
ital
Wor
k-in
-Pro
gres
s 3
,042
.93
2,9
54.1
8 2
,964
.54
3 D
Leas
ed a
sset
sTh
e le
ase
term
in re
spec
t of P
lant
& M
achi
nery
con
side
red
unde
r fin
ance
leas
e is
for t
he e
ntire
life
of t
he a
sset
s w
hich
is 1
5 ye
ars
base
d on
its
usef
ul li
fe. F
utur
e m
inim
um
leas
e ob
ligat
ion
paya
ble
on le
aseh
old
plan
t & m
achi
nery
dur
ing
next
one
yea
r Rs
37.4
8 M
illio
n (a
s on
31
Mar
ch 2
016:
Rs
37.4
8 M
illio
n, 1
Apr
il 20
15: R
s 37
.48
Mill
ion)
la
ter t
han
one
year
but
not
late
r tha
n fiv
e ye
ars
Rs 1
49.9
2 M
illio
n (a
s on
31
Mar
ch 2
016:
Rs
149.
92 M
illio
n, 1
Apr
il 20
15: R
s. 1
49.9
2 M
illio
n) a
nd la
ter t
han
five
year
s Rs
. 18
5.66
Mill
ion
(as
on 3
1 M
arch
201
6: R
s. 2
23.1
4 M
illio
n, 1
Apr
il 20
15: R
s. 2
60.6
2 M
illio
n).
3 E
The
Prop
erty
, pla
nt a
nd e
quip
men
t inc
lusi
ve o
f lan
ds h
ave
been
ple
dged
to s
ecur
e bo
rrow
ings
of t
he C
ompa
ny. T
he a
sset
s ha
ve b
een
pled
ged
as s
ecur
ity fo
r ban
k lo
ans
unde
r a m
ortg
age.
See
Not
e no
. 50
for d
etai
ls o
f sec
urity
ple
dged
for e
ach
clas
s of
bor
row
ings
.
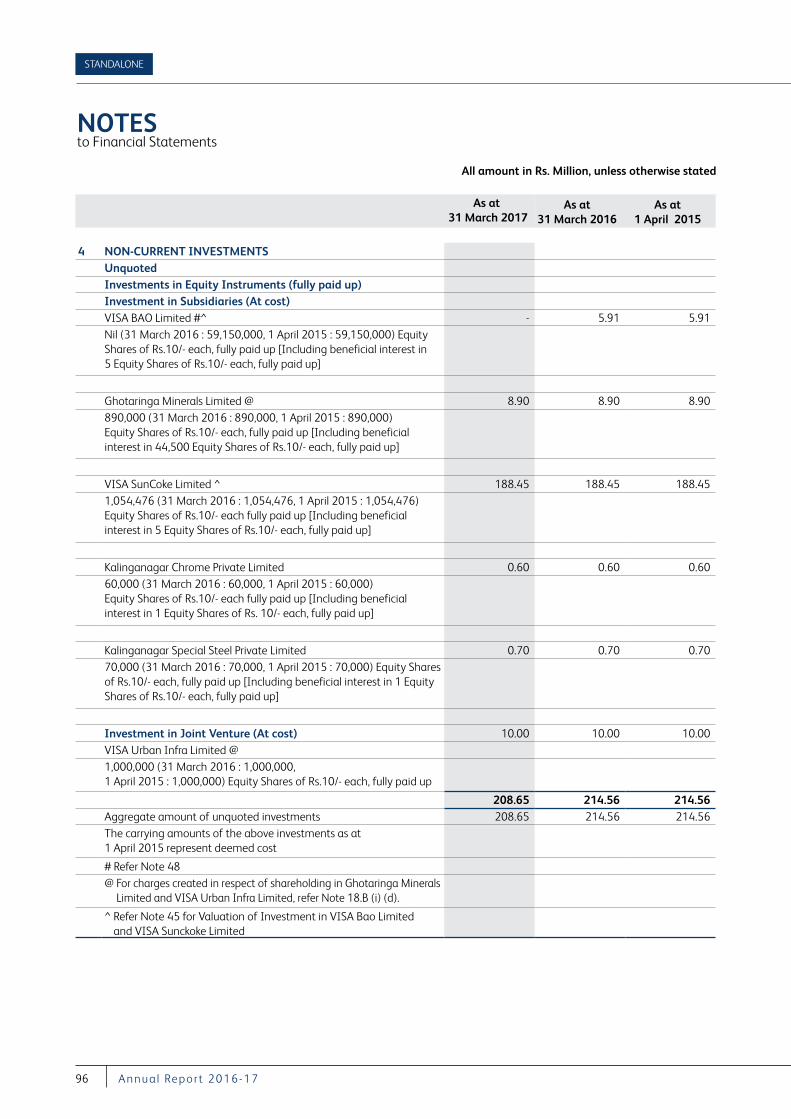
NOTES to Financial Statements
All amount in Rs. Million, unless otherwise stated
STANDALONE
96 A nnu a l Repor t 2016-17
As at 31 March 2017
As at 31 March 2016
As at 1 April 2015
4 NON-CURRENT INVESTMENTSUnquotedInvestments in Equity Instruments (fully paid up)Investment in Subsidiaries (At cost)VISA BAO Limited #^ - 5.91 5.91 Nil (31 March 2016 : 59,150,000, 1 April 2015 : 59,150,000) Equity Shares of Rs.10/- each, fully paid up [Including beneficial interest in 5 Equity Shares of Rs.10/- each, fully paid up]
Ghotaringa Minerals Limited @ 8.90 8.90 8.90 890,000 (31 March 2016 : 890,000, 1 April 2015 : 890,000) Equity Shares of Rs.10/- each, fully paid up [Including beneficial interest in 44,500 Equity Shares of Rs.10/- each, fully paid up]
VISA SunCoke Limited ^ 188.45 188.45 188.45 1,054,476 (31 March 2016 : 1,054,476, 1 April 2015 : 1,054,476) Equity Shares of Rs.10/- each fully paid up [Including beneficial interest in 5 Equity Shares of Rs.10/- each, fully paid up]
Kalinganagar Chrome Private Limited 0.60 0.60 0.60 60,000 (31 March 2016 : 60,000, 1 April 2015 : 60,000) Equity Shares of Rs.10/- each fully paid up [Including beneficial interest in 1 Equity Shares of Rs. 10/- each, fully paid up]
Kalinganagar Special Steel Private Limited 0.70 0.70 0.70 70,000 (31 March 2016 : 70,000, 1 April 2015 : 70,000) Equity Shares of Rs.10/- each, fully paid up [Including beneficial interest in 1 Equity Shares of Rs.10/- each, fully paid up]
Investment in Joint Venture (At cost) 10.00 10.00 10.00 VISA Urban Infra Limited @1,000,000 (31 March 2016 : 1,000,000, 1 April 2015 : 1,000,000) Equity Shares of Rs.10/- each, fully paid up
208.65 214.56 214.56 Aggregate amount of unquoted investments 208.65 214.56 214.56 The carrying amounts of the above investments as at 1 April 2015 represent deemed cost
# Refer Note 48@ For charges created in respect of shareholding in Ghotaringa Minerals
Limited and VISA Urban Infra Limited, refer Note 18.B (i) (d).
^ Refer Note 45 for Valuation of Investment in VISA Bao Limited and VISA Sunckoke Limited
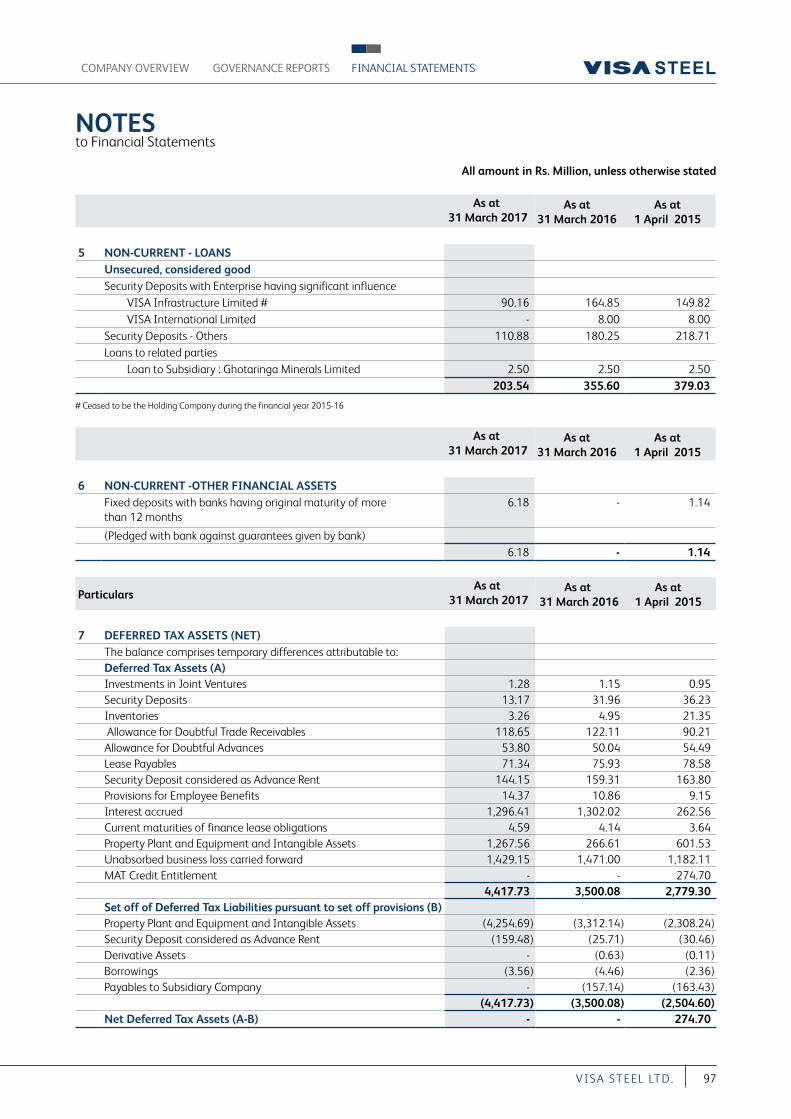
NOTES to Financial Statements
All amount in Rs. Million, unless otherwise stated
COMPANY OVERVIEW FINANCIAL STATEMENTSGOVERNANCE REPORTS
97VI S A S T EEL LT D.
As at 31 March 2017
As at 31 March 2016
As at 1 April 2015
5 NON-CURRENT - LOANS Unsecured, considered goodSecurity Deposits with Enterprise having significant influence VISA Infrastructure Limited # 90.16 164.85 149.82 VISA International Limited - 8.00 8.00 Security Deposits - Others 110.88 180.25 218.71 Loans to related parties Loan to Subsidiary : Ghotaringa Minerals Limited 2.50 2.50 2.50
203.54 355.60 379.03
# Ceased to be the Holding Company during the financial year 2015-16
As at 31 March 2017
As at 31 March 2016
As at 1 April 2015
6 NON-CURRENT -OTHER FINANCIAL ASSETSFixed deposits with banks having original maturity of more than 12 months
6.18 - 1.14
(Pledged with bank against guarantees given by bank) 6.18 - 1.14
ParticularsAs at
31 March 2017As at
31 March 2016As at
1 April 2015
7 DEFERRED TAX ASSETS (NET)The balance comprises temporary differences attributable to:Deferred Tax Assets (A)Investments in Joint Ventures 1.28 1.15 0.95 Security Deposits 13.17 31.96 36.23 Inventories 3.26 4.95 21.35 Allowance for Doubtful Trade Receivables 118.65 122.11 90.21 Allowance for Doubtful Advances 53.80 50.04 54.49 Lease Payables 71.34 75.93 78.58 Security Deposit considered as Advance Rent 144.15 159.31 163.80 Provisions for Employee Benefits 14.37 10.86 9.15 Interest accrued 1,296.41 1,302.02 262.56 Current maturities of finance lease obligations 4.59 4.14 3.64 Property Plant and Equipment and Intangible Assets 1,267.56 266.61 601.53 Unabsorbed business loss carried forward 1,429.15 1,471.00 1,182.11 MAT Credit Entitlement - - 274.70
4,417.73 3,500.08 2,779.30 Set off of Deferred Tax Liabilities pursuant to set off provisions (B) Property Plant and Equipment and Intangible Assets (4,254.69) (3,312.14) (2,308.24)Security Deposit considered as Advance Rent (159.48) (25.71) (30.46)Derivative Assets - (0.63) (0.11)Borrowings (3.56) (4.46) (2.36)Payables to Subsidiary Company - (157.14) (163.43)
(4,417.73) (3,500.08) (2,504.60)Net Deferred Tax Assets (A-B) - - 274.70
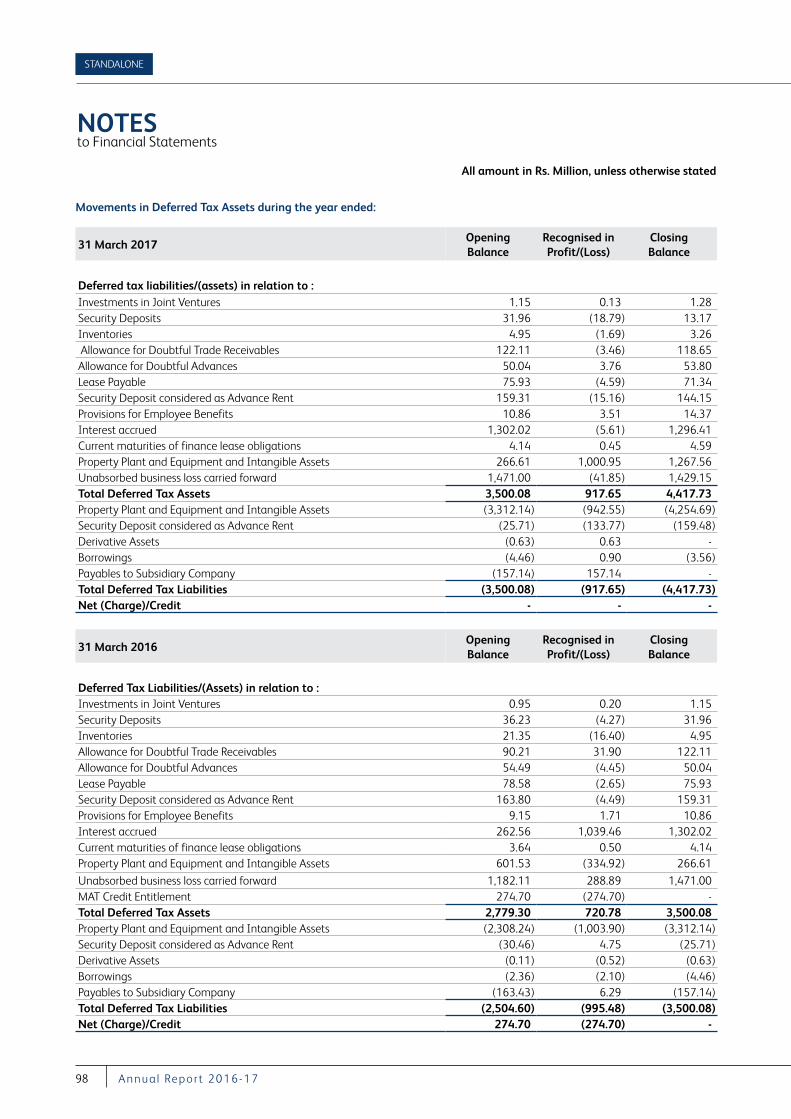
NOTES to Financial Statements
All amount in Rs. Million, unless otherwise stated
STANDALONE
98 A nnu a l Repor t 2016-17
Movements in Deferred Tax Assets during the year ended:
31 March 2017Opening Balance
Recognised in Profit/(Loss)
Closing Balance
Deferred tax liabilities/(assets) in relation to :Investments in Joint Ventures 1.15 0.13 1.28 Security Deposits 31.96 (18.79) 13.17 Inventories 4.95 (1.69) 3.26 Allowance for Doubtful Trade Receivables 122.11 (3.46) 118.65 Allowance for Doubtful Advances 50.04 3.76 53.80 Lease Payable 75.93 (4.59) 71.34 Security Deposit considered as Advance Rent 159.31 (15.16) 144.15 Provisions for Employee Benefits 10.86 3.51 14.37 Interest accrued 1,302.02 (5.61) 1,296.41 Current maturities of finance lease obligations 4.14 0.45 4.59 Property Plant and Equipment and Intangible Assets 266.61 1,000.95 1,267.56 Unabsorbed business loss carried forward 1,471.00 (41.85) 1,429.15 Total Deferred Tax Assets 3,500.08 917.65 4,417.73 Property Plant and Equipment and Intangible Assets (3,312.14) (942.55) (4,254.69)Security Deposit considered as Advance Rent (25.71) (133.77) (159.48)Derivative Assets (0.63) 0.63 - Borrowings (4.46) 0.90 (3.56)Payables to Subsidiary Company (157.14) 157.14 - Total Deferred Tax Liabilities (3,500.08) (917.65) (4,417.73)Net (Charge)/Credit - - -
31 March 2016Opening Balance
Recognised in Profit/(Loss)
Closing Balance
Deferred Tax Liabilities/(Assets) in relation to :Investments in Joint Ventures 0.95 0.20 1.15 Security Deposits 36.23 (4.27) 31.96 Inventories 21.35 (16.40) 4.95 Allowance for Doubtful Trade Receivables 90.21 31.90 122.11 Allowance for Doubtful Advances 54.49 (4.45) 50.04 Lease Payable 78.58 (2.65) 75.93 Security Deposit considered as Advance Rent 163.80 (4.49) 159.31 Provisions for Employee Benefits 9.15 1.71 10.86 Interest accrued 262.56 1,039.46 1,302.02 Current maturities of finance lease obligations 3.64 0.50 4.14 Property Plant and Equipment and Intangible Assets 601.53 (334.92) 266.61
Unabsorbed business loss carried forward 1,182.11 288.89 1,471.00 MAT Credit Entitlement 274.70 (274.70) - Total Deferred Tax Assets 2,779.30 720.78 3,500.08 Property Plant and Equipment and Intangible Assets (2,308.24) (1,003.90) (3,312.14)Security Deposit considered as Advance Rent (30.46) 4.75 (25.71)Derivative Assets (0.11) (0.52) (0.63)Borrowings (2.36) (2.10) (4.46)Payables to Subsidiary Company (163.43) 6.29 (157.14)Total Deferred Tax Liabilities (2,504.60) (995.48) (3,500.08)Net (Charge)/Credit 274.70 (274.70) -
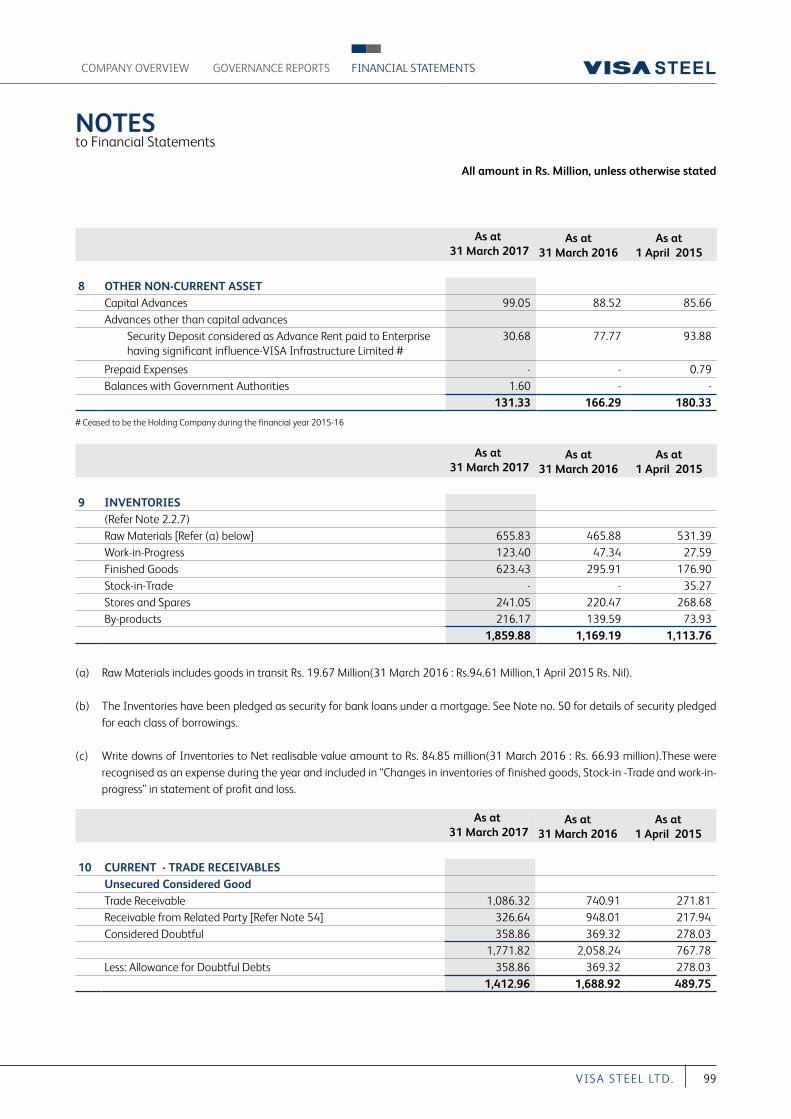
NOTES to Financial Statements
All amount in Rs. Million, unless otherwise stated
COMPANY OVERVIEW FINANCIAL STATEMENTSGOVERNANCE REPORTS
99VI S A S T EEL LT D.
As at 31 March 2017
As at 31 March 2016
As at 1 April 2015
8 OTHER NON-CURRENT ASSETCapital Advances 99.05 88.52 85.66 Advances other than capital advances Security Deposit considered as Advance Rent paid to Enterprise
having significant influence-VISA Infrastructure Limited # 30.68 77.77 93.88
Prepaid Expenses - - 0.79 Balances with Government Authorities 1.60 - -
131.33 166.29 180.33
# Ceased to be the Holding Company during the financial year 2015-16
As at 31 March 2017
As at 31 March 2016
As at 1 April 2015
9 INVENTORIES(Refer Note 2.2.7)Raw Materials [Refer (a) below] 655.83 465.88 531.39 Work-in-Progress 123.40 47.34 27.59 Finished Goods 623.43 295.91 176.90 Stock-in-Trade - - 35.27 Stores and Spares 241.05 220.47 268.68 By-products 216.17 139.59 73.93
1,859.88 1,169.19 1,113.76
(a) Raw Materials includes goods in transit Rs. 19.67 Million(31 March 2016 : Rs.94.61 Million,1 April 2015 Rs. Nil).
(b) The Inventories have been pledged as security for bank loans under a mortgage. See Note no. 50 for details of security pledged for each class of borrowings.
(c) Write downs of Inventories to Net realisable value amount to Rs. 84.85 million(31 March 2016 : Rs. 66.93 million).These were recognised as an expense during the year and included in “Changes in inventories of finished goods, Stock-in -Trade and work-in-progress” in statement of profit and loss.
As at 31 March 2017
As at 31 March 2016
As at 1 April 2015
10 CURRENT - TRADE RECEIVABLESUnsecured Considered GoodTrade Receivable 1,086.32 740.91 271.81 Receivable from Related Party [Refer Note 54] 326.64 948.01 217.94 Considered Doubtful 358.86 369.32 278.03
1,771.82 2,058.24 767.78 Less: Allowance for Doubtful Debts 358.86 369.32 278.03
1,412.96 1,688.92 489.75
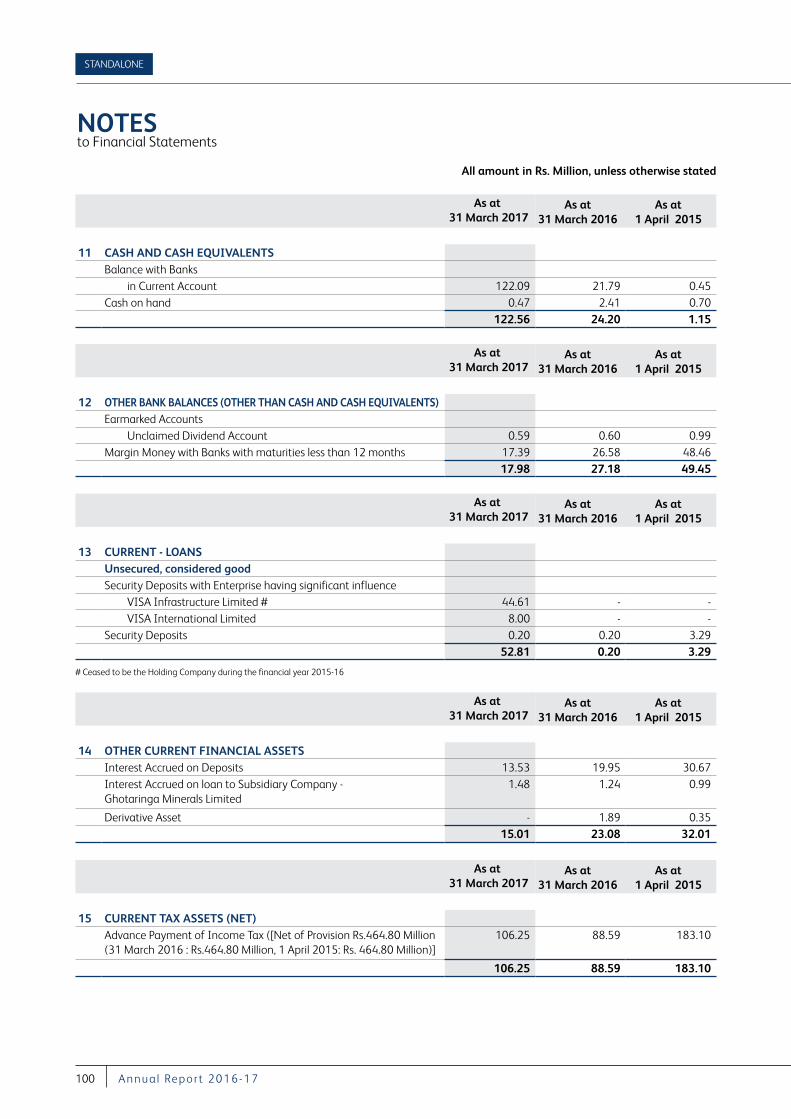
NOTES to Financial Statements
All amount in Rs. Million, unless otherwise stated
STANDALONE
100 A nnu a l Repor t 2016-17
As at 31 March 2017
As at 31 March 2016
As at 1 April 2015
11 CASH AND CASH EQUIVALENTSBalance with Banks in Current Account 122.09 21.79 0.45 Cash on hand 0.47 2.41 0.70
122.56 24.20 1.15
As at 31 March 2017
As at 31 March 2016
As at 1 April 2015
12 OTHER BANK BALANCES (OTHER THAN CASH AND CASH EQUIVALENTS) Earmarked Accounts Unclaimed Dividend Account 0.59 0.60 0.99 Margin Money with Banks with maturities less than 12 months 17.39 26.58 48.46
17.98 27.18 49.45
As at 31 March 2017
As at 31 March 2016
As at 1 April 2015
13 CURRENT - LOANS Unsecured, considered goodSecurity Deposits with Enterprise having significant influence VISA Infrastructure Limited # 44.61 - - VISA International Limited 8.00 - - Security Deposits 0.20 0.20 3.29
52.81 0.20 3.29
# Ceased to be the Holding Company during the financial year 2015-16
As at 31 March 2017
As at 31 March 2016
As at 1 April 2015
14 OTHER CURRENT FINANCIAL ASSETSInterest Accrued on Deposits 13.53 19.95 30.67 Interest Accrued on loan to Subsidiary Company - Ghotaringa Minerals Limited
1.48 1.24 0.99
Derivative Asset - 1.89 0.35 15.01 23.08 32.01
As at 31 March 2017
As at 31 March 2016
As at 1 April 2015
15 CURRENT TAX ASSETS (NET)Advance Payment of Income Tax ([Net of Provision Rs.464.80 Million (31 March 2016 : Rs.464.80 Million, 1 April 2015: Rs. 464.80 Million)]
106.25 88.59 183.10
106.25 88.59 183.10
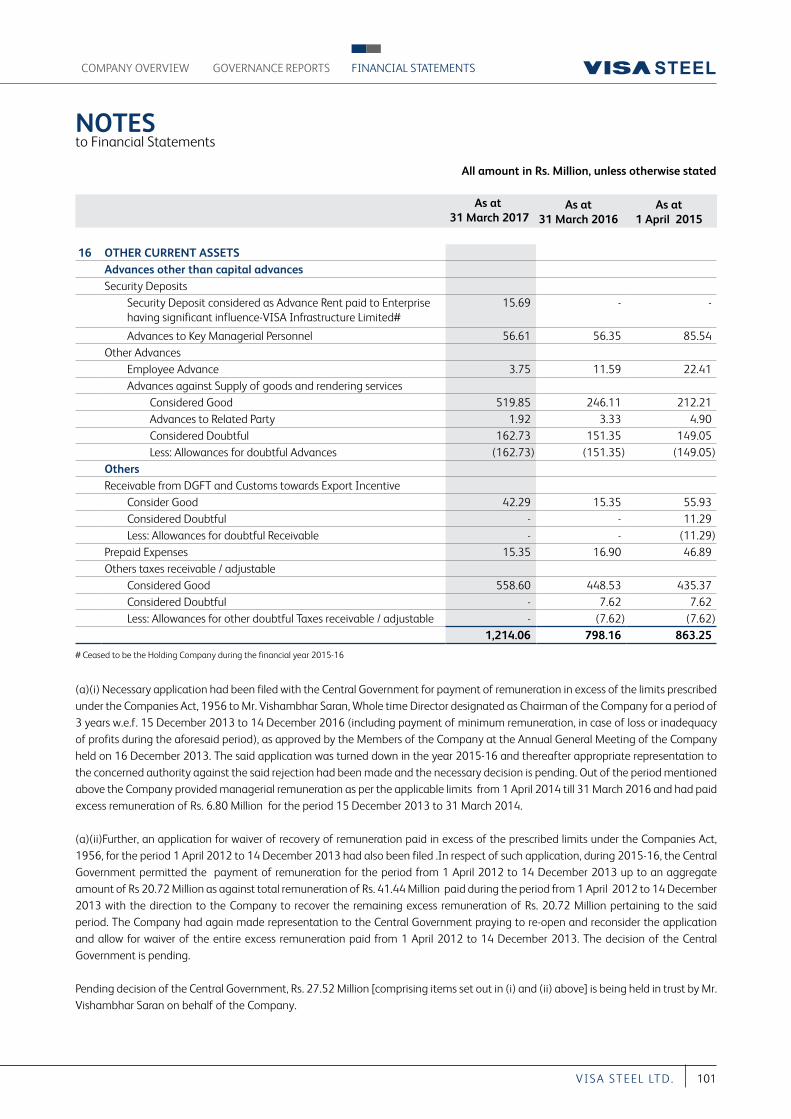
NOTES to Financial Statements
All amount in Rs. Million, unless otherwise stated
COMPANY OVERVIEW FINANCIAL STATEMENTSGOVERNANCE REPORTS
101VI S A S T EEL LT D.
As at 31 March 2017
As at 31 March 2016
As at 1 April 2015
16 OTHER CURRENT ASSETS Advances other than capital advancesSecurity Deposits Security Deposit considered as Advance Rent paid to Enterprise
having significant influence-VISA Infrastructure Limited# 15.69 - -
Advances to Key Managerial Personnel 56.61 56.35 85.54 Other Advances Employee Advance 3.75 11.59 22.41 Advances against Supply of goods and rendering services Considered Good 519.85 246.11 212.21 Advances to Related Party 1.92 3.33 4.90 Considered Doubtful 162.73 151.35 149.05 Less: Allowances for doubtful Advances (162.73) (151.35) (149.05)Others Receivable from DGFT and Customs towards Export Incentive Consider Good 42.29 15.35 55.93 Considered Doubtful - - 11.29 Less: Allowances for doubtful Receivable - - (11.29)Prepaid Expenses 15.35 16.90 46.89 Others taxes receivable / adjustable Considered Good 558.60 448.53 435.37 Considered Doubtful - 7.62 7.62 Less: Allowances for other doubtful Taxes receivable / adjustable - (7.62) (7.62)
1,214.06 798.16 863.25
# Ceased to be the Holding Company during the financial year 2015-16
(a)(i) Necessary application had been filed with the Central Government for payment of remuneration in excess of the limits prescribed under the Companies Act, 1956 to Mr. Vishambhar Saran, Whole time Director designated as Chairman of the Company for a period of 3 years w.e.f. 15 December 2013 to 14 December 2016 (including payment of minimum remuneration, in case of loss or inadequacy of profits during the aforesaid period), as approved by the Members of the Company at the Annual General Meeting of the Company held on 16 December 2013. The said application was turned down in the year 2015-16 and thereafter appropriate representation to the concerned authority against the said rejection had been made and the necessary decision is pending. Out of the period mentioned above the Company provided managerial remuneration as per the applicable limits from 1 April 2014 till 31 March 2016 and had paid excess remuneration of Rs. 6.80 Million for the period 15 December 2013 to 31 March 2014.
(a)(ii)Further, an application for waiver of recovery of remuneration paid in excess of the prescribed limits under the Companies Act, 1956, for the period 1 April 2012 to 14 December 2013 had also been filed .In respect of such application, during 2015-16, the Central Government permitted the payment of remuneration for the period from 1 April 2012 to 14 December 2013 up to an aggregate amount of Rs 20.72 Million as against total remuneration of Rs. 41.44 Million paid during the period from 1 April 2012 to 14 December 2013 with the direction to the Company to recover the remaining excess remuneration of Rs. 20.72 Million pertaining to the said period. The Company had again made representation to the Central Government praying to re-open and reconsider the application and allow for waiver of the entire excess remuneration paid from 1 April 2012 to 14 December 2013. The decision of the Central Government is pending.
Pending decision of the Central Government, Rs. 27.52 Million [comprising items set out in (i) and (ii) above] is being held in trust by Mr. Vishambhar Saran on behalf of the Company.
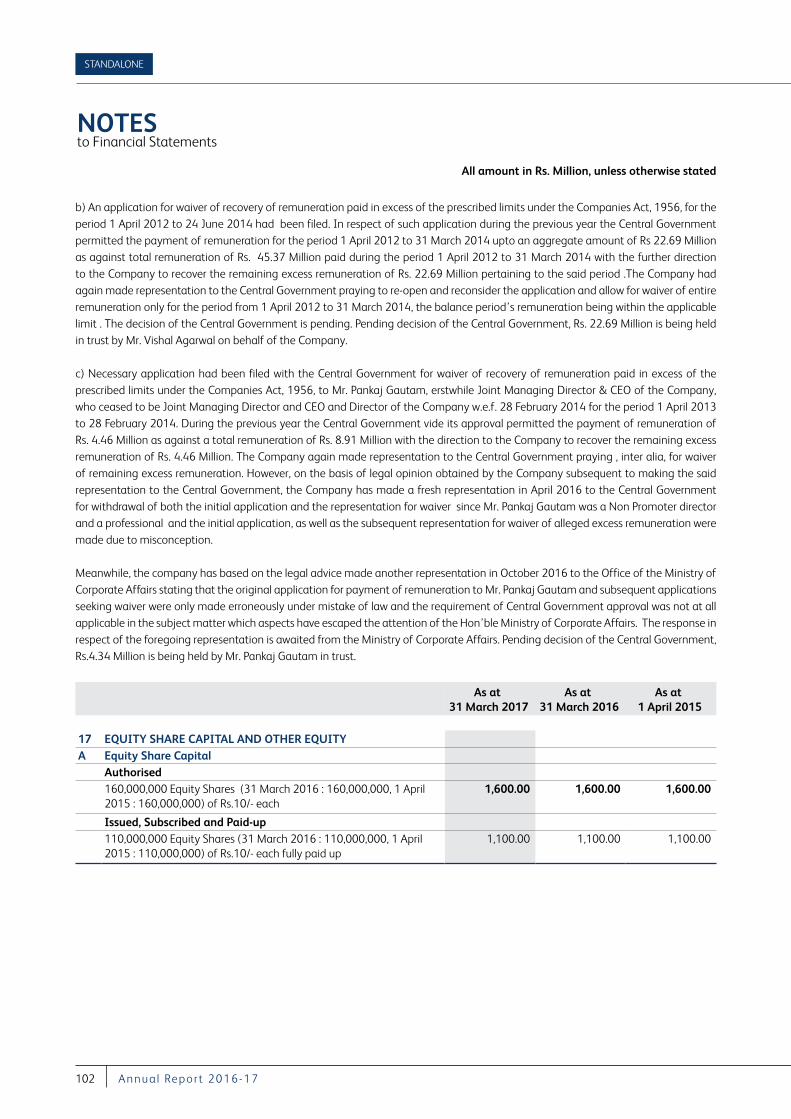
NOTES to Financial Statements
All amount in Rs. Million, unless otherwise stated
STANDALONE
102 A nnu a l Repor t 2016-17
b) An application for waiver of recovery of remuneration paid in excess of the prescribed limits under the Companies Act, 1956, for the period 1 April 2012 to 24 June 2014 had been filed. In respect of such application during the previous year the Central Government permitted the payment of remuneration for the period 1 April 2012 to 31 March 2014 upto an aggregate amount of Rs 22.69 Million as against total remuneration of Rs. 45.37 Million paid during the period 1 April 2012 to 31 March 2014 with the further direction to the Company to recover the remaining excess remuneration of Rs. 22.69 Million pertaining to the said period .The Company had again made representation to the Central Government praying to re-open and reconsider the application and allow for waiver of entire remuneration only for the period from 1 April 2012 to 31 March 2014, the balance period’s remuneration being within the applicable limit . The decision of the Central Government is pending. Pending decision of the Central Government, Rs. 22.69 Million is being held in trust by Mr. Vishal Agarwal on behalf of the Company.
c) Necessary application had been filed with the Central Government for waiver of recovery of remuneration paid in excess of the prescribed limits under the Companies Act, 1956, to Mr. Pankaj Gautam, erstwhile Joint Managing Director & CEO of the Company, who ceased to be Joint Managing Director and CEO and Director of the Company w.e.f. 28 February 2014 for the period 1 April 2013 to 28 February 2014. During the previous year the Central Government vide its approval permitted the payment of remuneration of Rs. 4.46 Million as against a total remuneration of Rs. 8.91 Million with the direction to the Company to recover the remaining excess remuneration of Rs. 4.46 Million. The Company again made representation to the Central Government praying , inter alia, for waiver of remaining excess remuneration. However, on the basis of legal opinion obtained by the Company subsequent to making the said representation to the Central Government, the Company has made a fresh representation in April 2016 to the Central Government for withdrawal of both the initial application and the representation for waiver since Mr. Pankaj Gautam was a Non Promoter director and a professional and the initial application, as well as the subsequent representation for waiver of alleged excess remuneration were made due to misconception.
Meanwhile, the company has based on the legal advice made another representation in October 2016 to the Office of the Ministry of Corporate Affairs stating that the original application for payment of remuneration to Mr. Pankaj Gautam and subsequent applications seeking waiver were only made erroneously under mistake of law and the requirement of Central Government approval was not at all applicable in the subject matter which aspects have escaped the attention of the Hon’ble Ministry of Corporate Affairs. The response in respect of the foregoing representation is awaited from the Ministry of Corporate Affairs. Pending decision of the Central Government, Rs.4.34 Million is being held by Mr. Pankaj Gautam in trust.
As at 31 March 2017
As at 31 March 2016
As at 1 April 2015
17 EQUITY SHARE CAPITAL AND OTHER EQUITYA Equity Share Capital
Authorised 160,000,000 Equity Shares (31 March 2016 : 160,000,000, 1 April 2015 : 160,000,000) of Rs.10/- each
1,600.00 1,600.00 1,600.00
Issued, Subscribed and Paid-up110,000,000 Equity Shares (31 March 2016 : 110,000,000, 1 April 2015 : 110,000,000) of Rs.10/- each fully paid up
1,100.00 1,100.00 1,100.00
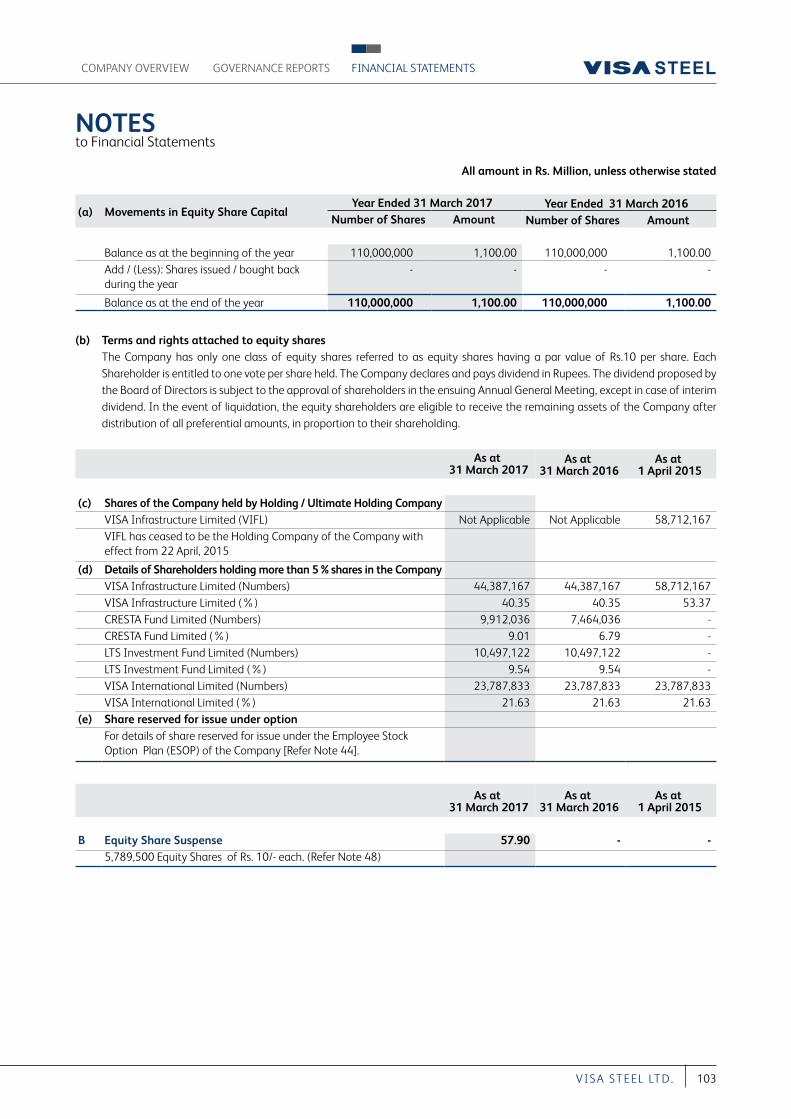
NOTES to Financial Statements
All amount in Rs. Million, unless otherwise stated
COMPANY OVERVIEW FINANCIAL STATEMENTSGOVERNANCE REPORTS
103VI S A S T EEL LT D.
(a) Movements in Equity Share CapitalYear Ended 31 March 2017 Year Ended 31 March 2016
Number of Shares Amount Number of Shares Amount
Balance as at the beginning of the year 110,000,000 1,100.00 110,000,000 1,100.00Add / (Less): Shares issued / bought back during the year
- - - -
Balance as at the end of the year 110,000,000 1,100.00 110,000,000 1,100.00
(b) Terms and rights attached to equity shares The Company has only one class of equity shares referred to as equity shares having a par value of Rs.10 per share. Each
Shareholder is entitled to one vote per share held. The Company declares and pays dividend in Rupees. The dividend proposed by the Board of Directors is subject to the approval of shareholders in the ensuing Annual General Meeting, except in case of interim dividend. In the event of liquidation, the equity shareholders are eligible to receive the remaining assets of the Company after distribution of all preferential amounts, in proportion to their shareholding.
As at 31 March 2017
As at 31 March 2016
As at 1 April 2015
(c) Shares of the Company held by Holding / Ultimate Holding Company VISA Infrastructure Limited (VIFL) Not Applicable Not Applicable 58,712,167 VIFL has ceased to be the Holding Company of the Company with effect from 22 April, 2015
(d) Details of Shareholders holding more than 5 % shares in the CompanyVISA Infrastructure Limited (Numbers) 44,387,167 44,387,167 58,712,167 VISA Infrastructure Limited (%) 40.35 40.35 53.37 CRESTA Fund Limited (Numbers) 9,912,036 7,464,036 - CRESTA Fund Limited (%) 9.01 6.79 - LTS Investment Fund Limited (Numbers) 10,497,122 10,497,122 - LTS Investment Fund Limited (%) 9.54 9.54 - VISA International Limited (Numbers) 23,787,833 23,787,833 23,787,833 VISA International Limited (%) 21.63 21.63 21.63
(e) Share reserved for issue under optionFor details of share reserved for issue under the Employee Stock Option Plan (ESOP) of the Company [Refer Note 44].
As at 31 March 2017
As at 31 March 2016
As at 1 April 2015
B Equity Share Suspense 57.90 - - 5,789,500 Equity Shares of Rs. 10/- each. (Refer Note 48)
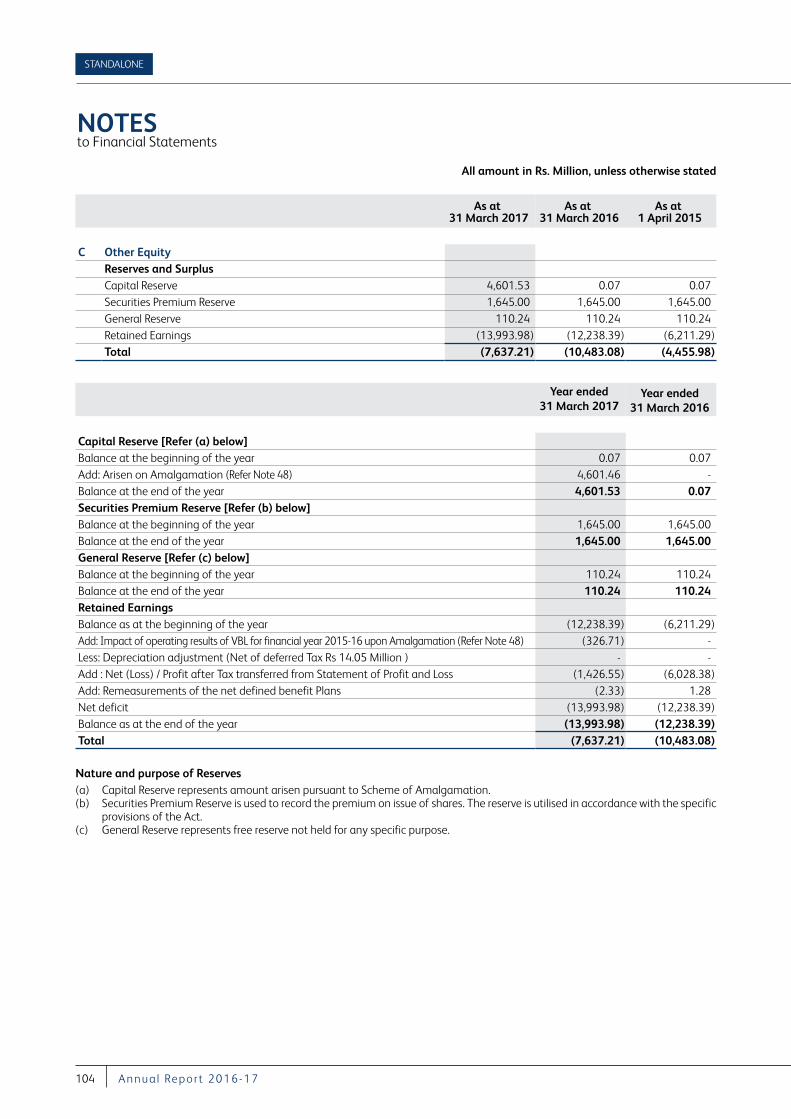
NOTES to Financial Statements
All amount in Rs. Million, unless otherwise stated
STANDALONE
104 A nnu a l Repor t 2016-17
As at 31 March 2017
As at 31 March 2016
As at 1 April 2015
C Other EquityReserves and SurplusCapital Reserve 4,601.53 0.07 0.07 Securities Premium Reserve 1,645.00 1,645.00 1,645.00 General Reserve 110.24 110.24 110.24 Retained Earnings (13,993.98) (12,238.39) (6,211.29)Total (7,637.21) (10,483.08) (4,455.98)
Year ended 31 March 2017
Year ended 31 March 2016
Capital Reserve [Refer (a) below]Balance at the beginning of the year 0.07 0.07 Add: Arisen on Amalgamation (Refer Note 48) 4,601.46 -Balance at the end of the year 4,601.53 0.07 Securities Premium Reserve [Refer (b) below]Balance at the beginning of the year 1,645.00 1,645.00 Balance at the end of the year 1,645.00 1,645.00 General Reserve [Refer (c) below]Balance at the beginning of the year 110.24 110.24 Balance at the end of the year 110.24 110.24 Retained EarningsBalance as at the beginning of the year (12,238.39) (6,211.29)Add: Impact of operating results of VBL for financial year 2015-16 upon Amalgamation (Refer Note 48) (326.71) - Less: Depreciation adjustment (Net of deferred Tax Rs 14.05 Million ) - - Add : Net (Loss) / Profit after Tax transferred from Statement of Profit and Loss (1,426.55) (6,028.38)Add: Remeasurements of the net defined benefit Plans (2.33) 1.28 Net deficit (13,993.98) (12,238.39)Balance as at the end of the year (13,993.98) (12,238.39)Total (7,637.21) (10,483.08)
Nature and purpose of Reserves (a) Capital Reserve represents amount arisen pursuant to Scheme of Amalgamation. (b) Securities Premium Reserve is used to record the premium on issue of shares. The reserve is utilised in accordance with the specific
provisions of the Act. (c) General Reserve represents free reserve not held for any specific purpose.
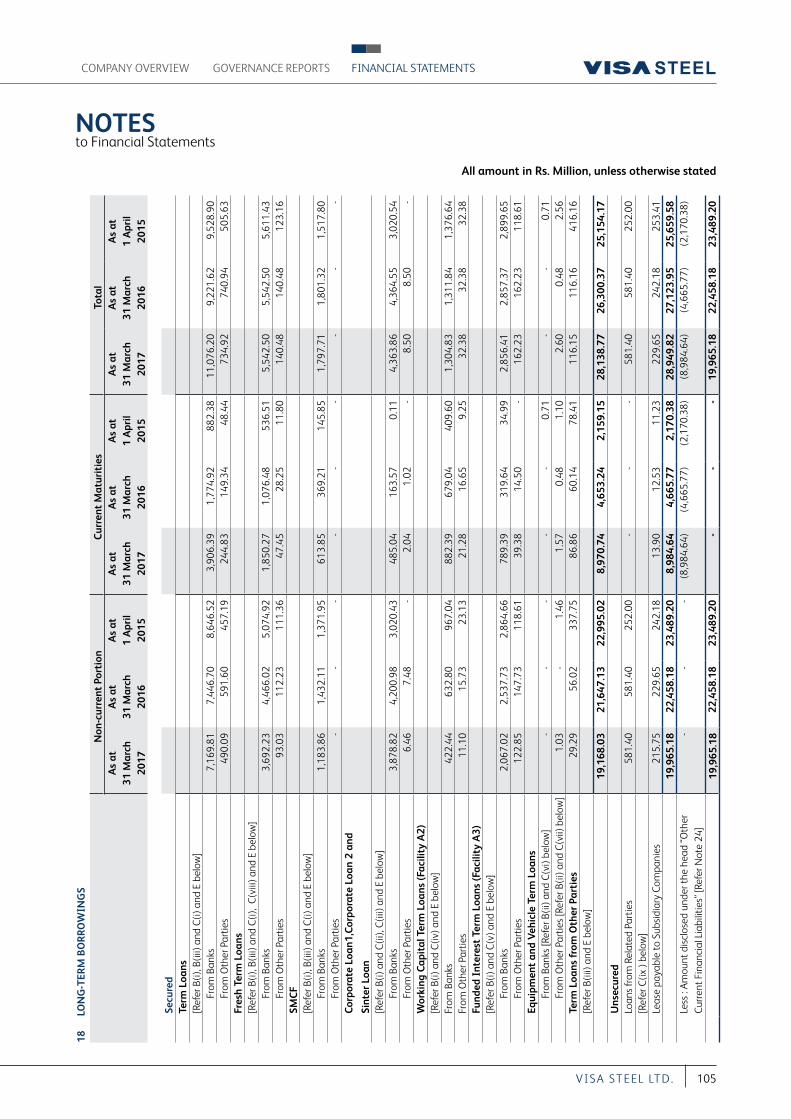
NOTES to Financial Statements
All amount in Rs. Million, unless otherwise stated
COMPANY OVERVIEW FINANCIAL STATEMENTSGOVERNANCE REPORTS
105VI S A S T EEL LT D.
18
LON
G-T
ERM
BO
RR
OW
ING
S
Non
-cur
rent
Por
tion
Cur
rent
Mat
urit
ies
Tota
lA
s at
31
Mar
ch
2017
As
at
31 M
arch
20
16
As
at
1 A
pril
20
15
As
at
31 M
arch
20
17
As
at
31 M
arch
20
16
As
at
1 A
pril
20
15
As
at
31 M
arch
20
17
As
at
31 M
arch
20
16
As
at
1 A
pril
20
15
Secu
red
Term
Loa
ns
[Ref
er B
(i), B
(iii)
and
C(i)
and
E b
elow
]Fr
om B
anks
7
,169
.81
7,4
46.7
0 8
,646
.52
3,9
06.3
9 1
,774
.92
882
.38
11,
076.
20
9,2
21.6
2 9
,528
.90
From
Oth
er P
artie
s 4
90.0
9 5
91.6
0 4
57.1
9 2
44.8
3 1
49.3
4 4
8.44
7
34.9
2 7
40.9
4 5
05.6
3 Fr
esh
Term
Loa
ns
[Ref
er B
(i), B
(iii)
and
C(i)
, C
(viii
) and
E b
elow
]Fr
om B
anks
3
,692
.23
4,4
66.0
2 5
,074
.92
1,8
50.2
7 1
,076
.48
536
.51
5,5
42.5
0 5
,542
.50
5,6
11.4
3 Fr
om O
ther
Par
ties
93.
03
112
.23
111
.36
47.
45
28.
25
11.
80
140
.48
140
.48
123
.16
SMC
F [R
efer
B(i)
, B(ii
i) an
d C
(i) a
nd E
bel
ow]
From
Ban
ks
1,1
83.8
6 1
,432
.11
1,3
71.9
5 6
13.8
5 3
69.2
1 1
45.8
5 1
,797
.71
1,8
01.3
2 1
,517
.80
From
Oth
er P
artie
s -
- -
- -
- -
- -
Cor
pora
te L
oan1
,Cor
pora
te L
oan
2 an
d
Sint
er L
oan
[Ref
er B
(i) a
nd C
(ii),
C(ii
i) an
d E
belo
w]
From
Ban
ks
3,8
78.8
2 4
,200
.98
3,0
20.4
3 4
85.0
4 1
63.5
7 0
.11
4,3
63.8
6 4
,364
.55
3,0
20.5
4 Fr
om O
ther
Par
ties
6.4
6 7
.48
- 2
.04
1.0
2 -
8.5
0 8
.50
- W
orki
ng C
apit
al T
erm
Loa
ns (F
acili
ty A
2)[R
efer
B(i)
and
C(iv
) and
E b
elow
]Fr
om B
anks
4
22.4
4 6
32.8
0 9
67.0
4 8
82.3
9 6
79.0
4 4
09.6
0 1
,304
.83
1,3
11.8
4 1
,376
.64
From
Oth
er P
artie
s 1
1.10
1
5.73
2
3.13
2
1.28
1
6.65
9
.25
32.
38
32.
38
32.
38
Fund
ed I
nter
est
Term
Loa
ns (F
acili
ty A
3)[R
efer
B(i)
and
C(v
) and
E b
elow
]Fr
om B
anks
2
,067
.02
2,5
37.7
3 2
,864
.66
789
.39
319
.64
34.
99
2,8
56.4
1 2
,857
.37
2,8
99.6
5 Fr
om O
ther
Par
ties
122
.85
147
.73
118
.61
39.
38
14.
50
- 1
62.2
3 1
62.2
3 1
18.6
1 Eq
uipm
ent
and
Veh
icle
Ter
m L
oans
Fr
om B
anks
[Ref
er B
(ii) a
nd C
(vi)
belo
w]
- -
- -
- 0
.71
- -
0.7
1 Fr
om O
ther
Par
ties
[Ref
er B
(ii) a
nd C
(vii)
bel
ow]
1.0
3 -
1.4
6 1
.57
0.4
8 1
.10
2.6
0 0
.48
2.5
6 Te
rm L
oans
fro
m O
ther
Par
ties
29.
29
56.
02
337
.75
86.
86
60.
14
78.
41
116
.15
116
.16
416
.16
[Ref
er B
(iii)
and
E be
low
] 1
9,16
8.03
2
1,64
7.13
2
2,99
5.02
8
,970
.74
4,6
53.2
4 2
,159
.15
28,
138.
77
26,
300.
37
25,
154.
17
Uns
ecur
edLo
ans
from
Rel
ated
Par
ties
581
.40
581
.40
252
.00
- -
- 5
81.4
0 5
81.4
0 2
52.0
0 [R
efer
C(ix
) be
low
]Le
ase
paya
ble
to S
ubsi
diar
y Co
mpa
nies
215
.75
229
.65
242
.18
13.
90
12.
53
11.
23
229
.65
242
.18
253
.41
19,
965.
18
22,
458.
18
23,
489.
20
8,9
84.6
4 4
,665
.77
2,1
70.3
8 2
8,94
9.82
2
7,12
3.95
2
5,65
9.58
Le
ss :
Am
ount
dis
clos
ed u
nder
the
head
“Oth
er
Cur
rent
Fin
anci
al L
iabi
litie
s” [R
efer
Not
e 24
] -
- -
(8,9
84.6
4) (4
,665
.77)
(2,1
70.3
8) (8
,984
.64)
(4,6
65.7
7) (2
,170
.38)
19,
965.
18
22,
458.
18
23,
489.
20
- -
- 1
9,96
5.18
2
2,45
8.18
2
3,48
9.20
NOTES to Financial Statements
All amount in Rs. Million, unless otherwise stated
STANDALONE
106 A nnu a l Repor t 2016-17
A. Debt Restructuring i) Pursuant to restructuring of the Company’s debts, a Master
Restructuring Agreement dated 19 December 2012 (MRA) had been executed to give effect to the CDR package approved by the Corporate Debt Restructuring (CDR) cell with effect from 1 March 2012. Further, pursuant to the approval of the Company’s Business Re-organisation Plan (Refer Note 37) by the CDR cell, a Common Loan Agreement (CLA) had also been executed on 28 March 2015 among the Company, its Subsidiary company, VISA Special Steel Limited, and lenders. In terms of MRA and CLA, the Company’s Debt portfolio has been reorganised/reallocated and secured as under:
i) Principal Term Loans ii) Fresh Term Loan (Loan pursuant to CDR package) iii) Working Capital Term Loans (WCTL) (Loan pursuant
to CDR package) iv) Funded Interest Term Loans (FITL) (Loan pursuant to
CDR package) v) Corporate Loan 1 & 2 and Sinter Loan (Loan pursuant
to Debt Restructuring under CLA) vi) Working Capital Loans [Indicated in Note 22] vii) Structured Mezzanine Credit Facility [SMCF(Sub debt)]
The Company is under discussion with the JLF for restructuring of debt to a sustainable level based on hardcost of the project and considering principal term loan for setting up the plant. Pending outcome of such discussion, the JLF have allowed for the time being “Holding-On operation” status to the Company and for the purpose of these financial statements, the Company has followed reorganization/reallocation and other terms and conditions of MRA/CLA as set out above. The Company stands exited from the CDR mechanism on account of failure of CDR package implemented with a cut off date of 1 March 2012.
ii) Pursuant to the amalgamation of VBL with VSL as referred to in Note 48, the rupees term loan of VBL amounting to Rs 1,013.27 Million have been merged with the Term Loan above.
B . Details of Securities i. Term Loans (I & II), VBL Term Loan, SMCF (Sub
debts), Working Capital Term Loans(WCTL), Funded Interest Term Loans (FITL), Corporate Term Loans (I & II) , Fresh Term Loan (For Sinter Plant) and Working Capital facilities:
(a) First pari-passu charge by way of hypothecation of all the Company’s current assets and fixed assets
(excluding land) including movable and immovable plant and machinery, machinery spares, tools and accessories, vehicles and other moveable assets both present and future (“Hypothecated Assets”) of the Company, save and except specific assets charged to Banks, Financial Institutions and Non Banking Financial Companies (NBFC).
(b) First pari-passu mortgage and charge on the immovable properties of the Company situated at Kalinganagar Industrial Complex, Jajpur, (Odisha), Golagaon, Jajpur, (Odisha), Raigarh, (Chhattisgarh) and office premises of the Company at Bhubaneshwar, (Odisha).
(c) Pursuant to CDR, pledge of equity shares of the Company with the CDR Lenders.
(d) Pursuant to CDR, pledge of Equity Shares equivalent to 51% of the present shareholding in Ghotaringa Minerals Limited held by the Company and entire Equity Shares held by the Company in VISA Urban Infra Limited.
(e) Lien on all Bank Accounts including the Trust and Retention Account.
(f) The Lenders of SMCF are having a second pari-passu charge on the hypothecated assets and a second charge on the mortgaged assets of the Company.
(g) SIDBI (exposure of Rs.76.40 Million as on 1 March 2012 for bill discounting facility relating to working capital finance) has a second charge on fixed assets.
Further, the above facilities are also covered by the following:
- The Corporate Guarantee of VISA International Limited and personal Guarantee of Mr. Vishal Agarwal, Vice Chairman and Managing Director of the Company.
- Pursuant to CDR, the corporate guarantee of Ghotaringa Minerals Limited and Personal Gurantee of Mr. Vishambhar Saran, Chairman.
The Corporate Guarantee of VISA Infrastructure Ltd. with negative Lien on VISA House situated at 8/10 Alipore Road, Kolkata 700027, was valid and subsisting till infusion of additional equity of Rs.1,250.00 Million over and above of Rs.3,250.00 Million(already infused) in the Company as
NOTES to Financial Statements
All amount in Rs. Million, unless otherwise stated
COMPANY OVERVIEW FINANCIAL STATEMENTSGOVERNANCE REPORTS
107VI S A S T EEL LT D.
envisaged in the CDR package. The infusion of equity could be brought in the form of unsecured loan / Preference shares or by issuing fresh shares through QIP / FPO / PE / Strategic Investment etc. or by merging / demerging some business divisions into separate Companies / SPV’s through scheme/slump sale and inviting strategic investor; and has since been brought in upon amalgamation of VBL with the Company.
ii. Equipment and Vehicle Term Loans These loans are secured by way of hypothecation of
vehicles / machinery acquired under the respective loan arrangements.
iii. Term Loans from Bank and Other Parties (a) Term Loan from IL&FS Financial Services - These loans are secured by way of second pari-passu
charge on entire pooled assets of the Company. This loan is also covered by a Corporate Guarantee of VISA International Limited. Subsequently, in September 2015 this loan has been assigned by IL&FS Limited to State Bank of India, CAG Branch, Kolkata.
(b) Term Loan from HUDCO - Secured loan from other parties includes Term Loan
(CDR) of Rs.501.20 Million., Funded Interest Term Loan (FITL) of Rs.100.50 Million. and Term Loan (Non CDR) of Rs.116.15 Million due and outstanding to HUDCO. The subsisting charge in respect of the Term Loan (CDR) and FITL became irrelevant and stood satisfied upon the Company entering into Master Restructuring Agreement (MRA) dated 19 December 2012 with the CDR lenders and the same was substituted by the fresh charge created in favour of the lenders who became parties to the MRA.
Both the Company and the State Bank of India, as the Lead Bank has since been calling upon HUDCO to execute a Deed of Accession so that the aforesaid charge substituted in favour of the CDR lenders could also be extended to HUDCO. HUDCO, however, has refused to do so despite specific order passed to the said effect by the Hon’ble High Court of Orissa at Cuttack in Copet No 17 of 2014 (Re: Visa Steel Ltd and Visa Special Steel Ltd) on 13 October 2015, and has instead filed an application in the said proceeding for recalling the said order. The matter is since sub-judice and awaiting further orders of the Hon’ble Court. For creation of charge on the Term Loan (Non CDR), the charge documents need to be executed between HUDCO and the Company, which by reason of the
pendency of the dispute referred hereinabove has also not yet taken place and is awaiting finalisation.
C. Terms of Repayment of loans i. Terms of Repayment and outstanding balance
as at the year end of Term Loans including Fresh Term Loan and SMCF (TL):
Upon implementation of CDR Package during the Financial Year 2012-13, then existing Restructured Term Loan of Rs.12,355.48 Million and Additional Term Loan of Rs.6,100.00 Million sanctioned as per CDR package, were to be repaid over a period of 10 years in quarterly instalments commencing from March 2013. Further such loans carry interest @ 10.75% p.a. for the first 4 years, @ 11.5% for 5th and 6th year and @ 12%, linked to the base rate, for subsequent years of restructuring. Above mentioned loan amounting to Rs. 17,421.22 Million outstanding as on balance sheet date are to be repaid as per the repayment schedule given below.
Repayment Schedule :
YearPercentage of TL (originally
restructured) due for Repayment (%)
2017-18 13.00%2018-19 15.50%2019-20 15.50%2020-21 15.50%2021-22 15.50%
ii Term of Repayment and outstanding balances of VBL Term Loan
VBL, since amalgamated with the Company, had entered in Joint consortium agreement with Punjab National Bank, Oriental Bank of Commerce, EXIM Bank and Punjab and Sind Bank on 16 January 2012, whereby an amount of Rs. 1,820.00 Million was sanctioned at (PNB BR + 2.5% + Term Premium i.e 0.5%) with annual reset.
Repayment Schedule :
YearPercentage of TL (originally
restructured) due for Repayment (%)
2017-18 16.67%2018-19 16.67%2019-20 16.67%2020-21 16.67%2021-22 4.16%

NOTES to Financial Statements
All amount in Rs. Million, unless otherwise stated
STANDALONE
108 A nnu a l Repor t 2016-17
Subsequently, Punjab National Bank has sanctioned another Rupee Term Loan of Rs. 76.90 Million at SBI BR+2.5%. vide an agreement dated 8 July 2015 on terms and conditions similar to the aforesaid agreement.
Repayment Schedule :
YearPercentage of TL (originally
restructured) due for Repayment (%)
2017-18 16.67%2018-19 16.67%2019-20 16.67%2020-21 16.67%2021-22 4.16%
VBL had obtained a long term loan of Rs. 30.00 Million for a period of 36 month from the date of disbursement from IL&FS Limited for the purpose of acquistion of certain plant & equipments. Subsequentely, in September 2015, this loan has been assigned by IL&FS Limited to State Bank of India, CAG Branch, Kolkata.
iii. Terms of Repayment and outstanding balances of Corporate Term Loans :
In line of aforementioned CLA, Corporate Term Loan amounting Rs 4,500 Million, bearing an interest rate at 2.50% p.a. above the SBI’s Base Rate, was sanctioned. Outstanding balance of such loan as at the balance sheet date is Rs 4,345.26 Million, which shall be repayable in structured quarterly installments starting from June 2016 and ending on March 2023, as mentioned below.
Repayment Schedule :
YearPercentage of Corporate Term Loan due for Repayment (%)
2017-18 8.00%2018-19 10.00%2019-20 12.00%2020-21 12.00%2021-22 16.00%2022-23 38.00%
iv. Terms of Repayment and outstanding balances of Fresh Term Loan (For Sinter Plant):
Fresh Term Loan (For Sinter Plant) of Rs 650 Million was sanctioned vide the CLA, bearing an interest rate at 2.50% p.a. above the SBI’s Base Rate. Outstanding balance of such loan as at balance sheet is Rs 27.10 Million which is repayable in structured quarterly installments starting from December 2015 and ending on March 2022, as mentioned below.
Repayment Schedule :
YearPercentage of Fresh Term Loan
due for Repayment (%)
2017-18 12.00%2018-19 12.00%2019-20 12.00%2020-21 20.00%2021-22 32.00%
v Terms of Repayment and outstanding balance as at year end of Working Capital Term Loan (WCTL):
Upon implementation of CDR package during the Financial Year 2012-13, then overdrawn cash credit accounts of the Company amounting to Rs.1,720.00 Million had been carved out into a separate Working Capital Term Loans, which were to be repaid over a period of 8 years in quarterly instalments commencing from March 2013. Further such loans carry the interest rate @ 10.50% p.a. throughout the tenure of facility. Above mentioned loan amounting to Rs. 1,337.21 Million outstanding as on balance sheet date are to be repaid as per the repayment schedule given below.
Repayment Schedule :
YearPercentage of WCTL (originally
restructured) due for Repayment (%)
2017-18 12.50%2018-19 15.00%2019-20 10.00%
vi. Terms of Repayment and outstanding balances of Funded Interest Term Loans (FITL):
In terms of the CDR Package, the aggregate amount of interest accrued and due on the prinicpal amounts
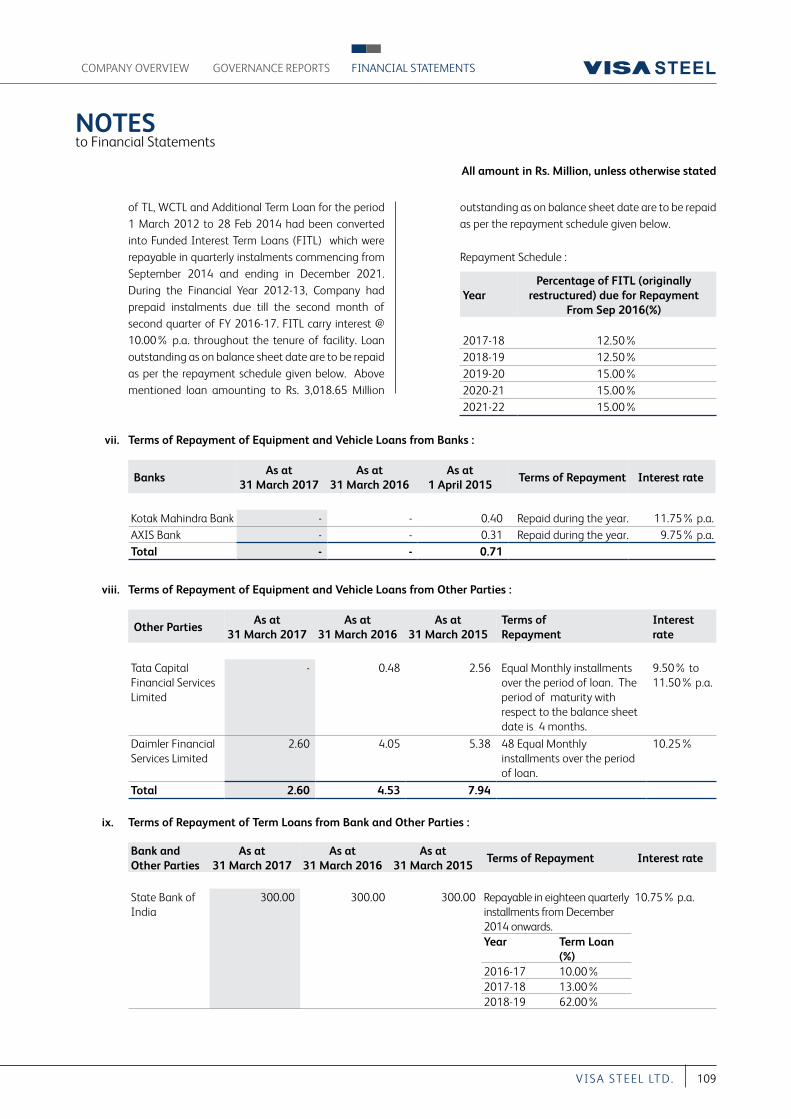
NOTES to Financial Statements
All amount in Rs. Million, unless otherwise stated
COMPANY OVERVIEW FINANCIAL STATEMENTSGOVERNANCE REPORTS
109VI S A S T EEL LT D.
of TL, WCTL and Additional Term Loan for the period 1 March 2012 to 28 Feb 2014 had been converted into Funded Interest Term Loans (FITL) which were repayable in quarterly instalments commencing from September 2014 and ending in December 2021. During the Financial Year 2012-13, Company had prepaid instalments due till the second month of second quarter of FY 2016-17. FITL carry interest @ 10.00% p.a. throughout the tenure of facility. Loan outstanding as on balance sheet date are to be repaid as per the repayment schedule given below. Above mentioned loan amounting to Rs. 3,018.65 Million
outstanding as on balance sheet date are to be repaid as per the repayment schedule given below.
Repayment Schedule :
YearPercentage of FITL (originally
restructured) due for Repayment From Sep 2016(%)
2017-18 12.50%2018-19 12.50%2019-20 15.00%2020-21 15.00%2021-22 15.00%
vii. Terms of Repayment of Equipment and Vehicle Loans from Banks :
Banks As at
31 March 2017 As at
31 March 2016 As at
1 April 2015 Terms of Repayment Interest rate
Kotak Mahindra Bank - - 0.40 Repaid during the year. 11.75% p.a.AXIS Bank - - 0.31 Repaid during the year. 9.75% p.a.Total - - 0.71
viii. Terms of Repayment of Equipment and Vehicle Loans from Other Parties :
Other Parties As at
31 March 2017 As at
31 March 2016 As at
31 March 2015Terms of Repayment
Interest rate
Tata Capital Financial Services Limited
- 0.48 2.56 Equal Monthly installments over the period of loan. The period of maturity with respect to the balance sheet date is 4 months.
9.50% to 11.50% p.a.
Daimler Financial Services Limited
2.60 4.05 5.38 48 Equal Monthly installments over the period of loan.
10.25%
Total 2.60 4.53 7.94
ix. Terms of Repayment of Term Loans from Bank and Other Parties :
Bank and Other Parties
As at 31 March 2017
As at 31 March 2016
As at 31 March 2015
Terms of Repayment Interest rate
State Bank of India
300.00 300.00 300.00 Repayable in eighteen quarterly installments from December 2014 onwards.
10.75% p.a.
Year Term Loan (%)
2016-17 10.00%2017-18 13.00%2018-19 62.00%
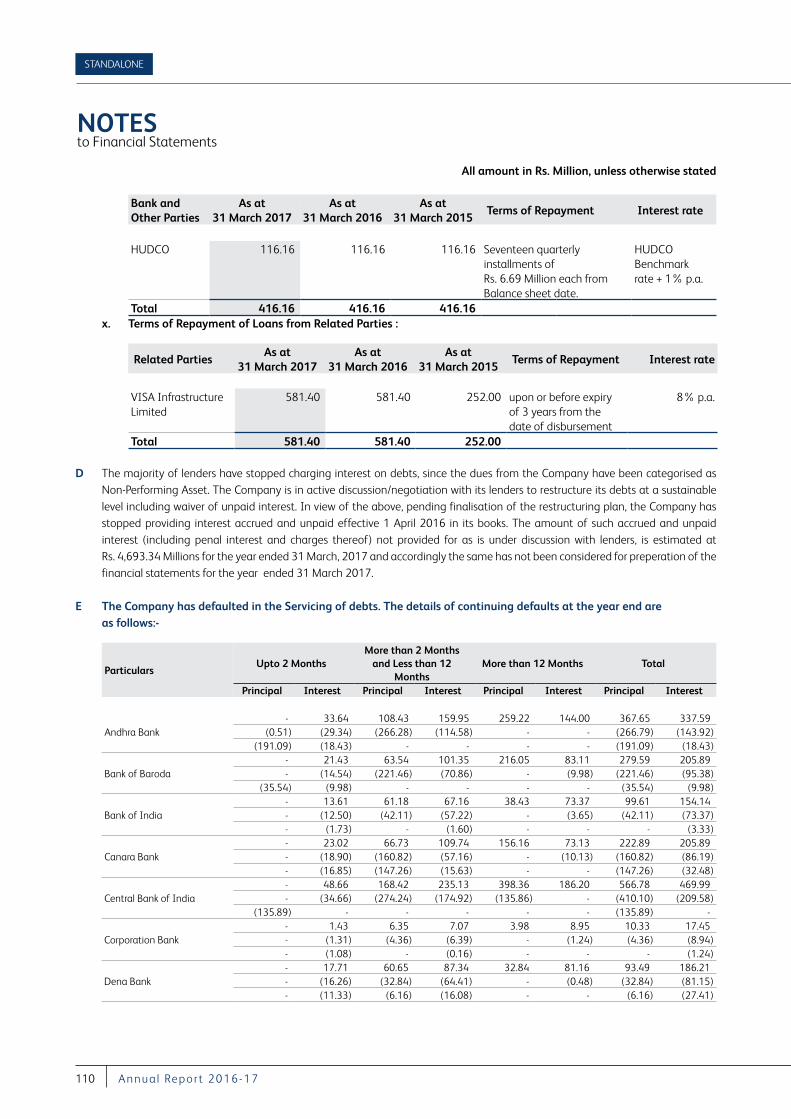
NOTES to Financial Statements
All amount in Rs. Million, unless otherwise stated
STANDALONE
110 A nnu a l Repor t 2016-17
Bank and Other Parties
As at 31 March 2017
As at 31 March 2016
As at 31 March 2015
Terms of Repayment Interest rate
HUDCO 116.16 116.16 116.16 Seventeen quarterly installments of Rs. 6.69 Million each from Balance sheet date.
HUDCO Benchmark rate + 1% p.a.
Total 416.16 416.16 416.16 x. Terms of Repayment of Loans from Related Parties :
Related Parties As at
31 March 2017 As at
31 March 2016 As at
31 March 2015 Terms of Repayment Interest rate
VISA Infrastructure Limited
581.40 581.40 252.00 upon or before expiry of 3 years from the date of disbursement
8% p.a.
Total 581.40 581.40 252.00
D The majority of lenders have stopped charging interest on debts, since the dues from the Company have been categorised as Non-Performing Asset. The Company is in active discussion/negotiation with its lenders to restructure its debts at a sustainable level including waiver of unpaid interest. In view of the above, pending finalisation of the restructuring plan, the Company has stopped providing interest accrued and unpaid effective 1 April 2016 in its books. The amount of such accrued and unpaid interest (including penal interest and charges thereof) not provided for as is under discussion with lenders, is estimated at Rs. 4,693.34 Millions for the year ended 31 March, 2017 and accordingly the same has not been considered for preperation of the financial statements for the year ended 31 March 2017.
E The Company has defaulted in the Servicing of debts. The details of continuing defaults at the year end are as follows:-
ParticularsUpto 2 Months
More than 2 Months and Less than 12
MonthsMore than 12 Months Total
Principal Interest Principal Interest Principal Interest Principal Interest
Andhra Bank - 33.64 108.43 159.95 259.22 144.00 367.65 337.59
(0.51) (29.34) (266.28) (114.58) - - (266.79) (143.92) (191.09) (18.43) - - - - (191.09) (18.43)
Bank of Baroda - 21.43 63.54 101.35 216.05 83.11 279.59 205.89 - (14.54) (221.46) (70.86) - (9.98) (221.46) (95.38)
(35.54) (9.98) - - - - (35.54) (9.98)
Bank of India - 13.61 61.18 67.16 38.43 73.37 99.61 154.14 - (12.50) (42.11) (57.22) - (3.65) (42.11) (73.37) - (1.73) - (1.60) - - - (3.33)
Canara Bank - 23.02 66.73 109.74 156.16 73.13 222.89 205.89 - (18.90) (160.82) (57.16) - (10.13) (160.82) (86.19) - (16.85) (147.26) (15.63) - - (147.26) (32.48)
Central Bank of India - 48.66 168.42 235.13 398.36 186.20 566.78 469.99 - (34.66) (274.24) (174.92) (135.86) - (410.10) (209.58)
(135.89) - - - - - (135.89) -
Corporation Bank - 1.43 6.35 7.07 3.98 8.95 10.33 17.45 - (1.31) (4.36) (6.39) - (1.24) (4.36) (8.94) - (1.08) - (0.16) - - - (1.24)
Dena Bank - 17.71 60.65 87.34 32.84 81.16 93.49 186.21 - (16.26) (32.84) (64.41) - (0.48) (32.84) (81.15) - (11.33) (6.16) (16.08) - - (6.16) (27.41)
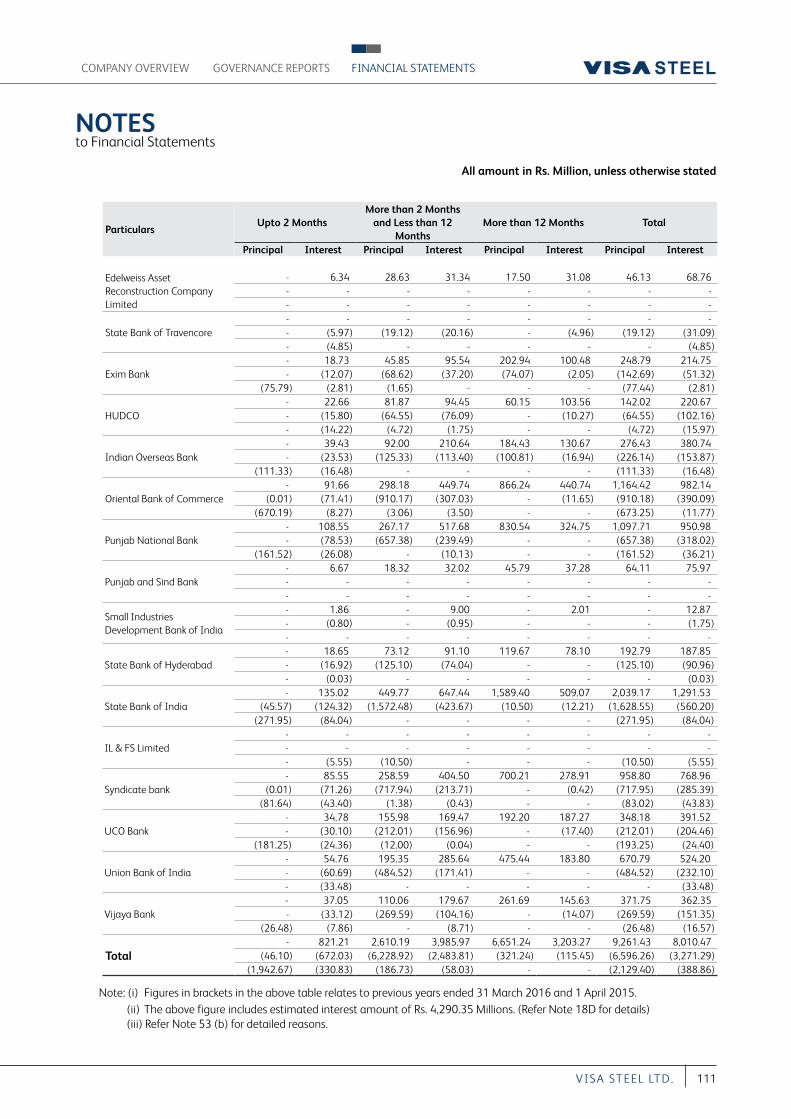
NOTES to Financial Statements
All amount in Rs. Million, unless otherwise stated
COMPANY OVERVIEW FINANCIAL STATEMENTSGOVERNANCE REPORTS
111VI S A S T EEL LT D.
ParticularsUpto 2 Months
More than 2 Months and Less than 12
MonthsMore than 12 Months Total
Principal Interest Principal Interest Principal Interest Principal Interest
Edelweiss Asset Reconstruction Company Limited
- 6.34 28.63 31.34 17.50 31.08 46.13 68.76 - - - - - - - - - - - - - - - -
State Bank of Travencore - - - - - - - - - (5.97) (19.12) (20.16) - (4.96) (19.12) (31.09) - (4.85) - - - - - (4.85)
Exim Bank - 18.73 45.85 95.54 202.94 100.48 248.79 214.75 - (12.07) (68.62) (37.20) (74.07) (2.05) (142.69) (51.32)
(75.79) (2.81) (1.65) - - - (77.44) (2.81)
HUDCO - 22.66 81.87 94.45 60.15 103.56 142.02 220.67 - (15.80) (64.55) (76.09) - (10.27) (64.55) (102.16) - (14.22) (4.72) (1.75) - - (4.72) (15.97)
Indian Overseas Bank - 39.43 92.00 210.64 184.43 130.67 276.43 380.74 - (23.53) (125.33) (113.40) (100.81) (16.94) (226.14) (153.87)
(111.33) (16.48) - - - - (111.33) (16.48)
Oriental Bank of Commerce - 91.66 298.18 449.74 866.24 440.74 1,164.42 982.14
(0.01) (71.41) (910.17) (307.03) - (11.65) (910.18) (390.09) (670.19) (8.27) (3.06) (3.50) - - (673.25) (11.77)
Punjab National Bank - 108.55 267.17 517.68 830.54 324.75 1,097.71 950.98 - (78.53) (657.38) (239.49) - - (657.38) (318.02)
(161.52) (26.08) - (10.13) - - (161.52) (36.21)
Punjab and Sind Bank - 6.67 18.32 32.02 45.79 37.28 64.11 75.97 - - - - - - - - - - - - - - - -
Small Industries Development Bank of India
- 1.86 - 9.00 - 2.01 - 12.87 - (0.80) - (0.95) - - - (1.75) - - - - - - - -
State Bank of Hyderabad - 18.65 73.12 91.10 119.67 78.10 192.79 187.85 - (16.92) (125.10) (74.04) - - (125.10) (90.96) - (0.03) - - - - - (0.03)
State Bank of India - 135.02 449.77 647.44 1,589.40 509.07 2,039.17 1,291.53
(45.57) (124.32) (1,572.48) (423.67) (10.50) (12.21) (1,628.55) (560.20) (271.95) (84.04) - - - - (271.95) (84.04)
IL & FS Limited - - - - - - - - - - - - - - - - - (5.55) (10.50) - - - (10.50) (5.55)
Syndicate bank - 85.55 258.59 404.50 700.21 278.91 958.80 768.96
(0.01) (71.26) (717.94) (213.71) - (0.42) (717.95) (285.39) (81.64) (43.40) (1.38) (0.43) - - (83.02) (43.83)
UCO Bank - 34.78 155.98 169.47 192.20 187.27 348.18 391.52 - (30.10) (212.01) (156.96) - (17.40) (212.01) (204.46)
(181.25) (24.36) (12.00) (0.04) - - (193.25) (24.40)
Union Bank of India - 54.76 195.35 285.64 475.44 183.80 670.79 524.20 - (60.69) (484.52) (171.41) - - (484.52) (232.10) - (33.48) - - - - - (33.48)
Vijaya Bank - 37.05 110.06 179.67 261.69 145.63 371.75 362.35 - (33.12) (269.59) (104.16) - (14.07) (269.59) (151.35)
(26.48) (7.86) - (8.71) - - (26.48) (16.57)
Total - 821.21 2,610.19 3,985.97 6,651.24 3,203.27 9,261.43 8,010.47
(46.10) (672.03) (6,228.92) (2,483.81) (321.24) (115.45) (6,596.26) (3,271.29) (1,942.67) (330.83) (186.73) (58.03) - - (2,129.40) (388.86)
Note: (i) Figures in brackets in the above table relates to previous years ended 31 March 2016 and 1 April 2015. (ii) The above figure includes estimated interest amount of Rs. 4,290.35 Millions. (Refer Note 18D for details) (iii) Refer Note 53 (b) for detailed reasons.
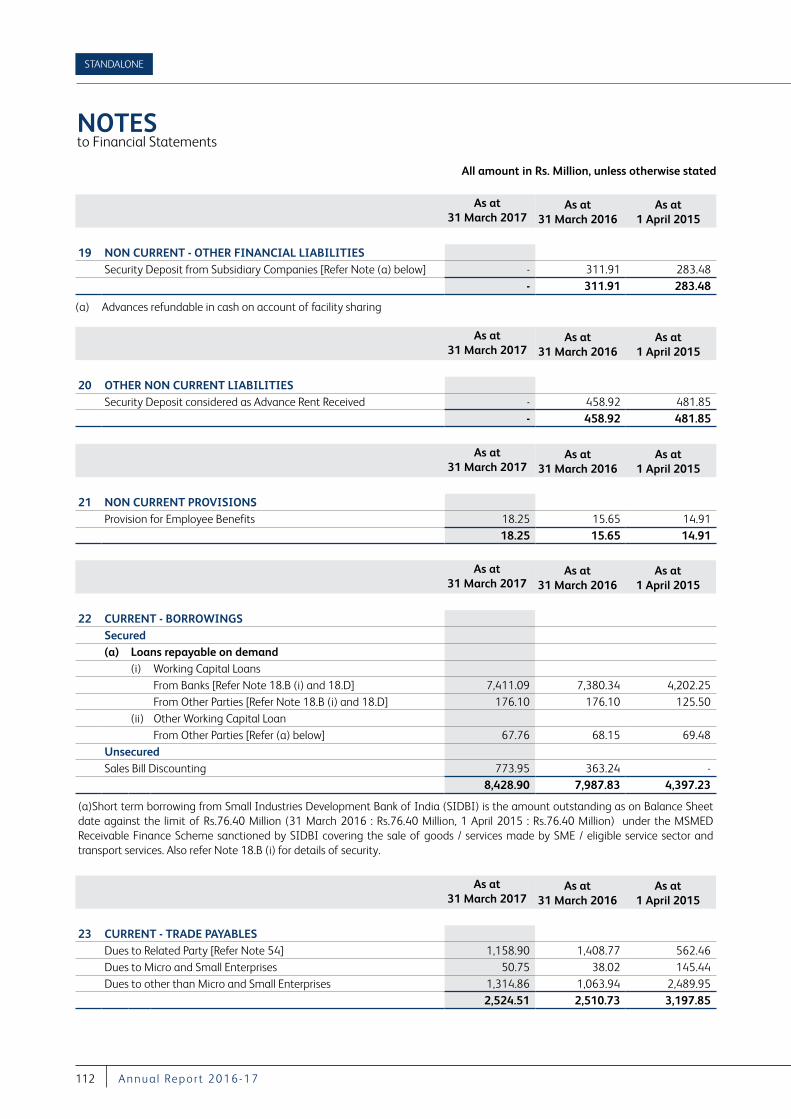
NOTES to Financial Statements
All amount in Rs. Million, unless otherwise stated
STANDALONE
112 A nnu a l Repor t 2016-17
As at 31 March 2017
As at 31 March 2016
As at 1 April 2015
19 NON CURRENT - OTHER FINANCIAL LIABILITIESSecurity Deposit from Subsidiary Companies [Refer Note (a) below] - 311.91 283.48
- 311.91 283.48
(a) Advances refundable in cash on account of facility sharing
As at 31 March 2017
As at 31 March 2016
As at 1 April 2015
20 OTHER NON CURRENT LIABILITIESSecurity Deposit considered as Advance Rent Received - 458.92 481.85
- 458.92 481.85
As at 31 March 2017
As at 31 March 2016
As at 1 April 2015
21 NON CURRENT PROVISIONSProvision for Employee Benefits 18.25 15.65 14.91
18.25 15.65 14.91
As at 31 March 2017
As at 31 March 2016
As at 1 April 2015
22 CURRENT - BORROWINGS Secured(a) Loans repayable on demand
(i) Working Capital Loans From Banks [Refer Note 18.B (i) and 18.D] 7,411.09 7,380.34 4,202.25 From Other Parties [Refer Note 18.B (i) and 18.D] 176.10 176.10 125.50
(ii) Other Working Capital Loan From Other Parties [Refer (a) below] 67.76 68.15 69.48
UnsecuredSales Bill Discounting 773.95 363.24 -
8,428.90 7,987.83 4,397.23
(a)Short term borrowing from Small Industries Development Bank of India (SIDBI) is the amount outstanding as on Balance Sheet date against the limit of Rs.76.40 Million (31 March 2016 : Rs.76.40 Million, 1 April 2015 : Rs.76.40 Million) under the MSMED Receivable Finance Scheme sanctioned by SIDBI covering the sale of goods / services made by SME / eligible service sector and transport services. Also refer Note 18.B (i) for details of security.
As at 31 March 2017
As at 31 March 2016
As at 1 April 2015
23 CURRENT - TRADE PAYABLESDues to Related Party [Refer Note 54] 1,158.90 1,408.77 562.46 Dues to Micro and Small Enterprises 50.75 38.02 145.44 Dues to other than Micro and Small Enterprises 1,314.86 1,063.94 2,489.95
2,524.51 2,510.73 3,197.85
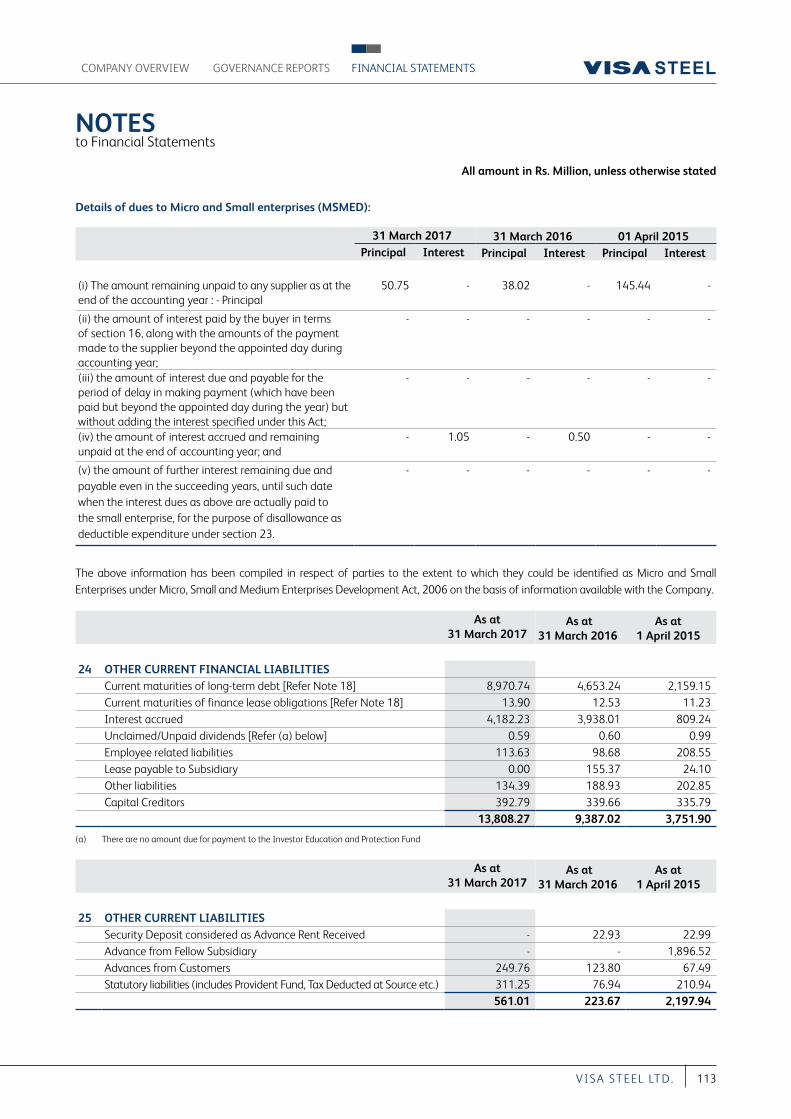
NOTES to Financial Statements
All amount in Rs. Million, unless otherwise stated
COMPANY OVERVIEW FINANCIAL STATEMENTSGOVERNANCE REPORTS
113VI S A S T EEL LT D.
Details of dues to Micro and Small enterprises (MSMED):
31 March 2017 31 March 2016 01 April 2015 Principal Interest Principal Interest Principal Interest
(i) The amount remaining unpaid to any supplier as at the end of the accounting year : - Principal
50.75 - 38.02 - 145.44 -
(ii) the amount of interest paid by the buyer in terms of section 16, along with the amounts of the payment made to the supplier beyond the appointed day during accounting year;
- - - - - -
(iii) the amount of interest due and payable for the period of delay in making payment (which have been paid but beyond the appointed day during the year) but without adding the interest specified under this Act;
- - - - - -
(iv) the amount of interest accrued and remaining unpaid at the end of accounting year; and
- 1.05 - 0.50 - -
(v) the amount of further interest remaining due and payable even in the succeeding years, until such date when the interest dues as above are actually paid to the small enterprise, for the purpose of disallowance as deductible expenditure under section 23.
- - - - - -
The above information has been compiled in respect of parties to the extent to which they could be identified as Micro and Small Enterprises under Micro, Small and Medium Enterprises Development Act, 2006 on the basis of information available with the Company.
As at 31 March 2017
As at 31 March 2016
As at 1 April 2015
24 OTHER CURRENT FINANCIAL LIABILITIES Current maturities of long-term debt [Refer Note 18] 8,970.74 4,653.24 2,159.15 Current maturities of finance lease obligations [Refer Note 18] 13.90 12.53 11.23 Interest accrued 4,182.23 3,938.01 809.24 Unclaimed/Unpaid dividends [Refer (a) below] 0.59 0.60 0.99 Employee related liabilities 113.63 98.68 208.55 Lease payable to Subsidiary 0.00 155.37 24.10 Other liabilities 134.39 188.93 202.85 Capital Creditors 392.79 339.66 335.79
13,808.27 9,387.02 3,751.90
(a) There are no amount due for payment to the Investor Education and Protection Fund
As at 31 March 2017
As at 31 March 2016
As at 1 April 2015
25 OTHER CURRENT LIABILITIESSecurity Deposit considered as Advance Rent Received - 22.93 22.99 Advance from Fellow Subsidiary - - 1,896.52 Advances from Customers 249.76 123.80 67.49 Statutory liabilities (includes Provident Fund, Tax Deducted at Source etc.) 311.25 76.94 210.94
561.01 223.67 2,197.94
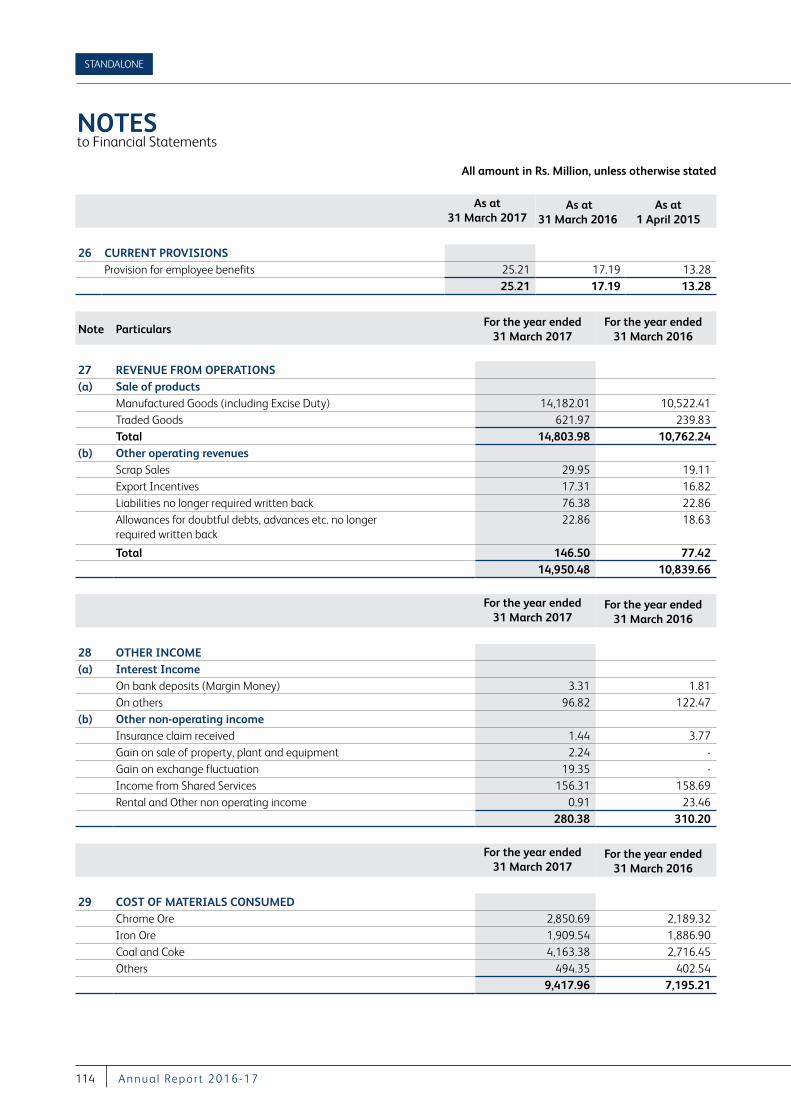
NOTES to Financial Statements
All amount in Rs. Million, unless otherwise stated
STANDALONE
114 A nnu a l Repor t 2016-17
As at 31 March 2017
As at 31 March 2016
As at 1 April 2015
26 CURRENT PROVISIONSProvision for employee benefits 25.21 17.19 13.28
25.21 17.19 13.28
Note ParticularsFor the year ended
31 March 2017For the year ended
31 March 2016
27 REVENUE FROM OPERATIONS(a) Sale of products
Manufactured Goods (including Excise Duty) 14,182.01 10,522.41 Traded Goods 621.97 239.83 Total 14,803.98 10,762.24
(b) Other operating revenuesScrap Sales 29.95 19.11 Export Incentives 17.31 16.82 Liabilities no longer required written back 76.38 22.86 Allowances for doubtful debts, advances etc. no longer required written back
22.86 18.63
Total 146.50 77.42 14,950.48 10,839.66
For the year ended 31 March 2017
For the year ended 31 March 2016
28 OTHER INCOME(a) Interest Income
On bank deposits (Margin Money) 3.31 1.81 On others 96.82 122.47
(b) Other non-operating incomeInsurance claim received 1.44 3.77 Gain on sale of property, plant and equipment 2.24 - Gain on exchange fluctuation 19.35 - Income from Shared Services 156.31 158.69 Rental and Other non operating income 0.91 23.46
280.38 310.20
For the year ended 31 March 2017
For the year ended 31 March 2016
29 COST OF MATERIALS CONSUMEDChrome Ore 2,850.69 2,189.32 Iron Ore 1,909.54 1,886.90 Coal and Coke 4,163.38 2,716.45 Others 494.35 402.54
9,417.96 7,195.21
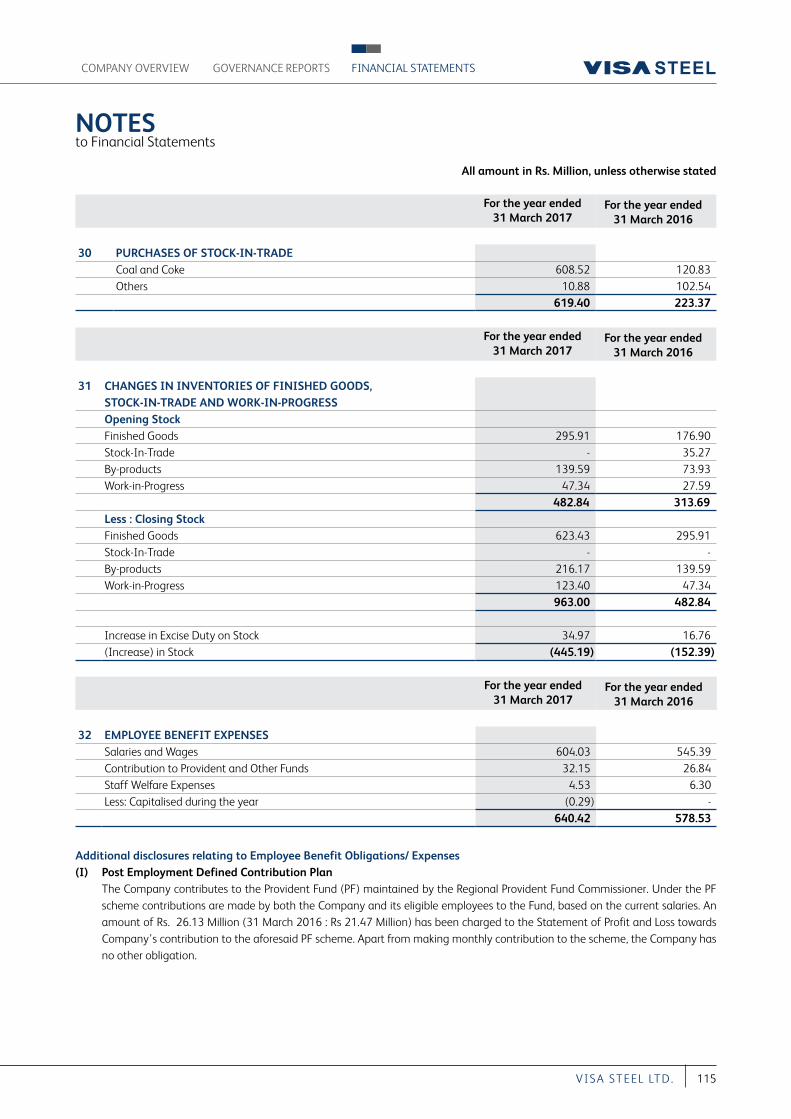
NOTES to Financial Statements
All amount in Rs. Million, unless otherwise stated
COMPANY OVERVIEW FINANCIAL STATEMENTSGOVERNANCE REPORTS
115VI S A S T EEL LT D.
For the year ended 31 March 2017
For the year ended 31 March 2016
30 PURCHASES OF STOCK-IN-TRADECoal and Coke 608.52 120.83 Others 10.88 102.54
619.40 223.37
For the year ended 31 March 2017
For the year ended 31 March 2016
31 CHANGES IN INVENTORIES OF FINISHED GOODS, STOCK-IN-TRADE AND WORK-IN-PROGRESSOpening Stock Finished Goods 295.91 176.90 Stock-In-Trade - 35.27 By-products 139.59 73.93 Work-in-Progress 47.34 27.59
482.84 313.69 Less : Closing StockFinished Goods 623.43 295.91 Stock-In-Trade - - By-products 216.17 139.59 Work-in-Progress 123.40 47.34
963.00 482.84
Increase in Excise Duty on Stock 34.97 16.76 (Increase) in Stock (445.19) (152.39)
For the year ended 31 March 2017
For the year ended 31 March 2016
32 EMPLOYEE BENEFIT EXPENSESSalaries and Wages 604.03 545.39 Contribution to Provident and Other Funds 32.15 26.84 Staff Welfare Expenses 4.53 6.30 Less: Capitalised during the year (0.29) -
640.42 578.53
Additional disclosures relating to Employee Benefit Obligations/ Expenses(I) Post Employment Defined Contribution Plan The Company contributes to the Provident Fund (PF) maintained by the Regional Provident Fund Commissioner. Under the PF
scheme contributions are made by both the Company and its eligible employees to the Fund, based on the current salaries. An amount of Rs. 26.13 Million (31 March 2016 : Rs 21.47 Million) has been charged to the Statement of Profit and Loss towards Company’s contribution to the aforesaid PF scheme. Apart from making monthly contribution to the scheme, the Company has no other obligation.
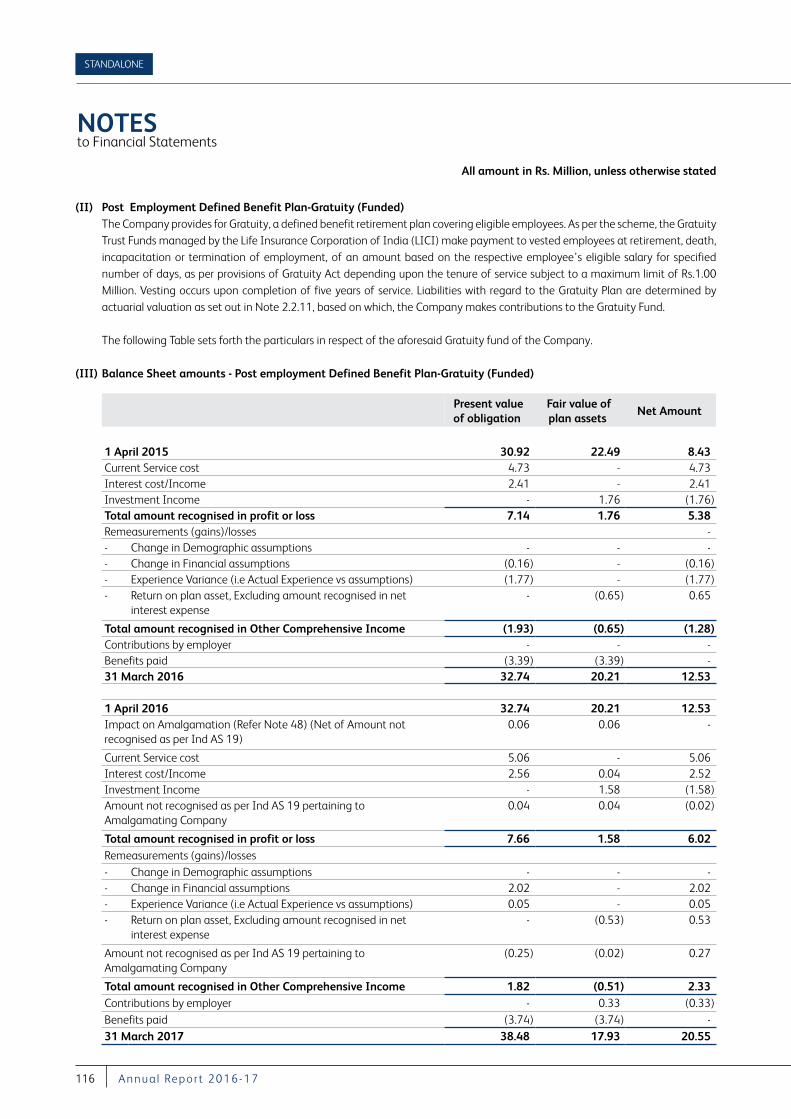
NOTES to Financial Statements
All amount in Rs. Million, unless otherwise stated
STANDALONE
116 A nnu a l Repor t 2016-17
(II) Post Employment Defined Benefit Plan-Gratuity (Funded) The Company provides for Gratuity, a defined benefit retirement plan covering eligible employees. As per the scheme, the Gratuity
Trust Funds managed by the Life Insurance Corporation of India (LICI) make payment to vested employees at retirement, death, incapacitation or termination of employment, of an amount based on the respective employee’s eligible salary for specified number of days, as per provisions of Gratuity Act depending upon the tenure of service subject to a maximum limit of Rs.1.00 Million. Vesting occurs upon completion of five years of service. Liabilities with regard to the Gratuity Plan are determined by actuarial valuation as set out in Note 2.2.11, based on which, the Company makes contributions to the Gratuity Fund.
The following Table sets forth the particulars in respect of the aforesaid Gratuity fund of the Company.
(III) Balance Sheet amounts - Post employment Defined Benefit Plan-Gratuity (Funded)
Present value of obligation
Fair value of plan assets
Net Amount
1 April 2015 30.92 22.49 8.43 Current Service cost 4.73 - 4.73 Interest cost/Income 2.41 - 2.41 Investment Income - 1.76 (1.76)Total amount recognised in profit or loss 7.14 1.76 5.38Remeasurements (gains)/losses - - Change in Demographic assumptions - - - - Change in Financial assumptions (0.16) - (0.16)- Experience Variance (i.e Actual Experience vs assumptions) (1.77) - (1.77)- Return on plan asset, Excluding amount recognised in net
interest expense- (0.65) 0.65
Total amount recognised in Other Comprehensive Income (1.93) (0.65) (1.28)Contributions by employer - - - Benefits paid (3.39) (3.39) - 31 March 2016 32.74 20.21 12.53
1 April 2016 32.74 20.21 12.53 Impact on Amalgamation (Refer Note 48) (Net of Amount not recognised as per Ind AS 19)
0.06 0.06 -
Current Service cost 5.06 - 5.06 Interest cost/Income 2.56 0.04 2.52 Investment Income - 1.58 (1.58)Amount not recognised as per Ind AS 19 pertaining to Amalgamating Company
0.04 0.04 (0.02)
Total amount recognised in profit or loss 7.66 1.58 6.02Remeasurements (gains)/losses - Change in Demographic assumptions - - - - Change in Financial assumptions 2.02 - 2.02 - Experience Variance (i.e Actual Experience vs assumptions) 0.05 - 0.05 - Return on plan asset, Excluding amount recognised in net
interest expense- (0.53) 0.53
Amount not recognised as per Ind AS 19 pertaining to Amalgamating Company
(0.25) (0.02) 0.27
Total amount recognised in Other Comprehensive Income 1.82 (0.51) 2.33Contributions by employer - 0.33 (0.33)Benefits paid (3.74) (3.74) - 31 March 2017 38.48 17.93 20.55
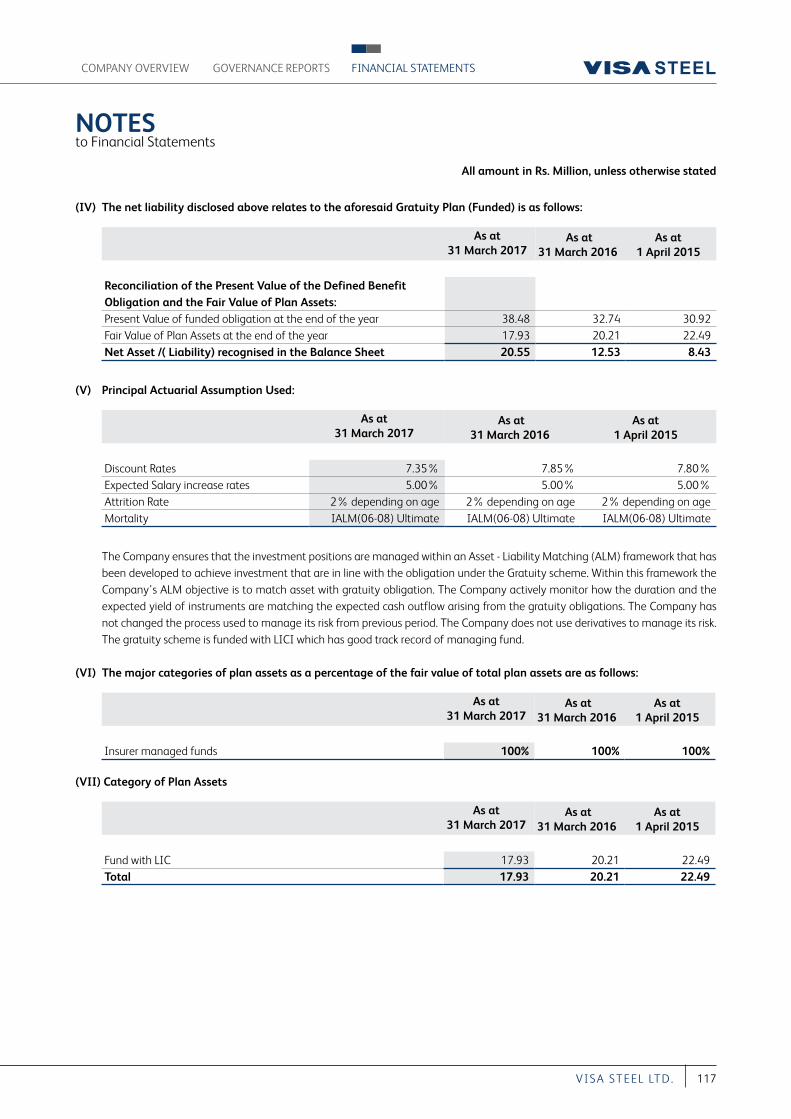
NOTES to Financial Statements
All amount in Rs. Million, unless otherwise stated
COMPANY OVERVIEW FINANCIAL STATEMENTSGOVERNANCE REPORTS
117VI S A S T EEL LT D.
(IV) The net liability disclosed above relates to the aforesaid Gratuity Plan (Funded) is as follows:
As at 31 March 2017
As at 31 March 2016
As at 1 April 2015
Reconciliation of the Present Value of the Defined Benefit Obligation and the Fair Value of Plan Assets:Present Value of funded obligation at the end of the year 38.48 32.74 30.92 Fair Value of Plan Assets at the end of the year 17.93 20.21 22.49 Net Asset /( Liability) recognised in the Balance Sheet 20.55 12.53 8.43
(V) Principal Actuarial Assumption Used:
As at
31 March 2017 As at
31 March 2016 As at
1 April 2015
Discount Rates 7.35% 7.85% 7.80%Expected Salary increase rates 5.00% 5.00% 5.00%Attrition Rate 2% depending on age 2% depending on age 2% depending on ageMortality IALM(06-08) Ultimate IALM(06-08) Ultimate IALM(06-08) Ultimate
The Company ensures that the investment positions are managed within an Asset - Liability Matching (ALM) framework that has been developed to achieve investment that are in line with the obligation under the Gratuity scheme. Within this framework the Company’s ALM objective is to match asset with gratuity obligation. The Company actively monitor how the duration and the expected yield of instruments are matching the expected cash outflow arising from the gratuity obligations. The Company has not changed the process used to manage its risk from previous period. The Company does not use derivatives to manage its risk. The gratuity scheme is funded with LICI which has good track record of managing fund.
(VI) The major categories of plan assets as a percentage of the fair value of total plan assets are as follows:
As at
31 March 2017 As at
31 March 2016 As at
1 April 2015
Insurer managed funds 100% 100% 100%
(VII) Category of Plan Assets
As at
31 March 2017 As at
31 March 2016 As at
1 April 2015
Fund with LIC 17.93 20.21 22.49Total 17.93 20.21 22.49
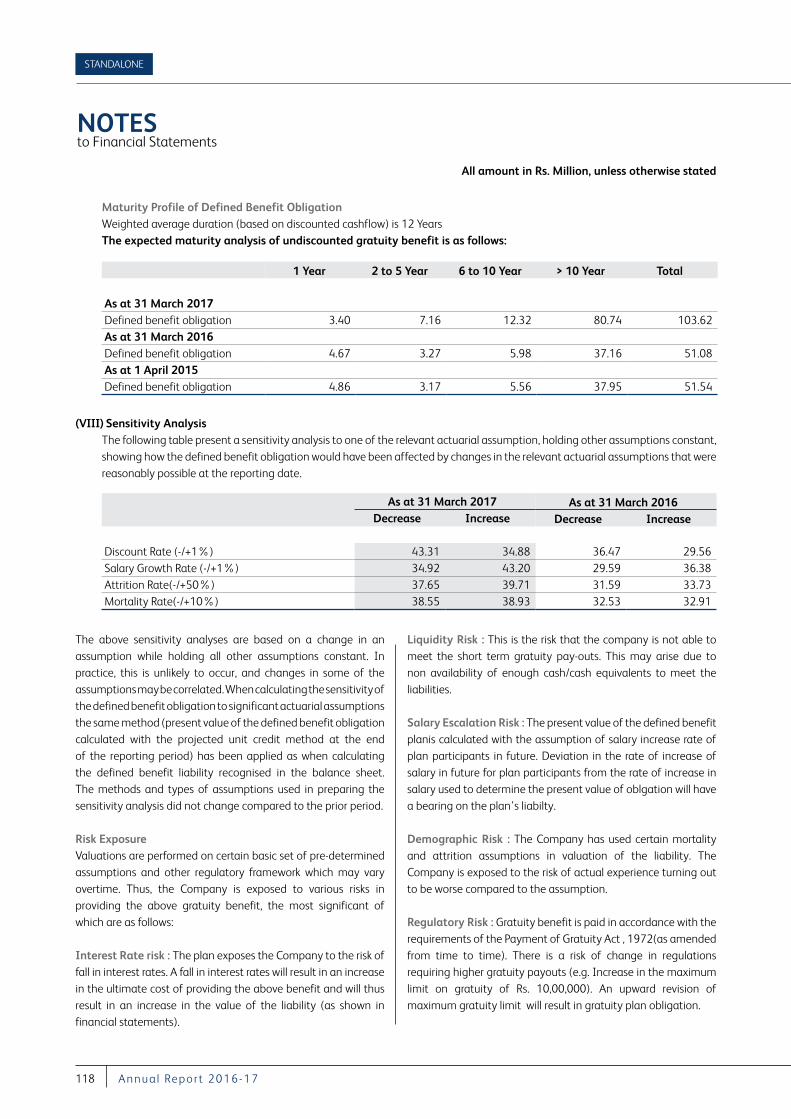
NOTES to Financial Statements
All amount in Rs. Million, unless otherwise stated
STANDALONE
118 A nnu a l Repor t 2016-17
The above sensitivity analyses are based on a change in an assumption while holding all other assumptions constant. In practice, this is unlikely to occur, and changes in some of the assumptions may be correlated. When calculating the sensitivity of the defined benefit obligation to significant actuarial assumptions the same method (present value of the defined benefit obligation calculated with the projected unit credit method at the end of the reporting period) has been applied as when calculating the defined benefit liability recognised in the balance sheet. The methods and types of assumptions used in preparing the sensitivity analysis did not change compared to the prior period.
Risk Exposure Valuations are performed on certain basic set of pre-determined assumptions and other regulatory framework which may vary overtime. Thus, the Company is exposed to various risks in providing the above gratuity benefit, the most significant of which are as follows:
Interest Rate risk : The plan exposes the Company to the risk of fall in interest rates. A fall in interest rates will result in an increase in the ultimate cost of providing the above benefit and will thus result in an increase in the value of the liability (as shown in financial statements).
Liquidity Risk : This is the risk that the company is not able to meet the short term gratuity pay-outs. This may arise due to non availability of enough cash/cash equivalents to meet the liabilities.
Salary Escalation Risk : The present value of the defined benefit planis calculated with the assumption of salary increase rate of plan participants in future. Deviation in the rate of increase of salary in future for plan participants from the rate of increase in salary used to determine the present value of oblgation will have a bearing on the plan’s liabilty.
Demographic Risk : The Company has used certain mortality and attrition assumptions in valuation of the liability. The Company is exposed to the risk of actual experience turning out to be worse compared to the assumption.
Regulatory Risk : Gratuity benefit is paid in accordance with the requirements of the Payment of Gratuity Act , 1972(as amended from time to time). There is a risk of change in regulations requiring higher gratuity payouts (e.g. Increase in the maximum limit on gratuity of Rs. 10,00,000). An upward revision of maximum gratuity limit will result in gratuity plan obligation.
Maturity Profile of Defined Benefit Obligation Weighted average duration (based on discounted cashflow) is 12 Years The expected maturity analysis of undiscounted gratuity benefit is as follows:
1 Year 2 to 5 Year 6 to 10 Year > 10 Year Total
As at 31 March 2017Defined benefit obligation 3.40 7.16 12.32 80.74 103.62 As at 31 March 2016Defined benefit obligation 4.67 3.27 5.98 37.16 51.08 As at 1 April 2015Defined benefit obligation 4.86 3.17 5.56 37.95 51.54
(VIII) Sensitivity Analysis The following table present a sensitivity analysis to one of the relevant actuarial assumption, holding other assumptions constant, showing how the defined benefit obligation would have been affected by changes in the relevant actuarial assumptions that were reasonably possible at the reporting date.
As at 31 March 2017 As at 31 March 2016Decrease Increase Decrease Increase
Discount Rate (-/+1%) 43.31 34.88 36.47 29.56Salary Growth Rate (-/+1%) 34.92 43.20 29.59 36.38Attrition Rate(-/+50%) 37.65 39.71 31.59 33.73Mortality Rate(-/+10%) 38.55 38.93 32.53 32.91
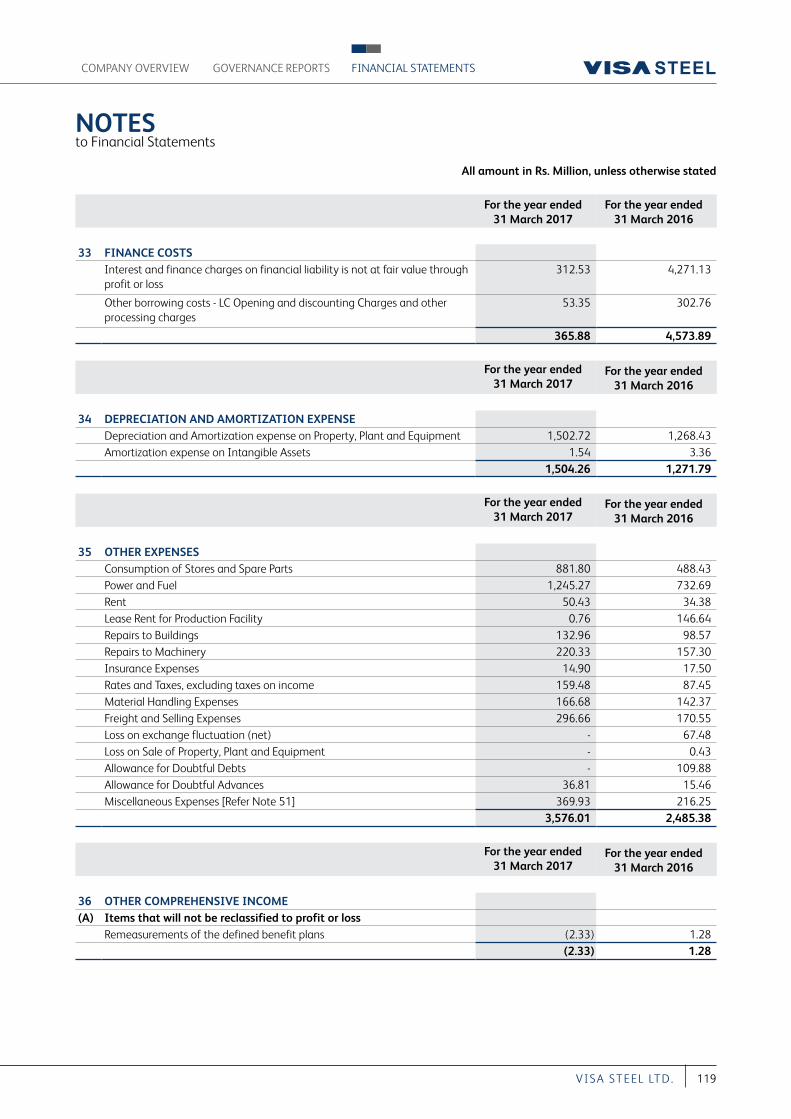
NOTES to Financial Statements
All amount in Rs. Million, unless otherwise stated
COMPANY OVERVIEW FINANCIAL STATEMENTSGOVERNANCE REPORTS
119VI S A S T EEL LT D.
For the year ended 31 March 2017
For the year ended 31 March 2016
33 FINANCE COSTSInterest and finance charges on financial liability is not at fair value through profit or loss
312.53 4,271.13
Other borrowing costs - LC Opening and discounting Charges and other processing charges
53.35 302.76
365.88 4,573.89
For the year ended 31 March 2017
For the year ended 31 March 2016
34 DEPRECIATION AND AMORTIZATION EXPENSEDepreciation and Amortization expense on Property, Plant and Equipment 1,502.72 1,268.43 Amortization expense on Intangible Assets 1.54 3.36
1,504.26 1,271.79
For the year ended 31 March 2017
For the year ended 31 March 2016
35 OTHER EXPENSESConsumption of Stores and Spare Parts 881.80 488.43 Power and Fuel 1,245.27 732.69 Rent 50.43 34.38 Lease Rent for Production Facility 0.76 146.64 Repairs to Buildings 132.96 98.57 Repairs to Machinery 220.33 157.30 Insurance Expenses 14.90 17.50 Rates and Taxes, excluding taxes on income 159.48 87.45 Material Handling Expenses 166.68 142.37 Freight and Selling Expenses 296.66 170.55 Loss on exchange fluctuation (net) - 67.48 Loss on Sale of Property, Plant and Equipment - 0.43 Allowance for Doubtful Debts - 109.88 Allowance for Doubtful Advances 36.81 15.46 Miscellaneous Expenses [Refer Note 51] 369.93 216.25
3,576.01 2,485.38
For the year ended 31 March 2017
For the year ended 31 March 2016
36 OTHER COMPREHENSIVE INCOME(A) Items that will not be reclassified to profit or loss
Remeasurements of the defined benefit plans (2.33) 1.28 (2.33) 1.28
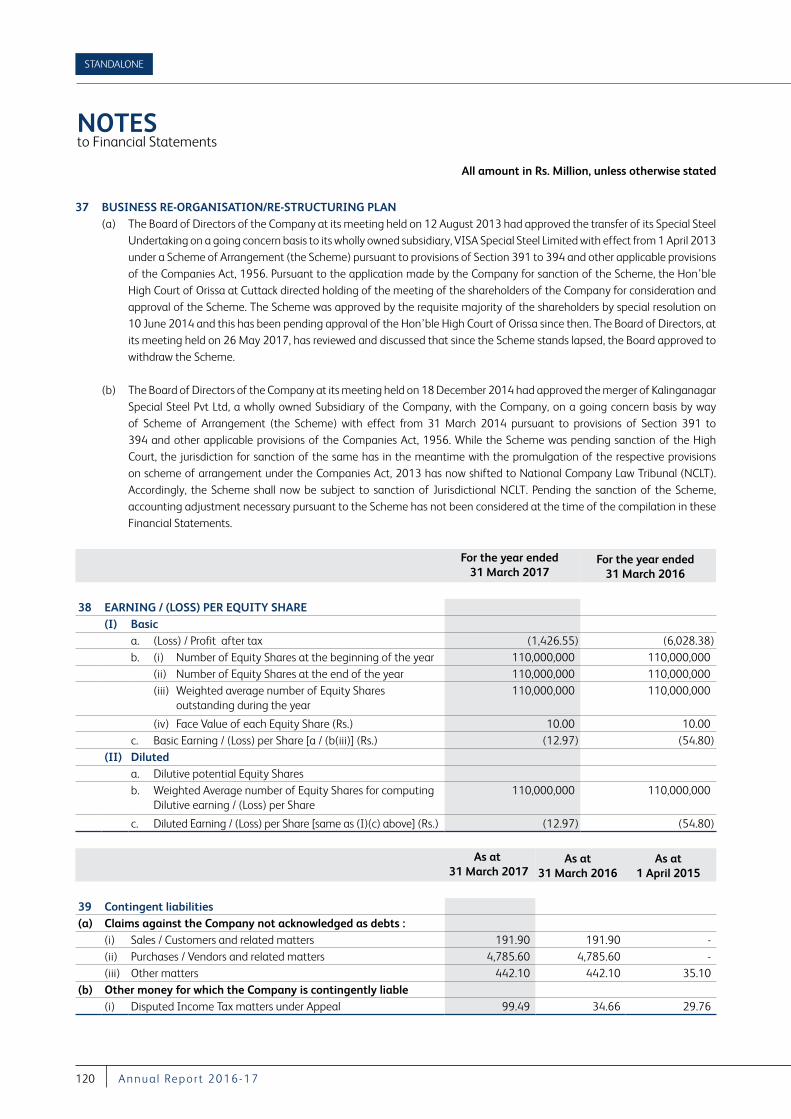
NOTES to Financial Statements
All amount in Rs. Million, unless otherwise stated
STANDALONE
120 A nnu a l Repor t 2016-17
37 BUSINESS RE-ORGANISATION/RE-STRUCTURING PLAN (a) The Board of Directors of the Company at its meeting held on 12 August 2013 had approved the transfer of its Special Steel
Undertaking on a going concern basis to its wholly owned subsidiary, VISA Special Steel Limited with effect from 1 April 2013 under a Scheme of Arrangement (the Scheme) pursuant to provisions of Section 391 to 394 and other applicable provisions of the Companies Act, 1956. Pursuant to the application made by the Company for sanction of the Scheme, the Hon’ble High Court of Orissa at Cuttack directed holding of the meeting of the shareholders of the Company for consideration and approval of the Scheme. The Scheme was approved by the requisite majority of the shareholders by special resolution on 10 June 2014 and this has been pending approval of the Hon’ble High Court of Orissa since then. The Board of Directors, at its meeting held on 26 May 2017, has reviewed and discussed that since the Scheme stands lapsed, the Board approved to withdraw the Scheme.
(b) The Board of Directors of the Company at its meeting held on 18 December 2014 had approved the merger of Kalinganagar Special Steel Pvt Ltd, a wholly owned Subsidiary of the Company, with the Company, on a going concern basis by way of Scheme of Arrangement (the Scheme) with effect from 31 March 2014 pursuant to provisions of Section 391 to 394 and other applicable provisions of the Companies Act, 1956. While the Scheme was pending sanction of the High Court, the jurisdiction for sanction of the same has in the meantime with the promulgation of the respective provisions on scheme of arrangement under the Companies Act, 2013 has now shifted to National Company Law Tribunal (NCLT). Accordingly, the Scheme shall now be subject to sanction of Jurisdictional NCLT. Pending the sanction of the Scheme, accounting adjustment necessary pursuant to the Scheme has not been considered at the time of the compilation in these Financial Statements.
For the year ended 31 March 2017
For the year ended 31 March 2016
38 EARNING / (LOSS) PER EQUITY SHARE(I) Basic
a. (Loss) / Profit after tax (1,426.55) (6,028.38)b. (i) Number of Equity Shares at the beginning of the year 110,000,000 110,000,000 (ii) Number of Equity Shares at the end of the year 110,000,000 110,000,000 (iii) Weighted average number of Equity Shares
outstanding during the year 110,000,000 110,000,000
(iv) Face Value of each Equity Share (Rs.) 10.00 10.00 c. Basic Earning / (Loss) per Share [a / (b(iii)] (Rs.) (12.97) (54.80)
(II) Diluteda. Dilutive potential Equity Sharesb. Weighted Average number of Equity Shares for computing
Dilutive earning / (Loss) per Share 110,000,000 110,000,000
c. Diluted Earning / (Loss) per Share [same as (I)(c) above] (Rs.) (12.97) (54.80)
As at 31 March 2017
As at31 March 2016
As at1 April 2015
39 Contingent liabilities (a) Claims against the Company not acknowledged as debts :
(i) Sales / Customers and related matters 191.90 191.90 - (ii) Purchases / Vendors and related matters 4,785.60 4,785.60 - (iii) Other matters 442.10 442.10 35.10
(b) Other money for which the Company is contingently liable(i) Disputed Income Tax matters under Appeal 99.49 34.66 29.76
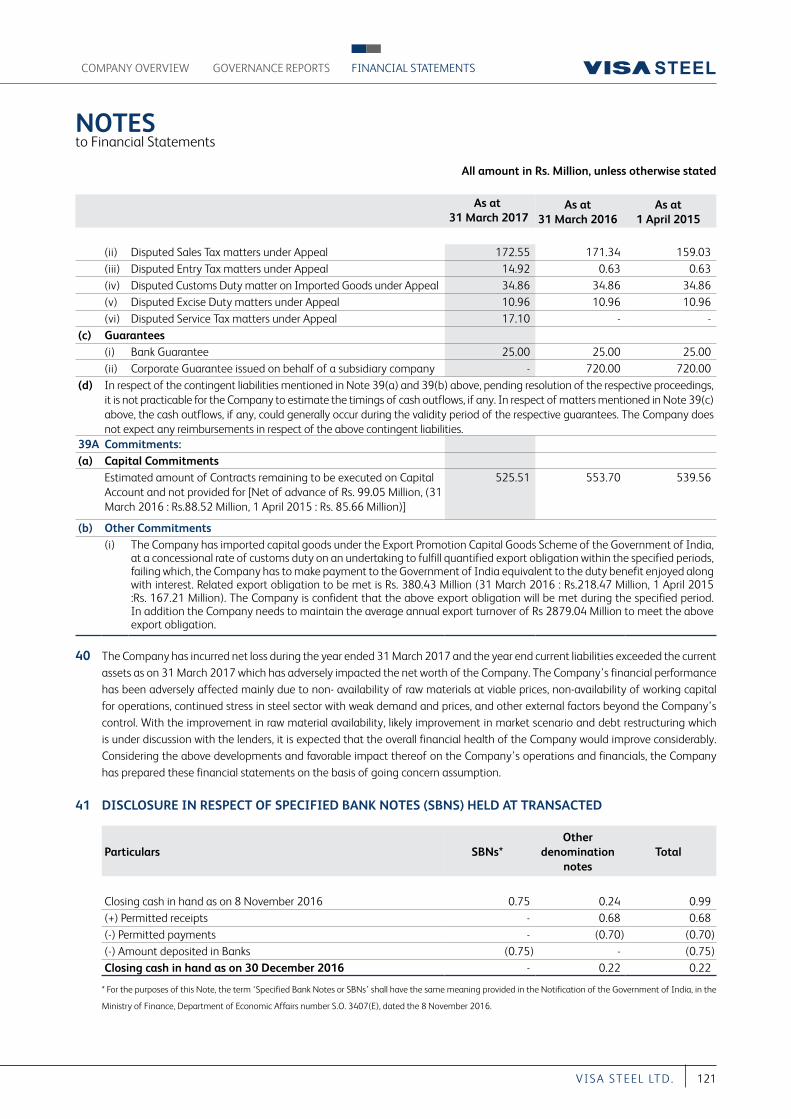
NOTES to Financial Statements
All amount in Rs. Million, unless otherwise stated
COMPANY OVERVIEW FINANCIAL STATEMENTSGOVERNANCE REPORTS
121VI S A S T EEL LT D.
As at 31 March 2017
As at31 March 2016
As at1 April 2015
(ii) Disputed Sales Tax matters under Appeal 172.55 171.34 159.03 (iii) Disputed Entry Tax matters under Appeal 14.92 0.63 0.63 (iv) Disputed Customs Duty matter on Imported Goods under Appeal 34.86 34.86 34.86 (v) Disputed Excise Duty matters under Appeal 10.96 10.96 10.96 (vi) Disputed Service Tax matters under Appeal 17.10 - -
(c) Guarantees(i) Bank Guarantee 25.00 25.00 25.00 (ii) Corporate Guarantee issued on behalf of a subsidiary company - 720.00 720.00
(d) In respect of the contingent liabilities mentioned in Note 39(a) and 39(b) above, pending resolution of the respective proceedings, it is not practicable for the Company to estimate the timings of cash outflows, if any. In respect of matters mentioned in Note 39(c) above, the cash outflows, if any, could generally occur during the validity period of the respective guarantees. The Company does not expect any reimbursements in respect of the above contingent liabilities.
39A Commitments:(a) Capital Commitments
Estimated amount of Contracts remaining to be executed on Capital Account and not provided for [Net of advance of Rs. 99.05 Million, (31 March 2016 : Rs.88.52 Million, 1 April 2015 : Rs. 85.66 Million)]
525.51 553.70 539.56
(b) Other Commitments(i) The Company has imported capital goods under the Export Promotion Capital Goods Scheme of the Government of India,
at a concessional rate of customs duty on an undertaking to fulfill quantified export obligation within the specified periods, failing which, the Company has to make payment to the Government of India equivalent to the duty benefit enjoyed along with interest. Related export obligation to be met is Rs. 380.43 Million (31 March 2016 : Rs.218.47 Million, 1 April 2015 :Rs. 167.21 Million). The Company is confident that the above export obligation will be met during the specified period. In addition the Company needs to maintain the average annual export turnover of Rs 2879.04 Million to meet the above export obligation.
40 The Company has incurred net loss during the year ended 31 March 2017 and the year end current liabilities exceeded the current assets as on 31 March 2017 which has adversely impacted the net worth of the Company. The Company’s financial performance has been adversely affected mainly due to non- availability of raw materials at viable prices, non-availability of working capital for operations, continued stress in steel sector with weak demand and prices, and other external factors beyond the Company’s control. With the improvement in raw material availability, likely improvement in market scenario and debt restructuring which is under discussion with the lenders, it is expected that the overall financial health of the Company would improve considerably. Considering the above developments and favorable impact thereof on the Company’s operations and financials, the Company has prepared these financial statements on the basis of going concern assumption.
41 DISCLOSURE IN RESPECT OF SPECIFIED BANK NOTES (SBNS) HELD AT TRANSACTED
Particulars SBNs*Other
denomination notes
Total
Closing cash in hand as on 8 November 2016 0.75 0.24 0.99 (+) Permitted receipts - 0.68 0.68 (-) Permitted payments - (0.70) (0.70)(-) Amount deposited in Banks (0.75) - (0.75)Closing cash in hand as on 30 December 2016 - 0.22 0.22
* For the purposes of this Note, the term ‘Specified Bank Notes or SBNs’ shall have the same meaning provided in the Notification of the Government of India, in the
Ministry of Finance, Department of Economic Affairs number S.O. 3407(E), dated the 8 November 2016.
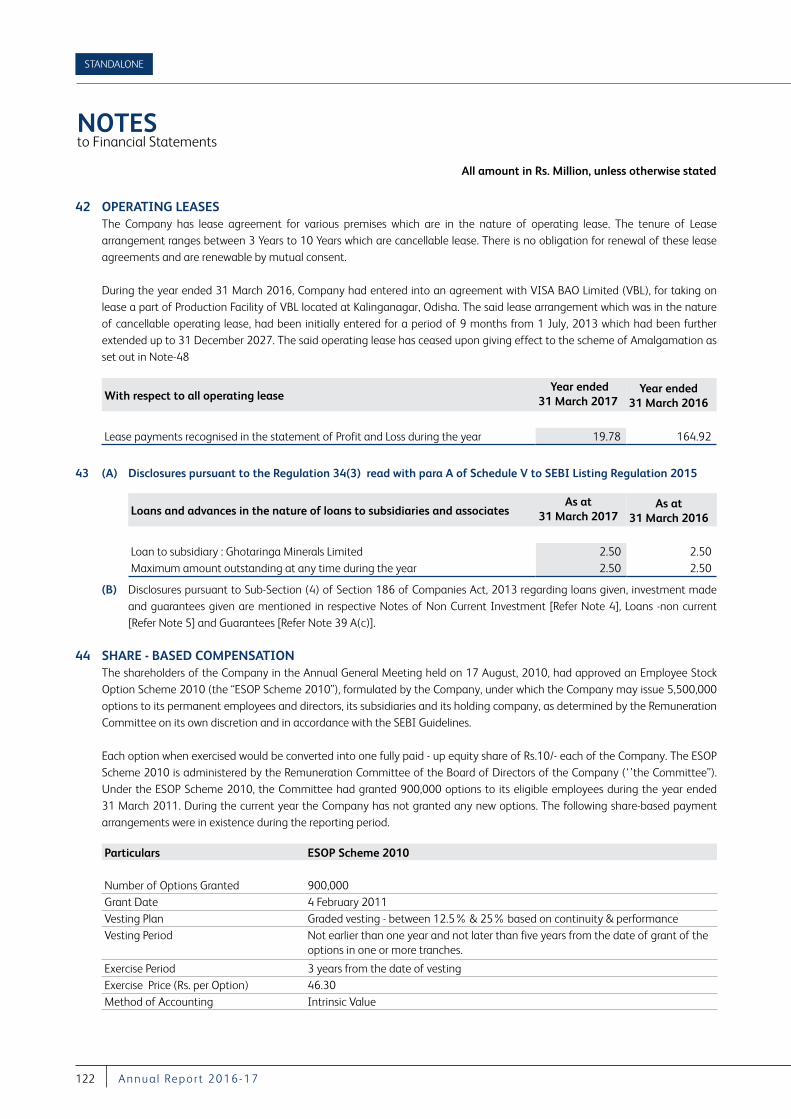
NOTES to Financial Statements
All amount in Rs. Million, unless otherwise stated
STANDALONE
122 A nnu a l Repor t 2016-17
42 OPERATING LEASES The Company has lease agreement for various premises which are in the nature of operating lease. The tenure of Lease arrangement ranges between 3 Years to 10 Years which are cancellable lease. There is no obligation for renewal of these lease agreements and are renewable by mutual consent.
During the year ended 31 March 2016, Company had entered into an agreement with VISA BAO Limited (VBL), for taking on lease a part of Production Facility of VBL located at Kalinganagar, Odisha. The said lease arrangement which was in the nature of cancellable operating lease, had been initially entered for a period of 9 months from 1 July, 2013 which had been further extended up to 31 December 2027. The said operating lease has ceased upon giving effect to the scheme of Amalgamation as set out in Note-48
With respect to all operating lease Year ended
31 March 2017 Year ended
31 March 2016
Lease payments recognised in the statement of Profit and Loss during the year 19.78 164.92
43 (A) Disclosures pursuant to the Regulation 34(3) read with para A of Schedule V to SEBI Listing Regulation 2015
Loans and advances in the nature of loans to subsidiaries and associates As at
31 March 2017As at
31 March 2016
Loan to subsidiary : Ghotaringa Minerals Limited 2.50 2.50Maximum amount outstanding at any time during the year 2.50 2.50
(B) Disclosures pursuant to Sub-Section (4) of Section 186 of Companies Act, 2013 regarding loans given, investment made and guarantees given are mentioned in respective Notes of Non Current Investment [Refer Note 4], Loans -non current [Refer Note 5] and Guarantees [Refer Note 39 A(c)].
44 SHARE - BASED COMPENSATION The shareholders of the Company in the Annual General Meeting held on 17 August, 2010, had approved an Employee Stock
Option Scheme 2010 (the “ESOP Scheme 2010”), formulated by the Company, under which the Company may issue 5,500,000 options to its permanent employees and directors, its subsidiaries and its holding company, as determined by the Remuneration Committee on its own discretion and in accordance with the SEBI Guidelines.
Each option when exercised would be converted into one fully paid - up equity share of Rs.10/- each of the Company. The ESOP Scheme 2010 is administered by the Remuneration Committee of the Board of Directors of the Company (‘’the Committee”). Under the ESOP Scheme 2010, the Committee had granted 900,000 options to its eligible employees during the year ended 31 March 2011. During the current year the Company has not granted any new options. The following share-based payment arrangements were in existence during the reporting period.
Particulars ESOP Scheme 2010
Number of Options Granted 900,000Grant Date 4 February 2011Vesting Plan Graded vesting - between 12.5% & 25% based on continuity & performanceVesting Period Not earlier than one year and not later than five years from the date of grant of the
options in one or more tranches.
Exercise Period 3 years from the date of vesting Exercise Price (Rs. per Option) 46.30Method of Accounting Intrinsic Value
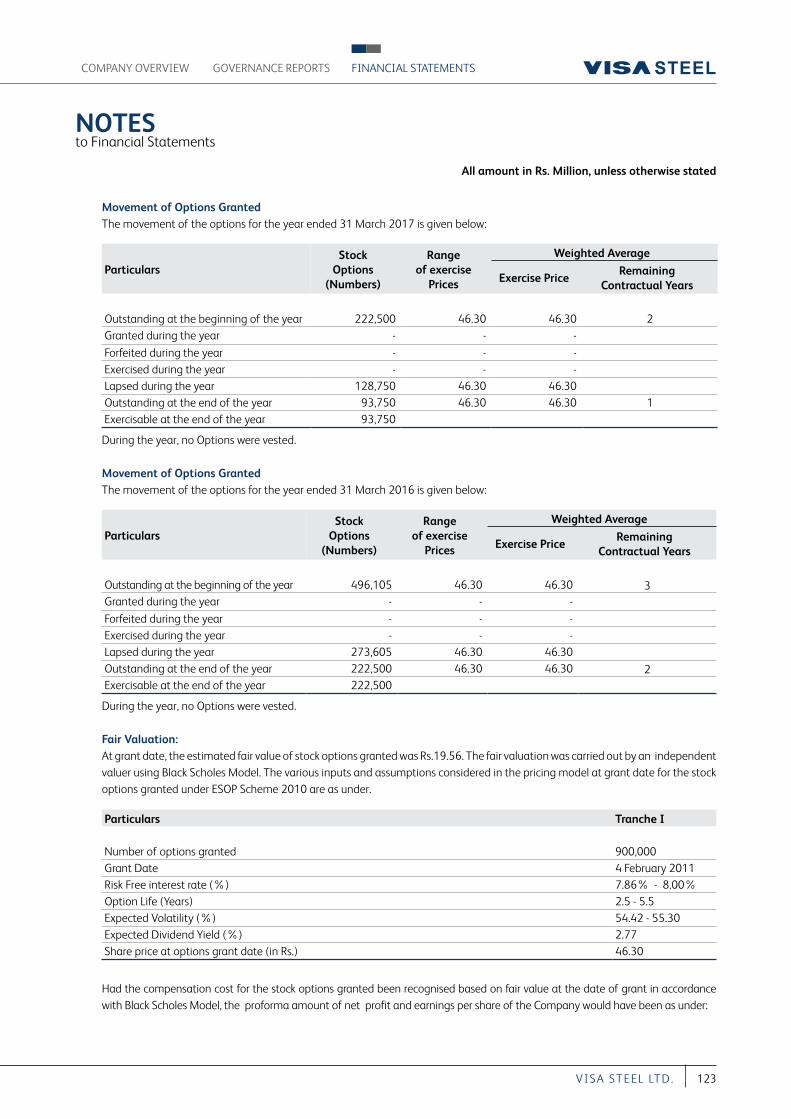
NOTES to Financial Statements
All amount in Rs. Million, unless otherwise stated
COMPANY OVERVIEW FINANCIAL STATEMENTSGOVERNANCE REPORTS
123VI S A S T EEL LT D.
Movement of Options Granted The movement of the options for the year ended 31 March 2017 is given below:
ParticularsStock
Options (Numbers)
Range of exercise
Prices
Weighted Average
Exercise PriceRemaining
Contractual Years
Outstanding at the beginning of the year 222,500 46.30 46.30 2Granted during the year - - -
Forfeited during the year - - - Exercised during the year - - - Lapsed during the year 128,750 46.30 46.30 Outstanding at the end of the year 93,750 46.30 46.30 1Exercisable at the end of the year 93,750
During the year, no Options were vested.
Movement of Options Granted The movement of the options for the year ended 31 March 2016 is given below:
ParticularsStock
Options (Numbers)
Range of exercise
Prices
Weighted Average
Exercise PriceRemaining
Contractual Years
Outstanding at the beginning of the year 496,105 46.30 46.30 3Granted during the year - - -
Forfeited during the year - - - Exercised during the year - - - Lapsed during the year 273,605 46.30 46.30 Outstanding at the end of the year 222,500 46.30 46.30 2Exercisable at the end of the year 222,500
During the year, no Options were vested.
Fair Valuation: At grant date, the estimated fair value of stock options granted was Rs.19.56. The fair valuation was carried out by an independent valuer using Black Scholes Model. The various inputs and assumptions considered in the pricing model at grant date for the stock options granted under ESOP Scheme 2010 are as under.
Particulars Tranche I
Number of options granted 900,000Grant Date 4 February 2011Risk Free interest rate (%) 7.86% - 8.00%Option Life (Years) 2.5 - 5.5Expected Volatility (%) 54.42 - 55.30 Expected Dividend Yield (%) 2.77Share price at options grant date (in Rs.) 46.30
Had the compensation cost for the stock options granted been recognised based on fair value at the date of grant in accordance with Black Scholes Model, the proforma amount of net profit and earnings per share of the Company would have been as under:
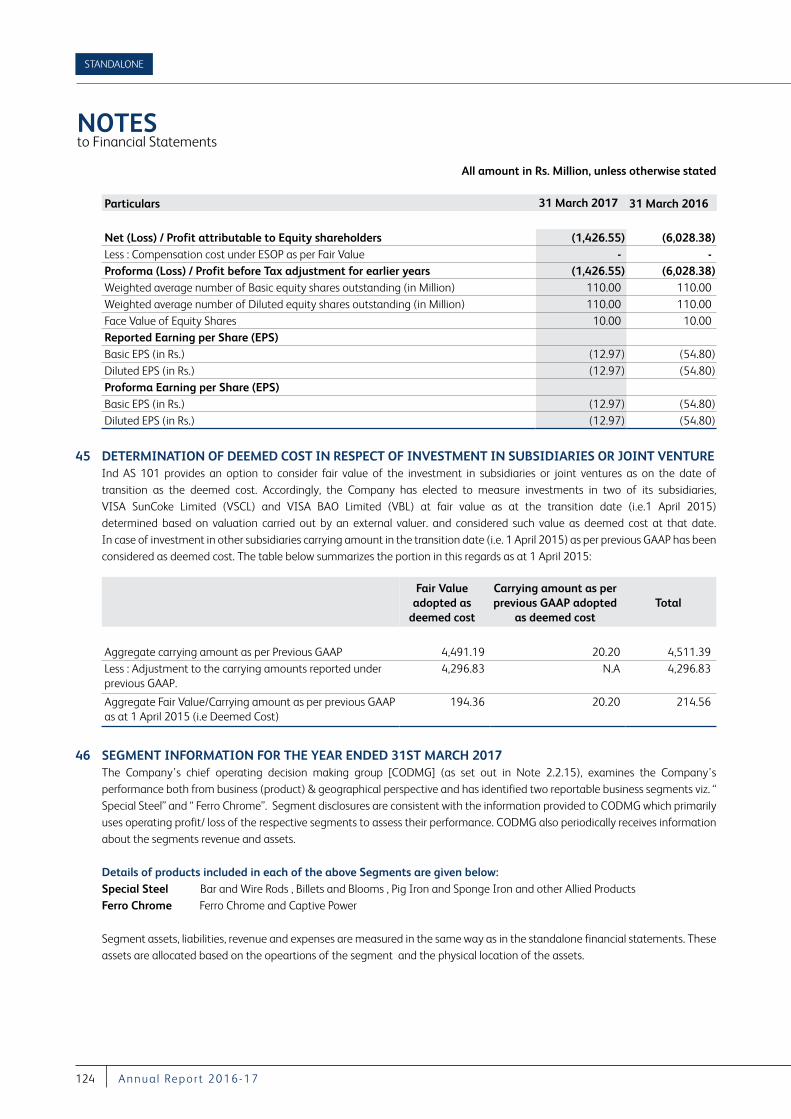
NOTES to Financial Statements
All amount in Rs. Million, unless otherwise stated
STANDALONE
124 A nnu a l Repor t 2016-17
Particulars 31 March 2017 31 March 2016
Net (Loss) / Profit attributable to Equity shareholders (1,426.55) (6,028.38)Less : Compensation cost under ESOP as per Fair Value - - Proforma (Loss) / Profit before Tax adjustment for earlier years (1,426.55) (6,028.38)Weighted average number of Basic equity shares outstanding (in Million) 110.00 110.00 Weighted average number of Diluted equity shares outstanding (in Million) 110.00 110.00 Face Value of Equity Shares 10.00 10.00 Reported Earning per Share (EPS)Basic EPS (in Rs.) (12.97) (54.80)Diluted EPS (in Rs.) (12.97) (54.80)Proforma Earning per Share (EPS)Basic EPS (in Rs.) (12.97) (54.80)Diluted EPS (in Rs.) (12.97) (54.80)
45 DETERMINATION OF DEEMED COST IN RESPECT OF INVESTMENT IN SUBSIDIARIES OR JOINT VENTURE Ind AS 101 provides an option to consider fair value of the investment in subsidiaries or joint ventures as on the date of
transition as the deemed cost. Accordingly, the Company has elected to measure investments in two of its subsidiaries, VISA SunCoke Limited (VSCL) and VISA BAO Limited (VBL) at fair value as at the transition date (i.e.1 April 2015) determined based on valuation carried out by an external valuer. and considered such value as deemed cost at that date. In case of investment in other subsidiaries carrying amount in the transition date (i.e. 1 April 2015) as per previous GAAP has been considered as deemed cost. The table below summarizes the portion in this regards as at 1 April 2015:
Fair Value adopted as
deemed cost
Carrying amount as per previous GAAP adopted
as deemed costTotal
Aggregate carrying amount as per Previous GAAP 4,491.19 20.20 4,511.39 Less : Adjustment to the carrying amounts reported under previous GAAP.
4,296.83 N.A 4,296.83
Aggregate Fair Value/Carrying amount as per previous GAAP as at 1 April 2015 (i.e Deemed Cost)
194.36 20.20 214.56
46 SEGMENT INFORMATION FOR THE YEAR ENDED 31ST MARCH 2017 The Company’s chief operating decision making group [CODMG] (as set out in Note 2.2.15), examines the Company’s
performance both from business (product) & geographical perspective and has identified two reportable business segments viz. “ Special Steel” and “ Ferro Chrome”. Segment disclosures are consistent with the information provided to CODMG which primarily uses operating profit/ loss of the respective segments to assess their performance. CODMG also periodically receives information about the segments revenue and assets.
Details of products included in each of the above Segments are given below: Special Steel Bar and Wire Rods , Billets and Blooms , Pig Iron and Sponge Iron and other Allied Products Ferro Chrome Ferro Chrome and Captive Power
Segment assets, liabilities, revenue and expenses are measured in the same way as in the standalone financial statements. These assets are allocated based on the opeartions of the segment and the physical location of the assets.
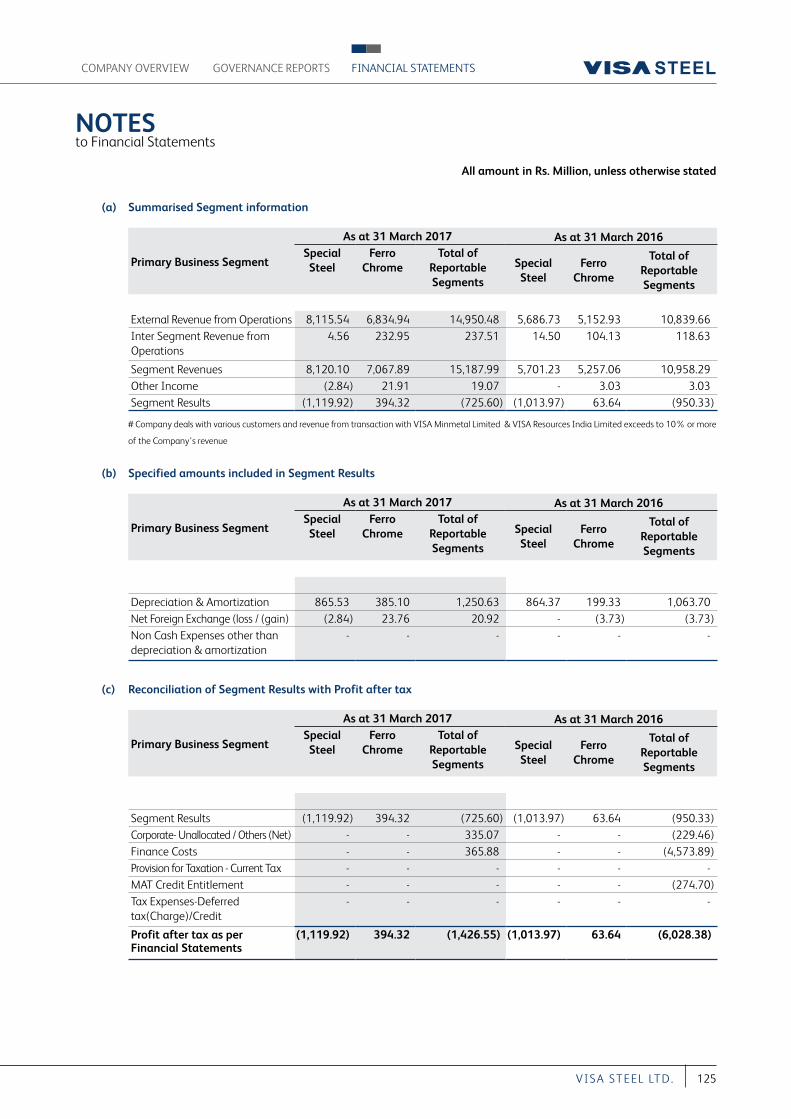
NOTES to Financial Statements
All amount in Rs. Million, unless otherwise stated
COMPANY OVERVIEW FINANCIAL STATEMENTSGOVERNANCE REPORTS
125VI S A S T EEL LT D.
(a) Summarised Segment information
Primary Business Segment
As at 31 March 2017 As at 31 March 2016Special Steel
Ferro Chrome
Total of Reportable Segments
Special Steel
Ferro Chrome
Total of Reportable Segments
External Revenue from Operations 8,115.54 6,834.94 14,950.48 5,686.73 5,152.93 10,839.66 Inter Segment Revenue from Operations
4.56 232.95 237.51 14.50 104.13 118.63
Segment Revenues 8,120.10 7,067.89 15,187.99 5,701.23 5,257.06 10,958.29 Other Income (2.84) 21.91 19.07 - 3.03 3.03 Segment Results (1,119.92) 394.32 (725.60) (1,013.97) 63.64 (950.33)
# Company deals with various customers and revenue from transaction with VISA Minmetal Limited & VISA Resources India Limited exceeds to 10% or more
of the Company’s revenue
(b) Specified amounts included in Segment Results
Primary Business Segment
As at 31 March 2017 As at 31 March 2016Special Steel
Ferro Chrome
Total of Reportable Segments
Special Steel
Ferro Chrome
Total of Reportable Segments
Depreciation & Amortization 865.53 385.10 1,250.63 864.37 199.33 1,063.70 Net Foreign Exchange (loss / (gain) (2.84) 23.76 20.92 - (3.73) (3.73)Non Cash Expenses other than depreciation & amortization
- - - - - -
(c) Reconciliation of Segment Results with Profit after tax
Primary Business Segment
As at 31 March 2017 As at 31 March 2016Special Steel
Ferro Chrome
Total of Reportable Segments
Special Steel
Ferro Chrome
Total of Reportable Segments
Segment Results (1,119.92) 394.32 (725.60) (1,013.97) 63.64 (950.33)Corporate- Unallocated / Others (Net) - - 335.07 - - (229.46)Finance Costs - - 365.88 - - (4,573.89)Provision for Taxation - Current Tax - - - - - - MAT Credit Entitlement - - - - - (274.70)Tax Expenses-Deferred tax(Charge)/Credit
- - - - - -
Profit after tax as per Financial Statements
(1,119.92) 394.32 (1,426.55) (1,013.97) 63.64 (6,028.38)
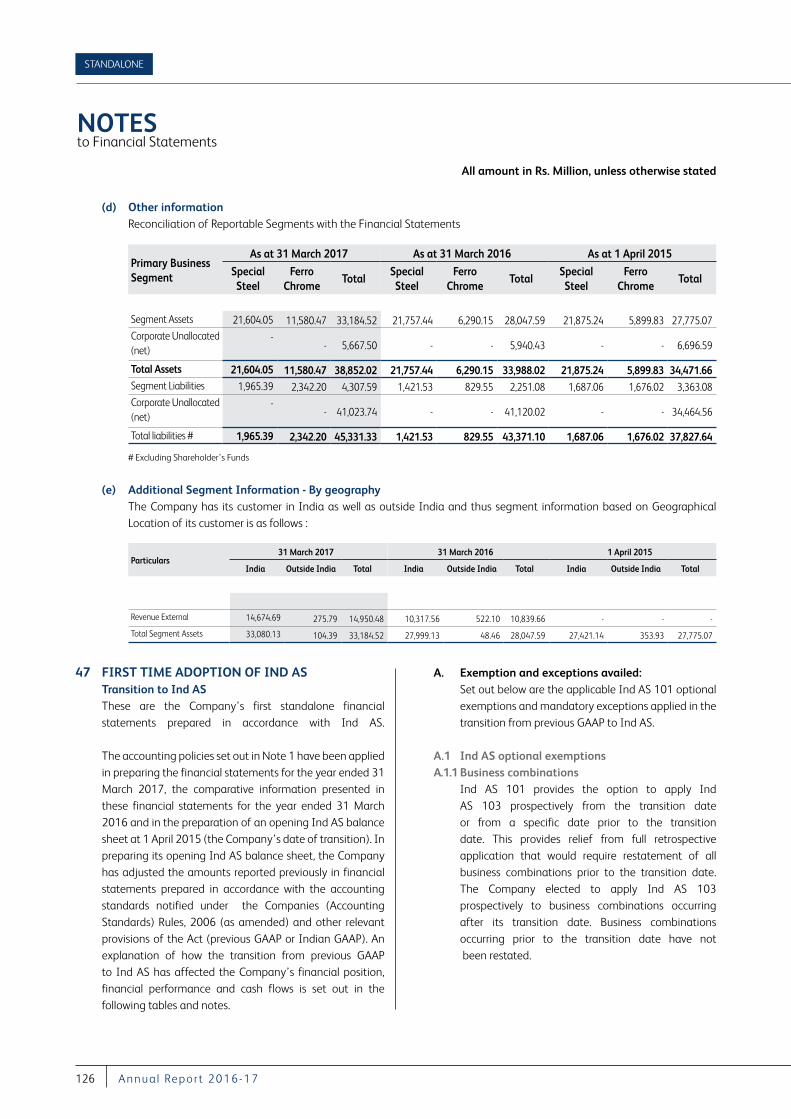
NOTES to Financial Statements
All amount in Rs. Million, unless otherwise stated
STANDALONE
126 A nnu a l Repor t 2016-17
(d) Other information Reconciliation of Reportable Segments with the Financial Statements
Primary Business Segment
As at 31 March 2017 As at 31 March 2016 As at 1 April 2015
Special Steel
Ferro Chrome
TotalSpecial Steel
Ferro Chrome
TotalSpecial Steel
Ferro Chrome
Total
Segment Assets 21,604.05 11,580.47 33,184.52 21,757.44 6,290.15 28,047.59 21,875.24 5,899.83 27,775.07 Corporate Unallocated (net)
- - 5,667.50 - - 5,940.43 - - 6,696.59
Total Assets 21,604.05 11,580.47 38,852.02 21,757.44 6,290.15 33,988.02 21,875.24 5,899.83 34,471.66 Segment Liabilities 1,965.39 2,342.20 4,307.59 1,421.53 829.55 2,251.08 1,687.06 1,676.02 3,363.08 Corporate Unallocated (net)
-- 41,023.74 - - 41,120.02 - - 34,464.56
Total liabilities # 1,965.39 2,342.20 45,331.33 1,421.53 829.55 43,371.10 1,687.06 1,676.02 37,827.64
# Excluding Shareholder’s Funds
(e) Additional Segment Information - By geography The Company has its customer in India as well as outside India and thus segment information based on Geographical
Location of its customer is as follows :
Particulars31 March 2017 31 March 2016 1 April 2015
India Outside India Total India Outside India Total India Outside India Total
Revenue External 14,674.69 275.79 14,950.48 10,317.56 522.10 10,839.66 - - -
Total Segment Assets 33,080.13 104.39 33,184.52 27,999.13 48.46 28,047.59 27,421.14 353.93 27,775.07
47 FIRST TIME ADOPTION OF IND AS Transition to Ind AS These are the Company’s first standalone financial
statements prepared in accordance with Ind AS. The accounting policies set out in Note 1 have been applied in preparing the financial statements for the year ended 31 March 2017, the comparative information presented in these financial statements for the year ended 31 March 2016 and in the preparation of an opening Ind AS balance sheet at 1 April 2015 (the Company’s date of transition). In preparing its opening Ind AS balance sheet, the Company has adjusted the amounts reported previously in financial statements prepared in accordance with the accounting standards notified under the Companies (Accounting Standards) Rules, 2006 (as amended) and other relevant provisions of the Act (previous GAAP or Indian GAAP). An explanation of how the transition from previous GAAP to Ind AS has affected the Company’s financial position, financial performance and cash flows is set out in the following tables and notes.
A. Exemption and exceptions availed: Set out below are the applicable Ind AS 101 optional
exemptions and mandatory exceptions applied in the transition from previous GAAP to Ind AS.
A.1 Ind AS optional exemptions A.1.1 Business combinations Ind AS 101 provides the option to apply Ind
AS 103 prospectively from the transition date or from a specific date prior to the transition date. This provides relief from full retrospective application that would require restatement of all business combinations prior to the transition date. The Company elected to apply Ind AS 103 prospectively to business combinations occurring after its transition date. Business combinations occurring prior to the transition date have not been restated.
NOTES to Financial Statements
All amount in Rs. Million, unless otherwise stated
COMPANY OVERVIEW FINANCIAL STATEMENTSGOVERNANCE REPORTS
127VI S A S T EEL LT D.
A.1.2 Deemed cost Ind AS 101 permits a first-time adopter to elect to
continue with the carrying value for all of its property, plant and equipment as recognised in the financial statements as at the date of transition to Ind AS, measured as per the previous GAAP and use that as its deemed cost as at the date of transition after making necessary adjustments for de-commissioning liabilities if any. This exemption can also be used for intangible assets covered by Ind AS 38 Intangible Assets. Accordingly, the Company has elected to measure all of its property, plant and equipment and intangible assets at their previous GAAP carrying value.
A.1.3 Investments in subsidiaries and joint ventures Ind AS 101 permits a first-time adopter to elect fair
value at the entity’s date of transition to Ind ASs in the separate financial statements for investment in subsidiaries or joint ventures and use that as its deemed cost as at the date of transition. A first-time adopter may elect the above option for each subsidiary or joint venture that it elects to measure using a deemed cost. Further, Ind AS 101 also permits a first time adopter to elect to continue with the carrying amount of investments in a subsidiary or joint venture as recognised in the seperate financial statements at the date of transition to Ind AS, measured as per the previous GAAP and use the same as it deemed cost. Accordingly, the Company has elected to measure investments in two of its subsidiaries, viz VISA Suncoke Limited and VISA BAO Limited at their respective fair value at the date of transition and used the same as deemed cost and elected to measure the investments in all other subsidiaries and joint venture as recognised in the seperate financial statements at their previous GAAP carrying value.
A.1.4 Leases Appendix C to Ind AS 17 requires an entity to assess
whether a contract or arrangement contains a lease. In accordance with Ind AS 17, this assessment should
be carried out at the inception of the contract or arrangement. Ind AS 101 provides an option to make this assessment on the basis of facts and circumstances existing at the date of transition to Ind AS, except where the effect is expected to be not material. The Company has elected to apply this exemption for such contracts/arrangements.
A.2 Ind AS mandatory exceptions A.2.1 Estimates An entity’s estimates in accordance with Ind ASs at
the date of transition to Ind AS shall be consistent with estimates made for the same date in accordance with previous GAAP (after adjustments to reflect any difference in accounting policies), unless there is objective evidence that those estimates were in error. Ind AS estimates as at 1 April 2015 are consistent with the estimates as at the same date made in conformity with previous GAAP. The Company made estimates for following items in accordance with Ind AS at the date of transition as these were not required under previous GAAP: - Impairment of financial assets based on expected credit loss model.
A.2.2 De-recognition of financial assets and liabilities Ind AS 101 requires a first-time adopter to apply the
de-recognition provisions of Ind AS 109 prospectively for transactions occurring on or after the date of transition to Ind AS. However, Ind AS 101 allows a first-time adopter to apply the de-recognition requirements in Ind AS 109 retrospectively from a date of the entity’s choosing, provided that the information needed to apply Ind AS 109 to financial assets and financial liabilities derecognised as a result of past transactions was obtained at the time of initially accounting for those transactions. The Company has elected to apply the de-recognition provisions of Ind AS 109 prospectively from the date of transition to Ind AS.
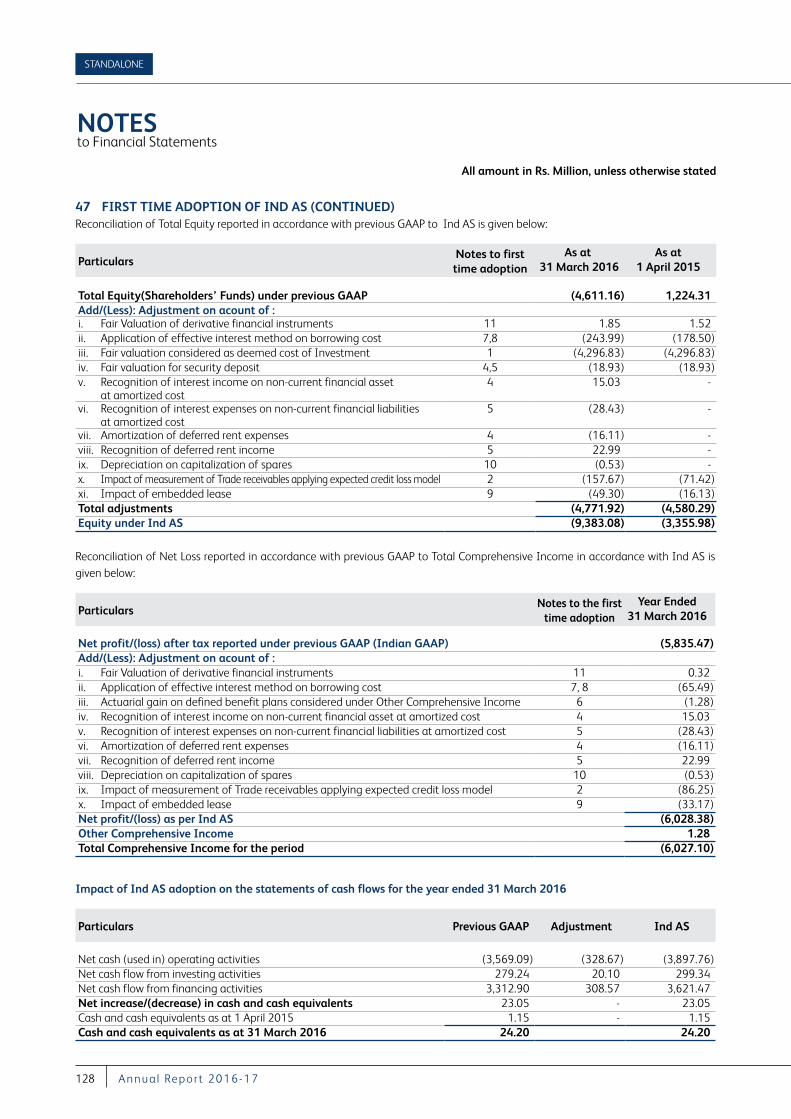
NOTES to Financial Statements
All amount in Rs. Million, unless otherwise stated
STANDALONE
128 A nnu a l Repor t 2016-17
47 FIRST TIME ADOPTION OF IND AS (CONTINUED) Reconciliation of Total Equity reported in accordance with previous GAAP to Ind AS is given below:
ParticularsNotes to first time adoption
As at 31 March 2016
As at 1 April 2015
Total Equity(Shareholders’ Funds) under previous GAAP (4,611.16) 1,224.31 Add/(Less): Adjustment on acount of :i. Fair Valuation of derivative financial instruments 11 1.85 1.52 ii. Application of effective interest method on borrowing cost 7,8 (243.99) (178.50)iii. Fair valuation considered as deemed cost of Investment 1 (4,296.83) (4,296.83)iv. Fair valuation for security deposit 4,5 (18.93) (18.93)v. Recognition of interest income on non-current financial asset
at amortized cost 4 15.03 -
vi. Recognition of interest expenses on non-current financial liabilities at amortized cost
5 (28.43) -
vii. Amortization of deferred rent expenses 4 (16.11) - viii. Recognition of deferred rent income 5 22.99 - ix. Depreciation on capitalization of spares 10 (0.53) - x. Impact of measurement of Trade receivables applying expected credit loss model 2 (157.67) (71.42)xi. Impact of embedded lease 9 (49.30) (16.13)Total adjustments (4,771.92) (4,580.29)Equity under Ind AS (9,383.08) (3,355.98)
Reconciliation of Net Loss reported in accordance with previous GAAP to Total Comprehensive Income in accordance with Ind AS is given below:
ParticularsNotes to the first
time adoptionYear Ended
31 March 2016
Net profit/(loss) after tax reported under previous GAAP (Indian GAAP) (5,835.47)Add/(Less): Adjustment on acount of :i. Fair Valuation of derivative financial instruments 11 0.32 ii. Application of effective interest method on borrowing cost 7, 8 (65.49)iii. Actuarial gain on defined benefit plans considered under Other Comprehensive Income 6 (1.28)iv. Recognition of interest income on non-current financial asset at amortized cost 4 15.03 v. Recognition of interest expenses on non-current financial liabilities at amortized cost 5 (28.43)vi. Amortization of deferred rent expenses 4 (16.11)vii. Recognition of deferred rent income 5 22.99 viii. Depreciation on capitalization of spares 10 (0.53)ix. Impact of measurement of Trade receivables applying expected credit loss model 2 (86.25)x. Impact of embedded lease 9 (33.17)Net profit/(loss) as per Ind AS (6,028.38)Other Comprehensive Income 1.28 Total Comprehensive Income for the period (6,027.10)
Impact of Ind AS adoption on the statements of cash flows for the year ended 31 March 2016
Particulars Previous GAAP Adjustment Ind AS
Net cash (used in) operating activities (3,569.09) (328.67) (3,897.76)Net cash flow from investing activities 279.24 20.10 299.34 Net cash flow from financing activities 3,312.90 308.57 3,621.47 Net increase/(decrease) in cash and cash equivalents 23.05 - 23.05 Cash and cash equivalents as at 1 April 2015 1.15 - 1.15 Cash and cash equivalents as at 31 March 2016 24.20 24.20
NOTES to Financial Statements
All amount in Rs. Million, unless otherwise stated
COMPANY OVERVIEW FINANCIAL STATEMENTSGOVERNANCE REPORTS
129VI S A S T EEL LT D.
Note 1: Fair valuation of investmentsInd AS 101 provides an option on transition date to consider fair value of the investment in subsidiaries or joint venture as on the date of transition as the deemed cost as cost for the purpose of Para 10 of Ind AS 27. Accordingly the Company has fair valued its investments in two of its subsidiaries viz. VISA Suncoke Limited (VSCL) and VISA BAO Limited (VBL) and have written down investments in VSCL to the extent of Rs. 3711.24 Million and in VBL to the extent of Rs. 585.59 Million as on 1 April 2015 to arrive at the deemed cost with a corresponding impact on Other Equity (retained earnings).
Note 2: Trade receivablesAs per Ind AS 109, the Company is required to apply expected credit loss model for recognising the allowance for doubtful debts. As a result, the allowance for doubtful debts increased by Rs. 157.67 Million as at 31 March 2016 (1 April 2015 : Rs. 71.42 Million). Consequently, the total equity as at 31 March 2016 decreased by Rs. 157.67 Million (1 April 2015 : Rs. 71.42 Million) and loss for the year ended 31 March 2016 increased by Rs. 86.25 Million.
Note 3: Excise dutyUnder the previous GAAP, revenue from sale of products was presented exclusive of excise duty. Under Ind AS, revenue from sale of goods is presented inclusive of excise duty. The excise duty paid is presented on the face of the statement of profit and loss as part of expenses. This change has resulted in an increase in total revenue and total expenses for the year ended 31 March 2016 by Rs. 727.76 Million. There is no impact on the total equity as at 31 March 2016 and loss for the year ended on that date.
Note 4: Security deposit givenUnder the previous GAAP, interest free lease security deposits (that are refundable in cash on completion of the lease term) are recorded at their transaction value. Under Ind AS, all financial assets are required to be recognised at fair value. Accordingly, the Company has fair valued these security deposits under Ind AS. Difference between the fair value and transaction value of the security deposit has been recognised as Security Deposit considered as Advance Rent paid. Consequent to this change, the amount of security deposits decreased by Rs. 96.65 Million as at 31 March 2016 (1 April 2015 Rs. 111.68 Million). The security deposit considered as advance rent paid increased by Rs. 77.77 Million as at 31 March 2016 (1 April 2015 - Rs. 93.88 Million). Total equity decreased by Rs. 17.80 Million as on 1 April 2015. The loss for the year ended 31 March 2016 increased by Rs. 1.08 Million due to amortisation of the prepaid rent of Rs. 16.11
Million which is partially off-set by the notional interest income of Rs. 15.03 Million recognised on security deposits.”
Note 5: Security deposit takenUnder the previous GAAP, interest free security deposits (that are refundable in cash on completion of the term) are recorded at their transaction value. Under Ind AS, all financial liabilities are required to be recognised at fair value. Accordingly, the Company has fair valued these security deposits under Ind AS. Difference between the fair value and transaction value of the security deposit taken has been recognised as Security Deposit considered as advance Rent received. Consequent to this change, the amount of security deposits decreased by Rs. 475.29 Million as at 31 March 2016 (1 April 2015 : Rs. 503.72 Million). The security deposit considered as advance rent received increased by Rs. 481.85 Million as at 31 March 2016 (1 April 2015 : Rs. 504.84 Million). Total equity decreased by Rs. 1.13 Million as on 1 April 2015. The loss for the year ended 31 March 2016 increased by Rs. 5.44 Million due to amortisation of the interest expenses of Rs. 28.43 Million which is partially off-set by the notional rental income of Rs. 22.99 Million recognised on security deposits.
Note 6: Remeasurements of post-employment benefit obligationsUnder Ind AS, remeasurements i.e. actuarial gains and losses and the return on plan assets, excluding amounts included in the net interest expense on the net defined benefit liability are recognised in other comprehensive income instead of profit or loss. Under the previous GAAP, these remeasurements were forming part of the profit or loss for the year. As a result of this change, the loss for the year ended 31 March 2016 decreased by Rs. 1.28 Million. There is no impact of this adjustment on the total equity as at 31 March 2016.
Note 7: Borrowings - Transaction costInd AS 109 requires transaction costs incurred towards origination of borrowings to be adjusted from the carrying amount of borrowings on initial recognition. These costs are recognised in the profit or loss over the tenure of the borrowing as part of the interest expense by applying the effective interest rate method. Under previous GAAP, these transaction costs were charged to profit or loss as and when incurred. Accordingly, borrowings as at 31 March 2016 have been reduced by Rs. 13.49 Million (1 April 2015 Rs. 7.27 Million) with a corresponding adjustment to retained earnings. The total equity increased by an equivalent amount. The loss for the year ended 31 March 2016 has increased by Rs. 6.22 Million as a result of the additional interest expense.
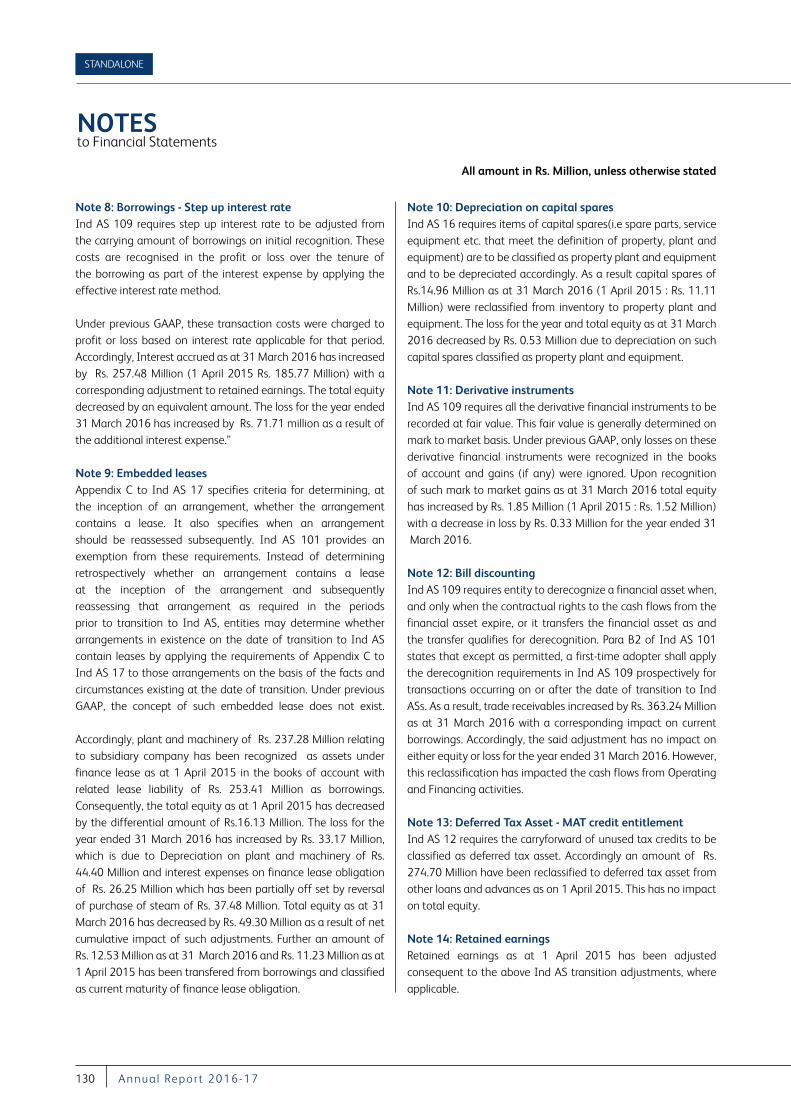
NOTES to Financial Statements
All amount in Rs. Million, unless otherwise stated
STANDALONE
130 A nnu a l Repor t 2016-17
Note 8: Borrowings - Step up interest rateInd AS 109 requires step up interest rate to be adjusted from the carrying amount of borrowings on initial recognition. These costs are recognised in the profit or loss over the tenure of the borrowing as part of the interest expense by applying the effective interest rate method.
Under previous GAAP, these transaction costs were charged to profit or loss based on interest rate applicable for that period. Accordingly, Interest accrued as at 31 March 2016 has increased by Rs. 257.48 Million (1 April 2015 Rs. 185.77 Million) with a corresponding adjustment to retained earnings. The total equity decreased by an equivalent amount. The loss for the year ended 31 March 2016 has increased by Rs. 71.71 million as a result of the additional interest expense.”
Note 9: Embedded leasesAppendix C to Ind AS 17 specifies criteria for determining, at the inception of an arrangement, whether the arrangement contains a lease. It also specifies when an arrangement should be reassessed subsequently. Ind AS 101 provides an exemption from these requirements. Instead of determining retrospectively whether an arrangement contains a lease at the inception of the arrangement and subsequently reassessing that arrangement as required in the periods prior to transition to Ind AS, entities may determine whether arrangements in existence on the date of transition to Ind AS contain leases by applying the requirements of Appendix C to Ind AS 17 to those arrangements on the basis of the facts and circumstances existing at the date of transition. Under previous GAAP, the concept of such embedded lease does not exist. Accordingly, plant and machinery of Rs. 237.28 Million relating to subsidiary company has been recognized as assets under finance lease as at 1 April 2015 in the books of account with related lease liability of Rs. 253.41 Million as borrowings. Consequently, the total equity as at 1 April 2015 has decreased by the differential amount of Rs.16.13 Million. The loss for the year ended 31 March 2016 has increased by Rs. 33.17 Million, which is due to Depreciation on plant and machinery of Rs. 44.40 Million and interest expenses on finance lease obligation of Rs. 26.25 Million which has been partially off set by reversal of purchase of steam of Rs. 37.48 Million. Total equity as at 31 March 2016 has decreased by Rs. 49.30 Million as a result of net cumulative impact of such adjustments. Further an amount of Rs. 12.53 Million as at 31 March 2016 and Rs. 11.23 Million as at 1 April 2015 has been transfered from borrowings and classified as current maturity of finance lease obligation.
Note 10: Depreciation on capital sparesInd AS 16 requires items of capital spares(i.e spare parts, service equipment etc. that meet the definition of property, plant and equipment) are to be classified as property plant and equipment and to be depreciated accordingly. As a result capital spares of Rs.14.96 Million as at 31 March 2016 (1 April 2015 : Rs. 11.11 Million) were reclassified from inventory to property plant and equipment. The loss for the year and total equity as at 31 March 2016 decreased by Rs. 0.53 Million due to depreciation on such capital spares classified as property plant and equipment.
Note 11: Derivative instrumentsInd AS 109 requires all the derivative financial instruments to be recorded at fair value. This fair value is generally determined on mark to market basis. Under previous GAAP, only losses on these derivative financial instruments were recognized in the books of account and gains (if any) were ignored. Upon recognition of such mark to market gains as at 31 March 2016 total equity has increased by Rs. 1.85 Million (1 April 2015 : Rs. 1.52 Million) with a decrease in loss by Rs. 0.33 Million for the year ended 31 March 2016.
Note 12: Bill discountingInd AS 109 requires entity to derecognize a financial asset when, and only when the contractual rights to the cash flows from the financial asset expire, or it transfers the financial asset as and the transfer qualifies for derecognition. Para B2 of Ind AS 101 states that except as permitted, a first-time adopter shall apply the derecognition requirements in Ind AS 109 prospectively for transactions occurring on or after the date of transition to Ind ASs. As a result, trade receivables increased by Rs. 363.24 Million as at 31 March 2016 with a corresponding impact on current borrowings. Accordingly, the said adjustment has no impact on either equity or loss for the year ended 31 March 2016. However, this reclassification has impacted the cash flows from Operating and Financing activities.
Note 13: Deferred Tax Asset - MAT credit entitlementInd AS 12 requires the carryforward of unused tax credits to be classified as deferred tax asset. Accordingly an amount of Rs. 274.70 Million have been reclassified to deferred tax asset from other loans and advances as on 1 April 2015. This has no impact on total equity.
Note 14: Retained earningsRetained earnings as at 1 April 2015 has been adjusted consequent to the above Ind AS transition adjustments, where applicable.
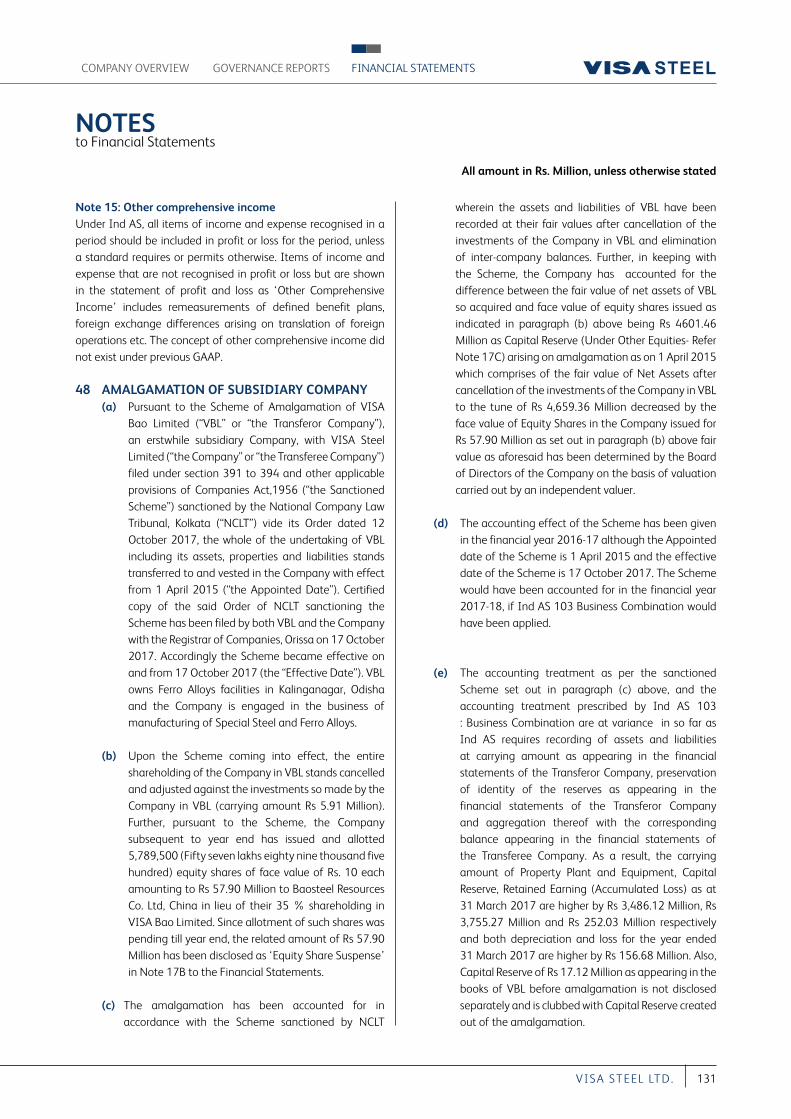
NOTES to Financial Statements
All amount in Rs. Million, unless otherwise stated
COMPANY OVERVIEW FINANCIAL STATEMENTSGOVERNANCE REPORTS
131VI S A S T EEL LT D.
Note 15: Other comprehensive incomeUnder Ind AS, all items of income and expense recognised in a period should be included in profit or loss for the period, unless a standard requires or permits otherwise. Items of income and expense that are not recognised in profit or loss but are shown in the statement of profit and loss as ‘Other Comprehensive Income’ includes remeasurements of defined benefit plans, foreign exchange differences arising on translation of foreign operations etc. The concept of other comprehensive income did not exist under previous GAAP.
48 AMALGAMATION OF SUBSIDIARY COMPANY (a) Pursuant to the Scheme of Amalgamation of VISA
Bao Limited (“VBL” or “the Transferor Company”), an erstwhile subsidiary Company, with VISA Steel Limited (“the Company” or “the Transferee Company”) filed under section 391 to 394 and other applicable provisions of Companies Act,1956 (“the Sanctioned Scheme”) sanctioned by the National Company Law Tribunal, Kolkata (“NCLT”) vide its Order dated 12 October 2017, the whole of the undertaking of VBL including its assets, properties and liabilities stands transferred to and vested in the Company with effect from 1 April 2015 (“the Appointed Date”). Certified copy of the said Order of NCLT sanctioning the Scheme has been filed by both VBL and the Company with the Registrar of Companies, Orissa on 17 October 2017. Accordingly the Scheme became effective on and from 17 October 2017 (the “Effective Date”). VBL owns Ferro Alloys facilities in Kalinganagar, Odisha and the Company is engaged in the business of manufacturing of Special Steel and Ferro Alloys.
(b) Upon the Scheme coming into effect, the entire shareholding of the Company in VBL stands cancelled and adjusted against the investments so made by the Company in VBL (carrying amount Rs 5.91 Million). Further, pursuant to the Scheme, the Company subsequent to year end has issued and allotted 5,789,500 (Fifty seven lakhs eighty nine thousand five hundred) equity shares of face value of Rs. 10 each amounting to Rs 57.90 Million to Baosteel Resources Co. Ltd, China in lieu of their 35 % shareholding in VISA Bao Limited. Since allotment of such shares was pending till year end, the related amount of Rs 57.90 Million has been disclosed as ‘Equity Share Suspense’ in Note 17B to the Financial Statements.
(c) The amalgamation has been accounted for in accordance with the Scheme sanctioned by NCLT
wherein the assets and liabilities of VBL have been recorded at their fair values after cancellation of the investments of the Company in VBL and elimination of inter-company balances. Further, in keeping with the Scheme, the Company has accounted for the difference between the fair value of net assets of VBL so acquired and face value of equity shares issued as indicated in paragraph (b) above being Rs 4601.46 Million as Capital Reserve (Under Other Equities- Refer Note 17C) arising on amalgamation as on 1 April 2015 which comprises of the fair value of Net Assets after cancellation of the investments of the Company in VBL to the tune of Rs 4,659.36 Million decreased by the face value of Equity Shares in the Company issued for Rs 57.90 Million as set out in paragraph (b) above fair value as aforesaid has been determined by the Board of Directors of the Company on the basis of valuation carried out by an independent valuer.
(d) The accounting effect of the Scheme has been given in the financial year 2016-17 although the Appointed date of the Scheme is 1 April 2015 and the effective date of the Scheme is 17 October 2017. The Scheme would have been accounted for in the financial year 2017-18, if Ind AS 103 Business Combination would have been applied.
(e) The accounting treatment as per the sanctioned Scheme set out in paragraph (c) above, and the accounting treatment prescribed by Ind AS 103 : Business Combination are at variance in so far as Ind AS requires recording of assets and liabilities at carrying amount as appearing in the financial statements of the Transferor Company, preservation of identity of the reserves as appearing in the financial statements of the Transferor Company and aggregation thereof with the corresponding balance appearing in the financial statements of the Transferee Company. As a result, the carrying amount of Property Plant and Equipment, Capital Reserve, Retained Earning (Accumulated Loss) as at 31 March 2017 are higher by Rs 3,486.12 Million, Rs 3,755.27 Million and Rs 252.03 Million respectively and both depreciation and loss for the year ended 31 March 2017 are higher by Rs 156.68 Million. Also, Capital Reserve of Rs 17.12 Million as appearing in the books of VBL before amalgamation is not disclosed separately and is clubbed with Capital Reserve created out of the amalgamation.
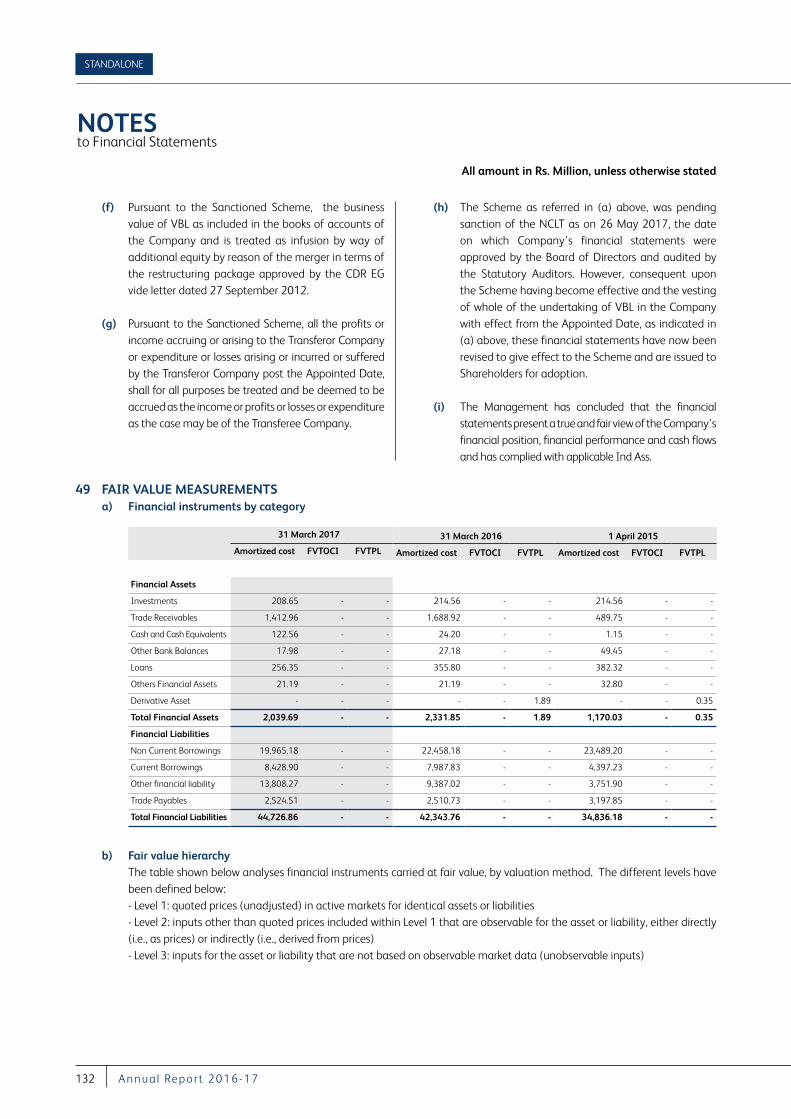
NOTES to Financial Statements
All amount in Rs. Million, unless otherwise stated
STANDALONE
132 A nnu a l Repor t 2016-17
(f) Pursuant to the Sanctioned Scheme, the business value of VBL as included in the books of accounts of the Company and is treated as infusion by way of additional equity by reason of the merger in terms of the restructuring package approved by the CDR EG vide letter dated 27 September 2012.
(g) Pursuant to the Sanctioned Scheme, all the profits or income accruing or arising to the Transferor Company or expenditure or losses arising or incurred or suffered by the Transferor Company post the Appointed Date, shall for all purposes be treated and be deemed to be accrued as the income or profits or losses or expenditure as the case may be of the Transferee Company.
(h) The Scheme as referred in (a) above, was pending sanction of the NCLT as on 26 May 2017, the date on which Company’s financial statements were approved by the Board of Directors and audited by the Statutory Auditors. However, consequent upon the Scheme having become effective and the vesting of whole of the undertaking of VBL in the Company with effect from the Appointed Date, as indicated in (a) above, these financial statements have now been revised to give effect to the Scheme and are issued to Shareholders for adoption.
(i) The Management has concluded that the financial statements present a true and fair view of the Company’s financial position, financial performance and cash flows and has complied with applicable Ind Ass.
49 FAIR VALUE MEASUREMENTS a) Financial instruments by category
31 March 2017 31 March 2016 1 April 2015
Amortized cost FVTOCI FVTPL Amortized cost FVTOCI FVTPL Amortized cost FVTOCI FVTPL
Financial Assets
Investments 208.65 - - 214.56 - - 214.56 - -
Trade Receivables 1,412.96 - - 1,688.92 - - 489.75 - -
Cash and Cash Equivalents 122.56 - - 24.20 - - 1.15 - -
Other Bank Balances 17.98 - - 27.18 - - 49.45 - -
Loans 256.35 - - 355.80 - - 382.32 - -
Others Financial Assets 21.19 - - 21.19 - - 32.80 - -
Derivative Asset - - - - - 1.89 - - 0.35
Total Financial Assets 2,039.69 - - 2,331.85 - 1.89 1,170.03 - 0.35
Financial Liabilities
Non Current Borrowings 19,965.18 - - 22,458.18 - - 23,489.20 - -
Current Borrowings 8,428.90 - - 7,987.83 - - 4,397.23 - -
Other financial liability 13,808.27 - - 9,387.02 - - 3,751.90 - -
Trade Payables 2,524.51 - - 2,510.73 - - 3,197.85 - -
Total Financial Liabilities 44,726.86 - - 42,343.76 - - 34,836.18 - -
b) Fair value hierarchy The table shown below analyses financial instruments carried at fair value, by valuation method. The different levels have
been defined below: - Level 1: quoted prices (unadjusted) in active markets for identical assets or liabilities - Level 2: inputs other than quoted prices included within Level 1 that are observable for the asset or liability, either directly
(i.e., as prices) or indirectly (i.e., derived from prices) - Level 3: inputs for the asset or liability that are not based on observable market data (unobservable inputs)
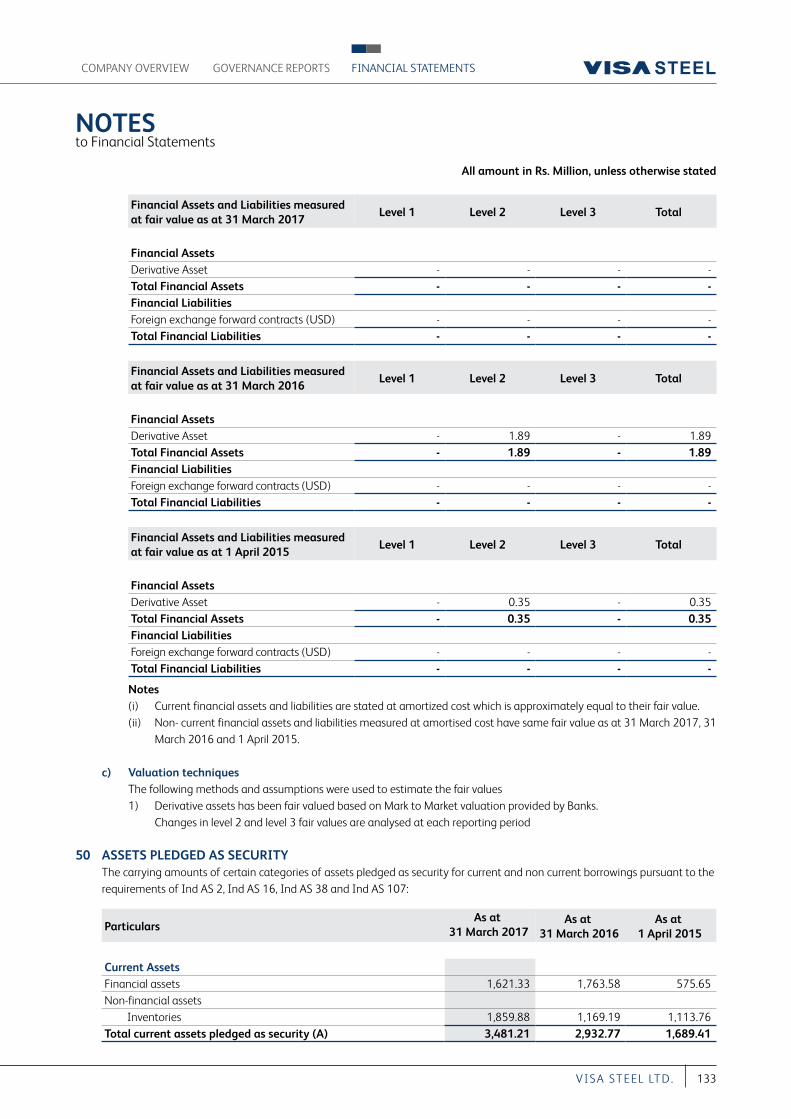
NOTES to Financial Statements
All amount in Rs. Million, unless otherwise stated
COMPANY OVERVIEW FINANCIAL STATEMENTSGOVERNANCE REPORTS
133VI S A S T EEL LT D.
Financial Assets and Liabilities measured at fair value as at 31 March 2017
Level 1 Level 2 Level 3 Total
Financial Assets Derivative Asset - - - - Total Financial Assets - - - - Financial LiabilitiesForeign exchange forward contracts (USD) - - - -Total Financial Liabilities - - - -
Financial Assets and Liabilities measured at fair value as at 31 March 2016
Level 1 Level 2 Level 3 Total
Financial Assets Derivative Asset - 1.89 - 1.89 Total Financial Assets - 1.89 - 1.89 Financial LiabilitiesForeign exchange forward contracts (USD) - - - -Total Financial Liabilities - - - -
Financial Assets and Liabilities measured at fair value as at 1 April 2015
Level 1 Level 2 Level 3 Total
Financial Assets Derivative Asset - 0.35 - 0.35 Total Financial Assets - 0.35 - 0.35 Financial LiabilitiesForeign exchange forward contracts (USD) - - - -Total Financial Liabilities - - - -
Notes (i) Current financial assets and liabilities are stated at amortized cost which is approximately equal to their fair value.(ii) Non- current financial assets and liabilities measured at amortised cost have same fair value as at 31 March 2017, 31
March 2016 and 1 April 2015.
c) Valuation techniques The following methods and assumptions were used to estimate the fair values 1) Derivative assets has been fair valued based on Mark to Market valuation provided by Banks. Changes in level 2 and level 3 fair values are analysed at each reporting period
50 ASSETS PLEDGED AS SECURITY The carrying amounts of certain categories of assets pledged as security for current and non current borrowings pursuant to the
requirements of Ind AS 2, Ind AS 16, Ind AS 38 and Ind AS 107:
ParticularsAs at
31 March 2017As at
31 March 2016As at
1 April 2015
Current AssetsFinancial assets 1,621.33 1,763.58 575.65 Non-financial assets Inventories 1,859.88 1,169.19 1,113.76 Total current assets pledged as security (A) 3,481.21 2,932.77 1,689.41
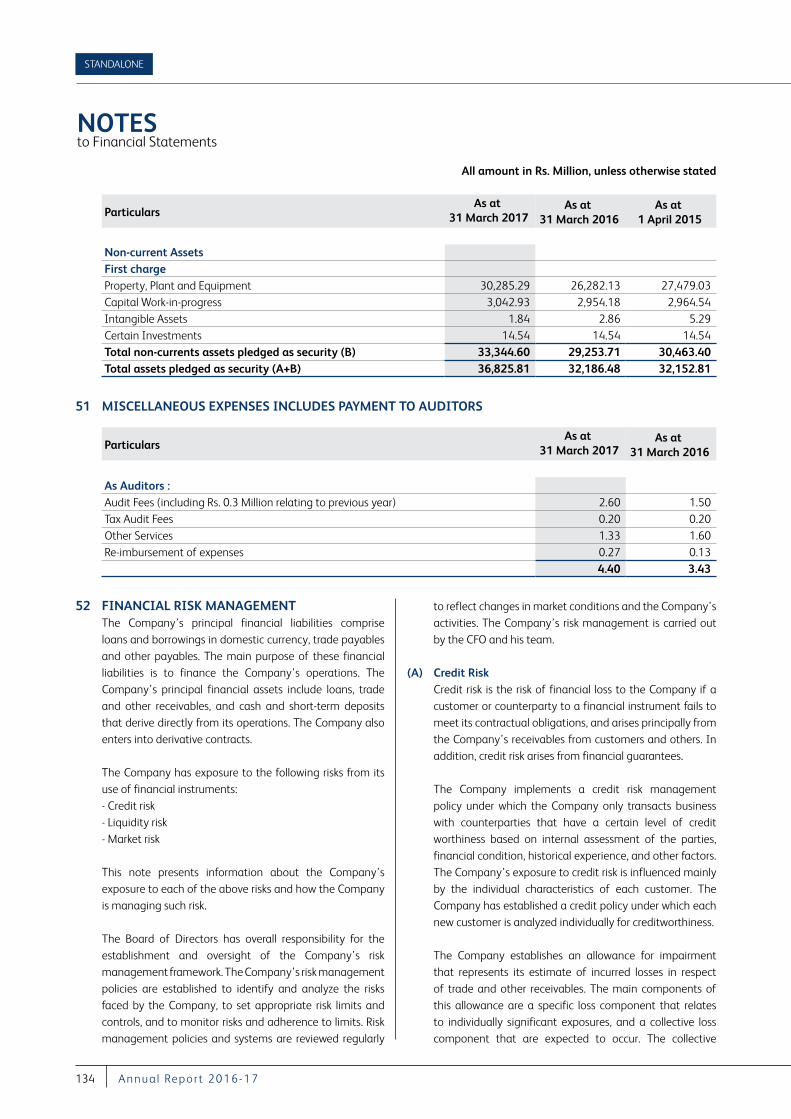
NOTES to Financial Statements
All amount in Rs. Million, unless otherwise stated
STANDALONE
134 A nnu a l Repor t 2016-17
ParticularsAs at
31 March 2017As at
31 March 2016As at
1 April 2015
Non-current AssetsFirst chargeProperty, Plant and Equipment 30,285.29 26,282.13 27,479.03 Capital Work-in-progress 3,042.93 2,954.18 2,964.54 Intangible Assets 1.84 2.86 5.29 Certain Investments 14.54 14.54 14.54Total non-currents assets pledged as security (B) 33,344.60 29,253.71 30,463.40Total assets pledged as security (A+B) 36,825.81 32,186.48 32,152.81
51 MISCELLANEOUS EXPENSES INCLUDES PAYMENT TO AUDITORS
ParticularsAs at
31 March 2017As at
31 March 2016
As Auditors :Audit Fees (including Rs. 0.3 Million relating to previous year) 2.60 1.50 Tax Audit Fees 0.20 0.20 Other Services 1.33 1.60 Re-imbursement of expenses 0.27 0.13
4.40 3.43
52 FINANCIAL RISK MANAGEMENT The Company’s principal financial liabilities comprise
loans and borrowings in domestic currency, trade payables and other payables. The main purpose of these financial liabilities is to finance the Company’s operations. The Company’s principal financial assets include loans, trade and other receivables, and cash and short-term deposits that derive directly from its operations. The Company also enters into derivative contracts.
The Company has exposure to the following risks from its use of financial instruments:
- Credit risk - Liquidity risk - Market risk
This note presents information about the Company’s exposure to each of the above risks and how the Company is managing such risk.
The Board of Directors has overall responsibility for the establishment and oversight of the Company’s risk management framework. The Company’s risk management policies are established to identify and analyze the risks faced by the Company, to set appropriate risk limits and controls, and to monitor risks and adherence to limits. Risk management policies and systems are reviewed regularly
to reflect changes in market conditions and the Company’s activities. The Company’s risk management is carried out by the CFO and his team.
(A) Credit Risk Credit risk is the risk of financial loss to the Company if a
customer or counterparty to a financial instrument fails to meet its contractual obligations, and arises principally from the Company’s receivables from customers and others. In addition, credit risk arises from financial guarantees.
The Company implements a credit risk management policy under which the Company only transacts business with counterparties that have a certain level of credit worthiness based on internal assessment of the parties, financial condition, historical experience, and other factors. The Company’s exposure to credit risk is influenced mainly by the individual characteristics of each customer. The Company has established a credit policy under which each new customer is analyzed individually for creditworthiness.
The Company establishes an allowance for impairment that represents its estimate of incurred losses in respect of trade and other receivables. The main components of this allowance are a specific loss component that relates to individually significant exposures, and a collective loss component that are expected to occur. The collective
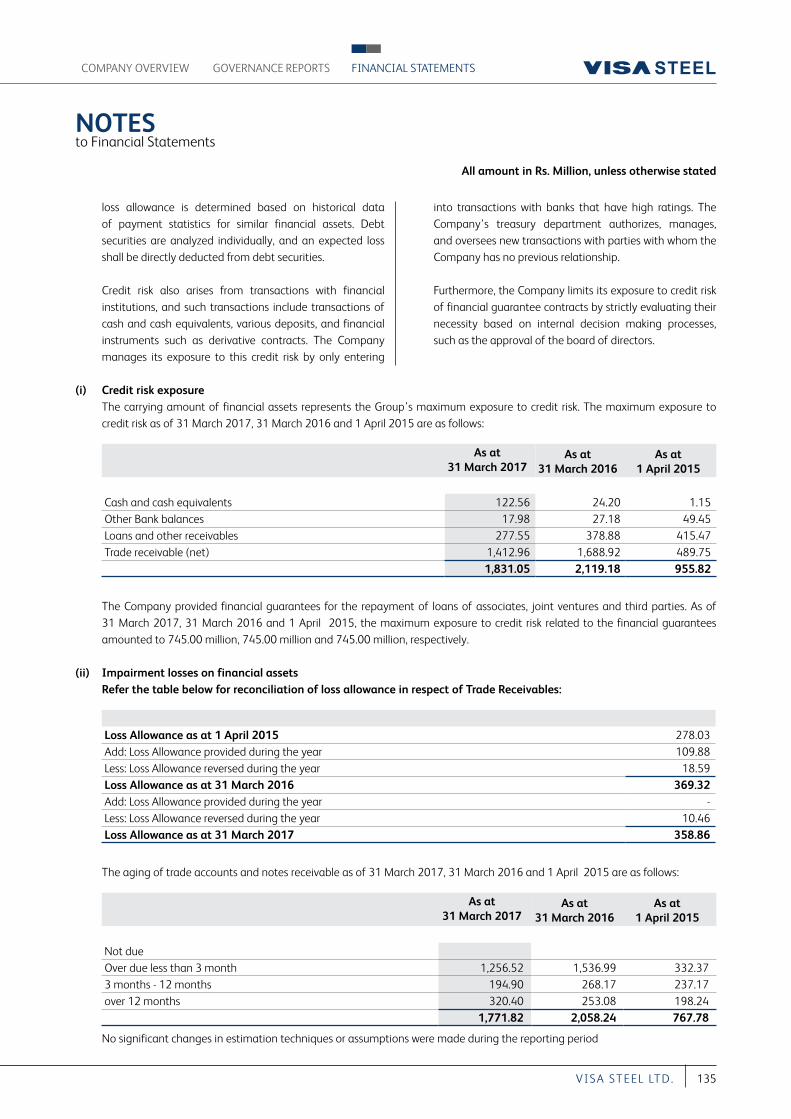
NOTES to Financial Statements
All amount in Rs. Million, unless otherwise stated
COMPANY OVERVIEW FINANCIAL STATEMENTSGOVERNANCE REPORTS
135VI S A S T EEL LT D.
loss allowance is determined based on historical data of payment statistics for similar financial assets. Debt securities are analyzed individually, and an expected loss shall be directly deducted from debt securities.
Credit risk also arises from transactions with financial institutions, and such transactions include transactions of cash and cash equivalents, various deposits, and financial instruments such as derivative contracts. The Company manages its exposure to this credit risk by only entering
into transactions with banks that have high ratings. The Company’s treasury department authorizes, manages, and oversees new transactions with parties with whom the Company has no previous relationship.
Furthermore, the Company limits its exposure to credit risk of financial guarantee contracts by strictly evaluating their necessity based on internal decision making processes, such as the approval of the board of directors.
(i) Credit risk exposure The carrying amount of financial assets represents the Group’s maximum exposure to credit risk. The maximum exposure to
credit risk as of 31 March 2017, 31 March 2016 and 1 April 2015 are as follows:
As at31 March 2017
As at31 March 2016
As at1 April 2015
Cash and cash equivalents 122.56 24.20 1.15 Other Bank balances 17.98 27.18 49.45 Loans and other receivables 277.55 378.88 415.47 Trade receivable (net) 1,412.96 1,688.92 489.75
1,831.05 2,119.18 955.82
The Company provided financial guarantees for the repayment of loans of associates, joint ventures and third parties. As of 31 March 2017, 31 March 2016 and 1 April 2015, the maximum exposure to credit risk related to the financial guarantees amounted to 745.00 million, 745.00 million and 745.00 million, respectively.
(ii) Impairment losses on financial assets Refer the table below for reconciliation of loss allowance in respect of Trade Receivables:
Loss Allowance as at 1 April 2015 278.03 Add: Loss Allowance provided during the year 109.88 Less: Loss Allowance reversed during the year 18.59 Loss Allowance as at 31 March 2016 369.32 Add: Loss Allowance provided during the year - Less: Loss Allowance reversed during the year 10.46 Loss Allowance as at 31 March 2017 358.86
The aging of trade accounts and notes receivable as of 31 March 2017, 31 March 2016 and 1 April 2015 are as follows:
As at31 March 2017
As at31 March 2016
As at1 April 2015
Not dueOver due less than 3 month 1,256.52 1,536.99 332.37 3 months - 12 months 194.90 268.17 237.17 over 12 months 320.40 253.08 198.24
1,771.82 2,058.24 767.78
No significant changes in estimation techniques or assumptions were made during the reporting period
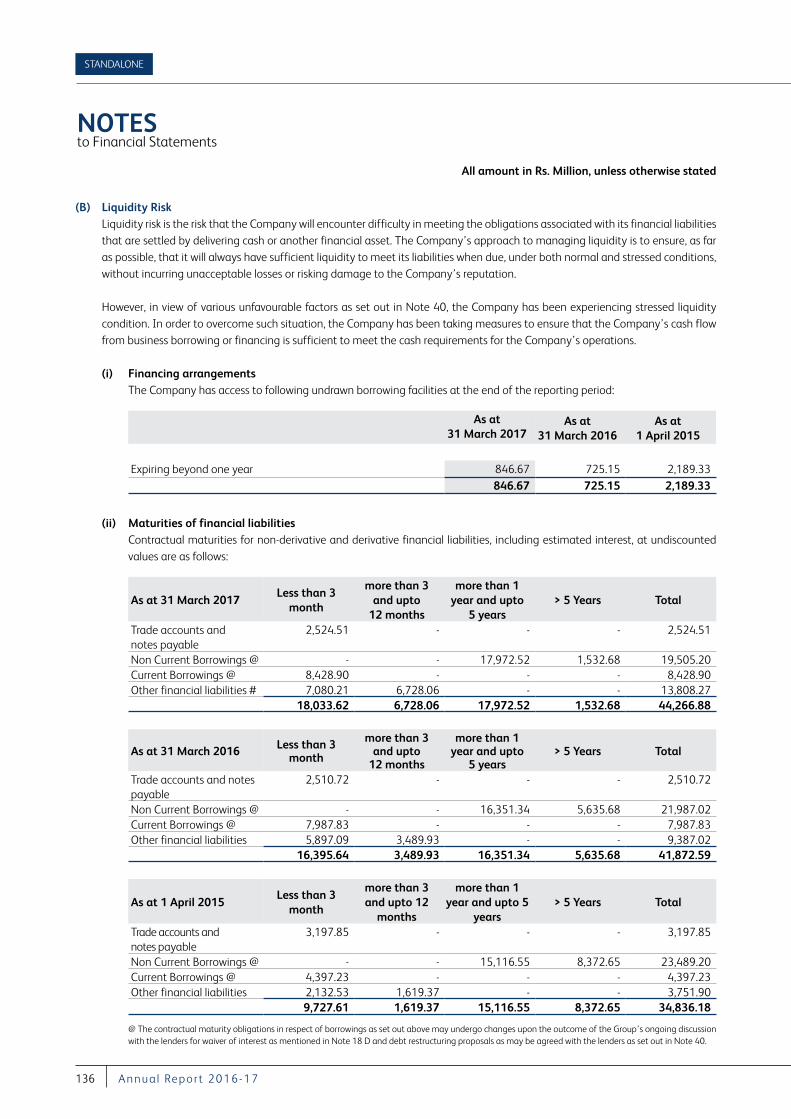
NOTES to Financial Statements
All amount in Rs. Million, unless otherwise stated
STANDALONE
136 A nnu a l Repor t 2016-17
(B) Liquidity Risk Liquidity risk is the risk that the Company will encounter difficulty in meeting the obligations associated with its financial liabilities
that are settled by delivering cash or another financial asset. The Company’s approach to managing liquidity is to ensure, as far as possible, that it will always have sufficient liquidity to meet its liabilities when due, under both normal and stressed conditions, without incurring unacceptable losses or risking damage to the Company’s reputation.
However, in view of various unfavourable factors as set out in Note 40, the Company has been experiencing stressed liquidity condition. In order to overcome such situation, the Company has been taking measures to ensure that the Company’s cash flow from business borrowing or financing is sufficient to meet the cash requirements for the Company’s operations.
(i) Financing arrangementsThe Company has access to following undrawn borrowing facilities at the end of the reporting period:
As at31 March 2017
As at31 March 2016
As at1 April 2015
Expiring beyond one year 846.67 725.15 2,189.33 846.67 725.15 2,189.33
(ii) Maturities of financial liabilities Contractual maturities for non-derivative and derivative financial liabilities, including estimated interest, at undiscounted
values are as follows:
As at 31 March 2017 Less than 3
month
more than 3 and upto
12 months
more than 1 year and upto
5 years> 5 Years Total
Trade accounts and notes payable
2,524.51 - - - 2,524.51
Non Current Borrowings @ - - 17,972.52 1,532.68 19,505.20Current Borrowings @ 8,428.90 - - - 8,428.90 Other financial liabilities # 7,080.21 6,728.06 - - 13,808.27
18,033.62 6,728.06 17,972.52 1,532.68 44,266.88
As at 31 March 2016 Less than 3 month
more than 3 and upto
12 months
more than 1 year and upto
5 years> 5 Years Total
Trade accounts and notes payable
2,510.72 - - - 2,510.72
Non Current Borrowings @ - - 16,351.34 5,635.68 21,987.02Current Borrowings @ 7,987.83 - - - 7,987.83 Other financial liabilities 5,897.09 3,489.93 - - 9,387.02
16,395.64 3,489.93 16,351.34 5,635.68 41,872.59
As at 1 April 2015Less than 3
month
more than 3 and upto 12
months
more than 1 year and upto 5
years> 5 Years Total
Trade accounts and notes payable
3,197.85 - - - 3,197.85
Non Current Borrowings @ - - 15,116.55 8,372.65 23,489.20 Current Borrowings @ 4,397.23 - - - 4,397.23 Other financial liabilities 2,132.53 1,619.37 - - 3,751.90
9,727.61 1,619.37 15,116.55 8,372.65 34,836.18
@ The contractual maturity obligations in respect of borrowings as set out above may undergo changes upon the outcome of the Group’s ongoing discussion with the lenders for waiver of interest as mentioned in Note 18 D and debt restructuring proposals as may be agreed with the lenders as set out in Note 40.
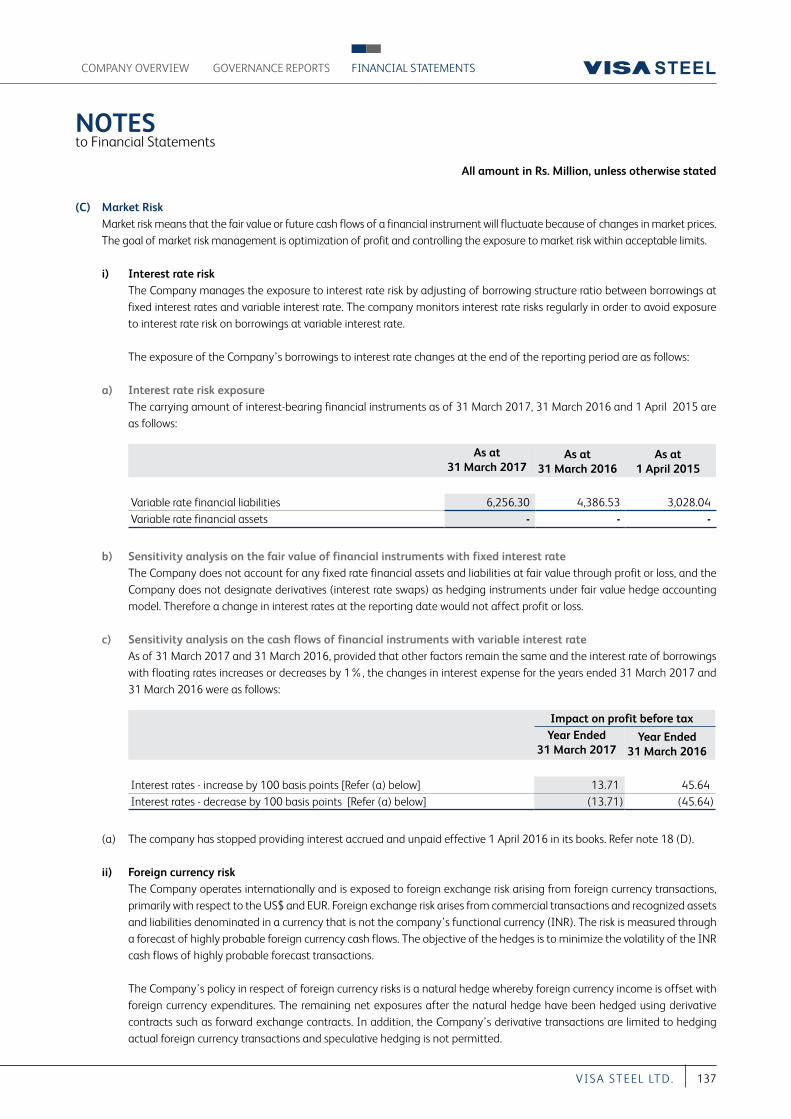
NOTES to Financial Statements
All amount in Rs. Million, unless otherwise stated
COMPANY OVERVIEW FINANCIAL STATEMENTSGOVERNANCE REPORTS
137VI S A S T EEL LT D.
(C) Market Risk Market risk means that the fair value or future cash flows of a financial instrument will fluctuate because of changes in market prices.
The goal of market risk management is optimization of profit and controlling the exposure to market risk within acceptable limits.
i) Interest rate risk The Company manages the exposure to interest rate risk by adjusting of borrowing structure ratio between borrowings at
fixed interest rates and variable interest rate. The company monitors interest rate risks regularly in order to avoid exposure to interest rate risk on borrowings at variable interest rate.
The exposure of the Company’s borrowings to interest rate changes at the end of the reporting period are as follows:
a) Interest rate risk exposure The carrying amount of interest-bearing financial instruments as of 31 March 2017, 31 March 2016 and 1 April 2015 are
as follows:
As at31 March 2017
As at31 March 2016
As at1 April 2015
Variable rate financial liabilities 6,256.30 4,386.53 3,028.04 Variable rate financial assets - - -
b) Sensitivity analysis on the fair value of financial instruments with fixed interest rate The Company does not account for any fixed rate financial assets and liabilities at fair value through profit or loss, and the
Company does not designate derivatives (interest rate swaps) as hedging instruments under fair value hedge accounting model. Therefore a change in interest rates at the reporting date would not affect profit or loss.
c) Sensitivity analysis on the cash flows of financial instruments with variable interest rate As of 31 March 2017 and 31 March 2016, provided that other factors remain the same and the interest rate of borrowings
with floating rates increases or decreases by 1%, the changes in interest expense for the years ended 31 March 2017 and 31 March 2016 were as follows:
Impact on profit before taxYear Ended
31 March 2017Year Ended
31 March 2016
Interest rates - increase by 100 basis points [Refer (a) below] 13.71 45.64 Interest rates - decrease by 100 basis points [Refer (a) below] (13.71) (45.64)
(a) The company has stopped providing interest accrued and unpaid effective 1 April 2016 in its books. Refer note 18 (D).
ii) Foreign currency risk The Company operates internationally and is exposed to foreign exchange risk arising from foreign currency transactions,
primarily with respect to the US$ and EUR. Foreign exchange risk arises from commercial transactions and recognized assets and liabilities denominated in a currency that is not the company’s functional currency (INR). The risk is measured through a forecast of highly probable foreign currency cash flows. The objective of the hedges is to minimize the volatility of the INR cash flows of highly probable forecast transactions.
The Company’s policy in respect of foreign currency risks is a natural hedge whereby foreign currency income is offset with foreign currency expenditures. The remaining net exposures after the natural hedge have been hedged using derivative contracts such as forward exchange contracts. In addition, the Company’s derivative transactions are limited to hedging actual foreign currency transactions and speculative hedging is not permitted.
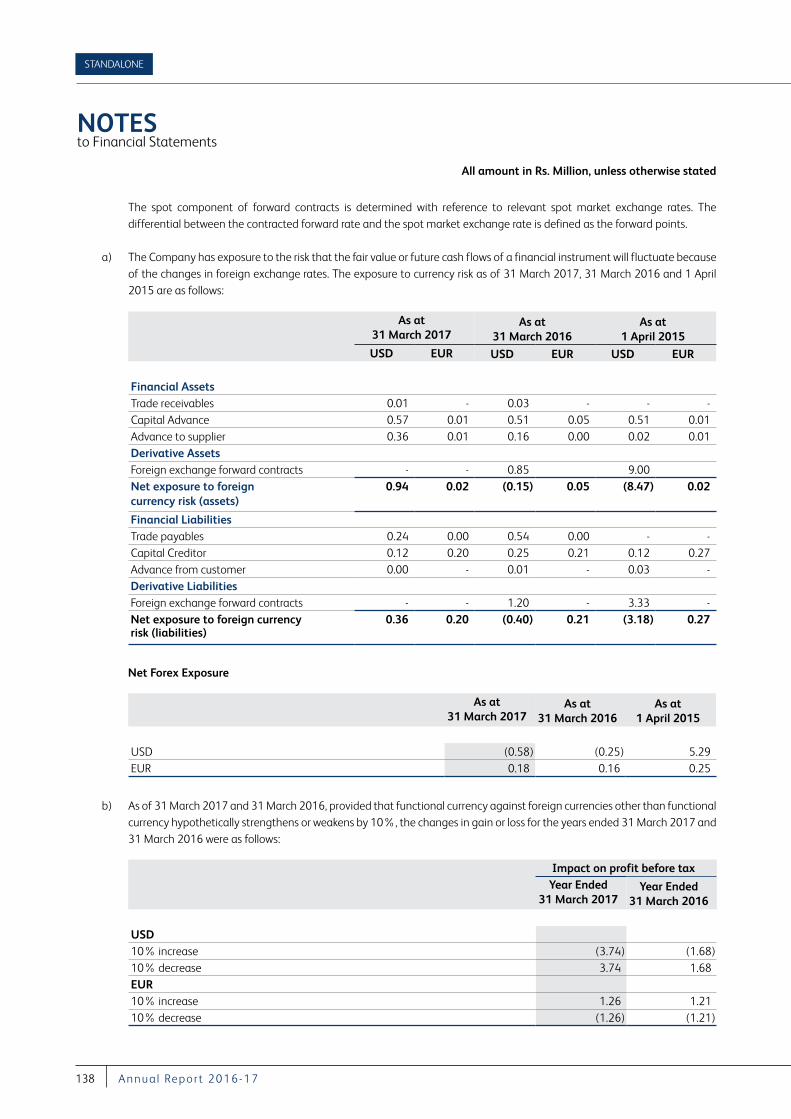
NOTES to Financial Statements
All amount in Rs. Million, unless otherwise stated
STANDALONE
138 A nnu a l Repor t 2016-17
The spot component of forward contracts is determined with reference to relevant spot market exchange rates. The differential between the contracted forward rate and the spot market exchange rate is defined as the forward points.
a) The Company has exposure to the risk that the fair value or future cash flows of a financial instrument will fluctuate because of the changes in foreign exchange rates. The exposure to currency risk as of 31 March 2017, 31 March 2016 and 1 April 2015 are as follows:
As at31 March 2017
As at31 March 2016
As at1 April 2015
USD EUR USD EUR USD EUR
Financial AssetsTrade receivables 0.01 - 0.03 - - - Capital Advance 0.57 0.01 0.51 0.05 0.51 0.01 Advance to supplier 0.36 0.01 0.16 0.00 0.02 0.01 Derivative AssetsForeign exchange forward contracts - - 0.85 9.00 Net exposure to foreign currency risk (assets)
0.94 0.02 (0.15) 0.05 (8.47) 0.02
Financial LiabilitiesTrade payables 0.24 0.00 0.54 0.00 - - Capital Creditor 0.12 0.20 0.25 0.21 0.12 0.27 Advance from customer 0.00 - 0.01 - 0.03 - Derivative LiabilitiesForeign exchange forward contracts - - 1.20 - 3.33 - Net exposure to foreign currency risk (liabilities)
0.36 0.20 (0.40) 0.21 (3.18) 0.27
Net Forex Exposure
As at31 March 2017
As at31 March 2016
As at1 April 2015
USD (0.58) (0.25) 5.29 EUR 0.18 0.16 0.25
b) As of 31 March 2017 and 31 March 2016, provided that functional currency against foreign currencies other than functional currency hypothetically strengthens or weakens by 10%, the changes in gain or loss for the years ended 31 March 2017 and 31 March 2016 were as follows:
Impact on profit before taxYear Ended
31 March 2017Year Ended
31 March 2016
USD10% increase (3.74) (1.68)10% decrease 3.74 1.68EUR10% increase 1.26 1.21 10% decrease (1.26) (1.21)
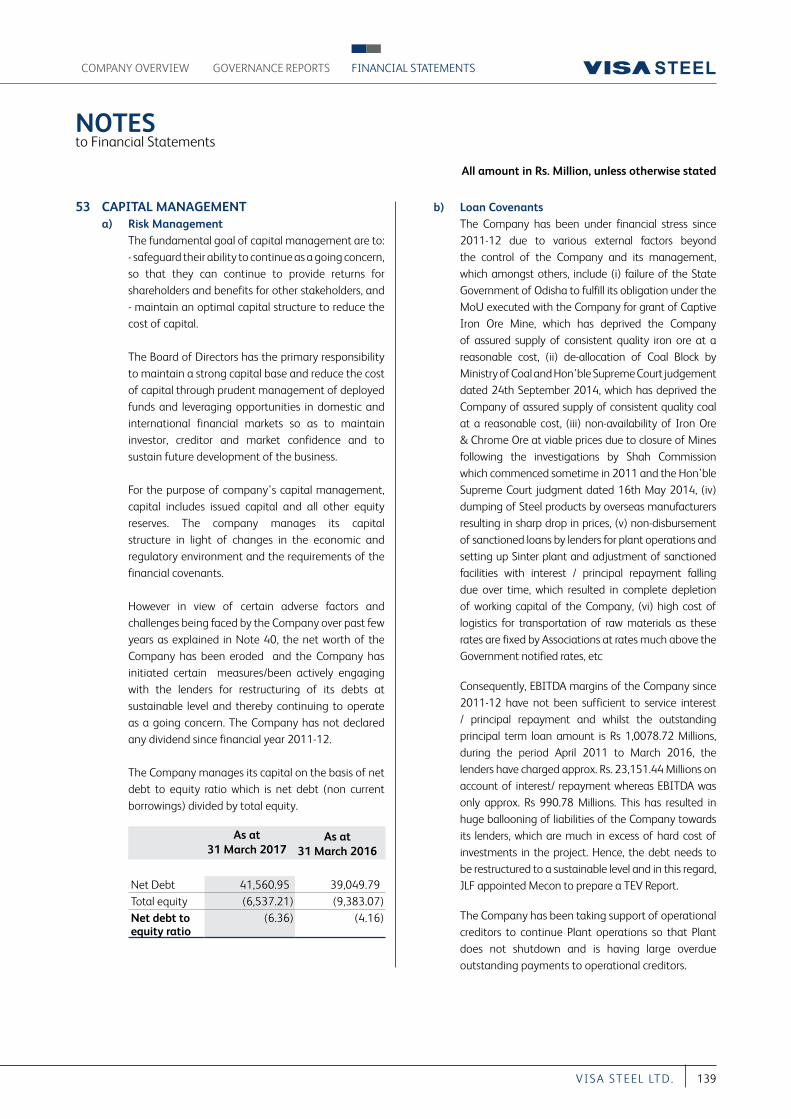
NOTES to Financial Statements
All amount in Rs. Million, unless otherwise stated
COMPANY OVERVIEW FINANCIAL STATEMENTSGOVERNANCE REPORTS
139VI S A S T EEL LT D.
53 CAPITAL MANAGEMENT a) Risk Management The fundamental goal of capital management are to:
- safeguard their ability to continue as a going concern, so that they can continue to provide returns for shareholders and benefits for other stakeholders, and - maintain an optimal capital structure to reduce the cost of capital.
The Board of Directors has the primary responsibility to maintain a strong capital base and reduce the cost of capital through prudent management of deployed funds and leveraging opportunities in domestic and international financial markets so as to maintain investor, creditor and market confidence and to sustain future development of the business.
For the purpose of company’s capital management, capital includes issued capital and all other equity reserves. The company manages its capital structure in light of changes in the economic and regulatory environment and the requirements of the financial covenants.
However in view of certain adverse factors and challenges being faced by the Company over past few years as explained in Note 40, the net worth of the Company has been eroded and the Company has initiated certain measures/been actively engaging with the lenders for restructuring of its debts at sustainable level and thereby continuing to operate as a going concern. The Company has not declared any dividend since financial year 2011-12.
The Company manages its capital on the basis of net debt to equity ratio which is net debt (non current borrowings) divided by total equity.
As at31 March 2017
As at31 March 2016
Net Debt 41,560.95 39,049.79Total equity (6,537.21) (9,383.07)Net debt to equity ratio
(6.36) (4.16)
b) Loan Covenants The Company has been under financial stress since
2011-12 due to various external factors beyond the control of the Company and its management, which amongst others, include (i) failure of the State Government of Odisha to fulfill its obligation under the MoU executed with the Company for grant of Captive Iron Ore Mine, which has deprived the Company of assured supply of consistent quality iron ore at a reasonable cost, (ii) de-allocation of Coal Block by Ministry of Coal and Hon’ble Supreme Court judgement dated 24th September 2014, which has deprived the Company of assured supply of consistent quality coal at a reasonable cost, (iii) non-availability of Iron Ore & Chrome Ore at viable prices due to closure of Mines following the investigations by Shah Commission which commenced sometime in 2011 and the Hon’ble Supreme Court judgment dated 16th May 2014, (iv) dumping of Steel products by overseas manufacturers resulting in sharp drop in prices, (v) non-disbursement of sanctioned loans by lenders for plant operations and setting up Sinter plant and adjustment of sanctioned facilities with interest / principal repayment falling due over time, which resulted in complete depletion of working capital of the Company, (vi) high cost of logistics for transportation of raw materials as these rates are fixed by Associations at rates much above the Government notified rates, etc
Consequently, EBITDA margins of the Company since 2011-12 have not been sufficient to service interest / principal repayment and whilst the outstanding principal term loan amount is Rs 1,0078.72 Millions, during the period April 2011 to March 2016, the lenders have charged approx. Rs. 23,151.44 Millions on account of interest/ repayment whereas EBITDA was only approx. Rs 990.78 Millions. This has resulted in huge ballooning of liabilities of the Company towards its lenders, which are much in excess of hard cost of investments in the project. Hence, the debt needs to be restructured to a sustainable level and in this regard, JLF appointed Mecon to prepare a TEV Report.
The Company has been taking support of operational creditors to continue Plant operations so that Plant does not shutdown and is having large overdue outstanding payments to operational creditors.
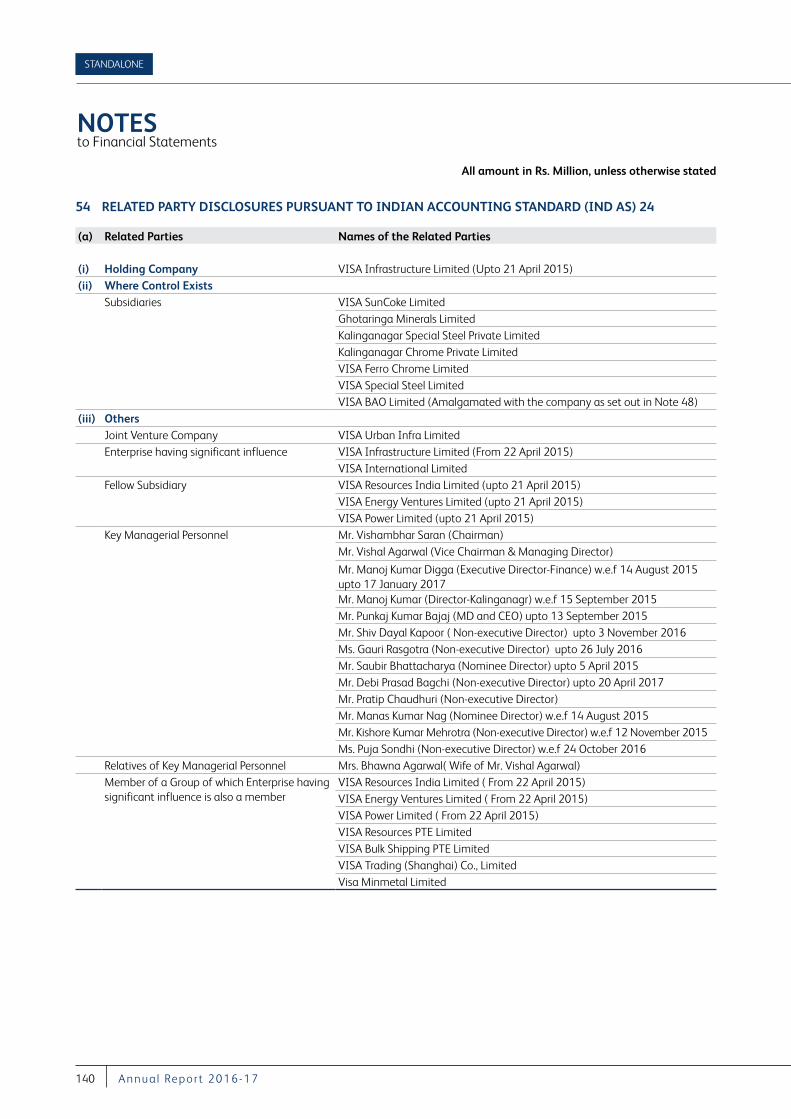
NOTES to Financial Statements
All amount in Rs. Million, unless otherwise stated
STANDALONE
140 A nnu a l Repor t 2016-17
54 RELATED PARTY DISCLOSURES PURSUANT TO INDIAN ACCOUNTING STANDARD (IND AS) 24
(a) Related Parties Names of the Related Parties
(i) Holding Company VISA Infrastructure Limited (Upto 21 April 2015)(ii) Where Control Exists
Subsidiaries VISA SunCoke Limited Ghotaringa Minerals LimitedKalinganagar Special Steel Private LimitedKalinganagar Chrome Private LimitedVISA Ferro Chrome LimitedVISA Special Steel LimitedVISA BAO Limited (Amalgamated with the company as set out in Note 48)
(iii) OthersJoint Venture Company VISA Urban Infra LimitedEnterprise having significant influence VISA Infrastructure Limited (From 22 April 2015)
VISA International LimitedFellow Subsidiary VISA Resources India Limited (upto 21 April 2015)
VISA Energy Ventures Limited (upto 21 April 2015)VISA Power Limited (upto 21 April 2015)
Key Managerial Personnel Mr. Vishambhar Saran (Chairman)Mr. Vishal Agarwal (Vice Chairman & Managing Director)
Mr. Manoj Kumar Digga (Executive Director-Finance) w.e.f 14 August 2015 upto 17 January 2017Mr. Manoj Kumar (Director-Kalinganagr) w.e.f 15 September 2015Mr. Punkaj Kumar Bajaj (MD and CEO) upto 13 September 2015Mr. Shiv Dayal Kapoor ( Non-executive Director) upto 3 November 2016Ms. Gauri Rasgotra (Non-executive Director) upto 26 July 2016Mr. Saubir Bhattacharya (Nominee Director) upto 5 April 2015Mr. Debi Prasad Bagchi (Non-executive Director) upto 20 April 2017Mr. Pratip Chaudhuri (Non-executive Director) Mr. Manas Kumar Nag (Nominee Director) w.e.f 14 August 2015Mr. Kishore Kumar Mehrotra (Non-executive Director) w.e.f 12 November 2015Ms. Puja Sondhi (Non-executive Director) w.e.f 24 October 2016
Relatives of Key Managerial Personnel Mrs. Bhawna Agarwal( Wife of Mr. Vishal Agarwal)Member of a Group of which Enterprise having significant influence is also a member
VISA Resources India Limited ( From 22 April 2015)VISA Energy Ventures Limited ( From 22 April 2015)VISA Power Limited ( From 22 April 2015)VISA Resources PTE LimitedVISA Bulk Shipping PTE LimitedVISA Trading (Shanghai) Co., LimitedVisa Minmetal Limited
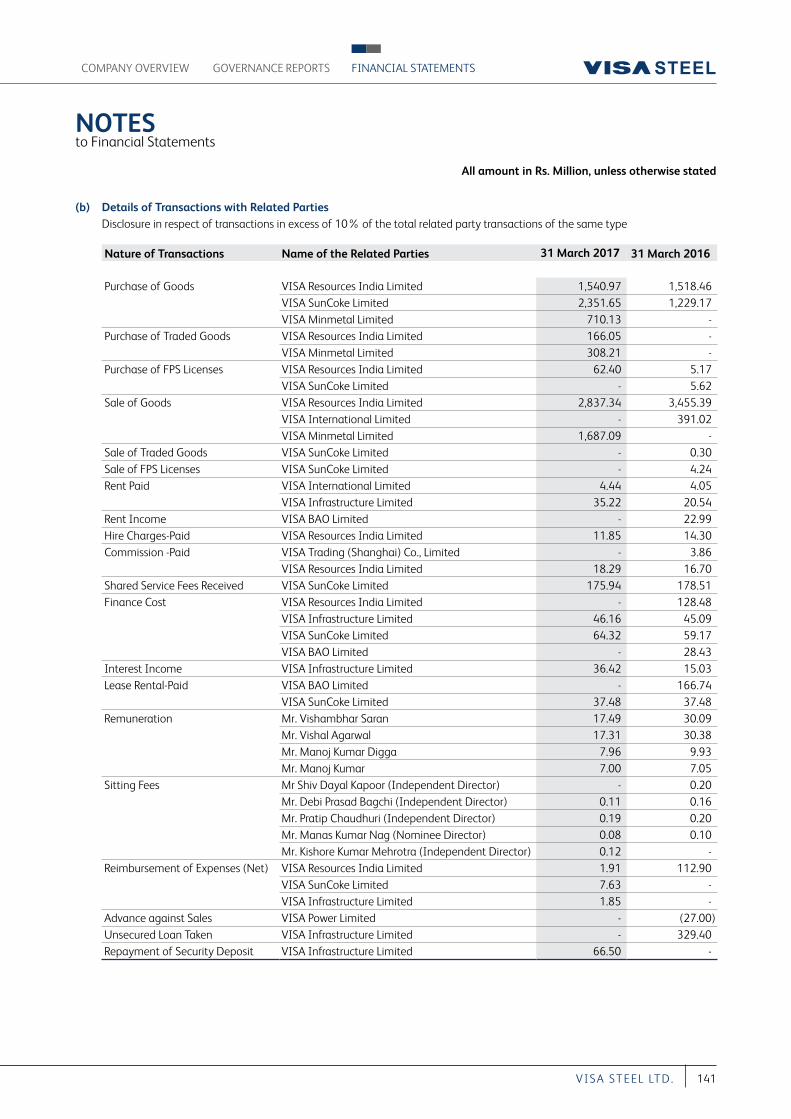
NOTES to Financial Statements
All amount in Rs. Million, unless otherwise stated
COMPANY OVERVIEW FINANCIAL STATEMENTSGOVERNANCE REPORTS
141VI S A S T EEL LT D.
(b) Details of Transactions with Related Parties Disclosure in respect of transactions in excess of 10% of the total related party transactions of the same type
Nature of Transactions Name of the Related Parties 31 March 2017 31 March 2016
Purchase of Goods VISA Resources India Limited 1,540.97 1,518.46 VISA SunCoke Limited 2,351.65 1,229.17 VISA Minmetal Limited 710.13 -
Purchase of Traded Goods VISA Resources India Limited 166.05 - VISA Minmetal Limited 308.21 -
Purchase of FPS Licenses VISA Resources India Limited 62.40 5.17 VISA SunCoke Limited - 5.62
Sale of Goods VISA Resources India Limited 2,837.34 3,455.39 VISA International Limited - 391.02 VISA Minmetal Limited 1,687.09 -
Sale of Traded Goods VISA SunCoke Limited - 0.30 Sale of FPS Licenses VISA SunCoke Limited - 4.24 Rent Paid VISA International Limited 4.44 4.05
VISA Infrastructure Limited 35.22 20.54 Rent Income VISA BAO Limited - 22.99 Hire Charges-Paid VISA Resources India Limited 11.85 14.30 Commission -Paid VISA Trading (Shanghai) Co., Limited - 3.86
VISA Resources India Limited 18.29 16.70 Shared Service Fees Received VISA SunCoke Limited 175.94 178.51 Finance Cost VISA Resources India Limited - 128.48
VISA Infrastructure Limited 46.16 45.09 VISA SunCoke Limited 64.32 59.17 VISA BAO Limited - 28.43
Interest Income VISA Infrastructure Limited 36.42 15.03 Lease Rental-Paid VISA BAO Limited - 166.74
VISA SunCoke Limited 37.48 37.48 Remuneration Mr. Vishambhar Saran 17.49 30.09
Mr. Vishal Agarwal 17.31 30.38 Mr. Manoj Kumar Digga 7.96 9.93 Mr. Manoj Kumar 7.00 7.05
Sitting Fees Mr Shiv Dayal Kapoor (Independent Director) - 0.20 Mr. Debi Prasad Bagchi (Independent Director) 0.11 0.16 Mr. Pratip Chaudhuri (Independent Director) 0.19 0.20 Mr. Manas Kumar Nag (Nominee Director) 0.08 0.10 Mr. Kishore Kumar Mehrotra (Independent Director) 0.12 -
Reimbursement of Expenses (Net) VISA Resources India Limited 1.91 112.90 VISA SunCoke Limited 7.63 - VISA Infrastructure Limited 1.85 -
Advance against Sales VISA Power Limited - (27.00)Unsecured Loan Taken VISA Infrastructure Limited - 329.40 Repayment of Security Deposit VISA Infrastructure Limited 66.50 -
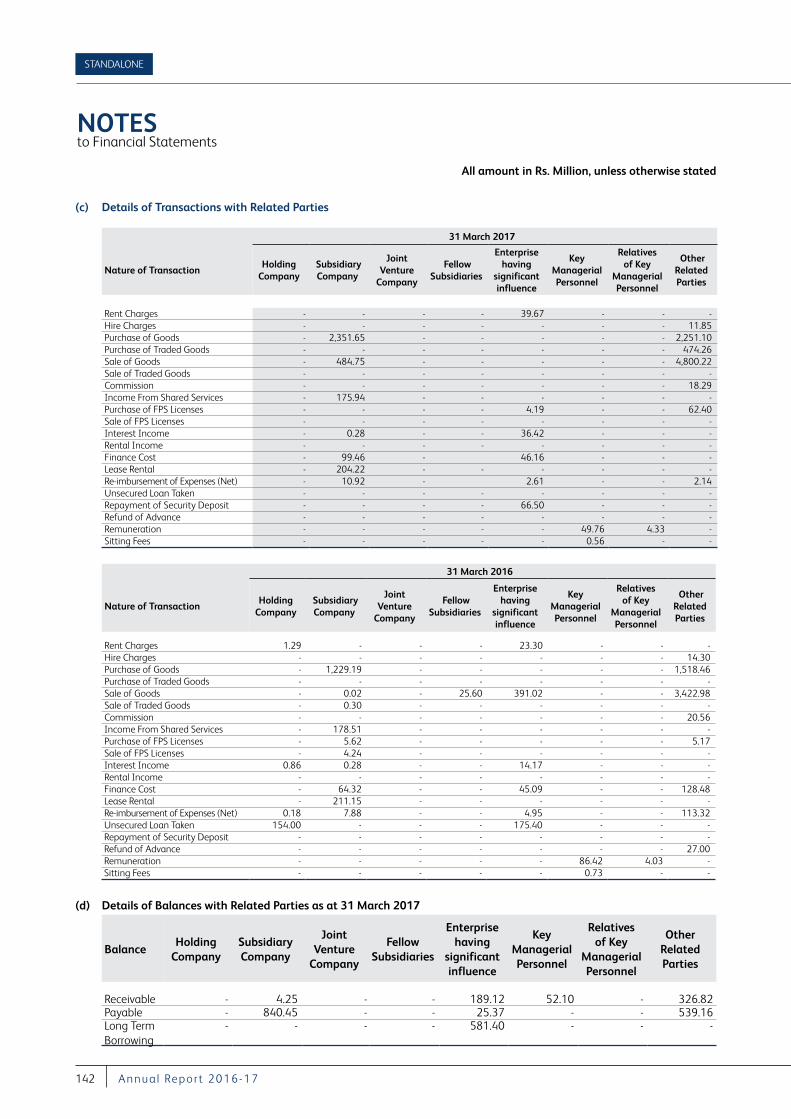
NOTES to Financial Statements
All amount in Rs. Million, unless otherwise stated
STANDALONE
142 A nnu a l Repor t 2016-17
(c) Details of Transactions with Related Parties
31 March 2017
Nature of TransactionHolding
Company Subsidiary Company
Joint Venture
Company
Fellow Subsidiaries
Enterprise having
significant influence
Key Managerial Personnel
Relatives of Key
Managerial Personnel
Other Related Parties
Rent Charges - - - - 39.67 - - - Hire Charges - - - - - - - 11.85 Purchase of Goods - 2,351.65 - - - - - 2,251.10 Purchase of Traded Goods - - - - - - - 474.26 Sale of Goods - 484.75 - - - - - 4,800.22 Sale of Traded Goods - - - - - - - - Commission - - - - - - - 18.29 Income From Shared Services - 175.94 - - - - - - Purchase of FPS Licenses - - - - 4.19 - - 62.40 Sale of FPS Licenses - - - - - - - - Interest Income - 0.28 - - 36.42 - - - Rental Income - - - - - - - - Finance Cost - 99.46 - 46.16 - - - Lease Rental - 204.22 - - - - - - Re-imbursement of Expenses (Net) - 10.92 - 2.61 - - 2.14 Unsecured Loan Taken - - - - - - - - Repayment of Security Deposit - - - - 66.50 - - -Refund of Advance - - - - - - - - Remuneration - - - - - 49.76 4.33 - Sitting Fees - - - - - 0.56 - -
31 March 2016
Nature of TransactionHolding
Company Subsidiary Company
Joint Venture
Company
Fellow Subsidiaries
Enterprise having
significant influence
Key Managerial Personnel
Relatives of Key
Managerial Personnel
Other Related Parties
Rent Charges 1.29 - - - 23.30 - - - Hire Charges - - - - - - - 14.30 Purchase of Goods - 1,229.19 - - - - - 1,518.46 Purchase of Traded Goods - - - - - - - - Sale of Goods - 0.02 - 25.60 391.02 - - 3,422.98 Sale of Traded Goods - 0.30 - - - - - - Commission - - - - - - - 20.56 Income From Shared Services - 178.51 - - - - - - Purchase of FPS Licenses - 5.62 - - - - - 5.17 Sale of FPS Licenses - 4.24 - - - - - - Interest Income 0.86 0.28 - - 14.17 - - - Rental Income - - - - - - - - Finance Cost - 64.32 - - 45.09 - - 128.48 Lease Rental - 211.15 - - - - - - Re-imbursement of Expenses (Net) 0.18 7.88 - - 4.95 - - 113.32 Unsecured Loan Taken 154.00 - - - 175.40 - - - Repayment of Security Deposit - - - - - - - -Refund of Advance - - - - - - - 27.00 Remuneration - - - - - 86.42 4.03 - Sitting Fees - - - - - 0.73 - -
(d) Details of Balances with Related Parties as at 31 March 2017
BalanceHolding
CompanySubsidiary Company
Joint Venture
Company
Fellow Subsidiaries
Enterprise having
significant influence
Key Managerial Personnel
Relatives of Key
Managerial Personnel
Other Related Parties
Receivable - 4.25 - - 189.12 52.10 - 326.82 Payable - 840.45 - - 25.37 - - 539.16 Long Term Borrowing
- - - - 581.40 - - -
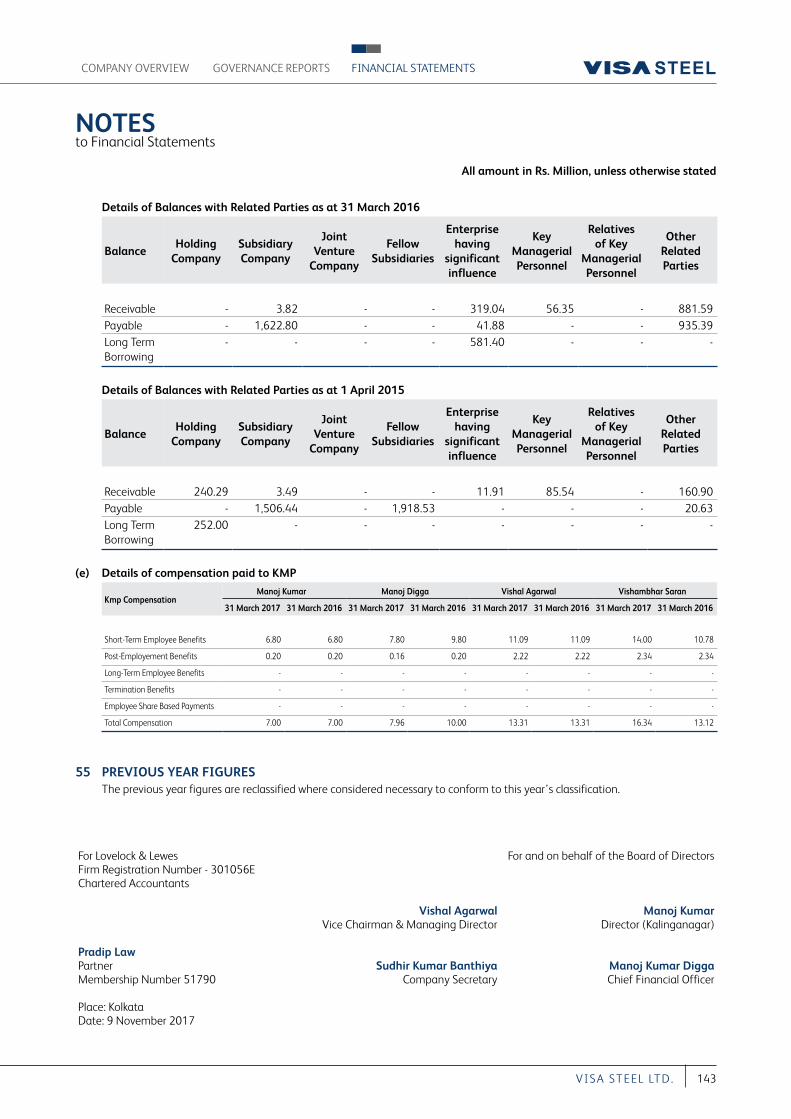
NOTES to Financial Statements
All amount in Rs. Million, unless otherwise stated
COMPANY OVERVIEW FINANCIAL STATEMENTSGOVERNANCE REPORTS
143VI S A S T EEL LT D.
Details of Balances with Related Parties as at 31 March 2016
BalanceHolding
CompanySubsidiary Company
Joint Venture
Company
Fellow Subsidiaries
Enterprise having
significant influence
Key Managerial Personnel
Relatives of Key
Managerial Personnel
Other Related Parties
Receivable - 3.82 - - 319.04 56.35 - 881.59 Payable - 1,622.80 - - 41.88 - - 935.39 Long Term Borrowing
- - - - 581.40 - - -
Details of Balances with Related Parties as at 1 April 2015
BalanceHolding
CompanySubsidiary Company
Joint Venture
Company
Fellow Subsidiaries
Enterprise having
significant influence
Key Managerial Personnel
Relatives of Key
Managerial Personnel
Other Related Parties
Receivable 240.29 3.49 - - 11.91 85.54 - 160.90 Payable - 1,506.44 - 1,918.53 - - - 20.63 Long Term Borrowing
252.00 - - - - - - -
(e) Details of compensation paid to KMP
Kmp CompensationManoj Kumar Manoj Digga Vishal Agarwal Vishambhar Saran
31 March 2017 31 March 2016 31 March 2017 31 March 2016 31 March 2017 31 March 2016 31 March 2017 31 March 2016
Short-Term Employee Benefits 6.80 6.80 7.80 9.80 11.09 11.09 14.00 10.78
Post-Employement Benefits 0.20 0.20 0.16 0.20 2.22 2.22 2.34 2.34
Long-Term Employee Benefits - - - - - - - -
Termination Benefits - - - - - - - -
Employee Share Based Payments - - - - - - - -
Total Compensation 7.00 7.00 7.96 10.00 13.31 13.31 16.34 13.12
55 PREVIOUS YEAR FIGURES The previous year figures are reclassified where considered necessary to conform to this year’s classification.
For Lovelock & Lewes For and on behalf of the Board of Directors Firm Registration Number - 301056EChartered Accountants
Vishal Agarwal Manoj Kumar Vice Chairman & Managing Director Director (Kalinganagar)
Pradip LawPartner Sudhir Kumar Banthiya Manoj Kumar Digga Membership Number 51790 Company Secretary Chief Financial Officer
Place: KolkataDate: 9 November 2017
CONSOLIDATED
144 A nnu a l Repor t 2016-17
INDEPENDENT AUDITORS’ REPORT
TO THE MEMBERS OF VISA STEEL LIMITED
Report on the Consolidated Indian Accounting Standards (Ind AS) Financial Statements1. This Report supersedes our Report dated May 26, 2017.
2. We have audited the accompanying consolidated Ind AS financial statements of VISA Steel Limited (“hereinafter referred to as the Holding Company”) in which is incorporated the financial information of erstwhile VISA BAO Ltd (an erstwhile subsidiary, the “Amalgamating Company”) (Refer sub paragraph 10 (b) of the Emphasis of Matter Paragraph below) and its subsidiaries (the Holding Company and its subsidiaries together referred to as “the Group”), and its joint venture (refer Note 49 to the attached consolidated financial statements), comprising the consolidated Balance Sheet as at March 31, 2017, the consolidated Statement of Profit and Loss (including Other Comprehensive Income), the consolidated Cash Flow Statement for the year then ended and the consolidated Statement of Changes in Equity for the year then ended, and a summary of significant accounting policies and other explanatory information prepared based on the relevant records (hereinafter referred to as “the Consolidated Ind AS Financial Statements”).
Management’s Responsibility for the Consolidated Ind AS Financial Statements 3. The Holding Company’s Board of Directors is responsible
for the preparation of these consolidated Ind AS financial statements in terms of the requirements of the Companies Act, 2013 (hereinafter referred to as “the Act”) that give a true and fair view of the consolidated financial position, consolidated financial performance, consolidated cash flows and consolidated changes in equity of the Group including its joint venture in accordance with accounting principles generally accepted in India including the Indian Accounting Standards specified in the Companies (Indian Accounting Standards) Rules, 2015 (as amended) under Section 133 of the Act. The Holding Company’s Board of Directors is also responsible for ensuring accuracy of records including financial information considered necessary for the preparation of consolidated Ind AS financial statements. The respective Board of Directors of the companies included in the Group and of its joint venture are responsible for maintenance of adequate accounting records in accordance with the provisions of the Act for safeguarding the assets of the Group and its joint venture respectively and for preventing and detecting frauds
and other irregularities; the selection and application of appropriate accounting policies; making judgements and estimates that are reasonable and prudent; and the design, implementation and maintenance of adequate internal financial controls, that were operating effectively for ensuring the accuracy and completeness of the accounting records, relevant to the preparation and presentation of the financial statements that give a true and fair view and are free from material misstatement, whether due to fraud or error, which has been used for the purpose of preparation of the consolidated Ind AS financial statements by the Directors of the Holding Company, as aforesaid.
Auditors’ Responsibility 4. Our responsibility is to express an opinion on these
consolidated Ind AS financial statements based on our audit. While conducting the audit, we have taken into account the provisions of the Act and the Rules made thereunder including the accounting and auditing standards and matters which are required to be included in the audit report.
5. We conducted our audit of the consolidated Ind AS financial statements in accordance with the Standards on Auditing specified under Section 143(10) of the Act and other applicable authoritative pronouncements issued by the Institute of Chartered Accountants of India. Those Standards and pronouncements require that we comply with ethical requirements and plan and perform the audit to obtain reasonable assurance about whether the consolidated Ind AS financial statements are free from material misstatement.
6. An audit involves performing procedures to obtain audit evidence about the amounts and disclosures in the consolidated Ind AS financial statements. The procedures selected depend on the auditors’ judgement, including the assessment of the risks of material misstatement of the consolidated Ind AS financial statements, whether due to fraud or error. In making those risk assessments, the auditor considers internal financial control relevant to the Holding Company’s preparation of the consolidated Ind AS financial statements that give a true and fair view, in order to design audit procedures that are appropriate in the circumstances. An audit also includes evaluating the appropriateness of the accounting policies used and the reasonableness of the accounting estimates made by the Holding Company’s Board of Directors, as well as evaluating the overall presentation of the consolidated Ind AS financial statements.
COMPANY OVERVIEW FINANCIAL STATEMENTSGOVERNANCE REPORTS
145VI S A S T EEL LT D.
INDEPENDENT AUDITORS’ REPORT
7. We believe that the audit evidence obtained by us and the audit evidence obtained by the other auditors in terms of their reports referred to in sub-paragraph 11 of the Other Matters paragraph below, is sufficient and appropriate to provide a basis for our qualified audit opinion on the consolidated Ind AS financial statements.
Basis for Qualified Opinion8. We draw your attention to Note 18D to the consolidated
Ind AS financial statements with regard to non-recognition of interest expense amounting to Rs. 4,693.34 Million on the borrowings of the Holding Company for the year ended March 31, 2017 which is not in accordance with the requirements of Ind AS 23: Borrowing Costs read with Ind AS 109: Financial Instruments.
Had the aforesaid interest expense been recognised, the consolidated Finance costs for the year ended March 31, 2017 would have been Rs. 5,159.14 Million instead of the reported amount of Rs. 465.80 Million; consolidated Total Expenses for the year ended March 31, 2017 would have been Rs. 22,744.25 Million instead of Rs. 18,050.91 Million; consolidated Loss before exceptional items and tax for the year ended March 31, 2017 would have been Rs. 5,870.78 Million instead of the reported amount of Rs. 1,177.44 Million; consolidated Loss before tax for the year ended March 31,2017 would have been Rs. 5,870.78 Million instead of the reported amount of Rs. 1,177.44 Million; consolidated Net Loss after tax for the year ended March 31, 2017 would have been Rs. 5,870.78 Million instead of the reported amount of Rs. 1,177.44 Million; consolidated Total Comprehensive Income for year ended March 31, 2017 would have been Rs. (5,873.67)Million instead of the reported amount of Rs. (1,180.33)Million and Loss Per Share for the year ended March 31, 2017 would have been Rs. 53.37 instead of the reported amount of Rs.10.70. Consolidated Other Equity and Other Current Financial Liabilities as at March 31, 2017 would have been Rs. (15,489.85)Million and Rs. 18,535.79 Million instead of the reported amount of Rs. (10,796.51) Million and Rs. 13,842.45 Million respectively.
Qualified Opinion9. In our opinion and to the best of our information and
according to the explanations given to us, the aforesaid consolidated Ind AS financial statements give the information required by the Act in the manner so required and except for the effect of matter referred to in paragraph 8 above give a true and fair view in conformity with the
accounting principles generally accepted in India of the consolidated state of affairs of the Group and joint venture as at March 31, 2017, their consolidated total comprehensive income (comprising consolidated loss and consolidated other comprehensive income), their consolidated cash flows and consolidated changes in equity for the year ended on that date.
Emphasis of Matter10. We draw attention to the following matters:(a) Note 39 (a) to the consolidated Ind AS financial
statements, regarding the preparation of the Ind AS financial statements of the Holding Company, ongoing concern basis. The Holding Company has incurred net loss during the year ended March 31, 2017 and, as of that date, the Holding Company’s current liabilities exceed current assets and the Holding Company’s net worth has been eroded as at the balance sheet date. These conditions along with other matters as set forth in the aforesaid Note, indicate the existence of a material uncertainty that may cast significant doubt about the Holding Company’s ability to continue as a going concern.
Based on the standalone financial statements of the Holding Company (after consolidation adjustments) total assets of Rs. 35,365.90 Million (93.58%) and net assets of Rs.(9,965.43) Million (110.07%) as at March 31, 2017, total revenue of Rs. 15,230.86 Million (90.27%), net loss of Rs. 1,426.56 Million (121.16%) and net cash flows amounting to Rs. 97.23 Million (81.93%) for the year ended March 31, 2017, have been considered in the consolidated financial statements of the Group and its joint venture. Consequently, this indicates the existence of a material uncertainty that may cast significant doubt about the Group and its joint venture’s ability to continue as a going concern.
(b) We draw attention to Note 46 to the consolidated Ind AS financial statements which describes the basis for revision of the consolidated Ind AS financial statements consequent to the merger of the Amalgamating Company with the Company, pursuant to a Scheme of Amalgamation sanctioned by the National Company Law Tribunal (“NCLT”) vide its order dated October 12, 2017 (the “Scheme”). We further report that, our audit procedures on the subsequent events in so far as it relates to the revision to the consolidated Ind AS financial statements (as amended) are restricted solely to the aforesaid matter relating to the Scheme and no effect have been given for any other events, if any, occurring after May 26, 2017 (being the date
CONSOLIDATED
146 A nnu a l Repor t 2016-17
on which the standalone Ind AS financial statements were first approved by the Board of Directors of the Company and reported upon by us by our report of that date).
(c) Note 46 to the consolidated financial statements relating to accounting for amalgamation of VISA BAO Limited (the “Transferor Company”) with the Company in accordance with the Ind AS 110, Consolidated Financial Statements, which requires that the merger of a subsidiary with the Holding Company be treated as an intra group transaction and eliminated in the consolidated financial statements.
Our opinion is not qualified in respect of these matters.
Other Matters11. We did not audit the financial statements of five subsidiaries,
and one joint venture whose Ind AS financial statements reflect total assets of Rs. 3,508.11 Million and net assets of Rs. 1,164.90 Million as at March 31, 2017, total revenue of Rs. 4,544.81 Million, total comprehensive income (comprising loss and other comprehensive income) of Rs. 79.84 Million and net cash flows amounting to Rs. 21.44 Million for the year ended on that date, as considered in the consolidated Ind AS financial statements. These financial statements/ financial information have been audited by other auditors whose reports have been furnished to us by the Management, and our opinion on the consolidated Ind AS financial statements insofar as it relates to the amounts and disclosures included in respect of these subsidiaries and joint venture and our report in terms of sub-section (3) of Section 143 of the Act insofar as it relates to the aforesaid subsidiaries and joint venture, is based solely on the reports of the other auditors.
Our opinion on the consolidated Ind AS financial statements and our report on Other Legal and Regulatory Requirements below, is not modified in respect of the above matters with respect to our reliance on the work done and the reports of the other auditors.
12. The comparative financial information of the Group for the year ended March 31, 2016 and the transition date opening balance sheet as at April 1, 2015 included in these consolidated Ind AS financial statements, are based on the previously issued statutory financial statements for the years ended March 31, 2016 and March 31, 2015 prepared in accordance with the Companies (Accounting Standards) Rules, 2006 (as amended) which were audited by us, on which we expressed an unmodified opinion dated May 27,
2016 and May 29, 2015 respectively. The adjustments to those financial statements for the differences in accounting principles adopted by the Group on transition to the Ind AS have been audited by us.
Our opinion is not qualified in respect of this matter.
Report on Other Legal and Regulatory Requirements13. As required by Section 143(3) of the Act, we report, to the
extent applicable, that:
(a) We have sought and obtained all the information and explanations which to the best of our knowledge and belief were necessary for the purposes of our audit of the aforesaid consolidated Ind AS financial statements.
(b) In our opinion, except for the matters referred to in paragraph 8 above, proper books of account as required by law maintained by the Holding Company, its subsidiaries included in the Group and joint venture incorporated in India including relevant records relating to preparation of the aforesaid consolidated Ind AS financial statements have been kept so far as it appears from our examination of those books and records of the Holding Company and the reports of the other auditors.
(c) The Consolidated Balance Sheet, the Consolidated Statement of Profit and Loss (including other comprehensive income), Consolidated Cash Flow Statement and the Consolidated Statement of Changes in Equity dealt with by this Report are in agreement with the relevant books of account maintained by the Holding Company, its subsidiaries included in the Group, joint venture incorporated in India including relevant records relating to the preparation of the consolidated Ind AS financial statements.
(d) In our opinion, except for the matters referred to in paragraph 8 above, the aforesaid consolidated Ind AS financial statements comply with the Indian Accounting Standards specified under Section 133 of the Act.
(e) The matter mentioned in 10 (a) above, in our opinion, may have an adverse effect on the functioning of the Group and its joint venture.
INDEPENDENT AUDITORS’ REPORT
COMPANY OVERVIEW FINANCIAL STATEMENTSGOVERNANCE REPORTS
147VI S A S T EEL LT D.
(f) On the basis of the written representations received from the directors of the Holding Company as on March 31, 2017 taken on record by the Board of Directors of the Holding Company and the reports of the statutory auditors of its subsidiary companies and joint venture incorporated in India, none of the directors of the Group companies and jointly controlled company incorporated in India is disqualified as on March 31, 2017 from being appointed as a director in terms of Section 164 (2) of the Act.
(g) With reference to maintenance of accounts and other matters connected therewith, reference is drawn to our comment in paragraph 13(b) above.
(h) With respect to the adequacy of the internal financial controls over financial reporting of the Holding Company, its subsidiary companies and jointly controlled company incorporated in India and the operating effectiveness of such controls, refer to our separate Report in Annexure A.
(i) With respect to the other matters to be included in the Auditors’ Report in accordance with Rule 11 of the Companies (Audit and Auditors) Rules, 2014, in our opinion and to the best of our information and according to the explanations given to us:
i. The consolidated financial statements disclose the impact, if any, of pending litigations as at March 31, 2017 on the consolidated financial position of
the Group and joint venture– Refer Note 38 to the consolidated Ind AS financial statements.
ii. The Group and joint venture had long-term contracts including derivative contracts as at March 31, 2017 for which there were no material foreseeable losses.
iii. There were no amounts which were required to be transferred to the Investor Education and Protection Fund by the Holding Company, and its subsidiary companies and joint venture incorporated in India during the year ended March 31, 2017.
iv. The Holding Company, its subsidiaries and joint venture incorporated in India have provided requisite disclosures in the consolidated financial statements as to holdings as well as dealings in Specified Bank Notes during the period from November 8, 2016 to December 30, 2016. Based on audit procedures and relying on the management representation we report that the disclosures are in accordance with books of account maintained by the Holding Company and as produced to us by the Management – Refer Note 40 to the consolidated Ind AS financial statements.
For Lovelock & LewesFirm Registration Number: 301056E
Chartered Accountants
Pradip LawKolkata PartnerNovember 9, 2017 Membership Number 51790
INDEPENDENT AUDITORS’ REPORT
CONSOLIDATED
148 A nnu a l Repor t 2016-17
ANNEXURE A TO INDEPENDENT AUDITORS’ REPORT
Report on the Internal Financial Controls under Clause (i) of Sub-section 3 of Section 143 of the Act1. This Report supersedes our Report dated May 26, 2017.
2. In conjunction with our audit of the consolidated Ind AS financial statements of the Company as of and for the year ended March 31, 2017, we have audited the internal financial controls over financial reporting of VISA Steel Limited (hereinafter referred to as “the Holding Company”) and its subsidiary companies and its jointly controlled company, which are companies incorporated in India, as of that date.
Management’s Responsibility for Internal Financial Controls3. The respective Board of Directors of the Holding company
and its subsidiary companies and its jointly controlled company, which are companies incorporated in India, are responsible for establishing and maintaining internal financial controls based on internal control over financial reporting criteria established by the Company considering the essential components of internal control stated in the Guidance Note on Audit of Internal Financial Controls Over Financial Reporting issued by the Institute of Chartered Accountants of India (ICAI). These responsibilities include the design, implementation and maintenance of adequate internal financial controls that were operating effectively for ensuring the orderly and efficient conduct of its business, including adherence to the respective company’s policies, the safeguarding of its assets, the prevention and detection of frauds and errors, the accuracy and completeness of the accounting records, and the timely preparation of reliable financial information, as required under the Act.
Auditor’s Responsibility4. Our responsibility is to express an opinion on the Company’s
internal financial controls over financial reporting based on our audit. We conducted our audit in accordance with the Guidance Note on Audit of Internal Financial Controls Over Financial Reporting (the“Guidance Note”) issued by the ICAI and the Standards on Auditing deemed to be prescribed under section 143(10) of the Companies Act, 2013, to the extent applicable to an audit of internal financial controls, both applicable to an audit of internal financial controls and both issued by the ICAI. Those Standards and the Guidance Note require that we comply with ethical requirements and plan and perform the audit to obtain reasonable assurance about whether adequate internal financial controls over financial reporting was established and maintained and if such controls operated effectively in all material respects.
5. Our audit involves performing procedures to obtain audit evidence about the adequacy of the internal financial controls system over financial reporting and their operating effectiveness. Our audit of internal financial controls over financial reporting included obtaining an understanding of internal financial controls over financial reporting, assessing the risk that a material weakness exists, and testing and evaluating the design and operating effectiveness of internal control based on the assessed risk. The procedures selected depend on the auditor’s judgement, including the assessment of the risks of material misstatement of the consolidated Ind AS financial statements, whether due to fraud or error.
6. We believe that the audit evidence we have obtained and the audit evidence obtained by the other auditors in terms of their reports referred to in the Other Matters paragraph below, is sufficient and appropriate to provide a basis for our qualified audit opinion on the Company’s internal financial controls system over financial reporting.
Meaning of Internal Financial Controls Over Financial Reporting7. A company’s internal financial control over financial
reporting is a process designed to provide reasonable assurance regarding the reliability of financial reporting and the preparation of financial statements for external purposes in accordance with generally accepted accounting principles. A company’s internal financial control over financial reporting includes those policies and procedures that (1) pertain to the maintenance of records that, in reasonable detail, accurately and fairly reflect the transactions and dispositions of the assets of the company; (2) provide reasonable assurance that transactions are recorded as necessary to permit preparation of financial statements in accordance with generally accepted accounting principles, and that receipts and expenditures of the company are being made only in accordance with authorisations of management and directors of the company; and (3) provide reasonable assurance regarding prevention or timely detection of unauthorised acquisition, use, or disposition of the company’s assets that could have a material effect on the financial statements.
Inherent Limitations of Internal Financial Controls Over Financial Reporting8. Because of the inherent limitations of internal financial
controls over financial reporting, including the possibility of collusion or improper management override of controls, material misstatements due to error or fraud may occur and not be detected. Also, projections of any evaluation
Referred to in paragraph 13 (h) of the Independent Auditors’ Report of even date to the members of VISA Steel Limited on the consolidated Ind AS financial statements for the year ended March 31, 2017
COMPANY OVERVIEW FINANCIAL STATEMENTSGOVERNANCE REPORTS
149VI S A S T EEL LT D.
ANNEXURE A TO INDEPENDENT AUDITORS’ REPORT
of the internal financial controls over financial reporting to future periods are subject to the risk that the internal financial control over financial reporting may become inadequate because of changes in conditions, or that the degree of compliance with the policies or procedures may deteriorate.
Basis for Qualified Opinion9. According to the information and explanations given to us
and based on our audit, the following material weakness has been identified in the operating effectiveness of internal financial controls over financial reporting of the Company as at March 31, 2017:
The internal financial controls of the Company relating to application of appropriate policies and procedures that provide reasonable assurance that transactions are recorded as necessary to permit preparation of financial statements in accordance with generally accepted accounting principles were not operating effectively which resulted in non-recognition of interest expense as indicated in Note 18D to the consolidated Ind AS financial statements.
10. A ‘material weakness’ is a deficiency, or a combination of deficiencies, in internal financial control over financial reporting, such that there is a reasonable possibility that a material misstatement of the company’s annual or interim financial statements will not be prevented or detected on a timely basis.
Qualified Opinion11. In our opinion, the Holding Company, its subsidiary
companies and its joint controlled company, which are companies incorporated in India, have in all material respects, an adequate internal financial controls system over financial reporting and except for the effects, as there may be, of the matter referred to in Basis for Qualified Opinion paragraph above, such internal financial controls over financial reporting were operating effectively as at March 31, 2017, based on the internal control over financial reporting criteria established by the Company considering the essential components of internal control stated in the Guidance Note on Audit of Internal Financial Controls Over Financial Reporting issued by the Institute of Chartered Accountants of India.
12. We have considered the material weakness identified and reported above in determining the nature, timing, and
extent of audit tests applied in our audit of the consolidated Ind AS financial statements of the Company for the year ended March 31, 2017, and the material weakness does affect our opinion on the consolidated Ind AS financial statements of the Company.
Emphasis of Matter13. We draw attention to Note 46 to the consolidated Ind
AS financial statements which describes the basis for revision of the consolidated Ind AS financial statements consequent to the amalgamation of VISA BAO Limited, an erstwhile subsidiary of the Holding Company with the Holding Company, pursuant to a Scheme of Amalgamation sanctioned by the National Company Law Tribunal (“NCLT”) vide its order dated October 12, 2017 and filed with the Registrar of Companies on October 17, 2017 (the “Scheme”). We further report that, our audit procedures on the subsequent events in so far as it relates to the revision to the consolidated Ind AS financial statements (as amended) with respect to the adequacy and operating effectiveness of internal financial controls over financial reporting therein are restricted solely to the aforesaid matter relating to the Scheme and no effect have been given for any other events, if any, occurring after May 26, 2017 (being the date on which the consolidated Ind AS financial statements were first approved by the Board of Directors of the Holding Company and reported upon by us by our report of that date).
Our opinion is not modified in respect of this matter.
Other Matters 14. Our aforesaid reports under section 143(3)(i) of the Act on
the adequacy and operating effectiveness of the internal financial controls over financial reporting insofar as it relates to five subsidiary and one jointly controlled company, which are companies incorporated in India, is based on the corresponding reports of the auditors of such companies incorporated in India. Our opinion is not qualified in respect of this matter.
For Lovelock & LewesFirm Registration Number: 301056E
Chartered Accountants
Pradip LawKolkata PartnerNovember 9, 2017 Membership Number 51790
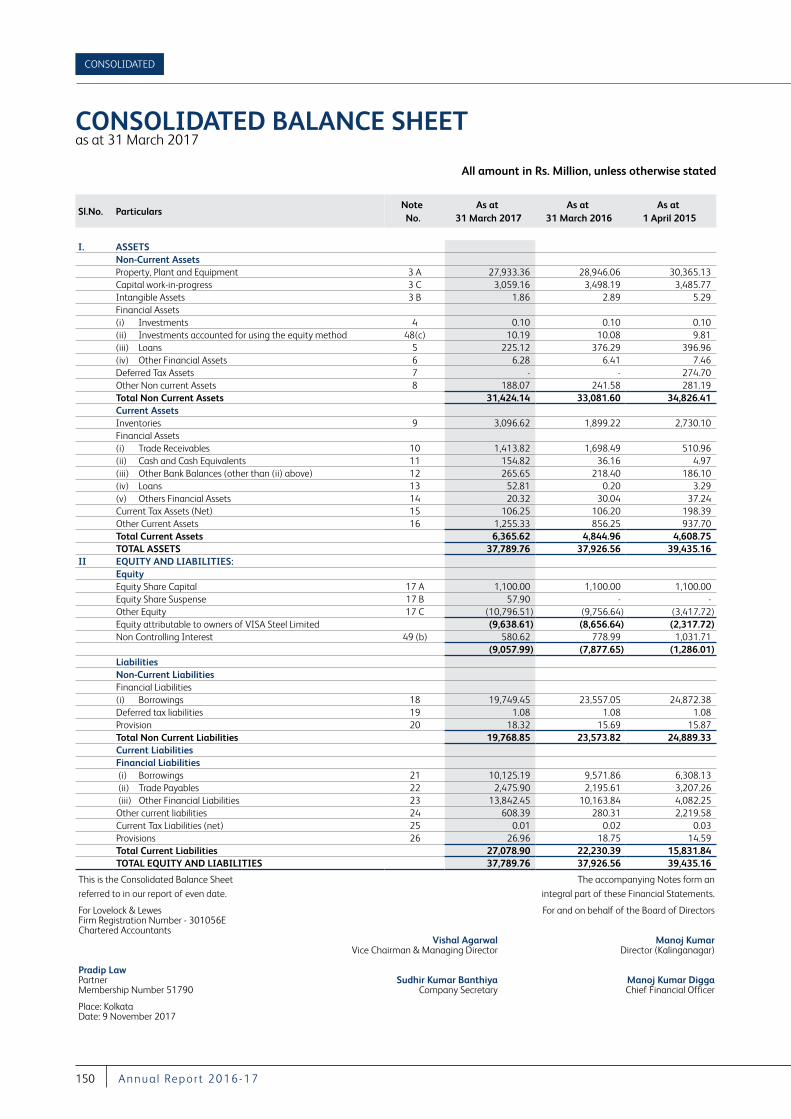
All amount in Rs. Million, unless otherwise stated
CONSOLIDATED
150 A nnu a l Repor t 2016-17
CONSOLIDATED BALANCE SHEETas at 31 March 2017
Sl.No. ParticularsNote No.
As at 31 March 2017
As at 31 March 2016
As at 1 April 2015
I. ASSETSNon-Current AssetsProperty, Plant and Equipment 3 A 27,933.36 28,946.06 30,365.13 Capital work-in-progress 3 C 3,059.16 3,498.19 3,485.77 Intangible Assets 3 B 1.86 2.89 5.29 Financial Assets(i) Investments 4 0.10 0.10 0.10(ii) Investments accounted for using the equity method 48(c) 10.19 10.08 9.81(iii) Loans 5 225.12 376.29 396.96 (iv) Other Financial Assets 6 6.28 6.41 7.46 Deferred Tax Assets 7 - - 274.70 Other Non current Assets 8 188.07 241.58 281.19 Total Non Current Assets 31,424.14 33,081.60 34,826.41 Current AssetsInventories 9 3,096.62 1,899.22 2,730.10 Financial Assets(i) Trade Receivables 10 1,413.82 1,698.49 510.96 (ii) Cash and Cash Equivalents 11 154.82 36.16 4.97(iii) Other Bank Balances (other than (ii) above) 12 265.65 218.40 186.10 (iv) Loans 13 52.81 0.20 3.29 (v) Others Financial Assets 14 20.32 30.04 37.24 Current Tax Assets (Net) 15 106.25 106.20 198.39 Other Current Assets 16 1,255.33 856.25 937.70 Total Current Assets 6,365.62 4,844.96 4,608.75 TOTAL ASSETS 37,789.76 37,926.56 39,435.16
II EQUITY AND LIABILITIES:Equity Equity Share Capital 17 A 1,100.00 1,100.00 1,100.00 Equity Share Suspense 17 B 57.90 - - Other Equity 17 C (10,796.51) (9,756.64) (3,417.72)Equity attributable to owners of VISA Steel Limited (9,638.61) (8,656.64) (2,317.72)Non Controlling Interest 49 (b) 580.62 778.99 1,031.71
(9,057.99) (7,877.65) (1,286.01)LiabilitiesNon-Current LiabilitiesFinancial Liabilities(i) Borrowings 18 19,749.45 23,557.05 24,872.38 Deferred tax liabilities 19 1.08 1.08 1.08 Provision 20 18.32 15.69 15.87 Total Non Current Liabilities 19,768.85 23,573.82 24,889.33 Current LiabilitiesFinancial Liabilities (i) Borrowings 21 10,125.19 9,571.86 6,308.13 (ii) Trade Payables 22 2,475.90 2,195.61 3,207.26 (iii) Other Financial Liabilities 23 13,842.45 10,163.84 4,082.25 Other current liabilities 24 608.39 280.31 2,219.58 Current Tax Liabilities (net) 25 0.01 0.02 0.03 Provisions 26 26.96 18.75 14.59 Total Current Liabilities 27,078.90 22,230.39 15,831.84 TOTAL EQUITY AND LIABILITIES 37,789.76 37,926.56 39,435.16
This is the Consolidated Balance Sheet The accompanying Notes form an
referred to in our report of even date. integral part of these Financial Statements.
For Lovelock & Lewes For and on behalf of the Board of Directors Firm Registration Number - 301056EChartered Accountants
Vishal Agarwal Manoj Kumar Vice Chairman & Managing Director Director (Kalinganagar)
Pradip LawPartner Sudhir Kumar Banthiya Manoj Kumar Digga Membership Number 51790 Company Secretary Chief Financial Officer
Place: KolkataDate: 9 November 2017
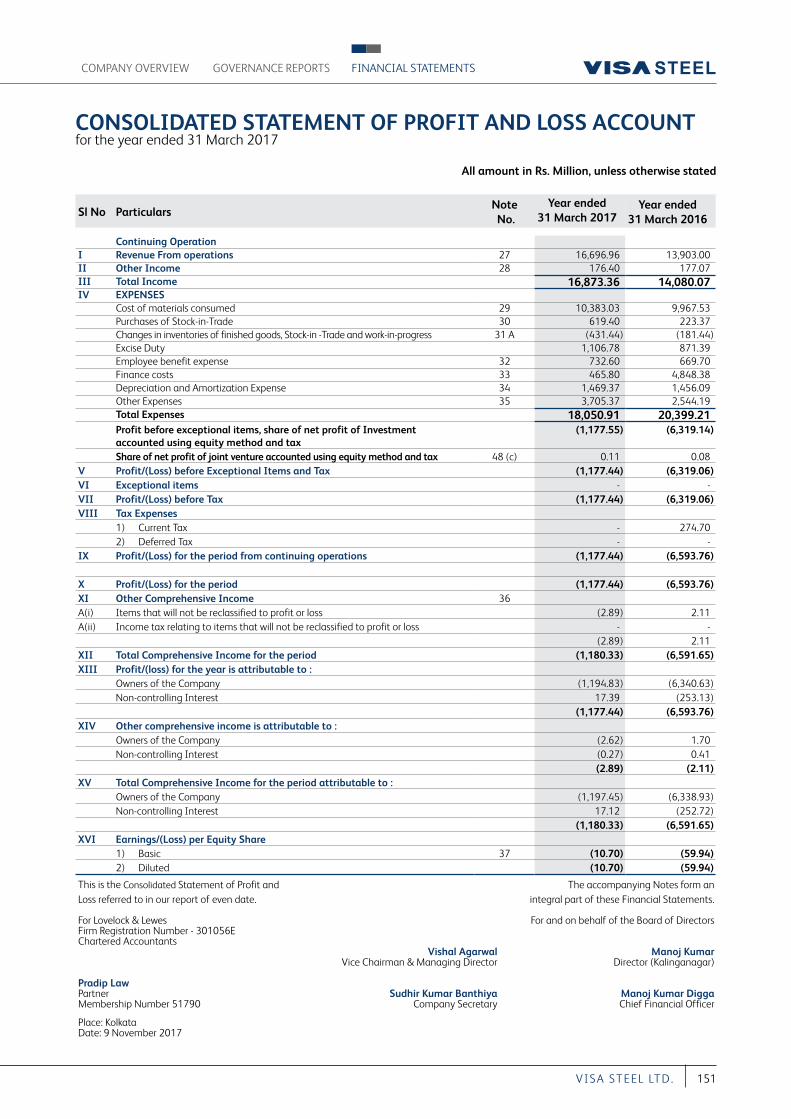
All amount in Rs. Million, unless otherwise stated
COMPANY OVERVIEW FINANCIAL STATEMENTSGOVERNANCE REPORTS
151VI S A S T EEL LT D.
CONSOLIDATED STATEMENT OF PROFIT AND LOSS ACCOUNT for the year ended 31 March 2017
Sl No ParticularsNote No.
Year ended 31 March 2017
Year ended 31 March 2016
Continuing OperationI Revenue From operations 27 16,696.96 13,903.00 II Other Income 28 176.40 177.07 III Total Income 16,873.36 14,080.07 IV EXPENSES
Cost of materials consumed 29 10,383.03 9,967.53 Purchases of Stock-in-Trade 30 619.40 223.37 Changes in inventories of finished goods, Stock-in -Trade and work-in-progress 31 A (431.44) (181.44)Excise Duty 1,106.78 871.39 Employee benefit expense 32 732.60 669.70 Finance costs 33 465.80 4,848.38 Depreciation and Amortization Expense 34 1,469.37 1,456.09 Other Expenses 35 3,705.37 2,544.19 Total Expenses 18,050.91 20,399.21 Profit before exceptional items, share of net profit of Investment accounted using equity method and tax
(1,177.55) (6,319.14)
Share of net profit of joint venture accounted using equity method and tax 48 (c) 0.11 0.08 V Profit/(Loss) before Exceptional Items and Tax (1,177.44) (6,319.06)VI Exceptional items - - VII Profit/(Loss) before Tax (1,177.44) (6,319.06)VIII Tax Expenses
1) Current Tax - 274.70 2) Deferred Tax - -
IX Profit/(Loss) for the period from continuing operations (1,177.44) (6,593.76)
X Profit/(Loss) for the period (1,177.44) (6,593.76)XI Other Comprehensive Income 36A(i) Items that will not be reclassified to profit or loss (2.89) 2.11 A(ii) Income tax relating to items that will not be reclassified to profit or loss - -
(2.89) 2.11 XII Total Comprehensive Income for the period (1,180.33) (6,591.65)XIII Profit/(loss) for the year is attributable to :
Owners of the Company (1,194.83) (6,340.63)Non-controlling Interest 17.39 (253.13)
(1,177.44) (6,593.76)XIV Other comprehensive income is attributable to :
Owners of the Company (2.62) 1.70 Non-controlling Interest (0.27) 0.41
(2.89) (2.11)XV Total Comprehensive Income for the period attributable to :
Owners of the Company (1,197.45) (6,338.93)Non-controlling Interest 17.12 (252.72)
(1,180.33) (6,591.65)XVI Earnings/(Loss) per Equity Share
1) Basic 37 (10.70) (59.94)2) Diluted (10.70) (59.94)
This is the Consolidated Statement of Profit and Loss referred to in our report of even date.
The accompanying Notes form an integral part of these Financial Statements.
For Lovelock & Lewes For and on behalf of the Board of Directors Firm Registration Number - 301056EChartered Accountants
Vishal Agarwal Manoj Kumar Vice Chairman & Managing Director Director (Kalinganagar)
Pradip LawPartner Sudhir Kumar Banthiya Manoj Kumar Digga Membership Number 51790 Company Secretary Chief Financial Officer
Place: KolkataDate: 9 November 2017
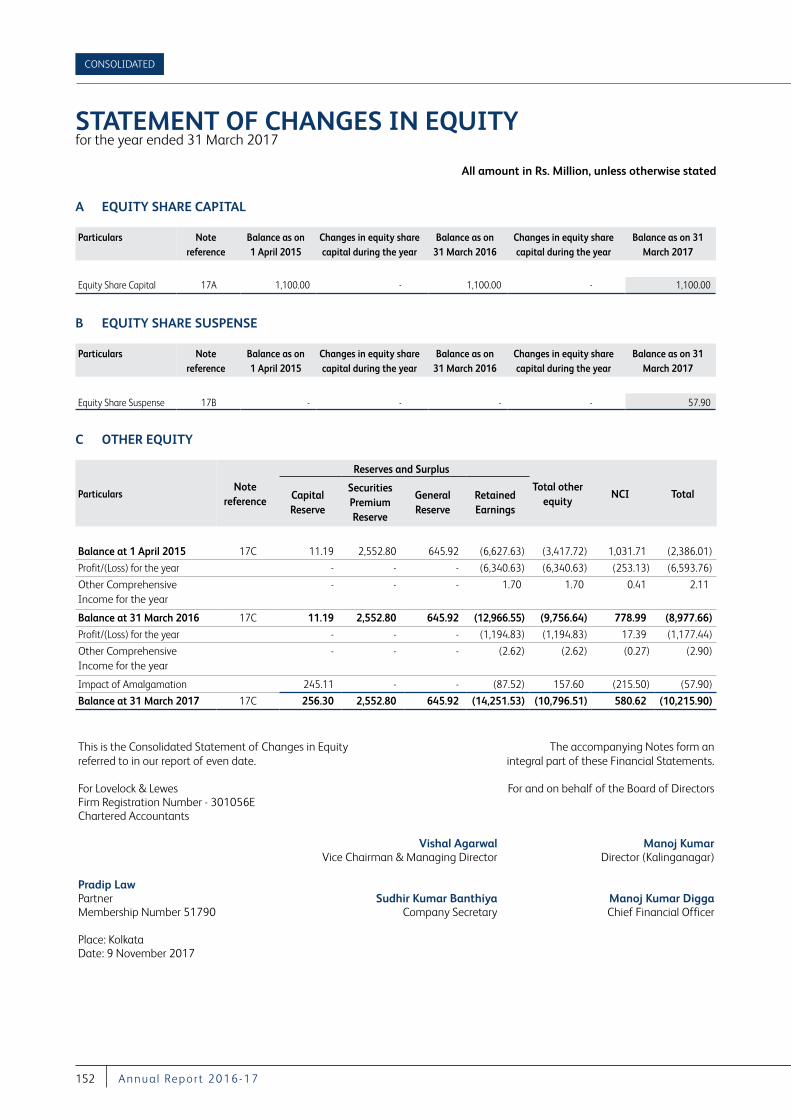
All amount in Rs. Million, unless otherwise stated
CONSOLIDATED
152 A nnu a l Repor t 2016-17
A EQUITY SHARE CAPITAL
Particulars Note reference
Balance as on 1 April 2015
Changes in equity share capital during the year
Balance as on 31 March 2016
Changes in equity share capital during the year
Balance as on 31 March 2017
Equity Share Capital 17A 1,100.00 - 1,100.00 - 1,100.00
B EQUITY SHARE SUSPENSE
Particulars Note reference
Balance as on 1 April 2015
Changes in equity share capital during the year
Balance as on 31 March 2016
Changes in equity share capital during the year
Balance as on 31 March 2017
Equity Share Suspense 17B - - - - 57.90
C OTHER EQUITY
ParticularsNote
reference
Reserves and Surplus
Total other equity
NCI TotalCapital Reserve
Securities Premium Reserve
General Reserve
Retained Earnings
Balance at 1 April 2015 17C 11.19 2,552.80 645.92 (6,627.63) (3,417.72) 1,031.71 (2,386.01)
Profit/(Loss) for the year - - - (6,340.63) (6,340.63) (253.13) (6,593.76)
Other Comprehensive Income for the year
- - - 1.70 1.70 0.41 2.11
Balance at 31 March 2016 17C 11.19 2,552.80 645.92 (12,966.55) (9,756.64) 778.99 (8,977.66)
Profit/(Loss) for the year - - - (1,194.83) (1,194.83) 17.39 (1,177.44)
Other Comprehensive Income for the year
- - - (2.62) (2.62) (0.27) (2.90)
Impact of Amalgamation 245.11 - - (87.52) 157.60 (215.50) (57.90)
Balance at 31 March 2017 17C 256.30 2,552.80 645.92 (14,251.53) (10,796.51) 580.62 (10,215.90)
This is the Consolidated Statement of Changes in Equity The accompanying Notes form an referred to in our report of even date. integral part of these Financial Statements.
For Lovelock & Lewes For and on behalf of the Board of Directors Firm Registration Number - 301056EChartered Accountants
Vishal Agarwal Manoj Kumar Vice Chairman & Managing Director Director (Kalinganagar)
Pradip LawPartner Sudhir Kumar Banthiya Manoj Kumar Digga Membership Number 51790 Company Secretary Chief Financial Officer
Place: KolkataDate: 9 November 2017
STATEMENT OF CHANGES IN EQUITY for the year ended 31 March 2017
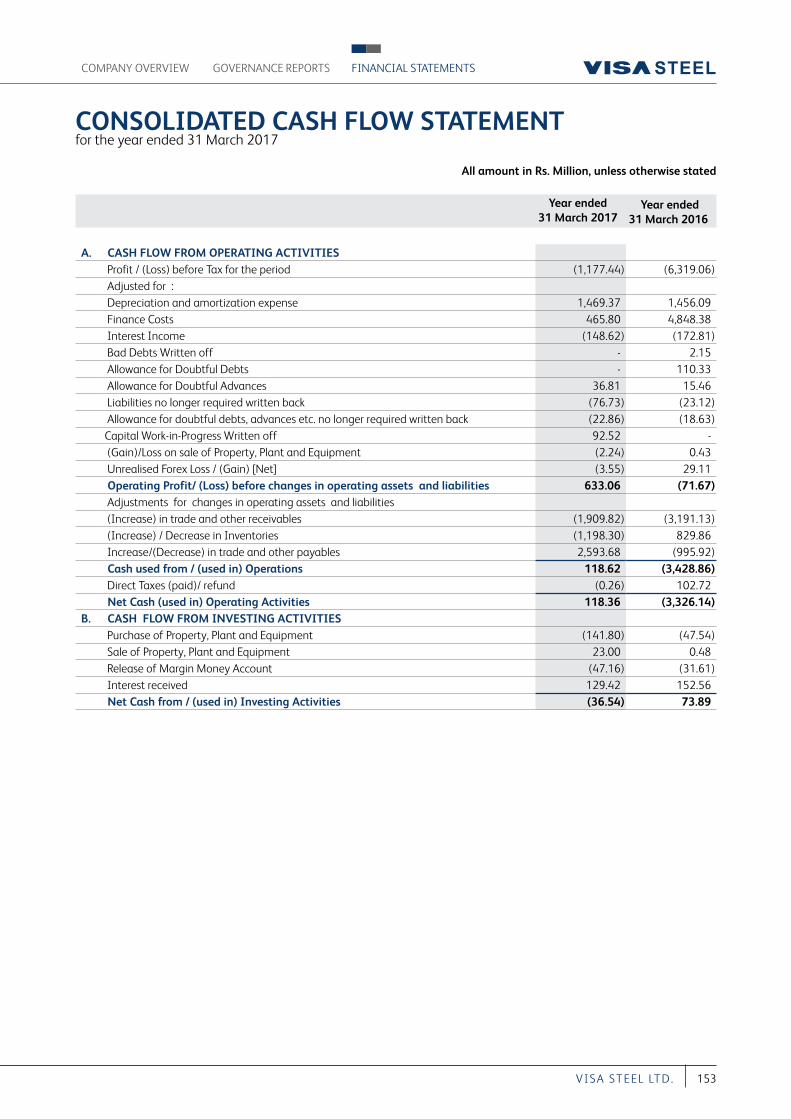
All amount in Rs. Million, unless otherwise stated
COMPANY OVERVIEW FINANCIAL STATEMENTSGOVERNANCE REPORTS
153VI S A S T EEL LT D.
CONSOLIDATED CASH FLOW STATEMENT for the year ended 31 March 2017
Year ended 31 March 2017
Year ended 31 March 2016
A. CASH FLOW FROM OPERATING ACTIVITIES Profit / (Loss) before Tax for the period (1,177.44) (6,319.06) Adjusted for : Depreciation and amortization expense 1,469.37 1,456.09 Finance Costs 465.80 4,848.38 Interest Income (148.62) (172.81) Bad Debts Written off - 2.15 Allowance for Doubtful Debts - 110.33 Allowance for Doubtful Advances 36.81 15.46 Liabilities no longer required written back (76.73) (23.12) Allowance for doubtful debts, advances etc. no longer required written back (22.86) (18.63)Capital Work-in-Progress Written off 92.52 - (Gain)/Loss on sale of Property, Plant and Equipment (2.24) 0.43 Unrealised Forex Loss / (Gain) [Net] (3.55) 29.11 Operating Profit/ (Loss) before changes in operating assets and liabilities 633.06 (71.67) Adjustments for changes in operating assets and liabilities (Increase) in trade and other receivables (1,909.82) (3,191.13) (Increase) / Decrease in Inventories (1,198.30) 829.86 Increase/(Decrease) in trade and other payables 2,593.68 (995.92) Cash used from / (used in) Operations 118.62 (3,428.86) Direct Taxes (paid)/ refund (0.26) 102.72 Net Cash (used in) Operating Activities 118.36 (3,326.14)
B. CASH FLOW FROM INVESTING ACTIVITIES Purchase of Property, Plant and Equipment (141.80) (47.54) Sale of Property, Plant and Equipment 23.00 0.48 Release of Margin Money Account (47.16) (31.61) Interest received 129.42 152.56 Net Cash from / (used in) Investing Activities (36.54) 73.89
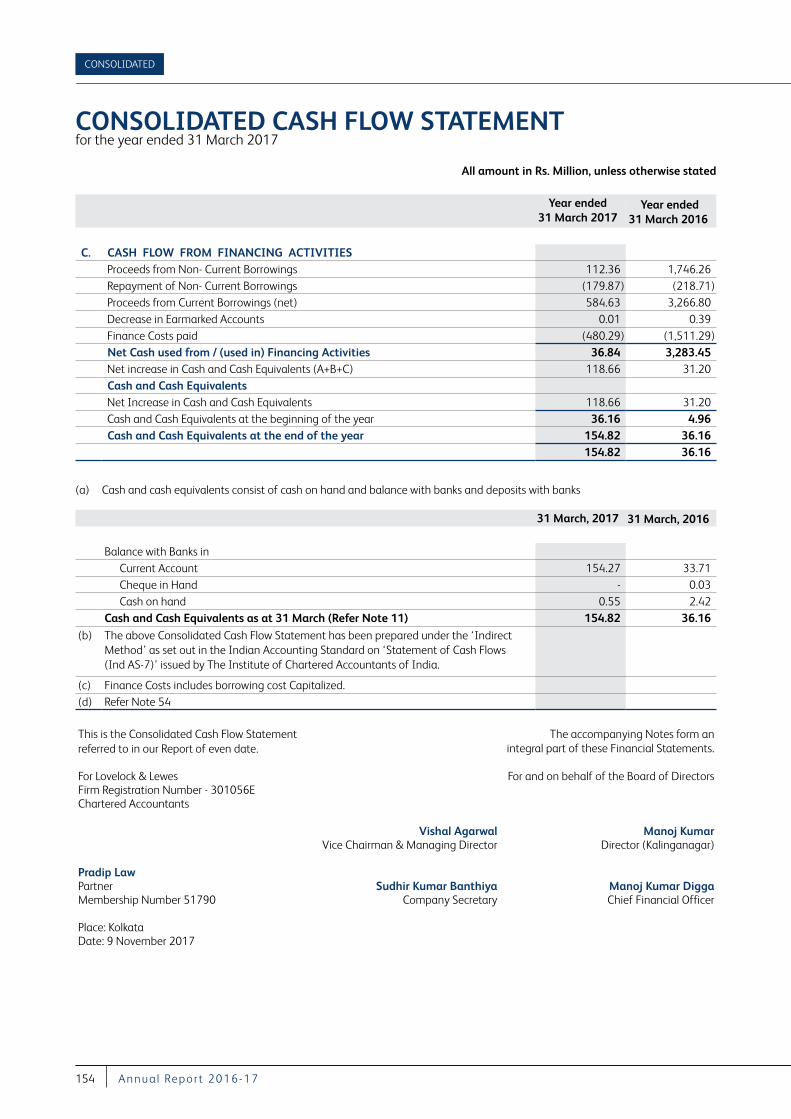
All amount in Rs. Million, unless otherwise stated
CONSOLIDATED
154 A nnu a l Repor t 2016-17
Year ended 31 March 2017
Year ended 31 March 2016
C. CASH FLOW FROM FINANCING ACTIVITIES Proceeds from Non- Current Borrowings 112.36 1,746.26 Repayment of Non- Current Borrowings (179.87) (218.71) Proceeds from Current Borrowings (net) 584.63 3,266.80 Decrease in Earmarked Accounts 0.01 0.39 Finance Costs paid (480.29) (1,511.29) Net Cash used from / (used in) Financing Activities 36.84 3,283.45 Net increase in Cash and Cash Equivalents (A+B+C) 118.66 31.20 Cash and Cash Equivalents Net Increase in Cash and Cash Equivalents 118.66 31.20 Cash and Cash Equivalents at the beginning of the year 36.16 4.96 Cash and Cash Equivalents at the end of the year 154.82 36.16
154.82 36.16
(a) Cash and cash equivalents consist of cash on hand and balance with banks and deposits with banks
31 March, 2017 31 March, 2016
Balance with Banks inCurrent Account 154.27 33.71 Cheque in Hand - 0.03 Cash on hand 0.55 2.42
Cash and Cash Equivalents as at 31 March (Refer Note 11) 154.82 36.16
(b) The above Consolidated Cash Flow Statement has been prepared under the ‘Indirect Method’ as set out in the Indian Accounting Standard on ‘Statement of Cash Flows (Ind AS-7)’ issued by The Institute of Chartered Accountants of India.
(c) Finance Costs includes borrowing cost Capitalized.(d) Refer Note 54
This is the Consolidated Cash Flow Statement referred to in our Report of even date.
The accompanying Notes form an integral part of these Financial Statements.
For Lovelock & Lewes For and on behalf of the Board of Directors Firm Registration Number - 301056EChartered Accountants
Vishal Agarwal Manoj Kumar Vice Chairman & Managing Director Director (Kalinganagar)
Pradip LawPartner Sudhir Kumar Banthiya Manoj Kumar Digga Membership Number 51790 Company Secretary Chief Financial Officer
Place: KolkataDate: 9 November 2017
CONSOLIDATED CASH FLOW STATEMENT for the year ended 31 March 2017
All amount in Rs. Million, unless otherwise stated
COMPANY OVERVIEW FINANCIAL STATEMENTSGOVERNANCE REPORTS
155VI S A S T EEL LT D.
1 Corporate Information VISA Steel Group is consisting of VISA Steel Limited
(‘VSL’ or ‘the Parent Company’) and its subsidiaries (together referred to as ‘group”). The Group is engaged in the manufacturing and dealing in Iron and Steel products like Pig Iron, Sponge Iron, Special Steel, High Carbon Ferro Chrome with captive power plant, Coke etc in Odisha. Incorporated on 10 September, 1996, VSL has its registered office at Bhubaneswar and Corporate Office in Kolkata with manufacturing units in Kalinganagar and Golagaon and branch offices across India. VSL is a Public Limited Company with its shares listed on BSE Limited (BSE) and National Stock Exchange of India Limited (NSE). For details on the subsidiaries, please refer to note-48.
2 Basis of preparation of financial statements, significant accounting policies and critical estimates & judgement
2.1 Basis of preparation of financial statements2.1.1 Compliance with Ind AS These Consolidated financial statements have been
prepared to comply in all material aspects with Indian Accounting Standards (“Ind AS”) notified under the Companies (Indian Accounting Standards) Rules, 2015 [As amended] notified under Section 133 of the Companies Act, 2013 (the Act) and other relevant provisions of the Act, to the extent applicable.
The Consolidated financial statements upto the year ended March 31, 2016, were prepared in accordance with the accounting standards notified under the Companies (Accounting Standard) Rules, 2006 (as amended) and other relevant provisions of the Act.
This Note provides a list of the significant accounting policies adopted in the preparation of these financial statements. These policies have been consistently applied to all the years presented, unless otherwise stated.
These Consolidated financial statements are the first financial statements of the Group under Ind AS. An explanation of how the transition from previous GAAP to Ind AS has affected the Group’s financial position, financial performance and cash flows is given in Note 44.
2.1.2 Historical cost convention The Consolidated Financial Statements have been
prepared on the historical cost convention and on accrual
basis except for the following: - certain financial assets and liabilities including derivative
instruments measured at fair value - defined benefit plans - plan assets measured at fair value - share-based payments
2.1.3 Principles of consolidation and equity accounting Subsidiaries
Subsidiaries are all entities (including structured entities) over which the group has control. The group controls an entity when the group is exposed to, or has rights to, variable returns from its involvement with the entity and has the ability to affect those returns through its power to direct the relevant activities of the entity. Subsidiaries are fully consolidated from the date on which control is transferred to the group. They are deconsolidated from the date that control ceases.
The acquisition method of accounting is used to account for business combinations by the group.
The group combines the financial statements of the parent and its subsidiaries line by line adding together like items of assets, liabilities, equity, income and expenses. Intercompany transactions, balances and unrealised gains on transactions between group companies are eliminated. Unrealised losses are also eliminated unless the transaction provides evidence of an impairment of the transferred asset. Accounting policies of subsidiaries have been changed where necessary to ensure consistency with the policies adopted by the group.
Non-controlling interests in the results and equity of subsidiaries are shown separately in the consolidated statement of profit and loss, consolidated statement of changes in equity and consolidated balance sheet respectively.
Joint ventures Interests in joint ventures are accounted for using the
equity method , after initially being recognised at cost in the consolidated balance sheet.
(i) Equity Method Under the equity method of accounting, the investments
are initially recognised at cost and adjusted thereafter to recognise the group’s share of the post-acquisition profits or losses of the investee in profit and loss, and the group’s share of other comprehensive income of
SIGNIFICANT ACCOUNTING POLICIES AND NOTES TO THE ACCOUNTS
All amount in Rs. Million, unless otherwise stated
CONSOLIDATED
156 A nnu a l Repor t 2016-17
the investee in other comprehensive income. Dividends received or receivable from associates and joint ventures are recognised as a reduction in the carrying amount of the investment.
When the group’s share of losses in an equity-accounted investment equals or exceeds its interest in the entity, including any other unsecured long-term receivables, the group does not recognise further losses, unless it has incurred obligations or made payments on behalf of the other entity.
Unrealised gains on transactions between the group and its associates and joint ventures are eliminated to the extent of the group’s interest in these entities. Unrealised losses are also eliminated unless the transaction provides evidence of an inpairment of the asset transferred. Accounting policies of equity accounted investees have been changed where necessary to ensure consistency with the policies adopted by the group.
The carrying amount of equity accounted investments are tested for impairment in accordance with the policy described in note 2.2.4.
(ii) Changes in ownership interests The group treats transactions with non-controlling
interests that do not result in a loss of control as transactions with equity owners of the group. A change in ownership interest results in an adjustment between the carrying amounts of the controlling and non-controlling interests to reflects their relative interests in the subsidiary. Any difference between the amount of the adjustment to non-controlling interests and any consideration paid or received is recognised within equity.
When the group ceases to consolidate or equity account for an investment because of a loss of control, joint control or significant influence, any retained interest in the entity is remeasured to its fair value with the change in carrying amount recognised in profit or loss. This fair value becomes the initial carrying amount for the purposes of subsequently accounting for the retained interest as an associate, joint venture or financial asset. In addition, any amounts previously recognised in other comprehensive income in respect of that entity are accounted for as if the group had directly disposed of the
related assets or liabilities. This may mean that amounts previously recognised in other comprehensive income are reclassified to profit or loss.
If the ownership interest in a joint venture or an associate is reduced but joint control or significant influence is retained, only a proportionate share of the amounts previously recognised in other comprehensive income are reclassified to profit or loss where appropriate.
2.1.4 Current versus non-current classification The Group presents assets and liabilities in the balance
sheet based on current/ non-current classification. An asset as current when it is:
Expected to be realised or intended to sold or consumed in normal operating cycle
Held primarily for the purpose of trading
Expected to be realised within twelve months after the reporting period, or
Cash or cash equivalent unless restricted from being exchanged or used to settle a liability for at least twelve months after the reporting period
All other assets are classified as non-current. A liability is current when:
It is expected to be settled in normal operating cycle
It is held primarily for the purpose of trading
It is due to be settled within twelve months after the reporting period, or
There is no unconditional right to defer the settlement of the liability for at least twelve months after the reporting period.
The Group classifies all other liabilities as non-current.
2.2 Summary of significant accounting policies2.2.1 Financial instruments2.2.1.1 A financial instrument is a contract that gives rise to a
financial asset of one Group and a financial liability or equity of another Group.
SIGNIFICANT ACCOUNTING POLICIES AND NOTES TO THE ACCOUNTS
All amount in Rs. Million, unless otherwise stated
COMPANY OVERVIEW FINANCIAL STATEMENTSGOVERNANCE REPORTS
157VI S A S T EEL LT D.
Financial asseti) Classification and measurement Classification The Group classifies its financial assets, other than
investments in subsidiaries and joint venture in the following measurement categories:
1) those to be measured subsequently at fair value (either through other comprehensive income, or through profit or loss), and
2) those measured at amortised cost. The classification depends on the Group’s business model
for managing the financial assets and the contractual terms of the cash flows.
For assets measured at fair value, gains and losses will either be recorded in profit or loss or other comprehensive income. For investments in debt instruments, this will depend on the business model in which the investment is held. For investments in equity instruments, this will depend on whether the Group has made an irrevocable election at the time of initial recognition to account for the equity investment at fair value through other comprehensive income.
The Group reclassifies debt investments when and only when its business model for managing those assets changes.
Measurement At initial recognition, all financial assets are measured
initially at fair value plus, in the case of financial assets not recorded at fair value through profit or loss, transaction costs that are attributable to the acquisition of the financial asset. Purchase or sales of financial assets that require delivery of assets within a time frame established by regulation or convention in the market place (regular way trade) are recognised on trade date.
Debt instruments Subsequent measurement of debt instruments depends
on the Group’s business model for managing the asset and the cash flow characteristics of the asset. There is only one measurement category into which the Group classifies its debt instruments as follows:
Amortised cost: Assets that are held for collection of contractual cash flows where those cash flows represent solely payments of principal and interest are measured at
amortised cost. A gain or loss on a debt investment that is subsequently measured at amortised cost and is not part of a hedging relationship is recognised in profit or loss when the asset is derecognised or impaired. Interest income from these financial assets is included in finance income using the effective interest rate method.
Trade receivables Trade receivables are recognised initially at fair value
and subsequently measured at amortised cost using the effective interest method, less provision for impairment.
Cash and Cash Equivalent For the purpose of presentation in the statement of cash
flows, cash and cash equivalents includes cash on hand, deposits held at call with financial institutions, other short-term, highly liquid investments with original maturities of three months or less that are readily convertible to known amounts of cash and which are subject to an insignificant risk of changes in value, and bank overdrafts. Bank overdrafts are shown within borrowings in current liabilities in the balance sheet.
ii) Impairment of financial assets The Group assesses on a forward looking basis the
expected credit losses associated with its assets carried at amortised cost. The impairment methodology applied depends on whether there has been a significant increase in credit risk. Note 50 details how the Group determines whether there has been a significant increase in credit risk.
For trade receivables only, the Group applies the simplified approach permitted by Ind AS 109 Financial Instruments, which requires expected lifetime losses to be recognised from initial recognition of the receivables.
iii) Derecognition of financial assets A financial asset (or, where applicable, a part of a financial
asset or part of a Group of similar financial assets) is primarily derecognised when:
The rights to receive cash flows from the financial asset have been transferred, or
The Group retains the contractual rights to receive the cash flows of the financial asset but assumes a contractual obligation to pay the cash flows to one or more recipients.
SIGNIFICANT ACCOUNTING POLICIES AND NOTES TO THE ACCOUNTS
All amount in Rs. Million, unless otherwise stated
CONSOLIDATED
158 A nnu a l Repor t 2016-17
When the Group has transferred an asset, it evaluates whether it has substantially transferred all risks and rewards of ownership of the financial asset. In such cases, the financial asset is derecognised. When the Group has not transferred substantially all the risks and rewards of ownership of a financial asset, the financial asset is not derecognised.
When the Group has neither transferred a financial asset nor retains substantially all risks and rewards of ownership of the financial asset, the financial asset is derecognised if the Group has not retained control of the financial asset. When the Group retains control of the financial asset, the asset is continued to be recognised to the extent of continuing involvement of the asset.
iv) Income recognition Interest income from debt instruments is recognised
using the effective interest rate method. The effective interest rate is the rate that exactly discounts estimated future cash receipts through the expected life of the financial asset to the gross carrying amount of a financial asset. When calculating the effective interest rate, the Group estimates the expected cash flows by considering all the contractual terms of the financial instrument (for example, prepayment, extension, call and similar options) but does not consider the expected credit losses.
Dividends are recognised in profit or loss only when the right to receive payment is established, it is probable that the economic benefits associated with the dividend will flow to the Group, and the amount of the dividend can be measured reliably.
2.2.1.2 Financial liabilitiesi) Initial recognition & measurement Financial liabilities are classified, at initial recognition, as
financial liabilities at fair value through profit or loss and amortised cost, as appropriate.
All financial liabilities are recognised initially at fair value and, in the case of loans and borrowings and payables, net of directly attributable transaction costs.
The Group’s financial liabilities includes trade and other payables and loans and borrowings including bank overdrafts.
ii) Subsequent measurement The measurement of financial liabilities depends on their
classification, as described below:
Financial liabilities at fair value through profit or loss include financial liabilities held for trading and financial liabilities designated upon initial recognition as at fair value through profit or loss. This category also includes derivative financial instruments entered into by the Group that are not designated as hedging instruments in hedge relationships as defined by Ind-AS 109.
Gains or losses on liabilities held for trading are recognised in the profit or loss.
Financial liabilities designated upon initial recognition at fair value through profit or loss are designated at the initial date of recognition, and only if the criteria in Ind-AS 109 are satisfied. For liabilities designated as Fair Value Through Profit or Loss, fair value gains/ losses attributable to changes in own credit risk are recognized in Other Comprehensive Income. These gains/loss are not subsequently transferred to statement of profit or loss. However, the Group may transfer the cumulative gain or loss within equity. All other changes in fair value of such liability are recognised in the statement of profit or loss.
Loans and Borrowings Borrowings are initially recognized at fair value, net of
transaction costs incurred. Borrowings are subsequently measured at amortised cost. Any difference between the proceeds (net of transaction costs) and the redemption amount is recognised in the statement of profit and loss over the period of the borrowings using the effective interest method. Fees paid on the establishment of loan facilities are recognised as transaction costs of the loan to the extent that it is probable that some or all of the facility will be drawn down. In this case, the fee is deferred until the draw down occurs. To the extent there is no evidence that it is probable that some or all of the facility will be drawn down, the fee is capitalized as a prepayment for liquidity services and amortised over the period of the facility to which it relates. Borrowings are removed from the balance sheet when the obligation specified in the contract is discharged, cancelled or expired.
SIGNIFICANT ACCOUNTING POLICIES AND NOTES TO THE ACCOUNTS
All amount in Rs. Million, unless otherwise stated
COMPANY OVERVIEW FINANCIAL STATEMENTSGOVERNANCE REPORTS
159VI S A S T EEL LT D.
Trade and other payables These amount represent liabilities for goods and services
provided to the Group prior to the end of the financial year which are unpaid. Trade and other paybles are classified as currrent liablities unless payment is not due for payment within 12 months after the reporting period. They are recognised initially at their fair value and subsequently measured at amortized cost model.
ii) Derecognition of financial liabilities A financial liability is derecognised when the obligation
under the liability is discharged or cancelled or expires. When an existing financial liability is replaced by another from the same lender on substantially different terms, or the terms of an existing liability are substantially modified, such an exchange or modification is treated as the derecognition of the original liability and the recognition of a new liability. The difference in the respective carrying amounts is recognised in the statement of profit or loss.
2.2.1.3 Derivatives Derivatives are initially recognised at fair value on the date
a derivative contract is entered into and are subsequently re-measured to their fair value at the end of each reporting period. The Group uses derivative financial instruments such as forward currency contracts to hedge its foreign currency risks. Such derivative financial instruments are recognised at fair value. Derivatives are carried as financial assets when the fair value is positive and as financial liabilities when the fair value is negative. Gains or losses arising from such fair valuation of derivatives is recognised as income or expense through profit or loss.
2.2.1.4 Offsetting of financial instrument Financial assets and financial liabilities are offset and the
net amount reported in the balance sheet if there is a enforceable legal right to offset the recognised amounts and there is an intention to settle on a net basis, to realise the assets and settle the liabilities simultaneously.The legally enforceable right must not be contingent on future events and must be enforceable in the normal course of business and in the event of default, insolvency or bankruptcy of the Group or the counterparty.
2.2.2 Property, plant and equipment Freehold land is carried at historical cost. All other items
of property, plant and equipment are carried at historical cost less accumulated depreciation and accumulated impairment loss, if any. Historical cost includes expenditure
that is directly attributable to the acquisition of the items.
Subsequent costs are included in the asset’s carrying amount or recognized as a separate asset, as appropriate, only when it is probable that future economic benefits associated with the item will flow to the Group and the cost of the item can be measured reliably. The carrying amount of any component accounted for as a separate asset is derecognised when replaced. All other repairs and maintenance are charged to profit or loss during the reporting period in which they are incurred. Gains and losses on disposals are determined by comparing proceeds with carrying amount. These are included in the statement of profit and loss within other income/expenses.
On transition to Ind AS, the Group has elected to continue with the carrying value of all of its property, plant and equipment recognised as at 1 April 2015 measured as per the previous GAAP and use that carrying value as the deemed cost of the property, plant and equipment.
Depreciation method, estimated useful lives and residual values Depreciation including amortization on tangible assets, where applicable is provided on pro-rata basis under Straight Line Method (SLM) over the estimated useful lives of the assets as specified in Schedule II to the Companies Act, 2013 (‘the Act’), other than the following:
(i) Assets of the Parent Company - Leasehold assets (Buildings and Plant and Machinery)
which are jointly held are amortized over the period of lease i.e, 6 to10 years, being lower than the useful lives specified in Schedule II to the Act for similar assets.
- Furnace refractories are depreciated over useful life of 5-6 years based on technical assessment done by the Group
- Leasehold land is amortized over the period of lease. No depreciation is provided for freehold land.
(ii) Assets of the Subsidiaries VISA Suncoke Limited(VSCL) has determined the useful
lives of its tangible assets on the basis of estimation performed by the management. The useful lives determined for the tangible assets are mentioned below:
SIGNIFICANT ACCOUNTING POLICIES AND NOTES TO THE ACCOUNTS
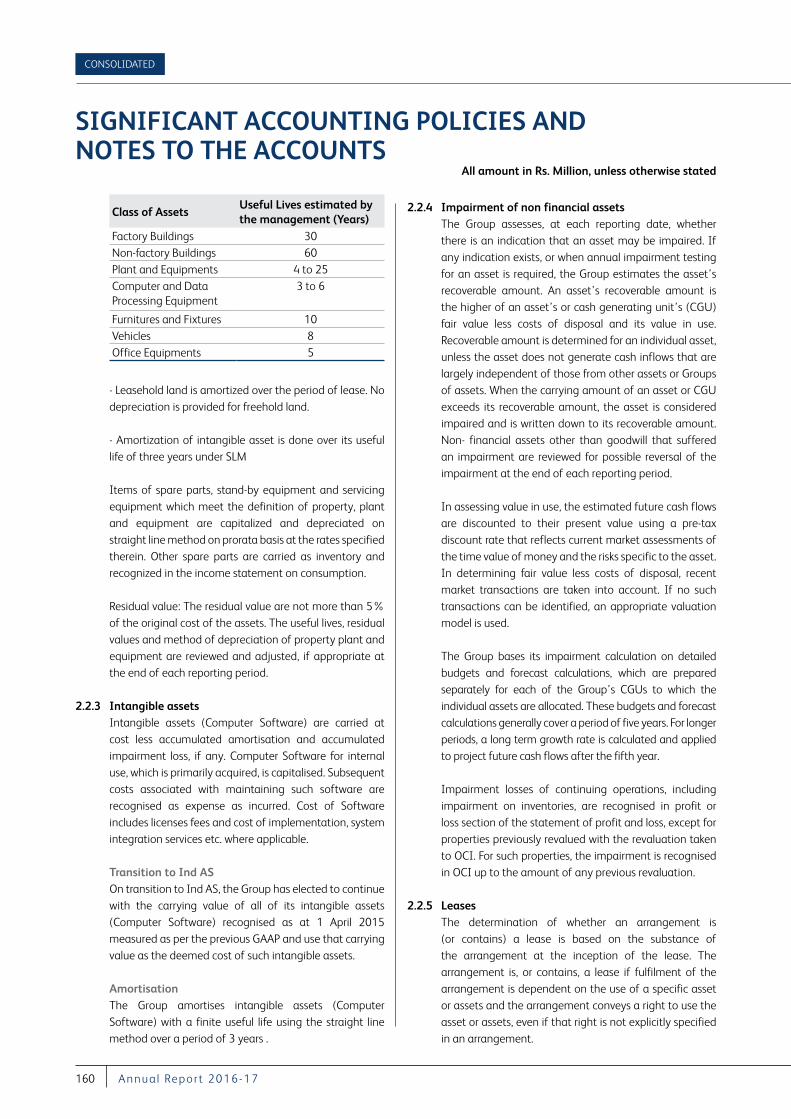
All amount in Rs. Million, unless otherwise stated
CONSOLIDATED
160 A nnu a l Repor t 2016-17
Class of Assets Useful Lives estimated by the management (Years)
Factory Buildings 30Non-factory Buildings 60Plant and Equipments 4 to 25Computer and Data Processing Equipment
3 to 6
Furnitures and Fixtures 10Vehicles 8Office Equipments 5
- Leasehold land is amortized over the period of lease. No depreciation is provided for freehold land.
- Amortization of intangible asset is done over its useful life of three years under SLM
Items of spare parts, stand-by equipment and servicing equipment which meet the definition of property, plant and equipment are capitalized and depreciated on straight line method on prorata basis at the rates specified therein. Other spare parts are carried as inventory and recognized in the income statement on consumption.
Residual value: The residual value are not more than 5% of the original cost of the assets. The useful lives, residual values and method of depreciation of property plant and equipment are reviewed and adjusted, if appropriate at the end of each reporting period.
2.2.3 Intangible assets Intangible assets (Computer Software) are carried at
cost less accumulated amortisation and accumulated impairment loss, if any. Computer Software for internal use, which is primarily acquired, is capitalised. Subsequent costs associated with maintaining such software are recognised as expense as incurred. Cost of Software includes licenses fees and cost of implementation, system integration services etc. where applicable.
Transition to Ind AS On transition to Ind AS, the Group has elected to continue
with the carrying value of all of its intangible assets (Computer Software) recognised as at 1 April 2015 measured as per the previous GAAP and use that carrying value as the deemed cost of such intangible assets.
Amortisation The Group amortises intangible assets (Computer
Software) with a finite useful life using the straight line method over a period of 3 years .
2.2.4 Impairment of non financial assets The Group assesses, at each reporting date, whether
there is an indication that an asset may be impaired. If any indication exists, or when annual impairment testing for an asset is required, the Group estimates the asset’s recoverable amount. An asset’s recoverable amount is the higher of an asset’s or cash generating unit’s (CGU) fair value less costs of disposal and its value in use. Recoverable amount is determined for an individual asset, unless the asset does not generate cash inflows that are largely independent of those from other assets or Groups of assets. When the carrying amount of an asset or CGU exceeds its recoverable amount, the asset is considered impaired and is written down to its recoverable amount.Non- financial assets other than goodwill that suffered an impairment are reviewed for possible reversal of the impairment at the end of each reporting period.
In assessing value in use, the estimated future cash flows are discounted to their present value using a pre-tax discount rate that reflects current market assessments of the time value of money and the risks specific to the asset. In determining fair value less costs of disposal, recent market transactions are taken into account. If no such transactions can be identified, an appropriate valuation model is used.
The Group bases its impairment calculation on detailed budgets and forecast calculations, which are prepared separately for each of the Group’s CGUs to which the individual assets are allocated. These budgets and forecast calculations generally cover a period of five years. For longer periods, a long term growth rate is calculated and applied to project future cash flows after the fifth year.
Impairment losses of continuing operations, including impairment on inventories, are recognised in profit or loss section of the statement of profit and loss, except for properties previously revalued with the revaluation taken to OCI. For such properties, the impairment is recognised in OCI up to the amount of any previous revaluation.
2.2.5 Leases The determination of whether an arrangement is
(or contains) a lease is based on the substance of the arrangement at the inception of the lease. The arrangement is, or contains, a lease if fulfilment of the arrangement is dependent on the use of a specific asset or assets and the arrangement conveys a right to use the asset or assets, even if that right is not explicitly specified in an arrangement.
SIGNIFICANT ACCOUNTING POLICIES AND NOTES TO THE ACCOUNTS
All amount in Rs. Million, unless otherwise stated
COMPANY OVERVIEW FINANCIAL STATEMENTSGOVERNANCE REPORTS
161VI S A S T EEL LT D.
For arrangements entered into prior to 1 April 2015, the date of inception is deemed to be 1 April 2015 in accordance with Ind-AS 101, First-time Adoption of Indian Accounting Standard.
As a lessee A lease is classified at the inception date as a finance lease
or an operating lease. A lease that transfers substantially all the risks and rewards incidental to ownership to the Group is classified as a finance lease. Leases in which a significant portion of the risks and rewards of ownership are retained by the lessor are classified as operating leases. Payments made under operating leases are charged to the Statement of Profit and Loss on a straight-line basis over the period of the lease.
Finance leases are capitalised at the inception date at fair value of the leased property or, if lower, at the present value of the minimum lease payments. The corresponding rental obligations, net of finance charges, are included in the borrowings or other financial liabilities as appropriate Lease payments are apportioned between finance charges and reduction of the lease liability so as to achieve a constant rate of interest on the remaining balance of the liability. Finance charges are recognised in finance costs in the statement of profit and loss. Contingent rents are charged as expenses in the period in which they are incurred.
A leased asset is depreciated over the useful life of the asset. However, if there is no reasonable certainty that the Group will obtain ownership by the end of the lease term, the asset is depreciated over the shorter of the estimated useful life of the asset and the lease term.
Operating lease payments are recognised as an expense in the statement of profit and loss on a straight-line basis over the lease term unless the payments are structured to increase in line with expected general inflation to compensate for the lessor’s expected inflationary cost increases.
As a lessor Leases in which the Group does not transfer substantially
all the risks and rewards of ownership of an asset are classified as operating leases. Lease income from operating leases is recognised as income on a straight-line basis over the lease term unless the receipts are structured
to increase in line with expected general inflation to compensate for the expected inflationary cost increases. Initial direct costs incurred in negotiating and arranging an operating lease are added to the carrying amount of the leased asset and recognised over the lease term on the same basis as rental income. Contingent rents are recognised as income in the period in which they are earned.
Leases are classified as finance leases when substantially all of the risks and rewards incidental to legal ownership transfer from the Group to the lessee. Amounts due from lessees under finance leases are recorded as receivables at the inception of the lease as the Group’s net investment in the lease. Lease payment receivable is treated by the lessor as repayment of principal and finance income to reimburse and reward the lessor for its investment and services. Initial direct costs incurred in negotiating and arranging a lease are included in the initial measurement of the finance lease receivable and reduce the amount of income recognised over the lease term. Finance lease income is allocated to accounting periods so as to reflect a constant periodic rate of return on the net investment outstanding in respect of the lease.
2.2.6 Inventories Raw materials and stores, work in progress, traded and
finished goods are stated at the lower of cost and net realisable value. Cost of raw materials and traded goods comprises cost of purchases. Cost of work-in progress and finished goods comprises direct materials, direct labour and an appropriate proportion of variable and fixed overhead expenditure, the latter being allocated on the basis of normal operating capacity. Cost of inventories also include all other costs incurred in bringing the inventories to their present location and condition. Costs are assigned to individual items of inventory on the basis of weighted average basis. Costs of purchased inventory are determined after deducting rebates, CENVAT credits and discounts. Net realisable value is the estimated selling price in the ordinary course of business less the estimated costs of completion and the estimated costs necessary to make the sale.
2.2.7 Capital work-in-progress The items of property, plant and equipment which are not
yet ready for use are disclosed as Capital work-in-progress and are carried at historical cost.
SIGNIFICANT ACCOUNTING POLICIES AND NOTES TO THE ACCOUNTS
All amount in Rs. Million, unless otherwise stated
CONSOLIDATED
162 A nnu a l Repor t 2016-17
Transition to Ind AS On transition to Ind AS, the Company has elected to
continue with the carrying value of all items of capital work-in-progress recognised as at 1st April, 2015 measured as per the previous GAAP and use that carrying value as the deemed cost of such items of capital work-in-progress.
2.2.8 Provisions and Contingent Liabilities Provisions are recognised when the Group has a present
legal or constructive obligation as a result of past events, it is probable that an outflow of resources will be required to settle the obligation and the amount can be reliably estimated. Provisions are not recognised for future operating losses.
Provisions are measured at the present value of management’s best estimate of the expenditure required to settle the present obligation at the end of the reporting period. The discount rate used to determine the present value is a pre-tax rate that reflects current market assessments of the time value of money and the risks specific to the liability. The increase in the provision due to the passage of time is recognised as interest expense. However contigent liablities are not considered. Contingent liabilities are disclosed when there is a possible obligation arising from past events, the existence of which will be confirmed only by the occurrence or non occurrence of one or more uncertain future events not wholly within the control of the Group or a present obligation that arises from past events where it is either not probable that an outflow of resources will be required to settle or a reliable estimate of the amount cannot be made.
2.2.9 Revenue recognition Revenue is measured at the fair value of the consideration
received or receivable. Amounts disclosed as revenue are inclusive of excise duty and net of returns, trade discounts, rebates, Value Added Tax and amounts collected on behalf of third parties.
The Group recognises revenue when the amount of revenue can be reliably measured, it is probable that future economic benefits will flow to the Group and specific criteria have been met for each of the Group’s activities as described below. The Group bases its estimates on historical results, taking into consideration the type of customer, the type of transaction and the specifics of each arrangement.
Sale of Goods: Revenue from the sale of goods is recognised when the goods are delivered and titles have passed, at which time all the following conditions are satisfied:
the Group has transferred to the buyer the significant risks and rewards of ownership of the goods;
the Group retains neither continuing managerial involvement to the degree usually associated with ownership nor effective control over the goods sold;
the amount of revenue can be measured reliably;
it is probable that the economic benefits associated with the transaction will flow to the Group; and
the costs incurred or to be incurred in respect of the transaction can be measured reliably.
Sale of Services : Sales are recognised upon the rendering of services and are recognised net of service tax.
All other items are recognised on accrual basis.
2.2.10 Income Tax The income tax expense or credit for the period is the tax
payable on the current period’s taxable income based on the applicable income tax rate for each jurisdiction adjusted by changes in deferred tax assets and liabilities attributable to temporary differences and to unused tax losses.
The current income tax charge is calculated on the basis of the tax laws enacted or substantively enacted at the end of the reporting period. Management periodically evaluates positions taken in tax returns with respect to situations in which applicable tax regulation is subject to interpretation. It establishes provisions where appropriate on the basis of amounts expected to be paid to the tax authorities.
Deferred income tax is provided in full, using the liability method, on temporary differences arising between the tax bases of assets and liabilities and their carrying amounts in the seperate financial statements. However, deferred tax liabilities are not recognised if they arise from the initial recognition of goodwill. Deferred income tax is also not accounted for if it arises from initial recognition of
SIGNIFICANT ACCOUNTING POLICIES AND NOTES TO THE ACCOUNTS
All amount in Rs. Million, unless otherwise stated
COMPANY OVERVIEW FINANCIAL STATEMENTSGOVERNANCE REPORTS
163VI S A S T EEL LT D.
an asset or liability in a transaction other than a business combination that at the time of the transaction affects neither accounting profit nor taxable profit (tax loss). Deferred income tax is determined using tax rates (and laws) that have been enacted or substantially enacted by the end of the reporting period and are expected to apply when the related deferred income tax asset is realised or the deferred income tax liability is settled.
Deferred tax assets are recognised for all deductible temporary differences and unused tax losses only if it is probable that future taxable amounts will be available to utilise those temporary differences and losses.
Deferred tax liabilities are not recognised for temporary differences between the carrying amount and tax bases of investments in subsidiaries and interest in joint arrangements where the Group is able to control the timing of the reversal of the temporary differences and it is probable that the differences will not reverse in the foreseeable future.
Deferred tax assets and liabilities are offset when there is a legally enforceable right to offset current tax assets and liabilities and when the deferred tax balances relate to the same taxation authority. Current tax assets and tax liabilities are offset where the Company has a legally enforceable right to offset and intends either to settle on a net basis, or to realise the asset and settle the liability simultaneously.
Current and deferred tax is recognised in profit or loss, except to the extent that it relates to items recognised in other comprehensive income or directly in equity. In this case, the tax is also recognised in other comprehensive income or directly in equity, respectively.
2.2.11 Employee benefits Short-term obligations Liabilities for wages and salaries, including non-monetary
benefits that are expected to be settled wholly within 12 months after the end of the period in which the employees render the related service are recognized in respect of employees services up to the end of the reporting period and are measured at the amounts expected to be paid when the liabilities are settled. The liabilities are presented as current employee benefit obligations in the balance sheet
Other long-term employee benefit obligations The liabilities for earned leave and sick leave are not
expected to be settled wholly within 12 months after the end of the period in which the employees render the related service. They are therefore measured as the present value of expected future payments to be made in respect of services provided by employees up to the end of the reporting period using the projected unit credit method. The benefits are discounted using the market yields at the end of the reporting period that have terms approximating to the terms of the related obligation. Remeasurements as a result of experience adjustments and changes in actuarial assumptions are recognised in profit or loss.
The obligations are presented as current liabilities in the balance sheet if the Group does not have an unconditional right to defer settlement for at least twelve months after the reporting period, regardless of when the actual settlement is expected to occur.
Post-employment obligations The Group operates the following post-employment
schemes
(a) defined benefit plans such as gratuity and
(b) defined contribution plans such as provident fund.
Defined benefit plan The liability or asset recognised in the balance sheet in
respect of defined benefit gratuity plans is the present value of the defined benefit obligation at the end of the reporting period less the fair value of plan assets. The defined benefit obligation is calculated annually by actuaries using the projected unit credit method.
The present value of the defined benefit obligation is determined by discounting the estimated future cash outflows by reference to market yields at the end of the reporting period on government bonds that have terms approximating to the terms of the related obligation.
The net interest cost is calculated by applying the discount rate to the net balance of the defined benefit obligation and the fair value of plan assets. This cost is included in employee benefit expense in the statement of profit and loss.
SIGNIFICANT ACCOUNTING POLICIES AND NOTES TO THE ACCOUNTS
All amount in Rs. Million, unless otherwise stated
CONSOLIDATED
164 A nnu a l Repor t 2016-17
Remeasurement gains and losses arising from experience adjustments and changes in actuarial assumptions are recognised in the period in which they occur, directly in other comprehensive income. They are included in retained earnings in the statement of changes in equity and in the balance sheet.
Changes in the present value of the defined benefit obligation resulting from plan amendments or curtailments are recognised immediately in profit or loss as past service cost.
Defined contribution plans The Group pays provident fund contributions to publicly
administered provident funds as per local regulations. The Group has no further payment obligations once the contributions have been paid. The contributions are accounted for as defined contribution plans and the contributions are recognised as employee benefit expense when they are due. Prepaid contributions are recognised as an asset to the extent that a cash refund or a reduction in the future payments is available.
Share-based payments Share-based compensation benefits are provided to
employees via the Employee Stock Option Scheme 2010.
The fair value of options granted under the Employee Stock Option Scheme 2010 is recognised as an employee benefits expense with a corresponding increase in equity. The total amount to be expensed is determined by reference to the fair value of the options granted:
- including any market performance conditions (e.g., the Parent Company’s share price)
- excluding the impact of any service and non-market performance vesting conditions (e.g. profitability, sales growth targets and remaining an employee of the Parent Company over a specified time period), and
- including the impact of any non-vesting conditions (e.g. the requirement for employees to save or holdings shares for a specific period of time).
The total expense is recognised over the vesting period, which is the period over which all of the specified vesting conditions are to be satisfied. At the end of each period, the Parent Company revises its estimates of the number of options that are expected to vest based on the non-
market vesting and service conditions. It recognises the impact of the revision to original estimates, if any, in profit or loss, with a corresponding adjustment to equity.
2.2.12 Foreign currency transactions The Group’s financial statements are presented in Indian
Rupee which is also the functional currency.
Foreign currency transactions are translated into the functional currency using the exchange rates at the dates of the transactions. Foreign exchange gains and losses resulting from the settlement of such transactions and from the translation of monetary assets and liabilities denominated in foreign currencies at year end exchange rates are generally recognised in profit or loss.
Foreign exchange differences regarded as an adjustment to borrowing costs are presented in the statement of profit and loss, within finance costs. All other foreign exchange gains and losses are presented in the statement of profit and loss on a net basis within other income/expenses.
Non-monetary items that are measured at fair value in a foreign currency are translated using the exchange rates at the date when the fair value was determined. Translation differences on assets and liabilities carried at fair value are reported as part of the fair value gain or loss.
2.2.13 Borrowing cost General and specific borrowing costs that are directly
attributable to the acquisition, construction or production of a qualifying asset are capitalised during the period of time that is required to complete and prepare the asset for its intended use or sale. Qualifying assets are assets that necessarily take a substantial period of time to get ready for their intended use or sale.
Other borrowing costs are expensed in the period in which they are incurred.
2.2.14 Earnings per share Basic Earning per Share is calculated by dividing the profit
for the year attributable to equity holders or owners of the Parent Company by the weighted average number of equity shares outstanding during the year.
Diluted Earning per Share is calculated by dividing the profit attributable to equity holders or owners of the Parent Company by the weighted average number of equity shares outstanding during the year plus the
SIGNIFICANT ACCOUNTING POLICIES AND NOTES TO THE ACCOUNTS
All amount in Rs. Million, unless otherwise stated
COMPANY OVERVIEW FINANCIAL STATEMENTSGOVERNANCE REPORTS
165VI S A S T EEL LT D.
weighted average number of equity shares that would be issued on conversion of all the dilutive potential equity shares into equity shares.
2.2.15 Segment Reporting Operating segments are reported in a manner consistent
with the internal reporting provided to the chief operating decision maker. Refer note 43 for details on segment information presented. Chief Operating Decision Making Group consists of the Executive Chairman, Vice Chairman & Managing Director, the CFO and the Director (Kalinganagar).
2.3 Critical estimates & judgements The preparation of financial statements requires the
use of accounting estimates which, by definition, will seldom equal the actual results. Management also needs to excercise judgement in applying the Group’s accounting policies.
This note provides an overview of the areas that involved a higher degree of judgement or complexity, and of items which are more likely to be materially adjusted due to estimates and assumptions turning out to be different than those originally assessed. Detailed information about each of these estimates and judgements is included in relevant notes together with information about the basis of calculation for each affected line item in the financial statements.
The areas involving critical estimates or judgements are: Estimated useful lives of property, plant and equipment and intangible assets - Note 2.2.2 & 2.2.3
Estimation of defined benefit obligation Note 32 Estimation of fair values of contingent liabilities Note 38 Impairment of trade receivables Note 10 Estimation of Finance cost Note 18 D Estimation of provision for unsalable/obsolete inventories - Note 9
Recognition of deferred tax assets for carried forward losses and current tax assets - Note 7 and 15
Estimates and judgements are continually evaluated. They are based on historical experience and other factors, including expectations of future events that may have a financial impact on the Group and that are believed to be reasonable under the circumstances.
Standards issued but not yet effectiveIn March 2017, the Ministry of Corporate Affairs issued the Companies (Indian Accounting Standards) (Amendments) Rules, 2017, notifying amendments to the following Indian Accounting Standards which will be applicable to the Company with effect from 1 April 2017
(a) Ind AS 7, ‘Statement of Cash Flows’(b) Ind AS 102, ‘Share based Payments’
Amendments to Ind AS 7 The amendments to Ind AS 7 requires the entities to provide disclosures that enable users of financial statements to evaluate changes in liabilities arising from financing activities, including both changes arising from cash flows and non-cash changes, suggesting inclusion of a reconciliation between the opening and closing balances in the balance sheet for liabilities arising from financing activities, to meet the disclosure requirement.
Amendments to Ind AS 102The amendments to Ind AS 102 addresses three classification and measurement issues. These relate to measurement of cash-settled awards, modification of cash-settled awards and equity-settled awards that include a ‘net settlement’ feature in respect of withholding taxes.
The Group intends to adopt these amendments when it becomes effective. Further, the Group is in the process of assessing the possible impact of aforesaid amendments in its financial statements.
SIGNIFICANT ACCOUNTING POLICIES AND NOTES TO THE ACCOUNTS
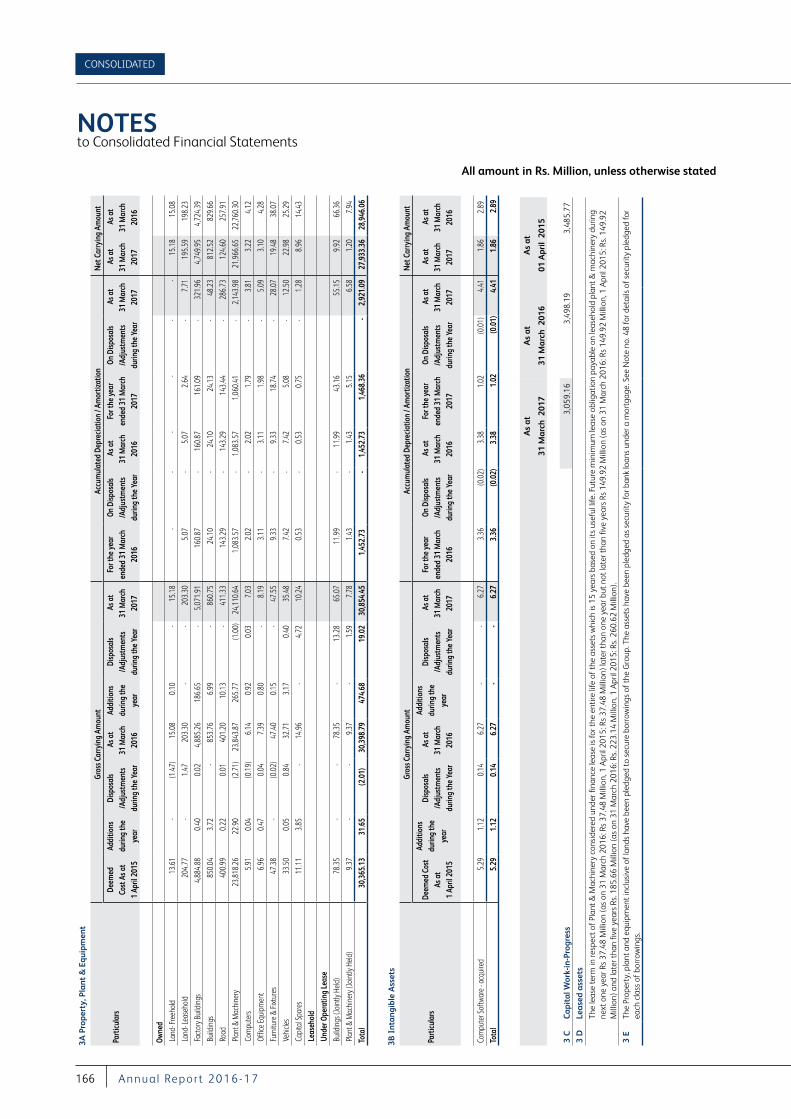
All amount in Rs. Million, unless otherwise stated
NOTES to Consolidated Financial Statements
CONSOLIDATED
166 A nnu a l Repor t 2016-17
3A P
rope
rty,
Pla
nt &
Equ
ipm
ent
Part
icula
rs
Gros
s Car
ryin
g Am
ount
Accu
mul
ated
Dep
recia
tion
/ Am
ortiz
atio
nN
et C
arry
ing
Amou
nt
Deem
ed
Cost
As a
t 1
April
201
5
Addi
tions
du
ring
the
year
Disp
osal
s /A
djus
tmen
ts
durin
g th
e Ye
ar
As a
t
31
Mar
ch
2016
Addi
tions
du
ring
the
year
Disp
osal
s /A
djus
tmen
ts
durin
g th
e Ye
ar
As a
t
31
Mar
ch
2017
For t
he y
ear
ende
d 31
Mar
ch
2016
On D
ispos
als
/Adj
ustm
ents
du
ring
the
Year
As a
t
31
Mar
ch
2016
For t
he y
ear
ende
d 31
Mar
ch
2017
On D
ispos
als
/Adj
ustm
ents
du
ring
the
Year
As a
t
31
Mar
ch
2017
As a
t
31
Mar
ch
2017
As a
t
31
Mar
ch
2016
Owne
d
Land
- Fre
ehol
d 1
3.61
-
(1.4
7) 1
5.08
0
.10
-
15.
18
-
-
-
-
-
-
15.
18
15.
08
Land
- Lea
seho
ld
204
.77
- 1
.47
203
.30
-
-
203
.30
5.0
7 -
5
.07
2.6
4 -
7
.71
195
.59
198
.23
Fact
ory B
uild
ings
4
,884
.88
0.4
0 0
.02
4,8
85.2
6 1
86.6
5 -
5
,071
.91
160
.87
- 1
60.8
7 1
61.0
9 -
3
21.9
6 4
,749
.95
4,7
24.3
9
Bui
ldin
gs
850
.04
3.7
2 -
8
53.7
6 6
.99
-
860
.75
24.
10
-
24.
10
24.
13
-
48.
23
812
.52
829
.66
Roa
d 4
00.9
9 0
.22
0.0
1 4
01.2
0 1
0.13
-
4
11.3
3 1
43.2
9 -
143
.29
143
.44
-
286
.73
124
.60
257
.91
Pla
nt &
Mac
hine
ry
23,
818.
26
22.
90
(2.7
1) 2
3,84
3.87
2
65.7
7 (1
.00)
24,
110.
64
1,0
83.5
7 -
1
,083
.57
1,0
60.4
1 -
2
,143
.98
21,
966.
65
22,
760.
30
Com
pute
rs 5
.91
0.0
4 (0
.19)
6.1
4 0
.92
0.0
3 7
.03
2.0
2 -
2
.02
1.7
9 -
3
.81
3.2
2 4
.12
Offi
ce Eq
uipm
ent
6.9
6 0
.47
0.0
4 7
.39
0.8
0 -
8
.19
3.1
1 -
3
.11
1.9
8 -
5
.09
3.1
0 4
.28
Furn
iture
& Fi
xtur
es
47.
38
-
(0.0
2) 4
7.40
0
.15
-
47.
55
9.3
3 -
9
.33
18.
74
-
28.
07
19.
48
38.
07
Veh
icles
3
3.50
0
.05
0.8
4 3
2.71
3
.17
0.4
0 3
5.48
7
.42
-
7.4
2 5
.08
-
12.
50
22.
98
25.
29
Cap
ital S
pare
s 1
1.11
3
.85
- 1
4.96
-
4.7
2 1
0.24
0
.53
- 0
.53
0.7
5 -
1.2
8 8
.96
14.
43
Lea
seho
ld
Und
er O
pera
ting
Leas
e
Bui
ldin
gs (J
oint
ly He
ld)
78.
35
-
-
78.
35
-
13.
28
65.
07
11.
99
-
11.
99
43.
16
55.
15
9.9
2 6
6.36
Pla
nt &
Mac
hine
ry (J
oint
ly He
ld)
9.3
7 -
-
9
.37
-
1.5
9 7
.78
1.4
3 -
1
.43
5.1
5 6
.58
1.2
0 7
.94
Tota
l 3
0,36
5.13
3
1.65
(2
.01)
30,
398.
79
474
.68
19.
02
30,
854.
45
1,4
52.7
3 -
1
,452
.73
1,4
68.3
6 -
2
,921
.09
27,
933.
36
28,
946.
06
3B I
ntan
gibl
e A
sset
s
Part
icula
rs
Gros
s Car
ryin
g Am
ount
Accu
mul
ated
Dep
recia
tion
/ Am
ortiz
atio
nN
et C
arry
ing
Amou
nt
Deem
ed C
ost
As a
t 1
April
201
5
Addi
tions
du
ring
the
year
Disp
osal
s /A
djus
tmen
ts
durin
g th
e Ye
ar
As a
t
31
Mar
ch
2016
Addi
tions
du
ring
the
year
Disp
osal
s /A
djus
tmen
ts
durin
g th
e Ye
ar
As a
t
31
Mar
ch
2017
For t
he y
ear
ende
d 31
Mar
ch
2016
On D
ispos
als
/Adj
ustm
ents
du
ring
the
Year
As a
t
31
Mar
ch
2016
For t
he y
ear
ende
d 31
Mar
ch
2017
On D
ispos
als
/Adj
ustm
ents
du
ring
the
Year
As a
t
31
Mar
ch
2017
As a
t
31
Mar
ch
2017
As a
t
31
Mar
ch
2016
Com
pute
r Sof
twar
e - a
cqui
red
5.2
9 1
.12
0.1
4 6
.27
-
-
6.2
7 3
.36
(0.0
2) 3
.38
1.0
2 (0
.01)
4.4
1 1
.86
2.8
9
Tota
l 5
.29
1.1
2 0
.14
6.2
7 -
-
6
.27
3.3
6 (0
.02)
3.3
8 1
.02
(0.0
1) 4
.41
1.8
6 2
.89
As
at
31 M
arch
201
7
As
at
31 M
arch
201
6
As
at
01 A
pril
201
5
3 C
Cap
ital
Wor
k-in
-Pro
gres
s 3
,059
.16
3,4
98.1
9 3
,485
.77
3 D
Leas
ed a
sset
s
The
leas
e te
rm in
resp
ect o
f Pla
nt &
Mac
hine
ry c
onsi
dere
d un
der f
inan
ce le
ase
is fo
r the
ent
ire li
fe o
f the
ass
ets
whi
ch is
15
year
s ba
sed
on it
s us
eful
life
. Fut
ure
min
imum
leas
e ob
ligat
ion
paya
ble
on le
aseh
old
plan
t & m
achi
nery
dur
ing
next
one
yea
r Rs
37.4
8 M
illio
n (a
s on
31
Mar
ch 2
016:
Rs
37.4
8 M
illio
n, 1
Apr
il 20
15: R
s 37
.48
Mill
ion)
late
r tha
n on
e ye
ar b
ut n
ot la
ter t
han
five
year
s Rs
149
.92
Mill
ion
(as
on 3
1 M
arch
201
6: R
s 14
9.92
Mill
ion,
1 A
pril
2015
: Rs.
149
.92
Mill
ion)
and
late
r tha
n fiv
e ye
ars
Rs. 1
85.6
6 M
illio
n (a
s on
31
Mar
ch 2
016:
Rs.
223
.14
Mill
ion,
1 A
pril
2015
: Rs.
260
.62
Mill
ion)
.
3 E
The
Prop
erty
, pla
nt a
nd e
quip
men
t inc
lusi
ve o
f lan
ds h
ave
been
ple
dged
to s
ecur
e bo
rrow
ings
of t
he G
roup
. The
ass
ets
have
bee
n pl
edge
d as
sec
urity
for b
ank
loan
s un
der a
mor
tgag
e. S
ee N
ote
no. 4
8 fo
r det
ails
of s
ecur
ity p
ledg
ed fo
r ea
ch c
lass
of b
orro
win
gs.
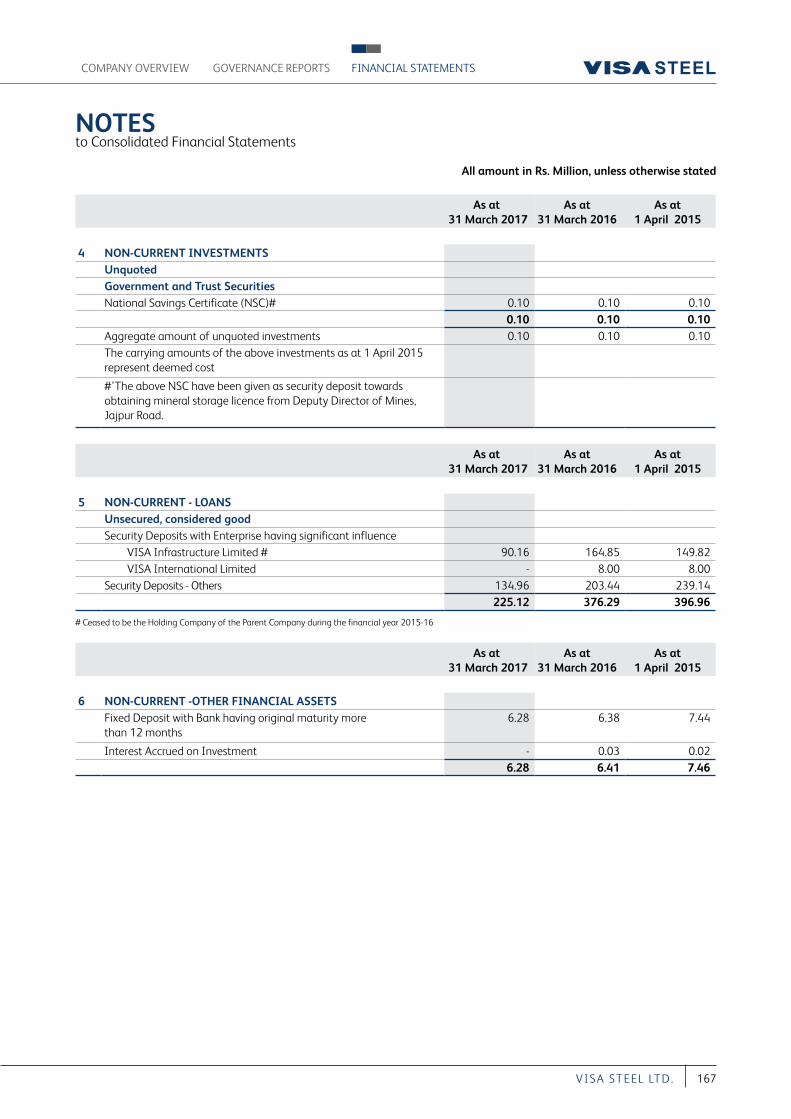
All amount in Rs. Million, unless otherwise stated
NOTES to Consolidated Financial Statements
COMPANY OVERVIEW FINANCIAL STATEMENTSGOVERNANCE REPORTS
167VI S A S T EEL LT D.
As at 31 March 2017
As at 31 March 2016
As at 1 April 2015
4 NON-CURRENT INVESTMENTSUnquotedGovernment and Trust SecuritiesNational Savings Certificate (NSC)# 0.10 0.10 0.10
0.10 0.10 0.10 Aggregate amount of unquoted investments 0.10 0.10 0.10 The carrying amounts of the above investments as at 1 April 2015 represent deemed cost
#’The above NSC have been given as security deposit towards obtaining mineral storage licence from Deputy Director of Mines, Jajpur Road.
As at 31 March 2017
As at 31 March 2016
As at 1 April 2015
5 NON-CURRENT - LOANS Unsecured, considered goodSecurity Deposits with Enterprise having significant influence VISA Infrastructure Limited # 90.16 164.85 149.82 VISA International Limited - 8.00 8.00 Security Deposits - Others 134.96 203.44 239.14
225.12 376.29 396.96
# Ceased to be the Holding Company of the Parent Company during the financial year 2015-16
As at 31 March 2017
As at 31 March 2016
As at 1 April 2015
6 NON-CURRENT -OTHER FINANCIAL ASSETSFixed Deposit with Bank having original maturity more than 12 months
6.28 6.38 7.44
Interest Accrued on Investment - 0.03 0.02 6.28 6.41 7.46
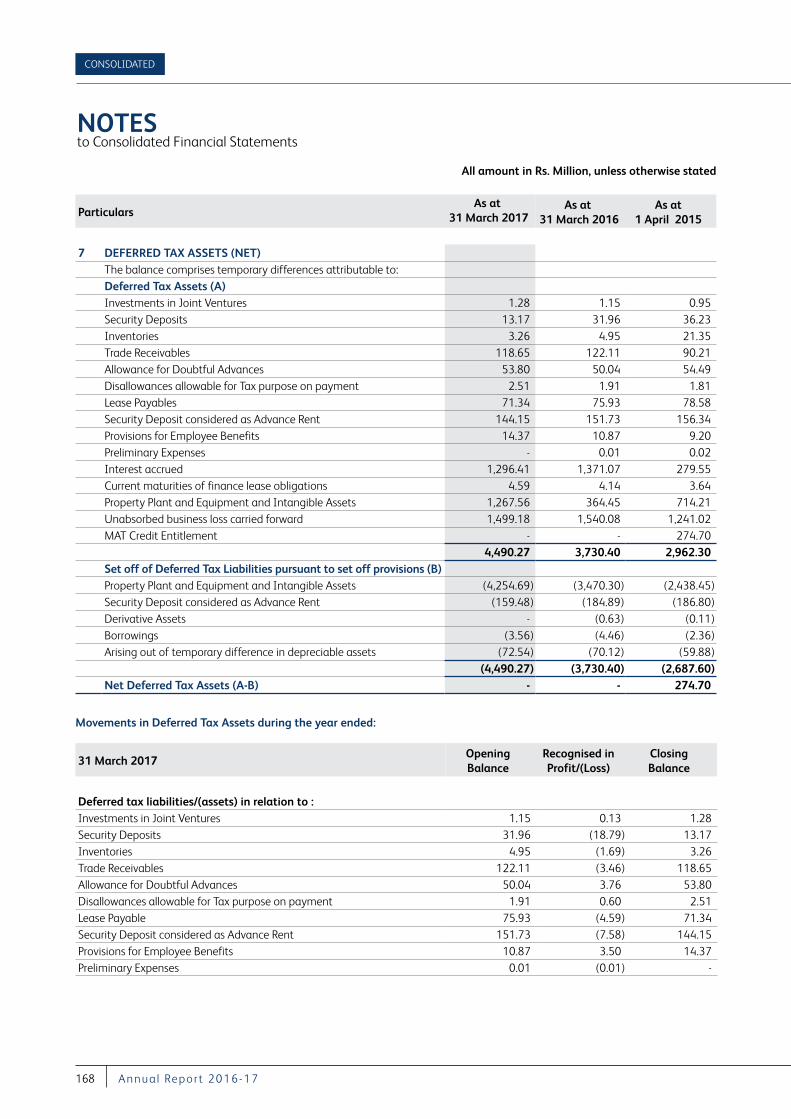
All amount in Rs. Million, unless otherwise stated
NOTES to Consolidated Financial Statements
CONSOLIDATED
168 A nnu a l Repor t 2016-17
ParticularsAs at
31 March 2017As at
31 March 2016As at
1 April 2015
7 DEFERRED TAX ASSETS (NET)The balance comprises temporary differences attributable to: Deferred Tax Assets (A)Investments in Joint Ventures 1.28 1.15 0.95 Security Deposits 13.17 31.96 36.23 Inventories 3.26 4.95 21.35 Trade Receivables 118.65 122.11 90.21 Allowance for Doubtful Advances 53.80 50.04 54.49 Disallowances allowable for Tax purpose on payment 2.51 1.91 1.81 Lease Payables 71.34 75.93 78.58 Security Deposit considered as Advance Rent 144.15 151.73 156.34 Provisions for Employee Benefits 14.37 10.87 9.20 Preliminary Expenses - 0.01 0.02 Interest accrued 1,296.41 1,371.07 279.55 Current maturities of finance lease obligations 4.59 4.14 3.64 Property Plant and Equipment and Intangible Assets 1,267.56 364.45 714.21 Unabsorbed business loss carried forward 1,499.18 1,540.08 1,241.02 MAT Credit Entitlement - - 274.70
4,490.27 3,730.40 2,962.30 Set off of Deferred Tax Liabilities pursuant to set off provisions (B) Property Plant and Equipment and Intangible Assets (4,254.69) (3,470.30) (2,438.45)Security Deposit considered as Advance Rent (159.48) (184.89) (186.80)Derivative Assets - (0.63) (0.11)Borrowings (3.56) (4.46) (2.36)Arising out of temporary difference in depreciable assets (72.54) (70.12) (59.88)
(4,490.27) (3,730.40) (2,687.60)Net Deferred Tax Assets (A-B) - - 274.70
Movements in Deferred Tax Assets during the year ended:
31 March 2017Opening Balance
Recognised in Profit/(Loss)
Closing Balance
Deferred tax liabilities/(assets) in relation to :Investments in Joint Ventures 1.15 0.13 1.28 Security Deposits 31.96 (18.79) 13.17 Inventories 4.95 (1.69) 3.26 Trade Receivables 122.11 (3.46) 118.65 Allowance for Doubtful Advances 50.04 3.76 53.80 Disallowances allowable for Tax purpose on payment 1.91 0.60 2.51 Lease Payable 75.93 (4.59) 71.34 Security Deposit considered as Advance Rent 151.73 (7.58) 144.15 Provisions for Employee Benefits 10.87 3.50 14.37 Preliminary Expenses 0.01 (0.01) -
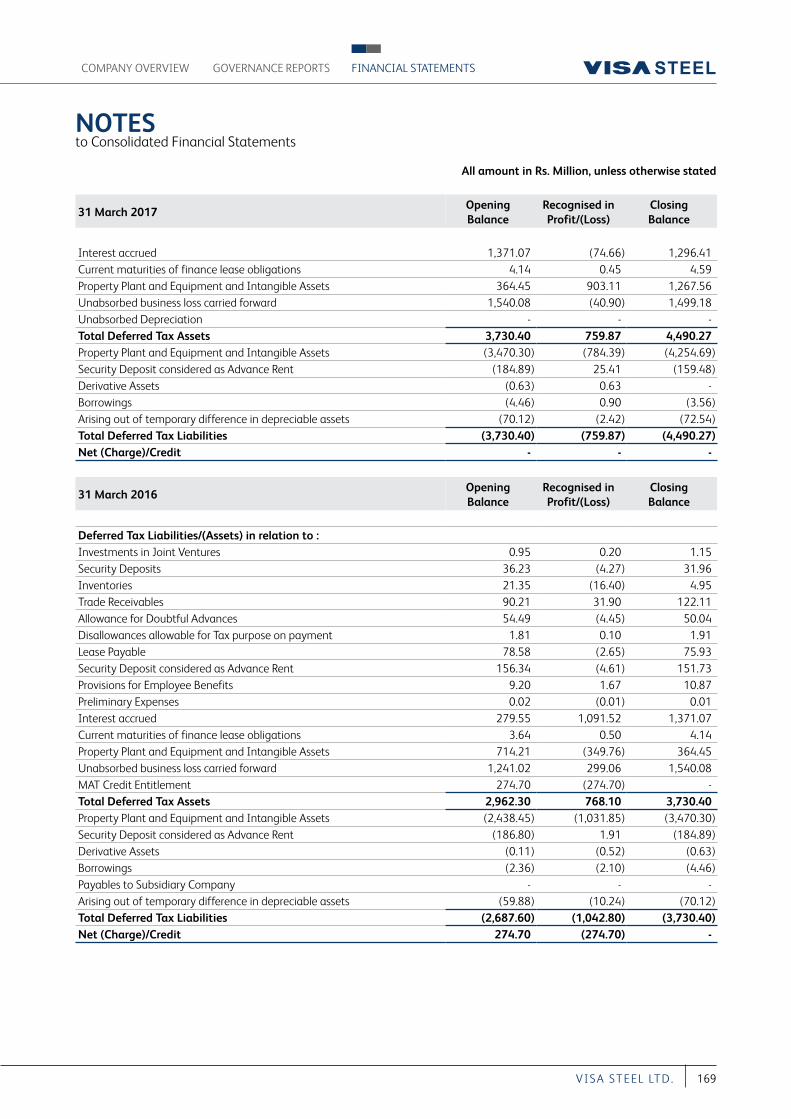
All amount in Rs. Million, unless otherwise stated
NOTES to Consolidated Financial Statements
COMPANY OVERVIEW FINANCIAL STATEMENTSGOVERNANCE REPORTS
169VI S A S T EEL LT D.
31 March 2017Opening Balance
Recognised in Profit/(Loss)
Closing Balance
Interest accrued 1,371.07 (74.66) 1,296.41 Current maturities of finance lease obligations 4.14 0.45 4.59 Property Plant and Equipment and Intangible Assets 364.45 903.11 1,267.56 Unabsorbed business loss carried forward 1,540.08 (40.90) 1,499.18 Unabsorbed Depreciation - - - Total Deferred Tax Assets 3,730.40 759.87 4,490.27 Property Plant and Equipment and Intangible Assets (3,470.30) (784.39) (4,254.69)Security Deposit considered as Advance Rent (184.89) 25.41 (159.48)Derivative Assets (0.63) 0.63 - Borrowings (4.46) 0.90 (3.56)Arising out of temporary difference in depreciable assets (70.12) (2.42) (72.54)Total Deferred Tax Liabilities (3,730.40) (759.87) (4,490.27)Net (Charge)/Credit - - -
31 March 2016Opening Balance
Recognised in Profit/(Loss)
Closing Balance
Deferred Tax Liabilities/(Assets) in relation to :Investments in Joint Ventures 0.95 0.20 1.15 Security Deposits 36.23 (4.27) 31.96 Inventories 21.35 (16.40) 4.95 Trade Receivables 90.21 31.90 122.11 Allowance for Doubtful Advances 54.49 (4.45) 50.04 Disallowances allowable for Tax purpose on payment 1.81 0.10 1.91 Lease Payable 78.58 (2.65) 75.93 Security Deposit considered as Advance Rent 156.34 (4.61) 151.73 Provisions for Employee Benefits 9.20 1.67 10.87 Preliminary Expenses 0.02 (0.01) 0.01 Interest accrued 279.55 1,091.52 1,371.07 Current maturities of finance lease obligations 3.64 0.50 4.14 Property Plant and Equipment and Intangible Assets 714.21 (349.76) 364.45 Unabsorbed business loss carried forward 1,241.02 299.06 1,540.08 MAT Credit Entitlement 274.70 (274.70) - Total Deferred Tax Assets 2,962.30 768.10 3,730.40 Property Plant and Equipment and Intangible Assets (2,438.45) (1,031.85) (3,470.30)Security Deposit considered as Advance Rent (186.80) 1.91 (184.89)Derivative Assets (0.11) (0.52) (0.63)Borrowings (2.36) (2.10) (4.46)Payables to Subsidiary Company - - - Arising out of temporary difference in depreciable assets (59.88) (10.24) (70.12)Total Deferred Tax Liabilities (2,687.60) (1,042.80) (3,730.40)Net (Charge)/Credit 274.70 (274.70) -
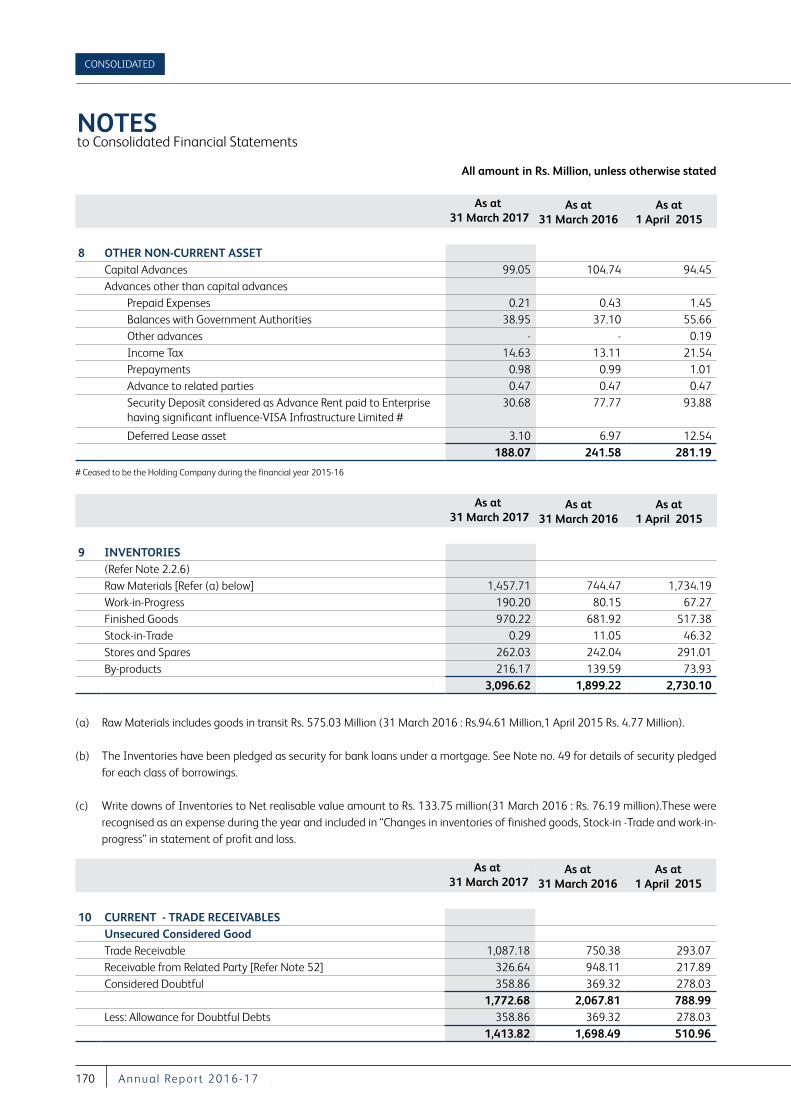
All amount in Rs. Million, unless otherwise stated
NOTES to Consolidated Financial Statements
CONSOLIDATED
170 A nnu a l Repor t 2016-17
As at 31 March 2017
As at 31 March 2016
As at 1 April 2015
8 OTHER NON-CURRENT ASSETCapital Advances 99.05 104.74 94.45 Advances other than capital advances Prepaid Expenses 0.21 0.43 1.45 Balances with Government Authorities 38.95 37.10 55.66 Other advances - - 0.19 Income Tax 14.63 13.11 21.54 Prepayments 0.98 0.99 1.01 Advance to related parties 0.47 0.47 0.47 Security Deposit considered as Advance Rent paid to Enterprise
having significant influence-VISA Infrastructure Limited # 30.68 77.77 93.88
Deferred Lease asset 3.10 6.97 12.54 188.07 241.58 281.19
# Ceased to be the Holding Company during the financial year 2015-16
As at 31 March 2017
As at 31 March 2016
As at 1 April 2015
9 INVENTORIES(Refer Note 2.2.6)Raw Materials [Refer (a) below] 1,457.71 744.47 1,734.19 Work-in-Progress 190.20 80.15 67.27 Finished Goods 970.22 681.92 517.38 Stock-in-Trade 0.29 11.05 46.32 Stores and Spares 262.03 242.04 291.01 By-products 216.17 139.59 73.93
3,096.62 1,899.22 2,730.10
(a) Raw Materials includes goods in transit Rs. 575.03 Million (31 March 2016 : Rs.94.61 Million,1 April 2015 Rs. 4.77 Million).
(b) The Inventories have been pledged as security for bank loans under a mortgage. See Note no. 49 for details of security pledged for each class of borrowings.
(c) Write downs of Inventories to Net realisable value amount to Rs. 133.75 million(31 March 2016 : Rs. 76.19 million).These were recognised as an expense during the year and included in “Changes in inventories of finished goods, Stock-in -Trade and work-in-progress” in statement of profit and loss.
As at 31 March 2017
As at 31 March 2016
As at 1 April 2015
10 CURRENT - TRADE RECEIVABLESUnsecured Considered GoodTrade Receivable 1,087.18 750.38 293.07 Receivable from Related Party [Refer Note 52] 326.64 948.11 217.89 Considered Doubtful 358.86 369.32 278.03
1,772.68 2,067.81 788.99 Less: Allowance for Doubtful Debts 358.86 369.32 278.03
1,413.82 1,698.49 510.96
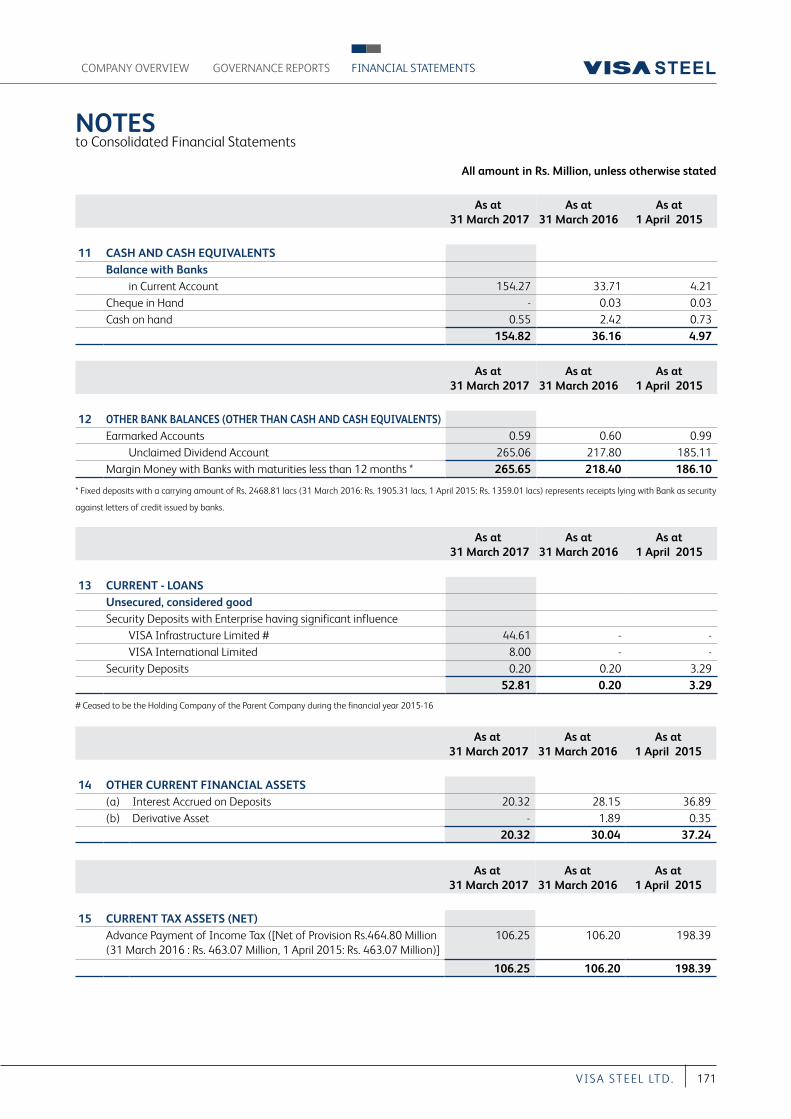
All amount in Rs. Million, unless otherwise stated
NOTES to Consolidated Financial Statements
COMPANY OVERVIEW FINANCIAL STATEMENTSGOVERNANCE REPORTS
171VI S A S T EEL LT D.
As at 31 March 2017
As at 31 March 2016
As at 1 April 2015
11 CASH AND CASH EQUIVALENTSBalance with Banks in Current Account 154.27 33.71 4.21 Cheque in Hand - 0.03 0.03 Cash on hand 0.55 2.42 0.73
154.82 36.16 4.97
As at 31 March 2017
As at 31 March 2016
As at 1 April 2015
12 OTHER BANK BALANCES (OTHER THAN CASH AND CASH EQUIVALENTS)Earmarked Accounts 0.59 0.60 0.99 Unclaimed Dividend Account 265.06 217.80 185.11 Margin Money with Banks with maturities less than 12 months * 265.65 218.40 186.10
* Fixed deposits with a carrying amount of Rs. 2468.81 lacs (31 March 2016: Rs. 1905.31 lacs, 1 April 2015: Rs. 1359.01 lacs) represents receipts lying with Bank as security
against letters of credit issued by banks.
As at 31 March 2017
As at 31 March 2016
As at 1 April 2015
13 CURRENT - LOANSUnsecured, considered goodSecurity Deposits with Enterprise having significant influence VISA Infrastructure Limited # 44.61 - - VISA International Limited 8.00 - - Security Deposits 0.20 0.20 3.29
52.81 0.20 3.29
# Ceased to be the Holding Company of the Parent Company during the financial year 2015-16
As at 31 March 2017
As at 31 March 2016
As at 1 April 2015
14 OTHER CURRENT FINANCIAL ASSETS(a) Interest Accrued on Deposits 20.32 28.15 36.89 (b) Derivative Asset - 1.89 0.35
20.32 30.04 37.24
As at 31 March 2017
As at 31 March 2016
As at 1 April 2015
15 CURRENT TAX ASSETS (NET)Advance Payment of Income Tax ([Net of Provision Rs.464.80 Million (31 March 2016 : Rs. 463.07 Million, 1 April 2015: Rs. 463.07 Million)]
106.25 106.20 198.39
106.25 106.20 198.39
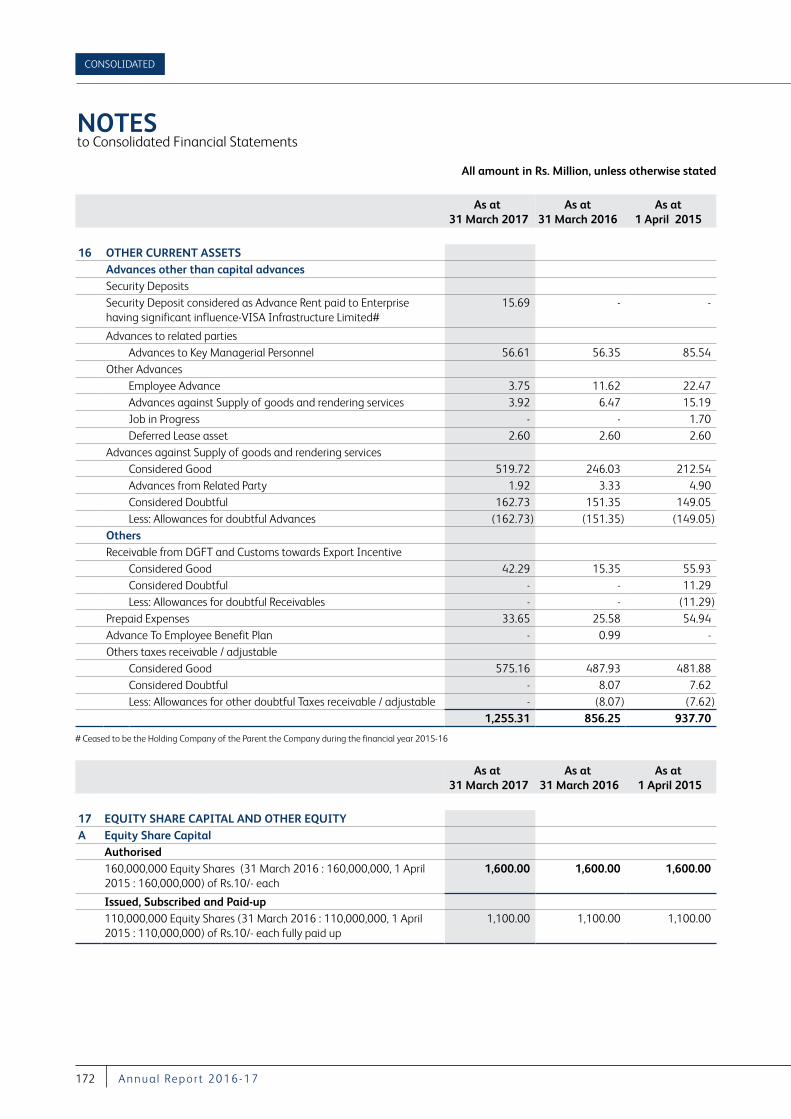
All amount in Rs. Million, unless otherwise stated
NOTES to Consolidated Financial Statements
CONSOLIDATED
172 A nnu a l Repor t 2016-17
As at 31 March 2017
As at 31 March 2016
As at 1 April 2015
16 OTHER CURRENT ASSETS Advances other than capital advancesSecurity Deposits Security Deposit considered as Advance Rent paid to Enterprise having significant influence-VISA Infrastructure Limited#
15.69 - -
Advances to related parties Advances to Key Managerial Personnel 56.61 56.35 85.54 Other Advances Employee Advance 3.75 11.62 22.47 Advances against Supply of goods and rendering services 3.92 6.47 15.19 Job in Progress - - 1.70 Deferred Lease asset 2.60 2.60 2.60 Advances against Supply of goods and rendering services Considered Good 519.72 246.03 212.54 Advances from Related Party 1.92 3.33 4.90 Considered Doubtful 162.73 151.35 149.05 Less: Allowances for doubtful Advances (162.73) (151.35) (149.05)Others Receivable from DGFT and Customs towards Export Incentive Considered Good 42.29 15.35 55.93 Considered Doubtful - - 11.29 Less: Allowances for doubtful Receivables - - (11.29)Prepaid Expenses 33.65 25.58 54.94 Advance To Employee Benefit Plan - 0.99 - Others taxes receivable / adjustable Considered Good 575.16 487.93 481.88 Considered Doubtful - 8.07 7.62 Less: Allowances for other doubtful Taxes receivable / adjustable - (8.07) (7.62)
1,255.31 856.25 937.70
# Ceased to be the Holding Company of the Parent the Company during the financial year 2015-16
As at 31 March 2017
As at 31 March 2016
As at 1 April 2015
17 EQUITY SHARE CAPITAL AND OTHER EQUITYA Equity Share Capital
Authorised 160,000,000 Equity Shares (31 March 2016 : 160,000,000, 1 April 2015 : 160,000,000) of Rs.10/- each
1,600.00 1,600.00 1,600.00
Issued, Subscribed and Paid-up110,000,000 Equity Shares (31 March 2016 : 110,000,000, 1 April 2015 : 110,000,000) of Rs.10/- each fully paid up
1,100.00 1,100.00 1,100.00
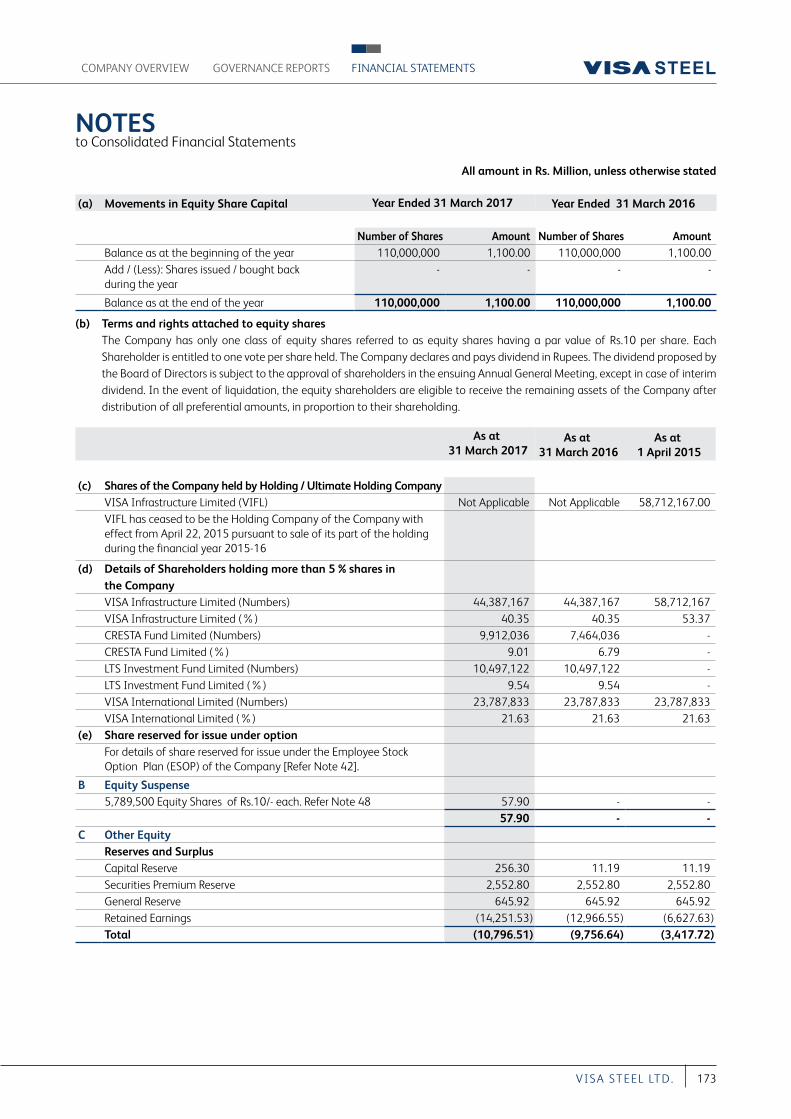
All amount in Rs. Million, unless otherwise stated
NOTES to Consolidated Financial Statements
COMPANY OVERVIEW FINANCIAL STATEMENTSGOVERNANCE REPORTS
173VI S A S T EEL LT D.
(a) Movements in Equity Share Capital Year Ended 31 March 2017 Year Ended 31 March 2016
Number of Shares Amount Number of Shares Amount Balance as at the beginning of the year 110,000,000 1,100.00 110,000,000 1,100.00Add / (Less): Shares issued / bought back during the year
- - - -
Balance as at the end of the year 110,000,000 1,100.00 110,000,000 1,100.00
(b) Terms and rights attached to equity shares The Company has only one class of equity shares referred to as equity shares having a par value of Rs.10 per share. Each
Shareholder is entitled to one vote per share held. The Company declares and pays dividend in Rupees. The dividend proposed by the Board of Directors is subject to the approval of shareholders in the ensuing Annual General Meeting, except in case of interim dividend. In the event of liquidation, the equity shareholders are eligible to receive the remaining assets of the Company after distribution of all preferential amounts, in proportion to their shareholding.
As at 31 March 2017
As at 31 March 2016
As at 1 April 2015
(c) Shares of the Company held by Holding / Ultimate Holding Company VISA Infrastructure Limited (VIFL) Not Applicable Not Applicable 58,712,167.00 VIFL has ceased to be the Holding Company of the Company with effect from April 22, 2015 pursuant to sale of its part of the holding during the financial year 2015-16
(d) Details of Shareholders holding more than 5 % shares in the CompanyVISA Infrastructure Limited (Numbers) 44,387,167 44,387,167 58,712,167 VISA Infrastructure Limited (%) 40.35 40.35 53.37 CRESTA Fund Limited (Numbers) 9,912,036 7,464,036 - CRESTA Fund Limited (%) 9.01 6.79 - LTS Investment Fund Limited (Numbers) 10,497,122 10,497,122 - LTS Investment Fund Limited (%) 9.54 9.54 - VISA International Limited (Numbers) 23,787,833 23,787,833 23,787,833 VISA International Limited (%) 21.63 21.63 21.63
(e) Share reserved for issue under optionFor details of share reserved for issue under the Employee Stock Option Plan (ESOP) of the Company [Refer Note 42].
B Equity Suspense5,789,500 Equity Shares of Rs.10/- each. Refer Note 48 57.90 - -
57.90 - - C Other Equity
Reserves and SurplusCapital Reserve 256.30 11.19 11.19 Securities Premium Reserve 2,552.80 2,552.80 2,552.80 General Reserve 645.92 645.92 645.92 Retained Earnings (14,251.53) (12,966.55) (6,627.63)Total (10,796.51) (9,756.64) (3,417.72)
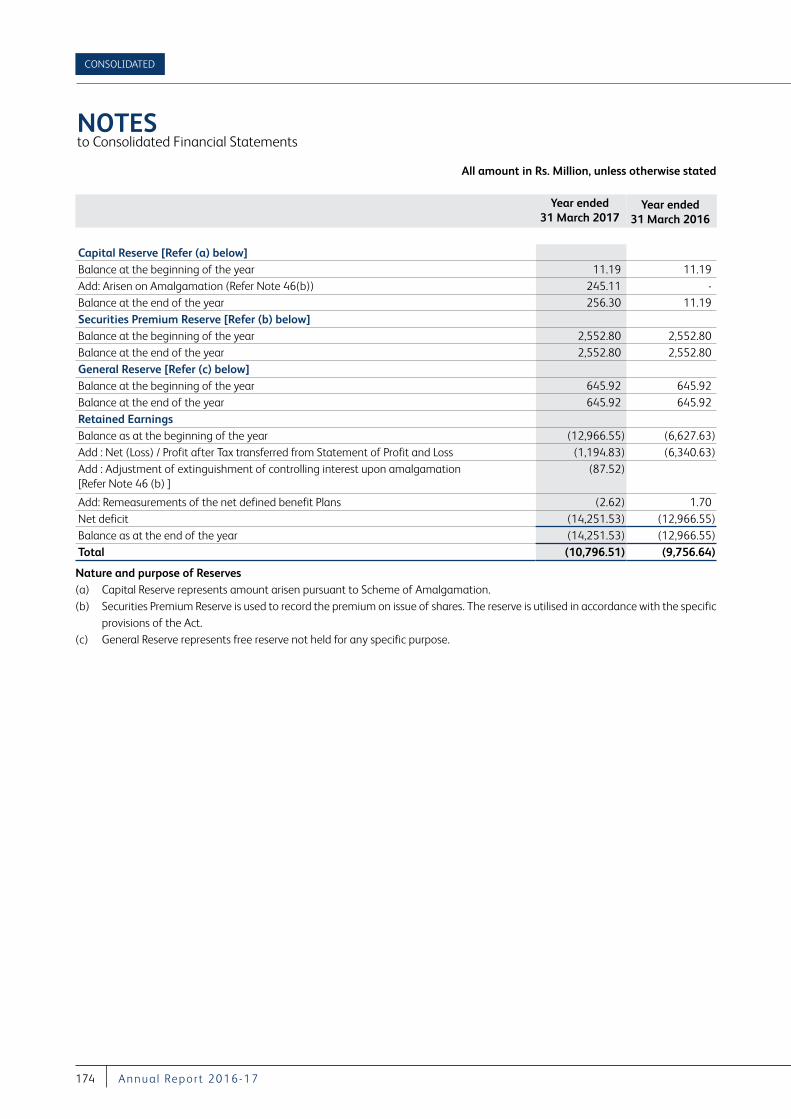
All amount in Rs. Million, unless otherwise stated
NOTES to Consolidated Financial Statements
CONSOLIDATED
174 A nnu a l Repor t 2016-17
Year ended 31 March 2017
Year ended 31 March 2016
Capital Reserve [Refer (a) below]Balance at the beginning of the year 11.19 11.19 Add: Arisen on Amalgamation (Refer Note 46(b)) 245.11 -Balance at the end of the year 256.30 11.19 Securities Premium Reserve [Refer (b) below]Balance at the beginning of the year 2,552.80 2,552.80 Balance at the end of the year 2,552.80 2,552.80 General Reserve [Refer (c) below]Balance at the beginning of the year 645.92 645.92 Balance at the end of the year 645.92 645.92 Retained EarningsBalance as at the beginning of the year (12,966.55) (6,627.63)Add : Net (Loss) / Profit after Tax transferred from Statement of Profit and Loss (1,194.83) (6,340.63)Add : Adjustment of extinguishment of controlling interest upon amalgamation [Refer Note 46 (b) ]
(87.52)
Add: Remeasurements of the net defined benefit Plans (2.62) 1.70 Net deficit (14,251.53) (12,966.55)Balance as at the end of the year (14,251.53) (12,966.55)Total (10,796.51) (9,756.64)
Nature and purpose of Reserves (a) Capital Reserve represents amount arisen pursuant to Scheme of Amalgamation. (b) Securities Premium Reserve is used to record the premium on issue of shares. The reserve is utilised in accordance with the specific
provisions of the Act. (c) General Reserve represents free reserve not held for any specific purpose.
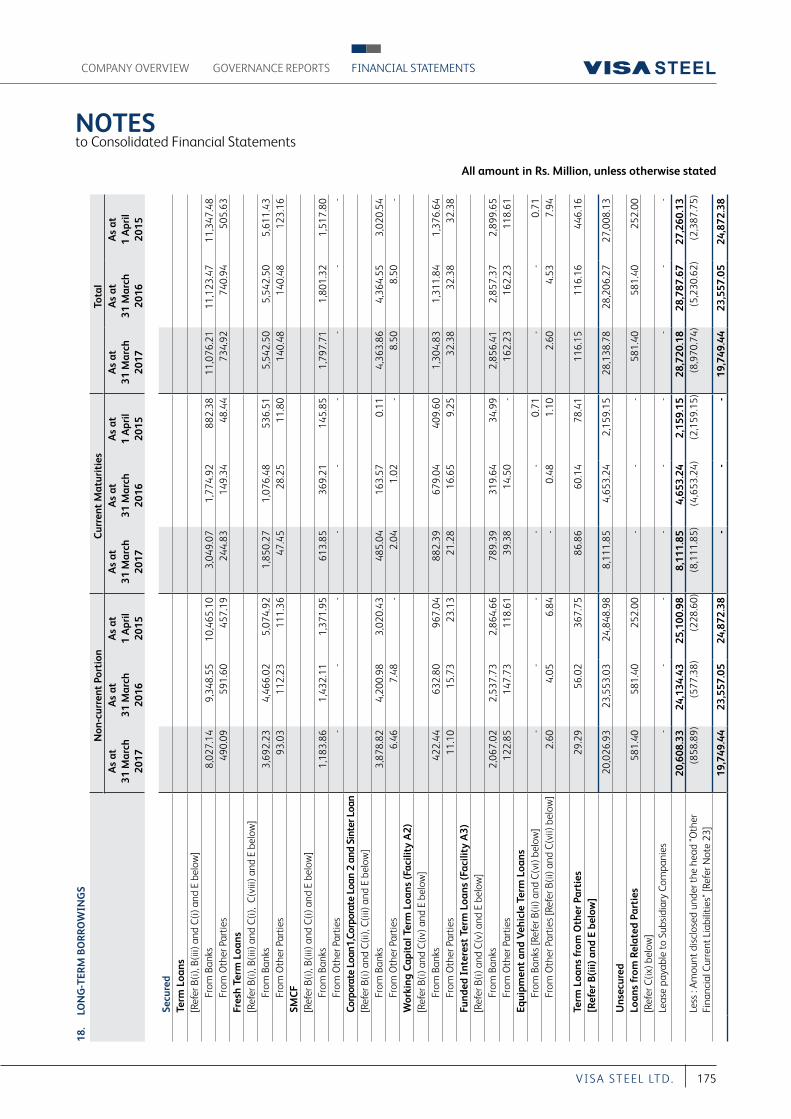
All amount in Rs. Million, unless otherwise stated
NOTES to Consolidated Financial Statements
COMPANY OVERVIEW FINANCIAL STATEMENTSGOVERNANCE REPORTS
175VI S A S T EEL LT D.
18.
LON
G-T
ERM
BO
RR
OW
ING
S
Non
-cur
rent
Por
tion
Cur
rent
Mat
urit
ies
Tota
lA
s at
31
Mar
ch
2017
As
at
31 M
arch
20
16
As
at
1 A
pril
20
15
As
at
31 M
arch
20
17
As
at
31 M
arch
20
16
As
at
1 A
pril
20
15
As
at
31 M
arch
20
17
As
at
31 M
arch
20
16
As
at
1 A
pril
20
15
Secu
red
Term
Loa
ns
[Ref
er B
(i), B
(iii)
and
C(i)
and
E b
elow
]Fr
om B
anks
8
,027
.14
9,3
48.5
5 1
0,46
5.10
3
,049
.07
1,7
74.9
2 8
82.3
8 1
1,07
6.21
1
1,12
3.47
1
1,34
7.48
Fr
om O
ther
Par
ties
490
.09
591
.60
457
.19
244
.83
149
.34
48.
44
734
.92
740
.94
505
.63
Fres
h Te
rm L
oans
[R
efer
B(i)
, B(ii
i) an
d C
(i),
C(v
iii) a
nd E
bel
ow]
From
Ban
ks
3,6
92.2
3 4
,466
.02
5,0
74.9
2 1
,850
.27
1,0
76.4
8 5
36.5
1 5
,542
.50
5,5
42.5
0 5
,611
.43
From
Oth
er P
artie
s 9
3.03
1
12.2
3 1
11.3
6 4
7.45
2
8.25
1
1.80
1
40.4
8 1
40.4
8 1
23.1
6 SM
CF
[Ref
er B
(i), B
(iii)
and
C(i)
and
E b
elow
]Fr
om B
anks
1
,183
.86
1,4
32.1
1 1
,371
.95
613
.85
369
.21
145
.85
1,7
97.7
1 1
,801
.32
1,5
17.8
0 Fr
om O
ther
Par
ties
-
-
-
-
-
-
-
-
-
Corp
orat
e Lo
an1,
Corp
orat
e Lo
an 2
and
Sin
ter L
oan
[Ref
er B
(i) a
nd C
(ii),
C(ii
i) an
d E
belo
w]
From
Ban
ks
3,8
78.8
2 4
,200
.98
3,0
20.4
3 4
85.0
4 1
63.5
7 0
.11
4,3
63.8
6 4
,364
.55
3,0
20.5
4 Fr
om O
ther
Par
ties
6.4
6 7
.48
-
2.0
4 1
.02
-
8.5
0 8
.50
-
Wor
king
Cap
ital
Ter
m L
oans
(Fac
ility
A2)
[Ref
er B
(i) a
nd C
(iv) a
nd E
bel
ow]
From
Ban
ks
422
.44
632
.80
967
.04
882
.39
679
.04
409
.60
1,3
04.8
3 1
,311
.84
1,3
76.6
4 Fr
om O
ther
Par
ties
11.
10
15.
73
23.
13
21.
28
16.
65
9.2
5 3
2.38
3
2.38
3
2.38
Fu
nded
Int
eres
t Te
rm L
oans
(Fac
ility
A3)
[Ref
er B
(i) a
nd C
(v) a
nd E
bel
ow]
From
Ban
ks
2,0
67.0
2 2
,537
.73
2,8
64.6
6 7
89.3
9 3
19.6
4 3
4.99
2
,856
.41
2,8
57.3
7 2
,899
.65
From
Oth
er P
artie
s 1
22.8
5 1
47.7
3 1
18.6
1 3
9.38
1
4.50
-
1
62.2
3 1
62.2
3 1
18.6
1 Eq
uipm
ent
and
Veh
icle
Ter
m L
oans
Fr
om B
anks
[Ref
er B
(ii) a
nd C
(vi)
belo
w]
-
-
-
-
-
0.7
1 -
-
0
.71
From
Oth
er P
artie
s [R
efer
B(ii
) and
C(v
ii) b
elow
] 2
.60
4.0
5 6
.84
-
0.4
8 1
.10
2.6
0 4
.53
7.9
4
Term
Loa
ns f
rom
Oth
er P
arti
es 2
9.29
5
6.02
3
67.7
5 8
6.86
6
0.14
7
8.41
1
16.1
5 1
16.1
6 4
46.1
6 [R
efer
B(i
ii) a
nd E
bel
ow]
20,
026.
93
23,
553.
03
24,
848.
98
8,1
11.8
5 4
,653
.24
2,1
59.1
5 2
8,13
8.78
2
8,20
6.27
2
7,00
8.13
U
nsec
ured
Loan
s fr
om R
elat
ed P
arti
es
581
.40
581
.40
252
.00
-
-
-
581
.40
581
.40
252
.00
[Ref
er C
(ix) b
elow
]Le
ase
paya
ble
to S
ubsi
diar
y Co
mpa
nies
-
--
-
-
-
-
--
20,
608.
33
24,
134.
43
25,
100.
98
8,1
11.8
5 4
,653
.24
2,1
59.1
5 2
8,72
0.18
2
8,78
7.67
2
7,26
0.13
Le
ss :
Am
ount
dis
clos
ed u
nder
the
head
"Oth
er
Fina
ncia
l Cur
rent
Lia
bilit
ies"
[Ref
er N
ote
23]
(858
.89)
(577
.38)
(228
.60)
(8,1
11.8
5) (4
,653
.24)
(2,1
59.1
5) (8
,970
.74)
(5,2
30.6
2) (2
,387
.75)
19,
749.
44 2
3,55
7.05
2
4,87
2.38
-
-
-
1
9,74
9.44
2
3,55
7.05
2
4,87
2.38
All amount in Rs. Million, unless otherwise stated
NOTES to Consolidated Financial Statements
CONSOLIDATED
176 A nnu a l Repor t 2016-17
A. Debt Restructuring In respect of Parent Company (the Company) Pursuant to restructuring of the Company’s debts, a Master
Restructuring Agreement dated 19 December 2012 (MRA) had been executed to give effect to the CDR package approved by the Corporate Debt Restructuring (CDR) cell with effect from 1 March 2012. Further, pursuant to the approval of the Company’s Business Re-organisation Plan by the CDR cell, a Common Loan Agreement (CLA) had also been executed on 28 March 2015 among the Company, its Subsidiary company, VISA Special Steel Limited, and lenders.In terms of MRA & CLA the Company’s existing Debt portfolio has been reorganised/reallocated and secured as under:
i) Principal Term Loans ii) Fresh Term Loan (Loan taken pursuant to CDR
package) iii) Working Capital Term Loans (WCTL) (Loan taken
pursuant to CDR package) iv) Funded Interest Term Loans (FITL) (Loan pursuant to
CDR package) v) Corporate Loan 1 & 2 and Sinter Loan (Loan pursuant
to Debt Restructuring under CLA) vi) Working Capital Loans [Indicated in Note 21] vii) Structured Mezzanine Credit Facility [SMCF(Sub debt)]
The Company is under discussion with the JLF for restructuring of debt to a sustainable level based on hardcost of the project and considering principal term loan for setting up the plant Pending outcome of such discussion, the JLF have allowed for the time being “Holding-On operation” status to the Company and for the purpose of these financial statements, the Company has followed reorganization/reallocation and other terms and conditions of MRA/CLA as set out above. The Company stands exited from the CDR mechanism on account of failure of CDR package implemented with a cut off date of 1 March 2012.
Pursuant to the amalgamation of the VBL with VSL, the rupees term loan of VBL amounting to Rs 1926.90 million financed by the lenders for setting up a ferro chrome plant have been merged with the Term Loan above.
B . Details of Securities i. Term Loans (I & II), SMCF (Sub debts), Working
Capital Term Loans(WCTL), Funded Interest Term Loans (FITL), Corporate Term Loans (I & II) , Fresh Term Loan (For Sinter Plant) and Working Capital facilities:
(a) First pari-passu charge by way of hypothecation of all the Company’s current assets and fixed assets
(excluding land) including movable and immovable plant and machinery, machinery spares, tools and accessories, vehicles and other moveable assets both present and future (“Hypothecated Assets”) of the Company, save and except specific assets charged to Banks, Financial Institutions and Non Banking Financial Companies (NBFC).
(b) First pari-passu mortgage and charge on the immovable properties of the Company situated at Kalinganagar Industrial Complex, Jajpur, Odisha, Golagaon, Jajpur, Odisha, Raigarh, Chhattisgarh and office premises of the Company at Bhubaneshwar, Odisha.
(c) Pursuant to CDR, pledge of equity shares of the Company with the CDR Lenders.
(d) Pledge of Equity Shares equivalent to 51% of the present shareholding in Ghotaringa Minerals Limited held by the Company and entire Equity Shares held by the Company in VISA Urban Infra Limited.
(e) Lien on all Bank Accounts including the Trust and Retention Account.
(f) The Lenders of SMCF are having a second pari-passu charge on the hypothecated assets and a second charge on the mortgaged assets of the Company.
(g) SIDBI (exposure of Rs. 76.40 Million as on 1 March 2012 for bill discounting facility relating to working capital finance) has a second charge on fixed assets
Further, the above facilities are also covered by the following:
- The Corporate Guarantee of VISA International Limited and personal Guarantee of Mr. Vishal Agarwal, Vice Chairman and Managing Director of the Company.
- Pursuant to CDR, the corporate guarantee of Ghotaringa Minerals Limited and Personal Gurantee of Mr. Vishambhar Saran, Chairman.
The Corporate Guarantee of VISA Infrastructure Ltd. with negative Lien on VISA House situated at 8/10 Alipore Road, Kolkata 700027, was valid and subsisting till infusion of additional equity of Rs.125 Crores over and above Rs.325 Crores (already infused) in the Company as envisaged in the CDR package. The infusion of equity could be brought in
All amount in Rs. Million, unless otherwise stated
NOTES to Consolidated Financial Statements
COMPANY OVERVIEW FINANCIAL STATEMENTSGOVERNANCE REPORTS
177VI S A S T EEL LT D.
the form of unsecured loan / Preference shares or by issuing fresh shares through QIP / FPO / PE / Strategic Investment etc. or by merging / demerging some business divisions into separate Companies / SPV’s through scheme/slump sale and inviting strategic investor; and has since been brought in upon amalgamation of VBL with the Company.
ii. Equipment and Vehicle Term Loans These loans are secured by way of hypothecation of
vehicles / machinery acquired under the respective loan arrangements.
iii. Term Loans from Bank and Other Parties (a) Term Loan from IL&FS Financial Services - These loans are secured by way of second
pari-passu charge on entire pooled assets of the Company save and except assets charged in favour of Banks/FI/NBFC and 50 acres of land on which VISA BAO Limited is setting up a Ferro Chrome Plant. This loan is also covered by a Corporate Guarantee of VISA International Limited. Subsequently, in September 2015 this loan has been assigned by IL&FS Limited to State Bank of India, CAG Branch, Kolkata.
(b) Term Loan from HUDCO - Secured loan from other parties includes Term
Loan (CDR) of Rs. 50.12 Cr., Funded Interest Term Loan (FITL) of Rs.10.05 Cr. and Term Loan (Non CDR) of Rs.11.615 Cr. due and outstanding to HUDCO. The subsisting charge in respect of the Term Loan (CDR) and FITL became irrelevant and stood satisfied upon the Company entering into Master Restructuring Agreemen (MRA) dated 19 december 2012 with the CDR lenders and the same was substituted by the fresh charge created in favour of the lenders who became parties to the MRA. Both the Company and the State Bank of India, as the Lead Bank has since been calling upon HUDCO to execute a Deed of Accession so that the aforesaid charge substituted in favour of the CDR lenders could also be extended to HUDCO. HUDCO, however, has refused to do so despite specific order passed to the said effect by the Hon’ble High Court of Orissa at Cuttack in Co Pet No 17 of 2014 (Re: Visa Steel Ltd and Visa Special Steel Ltd) on 13 October
2015, and has instead filed an application in the said proceeding for recalling the said order. The matter is since sub-judice and awaiting further orders of the Hon’ble Court. For creation of charge on the Term Loan (Non CDR), the charge documents need to be executed between HUDCO and the Company, which by reason of the pendency of the dispute referred hereinabove has also not yet taken place and is awaiting finalisation.
C. Terms of Repayment of loans i. Terms of Repayment and outstanding balance
as at the year end of Term Loans including Fresh Term Loan and SMCF (TL):
Upon implementation of CDR Package during the Financial Year 2012-13, then existing Restructured Term Loan of Rs.12,355.48 Million and Additional Term Loan of Rs.6,100.00 Million sanctioned as per CDR package, were to be repaid over a period of 10 years in quarterly installments commencing from March 2013. Further such loans carry interest @ 10.75% p.a. for the first 4 years, @ 11.5% for 5th and 6th year and @ 12%, linked to the base rate, for subsequent years of restructuring. Above mentioned loan amounting to Rs. 17,421.22 Million outstanding as on balance sheet date are to be repaid as per the repayment schedule given below.
Repayment Schedule :
YearPercentage of TL (originally
restructured) due for Repayment (%)
2017-18 13.00%2018-19 15.50%2019-20 15.50%2020-21 15.50%2021-22 15.50%
ii Term of Repayment and outstanding balances The Company has entered in Joint consortium
agreement with Punjab National Bank, Oriental Bank of Commerce, EXIM Bank and Punjab and Sind Bank on 16 January 2012, whereby an amount of Rs. 1,820.00 Million was sanctioned at (PNB BR + 2.5% + Term Premium i.e 0.5%) with annual reset.
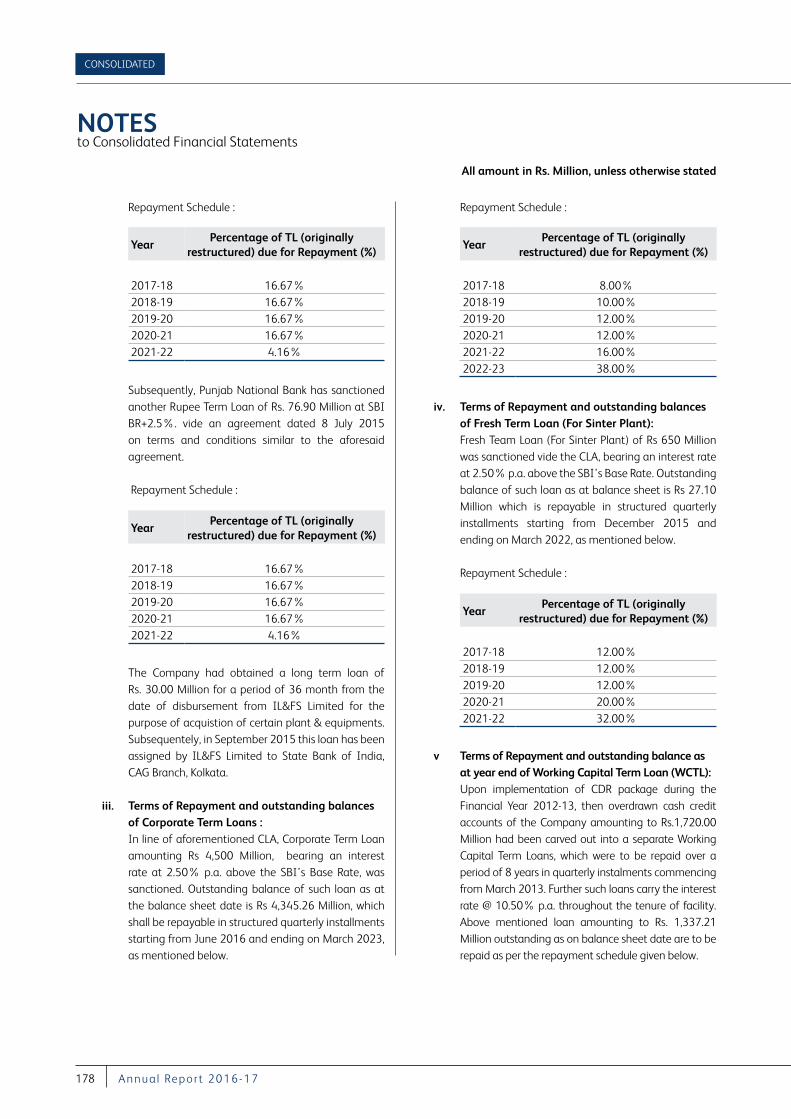
All amount in Rs. Million, unless otherwise stated
NOTES to Consolidated Financial Statements
CONSOLIDATED
178 A nnu a l Repor t 2016-17
Repayment Schedule :
YearPercentage of TL (originally
restructured) due for Repayment (%)
2017-18 16.67%2018-19 16.67%2019-20 16.67%2020-21 16.67%2021-22 4.16%
Subsequently, Punjab National Bank has sanctioned another Rupee Term Loan of Rs. 76.90 Million at SBI BR+2.5%. vide an agreement dated 8 July 2015 on terms and conditions similar to the aforesaid agreement.
Repayment Schedule :
YearPercentage of TL (originally
restructured) due for Repayment (%)
2017-18 16.67%2018-19 16.67%2019-20 16.67%2020-21 16.67%2021-22 4.16%
The Company had obtained a long term loan of Rs. 30.00 Million for a period of 36 month from the date of disbursement from IL&FS Limited for the purpose of acquistion of certain plant & equipments. Subsequentely, in September 2015 this loan has been assigned by IL&FS Limited to State Bank of India, CAG Branch, Kolkata.
iii. Terms of Repayment and outstanding balances of Corporate Term Loans :
In line of aforementioned CLA, Corporate Term Loan amounting Rs 4,500 Million, bearing an interest rate at 2.50% p.a. above the SBI’s Base Rate, was sanctioned. Outstanding balance of such loan as at the balance sheet date is Rs 4,345.26 Million, which shall be repayable in structured quarterly installments starting from June 2016 and ending on March 2023, as mentioned below.
Repayment Schedule :
YearPercentage of TL (originally
restructured) due for Repayment (%)
2017-18 8.00%2018-19 10.00%2019-20 12.00%2020-21 12.00%2021-22 16.00%2022-23 38.00%
iv. Terms of Repayment and outstanding balances of Fresh Term Loan (For Sinter Plant):
Fresh Team Loan (For Sinter Plant) of Rs 650 Million was sanctioned vide the CLA, bearing an interest rate at 2.50% p.a. above the SBI’s Base Rate. Outstanding balance of such loan as at balance sheet is Rs 27.10 Million which is repayable in structured quarterly installments starting from December 2015 and ending on March 2022, as mentioned below.
Repayment Schedule :
YearPercentage of TL (originally
restructured) due for Repayment (%)
2017-18 12.00%2018-19 12.00%2019-20 12.00%2020-21 20.00%2021-22 32.00%
v Terms of Repayment and outstanding balance as at year end of Working Capital Term Loan (WCTL):
Upon implementation of CDR package during the Financial Year 2012-13, then overdrawn cash credit accounts of the Company amounting to Rs.1,720.00 Million had been carved out into a separate Working Capital Term Loans, which were to be repaid over a period of 8 years in quarterly instalments commencing from March 2013. Further such loans carry the interest rate @ 10.50% p.a. throughout the tenure of facility. Above mentioned loan amounting to Rs. 1,337.21 Million outstanding as on balance sheet date are to be repaid as per the repayment schedule given below.
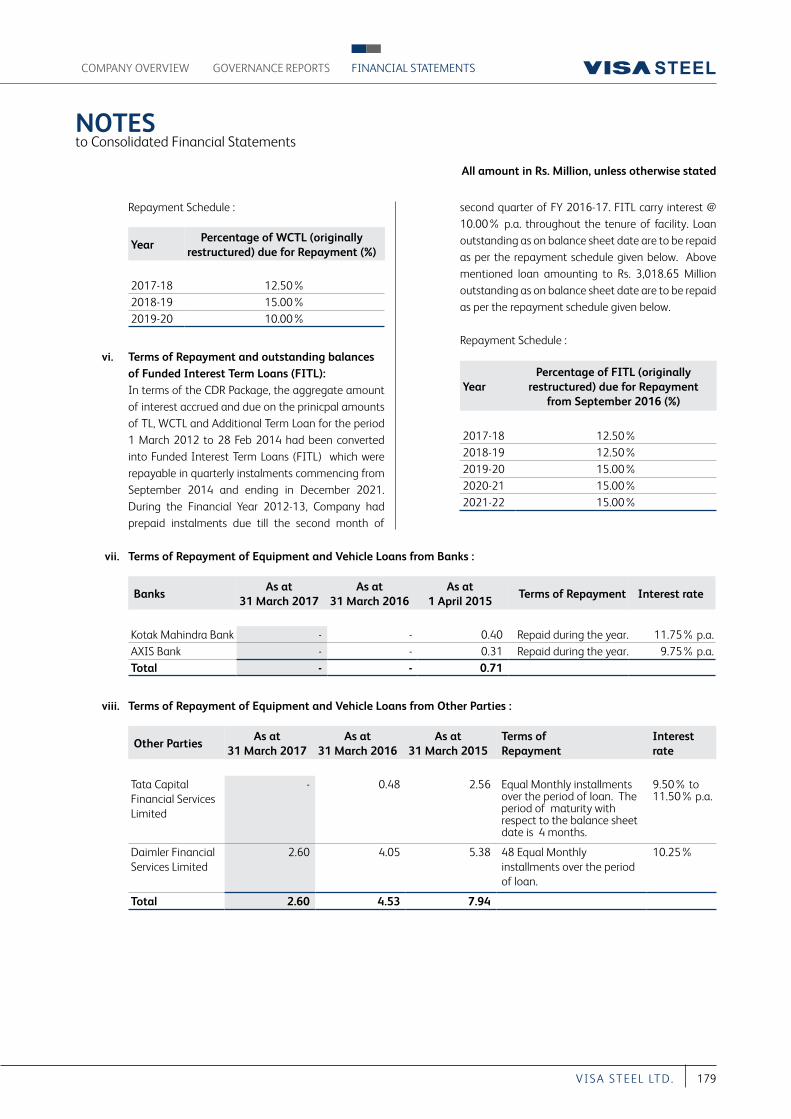
All amount in Rs. Million, unless otherwise stated
NOTES to Consolidated Financial Statements
COMPANY OVERVIEW FINANCIAL STATEMENTSGOVERNANCE REPORTS
179VI S A S T EEL LT D.
Repayment Schedule :
YearPercentage of WCTL (originally
restructured) due for Repayment (%)
2017-18 12.50%2018-19 15.00%2019-20 10.00%
vi. Terms of Repayment and outstanding balances of Funded Interest Term Loans (FITL):
In terms of the CDR Package, the aggregate amount of interest accrued and due on the prinicpal amounts of TL, WCTL and Additional Term Loan for the period 1 March 2012 to 28 Feb 2014 had been converted into Funded Interest Term Loans (FITL) which were repayable in quarterly instalments commencing from September 2014 and ending in December 2021. During the Financial Year 2012-13, Company had prepaid instalments due till the second month of
second quarter of FY 2016-17. FITL carry interest @ 10.00% p.a. throughout the tenure of facility. Loan outstanding as on balance sheet date are to be repaid as per the repayment schedule given below. Above mentioned loan amounting to Rs. 3,018.65 Million outstanding as on balance sheet date are to be repaid as per the repayment schedule given below.
Repayment Schedule :
YearPercentage of FITL (originally
restructured) due for Repayment from September 2016 (%)
2017-18 12.50%2018-19 12.50%2019-20 15.00%2020-21 15.00%2021-22 15.00%
vii. Terms of Repayment of Equipment and Vehicle Loans from Banks :
Banks As at
31 March 2017 As at
31 March 2016 As at
1 April 2015 Terms of Repayment Interest rate
Kotak Mahindra Bank - - 0.40 Repaid during the year. 11.75% p.a.AXIS Bank - - 0.31 Repaid during the year. 9.75% p.a.Total - - 0.71
viii. Terms of Repayment of Equipment and Vehicle Loans from Other Parties :
Other Parties As at
31 March 2017 As at
31 March 2016 As at
31 March 2015Terms of Repayment
Interest rate
Tata Capital Financial Services Limited
- 0.48 2.56 Equal Monthly installments over the period of loan. The period of maturity with respect to the balance sheet date is 4 months.
9.50% to 11.50% p.a.
Daimler Financial Services Limited
2.60 4.05 5.38 48 Equal Monthly installments over the period of loan.
10.25%
Total 2.60 4.53 7.94
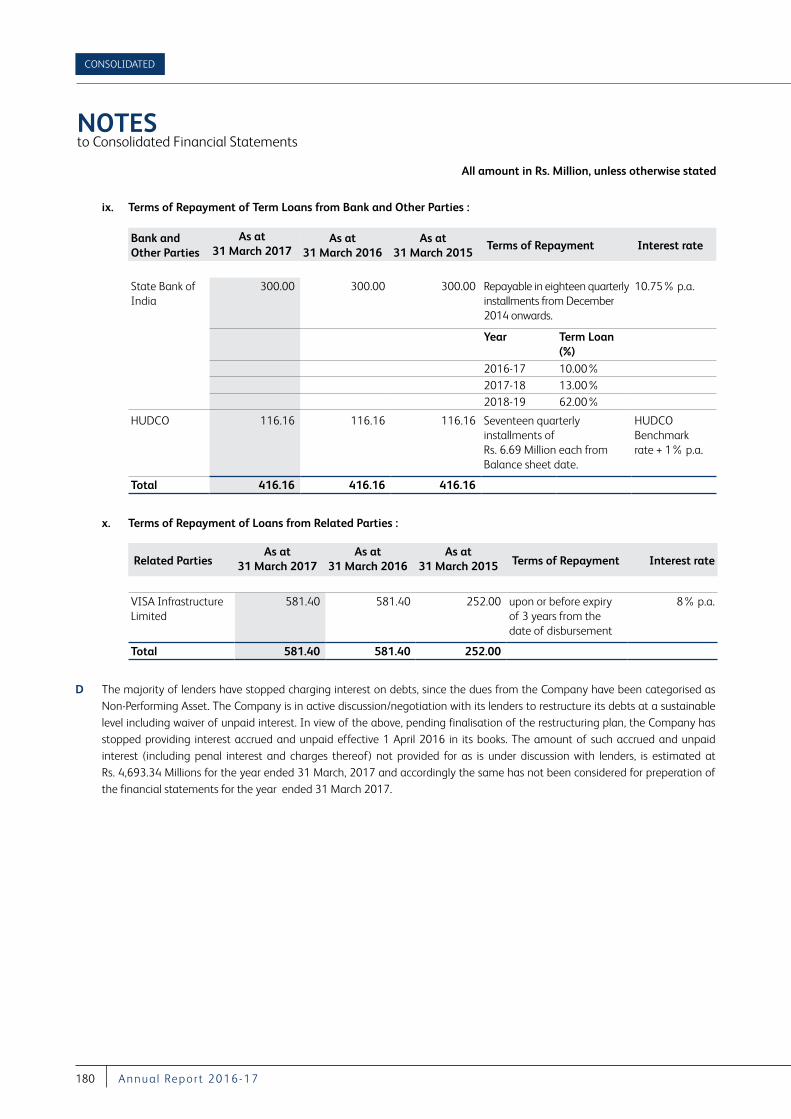
All amount in Rs. Million, unless otherwise stated
NOTES to Consolidated Financial Statements
CONSOLIDATED
180 A nnu a l Repor t 2016-17
ix. Terms of Repayment of Term Loans from Bank and Other Parties :
Bank and Other Parties
As at 31 March 2017
As at 31 March 2016
As at 31 March 2015
Terms of Repayment Interest rate
State Bank of India
300.00 300.00 300.00 Repayable in eighteen quarterly installments from December 2014 onwards.
10.75% p.a.
Year Term Loan (%)
2016-17 10.00%2017-18 13.00%2018-19 62.00%
HUDCO 116.16 116.16 116.16 Seventeen quarterly installments of Rs. 6.69 Million each from Balance sheet date.
HUDCO Benchmark rate + 1% p.a.
Total 416.16 416.16 416.16
x. Terms of Repayment of Loans from Related Parties :
Related Parties As at
31 March 2017 As at
31 March 2016 As at
31 March 2015 Terms of Repayment Interest rate
VISA Infrastructure Limited
581.40 581.40 252.00 upon or before expiry of 3 years from the date of disbursement
8% p.a.
Total 581.40 581.40 252.00
D The majority of lenders have stopped charging interest on debts, since the dues from the Company have been categorised as Non-Performing Asset. The Company is in active discussion/negotiation with its lenders to restructure its debts at a sustainable level including waiver of unpaid interest. In view of the above, pending finalisation of the restructuring plan, the Company has stopped providing interest accrued and unpaid effective 1 April 2016 in its books. The amount of such accrued and unpaid interest (including penal interest and charges thereof) not provided for as is under discussion with lenders, is estimated at Rs. 4,693.34 Millions for the year ended 31 March, 2017 and accordingly the same has not been considered for preperation of the financial statements for the year ended 31 March 2017.
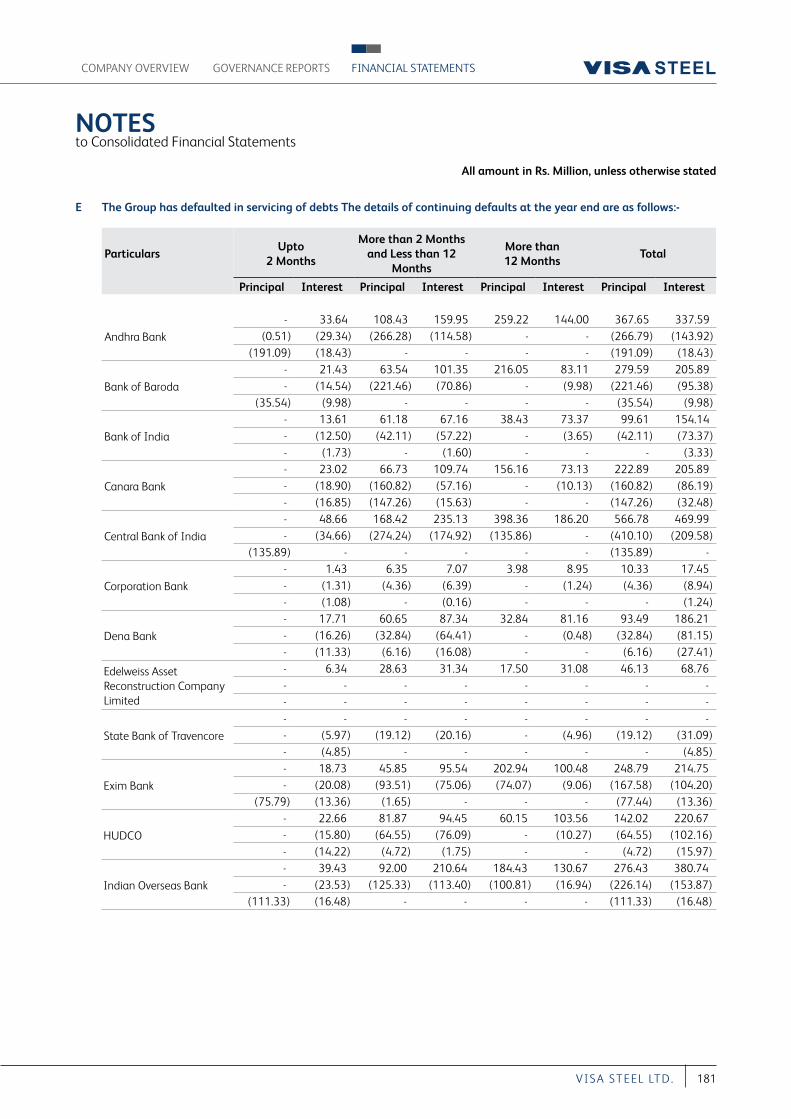
All amount in Rs. Million, unless otherwise stated
NOTES to Consolidated Financial Statements
COMPANY OVERVIEW FINANCIAL STATEMENTSGOVERNANCE REPORTS
181VI S A S T EEL LT D.
E The Group has defaulted in servicing of debts The details of continuing defaults at the year end are as follows:-
ParticularsUpto
2 Months
More than 2 Months and Less than 12
Months
More than 12 Months
Total
Principal Interest Principal Interest Principal Interest Principal Interest
Andhra Bank
- 33.64 108.43 159.95 259.22 144.00 367.65 337.59 (0.51) (29.34) (266.28) (114.58) - - (266.79) (143.92)
(191.09) (18.43) - - - - (191.09) (18.43)
Bank of Baroda
- 21.43 63.54 101.35 216.05 83.11 279.59 205.89 - (14.54) (221.46) (70.86) - (9.98) (221.46) (95.38)
(35.54) (9.98) - - - - (35.54) (9.98)
Bank of India
- 13.61 61.18 67.16 38.43 73.37 99.61 154.14 - (12.50) (42.11) (57.22) - (3.65) (42.11) (73.37) - (1.73) - (1.60) - - - (3.33)
Canara Bank
- 23.02 66.73 109.74 156.16 73.13 222.89 205.89 - (18.90) (160.82) (57.16) - (10.13) (160.82) (86.19) - (16.85) (147.26) (15.63) - - (147.26) (32.48)
Central Bank of India
- 48.66 168.42 235.13 398.36 186.20 566.78 469.99 - (34.66) (274.24) (174.92) (135.86) - (410.10) (209.58)
(135.89) - - - - - (135.89) -
Corporation Bank
- 1.43 6.35 7.07 3.98 8.95 10.33 17.45 - (1.31) (4.36) (6.39) - (1.24) (4.36) (8.94) - (1.08) - (0.16) - - - (1.24)
Dena Bank
- 17.71 60.65 87.34 32.84 81.16 93.49 186.21 - (16.26) (32.84) (64.41) - (0.48) (32.84) (81.15) - (11.33) (6.16) (16.08) - - (6.16) (27.41)
Edelweiss Asset Reconstruction Company Limited
- 6.34 28.63 31.34 17.50 31.08 46.13 68.76 - - - - - - - - - - - - - - - -
State Bank of Travencore
- - - - - - - - - (5.97) (19.12) (20.16) - (4.96) (19.12) (31.09) - (4.85) - - - - - (4.85)
Exim Bank
- 18.73 45.85 95.54 202.94 100.48 248.79 214.75 - (20.08) (93.51) (75.06) (74.07) (9.06) (167.58) (104.20)
(75.79) (13.36) (1.65) - - - (77.44) (13.36)
HUDCO
- 22.66 81.87 94.45 60.15 103.56 142.02 220.67 - (15.80) (64.55) (76.09) - (10.27) (64.55) (102.16) - (14.22) (4.72) (1.75) - - (4.72) (15.97)
Indian Overseas Bank
- 39.43 92.00 210.64 184.43 130.67 276.43 380.74 - (23.53) (125.33) (113.40) (100.81) (16.94) (226.14) (153.87)
(111.33) (16.48) - - - - (111.33) (16.48)
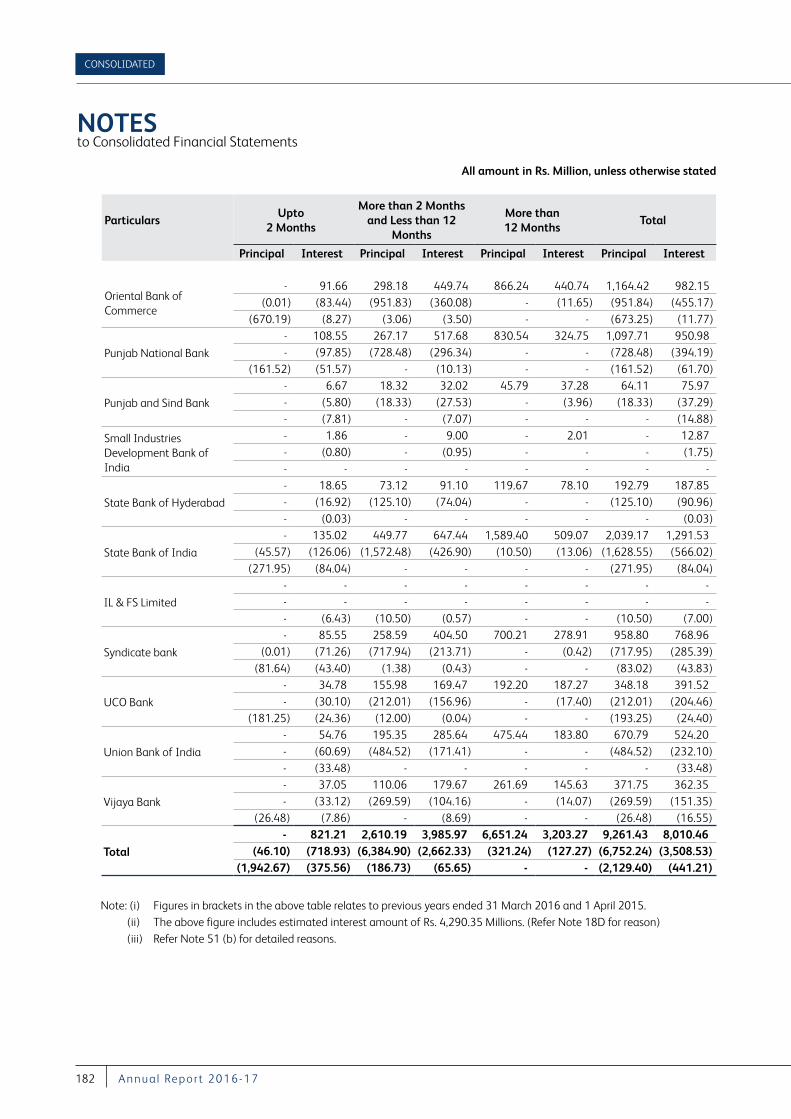
All amount in Rs. Million, unless otherwise stated
NOTES to Consolidated Financial Statements
CONSOLIDATED
182 A nnu a l Repor t 2016-17
ParticularsUpto
2 Months
More than 2 Months and Less than 12
Months
More than 12 Months
Total
Principal Interest Principal Interest Principal Interest Principal Interest
Oriental Bank of Commerce
- 91.66 298.18 449.74 866.24 440.74 1,164.42 982.15 (0.01) (83.44) (951.83) (360.08) - (11.65) (951.84) (455.17)
(670.19) (8.27) (3.06) (3.50) - - (673.25) (11.77)
Punjab National Bank
- 108.55 267.17 517.68 830.54 324.75 1,097.71 950.98 - (97.85) (728.48) (296.34) - - (728.48) (394.19)
(161.52) (51.57) - (10.13) - - (161.52) (61.70)
Punjab and Sind Bank
- 6.67 18.32 32.02 45.79 37.28 64.11 75.97 - (5.80) (18.33) (27.53) - (3.96) (18.33) (37.29) - (7.81) - (7.07) - - - (14.88)
Small Industries Development Bank of India
- 1.86 - 9.00 - 2.01 - 12.87 - (0.80) - (0.95) - - - (1.75) - - - - - - - -
State Bank of Hyderabad
- 18.65 73.12 91.10 119.67 78.10 192.79 187.85 - (16.92) (125.10) (74.04) - - (125.10) (90.96) - (0.03) - - - - - (0.03)
State Bank of India
- 135.02 449.77 647.44 1,589.40 509.07 2,039.17 1,291.53 (45.57) (126.06) (1,572.48) (426.90) (10.50) (13.06) (1,628.55) (566.02)
(271.95) (84.04) - - - - (271.95) (84.04)
IL & FS Limited
- - - - - - - - - - - - - - - - - (6.43) (10.50) (0.57) - - (10.50) (7.00)
Syndicate bank
- 85.55 258.59 404.50 700.21 278.91 958.80 768.96 (0.01) (71.26) (717.94) (213.71) - (0.42) (717.95) (285.39)
(81.64) (43.40) (1.38) (0.43) - - (83.02) (43.83)
UCO Bank
- 34.78 155.98 169.47 192.20 187.27 348.18 391.52 - (30.10) (212.01) (156.96) - (17.40) (212.01) (204.46)
(181.25) (24.36) (12.00) (0.04) - - (193.25) (24.40)
Union Bank of India
- 54.76 195.35 285.64 475.44 183.80 670.79 524.20 - (60.69) (484.52) (171.41) - - (484.52) (232.10) - (33.48) - - - - - (33.48)
Vijaya Bank
- 37.05 110.06 179.67 261.69 145.63 371.75 362.35 - (33.12) (269.59) (104.16) - (14.07) (269.59) (151.35)
(26.48) (7.86) - (8.69) - - (26.48) (16.55)
Total
- 821.21 2,610.19 3,985.97 6,651.24 3,203.27 9,261.43 8,010.46 (46.10) (718.93) (6,384.90) (2,662.33) (321.24) (127.27) (6,752.24) (3,508.53)
(1,942.67) (375.56) (186.73) (65.65) - - (2,129.40) (441.21)
Note: (i) Figures in brackets in the above table relates to previous years ended 31 March 2016 and 1 April 2015. (ii) The above figure includes estimated interest amount of Rs. 4,290.35 Millions. (Refer Note 18D for reason) (iii) Refer Note 51 (b) for detailed reasons.
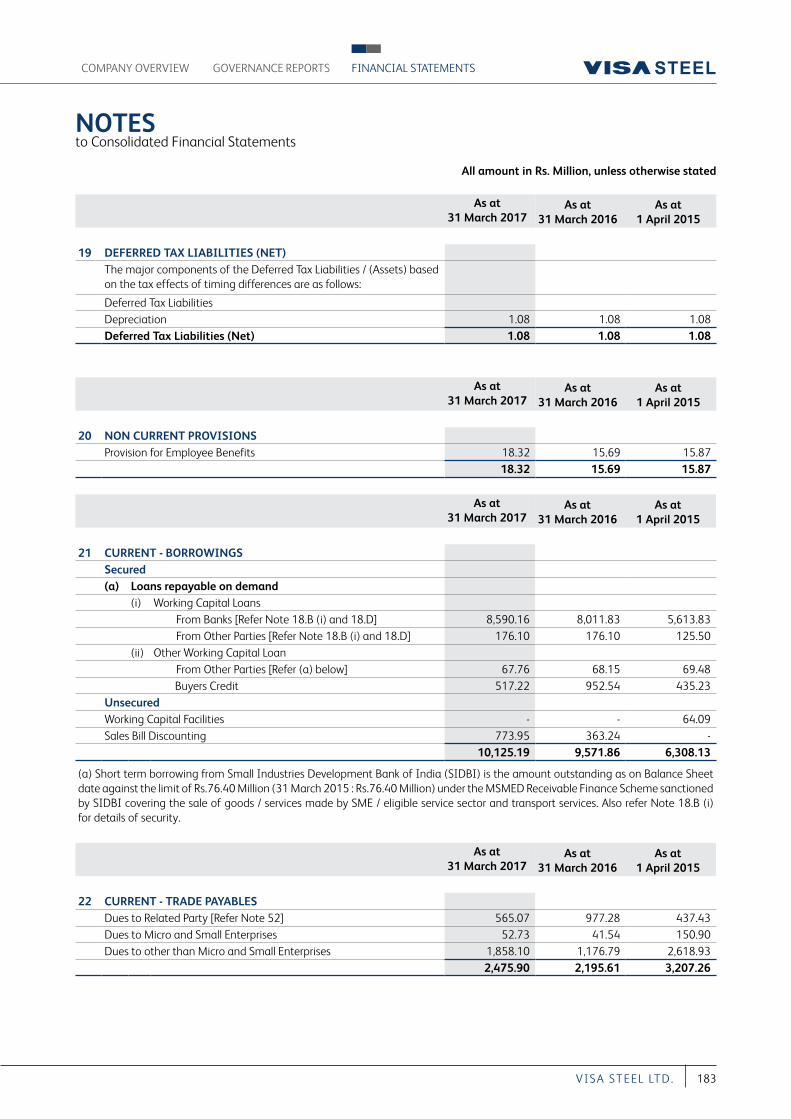
All amount in Rs. Million, unless otherwise stated
NOTES to Consolidated Financial Statements
COMPANY OVERVIEW FINANCIAL STATEMENTSGOVERNANCE REPORTS
183VI S A S T EEL LT D.
As at 31 March 2017
As at 31 March 2016
As at 1 April 2015
19 DEFERRED TAX LIABILITIES (NET)The major components of the Deferred Tax Liabilities / (Assets) based on the tax effects of timing differences are as follows:
Deferred Tax LiabilitiesDepreciation 1.08 1.08 1.08 Deferred Tax Liabilities (Net) 1.08 1.08 1.08
As at 31 March 2017
As at 31 March 2016
As at 1 April 2015
20 NON CURRENT PROVISIONSProvision for Employee Benefits 18.32 15.69 15.87
18.32 15.69 15.87
As at 31 March 2017
As at 31 March 2016
As at 1 April 2015
21 CURRENT - BORROWINGS Secured(a) Loans repayable on demand
(i) Working Capital Loans From Banks [Refer Note 18.B (i) and 18.D] 8,590.16 8,011.83 5,613.83 From Other Parties [Refer Note 18.B (i) and 18.D] 176.10 176.10 125.50
(ii) Other Working Capital Loan From Other Parties [Refer (a) below] 67.76 68.15 69.48
Buyers Credit 517.22 952.54 435.23 UnsecuredWorking Capital Facilities - - 64.09 Sales Bill Discounting 773.95 363.24 -
10,125.19 9,571.86 6,308.13
(a) Short term borrowing from Small Industries Development Bank of India (SIDBI) is the amount outstanding as on Balance Sheet date against the limit of Rs.76.40 Million (31 March 2015 : Rs.76.40 Million) under the MSMED Receivable Finance Scheme sanctioned by SIDBI covering the sale of goods / services made by SME / eligible service sector and transport services. Also refer Note 18.B (i) for details of security.
As at 31 March 2017
As at 31 March 2016
As at 1 April 2015
22 CURRENT - TRADE PAYABLESDues to Related Party [Refer Note 52] 565.07 977.28 437.43 Dues to Micro and Small Enterprises 52.73 41.54 150.90 Dues to other than Micro and Small Enterprises 1,858.10 1,176.79 2,618.93
2,475.90 2,195.61 3,207.26
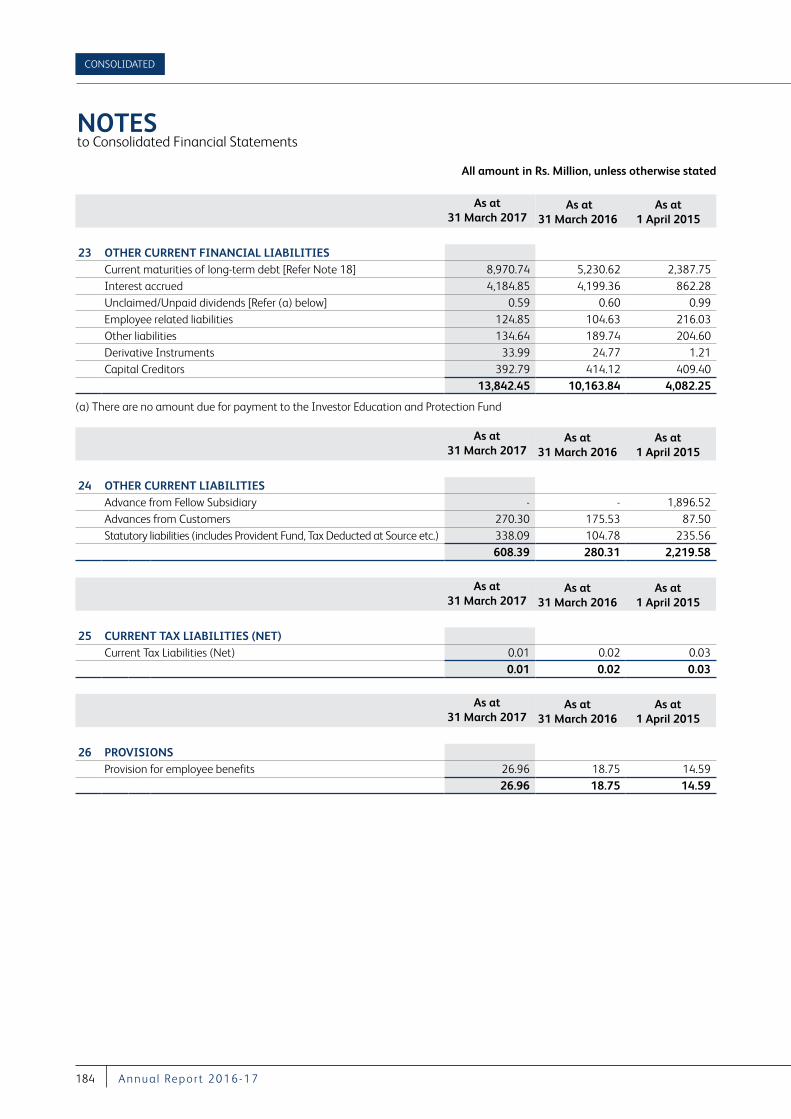
All amount in Rs. Million, unless otherwise stated
NOTES to Consolidated Financial Statements
CONSOLIDATED
184 A nnu a l Repor t 2016-17
As at 31 March 2017
As at 31 March 2016
As at 1 April 2015
23 OTHER CURRENT FINANCIAL LIABILITIES Current maturities of long-term debt [Refer Note 18] 8,970.74 5,230.62 2,387.75 Interest accrued 4,184.85 4,199.36 862.28 Unclaimed/Unpaid dividends [Refer (a) below] 0.59 0.60 0.99 Employee related liabilities 124.85 104.63 216.03 Other liabilities 134.64 189.74 204.60 Derivative Instruments 33.99 24.77 1.21 Capital Creditors 392.79 414.12 409.40
13,842.45 10,163.84 4,082.25
(a) There are no amount due for payment to the Investor Education and Protection Fund
As at 31 March 2017
As at 31 March 2016
As at 1 April 2015
24 OTHER CURRENT LIABILITIESAdvance from Fellow Subsidiary - - 1,896.52 Advances from Customers 270.30 175.53 87.50 Statutory liabilities (includes Provident Fund, Tax Deducted at Source etc.) 338.09 104.78 235.56
608.39 280.31 2,219.58
As at 31 March 2017
As at 31 March 2016
As at 1 April 2015
25 CURRENT TAX LIABILITIES (NET)Current Tax Liabilities (Net) 0.01 0.02 0.03
0.01 0.02 0.03
As at 31 March 2017
As at 31 March 2016
As at 1 April 2015
26 PROVISIONSProvision for employee benefits 26.96 18.75 14.59
26.96 18.75 14.59
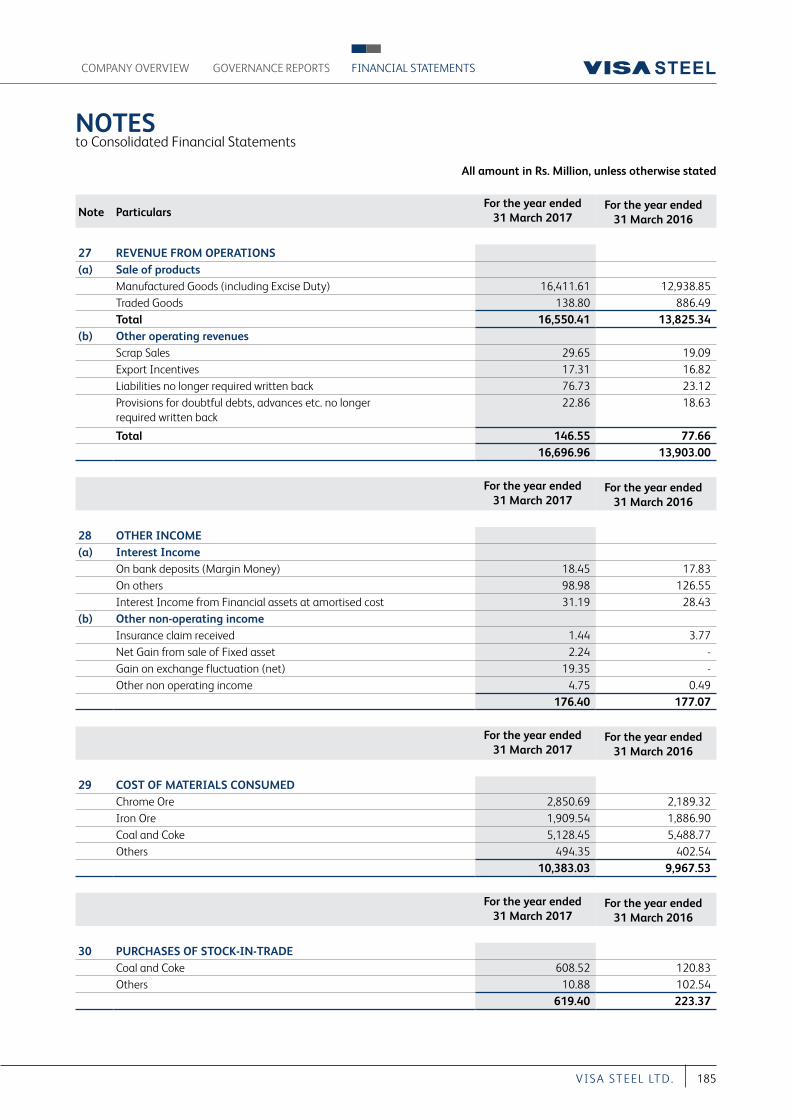
All amount in Rs. Million, unless otherwise stated
NOTES to Consolidated Financial Statements
COMPANY OVERVIEW FINANCIAL STATEMENTSGOVERNANCE REPORTS
185VI S A S T EEL LT D.
Note ParticularsFor the year ended
31 March 2017For the year ended
31 March 2016
27 REVENUE FROM OPERATIONS(a) Sale of products
Manufactured Goods (including Excise Duty) 16,411.61 12,938.85 Traded Goods 138.80 886.49 Total 16,550.41 13,825.34
(b) Other operating revenuesScrap Sales 29.65 19.09 Export Incentives 17.31 16.82 Liabilities no longer required written back 76.73 23.12 Provisions for doubtful debts, advances etc. no longer required written back
22.86 18.63
Total 146.55 77.66 16,696.96 13,903.00
For the year ended 31 March 2017
For the year ended 31 March 2016
28 OTHER INCOME(a) Interest Income
On bank deposits (Margin Money) 18.45 17.83 On others 98.98 126.55 Interest Income from Financial assets at amortised cost 31.19 28.43
(b) Other non-operating incomeInsurance claim received 1.44 3.77 Net Gain from sale of Fixed asset 2.24 - Gain on exchange fluctuation (net) 19.35 - Other non operating income 4.75 0.49
176.40 177.07
For the year ended 31 March 2017
For the year ended 31 March 2016
29 COST OF MATERIALS CONSUMEDChrome Ore 2,850.69 2,189.32 Iron Ore 1,909.54 1,886.90 Coal and Coke 5,128.45 5,488.77 Others 494.35 402.54
10,383.03 9,967.53
For the year ended 31 March 2017
For the year ended 31 March 2016
30 PURCHASES OF STOCK-IN-TRADECoal and Coke 608.52 120.83 Others 10.88 102.54
619.40 223.37
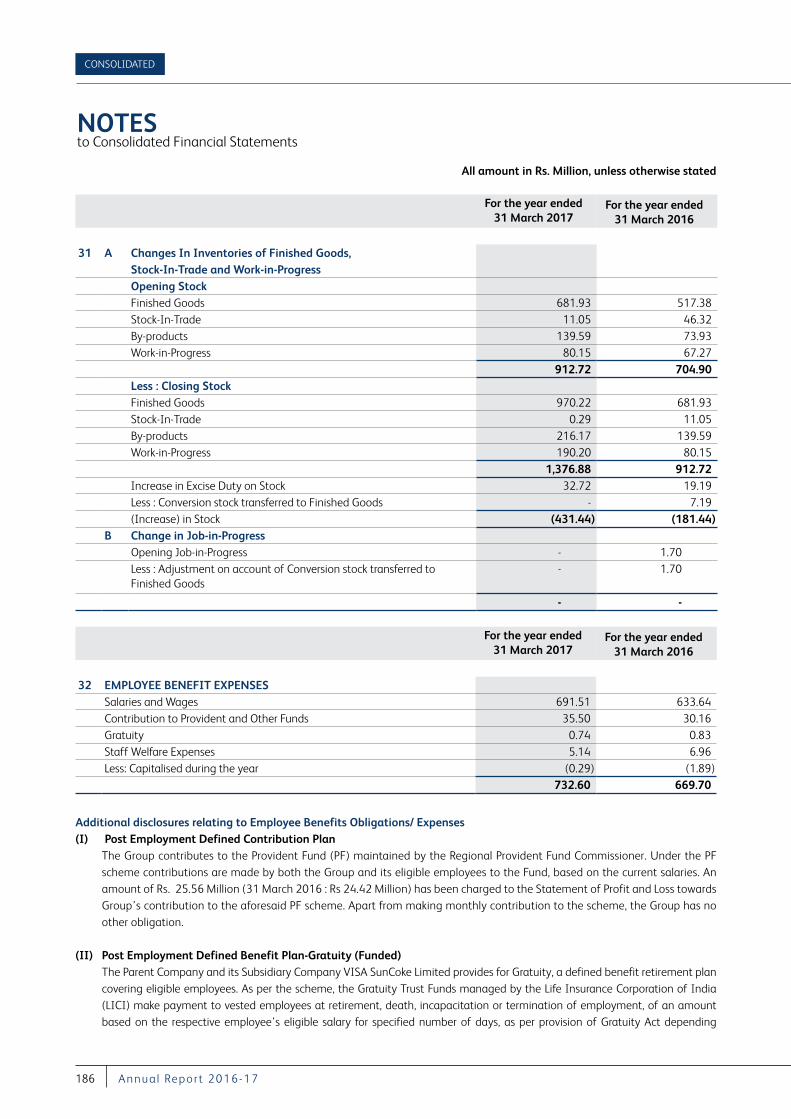
All amount in Rs. Million, unless otherwise stated
NOTES to Consolidated Financial Statements
CONSOLIDATED
186 A nnu a l Repor t 2016-17
For the year ended 31 March 2017
For the year ended 31 March 2016
31 A Changes In Inventories of Finished Goods, Stock-In-Trade and Work-in-ProgressOpening Stock Finished Goods 681.93 517.38 Stock-In-Trade 11.05 46.32 By-products 139.59 73.93 Work-in-Progress 80.15 67.27
912.72 704.90 Less : Closing StockFinished Goods 970.22 681.93 Stock-In-Trade 0.29 11.05 By-products 216.17 139.59 Work-in-Progress 190.20 80.15
1,376.88 912.72 Increase in Excise Duty on Stock 32.72 19.19 Less : Conversion stock transferred to Finished Goods - 7.19 (Increase) in Stock (431.44) (181.44)
B Change in Job-in-ProgressOpening Job-in-Progress - 1.70 Less : Adjustment on account of Conversion stock transferred to Finished Goods
- 1.70
- -
For the year ended 31 March 2017
For the year ended 31 March 2016
32 EMPLOYEE BENEFIT EXPENSESSalaries and Wages 691.51 633.64 Contribution to Provident and Other Funds 35.50 30.16 Gratuity 0.74 0.83 Staff Welfare Expenses 5.14 6.96 Less: Capitalised during the year (0.29) (1.89)
732.60 669.70
Additional disclosures relating to Employee Benefits Obligations/ Expenses(I) Post Employment Defined Contribution Plan The Group contributes to the Provident Fund (PF) maintained by the Regional Provident Fund Commissioner. Under the PF
scheme contributions are made by both the Group and its eligible employees to the Fund, based on the current salaries. An amount of Rs. 25.56 Million (31 March 2016 : Rs 24.42 Million) has been charged to the Statement of Profit and Loss towards Group’s contribution to the aforesaid PF scheme. Apart from making monthly contribution to the scheme, the Group has no other obligation.
(II) Post Employment Defined Benefit Plan-Gratuity (Funded) The Parent Company and its Subsidiary Company VISA SunCoke Limited provides for Gratuity, a defined benefit retirement plan
covering eligible employees. As per the scheme, the Gratuity Trust Funds managed by the Life Insurance Corporation of India (LICI) make payment to vested employees at retirement, death, incapacitation or termination of employment, of an amount based on the respective employee’s eligible salary for specified number of days, as per provision of Gratuity Act depending
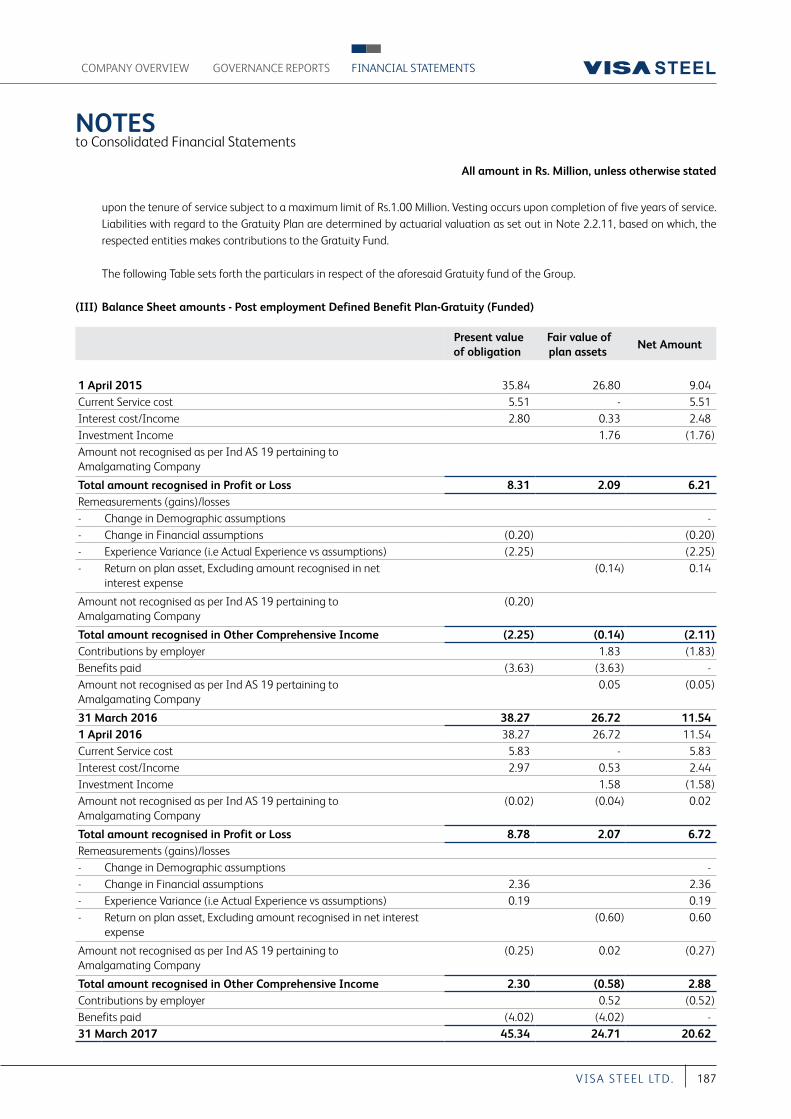
All amount in Rs. Million, unless otherwise stated
NOTES to Consolidated Financial Statements
COMPANY OVERVIEW FINANCIAL STATEMENTSGOVERNANCE REPORTS
187VI S A S T EEL LT D.
upon the tenure of service subject to a maximum limit of Rs.1.00 Million. Vesting occurs upon completion of five years of service. Liabilities with regard to the Gratuity Plan are determined by actuarial valuation as set out in Note 2.2.11, based on which, the respected entities makes contributions to the Gratuity Fund.
The following Table sets forth the particulars in respect of the aforesaid Gratuity fund of the Group.
(III) Balance Sheet amounts - Post employment Defined Benefit Plan-Gratuity (Funded)
Present value of obligation
Fair value of plan assets
Net Amount
1 April 2015 35.84 26.80 9.04 Current Service cost 5.51 - 5.51 Interest cost/Income 2.80 0.33 2.48 Investment Income 1.76 (1.76)Amount not recognised as per Ind AS 19 pertaining to Amalgamating Company
Total amount recognised in Profit or Loss 8.31 2.09 6.21Remeasurements (gains)/losses - Change in Demographic assumptions - - Change in Financial assumptions (0.20) (0.20)- Experience Variance (i.e Actual Experience vs assumptions) (2.25) (2.25)- Return on plan asset, Excluding amount recognised in net
interest expense (0.14) 0.14
Amount not recognised as per Ind AS 19 pertaining to Amalgamating Company
(0.20)
Total amount recognised in Other Comprehensive Income (2.25) (0.14) (2.11)Contributions by employer 1.83 (1.83)Benefits paid (3.63) (3.63) - Amount not recognised as per Ind AS 19 pertaining to Amalgamating Company
0.05 (0.05)
31 March 2016 38.27 26.72 11.54 1 April 2016 38.27 26.72 11.54 Current Service cost 5.83 - 5.83 Interest cost/Income 2.97 0.53 2.44 Investment Income 1.58 (1.58)Amount not recognised as per Ind AS 19 pertaining to Amalgamating Company
(0.02) (0.04) 0.02
Total amount recognised in Profit or Loss 8.78 2.07 6.72Remeasurements (gains)/losses - Change in Demographic assumptions - - Change in Financial assumptions 2.36 2.36 - Experience Variance (i.e Actual Experience vs assumptions) 0.19 0.19 - Return on plan asset, Excluding amount recognised in net interest
expense (0.60) 0.60
Amount not recognised as per Ind AS 19 pertaining to Amalgamating Company
(0.25) 0.02 (0.27)
Total amount recognised in Other Comprehensive Income 2.30 (0.58) 2.88Contributions by employer 0.52 (0.52)Benefits paid (4.02) (4.02) - 31 March 2017 45.34 24.71 20.62
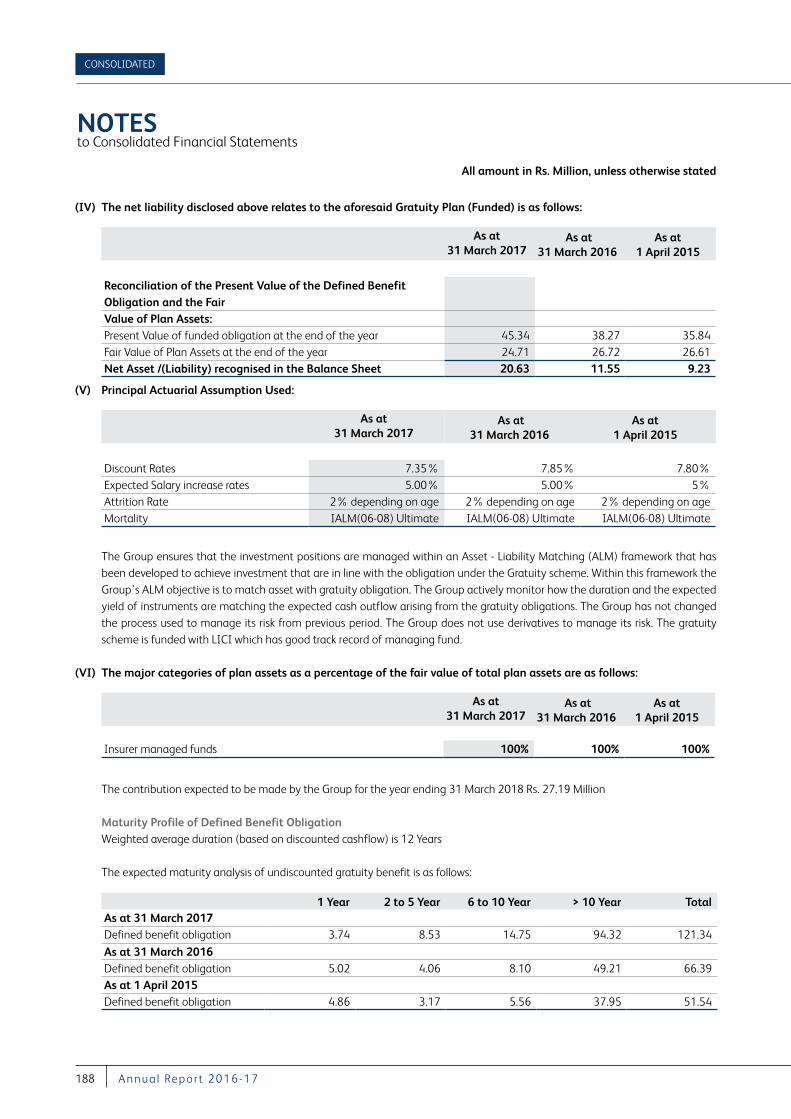
All amount in Rs. Million, unless otherwise stated
NOTES to Consolidated Financial Statements
CONSOLIDATED
188 A nnu a l Repor t 2016-17
(IV) The net liability disclosed above relates to the aforesaid Gratuity Plan (Funded) is as follows:
As at 31 March 2017
As at 31 March 2016
As at 1 April 2015
Reconciliation of the Present Value of the Defined Benefit Obligation and the Fair Value of Plan Assets:Present Value of funded obligation at the end of the year 45.34 38.27 35.84 Fair Value of Plan Assets at the end of the year 24.71 26.72 26.61 Net Asset /(Liability) recognised in the Balance Sheet 20.63 11.55 9.23
(V) Principal Actuarial Assumption Used:
As at
31 March 2017 As at
31 March 2016 As at
1 April 2015
Discount Rates 7.35% 7.85% 7.80%Expected Salary increase rates 5.00% 5.00% 5%Attrition Rate 2% depending on age 2% depending on age 2% depending on ageMortality IALM(06-08) Ultimate IALM(06-08) Ultimate IALM(06-08) Ultimate
The Group ensures that the investment positions are managed within an Asset - Liability Matching (ALM) framework that has been developed to achieve investment that are in line with the obligation under the Gratuity scheme. Within this framework the Group’s ALM objective is to match asset with gratuity obligation. The Group actively monitor how the duration and the expected yield of instruments are matching the expected cash outflow arising from the gratuity obligations. The Group has not changed the process used to manage its risk from previous period. The Group does not use derivatives to manage its risk. The gratuity scheme is funded with LICI which has good track record of managing fund.
(VI) The major categories of plan assets as a percentage of the fair value of total plan assets are as follows:
As at
31 March 2017 As at
31 March 2016 As at
1 April 2015
Insurer managed funds 100% 100% 100%
The contribution expected to be made by the Group for the year ending 31 March 2018 Rs. 27.19 Million
Maturity Profile of Defined Benefit Obligation Weighted average duration (based on discounted cashflow) is 12 Years
The expected maturity analysis of undiscounted gratuity benefit is as follows:
1 Year 2 to 5 Year 6 to 10 Year > 10 Year TotalAs at 31 March 2017Defined benefit obligation 3.74 8.53 14.75 94.32 121.34
As at 31 March 2016Defined benefit obligation 5.02 4.06 8.10 49.21 66.39 As at 1 April 2015Defined benefit obligation 4.86 3.17 5.56 37.95 51.54
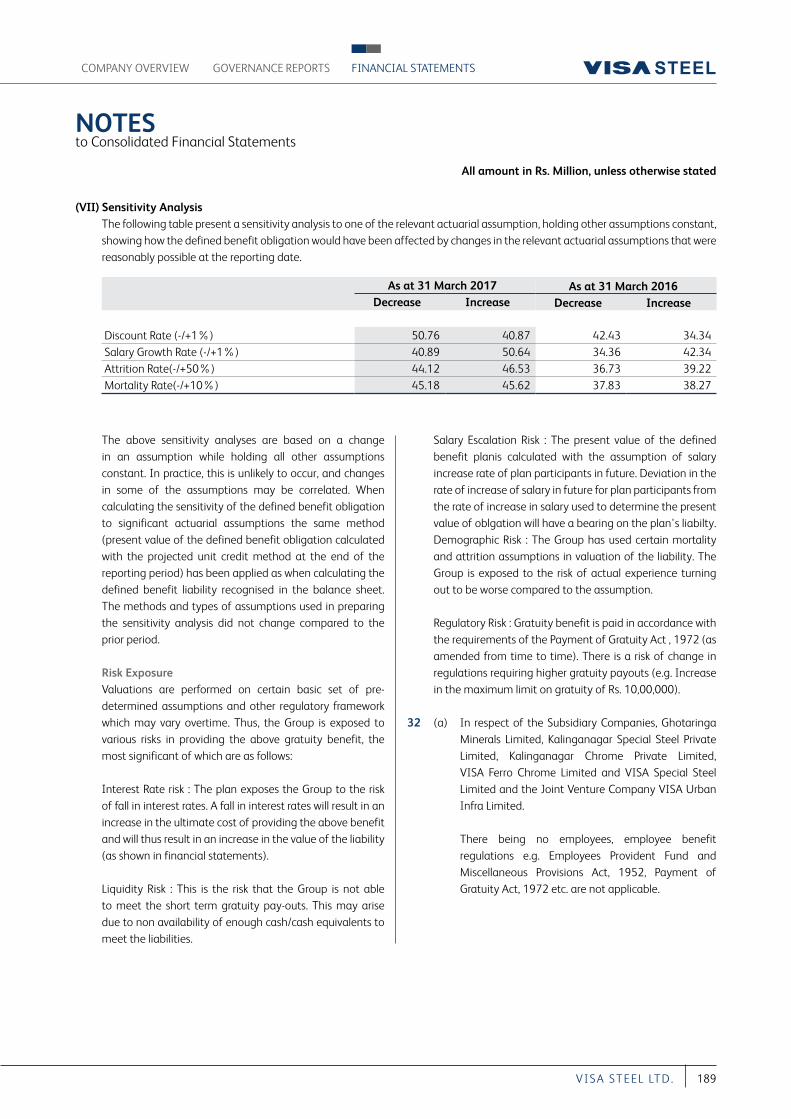
All amount in Rs. Million, unless otherwise stated
NOTES to Consolidated Financial Statements
COMPANY OVERVIEW FINANCIAL STATEMENTSGOVERNANCE REPORTS
189VI S A S T EEL LT D.
(VII) Sensitivity Analysis The following table present a sensitivity analysis to one of the relevant actuarial assumption, holding other assumptions constant, showing how the defined benefit obligation would have been affected by changes in the relevant actuarial assumptions that were reasonably possible at the reporting date.
As at 31 March 2017 As at 31 March 2016Decrease Increase Decrease Increase
Discount Rate (-/+1%) 50.76 40.87 42.43 34.34Salary Growth Rate (-/+1%) 40.89 50.64 34.36 42.34Attrition Rate(-/+50%) 44.12 46.53 36.73 39.22Mortality Rate(-/+10%) 45.18 45.62 37.83 38.27
The above sensitivity analyses are based on a change in an assumption while holding all other assumptions constant. In practice, this is unlikely to occur, and changes in some of the assumptions may be correlated. When calculating the sensitivity of the defined benefit obligation to significant actuarial assumptions the same method (present value of the defined benefit obligation calculated with the projected unit credit method at the end of the reporting period) has been applied as when calculating the defined benefit liability recognised in the balance sheet. The methods and types of assumptions used in preparing the sensitivity analysis did not change compared to the prior period.
Risk Exposure Valuations are performed on certain basic set of pre-
determined assumptions and other regulatory framework which may vary overtime. Thus, the Group is exposed to various risks in providing the above gratuity benefit, the most significant of which are as follows:
Interest Rate risk : The plan exposes the Group to the risk of fall in interest rates. A fall in interest rates will result in an increase in the ultimate cost of providing the above benefit and will thus result in an increase in the value of the liability (as shown in financial statements).
Liquidity Risk : This is the risk that the Group is not able to meet the short term gratuity pay-outs. This may arise due to non availability of enough cash/cash equivalents to meet the liabilities.
Salary Escalation Risk : The present value of the defined benefit planis calculated with the assumption of salary increase rate of plan participants in future. Deviation in the rate of increase of salary in future for plan participants from the rate of increase in salary used to determine the present value of oblgation will have a bearing on the plan's liabilty. Demographic Risk : The Group has used certain mortality and attrition assumptions in valuation of the liability. The Group is exposed to the risk of actual experience turning out to be worse compared to the assumption.
Regulatory Risk : Gratuity benefit is paid in accordance with the requirements of the Payment of Gratuity Act , 1972 (as amended from time to time). There is a risk of change in regulations requiring higher gratuity payouts (e.g. Increase in the maximum limit on gratuity of Rs. 10,00,000).
32 (a) In respect of the Subsidiary Companies, Ghotaringa Minerals Limited, Kalinganagar Special Steel Private Limited, Kalinganagar Chrome Private Limited, VISA Ferro Chrome Limited and VISA Special Steel Limited and the Joint Venture Company VISA Urban Infra Limited.
There being no employees, employee benefit regulations e.g. Employees Provident Fund and Miscellaneous Provisions Act, 1952, Payment of Gratuity Act, 1972 etc. are not applicable.
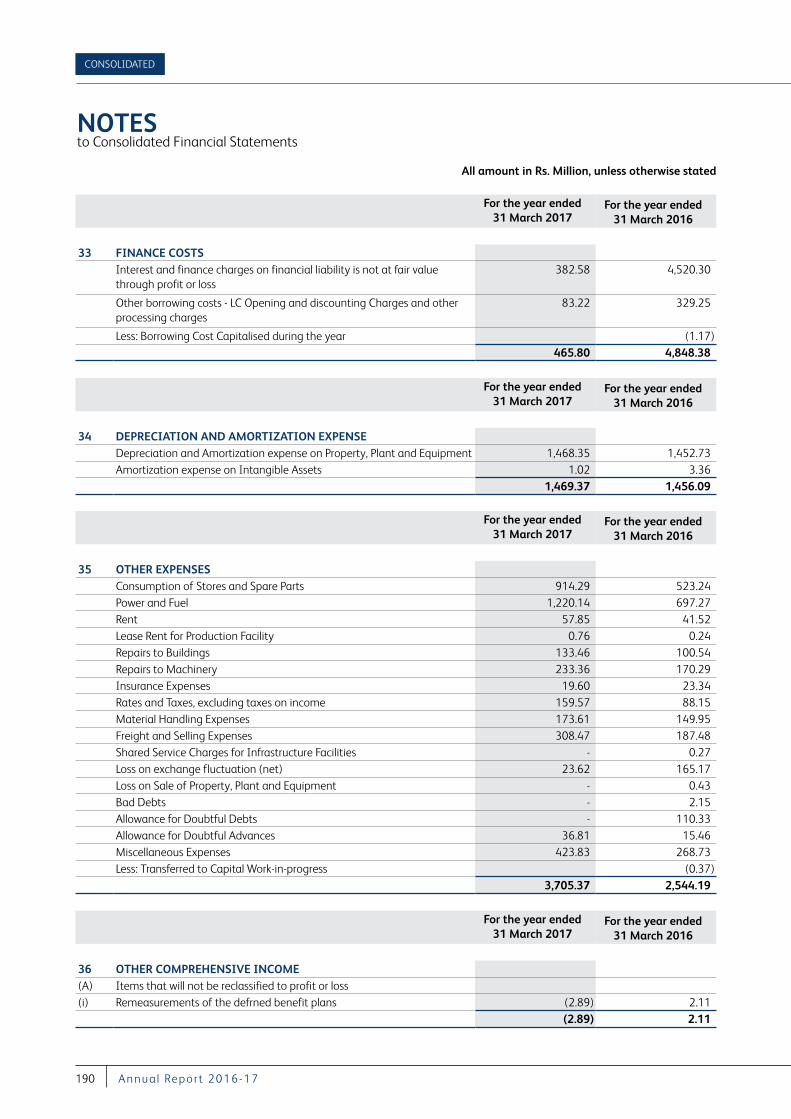
All amount in Rs. Million, unless otherwise stated
NOTES to Consolidated Financial Statements
CONSOLIDATED
190 A nnu a l Repor t 2016-17
For the year ended 31 March 2017
For the year ended 31 March 2016
33 FINANCE COSTSInterest and finance charges on financial liability is not at fair value through profit or loss
382.58 4,520.30
Other borrowing costs - LC Opening and discounting Charges and other processing charges
83.22 329.25
Less: Borrowing Cost Capitalised during the year (1.17) 465.80 4,848.38
For the year ended 31 March 2017
For the year ended 31 March 2016
34 DEPRECIATION AND AMORTIZATION EXPENSEDepreciation and Amortization expense on Property, Plant and Equipment 1,468.35 1,452.73 Amortization expense on Intangible Assets 1.02 3.36
1,469.37 1,456.09
For the year ended 31 March 2017
For the year ended 31 March 2016
35 OTHER EXPENSESConsumption of Stores and Spare Parts 914.29 523.24 Power and Fuel 1,220.14 697.27 Rent 57.85 41.52 Lease Rent for Production Facility 0.76 0.24 Repairs to Buildings 133.46 100.54 Repairs to Machinery 233.36 170.29 Insurance Expenses 19.60 23.34 Rates and Taxes, excluding taxes on income 159.57 88.15 Material Handling Expenses 173.61 149.95 Freight and Selling Expenses 308.47 187.48 Shared Service Charges for Infrastructure Facilities - 0.27 Loss on exchange fluctuation (net) 23.62 165.17 Loss on Sale of Property, Plant and Equipment - 0.43 Bad Debts - 2.15 Allowance for Doubtful Debts - 110.33 Allowance for Doubtful Advances 36.81 15.46 Miscellaneous Expenses 423.83 268.73 Less: Transferred to Capital Work-in-progress (0.37)
3,705.37 2,544.19
For the year ended 31 March 2017
For the year ended 31 March 2016
36 OTHER COMPREHENSIVE INCOME(A) Items that will not be reclassified to profit or loss(i) Remeasurements of the defrned benefit plans (2.89) 2.11
(2.89) 2.11
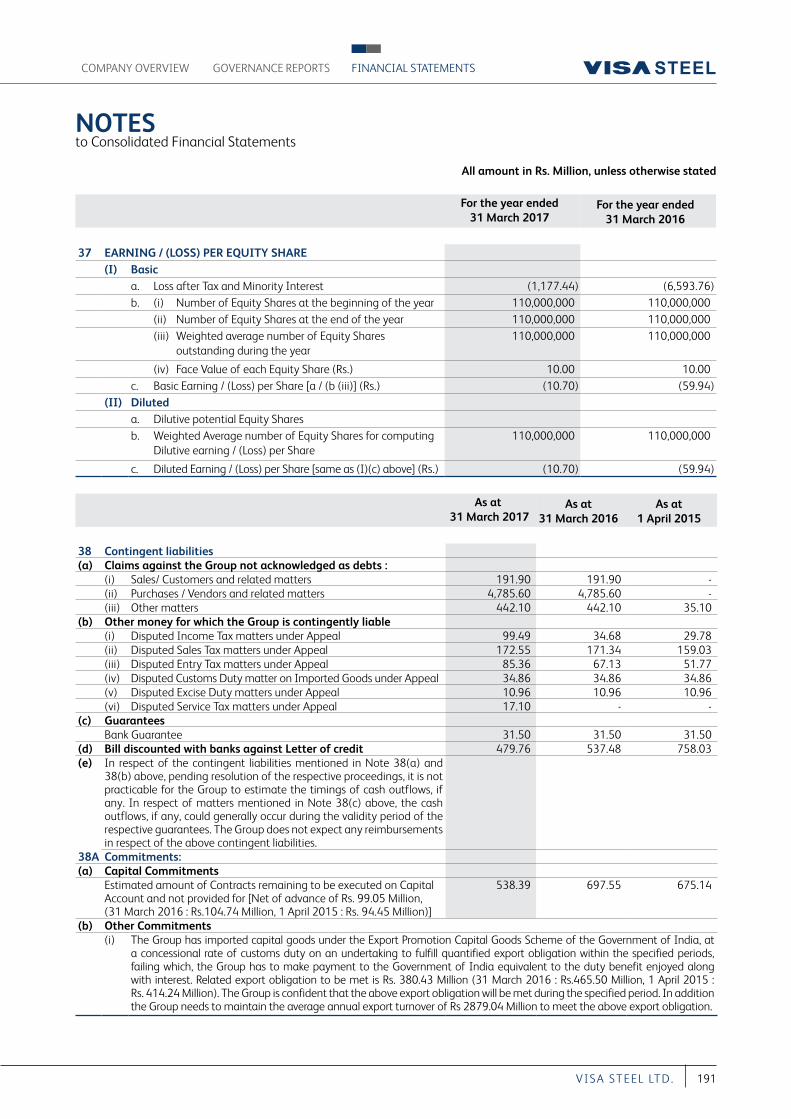
All amount in Rs. Million, unless otherwise stated
NOTES to Consolidated Financial Statements
COMPANY OVERVIEW FINANCIAL STATEMENTSGOVERNANCE REPORTS
191VI S A S T EEL LT D.
For the year ended 31 March 2017
For the year ended 31 March 2016
37 EARNING / (LOSS) PER EQUITY SHARE(I) Basic
a. Loss after Tax and Minority Interest (1,177.44) (6,593.76)b. (i) Number of Equity Shares at the beginning of the year 110,000,000 110,000,000 (ii) Number of Equity Shares at the end of the year 110,000,000 110,000,000 (iii) Weighted average number of Equity Shares
outstanding during the year 110,000,000 110,000,000
(iv) Face Value of each Equity Share (Rs.) 10.00 10.00 c. Basic Earning / (Loss) per Share [a / (b (iii)] (Rs.) (10.70) (59.94)
(II) Diluteda. Dilutive potential Equity Sharesb. Weighted Average number of Equity Shares for computing
Dilutive earning / (Loss) per Share 110,000,000 110,000,000
c. Diluted Earning / (Loss) per Share [same as (I)(c) above] (Rs.) (10.70) (59.94)
As at 31 March 2017
As at31 March 2016
As at1 April 2015
38 Contingent liabilities (a) Claims against the Group not acknowledged as debts :
(i) Sales/ Customers and related matters 191.90 191.90 - (ii) Purchases / Vendors and related matters 4,785.60 4,785.60 - (iii) Other matters 442.10 442.10 35.10
(b) Other money for which the Group is contingently liable(i) Disputed Income Tax matters under Appeal 99.49 34.68 29.78 (ii) Disputed Sales Tax matters under Appeal 172.55 171.34 159.03 (iii) Disputed Entry Tax matters under Appeal 85.36 67.13 51.77(iv) Disputed Customs Duty matter on Imported Goods under Appeal 34.86 34.86 34.86 (v) Disputed Excise Duty matters under Appeal 10.96 10.96 10.96 (vi) Disputed Service Tax matters under Appeal 17.10 - -
(c) GuaranteesBank Guarantee 31.50 31.50 31.50
(d) Bill discounted with banks against Letter of credit 479.76 537.48 758.03(e) In respect of the contingent liabilities mentioned in Note 38(a) and
38(b) above, pending resolution of the respective proceedings, it is not practicable for the Group to estimate the timings of cash outflows, if any. In respect of matters mentioned in Note 38(c) above, the cash outflows, if any, could generally occur during the validity period of the respective guarantees. The Group does not expect any reimbursements in respect of the above contingent liabilities.
38A Commitments:(a) Capital Commitments
Estimated amount of Contracts remaining to be executed on Capital Account and not provided for [Net of advance of Rs. 99.05 Million, (31 March 2016 : Rs.104.74 Million, 1 April 2015 : Rs. 94.45 Million)]
538.39 697.55 675.14
(b) Other Commitments(i) The Group has imported capital goods under the Export Promotion Capital Goods Scheme of the Government of India, at
a concessional rate of customs duty on an undertaking to fulfill quantified export obligation within the specified periods, failing which, the Group has to make payment to the Government of India equivalent to the duty benefit enjoyed along with interest. Related export obligation to be met is Rs. 380.43 Million (31 March 2016 : Rs.465.50 Million, 1 April 2015 : Rs. 414.24 Million). The Group is confident that the above export obligation will be met during the specified period. In addition the Group needs to maintain the average annual export turnover of Rs 2879.04 Million to meet the above export obligation.
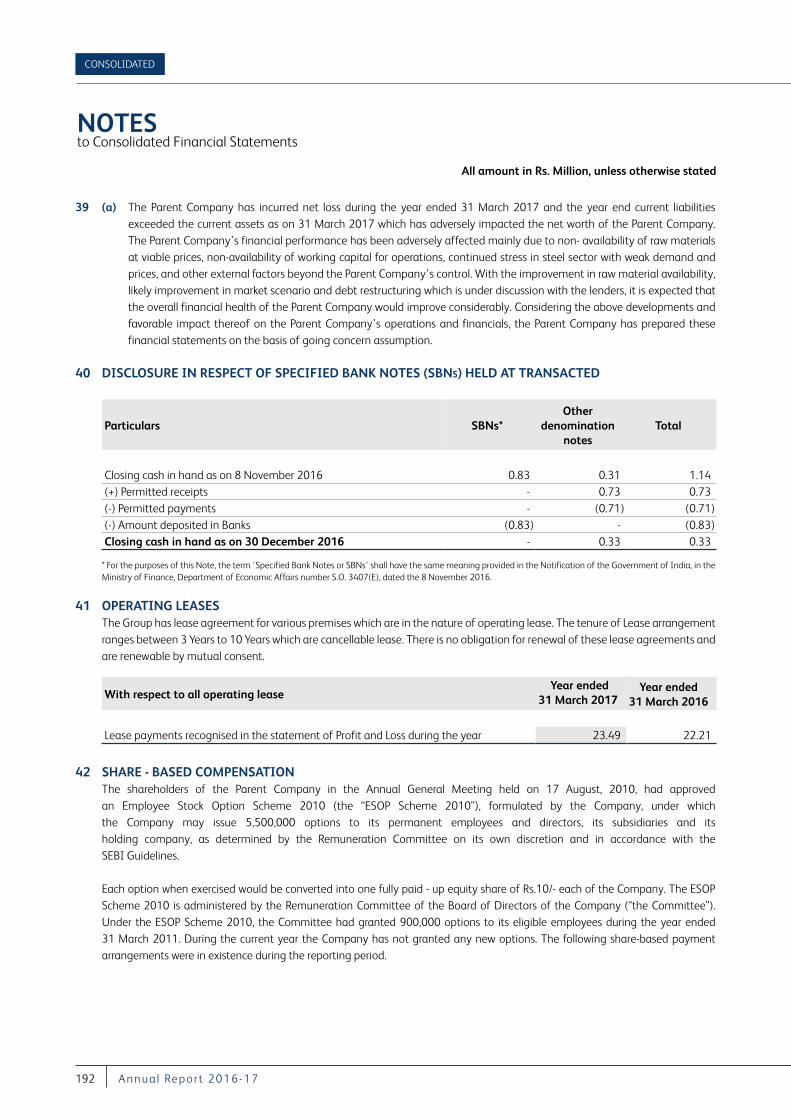
All amount in Rs. Million, unless otherwise stated
NOTES to Consolidated Financial Statements
CONSOLIDATED
192 A nnu a l Repor t 2016-17
39 (a) The Parent Company has incurred net loss during the year ended 31 March 2017 and the year end current liabilities exceeded the current assets as on 31 March 2017 which has adversely impacted the net worth of the Parent Company. The Parent Company’s financial performance has been adversely affected mainly due to non- availability of raw materials at viable prices, non-availability of working capital for operations, continued stress in steel sector with weak demand and prices, and other external factors beyond the Parent Company’s control. With the improvement in raw material availability, likely improvement in market scenario and debt restructuring which is under discussion with the lenders, it is expected that the overall financial health of the Parent Company would improve considerably. Considering the above developments and favorable impact thereof on the Parent Company’s operations and financials, the Parent Company has prepared these financial statements on the basis of going concern assumption.
40 DISCLOSURE IN RESPECT OF SPECIFIED BANK NOTES (SBNs) HELD AT TRANSACTED
Particulars SBNs*Other
denomination notes
Total
Closing cash in hand as on 8 November 2016 0.83 0.31 1.14 (+) Permitted receipts - 0.73 0.73 (-) Permitted payments - (0.71) (0.71)(-) Amount deposited in Banks (0.83) - (0.83)Closing cash in hand as on 30 December 2016 - 0.33 0.33
* For the purposes of this Note, the term ‘Specified Bank Notes or SBNs’ shall have the same meaning provided in the Notification of the Government of India, in the Ministry of Finance, Department of Economic Affairs number S.O. 3407(E), dated the 8 November 2016.
41 OPERATING LEASES The Group has lease agreement for various premises which are in the nature of operating lease. The tenure of Lease arrangement
ranges between 3 Years to 10 Years which are cancellable lease. There is no obligation for renewal of these lease agreements and are renewable by mutual consent.
With respect to all operating lease Year ended
31 March 2017 Year ended
31 March 2016
Lease payments recognised in the statement of Profit and Loss during the year 23.49 22.21
42 SHARE - BASED COMPENSATION The shareholders of the Parent Company in the Annual General Meeting held on 17 August, 2010, had approved
an Employee Stock Option Scheme 2010 (the “ESOP Scheme 2010”), formulated by the Company, under which the Company may issue 5,500,000 options to its permanent employees and directors, its subsidiaries and its holding company, as determined by the Remuneration Committee on its own discretion and in accordance with the SEBI Guidelines.
Each option when exercised would be converted into one fully paid - up equity share of Rs.10/- each of the Company. The ESOP Scheme 2010 is administered by the Remuneration Committee of the Board of Directors of the Company (“the Committee”). Under the ESOP Scheme 2010, the Committee had granted 900,000 options to its eligible employees during the year ended 31 March 2011. During the current year the Company has not granted any new options. The following share-based payment arrangements were in existence during the reporting period.
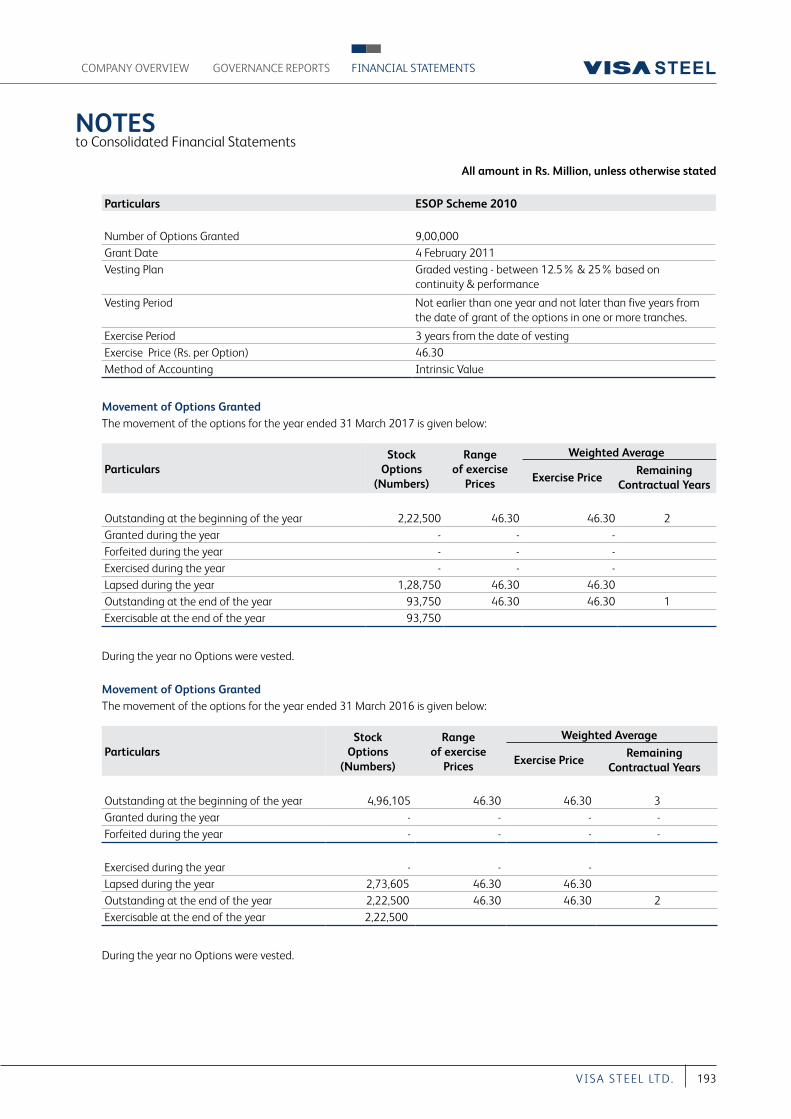
All amount in Rs. Million, unless otherwise stated
NOTES to Consolidated Financial Statements
COMPANY OVERVIEW FINANCIAL STATEMENTSGOVERNANCE REPORTS
193VI S A S T EEL LT D.
Particulars ESOP Scheme 2010
Number of Options Granted 9,00,000Grant Date 4 February 2011Vesting Plan Graded vesting - between 12.5% & 25% based on
continuity & performance
Vesting Period Not earlier than one year and not later than five years from the date of grant of the options in one or more tranches.
Exercise Period 3 years from the date of vesting Exercise Price (Rs. per Option) 46.30Method of Accounting Intrinsic Value
Movement of Options Granted The movement of the options for the year ended 31 March 2017 is given below:
ParticularsStock
Options (Numbers)
Range of exercise
Prices
Weighted Average
Exercise PriceRemaining
Contractual Years
Outstanding at the beginning of the year 2,22,500 46.30 46.30 2Granted during the year - - - Forfeited during the year - - - Exercised during the year - - - Lapsed during the year 1,28,750 46.30 46.30 Outstanding at the end of the year 93,750 46.30 46.30 1Exercisable at the end of the year 93,750
During the year no Options were vested.
Movement of Options Granted The movement of the options for the year ended 31 March 2016 is given below:
ParticularsStock
Options (Numbers)
Range of exercise
Prices
Weighted Average
Exercise PriceRemaining
Contractual Years
Outstanding at the beginning of the year 4,96,105 46.30 46.30 3Granted during the year - - - - Forfeited during the year - - - -
Exercised during the year - - - Lapsed during the year 2,73,605 46.30 46.30 Outstanding at the end of the year 2,22,500 46.30 46.30 2Exercisable at the end of the year 2,22,500
During the year no Options were vested.
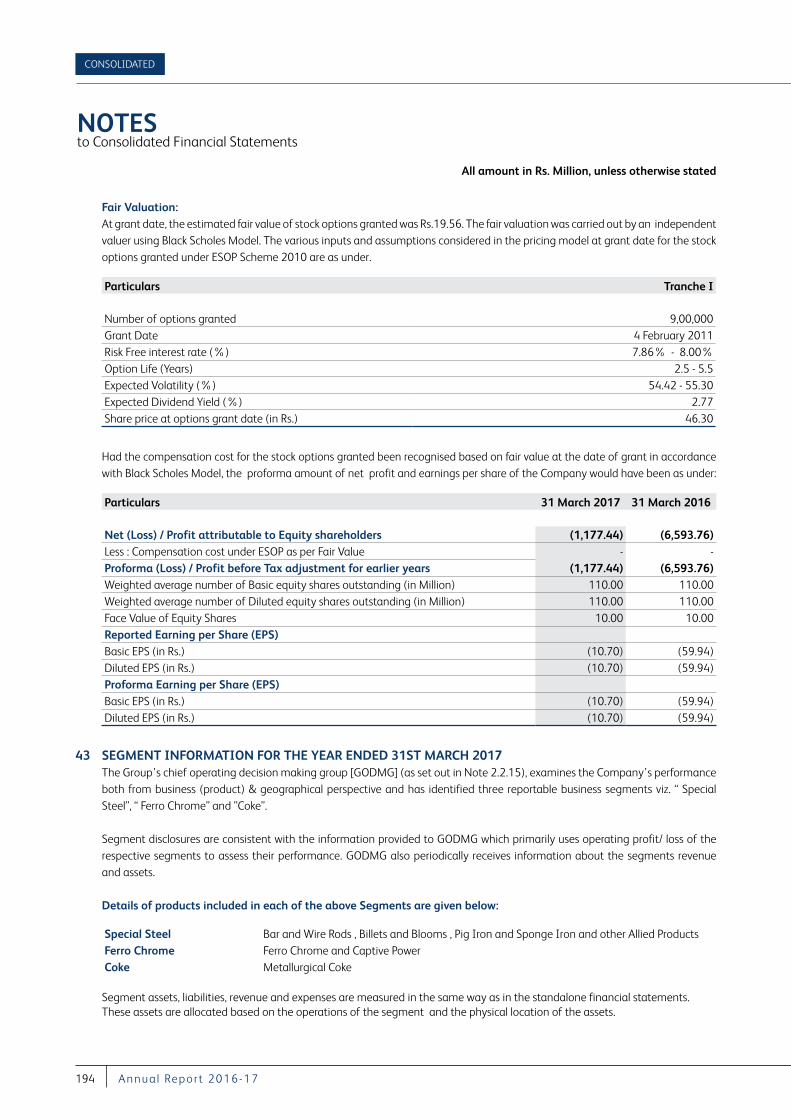
All amount in Rs. Million, unless otherwise stated
NOTES to Consolidated Financial Statements
CONSOLIDATED
194 A nnu a l Repor t 2016-17
Fair Valuation: At grant date, the estimated fair value of stock options granted was Rs.19.56. The fair valuation was carried out by an independent
valuer using Black Scholes Model. The various inputs and assumptions considered in the pricing model at grant date for the stock options granted under ESOP Scheme 2010 are as under.
Particulars Tranche I
Number of options granted 9,00,000Grant Date 4 February 2011Risk Free interest rate (%) 7.86% - 8.00%Option Life (Years) 2.5 - 5.5Expected Volatility (%) 54.42 - 55.30 Expected Dividend Yield (%) 2.77Share price at options grant date (in Rs.) 46.30
Had the compensation cost for the stock options granted been recognised based on fair value at the date of grant in accordance with Black Scholes Model, the proforma amount of net profit and earnings per share of the Company would have been as under:
Particulars 31 March 2017 31 March 2016
Net (Loss) / Profit attributable to Equity shareholders (1,177.44) (6,593.76)Less : Compensation cost under ESOP as per Fair Value - - Proforma (Loss) / Profit before Tax adjustment for earlier years (1,177.44) (6,593.76)Weighted average number of Basic equity shares outstanding (in Million) 110.00 110.00 Weighted average number of Diluted equity shares outstanding (in Million) 110.00 110.00 Face Value of Equity Shares 10.00 10.00 Reported Earning per Share (EPS)Basic EPS (in Rs.) (10.70) (59.94)Diluted EPS (in Rs.) (10.70) (59.94)Proforma Earning per Share (EPS)Basic EPS (in Rs.) (10.70) (59.94)Diluted EPS (in Rs.) (10.70) (59.94)
43 SEGMENT INFORMATION FOR THE YEAR ENDED 31ST MARCH 2017 The Group’s chief operating decision making group [GODMG] (as set out in Note 2.2.15), examines the Company’s performance
both from business (product) & geographical perspective and has identified three reportable business segments viz. “ Special Steel”, “ Ferro Chrome” and ”Coke”.
Segment disclosures are consistent with the information provided to GODMG which primarily uses operating profit/ loss of the respective segments to assess their performance. GODMG also periodically receives information about the segments revenue and assets.
Details of products included in each of the above Segments are given below:
Special Steel Bar and Wire Rods , Billets and Blooms , Pig Iron and Sponge Iron and other Allied ProductsFerro Chrome Ferro Chrome and Captive PowerCoke Metallurgical Coke
Segment assets, liabilities, revenue and expenses are measured in the same way as in the standalone financial statements. These assets are allocated based on the operations of the segment and the physical location of the assets.
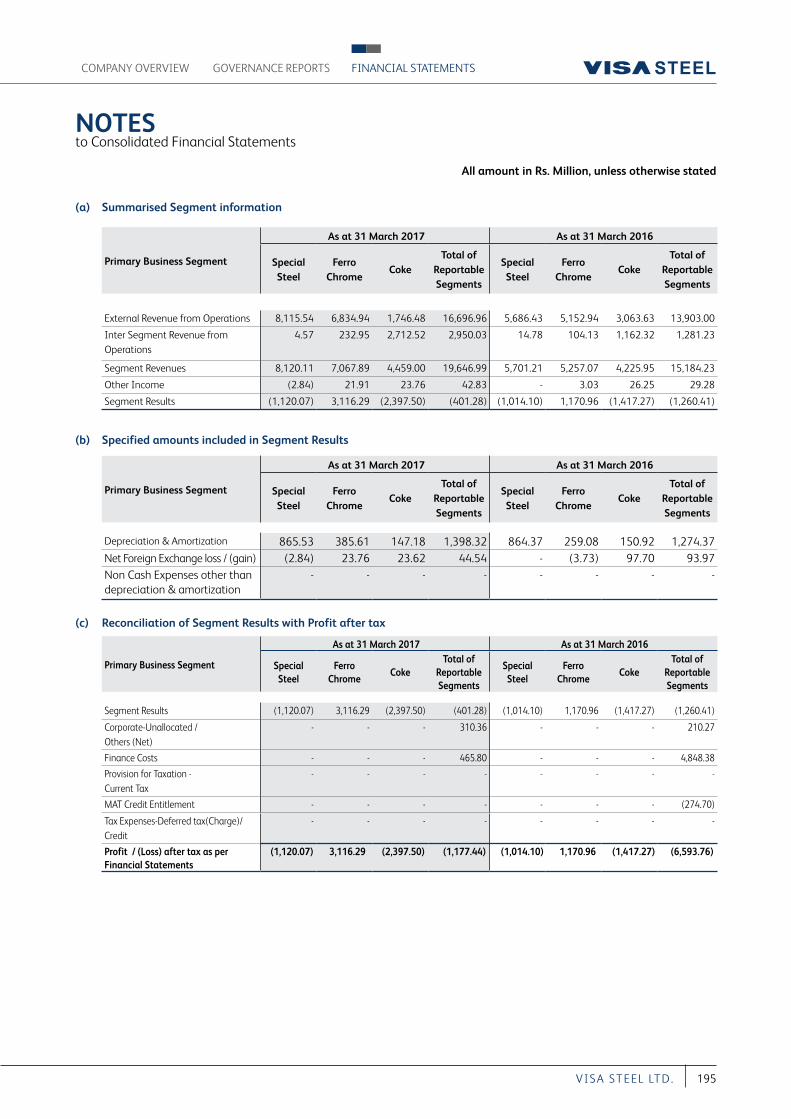
All amount in Rs. Million, unless otherwise stated
NOTES to Consolidated Financial Statements
COMPANY OVERVIEW FINANCIAL STATEMENTSGOVERNANCE REPORTS
195VI S A S T EEL LT D.
(a) Summarised Segment information
Primary Business Segment
As at 31 March 2017 As at 31 March 2016
Special Steel
Ferro Chrome
CokeTotal of
Reportable Segments
Special Steel
Ferro Chrome
CokeTotal of
Reportable Segments
External Revenue from Operations 8,115.54 6,834.94 1,746.48 16,696.96 5,686.43 5,152.94 3,063.63 13,903.00
Inter Segment Revenue from Operations
4.57 232.95 2,712.52 2,950.03 14.78 104.13 1,162.32 1,281.23
Segment Revenues 8,120.11 7,067.89 4,459.00 19,646.99 5,701.21 5,257.07 4,225.95 15,184.23
Other Income (2.84) 21.91 23.76 42.83 - 3.03 26.25 29.28
Segment Results (1,120.07) 3,116.29 (2,397.50) (401.28) (1,014.10) 1,170.96 (1,417.27) (1,260.41)
(b) Specified amounts included in Segment Results
Primary Business Segment
As at 31 March 2017 As at 31 March 2016
Special Steel
Ferro Chrome
CokeTotal of
Reportable Segments
Special Steel
Ferro Chrome
CokeTotal of
Reportable Segments
Depreciation & Amortization 865.53 385.61 147.18 1,398.32 864.37 259.08 150.92 1,274.37 Net Foreign Exchange loss / (gain) (2.84) 23.76 23.62 44.54 - (3.73) 97.70 93.97 Non Cash Expenses other than depreciation & amortization
- - - - - - - -
(c) Reconciliation of Segment Results with Profit after tax
Primary Business Segment
As at 31 March 2017 As at 31 March 2016
Special Steel
Ferro Chrome
CokeTotal of
Reportable Segments
Special Steel
Ferro Chrome
CokeTotal of
Reportable Segments
Segment Results (1,120.07) 3,116.29 (2,397.50) (401.28) (1,014.10) 1,170.96 (1,417.27) (1,260.41)
Corporate-Unallocated / Others (Net)
- - - 310.36 - - - 210.27
Finance Costs - - - 465.80 - - - 4,848.38
Provision for Taxation - Current Tax
- - - - - - - -
MAT Credit Entitlement - - - - - - - (274.70)
Tax Expenses-Deferred tax(Charge)/Credit
- - - - - - - -
Profit / (Loss) after tax as per Financial Statements
(1,120.07) 3,116.29 (2,397.50) (1,177.44) (1,014.10) 1,170.96 (1,417.27) (6,593.76)
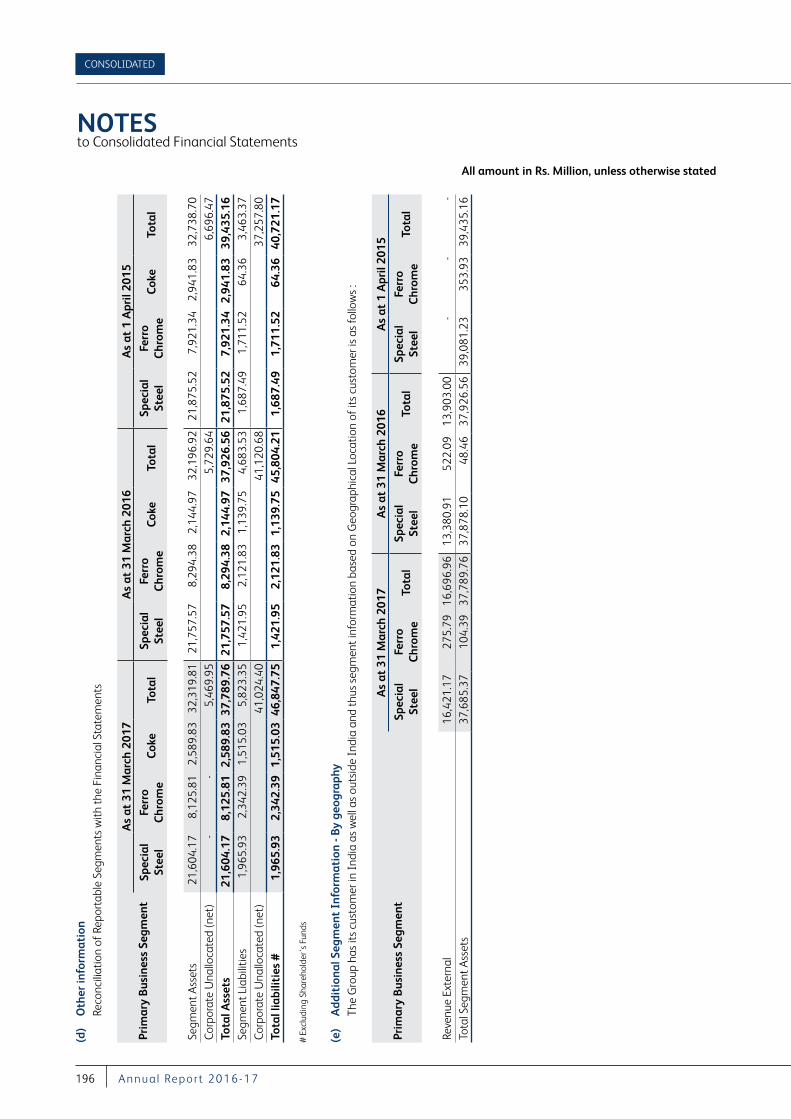
All amount in Rs. Million, unless otherwise stated
NOTES to Consolidated Financial Statements
CONSOLIDATED
196 A nnu a l Repor t 2016-17
(d)
Oth
er in
form
atio
n
Reco
ncili
atio
n of
Rep
orta
ble
Segm
ents
with
the
Fina
ncia
l Sta
tem
ents
Prim
ary
Bus
ines
s Se
gmen
tA
s at
31
Mar
ch 2
017
As
at 3
1 M
arch
201
6A
s at
1 A
pril
2015
Spec
ial
Stee
lFe
rro
Chr
ome
Cok
eTo
tal
Spec
ial
Stee
lFe
rro
Chr
ome
Cok
eTo
tal
Spec
ial
Stee
lFe
rro
Chr
ome
Cok
eTo
tal
Segm
ent A
sset
s 2
1,60
4.17
8
,125
.81
2,5
89.8
3 3
2,31
9.81
2
1,75
7.57
8
,294
.38
2,1
44.9
7 3
2,19
6.92
2
1,87
5.52
7
,921
.34
2,9
41.8
3 3
2,73
8.70
Co
rpor
ate
Una
lloca
ted
(net
) -
- 5,
469.
95 5
,729
.64
6,6
96.4
7 To
tal A
sset
s 2
1,60
4.17
8
,125
.81
2,5
89.8
3 3
7,78
9.76
21
,757
.57
8,2
94.3
8 2
,144
.97
37,
926.
56
21,8
75.5
2 7
,921
.34
2,9
41.8
3 3
9,43
5.16
Se
gmen
t Lia
bilit
ies
1,9
65.9
3 2
,342
.39
1,5
15.0
3 5
,823
.35
1,4
21.9
5 2
,121
.83
1,1
39.7
5 4
,683
.53
1,6
87.4
9 1
,711
.52
64.
36
3,4
63.3
7 Co
rpor
ate
Una
lloca
ted
(net
) 4
1,02
4.40
4
1,12
0.68
3
7,25
7.80
To
tal l
iabi
litie
s #
1,9
65.9
3 2
,342
.39
1,5
15.0
3 4
6,84
7.75
1
,421
.95
2,1
21.8
3 1
,139
.75
45,
804.
21
1,6
87.4
9 1
,711
.52
64.3
6 4
0,72
1.17
# Ex
clud
ing
Shar
ehol
der’
s Fu
nds
(e)
Add
itio
nal S
egm
ent
Info
rmat
ion
- By
geog
raph
y
The
Gro
up h
as it
s cu
stom
er in
Ind
ia a
s w
ell a
s ou
tsid
e In
dia
and
thus
seg
men
t inf
orm
atio
n ba
sed
on G
eogr
aphi
cal L
ocat
ion
of it
s cu
stom
er is
as
follo
ws
:
Prim
ary
Bus
ines
s Se
gmen
tA
s at
31
Mar
ch 2
017
As
at 3
1 M
arch
201
6A
s at
1 A
pril
2015
Spec
ial
Stee
lFe
rro
Chr
ome
Tota
lSp
ecia
l St
eel
Ferr
o C
hrom
eTo
tal
Spec
ial
Stee
lFe
rro
Chr
ome
Tota
l
Reve
nue
Exte
rnal
16,
421.
17
275
.79
16,
696.
96
13,
380.
91
522
.09
13,
903.
00
- -
- To
tal S
egm
ent A
sset
s 37
,685
.37
104
.39
37,
789.
76
37,
878.
10
48.
46
37,
926.
56
39,0
81.2
3 3
53.9
3 39
,435
.16
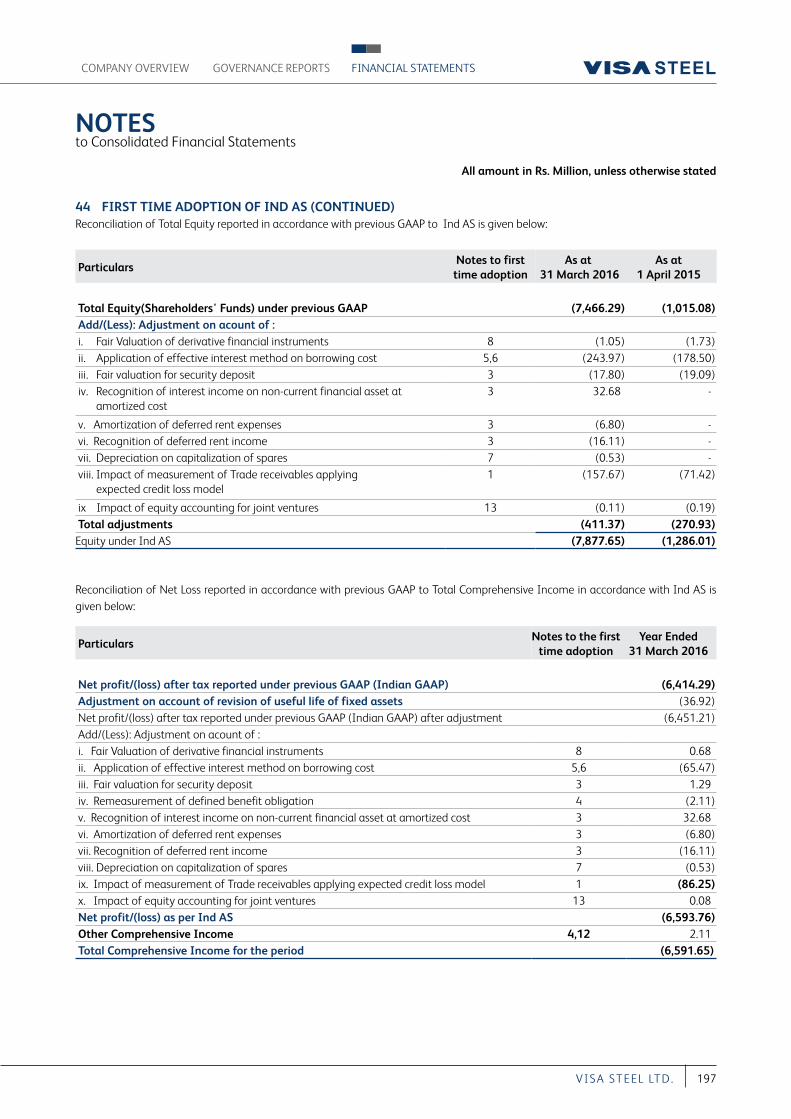
All amount in Rs. Million, unless otherwise stated
NOTES to Consolidated Financial Statements
COMPANY OVERVIEW FINANCIAL STATEMENTSGOVERNANCE REPORTS
197VI S A S T EEL LT D.
44 FIRST TIME ADOPTION OF IND AS (CONTINUED)Reconciliation of Total Equity reported in accordance with previous GAAP to Ind AS is given below:
ParticularsNotes to first time adoption
As at 31 March 2016
As at 1 April 2015
Total Equity(Shareholders' Funds) under previous GAAP (7,466.29) (1,015.08)Add/(Less): Adjustment on acount of :i. Fair Valuation of derivative financial instruments 8 (1.05) (1.73)ii. Application of effective interest method on borrowing cost 5,6 (243.97) (178.50)iii. Fair valuation for security deposit 3 (17.80) (19.09)iv. Recognition of interest income on non-current financial asset at
amortized cost 3 32.68 -
v. Amortization of deferred rent expenses 3 (6.80) - vi. Recognition of deferred rent income 3 (16.11) - vii. Depreciation on capitalization of spares 7 (0.53) - viii. Impact of measurement of Trade receivables applying
expected credit loss model1 (157.67) (71.42)
ix Impact of equity accounting for joint ventures 13 (0.11) (0.19)Total adjustments (411.37) (270.93)
Equity under Ind AS (7,877.65) (1,286.01)
Reconciliation of Net Loss reported in accordance with previous GAAP to Total Comprehensive Income in accordance with Ind AS is given below:
ParticularsNotes to the first
time adoptionYear Ended
31 March 2016
Net profit/(loss) after tax reported under previous GAAP (Indian GAAP) (6,414.29)Adjustment on account of revision of useful life of fixed assets (36.92)Net profit/(loss) after tax reported under previous GAAP (Indian GAAP) after adjustment (6,451.21)Add/(Less): Adjustment on acount of :i. Fair Valuation of derivative financial instruments 8 0.68 ii. Application of effective interest method on borrowing cost 5,6 (65.47)iii. Fair valuation for security deposit 3 1.29 iv. Remeasurement of defined benefit obligation 4 (2.11)v. Recognition of interest income on non-current financial asset at amortized cost 3 32.68 vi. Amortization of deferred rent expenses 3 (6.80)vii. Recognition of deferred rent income 3 (16.11)viii. Depreciation on capitalization of spares 7 (0.53)ix. Impact of measurement of Trade receivables applying expected credit loss model 1 (86.25)x. Impact of equity accounting for joint ventures 13 0.08 Net profit/(loss) as per Ind AS (6,593.76)Other Comprehensive Income 4,12 2.11 Total Comprehensive Income for the period (6,591.65)
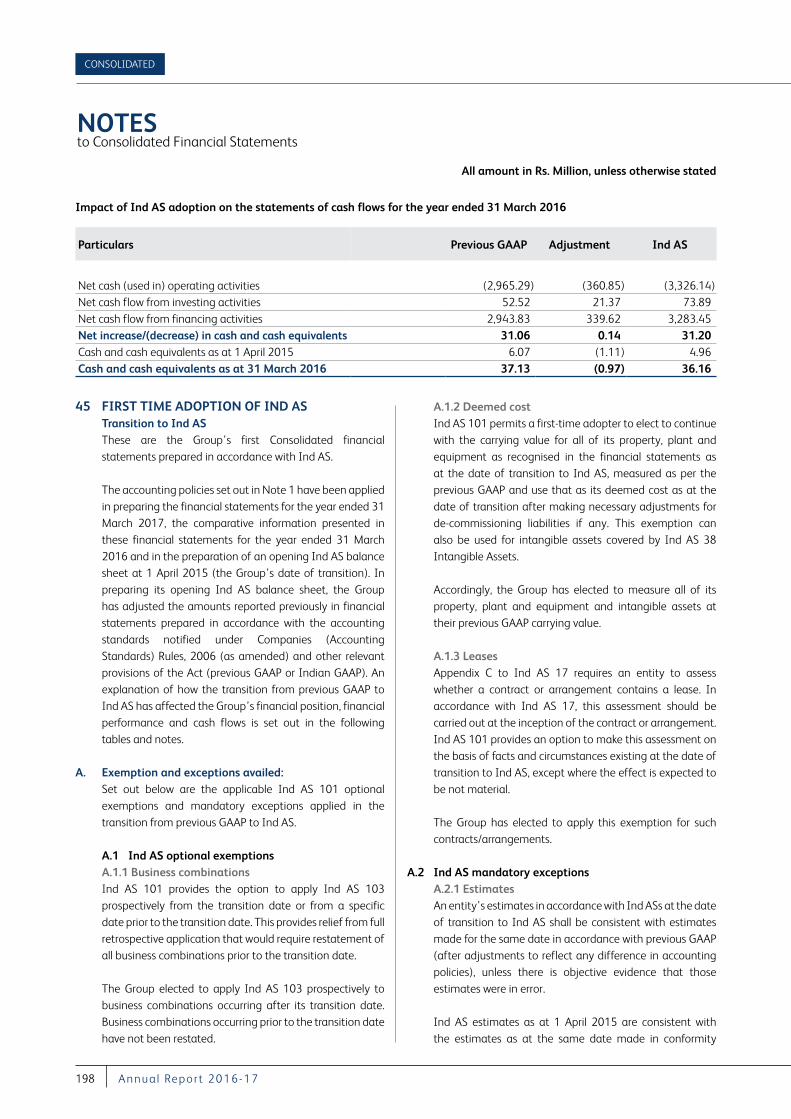
All amount in Rs. Million, unless otherwise stated
NOTES to Consolidated Financial Statements
CONSOLIDATED
198 A nnu a l Repor t 2016-17
Impact of Ind AS adoption on the statements of cash flows for the year ended 31 March 2016
Particulars Previous GAAP Adjustment Ind AS
Net cash (used in) operating activities (2,965.29) (360.85) (3,326.14)Net cash flow from investing activities 52.52 21.37 73.89 Net cash flow from financing activities 2,943.83 339.62 3,283.45 Net increase/(decrease) in cash and cash equivalents 31.06 0.14 31.20 Cash and cash equivalents as at 1 April 2015 6.07 (1.11) 4.96 Cash and cash equivalents as at 31 March 2016 37.13 (0.97) 36.16
45 FIRST TIME ADOPTION OF IND AS Transition to Ind AS These are the Group’s first Consolidated financial
statements prepared in accordance with Ind AS.
The accounting policies set out in Note 1 have been applied in preparing the financial statements for the year ended 31 March 2017, the comparative information presented in these financial statements for the year ended 31 March 2016 and in the preparation of an opening Ind AS balance sheet at 1 April 2015 (the Group’s date of transition). In preparing its opening Ind AS balance sheet, the Group has adjusted the amounts reported previously in financial statements prepared in accordance with the accounting standards notified under Companies (Accounting Standards) Rules, 2006 (as amended) and other relevant provisions of the Act (previous GAAP or Indian GAAP). An explanation of how the transition from previous GAAP to Ind AS has affected the Group’s financial position, financial performance and cash flows is set out in the following tables and notes.
A. Exemption and exceptions availed: Set out below are the applicable Ind AS 101 optional
exemptions and mandatory exceptions applied in the transition from previous GAAP to Ind AS.
A.1 Ind AS optional exemptions A.1.1 Business combinations Ind AS 101 provides the option to apply Ind AS 103
prospectively from the transition date or from a specific date prior to the transition date. This provides relief from full retrospective application that would require restatement of all business combinations prior to the transition date.
The Group elected to apply Ind AS 103 prospectively to business combinations occurring after its transition date. Business combinations occurring prior to the transition date have not been restated.
A.1.2 Deemed cost Ind AS 101 permits a first-time adopter to elect to continue
with the carrying value for all of its property, plant and equipment as recognised in the financial statements as at the date of transition to Ind AS, measured as per the previous GAAP and use that as its deemed cost as at the date of transition after making necessary adjustments for de-commissioning liabilities if any. This exemption can also be used for intangible assets covered by Ind AS 38 Intangible Assets.
Accordingly, the Group has elected to measure all of its property, plant and equipment and intangible assets at their previous GAAP carrying value.
A.1.3 Leases Appendix C to Ind AS 17 requires an entity to assess
whether a contract or arrangement contains a lease. In accordance with Ind AS 17, this assessment should be carried out at the inception of the contract or arrangement. Ind AS 101 provides an option to make this assessment on the basis of facts and circumstances existing at the date of transition to Ind AS, except where the effect is expected to be not material.
The Group has elected to apply this exemption for such contracts/arrangements.
A.2 Ind AS mandatory exceptions A.2.1 Estimates An entity’s estimates in accordance with Ind ASs at the date
of transition to Ind AS shall be consistent with estimates made for the same date in accordance with previous GAAP (after adjustments to reflect any difference in accounting policies), unless there is objective evidence that those estimates were in error.
Ind AS estimates as at 1 April 2015 are consistent with the estimates as at the same date made in conformity
All amount in Rs. Million, unless otherwise stated
NOTES to Consolidated Financial Statements
COMPANY OVERVIEW FINANCIAL STATEMENTSGOVERNANCE REPORTS
199VI S A S T EEL LT D.
with previous GAAP. The Group made estimates for following items in accordance with Ind AS at the date of transition as these were not required under previous GAAP: - Impairment of financial assets based on expected credit loss model.
A.2.2 De-recognition of financial assets and liabilities Ind AS 101 requires a first-time adopter to apply the de-
recognition provisions of Ind AS 109 prospectively for transactions occurring on or after the date of transition to Ind AS. However, Ind AS 101 allows a first-time adopter to apply the de-recognition requirements in Ind AS 109 retrospectively from a date of the entity’s choosing, provided that the information needed to apply Ind AS 109 to financial assets and financial liabilities derecognised as a result of past transactions was obtained at the time of initially accounting for those transactions.
The Group has elected to apply the de-recognition provisions of Ind AS 109 prospectively from the date of transition to Ind AS.
Note 1: Trade receivables As per Ind AS 109, the Group is required to apply expected
credit loss model for recognising the allowance for doubtful debts. As a result, the allowance for doubtful debts increased by Rs. 157.67 Million as at 31 March 2016 (1 April 2015 : Rs. 71.42 Million). Consequently, the total equity as at 31 March 2016 decreased by Rs. 157.67 Million (1 April 2015 : Rs. 71.42 Million) and loss for the year ended 31 March 2016 increased by Rs. 86.25 Million.
Note 2: Excise duty Under the previous GAAP, revenue from sale of products was
presented exclusive of excise duty. Under Ind AS, revenue from sale of goods is presented inclusive of excise duty. The excise duty paid is presented on the face of the statement of profit and loss as part of expenses. This change has resulted in an increase in total revenue and total expenses for the year ended 31 March 2016 by 871.39 Million. There is no impact on the total equity as at 31 March 2016 and loss for the year ended on that date.
Note 3: Security deposit Under the previous GAAP, interest free lease security
deposits (that are refundable in cash on completion of the lease term) are recorded at their transaction value. Under Ind AS, all financial assets are required to be recognised at fair value. Accordingly, the Group has fair valued these security deposits under Ind AS.
Difference between the fair value and transaction value of the security deposit has been recognised as Security Deposit considered as Advance Rent paid. Consequent to this change, the amount of security deposits decreased by 95.57 million as at 31 March 2016 (1 April 2015 115.93 Million). The security deposit considered as advance rent paid increased by 77.77 Million as at 31 March 2016 (1 April 2015 - 96.84 Million). Total equity decreased by 19.09 Million as on 1 April 2015. The loss for the year ended 31 March 2016 increased by Rs. 9.77 Million due to amortisation of the prepaid rent of 22.91 Million which is partially off-set by the notional interest income of Rs. 32.68 Million recognised on security deposits.
Note 4: Remeasurements of post-employment benefit obligations
Under Ind AS, remeasurements i.e. actuarial gains and losses and the return on plan assets, excluding amounts included in the net interest expense on the net defined benefit liability are recognised in other comprehensive income instead of profit or loss. Under the previous GAAP, these remeasurements were forming part of the profit or loss for the year. As a result of this change, the loss for the year ended 31 March 2016 Increases by Rs. 2.11 Million. There is no impact of this adjustment on the total equity as at 31 March 2016.
Note 5: Borrowings - Transaction cost Ind AS 109 requires transaction costs incurred towards
origination of borrowings to be adjusted from the carrying amount of borrowings on initial recognition. These costs are recognised in the profit or loss over the tenure of the borrowing as part of the interest expense by applying the effective interest rate method.
Under previous GAAP, these transaction costs were charged to profit or loss as and when incurred. Accordingly, borrowings as at 31 March 2016 have been reduced by Rs. 13.49 Million (1 April 2015 7.27 Million) with a corresponding adjustment to retained earnings. The total equity increased by an equivalent amount. The loss for the year ended 31 March 2016 has increased by Rs. 6.22 Million as a result of the additional interest expense.
Note 6: Borrowings - Step up interest rate Ind AS 109 requires step up interest rate to be adjusted from
the carrying amount of borrowings on initial recognition. These costs are recognised in the profit or loss over the tenure of the borrowing as part of the interest expense by applying the effective interest rate method.
All amount in Rs. Million, unless otherwise stated
NOTES to Consolidated Financial Statements
CONSOLIDATED
200 A nnu a l Repor t 2016-17
Under previous GAAP, these transaction costs were charged to profit or loss based on interest rate applicable for that period. Accordingly, Interest accrued as at 31 March 2016 has increased by Rs. 257.48 Million (1 April 2015 185.77 Million) with a corresponding adjustment to retained earnings. The total equity decreased by an equivalent amount. The loss for the year ended 31 March 2016 has increased by Rs. 71.71 million as a result of the additional interest expense.
Note 7: Depreciation on capital spares Ind AS 16 requires items of capital spares(i.e spare parts,
service equipment etc. that meet the definition of property, plant and equipment) are to be classified as property plant and equipment and to be depreciated accordingly. As a result capital spares of Rs.14.96 Million as at 31 March 2016 (1 April 2015 : Rs. 11.11 Million) were reclassified from inventory to property plant and equipment. The profit for the year and total equity as at 31 March 2016 decreased by Rs. 0.53 Million due to depreciation on such capital spares classified as property plant and equipment.
Note 8: Derivative instruments Ind AS 109 requires all the derivative financial instruments
to be recorded at fair value. This fair value is generally determined on mark to market basis. Under previous GAAP, only losses on these derivative financial instruments were recognized in the books of account and gains (if any) were ignored. Upon recognition of such mark to market gains as at 31 March 2016 total equity has decreased by Rs. 1.05 Million (1 April 2015 : Rs. 1.73 Million) with a increase in profit by Rs. 0.68 Million for the year ended 31 March 2016.
Note 9: Bill discounting Ind AS 109 requires entity to derecognize a financial asset
when, and only when the contractual rights to the cash flows from the financial asset expire, or it transfers the financial asset as and the transfer qualifies for derecognition. Para B2 of Ind AS 101 states that except as permitted, a first-time adopter shall apply the derecognition requirements in Ind AS 109 prospectively for transactions occurring on or after the date of transition to Ind ASs. As a result, trade receivables increased by 363.24 Million as at 31 March 2016 with a corresponding impact on current borrowings. Accordingly, the said adjustment has no impact on either equity or loss for the year ended 31 March 2016. However, this reclassification has impacted the cash flows from Operating and Financing activities.
Note 10: Deferred Tax Asset - MAT credit entitlement Ind AS 12 requires the carryforward of unused tax credits to
be classified as deferred tax asset. Accordingly an amount of Rs. 274.70 Million have been reclassified to deferred tax asset from other loans and advances as on 1 April 2015. This has no impact on total equity.
Note 11: Retained earnings Retained earnings as at 1 April 2015 has been adjusted
consequent to the above Ind AS transition adjustments, where applicable.
Note 12: Other comprehensive income Under Ind AS, all items of income and expense recognised
in a period should be included in profit or loss for the period, unless a standard requires or permits otherwise. Items of income and expense that are not recognised in profit or loss but are shown in the statement of profit and loss as ‘Other Comprehensive Income’ includes remeasurements of defined benefit plans, foreign exchange differences arising on translation of foreign operations etc. The concept of other comprehensive income did not exist under previous GAAP.”
Note 13: Equity pick up accounting for investment in joint venture
Under Ind AS, investment in joint ventures are to be accounted using equity method. Hence the investment in joint ventures have been consolidated using equity pick up accounting and total equity decreased by 0.11 Million as at 31 March 2016 (1 April 2015 : Rs. 0.19 Million) with a increase in profit by Rs. 0.08 Million for the year ended 31 March 2016.
46 AMALGAMATION OF SUBSIDIARY COMPANY(a) Pursuant to the Scheme of Amalgamation of VISA BAO
Limited (“VBL” or “the Transferor Company”), an erstwhile subsidiary Company, with VISA Steel Limited (“the Parent Company” or “the Transferee Company”) filed under section 391 to 394 and other applicable provisions of Companies Act,1956 (“the Sanctioned Scheme”) sanctioned by the National Company Law Tribunal, Kolkata (“NCLT”) vide its Order dated 12 October 2017, the whole of the undertaking of VBL including its assets, properties and liabilities stands transferred to and vested in the Company with effect from 1 April 2015 (“the Appointed Date”). Certified copy of the said Order of NCLT sanctioning the Scheme has been filed by both VBL and the Parent Company with the Registrar of
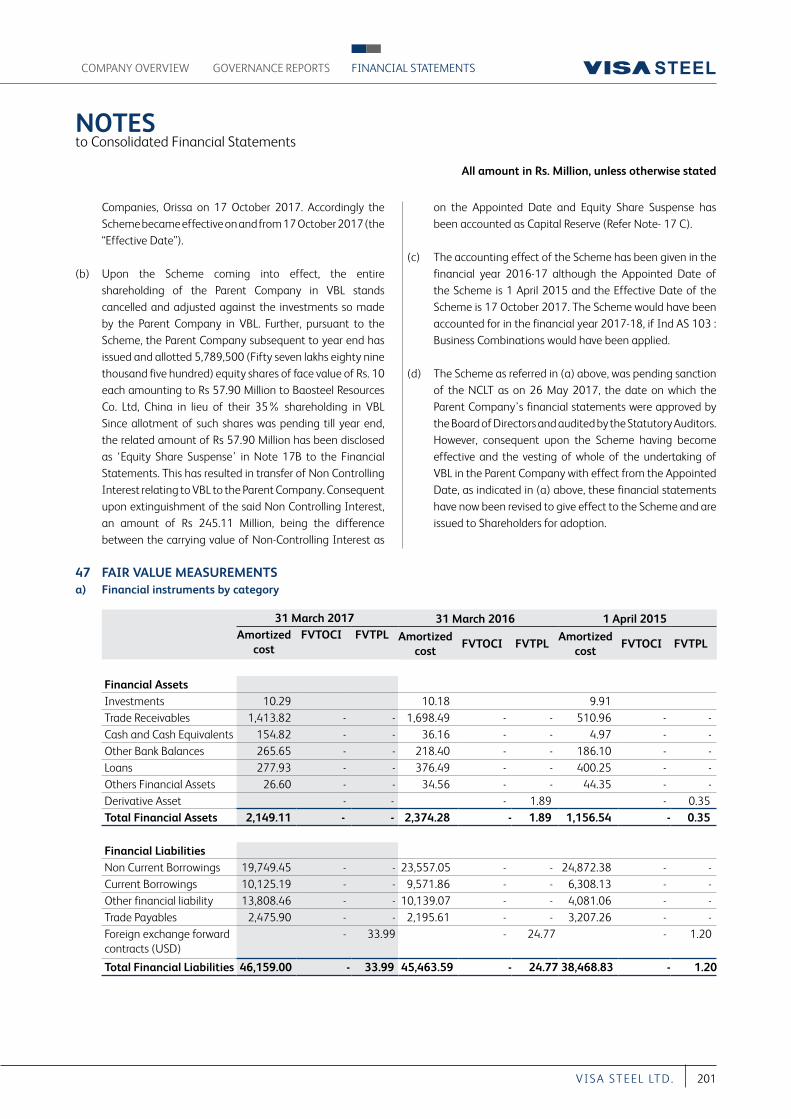
All amount in Rs. Million, unless otherwise stated
NOTES to Consolidated Financial Statements
COMPANY OVERVIEW FINANCIAL STATEMENTSGOVERNANCE REPORTS
201VI S A S T EEL LT D.
Companies, Orissa on 17 October 2017. Accordingly the Scheme became effective on and from 17 October 2017 (the “Effective Date”).
(b) Upon the Scheme coming into effect, the entire shareholding of the Parent Company in VBL stands cancelled and adjusted against the investments so made by the Parent Company in VBL. Further, pursuant to the Scheme, the Parent Company subsequent to year end has issued and allotted 5,789,500 (Fifty seven lakhs eighty nine thousand five hundred) equity shares of face value of Rs. 10 each amounting to Rs 57.90 Million to Baosteel Resources Co. Ltd, China in lieu of their 35% shareholding in VBL Since allotment of such shares was pending till year end, the related amount of Rs 57.90 Million has been disclosed as ‘Equity Share Suspense’ in Note 17B to the Financial Statements. This has resulted in transfer of Non Controlling Interest relating to VBL to the Parent Company. Consequent upon extinguishment of the said Non Controlling Interest, an amount of Rs 245.11 Million, being the difference between the carrying value of Non-Controlling Interest as
on the Appointed Date and Equity Share Suspense has been accounted as Capital Reserve (Refer Note- 17 C).
(c) The accounting effect of the Scheme has been given in the financial year 2016-17 although the Appointed Date of the Scheme is 1 April 2015 and the Effective Date of the Scheme is 17 October 2017. The Scheme would have been accounted for in the financial year 2017-18, if Ind AS 103 : Business Combinations would have been applied.
(d) The Scheme as referred in (a) above, was pending sanction of the NCLT as on 26 May 2017, the date on which the Parent Company’s financial statements were approved by the Board of Directors and audited by the Statutory Auditors. However, consequent upon the Scheme having become effective and the vesting of whole of the undertaking of VBL in the Parent Company with effect from the Appointed Date, as indicated in (a) above, these financial statements have now been revised to give effect to the Scheme and are issued to Shareholders for adoption.
47 FAIR VALUE MEASUREMENTSa) Financial instruments by category
31 March 2017 31 March 2016 1 April 2015Amortized
costFVTOCI FVTPL Amortized
costFVTOCI FVTPL
Amortized cost
FVTOCI FVTPL
Financial AssetsInvestments 10.29 10.18 9.91Trade Receivables 1,413.82 - - 1,698.49 - - 510.96 - -Cash and Cash Equivalents 154.82 - - 36.16 - - 4.97 - -Other Bank Balances 265.65 - - 218.40 - - 186.10 - -Loans 277.93 - - 376.49 - - 400.25 - -Others Financial Assets 26.60 - - 34.56 - - 44.35 - -Derivative Asset - - - 1.89 - 0.35 Total Financial Assets 2,149.11 - - 2,374.28 - 1.89 1,156.54 - 0.35
Financial LiabilitiesNon Current Borrowings 19,749.45 - - 23,557.05 - - 24,872.38 - -Current Borrowings 10,125.19 - - 9,571.86 - - 6,308.13 - -Other financial liability 13,808.46 - - 10,139.07 - - 4,081.06 - -Trade Payables 2,475.90 - - 2,195.61 - - 3,207.26 - -Foreign exchange forward contracts (USD)
- 33.99 - 24.77 - 1.20
Total Financial Liabilities 46,159.00 - 33.99 45,463.59 - 24.77 38,468.83 - 1.20
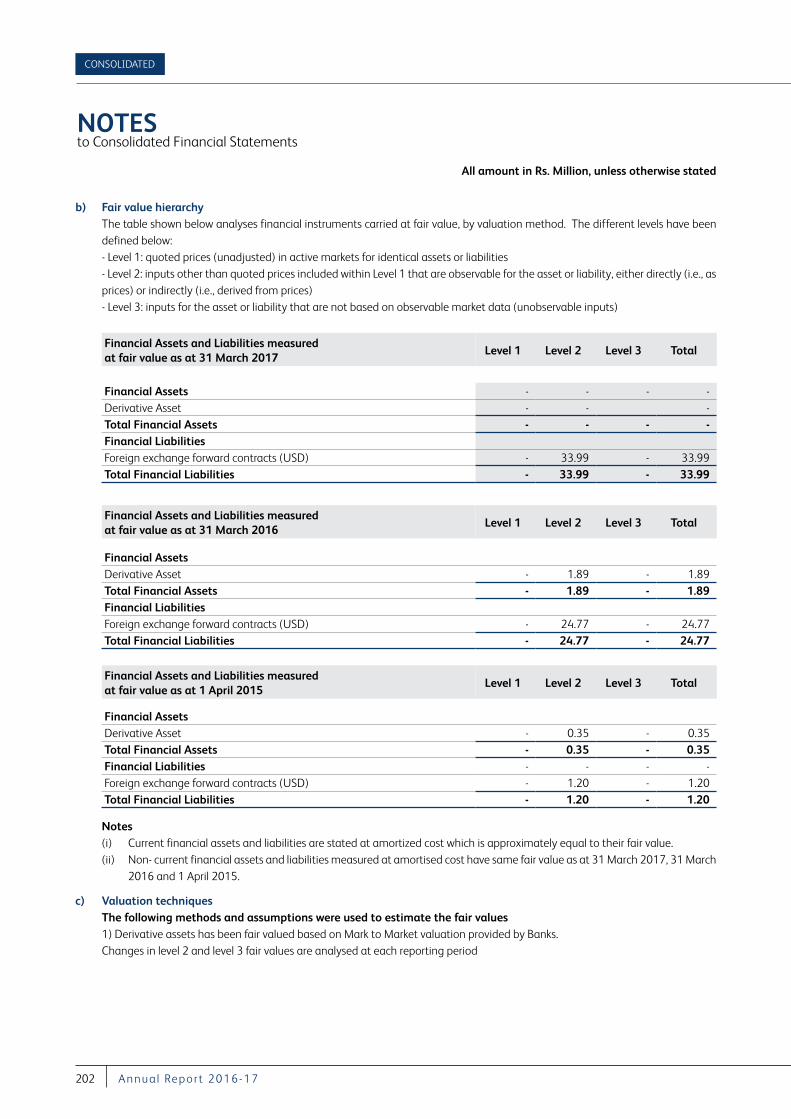
All amount in Rs. Million, unless otherwise stated
NOTES to Consolidated Financial Statements
CONSOLIDATED
202 A nnu a l Repor t 2016-17
b) Fair value hierarchy The table shown below analyses financial instruments carried at fair value, by valuation method. The different levels have been
defined below: - Level 1: quoted prices (unadjusted) in active markets for identical assets or liabilities - Level 2: inputs other than quoted prices included within Level 1 that are observable for the asset or liability, either directly (i.e., as
prices) or indirectly (i.e., derived from prices) - Level 3: inputs for the asset or liability that are not based on observable market data (unobservable inputs)
Financial Assets and Liabilities measured at fair value as at 31 March 2017
Level 1 Level 2 Level 3 Total
Financial Assets - - - -Derivative Asset - - - Total Financial Assets - - - - Financial LiabilitiesForeign exchange forward contracts (USD) - 33.99 - 33.99 Total Financial Liabilities - 33.99 - 33.99
Financial Assets and Liabilities measured at fair value as at 31 March 2016
Level 1 Level 2 Level 3 Total
Financial AssetsDerivative Asset - 1.89 - 1.89 Total Financial Assets - 1.89 - 1.89 Financial LiabilitiesForeign exchange forward contracts (USD) - 24.77 - 24.77 Total Financial Liabilities - 24.77 - 24.77
Financial Assets and Liabilities measured at fair value as at 1 April 2015
Level 1 Level 2 Level 3 Total
Financial Assets Derivative Asset - 0.35 - 0.35 Total Financial Assets - 0.35 - 0.35 Financial Liabilities - - - - Foreign exchange forward contracts (USD) - 1.20 - 1.20 Total Financial Liabilities - 1.20 - 1.20
Notes (i) Current financial assets and liabilities are stated at amortized cost which is approximately equal to their fair value. (ii) Non- current financial assets and liabilities measured at amortised cost have same fair value as at 31 March 2017, 31 March
2016 and 1 April 2015.
c) Valuation techniques The following methods and assumptions were used to estimate the fair values 1) Derivative assets has been fair valued based on Mark to Market valuation provided by Banks. Changes in level 2 and level 3 fair values are analysed at each reporting period
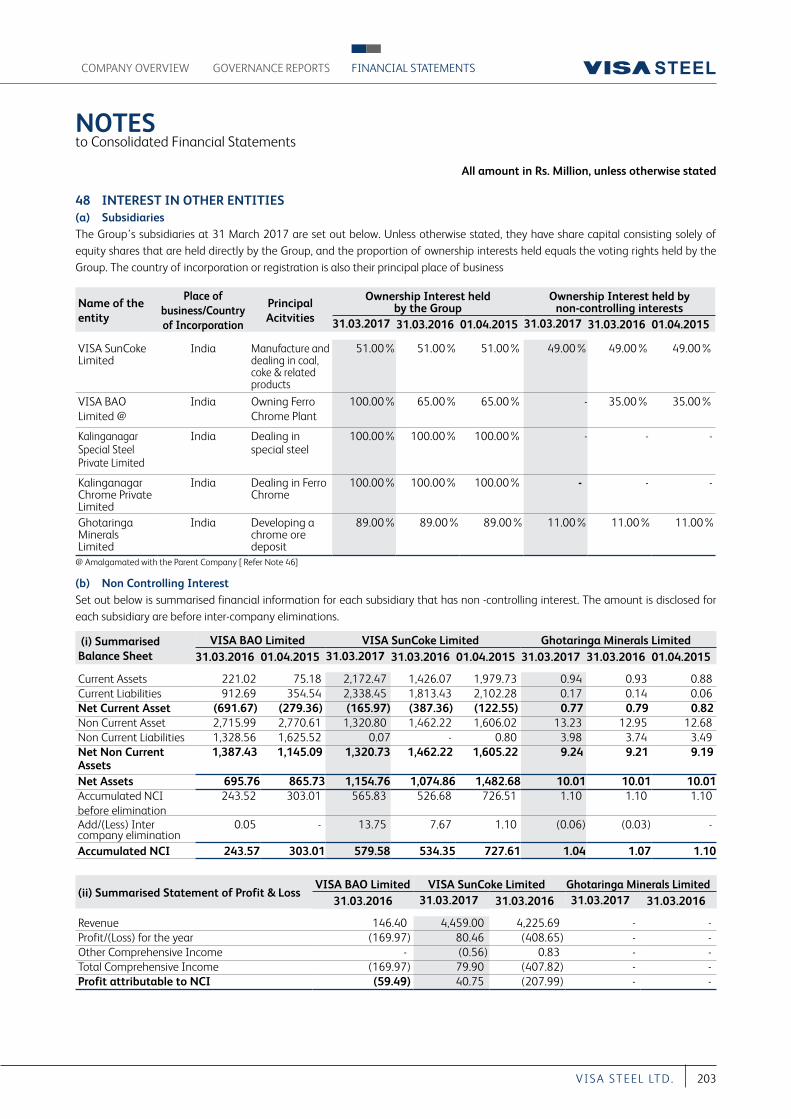
All amount in Rs. Million, unless otherwise stated
NOTES to Consolidated Financial Statements
COMPANY OVERVIEW FINANCIAL STATEMENTSGOVERNANCE REPORTS
203VI S A S T EEL LT D.
48 INTEREST IN OTHER ENTITIES(a) SubsidiariesThe Group’s subsidiaries at 31 March 2017 are set out below. Unless otherwise stated, they have share capital consisting solely of equity shares that are held directly by the Group, and the proportion of ownership interests held equals the voting rights held by the Group. The country of incorporation or registration is also their principal place of business
Name of the entity
Place of business/Country of Incorporation
Principal Acitvities
Ownership Interest held by the Group
Ownership Interest held by non-controlling interests
31.03.2017 31.03.2016 01.04.2015 31.03.2017 31.03.2016 01.04.2015
VISA SunCoke Limited
India Manufacture and dealing in coal, coke & related products
51.00% 51.00% 51.00% 49.00% 49.00% 49.00%
VISA BAO Limited @
India Owning Ferro Chrome Plant
100.00% 65.00% 65.00% - 35.00% 35.00%
Kalinganagar Special Steel Private Limited
India Dealing in special steel
100.00% 100.00% 100.00% - - -
Kalinganagar Chrome Private Limited
India Dealing in Ferro Chrome
100.00% 100.00% 100.00% - - -
Ghotaringa Minerals Limited
India Developing a chrome ore deposit
89.00% 89.00% 89.00% 11.00% 11.00% 11.00%
@ Amalgamated with the Parent Company [ Refer Note 46]
(b) Non Controlling Interest Set out below is summarised financial information for each subsidiary that has non -controlling interest. The amount is disclosed for each subsidiary are before inter-company eliminations.
(i) Summarised Balance Sheet
VISA BAO Limited VISA SunCoke Limited Ghotaringa Minerals Limited31.03.2016 01.04.2015 31.03.2017 31.03.2016 01.04.2015 31.03.2017 31.03.2016 01.04.2015
Current Assets 221.02 75.18 2,172.47 1,426.07 1,979.73 0.94 0.93 0.88 Current Liabilities 912.69 354.54 2,338.45 1,813.43 2,102.28 0.17 0.14 0.06 Net Current Asset (691.67) (279.36) (165.97) (387.36) (122.55) 0.77 0.79 0.82 Non Current Asset 2,715.99 2,770.61 1,320.80 1,462.22 1,606.02 13.23 12.95 12.68 Non Current Liabilities 1,328.56 1,625.52 0.07 - 0.80 3.98 3.74 3.49 Net Non Current Assets
1,387.43 1,145.09 1,320.73 1,462.22 1,605.22 9.24 9.21 9.19
Net Assets 695.76 865.73 1,154.76 1,074.86 1,482.68 10.01 10.01 10.01 Accumulated NCI before elimination
243.52 303.01 565.83 526.68 726.51 1.10 1.10 1.10
Add/(Less) Inter company elimination
0.05 - 13.75 7.67 1.10 (0.06) (0.03) -
Accumulated NCI 243.57 303.01 579.58 534.35 727.61 1.04 1.07 1.10
(ii) Summarised Statement of Profit & Loss VISA BAO Limited VISA SunCoke Limited Ghotaringa Minerals Limited
31.03.2016 31.03.2017 31.03.2016 31.03.2017 31.03.2016
Revenue 146.40 4,459.00 4,225.69 - -Profit/(Loss) for the year (169.97) 80.46 (408.65) - -Other Comprehensive Income - (0.56) 0.83 - -Total Comprehensive Income (169.97) 79.90 (407.82) - -Profit attributable to NCI (59.49) 40.75 (207.99) - -
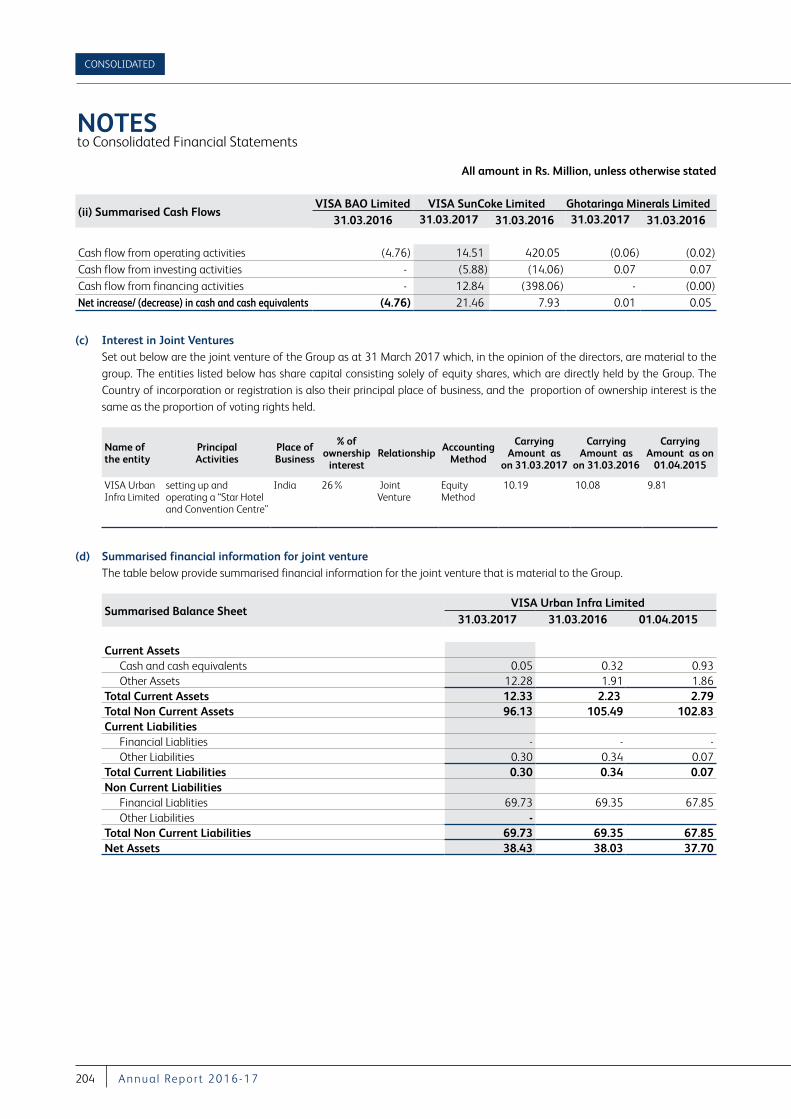
All amount in Rs. Million, unless otherwise stated
NOTES to Consolidated Financial Statements
CONSOLIDATED
204 A nnu a l Repor t 2016-17
(ii) Summarised Cash Flows VISA BAO Limited VISA SunCoke Limited Ghotaringa Minerals Limited
31.03.2016 31.03.2017 31.03.2016 31.03.2017 31.03.2016
Cash flow from operating activities (4.76) 14.51 420.05 (0.06) (0.02)Cash flow from investing activities - (5.88) (14.06) 0.07 0.07 Cash flow from financing activities - 12.84 (398.06) - (0.00)Net increase/ (decrease) in cash and cash equivalents (4.76) 21.46 7.93 0.01 0.05
(c) Interest in Joint Ventures Set out below are the joint venture of the Group as at 31 March 2017 which, in the opinion of the directors, are material to the
group. The entities listed below has share capital consisting solely of equity shares, which are directly held by the Group. The Country of incorporation or registration is also their principal place of business, and the proportion of ownership interest is the same as the proportion of voting rights held.
Name of the entity
Principal Activities
Place of Business
% of ownership
interestRelationship Accounting
Method
Carrying Amount as
on 31.03.2017
Carrying Amount as
on 31.03.2016
Carrying Amount as on
01.04.2015
VISA Urban Infra Limited
setting up and operating a “Star Hotel and Convention Centre”
India 26% Joint Venture
Equity Method
10.19 10.08 9.81
(d) Summarised financial information for joint venture The table below provide summarised financial information for the joint venture that is material to the Group.
Summarised Balance SheetVISA Urban Infra Limited
31.03.2017 31.03.2016 01.04.2015
Current AssetsCash and cash equivalents 0.05 0.32 0.93Other Assets 12.28 1.91 1.86
Total Current Assets 12.33 2.23 2.79 Total Non Current Assets 96.13 105.49 102.83Current Liabilities
Financial Liablities - - -Other Liabilities 0.30 0.34 0.07
Total Current Liabilities 0.30 0.34 0.07 Non Current Liabilities
Financial Liablities 69.73 69.35 67.85Other Liabilities -
Total Non Current Liabilities 69.73 69.35 67.85 Net Assets 38.43 38.03 37.70
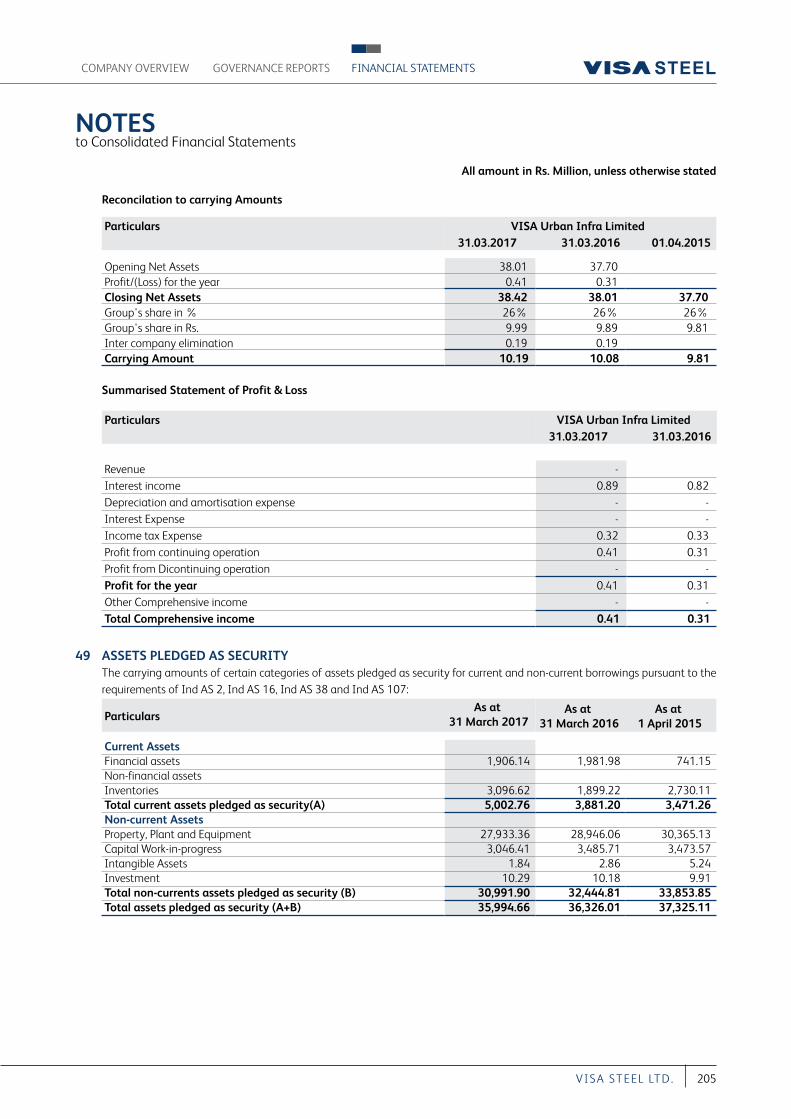
All amount in Rs. Million, unless otherwise stated
NOTES to Consolidated Financial Statements
COMPANY OVERVIEW FINANCIAL STATEMENTSGOVERNANCE REPORTS
205VI S A S T EEL LT D.
Reconcilation to carrying Amounts
Particulars VISA Urban Infra Limited31.03.2017 31.03.2016 01.04.2015
Opening Net Assets 38.01 37.70 Profit/(Loss) for the year 0.41 0.31 Closing Net Assets 38.42 38.01 37.70 Group's share in % 26% 26% 26%Group's share in Rs. 9.99 9.89 9.81 Inter company elimination 0.19 0.19 Carrying Amount 10.19 10.08 9.81
Summarised Statement of Profit & Loss
Particulars VISA Urban Infra Limited31.03.2017 31.03.2016
Revenue - Interest income 0.89 0.82 Depreciation and amortisation expense - -Interest Expense - - Income tax Expense 0.32 0.33 Profit from continuing operation 0.41 0.31 Profit from Dicontinuing operation - -Profit for the year 0.41 0.31 Other Comprehensive income - -Total Comprehensive income 0.41 0.31
49 ASSETS PLEDGED AS SECURITY The carrying amounts of certain categories of assets pledged as security for current and non-current borrowings pursuant to the
requirements of Ind AS 2, Ind AS 16, Ind AS 38 and Ind AS 107:
ParticularsAs at
31 March 2017 As at
31 March 2016 As at
1 April 2015
Current AssetsFinancial assets 1,906.14 1,981.98 741.15 Non-financial assetsInventories 3,096.62 1,899.22 2,730.11Total current assets pledged as security(A) 5,002.76 3,881.20 3,471.26Non-current AssetsProperty, Plant and Equipment 27,933.36 28,946.06 30,365.13Capital Work-in-progress 3,046.41 3,485.71 3,473.57Intangible Assets 1.84 2.86 5.24 Investment 10.29 10.18 9.91Total non-currents assets pledged as security (B) 30,991.90 32,444.81 33,853.85Total assets pledged as security (A+B) 35,994.66 36,326.01 37,325.11
All amount in Rs. Million, unless otherwise stated
NOTES to Consolidated Financial Statements
CONSOLIDATED
206 A nnu a l Repor t 2016-17
50 FINANCIAL RISK MANAGEMENT The Group’s principal financial liabilities comprise loans
and borrowings in domestic currency, trade payables and other payables. The main purpose of these financial liabilities is to finance the Group’s operations. The Group’s principal financial assets include loans, trade and other receivables, and cash and short-term deposits that derive directly from its operations. The Group also enters into derivative contracts.
The Group has exposure to the following risks from its use of financial instruments:
- Credit risk - Liquidity risk - Market risk
This note presents information about the Group’s exposure to each of the above risks and how the Group is managing such risk.
(A) Credit Risk Credit risk is the risk of financial loss to the Group if
a customer or counterparty to a financial instrument fails to meet its contractual obligations, and arises principally from the Group’s receivables from customers and others. In addition, credit risk arises from financial guarantees.
The Group implements a credit risk management policy under which the Group only transacts business with counterparties that have a certain level of credit worthiness based on internal assessment of parties, financial condition, historical experience,
and other factors. The Group’s exposure to credit risk is influenced mainly by the individual characteristics of each customer. The Group has established a credit policy under which each new customer is analyzed individually for creditworthiness. The Group establishes an allowance for impairment that represents its estimate of incurred losses in respect of trade and other receivables. The main components of this allowance are a specific loss component that relates to individually significant exposures, and a collective loss component that are expected to occur. The collective loss allowance is determined based on historical data of payment statistics for similar financial assets. Debt securities are analyzed individually, and an expected loss shall be directly deducted from debt securities. Credit risk also arises from transactions with financial institutions, and such transactions include transactions of cash and cash equivalents, various deposits, and financial instruments such as derivative contracts. The Group manages its exposure to this credit risk by only entering into transactions with banks that have high ratings. The Group’s treasury department authorizes, manages, and oversees new transactions with parties with whom the Group has no previous relationship. Furthermore, the Group limits its exposure to credit risk of financial guarantee contracts by strictly evaluating their necessity based on internal decision making processes, such as the approval of the board of directors.
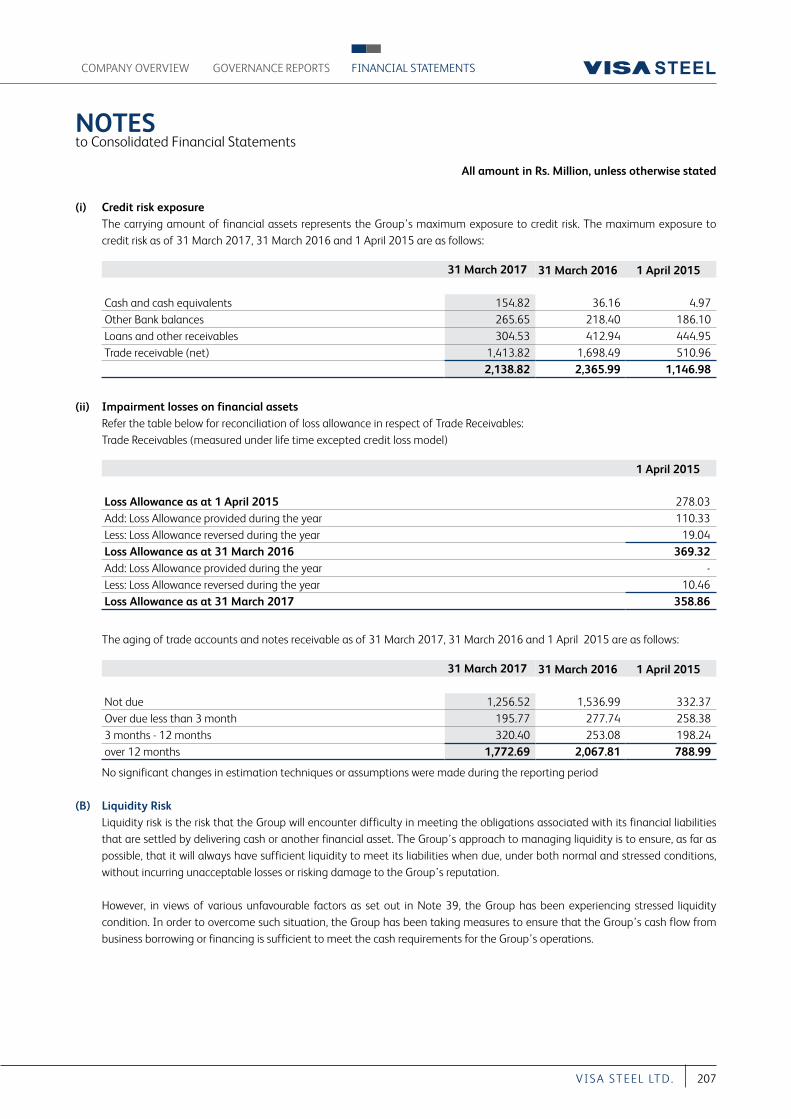
All amount in Rs. Million, unless otherwise stated
NOTES to Consolidated Financial Statements
COMPANY OVERVIEW FINANCIAL STATEMENTSGOVERNANCE REPORTS
207VI S A S T EEL LT D.
(i) Credit risk exposure The carrying amount of financial assets represents the Group’s maximum exposure to credit risk. The maximum exposure to
credit risk as of 31 March 2017, 31 March 2016 and 1 April 2015 are as follows:
31 March 2017 31 March 2016 1 April 2015
Cash and cash equivalents 154.82 36.16 4.97 Other Bank balances 265.65 218.40 186.10 Loans and other receivables 304.53 412.94 444.95 Trade receivable (net) 1,413.82 1,698.49 510.96
2,138.82 2,365.99 1,146.98
(ii) Impairment losses on financial assets Refer the table below for reconciliation of loss allowance in respect of Trade Receivables: Trade Receivables (measured under life time excepted credit loss model)
1 April 2015
Loss Allowance as at 1 April 2015 278.03 Add: Loss Allowance provided during the year 110.33 Less: Loss Allowance reversed during the year 19.04 Loss Allowance as at 31 March 2016 369.32 Add: Loss Allowance provided during the year - Less: Loss Allowance reversed during the year 10.46 Loss Allowance as at 31 March 2017 358.86
The aging of trade accounts and notes receivable as of 31 March 2017, 31 March 2016 and 1 April 2015 are as follows:
31 March 2017 31 March 2016 1 April 2015
Not due 1,256.52 1,536.99 332.37 Over due less than 3 month 195.77 277.74 258.38 3 months - 12 months 320.40 253.08 198.24 over 12 months 1,772.69 2,067.81 788.99
No significant changes in estimation techniques or assumptions were made during the reporting period
(B) Liquidity Risk Liquidity risk is the risk that the Group will encounter difficulty in meeting the obligations associated with its financial liabilities that are settled by delivering cash or another financial asset. The Group’s approach to managing liquidity is to ensure, as far as possible, that it will always have sufficient liquidity to meet its liabilities when due, under both normal and stressed conditions, without incurring unacceptable losses or risking damage to the Group’s reputation.
However, in views of various unfavourable factors as set out in Note 39, the Group has been experiencing stressed liquidity condition. In order to overcome such situation, the Group has been taking measures to ensure that the Group’s cash flow from business borrowing or financing is sufficient to meet the cash requirements for the Group’s operations.
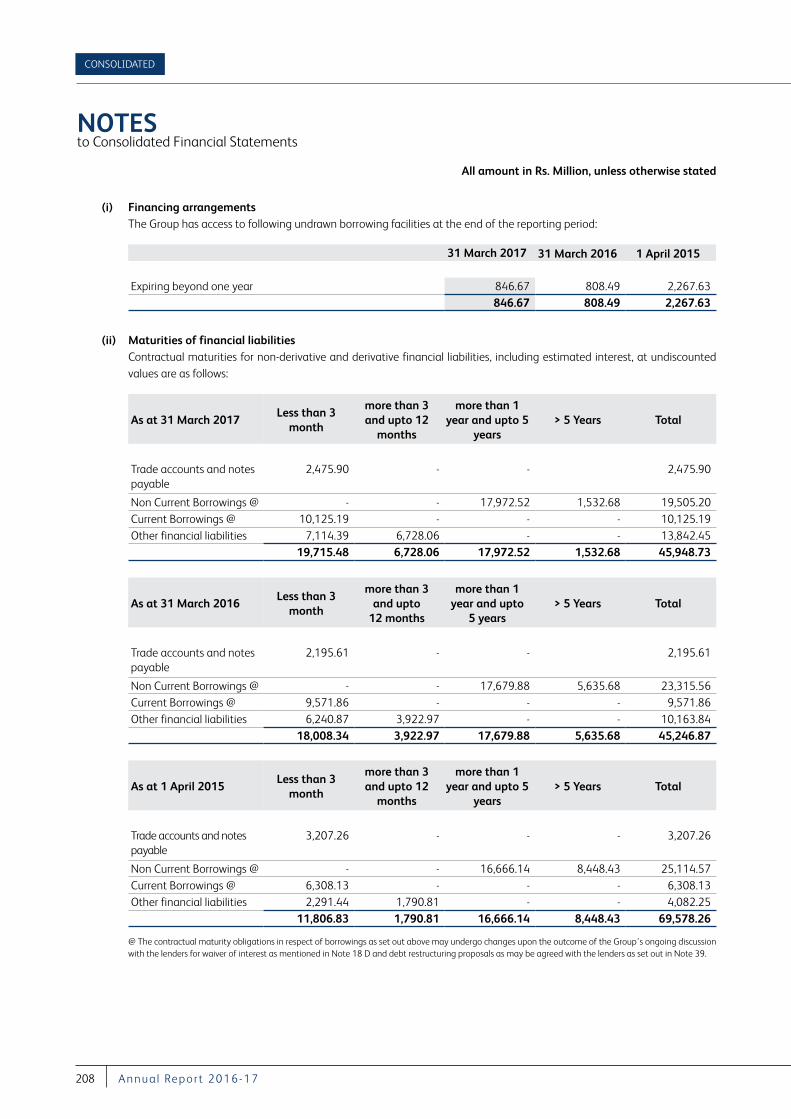
All amount in Rs. Million, unless otherwise stated
NOTES to Consolidated Financial Statements
CONSOLIDATED
208 A nnu a l Repor t 2016-17
(i) Financing arrangementsThe Group has access to following undrawn borrowing facilities at the end of the reporting period:
31 March 2017 31 March 2016 1 April 2015
Expiring beyond one year 846.67 808.49 2,267.63 846.67 808.49 2,267.63
(ii) Maturities of financial liabilities Contractual maturities for non-derivative and derivative financial liabilities, including estimated interest, at undiscounted
values are as follows:
As at 31 March 2017 Less than 3
month
more than 3 and upto 12
months
more than 1 year and upto 5
years> 5 Years Total
Trade accounts and notes payable
2,475.90 - - 2,475.90
Non Current Borrowings @ - - 17,972.52 1,532.68 19,505.20 Current Borrowings @ 10,125.19 - - - 10,125.19 Other financial liabilities 7,114.39 6,728.06 - - 13,842.45
19,715.48 6,728.06 17,972.52 1,532.68 45,948.73
As at 31 March 2016Less than 3
month
more than 3 and upto
12 months
more than 1 year and upto
5 years> 5 Years Total
Trade accounts and notes payable
2,195.61 - - 2,195.61
Non Current Borrowings @ - - 17,679.88 5,635.68 23,315.56 Current Borrowings @ 9,571.86 - - - 9,571.86 Other financial liabilities 6,240.87 3,922.97 - - 10,163.84
18,008.34 3,922.97 17,679.88 5,635.68 45,246.87
As at 1 April 2015Less than 3
month
more than 3 and upto 12
months
more than 1 year and upto 5
years> 5 Years Total
Trade accounts and notes payable
3,207.26 - - - 3,207.26
Non Current Borrowings @ - - 16,666.14 8,448.43 25,114.57 Current Borrowings @ 6,308.13 - - - 6,308.13 Other financial liabilities 2,291.44 1,790.81 - - 4,082.25
11,806.83 1,790.81 16,666.14 8,448.43 69,578.26
@ The contractual maturity obligations in respect of borrowings as set out above may undergo changes upon the outcome of the Group’s ongoing discussion with the lenders for waiver of interest as mentioned in Note 18 D and debt restructuring proposals as may be agreed with the lenders as set out in Note 39.
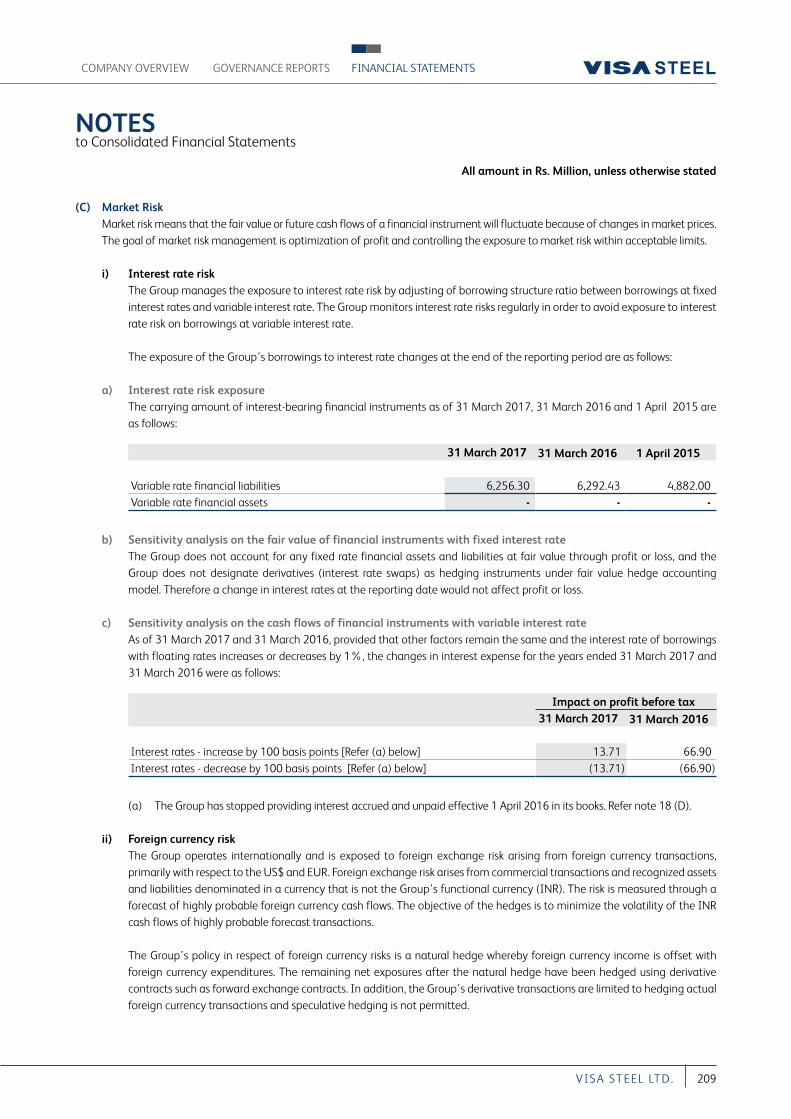
All amount in Rs. Million, unless otherwise stated
NOTES to Consolidated Financial Statements
COMPANY OVERVIEW FINANCIAL STATEMENTSGOVERNANCE REPORTS
209VI S A S T EEL LT D.
(C) Market Risk Market risk means that the fair value or future cash flows of a financial instrument will fluctuate because of changes in market prices.
The goal of market risk management is optimization of profit and controlling the exposure to market risk within acceptable limits.
i) Interest rate risk The Group manages the exposure to interest rate risk by adjusting of borrowing structure ratio between borrowings at fixed
interest rates and variable interest rate. The Group monitors interest rate risks regularly in order to avoid exposure to interest rate risk on borrowings at variable interest rate.
The exposure of the Group’s borrowings to interest rate changes at the end of the reporting period are as follows:
a) Interest rate risk exposure The carrying amount of interest-bearing financial instruments as of 31 March 2017, 31 March 2016 and 1 April 2015 are
as follows:
31 March 2017 31 March 2016 1 April 2015
Variable rate financial liabilities 6,256.30 6,292.43 4,882.00 Variable rate financial assets - - -
b) Sensitivity analysis on the fair value of financial instruments with fixed interest rateThe Group does not account for any fixed rate financial assets and liabilities at fair value through profit or loss, and the Group does not designate derivatives (interest rate swaps) as hedging instruments under fair value hedge accounting model. Therefore a change in interest rates at the reporting date would not affect profit or loss.
c) Sensitivity analysis on the cash flows of financial instruments with variable interest rateAs of 31 March 2017 and 31 March 2016, provided that other factors remain the same and the interest rate of borrowings with floating rates increases or decreases by 1%, the changes in interest expense for the years ended 31 March 2017 and 31 March 2016 were as follows:
Impact on profit before tax31 March 2017 31 March 2016
Interest rates - increase by 100 basis points [Refer (a) below] 13.71 66.90Interest rates - decrease by 100 basis points [Refer (a) below] (13.71) (66.90)
(a) The Group has stopped providing interest accrued and unpaid effective 1 April 2016 in its books. Refer note 18 (D).
ii) Foreign currency riskThe Group operates internationally and is exposed to foreign exchange risk arising from foreign currency transactions, primarily with respect to the US$ and EUR. Foreign exchange risk arises from commercial transactions and recognized assets and liabilities denominated in a currency that is not the Group’s functional currency (INR). The risk is measured through a forecast of highly probable foreign currency cash flows. The objective of the hedges is to minimize the volatility of the INR cash flows of highly probable forecast transactions.
The Group’s policy in respect of foreign currency risks is a natural hedge whereby foreign currency income is offset with foreign currency expenditures. The remaining net exposures after the natural hedge have been hedged using derivative contracts such as forward exchange contracts. In addition, the Group’s derivative transactions are limited to hedging actual foreign currency transactions and speculative hedging is not permitted.
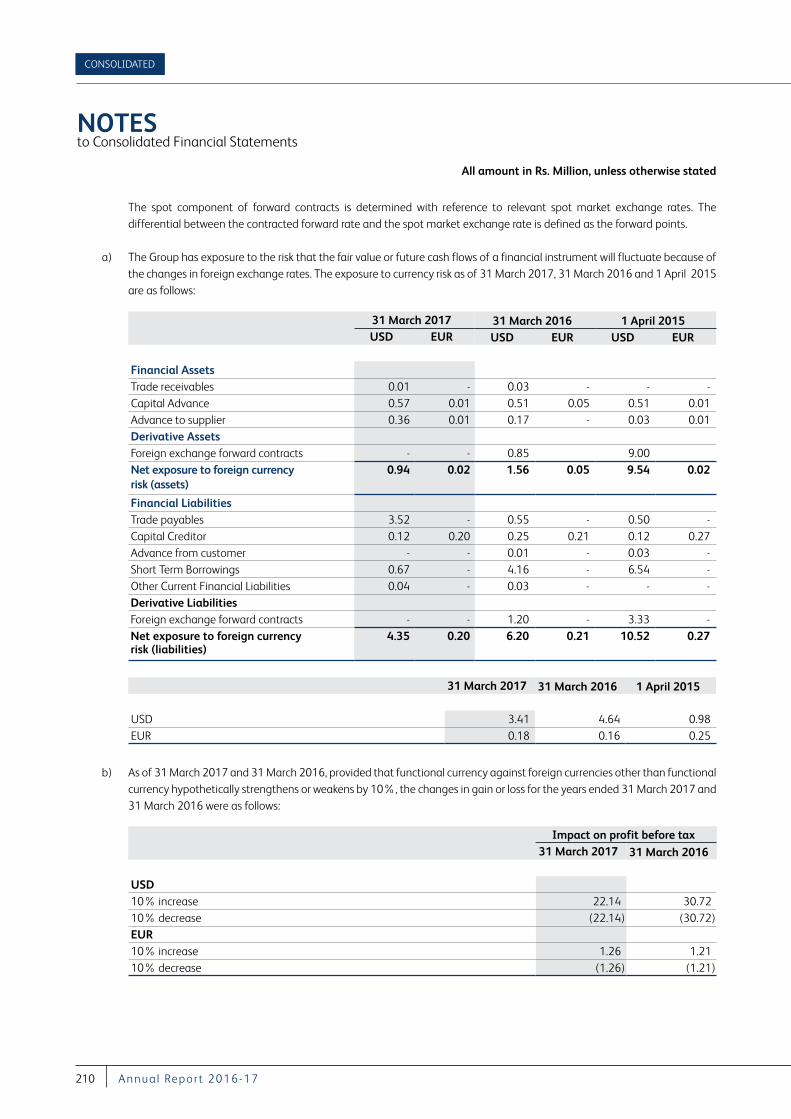
All amount in Rs. Million, unless otherwise stated
NOTES to Consolidated Financial Statements
CONSOLIDATED
210 A nnu a l Repor t 2016-17
The spot component of forward contracts is determined with reference to relevant spot market exchange rates. The differential between the contracted forward rate and the spot market exchange rate is defined as the forward points.
a) The Group has exposure to the risk that the fair value or future cash flows of a financial instrument will fluctuate because of the changes in foreign exchange rates. The exposure to currency risk as of 31 March 2017, 31 March 2016 and 1 April 2015 are as follows:
31 March 2017 31 March 2016 1 April 2015USD EUR USD EUR USD EUR
Financial AssetsTrade receivables 0.01 - 0.03 - - - Capital Advance 0.57 0.01 0.51 0.05 0.51 0.01 Advance to supplier 0.36 0.01 0.17 - 0.03 0.01 Derivative AssetsForeign exchange forward contracts - - 0.85 9.00 Net exposure to foreign currency risk (assets)
0.94 0.02 1.56 0.05 9.54 0.02
Financial LiabilitiesTrade payables 3.52 - 0.55 - 0.50 - Capital Creditor 0.12 0.20 0.25 0.21 0.12 0.27 Advance from customer - - 0.01 - 0.03 - Short Term Borrowings 0.67 - 4.16 - 6.54 - Other Current Financial Liabilities 0.04 - 0.03 - - - Derivative LiabilitiesForeign exchange forward contracts - - 1.20 - 3.33 - Net exposure to foreign currency risk (liabilities)
4.35 0.20 6.20 0.21 10.52 0.27
31 March 2017 31 March 2016 1 April 2015
USD 3.41 4.64 0.98 EUR 0.18 0.16 0.25
b) As of 31 March 2017 and 31 March 2016, provided that functional currency against foreign currencies other than functional currency hypothetically strengthens or weakens by 10%, the changes in gain or loss for the years ended 31 March 2017 and 31 March 2016 were as follows:
Impact on profit before tax31 March 2017 31 March 2016
USD10% increase 22.14 30.72 10% decrease (22.14) (30.72)EUR10% increase 1.26 1.21 10% decrease (1.26) (1.21)
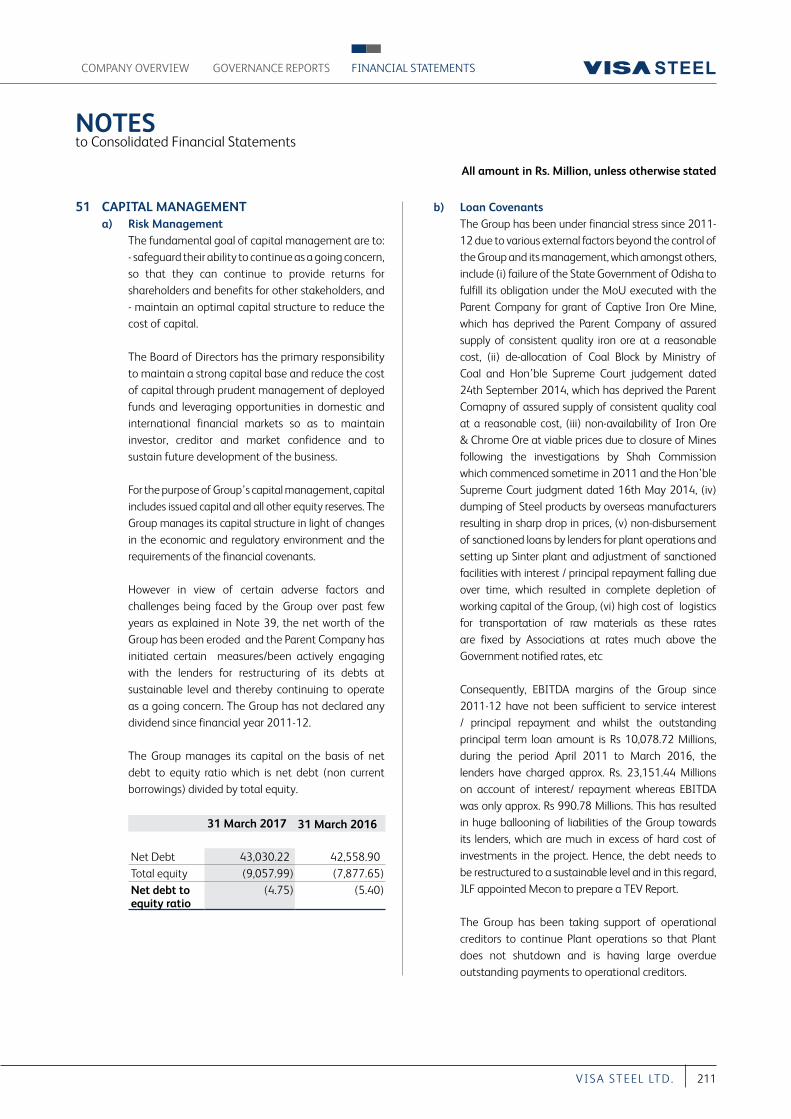
All amount in Rs. Million, unless otherwise stated
NOTES to Consolidated Financial Statements
COMPANY OVERVIEW FINANCIAL STATEMENTSGOVERNANCE REPORTS
211VI S A S T EEL LT D.
51 CAPITAL MANAGEMENT a) Risk Management The fundamental goal of capital management are to:
- safeguard their ability to continue as a going concern, so that they can continue to provide returns for shareholders and benefits for other stakeholders, and - maintain an optimal capital structure to reduce the cost of capital.
The Board of Directors has the primary responsibility to maintain a strong capital base and reduce the cost of capital through prudent management of deployed funds and leveraging opportunities in domestic and international financial markets so as to maintain investor, creditor and market confidence and to sustain future development of the business.
For the purpose of Group’s capital management, capital includes issued capital and all other equity reserves. The Group manages its capital structure in light of changes in the economic and regulatory environment and the requirements of the financial covenants.
However in view of certain adverse factors and challenges being faced by the Group over past few years as explained in Note 39, the net worth of the Group has been eroded and the Parent Company has initiated certain measures/been actively engaging with the lenders for restructuring of its debts at sustainable level and thereby continuing to operate as a going concern. The Group has not declared any dividend since financial year 2011-12.
The Group manages its capital on the basis of net debt to equity ratio which is net debt (non current borrowings) divided by total equity.
31 March 2017 31 March 2016
Net Debt 43,030.22 42,558.90 Total equity (9,057.99) (7,877.65)Net debt to equity ratio
(4.75) (5.40)
b) Loan Covenants The Group has been under financial stress since 2011-12 due to various external factors beyond the control of the Group and its management, which amongst others, include (i) failure of the State Government of Odisha to fulfill its obligation under the MoU executed with the Parent Company for grant of Captive Iron Ore Mine, which has deprived the Parent Company of assured supply of consistent quality iron ore at a reasonable cost, (ii) de-allocation of Coal Block by Ministry of Coal and Hon’ble Supreme Court judgement dated 24th September 2014, which has deprived the Parent Comapny of assured supply of consistent quality coal at a reasonable cost, (iii) non-availability of Iron Ore & Chrome Ore at viable prices due to closure of Mines following the investigations by Shah Commission which commenced sometime in 2011 and the Hon’ble Supreme Court judgment dated 16th May 2014, (iv) dumping of Steel products by overseas manufacturers resulting in sharp drop in prices, (v) non-disbursement of sanctioned loans by lenders for plant operations and setting up Sinter plant and adjustment of sanctioned facilities with interest / principal repayment falling due over time, which resulted in complete depletion of working capital of the Group, (vi) high cost of logistics for transportation of raw materials as these rates are fixed by Associations at rates much above the Government notified rates, etc
Consequently, EBITDA margins of the Group since 2011-12 have not been sufficient to service interest / principal repayment and whilst the outstanding principal term loan amount is Rs 10,078.72 Millions, during the period April 2011 to March 2016, the lenders have charged approx. Rs. 23,151.44 Millions on account of interest/ repayment whereas EBITDA was only approx. Rs 990.78 Millions. This has resulted in huge ballooning of liabilities of the Group towards its lenders, which are much in excess of hard cost of investments in the project. Hence, the debt needs to be restructured to a sustainable level and in this regard, JLF appointed Mecon to prepare a TEV Report.
The Group has been taking support of operational creditors to continue Plant operations so that Plant does not shutdown and is having large overdue outstanding payments to operational creditors.
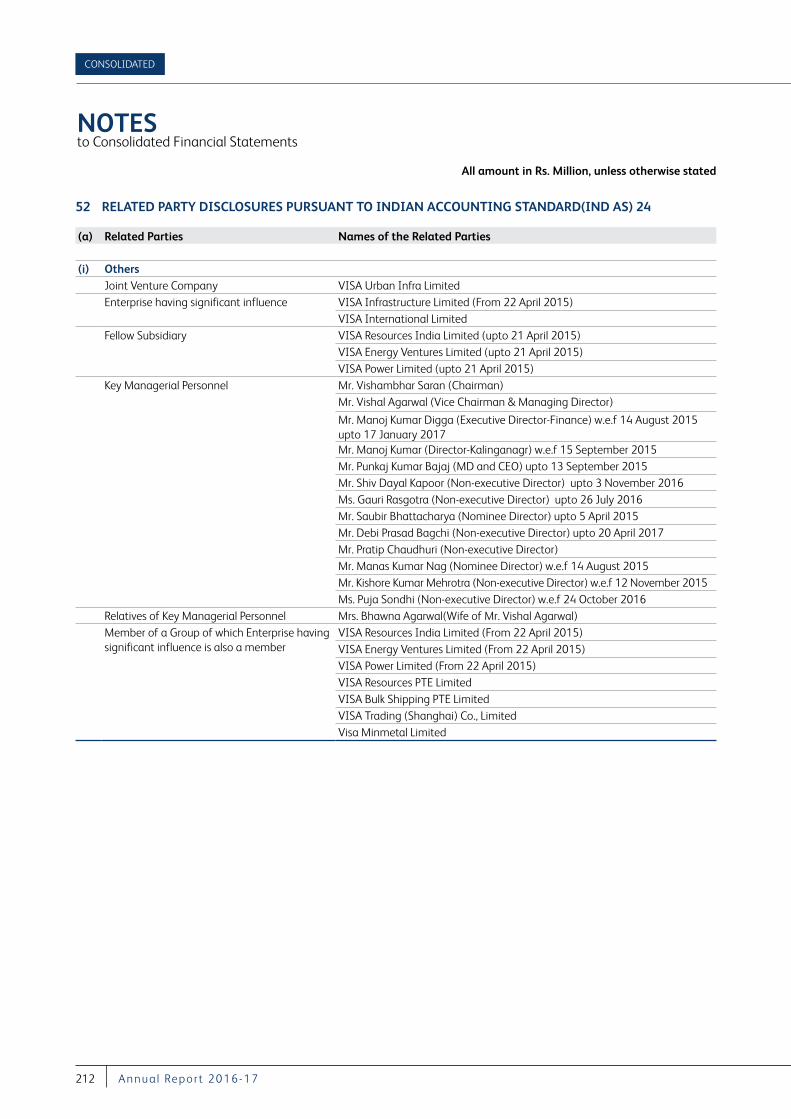
All amount in Rs. Million, unless otherwise stated
NOTES to Consolidated Financial Statements
CONSOLIDATED
212 A nnu a l Repor t 2016-17
52 RELATED PARTY DISCLOSURES PURSUANT TO INDIAN ACCOUNTING STANDARD(IND AS) 24
(a) Related Parties Names of the Related Parties
(i) OthersJoint Venture Company VISA Urban Infra LimitedEnterprise having significant influence VISA Infrastructure Limited (From 22 April 2015)
VISA International LimitedFellow Subsidiary VISA Resources India Limited (upto 21 April 2015)
VISA Energy Ventures Limited (upto 21 April 2015)VISA Power Limited (upto 21 April 2015)
Key Managerial Personnel Mr. Vishambhar Saran (Chairman)Mr. Vishal Agarwal (Vice Chairman & Managing Director)
Mr. Manoj Kumar Digga (Executive Director-Finance) w.e.f 14 August 2015 upto 17 January 2017Mr. Manoj Kumar (Director-Kalinganagr) w.e.f 15 September 2015Mr. Punkaj Kumar Bajaj (MD and CEO) upto 13 September 2015Mr. Shiv Dayal Kapoor (Non-executive Director) upto 3 November 2016Ms. Gauri Rasgotra (Non-executive Director) upto 26 July 2016Mr. Saubir Bhattacharya (Nominee Director) upto 5 April 2015Mr. Debi Prasad Bagchi (Non-executive Director) upto 20 April 2017Mr. Pratip Chaudhuri (Non-executive Director) Mr. Manas Kumar Nag (Nominee Director) w.e.f 14 August 2015Mr. Kishore Kumar Mehrotra (Non-executive Director) w.e.f 12 November 2015Ms. Puja Sondhi (Non-executive Director) w.e.f 24 October 2016
Relatives of Key Managerial Personnel Mrs. Bhawna Agarwal(Wife of Mr. Vishal Agarwal)Member of a Group of which Enterprise having significant influence is also a member
VISA Resources India Limited (From 22 April 2015)VISA Energy Ventures Limited (From 22 April 2015)VISA Power Limited (From 22 April 2015)VISA Resources PTE LimitedVISA Bulk Shipping PTE LimitedVISA Trading (Shanghai) Co., LimitedVisa Minmetal Limited
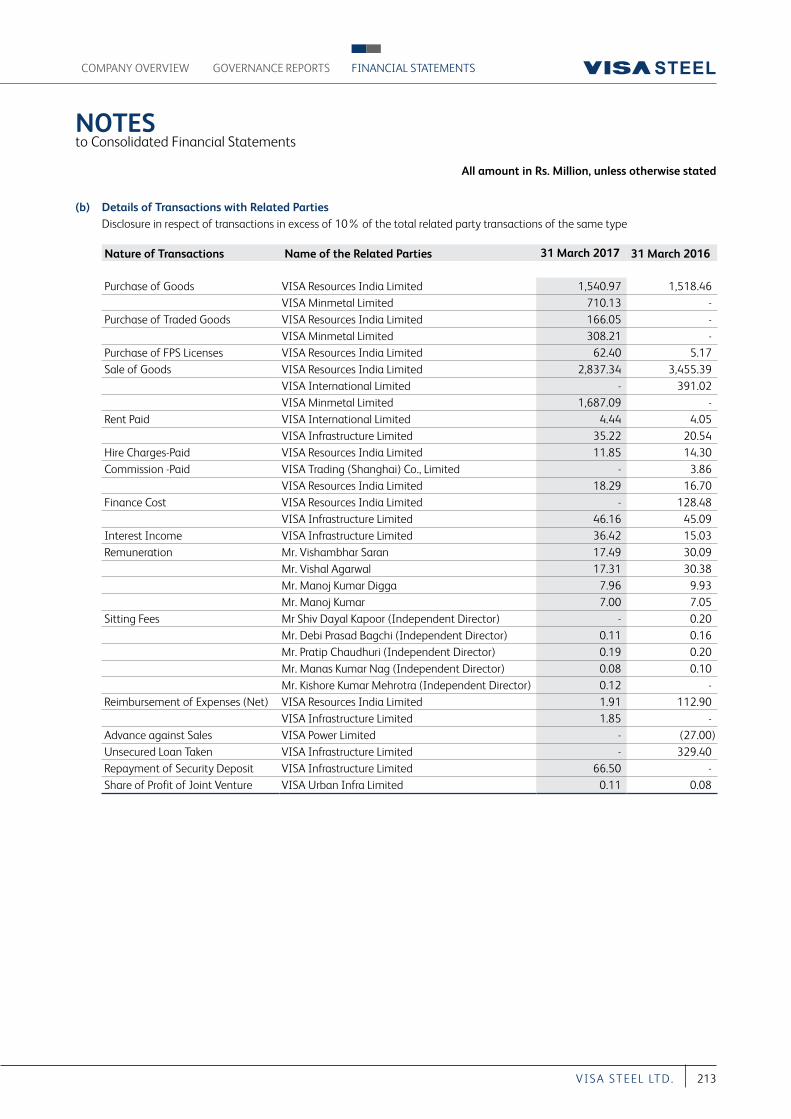
All amount in Rs. Million, unless otherwise stated
NOTES to Consolidated Financial Statements
COMPANY OVERVIEW FINANCIAL STATEMENTSGOVERNANCE REPORTS
213VI S A S T EEL LT D.
(b) Details of Transactions with Related Parties Disclosure in respect of transactions in excess of 10% of the total related party transactions of the same type
Nature of Transactions Name of the Related Parties 31 March 2017 31 March 2016
Purchase of Goods VISA Resources India Limited 1,540.97 1,518.46 VISA Minmetal Limited 710.13 -
Purchase of Traded Goods VISA Resources India Limited 166.05 - VISA Minmetal Limited 308.21 -
Purchase of FPS Licenses VISA Resources India Limited 62.40 5.17 Sale of Goods VISA Resources India Limited 2,837.34 3,455.39
VISA International Limited - 391.02 VISA Minmetal Limited 1,687.09 -
Rent Paid VISA International Limited 4.44 4.05 VISA Infrastructure Limited 35.22 20.54
Hire Charges-Paid VISA Resources India Limited 11.85 14.30 Commission -Paid VISA Trading (Shanghai) Co., Limited - 3.86
VISA Resources India Limited 18.29 16.70 Finance Cost VISA Resources India Limited - 128.48
VISA Infrastructure Limited 46.16 45.09 Interest Income VISA Infrastructure Limited 36.42 15.03 Remuneration Mr. Vishambhar Saran 17.49 30.09
Mr. Vishal Agarwal 17.31 30.38 Mr. Manoj Kumar Digga 7.96 9.93 Mr. Manoj Kumar 7.00 7.05
Sitting Fees Mr Shiv Dayal Kapoor (Independent Director) - 0.20 Mr. Debi Prasad Bagchi (Independent Director) 0.11 0.16 Mr. Pratip Chaudhuri (Independent Director) 0.19 0.20 Mr. Manas Kumar Nag (Independent Director) 0.08 0.10 Mr. Kishore Kumar Mehrotra (Independent Director) 0.12 -
Reimbursement of Expenses (Net) VISA Resources India Limited 1.91 112.90 VISA Infrastructure Limited 1.85 -
Advance against Sales VISA Power Limited - (27.00)Unsecured Loan Taken VISA Infrastructure Limited - 329.40 Repayment of Security Deposit VISA Infrastructure Limited 66.50 - Share of Profit of Joint Venture VISA Urban Infra Limited 0.11 0.08
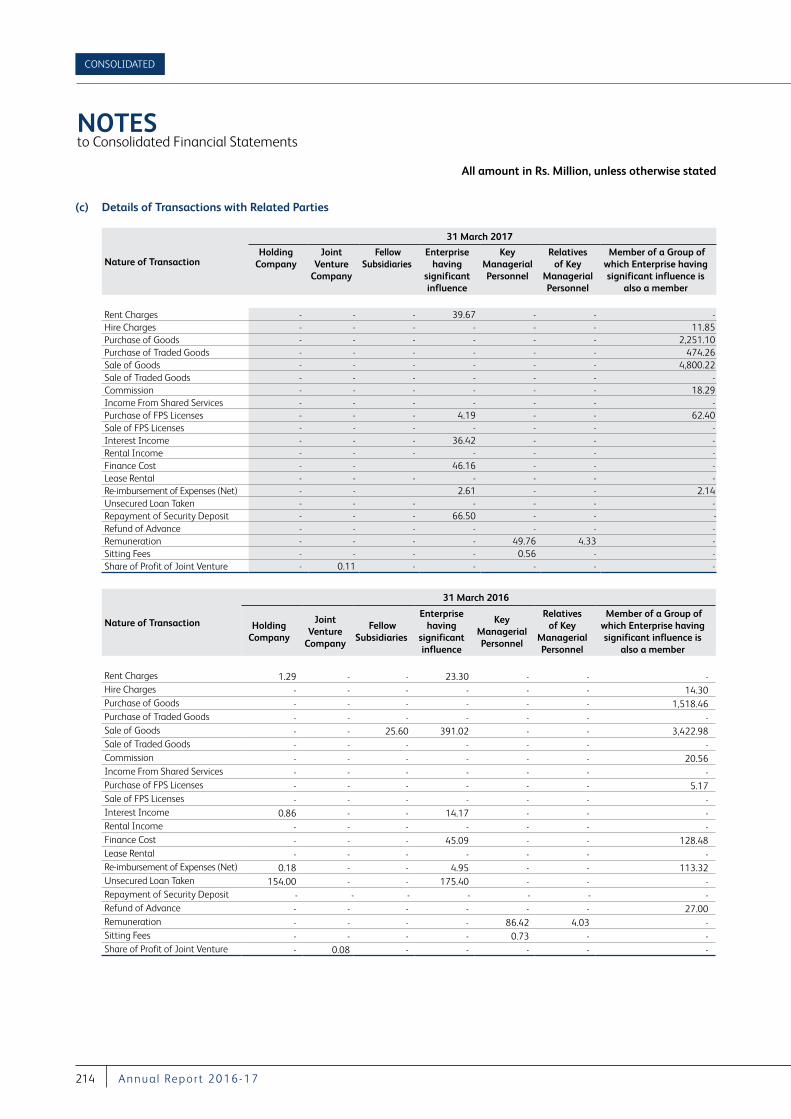
All amount in Rs. Million, unless otherwise stated
NOTES to Consolidated Financial Statements
CONSOLIDATED
214 A nnu a l Repor t 2016-17
(c) Details of Transactions with Related Parties
Nature of Transaction
31 March 2017
Holding Company
Joint Venture
Company
Fellow Subsidiaries
Enterprise having
significant influence
Key Managerial Personnel
Relatives of Key
Managerial Personnel
Member of a Group of which Enterprise having significant influence is
also a member
Rent Charges - - - 39.67 - - - Hire Charges - - - - - - 11.85Purchase of Goods - - - - - - 2,251.10 Purchase of Traded Goods - - - - - - 474.26 Sale of Goods - - - - - - 4,800.22 Sale of Traded Goods - - - - - - - Commission - - - - - - 18.29 Income From Shared Services - - - - - - - Purchase of FPS Licenses - - - 4.19 - - 62.40 Sale of FPS Licenses - - - - - - - Interest Income - - - 36.42 - - - Rental Income - - - - - - - Finance Cost - - 46.16 - - - Lease Rental - - - - - - - Re-imbursement of Expenses (Net) - - 2.61 - - 2.14 Unsecured Loan Taken - - - - - - - Repayment of Security Deposit - - - 66.50 - - - Refund of Advance - - - - - - - Remuneration - - - - 49.76 4.33 - Sitting Fees - - - - 0.56 - - Share of Profit of Joint Venture - 0.11 - - - - -
Nature of Transaction
31 March 2016
Holding Company
Joint Venture
Company
Fellow Subsidiaries
Enterprise having
significant influence
Key Managerial Personnel
Relatives of Key
Managerial Personnel
Member of a Group of which Enterprise having significant influence is
also a member
Rent Charges 1.29 - - 23.30 - - - Hire Charges - - - - - - 14.30 Purchase of Goods - - - - - - 1,518.46 Purchase of Traded Goods - - - - - - - Sale of Goods - - 25.60 391.02 - - 3,422.98 Sale of Traded Goods - - - - - - - Commission - - - - - - 20.56 Income From Shared Services - - - - - - - Purchase of FPS Licenses - - - - - - 5.17 Sale of FPS Licenses - - - - - - - Interest Income 0.86 - - 14.17 - - - Rental Income - - - - - - - Finance Cost - - - 45.09 - - 128.48 Lease Rental - - - - - - - Re-imbursement of Expenses (Net) 0.18 - - 4.95 - - 113.32 Unsecured Loan Taken 154.00 - - 175.40 - - - Repayment of Security Deposit - - - - - - -Refund of Advance - - - - - - 27.00 Remuneration - - - - 86.42 4.03 - Sitting Fees - - - - 0.73 - - Share of Profit of Joint Venture - 0.08 - - - - -
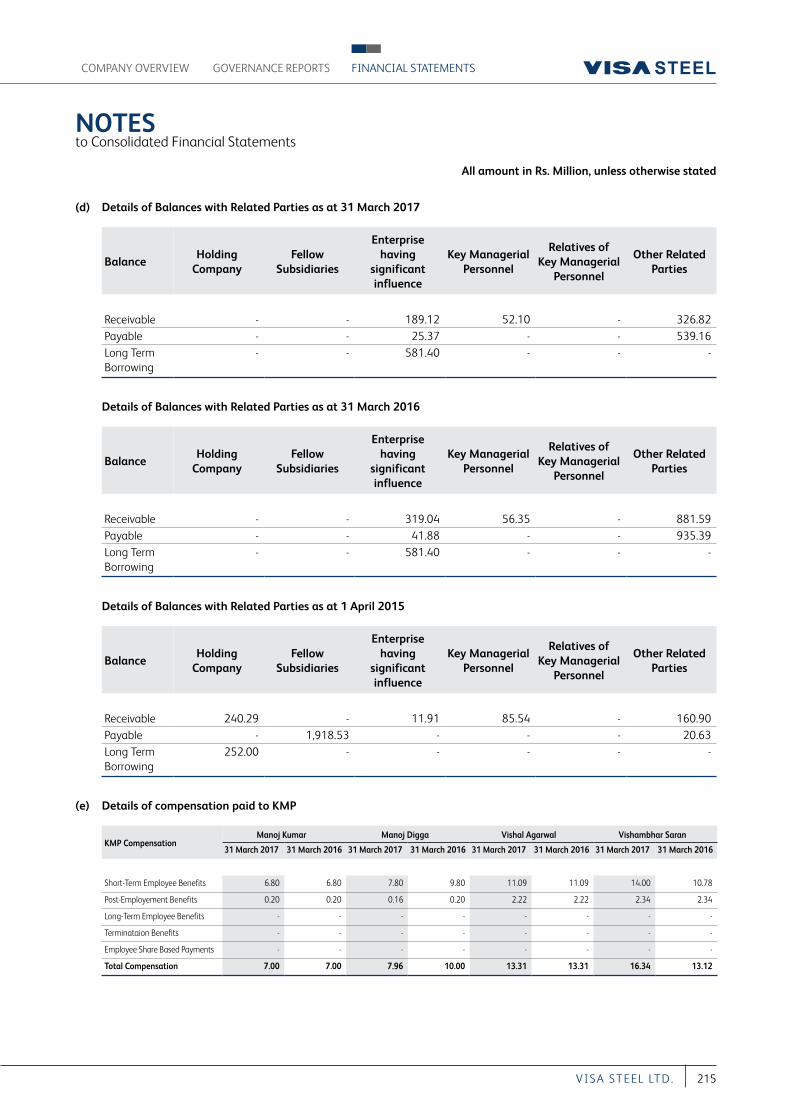
All amount in Rs. Million, unless otherwise stated
NOTES to Consolidated Financial Statements
COMPANY OVERVIEW FINANCIAL STATEMENTSGOVERNANCE REPORTS
215VI S A S T EEL LT D.
(d) Details of Balances with Related Parties as at 31 March 2017
BalanceHolding
CompanyFellow
Subsidiaries
Enterprise having
significant influence
Key Managerial Personnel
Relatives of Key Managerial
Personnel
Other Related Parties
Receivable - - 189.12 52.10 - 326.82 Payable - - 25.37 - - 539.16 Long Term Borrowing
- - 581.40 - - -
Details of Balances with Related Parties as at 31 March 2016
BalanceHolding
CompanyFellow
Subsidiaries
Enterprise having
significant influence
Key Managerial Personnel
Relatives of Key Managerial
Personnel
Other Related Parties
Receivable - - 319.04 56.35 - 881.59 Payable - - 41.88 - - 935.39 Long Term Borrowing
- - 581.40 - - -
Details of Balances with Related Parties as at 1 April 2015
BalanceHolding
CompanyFellow
Subsidiaries
Enterprise having
significant influence
Key Managerial Personnel
Relatives of Key Managerial
Personnel
Other Related Parties
Receivable 240.29 - 11.91 85.54 - 160.90 Payable - 1,918.53 - - - 20.63 Long Term Borrowing
252.00 - - - - -
(e) Details of compensation paid to KMP
KMP CompensationManoj Kumar Manoj Digga Vishal Agarwal Vishambhar Saran
31 March 2017 31 March 2016 31 March 2017 31 March 2016 31 March 2017 31 March 2016 31 March 2017 31 March 2016
Short-Term Employee Benefits 6.80 6.80 7.80 9.80 11.09 11.09 14.00 10.78
Post-Employement Benefits 0.20 0.20 0.16 0.20 2.22 2.22 2.34 2.34
Long-Term Employee Benefits - - - - - - - -
Terminataion Benefits - - - - - - - -
Employee Share Based Payments - - - - - - - -
Total Compensation 7.00 7.00 7.96 10.00 13.31 13.31 16.34 13.12
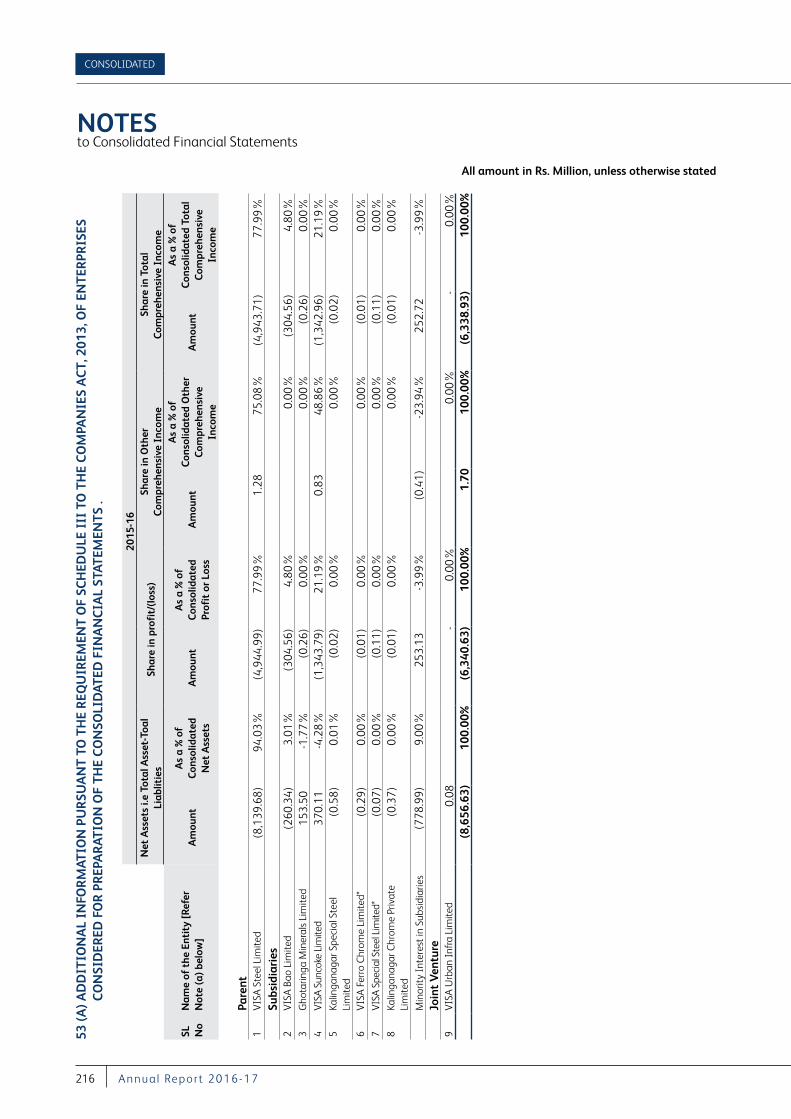
All amount in Rs. Million, unless otherwise stated
NOTES to Consolidated Financial Statements
CONSOLIDATED
216 A nnu a l Repor t 2016-17
53 (A
) AD
DIT
ION
AL
INFO
RM
ATIO
N P
UR
SUA
NT
TO
TH
E R
EQU
IREM
ENT
OF
SCH
EDU
LE I
II T
O T
HE
CO
MPA
NIE
S A
CT
, 201
3, O
F EN
TER
PRIS
ES
CO
NSI
DER
ED F
OR
PR
EPA
RAT
ION
OF
TH
E C
ON
SOLI
DAT
ED F
INA
NC
IAL
STAT
EMEN
TS
.
2015
-16
Net
Ass
ets
i.e T
otal
Ass
et-T
oal
Liab
litie
sSh
are
in p
rofi
t/(l
oss)
Shar
e in
Oth
er
Com
preh
ensi
ve I
ncom
eSh
are
in T
otal
C
ompr
ehen
sive
Inc
ome
SL
No
Nam
e of
the
Ent
ity
[Ref
er
Not
e (a
) bel
ow]
Am
ount
A
s a
% o
f C
onso
lidat
ed
Net
Ass
ets
Am
ount
As
a %
of
Con
solid
ated
Pr
ofit
or
Loss
Am
ount
As
a %
of
Con
solid
ated
Oth
er
Com
preh
ensi
ve
Inco
me
Am
ount
As
a %
of
Con
solid
ated
Tot
al
Com
preh
ensi
ve
Inco
me
Pare
nt1
VIS
A S
teel
Lim
ited
(8,1
39.6
8)94
.03%
(4,9
44.9
9)77
.99%
1.2
8 75
.08%
(4,9
43.7
1)77
.99%
Subs
idia
ries
2V
ISA
Bao
Lim
ited
(260
.34)
3.01
% (3
04.5
6)4.
80%
0.00
% (3
04.5
6)4.
80%
3G
hota
ringa
Min
eral
s Li
mite
d 1
53.5
0 -1
.77%
(0.2
6)0.
00%
0.00
% (0
.26)
0.00
%4
VISA
Sun
coke
Lim
ited
370
.11
-4.2
8% (1
,343
.79)
21.1
9% 0
.83
48.8
6% (1
,342
.96)
21.1
9%5
Kalin
gana
gar S
peci
al S
teel
Li
mite
d (0
.58)
0.01
% (0
.02)
0.00
%0.
00%
(0.0
2)0.
00%
6V
ISA
Fer
ro C
hrom
e Li
mite
d* (0
.29)
0.00
% (0
.01)
0.00
%0.
00%
(0.0
1)0.
00%
7VI
SA S
peci
al S
teel
Lim
ited*
(0.0
7)0.
00%
(0.1
1)0.
00%
0.00
% (0
.11)
0.00
%8
Kalin
gana
gar C
hrom
e Pr
ivat
e Li
mite
d (0
.37)
0.00
% (0
.01)
0.00
%0.
00%
(0.0
1)0.
00%
Min
ority
Inte
rest
in S
ubsi
diar
ies
(778
.99)
9.00
% 2
53.1
3 -3
.99%
(0.4
1)-2
3.94
% 2
52.7
2 -3
.99%
Join
t V
entu
re9
VIS
A U
rban
Infra
Lim
ited
0.0
8 -
0.00
%0.
00%
- 0.
00%
(8,6
56.6
3)10
0.00
% (6
,340
.63)
100.
00%
1.7
0 10
0.00
% (6
,338
.93)
100.
00%
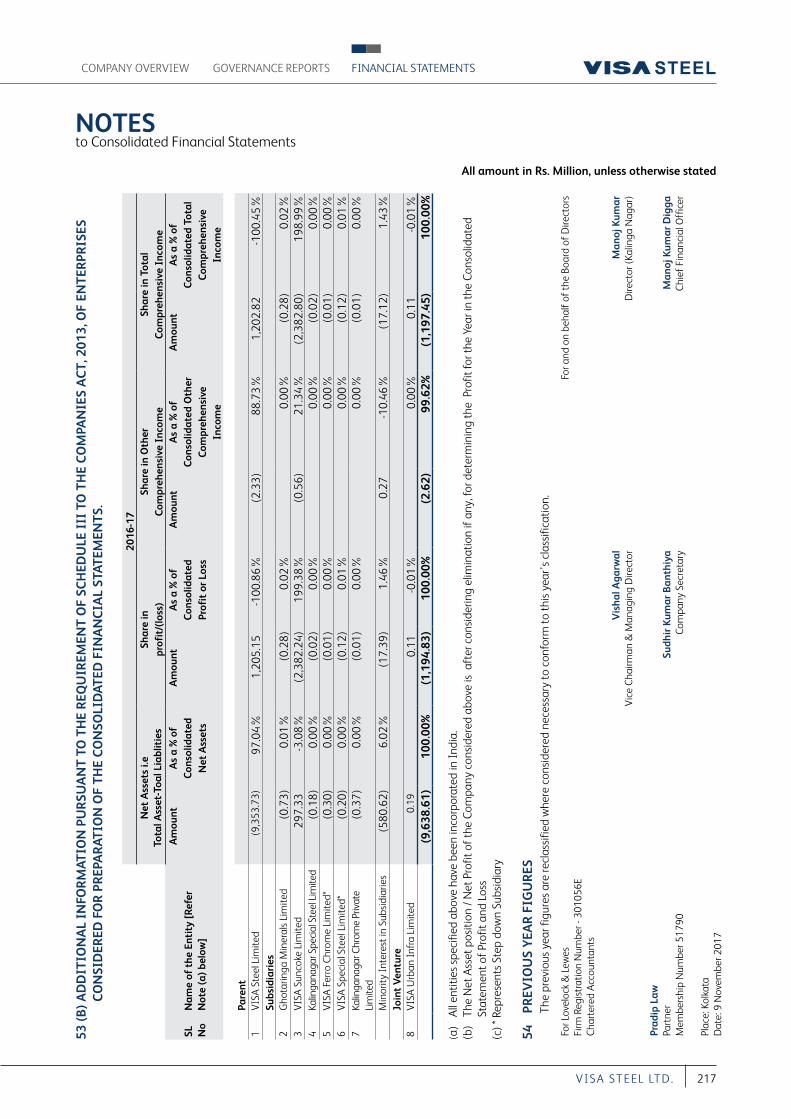
All amount in Rs. Million, unless otherwise stated
NOTES to Consolidated Financial Statements
COMPANY OVERVIEW FINANCIAL STATEMENTSGOVERNANCE REPORTS
217VI S A S T EEL LT D.
53 (B
) AD
DIT
ION
AL
INFO
RM
ATIO
N P
UR
SUA
NT
TO
TH
E R
EQU
IREM
ENT
OF
SCH
EDU
LE I
II T
O T
HE
CO
MPA
NIE
S A
CT
, 201
3, O
F EN
TER
PRIS
ES
CO
NSI
DER
ED F
OR
PR
EPA
RAT
ION
OF
TH
E C
ON
SOLI
DAT
ED F
INA
NC
IAL
STAT
EMEN
TS.
2016
-17
Net
Ass
ets
i.e
Tota
l Ass
et-T
oal L
iabl
itie
sSh
are
in
prof
it/(
loss
)Sh
are
in O
ther
C
ompr
ehen
sive
Inc
ome
Shar
e in
Tot
al
Com
preh
ensi
ve I
ncom
e
SL
No
Nam
e of
the
Ent
ity
[Ref
er
Not
e (a
) bel
ow]
Am
ount
A
s a
% o
f C
onso
lidat
ed
Net
Ass
ets
Am
ount
A
s a
% o
f C
onso
lidat
ed
Prof
it o
r Lo
ss
Am
ount
A
s a
% o
f C
onso
lidat
ed O
ther
C
ompr
ehen
sive
In
com
e
Am
ount
A
s a
% o
f C
onso
lidat
ed T
otal
C
ompr
ehen
sive
In
com
e
Pare
nt1
VIS
A S
teel
Lim
ited
(9,3
53.7
3)97
.04%
1,2
05.1
5 -1
00.8
6% (2
.33)
88.7
3% 1
,202
.82
-100
.45%
Subs
idia
ries
2G
hota
ringa
Min
eral
s Li
mite
d (0
.73)
0.01
% (0
.28)
0.02
%0.
00%
(0.2
8)0.
02%
3V
ISA
Sun
coke
Lim
ited
297
.33
-3.0
8% (2
,382
.24)
199.
38%
(0.5
6)21
.34%
(2,3
82.8
0)19
8.99
%4
Kalin
gana
gar S
peci
al S
teel
Lim
ited
(0.1
8)0.
00%
(0.0
2)0.
00%
0.00
% (0
.02)
0.00
%5
VIS
A F
erro
Chr
ome
Lim
ited*
(0.3
0)0.
00%
(0.0
1)0.
00%
0.00
% (0
.01)
0.00
%6
VIS
A S
peci
al S
teel
Lim
ited*
(0.2
0)0.
00%
(0.1
2)0.
01%
0.00
% (0
.12)
0.01
%7
Kalin
gana
gar C
hrom
e Pr
ivat
e Li
mite
d (0
.37)
0.00
% (0
.01)
0.00
%0.
00%
(0.0
1)0.
00%
Min
ority
Inte
rest
in S
ubsi
diar
ies
(580
.62)
6.02
% (1
7.39
)1.
46%
0.2
7 -1
0.46
% (1
7.12
)1.
43%
Join
t V
entu
re8
VIS
A U
rban
Infra
Lim
ited
0.1
9 0
.11
-0.0
1%0.
00%
0.1
1 -0
.01%
(9,6
38.6
1)10
0.00
% (1
,194
.83)
100.
00%
(2.6
2)99
.62%
(1,1
97.4
5)10
0.00
%
(a)
All
entit
ies
spec
ified
abo
ve h
ave
been
inco
rpor
ated
in In
dia.
(b
) Th
e N
et A
sset
pos
ition
/ N
et P
rofit
of t
he C
ompa
ny c
onsi
dere
d ab
ove
is a
fter
con
side
ring
elim
inat
ion
if an
y, fo
r det
erm
inin
g th
e P
rofit
for t
he Y
ear i
n th
e Co
nsol
idat
ed
Stat
emen
t of P
rofit
and
Los
s
(c
) * R
epre
sent
s St
ep d
own
Subs
idia
ry
54
PREV
IOU
S Y
EAR
FIG
UR
ES
Th
e pr
evio
us y
ear f
igur
es a
re re
clas
sifie
d w
here
con
side
red
nece
ssar
y to
con
form
to th
is y
ear’
s cl
assi
ficat
ion.
For L
ovel
ock
& L
ewes
For
and
on
beha
lf of
the
Boar
d of
Dire
ctor
s Fi
rm R
egis
trat
ion
Num
ber -
301
056E
Cha
rter
ed A
ccou
ntan
ts
Vis
hal A
garw
al
Man
oj K
umar
V
ice
Cha
irman
& M
anag
ing
Dire
ctor
D
irect
or (K
alin
ga N
agar
)
Prad
ip L
awPa
rtne
r
S
udhi
r Ku
mar
Ban
thiy
a M
anoj
Kum
ar D
igga
M
embe
rshi
p N
umbe
r 517
90
Com
pany
Sec
reta
ry
Chi
ef F
inan
cial
Off
icer
Plac
e: K
olka
taD
ate:
9 N
ovem
ber 2
017
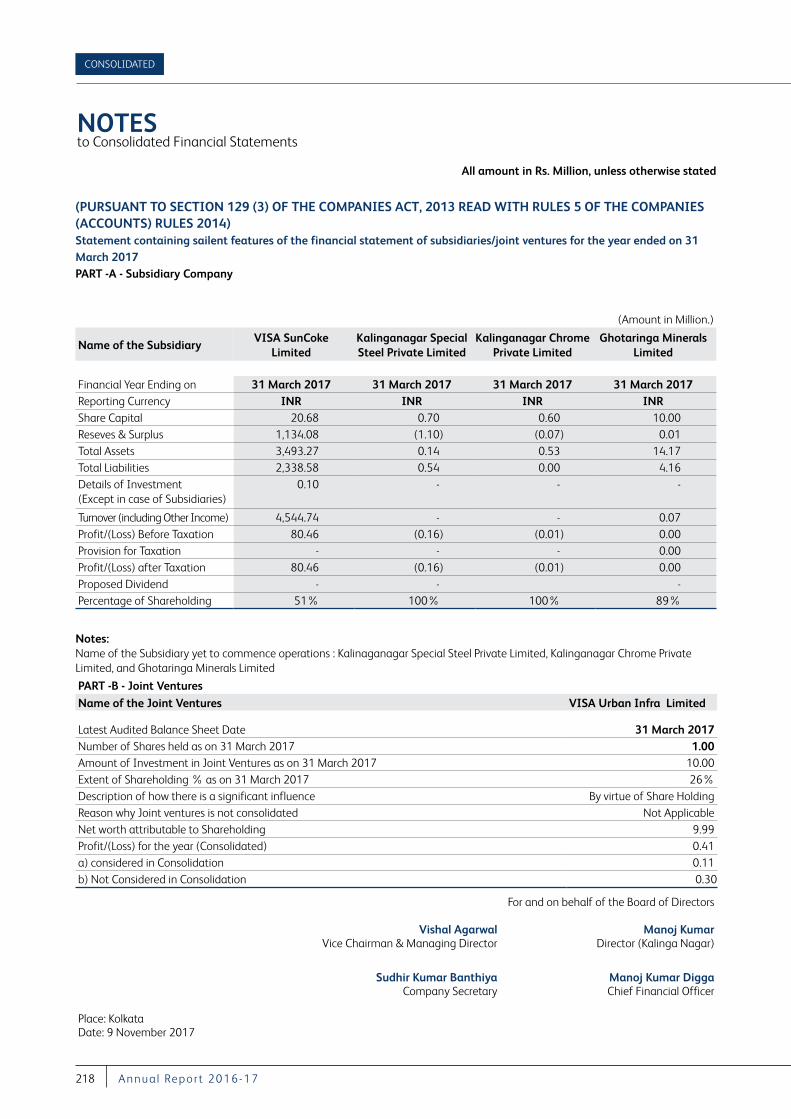
218 A nnu a l Repor t 2016-17
All amount in Rs. Million, unless otherwise stated
NOTES to Consolidated Financial Statements
(PURSUANT TO SECTION 129 (3) OF THE COMPANIES ACT, 2013 READ WITH RULES 5 OF THE COMPANIES (ACCOUNTS) RULES 2014) Statement containing sailent features of the financial statement of subsidiaries/joint ventures for the year ended on 31 March 2017PART -A - Subsidiary Company
(Amount in Million.)
Name of the SubsidiaryVISA SunCoke
Limited Kalinganagar Special Steel Private Limited
Kalinganagar Chrome Private Limited
Ghotaringa Minerals Limited
Financial Year Ending on 31 March 2017 31 March 2017 31 March 2017 31 March 2017Reporting Currency INR INR INR INRShare Capital 20.68 0.70 0.60 10.00 Reseves & Surplus 1,134.08 (1.10) (0.07) 0.01 Total Assets 3,493.27 0.14 0.53 14.17 Total Liabilities 2,338.58 0.54 0.00 4.16 Details of Investment (Except in case of Subsidiaries)
0.10 - - -
Turnover (including Other Income) 4,544.74 - - 0.07 Profit/(Loss) Before Taxation 80.46 (0.16) (0.01) 0.00 Provision for Taxation - - - 0.00 Profit/(Loss) after Taxation 80.46 (0.16) (0.01) 0.00 Proposed Dividend - - - Percentage of Shareholding 51% 100% 100% 89%
Notes: Name of the Subsidiary yet to commence operations : Kalinaganagar Special Steel Private Limited, Kalinganagar Chrome Private Limited, and Ghotaringa Minerals Limited
PART -B - Joint Ventures
Name of the Joint Ventures VISA Urban Infra Limited
Latest Audited Balance Sheet Date 31 March 2017Number of Shares held as on 31 March 2017 1.00 Amount of Investment in Joint Ventures as on 31 March 2017 10.00 Extent of Shareholding % as on 31 March 2017 26%Description of how there is a significant influence By virtue of Share Holding Reason why Joint ventures is not consolidated Not Applicable Net worth attributable to Shareholding 9.99 Profit/(Loss) for the year (Consolidated) 0.41 a) considered in Consolidation 0.11 b) Not Considered in Consolidation 0.30
For and on behalf of the Board of Directors
Vishal Agarwal Manoj Kumar Vice Chairman & Managing Director Director (Kalinga Nagar)
Sudhir Kumar Banthiya Manoj Kumar Digga Company Secretary Chief Financial Officer
Place: KolkataDate: 9 November 2017
CONSOLIDATED

NOTES

NOTES
CORPORATE INFORMATION
Board of DirectorsMr. Vishambhar Saran, ChairmanMr. Vishal Agarwal, Vice Chairman & Managing DirectorMr. Pratip Chaudhuri, Independent DirectorMr. Kishore Kumar Mehrotra, Independent DirectorMr. Sheo Raj Rai, Independent Director Ms. Rupanjana De, Independent DirectorMr. Manas Kumar Nag, Nominee DirectorMr. Manoj Kumar, Wholetime Director designated as Director (Kalinganagar)
Chief Financial OfficerMr. Manoj Kumar Digga
Company SecretaryMr. Sudhir Kumar Banthiya
Statutory AuditorsLovelock & Lewes
Internal AuditorsL. B. Jha & Co.
Bankers & Financial InstitutionsAndhra BankBank of BarodaBank of IndiaCanara BankCentral Bank of IndiaCorporation BankDena BankEdelweiss Asset Reconstruction Company LimitedExport Import Bank of IndiaHUDCOIndian Overseas BankOriental Bank of CommercePunjab National BankSIDBIState Bank of IndiaSyndicate BankUCO Bank
Union Bank of IndiaVijaya BankPunjab & Sind Bank
RegistrarsKarvy Computershare Private Limited
Registered OfficeBHUBANESWAR11 Ekamra Kanan, Nayapalli,Bhubaneswar - 751015.Tel: +91 (674) 2552 479,Fax: +91 (674) 2554 661
Corporate OfficeKOLKATAVISA House,8/10 Alipore Road,Kolkata - 700027Tel: +91 (33) 3011 9000Fax: +91 (33) 3011 9002
Plant OfficesKalinganagar Plant SiteKalinganagar Industrial Complex,P.O. Jakhapura,Jajpur 755 026,OdishaTel: +91 (6726) 242 441Fax: +91 (6726) 242 442
Corporate Identification NumberL51109OR1996PLC004601

www.visasteel.com