Embed Size (px)
Citation preview

Page 1
Annual Report
2015
Annual Report 2015
Page 1
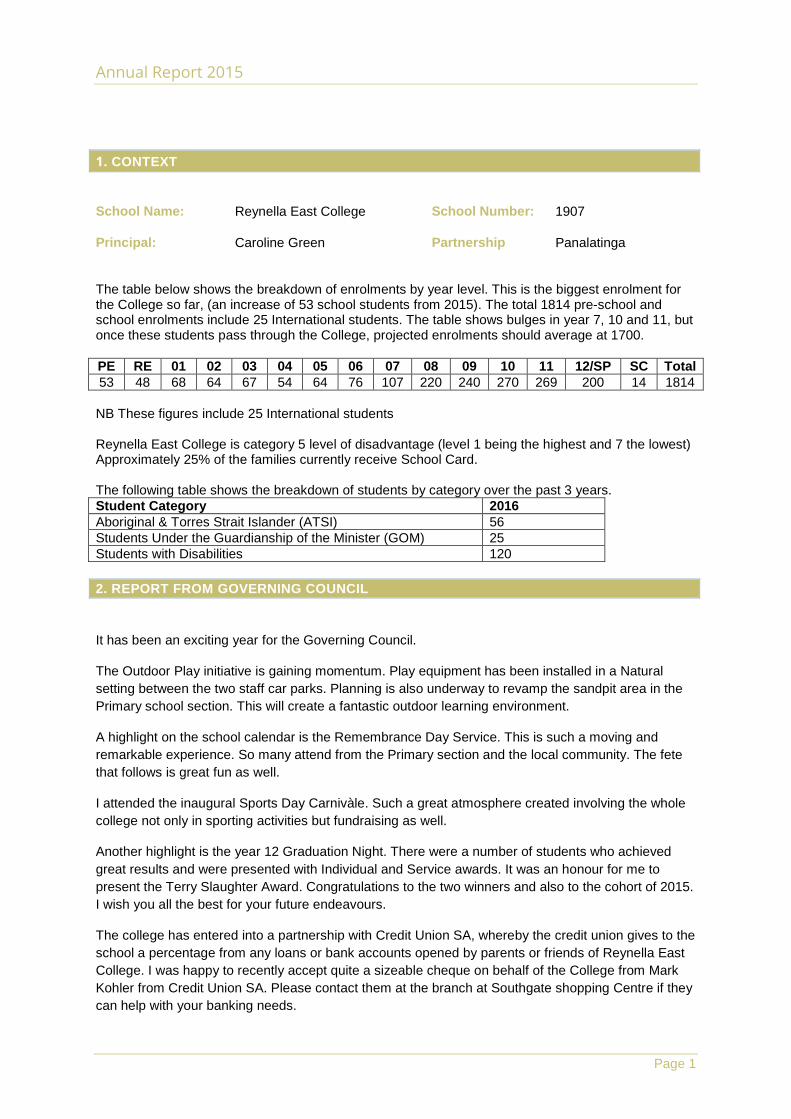
1. CONTEXT
School Name: Reynella East College School Number: 1907
Principal: Caroline Green Partnership Panalatinga
The table below shows the breakdown of enrolments by year level. This is the biggest enrolment for the College so far, (an increase of 53 school students from 2015). The total 1814 pre-school and school enrolments include 25 International students. The table shows bulges in year 7, 10 and 11, but once these students pass through the College, projected enrolments should average at 1700. PE RE 01 02 03 04 05 06 07 08 09 10 11 12/SP SC Total 53 48 68 64 67 54 64 76 107 220 240 270 269 200 14 1814 NB These figures include 25 International students Reynella East College is category 5 level of disadvantage (level 1 being the highest and 7 the lowest) Approximately 25% of the families currently receive School Card. The following table shows the breakdown of students by category over the past 3 years. Student Category 2016 Aboriginal & Torres Strait Islander (ATSI) 56 Students Under the Guardianship of the Minister (GOM) 25 Students with Disabilities 120 2. REPORT FROM GOVERNING COUNCIL
It has been an exciting year for the Governing Council.
The Outdoor Play initiative is gaining momentum. Play equipment has been installed in a Natural setting between the two staff car parks. Planning is also underway to revamp the sandpit area in the Primary school section. This will create a fantastic outdoor learning environment.
A highlight on the school calendar is the Remembrance Day Service. This is such a moving and remarkable experience. So many attend from the Primary section and the local community. The fete that follows is great fun as well.
I attended the inaugural Sports Day Carnivàle. Such a great atmosphere created involving the whole college not only in sporting activities but fundraising as well.
Another highlight is the year 12 Graduation Night. There were a number of students who achieved great results and were presented with Individual and Service awards. It was an honour for me to present the Terry Slaughter Award. Congratulations to the two winners and also to the cohort of 2015. I wish you all the best for your future endeavours.
The college has entered into a partnership with Credit Union SA, whereby the credit union gives to the school a percentage from any loans or bank accounts opened by parents or friends of Reynella East College. I was happy to recently accept quite a sizeable cheque on behalf of the College from Mark Kohler from Credit Union SA. Please contact them at the branch at Southgate shopping Centre if they can help with your banking needs.

Annual Report 2015
Page 2
Finally I wish to say it was again a privilege and pleasure to serve on Governing Council and as Chairperson this year. I thank all Governing Council members for their time, effort and input.
Barry Temme
Governing Council Chairperson
3. 2015 HIGHLIGHTS In March 2015, we opened another exciting new chapter for Reynella East College by bringing all 1717 students and 45 pre-school children together for our Inaugural P-12 Sports Day. The 12 elected captains and vice captains lead teams of over 400 on a grand march to the formal opening ceremony where our youngest preschooler and oldest student cut the ribbon. The Carnivàle theme, included novelty activities, great food and was attended by over 1,000 parents and friends. Other inaugural P-12 events included RU OK Day to promote strategies and programs to address mental health and well-being and MABO Day event Our combined Remembrance Day and Grand-Parents Day program was acknowledged by Education Minister, Hon. Susan Close. The formal assembly service to observe a minutes silence for our fallen soldiers and showcase aspects of the learning program from primary groups was followed by open classrooms and fundraising activities. Proceeds from the day were put towards the Nature Play program. In term 4, the Middle Years Review came to a conclusion after 18 month of survey, research and observation of other schools’ practice. The Review recommendations have shaped significant changes to the structure of the College and next year 6-9 students will be grouped into learning communities and benefit from up-graded facilities and more flexible learning spaces. We introduced a new Learner Management System SEQTA to track and monitor student attendance and achievement and we’ve been gearing up to open the parent portal to provide easy access to attendance, assessment and achievement information for parents in 2016. On 5 June, over 500 teachers and support staff our local Panalatinga Partnership, met for the first time on the Student Free day, to learn about fixed verses ‘growth mindset’ and the influence this has on our pre-school children and students of all ages. The Panalatinga Partnership of schools and pre-schools also participated in the first Partnership review and the feedback was very positive. The International Student Program continued to grow in 2015, in line with the goals set out in the Strategic Plan. An increase in the school’s homestay network has seen increased numbers of Study Abroad and Graduate students, including new business from Thailand and Korea. This was helped by visits by key staff to schools in Thailand, which developed relationships. Ongoing programs continued, including Study Tours from Mishima and Ritsumeikan in Japan, and an Intensive English class in term 1. There were also outbound opportunities for students, including a scholarship for one Reynella East student to travel to Mishima in Japan in the April school holidays. Students involved in the German program began preparations for an exchange program with Valentin-Heider Gymnasium, Lindau in Germany; while students in the French program began preparations for an exchange with Lycee St-Expiry in Reunion Island.
The P-12 Outdoor Learning Project made great headway this year. We officially launched our first outdoor nature play-space at the end of 2015. ‘The Garden’ (affectionately named by the children) is a space to get amongst nature exploring the outdoors as well as creativity skills with cubby building. ‘The Garden’ is now open as a lunchtime club for early year’s children. Our fundraising partner Credit Union S.A. presented the College with $6,000 which has helped fund our Nature Play Sandpit Redevelopment expected to be completed early in 2016. Further plans focus on outdoor spaces for middle to secondary years.

Annual Report 2015
Page 3
In 2015 a number of students (and staff) were acknowledged for outstanding contributions and achievements including:
• Zachary Oats placed 1st place in the SA Japanese Recital Contest • Bonni King was selected to represent SA in Soccer • Montana McKinnon and Jessica Marshman were selected to represent SA in Netball • Bowen Pollard, Ben Warman and James Huntley were selected to represent SA in Rugby • Zach Reekie was selected to represent SA in Indoor Netball • Mitchell Rogers won the Year 10 State Table Tennis Champion • Deakin Hamilton and Zach Reekie were selected to represent SA in Indoor Cricket • Kaitlyn Ineson was selected to represent SA in Ice Skating • Brayden Davidson won 2015 Elite Athlete with a Disability of the Year in Para-Athletics • REC U18 Boys won the State U18 Rugby Championship. • REC Volleyball Squad – won a Silver Medal at the Australian Volleyball Cup Tournament. • Mitchell Rogers (Table Tennis), Montana Edwards (Softball), Natasha Strapps (Softball), were
selected to represent SA at the Pacific Schools Games. • REC won the 2015 'Principal's Cup' for Southern Zone Sport • Staff member Jo Draper wins ACHPER (SA) Award for outstanding commitment. • Janice Collinson & Akira Musson Aust. Vocational Student of the Year 2015
Finally, one of our most outstanding achievements was being rated as EXCEEDING ALL 7 NATIONAL QUALTY STANDARDS in the National Quality Standards Assessment. This means that the educational programs and practice, the quality of the environment, health and safety practices, partnerships with families and teaching and leadership are of extremely high quality. Congratulations to all staff and families who contributed to this outstanding outcome. 4. SITE IMPROVEMENT PLANNING AND TARGETS Attendance
• All absence is explained • Reduction in lateness across the College (particularly 8-10) • Sanctioned (explained absence) is reduced significantly across the College
Student Achievement
• All students without special needs achieve literacy and numeracy NAPLAN benchmarks • Increase in the number of A & B grades in SACE stage 1 & 2 • Teacher assessment is consistent with moderation in SACE Stage 2 subjects
Staff Performance & Development
• All teachers engage in self-assessment and identify areas for development and improvement. • All teachers develop a Performance & Development Plan and gather evidence of professional
development & improvement. • Improve leadership capacity to provide quality performance & development support for line-
management teams. • All staff seeks and receives performance feedback.
Intervention and Support
• English as second language or dialect (EALD) students to improve by at least one Language and Literacy level each year.
• ATSI students to meet learning goals identified. • All plans for verified students with disabilities reflect short-term learning goals. • All verified students make regular progress. • Increased SACE completion results for verified students. • Increased choice of subjects for verified students and students at risk of barriers

Annual Report 2015
Page 4
4.1 Junior Primary and Early Years Scheme Funding
We commenced the 2016 school year with six Reception – Year 2 classes and two Year 2/3 composite classes. Based on our enrolments, we were able to create an additional Early Years class at the start of Term 2.
Numbers in all Early Years classes were reduced to meet ratios and this has allowed teaching staff to ‘know their learners’ on a deeper level and differentiate the curriculum accordingly. Given this was the first year of the ‘Same First Day’ policy we created an additional Year One class as this allowed the establishment of three straight Reception classes. This resulted in greater collaboration with our Preschool and supported extended transition from midyear.
4.2 Better Schools Funding
This funding is intended to contribute to literacy and numeracy improvement: Our strategy In 2015 The Better Schools Funding was used to release teachers to work with the DECD funded literacy coach and school based teaching and learning coordinators. The time was allocated for observation, team teaching, programming and planning and to address literacy improvement priorities. This included the development of an R-12 whole school literacy agreement available on the College website at www.reynellaec.sa.edu.au 5. STUDENT ACHIEVEMENT Running Records A running record allows assessment of a students reading performance as she/he reads from a benchmark text. It is a tool that helps teachers identify patterns in a students reading behaviours and allows teachers to see the strategies a student uses to make meaning of individual words and texts as awhole Year 1
Year 2
The graphs above indicate that year 1 and 2 students at REC significantly out-performed the state and like-schools in the higher reading levels.

Annual Report 2015
Page 5
Whilst this is very pleasing, it should be noted that there has been some disparity about how the assessment has been administered across the College and State. Moderation and consistent administration of the test will be a focus for 2016.
5.1 NAPLAN The National Assessment Program - Literacy and Numeracy (NAPLAN) assesses students using common national tests in Reading, Writing, Language Conventions (Spelling, Grammar and Punctuation) and Numeracy. Results for each of these five NAPLAN assessment domains covering year 3, 5, 7 and 9 are reported on a common scale using a mean score of 500. Figure 5: Year 3 Mean Scores
0
100
200
300
400
500
Mean
Res
ult
Year 3
Numeracy Reading Writing Spelling Grammar
2013 2014 2015
Mean Scores
Summary of year 3 results by mean scores In most aspects there was a dip in overall ‘average’ scores from 2013-2014. However there has been improvement in all tests over the past 12 months. Percentage of Year 3 students who sat the tests achieving National Minimum Standard Reading 87% Writing 93% Spelling 89% Grammar 76% Numeracy 89%
Summary of Recommendations
1. Explicit teaching of reading comprehension
2. Explicit teaching of composing texts with focus on spelling and punctuation
3. Focus on problem solving in maths.
Figure 1: Year 5 Mean Score

Annual Report 2015
Page 6
0
100
200
300
400
500
Mean
Res
ult
Year 5
Numeracy Reading Writing Spelling Grammar
2013 2014 2015
Mean Scores
Summary of Year 5 results by Mean Score The Year 5 results show a more consistent pattern of performance overall. Percentage of Year 5 students who sat the tests achieving National Minimum Standard Reading 85 % Writing 87% Spelling 91% Grammar 80% Numeracy 91% Summary of Recommendations
4. Explicit teaching of reading comprehension
5. Explicit teaching of composing texts with focus on spelling and punctuation
6. Focus on problem solving in maths.
Figure 7: Year 7 Mean Score
0
200
400
600
Mean
Res
ult
Year 7
Numeracy Reading Writing Spelling Grammar
2013 2014 2015
Mean Scores

Annual Report 2015
Page 7
Summary of Year 7 results by Mean Score The Year 7 results show slight improvement in all aspects of the NAPLAN in 2015. 93% of student achieved the National Minimum Standard in all areas which means they are achieving the standard expected at year 7 level. The target will be to reach 100% in 2017. Percentage of Year 7students who sat the tests achieving National Minimum Standard Reading 94% Writing 94% Spelling 93% Grammar 93% Numeracy 94% Summary of Recommendations
7. Explicit teaching of reading comprehension
8. Explicit teaching of composing texts with focus on spelling and punctuation
9. Focus on problem solving in maths.
Figure 8: Year 9 Mean Scores
0
200
400
600
Mean
Res
ult
Year 9
Numeracy Reading Writing Spelling Grammar
2013 2014 2015
Mean Scores
Summary of Year 9 results by Mean Score In Year 9 there is a variation in test performance. Whilst there was a slight improvement in numeracy, performance in writing indicates concern for those who sat the test.
The mean scores show improvement but they don’t indicate our achievement when compared with state and national achievement. Percentage of Year 9 students who sat the tests achieving National Minimum Standard Reading 92% Writing 72% Spelling 86% Grammar 83% Numeracy 98% Summary of Recommendations
10. Explicit teaching of reading comprehension
11. Explicit teaching of composing texts with focus on spelling and punctuation
12. Focus on problem solving in maths.

Annual Report 2015
Page 8
2013 2014 2015
Year 3 Numeracy 92.9% 94.5% 89.6%
Reading 92.9% 94.5% 91.7%
Writing 95.2% 94.5% 89.6%
Grammar 95.2% 94.5% 89.6%
Spelling 95.2% 94.5% 89.6%
Year 5 Numeracy 98.3% 95.0% 92.7%
Reading 98.3% 93.8% 94.5%
Writing 98.3% 95.0% 94.5%
Grammar 98.3% 96.3% 94.5%
Spelling 98.3% 96.3% 94.5%
Year 7 Numeracy 90.8% 97.8% 95.2%
Reading 94.3% 98.9% 95.2%
Writing 94.3% 98.9% 95.2%
Grammar 94.3% 98.9% 95.2%
Spelling 94.3% 98.9% 95.2%
Year 9 Numeracy 91.0% 80.7% 76.4%
Reading 91.4% 81.5% 79.8%
Writing 91.8% 85.0% 82.9%
Grammar 91.8% 85.0% 83.3%
Spelling 91.8% 85.0% 83.3% 5.2 Senior Secondary
Annual Report 2015
Page 9
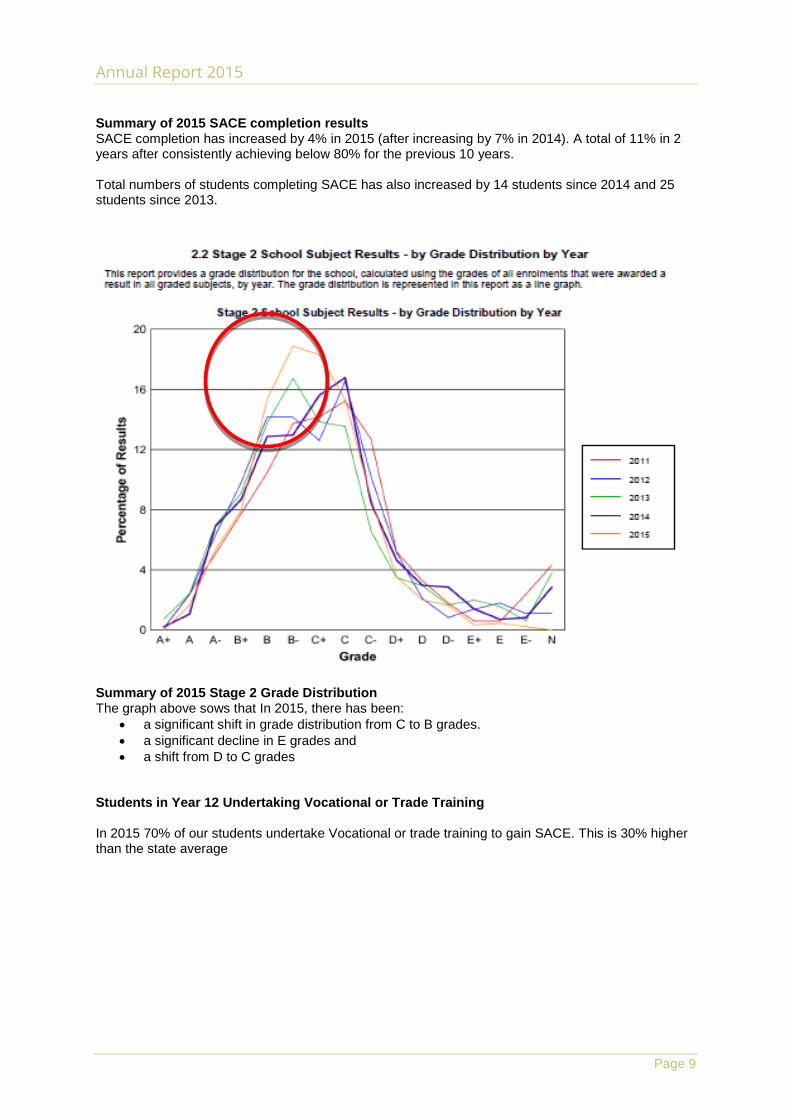
Summary of 2015 SACE completion results SACE completion has increased by 4% in 2015 (after increasing by 7% in 2014). A total of 11% in 2 years after consistently achieving below 80% for the previous 10 years. Total numbers of students completing SACE has also increased by 14 students since 2014 and 25 students since 2013.
Summary of 2015 Stage 2 Grade Distribution The graph above sows that In 2015, there has been:
• a significant shift in grade distribution from C to B grades. • a significant decline in E grades and • a shift from D to C grades
Students in Year 12 Undertaking Vocational or Trade Training In 2015 70% of our students undertake Vocational or trade training to gain SACE. This is 30% higher than the state average

Annual Report 2015
Page 10
Students in Yr 12 Attaining a Yr 12 Certificate or Equivalent VET Qualification
In the past 3 years 70% of REC students have continued to study VET and school based subjects. This trend continues to exceed state average and has significantly contributed to SACE achievement. Changes to VET funding explain the reduction in the number of students studying VET subjects.
Recommendations
1. Continue to maximize SACE flexibilities for all students to complete SACE (including Community Studies B)
2. Focus on task design and moderation to achieve increase in merits and A and B grades

Annual Report 2015
Page 11
6. STUDENT DATA 6.1 Attendance Figure 12: Attendance by Year Level
0
20
40
60
80
100
Rat
e
Rec
eptio
n
Yea
r 1
Yea
r 2
Yea
r 3
Yea
r 4
Yea
r 5
Yea
r 6
Yea
r 7
Yea
r 8
Yea
r 9
Yea
r 10
Yea
r 11
Yea
r 12
Sec
onda
ry O
ther
Tota
l All
Yea
r Lev
els
Tota
l AC
AR
A
1 TO
10
Year Level
2013
2014
2015
National Attendance Rates Semester 1
Table 12: Attendance by Year Level
Attendance by Year Level % Attendance 2013 2014 2015
Reception 93.7 91.4 95.7
Year 1 92.0 92.9 94.0
Year 2 92.6 91.6 94.5
Year 3 93.2 92.3 93.0
Year 4 92.1 93.6 91.5
Year 5 95.3 92.5 93.9
Year 6 89.1 94.2 93.2
Year 7 93.2 90.6 94.3
Year 8 90.9 91.1 91.9
Year 9 86.1 89.6 91.6
Year 10 83.9 84.6 90.7
Year 11 80.1 85.6 92.8
Year 12 85.3 84.3 94.3
Secondary Other 86.9 92.4 87.1
Total All Year Levels 87.5 88.8 92.6
Total ACARA 1 TO 10 89.0 90.0 92.2 Summary of Attendance The graph and table above show attendance improvement in most year levels. Of particular note is the improvement in attendance for year 8 and 9 students which was identifies as an area for improvement in the Site Improvement Plan for 2014-15. Implementation of a new Learner Management System has lesson by lesson subject attendance monitoring and reporting and five weekly snapshots and improved case management have impacted significantly on improved results.

Annual Report 2015
Page 12
Recommendations 1. Continue to focus on improved attendance to achieve DECD target of 95% 2. Focus on reducing ‘sanctioned’ absence and lateness.
6.2 Destination
Table 13: Intended Destination 2015 data is not yet available 7. CLIENT OPINION In 2015 Staff, students and parents were surveyed using the DECD Opinion survey tool Parents, staff and students agree that we have high expectations at Reynella East College and that we look for ways to improve. Behaviour management and or the standard of behaviour at the College was rated between 3 -4 by parents, students and staff and has been identified as an area for further investigation in light of:
• the overall improvement in secondary time-out • improved R-12 suspension data • implementation of Middle School Review recommendations (including the development of
sub-school learning communities to improve connectedness between students and teachers and a buddy system to support responsible behaviour)
• the implementation of the new R-12 Responsible Behaviour Policy Students also identified the quality of feedback about their learning as an area for improvement Recommendations
1. Develop authentic student voice and leadership forums 2. Address the perception of behaviour standards and management of behaviour 3. Continue to review Governing Council sub-committee structure and build on strategies to
increase parent participation. 4. Include quality feedback for learners as an area for improvement in the Site Improvement
Plan My School website http://www.myschool.edu.au/ 8. ACCOUNTABILITY 8.1 Behaviour Management
Annual Report 2015
Page 13
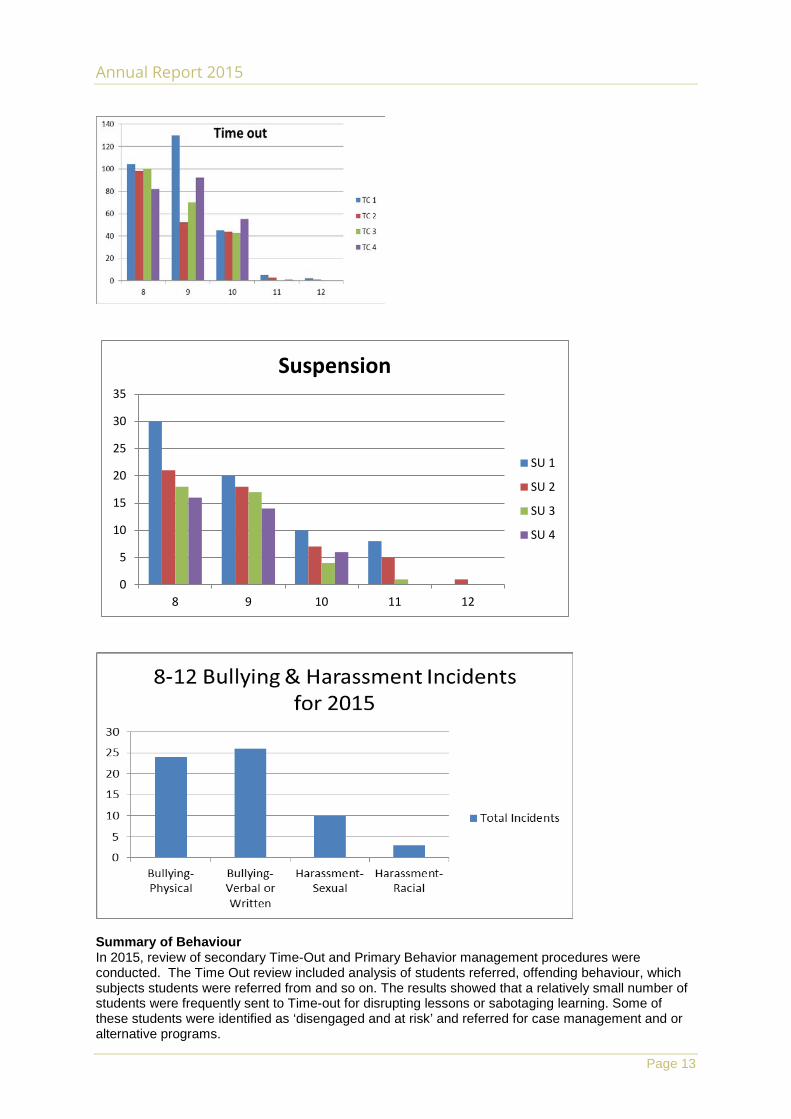
0
5
10
15
20
25
30
35
8 9 10 11 12
Suspension
SU 1
SU 2
SU 3
SU 4
Summary of Behaviour In 2015, review of secondary Time-Out and Primary Behavior management procedures were conducted. The Time Out review included analysis of students referred, offending behaviour, which subjects students were referred from and so on. The results showed that a relatively small number of students were frequently sent to Time-out for disrupting lessons or sabotaging learning. Some of these students were identified as ‘disengaged and at risk’ and referred for case management and or alternative programs.
Annual Report 2015
Page 14
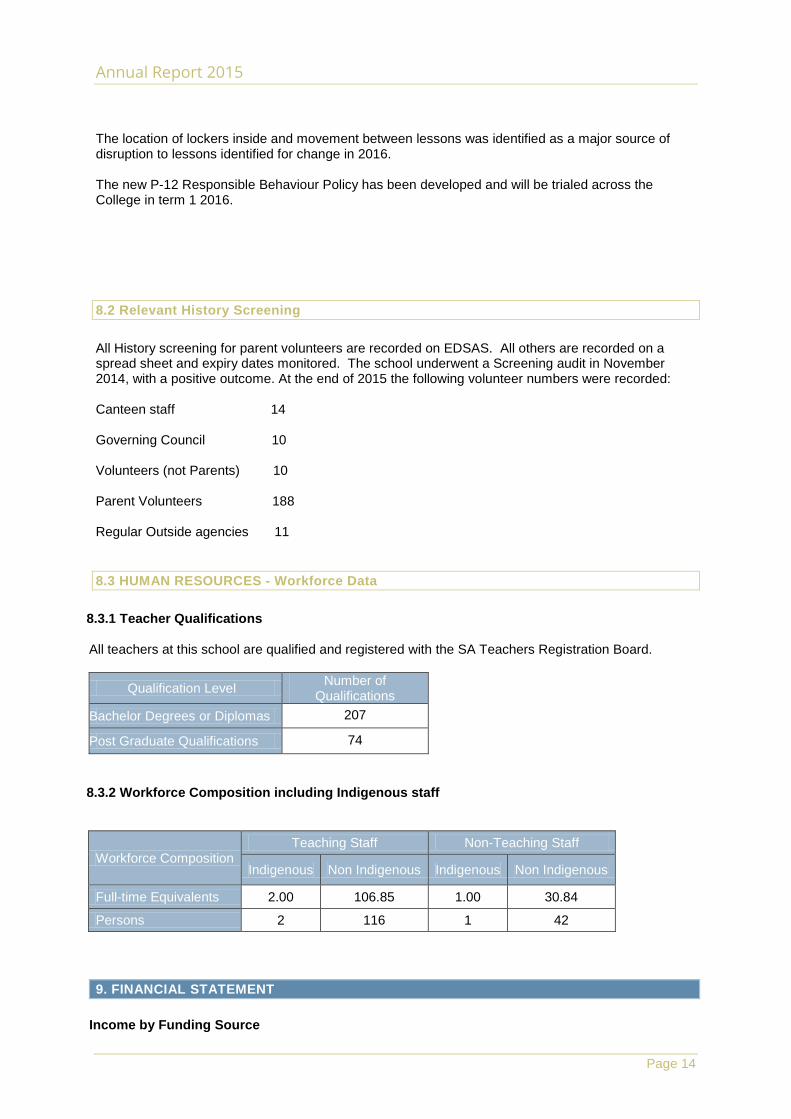
The location of lockers inside and movement between lessons was identified as a major source of disruption to lessons identified for change in 2016. The new P-12 Responsible Behaviour Policy has been developed and will be trialed across the College in term 1 2016. 8.2 Relevant History Screening All History screening for parent volunteers are recorded on EDSAS. All others are recorded on a spread sheet and expiry dates monitored. The school underwent a Screening audit in November 2014, with a positive outcome. At the end of 2015 the following volunteer numbers were recorded: Canteen staff 14 Governing Council 10 Volunteers (not Parents) 10 Parent Volunteers 188 Regular Outside agencies 11 8.3 HUMAN RESOURCES - Workforce Data
8.3.1 Teacher Qualifications All teachers at this school are qualified and registered with the SA Teachers Registration Board.
Qualification Level Number of Qualifications
Bachelor Degrees or Diplomas 207
Post Graduate Qualifications 74
8.3.2 Workforce Composition including Indigenous staff
Workforce Composition Teaching Staff Non-Teaching Staff
Indigenous Non Indigenous Indigenous Non Indigenous
Full-time Equivalents 2.00 106.85 1.00 30.84
Persons 2 116 1 42
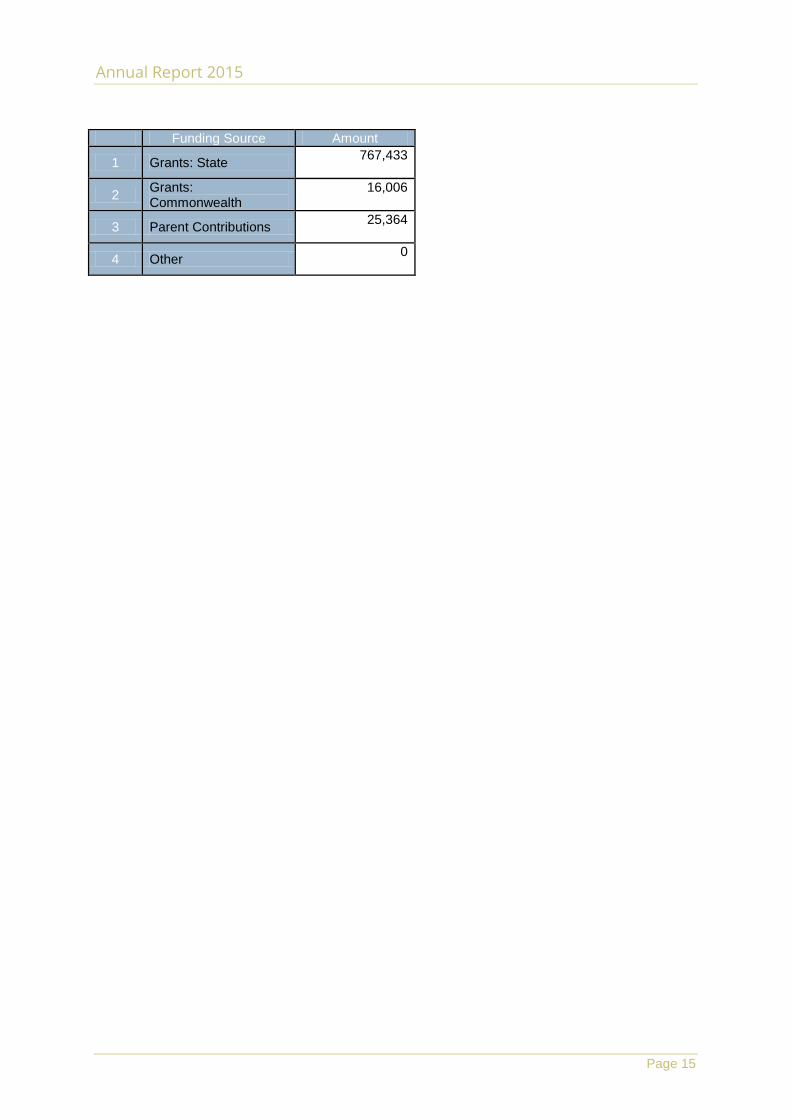
9. FINANCIAL STATEMENT
Income by Funding Source
Annual Report 2015
Page 15
Funding Source Amount
1 Grants: State 767,433
2 Grants: Commonwealth
16,006
3 Parent Contributions 25,364
4 Other 0