Embed Size (px)
Citation preview

Annual Report 2015

The BAUER Group is an international construction and machinery manufacturing
concern based in Schrobenhausen, Bavaria. The stock market-listed holding
company BAUER Aktiengesellschaft is the parent of more than 110 subsidiary
businesses across its Construction, Equipment and Resources segments. Bauer
is a leader in the execution of complex excavation pits, foundation and vertical
seals, as well as in the development and manufacture of related machinery for
this dynamic market. The Group also deploys its expertise in the exploration,
mining and safeguarding of valuable natural resources. In 2015 the companies
of the BAUER Group employed some 10,738 people in around 70 countries and
achieved total Group revenues of EUR 1.66 billion.
Passion for progress –
The origins of Bauer date back as far as 1790, and still today the company's
success is founded on highly flexible application of the specialist know-how it
has built up over those many years. As an innovator and technology leader,
Bauer has played a major role in the advancement of the international specialist
foundation engineering industry and related busniess fields. Indeed, today Bauer
is also the world market leader in the manufacture of the relevant machinery. It is
with just such innovative strength and a keen focus on the challenges of the future
that the Group is also developing its recently established Resources segment.

The Group at a glance
GROUP KEY FIGURES 2012 – 2015
IFRS in EUR million 2012 2013 2014 ** 2015 Change
2014/2015
Total Group revenues 1,435.8 1,504.2 1,560.2 1,656.4 6.2 %
of which Germany 378.6 410.4 440.2 473.7 7.6 %
International 1,057.2 1,093.8 1,120.0 1,182.7 5.6 %
International in % 73.6 72.7 71.8 71.4 n/a
of which Construction 655.2 741.7 725.6 742.9 2.4 %
Equipment 589.1 628.6 639.2 753.1 17.8 %
Resources 262.8 188.9 252.8 221.6 -12.3 %
Other/Consolidation -71.3 -55.0 -57.4 -61.2 n/a
Consolidated revenues 1,376.1 1,447.5 1,506.0 1,587.9 5.4 %
Sales revenues 1,344.4 1,402.2 1,375.7 1,379.0 0.2 %
Order intake 1,470.8 1,484.5 1,521.1 1,811.4 19.1 %
Order backlog 785.0 765.2 762.7 995.6 30.5 %
EBITDA 163.8 124.0 171.0 185.1 8.2 %
EBITDA margin in % (of sales revenues) 12.2 8.8 12.4 13.4 n/a
EBIT 72.0 30.1 76.4 90.7 18.7 %
EBIT margin in % (of sales revenues) 5.4 2.1 5.6 6.6 n/a
Net result for the period 25.8 -19.4 15.7 29.0 84.7 %
Capital investment in property, plant and equipment 96.4 91.9 64.1 83.2 29.8 %
Equity 462.5 419.8 418.9 451.2 7.7 %
Equity ratio in % 30.2 26.5 26.6 27.2 n/a
Net assets 1,529.4 1,585.8 1,575.1 1,656.9 5.2 %
Earnings per share 1.44 -0.99 0.85 1.73 n/a
Distribution 5.14 0.00 2.57 2.57* n/a
Dividend per share in EUR 0.30 0.00 0.15 0.15* n/a
Return on equity after tax in % 5.6 -4.2 3.7 6.9 n/a
Employees (on average over the year) 10,253 10,264 10,405 10,738 3.2 %
of which Germany 4,090 4,144 4,158 4,166 0.2 %
International 6,163 6,120 6,247 6,572 5.2 %
* Proposed; subject to the consent of the Annual General Meeting to be held on June 23, 2016
** Previous year adjusted; see notes on page 106
At variance with the consolidated revenues presented in the Group income statement, the total Group revenues
presented here include portions of revenues from associated companies as well as revenues of non-consolidated
subsidiaries and joint ventures.

DEVELOPMENT OF TOTAL GROUP REVENUES BY SEGMENT
in EUR million
2012 1,436
2013 1,504
2014 1,560
2015 1,656
GR
OU
P K
EY
FIG
UR
ES
AT
A G
LA
NC
E
>>>
CONSTRUCTION SEGMENT KEY FIGURES
in EUR '000 2014 * 2015 Change
Total Group revenues 725,626 742,862 2.4 %
Sales revenues 646,628 650,762 0.6 %
Order intake 682,410 878,436 28.7 %
Order backlog 455,485 591,059 29.8 %
EBIT 26,033 13,916 -46.5 %
Net result for the period 2,524 -7,316 n/a
Employees (on average over the year) 5,777 6,243 8.1 %
EQUIPMENT SEGMENT KEY FIGURES
in EUR '000 2014 * 2015 Change
Total Group revenues 639,151 753,083 17.8 %
Sales revenues 532,691 548,039 2.9 %
Order intake 676,801 649.108 -4.1 %
Order backlog 154,175 128,096 -16.9 %
EBIT 35,952 99,441 n/a
Net result for the period 8,847 65,397 n/a
Employees (on average over the year) 2,936 2,919 -0.6 %
RESOURCES SEGMENT KEY FIGURES
in EUR '000 2014 2015 Change
Total Group revenues 252,830 221,609 -12.3 %
Sales revenues 195,860 179,319 -8.4 %
Order intake 219,306 345,045 57.3 %
Order backlog 153,027 276,463 80.7 %
EBIT 15,932 -19,807 n/a
Net result for the period 4,347 -29,398 n/a
Employees (on average over the year) 1,400 1,276 -8.9 %
* Previous year adjusted; see notes on page 106
Construction Equipment Resources

BAUER AktiengesellschaftAnnual Report 2015
2 Milestones in the Company's History
4 Pictures of 2015
6 Mission and Strategy
8 The World is our Market
10 Foreword
13 Combined Management Report
62 The Bauer Share
64 Corporate Governance Report
68 Report of the Supervisory Board
71 Balance sheet and income statement
of BAUER Aktiengesellschaft
in accordance with HGB
75 Consolidated financial statements
in accordance with IFRS
164 Assurance by the legal representatives
165 Audit opinion
166 Glossary
168 Imprint

2
Milestones in the Company's History
1958
Invention of the injection anchor on the construction site
of the Bayrischer Rundfunk building in Munich
1969
First anchor drilling rig UBW 01
1972
Construction of the new head office administration block
1975
First contracts in Libya, Saudi Arabia and the United Arab
Emirates
1976
First heavy-duty rotary drilling rig BG 7
1984
Work complex West begins operations; manufacture and
deployment of the first trench cutter
1902
Drilling of an artesian well for Schrobenhausen railway
station
1928
Dipl.-Ing. Karl Bauer constructs the Schrobenhausen water
supply system; construction of wells and water pipes
throughout Bavaria
1948
First works on Wittelsbacherstrasse
1840
Copper cladding for the steeple roof of St. Jakob's church
in Schrobenhausen
1900
Start of well drilling by Andreas Bauer
1790
Sebastian Bauer acquires a coppersmith's shop in the
center of Schrobenhausen; in the 19th century, subsequent
Bauer generations were engaged in copper working,
primarily for breweries and domestic households
1956
Dr.-Ing. Karlheinz Bauer, a shareholder in the company
since 1952, becomes sole managing director; construction
of a first office building in Wittelsbacherstrasse
Dipl.-Ing. Karl Bauer (left) turned the company into
an industrial well builder known throughout Bavaria.
Dr.-Ing. Karlheinz Bauer (center) led the company onto
the international stage, taking it into the field of specialist
foundation engineering and launching equipment manu-
facturing operations. Prof. Dr. Dipl.-Kfm. Thomas Bauer
shaped the current global Group, with a network of
operations on every continent.
1790 – 1948 1956 – 1984

3MILESTONES IN THE COMPANY'S HISTORY
1986
Prof. Thomas Bauer becomes sole managing director
of BAUER Spezialtiefbau GmbH and drives forward the
international growth of the Group
1990
Founding of BAUER und MOURIK Umwelttechnik GmbH
and of SPESA Spezialbau und Sanierung GmbH
1992
Takeover of SCHACHTBAU NORDHAUSEN GmbH
2007
Founding of BAUER Resources GmbH, entailing a restructuring
of the mining and environmental business; market launch of the
three new segments: Construction, Equipment and Resources
2008
Expansion of machinery manufacturing capacities in Aresing
and Nordhausen as well as in Tianjin and Shanghai, China
2009
The BAUER Group completed the largest investment
program in the company's history: new administration
building in Schrobenhausen, Edelshausen plant, machinery
manufacturing plant in Conroe, Texas, USA
2011
The first deep drilling rig is sold to South America
2012
During the year, the Group's global workforce topped the
10,000 mark for the first time
2013
Bauma Innovation Prize for an underwater drilling technique
2014
Execution of the Schwarzkopf Tunnel bypass railway project
in Lower Franconia
2015
Joint Venture in the field of deep drilling technology with
Schlumberger, the world's leading supplier of technology
and project management for oil and gas industry customers
1986 – 2006 2007 – 2015
1994
Founding of BAUER Aktiengesellschaft
1998
Takeover of KLEMM Bohrtechnik GmbH
2001
BAUER Maschinen GmbH becomes independent company
2002
Purchase of large machinery manufacturing facility in Aresing
2003 – 2005
Specialist companies in a variety of fields are acquired
and integrated into the BAUER Group: FWS Filter- und
Wassertechnik GmbH; PRAKLA Bohrtechnik GmbH;
TracMec Srl, Imola, Italy; Pileco, Inc., Houston, Texas, USA
2006
BAUER AG is listed on the stock market

Major Dam Project on Mauritius
Mauritius – The island nation of Mauritius is getting a new
dam for a water reservoir that will ensure supply of drinking
water for the population. The last panel of the cut-off wall
was constructed on 9 May, almost exactly a year after work
commenced for the EUR 35 million Bagatelle Dam Project.
Reason enough for a small celebration, which Prof. Thomas
Bauer, Chairman of the Management Board of BAUER AG,
also took part in, along with the Chinese ambassador as well
as representatives of the China International Water & Electric
Corp., the project's main contractor.
Bauer Spezialtiefbau constructed a 2.4 km long diaphragm
cut-off wall (56,781 m2), socketed into rock. The soil partially
consists of very hard basalt – about 20,000 m2 of slightly to
moderately weathered basalt had to be penetrated over the
entire structure for the new dam. Furthermore, in the central
dam area, heavy layers of basalt, up to 28 m deep, were re-
moved in order to construct the cut-off wall with the specified
depth. Three duty cycle cranes of the type MC 96 and MC
128 with a BC 40 trench cutter, as well as two grabs were
used.
Despite plenty of rainfall, the country has problems with
ensuring water supply because of lack of storage capacity
on the island. The Bagatelle Dam Project will change that.
The Ministry of Energy and Public Utilities of Mauritius is the
client.
Ground-breaking ceremony for the largest-ever
contract
Schrobenhausen/Grenzach-Wyhlen, Germany – Remediation
of perimeter 1/3 northwest of the former Kesslergrube landfill
started at the end of September. Last July, Roche Pharma AG
awarded Bauer as the general contractor for the remediation.
BAUER Umwelt GmbH will be responsible for tasks such as
site mobilization and operations, all civil engineering activities,
the excavation, removal and thermal disposal of the soil as well
1
2
Pictures of 2015
1
2 3
1

as the refill of the excavated pit. This is the BAUER Group's
largest single contract to date. According to the motto “Let’s
go”, around 60 guests celebrated the ground-breaking cere-
mony. This event marked the official start of the remediation of
perimeter 1/3 northwest of the former Kesslergrube landfill.
Back to the Canadian polar circle
Yellowknife, Canada – In August, BAUER Foundations Canada
Inc. acquired a major project worth about EUR 65 million to
build a cut-off wall for the Diavik Diamond Mine in Canada.
The Diavik mine is operated by Diavik Diamond Mines (2012)
Inc., a member of the Rio Tinto Group, and is located approxi-
mately 220 km south of the Arctic Circle. From 2000 to 2002,
BAUER Maschinen GmbH – in partnership with other com-
panies and using a range of equipment – was involved in the
construction of the water retention dikes that enabled open-
pit mining of diamonds from the first three kimberlite pipes.
A 26 m deep cut-off wall is required for the 2.2 km dike so
that the fourth kimberlite pipe, located under the waters of
Lac de Gras, can be mined using the openpit method. Bauer
suggested using the Cutter-Soil-Mixing method (CSM), which
combines diaphragm wall technologies and the Mixed-in-Place
method. The project will be completed in two stages in 2016
and 2017.
In-house exhibition 2015
Schrobenhausen, Germany – It has become a tradition that
is especially appreciated by clients and partners of the BAUER
Maschinen Group: the in-house exhibition. In April, BAUER
Maschinen GmbH and its subsidiaries showcased a number
of innovations and further developments as well as proven
technology as part of this exhibition. Nearly 1,700 guests
from more than 70 countries accepted the invitation again
and traveled to the company's headquarters in Schroben-
hausen in Upper Bavaria.
4
2
3
4
4
6
Mission and Strategy
>>> Target: ~ 40 percent of total Group revenues
>>> Market leader in specialist foundation engineering
machinery and equipment
>>> New products for mining, deep drilling and offshore
drilling
>>> 80 percent of sales generated outside of Germany
>>> Multi-branding strategy
OUR MISSION
SERVICES, EQUIPMENT AND PRODUCTS DEALING
WITH GROUND AND GROUNDWATER
>>>

7MISSION AND STRATEGY
>>> The world is our market
>>> World market leadership in specialist foundation
technologies
>>> Powerful development of drilling techniques
and applications for related markets such as
environment, water and natural resources
>>> Target: ~ 20 percent of total Group revenues
>>> Activities in environmental technology, mining,
deep drilling, well construction, materials
>>> Target: ~ 40 percent of total Group revenues
>>> Global provider of specialist foundation engineering services
>>> Specialist construction services
>>> Focus on complex international projects
>>> Optimization of worldwide organizational structures
and of the Group's self-managed business units
>>> Annual growth from 3 to 8 percent
OUR STRATEGY

8
The World is our Market
OVER 110 GROUP COMPANIES
IN MORE THAN 70
COUNTRIES
EUR 1.66 BILLION TOTAL
GROUP REVENUES
10,738 EMPLOYEES FROM 77 NATIONS

9THE WORLD IS OUR MARKET
Construction
Equipment sales
Resources
Equipment production locations
25 PRODUCTION FACILITIES
and many other service centers and construction yards

10
Foreword
Dear Shareholders, Partners and Friends of our company,
Ladies and Gentlemen,
2015 was once again a year with many challenges. Comparing the forecast presented one year ago against the key figures that
have now been achieved – total Group revenues of EUR 1.66 billion and earnings after tax of EUR 29.0 million – it is tempting
to assume that our business figures have exceeded our forecasts. However, this is only one side of the coin. The figures for the
2015 business year are composed of such a large number of positive and negative individual themes that the first impression is
not sufficient for such an assessment.
Basically, it can be observed that we achieved a positive Group result solely in operative terms, without however being able to
meet our forecast in full.
Our Construction segment performed well on the whole. We have successfully processed numerous projects in all regions of
the world. With the exception of only individual weaker markets, we suffered a significant loss in the USA above all. This was
due to delays in acceptance of the Center Hill Dam project extending over several months, and additional follow-on problems
with the local subsidiary. Consequently, the segment was not able to record a positive result.
In the Equipment segment, we were able to give a good account of ourselves in a market environment that remains very difficult –
operatively speaking, the parent company and most of the subsidiaries achieved a solid result. In addition to this, two special
topics delivered significant positive earnings contributions. One contribution to this was the foundation of the joint venture with
Schlumberger, the world's leading oil services provider, to build deep drilling rigs. As part of a capital increase, Schlumberger
has invested in two subsidiaries, resulting in significant exceptional earnings. Moreover, the sale of shares in our subsidiary for
tensioning and anchor technology delivered a further good profit.
The Resources segment experienced two contrasting developments during the past year. The subsidiaries in the environmental
and water business had a good commercial year. On the other hand, companies involved in water and exploration drilling suffered
significantly from the steep decline in raw materials markets. Consequently, it was scarcely possible to achieve capacity utilization.
This, combined with significant restructuring, represented the main reason for the negative result in the segment.
Given the positive exceptional earnings, it was possible for us to undertake extensive restructuring measures in all areas of the
Group that became necessary due to significant market changes. In the Resources segment above all, business activities no
longer offering prospects for success were terminated, capacities reduced and subsidiaries shut down. In the Equipment seg-
ment too, it was necessary for smaller Group companies and their products to be re-orientated.
Taking a look at all these topics, it becomes clear how the significant variations occurred in the revenues and earnings figures
of the individual segments. The business activities relevant for the future also delivered good, positive operational results in the
year under review. Assessing the results without special influences leads to the conclusion that our businesses are on the right
path overall. The numerous measures that have been taken form a good starting point for the years to come.
The very high order backlog that we have been able to achieve in the Construction and Resources segments above all indicates
our strength in the market. In the environmental business, we are working on some long-term orders including the largest individual
order in the company's history with a remediation project in Germany. In Construction, the order backlog is evenly distributed
throughout the world, meaning that all regions have a good workload. Moreover, there are also new, large projects in the market
which represent good opportunities for us.

11
The Equipment business remains highly competitive. Chinese manufacturers have had to post significant drops in sales because
of the weakness in their domestic market and have responded with swingeing cuts in their capacities; we on the other hand have
performed well. We have got to continue the success. Unfortunately, entirely satisfying margins will only be achieved over time –
the competition will return to normal, however.
The joint venture with Schlumberger represents a major opportunity. In recent years, we have worked hard to develop not only
expertise but also innovative and novel techniques for deep drilling rigs. The fact that the largest oil services provider in the world
is now working with us in this field represents a pleasing success and points the way to the future.
In spite of this relatively good starting point, we do however see problems in the world as well. These include the developments
in Russia and China, and events in the Middle East where not only the so-called Islamic State but also the low oil price are sowing
the seeds of great uncertainty. The oil price in particular represents a significant danger for individual states whose budgets are
significantly dependent on oil exports. These include countries in South America and the Far East, as well as the Middle East.
A sustained low oil price will result in reductions in spending by many countries, and without doubt construction companies will
also be victims of this.
On the one hand, we can look to the future with optimism because we are offering products and services that are urgently required
over the coming decades. And additionally, we have re-orientated our companies in many respects. On the other hand, instabilities
in the world will also represent a major challenge in future.
As a result, we are cautiously optimistic for the coming year. For 2016, we are expecting total Group revenues of about EUR 1.65
billion and earnings after tax of about EUR 20 to 25 million.
I would like to express my sincere gratitude to all employees, shareholders, customers and partners for their loyalty and support.
Recent years have been very challenging, and we are faced with new tasks. The management and all the workforce are highly
motivated to build on the experience and the accrued strengths of the company in developing future success. You can follow
us on this path!
Kind regards,
Prof. Thomas Bauer
FOREWORD
Heinz KalteneckerProf. Thomas BauerHartmut Beutler


13
The Group
Group structure
Corporate Governance and control system
Business Report
Macro-economic trend
A general view of our markets
Course of business
Construction segment
Equipment segment
Resources segment
Other / Consolidation segments
Earnings, financial and net asset position
Group earnings position
Group financial and net asset position
Financial statements of BAUER Aktiengesellschaft
Sustainability
Sustainability in the BAUER Group
Employees
Capital Investments
Research and Development
Health Safety Environment (HSE)
Quality
Legal disclosures
Remuneration Report
Statutory disclosures regarding takeovers
Follow-up Report
Risk and Opportunity Report
Risk Report
Opportunity Report
Forecast Report
15
15
15
17
17
18
20
22
24
26
28
32
32
34
39
40
40
40
42
42
44
44
45
45
47
49
51
51
57
59
I.
II.
III.
IV.
V.
VI.
VII.
VIII.
IX.
Combined Management Report
Changi Airport in Singapore is being expanded by an area of 1,000 hectares. The entire area must be improved with 480,000 soil
mixing columns. Several Bauer machines are being used there.


15
GROUP STRUCTURE
The BAUER Group is a leading provider of services, equipment
and products related to ground and groundwater. With over
110 subsidiaries, Bauer operates a worldwide network on
all continents. The operations of the Group are divided into
three future-oriented segments with high synergy potential:
Construction, Equipment and Resources.
The Construction segment applies all the established methods
and techniques of specialist foundation engineering all over
the world. These include creating complex excavation pits,
foundations for large infrastructure projects and buildings,
cut-off walls and ground improvements. Its specialist con-
struction unit also performs other construction services such
as civil engineering and remediation works.
Bauer is a world market leader in the Equipment segment
and provides a full range of equipment for specialist foun-
dation engineering as well as for the exploration, mining and
extraction of natural resources. Besides its headquarters
in Schrobenhausen, the Equipment segment operates a
worldwide distribution network and additional production
facilities in Germany, China, Malaysia, Russia, Italy, Turkey,
the USA among other locations.
In the Resources segment, Bauer focuses on highly innovative
products and services in the areas of water, environment and
natural resources. BAUER Resources GmbH is the holding
company of the business segment, under the umbrella of
which the subsidiaries operate as full-service providers with
their focus on environmental technology, water and natural
resources for industrial customers.
BAUER Aktiengesellschaft is the holding company of the Group
and is listed on the Frankfurt Stock Exchange. BAUER AG
provides central management and service functions for its
affiliates. These specifically include human resources, account-
ing, finance, legal and tax affairs, IT, facility management, and
health, safety and environment (HSE).
CORPORATE GOVERNANCE AND CONTROL SYSTEM
The principal task of the Management Board of BAUER AG
is the strategic management of a global group of companies.
As part of central strategies, goals and regulations, the main
companies in the three operating segments – BAUER Spezial-
tiefbau GmbH, BAUER Maschinen GmbH and BAUER Re-
sources GmbH – develop their own detailed strategies which
are converged at holding company level and integrated into
the strategic corporate planning process.
The development and implementation of a self-managing
organizational structure with decentralized business units is
the primary characteristic of corporate governance within
the BAUER Group. The managers of the various Group
companies operate under their own responsibility, and are
provided with a large degree of independence within the
framework of the corporate strategy in determining how
their business units progress.
The autonomous management of the individual operating
business units is constrained by framework guidelines and
standards laid down by the Group and the individual subsi-
diaries. The principles of proper conduct, including adherence
to our ethical and moral standards, are defined among other
instances by an ethics management and values program
covering all the companies of the BAUER Group, flanked by
corporate management guidelines and a code of conduct
imposed on our employees. The self-managing structure
is linked to a centralized system of risk management and
control, and to a central Group accounting function. Internal
auditing systems monitor compliance with laws and standards
across the Group.
The roles of the Management Board and Supervisory Board
and other aspects of corporate governance are set forth in the
Declaration on Corporate Governance on pages 64 to 67
of this Annual Report, which is published on the Internet at
http://www.bauer.de/ in the Investor Relations section under
Reports & Accounts.
Financial performance indicators
The trend in total Group revenues is used as the fundamental
and significant key financial performance indicator for the
management of the Group. The total Group revenues rep-
resent the revenues of all the companies forming part of our
Group. The difference between the consolidated revenues
Combined Management ReportI. THE GROUP
The Gut Großlappen sewage treatment plant on the northern outskirts of Munich is being updated to the latest state of the art.
For the connecting lines from the clarifi cation tanks to the biological clarifi cation stage, Bauer built six individual excavation pits
encompassing a total area of about 12,500 m² static Mixed-in-Place cut-off wall.

16COMBINED MANAGEMENT REPORTThe Group
They primarily comprise balance sheet and income statement
figures and the indicators of capital structure, profitability and
liquidity derived from them.
Non-financial performance indicators
Many non-financial indicators of Group performance are
measured as part of a comprehensive reporting system,
although they have no individual material significance in
terms of internal controls and other respects. The reporting
on trends in those performance indicators in the „Sustainability“
section is primarily intended to convey an overall picture of
the operations of the BAUER Group.
The indicators included originate, among other sources, from
the Human Resources function, such as workforce numbers.
Indicators on further and advanced training as well as others
derived from the Research and Development field are also
reported.
and the total Group revenues is derived from the revenues
of the associated companies, from our portion of revenues
in joint ventures, and from the revenues of non-consolidated
companies. The trend in total Group revenues and the con-
tributions to them by the various segments are depicted in
the Business Report.
Alongside total Group revenues, earnings before interest and
taxes (EBIT) and the net result for the period are used as key
financial performance indicators for internal management. The
Business Report details the trends in EBIT and net result for
the period and trends in the various segments.
A wide range of other financial performance indicators, which
are of comparatively minor significance to the medium- and
long-term development of the Group, are collated and inte-
grated in the course of internal Group management activities.
Our customer Botte Fondations carried out the diaphragm walling work for an underground garage in Paris. An MC 64 duty-cycle
crane with an MBC 30 trench cutter was used.
>>>

17COMBINED MANAGEMENT REPORT
Business Report
We can therefore basically expect favorable growth during
the next few years.
This fundamentally positive outlook is contrasted by the
negative influences of political, economic and warlike
confusion:
• The after-effects of the financial market crisis seven years
ago can still be felt. The entire financial system of the global
economy was rocked by that shock. Only massive govern-
ment measures managed to avert a collapse of the financial
markets. Many countries slid into recession. The situation
has stabilized somewhat since then, but many countries
have been unable to regain their old strength. Many banks
still suffer today from the massive capital consumption of
that period. A process of adaptation with many ups and
downs still prevents a sustainable economic stabilization.
This trend will accompany us for quite a while to come.
• The financial market crisis has saddled quite a few countries
in Europe with considerable budgetary difficulties. This has
focused more attention on problems which were created
many years ago by incorrect budgetary management. In
addition, countries had to intervene in order to rescue
troubled banks and stabilize their economies. In countries
like Greece, Ireland or Spain, the resulting crises could
only be cushioned by financial aid and extreme austerity.
Greece narrowly avoided national bankruptcy in 2015
because it was no longer able to solve its problems by
its own efforts.
• The Russian-Ukrainian crisis unleashed a continuing
conflict in 2014, resulting in major worldwide economic
consequences. Trade in goods and services with Russia
has declined significantly since then. The construction and
construction machine sectors have slumped even more.
Even if efforts to find a political solution should achieve a
step-by-step rapprochement, it would take quite a few
years to repair the economic damage.
• There are various reasons for the severe deterioration of
oil prices. One of the causes is an over-supply resulting
from new production techniques such as fracking. Another
cause is the result of the conflicts in the Arab world. The
resource-rich countries seek to finance not only their conflicts
but also their extensive construction measures by selling
MACRO-ECONOMIC TREND
There has hardly been any previous year in which the world has
seen so many crises and problem areas as in 2015. Despite the
numerous achievements of society in communications and
mobility, which might have been expected to bring the nations
together, the world has not developed positively – on the
contrary. All the changes also affect economic development,
which is burdened with constantly increasing negative
phenomena. However, they are counteracted by many
positive stimuli from globalization. Overall therefore, the
normally possible expectations could not be fulfilled.
Only a short while ago, all major research institutes anticipated
growth rates ranging from 3.5 to 4 %. These forecasts have
since been continuously adjusted in the direction of 3 % – and
the downtrend continues.
For the construction industry, however, just over 3 % growth
remains a good base for its international business, since the
global economy can only grow if the construction of buildings
and infrastructure creates the necessary preconditions. Even
better growth expectations beckon for companies in the sector
of specialist foundation engineering, since construction is taking
place in increasingly confined urban areas. This demands
progressively higher buildings, which calls for extensive foun-
dation work. In addition, stationary and flowing traffic must
be ever-increasingly transferred below ground, which also
leads to growth in specialist foundation engineering. More-
over, many buildings and infrastructural projects no longer
involve new construction but are converted or expanded
instead. The necessary preparatory earth-moving work is
greatly increasing, since unusual types of construction are
required and the work has to be done in very confined condi-
tions. We can therefore anticipate a basically favorable trend
that is merely slowed down by the negative world events.
The present trend is a mixture of positive and negative influen-
ces. A continuing positive factor is the worldwide need to
catch up with an enormous backlog of infrastructure services,
which is equally strong in developing countries and rising
economic states, but also in the established industrial nations.
A tremendous catching-up process has begun in more than
half of the countries in the world during the past two decades.
The general conditions for this are very favorable, since the
new possibilities of communication and mobility enable market
actors to pursue this catch-up race at increasingly low costs.
II. BUSINESS REPORT

18COMBINED MANAGEMENT REPORTBusiness Report
the refugee crisis imperil European stability, the European
economy could be endangered.
Nobody who seeks to weigh the positive and negative influ-
ences can predict what the total impact may be. However,
solid growth in the global economy can continue to be
expected. For our company, this means that we must react
as flexibly as possible to these changes and seize the resulting
opportunities. Our worldwide presence makes this quite
possible.
A GENERAL VIEW OF OUR MARKETS
The construction markets continue to show good growth:
The construction sector in particular benefits from an enor-
mous need to catch up with backlogs in the rising economic
countries, but also in the established industrial nations. Con-
stantly increasing urbanization and growing infrastructural
needs are leading to increasingly large-scale building schemes,
which offer many interesting project opportunities to the
construction industry. The amount of construction under-
taken in the economically established countries was clearly
inadequate for many years. It is realized today that buildings
too must constantly be adapted to population needs and
economic requirements. This applies not only to traffic
infrastructure but also to residential and public buildings,
dams or flood protection facilities.
ever-increasing volumes of oil and gas. This inevitably glutted
the markets and consequently brought prices down. Few
tangible economic consequences have so far emerged
because the countries involved are still relying on their
financial reserves to pursue their construction goals.
However, this cannot continue for much longer, so that
particularly in the Arab world, major savings efforts and a
commensurate economic decline can be expected soon.
These problems also affect other countries which depend
strongly on oil export revenues: Angola, Malaysia, Mexico,
Brazil and a number of others.
• The many religious and political conflicts in the Middle
East are a major cause for concern. The outcome of
the conflict with the Islamic State remains completely
unresolved. Nobody can predict the future impact of this
today. The agreement with Iran on the use of nuclear
energy is a welcome development. It opens up new
economic opportunities.
• Due to the size of its economy, China has become a
main driver or – if a negative trend sets in – a brakeman
of the global economy. Its economic growth has currently
slowed to little more than 6 %. Compared with the Chinese
construction sector and the associated construction equip-
ment industry, this is still very high. The local construction
machinery industry contracted significantly in the past year.
Radical measures had to be taken to reduce its completely
oversized production capacities. If this proves to be an
example of other overheating symptoms, the Chinese
developments will cause world economic growth to
slow down even further in coming years.
• A few years ago, the BRIC states were still a synonym
for the upcoming economic nations. Very little of these
prospects remains evident today. China is heading towards
normality, India is crippling itself through its own bureau-
cracy, Russia is blocked by its conflicts and a major corrup-
tion scandal is forcing Brazil to cope with a recession.
• A completely new problem which developed in Europe
during the second half of 2015 has no immediately negative
consequences for economic development, and could indeed
even bring it forward: the wave of refugees. But if goods
traffic is impeded by the closure of an increasing number
of national frontiers, and if the political conflicts aroused by
in % Revenues Order intake Employees
Residential construction 7.1 13.3 ---
Commercial construction 0.3 1.1 ---
Public construction -0.8 5.4 ---
Total 1.4 5.2 1.4
Source: Central Federation of the German Construction Industry
Construction statistics Germany – Change 2015/2014
The companies of the BAUER Group can read the general
trend from their very good order backlog, which is evenly
distributed over all regions of the world. Sales of construction
machinery are directly linked to the situation on construction
markets, so that favorable sales opportunities can be expected
in this sector too in coming years.
Besides the general trends, current developments and future
perspectives on construction markets in the various regions
around the world vary considerably:

19COMBINED MANAGEMENT REPORT
Business Report
Qatar and the United Arab Emirates. New subway lines,
railroad sections, stadiums and other large-scale projects
are in full swing. If oil prices remain low for much longer,
however, investments will decline and saving measures will
have to be introduced, which would affect the construction
industry as well. Construction companies must prepare for
this eventuality.
The situation in Iraq and Syria remains extremely problem-
atical. The armed conflict with the Islamic State has all but
paralyzed economic development and specifically the con-
struction sector. Neighboring states such as Jordan and
Lebanon are also hampered by the situation, so that their
economic development has significantly abated. In Libya,
last year was overshadowed by civil war. The opposing
forces finally agreed to form a joint government, raising
at least some hope of stabilization.
In Egypt, the government firmly established itself with the
backing of a strong military establishment. The country is
gripped by a regular building boom, which is boosting the
economy. The Suez Canal was widened in record time and
is generating many other construction projects, since tunnels
Germany
The German construction market will continue to see positive
growth over the coming years. Residential construction is being
driven up primarily by low interest rates, but also by govern-
ment subsidies. Public sector construction is benefiting from
a huge backlog of infrastructure work, for which administrative
budgets will now provide considerably increased funds. The
pace of commercial construction will depend on the develop-
ment of the future outlook for the industry.
Germany especially has recognized the need to return to
more construction. The German federal government has
therefore considerably expanded the construction budget
for future years, which will help to increase building activity.
This situation is reinforced by the need generated by the
influx of refugees. The government is reacting here too by
releasing considerable additional funds.
Europe
Construction markets in Western Europe will remain relatively
restrained in coming years. This is largely due to the fact that
the investment budgets of these countries remain low. However,
there are large infrastructure projects in some countries, such
as Switzerland or France with the Metro Ring in Paris. Other
major cities are also planning to upgrade their infrastructure.
Smaller markets in Eastern Europe largely collapsed as a result
of the financial crisis. There have recently been signs of a slight
upturn, though at a very low level.
The crisis embroiling Russia and Ukraine continues to impose
a serious burden on the development of both countries. Ukraine
is practically incapable of maintaining a construction sector
any longer – due to lack of funds. Although Russia is trying
to continue funding its building sector, the financial deficits
brought about by sanctions and the low oil price are forcing
the country to pursue a policy of extreme frugality. Commer-
cial construction has almost completely shut down. It can be
assumed that Russia will suffer from the consequences of
the crisis for years to come. Equipment sales will therefore
also remain at a low level.
Middle East & Central Asia
Very intensive construction is still taking place in the oil- and
gas-rich countries of the Middle East, such as Saudi Arabia,
Geographical breakdown of total Group revenues
in EUR million
Total 1,656
Germany 474 (29 %)
Africa 77 (4 %)
Americas 297 (18 %)
Asia-Pacific,
Far East & Australia
348 (21 %)
Middle East & Central Asia
227 (14 %)
Europe (other)
71 (4 %)
EU (excl. Germany)
162 (10 %)

20COMBINED MANAGEMENT REPORTBusiness Report
however, these topical fields will regain prominence and
stimulate demand for construction accordingly.
These issues are opening up wide-ranging new opportunities
for us too. In operation for several years now, our Resources
segment is focused on matters relating to the environment,
water and natural resources. We have already handled suc-
cessful projects in some countries around the world and
expect demand for these services to grow considerably.
COURSE OF BUSINESS
The BAUER Group achieved total Group revenues
amounting to EUR 1,656 million during the 2015 financial
year, a 6.2 % increase over the previous year’s value of EUR
1,560 million. The increase includes contributions from the
divestment and revaluation of businesses amounting to EUR
77.8 million. If these and similar effects in the previous year
(EUR 36.5 million) are disregarded, the increase amounted to
3.6 %. EBIT came to EUR 90.7 million (previous year: EUR
76.4 million). The net result for the period was EUR 29.0
million (previous year: EUR 15.7 million).
In 2015, the BAUER Group was influenced by a number of
problems with a major financial impact and by difficult market
conditions. On the other hand, we also achieved some pleasing
successes. Overall, we could achieve our earnings after tax
and EBIT largely only by means of non-operative profits. We
are pleased to state that the exceptional results considerably
outstripped expectations. If these exceptional earnings had
not been included, we would not have reached the forecast
of results given in the annual report for 2014. We had predicted
total Group revenues of about EUR 1.6 billion, earnings after
tax of about EUR 18 to 23 million and an EBIT of about EUR
75 million.
Negative business influences were exerted mainly by our
construction subsidiary in the United States and many restruc-
turing measures that primarily affected our Resources segment,
but also the Equipment segment and SCHACHTBAU NORD-
HAUSEN GmbH. In addition, stagnant raw material markets
and low oil prices curbed the utilization of our drilling rigs in
Africa and those of our Jordanian subsidiary. Overall, these
influences considerably increased our financial expenditures.
and harbors must be built in the vicinity. The Cairo subway is
being expanded along with many other building works. It is
not yet clear whether this development is sustainable.
Asia-Pacific, Far East & Australia
Construction markets in the Far East remain pleasingly stable.
Almost every country in the region is undertaking major
infrastructure projects. In Hong Kong, construction sector
capacities are being well utilized by extensive rail and road
construction works. The prospect of the airport expansion
raises our hopes of major new projects in the years ahead.
The same applies to Singapore and Malaysia. In Singapore
for example, new subway lines and urban motorways are
being built. The port, one of the most important and biggest
in the world, is being relocated. Economies such as Indo-
nesia and the Philippines are also seeing healthy growth.
By contrast, the Australian economy is no longer developing
quite so positively. Construction activity has slowed down
somewhat.
Americas
The USA’s economy is returning to its role as the driver of
global growth. A very high level of backlog demand has
arisen in many infrastructure areas, due to a lack of ad-
equate building activities over recent decades. We are
expecting major efforts over the coming years to make
good this deficit, providing a new boost to the economy
as a positive side effect. Overall, we regard the situation as
stable and anticipate good opportunities for further growth
in both our Construction and Equipment segments. The
Canadian construction market is similarly firm. Interesting
projects frequently crop up in Central America.
Africa
In Africa, active pursuit of new business is worthwhile even
if the overall economic level of these countries does not
permit a very great contribution to our total Group revenues.
Some countries have a very good chance to improve their
prosperity by virtue of their vast raw material resources.
The current problems in the world have shifted such major
issues of the future as the environment, demography and
energy into the background. As stabilization progresses,

21COMBINED MANAGEMENT REPORT
Business Report
Summary
The many positive and negative special influences naturally
complicate consideration of the operative business consid-
erably. Particularly in the segments, the key figures have
undergone very pronounced changes. On the whole, it
remains to be said that the operational results lay within the
positive range when stripped of one-off effects identified by
the company. All in all, the present and future outlook for the
Group is therefore favorable.
However, we cannot be satisfied with our results for 2015.
We were only able to achieve a healthy, positive result due to
exceptional results. We expect the positive business trend to
continue because we managed even in difficult circumstances
to increase total Group revenues. We will be able to build on
that foundation in the financial year 2016.
On the other hand, agreement on our joint venture with
Schlumberger, the world’s leading supplier of technology,
integrated project management and information solutions for
oil and gas industry customers, enabled us to take a major
step forward in the field of deep drilling rigs. This joint venture
and the sale of shares of a subsidiary in the Equipment
segment enabled us to secure the predicted annual result.
Furthermore, the positive exceptional earnings enabled the
Group to fund restructuring expenditures by loss-making
subsidiaries.
The order backlog of the Group also developed extremely
well and grew to EUR 995.6 million by the end of 2015, or
30.5 % above the previous year’s figure of EUR 762.7 million.
Along with the Construction segment, which managed to
acquire several major projects, the order backlog was in-
creased by the largest order so far gained by the Group,
a project won by the Resources segment in Germany.
Development of total Group revenues by segment
in EUR million (segments after deducting Other/Consolidation)
1,800
1,600
1,400
1,200
1,000
800
600
400
200
0
Resources
218
Equipment
705
Construction
international
551
Construction
Germany
182
2000 2001 2002 2003 2004 2005 2006 2007 2008 2009 2010 2011 2012 2013 2014 2015
Total 1,656

22COMBINED MANAGEMENT REPORTBusiness Report
important contribution to the revenues of the segment in
Far Eastern markets in 2015, although the level of orders
has weakened somewhat in comparison to the extremely
good preceding years. The German construction market also
performed well on the whole during the previous financial year,
which enabled us to repeat the high level of the preceding year.
The Austrian subsidiary boosted its revenues significantly with
projects in its home market as well as with a major contract
in Montenegro.
By contrast, we recorded a weak trend and losses in Russia
because local construction activities have been considerably
reduced in the wake of sanctions and the decline of the ruble.
Our subsidiaries in Switzerland, England and the Netherlands
obtained fewer orders and consequently fell short of our
planned levels.
Our subsidiary in the USA was the determinant of the unsa-
tisfactory trend in results for the segment. The approval of
the major Center Hill Dam project was unexpectedly delayed
by several months and as a result, as in the previous year,
added additional considerable financial strains. The difficult
conditions surrounding the project led to considerable pro-
blems in the further business activities and the organization
of the subsidiary. This necessitated restructuring measures
to increase the subsidiary’s ability to compete in the American
market once more. These measures created additional
significant financial burdens.
At SCHACHTBAU NORDHAUSEN GmbH, which operates
mainly in Germany and performs services in all three business
segments of the Group, several restructuring measures were
CONSTRUCTION SEGMENT
in EUR ’000 2014 * 2015 Change
Total Group revenues 725,626 742,862 2.4 %
Sales revenues 646,628 650,762 0.6 %
Order intake 682,410 878,436 28.7 %
Order backlog 455,485 591,059 29.8 %
EBIT 26,033 13,916 -46.5 %
Net result for the period 2,524 -7,316 n/a
Employees (on average over the year) 5,777 6,243 8.1 %
* Previous year adjusted; see notes on page 106
General conditions
Construction markets continued to develop positively in 2015,
allowing us to record good growth. This growth is additionally
propelled by the enormous need for infrastructural works such
as roads, bridges, dams and energy supplies as well as in-
creasing urbanization. Since construction must be carried
out in increasingly complex, troublesome circumstances, the
need for specialist foundation engineering services is also
expanding, so that we are acting here in a market with a
promising future.
The positive trend in the past year was bolstered by construc-
tion markets in the Middle and Far East as well as in the USA
and Germany. The situation in European markets was highly
differentiated. In Russia, building activities were significantly
reduced in response to sanctions. However, we can look back
to a good overall market trend in 2015.
Significant events
The Construction segment achieved total Group revenues
of EUR 742.9 million in the financial year 2015 with 2.4 % be-
yond the previous year’s level of EUR 725.6 million. EBIT fell
back by 46.5 % from EUR 26.0 million in the previous year
to EUR 13.9 million. The net result for the period was
negative, declining to EUR -7.3 million after EUR 2.5 million
in the previous year.
Particularly the Middle Eastern subsidiaries had a positive
business year 2015. Revenues in Saudi Arabia, Qatar and
Egypt improved significantly. We are participating in major
subway construction sites in Doha, Riyadh and Cairo as well
as in projects relating to the Suez Canal. We achieved an

23COMBINED MANAGEMENT REPORT
Business Report
If oil prices remain at a persistently low level, this will very
probably have a negative impact on construction markets in
the Arab world. Oil revenues have a determining influence on
the investment budgets of many countries in that region. In
Russia, we anticipate little improvement during the current
year. In other world regions, we are assuming stable or even
better developments than in the past year. With the completion
of the Center Hill Dam project last year, losses from the project
will fall away and in future lead to noticeably improved overall
earnings.
We expect total Group revenues of the segment to end up
slightly above the previous year’s level in 2016. As far as EBIT
is concerned, we are expecting a considerable improvement.
Furthermore, we are expecting good, positive earnings after
tax.
taken in 2015 in response to business developments.
The environmental technology division, which is primarily
responsible for building biogas and sewage treatment
plants, was shut down as a result of changed political
circumstances. The equipment division will be integrated
into the production network of BAUER Maschinen GmbH
in order to exploit synergy potentials.
Order situation
The order intake developed positively during the past
financial year to reach EUR 878.4 million at the end of the
year, 28.7 % above the previous year’s value of EUR 682.4
million. The order backlog rose to EUR 591.1 million, 29.8 %
above the previous year (EUR 455.5 million). We succeeded
in winning new orders in all regions of the world. Along with
many small and medium-sized building sites, we were again
able to add several major projects to our backlog. This includes
orders in Switzerland, England and Australia. In Canada, we
were commissioned to build a cut-off wall for the Diavik Mine
with a value of around EUR 65 million. The project is already
under way and will continue until 2017. In a joint venture in
India, we won a contract with an order volume of about EUR
60 million to build a diaphragm wall for the Polavaram Dam.
The work is scheduled for completion by the end of 2017.
Due to a record-level order backlog, we are entering the
current financial year on a very sound footing. It is gratifying
to find that further opportunities for orders exist around the
world – they once more include a number of major projects,
such as in Hong Kong.
Outlook
The overall performance of the world regions remains positive,
despite all the existing political and economic disturbances.
Our worldwide presence enables us to exploit opportunities
in markets with good business conditions and compensate
for weaker markets. Our worldwide order backlog has grown
considerably in comparison to the previous year, since we
have once again acquired several major projects along with
smaller and medium-sized orders.
Geographical breakdown of total Group revenues
Construction segment
in EUR million (after deduction of Consolidation)
Total 733
Germany 182 (25 %)
Africa 47 (6 %)
Americas 113 (16 %)
Asia-Pacific,
Far East & Australia
191 (26 %)
Middle East & Central Asia
127 (17 %)
Europe (other)
30 (4 %)
EU (excl. Germany) 43 (6 %)

24COMBINED MANAGEMENT REPORTBusiness Report
revaluation of our remaining 40 % stake in SPANTEC Spann-
und Ankertechnik GmbH. Another exceptional result arose
from the joint venture agreement with Schlumberger, the
world’s leading supplier of technology, integrated project
management and information solutions for oil and gas industry
customers. With a cash capital increase Schlumberger con-
tributed 49 % to BAUER Deep Drilling GmbH, Germany, and
BAUER Manufacturing LLC, USA. In total, these transactions
led to an exceptional result after tax amounting to EUR 71.6
million. The effect on revenues and the operating result
amounted to EUR 77.8 million, including a taxation effect
of EUR 6.2 million.
The exceptional earnings resulted from our efforts in recent
years to develop specialized know-how for deep-drilling rigs
and from the very successful development of our business
with anchoring and tensioning technology. As SPANTEC
Spann- und Ankertechnik GmbH gains the major part of
its earnings from the sale of materials to our construction
industry competitors in Germany, surrendering the majority
shareholding to our partner was a necessary strategic step
to give the company more freedom of movement in future.
By contrast, the Equipment segment was burdened during
the past year by restructuring costs as well as by losses from
the subsidiary which manufactures well drilling rigs, which
faced low demand in weak markets in the field of exploration.
The machinery plant in the USA remained underutilized as
well. Additional expenditures also arose in the course of
preparations for the joint venture, owing to legal costs as
well as the need to prepare the two introduced subsidiaries
organizationally and financially. The positive exceptional
earnings enabled further restructuring measures to be taken.
EQUIPMENT SEGMENT
in EUR ’000 2014 * 2015 Change
Total Group revenues 639,151 753,083 17.8 %
Sales revenues 532,691 548,039 2.9 %
Order intake 676,801 649,108 -4.1 %
Order backlog 154,175 128,096 -16.9 %
EBIT 35,952 99,441 n/a
Net result for the period 8,847 65,397 n/a
Employees (on average over the year) 2,936 2,919 -0.6 %
* Previous year adjusted; see notes on page 106
General conditions
Construction equipment markets showed widely disparate
trends in 2015. Whereas demand increased in Europe and the
USA – and even considerably in the Middle East – economic
conditions in Russia, China, Africa and Latin America brought
declines that were considerable in some cases.
The competitive situation in the Chinese market changed
greatly during the course of 2015. The exaggerated market
expectations of local competitors created considerable surplus
production capacities in past years. Consequently, a number
of these companies embarked on substantial capacity cut-
backs in the past year, especially in terms of personnel layoffs.
We therefore expect a market adjustment and a normalization
of the competitive situation in coming years.
The development of raw material prices also influenced our
business. The considerable price declines reduced demand
for well drilling rigs, which are also used for raw material explo-
ration. Sales of our deep drilling rigs were likewise affected by
the market situation.
In this difficult market environment, we succeeded in raising
sales in combination with good operational earnings. Thanks
to our vigorous efforts regarding product quality, worldwide
service and offers of customer-specific solutions, we
successfully asserted ourselves in the market and effectively
compensated for sales declines in poor regions with other
areas.
Significant events
The key figures of the segment – and ultimately the entire
Group – are very strongly influenced by exceptional earnings.
On the one hand was the sale of 50 % of the shares and the

25COMBINED MANAGEMENT REPORT
Business Report
sales situation, this resulted in a negative earnings contribution.
In the course of consolidating the locations, the organization
and processes were adapted and the inventory of hired
equipment was reduced. Equipment production in the plant
remains short of an adequate level.
The joint venture with Schlumberger in the field of deep
drilling technology has now positioned this business with
positive future prospects and provides a stable base in
this market, which is dependent on oil prices and therefore
extremely cyclical. In the joint venture, large drilling rigs are
being developed and built for Schlumberger and third parties
for use in oil and gas drilling as well as geothermal boring.
Two drilling rigs have already been produced for Schlum-
berger, and more rigs are planned to be built in 2016.
Order situation
Despite fluctuations during the year, the order intake was
almost exactly in line with the planned level at the end of the
year. The order backlog dropped to EUR 128.1 million,
16.9 % below the previous year (EUR 154.2 million). The
deep drilling rig business was chiefly responsible for reducing
In the past financial year, total Group revenues in the
Equipment segment increased significantly by 17.8 %,
from EUR 639.2 million to EUR 753.1 million. The increase
includes contributions from the divestment and revaluation
of businesses amounting to EUR 77.8 million. If these are
subtracted, the increase amounts to 8.3 %. The sales
revenues grew by 2.9 % from EUR 532.7 million to EUR
548.0 million. EBIT rose considerably from EUR 36.0 million
to EUR 99.4 million. If the exceptional earnings of EUR 77.8
million for 2015 are subtracted, EBIT decreased by 40.0 %
to EUR 21.6 million. The net result for the period rose
significantly from EUR 8.8 million to EUR 65.4 million.
Disregarding the special influences on the key figures of the
segment identified by the company, it should be noted that
a slight increase in equipment sales was achieved in tandem
with good operational earnings. We regard this as a great
success in a difficult market environment.
The main contributions to this success came from the markets
in the Middle East, Africa and the USA. We achieved good
sales in Europe as well. Our subsidiaries recorded particularly
good sales of anchor drilling rigs and rotary drives in the past
financial year. Our new machines, the duty-cycle crane series
and the new developments in pile-driving technology estab-
lished themselves firmly in the market. The service and spare
parts business has continued to develop into an important
area of activity. The production and distribution organization
in the Far East once more provided a good contribution to
the Group’s revenues and earnings. The construction equip-
ment market in China itself shrank considerably, severely
burdening local competitors. We nevertheless managed to
keep our sales stable. As a result, we effectively increased
our market share.
On the other hand, the sanctions against Russia and the
plunging value of the ruble led to an almost complete collapse
of equipment sales here. Our commitment in Russia conse-
quently led to a significant loss. Sales trends in Central Asian
countries such as Azerbaijan and Kazakhstan were very weak.
Project delays considerably reduced sales in South America.
In the USA, the production of specialist foundation engineering
equipment in Conroe and the sales company were combined
in the BAUER-Pileco Inc. subsidiary. Independently of the good
Geographical breakdown of total Group revenues
Equipment segment
in EUR million (after deduction of Consolidation)
Total 705
Germany 164 (23 %)
Africa 20 (3 %)
Americas 172 (24 %)
Asia-Pacific,
Far East & Australia
154 (22 %)
Middle East & Central Asia
60 (8 %)
Europe (other)
39 (6 %)
EU (excl. Germany) 96 (14 %)
26COMBINED MANAGEMENT REPORTBusiness Report
business, while the normalization of market conditions can
be expected to continue.
We expect a likewise stable development of Middle Eastern
markets on the strength of the known projects. However, the
low oil prices could trigger a decline in the course of 2016. We
see the Russian market remaining similarly weak as in 2015.
In our opinion, the removal of sanctions against Iran will offer
special opportunities for the equipment business. Through the
joint venture with Schlumberger, we have gained a sound base
for the deep drilling business. It will additionally enable us to
improve the utilization of our plant in the USA, which market
conditions for specialist foundation engineering equipment
did not permit over the last years.
For the year 2016, we expect total Group revenues of this
segment to fall short of the level in 2015 because of the
absence of the previously described special influences. This
also applies to EBIT and earnings after tax. In the operational
business, we expect slightly improved total Group revenues
and markedly higher earnings figures, which points to positive
earnings after tax.
the order backlog. Order intake decreased from EUR 676.8
million to EUR 649.1 million.
Customers for specialist foundation engineering equipment
continue to order at relatively short notice. Only occasional
equipment orders for special projects are placed somewhat
longer ahead of time. This results in very swift deliveries to
customers, so that the order backlog lasts between two and
three months throughout the year. Many machines were again
delivered at the end of 2015, so that the order backlog was
accordingly reduced in December.
In the area of deep drilling rigs, two rigs for Schlumberger were
included in the 2015 order backlog and were delivered at the
beginning of 2016.
Outlook
Economic and political concerns did not make 2015 an easy
year for the equipment business. We nevertheless register
generally good demand from the overall growth of world
construction markets. We see market conditions ranging
from stable to positive in Europe, the USA, Africa and the Far
East. In China, we anticipate a stable development of our
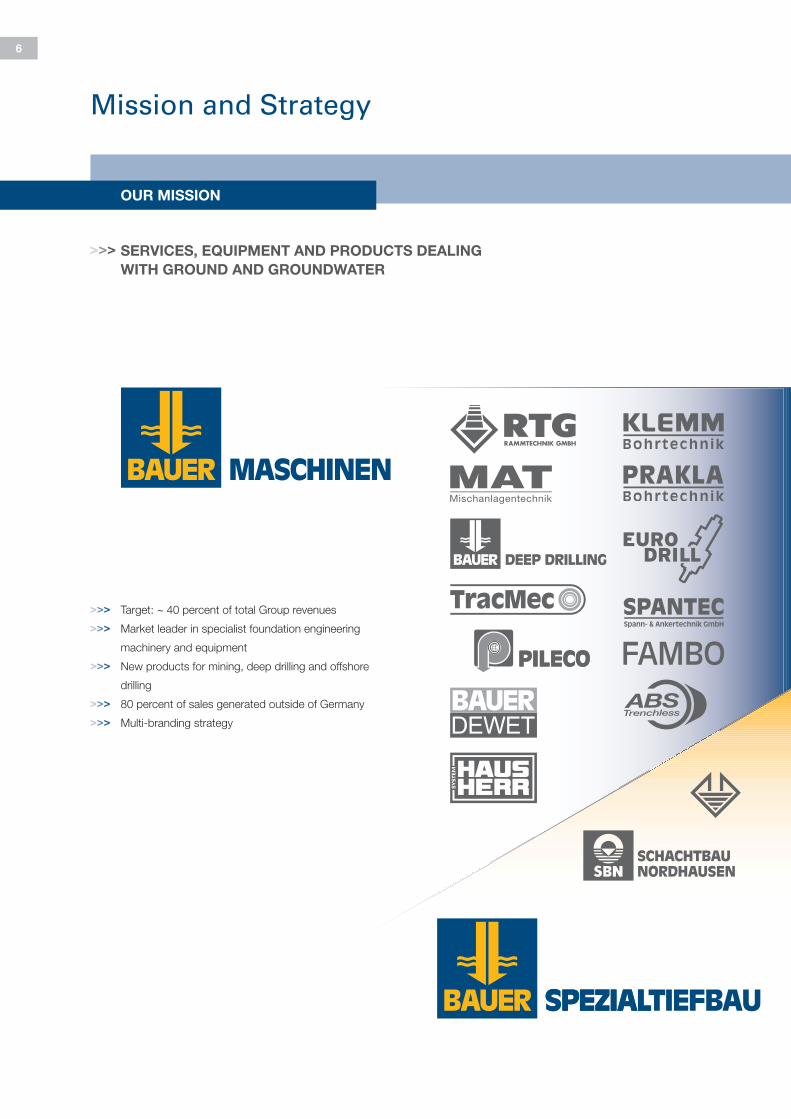
RESOURCES SEGMENT
in EUR ’000 2014 2015 Change
Total Group revenues 252,830 221,609 -12.3 %
Sales revenues 195,860 179,319 -8.4 %
Order intake 219,306 345,045 57.3 %
Order backlog 153,027 276,463 80.7 %
EBIT 15,932 -19,807 n/a
Net result for the period 4,347 -29,398 n/a
Employees (on average over the year) 1,400 1,276 -8.9 %
General conditions
The Resources segment focuses on the fields of water,
environment and natural resources. In the field of water,
we were able to register rising demand for brewing and
beverage technology as well as water purification plants in
the past financial year.
The market for deep drilling to exploit oil, gas, water and
natural resources proved to be particularly difficult. Heavy
pressure on raw material prices left hardly any projects for
our companies. This situation burdened us considerably in
the past year. Our subsidiaries in Jordan and South Africa
were particularly affected.
27
2013, the initiated restructuring was largely concluded in
2015. Our drilling companies in Africa also gained hardly
any orders because of the market situation and therefore
reported losses.
A positive trend was shown above all by our subsidiaries in
the environmental and water businesses. BAUER Umwelt
GmbH in Germany outperformed our revenue expectations.
The company scored a decisive success by winning an order
from Roche Pharma AG to remediate two sections of the old
Kesslergrube landfill site in Grenzach-Wyhlen. The order
amounts to more than EUR 100 million and is the largest
individual order yet gained by the BAUER Group. The share-
holding in Oman also provided a positive earnings contribution
once more. The company primarily operates the large-scale
reed-bed treatment plant to clean oil-contaminated water for
the regional oil company.
The Resources segment also includes the mining division of
SCHACHTBAU NORDHAUSEN GmbH, which chiefly performs
restoration and safeguarding of mines. The continuing positive
COMBINED MANAGEMENT REPORTBusiness Report
By contrast, the environmental business presented a very
positive picture. Germany is providing increased orders in
the field of remediation, such as land recycling, groundwater
treatment or the disposal of contaminated soils and surfaces.
In the Middle East, our waste management offers enabled us
to gain new orders.
Significant events
Total Group revenues in the Resources segment decreased
by 12.3 % from EUR 252.8 million in the previous year to EUR
221.6 million. The previous year’s figure included revenues from
the disposal and revaluation of businesses to the value of
EUR 36.5 million, following the sale of a 21 % shareholding
in the Oman subsidiary. Subtracting these figures from the
previous year’s performance leaves an increase of 2.5 %.
EBIT decreased from EUR 15.9 million to EUR -19.8 million.
If the exceptional earnings are subtracted from the previous
year’s figure, a slight improvement of the EBIT remains. The
net result for the period was clearly negative at EUR -29.4
million (previous year: EUR 4.3 million).
The Resources segment demanded a great deal of effort
from us in the past financial year. The reorganization of the
segment, which began in 2014 with its transformation into a
regional distribution unit, has already proved advantageous.
A great deal of further restructuring was carried out in the
past financial year to set up the segment in a strategically
new, future-oriented form. These influence factors and
measures created considerable financial burdens in 2015
and consequently led to a considerable loss.
The target of the restructuring was the GWE Group, which
has stopped producing standard PE pipes and is now con-
centrating on the well drilling and geothermal energy busi-
nesses. This necessitated a consolidation of locations and
a workforce reduction. Other, smaller subsidiaries in the
segment were shut down or are still being liquidated.
The greatest impact from the lack of deep drilling projects was
suffered by the Site Group for Services and Well Drilling Ltd.
Co. in Jordan. The low raw material prices and the plight
of refugees in Jordan caused investments in this market
to collapse. The performance therefore slumped far below
expectations and the burden imposed by idle drilling rigs
produced a significantly negative result. After the loss in
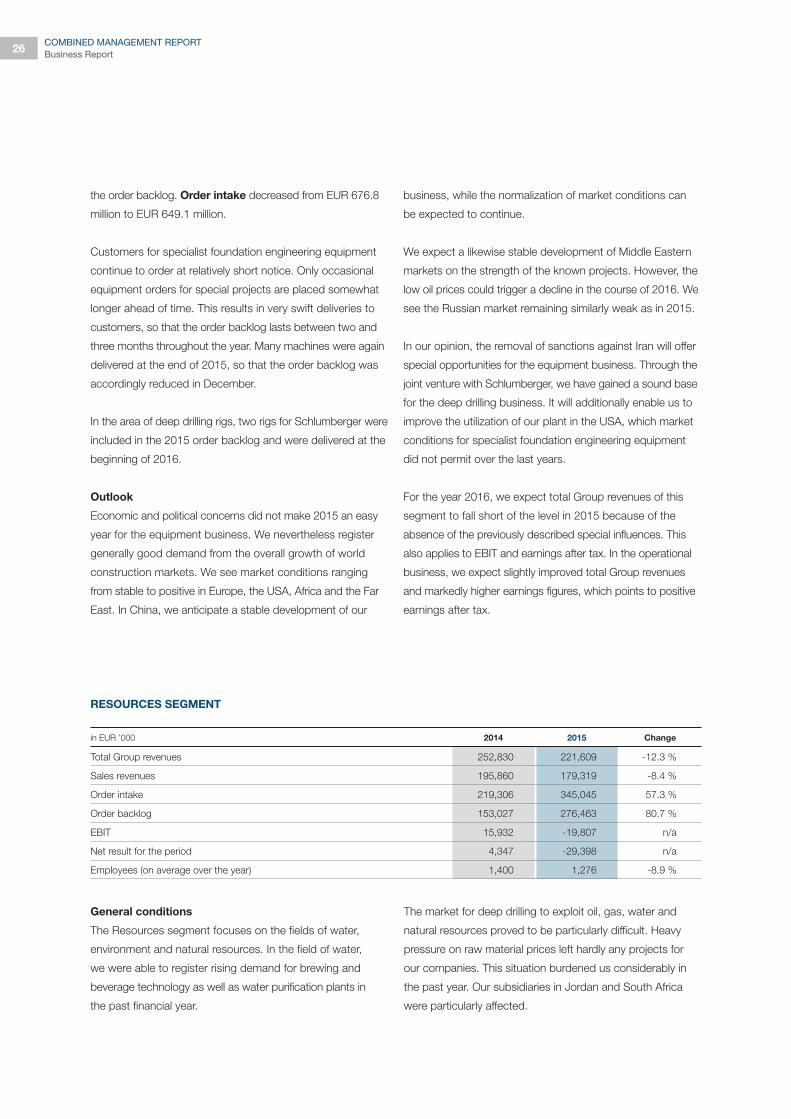
Geographical breakdown of total Group revenues
Resources segment
in EUR million (after deduction of Consolidation)
Total 218
Germany 128 (59 %)
Africa 11 (5 %)
Americas 12 (5 %)
Asia-Pacific,
Far East & Australia
2 (1 %)
Middle East & Central Asia
40 (18 %)
Europe (other)
2 (1 %)
EU (excl. Germany) 23 (11 %)

28COMBINED MANAGEMENT REPORTBusiness Report
The environmental business remains very positive, with a very
good overall order situation and capacity utilization. The major
Grenzach-Wyhlen project in Germany is expected to keep us
busy until as late as 2020. The overall order situation in the
field of water is also good and offers us further opportunities
for the future. All these matters will influence the current
financial year.
For 2016, we expect that total Group revenues will be consid-
erably higher than in the previous year. EBIT should be in the
positive area, whereas the current outlook for earnings after
tax is still negative.
OTHER / CONSOLIDATION SEGMENTS
The Other and Consolidation segments bundle the revenues
and earnings of the Group which cannot be allocated to the
operating segments. The Other segment essentially comprises
the revenues of the parent company BAUER AG itself, gener-
ated from a wide variety of administrative services provided
to Group subsidiaries.
The Other segment reports EBIT of EUR 4.6 million (previous
year: EUR 3.3 million). This includes EUR 4.0 million of dividend
payments by Group subsidiaries to the parent company. The
net result for the period was EUR 6.8 million (previous year:
EUR 4.9 million). The segment’s revenues are especially
generated by intra-Group charges.
The Consolidation segment reflects the consolidation within
the Group. The negative EBIT of EUR -7.4 million (previous
year: EUR -4.8 million) largely matches the aforementioned
dividend payments by Group subsidiaries to BAUER AG. The
net result for the period was EUR -6.5 million (previous year:
EUR -4.9 million).
state of the market allowed revenues to remain at a healthy
level. Along with many projects in Germany, an extensive order
is being handled in Kazakhstan. The division made a good
positive contribution to earnings.
Order situation
The order intake with EUR 345.0 million in 2015 exceeded
the previous year’s level of EUR 219.3 million considerably
by 57.3 %. The order backlog of EUR 276.5 million was
accordingly higher than in the previous year (EUR 153.0
million) by 80.7 %. The main reason for the increase was the
previously mentioned major project in Germany. In addition,
the environmental business won a large order for waste
management from an oil company in Oman. The subsidiaries
which produce water purification plants and brewing and
beverage technology systems also gained new orders and
expanded the backlog with good contributions.
Outlook
In the Resources segment, considerable efforts were again
undertaken in the past financial year towards the reorganization
that was already initiated in 2014. Consistent work was devoted
to cost structures, unprofitable businesses and subsidiaries
were terminated and locations were abandoned or consoli-
dated. The extensive restructuring measures created major
financial burdens.
Raw material markets and prices unfortunately continued
their negative trends too, so that our drilling companies were
particularly affected by scarce orders. The market situation
cannot be expected to improve quickly, even though there
are many planned projects which continue to offer us
opportunities.
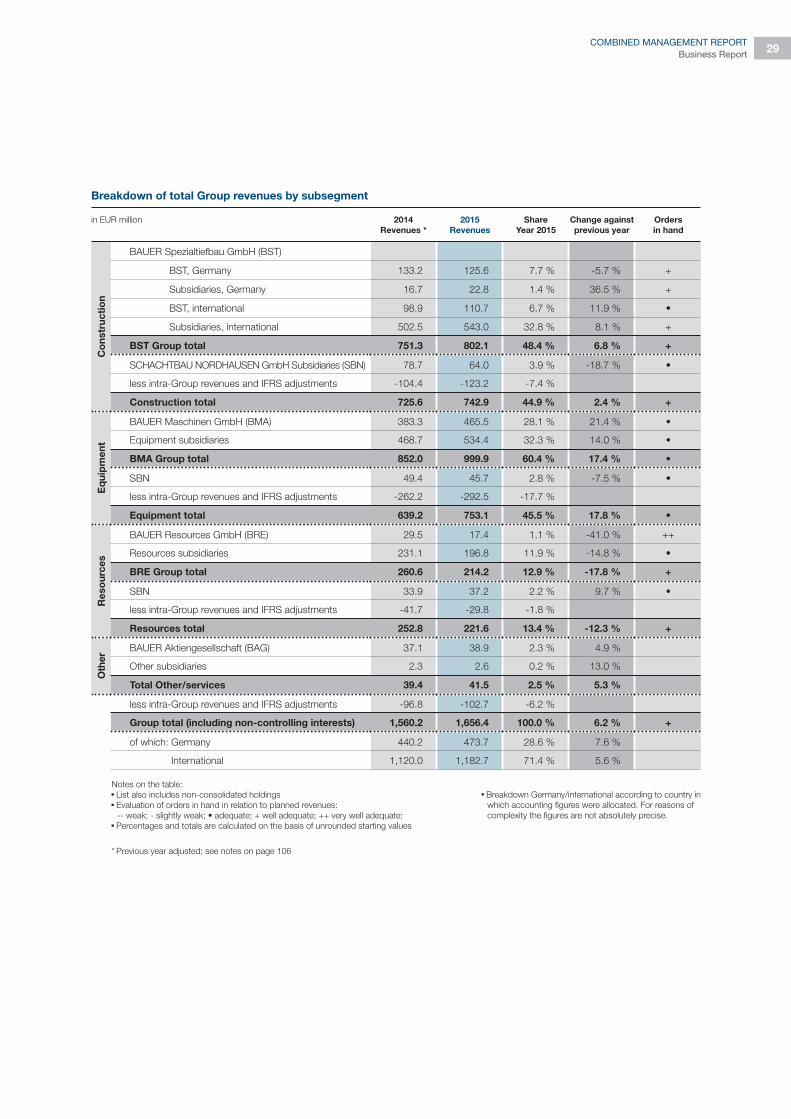
29COMBINED MANAGEMENT REPORT
Business Report
in EUR million 2014
Revenues *
2015
Revenues
Share
Year 2015
Change against
previous year
Orders
in hand
Co
nstr
uc
tio
n
BAUER Spezialtiefbau GmbH (BST)
BST, Germany 133.2 125.6 7.7 % -5.7 % +
Subsidiaries, Germany 16.7 22.8 1.4 % 36.5 % +
BST, international 98.9 110.7 6.7 % 11.9 % •
Subsidiaries, international 502.5 543.0 32.8 % 8.1 % +
BST Group total 751.3 802.1 48.4 % 6.8 % +
SCHACHTBAU NORDHAUSEN GmbH Subsidiaries (SBN) 78.7 64.0 3.9 % -18.7 % •
less intra-Group revenues and IFRS adjustments -104.4 -123.2 -7.4 %
Construction total 725.6 742.9 44.9 % 2.4 % +
Eq
uip
me
nt
BAUER Maschinen GmbH (BMA) 383.3 465.5 28.1 % 21.4 % •
Equipment subsidiaries 468.7 534.4 32.3 % 14.0 % •
BMA Group total 852.0 999.9 60.4 % 17.4 % •
SBN 49.4 45.7 2.8 % -7.5 % •
less intra-Group revenues and IFRS adjustments -262.2 -292.5 -17.7 %
Equipment total 639.2 753.1 45.5 % 17.8 % •
Re
so
urc
es
BAUER Resources GmbH (BRE) 29.5 17.4 1.1 % -41.0 % ++
Resources subsidiaries 231.1 196.8 11.9 % -14.8 % •
BRE Group total 260.6 214.2 12.9 % -17.8 % +
SBN 33.9 37.2 2.2 % 9.7 % •
less intra-Group revenues and IFRS adjustments -41.7 -29.8 -1.8 %
Resources total 252.8 221.6 13.4 % -12.3 % +
Oth
er
BAUER Aktiengesellschaft (BAG) 37.1 38.9 2.3 % 4.9 %
Other subsidiaries 2.3 2.6 0.2 % 13.0 %
Total Other/services 39.4 41.5 2.5 % 5.3 %
less intra-Group revenues and IFRS adjustments -96.8 -102.7 -6.2 %
Group total (including non-controlling interests) 1,560.2 1,656.4 100.0 % 6.2 % +
of which: Germany 440.2 473.7 28.6 % 7.6 %
International 1,120.0 1,182.7 71.4 % 5.6 %
Notes on the table: List also includes non-consolidated holdings Evaluation of orders in hand in relation to planned revenues:
-- weak; - slightly weak; • adequate; + well adequate; ++ very well adequate; Percentages and totals are calculated on the basis of unrounded starting values
Breakdown Germany/international according to country in
which accounting figures were allocated. For reasons of
complexity the figures are not absolutely precise.
Breakdown of total Group revenues by subsegment
* Previous year adjusted; see notes on page 106

30COMBINED MANAGEMENT REPORTBusiness Report
Breakdown of total Group revenues across the companies of the BAUER GroupShareholdings < 50 % are listed with their revenue share
in EUR million 2014 * 2015
BAUER Spezialtiefbau GmbH - Group
BAUER Spezialtiefbau GmbH, Schrobenhausen, Germany (BST) 232.1 236.3
Wöhr + Bauer GmbH, Munich, Germany (33 % share) – (sub-group consolidated financial statements) 14.5 19.9
BAUER Funderingstechniek B.V., Mijdrecht, Netherlands 4.7 4.6
BAUER Technologies Limited, Bishops Stortford, Great Britain 2.6 10.3
BAUER Spezialtiefbau Schweiz AG, Baden-Dättwil, Switzerland 28.6 9.2
BAUER Magyarország Speciális Mélyépítö Kft., Budapest, Hungary 7.7 9.7
BAUER ROMANIA S.R.L., Bucarest, Rumania 2.1 1.3
BAUER BULGARIA EOOD, Sofia, Bulgaria 4.5 3.9
BAUER SPEZIALTIEFBAU Gesellschaft m.b.H., Vienna, Austria 14.4 22.7
OOO BAUER Technologie, Moscow, Russian Federation 31.3 9.8
BAUER EGYPT S.A.E. Specialised Foundation Contractors, Cairo, Egypt 22.9 37.4
BAUER LEBANON FOUNDATION SPECIALIST S.a.r.l., Beirut, Lebanon 16.5 12.5
BAUER Georgia Foundation Specialists LCC, Batumi, Georgia 3.3 4.3
BAUER International FZE, Dubai, United Arab Emirates 37.0 34.8
BAUER Geotechnical Specialized Foundation LLC, Abu Dhabi, United Arab Emirates 20.7 34.0
BAUER International Qatar LLC, Doha, Qatar 13.8 34.5
Saudi BAUER Foundation Contractors Ltd., Jeddah, Saudi Arabia 10.8 24.0
BAUER (MALAYSIA) SDN. BHD., Petaling Jaya, Malaysia - (sub-group consolidated financial statements) 84.7 76.9
BAUER Hong Kong Limited, Hong Kong, People’s Republic of China 45.3 28.2
BAUER Vietnam Ltd., Ho Chi Minh City, Vietnam 2.9 6.0
BAUER Foundations Philippines, Inc., Quezon City, Philippines 10.2 22.8
P.T. BAUER Pratama Indonesia, Jakarta, Indonesia 30.2 12.7
Thai BAUER Co. Ltd., Bangkok, Thailand 21.2 18.1
BAUER Foundation Australia Pty Ltd., Brisbane, Australia 6.7 5.8
BAUER FOUNDATION CORP., Odessa, United States of America 42.2 55.3
BAUER Foundations Canada Inc., Calgary, Canada 9.1 26.3
BAUER FUNDACIONES PANAMÁ S.A., Panama City, Panama 11.7 10.5
BAUER FUNDACIONES DOMINICANA, S.R.L, Santo Domingo, Dominican Republic 2.0 7.5
Other BST shareholdings 15.6 20.1
Joint ventures, Germany - (BST share only) 2.0 2.7
Intra-Group sales -93.9 -111.3
BST Group total 657.4 690.8
SCHACHTBAU NORDHAUSEN GmbH - Group
SCHACHTBAU NORDHAUSEN GmbH, Nordhausen, Germany (SBN) 107.3 82.8
SBN participations 33.8 41.8
Joint ventures SCHACHTBAU NORDHAUSEN GmbH - (SBN share only) 0.0 1.9
SPESA Spezialbau und Sanierung GmbH, Schrobenhausen, Germany 14.2 17.3
Joint ventures SPESA - (SPESA share only) 6.7 3.1
Intra-Group sales -59.0 -57.4
SBN Group total 103.0 89.5
BAUER Maschinen GmbH - Group
BAUER Maschinen GmbH, Schrobenhausen, Germany (BMA) 383.3 465.5
KLEMM Bohrtechnik GmbH, Drolshagen, Germany 42.9 46.5
EURODRILL GmbH, Drolshagen, Germany 12.4 13.0
RTG Rammtechnik GmbH, Schrobenhausen, Germany 26.4 33.9
MAT Mischanlagentechnik GmbH, Immenstadt, Germany 11.8 -
PRAKLA Bohrtechnik GmbH, Peine, Germany 13.0 6.3
Compared to the breakdown of total Group revenues by segment, in the breakdown of total Group revenues by company the total of the individual groups is shown
after consolidation.

31COMBINED MANAGEMENT REPORT
Business Report
in EUR million 2014 * 2015
BAUER Maschinen GmbH - Group
Olbersdorfer Guß GmbH, Olbersdorf, Germany 7.9 7.0
SPANTEC Spann- & Ankertechnik GmbH, Schrobenhausen, Germany 21.5 16.6
BAUER Deep Drilling GmbH, Schrobenhausen, Germany 1.3 31.3
TracMec Srl, Mordano, Italy 11.4 13.0
BAUER EQUIPMENT UK LIMITED Rotherham, Great Britain 7.4 11.5
BAUER Macchine Italia Srl, Mordano, Italy 13.1 7.2
OOO BAUER Maschinen Russland, Moscow, Russian Federation 7.8 6.0
OOO BAUER Maschinen - Kurgan, Kurgan, Russian Federation 5.6 5.2
OOO BG-TOOLS-MSI, Lyubertsy, Russian Federation 1.6 1.6
BAUER Equipment Gulf FZE, Dubai, United Arab Emirates 8.4 9.9
BAUER Casings Makina Sanayi ve Ticaret Limited Sirketi, Ankara, Turkey 3.9 4.4
BAUER-DE WET EQUIPMENT (PROPRIETARY) LIMITED, Rasesa, Botswana 2.1 0.6
BAUER Technologies Far East Pte. Ltd., Singapore, Singapore - (sub-group consolidated financial statements) 152.9 135.2
NIPPON BAUER Y.K., Tokyo, Japan 7.3 5.9
BAUER Equipment Australia Pty. Ltd., Baulkham Hills, Australia 6.4 9.5
BAUER-Pileco Inc., Conroe, Texas, United States of America 76.3 98.0
BAUER Machinery USA Inc., Conroe, United States of America - 45.0
BAUER Manufacturing Inc., Conroe, United States of America 22.2 16.9
Other BMA participations 5.1 9.9
Intra-Group sales -220.5 -251.7
BMA Group total 631.5 748.2
BAUER Resources GmbH - Group
BAUER Resources GmbH, Schrobenhausen, Germany (BRE) 29.6 17.4
GWE pumpenboese GmbH, Peine, Germany 56.0 49.1
BAUER Umwelt GmbH, Schrobenhausen, Germany (BMU) 54.8 56.6
BAUER Water GmbH, Oberndorf a.N., Germany 13.5 11.2
Esau & Hueber GmbH, Schrobenhausen, Germany 15.4 15.4
BAUER Foralith GmbH, Schrobenhausen, Germany 5.1 0.5
GWE POL-Bud Sp.z.o.o, Lodz, Poland 3.1 3.4
FORALITH Drilling Support AG, St. Gallen, Switzerland 5.1 2.1
BAUER Ambiente S.r.l., Milan, Italy 1.4 0.6
GWE Budafilter Kft., Mezöfalva, Hungary 3.2 3.5
BAUER Resources GmbH / Jordan Ltd. Co., Amman, Jordan - (sub-group consolidated financial statements) 29.9 22.7
BAUER Nimr LLC, Maskat-Al Mina, Sultanate of Oman 17.4 7.4
BAUER Emirates Environment Technologies & Services LLC, Abu Dhabi, United Arab Emirates 4.8 4.2
BAUER Technologies South Africa (PTY) Ltd., Cape Town, South Africa -
(sub-group consolidated financial statements) 2.4 3.0
BAUER RESOURCES GHANA LIMITED, Accra, Ghana 2.5 0.8
BAUER Senegal SARL, Dakar, Senegal 0.0 2.5
GWE Tubomin S.A., City of Santiago, Chile 3.3 4.3
BAUER Resources Canada Ltd., Edmonton, Canada - (sub-group financial statements) 1.2 0.1
Other participations of BRE 7.3 7.0
Joint ventures BAUER Umwelt GmbH - (BMU share only) 4.6 2.4
Intra-Group sales -34.9 -25.1
BRE Group total 225.7 189.1
BAUER Aktiengesellschaft, Schrobenhausen, Germany (BAG) 37.1 38.9
Other participations of BAG 2.3 2.6
Intra-Group sales -96.8 -102.7
GROUP TOTAL 1,560.2 1,656.4
* Previous year adjusted; see notes on page 106

III. EARNINGS, FINANCIAL AND NET ASSET POSITION
will not be able to achieve these returns entirely in the coming
year, because similar special effects are not to be expected.
There have been noticeable changes to individual income
statement items. This is chiefly a result of the special influences
described above which are included in the past two business
years.
The individual income statement items are summarized in the
following.
Consolidated revenues rose by 5.4 % against the previous
year (EUR 1,506.0 million) to EUR 1,587.9 million. Without the
described special effects in the previous year and the reporting
year, the increase would have been 2.8 %.
Sales revenues were up slightly by 0.2 % compared to the
previous year (EUR 1,375.7 million) at EUR 1,379.0 million.
Changes in inventories increased by 8.9 % from EUR 26.6
million to EUR 29.0 million.
Other capitalized goods and services for own account
increased by 54.8 % from EUR 14.7 million to EUR 22.7 million
due to higher investments in equipment from own production
in 2015.
Other income rose very significantly against the previous
year, from EUR 89.0 million to EUR 157.2 million. The special
earnings already described provided a further significant
boost for this item in 2014 (Oman) and in the completed
business year (joint venture and Spantec). Moreover, the
book profits on asset disposal (EUR 16.4 million) rose by
EUR 11.0 million. Other key changes to this item related
to realized and unrealized foreign currency gains as well as
gains from foreign exchange forward contracts, which overall
GROUP EARNINGS POSITION
The Group earnings position in 2015 was significantly influ-
enced by contradictory developments. The purely operating
result without restructuring expenditures and negative excep-
tional effects identified by the company was positive, although
significantly below the forecast made for the business year.
Many restructuring activities that were necessary in various
areas led to significant expenditure, and thus a considerable,
negative contribution to earnings. In addition, there were
special losses such as in the USA or in Jordan because of
missing drilling orders. On the other hand, the sale of 50 %
of the shares in SPANTEC Spann- und Ankertechnik GmbH
and the joint venture with Schlumberger in the deep drilling rig
business made it possible to achieve significant special results
(at EBIT level) amounting to EUR 77.8 million overall.
All these effects led to a net result for the period of EUR
29.0 million (previous year: EUR 15.7 million).
Comparing the earnings figures with the previous year indicates
that 2014 includes an income item from sale and consolidation
amounting to EUR 36.5 million resulting from the sale of 21 %
of the shares in our subsidiary BAUER Nimr LLC in Oman.
EBIT increased from EUR 76.4 million to EUR 90.7 million.
EBITDA increased by 8.2 % from EUR 171.0 million to EUR
185.1 million, representing 11.7 % (previous year: 11.4 %) of
consolidated revenues.
The pre-tax return on equity as the ratio of pre-tax profit to
shareholders’ equity (equity at the start of the period) improved
significantly against the previous year from 9.0 % to 13.5 % –
in particular due to the special effects. The return on equity
after tax was 6.9 % (previous year: 3.7 %). The return on
sales after tax (relative to the consolidated income statement
revenues) improved from 1.0 % to 1.8 % year-on-year. We
32COMBINED MANAGEMENT REPORTEarnings, fi nancial and net asset position
in EUR million Q1 2015 Q2 2015 Q3 2015 Q4 2015 Full year 2015
BAUER Group 409.101 371.258 414.498 461.555 1,656.412
Construction 193.470 176.437 194.519 178.436 742.862
Equipment 173.821 159.565 163.205 256.492 753.083
Resources 54.251 47.830 75.118 44.410 221.609
Other/Consolidation -12.441 -12.574 -18.344 -17.783 -61.142
Trend in total Group revenues by quarter
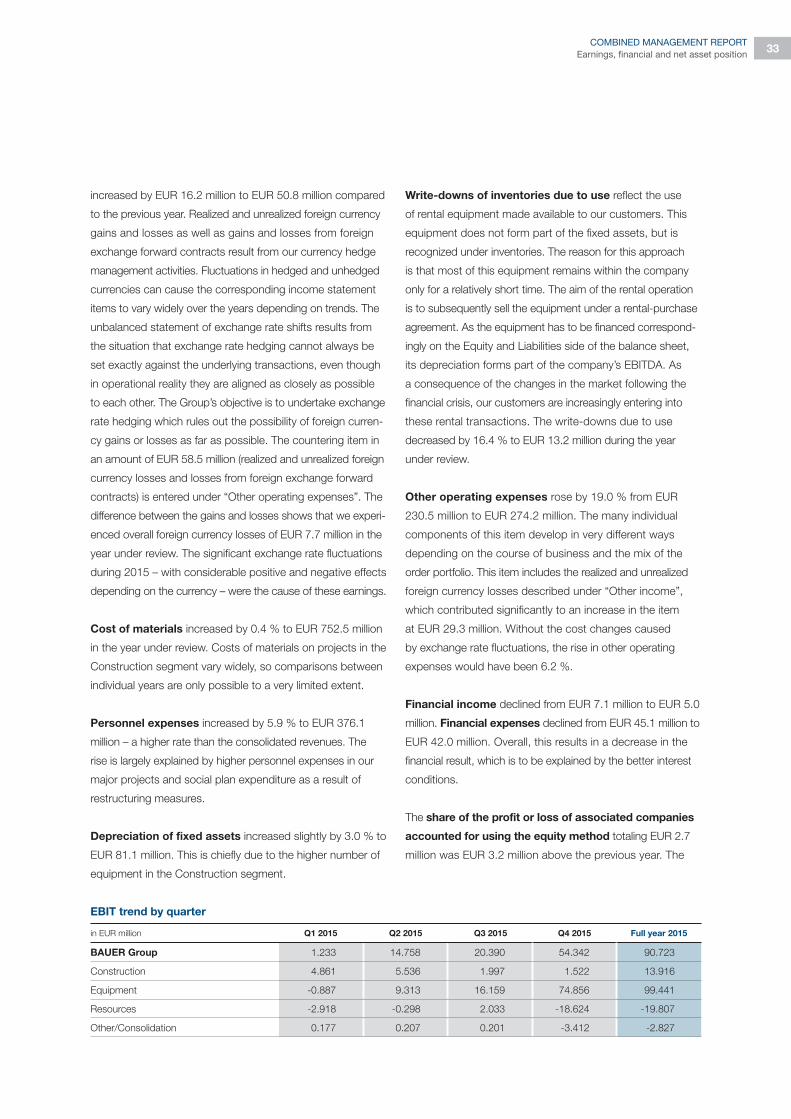
33COMBINED MANAGEMENT REPORT
Earnings, fi nancial and net asset position
Write-downs of inventories due to use reflect the use
of rental equipment made available to our customers. This
equipment does not form part of the fixed assets, but is
recognized under inventories. The reason for this approach
is that most of this equipment remains within the company
only for a relatively short time. The aim of the rental operation
is to subsequently sell the equipment under a rental-purchase
agreement. As the equipment has to be financed correspond-
ingly on the Equity and Liabilities side of the balance sheet,
its depreciation forms part of the company’s EBITDA. As
a consequence of the changes in the market following the
financial crisis, our customers are increasingly entering into
these rental transactions. The write-downs due to use
decreased by 16.4 % to EUR 13.2 million during the year
under review.
Other operating expenses rose by 19.0 % from EUR
230.5 million to EUR 274.2 million. The many individual
components of this item develop in very different ways
depending on the course of business and the mix of the
order portfolio. This item includes the realized and unrealized
foreign currency losses described under “Other income”,
which contributed significantly to an increase in the item
at EUR 29.3 million. Without the cost changes caused
by exchange rate fluctuations, the rise in other operating
expenses would have been 6.2 %.
Financial income declined from EUR 7.1 million to EUR 5.0
million. Financial expenses declined from EUR 45.1 million to
EUR 42.0 million. Overall, this results in a decrease in the
financial result, which is to be explained by the better interest
conditions.
The share of the profit or loss of associated companies
accounted for using the equity method totaling EUR 2.7
million was EUR 3.2 million above the previous year. The
increased by EUR 16.2 million to EUR 50.8 million compared
to the previous year. Realized and unrealized foreign currency
gains and losses as well as gains and losses from foreign
exchange forward contracts result from our currency hedge
management activities. Fluctuations in hedged and unhedged
currencies can cause the corresponding income statement
items to vary widely over the years depending on trends. The
unbalanced statement of exchange rate shifts results from
the situation that exchange rate hedging cannot always be
set exactly against the underlying transactions, even though
in operational reality they are aligned as closely as possible
to each other. The Group’s objective is to undertake exchange
rate hedging which rules out the possibility of foreign curren-
cy gains or losses as far as possible. The countering item in
an amount of EUR 58.5 million (realized and unrealized foreign
currency losses and losses from foreign exchange forward
contracts) is entered under “Other operating expenses”. The
difference between the gains and losses shows that we experi-
enced overall foreign currency losses of EUR 7.7 million in the
year under review. The significant exchange rate fluctuations
during 2015 – with considerable positive and negative effects
depending on the currency – were the cause of these earnings.
Cost of materials increased by 0.4 % to EUR 752.5 million
in the year under review. Costs of materials on projects in the
Construction segment vary widely, so comparisons between
individual years are only possible to a very limited extent.
Personnel expenses increased by 5.9 % to EUR 376.1
million – a higher rate than the consolidated revenues. The
rise is largely explained by higher personnel expenses in our
major projects and social plan expenditure as a result of
restructuring measures.
Depreciation of fixed assets increased slightly by 3.0 % to
EUR 81.1 million. This is chiefly due to the higher number of
equipment in the Construction segment.
in EUR million Q1 2015 Q2 2015 Q3 2015 Q4 2015 Full year 2015
BAUER Group 1.233 14.758 20.390 54.342 90.723
Construction 4.861 5.536 1.997 1.522 13.916
Equipment -0.887 9.313 16.159 74.856 99.441
Resources -2.918 -0.298 2.033 -18.624 -19.807
Other/Consolidation 0.177 0.207 0.201 -3.412 -2.827
EBIT trend by quarter

34COMBINED MANAGEMENT REPORTEarnings, fi nancial and net asset position
extent. The reasons for the considerable rise over recent
years following the financial crisis are detailed below:
The level of the net debt in the Group is largely dependent
on the level of the working capital. The working capital of
our businesses is inevitably relatively high due to the nature
of our business model and the special market in which we
operate. Our construction projects run for only comparatively
short periods of time. As opposed to building construction
contractors, who work on longer-running projects, we only
sometimes receive advance payments for the construction
project in question meaning that it is very rare for us to
generate a positive cash flow over the term of the project.
Short-running construction contracts – such as we mostly
carry out – require financing across the Group’s many con-
struction sites corresponding to roughly three months’ sales
of the Construction segment. Consequently, settlement always
takes place after the activity has been carried out.
The situation in the Equipment segment is similar. Production
lead times for our specialist machinery are around 12 months.
Since customers usually only order equipment once they have
an actual contract to fulfill, and so expect short delivery lead
times from us, we are forced to hold stocks of finished
machinery. Moreover, we have a very broad product range
and we need to stock spare parts for our customers world-
wide, leading to a corresponding increase in the need for
financing.
Nevertheless, we judge that the working capital of the BAUER
Group is currently too high in relation to our business volumes.
Our levels of inventories, finished goods and receivables have
increased beyond the normal bounds. This is not good, but
on the other hand is explainable, because we are aware of
the reasons why it is so: they reflect market trends as well
as special effects. Furthermore, substantial amounts are
significant positive contribution to results is due to the partici-
pation in Oman.
Income tax expense of EUR 27.4 million was EUR 5.3 million
above the previous year’s level. This item includes EUR 6.2
million of deferred tax expense on valuations in connection
with the foundation of the joint venture with Schlumberger.
Negative result contributions from subsidiaries in individual
countries only have the effect of reducing the tax burden on
the Group if it is possible to establish deferred tax assets on
the basis of positive tax-related earnings planning. In some
cases, this was not possible last year. In future, we expect
an income tax burden of between 30 % and 40 %.
The result attributable to non-controlling interests was
EUR -0.7 million (previous year: EUR 1.2 million).
The result attributable to BAUER AG shareholders was
EUR 29.7 million (previous year: EUR 14.5 million).
GROUP FINANCIAL AND NET ASSET POSITION
With consolidated revenues up 5.4 % on the previous year, the
Group’s net assets increased by 5.2 % from EUR 1,575.1
million to EUR 1,656.9 million. The equity ratio of 27.2 % was
well up on the previous year (26.6 %). The loss in 2013 meant
that the equity ratio fell below 30 %. We are once again aiming
to achieve a value in excess of 30 % in coming years. All
investment and growth plans of the business are aligned
to this target.
The net debt of our business increased again by 3.0 % in
the year under review after a decrease in the previous year.
In the coming years, we will continue to work intensively on
reducing net debt in relation to net assets. We must stress,
however, that in view of the nature of our business and the
current economic climate, that is only possible to a certain
1 EUR corresponds to Average rate
2014
Q1 2015 Q2 2015 Q3 2015 Q4 2015 Average rate
2015
USD 1.3219 1.0740 1.1141 1.1165 1.0892 1.1039
GBP 0.8028 0.7234 0.7084 0.7371 0.7350 0.7236
RUB 51.5000 62.4155 62.3326 73.2499 80.4168 68.6566
CNY 8.1575 6.6572 6.9100 7.0967 7.0724 6.9434
Exchange rate trend 2015

35COMBINED MANAGEMENT REPORT
Earnings, fi nancial and net asset position
turing operations). Some specific items relate primarily to the
Construction element, while others, in contrast, relate to the
Equipment element. The main items of such kinds are listed
in the following:
• Within property, plant and equipment, about two thirds
of the land, land rights and buildings item relates to the
Equipment segment. On the other hand, about two thirds of
the technical equipment and machinery item is attributable
to the Construction segment.
• Some 40 % of the raw materials and supplies item is
linked to the machinery manufacturing operations of the
Equipment segment.
• More than 90 % of the work in progress and finished
goods and stock for trade item relates to the Equipment
segment, with a small percentage attributable to the Con-
struction and Resources segments. In the Equipment
segment, it is essential to successful selling operations
to maintain stocks of rental equipment as part of current
assets, so that customers can try out the machinery before
making their final purchasing decision. Equipment can also
be drawn from the pool to cover short-term capacity
bottlenecks on construction sites. The machinery in
production at the balance sheet date also represents
a very substantial capital tie-up.
• Receivables from construction contracts (PoC) are
attributable to the Construction and Resources segments.
The trade receivables item is broken down according to
the respective segments’ shares of total Group revenues.
These different weightings are barely relevant to inter-period
balance sheet comparisons when the rate of growth – either
positive or negative – of the business areas is roughly the same.
With regard to the items on the balance sheet, the following
material changes should be noted:
On the Assets side:
• Intangible assets declined by EUR 7.0 million. The
main reduction concerns development costs which were
transferred to the joint venture with Schlumberger. The
corresponding development costs for large deep drilling
rigs are thus no longer in the basis of consolidation.
imposing a burden, as claims in respect of supplementary
work on completed international construction projects are
having to be asserted by legal action. Even though the
amounts are recognized with due commercial caution in the
accounts, they are nevertheless imposing a burden in terms
of the indebtedness of the business.
We are aware that the Group’s higher financing requirements
place greater weight on the question of our self-financing
capabilities. Following the loss made in 2013, the equity ratio
has fallen too low, so it will have to be increased again in the
years ahead. It would be much higher if the hidden reserves
were included. Since changing over to IFRS we have used
the historical cost model to value land and buildings. With
a carrying amount for the land and buildings of EUR 184.2
million, there is a considerable reserve here.
The net debt to EBITDA and EBITDA to net interest coverage
ratios agreed with lenders as covenants have worsened since
the financial crisis, and especially as a result of the loss made
in the 2013 financial year. In 2015, it was possible to move the
net debt to EBITDA ratio to a somewhat better level at 3.59,
representing an improvement compared to the previous year
(3.78). The two other agreed covenant ratios – EBITDA to net
interest coverage and equity ratio – are adequately within the
agreed thresholds. The Group has entered into covenants in
respect of a number of long-term loans, which were valued
as per the 2015 year-end at EUR 193.5 million. The covenants
on them stipulate net debt to EBITDA ratio thresholds between
3.75 and 5.0.
2014 2015
Net debt/EBITDA 3.78 3.59
EBITDA/net interest coverage 4.49 4.99
Equity ratio in % 26.6 27.2
Covenants trend
The syndicated loan agreed in 2014 amounting to EUR 450
million, to which the named thresholds also apply, will still run
until April 2017. We will carry out the refinancing process in
the current year.
In assessing the Assets side of the consolidated balance sheet,
it is important to note that this is composed of a Construction
element (relating to the Construction and Resources segments)
and an Equipment element (relating to machinery manufac-

36
• Receivables from construction contracts (PoC) de-
creased by EUR 2.7 million to EUR 129.5 million. Changes
in this item result from the percentage of completion of our
projects at the year-end closing date.
• Trade receivables increased by EUR 32.5 million to EUR
343.9 million.
• Other current financial assets increased by EUR 8.8
million to EUR 28.9 million. The main reason is the reas-
signment of a receivable from other non-current financial
assets.
• Cash and cash equivalents increased by EUR 5.6 million
to EUR 47.4 million. Attempts are made to minimize this
figure at the year-end by appropriate liquidity management.
On the Equity and Liabilities side:
• Equity increased significantly by EUR 32.3 million to EUR
451.2 million. Factors contributing positively to this change
were the net result for the period (EUR 29.0 million), currency
fluctuations (EUR 7.8 million) and the interest-related
adaptation in provisions for pensions netted against the
associated deferred tax assets (EUR 4.7 million). Changes
in the basis of consolidation (EUR 4.3 million) and dividend
payments (EUR 3.1 million) had a reducing effect.
• Land, land rights and buildings declined by EUR 22.3
million to EUR 184.2 million. The main influencing factor
was the incorporation of BAUER Manufacturing LLC, USA,
and thus the plant in Conroe, into the joint venture. Other-
wise, only relatively small building projects were undertaken
during the financial year or smaller buildings sold.
• Technical equipment and machinery decreased by
EUR 18.9 million to EUR 187.3 million. The reduction is
largely due to disinvestments in Jordan. Basically, the shift
in demand on international construction markets means
that our construction works require increasingly large
machinery and equipment. Consequently, small equipment
is increasingly being replaced by much larger machinery,
leading to a general increase in fixed assets.
Property, plant and equipment and investment property
were reduced overall by EUR 42.6 million to EUR 404.0 million.
• Investments accounted for using the equity method
increased by EUR 89.6 million to EUR 132.6 million. In this
case, the companies included in the joint venture with
Schlumberger were accounted for at the equity method as
well as our residual share amounting to 40 % in SPANTEC
Spann- und Ankertechnik GmbH both totaling up to EUR
90.9 million. The corresponding market values were derived
from the capital inpayments and purchase prices of our
particular partners.
COMBINED MANAGEMENT REPORTEarnings, fi nancial and net asset position
Assets Equity and liabilities
Non-current assets
EUR 618.2 million (37.3 %)
(2014: EUR 594.8 million (37.8 %))
Current assets
EUR 991.3 million (59.8 %)
(2014: EUR 938.5 million (59.6 %))
Liquid funds
EUR 47.4 million (2.9 %)
(2014: EUR 41.8 million (2.6 %))
EUR 1,656.9 million EUR 1,656.9 million
Equity
EUR 451.2 million (27.2 %)
(2014: EUR 418.9 million (26.6 %))
Non-current debt
EUR 533.9 million (32.2 %)
(2014: EUR 523.3 million (33.2 %))
Current debt
EUR 671.8 million (40.6 %)
(2014: EUR 632.9 million (40.2 %))

37
• Owing to the effects set out under “Group earnings posi-
tion”, earnings before tax of EUR 56.4 million were made
compared to earnings of EUR 37.8 million in the previous
year.
• Depreciation of fixed assets increased slightly by EUR 2.4
million, and contributed EUR 81.1 million to the inflow of
funds from ongoing business activity.
• The other non-cash transactions and results of deconsoli-
dations contain effects from deconsolidations amounting
to EUR 77.9 million (previous year: EUR 36.5 million).
• The increase in trade receivables resulted in a capital tie-up
of EUR 38.8 million.
• The increase in inventories burdened the operating cash
flow to the tune of EUR 38,0 million.
• The other current and non-current liabilities changed by
EUR -34.8 million compared to the previous year.
Cash flow from investment activities totaled EUR -37.5
million, decreasing by EUR 10.0 million below the previous
year’s figure, especially due to higher proceeds from the sale
of fixed assets.
The outflow of funds from financing activities was EUR 9.1
million. The main factors influencing this were repayments
of loans and liabilities to banks amounting to EUR 159.2
million and interest payments of EUR 38.6 as well as new
indebtedness to banks in the amount of EUR 213.4 million.
• Non-controlling interests decreased by EUR 7.2 million
to EUR 12.4 million. The main factors were the changes
caused by the sale of shares in SPANTEC Spann- und
Ankertechnik GmbH and a reassignment to the majority
capital concerning the Site Group for Services and Well
Drilling Ltd. Co.
• The non-current portion of liabilities to banks increased
from EUR 364.8 million to EUR 376.6 million.
• Long-term provisions for pensions decreased by EUR
4.1 million to EUR 112.3 million. The reduction is largely due
to the return to an increase in the discount rate at 2.35 %
(previous year: 2.0 %). The annual injection from ongoing
pension commitments counteracted this reduction.
• Other non-current financial liabilities decreased from
EUR 10.0 million to EUR 4.4 million.
• The current portion of liabilities to banks increased
from EUR 266.5 million to EUR 297.7 million. Financing
increased by EUR 43.0 million overall in terms of current
and non-current liabilities to banks.
• Trade payables increased by EUR 16.0 million to EUR
185.0 million. When it is sensible to do so, we use all
discounting opportunities.
• Other current financial liabilities decreased by EUR
13.6 million to EUR 12.1 million. This is largely due to
liabilities from foreign exchange forward contracts.
The ratio of net assets to consolidated revenues decreased
slightly from 104.6 % to 104.3 %.
Net cash from operating activities shown in the cash flow
statement decreased substantially from EUR 115.4 million
to EUR 32.4 million. The following factors contributed to this
change:
COMBINED MANAGEMENT REPORTEarnings, fi nancial and net asset position

38ZUSAMMENGEFASSTER LAGEBERICHTEinzelabschluss BAUER Aktiengesellschaft

39
• Other operating expenses rose by EUR 31.0 million. The
main reasons for this significant rise are the payments by
BAUER AG for the restructuring measures in the subsidiaries
of BAUER Resources GmbH.
• The operating result deteriorated by EUR 30.9 million to
EUR -31.1 million.
• The net result for the year with EUR -25.2 million is EUR
31.1 million below the previous year. The unappropriated
net profit decreased significantly from EUR 33.3 million to
EUR 5.6 million.
The payment of dividends to shareholders is based on the
unappropriated net profit of BAUER AG as the parent com-
pany, taking into account the Group’s consolidated earnings.
The dividend policy of BAUER AG is one of continuity, mean-
ing that in principle a dividend should be paid even in difficult
years, where financially justifiable. As the Group’s holding
company, BAUER AG is dependent on the earnings of its
subsidiaries, and additionally provides financing to them.
Following the difficult financial year in 2015, the planned
earnings after tax in the Group could only be achieved by
means of exceptional results. We believe it is appropriate to
allow our shareholders to participate in this, so we intend
to pay a small dividend. The Management Board will thus
recommend to the Supervisory Board that it propose a
dividend of EUR 0.15 (previous year: EUR 0.15) to the
shareholders. In order to reduce the burden on the capital
base of BAUER AG which is making the dividend payment,
it has not been possible to increase the dividend in spite
of the fact that higher earnings after tax were achieved in
the Group. Moreover, we are still intensively pursuing the
objective of improving the equity ratio of the Group.
As the Group’s holding company, BAUER AG receives
earnings in particular from its subsidiaries. In 2016, dividend
payments by the subsidiaries will be approximately the same
as in 2015, although no special effects are to be expected.
Consequently, BAUER AG should once again achieve a profit.
The annual report combines the Group management report
and the management report of BAUER AG as the parent
company. The balance sheet and the income statement of
BAUER AG (according to the German Commercial Code,
HGB) will thus be explained at this point.
BAUER AG posted a significant loss in 2015, amounting to
EUR 25.2 million. Extensive restructuring measures in the
Resources segment obliged BAUER AG to undertake share-
holder contributions to subsidiaries amounting to EUR 29.7
million. This measure was taken in order to safeguard the
future business of the segment, and was thus unavoidable.
Furthermore, BAUER AG was burdened by a high injection
into provisions for pensions (EUR 1.6 million). A dividend
payment by BAUER Maschinen GmbH (EUR 4.0 million) and
its own positive contributions to results made it possible to
reduce the loss to EUR 25.2 million.
The following items in the balance sheet and income statement
changed significantly during the completed financial year
compared to the previous year:
Main changes to the balance sheet:
• Receivables and other assets decreased by EUR 7.2
million. This was due to the change in receivables from
affiliated companies amounting to EUR 7.0 million.
• Equity decreased from EUR 161.2 million to EUR 133.5
million. This was caused by the loss for the year amounting
to EUR 25.2 million and the payment of the dividend in 2015
amounting to EUR 2.6 million.
• Liabilities increased from EUR 161.9 million to EUR 184.2
million. The main factor responsible for this was growth in
liabilities to banks by EUR 17.9 million, due to the financing
activity of BAUER AG for the Group. Liabilities to affiliated
companies increased by EUR 3.6 million.
Main changes to the income statement:
• Sales revenues, primarily related to charging of administra-
tive services to subsidiaries, increased by EUR 2.0 million
to EUR 32.1 million.
COMBINED MANAGEMENT REPORTFinancial Statements of BAUER Aktiengesellschaft
IV. FINANCIAL STATEMENTS OF BAUER AKTIENGESELLSCHAFT
It has now become a tradition that customers and partners have come to especially appreciate: In April, the BAUER Maschinen Group
organized its in-house exhibition, presenting all kinds of new and further developments as well as tried-and-tested technology.

40COMBINED MANAGEMENT REPORTSustainability
V. SUSTAINABILITY
SUSTAINABILITY IN THE BAUER GROUP
Taking the slogan “BAUER’s Triple A”, the BAUER Group has
defined its most important action areas: health, safety and
environment, quality and ethics as well as performance. The
slogan is based on the highest grade awarded by rating
agencies when they evaluate the strength of a company.
We have introduced many measures for the benefit of our
employees and customers in the field of health, safety and
environment. Besides this, we seek to do justice to the
expectations of our customers by offering a constantly
perfected product range and top-quality services. In doing
so, we treat each other with respect and communicate on
an open partnership basis with the diverse stakeholder
groups. Performance, meaning the exertion of our corporate
economic power, is the key to the continued future develop-
ment of the company. Our goal is to achieve the highest
grades – the A’s – in all three areas.
EMPLOYEES
Our employees make the company what it is. Every single one
of them jointly contributes to the success of the BAUER Group
with their performance and their commitment. We owe thanks
to our employees in 2015 for being able to look back on 225
years of experience at Bauer.
Employee-related data
The companies of the BAUER Group employed an annual
average of 10,738 employees all over the world (previous year:
10,405). They are divided up as follows:
• Construction segment:
6,243 employees (previous year: 5,777)
• Equipment segment:
2,919 employees (previous year: 2,936)
• Resources segment:
1,276 employees (previous year: 1,400)
• BAUER AG and subsidiaries:
300 employees (previous year: 292)
The trend in personnel numbers within the Group was in
line with our expectations. Changes in our subsidiaries were
primarily registered outside of Germany in connection with
international construction projects. Individual contracts often
make major changes possible.
By the nature of its operations, the workforce of the Con-
struction segment is subject to the greatest fluctuation,
3,664
23910,253
6,350
3,835 3,9484,050
240 24824510,264 10,405
10,738
6,189 6,209 6,443
12,000
10,000
8,000
6,000
4,000
2,000
02012 2013 2014 2015
12,000
10,000
8,000
6,000
4,000
2,000
02012 2013 2014 2015
2,952
1,578
26910,253
5,454
2,998 2,9362,919
1,449 1,4001,276
286 29230010,264 10,405
5,531 5,7776,243
10,738
Employees by employment typeEmployees by segment
Industrial Salaried staff ApprenticesConstruction Equipment Resources Others
The action areas defined under BAUER’s Triple A also
represent the core aspects of sustainability management.
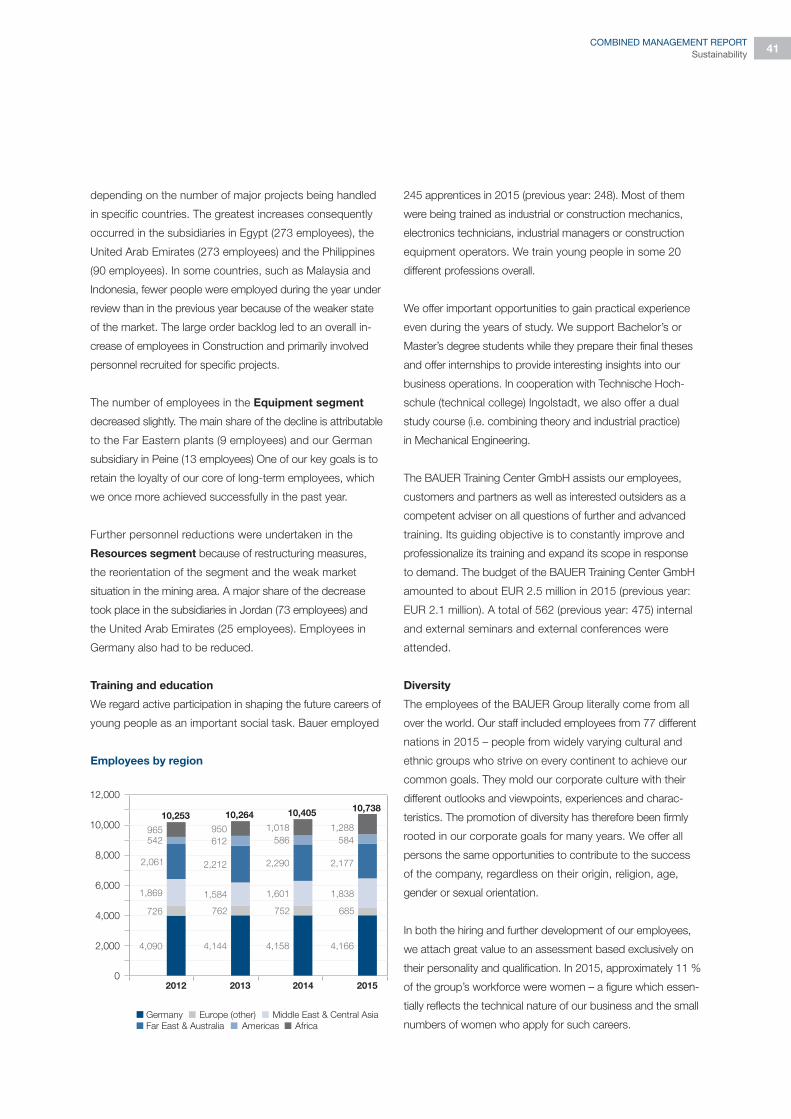
41COMBINED MANAGEMENT REPORT
Sustainability
245 apprentices in 2015 (previous year: 248). Most of them
were being trained as industrial or construction mechanics,
electronics technicians, industrial managers or construction
equipment operators. We train young people in some 20
different professions overall.
We offer important opportunities to gain practical experience
even during the years of study. We support Bachelor’s or
Master’s degree students while they prepare their final theses
and offer internships to provide interesting insights into our
business operations. In cooperation with Technische Hoch-
schule (technical college) Ingolstadt, we also offer a dual
study course (i.e. combining theory and industrial practice)
in Mechanical Engineering.
The BAUER Training Center GmbH assists our employees,
customers and partners as well as interested outsiders as a
competent adviser on all questions of further and advanced
training. Its guiding objective is to constantly improve and
professionalize its training and expand its scope in response
to demand. The budget of the BAUER Training Center GmbH
amounted to about EUR 2.5 million in 2015 (previous year:
EUR 2.1 million). A total of 562 (previous year: 475) internal
and external seminars and external conferences were
attended.
Diversity
The employees of the BAUER Group literally come from all
over the world. Our staff included employees from 77 different
nations in 2015 – people from widely varying cultural and
ethnic groups who strive on every continent to achieve our
common goals. They mold our corporate culture with their
different outlooks and viewpoints, experiences and charac-
teristics. The promotion of diversity has therefore been firmly
rooted in our corporate goals for many years. We offer all
persons the same opportunities to contribute to the success
of the company, regardless on their origin, religion, age,
gender or sexual orientation.
In both the hiring and further development of our employees,
we attach great value to an assessment based exclusively on
their personality and qualification. In 2015, approximately 11 %
of the group’s workforce were women – a figure which essen-
tially reflects the technical nature of our business and the small
numbers of women who apply for such careers.
depending on the number of major projects being handled
in specific countries. The greatest increases consequently
occurred in the subsidiaries in Egypt (273 employees), the
United Arab Emirates (273 employees) and the Philippines
(90 employees). In some countries, such as Malaysia and
Indonesia, fewer people were employed during the year under
review than in the previous year because of the weaker state
of the market. The large order backlog led to an overall in-
crease of employees in Construction and primarily involved
personnel recruited for specific projects.
The number of employees in the Equipment segment
decreased slightly. The main share of the decline is attributable
to the Far Eastern plants (9 employees) and our German
subsidiary in Peine (13 employees) One of our key goals is to
retain the loyalty of our core of long-term employees, which
we once more achieved successfully in the past year.
Further personnel reductions were undertaken in the
Resources segment because of restructuring measures,
the reorientation of the segment and the weak market
situation in the mining area. A major share of the decrease
took place in the subsidiaries in Jordan (73 employees) and
the United Arab Emirates (25 employees). Employees in
Germany also had to be reduced.
Training and education
We regard active participation in shaping the future careers of
young people as an important social task. Bauer employed
Employees by region
12,000
10,000
8,000
6,000
4,000
2,000
02012 2013 2014 2015
2,061
542
965
10,253
4,090
726
1,869
2,212 2,290 2,177
612 586 584
950 1,018 1,288
10,264 10,40510,738
4,144 4,158 4,166
762 752 685
1,584 1,601 1,838
Germany Europe (other) Middle East & Central Asia
Far East & Australia Americas Africa

42
RESEARCH AND DEVELOPMENT
The BAUER Group once again invested substantial sums in
developing new construction methods and machinery as well
as for research purposes in financial 2015. The accent here
is on the new and further development of different equipment
for specialist foundation engineering, the matching drilling
tools and add-on units as well as deep drilling technology.
This is flanked by the new development and optimization of
construction site applications and procedures.
Research and development work in the BAUER Group is
organized on a decentralized basis. In companies belonging
to BAUER Maschinen GmbH, each major product group
has its own development unit that concentrates entirely on
the corresponding equipment, such as rotary or anchor
drilling rigs. Within BAUER Maschinen GmbH, the diversified
product range is divided into business areas that constantly
develop their equipment families and ensure innovation in
their area. The central development department develops the
technologies and components of a machine that are used in
several product groups. Basic research work is also located
in the central development department. Development work in
the BAUER Maschinen GmbH subsidiaries is grouped into the
system described above.
Our construction areas also have their own development
capacities. In particular, BAUER Spezialtiefbau GmbH
maintains a department for construction technology which
develops new methods and conducts fundamental research.
To promote research that might be of Group-wide importance,
internal and external orders for research work are placed via
the BAUER Forschungsgemeinschaft (research community).
Simple ideas sometimes give rise to outstanding new tech-
niques that help our companies to achieve technological
advances.
This type of overall organization for research and development
work has proven highly effective. Rapid decisions and great
flexibility allow all products to be kept at the cutting edge, while
new ideas and market requirements can be implemented
quickly.
A major focus of equipment development in the past year was
the ValueLine, a range of rotary drilling rigs optimized for kelly
CAPITAL INVESTMENTS
In view of the general economic situation, we kept our capital
investments in 2015 at a relatively low level compared with
previous years, roughly approximating the level of amortiza-
tion. This was made possible by the extensive investments
devoted to our plants in previous years. The pace of techno-
logical progress in our business has accelerated, however, so
that any future increase of our revenues will demand higher
investments once more.
In the Construction segment, further investments were made
in equipment to meet the market demand for ever more power-
ful machinery to handle specialist projects. For years now, we
have seen a trend towards increasingly large-scale international
infrastructure projects which foster growing demand for
specialist foundation engineering works that can only be
carried out by ever-larger machinery. This demands higher
individual investments, but also opens up new market
opportunities for us. We have also concentrated specifically
on investments to equip our construction sites with modern
communications technology.
In the Equipment segment, the investments were chiefly
channeled into modernizing the equipment available to the
production sites.
Investments in the Resources segment in 2015 were also
at a low level. The investments went into the modernization
of existing production systems.
In financial 2015 the BAUER Group invested a total of EUR
91.0 million (previous year: EUR 72.7 million) in intangible assets
and property, plant and equipment. Depreciation of fixed assets
across the Group totaled EUR 81.1 million (previous year: EUR
78.8 million). Write-downs of inventories due to use Group-wide
totaled EUR 13.2 million (previous year: EUR 15.8 million).
Additions to the property, plant and equipment assets of
BAUER AG in the 2015 financial year totaled EUR 6.5 million
(previous year: EUR 2.3 million), against depreciation of EUR
2.9 million (previous year: EUR 2.9 million).
We will again keep investments in balance with amortizations
in 2016.
COMBINED MANAGEMENT REPORTSustainability
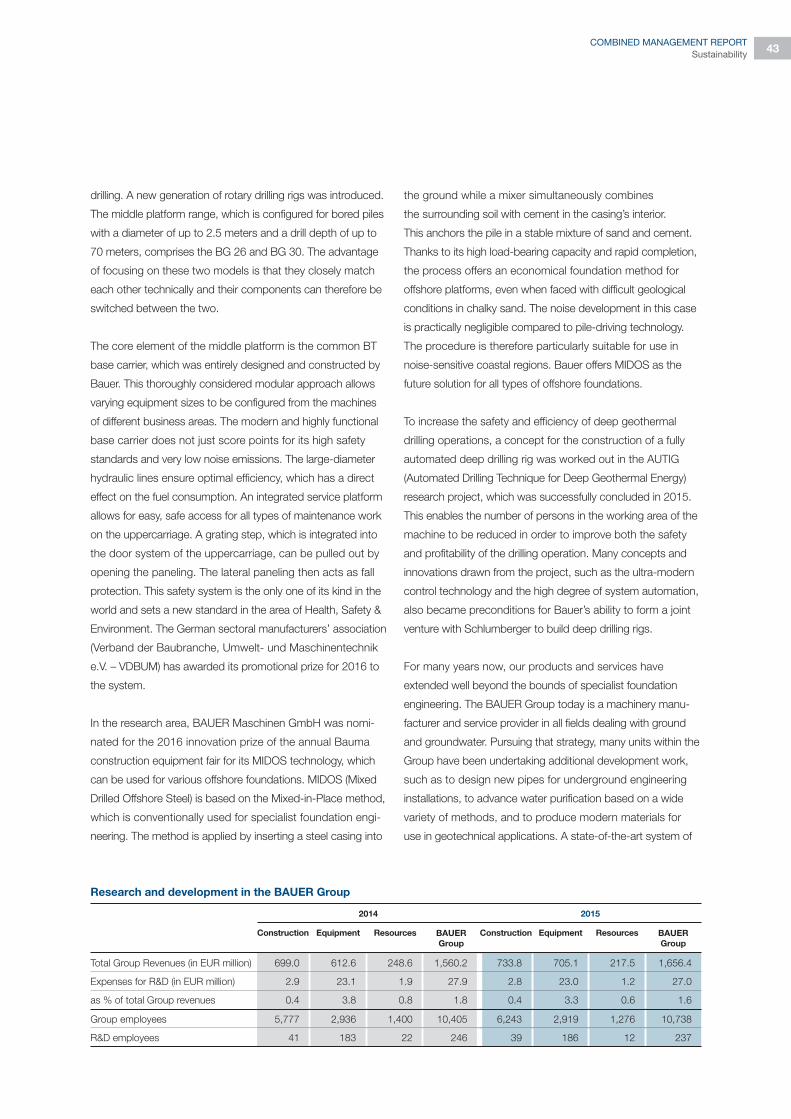
43COMBINED MANAGEMENT REPORT
Sustainability
the ground while a mixer simultaneously combines
the surrounding soil with cement in the casing’s interior.
This anchors the pile in a stable mixture of sand and cement.
Thanks to its high load-bearing capacity and rapid completion,
the process offers an economical foundation method for
offshore platforms, even when faced with difficult geological
conditions in chalky sand. The noise development in this case
is practically negligible compared to pile-driving technology.
The procedure is therefore particularly suitable for use in
noise-sensitive coastal regions. Bauer offers MIDOS as the
future solution for all types of offshore foundations.
To increase the safety and efficiency of deep geothermal
drilling operations, a concept for the construction of a fully
automated deep drilling rig was worked out in the AUTIG
(Automated Drilling Technique for Deep Geothermal Energy)
research project, which was successfully concluded in 2015.
This enables the number of persons in the working area of the
machine to be reduced in order to improve both the safety
and profitability of the drilling operation. Many concepts and
innovations drawn from the project, such as the ultra-modern
control technology and the high degree of system automation,
also became preconditions for Bauer’s ability to form a joint
venture with Schlumberger to build deep drilling rigs.
For many years now, our products and services have
extended well beyond the bounds of specialist foundation
engineering. The BAUER Group today is a machinery manu-
facturer and service provider in all fields dealing with ground
and groundwater. Pursuing that strategy, many units within the
Group have been undertaking additional development work,
such as to design new pipes for underground engineering
installations, to advance water purification based on a wide
variety of methods, and to produce modern materials for
use in geotechnical applications. A state-of-the-art system of
drilling. A new generation of rotary drilling rigs was introduced.
The middle platform range, which is configured for bored piles
with a diameter of up to 2.5 meters and a drill depth of up to
70 meters, comprises the BG 26 and BG 30. The advantage
of focusing on these two models is that they closely match
each other technically and their components can therefore be
switched between the two.
The core element of the middle platform is the common BT
base carrier, which was entirely designed and constructed by
Bauer. This thoroughly considered modular approach allows
varying equipment sizes to be configured from the machines
of different business areas. The modern and highly functional
base carrier does not just score points for its high safety
standards and very low noise emissions. The large-diameter
hydraulic lines ensure optimal efficiency, which has a direct
effect on the fuel consumption. An integrated service platform
allows for easy, safe access for all types of maintenance work
on the uppercarriage. A grating step, which is integrated into
the door system of the uppercarriage, can be pulled out by
opening the paneling. The lateral paneling then acts as fall
protection. This safety system is the only one of its kind in the
world and sets a new standard in the area of Health, Safety &
Environment. The German sectoral manufacturers’ association
(Verband der Baubranche, Umwelt- und Maschinentechnik
e.V. – VDBUM) has awarded its promotional prize for 2016 to
the system.
In the research area, BAUER Maschinen GmbH was nomi-
nated for the 2016 innovation prize of the annual Bauma
construction equipment fair for its MIDOS technology, which
can be used for various offshore foundations. MIDOS (Mixed
Drilled Offshore Steel) is based on the Mixed-in-Place method,
which is conventionally used for specialist foundation engi-
neering. The method is applied by inserting a steel casing into
2014 2015
Construction Equipment Resources BAUER
Group
Construction Equipment Resources BAUER
Group
Total Group Revenues (in EUR million) 699.0 612.6 248.6 1,560.2 733.8 705.1 217.5 1,656.4
Expenses for R&D (in EUR million) 2.9 23.1 1.9 27.9 2.8 23.0 1.2 27.0
as % of total Group revenues 0.4 3.8 0.8 1.8 0.4 3.3 0.6 1.6
Group employees 5,777 2,936 1,400 10,405 6,243 2,919 1,276 10,738
R&D employees 41 183 22 246 39 186 12 237
Research and development in the BAUER Group

44
As a globally operating company, we bear a special respon-
sibility for our environment. In all aspects of our company,
we therefore place great emphasis on protecting it and
handling natural resources with care. Along with the topics
of health and safety, environmental management at Bauer is
an essential constituent of the Group-wide HSE policy. We
continuously examine the implementation of our environmental
policy in the course of internal audits.
QUALITY
High-quality products, services and equipment are the
precondition for satisfying our customers and the key to our
success. To meet the multi-faceted needs and expectations of
our customers as fully as possible, we place great emphasis
on preserving the high quality standard of our company and
expanding it wherever possible. We focus special attention on
the issues of ethics, safety and health protection, environ-
mental compatibility, profitability and sustainability.
Our quality management system is based on ISO 9001 and
the relevant statutory and industrial standards. We conduct
regular audits and benchmark reviews to make sure we are
meeting our planned quality goals. The findings from these
audits and reviews are incorporated into our regular training
programs. We motivate our staff by demonstrating our own
commitment to quality, setting challenging goals for them,
giving them sufficient responsibility and recognizing good
performance. Active cooperation is essential to meet our
work targets quickly.
At the beginning of 2015, BAUER Maschinen GmbH submit-
ted to an audit by the American Petroleum Institute (API), the
largest representative body of the oil and gas industry as well
as the petrochemical industry in the USA. For this purpose,
BAUER Maschinen GmbH updated its entire management
documentation and added the API Q1 requirements to the
ISO 9001 standard. This enabled the company to attain API
Q1 certification.
innovation management is practiced with great intensity by all
Group units.
In the Equipment segment we invest a good 3.3 % (including
internal and project-related expenditure) of the corresponding
portion of total Group revenues in research and development.
A staff of 186 people are involved in this field, as well as
outside consulting engineers and interns. Research and
development activities are routinely reviewed and maintained
at a high level to keep pace with the ever-increasing rate of
change in market demands.
Research and development expenditure in the Construction
segment is 0.4 % of total Group revenues, and in the
Resources segment 0.6 %. We are investing considerable
further resources to prepare and design construction sites.
HEALTH SAFETY ENVIRONMENT (HSE)
For the BAUER Group, Health, Safety & Environment (HSE)
is an integral element of everything we do in creating and
developing all our products, specialist services, and business
processes. Globally applied HSE standards have enabled us
to create a uniform HSE management system for all compa-
nies in the Group. By constantly reviewing our performance
and comparing it against our set goals and parameters,
we seek to continuously improve our HSE system and thus
consistently minimize our accident and damage rates. The
application of our health, safety and environmental policy is a
central task of the respective managements and is regularly
audited within the Group.
The efficacy of occupational protection measures in our com-
pany is determined to a large extent by the conduct of our
employees. We are consequently committed in many ways to
raise awareness of the occupational safety issue throughout
the Group. We offer regular training courses on HSE. Weekly
safety meetings are held at our construction sites and all our
production facilities. This ensures a better understanding and
greater acceptance of safety guidelines among our staff.
COMBINED MANAGEMENT REPORTSustainability

45COMBINED MANAGEMENT REPORT
Legal disclosures
and is paid in full if all set goals are attained. If business
performance is exceptionally good, the said levels may be
surpassed by up to 1.8 times.
The short-term criteria applied in setting the variable remu-
neration elements are the performance of the respective
Management Board members in the past financial year and
the economic position of the Group in respect of attainment
of budget targets in the year under review, particularly the
attainment of profit and revenue targets, taking into account
general economic trends.
The long-term criteria applied in setting the variable remu-
neration elements are the success and future prospects of
the Group and the performance of the Management Board
in respect of these criteria. This assessment judges the decisi-
on-making of the Management Board in terms of sustainable
business development over the past three financial years and
the effects of this decision-making in achieving long-term
stability for the business. Criteria applied here are long-term
profit and revenue prospects, sustainable personnel deve-
lopment in accordance with the future prospects of the Group,
the development of the corporate culture, the development
of intra-Group collaboration, the safeguarding of corporate
harmony, strategic market and product development, risk
and security management, long-term financial stability, and
the quality of key financial indicators relative to the prevailing
economic conditions.
In assessing the appropriateness of the remuneration paid
to the Management Board, the variable remuneration is set
and compared in proportion to the fixed basic salary. Further-
more, the fixed and variable portions respectively, and the
overall remuneration paid, are compared against the normal
levels of remuneration received by management board mem-
bers of other stock market quoted companies, and other
companies operating in the same sector, or companies
similar in other ways, in Germany (horizontal comparison).
A vertical comparison is carried out on two levels: firstly, the
salaries of the Management Board members are compared
against those of the directors of the major BAUER Group
subsidiaries; secondly, they are assessed relative to salary
grade A VIII stipulated in the collective pay agreement appli-
cable within the Group within the industry-wide framework
of salary and training remuneration to salaried staff and fore-
men in the construction sector.
REMUNERATION REPORT
The Remuneration Report sets forth the system of remune-
ration paid to the members of the Management Board and
the total amounts paid to them, and explains the underlying
principles and amount with regard to the remuneration paid
to the Supervisory Board.
Remuneration of the Management Board
The Management Board of BAUER AG, as previously,
comprised three members in the year under review. The
Supervisory Board sets the overall levels of remuneration
paid to the individual members of the Management Board,
based on proposals submitted by the Presidial and Personnel
Committee. The plenary Supervisory Board approves the
remuneration system for the members of the Management
Board following prior consultations in the Presidial and
Personnel Committee.
The system of remuneration paid to the members of the
Management Board did not change from the previous year.
The overall levels of remuneration paid to the individual
members are set on the basis of a performance assessment.
This process assures that the overall remuneration is appro-
priate to the duties and performance of the Management
Board member concerned and to the situation of the com-
pany. The remuneration paid to each Management Board
member is composed of non-performance-related com-
ponents, chiefly a fixed basic salary, paid in equal monthly
installments, and a performance-related component in the
form of a variable annual bonus. This is set by the Supervi-
sory Board on the basis of short and long-term evaluation
criteria, in which case the short-term evaluation criteria are
equally weighted with the long-term ones when setting the
variable remuneration.
The criteria for setting the fixed remuneration to members
of the Management Board are the assignment of duties, the
performance of the respective Management Board member,
the economic position of the Group and its profitability and
ongoing future prospects.
Maximum limits are imposed on the total remuneration paid.
The variable remuneration paid to each member of the
Management Board is limited by an individually defined
maximum bonus level. This maximum is the upper limit of
potential bonus payment in the normal course of business,
VI. LEGAL DISCLOSURES

46COMBINED MANAGEMENT REPORTLegal disclosures
Remuneration of the Supervisory Board
The Supervisory Board of BAUER AG comprises 12 members.
Calculation of the remuneration paid to the members of the
Supervisory Board is specified in detail in the Articles of
Association of BAUER AG. Each member of the Supervisory
Board receives a basic annual fee of EUR 18 thousand,
payable in December of each financial year, plus reimbur-
sement of out-of-pocket expenses and any sales tax (VAT)
liability incurred in performing the duties of a Supervisory
Board member. The Chairman of the Supervisory Board
receives twice that amount of remuneration, and the Deputy
Chairman 1.5 times the amount. The basic remuneration
amounts are increased by 10 % for each membership of a
Supervisory Board committee, provided that the committee
in question was convened at least twice in the financial year.
Membership of the Mediation Committee is excluded from
these remuneration provisions. Changes to the Supervisory
Board and/or its committees are taken into account in the
remuneration proportionate to the respective member’s time in
office, and rounded up or down to full months based on the
standard commercial rule. The members of the Supervisory
Board receive no performance-related pay.
The net remuneration paid to all the members of the Super-
visory Board in the 2015 financial year totaled EUR 254 thous-
and (previous year: EUR 254 thousand).
Other
No loans or advances were paid to members of executive
bodies of the company in the year under review, nor were any
liabilities entered into in their favor. As a matter of principle,
no securities-oriented incentive systems exist for members
of the Management Board or Supervisory Board of BAUER
AG, or for Group employees in Germany. BAUER AG provides
D&O (Directors and Officers) group insurance cover in respect
of liability for economic loss to the members of executive
bodies of BAUER AG and of all affiliates in Germany and
internationally in which a majority share is held. The D&O
policy includes an appropriate excess for the insured parties.
For the members of the Management Board, the minimum
excess stipulated by law of 10 % of the loss up to at least
an amount representing one and a half times the fixed
annual remuneration of the Management Board member
concerned was agreed in the D&O insurance policy in the
year under review.
The remuneration is further set so as to remain competitive
with that generally paid to highly qualified management staff
on the market as a whole.
The Annual General Meeting held on June 30, 2011 resolved
that the BAUER AG financial statements and the Group con-
solidated financial statements for the financial years 2011 to
2015 would contain no disclosures of the remuneration paid
to individual Management Board members, thereby applying
the legal authority assigned to it by section 286, subsection
5 and section 314, subsection 2 of the German Commercial
Code (HGB).
The total remuneration paid to members of the Management
Board in the year under review, excluding allocations to pension
provisions, was EUR 1,274 thousand (previous year: EUR
1,150 thousand). Of that total, EUR 1,124 thousand (previous
year: EUR 1,090 thousand) was not performance-related and
EUR 150 thousand (previous year: EUR 60 thousand) was per-
formance-related. The total remuneration includes benefits
in kind arising from the private use of a company car and reim-
bursement of expenses for each member of the Management
Board, as well as group accident insurance premiums and
employer’s liability insurance association contributions.
The company pension scheme for Management Board
members incurred pension service costs totaling EUR 155
thousand (previous year: EUR 159 thousand). The baseline
salary defined for calculating retirement benefits is significantly
lower in all contracts than the basic salary. Calculated in
accordance with IAS 19, the defined benefit obligation
entailed by all pension commitments to members of the
Management Board at the year-end was EUR 5,537
thousand (previous year: EUR 5,531 thousand).
The contracts of Management Board members include
individual severance clauses regulating the specific terms
of premature termination, with settlements oriented to the
length of service of the Management Board member con-
cerned and gauged so as not to exceed the sum of two ye-
ars’ remuneration for any one Management Board member.
No provisions for compensation in the event of a takeover
offer being made have been agreed with the members of the
Management Board.

47COMBINED MANAGEMENT REPORT
Legal disclosures
Composition of subscribed capital
The subscribed capital (share capital) of BAUER AG re-
mains unchanged at EUR 73,001,420.45 and is divided into
17,131,000 no-nominal-value bearer shares, representing
a pro rata amount of approximately EUR 4.26 per share
of the total share capital. Each share entails equal rights,
and entitles the holder to one vote at the Annual General
Meeting, with the exception of share categories precluded
from voting by law pursuant to section 136 of the German
Stock Corporation Act (AktG) and section 28 of the German
Securities Trading Act (WpHG).
As in the previous year, 51.81 % of the shares were in free
float. The members of the Bauer family and the BAUER
Stiftung, Schrobenhausen, own a total of 8,256,246 no-
nominal-value shares in BAUER AG on the basis of a pool
agreement, representing a 48.19 % share in the company.
The pool agreement provisions include binding voting com-
mitments as well as restrictions on the transferability of pool
members’ shares. No other direct or indirect holdings of
BAUER AG share capital exceeding 10 % of the voting
rights are known to the company.
The members of the Management Board are required to
limit the extent to which they take on Supervisory Board
mandates and other administrative or voluntary functions
outside of the company. The members of the Management
Board may not, without the consent of the Supervisory
Board, carry out any trade or business or conduct, on their
own or a third-party’s account, any dealings in the sector in
which the company operates. Further, they may not, without
the consent of the Supervisory Board, become a manage-
ment board member, director or personally liable sharehol-
der of any other trading company. This ensures that no conflict
arises with the assigned duties of the Management Board
member either in relation to time commitment or to remun-
eration received. No separate remuneration is paid for the
assumption of executive or supervisory mandates on the
boards of Group companies.
STATUTORY DISCLOSURES REGARDING TAKEOVERS
The following disclosures are made pursuant to section 315,
subsection 4 and section 289, subsection 4 of the German
Commercial Code (HGB) as per December 31, 2015.
Remuneration Supervisory Board (not including sales tax proportion and reimbursement of expenses)
in EUR ’000 2014 2015
Chairman
Dr. Klaus Reinhardt 38 38
Deputy Chairman
Robert Feiger 27 27
Employer representatives
Dr.-Ing. Johannes Bauer 20 20
Dipl.-Ing. (FH) Rainer Schuster 18 18
Dipl.-Ing. (FH) Elisabeth Teschemacher 18 18
Gerardus N. G. Wirken 20 20
Prof. Dr. Manfred Nussbaumer 20 20
Employee representatives
Dipl.-Volkswirt Norbert Ewald 20 20
Dipl.-Kfm. (FH) Stefan Reindl 18 18
Regina Andel 18 18
Dipl.-Ing. Gerold Schwab 20 20
Reinhard Irrenhauser 18 18
Total * 254 254
* rounded

48COMBINED MANAGEMENT REPORTLegal disclosures
market, the acquisition price (excluding ancillary costs) may
be no more than 10 % above or 20 % below the price de-
termined by the opening auction on the trading day for shares
in the company in Xetra trading (or a comparable successor
system) on the Frankfurt Stock Exchange. If the acquisition
is effected by means of a public tender offer, the purchase
price or the limits of the purchase price span per share
(excluding ancillary costs) may be no more than 10 % above
or 20 % below the average of the closing prices per share
in the company in Xetra trading (or a comparable successor
system) on the three trading days prior to the day of issue
of the public tender offer. If not insignificant variations of the
decisive share price occur after the day of issue of the public
tender offer, the purchase price may be adjusted.
The Management Board shall be authorized to appropriate
shares in the company acquired pursuant to the above au-
thorizations for all legally admissible purposes. Consequently,
the acquired shares may also in particular be sold by means
other than by way of the stock market or by means of an
offer to the shareholders, if the shares are sold for cash at
a price (excluding ancillary costs) not materially below the
stock market price of shares of the company carrying the
same rights at the time of the sale in Xetra trading (or a
comparable successor system). The shares may also be
sold in return for non-cash payment, provided this is done
for the purpose of effecting company mergers or acquiring
companies, parts of companies, shareholdings in companies
or other assets. The aforementioned shares may be redeemed
without need of a further Annual General Meeting in order
to approve the redemption or its execution. With regard to
use of the bought-back shares, the authorization provides,
in specific cases, for legal rights of subscription of shareholders
to be excluded. The facility to acquire treasury stock has not
been utilized to date.
Appointment and termination of appointment of
Management Board members, amendments of the
Articles of Association
The appointment and termination of appointment of mem-
bers of the Management Board of BAUER AG is regulated
by sections 84 and 85 of the German Stock Corporation
Act (AktG) and sections 30 ff. of the German Co-determi-
nation Act (MitbestG) in conjunction with Articles 5 and 6
None of the shareholders have special rights entailing con-
trolling powers. Nor does any voting rights control exist on
the part of the employees holding shares in the capital.
Authority of the Management Board to issue or buy
back shares
Section 4, subsection 4 of the company’s Articles of Asso-
ciation authorizes the Management Board, with the consent
of the Supervisory Board, to increase the share capital once
or more than once up to June 27, 2017 by up to a total of
EUR 7.3 million by the issue of new ordinary bearer shares
against cash and/or non-cash contributions. To that end,
the Management Board is authorized, with the consent of
the Supervisory Board, to exclude the legal subscription
rights of shareholders in the following cases:
• in the event of capital increases against non-cash contri-
butions;
• in the event of capital increases against cash contributions
where the issue amount of the new shares issued is not
materially below the market price of the already quoted
shares at the time of definitive setting of the issue price
and the shares issued excluding shareholders’ subscription
rights pursuant to section 186, subsection 3, clause 4
AktG do not in total exceed 10 % of the existing share
capital either at the time this authority takes effect or at
the time of exercising this authority. Shares which have
been or are to be sold or issued in direct or correspon-
ding application of section 186, subsection 3, clause 4
AktG while this authority is in place until such time as it
is exercised, pursuant to other authorities, excluding sub-
scription rights, are to be set off against the said 10 % limit;
• to balance out fractional amounts.
By resolution of the Ordinary Annual General Meeting held
on June 26, 2014, the company was authorized to acquire
treasury stock, over a limited period up to June 25, 2019,
representing up to a total of 10 % of the company’s share
capital at the time the resolution was passed. The shares
shall be acquired at the discretion of the Management Board
by means of a public tender offer or by way of the stock
market. If the acquisition is effected by way of the stock

49COMBINED MANAGEMENT REPORT
Follow-up Report
amounts to less than 40 % of the capital shares or voting
rights in BAUER AG. A third party gains control if, overall,
more than 50 % of the capital shares or voting rights in
BAUER AG is held directly or indirectly by one or more
persons acting jointly (with the exception of the pooled
members of the Bauer family).
Furthermore, several long-term loans with balances totaling
EUR 178.5 million as per the balance sheet date, agreed
by BAUER AG together with other Group companies as the
borrower and guarantor, provide for a right of termination
for cause by the lender in the event of a change of control
in BAUER AG. A change of control is considered to have
taken place where a third party, not forming part of the circle
of existing main shareholders, directly or indirectly acquires
control of at least 30 % of voting shares or the majority
of outstanding share capital of BAUER AG. Any loaned
amounts would have to be repaid in the event of termination.
The terminated credit line would no longer be available for
new borrowing.
Additional short- and long-term loan agreements also exist
within the Group which provide for a right of termination for
cause, at market terms, in the event of a change of control.
VII. FOLLOW-UP REPORT
No matters of special note occurred after the end of the
financial year.
of the company’s Articles of Association. Pursuant to the
company’s Articles of Association, the Management Board
comprises at least two persons, who are appointed by the
Supervisory Board for a maximum term of office of five years.
At present the Management Board comprises three mem-
bers appointed by the Supervisory Board and a Chairman
of the Management Board, as well as a Labor Director. It is
permissible to re-appoint or extend the appointment of a
member of the Management Board for a further maximum
term of office of five years. Any appointment or re-appoint-
ment requires a decision by the Supervisory Board, which
may be taken no earlier than one year prior to the end of
the relevant term of office. The Supervisory Board may
rescind an appointment to the Management Board or an
appointment as Chairman for good cause. The Presidial and
Personnel Committee of the Supervisory Board prepares
the Supervisory Board’s decisions on the appointment and
termination of appointment of Management Board members
and concerns itself with the long-term planning of successor
members for appointment to the Management Board.
In accordance with section 119, subsection 1 clause 5 and
with section 179 AktG, the amendment of the Articles of
Association is passed by the Annual General Meeting with
a majority of at least three quarters of the share capital
represented at the vote. Pursuant to Article 12 of the Articles
of Association, the Supervisory Board is authorized to pass
amendments to the Articles of Association which relate only
to its wording. The Supervisory Board is further authorized
to adapt the wording of Article 4 of the Articles of Associati-
on (amount and division of the share capital) following full or
partial execution of the increase in share capital or on expi-
ration of the authorization period according to the respective
utilization of the authorized capital.
Change of control
BAUER AG, together with other Group companies, has
concluded a syndicated loan agreement providing a credit
line of up to EUR 450 million; this contains provision for the
lender to terminate its loan commitments in the event of
a change of control or if control is gained by a third party.
As defined by this syndicated loan agreement, a change of
control is defined as a situation in which the total sharehol-
ding held by the pooled members of the Bauer family directly

50ZUSAMMENGEFASSTER LAGEBERICHTNachtragsbericht

51COMBINED MANAGEMENT REPORT
Risk and Opportunity Report
BASIC PRINCIPLE OF RISK MANAGEMENT
As part of our business activities, we are exposed to risks that
are inseparably linked with our operations. It is impossible to
run a business without taking risks. True risks result from un-
foreseeable events that can bring both hazards and oppor-
tunities along with them. To us therefore, risk management
means not only reducing the hazards but also knowing how
to take advantage of the opportunities. The goals of risk
management are to protect our business objectives, increase
the value of our company and reduce the costs of risk. The
tasks of risk management are to identify, analyze, evaluate
and monitor existing and foreseeable risks along the entire
value chain and devise actions to deal with them. This involves
assessing external risks for our company as well as those
that arise internally. Our risk management is based on a
fundamentally risk-avoiding approach that aims to safeguard
us against impending risks rather than to grasp opportunities
for short-term gain. As a general rule, we do not take risks
that threaten the existence of the company.
Risk management system
Our risk management system is based on the risk policy
defined by the Management Board, and regulates the hand-
ling of risks within the BAUER Group. It defines a uniform
methodology applicable to all segments and their member
companies. It is continually reviewed and adjusted as
required.
Our risk management system is an integral element of our
overall management system and, like all our management
systems, serves as an instrument of value- and success-
oriented corporate governance. Audits routinely verify its
implementation and management reviews continuously
improve its efficacy. Furthermore, our auditors annually
review the extent to which our early risk-warning system is
capable of detecting existentially threatening risks in good
time. Their suggestions are incorporated in order to improve
the system. The process steps involved in risk management
are: identification, assessment, control of measures and
monitoring.
For the identification of risk, risk categories are defined and
assigned to specific areas of risk. This defines areas of focus.
Risk categories defined by the BAUER Group are: strategic
risks; market risks; financial market risks; political and legal
risks; organizational and governance risks; risks arising
from the value creation chain; and risks of the supporting
processes. These risks are grouped as latent risks and
managed in a unified process within the framework of our
risk management system. Conversely, project risks are
managed by an additional, independent process according
to their nature and significance.
The process of identifying and assessing latent risks is
reviewed biannually at working sessions of the relevant
Group company managements and is implemented jointly
with departmental and central function heads as well as
individual specialists. This process ensures that potential
new and familiar risks and opportunities are submitted for
review at management level. Structured risk identification is
followed by risk assessment based on a scale of relevance.
Relevant risks above a certain threshold value are quantified
based on scenarios. Planning risks are estimated on the basis
of empirical values, applying standard deviations. Risks from
within the subgroups are consolidated at Group level.
Following assessment, risk-specific management measures
are defined. Where possible and useful, we have taken out
appropriate insurance cover in respect of potential damage
and liability risk, in order to reduce our risk exposure and
avoid, or at least minimize, potential losses. Responsibility
for monitoring the particular risks lies with the risk managers
of the operative areas.
The effects of individual risks are aggregated in the context of
corporate planning by means of risk simulation. This means
that the income statement for a given financial year is played
through several thousand times in independent simulations
based on random figures (Monte Carlo simulation).
The risk analysis, comprising identification, evaluation and
definition of measures, is carried out at least every six months.
Yearly reports are submitted to the Management Board and
Supervisory Board. The system is continually being updated
and continuously improved both qualitatively and structurally
VIII. RISK AND OPPORTUNITY REPORT
RISK REPORT
Our customer Drill Tech Drilling & Shoring, Inc. decided to use a BG 50 during the demolition of a power plant at Eureka in California.
During work on the site, the gigantic rotary drilling rig achieved a mixing depth of about 52 m – more than has ever before been
achieved with a kelly-guided CSM unit.

52COMBINED MANAGEMENT REPORTRisk and Opportunity Report
in terms of the integration of more Group companies. To
communicate acute risks, the routine risk analysis is supple-
mented by immediate reporting. Our risk management
system covers both risks and opportunities.
Handling of project risks
Project risks are the principal performance risks, and thus
are an integral element in the work of the Construction and
Resources segments, wherever construction work or plant
assembly is carried out on the customer’s premises. Associ-
ated risks, such as in relation to the ground and resulting from
the individual character of each individual project – including
contract, timetable and damage risks – can thus accumulate
detrimentally in specific cases in such a way that they may
threaten the existence, if not of the Group as a whole, at
least potentially of smaller subsidiary companies. In respect
of all relevant projects above low threshold values, prior to
submission of quotes all conceivable risks and opportunities
are systematically identified, analyzed and assessed, and
appropriate measures are defined to minimize risks and
track opportunities. In ongoing projects, the risks relating to
continuous project controlling and project management are
analyzed; this means they are identified, evaluated and have
measures applied to them.
Each project is assigned to a risk class and organizationally
escalated according to its risk class, and is thus subject to
a strict approval process. Risk classification is based, firstly,
on defined checklists applying the K.O. principle, in order to
prevent inadvertent assignment to an inappropriately low risk
class. Secondly, it is based on potential harm identified in
relation to the project, with the worst-case outcome serving
as the decisive factor. The risk classes defined by this process
are taken into account at fixed cost surcharges to cover the
identified risks.
The system has been developed over a number of years
across the corporate units faced by the relevant project risks
and expanded to apply to the relevant operations.
Risks
In the following we set forth potential risks which may have a
significant impact on our financial and earnings position and
on our reputation, and assess the relevance to our business.
The breakdown follows the same risk categories as we apply in
our risk management system. The areas of risk are aggregated.
Unless otherwise specified, all risks set out in the following
relate to all our segments.
STRATEGIC RISKS
Segmental structure
We counter the strategic risks arising from the segmental
structure of the Group by dividing it into separate Construction,
Equipment and Resources segments, thereby pursuing the
aim of greater independence from the economic cycles of the
construction industry.
The Equipment segment’s move into deep drilling and the
manufacture of machinery for mining applications will further
reduce its dependence on the Construction segment. We
class the risks associated with the structure of our business
as medium.
Brands, image, PR
The Bauer brand carries a cachet for purchasers, especially in
the Equipment segment, because it is known for high quality.
Negative influences on our image, whether due to publications
about accidents at work or quality and service defects for
example, can result in falling demand for our machines. We
minimize this risk by, among other measures, our highly
developed quality and HSE management system. We regard
the risk of damage to our image as a moderate one.
Relevance Definition Identified risks
1 Insignificant to low risk Risks with this relevance are identified
in our business2 Medium risk
3 Significant risk
We do not see risks with this relevance
in our business4 Serious risk
5 Critical risk
Relevance scale of the BAUER Group

53COMBINED MANAGEMENT REPORT
Risk and Opportunity Report
of our machinery. The lack of market experience of Chinese
manufacturers, combined with the facts that the quality of
their products remains significantly lower and their after-sales
service is generally of a less developed nature, has to date
impeded exports of Chinese construction machinery on a
grand scale to the markets of relevance to us. Several of
these enterprises embarked on substantial capacity cutbacks
and layoffs in the course of 2015. A number of Chinese
competitors have already been forced out of market. This
risk is still rated as low in the short term, but medium in the
medium term.
Risks of market development
High levels of public sector debt in the USA, as well as in some
EU member-states, significant interventions by some central
banks as well as uncertainty as to the stability of markets in
specific countries and the phases of significant downturn on
the market in China and the other BRIC nations influence our
appraisals of the macro-economic situation. Ongoing political
unrest in the Middle East is impeding willingness to invest in
the countries immediately affected, and often beyond.
The significant drop in the oil price may well be easing pressure
on importing countries’ balances of trade, but in the long term
it will restrict the purchasing power and investment appetite
of the oil producing countries in the Middle East and Russia. If
the oil price remains low for a long period, this could also have
a negative effect on demand for deep drilling rigs and services
for the oil industry, as well as on infrastructure expenditure by
oil-producing countries. As a result of the significantly reduced
oil price and the tense situation in the east of Ukraine, leading
to sanctions against Russia, there was a significant drop in
value of the Russian ruble against the euro. All in all, this
hampers equipment sales to Russia.
These issues have created both exchange rate risks and
demand-related risks in the markets concerned. By contrast,
the overall positive macro-economic situation in the Far East
is creating a structurally greater dependence of the Group on
that region.
The Group Management Board and the directors of the three
operating segments routinely consider projections based on
specific scenarios to estimate the impact of any given risks
on the company in question and on the Group as a whole.
Any necessary and relevant measures are derived from these
MARKET RISKS
Selling market risks
It has always been one of our key strategic principles to count-
er risks on our selling markets by means of a multi-segment
organization. Whereas our machinery manufacturing business
is still heavily influenced – if at a delay – by economic trends in
the construction sector, the establishment of the Resources
segment has enabled us to isolate part of our business from
the effects of construction cycles much more effectively. Our
strategy of spreading business in each segment across a large
number of markets worldwide further reduces the overall risk,
so that no serious risk is posed to the Group as a whole in
the event of any weakening or collapse of individual regional
markets. Moreover, in the event of a regional market downturn
our network strategy in the Construction segment enables
us to relocate our capacities rapidly to another country and
continue operations at the new location. This strategy has
proven effective during various regional crisis situations in the
past, in which it cushioned negative impacts on the overall
result. Our Resources segment has also already expanded on
an international scale. We rate risks associated with our selling
markets as medium.
Competitive environment
In the Equipment segment especially, we operate in highly
competitive, price-sensitive markets. The Chinese construction
market – and to an even greater extent in its wake, the Chinese
construction machinery market – have seen highly dynamic
growth in the past as a result of government policy. As a
consequence, major production capacities for construction
machinery were created. The repeated stagnation of the
Chinese construction market since 2012 has seen demand
for new machinery decline, in some cases disproportionately
dramatically. The resultant overcapacity in the country has
placed prices and margins under heavy pressure at times. We
have implemented intensive cost-cutting measures in order to
lastingly improve our competitiveness in China. For example,
production above all as well as sourcing has been localized to
a significant extent, and the level of professionalism increased
while retaining the familiar high quality standards. Furthermore,
the after-sales service has been expanded further in all markets
as a stabilizing factor for new business.
Despite the overcapacity and associated pressure on margins
in China, we were able to maintain our market position based
on the recognized high quality and still clear technical edge

54COMBINED MANAGEMENT REPORTRisk and Opportunity Report
undertake a write-down. We estimate that the risk of needing
to undertake a write-down on the goodwill is a moderate one.
POLITICAL AND LEGAL RISKS
Compliance
For the BAUER Group, acting responsibly and in keeping with
the law is a fundamental principle underpinning our commer-
cial success, the quality of our products and services and
our sustainable ongoing development. We place the utmost
value in upholding social conventions and in complying with
applicable laws and business standards, so as to minimize the
risk of non-compliance. For us, compliance means observing
all applicable laws, rules and regulations. Legally compliant,
ethical and socially sustainable action is the cornerstone of
our values management system. This will be applied to ensure
staff are aware of our fundamental values as soon as they are
hired. Special training courses enable them to extend their
knowledge. A special software program ensures that we do
not do business with any companies cited on an EU or US
sanctions list.
In summary, we are of the opinion that our existing values
management system provides us with an efficient means of
keeping our compliance risk to a low level.
Contract risks
Our Construction and Resources segments primarily provide
construction, drilling and environmental services. The under-
lying projects are almost always prototypes executed in each
case on the basis of customized contracts. The resultant risks
are subject to stringent management routines, and so can be
rated as low.
Current legal cases
Legal disputes arise almost exclusively from our provision of
services, in particular in the project business. Judicial disputes
exist with regard to clients, suppliers and business partners,
and in the majority of cases relate to remuneration, claimed
deficiencies in performance or delays in completing a project.
By their very nature, it is impossible to say for certain how the
court or arbitration proceedings we are involved in will turn out.
Nevertheless, following careful examination, we assume that
adequate provision has been made in the balance sheet for all
legal disputes.
analyses and implemented in full. The risks to the market
development are currently assessed to be moderate.
FINANCIAL MARKET RISKS
Financial stability and liquidity
Several long-term loans are covered by covenants linked to
pre-determined financial variables. These are primarily the
ratio of net debt to EBITDA, the ratio of EBITDA to net interest
coverage, and the equity ratio. The key figures agreed for the
promissory notes and the syndicated loan concluded in 2014
were met by the year end.
In addition to the earnings situation of the Group as a whole,
higher financing requirements in particular may pose an
increased covenant risk. This applies, for example, to changes
in inventories in the Equipment segment. In order to reduce
that risk, active selling of surplus stocks is initiated and
production volumes are reduced as necessary. A high level
of outstanding receivables can likewise result in the inability
to meet agreed covenants.
Based on forward-thinking planning and sound financial
controlling, we are making every effort to keep within the
agreed limits. This risk is classed as medium.
The risk of financial instability and supply shortages on inter-
national financial markets was countered by concluding a
syndicated loan agreement. This agreement ensures the
medium-term liquidity supply for the Group of companies, and
is an important tool for alleviating major risks on the financial
markets.
Foreign exchange risks
Where possible and available, we counter foreign exchange
risks by financing our international holdings in their respective
local currency. Transaction risks (foreign currency risks arising
from the current cash flow) are minimized in all business
divisions by means of suitable rate hedging instruments.
The remaining currency risks are evaluated as slight.
Participations, acquisitions, financial assets
The valuations of the shares in associated companies contain
goodwill items, the values of which are subject to the risk from
future company developments. If these future expectations do
not come to fruition as expected, it will become necessary to

55COMBINED MANAGEMENT REPORT
Risk and Opportunity Report
A further risk in order fulfillment is entailed by the selection and
application of drilling techniques. Misjudging ground conditions
can likewise result in increased risk costs. Disturbances to the
project timetable must be identified by the project manager and
communicated at an early stage. The management is aware of
these risks, and relies on experienced project and production
managers in all segments. In spite of all the precautions taken
when carrying out orders, there is still a risk of management
errors in major projects. All the listed risks are subjected to a
threat and opportunity analysis at project level in the Con-
struction and Resources segments.
Project risks are essentially the principal performance risks in
the Construction and Resources segments, especially as each
project has its own individual characteristics. Although we work
on the assumption that our projects are costed with due dili-
gence, the possibility cannot be definitively ruled out that, on
finally billing the customer, lower earnings will ultimately be gen-
erated. As a result of the trend for projects to increase in size
and complexity, the resulting risks must be evaluated as of a
medium level.
Supplements and claims management
Especially in respect of complex construction works, we are
increasingly seeing parties resort to legal action when disputes
arise in relation to contract interpretation as well as additional
works and supplements. Clients’ representatives are increas-
ingly rarely authorized to resolve conflicts by mutual consent.
As a result, final project settlement is increasingly being delayed
by legal action, and additional costs are being incurred. We
manage this risk by professional management of supplemental
requirements in the course of the construction project, and
based on full documentation of the work carried out. Despite
all efforts, the outcomes of some negotiations on supplemen-
tal requirements pose a residual risk to the company. The risks
arising from supplemental requirements are rated as medium.
RISKS OF SUPPORTING PROCESSES
Information technology (IT)
Security to prevent data loss or unauthorized access, as well
as to safeguard system and data availability, is ensured by
means of state-of-the-art hardware and software and building
services technology, so IT risks are classed as low.
VALUE CREATION RISKS
Research and development risks
As a technology leader, particularly in our Equipment segment,
we counter any possible weakening of our market position by
means of continuous research and development. Although
the booming markets in the Far East and the resultant new
competitors are sharpening the innovative pressures, we have
to date succeeded in maintaining the necessary edge as a
technology leader.
Moreover, there is a risk of incurring additional costs in this
context due to development and design mistakes necessi-
tating modifications. This risk is minimized by a structured,
multi-stage product creation process.
Thanks to our great innovative strength and transparent
product creation process, we rate the risks in relation to
research and development as being currently medium.
Acquisition, sales and contract negotiations
The risks of miscalculating quotations and of warranting
technical characteristics which cannot be fulfilled are minimized
by the strict application of the dual-control principle, and can
basically be regarded as low.
Materials management and procurement
Thanks to our long-standing and successful policy in our
machinery manufacturing operations of planning well ahead to
safeguard supplies of components which may be subject to
bottlenecks, and based on additional measures we have taken
and on our ability to have time-critical components made within
the Group in the event of a bottleneck, the risks in terms of
procurement currently remain classed as low. We also estimate
the reliance on subcontractors or individual suppliers in the
Construction and Resources segments as a low risk.
Production and order fulfillment
Technical failures arising from design errors or miscalculations
of statics in the project business can result in significant delays,
both on the company’s own construction projects and on our
customers’ projects. In the BAUER Group, the risks resulting
from this represent an inherent component of our project
business. Consequently, designs and statics are predominantly
produced in our own design bureaus by experienced em-
ployees. Consequently, we can assess the risks resulting
from this as low.

56COMBINED MANAGEMENT REPORTRisk and Opportunity Report
The individual Group companies and departments are
monitored and controlled on a monthly basis by the central
commercial departments in the respective segments and
are then reviewed by Group Accounting further reducing the
accounting, valuation and reporting risks.
The consolidated figures are in turn checked on a monthly
basis against the figures from the annual Group-wide planning
process and analyzed on the basis of Group key performance
indicators (KPIs). Any necessary correction of non-conformance
to plan is implemented promptly by the managers of the units
concerned.
The annual financial statements and the year-end consolidated
financial statements are audited by auditors in accordance
with the applicable legal requirements and standards, and are
reviewed by the Supervisory Boards established in the various
business units as part of their duty of supervision. These
figures and information reports are regularly submitted to the
Management Board and the Supervisory Board of BAUER AG
from Group Accounting function on a monthly basis.
The IT systems employed in these procedures are protected
by appropriate security systems against unauthorized access
and data loss. Based on the systematic multi-segment struc-
turing of the Group’s accounting process, with its redundant
control instances, we are able to classify the resultant risks as
low.
OVERALL RISK
At present, no individual or aggregated risks can be detected
that could threaten the existence of the BAUER Group in the
2016 financial year. The management sees no change in the
overall risk situation, in view of future business prospects
among other factors.
Accounting-related system of internal controls and risk
management
Consolidated accounting risks comprise risks in respect of
accounting, valuation and recognition. To counteract them,
the accounting functions of the parent company as well as of
BAUER Spezialtiefbau GmbH, BAUER Maschinen GmbH and
BAUER Resources GmbH are managed centrally at headquar-
ters in Schrobenhausen. This allows business transactions to
be handled in a standardized way.
The accounting functions for the other subsidiaries are usually
managed by decentralized in-house commercial departments.
In this, our subsidiaries are assisted by external accountants
and auditors as well as by the investment controllers of BAUER
Spezialtiefbau GmbH, BAUER Maschinen GmbH and BAUER
Resources GmbH, so as to ensure properly qualified financial
reporting in accordance with the relevant national or interna-
tional accounting regulations. Furthermore, statements are
subjected to auditing in accordance with the relevant national
regulations.
In order to draw up the monthly Group reporting as well as
quarterly statements and the consolidated financial statements
according to international accountancy regulations (IFRS), the
subsidiaries use a uniform Group chart of accounts.
The individual financial statements are drawn up either based
on an accounting guideline applicable throughout the Group
or are applied to the regulations of the accounting guideline by
Group Accounting in the course of adjustment entries by the
corresponding accountancy regulations in national law.
At the major Group companies, the success of each individual
department is mapped as a central management instrument
by means of an expense distribution sheet. This reveals any
non-conformance to annual budgets. At project level, a monthly
reconciliation is carried out to cross-check the actual figures
against the cost accounting and site management budgets.
Our judgment and experience tells us that self-monitoring and
establishing dual control principles are the effective elements
of our system of internal controls.

57
sector in particular benefits from an enormous need to catch
up with backlogs in the rising economic countries, but also
in the established industrial nations. This applies not only to
traffic infrastructure but also to residential and public buildings,
dams or flood protection facilities. Moreover, building is taking
place in urban areas where space is increasingly at a premium.
This demands progressively higher buildings, which calls for
extensive foundation work. In addition, stationary and flowing
traffic must be ever-increasingly transferred below ground,
which also leads to growth in specialist foundation engineering.
Opportunities for deep drilling technology have increased
further through the establishment of a joint venture with
Schlumberger. In the joint venture, a new generation of highly
modern deep drilling rigs for use with oil and gas drilling rigs
in geothermal drilling will be developed and constructed for
Schlumberger and third parties. The partners involved, Bauer
and Schlumberger, anticipate that the joint venture could soon
achieve revenues of more than EUR 100 million and open up
great opportunities for the future. Overall, we are convinced
that deep drilling technology will make an important positive
contribution to our results in future.
In the Resources segment, we have succeeded in expanding
out of our traditional sphere of pollution remediation into indus-
trial process water treatment, and thus attracting customers in
the automotive, chemicals, oil and gas industries. The demand-
ing quality requirements combined with large quantities of
industrial process waters occurring in oil production, against a
background of ever more stringent environmental standards,
offer additional outstanding market opportunities for our
products and services.
VALUE CREATION OPPORTUNITIES
Development and innovation
Development and innovation are systematically integrated into
many standard processes within the Group. Their efficiency
is monitored as part of the quality management system and
by way of the corporate controlling function. It is also ensured
that customers’ wishes are understood as being opportunities,
and are translated into innovations for our products and
services in a timely manner. The capacities of our engineering
offices are systematically being strengthened by resources
from countries with high levels of education allied to low labor
costs, such as India.
The opportunities arising are classified in parallel with the
detailing of risks. In this context, too, the areas of opportunity
have been aggregated. Unless otherwise specified, all oppor-
tunities set out in the following relate to all our segments.
STRATEGIC OPPORTUNITIES
Over the years, the Group has built up expertise through
handling projects in areas associated with its core business,
and has developed synergy effects from this which today
shape the Resources segment.
These include the environmental technology business which
deals with treating contaminated ground and groundwater,
and has taken on an increasingly international character since
its beginnings more than 20 years ago. A similar business
grew out of the first use of specialist foundation engineering
equipment for diamond exploration. Today, bore holes are dug
for all kinds of natural resources. In the water business, we
also develop high-quality products for expanding wells and for
close-to-the-surface geothermal energy applications, as well
as for treating and purifying drinking water, process water and
industrial waste water.
By merging these three areas into the Resources business
segment, we are addressing some of the most important
issues of the 21st century. Moreover, the Resources segment
is less dependent on the economic cycles of our traditional
Construction and Equipment segments.
In order to bring about the internationalization of the Re-
sources segment, we are utilizing the experience of our long-
standing organizational units in the other two segments.
In the event of a regional market downturn, our network
strategy in the Construction segment will enable us to relocate
our capacities rapidly to another country and continue ope-
rations at the new location. This leads to speed and cost
advantages in our project business.
MARKET OPPORTUNITIES
Constantly increasing urbanization and growing infrastruc-
tural needs are leading to increasingly large-scale building
schemes, which offer many interesting project opportunities
to the construction industry – and especially the companies in
the specialist foundation engineering sector. The construction
COMBINED MANAGEMENT REPORTRisk and Opportunity Report
OPPORTUNITY REPORT

58COMBINED MANAGEMENT REPORTRisk and Opportunity Report
Supplements and claims management
The assertion of requirements and supplements does not only
entails risks, but also the opportunity to achieve better earnings
than originally specified in the contract based on changes
to the ordered construction services or supplemental work
ordered by the client. On projects involving high potential
for changes, this can result in a substantial improvement
in earnings. We attempt to exploit such opportunities by
professional management of supplemental requirements in
the course of the construction project.
OVERALL OPPORTUNITIES
We are seeing a steady improvement in our opportunities on
global markets as our Resources segment becomes increas-
ingly well established. This is also being boosted by new,
innovative products. Our strategy of systematically interlinking
our mainly small and medium-sized globally operating units
to create efficient networks is enabling us more and more
effectively to generate speed and cost benefits from the
associated economies of scale. All in all, we see the oppor-
tunities for our Group’s worldwide business increasing once
again in 2016.
Innovation is possible at practically every point within our
business processes. Our employees are best placed to know
where improvements are achievable in their particular sphere
of work. In order to collate and make use of the many good
suggestions which our employees submit, we have devised
a system for the unbureaucratic recording, evaluation, imple-
mentation and rewarding of suggested improvements, which
has been in turn rewarded by a number of good ideas.
Project opportunities
Regardless of national and global market cycles, projects often
arise in otherwise weak markets which we as a corporation are
extremely well equipped to handle thanks to the mix of our
products and services portfolio. Examples of this are processes
for retrofitting of core seals in earthwork dams, or for the long-
term, environmentally compatible treatment and disposal of
industrial process water.
The resultant projects in some cases entail very large lot units.
When contracted, we are able to manage them successfully
by converging our global resources and based on our many
years of experience in handling large-scale projects.
In the Kingdom of Bhutan, on the banks of the Mangdechhu River, a new hydro-electric power station is being built. Bauer built
a total of 4,575 m² diaphragm wall so as to control the ingress of groundwater from the diverted river into the excavation pit.
>>>

59
in the future. The losses that have been made in some areas
were all caused by factors which do not represent a long-
lasting burden on the business – as is the case with the
significant amounts invested in the reorientation. In two
projects in particular, some mistakes exacerbated by general
conditions led to significant losses which have imposed a
burden on us for several years. To cope with the financial
crisis, we embarked on numerous relatively small business
operations post-2008 and continued them for some time
despite the fact that, regrettably, they did not prove to be
promising in some cases; and now we have been forced to
terminate them incurring significant costs.
The boom years of 2007 and 2008 obliged us to invest in
expanding our capacities. The new plants were completed
just when the financial crisis broke. Since then, the market
situation and fiercer competition have prevented us from
achieving adequate capacity utilization. However, the deve-
lopment in sales over the past few years has already improved
the situation pleasingly, and the joint venture with Schlum-
berger for manufacturing deep drilling rigs represents a
significant opportunity for us to achieve future success.
Our business operations in Construction as well as in Equip-
ment and in plant engineering offer the advantage in such a
difficult phase that each project represents a new success
opportunity. Individual problems in the past are not carried
forward into the future; in fact, they can even be seen as an
opportunity because the experience is channeled into new
projects. As a result of our significant efforts to keep cost
structures in our companies as lean as possible, our global IT
structure as well as the international experience possessed
by our management team, we believe we are well prepared
to lead the company into the future in combination with a
stable earnings trend. Our efforts in this regard are concen-
trated on our innovative product range and our special
services with their prospects for future success.
In view of the general conditions, it is our opinion that our
business model will prove robust in 2016 as well. In our
planning, we have attempted to evaluate all known threats
and opportunities, thinking through both positive and negative
scenarios as effectively as possible. Overall, we are convinced
that our planning for 2016 is realistic. This applies to all
segments and to the Group overall.
As was already explained in the Business Report, the BAUER
Group operates in markets which display good underlying
growth rates. As a result of the enormous pent-up demand
for construction activities existing in the world, we are of the
opinion that this situation will not change over the coming
years, in spite of the turbulence that is affecting global
markets. Nevertheless, it will be necessary to respond to
shifts in the market focus by displaying great flexibility. For
example, it is to be expected that construction activities
and, as a result, demand for new machinery in the oil and
gas-dependent markets will decrease in the next few years.
Both of these ought to increase in the established industria-
lized nations, however, as a result of the positive effects of
low oil prices. These countries will be able to invest in new
construction projects because their financial position will
have improved again.
Our excellent order backlog at the end of 2015 indicates that
we are successfully exploiting the opportunities presented by
the markets. Furthermore, there are many interesting major
projects all over the world which will enable us to maintain
this high level. In the Construction and Resources segments,
we are able to achieve relatively high order backlogs as a
result of the longer project durations.
The order backlog in the Equipment segment is rather
low, however. This is not set to change in coming years.
Equipment customers interested in special construction
machinery tend only to order machines when they have a
particular project to carry out. In addition, there is still significant
overcapacity in the market – specifically among Chinese manu-
facturers – meaning that finished machines have to be stored
awaiting sale. Given the short order lead times, it is difficult
to accomplish equipment planning in line with future demand –
above all because components and parts have got to be
ordered several months ahead of production. We are respon-
ding to this development with a corresponding platform
strategy and appropriate standardization measures, and in
this way we are attempting to make production more flexible
and reduce the inventory level. We assume that this situation
will be a feature of our business for some time to come – even
though the Chinese manufacturers have now started to correct
their strategy and cut capacities.
One important factor in the forecast is of course whether
failures in past years will influence the prospects of success
COMBINED MANAGEMENT REPORTForecast Report
IX. FORECAST REPORT

60COMBINED MANAGEMENT REPORTForecast Report
in EUR million Actual 2015 Forecast 2016
Total Group revenues 1.656 ~ 1.650
EBIT 90,7 ~ 75
Net profit or loss 29,0 ~ 20 - 25
Comparison: 2015 actual/2016 forecast
any major acquisitions at present, as we are intending to
strengthen our capital base especially over the years ahead.
Based on the information available to us at the time of com-
pleting this report, we forecast that total Group revenues
for the 2016 financial year will be around EUR 1.65 billion.
We forecast earnings after tax of about EUR 20 to 25
million and an EBIT of about EUR 75 million.
We are continuing to plan for growth of between 3 % and 8 %
in total Group revenues for the coming years.
Nevertheless, we are obliged to point out that specialist
foundation engineering and our other businesses are ex-
posed to greater risk than the business activities undertaken
by most other companies. Our activity always contains a
factor that cannot be perfectly analyzed in advance – the
subsoil or the ground itself. Even after conducting extensive
and detailed preliminary ground surveys, some factors which
were not detectable will occur on a regular basis. They can
impede construction works in a wide variety of ways, and in
some cases also cause financial losses. We are continuously
working hard to optimize our approach to risk, so as to avoid
the issues that have impacted on us over recent years.
Of course, an opportunity can also arise if the ground has
been assessed too negatively prior to starting construction
works. Our construction sites can then also generate additional
profit.
We see no need to change our strategic objectives at present.
The strategy comprising the Construction, Equipment and
Resources segments will continue to dictate the direction
of the Group over the coming years. We are not planning
In July 2015, BAUER Umwelt GmbH was appointed general contractor by Roche Pharma AG for the remediation of perimeters 1/3 north-west of the former Kesslergrube landfill. In the course of the remediation, work started on a temporary shipping pier on the River Rhine in autumn 2015.
>>>
We still expect to make a loss in the first quarter, in line with
seasonal norms, though it will be balanced out over the
following quarters. The trend over the full year will thus be
in line with patterns in our business seen in earlier times.

61
exceptional results. We believe it is appropriate to allow our
shareholders to participate in this, so we intend to pay a
small dividend. The Management Board will thus recommend
to the Supervisory Board that it propose a dividend of EUR
0.15 (previous year: EUR 0.15) to the shareholders. In order to
reduce the burden on the capital base of BAUER AG which
is making the dividend payment, it has not been possible to
increase the dividend in spite of the fact that higher earnings
after tax were achieved in the Group. In the medium term,
the dividend quota should be about 25 to 30 % of the
reported earnings after tax.
We do not see any existential risk or relevant risk to future
progress in our trading environment. The global economy
remains marked by great change, however, which may also
have a negative impact on our situation again. We should
point out that future forecasts are based on assumptions and
estimates of the company management. These assumptions
and estimates always entail a degree of uncertainty and risk,
which may mean that actual performance differs from that
forecast.
The reason for this is that fewer machines can be invoiced at
the start of the year, because customers do not start buying
equipment until the construction season gets underway. In
the Construction segment, the winter period has a heavy
impact on a number of our markets.
Our balance sheet ratios have changed markedly over recent
years. This is illustrated most clearly by the increase in working
capital, which also resulted in a substantial increase in net
debt. This trend was largely attributable to the normalization
of our machinery business, in which inventories increased
significantly due to the return of shorter lead times. No sig-
nificant change to the balance sheet structure is to be ex-
pected in the coming year, as our business model is tied to
high levels of up-front financing. With stronger demand for
machinery, however, the ratios will improve again. Over the
coming years, we will be making great efforts to increase our
equity ratio back to more than 30 %.
Following the difficult financial year in 2015, the earnings
after tax in the Group could only be achieved by means of
COMBINED MANAGEMENT REPORTForecast Report
Schrobenhausen, March 31, 2016
BAUER Aktiengesellschaft
Prof. Thomas Bauer
Chairman of the Management Board
Dipl.-Betriebswirt (FH) Hartmut Beutler Dipl.-Ing. Heinz Kaltenecker

62
Global economy stable despite numerous crises
2015 was a crisis-ridden year in many aspects with the
Russia/Ukraine conflict, China's problems, the oil price
situation, Brazil's issues, currency fluctuations, international
terrorism and the wave of refugees, and all of these topics
have a major impact on global developments.
It is almost a miracle that the global economy is withstanding
all of the problems. It grew very steadily by 3.1 % in 2015.
The US market showed positive development as well as
the Eurozone, which grew by 1.6 %. However, there is also
another side: Russia suffered severely under the sanctions
and the depreciation of the ruble and the economy shrank
by 3.7 %. China's weak economy created uncertainty at
stock exchanges around the globe. Growth in this country
dropped to a mere 6.9 %, with forecasts indicating a con-
tinuing downward trend.
The oil price slumped severely by almost 35 % in 2015. The
surplus in the market negatively affected the major oil com-
panies and equipment suppliers alike as well as those coun-
tries depending on oil, especially in South America and the
Middle East.
Despite the stable development in Europe, political tension
has increased in this region. The influx of refugees provoked a
return to national demarcation, which triggered discussions
about open borders and the joint currency.
All that is left are low interest rates. The European Central
Bank is sticking to its low interest policy and even has
extended the bond purchasing program. The US Federal
Reserve increased the Fed Rate by 0.25 % at year-end.
However, this cannot yet be regarded as the start of an
interest rate turnaround, but rather as pressure to have to
deliver on the Federal Reserve's own announcements.
Bauer share rises in a positive stock market environ-
ment
The Bauer share developed relatively positively in 2015, rising
by 30.3 % during the course of the year. This performance is
roughly on par with the SDAX (+26.6 %). The DAX (+9.6 %),
on the other hand, fell behind.
Based on the opening price of EUR 13.35, the share gained
in the first weeks, reaching an interim high at EUR 18.00 in
mid-March. After a short sideward move, the share followed
the general stock market trend as from mid-April and dropped
below the EUR 15 mark by mid-June.
The Bauer share was removed from the SDAX effective June
22. Both market capitalization and liquidity were no longer
sufficient for a listing on this index.
The share recovered quickly from mid-June to mid-July and
reached a second interim high at EUR 17.72. The indices went
through a serious slump in August, which also impacted the
Performance of the Bauer Share 2015
in %
The Bauer Share
01.01.2015 01.04.2015 01.07.2015 01.10.2015 31.12.2015 31.03.2016
50
40
30
20
10
0
(10)
(20)
(30)
BAUER AG DAX MDAX SDAX

63
Bauer share. The share had dropped to a mere EUR 14.29 on
August 24.
During the subsequent recovery, the share made a clear break
from the indices and gained significantly, reaching the annual
high at EUR 19.20 at the end of October.
The share then fell slightly again until year-end. During the
last trading days, it fell below the EUR 18 mark and closed
the year at EUR 17.40.
Continuous exchange with stakeholders
Investor relations primarily focus on continuous communication
with the capital market and shareholders.
In particular, the Management Board participates in road-
shows such as in Scandinavia, USA and Germany. The
members of the Management Board also talk to German
and foreign investors at capital market conferences.
The number of analysts reporting on Bauer dropped to four
by the end of 2015. The reason for this development were
the banks' restructuring measures and the share's exit from
the SDAX. All analysts recommended to hold the share at
year-end, and the average target price was EUR 17.50.
Particularly our private shareholders used the Annual General
Meeting in June to obtain information from Prof. Thomas Bauer.
Around 400 shareholders and guests attended the meeting
in Schrobenhausen.
Dividend policy
Our dividend strategy is fundamentally oriented to the goals
of providing shareholders with an appropriate and fair parti-
cipation in the success of the business, maintaining continuity,
and safeguarding the equity ratio.
2015 was yet another difficult financial year. The budgeted
earnings after tax were only generated through exceptional
results, with numerous expenses on the opposite. We believe
it is appropriate to allow our shareholders to participate
in this, so we intend to pay a small dividend.
The Management Board will thus recommend to the Super-
visory Board that it propose a dividend of EUR 0.15 (previous
year: EUR 0.15) to the shareholders at the Annual General
Meeting on June 23, 2016.
THE BAUER SHARE
KEY FIGURES 2012 2013 2014 2015
Earnings per share (in EUR) 1.44 -0.99 0.85 1.73
Dividend per share (in EUR) 0.30 0 0.15 0.15 *
Dividend total (in EUR ’000) 5,139 0 2,570 2.570 *
Year-end price (in EUR) 19.32 18.81 13.35 17.40
Annual high (in EUR) 26.50 23.05 20.04 19.20
Annual low (in EUR) 16.13 17.33 11.75 13.85
Market capitalization at year-end (in EUR ’000) 330,971 322,234 228,699 298,079
Average daily trading volume (units) 48,584 39,017 26,984 25,570
* Proposed; subject to the consent of the Annual General Meeting to be held on June 23, 2016
ISIN / WKN DE0005168108 / 516810
Trading symbol B5A
Trading segment Frankfurt, Prime Standard
Share indexes CDAX, GEX, DAXPlus Family
Class of share No-nominal-value individual bearer shares
Share capital EUR 73,001,420.45
Number of shares 17,131,000
Shareholder structure Bauer family 48.19 %, free float 51.81 %
Share information
More information:
http://ir.bauer.de

64
The Management Board, also on behalf of the Supervisory
Board, submits the following report on the company's
Corporate Governance in accordance with Article 3.10 of
the German Corporate Governance Code. The Corporate
Governance Report also includes the Declaration on
Corporate Governance pursuant to Article 289a of the
German Commercial Code (HGB), which forms part of
the Management Report for the 2015 financial year.
Declaration of Conformity 2015
In the year under review, based on preliminary work by the
Presidial and Personnel Committee, the Management Board
and Supervisory Board reviewed the company's compliance
with the German Corporate Governance Code. On December
8, 2015 the Management Board and Supervisory Board
passed the following declaration of conformity:
"Since the last declaration in December 2014 the company
has complied with, and currently complies with, each of the
recommendations of the "Government Commission of the
German Corporate Governance Code" as published by the
German Federal Ministry of Justice in the official section of
the electronic version of the German Federal Gazette ("Bun-
desanzeiger"), with the following exceptions:
1. Contrary to Article 3.8 an excess of at least 10 percent of
the loss up to at least an amount representing one and
a half times the fixed annual remuneration of Supervisory
Board members is not agreed for D&O insurance for the
Supervisory Board. As a result of the moderate remunera-
tion provisions for the Supervisory Board in the Articles of
Association, a corresponding excess for the Supervisory
Board is not approved. Even without a corresponding
excess, the Supervisory Board members will perform
their duties responsibly.
2. Contrary to Article 4.1.5, there is no appropriate inclusion
or participation of women arranged for in the filling of
management positions. In particular, the introduction of
a quota for women is not supported in order to ensure
equal opportunities. These positions should be filled
regardless of gender so that neither the female gender
nor the male gender is favored or discriminated against. In
addition, a candidate should not suffer any disadvantage
on the grounds of racial or ethnic origin, religion or belief.
3. The individualized disclosures of the benefits, the remune-
ration and the retirement benefits awarded to each member
of the Management Board are not individualized for each
member of the Management Board in the remuneration
report as the Annual General Meeting dated June 30, 2011
resolved on the omission of the disclosures according to
section 285, no. 9, letter a, sentences 5 to 8, section 315a,
subsection 1 and section 314, subsection 1, no. 6, letter a,
sentences 5 to 8 of the German Commercial Code (HGB)
and therefore the disclosures required under Article 4.2.5
would contradict such Shareholder resolution.
4. Contrary to Articles 5.1.2 and 5.4.1, no age limit for mem-
bers of the Management Board or Supervisory Board and
no time limit to the length of membership in the Supervisory
Board are specified. Expertise and performance as well as
independence cannot be determined on the basis of rigid
age limits or length of membership. Upon the appoint-
ment of new Management Board and Supervisory Board
members or upon prolongation of their membership at
the end of the statutory term of office, the persons in the
Supervisory Board and the Annual General Meeting who
bear responsibility for selecting suitable members will take
account of the age and the independence of the chosen
person when reaching their decision, alongside assessing
their skills.
5. Contrary to Article 7.1.2, the consolidated financial state-
ments at December 31, 2014 were made public within
100 days rather than 90 days of the end of the financial
year. As a result of the international structure of the Group,
the completion and consolidation of the separate financial
statements takes a considerable amount of time. In the
interests of conscientious accounting processes, efforts
to improve the accounting procedures continue.
Furthermore, BAUER Aktiengesellschaft already conforms
largely to the additional suggestions of the German Govern-
ment Commission on the Corporate Governance Code.
Roles of the Management Board and Supervisory
Board
German company law prescribes a dual system of manage-
ment for BAUER AG, characterized by a strict separation of
personnel between the Management Board as the executive
Corporate Governance ReportAND DECLARATION ON CORPORATE GOVERNANCE

65
consolidated financial statements and the parent company
and Group Management Report, as well as proposals for
the appropriation of net profit available for distribution. The
Chairman of the Supervisory Board coordinates the work of
the Supervisory Board, chairs its meetings and represents
the Supervisory Board externally. The Supervisory Board
regularly reviews the efficacy of its activities.
Composition of the Supervisory Board
The Supervisory Board of BAUER AG comprises 12 members,
with half of them being appointed by the employees and the
other half by the Annual General Meeting. The Supervisory
Board includes a sufficient number of independent members
who have no business or personal links to the company, to
its executive bodies, to any controlling shareholder or to any
company associated with any such shareholder which may
give grounds for a material and not merely temporary conflict
of interests. Moreover, all members of the Supervisory Board
are obligated to immediately disclose to the Supervisory Board
any conflicts of interest as and when they arise. No conflicts of
interest were disclosed to the Supervisory Board by any of its
members during the year under review.
The Supervisory Board of BAUER AG currently comprises two
women and 10 men. In the future, however, the Supervisory
Board of a listed company will have to be comprised of at
least 30 % women and at least 30 % men pursuant to Section
92 (2) of the German Stock Corporation Act (Aktiengesetz;
AktG) The shareholders and employee representatives both
rejected the total fulfillment of this gender quota, so that the
minimum quota for the elections to the Supervisory Board
of BAUER AG due in the first half of 2016 must be fulfilled
separately by the shareholders and the employees.
Objectives of the Supervisory Board with regard to its
composition
The following objectives must be taken into account by the
Nominations Committee and by the Supervisory Board when
proposing candidates for election to the Supervisory Board
at the Annual General Meeting:
• The Supervisory Board shall be composed such that
its members collectively possess the necessary skills,
knowledge and professional experience to carry out its
assigned role in a correct and proper manner.
management body and the Supervisory Board as the super-
vising body. Moreover, the company's Articles of Association
and the rules of procedure governing the work of the Super-
visory Board and of the Management Board also lay down the
basic structures of their collaboration.
The Management Board is assigned independent responsibility
for managing the company. Notwithstanding the joint overall
responsibility of the Management Board, each member of
the Management Board acts on his or her own responsibility
within his or her assigned portfolio of functions. Measures and
transactions of a division of the Management Board that are of
extraordinary importance for the company or a business unit,
or which are associated with an extraordinary financial risk,
require the prior approval of the entire Management Board.
The Chairman of the Management Board coordinates the work
of the Management Board. The Management Board members
report on a regular basis to the Chairman of the Management
Board in respect of all material matters and on the course of
business within their assigned functions. A member of the
Management Board has been appointed Labor Director, and
is responsible to an increased extent for human resources and
social policy topics in the company. The Management Board
defines the corporate strategy, agrees it in consultation with
the Supervisory Board, and ensures that it is implemented.
The Management Board provides the Supervisory Board and
its subcommittees with regular, detailed information, in written
form by way of monthly reports, by conference calls and at
routine meetings, as well as at extraordinary meetings held as
and when required, in respect of all matters of relevance to the
company.
The Supervisory Board appoints the Management Board.
In doing so, it considers not only the relevant professional
qualification of its members but also – given the international
nature of the business – the diversity of its composition. The
Supervisory Board also sets the overall level of remuneration
paid to the Management Board, regularly reviews remunera-
tion levels, and specifies the remuneration paid to individual
members of the Management Board. It appoints, supervises
and advises the Management Board, and participates in
decisions of fundamental significance to the company. The
company's Articles of Association stipulate relevant transac-
tions and undertakings which require the consent of the
Supervisory Board. Duties of the Supervisory Board include
reviewing the annual financial statements of the company, the
CORPORATE GOVERNANCE REPORT

66
The Presidial and Personnel Committee comprises the
Chairman of the Supervisory Board as well as one Supervi-
sory Board member elected by the shareholder representa-
tives and one by the employee representatives respectively.
Its role includes preparing the way for Supervisory Board
decisions relating to the setting of overall remuneration to
individual Management Board members and to the remune-
ration system for the Management Board in general, as well
as responsibility for establishing, amending and terminating
service contracts with the members of the Management
Board. It also discusses corporate governance matters.
The Audit Committee comprises three members elected by
the Supervisory Board by a majority of the votes cast, with two
members proposed by the Supervisory Board members of the
shareholders and one member proposed by the Supervisory
Board member of the employees. The Chairman of the Audit
Committee is elected by the Supervisory Board at the sugge-
stion of the shareholders' representatives. The Chairman of
this committee is an independent member of the Supervisory
Board possesses specific knowledge and experience in the
application of accounting policies and audit procedures, and
is neither a former member of the company's Management
Board nor the Chairman of the Supervisory Board. The role
of the Audit Committee is in particular to monitor accounting
procedures and to review the efficiency of the system of
internal controls, the risk management system and the internal
auditing system including compliance. The Audit Committee
prepares the proposal of the Supervisory Board to the Annual
General Meeting concerning the appointment of auditors, and
assess their independence. It undertakes a preliminary review
of the annual financial statements of the parent company
and the consolidated financial statements of the Group
together with the Combined Management Report, as well as
preparing the proposal on appropriation of net profit available
for distribution and consulting on the audit reports with the
auditors. It also reviews the interim reports.
The Nominations Committee comprises three shareholder
representative members of the Supervisory Board. The Chair-
man and the Deputy Chairman of the Nominations Committee
are proposed and elected by the Supervisory Board members
of the shareholders. The task of the Nominations Committee
is to submit to the Supervisory Board proposals of suitable
candidates to be put forward to the Annual General Meeting
for election to the Supervisory Board.
• The appointment of shareholders' representatives to the
Supervisory Board shall take due account of the Group's
fundamental character as a family business, giving due
consideration to the implications of that character in terms
of the corporate culture, whereby two members shall be
appointed from the Bauer family, provided the candidates
are suitable.
• At least two of the shareholders' representatives on the
Supervisory Board shall have substantial experience in the
management of construction and/or construction machinery
manufacturing companies.
• At least one of the shareholders' representatives on the
Supervisory Board shall possess specialist skills and ex-
perience in the application of financial reporting standards
and the implementation of internal control procedures.
• The employees' representatives on the Supervisory Board
will be elected in accordance with the provisions of the
German Employees' Co-determination Act.
• The Supervisory Board shall include not more than four
members in total who have business or personal links to
BAUER AG, to its executive bodies, to any controlling
shareholder or to any company associated with any such
shareholder which may give grounds for a material and
not merely temporary conflict of interests.
• Supervisory Board posts shall be filled on merit, regardless
of gender so that neither men nor women are preferred or
disadvantaged. Moreover, when appointments are made to
the Supervisory Board, a candidate shall not be disadvanta-
ged for reason of race, ethnic origin, religion or world view.
The objectives are fully embodied in the current composition
of the Supervisory Board.
Composition and roles of the subcommittees
The Supervisory Board has established four standing commit-
tees constituted from among its members. The Supervisory
Board subcommittees and their roles and procedures are laid
down in the rules of procedure governing the Supervisory
Board. The chairmen of the various committees submit regular
reports on their work to the plenary Supervisory Board
meetings.
CORPORATE GOVERNANCE REPORT
67
An appropriate system of risk management and of internal
controls is established within the company. The essential
features of the control and risk management system are
set out in the Risk Report forming part of the Combined
Management Report. Internal auditing systems monitor
compliance with laws and standards across the Group. The
Management Board regularly updates the Supervisory Board
on existing risks and risk trends, as well as on internal auditing
procedures.
SHAREHOLDERS AND TRANSPARENCY
The company provides regular and timely information relating
to the position of the company and in respect of material
changes to the business. The company's website contains
comprehensive information (particularly the interim reports and
annual financial statements as well as Annual General Meeting
documentation). In addition, electronic distribution systems
and the German Federal Gazette ("Bundesanzeiger") are
used to ensure timely communication with our shareholders
and with the public at large.
The Annual General Meeting passed a resolution, with
the necessary three-quarters majority, stipulating that the
remuneration paid to members of the Management Board
shall not be disclosed individually. Consequently, as has
been the policy to date, only the remuneration paid to
the Management Board in total and the structure of the
remuneration system are disclosed in the Remuneration
Report on pages 45 to 47 of the company's Annual Report.
Members of the Management Board at the year-end held a
total of 1,742,022 (previous year: 1,742,022) shares in the
company as per December 31, 2015. This corresponded
to 10.17 % (previous year: 10.17 %) of the share capital of
BAUER AG. On the same date, members of the Supervisory
Board held a total of 1,310,531 (previous year: 1,310,531)
Bauer shares, corresponding to 7.65 % (previous year: 7.65 %)
of the company's share capital. No company share option
schemes or similar stock incentive programs existed during
the past financial year.
The Mediation Committee, constituted pursuant to the
German Co-determination Act, comprises two shareholder
representative and two employee representative members
respectively. The Mediation Committee is only convened
if a proposed candidate for appointment as a member of
the Management Board has not obtained the majority vote
required by the German Co-determination Act.
In his report to the Annual General Meeting, the Chairman
of the Supervisory Board summarizes the work of the
Supervisory Board and its subcommittees over the past
financial year. The Report of the Supervisory Board for the
2015 financial year is published in the company's Annual
Report on pages 68 to 69. This report is thereby quoted by
way of reference.
Determination of the female quota in the Management
Board and executive levels
The Supervisory Board determined a female target quota of 0
% for the Management Board until June 30, 2017. This target
has been met by the current Management Board structure.
The Management Board specified a female target quota
of 22.2 % rounded in the top executive level beneath the
Management Board until June 30, 2017 and 27.3 % rounded
until June 30, 2017 for the second executive level beneath
the Management Board. These targets were also fulfilled at
the end of the reporting year. The statutory provisions on
determining the targets are regarded as critical for reasons
of equal opportunity.
Corporate Governance and Compliance
The company's system of corporate governance is based
on German law, specifically on legislation governing public
limited companies, corporate co-determination and capital
markets, as well as on the company's Articles of Association.
The company's Articles of Association are published on the
company website at www.bauer.de, in the "Investor Relations"
section under "Corporate Governance". The Management
Board employs the Corporate Management Manual imple-
mented throughout the Group as its central instrument of
management. This manual also stipulates the framework
guidelines and management principles applicable for the
Group as well as its basic values. A code of conduct has
also been published on the company's website to ensure
that all BAUER Group employees conduct themselves in
compliance with the rules.
CORPORATE GOVERNANCE REPORT
68
The Supervisory Board regularly monitored the work of the
Management Board during the 2015 financial year on the
basis of the detailed reports provided by the Management
Board in written and verbal form, and provided support in
the form of advice. The Management Board discharged its
duties to provide the Supervisory Board with regular, prompt
and comprehensive information about all questions of strategy,
planning, company development, risk development and
compliance that are relevant to the company and the Group.
Between the meetings, the Management Board submitted
monthly written reports on all important business transactions
and financial indicators of the Group and the company. The
Chairman of the Supervisory Board was also in regular contact
with the Management Board, and gathered information as
appropriate relating to the course of business and key
transactions.
In their subcommittees and plenary sessions, the Supervisory
Board members always had the opportunity to scrutinize the
reports and proposals submitted by the Management Board
and to set forth their own suggestions. In particular, the Super-
visory Board intensively discussed all business transactions
important for the company on the basis of written and verbal
reports from the Management Board, and examined them
with regard to plausibility.
There were no indications of conflicts of interest among
members of the Management Board or Supervisory Board
requiring immediate notification of the Supervisory Board and
disclosure to the Annual General Meeting. There were no
changes of personnel on the Supervisory Board in the past
financial year.
Main focus of consultations in Supervisory Board
meetings
Four regular plenary meetings and one conference call were
held during the reporting year. Apart from Mr. Feiger, who
attended less than half of the meetings, all members of the
Supervisory Board attended all of the meetings of the Super-
visory Board.
Several times last year, the Supervisory Board discussed the
enforcement of supplementary claims for major projects and
the development of earnings in the segments and individual
subsidiaries. The current business performance, order backlog
development and development in the markets in the Con-
struction, Equipment, and Resources segments as well as
the strategic alignment were discussed at all Supervisory
Board meetings.
At the annual financial review meeting in April relating to the
annual parent company and consolidated financial statements
for the 2014 financial year, also attended by the auditors, a
detailed review was undertaken of the respective financial
statements and associated management and audit reports,
taking into due consideration the report from the Audit
Committee, and the proposal of the Management Board with
regard to the appropriation of earnings. At the same meeting,
the Supervisory Board also discussed compliance with
financial performance indicators specified in loan agreements,
the year-end forecast, and the invitation to the Annual General
Meeting. The remuneration of the Management Board and
extension of the term of office of Prof. Dr-Ing. E.h. Thomas
Bauer, member of the Management Board, was also on the
agenda, and the efficiency review was performed with a
positive outcome.
At the second meeting in the financial year, the Supervisory
Board focused on business performance, determined a target
percentage of female members of the Management Board
and discussed the gender ratio of the Supervisory Board.
The opportunities and risks related to the conclusion of a joint
venture with Schlumberger Group were discussed during the
conference call. The September meeting dealt with matters
such as various major projects, the deep drilling rig business
performance, and the internal control system. The expected
development of earnings was also discussed. The participants
approved the medium-term plan with regard to the consolida-
ted balance sheet.
At the last Supervisory Board meeting in December of the
reporting year, the members particularly discussed the con-
solidation measures in the Resources segment, the joint
venture with Schlumberger, and the tender for the audit of
financial statements. An updated declaration of conformity to
the German Corporate Governance Code was passed, and
approval was given to the employee bonus framework.
Report of the Supervisory Board 2015

69
Work carried out by the subcommittees
There were four committees of the Supervisory Board. The
Mediation Committee and the Nominations Committee were
not required to convene. The chairpersons submitted regular
reports on the main content of the subcommittee meetings
to the plenary Supervisory Board meetings. The meetings of
the various subcommittees of the Supervisory Board in the
financial year were attended by all the respective members.
Two meetings of the Presidial and Personnel Committee were
convened as well as one conference call. At those meetings,
preparations were made for the decision of the Supervisory
Board relating to the setting of the salaries and performance
bonuses of the members of the Management Board and to
the structuring of its remuneration system, as well as to the
performance bonus framework. Consideration was also given
to the declaration of conformity to the German Corporate
Governance Code, the appointment of managing directors
at the subsidiaries, the extension of the contract of service
of Management Board member Prof. Dr.-Ing. E.h. Thomas
Bauer, and the succession plans for the Management Board.
The Audit Committee held two conference calls and three
meetings in the financial year. The committee reviewed the
audit of the interim reports and, in the presence of the
auditors, the audit of the annual financial statements of the
parent company and the consolidated financial statements
of the Group. It also scrutinized the Management Board's
proposal regarding the appropriation of earnings. It also
prepared the appointment of the auditor, taking account of
the examination into the latter's impartiality. The strategy in
the segments was also discussed, the risk management
and Internal Audit reviewed, and improvements to the ethics
management system considered.
Auditing of 2015 annual and consolidated financial
statements
The annual financial statements of BAUER AG to December
31, 2015 and the consolidated financial statements of the
Group, as well as the Combined Management Report, in-
cluding the Group accounts, were audited by the auditors
elected by the Annual General Meeting and duly appointed
by the Supervisory Board, PricewaterhouseCoopers AG und
Wirtschaftsprüfungsgesellschaft, Stuttgart. The accounts
were certified by the auditors without reservation. The Audit
Committee subjected the audit documentation and reports
to thorough scrutiny. The Committee reported on its review
to the Supervisory Board. The auditors attended the meeting
of the Audit Committee as well as the annual financial review
meeting of the plenary Supervisory Board.
The audit documentation and reports from the auditors were
provided to all members of the Supervisory Board in good
time for scrutiny. The Supervisory Board duly noted and
concurred with the findings of the auditors' review of the
parent company and Group consolidated financial statements
and the Combined Management Report. On conclusion of the
Supervisory Board's review, no objections were raised. The
annual financial statements of BAUER AG and the con-
solidated financial statements of the Group were approved
by the Supervisory Board at its financial review meeting on
April 13, 2016. The annual financial statements of BAUER
AG were thereby confirmed. Following prior consultations
by the Audit Committee, the Supervisory Board concurred
with the proposal of the Management Board regarding the
appropriation of net profit available for distribution.
On behalf of the Supervisory Board, I would like to thank
the members of the Management Board, all the Group's
employees and the employee representatives within all Group
companies for their great commitment throughout the past
financial year.
Schrobenhausen, April 2016
The Supervisory Board
Dr. Klaus Reinhardt
Chairman of the Supervisory Board
REPORT OF THE SUPERVISORY BOARD


71
CO
NS
OL
IDA
TE
D F
INA
NC
IAL
STA
TE
ME
NT
S2
01
5
Income statement of BAUER Aktiengesellschaft
Balance sheet of BAUER Aktiengesellschaft as at december 31, 2015
72
73
Balance sheet and income statement of BAUER Aktiengesellschaft in accordance with HGB (German Commercial Code)
The island nation of Mauritius is getting a new dam for a water storage reservoir, which will safeguard drinking water supplies.
Almost exactly a year to the day after work started on the EUR 35 million Bagatelle dam project, Bauer built the last panel of the
cut-off wall in May 2015.

72
Income statement of BAUER Aktiengesellschaft
in EUR ’000 12M/2014 12M/2015
1. Sales revenues 30,046 32,065
2. Other capitalized goods and services for own account 8 0
3. Other operating income 5,749 5,013
35,803 37,078
4. Cost of materials -1,052 -1,056
5. Personel expenses -15,450 -16,553
6. Amortization of intangible assets and depreciation of property, plant and equipment -2,874 -2,875
7. Other operating expenses -16,667 -47,693
-36,043 -68,177
Operating result -240 -31,099
8. Income from participations 4,950 3,960
9. Other interest and similar income 7,950 9,949
10. Interest and similar expenses -5,914 -6,988
Financial result 6,986 6,921
Result from operating activities 6,746 -24,178
11. Extraordinary expenses -141 -141
12. Income tax expense -666 -826
13. Other taxes -18 -19
14. Net result for the year 5,921 -25,164
15. Profit carried forward 27,429 33,350
16. Dividend payment 0 -2,570
17. Net earnings available for distribution 33,350 5,616

73
CO
NS
OL
IDA
TE
D F
INA
NC
IAL
STA
TE
ME
NT
S2
01
5
Balance sheet of BAUER Aktiengesellschaft as at december 31, 2015
Assets
in EUR ’000 Dec. 31, 2014 Dec. 31, 2015
A. Fixed assets
I. Intangible assets 2,616 3,693
II. Property, plant and equipment 3,557 5,808
III. Financial assets 116,646 116,745
122,819 126,246
B. Current assets
I. Inventories
Raw materials and supplies 71 44
II. Receivables and other assets
(of which receivables from affiliated companies)
205,920
(204,598)
198,682
(197,556)
III. Cash at banks 960 273
206,951 198,999
C. Prepayments and deferred charges 641 1,061
D. Deferred tax assets 603 1,080
331,014 327,386
Equity and liabilities
in EUR ’000 Dec. 31, 2014 Dec. 31, 2015
A. Equity
I. Subscribed capital 73,001 73,001
II. Capital reserve 39,781 39,781
III. Revenue reserves 15,100 15,100
IV. Unappropriated net profit
(of which profit carried forward: EUR 33,350 thousand; previous year: EUR 27,429 thousand) 33,350 5,616
161,232 133,498
B. Provisions
(of which provisions for pensions)
7,841
(6,600)
9,662
(8,165)
C. Liabilities
(of which liabilities payable to affiliated companies)
161,941
(34,942)
184,226
(38,543)
331,014 327,386
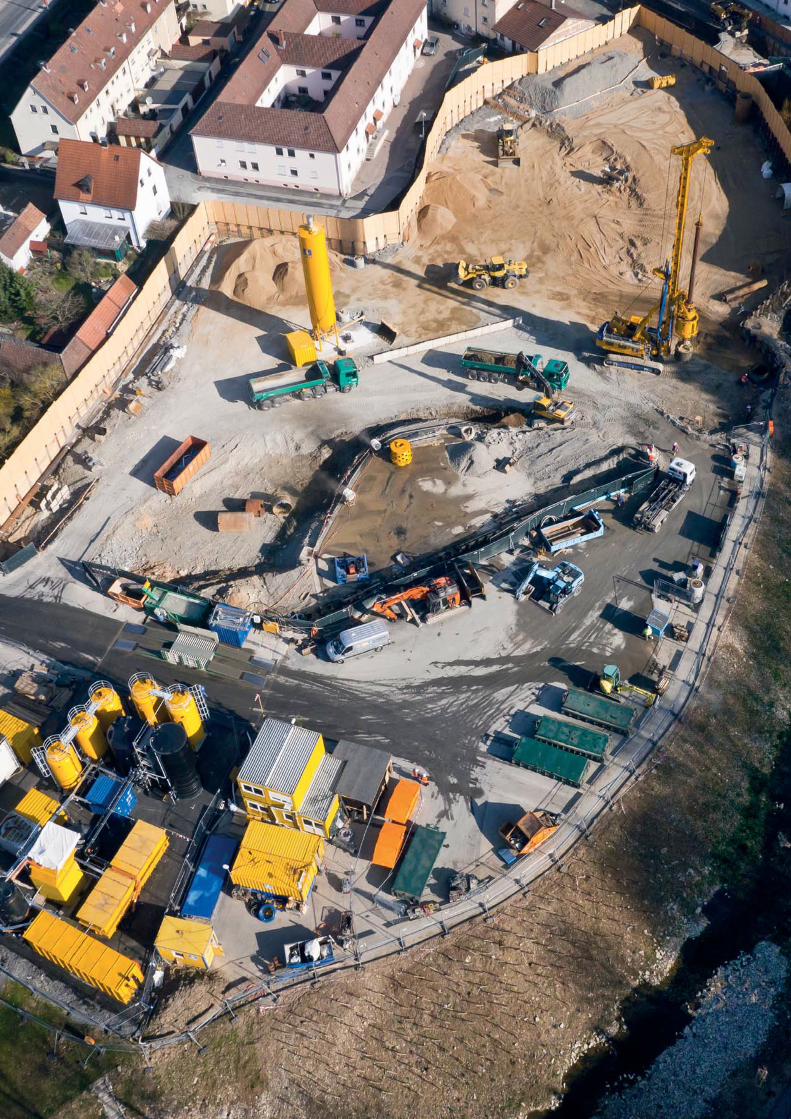
75
CO
NS
OL
IDA
TE
D F
INA
NC
IAL
STA
TE
ME
NT
S2
01
5
Consolidated financial statements in accordance with IFRS
In Schonungen, a town in the Lower Franconia region of Bavaria, BAUER Umwelt GmbH and BAUER Spezialtiefbau GmbH worked
together on the decontamination of a hazardous waste site. The work took place over an area of about 11,500 m² and included soil
remediation work as well as special foundation work with replacement bores.
Consolidated income statement
Consolidated statement of comprehensive income
Consolidated statement of cash flows
Consolidated balance sheet at december 31, 2015
Consolidated statement of changes in equity
Notes to the consolidated financial statements
General notes
Segment reporting
Explanatory notes to the income statement
Explanatory notes to the balance sheet
Other disclosures
Major participations of the Group
Assurance by the legal representatives
Audit opinion
76
76
77
78
80
81
81
106
108
113
142
160
164
165

76
Consolidated income statement and consolidated statement of comprehensive income
Income statement
in EUR ’000 Appendix 12M/2014 12M/2015
1. Sales revenues (7) 1,375,679 1,378,991
2. Changes in inventories 26,622 28,994
3. Other capitalized goods and services for own account (8) 14,696 22,748
4. Other income (9) 89,022 157,213
CONSOLIDATED REVENUES 1,506,019 1,587,946
5. Cost of materials (10) -749,247 -752,532
6. Personel expenses (11) -355,250 -376,118
7. Depreciation and amortization
a) Depreciation of fixed assets (12) -78,781 -81,143
b) Write-downs of inventories due to use (13) -15,789 -13,195
8. Other operating expenses (14) -230,526 -274,235
OPERATING RESULT (EBIT) 76,426 90,723
9. Financial income (15) 7,096 4,972
10. Financial expenses (16) -45,149 -41,982
11. Share of the profit or loss of associated companies accounted for using the equity method -572 2,672
EARNINGS BEFORE TAX 37,801 56,385
12. Income tax expense (17) -22,075 -27,393
NET RESULT FOR THE PERIOD 15,726 28,992
of which attributable to shareholders of BAUER AG 14,481 29,715
of which attributable to non-controlling interests 1,245 -723
in EUR 12M/2014 12M/2015
Basic earnings per share (18) 0.85 1.73
Diluted earnings per share (18) 0.85 1.73
Average number of shares in circulation (basic) 17,131,000 17,131,000
Average number of shares in circulation (diluted) 17,131,000 17,131,000
Statement of comprehensive income
in EUR ’000 12M/2014 12M/2015
Net result for the period 15,726 28,992
Income and expenses which will not be subsequently reclassified to profit and loss
Revaluation of commitments arising from employee benefits after termination
of employment -32,264 6,543
Deferred taxes on that revaluation with no effect on profit and loss 9,046 -1,819
Income and expenses which will be subsequently reclassified to profit and loss
Market valuation of derivative financial instruments -5,323 1,024
Included in profit and loss 6,497 -834
Deferred taxes on financial instruments with no effect on profit and loss 54 -53
Differences from currency translation 10,545 6,733
Other comprehensive income -11,445 11,594
Total comprehensive income 4,281 40,586
of which attributable to shareholders of BAUER AG 2,360 40,891
of which attributable to non-controlling interests 1,921 -305

77
CO
NS
OL
IDA
TE
D F
INA
NC
IAL
STA
TE
ME
NT
S2
01
5
Consolidated statement of cash flows
in EUR ’000 12M/2014 12M/2015
Cash flows from operational activity:
Earnings before tax 37,801 56,385
Depreciation of fixed assets 78,781 81,143
Write-downs of inventories due to use 15,789 13,195
Financial income * -7,096 -4,972
Financial expenses * 45,149 41,982
Other non-cash transactions and results of de-consolidations * -50,853 -85,281
Dividends received 450 1,168
Result from the disposal of fixed assets -4,773 -15,371
Result from associated companies accounted for using the equity method * -572 2,672
Change in provisions 314 1,474
Change in trade receivables 20,634 -38,763
Change in receivables from construction contracts 24,309 13,872
Change in receivables from concession arrangements 2,309 0
Change in other assets and in prepayments and deferred charges -10,506 4,648
Change in inventories -37,316 -38,028
Change in trade payables -21,114 13,174
Change in liabilities from construction contracts 18,551 16,874
Change in other current and non-current liabilities 22,776 -12,068
Cash and cash equivalents generated from day-to-day business operations 134,633 52,104
Income tax paid -19,235 -19,679
Net cash from operating activities 115,398 32,425
Cash flows from investment activity:
Acquisition of property, plant and equipment and intangible assets -69,119 -82,027
Proceeds from sale of fixed assets 26,854 53,803
Consolidation scope-related change in financial resources -5,187 -9,268
Net cash used in investing activities -47,452 -37,492
Cash flows from financing activity:
Raising of loans and liabilities to banks 202,306 213,371
Repayment of loans and liabilities to banks -237,761 -159,173
Repayment of liabilities from finance lease agreements -11,074 -7,804
Disbursements for the acquisition of additional shares in subsidiaries 0 610
Dividends paid -2,872 -3,143
Interest paid -42,952 -38,593
Interest received 5,462 3,851
Net cash used in financing activities -86,891 9,119
Changes in liquid funds affecting payments -18,945 4,052
Influence of exchange rate movements on cash 3,563 1,519
Total change in liquid funds -15,382 5,571
Cash and cash equivalents at beginning of reporting period 57,217 41,835
Cash and cash equivalents at end of reporting period 41,835 47,406
Change in cash and cash equivalents -15,382 5,571
* Previous year adjusted

78
Consolidated balance sheet at december 31, 2015
Assets
in EUR ’000 Appendix Dec. 31, 2014 Dec. 31, 2015
A. NON-CURRENT ASSETS
I. Intangible assets (19)
1. Concessions, industrial property rights and similar rights and values and licenses
to such rights and values 10,156 9,350
2. Capitalized software costs 39 11
3. Capitalized development costs 24,245 18,094
34,440 27,455
II. Property, plant and equipment and investment property (19)
1. Land, land rights and buildings 206,576 184,232
2. Investment property 804 784
3. Technical equipment and machinery 206,209 187,313
4. Other equipment, factory and office equipment 25,107 26,365
5. Payments on account and assets in course of construction 8,213 5,662
446,909 404,356
III. Investments accounted for using the equity method (19) 42,906 132,553
IV. Participations (19) 3,613 3,613
V. Deferred tax assets (20) 30,973 27,190
VI. Other non-current assets (21) 7,492 7,722
VII. Other non-current financial assets (22) 28,420 15,355
594,753 618,244
B. CURRENT ASSETS
I. Inventories (23)
1. Raw materials and supplies 155,334 155,718
2. Finished goods and work in progress and stock for trade 283,850 288,911
439,184 444,629
II. Receivables and other assets (24)
1. Receivables from construction contracts (PoC) 132,159 129,478
2. Trade receivables 311,417 343,933
3. Receivables from enterprises in which the company
has participating interests 67 3,272
4. Payments on account 4,304 5,364
5. Other current assets 28,603 33,381
6. Other current financial assets 20,100 28,901
496,650 544,329
III. Effective income tax refund claims 2,661 2,300
IV. Cash and cash equivalents (25) 41,835 47,406
980,330 1,038,664
1,575,083 1,656,908
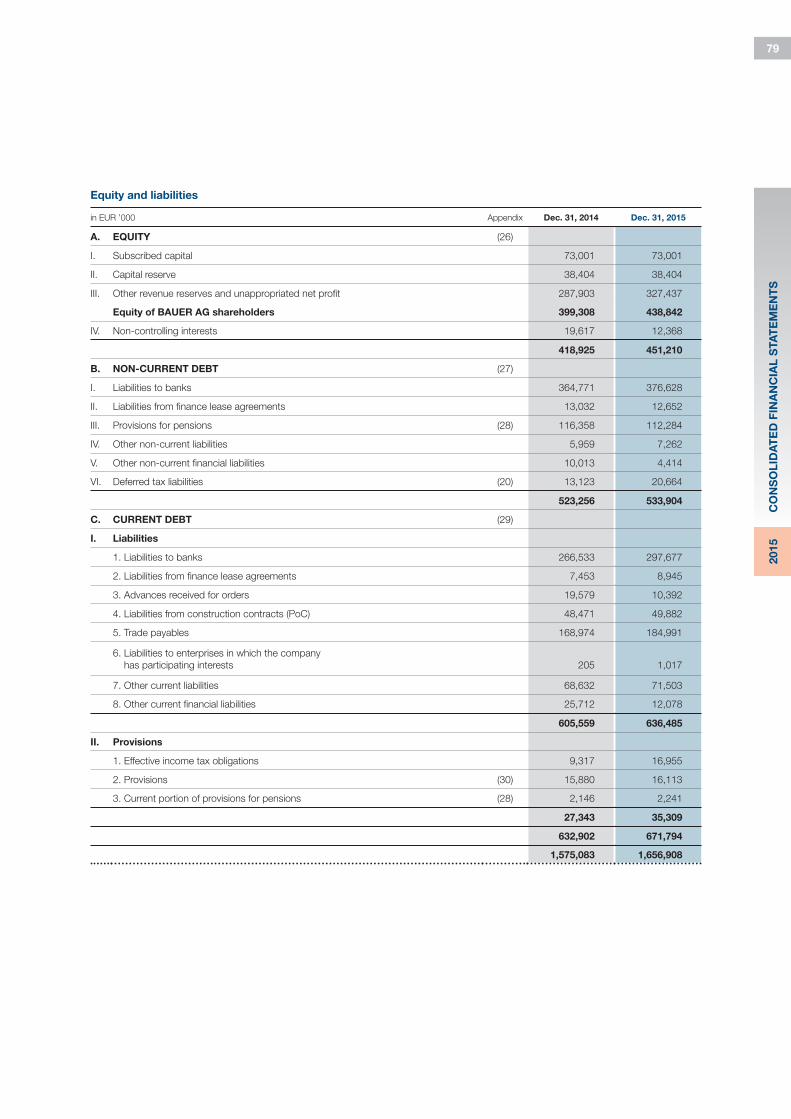
79
CO
NS
OL
IDA
TE
D F
INA
NC
IAL
STA
TE
ME
NT
S2
01
5
Equity and liabilities
in EUR ’000 Appendix Dec. 31, 2014 Dec. 31, 2015
A. EQUITY (26)
I. Subscribed capital 73,001 73,001
II. Capital reserve 38,404 38,404
III. Other revenue reserves and unappropriated net profit 287,903 327,437
Equity of BAUER AG shareholders 399,308 438,842
IV. Non-controlling interests 19,617 12,368
418,925 451,210
B. NON-CURRENT DEBT (27)
I. Liabilities to banks 364,771 376,628
II. Liabilities from finance lease agreements 13,032 12,652
III. Provisions for pensions (28) 116,358 112,284
IV. Other non-current liabilities 5,959 7,262
V. Other non-current financial liabilities 10,013 4,414
VI. Deferred tax liabilities (20) 13,123 20,664
523,256 533,904
C. CURRENT DEBT (29)
I. Liabilities
1. Liabilities to banks 266,533 297,677
2. Liabilities from finance lease agreements 7,453 8,945
3. Advances received for orders 19,579 10,392
4. Liabilities from construction contracts (PoC) 48,471 49,882
5. Trade payables 168,974 184,991
6. Liabilities to enterprises in which the company
has participating interests 205 1,017
7. Other current liabilities 68,632 71,503
8. Other current financial liabilities 25,712 12,078
605,559 636,485
II. Provisions
1. Effective income tax obligations 9,317 16,955
2. Provisions (30) 15,880 16,113
3. Current portion of provisions for pensions (28) 2,146 2,241
27,343 35,309
632,902 671,794
1,575,083 1,656,908
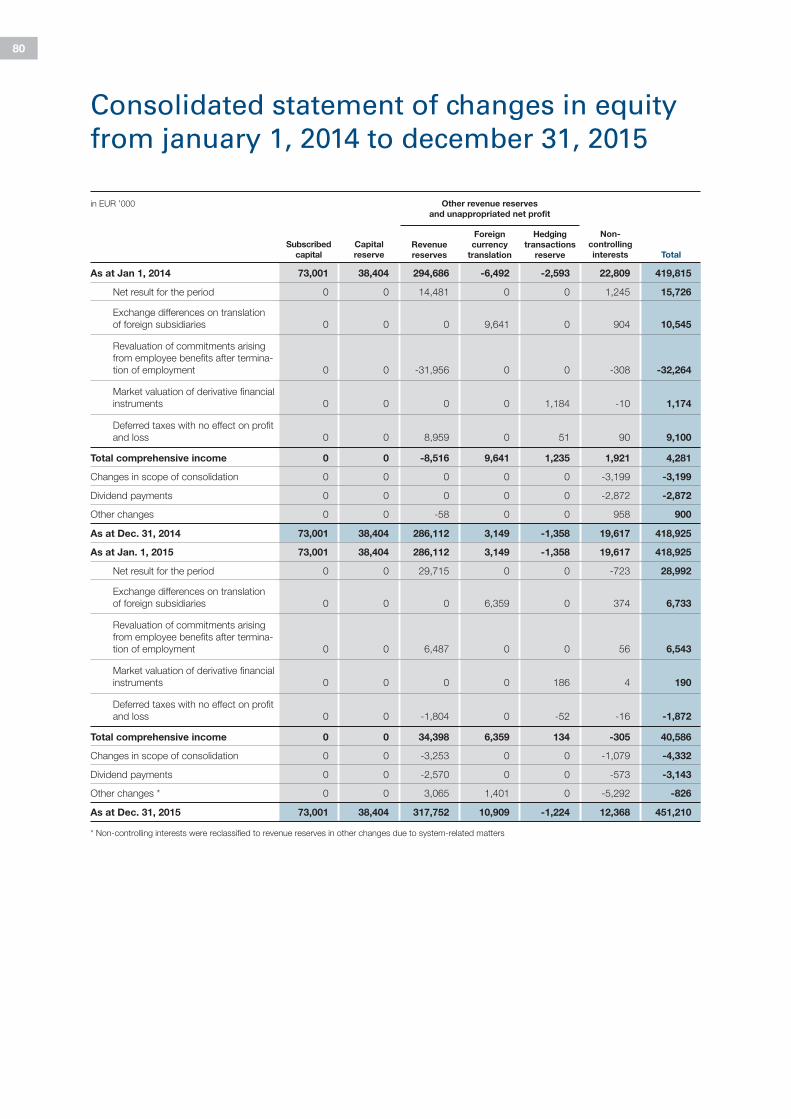
80
Consolidated statement of changes in equity from january 1, 2014 to december 31, 2015
in EUR ’000 Other revenue reserves
and unappropriated net profit
Subscribed
capital
Capital
reserve
Revenue
reserves
Foreign
currency
translation
Hedging
transactions
reserve
Non-
controlling
interests Total
As at Jan 1, 2014 73,001 38,404 294,686 -6,492 -2,593 22,809 419,815
Net result for the period 0 0 14,481 0 0 1,245 15,726
Exchange differences on translation
of foreign subsidiaries 0 0 0 9,641 0 904 10,545
Revaluation of commitments arising
from employee benefits after termina-
tion of employment 0 0 -31,956 0 0 -308 -32,264
Market valuation of derivative financial
instruments 0 0 0 0 1,184 -10 1,174
Deferred taxes with no effect on profit
and loss 0 0 8,959 0 51 90 9,100
Total comprehensive income 0 0 -8,516 9,641 1,235 1,921 4,281
Changes in scope of consolidation 0 0 0 0 0 -3,199 -3,199
Dividend payments 0 0 0 0 0 -2,872 -2,872
Other changes 0 0 -58 0 0 958 900
As at Dec. 31, 2014 73,001 38,404 286,112 3,149 -1,358 19,617 418,925
As at Jan. 1, 2015 73,001 38,404 286,112 3,149 -1,358 19,617 418,925
Net result for the period 0 0 29,715 0 0 -723 28,992
Exchange differences on translation
of foreign subsidiaries 0 0 0 6,359 0 374 6,733
Revaluation of commitments arising
from employee benefits after termina-
tion of employment 0 0 6,487 0 0 56 6,543
Market valuation of derivative financial
instruments 0 0 0 0 186 4 190
Deferred taxes with no effect on profit
and loss 0 0 -1,804 0 -52 -16 -1,872
Total comprehensive income 0 0 34,398 6,359 134 -305 40,586
Changes in scope of consolidation 0 0 -3,253 0 0 -1,079 -4,332
Dividend payments 0 0 -2,570 0 0 -573 -3,143
Other changes * 0 0 3,065 1,401 0 -5,292 -826
As at Dec. 31, 2015 73,001 38,404 317,752 10,909 -1,224 12,368 451,210
* Non-controlling interests were reclassifi ed to revenue reserves in other changes due to system-related matters
81
CO
NS
OL
IDA
TE
D F
INA
NC
IAL
STA
TE
ME
NT
S2
01
5
GENERAL INFORMATION
BAUER Aktiengesellschaft, Schrobenhausen (referred to in the following as BAUER AG) is a stock corporation under German law.
Its registered office is at BAUER-Strasse in Schrobenhausen, and the company is entered in the Register of Companies of
Ingolstadt (HRB 101375).
The BAUER Group is a provider of services, equipment and products dealing with ground and groundwater. The Group markets
its products and services all over the world. The operations of the Group are divided into three segments: Construction, Equip-
ment and Resources.
BAUER AG is listed in the Prime Standard of the German stock market.
1. BASIS OF PREPARATION
The consolidated financial statements of BAUER AG were prepared applying section 315a of the German Commercial Code
(HGB) in accordance with International Financial Reporting Standards (IFRS), as applicable in the EU. The consolidated financial
statements were prepared on the basis of historical cost, limited by the market-value valuation of available-for-sale financial assets
and by the fair-value valuation of financial assets and liabilities (including derivative financial instruments) affecting net income.
The previous year's figures have been determined according to the same principles.
The BAUER Group's financial year is the calendar year.
The consolidated financial statements were prepared in euros. Unless otherwise specified, all amounts are quoted in thousands
of euros (EUR '000).
The income statement was prepared according to the nature of expenses method.
2. BASIS OF CONSOLIDATION
The basis of consolidation includes BAUER AG and all major subsidiaries. Subsidiaries are all companies over which the
parent has control in terms of financial and corporate policy. This is routinely accompanied by a voting rights share of over
50 %. When assessing whether control is exerted, the existence and effect of potential voting rights currently exercisable
or convertible are considered.
122 companies were consolidated into the Group’s annual financial statements in 2015 (previous year: 120). In the financial year,
six (previous year: none) companies were included in the basis of consolidation for the first time. Since the beginning of 2015, four
(previous year: four) companies were de-consolidated due to merger, sale and discontinuation of operations. Joint ventures are
not included in the number of consolidated companies due to the short-term nature of these projects.
Notes to the consolidated financial statementsGENERAL NOTES

82 NOTES TO THE CONSOLIDATED FINANCIAL STATEMENTS 2015
The following overview shows the number of subsidiaries by segment (without construction joint ventures):
If the quality assessment of a new subsidiary finds that the company is immaterial in terms of the operative segment or Group,
it may not be included in the consolidated financial statements.
Consequently, the non-inclusion of any one company must not result in material changes to the Group's net asset, financial and
earnings position, nor must it mask any other materially relevant trends.
In a small number of cases, companies are fully consolidated into the financial statements of BAUER AG even though that
company holds less than 50 % of their voting rights. This is the result of state restrictions which stipulate that foreign investors
may not hold more than 50 % of the voting rights in domestic companies. In such cases BAUER AG makes use of so-called
agency constructions, whereby more than 50 % of the voting rights are commercially held in the company concerned, thus
allowing for full consolidation.
Subsidiaries are included in the consolidated financial statements (fully consolidated) from the point at which control, or the
option of control, is transferred to the Group. They are de-consolidated at the point when control ends. Companies of which
BAUER AG is able, directly or indirectly, to exercise a significant influence on the said companies’ financial and operating policy
decisions (associated companies) are consolidated according to the equity method. This related to 15 companies as at
December 31 (in the previous year: 15). Joint ventures were likewise consolidated according to the equity method.
The main subgroups and companies included in the consolidated financial statements are listed in the Major Participations
section. The disclosures in accordance with Section 313, Subsection 2 HGB are grouped in a separate list of holdings. This will
be published as part of the Notes to the financial statements of BAUER Aktiengesellschaft in the electronic version of the official
Gazette (“Bundesanzeiger”) of the Federal Republic of Germany. Subsidiaries with differing balance sheet dates compile interim
financial statements as per the Group balance sheet date. NuBa Equipment Ltd. prepares its annual financial statements for
September 30 as Nuna Logistics Limited another shareholder, also prepares its annual financial statements for this date. BAUER
Corporate Services Private Limited, India, and BAUER Equipment India Private Limited prepare their annual financial statements
for 31 March due to local statutory requirements.
Main business Head-
quarters
Number of com-
panies with 100 %
share
Number of compa-
nies with a share
less than 100 %
Number of
associated
company
Number of joint
ventures
Total
Dec. 31,
2014
Dec. 31,
2015
Dec. 31,
2014
Dec. 31,
2015
Dec. 31,
2014
Dec. 31,
2015
Dec. 31,
2014
Dec. 31,
2015
Dec. 31,
2014
Dec. 31,
2015
Construc-
tion seg-
ment
Specialist Foun-
dation Engi-
neering, Project
Development
Global 27 28 8 8 12 12 0 0 47 48
Equipment
segment
Equipment
Manufacture
and Sales
Global 24 22 10 8 1 1 0 3 35 34
Resources
segment
Environment and
Environmental
Technology
Global 25 25 6 6 2 2 2 3 35 36
'Other'
segment
Central
servicesGlobal 3 4 0 0 0 0 0 0 3 4
Total 79 79 24 22 15 15 2 6 120 122

83NOTES TO THE CONSOLIDATED FINANCIAL STATEMENTS 2015
CO
NS
OL
IDA
TE
D F
INA
NC
IAL
STA
TE
ME
NT
S2
01
5
Changes at subsidiaries:
Construction segment
On September 15, 2015, SCHACHTBAU NORDHAUSEN GmbH outsourced the Structural Steel Engineering division to
SCHACHTBAU NORDHAUSEN Stahlbau GmbH. Up to this point, the Structural Steel Engineering division had been reported
under the Equipment segment. This outsourcing had no other effect on the interim consolidated financial statements of
BAUER AG.
On December 17, 2015, BAUER (NEW ZEALAND) LIMITED was discontinued and therefore de-consolidated.
Equipment segment
In the second quarter of financial year 2015, 100 % of the shares in BAUER Mexico S.A. de C.V. were sold to BAUER Resources
GmbH (97.5 %) and PURE Umwelttechnik GmbH (2.5 %). These companies are reported in the Resources segment. This sale
had no effect on the consolidated financial statements of BAUER AG.
On June 30, 2015, BAUER Cimentationes y Equipos S.A. was discontinued and therefore de-consolidated.
In the third quarter of financial year 2015, BAUER Maschinen GmbH acquired the remaining 10 % share in the non-controlling
interests of MAT Mischanlagentechnik GmbH and since then holds 100 % of the shares in MAT Mischanlagentechnik GmbH.
In addition, MAT Mischanlagentechnik GmbH, the transferor entity, was merged with BAUER Maschinen GmbH and discontinued
in the process. The company Immenstadt is continued under the name of MAT Mischanlagentechnik, a branch office of BAUER
Maschinen GmbH.
In the fourth quarter of financial year 2015, BAUER Equipment Australia Pty. Ltd. and BAUER Equipment India Private Limited
were included in the consolidated financial statements for the first time. The company was previously not consolidated owing to its
minor importance.
Also in the fourth quarter of 2015, BAUER Machinery USA Inc. was included in the consolidated financial statements.
Disposals
By agreement dated September 9, 2015, BAUER Maschinen GmbH sold 50 % of its shares in SPANTEC Spann- & Ankertechnik
GmbH to SPANTEC Invest GmbH, effective September 15, 2015.

84 NOTES TO THE CONSOLIDATED FINANCIAL STATEMENTS 2015
These are the effects of the sale:
a) Consideration received
in EUR ’000 Sep. 15, 2015
Consideration received 12,509
in EUR ’000 Sep. 15, 2015
Quid pro quo consideration received 12,509
Net assets surrendered -10,666
Non-controlling interests 1,079
Fair value of the 40 % at-equity investment retained 10,200
Total income from the sale of shares 13,122
in EUR ’000 Sep. 15, 2015
Non-current assets
Intangible assets 448
Property, plant and equipment and investment property 425
Other non-current assets 47
Other non-current financial assets 4,592
Current assets
Inventories 1,304
Receivables and other assets 3,960
Cash and cash equivalents 2,143
Non-current debt
Provisions for pensions -253
Deferred tax liabilities -235
Current debt
Trade payables -1,066
Other current liabilities -443
Effective income tax obligations -256
Net assets sold 10,666
b) Disposal of assets and liabilities due to the loss of control
c) Total effects from the sale of the shares in SPANTEC Spann- & Ankertechnik GmbH
The total effect is not included in other income and stated separately in Article 9 as an effect of the de-consolidation and transition
consolidations.

85NOTES TO THE CONSOLIDATED FINANCIAL STATEMENTS 2015
CO
NS
OL
IDA
TE
D F
INA
NC
IAL
STA
TE
ME
NT
S2
01
5
in EUR ’000 Sep. 15, 2015
Sales price paid for with cash and cash equivalents 0
Less: cash and cash equivalents disposed of as part of the sale -2,143
Total net outflow of cash and cash equivalents disposed of as part of the sale -2,143
in EUR ’000 Dec. 15, 2015
Non-current assets
Intangible assets 4,166
Property, plant and equipment and investment property 97
Other non-current assets 3,536
Current assets
Inventories 217
Receivables and other assets 1,221
Cash and cash equivalents 153
Non-current debt
Provisions for pensions -406
Other non-current financial liabilities -23
Deferred tax liabilities -36
Current debt
Trade payables -233
Other current liabilities -390
Other current financial liabilities -510
Net assets disposed 7,792
d) Net outflow of cash and cash equivalents from the sale of the shares in SPANTEC Spann- & Ankertechnik GmbH
The at-equity investment retained was measured at fair value due to the sale of the shares in SPANTEC Spann- & Ankertechnik
GmbH. The fair value was determined from the discounted transaction price for the shares at the time they were sold. This
method is part of level 3 of the fair value hierarchy stated in IFRS 13.
Cash capital increase
By notarization dated December 15, 2015, Schlumberger GmbH, Vechta acquired shares in BAUER Deep Drilling GmbH
as part of a cash capital increase and the share of BAUER Maschinen GmbH in share capital decreased to 51 % as a result.
The joint venture agreement states that all decisions regarding material activities require the approval of the shareholders.
It is therefore a joint venture which is to be accounted for using the at equity method. The net assets of BAUER Deep Drilling
GmbH were derecognized due to the loss of control and the retained shareholding recognized at fair value.
These are the effects:
a) Disposal of assets and liabilities due to the loss of control
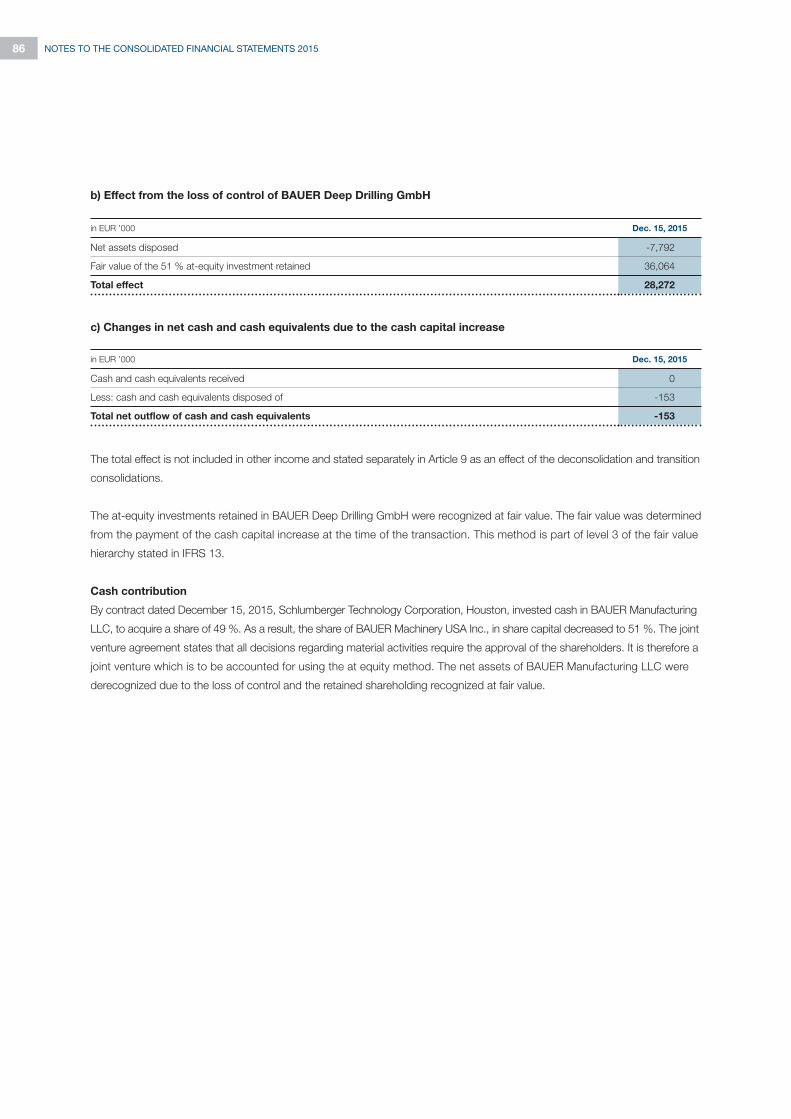
86 NOTES TO THE CONSOLIDATED FINANCIAL STATEMENTS 2015
The total effect is not included in other income and stated separately in Article 9 as an effect of the deconsolidation and transition
consolidations.
The at-equity investments retained in BAUER Deep Drilling GmbH were recognized at fair value. The fair value was determined
from the payment of the cash capital increase at the time of the transaction. This method is part of level 3 of the fair value
hierarchy stated in IFRS 13.
Cash contribution
By contract dated December 15, 2015, Schlumberger Technology Corporation, Houston, invested cash in BAUER Manufacturing
LLC, to acquire a share of 49 %. As a result, the share of BAUER Machinery USA Inc., in share capital decreased to 51 %. The joint
venture agreement states that all decisions regarding material activities require the approval of the shareholders. It is therefore a
joint venture which is to be accounted for using the at equity method. The net assets of BAUER Manufacturing LLC were
derecognized due to the loss of control and the retained shareholding recognized at fair value.
b) Effect from the loss of control of BAUER Deep Drilling GmbH
in EUR ’000 Dec. 15, 2015
Cash and cash equivalents received 0
Less: cash and cash equivalents disposed of -153
Total net outflow of cash and cash equivalents -153
c) Changes in net cash and cash equivalents due to the cash capital increase
in EUR ’000 Dec. 15, 2015
Net assets disposed -7,792
Fair value of the 51 % at-equity investment retained 36,064
Total effect 28,272

87NOTES TO THE CONSOLIDATED FINANCIAL STATEMENTS 2015
CO
NS
OL
IDA
TE
D F
INA
NC
IAL
STA
TE
ME
NT
S2
01
5in EUR ’000 Dec. 15, 2015
Cash and cash equivalents received 0
Less: cash and cash equivalents disposed of -7,558
Total net outflow of cash and cash equivalents -7,558
in EUR ’000 Dec. 15, 2015
Net assets disposed -7,593
Fair value of the 51 % at-equity investment retained 44,445
Foreign currency translation differences -488
Total effect 36,364
in EUR ’000 Dec. 15, 2015
Non-current assets
Property, plant and equipment and investment property 26,630
Current assets
Inventories 14,613
Receivables and other assets 237
Cash and cash equivalents 7,558
Non-current debt
Liabilities to banks -7,629
Other non-current financial liabilities -17
Current debt
Liabilities to banks -10,099
Liabilities from construction contracts (PoC) -17,697
Trade payables -5,470
Other current liabilities -533
Net assets disposed 7,593
These are the effects of the cash contribution:
a) Disposal of assets and liabilities due to the loss of control
b) Effect from the loss of control of BAUER Manufacturing LLC
c) Changes in net cash and cash equivalents due to the cash contribution
The total effect is not included in other income and stated separately in Article 9 as an effect of the de-consolidation and transition
consolidations.
The at-equity investments retained in BAUER Manufacturing LLC were recognized at fair value. The fair value was determined
from the payment of the cash contribution at the time of the transaction. This method is part of level 3 of the fair value hierarchy
stated in IFRS 13.
88 NOTES TO THE CONSOLIDATED FINANCIAL STATEMENTS 2015
Resources segment
On March 20, 2015, BAUER Resources Australia Pty. Ltd., was discontinued and de-consolidated.
In the first quarter of financial year 2015, BAUER Resources Maroc S.A.R.L, was included in the Group financial statements
for the first time. The company was previously not consolidated owing to its minor importance.
On August 28, 2015, BAUER Resources Hungary Kft. was discontinued and de-consolidated.
In the fourth quarter of financial year 2015, BAUER Resources Senegal S.A.R.L was included in the Group financial state-
ments for the first time. The company was previously not consolidated owing to its minor importance.
'Other' segment
On December 7, 2015, BAUER Maschinen GmbH sold all of its shares in BAUER Mietpool GmbH to BAUER Aktiengesellschaft.
It was also resolved to re-name BAUER Mietpool GmbH to WW Beteiligung GmbH. BAUER Mietpool GmbH had been
reported under the Equipment segment until the date of the sale.
3. CONSOLIDATION POLICIES
The assets and liabilities of the German and foreign companies included in the consolidated financial statements are stated
according to the uniform accounting and valuation methods applicable throughout the BAUER Group. Mutual receivables
and liabilities as well as expenses and income between consolidated companies are eliminated. Consolidated inventories and
fixed assets are adjusted by existing intra-group balances. Consolidation affecting net income is subject to deferral of taxes,
with deferred tax assets and liabilities being offset against each other provided the payment period and tax creditor are the
same. In respect of subsidiaries consolidated for the first time, the identifiable assets, liabilities and contingent liabilities of the
acquired companies were recorded at their applicable fair values at the time of acquisition. Goodwill occurring on initial
consolidation is capitalized and subjected to a yearly impairment test; an excess of the net fair value of the acquired net
assets over cost is recognized in the income statement immediately at the time of initial consolidation in accordance with
IFRS 3. Consolidation according to the equity method is subject to the same principles. If the pro rata loss in an associated
company is equal to or greater than the carrying amount of the participating interest, no further losses are recognized, unless a
consolidated Group company has entered into obligations or made payments on behalf of the associated company.
Non-controlling interests are a part of earnings and net assets which is not allocable to the Group. Earnings pertaining to
these interests are therefore recognized separately from the share in earnings allocable to the shareholders of the parent
company in the income statement. In the balance sheet, these earnings are recognized in equity, separately from the equity
allocable to the shareholders of the parent company. The acquisition of non-controlling interests and changes to the share-
holding of the parent company in a subsidiary which do not lead to a loss of control are reported as equity transactions in the
balance sheet.
4. CRITICAL ACCOUNTING ESTIMATES AND JUDGEMENTS
In the consolidated financial statements, assumptions and estimates must be made which influence the amounts and
recognition of assets and liabilities, income and expenses recorded, as well as contingent liabilities. Assumptions and
estimates are primarily used for determining the useful life of fixed assets, discounted cash flows during impairment tests,
and assessing the feasibility of deferred tax assets, recoverability of receivables and the recognition of provisions for legal
proceedings, pensions and other benefit commitments, taxes, warranties and guaranties. The actual values may differ from
the estimates made.
89NOTES TO THE CONSOLIDATED FINANCIAL STATEMENTS 2015
CO
NS
OL
IDA
TE
D F
INA
NC
IAL
STA
TE
ME
NT
S2
01
5
5. PRINCIPAL ACCOUNTING POLICIES
5.1. Changes in accounting policies
It was obligatory to apply the following standards and interpretations for the first time in the financial year:
• Annual improvements of IFRS, cycle 2011 - 2013
Within the scope of its process for implementing minor improvements in standards and interpretations
(annual improvement process), the IASB published another amendment. This affects the following standards:
• IFRS 1 – First-time Adoption of International Financial Reporting Standards
• IFRS 3 – Business Combinations
• IFRS 13 – Fair Value Measurement
• IAS 40 – Investment Property
Details of the amendments:
• IFRS 1 – First-time Adoption of International Financial Reporting Standards
The amendment to the “Basis for Conclusions” clarifies the meaning of “effective date” in connection with IFRS 1.
If there are two published versions of a standard at the time of transition to IFRS, one current version and one version only
compulsory in the future but subject to voluntary early application, first-time users of IFRS should be able to choose which
version to apply. However, the selected version of the standard then must be applied to all periods reported on in the
annual financial statements, subject to different provisions in IFRS 1.
• IFRS 3 – Business Combinations
The amendment re-words the existing exception of joint ventures from the applicability of IFRS 3. This clarifies that the
exception applies to all joint ventures within the meaning of IFRS 11. It also clarifies that the exception only relates to the
annual financial statements of the joint venture or the joint operation itself and not the accounting policies of the parties
involved in the joint venture. The amendment has to be applied prospectively.
• IFRS 13 – Fair Value Measurement
IFRS 13.48 permits companies which control a group of financial assets and liabilitieson the basis of their net market or
default risk to determine the fair value of this group in the same manner as market participants would value the net risk
position on the balance sheet date (so-called portfolio exception). The proposed amendment clarifies that this exception
for the determination of fair values relates to all contracts within the area of applicability of IAS 39 – Financial Instruments:
Recognition and Measurement and IFRS 9 – Financial Instruments, even if they do not fulfill the definition of a financial asset
or liability according to IAS 32 – Financial Instruments: Presentation (such as certain contracts for the acquisition and sale
of non-financial items, which can be fulfilled through cash compensation or other financial instruments). The amendment is
implemented prospectively as from the beginning of the financial year in which IFRS 13 was applied for the first time.
• IAS 40 – Investment Property
The amendment clarifies that the areas of applicability of IAS 40 – Investment property and IFRS 3 – Business Combinations
do not depend on one another, i.e. do not cancel each other out at any time. The amendment is always implemented
prospectively for all acquisitions of investment property carried out as from the beginning of the period in which the amend-
ment is applied for the first time, meaning that the previous year's figures do not have to be adjusted. The amendment may
be applied voluntarily to individual previous acquisitions if the information required for these transactions is available.

90 NOTES TO THE CONSOLIDATED FINANCIAL STATEMENTS 2015
The effects of the annual improvements to IFRS, cycle 2011 to 2013, do not have any material impact on the consolidated
financial statements of BAUER AG.
• Amendments to IAS 19 – Employee benefits – Employee Contributions
In November 2013, the IASB published an amendment to IAS 19R (2011) – Employee Contributions. The amendment
adds an option with regard to the accounting of defined benefit obligations in which employees (or third parties) participate by
way of obligatory contributions to the standard.
The effects of the amendment to IAS 19 have no significant influence on the consolidated financial statements of BAUER AG.
• Annual improvements of IFRS, cycle 2010 - 2012
Within the scope of its process for implementing minor improvements in standards and interpretations
(annual improvement process), the IASB published another amendment. This affects the following standards:
• IFRS 2 – Share-based Payment
• IFRS 3 – Business Combinations
• IFRS 8 – Operating Segments
• IFRS 13 – Fair Value Measurement
• IAS 16 – Property, Plant and Equipment
• IAS 38 – Intangible Assets
• IAS 24 – Related Party Disclosures
Details of the amendments:
• IFRS 2 – Share-based Payment
The amendment contains a clarification of the definition of “vesting conditions” by including separate definitions for
“performance conditions” and “service conditions” in Appendix A of the standard. The amendment applies prospectively
for share-based payments granted on or after July 1, 2014.
• IFRS 3 – Business Combinations
IFRS 3.40 stipulates that a “purchaser... has an obligation to pay conditional consideration in the form of a liability or equity
based on the definitions of an equity instrument and financial liability in paragraph 11 of IAS 32... or other applicable IFRS”.
As the question of classing conditional considerations as equity or financial liabilities arises only for conditional consideration
which fulfills the definition of afinancial instrument and the question of which “other applicable IFRS” should actually be
consulted for such classification, the wording of IFRS 3.40 was amended so that it only contains a reference to conditional
consideration incurred during business combinations that fulfills the definition of a financial instrumentand the reference to
“other applicable IFRS” will be deleted. The provision of IFRS 3.58 regarding the subsequent measurement of conditional
consideration was also ambiguous as conditional consideration not classed as equity must be recognized at fair value,
but reference is made at the same time to IFRS 9 (and IAS 39), IAS 37, and IFRS, which may not require any recognition
at fair value. The amendment must be applied prospectively to all business combinations acquired on or after July 1, 2014.

91
CO
NS
OL
IDA
TE
D F
INA
NC
IAL
STA
TE
ME
NT
S2
01
5
NOTES TO THE CONSOLIDATED FINANCIAL STATEMENTS 2015
• IFRS 8 – Operating Segments
The following clarifications are added to IFRS 8:
– When combining business segments into reportable segments, the deliberations made by management with regard
the identification of the reportable segments (short description of the combined business segments, economic factors,
which were used as a basis for determining the “comparable economic characteristics” within the meaning of IFRS 8.12)
must be stated, and
– Segment assets only have to be offset and reconciled with the respective balance sheet figures if information on the
segment assets also forms part of the financial information which is reported regularly to theresponsible instance in the
company (chief operating decision maker).
• IFRS 13 – Fair Value Measurement
The amendment of “Basis for Conclusion” of IFRS 13 clarifies that the IASB did not aim to remove the option to not apply a
discount to current receivables and liabilities if the effect achieved from this measure is immaterial through the amendment
to IFRS 9 and IAS 39 resulting from IFRS 13.
• IAS 16 – Property, Plant and Equipment / IAS 38 – Intangible Assets
The amendment clarifies how to determine cumulative depreciation and amortization at the time of measurement when
applying the revaluation model in accordance with IAS 16.35 and IAS 38.80 respectively. The transitional provisions
stipulate that the amendment only has to be applied to new measurements performed for the first time in financial years
starting on or after the time of initial application as well as financial years starting in the immediately preceding period.
• IAS 24 – Related Party Disclosures
The amendment expands the definition of “related parties” by companies which provide management services in key
positions for the reporting entity themselves or through one of their group companies without there being any other relation
within the meaning of IAS 24 between both companies (so-called “management entities”).
The effects of the annual improvements to IFRS, cycle 2010 to 2012, do not have any material impact on the consolidated
financial statements of BAUER AG.
Moreover, the IASB and the IFRIC have adopted further standards, interpretations and amendments, as listed below,
some of which were not yet bindingly applicable, or had not yet been recognized by the EU, in financial year 2015.
The BAUER Group had not implemented early application of these standards by December 31, 2015.

92 NOTES TO THE CONSOLIDATED FINANCIAL STATEMENTS 2015
Initial application of the standards is planned as from the point they are recognized and adopted by the EU.
Standard/Interpretation/Amendment Applicable
as from the
financial year
Adopted
by the EU
Amendment to IFRS 11; Acquisitions of Interests in Joint Operations 2016 Yes
Amendment to IAS 16 and IAS 38; Clarification of acceptable methods of depreciation and amortization 2016 Yes
Amendment to IAS 16 and IAS 41; Agriculture: Bearer Plants 2016 Yes
IFRS 15; Revenue from Contracts with Customers 2018 No
Amendment to IAS 27, Separate Financial Statements (Equity Method) 2016 No
Amendment to IFRS 10 and IAS 28; Sale or contribution of assets between an investor and its associate
or joint venture 2016 No
Annual improvement of IFRS (cycle 2012 - 2014) 2016 No
Amendment to IFRS 10, IFRS 12, and IAS 28; Application of the investment entities exceptions 2016 No
Amendment to IAS 1; Disclosure Initiative 2016 No
IFRS 14; Regulatory Deferral Accounts 2016 No
IFRS 9; Financial Instruments 2018 No
IFRS 16; Leasing relationships 2019 No
Potential effects of the initial application of IFRS – 15 Revenue from Contracts with Customers, IFRS 16 – Leasing Relationships
and IFRS 9 – Financial Instruments are currently being analyzed IFRS 15 will replace the contents of the IAS 18 “Sales Revenues”
and of the IAS 11 “Construction Contracts”. The new standard does not differentiate between different order and service types,
but instead puts in place uniform criteria of when sales revenues are to be realized in terms of time and period for a service
provision. This is the case when the client attains the power of disposition over the agreed goods and services and can capitalize
on this.
IFRS 16 will replace IAS 17 “Leasing relationships”, IFRIC 4 “Establishing if an agreement contains a leasing relationship”, SIC 15
“Operating leasing relationships – Incentives” as well as SIC 27 “Assessment of the profitability of transactions in the legal form of
leasing relationships”. The new standard does not undertake any classification in finance and operating leasing relationships
for lessees, instead basically all leasing relationships are included in the balance sheet in the form of usage rights and leasing
liabilities. There will be no major changes to lessor accounting compared to IAS 17. In contrast to IAS 17, IFRS 16 stipulates
more extensive details on the appendices.
IFRS 9 (2014) replaces the previous regulations of the IAS 39 on financial instruments. It includes changed regulations on
evaluation categories for financial assets and smaller changes in respect to the evaluation of financial liabilities. A fair value
evaluation which does not affect profit or loss is planned for certain borrowing instruments on the assets side. Additionally, it
includes regulations for impairments of assets and on hedge accounting. The regulations for impairment are initially tailored
to expected defaults. The new regulations on hedge accounting should also make it easier to illustrate risk management
activities in the consolidated financial statements. In this respect, IFRS 9 (2014), among others, expands the underlying
transactions which qualify for hedge accounting and simplifies the efficiency tests. BAUER AG does not expect any of the
other standards to have any material impact on the consolidated financial statements.
5.2. Significant accounting policies
Foreign currency translation
Foreign currency transactions are translated in the financial statements of BAUER AG and the consolidated subsidiaries
at the rates applying on the dates of the transactions. The financial statements of the foreign companies belonging to the
BAUER Group are translated into euros according to the functional currency concept. Accordingly, assets and liabilities are
translated at the rate applying on the balance sheet date and the income statement items at the average rate. The resulting
differences from currency translation are recognized in the provision for currency translation losses stated under equity without
having any effect on profit or loss.

93NOTES TO THE CONSOLIDATED FINANCIAL STATEMENTS 2015
CO
NS
OL
IDA
TE
D F
INA
NC
IAL
STA
TE
ME
NT
S2
01
5
1 EUR corresponds to Yearly average value Balance sheet date value
2014 2015 2014 2015
Egypt EGP 9.3713 8.5293 8.6984 8.4192
Argentina ARS 10.8648 10.4092 10.4039 14.1386
Australia AUD 1.4708 1.4787 1.4841 1.4894
Bulgaria BGL 1.9559 1.9558 1.9559 1.9558
Chile CLP 757.8911 727.6212 736.1344 772.0222
China CNY 8.1575 7.0724 7.5550 6.9434
Georgia GEL 2.3352 2.5284 2.2604 2.6140
Ghana GHS 4.0594 4.2281 3.9112 4.1725
Great Britain GBP 0.8028 0.7236 0.7818 0.7350
Hong Kong HKD 10.2525 8.5570 9.4373 8.4422
India INR 80.7777 70.9623 77.4729 72.3087
Indonesia IDR 15,669.6389 14,862.6723 15,139.9647 15,046.6072
Japan JPY 140.5059 133.5525 145.2439 131.1173
Jordan JOD 0.9357 0.7822 0.8611 0.7724
Canada CAD 1.4634 1.4239 1.4117 1.5125
Qatar QAR 1.3219 4.0194 4.4307 3.9659
Lebanon LBP 1,995.3273 1,665.1715 4.5653 1,642.5471
Malaysia MYR 4.3329 4.3409 4.2622 4.6730
Morocco MAD 11.1575 10.8081 10.9957 10.7831
Mexico MXP 17.6560 17.6440 17.9234 18.9240
New Zealand NZD 1.6001 1.5914 1.5506 1.5914
Oman OMR 0.5090 0.4250 0.4684 0.4193
Panama PAB 1.3219 1.1039 1.2166 1.0892
Peru PEN 3.7598 3.5349 3.6351 3.7081
Philippines PHP 58.7377 50.3376 54.4041 51.2554
Poland PLN 4.1955 4.1810 4.2902 4.2636
Romania RON 4.4386 4.4403 4.4845 4.5229
Russia RUB 51.5000 68.6566 67.5895 80.4168
Saudi Arabia SAR 4.9585 4.1416 4.5653 4.0886
Sweden SEK 9.1184 9.3339 9.4275 9.1831
Switzerland CHF 1.2124 1.0631 1.2024 1.0822
Singapore SGD 1.6778 1.5198 1.6074 1.5397
South Africa ZAR 14.3577 14.2607 14.0575 16.9831
Taiwan TWD 40.1344 35.0744 38.5999 35.8330
Thailand THB 42.9860 37.9774 40.0245 39.2530
Turkey TRY 2.8937 3.0361 2.8327 3.1815
Hungary HUF 309.9893 309.4268 314.9587 315.2762
United Arab Emirates AED 4.8553 4.0545 4.4685 4.0004
United States of America USD 1.3219 1.1039 1.2166 1.0892
Vietnam VND 28,039.4804 24,240.1659 26,031.7369 24,498.2509
The following table shows the exchange rates applied for the currency translation:

94 NOTES TO THE CONSOLIDATED FINANCIAL STATEMENTS 2015
Intangible assets
Intangible assets are capitalized at cost and amortized according to the straight-line method over the projected useful life
of 3 to 10 years.
Assets which have an indefinite useful life, such as goodwill, are not subjected to scheduled amortization but are impairment-
tested each year, or when relevant indications arise. The goodwill is the amount by which the acquisition cost of the acquisition
exceeds the fair value of the Group's shares in the net assets of the acquired entity at the date of acquisition. Goodwill created
by acquisition is recognized under “Intangible assets”. Goodwill resulting from the acquisition of an associated company is
included in the carrying amount of investments in associated companies and consequently is not impairment-tested separately,
but within the overall carrying amount. The recognized goodwill undergoes an annual impairment test is recognized at cost less
accumulated write-downs. Write-ups are impermissible. Gains and losses from the sale of a company comprise the carrying
amount of goodwill allocated to the company to be disposed of.
Assets subject to scheduled depreciation or amortization are tested for impairment if any events or changes of circumstances
indicate that the carrying amount may no longer be achievable.
Impairment in the amount of the carrying amount exceeding the attainable amount is recognized. The attainable amount is the
higher amount of the applicable fair value of the asset less selling costs and the value in use. For the impairment test, assets
are grouped at the lowest level for which cash flows can be separately identified (cash-generating units). With the exception of
goodwill, a test is performed on each balance sheet date in respect of non-cash assets for which in the past an impairment was
recognized as to whether a value recovery adjustment is required.
Research and development costs are generally charged as expenditure in the financial year in which they occurred, in accordance
with IAS 38. Exceptions to this are certain development costs which are capitalized where it is probable that a future economic
benefit will be drawn from the development project and the costs incurred can be measured reliably. In addition, the following
criteria in accordance with IAS 38.57 must be met:
• Technical feasibility of completion of the intangible asset so that it will be available for use or sale
• Intention to complete the intangible asset and to use or sell it
• Ability to use or sell the intangible asset
• Evidence of how the intangible asset will generate probable future economic benefits
• The availability of adequate technical, financial and other resources to complete the development and to use or sell
the intangible asset
• The ability to measure reliably the expenditure attributable to the intangible asset during its development
The cost of manufacture includes all costs directly attributable to the development process as well as appropriate portions
of development-related overheads. The assets in development are subjected to an annual impairment test and valued at their
original cost less cumulative depreciation. Amortization is undertaken according to the straight-line method as from start of
production over the intended term of the developed models. The projected useful life is between 3 and 6 years. Impairment
losses on intangible assets are recognized to the higher of the value in use or net realizable value. If the preconditions for an
impairment no longer exist, reversals of impairment – except for goodwill – are undertaken.
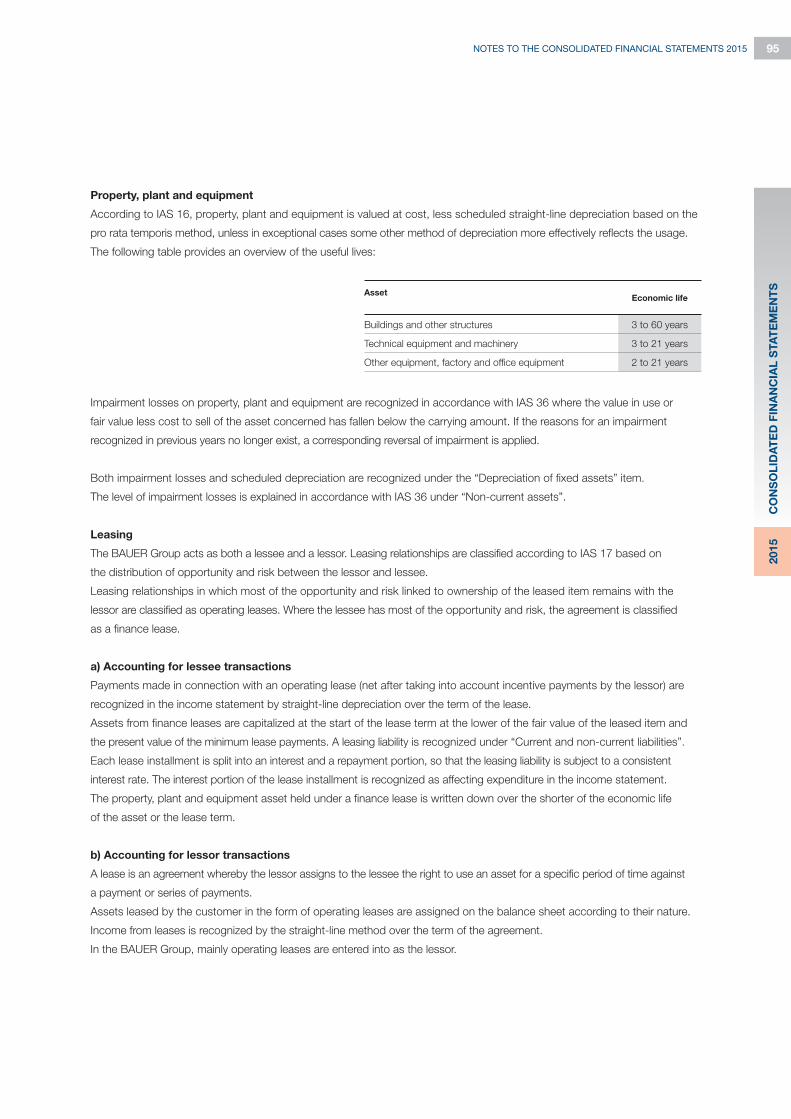
95
CO
NS
OL
IDA
TE
D F
INA
NC
IAL
STA
TE
ME
NT
S2
01
5
NOTES TO THE CONSOLIDATED FINANCIAL STATEMENTS 2015
Property, plant and equipment
According to IAS 16, property, plant and equipment is valued at cost, less scheduled straight-line depreciation based on the
pro rata temporis method, unless in exceptional cases some other method of depreciation more effectively reflects the usage.
The following table provides an overview of the useful lives:
Impairment losses on property, plant and equipment are recognized in accordance with IAS 36 where the value in use or
fair value less cost to sell of the asset concerned has fallen below the carrying amount. If the reasons for an impairment
recognized in previous years no longer exist, a corresponding reversal of impairment is applied.
Both impairment losses and scheduled depreciation are recognized under the “Depreciation of fixed assets” item.
The level of impairment losses is explained in accordance with IAS 36 under “Non-current assets”.
Leasing
The BAUER Group acts as both a lessee and a lessor. Leasing relationships are classified according to IAS 17 based on
the distribution of opportunity and risk between the lessor and lessee.
Leasing relationships in which most of the opportunity and risk linked to ownership of the leased item remains with the
lessor are classified as operating leases. Where the lessee has most of the opportunity and risk, the agreement is classified
as a finance lease.
a) Accounting for lessee transactions
Payments made in connection with an operating lease (net after taking into account incentive payments by the lessor) are
recognized in the income statement by straight-line depreciation over the term of the lease.
Assets from finance leases are capitalized at the start of the lease term at the lower of the fair value of the leased item and
the present value of the minimum lease payments. A leasing liability is recognized under “Current and non-current liabilities”.
Each lease installment is split into an interest and a repayment portion, so that the leasing liability is subject to a consistent
interest rate. The interest portion of the lease installment is recognized as affecting expenditure in the income statement.
The property, plant and equipment asset held under a finance lease is written down over the shorter of the economic life
of the asset or the lease term.
b) Accounting for lessor transactions
A lease is an agreement whereby the lessor assigns to the lessee the right to use an asset for a specific period of time against
a payment or series of payments.
Assets leased by the customer in the form of operating leases are assigned on the balance sheet according to their nature.
Income from leases is recognized by the straight-line method over the term of the agreement.
In the BAUER Group, mainly operating leases are entered into as the lessor.
AssetEconomic life
Buildings and other structures 3 to 60 years
Technical equipment and machinery 3 to 21 years
Other equipment, factory and office equipment 2 to 21 years

96 NOTES TO THE CONSOLIDATED FINANCIAL STATEMENTS 2015
Government grants
Government grants for assets including non-monetary benefits at fair value are recognized on the balance sheet as accruals
on the Equity and Liabilities side (Investment allowance) or, on determining the carrying amount of the asset, are deducted
from the Assets side (Invest subsidy).
Business combinations
Acquisitions of subsidiaries are accounted for in accordance with IFRS 3 based on the acquisition method. The cost of the ac-
quisition corresponds to the fair value of the assets contributed, the equity instruments issued and the liabilities created and/or
transferred at the transaction date. Assets, liabilities and contingent liabilities identifiable in the course of a business combination
are measured on initial consolidation at their fair values at the acquisition date. The amount by which the acquisition cost
exceeds the Group's share of the net assets measured at their fair value is stated as goodwill. The non-controlling interests
are valued either at cost (Partial Goodwill method) or at fair value (Full Goodwill method). The available option can be
exercised on a case-by-case basis. BAUER Group policy is to apply the Partial Goodwill method. If the acquisition cost is
less than the net assets of the acquired subsidiary measured at their fair value, the difference is recognized directly in the
income statement. Transaction costs directly linked to a business combination are recognized in the income statement. In the
event of successive acquisitions, the differences between the carrying amount and the applicable fair value of the shares
previously held are recognized as affecting net income at the time of acquisition. Existing contracts with the acquired entity at
the time of acquisition, except those under the terms of IAS 17 and IFRIC 4, are analyzed and reclassified where appropriate.
Borrowing costs
Borrowing costs linked directly to the acquisition, construction or production of qualifying assets in accordance with IAS 23 are
included in the cost of the asset in question for the period until start of use of the asset. No borrowing costs were capitalized
in the financial and previous year. Testing as to whether an asset is a qualifying asset is carried out according to internally
stipulated materiality limits for projects and installations. If the said materiality limits are exceeded, borrowing costs for qualified
assets are capitalized. Other financing costs are recognized as ongoing expenditure under “Financial expenses”.
Land and buildings maintained in order to generate rental income are accounted for at amortized cost in accordance with
IAS 40, with the useful lives applied for depreciation (straight-line according to the pro rata temporis method) corresponding
to those of the property, plant and equipment used by the company itself. The measurement is derived from current market
prices for similar property. This method is part of level 2 of the fair value hierarchy stated in IFRS 13.
Investments accounted for using the equity method
Associated companies
According to IAS 28, an associated company is any entity over which the investor has significant influence, though not
control. This routinely means voting shares of between 20 and 50 percent.
Shares in associated companies are valued at-equity and recognized initially at cost. The Group's shares in associated
companies include the goodwill created by the acquisition (less cumulative impairment).

97NOTES TO THE CONSOLIDATED FINANCIAL STATEMENTS 2015
CO
NS
OL
IDA
TE
D F
INA
NC
IAL
STA
TE
ME
NT
S2
01
5
The Group's share in the profits and losses of associated companies is reported in the income statement as from the time of
acquisition. The share in changes in reserves is recorded in the Group reserves. Cumulative changes after acquisition are set
off against the carrying amount of the investment. If the Group's share in the losses of an associated company is equal to
or more than the Group's shareholding in the said associate, including other unsecured claims, the Group recognizes no
additional losses, unless it has entered into obligations or made payments on behalf of the associated company.
Non-realized gains from transactions between Group companies and associated companies are eliminated according to
the Group's share in the associated company. Non-realized losses are likewise eliminated, unless the transaction implies an
impairment of the transferred asset.
Joint ventures
Joint ventures are joint arrangements in which the parties exercise joint control and have claims to the net assets of the
arrangement. The contractually agreed joint management of the arrangement jointly manages the venture. This is only
the case if decisions regarding the material activities require the unanimous approval of the parties involved in the joint
management.
Joint arrangements recognized at equity include joint ventures as well as the Arbeitsgemeinschaften (“ARGE”) consortia specific
to Germany, with there being a difference between ARGE consortia and umbrella ARGE consortia. Both consortia are subject to
the regulations of IFRS 11.
Assets are provided for and invoiced to ARGE provision consortia in the form of employees, material or equipment. The results
generated by the provision consortia are recognized in the balance sheet using the equity method, in accordance with IAS 28.
They are recognized in the balance sheet as investments accounted for using the equity method and as income from investments
accounted for using the equity method in the income statement.
An umbrella consortium, on the other hand, is always recognized without any effect on profit and loss. The compensation claims
between umbrella consortium and customer are identical to the compensation claims between the individual consortia and the
umbrella consortium. The umbrella consortium transfers all payments received from the customer in full to the individual consortia.
BAUER as a partner in an umbrella consortium accounts for the assets at its disposal and the liabilities it itself incurs, as well as
its own expenditures, and recognizes the income from such activities on a pro rata basis in its sales revenues.
Ongoing settlements from and to consortia are recognized in receivables or liabilities to joint ventures.
Joint operations
Joint operations are joint arrangements in which the parties assume joint control and hold rights in the assets as well as
obligations with regard to the liabilities of the arrangement. The contractually agreed joint control of the arrangement jointly
controls the arrangement. This is only the case if decisions regarding the material operations require the unanimous approval
of the parties involved in the joint control.
98 NOTES TO THE CONSOLIDATED FINANCIAL STATEMENTS 2015
Any operations performed by the BAUER Group as part of a joint operation relating to its share in the joint operation are
recognized in the following items:
- Its assets, including its share in jointly held assets
- Its liabilities, including its share in jointly incurred liabilities
- Its income from the sale of its share in the products of the joint operation
- Its share in income from the sale of products or services by the joint operation, and
- Its expenses, including its share in any jointly incurred expenses
For transactions such as the acquisition of assets by a Group company, gains and losses are recognized in the amount
of the Group share of other joint operations only once the assets are sold to third parties.
Financial instruments
a) Primary financial instruments
In the BAUER Group, primary financial instruments are assigned as financial assets to the following categories:
• Loans and Receivables (LaR)
• Available-for-Sale (AfS)
The “Loans and Receivables” category includes current and non-current financial assets.
The “Available-for-Sale” category includes marketable securities as well as equity portions which are not consolidated or
not recognized by the equity method. For those equity portions there is no active market, and no fair value can be reliably
determined for them, so the shares are valued at cost. We have no intention of selling them.
Financial assets held for sale are non-derivative financial assets classified as available for sale and those not classified as one
of the other categories of financial assetsstated. They are recognized at fair value both when initially entered and in the
subsequent periods.
Assets classified as held for sale are impairment-tested at each balance sheet date in relation to objective criteria
(such as significant financial difficulties of the debtor, high probability of insolvency proceedings being initiated against the
debtor, loss of an active market in the financial assets). Any impairment expenditure incurred because a fair value is less
than the carrying amount is recognized affecting net income. Where impairment of the fair values of assets held for sale was
previously stated not affecting net profit in the shareholders' equity, it must be eliminated from the shareholders' equity up to
the amount of the measured impairment and recognized in the income statement. If subsequent valuation reveals that the fair
value has objectively increased due to events occurring after entry, the impairment is reversed in the corresponding amount.
Recovery in the value of debt instruments is recognized in the income statement. Impairment affecting equity instruments held
for sale and recognized at cost must not be reversed.
Primary financial instruments as financial liabilities are assigned to the following category:
• Financial Liabilities Measured at Amortized Cost (FLAC) or Other Financial Liabilities
The “Financial Liabilities Measured at Amortized Cost” category includes liabilities to banks, trade payables as well as other
current and non-current liabilities and current and non-current financial liabilities.
99NOTES TO THE CONSOLIDATED FINANCIAL STATEMENTS 2015
CO
NS
OL
IDA
TE
D F
INA
NC
IAL
STA
TE
ME
NT
S2
01
5
Receivables and liabilities in the “Financial Liabilities Measured at Amortized Cost” and “Loans and Receivables” categories
are initially recognized at the applicable fair value, including transaction costs directly attributable to acquisition of the financial
asset or incurring of the financial liability, and subsequently measured at amortized cost, applying the effective interest rate
method. The amortized cost of a financial asset or liability is calculated, applying the effective interest rate method, from the
historical cost less the repayments made, plus or less the cumulative amortization of any difference between the original
amount and the amount repayable at the final due date, and also less depreciation and impairment or plus appreciation and
value recovery adjustment.
In the case of current receivables and liabilities, the amortized cost always corresponds to the nominal amount, or the
amount repayable. Cash and cash equivalents comprise credit balances with banks as well as petty cash stocks, and
are valued at amortized cost.
In the case of financial assets or liabilities recognized in the income statement at fair value, the initial fair-value valuation excludes
the transaction costs. Financial liabilities are derecognized when they have been paid or the obligation has been extinguished.
Items are initially recorded on the performance date. In the case of financial assets, derecognition of potential default risks
is effected by value adjustments in separate value adjustment accounts. Financial assets are derecognized if the rights to
payments from the financial assets have expired or been transferred, and the Group has essentially transferred all risks and
opportunities associated with ownership, or the essential opportunities and risks have neither been transferred nor retained,
but right of disposal has been transferred. If there are doubts as to the collectability of receivables, they are valued at amortized
cost less appropriate single valuation allowances or a flat-rate allowance. Impairment of trade receivables is recognized when there
are objective signs (such as disputed contract variations, missed payments or insolvencies) indicating that the amounts due will
not be collectable in full. The impairment is recognized in the income statement by way of a value adjustment account. All other
impairments are written off directly and likewise recognized in the income statement. Group directives stipulate that impairment
of receivables must always be recorded in separate value adjustment accounts. They are derecognized at the same time as the
corresponding impaired receivable. The fair value option provided by IAS 39 was not exercised.
b) Derivative financial instruments
A derivative is a financial instrument or contract within the area of applicability of IAS 39, which cumulatively meets
the following criteria:
• which varies in value based on changes in a specific interest rate, price of a financial instrument, commodity price, exchange
rate, price or interest rate index, credit rating or credit index, or some similar variable, provided in the case of a non-financial
variable the variable is not specific to one party to the contract;
• which requires no payment in return for acquisition, or one which, compared to other forms of contract expected to react
similarly to changes in market conditions, is lower;
• which is settled at a later date.
In the BAUER Group, free-standing derivative financial instruments are assigned as financial assets to the following category:
• Financial Assets Held for Trading or “FAHfT”
Free-standing derivative financial instruments as financial liabilities are assigned to the following category:
• Financial Liabilities Held for Trading or “FLHfT”

100 NOTES TO THE CONSOLIDATED FINANCIAL STATEMENTS 2015
Changes in value of derivatives not forming part of a cash flow hedge are stated under other operating income or expenses in
the case of foreign exchange forward contracts or options or, in the case of interest-rate swaps, are recognized in the income
statement under financial expenses or income. The applicable fair values of the level 2 financial instruments are calculated on
the basis of the conditions prevailing at the balance sheet date, such as interest or exchange rates, and applying recognized
models, such as discount cash flow or option price models.
The free-standing derivative financial instruments of the “Financial Assets Held for Trading” and “Financial Liabilities Held for
Trading” categories include fair values of interest rate swaps, foreign exchange options, cross-currency swaps and foreign
exchange forward contracts not included in hedge accounting or not meeting the hedge accounting conditions.
In the BAUER Group, derivative financial instruments (interest rate swaps, foreign exchange options, cross-currency swaps
and foreign exchange forward contracts) are entered into solely to hedge against interest rate and currency risks. No deals
are made without an underlying transaction.
In the case of derivatives included in hedge accounting, when hedging expected future transactions (cash flow hedges) the
effective portion of the gain or loss from a hedging instrument is initially recognized in the shareholders' equity, taking into
account deferred taxes, and is only recognized in the income statement when the underlying hedged transaction is realized.
The ineffective portion of the hedge transaction is recognized in the income statement immediately. The derivative financial
instruments are stated at their fair values as assets or liabilities. The fair values of the foreign exchange forward contracts
are defined on the basis of current reference prices, taking into account forward premiums and discounts. The fair values
of the interest rate swaps are determined on the basis of discounted future payment flows, applying the market interest rates
applicable to the respective residual terms of the derivatives. Items are initially recorded on the trading date. Hedge accounting
was applied in financial 2015.
Inventories
Inventories of finished goods and work in progress and stock for trade as well as raw materials and supplies are valued
at manufacturing cost or at the lower net realizable value on the balance sheet date in accordance with IAS 2.
The net realizable value is the estimated achievable selling price in the ordinary course of business less the estimated costs
through to completion and the estimated necessary selling costs.
Raw materials and supplies are valued mainly at floating average cost.
Where the machinery and accessories classified as finished goods and stock for trade and primarily held for sale, are hired
out for a short period as a secondary sales promotion measure, the following factors are considered in determining their net
realizable values:
• Hire period
• Useful life of the machines
• Damage and inoperability
Where the net realizable value of previously written-down inventories has increased, corresponding value recovery adjust-
ments are made. The cost of manufacture includes all direct costs of the manufacturing process. The level of impairment
losses on inventories is explained in accordance with IAS 2 under “Inventories”.
101NOTES TO THE CONSOLIDATED FINANCIAL STATEMENTS 2015
CO
NS
OL
IDA
TE
D F
INA
NC
IAL
STA
TE
ME
NT
S2
01
5
Construction contracts
Construction contracts are accounted for by the percentage of completion method in accordance with IAS 11.
The sales are recognized according to the progress of work based on the percentage of completion method. The applicable
percentage of completion is determined according to the costs incurred (cost-to-cost method). Where the cumulative return
(contract costs and pro rata result) exceeds the payments on account in individual cases, the construction contracts are
recognized as assets under “Receivables from construction contracts (PoC)”. If a negative balance remains after deduction
of the payments on account, it is recognized as a liability under “Liabilities from construction contracts (PoC)”. Expected
losses on a contract are accounted for in full at the time they are identified, by adjustments to the valuation of any existing
receivables or by the creation of a provision. Construction contracts undertaken in joint ventures are valued according to the
percentage of completion method. Receivables from joint ventures also include the pro rata result from the contract.
Expected losses are covered by write-downs or liabilities as appropriate, and are taken into account in the contract result.
Service concession arrangements
Service concession arrangements entailing an unconditional contractual right to receive a payment in accordance with
IFRIC 12 are recognized separately under “Receivables from concession arrangements”. The short-term portions of the
receivables from concession arrangements are stated under “Other current financial assets”. The receivables are allocated
to the “Loans and Receivables” category and recognized at the present value of the remuneration payable. The annual
interest due according to the effective interest rate method is recorded in the financial income.
Cash and cash equivalents
Cash and cash equivalents comprise cash and sight deposits with an original term of no more than three months.
Deferred taxes
In accordance with IAS 12, deferred taxes are taken into account in respect of variations between the valuations of assets
and liabilities according to IFRS and their corresponding tax bases in the amount of the projected future tax charge or refund.
In addition, deferred tax assets are recognized for future advantages arising from tax losses carried forward, provided it is
probable that they will be realized.
Deferred taxes arising from temporary differences in connection with investments in subsidiaries and associated companies
are recognized, unless the date of reversal of the temporary differences can be determined by the Group and it is likely that the
temporary differences will not be reversed again in the foreseeable future because of this effect.
According to IAS 12.74, deferred tax assets and liabilities are to be offset if a legally enforceable right to set off current tax
assets against current tax liabilities exists. Offsetting should also be carried out if the deferred tax assets and liabilities relate
to income taxes levied by the same tax authority in respect of:
• either the same taxable entity or
• different taxable entities which intend either to settle current tax liabilities and assets on a net basis, or to realize the assets
and settle the liabilities simultaneously, in each future period in which significant amounts of deferred tax liabilities or assets are
expected to be settled or recovered.
The tax expenditure for the period comprises current and deferred taxes. Taxes are reported in the income statement,
unless they relate to items recognized directly in the shareholders' equity or in the other result. In this case; the taxes are
likewise recognized in the shareholders' equity or in the other result.

102 NOTES TO THE CONSOLIDATED FINANCIAL STATEMENTS 2015
In Germany, deferred taxes are stated on the basis of corporation tax, the “solidarity surcharge” and trade tax, in a range of
26.90 to 31.69 percent (previous year: 27.82 percent and 30.92 percent). Outside Germany, tax rates of between 0.00 percent
and 38.15 percent are applied (previous year: 0.00 and 38.15 percent).
Provisions
a) Provisions for pensions
The BAUER Group operates a number of defined benefit plans in Germany and internationally.
Typically, such plans define an amount of pension benefit which employees will receive on retirement and which is normally
dependent on one or more factors (such as age, years of service and salary).
The provision for defined benefit plans on the balance sheet corresponds to the cash value of the defined benefit obligation
(DBO) at the balance sheet date, less the fair value of the plan assets. The DBO is calculated annually by an independent actuary
applying the projected unit credit method. The cash value of the DBO is calculated by discounting the expected future inflow of
funds at the interest rate of industrial bonds of the highest credit rating. The industrial bonds are denominated in the currency
of the disbursements, and have terms corresponding to the pension commitments. In countries where the market in such bonds
is insufficiently developed, government bonds are applied.
Actuarial gains and losses based on experience-related adjustments to actuarial assumptions are recognized in the “Other
comprehensive income” in the shareholders' equity in the period in which they occur. Post-employment expenditure is recognized
in staff cost and the interest portion of the addition to provisions in financial expenses.
Under the contribution-based defined benefit plans, the entity concerned makes payments to pension institutions which
are stated in the personel expenses.
b) Provisions for tax purposes
Tax provisions include liabilities from current income taxes. Income tax provisions are balanced against corresponding
tax refund claims, provided they arise in the same tax territory and are identical in nature and in terms of due date.
c) Other provisions
The other provisions are created in accordance with IAS 37 where a present obligation arises from a past event, a relevant
claim is more likely than unlikely, and the amount of the claim can be reliably estimated. The provisions are stated at their
performance amount, and are not netted against profit contributions. Long-term provisions are recognized at present value.
Provisions are created only for legal or constructive obligations to third parties.
Income and expenses
Sales revenues and other incomes are realized in accordance with IAS 18 on performance of the supply or service or
on transfer of risk to the customer, as appropriate.
Dividend income is recognized at the date on which the right to receipt of payment is created. Dividends received are recognized
as income from operating investments under “Financial income”. Operating expenses are recognized as affecting net income
when the supply or service is claimed or at the time they are caused, as appropriate. Financial income and expenses are
recognized when incurred.
Income from service contracts is recognized according to the degree of completion.

103NOTES TO THE CONSOLIDATED FINANCIAL STATEMENTS 2015
CO
NS
OL
IDA
TE
D F
INA
NC
IAL
STA
TE
ME
NT
S2
01
5
6. SEGMENT REPORTING
Reporting on the segments of the BAUER Group was implemented in accordance with IFRS 8, as in the previous year.
The internal organizational and management structure and the internal system of reporting to the Management Board and
Supervisory Board dictate the segmentation employed by the BAUER Group.
The BAUER Group comprises the Construction, Equipment and Resources segments. Transactions between the segments are
conducted at market prices.
SCHACHTBAU NORDHAUSEN GmbH is the only Group company to operate in all three segments. The assets and liabilities
and income statement items of SCHACHTBAU NORDHAUSEN GmbH are assigned to the relevant segments.
Construction
The core business of the Construction segment is specialist foundation engineering. Complete excavation pits and
foundation works, often in difficult subgrade conditions, are carried out for major infrastructure projects and buildings.
In order to offer customers a full range of services, the companies of the BAUER Group additionally offer other construction
services, often involving a major specialist foundation engineering element. Examples of this include bridges, environmental
engineering, remediation and building renovation projects. The Construction segment is founded on the close interlinking of
all construction activities.
Equipment
In the Equipment segment, machinery for all specialist foundation engineering processes and for deep drilling is developed
and manufactured for worldwide distribution. The specialist foundation engineering equipment can be employed to produce
large-diameter and small-diameter bores for piles, diaphragm walls, anchors, injections and wells. The deep drilling equipment
can be employed to drill for geothermal energy, oil and gas. Equipment for ramming and ground improvement is also manu-
factured. The range is supplemented by a wide selection of add-on units and ancillary equipment, covering all the processes
involved in specialist foundation engineering.
Resources
The Resources segment brings together all the Group companies providing products and services relating to the remedia-
tion and extraction of natural resources essential to human life. They include environmental technology companies involved in
the treatment of ground and groundwater as well as companies involved in exploration drilling and mining of raw materials and
drilling of wells and geothermal energy sources. This segment also includes companies which manufacture and sell materials
for the engineering of bore holes, specifically for wells and geothermal energy sources.
Other
The Other segment comprises the central services (accounting, human resources, IT etc.) provided by BAUER AG to the
Group companies as well as other units not assignable to the separately listed segments, providing services such as in-house
and external education and training and centralized research and development.
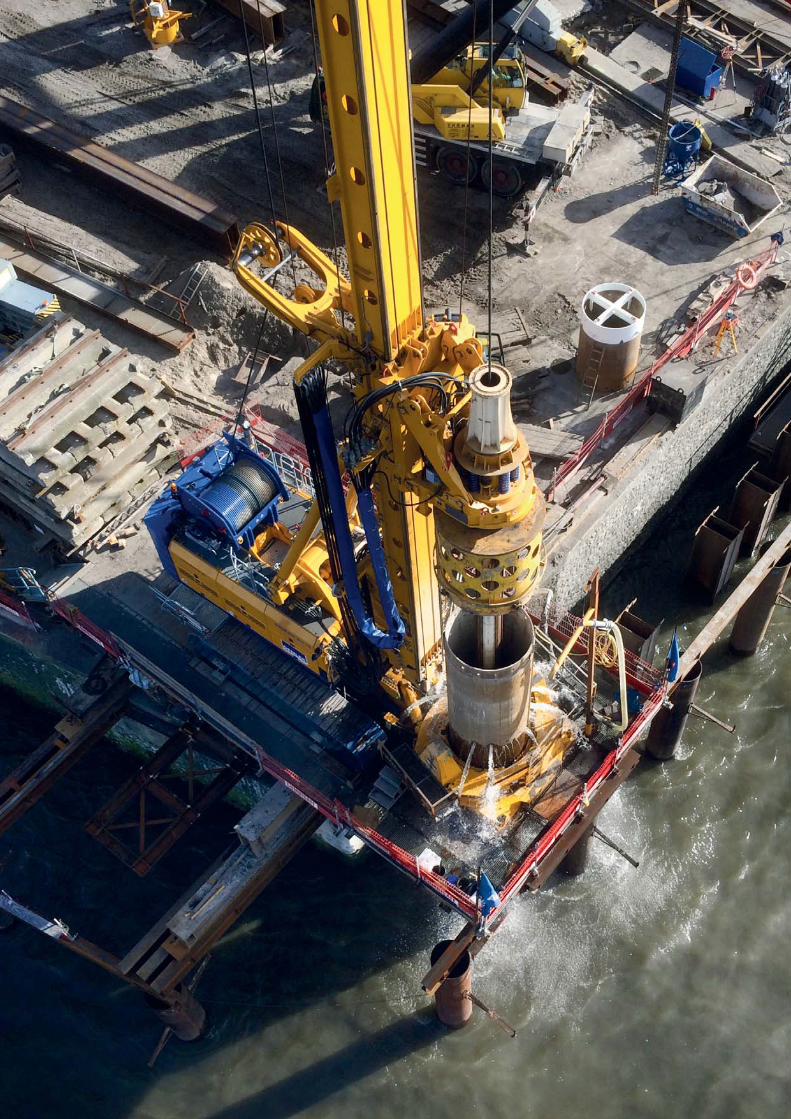

105NOTES TO THE CONSOLIDATED FINANCIAL STATEMENTS 2015
CO
NS
OL
IDA
TE
D F
INA
NC
IAL
STA
TE
ME
NT
S2
01
5
Consolidation
The intersegmental consolidation effects are grouped here under Consolidation. This includes offsetting of intra-Group sales
between the segments as well as income and expenses and interim results. The intersegmental consolidation effects are
adjusted within the respective segments.
The segment result for the period reflects the financial income and expenses as well as the net earnings
of shares valued at-equity and the income tax expenditure. The segments' assets and liabilities incorporate all the assets and
liabilities of the Group. The non-current assets stated in the segment report by region comprise intangible assets, property, plant
and equipment and investment property.
Total Group revenues, consolidated revenues and sales revenues with third parties
The consolidated revenues reflect the performance of all the companies included in the scope of consolidation. The
total Group revenues represent the revenues of all the companies forming part of our Group. The difference between the
consolidated revenues and the total Group revenues is derived from the revenues of the associated companies, from our
subcontractor shares in joint ventures, and from the revenues of non-consolidated companies.
The sales revenues with third parties are allocated to the business segments according to the customer’s location.
No one customer accounts for more than 10 percent of total sales.
No breakdown of sales revenues by product and service, or by groups of comparable products and services, was available
as per the balance sheet date.
Enlarging the access to the Port of Hamburg has extended the available tidal windows for large ships to enter and leave the port.
Our customer Demler Spezialtiefbau GmbH + Co KG secured the elevated section by a combined wall comprising supporting and
sheet piles. Two BG 39s with two BV 2000s casing oscillators were used.

106
SEGMENT REPORT BY BUSINESS SEGMENT
in EUR ’000
Construction Equipment
2014* 2015 2014* 2015
Total revenues (Group) 725,626 742,862 639,151 753,083
Sales revenues with third parties 646,628 650,762 532,691 548,039
Sales revenues between business segments 16,352 18,568 42,806 52,458
Changes in inventories -105 105 27,898 30,230
Other capitalized goods and services for own account 471 585 6,170 4,979
Other income 25,088 25,680 21,497 113,164
CONSOLIDATED REVENUES 688,434 695,700 631,062 748,870
OPERATING RESULT 26,033 13,916 35,952 99,441
Financial income 2,993 2,306 1,882 1,768
Financial expenses -16,165 -14,009 -20,863 -20,903
Share of the profit or loss of associated companies accounted for using
the equity method -1,330 171 -57 226
Income tax expense -9,007 -9,700 -8,067 -15,135
NET RESULT FOR THE PERIOD 2,524 -7,316 8,847 65,397
ADDITIONAL INFORMATION ON THE INCOME STATEMENT
Depreciation and amortization
Depreciation of fixed assets -45,945 -48,420 -19,412 -18,717
of which impairment losses on fixed assets 0 -89 -1,768 -765
Write-downs of inventories due to use 0 0 -15,789 -13,195
Major non-cash segment items
Impairment losses on financial assets -631 -13 -1,710 0
Impairment losses on inventories -282 -656 -8,052 -11,295
Allocation of valuation allowance of receivables -10,597 -21,204 -4,611 -8,965
Reversal of valuation allowance of receivables 14,726 14,617 3,881 4,321
SEGMENT REPORT BY REGION
in EUR ’000
Germany Europe (other) Europe excluding EU
2014 2015 2014 2015 2014 2015
Total revenues (Group) 440,205 473,727 151,958 161,910 124,886 70,766
Sales revenues with third parties 367,779 340,407 140,534 155,438 127,782 67,199
Non-current assets Dec. 31 244,151 230,580 18,132 19,627 16,383 12,978
Segment reporting
ADDITIONAL INFORMATION ON THE BALANCE SHEET
SEGMENT ASSET DEC. 31 586,378 616,089 759,510 818,061
of which shares in associated companies accounted for
using the equity method 10,687 9,430 42 90,975
of which capital investments in fixed assets 40,965 58,183 20,776 18,775
SEGMENT LIABILITIES DEC. 31 458,580 483,534 543,056 540,036
* Previous year figures adjusted; the Structural Steel Engineering division of SCHACHTBAU NORDHAUSEN GmbH was reclassified from the Equipment to the Construction segment
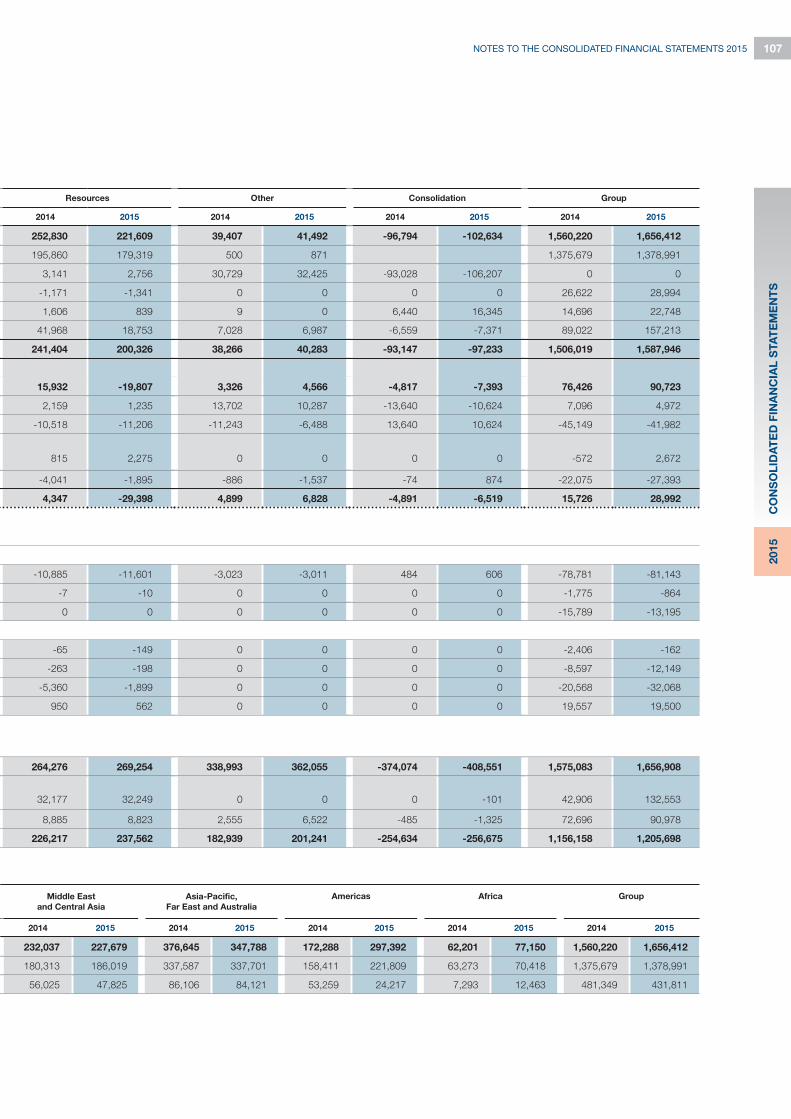
107NOTES TO THE CONSOLIDATED FINANCIAL STATEMENTS 2015
CO
NS
OL
IDA
TE
D F
INA
NC
IAL
STA
TE
ME
NT
S2
01
5
Resources Other Consolidation Group
2014 2015 2014 2015 2014 2015 2014 2015
252,830 221,609 39,407 41,492 -96,794 -102,634 1,560,220 1,656,412
195,860 179,319 500 871 1,375,679 1,378,991
3,141 2,756 30,729 32,425 -93,028 -106,207 0 0
-1,171 -1,341 0 0 0 0 26,622 28,994
1,606 839 9 0 6,440 16,345 14,696 22,748
41,968 18,753 7,028 6,987 -6,559 -7,371 89,022 157,213
241,404 200,326 38,266 40,283 -93,147 -97,233 1,506,019 1,587,946
15,932 -19,807 3,326 4,566 -4,817 -7,393 76,426 90,723
2,159 1,235 13,702 10,287 -13,640 -10,624 7,096 4,972
-10,518 -11,206 -11,243 -6,488 13,640 10,624 -45,149 -41,982
815 2,275 0 0 0 0 -572 2,672
-4,041 -1,895 -886 -1,537 -74 874 -22,075 -27,393
4,347 -29,398 4,899 6,828 -4,891 -6,519 15,726 28,992
-10,885 -11,601 -3,023 -3,011 484 606 -78,781 -81,143
-7 -10 0 0 0 0 -1,775 -864
0 0 0 0 0 0 -15,789 -13,195
-65 -149 0 0 0 0 -2,406 -162
-263 -198 0 0 0 0 -8,597 -12,149
-5,360 -1,899 0 0 0 0 -20,568 -32,068
950 562 0 0 0 0 19,557 19,500
Middle East
and Central Asia
Asia-Pacific,
Far East and Australia
Americas Africa Group
2014 2015 2014 2015 2014 2015 2014 2015 2014 2015
232,037 227,679 376,645 347,788 172,288 297,392 62,201 77,150 1,560,220 1,656,412
180,313 186,019 337,587 337,701 158,411 221,809 63,273 70,418 1,375,679 1,378,991
56,025 47,825 86,106 84,121 53,259 24,217 7,293 12,463 481,349 431,811
264,276 269,254 338,993 362,055 -374,074 -408,551 1,575,083 1,656,908
32,177 32,249 0 0 0 -101 42,906 132,553
8,885 8,823 2,555 6,522 -485 -1,325 72,696 90,978
226,217 237,562 182,939 201,241 -254,634 -256,675 1,156,158 1,205,698

108 NOTES TO THE CONSOLIDATED FINANCIAL STATEMENTS 2015
7. SALES REVENUES
The sales revenues generated in the amount of EUR 1,378.991 thousand (previous year: EUR 1,375,679 thousand) include
revenues arising from application of the percentage of completion method and revenues from the sale and hiring-out of
equipment and accessories.
The sales revenues from the application of the percentage of completion method amounted to EUR 697,066 thousand in the
financial year (previous year: EUR 649,625 thousand).
Sales revenues from the sale and hiring-out of equipment and accessories amounted to EUR 20,170 thousand in the financial
year (previous year: EUR 29,428 thousand).
With regard to the presentation and breakdown of sales revenues by operating segment and region, please refer to the notes
on segment reporting (see item 6).
Sales revenues provide only an incomplete picture of the performance in the financial year. Figures are therefore transferred to
total Group revenues in the following sections:
EXPLANATORY NOTES TO THE INCOME STATEMENT
in EUR ’000 2014 2015
Income from other capitalized goods and services for own account 14,696 22,748
in EUR ’000 2014 2015
Sales revenues 1,375,679 1,378,991
Changes in inventories 26,622 28,994
Other capitalized goods and services for own account 14,696 22,748
Other income 89,022 157,213
Consolidated revenues 1,506,019 1,587,946
Subcontractor share ARGEN 13,370 10,158
Revenues of associates and joint ventures 22,188 45,322
Revenues of non-consolidated companies 34,700 34,742
Intra-Group revenues -16,057 -21,756
Total revenues (Group) 1,560,220 1,656,412
The sales revenues include a net valuation allowance of EUR -3,107 thousand (previous year: EUR 5,381 thousand). The net
impairment result is attributable to the Construction segment, where final invoices, for example, may include supplementary
items which have not yet been finally negotiated with the customer and ordered. These may prove uncertain. Valuation allowances
(reductions for impairment) are made in respect of uncertain receivables and recorded under “Sales revenues”. If the uncertain
receivable is realized, the reduction for impairment is reversed. The reversal is likewise recorded under “Sales revenues”. The
net balance of the application and reversal of reductions for impairment in respect of uncertain receivables produces the
aforementioned net value adjustment.
The application and reversal of reductions for impairment by the other segments is stated under “Other operating expenses”.
8. OTHER CAPITALIZED GOODS AND SERVICES FOR OWN ACCOUNT

109NOTES TO THE CONSOLIDATED FINANCIAL STATEMENTS 2015
CO
NS
OL
IDA
TE
D F
INA
NC
IAL
STA
TE
ME
NT
S2
01
5
in EUR ’000 2014 2015
Income from disposal of property, plant and equipment 5,447 16,411
Realized and unrealized foreign currency gains 32,097 45,611
Income from insurance refunds 1,849 1,434
Other income from rentals 272 263
Income from changes in fair values of foreign exchange forward contracts 2,548 5,216
Effects from final and transitional consolidations 36,531 77,896
Other operating income 10,278 10,382
Total 89,022 157,213
9. OTHER INCOME
The realized and unrealized foreign currency gains as well as gains from foreign exchange forward contracts stated under
“Other income” totaling EUR 50,827 thousand (previous year: EUR 34,645 thousand) arose in connection with the global
currency hedging strategy and the underlying currency postings. In this context, the income is countered by realized and
unrealized foreign currency losses as well as losses from foreign exchange forward contracts totaling EUR 58,501 thousand
(previous year: EUR 29,767 thousand), stated under “Other operating expenses”.
Additionally, the other operating income mainly comprises income from benefits in money's worth, other reimbursements of
expenditure as well as other income spread across the consolidated companies which is of minor importance in the individual
instances.
10. COST OF MATERIALS
The employer's pension contributions in the financial year totaled EUR 21,758 thousand (previous year: EUR 20,653 thousand).
These are contribution-based schemes, as explained under 5.2 Significant accounting policies. Of that total, EUR 16,995
thousand (previous year: EUR 17,411 thousand) relate to Germany and EUR 4,763 thousand (previous year: EUR 3,242
thousand) to Group companies outside of Germany. The wages and salaries include severance payments in the amount of
EUR 1,560 thousand (previous year: EUR 735 thousand).
in EUR ’000 2014 2015
Expenses for raw materials and supplies and purchased goods 504,877 511,539
Expenses for purchased services 244,370 240,993
Total 749,247 752,532
in EUR ’000 2014 2015
Wages and salaries 299,785 317,893
Social security contributions 49,632 51,608
Expenses for retirement benefits 5,833 6,617
Total 355,250 376,118
11. PERSONEL EXPENSES
The expenses for retirement benefits include the expenditure on benefits as well as the allocations to provisions for defined
benefit plans excluding the interest portion, which is stated under “Interest and similar expenses”.
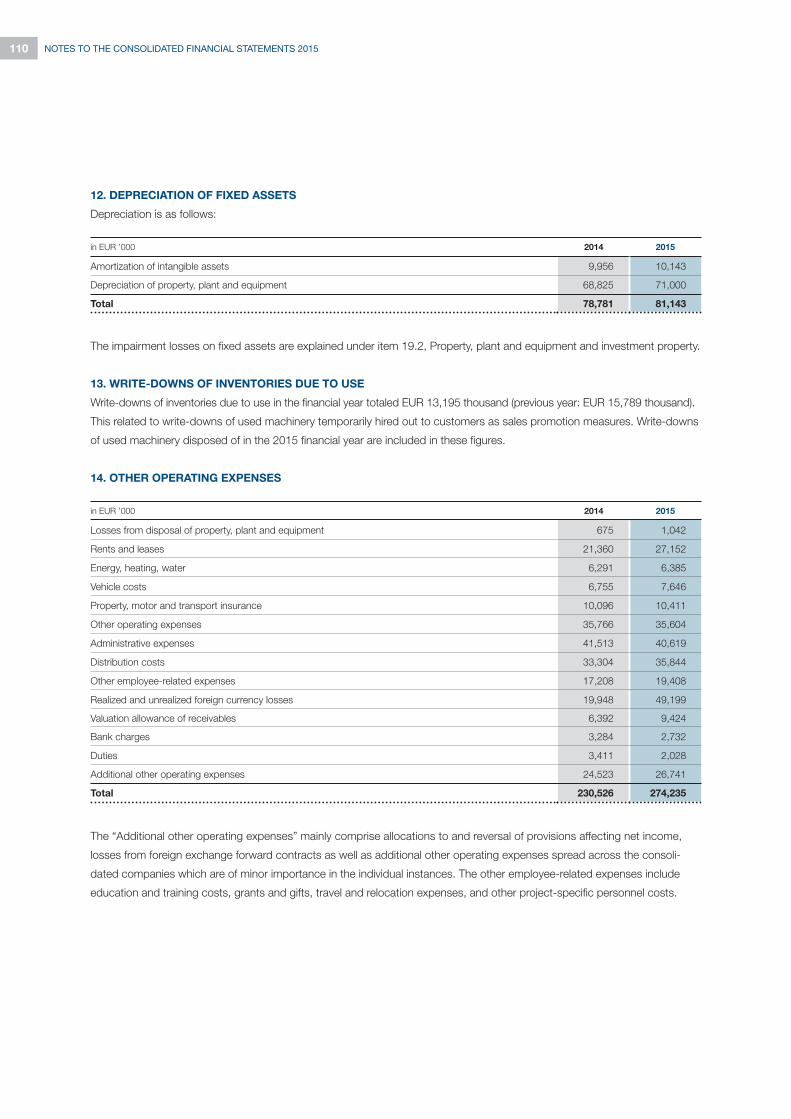
110 NOTES TO THE CONSOLIDATED FINANCIAL STATEMENTS 2015
The impairment losses on fixed assets are explained under item 19.2, Property, plant and equipment and investment property.
13. WRITE-DOWNS OF INVENTORIES DUE TO USE
Write-downs of inventories due to use in the financial year totaled EUR 13,195 thousand (previous year: EUR 15,789 thousand).
This related to write-downs of used machinery temporarily hired out to customers as sales promotion measures. Write-downs
of used machinery disposed of in the 2015 financial year are included in these figures.
14. OTHER OPERATING EXPENSES
in EUR ’000 2014 2015
Losses from disposal of property, plant and equipment 675 1,042
Rents and leases 21,360 27,152
Energy, heating, water 6,291 6,385
Vehicle costs 6,755 7,646
Property, motor and transport insurance 10,096 10,411
Other operating expenses 35,766 35,604
Administrative expenses 41,513 40,619
Distribution costs 33,304 35,844
Other employee-related expenses 17,208 19,408
Realized and unrealized foreign currency losses 19,948 49,199
Valuation allowance of receivables 6,392 9,424
Bank charges 3,284 2,732
Duties 3,411 2,028
Additional other operating expenses 24,523 26,741
Total 230,526 274,235
12. DEPRECIATION OF FIXED ASSETS
Depreciation is as follows:
in EUR ’000 2014 2015
Amortization of intangible assets 9,956 10,143
Depreciation of property, plant and equipment 68,825 71,000
Total 78,781 81,143
The “Additional other operating expenses” mainly comprise allocations to and reversal of provisions affecting net income,
losses from foreign exchange forward contracts as well as additional other operating expenses spread across the consoli-
dated companies which are of minor importance in the individual instances. The other employee-related expenses include
education and training costs, grants and gifts, travel and relocation expenses, and other project-specific personnel costs.

111NOTES TO THE CONSOLIDATED FINANCIAL STATEMENTS 2015
CO
NS
OL
IDA
TE
D F
INA
NC
IAL
STA
TE
ME
NT
S2
01
5
FINANCIAL RESULT
15. FINANCIAL INCOME
The financial income is broken down as follows:
in EUR ’000 2014 2015
Income from operating investments 14 59
Other interest and similar income 5,287 3,798
Income from changes in fair values of interest rate swaps 1,795 1,115
Total 7,096 4,972
in EUR ’000 2014 2015
Interest and similar expenses 41,273 36,648
Losses from changes in fair values of interest rate swaps 796 2,905
Interest portions of allocations to provisions for defined benefit plans and similar obligations 3,080 2,429
Total 45,149 41,982
16. FINANCIAL EXPENSES
The financial expenses are broken down as follows:
The interest from finance leases included under “Interest and similar expenses” in the financial year totaled EUR 869 thousand
(previous year: EUR 988 thousand). The financial result includes interest income from financial assets in an amount of EUR 3,762
thousand (previous year: EUR 5,278 thousand) and interest expenses from financial liabilities in an amount of EUR 35,779
thousand (previous year: EUR 40,285 thousand) which were not measured at fair value affecting profit and loss.
The interest and similar expenses include impairment losses on financial assets held for sale in an amount of EUR 162 thousand
(previous year: EUR 705 thousand). Of this amount, EUR 14 thousand (previous year: EUR 631 thousand) relates to the
Construction segment, EUR 0 (previous year: EUR 9 thousand) to the Equipment segment and EUR 148 thousand (previous
year: EUR 65 thousand) to the Resources segment.
17. INCOME TAX EXPENSE
The income tax expense is broken down as follows:
in EUR ’000 2014 2015
Actual taxes 19,721 21,438
Deferred taxes 2,354 5,955
Total 22,075 27,393
The theoretical tax rate is 28.08 percent (previous year: 28.08 percent).

112 NOTES TO THE CONSOLIDATED FINANCIAL STATEMENTS 2015
The tax effects of the non-deductible expenses and tax-free earnings contain effects from transitional and de-consolidations in
the amount of EUR -12,153 thousand (previous year: EUR -6,548 thousand).
Internal disbursements result in taxation effects after December 31, 2015 totaling EUR 31 thousand (previous year: EUR 39
thousand).
18. EARNINGS PER SHARE
The earnings per share are calculated by dividing the net result attributable to the shareholders of BAUER AG by the weighted
average number of ordinary shares outstanding. The earnings per share amount to the following values:
2014 2015
Net result attributable to the shareholders of BAUER AG, in EUR '000 14,481 29,715
Number of shares from 01.01. to 31.12. 17,131,000 17,131,000
Weighted average number of shares in circulation in financial year (basic) 17,131,000 17,131,000
Weighted average number of shares in circulation in financial year (diluted) 17,131,000 17,131,000
Basic earnings per share in EUR 0.85 1.73
Diluted earnings per share in EUR 0.85 1.73
Reconciliation from expected to actual income tax expenditure
The expected tax expenditure is below the recorded tax expenditure. The reasons for the difference between the expected and
recorded tax expenditure are as follows:
in EUR ’000 2014 2015
Earnings before tax 37,801 56,385
Theoretical tax expenditure 28.08 percent (previous year: 28.08 percent) 10,615 15,833
Differences in tax rate -1,534 1,313
Taxation effects of non-deductible expenses and tax-free income -4,869 -10,481
Effects of variations in the tax calculation base 2,000 1,594
At-equity valuation of associated companies 160 -750
Out-of-period tax payments/refunds for previous years -68 977
Effects of deferred tax assets in respect of losses carried forward and temporary differences 15,701 18,950
Other 70 -43
Income tax expense 22,075 27,393

113NOTES TO THE CONSOLIDATED FINANCIAL STATEMENTS 2015
CO
NS
OL
IDA
TE
D F
INA
NC
IAL
STA
TE
ME
NT
S2
01
5
The breakdown of the fixed asset items summarized on the balance sheet and their development is presented in the fixed asset
movement schedule on the following pages.
NON-CURRENT ASSETS
19. FIXED ASSETS
19.1 Intangible assets
EXPLANATORY NOTES TO THE BALANCE SHEET
in EUR ’000
Licenses, software
and similar rights
and values Goodwill
Internally generated
intangible assets
TotalCost of purchase/cost of manufacturingCapitalized
software costs
Capitalized
development costs
Jan. 1, 2014 33,078 2,186 357 39,354 74,975
Change in scope of consolidation -17 0 0 0 -17
Additions 2,422 0 0 6,186 8,608
Disposals 2,392 0 68 0 2,460
Transfers -6 0 0 22 16
Currency adjustment 452 0 0 6 458
Dec. 31, 2014 33,537 2,186 289 45,568 81,580
in EUR ’000
Licenses, software
and similar rights
and values Goodwill
Internally generated
intangible assets
TotalAccumulated depreciationCapitalized
software costs
Capitalized
development costs
Jan. 1, 2014 22,040 2,186 267 15,094 39,587
Change in scope of consolidation -6 0 0 0 -6
Additions 3,681 0 51 6,224 9,956
Disposals 2,619 0 68 0 2,687
Transfers 4 0 0 0 4
Currency adjustment 281 0 0 5 286
Dec. 31, 2014 23,381 2,186 250 21,323 47,140
Carrying amount Dec. 31, 2014 10,156 0 39 24,245 34,440
in EUR ’000
Licenses, software
and similar rights
and values Goodwill
Internally generated
intangible assets
TotalCost of purchase/cost of manufacturingCapitalized
software costs
Capitalized
development costs
Jan. 1, 2015 33,537 2,186 289 45,568 81,580
Change in scope of consolidation -443 0 0 -10,514 -10,957
Additions 3,019 0 0 4,792 7,811
Disposals 205 0 207 303 715
Transfers 1 0 0 0 1
Currency adjustment 309 0 0 -9 300
Dec. 31, 2015 36,218 2,186 82 39,534 78,020

114 NOTES TO THE CONSOLIDATED FINANCIAL STATEMENTS 2015
The changes to the basis of consolidation mainly comprise intangible assets from the de-consolidation of BAUER Deep
Drilling GmbH, Schrobenhausen, with a carrying amount of EUR 4,165 thousand.
Of the total research and development costs and patent costs incurred in 2015, EUR 4,936 thousand (previous year:
EUR 6,247 thousand) met the capitalization criteria in accordance with IFRS. The following amounts were recognized
in net income:
in EUR ’000
Licenses, software
and similar rights
and values Goodwill
Internally generated
intangible assets
TotalAccumulated depreciationCapitalized
software costs
Capitalized
development costs
Jan. 1, 2015 23,381 2,186 250 21,323 47,140
Change in scope of consolidation -305 0 0 -6,038 -6,343
Additions 3,787 0 28 6,328 10,143
Disposals 189 0 207 165 561
Transfers 0 0 0 0 0
Currency adjustment 194 0 0 -8 186
Dec. 31, 2015 26,868 2,186 71 21,440 50,565
Carrying amount Dec. 31, 2015 9,350 0 11 18,094 27,455
in EUR ’000 2014 2015
Research costs and non-capitalized development costs 18,567 19,470
Amortization of development costs and patents 6,473 6,528
Research and development costs recognized in net income 25,040 25,998

115NOTES TO THE CONSOLIDATED FINANCIAL STATEMENTS 2015
CO
NS
OL
IDA
TE
D F
INA
NC
IAL
STA
TE
ME
NT
S2
01
5
19.2 Property, plant and equipment and investment property
in EUR ’000
Land and
buildings
Investment
property
Technical
equipment and
machinery
Other equipment,
factory and office
equipment
Payments on
account and
assets in course
of construction Total
Cost of purchase/
cost of manufacturing
Jan. 1, 2014 302,284 1,763 488,855 73,032 5,282 871,216
Change in scope of consolidation -563 0 -2,063 -678 0 -3,304
Additions 3,926 6 43,524 7,310 9,322 64,088
Disposals 6,022 0 49,712 6,374 193 62,301
Transfers 765 -35 5,255 -112 -5,889 -16
Currency adjustment 5,802 0 27,331 2,119 -309 34,943
Dec. 31, 2014 306,192 1,734 513,190 75,297 8,213 904,626
in EUR ’000
Land and
buildings
Investment
property
Technical
equipment and
machinery
Other equipment,
factory and office
equipment
Payments on
account and
assets in course
of construction TotalAccumulated depreciation
Jan. 1, 2014 90,707 900 274,359 45,713 0 411,679
Change in scope of consolidation -5 0 -773 -485 0 -1,263
Additions 10,042 36 49,829 8,918 0 68,825
Disposals 2,000 0 32,386 5,366 0 39,752
Transfers 6 -6 168 -172 0 -4
Currency adjustment 866 0 15,784 1,582 0 18,232
Dec. 31, 2014 99,616 930 306,981 50,190 0 457,717
Carrying amount Dec. 31, 2014 206,576 804 206,209 25,107 8,213 446,909
of which finance lease,
carrying amount Dec. 31, 2014 2,935 0 19,150 5,122 0 27,207
in EUR ’000
Land and
buildings
Investment
property
Technical
equipment and
machinery
Other equipment,
factory and office
equipment
Payments on
account and
assets in course
of construction Total
Cost of purchase/
cost of manufacturing
Jan. 1, 2015 306,192 1,734 513,190 75,297 8,213 904,626
Change in scope of consolidation -28,058 0 -4,431 -407 -401 -33,297
Additions 4,499 15 59,539 11,083 8,031 83,167
Disposals 4,378 0 66,925 7,318 30 78,651
Transfers 4,794 0 4,766 146 -9,707 1
Currency adjustment 3,994 0 17,562 1,392 -444 22,504
Dec. 31, 2015 287,043 1,749 523,701 80,193 5,662 898,348

116 NOTES TO THE CONSOLIDATED FINANCIAL STATEMENTS 2015
The changes to the basis of consolidation comprise disposals of property, plant and equipment from the de-consolidation
of BAUER Manufacturing LLC, Conroe in the amount of EUR 26,271 thousand, SPANTEC Spann- & Ankertechnik GmbH,
Schrobenhausen, in the amount of EUR 425 thousand, and BAUER Deep Drilling GmbH, Schrobenhausen, in the amount of
EUR 97 thousand, as well as the initial consolidation of BAUER Equipment India Private Limited, Delhi, BAUER Equipment
Australien Pty. Ltd., Baulkham Hills, BAUER Resources Maroc S.A.R.L., Kenitra, and BAUER Resources Senegal SARL,
Dakar, with an addition of property, plant and equipment totaling EUR 1,587 thousand.
There are purchase options, which will be executed, for the majority of buildings and equipment subject to finance lease
contracts. The underlying interest rates of the contracts vary between 1.43 % and 7.50 % (previous year: 2.38 % and 7.89 %),
depending on the market and time of the conclusion of the contract. The lease payments due in the future and their present
values are stated in the following table:
The investment property has a market value of EUR 784 thousand (previous year: EUR 804 thousand) and was leased at
all times in 2015. It includes a hotel owned by SCHACHTBAU NORDHAUSEN GmbH, leased to third parties and depreciated
over a period of 48 years. Die SCHACHTBAU NORDHAUSEN GmbH also has a contractual obligation to maintain the property.
The measurement is derived from current market prices for similar property. This method is part of level 2 of the fair value
hierarchy stated in IFRS 13.
Rental income in the amount of EUR 51 thousand (previous year: EUR 60 thousand) was generated in the reporting period,
which are directly offset by operating expenses in the amount of EUR 14 thousand (previous year: 23 thousand).
Items of property, plant and equipment have a carrying amount of EUR 112,090 thousand (previous year: EUR 105,811 thousand)
and are subject to encumbrances such as mortgages and chattel mortgages. There are also common restraints on disposal on
leased assets, which are allocable to the Group (finance lease) in accordance with IAS 17 and amount to EUR 23,858 thousand
(previous year: EUR 27,207 thousand).
Olbersdorfer Guß GmbH was granted investment subsidies for expanding production in the amount of EUR 0 (previous year:
EUR 13 thousand) in the financial year. all of the covenants of the investment subsidies were met as of the balance sheet date.
in EUR ’000
Land and
buildings
Investment
property
Technical
equipment and
machinery
Other equipment,
factory and office
equipment
Payments on
account and
assets in course
of construction TotalAccumulated depreciation
Jan. 1, 2015 99,616 930 306,981 50,190 0 457,717
Change in scope of consolidation -4,209 0 -3,359 -459 -64 -8,091
Additions 9,661 35 52,350 8,954 0 71,000
Disposals 2,745 0 29,002 5,846 0 37,593
Transfers 0 0 0 0 0 0
Currency adjustment 488 0 9,418 989 64 10,959
Dec. 31, 2015 102,811 965 336,388 53,828 0 493,992
Carrying amount Dec. 31, 2015 184,232 784 187,313 26,365 5,662 404,356
of which finance lease, carrying
amount Dec. 31, 2015 1,687 0 16,231 5,940 0 23,858
in EUR ’000 Remaining term 2014 Remaining term 2015
under 1 year 1 to 5 years over 5 years Total under 1 year 1 to 5 years over 5 years Total
Minimum lease payments 8,470 13,707 0 22,177 9,606 13,120 0 22,726
Interest portions 1,017 675 0 1,692 661 468 0 1,129
Present value 7,453 13,032 0 20,485 8,945 12,652 0 21,597

117NOTES TO THE CONSOLIDATED FINANCIAL STATEMENTS 2015
CO
NS
OL
IDA
TE
D F
INA
NC
IAL
STA
TE
ME
NT
S2
01
5
No borrowing costs were capitalized in the financial year (previous year: none). Fixed assets were impaired by a total of
EUR 864 thousand (previous year: EUR 1,775 thousand) in the financial year. Of these impairments, EUR 89 thousand
(previous year: EUR 0) related to the Construction segment, EUR 765 thousand (previous year: EUR 1,768 thousand) to
the Equipment segment and EUR 10 thousand (previous year: EUR 7 thousand) to the Resources segment. Of the amount,
EUR 768 thousand (previous year: EUR 942 thousand) pertained to intangible assets and EUR 96 thousand (previous year:
EUR 833 thousand) to property, plant and equipment. The majority of impairments on intangible assets relates to capitalized
development costs in the amount of EUR 489 thousand at KLEMM Bohrtechnik GmbH and MAT Mischanlagentechnik,
branch offices of BAUER Maschinen GmbH, in the Equipment segment. The expected market development for various
internally developed devices was the key factor in this respect. Impairment losses on property, plant and equipment pertain to
technical equipment and machinery to the amount of EUR 94 thousand and to company and office equipment to the amount of
EUR 2 thousand. The impairments were applied on the basis of the recoverable amount. For the capitalized development costs,
this corresponded with the value in use. A discount rate of 7.72 % (previous year: 7.83 %) was applied in the financial year. The
recoverable amount of other non-financial assets regularly corresponded with the fair value less cost to sell. This method is part
of level 1 of the fair value hierarchy stated in IFRS 13.
19.3 Shares accounted for using the equity method and participations
The balance sheet approaches of the joint ventures and associated companies developed as follows:
in EUR ’000 Dec. 31, 2014 Dec. 31, 2015
Shares in joint ventures accounted for using the equity method 4,175 94,226
Shares in associated companies accounted for using the equity method 38,731 38,327
Total 42,906 132,553
in EUR ’000 Associated companies Joint ventures
Cost of purchase/cost of manufacturing 2014 2015 2014 2015
Jan. 1 9,947 40,916 3,302 4,175
Additions 31,089 0 662 90,863
Disposals 0 0 479 1,563
Profit/loss attributable 330 764 690 751
Dividend payments -450 -1,168 0 0
Transfers 0 0 0 0
Currency adjustment 0 0 0 0
Dec. 31 40,916 40,512 4,175 94,226
in EUR ’000 Associated companies Joint ventures
Accumulated depreciation 2014 2015 2014 2015
Jan. 1 0 2,185 0 0
Additions 2.185 0 0 0
Disposals 0 0 0 0
Transfers 0 0 0 0
Currency adjustment 0 0 0 0
Dec. 31 2,185 2,185 0 0
Carrying amount Dec. 31 38,731 38,327 4,175 94,226
The following table provides an overview of the changes in shares accounted for using the equity method:

118 NOTES TO THE CONSOLIDATED FINANCIAL STATEMENTS 2015
a) Joint ventures
The amounts stated in the financial information for joint ventures are recognized in the annual financial statements prepared in
accordance with local financial reporting standards, corrected by any adjustments to IFRS.
With the basic joint ventures, details on previous year values were no longer required as they were already fully consolidated
at that point in time.
These are the material joint ventures:
Financial year 2014:
There were no material joint ventures in financial year 2014.
Financial year 2015:
Non-current and current financial liabilities do not contain any trade payables and provisions.
Name Company's
activities
Headquarters Capital
share
Valuation method
SPANTEC Spann- & Ankertechnik GmbH Production Schrobenhausen, Germany 40 % At equity
BAUER Manufacturing LLC Production Conroe, USA 51 % At equity
BAUER Deep Drilling GmbH Production Schrobenhausen, Germany 51 % At equity
Summarized financial information on the material joint ventures (before consolidation):
BALANCE SHEET
in EUR ’000
SPANTEC Spann-
& Ankertechnik GmbH
BAUER Manufacturing LLC BAUER Deep Drilling GmbH
2014 2015 2014 2015 2014 2015
Non-current assets 0 5,473 0 26,683 0 15,504
Current assets 0 8,246 0 42,037 0 52,799
of which cash and cash equivalents 0 4,299 0 24,676 0 34,172
Total assets 0 13,719 0 68,720 0 68,303
Non-current debt 0 153 0 16 0 495
of which non-current financial liabilities 0 0 0 16 0 23
Current debt 0 1,325 0 18,671 0 17,887
of which current financial liabilities 0 0 0 0 0 10
Total liabilities 0 1,478 0 18,687 0 18,382
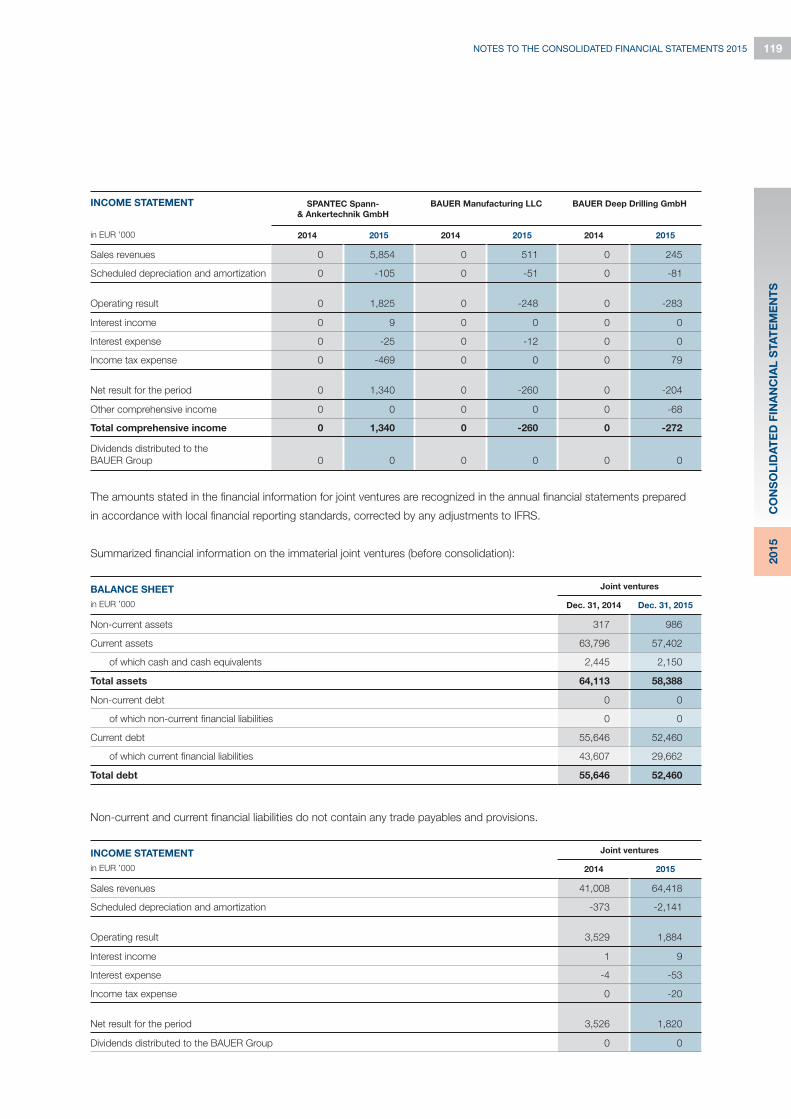
119NOTES TO THE CONSOLIDATED FINANCIAL STATEMENTS 2015
CO
NS
OL
IDA
TE
D F
INA
NC
IAL
STA
TE
ME
NT
S2
01
5
Non-current and current financial liabilities do not contain any trade payables and provisions.
The amounts stated in the financial information for joint ventures are recognized in the annual financial statements prepared
in accordance with local financial reporting standards, corrected by any adjustments to IFRS.
Summarized financial information on the immaterial joint ventures (before consolidation):
BALANCE SHEET
in EUR ’000
Joint ventures
Dec. 31, 2014 Dec. 31, 2015
Non-current assets 317 986
Current assets 63,796 57,402
of which cash and cash equivalents 2,445 2,150
Total assets 64,113 58,388
Non-current debt 0 0
of which non-current financial liabilities 0 0
Current debt 55,646 52,460
of which current financial liabilities 43,607 29,662
Total debt 55,646 52,460
INCOME STATEMENT
in EUR ’000
Joint ventures
2014 2015
Sales revenues 41,008 64,418
Scheduled depreciation and amortization -373 -2,141
Operating result 3,529 1,884
Interest income 1 9
Interest expense -4 -53
Income tax expense 0 -20
Net result for the period 3,526 1,820
Dividends distributed to the BAUER Group 0 0
INCOME STATEMENT
in EUR ’000
SPANTEC Spann-
& Ankertechnik GmbH
BAUER Manufacturing LLC BAUER Deep Drilling GmbH
2014 2015 2014 2015 2014 2015
Sales revenues 0 5,854 0 511 0 245
Scheduled depreciation and amortization 0 -105 0 -51 0 -81
Operating result 0 1,825 0 -248 0 -283
Interest income 0 9 0 0 0 0
Interest expense 0 -25 0 -12 0 0
Income tax expense 0 -469 0 0 0 79
Net result for the period 0 1,340 0 -260 0 -204
Other comprehensive income 0 0 0 0 0 -68
Total comprehensive income 0 1,340 0 -260 0 -272
Dividends distributed to the
BAUER Group 0 0 0 0 0 0

120 NOTES TO THE CONSOLIDATED FINANCIAL STATEMENTS 2015
Reconciliation to the summarized financial information on the immaterial joint ventures
The proportional carrying amount of the joint ventures can be offset and reconciled as follows:
Name Company's
activities
Headquarters Capital share
Wöhr + Bauer GmbH Project development Munich, Germany 33.33 %
NDH Entsorgungsbetreibergesellschaft mbH Waste disposal Bleicherode, Germany 25.00 %
TERRABAUER S. L. Specialist foundation engineering Madrid, Spain 30.00 %
BAUER Nimr LLCWater treatment and
soil remediation
Maskat, Al Mina,
Sultanate of Oman49.00 %
Name Company's
activities
Headquarters Capital share
Wöhr + Bauer GmbH Project development Munich, Germany 33.33 %
NDH Entsorgungsbetreibergesellschaft mbH Disposal Bleicherode, Germany 25.00 %
TERRABAUER S. L. Specialist foundation engineering Madrid, Spain 30.00 %
BAUER Nimr LLCWater treatment and
soil remediation
Maskat, Al Mina,
Sultanate of Oman49.00 %
in EUR ’000 Dec. 31, 2014 Dec. 31, 2015
Net assets of joint ventures 8,467 118,135
Share in joint ventures according to investment quota 4,175 59,166
Goodwill and other adjustments 0 35,060
Carrying amount reported in the balance sheet 4,175 94,226
Market value of the material joint ventures:
Financial year 2015:
in EUR ’000 Dec. 31, 2014 Dec. 31, 2015
SPANTEC Spann- & Ankertechnik GmbH 0 25,500
BAUER Manufacturing LLC 0 86,429
BAUER Deep Drilling GmbH 0 70,714
We did not state the fair value of our immaterial joint ventures as there is no listed market price.
The risk arising from the joint and several liability in the case of a shareholder defaulting is secured by mutual guarantees
issued within the joint venture. There are no other obligations or material restrictions.
b) Associated companies
The amounts stated in the financial information for associated companies are recognized in the annual financial statements
prepared in accordance with local financial reporting standards, corrected by any adjustments to IFRS.
These are the material associated companies:
Financial year 2014:

121NOTES TO THE CONSOLIDATED FINANCIAL STATEMENTS 2015
CO
NS
OL
IDA
TE
D F
INA
NC
IAL
STA
TE
ME
NT
S2
01
5
Summarized financial information for all associated companies (amounts before consolidation):
BALANCE SHEET
in EUR ’000
Wöhr + Bauer GmbH NDH Entsorgungsbe-
treibergesellschaft mbH
TERRABAUER S. L. BAUER Nimr LLC
Dec. 31, 2014 Dec. 31, 2015 Dec. 31, 2014 Dec. 31, 2015 Dec. 31, 2014 Dec. 31, 2015 Dec. 31, 2014 Dec. 31, 2015
Non-current assets 60,132 56,795 18,288 17,040 2,671 - 41,102 43,074
Current assets 48,073 101,161 26,857 28,532 11,407 - 13,187 11,660
(of which cash and
cash equivalents) 526 2,275 23,060 24,098 23 - 5,019 2,013
Total assets 108,205 157,956 45,145 45,572 14,078 - 54,289 54,734
Non-current debt 22,279 87,658 0 0 771 - 35,421 36,563
of which non-current
financial debt 21,897 36,125 0 0 90 - 34,968 22,146
Current debt 66,775 53,706 40,225 41,056 6,542 - 7,299 8,560
of which current
financial debt 0 35,980 3,225 2,833 575 - 2,327 2,845
Total debt 89,054 141,364 40,225 41,056 7,313 - 42,720 45,123
* Financial information was unavailable on the balance sheet date
INCOME STATEMENT
in EUR ’000
Wöhr + Bauer GmbH NDH Entsorgungsbe-
treibergesellschaft mbH
TERRABAUER S. L. BAUER Nimr LLC
2014 2015 2014 2015 2014 2015 * 2014 2015
Sales revenues 21,531 17,217 22,736 22,951 470 - 1,528 11,026
Scheduled depreciation
and amortization -1,774 -1,924 -2,956 -3,223 -589 - -367 -242
Operating result 2,550 -2,700 1,522 1,451 -695 - 281 5,725
Interest income 15 2 238 52 64 - 6 2,148
Interest expense -414 -927 -262 -271 -93 - -244 -3,209
Income tax expense -667 1,372 -509 -648 0 - 0 -699
Net result for the period 1,484 -2,322 989 584 -724 - 43 3,965
Net result for the period
in proportion to share 494 -774 247 146 0 - 21 1,943
Other comprehensive income 0 0 0 0 0 - 0 0
Total comprehensive income 1,484 -2,322 989 584 -724 - 43 3,965
Dividends distributed
to the BAUER Group 210 100 240 247 0 - 4,598 821
* Financial information was unavailable on the balance sheet date

122 NOTES TO THE CONSOLIDATED FINANCIAL STATEMENTS 2015
Reconciliation to the summarized financial information on associated companies
The proportional carrying amount of the associated companies can be offset and reconciled as follows:
in EUR ’000 Dec. 31, 2014 Dec. 31, 2015
Net assets of associated companies 35,792 30,850
Share in associated companies according to investment quota 13,331 11,408
Goodwill and other adjustments 16,908 16,887
Cash value of concession arrangement 8,709 8,162
Currency adjustment -217 1,870
Carrying amount reported in the balance sheet 38,731 38,327
The other adjustments pertain to temporal differences in reporting.
The market value of BAUER Nimr LLC was EUR 75,862 thousand (previous year: EUR 63,447 thousand) on December 31, 2015.
The market values of the other material associated companies were unavailable on the balance sheet date.
There were no obligations and material restrictions or risks with regard to the shares in associated companies on the balance
sheet date.
Summarized financial information for associated companies, which are immaterial on their own (amounts before consolidation):
BALANCE SHEET
in EUR ’000
Associated companies
Dec. 31, 2014 Dec. 31, 2015
Non-current assets 67 51
Current assets 239 228
of which cash and cash equivalents 33 4
Total assets 306 279
Non-current debt 22 18
of which non-current financial liabilities 22 0
Current debt 132 130
of which current financial liabilities 0 0
Total debt 154 148
INCOME STATEMENT
in EUR ’000
Associated companies
Dec. 31, 2014 Dec. 31, 2015
Sales revenues 825 853
Scheduled depreciation and amortization -29 -24
Operating result -22 -9
Interest income 0 0
Interest expense -1 -2
Income tax expense 0 0
Net result for the period -23 7
Net result for the period in proportion to share -7 2
Dividends distributed to the BAUER Group 0 0

123NOTES TO THE CONSOLIDATED FINANCIAL STATEMENTS 2015
CO
NS
OL
IDA
TE
D F
INA
NC
IAL
STA
TE
ME
NT
S2
01
5
in EUR ’000 Participations
Cost of purchase/cost of manufacturing 2014 2015
Jan. 1 4,429 4,429
Additions 0 0
Disposals 0 0
Profit/loss attributable 0 0
Dividend payments 0 0
Transfers 0 0
Currency adjustment 0 0
Dec. 31 4,429 4,429
in EUR ’000 Participations
Accumulated depreciation 2014 2015
Jan. 1 816 816
Additions 0 0
Disposals 0 0
Transfers 0 0
Currency adjustment 0 0
Dec. 31 816 816
Carrying amount Dec. 31 3,613 3,613
c) Participations
20. DEFERRED TAXES
Deferred tax assets and liabilities pertained to the following balance sheet items:
in EUR ’000 Dec. 31, 2014 Dec. 31, 2015 Dec. 31, 2014 Dec. 31, 2015
Deferred tax assets Deferred tax liabilities
Intangible assets 401 389 7,202 18,364
Property, plant and equipment 119 123 13,926 8,814
Inventories 3,763 876 2,498 2,229
Receivables and other assets 1,474 2,521 1,410 4,511
Provisions for pensions 19,652 18,340 208 562
Liabilities 10,201 7,027 4,800 2,711
Tax losses carried forward 12,559 13,617 0 0
Consolidation 3,999 5,366 4,274 4,542
Offsetting -21,195 -21,069 -21,195 -21,069
Net amount 30,973 27,190 13,123 20,664
In the table above, deferred tax assets in the amount of EUR 222 thousand (previous year: EUR 2,025 thousand) and deferred tax
liabilities in the amount of EUR 11 thousand (previous year: EUR 1,708 thousand) are included in liabilities, which is part of hedge-
accounting. Deferred tax assets in the amount of EUR 14,637 thousand (previous year: EUR 16,772 thousand) and deferred tax
liabilities in the amount of EUR 0 (previous year: EUR 4 thousand) are included in provisions for pensions for the actuarial gains and
losses recognized in equity.

124 NOTES TO THE CONSOLIDATED FINANCIAL STATEMENTS 2015
The share of current deferred tax assets in respect of losses carried forward amounts to EUR 6,848 thousand (previous year:
EUR 10,039 thousand) and the share of deferred tax liabilities to EUR 8,267 thousand (previous year: 7,280 thousand).
The tax losses carried forward at the end of the year are as follows:
in EUR ’000 Dec. 31, 2014 Dec. 31, 2015
Domestic losses (corporation tax) 75,553 80,325
Foreign losses 46,953 120,225
Total 122,506 200,550
Of which losses carried forward deductible for limited periods 25,461 83,203
No deferred taxes were recognized for unusable losses carried forward in the amount of EUR 161,045 thousand (previous year:
EUR 78,059 thousand) due to the medium-term income tax target.
The share of current deferred tax assets in respect of losses carried forward amounted to EUR 1,339 thousand (previous year:
EUR 1,028 thousand) in the financial year.
Deferred tax liabilities arising from temporary differences in connection with investments in subsidiaries and associated
companies are only recognized if the date of reversal of the temporary differences can be determined by the Group and it
is likely that the temporary differences will not be reversed again in the foreseeable future because of this effect. This is not
presently the case.
There are temporary differences in the amount of EUR 1,767 thousand (previous year: EUR 1,170 thousand) in connection
with shares in subsidiaries, for which no deferred tax liabilities were recognized.
21. OTHER NON-CURRENT ASSETS
The other non-current assets comprise the following items:
in EUR ’000 Dec. 31, 2014 Dec. 31, 2015
Claims from backup insurance 4,787 4,550
Sundry other non-current assets 2,705 3,172
Total 7,492 7,722
The additional other non-current assets did not incur any interest in the financial and previous year.
They also include assets arising from continuing involvements totaling EUR 1,537 thousand (previous year: EUR 1,068 thousand).
As in the previous year, the other non-current assets were neither impaired nor overdue in the year under review.
Within BAUER Group, trade receivables and services in the amount of EUR 16,263 thousand (previous year:
EUR 18,425 thousand) were sold to third parties within the scope of receivables sales agreements. It comprises
the maximum amount of the remaining risk which the BAUER Group would have to pay to the buyer.
The corresponding liability amounts to EUR 1,691 thousand (previous year: EUR 1,175 thousand), and is stated under
“Other non-current liabilities”. The difference reflects the fair value of the guarantees resulting from the remaining risk and
the servicing, and is recognized in net income.
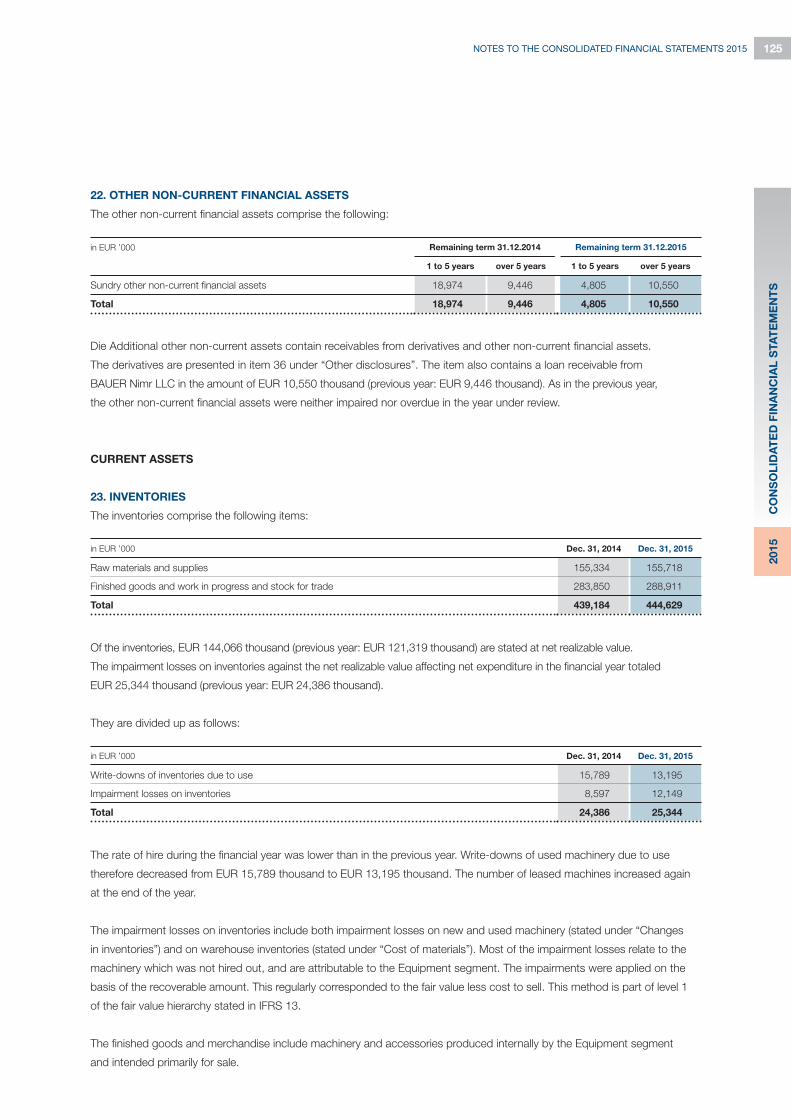
125NOTES TO THE CONSOLIDATED FINANCIAL STATEMENTS 2015
CO
NS
OL
IDA
TE
D F
INA
NC
IAL
STA
TE
ME
NT
S2
01
5
22. OTHER NON-CURRENT FINANCIAL ASSETS
The other non-current financial assets comprise the following:
Die Additional other non-current assets contain receivables from derivatives and other non-current financial assets.
The derivatives are presented in item 36 under “Other disclosures”. The item also contains a loan receivable from
BAUER Nimr LLC in the amount of EUR 10,550 thousand (previous year: EUR 9,446 thousand). As in the previous year,
the other non-current financial assets were neither impaired nor overdue in the year under review.
CURRENT ASSETS
23. INVENTORIES
The inventories comprise the following items:
Of the inventories, EUR 144,066 thousand (previous year: EUR 121,319 thousand) are stated at net realizable value.
The impairment losses on inventories against the net realizable value affecting net expenditure in the financial year totaled
EUR 25,344 thousand (previous year: EUR 24,386 thousand).
They are divided up as follows:
in EUR ’000 Dec. 31, 2014 Dec. 31, 2015
Raw materials and supplies 155,334 155,718
Finished goods and work in progress and stock for trade 283,850 288,911
Total 439,184 444,629
in EUR ’000 Dec. 31, 2014 Dec. 31, 2015
Write-downs of inventories due to use 15,789 13,195
Impairment losses on inventories 8,597 12,149
Total 24,386 25,344
in EUR ’000 Remaining term 31.12.2014 Remaining term 31.12.2015
1 to 5 years over 5 years 1 to 5 years over 5 years
Sundry other non-current financial assets 18,974 9,446 4,805 10,550
Total 18,974 9,446 4,805 10,550
The rate of hire during the financial year was lower than in the previous year. Write-downs of used machinery due to use
therefore decreased from EUR 15,789 thousand to EUR 13,195 thousand. The number of leased machines increased again
at the end of the year.
The impairment losses on inventories include both impairment losses on new and used machinery (stated under “Changes
in inventories”) and on warehouse inventories (stated under “Cost of materials”). Most of the impairment losses relate to the
machinery which was not hired out, and are attributable to the Equipment segment. The impairments were applied on the
basis of the recoverable amount. This regularly corresponded to the fair value less cost to sell. This method is part of level 1
of the fair value hierarchy stated in IFRS 13.
The finished goods and merchandise include machinery and accessories produced internally by the Equipment segment
and intended primarily for sale.

126 NOTES TO THE CONSOLIDATED FINANCIAL STATEMENTS 2015
We differentiate essentially between two forms of machinery and accessories (referred to in the following as “machinery”):
New machines
These are machines manufactured in the financial year or in earlier years which are available for sale but have not yet been
hired out. These machines are valued at manufacturing cost or at the lower net realizable value on the balance sheet date.
Used machines
Used machines are machines which are primarily up for sale and which have been temporarily hired out as a secondary sales
promotion measure during the financial year or in earlier years. New machines automatically become used machines the first
time they are hired out.
When hiring out machinery, the net realizable value is determined from the manufacturing cost less the write-downs due to
use and impairment losses on inventories.
In the case of a new machine, or a used machine which has not been hired out, the reduction in value against the net realizable
value is recognized by means of an impairment loss.
The sale and hire of machinery relates solely to the Equipment segment.
The following chart sets out the carrying amount before impairment of the used machinery and accessories along with the rate of
hire status on the balance sheet date:
In the financial year, apart from the usual retentions of title, inventories totaling EUR 460 thousand (previous year: EUR 119
thousand) with terms up until the year 2016 were provided as security for loans. The securities provided can only be claimed
by the lending banks in the event of definitive failure to fulfill contractual obligations, such as defaulting on interest and loan
payments or failure to meet agreed financial targets. No claims on securities provided are foreseeable.
24. RECEIVABLES AND OTHER ASSETS
Construction contracts
The construction contracts measured according to the percentage of completion method developed as follows:
in EUR ’000 Dec. 31, 2014 Dec. 31, 2015
Carrying amount of used machines 86,744 98,291
of which hired out 32,236 44,990
of which not hired out 54,508 53,301
in EUR ’000 Dec. 31, 2014 Dec. 31, 2015
Contract costs incurred (plus profits, less losses) for projects not yet completed 674,169 783,992
less down-payments 590,481 704,396
Balance 83,688 79,596
of which: Receivables from construction contracts (PoC) 132,159 129,478
of which: Liabilities from construction contracts (PoC) 48,471 49,882

127NOTES TO THE CONSOLIDATED FINANCIAL STATEMENTS 2015
CO
NS
OL
IDA
TE
D F
INA
NC
IAL
STA
TE
ME
NT
S2
01
5
Development of receivables and other assets
The receivables and other assets comprise the following:
The “Trade receivables” balance sheet item includes long-term receivables totaling EUR 8,845 thousand (previous year:
EUR 10,504 thousand).
The following table presents the changes in valuation allowances to current receivables:
in EUR ’000 Dec. 31, 2014 Dec. 31, 2015
Receivables from construction contracts (PoC) 132,159 129,478
Trade receivables 311,417 343,933
Receivables from enterprises in which the company has participating interests 67 3,272
Payments on account 4,304 5,364
Other current assets 28,603 33,381
Other current financial assets 20,100 28,901
Total 496,650 544,329
in EUR ’000 Dec. 31, 2014 Dec. 31, 2015
Valuation allowance at start of financial year 59,938 53,976
Change in scope of consolidation 0 0
Currency adjustment 842 399
Allocation 20,568 28,476
Reversal 19,557 19,500
Consumption 7,815 2,075
Valuation allowance at end of financial year 53,976 61,276
The valuation allowance for foreseeably uncollectable trade receivables of EUR 61,276 thousand (previous year: EUR 53,976
thousand) was calculated taking into account individual risks and on the basis of past experience in relation to payment
default. Valuation allowance were applied in respect of individual claims as well as on a portfolio flat-rate basis. The individual
valuation allowances were translated into flat-rate percentages spread across the age structure of the receivables. Within the
individual valuation allowance, 100 percent of the claim receivable was usually adjusted. The determination of valuation allow-
ances for uncertain receivables primarily bases on estimates and evaluations of individual claims, incorporating considerations
of the creditworthiness and late-payment record of the customer concerned as well as current economic trends and historical
experience in relation to default.
No receivables from construction contracts were impaired in the financial year (previous year: EUR 3,993 thousand).
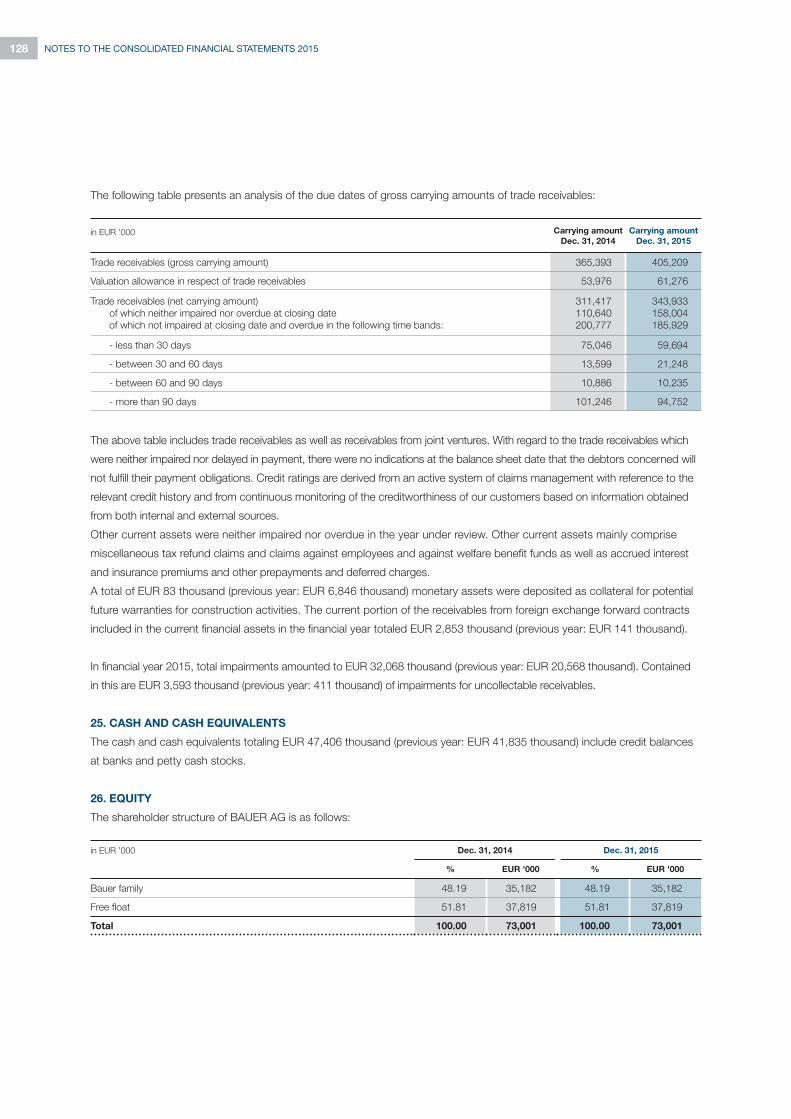
128 NOTES TO THE CONSOLIDATED FINANCIAL STATEMENTS 2015
The following table presents an analysis of the due dates of gross carrying amounts of trade receivables:
The above table includes trade receivables as well as receivables from joint ventures. With regard to the trade receivables which
were neither impaired nor delayed in payment, there were no indications at the balance sheet date that the debtors concerned will
not fulfill their payment obligations. Credit ratings are derived from an active system of claims management with reference to the
relevant credit history and from continuous monitoring of the creditworthiness of our customers based on information obtained
from both internal and external sources.
Other current assets were neither impaired nor overdue in the year under review. Other current assets mainly comprise
miscellaneous tax refund claims and claims against employees and against welfare benefit funds as well as accrued interest
and insurance premiums and other prepayments and deferred charges.
A total of EUR 83 thousand (previous year: EUR 6,846 thousand) monetary assets were deposited as collateral for potential
future warranties for construction activities. The current portion of the receivables from foreign exchange forward contracts
included in the current financial assets in the financial year totaled EUR 2,853 thousand (previous year: EUR 141 thousand).
In financial year 2015, total impairments amounted to EUR 32,068 thousand (previous year: EUR 20,568 thousand). Contained
in this are EUR 3,593 thousand (previous year: 411 thousand) of impairments for uncollectable receivables.
25. CASH AND CASH EQUIVALENTS
The cash and cash equivalents totaling EUR 47,406 thousand (previous year: EUR 41,835 thousand) include credit balances
at banks and petty cash stocks.
26. EQUITY
The shareholder structure of BAUER AG is as follows:
in EUR ’000 Carrying amount
Dec. 31, 2014
Carrying amount
Dec. 31, 2015
Trade receivables (gross carrying amount) 365,393 405,209
Valuation allowance in respect of trade receivables 53,976 61,276
Trade receivables (net carrying amount)
of which neither impaired nor overdue at closing date
of which not impaired at closing date and overdue in the following time bands:
311,417
110,640
200,777
343,933
158,004
185,929
- less than 30 days 75,046 59,694
- between 30 and 60 days 13,599 21,248
- between 60 and 90 days 10,886 10,235
- more than 90 days 101,246 94,752
in EUR ’000 Dec. 31, 2014 Dec. 31, 2015
% EUR '000 % EUR '000
Bauer family 48.19 35,182 48.19 35,182
Free float 51.81 37,819 51.81 37,819
Total 100.00 73,001 100.00 73,001
129NOTES TO THE CONSOLIDATED FINANCIAL STATEMENTS 2015
CO
NS
OL
IDA
TE
D F
INA
NC
IAL
STA
TE
ME
NT
S2
01
5
Please refer to the Notes to the Financial Statements of BAUER AG (published in the Federal Gazette (Bundesanzeiger)) on
December 31, 2015 for reports on the participations in BAUER AG.
Composition of subscribed capital
The subscribed capital (share capital) of BAUER AG amounts to EUR 73,001,420.45 and is divided into 17,131,000 no-nominal-
value bearer shares, representing a pro rata amount of approximately EUR 4.26 pershare of the total share capital. the shares
have no nominal value. Each share entails equal rights, and entitles the holder to one vote at the Annual General Meeting, with
the exception of share categories precluded from voting by law pursuant to section 136 of the German Stock Corporation Act
(AktG) and section 28 of the German Securities Trading Act (WpHG).
As in the previous year, 51.81 percent of the shares were in free float. The members of the Bauer family and a charitable
foundation own a total of 8,256,246 no-nominal-value shares in BAUER AG on the basis of a pool agreement, representing
a 48.19 percent share in the company. The pool agreement provisions include binding voting commitments as well as a right of
pre-emption of pool participants if any member of the pool sells shares to third parties. No other direct or indirect holdings of
BAUER AG share capital exceeding 10 % of the voting rights are known to the company.
None of the shareholders have special rights entailing controlling powers. Nor does any voting rights control exist on the part
of the employees holding shares in the capital.
Authority of the Management Board to issue or buy back shares
Section 4, subsection 4 of the company’s Articles of Association authorizes the Management Board, with the consent of the
Supervisory Board, to increase the share capital once or more than once up to June 27, 2017 by up to a total of EUR 7.3 million
by the issue of new ordinary bearer shares against cash and/or non-cash contributions. To that end, the Management Board is
authorized, with the consent of the Supervisory Board, to exclude the legal subscription rights of shareholders in the following
cases:
• in the event of capital increases against non-cash contributions;
• in the event of capital increases against cash contributions where the issue amount of the new shares issued is not
materially below the market price of the already quoted shares at the time of definitive setting of the issue price and
the shares issued excluding shareholders’ subscription rights pursuant to section 186, subsection 3, clause 4 AktG do
not in total exceed 10 % of the existing share capital either at the time this authority takes effect or at the time of exercising
this authority. Shares which have been or are to be sold or issued in direct or corresponding application of section 186,
subsection 3, clause 4 AktG while this authority is in place until such time as it is exercised, pursuant to other authorities,
excluding subscription rights, are to be set off against the said 10 % limit;
• to balance out fractional amounts.
By resolution of the Ordinary Annual General Meeting held on June 26, 2014, the company was authorized to acquire treasury
stock, over a limited period up to June 25, 2019, representing up to a total of 10 % of the company’s share capital at the time
the resolution was passed. The shares shall be acquired at the discretion of the Management Board by means of a public tender
offer or by way of the stock market. If the acquisition is effected by way of the stock market, the acquisition price (excluding
ancillary costs) may be no more than 10 % above or 20 % below the price determined by the opening auction on the trading
day for shares in the company in Xetra trading (or a comparable successor system) on the Frankfurt Stock Exchange. that
if the acquisition is effected by means of a public tender offer, the purchase price or the limits of the purchase price span per
share (excluding ancillary costs) may be no more than 10 percent above or 20 percent below the average of the closing prices
per share in the company in Xetra trading (or a comparable successor system) on the Frankfurt Stock Exchange on the three
trading days prior to the day of issue of the public tender offer. If not insignificant variations of the decisive share price occur
after the day of issue of the public tender offer, the purchase price may be adjusted.

130 NOTES TO THE CONSOLIDATED FINANCIAL STATEMENTS 2015
The Management Board shall be authorized to appropriate shares in the company acquired pursuant to the above authorizations
for all legally admissible purposes. Consequently, the acquired shares may also in particular be sold by means other than by
way of the stock market or by means of an offer to the shareholders, if the shares are sold for cash at a price (excluding ancillary
costs) not materially below the stock market price of shares of the company carrying the same rights at the time of the sale
in Xetra trading (or a comparable successor system). The shares may also be transferred to third parties, provided this is done
for the purpose of acquiring companies, parts in companies or investments in companies or other assets or effecting company
mergers. The aforementioned shares may be withdrawn without need of a further resolution by the Annual General Meeting.
With regard to use of the bought-back shares, the authorization provides, in specific cases, for legal rights of subscription of
shareholders to be excluded. The facility to acquire treasury stock has not been utilized to date.
The Supervisory Board is authorized to amend Article 4 of the Articles of Association accordingly following complete or partial
execution of the increase in share capital or on expiration of the period of authority.
The remaining shareholders' equity of the BAUER Group developed as follows:
In the financial year a dividend of EUR 0.15 (previous year: EUR 0.00) per share was paid to the shareholders.
in EUR ’000 Dec. 31, 2014 Dec. 31, 2015
I. Capital reserve 38,404 38,404
II. Other revenue reserves and unappropriated net profit 287,903 327,437
326,307 365,841
III. Non-controlling interests 19,617 12,368
Total 345,924 378,209
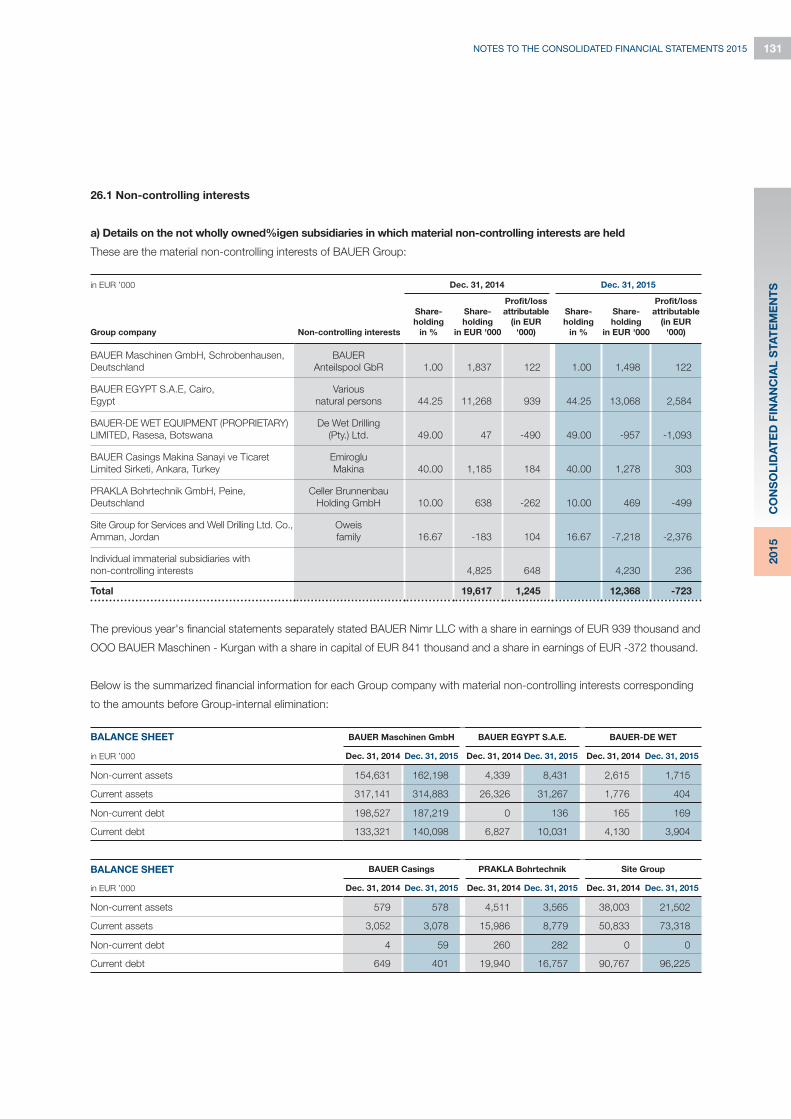
131NOTES TO THE CONSOLIDATED FINANCIAL STATEMENTS 2015
CO
NS
OL
IDA
TE
D F
INA
NC
IAL
STA
TE
ME
NT
S2
01
5
in EUR ’000
Non-controlling interests
Dec. 31, 2014 Dec. 31, 2015
Group company
Share-
holding
in %
Share-
holding
in EUR '000
Profit/loss
attributable
(in EUR
'000)
Share-
holding
in %
Share-
holding
in EUR '000
Profit/loss
attributable
(in EUR
'000)
BAUER Maschinen GmbH, Schrobenhausen,
Deutschland
BAUER
Anteilspool GbR 1.00 1,837 122 1.00 1,498 122
BAUER EGYPT S.A.E, Cairo,
Egypt
Various
natural persons 44.25 11,268 939 44.25 13,068 2,584
BAUER-DE WET EQUIPMENT (PROPRIETARY)
LIMITED, Rasesa, Botswana
De Wet Drilling
(Pty.) Ltd. 49.00 47 -490 49.00 -957 -1,093
BAUER Casings Makina Sanayi ve Ticaret
Limited Sirketi, Ankara, Turkey
Emiroglu
Makina 40.00 1,185 184 40.00 1,278 303
PRAKLA Bohrtechnik GmbH, Peine,
Deutschland
Celler Brunnenbau
Holding GmbH 10.00 638 -262 10.00 469 -499
Site Group for Services and Well Drilling Ltd. Co.,
Amman, Jordan
Oweis
family 16.67 -183 104 16.67 -7,218 -2,376
Individual immaterial subsidiaries with
non-controlling interests 4,825 648 4,230 236
Total 19,617 1,245 12,368 -723
26.1 Non-controlling interests
a) Details on the not wholly owned%igen subsidiaries in which material non-controlling interests are held
These are the material non-controlling interests of BAUER Group:
The previous year's financial statements separately stated BAUER Nimr LLC with a share in earnings of EUR 939 thousand and
OOO BAUER Maschinen - Kurgan with a share in capital of EUR 841 thousand and a share in earnings of EUR -372 thousand.
Below is the summarized financial information for each Group company with material non-controlling interests corresponding
to the amounts before Group-internal elimination:
BALANCE SHEET
in EUR ’000
BAUER Maschinen GmbH BAUER EGYPT S.A.E. BAUER-DE WET
Dec. 31, 2014 Dec. 31, 2015 Dec. 31, 2014 Dec. 31, 2015 Dec. 31, 2014 Dec. 31, 2015
Non-current assets 154,631 162,198 4,339 8,431 2,615 1,715
Current assets 317,141 314,883 26,326 31,267 1,776 404
Non-current debt 198,527 187,219 0 136 165 169
Current debt 133,321 140,098 6,827 10,031 4,130 3,904
BALANCE SHEET
in EUR ’000
BAUER Casings PRAKLA Bohrtechnik Site Group
Dec. 31, 2014 Dec. 31, 2015 Dec. 31, 2014 Dec. 31, 2015 Dec. 31, 2014 Dec. 31, 2015
Non-current assets 579 578 4,511 3,565 38,003 21,502
Current assets 3,052 3,078 15,986 8,779 50,833 73,318
Non-current debt 4 59 260 282 0 0
Current debt 649 401 19,940 16,757 90,767 96,225

132 NOTES TO THE CONSOLIDATED FINANCIAL STATEMENTS 2015
INCOME STATEMENT
in EUR ’000
BAUER Maschinen GmbH BAUER EGYPT S.A.E. BAUER-DE WET
2014 2015 2014 2015 2014 2015
Sales revenues 357,925 383,484 22,758 37,182 2,261 1,645
Operating result 23,788 38,655 3,064 7,291 -890 -1,724
Profit before tax 14,188 17,372 3,559 8,075 -1,155 1,740
Net result for the period 10,464 12,152 2,122 5,841 -1,001 -2,231
Profit/loss attributable to non-controlling interests 122 122 939 2,564 -490 -1,093
Profit/loss attributable to shareholders of BAUER AG 10,342 12,031 1,183 3,256 -510 -1,138
Dividends distributed to non-controlling interest -50 -40 -227 -446 0 0
CASH FLOW STATEMENT
in EUR ’000
BAUER Maschinen GmbH BAUER EGYPT S.A.E. BAUER-DE WET
2014 2015 2014 2015 2014 2015
Cash flow from operating activities 15,001 33,260 4,636 3,108 1,573 107
Cash flow from investing activities -16,205 -7,944 -2,929 -7,429 -17 -70
Cash flow from financing activities -1,631 -26,002 -19 -194 -1,537 -105
Influence of exchange rate movements on cash 0 0 1,117 387 2 -4
Changes in cash and cash equivalents with an effect
on liquidity -2.835 -686 2,805 -4,128 21 -72
INCOME STATEMENT
in EUR ’000
BAUER Casings PRAKLA Bohrtechnik Site Group
2014 2015 2014 2015 2014 2015
Sales revenues 3,687 4,264 11,696 6,990 11,224 10,377
Operating result 575 949 -1,872 -3,688 5,027 -9,162
Profit before tax 575 950 -2,537 -4,394 503 -14,465
Net result for the period 460 759 -2,623 -4,992 355 -14,664
Profit/loss attributable to non-controlling interests 184 303 -262 -499 104 -2,376
Profit/loss attributable to shareholders of BAUER AG 276 456 -2,361 -4,493 251 -12,288
Dividends distributed to non-controlling interest -146 -87 0 0 0 0
CASH FLOW STATEMENT
in EUR ’000
BAUER Casings PRAKLA Bohrtechnik Site Group
2014 2015 2014 2015 2014 2015
Cash flow from operating activities 537 394 7,870 -4,262 11,519 -25,176
Cash flow from investing activities -74 -155 -535 -565 -4,191 42,164
Cash flow from financing activities -375 -343 -7,533 4,819 -7,791 -16,170
Influence of exchange rate movements on cash 12 -27 0 0 516 42
Changes in cash and cash equivalents with an effect
on liquidity 100 -131 -198 -8 53 860

133NOTES TO THE CONSOLIDATED FINANCIAL STATEMENTS 2015
CO
NS
OL
IDA
TE
D F
INA
NC
IAL
STA
TE
ME
NT
S2
01
5
b) Changes in shareholdings in the Group's subsidiaries
In financial year 2015, BAUER Maschinen GmbH acquired the remaining 10 % of the shares in MAT Mischanlagentechnik GmbH
at a purchase price of EUR 110 thousand. The share thus increased to 100 %.
Shares with a value of EUR -318 thousand (share in the carrying amount of the net assets of MAT Mischanlagentechnik GmbH)
were transferred to BAUER Maschinen GmbH in the process.
The transferred shares were recognized in revenue reserves.
After the transfer of the shares, MAT Mischanlagentechnik GmbH, the transferor entity, was merged with
BAUER Maschinen GmbH and thus discontinued. The company Immenstadt is continued under the name of
MAT Mischanlagentechnik, a branch office of BAUER Maschinen GmbH.
In financial year 2015, BAUER Resources GmbH acquired the remaining 10 % of the shares in Esau & Hueber GmbH
at a purchase price of EUR 500 thousand. The share thus increased to 100 %.
Shares with a value of EUR -119 thousand (share in the carrying amount of the net assets of Esau & Hueber GmbH)
were transferred to BAUER Resources GmbH in the process.
The transferred shares were recognized in revenue reserves.
26.2 Additional disclosures regarding capital management
The object of Bauer's capital management is to safeguard a strong financial profile. In particular, it aims to provide
shareholders with appropriate dividend payments and to safeguard servicing of capital on behalf of lenders. We also aim to
provide ourselves with adequate financial resources to sustain our growth strategy. The risk profile is actively managed and
monitored. This is focused primarily on key indicators such as the equity ratio, net debt and net profit or loss for the period.
The key indicators are presented below:
in EUR ’000 Dec. 31, 2014 Dec. 31, 2015
Equity 418,925 451,210
Equity ratio 26.60 % 27.23 %
Net result for the period 15,726 28,992
Net debt 645,679 664,988
Financial indebtedness 687,514 712,394
Liquid funds 41,835 47,406
Net debt / EBITDA 3.78 3.59
EBITDA / net interest coverage 4.49 4.99

134 NOTES TO THE CONSOLIDATED FINANCIAL STATEMENTS 2015
As part of the capital management strategy covering the subsidiaries of the BAUER Group, it is ensured that member companies
are provided with an equity base in line with local requirements. Our aim in doing this is to provide the necessary flexibility in terms
of finance and liquidity. In the year under review all externally imposed capital covenants were fulfilled.
NON-CURRENT DEBT
27. NON-CURRENT LIABILITIES
The non-current portions of the liabilities comprise the following:
in EUR ’000 Remaining term Dec. 31, 2014 Remaining term Dec. 31, 2015
1 to 5 years over 5 years 1 to 5 years over 5 years
Liabilities to banks 357,678 7,093 363,166 13,462
Liabilities from finance lease agreements 13,032 0 12,652 0
Other non-current liabilities 5,959 0 7,262 0
Other non-current financial liabilities 10,013 0 4,414 0
Total 386,682 7,093 387,494 13,462
in EUR ’000 Fair value Interest rate margin
Dec. 31, 2014 Dec. 31, 2015 Dec. 31, 2014 Dec. 31, 2015
Liabilities to banks 378,016 384,999 0.50 - 11.2 % 0.50 - 11.2 %
Liabilities from finance lease agreements 13,032 12,652 2.38 - 7.89 % 1.43 - 7.50 %
Other non-current financial liabilities 9,904 4,409 0.85 - 12.5 % 3.5 - 12.5 %
Total 400,952 402,060 - -
The other non-current liabilities include non-current portions of liabilities from obligations in respect of part-time retirement and
service anniversary payments, trade payables, and liabilities from continuing involvements.
The other non-current financial liabilities mainly comprise the fair values of the derivatives as well as other liabilities to finance
companies and convertible bonds (see the Notes to the financial instruments in section 36).
28. PROVISIONS FOR PENSIONS
The BAUER Group operates a number of defined benefit plans in Germany and internationally. The provisions for defined
benefit plans of the companies in Schrobenhausen recognized on the consolidated balance sheet cover most (96 %) of the
balance sheet value. Those companies are governed by the occupational pension scheme of Bauer Spezialtiefbau GmbH
constituted on July 1, 1992 as amended by the in-company agreement dated November 18, 1998. In it, the company grants
all employees who joined by March 31, 1998 and their surviving dependents a retirement pension and invalidity benefit as well
as a widow's/widower's pension Employees qualify for the retirement pension on reaching the standard retirement age,
or on prior qualification for a pension from the statutory pension fund. The pension payable amounts to 0.225 percent of
the employee's pensionable earnings for each pensionable year of service, plus 0.075 percent of pensionable earnings for
each pensionable year of service completed before January 1, 1999; plus, for the portion of pensionable earnings above
the contribution assessment limit in the statutory pension fund, 0.375 percent plus 0.125 percent for each pensionable year
of service completed before January 1, 1999. In the case of scheme members who are not members of the Zusatzversorgungs-
kasse des Baugewerbes (construction industry ancillary benefits fund): For each pensionable year of service, 0.3 percent of
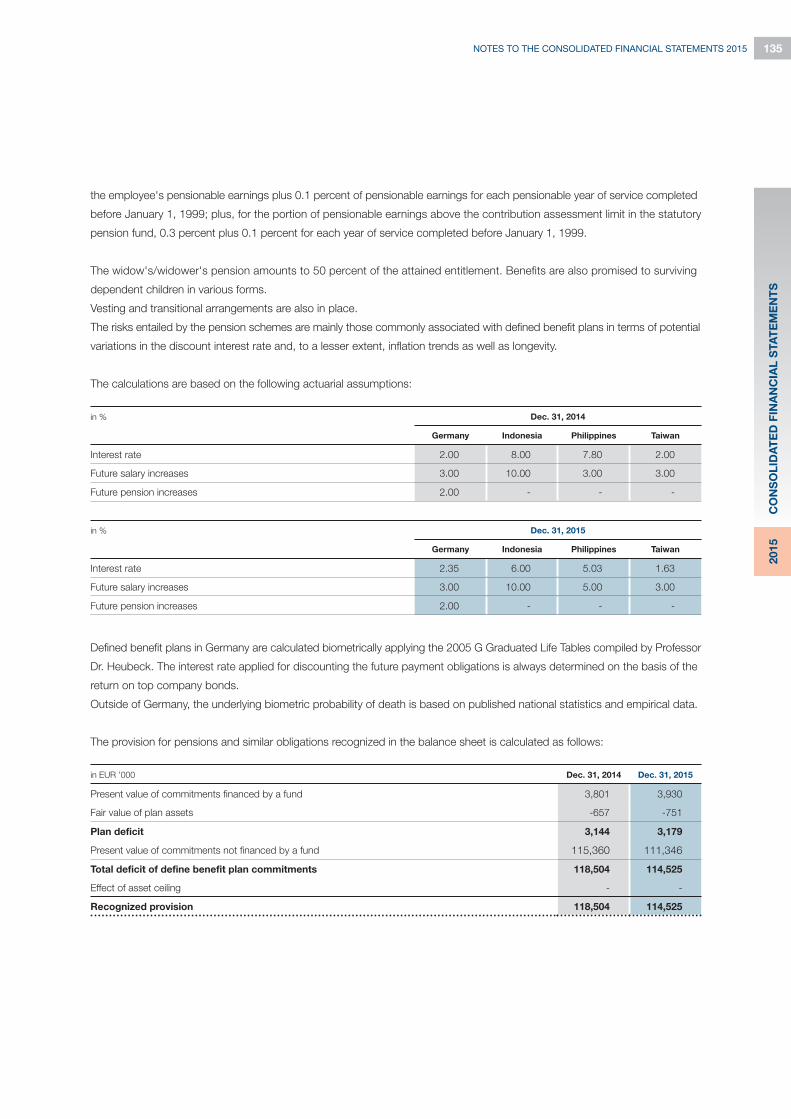
135NOTES TO THE CONSOLIDATED FINANCIAL STATEMENTS 2015
CO
NS
OL
IDA
TE
D F
INA
NC
IAL
STA
TE
ME
NT
S2
01
5
the employee's pensionable earnings plus 0.1 percent of pensionable earnings for each pensionable year of service completed
before January 1, 1999; plus, for the portion of pensionable earnings above the contribution assessment limit in the statutory
pension fund, 0.3 percent plus 0.1 percent for each year of service completed before January 1, 1999.
The widow's/widower's pension amounts to 50 percent of the attained entitlement. Benefits are also promised to surviving
dependent children in various forms.
Vesting and transitional arrangements are also in place.
The risks entailed by the pension schemes are mainly those commonly associated with defined benefit plans in terms of potential
variations in the discount interest rate and, to a lesser extent, inflation trends as well as longevity.
The calculations are based on the following actuarial assumptions:
in % Dec. 31, 2014
Germany Indonesia Philippines Taiwan
Interest rate 2.00 8.00 7.80 2.00
Future salary increases 3.00 10.00 3.00 3.00
Future pension increases 2.00 - - -
in % Dec. 31, 2015
Germany Indonesia Philippines Taiwan
Interest rate 2.35 6.00 5.03 1.63
Future salary increases 3.00 10.00 5.00 3.00
Future pension increases 2.00 - - -
Defined benefit plans in Germany are calculated biometrically applying the 2005 G Graduated Life Tables compiled by Professor
Dr. Heubeck. The interest rate applied for discounting the future payment obligations is always determined on the basis of the
return on top company bonds.
Outside of Germany, the underlying biometric probability of death is based on published national statistics and empirical data.
The provision for pensions and similar obligations recognized in the balance sheet is calculated as follows:
in EUR ’000 Dec. 31, 2014 Dec. 31, 2015
Present value of commitments financed by a fund 3,801 3,930
Fair value of plan assets -657 -751
Plan deficit 3,144 3,179
Present value of commitments not financed by a fund 115,360 111,346
Total deficit of define benefit plan commitments 118,504 114,525
Effect of asset ceiling - -
Recognized provision 118,504 114,525
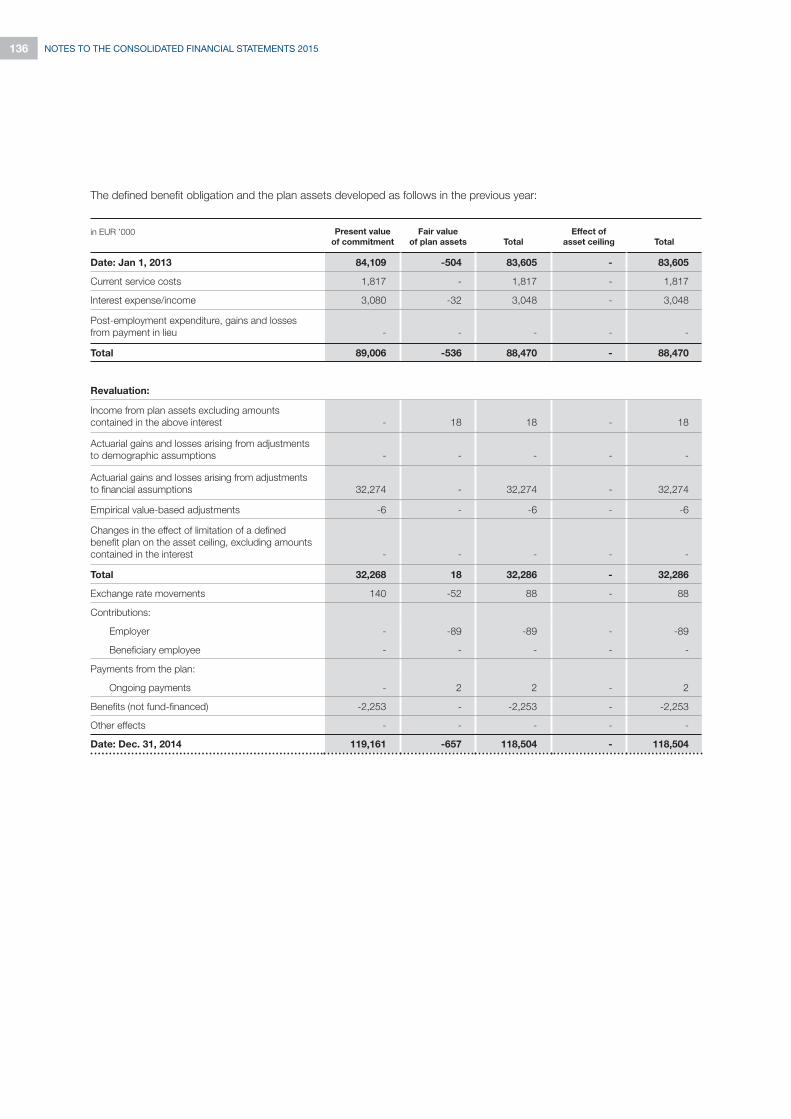
136 NOTES TO THE CONSOLIDATED FINANCIAL STATEMENTS 2015
The defined benefit obligation and the plan assets developed as follows in the previous year:
in EUR ’000 Present value
of commitment
Fair value
of plan assets Total
Effect of
asset ceiling Total
Date: Jan 1, 2013 84,109 -504 83,605 - 83,605
Current service costs 1,817 - 1,817 - 1,817
Interest expense/income 3,080 -32 3,048 - 3,048
Post-employment expenditure, gains and losses
from payment in lieu - - - - -
Total 89,006 -536 88,470 - 88,470
Revaluation:
Income from plan assets excluding amounts
contained in the above interest - 18 18 - 18
Actuarial gains and losses arising from adjustments
to demographic assumptions - - - - -
Actuarial gains and losses arising from adjustments
to financial assumptions 32,274 - 32,274 - 32,274
Empirical value-based adjustments -6 - -6 - -6
Changes in the effect of limitation of a defined
benefit plan on the asset ceiling, excluding amounts
contained in the interest - - - - -
Total 32,268 18 32,286 - 32,286
Exchange rate movements 140 -52 88 - 88
Contributions:
Employer - -89 -89 - -89
Beneficiary employee - - - - -
Payments from the plan:
Ongoing payments - 2 2 - 2
Benefits (not fund-financed) -2,253 - -2,253 - -2,253
Other effects - - - - -
Date: Dec. 31, 2014 119,161 -657 118,504 - 118,504

137NOTES TO THE CONSOLIDATED FINANCIAL STATEMENTS 2015
CO
NS
OL
IDA
TE
D F
INA
NC
IAL
STA
TE
ME
NT
S2
01
5
The defined benefit obligation and the plan assets developed as follows during the financial year:
in EUR ’000 Present value
of commitment
Fair value
of plan assets Total
Effect of
asset ceiling Total
Date: Jan 1, 2015 119,161 -657 118,504 - 118,504
Current service costs 2,838 - 2,838 - 2,838
Interest expense/income 2,429 -37 2,392 - 2,392
Post-employment expenditure, gains and losses
from payment in lieu - - - - -
Total 124,428 -694 123,734 - 123,734
Revaluation:
Income from plan assets excluding amounts
contained in the above interest - 39 39 - 39
Actuarial gains and losses arising from adjustments
to demographic assumptions - - - - -
Actuarial gains and losses arising from adjustments
to financial assumptions -8,267 - -8,267 - -8,267
Empirical value-based adjustments 1,686 - 1,686 - 1,686
Changes in the effect of limitation of a defined
benefit plan on the asset ceiling, excluding amounts
contained in the interest - - - - -
Total -6,581 39 -6,542 - -6.542
Exchange rate movements 30 -6 24 - 24
Contributions:
Employer - -90 -90 - -90
Beneficiary employee - - - - -
Payments from the plan:
Ongoing payments - - - - -
Benefits (not fund-financed) -2,292 - -2,292 - -2,292
Other effects -309 - -309 - -309
Date: Dec. 31, 2015 115,276 -751 114,525 - 114,525
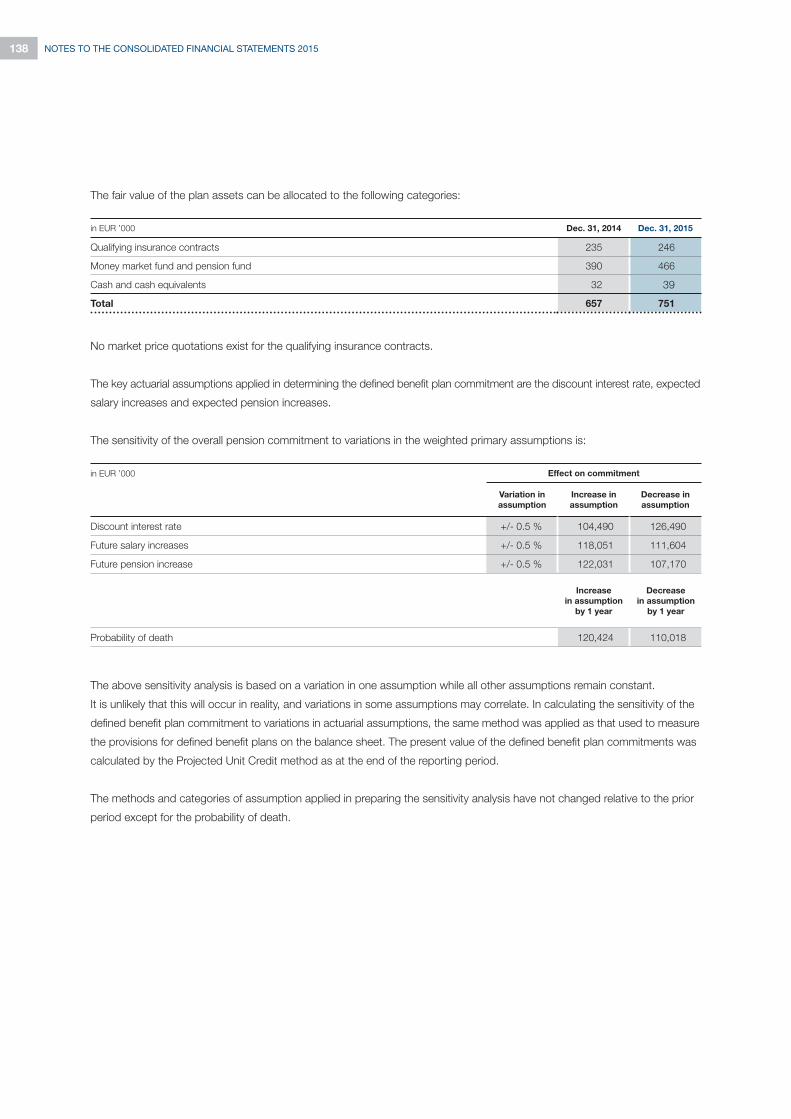
138 NOTES TO THE CONSOLIDATED FINANCIAL STATEMENTS 2015
The fair value of the plan assets can be allocated to the following categories:
No market price quotations exist for the qualifying insurance contracts.
The key actuarial assumptions applied in determining the defined benefit plan commitment are the discount interest rate, expected
salary increases and expected pension increases.
The sensitivity of the overall pension commitment to variations in the weighted primary assumptions is:
in EUR ’000 Dec. 31, 2014 Dec. 31, 2015
Qualifying insurance contracts 235 246
Money market fund and pension fund 390 466
Cash and cash equivalents 32 39
Total 657 751
The above sensitivity analysis is based on a variation in one assumption while all other assumptions remain constant.
It is unlikely that this will occur in reality, and variations in some assumptions may correlate. In calculating the sensitivity of the
defined benefit plan commitment to variations in actuarial assumptions, the same method was applied as that used to measure
the provisions for defined benefit plans on the balance sheet. The present value of the defined benefit plan commitments was
calculated by the Projected Unit Credit method as at the end of the reporting period.
The methods and categories of assumption applied in preparing the sensitivity analysis have not changed relative to the prior
period except for the probability of death.
in EUR ’000 Effect on commitment
Variation in
assumption
Increase in
assumption
Decrease in
assumption
Discount interest rate +/- 0.5 % 104,490 126,490
Future salary increases +/- 0.5 % 118,051 111,604
Future pension increase +/- 0.5 % 122,031 107,170
Increase
in assumption
by 1 year
Decrease
in assumption
by 1 year
Probability of death 120,424 110,018

139NOTES TO THE CONSOLIDATED FINANCIAL STATEMENTS 2015
CO
NS
OL
IDA
TE
D F
INA
NC
IAL
STA
TE
ME
NT
S2
01
5
The defined benefit plan commitments and plan assets by country are as follows:
in EUR ’000 Dec. 31, 2014
Germany Indonesia Philippines Taiwan Total
Present value of commitments 117,773 1,027 223 138 119,161
Fair value of plan assets -235 -390 0 -32 -657
Total 117,538 637 223 106 118,504
Effect of asset ceiling - - - - -
Total 117,538 637 223 106 118,504
in EUR ’000 Dec. 31, 2015
Germany Indonesia Philippines Taiwan Total
Present value of commitments 113,724 1,079 269 204 115,276
Fair value of plan assets -246 -466 0 -39 -751
Total 113,478 -613 269 165 114,525
Effect of asset ceiling - - - - -
Total 113,478 -613 269 165 114,525
in EUR ’000 under
1 year
1 to 5 years 6 to 10 years Dec. 31, 2015
Total
Pension payments 2,518 12,189 20,536 35,243
in EUR ’000 Dec. 31, 2014 Dec. 31, 2015
Active scheme members 75,169 71,423
Deferred beneficiaries 6,522 6,365
Retired employees 37,470 37,488
Total 119,161 115,276
The present value of the defined benefit plan commitment is distributed as follows among the plan members:
The weighted average term of the defined benefit plans is 19.44 years.
Pension payment in financial year 2016 are expected to amount to EUR 2,518 thousand (previous year: EUR 2,314 thousand).
Of that total, EUR 2,518 thousand (previous year: EUR 2,314 thousand) is projected to be contributed by the employer.
Contributions to the external plan assets totaling EUR 90 thousand (previous year: EUR 89 thousand) are expected for 2016.
The following table provides an overview of the due dates of the undiscounted pension payments:
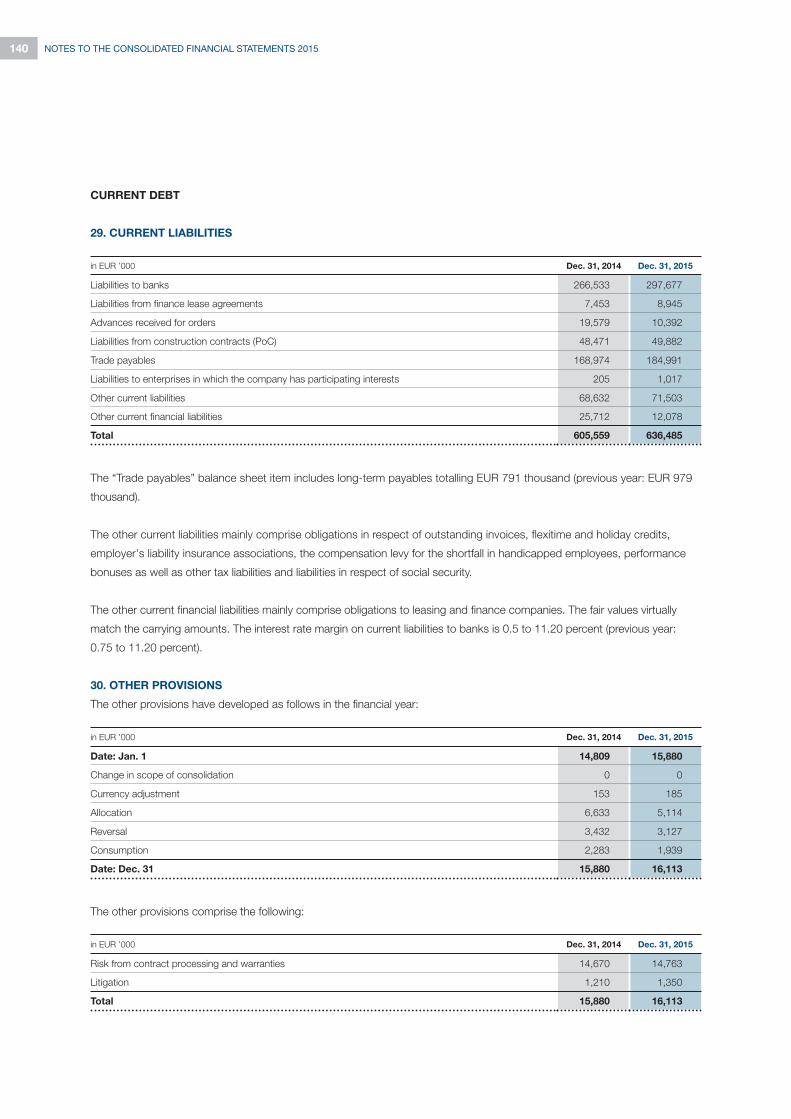
140 NOTES TO THE CONSOLIDATED FINANCIAL STATEMENTS 2015
CURRENT DEBT
29. CURRENT LIABILITIES
The “Trade payables” balance sheet item includes long-term payables totalling EUR 791 thousand (previous year: EUR 979
thousand).
The other current liabilities mainly comprise obligations in respect of outstanding invoices, flexitime and holiday credits,
employer's liability insurance associations, the compensation levy for the shortfall in handicapped employees, performance
bonuses as well as other tax liabilities and liabilities in respect of social security.
The other current financial liabilities mainly comprise obligations to leasing and finance companies. The fair values virtually
match the carrying amounts. The interest rate margin on current liabilities to banks is 0.5 to 11.20 percent (previous year:
0.75 to 11.20 percent).
30. OTHER PROVISIONS
The other provisions have developed as follows in the financial year:
in EUR ’000 Dec. 31, 2014 Dec. 31, 2015
Liabilities to banks 266,533 297,677
Liabilities from finance lease agreements 7,453 8,945
Advances received for orders 19,579 10,392
Liabilities from construction contracts (PoC) 48,471 49,882
Trade payables 168,974 184,991
Liabilities to enterprises in which the company has participating interests 205 1,017
Other current liabilities 68,632 71,503
Other current financial liabilities 25,712 12,078
Total 605,559 636,485
in EUR ’000 Dec. 31, 2014 Dec. 31, 2015
Date: Jan. 1 14,809 15,880
Change in scope of consolidation 0 0
Currency adjustment 153 185
Allocation 6,633 5,114
Reversal 3,432 3,127
Consumption 2,283 1,939
Date: Dec. 31 15,880 16,113
The other provisions comprise the following:
in EUR ’000 Dec. 31, 2014 Dec. 31, 2015
Risk from contract processing and warranties 14,670 14,763
Litigation 1,210 1,350
Total 15,880 16,113

141NOTES TO THE CONSOLIDATED FINANCIAL STATEMENTS 2015
CO
NS
OL
IDA
TE
D F
INA
NC
IAL
STA
TE
ME
NT
S2
01
5
in EUR ’000 Dec. 31, 2014 Dec. 31, 2015
Liabilities from guarantees 5,112 112,035
in EUR ’000 Remaining term
under 1 year 1 to 5 years over 5 years
Dec. 31, 2014 Dec. 31, 2015 Dec. 31, 2014 Dec. 31, 2015 Dec. 31, 2014 Dec. 31, 2015
Minimum lease payments
from operating leases 9,663 9,784 22,048 12,636 77 303
Other financial obligations 6,715 13,385 3,677 7,225 6,749 6,435
The provisions for risk from contract processing and warranties include all risks arising from carrying out specialist foundation
engineering work and from the sale of machinery, equipment and tools for specialist foundation engineering, with the associated
services. These primarily relate to warranty obligations and to other uncertain commitments. The risk from contract processing
and warranties is determined specific to project/construction site.
The provisions for risks arising from contract processing and warranties and material provisions for litigation are predicted to
be used up during 2016. The provisions for litigation in the amount of EUR 434 thousand (previous year: EUR 427 thousand)
are expected to be used during the course of 2017. The provisions for litigation relate for the most part to provisions for legal
disputes on supplementary receivables.
31. CONTINGENT LIABILITIES
Contingent liabilities are liabilities not yet recognized in the financial statements, which are recognized in the amount of the
maximum possible exposure on the balance sheet date.
In the construction industry, it is common and essential practice to issue various guarantees to secure obligations arising
from construction contracts. These guarantees are usually issued by banks or credit insurance companies (guarantors), and
essentially guarantee quotations, contract performance, prepayments and warranty commitments. In the event of a guarantee
being given, the guarantors have a right of recourse against the Group. A risk of a guarantee being implemented exists only
when the underlying contractual obligations are not duly met.
The contingent liabilities were mainly in relation to the securing of contract performance, to warranty obligations and to advance
payments. Liabilities from guarantees exist to third parties. In addition, we are subject to joint and several liability in respect of all
joint ventures in which we participate.
The maturities of payments for liabilities were not stated for reasons of practicality.
32. OTHER FINANCIAL OBLIGATIONS
The operating leases relate mainly to mutual agreements about factory and office equipment, as well as to technical equipment
and machinery which were added in the financial year and are classified as operating leases. The BAUER Group is committed
to rental agreements of unlimited term totaling monthly EUR 1,342 thousand (previous year: EUR 685 thousand). The other
financial obligations mainly include limited-term property rentals and leases.
33. DISCONTINUED OPERATIONS
There are no plans to discontinue business operations under the terms of IFRS 5.
34. EVENTS AFTER THE BALANCE SHEET DATE
No events subject to mandatory reporting in accordance with IAS 10 occurred after December 31, 2015.

142 NOTES TO THE CONSOLIDATED FINANCIAL STATEMENTS 2015
35. CASH FLOW STATEMENT
The funds shown in the cash flow statement comprise only the cash and cash equivalents stated on the balance sheet.
The cash flow statement details payment flows, broken down by inflow and outflow of funds from operating activities and
from investing and financing activities.
The cash flow from operating activities is derived indirectly from the pre-tax profit. The pre-tax profit is adjusted by non-cash
transactions. The cash flow from operating activities is produced taking account of the changes in working capital.
Investing activities include additions to property, plant and equipment and to financial assets and intangible assets, as well
as income from the sale of assets. Financing activities include outflows of cash and cash equivalents arising from dividend
payments as well as the change in other financial indebtedness.
The changes in balance sheet items applied for the preparation of the cash flow statement are not directly derivable from
the balance sheet, as the effects of currency translation and changes in the scope of consolidation, as well as the allocation
and elimination of value adjustments on trade receivables, do not affect payments and are stripped out.
36. FINANCIAL INSTRUMENTS
In its business operations and financing activities the BAUER Group is subject in particular to fluctuations in exchange rates
and interest rates. It is the company's policy to exclude, or at least limit, these risks by entering into hedge transactions.
All hedging measures are controlled and executed centrally by BAUER AG.
Application of the segregation-of-duties approach ensures that there is an adequate split between the trading and execution
functions. The segregation-of-duties approach is implemented by spreading functions across the Management Board (financial
reporting) and the corporate departments (operational handling). All derivatives transactions are entered into only with banks
of the highest possible credit rating.
MARKET RISKS
Foreign exchange rate risks
Foreign exchange rate risks under the terms of IFRS 7 are created by financial instruments which are denominated in a currency
different to the functional currency and are of a monetary nature. Exchange rate-related differences when converting financial
statements into the Group currency are ignored. All non-functional currencies in which the BAUER Group enters into financial
instruments are classed, as a matter of principle, as relevant risk variables.
The existing foreign exchange forward contracts and cross-currency swaps safeguard our currency hedging strategy.
Within the BAUER Group, the primary monetary financial instruments are either denominated directly in functional currency
or are largely transferred into the functional currency by means of derivatives. In view of the usually short-term maturity of the
instruments too, possible changes in exchange rates have only very minor effects on earnings or equity.
For the purposes of sensitivity analysis, foreign exchange rate risks arising from monetary financial instruments which were not
concluded in the functional currencies of the individual member companies of the BAUER Group are included in the analysis.
OTHER DISCLOSURES
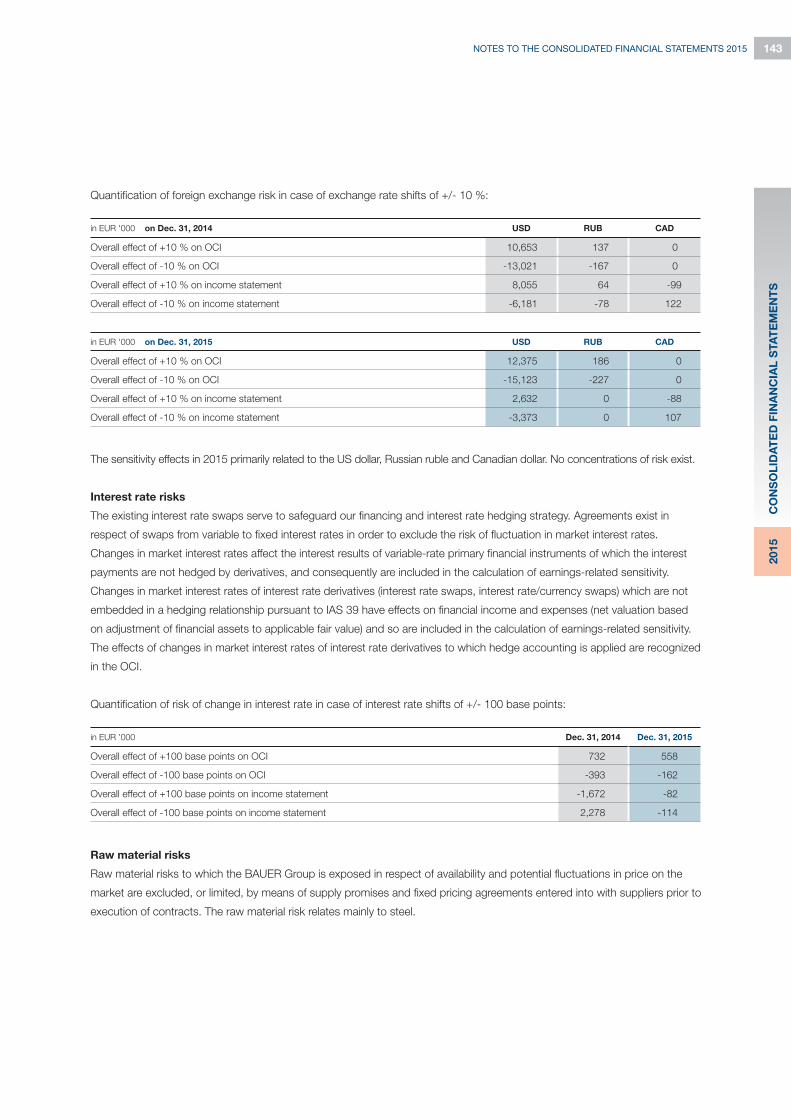
143NOTES TO THE CONSOLIDATED FINANCIAL STATEMENTS 2015
CO
NS
OL
IDA
TE
D F
INA
NC
IAL
STA
TE
ME
NT
S2
01
5
Quantification of foreign exchange risk in case of exchange rate shifts of +/- 10 %:
in EUR '000 on Dec. 31, 2014 USD RUB CAD
Overall effect of +10 % on OCI 10,653 137 0
Overall effect of -10 % on OCI -13,021 -167 0
Overall effect of +10 % on income statement 8,055 64 -99
Overall effect of -10 % on income statement -6,181 -78 122
in EUR '000 on Dec. 31, 2015 USD RUB CAD
Overall effect of +10 % on OCI 12,375 186 0
Overall effect of -10 % on OCI -15,123 -227 0
Overall effect of +10 % on income statement 2,632 0 -88
Overall effect of -10 % on income statement -3,373 0 107
in EUR ’000 Dec. 31, 2014 Dec. 31, 2015
Overall effect of +100 base points on OCI 732 558
Overall effect of -100 base points on OCI -393 -162
Overall effect of +100 base points on income statement -1,672 -82
Overall effect of -100 base points on income statement 2,278 -114
The sensitivity effects in 2015 primarily related to the US dollar, Russian ruble and Canadian dollar. No concentrations of risk exist.
Interest rate risks
The existing interest rate swaps serve to safeguard our financing and interest rate hedging strategy. Agreements exist in
respect of swaps from variable to fixed interest rates in order to exclude the risk of fluctuation in market interest rates.
Changes in market interest rates affect the interest results of variable-rate primary financial instruments of which the interest
payments are not hedged by derivatives, and consequently are included in the calculation of earnings-related sensitivity.
Changes in market interest rates of interest rate derivatives (interest rate swaps, interest rate/currency swaps) which are not
embedded in a hedging relationship pursuant to IAS 39 have effects on financial income and expenses (net valuation based
on adjustment of financial assets to applicable fair value) and so are included in the calculation of earnings-related sensitivity.
The effects of changes in market interest rates of interest rate derivatives to which hedge accounting is applied are recognized
in the OCI.
Quantification of risk of change in interest rate in case of interest rate shifts of +/- 100 base points:
Raw material risks
Raw material risks to which the BAUER Group is exposed in respect of availability and potential fluctuations in price on the
market are excluded, or limited, by means of supply promises and fixed pricing agreements entered into with suppliers prior to
execution of contracts. The raw material risk relates mainly to steel.
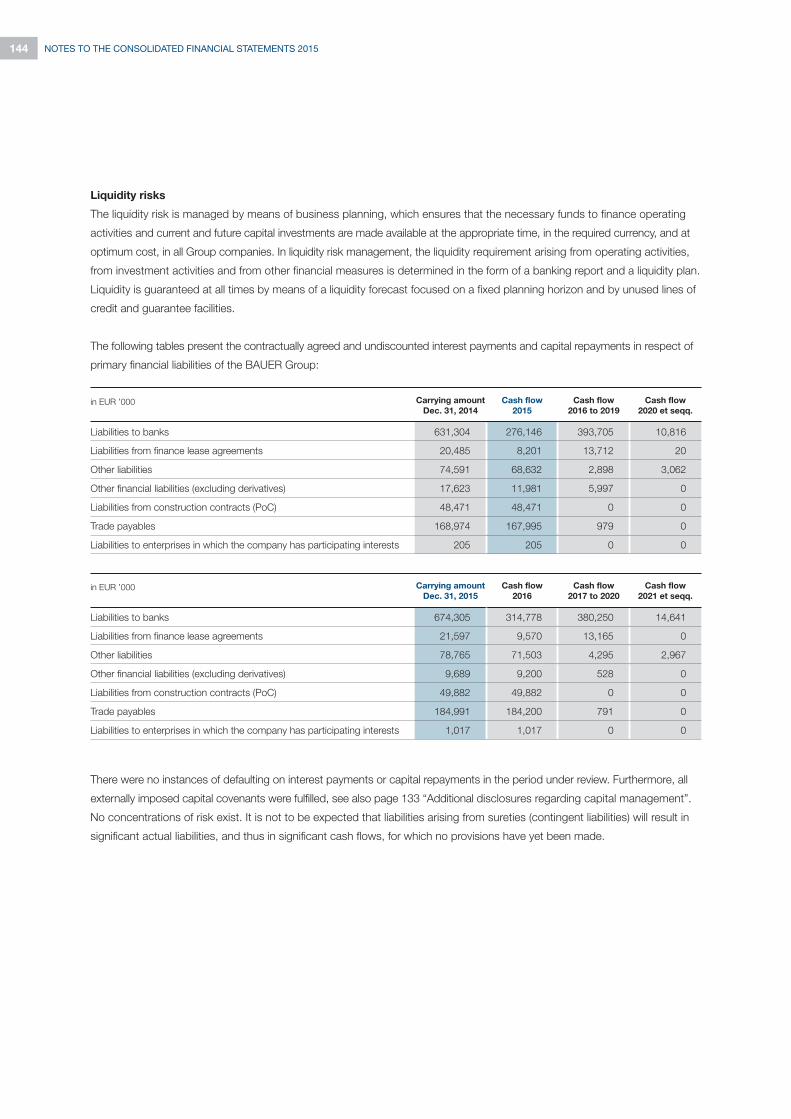
144 NOTES TO THE CONSOLIDATED FINANCIAL STATEMENTS 2015
Liquidity risks
The liquidity risk is managed by means of business planning, which ensures that the necessary funds to finance operating
activities and current and future capital investments are made available at the appropriate time, in the required currency, and at
optimum cost, in all Group companies. In liquidity risk management, the liquidity requirement arising from operating activities,
from investment activities and from other financial measures is determined in the form of a banking report and a liquidity plan.
Liquidity is guaranteed at all times by means of a liquidity forecast focused on a fixed planning horizon and by unused lines of
credit and guarantee facilities.
The following tables present the contractually agreed and undiscounted interest payments and capital repayments in respect of
primary financial liabilities of the BAUER Group:
in EUR ’000 Carrying amount
Dec. 31, 2014
Cash flow
2015
Cash flow
2016 to 2019
Cash flow
2020 et seqq.
Liabilities to banks 631,304 276,146 393,705 10,816
Liabilities from finance lease agreements 20,485 8,201 13,712 20
Other liabilities 74,591 68,632 2,898 3,062
Other financial liabilities (excluding derivatives) 17,623 11,981 5,997 0
Liabilities from construction contracts (PoC) 48,471 48,471 0 0
Trade payables 168,974 167,995 979 0
Liabilities to enterprises in which the company has participating interests 205 205 0 0
in EUR ’000 Carrying amount
Dec. 31, 2015
Cash flow
2016
Cash flow
2017 to 2020
Cash flow
2021 et seqq.
Liabilities to banks 674,305 314,778 380,250 14,641
Liabilities from finance lease agreements 21,597 9,570 13,165 0
Other liabilities 78,765 71,503 4,295 2,967
Other financial liabilities (excluding derivatives) 9,689 9,200 528 0
Liabilities from construction contracts (PoC) 49,882 49,882 0 0
Trade payables 184,991 184,200 791 0
Liabilities to enterprises in which the company has participating interests 1,017 1,017 0 0
There were no instances of defaulting on interest payments or capital repayments in the period under review. Furthermore, all
externally imposed capital covenants were fulfilled, see also page 133 “Additional disclosures regarding capital management”.
No concentrations of risk exist. It is not to be expected that liabilities arising from sureties (contingent liabilities) will result in
significant actual liabilities, and thus in significant cash flows, for which no provisions have yet been made.

145NOTES TO THE CONSOLIDATED FINANCIAL STATEMENTS 2015
CO
NS
OL
IDA
TE
D F
INA
NC
IAL
STA
TE
ME
NT
S2
01
5
The due dates of derivative financial instruments based on outflow and inflow of cash and cash equivalents are as follows:
in EUR '000 on Dec. 31, 2014 Carrying amount 2015 2016 to 2019 as from 2020
Liabilities from foreign exchange forward contracts 12,926 -12,804 -279 0
Outflow of cash and cash equivalents - -228,410 -8,220 0
Inflow of cash and cash equivalents - 215,606 7,941 0
Liabilities from interest rate swaps 5,176 -2,598 -2,341 -29
Outflow of cash and cash equivalents - -2,598 -2,341 -29
Inflow of cash and cash equivalents - 0 0 0
in EUR '000 on Dec. 31, 2015 Carrying amount 2016 2017 to 2020 as from 2021
Liabilities from foreign exchange forward contracts 3,375 -2,654 -2,188 0
Outflow of cash and cash equivalents - -74,496 -37,330 0
Inflow of cash and cash equivalents - 71,842 35,142 0
Liabilities from interest rate swaps 3,428 -1,714 -2,766 -1,505
Outflow of cash and cash equivalents - -1,714 -2,766 -1,505
Inflow of cash and cash equivalents - 0 0 0
To calculate the cash inflows from interest rate swaps the conditions as per December 31, 2015 were applied.
Risk of default
The risk of default is managed at Group level. Default risks arise from cash and cash equivalents, derivative financial instru-
ments and deposits at banks and financial service companies. Only banks and financial services companies with the highest
possible credit ratings are selected as partners. No credit limit was exceeded in the reporting period. The management expects
no defaults on the part of these business partners.
The risk of default on financial assets exists in terms of the risk of failure of a contract party and thus to a maximum in the
amount of the carrying amount of the exposure to the said party. A presentation of the carrying amounts and the resultant
maximum risk of default per category is given in the table starting on page 150. The risk arising from primary financial instruments
is countered by means of value adjustments for bad debt, and in Germany also by means of credit insurance cover. As derivative
financial instruments are entered into only with banks with the highest possible credit ratings, and the risk management system
sets limits for each party, the actual risk of default is negligible. No concentrations of risk exist.
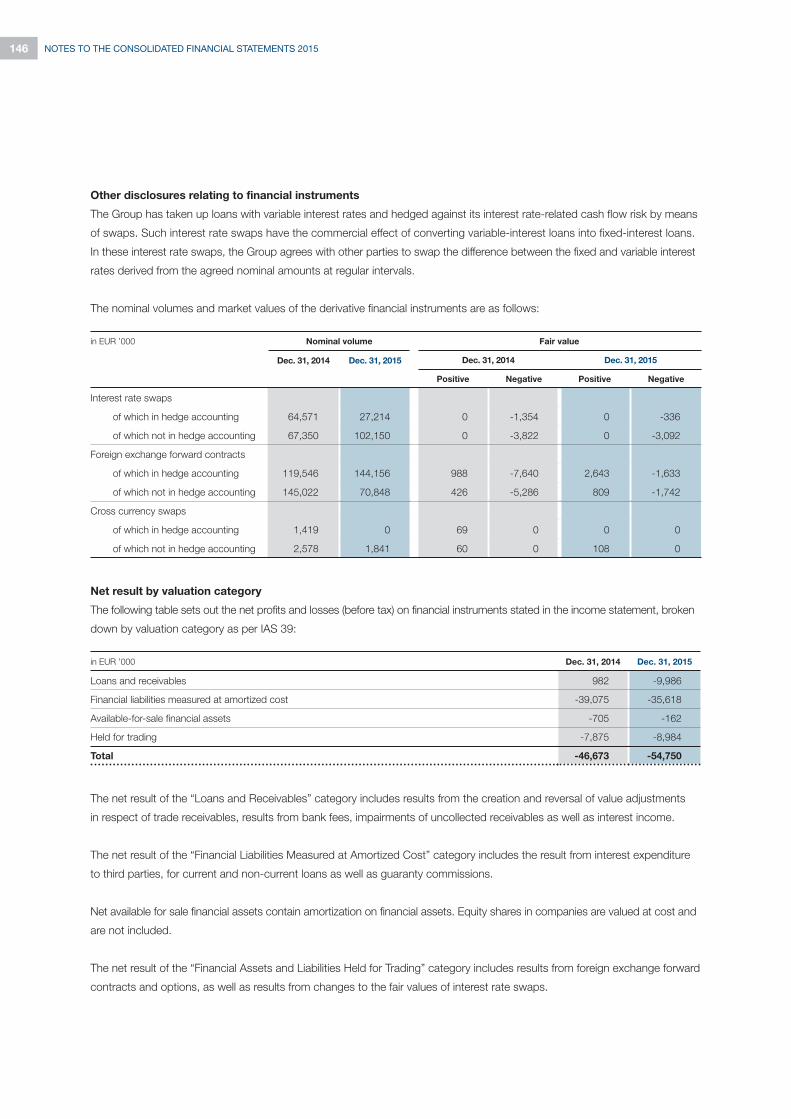
146 NOTES TO THE CONSOLIDATED FINANCIAL STATEMENTS 2015
Other disclosures relating to financial instruments
The Group has taken up loans with variable interest rates and hedged against its interest rate-related cash flow risk by means
of swaps. Such interest rate swaps have the commercial effect of converting variable-interest loans into fixed-interest loans.
In these interest rate swaps, the Group agrees with other parties to swap the difference between the fixed and variable interest
rates derived from the agreed nominal amounts at regular intervals.
The nominal volumes and market values of the derivative financial instruments are as follows:
Net result by valuation category
The following table sets out the net profits and losses (before tax) on financial instruments stated in the income statement, broken
down by valuation category as per IAS 39:
in EUR ’000 Dec. 31, 2014 Dec. 31, 2015
Loans and receivables 982 -9,986
Financial liabilities measured at amortized cost -39,075 -35,618
Available-for-sale financial assets -705 -162
Held for trading -7,875 -8,984
Total -46,673 -54,750
in EUR ’000 Nominal volume Fair value
Dec. 31, 2014 Dec. 31, 2015 Dec. 31, 2014 Dec. 31, 2015
Positive Negative Positive Negative
Interest rate swaps
of which in hedge accounting 64,571 27,214 0 -1,354 0 -336
of which not in hedge accounting 67,350 102,150 0 -3,822 0 -3,092
Foreign exchange forward contracts
of which in hedge accounting 119,546 144,156 988 -7,640 2,643 -1,633
of which not in hedge accounting 145,022 70,848 426 -5,286 809 -1,742
Cross currency swaps
of which in hedge accounting 1,419 0 69 0 0 0
of which not in hedge accounting 2,578 1,841 60 0 108 0
The net result of the “Loans and Receivables” category includes results from the creation and reversal of value adjustments
in respect of trade receivables, results from bank fees, impairments of uncollected receivables as well as interest income.
The net result of the “Financial Liabilities Measured at Amortized Cost” category includes the result from interest expenditure
to third parties, for current and non-current loans as well as guaranty commissions.
Net available for sale financial assets contain amortization on financial assets. Equity shares in companies are valued at cost and
are not included.
The net result of the “Financial Assets and Liabilities Held for Trading” category includes results from foreign exchange forward
contracts and options, as well as results from changes to the fair values of interest rate swaps.

147NOTES TO THE CONSOLIDATED FINANCIAL STATEMENTS 2015
CO
NS
OL
IDA
TE
D F
INA
NC
IAL
STA
TE
ME
NT
S2
01
5
Carrying amounts and fair values
The fair value of a financial instrument is the consideration for which an asset might be exchanged, or a debt paid, between
informed, willing and mutually independent parties. Where financial instruments are quoted on an active market – such as
in particular shares held and bonds issued – the price quoted on the market in question is the fair value. If no active market
exists, the fair value is determined by financial valuation methods. For securities (AfS) the BAUER Group has at its disposal the
prices quoted on an active market.
The fair values of foreign exchange forward contracts and cross-currency swaps are measured separately at their respective
forward prices and discounted to the reference date based on the corresponding interest rate curve. The market prices of
foreign exchange forward options are determined by recognized option models.
The fair values of the interest swaps correspond to the respective market value as determined by appropriate financial valuation
methods, such as by discounting expected future cash flows.
For cash and cash equivalents, current trade receivables and other current assets, current trade payables and other current
liabilities, owing to their short remaining terms the carrying amount should be adopted as a realistic estimate of the fair value.
The fair values of non-current financial assets and of other non-current financial liabilities correspond to the cash values of the
payment flows linked to the assets, taking into account the applicable interest rate parameters, which reflect changes in the
terms and expectations of the market and of the respective parties.
The fair values of financial instruments are determined on the basis of one of the methods set out on the three following levels:
• Level 1: Quoted prices (adopted unchanged) on active markets for identical assets and liabilities
• Level 2: Directly or indirectly observable input data for the asset or liability other than quoted prices as per level 1
• Level 3: Applied input data which does not originate from observable market data for measurement of the asset and liability
(non-observable input data)
There were no transfers between the levels during the year. If circumstances arise necessitating a reclassification, it is undertaken
at the end of the reporting period.
Other disclosures relating to hedging transactions
In financial year 2015, changes in equity due to cash flow hedges in the amount of EUR 190 thousand (previous year:
EUR 1,174 thousand) before taxes and in the amount of EUR 137 thousand (previous year: EUR 1,120 thousand) after taxes
were recognized as hedge reserve in equity without any effect on profit and loss. An amount of EUR 834 thousand (previous
year: EUR -6,497 thousand) was recognized in profit and loss from the hedge reserve created with no effect on net income
in the shareholders' equity. Fair value changes resulting from the derivative financial instruments held on December 31, 2015
were recognized in equity (increase) in the amount of EUR 1,024 thousand (previous year: EUR -5,313 thousand). In addition,
the changes in deferred taxes in the amount of EUR -53 thousand (previous year: EUR 54 thousand) were recognized in eq-
uity without any effect on profit and loss. Future transactions in foreign currencies secured by hedging and changes in market
interest rates are expected to be realized by 2020 at the latest. Gains and losses on future contracts in foreign currency and

148 NOTES TO THE CONSOLIDATED FINANCIAL STATEMENTS 2015
interest rates at December 31, 2015 included in the hedge reserve in the OCI are recognized in the income statement in the
period in which the hedged planned transaction impacts on the income statement.
The prospective effectiveness is measured according to the Critical Term Match method and the retrospective effectiveness
according to the Dollar Offset method based on the Hypothetical Derivatives method.
Offsetting financial assets and financial liabilities
a) Financial assets
The following financial assets are subject to offsetting, enforceable master-netting arrangements or similar arrangements.
in EUR ’000 Related amounts,
which are not offset in the balance sheet
Gross financial
assets recognized
Gross financial
liabilities offset on
the balance sheet
Net amount of
financial assets
recognized on the
balance sheet
Financial
instruments
Cash securities
received Net amount
Date: Dec. 31, 2014
Derivative financial assets 1,543 0 1,543 -1,484 - 59
Cash and cash equivalents 41,835 0 41,835 -4,402 - 37,433
Total 43,378 0 43,378 -5,886 - 37,492
Date: Dec. 31, 2015
Derivative financial assets 3,560 0 3,560 -1,662 - 1,898
Cash and cash equivalents 47,406 0 47,406 -4,000 - 43,406
Total 50,966 0 50,966 -5,662 - 45,304
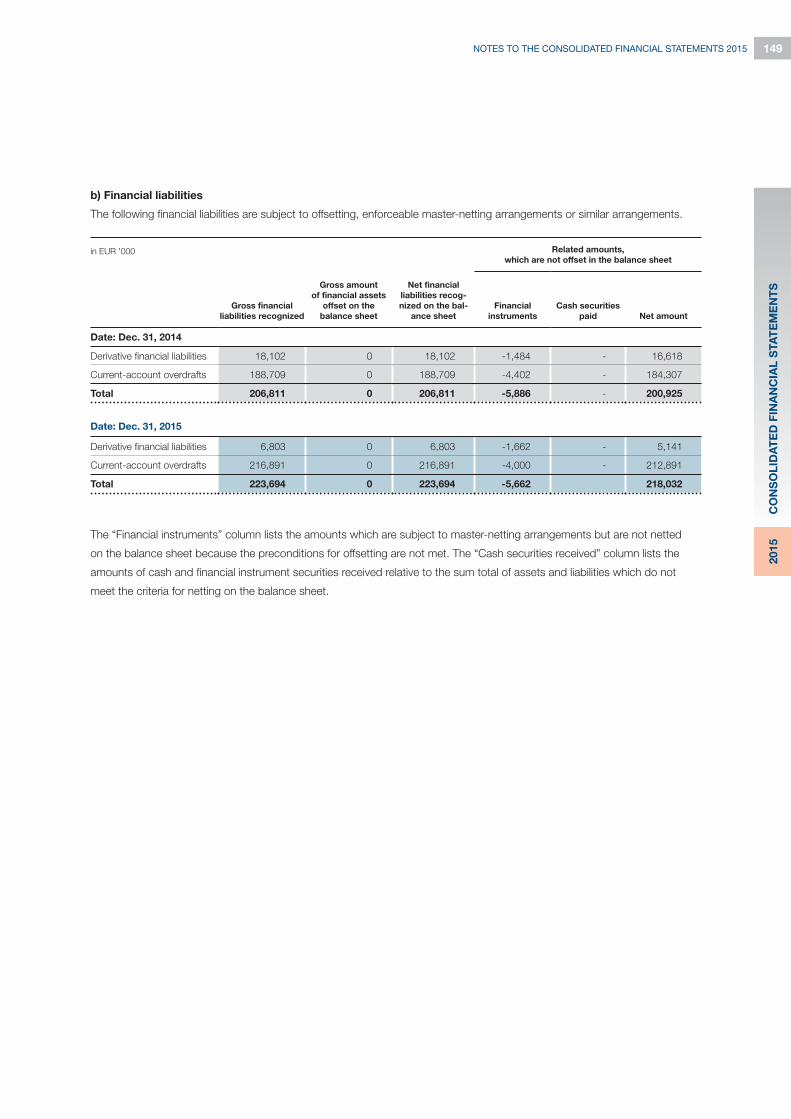
149NOTES TO THE CONSOLIDATED FINANCIAL STATEMENTS 2015
CO
NS
OL
IDA
TE
D F
INA
NC
IAL
STA
TE
ME
NT
S2
01
5
b) Financial liabilities
The following financial liabilities are subject to offsetting, enforceable master-netting arrangements or similar arrangements.
in EUR ’000 Related amounts,
which are not offset in the balance sheet
Gross financial
liabilities recognized
Gross amount
of financial assets
offset on the
balance sheet
Net financial
liabilities recog-
nized on the bal-
ance sheet
Financial
instruments
Cash securities
paid Net amount
Date: Dec. 31, 2014
Derivative financial liabilities 18,102 0 18,102 -1,484 - 16,618
Current-account overdrafts 188,709 0 188,709 -4,402 - 184,307
Total 206,811 0 206,811 -5,886 - 200,925
Date: Dec. 31, 2015
Derivative financial liabilities 6,803 0 6,803 -1,662 - 5,141
Current-account overdrafts 216,891 0 216,891 -4,000 - 212,891
Total 223,694 0 223,694 -5,662 218,032
The “Financial instruments” column lists the amounts which are subject to master-netting arrangements but are not netted
on the balance sheet because the preconditions for offsetting are not met. The “Cash securities received” column lists the
amounts of cash and financial instrument securities received relative to the sum total of assets and liabilities which do not
meet the criteria for netting on the balance sheet.

150 NOTES TO THE CONSOLIDATED FINANCIAL STATEMENTS 2015
Within the Group, financial instruments are classified in the same way as the respective balance sheet items. No fair value
was stated for current financial instruments and financial instruments recognized at cost in accordance with IFRS 7.29.
The following table presents a progression of the classes to the categories of IAS 39 and the respective market values:
in EUR ’000
Measurement benchmark Carrying amount Loans and receivables/
other financial liabilities
Dec. 31, 2014 Dec. 31, 2015 Dec. 31, 2014 Dec. 31, 2015
NON-CURRENT ASSETS
Participations 3,613 3,613 0 0
Other non-current financial assets 28,420 15,355
1,402 707 0 0
22,671 11,408 22,671 11,408
4,347 3,240 0 0
CURRENT ASSETS
Receivables from construction contracts 132,159 129,478 132,159 129,478
Trade receivables 311,417 343,933 311,417 343,933
Receivables from enterprises
in which the company has participating interests 67 3,272 67 3,272
Other current financial assets 20,100 28,901
141 2.853 0 0
19,959 26,048 19,959 26,048
Cash and cash equivalents 41,835 47,406 41,835 47,406
Total financial assets 537,611 571,958 528,108 561,545

151NOTES TO THE CONSOLIDATED FINANCIAL STATEMENTS 2015
CO
NS
OL
IDA
TE
D F
INA
NC
IAL
STA
TE
ME
NT
S2
01
5
Balance sheet valuation as per IAS 39 Not allocated to any IAS 39 category
Measure-
ment level
in accor-
dance with
IFRS 13
Available
for Sale
Financial Assets and
Liabilities Held for Trading
Derivatives in Hedge
Accounting
Recognition in the
balance sheet in accordance
with IAS 17
Fair Value in accordance
with IFRS 7 and IFRS 13
Dec. 31, 2014 Dec. 31, 2015 Dec. 31, 2014 Dec. 31, 2015 Dec. 31, 2014 Dec. 31, 2015 Dec. 31, 2014 Dec. 31, 2015 Dec. 31, 2014 Dec. 31, 2015
3,613 3,613 0 0 0 0 0 0 n/a n/a n/a
0 0 349 108 1,053 599 0 0 1,402 707 2
0 0 0 0 0 0 0 0 22,224 9,960 2
4,347 3,240 0 0 0 0 0 0 n/a n/a n/a
0 0 0 0 0 0 0 0 n/a n/a n/a
0 0 0 0 0 0 0 0 310,972 343,404 2
0 0 0 0 0 0 0 0 n/a n/a n/a
0 0 136 809 5 2,044 0 0 141 2,853 2
0 0 0 0 0 0 0 0 n/a n/a n/a
0 0 0 0 0 0 0 0 n/a n/a n/a
7,960 6,853 485 917 1,058 2,643 0 0 334,739 356,924

152 NOTES TO THE CONSOLIDATED FINANCIAL STATEMENTS 2015
in EUR ’000
Measurement benchmark Carrying amount Loans and receivables/
other financial liabilities
Dec. 31, 2014 Dec. 31, 2015 Dec. 31, 2014 Dec. 31, 2015
NON-CURRENT DEBT
Liabilities to banks 364,771 376,628 364,771 376,628
Liabilities from finance lease agreements 13,032 12,652 0 0
Other non-current financial liabilities 10,013 4,414
4,371 3,925 0 0
5,642 489 5,642 489
CURRENT DEBT
Liabilities to banks 266,533 297,677 266,533 297,677
Liabilities from finance lease agreements 7,453 8,945 0 0
Liabilities from construction contracts 48,471 49,882 48,471 49,882
Trade payables 168,974 184,991 168,974 184,991
Liabilities to enterprises
in which the company has participating interests 205 1,017 205 1,017
Other current financial liabilities 25,712 12,078
13,731 2,878 0 0
11,981 9,200 11,981 9,200
Total financial liabilities 905,164 948,284 866,577 919,884

153NOTES TO THE CONSOLIDATED FINANCIAL STATEMENTS 2015
CO
NS
OL
IDA
TE
D F
INA
NC
IAL
STA
TE
ME
NT
S2
01
5
Balance sheet valuation as per IAS 39 Not allocated to any IAS 39 category
Measure-
ment level
in accor-
dance with
IFRS 13
Available
for Sale
Financial Assets and
Liabilities Held for Trading
Derivatives in Hedge
Accounting
Recognition in the
balance sheet in accordance
with IAS 17
Fair Value in accordance
with IFRS 7 and IFRS 13
Dec. 31, 2014 Dec. 31, 2015 Dec. 31, 2014 Dec. 31, 2015 Dec. 31, 2014 Dec. 31, 2015 Dec. 31, 2014 Dec. 31, 2015 Dec. 31, 2014 Dec. 31, 2015
0 0 0 0 0 0 0 0 378,016 384,999 2
0 0 0 0 0 0 13,032 12,652 13,032 12,652 n/a
0 0 3,648 2,470 723 1,455 0 0 4,371 3,925 2
0 0 0 0 0 0 0 0 5,533 484 2
0 0 0 0 0 0 0 0 n/a n/a n/a
0 0 0 0 0 0 7,453 8,945 7,453 8,945 n/a
0 0 0 0 0 0 0 0 n/a n/a n/a
0 0 0 0 0 0 0 0 n/a n/a n/a
0 0 0 0 0 0 0 0 n/a n/a n/a
0 0 5,460 2,364 8,271 514 0 0 13,731 2,878 2
0 0 0 0 0 0 0 0 n/a n/a n/a
0 0 9,108 4,834 8,994 1,969 20,485 21,597 422,136 413,883

154 NOTES TO THE CONSOLIDATED FINANCIAL STATEMENTS 2015
37. EXECUTIVE BODIES
In the year under review the Supervisory Board comprised the following members:
Chairman
• Dr. Klaus Reinhardt, General a. D., Starnberg
Deputy Chairman
• Robert Feiger, Neusäss
Chairman of the Federal Executive Committee of the IG Bauen-Agrar-Umwelt trade union, Frankfurt am Main
Supervisory Board, Zusatzversorgungskasse des Baugewerbes AG, Wiesbaden, member
Supervisory Board Zusatzversorgungskasse Gerüstbaugewerbe VVaG, Wiesbaden, Chairman (until June 30, 2015)
Employer representatives
• Dr.-Ing. Johannes Bauer, Schrobenhausen
Construction engineer with BAUER Designware GmbH, Schrobenhausen
• Dipl.-Ing. (FH) Rainer Schuster, Freising
Retired civil engineer
• Dipl.-Ing. (FH) Elisabeth Teschemacher, née Bauer, Schrobenhausen
1. Chair of the management board of Caritasverband Neuburg-Schrobenhausen e.V., Neuburg
• Gerardus N. G. Wirken, Breda, Netherlands
Freelance consultant on strategy, controlling and accounting
Supervisory Board Vendor Beheer B.V., Tilburg, Netherlands, Chairman (until September 1, 2015)
Supervisory Board Winters Bouw- en Ontwikkeling B.V., Breda, Netherlands, Chairman
• Prof. Dr.-Ing. E.h. Manfred Nußbaumer M.Sc, Munich
Retired civil engineer
Supervisory Board Leonhardt, Andrä und Partner Beratende Ingenieure VBI AG, Stuttgart, member
Employee representatives
• Regina Andel, Ellrich
Chair of the Works Council, SCHACHTBAU NORDHAUSEN GmbH, Nordhausen
• Dipl.-Volkswirt Norbert Ewald, Bad Vilbel
Member of the Management Board, Zusatzversorgungskasse des Steinmetz- und Steinbildhauerhandwerks VVaG, Wiesbaden
• Reinhard Irrenhauser, Schrobenhausen
Supervisory Board BAUER Maschinen GmbH, Schrobenhausen,
Chairman of the Works Council, BAUER Maschinen GmbH, Schrobenhausen
• Dipl.-Kfm. (FH) Stefan Reindl, Schrobenhausen
Human Resources Director of BAUER Aktiengesellschaft, Schrobenhausen
Advisory Board, BAUER Training Center GmbH, Schrobenhausen, Chairman
• Dipl.-Ing. Gerold Schwab, Kernen
Construction Engineer in the Technical Division of BAUER Spezialtiefbau GmbH, Schrobenhausen

155NOTES TO THE CONSOLIDATED FINANCIAL STATEMENTS 2015
CO
NS
OL
IDA
TE
D F
INA
NC
IAL
STA
TE
ME
NT
S2
01
5
Management Board
• Prof. Dr.-Ing. E.h. Dipl.-Kfm. Thomas Bauer, Schrobenhausen, Chairman, Functions: Participations in Subsidiaries, Accounting,
Planning, Advertising, Controlling
Supervisory Board, BAUER Spezialtiefbau GmbH, Schrobenhausen, Chairman
Supervisory Board, BAUER Maschinen GmbH, Schrobenhausen, Chairman
Supervisory Board BAUER Resources GmbH, Schrobenhausen, Deputy Chairman
Supervisory Board SCHACHTBAU NORDHAUSEN GmbH, Nordhausen, Chairman
Supervisory Board BAUER EGYPT S.A.E., Cairo, Chairman
• Dipl.-Betriebswirt (FH) Hartmut Beutler, Schrobenhausen, Functions: Finance, Legal Affairs and Insurance, Investor Relations,
Facility Management
Supervisory Board BAUER Resources GmbH, Schrobenhausen, Member
Supervisory Board Schrobenhausener Bank e.G., Schrobenhausen, Chairman
• Dipl.-Ing. Heinz Kaltenecker, Schrobenhausen, Functions: Participations in Subsidiaries, Information Technology,
Human Resources, Quality Management, Risk Management, Health Safety Environment
Supervisory Board, BAUER Spezialtiefbau GmbH, Schrobenhausen, Deputy Chairman
Supervisory Board, BAUER Maschinen GmbH, Schrobenhausen, Deputy Chairman
Supervisory Board, BAUER Resources GmbH, Schrobenhausen, Chairman
Supervisory Board, SCHACHTBAU NORDHAUSEN GmbH, Nordhausen, Deputy Chairman
The total remuneration paid to members of the Management Board in the year under review, excluding allocations to
pension provisions, was EUR 1,274 thousand (previous year: EUR 1,150 thousand). Of that total, EUR 1,124 thousand
(previous year: EUR 1,090 thousand) was not performance-related and EUR 150 thousand (previous year: EUR 60 thousand)
was performance-related. The total remuneration includes benefits in kind arising from the private use of a company car and
reimbursement of travel expenses for each member of the Management Board, as well as pro rata group accident insurance
premiums and employer’s liability insurance association contributions. The company pension scheme for Management Board
members incurred pension service costs totaling EUR 155 thousand (previous year: EUR 159 thousand). The pensionable
earnings serving as the basis for calculating pension levels are significantly lower than the basic salary in all contracts. Calculated
in accordance with IAS 19, the defined benefit obligation entailed by all pension commitments to members of the Manage-
ment Board at the year-end was EUR 5,537 thousand (previous year: EUR 5,531 thousand). Former members of the manage-
ment bodies of the parent company received total remuneration of EUR 0 thousand (previous year: 0) in return for duties
performed on behalf of the parent company.

156 NOTES TO THE CONSOLIDATED FINANCIAL STATEMENTS 2015
The remuneration paid to the Supervisory Board for the 2015 financial year totaled EUR 254 thousand (previous year:
254 thousand) and was distributed as follows:
38. RELATED PARTY DISCLOSURES
Related parties under the terms of IAS 24 are parties that the reporting enterprise has the ability to control or exercise significant
influence over, or parties that have the ability to control or exercise significant influence over the reporting enterprise.
Transactions with related parties are defined as the transfer of resources, services or obligations between the reporting entity
and a related party, regardless of whether an invoice is issued in respect of the transaction or not.
Members of the Management Board of BAUER AG are members of Supervisory Boards and Management Boards of other
companies with which BAUER AG maintains relations in the course of its ordinary business operations. Members of the
Supervisory Board received pensions totaling EUR 55 thousand (previous year: EUR 55 thousand) in respect of former
employment within the BAUER Group. The members of the Supervisory Board, by virtue of their role as employees, received
remuneration totaling EUR 483 thousand (previous year: EUR 468 thousand). Lease and service contracts and contracts
of employment (except for the remuneration to members of the Management Board disclosed) exist with members of the
Management Board, including close family, in respect of which remuneration to an amount of EUR 1,032 thousand
(previous year: EUR 879 thousand) was paid.
in EUR ’000 2014 2015
Chairman
Dr. Klaus Reinhardt 38 38
Deputy Chairman
Robert Feiger 27 27
Employer representatives
Dr.-Ing. Johannes Bauer 20 20
Dipl.-Ing. (FH) Rainer Schuster 18 18
Dipl.-Ing. (FH) Elisabeth Teschemacher 18 18
Gerardus N. G. Wirken 20 20
Prof. Dr. Manfred Nussbaumer 20 20
Employee representatives
Dipl.-Volkswirt Norbert Ewald 20 20
Dipl.-Kfm. (FH) Stefan Reindl 18 18
Regina Andel 18 18
Dipl.-Ing. Gerold Schwab 20 20
Reinhard Irrenhauser 18 18
Total * 254 254
* rounded

157NOTES TO THE CONSOLIDATED FINANCIAL STATEMENTS 2015
CO
NS
OL
IDA
TE
D F
INA
NC
IAL
STA
TE
ME
NT
S2
01
5
Loan commitments to the BAUER Foundation existed totaling EUR 1,000 thousand (previous year: EUR 1,000 thousand), for
which interest amounting to EUR 55 thousand (previous year: 55 thousand) was paid.
At the end of the financial year no loan commitments existed to shareholders of BAUER AG.
The key relationships between fully consolidated Group companies and related parties are set out in the following table:
Project Company's activities Headquarters Shareholding
Bangaroo Project Specialist foundation engineering Sydney, Australia 60 %
Sebuku Island Specialist foundation engineering South Kalimantan, Indonesia 35 %
Deep-Bauer Foundation Inc. Specialist foundation engineering Calgary, Canada 44 %
Project Company's activities Headquarters Shareholding
Bangaroo Project Specialist foundation engineering Sydney, Australia 50 %
Deep-Bauer Foundation Inc. Specialist foundation engineering Calgary, Canada 44 %
The purchased services essentially comprise all expenses incurred with related parties during the financial year.
Transactions with related parties are conducted at standard market terms.
The receivables and other assets include uncollectable receivables as well as financial assets in respect of related parties.
39. JOINT OPERATIONS
The material joint operations are listed below:
Financial year 2014:
Financial year 2015:
in EUR ’000 Associated companies Non-consolidated companies Joint ventures
2014 2015 2014 2015 2014 2015
Income 1,990 7,325 14,651 20,620 11,812 10,834
Purchased services 172 1,389 2,875 2,558 0 0
Receivables and other
assets (Dec. 31) 0 794 18,863 12,490 24,738 35,751
Liabilities (Dec. 31) 125 701 2,538 3,859 0 1,102
Impairment of receivables 0 0 891 1,927 16,790 22,887
Expenses for uncollectible
and doubtful debts 0 328 0 1,088 34 6,314

158 NOTES TO THE CONSOLIDATED FINANCIAL STATEMENTS 2015
40. FEES AND SERVICES OF THE AUDITORS
The fee paid to the auditors and recorded as expenditure in the financial year is broken down as follows:
PricewaterhouseCoopers AG:
In addition, Roland Jehle GmbH Wirtschaftsprüfungsgesellschaft Steuerberatungsgesellschaft was engaged to audit the major
German capital corporations included in the Group's consolidated financial statements.
The fees for this recognized in the financial year are broken down in accordance with Section 285, Paragraph 17 and Section 314,
Subsection 1, Paragraph 9 HGB as follows:
41. DECLARATION OF CONFORMITY TO THE GERMAN CORPORATE GOVERNANCE CODE
The management Board and Supervisory Board of BAUER AG issued the Declaration of conformity prescribed by Paragraph
161 AktG on December 8, 2015 and made it permanently available for the shareholders on the website www.bauer.de.
42. AVERAGE NUMBER OF EMPLOYEES
43. AUTHORIZATION FOR ISSUE OF THE CONSOLIDATED FINANCIAL STATEMENTS
The Management Board has submitted the consolidated financial statements to the Supervisory Board for authorization for issue
(the Supervisory Board meeting is scheduled for April 13, 2016).
in EUR ’000 2014 2015
Fees for auditing services 668 723
Fees for other certification 5 14
Fees for tax advice 21 75
Fees for other services 45 79
Total 739 891
in EUR ’000 2014 2015
Auditing fees 37 39
Fees for other certification 0 2
Fees for tax advice 7 7
Fees for other services 0 0
Total 44 48
2014 2015
Salaried staff 3,948 4,050
Germany 1,984 2,001
International 1,964 2,049
Industrial & trades 6,209 6,443
Germany 1,926 1,920
International 4,283 4,523
Apprentices 248 245
Total number of employees 10,405 10,738

159NOTES TO THE CONSOLIDATED FINANCIAL STATEMENTS 2015
CO
NS
OL
IDA
TE
D F
INA
NC
IAL
STA
TE
ME
NT
S2
01
5
44. PROPOSAL ON APPROPRIATION OF NET EARNINGS AVAILABLE FOR DISTRIBUTION
The Management Board and Supervisory Board of BAUER AG propose to resolve to distribute a dividend of EUR 0.15
per dividend-bearing share to the shareholders from unappropriated net profit in financial year 2015 in the amount of
EUR 5,615,809.55. At 17,131,000 dividend-bearing no-nominal-value shares, this corresponds to a dividend of EUR
2,569,650. The boards further propose to carry the remaining unappropriated net profit in the amount of EUR 3,046,159.55
forward to new account. Any partial amount relating to non-dividend-bearing no-nominal-value shares will also be carried
forward to new account.
Schrobenhausen, March 31, 2016
The Management Board
Prof. Thomas Bauer Dipl.-Betriebswirt (FH) Hartmut Beutler Dipl.-Ing. Heinz Kaltenecker
Chairman of the Management Board

160
Major participations of the BAUER Group at december 31, 2015
NAME AND REGISTERED OFFICE OF COMPANY Currency Capital share
in %
1. Fully consolidated companies
BAUER Aktiengesellschaft EUR
A. Germany
BAUER Spezialtiefbau GmbH, Schrobenhausen, Deutschland EUR 99.00
BAUER Maschinen GmbH, Schrobenhausen, Deutschland EUR 99.00
SCHACHTBAU NORDHAUSEN GmbH, Nordhausen, Germany EUR 99.00
SPESA Spezialbau und Sanierung GmbH, Schrobenhausen, Germany EUR 99.00
BAUER Resources GmbH, Schrobenhausen, Germany EUR 99.00
BAUER Training Center GmbH, Schrobenhausen, Germany EUR 100.00
BAUER Designware GmbH, Schrobenhausen, Germany EUR 100.00
BAUER Umwelt GmbH, Schrobenhausen, Germany EUR 100.00
KLEMM Bohrtechnik GmbH, Drolshagen, Germany EUR 100.00
EURODRILL GmbH, Drolshagen, Germany EUR 100.00
WW Beteiligung GmbH, Schrobenhausen, Germany EUR 100.00
RTG Rammtechnik GmbH, Schrobenhausen, Germany EUR 100.00
PRAKLA Bohrtechnik GmbH, Peine, Germany EUR 90.00
Olbersdorfer Guß GmbH, Olbersdorf, Germany EUR 75.00
Schachtbau Nordhausen Bau GmbH, Nordhausen, Germany EUR 100.00
SCHACHTBAU NORDHAUSEN Stahlbau GmbH, Nordhausen, Germany EUR 100.00
MMG Mitteldeutsche MONTAN GmbH, Nordhausen, Germany EUR 100.00
HGC Hydro-Geo-Consult GmbH, Freiberg, Germany EUR 100.00
BAUER Water GmbH, Dunningen, Germany EUR 100.00
PURE Umwelttechnik GmbH, Schrobenhausen, Germany EUR 100.00
BAUER Foralith GmbH, Schrobenhausen, Germany EUR 100.00
GWE pumpenboese GmbH, Peine, Germany EUR 100.00
Esau & Hueber GmbH, Schrobenhausen, Germany EUR 100.00
hydesco24 GmbH, Hamburg, Germany EUR 60.00
B. EU excluding Germany
GWE Budafilter Kft., Mezöfalva, Hungary HUF 100.00
BAUER Ambiente S.r.l., Milan, Italy EUR 100.00
BAUER SPEZIALTIEFBAU Gesellschaft m.b.H., Vienna, Austria EUR 100.00
BAUER Technologies Limited, Bishops Stortford, Great Britain GBP 100.00
BAUER RENEWABLES LIMITED, Beverley, Great Britain GBP 100.00
BAUER EQUIPMENT UK LIMITED, Rotherham, Great Britain GBP 100.00
BAUER Magyarország Speciális Mélyépítö Kft., Budapest, Hungary HUF 100.00

161NOTES TO THE CONSOLIDATED FINANCIAL STATEMENTS 2015
CO
NS
OL
IDA
TE
D F
INA
NC
IAL
STA
TE
ME
NT
S2
01
5
NAME AND REGISTERED OFFICE OF COMPANY Currency Capital share
in %
Continued: B. EU excluding Germany
BAUER ROMANIA S.R.L., Bucarest, Rumania RON 100.00
BAUER BULGARIA EOOD, Sofia, Bulgaria BGN 100.00
BAUER Funderingstechniek B.V., Mijdrecht, Netherlands EUR 100.00
BAUER Foundations (IRL) Ltd., Dublin, Ireland EUR 100.00
GWE France S.A.S., Aspiran, France EUR 100.00
TracMec Srl, Mordano, Italy EUR 100.00
BAUER Macchine Italia Srl, Mordano, Italy EUR 100.00
FAMBO Sweden AB, Eslöv, Sweden SEK 100.00
GWE POL-Bud Sp.z.o.o, Lodz, Poland PLN 100.00
BAUER RESOURCES SPAIN S.A., Leganes, Spain EUR 100.00
BAUER Resources UK Ltd., Beverley, Great Britain GBP 100.00
C. Europe (other)
BAUER Spezialtiefbau Schweiz AG, Baden-Dättwil, Switzerland CHF 100.00
FORALITH Drilling Support AG, St. Gallen, Switzerland CHF 100.00
OOO BAUER Maschinen - Kurgan, Kurgan, Russian Federation RUB 65,00
OOO BAUER Maschinen SPb, St. Petersburg, Russian Federation RUB 100.00
OOO BG-TOOLS-MSI, Ljuberzy, Russian Federation RUB 55.00
OOO BAUER Maschinen Russia, Moscow, Russian Federation RUB 100.00
OOO BAUER Technologie, Moscow, Russian Federation RUB 100.00
BAUER Georgia Foundation Specialists LCC, Batumi, Georgia GEL 100.00
D. Middle East & Central Asia
Saudi BAUER Foundation Contractors Ltd., Jeddah, Saudi Arabia SAR 100.00
BAUER LEBANON FOUNDATION SPECIALISTS S.a.r.l., Beirut, Lebanon USD 100.00
BAUER International FZE, Dubai, United Arab Emirates AED 100.00
BAUER International Qatar LLC, Doha, Qatar QAR 49.00 *
BAUER Equipment Gulf FZE, Dubai, United Arab Emirates AED 100.00
BAUER Emirates Environment Technologies & Services LLC,
Abu Dhabi, United Arab Emirates AED 49.00 *
BAUER Resources GmbH / Jordan Ltd. Co., Amman, Jordan -
(sub-group consolidated financial statements) USD 100.00
Site Group for Services and Well Drilling Ltd. Co., Amman, Jordan USD 83.33
Site Group for Services and Well Drilling Ltd. Co., Ramallah, Palestine USD 100.00
Site Drilling Ltd. Co., Limassol, Cyprus USD 100.00
BAUER Casings Makina Sanayi ve Ticaret Limited Sirketi, Ankara, Turkey TRY 60.00
BAUER Corporate Services Private Limited, Mumbai, India INR 100.00
BAUER Geotechnical Specialized Foundation LLC, Abu Dhabi, United Arab Emirates AED 100.00
BAUER Equipment India Private Limited, Delhi, India INR 100.00

162
NAME AND REGISTERED OFFICE OF COMPANY Currency Capital share
in %
E. Asia-Pacific, Far East and Australia
BAUER (MALAYSIA) SDN. BHD. - (subsidiary consolidated financial statements), Petaling Jaya,
Malaysia MYR 100.00
BAUER Foundations Australia Pty Ltd, Brisbane, Australia AUD 100.00
P.T. BAUER Pratama Indonesia, Jakarta, Indonesia IDR 100.00
BAUER Services Singapore Pte Ltd, Singapore EUR 100.00
BAUER Hong Kong Limited, Hong Kong, People’s Republic of China HKD 100.00
BAUER Vietnam Ltd., Ho Chi Minh City, Vietnam VND 100.00
BAUER Foundations Philippines, Inc., Quezon City, Philippines PHP 100.00
BAUER Technologies Far East Pte. Ltd. - (subsidiary consolidated financial statements), Singapore EUR 100.00
BAUER EQUIPMENT SOUTH ASIA PTE. LTD., Singapore EUR 100.00
BAUER Technologies Taiwan Ltd., Taipei, Taiwan TWD 99.88
BAUER Tianjin Technologies Co. Ltd., Tianjin, People's Republic of China CNY 100.00
BAUER Equipment Hong Kong Ltd., Hong Kong, People's Republic of China EUR 100.00
BAUER Equipment (Malaysia) Sdn. Bhd., Shah Alam, Malaysia MYR 100.00
Shanghai BAUER Technologies Co. Ltd., Shanghai, People's Republic of China CNY 100.00
BAUER Equipment (Shanghai) Co. Ltd., Shanghai, People's Republic of China CNY 100.00
NIPPON BAUER Y.K., Tokyo, Japan JPY 100.00
Inner City (Thailand) Company Limited, Bangkok, Thailand THB 49.00 *
Thai BAUER Co. Ltd., Bangkok, Thailand THB 73.99
BAUER Equipment Australia Pty. Ltd., Baulkham Hills, Australia AUD 100.00
F. Americas
BAUER FUNDACIONES PANAMÁ S.A., Panama City, Panama USD 100.00
BAUER MEXICO, S.A. DE C.V., Mexico City, Mexico MXP 100.00
BAUER Resources Canada Ltd., Edmonton, Canada CAD 100.00
BAUER Foundations Canada Inc., Calgary, Canada CAD 100.00
BAUER FOUNDATION CORP., Odessa, Florida, United States of America USD 100.00
BAUER Resources Chile Limitada - (subsidiary consolidated financial statements),
Santiago de Chile, Chile CLP 100.00
GWE Tubomin S.A., Santiago de Chile, Chile CLP 60.00
BAUER Machinery USA Inc., Conroe, United States of America USD 100.00
BAUER-Pileco Inc., Conroe, Texas, United States of America USD 100.00
G. Africa
BAUER EGYPT S.A.E. Specialised Foundation Contractors, Cairo, Egypt EGP 55.75
BAUER Technologies South Africa (PTY) Ltd. (subsidiary consolidated financial statements),
Cape Town, South Africa ZAR 100.00
MINERAL BULK SAMPLING NAMIBIA (PTY) LTD, Windhoek, Namibia NAD 100.00
MINERAL BULK SAMPLING SOUTH AFRICA (PTY) LTD, Cape Town, South Africa ZAR 100.00
BAUER RESOURCES GHANA LIMITED, Accra, Ghana GHS 100.00
BAUER Resources Maroc S.A.R.L., Kenitra, Morocco MAD 100.00
BAUER-DE WET EQUIPMENT (PROPRIETARY) LIMITED, Rasesa, Botswana BWP 51.00
BAUER Resources Senegal SARL, Dakar, Senegal XOF 100.00
NOTES TO THE CONSOLIDATED FINANCIAL STATEMENTS 2015

163NOTES TO THE CONSOLIDATED FINANCIAL STATEMENTS 2015
CO
NS
OL
IDA
TE
D F
INA
NC
IAL
STA
TE
ME
NT
S2
01
5
NAME AND REGISTERED OFFICE OF COMPANY Currency Capital share
in %
2. Associates and joint ventures
A. Germany
Wöhr + Bauer GmbH (subsidiary consolidated financial statements), Munich, Germany EUR 33.33
Wöhr + Bauer Angerhof GmbH & Co. KG, Munich, Germany EUR 100.00
Wöhr + Bauer Angerhof Verwaltungs GmbH, Munich, Germany EUR 100.00
WÖHR + BAUER PARKING GmbH, Munich, Germany EUR 100.00
Wöhr + Bauer H2O Verwaltungs GmbH, Munich, Germany EUR 100.00
Wöhr + Bauer H2O GmbH & Co. KG, Munich, Germany EUR 100.00
Wöhr + Bauer Projekt HTW Verwaltungs GmbH, Munich, Germany EUR 100.00
Wöhr + Bauer Projekt HTW GmbH & Co. KG, Munich, Germany EUR 100.00
WÖHR + BAUER Tower Riem Verwaltungs GmbH, Munich, Germany EUR 100.00
WÖHR + BAUER Tower Riem GmbH & Co. KG, Munich, Germany EUR 100.00
Riem Vermietungs GmbH, Muncih, Germany EUR 100.00
WÖHR + BAUER Projekt A Verwaltungs GmbH, Munich, Germany EUR 100.00
WÖHR + BAUER Projekt A GmbH & Co. KG, Munich, Germany EUR 100.00
NDH Entsorgungsbetreibergesellschaft mbH, Bleicherode, Germany EUR 25.00
Grunau und Schröder Maschinentechnik GmbH, Drolshagen, Germany EUR 30.00
SPANTEC Spann- & Ankertechnik GmbH, Schrobenhausen, Germany EUR 40.00
BAUER Deep Drilling GmbH, Schrobenhausen, Germany EUR 51.00
B. International
TERRABAUER S. L., Madrid, Spain EUR 30.00
NuBa Equipment Ltd., Edmonton, Canada CAD 50.00
Bauer + Moosleitner Entsorgungstechnik GmbH, Salzburg, Austria EUR 50.00
BAUER Nimr LLC, Maskat - Al Mina, Sultanate of Oman OMR 49.00
BAUER Manufacturing LLC, Conroe, United States of America USD 51.00
TOO SCHACHTBAU Kasachstan, Almaty, Kazakhstan KZT 50.00
3. Enterprises in which the company has participating interests
A. Germany
TMG Tiefbaumaterial GmbH, Emmering, Germany EUR 33.33
Nordhäuser Bauprüfinstitut GmbH, Nordhausen, Germany EUR 20.00
Harz Hotel Grimmelallee Nordhausen Beteiligungsgesellschaft mbH, Nordhausen, Germany EUR 20.00
Harz Hotel Grimmelallee Nordhausen GmbH & Co. KG, Nordhausen, Germany EUR 20.00
Stadtmarketing Schrobenhausen e.G., Schrobenhausen, Germany EUR 4.11
B. International
OAO Mostostrojindustria, Moscow, Russian Federation RUB 15.00
* Commercial ownership is 100 percent

164
We hereby assure that, to the best of our knowledge, the consolidated financial statements give a true and fair view of the
net assets, financial position and earnings of the company in accordance with the accounting principles applicable to financial
reporting, and that the Combined Management Report depicts the course of business, including the earnings and overall situation
of the Group, in such a way that a true and fair view is conveyed and the material opportunities and risks of the foreseeable
development of the Group are set out.
Schrobenhausen, March 31, 2016
The Management Board
Prof. Thomas Bauer Dipl.-Betriebswirt (FH) Hartmut Beutler Dipl.-Ing. Heinz Kaltenecker
Chairman of the Management Board
Assurance by the legal representatives

165
CO
NS
OL
IDA
TE
D F
INA
NC
IAL
STA
TE
ME
NT
S2
01
5
“We have audited the consolidated financial statements prepared by BAUER Aktiengesellschaft, Schrobenhausen, comprising
the balance sheet, the income statement and statement of comprehensive income, statement of changes in equity, cash flow
statement and the notes to the consolidated financial statements, together with the Group management report for the financial
year from January 1 to December 31, 2015. The preparation of the consolidated financial statements and the Group manage-
ment report in accordance with the IFRS, as adopted by the EU, and the additional requirements of German commercial law
pursuant to § (Article) 315a, Abs. (paragraph) 1 HGB (“Handelsgesetzbuch”: German Commercial Code) are the responsibility of
the parent company's Management Board. Our responsibility is to express an opinion on the consolidated financial statements
and the Group management report, based on our audit.
We conducted our audit of the consolidated financial statements in accordance with § 317 HGB and the generally accepted
German standards for the audit of financial statements promulgated by the Institut der Wirtschaftsprüfer (Institute of Public
Auditors in Germany) (IDW). Those standards require that we plan and perform the audit such that misstatements materially
affecting the presentation of the net assets, financial position and results of operations in the consolidated financial statements
in accordance with the applicable financial reporting framework and in the Group management report are detected with reasonable
assurance. Knowledge of the business activities and the economic and legal environment of the Group and expectations as
to possible misstatements are taken into account in the determination of audit procedures. The effectiveness of the account-
ing-related internal control system and the evidence supporting the disclosures in the consolidated financial statements and
the Group management report are examined primarily on a test basis within the framework of the audit.
The audit includes assessing the annual financial statements of those entities included in consolidation, the determination of
the entities to be included in consolidation, the accounting and consolidation principles used and significant estimates made
by the company's Management Board, as well as evaluating the overall presentation of the consolidated financial statements
and the Group management report. We believe that our audit provides a reasonable basis for our opinion.
Our audit has not led to any reservations.
In our opinion, based on the findings of our audit, the consolidated financial statements comply with the IFRS as adopted
by the EU and the additional requirements of German commercial law pursuant to Paragraph 315a, Sub-paragraph 1 HGB,
and give a true and fair view of the net assets, financial position and results of operations of the Group in accordance with
these requirements. The Group management report is consistent with the consolidated financial statements, and as a whole
provides a suitable view of the Group's position, and suitably presents the opportunities and risks of future development.”
Stuttgart, March 31, 2016
Udo Bäder Klaus Neubarth
Auditor Auditor
Audit opinion

166
A
ASSOCIATED COMPANIES | Material but not controlling
influence can be asserted over associated companies
The usual shareholding is between 20 5 and 50 %. These
companies are accounted for using the equity method.
C
CASH FLOW | This performance indicator shows the
amount of funds a company has generated with its own
resources and how many it can re-use. Key components
are profit, depreciation and amortization, and increases in
provisions.
CONSOLIDATED REVENUES | Consolidated revenues are
stated in the income statement and comprise the revenues of
the (consolidated) companies fully included in the consolidat-
ed financial statements.
D
DRILLING | This term describes the construction of shafts
or bore holes for the extraction of deposits or mining of
resources.
DEEP DRILLING RIG | This series was specially developed
for excavating particularly deep raw materials deposits by
way of drilling. The machines can drill more than 5,000
meters deep and are used for excavating oil, gas, water and
geothermal energy.
E
EBIT | Earnings before interest and taxes. EBIT is the result
from operations before interest and taxes.
EBITDA | Earnings before interest, taxes, depreciation
and amortization. EBITDA is the result of interest, taxes,
depreciation and amortization (on property, plant and
equipment and intangible assets).
EBIT MARGIN | The EBIT margin is a profitability indicator
and describes a Company's ratio between EBIT and sales
revenues.
EQUITY METHOD / AT EQUITY | The equity method is
used for recognizing shares in associated companies in the
consolidated financial statements. The carrying amounts
of the investments are amortized by the development of
proportional equity in the participating company.
F
FINANCIAL COVENANTS | Some credit agreements
contain clauses which stipulate specific thresholds for
specified financial performance indicators.
FINANCIAL INSTRUMENT | Any contract resulting in a
financial asset for one company and a financial liability (or
equity instrument) for another.
G
GROSS DOMESTIC PRODUCT (GDP) | the gross
domestic product corresponds to the total value of all goods
and services to end users produced and provided within an
economy during the course of a year. GDP is a benchmark
for an economy’s performance.
H
HGB FINANCIAL STATEMENTS | The German
Commercial Code (Handelsgesetzbuch; HGB) stipulates
the requirements for the preparation of annual financial
statements and financial reporting for German capital
corporations.
I
IFRS FINANCIAL STATEMENTS | The International
Financial Reporting Standards (IFRS) are accounting
policies for companies with a focus on the capital market.
The International Accounting Standards Board (IASB)
publishes the standards and aim to ensure that annual and
consolidated financial statements can be compared on
an international level. BAUER Group started preparing its
financial statements in accordance with IFRS in 2004.
Glossary

167
N
NET RESULT FOR THE PERIOD | The net result for the
period, also called earnings after taxes, shows the profit or
loss during a specified period.
O
ORDER BACKLOG | States a company’s order volume in
existence at the time the balance sheet is prepared.
ORDER INTAKE | Corresponds to the total of all orders
received during a specified reporting period. Order intake is
an indication of the future order volume.
P
PERCENTAGE OF COMPLETION METHOD (POC) |
This method is used for determining and recognizing the
profit realization according to the percentage of completion
on the basis of order costs and income (actual values and
forecasts) for long-term orders.
PREMIUMLINE | The PremiumLine comprises the
multi-function devices of the rotary drilling rig series (BG)
designed for diverse applications in specialist foundation
engineering. It is also possible to attach deep vibrators or
trench cutters.
R
ROTARY DRILLING RIG (BG) | BAUER Maschinen GmbH
specializes in the construction and development of rotary
drilling rigs. The machines are produced on two lines, the
PremiumLine and ValueLine. These devices can be used for
diverse applications in specialist foundation engineering.
REVENUE | The revenue comprises sales revenues, changes
in inventories, other capitalized goods and services for own
account and other operating income of the respective sub-
sidiary, associated company or joint venture.
S
SALES REVENUES | Unlike performance, for which all
goods manufactured are evaluated, sales revenues are all
services and goods finally invoiced and sold during a specific
period recognized in the income statement. The difference
between both values mainly relates to changes in semi-fin-
ished goods, warehouses and other income.
SEGMENTS | The segments are the operating units of the
Group – in our case these are Construction, Equipment and
Resources Each segment contains the holding company
and subsidiaries with equal product and/or service portfolios.
SCHACHTBAU NORDHAUSEN GmbH is the only Group
company to operate in all three segments.
STAKEHOLDER | This term describes persons or groups
with a justified interest in the performance of a company.
Various stakeholders can have very different interests.
T
TOTAL GROUP REVENUES | Total Group revenues
include revenues from the consolidated companies as well
as portions of revenues from associated companies and
revenues of non-consolidated subsidiaries and joint ventures.
V
VALUELINE | The ValueLine comprises rotary drilling rigs
(BG) optimized exclusively for the kelly drilling method.
VALUE CREATION | Value creation is a company’s
contribution to society. Value creation reflects how the
performance of a company is distributed across diverse
stakeholders.
W
WORKING CAPITAL | Working capital is the part of current
assets tied by the operative production process and the sale
of services (e.g. receivables).
GLOSSARY
CO
NS
OL
IDA
TE
D F
INA
NC
IAL
STA
TE
ME
NT
S2
01
5

IMPRINT
Published by
BAUER Aktiengesellschaft
BAUER-Strasse 1
86529 Schrobenhausen, Germany
www.bauer.de
Photos
BAUER Group
Press photo Roche
Erich Meyer aerial photo (p. 5)
Press photo Roche (p. 60)
Contact
Investor Relations
BAUER Aktiengesellschaft
BAUER-Strasse 1
86529 Schrobenhausen, Germany
Tel.: +49 8252 97-1215
Fax: +49 8252 97-2900
Registered place of business
86529 Schrobenhausen, Germany
Registered at the District Court of
Ingolstadt under HRB 101375
Hupfauf Druck,
Schrobenhausen
http://ir.bauer.de
http://www.youtube.com/
BAUER Group
This Annual Report is published
in German and English.
168

>>>
GR
OU
P K
EY
FIG
UR
ES
: IN
CO
ME
STA
TE
ME
NT
AN
D B
AL
AN
CE
SH
EE
T
Construction Equipment Resources
The Resources segment is focused on
products and services in the areas of
water, environment and natural resources.
BAUER Resources GmbH is the holding
company, under the umbrella of which the
subsidiaries operate as full-service providers.
The competence centers of Water Treatment,
Process and Biotechnology, Environmental
Rehabilitation and Waste Management, Drilling
Technologies as well as Well Drilling and Geo-
thermal pool their expertise and support the
subsidiaries in carrying out projects.
BAUER Spezialtiefbau GmbH, the original
parent company of the BAUER Group, has
been a major driving force in the development
of specialist foundation engineering, and
carries out projects all over the world. Bauer
Spezialtiefbau is organized on a regional basis
in Germany, and operates on all the world's
continents with over 50 subsidiaries and
branch offices. Market trends have meant that
most of the company’s revenues are now gen-
erated outside of Germany. Bauer has major
subsidiaries and branch offices in the United
Arab Emirates, Malaysia, Egypt and the USA
among other locations. Bauer Spezialtiefbau
has built up networks in numerous regions
across the world, enabling it to acquire and
execute contracts both in the countries in
which it is represented and in neighbouring
countries, using its own machinery and in-
house engineering consultancy. In addition to
the predominant field of specialist foundation
engineering, Group companies SCHACHTBAU
NORDHAUSEN GmbH, SPESA Spezialbau
und Sanierung GmbH and Wöhr + Bauer
GmbH also carry out general construction ac-
tivities such as civil engineering, environmental
engineering and project development.
The BAUER Maschinen Group is the world
market leader in the development and man-
ufacture of specialist foundation engineering
equipment. BAUER Maschinen GmbH – the
holding company for a number of subsidiaries
– designs and builds heavy-duty drilling rigs,
trench cutters, grab systems, vibrators and
deep drilling rigs, as well as the related tool-
ing, at its plants in Schrobenhausen, Aresing
and Edelshausen. The company also operates
manufacturing facilities in the USA, Russia,
China, Malaysia, Italy, Singapore and Turkey.
It is supplied with components from within the
BAUER Group by Schachtbau Nordhausen
and Olbersdorfer Guß. The BAUER Maschinen
Group operates a global sales and service
network.

Consolidated statement of profit or loss
in EUR '000 12M/2014 12M/2015 Change
SALES REVENUES 1,375,679 1,378,991 0.24 %
Changes in inventories 26,622 28,994 8.91 %
Other capitalized goods and services for own account 14,696 22,748 54.79 %
Other income 89,022 157,213 76.60 %
CONSOLIDATED REVENUES 1,506,019 1,587,946 5.44 %
Cost of materials -749,247 -752,532 0.44 %
Staff costs -355,250 -376,118 5.87 %
Depreciation of fixed assets -78,781 -81,143 3.00 %
Write-downs of inventories due to use -15,789 -13,195 -16.43 %
Other operating expenses -230,526 -274,235 18.96 %
OPERATING RESULT 76,426 90,723 18.71 %
Financial income 7,096 4,972 -29.93 %
Financial expenses -45,149 -41,982 -7.01 %
Share of the profit or loss of associated companies
accounted for using the equity method -572 2,672 n/a
EARNINGS BEFORE TAX 37,801 56,385 49.16 %
Income tax expense -22,075 -27,393 24.09 %
NET RESULT FOR THE PERIOD 15,726 28,992 84.36 %
Consolidated balance sheet
ASSETS in EUR '000 31.12.2014 31.12.2015 Change
NON-CURRENT ASSETS
Intangible assets 34,440 27,455 -20.28 %
Property, plant and equipment and investment property 446,909 404,356 -9.52 %
Investments accounted for using the equity method 42,906 132,553 n/a
Participations 3,613 3,613 0.00 %
Deferred tax assets 30,973 27,190 -12.21 %
Other non-current assets 7,492 7,722 3.07 %
Other non-current financial assets 28,420 15,355 -45.97 %
594,753 618,244 3.95 %
CURRENT ASSETS
Inventories 439,184 444,629 1.24 %
Receivables and other assets 496,650 544,329 9.60 %
Effective income tax refund claims 2,661 2,300 -13.57 %
Cash and cash equivalents 41,835 47,406 13.32 %
980,330 1,038,664 5.95 %
1,575,083 1,656,908 5.19 %
EQUITY AND LIABILITIES in EUR '000 31.12.2014 31.12.2015 Change
EQUITY
Equity of BAUER AG shareholders 399,308 438,842 9.90 %
Non-controlling interests 19,617 12,368 -36.95 %
418,925 451,210 7.71 %
NON-CURRENT LIABILITIES
Provisions for pensions 116,358 112,284 -3.50 %
Financial liabilities 387,816 393,694 1.52 %
Other non-current liabilities 5,959 7,262 21.87 %
Deferred tax liabilities 13,123 20,664 57.46 %
523,256 533,904 2.03 %
CURRENT LIABILITIES
Financial liabilities 299,698 318,700 6.34 %
Other current liabilities 305,861 317,785 3.90 %
Effective income tax obligations 9,317 16,955 81.98 %
Provisions 18,026 18,354 1.82 %
632,902 671,794 6.15 %
1,575,083 1,656,908 5.19 %
In the “Change” column, there may be differences from the Group key figures as a result of roundings and a different representation
between thousands of EUR and millions of EUR.

April 18, 2016 Publication Annual Report 2015
Annual Press Conference
Analysts' Conference
May 13, 2016 Quarterly Statement Q1 2016
June 23, 2016 Annual General Meeting
August 12, 2016 Half-Year Interim Report to June 30, 2016
November 14, 2016 Quarterly Statement 9M/Q3 2016
Financial calendar 2016

BAUER AktiengesellschaftBAUER-Strasse 1
86529 Schrobenhausen, Germanywww.bauer.de