Embed Size (px)
Citation preview
ANNUAL REPORT2015
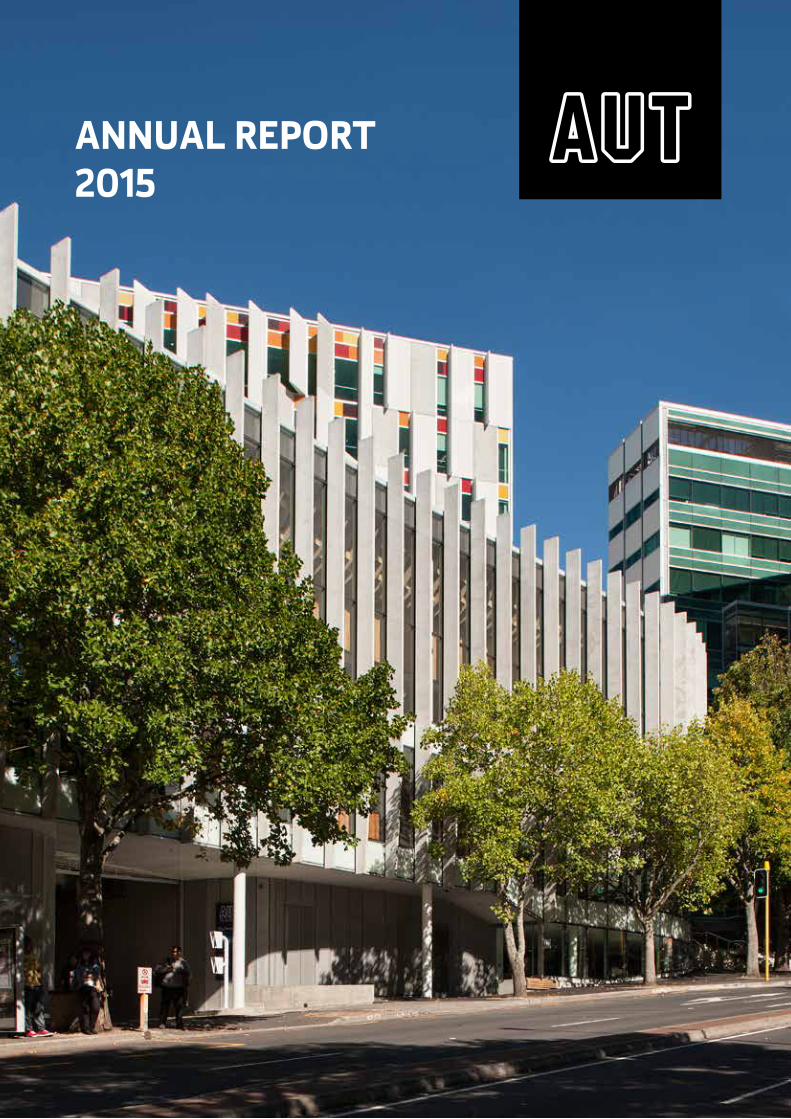
Tāwhaitia te ara o te tika, te pono me te aroha; kia piki ki te taumata tiketike
Follow the path of integrity, respect and compassion; scale the heights of achievement
2015 annual report 1
contents
Front cover: Sir paul reeves Building from Mayoral DriveImage: Simon Devitt, Photographer
Inside cover: this carving of Kahungunu, the eponymous ancestor of ngāti Kahungunu, is the central figure of a tukutuku panel displayed in the Sir paul reeves Building. Gifted to atI by the Māori people of auckland in 1983, it is made of rimu taken from the demolished army buildings of rangitoto and uses paua from the Far north and Far South of new Zealand. the carving is representative of scholarship and leadership and is surrounded by manaia denoting strengths of character for which Kahungunu was renowned. the pen and book are symbolic of learning and scholarship.Image: Graham Roberts, Strategy & Planning, AUT
tHe YeAR: 2015 4 Chancellor’s Foreword
7 The Council of Auckland University of Technology
8 Vice-Chancellor’s Report
15 Officers of Auckland University of Technology
16 AUT – the university for our changing world
19 Making a difference
21 Key Facts and Figures
26 Financial Review
27 Statement of Responsibility
28 Independent Auditor’s Report
stAteMent oF seRVIce PeRFoRMAnce 32 Impact 1: Excellent scholars and sought-after graduates
36 Impact 2: Research that inspires curiosity, advances knowledge and benefits communities
42 Impact 3: Wider participation and success in education
46 Impact 4: Educated citizens igniting change in their communities
50 Impact 5: A stronger reputation for AUT
FInAncIAL stAteMents 58 Statement of Financial Performance
59 Statement of Other Comprehensive Revenue and Expense
60 Statement of Financial Position
61 Statement of Changes in Equity
62 Statement of Cash Flows
63 Notes to the Consolidated Financial Statements
stAteMent oF ResoURces
108 Compulsory Student Services Fees
112 Library
114 Information and Communications Technology Services
115 Land and Buildings
2 2015 annual report
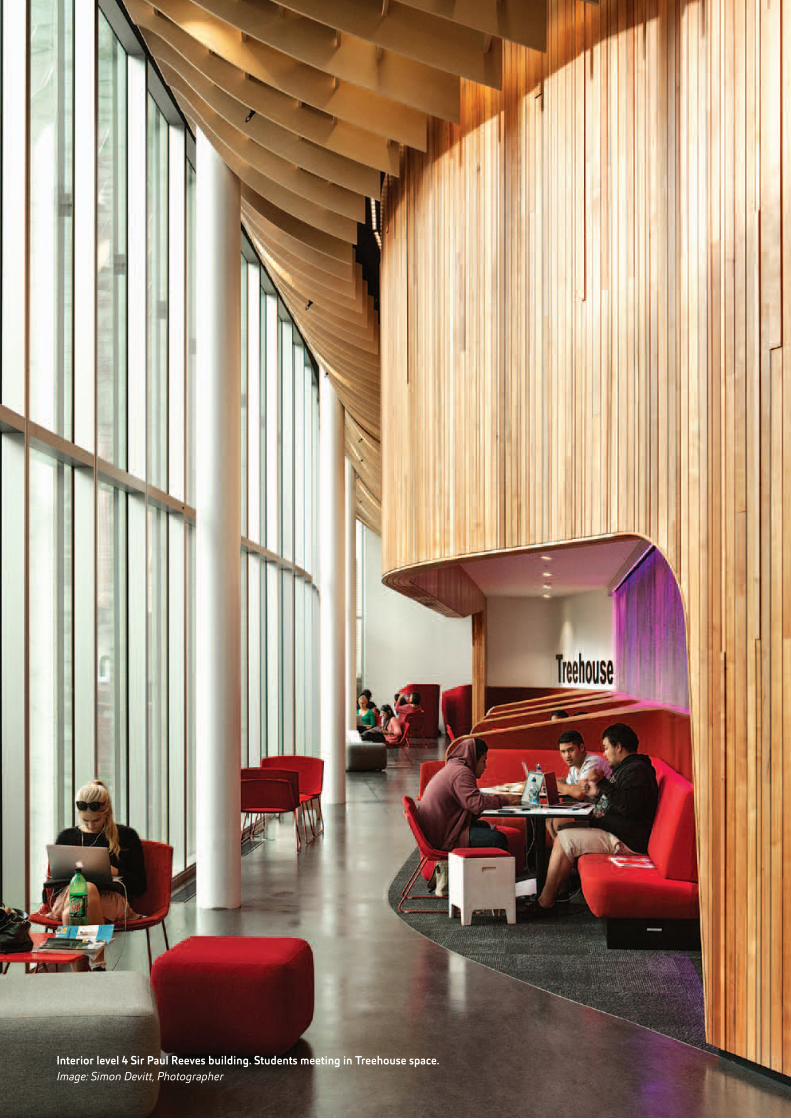
Interior level 4 Sir paul reeves building. Students meeting in treehouse space.Image: Simon Devitt, Photographer

2015 annual report 3
tHe YeAR: 2015

4 2015 annual report
cHAnceLLoR’s FoRewoRd
Viet Nam Strategic Engagement Plan on Education. The Strategic Engagement Plan includes new agreements for AUT with Saigon University and the University of Social Sciences and Humanities. Minister Steven Joyce, who signed the Plan, noted that the partnerships “represent significant milestones in our education relationship with Viet Nam [that will] deepen the level of engagement between our two countries and enrich our students’ learning”. Prime Minister John Key attended the signing ceremony.
Several outstanding individuals were honoured for their achievements during the year. I pass on Council’s congratulations to Tagaloatele Professor Peggy Fairbairn-Dunlop, who was made a Companion of the New Zealand Order of Merit for services to education and the Pacific community; Dr Huhana Hickey, who was made a Member of the New Zealand Order of Merit for services to people with disabilities; Professor Valery Feigin, who received the Royal Society of New Zealand’s MacDiarmid Medal for his work on stroke prevention; Professor Stephen Henry, who received the New Zealand Innovators Supreme Award for his new cancer treatment; and Professor Nikola Kasabov, winner of the third Auckland University of Technology medal for his continued excellence in research, teaching and mentoring. These awards are richly deserved and are testament to the culture of excellence and devotion to service at AUT.
One of Council’s major tasks for the year was the adoption of the new health and safety policy. The new policy describes a culture where health, safety and well-being are valued as fundamental components of the work environment, to the end that no-one comes to harm while visiting, studying or working at the University. This is an aspirational goal and one the University is determined to achieve. It is, moreover, a natural outworking of the University’s core values of tika, pono and aroha and, I am proud to say, demonstrates the depth of AUT’s commitment to its people.
Kia ora tātou and welcome to Auckland University of Technology’s Annual Report 2015. It is again my pleasure to share with you the highlights of another year at this ever-changing, ever-growing university.
Two of AUT’s outstanding achievements in 2015 were being recognised in the top three percent of world universities by international quality agency Quacquerelli Symonds (QS), and being named in the top four percent by Times Higher Education (THE). The QS result places AUT third of all worldwide universities under 20 years old, while THE ranked AUT 12th in the world for international outlook. These are superb outcomes that testify to the breadth and depth of the impact created by AUT. On behalf of Council, I wish to extend my congratulations to all staff for their part in these milestones; we anticipate more great things to come.
The continued growth at South Campus has long been a highlight and Council was pleased to approve the commencement of the next stage of development: the construction of MH Building, which will be completed in 2017. As well as providing capacity for 3,000 equivalent full-time students (EFTS) at South Campus, MH will offer plenty of space for hosting community and industry events, based on the highly successful model of the Sir Paul Reeves Building on City Campus. The commencement of such a large-scale project is yet further evidence of the value AUT places on the South Auckland region and its level of commitment to ensuring the region’s growth and improved prosperity. As anticipated, the open and welcoming atmosphere of South Campus invites community involvement in education and research and is successfully attracting students who may not otherwise have been able to access higher education.
AUT’s influence in Southeast Asia continued to increase with the commencement of two new significant partnerships: an educational memorandum of understanding with Viet Nam’s Quang Ninh Province and the New Zealand –
2015 annual report 5
Turning now to governance matters, the Education Amendment Act 2015 has significant implications for Council. The Act comes into effect in 2016 and will reduce the size of university councils to a maximum of 12, including at least one Māori member and four members appointed by the Minister for Tertiary Education, Skills and Employment. Council has long valued the diversity of perspectives brought by the current representative structure; such variety engenders robust debate that enriches our individual and collective contribution to the University. For this reason Council was determined to maintain a diverse membership despite the reduction in numbers, and held consultations with AUT staff and AuSM (the AUT students’ association) in mid-2015 to determine the best structure to do so. As a result, from 2016 Council will include two elected staff members (one academic and one professional), one member of AuSM, and four other members appointed by Council, taking into account the ethnic and socio-economic diversity of AUT’s communities and an appropriate gender balance. Alongside the ministerial appointees, Council and the University are confident this structure will ensure the interests of AUT’s vital stakeholders are represented and that councillors will maintain the highest standards of academic freedom, autonomy and community service.
Once again, I express Council’s appreciation for Vice-Chancellor Derek McCormack and the strategic leadership team. As this Annual Report outlines, we have much cause for celebration from the achievements of AUT over the past year. However, from my perspective as Chancellor, I am even more proud of the culture the senior leaders have created. I am proud of the way the University lives out its values; the expansion of South Campus, the Viet Nam partnerships and the health and safety policy are all founded on tika, pono, aroha and an unwavering commitment to excellence. The ensuing national and international recognition is well deserved.
John Maasland Chancellor
6 2015 annual report
2015 annual report 7
As at 31 December 2015
The AUT Council is the University’s governing body. AUT Council is empowered to establish committees, and delegate authority to committees or officers of the University. It is made up of elected staff and student representatives, and people appointed or co-opted from outside the University.
chancellor John Maasland MA, FIOD Appointed by Auckland University of Technology Council
(in consultation with BusinessNZ)
Pro-chancellor Lex Henry LLB Appointed by the Minister for Tertiary Education, Skills and Employment
secretary to council dr Andrea Vujnovich LLB (Hons), MSc (Hons), PhD Auckland Assistant Vice-Chancellor (Corporate Development) and General Counsel
Members dr Pat Alley MBChB, FRACS, Dip Prof Ethics Appointed by Auckland University of Technology Council
(after consultation with the Council of Trade Unions)
Urshula Ansell Appointed by the Auckland Student Movement at Auckland University of Technology
sophie Hayman BA (Hons), PgDipArts, PGCE Elected by the professional staff of Auckland University of Technology
Lyn Lim LLB (Hons) Appointed by the Minister for Tertiary Education, Skills and Employment
derek Mccormack MSc, Dip Tchg Vice-Chancellor of Auckland University of Technology
April Pokino Appointed by the Auckland Student Movement at Auckland University of Technology
James schofield BCom, MSc (Econ), FCA Co-opted member
stephen stehlin BA Appointed by Auckland University of Technology Council
(after consultation with Pacific Island organisations and communities of New Zealand)
Judith thompson BSocSc, MMgt Appointed by the Minister for Tertiary Education, Skills and Employment
sussan turner Appointed by the Minister for Tertiary Education, Skills and Employment
Professor Pare Keiha QSO, MBA, MComLaw, MSc, PhD, FRSA, MInstD, MRSNZ Special Advisor to Council on Māori
tHe coUncIL oF AUcKLAndUnIVeRsItY oF tecHnoLogY
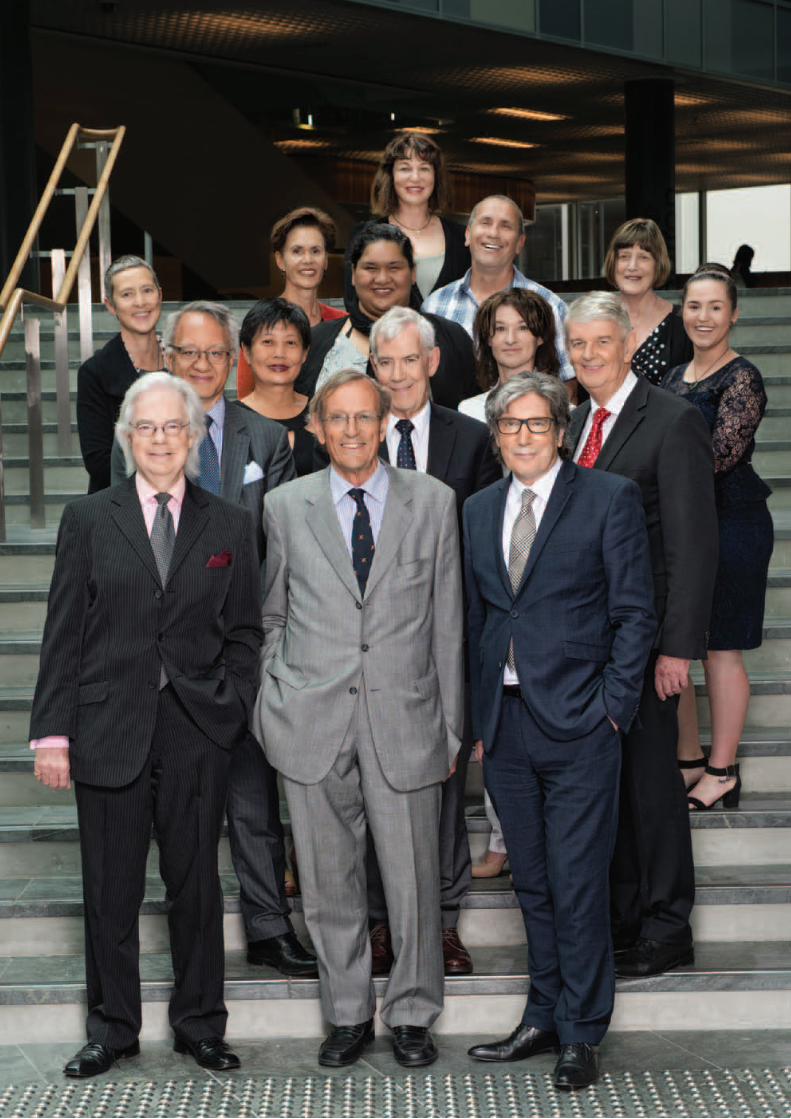
Left image: the Council of auckland university of technologyFront row (from left): lex Henry, John Maasland, Derek McCormackSecond row: professor pare Keiha (in attendance), lyn lim, Dr pat alley, Sussan turner, James Schofield, urshula ansellthird row: Sophie Hayman, Judith thompson, april pokino, Stephen Stehlin, Jocelyn Martin (Chair of property Committee, in attendance) Back: Dr andrea VujnovichImage: Nigel King, White Door Event Photography

8 2015 annual report
VIce-cHAnceLLoR’s RePoRt
I am pleased to report that 2015 was another impressive year for AUT. Midway through our second decade, AUT became New Zealand’s second largest university, and remains the fastest growing. The University continues to be recognised nationally and internationally for some outstanding achievements, many of which are detailed in this Annual Report. Over the past year, AUT has been ranked as New Zealand’s most internationally-engaged university, several of our staff have received national awards, honours and appointments, and we continued to develop our campuses and facilities. There is a genuine and growing sense of momentum as the University builds towards its next phase of development.
The Strategic Plan 2012-2016 is nearing the end of its timespan and conversations have already begun that will shape the development of the next plan. Further consultation will take place as the plan develops through 2016. In the meantime however, it is clear that the University has made significant developmental leaps during the past four years and, as this report shows, there is considerable impetus for more.
LeARnIng And teAcHIngAUT continued to generate growth in student numbers, with total enrolments reaching 19,798 EFTS, an increase of almost seven percent since 2011. Moreover, enrolment data for the university sub-sector showed that over the past six years AUT has increased its market share in all the subjects it offers. Some of the strongest growth has been experienced at the advanced levels of study, which has meant that the University has exceeded two of its Strategic Plan goals a year ahead of schedule. Postgraduate enrolments grew from 12% in 2011 to 16% in 2015 and the number of doctoral students reached 787, well in advance of the targeted 750 by 2016. Such sustained growth testifies to the relevance of the curriculum and the quality of the student experience the University offers. AUT awarded more than 7,500 qualifications in 2015, including a record 13 Māori doctoral completions.
AUT and Massey University were the first universities to join the new Ako Aronui programme in 2015. Ako Aronui encourages academics to become better teachers through innovation, student-centred learning and continuous personal development. Participants are also able to apply for accreditation as a fellow or associate fellow of the United Kingdom (UK) Higher Education Academy. A total of 43 staff joined the programme during the year.
The Faculty of Design and Creative Technologies entered into a new partnership with Spark Ventures that will see students working to solve issues faced by industry, and Spark staff providing assistance with student projects. InterNZ, AUT’s flagship American-based internship programme, has continued to grow. New host organisations that joined the programme in 2015 include the Metropolitan Museum of Art, the American Museum of Natural History, and consultancy firm rogenSi.
Doctoral studentsin 2015
787
Increase in international postgraduate enrolments since 2013
37%
2015 annual report 9
The University also introduced UniPrep, a summer programme at South Campus designed to support a successful transition to University through mentoring, academic preparation and family/whānau involvement. UniPrep was well received by participants and close to 85% chose to continue their studies with AUT in 2015.
ReseARcH And deVeLoPMentThere were some outstanding research successes in 2015 and none more so than the Kode™ technology developed by Professor Stephen Henry. Kode™ is a coating that changes the appearance of cancer cells so the body’s own immune system will reject them. This technology takes only weeks to work, has low toxicity, and has the potential to forever change the way cancer is treated. The technology was licenced to Agalimmune, a UK-based company, and human clinical trials are expected to begin in Europe in 2016.
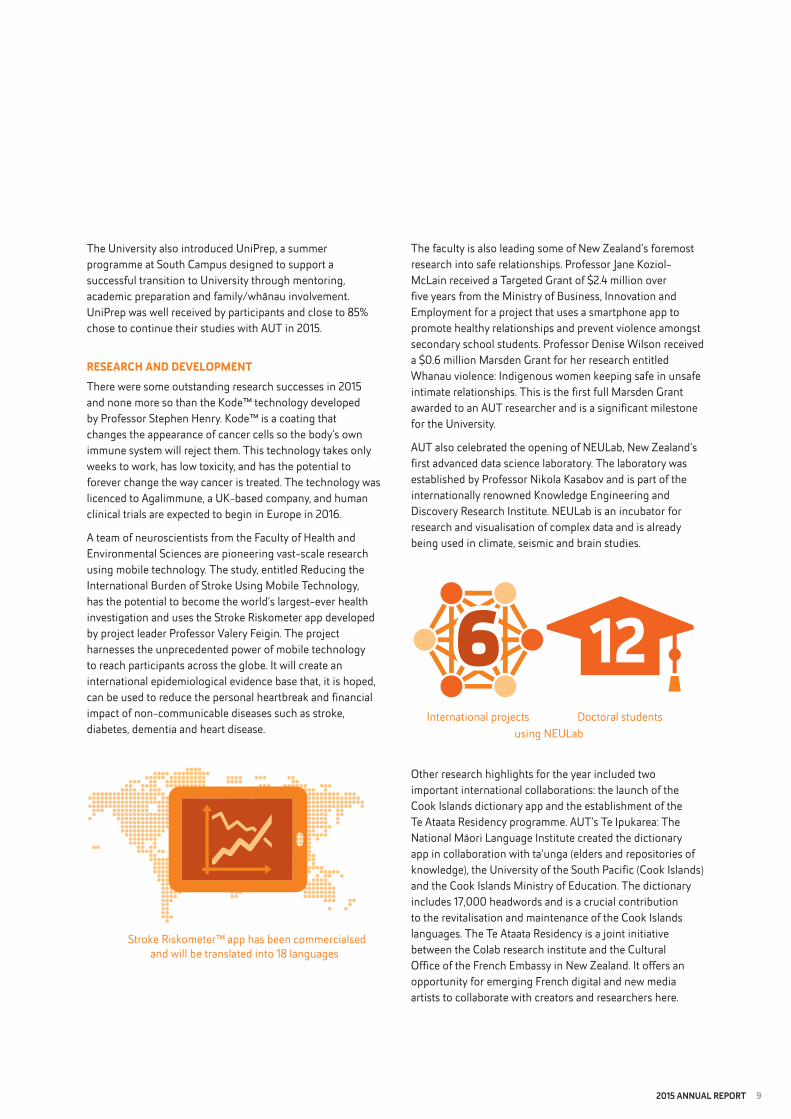
A team of neuroscientists from the Faculty of Health and Environmental Sciences are pioneering vast-scale research using mobile technology. The study, entitled Reducing the International Burden of Stroke Using Mobile Technology, has the potential to become the world’s largest-ever health investigation and uses the Stroke Riskometer app developed by project leader Professor Valery Feigin. The project harnesses the unprecedented power of mobile technology to reach participants across the globe. It will create an international epidemiological evidence base that, it is hoped, can be used to reduce the personal heartbreak and financial impact of non-communicable diseases such as stroke, diabetes, dementia and heart disease.
The faculty is also leading some of New Zealand’s foremost research into safe relationships. Professor Jane Koziol-McLain received a Targeted Grant of $2.4 million over five years from the Ministry of Business, Innovation and Employment for a project that uses a smartphone app to promote healthy relationships and prevent violence amongst secondary school students. Professor Denise Wilson received a $0.6 million Marsden Grant for her research entitled Whanau violence: Indigenous women keeping safe in unsafe intimate relationships. This is the first full Marsden Grant awarded to an AUT researcher and is a significant milestone for the University.
AUT also celebrated the opening of NEULab, New Zealand’s first advanced data science laboratory. The laboratory was established by Professor Nikola Kasabov and is part of the internationally renowned Knowledge Engineering and Discovery Research Institute. NEULab is an incubator for research and visualisation of complex data and is already being used in climate, seismic and brain studies.
Other research highlights for the year included two important international collaborations: the launch of the Cook Islands dictionary app and the establishment of the Te Ataata Residency programme. AUT’s Te Ipukarea: The National Māori Language Institute created the dictionary app in collaboration with ta’unga (elders and repositories of knowledge), the University of the South Pacific (Cook Islands) and the Cook Islands Ministry of Education. The dictionary includes 17,000 headwords and is a crucial contribution to the revitalisation and maintenance of the Cook Islands languages. The Te Ataata Residency is a joint initiative between the Colab research institute and the Cultural Office of the French Embassy in New Zealand. It offers an opportunity for emerging French digital and new media artists to collaborate with creators and researchers here.
Stroke Riskometer™ app has been commercialsed and will be translated into 18 languages
12International projects
using NEULab
666Doctoral students
10 2015 annual report
The Design for Health and Wellbeing Lab, led by Dr Stephen Reay, received top honours at the Best Design Awards. The world-first laboratory is based at Auckland City Hospital and is a collaboration between AUT and the Auckland District Health Board. It provides a space to develop and test design-led solutions to improve the healthcare experience for patients, families and staff. Current projects being trialled include child-friendly medical equipment and navigation guides to help patients know what to expect.
The Vice-Chancellor’s External Engagement Project aims to build on such successes and enhance the University’s connections with industry, government and community partners. AUT has a strong reputation for engagement and there is already a significant level of activity across the University, including collaborative research, student placements and internships, events, and shared use of facilities. Increasing these activities will support our objective to produce graduates who are ready to make a real difference in the world through the knowledge, skills and professionalism they gain during their time at AUT. The project has three main focus points, including enriching our students’ experience of the world outside university, building our reputation as an expertise-based organisation, and enhancing our relevance to society. Work undertaken in 2015 has identified a set of actions to take, including improving communication and co-ordination across the University, expanding our expertise with regard to engagement, and building a positive academic culture which values staff who incorporate external engagement into their teaching and research. This project forms part of AUT’s wider contribution to the Government’s priority of delivering skills for industry.
stAFFThis year the University celebrated some well-deserved national and global recognition received by AUT staff, including our first Royal Society of New Zealand medal, awarded to Professor Valery Feigin. Along with his supreme award, Professor Stephen Henry’s KODE Biotech research institute won best innovation in health and science at the New Zealand Innovators Awards. Tagaloatele Professor Peggy Fairbairn-Dunlop and Dr Huhana Hickey were named in the 2015 New Zealand Royal Honours List. The International Society of Biomechanics in Sports named Professor Patria Hume as the winner of their most prestigious award for her work in translating biomechanics research into sports practice. Professor Richard Bedford was elected president of the Royal Society of New Zealand. Associate Professor Sharyn Graham Davies won the prestigious international Ruth Benedict Book Prize for her publication Sex and Sexualities in Contemporary Indonesia: Sexual politics, diversity, representations and health. Associate Professor Charles Walker was appointed as the creative director and curator for the New Zealand exhibition at the 2016 Venice Architecture Biennale, and Professor John Raine was appointed to the board of the new MedTech Centre of Research Excellence.
AUT also recognised high-achieving staff at the 2015 Excellence Awards. Professor Nikola Kasabov received the University Medal for his internationally acclaimed work in artificial intelligence and knowledge engineering. The ceremony included the inaugural Professional Excellence Awards, in recognition of the vital contributions made by AUT’s professional staff. Professors Steve Pointing and Paul Moon also received special commendations for communicating science and scholarship in the public arena, and advancing discussion of current public issues. I pass on my warmest congratulations to all winners.
New Zealand’s fifth most attractive employer (2015 Randstand Awards)
#5RANKED

2015 annual report 11
2015 exceLLence AwARd wInneRs
proFeSSIonal exCellenCe:Tim Davison (Strategy and Planning)Sophie Hayman (Faculty of Design and Creative Technologies)Agnes Naera (Faculty of Business and Law)AUTonline/Blackboard team (Centre for Learning and Teaching)External and Industry Relations team (Business and Community Relations and the School of Engineering, Computer and Mathematical Sciences)Highly commended: Hospitality Services team (Estates)
reSearCH exCellenCe:Professor Valery Feigin (National Institute for Stroke and Applied Neurosciences)Dr Matt Brughelli (Sports Performance Research Institute New Zealand)Jim Marbrook (School of Communication Studies)Dr Barbara Breen (School of Applied Sciences)New Zealand Tourism Research Institute (Faculty of Culture and Society)
teaCHInG exCellenCe:Dr Katharine Jones (AUT Business School)David Sinfield (School of Art and Design)Chris Whittington (School of Engineering, Computer and Mathematical Sciences)Knowledge, Enquiry and Communication team (Faculty of Health and Environmental Sciences)Highly commended: Culture and Society paper team (Faculty of Culture and Society, Te Ara Poutama and the Centre for Learning and Teaching)
SpeCIal CoMMenDatIonS:Professor Steve Pointing (Institute for Applied Ecology New Zealand) for communicating science and scholarshipProfessor Paul Moon (Te Ara Poutama) for advancing discussion of current public issues
unIVerSIty MeDal:Professor Nikola Kasabov (Knowledge Engineering and Discovery Research Institute)
AUT introduced the early career development programme to support new staff to build their teaching skills, extend their research capability, and gain confidence in their professional and leadership roles. The programme is grounded in kaupapa Māori and Pacific learning philosophies and frameworks, and each participant is mentored by a senior academic.
engAgeMent wItH coMMUnItIesThe expansion of AUT South Campus continues. EFTS have almost doubled in the last three years, from 700 in 2012 to more than 1,300 in 2015. The new Mod Quad building has provided much-needed classroom, office and student space, along with AUT’s first flexible laboratory. While the South Campus’ primary role is that of an education hub for the South Auckland region, it is also a valuable gateway to further educational and employment opportunities in Auckland and the world. More than 1,000 new students from the key local board areas of Māngere-Ōtāhuhu, Manurewa, Ōtara-Papatoetoe and Papakura enrolled at AUT’s three campuses in 2015, an overall increase of 20 percent since 2012.
20% more new students from South and Southwest Auckland since 2012
The 12 recipients of the 2014 Woolf Fisher Trust First-in-Family Scholarships commenced their studies, with another 13 scholarships offered in 2015. The programme is grounded in the principles of community engagement and shared success. Recipients have regular contact with a student advisor during their first year of study, and in their second and third years act as mentors to students at secondary schools in lower socio-economic areas.
AUT has continued to build on the momentum generated by gaining the Rainbow Tick in 2014. More than 70 staff have subsequently attended Rainbow Tick workshops, increasing their knowledge of issues relating to sexuality and gender diversity. In a significant step forward, students, current staff and new applicants for roles at AUT can self-identify as gender diverse when providing personal information.
New Zealand’s first and only university to have the Rainbow Tick
12 2015 annual report
The plight of Syrian refugees has been well documented in international media in 2015, making the Refugee Education Conference particularly topical. Speakers, many of whom were from a refugee background, presented research into best practice and shared their personal experiences with the New Zealand education system. More than 200 delegates attended the conference, which was jointly hosted by AUT and the Ministry of Education.
contInUoUs deVeLoPMent And cAPAcItY bUILdIngAUT performed well financially in 2015, again achieving all its financial targets and covenants by a comfortable margin. Revenue increased by almost $21 million and the University posted a net surplus of more than $14 million.
The Academic Quality Agency for New Zealand Universities undertook its Cycle 5 academic audit of AUT in late 2015, focussed on all activities related to teaching, learning and student support. The auditors commented that “AUT is characterised by a philosophy which is widely understood by staff and is directly translated into practice. In particular, it is collegial, inclusive, focussed on providing opportunity and genuinely centred on teaching, learning and student engagement.”
Two major international rankings agencies, THE and QS, acknowledged the quality of the scholarship taking place at AUT. For the first time, THE ranked AUT in the top four percent of world universities. THE further placed AUT twelfth in the world, and first in New Zealand, for international outlook based on metrics related to international staff, international co-authorship of research and international students. QS placed AUT within the top three percent, and third of all universities under the age of 20. QS’s individual subject rankings also revealed some excellent results: Art and Design achieved a place in the top 50 of all universities worldwide, and first in New Zealand; Accounting and Finance was in the top 150; Business and Management in the top 200; and Computer Science and Information Systems in the top 300.
The University formalised three new agreements with Vietnamese partners. The memorandum of understanding with Quang Ninh Province positions AUT as a key training and consultancy partner, focussed on academic research and commercial collaboration in tourism and hospitality. The New Zealand – Viet Nam Strategic Engagement Plan on Education was signed by Steven Joyce, Minister for Tertiary Education, Skills and Employment, and included two further memoranda of understanding between AUT and Saigon University and the University of Social Sciences and Humanities.
These agreements covered the disciplines of education, language and culture, hospitality and tourism, and social policy. AUT’s involvement with education in Viet Nam now spans more than 20 years.
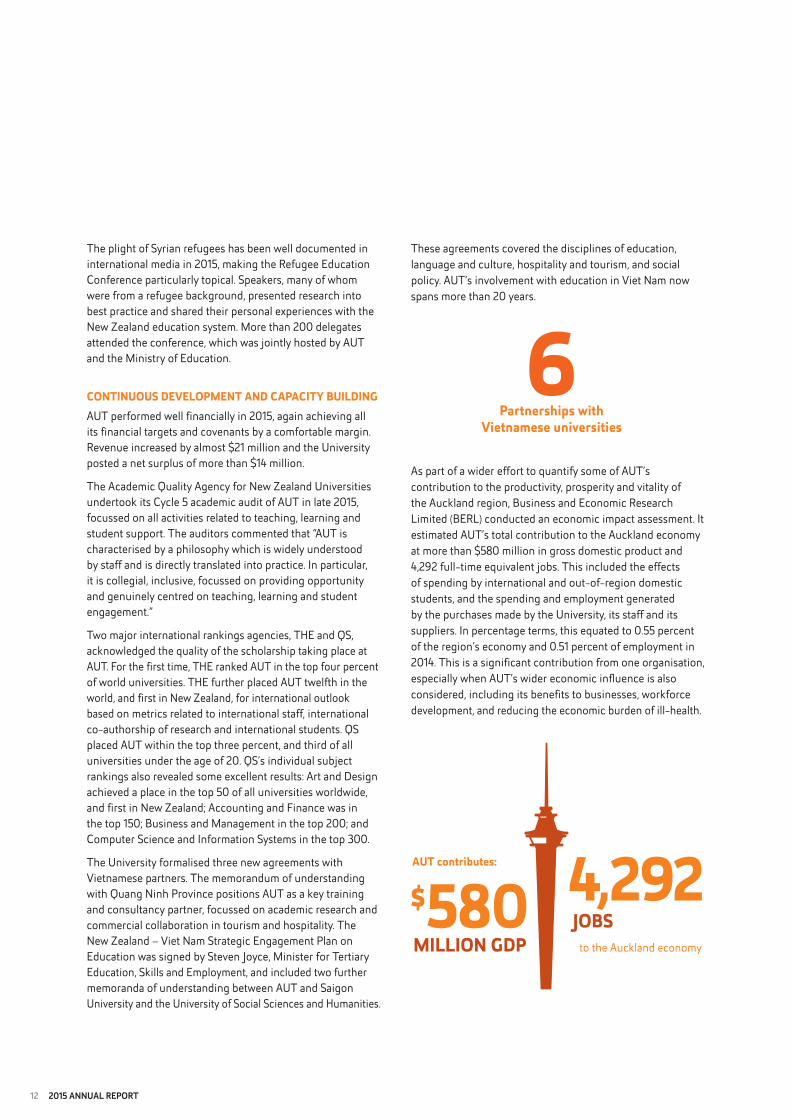
Partnerships withVietnamese universities
As part of a wider effort to quantify some of AUT’s contribution to the productivity, prosperity and vitality of the Auckland region, Business and Economic Research Limited (BERL) conducted an economic impact assessment. It estimated AUT’s total contribution to the Auckland economy at more than $580 million in gross domestic product and 4,292 full-time equivalent jobs. This included the effects of spending by international and out-of-region domestic students, and the spending and employment generated by the purchases made by the University, its staff and its suppliers. In percentage terms, this equated to 0.55 percent of the region’s economy and 0.51 percent of employment in 2014. This is a significant contribution from one organisation, especially when AUT’s wider economic influence is also considered, including its benefits to businesses, workforce development, and reducing the economic burden of ill-health.
AUT contributes:
to the Auckland economy
$
MILLION GDP
4,292JOBS580

2015 annual report 13
This influence will continue to grow in the coming years as the University prepares for the further expansion of the South Campus. The construction of the new MH Building commenced mid-year. This 11,200m2 facility will provide classrooms, lecture theatres and postgraduate space, alongside areas for collaborative learning and events, following the successful model of the Sir Paul Reeves Building. MH Building is part of a $400 million development programme that includes major developments at all three campuses over the next few years. Design work continued throughout the year on the planned Engineering, Technology and Design building at the City Campus and the A1 Building at the North Campus.
As part of the University’s ongoing commitment to environmental sustainability, these new buildings will incorporate sustainable building practices. The energy efficiency measures in the MH Building alone are expected to save close to 720,000 kilowatt hours each year and were funded through $0.5 million in Crown loans and grants from the Energy Efficiency and Conservation Authority. The Vice-Chancellor’s Taskforce for Sustainability conducted University-wide stocktakes of sustainability content in the curricula and in research, providing useful baselines for measuring progress. The University is working to encourage further initiatives in teaching and research. The taskforce held two learning and teaching fora for staff and postgraduate students, and sustainability was made a consideration for funding from the Strategic Research Investment Fund. AUT also seeks practical ways to make Auckland a more sustainable city: travel plans for all three campuses are under review, and the City Campus now has its own beehive. The beehive helps address the shortage of bees in Auckland as well as providing research opportunities and supplying honey to the University’s cafes.
Sustainable Enterprise major – finalist in the New Zealand
Sustainable Business Network awards
FInAL tHoUgHtsWe acknowledge and celebrate the University’s achievements over the past year and use these milestones not as resting posts, but to spur us on to further heights of achievement. In particular, the contribution of AUT’s South Campus has only just begun and we look forward to the opportunities the expansion of the campus will bring.
I again thank Chancellor John Maasland and the AUT Council for their wise leadership over the past year. I also acknowledge the important contribution of April Pokino and the Auckland Student Movement of AUT (AuSM); AUT is a better place because of them. Finally, I wish to thank all staff for their dedication and commitment to AUT, to our students and to our communities. We are justly proud of the many successes discussed in this report; we have shared in their attainment and we celebrate them together.
derek Mccormack Vice-Chancellor
14 2015 annual report
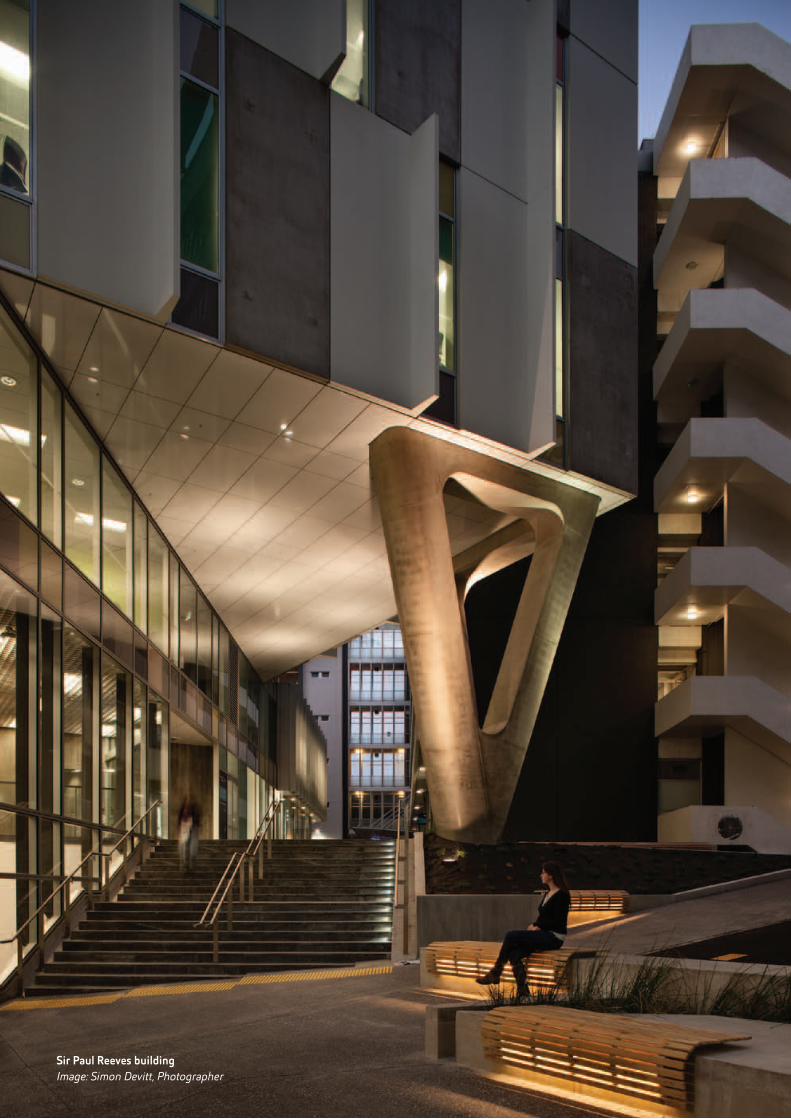
Sir paul reeves buildingImage: Simon Devitt, Photographer
2015 annual report 15
As at 31 December 2015
AUT is led by the Vice-Chancellor who appoints the senior officers employed by the University. The officers are responsible for providing the strategic direction for AUT and for ensuring that the University is well managed, its academic standards are maintained, and the various needs of the University’s stakeholders are met.
Vice-chancellor derek Mccormack MSc, Dip Tchg
deputy Vice-chancellor Professor Robert Allen BA (Econ), PhD Edinburgh
Pro Vice-chancellors and deans
Pro Vice-Chancellor (South Auckland) Dean, Faculty of Business and Law
Professor geoff Perry BA, MA, MPhil (Hons), PhD Auckland, DipCom, PGDipSocSci (Dstn), Dip Tchg
Pro Vice-Chancellor (International)Dean, Faculty of Culture and Society
Professor nigel Hemmington BSc (Hons), PhD Surrey, FCIM, FICPD, FIH, Chartered Marketer
Pro Vice-Chancellor (Student Success) Dean, Faculty of Design and Creative Technologies
Professor desna Jury MEd (Hons), Dip Tchg, FDINZ, FRSA
Pro Vice-Chancellor (North Shore) Dean, Faculty of Health and Environmental Sciences
Professor Max Abbott BA, BSc, MA (Hons), PhD Canterbury, DipClinPsych, TColDip (Dstn), MNZCCP, MRSNZ
Pro Vice-Chancellor (Learning and Teaching)Pro Vice-Chancellor (Māori Advancement)Dean, Te Ara Poutama (Faculty of Māori Development)
Professor Pare Keiha QSO, MBA, MComLaw, MSc, PhD Auckland, FRSA, MInstD, MRSNZ
Pro Vice-Chancellor (Research and Innovation) Professor John Raine BE (Hons), PhD Canterbury, CEng, FIMechE, DistFIPENZ, MSAE, MASPACI
Pro Vice-Chancellor Professor Philip sallis BA, PhD City (UK), DipGrad (Theol), FIITNZ, FSMC, MIEEE, MIAGS, MRSNZ, MIDNZ
Pro Vice-Chancellor Professor Ian shirley MA (Hons), PhD Massey
Assistant Vice-chancellors Corporate Development; General Counsel dr Andrea Vujnovich LLB (Hons), MSc (Hons), PhD Auckland
Finance and Infrastructure; Chief Financial Officer Lyle williams BCom, CA
Strategy, Students and Marketing Jenny bygrave LLB, MEdAdmin (Hons)
group directorsBrand and Marketing Services Luke Patterson MBA
Student Services and Administration Joanna scarbroughPeople and Organisation John woods BA
Head of Pacific Advancement walter Fraser BA, PGDipCom
chief Information officer Liz gosling MBA (Human Resources Management)
Internal Auditor Alastair burrows CFIIA, AIIA (NZ)
Auditor Audit new Zealand on behalf of the Auditor-general
bankers AnZ bank new Zealand Limited and westpac new Zealand Limited
oFFIceRs oF AUcKLAndUnIVeRsItY oF tecHnoLogY
16 2015 annual report
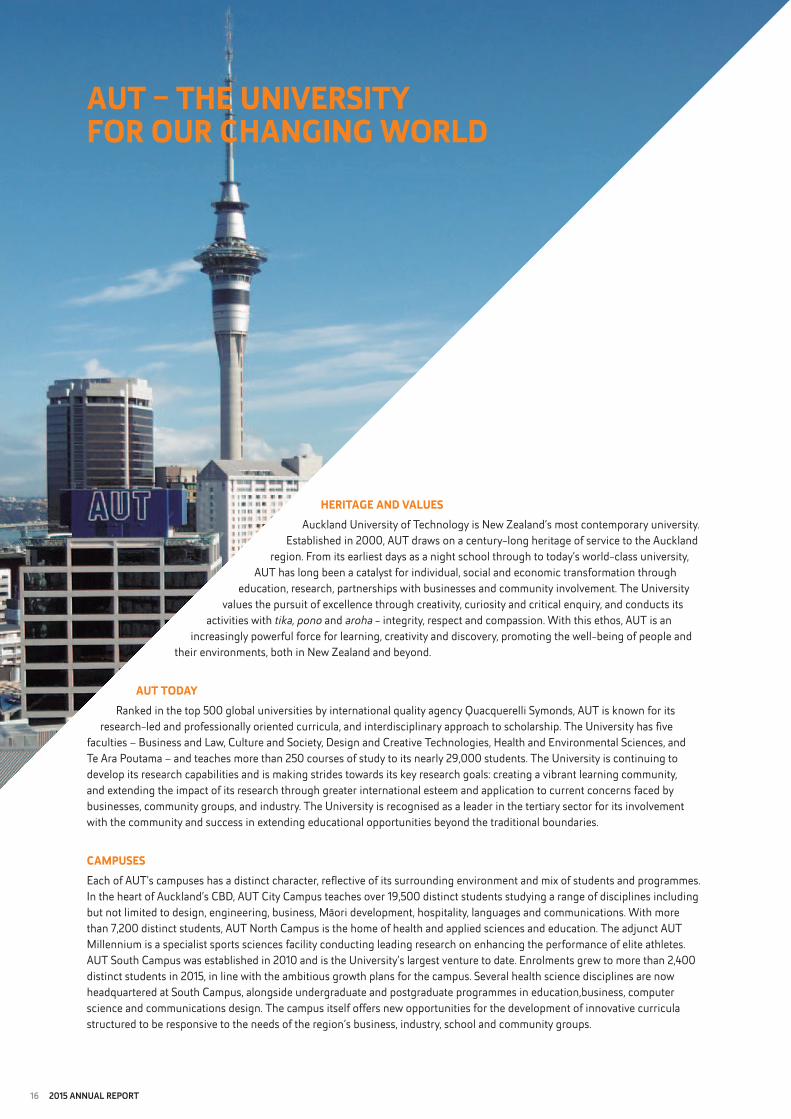
HeRItAge And VALUesAuckland University of Technology is New Zealand’s most contemporary university.
Established in 2000, AUT draws on a century-long heritage of service to the Auckland region. From its earliest days as a night school through to today’s world-class university,
AUT has long been a catalyst for individual, social and economic transformation through education, research, partnerships with businesses and community involvement. The University
values the pursuit of excellence through creativity, curiosity and critical enquiry, and conducts its activities with tika, pono and aroha - integrity, respect and compassion. With this ethos, AUT is an
increasingly powerful force for learning, creativity and discovery, promoting the well-being of people and their environments, both in New Zealand and beyond.
AUt todAYRanked in the top 500 global universities by international quality agency Quacquerelli Symonds, AUT is known for its
research-led and professionally oriented curricula, and interdisciplinary approach to scholarship. The University has five faculties – Business and Law, Culture and Society, Design and Creative Technologies, Health and Environmental Sciences, and Te Ara Poutama – and teaches more than 250 courses of study to its nearly 29,000 students. The University is continuing to develop its research capabilities and is making strides towards its key research goals: creating a vibrant learning community, and extending the impact of its research through greater international esteem and application to current concerns faced by businesses, community groups, and industry. The University is recognised as a leader in the tertiary sector for its involvement with the community and success in extending educational opportunities beyond the traditional boundaries.
cAMPUsesEach of AUT’s campuses has a distinct character, reflective of its surrounding environment and mix of students and programmes. In the heart of Auckland’s CBD, AUT City Campus teaches over 19,500 distinct students studying a range of disciplines including but not limited to design, engineering, business, Māori development, hospitality, languages and communications. With more than 7,200 distinct students, AUT North Campus is the home of health and applied sciences and education. The adjunct AUT Millennium is a specialist sports sciences facility conducting leading research on enhancing the performance of elite athletes. AUT South Campus was established in 2010 and is the University’s largest venture to date. Enrolments grew to more than 2,400 distinct students in 2015, in line with the ambitious growth plans for the campus. Several health science disciplines are now headquartered at South Campus, alongside undergraduate and postgraduate programmes in education,business, computer science and communications design. The campus itself offers new opportunities for the development of innovative curricula structured to be responsive to the needs of the region’s business, industry, school and community groups.
AUt – tHe UnIVeRsItY FoR oUR cHAngIng woRLd
2015 annual report 17
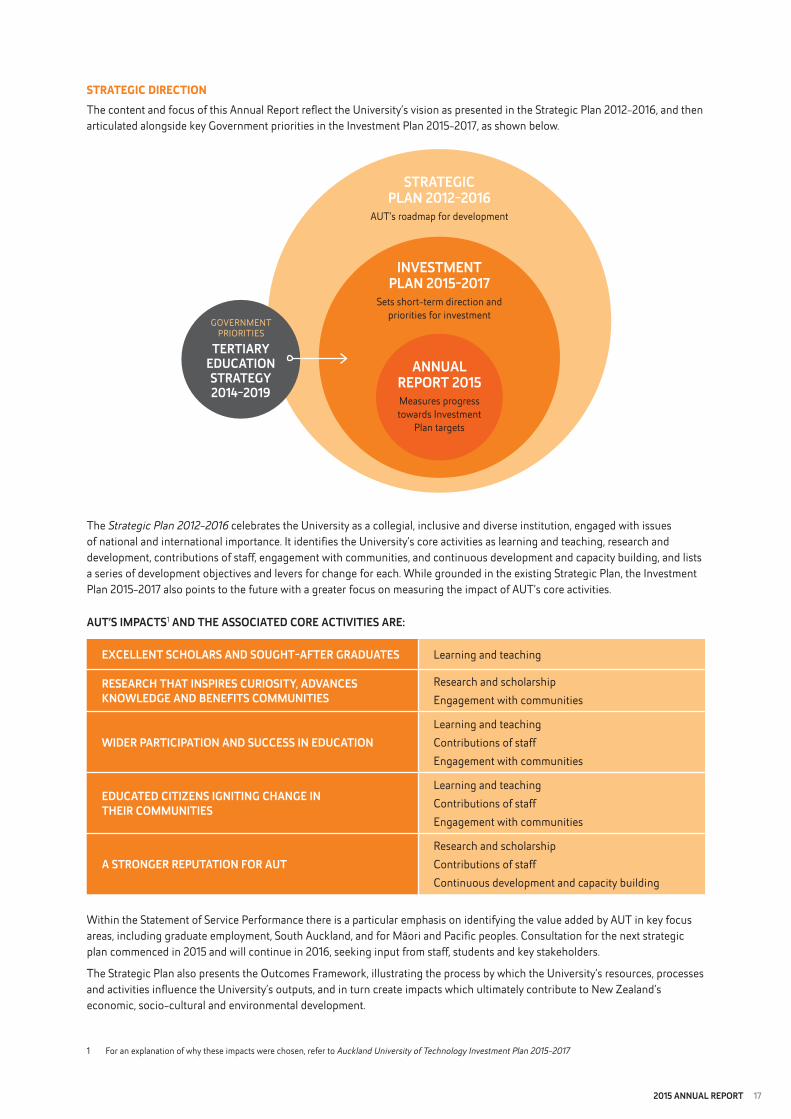
stRAtegIc dIRectIonThe content and focus of this Annual Report reflect the University’s vision as presented in the Strategic Plan 2012-2016, and then articulated alongside key Government priorities in the Investment Plan 2015-2017, as shown below.
The Strategic Plan 2012-2016 celebrates the University as a collegial, inclusive and diverse institution, engaged with issues of national and international importance. It identifies the University’s core activities as learning and teaching, research and development, contributions of staff, engagement with communities, and continuous development and capacity building, and lists a series of development objectives and levers for change for each. While grounded in the existing Strategic Plan, the Investment Plan 2015-2017 also points to the future with a greater focus on measuring the impact of AUT’s core activities.
aut’S IMpaCtS1 anD tHe aSSoCIateD Core aCtIVItIeS are:
exCellent SCHolarS anD SouGHt-aFter GraDuateS Learning and teaching
reSearCH tHat InSpIreS CurIoSIty, aDVanCeS KnowleDGe anD BeneFItS CoMMunItIeS
Research and scholarshipEngagement with communities
wIDer partICIpatIon anD SuCCeSS In eDuCatIon Learning and teachingContributions of staffEngagement with communities
eDuCateD CItIZenS IGnItInG CHanGe In tHeIr CoMMunItIeS
Learning and teachingContributions of staffEngagement with communities
a StronGer reputatIon For autResearch and scholarshipContributions of staffContinuous development and capacity building
Within the Statement of Service Performance there is a particular emphasis on identifying the value added by AUT in key focus areas, including graduate employment, South Auckland, and for Māori and Pacific peoples. Consultation for the next strategic plan commenced in 2015 and will continue in 2016, seeking input from staff, students and key stakeholders.
The Strategic Plan also presents the Outcomes Framework, illustrating the process by which the University’s resources, processes and activities influence the University’s outputs, and in turn create impacts which ultimately contribute to New Zealand’s economic, socio-cultural and environmental development.
tertIary eDuCatIon StrateGy 2014-2019
GOVERNMENT PRIORITIES
StrateGIC plan 2012-2016
AUT’s roadmap for development
InVeStMent plan 2015-2017
Sets short-term direction and priorities for investment
annual report 2015Measures progress towards Investment
Plan targets
1 For an explanation of why these impacts were chosen, refer to Auckland University of Technology Investment Plan 2015-2017

18 2015 annual report
AUcKLAnd UnIVeRsItY oF tecHnoLogY’s oUtcoMes FRAMewoRK
tHRoUgH LeARnIng And teAcHIngtHRoUgH e
ngAg
eMen
t w
ItH
tHRoUgH contRIbUtIons oF stAFF
tHRo
UgH ReseARcH And scHoLARsHIP
Extend research activityand capability across
the University
Enhance support services and resources for
students
Build a diverse student profile
Continue to improveits educational performance
indicator results
Expand AUT South Campus
Enhance studentengagement and
satisfaction
Build itsreputation
Meet agreed financial
covenants
Enhance facilitiesand infrastructure
Diversify itsrevenue base
Enable staff achievement
Enhance its open, inclusive andcollegial culture
Increase diversity inacademic and senior
positions
Enhance engagementand the advancement
of Pacific peoples
Strengthen itscontribution to
Māori advancement
Deepenrelationships
with professions,industry, businessand communities
Strengthen international
relationships andcollaborations
Increasepostgraduate
students
Increase externalresearch revenue
Increase allocation ofinternal resources
to research
AUT WILL:
Advance knowledge andprofessional practice
Create inspirationallearning experiences
Serve ourdiverse communities
Create a vibrant andrewarding environmentfor work and learning
Secure AUT’sfuture through
a soundreputation and
good stewardship
Make a nationaland global
impact
Spark debate and shareknowledge
WHICH WILL:
LEADING TO:
Research that inspirescuriosity, advances knowledge
and benefits communities
Excellent scholarsand sought-after
graduates
Wider participationand success in
education
A strongerreputation for AUT
Educated citizensigniting change intheir communities
Learning, creativity and discovery
New Zealanders having theknowledge, skills and values to be
successful citizens
Social, cultural, economic and environmental development and
wellbeing
ANDCONTRIBUTING TO:
tHRoUgH
contInUoUs deVeLoPM
ent And
cAPAcItY bUILdIngcoM
MUn
ItIe
s
tHIs Is AUt: ResPonsIVe, conteMPoRARY And engAged. tHe UnIVeRsItY FoR oUR cHAngIng woRLd.
2015 annual report 19
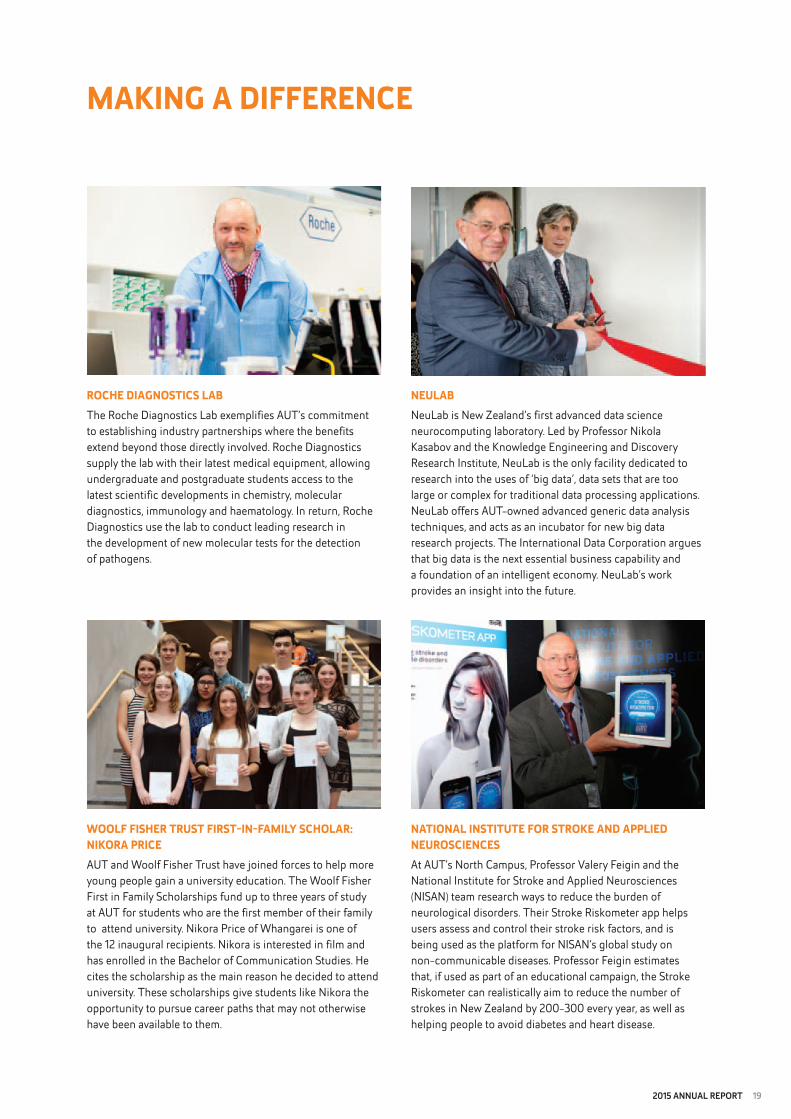
wooLF FIsHeR tRUst FIRst-In-FAMILY scHoLAR: nIKoRA PRIceAUT and Woolf Fisher Trust have joined forces to help more young people gain a university education. The Woolf Fisher First in Family Scholarships fund up to three years of study at AUT for students who are the first member of their family to attend university. Nikora Price of Whangarei is one of the 12 inaugural recipients. Nikora is interested in film and has enrolled in the Bachelor of Communication Studies. He cites the scholarship as the main reason he decided to attend university. These scholarships give students like Nikora the opportunity to pursue career paths that may not otherwise have been available to them.
MAKIng A dIFFeRence
nAtIonAL InstItUte FoR stRoKe And APPLIed neURoscIencesAt AUT’s North Campus, Professor Valery Feigin and the National Institute for Stroke and Applied Neurosciences (NISAN) team research ways to reduce the burden of neurological disorders. Their Stroke Riskometer app helps users assess and control their stroke risk factors, and is being used as the platform for NISAN’s global study on non-communicable diseases. Professor Feigin estimates that, if used as part of an educational campaign, the Stroke Riskometer can realistically aim to reduce the number of strokes in New Zealand by 200-300 every year, as well as helping people to avoid diabetes and heart disease.
RocHe dIAgnostIcs LAbThe Roche Diagnostics Lab exemplifies AUT’s commitment to establishing industry partnerships where the benefits extend beyond those directly involved. Roche Diagnostics supply the lab with their latest medical equipment, allowing undergraduate and postgraduate students access to the latest scientific developments in chemistry, molecular diagnostics, immunology and haematology. In return, Roche Diagnostics use the lab to conduct leading research in the development of new molecular tests for the detection of pathogens.
neULAbNeuLab is New Zealand’s first advanced data science neurocomputing laboratory. Led by Professor Nikola Kasabov and the Knowledge Engineering and Discovery Research Institute, NeuLab is the only facility dedicated to research into the uses of ‘big data’, data sets that are too large or complex for traditional data processing applications. NeuLab offers AUT-owned advanced generic data analysis techniques, and acts as an incubator for new big data research projects. The International Data Corporation argues that big data is the next essential business capability and a foundation of an intelligent economy. NeuLab’s work provides an insight into the future.

20 2015 annual report
textILe And desIgn LAbThe Textile and Design Lab (TDL) is a unique research and development centre, supporting design and innovation in new fashion and textile technologies. The TDL is a hub for engagement with the fashion industry and is used for research, prototyping, sampling and small-scale production. Regular users include students, designers, commercial businesses and research organisations. The lab can also be used for training and education; high-profile retail organisations such as Farmers and The Warehouse have held training courses at the TDL. The TDL is part of the Faculty of Design and Creative Technology’s Labs Network.
scI21Sci21’s vision is to entertain, inform and inspire interest in the science of tomorrow. Sponsored by AUT’s School of Applied Sciences, Sci21 brings research conducted by southern hemisphere scientists to the global stage through a series of entertaining, engaging webcasts. Topics of discussion reflect New Zealand’s National Science Challenges, as well as other critical areas that will affect the world of tomorrow. To date, leading scientists have discussed human health and nutrition, climate change, the natural environment, urbanisation and natural disasters, among other topics.
Sci21Science that willtransform our worldin the 21st Century
www.sci21.co.nz
HUMAn PotentIAL centReNeuroscientific research is beginning to reveal the scale of importance of physical activity for maintaining a healthy brain. Under the directorship of Professor Grant Schofield, the Human Potential Centre (HPC) is researching the efficacy of health promotion efforts in the workplace, from both an individual and a business perspective. In partnership with Sovereign, the HPC created the Sovereign Wellbeing Index, and has consulted with Vitality Works, Sanitarium’s workplace health arm.
HeALtH And weLLbeIng LAbThe Design for Health and Wellbeing Lab is a collaboration between AUT’s School of Art and Design and Auckland District Health Board. Together, they apply design-led solutions to create a better experience for patients, visitors and staff. The lab also provides postgraduate students with invaluable real-world design experience working with hospital users. Projects have included an anaesthetic bottle clip that both prevents leaks and indicates usage, and Sprout, a child-friendly IV drip pole.
2015 annual report 21
KeY FActs And FIgURes
2 Equivalent full-time students 3 SAC-funded refers to students eligible for Student Achievement Component funding 4 Includes International SAC-funded EFTS (French and German postgraduate students and diplomatic staff and family), International Research SAC-funded EFTS (on-shore international doctorates and international postgraduate research MoE), and International Exchange (SAC-funded) EFTS
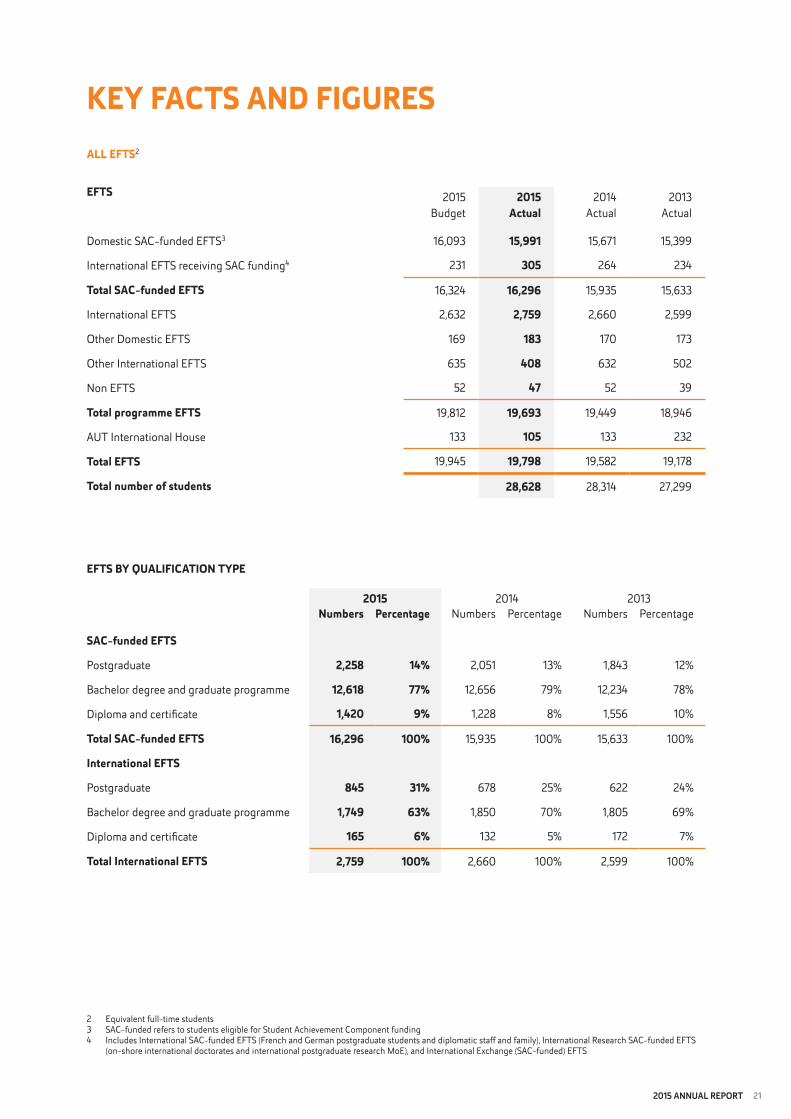
ALL eFts2
eFts 2015Budget
2015Actual
2014Actual
2013Actual
Domestic SAC-funded EFTS3 16,093 15,991 15,671 15,399
International EFTS receiving SAC funding4 231 305 264 234
total sAc-funded eFts 16,324 16,296 15,935 15,633
International EFTS 2,632 2,759 2,660 2,599
Other Domestic EFTS 169 183 170 173
Other International EFTS 635 408 632 502
Non EFTS 52 47 52 39
total programme eFts 19,812 19,693 19,449 18,946
AUT International House 133 105 133 232
total eFts 19,945 19,798 19,582 19,178
total number of students 28,628 28,314 27,299
eFts bY qUALIFIcAtIon tYPe
2015 2014 2013numbers Percentage Numbers Percentage Numbers Percentage
sAc-funded eFts
Postgraduate 2,258 14% 2,051 13% 1,843 12%
Bachelor degree and graduate programme 12,618 77% 12,656 79% 12,234 78%
Diploma and certificate 1,420 9% 1,228 8% 1,556 10%
total sAc-funded eFts 16,296 100% 15,935 100% 15,633 100%
International eFts
Postgraduate 845 31% 678 25% 622 24%
Bachelor degree and graduate programme 1,749 63% 1,850 70% 1,805 69%
Diploma and certificate 165 6% 132 5% 172 7%
total International eFts 2,759 100% 2,660 100% 2,599 100%

22 2015 annual report
5 Based on students’ primary self-selected ethnicity 6 Gender diverse is a new option for students from 20157 This includes International students that are SAC-funded
doMestIc sAc-FUnded stUdents
2015 2014 2013numbers Percentage Numbers Percentage Numbers Percentage
students by ethnicity5
Asian 5,203 24% 5,104 24% 5,094 24%
Māori 2,289 11% 2,136 10% 2,100 10%
New Zealand European/Pākehā 9,157 43% 9,110 44% 9,033 43%
Pacific 2,954 14% 2,816 13% 2,710 13%
Other 1,633 8% 1,630 8% 1,791 9%
Non-declared 184 <1% 196 1% 188 1%
students by mode of study
Full-time 14,928 70% 14,606 70% 14,200 68%
Part-time 6,492 30% 6,386 30% 6,716 32%
students by age
Under 25 years 14,447 68% 13,913 66% 13,659 65%
25-39 years 4,781 22% 4,816 23% 4,974 24%
40+ years 2,192 10% 2,263 11% 2,283 11%
students by gender
Female 13,027 61% 12,758 61% 12,632 60%
Male 8,393 39% 8,234 39% 8,284 40%
Gender diverse6 0 0% – – – –
InteRnAtIonAL stUdents International students were enrolled from 88 countries. The top ten are listed below.
2015 2014numbers Percentage Percentage
China 1,902 48% 48%
India 458 11% 10%
Saudi Arabia 195 5% 5%
Vietnam 194 5% 5%
South Korea 147 4% 4%
Hong Kong 76 2% 2%
Malaysia 74 2% 2%
Taiwan 73 2% 2%
Indonesia 57 1% 1%
Russia 52 1% 2%
Other (78 countries) 748 19% 19%
total International students7 3,976 100% 100%
2015 annual report 23
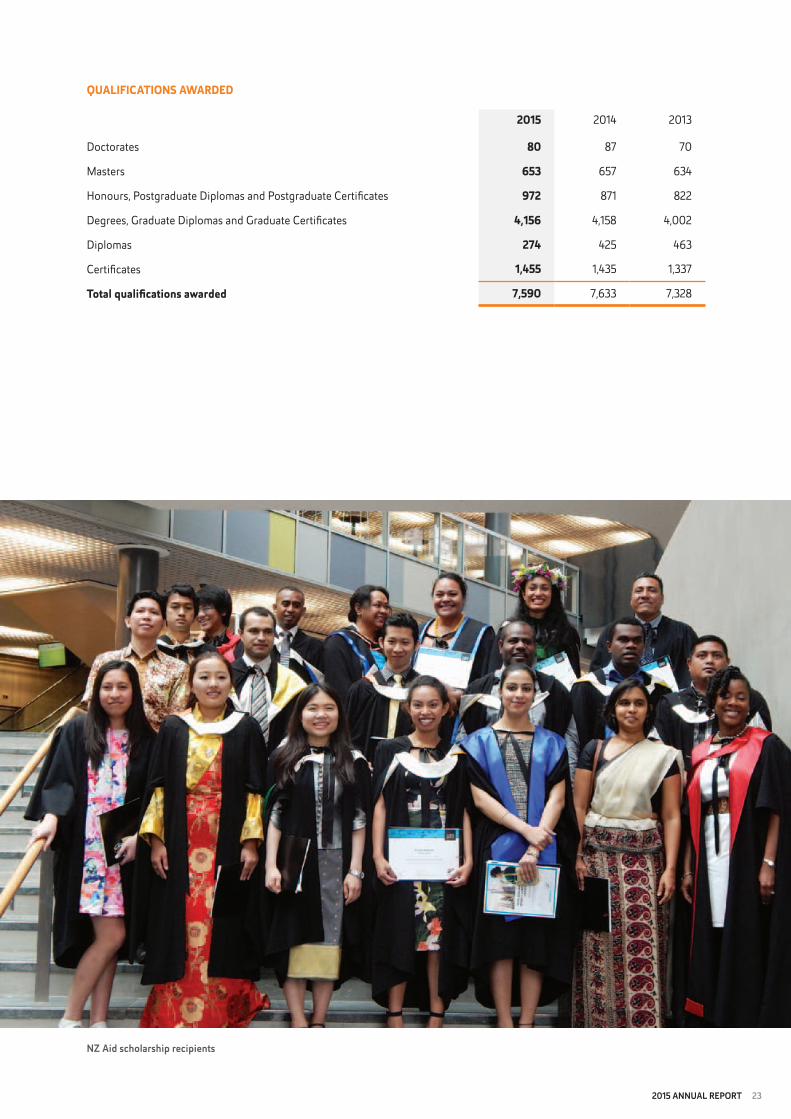
qUALIFIcAtIons AwARded
2015 2014 2013
Doctorates 80 87 70
Masters 653 657 634
Honours, Postgraduate Diplomas and Postgraduate Certificates 972 871 822
Degrees, Graduate Diplomas and Graduate Certificates 4,156 4,158 4,002
Diplomas 274 425 463
Certificates 1,455 1,435 1,337
total qualifications awarded 7,590 7,633 7,328
nZ aid scholarship recipients

24 2015 annual report
busin
ess
and
Law
cultu
rean
d so
ciet
yde
sign
and
crea
tive
te
chno
logi
esHe
alth
and
en
viro
nmen
tal s
cien
ces
te A
ra
Pout
ama
Rese
ARcH
And
cos
t oF
seR
VIce
2015
Actu
al20
14Ac
tual
2015
Actu
al20
14Ac
tual
2015
Actu
al20
14Ac
tual
2015
Actu
al20
14Ac
tual
2015
Actu
al20
14Ac
tual
Stud
ent:a
cade
mic
staf
f rat
io9
28.8
:126
.9:1
17.4
:118
.9:1
18.4
:119
.2:1
13.9
:114
.9:1
12.3
:112
.1:1
MoE
bul
k-fu
nded
taug
ht E
FTS10
4,89
64,
576
3,18
83,
381
5,31
35,
145
5,33
45,
222
289
269
Rese
arch
Rese
arch
out
puts
1133
728
434
420
964
546
757
563
927
18
Exte
rnal
gra
nts
$447
,497
$272
,965
$147
,364
$115
,970
$2,15
7,37
8$2
,049
,626
$7,3
89,4
10$7
,859
,705
$118
,658
$2,6
82
Fina
ncia
l $00
0s
Facu
lty c
osts
33,8
4831
,193
29,0
3825
,539
52,6
2739
,600
60,3
5739
,362
3,00
42,
605
Adm
inis
trativ
e co
sts
26,0
3021
,562
22,2
6817
,639
42,0
1435
,164
37,4
1229
,311
1,851
1,334
tota
l cos
ts59
,878
52,75
551
,306
43,17
894
,641
74,76
497
,769
68,6
734,
855
3,93
9
Less
reco
verie
s1,7
9327
85,
015
2,82
35,
221
265
6,29
515
321
013
8
n et c
ost o
f ser
vice
58,0
8552
,477
46,2
9140
,355
89,4
2074
,499
91,4
7468
,520
4,64
53,
801
Net
cos
t of s
ervi
ce p
er E
FTS
$11,8
64$1
1,468
$14,
520
$11,9
36$1
6,83
0$1
4,48
0$1
7,14
9$1
3,12
1$1
6,07
3$1
4,13
1
8 An
nual
Rep
ort 2
014
inco
rrec
tly in
clud
ed 13
3 AU
T In
tern
atio
nal H
ouse
EFT
S. 2
014
resu
lts h
ave
been
rest
ated
acc
ordi
ngly
9 20
14 fi
gure
s hav
e be
en re
stat
ed to
incl
ude
all T
augh
t EFT
S fo
r eac
h fa
culty
10
Thes
e fig
ures
do
not i
nclu
de 3
5 EF
TS th
at w
ere
not a
ttrib
uted
to a
ny fa
culty
. Of t
hese
, 34
wer
e fro
m th
e U
niPr
ep p
rogr
amm
e11
In
line
with
the
Uni
vers
ity’s
stra
tegi
c di
rect
ion,
thes
e re
sults
now
incl
ude
only
thos
e ou
tput
s tha
t are
bot
h ve
rified
and
qua
lity
assu
red,
whe
reas
all
verifi
ed o
utpu
ts w
ere
repo
rted
in p
revi
ous A
nnua
l Rep
orts
. 201
4 re
sults
hav
e be
en re
stat
ed
ac
cord
ingl
y . W
here
ther
e ar
e m
ultip
le A
UT
auth
ors i
n m
ore
than
one
facu
lty, a
n ou
tput
is c
ount
ed o
nce
per f
acul
ty. T
he U
nive
rsity
tota
l of d
istin
ct, v
erifi
ed a
nd q
ualit
y-as
sure
d re
sear
ch o
utpu
ts is
repo
rted
in K
PI 2
.1
KeY
FAct
s bY
FAcU
LtY
busin
ess
and
Law
cultu
rean
d so
ciet
yde
sign
and
crea
tive
tech
nolo
gies
Heal
th an
d en
viro
nmen
tal s
cien
ces
te A
ra
Pout
ama
Univ
ersit
y pro
gram
mes
eFts
2015
Actu
al20
14Ac
tual
2015
Actu
al20
14Ac
tual
2015
Actu
al20
14Ac
tual
2015
Actu
al20
14Ac
tual
2015
Actu
al20
14Ac
tual
2015
Actu
al20
14Ac
tual
enro
lmen
ts
SAC-
fund
ed E
FTS
3,42
83,
299
2,88
93,
084
4,25
14,
052
4,94
04,
842
7650
712
608
Inte
rnat
iona
l EFT
S 1,1
971,1
7347
545
181
175
226
427
11
111
12
Oth
er E
FTS
5727
252
5921
722
316
715
8-
-14
514
2
tota
l pr o
gram
me
eFts
4,68
24,
744
3,41
63,
594
5,27
95,
027
5,37
15,
271
7751
868
762
Taug
ht E
FTS8
4,96
04,
738
3,28
73,
596
5,57
75,
417
5,53
85,
418
295
279
362
2015 annual report 25
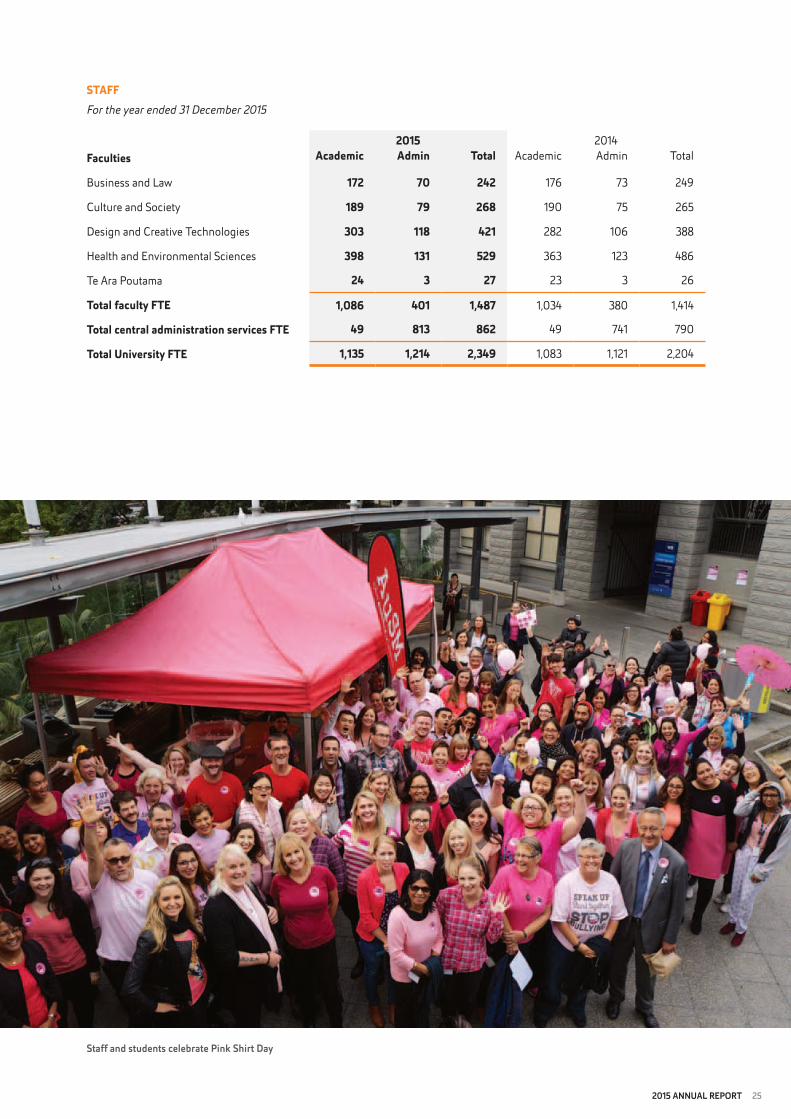
stAFFFor the year ended 31 December 2015
2015 2014Faculties Academic Admin total Academic Admin Total
Business and Law 172 70 242 176 73 249
Culture and Society 189 79 268 190 75 265
Design and Creative Technologies 303 118 421 282 106 388
Health and Environmental Sciences 398 131 529 363 123 486
Te Ara Poutama 24 3 27 23 3 26
total faculty Fte 1,086 401 1,487 1,034 380 1,414
total central administration services Fte 49 813 862 49 741 790
total University Fte 1,135 1,214 2,349 1,083 1,121 2,204
Staff and students celebrate pink Shirt Day
26 2015 annual report
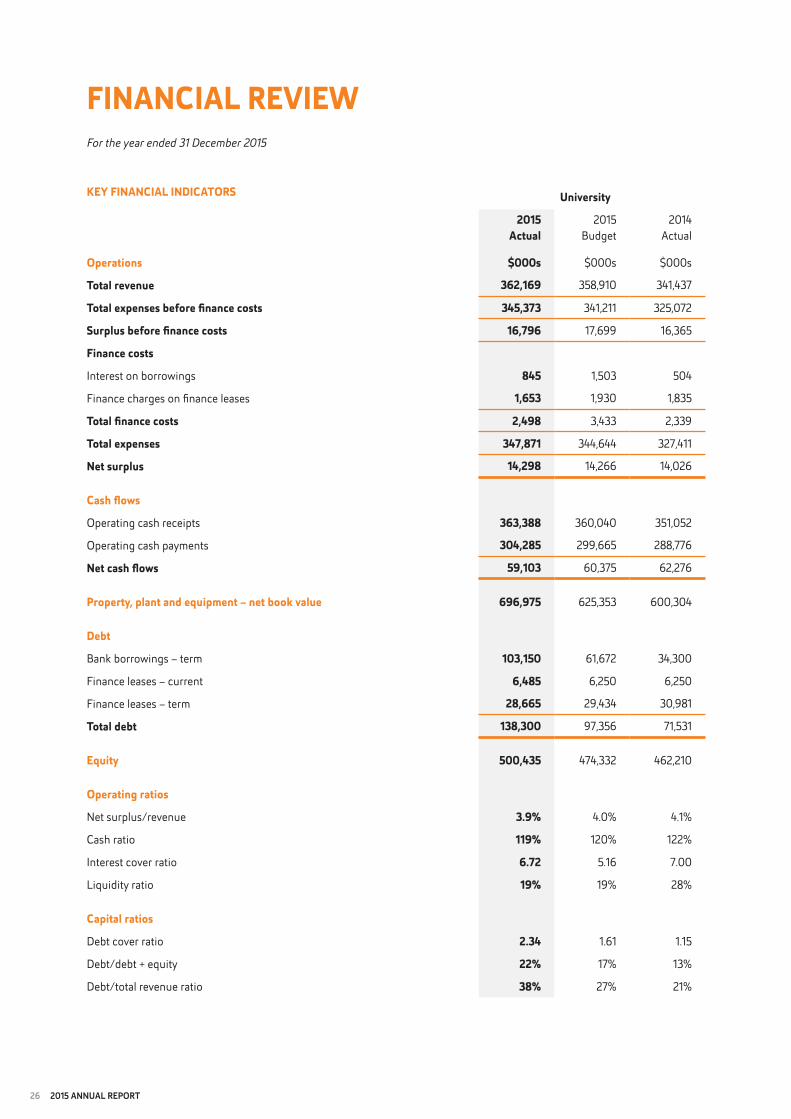
FInAncIAL ReVIewFor the year ended 31 December 2015
KeY FInAncIAL IndIcAtoRs University
2015Actual
2015Budget
2014Actual
operations $000s $000s $000s
total revenue 362,169 358,910 341,437
total expenses before finance costs 345,373 341,211 325,072
surplus before finance costs 16,796 17,699 16,365
Finance costs
Interest on borrowings 845 1,503 504
Finance charges on finance leases 1,653 1,930 1,835
total finance costs 2,498 3,433 2,339
total expenses 347,871 344,644 327,411
net surplus 14,298 14,266 14,026
cash flows
Operating cash receipts 363,388 360,040 351,052
Operating cash payments 304,285 299,665 288,776
net cash flows 59,103 60,375 62,276
Property, plant and equipment – net book value 696,975 625,353 600,304
debt
Bank borrowings – term 103,150 61,672 34,300
Finance leases – current 6,485 6,250 6,250
Finance leases – term 28,665 29,434 30,981
total debt 138,300 97,356 71,531
equity 500,435 474,332 462,210
operating ratios
Net surplus/revenue 3.9% 4.0% 4.1%
Cash ratio 119% 120% 122%
Interest cover ratio 6.72 5.16 7.00
Liquidity ratio 19% 19% 28%
capital ratios
Debt cover ratio 2.34 1.61 1.15
Debt/debt + equity 22% 17% 13%
Debt/total revenue ratio 38% 27% 21%
2015 annual report 27
In terms of the Education Act 1989 and the Crown Entities Act 2004 we certify that:
• theCouncilandmanagementoftheAucklandUniversityofTechnologyacceptresponsibilityforthepreparationofthesestatements of service performance and financial statements and the judgements used therein; and
• theCouncilandmanagementoftheAucklandUniversityofTechnologyacceptresponsibilityforestablishingandmaintaininga system of internal control designed to provide reasonable assurance as to the integrity and reliability of performance reporting and financial reporting; and
• theCouncilandmanagementoftheAucklandUniversityofTechnologyareoftheopinionthatthesestatementsofserviceperformance and financial statements fairly reflect the financial position for the Auckland University of Technology and Group at 31 December 2015 and the results of the operations for the year ended 31 December 2015.
John Maasland Derek McCormack Chancellor Vice-Chancellor
4 April 2016
stAteMent oF ResPonsIbILItYFor the year ended 31 December 2015

28 2015 annual report
IndePendent AUdItoR’s RePoRt
To the readers of Auckland University of Technology and group’s financial statements and non-financial performance information for the year ended 31 December 2015
The Auditor General is the auditor of the Auckland University of Technology (the University) and group. The Auditor General has appointed me, Leon Pieterse, using the staff and resources of Audit New Zealand, to carry out the audit of the financial statements and non financial performance information of the University and group on her behalf.
We have audited:
• thefinancialstatementsoftheUniversityandgrouponpages 58 to 107, that comprise the statement of financial position as at 31 December 2015, the statement of financial performance, statement of other comprehensive revenue and expense, statement of changes in equity and statement of cash flows for the year ended on that date and the notes to the consolidated financial statements that include accounting policies and other explanatory information; and
• thestatementofserviceperformanceoftheUniversity and group on pages 32 to 55.
oPInIonIn our opinion:
• thefinancialstatementsoftheUniversityandgrouponpages 58 to 107:
– present fairly, in all material respects the University and group’s:
• financialpositionasat31December2015;and
• financialperformanceandcashflowsfortheyearended;
– comply with generally accepted accounting practice in New Zealand and have been prepared in accordance with Public Benefit Entity Reporting Standards; and
• thestatementofserviceperformanceoftheUniversityand group on pages 32 to 55 fairly reflects the University and group’s service performance achievements measured against the performance targets adopted in the investment plan for the year ended 31 December 2015.
Our audit was completed on 4 April 2016. This is the date at which our opinion is expressed.
The basis of our opinion is explained below. In addition, we outline the responsibilities of the Council and our responsibilities, and we explain our independence.
bAsIs oF oPInIonWe carried out our audit in accordance with the Auditor General’s Auditing Standards, which incorporate the International Standards on Auditing (New Zealand). Those standards require that we comply with ethical requirements and plan and carry out our audit to obtain reasonable assurance about whether the financial statements and non financial performance information are free from material misstatement.
Material misstatements are differences or omissions of amounts and disclosures that, in our judgement, are likely to influence readers’ overall understanding of the financial statements and non financial performance information. If we had found material misstatements that were not corrected, we would have referred to them in our opinion.
An audit involves carrying out procedures to obtain audit evidence about the amounts and disclosures in the financial statements and non financial performance information. The procedures selected depend on our judgement, including our assessment of risks of material misstatement of the financial statements and non financial performance information, whether due to fraud or error. In making those risk assessments, we consider internal control relevant to the University and group’s preparation of the financial statements and non financial performance information that fairly reflect the matters to which they relate. We consider internal control in order to design audit procedures that are appropriate in the circumstances but not for the purpose of expressing an opinion on the effectiveness of the University and group’s internal control.
An audit also involves evaluating:
• theappropriatenessofaccountingpoliciesusedandwhether they have been consistently applied;
• thereasonablenessofthesignificantaccountingestimatesand judgements made by the Council;
• theadequacyofalldisclosuresinthefinancialstatementsand non-financial performance information; and
• theoverallpresentationofthefinancialstatementsandnon-financial performance information.
We did not examine every transaction, nor do we guarantee complete accuracy of the financial statements and non financial performance information. Also we did not evaluate the security and controls over the electronic publication of the financial statements and non financial performance information.

2015 annual report 29
Leon PieterseAudit New ZealandOn behalf of the Auditor-GeneralAuckland, New Zealand
We have obtained all the information and explanations we have required and we believe we have obtained sufficient and appropriate audit evidence to provide a basis for our audit opinion.
ResPonsIbILItIes oF tHe coUncIL The Council is responsible for preparing financial statements that:
• complywithgenerallyacceptedaccountingpracticeinNew Zealand; and
• fairlyreflecttheUniversityandgroup’sfinancialposition,financial performance and cash flows.
The Council is also responsible for preparing a statement of service performance that fairly reflects the University and group’s service performance achievements measured against the performance targets adopted in the investment plan.
The Council is responsible for such internal control as it determines is necessary to enable the preparation of financial statements and non financial performance information that are free from material misstatement, whether due to fraud or error. The Council is also responsible for the publication of the financial statements and non financial performance information, whether in printed or electronic form.
The Council’s responsibilities arise from the Education Act 1989 and the Crown Entities Act 2004.
ResPonsIbILItIes oF tHe AUdItoR We are responsible for expressing an independent opinion on the financial statements and non financial performance information and reporting that opinion to you based on our audit. Our responsibility arises from section 15 of the Public Audit Act 2001 and the Crown Entities Act 2004.
IndePendenceWhen carrying out the audit, we followed the independence requirements of the Auditor General, which incorporate the independence requirements of the External Reporting Board.
In addition to the audit we will carry out an assignment over external research income. This is compatible with those independence requirements. Other than the audit and this assignment, we have no relationship with or interests in the University or any of its subsidiaries.

30 2015 annual report
City Campus Business School building
2015 annual report 31
stAteMent oF seRVIce PeRFoRMAnce
The following Statement of Service Performance contains information on the University’s KPIs. This documents the services provided by AUT to meet stakeholder needs and to ensure the intent of the Strategic Plan is fulfilled. For an overall view of the performance of the University, the Statement of Service Performance section must be read in conjunction with the section entitled ‘The Year: 2015’.
32 2015 annual report
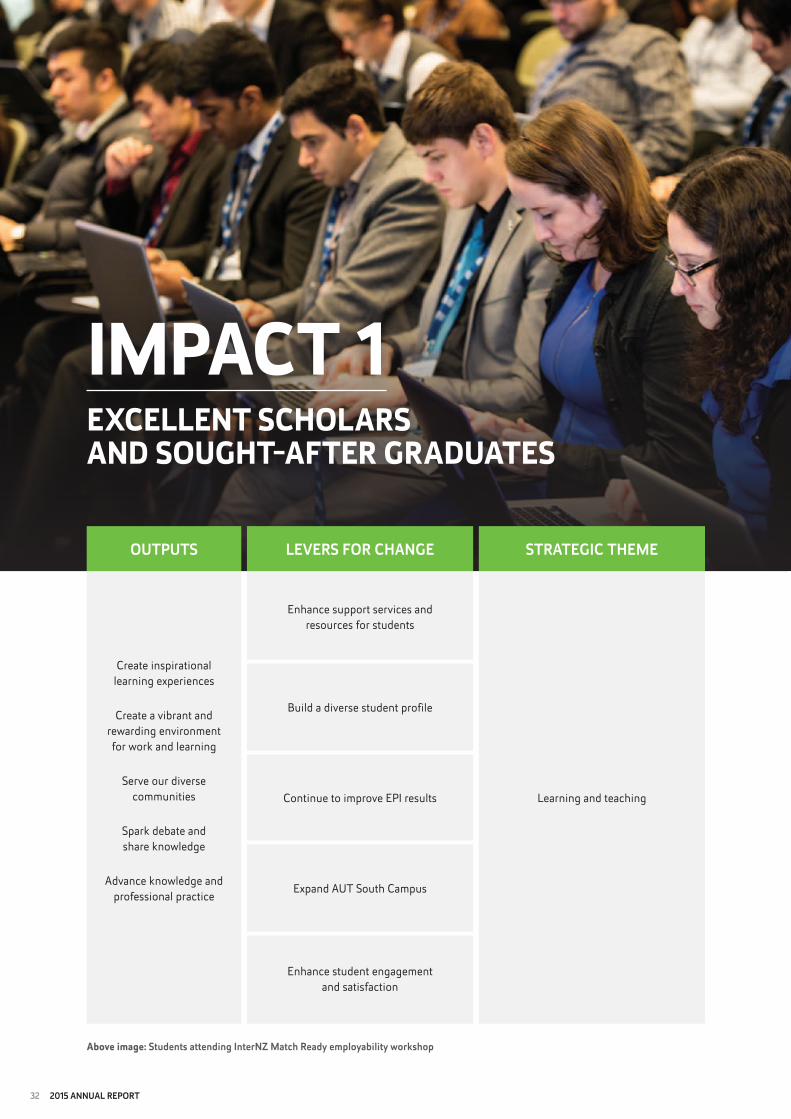
IMPAct 1exceLLent scHoLARs And soUgHt-AFteR gRAdUAtes
outputS
Create inspirational learning experiences
Create a vibrant and rewarding environment for work and learning
Serve our diverse communities
Spark debate and share knowledge
Advance knowledge and professional practice
leVerS For CHanGe
Enhance support services and resources for students
Build a diverse student profile
Continue to improve EPI results
Expand AUT South Campus
Enhance student engagement and satisfaction
StrateGIC tHeMe
Learning and teaching
Above image: Students attending InternZ Match ready employability workshop
2015 annual report 33
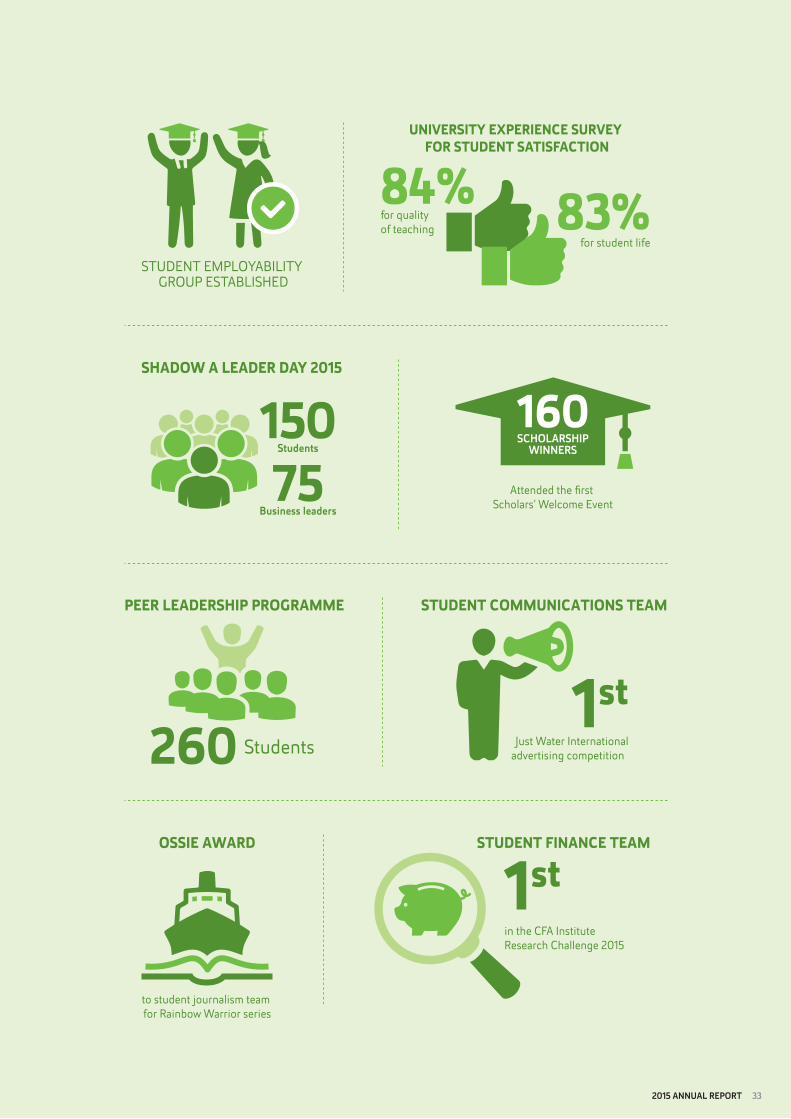
SHADOW A LEADER DAY 2015
Business leaders
15075Students
160SCHOLARSHIP
WINNERS
Attended the first Scholars’ Welcome Event
260 Students
PEER LEADERSHIP PROGRAMME
STUDENT EMPLOYABILITY GROUP ESTABLISHED
STUDENT COMMUNICATIONS TEAM
Just Water Internationaladvertising competition
1st
to student journalism team for Rainbow Warrior series
OSSIE AWARD
in the CFA Institute Research Challenge 2015
1stSTUDENT FINANCE TEAM
UNIVERSITY EXPERIENCE SURVEY FOR STUDENT SATISFACTION
84% 83%for qualityof teaching
for student life
34 2015 annual report
PeRFoRMAnce MeAsURes
1.1 Create employable, work-ready graduates
Key performance indicators
Target2015
Actual2015
Actual2014
Actual2013
1.1.1 Percentage of bachelors graduates who completed a work placement while studying
>80% 89% 89% 88%*
1.1.2 Percentage of available graduates who are working full time**
85% 82% 82% 84%
* This figure has been restated from Investment Plan 2015-2017 due to improved accuracy of reporting
** This figure is taken from the annual Graduate Survey. It shows the proportion of all domestic graduates who are available for full-time employment and are working full-time approximately six months after graduation. The response rate to the 2015 Graduate Survey for domestic students was 38%, which is in line with other AUT surveys
Work placements are a key point of difference for AUT’s bachelor degrees and one that is highly valued by students and employers alike. Although the overall target for full-time employment of available graduates was not met, the result was maintained from 2014. In response to changing employer needs, the Careers Centre increased its emphasis on building student and graduate employability, which will culminate in the opening of an employability hub in 2016. This approach aligns with existing curriculum-based efforts to impart the relevant skills, attitudes and experience that result in sought-after graduates.
Partially achieved
1.2 Increase postgraduate provision
Key performance indicators
Target2015
Actual2015
Actual2014
Actual2013
1.2.1 More than 15% of EFTS in postgraduate study
16% 16% 15% 14%
1.2.2 Increase the number of doctoral students
700 787 696 627
The University has already achieved the challenging targets set for postgraduate provision in the Strategic Plan 2012-2016. As evidence of AUT’s increasing reputation, this was enabled by strong growth in both domestic and international enrolments; international postgraduate enrolments have increased by more than a third since 2013 while domestic numbers have increased by 21%. In the case of doctoral students, AUT has exceeded its targeted 750 candidates a year earlier than expected.
Achieved
2015 annual report 35
PeRFoRMAnce MeAsURes (continued)
1.3 Enhance engagement and satisfaction of students
Key performance indicator
Target2015
Actual2015
Actual2014
Actual2013
1.3.1 Percentage of students who would recommend AUT to others
88% 88% 88% 87%
AUT is proud that its inspirational learning experiences and excellent preparation for employment have resulted in a consistently high level of student satisfaction. The University introduced several new initiatives in 2015 to better support students and respond to employer demands. These include a subsidy for those who require a learning assessment due to impairments. Eligible students now receive funding for an assessment through an external provider, which significantly reduces their waiting period. The University has also continued to work with Be. Accessible to ensure its signage, publications, and learning and promotional material are accessible for people with disabilities. Another initiative was the AUT Uni Life blog series, which provides an insight into the university and life experiences of six different student bloggers.
Achieved
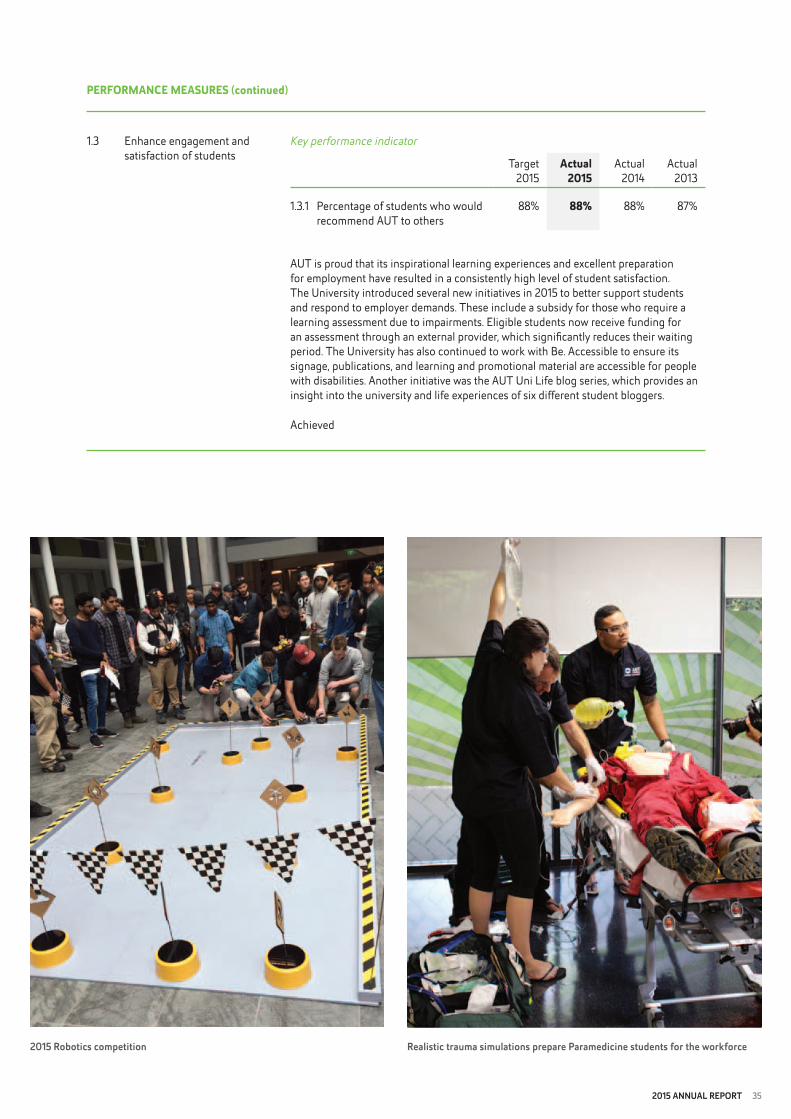
2015 robotics competition realistic trauma simulations prepare paramedicine students for the workforce

36 2015 annual report
IMPAct 2ReseARcH tHAt InsPIRes cURIosItY, AdVAnces KnowLedge And beneFIts coMMUnItIes
outputS
Advance knowledge and professional practice
Serve our diverse communities
Make a national and global impact
Spark debate and share knowledge
leVerS For CHanGe
Extend research activity and capability across the University
Increase allocation of internal resources to research
Increase external research income
Increase postgraduate students
Strengthen international relationships and collaborations
Deepen relationships with professions, industry, business and communities
Strengthen the contribution to Māori advancement
Enhance engagement and advancement of Pacific peoples
StrateGIC tHeMeS
Research and scholarship
Engagement with communities
Above image: Design for Health & wellbeing lab

2015 annual report 37
Strategic Research Investment Fund grants
1.8$ MILLION
Papakura Kidz study with Middlemore Hospital addresses
health, education and housing issues
Cook Islands Dictionary app launchedAUT neuroscience team uses
their Stroke Riskometer app
MAJOR GLOBAL HEALTH STUDY
AUT researchers helping rebuild tourism in Vanuatu after Cyclone Pam
Sci21 webcast series launched to make science more accessible
KODE Biotech research licenced by UK pharmaceutical company
for cancer research
Major grants for family violence research
2
Researchers find ways to support visually impaired people at work

38 2015 annual report
PeRFoRMAnce MeAsURes
2.1 Increase the number of quality-assured research outputs
Key performance indicator
Target2015
Actual2015
Actual2014
Actual2013
Number of quality-assured research outputs
1,745 1,855 1,547 1,536
Quality-assured research outputs increased 20% between 2014 and 2015 to exceed the target for 2015 by 6%. The University continued to support research activity through such initiatives as the Strategic Research Investment Fund, which awarded $1.8 million to a range of projects in 2015. The Research and Innovation Office also held numerous workshops and seminars to help academic staff enhance their publication plans, and to prepare for the Performance-Based Research Fund quality evaluation round in 2018, both of which are likely to have influenced publication rates.
Achieved
2.2 Increase the proportion of academic staff contributing verified research outputs to 75% by 2016
Key performance indicator
Target2015
Actual2015
Actual2014
Actual2013
Proportion of academic staff contributing research outputs
69% 57% 59%* 58%
* This was incorrectly stated as 61% in Annual Report 2014
The proportion of academic staff contributing research outputs declined from 2014 to 2015, against the trend of several years. There was some turnover of academic staff during 2015 which contributed to this result. More positively, as is shown in KPI 2.1, those who are research active are producing significantly more outputs. While the Strategic Plan target of 75% remains a challenge, the University is committed to increasing the breadth and depth of research activity. AUT introduced several initiatives to encourage all academic staff to conduct research in 2015. These include an online resource that collates information on research development resources, events and assistance available across the University, an interdisciplinary writing group to support staff in the early stages of their publishing careers, appointment of a Researcher Development Manager, and the Early Career Academics programme. AUT expects a speedy return to the trend of increasing research activity across the University.
Not achieved
2015 annual report 39
PeRFoRMAnce MeAsURes (continued)
2.3 Increase external research revenue
Key performance indicators
Target2015
Actual2015
Actual2014
Actual2013
2.3.1 Total external research revenue $13.3M $11.1M $9.6M $9.6M
2.3.2 External research revenue from research with industry
$4.4M $3.8M $3.6M $3.2M
External research revenue grew 17% from 2014 to 2015, an impressive achievement built on some pleasing successes throughout the year, including an MBIE Targeted Grant of $2.4 million for Professor Koziol-McLain and the University’s first full Marsden Grant. The Research and Innovation Office has implemented a strategy to achieve the challenging goals AUT has set for growing its research revenue. This strategy includes building consultancy services, especially those with embedded research contracts, and working closely with contestable funders and government agencies and ministries to generate contract activity. Although the target was not achieved for 2015, the University is already starting to experience the benefits of this approach and more are expected in 2016.
Not achieved
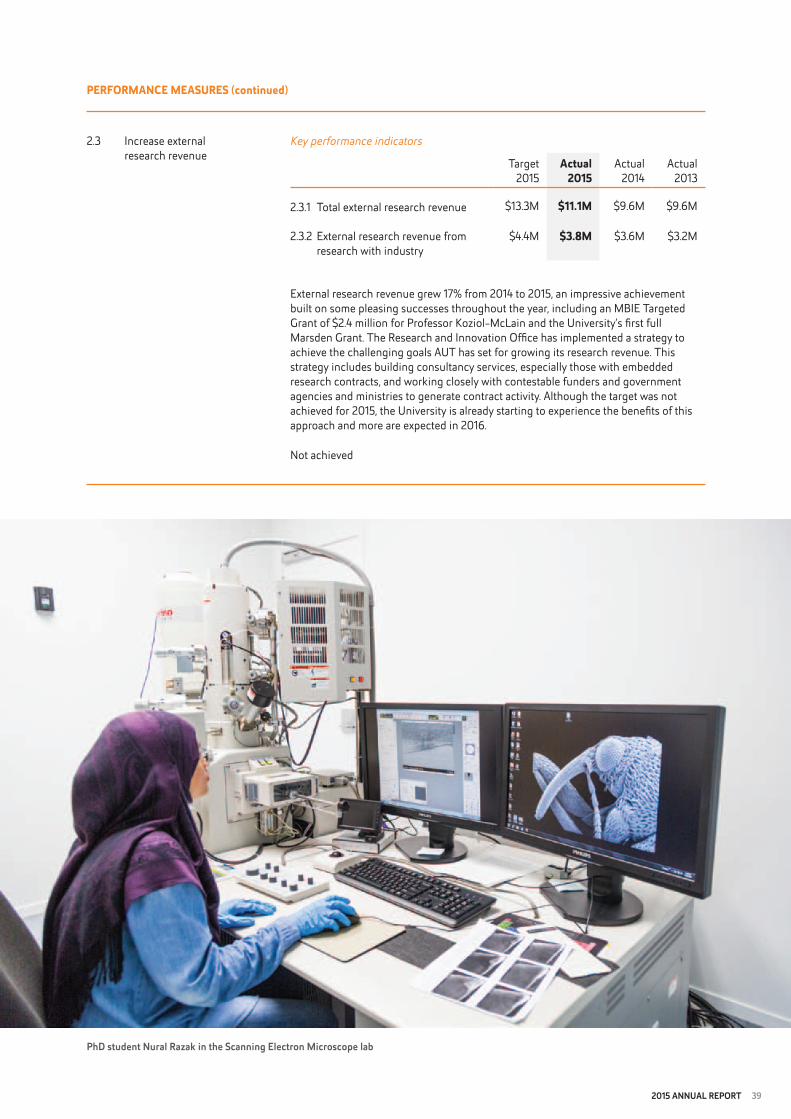
phD student nural razak in the Scanning electron Microscope lab

40 2015 annual report
PeRFoRMAnce MeAsURes (continued)
2.4 Increase commercialisation and industry engagement activities
2015 heralded AUT’s most successful commercialisation year to date, with several outstanding achievements on the national and global stages. The most significant success was a licensing deal with United Kingdom-based Agalimmune for Kode™ Technology developed by Professor Stephen Henry. The University also secured a licence agreement with an Australian company for a mole analysis and classification tool developed by Dr Hamid Gholam Hosseini, School of Engineering. The tool is designed to be used in tele-health procedures and can be used for referring patients to health practitioners. The agreement covered funding for ongoing research and development, a licensing fee and royalties. In another trans-Tasman success, Professor John Cronin and Dr Andrew Kilding, Sports Performance Research Institute New Zealand, licenced their online course Enhancing Physiological Performance to Melbourne’s Victoria University.
Dr David White, also from the School of Engineering, secured a Kiwinet Pre-Seed Accelerator Fund grant of $0.18 million to fund the development of respiratory technology. AUT matched the grant with both funding and in-kind support. AUT Enterprises Ltd subsequently filed two patents for Dr White in the field of respiratory therapy.
Also in the healthcare field, Professor Valery Feigin’s Stroke Riskometer app was commercialised and will be translated into 18 languages. This free app has the potential to save countless lives by helping users identify their risk of stroke and other cardiovascular disorders. Professor Feigin and his team at the National Institute of Stroke and Applied Neurosciences raised $1.35 million to use the app as the basis for brain research and studies on the prevention of stroke and cardiovascular disease.
AUT staff consultancy services continue to grow apace; the consultancy programme attracted $1.23 million in 2015, well in advance of the expected $0.8 million. This outstanding result included a large international contract in the United States worth $0.7 million.
AUT has targeted industry engagement in general, and commercialisation in particular, as a key area for growth over the coming years. The Vice-Chancellor’s external engagement project commenced with a stocktake which revealed the depth and breadth of industry engagement activities across the University. From this, the project leaders identified a set of actions that will help the University capitalise on the excellent work already being done and build for the future. These include improved communication and co-ordination of industry engagement activities, and reinforcing an academic culture where such engagement is valued.
Turning now to activities that are focussed on increasing AUT’s profile in the Auckland business community, the University was named as one of Auckland Council’s top 23 strategic partners and entered a new agreement with the Vodafone Event Centre in Manukau. AUT again hosted the Trans-Tasman Business Circle’s post-Budget lunch and the Kea Inspire Day, and was the supreme sponsor of Kea’s World Class New Zealand awards. The University was made a partner of ngConnect New Zealand, an organisation focussed on the design and testing of technology for businesses. This partnership included a fully funded project for an AUT student. Finally, the Faculty of Design and Creative Technologies secured a partnership with Spark Ventures, which includes funding for postgraduate scholarships in 2016.
Achieved
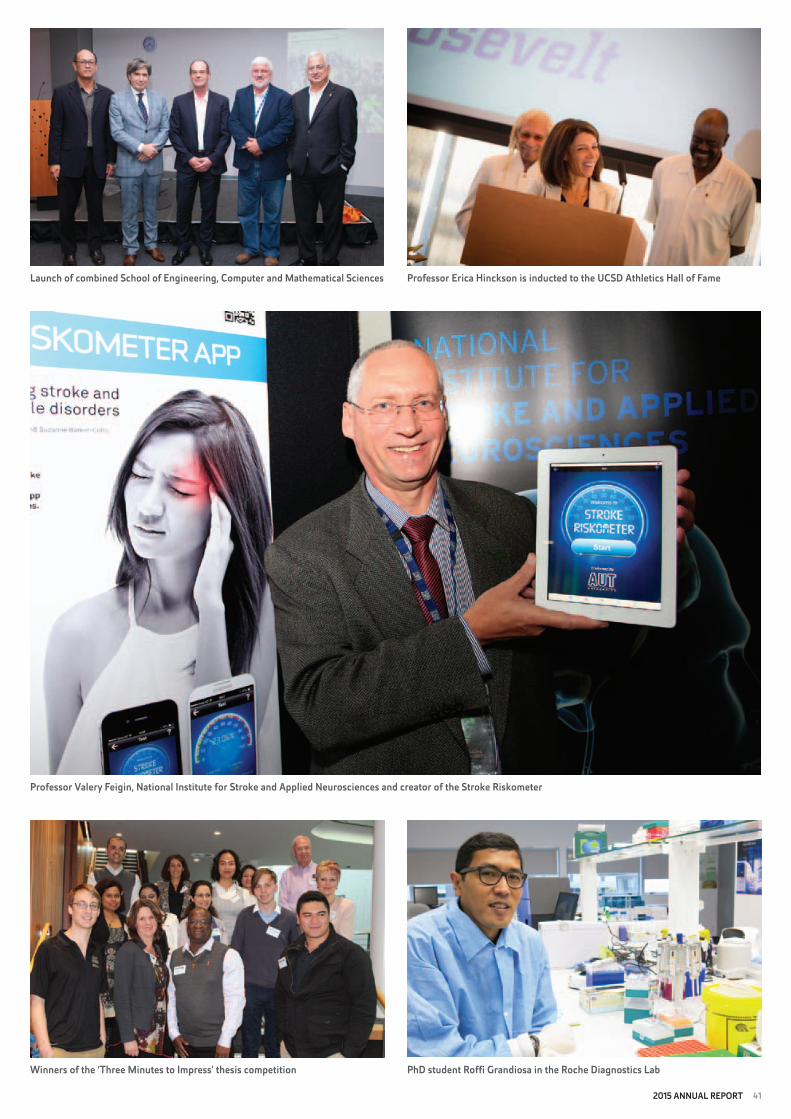
2015 annual report 41
launch of combined School of engineering, Computer and Mathematical Sciences professor erica Hinckson is inducted to the uCSD athletics Hall of Fame
professor Valery Feigin, national Institute for Stroke and applied neurosciences and creator of the Stroke riskometer
winners of the ‘three Minutes to Impress’ thesis competition phD student roffi Grandiosa in the roche Diagnostics lab
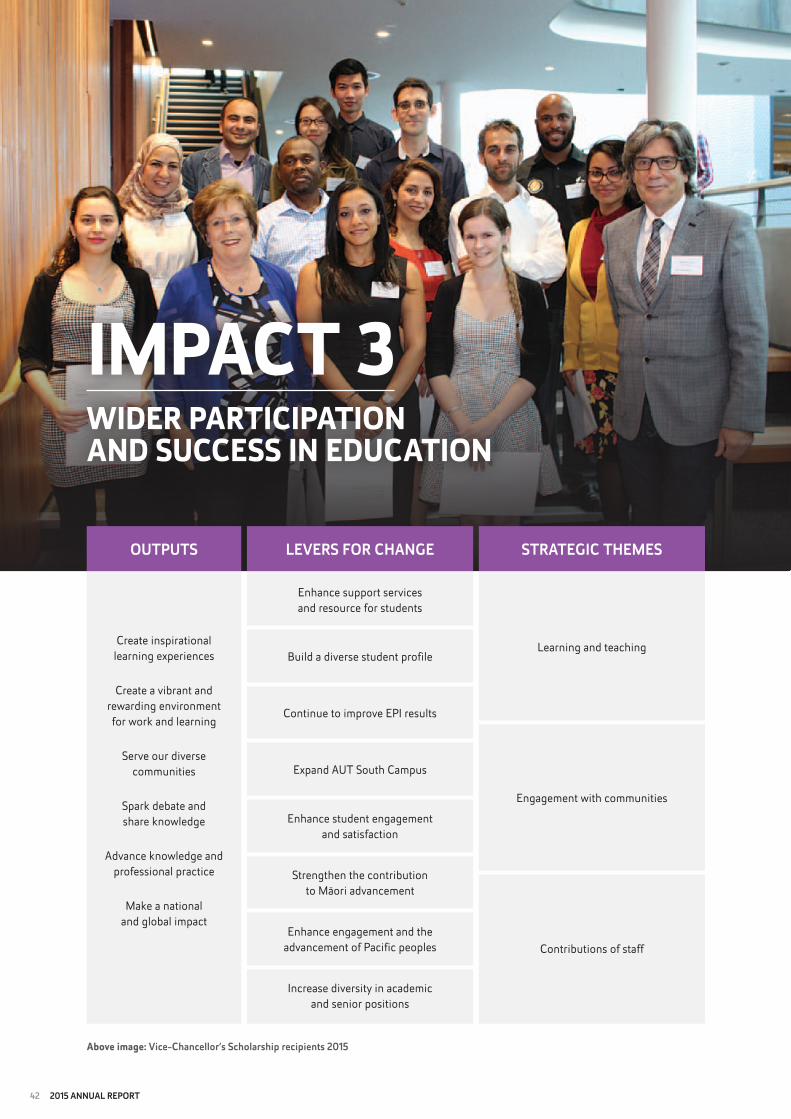
42 2015 annual report
IMPAct 3wIdeR PARtIcIPAtIon And sUccess In edUcAtIon
outputS
Create inspirational learning experiences
Create a vibrant and rewarding environment for work and learning
Serve our diverse communities
Spark debate and share knowledge
Advance knowledge and professional practice
Make a national and global impact
leVerS For CHanGe
Enhance support services and resource for students
Build a diverse student profile
Continue to improve EPI results
Expand AUT South Campus
Enhance student engagement and satisfaction
Strengthen the contribution to Māori advancement
Enhance engagement and the advancement of Pacific peoples
Increase diversity in academic and senior positions
StrateGIC tHeMeS
Learning and teaching
Engagement with communities
Contributions of staff
Above image: Vice-Chancellor’s Scholarship recipients 2015
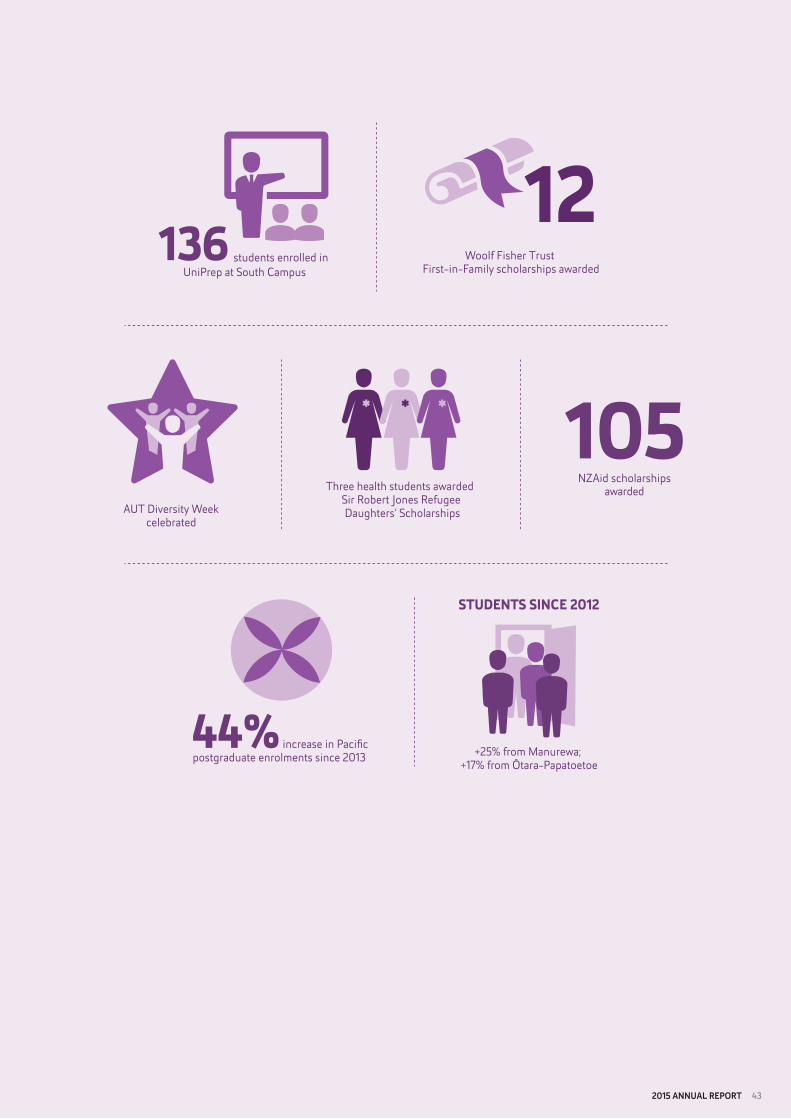
2015 annual report 43
136 students enrolled in UniPrep at South Campus
AUT Diversity Week celebrated
Woolf Fisher Trust First-in-Family scholarships awarded
12
44% increase in Pacific postgraduate enrolments since 2013
Three health students awarded Sir Robert Jones Refugee Daughters’ Scholarships
+25% from Manurewa; +17% from Ōtara-Papatoetoe
STUDENTS SINCE 2012
105NZAid scholarships
awarded
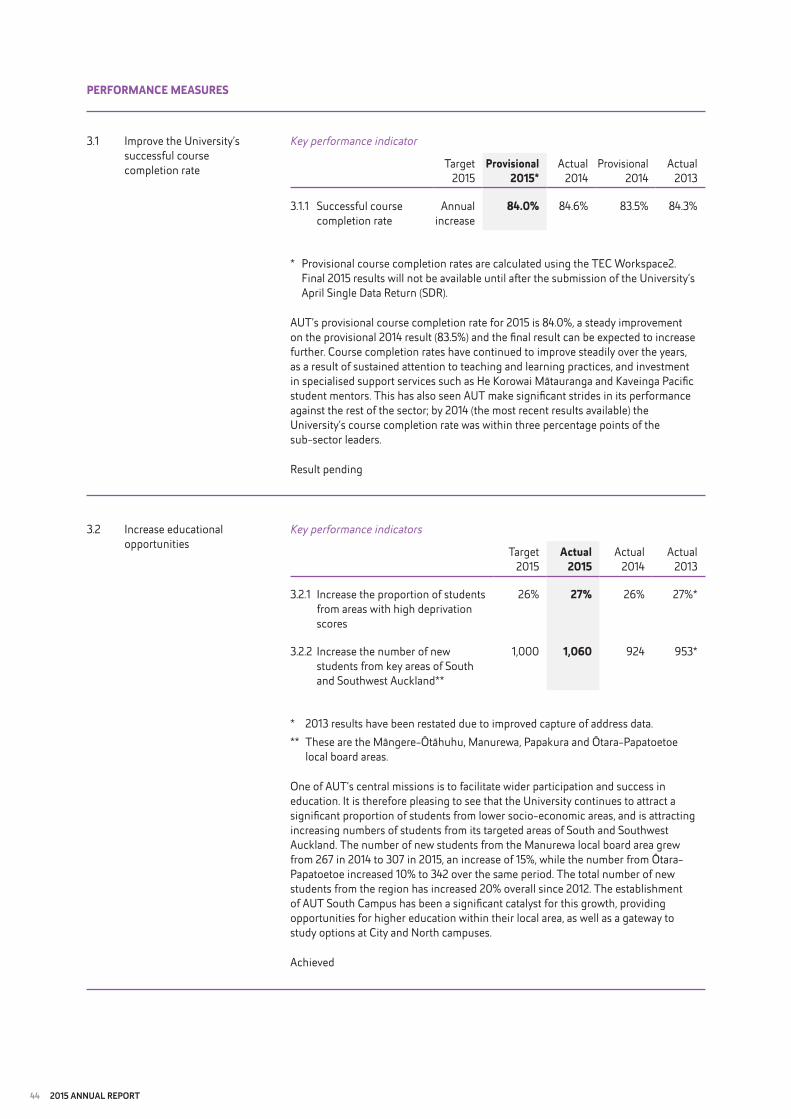
44 2015 annual report
PeRFoRMAnce MeAsURes
3.1 Improve the University’s successful course completion rate
Key performance indicator
Target2015
Provisional2015*
Actual2014
Provisional2014
Actual2013
3.1.1 Successful course completion rate
Annual increase
84.0% 84.6% 83.5% 84.3%
* Provisional course completion rates are calculated using the TEC Workspace2. Final 2015 results will not be available until after the submission of the University’s April Single Data Return (SDR).
AUT’s provisional course completion rate for 2015 is 84.0%, a steady improvement on the provisional 2014 result (83.5%) and the final result can be expected to increase further. Course completion rates have continued to improve steadily over the years, as a result of sustained attention to teaching and learning practices, and investment in specialised support services such as He Korowai Mātauranga and Kaveinga Pacific student mentors. This has also seen AUT make significant strides in its performance against the rest of the sector; by 2014 (the most recent results available) the University’s course completion rate was within three percentage points of the sub-sector leaders.
Result pending
3.2 Increase educational opportunities
Key performance indicators
Target2015
Actual2015
Actual2014
Actual2013
3.2.1 Increase the proportion of students from areas with high deprivation scores
26% 27% 26% 27%*
3.2.2 Increase the number of new students from key areas of South and Southwest Auckland**
1,000 1,060 924 953*
* 2013 results have been restated due to improved capture of address data.** These are the Māngere-Ōtāhuhu, Manurewa, Papakura and Ōtara-Papatoetoe
local board areas.
One of AUT’s central missions is to facilitate wider participation and success in education. It is therefore pleasing to see that the University continues to attract a significant proportion of students from lower socio-economic areas, and is attracting increasing numbers of students from its targeted areas of South and Southwest Auckland. The number of new students from the Manurewa local board area grew from 267 in 2014 to 307 in 2015, an increase of 15%, while the number from Ōtara-Papatoetoe increased 10% to 342 over the same period. The total number of new students from the region has increased 20% overall since 2012. The establishment of AUT South Campus has been a significant catalyst for this growth, providing opportunities for higher education within their local area, as well as a gateway to study options at City and North campuses.
Achieved

2015 annual report 45
PeRFoRMAnce MeAsURes (continued)
3.3 Increase participation and success for Māori
Key performance indicators
Target2015
Actual2015
Actual2014
Actual2013
3.3.1 Increase the number of Māori graduates from bachelors degrees
330 272 301 278
3.3.2 Increase the number of postgraduate students that are Māori
310 324 295 274
After several years of steady growth, there was a slight decrease in the number of Māori graduates from bachelors degrees. More positively, the number of postgraduate completions increased from 79 in 2014 to 98 in 2015, including 13 new doctoral graduates. The University also expects a speedy return to growth in the number of graduates from bachelors degrees; as discussed in KPI 4.1, AUT introduced several new initiatives to attract and assist Māori students into degree-level study during the year. There is also a comprehensive suite of programmes to support Māori through their study. These include He Korowai Mātauranga and Inspiring Māori and Pacific Success (IMAPS), both of which were discussed in Annual Report 2014. Māori postgraduate enrolments continue their upward trend, increasing 19% since 2013. The University supports Māori and Pacific postgraduate students through the Wānanga Series, a year-long programme including writing retreats, discussion and networking weekends, and workshops.
Partially achieved
3.4 Increase participation and success for Pacific peoples
Key performance indicators
Target2015
Actual2015
Actual2014
Actual2013
3.4.1 Increase the number of Pacific graduates from bachelors degrees
385 336 330 319
3.4.2 Increase the number of Pacific postgraduate students
235 299 249 207
The number of Pacific students attaining bachelors degrees at AUT continues to grow, although at a slower rate than anticipated. As with Māori students, postgraduate completions are increasing rapidly; the total number of postgraduate qualifications awarded to Pacific students grew from 56 in 2014 to 90 in 2015, including five doctoral qualifications. This trend is expected to continue given the sustained growth in Pacific postgraduate enrolments, which have increased 44% from 2013 to 2015. The increased support for postgraduate students provided by the Wānanga series has been an important factor in this achievement, as have faculty-based initiatives such as the Path Less Travelled event held by the Faculty of Business and Law. These efforts are assisted by AUT’s increasing reputation for excellence in Pacific research, driven by the Pacific Media Centre, the New Zealand Tourism Research Institute and the Pacific Islands Families Studies.
Partially achieved

46 2015 annual report
IMPAct 4edUcAted cItIZens IgnItIng cHAnge In tHeIR coMMUnItIes
outputS
Create inspirational learning experiences
Create a vibrant and rewarding environment for work and learning
Serve our diverse communities
Spark debate and share knowledge
Advance knowledge and professional practice
Make a national and global impact
leVerS For CHanGe
Enhance support services and resource for students
Build a diverse student profile
Continue to improve EPI results
Expand AUT South Campus
Enhance student engagement and satisfaction
Strengthen the contribution to Māori advancement
Enhance engagement and the advancement of Pacific peoples
Increase diversity in academic and senior positions
StrateGIC tHeMeS
Learning and teaching
Engagement with communities
Contributions of staff
Above image: teaching children at South Campus open day
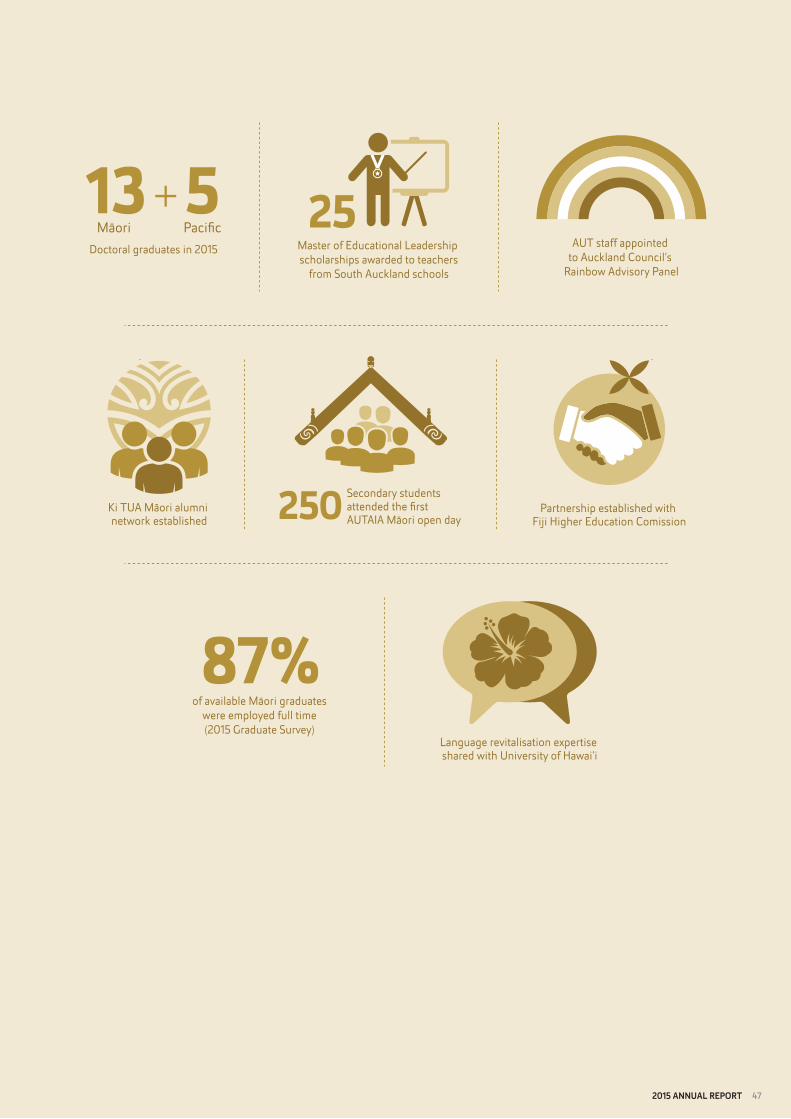
2015 annual report 47
AUT staff appointed to Auckland Council’s
Rainbow Advisory Panel
Language revitalisation expertise shared with University of Hawai’i
Ki TUA Māori alumni network established
Master of Educational Leadership scholarships awarded to teachers
from South Auckland schools
25
Partnership established with Fiji Higher Education Comission250 Secondary students
attended the first AUTAIA Māori open day
of available Māori graduates were employed full time (2015 Graduate Survey)
87%
Doctoral graduates in 2015
5Pacific
13Māori
+
48 2015 annual report
PeRFoRMAnce MeAsURes
4.1 Strengthen the contribution to Māori advancement
In 2015 AUT fulfilled its Strategic Plan commitment to celebrate and advance Māori potential and educational success through research, partnerships with iwi, preparing young people for higher education, developing Māori teachers, and promoting te Reo Māori.
A team of experts from Te Ipukarea: The National Māori Language Institute, commenced a study of the users of Te Aka, the online te Reo dictionary created by AUT’s Professor John Moorfield. Te Aka is now the world’s most comprehensive and popular online Māori language dictionary, and the study aims to deepen understanding of the usefulness of online resources for language revitalisation. Findings will be used to inform the development of other resources including the Cook Islands Dictionary app also released in 2015.
The release of the Te Māhuri app added to AUT’s rich repository of Māori language resources. The Te Māhuri app is the upper-intermediate stage of Te Whanake, the te Reo resource, which offers animations, podcasts and exercises for te Reo learners. The University also sponsored the Auckland and national Ngā Manu Kōrero secondary schools speech competitions. Finalists attended a mentoring breakfast with current AUT Māori students, met with the president of AuSM, and attended a workshop on using digital devices as learning tools.
The University established several important new initiatives with mana whenua groups in Auckland, including a symposium with secondary and tertiary students and professionals from Ngāti Whātua iwi. The Te Puea Memorial Marae Whānau Day shared information on educational pathways with the Mangere community, the first of several such events to be held at marae around Auckland.
The inaugural AUTAIA Māori Open Day showcased higher education and Māori success to secondary students from Auckland, Northland, Tokoroa and Rotorua. The University also hosted the Ngātiwai Putaiao Academy, a science academy for Year 9 students at Kamo High School. The students stayed at Ngā Wai o Horotiu marae and attended workshops with the School of Applied Sciences and Te Ara Poutama.
As part of its strategy to illuminate the pathway to academic achievement, the University is committed to developing those who teach young Māori, both in Auckland and further afield. AUT held professional development sessions for teachers from Te Rumuaki Reo o Ngā Puna o Waiorea at Western Springs College and Te Kura Kaupapa o Pukemiro in Kaitaia, and conducted presentations to principals and community leaders from several Far North schools. Further south, the University delivered workshops based on communication, self-development and Māori concepts to teachers from five Kapiti Coast kura, including Te Kura Kaupapa Māori o Te Rito, Paraparaumu College and Te Kura ā iwi o Whakatupuranga.
The 2015 Graduate Survey revealed highly positive outcomes for AUT’s Māori graduates. Almost nine in ten (87%) of those who were available for full-time employment were employed full time, compared with 82% of all domestic graduates. More than half (61%) of those who were not employed were enrolled in further study. Additionally, a very high 89% of Māori graduates believed that their qualification improved their employability, compared to 84% overall. Sixty alumni attended the Ki TUA event in September, which celebrated the success of Māori graduates. In a further boost for Māori alumni, the AUT International Whānau Council received a $31,000 grant from Education New Zealand to support the establishment of a chapter in the United States. The Whānau Council currently has more than 1,000 registered members in 11 European nations, and the American chapter will foster cultural exchange between former international students and their Māori whanau.
Achieved
2015 annual report 49
PeRFoRMAnce MeAsURes (continued)
4.2 Strengthen the contribution to the advancement of Pacific peoples
AUT continued to make a strong contribution to Pacific advancement through the achievements of its staff and students and its engagement with community groups.
As the New Zealand experience demonstrates, language revitalisation and cultural revival are inextricably linked, and AUT has shown the value of digital resources in this process. The release of the Cook Islands Dictionary app was an important milestone in the journey for the Pacific region. The app was created by Te Ipukarea: The National Māori Language Institute in conjunction with university and government representatives from the Cook Islands, along with ta’unga, who are community elders and repositories of knowledge. The dictionary includes 17,000 headwords in the languages of Rarotonga, Mangaia and Tongareva, along with some words unique to different islands in the group. AUT’s influence in Pacific language revitalisation continues to grow; a 30-strong delegation from Hawai’i attended a knowledge-sharing summit in April. The delegation included representatives from the University of Hawai’i, the Hawai’i State Department of Education, Kamehameha Schools and Polynesian Voyaging Society.
Researchers from the Pacific Islands Families Study (PIFS) visited participants who had moved to Australia part-way through the study to begin analysing trends across the two countries. Dr Talita Tolutau became the first female Pacific graphic designer to achieve a doctorate with a practice-led thesis. Her work was described by an examiner as an “academic and cultural milestone.”
The UniPrep programme was trialled at South Campus in early 2015. UniPrep aims to facilitate a smooth transition from school to higher education. Participants received an introduction into the demands of university study, completing papers in academic literacies and foundation mathematics, while being mentored by high-achieving Māori and Pacific students currently enrolled at AUT. Of the 136 participants, 92 were of Pacific descent. Feedback from participants showed that more than 90% found the programme useful and close to 85% continued their studies at AUT.
The University is also successfully encouraging more students into postgraduate study. As discussed in KPI 3.4, Pacific postgraduate enrolments have increased 44% since 2013, and the number of Pacific students enrolled in a doctoral qualification has grown from 27 to 34 over the same period. The University seeks to increase these numbers further through such initiatives as the Faculty of Business and Law’s Māori and Pacific Emerging Scholars programme. The programme aims to increase the number of Māori and Pacific academics by supporting students through undergraduate and postgraduate study and into academic positions. The ultimate aim is to contribute to better economic, social and political outcomes for Māori and Pacific peoples through research and education. The Path Less Travelled event held in 2015 was part of this programme, providing a platform for Māori and Pacific postgraduate students to share experiences and advice with their undergraduate counterparts. The inaugural event was attended by 60 students and two further events are planned for 2016.
AUT continued to fulfil its leadership role within the Pacific communities. Professor David Robie, School of Communication Studies, was awarded the Asian Media Information and Communication Centre’s Asia Communication Award. The citation described his “unstinting contribution” as an Asia-Pacific journalist, media educator, and human rights and environmental champion. AUT South Campus hosted a forum on sport as a catalyst for social change and development. The forum included a presentation from doctoral candidate Richard Aijee, considering sport as a vehicle for migrants to integrate into the community. South Campus also hosted the inaugural Rainbow Pacific event, which celebrated the Pacific LGBTI community and aimed to increase awareness of support services for both Pacific and LGBTI students.
Achieved
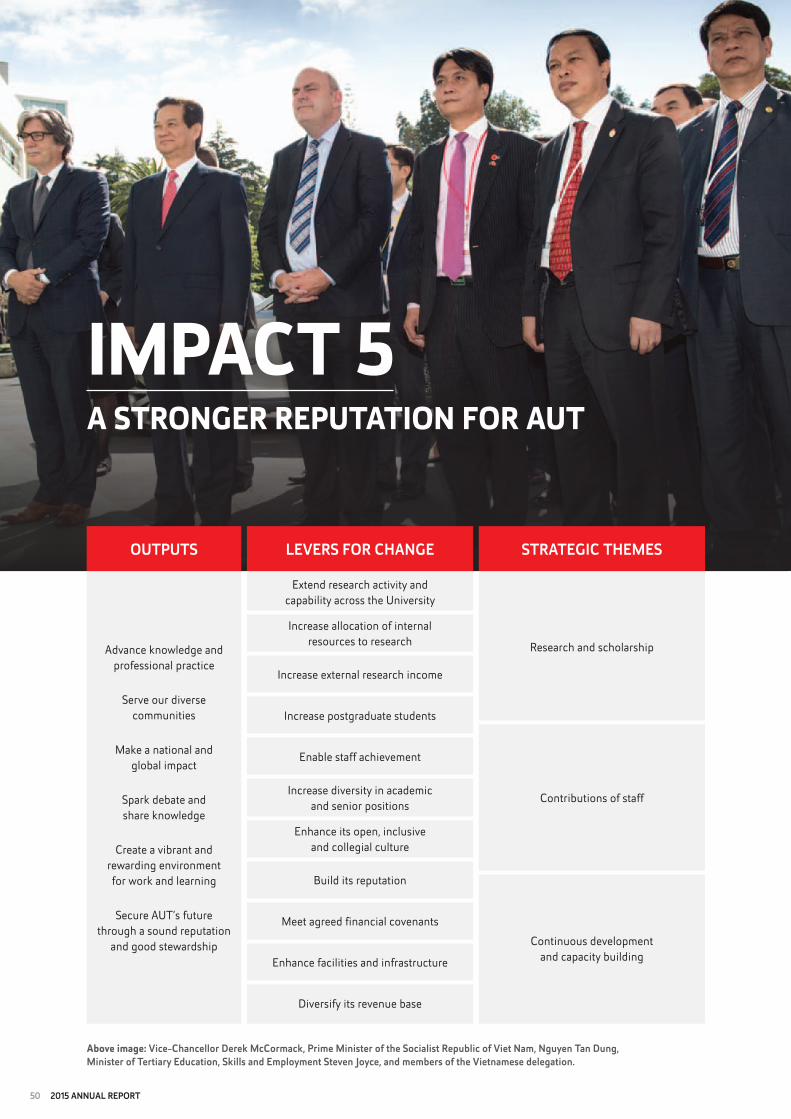
50 2015 annual report
IMPAct 5A stRongeR RePUtAtIon FoR AUt
outputS
Advance knowledge and professional practice
Serve our diverse communities
Make a national and global impact
Spark debate and share knowledge
Create a vibrant and rewarding environment for work and learning
Secure AUT’s future through a sound reputation
and good stewardship
leVerS For CHanGe
Extend research activity and capability across the University
Increase allocation of internal resources to research
Increase external research income
Increase postgraduate students
Enable staff achievement
Increase diversity in academic and senior positions
Enhance its open, inclusive and collegial culture
Build its reputation
Meet agreed financial covenants
Enhance facilities and infrastructure
Diversify its revenue base
StrateGIC tHeMeS
Research and scholarship
Contributions of staff
Continuous development and capacity building
Above image: Vice-Chancellor Derek McCormack, prime Minister of the Socialist republic of Viet nam, nguyen tan Dung, Minister of tertiary education, Skills and employment Steven Joyce, and members of the Vietnamese delegation.
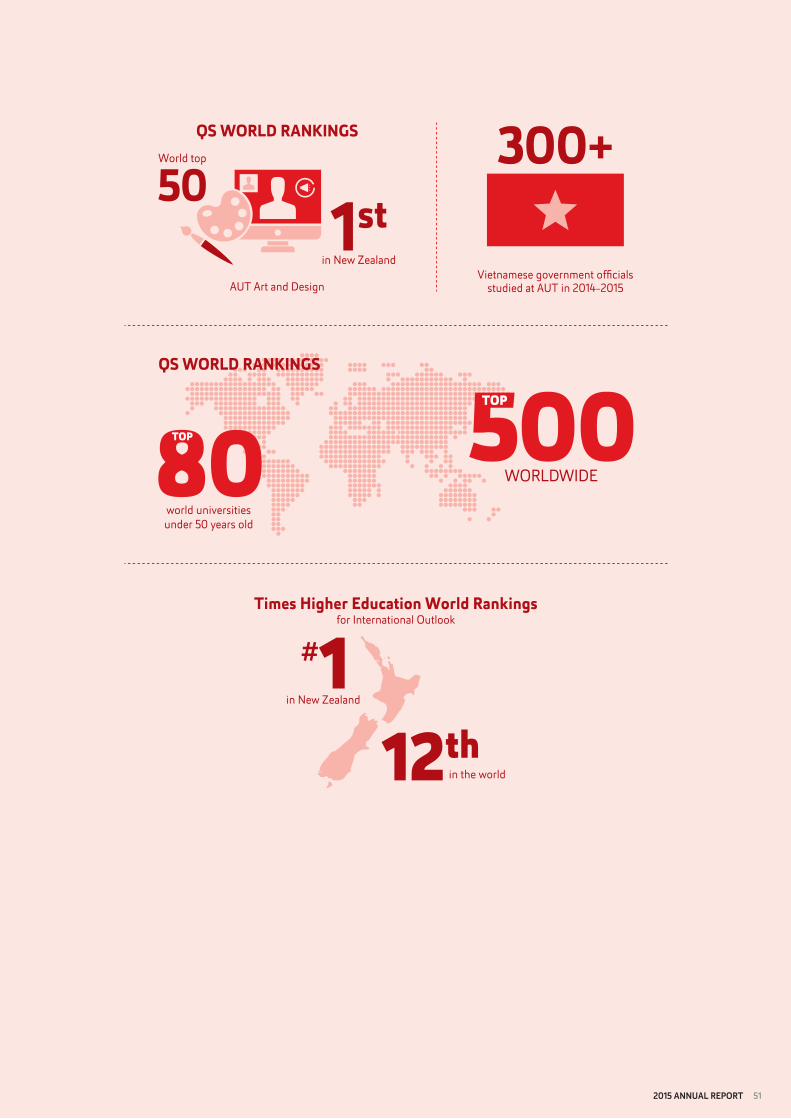
2015 annual report 51
Vietnamese government officialsstudied at AUT in 2014-2015
300+
in the world
in New Zealand
Times Higher Education World Rankingsfor International Outlook
AUT Art and Design
QS WORLD RANKINGS
1stin New Zealand
World top
world universities under 50 years old
WORLDWIDE
QS WORLD RANKINGS
52 2015 annual report
PeRFoRMAnce MeAsURes
5.1 Continue to build and benchmark the University’s national and international reputation
AUT celebrated some exceptional achievements on the global stage in 2015. As was discussed earlier in this report, ratings agencies QS and THE named AUT within the top echelon of world universities. Alongside a placing within the top 500 of all higher education institutions, QS ranked AUT in the top 80 amongst young universities (under the age of 50). THE named AUT in the top 800 overall, and as the world’s 12th most international university. These successes simultaneously recognise, reinforce and extend AUT’s growing reputation amongst the world’s best.
AUT’s expanding influence in Asia is a crucial driver of this growing recognition. More than 300 senior Vietnamese government officials attended training at AUT over 2014 and 2015. Prime Minister Ngyuen Tan Dung visited AUT along with 12 of his senior ministers to mark the 40th anniversary of bilateral relations between our two countries. In return, the University was part of the New Zealand Prime Ministerial delegation to Vietnam for the signing of the New Zealand – Viet Nam Strategic Engagement Plan on Education. AUT also secured partnerships with the Foreign Trade University in Hanoi and the government of the Quang Ninh Province.
Other notable achievements in Asia include a new MoU with Shanghai Normal University, inaugural alumni events in Shanghai and Thailand, sponsorship of APEC Voice of the Future in the Philippines, and meetings with the speaker of the Upper House and senior ministers of the government of Myanmar. Pak Amris Hassan, a former Indonesian Ambassador to New Zealand, was one of three trusted business advisors appointed during the year, two for Indonesia and one for Thailand. Within New Zealand AUT hosted the Diversity Dividend forum with leaders from the Māori, Pacific and Asian business communities, became the exclusive strategic partner of the ASEAN New Zealand Business Council, and hosted an ASEAN forum with Trade Minister Tim Groser.
The University is also building partnerships throughout Europe, with the signing of an MoU with the University of Trento in Italy, and the establishment of Europe House at AUT City Campus. Europe House is a focal point for Auckland-based cultural activities related to the European Union. It also provides a venue for visiting diplomats, officials, academics, and cultural and business associations to use while in the city.
Within New Zealand, AUT sought to strengthen its reputation as an inclusive, welcoming and safe place to work and study through involvement with key community groups. Relationships with Māori and Pacific people and people with disabilities were discussed previously in this Annual Report. Focussing on the Rainbow community, the University sponsored the Big Gay Out, the Queers in Tertiary Hui, and the Pride Parade in 2015, and welcomed the first two recipients of the Gay Auckland Business Association (GABA) AUT Tertiary scholarship. The scholarships were established in partnership with GABA and support young members of the Rainbow community through their first year of study.
A university’s reputation is built on the success of its alumni and AUT sought to extend its involvement with former students in 2015. AUT held alumni events in Hanoi and Ho Chi Minh City during the 40th anniversary celebrations in Viet Nam, and met with representatives of all six Vietnamese university partners to discuss an international alumni programme. In a celebration of the University’s heritage, the Seddon Technical Memorial College Morning Tea honoured alumni from the years 1913 to 1963. This resulted in an early bequest to the University. An e-newsletter was also introduced, featuring profiles of successful alumni and news of upcoming events.
Achieved
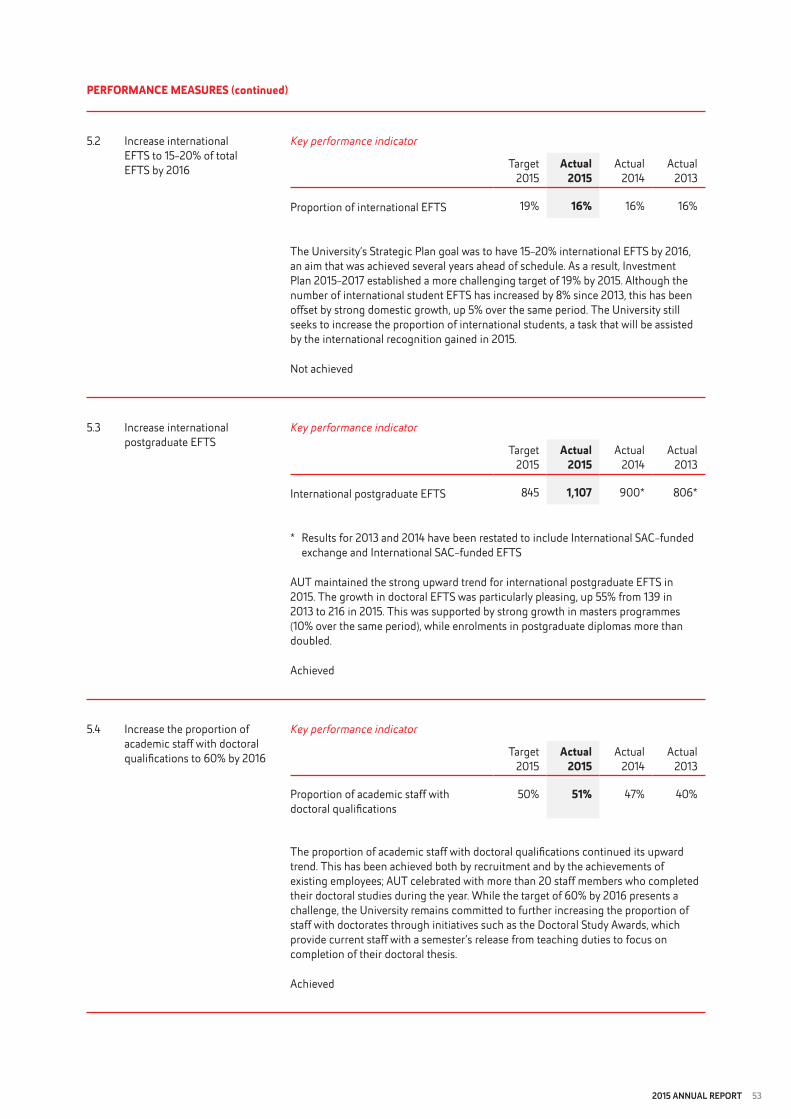
2015 annual report 53
PeRFoRMAnce MeAsURes (continued)
5.2 Increase international EFTS to 15-20% of total EFTS by 2016
Key performance indicator
Target2015
Actual2015
Actual2014
Actual2013
Proportion of international EFTS 19% 16% 16% 16%
The University’s Strategic Plan goal was to have 15-20% international EFTS by 2016, an aim that was achieved several years ahead of schedule. As a result, Investment Plan 2015-2017 established a more challenging target of 19% by 2015. Although the number of international student EFTS has increased by 8% since 2013, this has been offset by strong domestic growth, up 5% over the same period. The University still seeks to increase the proportion of international students, a task that will be assisted by the international recognition gained in 2015.
Not achieved
5.3 Increase international postgraduate EFTS
Key performance indicator
Target2015
Actual2015
Actual2014
Actual2013
International postgraduate EFTS 845 1,107 900* 806*
* Results for 2013 and 2014 have been restated to include International SAC-funded exchange and International SAC-funded EFTS
AUT maintained the strong upward trend for international postgraduate EFTS in 2015. The growth in doctoral EFTS was particularly pleasing, up 55% from 139 in 2013 to 216 in 2015. This was supported by strong growth in masters programmes (10% over the same period), while enrolments in postgraduate diplomas more than doubled.
Achieved
5.4 Increase the proportion of academic staff with doctoral qualifications to 60% by 2016
Key performance indicator
Target2015
Actual2015
Actual2014
Actual2013
Proportion of academic staff with doctoral qualifications
50% 51% 47% 40%
The proportion of academic staff with doctoral qualifications continued its upward trend. This has been achieved both by recruitment and by the achievements of existing employees; AUT celebrated with more than 20 staff members who completed their doctoral studies during the year. While the target of 60% by 2016 presents a challenge, the University remains committed to further increasing the proportion of staff with doctorates through initiatives such as the Doctoral Study Awards, which provide current staff with a semester’s release from teaching duties to focus on completion of their doctoral thesis.
Achieved

54 2015 annual report
PeRFoRMAnce MeAsURes (continued)
5.5 Continue to develop an open, inclusive and consultative staff culture
Key performance indicator
Target2015
Actual2015
Actual2014
Actual2013
5.5.1 Overall employee engagement index score
73.0% * * 72.2%
* The biennial Employee Engagement Survey will now be held in 2016, rather than 2015 as scheduled, due to the implementation of the new AUTOne finance, payroll and human resource management system.
Although the academic workforce is well-known to be ageing, there are still significant barriers to entry. In 2015 AUT trialled a programme to support early career academic staff through their first year, covering the four critical areas of teaching, research, leadership, and professional and career development. Jointly delivered by People and Organisation and the Centre for Learning and Teaching, the programme also includes workshops that will increase participants’ understanding of kaupapa Māori philosophy and values.
AUT also continued to implement new initiatives to improve staff engagement based on the results of the 2013 Employee Engagement Survey. Aspire was launched in response to a clear call for more support and training for managers. This programme helps newly appointed frontline leaders develop the skills and mind-set needed for their position and was developed in consultation with AUT managers. New and existing managers can also benefit from the new Navigate course, an e-learning and interactive toolkit based on the best practice guidelines developed by the Chartered Institute of Personnel and Development and customised for AUT. Another professional development programme for administrative staff was introduced, centred on the needs of those in executive assistant roles.
The Kin network was launched for all staff in 2015 with the aim of encouraging greater communication and collaboration across AUT. Kin also provides a vehicle by which individual staff can engage with senior leaders in informal relaxed settings, fostering improved staff relations. The initial events were well attended and the organising committee received highly positive feedback.
For the first time professional staff were recognised at the annual Vice-Chancellor’s Excellence Awards, alongside the teaching and research awards. The awards recognised and rewarded professional staff who had demonstrated a significant and sustained contribution to the strategic development of the University.
As a safe, welcoming, inclusive and diverse community, AUT embraces its responsibilities as an equal opportunity employer. AUT remains the only tertiary institution in New Zealand to have achieved the Rainbow Tick, and was successfully reaccredited in December 2015 in recognition of the University’s engagement with and support for the Rainbow community. As a direct result of this initiative, staff and students are now able to select ‘Gender diverse’ when entering personal details.
The Disability, Access and Inclusion Network was expanded and relaunched with the aim of improving access and inclusion for staff and students with disabilities. The network hosted Touch Compass, New Zealand’s only professional inclusive dance company, at the 2015 Diversity Week and the AUT Cultural Event. An Inside AUT article on Jordan Milroy, an athlete, final-year public relations student and disability awareness advocate, celebrated disability culture along with promoting better understanding of disability and inclusion. The Excellence in Business Support Awards, hosted by the Faculty of Business and Law, received Platinum accreditation by Be. Accessible.
From a policy perspective, AUT conducted a diversity impact assessment on each of its employment policies and procedures to ensure its support for the University’s diversity objectives and identify any required changes. Initiatives to support Māori and Pacific staff are discussed in KPI 5.6.
Achieved
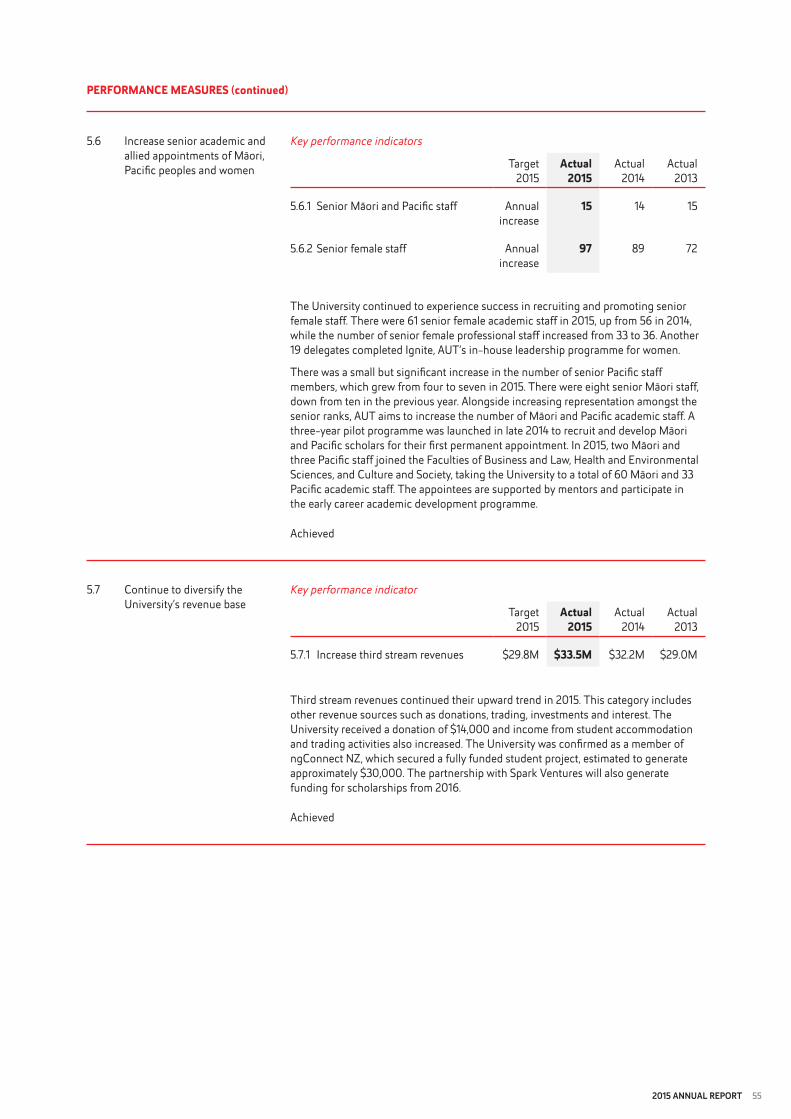
2015 annual report 55
PeRFoRMAnce MeAsURes (continued)
5.6 Increase senior academic and allied appointments of Māori, Pacific peoples and women
Key performance indicators
Target2015
Actual2015
Actual2014
Actual2013
5.6.1 Senior Māori and Pacific staff Annual increase
15 14 15
5.6.2 Senior female staff Annual increase
97 89 72
The University continued to experience success in recruiting and promoting senior female staff. There were 61 senior female academic staff in 2015, up from 56 in 2014, while the number of senior female professional staff increased from 33 to 36. Another 19 delegates completed Ignite, AUT’s in-house leadership programme for women.
There was a small but significant increase in the number of senior Pacific staff members, which grew from four to seven in 2015. There were eight senior Māori staff, down from ten in the previous year. Alongside increasing representation amongst the senior ranks, AUT aims to increase the number of Māori and Pacific academic staff. A three-year pilot programme was launched in late 2014 to recruit and develop Māori and Pacific scholars for their first permanent appointment. In 2015, two Māori and three Pacific staff joined the Faculties of Business and Law, Health and Environmental Sciences, and Culture and Society, taking the University to a total of 60 Māori and 33 Pacific academic staff. The appointees are supported by mentors and participate in the early career academic development programme.
Achieved
5.7 Continue to diversify the University’s revenue base
Key performance indicator
Target2015
Actual2015
Actual2014
Actual2013
5.7.1 Increase third stream revenues $29.8M $33.5M $32.2M $29.0M
Third stream revenues continued their upward trend in 2015. This category includes other revenue sources such as donations, trading, investments and interest. The University received a donation of $14,000 and income from student accommodation and trading activities also increased. The University was confirmed as a member of ngConnect NZ, which secured a fully funded student project, estimated to generate approximately $30,000. The partnership with Spark Ventures will also generate funding for scholarships from 2016.
Achieved

56 2015 annual report

2015 annual report 57
FInAncIAL stAteMents
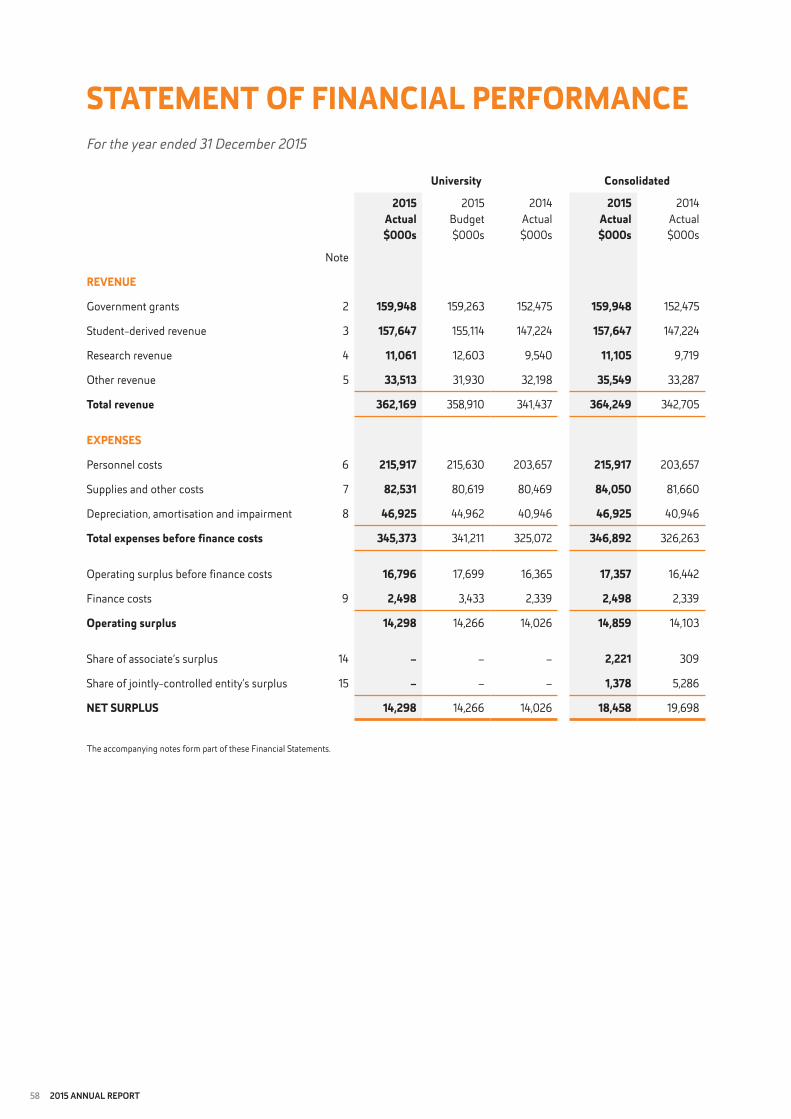
58 2015 annual report
For the year ended 31 December 2015
stAteMent oF FInAncIAL PeRFoRMAnce
University consolidated
2015 Actual$000s
2015 Budget$000s
2014 Actual$000s
2015 Actual$000s
2014 Actual$000s
Note
ReVenUe
Government grants 2 159,948 159,263 152,475 159,948 152,475
Student-derived revenue 3 157,647 155,114 147,224 157,647 147,224
Research revenue 4 11,061 12,603 9,540 11,105 9,719
Other revenue 5 33,513 31,930 32,198 35,549 33,287
total revenue 362,169 358,910 341,437 364,249 342,705
exPenses
Personnel costs 6 215,917 215,630 203,657 215,917 203,657
Supplies and other costs 7 82,531 80,619 80,469 84,050 81,660
Depreciation, amortisation and impairment 8 46,925 44,962 40,946 46,925 40,946
total expenses before finance costs 345,373 341,211 325,072 346,892 326,263
Operating surplus before finance costs 16,796 17,699 16,365 17,357 16,442
Finance costs 9 2,498 3,433 2,339 2,498 2,339
operating surplus 14,298 14,266 14,026 14,859 14,103
Share of associate’s surplus 14 – – – 2,221 309
Share of jointly-controlled entity’s surplus 15 – – – 1,378 5,286
net sURPLUs 14,298 14,266 14,026 18,458 19,698
The accompanying notes form part of these Financial Statements.

2015 annual report 59
For the year ended 31 December 2015
stAteMent oF otHeR coMPReHensIVe ReVenUe And exPense
University consolidated
2015 Actual$000s
2015 Budget$000s
2014 Actual$000s
2015 Actual$000s
2014 Actual$000s
Note
net sURPLUs 14,298 14,266 14,026 18,458 19,698
otHeR coMPReHensIVe ReVenUe And exPense Items that may be reclassified subsequently to surplus/(deficit)Net gain/(loss) on cash flow hedges 26 (50) – 42 (50) 42
Item that will not be reclassified to surplus/(deficit)
Net gain on asset revaluations 26 23,977 – 11,643 23,977 11,643
total other comprehensive revenue and expense
23,927 – 11,685 23,927 11,685
totAL coMPReHensIVe ReVenUe 38,225 14,266 25,711 42,385 31,383And exPense
The accompanying notes form part of these Financial Statements.
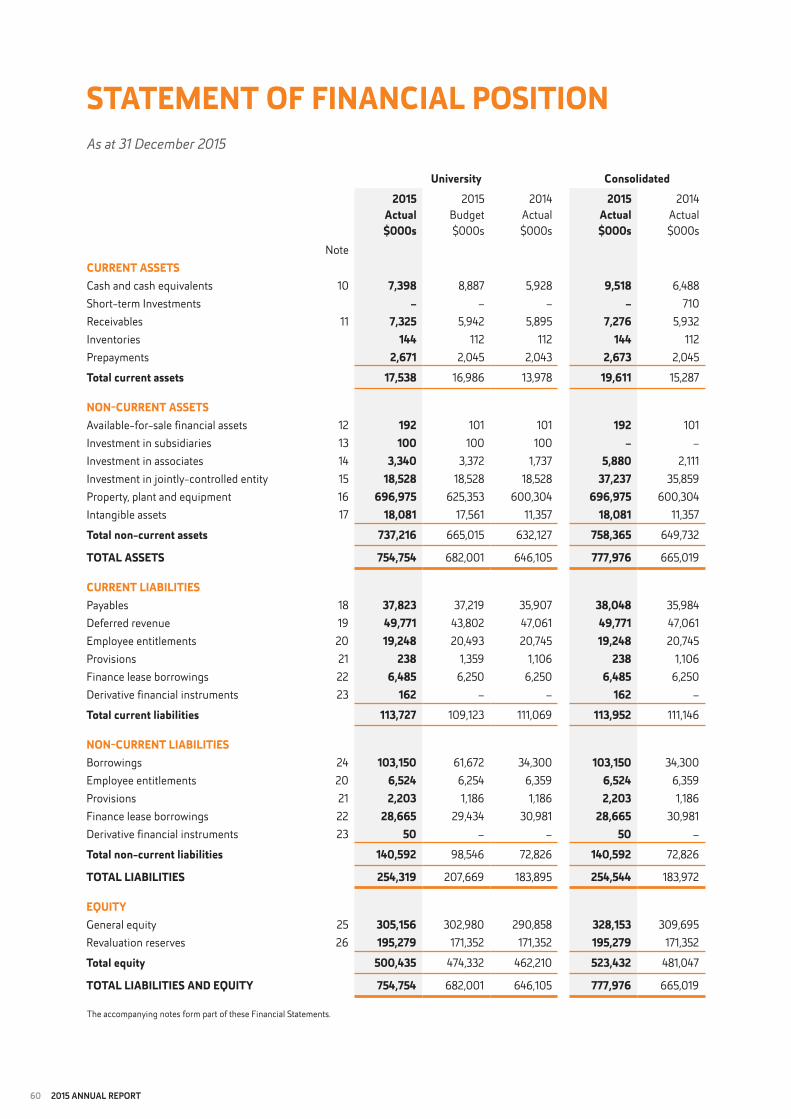
60 2015 annual report
stAteMent oF FInAncIAL PosItIonAs at 31 December 2015
University consolidated2015
Actual$000s
2015 Budget$000s
2014 Actual$000s
2015 Actual$000s
2014 Actual$000s
NotecURRent AssetsCash and cash equivalents 10 7,398 8,887 5,928 9,518 6,488Short-term Investments – – – – 710Receivables 11 7,325 5,942 5,895 7,276 5,932Inventories 144 112 112 144 112Prepayments 2,671 2,045 2,043 2,673 2,045
total current assets 17,538 16,986 13,978 19,611 15,287
non-cURRent AssetsAvailable-for-sale financial assets 12 192 101 101 192 101Investment in subsidiaries 13 100 100 100 – –Investment in associates 14 3,340 3,372 1,737 5,880 2,111Investment in jointly-controlled entity 15 18,528 18,528 18,528 37,237 35,859Property, plant and equipment 16 696,975 625,353 600,304 696,975 600,304Intangible assets 17 18,081 17,561 11,357 18,081 11,357
total non-current assets 737,216 665,015 632,127 758,365 649,732
totAL Assets 754,754 682,001 646,105 777,976 665,019
cURRent LIAbILItIesPayables 18 37,823 37,219 35,907 38,048 35,984Deferred revenue 19 49,771 43,802 47,061 49,771 47,061Employee entitlements 20 19,248 20,493 20,745 19,248 20,745Provisions 21 238 1,359 1,106 238 1,106Finance lease borrowings 22 6,485 6,250 6,250 6,485 6,250Derivative financial instruments 23 162 – – 162 –
total current liabilities 113,727 109,123 111,069 113,952 111,146
non-cURRent LIAbILItIesBorrowings 24 103,150 61,672 34,300 103,150 34,300Employee entitlements 20 6,524 6,254 6,359 6,524 6,359Provisions 21 2,203 1,186 1,186 2,203 1,186Finance lease borrowings 22 28,665 29,434 30,981 28,665 30,981Derivative financial instruments 23 50 – – 50 –
total non-current liabilities 140,592 98,546 72,826 140,592 72,826
totAL LIAbILItIes 254,319 207,669 183,895 254,544 183,972
eqUItYGeneral equity 25 305,156 302,980 290,858 328,153 309,695Revaluation reserves 26 195,279 171,352 171,352 195,279 171,352
total equity 500,435 474,332 462,210 523,432 481,047
totAL LIAbILItIes And eqUItY 754,754 682,001 646,105 777,976 665,019
The accompanying notes form part of these Financial Statements.
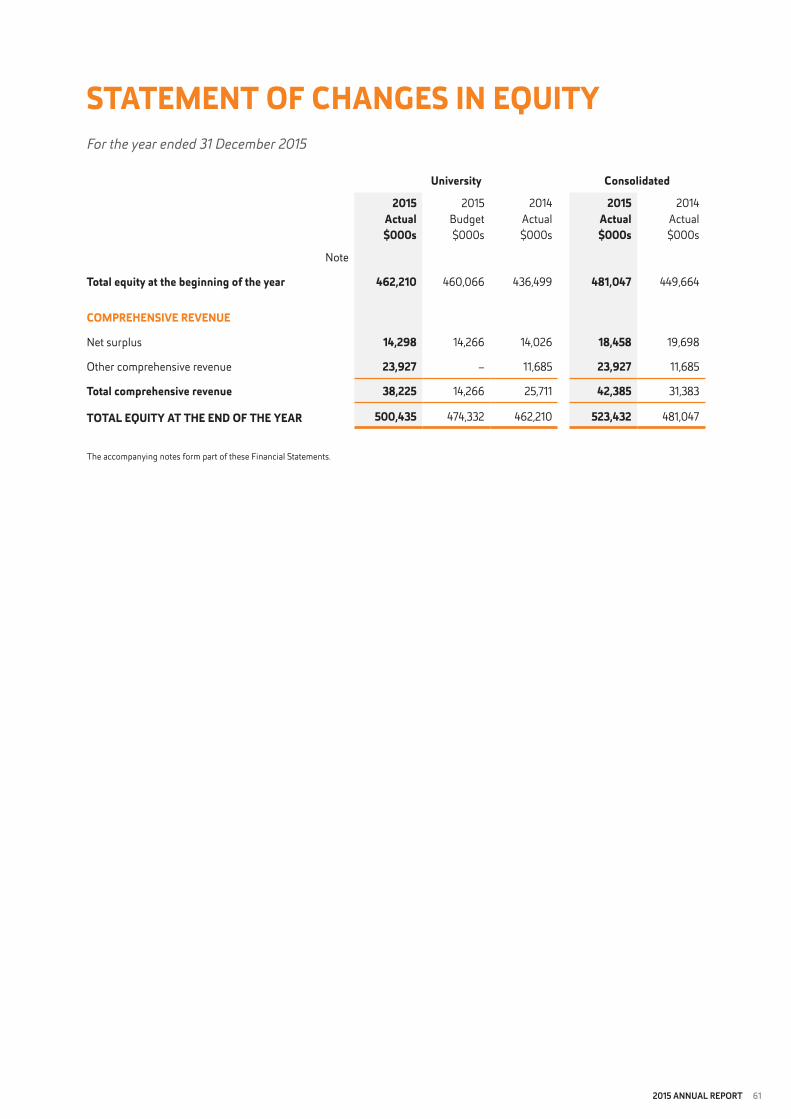
2015 annual report 61
stAteMent oF cHAnges In eqUItYFor the year ended 31 December 2015
University consolidated
2015 Actual$000s
2015 Budget$000s
2014 Actual$000s
2015 Actual$000s
2014 Actual$000s
Note
total equity at the beginning of the year 462,210 460,066 436,499 481,047 449,664
coMPReHensIVe ReVenUe
Net surplus 14,298 14,266 14,026 18,458 19,698
Other comprehensive revenue 23,927 – 11,685 23,927 11,685
total comprehensive revenue 38,225 14,266 25,711 42,385 31,383
totAL eqUItY At tHe end oF tHe YeAR 500,435 474,332 462,210 523,432 481,047
The accompanying notes form part of these Financial Statements.
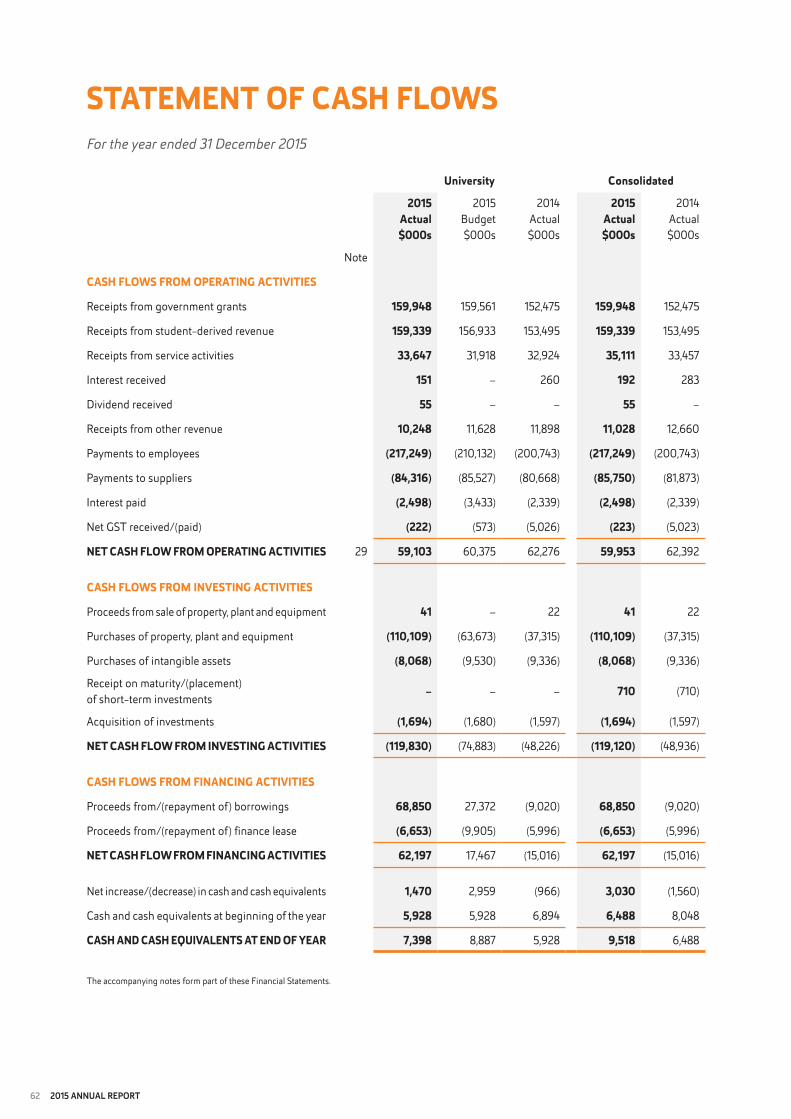
62 2015 annual report
stAteMent oF cAsH FLows
University consolidated
2015 Actual$000s
2015 Budget$000s
2014 Actual$000s
2015 Actual$000s
2014 Actual$000s
Note
cAsH FLows FRoM oPeRAtIng ActIVItIes
Receipts from government grants 159,948 159,561 152,475 159,948 152,475
Receipts from student-derived revenue 159,339 156,933 153,495 159,339 153,495
Receipts from service activities 33,647 31,918 32,924 35,111 33,457
Interest received 151 – 260 192 283
Dividend received 55 – – 55 –
Receipts from other revenue 10,248 11,628 11,898 11,028 12,660
Payments to employees (217,249) (210,132) (200,743) (217,249) (200,743)
Payments to suppliers (84,316) (85,527) (80,668) (85,750) (81,873)
Interest paid (2,498) (3,433) (2,339) (2,498) (2,339)
Net GST received/(paid) (222) (573) (5,026) (223) (5,023)
net cAsH FLow FRoM oPeRAtIng ActIVItIes 29 59,103 60,375 62,276 59,953 62,392
cAsH FLows FRoM InVestIng ActIVItIes
Proceeds from sale of property, plant and equipment 41 – 22 41 22
Purchases of property, plant and equipment (110,109) (63,673) (37,315) (110,109) (37,315)
Purchases of intangible assets (8,068) (9,530) (9,336) (8,068) (9,336)
Receipt on maturity/(placement) of short-term investments
– – – 710 (710)
Acquisition of investments (1,694) (1,680) (1,597) (1,694) (1,597)
net cAsH FLow FRoM InVestIng ActIVItIes (119,830) (74,883) (48,226) (119,120) (48,936)
cAsH FLows FRoM FInAncIng ActIVItIes
Proceeds from/(repayment of) borrowings 68,850 27,372 (9,020) 68,850 (9,020)
Proceeds from/(repayment of) finance lease (6,653) (9,905) (5,996) (6,653) (5,996)
net cAsH FLow FRoM FInAncIng ActIVItIes 62,197 17,467 (15,016) 62,197 (15,016)
Net increase/(decrease) in cash and cash equivalents 1,470 2,959 (966) 3,030 (1,560)
Cash and cash equivalents at beginning of the year 5,928 5,928 6,894 6,488 8,048
cAsH And cAsH eqUIVALents At end oF YeAR 7,398 8,887 5,928 9,518 6,488
The accompanying notes form part of these Financial Statements.
For the year ended 31 December 2015

2015 annual report 63
notes to tHe consoLIdAtedFInAncIAL stAteMentsFor the year ended 31 December 2015
note 1: sUMMARY oF sIgnIFIcAnt AccoUntIng PoLIcIes
The principal accounting policies applied in the preparation of these Financial Statements are set out below. The Financial Statements comprise Financial Statements for Auckland University of Technology (the University) as an individual entity, and for the consolidated entity consisting of the University, its subsidiaries, interest in associates and joint venture interests (the Consolidated Group).
(a) Reporting entity
Auckland University of Technology is a University under the Auckland University of Technology (Establishment) Order 1999 and is domiciled in New Zealand. The relevant legislation governing the University’s operations includes the Crown Entities Act 2004 and the Education Act 1989. The primary objective of the University is to provide tertiary education and research services for the benefit of the community rather than making a financial return. For the purposes of financial reporting, the University and the Consolidated Group are considered to be Public Benefit Entities (PBE).
The Financial Statements of the University and the Consolidated Group are for the year ended 31 December 2015. The Financial Statements are authorised for issue by the Council of Auckland University of Technology on 4 April 2016.
(b) basis of preparation
Statement of complianceThe Financial Statements of the University and the Consolidated Group have been prepared in accordance with the requirements of the Crown Entities Act 2004, as referred to in section 203 of the Education Act 1989, which includes the requirement to comply with generally accepted accounting practice in New Zealand (NZ GAAP). The Financial Statements have been prepared to comply with Public Benefit Entity International Public Sector Accounting Standards (PBE IPSAS) for a Tier 1 entity.
The Financial Statements have been prepared on the going concern basis, and the accounting policies have been applied consistently throughout the period.
Transition to PBE Accounting StandardsThese financial statements are the first financial statements presented in accordance with the new PBE accounting standards. The material adjustments arising on transition to the new PBE accounting standards are explained in Note 41.
Measurement baseThe Financial Statements have been prepared on an accruals basis and are based on the historical cost convention as modified by the revaluation of certain assets and liabilities as identified in the summary of significant accounting policies. These include the revaluation of available-for-sale financial assets, financial assets and liabilities (including derivative instruments) at fair value through other comprehensive revenue and expense and certain classes of property, plant and equipment.
Functional and presentation currencyThe Financial Statements are presented in New Zealand dollars and all values are rounded to the nearest thousand dollars, unless otherwise stated. The functional currency of the University and its subsidiaries is New Zealand dollars.
Standards issued and not yet effective and not early adoptedNot-for-profit enhancements
In May 2013, the NZ External Reporting Board issued a new suite of Public Benefit Entity (PBE) accounting standards for application by public sector entities for reporting periods beginning on or after 1 July 2014. The University and the Consolidated Group has applied these standards in preparing the 31 December 2015 financial statements.
In October 2014, the PBE suite of accounting standards was updated to include requirements and guidance for the not-for-profit sector. These updated standards apply to PBEs with reporting periods beginning on or after 1 April 2015. The University and the Consolidated Group will apply these updated standards in preparing its 31 December 2016 financial statements and it expects there will be minimal or no change in applying these updated accounting standards.
64 2015 annual report
Disclosure initiative
PBE IPSAS 1 Presentation of Financial Statements has recently been updated to address perceived impediments to preparers exercising their judgements in preparing financial statements.
These amendments apply to the University and the Consolidated Group in preparing the 31 December 2016 financial statements. The University and the Consolidated Group will be considering these amendments and relooking at how its financial statements are presented in preparing the 31 December 2016 financial statements.
Other amendments
While there are other amendments issued and not yet effective, the University and the Consolidated Group does not consider these to be relevant and therefore no information has been disclosed about these amendments.
(c) basis of consolidation
The consolidated Financial Statements comprise the Financial Statements of the University, its subsidiaries, interest in an associate and joint venture interests.
SubsidiariesSubsidiaries are all those entities over which the University has the power to govern the financial and operating policies, generally accompanying a shareholding of more than one half of the voting rights. Subsidiaries are fully consolidated from the date on which control is transferred to the University. They are deconsolidated from the date that control ceases.
Inter-company transactions, balances and unrealised gains on transactions between consolidated entities are eliminated. Unrealised losses are also eliminated unless the transaction provides evidence of the impairment of the asset transferred.
Investments in subsidiaries are carried at cost in the parent entity financial statements.
AssociatesAssociates are entities over which the University has significant influence but not control, generally accompanying a shareholding between 20% and 50% of the voting rights. Investments in material associates are accounted for in the parent entity financial statements using the cost method and in the consolidated financial statements using the equity method of accounting, after initially being recognised at cost.
Joint venturesA joint venture is a contractual arrangement whereby the University and other parties undertake economic activities that are subject to joint control. The University has interests in joint ventures which comprise a jointly-controlled entity and jointly-controlled assets.
Jointly-controlled entity
Interest in a jointly-controlled entity, whereby the venturers have a contractual arrangement that establishes joint control over the economic activities of the entity. The University recognises its interest in the jointly-controlled entity using the equity method of consolidation.
Under the equity method, the investment in the jointly-controlled entity is carried at cost less impairment in the parent entity financial statements. In the consolidated financial statements, the investment is initially recognised at cost and subsequently adjusted for changes in the University’s share of net assets of the joint venture, less any impairment in the value of investment. The University’s share of the results of the joint venture is recognised in the surplus or deficit.
The financial statements of the joint venture are prepared for the same reporting period as the University. Adjustments are made where necessary to bring the accounting policies in line with those of the University.
Jointly-controlled assets
Interest in jointly-controlled assets, whereby the venturers have a contractual arrangement that involves joint control and ownership of assets dedicated to the purposes of the joint venture. The University recognises its share of the jointly-controlled assets in the financial statements, classified according to their nature. Liabilities and expenses incurred directly in respect of interests in jointly- controlled assets are accounted for on an accruals basis. Revenue from the sale or use of the University’s share of jointly-controlled assets, and its share of joint venture expenses, are recognised when it is probable that the economic benefits associated with the transactions will flow to/from the University and the amount can be measured reliably.
2015 annual report 65
(d) Revenue recognition
Revenue is measured at the fair value. The University recognises revenue from individual categories of transactions as follows:
Student Achievement Component (SAC) fundingSAC funding is the University’s main source of operational funding from the Tertiary Education Commission (TEC). The University considers SAC funding to be non-exchange and recognises SAC funding as revenue when the course withdrawal date has passed, based on the number of eligible students enrolled in the course at that date and the value of the course.
Performance-Based Research Fund (PBRF)The University considers PBRF funding to be non-exchange in nature. PBRF funding is specifically identified by the TEC as being for a funding period as required by section 159YA of the Education Act 1989. The University recognises its confirmed allocation of PBRF funding at the commencement of the specified funding period, which is the same as the University’s financial year. PBRF revenue is measured based on the University’s funding entitlement adjusted for any expected adjustments as part of the final wash-up process. Indicative funding for future periods is not recognised until confirmed for that future period.
Other grants received Other grants are recognised as revenue when they become receivable unless there is an obligation in substance to return the funds if conditions of the grant are not met. If there is such an obligation, the grants are initially recorded as grants received in advance when received and recognised as revenue when the conditions of the grant are satisfied.
Domestic student tuition fees Domestic student tuition fees are subsidised by government funding and are considered non-exchange. Revenue is recognised when the course withdrawal date has passed, which is when a student is no longer entitled to a refund for withdrawing from the course.
International student tuition fees International student tuition fees are accounted for as exchange transactions and recognised as revenue on a course percentage of completion basis. The percentage of completion is measured by reference to the days of the course completed as a proportion of the total course days.
Research revenue The University exercises its judgement in determining whether funding received under a research contract is received in an exchange or non-exchange transaction. In determining whether a research contract is exchange or non-exchange, the University considers factors such as the following:• Whetherthefunderhassubstantiverightstotheresearchoutput.Thisisapersuasiveindicatorofexchangeornon-exchange.• Howtheresearchfundswereobtained.Forexample,whetherthroughacommercialtenderprocessforspecifiedworkorfrom
applying to a more general research funding pool.• Natureofthefunder.• Specificityoftheresearchbrieforcontract.
For an exchange research contract, revenue is recognised on a percentage completion basis. The percentage of completion is measured by reference to the actual research expenditure incurred as a proportion to total expenditure expected to be incurred.
For a non-exchange research contract, the total funding receivable under the contract is recognised as revenue immediately, unless there are substantive conditions in the contract. If there are substantive conditions, revenue is recognised when the conditions are satisfied. A condition could include the requirement to complete research to the satisfaction of the funder to retain funding or return unspent funds. Revenue for future periods is not recognised where the contract contains substantive termination provisions for failure to comply with the requirements of the contract. Conditions and termination provisions need to be substantive, which is assessed by considering factors such as contract monitoring mechanisms of the funder and the past practice of the funder. Judgement is often required in determining the timing of revenue recognition for contracts that span a balance date and multi-year research contracts.
Donations, bequests, and pledges Donations and bequests are recognised as revenue when the right to receive the fund or asset has been established, unless there is an obligation in substance to return the funds if conditions of the donation or bequest are not met. If there is such an obligation, they are initially recorded as revenue in advance when received and recognised as revenue when the conditions are satisfied. Pledges are not recognised as assets or revenue until the pledged item is received.
66 2015 annual report
Trading revenue Trading revenue includes revenue from the sales of goods and services, which is recognised when the product is sold to the customer, or the service provided.
Student accommodation services Revenue from the provision of student accommodation services is recognised on a percentage completion basis. This is determined by reference to the number of accommodation days used as a proportion of the total accommodation days contracted for with the individual.
Interest and dividends Interest revenue is recognised using the effective interest method. Dividends are recognised when the right to receive payment has been established.
(e) Property, plant and equipment
Each class of property, plant and equipment is valued at historical cost or fair value less, where applicable, any accumulated depreciation and impairment losses.
Land and buildingsCrown-owned land and buildings that are used by the University are included as part of the University’s property, plant and equipment. The University has sole and unrestricted use of this land and these buildings and has assumed ownership of these assets by means of a lease from the Ministry of Education for a period of thirty-three years from 1 November 1994, with rights of renewal for two further periods of thirty-three years each.
Following initial recognition at cost, all land and buildings, whether owned by the Crown or purchased and built out of the University’s reserves, are shown at fair value. Revaluation of land and buildings is carried out at least every three years by an independent Registered Valuer to ensure that the carrying amounts of these assets do not differ materially from their fair values at the balance date.
Any revaluation surplus arising on revaluation is credited to the asset revaluation reserve included in the equity section of the Statement of Financial Position. Decreases that offset previous increases of the same asset class are charged against the asset revaluation reserve directly in equity; all other decreases are charged to the surplus or deficit.
The carrying values of revalued land and buildings are assessed annually to ensure that they do not differ materially from fair value. If there is evidence supporting a material difference, then the off-cycle asset classes are revalued.
Library collectionThe Library collection is valued at historical cost less accumulated depreciation and, where applicable, any impairment losses.
Work in progressWork in progress is valued on the basis of expenditure incurred up to balance date and is not depreciated. Financing costs have not been capitalised during the construction of assets. The total cost of a project is transferred to the relevant asset class on completion and is then depreciated.
DepreciationProperty, plant and equipment are depreciated using the straight-line method (except for motor vehicles, which uses the diminishing value method) to allocate cost or revalued amount to residual value over their estimated useful lives, as follows:
Buildings 20 - 50 years straight-lineLibrary collection 5 - 10 years straight-linePlant and equipment 5 - 20 years straight-lineSpecialty electronics 6 years straight-lineFurniture and fittings 5 years straight-lineLeasehold improvements 5 years straight-lineOffice equipment 5 years straight-lineComputers and electronic equipment 3 years straight-lineMotor vehicles 20% diminishing value
The assets’ residual values and useful lives are reviewed and adjusted, if appropriate, at each balance date. Any changes are accounted for prospectively as a change in accounting estimate. An asset’s carrying amount is written down immediately to its recoverable amount if the asset’s carrying amount is greater than its estimated recoverable amount (see Note (f)). Gains and losses on disposals are determined by comparing proceeds with carrying amounts. These are included in the surplus or deficit.
Land, works of art and work in progress are not depreciated.

2015 annual report 67
(f) Intangible assets
Computer softwareComputer software licences are capitalised on the basis of the costs incurred to acquire and to bring the software to use. These costs are amortised on a straight-line basis over their estimated useful lives, being three years.
Costs associated with maintaining computer software are recognised as an expense when incurred. Costs that are directly associated with the development of identifiable and unique software controlled by the University, and that will probably generate economic benefits exceeding costs beyond one year, are recognised as intangible assets. Direct costs include software development, employee costs and an appropriate portion of relevant overheads. Computer software development costs recognised as assets are amortised on a straight-line basis over their estimated useful lives, being three years to seven years.
Programme developmentCosts incurred on development of new academic programmes are capitalised to the extent that such costs are expected to be recovered. Capital costs are amortised from the commencement of a particular programme on a straight-line basis over the period of their expected benefits, being three years.
Intellectual propertyIntellectual property is valued at cost of acquisition and is amortised on a straight line basis over the period of its expected benefits, being five years.
(g) Impairment of property, plant, and equipment and intangible assets
Intangible assets subsequently measured at cost that have an indefinite useful life, or are not yet available for use, and goodwill, are not subject to amortisation and are tested annually for impairment.
Property, plant, and equipment and intangible assets subsequently measured at cost that have a finite useful life are reviewed for impairment whenever events or changes in circumstances indicate that the carrying amount may not be recoverable.
An impairment loss is recognised for the amount by which the asset’s carrying amount exceeds its recoverable amount. The recoverable amount is the higher of an asset’s fair value less costs to sell and value in use.
If an asset’s carrying amount exceeds its recoverable amount, the asset is regarded as impaired and the carrying amount is written down to the recoverable amount. The total impairment loss is recognised in the surplus or deficit. The reversal of an impairment loss is recognised in the surplus or deficit.
Value in use for non-cash-generating assetsNon-cash-generating assets are those assets that are not held with the primary objective of generating a commercial return. For non-cash generating assets, value in use is determined using an approach based on either a depreciated replacement cost approach, restoration cost approach, or a service units approach. The most appropriate approach used to measure value in use depends on the nature of the impairment and availability of information.
(h) cash and cash equivalents
Cash and cash equivalents include cash on hand, deposits held on call with banks, other short-term, highly liquid investments with original maturities of three months or less that are readily convertible to known amounts of cash and which are subject to an insignificant risk of change in values, and bank overdrafts. Bank overdrafts are shown within borrowings as current liabilities in the statement of financial position.
(i) short-term investments
Short-term deposits with financial institutions that have maturities of greater than three months, but less than one year, are classified as short-term investments and are included within investing activities in the Statement of Cash Flows. Interest on short-term investments is recognised on an accruals basis over the life of the investment.
(j) Receivables
Receivables are recognised initially at fair value and subsequently measured at amortised cost, less any provision for impairment.
Collectability of receivables is reviewed on an on-going basis. Receivables which are known to be uncollectable are written off. A provision for impairment of receivables is established when there is objective evidence that the University will not be able to collect all amounts due according to the original terms of payment.
68 2015 annual report
(k) Inventories
Inventories available for resale are valued at the lower of cost and net realisable value, with adjustment for slow moving and obsolete inventories. Cost is determined on a first-in first-out basis. Inventories acquired through non-exchange transactions are measured at fair value at the date of acquisition.
All consumables are charged directly to expenditure. No inventories are pledged as security for liabilities at the balance date.
(l) Financial assets
The University classifies its financial assets into the following categories: financial assets at fair value through surplus or deficit, loans and receivables, held-to-maturity investments, and financial assets at fair value through other comprehensive revenue and expense. The classification depends on the purpose for which the financial assets were acquired. The University determines the classification of its financial assets at initial recognition and re-evaluates this designation at each balance date.
Financial assets at fair value through surplus or deficitFinancial assets at fair value through surplus or deficit include financial assets held for trading and financial assets designated upon initial recognition at fair value through surplus or deficit. Financial assets are classified as held for trading if they are acquired principally for the purpose of selling in the short-term or it is part of a portfolio of identified financial instruments that are managed together and for which there is evidence of short-term profit-taking. Derivatives are also categorised as held for trading unless they are designated into a hedge accounting relationship for which hedge accounting is applied.
Assets in this category are classified as current assets if they are either held for trading or are expected to be realised within 12 months of the balance date.
After initial recognition, financial assets in this category are measured at their fair values with gains or losses on re-measurement recognised in the surplus or deficit.
The University and Consolidated group have not designated any financial assets at fair value through surplus or deficit.
Loans and receivablesLoans and receivables are non-derivative financial assets with fixed or determinable payments that are not quoted in an active market. They are included in current assets, except for maturities greater than 12 months after the balance date, which are included in non-current assets.
After initial recognition, loans and receivables are measured at amortised cost, using the effective interest method, less impairment. Gains and losses when the asset is impaired or derecognised are recognised in the surplus or deficit.
The University and Consolidated group’s loans and receivables comprise “Receivables” and “Cash and cash equivalent” in the Statement of Financial Position.
Held-to-maturity investmentsHeld-to-maturity investments are non-derivative financial assets with fixed or determinable payments and fixed maturities that the University has the positive intention and ability to hold to maturity. They are included in current assets, except for maturities greater than 12 months after balance date, which are included in non-current assets.
After initial recognition they are measured at amortised cost, using the effective interest method, less impairment. Gains and losses when the asset is impaired or derecognised are recognised in the surplus or deficit.
The University and Consolidated group did not have any held-to-maturity investments during the years ended 31 December 2015 (2014: Nil).
Available-for-sale financial assetsAvailable-for-sale financial assets are non-derivative financial assets that are designated as available-for-sale or are not classified in any of the above categories of financial assets. They are included in non-current assets unless management intends to dispose of, or realise, the investment within 12 months of balance date. The University and Consolidated group includes in this category:• Investmentsthatitintendstoholdlong-termbutwhichmayberealisedbeforematurity;and• Shareholdingsthatitholdsforstrategicpurposes.
These investments are measured at their fair value, with gains and losses recognised in other comprehensive revenue and expense, except for impairment losses, which are recognised in the surplus or deficit.
The fair values of quoted investments are based on current bid prices. If the market for a financial asset is not active (and for unlisted securities), the University establishes fair value by using appropriate valuation techniques. These include reference to the fair value of recent arm’s length transactions involving the same instruments or other instruments that are substantially the same, discounted cash flow analysis, and option pricing models refined to reflect the issuer’s specific circumstance. Where the fair value cannot be reliably determined the investments are measured at cost.
2015 annual report 69
On de-recognition, the cumulative gain or loss previously recognised in other comprehensive revenue and expense is reclassified from equity to the surplus or deficit.
The University and Consolidated group’s available-for-sale financial assets comprise principally marketable equity securities.
(m) Impairment of financial assets
Financial assets not subsequently measured at fair value through surplus or deficit are assessed for evidence of impairment at each reporting date. Impairment losses are recognised in the surplus or deficit.
Loans and receivables, and held-to-maturity investmentsImpairment is established when there is evidence that the University and consolidated group will not be able to collect amounts due according to the original terms of the receivable. Significant financial difficulties of the debtor, probability that the debtor will enter into bankruptcy, receivership, or liquidation and default in payments are indicators that the asset is impaired. The amount of the impairment is the difference between the asset’s carrying amount and the present value of estimated future cash flows, discounted using the original effective interest rate. For debtors and other receivables, the carrying amount of the asset is reduced through the use of an allowance account, and the amount of the loss is recognised in the surplus or deficit. When the receivable is uncollectible, it is written-off against the allowance account.
Available-for-sale financial assetsIn the case of equity securities classified as available for sale, a significant or prolonged decline in the fair value of the equity security below its cost is considered objective evidence of impairment.
If impairment evidence exists for available-for-sale financial assets, the cumulative loss (measured as the difference between the acquisition cost and the current fair value, less any impairment loss on that financial asset previously recognised in the surplus or deficit) recognised in other comprehensive revenue and expense is reclassified from equity to the surplus or deficit.
Equity instrument impairment losses recognised in the surplus or deficit are not reversed through the surplus or deficit.
(n) Leases
Finance leasesLeases where the University assumes substantially all the risks and rewards of ownership are classified as finance leases, whether or not title is eventually transferred.
Finance leases are capitalised at the lower of the fair value of the leased asset and the present value of the minimum lease payments at inception of the lease, less accumulated depreciation and impairment losses. The corresponding liability to the lessor, net of finance charges, is included in the Statement of Financial Position as a finance lease obligation.
Lease payments are apportioned between finance charges and reduction of the finance lease obligation so as to achieve a constant rate of interest on the remaining balance of the liability. Finance charges are included in the surplus or deficit as finance costs.
Capitalised leased assets are depreciated over the estimated useful life of the asset or the lease term, whichever is shorter.
For a lease of land and buildings in which the minimum lease payments cannot be allocated reliably between the land and the building elements in proportion to the relative fair values of the leasehold interests in the land element and buildings element of the lease at the inception of the lease, the entire lease is classified as a finance lease, unless it is clear that both elements are operating leases, in which case the entire lease is classified as an operating lease.
Operating leasesLeases where the lessor retains substantially all the risks and rewards of ownership are classified as operating leases. Payments made under operating leases (net of any incentives received from the lessor) are charged to the surplus or deficit on a straight-line basis over the period of the lease.
(o) Foreign currency translation
Transactions in foreign currencies are translated to New Zealand dollars at the foreign exchange rate ruling at the date of the transaction. Monetary assets and liabilities denominated in foreign currencies at the balance date are translated to New Zealand dollars at the foreign exchange rate ruling at that date. All foreign exchange differences arising on translation are recognised in the surplus or deficit.
70 2015 annual report
(p) derivative financial instruments and hedge accounting
The University uses derivative financial instruments, such as interest rate swaps and forward foreign exchange contracts, to hedge its interest rate risks and foreign currency risks respectively. In accordance with its treasury policy, the University does not hold or issue derivative financial instruments for trading purposes. However, derivatives that do not qualify for hedge accounting are accounted for as trading instruments. Derivative financial instruments are initially recognised at fair value on the date a derivative contract is entered into and are subsequently remeasured at their fair value. The fair value of interest rate swaps and forward foreign exchange contracts are determined by reference to market values for similar instruments.
For the purposes of hedge accounting, all the University’s hedging instruments are designated as cash flow hedges. A cash flow hedge is defined as that which mitigates the exposure to variability in cash flows attributable to a particular risk associated with a recognised asset or liability, firm commitment, or highly probable forecast transaction, which could affect surplus or deficit. A cash flow hedge protects against the risk caused by variable prices, costs, rates or terms which cause uncertainty in the future.
The University documents, at the inception of the transaction, the relationship between hedging instruments and hedged items, as well as its risk management objective and strategy for undertaking various hedge transactions. The University also documents its assessment, both at hedge inception and on an on-going basis, of whether the derivatives that are used in hedging transactions are highly effective in offsetting changes in fair value or cash flows of hedged items.
The portion of the gain or loss on the hedging instrument that is determined to be an effective hedge is recognised directly in Other Comprehensive Revenue and Expense, within the Statement of Other Comprehensive Revenue and Expense and the ineffective portion is recognised immediately in the surplus or deficit as part of the finance costs.
The gain or loss accumulated in equity is recognised in the surplus or deficit when the hedged cash flows are settled.
Changes in the fair value of any derivative instrument that do not qualify for hedge accounting are recognised immediately in the surplus or deficit.
(q) goods and services tax (gst)
Auckland University of Technology is a registered ‘person’ as defined by the Goods and Services Act 1985. The Financial Statements have been prepared on a GST exclusive basis with the exception of receivables and payables, which are stated GST inclusive. When GST is not recoverable on input tax then it is recognised as part of the related asset or expense.
The net amount of GST recoverable from, or payable to, the Inland Revenue Department at balance date is included as part of receivables or payables in the Statement of Financial Position.
The net GST paid to, or received from, the Inland Revenue Department, including the GST relating to investing and financing activities, is classified as an operating cash flow in the Statement of Cash Flows.
Commitments and contingencies are disclosed exclusive of GST.
(r) taxation
The University and its subsidiaries are exempt from the payment of income tax as they are treated by the Inland Revenue Department as charitable organisations for the purposes of the Income Tax Act. Accordingly, no provision for income tax has been made.
(s) budget figures
The budget figures are those approved by the Council of the Auckland University of Technology before the beginning of each financial year. They have been prepared in accordance with generally accepted accounting practice and are consistent with the accounting policies adopted by the Council in preparing these Financial Statements.
(t) Payables
Payables are initially measured at fair value and subsequently measured at amortised cost using the effective interest method.
(u) employee entitlements
Employee entitlements to salaries and wages, annual leave, sick leave, long service leave, retirement leave and other similar benefits are recognised in the surplus or deficit when they accrue to employees. Employee entitlements to be settled within twelve months are reported at the amount expected to be paid. The liability for long-term employee entitlements is reported as the present value of the estimated future cash outflows.
2015 annual report 71
Annual leaveLiability for annual leave is measured as the amount of unused entitlement accumulated at balance date at relevant current rates of pay.
Sick leaveLiability for sick leave is recognised to the extent that absences in the coming year are expected to be greater than the sick leave entitlements earned in the coming year. The amount is calculated based on the unused sick leave entitlement that can be carried forward at balance date to the extent it will be used by employees to cover those future absences.
Long service leave and retirement leaveLiability for long service leave and retirement leave is calculated on an actuarial basis and is based on:The likely future entitlements accruing to staff based on years of service, years to entitlement, the likelihood that staff will reach the point of entitlement and contractual entitlements information, and the present value of the estimated future cash flows. Expected future payments are discounted using market yields on New Zealand government bonds at balance date with terms to maturity that match, as closely as possible, the estimated future cash outflows for entitlements. The inflation factor is based on the expected long-term increase in remuneration for employees.
Research and study leaveLiability for research and study leave is measured as the value of unused guaranteed entitlements accumulated at balance date that the University anticipates employees will use in future periods.
Superannuation schemesDefined contribution schemes
Obligations for contributions to KiwiSaver and two of the National Provident Fund (NPF) Superannuation schemes, namely the Lump Sum National Scheme and the Pension National Scheme, are accounted for as defined contribution schemes and are recognised as an expense in the surplus or deficit as incurred.
Defined benefit schemes
The University belongs to the Government Superannuation Fund (GSF) scheme, which is a defined benefit scheme managed by the Government Superannuation Fund Authority. The University has no underwriting responsibilities as any shortfall is met by the Government. As such, the GSF scheme is accounted for as a defined contribution scheme.
(v) Interest-bearing borrowings
Interest-bearing borrowings are initially recognised at cost, being the fair value of the consideration received net of transaction costs associated with the borrowings.
Subsequent to initial recognition, interest-bearing borrowings are measured at amortised cost using the effective interest method. Amortised cost is calculated by taking into account any transaction costs, and any discount or premium on settlement.
Gains or losses are recognised in the surplus or deficit when the liabilities are derecognised and through the amortisation process.
(w) borrowing costs
Borrowing costs are recognised as an expense in the period in which they are incurred.
(x) Provisions
Provisions are recognised when the University has a present legal or constructive obligation as a result of past events, when it is more likely than not that an outflow of resources will be required to settle the obligation, and when the amount has been reliably estimated. Provisions are not recognised for future operating losses.
Where there are a number of similar obligations, the likelihood that an outflow will be required in settlement is determined by considering the class of obligations as a whole.
Provisions are measured at the present value of the expenditures expected to be required to settle the obligation using a discount rate that reflects current market assessments of the time value of money and the risks specific to the obligation. The increase in the provision due to passage of time is recognised in the surplus or deficit.
72 2015 annual report
(y) equity
Equity is measured as the difference between total assets and total liabilities. Equity is disaggregated and classified into a number of components. The components of equity are:
General fundsGeneral funds comprise general equity.
Revaluation reservesRevaluation reserves comprise the asset revaluation reserve which relates to the revaluation of land and buildings to fair value; the available-for-sale financial assets revaluation reserve which relates to the revaluation of marketable equity securities to fair value; and the cash flow hedge reserve which relates to the gain or loss on the hedging instrument that is determined to be an effective cash flow hedge and the change in the fair value of the hedging instrument through Other Comprehensive Revenue and Expense.
(z) critical accounting estimates and assumptions
In preparing these Financial Statements, the University and the Consolidated Group have made estimates and assumptions concerning the future. These estimates and assumptions may differ from the subsequent actual results. Estimates and assumptions are continually evaluated and are based on historical experience and other factors, including expectations of future events that are believed to be reasonable under the circumstances. The estimates and assumptions that have a significant risk of causing a material adjustment to the carrying amounts of assets and liabilities within the next financial year are discussed below:
Revaluation of land and buildingsNote 16 provides information about the estimates and assumptions exercised in the measurement of revalued land and buildings. The University relies on the services of an independent Registered Valuer to assess the carrying values of land and buildings.
Long service leave and retirement leaveNote 20 provides an analysis of the exposure in relation to estimates and uncertainties surrounding long service leave and retirement leave liabilities. Assumptions made include discount rates, salary inflation and the number of staff who will reach the point of entitlement.
Reinstatement provisionNote 21 represents the University’s estimated liability to reinstate leased buildings to their original state at the expiry of the lease terms.
Depreciation and amortisationAt each balance date, the University reviews the useful lives and residual values of its property, plant and equipment, and intangible assets. Assessing the appropriateness of useful life and residual value estimates of property, plant and equipment, and intangible assets requires the University to consider a number of factors such as the physical condition of the asset, expected period of use of the asset by the University, and expected disposal proceeds from the future sale of the asset. An incorrect estimate of the useful life or residual value will impact on the depreciable or amortisable amount of an asset, therefore impacting on the depreciation or amortisation expense recognised in the surplus or deficit, and on the carrying amount of the asset in the Statement of Financial Position. The carrying amounts of property, plant and equipment are disclosed in Note 16 and intangible assets in Note 17.
(aa) critical judgements in applying accounting policies
The University has made the following critical judgements in applying accounting policies for the year ended 31 December 2015:
Crown-owned land and buildingsProperty in the legal name of the Crown that is occupied by the University is recognised as an asset in the Statement of Financial Position. The University considers that it has assumed all the normal risks and rewards of ownership of this property despite legal ownership not being transferred. Accordingly it would be misleading to exclude these assets from the Financial Statements.
The University has secured the use of the property by means of a lease from the Ministry of Education for a period of thirty three years from 1 November 1994, with rights of renewal for two further periods of thirty three years each.
Research and study leaveSome academic staff are entitled to guaranteed research and study leave in certain circumstances. The substance of this leave is to enable staff to take leave from teaching duties in order to undertake research activity, whilst continuing to earn their salary and other employee entitlements. The University is of the view that guaranteed research and study leave is the value of the future benefit that academic staff have earned in return for their service in the current and prior periods. Accordingly, a liability has been recognised for such leave.
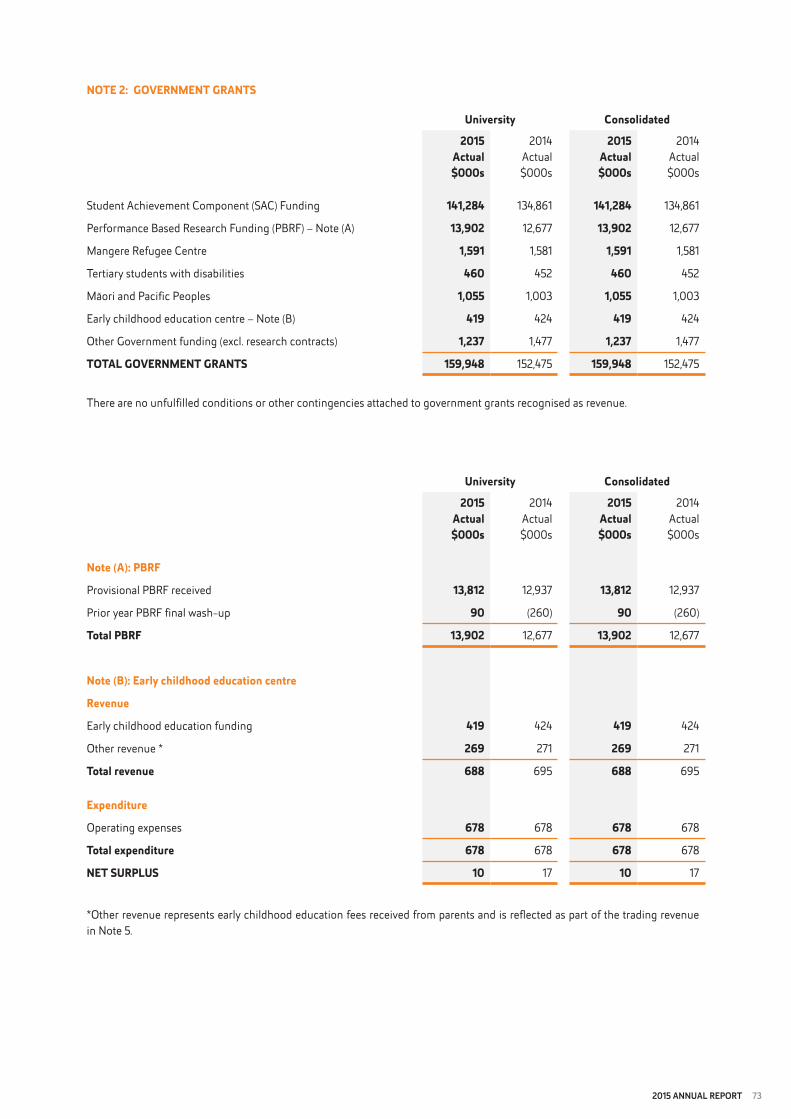
2015 annual report 73
note 2: goVeRnMent gRAnts
University consolidated
2015 Actual$000s
2014 Actual$000s
2015 Actual$000s
2014 Actual$000s
Student Achievement Component (SAC) Funding 141,284 134,861 141,284 134,861
Performance Based Research Funding (PBRF) – Note (A) 13,902 12,677 13,902 12,677
Mangere Refugee Centre 1,591 1,581 1,591 1,581
Tertiary students with disabilities 460 452 460 452
Māori and Pacific Peoples 1,055 1,003 1,055 1,003
Early childhood education centre – Note (B) 419 424 419 424
Other Government funding (excl. research contracts) 1,237 1,477 1,237 1,477
totAL goVeRnMent gRAnts 159,948 152,475 159,948 152,475
There are no unfulfilled conditions or other contingencies attached to government grants recognised as revenue.
University consolidated
2015 Actual$000s
2014 Actual$000s
2015 Actual$000s
2014 Actual$000s
note (A): PbRF
Provisional PBRF received 13,812 12,937 13,812 12,937
Prior year PBRF final wash-up 90 (260) 90 (260)
total PbRF 13,902 12,677 13,902 12,677
note (b): early childhood education centre
Revenue
Early childhood education funding 419 424 419 424
Other revenue * 269 271 269 271
total revenue 688 695 688 695
expenditure
Operating expenses 678 678 678 678
total expenditure 678 678 678 678
net sURPLUs 10 17 10 17
*Other revenue represents early childhood education fees received from parents and is reflected as part of the trading revenue in Note 5.
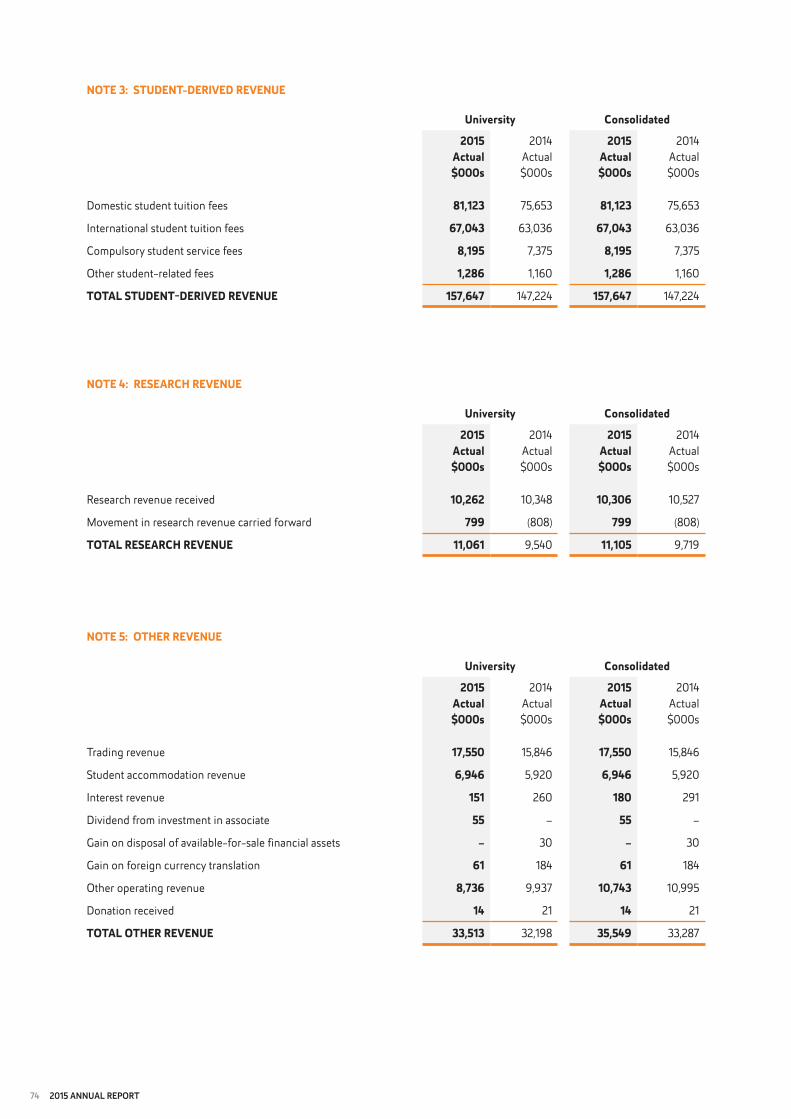
74 2015 annual report
note 3: stUdent-deRIVed ReVenUe
note 4: ReseARcH ReVenUe
note 5: otHeR ReVenUe
University consolidated
2015 Actual$000s
2014 Actual$000s
2015 Actual$000s
2014 Actual$000s
Trading revenue 17,550 15,846 17,550 15,846
Student accommodation revenue 6,946 5,920 6,946 5,920
Interest revenue 151 260 180 291
Dividend from investment in associate 55 – 55 –
Gain on disposal of available-for-sale financial assets – 30 – 30
Gain on foreign currency translation 61 184 61 184
Other operating revenue 8,736 9,937 10,743 10,995
Donation received 14 21 14 21
totAL otHeR ReVenUe 33,513 32,198 35,549 33,287
University consolidated
2015 Actual$000s
2014 Actual$000s
2015 Actual$000s
2014 Actual$000s
Domestic student tuition fees 81,123 75,653 81,123 75,653
International student tuition fees 67,043 63,036 67,043 63,036
Compulsory student service fees 8,195 7,375 8,195 7,375
Other student-related fees 1,286 1,160 1,286 1,160
totAL stUdent-deRIVed ReVenUe 157,647 147,224 157,647 147,224
University consolidated
2015 Actual$000s
2014 Actual$000s
2015 Actual$000s
2014 Actual$000s
Research revenue received 10,262 10,348 10,306 10,527
Movement in research revenue carried forward 799 (808) 799 (808)
totAL ReseARcH ReVenUe 11,061 9,540 11,105 9,719
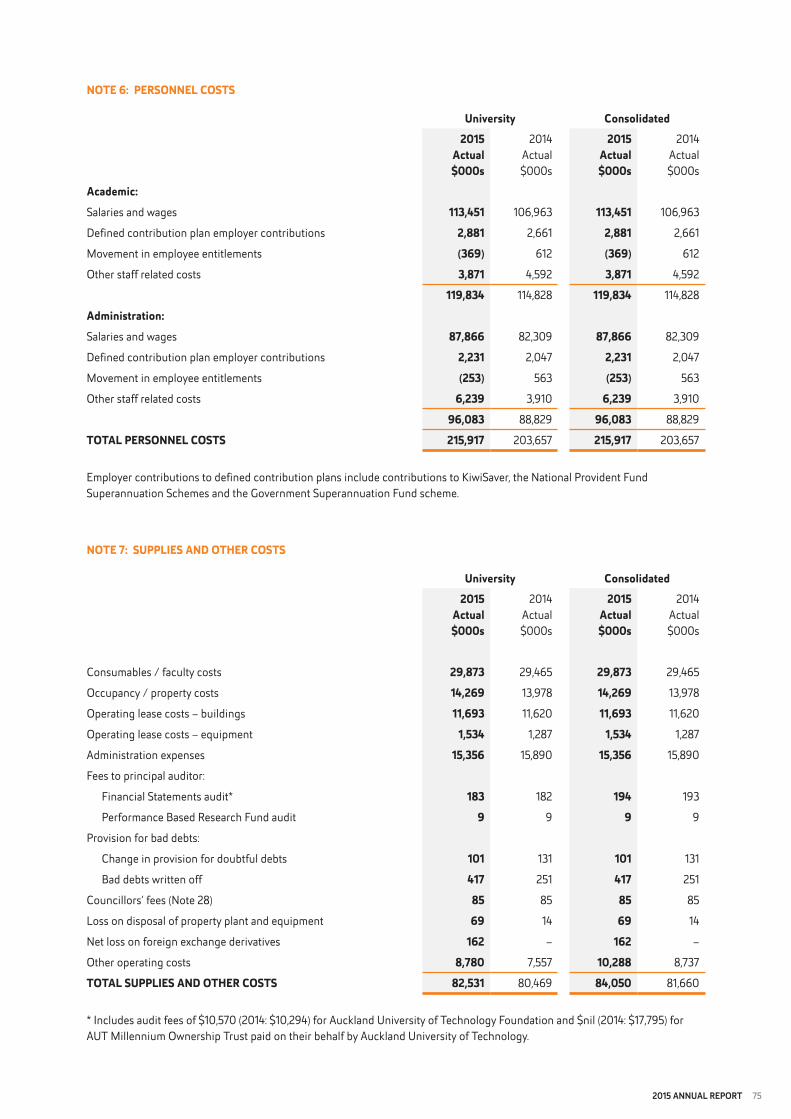
2015 annual report 75
note 7: sUPPLIes And otHeR costs
note 6: PeRsonneL costs
University consolidated2015
Actual$000s
2014 Actual$000s
2015 Actual$000s
2014 Actual$000s
Consumables / faculty costs 29,873 29,465 29,873 29,465
Occupancy / property costs 14,269 13,978 14,269 13,978
Operating lease costs – buildings 11,693 11,620 11,693 11,620
Operating lease costs – equipment 1,534 1,287 1,534 1,287
Administration expenses 15,356 15,890 15,356 15,890
Fees to principal auditor:
Financial Statements audit* 183 182 194 193
Performance Based Research Fund audit 9 9 9 9
Provision for bad debts:
Change in provision for doubtful debts 101 131 101 131
Bad debts written off 417 251 417 251
Councillors’ fees (Note 28) 85 85 85 85
Loss on disposal of property plant and equipment 69 14 69 14
Net loss on foreign exchange derivatives 162 – 162 –
Other operating costs 8,780 7,557 10,288 8,737
totAL sUPPLIes And otHeR costs 82,531 80,469 84,050 81,660
* Includes audit fees of $10,570 (2014: $10,294) for Auckland University of Technology Foundation and $nil (2014: $17,795) for AUT Millennium Ownership Trust paid on their behalf by Auckland University of Technology.
University consolidated2015
Actual$000s
2014 Actual$000s
2015 Actual$000s
2014 Actual$000s
Academic:Salaries and wages 113,451 106,963 113,451 106,963
Defined contribution plan employer contributions 2,881 2,661 2,881 2,661
Movement in employee entitlements (369) 612 (369) 612
Other staff related costs 3,871 4,592 3,871 4,592
119,834 114,828 119,834 114,828
Administration:Salaries and wages 87,866 82,309 87,866 82,309
Defined contribution plan employer contributions 2,231 2,047 2,231 2,047
Movement in employee entitlements (253) 563 (253) 563
Other staff related costs 6,239 3,910 6,239 3,910
96,083 88,829 96,083 88,829
totAL PeRsonneL costs 215,917 203,657 215,917 203,657
Employer contributions to defined contribution plans include contributions to KiwiSaver, the National Provident Fund Superannuation Schemes and the Government Superannuation Fund scheme.

76 2015 annual report
note 8: dePRecIAtIon, AMoRtIsAtIon And IMPAIRMent
note 9: FInAnce costs
note 10: cAsH And cAsH eqUIVALents
University consolidated
2015 Actual$000s
2014 Actual$000s
2015 Actual$000s
2014 Actual$000s
Depreciation (Note 16) 43,981 37,951 43,981 37,951
Amortisation (Note 17) 2,943 2,087 2,943 2,087
Impairment (Note 16 & 17) 1 908 1 908
totAL dePRecIAtIon, AMoRtIsAtIon 46,925 40,946 46,925 40,946And IMPAIRMent
University consolidated
2015 Actual$000s
2014 Actual$000s
2015 Actual$000s
2014 Actual$000s
Interest on borrowings 845 504 845 504
Finance charges on finance leases 1,653 1,835 1,653 1,835
totAL FInAnce costs 2,498 2,339 2,498 2,339
University consolidated
2015 Actual$000s
2014 Actual$000s
2015 Actual$000s
2014 Actual$000s
Cash at bank and on hand 1,166 982 3,286 1,542
Short-term bank deposits 6,232 4,946 6,232 4,946
totAL cAsH And cAsH eqUIVALents 7,398 5,928 9,518 6,488As PeR tHe stAteMent oF cAsH FLows
Cash at banks earns interest at floating rates based on daily bank deposit rates. Short-term bank deposits are made for varying periods of time, from one day to three months, depending on immediate cash requirements, and earn interest at the respective short-term deposit rates.
The carrying value of cash at bank and short-term deposits with maturity dates of three months or less approximates their fair value.
Financial assets recognised in a non-exchange transaction that are subject to restrictionsThe cash and cash equivalents balance of the Consolidated Group includes an amount of $1.55m (2014: $0.38m) that relates to unspent funds received that are subject to restrictions. These unspent funds relate to donations and bequests received the Auckland University of Technology Foundation. The restrictions generally specify how the funds are required to be used for specified purposes as outlined by donors.
The weighted average effective interest rate for cash and cash equivalents was 2.31% (2014: 3.48%).
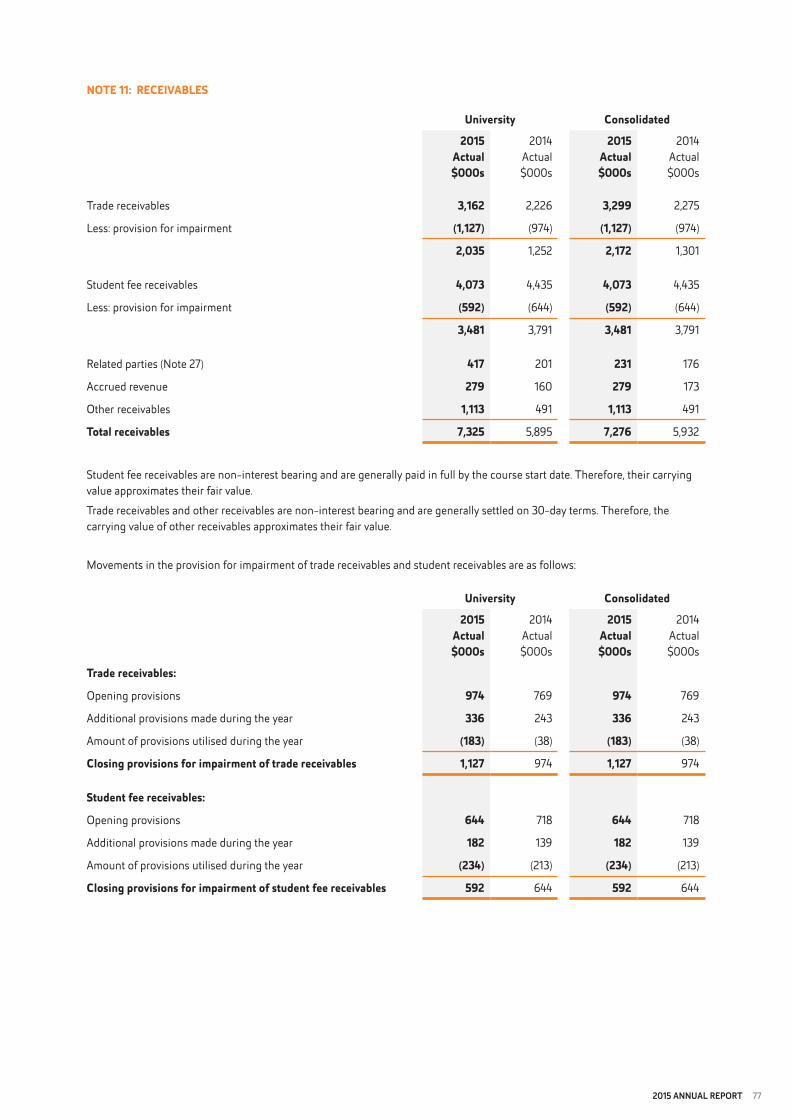
2015 annual report 77
note 11: ReceIVAbLes
University consolidated
2015 Actual$000s
2014 Actual$000s
2015 Actual$000s
2014 Actual$000s
Trade receivables 3,162 2,226 3,299 2,275
Less: provision for impairment (1,127) (974) (1,127) (974)
2,035 1,252 2,172 1,301
Student fee receivables 4,073 4,435 4,073 4,435
Less: provision for impairment (592) (644) (592) (644)
3,481 3,791 3,481 3,791
Related parties (Note 27) 417 201 231 176
Accrued revenue 279 160 279 173
Other receivables 1,113 491 1,113 491
total receivables 7,325 5,895 7,276 5,932
Student fee receivables are non-interest bearing and are generally paid in full by the course start date. Therefore, their carrying value approximates their fair value.
Trade receivables and other receivables are non-interest bearing and are generally settled on 30-day terms. Therefore, the carrying value of other receivables approximates their fair value.
Movements in the provision for impairment of trade receivables and student receivables are as follows:
University consolidated
2015 Actual$000s
2014 Actual$000s
2015 Actual$000s
2014 Actual$000s
trade receivables:
Opening provisions 974 769 974 769
Additional provisions made during the year 336 243 336 243
Amount of provisions utilised during the year (183) (38) (183) (38)
closing provisions for impairment of trade receivables 1,127 974 1,127 974
student fee receivables:
Opening provisions 644 718 644 718
Additional provisions made during the year 182 139 182 139
Amount of provisions utilised during the year (234) (213) (234) (213)
closing provisions for impairment of student fee receivables 592 644 592 644

78 2015 annual report
note 11: ReceIVAbLes (continued)
The ageing profile of trade receivables and student receivables at the balance date is as follows:
University consolidated
Gross$000s
Impairment$000s
Net$000s
Gross$000s
Impairment$000s
Net$000s
trade receivables:
2015 – Under 30 days 252 – 252 389 – 389
31 – 60 days 603 – 603 603 – 603
61 – 90 days 244 (110) 134 244 (110) 134
Over 90 days 2,063 (1,017) 1,046 2,063 (1,017) 1,046
total trade receivables 3,162 (1,127) 2,035 3,299 (1,127) 2,172
2014 – Under 30 days 766 – 766 815 – 815
31 – 60 days 500 (14) 486 500 (14) 486
61 – 90 days 276 (276) – 276 (276) –
Over 90 days 684 (684) – 684 (684) –
total trade receivables 2,226 (974) 1,252 2,275 (974) 1,301
student fee receivables:
2015 – Under 30 days 3,144 – 3,144 3,144 – 3,144
31 – 60 days 246 (28) 218 246 (28) 218
61 – 90 days 53 (6) 47 53 (6) 47
Over 90 days 630 (558) 72 630 (558) 72
total student fee receivables 4,073 (592) 3,481 4,073 (592) 3,481
2014 – Under 30 days 3,411 – 3,411 3,411 – 3,411
31 – 60 days 213 (27) 186 213 (27) 186
61 – 90 days 60 (8) 52 60 (8) 52
Over 90 days 751 (609) 142 751 (609) 142
total student fee receivables 4,435 (644) 3,791 4,435 (644) 3,791
Due to the large number of student fee receivables, the impairment assessment is performed on a collective basis, based on an analysis of past collection history and debt write-offs.
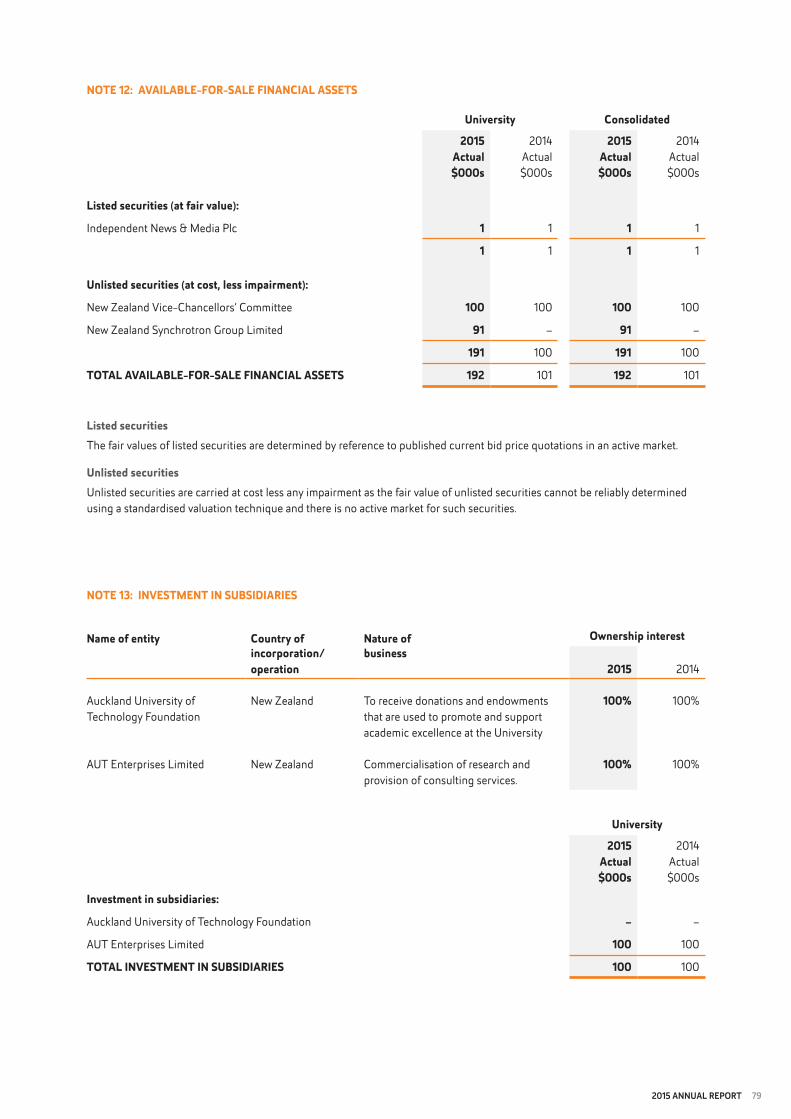
2015 annual report 79
note 13: InVestMent In sUbsIdIARIes
Listed securitiesThe fair values of listed securities are determined by reference to published current bid price quotations in an active market.
Unlisted securitiesUnlisted securities are carried at cost less any impairment as the fair value of unlisted securities cannot be reliably determined using a standardised valuation technique and there is no active market for such securities.
note 12: AVAILAbLe-FoR-sALe FInAncIAL Assets
University consolidated
2015 Actual$000s
2014 Actual$000s
2015 Actual$000s
2014 Actual$000s
Listed securities (at fair value):
Independent News & Media Plc 1 1 1 1
1 1 1 1
Unlisted securities (at cost, less impairment):
New Zealand Vice-Chancellors’ Committee 100 100 100 100
New Zealand Synchrotron Group Limited 91 – 91 –
191 100 191 100
totAL AVAILAbLe-FoR-sALe FInAncIAL Assets 192 101 192 101
name of entity country of nature of ownership interestincorporation/ operation
business2015 2014
Auckland University of Technology Foundation
New Zealand To receive donations and endowments that are used to promote and support academic excellence at the University
100% 100%
AUT Enterprises Limited New Zealand Commercialisation of research and provision of consulting services.
100% 100%
University
2015 Actual$000s
2014 Actual$000s
Investment in subsidiaries:
Auckland University of Technology Foundation – –
AUT Enterprises Limited 100 100
totAL InVestMent In sUbsIdIARIes 100 100
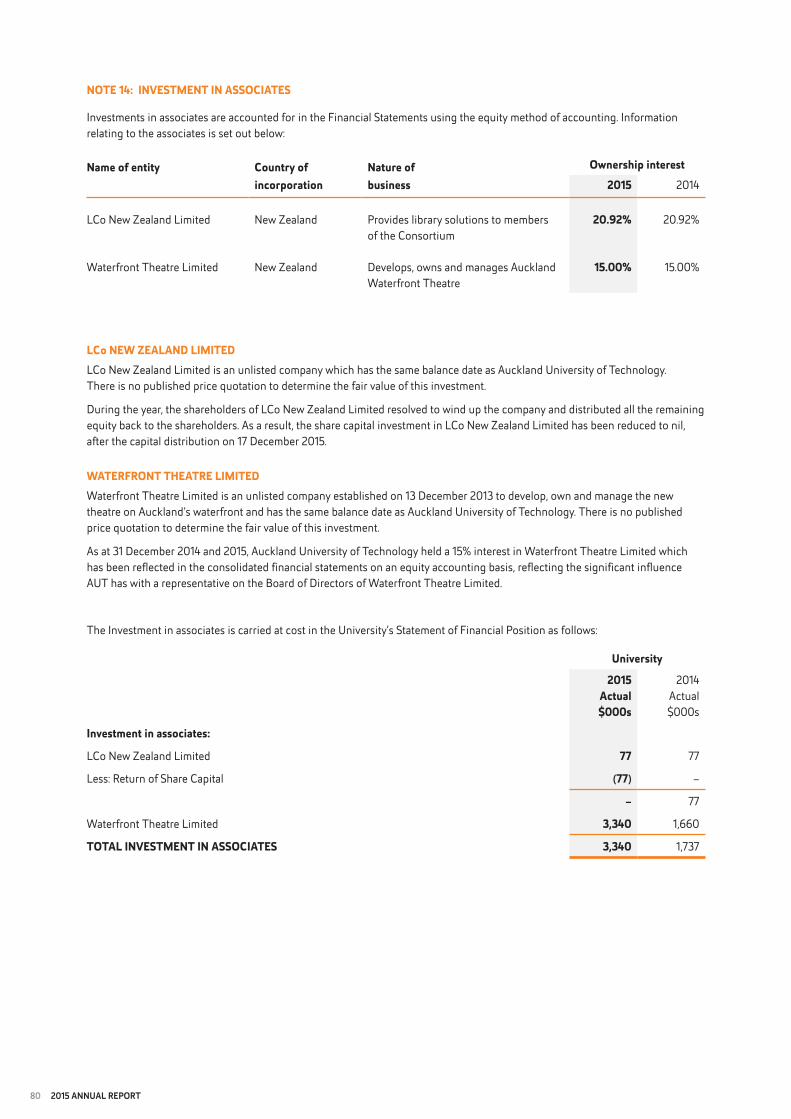
80 2015 annual report
note 14: InVestMent In AssocIAtes
Investments in associates are accounted for in the Financial Statements using the equity method of accounting. Information relating to the associates is set out below:
Lco new ZeALAnd LIMItedLCo New Zealand Limited is an unlisted company which has the same balance date as Auckland University of Technology. There is no published price quotation to determine the fair value of this investment.
During the year, the shareholders of LCo New Zealand Limited resolved to wind up the company and distributed all the remaining equity back to the shareholders. As a result, the share capital investment in LCo New Zealand Limited has been reduced to nil, after the capital distribution on 17 December 2015.
wAteRFRont tHeAtRe LIMItedWaterfront Theatre Limited is an unlisted company established on 13 December 2013 to develop, own and manage the new theatre on Auckland’s waterfront and has the same balance date as Auckland University of Technology. There is no published price quotation to determine the fair value of this investment.
As at 31 December 2014 and 2015, Auckland University of Technology held a 15% interest in Waterfront Theatre Limited which has been reflected in the consolidated financial statements on an equity accounting basis, reflecting the significant influence AUT has with a representative on the Board of Directors of Waterfront Theatre Limited.
The Investment in associates is carried at cost in the University’s Statement of Financial Position as follows:
name of entity country of nature of ownership interestincorporation business 2015 2014
LCo New Zealand Limited New Zealand Provides library solutions to members of the Consortium
20.92% 20.92%
Waterfront Theatre Limited New Zealand Develops, owns and manages Auckland Waterfront Theatre
15.00% 15.00%
University
2015 Actual$000s
2014 Actual$000s
Investment in associates:
LCo New Zealand Limited 77 77
Less: Return of Share Capital (77) –
– 77
Waterfront Theatre Limited 3,340 1,660
totAL InVestMent In AssocIAtes 3,340 1,737
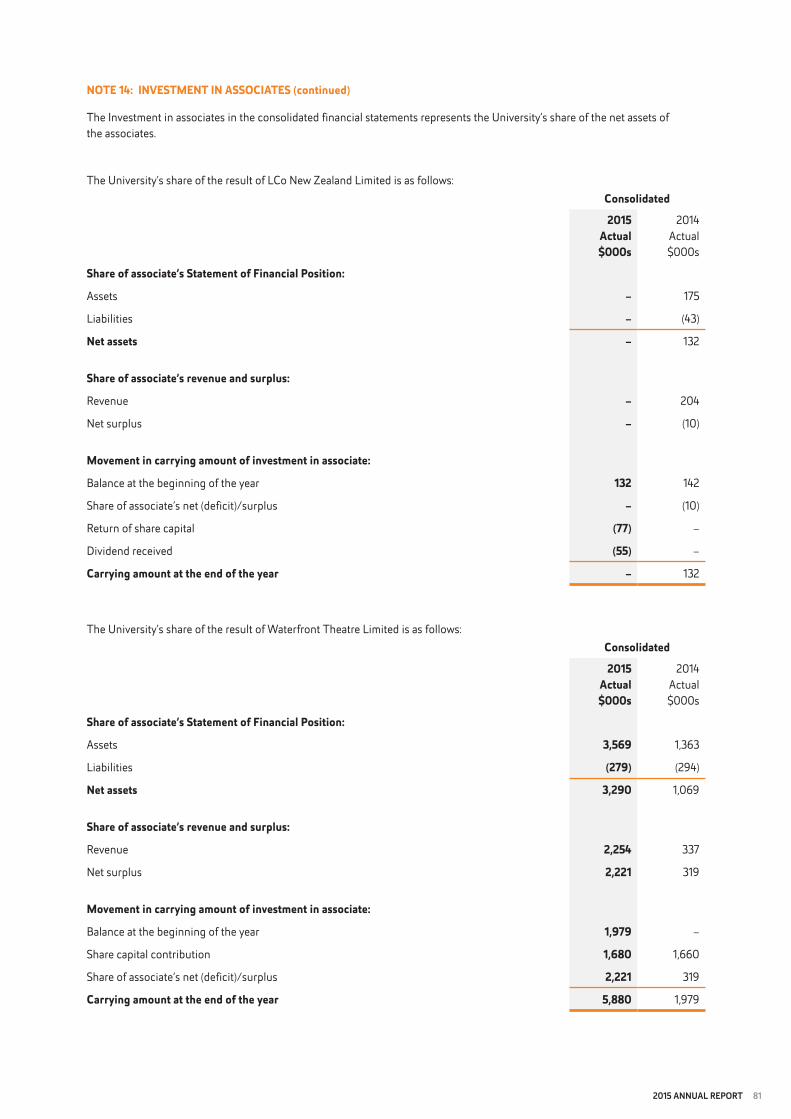
2015 annual report 81
consolidated
2015 Actual$000s
2014 Actual$000s
share of associate’s statement of Financial Position:
Assets – 175
Liabilities – (43)
net assets – 132
share of associate’s revenue and surplus:
Revenue – 204
Net surplus – (10)
Movement in carrying amount of investment in associate:
Balance at the beginning of the year 132 142
Share of associate’s net (deficit)/surplus – (10)
Return of share capital (77) –
Dividend received (55) –
carrying amount at the end of the year – 132
note 14: InVestMent In AssocIAtes (continued)
The Investment in associates in the consolidated financial statements represents the University’s share of the net assets of the associates.
The University’s share of the result of LCo New Zealand Limited is as follows:
consolidated
2015 Actual$000s
2014 Actual$000s
share of associate’s statement of Financial Position:
Assets 3,569 1,363
Liabilities (279) (294)
net assets 3,290 1,069
share of associate’s revenue and surplus:
Revenue 2,254 337
Net surplus 2,221 319
Movement in carrying amount of investment in associate:
Balance at the beginning of the year 1,979 –
Share capital contribution 1,680 1,660
Share of associate’s net (deficit)/surplus 2,221 319
carrying amount at the end of the year 5,880 1,979
The University’s share of the result of Waterfront Theatre Limited is as follows:
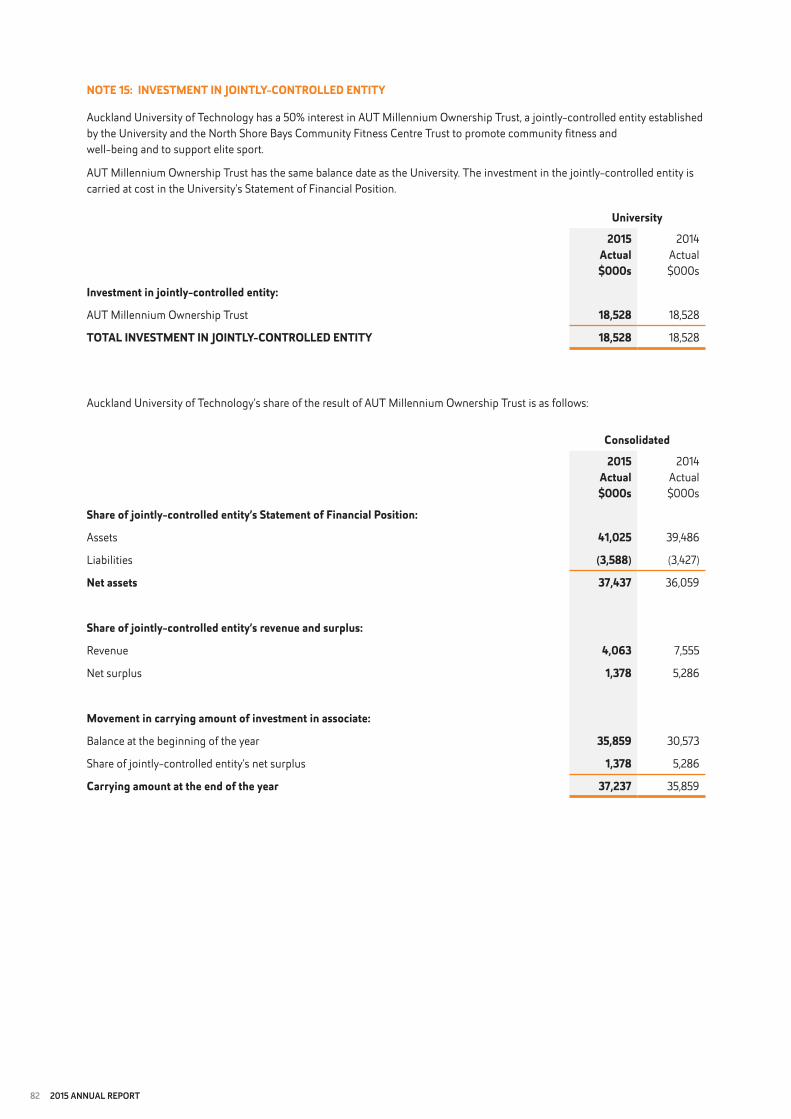
82 2015 annual report
consolidated
2015 Actual$000s
2014 Actual$000s
share of jointly-controlled entity’s statement of Financial Position:
Assets 41,025 39,486
Liabilities (3,588) (3,427)
net assets 37,437 36,059
share of jointly-controlled entity’s revenue and surplus:
Revenue 4,063 7,555
Net surplus 1,378 5,286
Movement in carrying amount of investment in associate:
Balance at the beginning of the year 35,859 30,573
Share of jointly-controlled entity’s net surplus 1,378 5,286
carrying amount at the end of the year 37,237 35,859
note 15: InVestMent In JoIntLY-contRoLLed entItY
Auckland University of Technology has a 50% interest in AUT Millennium Ownership Trust, a jointly-controlled entity established by the University and the North Shore Bays Community Fitness Centre Trust to promote community fitness and well-being and to support elite sport.
AUT Millennium Ownership Trust has the same balance date as the University. The investment in the jointly-controlled entity is carried at cost in the University’s Statement of Financial Position.
Auckland University of Technology’s share of the result of AUT Millennium Ownership Trust is as follows:
University
2015 Actual$000s
2014 Actual$000s
Investment in jointly-controlled entity:
AUT Millennium Ownership Trust 18,528 18,528
totAL InVestMent In JoIntLY-contRoLLed entItY 18,528 18,528

2015 annual report 83
note 16: PRoPeRtY, PLAnt And eqUIPMent
Revaluation of land and buildingsLand is valued at fair value using market-based evidence based on its highest and best use with reference to comparable land values. Adjustments have been made to the “unencumbered” land value for campus land where there is a designation against the land or the use of the land is restricted because of reserve or endowment status. These adjustments are intended to reflect the negative effect on the value of the land where an owner is unable to use the land more intensively.
A desktop revaluation of Crown-owned and AUT-owned land was performed by Seagar & Partners (Auckland) Limited, an independent Registered Valuer, at 31 December 2015 to a fair value of $188,116,000. Details of the land revaluation movements are as follows:
All buildings, whether Crown-owned or AUT-owned, were last revalued by Seagar & Partners (Auckland) Limited, an independent Registered Valuer, at 31 December 2013 to a fair value of $379,384,000 using the depreciated replacement cost because no reliable market data was available for buildings designed for education delivery purposes.
A desktop revaluation of buildings was completed as at 31 December 2015 by Seagar & Partners (Auckland) Limited, an independent Registered Valuer. The percentage change between the valuer’s desktop revaluation and the carrying net book value is not significantly different, and therefore no change has been made to the asset revaluation reserve.
non-cash transactionsDuring the year the University acquired $4.6 million of computers and electronic equipment under finance leases (2014: $7.2 million).
disposalsIncluded in the current financial year’s disposals are $16.4 million of property, plant and equipment and $2.8 million of intangible assets that had been retired from active use and fully depreciated. Accordingly, their cost and related accumulated depreciation or amortisation was completely removed from the Statement of Financial Position during the financial year.
Net book value (before
revaluation)$000s
Revaluationincrement/
(decrement)$000s
Accumulated depreciation
eliminated$000s
Net revaluation movements
$000s
Net book value (after
revaluation)$000s
University/consolidated
AUT-owned land 92,092 9,485 – 9,485 101,577
Crown-owned land 72,047 14,492 – 14,492 86,539
totAL 164,139 23,977 – 23,977 188,116
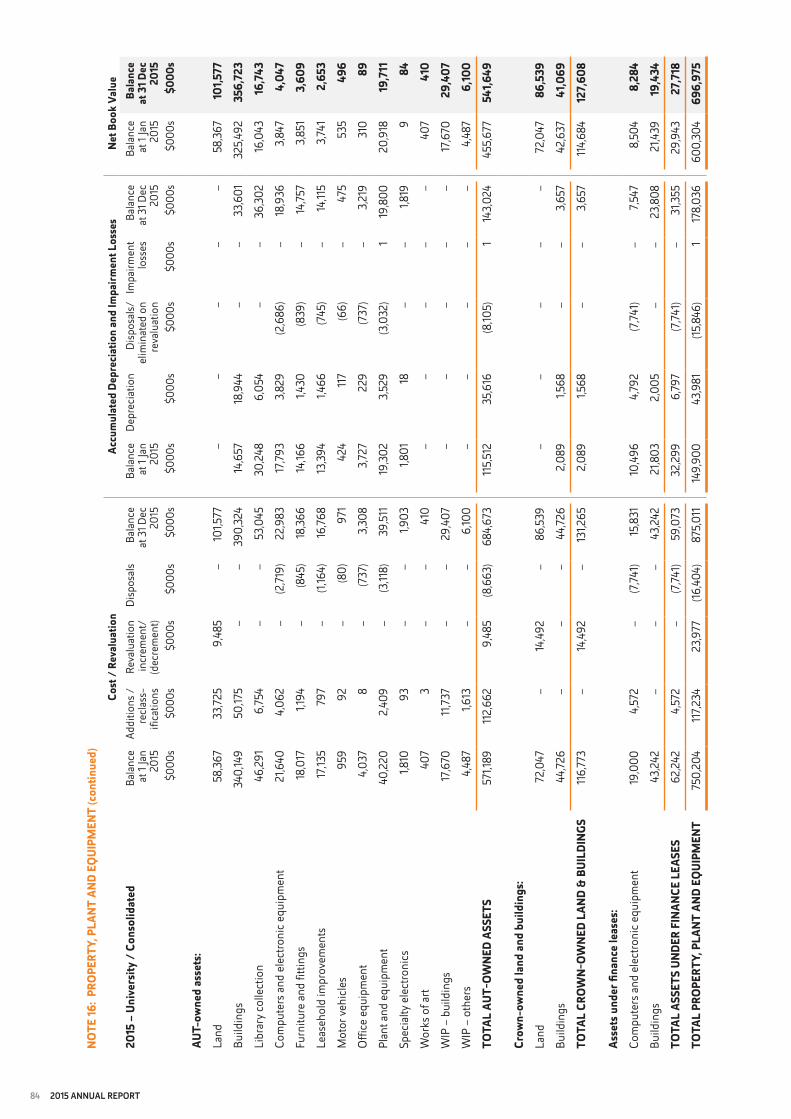
84 2015 annual report
cost
/ R
eval
uatio
nAc
cum
ulat
ed d
epre
ciat
ion
and
Impa
irmen
t Los
ses
net b
ook
Valu
e20
15 –
Uni
vers
ity /
con
solid
ated
Bala
nce
at 1
Jan
2015
Addi
tions
/re
clas
s-ifi
catio
ns
Reva
luat
ion
incr
emen
t/(d
ecre
men
t)
Dis
posa
lsBa
lanc
e at
31 D
ec
2015
Bala
nce
at 1
Jan
2015
Dep
reci
atio
nD
ispo
sals/
elim
inat
ed o
n re
valu
atio
n
Impa
irmen
tlo
sses
Bala
nce
at 3
1 Dec
20
15
Bala
nce
at 1
Jan
2015
bala
nce
at 3
1 dec
20
15$0
00s
$000
s$0
00s
$000
s$0
00s
$000
s$0
00s
$000
s$0
00s
$000
s$0
00s
$000
s
AUt-
owne
d as
sets
:La
nd
58,3
6733
,725
9,48
5–
101,5
77–
––
––
58,3
6710
1,577
Build
ings
340,
149
50,17
5–
–39
0,32
414
,657
18,9
44–
–33
,601
325,
492
356,
723
Libr
ary
colle
ctio
n46
,291
6,75
4–
–53
,045
30,2
486,
054
––
36,3
0216
,043
16,7
43Co
mpu
ters
and
ele
ctro
nic
equi
pmen
t21
,640
4,06
2–
(2,71
9)22
,983
17,79
33,
829
(2,6
86)
–18
,936
3,84
74,
047
Furn
iture
and
fitti
ngs
18,0
171,1
94–
(845
)18
,366
14,16
61,4
30(8
39)
–14
,757
3,85
13,
609
Leas
ehol
d im
prov
emen
ts17
,135
797
–(1,
164)
16,76
813
,394
1,466
(745
)–
14,11
53,
741
2,65
3M
otor
veh
icle
s95
992
–(8
0)97
142
411
7(6
6)–
475
535
496
Offi
ce e
quip
men
t4,
037
8–
(737
)3,
308
3,72
722
9(7
37)
–3,
219
310
89Pl
ant a
nd e
quip
men
t40
,220
2,40
9–
(3,11
8)39
,511
19,3
023,
529
(3,0
32)
119
,800
20,9
1819
,711
Spec
ialty
ele
ctro
nics
1,810
93–
–1,9
031,8
0118
––
1,81
99
84W
orks
of a
rt40
73
––
410
––
––
–40
741
0W
IP –
bui
ldin
gs
17,6
7011
,737
––
29,4
07–
––
––
17,6
7029
,407
WIP
– o
ther
s4,
487
1,613
––
6,10
0–
––
––
4,48
76,
100
totA
L AU
t-ow
ned
Asse
ts57
1,189
112,
662
9,48
5(8
,663
)68
4,67
311
5,51
235
,616
(8,10
5)1
143,
024
455,
677
541,6
49
crow
n-ow
ned
land
and
build
ings
:La
nd72
,047
–14
,492
–86
,539
––
––
–72
,047
86,5
39Bu
ildin
gs44
,726
––
–44
,726
2,08
91,5
68–
–3,
657
42,6
3741
,069
totA
L cR
own-
owne
d LA
nd &
bUI
LdIn
gs11
6,77
3–
14,4
92–
131,2
652,
089
1,568
––
3,65
711
4,68
412
7,60
8
A sse
ts u
nder
fina
nce
leas
es:
Com
pute
rs a
nd e
lect
roni
c eq
uipm
ent
19,0
004,
572
–(7
,741)
15,8
3110
,496
4,79
2(7
,741)
–7,5
478,
504
8,28
4Bu
ildin
gs43
,242
––
–43
,242
21,8
032,
005
––
23,8
0821
,439
19,4
34to
tAL
Asse
ts U
ndeR
FIn
Ance
LeA
ses
62,2
424,
572
–(7
,741)
59,0
7332
,299
6,79
7(7
,741)
–31
,355
29,9
4327
,718
totA
L PR
oPeR
tY, P
LAnt
And
eqU
IPM
ent
750,
204
117,2
3423
,977
(16,4
04)
875,
011
149,
900
43,9
81(15
,846
)1
178,
036
600,
304
696,
975
note
16: P
RoPe
RtY,
PLA
nt A
nd e
qUIP
Men
t (c
ontin
ued)
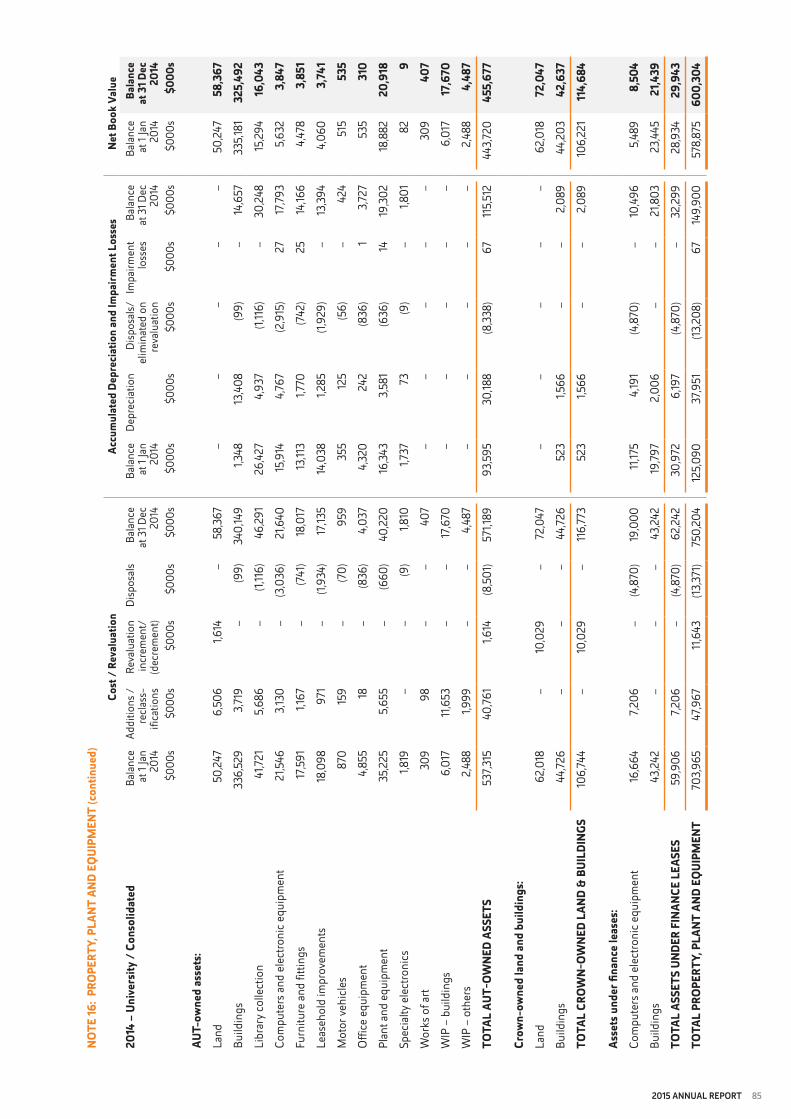
2015 annual report 85
note
16: P
RoPe
RtY,
PLA
nt A
nd e
qUIP
Men
t (c
ontin
ued)
cost
/ R
eval
uatio
nAc
cum
ulat
ed d
epre
ciat
ion
and
Impa
irmen
t Los
ses
net b
ook
Valu
e20
14 –
Uni
vers
ity /
con
solid
ated
Bala
nce
at 1
Jan
2014
Addi
tions
/re
clas
s-ifi
catio
ns
Reva
luat
ion
incr
emen
t/(d
ecre
men
t)
Dis
posa
lsBa
lanc
e at
31 D
ec
2014
Bala
nce
at 1
Jan
2014
Dep
reci
atio
nD
ispo
sals/
elim
inat
ed o
n re
valu
atio
n
Impa
irmen
tlo
sses
Bala
nce
at 3
1 Dec
20
14
Bala
nce
at 1
Jan
2014
bala
nce
at 3
1 dec
20
14$0
00s
$000
s$0
00s
$000
s$0
00s
$000
s$0
00s
$000
s$0
00s
$000
s$0
00s
$000
s
AUt-
owne
d as
sets
:La
nd
50,2
476,
506
1,614
–58
,367
––
––
–50
,247
58,3
67Bu
ildin
gs33
6,52
93,
719
–(9
9)34
0,14
91,3
4813
,408
(99)
–14
,657
335,
181
325,
492
Libr
ary
colle
ctio
n41
,721
5,68
6–
(1,11
6)46
,291
26,4
274,
937
(1,11
6)–
30,2
4815
,294
16,0
43Co
mpu
ters
and
ele
ctro
nic
equi
pmen
t21
,546
3,13
0–
(3,0
36)
21,6
4015
,914
4,76
7(2
,915
)27
17,79
35,
632
3,84
7Fu
rnitu
re a
nd fi
tting
s17
,591
1,167
–(7
41)
18,0
1713
,113
1,770
(742
)25
14,16
64,
478
3,85
1Le
aseh
old
impr
ovem
ents
18,0
9897
1–
(1,93
4)17
,135
14,0
381,2
85(1,
929)
–13
,394
4,06
03,
741
Mot
or v
ehic
les
870
159
–(7
0)95
935
512
5(5
6)–
424
515
535
Offi
ce e
quip
men
t4,
855
18–
(836
)4,
037
4,32
024
2(8
36)
13,
727
535
310
Plan
t and
equ
ipm
ent
35,2
255,
655
–(6
60)
40,2
2016
,343
3,58
1(6
36)
1419
,302
18,8
8220
,918
Spec
ialty
ele
ctro
nics
1,819
––
(9)
1,810
1,737
73(9
)–
1,801
829
Wor
ks o
f art
309
98–
–40
7–
––
––
309
407
WIP
– b
uild
ings
6,
017
11,6
53–
–17
,670
––
––
–6,
017
17,6
70W
IP –
oth
ers
2,48
81,9
99–
–4,
487
––
––
–2,
488
4,48
7to
tAL
AUt-
owne
d As
sets
537,3
1540
,761
1,614
(8,5
01)
571,1
8993
,595
30,18
8(8
,338
)67
115,
512
443,
720
455,
677
crow
n-ow
ned
land
and
build
ings
:La
nd62
,018
–10
,029
–72
,047
––
––
–62
,018
72,0
47Bu
ildin
gs44
,726
––
–44
,726
523
1,566
––
2,08
944
,203
42,6
37to
tAL
cRow
n-ow
ned
LAnd
& b
UILd
Ings
106,
744
–10
,029
–11
6,77
352
31,5
66–
–2,
089
106,
221
114,
684
Asse
ts u
nder
fina
nce
leas
es:
Com
pute
rs a
nd e
lect
roni
c eq
uipm
ent
16,6
647,2
06–
(4,8
70)
19,0
0011
,175
4,19
1(4
,870
)–
10,4
965,
489
8,50
4Bu
ildin
gs43
,242
––
–43
,242
19,79
72,
006
––
21,8
0323
,445
21,4
39to
tAL
Asse
ts U
ndeR
FIn
Ance
LeA
ses
59,9
067,2
06–
(4,8
70)
62,2
4230
,972
6,19
7(4
,870
)–
32,2
9928
,934
29,9
43to
tAL
PRoP
eRtY
, PLA
nt A
nd e
qUIP
Men
t70
3,96
547
,967
11,6
43(13
,371
)75
0,20
412
5,09
037
,951
(13,2
08)
6714
9,90
057
8,87
560
0,30
4
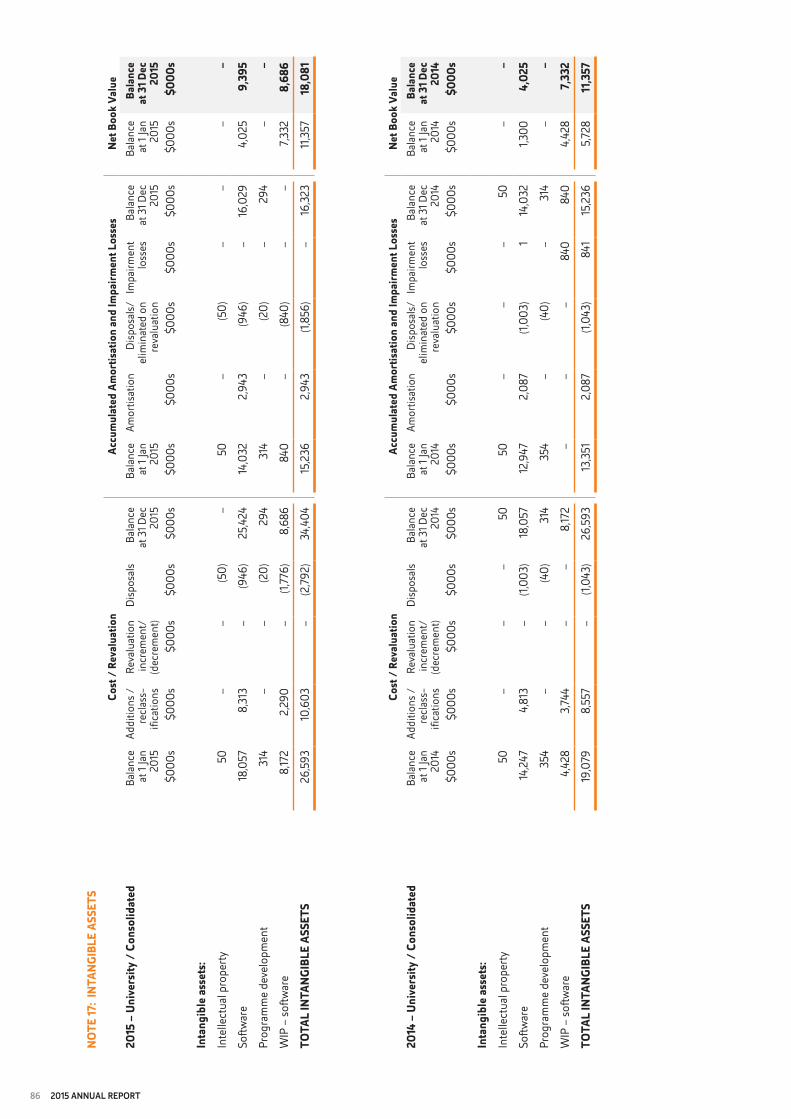
86 2015 annual report
cost
/ R
eval
uatio
nAc
cum
ulat
ed A
mor
tisat
ion
and
Impa
irmen
t Los
ses
net b
ook
Valu
e20
15 –
Uni
vers
ity /
con
solid
ated
Bala
nce
at 1
Jan
2015
Addi
tions
/re
clas
s-ifi
catio
ns
Reva
luat
ion
incr
emen
t/(d
ecre
men
t)
Dis
posa
lsBa
lanc
e at
31 D
ec
2015
Bala
nce
at 1
Jan
2015
Amor
tisat
ion
Dis
posa
ls/el
imin
ated
on
reva
luat
ion
Impa
irmen
tlo
sses
Bala
nce
at 3
1 Dec
20
15
Bala
nce
at 1
Jan
2015
bala
nce
at 3
1 dec
20
15$0
00s
$000
s$0
00s
$000
s$0
00s
$000
s$0
00s
$000
s$0
00s
$000
s$0
00s
$000
s
Inta
ngib
le as
sets
:In
telle
ctua
l pro
perty
50–
–(5
0)–
50–
(50)
––
––
Softw
are
18,0
578,
313
–(9
46)
25,4
2414
,032
2,94
3(9
46)
–16
,029
4,02
59,
395
Prog
ram
me
deve
lopm
ent
314
––
(20)
294
314
–(2
0)–
294
––
WIP
– so
ftwar
e 8,
172
2,29
0–
(1,77
6)8,
686
840
–(8
40)
––
7,332
8,68
6to
tAL
IntA
ngIb
Le A
sset
s26
,593
10,6
03–
(2,79
2)34
,404
15,2
362,
943
(1,85
6)–
16,3
2311
,357
18,0
81
note
17: I
ntA n
gIbL
e As
sets
cost
/ R
eval
uatio
nAc
cum
ulat
ed A
mor
tisat
ion
and
Impa
irmen
t Los
ses
net b
ook
Valu
e20
14 –
Uni
vers
ity /
con
solid
ated
Bala
nce
at 1
Jan
2014
Addi
tions
/re
clas
s-ifi
catio
ns
Reva
luat
ion
incr
emen
t/(d
ecre
men
t)
Dis
posa
lsBa
lanc
e at
31 D
ec
2014
Bala
nce
at 1
Jan
2014
Amor
tisat
ion
Dis
posa
ls/el
imin
ated
on
reva
luat
ion
Impa
irmen
tlo
sses
Bala
nce
at 3
1 Dec
20
14
Bala
nce
at 1
Jan
2014
bala
nce
at 3
1 dec
20
14$0
00s
$000
s$0
00s
$000
s$0
00s
$000
s$0
00s
$000
s$0
00s
$000
s$0
00s
$000
s
Inta
ngib
le as
sets
:In
telle
ctua
l pro
perty
50–
––
5050
––
–50
––
Softw
are
14,2
474,
813
–(1,
003)
18,0
5712
,947
2,08
7(1,
003)
114
,032
1,300
4,02
5Pr
ogra
mm
e de
velo
pmen
t35
4–
–(4
0)31
435
4–
(40)
–31
4–
–W
IP –
softw
are
4,42
83,
744
––
8,17
2–
––
840
840
4,42
87,
332
totA
L In
t Ang
IbLe
Ass
ets
19,0
798,
557
–(1,
043)
26,5
9313
,351
2,08
7(1,
043)
841
15,2
365,
728
11,3
57
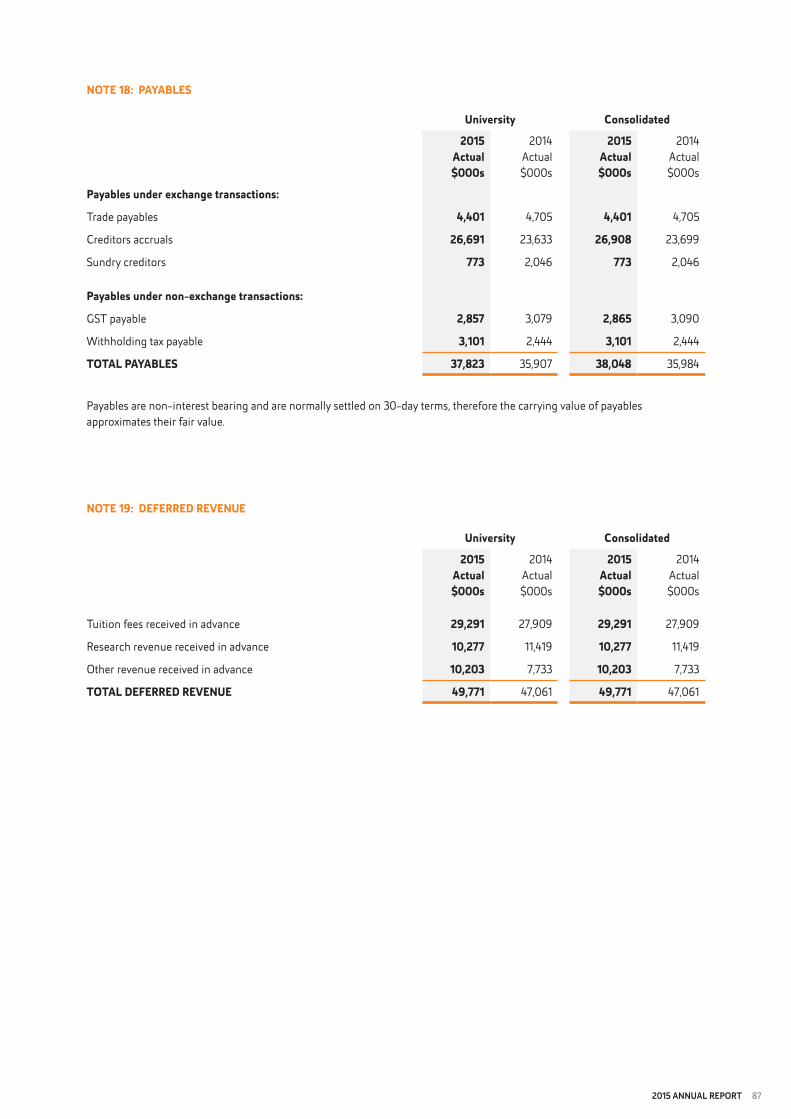
2015 annual report 87
University consolidated
2015 Actual$000s
2014 Actual$000s
2015 Actual$000s
2014 Actual$000s
Payables under exchange transactions:
Trade payables 4,401 4,705 4,401 4,705
Creditors accruals 26,691 23,633 26,908 23,699
Sundry creditors 773 2,046 773 2,046
Payables under non-exchange transactions:
GST payable 2,857 3,079 2,865 3,090
Withholding tax payable 3,101 2,444 3,101 2,444
totAL PAYAbLes 37,823 35,907 38,048 35,984
Payables are non-interest bearing and are normally settled on 30-day terms, therefore the carrying value of payables approximates their fair value.
University consolidated
2015 Actual$000s
2014 Actual$000s
2015 Actual$000s
2014 Actual$000s
Tuition fees received in advance 29,291 27,909 29,291 27,909
Research revenue received in advance 10,277 11,419 10,277 11,419
Other revenue received in advance 10,203 7,733 10,203 7,733
totAL deFeRRed ReVenUe 49,771 47,061 49,771 47,061
note 18: PAYAbLes
note 19: deFeRRed ReVenUe
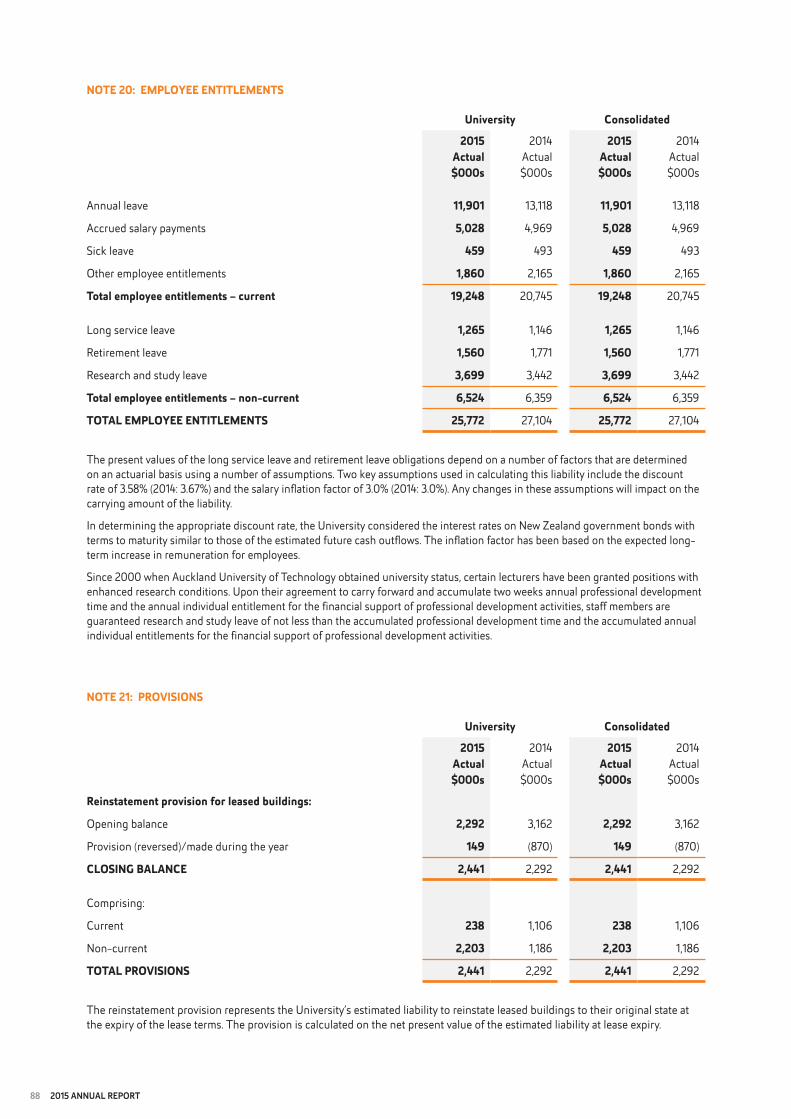
88 2015 annual report
University consolidated
2015 Actual$000s
2014 Actual$000s
2015 Actual$000s
2014 Actual$000s
Annual leave 11,901 13,118 11,901 13,118
Accrued salary payments 5,028 4,969 5,028 4,969
Sick leave 459 493 459 493
Other employee entitlements 1,860 2,165 1,860 2,165
total employee entitlements – current 19,248 20,745 19,248 20,745
Long service leave 1,265 1,146 1,265 1,146
Retirement leave 1,560 1,771 1,560 1,771
Research and study leave 3,699 3,442 3,699 3,442
total employee entitlements – non-current 6,524 6,359 6,524 6,359
totAL eMPLoYee entItLeMents 25,772 27,104 25,772 27,104
University consolidated
2015 Actual$000s
2014 Actual$000s
2015 Actual$000s
2014 Actual$000s
Reinstatement provision for leased buildings:
Opening balance 2,292 3,162 2,292 3,162
Provision (reversed)/made during the year 149 (870) 149 (870)
cLosIng bALAnce 2,441 2,292 2,441 2,292
Comprising:
Current 238 1,106 238 1,106
Non-current 2,203 1,186 2,203 1,186
totAL PRoVIsIons 2,441 2,292 2,441 2,292
note 20: eMPLoYee entItLeMents
note 21: PRoVIsIons
The reinstatement provision represents the University’s estimated liability to reinstate leased buildings to their original state at the expiry of the lease terms. The provision is calculated on the net present value of the estimated liability at lease expiry.
The present values of the long service leave and retirement leave obligations depend on a number of factors that are determined on an actuarial basis using a number of assumptions. Two key assumptions used in calculating this liability include the discount rate of 3.58% (2014: 3.67%) and the salary inflation factor of 3.0% (2014: 3.0%). Any changes in these assumptions will impact on the carrying amount of the liability.
In determining the appropriate discount rate, the University considered the interest rates on New Zealand government bonds with terms to maturity similar to those of the estimated future cash outflows. The inflation factor has been based on the expected long-term increase in remuneration for employees.
Since 2000 when Auckland University of Technology obtained university status, certain lecturers have been granted positions with enhanced research conditions. Upon their agreement to carry forward and accumulate two weeks annual professional development time and the annual individual entitlement for the financial support of professional development activities, staff members are guaranteed research and study leave of not less than the accumulated professional development time and the accumulated annual individual entitlements for the financial support of professional development activities.
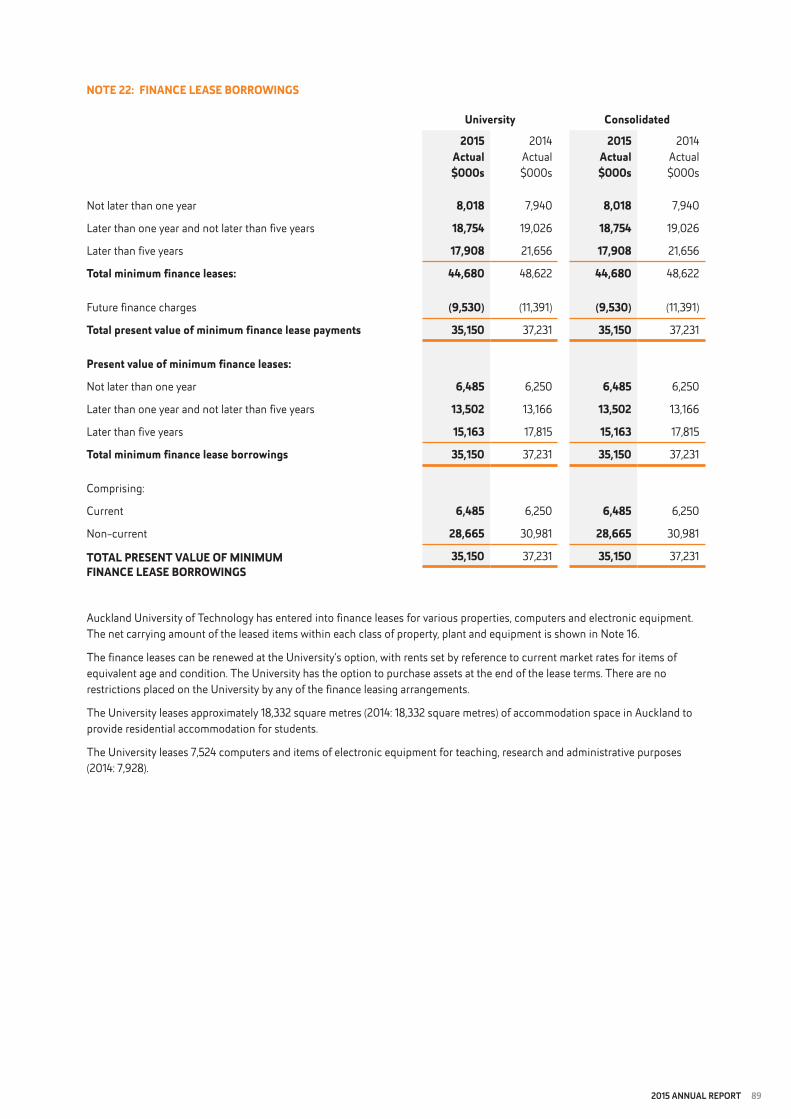
2015 annual report 89
Auckland University of Technology has entered into finance leases for various properties, computers and electronic equipment. The net carrying amount of the leased items within each class of property, plant and equipment is shown in Note 16.
The finance leases can be renewed at the University’s option, with rents set by reference to current market rates for items of equivalent age and condition. The University has the option to purchase assets at the end of the lease terms. There are no restrictions placed on the University by any of the finance leasing arrangements.
The University leases approximately 18,332 square metres (2014: 18,332 square metres) of accommodation space in Auckland to provide residential accommodation for students.
The University leases 7,524 computers and items of electronic equipment for teaching, research and administrative purposes (2014: 7,928).
University consolidated
2015 Actual$000s
2014 Actual$000s
2015 Actual$000s
2014 Actual$000s
Not later than one year 8,018 7,940 8,018 7,940
Later than one year and not later than five years 18,754 19,026 18,754 19,026
Later than five years 17,908 21,656 17,908 21,656
total minimum finance leases: 44,680 48,622 44,680 48,622
Future finance charges (9,530) (11,391) (9,530) (11,391)
total present value of minimum finance lease payments 35,150 37,231 35,150 37,231
Present value of minimum finance leases:
Not later than one year 6,485 6,250 6,485 6,250
Later than one year and not later than five years 13,502 13,166 13,502 13,166
Later than five years 15,163 17,815 15,163 17,815
total minimum finance lease borrowings 35,150 37,231 35,150 37,231
Comprising:
Current 6,485 6,250 6,485 6,250
Non-current 28,665 30,981 28,665 30,981
totAL PResent VALUe oF MInIMUM 35,150 37,231 35,150 37,231FInAnce LeAse boRRowIngs
note 22: FInAnce LeAse boRRowIngs
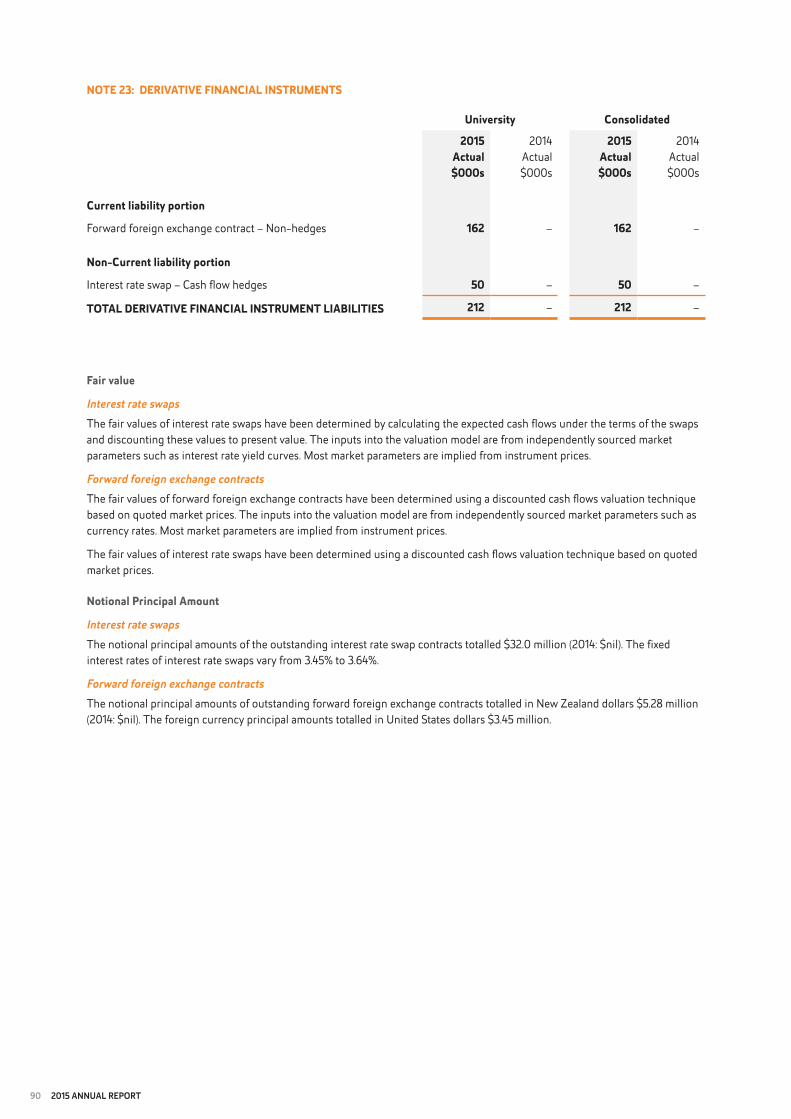
90 2015 annual report
Fair value
Interest rate swapsThe fair values of interest rate swaps have been determined by calculating the expected cash flows under the terms of the swaps and discounting these values to present value. The inputs into the valuation model are from independently sourced market parameters such as interest rate yield curves. Most market parameters are implied from instrument prices.
Forward foreign exchange contractsThe fair values of forward foreign exchange contracts have been determined using a discounted cash flows valuation technique based on quoted market prices. The inputs into the valuation model are from independently sourced market parameters such as currency rates. Most market parameters are implied from instrument prices.
The fair values of interest rate swaps have been determined using a discounted cash flows valuation technique based on quoted market prices.
notional Principal Amount
Interest rate swapsThe notional principal amounts of the outstanding interest rate swap contracts totalled $32.0 million (2014: $nil). The fixed interest rates of interest rate swaps vary from 3.45% to 3.64%.
Forward foreign exchange contractsThe notional principal amounts of outstanding forward foreign exchange contracts totalled in New Zealand dollars $5.28 million (2014: $nil). The foreign currency principal amounts totalled in United States dollars $3.45 million.
University consolidated
2015 Actual$000s
2014 Actual$000s
2015 Actual$000s
2014 Actual$000s
current liability portion
Forward foreign exchange contract – Non-hedges 162 – 162 –
non-current liability portion
Interest rate swap – Cash flow hedges 50 – 50 –
totAL deRIVAtIVe FInAncIAL InstRUMent LIAbILItIes 212 – 212 –
note 23: deRIVAtIVe FInAncIAL InstRUMents
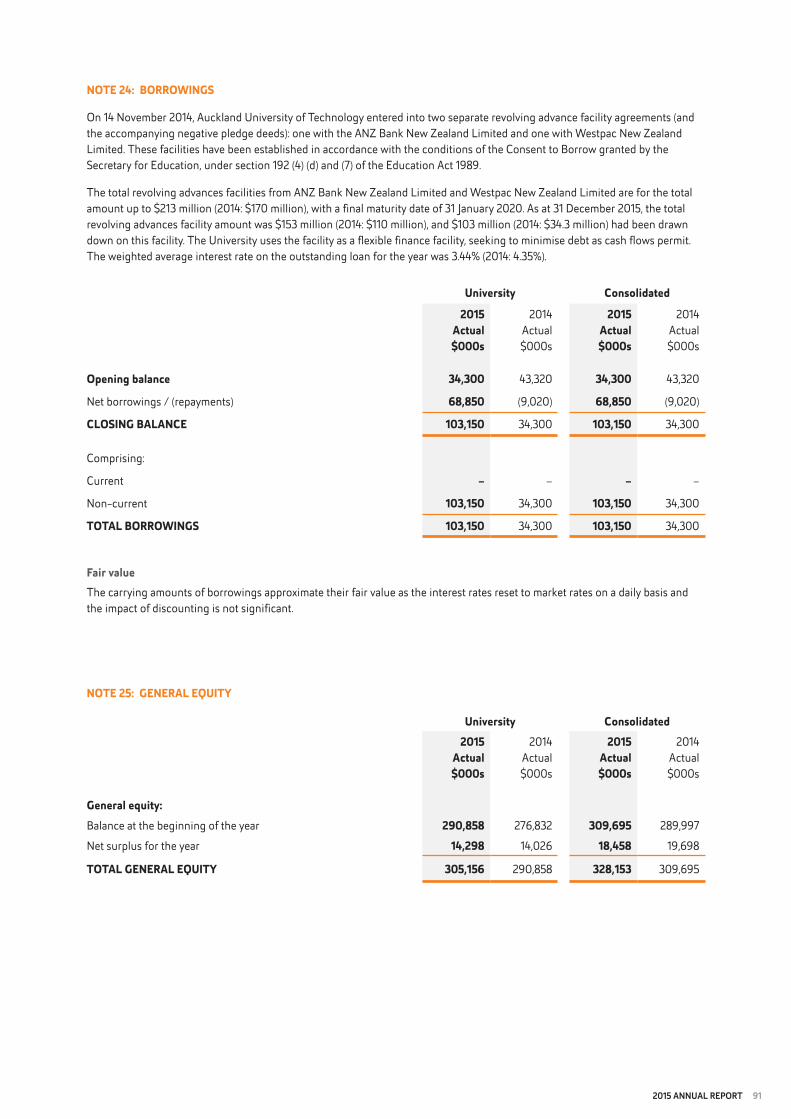
2015 annual report 91
note 24: boRRowIngs
On 14 November 2014, Auckland University of Technology entered into two separate revolving advance facility agreements (and the accompanying negative pledge deeds): one with the ANZ Bank New Zealand Limited and one with Westpac New Zealand Limited. These facilities have been established in accordance with the conditions of the Consent to Borrow granted by the Secretary for Education, under section 192 (4) (d) and (7) of the Education Act 1989.
The total revolving advances facilities from ANZ Bank New Zealand Limited and Westpac New Zealand Limited are for the total amount up to $213 million (2014: $170 million), with a final maturity date of 31 January 2020. As at 31 December 2015, the total revolving advances facility amount was $153 million (2014: $110 million), and $103 million (2014: $34.3 million) had been drawn down on this facility. The University uses the facility as a flexible finance facility, seeking to minimise debt as cash flows permit. The weighted average interest rate on the outstanding loan for the year was 3.44% (2014: 4.35%).
Fair valueThe carrying amounts of borrowings approximate their fair value as the interest rates reset to market rates on a daily basis and the impact of discounting is not significant.
University consolidated
2015 Actual$000s
2014 Actual$000s
2015 Actual$000s
2014 Actual$000s
opening balance 34,300 43,320 34,300 43,320
Net borrowings / (repayments) 68,850 (9,020) 68,850 (9,020)
cLosIng bALAnce 103,150 34,300 103,150 34,300
Comprising:
Current – – – –
Non-current 103,150 34,300 103,150 34,300
totAL boRRowIngs 103,150 34,300 103,150 34,300
University consolidated2015
Actual$000s
2014 Actual$000s
2015 Actual$000s
2014 Actual$000s
general equity:Balance at the beginning of the year 290,858 276,832 309,695 289,997
Net surplus for the year 14,298 14,026 18,458 19,698
totAL geneRAL eqUItY 305,156 290,858 328,153 309,695
note 25: geneRAL eqUItY

92 2015 annual report
Land was revalued as at 31 December 2015 following the desktop revaluation completed by Seagar & Partners (Auckland) Limited, an independent Registered Valuer.
Land at the AUT North Shore Campus appreciated in value by 21% from 2014 to 2015 driven by increases in value of comparable sites recently sold in the area, and the valuer’s professional assessment on the impact which the Proposed Auckland Unitary Plan has on the value of the land at this campus. Land at the AUT City Campus appreciated in value by 19% over the same period recognising the increase in market value driven primarily by sales of comparable sites in the area. Land at the AUT South Campus appreciated in value by 2% from 2014 to 2015.
University consolidated
2015 Actual$000s
2014 Actual$000s
2015 Actual$000s
2014 Actual$000s
Asset revaluation reserve:
Land revaluation reserve
Balance at the beginning of the year 49,163 37,520 49,163 37,520
Net revaluation movement in the year
Crown-owned Land 14,492 10,029 14,492 10,029
AUT-owned Land 9,485 1,614 9,485 1,614
Balance at the end of the year 73,140 49,163 73,140 49,163
Buildings revaluation reserve
Balance at the beginning of the year 122,228 122,228 122,228 122,228
Net revaluation movement in the year – – – –
Balance at the end of the year 122,228 122,228 122,228 122,228
balance at the end of the year 195,368 171,391 195,368 171,391
Available-for-sale financial assets revaluation reserve:
Balance at the beginning of the year (39) (39) (39) (39)
Net fair value gains/(losses) in the year – – – –
balance at the end of the year (39) (39) (39) (39)
cash flow hedge reserve:
Balance at the beginning of the year – (42) – (42)
Net fair value gains/(losses) in the year (50) 42 (50) 42
balance at the end of the year (50) – (50) –
totAL ReVALUAtIon ReseRVes 195,279 171,352 195,279 171,352
note 26: ReVALUAtIon ReseRVes
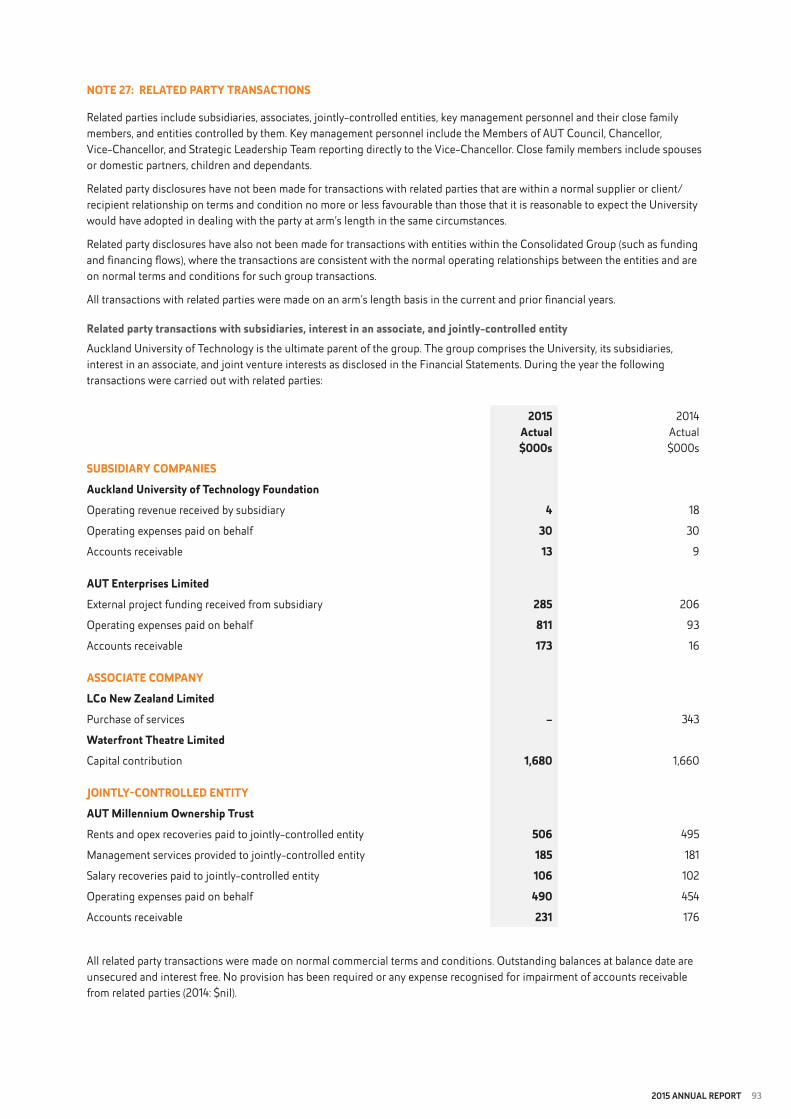
2015 annual report 93
note 27: ReLAted PARtY tRAnsActIons
Related parties include subsidiaries, associates, jointly-controlled entities, key management personnel and their close family members, and entities controlled by them. Key management personnel include the Members of AUT Council, Chancellor, Vice-Chancellor, and Strategic Leadership Team reporting directly to the Vice-Chancellor. Close family members include spouses or domestic partners, children and dependants.
Related party disclosures have not been made for transactions with related parties that are within a normal supplier or client/recipient relationship on terms and condition no more or less favourable than those that it is reasonable to expect the University would have adopted in dealing with the party at arm’s length in the same circumstances.
Related party disclosures have also not been made for transactions with entities within the Consolidated Group (such as funding and financing flows), where the transactions are consistent with the normal operating relationships between the entities and are on normal terms and conditions for such group transactions.
All transactions with related parties were made on an arm’s length basis in the current and prior financial years.
Related party transactions with subsidiaries, interest in an associate, and jointly-controlled entityAuckland University of Technology is the ultimate parent of the group. The group comprises the University, its subsidiaries, interest in an associate, and joint venture interests as disclosed in the Financial Statements. During the year the following transactions were carried out with related parties:
2015 Actual$000s
2014 Actual$000s
sUbsIdIARY coMPAnIesAuckland University of technology FoundationOperating revenue received by subsidiary 4 18
Operating expenses paid on behalf 30 30
Accounts receivable 13 9
AUt enterprises Limited External project funding received from subsidiary 285 206
Operating expenses paid on behalf 811 93
Accounts receivable 173 16
AssocIAte coMPAnYLco new Zealand Limited Purchase of services – 343
waterfront theatre LimitedCapital contribution 1,680 1,660
JoIntLY-contRoLLed entItYAUt Millennium ownership trustRents and opex recoveries paid to jointly-controlled entity 506 495
Management services provided to jointly-controlled entity 185 181
Salary recoveries paid to jointly-controlled entity 106 102
Operating expenses paid on behalf 490 454
Accounts receivable 231 176
All related party transactions were made on normal commercial terms and conditions. Outstanding balances at balance date are unsecured and interest free. No provision has been required or any expense recognised for impairment of accounts receivable from related parties (2014: $nil).
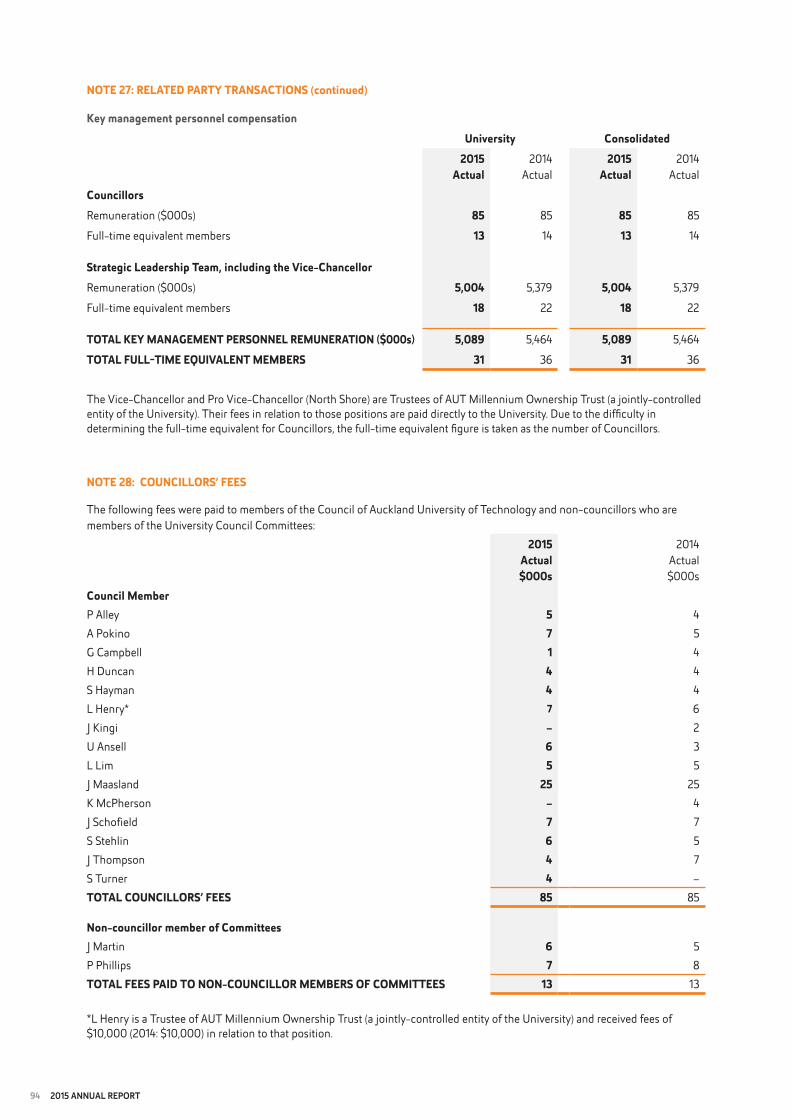
94 2015 annual report
Key management personnel compensationUniversity consolidated
2015 Actual
2014 Actual
2015 Actual
2014 Actual
councillorsRemuneration ($000s) 85 85 85 85
Full-time equivalent members 13 14 13 14
strategic Leadership team, including the Vice-chancellorRemuneration ($000s) 5,004 5,379 5,004 5,379
Full-time equivalent members 18 22 18 22
totAL KeY MAnAgeMent PeRsonneL ReMUneRAtIon ($000s) 5,089 5,464 5,089 5,464
totAL FULL-tIMe eqUIVALent MeMbeRs 31 36 31 36
The Vice-Chancellor and Pro Vice-Chancellor (North Shore) are Trustees of AUT Millennium Ownership Trust (a jointly-controlled entity of the University). Their fees in relation to those positions are paid directly to the University. Due to the difficulty in determining the full-time equivalent for Councillors, the full-time equivalent figure is taken as the number of Councillors.
note 27: ReLAted PARtY tRAnsActIons (continued)
2015 Actual$000s
2014 Actual$000s
council MemberP Alley 5 4A Pokino 7 5G Campbell 1 4H Duncan 4 4S Hayman 4 4L Henry* 7 6J Kingi – 2U Ansell 6 3L Lim 5 5J Maasland 25 25K McPherson – 4J Schofield 7 7S Stehlin 6 5J Thompson 4 7S Turner 4 –totAL coUncILLoRs’ Fees 85 85
non-councillor member of committeesJ Martin 6 5P Phillips 7 8totAL Fees PAId to non-coUncILLoR MeMbeRs oF coMMIttees 13 13
*L Henry is a Trustee of AUT Millennium Ownership Trust (a jointly-controlled entity of the University) and received fees of $10,000 (2014: $10,000) in relation to that position.
note 28: coUncILLoRs’ Fees
The following fees were paid to members of the Council of Auckland University of Technology and non-councillors who are members of the University Council Committees:
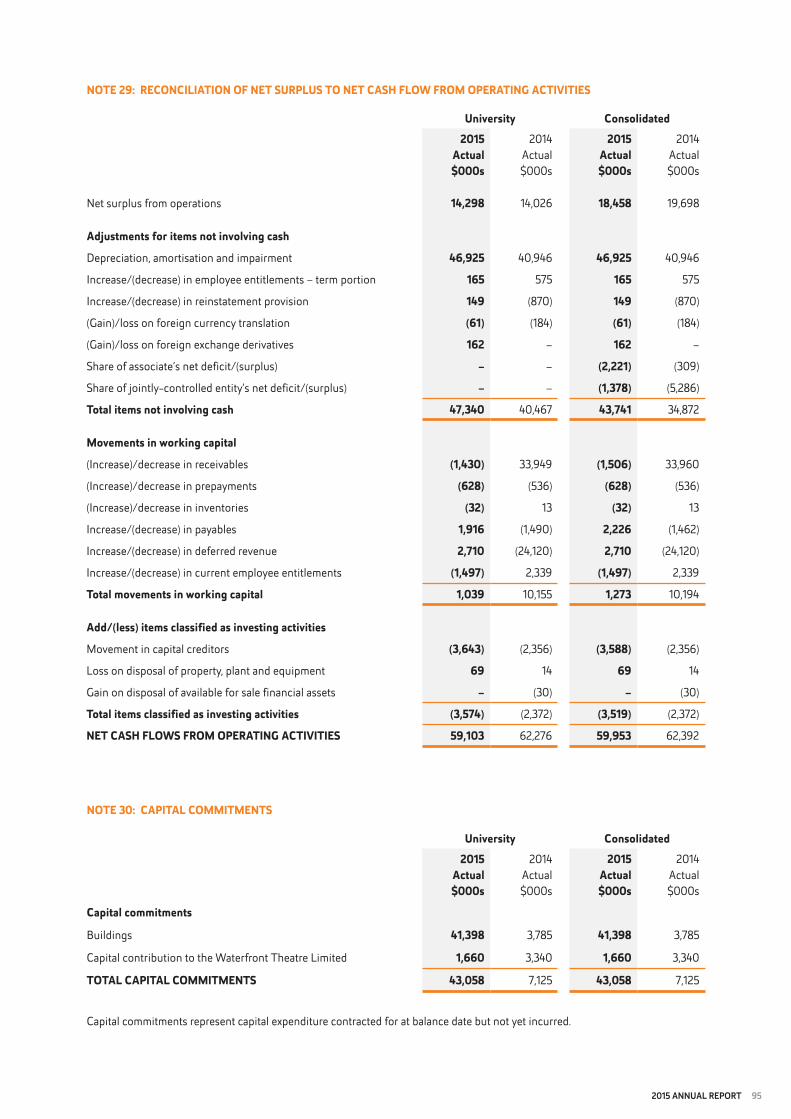
2015 annual report 95
note 29: ReconcILIAtIon oF net sURPLUs to net cAsH FLow FRoM oPeRAtIng ActIVItIes
note 30: cAPItAL coMMItMents
University consolidated2015
Actual$000s
2014 Actual$000s
2015 Actual$000s
2014 Actual$000s
Net surplus from operations 14,298 14,026 18,458 19,698
Adjustments for items not involving cash
Depreciation, amortisation and impairment 46,925 40,946 46,925 40,946
Increase/(decrease) in employee entitlements – term portion 165 575 165 575
Increase/(decrease) in reinstatement provision 149 (870) 149 (870)
(Gain)/loss on foreign currency translation (61) (184) (61) (184)
(Gain)/loss on foreign exchange derivatives 162 – 162 –
Share of associate’s net deficit/(surplus) – – (2,221) (309)
Share of jointly-controlled entity’s net deficit/(surplus) – – (1,378) (5,286)
total items not involving cash 47,340 40,467 43,741 34,872
Movements in working capital
(Increase)/decrease in receivables (1,430) 33,949 (1,506) 33,960
(Increase)/decrease in prepayments (628) (536) (628) (536)
(Increase)/decrease in inventories (32) 13 (32) 13
Increase/(decrease) in payables 1,916 (1,490) 2,226 (1,462)
Increase/(decrease) in deferred revenue 2,710 (24,120) 2,710 (24,120)
Increase/(decrease) in current employee entitlements (1,497) 2,339 (1,497) 2,339
total movements in working capital 1,039 10,155 1,273 10,194
Add/(less) items classified as investing activities
Movement in capital creditors (3,643) (2,356) (3,588) (2,356)
Loss on disposal of property, plant and equipment 69 14 69 14
Gain on disposal of available for sale financial assets – (30) – (30)
total items classified as investing activities (3,574) (2,372) (3,519) (2,372)
net cAsH FLows FRoM oPeRAtIng ActIVItIes 59,103 62,276 59,953 62,392
University consolidated2015
Actual$000s
2014 Actual$000s
2015 Actual$000s
2014 Actual$000s
capital commitments
Buildings 41,398 3,785 41,398 3,785
Capital contribution to the Waterfront Theatre Limited 1,660 3,340 1,660 3,340
totAL cAPItAL coMMItMents 43,058 7,125 43,058 7,125
Capital commitments represent capital expenditure contracted for at balance date but not yet incurred.
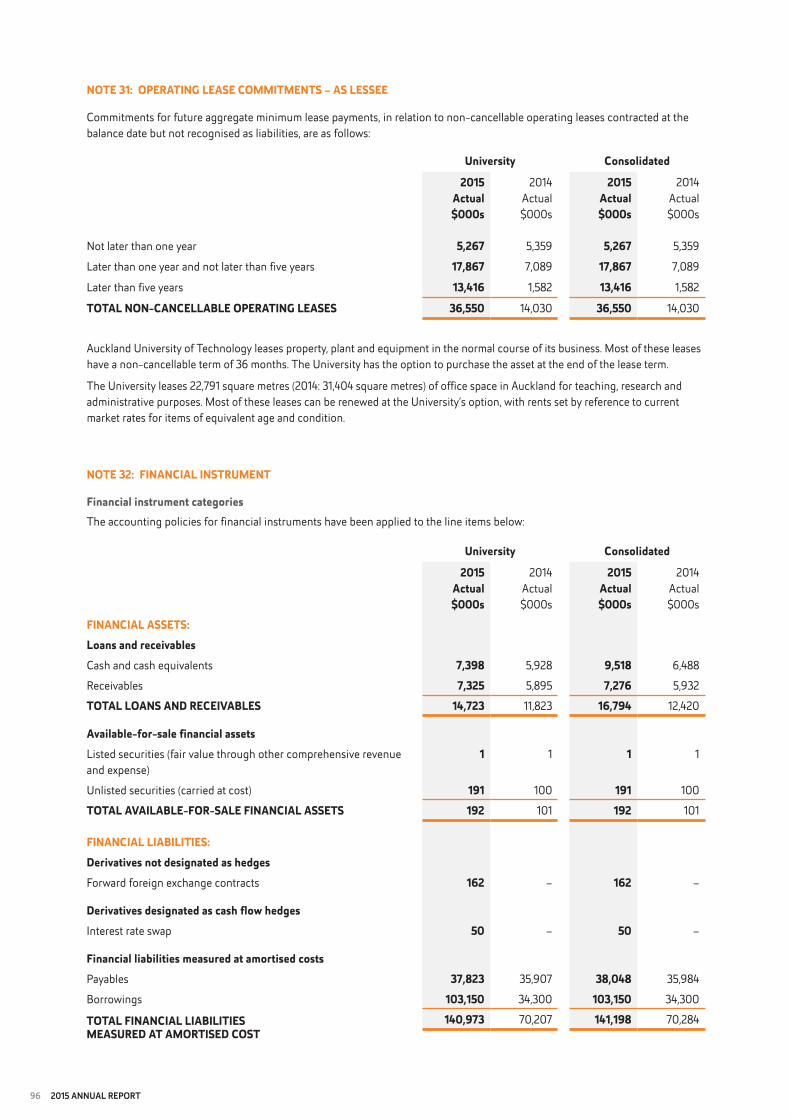
96 2015 annual report
University consolidated
2015 Actual$000s
2014 Actual$000s
2015 Actual$000s
2014 Actual$000s
Not later than one year 5,267 5,359 5,267 5,359
Later than one year and not later than five years 17,867 7,089 17,867 7,089
Later than five years 13,416 1,582 13,416 1,582
totAL non-cAnceLLAbLe oPeRAtIng LeAses 36,550 14,030 36,550 14,030
note 31: oPeRAtIng LeAse coMMItMents – As Lessee
Commitments for future aggregate minimum lease payments, in relation to non-cancellable operating leases contracted at the balance date but not recognised as liabilities, are as follows:
Auckland University of Technology leases property, plant and equipment in the normal course of its business. Most of these leases have a non-cancellable term of 36 months. The University has the option to purchase the asset at the end of the lease term.
The University leases 22,791 square metres (2014: 31,404 square metres) of office space in Auckland for teaching, research and administrative purposes. Most of these leases can be renewed at the University’s option, with rents set by reference to current market rates for items of equivalent age and condition.
note 32: FInAncIAL InstRUMent
Financial instrument categoriesThe accounting policies for financial instruments have been applied to the line items below:
University consolidated
2015 Actual$000s
2014 Actual$000s
2015 Actual$000s
2014 Actual$000s
FInAncIAL Assets:Loans and receivablesCash and cash equivalents 7,398 5,928 9,518 6,488
Receivables 7,325 5,895 7,276 5,932
totAL LoAns And ReceIVAbLes 14,723 11,823 16,794 12,420
Available-for-sale financial assetsListed securities (fair value through other comprehensive revenue and expense)
1 1 1 1
Unlisted securities (carried at cost) 191 100 191 100
totAL AVAILAbLe-FoR-sALe FInAncIAL Assets 192 101 192 101
FInAncIAL LIAbILItIes:derivatives not designated as hedgesForward foreign exchange contracts 162 – 162 –
derivatives designated as cash flow hedgesInterest rate swap 50 – 50 –
Financial liabilities measured at amortised costsPayables 37,823 35,907 38,048 35,984
Borrowings 103,150 34,300 103,150 34,300
totAL FInAncIAL LIAbILItIes 140,973 70,207 141,198 70,284MeAsURed At AMoRtIsed cost

2015 annual report 97
note 32: FInAncIAL InstRUMent (continued)
Fair value hierarchy disclosuresFor those instruments recognised at fair value on the Statement of Financial Position, fair values are determined according to the following hierarchy:
• Quotedmarketprice–financialinstrumentswithquotedpricesforidenticalinstrumentsinactivemarkets.• Valuationtechniqueusingobservableinputs–financialinstrumentswithquotedpricesforsimilarinstrumentsinactive
markets, or quoted prices for identical or similar instruments in inactive markets, and financial instruments valued using models where all significant inputs are observable.
• Valuationtechniqueswithsignificantnon-observableinputs–financialinstrumentsvaluedusingmodelswhereoneor more significant inputs are not observable.
The following table analyses the basis of the valuation of classes of financial instruments measured at fair value on the Statement of Financial Position:
Valuation technique Quoted Significant market Observable non-observable Total price inputs input University 2015 $000s $000s $000s $000s
Financial assets Listed securities 1 1 – –
Financial liabilities Forward foreign exchange contracts – Non-hedges 162 – 162 – Interest rate swap –Cash flow hedges 50 – 50 –
consolidated 2015
Financial assets Listed securities 1 1 – –
Financial liabilities Forward foreign exchange contracts – Non-hedges 162 – 162 – Interest rate swap –Cash flow hedges 50 – 50 –
University 2014
Financial assets Listed securities 1 1 – –
Financial liabilities Forward foreign exchange contracts – Non-hedges – – – – Interest rate swap – Cash flow hedges – – – –
consolidated 2014
Financial assets Listed securities 1 1 – –
Financial liabilities Forward foreign exchange contracts – Non-hedges – – – – Interest rate swap – Cash flow hedges – – – –
98 2015 annual report
note 33: FInAncIAL InstRUMent RIsKs
Auckland University of Technology’s activities expose it to a variety of financial risks including market risk (interest rate risk, currency risk and price risk), credit risk and liquidity risk. The University’s Treasury Management Policy and overall risk management programme focuses on the unpredictability of financial markets and seeks to minimise potential adverse effects on the financial performance of the University. The University uses derivative financial instruments such as interest rate swaps and forward foreign exchange contracts to hedge certain risk exposures.
Financial risk management is carried out under the Treasury Management Policy approved by the Council of the University. The Council provides written principles for overall risk management, as well as policies covering specific areas such as interest rate risk, credit risk, use of derivative financial instruments and non-derivative financial instruments, and investment of excess liquidity.
Treasury Management Policy does not allow any transactions that are speculative in nature to be entered into.
Market risk
Interest rate riskInterest rate risk is the risk that the fair value or future cash flows of the University’s financial instruments will fluctuate due to changes in market interest rates. Auckland University of Technology is exposed to interest rate risk from its interest-earning financial assets and interest-bearing liabilities.
The University is risk averse and seeks to minimise exposure arising from its treasury activities. It does not undertake unnecessary investment or borrowing activity, nor is it speculative in the activity it undertakes.
The University manages its interest rate risk on borrowings by using floating-to-fixed interest rate swaps. Such interest rate swaps have the economic effect of converting borrowings at floating rates and swapping them into fixed rates that are generally lower than those available if the University borrowed at fixed rates directly. Under the interest rate swaps, the University agrees with other parties to exchange, at specified intervals, the difference between fixed contract rates and floating-rate interest amounts calculated by reference to the agreed notional principal amounts.
Currency riskCurrency risk is the risk that the fair value or future cash flows of a financial instrument will fluctuate due to changes in foreign exchange rates. Auckland University of Technology has transactional currency exposure. Such exposure arises from the purchase of goods and services in currencies other than the local currency.
It is the University’s Treasury Management Policy to manage foreign currency risks arising from contractual commitments and liabilities that are above specified amounts by entering into forward foreign exchange contracts, or supplier guaranteed New Zealand Dollar purchase price contracts, to hedge the foreign currency risk exposure.
Price riskAuckland University of Technology is exposed to equity securities price risk. This arises from investments held by the University and classified in the Statement of Financial Position either as available-for-sale financial assets or at fair value through surplus or deficit.
The University does not manage the price risk arising from investments in equity securities. The price risk for the equity securities is immaterial in terms of the possible impact on surplus or deficit or total equity. It has therefore not been included in the sensitivity analysis.
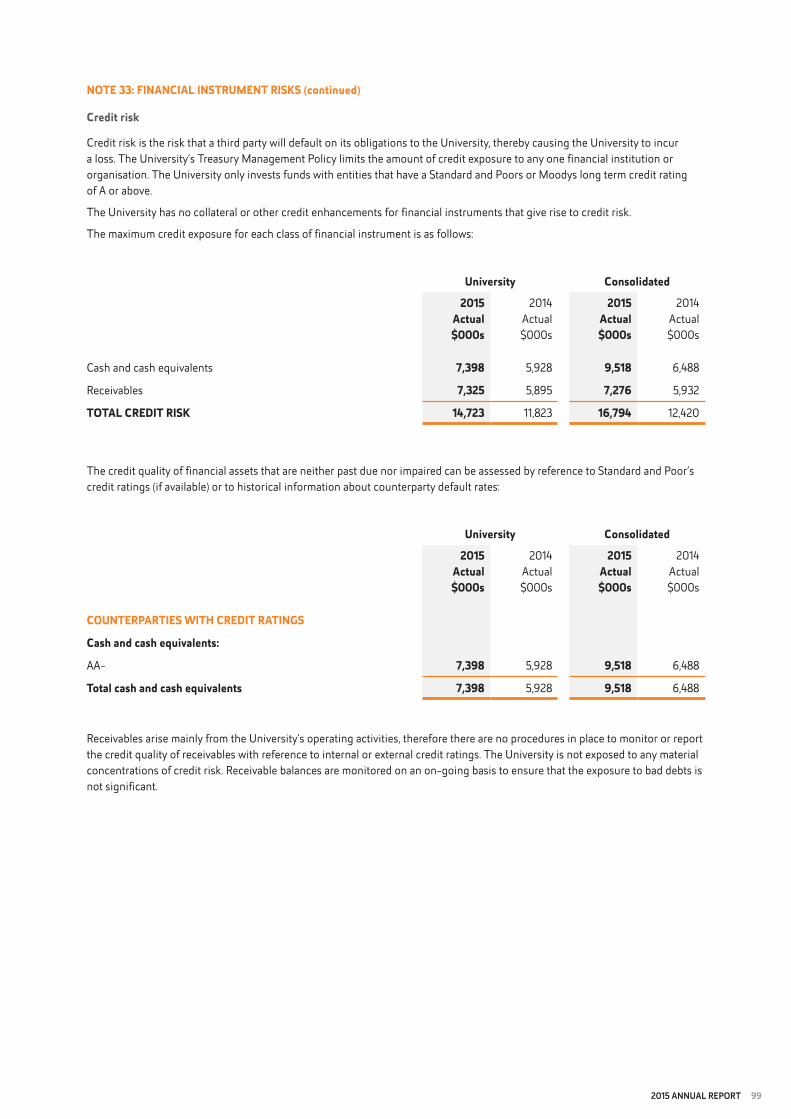
2015 annual report 99
note 33: FInAncIAL InstRUMent RIsKs (continued)
credit risk
Credit risk is the risk that a third party will default on its obligations to the University, thereby causing the University to incur a loss. The University’s Treasury Management Policy limits the amount of credit exposure to any one financial institution or organisation. The University only invests funds with entities that have a Standard and Poors or Moodys long term credit rating of A or above.
The University has no collateral or other credit enhancements for financial instruments that give rise to credit risk.
The maximum credit exposure for each class of financial instrument is as follows:
University consolidated
2015 Actual$000s
2014 Actual$000s
2015 Actual$000s
2014 Actual$000s
Cash and cash equivalents 7,398 5,928 9,518 6,488
Receivables 7,325 5,895 7,276 5,932
totAL cRedIt RIsK 14,723 11,823 16,794 12,420
University consolidated
2015 Actual$000s
2014 Actual$000s
2015 Actual$000s
2014 Actual$000s
coUnteRPARtIes wItH cRedIt RAtIngs
cash and cash equivalents:
AA- 7,398 5,928 9,518 6,488
total cash and cash equivalents 7,398 5,928 9,518 6,488
The credit quality of financial assets that are neither past due nor impaired can be assessed by reference to Standard and Poor’s credit ratings (if available) or to historical information about counterparty default rates:
Receivables arise mainly from the University’s operating activities, therefore there are no procedures in place to monitor or report the credit quality of receivables with reference to internal or external credit ratings. The University is not exposed to any material concentrations of credit risk. Receivable balances are monitored on an on-going basis to ensure that the exposure to bad debts is not significant.
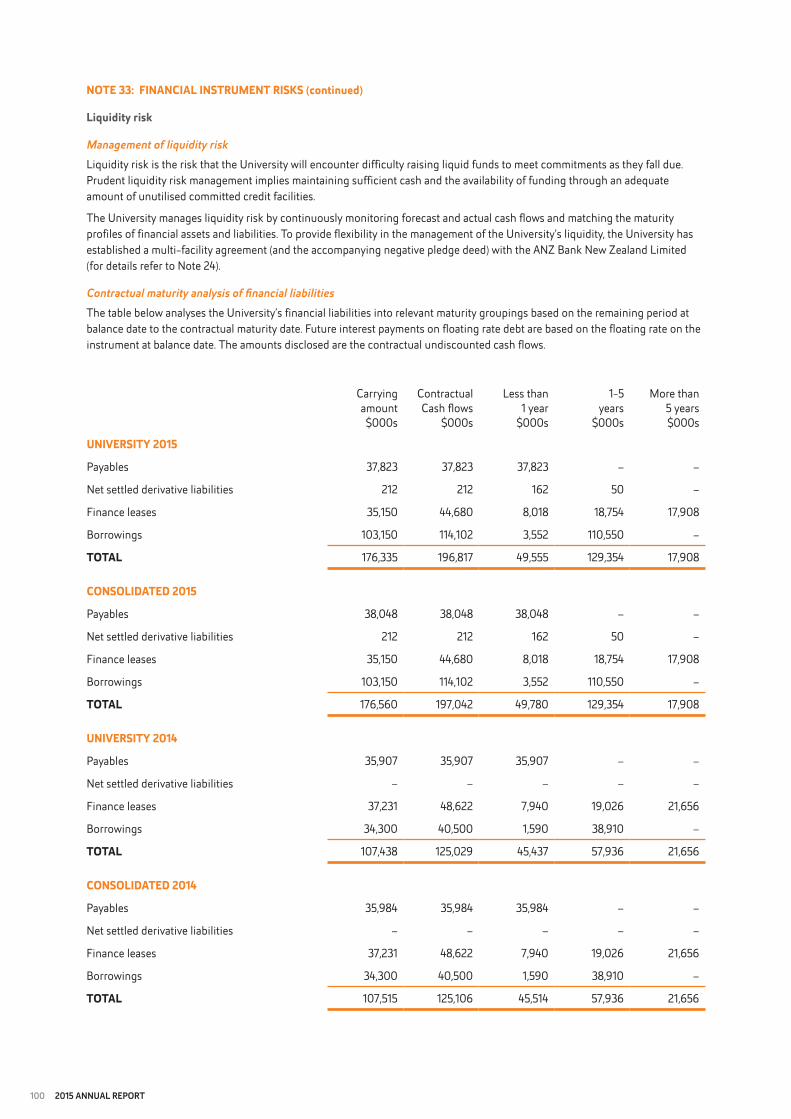
100 2015 annual report
Carrying amount $000s
Contractual Cash flows
$000s
Less than 1 year
$000s
1-5 years
$000s
More than 5 years$000s
UnIVeRsItY 2015
Payables 37,823 37,823 37,823 – –
Net settled derivative liabilities 212 212 162 50 –
Finance leases 35,150 44,680 8,018 18,754 17,908
Borrowings 103,150 114,102 3,552 110,550 –
totAL 176,335 196,817 49,555 129,354 17,908
consoLIdAted 2015
Payables 38,048 38,048 38,048 – –
Net settled derivative liabilities 212 212 162 50 –
Finance leases 35,150 44,680 8,018 18,754 17,908
Borrowings 103,150 114,102 3,552 110,550 –
totAL 176,560 197,042 49,780 129,354 17,908
UnIVeRsItY 2014
Payables 35,907 35,907 35,907 – –
Net settled derivative liabilities – – – – –
Finance leases 37,231 48,622 7,940 19,026 21,656
Borrowings 34,300 40,500 1,590 38,910 –
totAL 107,438 125,029 45,437 57,936 21,656
consoLIdAted 2014
Payables 35,984 35,984 35,984 – –
Net settled derivative liabilities – – – – –
Finance leases 37,231 48,622 7,940 19,026 21,656
Borrowings 34,300 40,500 1,590 38,910 –
totAL 107,515 125,106 45,514 57,936 21,656
note 33: FInAncIAL InstRUMent RIsKs (continued)
Liquidity risk
Management of liquidity riskLiquidity risk is the risk that the University will encounter difficulty raising liquid funds to meet commitments as they fall due. Prudent liquidity risk management implies maintaining sufficient cash and the availability of funding through an adequate amount of unutilised committed credit facilities.
The University manages liquidity risk by continuously monitoring forecast and actual cash flows and matching the maturity profiles of financial assets and liabilities. To provide flexibility in the management of the University’s liquidity, the University has established a multi-facility agreement (and the accompanying negative pledge deed) with the ANZ Bank New Zealand Limited (for details refer to Note 24).
Contractual maturity analysis of financial liabilitiesThe table below analyses the University’s financial liabilities into relevant maturity groupings based on the remaining period at balance date to the contractual maturity date. Future interest payments on floating rate debt are based on the floating rate on the instrument at balance date. The amounts disclosed are the contractual undiscounted cash flows.
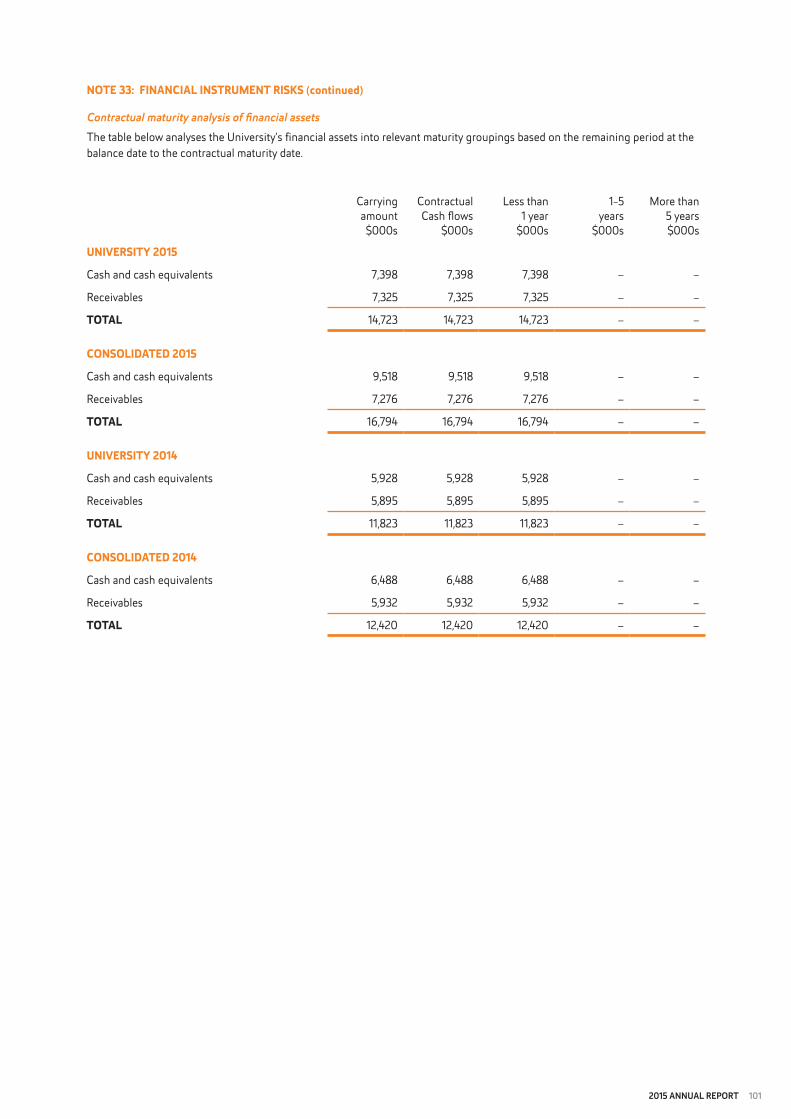
2015 annual report 101
note 33: FInAncIAL InstRUMent RIsKs (continued)
Contractual maturity analysis of financial assetsThe table below analyses the University’s financial assets into relevant maturity groupings based on the remaining period at the balance date to the contractual maturity date.
Carrying amount $000s
Contractual Cash flows
$000s
Less than 1 year
$000s
1-5 years
$000s
More than 5 years$000s
UnIVeRsItY 2015
Cash and cash equivalents 7,398 7,398 7,398 – –
Receivables 7,325 7,325 7,325 – –
totAL 14,723 14,723 14,723 – –
consoLIdAted 2015
Cash and cash equivalents 9,518 9,518 9,518 – –
Receivables 7,276 7,276 7,276 – –
totAL 16,794 16,794 16,794 – –
UnIVeRsItY 2014
Cash and cash equivalents 5,928 5,928 5,928 – –
Receivables 5,895 5,895 5,895 – –
totAL 11,823 11,823 11,823 – –
consoLIdAted 2014
Cash and cash equivalents 6,488 6,488 6,488 – –
Receivables 5,932 5,932 5,932 – –
totAL 12,420 12,420 12,420 – –
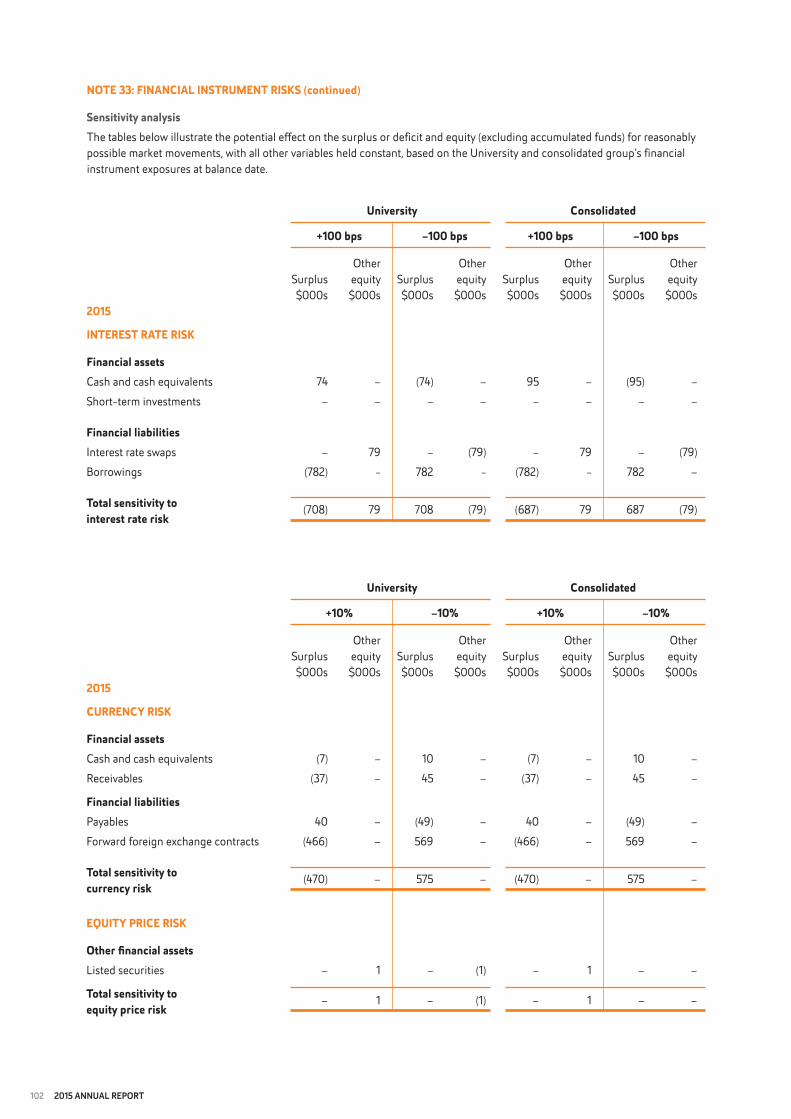
102 2015 annual report
note 33: FInAncIAL InstRUMent RIsKs (continued)
sensitivity analysisThe tables below illustrate the potential effect on the surplus or deficit and equity (excluding accumulated funds) for reasonably possible market movements, with all other variables held constant, based on the University and consolidated group’s financial instrument exposures at balance date.
University consolidated
+100 bps –100 bps +100 bps –100 bps
Other Other Other Other Surplus equity Surplus equity Surplus equity Surplus equity $000s $000s $000s $000s $000s $000s $000s $000s2015
InteRest RAte RIsK
Financial assets Cash and cash equivalents 74 – (74) – 95 – (95) –
Short-term investments – – – – – – – –
Financial liabilities Interest rate swaps – 79 – (79) – 79 – (79)
Borrowings (782) - 782 - (782) - 782 –
total sensitivity to (708) 79 708 (79) (687) 79 687 (79)interest rate risk
University consolidated
+10% –10% +10% –10%
Other Other Other Other Surplus equity Surplus equity Surplus equity Surplus equity $000s $000s $000s $000s $000s $000s $000s $000s2015
cURRencY RIsK
Financial assets Cash and cash equivalents (7) – 10 – (7) – 10 –
Receivables (37) – 45 – (37) – 45 –
Financial liabilities Payables 40 – (49) – 40 – (49) –
Forward foreign exchange contracts (466) – 569 – (466) – 569 –
total sensitivity to (470) – 575 – (470) – 575 –currency risk
eqUItY PRIce RIsK
other financial assets Listed securities – 1 – (1) – 1 – –
total sensitivity to – 1 – (1) – 1 – –equity price risk
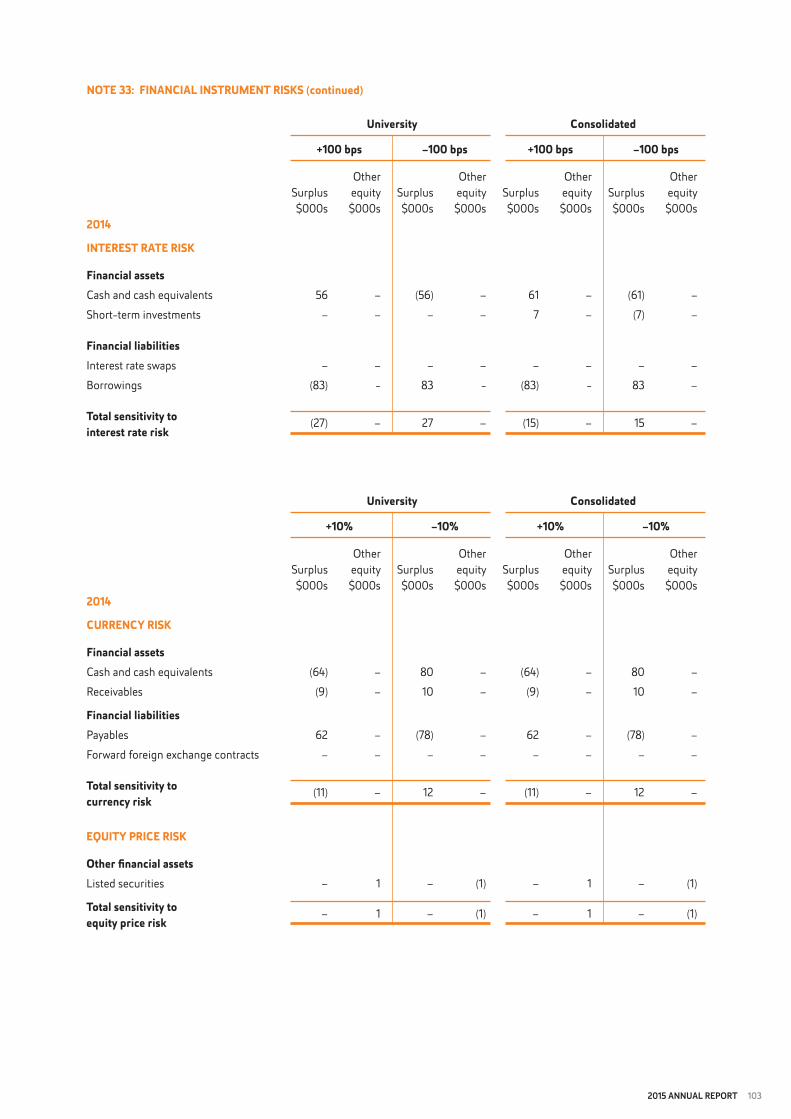
2015 annual report 103
note 33: FInAncIAL InstRUMent RIsKs (continued)
University consolidated
+100 bps –100 bps +100 bps –100 bps
Other Other Other Other Surplus equity Surplus equity Surplus equity Surplus equity $000s $000s $000s $000s $000s $000s $000s $000s2014
InteRest RAte RIsK
Financial assets Cash and cash equivalents 56 – (56) – 61 – (61) –
Short-term investments – – – – 7 – (7) –
Financial liabilities Interest rate swaps – – – – – – – –
Borrowings (83) - 83 - (83) - 83 –
total sensitivity to (27) – 27 – (15) – 15 –interest rate risk
University consolidated
+10% –10% +10% –10%
Other Other Other Other Surplus equity Surplus equity Surplus equity Surplus equity $000s $000s $000s $000s $000s $000s $000s $000s2014
cURRencY RIsK
Financial assets Cash and cash equivalents (64) – 80 – (64) – 80 –
Receivables (9) – 10 – (9) – 10 –
Financial liabilities Payables 62 – (78) – 62 – (78) –
Forward foreign exchange contracts – – – – – – – –
total sensitivity to (11) – 12 – (11) – 12 –currency risk
eqUItY PRIce RIsK
other financial assets Listed securities – 1 – (1) – 1 – (1)
total sensitivity to – 1 – (1) – 1 – (1)equity price risk

104 2015 annual report
note 34: cAPItAL MAnAgeMent
The University’s capital is its equity, which comprises retained surpluses and reserves. Equity is represented by net assets. The University manages its revenue, expenses, assets, liabilities, and general financial dealings prudently. The University’s equity is largely managed as a result of managing revenue, expenses, assets and liabilities.
The objective of managing the University’s equity is to ensure the University effectively achieves the goals and objectives for which it has been established, whilst remaining a going concern.
note 35: segMentAL InFoRMAtIon
Auckland University of Technology operates predominantly in one industry, tertiary education, and in one geographical area, Auckland, New Zealand.
note 36: excePtIonAL RIsKs oF oPeRAtIng
There are a number of factors that could adversely affect Auckland University of Technology’s operating surplus. Most notably, international student revenue could be affected by a significant change to New Zealand’s, or foreign governments’, immigration or visitors’ permits policies. 19% (2014: 18%) of total revenue is derived from International student fees.
note 37: contIngencIes
contingent assetsThere are no contingent assets as at 31 December 2015 (2014: Nil).
contingent liabilities There are no contingent liabilities as at 31 December 2015 (2014: Nil).

2015 annual report 105
note 38: exPLAnAtIon oF VARIAnces AgAInst bUdget
Explanations for major variances against budget are as follows:
statement of Financial Performance
Student-derived revenueStudent-derived revenue was $2.5 million ahead of budget driven by a 4.9% increase in international enrolments.
Research revenueResearch grants recognised in 2015 were $1.5 million below budget primarily due to lower than expected external research revenue generated during the year.
Other revenueOther revenue was $1.5 million ahead of budget as a result of higher third stream revenue generated across all operational areas and other external revenue.
Supplies and other costsSupplies and other costs were $1.9 million above budget mainly due to additional agency commission payments on international enrolments.
Depreciation, amortisation and impairmentDepreciation, amortisation and impairment were $2.0 million above budget, mainly due to an adjustment of depreciation rates for the WL carpark building to more accurately recognise the building’s estimated useful life.
statement of Financial Position
Cash and cash equivalentsCash and cash equivalents were $1.5 million below budget mainly due to higher capital expenditure at the end of the financial year.
ReceivablesReceivables were $1.4 million above budget, mainly due to the timing of receipts compared with budget.
Property, plant and equipmentProperty, plant and equipment was $71.6 million above budget, mainly due to the $43 million acquisition of WO office building (not budgeted), and a $23.9 million increase in land valuation.
Deferred revenueDeferred revenue was $5.9 million above budget mainly due to the early invoicing of student fees.
Employee entitlementsTotal employee entitlements of $25.7 million were $1.0 million below budget, mainly due to lower outstanding annual leave balances.
Bank borrowingsBank borrowings were $41.4 million above budget at year end 2015. This was mainly due to the higher than budgeted capital expenditure during the year.
ReservesReserves were $23.9 million above budget due to an increase in the valuation of land compared to budget.
statement of cash Flows
The explanation for ‘Bank borrowings’ above explains the Cash Flow variances.

106 2015 annual report
note 39: InteRest In JoIntLY-contRoLLed Assets
The University has a joint venture interest in Ko Awatea Education Centre, situated at Middlemore Hospital. The joint venture is between Counties Manukau District Health Board (39.4%), Manukau Institute of Technology (31%), University of Auckland (16.4%) and Auckland University of Technology (13.2%), with Counties Manukau District Health Board as manager and operator of the joint venture.
note 40: eVents AFteR tHe RePoRtIng PeRIod
On 3 February 2016, the University made a final capital contribution payment of $1.66 million (see note 30) to the Waterfront Theatre Limited, in accordance with the Shareholders’ Agreement dated 13 December 2013.
ownership interestJointly controlled assets nature of joint venture 2015 2014
Ko Awatea Education Centre Partnership with healthcare professionals and educational institutes to improve efficiency and achieve effective application of healthcare.
13.2% 13.2%
The University’s share of the jointly-controlled assets which are included in the Financial Statements is as follows:
University2015
Actual$000s
2014 Actual$000s
Property, plant and equipment 6 19
totAL JoIntLY contRoLLed Assets 6 19
There were no material capital expenditure commitments or contingent liabilities in relation to the jointly-controlled assets.

2015 annual report 107
note 41: AdJUstMents to tHe coMPARAtIVe YeAR FInAncIAL stAteMents
Reclassification adjustmentsCertain comparative figures in the prior year have been reclassified to conform with this year’s presentation.
Recognition and measurement adjustmentsThe table below explains the recognition and measurement adjustments to the 31 December 2014 comparative figures resulting from the transition to the new PBE IPSAS accounting standards.
Note
NZ IFRS (PBE)2014
$000s
Adjustment
$000s
PBE IPSAS 2014
$000s
UnIVeRsItY
statement of Financial Position
Current liabilities – deferred revenue (A) 49,205 (2,144) 47,061
Equity – general equity (A) 288,714 2,144 290,858
statement of Financial Performance
Revenue – student-derived revenue (A) 146,950 274 147,224
statement of changes in equity
Balance at 1 January (A) 434,629 1,870 436,499
Total comprehensive revenue (A) 25,437 274 25,711
bALAnce At 31 deceMbeR 460,066 2,144 462,210
consoLIdAted
statement of Financial Position
Current liabilities – deferred revenue (A), (B) 49,255 (2,194) 47,061
Equity – general equity (A), (B) 307,501 2,194 309,695
statement of Financial Performance
Revenue – student-derived revenue (A) 146,950 274 147,224
statement of changes in equity
Balance at 1 January (A), (B) 447,744 1,920 449,664
Total comprehensive revenue (A) 31,109 274 31,383
bALAnce At 31 deceMbeR 478,853 2,194 481,047
Note (A) – As a result of adopting new PBE IPSAS accounting standards, the timing of the recognition of the tuition fees revenue from domestic students funded by TEC SAC funding has changed. The revenue is recognised when the course withdrawal date has passed, which is when a student is no longer entitled to a refund for withdrawing from the course as opposed to being recognised on a course percentage of completion basis under NZ IFRS (PBE). Under the new PBE IPSAS 23, additional tuition fees revenue from domestic students of $274,000 has been recognised for year ended 31 December 2014. These adjustments have consequentially affected the total General Equity.
Note (B) - Under the new PBE IPSAS 23, a grant without stipulations is recognised as revenue as soon as the right to receive the grant is met. A grant received in 2013 to fund the incubator activity of AUT Enterprises Limited has no stipulations attached to it. The previously recognised deferred revenue liability of $50,000 under NZ IFRS (PBE) has been derecognised and this was adjusted through opening equity.

108 2015 annual report
coMPULsoRY stUdent seRVIces FeesFor the year ended 31 December 2015
The Compulsory Student Services Fee (CSSF) was set at $497.50 (GST inclusive) per full-time student in 2015 and may be borrowed against a student loan. The fee is used to fund key services that assist student success, retention and overall wellbeing while enrolled at AUT. It is compulsory for all students except those on exchange or studying by distance.
stUdent AdVIsoRY coMMItteeAUT’s formal partnership with AuSM is through the Student Advisory Committee, which also provides oversight and guidance on the allocation of the CSSF. The membership consists of equal numbers of representatives from AUT and AuSM. The committee is responsible for ensuring the best value for students and promoting student engagement with learning and with AUT. The following report outlines the investment in service provision in 2015.
AdVocAcY And LegAL AdVIceAuSM provides AUT students with independent and confidential support, advice and advocacy services. This includes assistance for legal matters, disciplinary action, harassment, complaints, employment and tenant rights, grade appeals, and general information and translation of AUT rules and policies.
cAReeRs AdVIce And gUIdAnceAUT offers career counselling, career development services and job search support to prospective and current AUT students and alumni. AUT’s career specialists provide advice and support clients to make informed decisions about their career path and study programme, and to improve their employability.
cLUbs And socIetIesAuSM offers a range of student-run social, sustainability, academic and cultural clubs through which students can meet new people, participate in events, and get involved in campus life.
cHILdcARe seRVIces AUT hosts two childcare facilities – one at City Campus (run by AUT) and an independently-run crèche at North Campus. Both centres provide excellent facilities and services, including school holiday programmes. Health, Counselling and Wellbeing also provide comfortable and private rooms for breastfeeding at all three main campuses.
AUT offers a childcare subsidy of up to $50 per week per dependent child, which is paid directly to the early childhood centre where the child is enrolled.
coUnseLLIng And PAstoRAL cAReAUT has a range of pastoral and counselling services to facilitate our diverse students’ integration into university life and provide on-going personal, spiritual, psychological and emotional support. The University offers specialised services to students with an impairment or disability, or who are Māori, Pacific, Chinese, International, LGBTI, or elite athletes.
The University also operates a comprehensive orientation and transition programme, and an early intervention service to promote the success and retention of our students.
eMPLoYMent InFoRMAtIon AuSM provides students with employment information and funding for Student Job Search (SJS). SJS is an employment agency targeted at finding employment for students.
FInAncIAL sUPPoRt And AdVIce AUT offers students information and advice to help manage their money, including assistance with Studylink issues, budgeting, and banking. In addition, the University provides Justice of the Peace services and emergency financial assistance for students experiencing extreme financial hardship.
HeALtH seRVIces The health centres at City and North Campuses offer integrated general practice medical, nursing, counselling, spiritual and wellbeing services to support students’ overall health and wellbeing. The Centres are part of the Auckland primary health organisation. Routine consultations are free for domestic students who register with one of the centres as their primary health care organisation.
For students based at South Campus, the University offers a nurse and counselling service, as well as access to funded doctor consultations with four local medical practitioners.
MedIA AuSM supports the production and dissemination of information by students for students through Debate magazine and online media.
sPoRt, RecReAtIon And cULtURAL seRVIces AUT delivers a range of recreational and competitive sport events and activities. Each campus has a fitness centre offering quality fitness equipment, group classes and personalised exercise programmes, and access to sport and exercise services.
The University also offers a wide range of cultural events and diversity-related activities to promote diversity and inclusion on campus, as well as to support student engagement.
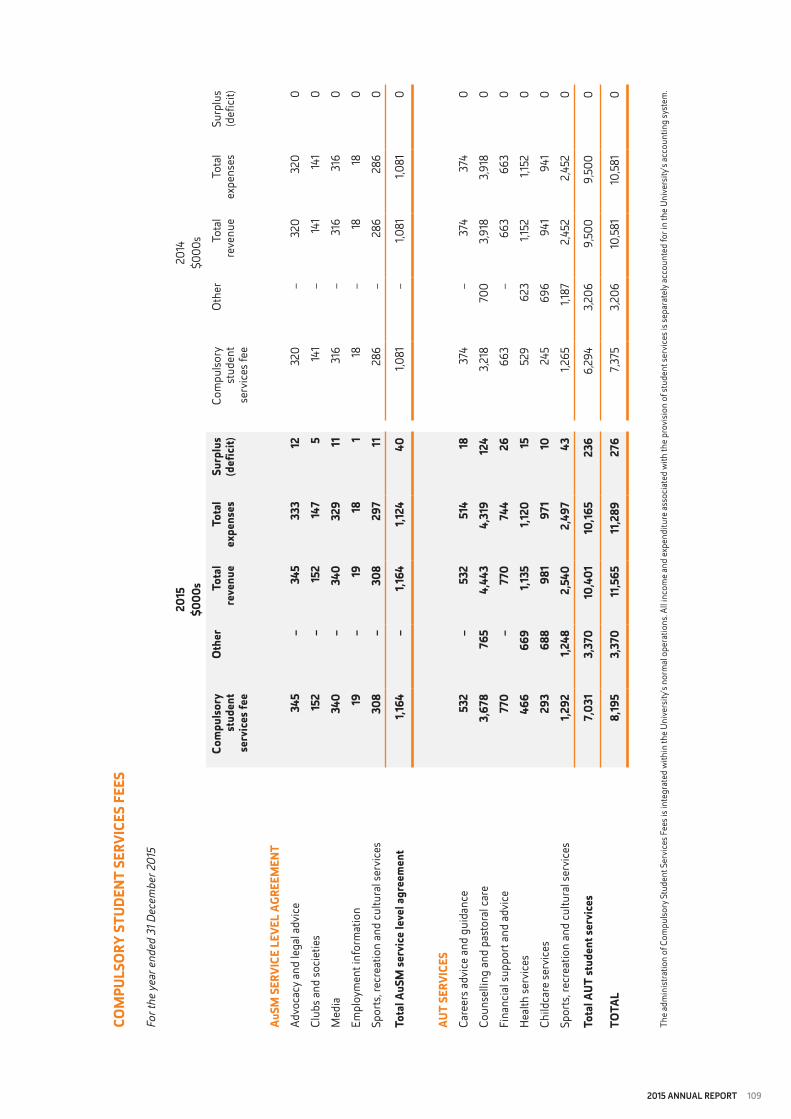
2015 annual report 109
2015
$000
s20
14$0
00s
com
pulso
ry
stud
ent
serv
ices
fee
othe
rto
tal
r eve
nue
tota
l ex
pens
essu
rplu
s (d
efic
it)Co
mpu
lsory
st
uden
t se
rvic
es fe
e
Oth
erTo
tal
reve
nue
Tota
l ex
pens
esSu
rplu
s (d
efic
it)
AusM
seR
VIce
LeV
eL A
gRee
Men
tAd
voca
cy a
nd le
gal a
dvic
e34
5–
345
333
1232
0–
320
320
0
Club
s and
soci
etie
s15
2–
152
147
514
1–
141
141
0
Med
ia34
0–
340
329
1131
6–
316
316
0
Empl
oym
ent i
nfor
mat
ion
19–
1918
118
–18
180
Spor
ts, r
ecre
atio
n an
d cu
ltura
l ser
vice
s30
8–
308
297
1128
6–
286
286
0
tota
l Aus
M se
rvic
e le
vel a
gree
men
t1,1
64–
1,164
1,124
401,0
81–
1,081
1,081
0
AUt
seRV
Ices
Care
ers a
dvic
e an
d gu
idan
ce53
2–
532
514
1837
4–
374
374
0
Coun
selli
ng a
nd p
asto
ral c
are
3,67
876
54,
443
4,31
912
43,
218
700
3,91
83,
918
0
Fina
ncia
l sup
port
and
advi
ce
770
–77
074
426
663
–66
366
30
Hea
lth se
rvic
es46
666
91,1
351,1
2015
529
623
1,152
1,152
0
Child
care
serv
ices
293
688
981
971
1024
569
694
194
10
Spor
ts, r
ecre
atio
n an
d cu
ltura
l ser
vice
s1,2
921,2
482,
540
2,49
743
1,265
1,187
2,45
22,
452
0
tota
l AU t
stud
ent s
ervi
ces
7,03
13,
370
10,4
0110
,165
236
6,29
43,
206
9,50
09,
500
0
totA
L8,
195
3,37
011
,565
11,2
8927
67,3
753,
206
10,5
8110
,581
0
The
adm
inis
tratio
n of
Com
pulso
ry S
tude
nt S
ervi
ces F
ees i
s int
egra
ted
with
in th
e U
nive
rsity
’s no
rmal
ope
ratio
ns. A
ll in
com
e an
d ex
pend
iture
ass
ocia
ted
with
the
prov
isio
n of
stud
ent s
ervi
ces i
s sep
arat
ely a
ccou
nted
for i
n th
e U
nive
rsity
’s ac
coun
ting
syst
em.
coM
PULs
oRY
stUd
ent
seRV
Ices
Fee
s
For t
he y
ear e
nded
31 D
ecem
ber 2
015
110 2015 annual report

2015 annual report 111
stAteMent oF ResoURces

112 2015 annual report
LIbRARY
12 This decrease is due to changes in the accounting method approved by the Council of Australian University Librarians (CAUL)13 This decrease is due to a range of factors including the removal of administrative activities14 This decrease is due to improved detection and removal of spam activities15 This decrease is due to the reduced number of pages and more streamlined access to information resources on the new LibGuide platform16 This decrease is due to increased use of the Library website, online tutorials and research consultations 17 This figure represents total annualised Paid FTE for the Library, in line with the method of calculation used throughout this Annual Report. Using the CAUL methodology, the FTE figure is 71.5
2015 2014
e-resources
e-journal titles12 80,072 88,798
e-book titles 104,276 102,826
e-reserve items (AUTonline) 4,858 4,408
Research repository items (Scholarly Commons) 4,534 3,728
Print resources (titles)
Books 214,011 219,168
Journals (serials) 1,950 2,008
Multimedia (AV items) 14,219 16,814
online access – full-text downloads
e-journal full-text downloads 2,239,918 2,252,965
e-book full-text downloads 397,966 336,498
e-reserve full-text downloads13 48,245 80,334
Research repository full-text downloads14 680,663 723,316
online access – page views
Research repository page views 249,521 370,101
Library guides page views15 524,655 734,358
Library website page views 1,171,282 1,011,893
Physical access
Turnstile counts (visits to Library) 1,221,663 1,243,984
Opening hours (per week) 86 86
Loans
Print and multimedia (includes renewals) 169,931 206,370
Course reserve (high demand) (includes renewals) 36,219 39,064
Interloan items supplied and received 7,074 5,266
Information services
Information literacy workshops (participants) 8,784 8,691
Information literacy workshops (groups) 501 544
Research consultations 4,475 3,490
Library Help Desk enquiries16 6,799 9,069
Online tutorial views 9,732 5,451
Total Library staff (FTE)17 68.4 69.1
ReseARcH tHAt InsPIRes cURIosItY, AdVAnces KnowLedge And beneFIts coMMUnItIeswIdeR PARtIcIPAtIon And sUccess In edUcAtIonA stRongeR RePUtAtIon FoR AUt
2015 annual report 113
2015 2014
expenditure — $000s
Operating expenditure – excluding depreciation 6,307 6,176
Depreciation and asset impairment 6,058 4,984
Total operating expenditure 12,365 11,160
Capital expenditure — information resources 6,138 5,534
total Library expenditure 18,503 16,694
Total Library expenditure ($) per EFTS (MoE and International) and FTE 864 803
Image: Graham Roberts, Strategy & Planning, AUT
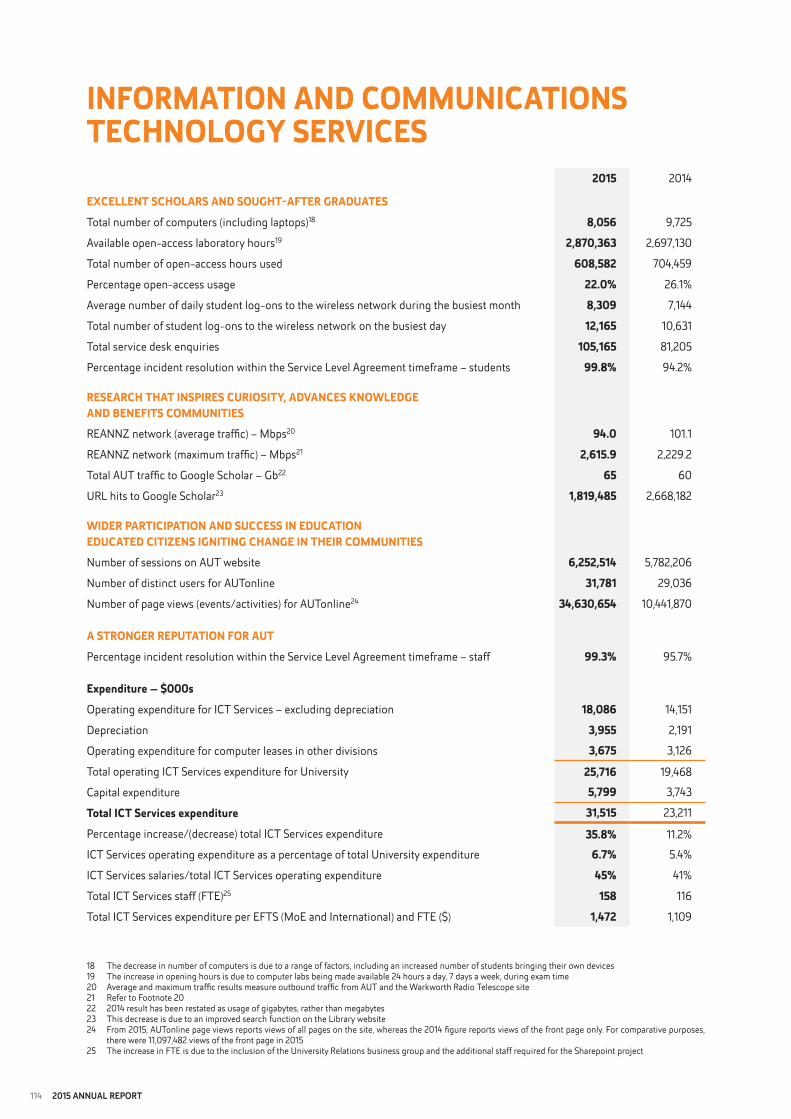
114 2015 annual report
InFoRMAtIon And coMMUnIcAtIons tecHnoLogY seRVIces
18 The decrease in number of computers is due to a range of factors, including an increased number of students bringing their own devices19 The increase in opening hours is due to computer labs being made available 24 hours a day, 7 days a week, during exam time20 Average and maximum traffic results measure outbound traffic from AUT and the Warkworth Radio Telescope site21 Refer to Footnote 2022 2014 result has been restated as usage of gigabytes, rather than megabytes23 This decrease is due to an improved search function on the Library website24 From 2015, AUTonline page views reports views of all pages on the site, whereas the 2014 figure reports views of the front page only. For comparative purposes, there were 11,097,482 views of the front page in 201525 The increase in FTE is due to the inclusion of the University Relations business group and the additional staff required for the Sharepoint project
2015 2014
exceLLent scHoLARs And soUgHt-AFteR gRAdUAtesTotal number of computers (including laptops)18 8,056 9,725
Available open-access laboratory hours19 2,870,363 2,697,130
Total number of open-access hours used 608,582 704,459
Percentage open-access usage 22.0% 26.1%
Average number of daily student log-ons to the wireless network during the busiest month 8,309 7,144
Total number of student log-ons to the wireless network on the busiest day 12,165 10,631
Total service desk enquiries 105,165 81,205
Percentage incident resolution within the Service Level Agreement timeframe – students 99.8% 94.2%
ReseARcH tHAt InsPIRes cURIosItY, AdVAnces KnowLedge And beneFIts coMMUnItIesREANNZ network (average traffic) – Mbps20 94.0 101.1
REANNZ network (maximum traffic) – Mbps21 2,615.9 2,229.2
Total AUT traffic to Google Scholar – Gb22 65 60
URL hits to Google Scholar23 1,819,485 2,668,182
wIdeR PARtIcIPAtIon And sUccess In edUcAtIonedUcAted cItIZens IgnItIng cHAnge In tHeIR coMMUnItIesNumber of sessions on AUT website 6,252,514 5,782,206
Number of distinct users for AUTonline 31,781 29,036
Number of page views (events/activities) for AUTonline24 34,630,654 10,441,870
A stRongeR RePUtAtIon FoR AUt Percentage incident resolution within the Service Level Agreement timeframe – staff 99.3% 95.7%
expenditure — $000sOperating expenditure for ICT Services – excluding depreciation 18,086 14,151
Depreciation 3,955 2,191
Operating expenditure for computer leases in other divisions 3,675 3,126
Total operating ICT Services expenditure for University 25,716 19,468
Capital expenditure 5,799 3,743
total Ict services expenditure 31,515 23,211
Percentage increase/(decrease) total ICT Services expenditure 35.8% 11.2%
ICT Services operating expenditure as a percentage of total University expenditure 6.7% 5.4%
ICT Services salaries/total ICT Services operating expenditure 45% 41%
Total ICT Services staff (FTE)25 158 116
Total ICT Services expenditure per EFTS (MoE and International) and FTE ($) 1,472 1,109

2015 annual report 115
LAnd And bUILdIngs
2015 2014 LAnd bY cAMPUs26 gross
Area haValue
$000sGross
Area haValue
$000s
City Campus27 3.7 98,002 3.5 68,565
North Campus 14.4 34,925 14.4 27,855
South Campus28 12.2 48,129 7.8 27,244
AUT Millennium29 2.0 7,060 2.0 6,750
total land 32.3 188,116 27.7 130,414
2015 2014 bUILdIngs bY cAMPUs30
gross
Area m2
net book Value
$000s
Gross
Area m2
Net Book Value
$000s
City Campus31 122,666 302,347 112,193 279,925
North Campus 35,948 64,976 35,948 68,568
South Campus32 9,706 30,469 8,156 19,636
AUT Millennium33 4,307 – 4,307 –
Work in progress – 29,407 – 17,670
total buildings 172,627 427,199 160,604 385,799
total land and buildings 615,315 516,213
Contractual leases (various)34,35 44,694 54,922
University total gross area 217,321 215,526
Less: Non-leasable area 35,802 34,838
Usable area 181,519 180,688
2015 2014Used as follows Usable
Area m2totaleFts
Area m2 per eFts
Usable Area m2
Total EFTS
Area m2 per EFTS
Faculty space 103,411 110,027
Administration36 73,801 66,185
In development/vacant37 4,307 4,476
totAL 181,519 19,798 9.2 180,688 19,581 9.2
26 Land at all four campuses was revalued as at 31 December 2015 by Seagar and Partners (Auckland) Ltd27 The increase in land area is due to the purchase of 56 Wakefield Street28 The increase in land area is due to the purchase of 622 Great South Road29 The gross area for AUT Millennium Campus was incorrectly stated in the 2014 Annual Report. The 2014 value has been corrected accordingly30 There were no building valuations conducted in 2015; values reported here are based on the net book value entered in the fixed asset register31 The increase in gross floor area is due to the purchase of 56 Wakefield Street. This was previously reported in Contractual leases32 The increase in gross floor area is due to the inclusion of ME Building33 AUT owns 4,307m2 at AUT Millennium, which is the gross floor area of the ADIS property. The remaining space at AUT Millennium (2,767m2) is owned by the AUT Millennium Ownership Trust (AMOT). AUT is a 50% partner in AMOT. The ADIS property is currently vacant so it was not valued in 201534 The gross floor area of the ADIS property was incorrectly included in Contractual leases in the 2014 Annual Report. 2014 values have been corrected accordingly35 Refer to Footnote 3136 This includes space for administration services, student accommodation and carparks37 The ADIS property was incorrectly counted twice as vacant space in the 2014 Annual Report. 2014 values have been corrected accordingly

Auckland University of TechnologyApril 2016 Private Bag 92006Auckland 114255 Wellesley Street EastAuckland, New Zealand
Phone: +64 9 921 9999Fax: +64 9 921 9983www.aut.ac.nz
AR-04/2016-350
ISSN 2382-0446