Embed Size (px)
Citation preview
Annual Report 2014/2015 1
Annual Report 2014/2015 2
TABLE OF CONTENTS
CHAPTER 1 – MAYOR’S FOREWORD AND EXECUTIVE SUMMARY
COMPONENT A: EXECUTIVE MAYOR’S OVERVIEW 6
COMPONENT B: EXECUTIVE SUMMARY
MUNICIPAL MANAGER’S OVERVIEW 8
1.1 VISION AND MISSION OF THE WEST COAST DISTRICT MUNICIPALITY 10
1.2 MUNICIPAL FUNCTIONS, POPULATION AND ENVIRONMENTAL OVERVIEW 11
1.3 SERVICE DELIVERY OVERVIEW 18
1.4 FINANCIAL HEALTH OVERVIEW 20
1.5 ORGANISATIONAL DEVELOPMENT OVERVIEW 21
1.6 AUDITOR-GENERAL REPORT 24
1.7 STATUTORY ANNUAL REPORT PROCESS 25
CHAPTER 2 – GOVERNANCE
COMPONENT A: POLITICAL AND ADMINISTRATIVE GOVERNANCE 26
2.1 POLITICAL GOVERNANCE 26
2.2 ADMINISTRATIVE GOVERNANCE 32
COMPONENT B: INTERGOVERNMENTAL RELATIONS 33
2.3 INTERGOVERNMENTAL RELATIONS 33
COMPONENT C: PUBLIC ACCOUNTABILITY AND PARTICIPATION 34
2.4 PUBLIC MEETINGS 35
2.5 INTEGRATED DEVELOPMENT PLAN PARTICIPATION AND ALIGNMENT 36
COMPONENT D: CORPORATE GOVERNANCE 37
2.6 RISK MANAGEMENT 37
2.7 ANTI-CORRUPTION AND FRAUD 38
2.8 SUPPLY CHAIN MANAGEMENT 39
2.9 BY-LAWS 40
2.10 WEBSITE 41
CHAPTER 3 – SERVICE DELIVERY PERFORMANCE (PERFORMANCE REPORT PART I)
COMPONENT A: BASIC SERVICES 42
3.1 WATER PROVISION 42
3.2 FREE BASIC SERVICES AND INDIGENT SUPPORT 53
COMPONENT B: ROADS 54
Annual Report 2014/2015 3
3.3 ROADS 54
COMPONENT C: PLANNING AND DEVELOPMENT 62
3.4 TOWN PLANNING 62
3.5 LOCAL ECONOMIC DEVELOPMENT 65
3.6 TOURISM 69
COMPONENT D: COMMUNITY AND SOCIAL SERVICES 76
3.7 CHILD CARE; AGED CARE; SOCIAL PROGRAMMES 76
COMPONENT E: ENVIRONMENTAL PROTECTION 81
3.8.1 POLLUTION CONTROL 81
3.8.2 BIODIVERSITY; LANDSCAPE (INCLUDING OPEN SPACES); OTHER (E.G. COASTAL PROTECTION)
82
COMPONENT F: HEALTH 89
3.9 HEALTH INSPECTION; FOOD LICENSING AND INSPECTION 89
COMPONENT G: SECURITY AND SAFETY 91
3.10 FIRE SERVICES 91
3.11 DISASTER MANAGEMENT 95
COMPONENT H: RECREATION 105
3.12 GANZEKRAAL RESORT 105
COMPONENT I: CORPORATE POLICY OFFICES AND OTHER SERVICES 107
3.13 EXECUTIVE AND COUNCIL 107
3.14 ADMINISTRATION 109
3.15 FINANCIAL SERVICES 117
3.16 HUMAN RESOURCE SERVICES 120
3.17 INFORMATION TECHNOLOGY 122
3.18 OFFICE OF THE MUNICIPAL MANAGER 124
3.19 INTERNAL AUDIT 125
CHAPTER 4 – ORGANISATIONAL DEVELOPMENT PERFORMANCE
(PERFORMANCE REPORT PART II)
COMPONENT A: INTRODUCTION TO THE MUNICIPAL PERSONNEL 126
4.1 EMPLOYEE TOTALS, TURNOVER AND VACANCIES 127
4.2 HUMAN RESOURCE POLICIES 128
COMPONENT B: MANAGING THE MUNICIPAL WORKFORCE 129
4.3 INJURIES, SICKNESS AND SUSPENSIONS 129
4.4 PERFORMANCE REWARDS 130
COMPONENT C: CAPACITATING THE MUNICIPAL WORKFORCE 131
4.5 SKILLS DEVELOPMENT AND TRAINING 131
Annual Report 2014/2015 4
SKILLS DEVELOPMENT AND WORKFORCE EXPENDITURE 131
CHAPTER 5 – FINANCIAL PERFORMANCE
COMPONENT A: STATEMENTS OF FINANCIAL PERFORMANCE: FUNCTIONS 134
5.1 STATEMENTS OF FINANCIAL PERFORMANCE: FUNCTIONS 135
5.2 GRANTS 137
5.3 ASSET MANAGEMENT 138
5.4 FINANCIAL RATIOS 139
COMPONENT B: STATEMENT OF COMPARISION BETWEEN BUDGET AND ACTUAL PERFORMANCE: 30 JUNE 2015
144
5.5 CAPITAL EXPENDITURE 145
5.6 SOURCES OF FINANCE 149
5.7 CAPITAL SPENDING ON FIVE LARGEST PROJECTS 151
5.8 BASIC SERVICE AND INFRASTRUCTURE BACKLOGS – OVERVIEW 153
COMPONENT C: CASH FLOW MANAGEMENT AND INVESTMENTS 154
5.9 CASH FLOW 154
5.10 BORROWING AND INVESTMENTS 155
5.11 SUPPLY CHAIN MANAGEMENT 158
CHAPTER 6 – AUDITOR-GENERAL AUDIT FINDINGS
COMPONENT B: AUDITOR-GENERAL OPINION 2014/2015 160
AUDITOR-GENERAL REPORTS 2014/2015 160
6.1 COMPONENT A: AUDITOR-GENERAL OPINION OF FINANCIAL STATEMENTS 2013/2014 164
AUDITOR-GENERAL REPORT 2013/2014 164
GLOSSARY 167
APPENDICES
APPENDIX A – COUNCILLORS, COMMITTEE ALLOCATION AND COUNCIL ATTENDANCE 170
APPENDIX B – COMMITTEES AND COMMITTEE PURPOSES 171
APPENDIX C – THIRD-TIER ADMINISTRATIVE STRUCTURE 173
APPENDIX D – FUNCTIONS OF MUNICIPALITY/ENTITY 174
APPENDIX E – WARD REPORTING 176
APPENDIX F – WARD INFORMATION 177
APPENDIX G – RECOMMENDATIONS OF THE MUNICIPAL AUDIT COMMITTEE 2013/2014 178
APPENDIX H – LONG-TERM CONTRACTS AND PUBLIC-PRIVATE PARTNERSHIPS 180
Annual Report 2014/2015 5
APPENDIX I – MUNICIPAL ENTITY/SERVICE PROVIDER PERFORMANCE SCHEDULE 182
APPENDIX J – DISCLOSURES OF FINANCIAL INTERESTS: COUNCILLORS 196
APPENDIX J – DISCLOSURES OF FINANCIAL INTERESTS: SECTION 57 OFFICIALS 195
APPENDIX K – REVENUE COLLECTION PERFORMANCE BY VOTE AND BY SOURCE 196
APPENDIX K (i) – REVENUE COLLECTION PERFORMANCE BY VOTE 197
APPENDIX K (ii) – REVENUE COLLECTION PERFORMANCE BY SOURCE 198
APPENDIX L – CONDITIONAL GRANTS RECEIVED, EXCLUDING MIG 199
APPENDIX M – CAPITAL EXPENDITURE: NEW AND UPGRADE/RENEWAL PROGRAMMES 200
APPENDIX M (i) – CAPITAL EXPENDITURE: NEW ASSETS PROGRAMME 201
APPENDIX M (ii) – CAPITAL EXPENDITURE: UPGRADE/RENEWAL PROGRAMME 202
APPENDIX N – CAPITAL PROGRAMME BY PROJECT: YEAR 1 203
APPENDIX O – CAPITAL PROGRAMME BY PROJECT BY WARD 204
APPENDIX P – SERVICE CONNECTION BACKLOGS AT SCHOOLS AND CLINICS 205
APPENDIX Q – SERVICE BACKLOGS EXPERIENCED BY THE COMMUNITY WHERE ANOTHER SPHERE OF GOVERNMENT IS RESPONSIBLE FOR SERVICE PROVISION
206
APPENDIX R – DECLARATION OF LOANS AND GRANTS MADE BY THE MUNICIPALITY 207
APPENDIX S – DECLARATION OF RETURNS NOT MADE IN DUE TIME UNDER MFMA S71 208
APPENDIX T – NATIONAL AND PROVINCIAL OUTCOMES FOR LOCAL GOVERNMENT 209
VOLUME I: ANNUAL PERFORMANCE REPORT 210
VOLUME II: ANNUAL FINANCIAL STATEMENTS 237
Annual Report 2014/2015 6
CHAPTER 1 – MAYOR’S FOREWORD AND EXECUTIVE SUMMARY
COMPONENT A: EXECUTIVE MAYOR’S OVERVIEW
EXECUTIVE MAYOR’S FOREWORD
During the year under review, we could once again manage to keep fulfilling our vision and mission and give
effect thereto. As our vision states, A Quality Destination of Choice through an Open Opportunity Society, we
must at all times ensure that we provide outstanding service delivery on the West Coast to be the destination
of choice. It was a year of many challenges but I can proudly report that we, politicians and officials, worked
hard to deliver excellent services to people.
Our five strategic objectives namely:
Ensuring environmental integrity for the West Coast
Ensuring good governance and financial viability
Pursuing economic growth and facilitation of job
opportunities
Promoting social well-being of the community
Providing essential bulk services in the region
are the drivers of our IDP and are also in line with the Provincial Growth and Development Strategy. With the
limited funds at our disposal, we could successfully manage our IDP.
Public participation is of utmost importance to our District and therefore we created an open opportunity for
our clients, the five B-municipalities, to engage with us through our bi-literal meetings. This platform grants us
the opportunity to find out how we can assist the municipalities in our district.
Annual Report 2014/2015 7
It is our aim to always put our people first and will therefore ensure that the best services are provided to them.
The strength and success of our municipality is built on the commitment and loyalty of all our officials. During
the past year we could again reap the fruit of competency, honesty and transparency. I wish to thank all our
officials and management team for their hard work and dedication. They are a team who I am really proud of.
Thanks to the members of the Executive Mayoral Committee and councillors for their support the past year.
EXECUTIVE MAYOR: ALD JH CLEOPHAS
Annual Report 2014/2015 8
COMPONENT B: EXECUTIVE SUMMARY
MUNICIPAL MANAGER’S OVERVIEW
MUNICIPAL MANAGER’S FOREWORD
The Annual Report has been prepared in accordance with Circular 63 of National Treasury. The Municipality can celebrate its achievement of a fifth consecutive Unqualified Audit opinion without matters. This achievement is the culmination of a continued and diligent effort by the Executive Mayor and Council and the administration to ensure an efficient, effective and accountable administration. We need to acknowledge the advisory role of a competent Audit Committee.
The West Coast District’s economy remains vulnerable to provincial, national and global economic developments. However, the infrastructure developments necessitated by the proclaimed Saldanha Bay Industrial Development Zone can support and benefit growth of the regional economy.
A District Spatial Development Framework Plan was adopted in this financial year and represents the overarching spatial vision for the District Municipality.
The total operating budget for the Municipality was R312 856 060 and actual income for the year amounted to R328 331 288 and expenditure of R290 044 432. The Municipality thus incurred an operating surplus of R38 286 856. Capital expenditure was 99.94% amounting to R16 155 002. The municipality spent 100% of its conditional grant transfers from National Treasury. Due to the nature of its functions, the Municipality is limited in its
Annual Report 2014/2015 9
revenue streams. Council adopted a Long Term Financial Plan which will guide and inform future budgets and financial decisions.
I can report that all senior and critical positions are filled and that 15 officials successfully completed the training in Minimum Competency Levels as prescribed by the Municipal Finance Management Act and 12 officials currently enrolled for the training.
As a municipality, we also suffered great loss with the passing of colleagues; may their souls rest in peace.
Lastly, thank you to the Executive Mayor and Council, officials and our partners in developmental local government for their continued dedication and drive to service delivery.
MUNICIPAL MANAGER: MR HF PRINS
Annual Report 2014/2015 10
1.1 VISION AND MISSION OF THE WEST COAST DISTRICT MUNICIPALITY
VISION A quality destination of choice through an open opportunity society MISSION To ensure outstanding service delivery on the West Coast by pursuing the following objectives: STRATEGIC OBJECTIVES These objectives also respond to those priorities at the global, national and provincial level and align with its strategic intent. As early as 2003, the United Nations Development Programme outlined five central challenges facing sustainable development in South Africa in the South Africa Human Development Report (UNDP:2003), and these are:
the eradication of poverty and extreme income and wealth inequalities, the provision of access
to quality and affordable basic services to all South Africans, the promotion of environmental sustainability,
a sustained reduction in the unemployment rate,
and the attainment of sustainable high growth rates. The fact that the five high-level strategic objectives that have been identified by the WCDM are in line with these challenges reinforces that they are still confronting the country and, in particular, the district.
Ensuring environmental integrity for the West Coast
Ensuring good governance and financial viability
Pursuing economic growth and facilitation of job opportunities
Promoting social well-being of the community
Providing essential bulk services in the Region
CORE VALUES
Integrity – to conduct business with integrity and be accountable to stakeholders
Transparency – to be transparent and open in our business
Loyalty – to be honest
Ethical – in our behaviour
Respect – will treat public and colleagues with fairness, respect and consideration
Quality – committed to delivering good quality services
Annual Report 2014/2015 11
1.2 MUNICIPAL FUNCTIONS, POPULATION AND ENVRIONMENTAL OVERVIEW
1.2.1 INTRODUCTION: BACKGROUND DATA
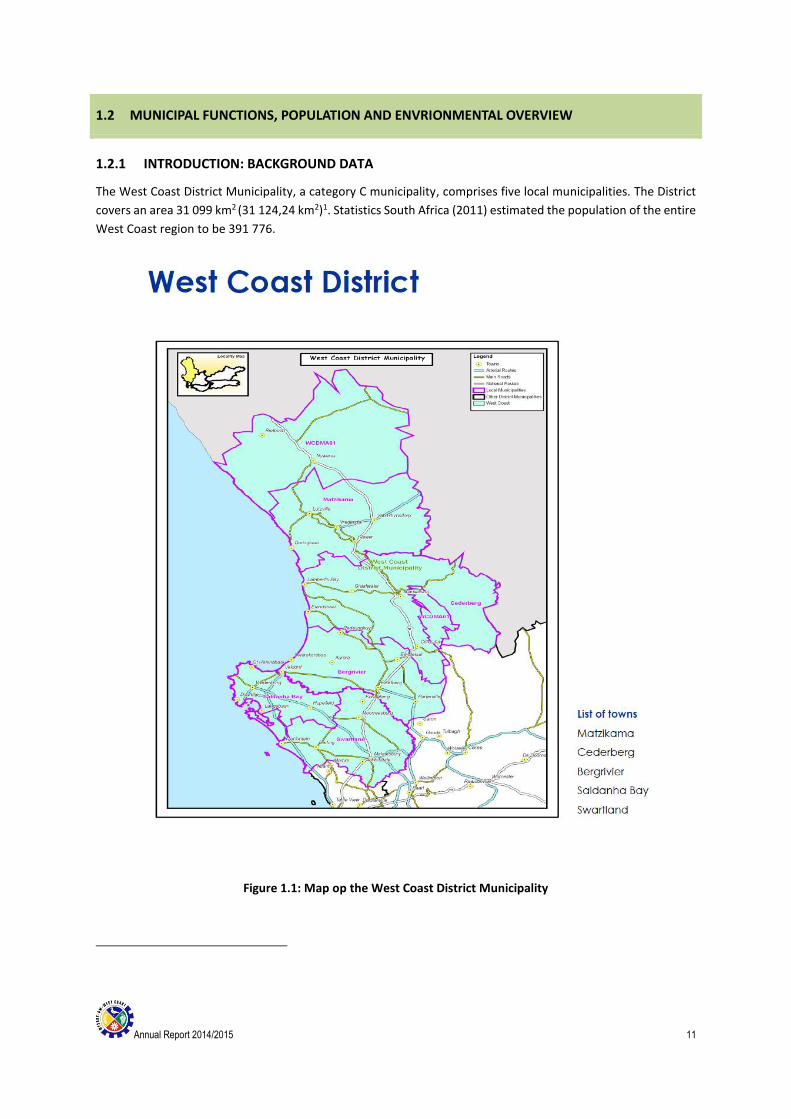
The West Coast District Municipality, a category C municipality, comprises five local municipalities. The District
covers an area 31 099 km2 (31 124,24 km2)1. Statistics South Africa (2011) estimated the population of the entire
West Coast region to be 391 776.
Figure 1.1: Map op the West Coast District Municipality
Annual Report 2014/2015 12
1.2.2 HEADQUARTERS OF THE CATEGORY B MUNICIPALITIES
The West Coast District is a category C municipality and comprises of the following category B local
municipalities: Matzikama, Cederberg, Bergrivier, Saldanha Bay and Swartland.
The table below sets out the various municipalities that make up the West Coast District Municipality, along with
their provincial codes and principal administrative centre.
Table 1.1: Municipalities within the West Coast District Municipality
Code Local municipality Headquarters
WC013 Bergrivier Municipality Piketberg
WC012 Cederberg Municipality Clanwilliam
WC011 Matzikama Municipality Vredendal
WC014 Saldanha Bay Municipality Vredenburg
WC015 Swartland Municipality Malmesbury
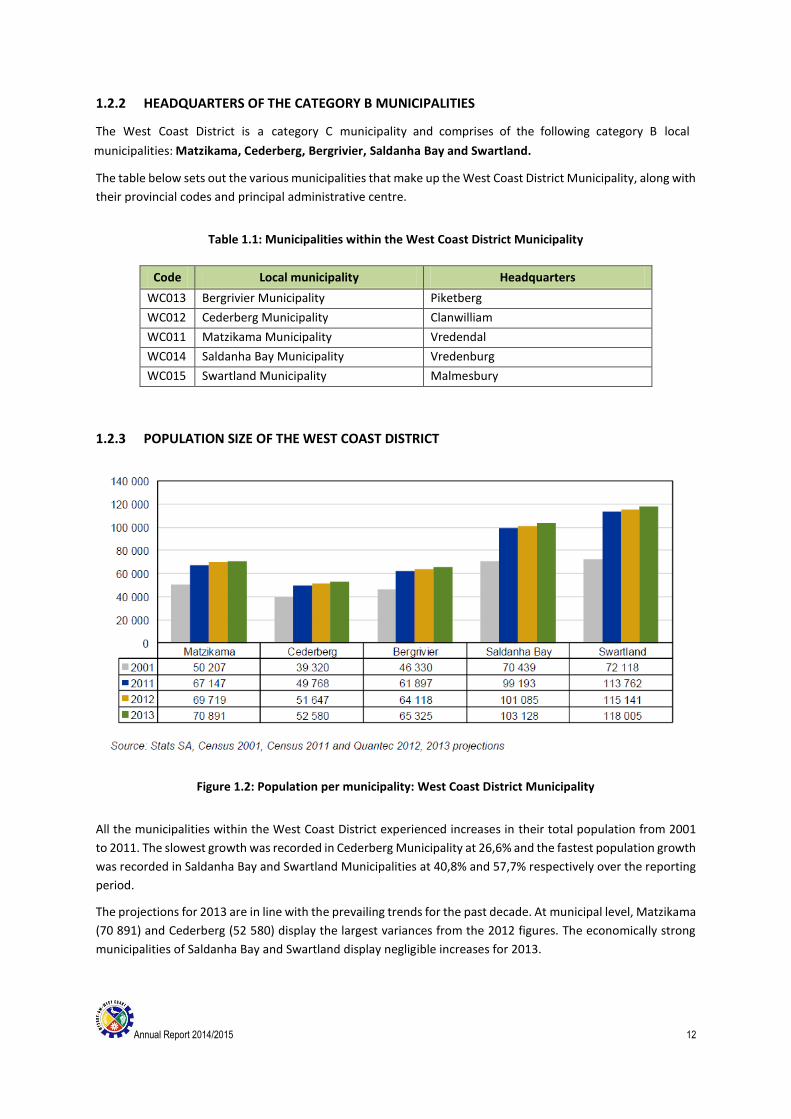
1.2.3 POPULATION SIZE OF THE WEST COAST DISTRICT
Figure 1.2: Population per municipality: West Coast District Municipality
All the municipalities within the West Coast District experienced increases in their total population from 2001
to 2011. The slowest growth was recorded in Cederberg Municipality at 26,6% and the fastest population growth
was recorded in Saldanha Bay and Swartland Municipalities at 40,8% and 57,7% respectively over the reporting
period.
The projections for 2013 are in line with the prevailing trends for the past decade. At municipal level, Matzikama
(70 891) and Cederberg (52 580) display the largest variances from the 2012 figures. The economically strong
municipalities of Saldanha Bay and Swartland display negligible increases for 2013.
Annual Report 2014/2015 13
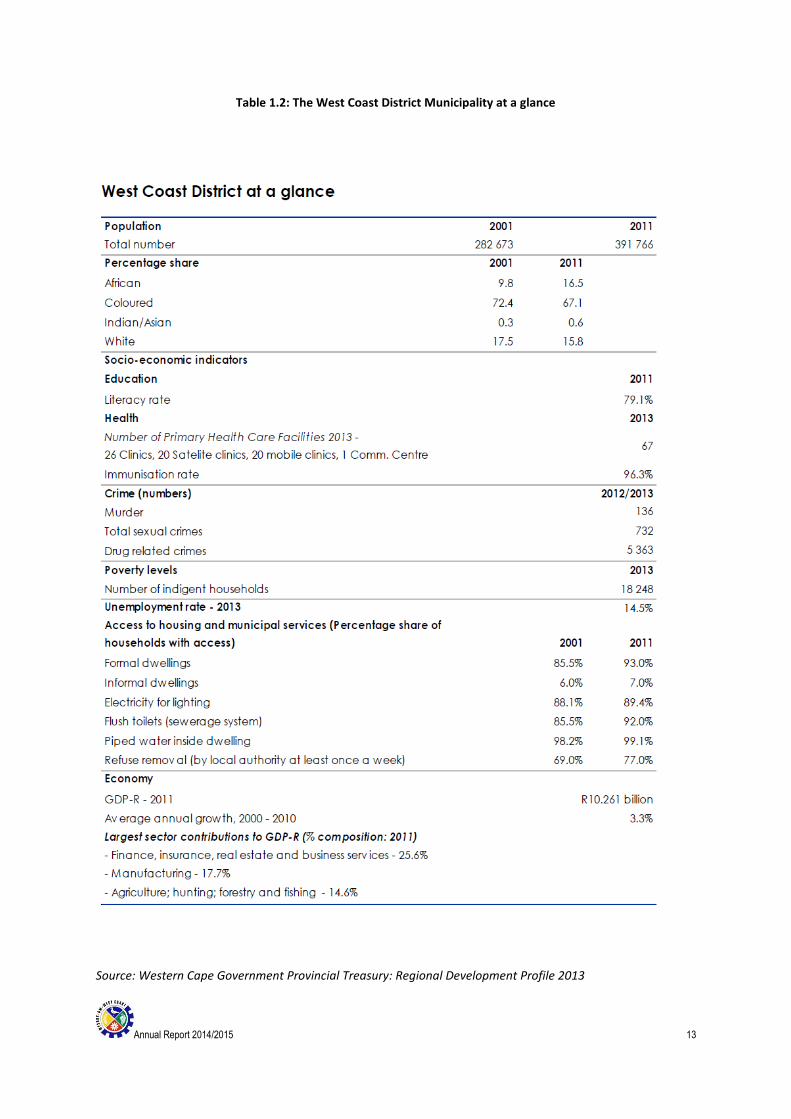
Table 1.2: The West Coast District Municipality at a glance
Source: Western Cape Government Provincial Treasury: Regional Development Profile 2013
Annual Report 2014/2015 14
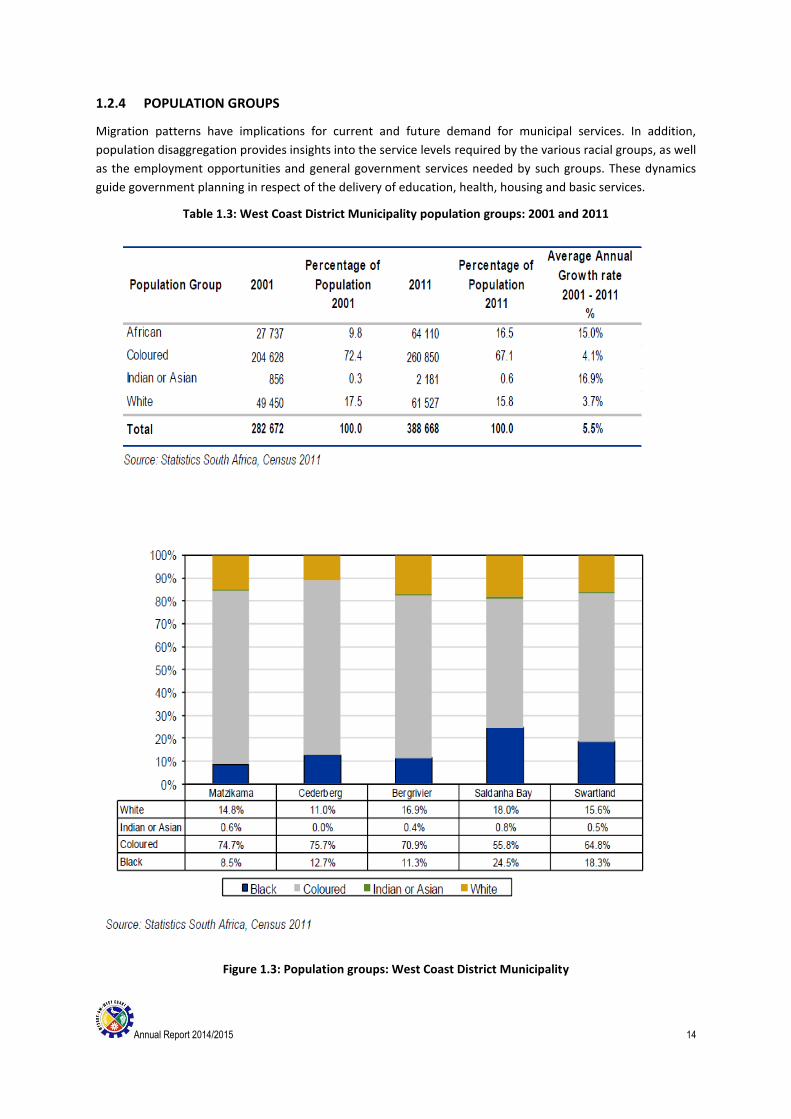
1.2.4 POPULATION GROUPS
Migration patterns have implications for current and future demand for municipal services. In addition,
population disaggregation provides insights into the service levels required by the various racial groups, as well
as the employment opportunities and general government services needed by such groups. These dynamics
guide government planning in respect of the delivery of education, health, housing and basic services.
Table 1.3: West Coast District Municipality population groups: 2001 and 2011
Figure 1.3: Population groups: West Coast District Municipality
Annual Report 2014/2015 15
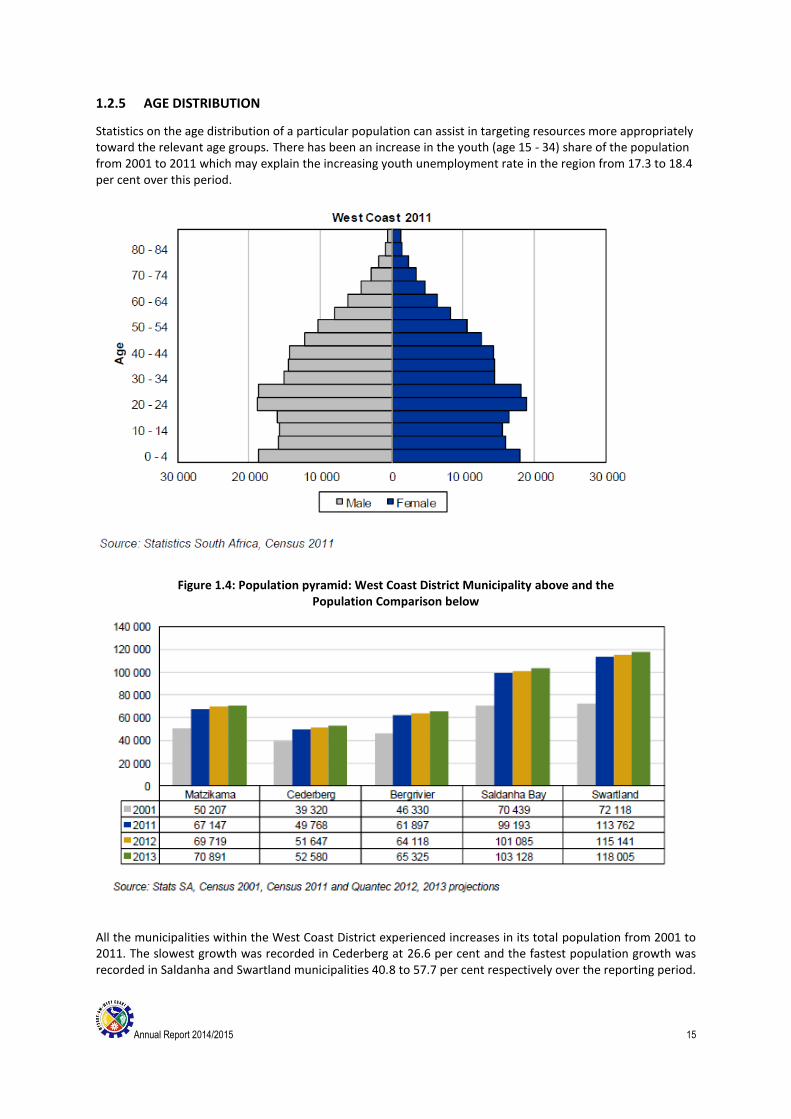
1.2.5 AGE DISTRIBUTION
Statistics on the age distribution of a particular population can assist in targeting resources more appropriately toward the relevant age groups. There has been an increase in the youth (age 15 - 34) share of the population from 2001 to 2011 which may explain the increasing youth unemployment rate in the region from 17.3 to 18.4 per cent over this period.
Figure 1.4: Population pyramid: West Coast District Municipality above and the Population Comparison below
All the municipalities within the West Coast District experienced increases in its total population from 2001 to 2011. The slowest growth was recorded in Cederberg at 26.6 per cent and the fastest population growth was recorded in Saldanha and Swartland municipalities 40.8 to 57.7 per cent respectively over the reporting period.
Annual Report 2014/2015 16
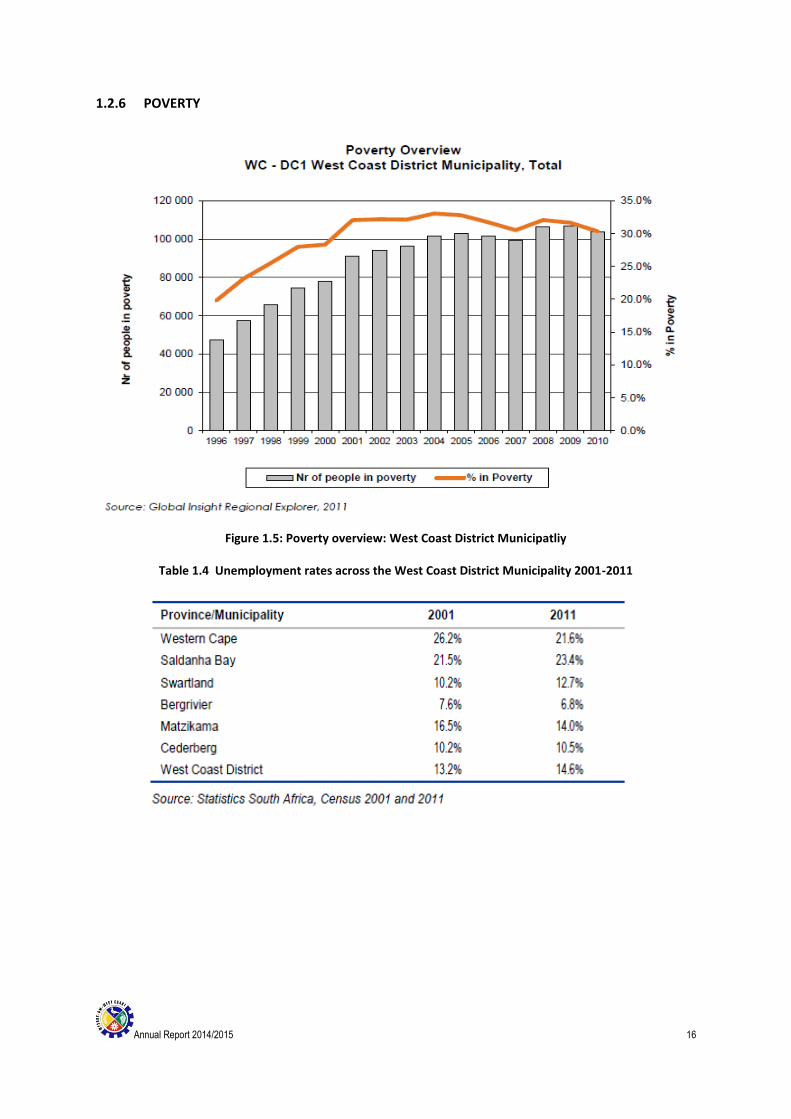
1.2.6 POVERTY
Figure 1.5: Poverty overview: West Coast District Municipatliy
Table 1.4 Unemployment rates across the West Coast District Municipality 2001-2011
Annual Report 2014/2015 17
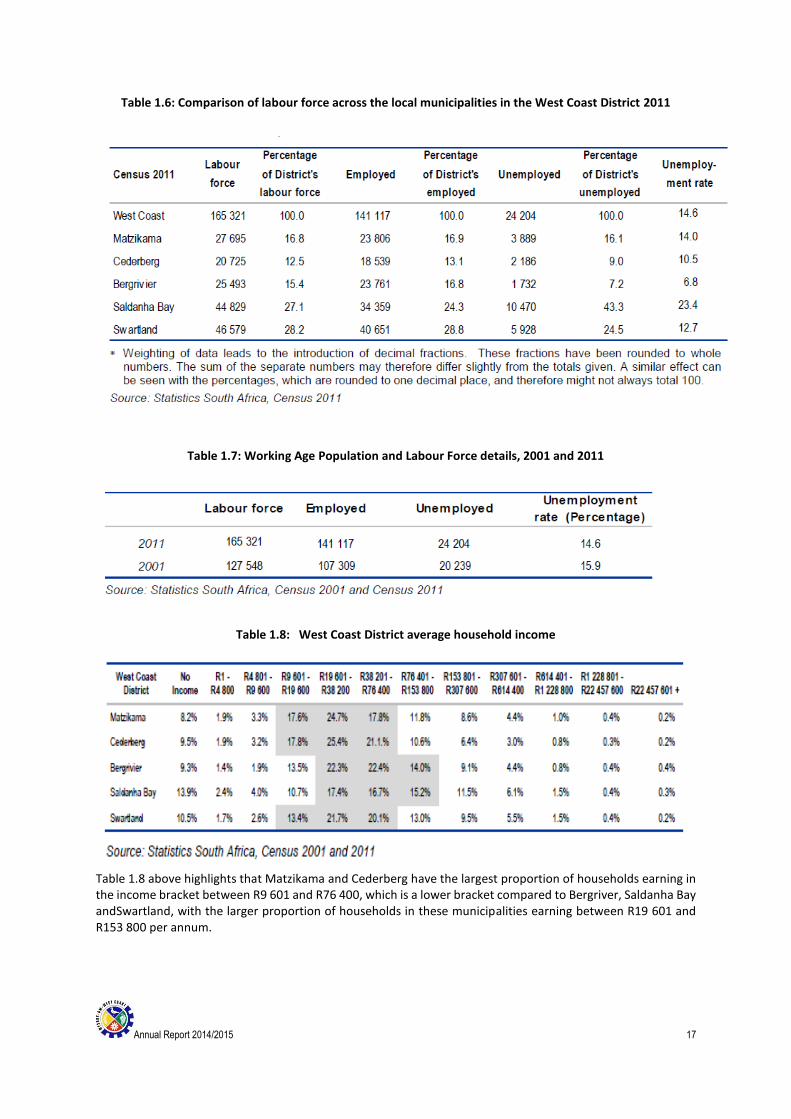
Table 1.6: Comparison of labour force across the local municipalities in the West Coast District 2011
Table 1.7: Working Age Population and Labour Force details, 2001 and 2011
Table 1.8: West Coast District average household income
Table 1.8 above highlights that Matzikama and Cederberg have the largest proportion of households earning in the income bracket between R9 601 and R76 400, which is a lower bracket compared to Bergriver, Saldanha Bay andSwartland, with the larger proportion of households in these municipalities earning between R19 601 and R153 800 per annum.
Annual Report 2014/2015 18
1.3 SERVICE DELIVERY OVERVIEW
1.3.1 INTRODUCTION
The West Coast District Municipality is responsible for the delivery of basic services in terms of bulk water
provision to local municipalities, maintenance of provincial roads on an agency basis for the Western Cape
Department of Transport and Public Works, and spatial planning on a regional basis. No households are provided
with basic services by the District Municipality.
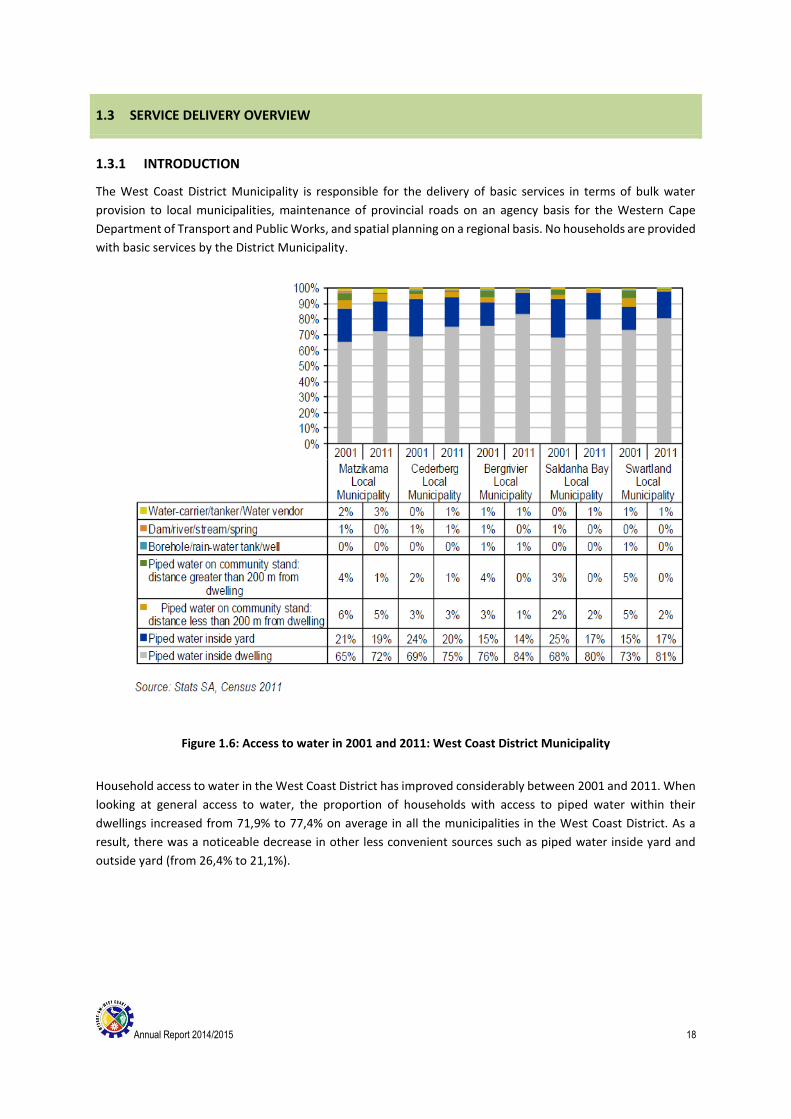
Figure 1.6: Access to water in 2001 and 2011: West Coast District Municipality
Household access to water in the West Coast District has improved considerably between 2001 and 2011. When
looking at general access to water, the proportion of households with access to piped water within their
dwellings increased from 71,9% to 77,4% on average in all the municipalities in the West Coast District. As a
result, there was a noticeable decrease in other less convenient sources such as piped water inside yard and
outside yard (from 26,4% to 21,1%).
Annual Report 2014/2015 19
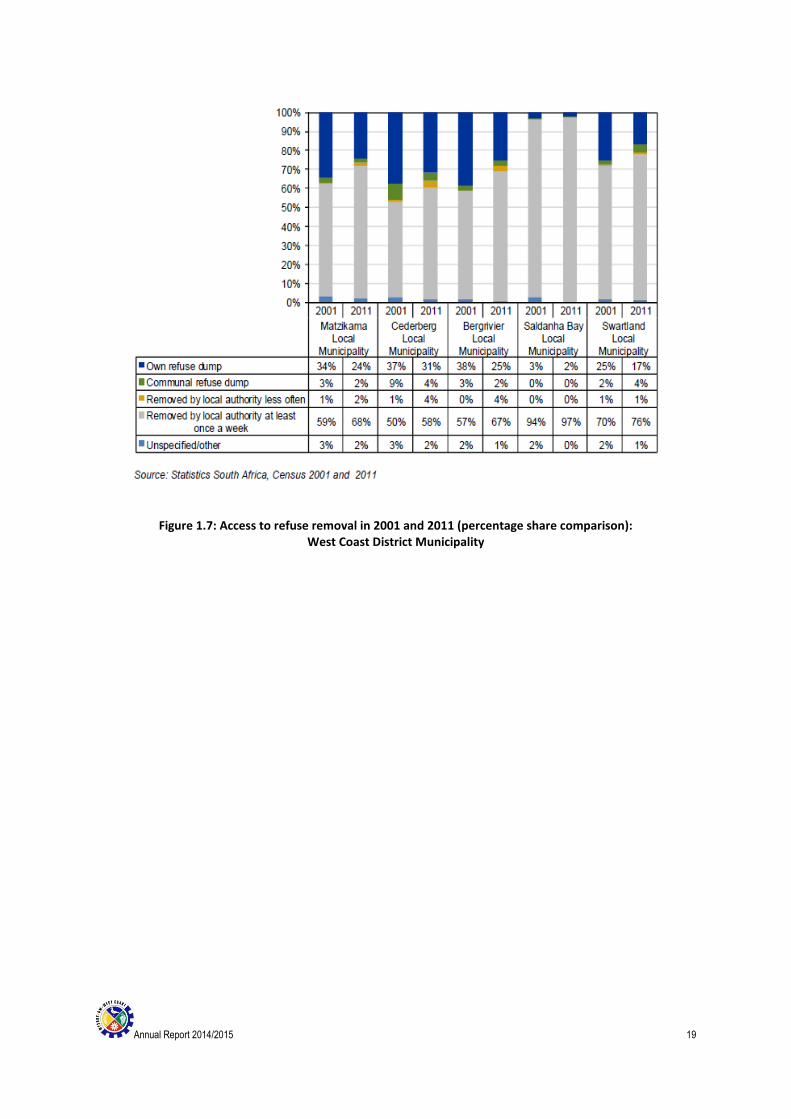
Figure 1.7: Access to refuse removal in 2001 and 2011 (percentage share comparison): West Coast District Municipality
Annual Report 2014/2015 20
1.4 FINANCIAL HEALTH OVERVIEW
1.4.1 INTRODUCTION
The Department Finance is responsible for the management of corporate financial services of the municipality
in order to ensure maximum utilisation of the available financial resources.
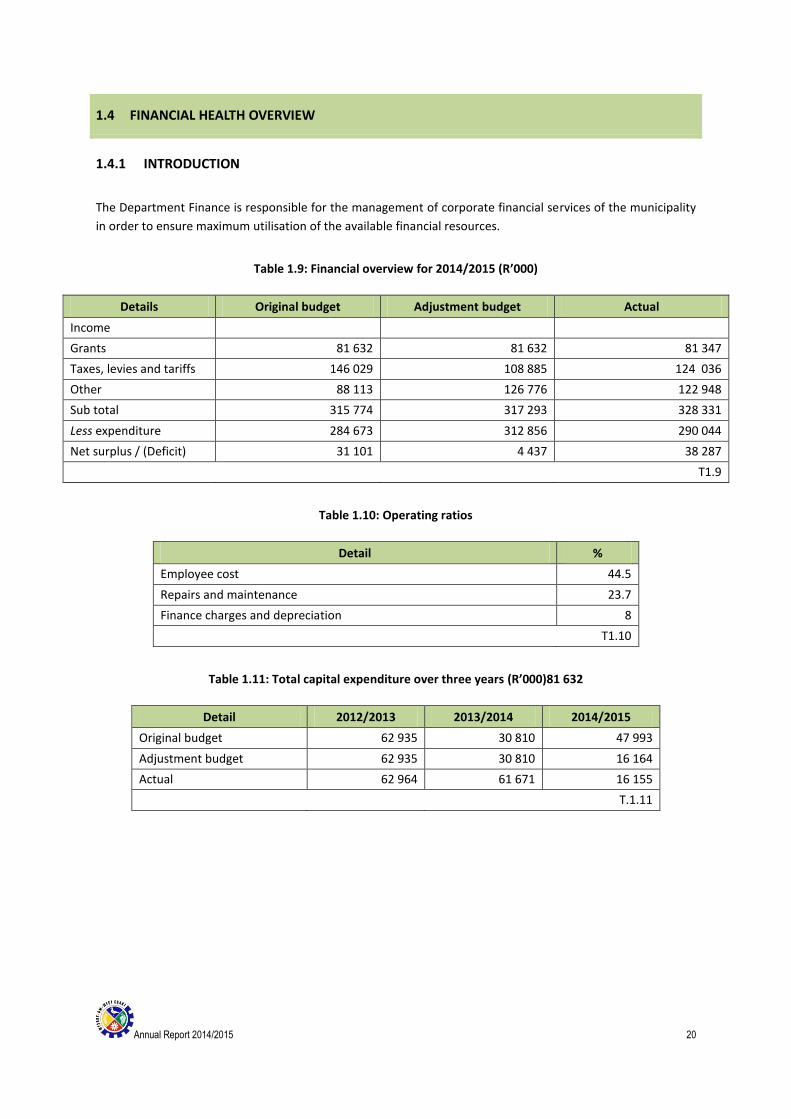
Table 1.9: Financial overview for 2014/2015 (R’000)
Details Original budget Adjustment budget Actual
Income
Grants 81 632 81 632 81 347
Taxes, levies and tariffs 146 029 108 885 124 036
Other 88 113 126 776 122 948
Sub total 315 774 317 293 328 331
Less expenditure 284 673 312 856 290 044
Net surplus / (Deficit) 31 101 4 437 38 287
T1.9
Table 1.10: Operating ratios
Detail %
Employee cost 44.5
Repairs and maintenance 23.7
Finance charges and depreciation 8
T1.10
Table 1.11: Total capital expenditure over three years (R’000)81 632
Detail 2012/2013 2013/2014 2014/2015
Original budget 62 935 30 810 47 993
Adjustment budget 62 935 30 810 16 164
Actual 62 964 61 671 16 155
T.1.11
Annual Report 2014/2015 21
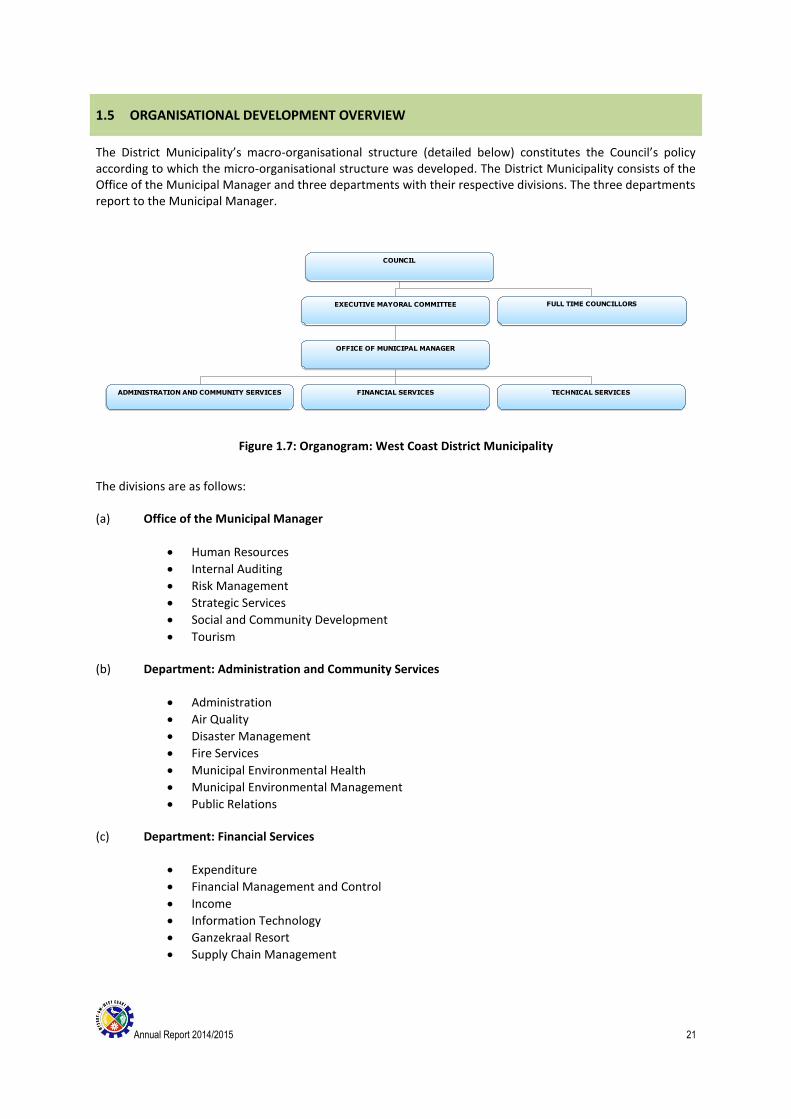
1.5 ORGANISATIONAL DEVELOPMENT OVERVIEW
The District Municipality’s macro-organisational structure (detailed below) constitutes the Council’s policy according to which the micro-organisational structure was developed. The District Municipality consists of the Office of the Municipal Manager and three departments with their respective divisions. The three departments report to the Municipal Manager.
Figure 1.7: Organogram: West Coast District Municipality
The divisions are as follows: (a) Office of the Municipal Manager
Human Resources
Internal Auditing
Risk Management
Strategic Services
Social and Community Development
Tourism (b) Department: Administration and Community Services
Administration
Air Quality
Disaster Management
Fire Services
Municipal Environmental Health
Municipal Environmental Management
Public Relations (c) Department: Financial Services
Expenditure
Financial Management and Control
Income
Information Technology
Ganzekraal Resort
Supply Chain Management
COUNCIL
EXECUTIVE MAYORAL COMMITTEE
OFFICE OF MUNICIPAL MANAGER
ADMINISTRATION AND COMMUNITY SERVICES FINANCIAL SERVICES TECHNICAL SERVICES
FULL TIME COUNCILLORS
Annual Report 2014/2015 22
(d) Department: Infrastructure Services
Civil Engineering Projects
Mechanical Workshops
Roads Construction and Maintenance
Town and Regional Planning
Water Purification
Water Distribution The respective departments are responsible for the following functions: (a) Office of the Municipal Manager
Employment Equity
Employment Assistance Programme
Human Resource Development
Integrated Development Programmes /Local Economic Development
Internal Auditing
Internal Audit Risk Management
Occupational Health and Safety
Labour Relations
Organisational and Workstudy
Social and Community Development
Strategic Management
Strategic Programmes
Tourism Marketing and Development
Training and Development (b) Department: Administration and Community Services
Administrative support services
Air Quality Control
Archive services
Cleaning services
Disaster Management
Environmental Management
Fire and Rescue services
Legal Support services
Municipal Environmental Health
Public Relations
Reprographic services
Secretariat services (c) Department: Financial Services
Asset control
Budget Control
Expenditure Control
Financial Statements
Information Technology
Resort management
Revenue (Income)
Annual Report 2014/2015 23
Supply Chain Management (d) Department: Infrastructure Services
Building maintenance
Bulk water supply
Construction of Roads
Maintenance of Roads
Mechanical workshops
Project management
Technical support (electrical, instrumentation, etc.)
Town and Regional Planning
Water purification
Annual Report 2014/2015 24
1.6 AUDITOR-GENERAL REPORT
During the 2011/2012, 2012/2013 and 2013/2014 financial years, a Clean Audit reports was obtained.
1.6.1 COMMITMENT TO CLEAN AUDIT TARGET
The West Coast District Municipality achieved a clean audit for the three financial years and strived to sustain
the audit opinion/outcome, which resulted in the clean audit in the following year.
1.6.1.1 POLITICAL COMMITMENT TO SUSTAINING CLEAN AUDIT OPINION
The mayor leads the commitment to improve and sustain good governance.
All councillors are committed and understand their oversight role (training initiatives).
A positive environment has been created for administration to focus on implementation.
1.6.1.2 LEVEL OF PROGRESS MADE
a) IT controls
Considerable amount of resources has been invested in IT technology to prepare for the Municipal
Standard Charts of Accounts (MSCOA) as required by National Treasury for implementation 1 July 2017.
Implementation.
Formal controls over the IT systems have still been a top priority for management during the current
year to ensure the reliability of the systems and the availability, accuracy and protection of information.
b) Milestones achieved
Management has developed and monitored the implementation of an action plans to address internal
control deficiencies identified by internal audit and the auditor general.
Management has prepared regular, accurate and complete financial and performance reports that are supported and evidenced by reliable information.
Reviewed and monitored compliance with applicable legislation related to financial and performance management.
Annual Report 2014/2015 25
1.7 STATUTORY ANNUAL REPORT PROCESS
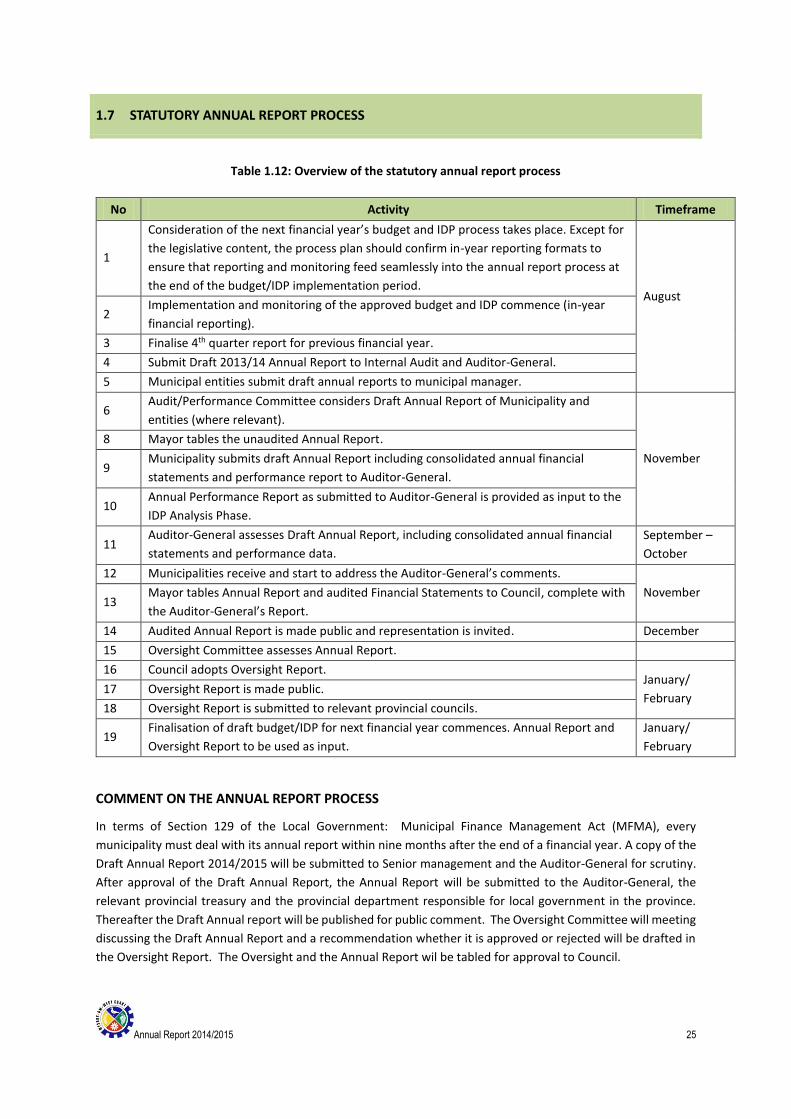
Table 1.12: Overview of the statutory annual report process
No Activity Timeframe
1
Consideration of the next financial year’s budget and IDP process takes place. Except for
the legislative content, the process plan should confirm in-year reporting formats to
ensure that reporting and monitoring feed seamlessly into the annual report process at
the end of the budget/IDP implementation period. August
2 Implementation and monitoring of the approved budget and IDP commence (in-year
financial reporting).
3 Finalise 4th quarter report for previous financial year.
4 Submit Draft 2013/14 Annual Report to Internal Audit and Auditor-General.
5 Municipal entities submit draft annual reports to municipal manager.
6 Audit/Performance Committee considers Draft Annual Report of Municipality and
entities (where relevant).
November
8 Mayor tables the unaudited Annual Report.
9 Municipality submits draft Annual Report including consolidated annual financial
statements and performance report to Auditor-General.
10 Annual Performance Report as submitted to Auditor-General is provided as input to the
IDP Analysis Phase.
11 Auditor-General assesses Draft Annual Report, including consolidated annual financial
statements and performance data.
September –
October
12 Municipalities receive and start to address the Auditor-General’s comments.
November 13
Mayor tables Annual Report and audited Financial Statements to Council, complete with
the Auditor-General’s Report.
14 Audited Annual Report is made public and representation is invited. December
15 Oversight Committee assesses Annual Report.
16 Council adopts Oversight Report. January/
February 17 Oversight Report is made public.
18 Oversight Report is submitted to relevant provincial councils.
19 Finalisation of draft budget/IDP for next financial year commences. Annual Report and
Oversight Report to be used as input.
January/
February
COMMENT ON THE ANNUAL REPORT PROCESS
In terms of Section 129 of the Local Government: Municipal Finance Management Act (MFMA), every
municipality must deal with its annual report within nine months after the end of a financial year. A copy of the
Draft Annual Report 2014/2015 will be submitted to Senior management and the Auditor-General for scrutiny.
After approval of the Draft Annual Report, the Annual Report will be submitted to the Auditor-General, the
relevant provincial treasury and the provincial department responsible for local government in the province.
Thereafter the Draft Annual report will be published for public comment. The Oversight Committee will meeting
discussing the Draft Annual Report and a recommendation whether it is approved or rejected will be drafted in
the Oversight Report. The Oversight and the Annual Report wil be tabled for approval to Council.
Annual Report 2014/2015 26
CHAPTER 2 – GOVERNANCE
COMPONENT A: POLITICAL AND ADMINISTRATIVE GOVERNANCE 2.1 POLITICAL GOVERNANCE
2.1.1 OVERVIEW: COMPREHENSIVE POLITICAL OVERSIGHT WITHIN THE MUNICIPALITY AT
PRESENT
As committee members have developed or are able to develop specialised skills, the quality of the work done
by them is potentially of a higher standard than that of larger structures. The composition of committees usually
represents all political parties.
Sections 79 and 80 of the Local Government: Municipal Structure Act, Act 117 of 1998 deal with non-executive
and executive committees. Section 79 committees are non-executive committees that may be established for
the effective and efficient performance of any of a municipal council’s functions, or the exercise of any of its
powers, provided that the municipal council determines the functions of a committee and delegates duties and
powers to it. The council must appoint the chairperson, and may authorise a committee to co-opt advisory
members who are not members of the council within the limits determined by the council. The council may also
determine a committee’s procedures.
Section 80 committees are provided to assist the executive committee or executive mayor. If a municipal council
has an executive committee or executive mayor, it may appoint, in terms of Section 79, committees of
councillors to assist the executive committee or executive mayor. Such committees may not in number exceed
the number of members of the executive committee or mayoral committee. The executive committee or
executive mayor appoints a chairperson for each committee from the executive committee or mayoral
committee, and may delegate any powers and duties of the executive committee or executive mayor to the
committee. Section 80 committees must report to the executive committee or executive mayor in accordance
with the directions of the executive committee or executive mayor.
2.1.2 OVERSIGHT COMMITTEE
The Oversight Committee at the West Coast District Municipality is established in terms of Section 79 of the
Municipal Structures Act. Only non-executive members serve on the Oversight Committee.
The Oversight Committee follows the MFMA Circular 32 guideline on the oversight process when considering
the Annual Report and producing the Oversight Report.
The Oversight Committee is responsible for the detailed analysis and review of the Annual Report and then the
drafting of an oversight report that may be taken to full Council for discussion. This committee receives and
reviews made by the public and also seeks inputs from other councillors and council portfolio committees.
The Municipality takes into account all costs of the various mechanisms (such as the Oversight Committee and
other meetings) for reviewing the Annual Report and preparing an oversight report – the cost needs to be
balanced against the need for transparency, good governance practice and accountability, the capacity of the
Municipality and the need for an effective process within the time allowed.
2.1.3 AUDIT COMMITTEE
Section 166(1) of the Municipal Finance Management Act, Act 56 of 2003 (MFMA) states “that each municipality
or municipal entity must have an Audit Committee”, and Section 166(4) (a) of the MFMA states that “an Audit
Committee must consist of at least three persons with appropriate experience”. The Audit Committee is an
Annual Report 2014/2015 27
independent advisory body and presently consists of five members who are appointed by the Council. With
reference to the West Coast District Municipality Audit Charter, the Committee assists the Council by providing
inputs to ensure effective systems that complement service delivery, the safeguarding of municipal assets, and
the maintenance of financial records, risk management, corporate governance and an effective internal control
system. The Audit Committee also investigates matters within the scope of the Committee’s duties if referred
to by Council or the municipal manager.
Furthermore, the Audit Committee provides independent specialist advice on financial performance, efficiency
and effectiveness, performance management and compliance with legislation.
2.1.4 MUNICIPAL PUBLIC ACCOUNTS COMMITTEE (MPAC)
The purpose of the MPAC is to serve as an oversight committee to exercise oversight over the executive
obligations of council. The MPAC will assist council to hold the executive to account, and to ensure the efficient
and effective use of municipal resources. By so doing, the MPAC will help to increase council and public
awareness of the financial and performance issues of the municipality.
The MPAC is established in terms of section 79 of the MSA and performs an oversight function on behalf of
council and is not a duplication of other committees of council, such as the Audit Committee.
The MPAC may engage directly with the public and consider public comments when received and will be entitled
to request for documents or evidence from the accounting officer. The MPAC will report to council on the
activities of the committee. The report must include detail of its activities of the preceding and current financial
years, the number of meetings held, the membership of the committee and key resolutions taken in the annual
report.
Annual Report 2014/2015 28
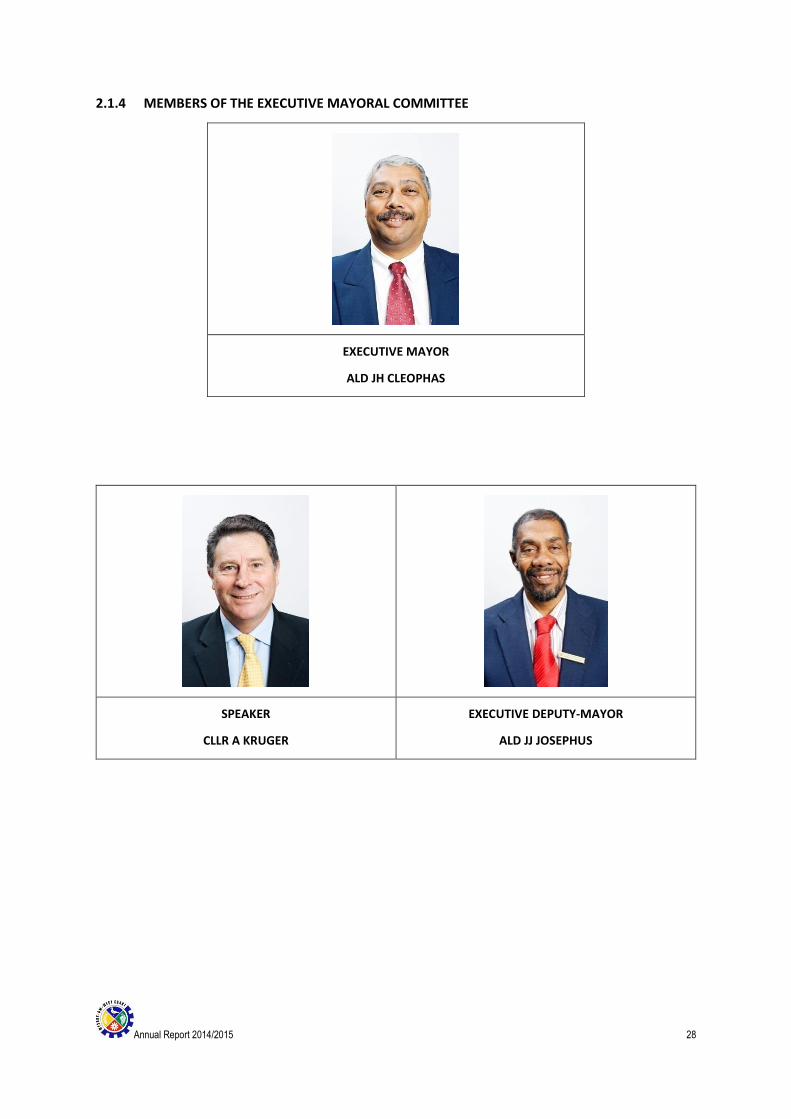
2.1.4 MEMBERS OF THE EXECUTIVE MAYORAL COMMITTEE
EXECUTIVE MAYOR
ALD JH CLEOPHAS
SPEAKER
CLLR A KRUGER
EXECUTIVE DEPUTY-MAYOR
ALD JJ JOSEPHUS
Annual Report 2014/2015 29
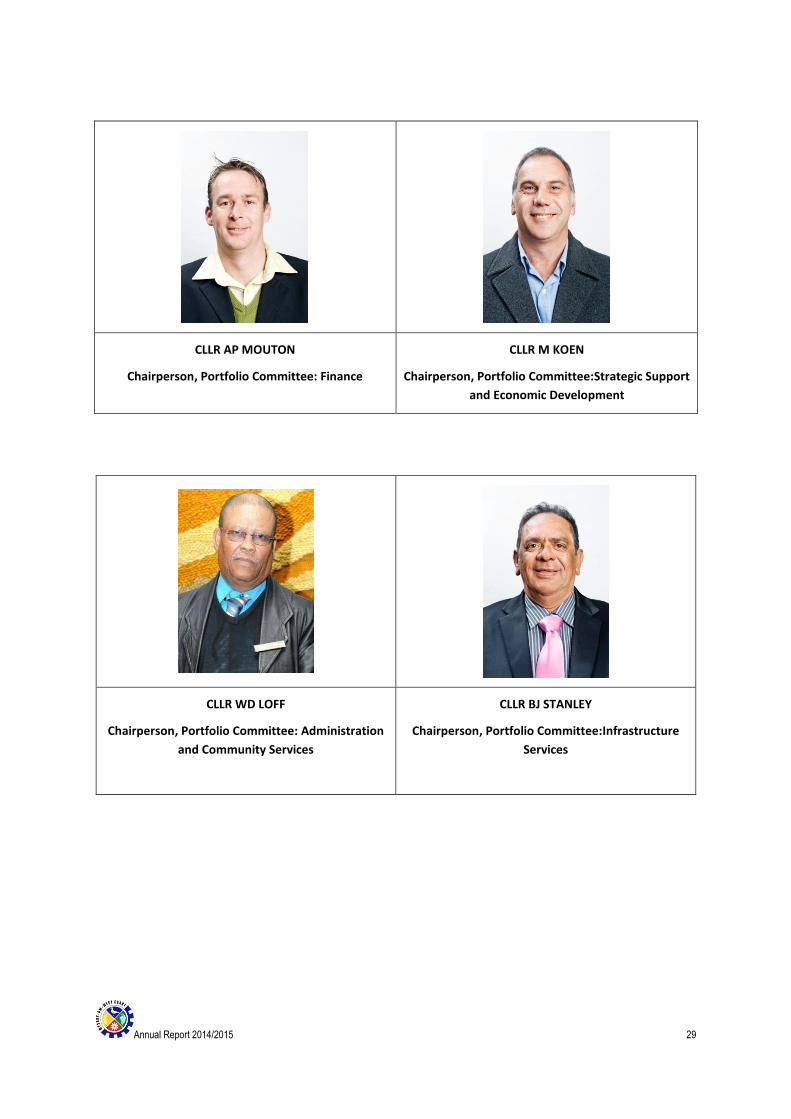
CLLR AP MOUTON
Chairperson, Portfolio Committee: Finance
CLLR M KOEN
Chairperson, Portfolio Committee:Strategic Support
and Economic Development
CLLR WD LOFF
Chairperson, Portfolio Committee: Administration
and Community Services
CLLR BJ STANLEY
Chairperson, Portfolio Committee:Infrastructure
Services
Annual Report 2014/2015 30
2.1.4 FUNCTION: EXECUTIVE AUTHORITY AND COUNCIL
The West Coast District Municipality consists of 24 councillors of which 40% have been directly elected
(proportional). Of the remaining representation, 60% are members who have been elected from the
municipalities within the District Municipality’s area of jurisdiction.
The 60% are representatives from the following municipalities:
Swartland Municipality 4 representatives
Cederberg Municipality 2 representatives
Bergrivier Municipality 2 representatives
Saldanha Bay Municipality 4 representatives
Matzikama Municipality 2 representatives
The Mayoral Committee consists of the chairs of the respective portfolio committees which have been
established in terms of Section 80 of the Local Government: Municipal Structures Act (117 of 1998).
Mayor Ald JH Cleophas
Deputy mayor Ald JJ Josephus
Speaker Cllr A Kruger
The Section 80 committees advise and make recommendations to the Executive Mayoral Committee and
Council.
The following Section 80 committees have been established and the chairs of these committees are as follows:
Portfolio Committee: Strategic Support and
Economic Development
Cllr M Koen
Portfolio Committee: Finance Cllr AP Mouton
Portfolio Committee: Administration and
Community Services
Cllr WD Loff
Portfolio Committee: Infrastructure Services Cllr B Stanley
Members of the Council are as follows:
Speaker Cllr A Kruger DA Saldanha Bay Municipality
Executive Mayor Ald JH Cleophas DA Swartland Municipality
Executive Mayoral Committee Ald JJ Josephus DA West Coast District Municipality
Executive Mayoral Committee Cllr M Koen DA West Coast District Municipality
Executive Mayoral Committee Cllr AP Mouton DA West Coast District Municipality
Executive Mayoral Committee Cllr WD Loff DA West Coast District Municipality
Executive Mayoral Committee Cllr BJ Stanley DA Swartland Municipality
Annual Report 2014/2015 31
Councillors
Cllr J Swart ANC West Coast District Municipality
Cllr R Skei ANC West Coast District Municipality
Ald E Plaatjies ANC West Coast District Municipality
Cllr NG Delport ANC West Coast District Municipality
Cllr CH Heyns DA West Coast District Municipality
Cllr WD Loff DA West Coast District Municipality
Cllr MR Smit DA West Coast District Municipality
Cllr CJ Snyders DA Bergrivier Municipality
Cllr SR Claasen ANC Bergrivier Municipality
Cllr J Barnard DA Cederberg Municipality
Cllr JJ Fransman ANC Cederberg Municipality
Cllr EL Mqingi ANC Matzikama Municipality
Cllr A Sindyamba DA Matzikama Municipality
Ald JJ Cillie DA Saldanha Bay Municipality
Cllr ST Vries DA Saldanha Bay Municipality
Ald NV Mgoqi ANC Saldanha Bay Municipality
Ald NJA Rust DA Swartland Municipality
Cllr NS Zatu ANC Swartland Municipality
The Council meets once per quarter. The Council has delegated all its powers and functions (except those
functions which, according to law, cannot be delegated) also to the executive mayor. In this way, effective
service delivery can be accelerated.
See Appendix A where a list of Councillors may be found, as well as committee allocations and council meeting
attendance figures.
See Appendix B which sets out committees and committee purposes.
Annual Report 2014/2015 32
2.2 ADMINISTRATIVE GOVERNANCE
2.2.1 INTRODUCTION
In terms of Section 60(b) of the MFMA, the municipal manager of a municipality is the accounting officer of the
municipality for the purposes of this act and must provide guidance on compliance with this act to political
structures, political office bearers, and officials of the municipality and any entity under the sole or shared
control of the municipality.
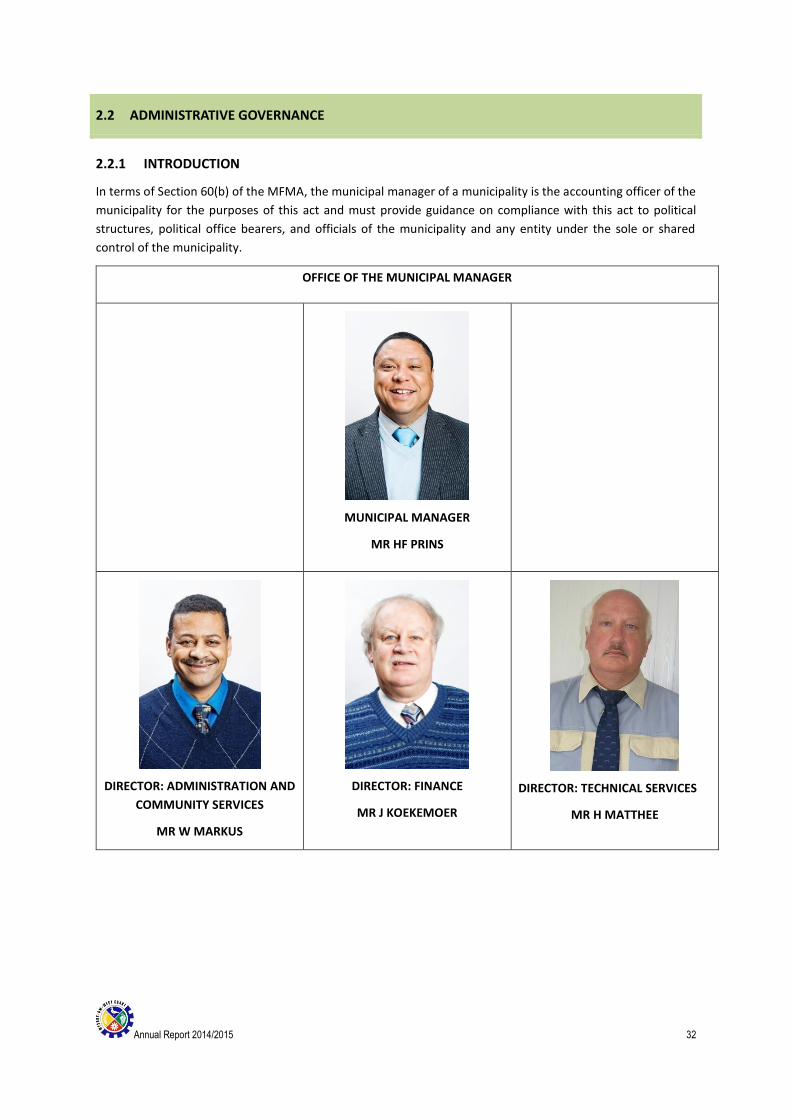
OFFICE OF THE MUNICIPAL MANAGER
MUNICIPAL MANAGER
MR HF PRINS
DIRECTOR: ADMINISTRATION AND
COMMUNITY SERVICES
MR W MARKUS
DIRECTOR: FINANCE
MR J KOEKEMOER
DIRECTOR: TECHNICAL SERVICES
MR H MATTHEE
Annual Report 2014/2015 33
COMPONENT B: INTERGOVERNMENTAL RELATIONS
2.3 INTERGOVERNMENTAL RELATIONS
2.3.1 NATIONAL INTERGOVERNMENTAL STRUCTURES
IDP Managers’ Forum
LED Managers’ Forum
Various South African Local Government Association (SALGA) national working groups
2.3.2 PROVINCIAL INTERGOVERNMENTAL STRUCTURES
Premier’s Co-ordinating Forum
Technical Committee
Western Cape Municipal Manager’s Forum
Chief Financial Officer’s Forum
Provincial IDP Managers’ Forum
LED Managers’ Forum
Various SALGA provincial working groups
Provincial Public Participation Forum
Others
2.3.3 RELATIONSHIPS WITH MUNICIPAL ENTITIES
No municipal entities
2.3.4 DISTRICT INTERGOVERNMENTAL STRUCTURES
District Co-ordinating Forum and Technical Committee (Municipal Managers’ Forum)
IDP Co-ordinating Committee
Multi-sectoral Forum
District Safety Forum
Disaster Management Advisory Forum
IDP LED Managers’ Forum incorporating public participation
District Internal Auditors’ Forum
Others
Regular bilateral engagements between district and local municipalities and with the respective provincial and
national sector departments are held.
Annual Report 2014/2015 34
COMPONENT C: PUBLIC ACCOUNTABILITY AND PARTICIPATION
OVERVIEW: PUBLIC ACCOUNTABILITY AND PARTICIPATION
Section S15(b) of the Municipal Systems Act (MSA) requires a municipality to establish and organise its
administration to facilitate and cultivate a culture of accountability among its staff. S16(i) states that a
municipality must develop a system of municipal governance that complements formal representative
governance with a system of participatory governance. S18(i)(d) requires a municipality to supply its community
with information concerning municipal governance, management and development.
COMMENT ON PUBLIC ACCOUNTABILITY
Public participation, accountability and citizen engagement are achieved through a structured process of
targeted public stakeholder engagement. This process is driven in conjunction with all the local municipalities in
the district, using a shared platform of public engagement at the municipal level, and is further enhanced
through direct engagements with the local municipalities in the district. In this regard, priority issues emanating
from the local municipality areas are incorporated into the strategic planning of the District Municipality and,
where applicable, referred to the relevant sector department.
In addition, the West Coast District Municipality promotes and supports district-wide public participation and
the mobilisation of civil society through initiatives aimed at strengthening the functioning of ward structures
throughout the region.
Annual Report 2014/2015 35
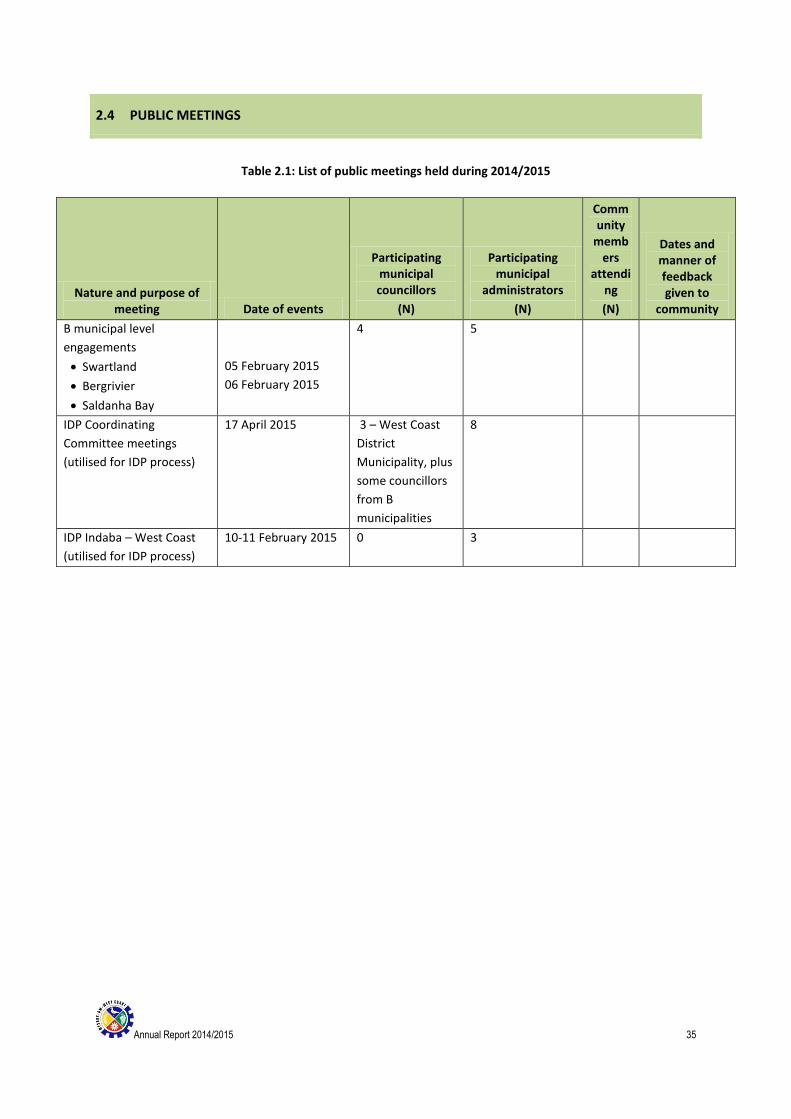
2.4 PUBLIC MEETINGS
Table 2.1: List of public meetings held during 2014/2015
Nature and purpose of meeting Date of events
Participating municipal councillors
(N)
Participating municipal
administrators
(N)
Community
members
attending
(N)
Dates and manner of feedback given to
community
B municipal level
engagements
Swartland
Bergrivier
Saldanha Bay
05 February 2015
06 February 2015
4 5
IDP Coordinating
Committee meetings
(utilised for IDP process)
17 April 2015 3 – West Coast
District
Municipality, plus
some councillors
from B
municipalities
8
IDP Indaba – West Coast
(utilised for IDP process)
10-11 February 2015
0 3
Annual Report 2014/2015 36
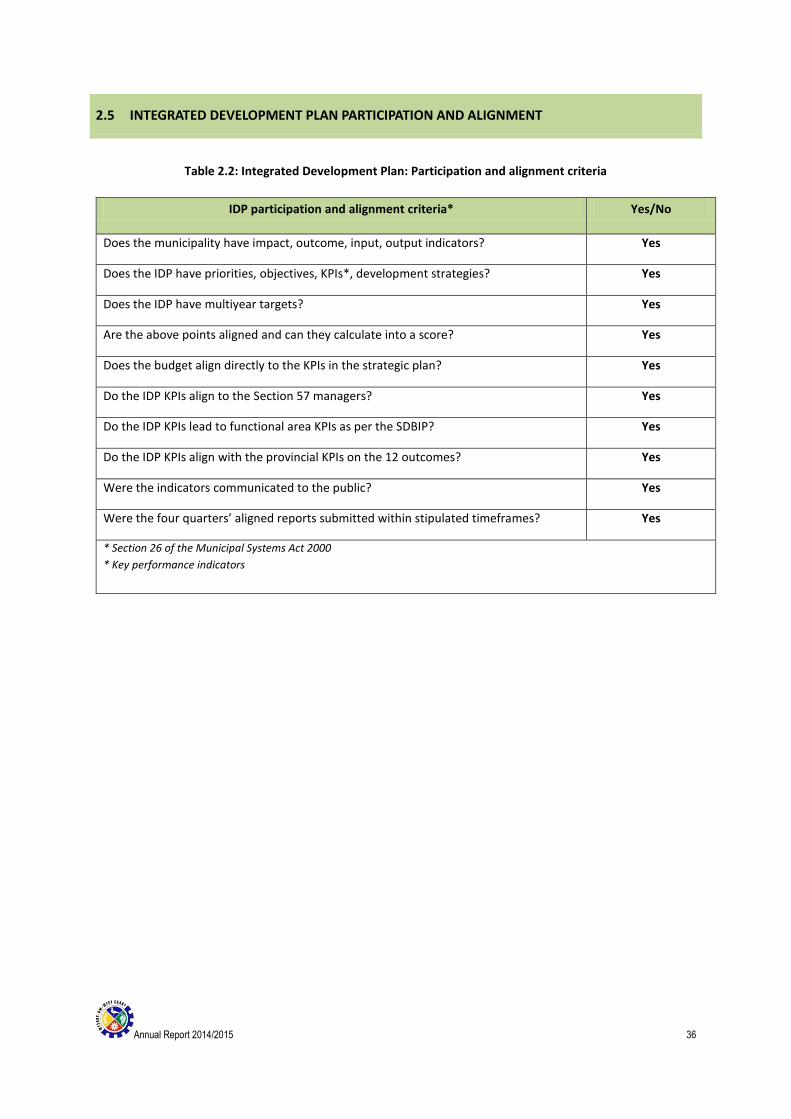
2.5 INTEGRATED DEVELOPMENT PLAN PARTICIPATION AND ALIGNMENT
Table 2.2: Integrated Development Plan: Participation and alignment criteria
IDP participation and alignment criteria* Yes/No
Does the municipality have impact, outcome, input, output indicators? Yes
Does the IDP have priorities, objectives, KPIs*, development strategies? Yes
Does the IDP have multiyear targets? Yes
Are the above points aligned and can they calculate into a score? Yes
Does the budget align directly to the KPIs in the strategic plan? Yes
Do the IDP KPIs align to the Section 57 managers? Yes
Do the IDP KPIs lead to functional area KPIs as per the SDBIP? Yes
Do the IDP KPIs align with the provincial KPIs on the 12 outcomes? Yes
Were the indicators communicated to the public? Yes
Were the four quarters’ aligned reports submitted within stipulated timeframes? Yes
* Section 26 of the Municipal Systems Act 2000
* Key performance indicators
Annual Report 2014/2015 37
COMPONENT D: CORPORATE GOVERNANCE
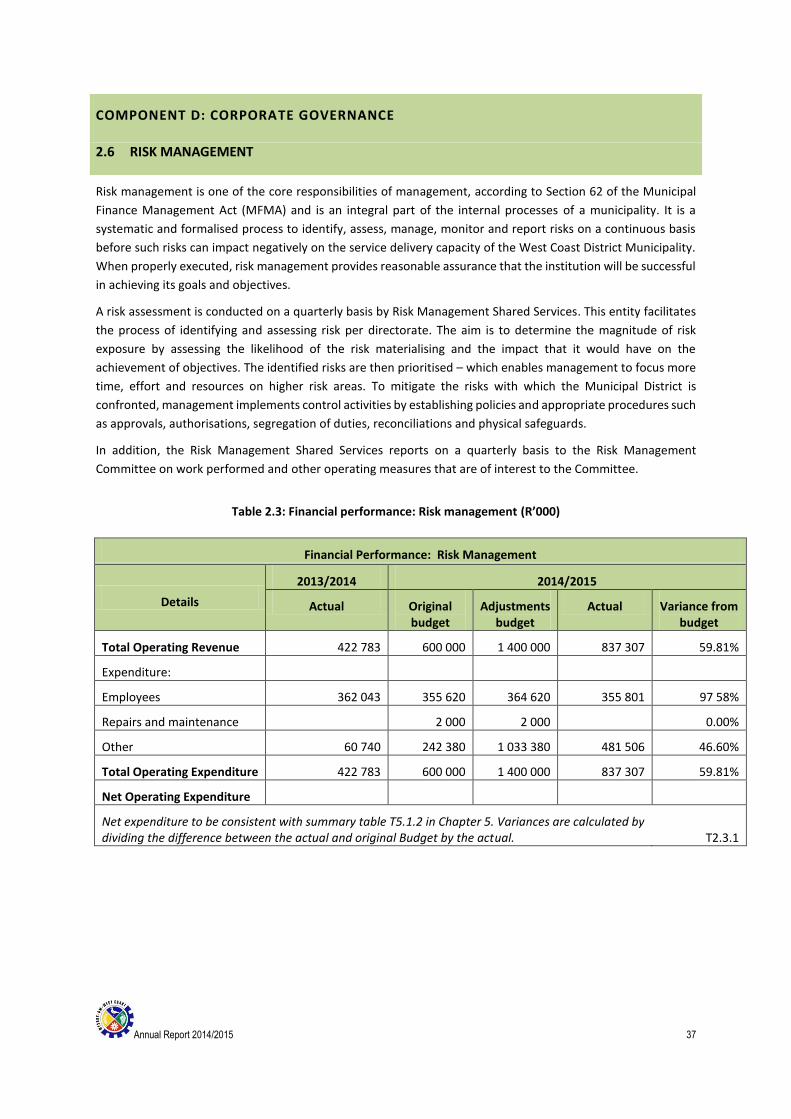
2.6 RISK MANAGEMENT
Risk management is one of the core responsibilities of management, according to Section 62 of the Municipal
Finance Management Act (MFMA) and is an integral part of the internal processes of a municipality. It is a
systematic and formalised process to identify, assess, manage, monitor and report risks on a continuous basis
before such risks can impact negatively on the service delivery capacity of the West Coast District Municipality.
When properly executed, risk management provides reasonable assurance that the institution will be successful
in achieving its goals and objectives.
A risk assessment is conducted on a quarterly basis by Risk Management Shared Services. This entity facilitates
the process of identifying and assessing risk per directorate. The aim is to determine the magnitude of risk
exposure by assessing the likelihood of the risk materialising and the impact that it would have on the
achievement of objectives. The identified risks are then prioritised – which enables management to focus more
time, effort and resources on higher risk areas. To mitigate the risks with which the Municipal District is
confronted, management implements control activities by establishing policies and appropriate procedures such
as approvals, authorisations, segregation of duties, reconciliations and physical safeguards.
In addition, the Risk Management Shared Services reports on a quarterly basis to the Risk Management
Committee on work performed and other operating measures that are of interest to the Committee.
Table 2.3: Financial performance: Risk management (R’000)
Financial Performance: Risk Management
Details
2013/2014 2014/2015
Actual Original budget
Adjustments budget
Actual Variance from budget
Total Operating Revenue 422 783 600 000 1 400 000 837 307 59.81%
Expenditure:
Employees 362 043 355 620 364 620 355 801 97 58%
Repairs and maintenance 2 000 2 000 0.00%
Other 60 740 242 380 1 033 380 481 506 46.60%
Total Operating Expenditure 422 783 600 000 1 400 000 837 307 59.81%
Net Operating Expenditure
Net expenditure to be consistent with summary table T5.1.2 in Chapter 5. Variances are calculated by dividing the difference between the actual and original Budget by the actual. T2.3.1

Annual Report 2014/2015 38
2.7 ANTI-CORRUPTION AND ANTI-FRAUD
2.7.1 ANTI-CORRUPTION AND ANTI-FRAUD STRATEGY
The West Coast District Municipality has adopted a zero tolerance stance when it comes to fraud and corruption
and this is further enhanced by our fraud prevention policy.
Our officials are empowered to report any suspected fraud or corruption anonymously on our national
whistleblowing hotline, 0800 701 701.
For the year under review, we are delighted to report that no instances of suspected fraud or corruption took
place.
2.7.1.1 ANTI-CORRUPTION STRATEGY
The West Coast District Municipality has developed the following policy documents to prevent fraud, corruption
and theft:
Fraud Prevention Plan
Whistleblowing Policy
The documents provide assurance that the West Coast District Municipality has a zero tolerance policy for
fraudulent and corrupt activities. This has led to a fraud- and corruption-free financial year for the West Coast
District Municipality.
Annual Report 2014/2015 39
2.8 SUPPLY CHAIN MANAGEMENT (APPENDIX I)
West Coast District Municipalty adopted and approved her SCM Policy on 14 December 2005.
An assessment of the Municipality’s SCM policy was conducted by the Provincial Treasury in November 2010.
Recommendations were provided to the municipality in order to align the policy to the regulatory framework. The neccessary amendments was made and the the amended policy was submitted to Provincial Treasury for scrutiny and to determine its consistency with the Supply Chain Management legislation.
The assessment of the amended SCM policy by Provincial Treasury was very satisfactory with minor recommendations. The reviewed SCM Policy was adopted by Council on 30 November 2011.
Regulation 3 of the Supply Chain Management Policy of the West Coast District Municipality determines that each Municipality must annually review and if necessary, amend it Supply Chain Management Policy.
The Supply Chain Management Policy was again reviewed and amended with the newest Supply Chain Management prescripts and practices. The new reviewed SCM Policy was adopted by Council on
5 December 2012.
The SCM Policy of 5 December 2012 was submitted to Provincial Treasury for scrutiny and to determine its consistency with the Supply Chain Management legislation as contained in the MFMA and the SCM Regulations as well as alignment to the SCM Model Policy and SCM guidelines.
Provincial Treasury responded on 25 October 2013 and found: a) The Municipality’s SCM Policy is of sound quality and closely to the Model Policy, b) Paragraph and sub paragraph numbers are correctly numbered and are all in proper order, c) The policy document is free from spelling and grammatical errors.
Provincial Treasury’s minor findings on the assessed SCM Policy was refined and considered in the next amendment of the Supply Chain Management Policy to be tabled at the next Council meeting.
The Supply Chain Management Policy was again amended with the newest Supply Chain Management prescripts and practices. The new reviewed SCM Policy was adopted by Council on14 August 2014.
The West Coast District Municipality has established a Supply Chain Management Unit in line with the SCM Policy
The SCM Manager reports directly to the Chief Financial Officer.
The calling of tenders is an integral part of SCM, as legislation compels public institutions to follow prescribed processes. A thorough knowledge of the different phases of SCM and accompanying procedures is therefore necessary to ensure that officials procure goods and services timeleuosly and according to the requested requirements.
The Accounting Officer has approved the various Bid Committees which is fully operational. The Municipality ensures that the SCM processes is fair, transparent, equitable, competitive and cost effective.
Annual Report 2014/2015 40
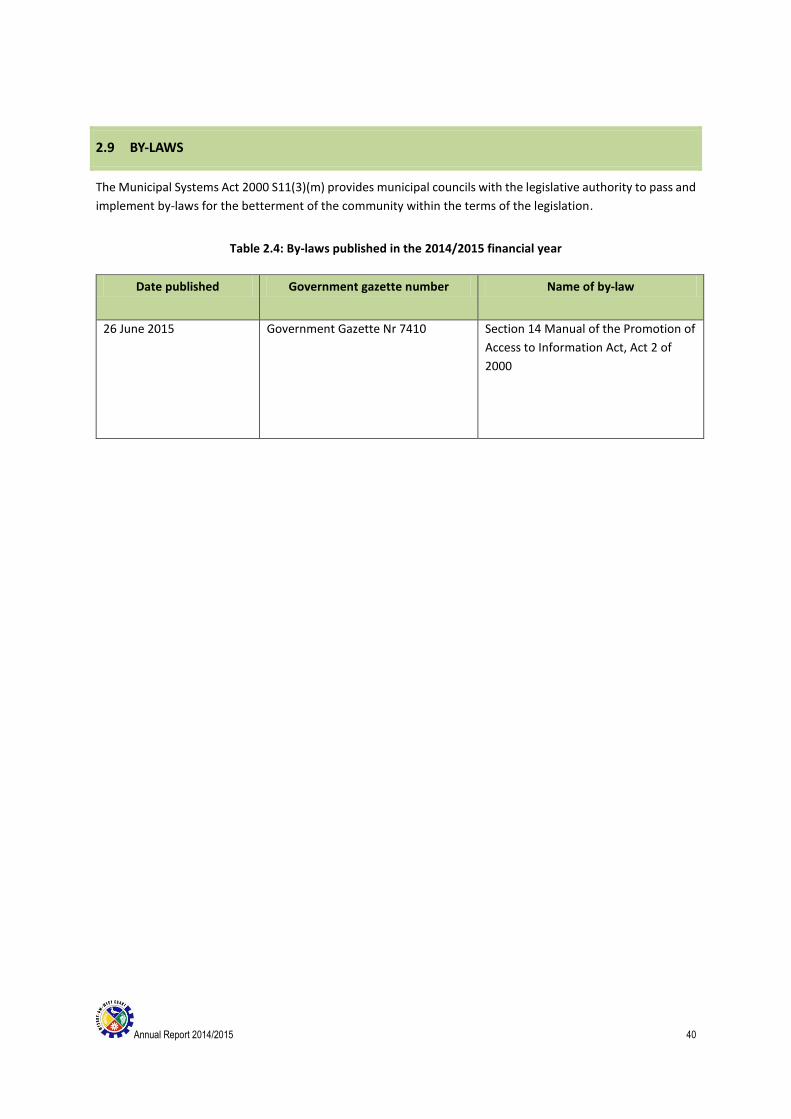
2.9 BY-LAWS
The Municipal Systems Act 2000 S11(3)(m) provides municipal councils with the legislative authority to pass and
implement by-laws for the betterment of the community within the terms of the legislation.
Table 2.4: By-laws published in the 2014/2015 financial year
Date published Government gazette number Name of by-law
26 June 2015 Government Gazette Nr 7410
Section 14 Manual of the Promotion of
Access to Information Act, Act 2 of
2000
Annual Report 2014/2015 41
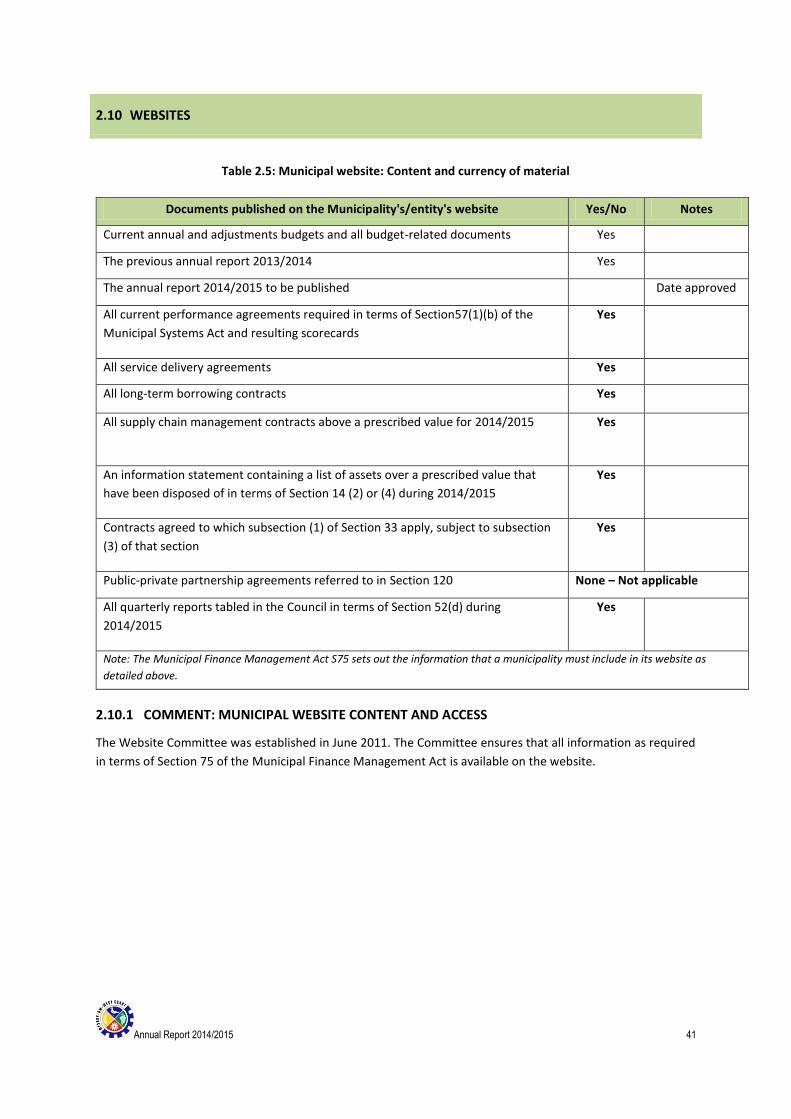
2.10 WEBSITES
Table 2.5: Municipal website: Content and currency of material
Documents published on the Municipality's/entity's website Yes/No Notes
Current annual and adjustments budgets and all budget-related documents Yes
The previous annual report 2013/2014 Yes
The annual report 2014/2015 to be published Date approved
All current performance agreements required in terms of Section57(1)(b) of the
Municipal Systems Act and resulting scorecards
Yes
All service delivery agreements Yes
All long-term borrowing contracts Yes
All supply chain management contracts above a prescribed value for 2014/2015 Yes
An information statement containing a list of assets over a prescribed value that
have been disposed of in terms of Section 14 (2) or (4) during 2014/2015
Yes
Contracts agreed to which subsection (1) of Section 33 apply, subject to subsection
(3) of that section
Yes
Public-private partnership agreements referred to in Section 120 None – Not applicable
All quarterly reports tabled in the Council in terms of Section 52(d) during
2014/2015
Yes
Note: The Municipal Finance Management Act S75 sets out the information that a municipality must include in its website as
detailed above.
2.10.1 COMMENT: MUNICIPAL WEBSITE CONTENT AND ACCESS
The Website Committee was established in June 2011. The Committee ensures that all information as required
in terms of Section 75 of the Municipal Finance Management Act is available on the website.
Annual Report 2014/2015 42
CHAPTER 3 – SERVICE DELIVERY PERFORMANCE
(PERFORMANCE REPORT PART I)
COMPONENT A: BASIC SERVICES
INTRODUCTION
The West Coast District Municipality is responsible for the delivery of basic services in terms of bulk water
provision to local municipalities, maintenance of provincial roads on an agency basis for the Western Cape
Department of Transport and Public Works, and spatial planning and planning on a regional basis. No households
are provided with basic services by the District Municipality.
3.1 WATER PROVISION
3.1.1 INTRODUCTION
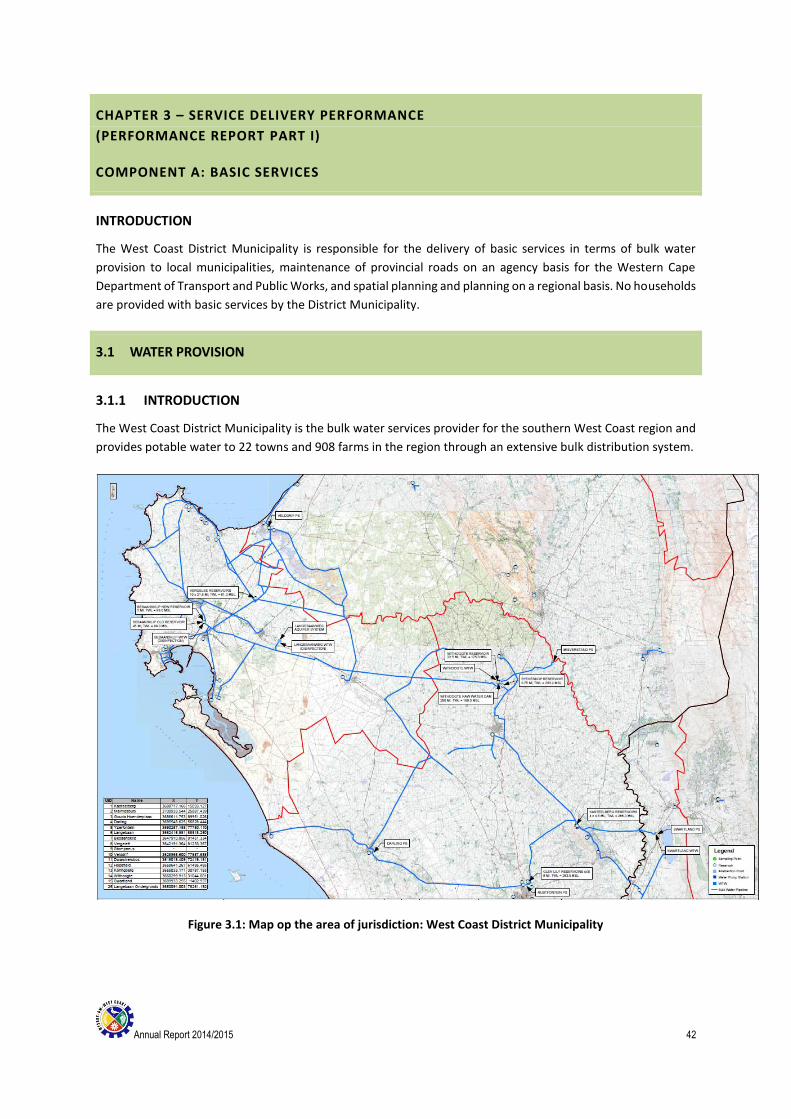
The West Coast District Municipality is the bulk water services provider for the southern West Coast region and
provides potable water to 22 towns and 908 farms in the region through an extensive bulk distribution system.
Figure 3.1: Map op the area of jurisdiction: West Coast District Municipality
Annual Report 2014/2015 43
The system consists of the Swartland Scheme in the south of the region, and the Management Scheme in the
north. The Swartland Scheme supplies bulk water from the Voëlvlei Dam via the Voëlvlei Water Treatment Works
to the towns of Hermon and Gouda in the Drakenstein Municipal area, and to the towns of Riebeek West,
Riebeek Kasteel, Malmesbury (including Chatsworth, Riverlands, Abbotsdale and Kalbaskraal), Darling,
Yzerfontein, Moorreesburg and Koringberg in the Swartland Municipality.
The Misverstand Scheme supplies bulk water from the Misverstand Dam via the Withoogte Water Treatment
Works to the towns of Velddrif and Dwarskersbos in the Berg River Municipality, and to Hopefield, Langebaan,
Saldanha Bay, Vredenburg, Paternoster, St Helena Bay and Stompneusbaai in the Saldanha Bay Municipality.
The Misverstand Scheme is augmented with extraction from the Langebaan Road aquifer at Langebaan Road.
Blue Drop awards were received in the years 2009, 2010, 2011 and 2012 for both these systems, as well as for
the Gouda system. The West Coast District Municipality also received awards for the fourth best blue drop
performance nationally, as well as for the third best provincially. Blue drop evaluation has been done from 2013,
every second year.
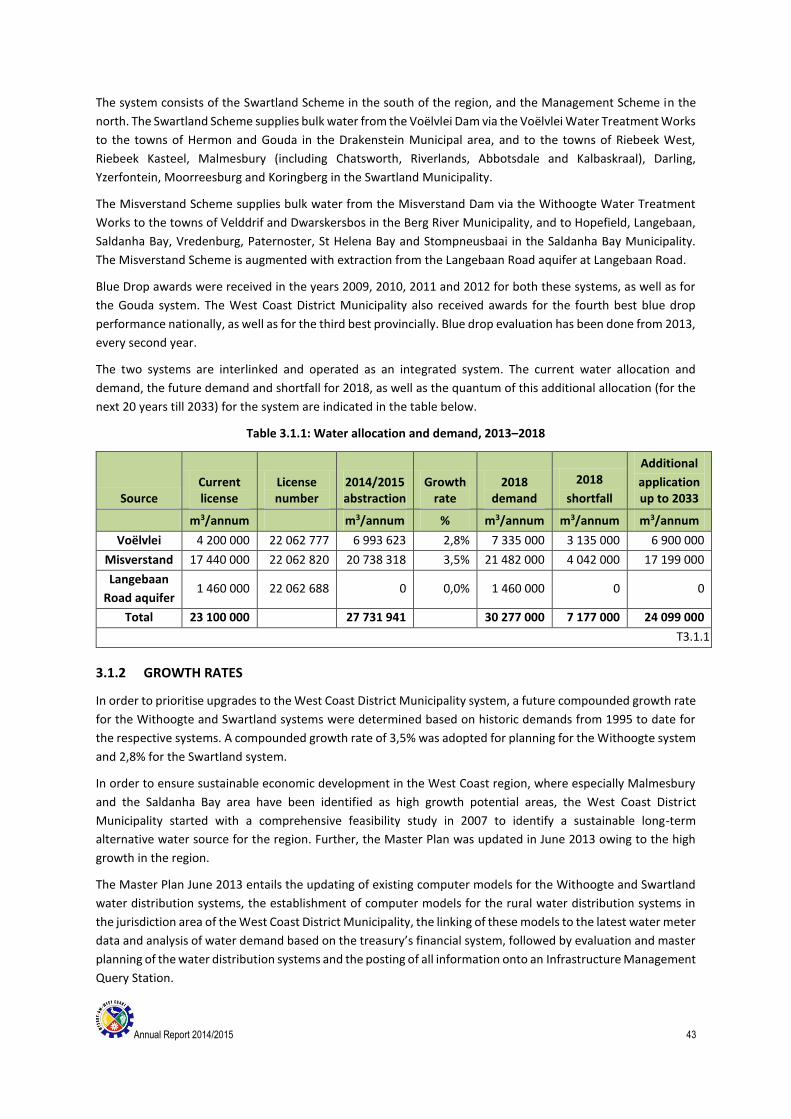
The two systems are interlinked and operated as an integrated system. The current water allocation and
demand, the future demand and shortfall for 2018, as well as the quantum of this additional allocation (for the
next 20 years till 2033) for the system are indicated in the table below.
Table 3.1.1: Water allocation and demand, 2013–2018
Source Current license
License number
2014/2015 abstraction
Growth rate
2018 demand
2018
shortfall
Additional
application up to 2033
m3/annum m3/annum % m3/annum m3/annum m3/annum
Voëlvlei 4 200 000 22 062 777 6 993 623 2,8% 7 335 000 3 135 000 6 900 000
Misverstand 17 440 000 22 062 820 20 738 318 3,5% 21 482 000 4 042 000 17 199 000
Langebaan
Road aquifer 1 460 000 22 062 688 0 0,0% 1 460 000 0 0
Total 23 100 000 27 731 941 30 277 000 7 177 000 24 099 000
T3.1.1
3.1.2 GROWTH RATES
In order to prioritise upgrades to the West Coast District Municipality system, a future compounded growth rate
for the Withoogte and Swartland systems were determined based on historic demands from 1995 to date for
the respective systems. A compounded growth rate of 3,5% was adopted for planning for the Withoogte system
and 2,8% for the Swartland system.
In order to ensure sustainable economic development in the West Coast region, where especially Malmesbury
and the Saldanha Bay area have been identified as high growth potential areas, the West Coast District
Municipality started with a comprehensive feasibility study in 2007 to identify a sustainable long-term
alternative water source for the region. Further, the Master Plan was updated in June 2013 owing to the high
growth in the region.
The Master Plan June 2013 entails the updating of existing computer models for the Withoogte and Swartland
water distribution systems, the establishment of computer models for the rural water distribution systems in
the jurisdiction area of the West Coast District Municipality, the linking of these models to the latest water meter
data and analysis of water demand based on the treasury’s financial system, followed by evaluation and master
planning of the water distribution systems and the posting of all information onto an Infrastructure Management
Query Station.
Annual Report 2014/2015 44
3.1.3 COMMENT: WATER USE BY SECTOR
Bulk water is provided by the West Coast District Municipality to three local municipalities and 908 farms in the
West Coast region.
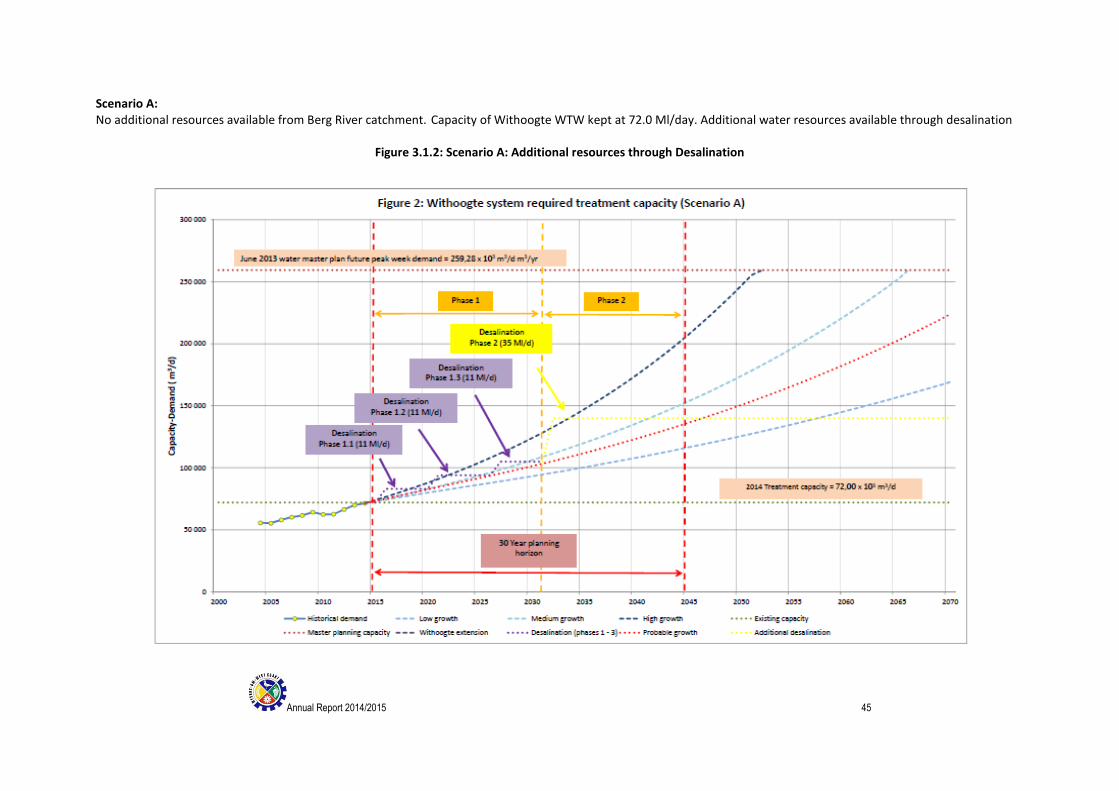
RESOURCE CAPACITY FOR WITHOOGTE SYSTEM Future resources and treatment capacity scenarios for the Withoogte system was investigate for the next 30 years and entails the following 3 scenarios. Scenario A: No additional resources available from Berg River catchment. Capacity of Withoogte WTW kept at 72.0 Ml/day. Additional water resources available through desalination.
Annual Report 2014/2015 45
Scenario A: No additional resources available from Berg River catchment. Capacity of Withoogte WTW kept at 72.0 Ml/day. Additional water resources available through desalination
Figure 3.1.2: Scenario A: Additional resources through Desalination
Annual Report 2014/2015 46
Scenario B:
Additional resources available from Berg River catchment. Upgrades to the Capacity of Withoogte WTW capped
to a capacity of 105 Ml/day (any further extensions to Withoogte WTW will require upgrading of 1100 diameter
raw water pipeline from the Misverstand dam to the Withoogte WTW and the 1100/1200 mm diameter bulk
water pipeline between the Withoogte WTW and the Besaansklip reservoir).
Annual Report 2014/2015 47
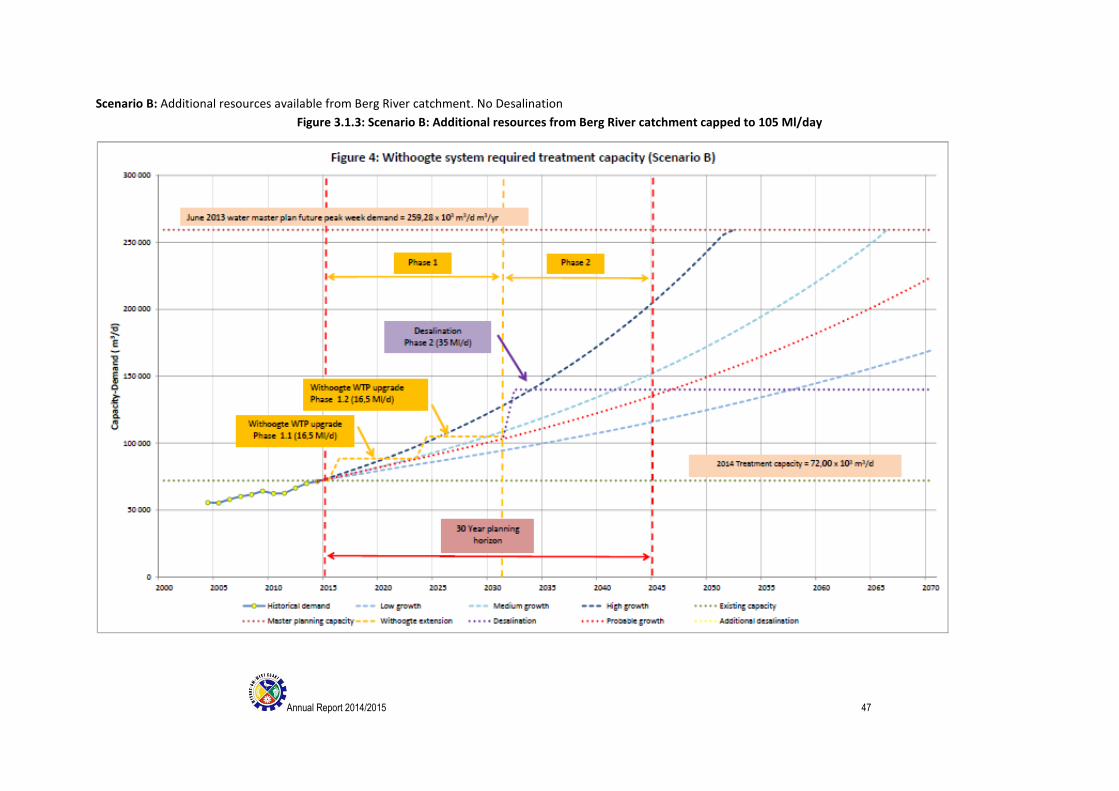
Scenario B: Additional resources available from Berg River catchment. No Desalination
Figure 3.1.3: Scenario B: Additional resources from Berg River catchment capped to 105 Ml/day
Annual Report 2014/2015 48
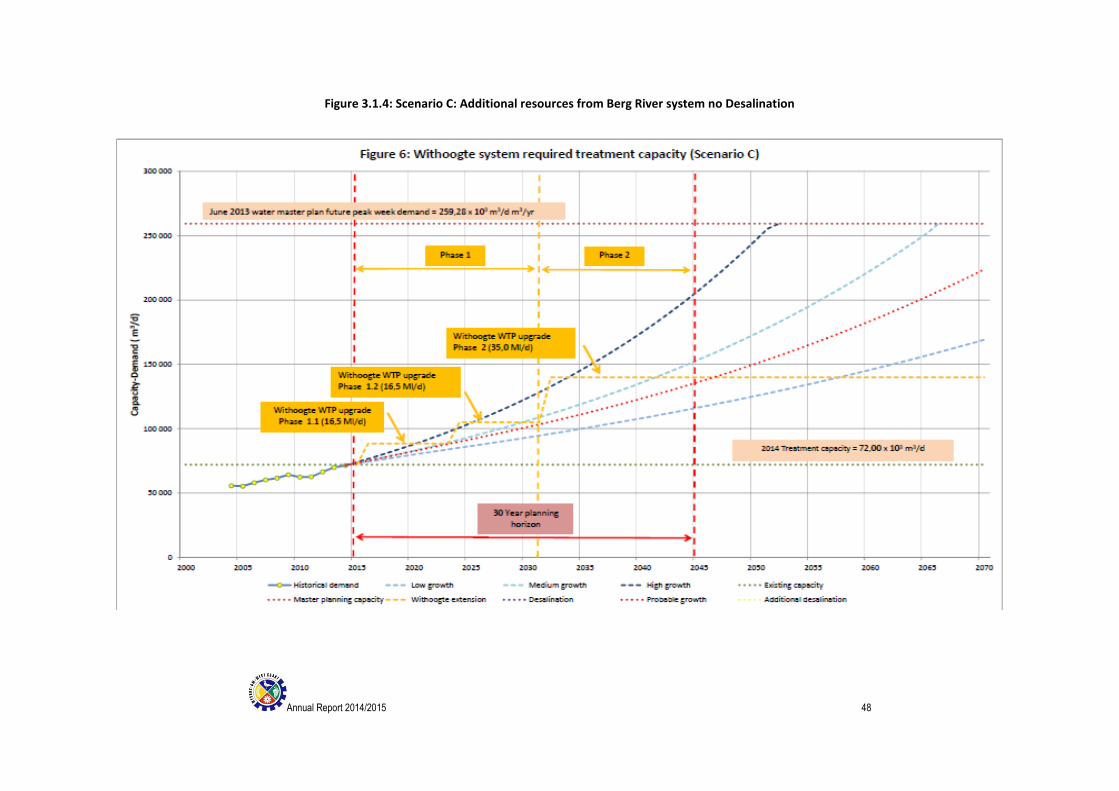
Figure 3.1.4: Scenario C: Additional resources from Berg River system no Desalination
Annual Report 2014/2015 49
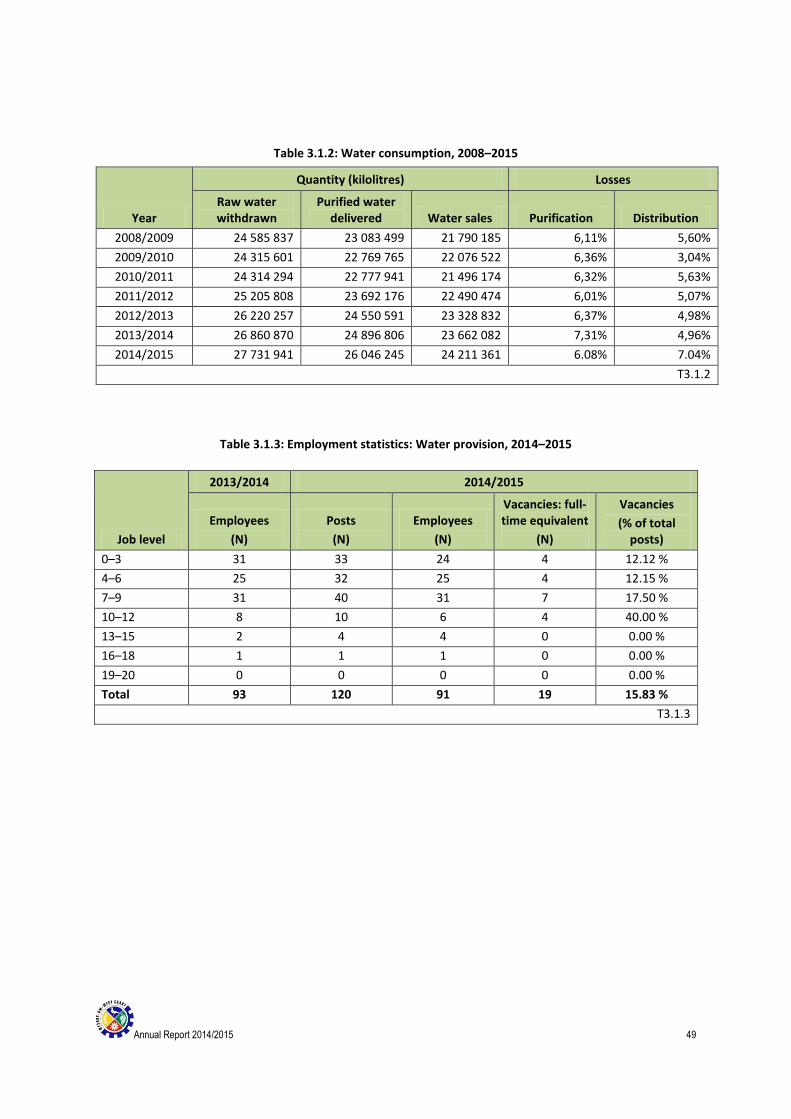
Table 3.1.2: Water consumption, 2008–2015
Table 3.1.3: Employment statistics: Water provision, 2014–2015
Job level
2013/2014 2014/2015
Employees
(N)
Posts
(N)
Employees
(N)
Vacancies: full-time equivalent
(N)
Vacancies
(% of total posts)
0–3 31 33 24 4 12.12 %
4–6 25 32 25 4 12.15 %
7–9 31 40 31 7 17.50 %
10–12 8 10 6 4 40.00 %
13–15 2 4 4 0 0.00 %
16–18 1 1 1 0 0.00 %
19–20 0 0 0 0 0.00 %
Total 93 120 91 19 15.83 %
T3.1.3
Year
Quantity (kilolitres) Losses
Raw water withdrawn
Purified water delivered Water sales Purification Distribution
2008/2009 24 585 837 23 083 499 21 790 185 6,11% 5,60%
2009/2010 24 315 601 22 769 765 22 076 522 6,36% 3,04%
2010/2011 24 314 294 22 777 941 21 496 174 6,32% 5,63%
2011/2012 25 205 808 23 692 176 22 490 474 6,01% 5,07%
2012/2013 26 220 257 24 550 591 23 328 832 6,37% 4,98%
2013/2014 26 860 870 24 896 806 23 662 082 7,31% 4,96%
2014/2015 27 731 941 26 046 245 24 211 361 6.08% 7.04%
T3.1.2
Annual Report 2014/2015 50
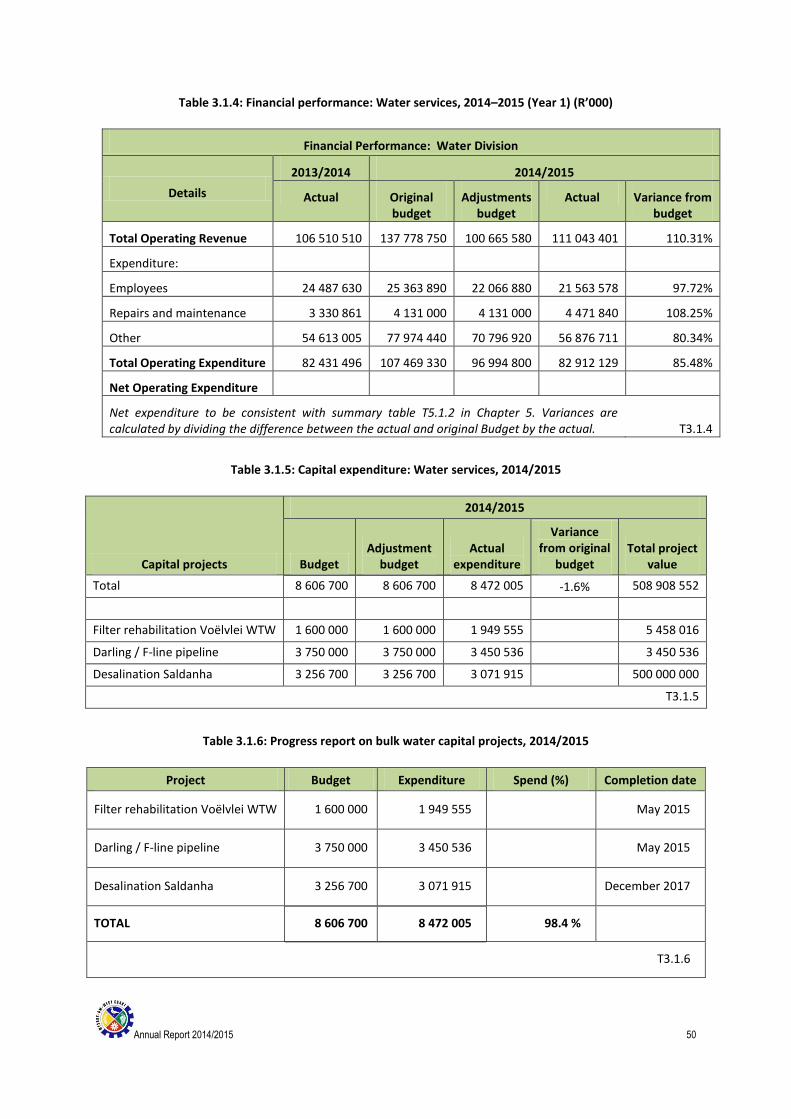
Table 3.1.4: Financial performance: Water services, 2014–2015 (Year 1) (R’000)
Financial Performance: Water Division
Details
2013/2014 2014/2015
Actual Original budget
Adjustments budget
Actual Variance from budget
Total Operating Revenue 106 510 510 137 778 750 100 665 580 111 043 401 110.31%
Expenditure:
Employees 24 487 630 25 363 890 22 066 880 21 563 578 97.72%
Repairs and maintenance 3 330 861 4 131 000 4 131 000 4 471 840 108.25%
Other 54 613 005 77 974 440 70 796 920 56 876 711 80.34%
Total Operating Expenditure 82 431 496 107 469 330 96 994 800 82 912 129 85.48%
Net Operating Expenditure
Net expenditure to be consistent with summary table T5.1.2 in Chapter 5. Variances are calculated by dividing the difference between the actual and original Budget by the actual. T3.1.4
Table 3.1.5: Capital expenditure: Water services, 2014/2015
Capital projects
2014/2015
Budget Adjustment
budget Actual
expenditure
Variance from original
budget Total project
value
Total 8 606 700 8 606 700 8 472 005 -1.6% 508 908 552
Filter rehabilitation Voëlvlei WTW 1 600 000 1 600 000 1 949 555 5 458 016
Darling / F-line pipeline 3 750 000 3 750 000 3 450 536 3 450 536
Desalination Saldanha 3 256 700 3 256 700 3 071 915 500 000 000
T3.1.5
Table 3.1.6: Progress report on bulk water capital projects, 2014/2015
Project Budget Expenditure Spend (%) Completion date
Filter rehabilitation Voëlvlei WTW 1 600 000 1 949 555 May 2015
Darling / F-line pipeline 3 750 000 3 450 536 May 2015
Desalination Saldanha 3 256 700 3 071 915 December 2017
TOTAL 8 606 700 8 472 005 98.4 %
T3.1.6
Annual Report 2014/2015 51
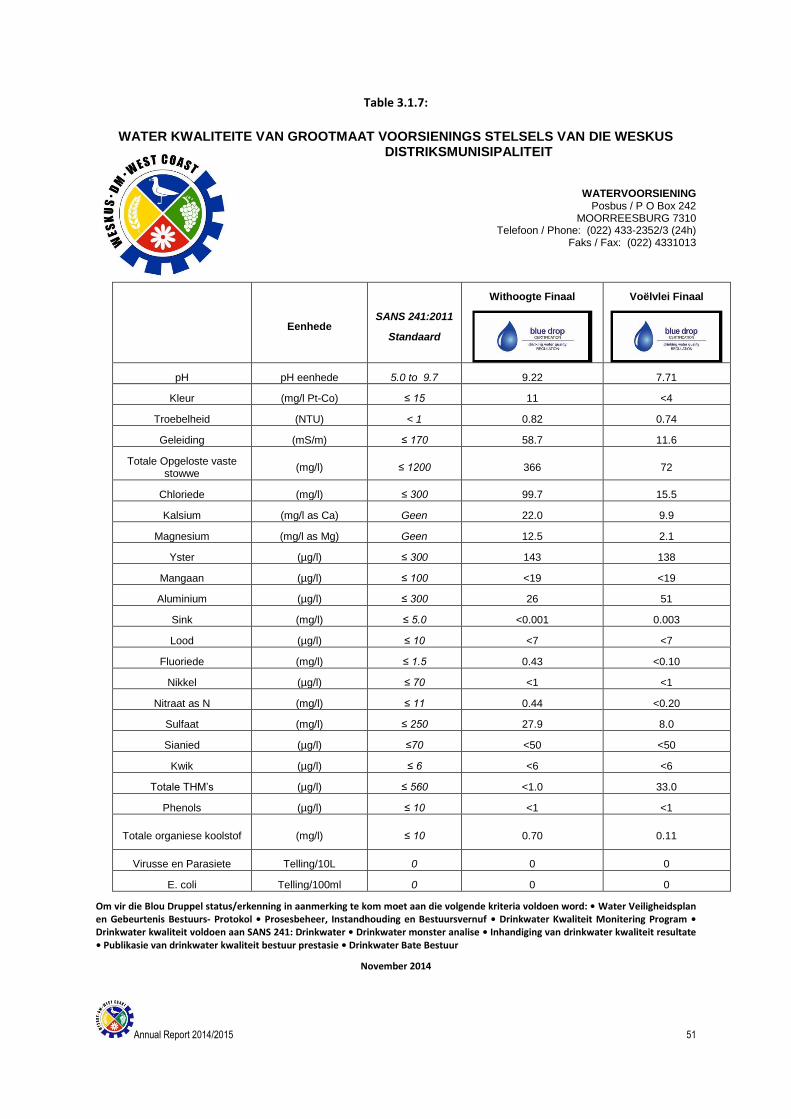
Table 3.1.7:
WATER KWALITEITE VAN GROOTMAAT VOORSIENINGS STELSELS VAN DIE WESKUS DISTRIKSMUNISIPALITEIT
WATERVOORSIENING Posbus / P O Box 242
MOORREESBURG 7310 Telefoon / Phone: (022) 433-2352/3 (24h)
Faks / Fax: (022) 4331013
Eenhede
SANS 241:2011
Standaard
Withoogte Finaal
Voëlvlei Finaal
pH pH eenhede 5.0 to 9.7 9.22 7.71
Kleur (mg/l Pt-Co) ≤ 15 11 <4
Troebelheid (NTU) < 1 0.82 0.74
Geleiding (mS/m) ≤ 170 58.7 11.6
Totale Opgeloste vaste stowwe
(mg/l) ≤ 1200 366 72
Chloriede (mg/l) ≤ 300 99.7 15.5
Kalsium (mg/l as Ca) Geen 22.0 9.9
Magnesium (mg/l as Mg) Geen 12.5 2.1
Yster (µg/l) ≤ 300 143 138
Mangaan (µg/l) ≤ 100 <19 <19
Aluminium (µg/l) ≤ 300 26 51
Sink (mg/l) ≤ 5.0 <0.001 0.003
Lood (µg/l) ≤ 10 <7 <7
Fluoriede (mg/l) ≤ 1.5 0.43 <0.10
Nikkel (µg/l) ≤ 70 <1 <1
Nitraat as N (mg/l) ≤ 11 0.44 <0.20
Sulfaat (mg/l) ≤ 250 27.9 8.0
Sianied (µg/l) ≤70 <50 <50
Kwik (µg/l) ≤ 6 <6 <6
Totale THM’s (µg/l) ≤ 560 <1.0 33.0
Phenols (µg/l) ≤ 10 <1 <1
Totale organiese koolstof (mg/l) ≤ 10 0.70 0.11
Virusse en Parasiete Telling/10L 0 0 0
E. coli Telling/100ml 0 0 0
Om vir die Blou Druppel status/erkenning in aanmerking te kom moet aan die volgende kriteria voldoen word: • Water Veiligheidsplan en Gebeurtenis Bestuurs- Protokol • Prosesbeheer, Instandhouding en Bestuursvernuf • Drinkwater Kwaliteit Monitering Program • Drinkwater kwaliteit voldoen aan SANS 241: Drinkwater • Drinkwater monster analise • Inhandiging van drinkwater kwaliteit resultate • Publikasie van drinkwater kwaliteit bestuur prestasie • Drinkwater Bate Bestuur
November 2014
Annual Report 2014/2015 52
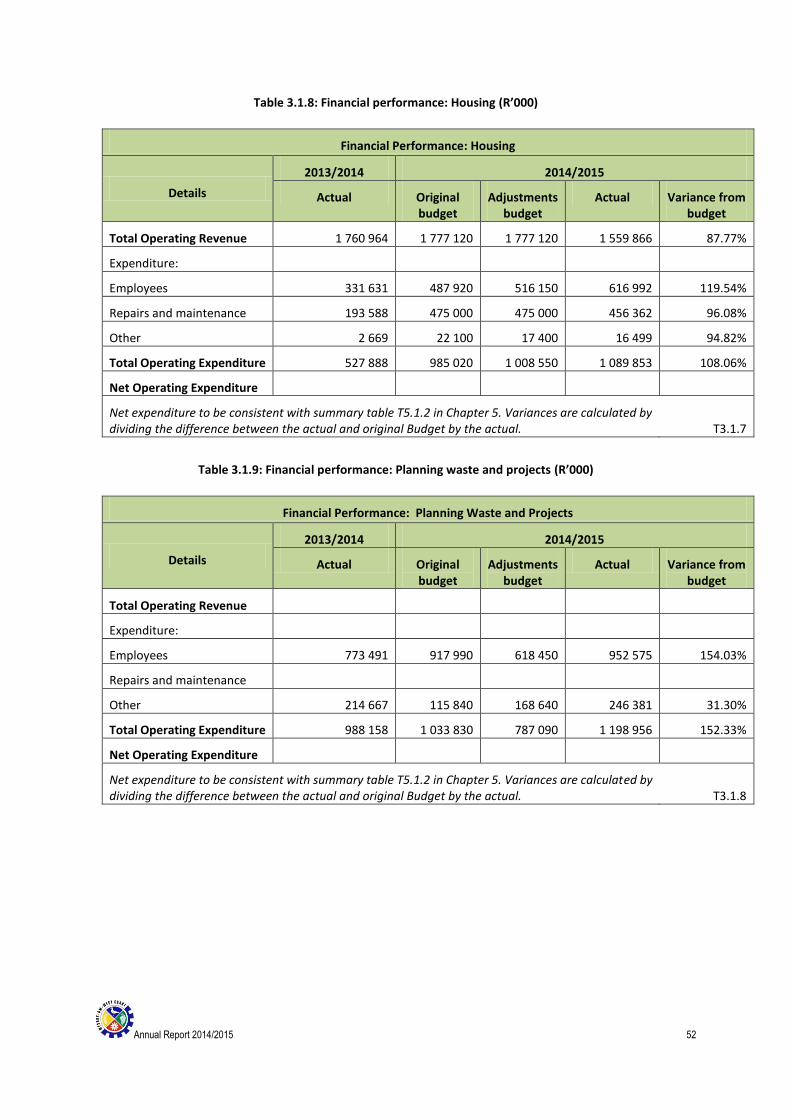
Table 3.1.8: Financial performance: Housing (R’000)
Financial Performance: Housing
Details
2013/2014 2014/2015
Actual Original budget
Adjustments budget
Actual Variance from budget
Total Operating Revenue 1 760 964 1 777 120 1 777 120 1 559 866 87.77%
Expenditure:
Employees 331 631 487 920 516 150 616 992 119.54%
Repairs and maintenance 193 588 475 000 475 000 456 362 96.08%
Other 2 669 22 100 17 400 16 499 94.82%
Total Operating Expenditure 527 888 985 020 1 008 550 1 089 853 108.06%
Net Operating Expenditure
Net expenditure to be consistent with summary table T5.1.2 in Chapter 5. Variances are calculated by dividing the difference between the actual and original Budget by the actual. T3.1.7
Table 3.1.9: Financial performance: Planning waste and projects (R’000)
Financial Performance: Planning Waste and Projects
Details
2013/2014 2014/2015
Actual Original budget
Adjustments budget
Actual Variance from budget
Total Operating Revenue
Expenditure:
Employees 773 491 917 990 618 450 952 575 154.03%
Repairs and maintenance
Other 214 667 115 840 168 640 246 381 31.30%
Total Operating Expenditure 988 158 1 033 830 787 090 1 198 956 152.33%
Net Operating Expenditure
Net expenditure to be consistent with summary table T5.1.2 in Chapter 5. Variances are calculated by dividing the difference between the actual and original Budget by the actual. T3.1.8
Annual Report 2014/2015 53
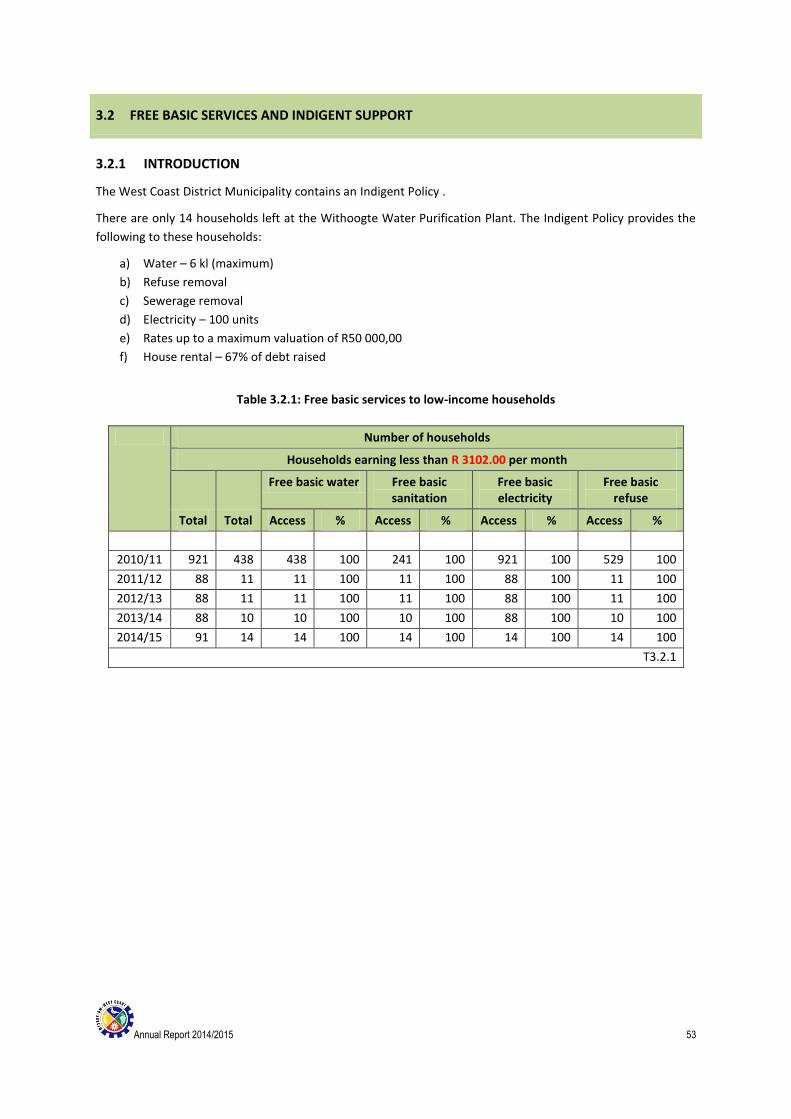
3.2 FREE BASIC SERVICES AND INDIGENT SUPPORT
3.2.1 INTRODUCTION
The West Coast District Municipality contains an Indigent Policy .
There are only 14 households left at the Withoogte Water Purification Plant. The Indigent Policy provides the
following to these households:
a) Water – 6 kl (maximum)
b) Refuse removal
c) Sewerage removal
d) Electricity – 100 units
e) Rates up to a maximum valuation of R50 000,00
f) House rental – 67% of debt raised
Table 3.2.1: Free basic services to low-income households
Number of households
Households earning less than R 3102.00 per month
Total Total
Free basic water Free basic sanitation
Free basic electricity
Free basic refuse
Access % Access % Access % Access %
2010/11 921 438 438 100 241 100 921 100 529 100
2011/12 88 11 11 100 11 100 88 100 11 100
2012/13 88 11 11 100 11 100 88 100 11 100
2013/14 88 10 10 100 10 100 88 100 10 100
2014/15 91 14 14 100 14 100 14 100 14 100
T3.2.1
Annual Report 2014/2015 54
COMPONENT B: AGENCY SERVICES
3.3 ROADS
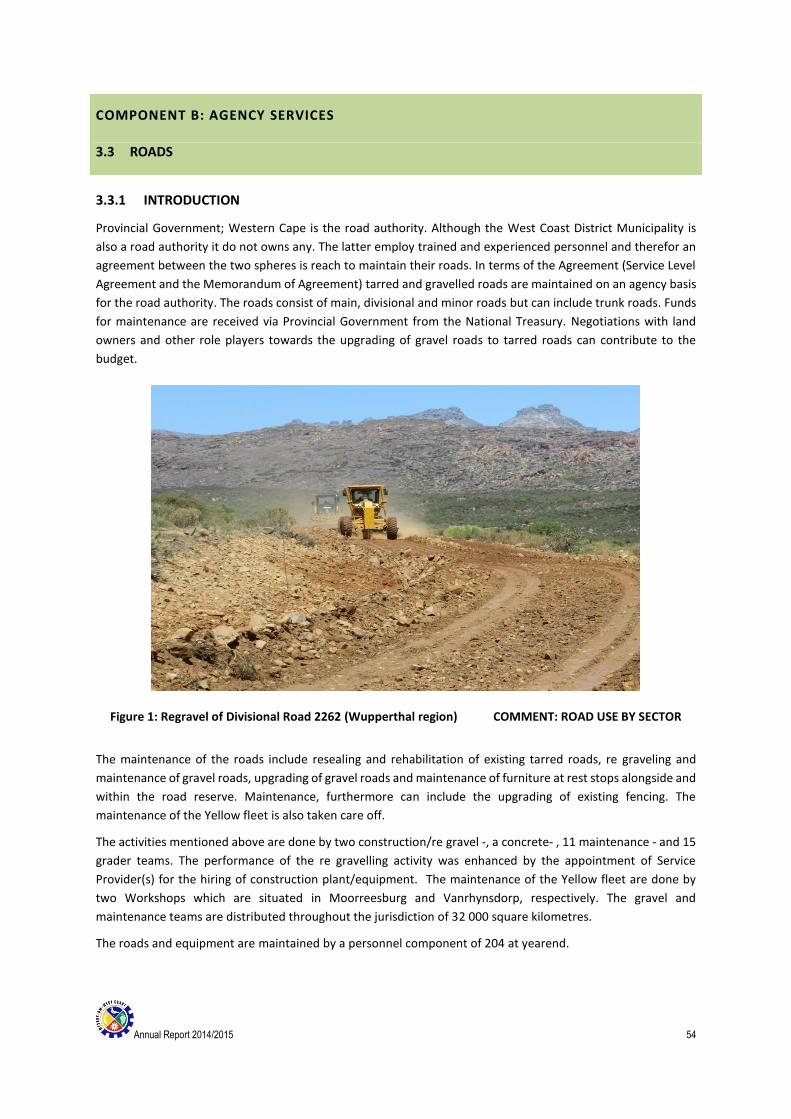
3.3.1 INTRODUCTION
Provincial Government; Western Cape is the road authority. Although the West Coast District Municipality is
also a road authority it do not owns any. The latter employ trained and experienced personnel and therefor an
agreement between the two spheres is reach to maintain their roads. In terms of the Agreement (Service Level
Agreement and the Memorandum of Agreement) tarred and gravelled roads are maintained on an agency basis
for the road authority. The roads consist of main, divisional and minor roads but can include trunk roads. Funds
for maintenance are received via Provincial Government from the National Treasury. Negotiations with land
owners and other role players towards the upgrading of gravel roads to tarred roads can contribute to the
budget.
Figure 1: Regravel of Divisional Road 2262 (Wupperthal region) COMMENT: ROAD USE BY SECTOR
The maintenance of the roads include resealing and rehabilitation of existing tarred roads, re graveling and
maintenance of gravel roads, upgrading of gravel roads and maintenance of furniture at rest stops alongside and
within the road reserve. Maintenance, furthermore can include the upgrading of existing fencing. The
maintenance of the Yellow fleet is also taken care off.
The activities mentioned above are done by two construction/re gravel -, a concrete- , 11 maintenance - and 15
grader teams. The performance of the re gravelling activity was enhanced by the appointment of Service
Provider(s) for the hiring of construction plant/equipment. The maintenance of the Yellow fleet are done by
two Workshops which are situated in Moorreesburg and Vanrhynsdorp, respectively. The gravel and
maintenance teams are distributed throughout the jurisdiction of 32 000 square kilometres.
The roads and equipment are maintained by a personnel component of 204 at yearend.
Annual Report 2014/2015 55
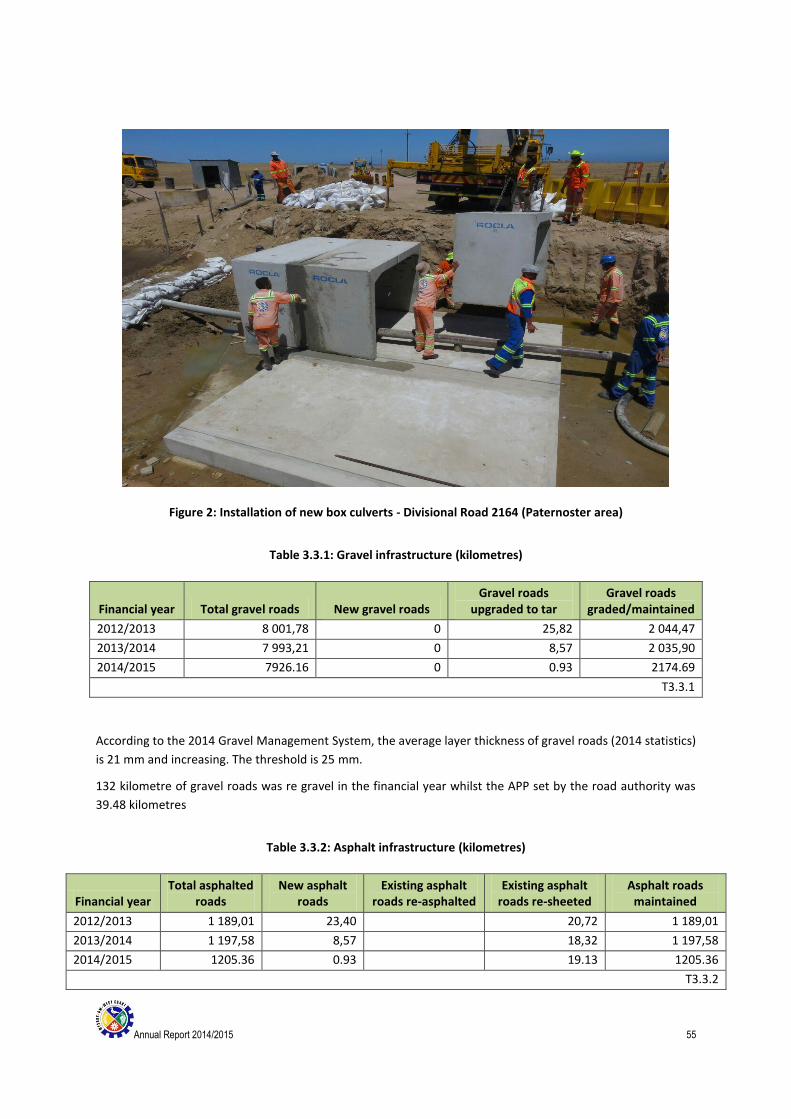
Figure 2: Installation of new box culverts - Divisional Road 2164 (Paternoster area)
Table 3.3.1: Gravel infrastructure (kilometres)
Financial year Total gravel roads New gravel roads Gravel roads
upgraded to tar Gravel roads
graded/maintained
2012/2013 8 001,78 0 25,82 2 044,47
2013/2014 7 993,21 0 8,57 2 035,90
2014/2015 7926.16 0 0.93 2174.69
T3.3.1
According to the 2014 Gravel Management System, the average layer thickness of gravel roads (2014 statistics)
is 21 mm and increasing. The threshold is 25 mm.
132 kilometre of gravel roads was re gravel in the financial year whilst the APP set by the road authority was
39.48 kilometres
Table 3.3.2: Asphalt infrastructure (kilometres)
Financial year Total asphalted
roads New asphalt
roads Existing asphalt
roads re-asphalted Existing asphalt
roads re-sheeted Asphalt roads
maintained
2012/2013 1 189,01 23,40 20,72 1 189,01
2013/2014 1 197,58 8,57 18,32 1 197,58
2014/2015 1205.36 0.93 19.13 1205.36
T3.3.2
Annual Report 2014/2015 56
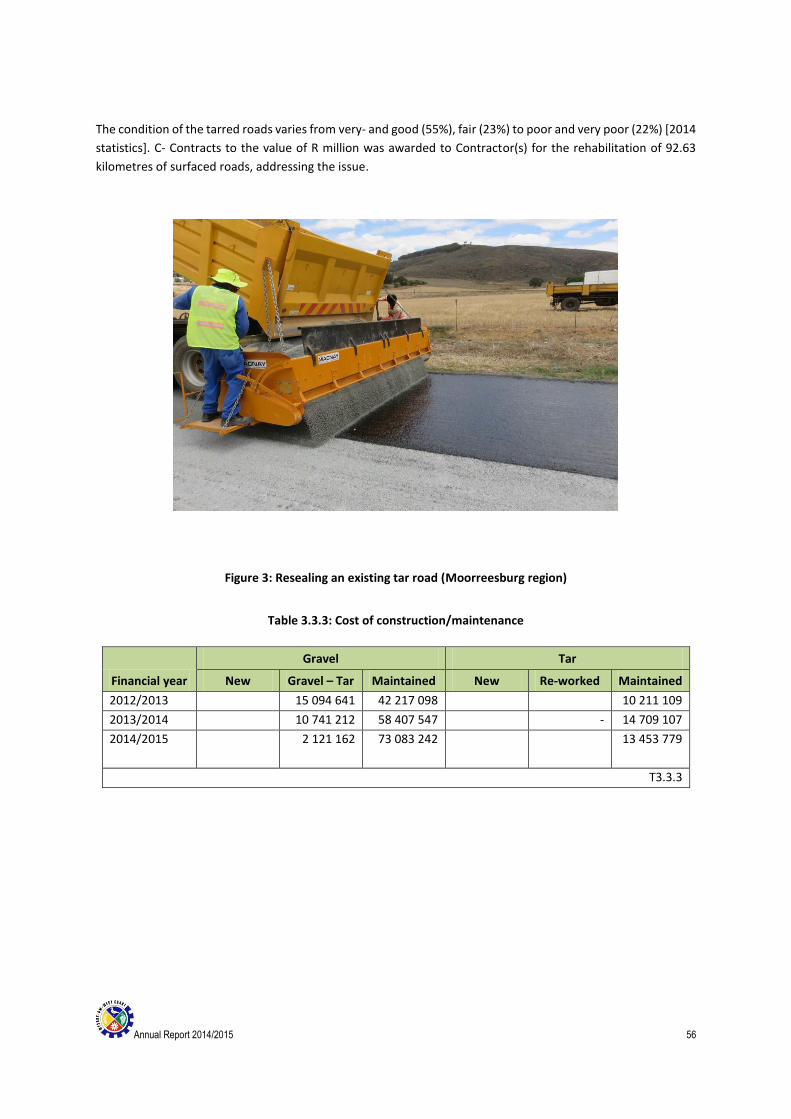
The condition of the tarred roads varies from very- and good (55%), fair (23%) to poor and very poor (22%) [2014
statistics]. C- Contracts to the value of R million was awarded to Contractor(s) for the rehabilitation of 92.63
kilometres of surfaced roads, addressing the issue.
Figure 3: Resealing an existing tar road (Moorreesburg region)
Table 3.3.3: Cost of construction/maintenance
Financial year
Gravel Tar
New Gravel – Tar Maintained New Re-worked Maintained
2012/2013 15 094 641 42 217 098 10 211 109
2013/2014 10 741 212 58 407 547 - 14 709 107
2014/2015 2 121 162
73 083 242 13 453 779
T3.3.3
Annual Report 2014/2015 57
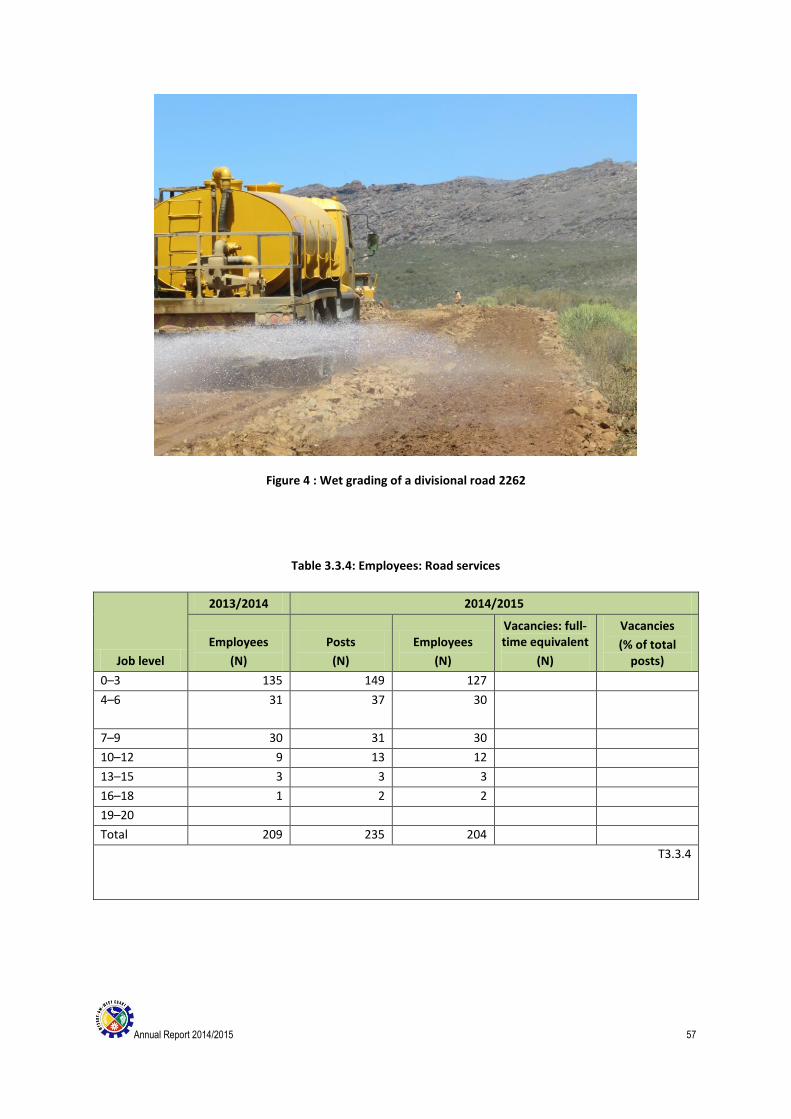
Figure 4 : Wet grading of a divisional road 2262
Table 3.3.4: Employees: Road services
Job level
2013/2014 2014/2015
Employees
(N)
Posts
(N)
Employees
(N)
Vacancies: full-time equivalent
(N)
Vacancies
(% of total posts)
0–3 135 149 127
4–6 31 37
30
7–9 30 31 30
10–12 9 13 12
13–15 3 3 3
16–18 1 2 2
19–20
Total 209 235 204
T3.3.4
Annual Report 2014/2015 58
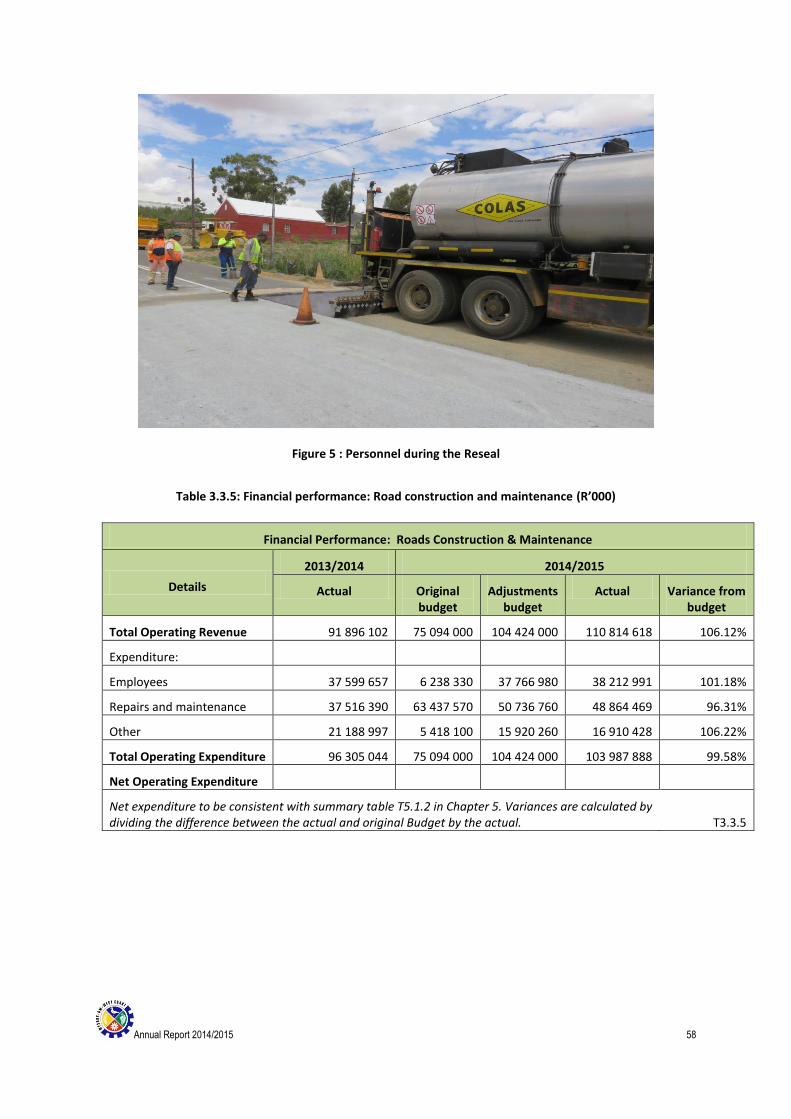
Figure 5 : Personnel during the Reseal
Table 3.3.5: Financial performance: Road construction and maintenance (R’000)
Financial Performance: Roads Construction & Maintenance
Details
2013/2014 2014/2015
Actual Original budget
Adjustments budget
Actual Variance from budget
Total Operating Revenue 91 896 102 75 094 000 104 424 000 110 814 618 106.12%
Expenditure:
Employees 37 599 657 6 238 330 37 766 980 38 212 991 101.18%
Repairs and maintenance 37 516 390 63 437 570 50 736 760 48 864 469 96.31%
Other 21 188 997 5 418 100 15 920 260 16 910 428 106.22%
Total Operating Expenditure 96 305 044 75 094 000 104 424 000 103 987 888 99.58%
Net Operating Expenditure
Net expenditure to be consistent with summary table T5.1.2 in Chapter 5. Variances are calculated by dividing the difference between the actual and original Budget by the actual. T3.3.5
Annual Report 2014/2015 59
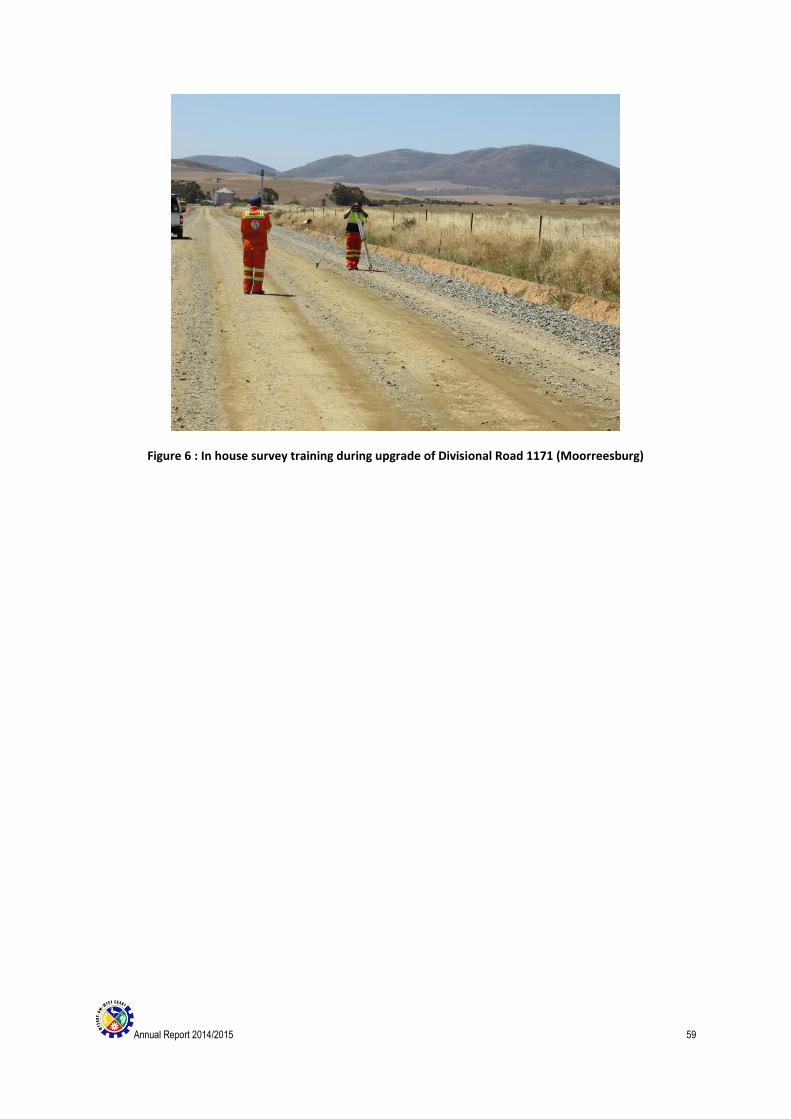
Figure 6 : In house survey training during upgrade of Divisional Road 1171 (Moorreesburg)
Annual Report 2014/2015 60
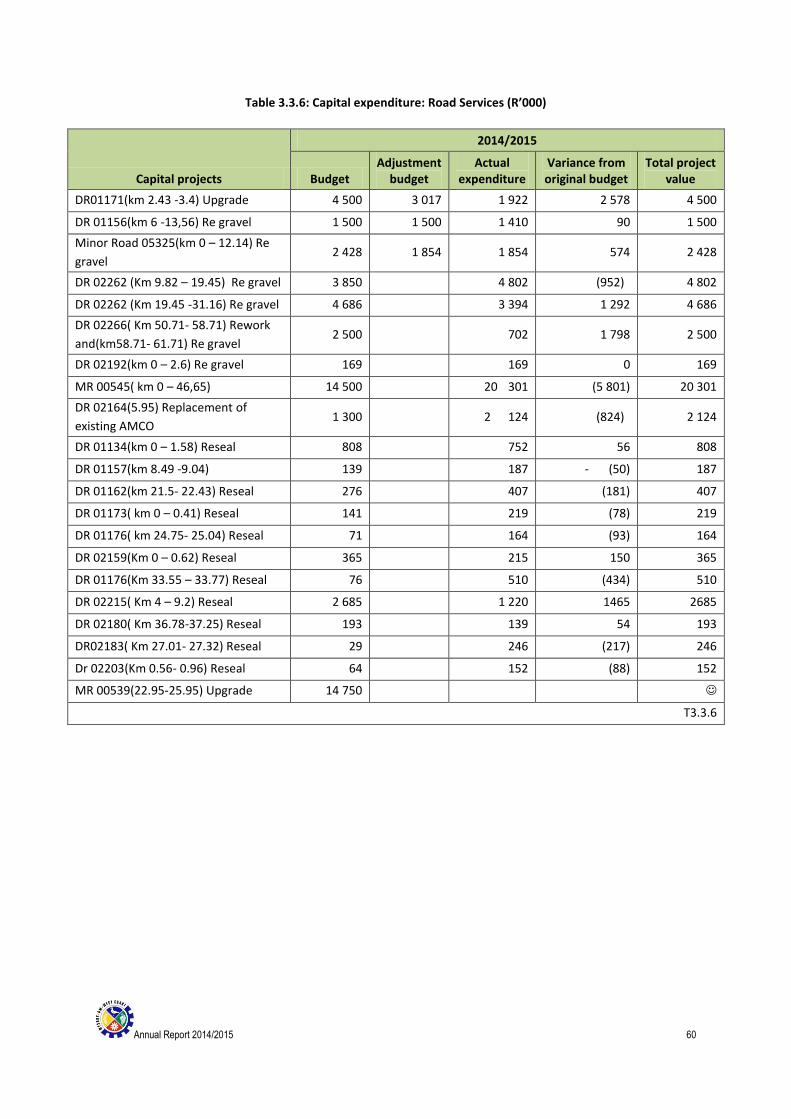
Table 3.3.6: Capital expenditure: Road Services (R’000)
Capital projects
2014/2015
Budget Adjustment
budget Actual
expenditure Variance from original budget
Total project value
DR01171(km 2.43 -3.4) Upgrade 4 500 3 017 1 922 2 578 4 500
DR 01156(km 6 -13,56) Re gravel 1 500 1 500 1 410 90 1 500
Minor Road 05325(km 0 – 12.14) Re
gravel 2 428 1 854 1 854 574 2 428
DR 02262 (Km 9.82 – 19.45) Re gravel 3 850 4 802 (952) 4 802
DR 02262 (Km 19.45 -31.16) Re gravel 4 686 3 394 1 292 4 686
DR 02266( Km 50.71- 58.71) Rework
and(km58.71- 61.71) Re gravel 2 500 702 1 798 2 500
DR 02192(km 0 – 2.6) Re gravel 169 169 0 169
MR 00545( km 0 – 46,65) 14 500 20 301 (5 801) 20 301
DR 02164(5.95) Replacement of
existing AMCO 1 300 2 124 (824) 2 124
DR 01134(km 0 – 1.58) Reseal 808 752 56 808
DR 01157(km 8.49 -9.04) 139 187 - (50) 187
DR 01162(km 21.5- 22.43) Reseal 276 407 (181) 407
DR 01173( km 0 – 0.41) Reseal 141 219 (78) 219
DR 01176( km 24.75- 25.04) Reseal 71 164 (93) 164
DR 02159(Km 0 – 0.62) Reseal 365 215 150 365
DR 01176(Km 33.55 – 33.77) Reseal 76 510 (434) 510
DR 02215( Km 4 – 9.2) Reseal 2 685 1 220 1465 2685
DR 02180( Km 36.78-37.25) Reseal 193 139 54 193
DR02183( Km 27.01- 27.32) Reseal 29 246 (217) 246
Dr 02203(Km 0.56- 0.96) Reseal 64 152 (88) 152
MR 00539(22.95-25.95) Upgrade 14 750
T3.3.6
Annual Report 2014/2015 61
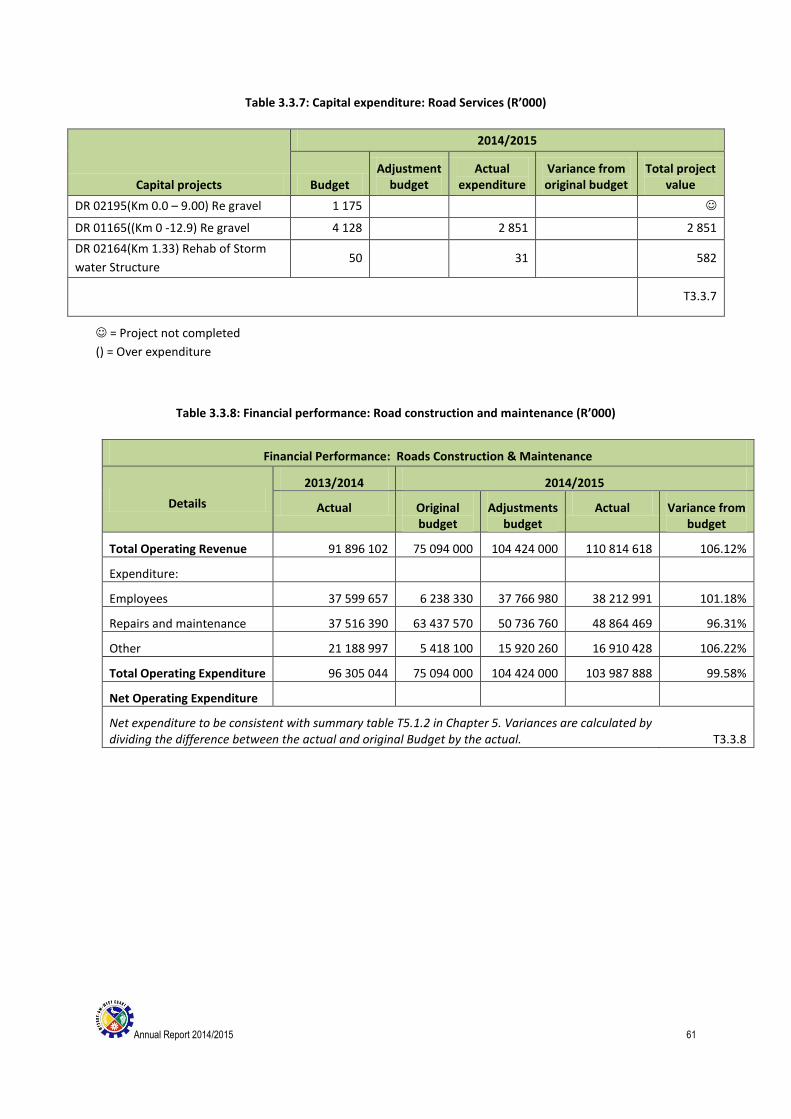
Table 3.3.7: Capital expenditure: Road Services (R’000)
Capital projects
2014/2015
Budget Adjustment
budget Actual
expenditure Variance from original budget
Total project value
DR 02195(Km 0.0 – 9.00) Re gravel 1 175
DR 01165((Km 0 -12.9) Re gravel 4 128 2 851 2 851
DR 02164(Km 1.33) Rehab of Storm
water Structure 50 31 582
T3.3.7
= Project not completed
() = Over expenditure
Table 3.3.8: Financial performance: Road construction and maintenance (R’000)
Financial Performance: Roads Construction & Maintenance
Details
2013/2014 2014/2015
Actual Original budget
Adjustments budget
Actual Variance from budget
Total Operating Revenue 91 896 102 75 094 000 104 424 000 110 814 618 106.12%
Expenditure:
Employees 37 599 657 6 238 330 37 766 980 38 212 991 101.18%
Repairs and maintenance 37 516 390 63 437 570 50 736 760 48 864 469 96.31%
Other 21 188 997 5 418 100 15 920 260 16 910 428 106.22%
Total Operating Expenditure 96 305 044 75 094 000 104 424 000 103 987 888 99.58%
Net Operating Expenditure
Net expenditure to be consistent with summary table T5.1.2 in Chapter 5. Variances are calculated by dividing the difference between the actual and original Budget by the actual. T3.3.8
Annual Report 2014/2015 62
COMPONENT C: PLANNING AND DEVELOPMENT 3.4 TOWN PLANNING
3.4.1 INTRODUCTION
In accordance with the Municipal Systems Act 32 of 2000, the West Coast District Municipality embarked on the
update and review of it’s Spatial Development Framework (SDF) in 2012. The final document, which was
approved by Council on 27 August 2014, is the product of an extensive process that provided all interested and
affected parties and stakeholders with the opportunity to participate to ensure the SDF reflects the vision for
the future spatial development of the West Coast District. The approved West Coast District SDF is aligned with
the latest policies and guidelines and serves as a framework to guide and inform spatial planning decisions in
the West Coast District for the next five years.
Comments are provided on all projects that are circulated to the West Coast District Municipality as part of the
public participation process for environmental assessments in terms of the National Environmental
Management Act, 1998. Socioeconomic, spatial planning and environmental comments are provided on all
projects or developments that have a regional impact or that have an impact on West Coast District Municipal
functions.
The West Coast District Municipality does not process applications for land use management. This is the function
of the respective category B municipalities in their areas of jurisdiction. However, comments on socioeconomic
status, spatial planning, environmental health, environmental management, fire management and disaster
management are provided by the West Coast District Municipality when land use management applications in
the category B municipal areas are circulated for comment to stakeholders and organs of state, as required by
legislation.
3.4.2 COMMENTS: PLANNING
3.4.2.1 ENVIRONMENTAL ASSESSMENT REPORTS
The Division Spatial Planning and Development provided comments to the environmental assessment
practitioners and the competent authorities on Environmental Assessment Reports for 71 projects in the West
Coast District Municipal Area undergoing environmental assessment in terms of the National Environmental
Management Act (NEMA) and the Mineral and Petroleum Resources Development Act (MPRDA).
3.4.2.2 LAND USE MANAGEMENT APPLICATIONS
The West Coast District Municipality received 15 requests for comment on land use management applications
received by B Municipalities. Comments on these applications were provided to the respective municipalities.
3.4.2.3 SPATIAL DEVELOPMENT FRAMEWORK
The update and review of the West Coast District Municipality Spatial Development Framework (SDF)
commenced in September 2012. The service provider compiled a draft spatial development framework which
was presented to the Steering and Technical Committee meeting during May 2013. However, the Growth
Potential of Towns Study, undertaken by Stellenbosch University for the Provincial Department of Environmental
Affairs and Development Planning as part of the Provincial Spatial Development Framework, did not reflect the
latest census data. The West Coast District Municipality and the service provider therefore agreed to postpone
the updating and review of the West Coast District Municipality Spatial Development Framework until the
updated version of the Growth Potential of Towns Study was available, since the results of the study are an
important informant in all spatial development frameworks. Upon receipt of the updated figures of the Growth
Annual Report 2014/2015 63
Potential of Towns Study in early 2014, the project proceeded. The revised draft spatial development framework
was presented to the Steering and Technical Committee, as well as Council during April 2014. A public
participation process commenced in June 2014 and ran until 4 July 2014. Relevant inputs, recommendations
and comments received during the public participation process were incorporated into the Final SDF, which was
presented to and approved by Council on 27 August 2014.
3.4.2.4 SHARED SERVICES
The West Coast District Municipality provided spatial planning and land use management services to Cederberg
Municipality until 1 February 2015.
3.4.2.5 CEDERBERG MUNICIPALITY
a) Environmental Assessment Reports
The Division Spatial Planning and Development submitted comments to the environmental assessment
practitioners for 3 projects situated in the rural area of the Cederberg municipal area undergoing environmental
assessment in terms of NEMA and/or the MPRDA.
b) Land Use Management Applications
Three land use management applications were processed and submitted to Cederberg Municipality for Council’s
decision.
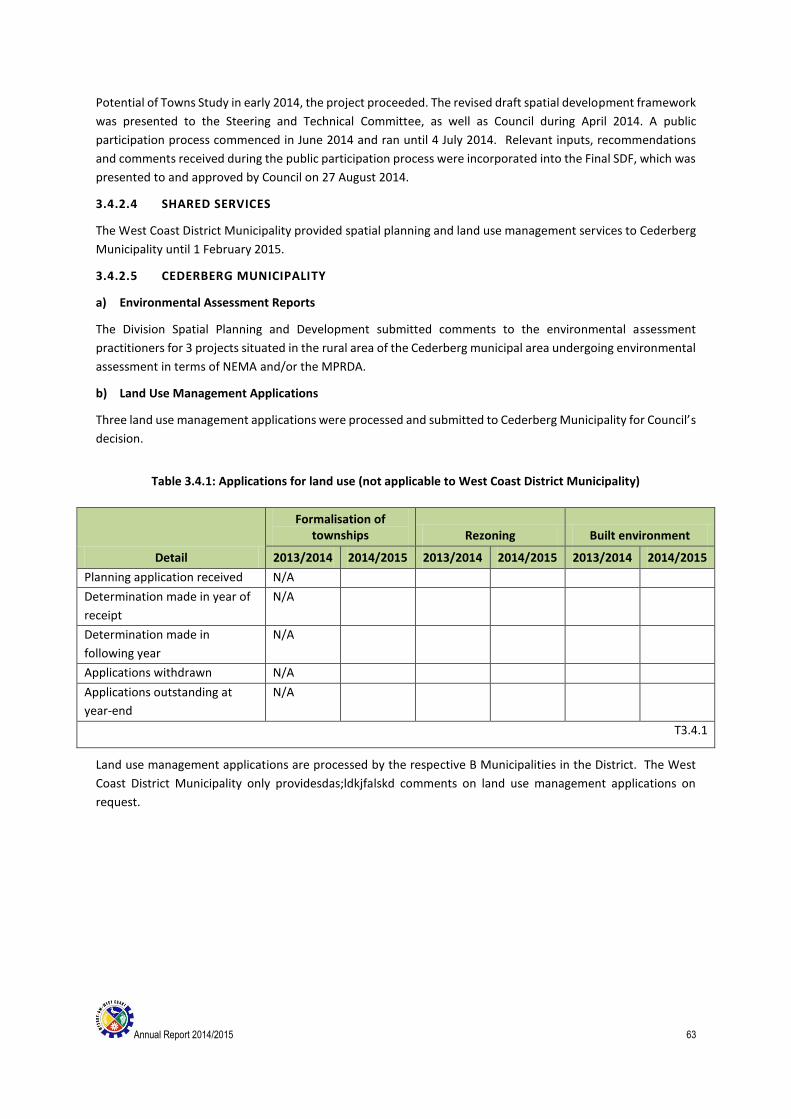
Table 3.4.1: Applications for land use (not applicable to West Coast District Municipality)
Detail
Formalisation of townships Rezoning Built environment
2013/2014 2014/2015 2013/2014 2014/2015 2013/2014 2014/2015
Planning application received N/A
Determination made in year of
receipt
N/A
Determination made in
following year
N/A
Applications withdrawn N/A
Applications outstanding at
year-end
N/A
T3.4.1
Land use management applications are processed by the respective B Municipalities in the District. The West
Coast District Municipality only providesdas;ldkjfalskd comments on land use management applications on
request.
Annual Report 2014/2015 64
Table 3.4.2: Employees: Planning
Job level
2013/2014 2014/2015
Employees
(N)
Posts
(N)
Employees
(N)
Vacancies: full-time equivalent
(N)
Vacancies
(% of total posts)
13–15 1 1 1 0 0%
Total 1 1 1 0 0%
T3.4.2
Table 3.4.3: Land and Buildings
Financial Performance: Land and Buildings
Details
2013/2014 2014/2015
Actual Original budget
Adjustments budget
Actual Variance from budget
Total Operating Revenue 1 418 245 1 376 900 1 376 900 1 513 854 109.95%
Expenditure:
Employees 729 999 836 620 1 380 820 1 249 100 90.46%
Repairs and maintenance 111 975 556 290 556 290 406 292 73.04%
Other 1 577 851 1 915 910 1 912 510 1 558 757 81.50%
Total Operating Expenditure 2 419 825 3 308 820 3 849 620 3 214 149 83.49%
Net Operating Expenditure
Net expenditure to be consistent with summary table T5.1.2 in Chapter 5. Variances are calculated by dividing the difference between the actual and original Budget by the actual. T3.4.3
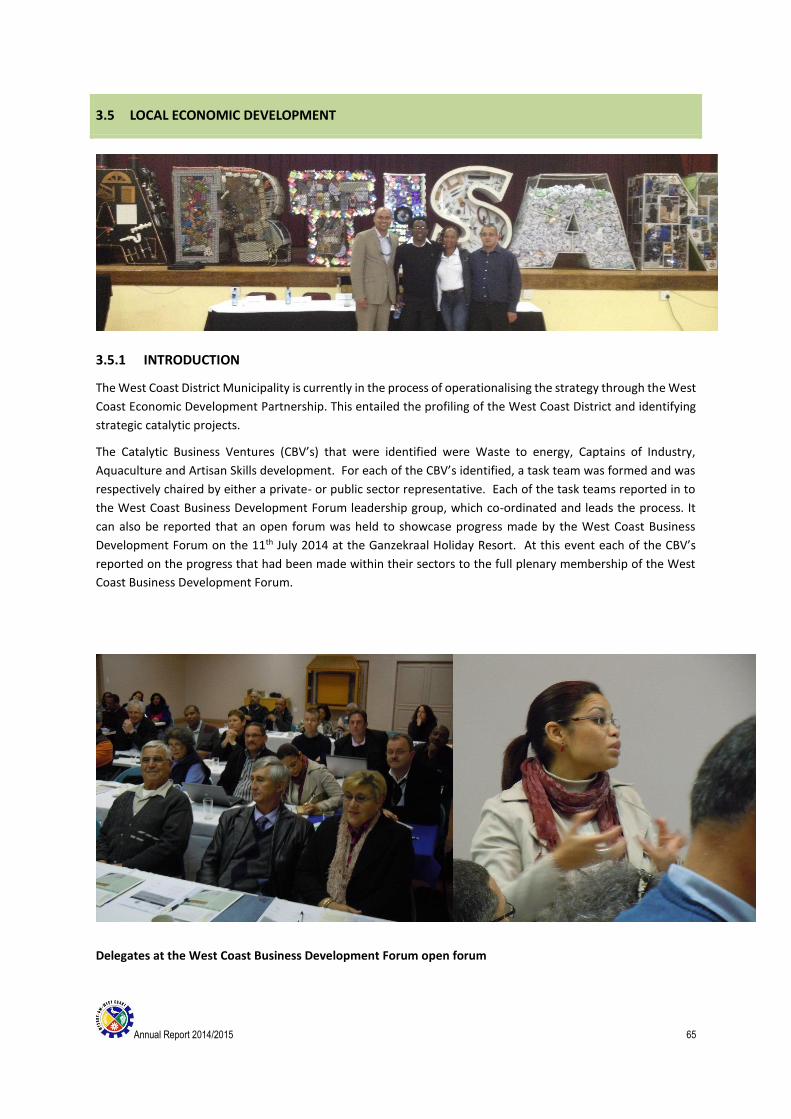
Annual Report 2014/2015 65
3.5 LOCAL ECONOMIC DEVELOPMENT
3.5.1 INTRODUCTION
The West Coast District Municipality is currently in the process of operationalising the strategy through the West
Coast Economic Development Partnership. This entailed the profiling of the West Coast District and identifying
strategic catalytic projects.
The Catalytic Business Ventures (CBV’s) that were identified were Waste to energy, Captains of Industry,
Aquaculture and Artisan Skills development. For each of the CBV’s identified, a task team was formed and was
respectively chaired by either a private- or public sector representative. Each of the task teams reported in to
the West Coast Business Development Forum leadership group, which co-ordinated and leads the process. It
can also be reported that an open forum was held to showcase progress made by the West Coast Business
Development Forum on the 11th July 2014 at the Ganzekraal Holiday Resort. At this event each of the CBV’s
reported on the progress that had been made within their sectors to the full plenary membership of the West
Coast Business Development Forum.
Delegates at the West Coast Business Development Forum open forum
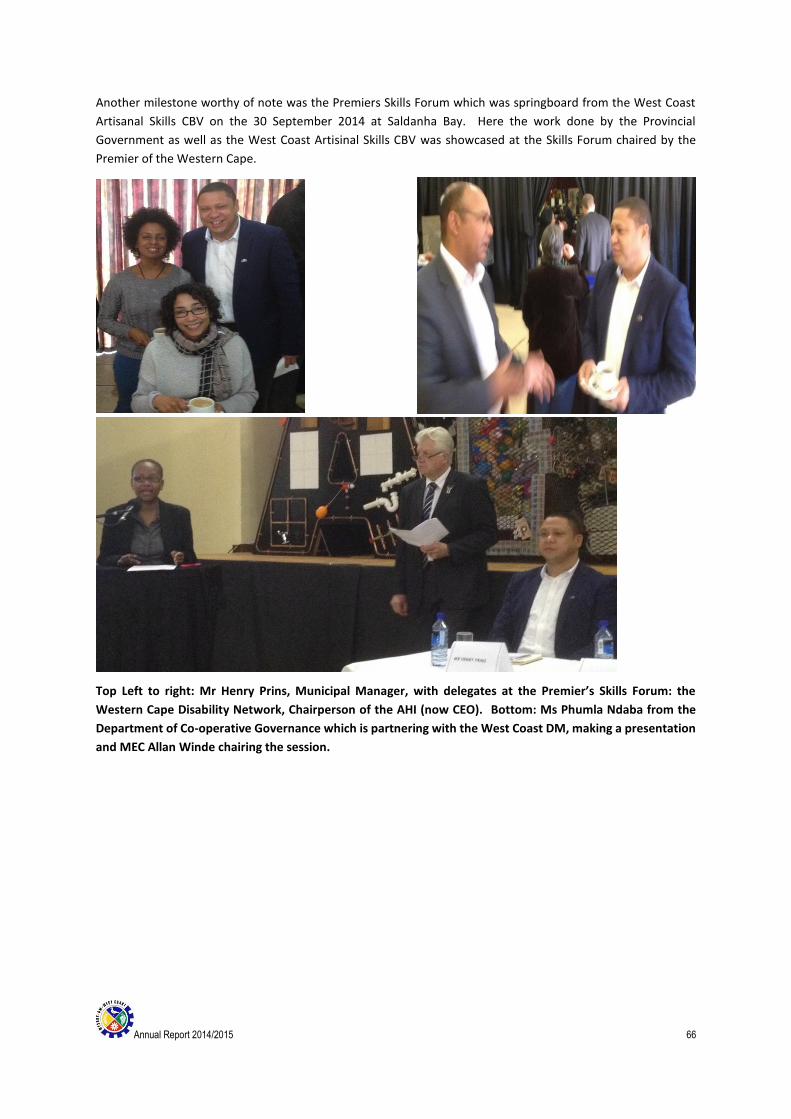
Annual Report 2014/2015 66
Another milestone worthy of note was the Premiers Skills Forum which was springboard from the West Coast
Artisanal Skills CBV on the 30 September 2014 at Saldanha Bay. Here the work done by the Provincial
Government as well as the West Coast Artisinal Skills CBV was showcased at the Skills Forum chaired by the
Premier of the Western Cape.
Top Left to right: Mr Henry Prins, Municipal Manager, with delegates at the Premier’s Skills Forum: the
Western Cape Disability Network, Chairperson of the AHI (now CEO). Bottom: Ms Phumla Ndaba from the
Department of Co-operative Governance which is partnering with the West Coast DM, making a presentation
and MEC Allan Winde chairing the session.
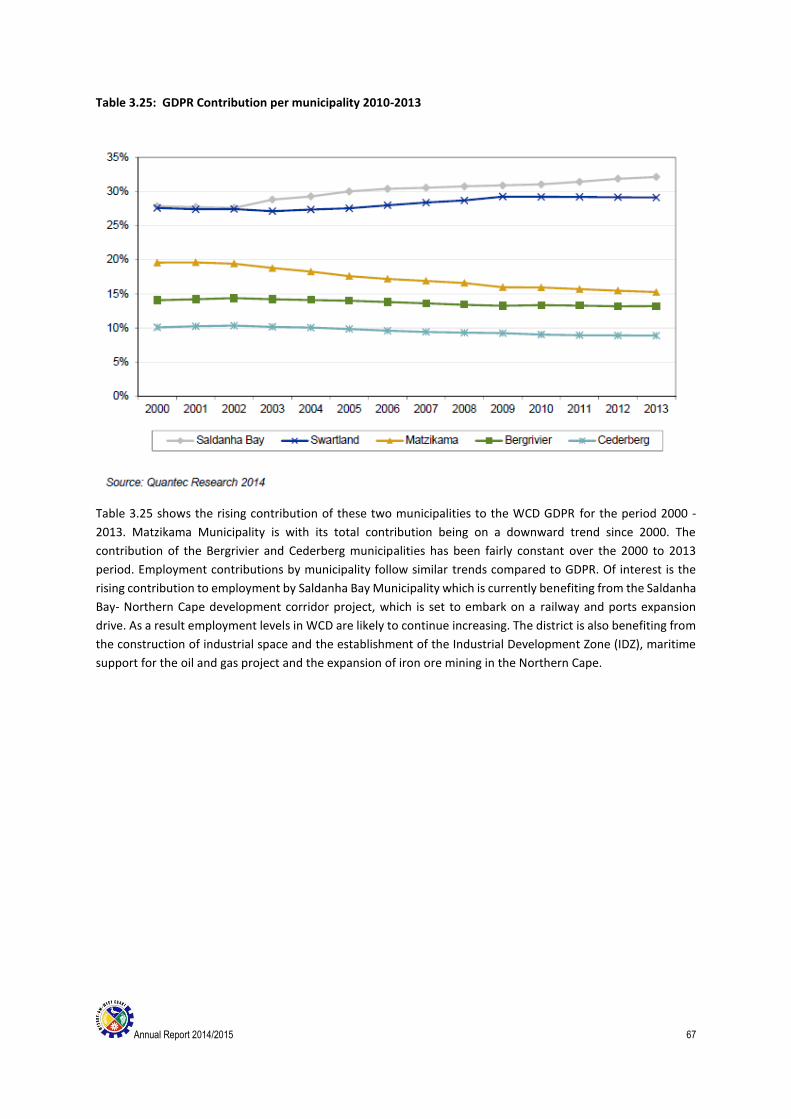
Annual Report 2014/2015 67
Table 3.25: GDPR Contribution per municipality 2010-2013
Table 3.25 shows the rising contribution of these two municipalities to the WCD GDPR for the period 2000 -
2013. Matzikama Municipality is with its total contribution being on a downward trend since 2000. The
contribution of the Bergrivier and Cederberg municipalities has been fairly constant over the 2000 to 2013
period. Employment contributions by municipality follow similar trends compared to GDPR. Of interest is the
rising contribution to employment by Saldanha Bay Municipality which is currently benefiting from the Saldanha
Bay- Northern Cape development corridor project, which is set to embark on a railway and ports expansion
drive. As a result employment levels in WCD are likely to continue increasing. The district is also benefiting from
the construction of industrial space and the establishment of the Industrial Development Zone (IDZ), maritime
support for the oil and gas project and the expansion of iron ore mining in the Northern Cape.
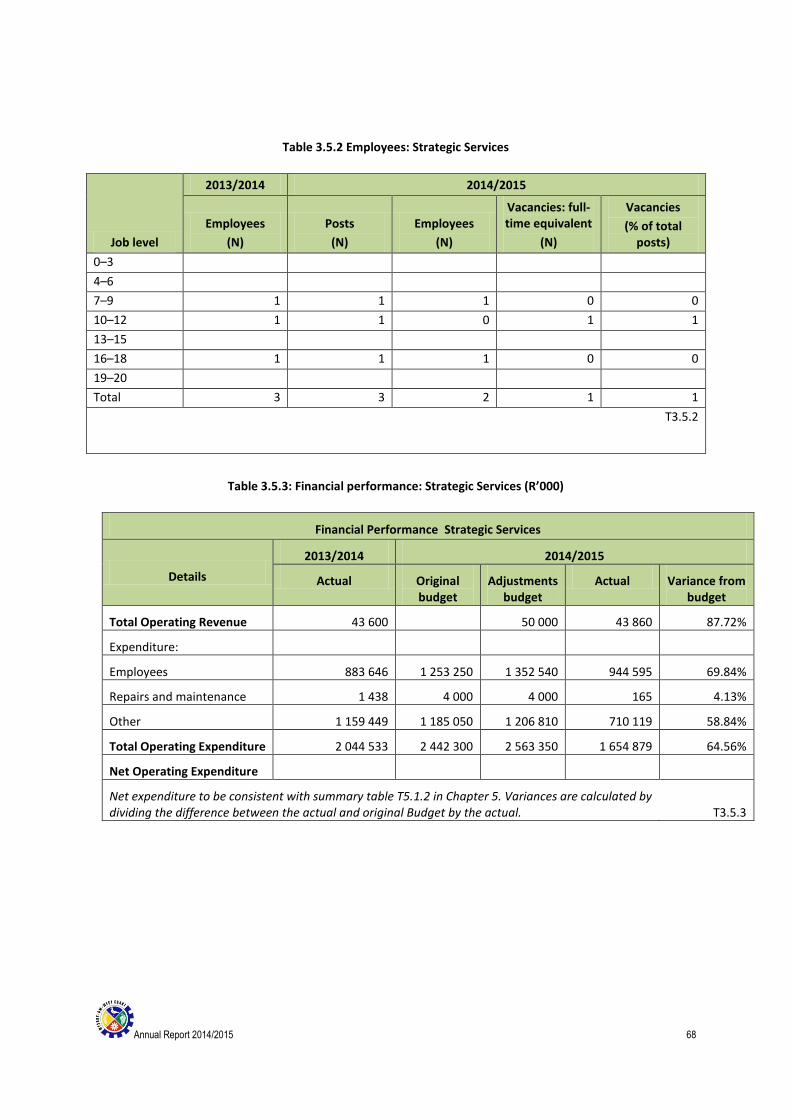
Annual Report 2014/2015 68
Table 3.5.2 Employees: Strategic Services
Job level
2013/2014 2014/2015
Employees
(N)
Posts
(N)
Employees
(N)
Vacancies: full-time equivalent
(N)
Vacancies
(% of total posts)
0–3
4–6
7–9 1 1 1 0 0
10–12 1 1 0 1 1
13–15
16–18 1 1 1 0 0
19–20
Total 3 3 2 1 1
T3.5.2
Table 3.5.3: Financial performance: Strategic Services (R’000)
Financial Performance Strategic Services
Details
2013/2014 2014/2015
Actual Original budget
Adjustments budget
Actual Variance from budget
Total Operating Revenue 43 600 50 000 43 860 87.72%
Expenditure:
Employees 883 646 1 253 250 1 352 540 944 595 69.84%
Repairs and maintenance 1 438 4 000 4 000 165 4.13%
Other 1 159 449 1 185 050 1 206 810 710 119 58.84%
Total Operating Expenditure 2 044 533 2 442 300 2 563 350 1 654 879 64.56%
Net Operating Expenditure
Net expenditure to be consistent with summary table T5.1.2 in Chapter 5. Variances are calculated by dividing the difference between the actual and original Budget by the actual. T3.5.3
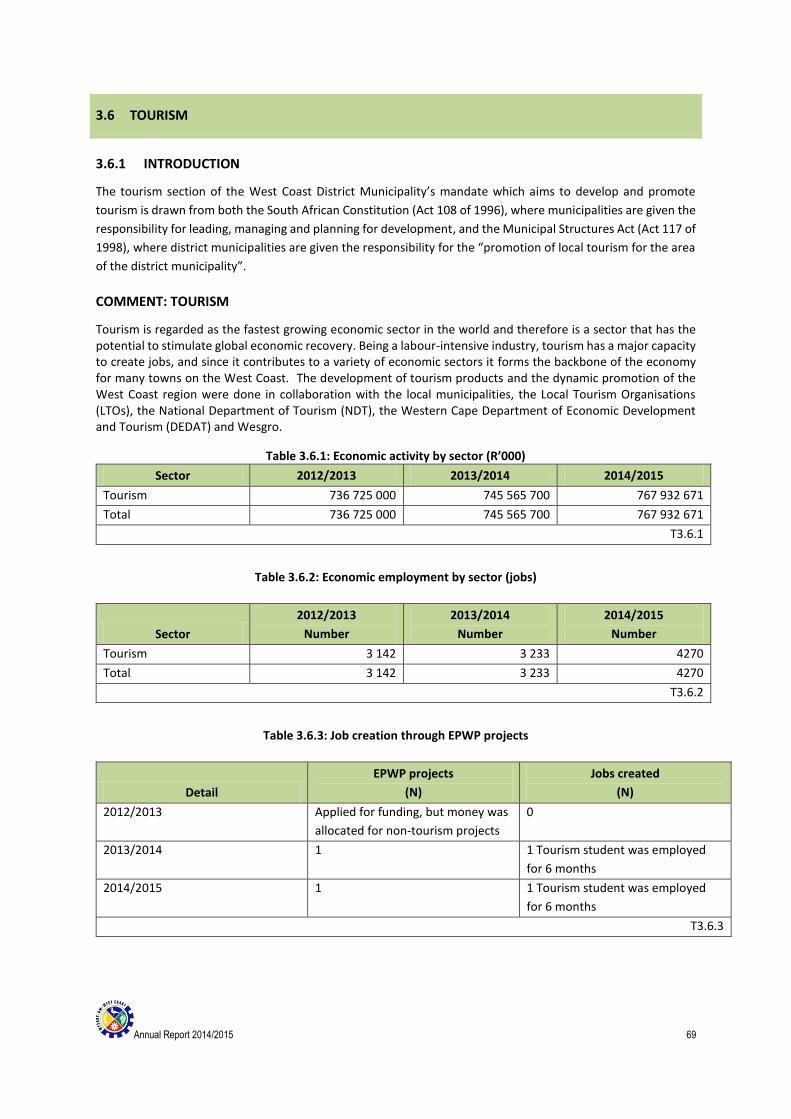
Annual Report 2014/2015 69
3.6 TOURISM
3.6.1 INTRODUCTION
The tourism section of the West Coast District Municipality’s mandate which aims to develop and promote
tourism is drawn from both the South African Constitution (Act 108 of 1996), where municipalities are given the
responsibility for leading, managing and planning for development, and the Municipal Structures Act (Act 117 of
1998), where district municipalities are given the responsibility for the “promotion of local tourism for the area
of the district municipality”.
COMMENT: TOURISM
Tourism is regarded as the fastest growing economic sector in the world and therefore is a sector that has the potential to stimulate global economic recovery. Being a labour-intensive industry, tourism has a major capacity to create jobs, and since it contributes to a variety of economic sectors it forms the backbone of the economy for many towns on the West Coast. The development of tourism products and the dynamic promotion of the West Coast region were done in collaboration with the local municipalities, the Local Tourism Organisations (LTOs), the National Department of Tourism (NDT), the Western Cape Department of Economic Development and Tourism (DEDAT) and Wesgro.
Table 3.6.1: Economic activity by sector (R’000)
Sector 2012/2013 2013/2014 2014/2015
Tourism 736 725 000 745 565 700 767 932 671
Total 736 725 000 745 565 700 767 932 671
T3.6.1
Table 3.6.2: Economic employment by sector (jobs)
Sector
2012/2013
Number
2013/2014
Number
2014/2015
Number
Tourism 3 142 3 233 4270
Total 3 142 3 233 4270
T3.6.2
Table 3.6.3: Job creation through EPWP projects
Detail
EPWP projects
(N)
Jobs created
(N)
2012/2013 Applied for funding, but money was
allocated for non-tourism projects
0
2013/2014 1 1 Tourism student was employed
for 6 months
2014/2015 1 1 Tourism student was employed
for 6 months
T3.6.3
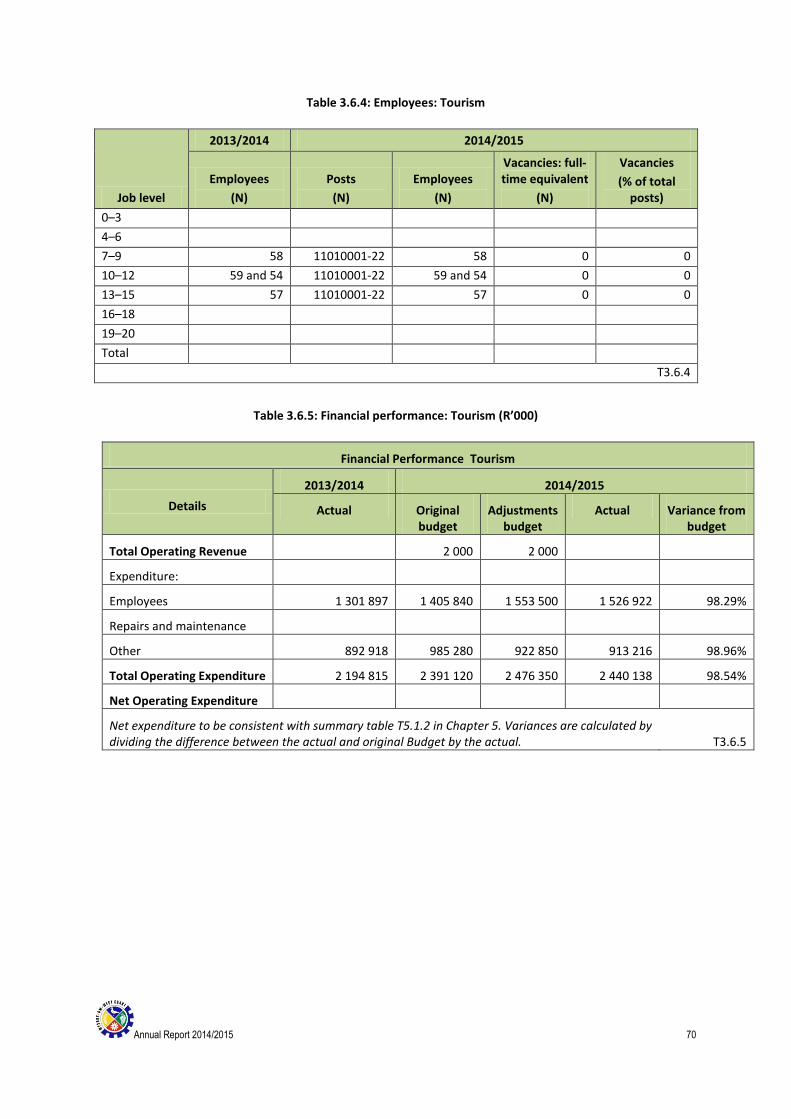
Annual Report 2014/2015 70
Table 3.6.4: Employees: Tourism
Job level
2013/2014 2014/2015
Employees
(N)
Posts
(N)
Employees
(N)
Vacancies: full-time equivalent
(N)
Vacancies
(% of total posts)
0–3
4–6
7–9 58 11010001-22 58 0 0
10–12 59 and 54 11010001-22 59 and 54 0 0
13–15 57 11010001-22 57 0 0
16–18
19–20
Total
T3.6.4
Table 3.6.5: Financial performance: Tourism (R’000)
Financial Performance Tourism
Details
2013/2014 2014/2015
Actual Original budget
Adjustments budget
Actual Variance from budget
Total Operating Revenue 2 000 2 000
Expenditure:
Employees 1 301 897 1 405 840 1 553 500 1 526 922 98.29%
Repairs and maintenance
Other 892 918 985 280 922 850 913 216 98.96%
Total Operating Expenditure 2 194 815 2 391 120 2 476 350 2 440 138 98.54%
Net Operating Expenditure
Net expenditure to be consistent with summary table T5.1.2 in Chapter 5. Variances are calculated by dividing the difference between the actual and original Budget by the actual. T3.6.5
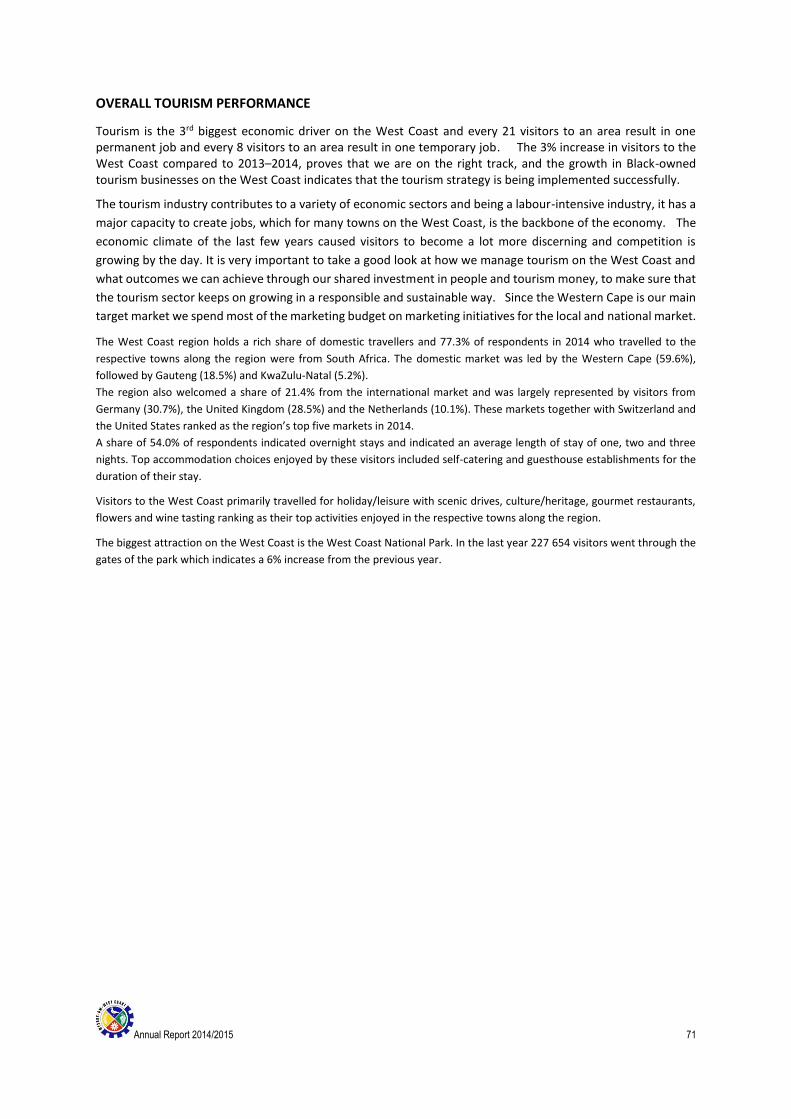
Annual Report 2014/2015 71
OVERALL TOURISM PERFORMANCE
Tourism is the 3rd biggest economic driver on the West Coast and every 21 visitors to an area result in one permanent job and every 8 visitors to an area result in one temporary job. The 3% increase in visitors to the West Coast compared to 2013–2014, proves that we are on the right track, and the growth in Black-owned tourism businesses on the West Coast indicates that the tourism strategy is being implemented successfully.
The tourism industry contributes to a variety of economic sectors and being a labour-intensive industry, it has a
major capacity to create jobs, which for many towns on the West Coast, is the backbone of the economy. The
economic climate of the last few years caused visitors to become a lot more discerning and competition is
growing by the day. It is very important to take a good look at how we manage tourism on the West Coast and
what outcomes we can achieve through our shared investment in people and tourism money, to make sure that
the tourism sector keeps on growing in a responsible and sustainable way. Since the Western Cape is our main
target market we spend most of the marketing budget on marketing initiatives for the local and national market.
The West Coast region holds a rich share of domestic travellers and 77.3% of respondents in 2014 who travelled to the
respective towns along the region were from South Africa. The domestic market was led by the Western Cape (59.6%),
followed by Gauteng (18.5%) and KwaZulu-Natal (5.2%).
The region also welcomed a share of 21.4% from the international market and was largely represented by visitors from
Germany (30.7%), the United Kingdom (28.5%) and the Netherlands (10.1%). These markets together with Switzerland and
the United States ranked as the region’s top five markets in 2014.
A share of 54.0% of respondents indicated overnight stays and indicated an average length of stay of one, two and three
nights. Top accommodation choices enjoyed by these visitors included self-catering and guesthouse establishments for the
duration of their stay.
Visitors to the West Coast primarily travelled for holiday/leisure with scenic drives, culture/heritage, gourmet restaurants,
flowers and wine tasting ranking as their top activities enjoyed in the respective towns along the region.
The biggest attraction on the West Coast is the West Coast National Park. In the last year 227 654 visitors went through the
gates of the park which indicates a 6% increase from the previous year.
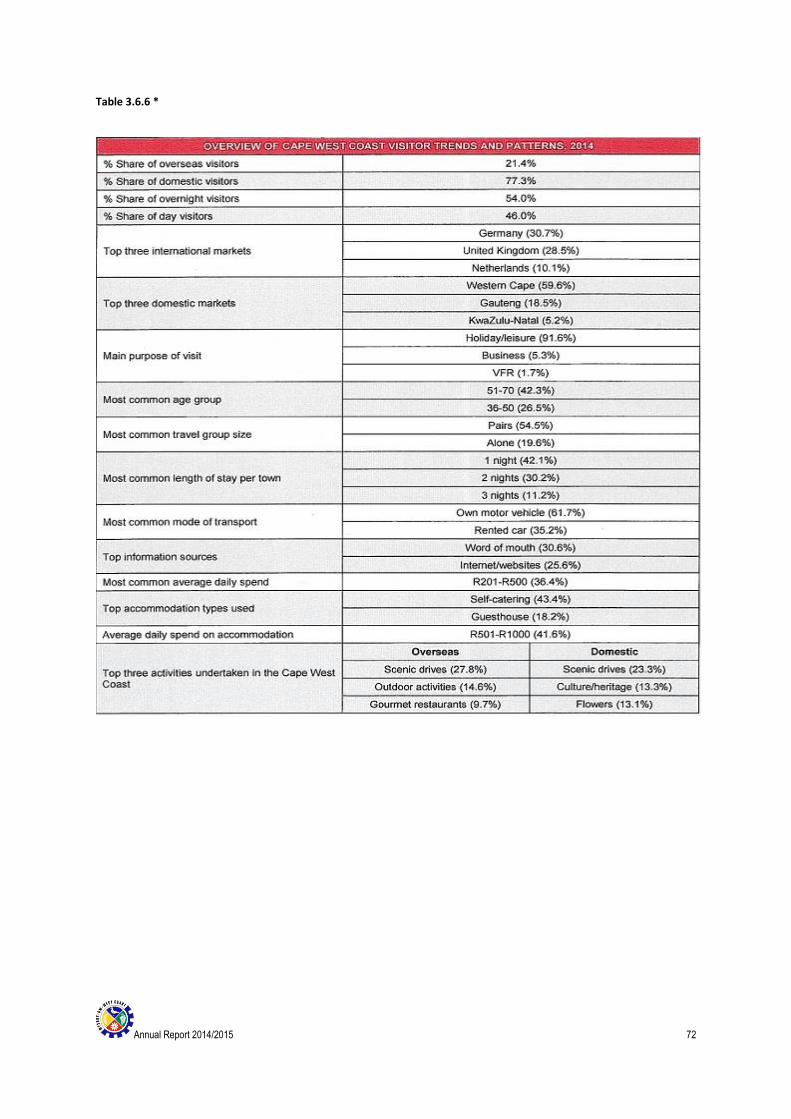
Annual Report 2014/2015 72
Table 3.6.6 *
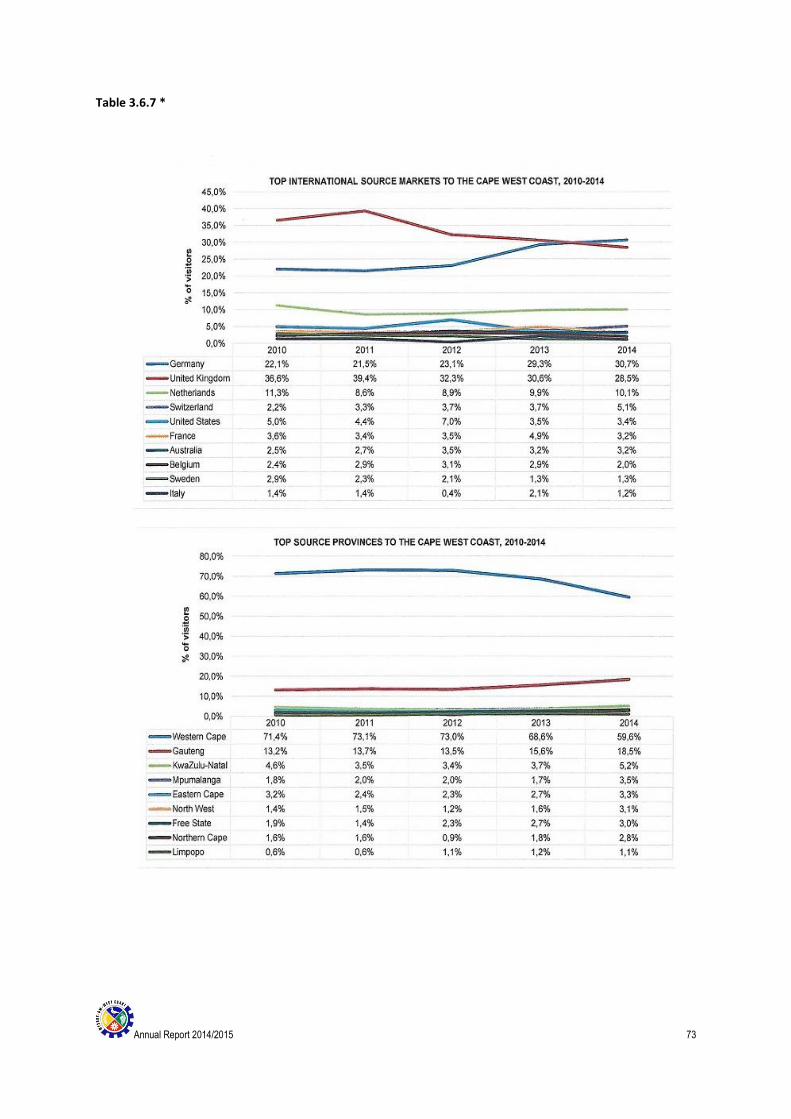
Annual Report 2014/2015 73
Table 3.6.7 *
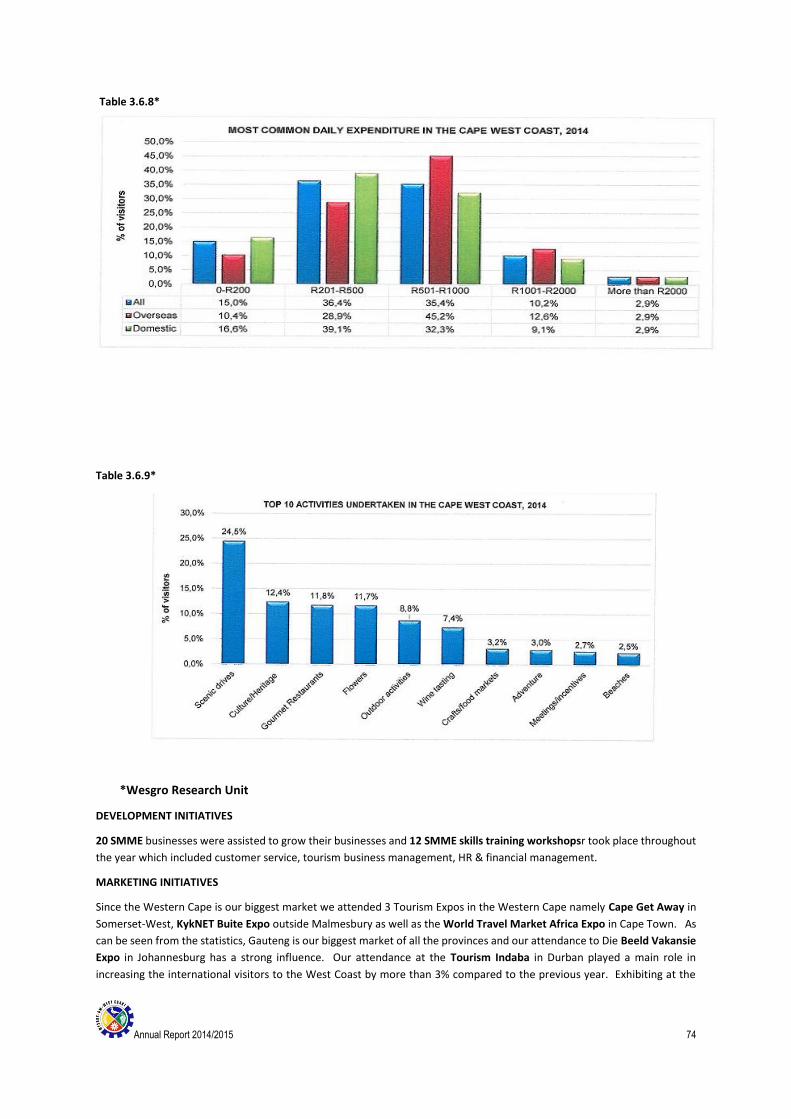
Annual Report 2014/2015 74
Table 3.6.8*
Table 3.6.9*
*Wesgro Research Unit
DEVELOPMENT INITIATIVES
20 SMME businesses were assisted to grow their businesses and 12 SMME skills training workshopsr took place throughout
the year which included customer service, tourism business management, HR & financial management.
MARKETING INITIATIVES
Since the Western Cape is our biggest market we attended 3 Tourism Expos in the Western Cape namely Cape Get Away in
Somerset-West, KykNET Buite Expo outside Malmesbury as well as the World Travel Market Africa Expo in Cape Town. As
can be seen from the statistics, Gauteng is our biggest market of all the provinces and our attendance to Die Beeld Vakansie
Expo in Johannesburg has a strong influence. Our attendance at the Tourism Indaba in Durban played a main role in
increasing the international visitors to the West Coast by more than 3% compared to the previous year. Exhibiting at the
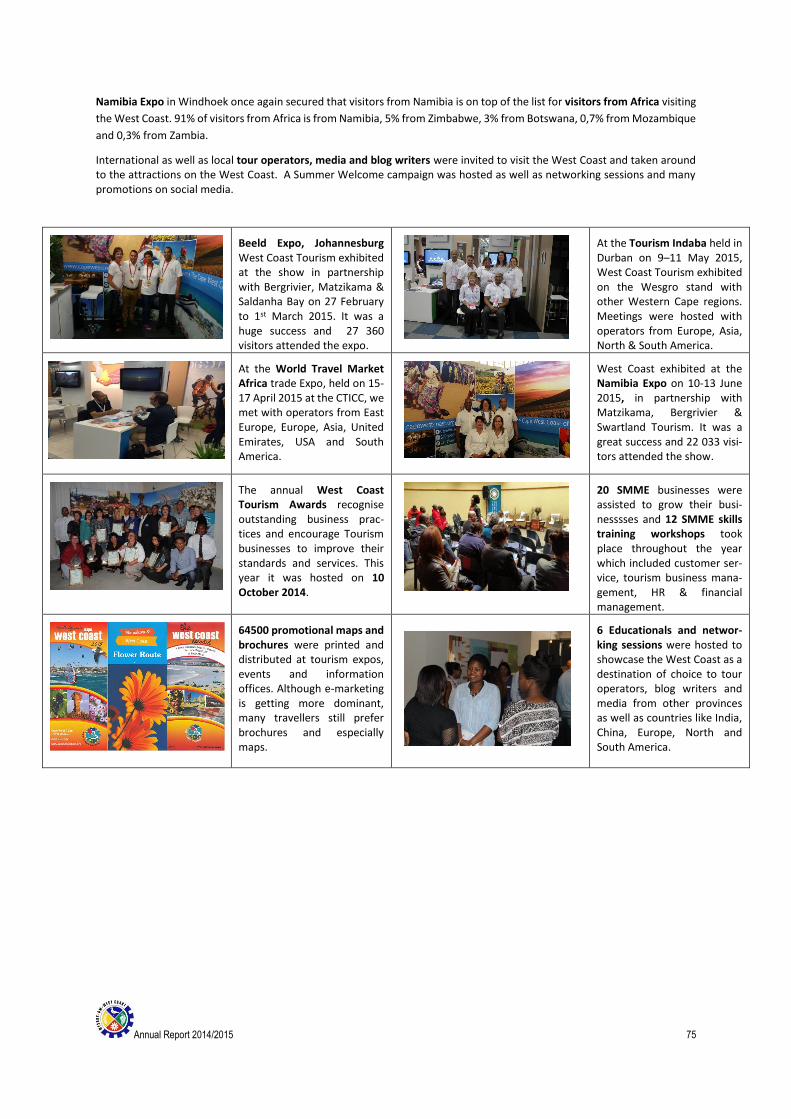
Annual Report 2014/2015 75
Namibia Expo in Windhoek once again secured that visitors from Namibia is on top of the list for visitors from Africa visiting
the West Coast. 91% of visitors from Africa is from Namibia, 5% from Zimbabwe, 3% from Botswana, 0,7% from Mozambique
and 0,3% from Zambia.
International as well as local tour operators, media and blog writers were invited to visit the West Coast and taken around to the attractions on the West Coast. A Summer Welcome campaign was hosted as well as networking sessions and many promotions on social media.
Beeld Expo, Johannesburg West Coast Tourism exhibited at the show in partnership with Bergrivier, Matzikama & Saldanha Bay on 27 February to 1st March 2015. It was a huge success and 27 360 visitors attended the expo.
At the Tourism Indaba held in Durban on 9–11 May 2015, West Coast Tourism exhibited on the Wesgro stand with other Western Cape regions. Meetings were hosted with operators from Europe, Asia, North & South America.
At the World Travel Market Africa trade Expo, held on 15-17 April 2015 at the CTICC, we met with operators from East Europe, Europe, Asia, United Emirates, USA and South America.
West Coast exhibited at the Namibia Expo on 10-13 June 2015, in partnership with Matzikama, Bergrivier & Swartland Tourism. It was a great success and 22 033 visi-tors attended the show.
The annual West Coast Tourism Awards recognise outstanding business prac-tices and encourage Tourism businesses to improve their standards and services. This year it was hosted on 10 October 2014.
20 SMME businesses were assisted to grow their busi-nesssses and 12 SMME skills training workshops took place throughout the year which included customer ser-vice, tourism business mana-gement, HR & financial management.
64500 promotional maps and brochures were printed and distributed at tourism expos, events and information offices. Although e-marketing is getting more dominant, many travellers still prefer brochures and especially maps.
6 Educationals and networ-king sessions were hosted to showcase the West Coast as a destination of choice to tour operators, blog writers and media from other provinces as well as countries like India, China, Europe, North and South America.
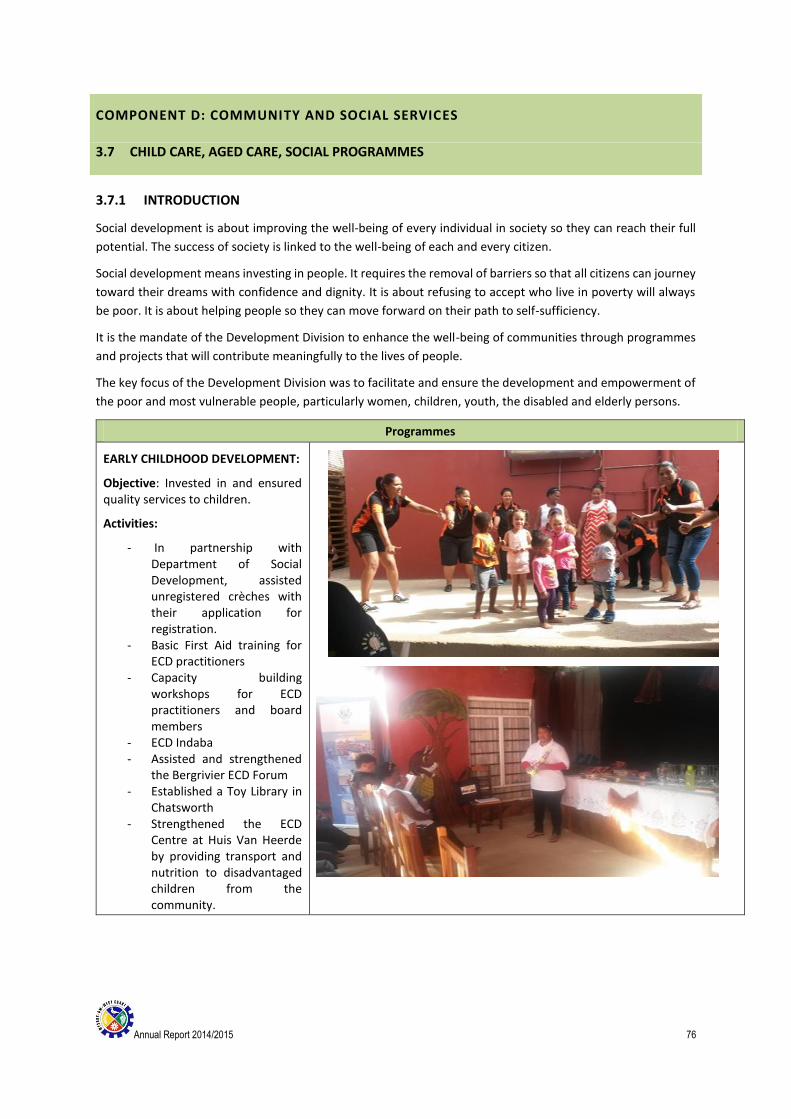
Annual Report 2014/2015 76
COMPONENT D: COMMUNITY AND SOCIAL SERVICES
3.7 CHILD CARE, AGED CARE, SOCIAL PROGRAMMES
3.7.1 INTRODUCTION
Social development is about improving the well-being of every individual in society so they can reach their full
potential. The success of society is linked to the well-being of each and every citizen.
Social development means investing in people. It requires the removal of barriers so that all citizens can journey
toward their dreams with confidence and dignity. It is about refusing to accept who live in poverty will always
be poor. It is about helping people so they can move forward on their path to self-sufficiency.
It is the mandate of the Development Division to enhance the well-being of communities through programmes
and projects that will contribute meaningfully to the lives of people.
The key focus of the Development Division was to facilitate and ensure the development and empowerment of
the poor and most vulnerable people, particularly women, children, youth, the disabled and elderly persons.
Programmes
EARLY CHILDHOOD DEVELOPMENT:
Objective: Invested in and ensured quality services to children.
Activities:
- In partnership with Department of Social Development, assisted unregistered crèches with their application for registration.
- Basic First Aid training for ECD practitioners
- Capacity building workshops for ECD practitioners and board members
- ECD Indaba - Assisted and strengthened
the Bergrivier ECD Forum - Established a Toy Library in
Chatsworth - Strengthened the ECD
Centre at Huis Van Heerde by providing transport and nutrition to disadvantaged children from the community.
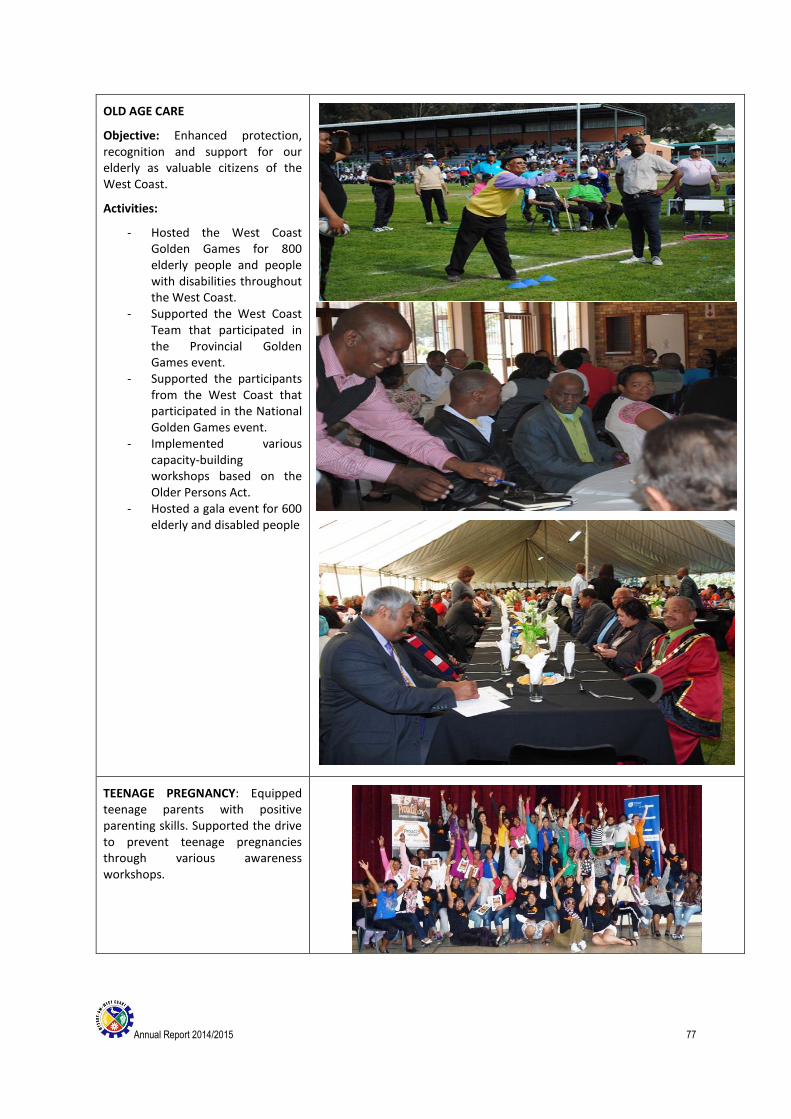
Annual Report 2014/2015 77
OLD AGE CARE
Objective: Enhanced protection, recognition and support for our elderly as valuable citizens of the West Coast.
Activities:
- Hosted the West Coast Golden Games for 800 elderly people and people with disabilities throughout the West Coast.
- Supported the West Coast Team that participated in the Provincial Golden Games event.
- Supported the participants from the West Coast that participated in the National Golden Games event.
- Implemented various capacity-building workshops based on the Older Persons Act.
- Hosted a gala event for 600 elderly and disabled people
TEENAGE PREGNANCY: Equipped teenage parents with positive parenting skills. Supported the drive to prevent teenage pregnancies through various awareness workshops.
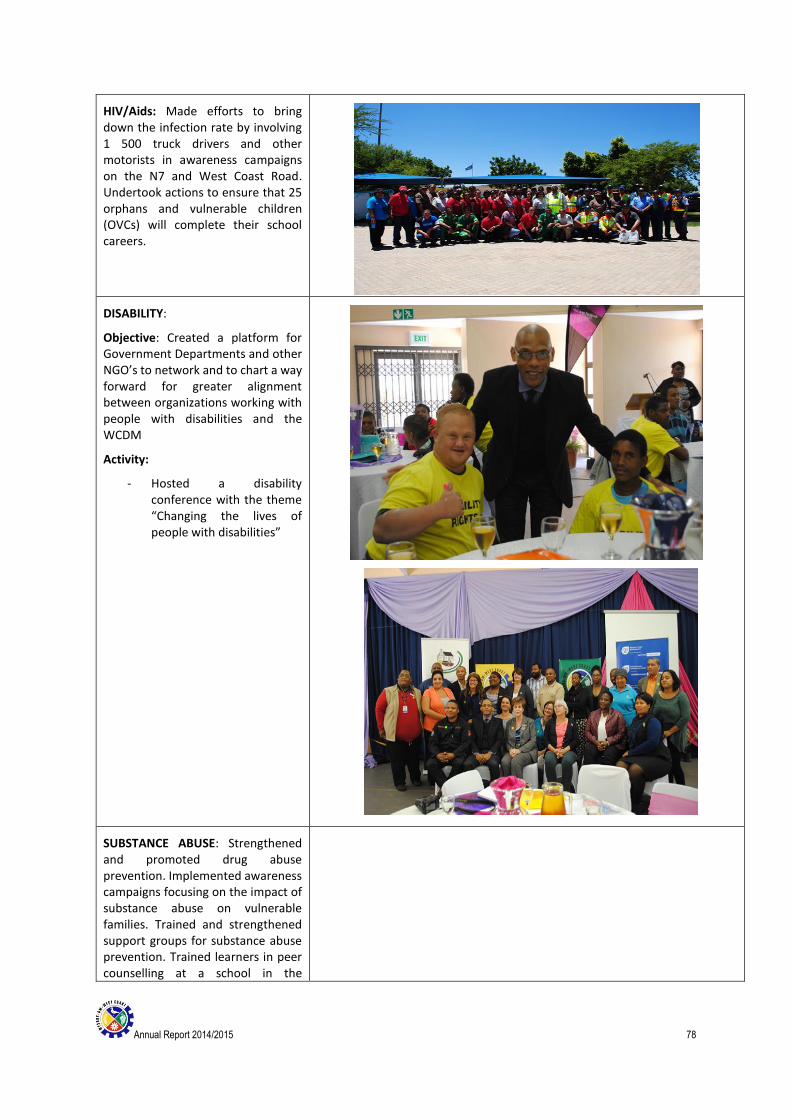
Annual Report 2014/2015 78
HIV/Aids: Made efforts to bring down the infection rate by involving 1 500 truck drivers and other motorists in awareness campaigns on the N7 and West Coast Road. Undertook actions to ensure that 25 orphans and vulnerable children (OVCs) will complete their school careers.
DISABILITY:
Objective: Created a platform for Government Departments and other NGO’s to network and to chart a way forward for greater alignment between organizations working with people with disabilities and the WCDM
Activity:
- Hosted a disability conference with the theme “Changing the lives of people with disabilities”
SUBSTANCE ABUSE: Strengthened and promoted drug abuse prevention. Implemented awareness campaigns focusing on the impact of substance abuse on vulnerable families. Trained and strengthened support groups for substance abuse prevention. Trained learners in peer counselling at a school in the
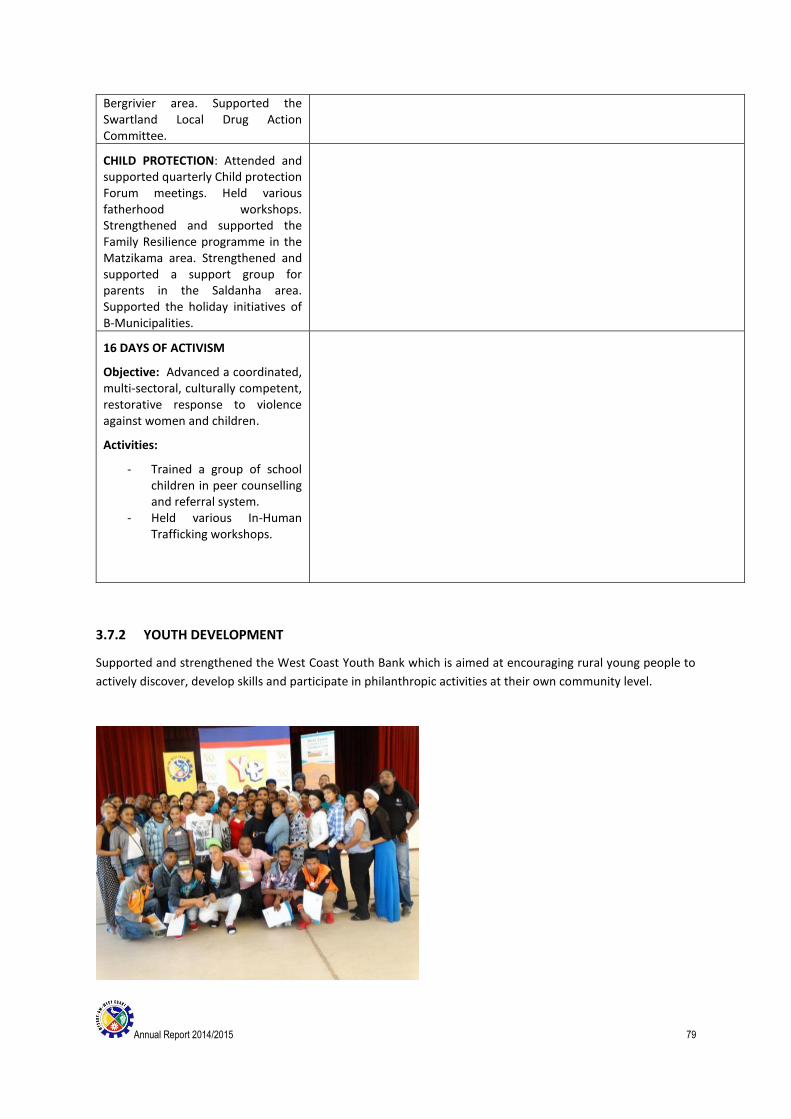
Annual Report 2014/2015 79
Bergrivier area. Supported the Swartland Local Drug Action Committee.
CHILD PROTECTION: Attended and supported quarterly Child protection Forum meetings. Held various fatherhood workshops. Strengthened and supported the Family Resilience programme in the Matzikama area. Strengthened and supported a support group for parents in the Saldanha area. Supported the holiday initiatives of B-Municipalities.
16 DAYS OF ACTIVISM
Objective: Advanced a coordinated, multi-sectoral, culturally competent, restorative response to violence against women and children.
Activities:
- Trained a group of school children in peer counselling and referral system.
- Held various In-Human Trafficking workshops.
3.7.2 YOUTH DEVELOPMENT
Supported and strengthened the West Coast Youth Bank which is aimed at encouraging rural young people to
actively discover, develop skills and participate in philanthropic activities at their own community level.
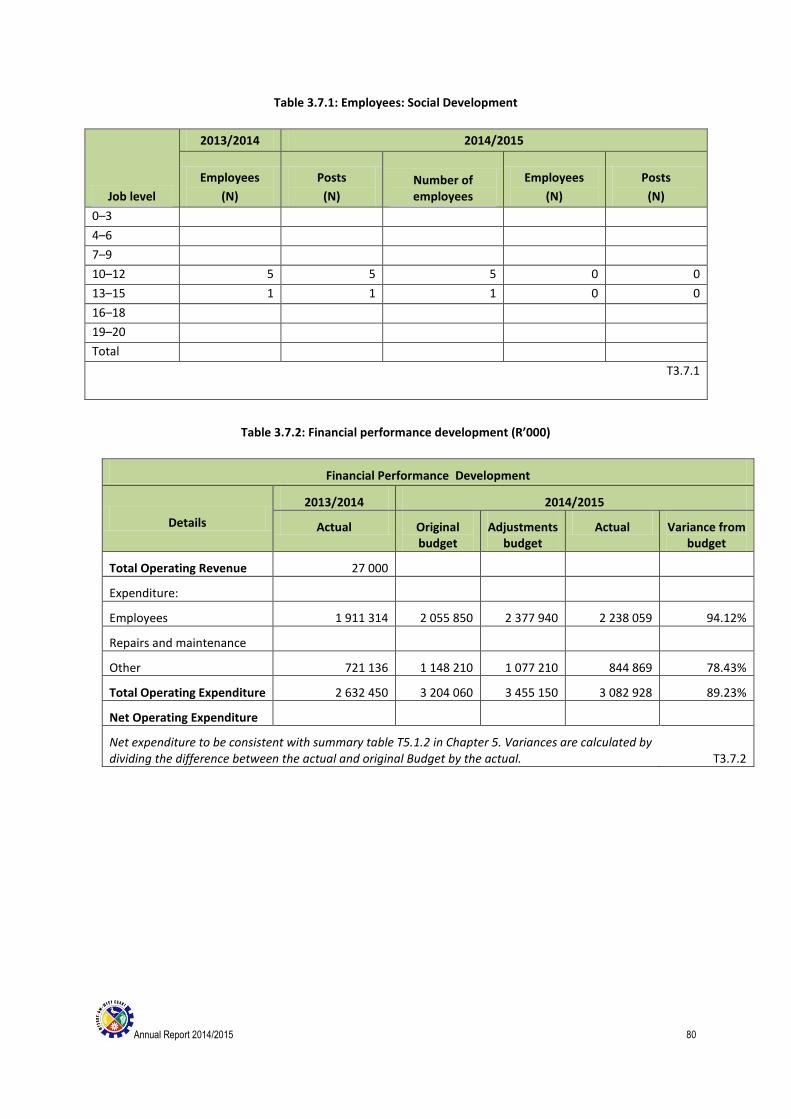
Annual Report 2014/2015 80
Table 3.7.1: Employees: Social Development
Job level
2013/2014 2014/2015
Employees
(N)
Posts
(N) Number of employees
Employees
(N)
Posts
(N)
0–3
4–6
7–9
10–12 5 5 5 0 0
13–15 1 1 1 0 0
16–18
19–20
Total
T3.7.1
Table 3.7.2: Financial performance development (R’000)
Financial Performance Development
Details
2013/2014 2014/2015
Actual Original budget
Adjustments budget
Actual Variance from budget
Total Operating Revenue 27 000
Expenditure:
Employees 1 911 314 2 055 850 2 377 940 2 238 059 94.12%
Repairs and maintenance
Other 721 136 1 148 210 1 077 210 844 869 78.43%
Total Operating Expenditure 2 632 450 3 204 060 3 455 150 3 082 928 89.23%
Net Operating Expenditure
Net expenditure to be consistent with summary table T5.1.2 in Chapter 5. Variances are calculated by dividing the difference between the actual and original Budget by the actual. T3.7.2
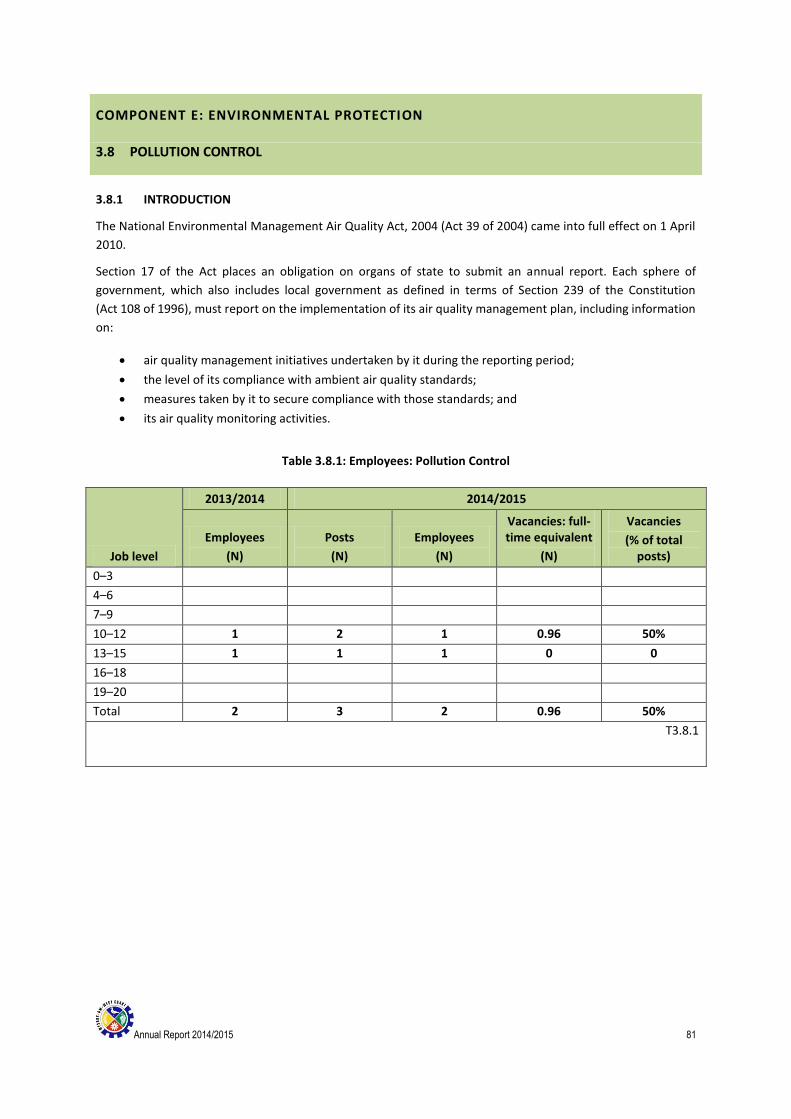
Annual Report 2014/2015 81
COMPONENT E: ENVIRONMENTAL PROTECTION
3.8 POLLUTION CONTROL
3.8.1 INTRODUCTION
The National Environmental Management Air Quality Act, 2004 (Act 39 of 2004) came into full effect on 1 April
2010.
Section 17 of the Act places an obligation on organs of state to submit an annual report. Each sphere of
government, which also includes local government as defined in terms of Section 239 of the Constitution
(Act 108 of 1996), must report on the implementation of its air quality management plan, including information
on:
air quality management initiatives undertaken by it during the reporting period;
the level of its compliance with ambient air quality standards;
measures taken by it to secure compliance with those standards; and
its air quality monitoring activities.
Table 3.8.1: Employees: Pollution Control
Job level
2013/2014 2014/2015
Employees
(N)
Posts
(N)
Employees
(N)
Vacancies: full-time equivalent
(N)
Vacancies
(% of total posts)
0–3
4–6
7–9
10–12 1 2 1 0.96 50%
13–15 1 1 1 0 0
16–18
19–20
Total 2 3 2 0.96 50%
T3.8.1
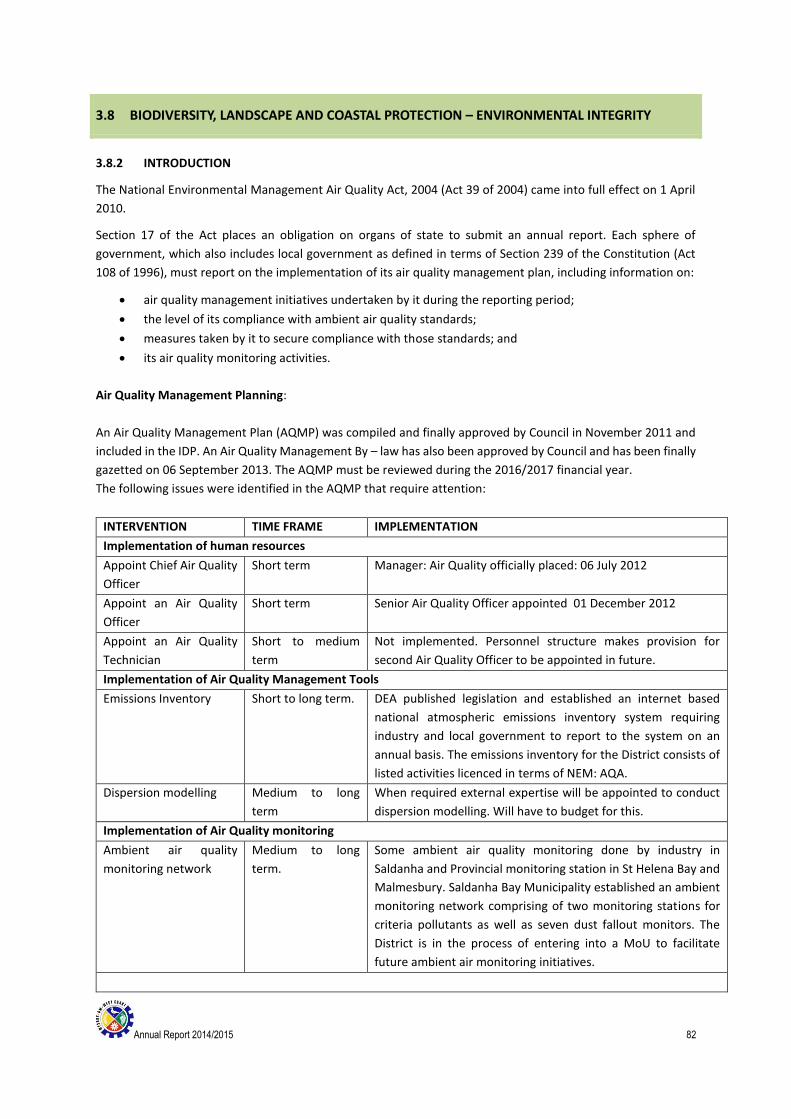
Annual Report 2014/2015 82
3.8 BIODIVERSITY, LANDSCAPE AND COASTAL PROTECTION – ENVIRONMENTAL INTEGRITY
3.8.2 INTRODUCTION
The National Environmental Management Air Quality Act, 2004 (Act 39 of 2004) came into full effect on 1 April
2010.
Section 17 of the Act places an obligation on organs of state to submit an annual report. Each sphere of
government, which also includes local government as defined in terms of Section 239 of the Constitution (Act
108 of 1996), must report on the implementation of its air quality management plan, including information on:
air quality management initiatives undertaken by it during the reporting period;
the level of its compliance with ambient air quality standards;
measures taken by it to secure compliance with those standards; and
its air quality monitoring activities.
Air Quality Management Planning:
An Air Quality Management Plan (AQMP) was compiled and finally approved by Council in November 2011 and
included in the IDP. An Air Quality Management By – law has also been approved by Council and has been finally
gazetted on 06 September 2013. The AQMP must be reviewed during the 2016/2017 financial year.
The following issues were identified in the AQMP that require attention:
INTERVENTION TIME FRAME IMPLEMENTATION
Implementation of human resources
Appoint Chief Air Quality
Officer
Short term Manager: Air Quality officially placed: 06 July 2012
Appoint an Air Quality
Officer
Short term Senior Air Quality Officer appointed 01 December 2012
Appoint an Air Quality
Technician
Short to medium
term
Not implemented. Personnel structure makes provision for
second Air Quality Officer to be appointed in future.
Implementation of Air Quality Management Tools
Emissions Inventory Short to long term. DEA published legislation and established an internet based
national atmospheric emissions inventory system requiring
industry and local government to report to the system on an
annual basis. The emissions inventory for the District consists of
listed activities licenced in terms of NEM: AQA.
Dispersion modelling Medium to long
term
When required external expertise will be appointed to conduct
dispersion modelling. Will have to budget for this.
Implementation of Air Quality monitoring
Ambient air quality
monitoring network
Medium to long
term.
Some ambient air quality monitoring done by industry in
Saldanha and Provincial monitoring station in St Helena Bay and
Malmesbury. Saldanha Bay Municipality established an ambient
monitoring network comprising of two monitoring stations for
criteria pollutants as well as seven dust fallout monitors. The
District is in the process of entering into a MoU to facilitate
future ambient air monitoring initiatives.
Annual Report 2014/2015 83
Emission Reduction / Control Strategies
Reduce / control
domestic fuel burning
Short to long term.
Local Municipalities
to address.
Promote the use of renewable energy and create awareness.
Control of
transportation
emissions.
Short to long term.
Local Municipalities
in terms of By-laws.
Do vehicle count and diesel vehicle testing. No implementation
yet.
Control of emissions
from mining activities.
Short to long term.
Local Municipalities
with assistance
from District and
Province.
Control of dust. No implementation yet.
Control of emissions
from agricultural
activities.
Local Municipalities
with assistance
from District and
Agriculture.
Control of dust in terms of Local Municipal By-laws. Planning
meeting with relevant authorities and agriculture. Meeting with
role players took place on 26 August 2013. No further
development in this regard.
Control of emissions
from industrial activities.
Short to long term.
District and Local
Municipalities
responsibility.
Licensing of listed activities done by District. Emissions standards
enforced through issuing of licences.
Control of emissions
from waste treatment
disposal activities.
Short to long term.
Local Municipalities
and District with
assistance from
Provincial
Government.
Incineration controlled through licensing in terms of Air Quality
Act emission standards. Landfills still to be properly controlled
by Local Municipalities with assistance from District and
Provincial Government.
Control of emissions
from biomass burning
i.e. veld fires.
Short to long term.
Local and District
Municipality’s
responsibility.
Strict control over veld fires whether naturally occurring or due
to planned burning should be implemented.
As per Councils resolution of 30 May 2012 a Memorandum of Understanding (MoU) will be entered into between
District and Local Municipalities once functions have been agreed upon. The MoU has now been finalised and
submitted to Local Municipalities for approval and signature. In order to ensure that the requirements regarding
the division of functions between the District and Local Municipalities are met a Joint Municipal Air Quality
Working Group has been established. The working group will meet on quarterly intervals to discuss issues of
common interest.
With regards to the implementation of the AQMP it is important to note that a Manager: Air Quality and Senior
Air Quality Officer has been appointed and that awareness raising is being done through the establishment of
working groups and environmental stakeholders forums.
The main function of the West Coast District Municipality is the licensing of listed activities assigned to it in terms
of the National Environmental Management: Air Quality Act. Emission standards established in terms of the Air
Quality Act are enforced through licence conditions.
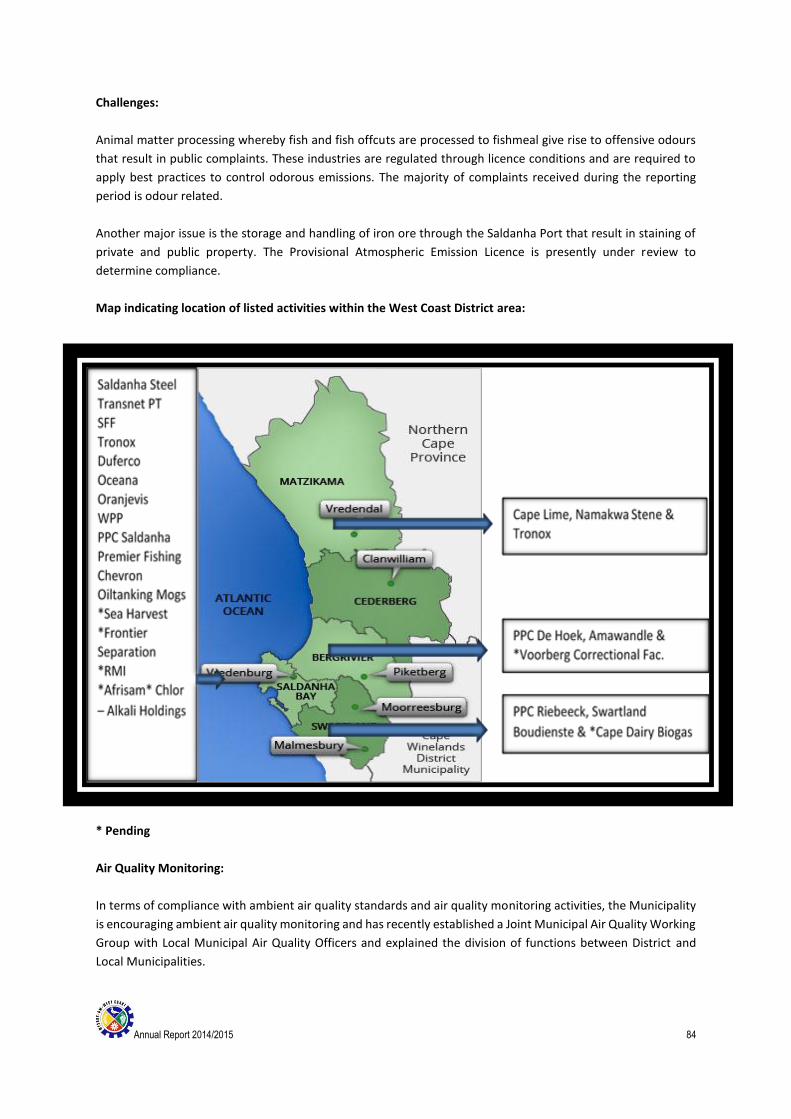
Annual Report 2014/2015 84
Challenges:
Animal matter processing whereby fish and fish offcuts are processed to fishmeal give rise to offensive odours
that result in public complaints. These industries are regulated through licence conditions and are required to
apply best practices to control odorous emissions. The majority of complaints received during the reporting
period is odour related.
Another major issue is the storage and handling of iron ore through the Saldanha Port that result in staining of
private and public property. The Provisional Atmospheric Emission Licence is presently under review to
determine compliance.
Map indicating location of listed activities within the West Coast District area:
* Pending
Air Quality Monitoring:
In terms of compliance with ambient air quality standards and air quality monitoring activities, the Municipality
is encouraging ambient air quality monitoring and has recently established a Joint Municipal Air Quality Working
Group with Local Municipal Air Quality Officers and explained the division of functions between District and
Local Municipalities.
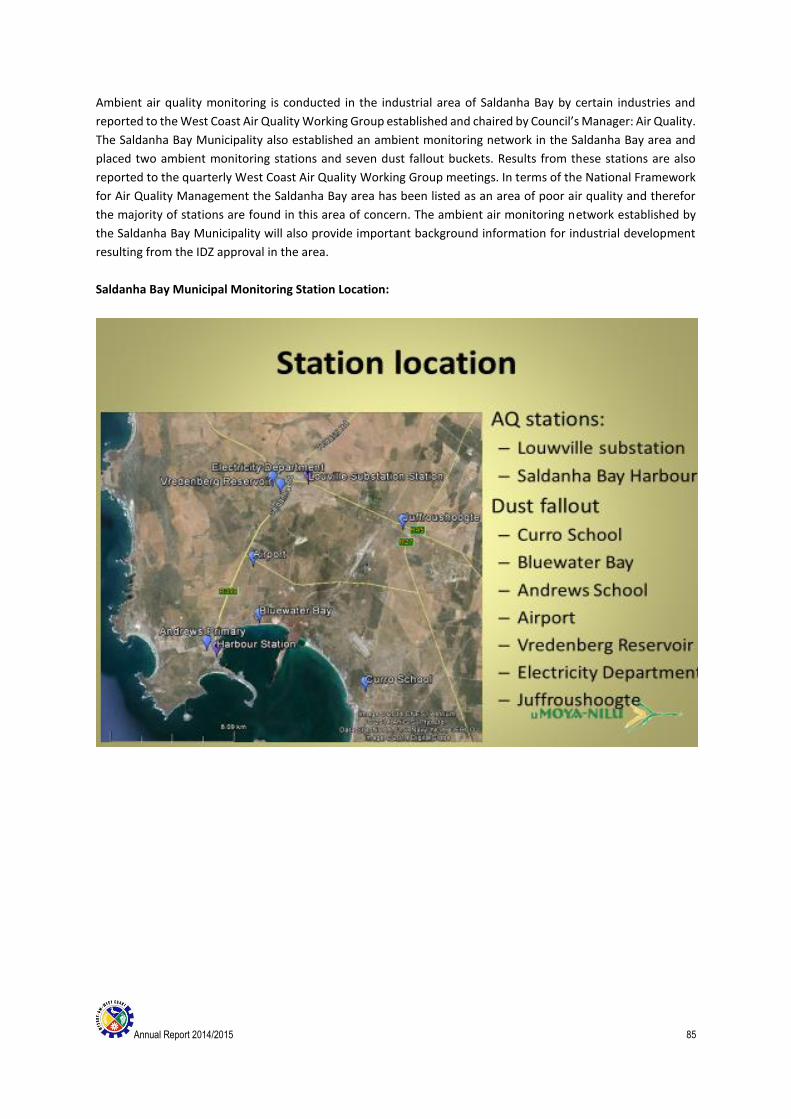
Annual Report 2014/2015 85
Ambient air quality monitoring is conducted in the industrial area of Saldanha Bay by certain industries and
reported to the West Coast Air Quality Working Group established and chaired by Council’s Manager: Air Quality.
The Saldanha Bay Municipality also established an ambient monitoring network in the Saldanha Bay area and
placed two ambient monitoring stations and seven dust fallout buckets. Results from these stations are also
reported to the quarterly West Coast Air Quality Working Group meetings. In terms of the National Framework
for Air Quality Management the Saldanha Bay area has been listed as an area of poor air quality and therefor
the majority of stations are found in this area of concern. The ambient air monitoring network established by
the Saldanha Bay Municipality will also provide important background information for industrial development
resulting from the IDZ approval in the area.
Saldanha Bay Municipal Monitoring Station Location:
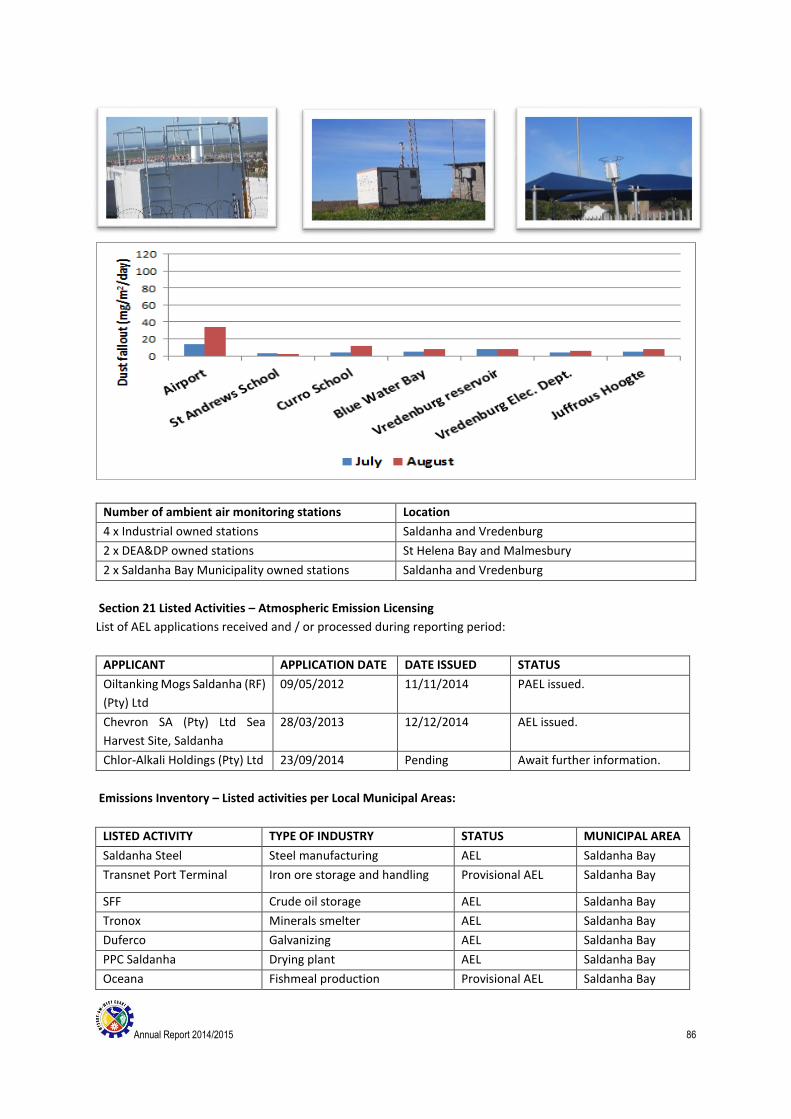
Annual Report 2014/2015 86
Number of ambient air monitoring stations Location
4 x Industrial owned stations Saldanha and Vredenburg
2 x DEA&DP owned stations St Helena Bay and Malmesbury
2 x Saldanha Bay Municipality owned stations Saldanha and Vredenburg
Section 21 Listed Activities – Atmospheric Emission Licensing
List of AEL applications received and / or processed during reporting period:
APPLICANT APPLICATION DATE DATE ISSUED STATUS
Oiltanking Mogs Saldanha (RF)
(Pty) Ltd
09/05/2012 11/11/2014 PAEL issued.
Chevron SA (Pty) Ltd Sea
Harvest Site, Saldanha
28/03/2013 12/12/2014 AEL issued.
Chlor-Alkali Holdings (Pty) Ltd 23/09/2014 Pending Await further information.
Emissions Inventory – Listed activities per Local Municipal Areas:
LISTED ACTIVITY TYPE OF INDUSTRY STATUS MUNICIPAL AREA
Saldanha Steel Steel manufacturing AEL Saldanha Bay
Transnet Port Terminal Iron ore storage and handling Provisional AEL Saldanha Bay
SFF Crude oil storage AEL Saldanha Bay
Tronox Minerals smelter AEL Saldanha Bay
Duferco Galvanizing AEL Saldanha Bay
PPC Saldanha Drying plant AEL Saldanha Bay
Oceana Fishmeal production Provisional AEL Saldanha Bay
Annual Report 2014/2015 87
Oranjevis Fishmeal production Provisional AEL Saldanha Bay
WPP Fishmeal production Provisional AEL Saldanha Bay
Premier Fishing Fishmeal production Provisional AEL Saldanha Bay
Afrisam Cement manufacturing Pending Saldanha Bay
Sea Harvest Fishmeal production Pending Saldanha Bay
Oiltanking Mogs Crude oil storage PAEL Saldanha Bay
RMI Rare Metals industry Pending Saldanha Bay
Frontier Separation Rare earth separation plant Pending Saldanha Bay
Chevron Storage of petroleum products AEL Saldanha Bay
Chlor-Alkali Holdings Chemicals production Pending Saldanha Bay
PPC Riebeeck Cement manufacturing AEL Swartland
Swartland Boudienste Wood drying AEL Swartland
Cape Dairy Biogas Animal matter processing Pending Swartland
PPC De Hoek Cement manufacturing AEL Bergrivier
Foodcorp Fishmeal production Provisional AEL Bergrivier
Voorberg Correctional
facility
Incinerator Pending Bergrivier
Namakwa Stene Clay brick manufacturing AEL Matzikama
Tronox Mineral Sands Drying plant Provisional AEL Matzikama
Cape Lime Lime production Provisional AEL Matzikama
Summary of Complaints:
Type of complaint WCDM
Annual Total
Fumes 0
Smoke 3
Dust 8
Burning waste/Tyres 0
Farm land burning 0
Crop spraying 0
Offensive odours 71
Unlicensed Facilities 0
Noise 0
Other 0
Total 82
Annual Report 2014/2015 88
Co-operative Governance:
The following compliance and enforcement inspections were conducted where all three spheres of
government were involved.
Name of industry Industry type Government departments
Oranjevis Fishmeal production DEA, DEA&DP & WCDM
Lucky Star Fishmeal production DEA, DEA&DP & WCDM
WPP Fishmeal production DEA, DEA&DP & WCDM
Foodcorp Fishmeal production DEA, DEA&DP & WCDM
Tronox Smelter plant DEA&DP & WCD M
Table 3.8.2: Capital expenditure: Environmental Integrity (R’000)
Capital projects
2014/2015
Budget Adjustment
budget Actual
expenditure
Variance from original
budget Total project
value
Total all R 1 091 604 R 1 091 604 R 1 091 604
Education and awareness R 30 000 R 30 000 R 30 000
Estuary management R 50 000 R 50 000 R 50 000
Coastal management R 90 000 R 90 000 R 90 000
Alien vegetation removal and cleanups R 100 000 R 100 000 R 100 000
GCBC R 30 000 R 30 000 R 30 000
EPWP Programme R 330 000 R 330 000 R 330 000
WFW Programme R 461 604 R 461 604 R 461 604
Professional fees (CMP) R 0 R 0 R 0
T3. 8.2
Annual Report 2014/2015 89
COMPONENT F: HEALTH
3.9 HEALTH INSPECTIONS, FOOD LICENSING AND FOOD INSPECTIONS
3.9.1 INTRODUCTION
The Division of Environmental Health, being aware of the constitutional right of every person to an environment
that is not harmful to his or her health or well-being, and the principles that underlie the National Health Act,
2003 (Act 61 of 2003) and the National Environmental Management Act, 1998 (Act 107 of 1998), aims to protect
and promote the health and well-being of all our residents in the West Coast District Municipal region by
providing, in accordance with applicable laws, a sustainable, effective and responsible environmental health
service.
Section 24 of the Constitution of South Africa, 1996 (Act 108 of 1996) states that every resident of our country
has the right to an environment that is not harmful to his or her health and well-being. All local authorities in the
West Coast District Municipal region still face the challenge to ensure such an environment to its residents.
Environmental health denotes a condition of optimal wholesomeness of the environment in which man exists
and interacts with others in the lowest possible presence or total absence of any stimuli detrimental to human
health.
The Division of Environmental Health is therefore responsible for the identification, evaluation, control and
prevention of those factors that can be detrimental to people’s health and well-being. In terms of the above-
mentioned Acts, the functions of the Environmental Health Services are as follows:
1) Waste management and monitoring
2) Food control
3) Control of premises
4) Communicable disease control
5) Vector control
6) Environmental pollution control
7) Chemical safety
8) Disposal of the dead
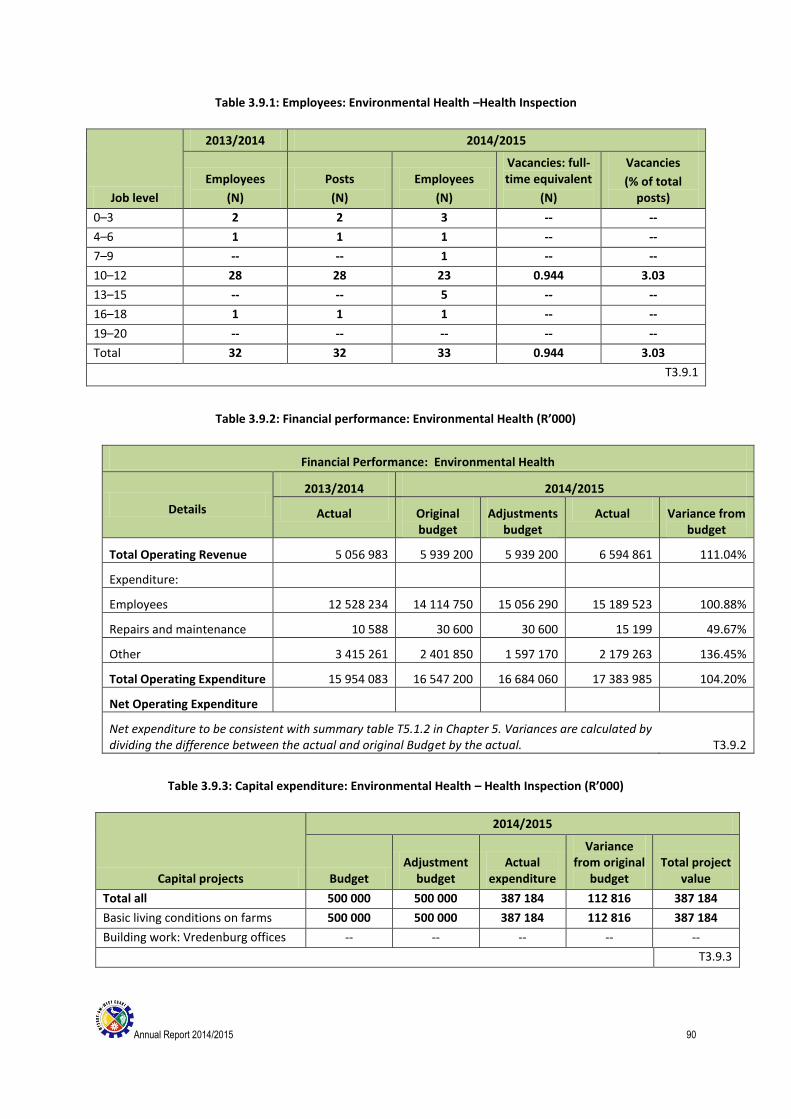
Annual Report 2014/2015 90
Table 3.9.1: Employees: Environmental Health –Health Inspection
Job level
2013/2014 2014/2015
Employees
(N)
Posts
(N)
Employees
(N)
Vacancies: full-time equivalent
(N)
Vacancies
(% of total posts)
0–3 2 2 3 -- --
4–6 1 1 1 -- --
7–9 -- -- 1 -- --
10–12 28 28 23 0.944 3.03
13–15 -- -- 5 -- --
16–18 1 1 1 -- --
19–20 -- -- -- -- --
Total 32 32 33 0.944 3.03
T3.9.1
Table 3.9.2: Financial performance: Environmental Health (R’000)
Financial Performance: Environmental Health
Details
2013/2014 2014/2015
Actual Original budget
Adjustments budget
Actual Variance from budget
Total Operating Revenue 5 056 983 5 939 200 5 939 200 6 594 861 111.04%
Expenditure:
Employees 12 528 234 14 114 750 15 056 290 15 189 523 100.88%
Repairs and maintenance 10 588 30 600 30 600 15 199 49.67%
Other 3 415 261 2 401 850 1 597 170 2 179 263 136.45%
Total Operating Expenditure 15 954 083 16 547 200 16 684 060 17 383 985 104.20%
Net Operating Expenditure
Net expenditure to be consistent with summary table T5.1.2 in Chapter 5. Variances are calculated by dividing the difference between the actual and original Budget by the actual. T3.9.2
Table 3.9.3: Capital expenditure: Environmental Health – Health Inspection (R’000)
Capital projects
2014/2015
Budget Adjustment
budget Actual
expenditure
Variance from original
budget Total project
value
Total all 500 000 500 000 387 184 112 816 387 184
Basic living conditions on farms 500 000 500 000 387 184 112 816 387 184
Building work: Vredenburg offices -- -- -- -- --
T3.9.3
Annual Report 2014/2015 91
COMPONENT G: SECURITY AND SAFETY
3.10 FIRE SERVICES
3.10.1 INTRODUCTION
The 2014/2015 year was a fairly quiet year for the Fire and Rescue Services of the West Coast District
Municipality in relation to the attendance of wildland fires. The service only attended to 196 wildfires for the
2014/2015 summer season in comparison with the 398 wildfires for the 2013/2014 summer season. This
afforded us the opportunity to assist other Municipalities, as well as the City of Cape Town, who was
experiencing a very busy summer season. This service assisted with wildfires in the Overstrand Municipality,
Cape Winelands District Municipality and City of Cape Town.
Operationally, the personnel of the Fire and Rescue Services of the West Coast District Municipality attended to
a total of 1 865 incidents, which equates to 17 601 manhours spent on these incidents. This does not include the
time spent on training, fire prevention and public training activities which are also provided by this Service to
the communities within the boundaries of the West Coast District Municipality.
This department also attended the annual Fire Fighters’ Day which is celebrated internationally on 4 May each
year. The event was hosted this year by the City of Cape Town Fire and Rescue Services. The event was held over
three days. The West Coast District Municipality Fire and Rescue Services is still the only professional full-time
fire and rescue service for the whole of the West Coast District Municipality and renders services in the areas of
our local municipalities through memoranda of understanding.
As from 1 April 2014, the West Coast District Municipality entered into a three-year contract with Saldanha Bay
Municipality, whereby the West Coast District Municipality will render a professional fire and rescue service on
behalf of Saldanha Bay Municipality. In the process, the West Coast District Municipality will also assist Saldanha
Bay Municipality in building its own service for the future.
During September 2014 the Chief Fire Officer was part of a team of professionals who attended a USAID/US
Forest Service IMT Initiative in Missoulla, Montana in America as part of the Incident Command Team. They
attended a major fire incident to participate in the Incident Command Structure that included the following
components,
Command, Planning, Operations, Logistics, Finance/Administration.
Firefighter Nazeem Davies passed away in the line of duty on 5 March 2015. He was a valued and respected
member of our team and it was a privilege working alongside him.
3.10.2 OPERATIONAL MATTERS
As mentioned previously, the Fire and Rescue Services of the West Coast District attended to a total of 1 865
incidents during the 2014/2015 year. It is 488 incidents more than the 2013/2014 year. This service still assists
Emergency Management Services (EMS) and Metro in responding to medical incidents when an ambulance may
not be available immediately. This arrangement is only for priority one emergencies.
Since attending to emergency incidents is one of our service delivery priority areas, we can report that our Fire
Service has complied 100%, as every incident that was reported to the control room at Moorreesburg, which is
operational 24 hours a day, received attention. Most of the calls attended to were not for assigned functions of
a District Fire Service. This was done with great efficiency as this Fire Service achieved an average turn out time
of 2 minutes and 19 seconds. The target is set at 5 minutes flat.
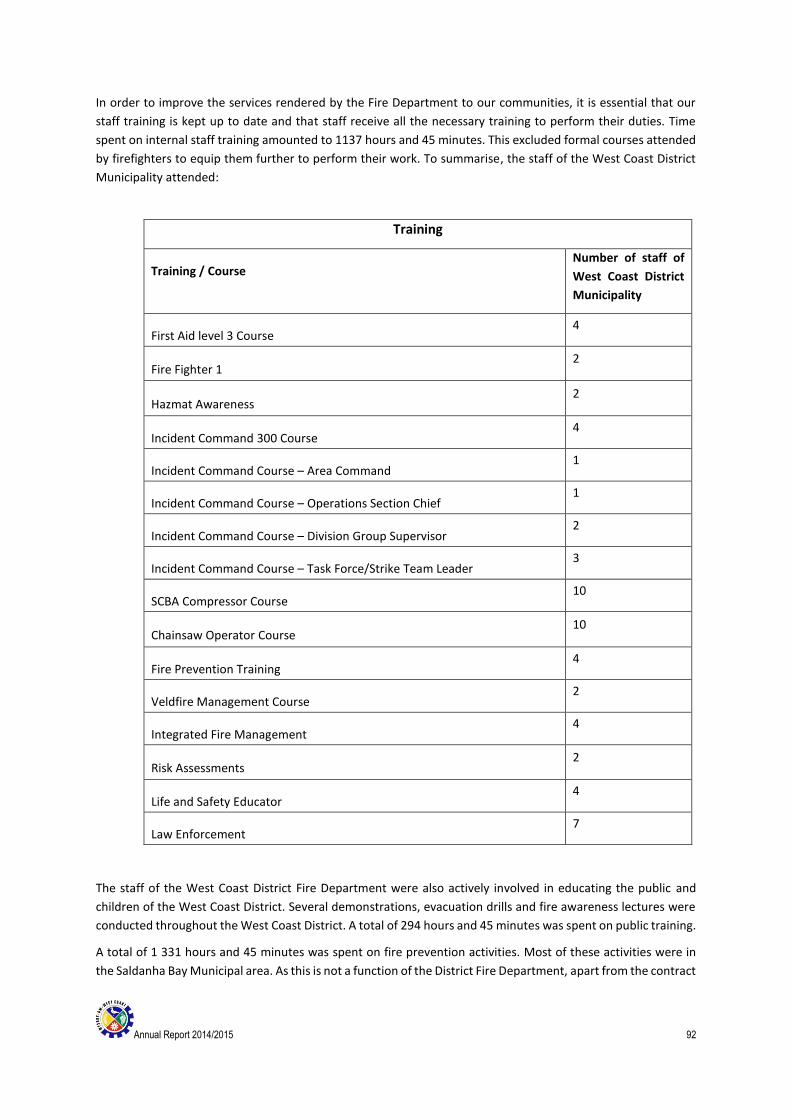
Annual Report 2014/2015 92
In order to improve the services rendered by the Fire Department to our communities, it is essential that our
staff training is kept up to date and that staff receive all the necessary training to perform their duties. Time
spent on internal staff training amounted to 1137 hours and 45 minutes. This excluded formal courses attended
by firefighters to equip them further to perform their work. To summarise, the staff of the West Coast District
Municipality attended:
Training
Training / Course Number of staff of
West Coast District
Municipality
First Aid level 3 Course 4
Fire Fighter 1 2
Hazmat Awareness 2
Incident Command 300 Course 4
Incident Command Course – Area Command 1
Incident Command Course – Operations Section Chief 1
Incident Command Course – Division Group Supervisor 2
Incident Command Course – Task Force/Strike Team Leader 3
SCBA Compressor Course 10
Chainsaw Operator Course 10
Fire Prevention Training 4
Veldfire Management Course 2
Integrated Fire Management 4
Risk Assessments 2
Life and Safety Educator 4
Law Enforcement 7
The staff of the West Coast District Fire Department were also actively involved in educating the public and
children of the West Coast District. Several demonstrations, evacuation drills and fire awareness lectures were
conducted throughout the West Coast District. A total of 294 hours and 45 minutes was spent on public training.
A total of 1 331 hours and 45 minutes was spent on fire prevention activities. Most of these activities were in
the Saldanha Bay Municipal area. As this is not a function of the District Fire Department, apart from the contract
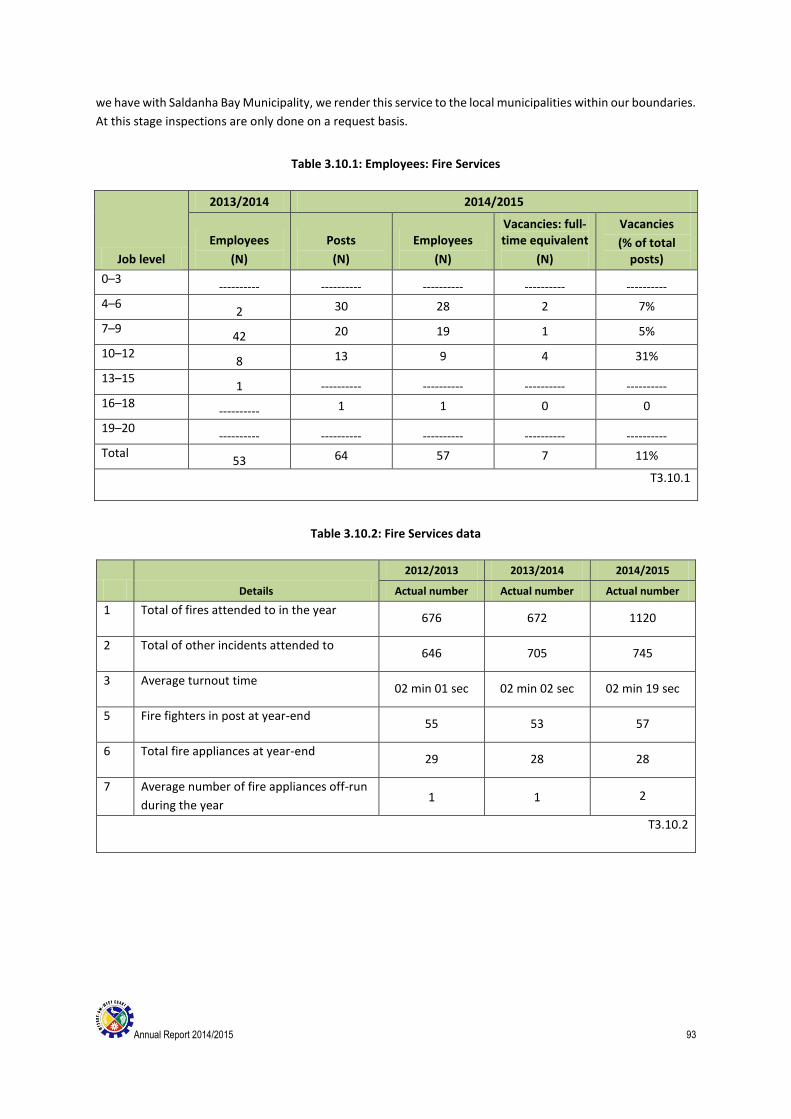
Annual Report 2014/2015 93
we have with Saldanha Bay Municipality, we render this service to the local municipalities within our boundaries.
At this stage inspections are only done on a request basis.
Table 3.10.1: Employees: Fire Services
Job level
2013/2014 2014/2015
Employees
(N)
Posts
(N)
Employees
(N)
Vacancies: full-time equivalent
(N)
Vacancies
(% of total posts)
0–3 ---------- ---------- ---------- ---------- ----------
4–6 2 30 28 2 7%
7–9 42 20 19 1 5%
10–12 8 13 9 4 31%
13–15 1 ---------- ---------- ---------- ----------
16–18 ---------- 1 1 0 0
19–20 ---------- ---------- ---------- ---------- ----------
Total 53 64 57 7 11%
T3.10.1
Table 3.10.2: Fire Services data
Details
2012/2013 2013/2014 2014/2015
Actual number Actual number Actual number
1 Total of fires attended to in the year 676 672 1120
2 Total of other incidents attended to 646 705 745
3 Average turnout time 02 min 01 sec 02 min 02 sec 02 min 19 sec
5 Fire fighters in post at year-end 55 53 57
6 Total fire appliances at year-end 29 28 28
7 Average number of fire appliances off-run
during the year 1 1 2
T3.10.2
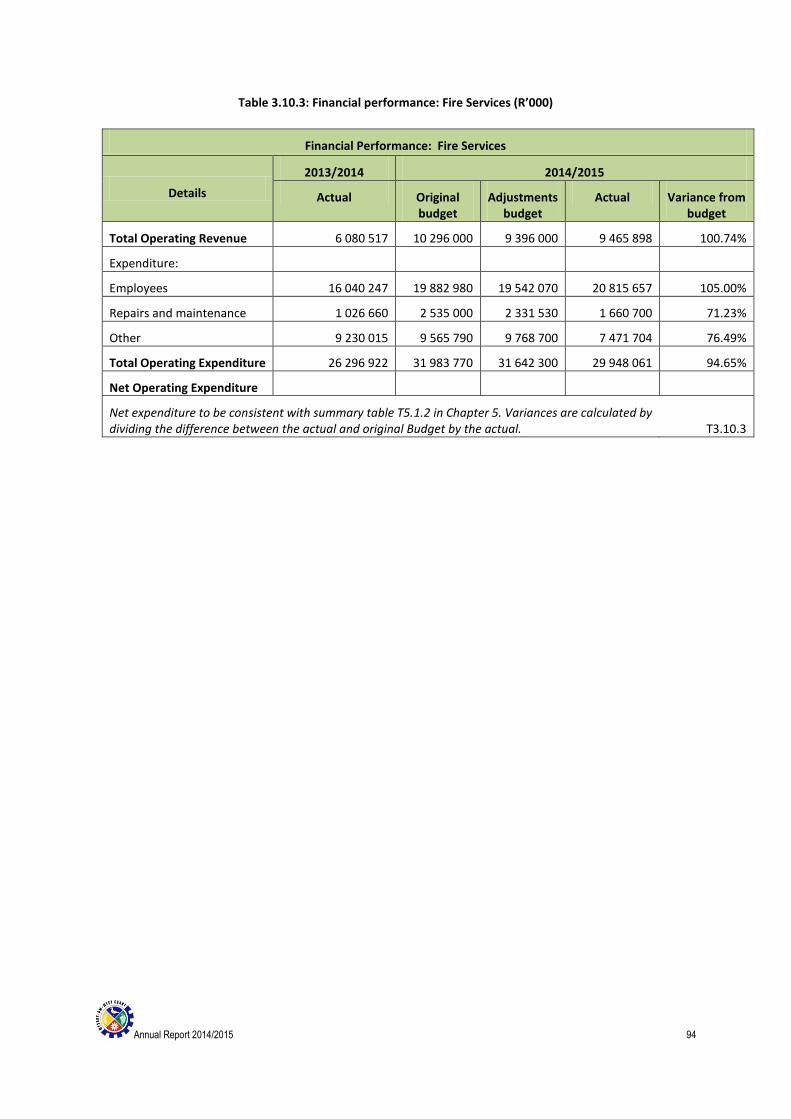
Annual Report 2014/2015 94
Table 3.10.3: Financial performance: Fire Services (R’000)
Financial Performance: Fire Services
Details
2013/2014 2014/2015
Actual Original budget
Adjustments budget
Actual Variance from budget
Total Operating Revenue 6 080 517 10 296 000 9 396 000 9 465 898 100.74%
Expenditure:
Employees 16 040 247 19 882 980 19 542 070 20 815 657 105.00%
Repairs and maintenance 1 026 660 2 535 000 2 331 530 1 660 700 71.23%
Other 9 230 015 9 565 790 9 768 700 7 471 704 76.49%
Total Operating Expenditure 26 296 922 31 983 770 31 642 300 29 948 061 94.65%
Net Operating Expenditure
Net expenditure to be consistent with summary table T5.1.2 in Chapter 5. Variances are calculated by dividing the difference between the actual and original Budget by the actual. T3.10.3
Annual Report 2014/2015 95
3.11 DISASTER MANAGEMENT
3.11.1 INTRODUCTION
There have been no further updates to the West Coast Disaster Management Framework since 2012/13. This
document is being used as the guiding document for disaster management within the district and is available on
the website: www.westcoastdm.co.za along with all the other disaster management related documents.
3.11.2 CAPACITY
The Centre: The West Coast District Municipality has an active disaster management centre since 2008. The
head of the centre and a cleaner has been appointed in 2010. Since December 2014 a contract position has
been made available for the sole purpose of assisting with the update of the disaster management plan. This
entails also the updating of all the risk specific contingency plans applicable to the district.
Staff: This addition of one staff member has added valuable capacity to the centre. During exercises and the
October protest march it became clear that the disaster management centre cannot function at the level needed
with the current staff structure. Additional staff is needed.
Volunteers: The centre makes use of the services of established NGO’s e.g. Lions, to assist communities. The
Centre also assist NGO’s to expand their own capacity through internal training programmes e.g. ALERT.
Call-taking and dispatch facility: The West Coast Disaster Management Centre has a call-taking and dispatch
facility that is operated in conjunction with Department of Health: EMS according to a Memorandum of
Agreement. In this facility all emergencies call are taken and the needed services are dispatch (EMS, fire,
provincial traffic, municipal fire, SANRAL and they will notify the police as well). The centre handles about 13
000 calls per month. Further details are available in the report from the West Coast fire brigade. EMS has a
service level agreement with Dimension Data for maintaining the CaremonX programme developed by Valentia.
Organization management facility: This facility is part of the Disaster Management building and used as a Joint
Operation Centre (JOC) during the managing of a mayor incidents. For the rest of the time it is used as a meeting
facility to discuss the prevention measures during the day to day activities. As part of prevention, it is also used
as a training facility that is open to all government departments within the district.
Administration: In addition to the day-to-day functioning, the centre also assisted with various general
administration tasks:
Asset management (July & March)
Disciplinary hearings of staff in other departments (on-going)
General maintenance of equipment and building (daily)
Supply chain procedures
Monthly performance management updates on the Ignite system
Meetings: The Centre is represented on various meetings.
Cape Winelands Disaster Management Advisory meeting (quarterly)
City of Cape Town: Emergency Planning Committee – Koeberg (quarterly)
Director: Administration and Community Services (weekly)
Department of Community Safety: West Coast Community Safety forum (quarterly) Department of Energy: Emergency Planning Steering and Oversight Committee - Koeberg (quarterly) Department of Local Government: Head of Centre meeting with the Chief Directorate: Disaster Management & Fire Services (quarterly)
Annual Report 2014/2015 96
Department of Local Government: Western Cape Disaster Management Advisory meeting (quarterly) Department of Local Government: Institutional capacity March 2015 (ad-hoc) Disaster Management Institute of South Africa -DMISA (quarterly) Larger management meeting with Municipal Manager (quarterly) Local Municipalities: Bergrivier Municipality, Cederberg Municipality, Matzikama Municipality, Saldanha Bay Municipality, Swartland Municipality (quarterly) Portfolio meeting with the Councillors (monthly)
SANRAL (bi-annual)
Terrain meeting with Department of Health and Fire Services (monthly)
West Coast IDP Co-ordinating Committee (quarterly) West Coast Disaster Management Advisory Forum (October & May) West Coast District website committee (quarterly or as needed) Other: Central Karoo District Municipality: Peer learning engagement (October) Department of Agriculture, Western Cape (to discuss framework) Department of Education to draft safety plans for schools. Department of Environmental Affairs (Section 30 incidents) Department of Social Development & SASSA (regarding the grants after disaster declaration) Department of Water Affairs (to join WCDM call centre) Dimension Data (service provider for the Call Centre) Disaster Management Solutions – grading of the Centre (pilot project for South Africa) HAMNET amateur radio network Incident Command meeting (September 2014) LGMTEC3 meeting National Council of Provinces (September 2014) SALGA to discuss funding options Training received:
Ebola training during September 2014 (Presented by Department of Health)
Disaster management support tool during September (Department of Local Government)
Incident Command systems in September (Working on Fire)
Incident Command Systems – Situation Unit Leader during October (Working on Fire)
Law enforcement course (Nelson Metropolitan University)
Risk champion training from 26-28 August 2014, provided by Department Treasury
South African Maritime Search and Rescue, during September (SAMSA) Training given (Awareness):
ACVV- September 2014, Moorreesburg
Disaster Management training to staff of EMS 17-19 March 2015
3.11.3 RISK ASSESSMENT
The original Disaster Risk Assessment was updated in October 2013 and is available on the website. The
following risks were identified for the West Coast:
Accidents (aircraft);
Accidents (road);
African horse sickness (February 2011, Malmesbury area; March 2014, Porterville);
Anthrax
Coastal erosion
Deforestation
Annual Report 2014/2015 97
Desertification
Diseases – Human: (cholera, TB, HIV/Aids, food poisoning, measles, influenza, etc.)
Diseases - Ebola
Diseases – Animals (Foot and mouth, Newcastle disease. Also see African horse sickness)
Drought
Electricity disruption
Events, provincial rugby games, state funerals & festivals
Fires (veldt & structural)
Floods (including flash floods due to severe weather or dam wall failure)
Hail (17 February 2011, Citrusdal, 20 minutes, 19 mm of rain – no serious damage, 2015)
Hazardous installations
Hazmat (rail, road, sea)
Heat waves (in excess of 40 degrees Celsius)
Land degradation
Lightning (2015: 3 casualties)
Municipal elections (2011 and 2014)
Nuclear event (Koeberg & ships transporting nuclear)
Pollution (air and water)
Red tide (harmful algae bloom) and other animal stranding (2013, 2015)
Rift Valley fever (2010)
Sand dune migration
Seismic hazards (earthquakes)
Severe weather
Social conflict (2012)
Storm surges
Winds
During February 2015, community based risk assessments were done for the Bergrivier and Cederberg
Municipalities. Saldanha Bay will be done during the second half of 2015. The final reports have not been made
available as yet, but the results of the workshops were more or less in line with the results of the risk assessment
for the district.
3.11.4 RISK REDUCTION
Risk reduction measures take place mainly within the line function, but in extreme cases the Centre will become
involved in addressing the problem. Risk reduction measures for identified risks are as follows:
Accidents (aircraft): Avian legislation applies.
SAMSA gives training
Accidents (road):
Department of Community Safety legislation applies;
Department of Community Safety (Provincial Traffic): regular roadblocks
Department of Transport: weigh bridges do daily checks;
Department of Transport – N7 quarterly meetings
Department of Transport – SANRAL: distribute weekly schedules to blasting on N7
WCDM Section Roads does maintenance;
Annual Report 2014/2015 98
SANRAL does road maintenance on N7
Draft contingency plan for the Verlorenvlei for R27 (July, Aug 2014)
Accidents (sea):
An maritime search and rescue exercise was held in April 2015 in conjunction with Department of
Transport (Saldanha Bay harbour)
African horse sickness: The Department of Agriculture has a prevention plan.
Anthrax (humans): The Department of Health monitors the situation.
Coastal erosion: Set-back lines were established for future developments
WCDM Environmental Management section monitors situation and make recommendations
regarding rehabilitation in conjunction with Department of Environmental Affairs and
Agriculture.
Deforestation: The Department of Environmental Affairs monitors the situation; Working for Water and
Working for Fires are example of job creation projects that are conducted in conjunction with West Coast
District Environmental Management and Fire to assist with alien clearing.
Desertification: The Department of Environmental Affairs and land owners monitor the situation.
Rehabilitation projects are being done in conjunction with West Coast District.
The Department of Agriculture: monthly Agro Meteorological committee Advisory on weather and crops
are distributed
Diseases (Human) (cholera, TB, HIV/Aids, food poisoning, measles, etc.): Monitoring is done by the Department
of Health via clinics, mobile clinics and GPs. Additional support is provided by West Coast District
Environmental Health.
Diseases (Human - Ebola): during July 2014 started to draft a contingency plan for the West Coast in conjunction
with Department of Health guidelines and National Institute for communicable diseases as well as
distributing information made available for awareness.
Diseases (Human - Food poisoning): Awareness and training being done regarding the handling of food by the
Health inspectors
Diseases (Human - Influenza)
Awareness
Various prevention measures that are in place from Department of Health e.g. vaccine
Influenza prevention plan Department Health (swine flu been removed as a communicable disease)
Protective clothing for staff members
Diseases (Animals): Foot and mouth disease,
Drought: The West Coast District’s Bulk Water Master Plan is in place. Desalination plants were built and more
are in the process of being built. No water restrictions have been published by Department of Water Affairs.
In collaboration with Department of Agriculture & Department of Water Affairs and Sanitation:
monthly Agro Meteorological committee Advisory on weather and crops
Clanwilliam dam water shortage: The dam was reaching the critical level of 6% as the traditional first
rain was lacking by 8 weeks. A task team was established on 29 April consisting of agriculture, local
municipalities, water affairs. An action plan was drafted. The municipalities in collaboration with the
water users associations started with awareness programmes to save water. By 30 June 2015 the dam
Annual Report 2014/2015 99
was on 21%. It is hoped that the future rain and snow will replenish the dam to its usual levels in rest
of the winter.
Department of Agriculture (Western Cape): is busy with a draft plan for drought
Electricity disruption: updated the contingency plan as changes are received from Department of Energy or
other role players. Encourage the B-Municipalities to also draft their own contingency plans. Received a
plan from Swartland Municipality.
Load shedding
Events: 2010 World Cup Soccer: The Disaster Management Plan was drafted based on the SANS Code for Mass
Events.2 New legislation and lessons learnt were incorporated into the event plans for event planning. Each
event is managed by the local authority.
Discussed on the quarterly Community Safety Forum
International exercise: 13 October -14 November 2014 : IBSA Maritime between India, Brazil and South
African, planning meetings were held.
Golden Games (May) planning meetings were held for the events in Moorreesburg and Vredendal
WCDM uses a check list to make sure that all the requirements are met. The Health inspectors see to
that all food stalls have a certificate of fitness.
Fires: (structural) – assisted Department of Education in July to draft the evacuation plans of schools within the
West Coast .
Awareness programmes of Fire Brigade services
Adhere to building regulations
Ensure adequate maintenance to all electrical appliances
Drafted a contingency plan
Structural fire is a function of the B-Municipality, and Saldanha Bay municipality has gone into an MOU
where the fire service of the district will perform this function on behalf of the municipality for the next
three years (see report of the Fire Brigade section).
Fires (veldt) :
Awareness:
o The centre prints annually at least 1000 pamphlets with the emergency number. These pamphlets
are divided between the disaster management centre, fire brigade, EMS and provincial traffic who
uses it with their own awareness initiatives.
o Visits from groups to the disaster management centre
Awareness campaigns that are being run in collaboration with the Fire Brigade Services of the district:
Visits to schools to do talks and practical demonstrations
Assisting schools to update their emergency plans
Assisting schools to practice their evacuation drills
Visits by the public to the disaster management centre
Training of role-players during information sessions
Awareness actions in collaboration with Department of Local Government:
2 South African National Standard 10366: Health and safety at events – General requirements
Annual Report 2014/2015 100
o the opening of the fire season on 1 December every year in collaboration with Department of Local
Government. During this session a demonstration was given to the Working On Fire (WOF)
resources available for the fire season.
o Theatre performances were held during February at some the primary schools in the west coast
area.
o Awareness: The opening of the fires season on 1 December every year with WOF at Porterville
airstrip where WOF gave a presentation on the resources available for the season ahead.
In the weather warnings are issued by the SA Weather bureau with suggestion on prevention measures to
the public
Awareness campaigns with Department of Agriculture: monthly Agro Meteorological committee Advisory on
weather and crops are distributed to all the members of the West Coast Disaster Management Advisory
Forum.
Veld fire policies – veld fire management
Legislation in place to prevent the making of fires
Department of Environmental Affairs: Weather office : daily forecasts
Department of Environmental Affairs: Warnings: Fire Danger Index are provided every day
Department of Agriculture: Provide long term predictions to the farmers Department of Agriculture:
monthly Agro Meteorological committee Advisory on weather and crops
The West Coast District presents education programmes and training; and has a permit system for
controlled burning. Legislation is implemented.
Contingency plan drafted and updated in collaboration with the Fire Brigade section of WCDM.
See the section of the Fire Brigade Services for a full report of their activities for the year in relation to veld
fires
Floods:
West Coast Winter preparedness plan (April)
Cleaning of water systems by Municipalities
Department of Water Affairs: has a draft flood plan for addressing flooding from rivers and dams.
Estuary plans were updated to include emergency opening and closing procedures.
West Coast District monitors and responds to requests as received. The West Coast District
Environmental Management runs river maintenance projects.
Clanwillian dam has a maintenance plan as well as a management plan for when there is a dam wall failure.
Weather office sends out early warnings via the internet www.weathersa.co.za and sms and via e-mail.
Department of Agriculture: monthly Agro Meteorological committee Advisory on weather and crops
Hail: The South African Weather Service provides early warnings; land owners protect produce where possible.
SA Weather office sents out early warnings
Department of Agriculture: monthly Agro Meteorological committee Advisory on weather and crops
Hazardous installations: Legislation applies. Training is done on a regular basis. Health and safety
implementations are done.
Hazmat (rail): The Department of Transport is responsible.
Drafted a contingency plan is available.
Hazmat (road):
Annual Report 2014/2015 101
The Department of Community Safety legislation applies for roadworthiness and road traffic.
Department of Transport (Provincial Traffic) monitoring and law enforcement at way bridges
Public education is available.
The West Coast District (Fire Brigade Service) is on standby. Legislation applies; education is available.
NEMA: legislation is applicable.
Hazmat (sea):
The legislation of both the Department of Environmental Affairs and the Department of Transport applies.
The Centre took part in an exercise that was held by Department of Environmental Affairs during 21-23
October at Velddrift to test the oil pollution plan for the West Coast and the Swartland zones. This was
done by providing input to the planning of the exercise, gave an presentation of the functions of the Disaster
Management Centre as well as the Incident Command system and also taking part in the practical
application of the exercise.
Heat waves: SA Weather offices sends out early warnings via media
Department of Agriculture: monthly Agro Meteorological committee Advisory on weather and crops
Municipal health inspectors do awareness regarding storing and handling of food during extremely hot periods.
Land degradation: Land owners monitor the situation and the Department of Environmental Affairs legislation
and rehabilitation projects support the process. Cape Nature and NGOs assist.
Lightning: Weather office sends out warnings
Department of Agriculture: monthly Agro Meteorological committee Advisory on weather and crops
Municipal elections: The Department of Cooperative Affairs and the IEC oversee the process. Training and
education was provided by the IEC.
Nuclear:
Awareness: Koeberg had a Road show 27-31 October with the truck that transport the radioactive
material to Vaalputs.
The centre attends the quarterly Emergency Planning Steering and Oversight committee that is chaired
by the Department of Energy. The West Coast District is a co-signature to the MOU with the City of
Cape Town.
Quaterly Emergency Planning meetings are attended with the City of Cape Town. An MOU with
Bergrivier, Saldanha Bay and Swartland was supply accommodation in the case of an evacuation.
Koeberg Nuclear Station holds regular exercises in which the centre plays a role 27 Sept-22 Oct 2014,
every Wednesday. The regulators exercise was held on 22 October 2014. Exercise held 11 June 2015.
Pollution (air): West Coast District (Environmental Health) does monitoring; legislation applies.
Pollution (water): West Coast District (Environmental Health) does monitoring by taking samples; legislation
applies. Monitoring of river water is also done on behalf of Department of Water Affairs and Sanitation
according to an MOU that is in affect for the next two year.
Red tide (and other animal stranding): The Department of Environmental Affairs monitors the situation and
issues warnings; and has a rock lobster response contingency plan in place.
Early warning (Department of Agriculture)
Monitoring are done according to green, yellow and red stages
Live lobsters are relocated
Updated the West Coast Rock Lobster contingency plan
Also see report from Section Environmental Management.
Annual Report 2014/2015 102
Rift Valley fever: The Department of Agriculture has a plan.
Sand dune migration: polls that were harvested during the alien clearing projects are being use to anker the
bales that are used during dune rehabilitation projects.
Seismic hazards:
Preparedness plans
Building regulations are applied
Severe weather:
Weather office sent out a warning that Spring tide, full moon and new moon will be more severe this
year due to alignment of the moon and the sun.
Early warnings are sent out by the SA Weatherservices
Department of Agriculture: monthly Agro Meteorological committee Advisory on weather and crops
Social conflict:
Awareness by community leaders within the Municipalities
Department of Community Safety: meet regularly with the community leaders
Department of Foreign Affairs: legislation in place to prevent illegal immigrants
The Draft Social Conflict Plan is coordinated by the Disaster Management Centre of the West Coast and
clusters of the South African Police Services.
Community Safety meeting are being held on a quarterly basis with all role players.
Ad hoc meetings are called by Department of Community Safety where all role players are present for
a specific cluster e.g. Vredenburg Cluster and Malmesbury.
Updated the contingency plan.
Storm surges: The Weather Services provide early warnings.
Winds: The Weather Services provide early warnings.
In addition to the six new risks that were added to the risk assessment, draft response plans are being compiled
for each of the new risks as part of the Disaster Management Plan. Good progress has been made during the
year with establishing relationships with all the non-governmental organisations in order to enlist their
assistance with relief measures.
3.11.5 SPECIFIC RESPONSE AND RECOVERY EFFORTS
Accidents (aircraft): No response was required.
Accidents (road): Response is provided by the Fire Brigade Services, Traffic department, EMS and SAPS.
African horse sickness: None reported to the centre.
Anthrax: None.
Coastal erosion:
Deforestation: The Department of Agriculture and Environmental Affairs (West Coast District) responds to this
issue.
Desertification: The Department of Agriculture responds to this issue.
Diseases - Human (cholera, TB, HIV/Aids, food poisoning, measles, etc.): Regular monitoring takes place. No
epidemic has been reported.
Disease – Human: Food Poisoning: Two incidences were reported. One in Clanwilliam (273 students) and one
in Nuwerust (50 people). In both cases the test results show that contaminated chicken caused of it.
Diseases – Animals:
Drought: The West Coast District has a water plan in place.
Electricity disruption:
Annual Report 2014/2015 103
Events:
Fires: The Fire Brigade Services respond according to their standard operating procedures (SOPs).
Floods: No serious flooding was reported. A flooding plan is in place in all B municipalities.
Hail: Department of Agriculture has reported an incident where three farms were affected. These farms were
partly in the Cape Winelands area as well. A task team was established consisting of Departments of
Agriculture, Labour, Social Development, Cape Winelands, Bergrvier Municipality and the centre to try and
address the needs of the farming community.
Hazardous installations: The Fire Brigade Services respond (see report of the Fire Service).
Hazmat (rail): Normal response to incidents
Hazmat (road): The Fire Brigade Services and Environmental Management respond.
Department of Environmental management report all section 30 incidents to the provincial
departments and monitor the clean-up procedures.
Hazmat (sea): Line functions respond on request.
Heat waves: any advisories from SAWeather Services are distrusted to the role-players.
Land degradation: The Department of Agriculture responds. No requests were received by Disaster
Management.
Lightning: The centre was informed by Cederberg Municipality that three workers in Citrusdal were fatally struck
by lightning 26 March 2014.
Department of Agriculture was informed
Department of Social Development was informed and assisted with counselling to the families
Municipal elections:
Nuclear event:
Pollution (air and water): Environmental Health monitors the situation.
Recovery: This activity is carried out by the entity responsible for maintenance.
Red tide (and animal strandings):
Disaster Management coordinates responses in conjunction with the Department of Fisheries.
West Coast Rock Lobster walked out occurred February - March 2015 at Elands Bay and about 500 tons
of crayfish were removed (3 ton live lobster were relocated). Bergrivier and Cederberg Municipality
responded to this as well. The walk out carried on for more than usual – about 8 weeks and it was the
largest walk out up to date.
Dead fish were found at Verlorenvlei during December 2014. Possible causes were oxygen depletion
or water pollution. The final report is still outstanding.
Dead whales were reported in Ganzekraal and St. Helena Bay and were dealt with accordingly.
Rift valley fever: was not reported.
Sand dune migration: no serious disruptions were reported
Seismic hazards: no earthquakes were reported
Severe weather:
Ganzekraal holiday resort was covered in foam from the sea on 26 December 2014. The staff of the
resort in collaboration with the WCDM Fire Brigade services restored the situation.
Social conflict:
12 July 2014 - Hopefield. Saldanha Bay municipality formed a steering committee that ensured the
successful re-intergration of the 30 Somalian people.
Aug 2014 – Saldanha Bay Municipality saw to the successful re-integration of this group.
Service level protest march – 31 October 2014 was monitored from the disaster management centre in
collaboration with the Vredenburg SAPS cluster.
It is a standing item on the agenda of the West Coast IDP CC
Annual Report 2014/2015 104
Storm surges: Response is provided as needed: In the Swartland area, houses were damaged in June 2013 in
Moorreesburg, and again in March 2014 in Darling, owing to strong winds. Funds were made available by
the Department of Housing in April 2014 for reconstruction.
Winds: Line functions respond, as needed.
Table 3.11.1: Financial performance: Disaster Management (R’000)
Financial Performance: Disaster Management
Details
2013/2014 2014/2015
Actual Original budget
Adjustments budget
Actual Variance from budget
Total Operating Revenue 3 500 2 000 2 000 %
Expenditure:
Employees 644 532 1 164 400 1 242 050 720 717 58.03%
Repairs and maintenance 18 722 57 170 57 170 44 227 77.36%
Other 163 343 1 217 300 1 118 800 72 803 6.51%
Total Operating Expenditure 826 597 2 438 870 2 418 020 837 747 34.69%
Net Operating Expenditure
Net expenditure to be consistent with summary table T5.1.2 in Chapter 5. Variances are calculated by dividing the difference between the actual and original Budget by the actual. T3.11.1
Table 3.11.2: Employees: Disaster Management
Job level
2012/2013 2013/2014
Employees
(N)
Posts
(N)
Employees
(N)
Vacancies: full-time equivalent
(N)
Vacancies
(% of total posts)
0–3 1 1 1 0 0
4–6
7–9
10–12
13–15 1 1 1 0 0
16–18
19–20
Total 2 2 2 0 0
T3.11.2
Annual Report 2014/2015 105
COMPONENT H: RECREATION
3.12 GANZEKRAAL HOLIDAY RESORT
INTRODUCTION
Ganzekraal Holiday Resort, with its conference facilities and chalets, was established within the Admiralty
Reserve (narrow strips of State land that are situated along the coastline above the high water mark) 20 km
north of Melkbosstrand.
The Ganzekraal Coastal Resort is just off the R27 along the Atlantic Ocean, with 28 sea-facing, fully equipped, 4–
6 sleeper, self-catering chalets. It also has a tidal pool, slipway, conference facility/wedding venue, lapa, bar and
restaurant.
The air-conditioned conference hall seats 80 delegates and is fully equipped with video and overhead projector,
whiteboards and flip-charts, and has bar facilities. The self-catering restaurant overlooks the ocean, seats
approximately 100 people and has its own bar and facilities, offering a carvery or menu option from a modern
kitchen.
This report gives details of the resort performance and activities and is on condition of performance, occuapation
statistics, housekeeping, repairs and maintenance, administration, security , finance, administration and
general.
Table 3.12.1: Employees: Ganzekraal Holiday Resort
Job level
2013/2014 2014/2015
Employees
(N)
Posts
(N)
Employees
(N)
Vacancies: full-time
equivalent
(N)
Vacancies
(% of total posts)
0–3 9 9 9 0 0
4–6 1 1 1 0 0
7–9 3 3 3 0 0
10–12 1 1 1 0 0
13–15
16–18
19–20
Total 14 14 14 0 0
T3.12.1
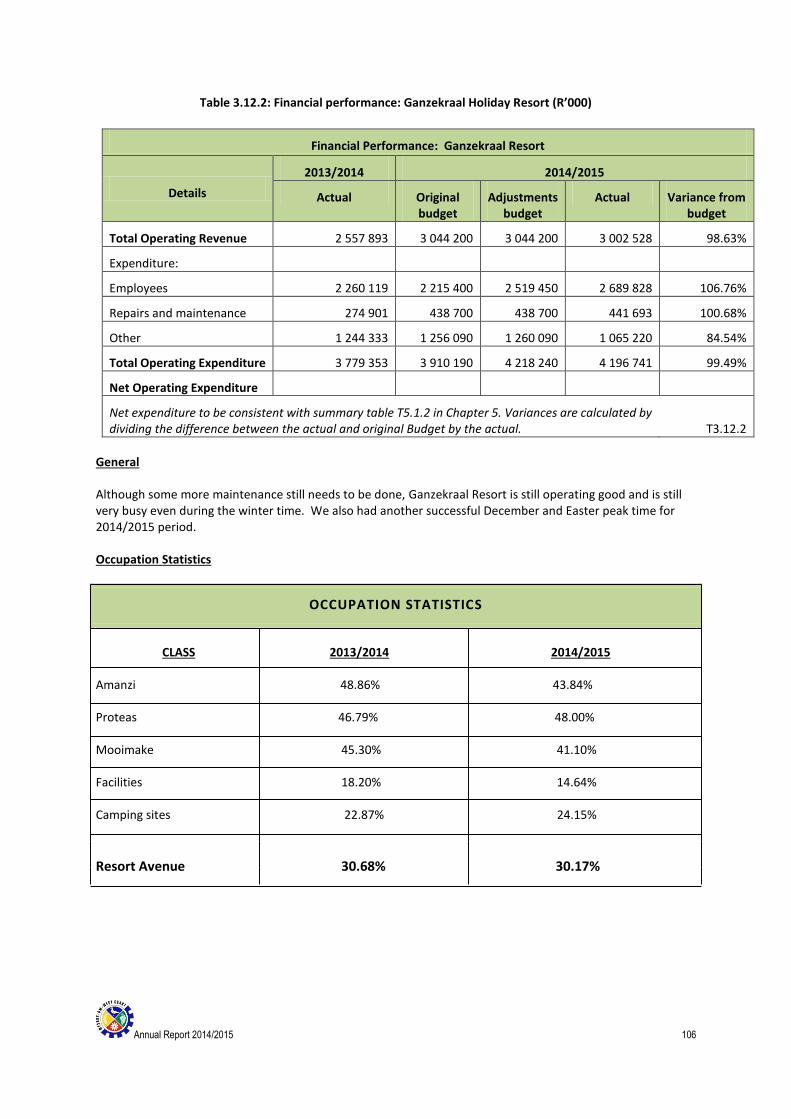
Annual Report 2014/2015 106
Table 3.12.2: Financial performance: Ganzekraal Holiday Resort (R’000)
Financial Performance: Ganzekraal Resort
Details
2013/2014 2014/2015
Actual Original budget
Adjustments budget
Actual Variance from budget
Total Operating Revenue 2 557 893 3 044 200 3 044 200 3 002 528 98.63%
Expenditure:
Employees 2 260 119 2 215 400 2 519 450 2 689 828 106.76%
Repairs and maintenance 274 901 438 700 438 700 441 693 100.68%
Other 1 244 333 1 256 090 1 260 090 1 065 220 84.54%
Total Operating Expenditure 3 779 353 3 910 190 4 218 240 4 196 741 99.49%
Net Operating Expenditure
Net expenditure to be consistent with summary table T5.1.2 in Chapter 5. Variances are calculated by dividing the difference between the actual and original Budget by the actual. T3.12.2
General Although some more maintenance still needs to be done, Ganzekraal Resort is still operating good and is still very busy even during the winter time. We also had another successful December and Easter peak time for 2014/2015 period. Occupation Statistics
OCCUPATION STATISTICS
CLASS 2013/2014 2014/2015 Amanzi 48.86% 43.84% Proteas 46.79% 48.00% Mooimake 45.30% 41.10% Facilities 18.20% 14.64% Camping sites 22.87% 24.15%
Resort Avenue 30.68% 30.17%
Annual Report 2014/2015 107
COMPONENT I: CORPORATE POLICY OFFICES AND OTHER SERVICES
This component includes corporate policy offices, financial services, human resource services, ICT services and
property services.
3.13 EXECUTIVE AND COUNCIL
This component includes the executive office (mayor, councillors, and municipal manager).
3.13.1 EXECUTIVE AND COUNCIL VISION
A quality destination of choice through an open opportunity society
3.13.2 MISSION
To ensure outstanding service delivery on the West Coast by pursuing the following objectives:
3.13.3 STRATEGIC OBJECTIVES
These objectives respond to local as well as priorities at the global, national and provincial level and align with
the strategic intent. As early as 2003, the United Nations Development Programme outlined five central
challenges facing sustainable development in South Africa in the South Africa Human Development Report
(UNDP:2003), and these are:
the eradication of poverty and extreme income and wealth inequalities,
the provision of access to quality and affordable basic services to all South Africans,
the promotion of environmental sustainability,
a sustained reduction in the unemployment rate, and
the attainment of sustainable high growth rates.
The fact that the five high-level strategic objectives that have been identified by the West Coast District
Municipality are in line with these challenges reinforces the fact that the District Municipality continues to
confront the issues of the country and, in particular, of the district. The District Municipality’s objectives are as
follows:
Ensuring environmental integrity for the West Coast
Ensuring good governance and financial viability
Pursuing economic growth and facilitation of job opportunities
Promoting social well-being of the community
Providing essential bulk services in the Region
3.13.4 CORE VALUES
Integrity – to conduct business with integrity and be accountable to stakeholders
Transparency – to be transparent and open in our business
Loyalty – to be honest
Ethical – to display moral values in our behaviour
Respect – to treat the public and colleagues with fairness, respect and consideration
Quality – to be committed to delivering good quality services
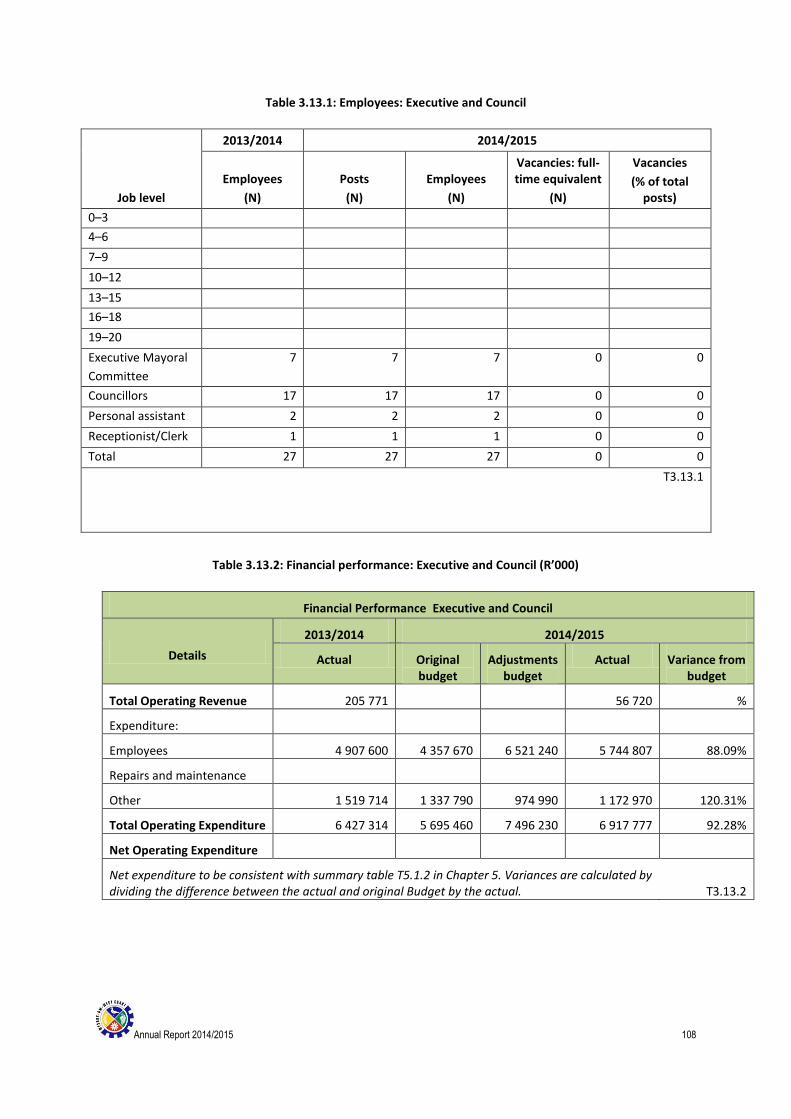
Annual Report 2014/2015 108
Table 3.13.1: Employees: Executive and Council
Job level
2013/2014 2014/2015
Employees
(N)
Posts
(N)
Employees
(N)
Vacancies: full-time equivalent
(N)
Vacancies
(% of total posts)
0–3
4–6
7–9
10–12
13–15
16–18
19–20
Executive Mayoral
Committee
7 7 7 0 0
Councillors 17 17 17 0 0
Personal assistant 2 2 2 0 0
Receptionist/Clerk 1 1 1 0 0
Total 27 27 27 0 0
T3.13.1
Table 3.13.2: Financial performance: Executive and Council (R’000)
Financial Performance Executive and Council
Details
2013/2014 2014/2015
Actual Original budget
Adjustments budget
Actual Variance from budget
Total Operating Revenue 205 771 56 720 %
Expenditure:
Employees 4 907 600 4 357 670 6 521 240 5 744 807 88.09%
Repairs and maintenance
Other 1 519 714 1 337 790 974 990 1 172 970 120.31%
Total Operating Expenditure 6 427 314 5 695 460 7 496 230 6 917 777 92.28%
Net Operating Expenditure
Net expenditure to be consistent with summary table T5.1.2 in Chapter 5. Variances are calculated by dividing the difference between the actual and original Budget by the actual. T3.13.2
Annual Report 2014/2015 109
3.14 ADMINISTRATION
3.14.1 INTRODUCTION
The Administration Division manages the key performance areas of the West Coast District Municipality by
providing an effective administrative service to core service delivery functions by designing, developing and
aligning policies; implementing procedures; reviewing policies and procedures; and aligning document
management systems to facilitate effective circulation, response, storage and retrieval. The Division also
manages and controls strict adherence to Council policy and relevant legislation.
3.14.2 COMPILATION OF THE ANNUAL REPORT AND OVERSIGHT REPORT
The Administration Division is responsible for the compilation of the Annual Report by drawing up timeframes
for all tasks relating to the completion of the Annual Report; liaising with departmental heads; tabling the Annual
Report to Council; distributing the Annual Report to the relevant government departments; and the final phase
of translating, editing and printing the final version. The Division also manages both the process and drafting of
the Oversight Report, in collaboration with the Oversight Committee, and tables the Oversight Report to Council.
3.14.3 SECRETARIAT
As the administrative arm of the Municipality, the Secretariat Division renders an administrative support service
to Council and its political structures and ensures quality administrative service delivery, by managing all
standing committee and ad hoc committee meetings and ensures effective coordination and prompt secretariat
support.
The Secretariat Division is responsible for the following meetings:
Council Meetings, Special Council Meetings, DCF, District Coordinating Committee – Technical Committee
Meetings, Water Monitoring Meetings, Water Monitoring Technical Committee Meetings, Oversight Committee
Meetings, Risk Management Meetings, Portfolio Committees: Administration and Community Service, Finance
and Technical Services Meetings, and Bid Committee Meetings: Specification and Evaluation, Bid Adjudication
Committee and Audit Committee Meetings.
3.14.4 OFFICE SUPPORT SERVICES
3.14.4.1 RECORDS AND ARCHIVES
The Administration Division manages the implementation of procedures and systems associated with document
flow, such as the archiving and keeping of records systems (in accordance with statutory prescriptions) and the
establishment, evaluation and maintenance of registry procedures for the operating of the main registry office
and sub-offices and regulating record keeping. The Division also oversees compliance with statutory
requirements regarding control over the maintenance and application of the filing system and records control
schedule.
3.14.4.2 SWITCHBOARD AND RECEPTION
The switchboard and reception play an important public relations role at the head office of the West Coast
District Municipality and are an integral part of the organisation. These activities entail liaison with the public
and the promotion of the Batho Pele principles, as well as the delivery and promotion of service delivery to the
public.
Annual Report 2014/2015 110
3.14.4.3 REPROGRAPHER
As a support to Council, an effective reprographer service is rendered to ensure the prompt making of
photocopies for the administrative offices of Council.
3.14.4.4 CARETAKER AND CLEANING SERVICE
The Caretaker and Cleaning Service Section is responsible for the controlled access to the buildings of West Coast
District Municipality I and West Coast District Municipality II. All entrances of the buildings are secured by a
controlled access mechanism during and after office hours.
An effective cleaning and caretaking service is rendered to the administration buildings of the Municipality.
Annual Report 2014/2015 111
3.14.4.5 PUBLIC RELATIONS
The Public Relations Service promotes the activities of Council and liaises with the public regarding service
delivery with the aim of building and establishing an accountable and transparent profile of the West Coast
District Municipality.
Inleiding
Die afgelope jaar het soos die vorige jare ook weer sy kwota drama opgelewer. Die raad se kommunikasie
afdeling moes redelik rondstaan met die beantwoording van navrae deur die media, wat gewissel het van die
rooigety wat ons strande bedreig, tot by die heengaan van een van ons brandbestryders.
Die doel
Die doel van bogenoemde afdeling is natuurlik om beter en gesonde kommunikasie te bewerkstellig tussen die
munisipaliteit, die nasionale- en provinsiale departemente en ook tussen die B-munisipaliteite in ons gebied,
sowel as ander munisipaliteite in die Wes-Kaap. Om ons verskillende inwoners te bereik en op hoogte te hou
van gebeure in die Weskus is een van ons oorkoepelende doelwitte.
Kommunikasiemiddele
Ons webtuiste is nou op ‘n goed gevestigde basis en baie van ons dokumente is reeds daarop gelaai. Dit het ook
‘n goeie verwysings middel geword en dikwels, soos verlede week, is daar weer ‘n navraag van provinsie ontvang
oor ‘n spesifieke dokument en ons kon hulle verwys na ons webtuiste om die betrokke dokument af te laai.
Die kommunikasiebeleid lê tans dormant as gevolg van faktore buite ons beheer. Dit is wel nog in die sorg van
Strategiese Dienste.
Dit bly steeds ‘n teerpunt in die munisipaliteit oor die instelling van sosiale media. Tot hede is die gevoel dat
daar nie gebruik gemaak word van die medium nie. Daar word op ‘n gereelde basis en in verskillende
vergaderings oor die aspek gedebateer.
Tot ‘n sekere mate word daar wel gebruik gemaak van sosiale media, maar is slegs beperk tot kennisname aan
Raadslede rakende vergaderings wat vervroeg of uitgestel is.
Die heengaan van een van ons brandbestryders vroeër vanjaar het weer die fokus laat val op die aspek toe die
betrokke brandbestryder se heengaan op die media uitgespel is. ‘n Foto van die oorledene was nie beskikbaar
nie en moes van ‘n sosiale blad afgelaai word vir publikasie, in die gedrukte media.
Sover verneem word, is dit slegs Saldanhabaai, een van ons B-munisiapaliteite, wat van ‘n Face Book bladsy
gebruik maak. Die ander munisipaliteite is ook maar skepties oor die gebruik van sosiale media en in baie gevalle
is dit ook die finansiële implikasie wat daarmee gepaard gaan, wat maak dat lede nie baie geïnteresseerd is om
die roete in te slaan nie .
Die gedrukte media bly een van ons hoof kommunikasiemiddele met die gemeenskap en die man in die straat.
Ons vind dit ook meer effektief aangesien baie van ons senior inwoners nie oor die elektroniese kundigheid en
toerusting beskik nie en dit makliker vind om in die gedrukte media te lees oor sake wat hulle na aan die hart lê.
Ook op interne vlak gaan ons voort, om met ons personeel in die uithoeke van die distrik te gesels en op hoogte
te hou van sake wat hulle binne die munisipaliteit raak.
Advertensies
As deel van ons besparingsmaatreëls maak die munisipaliteit nie veel gebruik van duur advertensies in
glanstydskrifte nie, alhoewel ons baie versoeke kry. Dit is die munisipaliteit se siening dat die Jaarverslag as
Annual Report 2014/2015 112
advertensiemiddel dien. Noodsaaklike advertensies en kennisgewings veral oor paaie wat gesluit word vir
verbeterings, of die aankondiging van die geïntegreerde ontwikkelingsplan (GOP), wat deur wetgewing vereis
word, word geadverteer in plaaslike koerante. In die geval van herstelwerk aan paaie word daar van die
radiodienste se padverslag gebruik gemaak, om die boodskap so vining en doeltreffend onder die gemeenskap
se aandag te bring.
Vir die afgelope jaar het die druk waaronder die gedrukte media landwyd op die oomblik verkeer ook hier by
ons in die Weskus sy kop uitgesteek. Die Weslander, versprei wel in ons gebied, maar is nie meer baie gestel op
informasie oor ons nie. Die Gazette, wat ‘n susterskoerant is van die Weslander, dek ons gebied, op ‘n gereelde
basis.
Plaaslik Die Cazette: 13 artikels Die Courant: 10 artikels Die Weslander: 5 artikels Nasionale koerante 2 artikels.
Persverklarings
Persverklarings word gereeld uitgereik. Dit word eers deur senior lede nagegaan, voordat dit aan die publiek en
die media vrygestel word.
Nuusbriewe
Vier word per kwartaal versprei, op ‘n eksterne vlak en maandeliks word op ‘n interne vlak ‘n “Flyer” saam met
beamptes se salaristrokie uitgestuur.
Webtuiste
Die webtuiste is goed op dreef en opdatering vind gereeld plaas. Vergaderings rakende dit word ook op ‘n
gereelde basis gehou.
Telekonferensie
Dit is ‘n manier waarop ons kommunikasiebeamptes, by die onderskeie munisipaliteite met mekaar in die
Weskus praat en ook met die lede by provinsie.
Vergaderings
Die kwartaallikse vergaderings van provinsie word gereeld gehou.
Raadsvergadering en die bestuursvergadering word gereeld bygewoon en die besluite word dan aan die
gemeenskap gekommunikeer deur middel van persverklarings wat in koerante gepubliseer word as ook in die
nuusbrief en op die webtuiste.
Verdere opleiding
Geen opleiding het plaasgevind nie.
Verslae
Maandeliks word daar veslag gedoen oor die werksaamhede van die kommunikasiebeampte.
Toekoms
Soos in baie sfere van organisasies is kommunikasie nie juis ‘n hoe profiel aspek nie, maar is daar tog baie ruimte
vir verbetering op ‘n interne sowel as eksterne vlak. Die gebrek aan samewerking tussen departemente bly een
van die hoof kopsere.
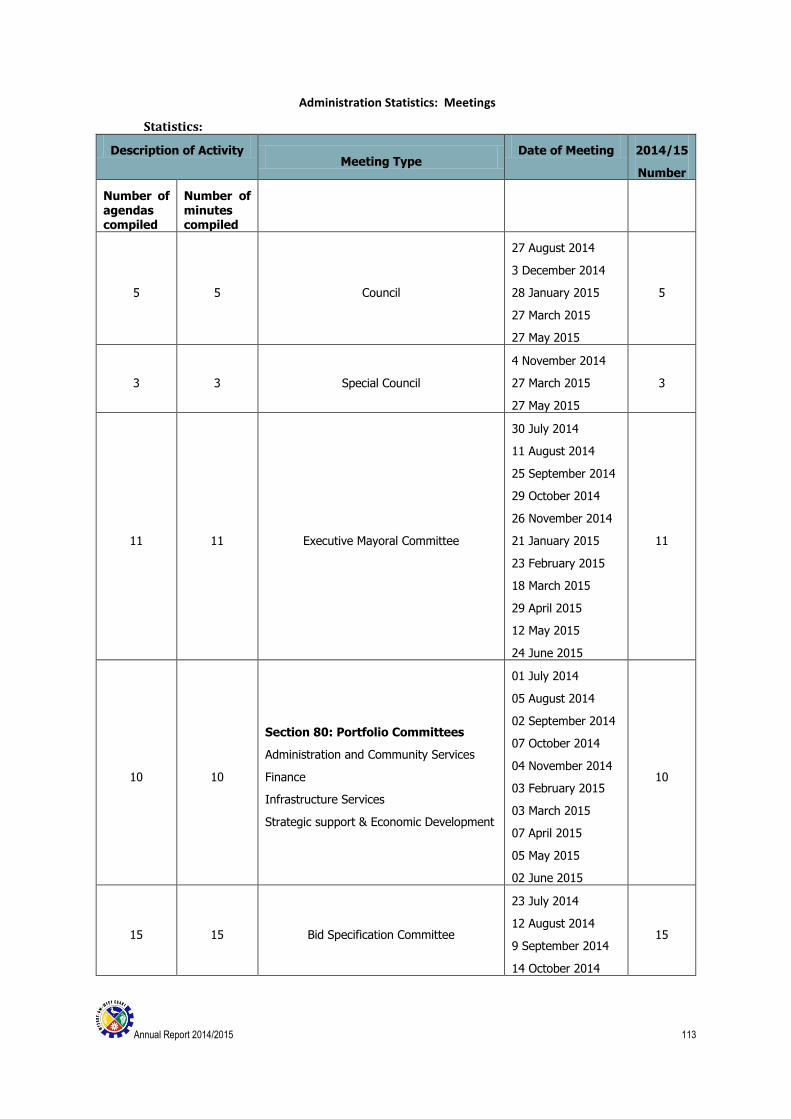
Annual Report 2014/2015 113
Administration Statistics: Meetings
Statistics:
Description of Activity Meeting Type
Date of Meeting 2014/15
Number
Number of agendas compiled
Number of minutes compiled
5 5 Council
27 August 2014
3 December 2014
28 January 2015
27 March 2015
27 May 2015
5
3 3 Special Council
4 November 2014
27 March 2015
27 May 2015
3
11 11 Executive Mayoral Committee
30 July 2014
11 August 2014
25 September 2014
29 October 2014
26 November 2014
21 January 2015
23 February 2015
18 March 2015
29 April 2015
12 May 2015
24 June 2015
11
10 10
Section 80: Portfolio Committees
Administration and Community Services
Finance
Infrastructure Services
Strategic support & Economic Development
01 July 2014
05 August 2014
02 September 2014
07 October 2014
04 November 2014
03 February 2015
03 March 2015
07 April 2015
05 May 2015
02 June 2015
10
15 15 Bid Specification Committee
23 July 2014
12 August 2014
9 September 2014
14 October 2014
15
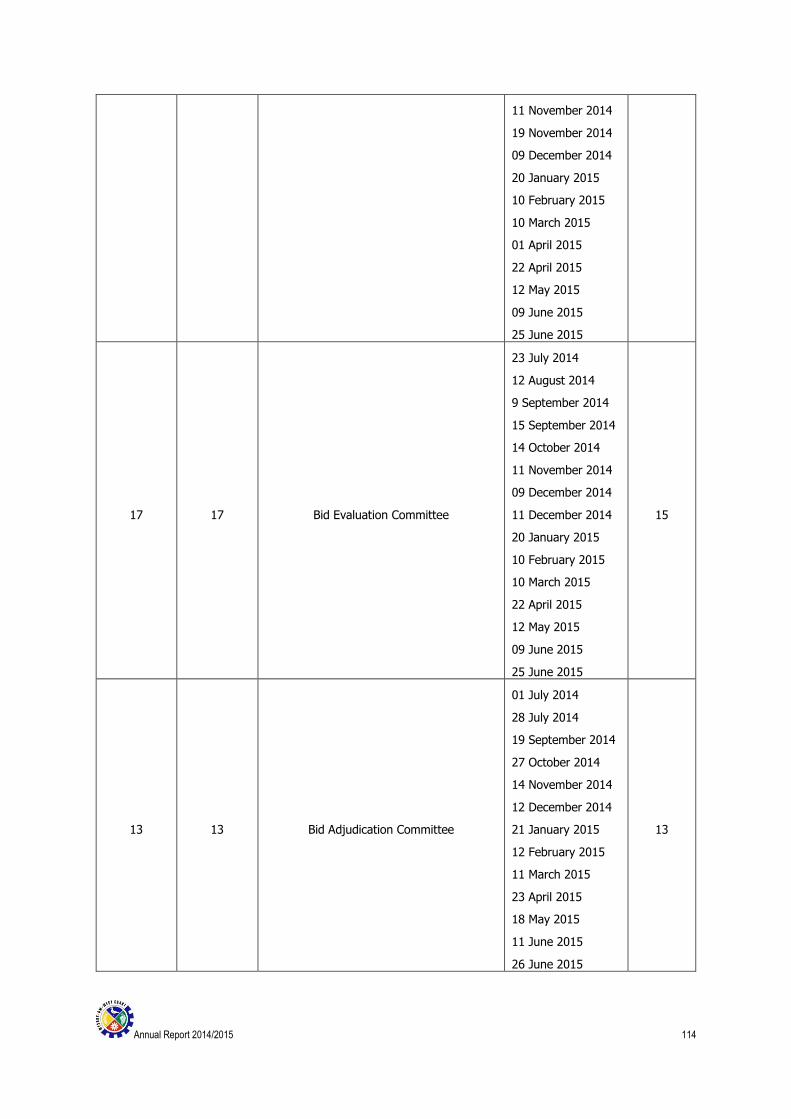
Annual Report 2014/2015 114
11 November 2014
19 November 2014
09 December 2014
20 January 2015
10 February 2015
10 March 2015
01 April 2015
22 April 2015
12 May 2015
09 June 2015
25 June 2015
17 17 Bid Evaluation Committee
23 July 2014
12 August 2014
9 September 2014
15 September 2014
14 October 2014
11 November 2014
09 December 2014
11 December 2014
20 January 2015
10 February 2015
10 March 2015
22 April 2015
12 May 2015
09 June 2015
25 June 2015
15
13 13 Bid Adjudication Committee
01 July 2014
28 July 2014
19 September 2014
27 October 2014
14 November 2014
12 December 2014
21 January 2015
12 February 2015
11 March 2015
23 April 2015
18 May 2015
11 June 2015
26 June 2015
13
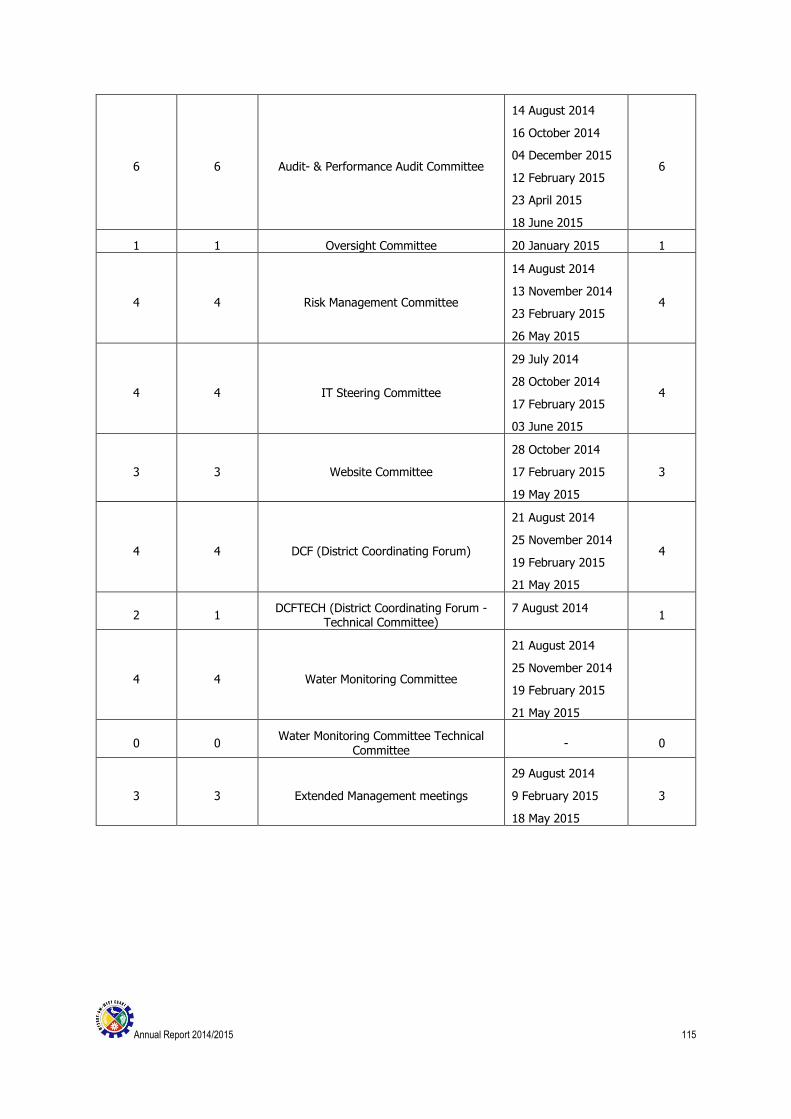
Annual Report 2014/2015 115
6 6 Audit- & Performance Audit Committee
14 August 2014
16 October 2014
04 December 2015
12 February 2015
23 April 2015
18 June 2015
6
1 1 Oversight Committee 20 January 2015 1
4 4 Risk Management Committee
14 August 2014
13 November 2014
23 February 2015
26 May 2015
4
4 4 IT Steering Committee
29 July 2014
28 October 2014
17 February 2015
03 June 2015
4
3 3 Website Committee
28 October 2014
17 February 2015
19 May 2015
3
4 4 DCF (District Coordinating Forum)
21 August 2014
25 November 2014
19 February 2015
21 May 2015
4
2 1 DCFTECH (District Coordinating Forum -
Technical Committee) 7 August 2014
1
4 4 Water Monitoring Committee
21 August 2014
25 November 2014
19 February 2015
21 May 2015
0 0 Water Monitoring Committee Technical
Committee - 0
3 3 Extended Management meetings
29 August 2014
9 February 2015
18 May 2015
3
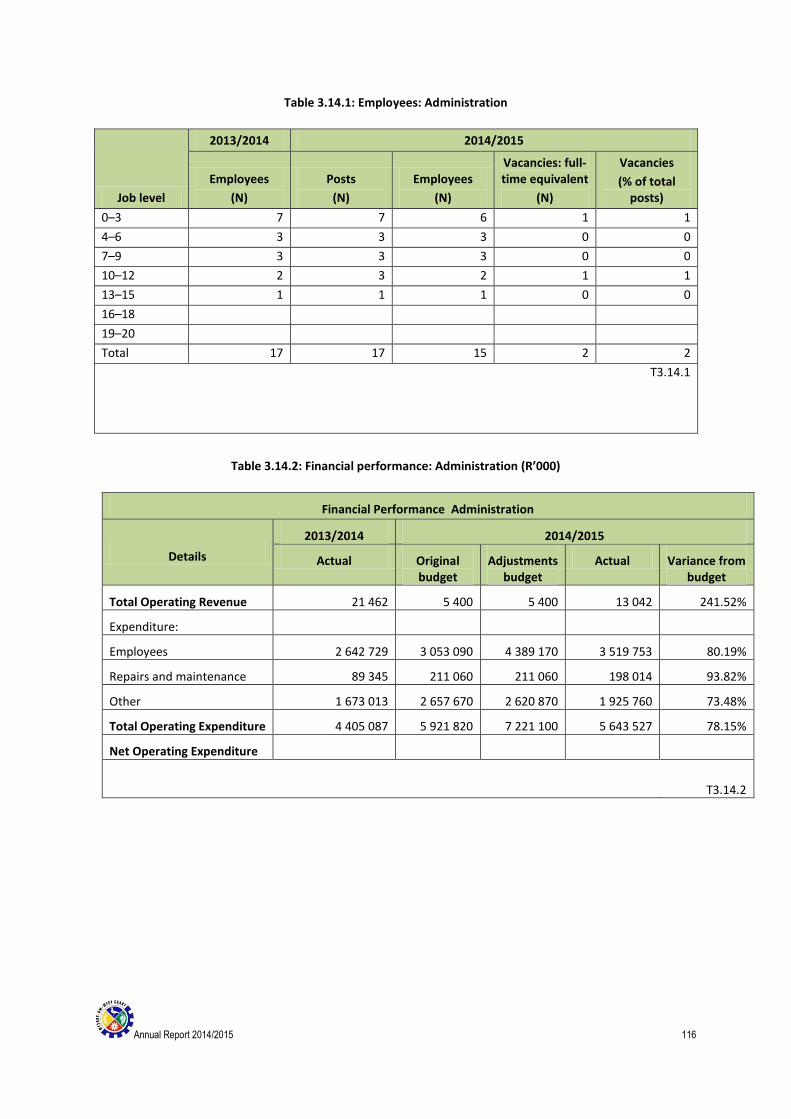
Annual Report 2014/2015 116
Table 3.14.1: Employees: Administration
Job level
2013/2014 2014/2015
Employees
(N)
Posts
(N)
Employees
(N)
Vacancies: full-time equivalent
(N)
Vacancies
(% of total posts)
0–3 7 7 6 1 1
4–6 3 3 3 0 0
7–9 3 3 3 0 0
10–12 2 3 2 1 1
13–15 1 1 1 0 0
16–18
19–20
Total 17 17 15 2 2
T3.14.1
Table 3.14.2: Financial performance: Administration (R’000)
Financial Performance Administration
Details
2013/2014 2014/2015
Actual Original budget
Adjustments budget
Actual Variance from budget
Total Operating Revenue 21 462 5 400 5 400 13 042 241.52%
Expenditure:
Employees 2 642 729 3 053 090 4 389 170 3 519 753 80.19%
Repairs and maintenance 89 345 211 060 211 060 198 014 93.82%
Other 1 673 013 2 657 670 2 620 870 1 925 760 73.48%
Total Operating Expenditure 4 405 087 5 921 820 7 221 100 5 643 527 78.15%
Net Operating Expenditure
T3.14.2
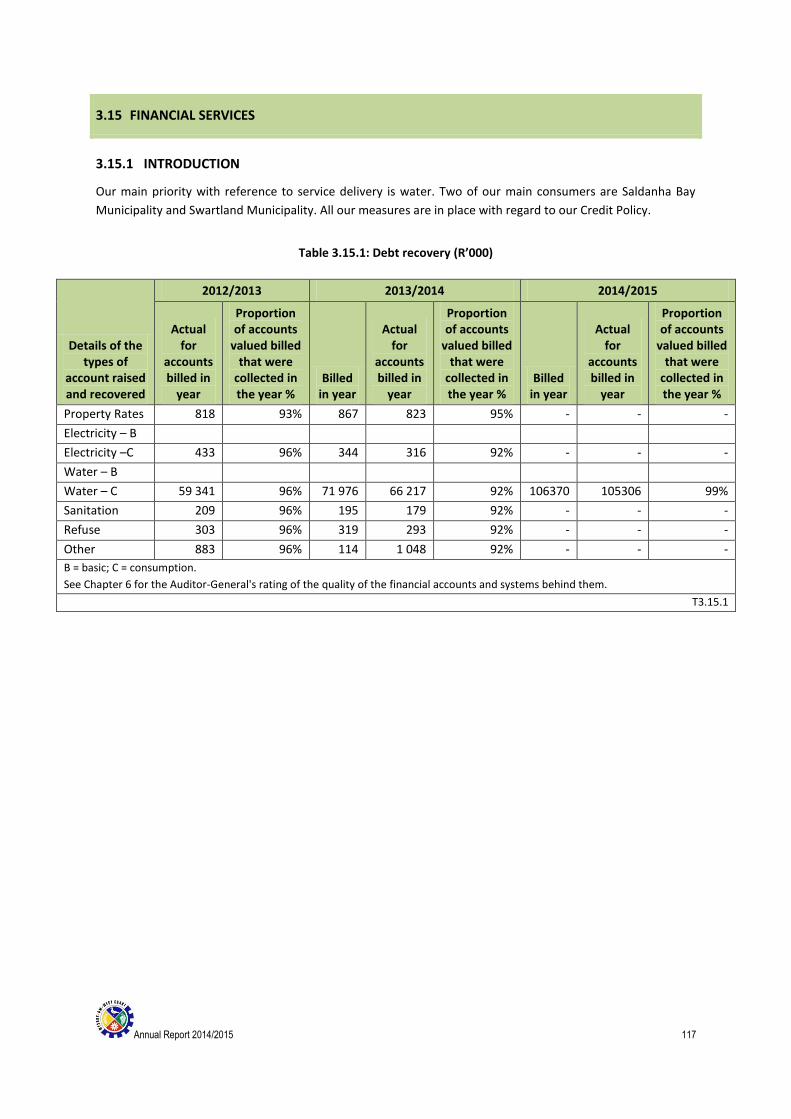
Annual Report 2014/2015 117
3.15 FINANCIAL SERVICES
3.15.1 INTRODUCTION
Our main priority with reference to service delivery is water. Two of our main consumers are Saldanha Bay
Municipality and Swartland Municipality. All our measures are in place with regard to our Credit Policy.
Table 3.15.1: Debt recovery (R’000)
Details of the types of
account raised and recovered
2012/2013 2013/2014 2014/2015
Actual for
accounts billed in
year
Proportion of accounts
valued billed that were
collected in the year %
Billed in year
Actual for
accounts billed in
year
Proportion of accounts
valued billed that were
collected in the year %
Billed in year
Actual for
accounts billed in
year
Proportion of accounts
valued billed that were
collected in the year %
Property Rates 818 93% 867 823 95% - - -
Electricity – B
Electricity –C 433 96% 344 316 92% - - -
Water – B
Water – C 59 341 96% 71 976 66 217 92% 106370 105306 99%
Sanitation 209 96% 195 179 92% - - -
Refuse 303 96% 319 293 92% - - -
Other 883 96% 114 1 048 92% - - -
B = basic; C = consumption.
See Chapter 6 for the Auditor-General's rating of the quality of the financial accounts and systems behind them.
T3.15.1
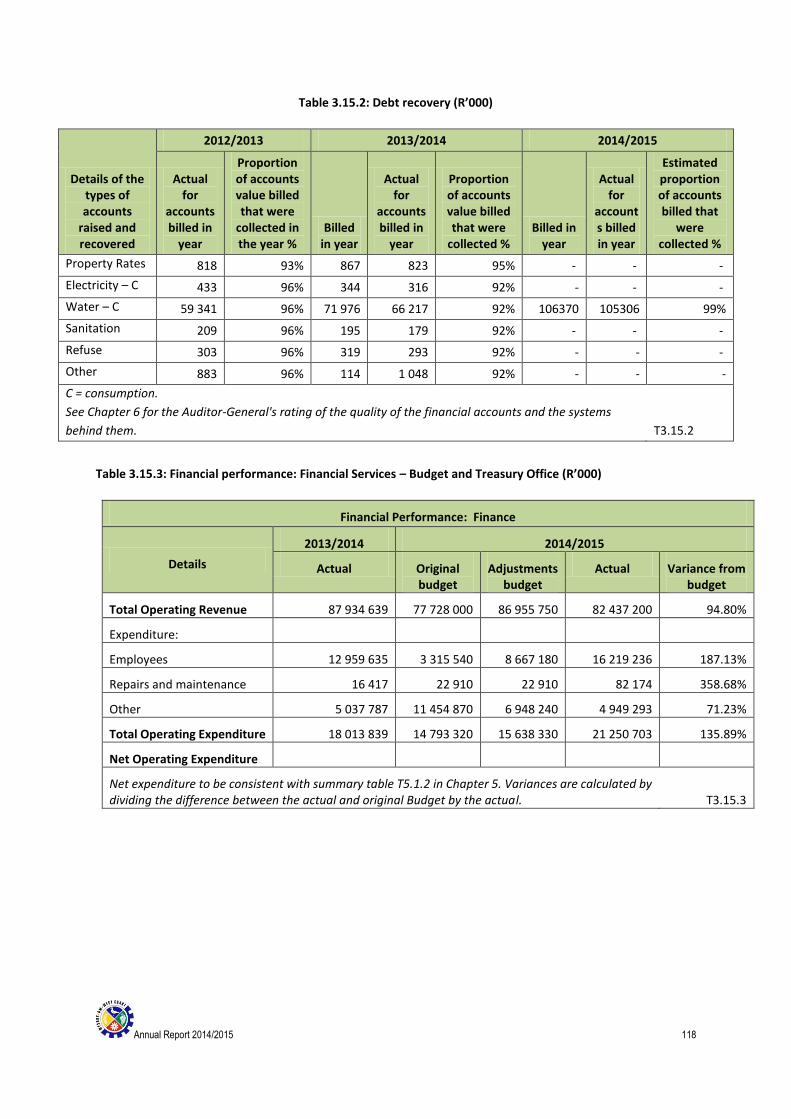
Annual Report 2014/2015 118
Table 3.15.2: Debt recovery (R’000)
Details of the types of accounts
raised and recovered
2012/2013 2013/2014 2014/2015
Actual for
accounts billed in
year
Proportion of accounts value billed that were
collected in the year %
Billed in year
Actual for
accounts billed in
year
Proportion of accounts value billed that were
collected % Billed in
year
Actual for
accounts billed in year
Estimated proportion of accounts billed that
were collected %
Property Rates 818 93% 867 823 95% - - -
Electricity – C 433 96% 344 316 92% - - -
Water – C 59 341 96% 71 976 66 217 92% 106370 105306 99%
Sanitation 209 96% 195 179 92% - - -
Refuse 303 96% 319 293 92% - - -
Other 883 96% 114 1 048 92% - - -
C = consumption.
See Chapter 6 for the Auditor-General's rating of the quality of the financial accounts and the systems
behind them. T3.15.2
Table 3.15.3: Financial performance: Financial Services – Budget and Treasury Office (R’000)
Financial Performance: Finance
Details
2013/2014 2014/2015
Actual Original budget
Adjustments budget
Actual Variance from budget
Total Operating Revenue 87 934 639 77 728 000 86 955 750 82 437 200 94.80%
Expenditure:
Employees 12 959 635 3 315 540 8 667 180 16 219 236 187.13%
Repairs and maintenance 16 417 22 910 22 910 82 174 358.68%
Other 5 037 787 11 454 870 6 948 240 4 949 293 71.23%
Total Operating Expenditure 18 013 839 14 793 320 15 638 330 21 250 703 135.89%
Net Operating Expenditure
Net expenditure to be consistent with summary table T5.1.2 in Chapter 5. Variances are calculated by dividing the difference between the actual and original Budget by the actual. T3.15.3
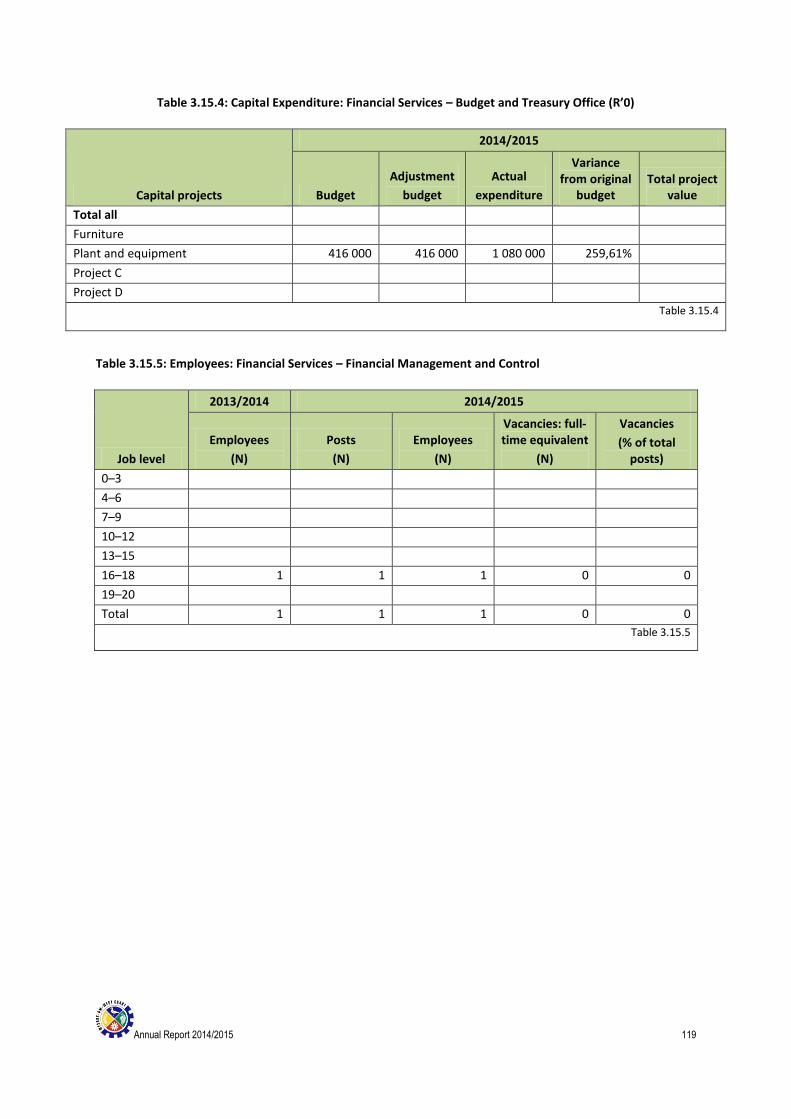
Annual Report 2014/2015 119
Table 3.15.4: Capital Expenditure: Financial Services – Budget and Treasury Office (R’0)
Capital projects
2014/2015
Budget
Adjustment
budget
Actual
expenditure
Variance from original
budget Total project
value
Total all
Furniture
Plant and equipment 416 000 416 000 1 080 000 259,61%
Project C
Project D
Table 3.15.4
Table 3.15.5: Employees: Financial Services – Financial Management and Control
Job level
2013/2014 2014/2015
Employees
(N)
Posts
(N)
Employees
(N)
Vacancies: full-time equivalent
(N)
Vacancies
(% of total posts)
0–3
4–6
7–9
10–12
13–15
16–18 1 1 1 0 0
19–20
Total 1 1 1 0 0
Table 3.15.5
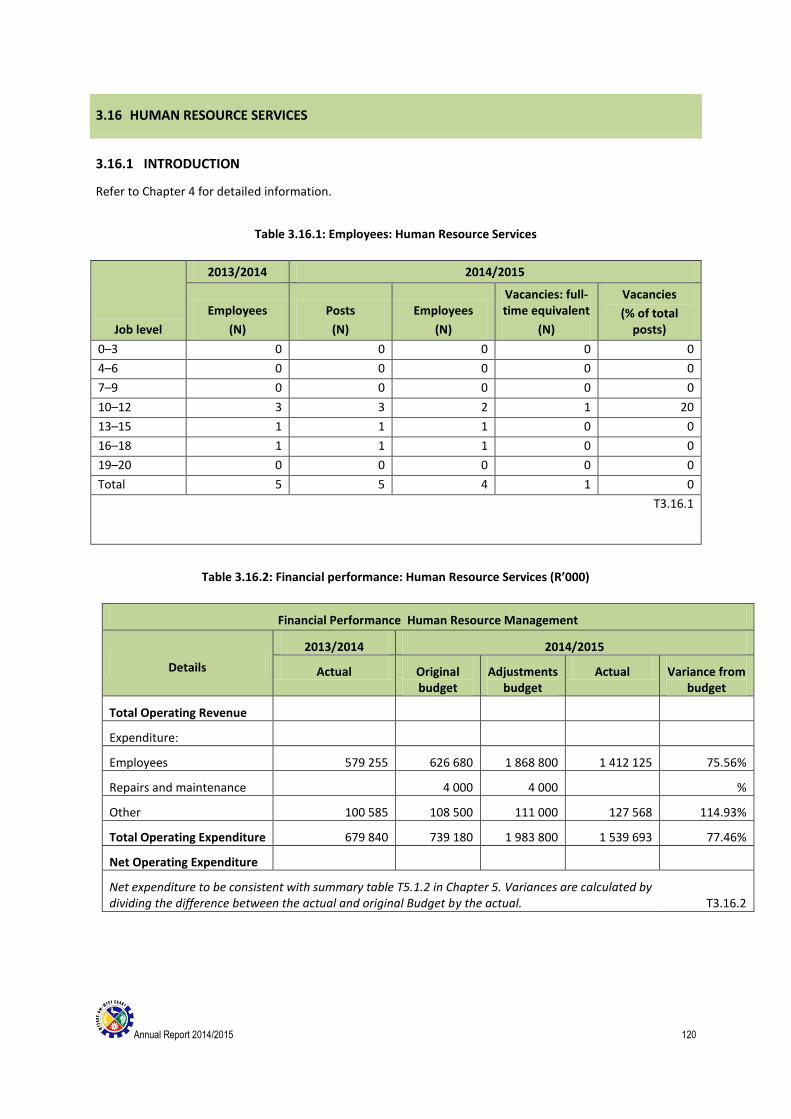
Annual Report 2014/2015 120
3.16 HUMAN RESOURCE SERVICES
3.16.1 INTRODUCTION
Refer to Chapter 4 for detailed information.
Table 3.16.1: Employees: Human Resource Services
Job level
2013/2014 2014/2015
Employees
(N)
Posts
(N)
Employees
(N)
Vacancies: full-time equivalent
(N)
Vacancies
(% of total posts)
0–3 0 0 0 0 0
4–6 0 0 0 0 0
7–9 0 0 0 0 0
10–12 3 3 2 1 20
13–15 1 1 1 0 0
16–18 1 1 1 0 0
19–20 0 0 0 0 0
Total 5 5 4 1 0
T3.16.1
Table 3.16.2: Financial performance: Human Resource Services (R’000)
Financial Performance Human Resource Management
Details
2013/2014 2014/2015
Actual Original budget
Adjustments budget
Actual Variance from budget
Total Operating Revenue
Expenditure:
Employees 579 255 626 680 1 868 800 1 412 125 75.56%
Repairs and maintenance 4 000 4 000 %
Other 100 585 108 500 111 000 127 568 114.93%
Total Operating Expenditure 679 840 739 180 1 983 800 1 539 693 77.46%
Net Operating Expenditure
Net expenditure to be consistent with summary table T5.1.2 in Chapter 5. Variances are calculated by dividing the difference between the actual and original Budget by the actual. T3.16.2
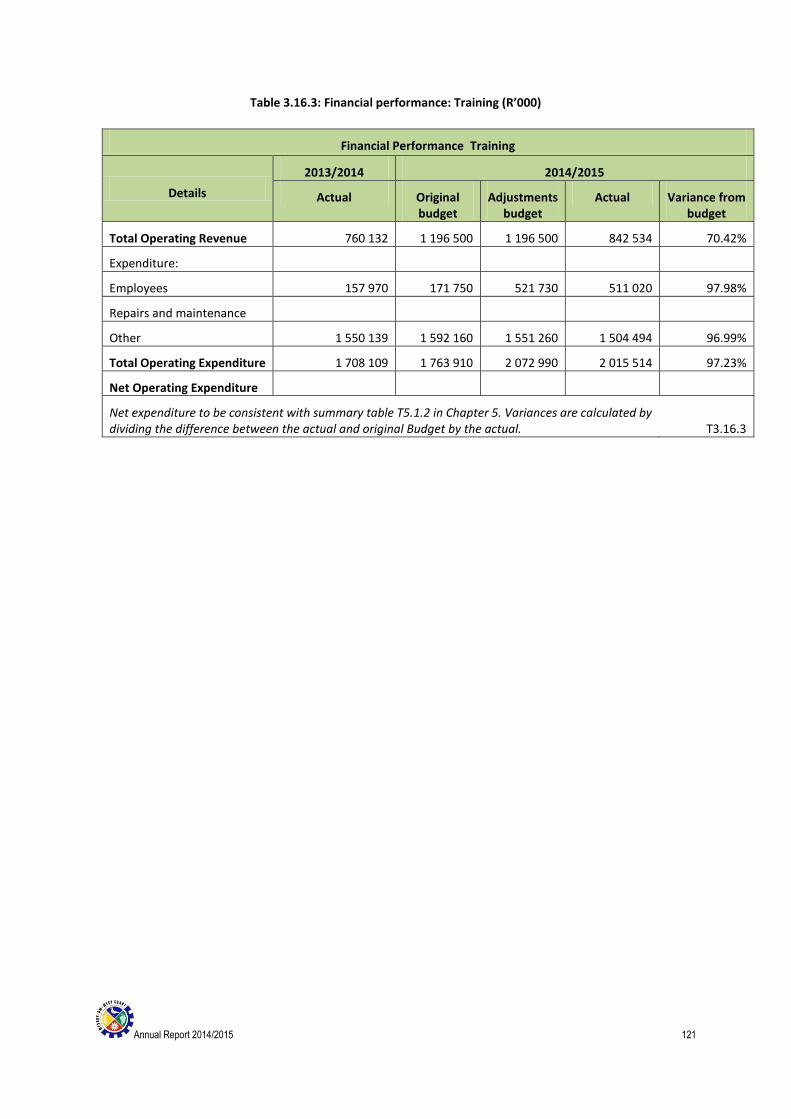
Annual Report 2014/2015 121
Table 3.16.3: Financial performance: Training (R’000)
Financial Performance Training
Details
2013/2014 2014/2015
Actual Original budget
Adjustments budget
Actual Variance from budget
Total Operating Revenue 760 132 1 196 500 1 196 500 842 534 70.42%
Expenditure:
Employees 157 970 171 750 521 730 511 020 97.98%
Repairs and maintenance
Other 1 550 139 1 592 160 1 551 260 1 504 494 96.99%
Total Operating Expenditure 1 708 109 1 763 910 2 072 990 2 015 514 97.23%
Net Operating Expenditure
Net expenditure to be consistent with summary table T5.1.2 in Chapter 5. Variances are calculated by dividing the difference between the actual and original Budget by the actual. T3.16.3
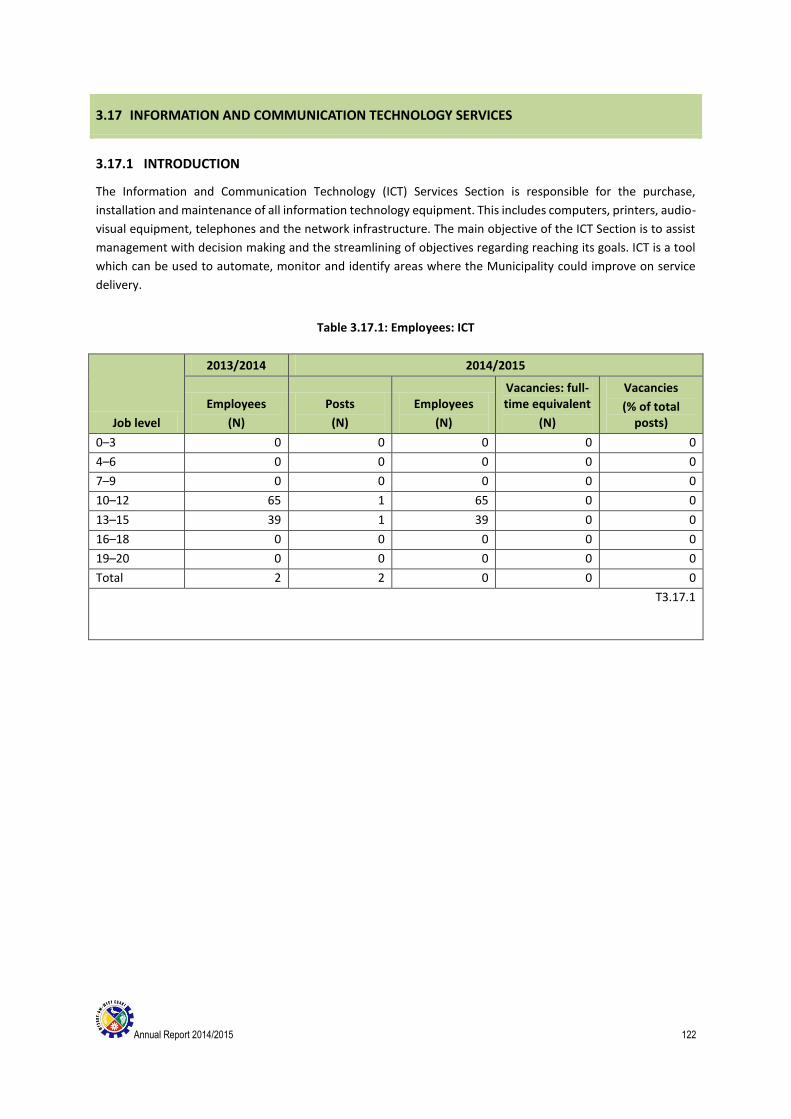
Annual Report 2014/2015 122
3.17 INFORMATION AND COMMUNICATION TECHNOLOGY SERVICES
3.17.1 INTRODUCTION
The Information and Communication Technology (ICT) Services Section is responsible for the purchase,
installation and maintenance of all information technology equipment. This includes computers, printers, audio-
visual equipment, telephones and the network infrastructure. The main objective of the ICT Section is to assist
management with decision making and the streamlining of objectives regarding reaching its goals. ICT is a tool
which can be used to automate, monitor and identify areas where the Municipality could improve on service
delivery.
Table 3.17.1: Employees: ICT
Job level
2013/2014 2014/2015
Employees
(N)
Posts
(N)
Employees
(N)
Vacancies: full-time equivalent
(N)
Vacancies
(% of total posts)
0–3 0 0 0 0 0
4–6 0 0 0 0 0
7–9 0 0 0 0 0
10–12 65 1 65 0 0
13–15 39 1 39 0 0
16–18 0 0 0 0 0
19–20 0 0 0 0 0
Total 2 2 0 0 0
T3.17.1
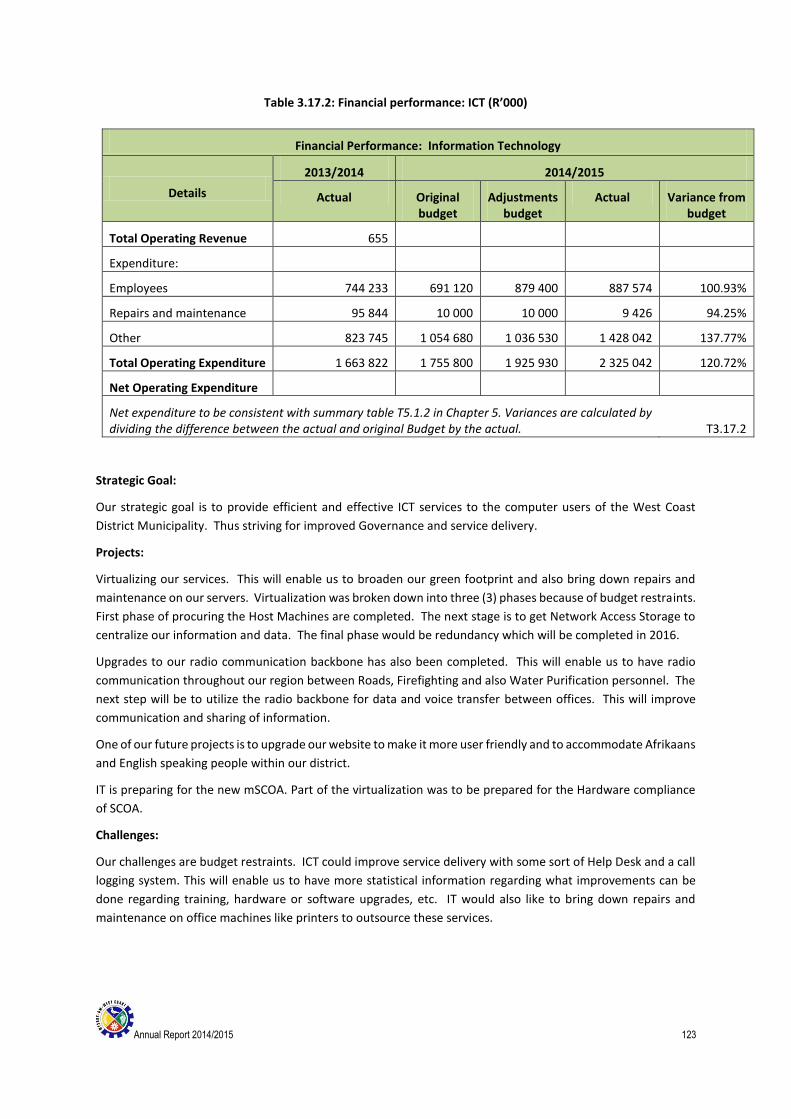
Annual Report 2014/2015 123
Table 3.17.2: Financial performance: ICT (R’000)
Financial Performance: Information Technology
Details
2013/2014 2014/2015
Actual Original budget
Adjustments budget
Actual Variance from budget
Total Operating Revenue 655
Expenditure:
Employees 744 233 691 120 879 400 887 574 100.93%
Repairs and maintenance 95 844 10 000 10 000 9 426 94.25%
Other 823 745 1 054 680 1 036 530 1 428 042 137.77%
Total Operating Expenditure 1 663 822 1 755 800 1 925 930 2 325 042 120.72%
Net Operating Expenditure
Net expenditure to be consistent with summary table T5.1.2 in Chapter 5. Variances are calculated by dividing the difference between the actual and original Budget by the actual. T3.17.2
Strategic Goal:
Our strategic goal is to provide efficient and effective ICT services to the computer users of the West Coast
District Municipality. Thus striving for improved Governance and service delivery.
Projects:
Virtualizing our services. This will enable us to broaden our green footprint and also bring down repairs and
maintenance on our servers. Virtualization was broken down into three (3) phases because of budget restraints.
First phase of procuring the Host Machines are completed. The next stage is to get Network Access Storage to
centralize our information and data. The final phase would be redundancy which will be completed in 2016.
Upgrades to our radio communication backbone has also been completed. This will enable us to have radio
communication throughout our region between Roads, Firefighting and also Water Purification personnel. The
next step will be to utilize the radio backbone for data and voice transfer between offices. This will improve
communication and sharing of information.
One of our future projects is to upgrade our website to make it more user friendly and to accommodate Afrikaans
and English speaking people within our district.
IT is preparing for the new mSCOA. Part of the virtualization was to be prepared for the Hardware compliance
of SCOA.
Challenges:
Our challenges are budget restraints. ICT could improve service delivery with some sort of Help Desk and a call
logging system. This will enable us to have more statistical information regarding what improvements can be
done regarding training, hardware or software upgrades, etc. IT would also like to bring down repairs and
maintenance on office machines like printers to outsource these services.
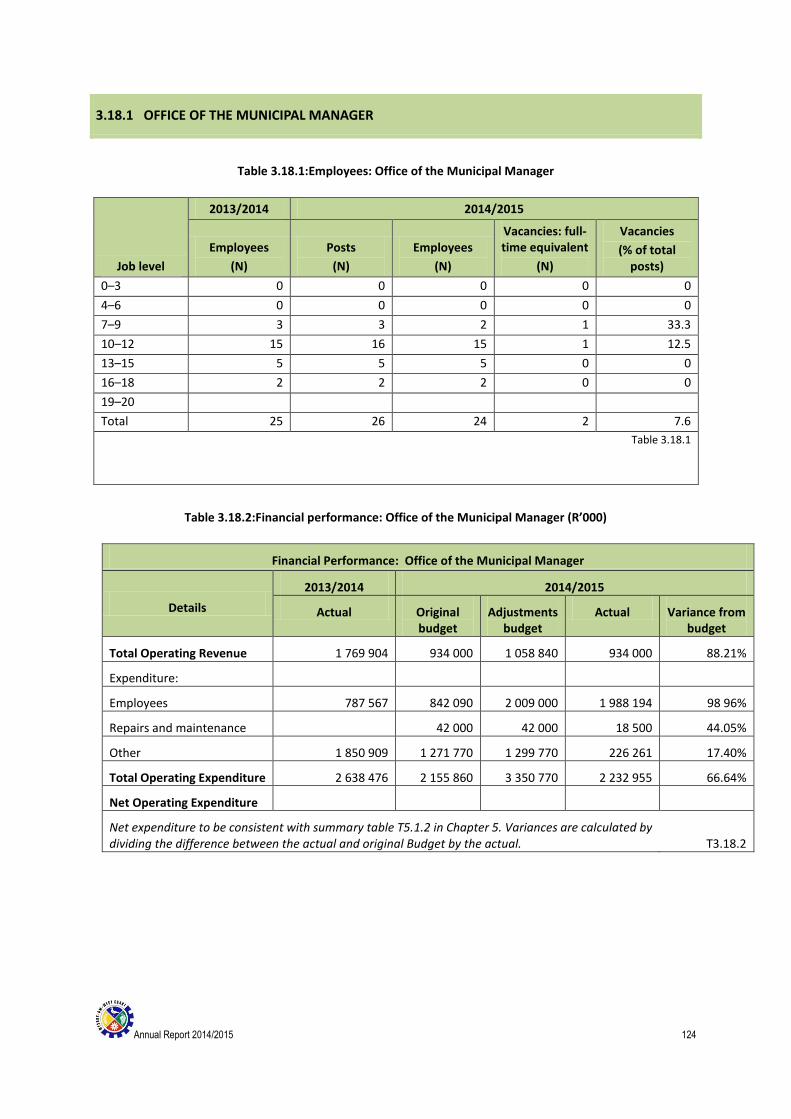
Annual Report 2014/2015 124
3.18.1 OFFICE OF THE MUNICIPAL MANAGER
Table 3.18.1:Employees: Office of the Municipal Manager
Job level
2013/2014 2014/2015
Employees
(N)
Posts
(N)
Employees
(N)
Vacancies: full-time equivalent
(N)
Vacancies
(% of total posts)
0–3 0 0 0 0 0
4–6 0 0 0 0 0
7–9 3 3 2 1 33.3
10–12 15 16 15 1 12.5
13–15 5 5 5 0 0
16–18 2 2 2 0 0
19–20
Total 25 26 24 2 7.6
Table 3.18.1
Table 3.18.2:Financial performance: Office of the Municipal Manager (R’000)
Financial Performance: Office of the Municipal Manager
Details
2013/2014 2014/2015
Actual Original budget
Adjustments budget
Actual Variance from budget
Total Operating Revenue 1 769 904 934 000 1 058 840 934 000 88.21%
Expenditure:
Employees 787 567 842 090 2 009 000 1 988 194 98 96%
Repairs and maintenance 42 000 42 000 18 500 44.05%
Other 1 850 909 1 271 770 1 299 770 226 261 17.40%
Total Operating Expenditure 2 638 476 2 155 860 3 350 770 2 232 955 66.64%
Net Operating Expenditure
Net expenditure to be consistent with summary table T5.1.2 in Chapter 5. Variances are calculated by dividing the difference between the actual and original Budget by the actual. T3.18.2
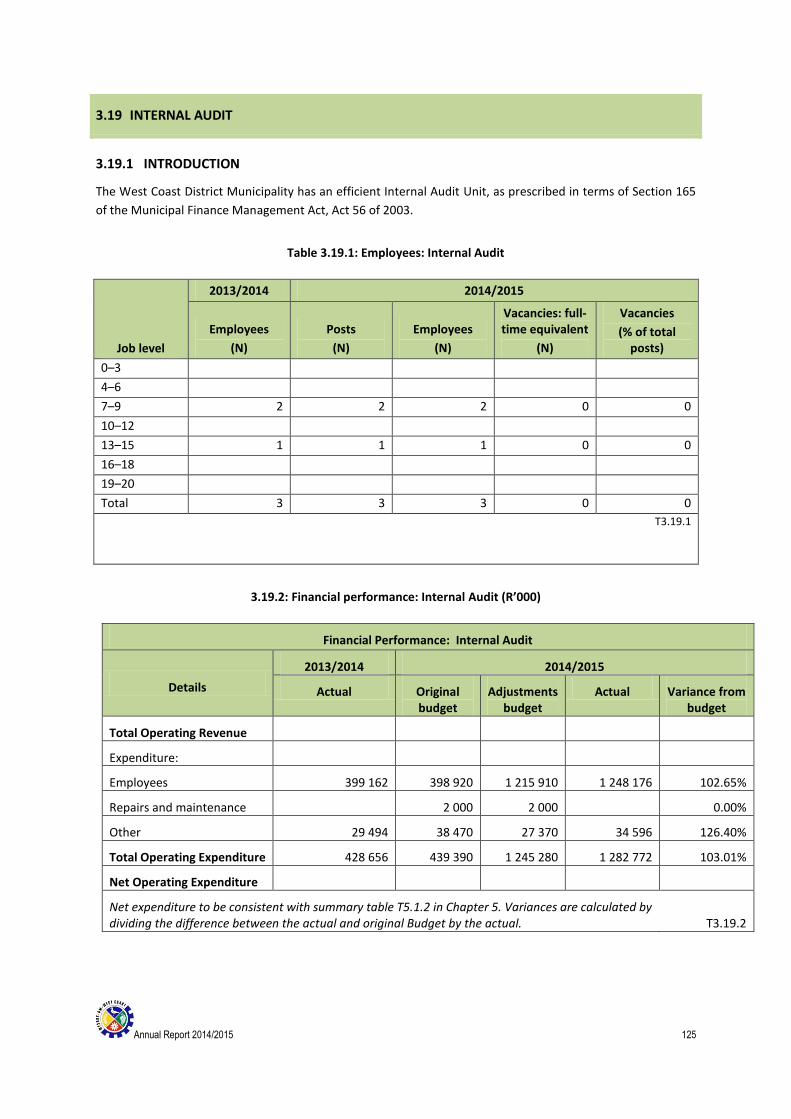
Annual Report 2014/2015 125
3.19 INTERNAL AUDIT
3.19.1 INTRODUCTION
The West Coast District Municipality has an efficient Internal Audit Unit, as prescribed in terms of Section 165
of the Municipal Finance Management Act, Act 56 of 2003.
Table 3.19.1: Employees: Internal Audit
Job level
2013/2014 2014/2015
Employees
(N)
Posts
(N)
Employees
(N)
Vacancies: full-time equivalent
(N)
Vacancies
(% of total posts)
0–3
4–6
7–9 2 2 2 0 0
10–12
13–15 1 1 1 0 0
16–18
19–20
Total 3 3 3 0 0
T3.19.1
3.19.2: Financial performance: Internal Audit (R’000)
Financial Performance: Internal Audit
Details
2013/2014 2014/2015
Actual Original budget
Adjustments budget
Actual Variance from budget
Total Operating Revenue
Expenditure:
Employees 399 162 398 920 1 215 910 1 248 176 102.65%
Repairs and maintenance 2 000 2 000 0.00%
Other 29 494 38 470 27 370 34 596 126.40%
Total Operating Expenditure 428 656 439 390 1 245 280 1 282 772 103.01%
Net Operating Expenditure
Net expenditure to be consistent with summary table T5.1.2 in Chapter 5. Variances are calculated by dividing the difference between the actual and original Budget by the actual. T3.19.2
Annual Report 2013/2014 126
CHAPTER 4 – ORGANISATIONAL DEVELOPMENT PERFORMANCE (PERFORMANCE REPORT PART II)
COMPONENT A: INTRODUCTION TO THE MUNICIPAL PERSONNEL
INTRODUCTION
The Municipality’s organisational development function is as follows:
The District Municipality’s macro-organisational structure (detailed below) constitutes the Council’s policy according to
which the micro-organisational structure was developed. The District Municipality consists of the Office of the
Municipal Manager and three departments with their respective divisions. The three departments report to the
Municipal Manager.
The divisions are as follows: (a) Office of the Municipal Manager
Human Resources
Internal Auditing
Risk Management
Strategic Services
Social and Community Development
Tourism (b) Department: Administration and Community Services
Administration
Air Quality
Disaster Management
Fire Services
Municipal Environmental Health
Municipal Environmental Management
Public Relations (c) Department: Financial Services
Expenditure
Financial Management and Control
Income
Information Technology
Ganzekraal Resort
Supply Chain Management (d) Department: Infrastructure Services
Civil Engineering Projects
Mechanical Workshops
Roads Construction and Maintenance
Town and Regional Planning
Water Purification
Water Distribution
Supply Chain Management
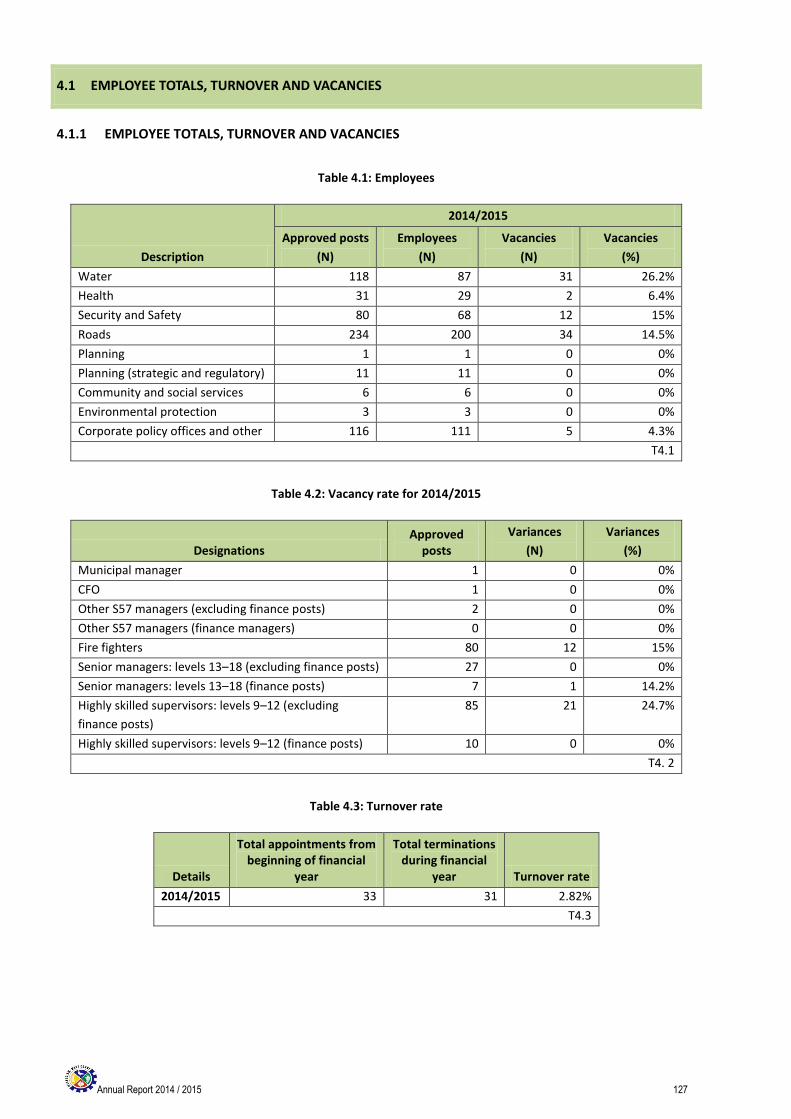
Annual Report 2014 / 2015 127
4.1 EMPLOYEE TOTALS, TURNOVER AND VACANCIES
4.1.1 EMPLOYEE TOTALS, TURNOVER AND VACANCIES
Table 4.1: Employees
Description
2014/2015
Approved posts
(N)
Employees
(N)
Vacancies
(N)
Vacancies
(%)
Water 118 87 31 26.2%
Health 31 29 2 6.4%
Security and Safety 80 68 12 15%
Roads 234 200 34 14.5%
Planning 1 1 0 0%
Planning (strategic and regulatory) 11 11 0 0%
Community and social services 6 6 0 0%
Environmental protection 3 3 0 0%
Corporate policy offices and other 116 111 5 4.3%
T4.1
Table 4.2: Vacancy rate for 2014/2015
Designations Approved
posts
Variances
(N)
Variances
(%)
Municipal manager 1 0 0%
CFO 1 0 0%
Other S57 managers (excluding finance posts) 2 0 0%
Other S57 managers (finance managers) 0 0 0%
Fire fighters 80 12 15%
Senior managers: levels 13–18 (excluding finance posts) 27 0 0%
Senior managers: levels 13–18 (finance posts) 7 1 14.2%
Highly skilled supervisors: levels 9–12 (excluding
finance posts)
85 21 24.7%
Highly skilled supervisors: levels 9–12 (finance posts) 10 0 0%
T4. 2
Table 4.3: Turnover rate
Details
Total appointments from beginning of financial
year
Total terminations during financial
year Turnover rate
2014/2015 33 31 2.82%
T4.3
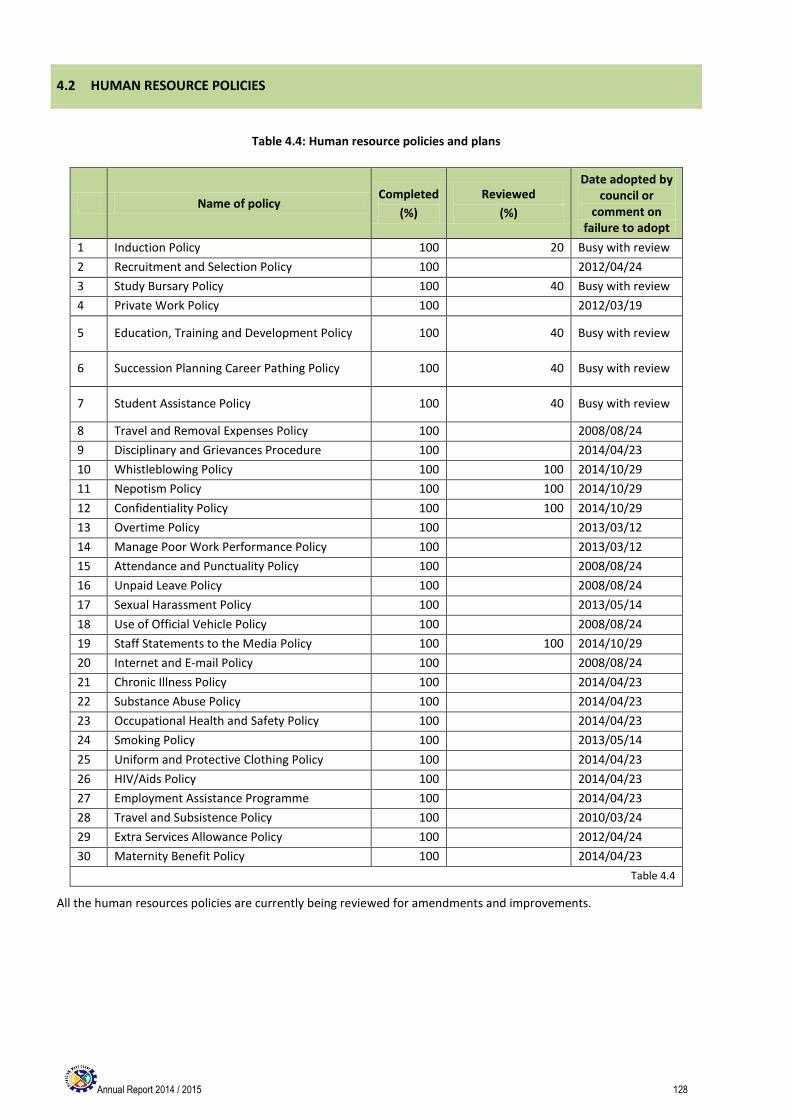
Annual Report 2014 / 2015 128
4.2 HUMAN RESOURCE POLICIES
Table 4.4: Human resource policies and plans
Name of policy Completed
(%)
Reviewed
(%)
Date adopted by council or
comment on failure to adopt
1 Induction Policy 100 20 Busy with review
2 Recruitment and Selection Policy 100 2012/04/24
3 Study Bursary Policy 100 40 Busy with review
4 Private Work Policy 100 2012/03/19
5 Education, Training and Development Policy 100 40 Busy with review
6 Succession Planning Career Pathing Policy 100 40 Busy with review
7 Student Assistance Policy 100 40 Busy with review
8 Travel and Removal Expenses Policy 100 2008/08/24
9 Disciplinary and Grievances Procedure 100 2014/04/23
10 Whistleblowing Policy 100 100 2014/10/29
11 Nepotism Policy 100 100 2014/10/29
12 Confidentiality Policy 100 100 2014/10/29
13 Overtime Policy 100 2013/03/12
14 Manage Poor Work Performance Policy 100 2013/03/12
15 Attendance and Punctuality Policy 100 2008/08/24
16 Unpaid Leave Policy 100 2008/08/24
17 Sexual Harassment Policy 100 2013/05/14
18 Use of Official Vehicle Policy 100 2008/08/24
19 Staff Statements to the Media Policy 100 100 2014/10/29
20 Internet and E-mail Policy 100 2008/08/24
21 Chronic Illness Policy 100 2014/04/23
22 Substance Abuse Policy 100 2014/04/23
23 Occupational Health and Safety Policy 100 2014/04/23
24 Smoking Policy 100 2013/05/14
25 Uniform and Protective Clothing Policy 100 2014/04/23
26 HIV/Aids Policy 100 2014/04/23
27 Employment Assistance Programme 100 2014/04/23
28 Travel and Subsistence Policy 100 2010/03/24
29 Extra Services Allowance Policy 100 2012/04/24
30 Maternity Benefit Policy 100 2014/04/23
Table 4.4
All the human resources policies are currently being reviewed for amendments and improvements.
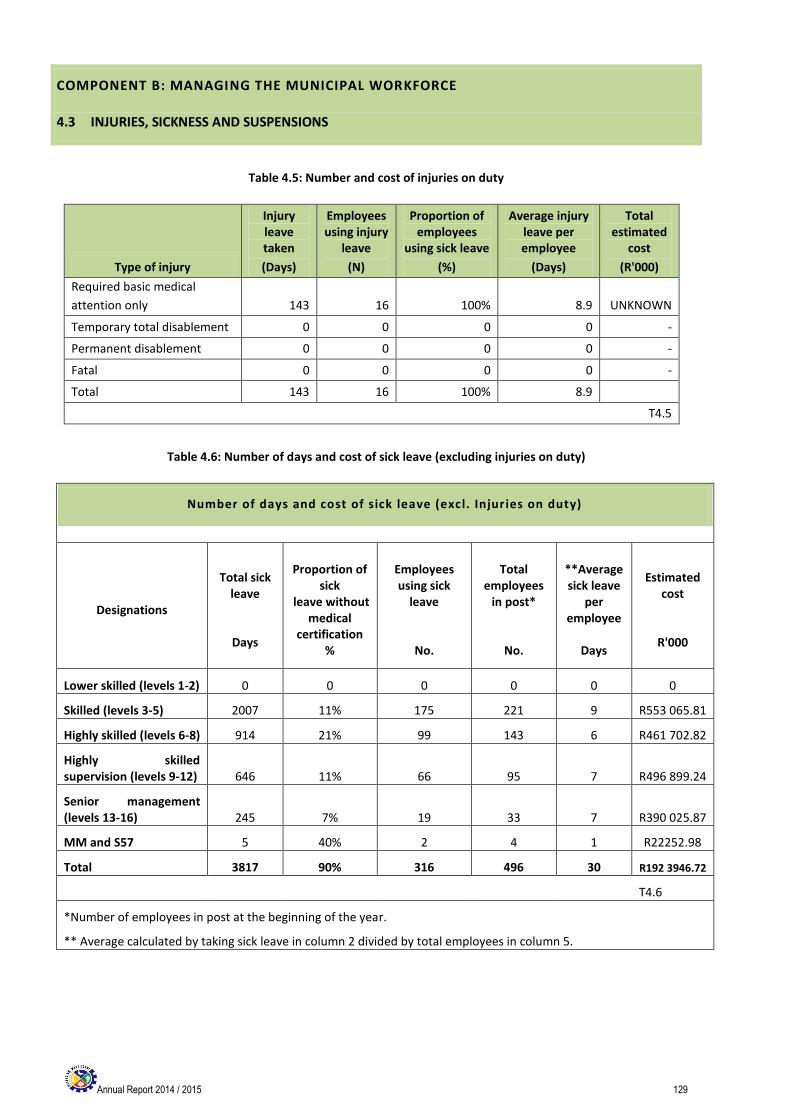
Annual Report 2014 / 2015 129
COMPONENT B: MANAGING THE MUNICIPAL WORKFORCE
4.3 INJURIES, SICKNESS AND SUSPENSIONS
Table 4.5: Number and cost of injuries on duty
Type of injury
Injury leave taken
(Days)
Employees using injury
leave
(N)
Proportion of employees
using sick leave
(%)
Average injury leave per employee
(Days)
Total estimated
cost
(R'000)
Required basic medical
attention only 143 16 100% 8.9 UNKNOWN
Temporary total disablement 0 0 0 0 -
Permanent disablement 0 0 0 0 -
Fatal 0 0 0 0 -
Total 143 16 100% 8.9
T4.5
Table 4.6: Number of days and cost of sick leave (excluding injuries on duty)
Number of days and cost of sick leave (excl. Injuries on duty)
Designations
Total sick leave
Days
Proportion of sick
leave without medical
certification %
Employees using sick
leave
No.
Total employees
in post*
No.
**Average sick leave
per employee
Days
Estimated cost
R'000
Lower skilled (levels 1-2) 0 0 0 0 0 0
Skilled (levels 3-5) 2007 11% 175 221 9 R553 065.81
Highly skilled (levels 6-8) 914 21% 99 143 6 R461 702.82
Highly skilled supervision (levels 9-12) 646 11% 66 95 7 R496 899.24
Senior management (levels 13-16) 245 7% 19 33 7 R390 025.87
MM and S57 5 40% 2 4 1 R22252.98
Total 3817 90% 316 496 30 R192 3946.72
T4.6
*Number of employees in post at the beginning of the year.
** Average calculated by taking sick leave in column 2 divided by total employees in column 5.
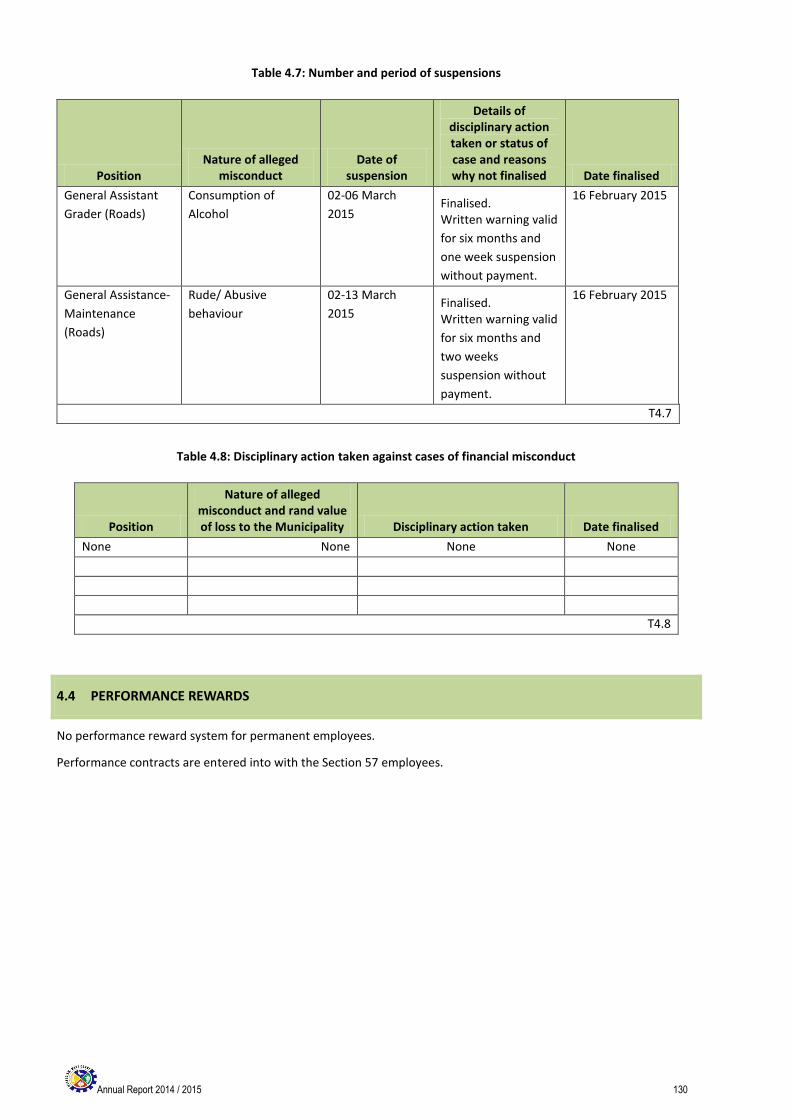
Annual Report 2014 / 2015 130
Table 4.7: Number and period of suspensions
Position Nature of alleged
misconduct Date of
suspension
Details of disciplinary action taken or status of case and reasons why not finalised Date finalised
General Assistant
Grader (Roads)
Consumption of
Alcohol
02-06 March
2015 Finalised. Written warning valid
for six months and
one week suspension
without payment.
16 February 2015
General Assistance-
Maintenance
(Roads)
Rude/ Abusive
behaviour
02-13 March
2015 Finalised. Written warning valid
for six months and
two weeks
suspension without
payment.
16 February 2015
T4.7
Table 4.8: Disciplinary action taken against cases of financial misconduct
Position
Nature of alleged misconduct and rand value of loss to the Municipality Disciplinary action taken Date finalised
None None None None
T4.8
4.4 PERFORMANCE REWARDS
No performance reward system for permanent employees.
Performance contracts are entered into with the Section 57 employees.
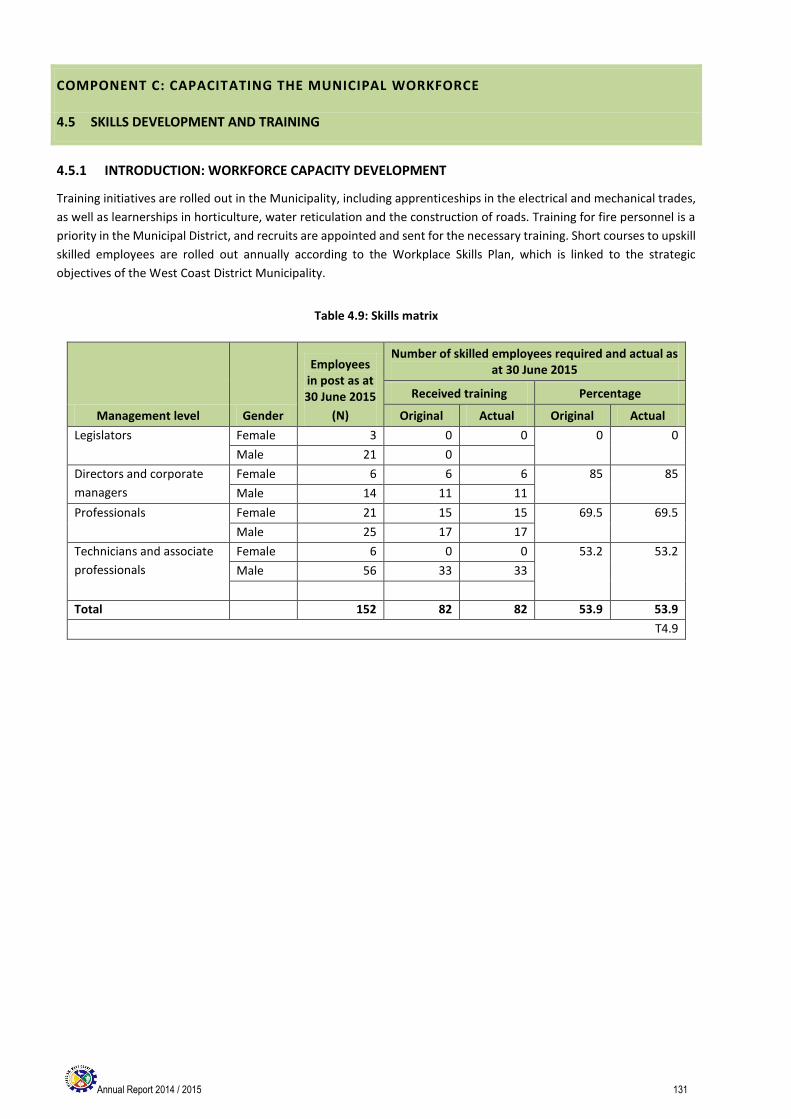
Annual Report 2014 / 2015 131
COMPONENT C: CAPACITATING THE MUNICIPAL WORKFORCE
4.5 SKILLS DEVELOPMENT AND TRAINING
4.5.1 INTRODUCTION: WORKFORCE CAPACITY DEVELOPMENT
Training initiatives are rolled out in the Municipality, including apprenticeships in the electrical and mechanical trades,
as well as learnerships in horticulture, water reticulation and the construction of roads. Training for fire personnel is a
priority in the Municipal District, and recruits are appointed and sent for the necessary training. Short courses to upskill
skilled employees are rolled out annually according to the Workplace Skills Plan, which is linked to the strategic
objectives of the West Coast District Municipality.
Table 4.9: Skills matrix
Management level Gender
Employees in post as at 30 June 2015
(N)
Number of skilled employees required and actual as at 30 June 2015
Received training Percentage
Original Actual Original Actual
Legislators Female 3 0 0 0 0
Male 21 0
Directors and corporate
managers
Female 6 6 6 85 85
Male 14 11 11
Professionals Female 21 15 15 69.5 69.5
Male 25 17 17
Technicians and associate
professionals
Female 6 0 0 53.2 53.2
Male 56 33 33
Total 152 82 82 53.9 53.9
T4.9
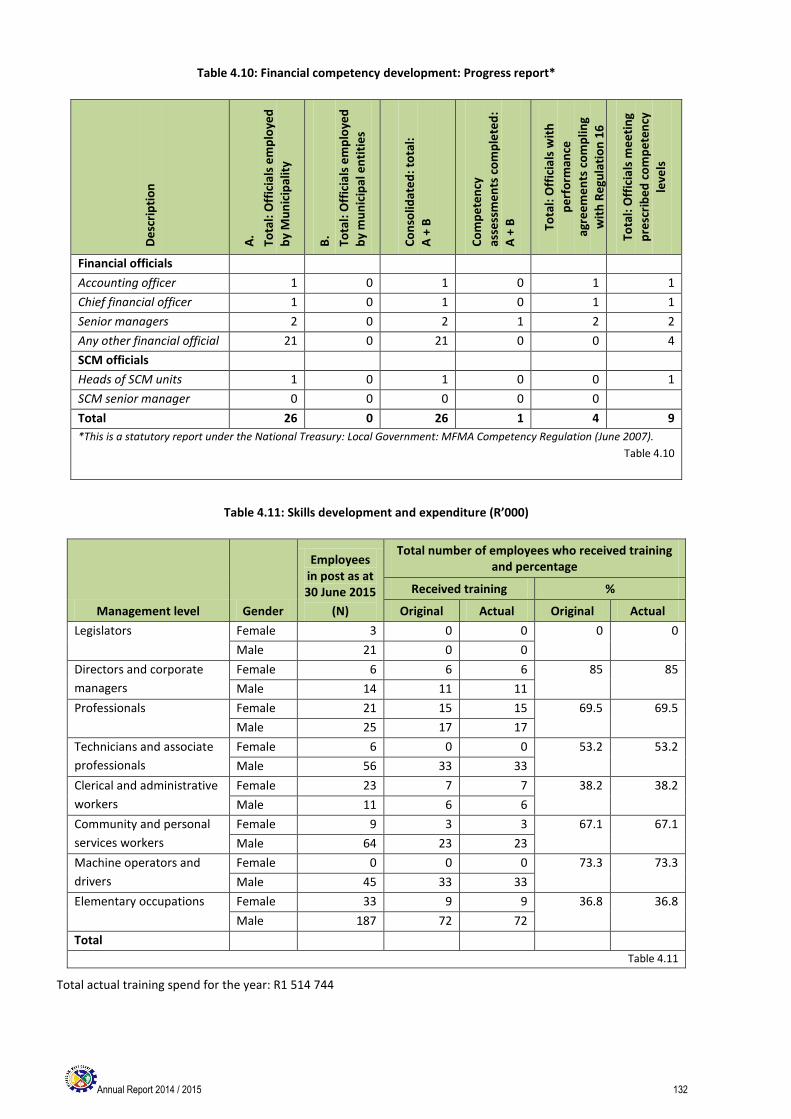
Annual Report 2014 / 2015 132
Table 4.10: Financial competency development: Progress report*
De
scri
pti
on
A.
Tota
l: O
ffic
ials
em
plo
yed
b
y M
un
icip
alit
y
B.
Tota
l: O
ffic
ials
em
plo
yed
b
y m
un
icip
al e
nti
tie
s
Co
nso
lidat
ed
: to
tal:
A
+ B
Co
mp
ete
ncy
asse
ssm
en
ts c
om
ple
ted
: A
+ B
Tota
l: O
ffic
ials
wit
h
pe
rfo
rman
ce
agre
em
en
ts c
om
plin
g w
ith
Re
gula
tio
n 1
6
Tota
l: O
ffic
ials
me
eti
ng
pre
scri
be
d c
om
pe
ten
cy
leve
ls
Financial officials
Accounting officer 1 0 1 0 1 1
Chief financial officer 1 0 1 0 1 1
Senior managers 2 0 2 1 2 2
Any other financial official 21 0 21 0 0 4
SCM officials
Heads of SCM units 1 0 1 0 0 1
SCM senior manager 0 0 0 0 0
Total 26 0 26 1 4 9
*This is a statutory report under the National Treasury: Local Government: MFMA Competency Regulation (June 2007).
Table 4.10
Table 4.11: Skills development and expenditure (R’000)
Management level Gender
Employees in post as at 30 June 2015
(N)
Total number of employees who received training and percentage
Received training %
Original Actual Original Actual
Legislators Female 3 0 0 0 0
Male 21 0 0
Directors and corporate
managers
Female 6 6 6 85 85
Male 14 11 11
Professionals Female 21 15 15 69.5 69.5
Male 25 17 17
Technicians and associate
professionals
Female 6 0 0 53.2
53.2
Male 56 33 33
Clerical and administrative
workers
Female 23 7 7 38.2 38.2
Male 11 6 6
Community and personal
services workers
Female 9 3 3 67.1 67.1
Male 64 23 23
Machine operators and
drivers
Female 0 0 0 73.3 73.3
Male 45 33 33
Elementary occupations Female 33 9 9 36.8 36.8
Male 187 72 72
Total
Table 4.11
Total actual training spend for the year: R1 514 744
Annual Report 2014 / 2015 133
CHAPTER 5: FINANCIAL PERFORMANCE (FUNCTIONS)
INTRODUCTION Chapter 5 contains information regarding financial performance and highlights specific accomplishments. The chapter comprises of three components:
Component A: Statement of Financial Performance (Functions)
Component B: Statement of Comparison between Budget and Actual Information as at 30 June 2015
Component C: Other Financial Matter
Annual Report 2014 / 2015 134
COMPONENT A: STATEMENTS OF FINANCIAL PERFORMANCE (FUNCTIONS)
Note: Statements of Revenue Collection Performance by vote and by source are included at Appendix K
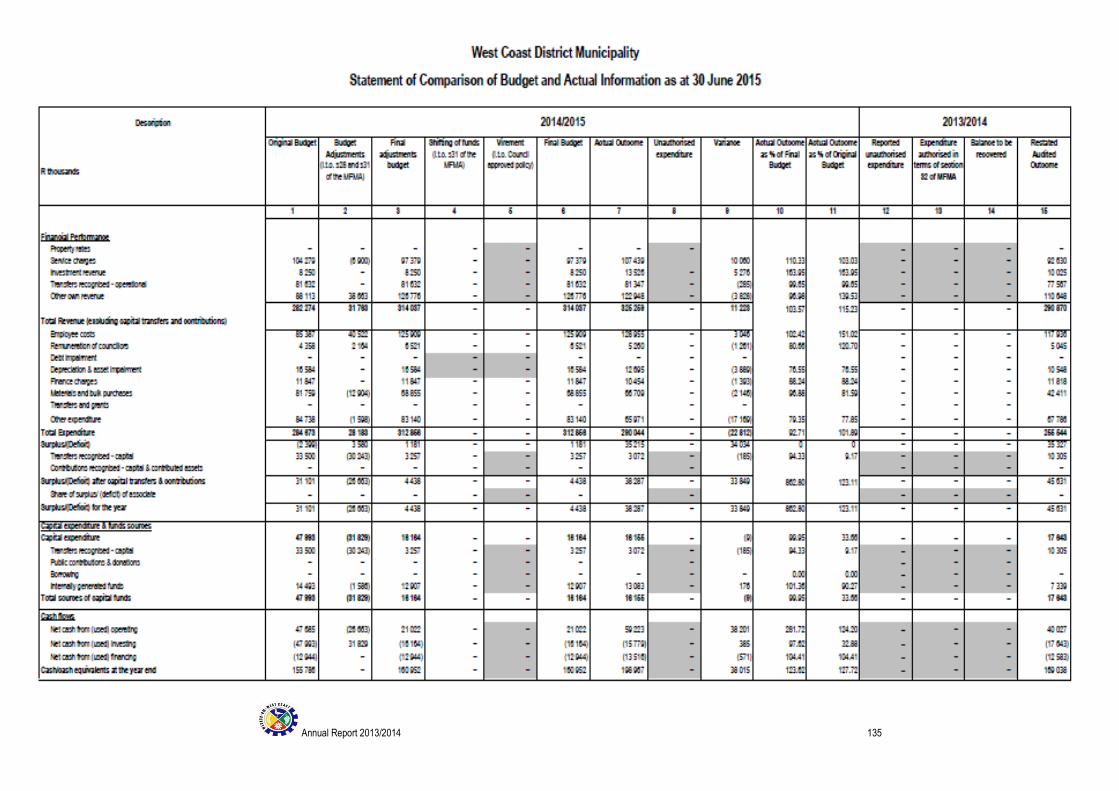
Annual Report 2013/2014 135
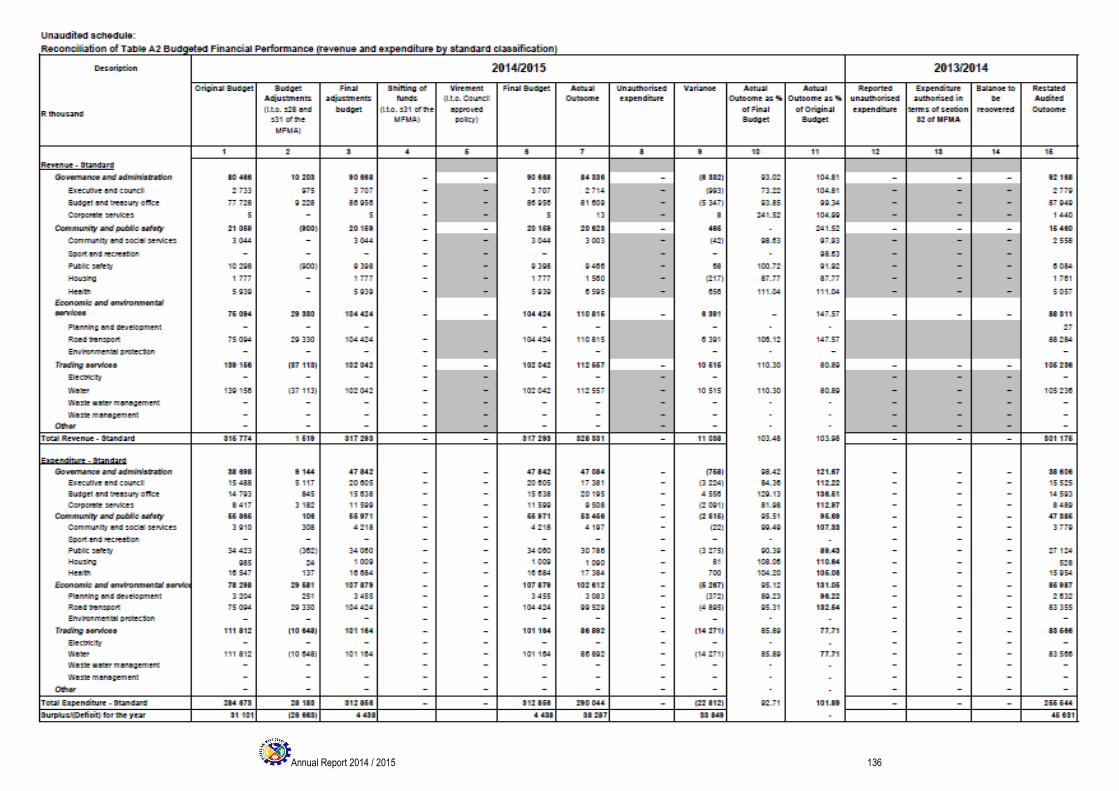
Annual Report 2014 / 2015 136
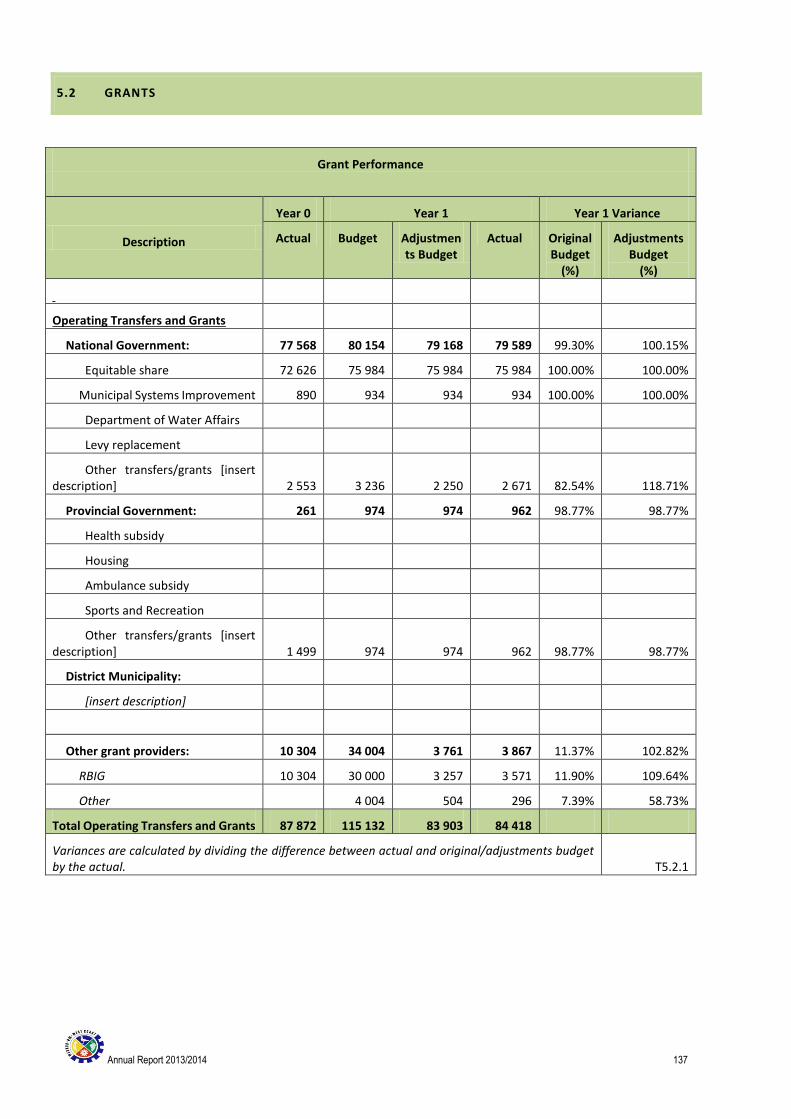
Annual Report 2013/2014 137
5.2 GRANTS
Grant Performance
Description
Year 0 Year 1 Year 1 Variance
Actual Budget Adjustments Budget
Actual Original Budget
(%)
Adjustments Budget
(%)
Operating Transfers and Grants
National Government: 77 568 80 154 79 168 79 589 99.30% 100.15%
Equitable share 72 626 75 984 75 984 75 984 100.00% 100.00%
Municipal Systems Improvement 890 934 934 934 100.00% 100.00%
Department of Water Affairs
Levy replacement
Other transfers/grants [insert description] 2 553 3 236 2 250 2 671 82.54% 118.71%
Provincial Government: 261 974 974 962 98.77% 98.77%
Health subsidy
Housing
Ambulance subsidy
Sports and Recreation
Other transfers/grants [insert description] 1 499 974 974 962 98.77% 98.77%
District Municipality:
[insert description]
Other grant providers: 10 304 34 004 3 761 3 867 11.37% 102.82%
RBIG 10 304 30 000 3 257 3 571 11.90% 109.64%
Other 4 004 504 296 7.39% 58.73%
Total Operating Transfers and Grants 87 872 115 132 83 903 84 418
Variances are calculated by dividing the difference between actual and original/adjustments budget by the actual. T5.2.1
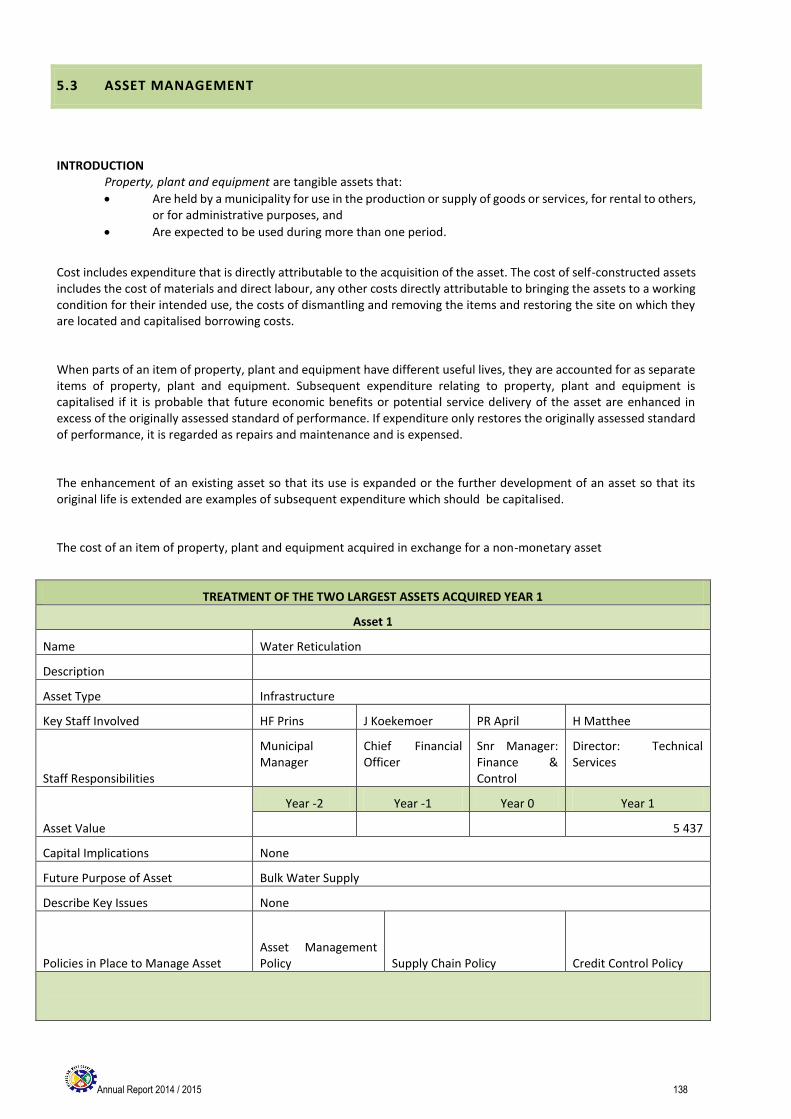
Annual Report 2014 / 2015 138
5.3 ASSET MANAGEMENT
INTRODUCTION Property, plant and equipment are tangible assets that:
Are held by a municipality for use in the production or supply of goods or services, for rental to others, or for administrative purposes, and
Are expected to be used during more than one period.
Cost includes expenditure that is directly attributable to the acquisition of the asset. The cost of self-constructed assets includes the cost of materials and direct labour, any other costs directly attributable to bringing the assets to a working condition for their intended use, the costs of dismantling and removing the items and restoring the site on which they are located and capitalised borrowing costs.
When parts of an item of property, plant and equipment have different useful lives, they are accounted for as separate items of property, plant and equipment. Subsequent expenditure relating to property, plant and equipment is capitalised if it is probable that future economic benefits or potential service delivery of the asset are enhanced in excess of the originally assessed standard of performance. If expenditure only restores the originally assessed standard of performance, it is regarded as repairs and maintenance and is expensed.
The enhancement of an existing asset so that its use is expanded or the further development of an asset so that its original life is extended are examples of subsequent expenditure which should be capitalised.
The cost of an item of property, plant and equipment acquired in exchange for a non-monetary asset
TREATMENT OF THE TWO LARGEST ASSETS ACQUIRED YEAR 1
Asset 1
Name Water Reticulation
Description
Asset Type Infrastructure
Key Staff Involved HF Prins J Koekemoer PR April H Matthee
Staff Responsibilities
Municipal Manager
Chief Financial Officer
Snr Manager: Finance & Control
Director: Technical Services
Asset Value
Year -2 Year -1 Year 0 Year 1
5 437
Capital Implications None
Future Purpose of Asset Bulk Water Supply
Describe Key Issues None
Policies in Place to Manage Asset Asset Management Policy Supply Chain Policy Credit Control Policy
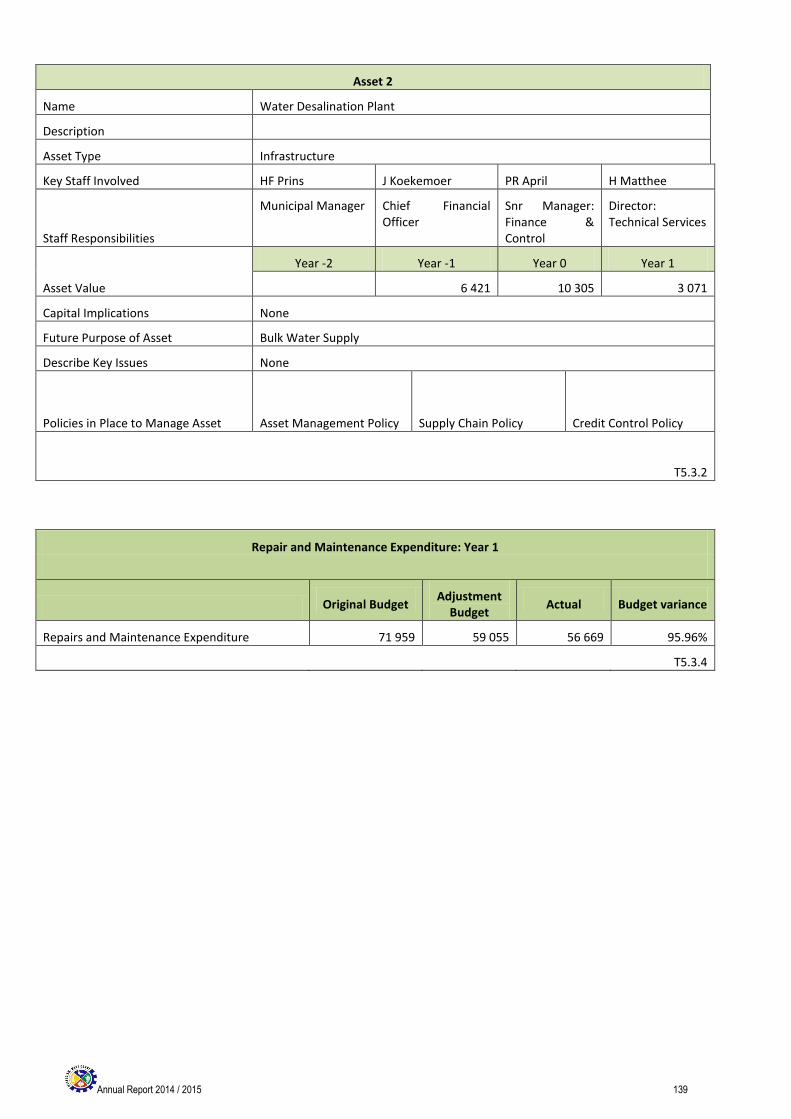
Annual Report 2014 / 2015 139
Asset 2
Name Water Desalination Plant
Description
Asset Type Infrastructure
Key Staff Involved HF Prins J Koekemoer PR April H Matthee
Staff Responsibilities
Municipal Manager Chief Financial Officer
Snr Manager: Finance & Control
Director: Technical Services
Asset Value
Year -2 Year -1 Year 0 Year 1
6 421 10 305 3 071
Capital Implications None
Future Purpose of Asset Bulk Water Supply
Describe Key Issues None
Policies in Place to Manage Asset Asset Management Policy Supply Chain Policy Credit Control Policy
T5.3.2
Repair and Maintenance Expenditure: Year 1
Original Budget
Adjustment Budget
Actual Budget variance
Repairs and Maintenance Expenditure 71 959 59 055 56 669 95.96%
T5.3.4
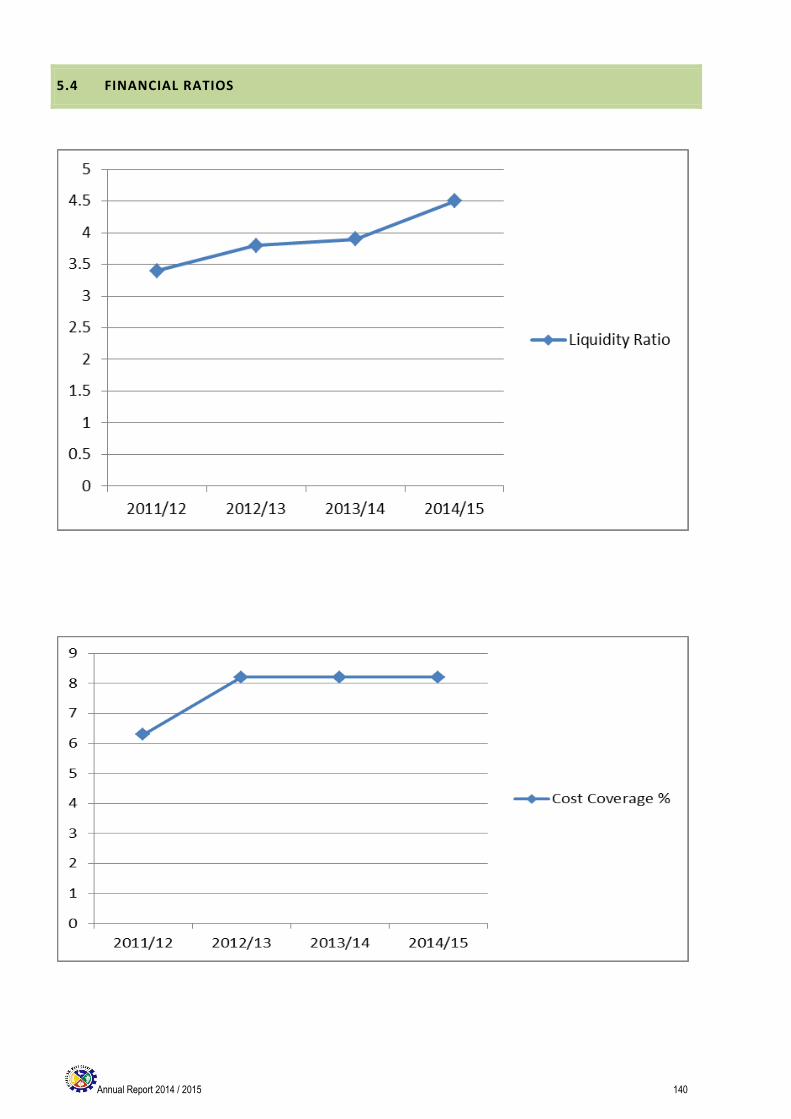
Annual Report 2014 / 2015 140
5.4 FINANCIAL RATIOS
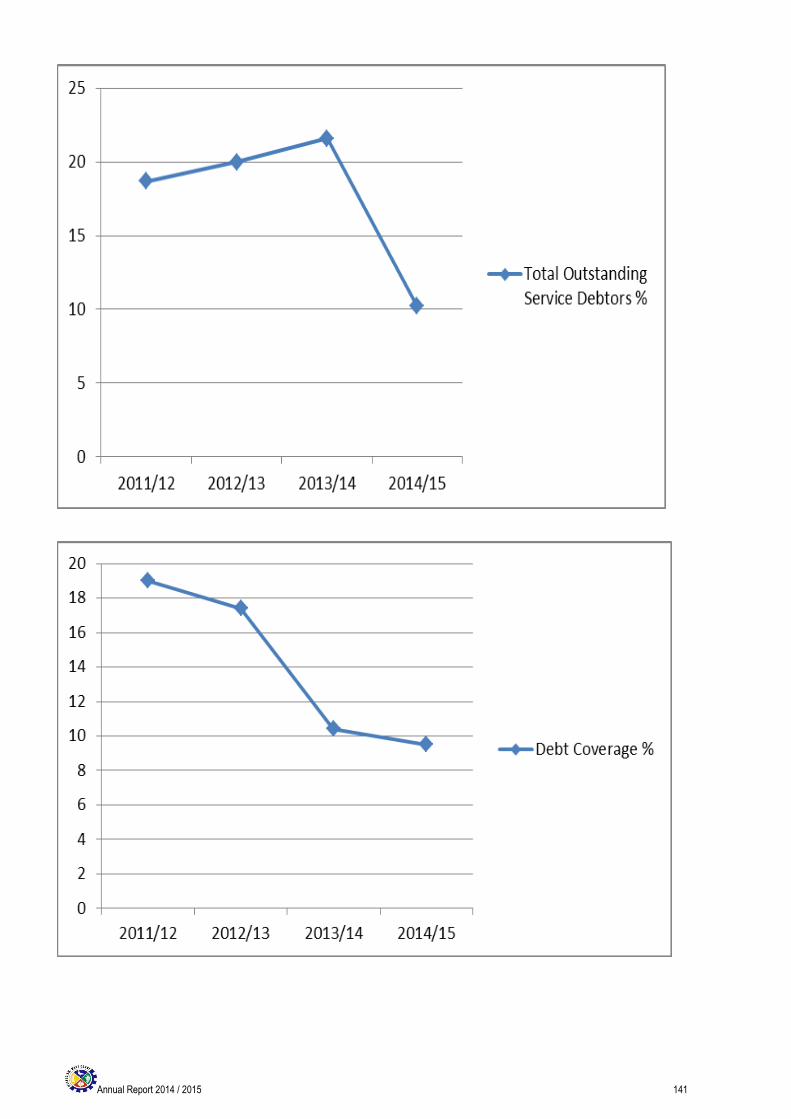
Annual Report 2014 / 2015 141
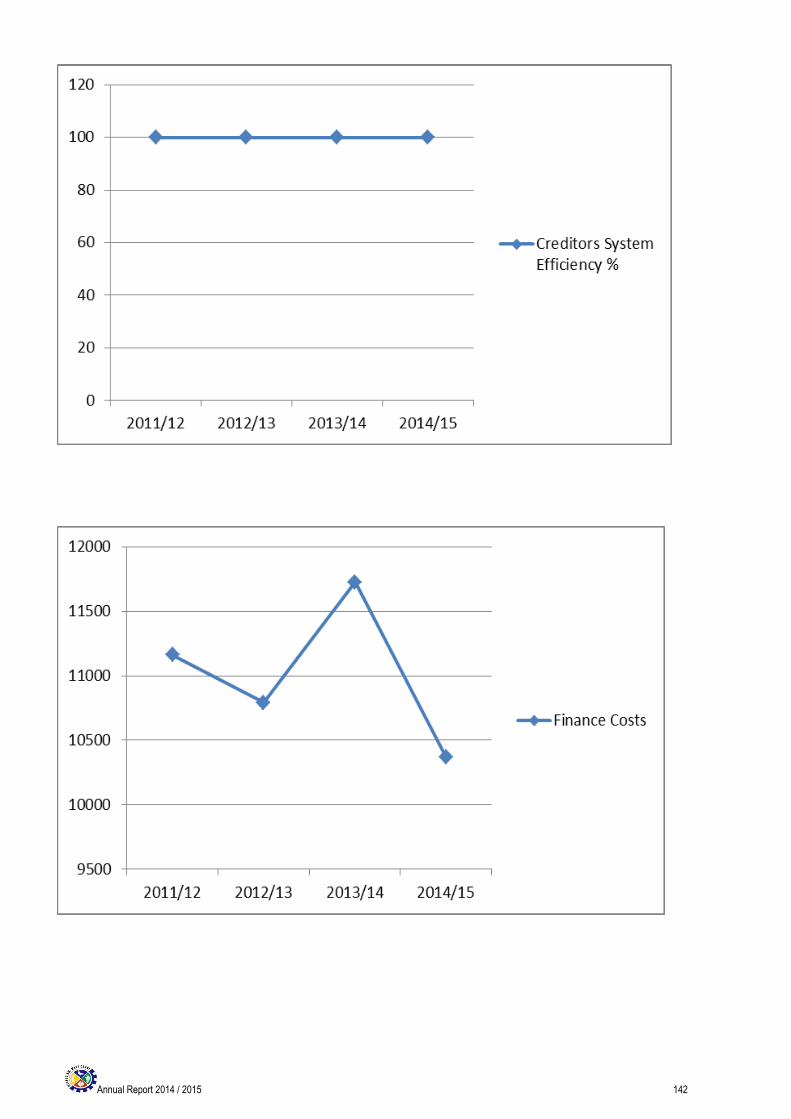
Annual Report 2014 / 2015 142
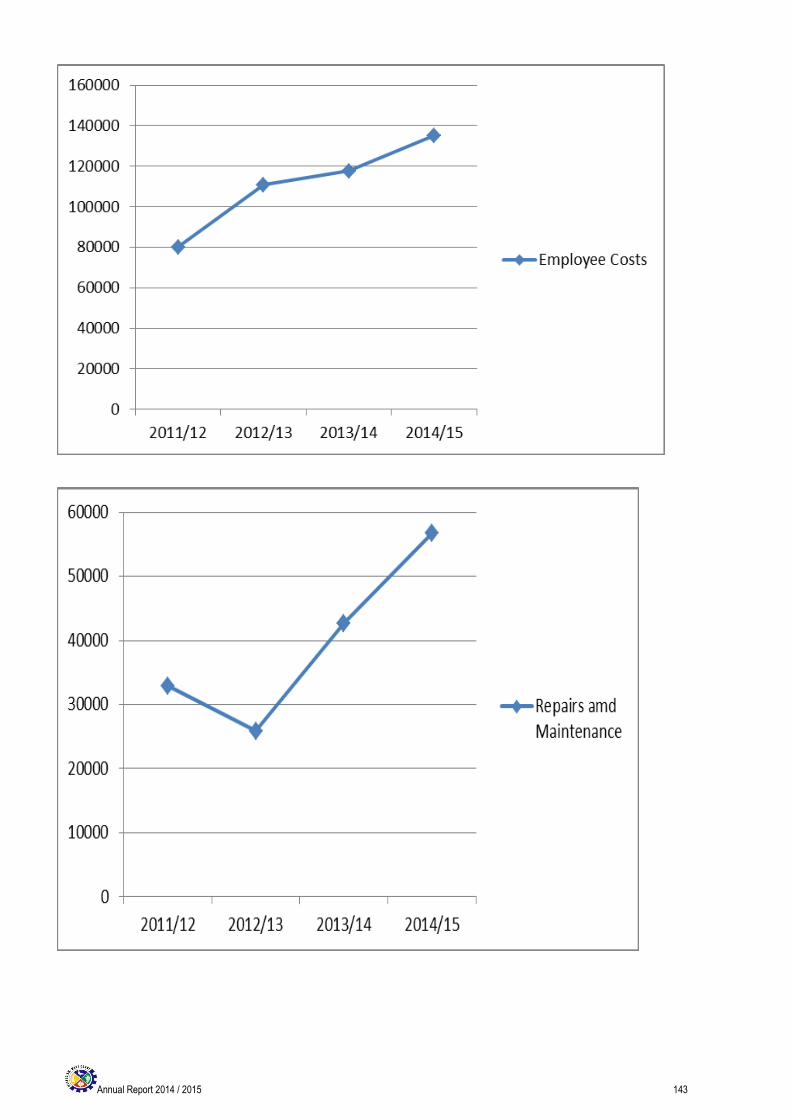
Annual Report 2014 / 2015 143
Annual Report 2014 / 2015 144
COMPONENT B: STATEMENT OF COMPARISON OF BUDGET AND ACTUAL INFORMATION AS AT 30
JUNE 2015
5.5 CAPITAL EXPENDITURE BY CLASSIFICATION
Refer to page 7 of Annual Financial Statement 2014/2015
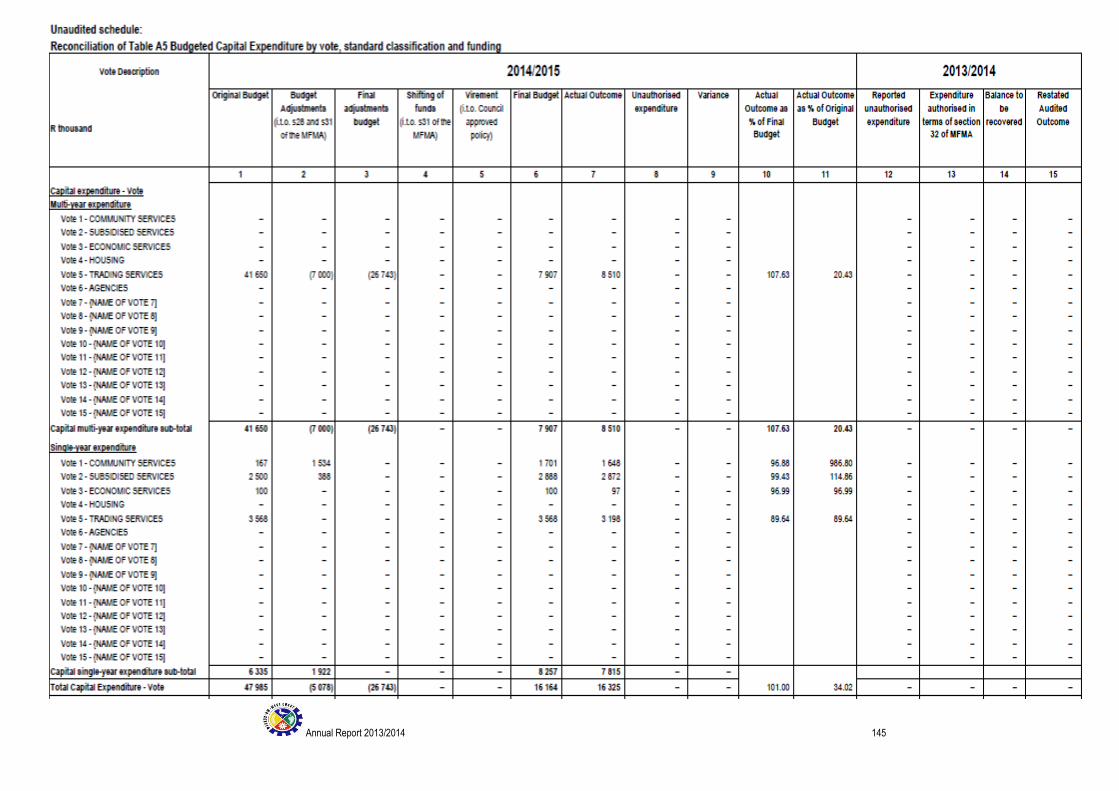
Annual Report 2013/2014 145
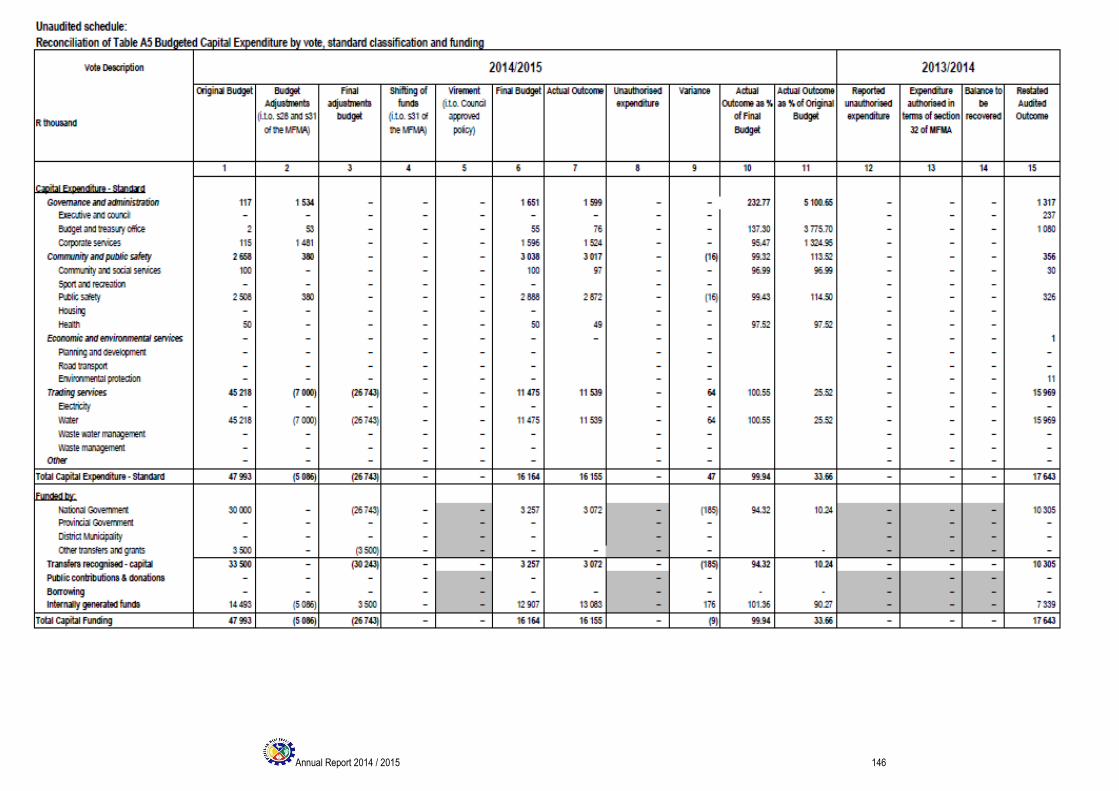
Annual Report 2014 / 2015 146
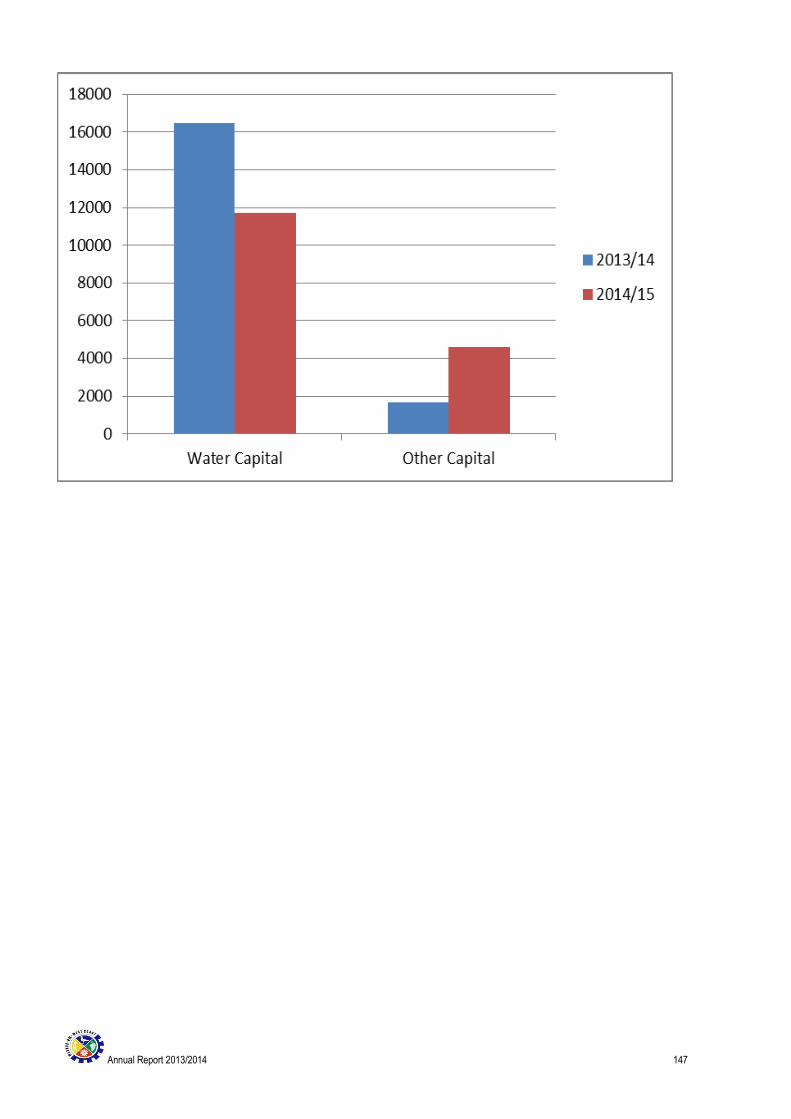
Annual Report 2013/2014 147
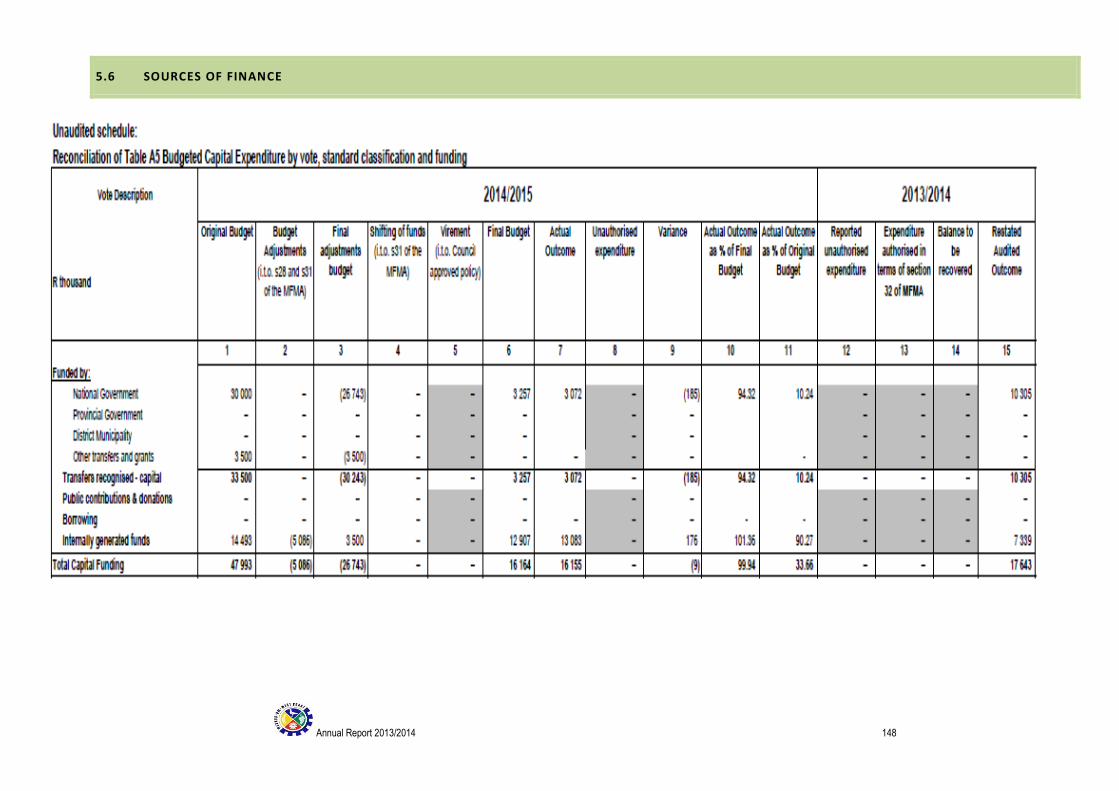
Annual Report 2013/2014 148
5.6 SOURCES OF FINANCE
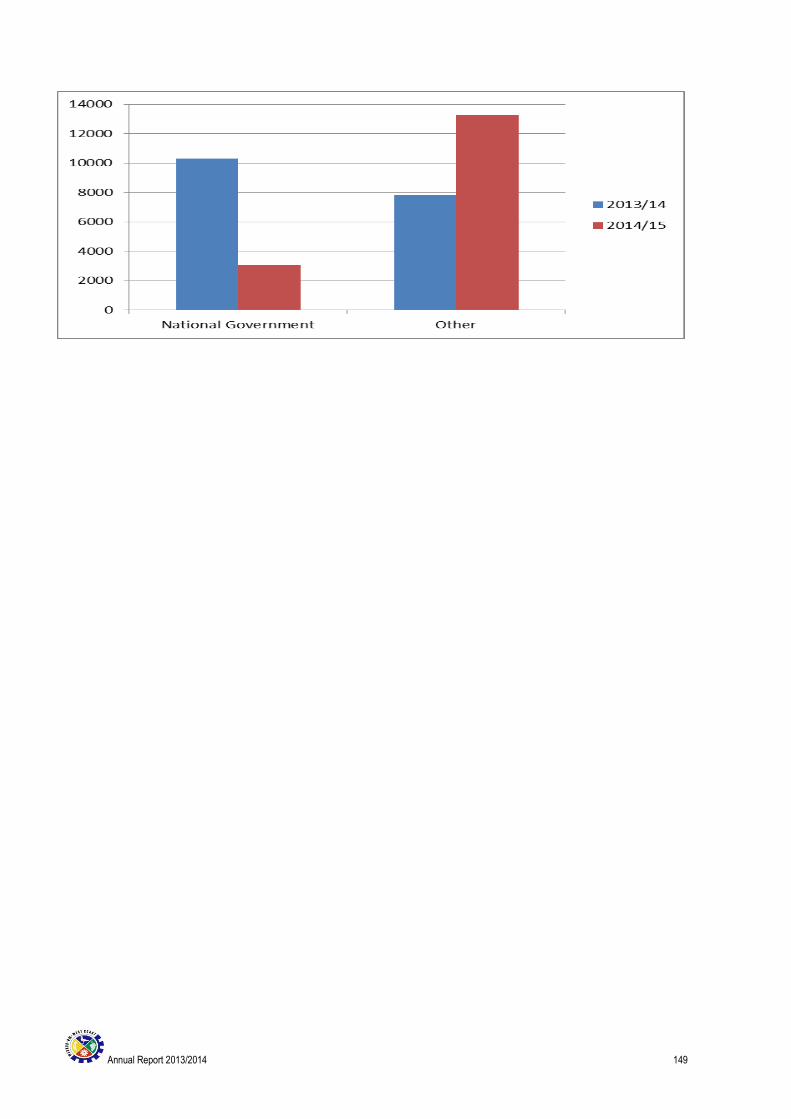
Annual Report 2013/2014 149
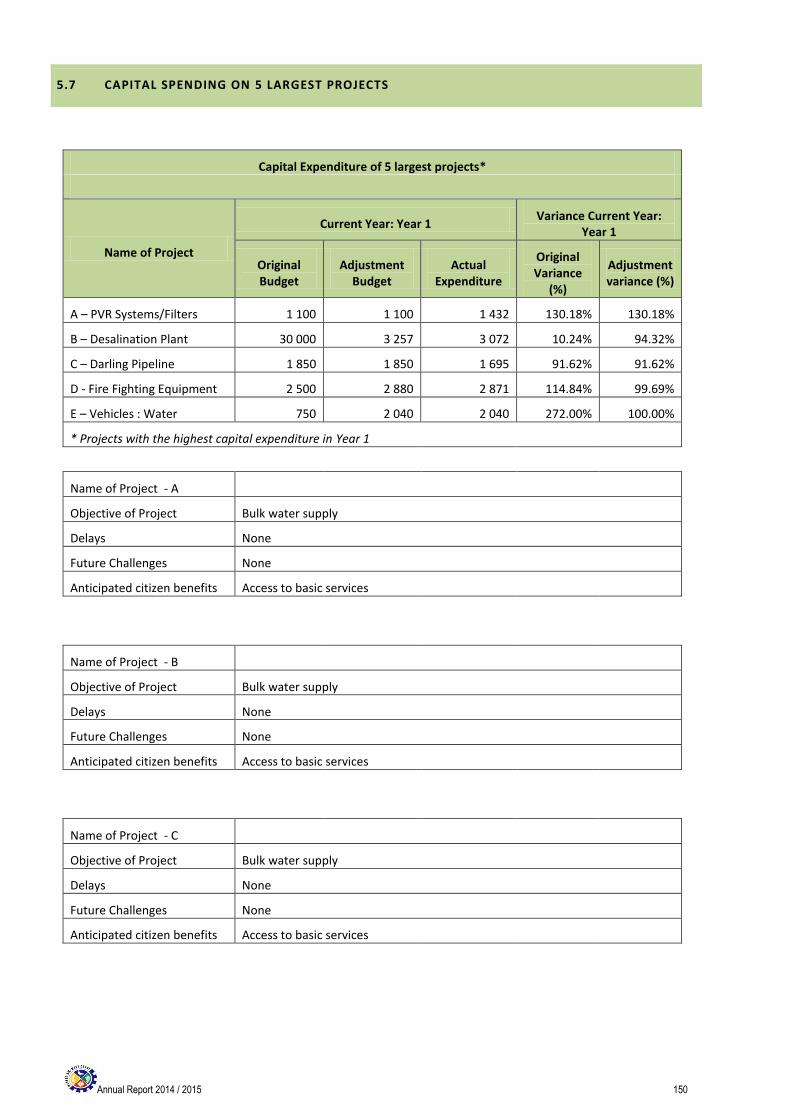
Annual Report 2014 / 2015 150
5.7 CAPITAL SPENDING ON 5 LARGEST PROJECTS
Capital Expenditure of 5 largest projects*
Name of Project
Current Year: Year 1 Variance Current Year:
Year 1
Original Budget
Adjustment Budget
Actual Expenditure
Original Variance
(%)
Adjustment variance (%)
A – PVR Systems/Filters 1 100 1 100 1 432 130.18% 130.18%
B – Desalination Plant 30 000 3 257 3 072 10.24% 94.32%
C – Darling Pipeline 1 850 1 850 1 695 91.62% 91.62%
D - Fire Fighting Equipment 2 500 2 880 2 871 114.84% 99.69%
E – Vehicles : Water 750 2 040 2 040 272.00% 100.00%
* Projects with the highest capital expenditure in Year 1
Name of Project - A
Objective of Project Bulk water supply
Delays None
Future Challenges None
Anticipated citizen benefits Access to basic services
Name of Project - B
Objective of Project Bulk water supply
Delays None
Future Challenges None
Anticipated citizen benefits Access to basic services
Name of Project - C
Objective of Project Bulk water supply
Delays None
Future Challenges None
Anticipated citizen benefits Access to basic services
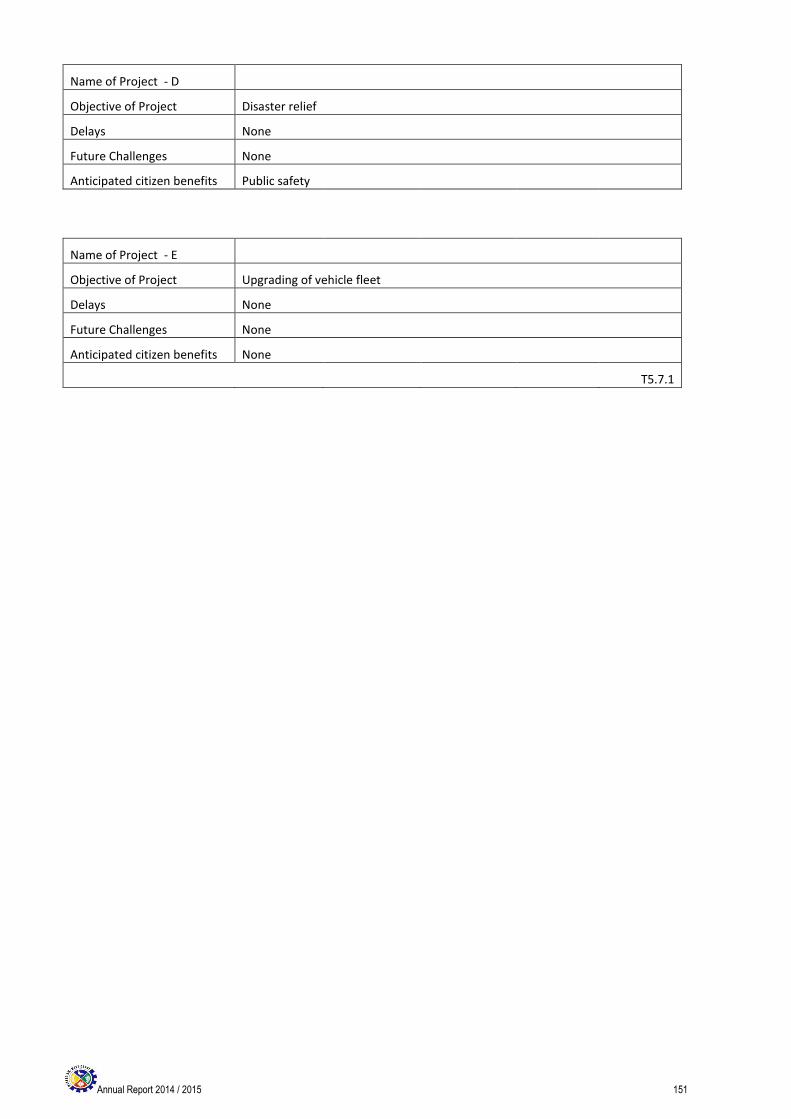
Annual Report 2014 / 2015 151
Name of Project - D
Objective of Project Disaster relief
Delays None
Future Challenges None
Anticipated citizen benefits Public safety
Name of Project - E
Objective of Project Upgrading of vehicle fleet
Delays None
Future Challenges None
Anticipated citizen benefits None
T5.7.1
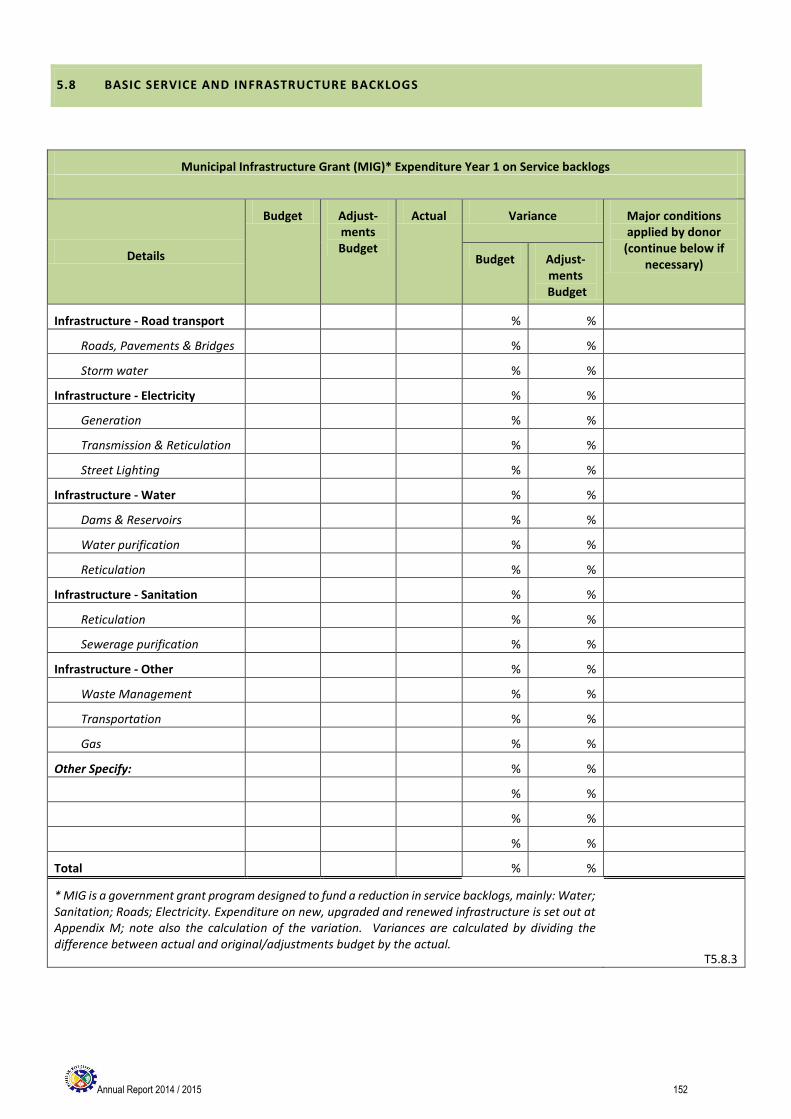
Annual Report 2014 / 2015 152
5.8 BASIC SERVICE AND INFRASTRUCTURE BACKLOGS
Municipal Infrastructure Grant (MIG)* Expenditure Year 1 on Service backlogs
Details
Budget Adjust-ments Budget
Actual Variance Major conditions applied by donor
(continue below if necessary) Budget Adjust-
ments Budget
Infrastructure - Road transport % %
Roads, Pavements & Bridges % %
Storm water % %
Infrastructure - Electricity % %
Generation % %
Transmission & Reticulation % %
Street Lighting % %
Infrastructure - Water % %
Dams & Reservoirs % %
Water purification % %
Reticulation % %
Infrastructure - Sanitation % %
Reticulation % %
Sewerage purification % %
Infrastructure - Other % %
Waste Management % %
Transportation % %
Gas % %
Other Specify: % %
% %
% %
% %
Total % %
* MIG is a government grant program designed to fund a reduction in service backlogs, mainly: Water; Sanitation; Roads; Electricity. Expenditure on new, upgraded and renewed infrastructure is set out at Appendix M; note also the calculation of the variation. Variances are calculated by dividing the difference between actual and original/adjustments budget by the actual.
T5.8.3
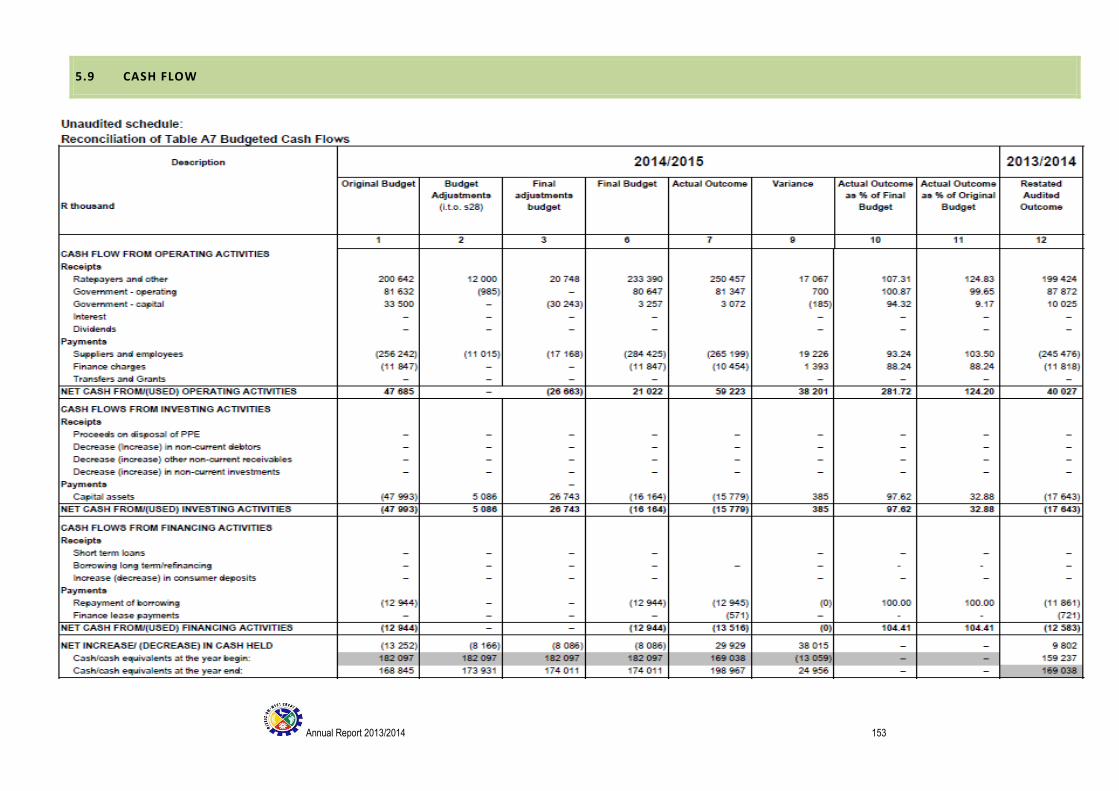
Annual Report 2013/2014 153
5.9 CASH FLOW
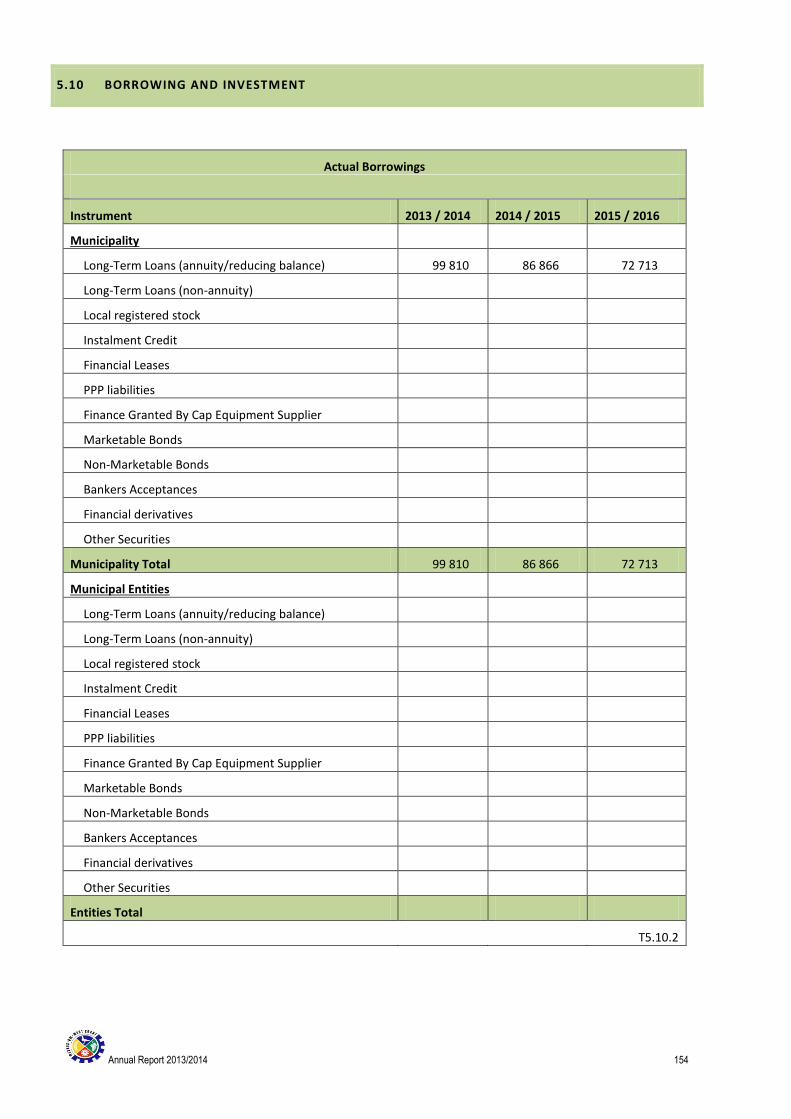
Annual Report 2013/2014 154
5.10 BORROWING AND INVESTMENT
Actual Borrowings
Instrument 2013 / 2014 2014 / 2015 2015 / 2016
Municipality
Long-Term Loans (annuity/reducing balance) 99 810 86 866 72 713
Long-Term Loans (non-annuity)
Local registered stock
Instalment Credit
Financial Leases
PPP liabilities
Finance Granted By Cap Equipment Supplier
Marketable Bonds
Non-Marketable Bonds
Bankers Acceptances
Financial derivatives
Other Securities
Municipality Total 99 810 86 866 72 713
Municipal Entities
Long-Term Loans (annuity/reducing balance)
Long-Term Loans (non-annuity)
Local registered stock
Instalment Credit
Financial Leases
PPP liabilities
Finance Granted By Cap Equipment Supplier
Marketable Bonds
Non-Marketable Bonds
Bankers Acceptances
Financial derivatives
Other Securities
Entities Total
T5.10.2
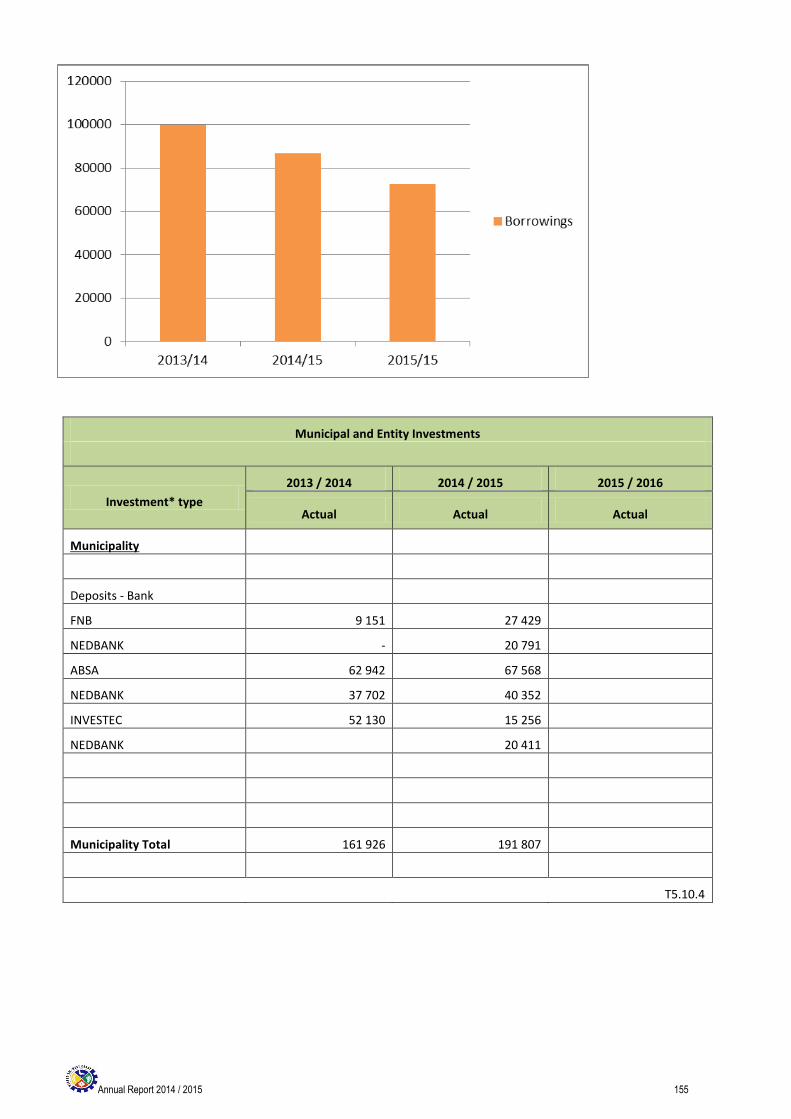
Annual Report 2014 / 2015 155
Municipal and Entity Investments
Investment* type
2013 / 2014 2014 / 2015 2015 / 2016
Actual Actual Actual
Municipality
Deposits - Bank
FNB 9 151 27 429
NEDBANK - 20 791
ABSA 62 942 67 568
NEDBANK 37 702 40 352
INVESTEC 52 130 15 256
NEDBANK 20 411
Municipality Total 161 926 191 807
T5.10.4
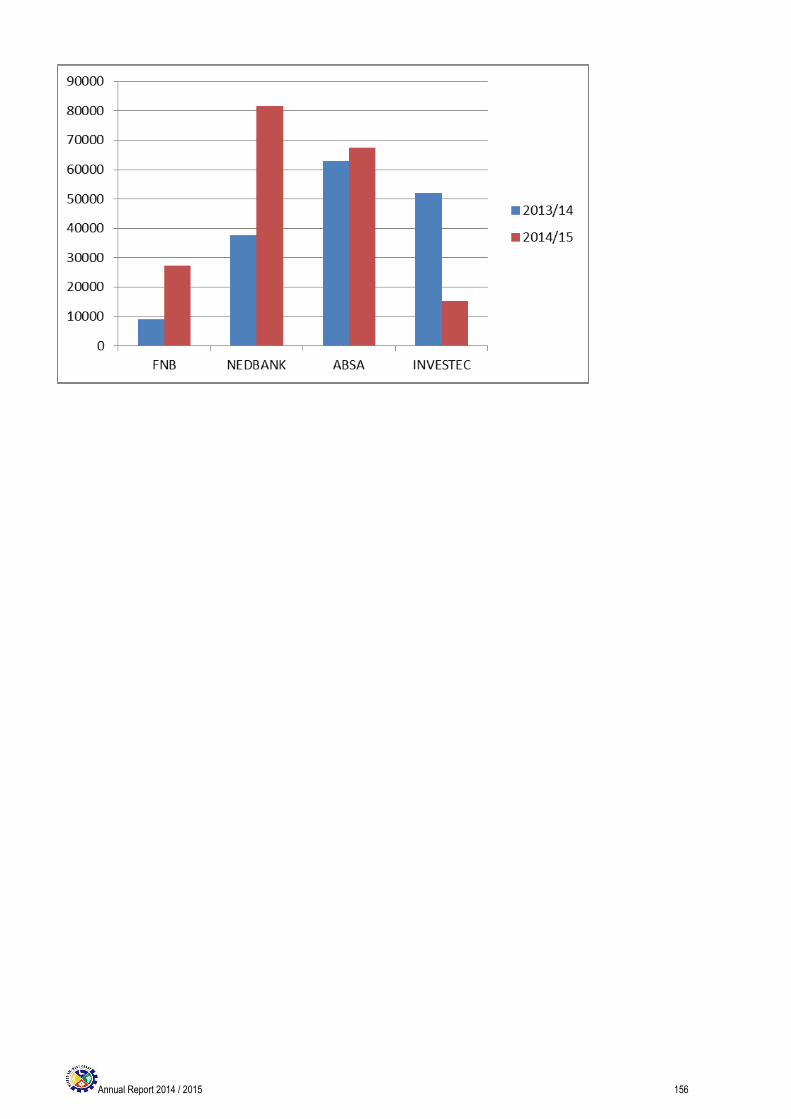
Annual Report 2014 / 2015 156
Annual Report 2014 / 2015 157
5.11 SUPPLY CHAIN MANAGEMENT
The West Coast District Municipality has established a fully operational Supply Chain Management (SCM) Unit in line
with the approved SCM Policy.
No councillor of the Municipality may be a member of a municipal bid committee or any other committee evaluating or
approving tenders, quotations, contracts or other bids, nor attend related meetings as an observer.
The Municipal Regulations on Minimum Competency Levels only indicate the minimum competency levels for heads
and managers in supply chain management and do not make reference to the minimum competency levels for SCM
officials who are not in management positions.
The SCM Manager and one (1) SCM practitioners comply with the prescribed minimum competency levels. Two (2) SCM Clerks comply with the prescribed minimum competency levels. One (1) SCM Clerk and one (1) SCM Store Clerk still need to complete 8 unit standards to comply with the prescribed minimum competency levels.
The other SCM officials have the required minimum years of relevant SCM working experience, as required by their job
functions. They also have the qualifications related to their job functions and have a general understanding of the
Municipality’s SCM Policy and SCM procedures.
Annual Report 2014 / 2015 158
CHAPTER 6 – AUDITOR-GENERAL AUDIT FINDINGS
INTRODUCTION
The Constitution S188 (1) (b) states that the functions of the Auditor-General includes the auditing and reporting on the
accounts, financial statements and financial management of all municipalities. MSA S45 states that the results of
performance measurement must be audited annually by the Auditor-General.
West Coast District Municipality received clean audit reports from 2010/2011 – 2014/2015 financial years.

Annual Report 2014 / 2015 159
Annual Report 2014 / 2015 160
COMPONENT A: AUDITOR-GENERAL OPINION 2014/2015
6.1 AUDITOR-GENERAL REPORT ON THE FINANCIAL STATEMENTS 2014/2015
Annual Report 2014 / 2015 161
Annual Report 2014 / 2015 162
Annual Report 2014 / 2015 163
Annual Report 2014 / 2015 164
COMPONENT A: AUDITOR-GENERAL OPINION 2013/2014
6.1 AUDITOR-GENERAL REPORT ON THE FINANCIAL STATEMENTS 2013/2014
Annual Report 2014 / 2015 165
Annual Report 2014 / 2015 166
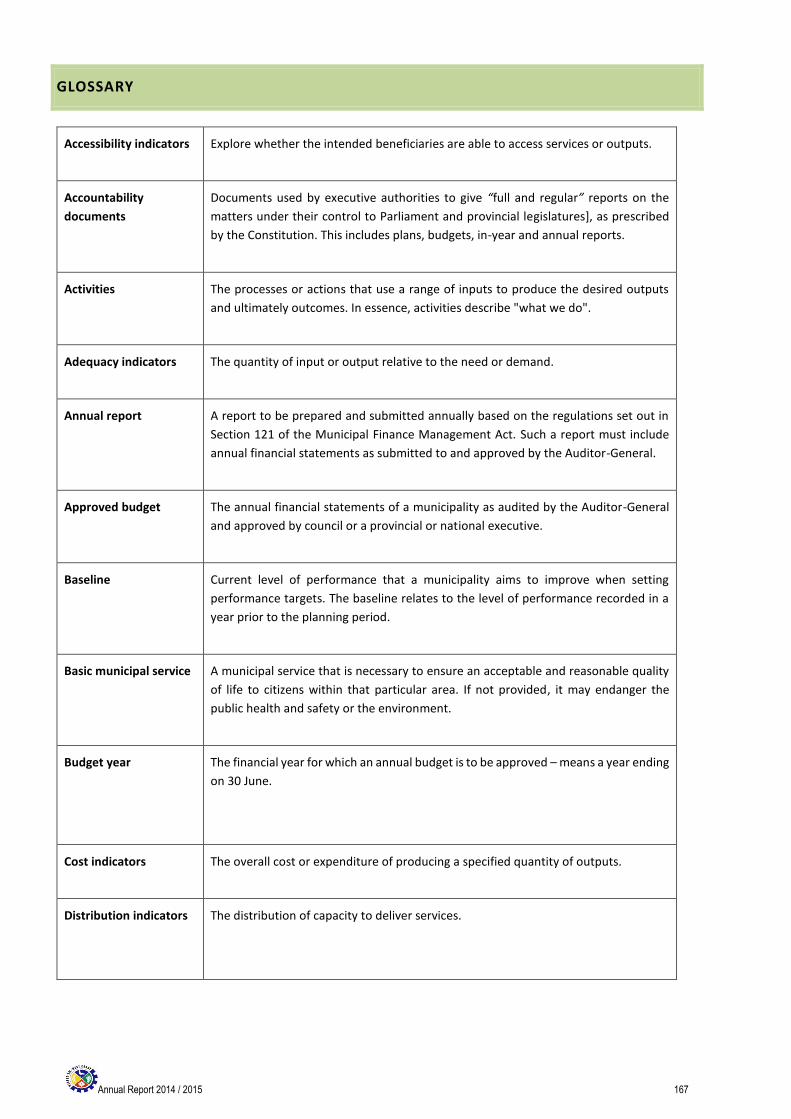
Annual Report 2014 / 2015 167
GLOSSARY
Accessibility indicators Explore whether the intended beneficiaries are able to access services or outputs.
Accountability
documents
Documents used by executive authorities to give “full and regular” reports on the
matters under their control to Parliament and provincial legislatures], as prescribed
by the Constitution. This includes plans, budgets, in-year and annual reports.
Activities The processes or actions that use a range of inputs to produce the desired outputs
and ultimately outcomes. In essence, activities describe "what we do".
Adequacy indicators The quantity of input or output relative to the need or demand.
Annual report A report to be prepared and submitted annually based on the regulations set out in
Section 121 of the Municipal Finance Management Act. Such a report must include
annual financial statements as submitted to and approved by the Auditor-General.
Approved budget The annual financial statements of a municipality as audited by the Auditor-General
and approved by council or a provincial or national executive.
Baseline Current level of performance that a municipality aims to improve when setting
performance targets. The baseline relates to the level of performance recorded in a
year prior to the planning period.
Basic municipal service A municipal service that is necessary to ensure an acceptable and reasonable quality
of life to citizens within that particular area. If not provided, it may endanger the
public health and safety or the environment.
Budget year The financial year for which an annual budget is to be approved – means a year ending
on 30 June.
Cost indicators The overall cost or expenditure of producing a specified quantity of outputs.
Distribution indicators The distribution of capacity to deliver services.
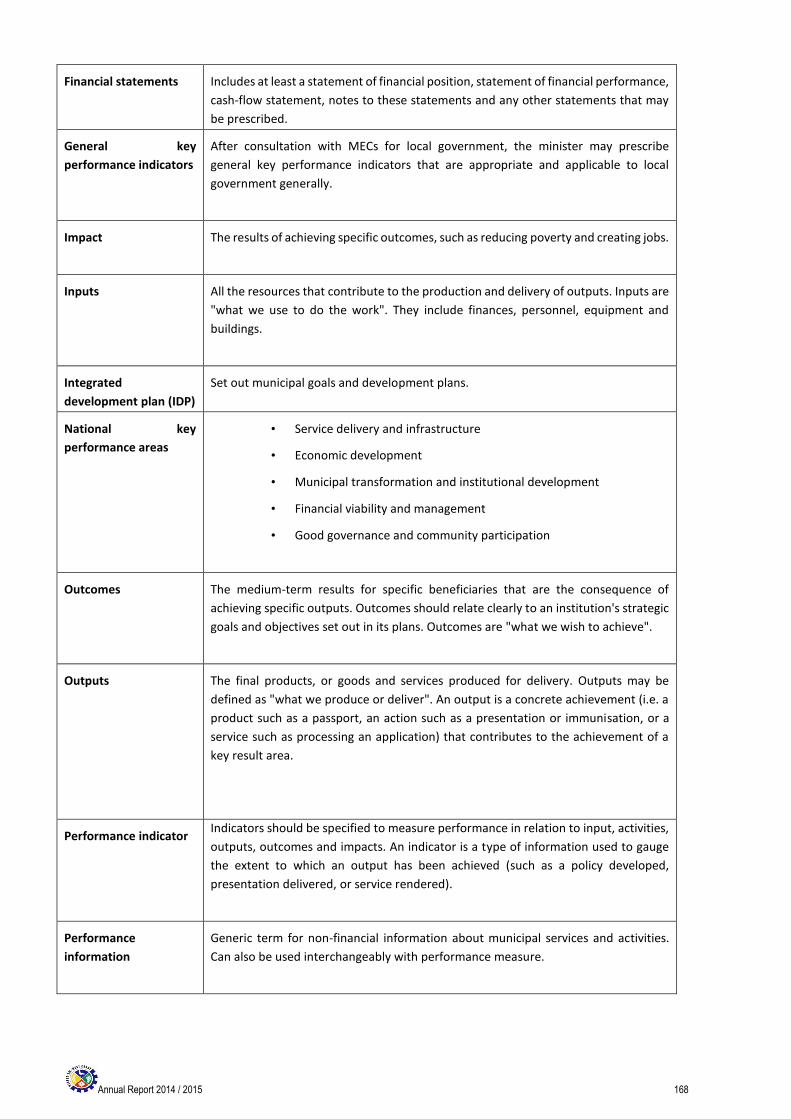
Annual Report 2014 / 2015 168
Financial statements Includes at least a statement of financial position, statement of financial performance,
cash-flow statement, notes to these statements and any other statements that may
be prescribed.
General key
performance indicators
After consultation with MECs for local government, the minister may prescribe
general key performance indicators that are appropriate and applicable to local
government generally.
Impact The results of achieving specific outcomes, such as reducing poverty and creating jobs.
Inputs All the resources that contribute to the production and delivery of outputs. Inputs are
"what we use to do the work". They include finances, personnel, equipment and
buildings.
Integrated
development plan (IDP)
Set out municipal goals and development plans.
National key
performance areas
• Service delivery and infrastructure
• Economic development
• Municipal transformation and institutional development
• Financial viability and management
• Good governance and community participation
Outcomes The medium-term results for specific beneficiaries that are the consequence of
achieving specific outputs. Outcomes should relate clearly to an institution's strategic
goals and objectives set out in its plans. Outcomes are "what we wish to achieve".
Outputs The final products, or goods and services produced for delivery. Outputs may be
defined as "what we produce or deliver". An output is a concrete achievement (i.e. a
product such as a passport, an action such as a presentation or immunisation, or a
service such as processing an application) that contributes to the achievement of a
key result area.
Performance indicator Indicators should be specified to measure performance in relation to input, activities,
outputs, outcomes and impacts. An indicator is a type of information used to gauge
the extent to which an output has been achieved (such as a policy developed,
presentation delivered, or service rendered).
Performance
information
Generic term for non-financial information about municipal services and activities.
Can also be used interchangeably with performance measure.
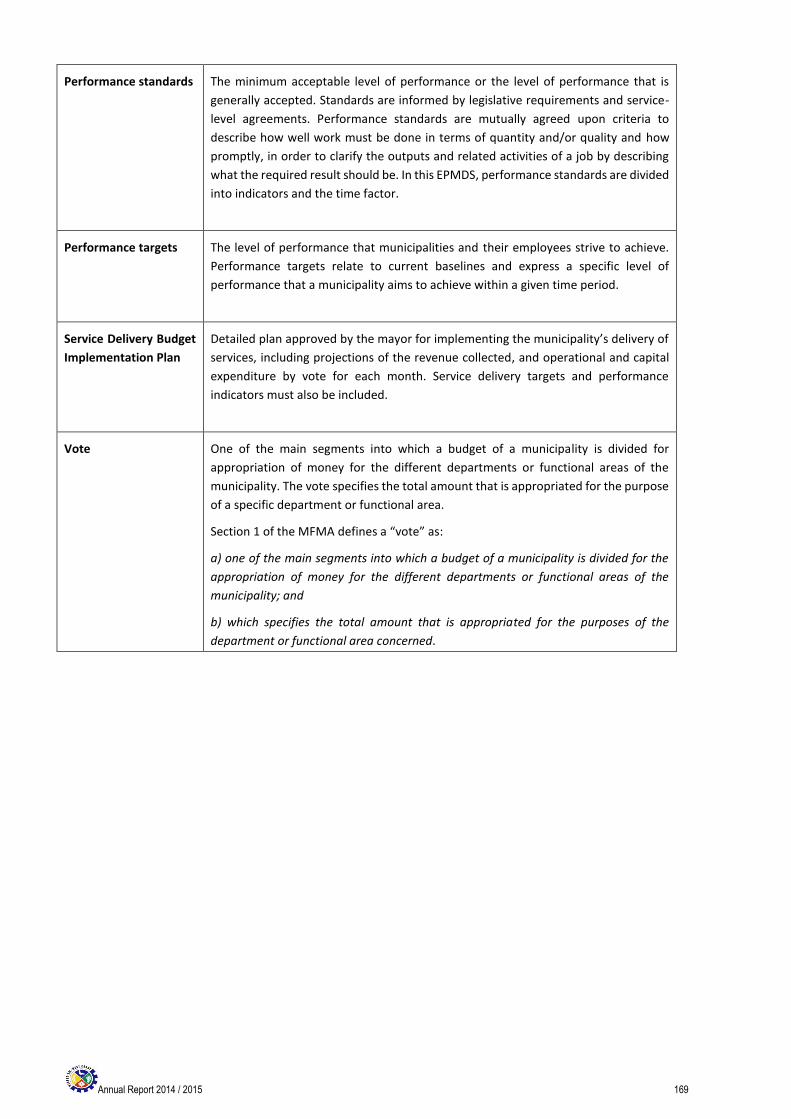
Annual Report 2014 / 2015 169
Performance standards The minimum acceptable level of performance or the level of performance that is
generally accepted. Standards are informed by legislative requirements and service-
level agreements. Performance standards are mutually agreed upon criteria to
describe how well work must be done in terms of quantity and/or quality and how
promptly, in order to clarify the outputs and related activities of a job by describing
what the required result should be. In this EPMDS, performance standards are divided
into indicators and the time factor.
Performance targets The level of performance that municipalities and their employees strive to achieve.
Performance targets relate to current baselines and express a specific level of
performance that a municipality aims to achieve within a given time period.
Service Delivery Budget
Implementation Plan
Detailed plan approved by the mayor for implementing the municipality’s delivery of
services, including projections of the revenue collected, and operational and capital
expenditure by vote for each month. Service delivery targets and performance
indicators must also be included.
Vote One of the main segments into which a budget of a municipality is divided for
appropriation of money for the different departments or functional areas of the
municipality. The vote specifies the total amount that is appropriated for the purpose
of a specific department or functional area.
Section 1 of the MFMA defines a “vote” as:
a) one of the main segments into which a budget of a municipality is divided for the
appropriation of money for the different departments or functional areas of the
municipality; and
b) which specifies the total amount that is appropriated for the purposes of the
department or functional area concerned.
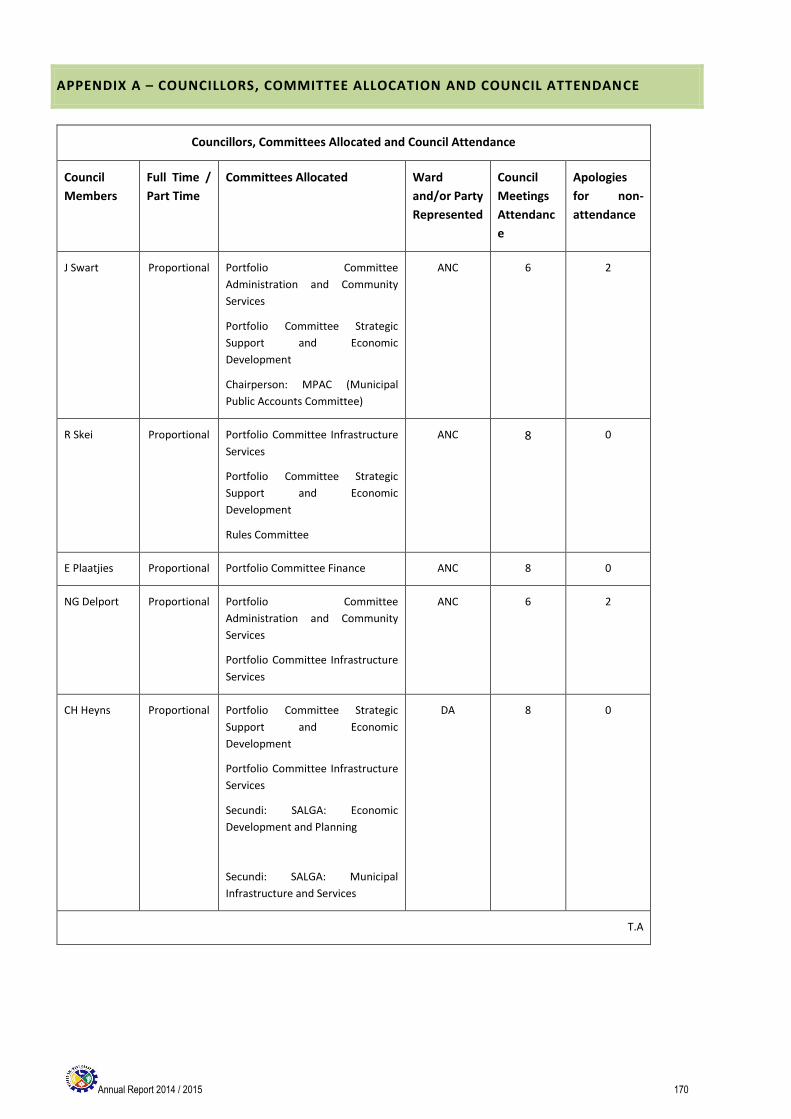
Annual Report 2014 / 2015 170
APPENDIX A – COUNCILLORS, COMMITTEE ALLOCATION AND COUNCIL ATTENDANCE
Councillors, Committees Allocated and Council Attendance
Council
Members
Full Time /
Part Time
Committees Allocated Ward
and/or Party
Represented
Council
Meetings
Attendanc
e
Apologies
for non-
attendance
J Swart Proportional Portfolio Committee
Administration and Community
Services
Portfolio Committee Strategic
Support and Economic
Development
Chairperson: MPAC (Municipal
Public Accounts Committee)
ANC 6 2
R Skei Proportional Portfolio Committee Infrastructure
Services
Portfolio Committee Strategic
Support and Economic
Development
Rules Committee
ANC 8 0
E Plaatjies Proportional Portfolio Committee Finance ANC 8 0
NG Delport Proportional Portfolio Committee
Administration and Community
Services
Portfolio Committee Infrastructure
Services
ANC 6 2
CH Heyns Proportional Portfolio Committee Strategic
Support and Economic
Development
Portfolio Committee Infrastructure
Services
Secundi: SALGA: Economic
Development and Planning
Secundi: SALGA: Municipal
Infrastructure and Services
DA 8 0
T.A
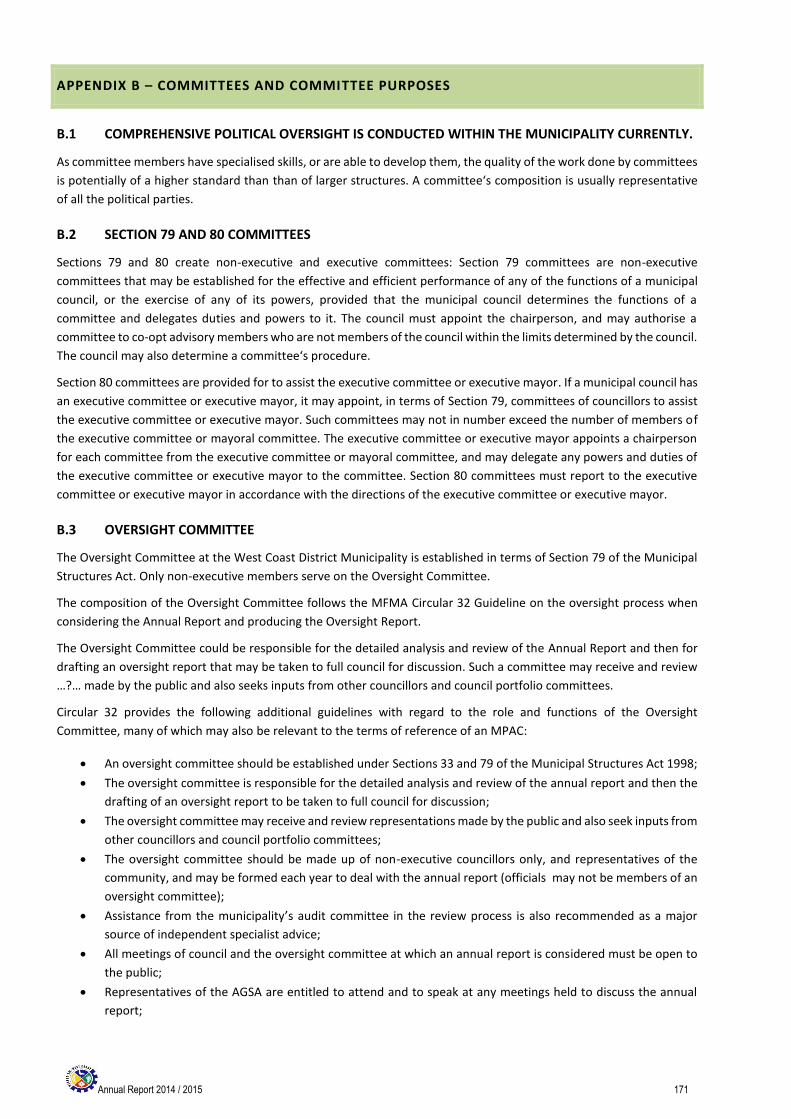
Annual Report 2014 / 2015 171
APPENDIX B – COMMITTEES AND COMMITTEE PURPOSES
B.1 COMPREHENSIVE POLITICAL OVERSIGHT IS CONDUCTED WITHIN THE MUNICIPALITY CURRENTLY.
As committee members have specialised skills, or are able to develop them, the quality of the work done by committees
is potentially of a higher standard than than of larger structures. A committee‘s composition is usually representative
of all the political parties.
B.2 SECTION 79 AND 80 COMMITTEES
Sections 79 and 80 create non-executive and executive committees: Section 79 committees are non-executive
committees that may be established for the effective and efficient performance of any of the functions of a municipal
council, or the exercise of any of its powers, provided that the municipal council determines the functions of a
committee and delegates duties and powers to it. The council must appoint the chairperson, and may authorise a
committee to co-opt advisory members who are not members of the council within the limits determined by the council.
The council may also determine a committee‘s procedure.
Section 80 committees are provided for to assist the executive committee or executive mayor. If a municipal council has
an executive committee or executive mayor, it may appoint, in terms of Section 79, committees of councillors to assist
the executive committee or executive mayor. Such committees may not in number exceed the number of members of
the executive committee or mayoral committee. The executive committee or executive mayor appoints a chairperson
for each committee from the executive committee or mayoral committee, and may delegate any powers and duties of
the executive committee or executive mayor to the committee. Section 80 committees must report to the executive
committee or executive mayor in accordance with the directions of the executive committee or executive mayor.
B.3 OVERSIGHT COMMITTEE
The Oversight Committee at the West Coast District Municipality is established in terms of Section 79 of the Municipal
Structures Act. Only non-executive members serve on the Oversight Committee.
The composition of the Oversight Committee follows the MFMA Circular 32 Guideline on the oversight process when
considering the Annual Report and producing the Oversight Report.
The Oversight Committee could be responsible for the detailed analysis and review of the Annual Report and then for
drafting an oversight report that may be taken to full council for discussion. Such a committee may receive and review
…?… made by the public and also seeks inputs from other councillors and council portfolio committees.
Circular 32 provides the following additional guidelines with regard to the role and functions of the Oversight
Committee, many of which may also be relevant to the terms of reference of an MPAC:
An oversight committee should be established under Sections 33 and 79 of the Municipal Structures Act 1998;
The oversight committee is responsible for the detailed analysis and review of the annual report and then the
drafting of an oversight report to be taken to full council for discussion;
The oversight committee may receive and review representations made by the public and also seek inputs from
other councillors and council portfolio committees;
The oversight committee should be made up of non-executive councillors only, and representatives of the
community, and may be formed each year to deal with the annual report (officials may not be members of an
oversight committee);
Assistance from the municipality’s audit committee in the review process is also recommended as a major
source of independent specialist advice;
All meetings of council and the oversight committee at which an annual report is considered must be open to
the public;
Representatives of the AGSA are entitled to attend and to speak at any meetings held to discuss the annual
report;
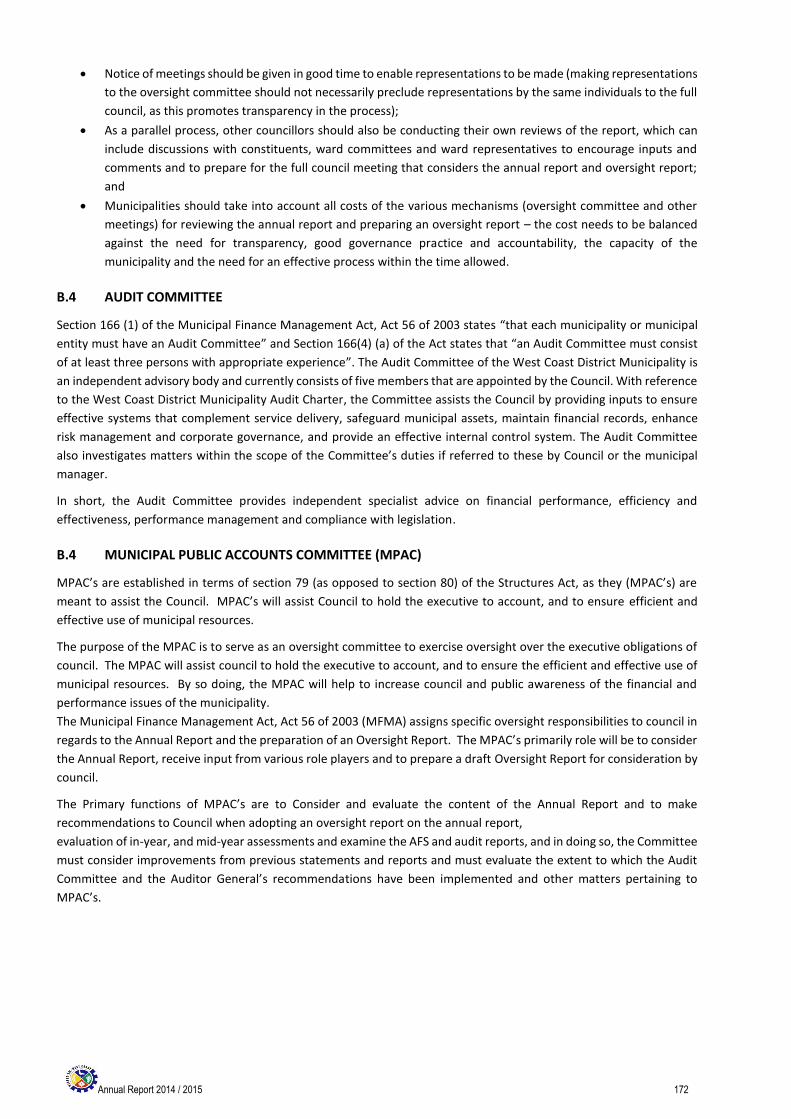
Annual Report 2014 / 2015 172
Notice of meetings should be given in good time to enable representations to be made (making representations
to the oversight committee should not necessarily preclude representations by the same individuals to the full
council, as this promotes transparency in the process);
As a parallel process, other councillors should also be conducting their own reviews of the report, which can
include discussions with constituents, ward committees and ward representatives to encourage inputs and
comments and to prepare for the full council meeting that considers the annual report and oversight report;
and
Municipalities should take into account all costs of the various mechanisms (oversight committee and other
meetings) for reviewing the annual report and preparing an oversight report – the cost needs to be balanced
against the need for transparency, good governance practice and accountability, the capacity of the
municipality and the need for an effective process within the time allowed.
B.4 AUDIT COMMITTEE
Section 166 (1) of the Municipal Finance Management Act, Act 56 of 2003 states “that each municipality or municipal
entity must have an Audit Committee” and Section 166(4) (a) of the Act states that “an Audit Committee must consist
of at least three persons with appropriate experience”. The Audit Committee of the West Coast District Municipality is
an independent advisory body and currently consists of five members that are appointed by the Council. With reference
to the West Coast District Municipality Audit Charter, the Committee assists the Council by providing inputs to ensure
effective systems that complement service delivery, safeguard municipal assets, maintain financial records, enhance
risk management and corporate governance, and provide an effective internal control system. The Audit Committee
also investigates matters within the scope of the Committee’s duties if referred to these by Council or the municipal
manager.
In short, the Audit Committee provides independent specialist advice on financial performance, efficiency and
effectiveness, performance management and compliance with legislation.
B.4 MUNICIPAL PUBLIC ACCOUNTS COMMITTEE (MPAC)
MPAC’s are established in terms of section 79 (as opposed to section 80) of the Structures Act, as they (MPAC’s) are
meant to assist the Council. MPAC’s will assist Council to hold the executive to account, and to ensure efficient and
effective use of municipal resources.
The purpose of the MPAC is to serve as an oversight committee to exercise oversight over the executive obligations of
council. The MPAC will assist council to hold the executive to account, and to ensure the efficient and effective use of
municipal resources. By so doing, the MPAC will help to increase council and public awareness of the financial and
performance issues of the municipality.
The Municipal Finance Management Act, Act 56 of 2003 (MFMA) assigns specific oversight responsibilities to council in
regards to the Annual Report and the preparation of an Oversight Report. The MPAC’s primarily role will be to consider
the Annual Report, receive input from various role players and to prepare a draft Oversight Report for consideration by
council.
The Primary functions of MPAC’s are to Consider and evaluate the content of the Annual Report and to make
recommendations to Council when adopting an oversight report on the annual report,
evaluation of in-year, and mid-year assessments and examine the AFS and audit reports, and in doing so, the Committee
must consider improvements from previous statements and reports and must evaluate the extent to which the Audit
Committee and the Auditor General’s recommendations have been implemented and other matters pertaining to
MPAC’s.
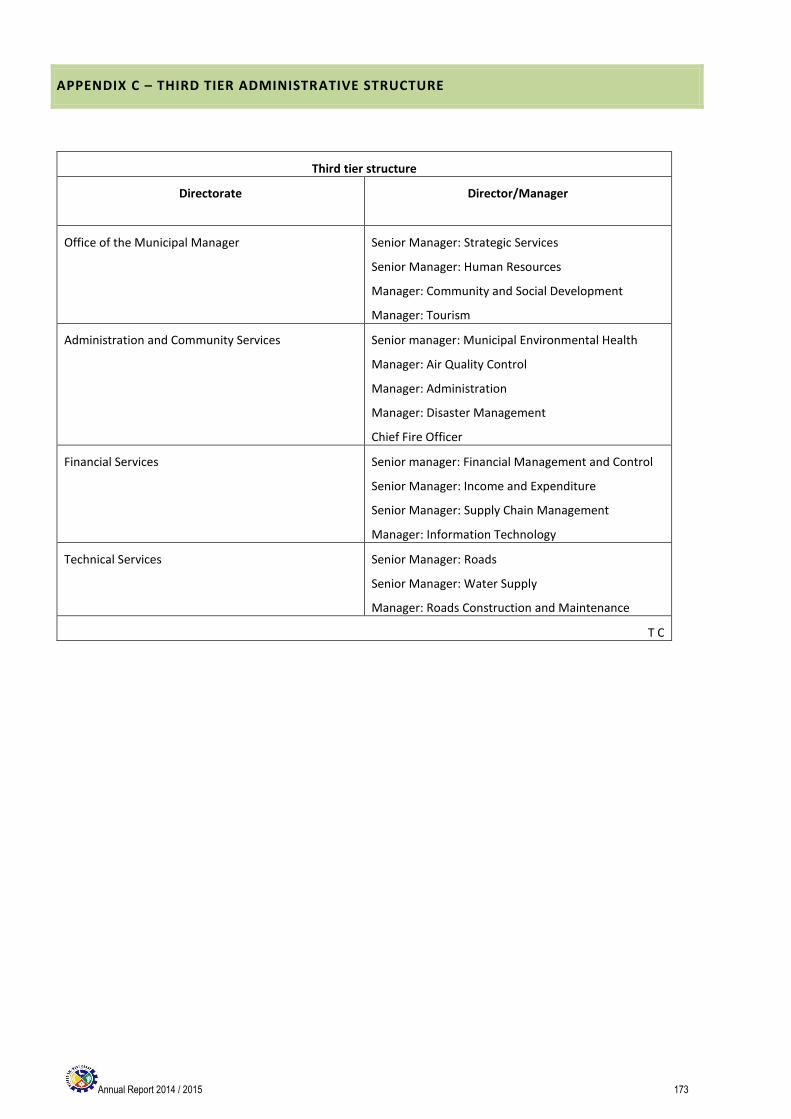
Annual Report 2014 / 2015 173
APPENDIX C – THIRD TIER ADMINISTRATIVE STRUCTURE
Third tier structure
Directorate Director/Manager
Office of the Municipal Manager Senior Manager: Strategic Services
Senior Manager: Human Resources
Manager: Community and Social Development
Manager: Tourism
Administration and Community Services Senior manager: Municipal Environmental Health
Manager: Air Quality Control
Manager: Administration
Manager: Disaster Management
Chief Fire Officer
Financial Services Senior manager: Financial Management and Control
Senior Manager: Income and Expenditure
Senior Manager: Supply Chain Management
Manager: Information Technology
Technical Services Senior Manager: Roads
Senior Manager: Water Supply
Manager: Roads Construction and Maintenance
T C
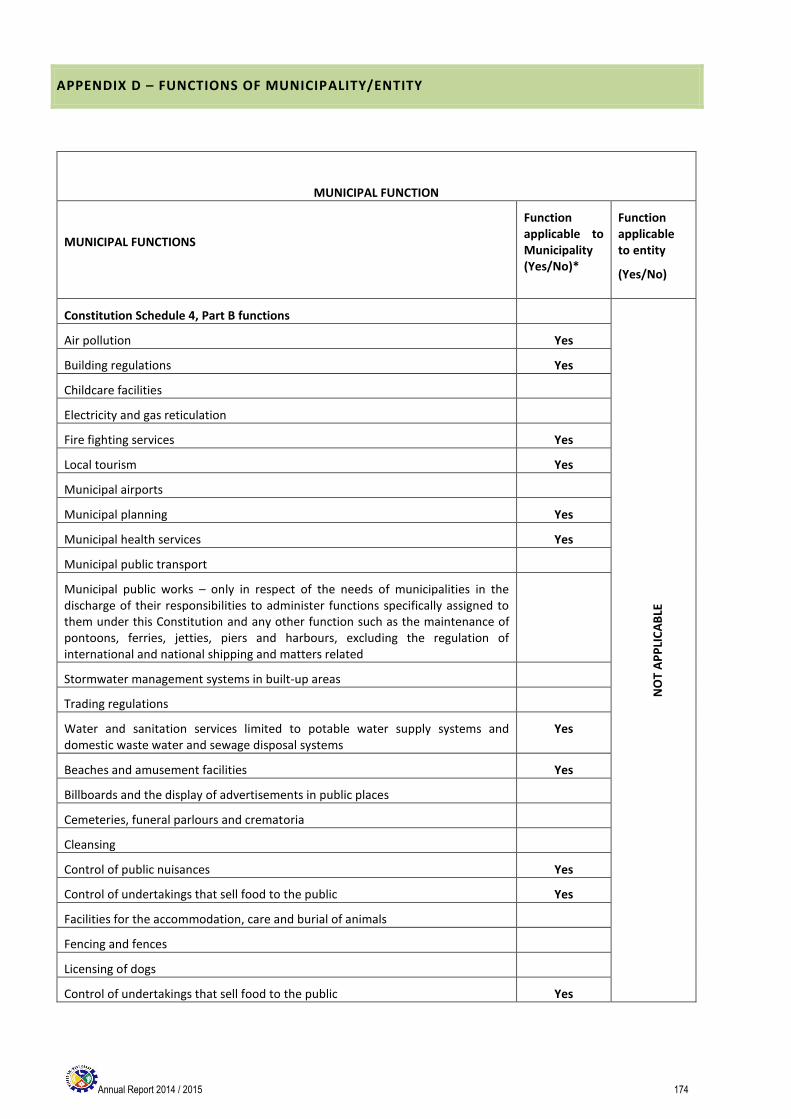
Annual Report 2014 / 2015 174
APPENDIX D – FUNCTIONS OF MUNICIPALITY/ENTITY
MUNICIPAL FUNCTION
MUNICIPAL FUNCTIONS
Function applicable to Municipality (Yes/No)*
Function applicable to entity
(Yes/No)
Constitution Schedule 4, Part B functions
NO
T A
PP
LIC
AB
LE
Air pollution Yes
Building regulations Yes
Childcare facilities
Electricity and gas reticulation
Fire fighting services Yes
Local tourism Yes
Municipal airports
Municipal planning Yes
Municipal health services Yes
Municipal public transport
Municipal public works – only in respect of the needs of municipalities in the discharge of their responsibilities to administer functions specifically assigned to them under this Constitution and any other function such as the maintenance of pontoons, ferries, jetties, piers and harbours, excluding the regulation of international and national shipping and matters related
Stormwater management systems in built-up areas
Trading regulations
Water and sanitation services limited to potable water supply systems and domestic waste water and sewage disposal systems
Yes
Beaches and amusement facilities Yes
Billboards and the display of advertisements in public places
Cemeteries, funeral parlours and crematoria
Cleansing
Control of public nuisances Yes
Control of undertakings that sell food to the public Yes
Facilities for the accommodation, care and burial of animals
Fencing and fences
Licensing of dogs
Control of undertakings that sell food to the public Yes
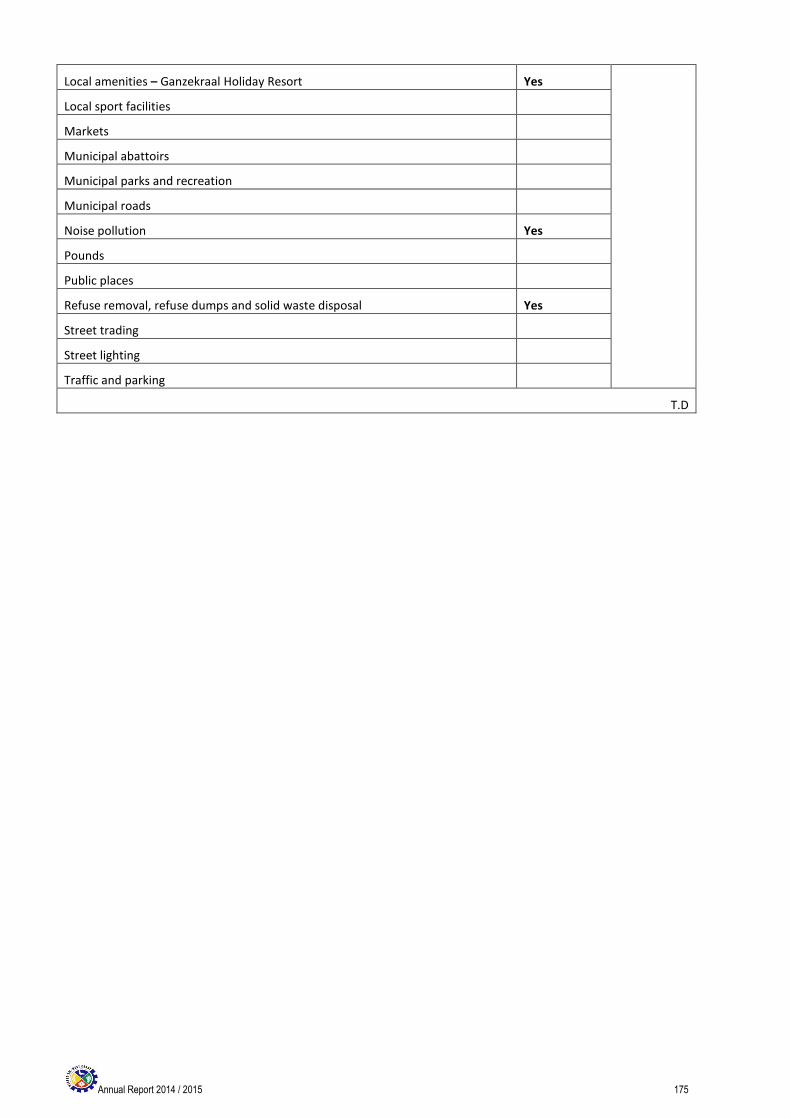
Annual Report 2014 / 2015 175
Local amenities – Ganzekraal Holiday Resort Yes
Local sport facilities
Markets
Municipal abattoirs
Municipal parks and recreation
Municipal roads
Noise pollution Yes
Pounds
Public places
Refuse removal, refuse dumps and solid waste disposal Yes
Street trading
Street lighting
Traffic and parking
T.D
Annual Report 2014 / 2015 176
APPENDIX E – WARD REPORTING
Not applicable to the District Municipality
Annual Report 2014 / 2015 177
APPENDIX F – WARD INFORMATION
Not applicable to the District Municipality
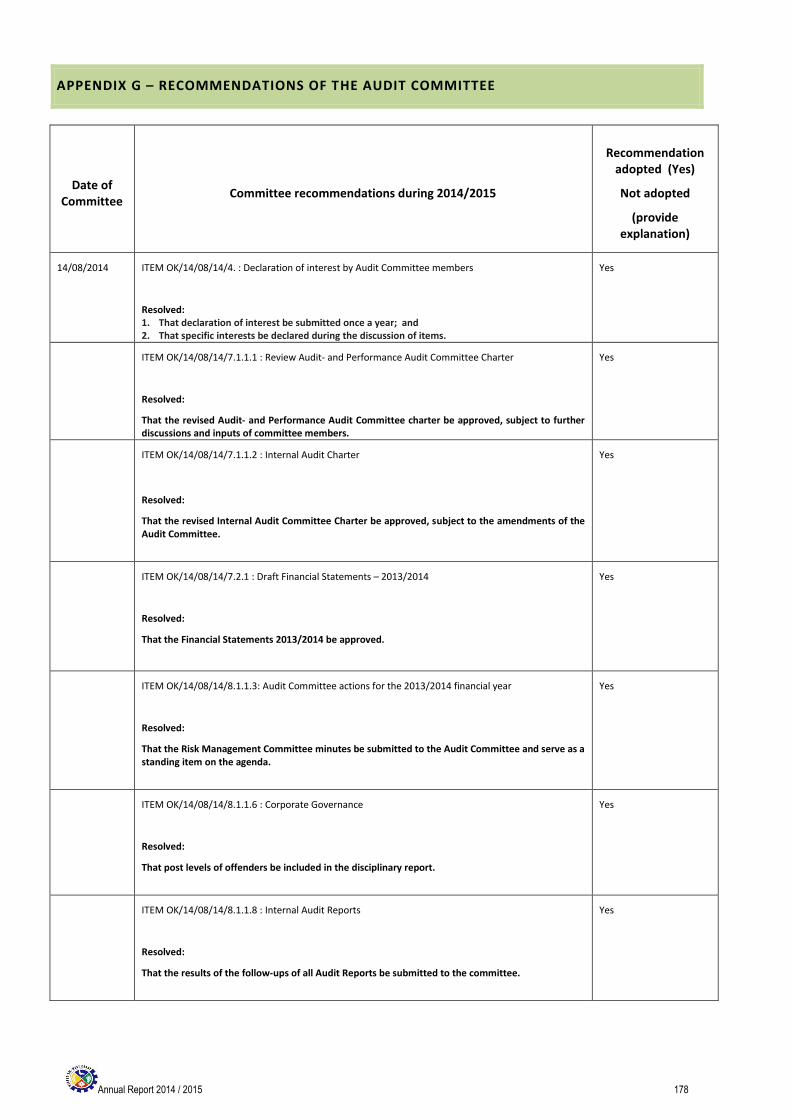
Annual Report 2014 / 2015 178
APPENDIX G – RECOMMENDATIONS OF THE AUDIT COMMITTEE
Date of Committee
Committee recommendations during 2014/2015
Recommendation adopted (Yes)
Not adopted
(provide explanation)
14/08/2014 ITEM OK/14/08/14/4. : Declaration of interest by Audit Committee members
Resolved: 1. That declaration of interest be submitted once a year; and 2. That specific interests be declared during the discussion of items.
Yes
ITEM OK/14/08/14/7.1.1.1 : Review Audit- and Performance Audit Committee Charter
Resolved:
That the revised Audit- and Performance Audit Committee charter be approved, subject to further discussions and inputs of committee members.
Yes
ITEM OK/14/08/14/7.1.1.2 : Internal Audit Charter
Resolved:
That the revised Internal Audit Committee Charter be approved, subject to the amendments of the Audit Committee.
Yes
ITEM OK/14/08/14/7.2.1 : Draft Financial Statements – 2013/2014
Resolved:
That the Financial Statements 2013/2014 be approved.
Yes
ITEM OK/14/08/14/8.1.1.3: Audit Committee actions for the 2013/2014 financial year
Resolved:
That the Risk Management Committee minutes be submitted to the Audit Committee and serve as a standing item on the agenda.
Yes
ITEM OK/14/08/14/8.1.1.6 : Corporate Governance
Resolved:
That post levels of offenders be included in the disciplinary report.
Yes
ITEM OK/14/08/14/8.1.1.8 : Internal Audit Reports
Resolved:
That the results of the follow-ups of all Audit Reports be submitted to the committee.
Yes
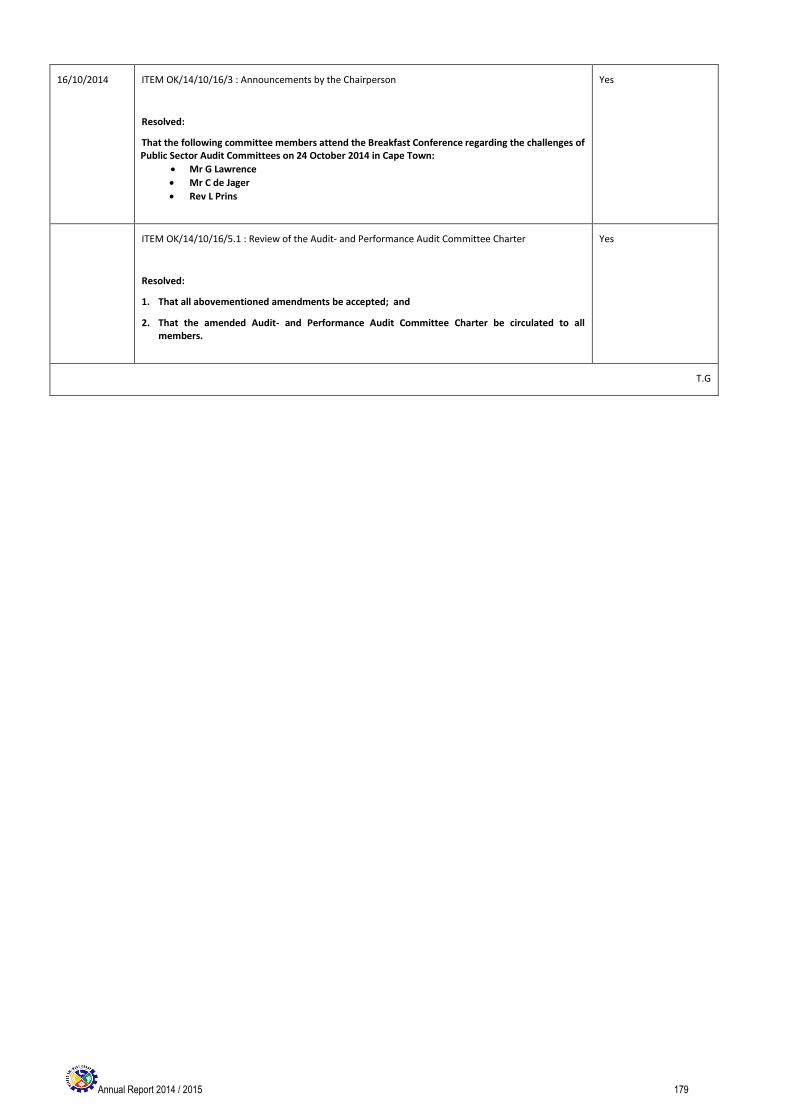
Annual Report 2014 / 2015 179
16/10/2014 ITEM OK/14/10/16/3 : Announcements by the Chairperson
Resolved:
That the following committee members attend the Breakfast Conference regarding the challenges of Public Sector Audit Committees on 24 October 2014 in Cape Town:
Mr G Lawrence
Mr C de Jager
Rev L Prins
Yes
ITEM OK/14/10/16/5.1 : Review of the Audit- and Performance Audit Committee Charter
Resolved:
1. That all abovementioned amendments be accepted; and
2. That the amended Audit- and Performance Audit Committee Charter be circulated to all members.
Yes
T.G
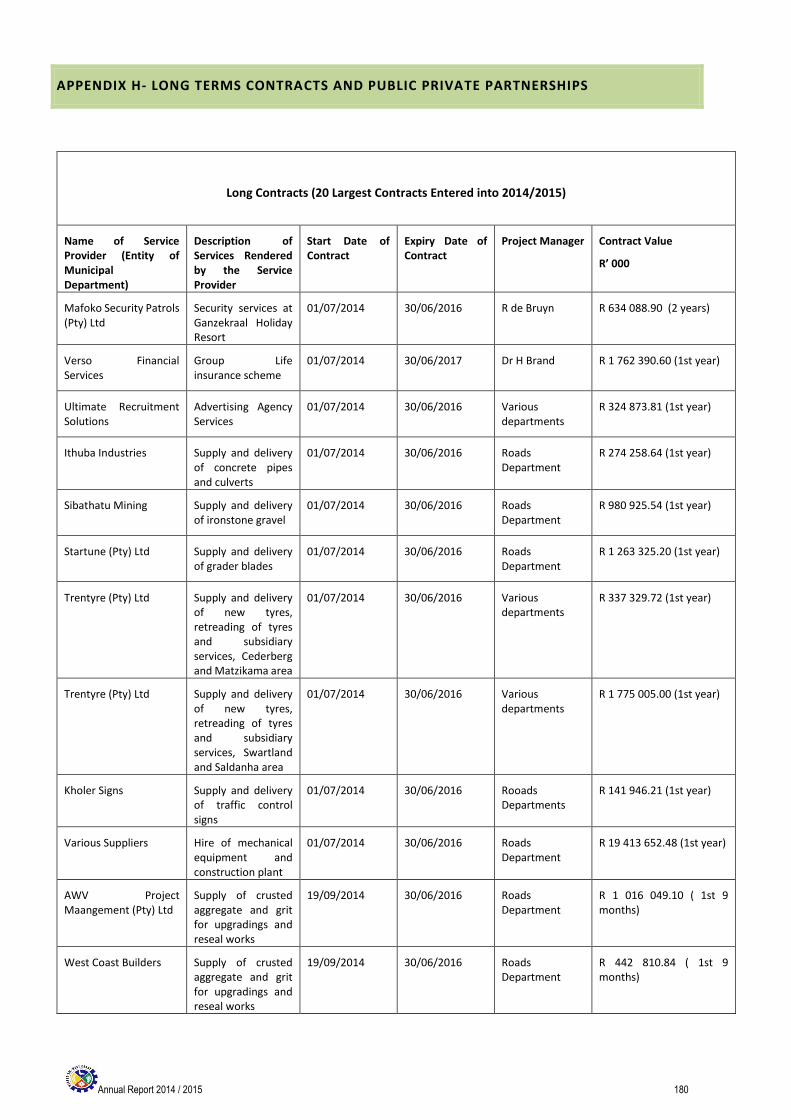
Annual Report 2014 / 2015 180
APPENDIX H- LONG TERMS CONTRACTS AND PUBLIC PRIVATE PARTNERSHIPS
Long Contracts (20 Largest Contracts Entered into 2014/2015)
Name of Service Provider (Entity of Municipal Department)
Description of Services Rendered by the Service Provider
Start Date of Contract
Expiry Date of Contract
Project Manager Contract Value
R’ 000
Mafoko Security Patrols (Pty) Ltd
Security services at Ganzekraal Holiday Resort
01/07/2014 30/06/2016 R de Bruyn R 634 088.90 (2 years)
Verso Financial Services
Group Life insurance scheme
01/07/2014 30/06/2017 Dr H Brand R 1 762 390.60 (1st year)
Ultimate Recruitment Solutions
Advertising Agency Services
01/07/2014 30/06/2016 Various departments
R 324 873.81 (1st year)
Ithuba Industries Supply and delivery of concrete pipes and culverts
01/07/2014 30/06/2016 Roads Department
R 274 258.64 (1st year)
Sibathatu Mining Supply and delivery of ironstone gravel
01/07/2014 30/06/2016 Roads Department
R 980 925.54 (1st year)
Startune (Pty) Ltd Supply and delivery of grader blades
01/07/2014 30/06/2016 Roads Department
R 1 263 325.20 (1st year)
Trentyre (Pty) Ltd Supply and delivery of new tyres, retreading of tyres and subsidiary services, Cederberg and Matzikama area
01/07/2014 30/06/2016 Various departments
R 337 329.72 (1st year)
Trentyre (Pty) Ltd Supply and delivery of new tyres, retreading of tyres and subsidiary services, Swartland and Saldanha area
01/07/2014 30/06/2016 Various departments
R 1 775 005.00 (1st year)
Kholer Signs Supply and delivery of traffic control signs
01/07/2014 30/06/2016 Rooads Departments
R 141 946.21 (1st year)
Various Suppliers Hire of mechanical equipment and construction plant
01/07/2014 30/06/2016 Roads Department
R 19 413 652.48 (1st year)
AWV Project Maangement (Pty) Ltd
Supply of crusted aggregate and grit for upgradings and reseal works
19/09/2014 30/06/2016 Roads Department
R 1 016 049.10 ( 1st 9 months)
West Coast Builders Supply of crusted aggregate and grit for upgradings and reseal works
19/09/2014 30/06/2016 Roads Department
R 442 810.84 ( 1st 9 months)
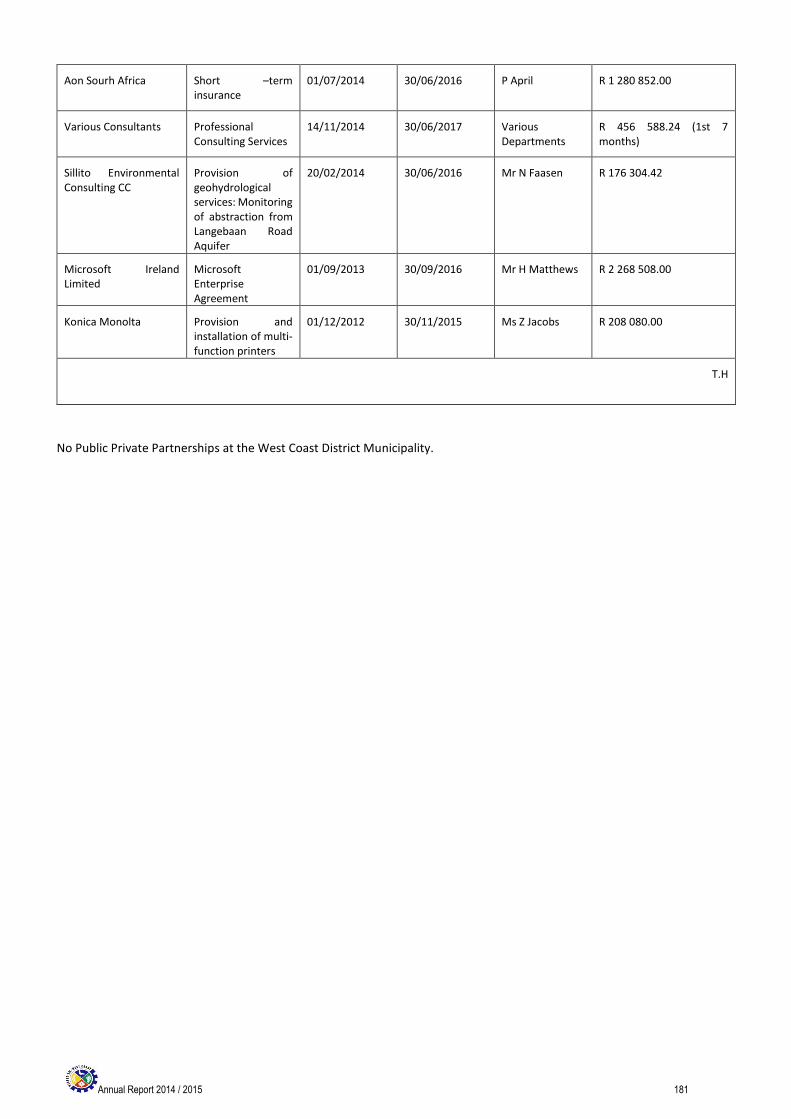
Annual Report 2014 / 2015 181
Aon Sourh Africa Short –term insurance
01/07/2014 30/06/2016 P April R 1 280 852.00
Various Consultants Professional Consulting Services
14/11/2014 30/06/2017 Various Departments
R 456 588.24 (1st 7 months)
Sillito Environmental Consulting CC
Provision of geohydrological services: Monitoring of abstraction from Langebaan Road Aquifer
20/02/2014 30/06/2016 Mr N Faasen R 176 304.42
Microsoft Ireland Limited
Microsoft Enterprise Agreement
01/09/2013 30/09/2016 Mr H Matthews R 2 268 508.00
Konica Monolta Provision and installation of multi-function printers
01/12/2012 30/11/2015 Ms Z Jacobs R 208 080.00
T.H
No Public Private Partnerships at the West Coast District Municipality.
Annual Report 2013/2014 182
APPENDIX I – SERVICE PROVIDER PERFORMANCE SCHEDULE
The extract of the Tender Report for the 2014 / 2015 financial year below:
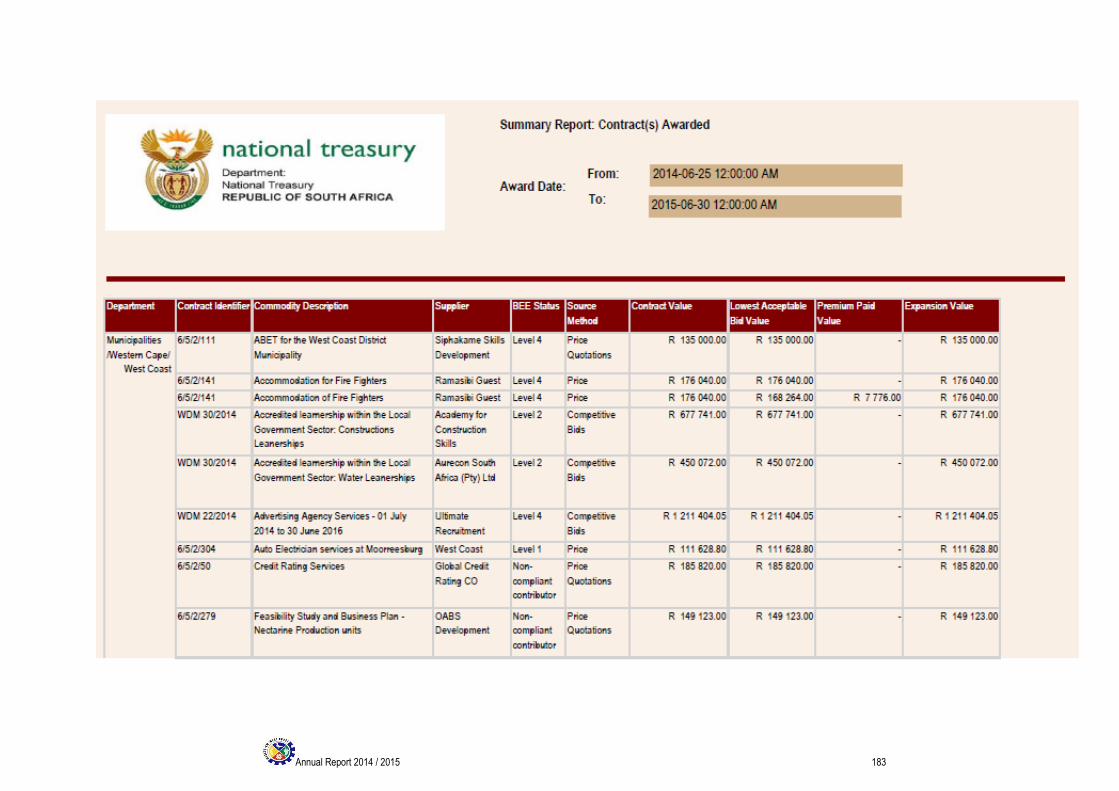
Annual Report 2014 / 2015 183
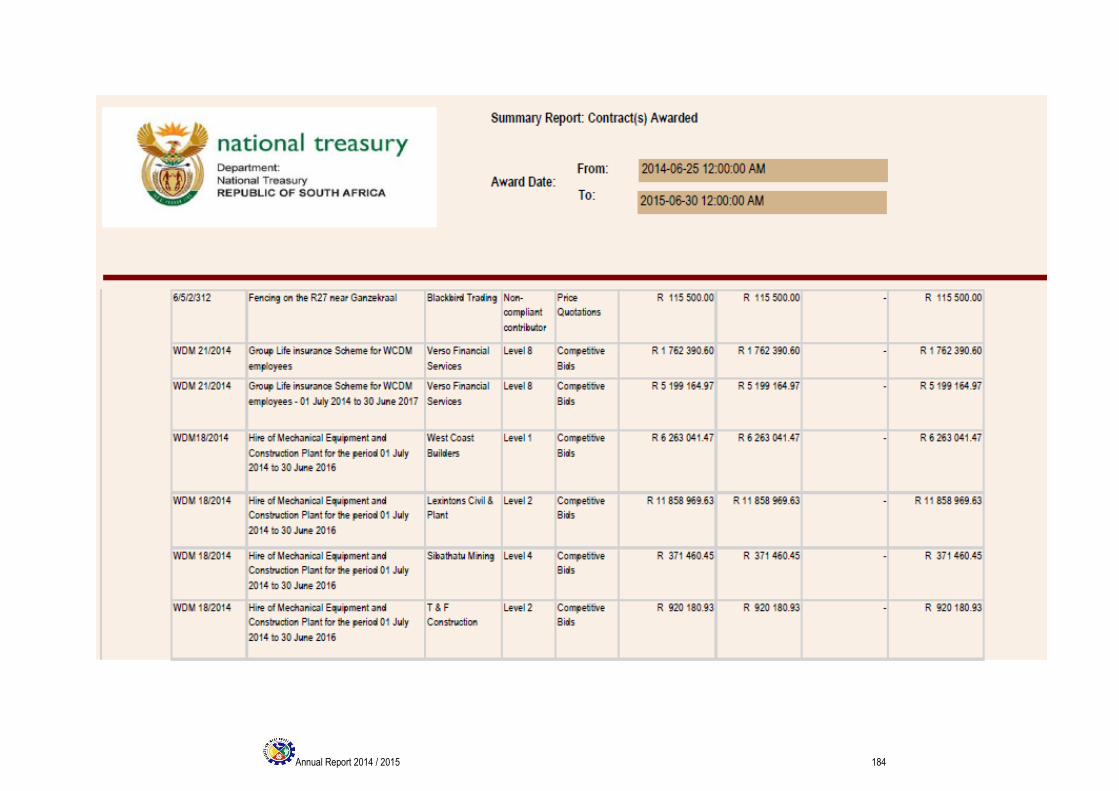
Annual Report 2014 / 2015 184
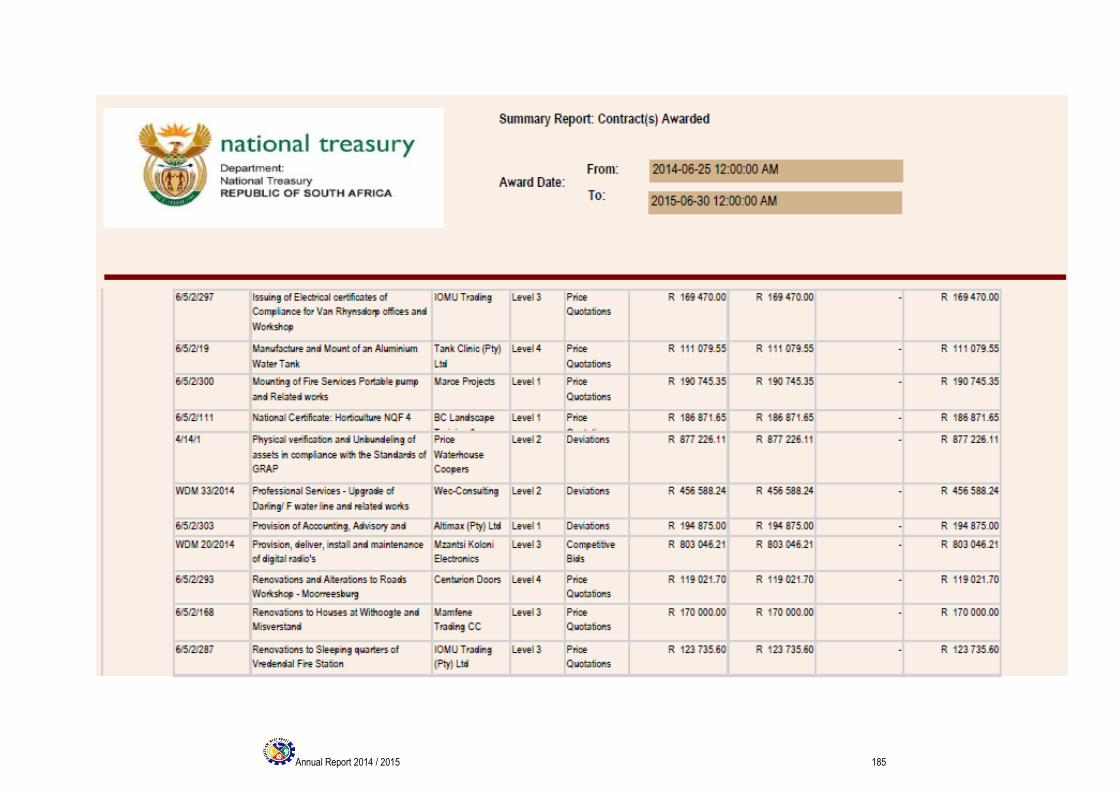
Annual Report 2014 / 2015 185
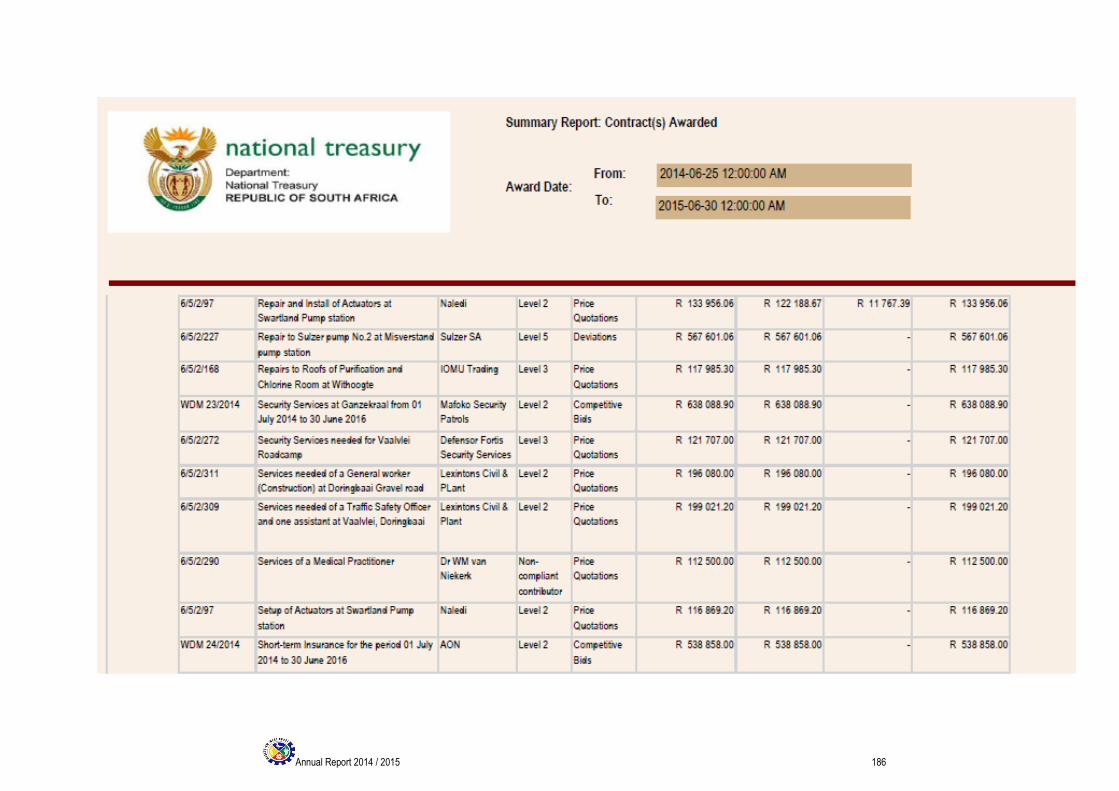
Annual Report 2014 / 2015 186
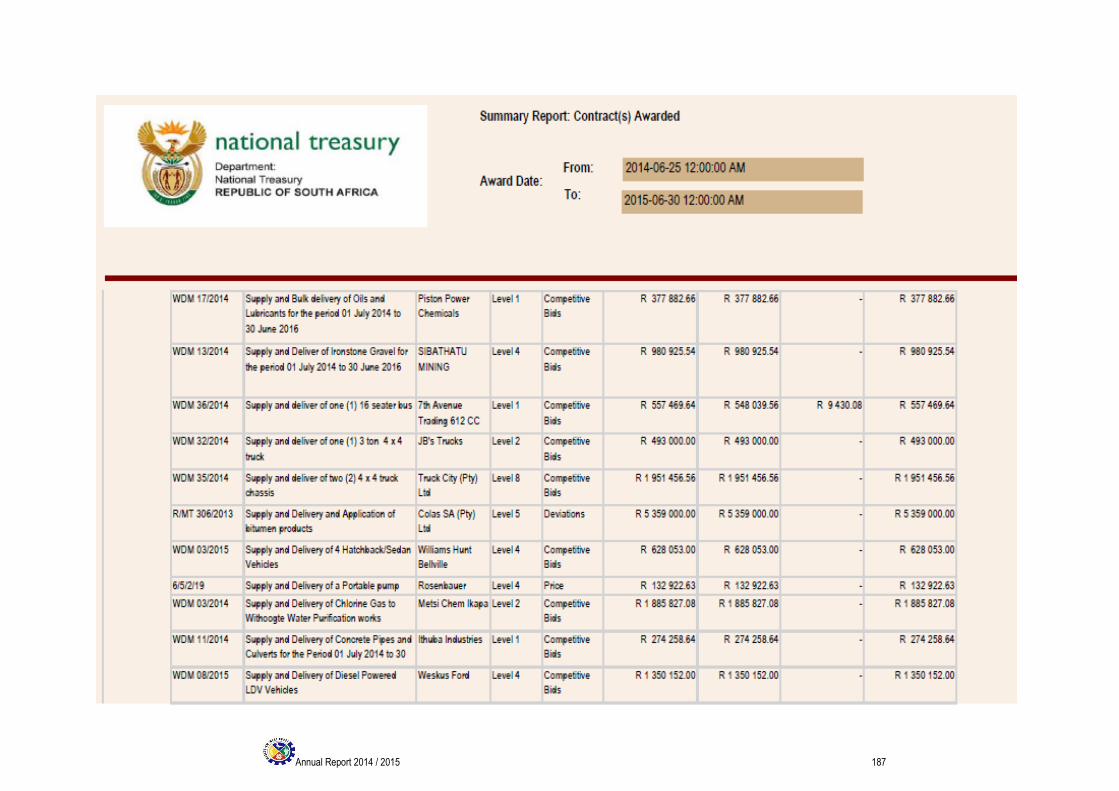
Annual Report 2014 / 2015 187
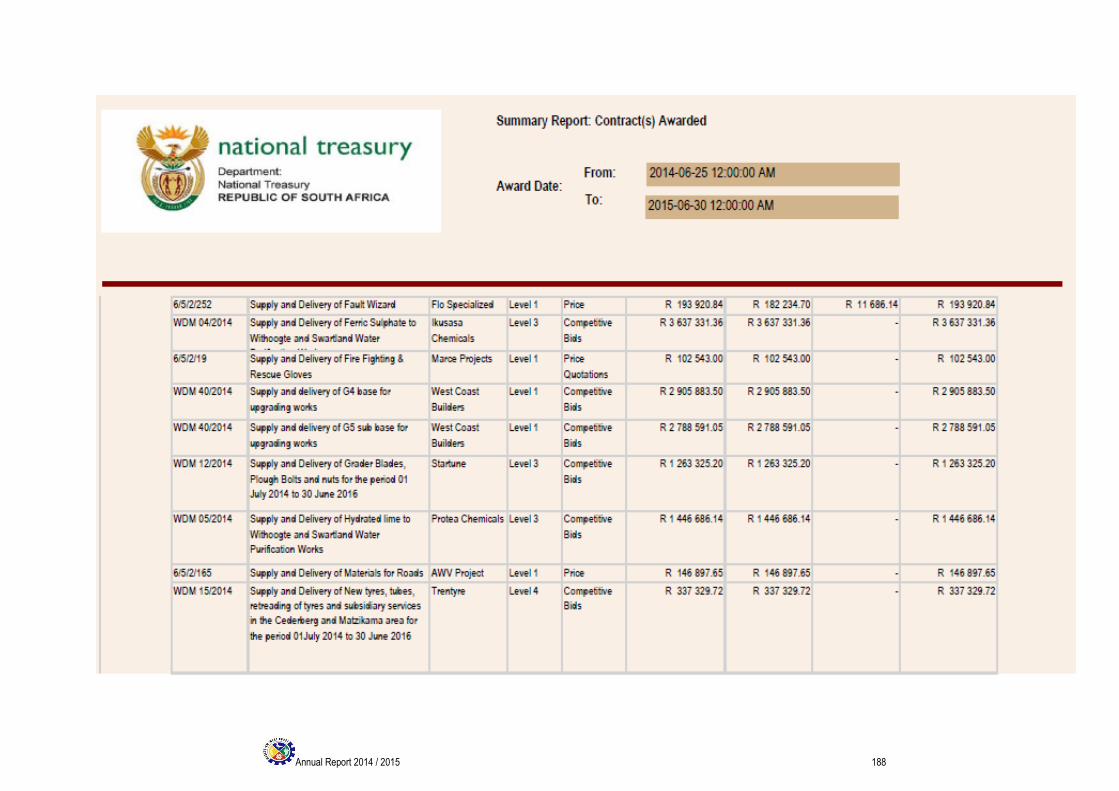
Annual Report 2014 / 2015 188
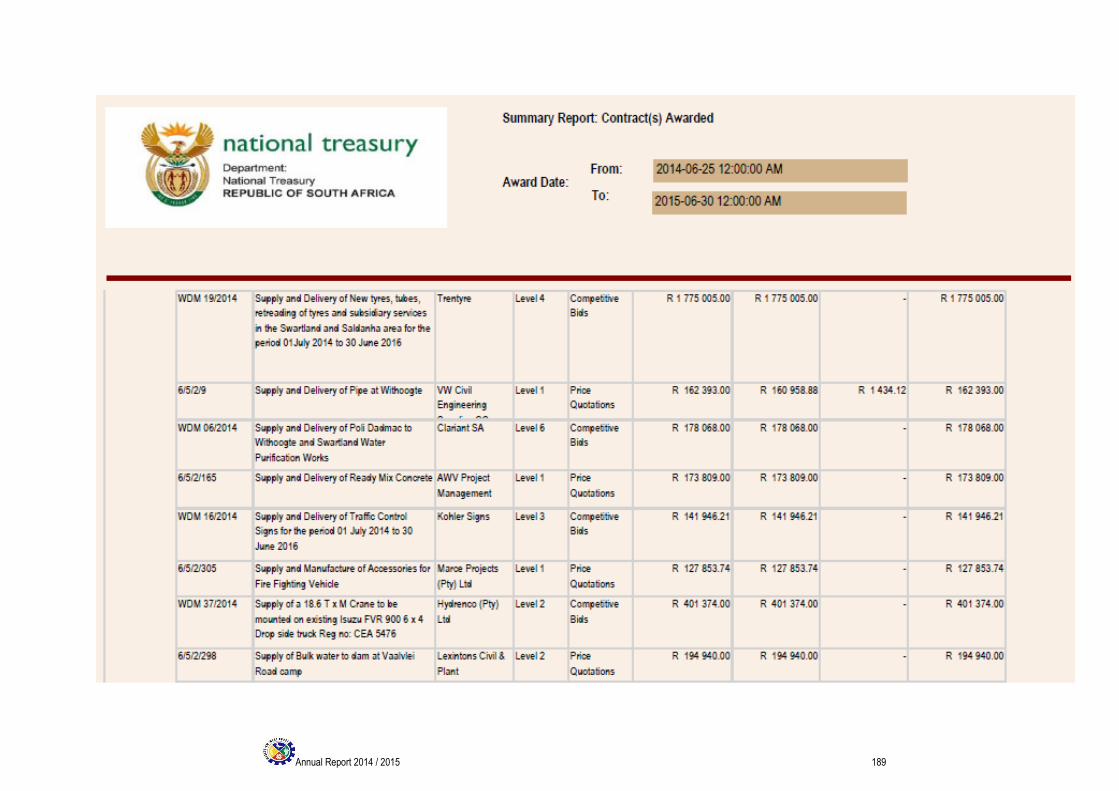
Annual Report 2014 / 2015 189
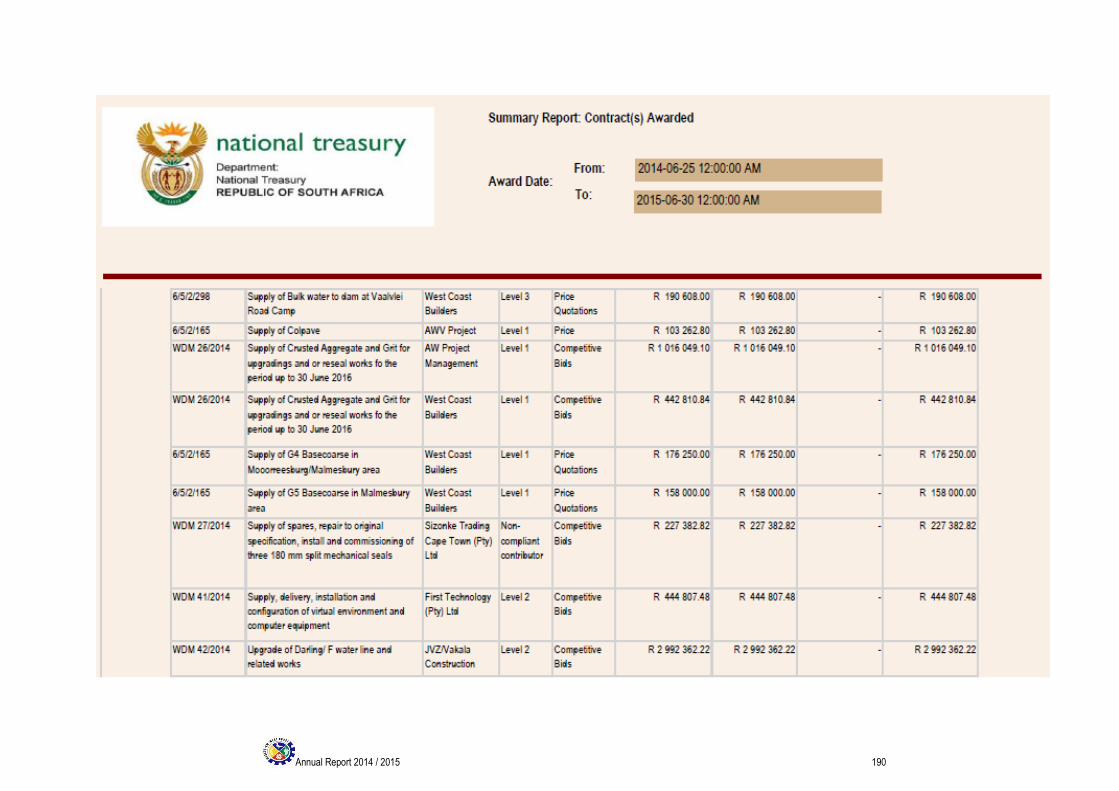
Annual Report 2014 / 2015 190
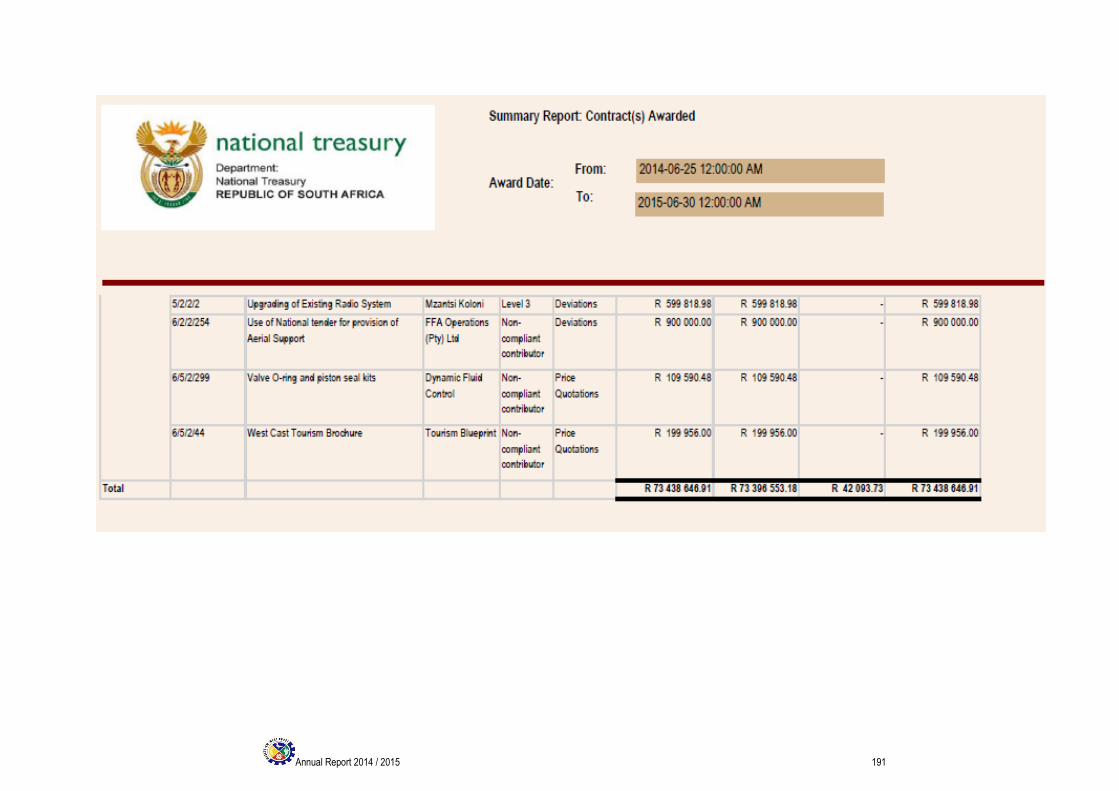
Annual Report 2014 / 2015 191
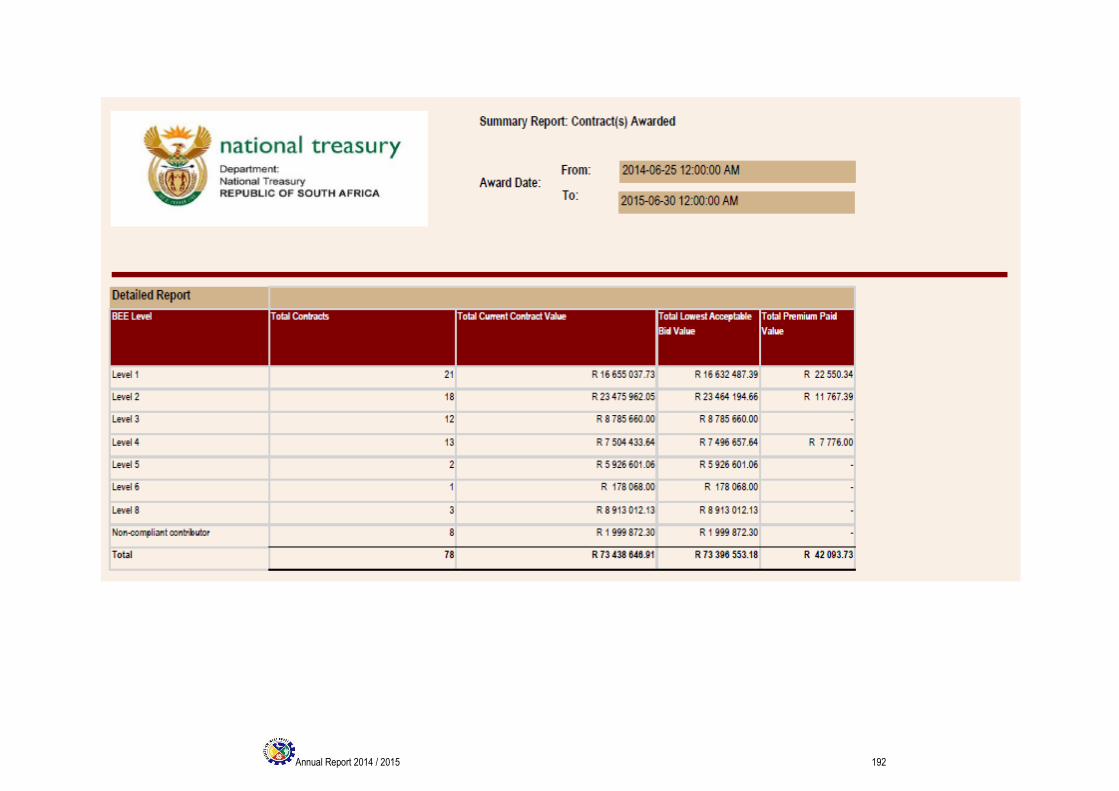
Annual Report 2014 / 2015 192
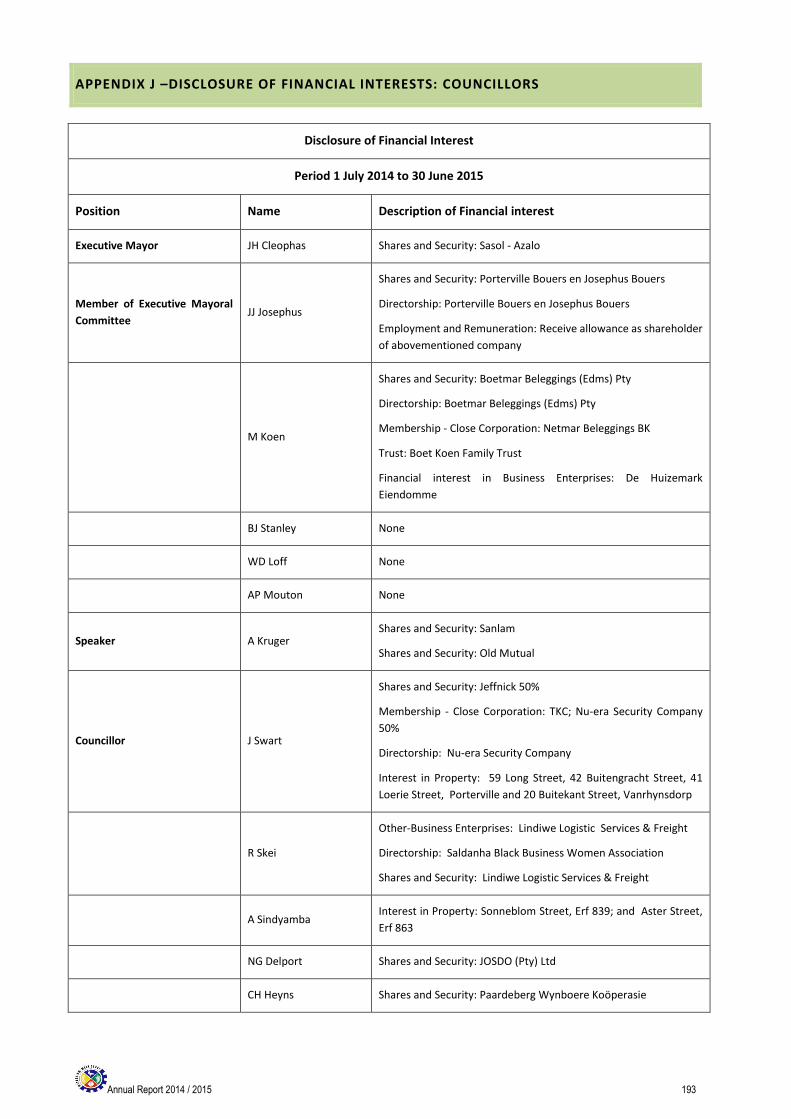
Annual Report 2014 / 2015 193
APPENDIX J –DISCLOSURE OF FINANCIAL INTERESTS: COUNCILLORS
Disclosure of Financial Interest
Period 1 July 2014 to 30 June 2015
Position Name Description of Financial interest
Executive Mayor JH Cleophas Shares and Security: Sasol - Azalo
Member of Executive Mayoral
Committee JJ Josephus
Shares and Security: Porterville Bouers en Josephus Bouers
Directorship: Porterville Bouers en Josephus Bouers
Employment and Remuneration: Receive allowance as shareholder
of abovementioned company
M Koen
Shares and Security: Boetmar Beleggings (Edms) Pty
Directorship: Boetmar Beleggings (Edms) Pty
Membership - Close Corporation: Netmar Beleggings BK
Trust: Boet Koen Family Trust
Financial interest in Business Enterprises: De Huizemark
Eiendomme
BJ Stanley None
WD Loff None
AP Mouton None
Speaker A Kruger Shares and Security: Sanlam
Shares and Security: Old Mutual
Councillor J Swart
Shares and Security: Jeffnick 50%
Membership - Close Corporation: TKC; Nu-era Security Company
50%
Directorship: Nu-era Security Company
Interest in Property: 59 Long Street, 42 Buitengracht Street, 41
Loerie Street, Porterville and 20 Buitekant Street, Vanrhynsdorp
R Skei
Other-Business Enterprises: Lindiwe Logistic Services & Freight
Directorship: Saldanha Black Business Women Association
Shares and Security: Lindiwe Logistic Services & Freight
A Sindyamba Interest in Property: Sonneblom Street, Erf 839; and Aster Street,
Erf 863
NG Delport Shares and Security: JOSDO (Pty) Ltd
CH Heyns Shares and Security: Paardeberg Wynboere Koöperasie
Annual Report 2014 / 2015 194
Directorship: Perdeverg Wynboere Koöperasie Beperk
Trust: Heyns Family Trust - Arnaud
Partnership: PJ Heyns (Father) and CH Heyns - Arnaud
T.J
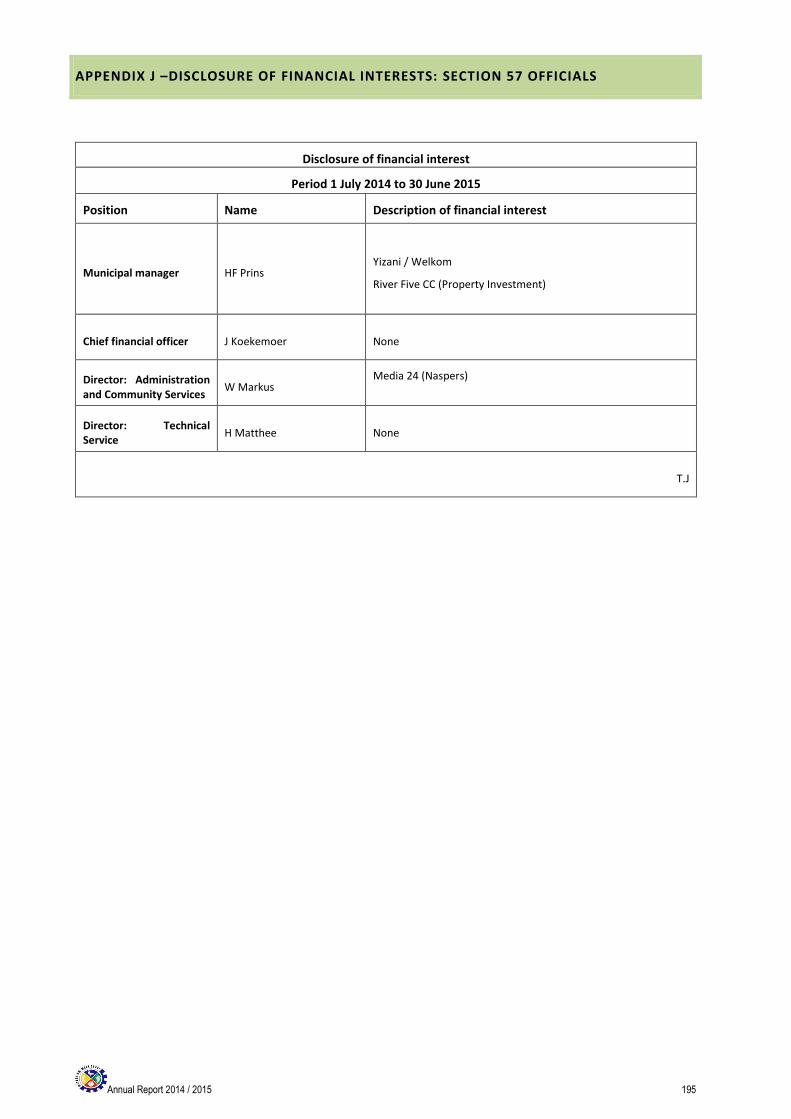
Annual Report 2014 / 2015 195
APPENDIX J –DISCLOSURE OF FINANCIAL INTERESTS: SECTION 57 OFFICIALS
Disclosure of financial interest
Period 1 July 2014 to 30 June 2015
Position Name Description of financial interest
Municipal manager HF Prins
Yizani / Welkom
River Five CC (Property Investment)
Chief financial officer J Koekemoer None
Director: Administration and Community Services
W Markus Media 24 (Naspers)
Director: Technical Service
H Matthee None
T.J
Annual Report 2014 / 2015 196
APPENDIX K – REVENUE COLLECTION PERFORMANCE BY FINANCIAL DISCLOSURE
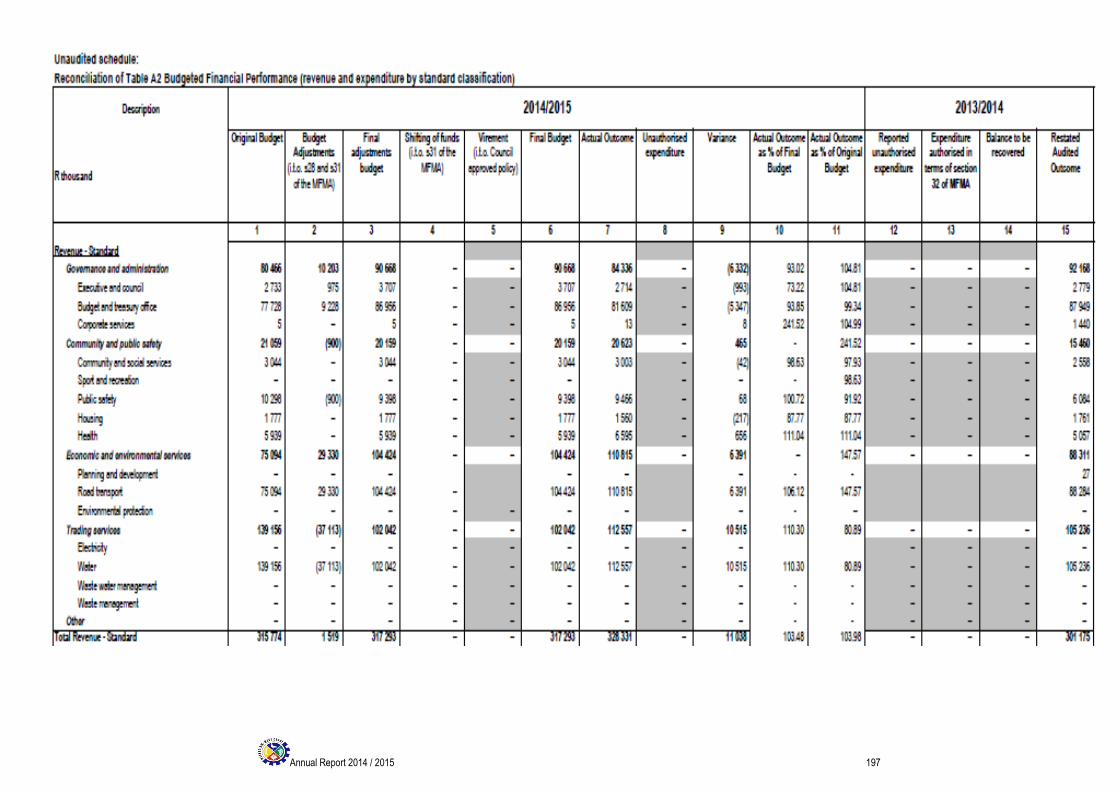
Annual Report 2014 / 2015 197
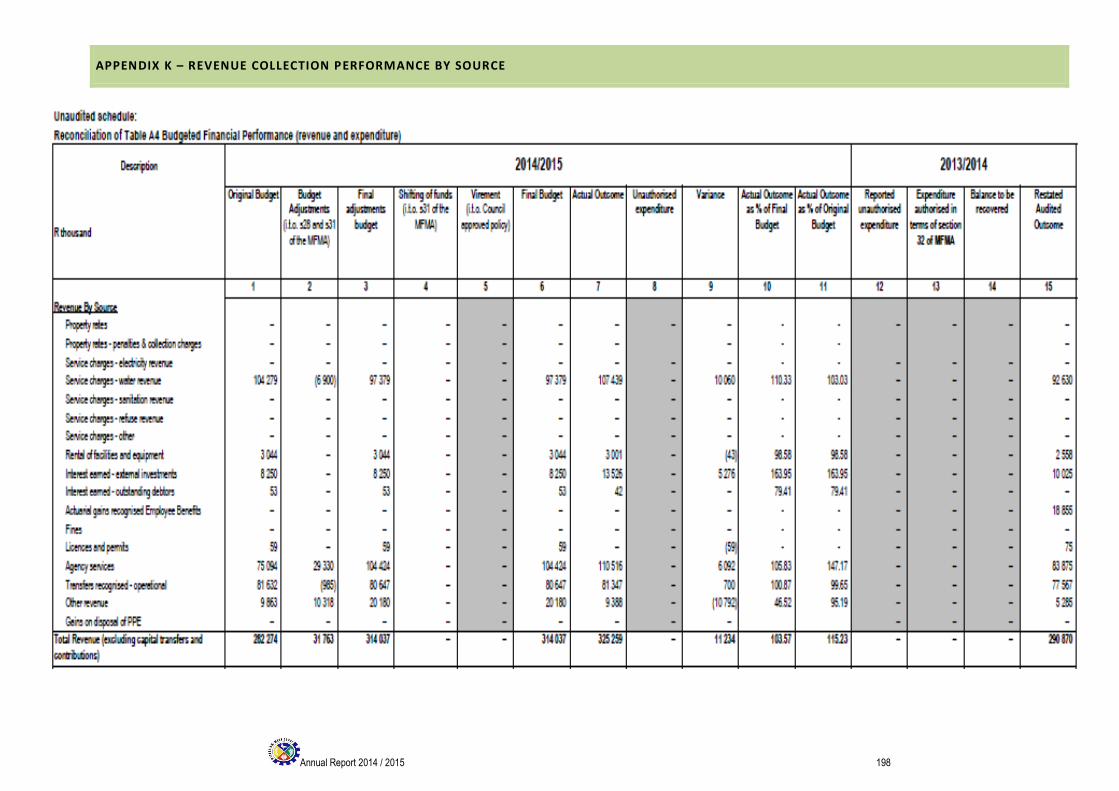
Annual Report 2014 / 2015 198
APPENDIX K – REVENUE COLLECTION PERFORMANCE BY SOURCE
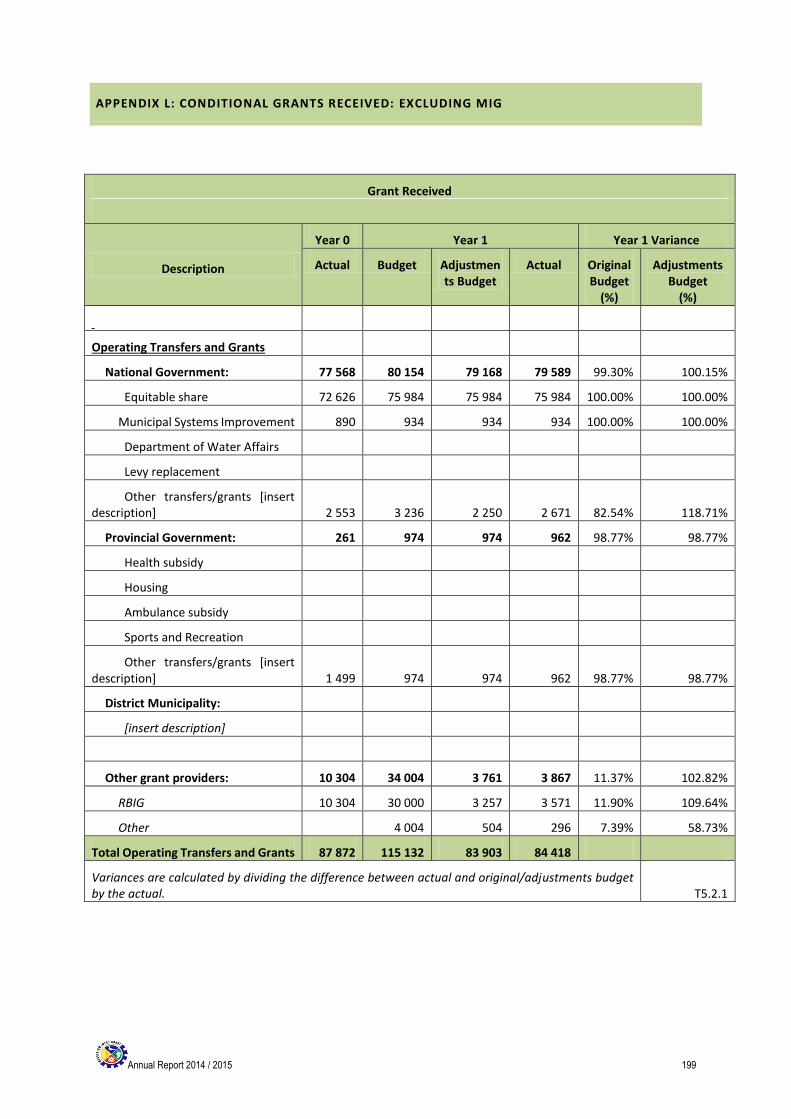
Annual Report 2014 / 2015 199
APPENDIX L: CONDITIONAL GRANTS RECEIVED: EXCLUDING MIG
Grant Received
Description
Year 0 Year 1 Year 1 Variance
Actual Budget Adjustments Budget
Actual Original Budget
(%)
Adjustments Budget
(%)
Operating Transfers and Grants
National Government: 77 568 80 154 79 168 79 589 99.30% 100.15%
Equitable share 72 626 75 984 75 984 75 984 100.00% 100.00%
Municipal Systems Improvement 890 934 934 934 100.00% 100.00%
Department of Water Affairs
Levy replacement
Other transfers/grants [insert description] 2 553 3 236 2 250 2 671 82.54% 118.71%
Provincial Government: 261 974 974 962 98.77% 98.77%
Health subsidy
Housing
Ambulance subsidy
Sports and Recreation
Other transfers/grants [insert description] 1 499 974 974 962 98.77% 98.77%
District Municipality:
[insert description]
Other grant providers: 10 304 34 004 3 761 3 867 11.37% 102.82%
RBIG 10 304 30 000 3 257 3 571 11.90% 109.64%
Other 4 004 504 296 7.39% 58.73%
Total Operating Transfers and Grants 87 872 115 132 83 903 84 418
Variances are calculated by dividing the difference between actual and original/adjustments budget by the actual. T5.2.1
Annual Report 2014 / 2015 200
APPENDIX M: CAPITAL EXPENDITURE – NEW & UPGRADE/RENEWAL PROGRAMMES
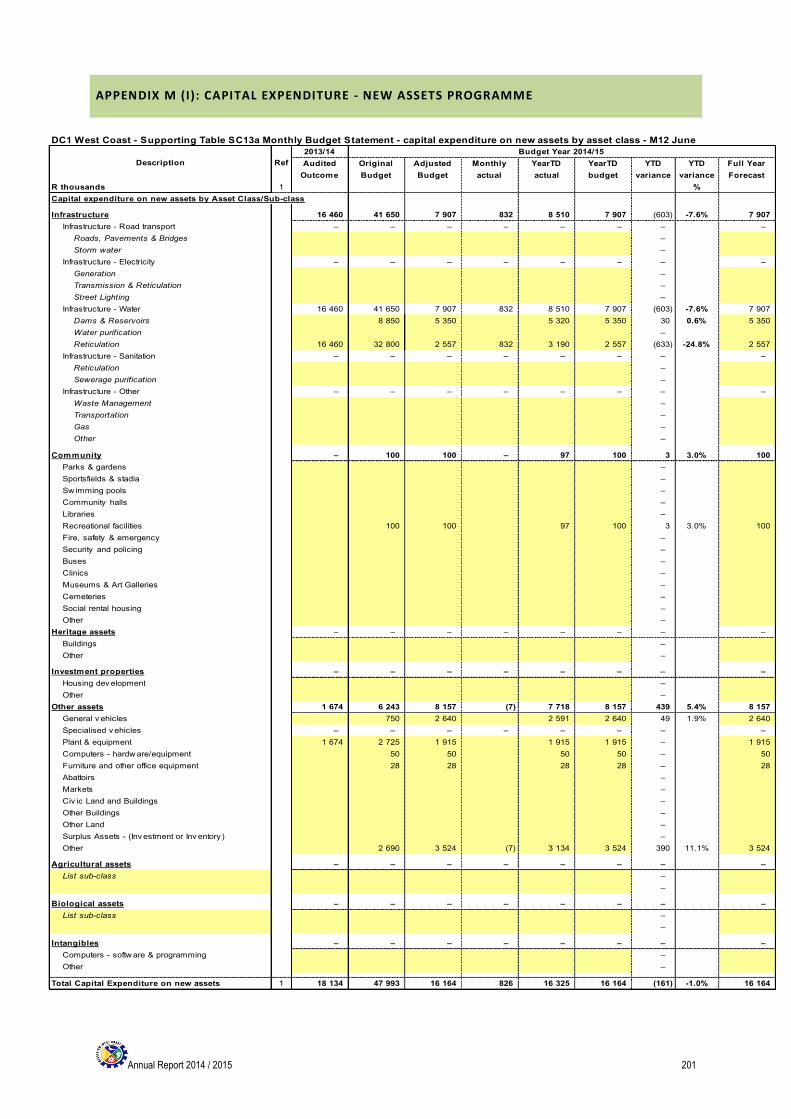
Annual Report 2014 / 2015 201
APPENDIX M (I): CAPITAL EXPENDITURE - NEW ASSETS PROGRAMME
2013/14 Budget Year 2014/15
Audited
Outcome
Original
Budget
Adjusted
Budget
Monthly
actual
YearTD
actual
YearTD
budget
YTD
variance
YTD
variance
Full Year
Forecast
R thousands 1 %
Capital expenditure on new assets by Asset Class/Sub-class
Infrastructure 16 460 41 650 7 907 832 8 510 7 907 (603) -7.6% 7 907
Infrastructure - Road transport – – – – – – – –
Roads, Pavements & Bridges –
Storm water –
Infrastructure - Electricity – – – – – – – –
Generation –
Transmission & Reticulation –
Street Lighting –
Infrastructure - Water 16 460 41 650 7 907 832 8 510 7 907 (603) -7.6% 7 907
Dams & Reservoirs 8 850 5 350 5 320 5 350 30 0.6% 5 350
Water purification –
Reticulation 16 460 32 800 2 557 832 3 190 2 557 (633) -24.8% 2 557
Infrastructure - Sanitation – – – – – – – –
Reticulation –
Sewerage purification –
Infrastructure - Other – – – – – – – –
Waste Management –
Transportation –
Gas –
Other –
Community – 100 100 – 97 100 3 3.0% 100
Parks & gardens –
Sportsfields & stadia –
Sw imming pools –
Community halls –
Libraries –
Recreational facilities 100 100 97 100 3 3.0% 100
Fire, safety & emergency –
Security and policing –
Buses –
Clinics –
Museums & Art Galleries –
Cemeteries –
Social rental housing –
Other –
Heritage assets – – – – – – – –
Buildings –
Other – –
Investment properties – – – – – – – –
Housing dev elopment –
Other –
Other assets 1 674 6 243 8 157 (7) 7 718 8 157 439 5.4% 8 157
General v ehicles 750 2 640 2 591 2 640 49 1.9% 2 640
Specialised v ehicles – – – – – – – –
Plant & equipment 1 674 2 725 1 915 1 915 1 915 – 1 915
Computers - hardw are/equipment 50 50 50 50 – 50
Furniture and other office equipment 28 28 28 28 – 28
Abattoirs –
Markets –
Civ ic Land and Buildings –
Other Buildings –
Other Land –
Surplus Assets - (Inv estment or Inv entory ) –
Other 2 690 3 524 (7) 3 134 3 524 390 11.1% 3 524
Agricultural assets – – – – – – – –
List sub-class –
–
Biological assets – – – – – – – –
List sub-class –
–
Intangibles – – – – – – – –
Computers - softw are & programming –
Other –
Total Capital Expenditure on new assets 1 18 134 47 993 16 164 826 16 325 16 164 (161) -1.0% 16 164
Description Ref
DC1 West Coast - Supporting Table SC13a Monthly Budget Statement - capital expenditure on new assets by asset class - M12 June
Annual Report 2014 / 2015 202
APPENDIX M ( ii): CAPITAL EXPENDITURE – UPGRADE/RENEWAL PROGRAMME
Not Applicable
Annual Report 2014 / 2015 203
APPENDIX N – CAPITAL PROGRAMME BY PROJECT YEAR 1
Not Applicable
Annual Report 2014 / 2015 204
APPENDIX O – CAPITAL PROGRAMME BY PROJECT BY WARD YEAR 1
Not Applicable
Annual Report 2014 / 2015 205
APPENDIX P – SERVICE CONNECTION B ACKLOGS AT SCHOOLS AND CLINICS
Service Backlogs: Schools and Clinics
Establishments lacking basic
services
Water Sanitation Electricity Solid Waste
Collection
Schools (NAMES,
LOCATIONS)
No
t A
pp
licab
le
No
t A
pp
licab
le
No
t A
pp
licab
le
No
t A
pp
licab
le
Clinics (NAMES, LOCATIONS)
Names and locations of schools and clinics lacking one or more services. Use 'x' to mark lack of service at appropriate level
for the number of people attending the school/clinic, allowing for the proper functioning of the establishment concerned.
TP
Annual Report 2014 / 2015 206
APPENDIX Q – SERVICE BACKLOGS EXPERIENCED BY THE COMMUNITY WHERE
ANOTHER SPHERE OF GOVERNMENT IS RESPONSIBLE FOR SERVICE PROVISION
Service backlogs experienced by the community where another sphere of government is the service provider (whether or not the municipality acts on an agency basis)
Services and locations Scale of backlogs Impact of backlogs
Clinics
NO
T A
PP
LIC
AB
LE –
DIS
TRIC
T
MU
NIC
IPA
LIT
Y
NO
T A
PP
LIC
AB
LE –
DIS
TRIC
T
MU
NIC
IPA
LIT
Y Housing
Licensing and testing centre
Reservoir schools (primary and high)
Sports fields
T.Q
Annual Report 2014 / 2015 207
APPENDIX R – DECLARATION OF LOANS AND GRANTS MADE BY THE MUNICIPALITY
Declaration of loans and grants made by the Municipality: Year 1*
All organisations or persons in receipt of loans*/grants* provided by the Municipality
Nature of project Conditions attached to funding
Value Year 1 R' 000 Total amount committed over previous and future years
No
t ap
plic
able
No
t ap
plic
able
No
t ap
plic
able
No
t ap
plic
able
No
t ap
plic
able
1* Loans/grants – whether in cash or in kind
T.R
Annual Report 2014 / 2015 208
APPENDIX S – DECLARATION OF RETURNS NOT MADE IN DUE TIME UNDER MFMA S71
MFMA Section 71 returns not made during Year 1 according to reporting requirements
Return Reason return has not been properly made on due date
NO
NE
NO
T A
PP
LIC
AB
LE
T.S
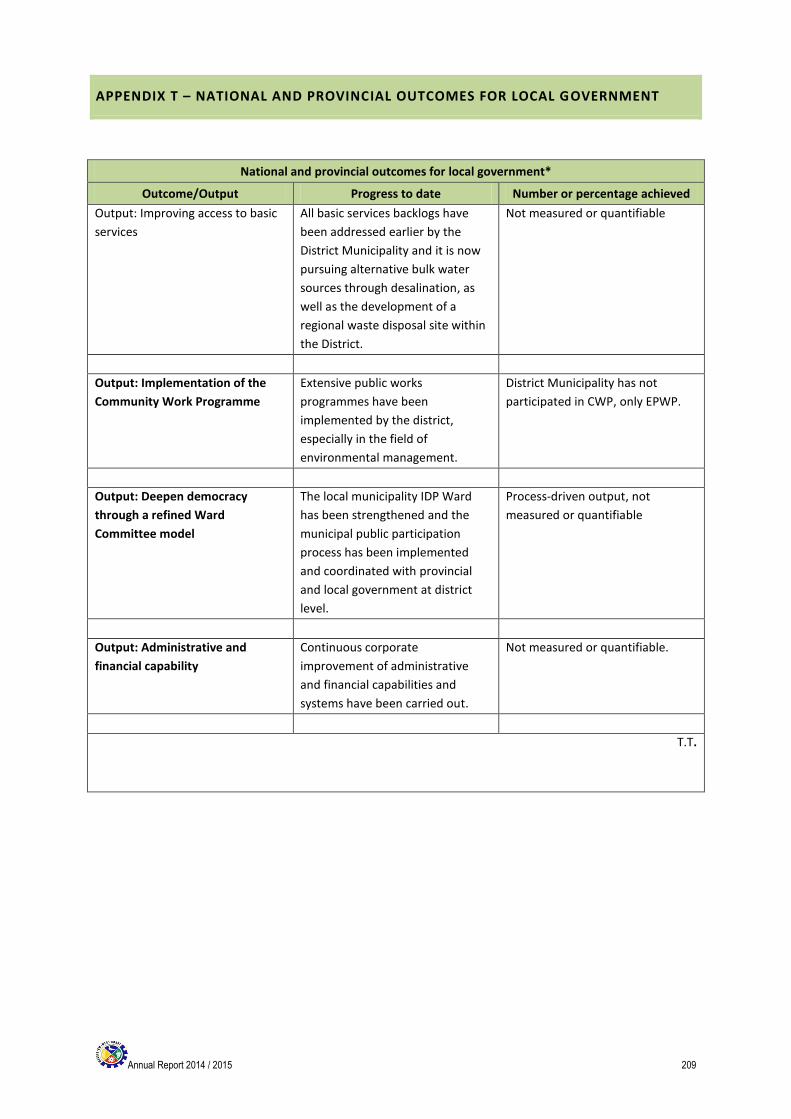
Annual Report 2014 / 2015 209
APPENDIX T – NATIONAL AND PROVINCIAL OUTCOMES FOR LOCAL GOVERNMENT
National and provincial outcomes for local government*
Outcome/Output Progress to date Number or percentage achieved
Output: Improving access to basic
services
All basic services backlogs have
been addressed earlier by the
District Municipality and it is now
pursuing alternative bulk water
sources through desalination, as
well as the development of a
regional waste disposal site within
the District.
Not measured or quantifiable
Output: Implementation of the
Community Work Programme
Extensive public works
programmes have been
implemented by the district,
especially in the field of
environmental management.
District Municipality has not
participated in CWP, only EPWP.
Output: Deepen democracy
through a refined Ward
Committee model
The local municipality IDP Ward
has been strengthened and the
municipal public participation
process has been implemented
and coordinated with provincial
and local government at district
level.
Process-driven output, not
measured or quantifiable
Output: Administrative and
financial capability
Continuous corporate
improvement of administrative
and financial capabilities and
systems have been carried out.
Not measured or quantifiable.
T.T.
Annual Report 2014 / 2015 210
VOLUME 1 – ANNUAL PERFORMANCE REPORT 2014 / 2015
Annual Performance Report attached.
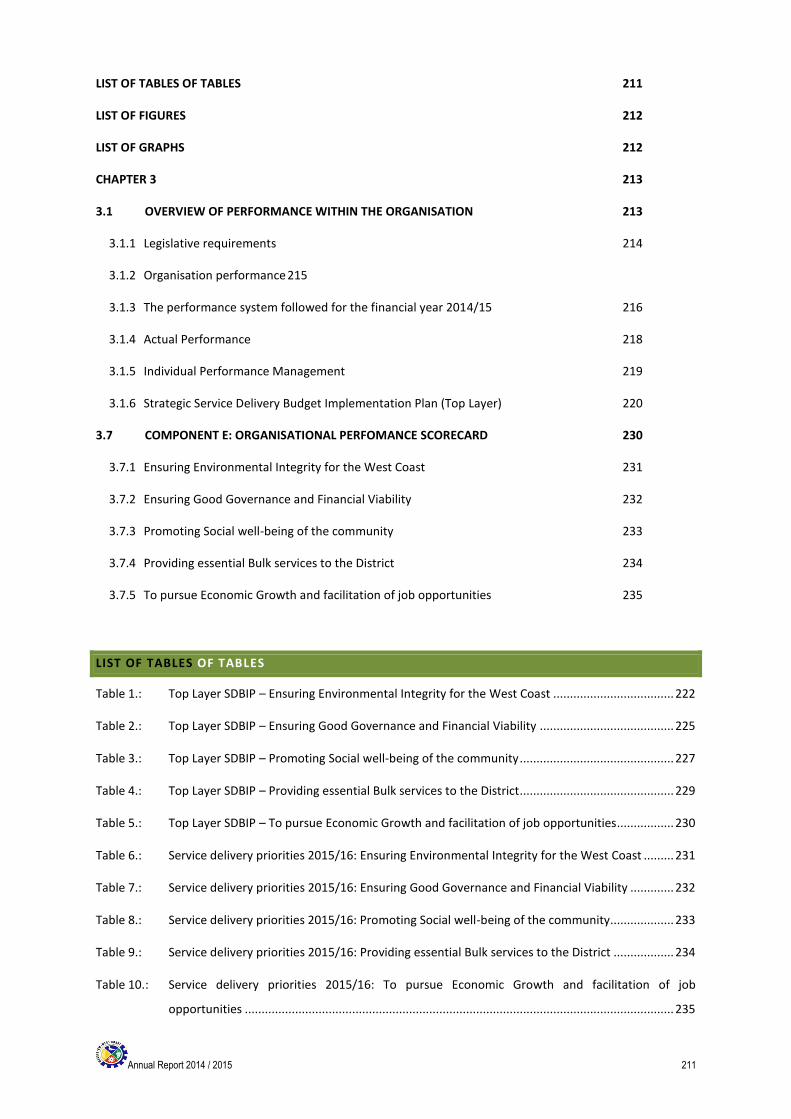
Annual Report 2014 / 2015 211
LIST OF TABLES OF TABLES 211
LIST OF FIGURES 212
LIST OF GRAPHS 212
CHAPTER 3 213
3.1 OVERVIEW OF PERFORMANCE WITHIN THE ORGANISATION 213
3.1.1 Legislative requirements 214
3.1.2 Organisation performance 215
3.1.3 The performance system followed for the financial year 2014/15 216
3.1.4 Actual Performance 218
3.1.5 Individual Performance Management 219
3.1.6 Strategic Service Delivery Budget Implementation Plan (Top Layer) 220
3.7 COMPONENT E: ORGANISATIONAL PERFOMANCE SCORECARD 230
3.7.1 Ensuring Environmental Integrity for the West Coast 231
3.7.2 Ensuring Good Governance and Financial Viability 232
3.7.3 Promoting Social well-being of the community 233
3.7.4 Providing essential Bulk services to the District 234
3.7.5 To pursue Economic Growth and facilitation of job opportunities 235
LIST OF TABLES OF TABLES
Table 1.: Top Layer SDBIP – Ensuring Environmental Integrity for the West Coast .................................... 222
Table 2.: Top Layer SDBIP – Ensuring Good Governance and Financial Viability ........................................ 225
Table 3.: Top Layer SDBIP – Promoting Social well-being of the community .............................................. 227
Table 4.: Top Layer SDBIP – Providing essential Bulk services to the District.............................................. 229
Table 5.: Top Layer SDBIP – To pursue Economic Growth and facilitation of job opportunities................. 230
Table 6.: Service delivery priorities 2015/16: Ensuring Environmental Integrity for the West Coast ......... 231
Table 7.: Service delivery priorities 2015/16: Ensuring Good Governance and Financial Viability ............. 232
Table 8.: Service delivery priorities 2015/16: Promoting Social well-being of the community................... 233
Table 9.: Service delivery priorities 2015/16: Providing essential Bulk services to the District .................. 234
Table 10.: Service delivery priorities 2015/16: To pursue Economic Growth and facilitation of job
opportunities ................................................................................................................................ 235
Annual Report 2014 / 2015 212
LIST OF FIGURES
Figure 1.: SDBIP Measurement Categories ................................................................................................... 220
LIST OF GRAPHS
Graph 1.: Overall performance per Strategic Objective ............................................................................... 221
Annual Report 2013/2014 213
CHAPTER 3
3.1 OVERVIEW OF PERFORMANCE WITHIN THE ORGANISATION
Performance management is a process which measures the implementation of the organisation’s strategy. It is also
a management tool to plan, monitor, measure and review performance indicators to ensure efficiency, effectiveness
and the impact of service delivery by the municipality.
At local government level performance management is institutionalized through the legislative requirements on the
performance management process for Local Government. Performance management provides the mechanism to
measure whether targets to meet its strategic goals, set by the organisation and its employees, are met.
The constitution of S.A (1996), section 152, dealing with the objectives of local government paves the way for
performance management with the requirements for an “accountable government”. The democratic values and
principles in terms of section 195 (1) are also linked with the concept of performance management, with reference
to the principles of inter alia:
the promotion of efficient, economic and effective use of resources,
accountable public administration
to be transparent by providing information,
to be responsive to the needs of the community; and
to facilitate a culture of public service and accountability amongst staff.
The Municipal Systems Act (MSA), 2000 requires municipalities to establish a performance management system.
Further, the MSA and the Municipal Finance Management Act (MFMA) requires the Integrated Development Plan
(IDP) to be aligned to the municipal budget and to be monitored for the performance of the budget against the IDP
via the Service Delivery and the Budget Implementation Plan (SDBIP).
In addition, Regulation 7 (1) of the Local Government: Municipal Planning and Performance Management
Regulations, 2001 states that “A Municipality’s Performance Management System entails a framework that
describes and represents how the municipality’s cycle and processes of performance planning, monitoring,
measurement, review, reporting and improvement will be conducted and managed, including determining the roles
of the different role players.” Performance management is not only relevant to the organisation as a whole, but also
to the individuals employed in the organization as well as the external service providers and the Municipal Entities.
This framework, inter alia, reflects the linkage between the IDP, Budget, SDBIP and individual and service provider
performance.
Annual Report 2014 / 2015 214
3.1.1 LEGISLATIVE REQUIREMENTS
In terms of section 46(1)(a) a municipality must prepare for each financial year a performance report reflecting the
municipality’s and any service provider’s performance during the financial year, including comparison with targets
of and with performance in the previous financial year. The report must, furthermore, indicate the development
and service delivery priorities and the performance targets set by the municipality for the following financial year
and measures that were or are to be taken to improve performance.
Annual Report 2014 / 2015 215
3.1.2 ORGANISATION PERFORMANCE
Strategic performance indicates how well the municipality is meeting its objectives and which policies and processes
are working. All government institutions must report on strategic performance to ensure that service delivery is
efficient, effective and economical. Municipalities must develop strategic plans and allocate resources for the
implementation. The implementation must be monitored on an on-going basis and the results must be reported on
during the financial year to various role-players to enable them to timeously implement corrective measures where
required.
This report highlight the strategic performance in terms of the municipality’s Top Layer Service Delivery Budget
Implementation Plan (SDBIP), high level performance in terms of the Strategic objectives and performance on the
National Key Performance Indicators prescribed in terms of section 43 of the Municipal Systems Act, 2000.
Annual Report 2014 / 2015 216
3.1.3 THE PERFORMANCE SYSTEM FOLLOWED FOR THE FINANCIAL YEAR 2014/15
A) ADOPTION OF A PERFORMANCE MANAGEMENT FRAMEWORK
Performance management is prescribed by chapter of the Municipal Systems Act, Act 32 of 2000 and the Municipal
Planning and Performance Management Regulations, 796 of August 2001. Section 7 (1) of the aforementioned
regulation states that “A Municipality’s Performance Management System entails a framework that describes and
represents how the municipality’s cycle and processes of performance planning, monitoring, measurement, review,
reporting and improvement will be conducted, organized and managed, including determining the responsibilities
of the different role players.” This framework, inter alia, reflects the linkage between the IDP, Budget, SDBIP and
individual and service provider performance. The municipality adopted a performance management framework that
was approved by Council on 26/09/2009.
B) THE IDP AND THE BUDGET
The revised IDP and the budget for 2014/15 was approved by Council on 26/5/2014 The IDP process and the
performance management process are integrated. The IDP fulfils the planning stage of performance management.
Performance management in turn, fulfils the implementation management, monitoring and evaluation of the IDP.
C) THE SERVICE DELIVERY BUDGET IMPLEMENTATION PLAN
The organisational performance is evaluated by means of a municipal scorecard (Top Layer SDBIP) at organisational
level and through the service delivery budget implementation plan (SDBIP) at directorate and departmental levels.
The SDBIP is a plan that converts the IDP and budget into measurable 'n on how, where and when the strategies,
objectives and normal business process of the municipality is implemented. It also allocates responsibility to
directorates to deliver the services in terms of the IDP and budget.
The MFMA Circular No.13 prescribes that:
The IDP and budget must be aligned
The budget must address the strategic priorities
The SDBIP should indicate what the municipality is going to do during next 12 months
The SDBIP should 'n the basis for measuring the performance against goals set during the budget /IDP
processes.
The SDBIP were prepared as described in the paragraphs below and approved by the Executive Mayor on
08/06/2015.
I) THE MUNICIPAL SCORECARD (TOP LAYER SDBIP)
The municipal scorecard (Top Layer SDBIP) consolidates service delivery targets set by Council / senior management
and provide an overall picture of performance for the municipality as a whole, reflecting performance on its strategic
priorities. Components of the Top Layer SDBIP include:
One-year detailed plan, but should include a three-year capital plan
The 5 necessary components includes:
Monthly projections of revenue to be collected for each source
Annual Report 2014 / 2015 217
Expected revenue to be collected NOT billed
Monthly projections of expenditure (operating and capital) and revenue for each vote
Section 71 format (Monthly budget statements)
Quarterly projections of service delivery targets and performance indicators for each vote
Non-financial measurable performance objectives in the form of targets and indicators
Output NOT input / internal management objectives
Level and standard of service being provided to the community
Ward information for expenditure and service delivery
Detailed capital project plan broken down by ward over three years
Top Layer KPI’s were prepared based on the following:
Key performance indicators (KPI’s) for the programmes / activities identified to address the strategic objectives
as documented in the IDP.
KPI’s identified during the IDP and KPI’s that need to be reported to key municipal stakeholders.
KPI’s to address the required national reporting requirements.
It is important to note that the municipal manager has implemented a system to monitor the submission of
Portfolios of Evidence (POE’s) for reporting and auditing purposes.
Annual Report 2014 / 2015 218
3.1.4 ACTUAL PERFORMANCE
The municipality utilizes an electronic web based system on which KPI owners update actual performance on a
monthly basis. KPI owners report on the results of the KPI by documenting the following information on the
performance system:
The actual result in terms of the target set.
A performance comment.
Actions to improve the performance against the target set, if the target was not achieved.
It is the responsibility of every KPI owner to maintain a portfolio of evidence to support actual
performance results updated.
Annual Report 2014 / 2015 219
3.1.5 INDIVIDUAL PERFORMANCE MANAGEMENT
A) MUNICIPAL MANAGER AND MANAGERS DIRECTLY ACCOUNTABLE TO THE MUNICIPAL MANAGER
The Municipal Systems Act, 2000 (Act 32 of 2000) prescribes that the municipality must enter into performance
based agreements with the all s57-employees and that performance agreements must be reviewed annually. This
process and the format are further regulated by Regulation 805 (August 2006). The performance agreements for
the 2014/15 financial year were signed during July 2014 as prescribed.
The appraisal of the actual performance in terms of the singed agreements takes place twice per annum as
regulated. The final evaluation of the 2014/15 financial year (1 January 2015 to 30 June 2015) took place on
05/11/2015 and the mid-year performance of 2014/15 (1 July 2014 to 31 December 2014) took place on
04/03/2015.
B) OTHER MUNICIPAL PERSONNEL
Cascading of performance management has been strengthened on the level of middle management.
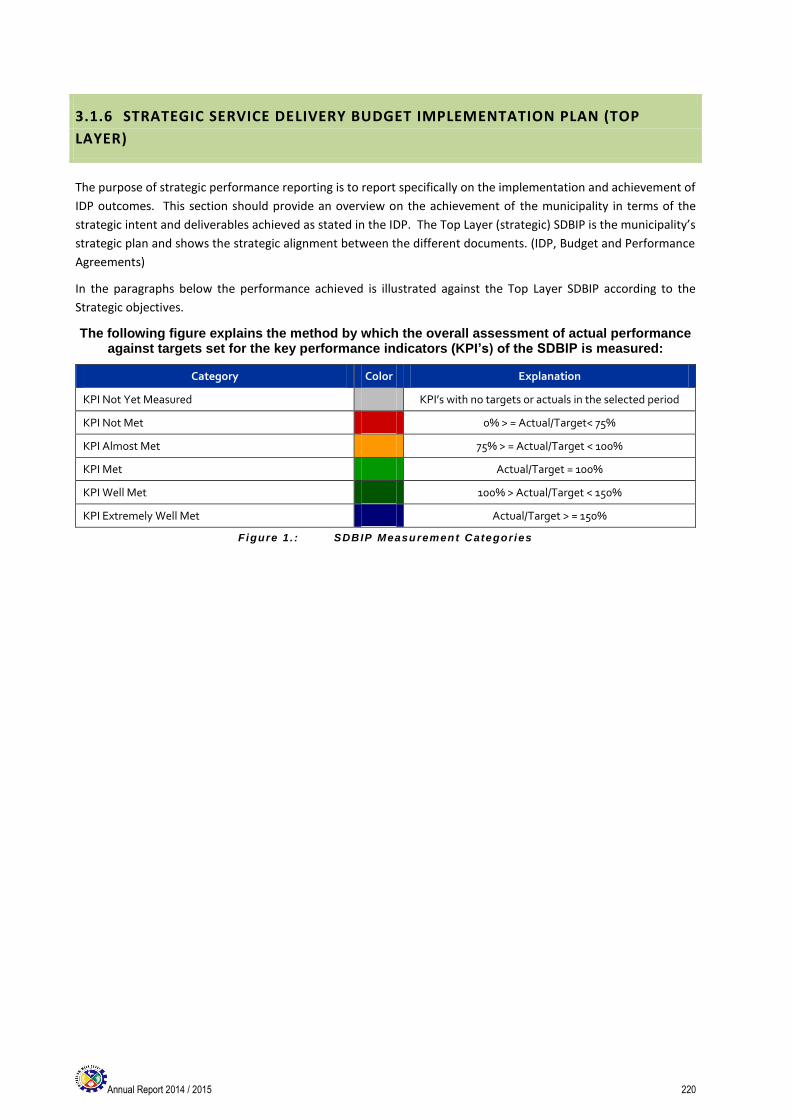
Annual Report 2014 / 2015 220
3.1.6 STRATEGIC SERVICE DELIVERY BUDGET IMPLEMENTATION PLAN (TOP
LAYER)
The purpose of strategic performance reporting is to report specifically on the implementation and achievement of
IDP outcomes. This section should provide an overview on the achievement of the municipality in terms of the
strategic intent and deliverables achieved as stated in the IDP. The Top Layer (strategic) SDBIP is the municipality’s
strategic plan and shows the strategic alignment between the different documents. (IDP, Budget and Performance
Agreements)
In the paragraphs below the performance achieved is illustrated against the Top Layer SDBIP according to the
Strategic objectives.
The following figure explains the method by which the overall assessment of actual performance against targets set for the key performance indicators (KPI’s) of the SDBIP is measured:
Category Color Explanation
KPI Not Yet Measured KPI’s with no targets or actuals in the selected period
KPI Not Met 0% > = Actual/Target< 75%
KPI Almost Met 75% > = Actual/Target < 100%
KPI Met Actual/Target = 100%
KPI Well Met 100% > Actual/Target < 150%
KPI Extremely Well Met Actual/Target > = 150%
Figure 1 . : SDBIP Measurement Categor ies
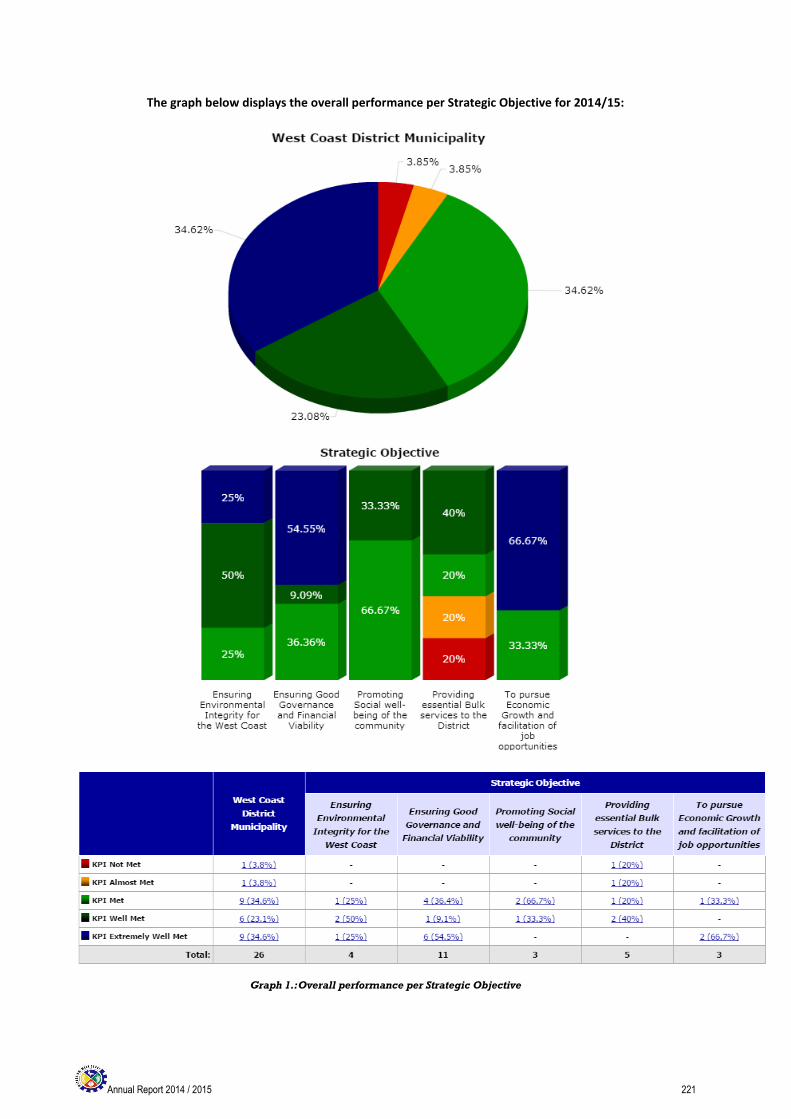
Annual Report 2014 / 2015 221
The graph below displays the overall performance per Strategic Objective for 2014/15:
Graph 1.: Overall performance per Strategic Objective
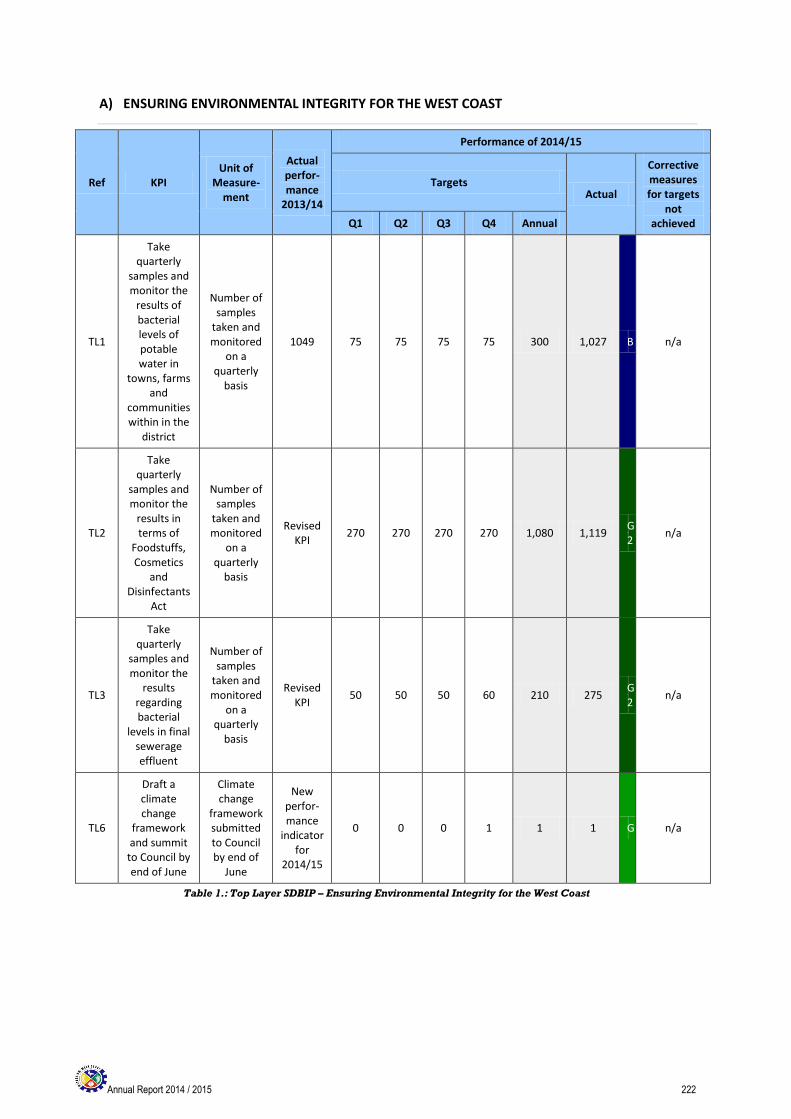
Annual Report 2014 / 2015 222
A) ENSURING ENVIRONMENTAL INTEGRITY FOR THE WEST COAST
Ref KPI Unit of
Measure-ment
Actual perfor-mance
2013/14
Performance of 2014/15
Targets Actual
Corrective measures for targets
not achieved Q1 Q2 Q3 Q4 Annual
TL1
Take quarterly
samples and monitor the
results of bacterial levels of potable water in
towns, farms and
communities within in the
district
Number of samples
taken and monitored
on a quarterly
basis
1049 75 75 75 75 300 1,027 B n/a
TL2
Take quarterly
samples and monitor the
results in terms of
Foodstuffs, Cosmetics
and Disinfectants
Act
Number of samples
taken and monitored
on a quarterly
basis
Revised KPI
270 270 270 270 1,080 1,119 G2
n/a
TL3
Take quarterly
samples and monitor the
results regarding bacterial
levels in final sewerage effluent
Number of samples
taken and monitored
on a quarterly
basis
Revised KPI
50 50 50 60 210 275 G2
n/a
TL6
Draft a climate change
framework and summit
to Council by end of June
Climate change
framework submitted to Council by end of
June
New perfor-mance
indicator for
2014/15
0 0 0 1 1 1 G n/a
Table 1.: Top Layer SDBIP – Ensuring Environmental Integrity for the West Coast
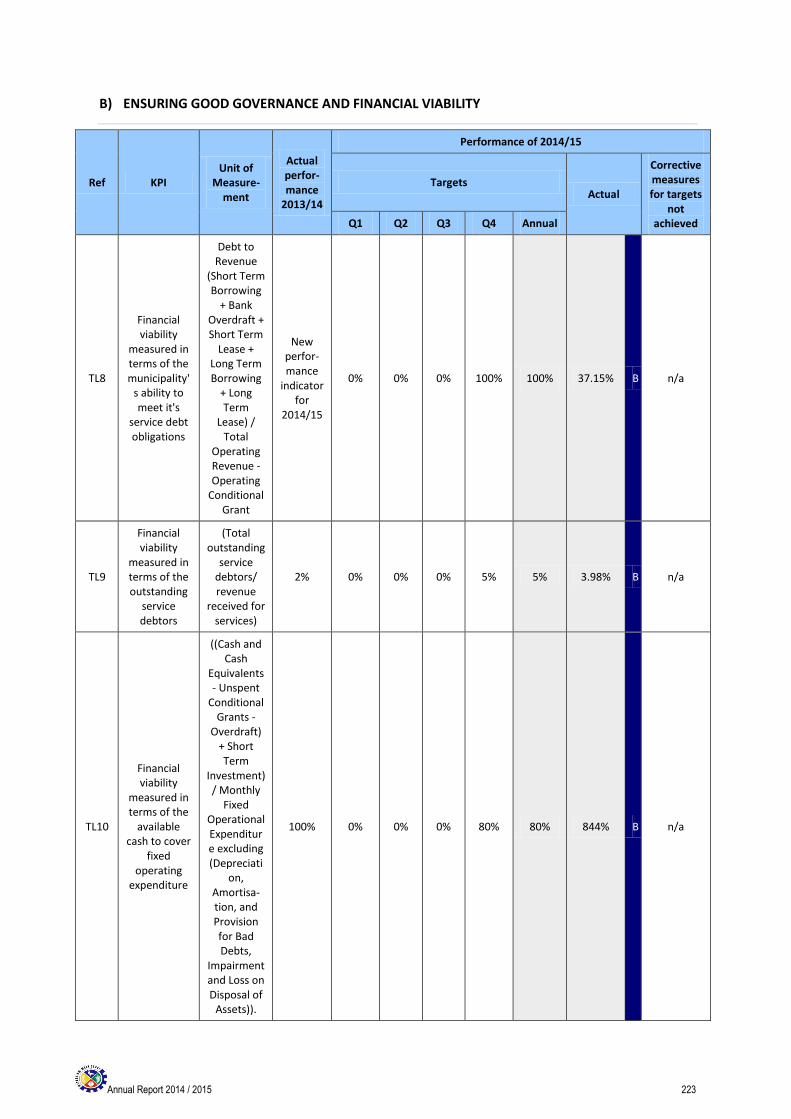
Annual Report 2014 / 2015 223
B) ENSURING GOOD GOVERNANCE AND FINANCIAL VIABILITY
Ref KPI Unit of
Measure-ment
Actual perfor-mance
2013/14
Performance of 2014/15
Targets Actual
Corrective measures for targets
not achieved Q1 Q2 Q3 Q4 Annual
TL8
Financial viability
measured in terms of the municipality'
s ability to meet it's
service debt obligations
Debt to Revenue
(Short Term Borrowing
+ Bank Overdraft + Short Term
Lease + Long Term Borrowing
+ Long Term
Lease) / Total
Operating Revenue - Operating
Conditional Grant
New perfor-mance
indicator for
2014/15
0% 0% 0% 100% 100% 37.15% B n/a
TL9
Financial viability
measured in terms of the outstanding
service debtors
(Total outstanding
service debtors/ revenue
received for services)
2% 0% 0% 0% 5% 5% 3.98% B n/a
TL10
Financial viability
measured in terms of the
available cash to cover
fixed operating
expenditure
((Cash and Cash
Equivalents - Unspent
Conditional Grants -
Overdraft) + Short Term
Investment) / Monthly
Fixed Operational Expenditure excluding (Depreciati
on, Amortisa-tion, and Provision for Bad Debts,
Impairment and Loss on Disposal of
Assets)).
100% 0% 0% 0% 80% 80% 844% B n/a
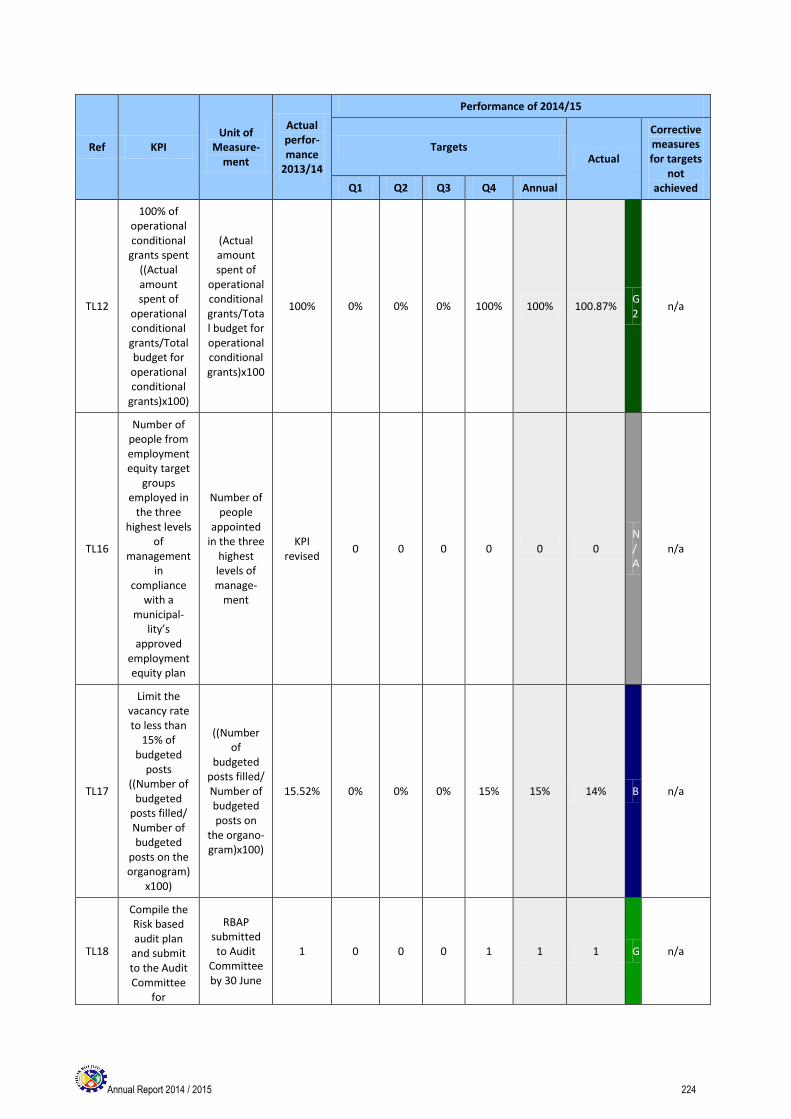
Annual Report 2014 / 2015 224
Ref KPI Unit of
Measure-ment
Actual perfor-mance
2013/14
Performance of 2014/15
Targets Actual
Corrective measures for targets
not achieved Q1 Q2 Q3 Q4 Annual
TL12
100% of operational conditional
grants spent ((Actual amount spent of
operational conditional grants/Total budget for operational conditional
grants)x100)
(Actual amount spent of
operational conditional grants/Total budget for operational conditional grants)x100
100% 0% 0% 0% 100% 100% 100.87% G2
n/a
TL16
Number of people from employment equity target
groups employed in
the three highest levels
of management
in compliance
with a municipal-
lity’s approved
employment equity plan
Number of people
appointed in the three
highest levels of manage-
ment
KPI revised
0 0 0 0 0 0 N/A
n/a
TL17
Limit the vacancy rate to less than
15% of budgeted
posts ((Number of
budgeted posts filled/ Number of budgeted
posts on the organogram)
x100)
((Number of
budgeted posts filled/ Number of budgeted posts on
the organo-gram)x100)
15.52% 0% 0% 0% 15% 15% 14% B n/a
TL18
Compile the Risk based audit plan
and submit to the Audit Committee
for
RBAP submitted to Audit
Committee by 30 June
1 0 0 0 1 1 1 G n/a
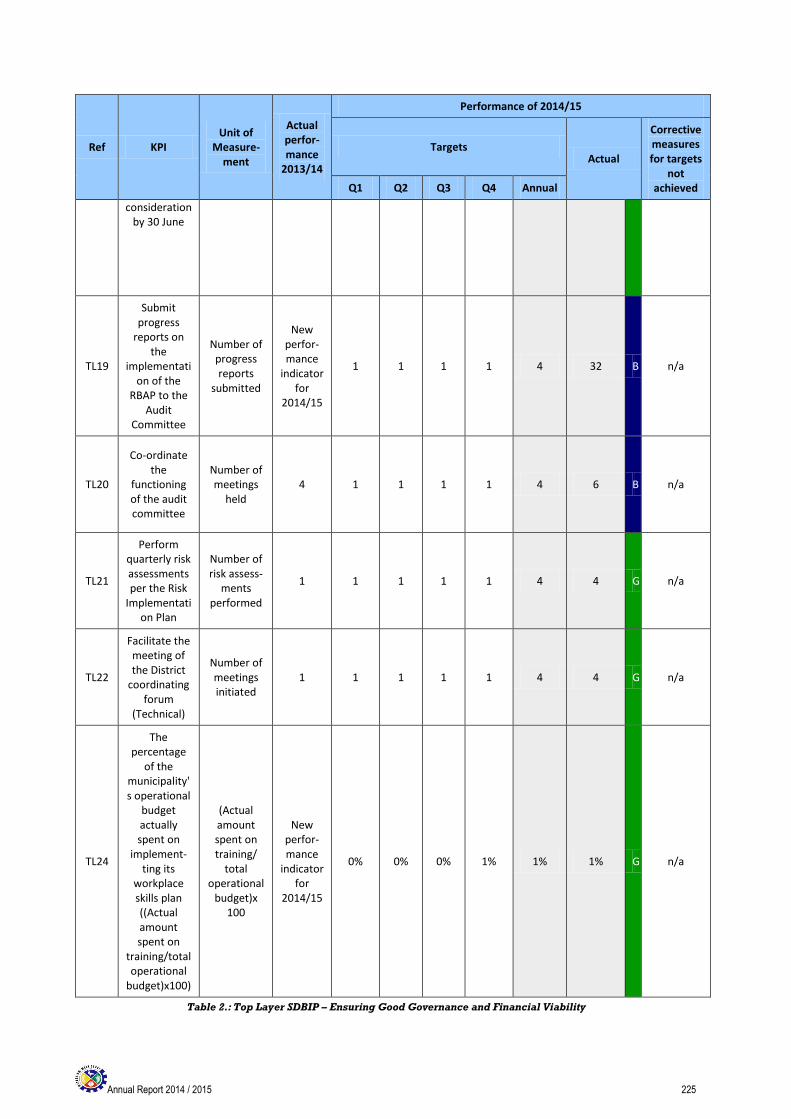
Annual Report 2014 / 2015 225
Ref KPI Unit of
Measure-ment
Actual perfor-mance
2013/14
Performance of 2014/15
Targets Actual
Corrective measures for targets
not achieved Q1 Q2 Q3 Q4 Annual
consideration by 30 June
TL19
Submit progress
reports on the
implementation of the
RBAP to the Audit
Committee
Number of progress reports
submitted
New perfor-mance
indicator for
2014/15
1 1 1 1 4 32 B n/a
TL20
Co-ordinate the
functioning of the audit committee
Number of meetings
held 4 1 1 1 1 4 6 B n/a
TL21
Perform quarterly risk assessments per the Risk
Implementation Plan
Number of risk assess-
ments performed
1 1 1 1 1 4 4 G n/a
TL22
Facilitate the meeting of the District
coordinating forum
(Technical)
Number of meetings initiated
1 1 1 1 1 4 4 G n/a
TL24
The percentage
of the municipality's operational
budget actually spent on
implement-ting its
workplace skills plan ((Actual amount spent on
training/total operational
budget)x100)
(Actual amount spent on training/
total operational
budget)x 100
New perfor-mance
indicator for
2014/15
0% 0% 0% 1% 1% 1% G n/a
Table 2.: Top Layer SDBIP – Ensuring Good Governance and Financial Viability

Annual Report 2014 / 2015 226
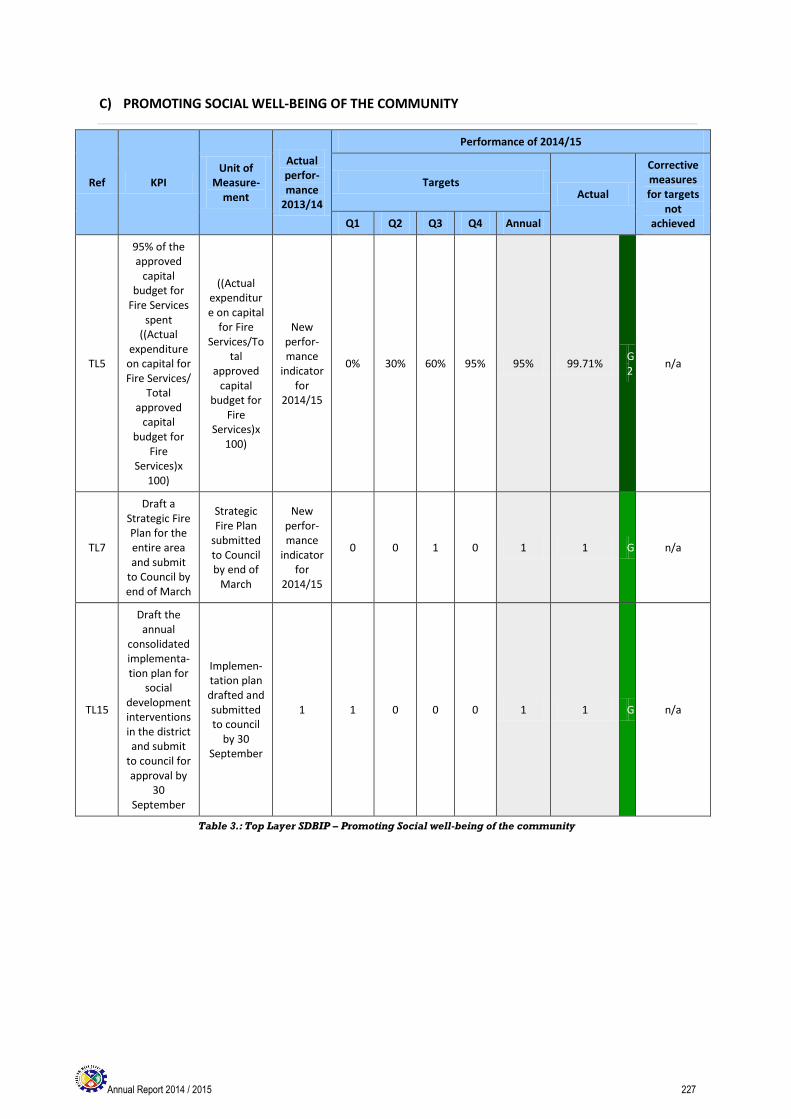
Annual Report 2014 / 2015 227
C) PROMOTING SOCIAL WELL-BEING OF THE COMMUNITY
Ref KPI Unit of
Measure-ment
Actual perfor-mance
2013/14
Performance of 2014/15
Targets Actual
Corrective measures for targets
not achieved Q1 Q2 Q3 Q4 Annual
TL5
95% of the approved
capital budget for
Fire Services spent
((Actual expenditure
on capital for Fire Services/
Total approved
capital budget for
Fire Services)x
100)
((Actual expenditure on capital
for Fire Services/To
tal approved
capital budget for
Fire Services)x
100)
New perfor-mance
indicator for
2014/15
0% 30% 60% 95% 95% 99.71% G2
n/a
TL7
Draft a Strategic Fire Plan for the entire area and submit
to Council by end of March
Strategic Fire Plan
submitted to Council by end of
March
New perfor-mance
indicator for
2014/15
0 0 1 0 1 1 G n/a
TL15
Draft the annual
consolidated implementa-tion plan for
social development interventions in the district and submit
to council for approval by
30 September
Implemen-tation plan drafted and submitted to council
by 30 September
1 1 0 0 0 1 1 G n/a
Table 3.: Top Layer SDBIP – Promoting Social well-being of the community
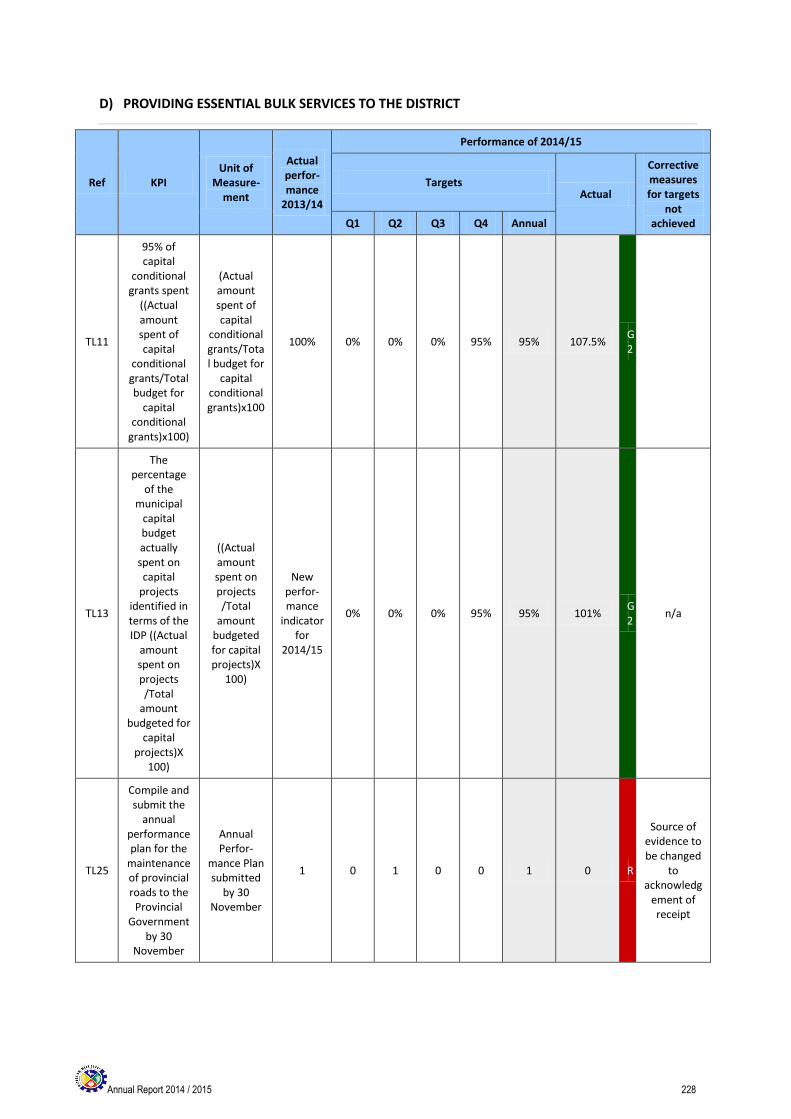
Annual Report 2014 / 2015 228
D) PROVIDING ESSENTIAL BULK SERVICES TO THE DISTRICT
Ref KPI Unit of
Measure-ment
Actual perfor-mance
2013/14
Performance of 2014/15
Targets Actual
Corrective measures for targets
not achieved Q1 Q2 Q3 Q4 Annual
TL11
95% of capital
conditional grants spent
((Actual amount spent of capital
conditional grants/Total budget for
capital conditional
grants)x100)
(Actual amount spent of capital
conditional grants/Total budget for
capital conditional grants)x100
100% 0% 0% 0% 95% 95% 107.5% G2
TL13
The percentage
of the municipal
capital budget actually spent on capital
projects identified in terms of the IDP ((Actual
amount spent on projects /Total
amount budgeted for
capital projects)X
100)
((Actual amount spent on projects /Total
amount budgeted for capital projects)X
100)
New perfor-mance
indicator for
2014/15
0% 0% 0% 95% 95% 101% G2
n/a
TL25
Compile and submit the
annual performance plan for the
maintenance of provincial roads to the
Provincial Government
by 30 November
Annual Perfor-
mance Plan submitted
by 30 November
1 0 1 0 0 1 0 R
Source of evidence to be changed
to acknowledg
ement of receipt
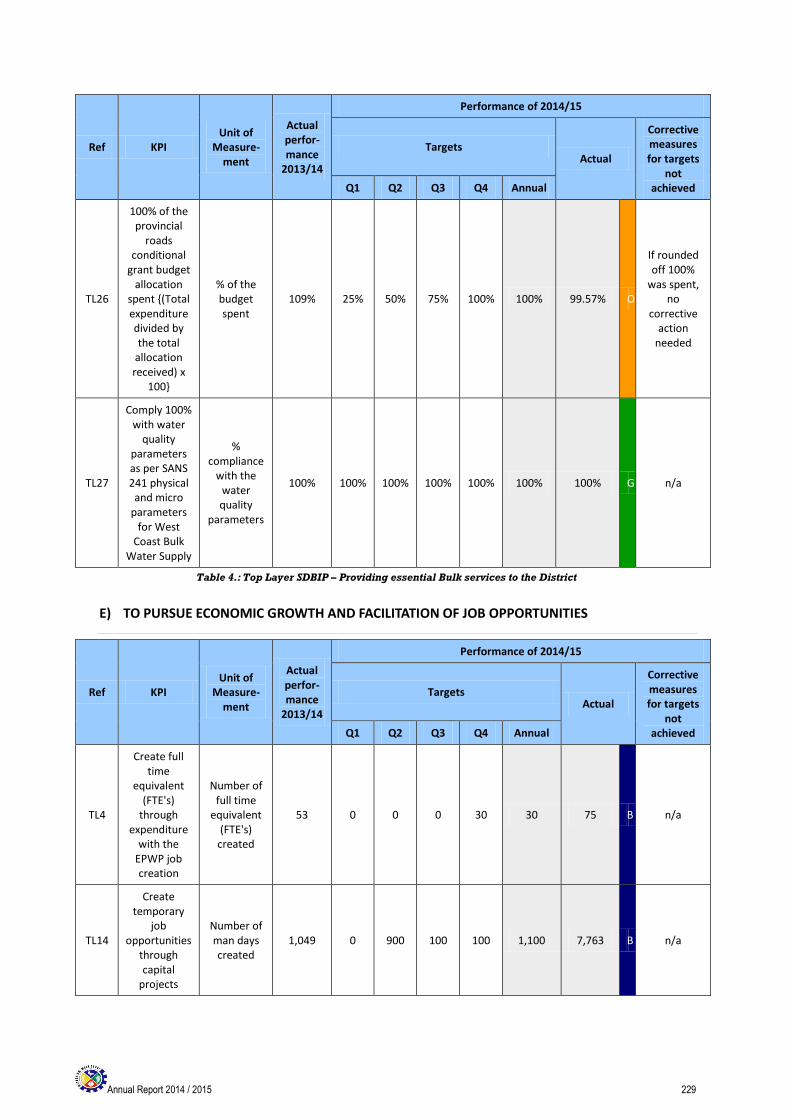
Annual Report 2014 / 2015 229
Ref KPI Unit of
Measure-ment
Actual perfor-mance
2013/14
Performance of 2014/15
Targets Actual
Corrective measures for targets
not achieved Q1 Q2 Q3 Q4 Annual
TL26
100% of the provincial
roads conditional
grant budget allocation
spent {(Total expenditure divided by the total
allocation received) x
100}
% of the budget spent
109% 25% 50% 75% 100% 100% 99.57% O
If rounded off 100%
was spent, no
corrective action
needed
TL27
Comply 100% with water
quality parameters as per SANS 241 physical
and micro parameters
for West Coast Bulk
Water Supply
% compliance
with the water quality
parameters
100% 100% 100% 100% 100% 100% 100% G n/a
Table 4.: Top Layer SDBIP – Providing essential Bulk services to the District
E) TO PURSUE ECONOMIC GROWTH AND FACILITATION OF JOB OPPORTUNITIES
Ref KPI Unit of
Measure-ment
Actual perfor-mance
2013/14
Performance of 2014/15
Targets Actual
Corrective measures for targets
not achieved Q1 Q2 Q3 Q4 Annual
TL4
Create full time
equivalent (FTE's)
through expenditure
with the EPWP job creation
Number of full time
equivalent (FTE's)
created
53 0 0 0 30 30 75 B n/a
TL14
Create temporary
job opportunities
through capital
projects
Number of man days created
1,049 0 900 100 100 1,100 7,763 B n/a
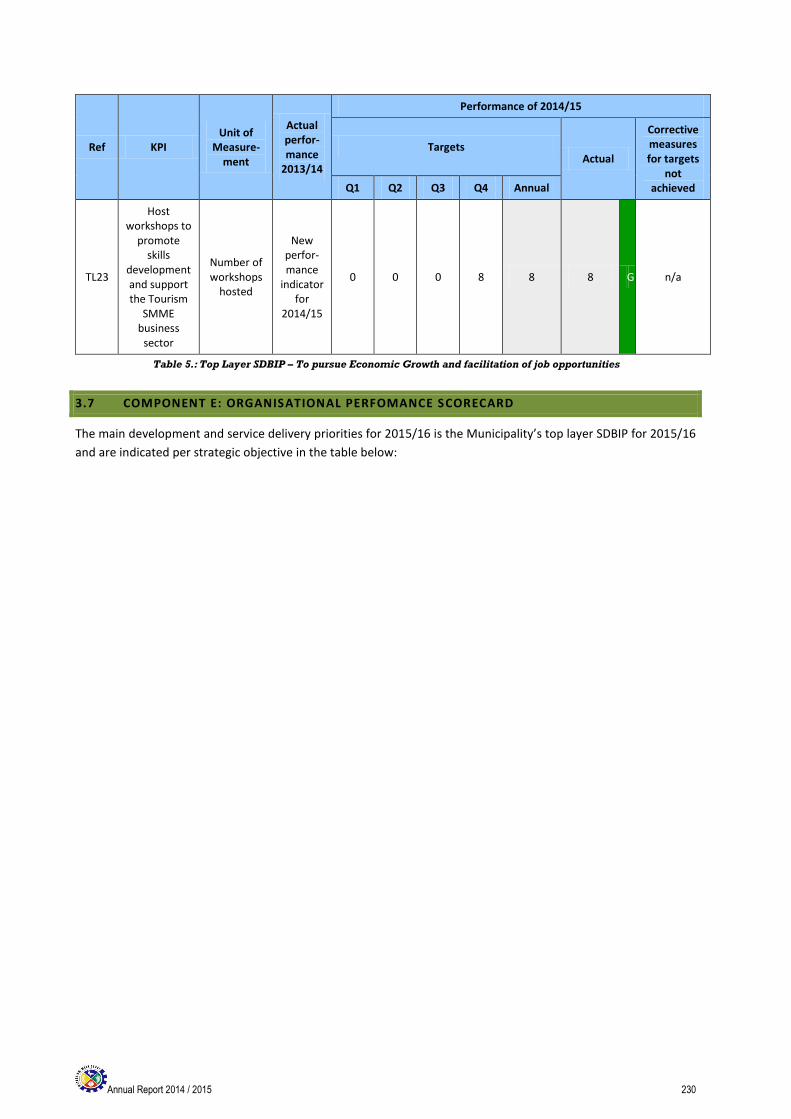
Annual Report 2014 / 2015 230
Ref KPI Unit of
Measure-ment
Actual perfor-mance
2013/14
Performance of 2014/15
Targets Actual
Corrective measures for targets
not achieved Q1 Q2 Q3 Q4 Annual
TL23
Host workshops to
promote skills
development and support the Tourism
SMME business
sector
Number of workshops
hosted
New perfor-mance
indicator for
2014/15
0 0 0 8 8 8 G n/a
Table 5.: Top Layer SDBIP – To pursue Economic Growth and facilitation of job opportunities
3.7 COMPONENT E: ORGANISATIONAL PERFOMANCE SCORECARD
The main development and service delivery priorities for 2015/16 is the Municipality’s top layer SDBIP for 2015/16
and are indicated per strategic objective in the table below:
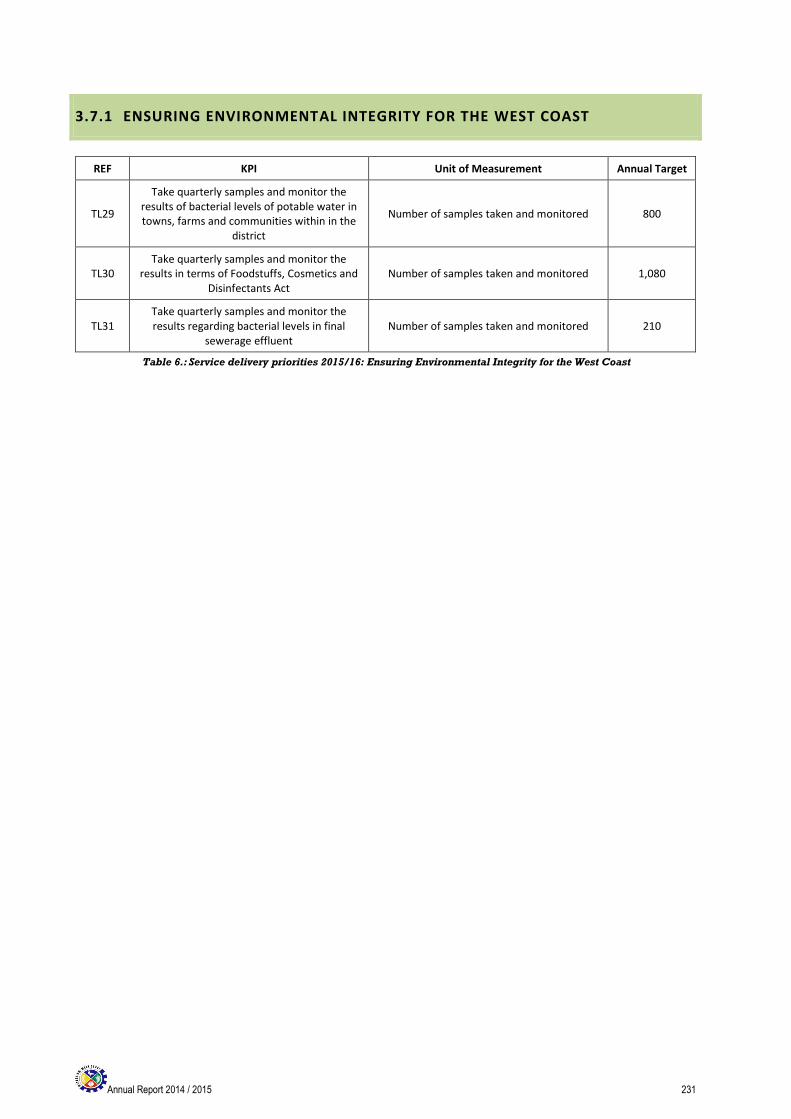
Annual Report 2014 / 2015 231
3.7.1 ENSURING ENVIRONMENTAL INTEGRITY FOR THE WEST COAST
REF KPI Unit of Measurement Annual Target
TL29
Take quarterly samples and monitor the results of bacterial levels of potable water in towns, farms and communities within in the
district
Number of samples taken and monitored 800
TL30 Take quarterly samples and monitor the
results in terms of Foodstuffs, Cosmetics and Disinfectants Act
Number of samples taken and monitored 1,080
TL31 Take quarterly samples and monitor the results regarding bacterial levels in final
sewerage effluent Number of samples taken and monitored 210
Table 6.: Service delivery priorities 2015/16: Ensuring Environmental Integrity for the West Coast
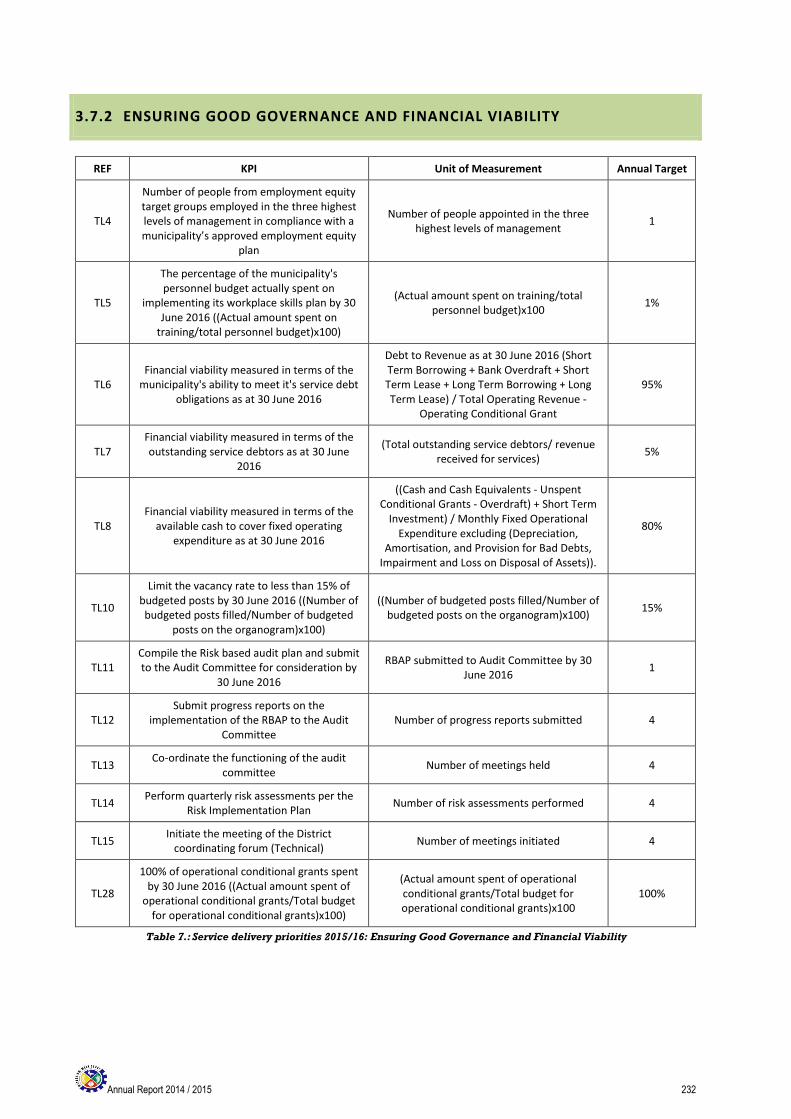
Annual Report 2014 / 2015 232
3.7.2 ENSURING GOOD GOVERNANCE AND FINANCIAL VIABILITY
REF KPI Unit of Measurement Annual Target
TL4
Number of people from employment equity target groups employed in the three highest levels of management in compliance with a municipality’s approved employment equity
plan
Number of people appointed in the three highest levels of management
1
TL5
The percentage of the municipality's personnel budget actually spent on
implementing its workplace skills plan by 30 June 2016 ((Actual amount spent on
training/total personnel budget)x100)
(Actual amount spent on training/total personnel budget)x100
1%
TL6 Financial viability measured in terms of the
municipality's ability to meet it's service debt obligations as at 30 June 2016
Debt to Revenue as at 30 June 2016 (Short Term Borrowing + Bank Overdraft + Short Term Lease + Long Term Borrowing + Long Term Lease) / Total Operating Revenue -
Operating Conditional Grant
95%
TL7 Financial viability measured in terms of the outstanding service debtors as at 30 June
2016
(Total outstanding service debtors/ revenue received for services)
5%
TL8 Financial viability measured in terms of the
available cash to cover fixed operating expenditure as at 30 June 2016
((Cash and Cash Equivalents - Unspent Conditional Grants - Overdraft) + Short Term
Investment) / Monthly Fixed Operational Expenditure excluding (Depreciation,
Amortisation, and Provision for Bad Debts, Impairment and Loss on Disposal of Assets)).
80%
TL10
Limit the vacancy rate to less than 15% of budgeted posts by 30 June 2016 ((Number of budgeted posts filled/Number of budgeted
posts on the organogram)x100)
((Number of budgeted posts filled/Number of budgeted posts on the organogram)x100)
15%
TL11 Compile the Risk based audit plan and submit to the Audit Committee for consideration by
30 June 2016
RBAP submitted to Audit Committee by 30 June 2016
1
TL12 Submit progress reports on the
implementation of the RBAP to the Audit Committee
Number of progress reports submitted 4
TL13 Co-ordinate the functioning of the audit
committee Number of meetings held 4
TL14 Perform quarterly risk assessments per the
Risk Implementation Plan Number of risk assessments performed 4
TL15 Initiate the meeting of the District
coordinating forum (Technical) Number of meetings initiated 4
TL28
100% of operational conditional grants spent by 30 June 2016 ((Actual amount spent of
operational conditional grants/Total budget for operational conditional grants)x100)
(Actual amount spent of operational conditional grants/Total budget for operational conditional grants)x100
100%
Table 7.: Service delivery priorities 2015/16: Ensuring Good Governance and Financial Viability
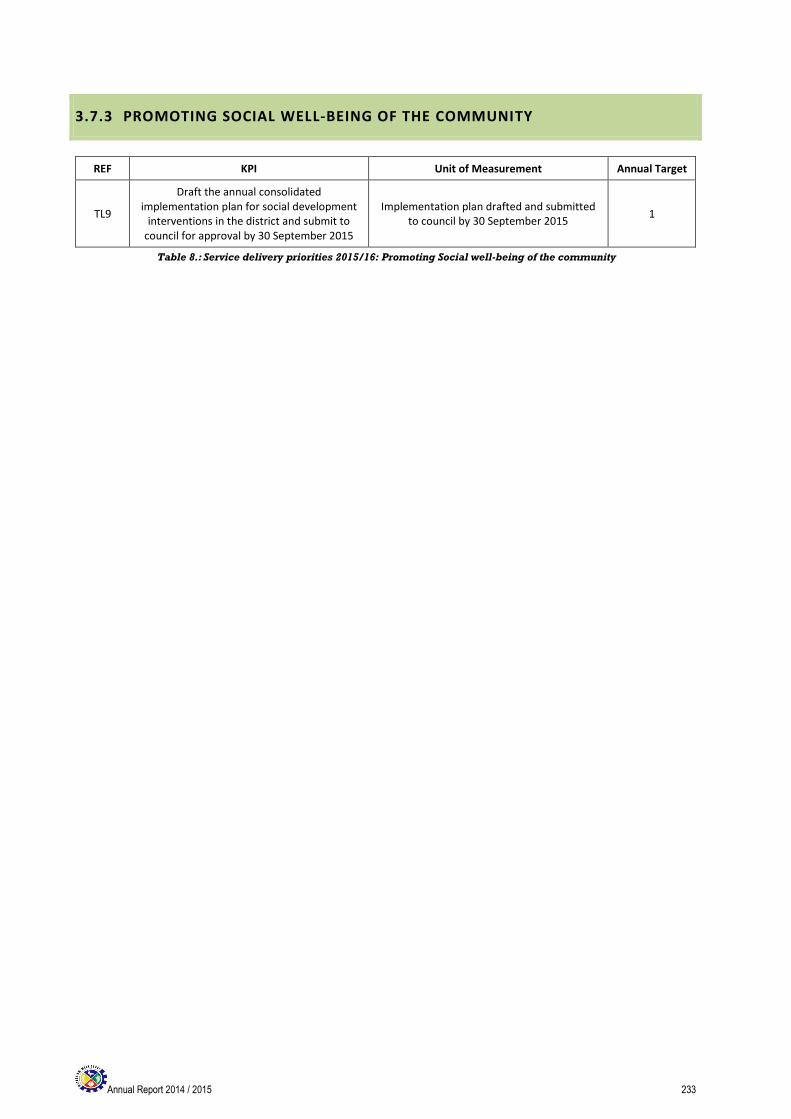
Annual Report 2014 / 2015 233
3.7.3 PROMOTING SOCIAL WELL-BEING OF THE COMMUNITY
REF KPI Unit of Measurement Annual Target
TL9
Draft the annual consolidated implementation plan for social development
interventions in the district and submit to council for approval by 30 September 2015
Implementation plan drafted and submitted to council by 30 September 2015
1
Table 8.: Service delivery priorities 2015/16: Promoting Social well-being of the community
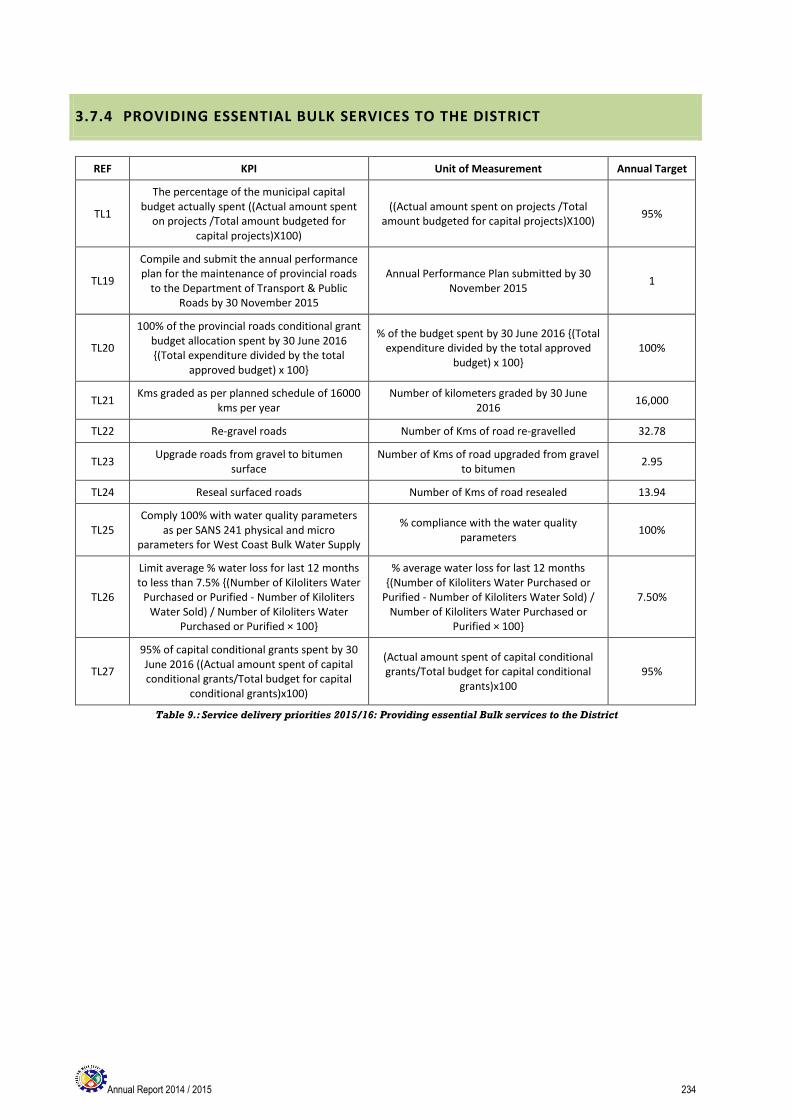
Annual Report 2014 / 2015 234
3.7.4 PROVIDING ESSENTIAL BULK SERVICES TO THE DISTRICT
REF KPI Unit of Measurement Annual Target
TL1
The percentage of the municipal capital budget actually spent ((Actual amount spent
on projects /Total amount budgeted for capital projects)X100)
((Actual amount spent on projects /Total amount budgeted for capital projects)X100)
95%
TL19
Compile and submit the annual performance plan for the maintenance of provincial roads
to the Department of Transport & Public Roads by 30 November 2015
Annual Performance Plan submitted by 30 November 2015
1
TL20
100% of the provincial roads conditional grant budget allocation spent by 30 June 2016 {(Total expenditure divided by the total
approved budget) x 100}
% of the budget spent by 30 June 2016 {(Total expenditure divided by the total approved
budget) x 100} 100%
TL21 Kms graded as per planned schedule of 16000
kms per year Number of kilometers graded by 30 June
2016 16,000
TL22 Re-gravel roads Number of Kms of road re-gravelled 32.78
TL23 Upgrade roads from gravel to bitumen
surface Number of Kms of road upgraded from gravel
to bitumen 2.95
TL24 Reseal surfaced roads Number of Kms of road resealed 13.94
TL25 Comply 100% with water quality parameters
as per SANS 241 physical and micro parameters for West Coast Bulk Water Supply
% compliance with the water quality parameters
100%
TL26
Limit average % water loss for last 12 months to less than 7.5% {(Number of Kiloliters Water
Purchased or Purified - Number of Kiloliters Water Sold) / Number of Kiloliters Water
Purchased or Purified × 100}
% average water loss for last 12 months {(Number of Kiloliters Water Purchased or
Purified - Number of Kiloliters Water Sold) / Number of Kiloliters Water Purchased or
Purified × 100}
7.50%
TL27
95% of capital conditional grants spent by 30 June 2016 ((Actual amount spent of capital conditional grants/Total budget for capital
conditional grants)x100)
(Actual amount spent of capital conditional grants/Total budget for capital conditional
grants)x100 95%
Table 9.: Service delivery priorities 2015/16: Providing essential Bulk services to the District
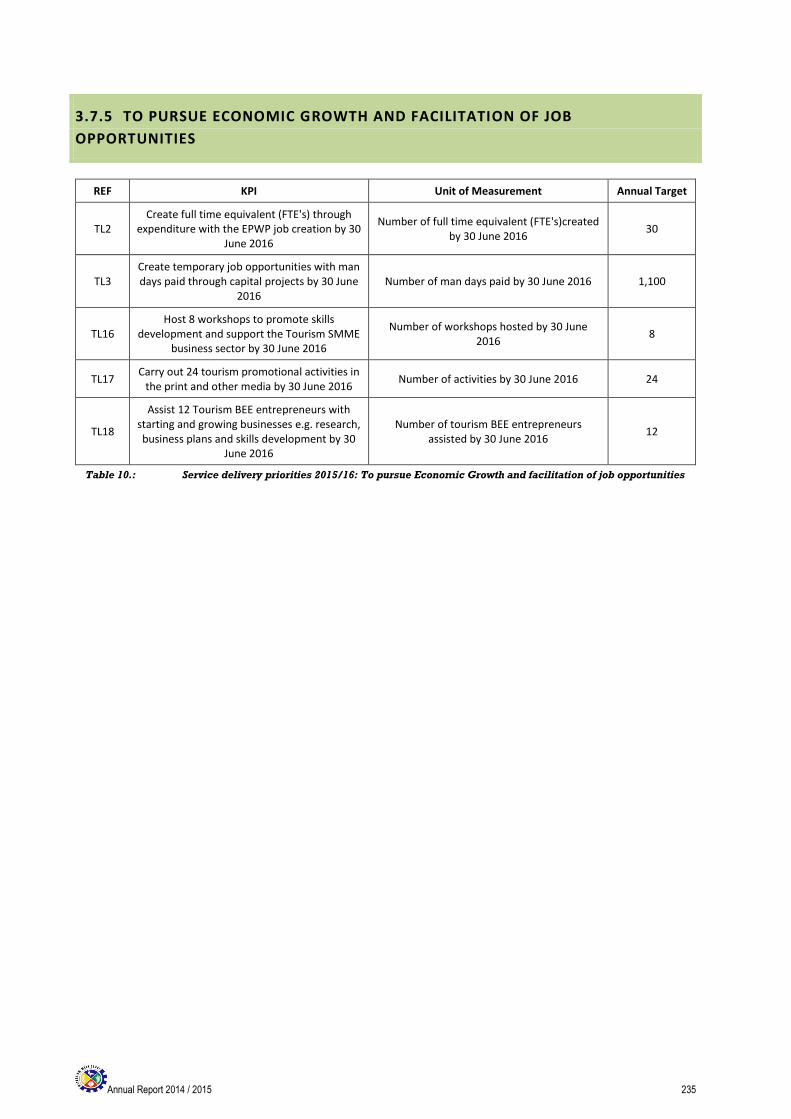
Annual Report 2014 / 2015 235
3.7.5 TO PURSUE ECONOMIC GROWTH AND FACILITATION OF JOB
OPPORTUNITIES
REF KPI Unit of Measurement Annual Target
TL2 Create full time equivalent (FTE's) through
expenditure with the EPWP job creation by 30 June 2016
Number of full time equivalent (FTE's)created by 30 June 2016
30
TL3 Create temporary job opportunities with man days paid through capital projects by 30 June
2016 Number of man days paid by 30 June 2016 1,100
TL16 Host 8 workshops to promote skills
development and support the Tourism SMME business sector by 30 June 2016
Number of workshops hosted by 30 June 2016
8
TL17 Carry out 24 tourism promotional activities in
the print and other media by 30 June 2016 Number of activities by 30 June 2016 24
TL18
Assist 12 Tourism BEE entrepreneurs with starting and growing businesses e.g. research, business plans and skills development by 30
June 2016
Number of tourism BEE entrepreneurs assisted by 30 June 2016
12
Table 10.: Service delivery priorities 2015/16: To pursue Economic Growth and facilitation of job opportunities
Annual Report 2014 / 2015 236
VOLUME II – ANNUAL FINANCIAL STATEMENTS
Financial statements attached