Embed Size (px)
Citation preview

Annual Report 2014
Zurich Insurance Group
Q4_2014_01_AR14_Group_Overview_en.indd 1 23.02.2015 16:10:31
Zurich Insurance Group Mythenquai 2 8002 Zurich, Switzerland Phone +41 (0) 44 625 25 25 www.zurich.com
48559–1502
Q4_2014_18_AR14_Shareholder_Info_Glossary_Disclaimer_en.indd 4 23.02.2015 16:48:46
Zurich Insurance Group A
nnu
al Repo
rt 2014w
ww
.zurich.com
Q4_2014_00_AR14_Cover_en.indd 1 23.02.2015 17:10:58
13
2
45
1 2 3
4 5
About Zurich
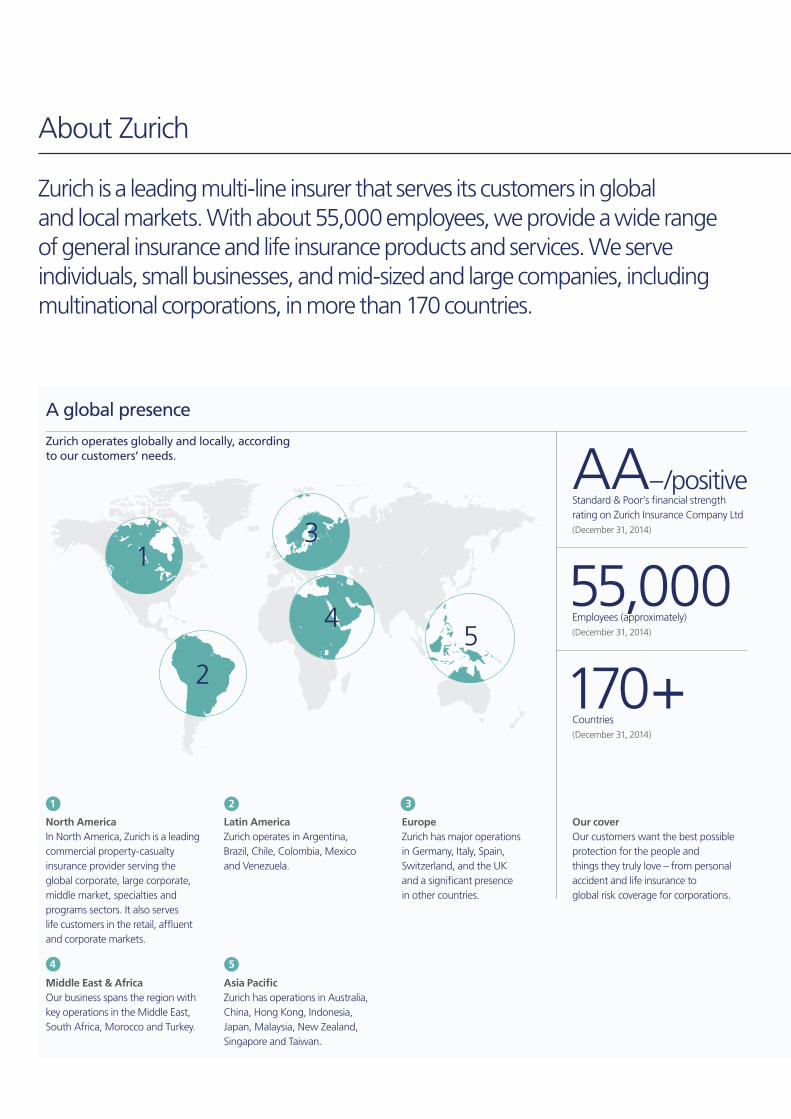
Zurich is a leading multi-line insurer that serves its customers in global and local markets. With about 55,000 employees, we provide a wide range of general insurance and life insurance products and services. We serve individuals, small businesses, and mid-sized and large companies, including multinational corporations, in more than 170 countries.
A global presence
Zurich operates globally and locally, according to our customers’ needs.
North AmericaIn North America, Zurich is a leading commercial property-casualty insurance provider serving the global corporate, large corporate, middle market, specialties and programs sectors. It also serves life customers in the retail, affluent and corporate markets.
Latin AmericaZurich operates in Argentina, Brazil, Chile, Colombia, Mexico and Venezuela.
EuropeZurich has major operations in Germany, Italy, Spain, Switzerland, and the UK and a significant presence in other countries.
AA–/positiveStandard & Poor’s financial strength rating on Zurich Insurance Company Ltd(December 31, 2014)
55,000Employees (approximately)(December 31, 2014)
170+Countries(December 31, 2014)
Middle East & AfricaOur business spans the region with key operations in the Middle East, South Africa, Morocco and Turkey.
Asia PacificZurich has operations in Australia, China, Hong Kong, Indonesia, Japan, Malaysia, New Zealand, Singapore and Taiwan.
Our coverOur customers want the best possible protection for the people and things they truly love – from personal accident and life insurance to global risk coverage for corporations.
Q4_2014_01_AR14_Group_Overview_en.indd 2 23.02.2015 16:10:32
Zurich Insurance Group Annual Report 2014
The Annual Report is published in English and German. In the event of inconsistencies in the German translation, the English original version shall prevail.
Design by Addison Group, www.addison-group.net
Photography by Anne Morgenstern except for cover image.
Publishing system: ns.publish by Multimedia Solutions AG, www.mmsag.ch
Cover printed on Heaven 42, an environmentally friendly paper sourced from well-managed forests independently certified according to the rules of the Forest Stewardship Council ® (FSC).
Content printed on MultiOffset, an environmentally friendly paper made from totally chlorine-free pulp also sourced from well-managed forests independently certified according to the rules of the Forest Stewardship Council ® (FSC).
Printed climate neutrally with ClimatePartner using green electricity end of February 2015 by Neidhart + Schön AG, www.nsgroup.ch. ISO 14001 certified.
Q4_2014_18_AR14_Shareholder_Info_Glossary_Disclaimer_en.indd 3 23.02.2015 16:48:46Q4_2014_00_AR14_Cover_en.indd 2 23.02.2015 17:10:59
Zurich Insurance Group Annual Report 2014 1
Gro
up overview
Govern
ance
Gro
up p
erform
ance review
Finan
cial inform
ation
About Zurich
55,000Employees (approximately)(December 31, 2014)
Group overview Performance overview 2Message from the Chairman and CEO 4Business environment 6How we create sustainable value 8Our strategy 2014 – 2016 10Business review 2014 12
GovernanceCorporate governance report 20Remuneration report 62
Group performance reviewOperating and financial review 98Risk review 114
Financial informationConsolidated financial statements 156Embedded value report 258Holding company 292Shareholder information 308Contact information 311Glossary 312
Contents
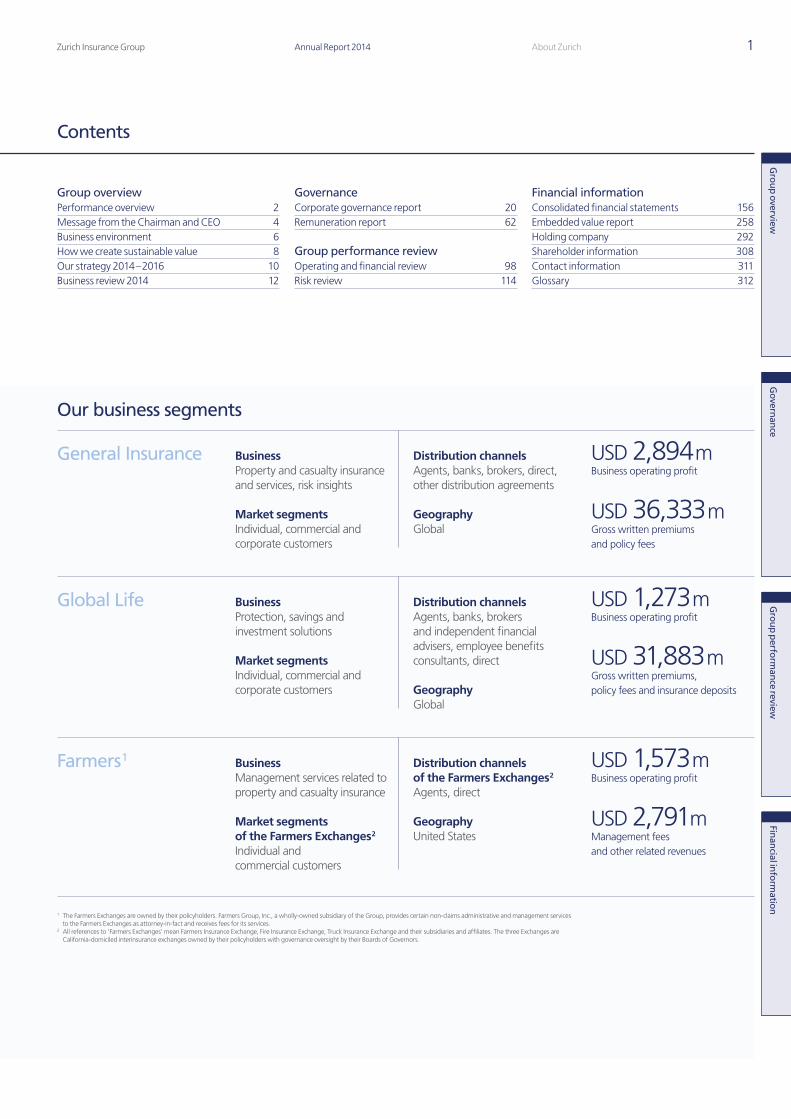
Our business segments
General Insurance
Global Life
Farmers 1
1 The Farmers Exchanges are owned by their policyholders. Farmers Group, Inc., a wholly-owned subsidiary of the Group, provides certain non-claims administrative and management services to the Farmers Exchanges as attorney-in-fact and receives fees for its services.
2 All references to ‘Farmers Exchanges’ mean Farmers Insurance Exchange, Fire Insurance Exchange, Truck Insurance Exchange and their subsidiaries and affiliates. The three Exchanges are California-domiciled interinsurance exchanges owned by their policyholders with governance oversight by their Boards of Governors.
BusinessProperty and casualty insurance and services, risk insights
Market segments Individual, commercial and corporate customers
BusinessProtection, savings and investment solutions
Market segmentsIndividual, commercial and corporate customers
BusinessManagement services related to property and casualty insurance
Market segments of the Farmers Exchanges 2 Individual and commercial customers
Distribution channelsAgents, banks, brokers, direct, other distribution agreements
GeographyGlobal
Distribution channels Agents, banks, brokers and independent financial advisers, employee benefits consultants, direct
GeographyGlobal
Distribution channels of the Farmers Exchanges 2
Agents, direct
GeographyUnited States
USD 2,894 mBusiness operating profit
USD 36,333 mGross written premiums and policy fees
USD 1,273 mBusiness operating profit
USD 31,883 mGross written premiums, policy fees and insurance deposits
USD 1,573 mBusiness operating profit
USD 2,791 mManagement fees and other related revenues
Q4_2014_01_AR14_Group_Overview_en.indd 1 24.02.2015 12:30:36
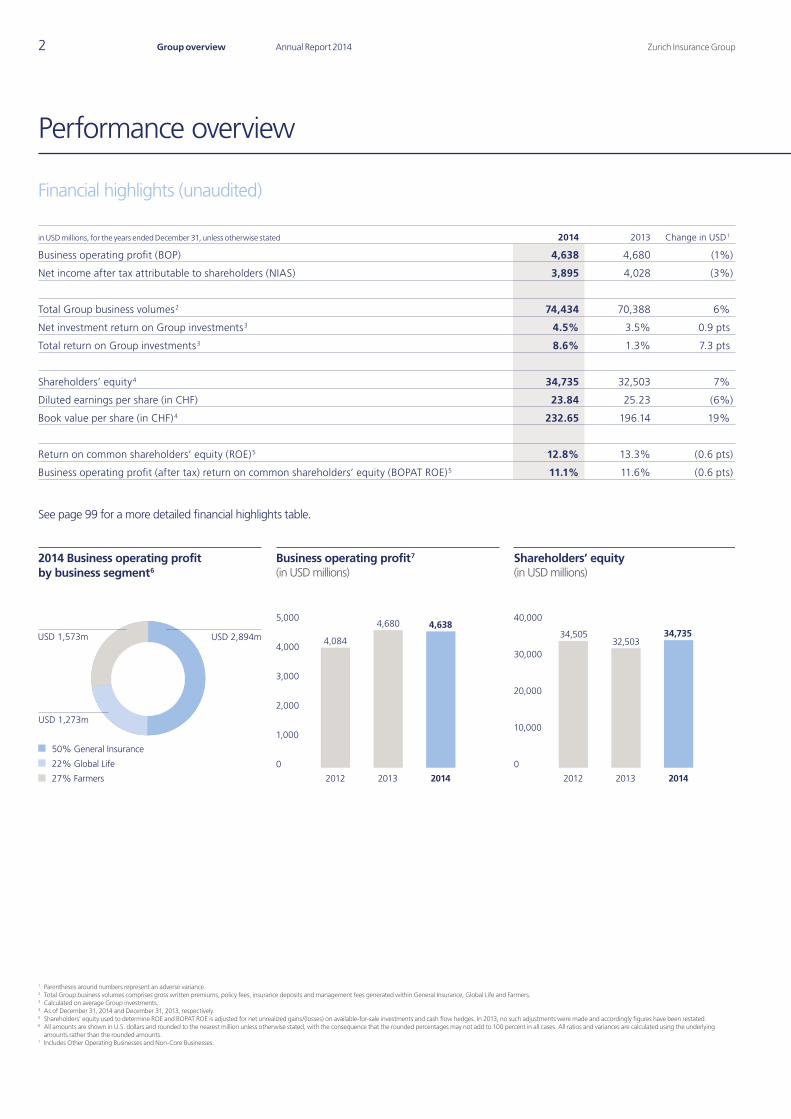
2014 Business operating profit by business segment6
Business operating profit7
(in USD millions)
0
1,000
2,000
3,000
4,0004,084
4,680
2012 2013 2014 2012 2013 2014
Shareholders’ equity(in USD millions)
20,000
10,000
0
30,000
40,0005,0004,638
34,50532,503
34,735
USD 1,273m
USD 1,573m USD 2,894m
50% General Insurance
22% Global Life
27% Farmers
Zurich Insurance GroupAnnual Report 2014Group overview2
Financial highlights (unaudited)
Performance overview
1 Parentheses around numbers represent an adverse variance.2 Total Group business volumes comprises gross written premiums, policy fees, insurance deposits and management fees generated within General Insurance, Global Life and Farmers.3 Calculated on average Group investments.4 As of December 31, 2014 and December 31, 2013, respectively.5 Shareholders’ equity used to determine ROE and BOPAT ROE is adjusted for net unrealized gains/(losses) on available-for-sale investments and cash flow hedges. In 2013, no such adjustments were made and accordingly figures have been restated.6 All amounts are shown in U.S. dollars and rounded to the nearest million unless otherwise stated, with the consequence that the rounded percentages may not add to 100 percent in all cases. All ratios and variances are calculated using the underlying
amounts rather than the rounded amounts.7 Includes Other Operating Businesses and Non-Core Businesses.
in USD millions, for the years ended December 31, unless otherwise stated 2014 2013 Change in USD 1
Business operating profit (BOP) 4,638 4,680 (1%)
Net income after tax attributable to shareholders (NIAS) 3,895 4,028 (3%)
Total Group business volumes 2 74,434 70,388 6%
Net investment return on Group investments 3 4.5% 3.5% 0.9 pts
Total return on Group investments 3 8.6% 1.3% 7.3 pts
Shareholders’ equity 4 34,735 32,503 7%
Diluted earnings per share (in CHF) 23.84 25.23 (6%)
Book value per share (in CHF) 4 232.65 196.14 19%
Return on common shareholders’ equity (ROE) 5 12.8% 13.3% (0.6 pts)
Business operating profit (after tax) return on common shareholders’ equity (BOPAT ROE) 5 11.1% 11.6% (0.6 pts)
See page 99 for a more detailed financial highlights table.
Q4_2014_01_AR14_Group_Overview_en.indd 2 24.02.2015 12:30:37
Zurich Insurance Group Annual Report 2014 3
Gro
up overview
Performance overview
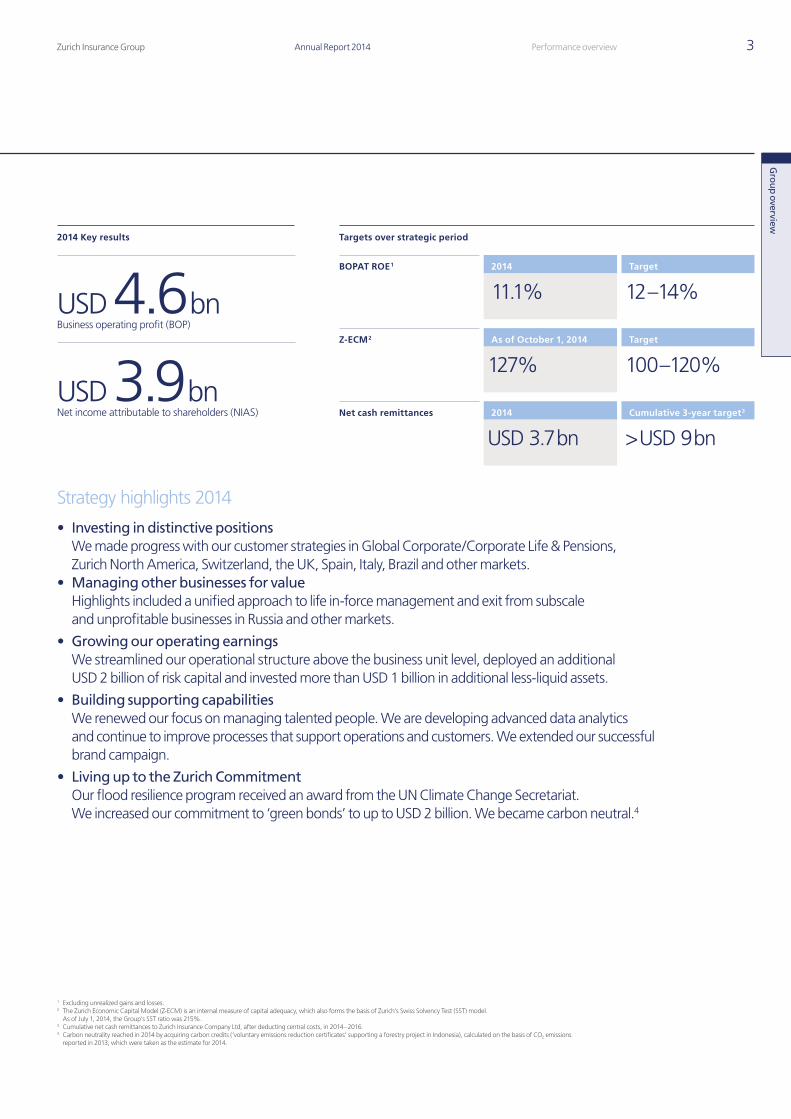
Strategy highlights 2014
• Investing in distinctive positions We made progress with our customer strategies in Global Corporate/Corporate Life & Pensions, Zurich North America, Switzerland, the UK, Spain, Italy, Brazil and other markets.
• Managing other businesses for value Highlights included a unified approach to life in-force management and exit from subscale and unprofitable businesses in Russia and other markets.
• Growing our operating earnings We streamlined our operational structure above the business unit level, deployed an additional USD 2 billion of risk capital and invested more than USD 1 billion in additional less-liquid assets.
• Building supporting capabilities We renewed our focus on managing talented people. We are developing advanced data analytics and continue to improve processes that support operations and customers. We extended our successful brand campaign.
• Living up to the Zurich Commitment Our flood resilience program received an award from the UN Climate Change Secretariat. We increased our commitment to ‘green bonds’ to up to USD 2 billion. We became carbon neutral.4
1 Excluding unrealized gains and losses.2 The Zurich Economic Capital Model (Z-ECM) is an internal measure of capital adequacy, which also forms the basis of Zurich’s Swiss Solvency Test (SST) model.
As of July 1, 2014, the Group’s SST ratio was 215%.3 Cumulative net cash remittances to Zurich Insurance Company Ltd, after deducting central costs, in 2014 – 2016.4 Carbon neutrality reached in 2014 by acquiring carbon credits (‘voluntary emissions reduction certificates’ supporting a forestry project in Indonesia), calculated on the basis of CO2 emissions
reported in 2013, which were taken as the estimate for 2014.
USD 4.6 bnBusiness operating profit (BOP)
USD 3.9 bnNet income attributable to shareholders (NIAS) 2014 Cumulative 3-year target 3
Target
BOPAT ROE 1
Z-ECM 2
Net cash remittances
11.1%Target
12 –14%
127% 100 –120%
USD 3.7 bn > USD 9 bn
2014 Key results Targets over strategic period
2014
As of October 1, 2014
Q4_2014_01_AR14_Group_Overview_en.indd 3 24.02.2015 12:30:37
Zurich Insurance GroupAnnual Report 2014Group overview4
Message from the Chairman and Chief Executive Officer
In 2014, Zurich delivered a business operating profit 1 (BOP) of USD 4.6 billion, one percent lower than in 2013. Our net income attributable to shareholders (NIAS) fell three percent to USD 3.9 billion in the same period, and our BOP after-tax return on equity in 2014 was 11.1 percent, down from 11.6 percent in 2013.
Zurich is very well capitalized. Our Zurich Economic Capital Model 2 (Z-ECM) was 127 percent as of October 1, 2014. Net cash remittances to the holding company were USD 3.7 billion, which puts us on course to deliver more than USD 9 billion over the three years to 2016, even with the impact from currency headwinds. Reflecting the stability of our business and strong capital position, our Board will propose a dividend of CHF 17.00 per share. Subject to shareholder approval at the Annual General Meeting on April 1, 2015, the proposed 2014 dividend would be paid from the Zurich Insurance Group Ltd’s capital contribution reserves.
At Farmers, 3 the development is very positive, with two consecutive quarters of growth and a continuation of positive trends.
We are continuing to execute on our three strategic cornerstones: prioritizing investment in distinctive positions; managing other businesses for value; and growing our operating earnings. This approach is designed to increase growth and profitability, working toward our 2016 financial targets.
While our financial results do not yet show the full benefit of the initiatives underway, we have made a positive start to the plans we set out at our December 2013 Investor Day.
In General Insurance, we continue to make good progress in improving our accident year combined ratio, although the results show that we still have much to do in our turnaround businesses, and in driving further improvement.
In Global Life, we see good momentum in our priority life markets, and expect to start seeing the benefits of in-force management initiatives coming through in our earnings over the next two years.
Tom de Swaan and Martin Senn
1 Business operating profit indicates the underlying performance of the Group’s business units by eliminating the impact of financial market volatility and other non-operational variables.
2 The Zurich Economic Capital Model (Z-ECM) is an internal measure of capital adequacy, which also forms the basis of Zurich’s Swiss Solvency Test (SST) model.
3 The Farmers Exchanges are owned by their policyholders. Farmers Group, Inc., a wholly owned subsidiary of the Group, provides certain non-claims administrative and management services to the Farmers Exchanges as attorney-in-fact and receives fees for its services.
Q4_2014_01_AR14_Group_Overview_en.indd 4 24.02.2015 12:30:47
Zurich Insurance Group Annual Report 2014 5
Gro
up overview
Message from the Chairman and CEO
Progress across all business segmentsIn 2014, General Insurance gross written premiums increased in local currency terms, led by the Group’s priority markets. General Insurance made good progress in the strategy to turn around or exit underperforming businesses – such as our decision to sell our general insurance retail business in Russia – and deliver an improved combined ratio, offset by lower releases on reserves established in prior years.
Global Life delivered strong growth in the U.S. and UK priority markets for retail, bank distribution and Corporate Life & Pensions in 2014. BOP was broadly flat compared with the prior year.
At the Farmers Exchanges, although gross written premiums were flat for the year, momentum was very positive, with growth of 2.4 percent in the final three months of 2014. Customer experience, measured by the Net Promoter Score, a measure of customer satisfaction and loyalty, improved considerably and customer retention rose to 76.8 percent at the end of 2014 from 74.8 percent at the end of 2013.
Corporate responsibilityWe believe that by acting responsibly, we can create sustainable value for all our stakeholders. In 2014 we doubled our commitment to invest in green bonds to up to USD 2 billion. The bonds will fund projects that help to reduce or mitigate the impact of climate change.
We are working to increase flood resilience in at-risk communities through our innovative flood resilience alliance. In 2014 the United Nations Framework Convention on Climate Change recognized Zurich’s flood resilience program as an exemplary ‘Lighthouse Activity.’ Zurich also significantly improved its performance in the Dow Jones Sustainability Index (DJSI). And at the end of 2014, Zurich was ‘carbon neutral.’ 4
Board and senior executive appointmentsAt the Annual General Meeting the Board of Directors will propose to elect Joan Amble and Kishore Mahbubani to the Board of Directors for a term of office of one year each. Joan Amble brings extensive business experience in finance, accounting, operational and risk management, and strategic
leadership to the Board. Kishore Mahbubani is widely recognized as an expert in geopolitical and economic issues and has a strong network in Asia and internationally.
On the Group Executive Committee, Cecilia Reyes, Chief Investment Officer, will take on the additional responsibility of Regional Chairman of Asia Pacific, succeeding Geoff Riddell, who is retiring from the Group. He will step down effective end of March 2015 and will continue to be involved for a transition period as Cecilia Reyes assumes this additional role effective April 1, 2015. We would like to thank Geoff for his outstanding contribution to the Group.
Looking aheadAlthough the economic environment is challenging, and interest rates are expected to remain low, we are convinced that the strategy we set out in 2013 is the right one, and are committed to delivering on our three strategic cornerstones. We thank you for your continued support.
Martin Senn Chief Executive Officer
Tom de Swaan Chairman of the Board of Directors
4 Carbon neutrality reached in 2014 by acquiring carbon credits (‘voluntary emissions reduction certificates’ supporting a forestry project in Indonesia), calculated on the basis of CO2 emissions reported in 2013, which were taken as the estimate for 2014.
Q4_2014_01_AR14_Group_Overview_en.indd 5 24.02.2015 12:30:47
Zurich Insurance GroupAnnual Report 2014Group overview6
Business environment
Zurich’s strategy is underpinned by developments in our target markets, new technologies, regulationand the expectations of our stakeholders.
Target markets
As part of our strategy for 2014 – 2016, we target customers in the corporate market, commercial mid-market and selected retail markets.
Corporate marketZurich is a leader in the growing corporate market. Growth is driven by the geographic expansion of large corporations based in the OECD countries and emergence of large corporations in developing countries. We target those corporations that actively manage their risks and seek the services of global insurers such as Zurich that can offer international coverage and risk insights.
Large corporations are centralizing and coordinating risk management and insurance purchasing. They must deal with the increasing interconnection of risks, regulatory complexity and impact of technological change. Our global coverage, experience in this market and holistic approach that brings together our Global Corporate and Corporate Life & Pensions products mean that Zurich is well positioned to be the insurer of choice.
Commercial mid-market Zurich aims to build its position in the commercial mid-market globally, beginning with North America – by far the largest market – where we have a top-five position. Our research identified five behavioral segments, of which we are targeting ‘expertise seekers’, who tend to seek relationships with companies that have expertise, and a strong brand and reputation. We are making use of technology known as predictive analytics to develop competitive value propositions aimed at this group. We believe this approach can be replicated and we intend to extend it to other national markets.
In the next five to 10 years, customers will look to their insurers to help them manage risks in an increasingly complex environment. Deep customer insights derived from predictive analytics will help us compete by enabling a more tailored approach to risk selection and risk pricing, along with delivering valuable risk insights to our customers. Our size and global reach are an advantage, as scale is needed to build sufficiently large data pools to enable us to draw valuable conclusions.
Retail marketsZurich’s retail strategy is to grow market share with our target customer segment, the ‘confident planners,’ in selected markets. Confident planners are sophisticated insurance buyers who seek expert advice and individual treatment. They are more interested in the benefits of insurance products and services than low prices. They have high expectations and want to buy from trustworthy insurers who provide convenience on the customer’s terms, through a range of channels, including digital technology.
Retail premiums are concentrated in Europe and North America. But retail insurance will continue to grow globally, driven by the growth of the middle classes and the shift from public to private provision in long-term protection and retirement savings. Emerging Asia and Latin America are the future centers of growth.
Emerging technology trends
By closely monitoring technological trends and sharing the insights we develop with our customers, Zurich will benefit by managing emerging risks and winning business through new products, services and solutions.
The ‘internet of things’ will see objects such as cars, household appliances and health-monitoring devices connected to the internet, producing large volumes of data that will be available to support better tailoring of risk solutions (subject to appropriate privacy controls). Automation and advanced robotics are creating the ability to automate physical and knowledge-intensive work. These technologies will improve many insurance processes, from underwriting to customer service. Ubiquity of data will allow insurers, through advanced analytics, to develop risk management insights that will help them better serve their customers and become more efficient. On-board sensors (telematics) and self-driving vehicles have the potential to increase vehicle and driving safety and change the nature of motor liability.
Regulatory developments
Global versus local regulationRisks are increasingly interconnected and global. Likewise, the insurance industry is increasingly becoming global, but insurance regulatory frameworks remain mainly focused on local markets. The fragmented nature of regulation threatens the efficient allocation of capital and makes it harder for global insurers to fulfill their risk-bearing and risk-spreading roles, thus weakening their ability to facilitate international trade, economic growth and individual well-being. This is why, in the interest of avoiding redundant and contradictory
Q4_2014_01_AR14_Group_Overview_en.indd 6 24.02.2015 12:30:48
Zurich Insurance Group Annual Report 2014 7
Gro
up overview
Business environment
regulation and also to ensure the effective use of its capital, Zurich supports a consolidated group-level approach to regulation, such as the ComFrame initiative.
The Financial Stability Board has asked the International Association of Insurance Supervisors to develop a global insurance capital standard (ICS) that addresses concerns about financial stability and the need for international supervision. Zurich supports well-designed global standards for capital. The ICS could help to provide regulatory certainty with respect to solvency, improve group supervision and provide a more level playing field for global insurers.
G-SII designations In November 2014, the Financial Stability Board updated its list of global systemically important insurers (G-SIIs), which are those it rates, in essence, as ‘too big to fail.’ As in 2013, Zurich was not placed on this list. We strongly believe that traditional insurers do not pose a systemic risk to the global financial system. This decision recognizes our focus on traditional insurance business.
Stakeholder expectations
Corporate responsibility Trust in large corporations has been eroded since the onset of the financial crisis in 2007. Against this backdrop, Zurich’s strong reputation is a long-term competitive asset. We aim to reinforce this asset by embedding corporate responsibility (CR) throughout our business. By acting responsibly in everything we do, we want to create sustainable value for all our stakeholders.
Insurance creates value for society. It allows people and businesses to protect themselves from risk and helps them become prosperous and resilient. Risks are becoming more complex as a result of climate change, globalization, urbanization and technological development. Expectations are now growing for insurers to use their core skills to help communities and society become more resilient to these interconnected risks, including natural hazards.
That is why our three lead areas in CR are flood resilience; responsible investment; and CR in our work with corporate customers, which includes taking account of environmental, social and governance factors in our underwriting decisions. These are all areas in which we can make use of our core insurance skills – such as risk management, investment management and underwriting – to address issues of concern to stakeholders.
Zurich’s responsible approach to business includes our corporate governance procedures. For us, high standards of corporate governance are not just a matter of regulatory compliance: good governance supports our reputation for integrity and ethical conduct.
For more information1 on the progress we made in corporate responsibility in 2014, please see: www.zurich.com/corporate-responsibility Political engagement Stakeholders increasingly expect companies to be transparent about how they engage with politicians and governments, including any political contributions. Zurich supports such voluntary disclosure. You can read more about our involvement in the political process at www.zurich.com/cr/strategy-priorities
1 Audited by PricewaterhouseCoopers AG.
Our people Our people play a key role in helping us to be the best global insurer. In turn, we must provide a working environment where they can be at their best so that we can deliver on our strategy and attract and retain the talented people we need.
The Zurich Commitment to stakeholders and Zurich Basics, our code of conduct, are part of the training of virtually every employee. They encapsulate our core values. We are now building on these values to evolve our culture toward one where our people can deliver even better results, inspire trust and confidence, show compassion and care and make a difference to those around them.
We have defined six people practices and a number of programs to support this cultural shift, aiming at further empowering people managers, fostering a more inclusive workplace, creating a diverse leadership pipeline and strengthening our employer brand.
Q4_2014_01_AR14_Group_Overview_en.indd 7 24.02.2015 12:30:48
Zurich Insurance GroupAnnual Report 2014Group overview8
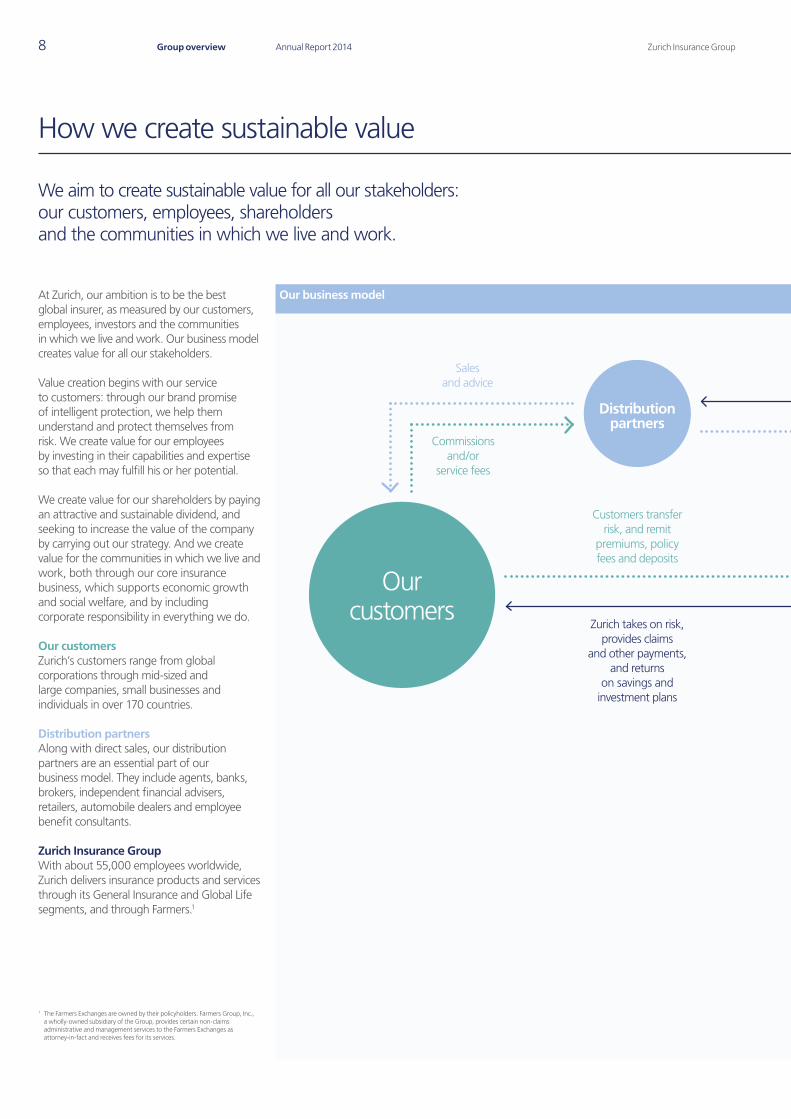
We aim to create sustainable value for all our stakeholders: our customers, employees, shareholders and the communities in which we live and work.
How we create sustainable value
At Zurich, our ambition is to be the best global insurer, as measured by our customers, employees, investors and the communities in which we live and work. Our business model creates value for all our stakeholders.
Value creation begins with our service to customers: through our brand promise of intelligent protection, we help them understand and protect themselves from risk. We create value for our employees by investing in their capabilities and expertise so that each may fulfill his or her potential.
We create value for our shareholders by paying an attractive and sustainable dividend, and seeking to increase the value of the company by carrying out our strategy. And we create value for the communities in which we live and work, both through our core insurance business, which supports economic growth and social welfare, and by including corporate responsibility in everything we do.
Our customers Zurich’s customers range from global corporations through mid-sized and large companies, small businesses and individuals in over 170 countries.
Distribution partners Along with direct sales, our distribution partners are an essential part of our business model. They include agents, banks, brokers, independent financial advisers, retailers, automobile dealers and employee benefit consultants.
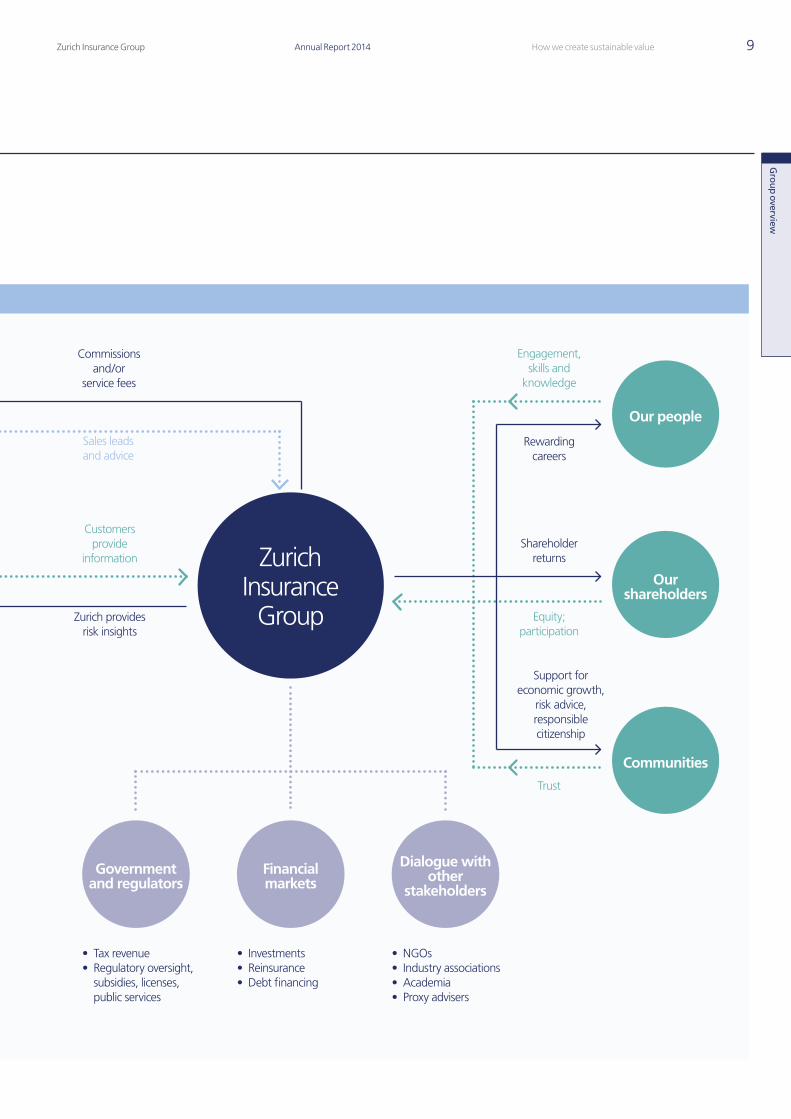
Zurich Insurance Group With about 55,000 employees worldwide, Zurich delivers insurance products and services through its General Insurance and Global Life segments, and through Farmers.1
1 The Farmers Exchanges are owned by their policyholders. Farmers Group, Inc., a wholly-owned subsidiary of the Group, provides certain non-claims administrative and management services to the Farmers Exchanges as attorney-in-fact and receives fees for its services.
Our business model
Distribution partners
Salesand advice
Commissions and/or
service fees
Customers transfer risk, and remit
premiums, policy fees and deposits
Zurich takes on risk, provides claims
and other payments, and returns
on savings and investment plans
Our customers
Q4_2014_01_AR14_Group_Overview_en.indd 8 24.02.2015 12:30:48
Zurich Insurance Group Annual Report 2014 9
Gro
up overview
How we create sustainable value
Commissionsand/or
service fees
Sales leadsand advice
Customers provide
information
Zurich provides risk insights
Government and regulators
Financialmarkets
Dialogue with other
stakeholders
• Tax revenue• Regulatory oversight,
subsidies, licenses, public services
• Investments• Reinsurance• Debt financing
• NGOs• Industry associations• Academia• Proxy advisers
Zurich Insurance
Group
Rewarding careers
Shareholder returns
Equity; participation
Engagement, skills and
knowledge
Support for economic growth,
risk advice, responsible citizenship
Our people
Ourshareholders
Communities
Trust
Q4_2014_01_AR14_Group_Overview_en.indd 9 24.02.2015 12:30:49
Intelligent protection
Who we are
Wh
at w
e do How we
do
it
Zurich Insurance GroupAnnual Report 2014Group overview10
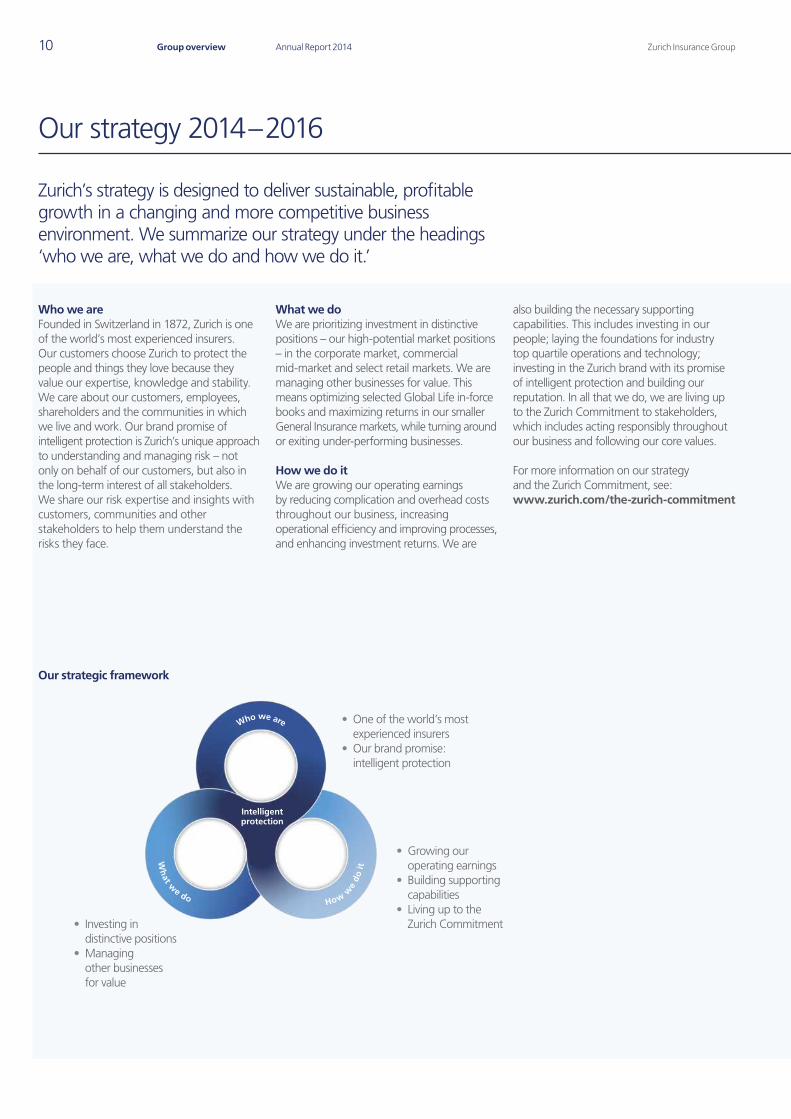
Zurich’s strategy is designed to deliver sustainable, profitable growth in a changing and more competitive business environment. We summarize our strategy under the headings ‘who we are, what we do and how we do it.’
Our strategy 2014 – 2016
Our strategic framework
• One of the world’s most experienced insurers
• Our brand promise: intelligent protection
Who we areFounded in Switzerland in 1872, Zurich is one of the world’s most experienced insurers. Our customers choose Zurich to protect the people and things they love because they value our expertise, knowledge and stability. We care about our customers, employees, shareholders and the communities in which we live and work. Our brand promise of intelligent protection is Zurich’s unique approach to understanding and managing risk – not only on behalf of our customers, but also in the long-term interest of all stakeholders. We share our risk expertise and insights with customers, communities and other stakeholders to help them understand the risks they face.
What we do We are prioritizing investment in distinctive positions – our high-potential market positions – in the corporate market, commercial mid-market and select retail markets. We are managing other businesses for value. This means optimizing selected Global Life in-force books and maximizing returns in our smaller General Insurance markets, while turning around or exiting under-performing businesses.
How we do itWe are growing our operating earnings by reducing complication and overhead costs throughout our business, increasing operational efficiency and improving processes, and enhancing investment returns. We are
also building the necessary supporting capabilities. This includes investing in our people; laying the foundations for industry top quartile operations and technology; investing in the Zurich brand with its promise of intelligent protection and building our reputation. In all that we do, we are living up to the Zurich Commitment to stakeholders, which includes acting responsibly throughout our business and following our core values.
For more information on our strategy and the Zurich Commitment, see: www.zurich.com/the-zurich-commitment
• Investing in distinctive positions
• Managing other businesses for value
• Growing our operating earnings
• Building supporting capabilities
• Living up to the Zurich Commitment
Q4_2014_01_AR14_Group_Overview_en.indd 10 24.02.2015 17:02:23
Zurich Insurance Group Annual Report 2014 11
Gro
up overview
Our strategy 2014 – 2016
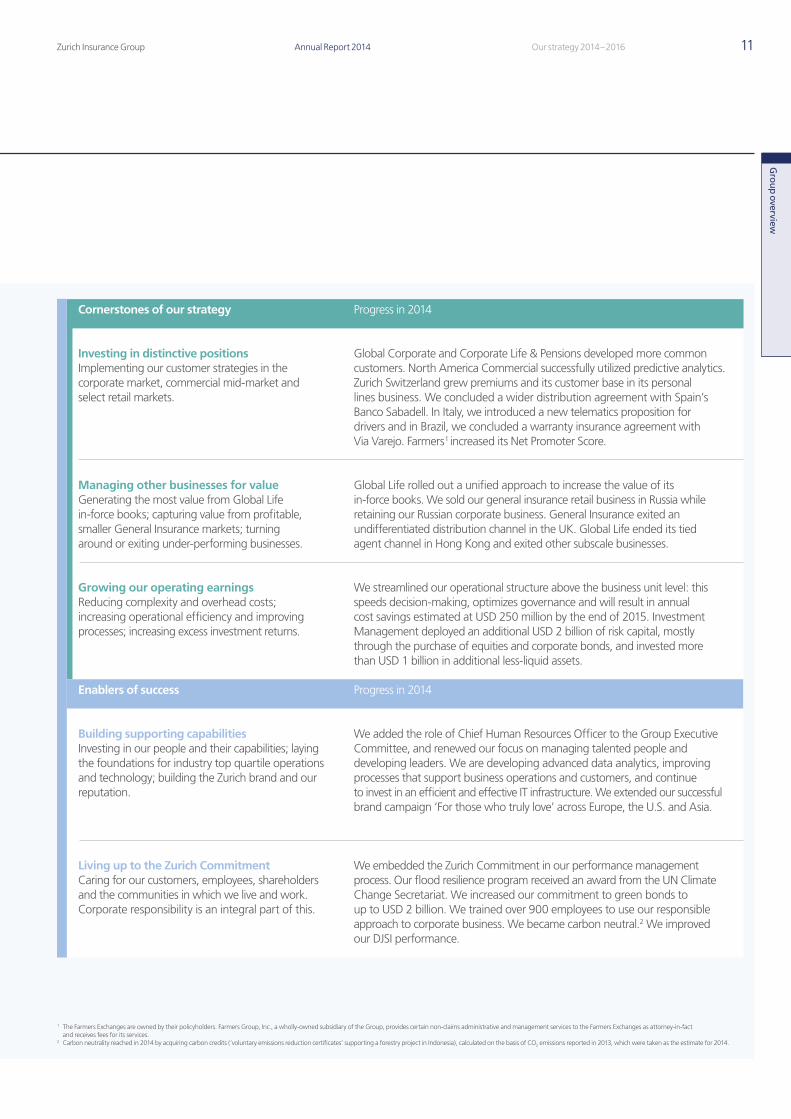
Progress in 2014Cornerstones of our strategy
Investing in distinctive positionsImplementing our customer strategies in the corporate market, commercial mid-market and select retail markets.
Managing other businesses for valueGenerating the most value from Global Life in-force books; capturing value from profitable, smaller General Insurance markets; turning around or exiting under-performing businesses.
Growing our operating earningsReducing complexity and overhead costs; increasing operational efficiency and improving processes; increasing excess investment returns.
Building supporting capabilitiesInvesting in our people and their capabilities; laying the foundations for industry top quartile operations and technology; building the Zurich brand and our reputation.
Global Corporate and Corporate Life & Pensions developed more common customers. North America Commercial successfully utilized predictive analytics. Zurich Switzerland grew premiums and its customer base in its personal lines business. We concluded a wider distribution agreement with Spain’s Banco Sabadell. In Italy, we introduced a new telematics proposition for drivers and in Brazil, we concluded a warranty insurance agreement with Via Varejo. Farmers 1 increased its Net Promoter Score.
Global Life rolled out a unified approach to increase the value of its in-force books. We sold our general insurance retail business in Russia while retaining our Russian corporate business. General Insurance exited an undifferentiated distribution channel in the UK. Global Life ended its tied agent channel in Hong Kong and exited other subscale businesses.
We streamlined our operational structure above the business unit level: this speeds decision-making, optimizes governance and will result in annual cost savings estimated at USD 250 million by the end of 2015. Investment Management deployed an additional USD 2 billion of risk capital, mostly through the purchase of equities and corporate bonds, and invested more than USD 1 billion in additional less-liquid assets.
We embedded the Zurich Commitment in our performance management process. Our flood resilience program received an award from the UN Climate Change Secretariat. We increased our commitment to green bonds to up to USD 2 billion. We trained over 900 employees to use our responsible approach to corporate business. We became carbon neutral.2 We improved our DJSI performance.
We added the role of Chief Human Resources Officer to the Group Executive Committee, and renewed our focus on managing talented people and developing leaders. We are developing advanced data analytics, improving processes that support business operations and customers, and continue to invest in an efficient and effective IT infrastructure. We extended our successful brand campaign ‘For those who truly love’ across Europe, the U.S. and Asia.
Living up to the Zurich CommitmentCaring for our customers, employees, shareholders and the communities in which we live and work. Corporate responsibility is an integral part of this.
Progress in 2014Enablers of success
1 The Farmers Exchanges are owned by their policyholders. Farmers Group, Inc., a wholly-owned subsidiary of the Group, provides certain non-claims administrative and management services to the Farmers Exchanges as attorney-in-fact and receives fees for its services.
2 Carbon neutrality reached in 2014 by acquiring carbon credits (‘voluntary emissions reduction certificates’ supporting a forestry project in Indonesia), calculated on the basis of CO2 emissions reported in 2013, which were taken as the estimate for 2014.
Q4_2014_01_AR14_Group_Overview_en.indd 11 24.02.2015 12:30:54
Zurich Insurance GroupAnnual Report 2014Group overview12
While our financial results for 2014 do not yet show the full benefit of the initiatives underway, we have made a positive start to the plans we set out at our December 2013 Investor Day.
Investing in distinctive positions
Corporate customers Our customers are facing increased levels of uncertainty and are looking for holistic solutions to manage all their risk needs. Zurich is one of the few companies able to serve large corporate customers by providing them with both general and life insurance through a single, unified approach.
Customers appreciate our way of doing business, which is reflected in an increase in the number of our cross-sold transactions, meaning those involving existing Global Corporate customers buying Corporate Life & Pensions products and vice versa. In 2014, the number of such transactions stood at over 170, more than double those in 2013. This is significant, especially as the customers involved represent some of the world’s largest companies.
Zurich’s ability to offer efficient solutions to multinational customers, and help them to better understand their complex exposure to cross-border risks, is also welcomed by large global brokers and employee benefits consultants, who see our approach as beneficial to their own customer relationships.
North AmericaOur priorities include Zurich’s North America Commercial business. As one of the largest providers of insurance to medium-sized companies and those with specialized risks, we are well positioned to offer solutions to these customers in the commercial insurance market. We are the fourth-largest commercial insurer in the U.S. based on premiums and are among the leaders in several industry segments, including construction and franchised U.S. auto dealers. Our size and strength allow us to draw on a large pool of data to gain statistically
We are executing on our three strategic cornerstones: prioritizing investment in distinctive positions; managing other businesses for value; and growing our operating earnings.
Business review 2014
credible information about the markets in which we do business.
The combination of North America Commercial’s wealth of proprietary data and our investment in predictive analytics gives us a competitive advantage. The insights we are now obtaining from data allow us to provide more accurate and comprehensive customer solutions. Using predictive analytics, we can price risks much more selectively. We can also go one step further to provide our customers with real insights into risks to help them understand and protect themselves from risk.
Predictive analytics and our businessThe availability and accessibility of large amounts of risk data have transformed, and will continue to transform the insurance industry. That is why our businesses are actively building predictive analytics capabilities and using the insights from analytics to improve our business and to serve customers.
SwitzerlandWith over 1.4 million customers, Zurich is one of Switzerland’s largest insurers. As a result of our aim to sharpen our focus on customers, we have begun to see clear signs of success in our personal lines (retail) business. In 2014 our personal lines customer base and gross written premiums increased. We are also investing in our digital capabilities to make sure we can quickly adapt to customer needs.
United KingdomZurich Corporate Risk, part of Zurich Global Life, entered the UK corporate market in 2009, helping companies to protect their employees’ and their dependents’ futures. In 2014, the business celebrated its five-year anniversary in a strong position, having gained a 6.5 percent share of the UK corporate risk market.
Zurich Corporate Risk in the UK generated over GBP 120 million in insured premiums in 2014, and has one million members and 3,000 protection plans in place. Our market position strengthened in 2014, when we won 22 percent of Group Life new business in the UK and secured our largest income
protection agreement, with 5,300 members, and another Group Life agreement with 7,000 members.
SpainZurich is strengthening its position in Spain, a market where banks are by far the most important channel for life insurance, comprising close to 80 percent of total distribution. We expanded a 2008 agreement with Banco Sabadell to include the network of the former Caja de Ahorros del Mediterraneo (CAM) and acquired 50 percent of the CAM general insurance carrier Mediterraneo Seguros Diversos. With this, we gain direct access to an additional 2.4 million customers for life, pension and general insurance through more than 600 branches in Murcia and Valencia in eastern Spain, and the Balearic Islands. The agreement lets Zurich reclaim its sole provider status for insurance and pension plans throughout Spain within the bank’s network and reaffirms Banco Sabadell’s trust in Zurich.
ItalyWe aim to increase our share of the growing telematics motor market in Italy through an innovative proposition, Zurich BluDrive, which offers protection to drivers, passengers and vehicles, and an anti-theft tracking ‘panic button’ along with pro-active roadside service. The device is fitted to a car and tracks the vehicle using GPS technology. It allows Zurich to measure how safely the car is driven and the mileage, factors which can be taken into account in renewal premiums. Its anti-theft tracking also means that if the car is stolen, the owner just needs to contact the operations center, which can locate the vehicle.
BrazilBrazil is the largest market for extended warranty insurance in Latin America, an important service for newly-affluent consumers who want to protect their possessions. In 2014 we signed an exclusive agreement with Brazilian retailer Via Varejo, the country’s largest retail conglomerate. For a small additional fee, customers buying appliances, furniture and other items from two large retail chains owned by Via Varejo – Casas Bahia and Ponto Frio –
Q4_2014_01_AR14_Group_Overview_en.indd 12 24.02.2015 12:30:55
Zurich Insurance Group Annual Report 2014 13
Gro
up overview
Business review 2014
can get an extended warranty for their purchases from Zurich. On average, we are currently selling one of these warranties every 10 seconds. By providing protection to millions of customers, including some who might be buying insurance for the first time, Zurich is growing its business and becoming a more familiar brand in an attractive market. Farmers 1
Farmers made significant progress in 2014 on its goal of improving customer experience, supported by key initiatives including major digital improvements, simplified customer communications, and improved agent interaction. The Net Promoter Score (NPS) for Farmers customers – a broad measure of customer satisfaction and loyalty – increased throughout the year, rising 25 percent from the final three months of 2013 to the final three months of 2014. As customer experience improved, customer retention also increased to 76.8 percent at the end of 2014 from 74.8 percent at the end of 2013.
Farmers was also able to improve and grow its agency force in 2014. Through better agent recruiting and training, and smarter resource allocation, the company reversed what had been a declining number of agents in 2013 to add a net 414 agents in 2014, resulting in a total of 13,200 agents. The rate of attrition was also reduced. In 2014, agent retention was at its highest level in over five years. The company also continued its expansion into the eastern U.S. by opening operations in Connecticut to add its sixth eastern state.
Managing other businesses for value
In-force businessGlobal Life began implementing a unified in-force approach designed to obtain the most value out of existing business in each country concerned. So far, this has been rolled out across Germany, the UK, the U.S. and Switzerland, which together represent around 70 percent of Global Life’s in-force book. Through a number of measures, including enhancing our customers’ experience in dealing with Zurich, we are working to increase business operating profit.
In our U.S. business, Farmers New World Life, which accounts for more than USD 2 billion of the value of our in-force business (more than 18 percent), we are using Texas as our pilot state to implement targeted customer communications and active customer engagement at key points in the customer decision-making process. We have received positive customer and agent feedback and have improved customer retention.
Exiting under-performing businesses Our strategy calls for us to either turn around or exit businesses that under-perform. Our decision to sell our general insurance retail business in Russia to OLMA Group is in line with this strategy. Zurich will keep and further build its Russian corporate business, which mainly focuses on underwriting risks for large Russian and multinational commercial customers. In 2014, General Insurance also exited the Zurich-branded aggregator distribution channel in the UK, while Global Life ended its tied agents channel in Hong Kong and exited some other subscale businesses.
Growing our operating earnings
EfficiencyTo help us grow our operating earnings, we announced in 2014 that we would streamline our organizational structure above the business unit level. This process, which was completed in December 2014, will speed up our decision-making and achieve optimum governance. It is expected to deliver annual cost savings of USD 250 million dollars by the end of 2015.
Risk capitalTo grow our operating earnings, we are deploying additional risk capital. Our investment strategy is designed to enable us to meet our insurance obligations even under extreme circumstances and is backed by substantial amounts of dedicated risk capital to allow absorption of unexpected losses.
In 2014, Investment Management deployed an additional USD 2 billion of risk capital, mostly through the purchase of equities and corporate bonds, and invested more than USD 1 billion in additional less-liquid assets. We are considering other types of investments in this area, including increased lending to corporations and infrastructure debt. In line with our proven investment approach, we ensure that these investments match our obligations, while also compensating us for holding less easily-tradable assets. Such investments are mostly carried out through external asset managers, to allow Zurich to benefit from their expert skills. Any investment has to meet our stringent requirements and fit our overall goal of achieving optimum returns relative to risk.
1 The Farmers Exchanges are owned by their policyholders. Farmers Group, Inc., a wholly-owned subsidiary of the Group, provides certain non-claims administrative and management services to the Farmers Exchanges as attorney-in-fact and receives fees for its services.
Q4_2014_01_AR14_Group_Overview_en.indd 13 24.02.2015 12:30:55
Zurich Insurance GroupAnnual Report 2014Group overview14
Business review 2014 continued
Operations and technologyOperations and information technology play a key role in supporting Zurich’s growth strategy. Our Group Operations & Technology function is leading a number of programs to increase our operational efficiency and profitability.
Group Operations & Technology is working in close collaboration with our businesses to better enable Zurich to use data insights and advanced analytics to make business decisions and serve our customers. We are also focusing on ensuring our technology is effective by improving the processes that support our business operations.
And we are using technology to improve the quality of our customer service, while creating additional capacity for efficient growth. As digitization challenges how businesses operate, we will continue to look at innovative workplace and mobility technology to serve our customers in better ways and provide our employees with a technology environment that will support our success, now and in the future.
Building our brandWe extended our successful brand campaign ‘For those who truly love’ across Europe, the U.S., and Asia in 2014, focusing on TV to build awareness and using digital media and communication to engage customers. The
Building supporting capabilities
Our people Our people play a key role in helping us to be the best global insurer. In return, we must provide a working environment where they can be at their best so that we can deliver on our strategy and attract and retain the talented people we need.
The Zurich Commitment to stakeholders and Zurich Basics, our code of conduct, are part of the training of virtually every employee. They encapsulate our core values. We are now building on these values to evolve our culture toward one where our people can deliver even better results, inspire trust and confidence, show compassion and care and make a difference to those around them.
We have defined six people practices and a number of programs to support this cultural shift, aiming at further empowering people managers, fostering a more inclusive workplace, creating a diverse leadership pipeline and strengthening our employer brand.
For more information on the progress we have made in developing and managing our people, please see: www.zurich.com/cr/our-people
campaign, which was launched in September 2013 in Switzerland, and in our main corporate and commercial businesses in the U.S., UK and Germany, is built around the concept that when you truly love something, you want to protect it in the best way possible. The latest phase included brand campaigns in support of Italy’s Zurich BluDrive proposition, based on the use of an in-car telematics device. The campaign also supported MyZurich, an online portal serving Global Corporate customers.
We continued to engage customers and employees with campaigns that appeal to the emotions, including our winter snowman campaign promoted via digital media, cinema and TV. We brought our brand promise of intelligent protection to life through thought leadership and corporate responsibility communications, including publications produced by Zurich itself and together with academia, NGOs and commercial media organizations. Golf sponsorship is also helping to build the Zurich brand.
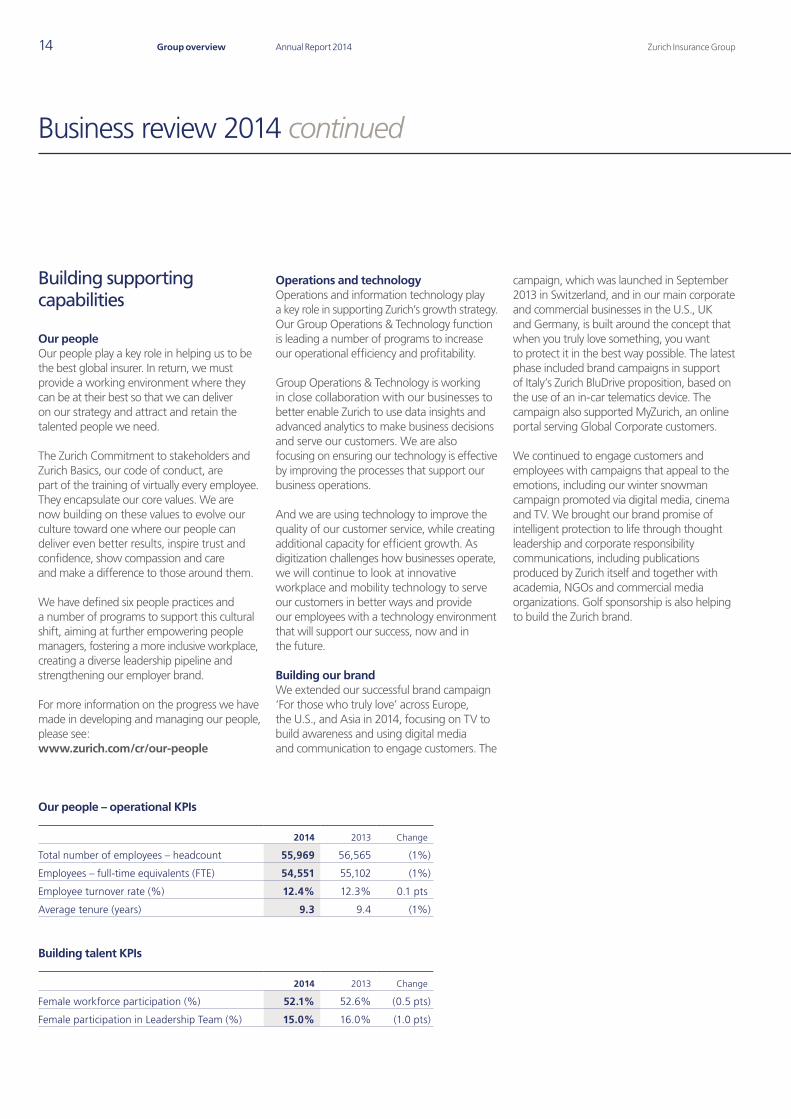
Our people – operational KPIs
2014 2013 Change
Total number of employees – headcount 55,969 56,565 (1%)
Employees – full-time equivalents (FTE) 54,551 55,102 (1%)
Employee turnover rate (%) 12.4% 12.3% 0.1 pts
Average tenure (years) 9.3 9.4 (1%)
Building talent KPIs
2014 2013 Change
Female workforce participation (%) 52.1% 52.6% (0.5 pts)
Female participation in Leadership Team (%) 15.0% 16.0% (1.0 pts)
Q4_2014_01_AR14_Group_Overview_en.indd 14 24.02.2015 12:30:55
Zurich Insurance Group Annual Report 2014 15
Gro
up overview
Business review 2014
Living up to the Zurich Commitment
The Zurich Commitment is a guide to behavior for all Zurich employees (see www.zurich.com/ en/about-us). It is a reminder of what we must do every day to win and keep the trust of our stakeholders: our customers, our employees, our shareholders and the communities in which we live and work. We are working hard to embed it throughout our business. For us, corporate responsibility is a key part of living the Zurich Commitment.
Corporate responsibilityCorporate responsibility is integrated within Zurich’s strategy. By acting responsibly in everything we do, we aim to create sustainable value for all our stakeholders.
Zurich’s flood resilience alliance brings together community, academic and private sector organizations. In 2014, the secretariat of the UN’s Framework Convention on Climate Change (UNFCCC) recognized the Zurich flood resilience program as a Momentum for Change Lighthouse Activity – an outstanding example of efforts to address climate change and its impacts. In 2014, we and other members of the alliance developed and tested an important flood resilience measurement tool which will assist us in our efforts to help communities protect themselves.
Our responsible investment program enables us to ‘do well and do good’ by investing our over USD 200 billion of assets. During 2014, we introduced minimum standards for integrating environmental, social and governance factors to all in-house managers of equity and fixed income investment portfolios. We also increased our commitment to invest in green bonds to up to USD 2 billion, of which over USD 500 million are already invested.
Zurich works with its customers, brokers and other distributors to ensure responsible and sustainable business practices and to protect reputations. Our approach systematically detects, assesses, and mitigates major environmental, social and ethical risks that are inherent in specific business transactions, and provides guidance on how to engage with our customers on those risks. In 2014, over 900 employees who work with corporate customers were trained to use this approach.
We began a process to better understand what the UN Guiding Principles on Business and Human Rights mean for Zurich, and led the development of Chief Risk Officer Forum’s 2014 discussion paper on human rights and corporate insurance, which seeks to raise awareness of this issue.
We joined 186 leading companies on the CDP Climate Performance Leadership Index 2014 (CPLI) in recognition of our position on climate change, which includes the impact of our insurance business, flood resilience work, responsible investment approach and carbon reduction efforts. In 2014, Zurich improved its score in the Dow Jones Sustainability Index (DJSI) from 73 to 79. Zurich is a member of DJSI World and DJSI Europe Indices. Zurich also received the Bronze Class distinction, placing it among the top nine companies in its industry assessed in terms of their CR performance.
At the end of 2014, Zurich became carbon neutral 1 through its ambitious internal carbon emissions reduction efforts and by offsetting remaining emissions through a forestry project in Indonesia, complementing our flood resilience work.
For more information 2 on the progress we made in corporate responsibility in 2014 please see: www.zurich.com/corporate-responsibility
1 Carbon neutrality reached in 2014 by acquiring carbon credits (‘voluntary emissions reduction certificates’ supporting a forestry project in Indonesia), calculated on the basis of CO2 emissions reported in 2013, which were taken as the estimate for 2014.
2 Audited by PricewaterhouseCoopers AG.
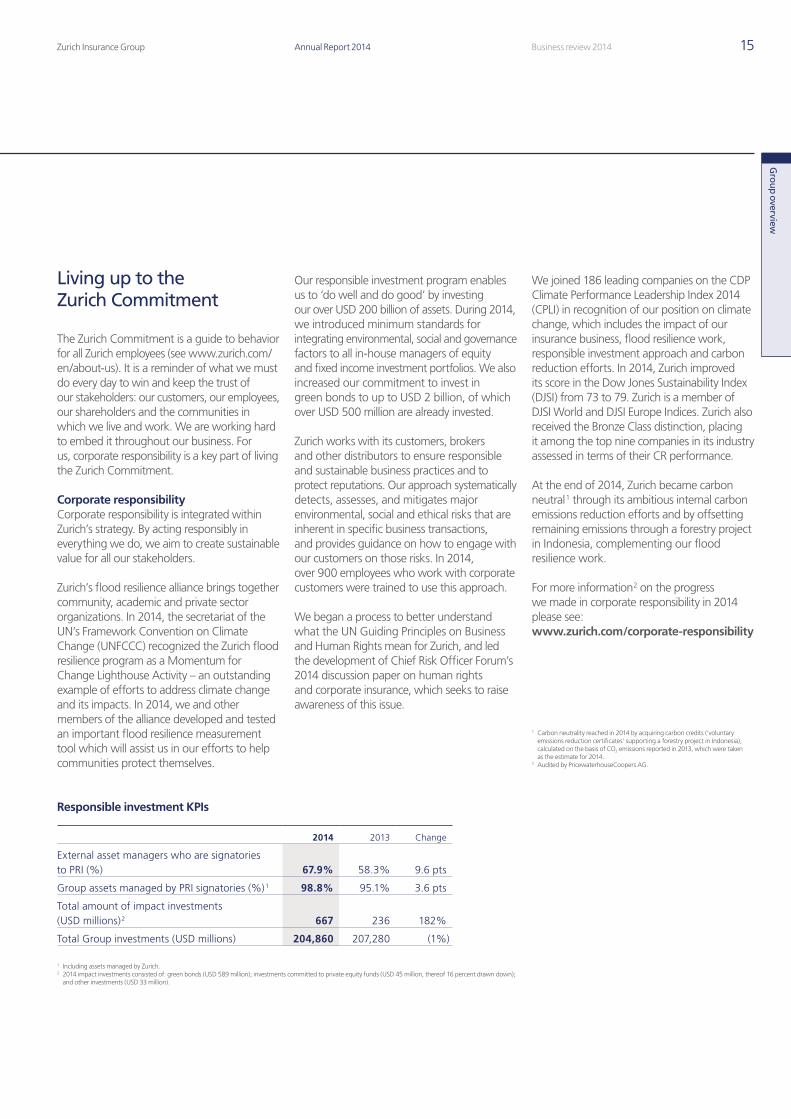
Responsible investment KPIs
2014 2013 Change
External asset managers who are signatories to PRI (%) 67.9% 58.3% 9.6 pts
Group assets managed by PRI signatories (%) 1 98.8% 95.1% 3.6 pts
Total amount of impact investments (USD millions) 2 667 236 182%
Total Group investments (USD millions) 204,860 207,280 (1%)
1 Including assets managed by Zurich.2 2014 impact investments consisted of: green bonds (USD 589 million); investments committed to private equity funds (USD 45 million, thereof 16 percent drawn down);
and other investments (USD 33 million).
Q4_2014_01_AR14_Group_Overview_en.indd 15 24.02.2015 12:30:56

Zurich Insurance GroupAnnual Report 201416 Governance
Q4_2014_02_AR14_Divider_Governance_en.indd 16 23.02.2015 16:12:11
17Annual Report 2014Zurich Insurance Group
In this sectionChairman’s statement on corporate governance 18Corporate governance report 20Statement of the Chairman of the Remuneration Committee 60Remuneration report 62
Governance
Q4_2014_02_AR14_Divider_Governance_en.indd 17 23.02.2015 16:12:11
Zurich Insurance GroupAnnual Report 201418 Governance
Chairman’s statement on corporate governance
Dear shareholders
The Board is responsible for overseeing the work of the Group Executive Committee and ensuring good governance. These Board functions are vital – not only to comply with regulations, but also to help build trust with our stakeholders, in line with our Zurich Commitment.1
Changes in our governance structureThe Board keeps Zurich’s corporate governance structure under review to ensure that it supports our strategic objectives. During the last year, Zurich has undergone significant change. In line with the simplification program which we initiated in 2014 and are still progressing, we have modified our governance structure.
We have made important changes with regard to governance and remuneration over the last year. We fully implemented the requirements of the Ordinance Against Excessive Compensation. You can find further information about this in the remuneration report which follows this section of our Annual Report.
We have given our business units more power to make decisions; we have simplified internal processes; and we are streamlining our reporting processes and policies. We have also introduced a new management committee structure, which we describe in this corporate governance report.
In addition, we are providing you with more information on the functioning of the Board in this corporate governance report and we have added information on our Board selection process.
Board diversityDiversity and inclusion are important aspects of Zurich’s strategy for the entire business, including the Board. We have made diversity a key factor in the selection of Board members to ensure that the Board includes a variety of people with complementary backgrounds and skills. This will help the Board to build a richer understanding of the opportunities and challenges our global business faces.
1 See the Zurich Commitment at www.zurich.com/the-zurich-commitment
Q4_2014_03_AR14_Corporate governance_part1_en.indd 18 23.02.2015 16:13:56
Govern
ance
Zurich Insurance Group Annual Report 2014 19Corporate governance report
Board and GEC changesIn the past year there have been changes on the Board and on the Group Executive Committee. At the Annual General Meeting in April 2014, you elected Christoph Franz as a new member of the Board of Directors, while Rolf Watter and Victor Chu stepped down.
The Board proposes to the shareholders to elect Ms. Joan Amble and Mr. Kishore Mahbubani as new members of the Board of Directors at the Annual General Meeting on April 1, 2015.
We have appointed three new members to the Group Executive Committee: Robert Dickie, George Quinn and Isabelle Welton. They have already made important contributions to the delivery of Zurich’s strategy. The appointment of Isabelle Welton to the GEC highlights the importance we attach to our Human Resources function and the vital role that our people play in the delivery of Zurich’s strategy.
Stakeholder dialogue I would like to thank you for your continued support and engagement. Dialogue is an essential part of our Zurich Commitment. We keep in touch with institutional investors through a year-round program of meetings. Many of you show your interest by attending our Annual General Meeting and I encourage you to do so once again on April 1, 2015.
We need high standards of corporate governance to help us succeed in the competitive environment in which we operate. The Board will safeguard and develop these standards to keep Zurich at the forefront of the global insurance industry.
Tom de Swaan Chairman of the Board of Directors
Diversity and inclusion are important aspects of Zurich’s strategy for the entire business, including the Board.”
Q4_2014_03_AR14_Corporate governance_part1_en.indd 19 23.02.2015 16:13:56
Zurich Insurance GroupAnnual Report 201420 Governance
Corporate governance report
Good corporate governance enables Zurich to create sustainable value for the benefit of its shareholders, customers, employees and other stakeholders.
The Corporate governance report describes the structures, rules and processes that are in place to provide effective governance by Zurich’s Board of Directors (the Board) and Management. It also reports on the work of the Board and its committees.
Contents
Introduction 21Group structure and shareholders 22Capital structure 25Board of Directors 28Group Executive Committee 44Shareholders’ participation rights 54Information Policy 55Employees 55Changes of control and defense measures 55Assurance at Zurich Insurance Group 56External Auditors 57Group Audit 58Group Compliance 59Risk Management and Internal Control Statement 59Going concern 59
Q4_2014_03_AR14_Corporate governance_part1_en.indd 20 23.02.2015 16:13:56
Govern
ance
Zurich Insurance Group Annual Report 2014 21Corporate governance report
IntroductionThe Zurich Insurance Group consisting of Zurich Insurance Group Ltd and its subsidiaries (the ‘Group’ or ‘Zurich’), is committed to effective corporate governance for the benefit of its shareholders, customers, employees and other stakeholders based on the principles of fairness, transparency and accountability. Structures, rules and processes are designed to provide for the proper organization and conduct of business within Zurich and to define the powers and responsibilities of its corporate bodies and employees.
This report describes the Group’s approach to corporate governance and illustrates the key elements of corporate governance within the Group. It includes the information required by the following rules, with which Zurich complies:
• Directive on Information Relating to Corporate Governance of the SIX Exchange Regulation (as of September 1, 2014).
• Swiss Code of Best Practice for Corporate Governance (Swiss Code of Best Practice), issued in 2002 by economiesuisse, as amended in October 2007 and on August 28, 2014.
The shares of Zurich Insurance Group Ltd are listed on the SIX Swiss Exchange. Certain Group companies have listed debt issued under its Euro Medium Term Note Program and other financial instruments.
Zurich is subject to insurance group supervision by the Swiss Financial Market Supervisory Authority (FINMA). As set out in its decree of December 28, 2011, FINMA stated that Zurich is subject to insurance group supervision according to art. 64 et seq. of the Swiss Insurance Supervision Law (ISL) and no longer qualified as a conglomerate. The Joint Committee of the European Supervisory Authorities has also designated the Group as an insurance group and not as an insurance conglomerate because of the small size of its non-insurance activities. The ISL requires Swiss insurance companies and groups to establish and maintain strong governance and risk management systems as well as effective internal control systems that are appropriate to their business activities. It prescribes the calculation of a risk-based solvency margin on a Group wide basis and at legal entity level pursuant to the Swiss Solvency Test (SST) and also a Solvency I margin. All major intra-group transactions must be reported to FINMA. In addition to the group supervision exercised by FINMA and its supervision of the legal entities Zurich Insurance Company Ltd and Zurich Life Insurance Company Ltd, the insurance subsidiaries and remaining financial services entities of the Group are supervised by relevant regional and local supervisory authorities.
The principles of corporate governance and the standards described above are incorporated and are reflected in a number of corporate documents, in particular the Articles of Incorporation, the Organizational Rules and the Charters of the Committees of the Board of Directors. The Governance and Nominations Committee, which is responsible for the governance of the Group, regularly reviews the Group’s corporate governance against best practice standards and ensures compliance with corporate governance requirements.
An effective structure is in place providing for cooperation between the Board of Directors of Zurich Insurance Group Ltd, management and internal control functions. This structure establishes checks and balances and is designed to provide for institutional independence of the Board from the Group Chief Executive Officer (CEO) and the Group Executive Committee (GEC) who together are responsible for managing the Group on a day-to-day basis. The Board is composed entirely of non-executive members independent from the management. The roles of Chairman of the Board and CEO are split, thus providing for separation of powers between these two roles and ensuring the independence of the Board.
In 2014, an initiative was carried out to streamline certain group processes in order to achieve more effective decision making, and to clearly allocate the duties and responsibilities of certain positions, corporate bodies and functions. In particular a new management committee structure and three distinct decision-making models for Group functions were established.
This report essentially follows the recommended structure outlined in the Directive on Information Relating to Corporate Governance of the SIX Exchange Regulation. The information on compensation, shareholdings and loans to Board members and members of the GEC is contained in a separate report, the remuneration report (see pages 62 to 95) which supplements this corporate governance report and also includes the information as required by the Circular 2010/1 on remuneration schemes (minimum standards for remuneration schemes of financial institutions) issued by FINMA on October 21, 2009 as amended on June 1, 2012 as well as the Ordinance against Excessive Compensation (Ordinance AEC) of November 20, 2013.
Q4_2014_03_AR14_Corporate governance_part1_en.indd 21 23.02.2015 16:13:57
Zurich Insurance GroupAnnual Report 201422 Governance
Corporate governance report continued
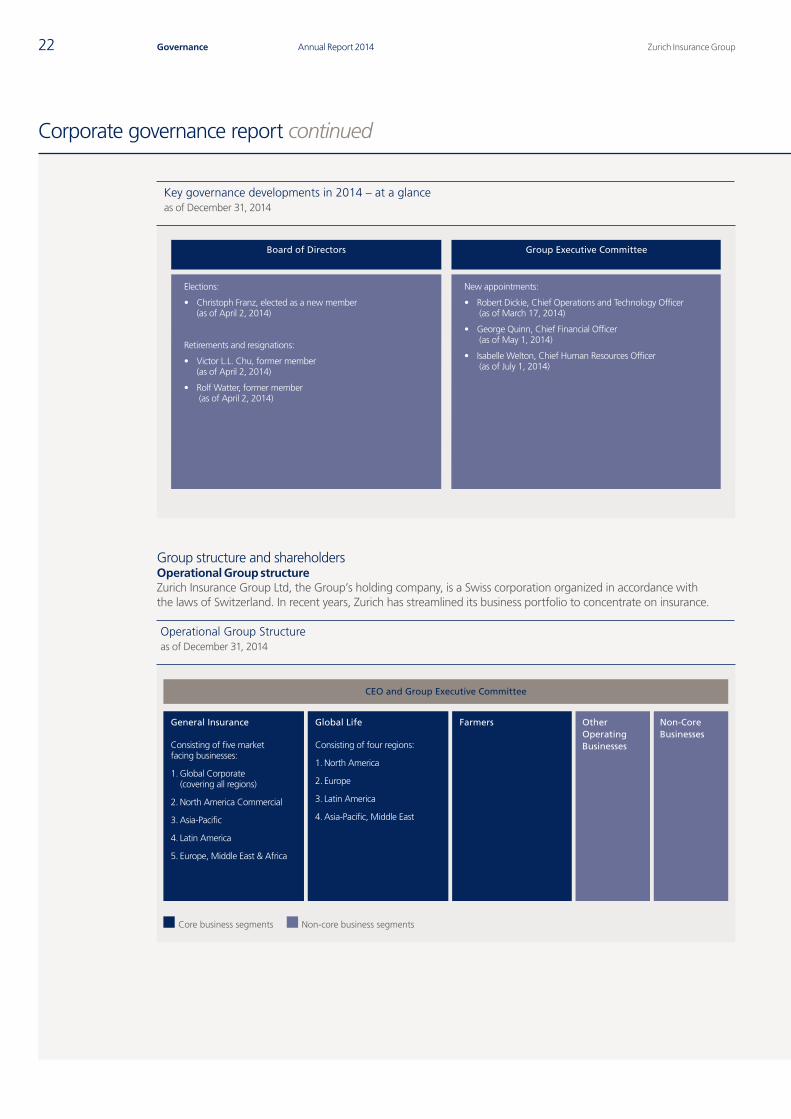
Key governance developments in 2014 – at a glanceas of December 31, 2014
Elections:
• Christoph Franz, elected as a new member (as of April 2, 2014)
Retirements and resignations:
• Victor L.L. Chu, former member (as of April 2, 2014)
• Rolf Watter, former member (as of April 2, 2014)
New appointments:
• Robert Dickie, Chief Operations and Technology Officer (as of March 17, 2014)
• George Quinn, Chief Financial Officer (as of May 1, 2014)
• Isabelle Welton, Chief Human Resources Officer (as of July 1, 2014)
Board of Directors Group Executive Committee
Group structure and shareholders Operational Group structure Zurich Insurance Group Ltd, the Group’s holding company, is a Swiss corporation organized in accordance with the laws of Switzerland. In recent years, Zurich has streamlined its business portfolio to concentrate on insurance.
Farmers Other Operating Businesses
Non-Core Businesses
Operational Group Structureas of December 31, 2014
CEO and Group Executive Committee
General Insurance
Consisting of five marketfacing businesses:
1. Global Corporate (covering all regions)
2. North America Commercial
3. Asia-Pacific
4. Latin America
5. Europe, Middle East & Africa
Global Life
Consisting of four regions:
1. North America
2. Europe
3. Latin America
4. Asia-Pacific, Middle East
Non-core business segmentsCore business segments
Q4_2014_03_AR14_Corporate governance_part1_en.indd 22 23.02.2015 16:13:57
Govern
ance
Zurich Insurance Group Annual Report 2014 23Corporate governance report
The Group pursues a customer-centric strategy and is managed on a matrix basis, reflecting both lines of business and geography. The GEC is headed by the CEO. The CEOs of the business segments General Insurance, Global Life and Farmers as well as the Chief Financial Officer (CFO), the Chief Investment Officer (CIO), the Chief Risk Officer (CRO), the Chief Operations and Technology Officer, the Group General Counsel and the Chief Human Resources Officer, are members of the GEC. The geographic regions of Europe, North America, Asia-Pacific and Middle East and Africa are represented on the GEC by Regional Chairmen who focus on stakeholder management and business development in the respective regions. For further information on the GEC see pages 44 to 54.
The Group’s operating segments have been identified on the basis of the businesses operated by the Group and how these are strategically managed to offer different products and services to specific customer groups. The Group’s reportable segments are as follows:
• General Insurance is the segment through which the Group provides a variety of motor, home and commercial products and services for individuals, as well as small and large businesses.
• Global Life pursues a strategy with market-leading propositions in unit-linked and protection products as well as fee-based solutions managed through three global pillars (Bank Distribution, Corporate Life & Pensions and in-force management) to develop leading positions in its target markets.
• Farmers provides, through Farmers Group, Inc. (FGI) and its subsidiaries, non-claims related, administrative and management services to the Farmers Exchanges as attorney-in-fact. FGI receives fee income for the provision of services to the Farmers Exchanges, which are owned by their policyholders and managed by Farmers Group, Inc. a wholly owned subsidiary of the Group. This segment also includes all reinsurance assumed from the Farmers Exchanges by the Group. Farmers Exchanges are prominent writers of personal and small commercial lines of business in the U.S.
For the purpose of discussing financial performance the Group considers General Insurance, Global Life and Farmers to be its core segments. The other business segments are:
• Other Operating Businesses predominantly consist of the Group’s headquarter and Holding and Financing activities. In addition, certain alternative investment positions not allocated to business operating segments are included within Holding and Financing.
• Non-Core Businesses include insurance businesses that the Group does not consider core to its operations and that are therefore mostly managed to achieve a beneficial run-off. Non-Core Businesses also include the Group’s remaining banking activities. Non-core businesses are mainly situated in the U.S., Bermuda, the United Kingdom and Ireland.
At a secondary level, the General Insurance segment is managed based on market-facing businesses, including: Global Corporate, North America Commercial, Europe, Middle East & Africa (EMEA), Latin America and Asia-Pacific.
The Global Life segment is managed on a regionally based structure within a global framework, including North America, Latin America, Europe and Asia-Pacific & Middle East. Effective January 1, 2015, Zurich has established a new Global Life Europe, Middle East and Africa region (GL EMEA), which will include the current Global Life Europe business units, Global Life Middle East, the Zurich International Life business (ZIL) on the Isle of Man, as well as the Zurich EuroLife Luxembourg (ZEL) business. The newly formed Global Life Asia Pacific (GL APAC) region will include the following business units: Australia, Hong Kong, Indonesia, Japan, Malaysia, Singapore and Taiwan. This new structure aligns the Global Life and General Insurance segments more closely.
A detailed review of the respective business segment results during 2014 can be found in the operating and financial review starting on page 98. Furthermore, an overview of the Group’s business strengths and activities is contained in the Annual Review, available on Zurich’s website www.zurich.com (www.zurich.com/_/media/dbe/corporate/docs/financial-reports/2014/annual-review-2014.pdf?la=en).
A list of the Group’s significant subsidiaries, including information on significant subsidiaries that are listed, can be found on pages 250 to 253. For further information on the share listing of Zurich Insurance Group Ltd, see the shareholder information on page 308 to 314.
Q4_2014_03_AR14_Corporate governance_part1_en.indd 23 23.02.2015 16:13:58
Zurich Insurance GroupAnnual Report 201424 Governance
Corporate governance report continued
Significant shareholdersAccording to the rules regarding the disclosure of significant shareholdings of Swiss companies listed in Switzerland, disclosure has to be made if certain thresholds starting at three percent are reached or if the shareholding subsequently falls below those thresholds. Call options and other financial instruments are added to any share position, even if they allow for cash settlement only. Disclosure must be made separately for purchase positions (including shares, long call options and short put options) and sale positions (including long put options and short call options). The percentage thresholds are calculated on the basis of the total amount of voting rights according to the number of shares issued as disclosed in the commercial register.
Zurich Insurance Group Ltd is obliged to announce shareholdings by third parties in its shares when notification is received from a third party that a threshold has been reached. During 2014 the Group received several notifications by third parties that they had either exceeded or fallen below the threshold of three percent as a result of purchases or sales.
As of December 31, 2014, Zurich Insurance Group Ltd is not aware of any person or institution, other than Black Rock, Inc., New York (5.03%), which, directly or indirectly, had an interest as a beneficial owner in shares, option rights and/or conversion rights relating to shares of Zurich Insurance Group Ltd representing three percent or more of its issued shares.
The announcements related to these notifications can be found via the search facility on the SIX Disclosure Office’s platform: http://www.six-exchange-regulation.com/obligations/disclosure/major_shareholders_en.html.
Zurich Insurance Group Ltd is not aware of any person or institution which, as of December 31, 2014, directly or indirectly, alone or with others, exercised or was a party to any arrangements to exercise control over Zurich Insurance Group Ltd.
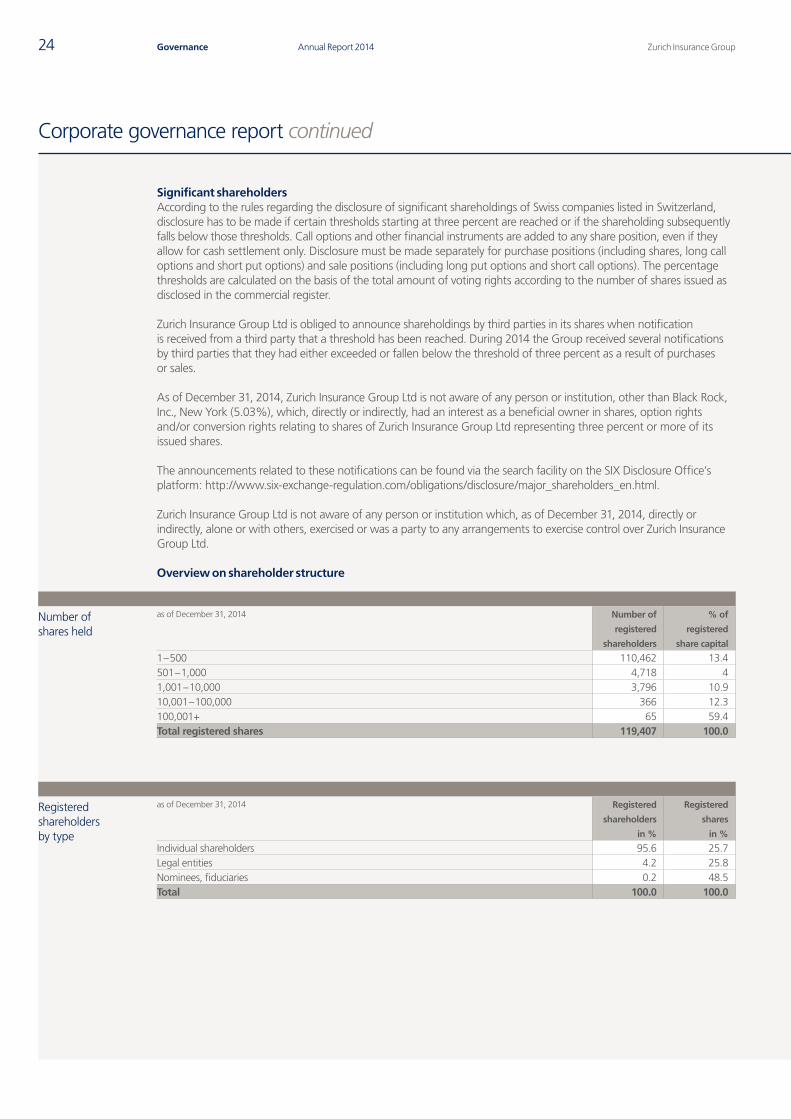
Overview on shareholder structure
Number of shares held
as of December 31, 2014 Number of
registered
shareholders
% of
registered
share capital
1 – 500 110,462 13.4501 – 1,000 4,718 41,001 – 10,000 3,796 10.910,001 – 100,000 366 12.3100,001+ 65 59.4Total registered shares 119,407 100.0
Registered shareholders by type
as of December 31, 2014 Registered
shareholders
in %
Registered
shares
in %
Individual shareholders 95.6 25.7Legal entities 4.2 25.8Nominees, fiduciaries 0.2 48.5Total 100.0 100.0
Q4_2014_03_AR14_Corporate governance_part1_en.indd 24 23.02.2015 16:13:58
Govern
ance
Zurich Insurance Group Annual Report 2014 25Corporate governance report
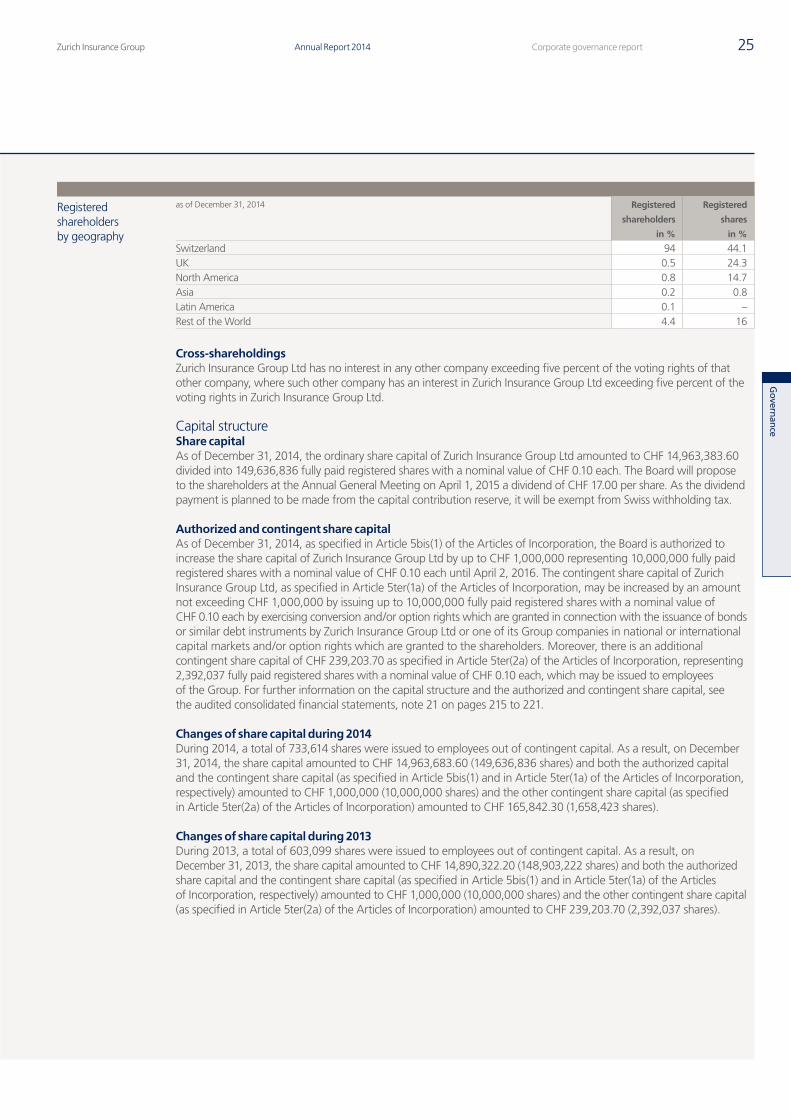
Registered shareholders by geography
as of December 31, 2014 Registered
shareholders
in %
Registered
shares
in %
Switzerland 94 44.1UK 0.5 24.3North America 0.8 14.7Asia 0.2 0.8Latin America 0.1 –Rest of the World 4.4 16
Cross-shareholdings Zurich Insurance Group Ltd has no interest in any other company exceeding five percent of the voting rights of that other company, where such other company has an interest in Zurich Insurance Group Ltd exceeding five percent of the voting rights in Zurich Insurance Group Ltd.
Capital structureShare capitalAs of December 31, 2014, the ordinary share capital of Zurich Insurance Group Ltd amounted to CHF 14,963,383.60 divided into 149,636,836 fully paid registered shares with a nominal value of CHF 0.10 each. The Board will propose to the shareholders at the Annual General Meeting on April 1, 2015 a dividend of CHF 17.00 per share. As the dividend payment is planned to be made from the capital contribution reserve, it will be exempt from Swiss withholding tax.
Authorized and contingent share capital As of December 31, 2014, as specified in Article 5bis(1) of the Articles of Incorporation, the Board is authorized to increase the share capital of Zurich Insurance Group Ltd by up to CHF 1,000,000 representing 10,000,000 fully paid registered shares with a nominal value of CHF 0.10 each until April 2, 2016. The contingent share capital of Zurich Insurance Group Ltd, as specified in Article 5ter(1a) of the Articles of Incorporation, may be increased by an amount not exceeding CHF 1,000,000 by issuing up to 10,000,000 fully paid registered shares with a nominal value of CHF 0.10 each by exercising conversion and/or option rights which are granted in connection with the issuance of bonds or similar debt instruments by Zurich Insurance Group Ltd or one of its Group companies in national or international capital markets and/or option rights which are granted to the shareholders. Moreover, there is an additional contingent share capital of CHF 239,203.70 as specified in Article 5ter(2a) of the Articles of Incorporation, representing 2,392,037 fully paid registered shares with a nominal value of CHF 0.10 each, which may be issued to employees of the Group. For further information on the capital structure and the authorized and contingent share capital, see the audited consolidated financial statements, note 21 on pages 215 to 221.
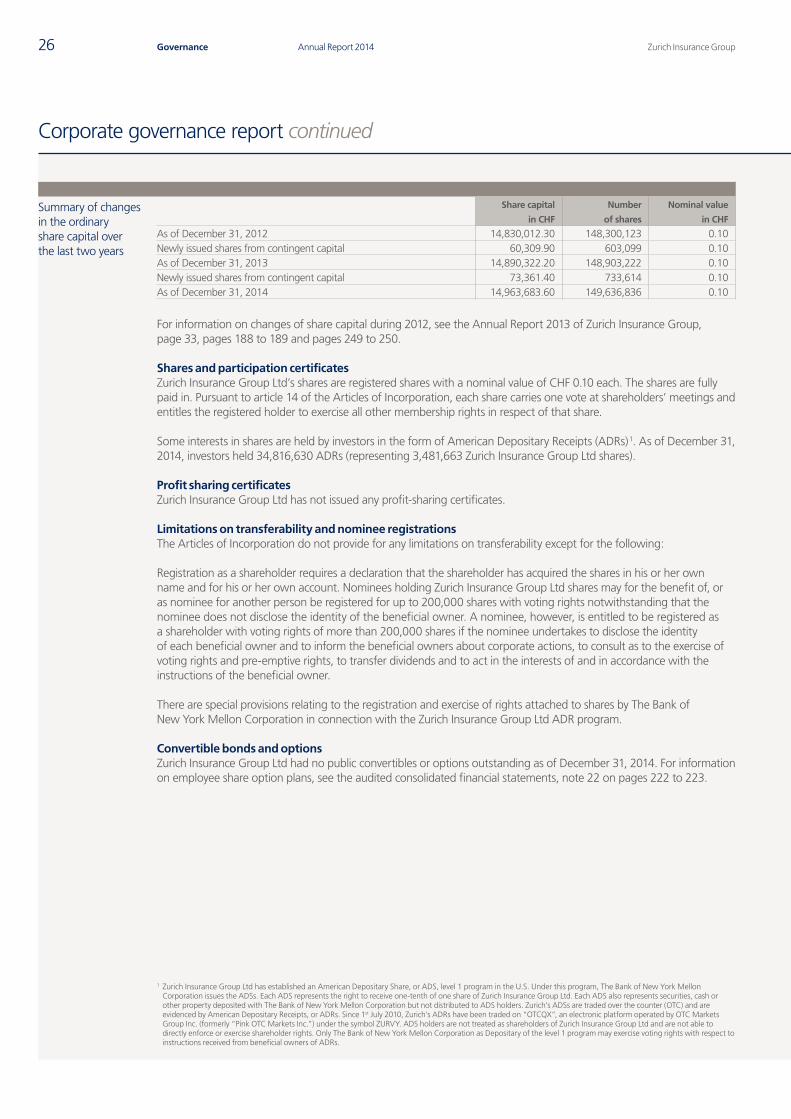
Changes of share capital during 2014During 2014, a total of 733,614 shares were issued to employees out of contingent capital. As a result, on December 31, 2014, the share capital amounted to CHF 14,963,683.60 (149,636,836 shares) and both the authorized capital and the contingent share capital (as specified in Article 5bis(1) and in Article 5ter(1a) of the Articles of Incorporation, respectively) amounted to CHF 1,000,000 (10,000,000 shares) and the other contingent share capital (as specified in Article 5ter(2a) of the Articles of Incorporation) amounted to CHF 165,842.30 (1,658,423 shares).
Changes of share capital during 2013During 2013, a total of 603,099 shares were issued to employees out of contingent capital. As a result, on December 31, 2013, the share capital amounted to CHF 14,890,322.20 (148,903,222 shares) and both the authorized share capital and the contingent share capital (as specified in Article 5bis(1) and in Article 5ter(1a) of the Articles of Incorporation, respectively) amounted to CHF 1,000,000 (10,000,000 shares) and the other contingent share capital (as specified in Article 5ter(2a) of the Articles of Incorporation) amounted to CHF 239,203.70 (2,392,037 shares).
Q4_2014_03_AR14_Corporate governance_part1_en.indd 25 23.02.2015 16:13:58
Zurich Insurance GroupAnnual Report 201426 Governance
Corporate governance report continued
Summary of changes in the ordinary share capital over the last two years
Share capital
in CHF
Number
of shares
Nominal value
in CHF
As of December 31, 2012 14,830,012.30 148,300,123 0.10Newly issued shares from contingent capital 60,309.90 603,099 0.10As of December 31, 2013 14,890,322.20 148,903,222 0.10Newly issued shares from contingent capital 73,361.40 733,614 0.10As of December 31, 2014 14,963,683.60 149,636,836 0.10
For information on changes of share capital during 2012, see the Annual Report 2013 of Zurich Insurance Group, page 33, pages 188 to 189 and pages 249 to 250.
Shares and participation certificatesZurich Insurance Group Ltd’s shares are registered shares with a nominal value of CHF 0.10 each. The shares are fully paid in. Pursuant to article 14 of the Articles of Incorporation, each share carries one vote at shareholders’ meetings and entitles the registered holder to exercise all other membership rights in respect of that share.
Some interests in shares are held by investors in the form of American Depositary Receipts (ADRs) 1. As of December 31, 2014, investors held 34,816,630 ADRs (representing 3,481,663 Zurich Insurance Group Ltd shares).
Profit sharing certificates Zurich Insurance Group Ltd has not issued any profit-sharing certificates.
Limitations on transferability and nominee registrations The Articles of Incorporation do not provide for any limitations on transferability except for the following:
Registration as a shareholder requires a declaration that the shareholder has acquired the shares in his or her own name and for his or her own account. Nominees holding Zurich Insurance Group Ltd shares may for the benefit of, or as nominee for another person be registered for up to 200,000 shares with voting rights notwithstanding that the nominee does not disclose the identity of the beneficial owner. A nominee, however, is entitled to be registered as a shareholder with voting rights of more than 200,000 shares if the nominee undertakes to disclose the identity of each beneficial owner and to inform the beneficial owners about corporate actions, to consult as to the exercise of voting rights and pre-emptive rights, to transfer dividends and to act in the interests of and in accordance with the instructions of the beneficial owner.
There are special provisions relating to the registration and exercise of rights attached to shares by The Bank of New York Mellon Corporation in connection with the Zurich Insurance Group Ltd ADR program.
Convertible bonds and optionsZurich Insurance Group Ltd had no public convertibles or options outstanding as of December 31, 2014. For information on employee share option plans, see the audited consolidated financial statements, note 22 on pages 222 to 223.
1 Zurich Insurance Group Ltd has established an American Depositary Share, or ADS, level 1 program in the U.S. Under this program, The Bank of New York Mellon Corporation issues the ADSs. Each ADS represents the right to receive one-tenth of one share of Zurich Insurance Group Ltd. Each ADS also represents securities, cash or other property deposited with The Bank of New York Mellon Corporation but not distributed to ADS holders. Zurich’s ADSs are traded over the counter (OTC) and are evidenced by American Depositary Receipts, or ADRs. Since 1st July 2010, Zurich’s ADRs have been traded on “OTCQX”, an electronic platform operated by OTC Markets Group Inc. (formerly “Pink OTC Markets Inc.”) under the symbol ZURVY. ADS holders are not treated as shareholders of Zurich Insurance Group Ltd and are not able to directly enforce or exercise shareholder rights. Only The Bank of New York Mellon Corporation as Depositary of the level 1 program may exercise voting rights with respect to instructions received from beneficial owners of ADRs.
Q4_2014_03_AR14_Corporate governance_part1_en.indd 26 23.02.2015 16:13:58

Govern
ance
Zurich Insurance Group Annual Report 2014 27Corporate governance report
THIS PAGE HAS INTENTIONALLY BEEN LEFT BLANK
Q4_2014_03_AR14_Corporate governance_part1_en.indd 27 23.02.2015 16:13:58

Zurich Insurance GroupAnnual Report 201428 Governance
Board of Directors
Relations between our Board and our Management are structured to support both bodies in fulfilling their commitments to deliver. This structure establishes checks and balances and is designed to provide for institutional independence of the Board of Directors from the Chief Executive Officer and the Group Executive Committee.
Tom de Swaan Chairman of the Board
Christoph Franz
Don Nicolaisen
Fred KindleVice-Chairman of the Board
Rafael del Pino
Susan Bies
Thomas K. Escher
Dame Alison Carnwath
Monica Mächler
Q4_2014_03_AR14_Corporate governance_part1_en.indd 28 23.02.2015 16:14:26
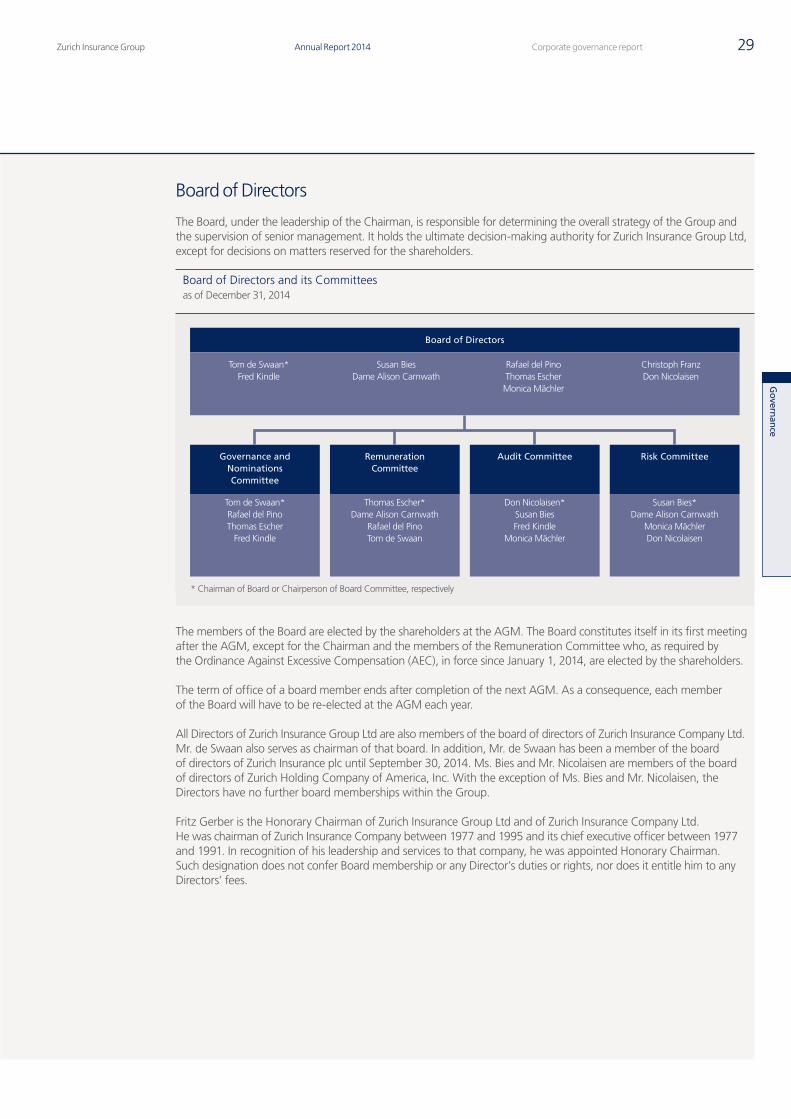
Govern
ance
Zurich Insurance Group Annual Report 2014 29Corporate governance report
Board of Directors
The Board, under the leadership of the Chairman, is responsible for determining the overall strategy of the Group and the supervision of senior management. It holds the ultimate decision-making authority for Zurich Insurance Group Ltd, except for decisions on matters reserved for the shareholders.
Board of Directors
Tom de Swaan*Fred Kindle
Susan BiesDame Alison Carnwath
Rafael del PinoThomas EscherMonica Mächler
Christoph FranzDon Nicolaisen
Governance andNominationsCommittee
Tom de Swaan*Rafael del PinoThomas Escher
Fred Kindle
Audit Committee
Don Nicolaisen*Susan BiesFred Kindle
Monica Mächler
Risk Committee
Susan Bies*Dame Alison Carnwath
Monica MächlerDon Nicolaisen
Thomas Escher*Dame Alison Carnwath
Rafael del PinoTom de Swaan
RemunerationCommittee
Board of Directors and its Committeesas of December 31, 2014
* Chairman of Board or Chairperson of Board Committee, respectively
The members of the Board are elected by the shareholders at the AGM. The Board constitutes itself in its first meeting after the AGM, except for the Chairman and the members of the Remuneration Committee who, as required by the Ordinance Against Excessive Compensation (AEC), in force since January 1, 2014, are elected by the shareholders.
The term of office of a board member ends after completion of the next AGM. As a consequence, each member of the Board will have to be re-elected at the AGM each year.
All Directors of Zurich Insurance Group Ltd are also members of the board of directors of Zurich Insurance Company Ltd. Mr. de Swaan also serves as chairman of that board. In addition, Mr. de Swaan has been a member of the board of directors of Zurich Insurance plc until September 30, 2014. Ms. Bies and Mr. Nicolaisen are members of the board of directors of Zurich Holding Company of America, Inc. With the exception of Ms. Bies and Mr. Nicolaisen, the Directors have no further board memberships within the Group.
Fritz Gerber is the Honorary Chairman of Zurich Insurance Group Ltd and of Zurich Insurance Company Ltd. He was chairman of Zurich Insurance Company between 1977 and 1995 and its chief executive officer between 1977 and 1991. In recognition of his leadership and services to that company, he was appointed Honorary Chairman. Such designation does not confer Board membership or any Director’s duties or rights, nor does it entitle him to any Directors’ fees.
Q4_2014_03_AR14_Corporate governance_part1_en.indd 29 23.02.2015 16:14:26
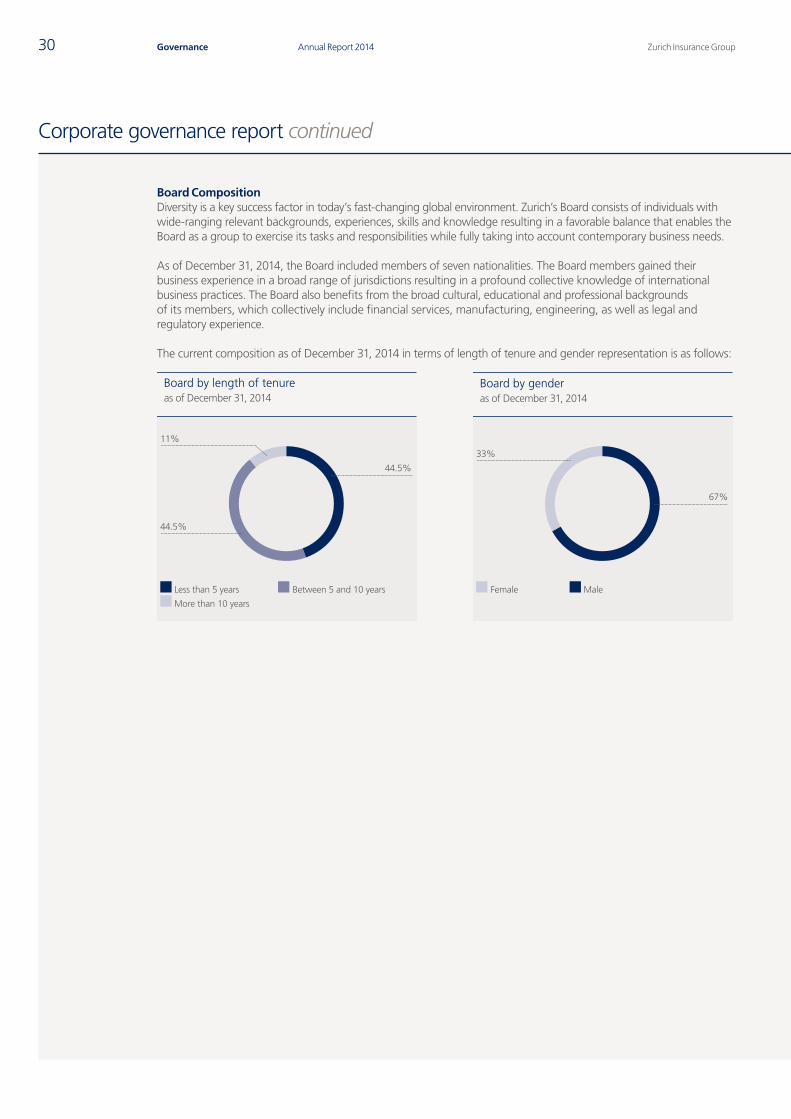
Zurich Insurance GroupAnnual Report 201430 Governance
Corporate governance report continued
Board CompositionDiversity is a key success factor in today’s fast-changing global environment. Zurich’s Board consists of individuals with wide-ranging relevant backgrounds, experiences, skills and knowledge resulting in a favorable balance that enables the Board as a group to exercise its tasks and responsibilities while fully taking into account contemporary business needs.
As of December 31, 2014, the Board included members of seven nationalities. The Board members gained their business experience in a broad range of jurisdictions resulting in a profound collective knowledge of international business practices. The Board also benefits from the broad cultural, educational and professional backgrounds of its members, which collectively include financial services, manufacturing, engineering, as well as legal and regulatory experience.
The current composition as of December 31, 2014 in terms of length of tenure and gender representation is as follows:
Female
33%
67%
Male
Board by genderas of December 31, 2014
44.5%
11%
44.5%
Less than 5 years Between 5 and 10 years
More than 10 years
Board by length of tenureas of December 31, 2014
Q4_2014_03_AR14_Corporate governance_part1_en.indd 30 23.02.2015 16:14:26
Govern
ance
Zurich Insurance Group Annual Report 2014 31Corporate governance report
Biographies
Tom de SwaanChairmanNationality: DutchBorn: 1946
Skills and experienceTom de Swaan has served in the banking industry of the Netherlands for over 40 years. He joined De Nederlandsche Bank N.V. in 1972 and from 1986 until 1998, was a member of the governing board. In January 1999, he became a member of the managing board and chief financial officer of ABN AMRO Bank. He retired from ABN AMRO in May 2006, but continued as an advisor to the managing board until June 2007. Between 1987 and 1988, Mr. de Swaan was chairman of the Amsterdam Financial Center and from 1995 to 1997, chairman of the banking supervisory sub-committee of the European Monetary Institute. He was also a member of the Basel Committee on Banking Supervision from 1991 to 1996, its chairman from 1997 to 1998, and a non-executive director on the board of the UK’s Financial Services Authority from January 2001 until the end of 2006. He has been a member of the boards of Zurich Insurance Group Ltd and of Zurich Insurance Company Ltd since April 2006. In March 2012 he was elected vice-chairman, acting as chairman from August 2013 on. He was elected chairman of the Board in September 2013.
Committee membershipGovernance and Nominations Committee (chairperson), Remuneration Committee
Other directorships within the GroupZurich Insurance Company Ltd
External appointmentsMr. de Swaan has been a non-executive member of the board of GlaxoSmithKline Plc since 2006. He has been a member of the supervisory board of Royal DSM, a Netherlands-based nutrition group, since 2006, and chairman of the supervisory board of Van Lanschot NV, the holding company of F. van Lanschot Bankiers, an independent Dutch bank, since 2008. In addition, Mr. de Swaan is chairman of the board of the Netherlands Cancer Institute, chairman of the board of trustees of the Van Leer Jerusalem Institute and acts as director of certain other non-profit organizations. He is also a member of the European Financial Services Round Table – EFR and of the advisory board of China Banking Regulatory Commission in Beijing.
Educational backgroundMr. de Swaan graduated from the University of Amsterdam with a master’s degree in economics.
Fred KindleVice-ChairmanNationality: Swiss and Principality of LiechtensteinBorn: 1959
Skills and experienceFred Kindle began working in the marketing department of Hilti AG in Liechtenstein in 1984. From 1988 until 1992 he was a consultant with McKinsey & Company in New York and Zurich. He then joined Sulzer AG in Switzerland, where he held several management positions. In 1999 he was appointed CEO of Sulzer Industries and in 2001 he became CEO of Sulzer AG, where he also served as a board member. After joining ABB Ltd in 2004, Mr. Kindle was appointed CEO of ABB Group in January 2005, a position he held until February 2008. He then became a partner of Clayton, Dubilier & Rice LLP, a private equity firm based in New York and London. He has been a member of the boards of Zurich Insurance Group Ltd and of Zurich Insurance Company Ltd since April 2006. He was elected vice-chairman in September 2013.
Committee membershipGovernance and Nominations Committee, Audit Committee
Other directorships within the GroupZurich Insurance Company Ltd
External appointmentsIn his capacity as a partner of Clayton, Dubilier & Rice, Mr. Kindle has served as chairman of Exova Ltd., UK since 2008 and as chairman of BCA Group, UK since 2010. He has been on the board of VZ Holding Ltd, Zurich, since 2002 and was elected chairman in 2014. He has been serving on the board of privately held Stadler Rail AG since 2008.
Educational backgroundMr. Kindle graduated from the Swiss Federal Institute of Technology (ETH) in Zurich with a master’s degree in engineering and holds an MBA from Northwestern University, Evanston.
Q4_2014_03_AR14_Corporate governance_part1_en.indd 31 23.02.2015 16:14:30
Zurich Insurance GroupAnnual Report 201432 Governance
Corporate governance report continued
Susan BiesMember of the Board of DirectorsNationality: U.S. Born: 1947
Skills and experienceSusan Bies began her career in 1970 as regional and banking structure economist with the Federal Reserve Bank of St. Louis, Missouri. In 1972, she became assistant professor of economics at Wayne State University, Detroit, Michigan. In 1977, she moved to Rhodes College, Memphis, Tennessee, in a similar role and in 1979 joined First Tennessee National Corporation in Memphis, where she remained until 2001. Her areas of responsibility included tactical planning and corporate development. In 1984 she became chief financial officer and chairman of the asset/liability committee. In 1995, she became executive vice president of risk management and auditor and chairman of the risk management committee, as well as continuing her duties with the asset/liability committee. From 2001 until 2007, she was a member of the Board of Governors of the Federal Reserve System. Between 1996 and 2001, Ms. Bies was a member of the Emerging Issues Task Force of the Financial Accounting Standards Board. She has been a member of the boards of Zurich Insurance Group Ltd and of Zurich Insurance Company Ltd since April 2008.
Committee membershipAudit Committee, Risk Committee (chairperson)
Other directorships within the GroupZurich Insurance Company Ltd, Zurich Holding Company of America, Inc.
External appointmentsMs. Bies has served as a member of the board of directors of The Bank of America Corporation since June 2009, and joined the board of directors of Merrill Lynch International, London, a subsidiary of Bank of America Corporation, in 2013. She has also been a member of the senior advisory board of Oliver Wyman since 2009. Ms. Bies is also a member of the board of trustees of the Global Association of Risk Professionals (GARP).
Educational backgroundMs. Bies graduated with a B.S. degree from the State University College at Buffalo, New York and with an M.A. degree from Northwestern University, Evanston, where she later gained a Ph.D.
Dame Alison CarnwathMember of the Board of Directors Nationality: British Born: 1953
Skills and experienceDame Alison Carnwath has substantial financial industry experience. She began her career with Peat Marwick Mitchell, now KPMG, where she practiced as a chartered accountant from 1975 to 1980. From 1980 to 1982, she worked as a corporate financier for Lloyds Bank International. From 1982 to 1993, she was assistant director, then director, at J. Henry Schroder Wagg & Co in London and New York. From 1993 to 1997, Dame Alison was a senior partner at the financial advisory firm Phoenix Partnership. The firm was taken over by Donaldson, Lufkin & Jenrette (DLJ) in late 1997; Dame Alison continued working for DLJ until 2000. Dame Alison has held several board offices. From 2000 to 2005, she was the chairman of the board of Vitec Group plc, from 2001 to 2006 a director of Welsh Water, from 2004 to 2007 of Friends Provident plc, from 2004 to 2007 of Gallaher Group and from 2007 to 2010, she was the independent chairman of MF Global Inc. She also served on the boards of directors of Barclays from 2010 to 2012, and of Man Group plc from 2001 to 2013. She has been a member of the boards of Zurich Insurance Group Ltd
and of Zurich Insurance Company Ltd since March 2012. She was awarded a Dame of the British Empire (DBE) in the 2014 New Year Honours List in the UK.
Committee membershipRemuneration Committee, Risk Committee
Other directorships within the GroupZurich Insurance Company Ltd
External appointmentsDame Alison has been a senior advisor of Evercore Partners since 2011 and an independent chairman of Living Bridge Equity Partners LLP (formerly ISIS Equity Partners LLP) since 2000. She has been chairman of the board of Land Securities Group plc since 2008 and a member of the board of PACCAR Inc. since 2005. Dame Alison is also a trustee of the British Library. In September 2013, she was appointed to the advisory council of the St. George’s Society of New York. Since May 2014 she is a member of the supervisory board of BASF SE and Chairman of the Audit Committee of BASF SE.
Educational backgroundDame Alison graduated in economics and German from the University of Reading. She was also awarded an honorary doctorate (LLB) from the University of Reading.
Q4_2014_03_AR14_Corporate governance_part1_en.indd 32 23.02.2015 16:14:34
Govern
ance
Zurich Insurance Group Annual Report 2014 33Corporate governance report
Rafael del PinoMember of the Board of DirectorsNationality: SpanishBorn: 1958
Skills and experienceRafael del Pino has more than 30 years of international management experience. From 1992 to 1999, he was CEO of Grupo Ferrovial and in 1999, he was appointed executive vice-chairman. In 2000, Mr. del Pino assumed the position of executive chairman and managing director of Ferrovial S.A. During his career at Ferrovial he has transformed the company from a mostly domestic construction company to a leading provider of infrastructure services around the world. In addition, Mr. del Pino was a member of the board of Banesto (Banco Español de Crédito S.A.) from 2003 to 2012 and of the International Advisory Board of Blackstone from 2007 to 2013. He has been a member of the boards of Zurich Insurance Group Ltd and of Zurich Insurance Company Ltd since March 2012.
Committee membershipGovernance and Nominations Committee, Remuneration Committee
Other directorships within the GroupZurich Insurance Company Ltd
External appointmentsMr. del Pino maintains contact with the academic world through his memberships on the MIT Corporation, the International Advisory Board of IESE and the European Advisory Board of Harvard Business School.
Educational backgroundMr. del Pino graduated in civil engineering from the Universidad Politécnica Madrid and obtained an MBA from MIT Sloan School of Management.
Thomas K. EscherMember of the Board of DirectorsNationality: SwissBorn: 1949
Skills and experienceThomas Konrad Escher has extensive experience in the fields of information technology (IT) and banking. He joined IBM in 1974 and had managerial responsibility for several international markets. In 1996, Mr. Escher joined Swiss Bank Corporation as a member of the executive board and was CEO for the major market region in Switzerland and for the IT organization. Following the merger of Swiss Bank Corporation and Union Bank of Switzerland to form UBS AG in 1998, he headed the IT business area of the wealth management and business banking division until mid-2005 as a member of the group managing board. Mr. Escher assumed the function of vice-chairman in the business group Global Wealth Management & Swiss Bank of UBS AG in 2005. He has been a member of the boards of Zurich Insurance Group Ltd and of Zurich Insurance Company Ltd since April 2004.
Committee membershipGovernance and Nominations Committee, Remuneration Committee (chairperson)
Other directorships within the GroupZurich Insurance Company Ltd
External appointmentsMr. Escher has been a member of the board of directors of Silent-Power AG of Cham, Switzerland, a company in the alternative energy field, since 2012, and its chairman since 2013. Mr. Escher has also been the president of the Genossenschaft zum Rüden since 2010.
Educational backgroundMr. Escher graduated both in electrical engineering and business management from the Swiss Federal Institute of Technology (ETH).
Q4_2014_03_AR14_Corporate governance_part1_en.indd 33 23.02.2015 16:14:38
Zurich Insurance GroupAnnual Report 201434 Governance
Corporate governance report continued
Christoph FranzMember of the Board of Directors Nationality: German Born: 1960
Skills and experienceChristoph Franz started his professional career in 1990 at Deutsche Lufthansa AG. From 1994 until 2003 he held different executive functions at Deutsche Bahn AG, including as member of the executive board and CEO of the passenger transport division. In 2004 he became CEO of Swiss International Air Lines Ltd, and in 2009 was promoted to the role of deputy chairman of the executive board of Deutsche Lufthansa AG and CEO Passenger Airlines. From 2011 to 2014, Mr. Franz was chairman of the executive board and CEO of Deutsche Lufthansa AG. He became a member of the boards of Zurich Insurance Group Ltd and Zurich Insurance Company Ltd in April 2014.
Other directorships within the GroupZurich Insurance Company Ltd
External appointmentsMr. Franz was elected chairman of the board of Roche Holding Ltd in March 2014. He is also vice-chairman of Swiss International Air Lines Ltd and a member of the board of directors of Stadler Rail AG and Lufthansa Technik Ltd. Mr. Franz serves as a member of the board of trustees of Avenir Suisse and Ernst-Goehner-Stiftung.
Educational backgroundMr. Franz studied industrial engineering at the Technical University Darmstadt (Germany) and completed his studies with a Ph.D. in economic sciences (Dr. rer. pol.) at the same university. He also studied at the Ecole Centrale de Lyon (France) and conducted post-doctorate research at the University of California, Berkeley.
Monica MächlerMember of the Board of Directors Nationality: SwissBorn: 1956
Skills and experienceMonica Mächler has substantial legal, regulatory and governance expertise in a national and international context. She served as vice-chair of the board of directors of the integrated Swiss Financial Market Supervisory Authority (FINMA) from 2009 to 2012, after having been the director of the Swiss Federal Office of Private Insurance from 2007 to 2008. From 2010 to 2012, Ms. Mächler chaired the Technical Committee of the International Association of Insurance Supervisors (IAIS). She assumed the roles of Group General Counsel and Head of the Board Secretariat of Zurich Insurance Group from 1999 to 2006 and was appointed a member of the Group Management Board in 2001 after joining in 1990. During the years 1985 to 1990 she was in private practice specializing in banking and business law. Ms. Mächler has been a member of several Swiss federal expert commissions on regulatory projects and regularly speaks, lectures and publishes on matters related to international business law and regulation, and their impact. She has been a member of the boards of Zurich Insurance Group Ltd and of Zurich Insurance Company Ltd since April 2013.
Committee membershipAudit Committee, Risk Committee
Other directorships within the GroupZurich Insurance Company Ltd
External appointmentsMs. Mächler has been a member of the supervisory board of directors of Deutsche Börse AG since May 2012. She also serves on the advisory board of the International Center for Insurance Regulation at the Goethe University Frankfurt am Main and on the board of the Stiftung für schweizerische Rechtspflege.
Educational backgroundMs. Mächler earned her J.D. at the University of Zurich’s Law School and complemented her studies by attending programs on UK, U.S. and private international law. She is admitted to the bar of the Canton of Zurich.
Q4_2014_03_AR14_Corporate governance_part1_en.indd 34 23.02.2015 16:14:43
Govern
ance
Zurich Insurance Group Annual Report 2014 35Corporate governance report
Don NicolaisenMember of the Board of Directors Nationality: U.S.Born: 1944
Skills and experienceDon Nicolaisen has substantial expertise in accounting, auditing and financial reporting. He joined Price Waterhouse in 1967 (which subsequently became PricewaterhouseCoopers or PwC). Mr. Nicolaisen was admitted to that firm’s partnership in 1978 where he served in various capacities, including as an auditor and as chairman of their Financial Services practice. Mr. Nicolaisen also led PwC’s National Office for Accounting and Securities and Exchange Commission Services from 1988 to 1994 and served on both the U.S. and global boards of PwC from 1994 to 2001. From September 2003 to November 2005, Mr. Nicolaisen was Chief Accountant of the U.S. Securities and Exchange Commission where he served as the principal adviser to the Commission on accounting and auditing matters. He has been a member of the boards of Zurich Insurance Group Ltd and of Zurich Insurance Company Ltd since April 2006.
Committee membershipAudit Committee (chairperson), Risk Committee
Other directorships within the GroupZurich Insurance Company Ltd, Zurich Holding Company of America, Inc.
External appointmentsMr. Nicolaisen has been a member of the board of directors of Verizon Communications Inc. since 2005, Morgan Stanley since 2006 and MGIC Investment Corporation since 2006. In addition, he serves on the board of advisors for the University of Southern California Leventhal School of Accounting.
Educational backgroundMr. Nicolaisen graduated from the University of Wisconsin-Whitewater with a B.B.A. degree.
The business address for each Board member is Mythenquai 2, 8002 Zurich, Switzerland.
Independence of the members of the Board of DirectorsZurich considers the independence of its Board members to be an essential feature of good corporate governance. Zurich’s independence criteria comply with applicable laws and reflect best-practice standards such as the Swiss Code of Best Practice and the SIX Exchange Regulation Directive on Information relating to Corporate Governance. Accordingly, the Board consists entirely of Directors who are non-executive, independent from the management and who – except for Ms. Mächler – have never held an executive position in the Group. Ms. Mächler held an executive position until 2006 and was elected in 2013 as a non-executive board member. According to the guidelines of the Swiss Code of Best Practice, she is considered independent.
Given the separation of the roles of Chairman and CEO and the fact that the Board consists entirely of non-executive members, there is no requirement for a lead director to be appointed under the Swiss Code of Best Practice.
The Governance and Nominations Committee reviews the independence of the Board members annually and reports its findings to the Board for final determination. Board members are also subject to rules and regulations to avoid conflicts of interest and the use of inside information.
Q4_2014_03_AR14_Corporate governance_part1_en.indd 35 23.02.2015 16:14:45
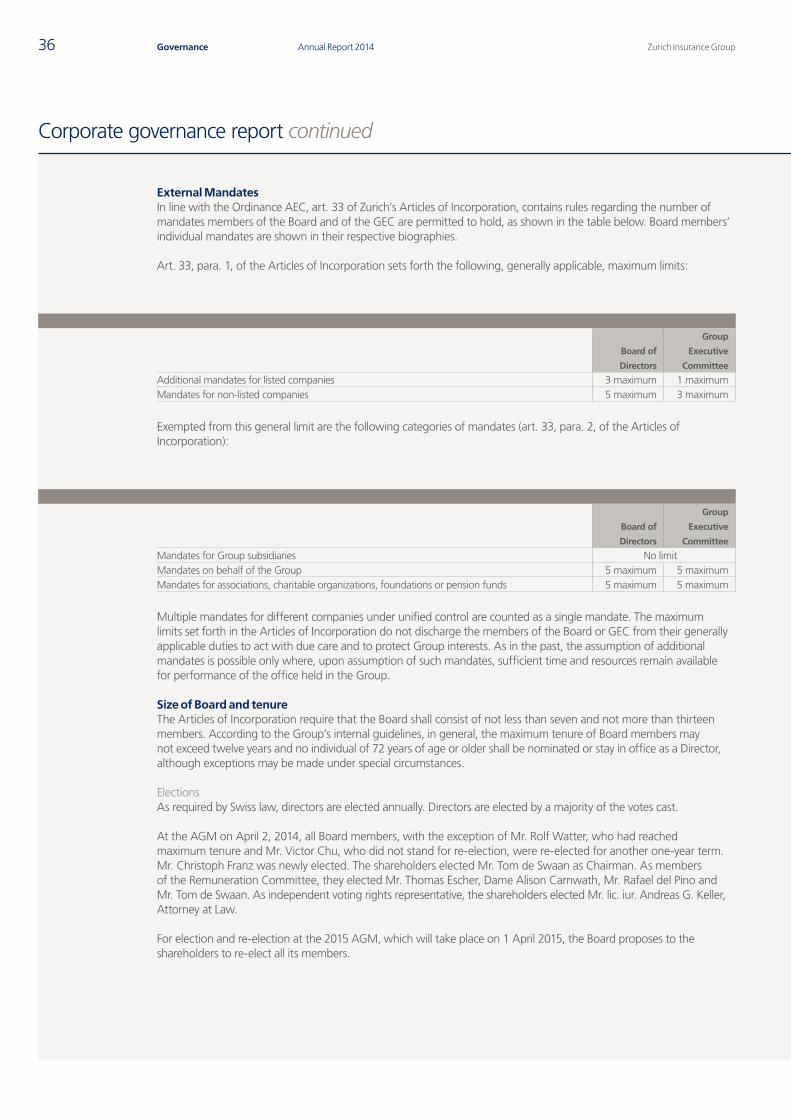
Zurich Insurance GroupAnnual Report 201436 Governance
Corporate governance report continued
External Mandates In line with the Ordinance AEC, art. 33 of Zurich’s Articles of Incorporation, contains rules regarding the number of mandates members of the Board and of the GEC are permitted to hold, as shown in the table below. Board members’ individual mandates are shown in their respective biographies.
Art. 33, para. 1, of the Articles of Incorporation sets forth the following, generally applicable, maximum limits:
Board of
Directors
Group
Executive
Committee
Additional mandates for listed companies 3 maximum 1 maximum Mandates for non-listed companies 5 maximum 3 maximum
Exempted from this general limit are the following categories of mandates (art. 33, para. 2, of the Articles of Incorporation):
Board of
Directors
Group
Executive
Committee
Mandates for Group subsidiaries No limit Mandates on behalf of the Group 5 maximum 5 maximum Mandates for associations, charitable organizations, foundations or pension funds 5 maximum 5 maximum
Multiple mandates for different companies under unified control are counted as a single mandate. The maximum limits set forth in the Articles of Incorporation do not discharge the members of the Board or GEC from their generally applicable duties to act with due care and to protect Group interests. As in the past, the assumption of additional mandates is possible only where, upon assumption of such mandates, sufficient time and resources remain available for performance of the office held in the Group.
Size of Board and tenure The Articles of Incorporation require that the Board shall consist of not less than seven and not more than thirteen members. According to the Group’s internal guidelines, in general, the maximum tenure of Board members may not exceed twelve years and no individual of 72 years of age or older shall be nominated or stay in office as a Director, although exceptions may be made under special circumstances.
ElectionsAs required by Swiss law, directors are elected annually. Directors are elected by a majority of the votes cast.
At the AGM on April 2, 2014, all Board members, with the exception of Mr. Rolf Watter, who had reached maximum tenure and Mr. Victor Chu, who did not stand for re-election, were re-elected for another one-year term. Mr. Christoph Franz was newly elected. The shareholders elected Mr. Tom de Swaan as Chairman. As members of the Remuneration Committee, they elected Mr. Thomas Escher, Dame Alison Carnwath, Mr. Rafael del Pino and Mr. Tom de Swaan. As independent voting rights representative, the shareholders elected Mr. lic. iur. Andreas G. Keller, Attorney at Law.
For election and re-election at the 2015 AGM, which will take place on 1 April 2015, the Board proposes to the shareholders to re-elect all its members.
Q4_2014_03_AR14_Corporate governance_part1_en.indd 36 23.02.2015 16:14:45
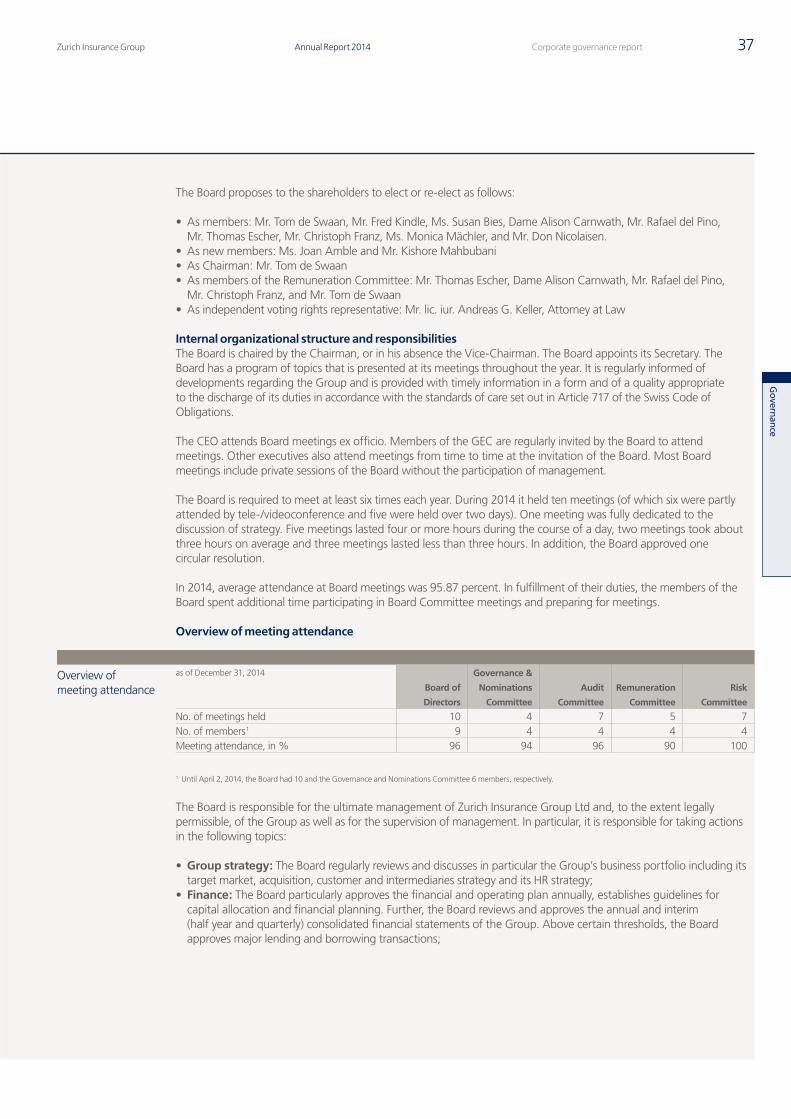
Govern
ance
Zurich Insurance Group Annual Report 2014 37Corporate governance report
The Board proposes to the shareholders to elect or re-elect as follows:
• As members: Mr. Tom de Swaan, Mr. Fred Kindle, Ms. Susan Bies, Dame Alison Carnwath, Mr. Rafael del Pino, Mr. Thomas Escher, Mr. Christoph Franz, Ms. Monica Mächler, and Mr. Don Nicolaisen.
• As new members: Ms. Joan Amble and Mr. Kishore Mahbubani• As Chairman: Mr. Tom de Swaan• As members of the Remuneration Committee: Mr. Thomas Escher, Dame Alison Carnwath, Mr. Rafael del Pino,
Mr. Christoph Franz, and Mr. Tom de Swaan• As independent voting rights representative: Mr. lic. iur. Andreas G. Keller, Attorney at Law
Internal organizational structure and responsibilitiesThe Board is chaired by the Chairman, or in his absence the Vice-Chairman. The Board appoints its Secretary. The Board has a program of topics that is presented at its meetings throughout the year. It is regularly informed of developments regarding the Group and is provided with timely information in a form and of a quality appropriate to the discharge of its duties in accordance with the standards of care set out in Article 717 of the Swiss Code of Obligations.
The CEO attends Board meetings ex officio. Members of the GEC are regularly invited by the Board to attend meetings. Other executives also attend meetings from time to time at the invitation of the Board. Most Board meetings include private sessions of the Board without the participation of management.
The Board is required to meet at least six times each year. During 2014 it held ten meetings (of which six were partly attended by tele-/videoconference and five were held over two days). One meeting was fully dedicated to the discussion of strategy. Five meetings lasted four or more hours during the course of a day, two meetings took about three hours on average and three meetings lasted less than three hours. In addition, the Board approved one circular resolution.
In 2014, average attendance at Board meetings was 95.87 percent. In fulfillment of their duties, the members of the Board spent additional time participating in Board Committee meetings and preparing for meetings.
Overview of meeting attendance
Overview of meeting attendance
as of December 31, 2014
Board of
Directors
Governance &
Nominations
Committee
Audit
Committee
Remuneration
Committee
Risk
Committee
No. of meetings held 10 4 7 5 7No. of members 1 9 4 4 4 4Meeting attendance, in % 96 94 96 90 100
1 Until April 2, 2014, the Board had 10 and the Governance and Nominations Committee 6 members, respectively.
The Board is responsible for the ultimate management of Zurich Insurance Group Ltd and, to the extent legally permissible, of the Group as well as for the supervision of management. In particular, it is responsible for taking actions in the following topics:
• Group strategy: The Board regularly reviews and discusses in particular the Group’s business portfolio including its target market, acquisition, customer and intermediaries strategy and its HR strategy;
• Finance: The Board particularly approves the financial and operating plan annually, establishes guidelines for capital allocation and financial planning. Further, the Board reviews and approves the annual and interim (half year and quarterly) consolidated financial statements of the Group. Above certain thresholds, the Board approves major lending and borrowing transactions;
Q4_2014_03_AR14_Corporate governance_part1_en.indd 37 23.02.2015 16:14:45
Zurich Insurance GroupAnnual Report 201438 Governance
Corporate governance report continued
• Structure and organization of the Group: The Board determines and regularly reviews the basic principles of the Group’s structure and major changes in the Group’s management organization including major changes of management functions. In this respect, the Board particularly discusses the Group’s corporate governance framework and its remuneration system. The Board also adopts and regularly reviews the basic principles of conduct, compliance and risk management for the Group. Further, as part of its duty to convene the shareholders’ meeting and submit proposals to the shareholders’ meeting, it discusses the dividend policy and the Board’s proposal for the payment of dividends. Within its authorities the Board also makes resolutions on capital increases and the certification of capital increases and respective amendments to the articles of incorporation;
• Business Development: Above certain thresholds, the Board regularly discusses and approves acquisitions and disposals of businesses and assets, investments, new businesses, mergers, joint ventures, co-operations and restructurings of business units or books of businesses.
In 2014, the Board specifically focused on the following topics:
• Strategy implementation and execution including further development of Zurich’s Human Resources strategy;• Detailed reviews of various regional business operations;• Customer trends, structural industry changes and disruptive technologies.
The Board may establish committees for specific topics, terms of reference and rules with respect to delegated tasks, responsibilities and reporting to the Board. Except for the Remuneration Committee, the Board constitutes such committees from among its members at its own discretion. The members of the Remuneration Committee are elected by the shareholders’ meeting. The committees assist the Board in performing its duties. They discuss and propose matters to the Board in order that it may take appropriate actions and pass resolutions unless they are authorized to take resolutions in specific areas on their own. In 2014, committee meetings lasted two hours on average.
Self-assessmentA self-assessment of the full Board is carried out once a year. In 2014, the Board’s self-assessment was carried out on the basis of a comprehensive questionnaire. The assessment considered the following key aspects of board effectiveness: a) the Board environment (culture and composition, skill set and definition and delineation of tasks); b) the work of the Board (strategy, risk and control, and performance management); and c) the use of time and process (planning and allocation). A detailed report identifying key strengths and challenges was produced for, and considered by the Board. A respective action plan decided by the Board is currently being implemented.
Committees of the Board of Directors The Board has the following standing committees, which regularly report to the Board and submit proposals for resolution by the Board:
Governance and Nominations CommitteeComposition and membership: The Governance and Nominations Committee consists of at least four Board members. Currently, Tom de Swaan (Chairperson), Rafael del Pino, Thomas Escher and Fred Kindle serve on this committee.
Key tasks and responsibilities: In general, the Governance and Nominations Committee:
• oversees the Group’s governance and measures it against best practice with a view to ensuring that the rights of shareholders are fully protected;
• develops and proposes guidelines to the Board for corporate governance and reviews them from time to time;• ensures compliance with corporate governance disclosure requirements as well as legal and regulatory requirements;• is entrusted with succession planning for the Board, the CEO and members of the GEC. In this regard, it proposes
the principles for the nomination and ongoing qualification of members of the Board and makes proposals to the Board on the composition of the Board, the appointment of the Chairman, the Vice-Chairman, the CEO and members of the GEC. Final decisions for nominations and appointments are made by the Board, subject to shareholder approval, where required. When identifying and proposing candidates as new Board members, the preservation and improvement of the Board’s diversity is a key factor. This includes diversity in many respects, such as gender, culture, technical and interpersonal skills, education and viewpoints, experience, geographical origins and a variety of complementary backgrounds, which should enable the Board to meet the current and future challenges of the Group. Notwithstanding the specific profile, every individual candidate should possess integrity and be of good standing of character, and be capable and available to fulfill his or her duty of care by serving, in close collaboration with the other Board members, in the best interest of the Group’s stakeholders;
• reviews the system for management development and supervises progress made in respect of succession planning.
Q4_2014_03_AR14_Corporate governance_part1_en.indd 38 23.02.2015 16:14:45
Govern
ance
Zurich Insurance Group Annual Report 2014 39Corporate governance report
Activities 2014: During 2014, in particular the following topics were discussed:
• developments with regard to corporate governance-related matters, including the implementation of legislative and regulatory changes;
• Board and management succession planning; • the Group’s subsidiary corporate governance framework; and• Board self-assessment and resulting recommendations.
The Governance and Nominations Committee meets at least four times a year. In 2014 it met four times.
Remuneration CommitteeComposition and membership: Zurich Insurance Group Ltd’s Organizational Rules require the Remuneration Committee to consist of at least four independent non-executive Board members. Currently, Thomas Escher (Chairperson), Dame Alison Carnwath, Rafael del Pino and Tom de Swaan serve on this committee.
Key tasks and responsibilities: In general, the Remuneration Committee:
• regularly evaluates the Group’s remuneration system and Zurich’s remuneration rules and proposes amendments to the Board which is responsible for the design, implementation and monitoring of the Group’s remuneration architecture; Further details of the Group’s remuneration framework, including the remuneration philosophy and the remuneration governance are set out in the Remuneration report on pages 62 to 95:
• reviews and proposes to the Board on an annual basis the terms of remuneration of the members of the Board;• based on Zurich’s Remuneration Rules, reviews and proposes to the Board the terms and conditions of employment
of the CEO and reviews those of other members of the GEC, as negotiated by the CEO, before submitting them to the Board for approval;
• liaises with the CEO on other important employment, salary and benefit matters;• reviews and proposes to the Board the total variable remuneration pool and reviews the performance relating
to short-term and long-term incentive plans, and also makes a qualitative assessment of the performance, e.g. taking into account a risk review carried out by the Chief Risk Officer, reviews and makes proposals to the Board for submission to the General Meeting on the approval of the Board’s and GEC’s remuneration;
• and prepares the remuneration report annually in accordance with applicable laws and regulations.
Activities 2014: During 2014, in particular the following topics were discussed:
• the performance of the Group, the segments and the GEC as well as the approval of STIP award level and LTIP vesting level for 2013 including the approval of the total variable remuneration pool for 2013;
• the regulatory environment such as implications from the Circular 2010/1 on minimum standards for remuneration schemes of financial institutions, issued by the Swiss Financial Market Supervisory Authority FINMA on October 21, 2009 and further guidance to it, issued on January 19, 2011; the Directive on Information relating to Corporate Governance of the SIX Exchange Regulation of September 1, 2014, aspects of remuneration raised by proxy advisors, external developments with regard to remuneration-related matters and their potential effect on Zurich;
• share ownership levels of the members of the Board and the GEC (for more details see the remuneration report on pages 62 to 95);
• in the annual joint meeting with the Risk Committee, risk management aspects of the Group’s remuneration architecture, as well as key activities with respect to identified Key Risk Taker (KRT) positions, e.g. risk-based assessment of KRTs;
• in its annual review, the remuneration report, Zurich’s Remuneration Rules and the Remuneration Committee Charter; these documents were approved;
• in its annual review, the Board’s and GEC’s compensation;• implementation of the requirements of the Ordinance AEC, in particular on total remuneration for the Board and
the GEC, to be presented to the vote of the shareholders at the Annual General meeting on April 1, 2015;• a review of the incentive architecture; and • an update on the activities of the Group Pension Committee.
The Remuneration Committee has retained its own independent advisors, Meridian Compensation Partners, LLC and Aon Hewitt to assist in its review of the remuneration structures and practices.
Q4_2014_03_AR14_Corporate governance_part1_en.indd 39 23.02.2015 16:14:46
Zurich Insurance GroupAnnual Report 201440 Governance
Corporate governance report continued
The Remuneration Committee meets at least four times a year. In 2014 it met five times.
Audit CommitteeComposition and membership: Zurich Insurance Group Ltd’s Organizational Rules require the Audit Committee to consist of at least four non-executive Board members, independent from management. Currently, Don Nicolaisen (Chairperson), Fred Kindle, Susan Bies and Monica Mächler, all of whom meet the relevant requirements for independence and qualification, serve on this committee.
The Audit Committee Charter provides that the Audit Committee, as a whole, should have (i) an understanding of IFRS and financial statements, (ii) the ability to assess the general application of such principles in connection with the accounting for estimates, accruals and reserves, (iii) experience in preparing, auditing, analyzing or evaluating financial statements that present a breadth and level of complexity of accounting issues that are generally comparable to those of Zurich Insurance Group Ltd and the Group, or experience in actively supervising one or more persons engaged in these activities, (iv) an understanding of internal controls and procedures for financial reporting, and (v) an understanding of audit committee functions.
To facilitate an ongoing exchange of information between the Risk Committee and the Audit Committee, the Chairperson of the Audit Committee is a member of the Risk Committee and at least one member of the Risk Committee is a member of the Audit Committee. The Chairman of the Board regularly participates in both the Audit and Risk Committee meetings as a guest.
The external auditors, the internal auditors, appropriate members of the GEC and other executives attend its meetings in order to, inter alia, discuss auditors’ reports, review and assess the auditing concept and the examination process and to assess the activities of both external and internal auditors. Private sessions with external and internal auditors are scheduled at the majority of Audit Committee meetings to enable discussion without the presence of management.
For more information on the supervision and control of the external audit process, see pages 57 and 58.
Key tasks and responsibilities: In general, the Audit Committee:
• serves as a focal point for communication and oversight regarding financial accounting and reporting, internal control, actuarial practice, and financial and regulatory compliance;
• reviews the Group’s auditing process (including establishing the basic principles relating to and making proposals for the audit of Zurich Insurance Group Ltd and the Group);
• at least annually, reviews the standards of internal control, including activities, plans, organization and quality of Group Audit and Group Compliance;
• reviews the annual, half-year and quarterly financial reporting of the Group before submission to the Board.
Activities 2014: During 2014, in particular the following topics were discussed:
• accounting policy changes;• quarterly reporting with a strong focus on accounting and reserving matters;• the effectiveness of the internal control framework;• Group Audit work plans, Group Audit findings and management implementation of remediation actions;• the work of the external auditors, the terms of their engagement and the external auditor’s findings on
key judgements and estimates in financial statements; and• the annual Group Compliance Plan, which it approved and against which it monitored progress during the year.
The Audit Committee also discussed compliance issues and trends, such as evolving regulatory expectations with regard to the compliance function.
• The Audit Committee meets at least four times a year. In 2014 it met seven times.
Q4_2014_03_AR14_Corporate governance_part1_en.indd 40 23.02.2015 16:14:46
Govern
ance
Zurich Insurance Group Annual Report 2014 41Corporate governance report
Risk CommitteeComposition and membership: Zurich Insurance Group Ltd’s Organizational Rules require the Risk Committee to consist of at least four non-executive Board members independent from the management. Currently, Susan Bies (Chairperson), Dame Alison Carnwath, Monica Mächler and Don Nicolaisen serve on this committee.
To facilitate an ongoing exchange of information between the Risk Committee and the Audit Committee, the Chairperson of the Audit Committee is a member of the Risk Committee and a member of the Risk Committee is a member of the Audit Committee.
Key tasks and responsibilities: In general, the Risk Committee:
• oversees the Group’s risk management, in particular the Group’s risk tolerance, including agreed limits that the Board regards as acceptable for Zurich to bear, the aggregation of agreed limits across the Group, the measurement of adherence to agreed risk limits and the Group’s risk tolerance in relation to anticipated capital levels;
• further oversees the Group-wide risk governance framework, including risk management and control, risk policies, their implementation and the risk strategy and the monitoring of operational risks;
• reviews the methodologies for risk measurement and the Group’s adherence to its risk limits and reviews the performance of the risk management function;
• reviews, with business management and the Group risk management function, the Group’s general policies and procedures and satisfies itself that effective systems of risk management are established and maintained; and
• receives periodic reports from the Group risk management function and assesses whether significant issues of a risk management and control nature are being appropriately addressed by management in a timely manner.
Activities 2014: From an enterprise risk management perspective, during 2014 the Risk Committee particularly discussed the following topics:
• the results of the Group’s risk profile assessment, and the development and assessment of the Group’s economic and regulatory capital;
• the results of the Group Total Risk Profiling™ (TRP) assessment including an update regarding risk ownership and mitigation actions;
• Zurich Risk Policy (ZRP) including the annual review and approval of new and changed chapters;• investment and asset/liability management, market and credit risks and controls including reports on derivatives;• operational risks and controls, including a detailed review on cyber risk and data security;• potential economic scenarios and their implications for the global outlook;• regulatory risk updates; and• in the annual joint meeting with the Remuneration Committee, risk management aspects of the Group’s
remuneration architecture.
Moreover, from a segment and regional risk perspective, the Risk Committee discussed:
• Farmers risk and controls, including a a detailed review of selected risks of the segment risk profile;• General Insurance risks and controls, accumulation management, underwriting reviews and reinsurance;• Global Life risks and controls, including the proposition approval process; and• business specific risks and controls and topical detailed reviews of North America and Asia Pacific.
For further information on risk governance, see the risk review on pages 114 –153.
The Risk Committee meets at least six times a year. In 2014 it met seven times.
Q4_2014_03_AR14_Corporate governance_part1_en.indd 41 23.02.2015 16:14:46
Zurich Insurance GroupAnnual Report 201442 Governance
Corporate governance report continued
Areas of responsibility of the Board and managementThe Board determines the overall strategy of the Group, supervises senior management and addresses key matters in the area of strategy, finance, structure and organization and business development. In particular, the Board approves the Group’s strategic plan and the annual financial plans developed by management and reviews and approves the annual, half-year and quarterly financial statements of Zurich Insurance Group Ltd and the Group. For more details with regard to the responsibilities of the Board see page 37 to 38.
Subject to the powers reserved to the Board as set out above, the Board has delegated the management of the Group to the CEO. The CEO and, under his leadership, the GEC are responsible for the development and execution of the strategic and financial plans approved by the Board. The CEO has specific powers and duties relating to strategic, financial and other matters as well as to the structure and organization of the Group and manages, supervises and coordinates the activities of members of the GEC. The CEO ensures that appropriate management tools for the Group are developed and implemented and represents the overall interests of the Group. The CEO holds delegated authority to approve certain acquisitions and divestments of businesses and assets, investments and the establishment of new businesses, mergers, joint ventures or cooperation with other organizations.
Information and control instruments vis-à-vis the Group Executive Committee The Board supervises management and monitors its performance through reporting and controlling processes. Regular reporting by the CEO and other executives to the Board provides for appropriate information and updates, including key data for the core businesses, financial information, existing and upcoming risks, and updates on developments in important markets and with regard to major competitors and other significant events. The Chairman of the Board regularly meets with the CEO. He also meets from time to time with other GEC members and executives outside regular Board meetings. The other members of the Board do so as well, especially with the Chief Financial Officer and the Chief Risk Officer.
The Group has an information and financial reporting system. The annual plan for the Group, which includes a summary of financial and operational metrics, is reviewed by the GEC in detail and approved by the Board. Monthly updates are prepared to compare actual performance to the plan. Full-year forecasts are revised if necessary to reflect changes in sensitivities and risks that may affect the results of the Group. Action is taken, where appropriate, when variances arise. This information is reviewed regularly by the GEC and the Board.
The Group has adopted and implemented a coordinated, formalized and consistent approach to risk management and control. Information concerning the Group’s risk management and internal control processes is included in the risk review starting on page 114. The internal audit function, the external auditors and the compliance function also assist the Board in exercising its controlling and supervisory duties. Information on major areas of activities of these functions is set out on pages 57 to 59.
Q4_2014_03_AR14_Corporate governance_part1_en.indd 42 23.02.2015 16:14:46

Govern
ance
Zurich Insurance Group Annual Report 2014 43Corporate governance report
THIS PAGE HAS INTENTIONALLY BEEN LEFT BLANK
Q4_2014_03_AR14_Corporate governance_part1_en.indd 43 23.02.2015 16:14:46

Zurich Insurance GroupAnnual Report 201444 Governance
Group Executive Committee
Our Management strives to meet our ambition to become the best global insurer as measured by our shareholders, customers and employees.
Martin Senn Chief Executive Officer
Mike FoleyCEO North America Commercial, Regional Chairman of North America
Axel P. LehmannChief Risk Officer, Regional Chairman of Europe
Geoff RiddellRegional Chairman of Asia-Pacific, Middle East and Africa
Jeff DaileyCEO Farmers Group, Inc.
Yannick HausmannGroup General Counsel
George QuinnChief Financial Officer
Kristof TerrynCEO Global Life
Robert DickieChief Operations & Technology Officer
Michael KernerCEO General Insurance
Cecilia ReyesChief Investment Officer
Isabelle WeltonChief Human Resources Officer
Q4_2014_04_AR14_Corporate governance_part2_en.indd 44 23.02.2015 16:17:11
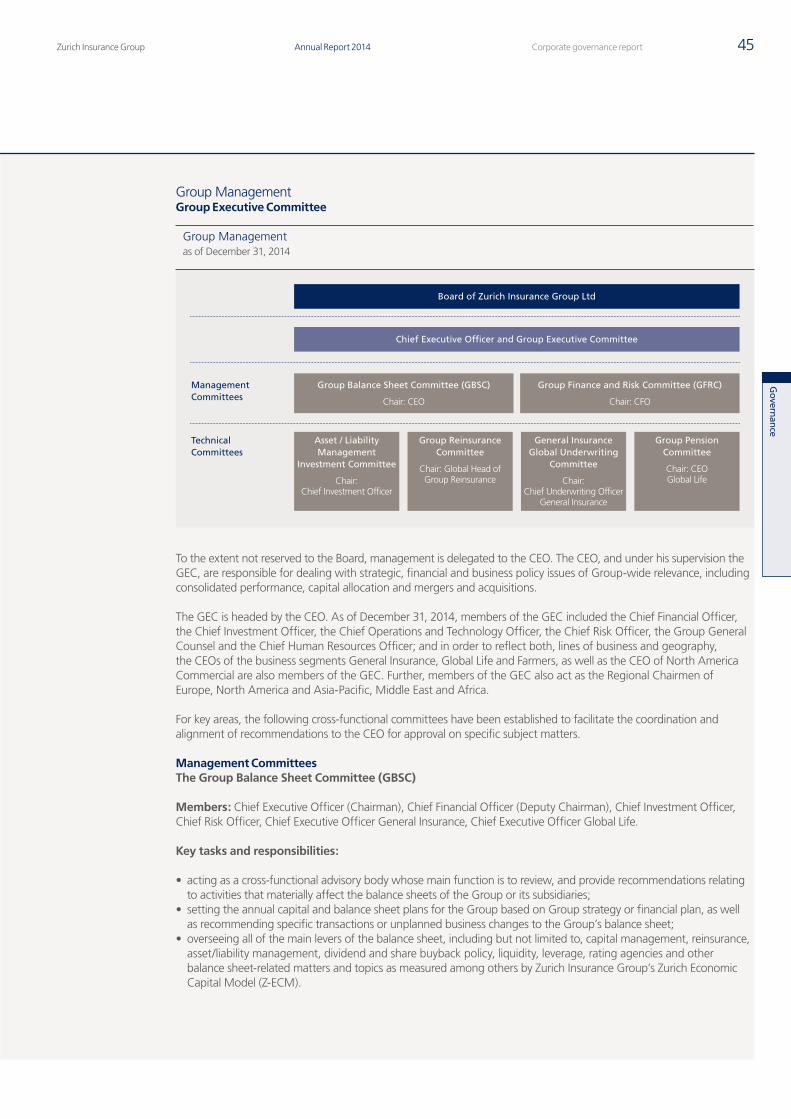
Govern
ance
Zurich Insurance Group Annual Report 2014 45Corporate governance report
Group ManagementGroup Executive Committee
Group Balance Sheet Committee (GBSC)
Chair: CEO
Management Committees
Technical Committees
Group Finance and Risk Committee (GFRC)
Chair: CFO
Asset / LiabilityManagement
Investment Committee
Chair: Chief Investment Officer
General InsuranceGlobal Underwriting
Committee
Chair: Chief Underwriting Officer
General Insurance
Group Pension Committee
Chair: CEOGlobal Life
Group Reinsurance Committee
Chair: Global Head of Group Reinsurance
Chief Executive Officer and Group Executive Committee
Board of Zurich Insurance Group Ltd
Group Managementas of December 31, 2014
To the extent not reserved to the Board, management is delegated to the CEO. The CEO, and under his supervision the GEC, are responsible for dealing with strategic, financial and business policy issues of Group-wide relevance, including consolidated performance, capital allocation and mergers and acquisitions.
The GEC is headed by the CEO. As of December 31, 2014, members of the GEC included the Chief Financial Officer, the Chief Investment Officer, the Chief Operations and Technology Officer, the Chief Risk Officer, the Group General Counsel and the Chief Human Resources Officer; and in order to reflect both, lines of business and geography, the CEOs of the business segments General Insurance, Global Life and Farmers, as well as the CEO of North America Commercial are also members of the GEC. Further, members of the GEC also act as the Regional Chairmen of Europe, North America and Asia-Pacific, Middle East and Africa.
For key areas, the following cross-functional committees have been established to facilitate the coordination and alignment of recommendations to the CEO for approval on specific subject matters.
Management CommitteesThe Group Balance Sheet Committee (GBSC)
Members: Chief Executive Officer (Chairman), Chief Financial Officer (Deputy Chairman), Chief Investment Officer, Chief Risk Officer, Chief Executive Officer General Insurance, Chief Executive Officer Global Life.
Key tasks and responsibilities:
• acting as a cross-functional advisory body whose main function is to review, and provide recommendations relating to activities that materially affect the balance sheets of the Group or its subsidiaries;
• setting the annual capital and balance sheet plans for the Group based on Group strategy or financial plan, as well as recommending specific transactions or unplanned business changes to the Group’s balance sheet;
• overseeing all of the main levers of the balance sheet, including but not limited to, capital management, reinsurance, asset/liability management, dividend and share buyback policy, liquidity, leverage, rating agencies and other balance sheet-related matters and topics as measured among others by Zurich Insurance Group’s Zurich Economic Capital Model (Z-ECM).
Q4_2014_04_AR14_Corporate governance_part2_en.indd 45 23.02.2015 16:17:12
Zurich Insurance GroupAnnual Report 201446 Governance
Corporate governance report continued
The Group Finance and Risk Committee (GFRC) Members: Chief Financial Officer (Chair), Chief Risk Officer (Deputy Chair), Chief Investment Officer, Group General Counsel, and the Chief Operations and Technology Officer.
Key tasks and responsibilities:
• acts as a cross-functional body for financial and risk management matters in the context of the strategy and the overall business activity of the Group;
• oversees financial implications of business decisions and the effective management of the Group’s overall risk profile, including risks related to insurance, financial markets, asset/liability management, credit and operational risks and the interaction among these risks; and
• reviews and formulates recommendations for future courses of action with respect to potential M&A transactions and topics relating to finance and risk management.
Changes to Management CommitteesIn line with the simplification and structural alignment of our organization which was initiated in 2014, we have made the following changes to our management committee structure:
On 1 January 2015, the Finance Committee (FC) and the Risk and Control Committee (RCC) have replaced the Group Balance Sheet Committee and the Group Finance and Risk Committee with clear mandates to avoid potential overlaps and duplication.
The Finance Committee, chaired by the Chief Financial Officer, is acting as a cross-segment and cross functional advisory body for matters that could materially impact the financial position or the profitability of the Group as a whole. Core topics are capital management, balance sheet management, financial risks and business development.
The Risk and Control Committee, which is chaired by the Chief Risk Officer, was set up as a cross-segment and cross-functional body for matters that could materially impact the overall risk of the Group as a whole. Its core mandates are the Group’s risk tolerance and adherence to risk limits, the Zurich Risk Policy, overall and specific risk exposures and risk management controls and processes.
Technical CommitteesIn addition to the Management Committees the Group governance structure provides for committees of a more technical nature to support other aspects of Zurich’s business activities.
The Asset/Liability Management Investment Committee, chaired by the Chief Investment Officer, acts as a cross-divisional body and has primary responsibility for monitoring and reviewing the Group’s asset/liability management and the strategic asset allocation of Zurich’s invested assets.
The Group Reinsurance Committee, chaired by the Global Head of Group Reinsurance, leads the Group’s reinsurance business process of the Group and is responsible for defining and executing its reinsurance strategy in alignment with its risk framework. It also governs the segments’ reinsurance activities and ensures that they have access to re-insurance capacity on economic terms.
The General Insurance Global Underwriting Committee, chaired by the Chief Underwriting Officer, General Insurance, is the focal point for the underwriting function within General Insurance. In particular, it approves the underwriting and related risk control policy for all General Insurance business, develops and agrees the Group’s underwriting strategy, observes emerging issues and trends, monitors accumulation control and approves mitigation plans. The Committee is also responsible for approving new products and oversees and monitors technical underwriting.
The Group Pension Committee, chaired by the CEO Global Life, is responsible for developing, reviewing and advising on the Group governance framework for matters relating to retirement benefit arrangements and post-employment benefits, including the relevant policies and processes. It provides oversight and guidance over the Group’s retirement benefit arrangements and post-retirement benefits for benefit design, funding, investment and accounting purposes and provides recommendations to the GBSC in terms of material pension related matters.
Q4_2014_04_AR14_Corporate governance_part2_en.indd 46 23.02.2015 16:17:12
Govern
ance
Zurich Insurance Group Annual Report 2014 47Corporate governance report
PanelsTo enhance its understanding and assessment of the challenges and risks Zurich may face, the Group continues to seek external expertise and perspective. As of December 31, 2014, the Group had access to three panels of leading academics, business and industry experts which provide feedback and insight. They are not corporate bodies of the Group and have no decision-making powers. These panels provide expertise and advice to senior management or certain functions of the Group. In particular, the International Advisory Council is mandated to provide an external perspective and expertise to the CEO and to members of the GEC on the Group’s growth and public policy strategies. The Investment Management Advisory Council offers feedback on Zurich’s investment results and strategy and on achieving superior risk-adjusted returns relative to the liabilities for the Group’s invested assets. The Natural Catastrophe Advisory Council provides insight into the patterns of occurrence, predictability and destructiveness of catastrophes and feedback about Zurich’s approach to such catastrophes in order to help improve the effectiveness of its underwriting and reinsurance purchasing.
For information on contractual termination benefits, see pages 55 and 56 of this report.
Q4_2014_04_AR14_Corporate governance_part2_en.indd 47 23.02.2015 16:17:12
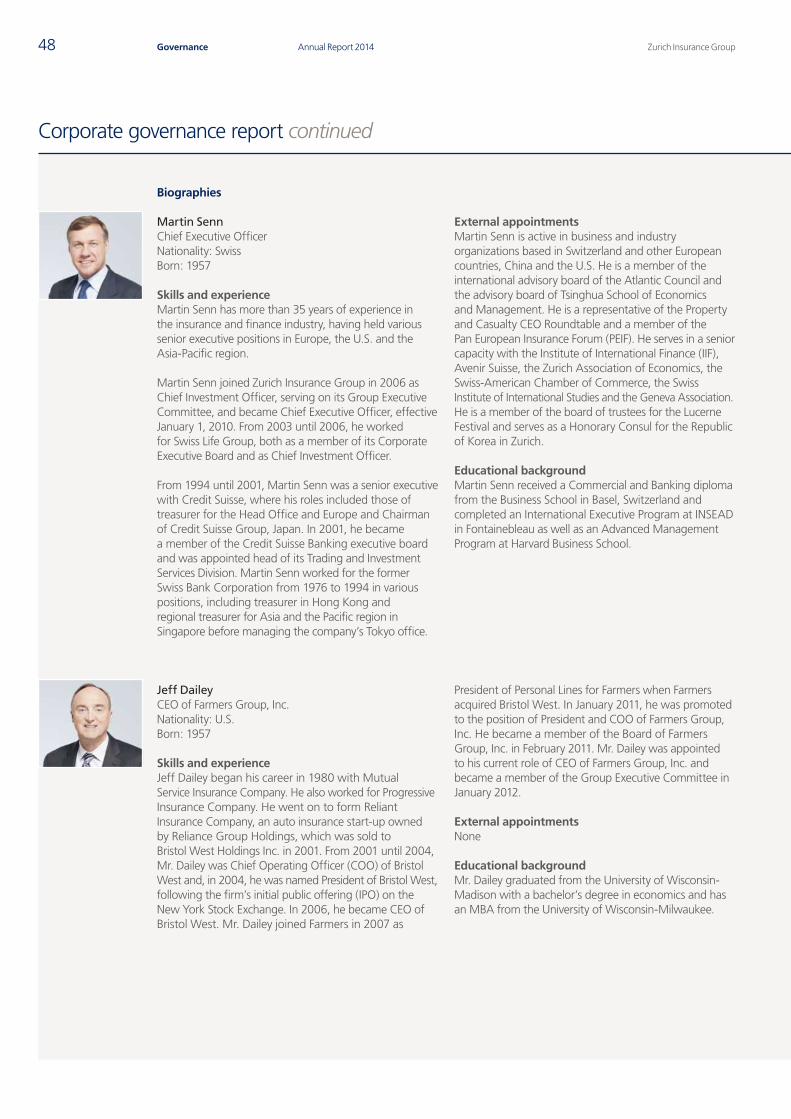
Zurich Insurance GroupAnnual Report 201448 Governance
Corporate governance report continued
Biographies
Martin SennChief Executive OfficerNationality: SwissBorn: 1957
Skills and experienceMartin Senn has more than 35 years of experience in the insurance and finance industry, having held various senior executive positions in Europe, the U.S. and the Asia-Pacific region.
Martin Senn joined Zurich Insurance Group in 2006 as Chief Investment Officer, serving on its Group Executive Committee, and became Chief Executive Officer, effective January 1, 2010. From 2003 until 2006, he worked for Swiss Life Group, both as a member of its Corporate Executive Board and as Chief Investment Officer.
From 1994 until 2001, Martin Senn was a senior executive with Credit Suisse, where his roles included those of treasurer for the Head Office and Europe and Chairman of Credit Suisse Group, Japan. In 2001, he became a member of the Credit Suisse Banking executive board and was appointed head of its Trading and Investment Services Division. Martin Senn worked for the former Swiss Bank Corporation from 1976 to 1994 in various positions, including treasurer in Hong Kong and regional treasurer for Asia and the Pacific region in Singapore before managing the company’s Tokyo office.
External appointmentsMartin Senn is active in business and industry organizations based in Switzerland and other European countries, China and the U.S. He is a member of the international advisory board of the Atlantic Council and the advisory board of Tsinghua School of Economics and Management. He is a representative of the Property and Casualty CEO Roundtable and a member of the Pan European Insurance Forum (PEIF). He serves in a senior capacity with the Institute of International Finance (IIF), Avenir Suisse, the Zurich Association of Economics, the Swiss-American Chamber of Commerce, the Swiss Institute of International Studies and the Geneva Association. He is a member of the board of trustees for the Lucerne Festival and serves as a Honorary Consul for the Republic of Korea in Zurich.
Educational backgroundMartin Senn received a Commercial and Banking diploma from the Business School in Basel, Switzerland and completed an International Executive Program at INSEAD in Fontainebleau as well as an Advanced Management Program at Harvard Business School.
Jeff DaileyCEO of Farmers Group, Inc.Nationality: U.S.Born: 1957
Skills and experienceJeff Dailey began his career in 1980 with Mutual Service Insurance Company. He also worked for Progressive Insurance Company. He went on to form Reliant Insurance Company, an auto insurance start-up owned by Reliance Group Holdings, which was sold to Bristol West Holdings Inc. in 2001. From 2001 until 2004, Mr. Dailey was Chief Operating Officer (COO) of Bristol West and, in 2004, he was named President of Bristol West, following the firm’s initial public offering (IPO) on the New York Stock Exchange. In 2006, he became CEO of Bristol West. Mr. Dailey joined Farmers in 2007 as
President of Personal Lines for Farmers when Farmers acquired Bristol West. In January 2011, he was promoted to the position of President and COO of Farmers Group, Inc. He became a member of the Board of Farmers Group, Inc. in February 2011. Mr. Dailey was appointed to his current role of CEO of Farmers Group, Inc. and became a member of the Group Executive Committee in January 2012.
External appointmentsNone
Educational backgroundMr. Dailey graduated from the University of Wisconsin-Madison with a bachelor’s degree in economics and has an MBA from the University of Wisconsin-Milwaukee.
Q4_2014_04_AR14_Corporate governance_part2_en.indd 48 23.02.2015 16:17:17
Govern
ance
Zurich Insurance Group Annual Report 2014 49Corporate governance report
Robert DickieChief Operations and Technology OfficerNationality: BritishBorn: 1959
Skills and experienceRobert Dickie held various senior positions with National Australia Bank Group in Australia and the UK from 1994 to 2000. From 2000 to 2002, he served as Managing Director, UK Enterprise, for Zurich in the UK. From 2003 to 2008 Mr. Dickie was Group Operations Director and a member of the executive committee of the UK-based bank Bradford & Bingley plc. In 2008 he joined American International Group, Inc. (AIG) where he served as Chief Operations and Systems Officer and was a member of the
global leadership team. He joined Zurich in March 2014 as Chief Operations and Technology officer and member of the Group Executive Committee responsible for Zurich’s shared services, information technology (IT), procurement and sourcing and operational transformation initiatives.
External appointmentsMr. Dickie is a fellow of the Chartered Institute of Bankers in Scotland and a fellow of the Royal Society for the encouragement of Arts, Manufactures and Commerce.
Educational backgroundRobert Dickie holds an MBA from the University of Strathclyde Graduate Business School.
Mike FoleyCEO North America Commercial and Regional Chairman of North AmericaNationality: U.S.Born: 1962
Skills and experienceMike Foley joined the financial management training program of Armtek Corporation in 1984. After graduating from Kellogg in 1989, Mr. Foley joined the Deerpath Group in Lake Forest, Illinois, as an associate. He later became vice president responsible for managing a portfolio of equity investments in various acquired businesses. In 1993 he joined Electrocal, Inc. in Connecticut as president. In 1996, Mr. Foley joined McKinsey & Company, where he later became a principal and led its North American property/casualty insurance practice.
He joined Zurich in 2006 as Chief Operating Officer of its North America Commercial business division and in January 2008 was appointed CEO of that division and a member of the GEC. Mr. Foley is also the Regional Chairman of North America and Chairman of the Board of Zurich Holding Company of America, Inc.
External appointmentsMr. Foley is a member of the Board of the American Insurance Association.
Educational backgroundMr. Foley graduated with a Bachelor of Science from Fairfield University, in Fairfield, Connecticut in 1984 and a master’s degree from the J.L. Kellogg Graduate School of Management at Northwestern University, Evanston, in 1989.
Q4_2014_04_AR14_Corporate governance_part2_en.indd 49 23.02.2015 16:17:21
Zurich Insurance GroupAnnual Report 201450 Governance
Corporate governance report continued
Michael KernerCEO General InsuranceNationality: U.S.Born: 1965
Skills and experienceMichael Kerner joined Zurich in 1992 from the Continental Insurance Company and has held a number of senior executive positions. These include Chief Operations Officer for Zurich North America Specialties and Head of Ceded Reinsurance for Zurich North America from 2002 to 2005. From January 2006 to June 2007, he served as the Global Head of Group Reinsurance and between 2007 and 2009, Mr. Kerner was Global Chief Underwriting Officer for General Insurance and Head of
Group Strategy in Zurich. Prior to his current role, he was Chief Executive Officer (CEO) for Zurich Global Corporate in North America. He became a member of the Group Executive Committee and CEO General Insurance in September 2012.
External appointmentsMr. Kerner is a Fellow of the Casualty Actuarial Society and a member of the American Academy of Actuaries.
Educational backgroundMr. Kerner holds a Bachelor of Science in mathematics and economics from the State University of New York at Binghamton.
Yannick HausmannGroup General Counsel Nationality: SwissBorn: 1967
Skills and experienceYannick Hausmann started his career in 1995 at a law firm in Basel. From 1998 to 2000, he was associate in the tax and legal department of Arthur Andersen AG and Andersen Legal in Zurich. He was a member of the Legal and Compliance Group of the Swiss Insurance Association for several years. Mr. Hausmann joined the Zurich Corporate Center Litigation and Investigation Team in 2000. He has held his current position since December 2009 and was promoted to be a member of the Group Executive Committee in July 2012. He oversees the Legal, Compliance and GAIA (Government and Industry Affairs) functions worldwide across the Zurich Group as well as the Board Secretariat. Mr. Hausmann has served on the Board of Directors of Farmers Group, Inc. since February 2011. In July 2013, he became a member of the Board of Directors of Zurich Insurance plc (Ireland).
External appointmentsSince 2009, Mr. Hausmann has been a member of the legal committees of the Swiss-American Chamber of Commerce and of economiesuisse. In 2011, he joined the board of trustees of the foundation that supports the Museum Haus Konstruktiv in Zurich. In May 2013 Mr. Hausmann became a member of the board of the Europa Institute at the University of Zurich.
Educational backgroundMr. Hausmann received a doctorate in law from the University of Basel in 1995 and was admitted to the bar in Switzerland (Canton of Basel) in 1997. He earned a Master of Laws (LL.M.) from the New York University School of Law in 2003 and attended the Advanced Management Program at Harvard Business School in 2012.
Q4_2014_04_AR14_Corporate governance_part2_en.indd 50 23.02.2015 16:17:25
Govern
ance
Zurich Insurance Group Annual Report 2014 51Corporate governance report
Axel P. LehmannChief Risk Officer andRegional Chairman of EuropeNationality: SwissBorn: 1959
Skills and experienceAxel P. Lehmann worked as a project manager and research associate at the Institute for Insurance Economics at the University of St. Gallen. In 1989, he was appointed as a lecturer in business administration at the University of St. Gallen and in 1990 as vice-president and head of consulting and management development at the Institute for Insurance Economics and the European Center. In 1994, he served as a visiting professor at the Bocconi University in Milan, Italy, before assuming the position of head of corporate planning and corporate controlling at Swiss Life in Zurich. Mr. Lehmann joined Zurich in 1996 as a member of the executive management team of Zurich Switzerland and subsequently acted as head of corporate development and head of commercial lines. Mr. Lehmann became a member of the Group management board responsible for business development functions in November 2000. In September 2001, he took over responsibility as CEO for Northern, Central and Eastern Europe and subsequently was appointed CEO of Zurich Group Germany. Mr. Lehmann became a member of the Group Executive Committee and CEO of the Continental Europe business division in March 2002. In 2004, he was in charge of the consolidation of the UK, Ireland and South Africa with the Continental
Europe division. In September 2004, he became CEO of Zurich American Insurance Company and Zurich North America Commercial business division in Schaumburg, Illinois. In January 2008, he assumed his current role as Chief Risk Officer and assumed additional responsibility for Group information technology (IT) until 2010. He became Chairman of the Board of Directors of Farmers Group, Inc. from July 2011 and Regional Chairman of Europe from October 2011.
External appointmentsMr. Lehmann is a member of the board of directors of UBS AG and is a member and former chairman of the CRO Forum. He is an honorary professor for business administration and service management, and chairman of the board of the Institute of Insurance Economics at the University of St. Gallen. Mr. Lehmann is also a member of the board of directors of economiesuisse and Chairman of the Global Agenda Council on the Global Financial System of the World Economic Forum (WEF).
Educational backgroundMr. Lehmann holds a Ph.D. and master’s in economics and business administration from the University of St. Gallen, where he also received his habilitation. He is a graduate of the Wharton School Advanced Management Program. His doctorate was awarded the Peter Werhahn Prize for the best Ph.D. thesis in the area of management science and academic theory. He did his research study at Harvard Business School and Arizona State University.
George QuinnChief Financial OfficerNationality: BritishBorn: 1966
Skills and experienceGeorge Quinn started his career at KPMG 1988 in London, where he held several positions working with the insurance and reinsurance industry. He joined Swiss Re in 1999 as Chief Accounting Officer based in Zurich and later served as Chief Financial Officer (CFO) for Swiss Re Group’s Financial Services. Mr. Quinn became the Regional CFO for Swiss Re Americas based in New York in 2003. In March 2007 he became Swiss Re Group’s CFO. Mr. Quinn joined Zurich in May 2014 as Group CFO.
External appointmentsMr. Quinn is a member of the Board of Trustees of the Zurich International School and a member of the Finance Chapter of the Swiss-American Chamber of Commerce.
Educational backgroundMr. Quinn holds a degree in engineering from the University of Strathclyde. Mr. Quinn is a member of the Institute of Chartered Accountants in England and Wales.
Q4_2014_04_AR14_Corporate governance_part2_en.indd 51 23.02.2015 16:17:29
Zurich Insurance GroupAnnual Report 201452 Governance
Corporate governance report continued
Geoffrey RiddellRegional Chairman of Asia-Pacific, Middle East and AfricaNationality: BritishBorn: 1956
Skills and experienceGeoffrey (Geoff) Riddell started his career with Price Waterhouse in 1978 and in 1982 moved to American International Group, Inc. (AIG), where he held various roles, including country manager for Hong Kong, Belgium and France. While in Hong Kong, he set up the first foreign general insurance company in China. He joined Zurich in 2000 as managing director of Zurich Commercial in the UK, becoming managing director of the UK Corporate and Government businesses. In 2002, he was appointed Chief Executive Officer (CEO) of General Insurance in the UK, Ireland and South Africa. Mr. Riddell assumed the position of CEO of Global Corporate in April 2004, becoming a member of the Group Executive Committee in October 2004. In 2009, he took on the roles of CEO of Asia-Pacific & Middle East (APME) – responsible for both Life and General Insurance in the APME region – and Chairman of Global Corporate. In 2010, he assumed the newly-created role of Regional Chairman of Asia-Pacific, Middle East and Africa.
Mr. Riddell is a former member of the General Insurance Council of the Association of British Insurers and for three years chaired its liability committee. From 1990 to 1995, he was a member of the Hong Kong Federation of Insurers Council. He was a director of Pool Re from February 2005 until August 2010 and of the Forum for Global Health Protection from 2007 until the end of 2010. He was a member of the Confederation of British Industry’s Chairmen’s Committee and chaired the CBI Financial Services Council until September 2010. Until late 2009, he was a member of the Foundation Board of IMD in Lausanne, the City of London EU Advisory Committee and the Lord Mayor of London’s Advisory Committee.
External appointmentsMr. Riddell has been a director of the General Committee of the British Chamber of Commerce in Hong Kong since April 1, 2011 and is now Deputy Chairman.
Educational backgroundMr. Riddell received an M.A. degree in natural sciences (chemistry) from Oxford University (The Queen’s College) and later qualified as a chartered accountant.
Cecilia ReyesChief Investment OfficerNationality: Swiss and PhilippineBorn: 1959
Skills and experienceCecilia Reyes has over 20 years experience in the international financial markets. Ms. Reyes worked from 1990 until 1995 for Credit Suisse in Zurich in various roles in Credit Suisse Asset Management, global treasury and securities trading. In 1995, she started working with ING Barings in London and in 1997 she became a director and head of trading risk analytics. She moved to Amsterdam in 2000 as head of risk analytics for ING Asset Management to develop risk management methods for the asset management operation. Ms. Reyes joined Zurich in 2001 as regional manager for Group Investments with responsibility for North America, and
became regional manager for Europe and International Businesses in 2004. From April 2006 until March 2010 she was Head of Investment Strategy Implementation. In April 2010, she assumed her current role as Chief Investment Officer.
External appointmentsMs. Reyes has been a member of the advisory board of the Department of Banking and Finance at the University of Zurich since 2011. In 2014 she became a member of the Board of Governors of the Asian Institute of Management.
Educational backgroundCecilia Reyes holds a Ph.D. in finance from London Business School and an MBA from the University of Hawaii.
Q4_2014_04_AR14_Corporate governance_part2_en.indd 52 23.02.2015 16:17:33
Govern
ance
Zurich Insurance Group Annual Report 2014 53Corporate governance report
Kristof TerrynCEO Global Life Nationality: BelgianBorn: 1967
Skills and experienceKristof Terryn began his career in 1993 in the banking industry, where he worked in capital markets. In 1997, he joined McKinsey & Company where he held various positions within the financial services practice in Brussels and Chicago. He joined Zurich in 2004 as Head of Planning and Performance Management. In 2007, he became COO for the Global Corporate business division and in 2009 was named COO for General Insurance.
Mr. Terryn became a member of the Group Executive Committee in 2010 on his appointment as Group Head of Operations. He assumed his current role as CEO Global Life in August 2013.
External appointmentsNone
Educational backgroundMr. Terryn holds a law degree and a degree in economics from the University of Leuven, Belgium, as well as an MBA from the University of Michigan.
Isabelle WeltonChief Human Resources OfficerNationality: SwissBorn: 1963
Skills and experienceIsabelle Welton started her career at Citibank in New York, and in Tokyo as product manager for custody and securities lending. She then moved to Simko Communication & Marketing in Geneva in 1992 where she was responsible for several financial services clients as advertising and communications consultant. In 1994, she moved to Interbrand, Zintzmeyer & Lux in Zurich, where she was responsible for the agency’s financial services clients. In 1996, she joined Zurich, leading external communications. In this position, she was responsible for branding, corporate identity, advertising, sponsoring and community marketing globally. She joined EFG Private Bank in 2001 as senior vice president and Head of Corporate Communications. In 2003 Ms. Welton joined IBM where she held several management positions in the
marketing and communications function. From 2010 to 2012 she was Country General Manager for IBM Switzerland. In January 2013 she joined Zurich as Chief Marketing Officer and was appointed Chief of Staff in September 2013. In this position, she was responsible for overseeing the operational delivery of Group Communications, Group Human Resources, Group Marketing and Group Strategy. In July 2014 she was appointed Chief Human Resources Officer and became a member of the Group Executive Committee.
External appointmentsMs. Welton is a member of the boards of Georg Fischer AG and AG für die Neue Zürcher Zeitung, a member of the Regional Economic Advisory Council of the Swiss National Bank and a member of the board of trustees of the Lucerne Festival.
Educational backgroundMs. Welton holds a law degree from the University of Zurich.
Q4_2014_04_AR14_Corporate governance_part2_en.indd 53 23.02.2015 16:17:37
Zurich Insurance GroupAnnual Report 201454 Governance
Corporate governance report continued
Changes to the GEC after January 1, 2015Mr. Geoffrey Riddell, Regional Chairman of Asia-Pacific, Middle East and Africa will step down from the GEC effective end of March 2015. Ms. Cecilia Reyes will take on the additional responsibility of Regional Chairman of Asia Pacific, and responsibility for Middle East and Africa will be transferred to Mr. Axel Lehmann, Chief Risk Officer and Regional Chairman of Europe.
Management contractsZurich Insurance Group Ltd has not transferred key parts of management by contract to other companies (or individuals) not belonging to (or employed by) the Group.
Shareholders’ participation rightsVoting rights restrictions and representationEach share entered into the share register entitles the holder to one vote. There are no voting rights restrictions.
A shareholder with voting rights can attend shareholders’ meetings of Zurich Insurance Group Ltd in person. He or she may also authorize, in writing, another shareholder with voting rights or any person permitted under the Articles of Incorporation and a more detailed directive of the Board to represent him or her at the shareholders’ meeting. Based on the Articles of Incorporation, minors or wards may be represented by their legal representatives, married persons by their spouses and a legal entity may be represented by a person authorized to bind it by his or her signature, even if such persons are not shareholders.
As of the enactment of the Ordinance AEC and reflected in article 13 of our Articles of Incorporation, authority of representation may be given to an independent voting rights representative only. The AGM elects an independent voting rights representative. The term of office ends after completion of the next AGM. The independent voting rights representative may be re-elected. In addition, the shareholders may give voting instructions to the independent voting rights representative for the AGM via the online platform Sherpany.
Zurich Insurance Group Ltd may under certain circumstances authorize the beneficial owners of the shares that are held by professional persons as nominees (such as a trust company, bank, professional asset manager, clearing organization, investment fund or another entity recognized by Zurich Insurance Group Ltd) to attend the shareholders’ meetings and exercise votes as proxy of the relevant nominee. For further details, see page 26 of this report. In accordance with Swiss law and practice, Zurich Insurance Group Ltd informs all shareholders at the beginning of the shareholders’ meeting of the aggregate number of proxy votes received. Zurich Insurance Group Ltd provided electronic voting devices to its shareholders for all the resolutions taken at the AGM on April 2, 2014.
Statutory quoraPursuant to the Articles of Incorporation, the AGM constitutes a quorum irrespective of the number of shareholders present and shares represented. Resolutions and elections generally require the approval of a simple majority of the votes cast, excluding abstentions, blank and invalid votes, unless respective provisions in the Articles of Incorporation (of which there are currently none) or mandatory legal provisions stipulate otherwise. Article 704 of the Swiss Code of Obligations provides for a two-thirds majority of votes represented and an absolute majority of the nominal value of shares represented for certain important matters, such as a change of the company’s purpose or domicile, a dissolution of the company and certain matters relating to capital increases. In the event of the votes being equally divided, the Chairman of the Board has a casting vote.
Convening of shareholders’ meetingsShareholders’ meetings are convened by the Board or, if necessary, by the auditors and other bodies in accordance with the provisions set out in articles 699 and 700 of the Swiss Code of Obligations. Shareholders with voting rights representing at least 10 percent of the share capital may call a shareholders’ meeting, indicating the matters to be discussed and the corresponding proposals. The invitation to shareholders is mailed at least 20 calendar days before the meeting is held and, in addition, is published in the Swiss Official Gazette of Commerce and in several newspapers.
AgendaThe Board is responsible for setting the agenda and sending it to shareholders. Shareholders with voting rights who together represent shares with a nominal value of at least CHF 10,000 may request in writing, no later than 45 days before the day of the meeting, that specific proposals be included in the agenda.
Q4_2014_04_AR14_Corporate governance_part2_en.indd 54 23.02.2015 16:17:38
Govern
ance
Zurich Insurance Group Annual Report 2014 55Corporate governance report
Registrations in the share register With a view to ensuring an orderly process, shortly before the AGM the Board determines the date on which a shareholder needs to be registered in the share register in order to exercise his or her participation rights by attending the shareholders’ meeting. That date is published, together with the invitation to the shareholders’ meeting, in the Swiss Official Gazette of Commerce and in several newspapers.
Information Policy As of December 31, 2014, Zurich Insurance Group Ltd had 119,407 shareholders registered in its share register, ranging from private individuals to large institutional investors (see p. 309). Each registered shareholder receives an invitation to a shareholders’ meeting. A Letter to Shareholders provides an overview of the Group’s activities as the year progresses and outlines its financial performance. A more comprehensive Annual Review, the Annual Report and half-year reports are available on Zurich’s website www.zurich.com (www.zurich.com/shareholder-information) and are also available in printed form on request. Information on the quarterly results reporting is also available for all shareholders on Zurich’s website.
Zurich Insurance Group Ltd maintains a regular dialogue with investors through its Investor Relations department and responds to questions and issues raised by institutional and private individual shareholders. In addition, Zurich Insurance Group Ltd organizes investor days for institutional investors and analysts to provide comprehensive information on its businesses and strategic direction. Such presentations can be followed via webcast or conference call. In 2014, an Investor Update was held in London on December 5, and focused on our North America Commercial business and Farmers. An Investor Day will take place on May 21, 2015 in Zurich. A wide range of Information on the Group and its businesses, including results reporting documents and the documentation from the Investor Update are available on the Investor Relations section of Zurich’s website www.zurich.com (www.zurich.com/investors).
Zurich Insurance Group Ltd will hold its Annual General Meeting on April 1, 2015. The meeting will be conducted in the Hallenstadion in Zurich-Oerlikon. An invitation setting out the agenda for this meeting and an explanation of the proposed resolutions is issued to shareholders at least 20 days before the meeting.
For addresses and further upcoming important dates, see shareholder information starting on page 308 (Financial Calendar on page 310).
EmployeesThe Group is committed to providing equal opportunities when recruiting and promoting people, whereby ability, experience, skills, knowledge, integrity and diversity are guiding principles. The Group actively encourages employee involvement in its activities through printed and online publications, team briefings and regular meetings with employees’ representatives. Further, the Group is party to an agreement with employee representatives of the Group’s companies in Europe. For further information on the Group’s people management activities, see page 14 of the Annual Report and a longer report on Zurich’s website www.zurich.com/cr/our-people.
In some countries, the Group has established broad-based employee share compensation and incentive plans to encourage employees to become shareholders of the Group.
Changes of control and defense measures Duty to make an offer The Articles of Incorporation of Zurich Insurance Group Ltd do not provide for opting out or opting up in the meaning of articles 22 and 32 of the Federal Act on Stock Exchanges and Securities Trading. Therefore, mandatory offers have to be submitted when a shareholder or a group of shareholders acting in concert exceed 331⁄3 percent ownership of the issued and outstanding share capital of Zurich Insurance Group Ltd.
Clauses on changes of control Employment agreements have been entered into with members of the GEC, setting out the terms and conditions on which they are employed. The longest notice period for members of the GEC is 12 months. No other benefits are provided in the case of a change of control.
Q4_2014_04_AR14_Corporate governance_part2_en.indd 55 23.02.2015 16:17:38
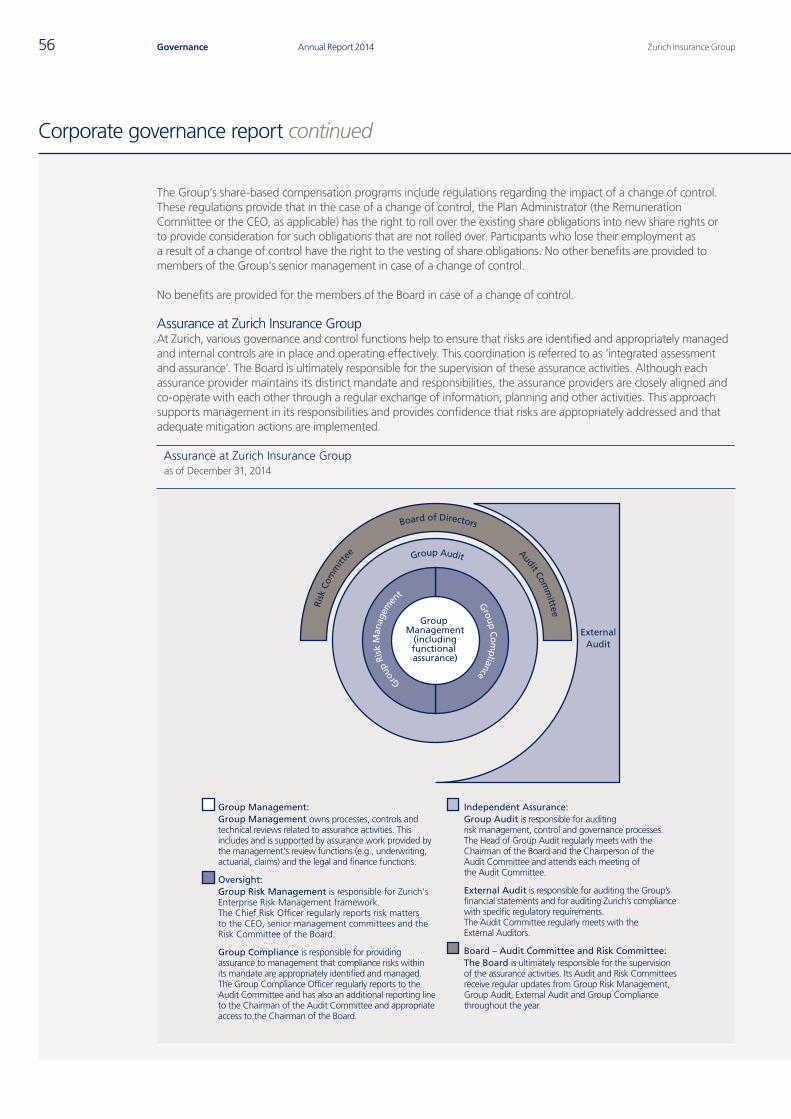
Zurich Insurance GroupAnnual Report 201456 Governance
Corporate governance report continued
The Group’s share-based compensation programs include regulations regarding the impact of a change of control. These regulations provide that in the case of a change of control, the Plan Administrator (the Remuneration Committee or the CEO, as applicable) has the right to roll over the existing share obligations into new share rights or to provide consideration for such obligations that are not rolled over. Participants who lose their employment as a result of a change of control have the right to the vesting of share obligations. No other benefits are provided to members of the Group’s senior management in case of a change of control.
No benefits are provided for the members of the Board in case of a change of control.
Assurance at Zurich Insurance GroupAt Zurich, various governance and control functions help to ensure that risks are identified and appropriately managed and internal controls are in place and operating effectively. This coordination is referred to as ‘integrated assessment and assurance’. The Board is ultimately responsible for the supervision of these assurance activities. Although each assurance provider maintains its distinct mandate and responsibilities, the assurance providers are closely aligned and co-operate with each other through a regular exchange of information, planning and other activities. This approach supports management in its responsibilities and provides confidence that risks are appropriately addressed and that adequate mitigation actions are implemented.
Assurance at Zurich Insurance Groupas of December 31, 2014
Group Management
(includingfunctional assurance)
ExternalAudit
Group Management:Group Management owns processes, controls and technical reviews related to assurance activities. This includes and is supported by assurance work provided by the management's review functions (e.g., underwriting, actuarial, claims) and the legal and finance functions.
Oversight:Group Risk Management is responsible for Zurich's Enterprise Risk Management framework. The Chief Risk Officer regularly reports risk matters to the CEO, senior management committees and the Risk Committee of the Board.
Group Compliance is responsible for providing assurance to management that compliance risks within its mandate are appropriately identified and managed. The Group Compliance Officer regularly reports to the Audit Committee and has also an additional reporting line to the Chairman of the Audit Committee and appropriate access to the Chairman of the Board.
Independent Assurance:Group Audit is responsible for auditing risk management, control and governance processes.The Head of Group Audit regularly meets with the Chairman of the Board and the Chairperson of theAudit Committee and attends each meeting of the Audit Committee.
External Audit is responsible for auditing the Group’s financial statements and for auditing Zurich’s compliance with specific regulatory requirements. The Audit Committee regularly meets with the External Auditors.
Board – Audit Committee and Risk Committee:The Board is ultimately responsible for the supervision of the assurance activities. Its Audit and Risk Committees receive regular updates from Group Risk Management, Group Audit, External Audit and Group Compliance throughout the year.
Group Audit
Board of Directors
Risk
Com
mitt
ee Audit Comm
ittee
Group Com
pliance
Group
Ris
k M
anag
emen
t
Q4_2014_04_AR14_Corporate governance_part2_en.indd 56 23.02.2015 16:17:38
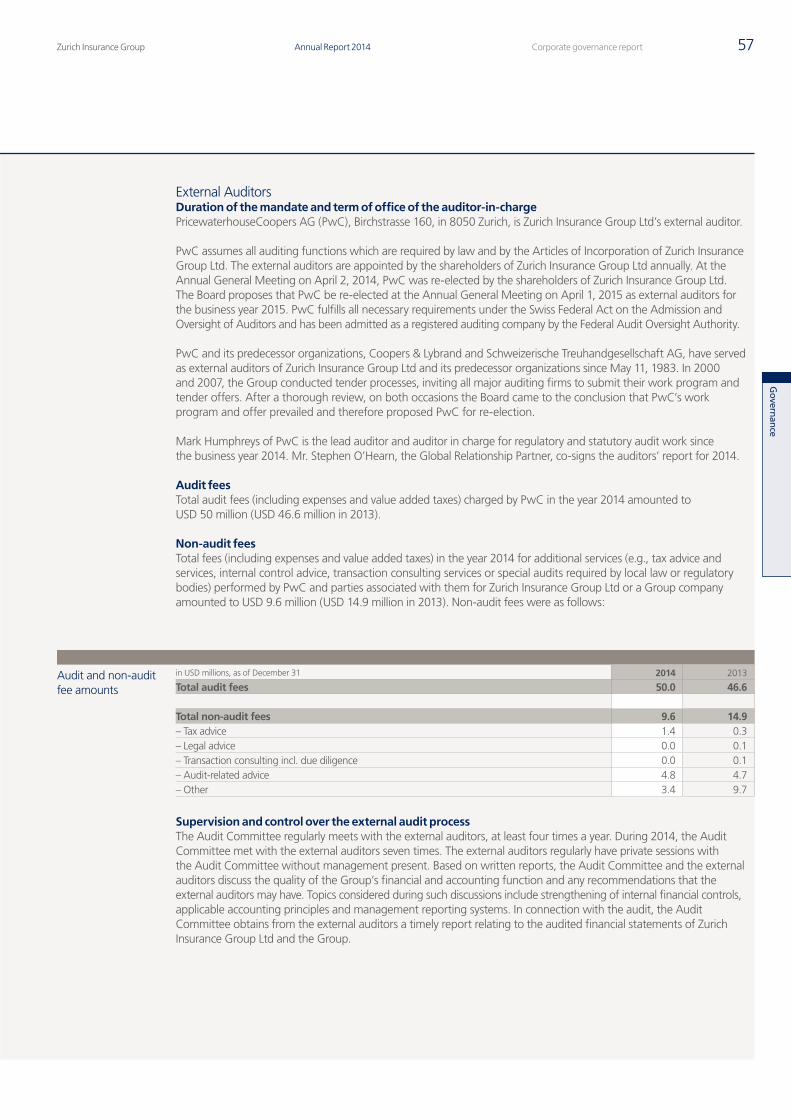
Govern
ance
Zurich Insurance Group Annual Report 2014 57Corporate governance report
External AuditorsDuration of the mandate and term of office of the auditor-in-charge PricewaterhouseCoopers AG (PwC), Birchstrasse 160, in 8050 Zurich, is Zurich Insurance Group Ltd’s external auditor.
PwC assumes all auditing functions which are required by law and by the Articles of Incorporation of Zurich Insurance Group Ltd. The external auditors are appointed by the shareholders of Zurich Insurance Group Ltd annually. At the Annual General Meeting on April 2, 2014, PwC was re-elected by the shareholders of Zurich Insurance Group Ltd. The Board proposes that PwC be re-elected at the Annual General Meeting on April 1, 2015 as external auditors for the business year 2015. PwC fulfills all necessary requirements under the Swiss Federal Act on the Admission and Oversight of Auditors and has been admitted as a registered auditing company by the Federal Audit Oversight Authority.
PwC and its predecessor organizations, Coopers & Lybrand and Schweizerische Treuhandgesellschaft AG, have served as external auditors of Zurich Insurance Group Ltd and its predecessor organizations since May 11, 1983. In 2000 and 2007, the Group conducted tender processes, inviting all major auditing firms to submit their work program and tender offers. After a thorough review, on both occasions the Board came to the conclusion that PwC’s work program and offer prevailed and therefore proposed PwC for re-election.
Mark Humphreys of PwC is the lead auditor and auditor in charge for regulatory and statutory audit work since the business year 2014. Mr. Stephen O’Hearn, the Global Relationship Partner, co-signs the auditors’ report for 2014.
Audit fees Total audit fees (including expenses and value added taxes) charged by PwC in the year 2014 amounted to USD 50 million (USD 46.6 million in 2013).
Non-audit feesTotal fees (including expenses and value added taxes) in the year 2014 for additional services (e.g., tax advice and services, internal control advice, transaction consulting services or special audits required by local law or regulatory bodies) performed by PwC and parties associated with them for Zurich Insurance Group Ltd or a Group company amounted to USD 9.6 million (USD 14.9 million in 2013). Non-audit fees were as follows:
Audit and non-audit fee amounts
in USD millions, as of December 31 2014 2013
Total audit fees 50.0 46.6 Total non-audit fees 9.6 14.9– Tax advice 1.4 0.3– Legal advice 0.0 0.1– Transaction consulting incl. due diligence 0.0 0.1– Audit-related advice 4.8 4.7– Other 3.4 9.7
Supervision and control over the external audit processThe Audit Committee regularly meets with the external auditors, at least four times a year. During 2014, the Audit Committee met with the external auditors seven times. The external auditors regularly have private sessions with the Audit Committee without management present. Based on written reports, the Audit Committee and the external auditors discuss the quality of the Group’s financial and accounting function and any recommendations that the external auditors may have. Topics considered during such discussions include strengthening of internal financial controls, applicable accounting principles and management reporting systems. In connection with the audit, the Audit Committee obtains from the external auditors a timely report relating to the audited financial statements of Zurich Insurance Group Ltd and the Group.
Q4_2014_04_AR14_Corporate governance_part2_en.indd 57 23.02.2015 16:17:38
Zurich Insurance GroupAnnual Report 201458 Governance
Corporate governance report continued
The Audit Committee oversees the work of the external auditors. It reviews, at least annually, the qualification, performance and independence of the external auditors and reviews any matters that may impair their objectivity and independence based on a written report by the external auditors describing the firm’s internal quality control procedures, any material issues raised and all relationships between the external auditors and the Group and/or its employees that could be considered to bear on the external auditors’ independence. The Audit Committee evaluates the performance of the external auditors during their audit examination. It elicits the comments of management regarding the auditors’ performance (based on criteria such as their understanding of Zurich’s business, technical knowledge and expertise, etc.) and the quality of the working relationship (responsiveness of the external auditors to the needs of Zurich Insurance Group Ltd and the Group and the clarity of communication). The Audit Committee reviews, prior to the commencement of the annual audit, the scope and general extent of the external audit and suggests areas requiring special emphasis.
The Audit Committee proposes the external auditors to the Board for appointment by the shareholders and is responsible for approving the audit fees. A proposal for fees for audit services is submitted to management by the external auditors and validated, before it is submitted to the Audit Committee for approval. The proposal is mainly based on an analysis of existing reporting units and expected changes to the legal and operational structure during the year.
The Audit Committee has approved a written policy on the use of external auditors for non-audit services, which sets out the rules for providing such services and related matters (including a list of prohibited services). Allowable non-audit services may include tax advice, comfort and consent letters, certifications and attestations, and due diligence and audit support in proposed transactions, to the extent that such work complies with applicable legal and regulatory requirements and does not compromise the independence or objectivity of the external auditors. In order to avoid conflicts of interest, all allowable non-audit services need pre-approval from the Audit Committee (Chairman), the Chief Financial Officer, the Group Controller or the local CFO, depending on the level of the expected fee. This policy further requires, among other things, an engagement letter specifying the services to be provided.
Group AuditThe internal audit function of the Group (Group Audit) is tasked with providing independent and objective assurance to the Board, the Audit Committee, the CEO and management and to the boards and audit committees of subsidiary companies. This is accomplished by developing a risk-based plan, which is updated continuously as the risks faced by the business change. The plan is based on the full spectrum of business risks including concerns and issues raised by the Audit Committee, management and other stakeholders. Group Audit executes the plan in accordance with defined operating standards, which incorporate and comply with the International Standards for the Professional Practice of Internal Auditing, issued by the Institute of Internal Auditors (IIA). Key issues raised by Group Audit are communicated to the responsible management function, the CEO and the Audit Committee using a suite of reporting tools.
The Audit Committee, boards and audit committees of subsidiary companies and CEO are regularly informed of important audit findings, including ineffective opinions, mitigation actions and attention provided by management. Group Audit is responsible for ensuring that issues that could have an impact on the Group’s operations are brought to the attention of the Audit Committee and appropriate levels of management and that timely follow-up action occurs. This is supported by the attendance of the Head of Group Audit at each meeting of the Audit Committee.
Group Audit is authorized to review all areas of the Group and has unrestricted access to all Group activities, accounts, records, property and personnel necessary to fulfill its duties. In the course of its work, Group Audit takes into consideration the work of other assurance functions. In particular, Group Audit co-ordinates its activities with the external auditors, sharing risk assessments, work plans, audit reports and updates on audit actions. Group Audit and the external auditors meet regularly at all levels of the organization to optimize assurance provision and efficiency.
The Audit Committee assesses the independence of Group Audit and reviews its activities, plans and organization, the quality of its work and its cooperation with the external auditors. As required by professional and regulatory quality assurance regulations the Internal Audit function has to be quality-reviewed periodically, at least every five years by an independent qualified body. This review was conducted most recently in 2011. The results confirmed that Group Audit’s practices conform with all Institute of Internal Audit standards and FINMA requirements and Group Audit was assessed as a very mature internal audit function.
Q4_2014_04_AR14_Corporate governance_part2_en.indd 58 23.02.2015 16:17:39
Govern
ance
Zurich Insurance Group Annual Report 2014 59Corporate governance report
The Audit Committee approves the Group Audit Plan annually, and reviews reports from the function on its activities and significant risk, control and governance issues, at least every quarter. The Head of Group Audit reports functionally to the Audit Committee and administratively to the CEO, and meets regularly with the Chairman of the Board and the Chairperson of the Audit Committee. Group Audit has no operational responsibilities over the areas it reviews and, to ensure independence, all Group Audit staff globally report (via audit managers) to the Head of Group Audit.
Group ComplianceThe Group’s core values are founded on the principle that it acts lawfully and seeks to do what is right. Sound compliance in everything the Group does, helps to protect Zurich’s reputation and supports the achievement of the Group’s ambitious goals.
The Group’s compliance function provides policies and guidance, business advice, training and assurance of appropriate compliance controls within its mandate. The compliance function also supports Zurich’s management in maintaining and promoting a culture of compliance and ethics consistent with Zurich Basics, the Group’s code of conduct. This compliance framework relies on an ongoing global compliance risk assessment to support a risk-based monitoring regime. The results of this assessment underpin the compliance function’s strategic planning which is conducted in consultation with business partners. The compliance plan is presented annually to the Audit Committee. Through a comprehensive program, the compliance function implements, embeds and monitors internal compliance policies and guidance. As part of that program, compliance officers introduce new employees to applicable rules and are involved in the integration of newly acquired companies. To help employees understand their responsibilities under Zurich Basics and internal compliance policies, all employees receive regular ethical and compliance training. In addition, the Group’s compliance function spearheads internal awareness campaigns on ethical and regulatory conduct. Each year all Zurich employees confirm their understanding of and compliance with Zurich Basics and internal policies. Zurich encourages its employees to speak up and report improper conduct that they believe is illegal, unethical, or violates Zurich Basics or our Group’s policies. Employees are free to report their concerns to management, Human Resources. the Group’s legal department, its compliance function, or through the Zurich Ethics Line (or similar service provided locally), a phone and web-based service run by an external specialized provider. Zurich does not tolerate retaliation against any employee who reports such concerns in good faith.
The Group’s compliance function, which consists of compliance professionals around the world is overseen by the Group Compliance Officer who reports to the Group General Counsel and regularly provides reports to the Group’s Audit Committee. The Group Compliance Officer has an additional reporting line to the Chairman of the Audit Committee and appropriate access to the Chairman of the Board.
Risk Management and Internal Control StatementFor information regarding the Group’s risk management and internal control framework, see the risk review of this Annual Report 2014 on p. 148 to 149. The Group no longer separately describes risk management and internal control information in this governance report.
Going concern The Directors are satisfied that, having reviewed the performance of the Group and forecasts for the forthcoming year, the Group has adequate resources to enable it to continue in business for the foreseeable future. For this reason, the Directors have adopted the going concern basis for the preparation of the consolidated financial statements.
Q4_2014_04_AR14_Corporate governance_part2_en.indd 59 23.02.2015 16:17:39
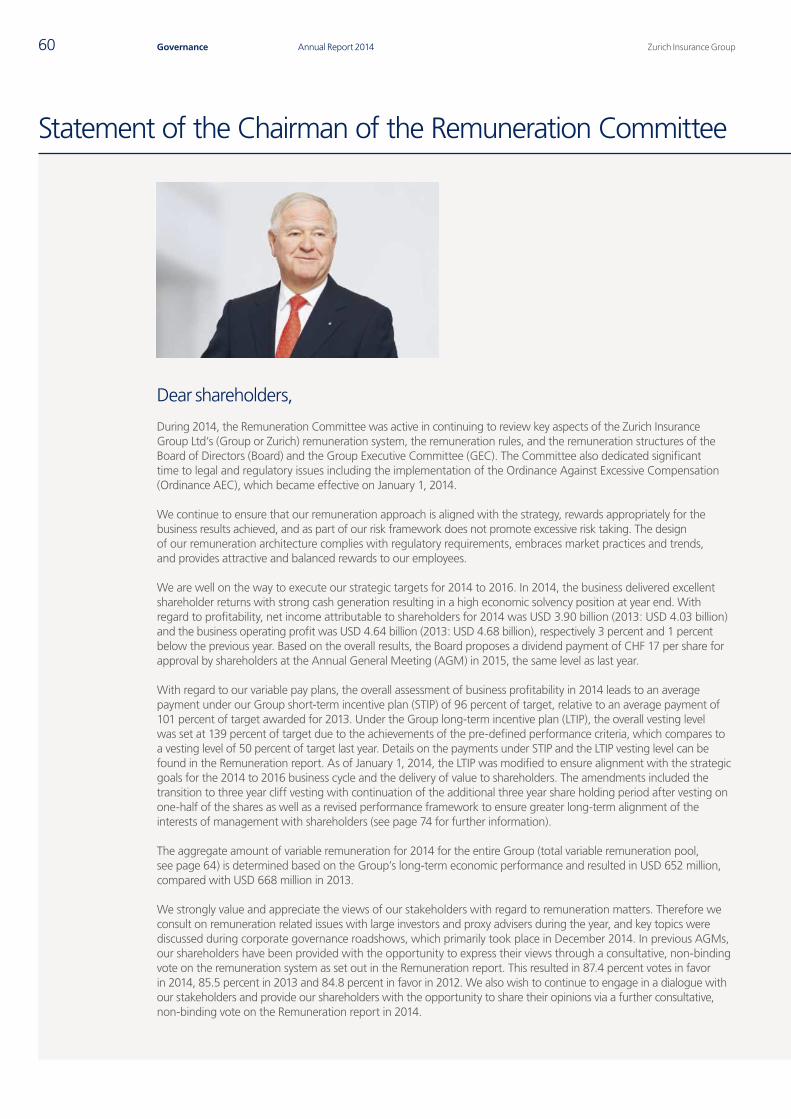
Zurich Insurance GroupAnnual Report 201460 Governance
Statement of the Chairman of the Remuneration Committee
Dear shareholders,
During 2014, the Remuneration Committee was active in continuing to review key aspects of the Zurich Insurance Group Ltd’s (Group or Zurich) remuneration system, the remuneration rules, and the remuneration structures of the Board of Directors (Board) and the Group Executive Committee (GEC). The Committee also dedicated significant time to legal and regulatory issues including the implementation of the Ordinance Against Excessive Compensation (Ordinance AEC), which became effective on January 1, 2014.
We continue to ensure that our remuneration approach is aligned with the strategy, rewards appropriately for the business results achieved, and as part of our risk framework does not promote excessive risk taking. The design of our remuneration architecture complies with regulatory requirements, embraces market practices and trends, and provides attractive and balanced rewards to our employees.
We are well on the way to execute our strategic targets for 2014 to 2016. In 2014, the business delivered excellent shareholder returns with strong cash generation resulting in a high economic solvency position at year end. With regard to profitability, net income attributable to shareholders for 2014 was USD 3.90 billion (2013: USD 4.03 billion) and the business operating profit was USD 4.64 billion (2013: USD 4.68 billion), respectively 3 percent and 1 percent below the previous year. Based on the overall results, the Board proposes a dividend payment of CHF 17 per share for approval by shareholders at the Annual General Meeting (AGM) in 2015, the same level as last year.
With regard to our variable pay plans, the overall assessment of business profitability in 2014 leads to an average payment under our Group short-term incentive plan (STIP) of 96 percent of target, relative to an average payment of 101 percent of target awarded for 2013. Under the Group long-term incentive plan (LTIP), the overall vesting level was set at 139 percent of target due to the achievements of the pre-defined performance criteria, which compares to a vesting level of 50 percent of target last year. Details on the payments under STIP and the LTIP vesting level can be found in the Remuneration report. As of January 1, 2014, the LTIP was modified to ensure alignment with the strategic goals for the 2014 to 2016 business cycle and the delivery of value to shareholders. The amendments included the transition to three year cliff vesting with continuation of the additional three year share holding period after vesting on one-half of the shares as well as a revised performance framework to ensure greater long-term alignment of the interests of management with shareholders (see page 74 for further information).
The aggregate amount of variable remuneration for 2014 for the entire Group (total variable remuneration pool, see page 64) is determined based on the Group’s long-term economic performance and resulted in USD 652 million, compared with USD 668 million in 2013.
We strongly value and appreciate the views of our stakeholders with regard to remuneration matters. Therefore we consult on remuneration related issues with large investors and proxy advisers during the year, and key topics were discussed during corporate governance roadshows, which primarily took place in December 2014. In previous AGMs, our shareholders have been provided with the opportunity to express their views through a consultative, non-binding vote on the remuneration system as set out in the Remuneration report. This resulted in 87.4 percent votes in favor in 2014, 85.5 percent in 2013 and 84.8 percent in favor in 2012. We also wish to continue to engage in a dialogue with our stakeholders and provide our shareholders with the opportunity to share their opinions via a further consultative, non-binding vote on the Remuneration report in 2014.
Q4_2014_05_AR14_Remuneration_report_part1_en.indd 60 23.02.2015 16:21:03
Zurich Insurance Group Annual Report 2014 61Remuneration report
Govern
anceTo comply with the Ordinance AEC, we are also submitting to our shareholders at the AGM in 2015 two new binding
votes on remuneration-related matters. The first vote relates to the approval of the maximum total amount of remuneration of the Board for the one year period from the AGM in 2015 to the AGM in 2016. The second vote relates to the approval of the maximum total amount of remuneration of the GEC for the financial year 2016. Details on the remuneration votes are included in the Board of Directors Report on the approval of the remuneration of the Board of Directors and of the Group Executive Committee of the Annual General Meeting 2015 of Zurich Insurance Group Ltd (Report on the approval of remuneration), which is distributed with the invitation to the AGM 2015.
Further, based on the requirements of the Ordinance AEC a thorough review and adjustments to the employment contracts of the members of the GEC are being implemented. During the year, the Remuneration report was also reviewed and amendments were made with the objective to increase transparency, enhance readability and incorporate the audit requirement of the Ordinance AEC.
Based on the recommendation of the Remuneration Committee, and subject to the approval of shareholders at the AGM in 2015, the Board proposes to make changes to the Board fee structure effective April 1, 2015. These changes are outlined in the Summary and Outlook sections to this Report.
The Board and I are grateful for your continuous trust in Zurich and for your valuable feedback with regard to our remuneration approach. On the following pages you will find further insights into Zurich’s Remuneration framework including the remuneration philosophy, the governance, and also the remuneration details of the members of the Board, the GEC and all employees for 2014. I believe that the information disclosed in the Remuneration report and also the details included in the Report on the approval of remuneration provide you with a clear picture on Zurich’s remuneration. We therefore seek your support at the AGM 2015.
The Board continues to be firmly of the opinion – also taking into account the changes to the LTIP in 2014 – that the remuneration architecture is aligned with the execution of the Group’s strategy and reflects current international best practices in terms of governance, plan design and disclosure.”
Thomas K. Escher Chairman of the Remuneration Committee of the Board of Directors
Q4_2014_05_AR14_Remuneration_report_part1_en.indd 61 23.02.2015 16:21:03
Zurich Insurance GroupAnnual Report 201462 Governance
Remuneration report
The Remuneration report describes the principles and governance framework relating to the remuneration of the members of the Board of Directors, Group Executive Committee and all employees. It also provides details of each remuneration element, and reports on the work of the Remuneration Committee.
In 2014, the Board of Directors continued to oversee and take decisions on the design and implementation of the remuneration principles, rules and architecture, which reflect international best practices in terms of governance, plan design and disclosure. The Group’s remuneration architecture is simple, transparent and market competitive, promotes a high performance culture, is aligned with our risk management principles and has an orientation toward the long-term for Key Risk Takers. With regard to the final rules in the Ordinance Against Excessive Compensation, a new set of Articles of Incorporation was approved by shareholders at the Annual General Meeting in 2014 and the first binding votes on the remuneration of the Board of Directors and the Group Executive Committee will take place at the Annual General Meeting in 2015. As set out in last year’s report, the Group long-term incentive plan with its new features became effective as of January 1, 2014 and strengthens the alignment between the strategy and the financial targets for the three year period 2014 to 2016.
Contents
2014 Remuneration summary 63Remuneration framework 662014 Remuneration and Shareholdings 78Outlook 93
Q4_2014_05_AR14_Remuneration_report_part1_en.indd 62 23.02.2015 16:21:03
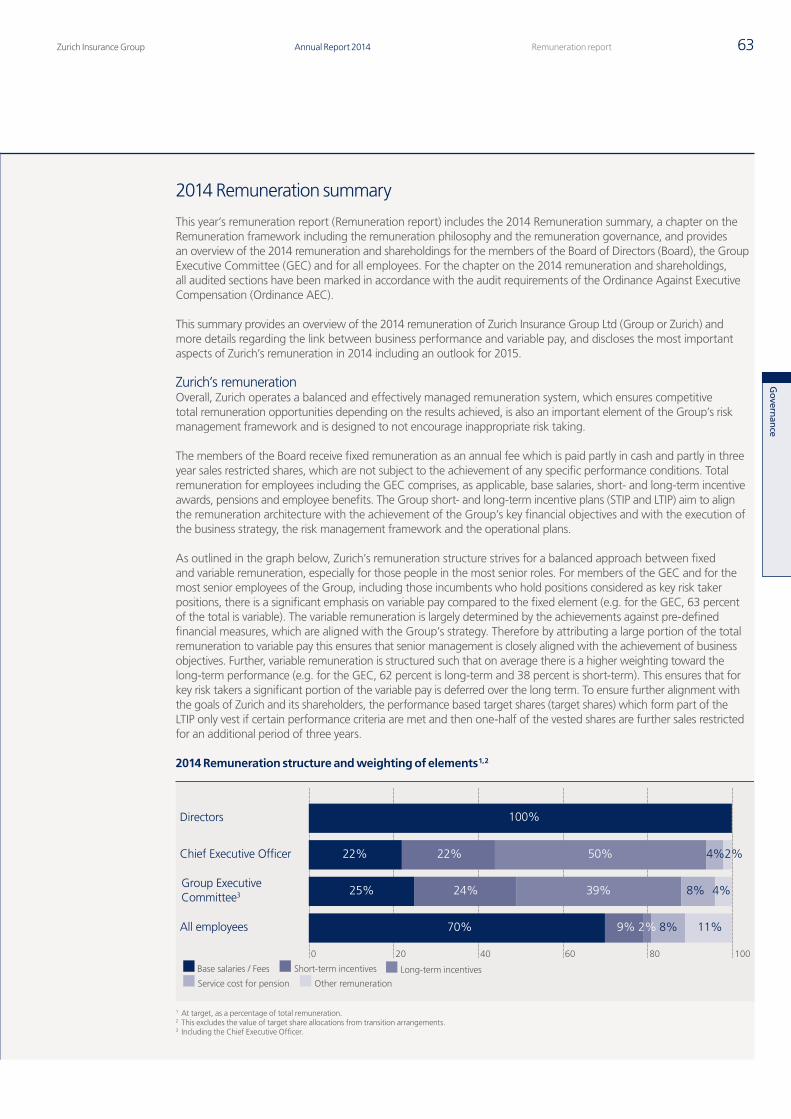
Zurich Insurance Group Annual Report 2014 63Remuneration report
Govern
ance
2014 Remuneration summary
This year’s remuneration report (Remuneration report) includes the 2014 Remuneration summary, a chapter on the Remuneration framework including the remuneration philosophy and the remuneration governance, and provides an overview of the 2014 remuneration and shareholdings for the members of the Board of Directors (Board), the Group Executive Committee (GEC) and for all employees. For the chapter on the 2014 remuneration and shareholdings, all audited sections have been marked in accordance with the audit requirements of the Ordinance Against Executive Compensation (Ordinance AEC).
This summary provides an overview of the 2014 remuneration of Zurich Insurance Group Ltd (Group or Zurich) and more details regarding the link between business performance and variable pay, and discloses the most important aspects of Zurich’s remuneration in 2014 including an outlook for 2015.
Zurich’s remunerationOverall, Zurich operates a balanced and effectively managed remuneration system, which ensures competitive total remuneration opportunities depending on the results achieved, is also an important element of the Group’s risk management framework and is designed to not encourage inappropriate risk taking.
The members of the Board receive fixed remuneration as an annual fee which is paid partly in cash and partly in three year sales restricted shares, which are not subject to the achievement of any specific performance conditions. Total remuneration for employees including the GEC comprises, as applicable, base salaries, short- and long-term incentive awards, pensions and employee benefits. The Group short- and long-term incentive plans (STIP and LTIP) aim to align the remuneration architecture with the achievement of the Group’s key financial objectives and with the execution of the business strategy, the risk management framework and the operational plans.
As outlined in the graph below, Zurich’s remuneration structure strives for a balanced approach between fixed and variable remuneration, especially for those people in the most senior roles. For members of the GEC and for the most senior employees of the Group, including those incumbents who hold positions considered as key risk taker positions, there is a significant emphasis on variable pay compared to the fixed element (e.g. for the GEC, 63 percent of the total is variable). The variable remuneration is largely determined by the achievements against pre-defined financial measures, which are aligned with the Group’s strategy. Therefore by attributing a large portion of the total remuneration to variable pay this ensures that senior management is closely aligned with the achievement of business objectives. Further, variable remuneration is structured such that on average there is a higher weighting toward the long-term performance (e.g. for the GEC, 62 percent is long-term and 38 percent is short-term). This ensures that for key risk takers a significant portion of the variable pay is deferred over the long term. To ensure further alignment with the goals of Zurich and its shareholders, the performance based target shares (target shares) which form part of the LTIP only vest if certain performance criteria are met and then one-half of the vested shares are further sales restricted for an additional period of three years.
2014 Remuneration structure and weighting of elements 1, 2
Directors
Chief Executive Officer
Group ExecutiveCommittee3
All employees
0 20 40 60 80 100
Base salaries / Fees Short-term incentives Long-term incentives
Service cost for pension Other remuneration
100%
22% 22% 50% 2%
25% 24% 39% 4%
70% 9% 2% 11%
4%
8%
8%
1 At target, as a percentage of total remuneration.2 This excludes the value of target share allocations from transition arrangements.3 Including the Chief Executive Officer.
Q4_2014_05_AR14_Remuneration_report_part1_en.indd 63 23.02.2015 16:21:04
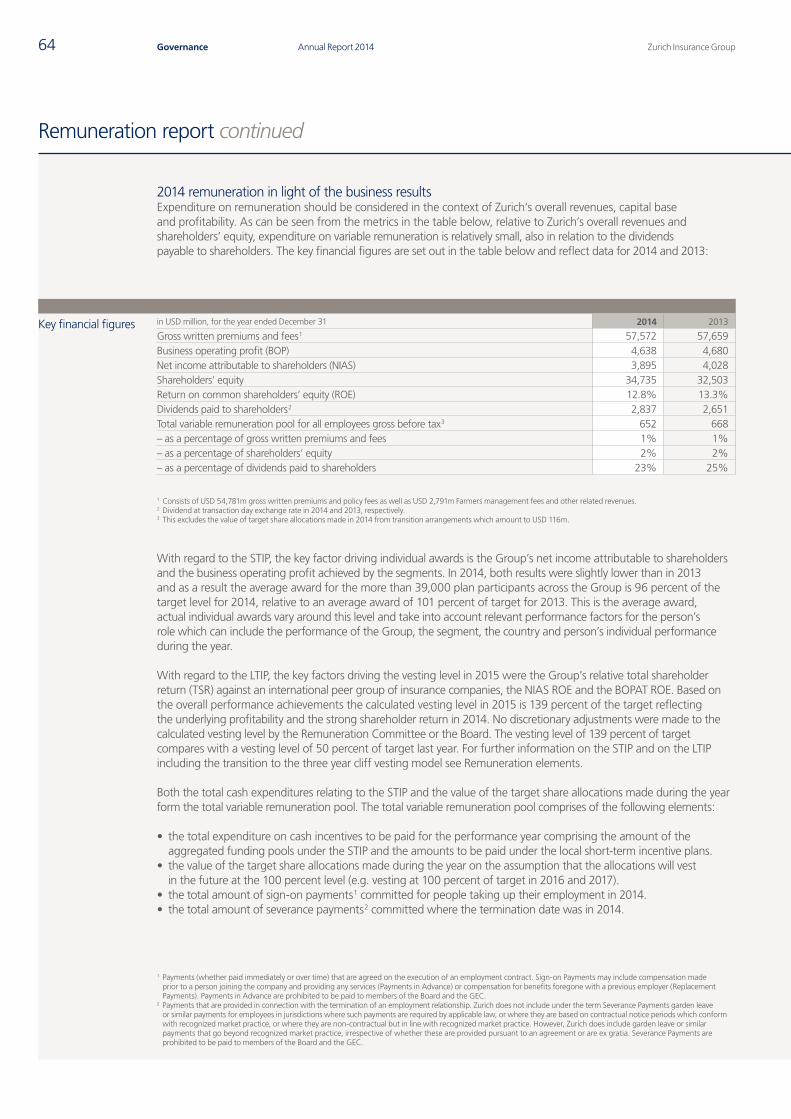
Zurich Insurance GroupAnnual Report 201464 Governance
Remuneration report continued
2014 remuneration in light of the business resultsExpenditure on remuneration should be considered in the context of Zurich‘s overall revenues, capital base and profitability. As can be seen from the metrics in the table below, relative to Zurich’s overall revenues and shareholders’ equity, expenditure on variable remuneration is relatively small, also in relation to the dividends payable to shareholders. The key financial figures are set out in the table below and reflect data for 2014 and 2013:
Key financial figures in USD million, for the year ended December 31 2014 2013
Gross written premiums and fees 1 57,572 57,659Business operating profit (BOP) 4,638 4,680Net income attributable to shareholders (NIAS) 3,895 4,028Shareholders’ equity 34,735 32,503Return on common shareholders’ equity (ROE) 12.8% 13.3%Dividends paid to shareholders 2 2,837 2,651Total variable remuneration pool for all employees gross before tax 3 652 668– as a percentage of gross written premiums and fees 1% 1%– as a percentage of shareholders’ equity 2% 2%– as a percentage of dividends paid to shareholders 23% 25%
1 Consists of USD 54,781m gross written premiums and policy fees as well as USD 2,791m Farmers management fees and other related revenues.2 Dividend at transaction day exchange rate in 2014 and 2013, respectively.3 This excludes the value of target share allocations made in 2014 from transition arrangements which amount to USD 116m.
With regard to the STIP, the key factor driving individual awards is the Group’s net income attributable to shareholders and the business operating profit achieved by the segments. In 2014, both results were slightly lower than in 2013 and as a result the average award for the more than 39,000 plan participants across the Group is 96 percent of the target level for 2014, relative to an average award of 101 percent of target for 2013. This is the average award, actual individual awards vary around this level and take into account relevant performance factors for the person’s role which can include the performance of the Group, the segment, the country and person’s individual performance during the year.
With regard to the LTIP, the key factors driving the vesting level in 2015 were the Group’s relative total shareholder return (TSR) against an international peer group of insurance companies, the NIAS ROE and the BOPAT ROE. Based on the overall performance achievements the calculated vesting level in 2015 is 139 percent of the target reflecting the underlying profitability and the strong shareholder return in 2014. No discretionary adjustments were made to the calculated vesting level by the Remuneration Committee or the Board. The vesting level of 139 percent of target compares with a vesting level of 50 percent of target last year. For further information on the STIP and on the LTIP including the transition to the three year cliff vesting model see Remuneration elements.
Both the total cash expenditures relating to the STIP and the value of the target share allocations made during the year form the total variable remuneration pool. The total variable remuneration pool comprises of the following elements:
• the total expenditure on cash incentives to be paid for the performance year comprising the amount of the aggregated funding pools under the STIP and the amounts to be paid under the local short-term incentive plans.
• the value of the target share allocations made during the year on the assumption that the allocations will vest in the future at the 100 percent level (e.g. vesting at 100 percent of target in 2016 and 2017).
• the total amount of sign-on payments 1 committed for people taking up their employment in 2014. • the total amount of severance payments 2 committed where the termination date was in 2014.
1 Payments (whether paid immediately or over time) that are agreed on the execution of an employment contract. Sign-on Payments may include compensation made prior to a person joining the company and providing any services (Payments in Advance) or compensation for benefits foregone with a previous employer (Replacement Payments). Payments in Advance are prohibited to be paid to members of the Board and the GEC.
2 Payments that are provided in connection with the termination of an employment relationship. Zurich does not include under the term Severance Payments garden leave or similar payments for employees in jurisdictions where such payments are required by applicable law, or where they are based on contractual notice periods which conform with recognized market practice, or where they are non-contractual but in line with recognized market practice. However, Zurich does include garden leave or similar payments that go beyond recognized market practice, irrespective of whether these are provided pursuant to an agreement or are ex gratia. Severance Payments are prohibited to be paid to members of the Board and the GEC.
Q4_2014_05_AR14_Remuneration_report_part1_en.indd 64 23.02.2015 16:21:04
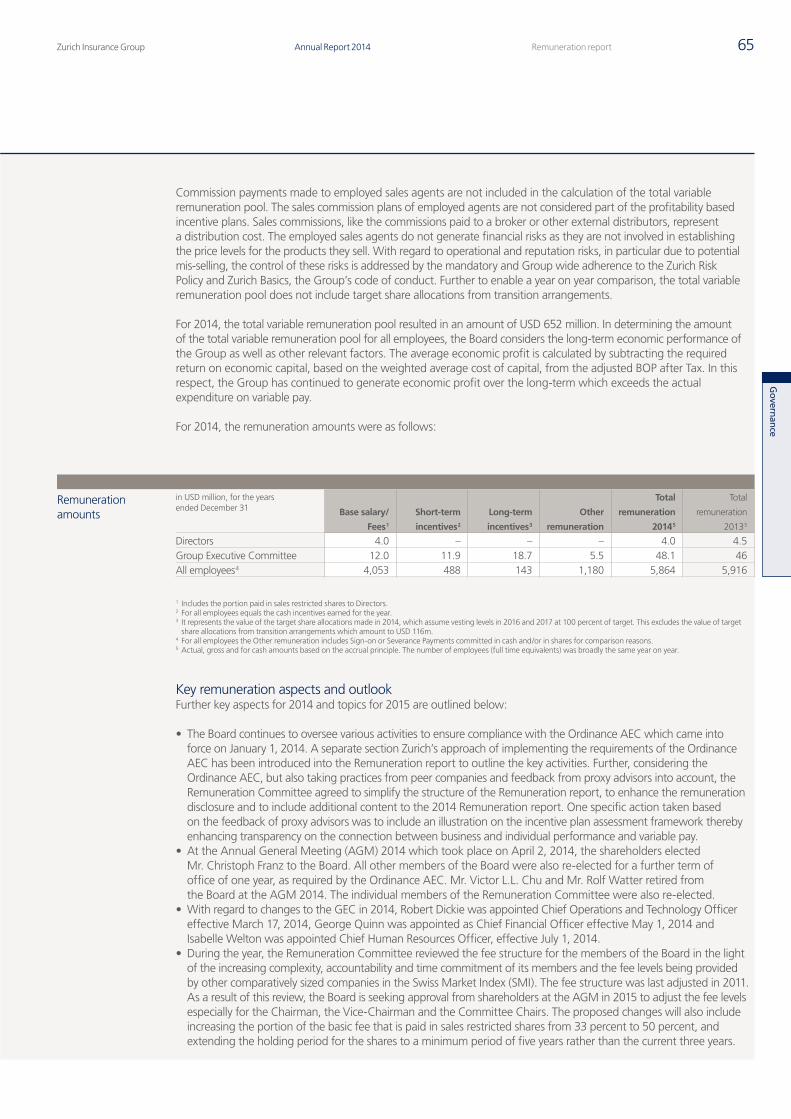
Zurich Insurance Group Annual Report 2014 65Remuneration report
Govern
ance
Commission payments made to employed sales agents are not included in the calculation of the total variable remuneration pool. The sales commission plans of employed agents are not considered part of the profitability based incentive plans. Sales commissions, like the commissions paid to a broker or other external distributors, represent a distribution cost. The employed sales agents do not generate financial risks as they are not involved in establishing the price levels for the products they sell. With regard to operational and reputation risks, in particular due to potential mis-selling, the control of these risks is addressed by the mandatory and Group wide adherence to the Zurich Risk Policy and Zurich Basics, the Group’s code of conduct. Further to enable a year on year comparison, the total variable remuneration pool does not include target share allocations from transition arrangements.
For 2014, the total variable remuneration pool resulted in an amount of USD 652 million. In determining the amount of the total variable remuneration pool for all employees, the Board considers the long-term economic performance of the Group as well as other relevant factors. The average economic profit is calculated by subtracting the required return on economic capital, based on the weighted average cost of capital, from the adjusted BOP after Tax. In this respect, the Group has continued to generate economic profit over the long-term which exceeds the actual expenditure on variable pay.
For 2014, the remuneration amounts were as follows:
Remuneration amounts
in USD million, for the years ended December 31 Base salary/
Fees 1
Short-term
incentives 2
Long-term
incentives 3
Other
remuneration
Total
remuneration
2014 5
Total
remuneration
2013 5
Directors 4.0 – – – 4.0 4.5Group Executive Committee 12.0 11.9 18.7 5.5 48.1 46All employees 4 4,053 488 143 1,180 5,864 5,916
1 Includes the portion paid in sales restricted shares to Directors.2 For all employees equals the cash incentives earned for the year.3 It represents the value of the target share allocations made in 2014, which assume vesting levels in 2016 and 2017 at 100 percent of target. This excludes the value of target
share allocations from transition arrangements which amount to USD 116m.4 For all employees the Other remuneration includes Sign-on or Severance Payments committed in cash and/or in shares for comparison reasons.5 Actual, gross and for cash amounts based on the accrual principle. The number of employees (full time equivalents) was broadly the same year on year.
Key remuneration aspects and outlookFurther key aspects for 2014 and topics for 2015 are outlined below:
• The Board continues to oversee various activities to ensure compliance with the Ordinance AEC which came into force on January 1, 2014. A separate section Zurich’s approach of implementing the requirements of the Ordinance AEC has been introduced into the Remuneration report to outline the key activities. Further, considering the Ordinance AEC, but also taking practices from peer companies and feedback from proxy advisors into account, the Remuneration Committee agreed to simplify the structure of the Remuneration report, to enhance the remuneration disclosure and to include additional content to the 2014 Remuneration report. One specific action taken based on the feedback of proxy advisors was to include an illustration on the incentive plan assessment framework thereby enhancing transparency on the connection between business and individual performance and variable pay.
• At the Annual General Meeting (AGM) 2014 which took place on April 2, 2014, the shareholders elected Mr. Christoph Franz to the Board. All other members of the Board were also re-elected for a further term of office of one year, as required by the Ordinance AEC. Mr. Victor L.L. Chu and Mr. Rolf Watter retired from the Board at the AGM 2014. The individual members of the Remuneration Committee were also re-elected.
• With regard to changes to the GEC in 2014, Robert Dickie was appointed Chief Operations and Technology Officer effective March 17, 2014, George Quinn was appointed as Chief Financial Officer effective May 1, 2014 and Isabelle Welton was appointed Chief Human Resources Officer, effective July 1, 2014.
• During the year, the Remuneration Committee reviewed the fee structure for the members of the Board in the light of the increasing complexity, accountability and time commitment of its members and the fee levels being provided by other comparatively sized companies in the Swiss Market Index (SMI). The fee structure was last adjusted in 2011. As a result of this review, the Board is seeking approval from shareholders at the AGM in 2015 to adjust the fee levels especially for the Chairman, the Vice-Chairman and the Committee Chairs. The proposed changes will also include increasing the portion of the basic fee that is paid in sales restricted shares from 33 percent to 50 percent, and extending the holding period for the shares to a minimum period of five years rather than the current three years.
Q4_2014_05_AR14_Remuneration_report_part1_en.indd 65 23.02.2015 16:21:05
Zurich Insurance GroupAnnual Report 201466 Governance
Remuneration report continued
Remuneration framework
Legal and regulatory requirementsThis Remuneration report provides all the information that is outlined in chapter 5 of the Directive on Information Relating to Corporate Governance of the SIX Exchange Regulation as amended with effect from September 1, 2014 (SIX Directive), the Swiss Code of Best Practice for Corporate Governance published on September 29, 2014 (Swiss Code of Best Practice) and Articles 14 –16 of the Ordinance AEC (replacing the information in the notes to the consolidated financial statements according to Article 663bbis of the Swiss Code of Obligations). This information s now subject to an audit of the respective sections in the Remuneration report instead of being audited in the notes to the financial statements of Zurich Insurance Group Ltd. Also included in the audited section of the Remuneration report is all the information as required by article 663c para 3 of the Swiss Code of Obligations. Finally, all details with regard to the Circular 2010/1 on minimum standards for remuneration schemes of financial institutions, issued by the Swiss Financial Market Supervisory Authority FINMA on October 21, 2009 and further guidance issued on January 19, 2011 (FINMA Circular on Remuneration Schemes) are also included in the Report. The structure of the Remuneration report is aligned with the requirements of the SIX Directive. All other information to be disclosed according to the SIX Directive is included in the Corporate governance report preceding this Remuneration report.
Zurich’s approach of implementing the requirements of the Ordinance AECThe following paragraph provides information regarding Zurich’s approach to the remuneration related topics that are required by the Ordinance AEC. The Ordinance AEC is effective as of January 1, 2014 with a two year transition period. To implement the new requirements of the Ordinance AEC, the Board presented a new set of Articles of Incorporation which was approved by Zurich’s shareholders at the AGM on April 2, 2014. In addition, to comply with the Ordinance AEC and the Articles of Incorporation, Zurich’s Remuneration Rules (see Governance framework) were reviewed and amended and the existing employment agreements of members of the GEC are being reviewed and adjusted as necessary. At the AGM 2015, taking place on April 1, 2015, shareholders will be invited to a consultative, non-binding vote on the Remuneration report. Through this, Zurich provides its shareholders with the opportunity to continue to express their opinion on the 2014 remuneration approach and the respective amounts. Further, the Ordinance AEC requires an annual vote on the total amounts of remuneration of the Board and of the GEC as of the AGM 2015. According to Article 18 para 1 of the Articles of Incorporation, shareholders will vote on the maximum total amount of remuneration of the Board for the one year period from the AGM in 2015 to the AGM in 2016. For the GEC, shareholders will vote on the maximum total amount of remuneration for the financial year 2016. Detailed information is provided in the Board report on the approval of remuneration accompanying the invitation to the AGM in 2015. According to the Ordinance AEC and Article 18 para 4 Articles of Incorporation, the Group and/or its subsidiaries are authorized to make payments to any member who joins the GEC during a period for which the AGM has already approved the remuneration of the GEC, of a supplementary amount for the period(s) in question, where the total amount already approved for such remuneration is not sufficient. The sum of all supplementary amounts may not exceed, during any one remuneration period, 30 percent of the respective total amount of approved maximum remuneration of the GEC. Details on performance related remuneration for the GEC, allocation of shares as well as the approach regarding loans and credits can be found in Articles 18 para 3, 28 and 34 Articles of Incorporation.
Further, the information provided according to Articles 14 –16 of the Ordinance AEC contained in the Remuneration report has been externally audited following the audit requirements of the Ordinance AEC (Article 13 para 1 and Article 17 of the Ordinance AEC). Therefore, all audited sections in this Report have been marked accordingly. The information disclosed according to Articles 14–16 of the Ordinance AEC and being audited in the Remuneration report, consists of:
• Indication of the total remuneration paid to current and former members of the GEC and the Board, specifying the highest amount paid to a member of the GEC mentioning the name and function and the potential supplementary amount paid to a new member of the GEC according to Article 18 para 4 Articles of Incorporation.
• Loans and credits granted to current and former members of the GEC and the Board which are still outstanding. • Compensation paid to related persons of members of the Board and the GEC, which is not at arm’s length and
loans and credits granted to related persons at non-market conditions.
Q4_2014_05_AR14_Remuneration_report_part1_en.indd 66 23.02.2015 16:21:05
Zurich Insurance Group Annual Report 2014 67Remuneration report
Govern
ance
Remuneration philosophyThe remuneration philosophy is an integral part of the overall employment offering to employees. Zurich operates a balanced and effectively managed remuneration system, which is aligned with risk considerations and provides for competitive total remuneration opportunities that attract, retain, motivate and reward employees to deliver outstanding performance.
Total remuneration for an individual employee is influenced by factors including the scope and complexity of the role, business performance and affordability, individual performance, internal relativities, external competitiveness, geographic location and legal requirements. Target opportunities are benchmarked to median levels in clearly defined markets and take into account the internal remuneration structures. Depending on the role, the relevant market can be global, regional or local and reflecting practices in either insurance, financial services or general industry. Remuneration is delivered through an overall framework overseen by the GEC, the Remuneration Committee and the Board itself.
In addition, Zurich has a clearly defined global performance management process which supports the achievement of the overall business strategy and operating plans, and links individual pay with business and personal performance. Actions of Zurich employees with regard to customers, people, shareholders and communities continue to be guided by the Zurich Basics and the Zurich Commitment. In order to support this undertaking, all Zurich employees have an objective regarding what they do to actively care for and add value to the stakeholder groups. Moreover, performance management objectives are also assessed on how they are achieved according to the values and behaviors underlying the Zurich Basics.
Guiding principles of the remuneration philosophyThe guiding principles of remuneration philosophy as set out in Zurich’s Remuneration Rules are as follows:
• The Group’s remuneration architecture is simple, transparent and easy to implement. For those individuals considered to be key risk takers for the Group, remuneration is focused on the long-term.
• The structure and level of total remuneration are aligned with the Group’s risk policies and risk taking capacity. • The Group promotes a high performance culture by differentiating total remuneration based on the relative
performance of businesses and individuals.• The Group clearly defines expected performance through a structured system of performance management and
uses this as the basis for remuneration decisions.• The Group links variable remuneration awards to key performance factors, which can include the performance of
the Group, the business segments, business units, and functions, as well as individual achievements.• STIP and LTIP used for variable remuneration are linked to appropriate absolute and relative performance measures
and the overall expenditure on variable pay is considered in connection with the Group’s long-term economic performance.
• The structure of the LTIP links remuneration to the future development of performance and risk by including features for deferred remuneration.
• The Group provides its employees with a range of benefits based on local market practices, taking into account the Group’s risk capacity with regard to pension funding and investments.
Q4_2014_05_AR14_Remuneration_report_part1_en.indd 67 23.02.2015 16:21:05
Zurich Insurance GroupAnnual Report 201468 Governance
Remuneration report continued
Governance frameworkRemuneration governance frameworkThe Board is responsible for the design and implementation of Zurich’s remuneration principles and remuneration rules (together Zurich’s Remuneration Rules). To support the Board in performing these duties, the Board has established a Remuneration Committee. Under the Ordinance AEC and as reflected in the Articles of Incorporation, the AGM elects the members of the Remuneration Committee individually. Their term of office ends with the conclusion of the next AGM with re-election being possible. The Remuneration Committee consists of at least three members of the Board, all of whom are experienced in the area of remuneration. In 2014 there were four members of the Committee. On an annual basis the Remuneration Committee evaluates the remuneration architecture and Zurich’s Remuneration Rules, and if appropriate, proposes amendments to the Board.
In reviewing remuneration structures and practices on a regular basis, the Remuneration Committee and the Board receive independent advice from the executive compensation practices at Meridian Compensation Partners LLC (Meridian) as well as at Aon Hewitt, part of Aon Corporation (Aon Hewitt). The Remuneration Committee reviews the mandates and fees, and evaluates ongoing performance. Both, Meridian and Aon Hewitt provide advice to the Board, with the lead consultant employed by Meridian. Meridian does not provide any other services to the Group. Although certain practice areas within Aon Hewitt – a large, international brokerage and human resources firm – undertake work for the Group from time to time, the Remuneration Committee does not consider the independence and integrity of the advice it receives from Aon Hewitt to be compromised by these separate assignments.
In accordance with Zurich’s Remuneration Rules, the Remuneration Committee is responsible for proposing to the Board on an annual basis the remuneration payable to the Directors, to the Chief Executive Officer (CEO) and to the other members of the GEC. For the other members of the GEC, these recommendations are based on proposals made by the CEO. The remuneration proposals are approved by the Board, and ultimately the shareholders approve the maximum total remuneration amounts of the members of the Board and the GEC.
The results of benchmarking studies are taken into account in setting fee levels for Directors and the remuneration structure and levels for the CEO and the other members of the GEC. In analyzing the results of the benchmarking studies, market practices in the various countries and the internal relativities between positions are taken into account. Overall positioning of target remuneration packages is toward the median levels. Management is supported in these activities by a variety of firms operating in the field of international executive compensation.
In the Remuneration Committee and the Board meetings where decisions are made on the individual remuneration of the Chairman, the Chairman is not present. In making decisions on the individual remuneration of the CEO, the CEO is not present. Where decisions are made on the individual remuneration of other members of the GEC, those members are also not present at the meetings. See page 39 in the Corporate governance report for further details of the Remuneration Committee’s responsibilities.
The STIP and the LTIP designs, which are explained in detail in the Remuneration report are regularly reviewed by the Remuneration Committee and the Board. Moreover, the Board reviews the implementation of the plans on a regular basis. The incentive plans are discretionary and can be terminated, modified, changed or revised at any time. The approval framework is set out below:
Q4_2014_05_AR14_Remuneration_report_part1_en.indd 68 23.02.2015 16:21:05
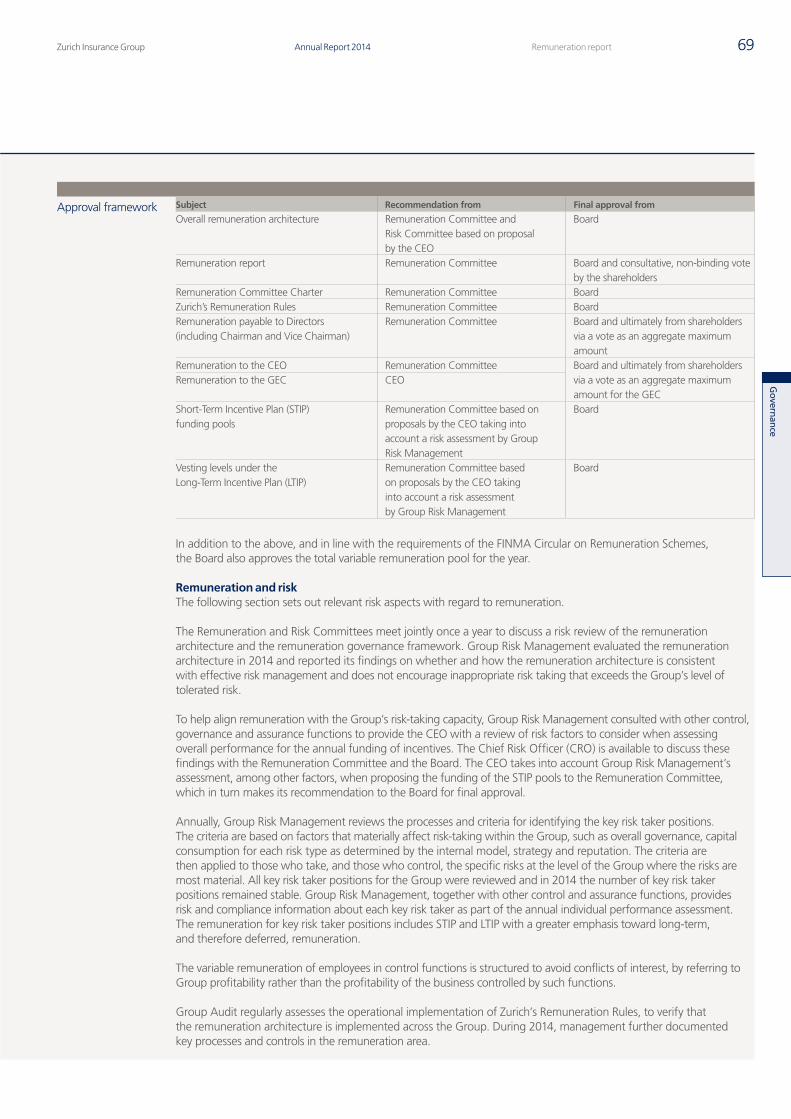
Zurich Insurance Group Annual Report 2014 69Remuneration report
Govern
ance
Approval framework Subject Recommendation from Final approval from
Overall remuneration architecture
Remuneration Committee and Risk Committee based on proposal by the CEO
Board
Remuneration report Remuneration Committee Board and consultative, non-binding vote by the shareholders
Remuneration Committee Charter Remuneration Committee BoardZurich’s Remuneration Rules Remuneration Committee BoardRemuneration payable to Directors (including Chairman and Vice Chairman)
Remuneration Committee
Board and ultimately from shareholders via a vote as an aggregate maximum amount
Remuneration to the CEO Remuneration Committee Board and ultimately from shareholders via a vote as an aggregate maximum amount for the GEC
Remuneration to the GEC CEO
Short-Term Incentive Plan (STIP) funding pools
Remuneration Committee based on proposals by the CEO taking into account a risk assessment by Group Risk Management
Board
Vesting levels under the Long-Term Incentive Plan (LTIP)
Remuneration Committee based on proposals by the CEO taking into account a risk assessment by Group Risk Management
Board
In addition to the above, and in line with the requirements of the FINMA Circular on Remuneration Schemes, the Board also approves the total variable remuneration pool for the year.
Remuneration and riskThe following section sets out relevant risk aspects with regard to remuneration.
The Remuneration and Risk Committees meet jointly once a year to discuss a risk review of the remuneration architecture and the remuneration governance framework. Group Risk Management evaluated the remuneration architecture in 2014 and reported its findings on whether and how the remuneration architecture is consistent with effective risk management and does not encourage inappropriate risk taking that exceeds the Group’s level of tolerated risk.
To help align remuneration with the Group’s risk-taking capacity, Group Risk Management consulted with other control, governance and assurance functions to provide the CEO with a review of risk factors to consider when assessing overall performance for the annual funding of incentives. The Chief Risk Officer (CRO) is available to discuss these findings with the Remuneration Committee and the Board. The CEO takes into account Group Risk Management’s assessment, among other factors, when proposing the funding of the STIP pools to the Remuneration Committee, which in turn makes its recommendation to the Board for final approval.
Annually, Group Risk Management reviews the processes and criteria for identifying the key risk taker positions. The criteria are based on factors that materially affect risk-taking within the Group, such as overall governance, capital consumption for each risk type as determined by the internal model, strategy and reputation. The criteria are then applied to those who take, and those who control, the specific risks at the level of the Group where the risks are most material. All key risk taker positions for the Group were reviewed and in 2014 the number of key risk taker positions remained stable. Group Risk Management, together with other control and assurance functions, provides risk and compliance information about each key risk taker as part of the annual individual performance assessment. The remuneration for key risk taker positions includes STIP and LTIP with a greater emphasis toward long-term, and therefore deferred, remuneration.
The variable remuneration of employees in control functions is structured to avoid conflicts of interest, by referring to Group profitability rather than the profitability of the business controlled by such functions.
Group Audit regularly assesses the operational implementation of Zurich’s Remuneration Rules, to verify that the remuneration architecture is implemented across the Group. During 2014, management further documented key processes and controls in the remuneration area.
Q4_2014_05_AR14_Remuneration_report_part1_en.indd 69 23.02.2015 16:21:05
Zurich Insurance GroupAnnual Report 201470 Governance
Remuneration report continued
Share ownership guidelinesTo align the interests of the Board and the GEC with those of shareholders, Directors and members of the GEC build their ownership position in the company and have to meet certain ownership requirements. Share ownership guidelines for members of the Board have been established at the level of one times the basic annual fee. For members of the GEC, share ownership guidelines with regard to vested awards have been established at the level of five times base salary for the CEO and of 2.5 times base salary for other members of the GEC. Directors achieve this requirement through part of their fee being made in three year sales restricted shares and market purchases. Members of the GEC achieve this through their participation in the LTIP and market purchases. Directors, the CEO and other members of the GEC have a period of five years to meet their ownership requirement and the Remuneration Committee monitors compliance with these guidelines on an annual basis.
As of December 31, 2014, Directors held 37,581 shares and members of the GEC held 147,169 vested shares and 148,567 vested options. To meet the share obligations under the share-based compensation plans, Zurich issued 733,614 new shares in 2014, and 603,099 new shares in 2013, thereby creating minimal dilution for shareholders.
Share dilutionInformation is also provided below on the share dilution impact arising from issuing shares to meet the obligations under the Group’s share based compensations plans. Zurich meets the share obligations arising from compensation plans either by issuing new shares from the contingent capital that has been authorized by the shareholders or by using Zurich shares purchased in the market. The share dilution impact is considered moderate and is in line with market practice.
In 2014, the company issued 733,614 shares (0.49 percent of capital based on 148,903,222 registered shares eligible for dividends as of December 31, 2013) to meet the share obligations arising from the vesting of shares and the exercise of share options during the year (in 2013, 603,099 shares or 0.41 percent of capital based on 148,300,123 registered shares eligible for dividends as of December 31, 2012).
As of December 31, 2014, the total number of unvested target shares under the regular LTIP was 870,747 from the allocations made in 2012, 2013 and 2014 excluding any accrued dividend equivalent target shares. Further, under the transition allocation made in 2014, the total number of unvested target shares was 376,409. Given the vesting level of 139 percent in 2015 and assuming 100 percent vesting in 2016 and 2017 for the regular LTIP, this would require the issuance of 977,155 shares or 0.65 percent of the share capital based on 149,636,836 registered shares eligible for dividends as of December 31, 2014. For the transition allocation, this would require the issuance of 425,342 shares.
As of December 31, 2014, the total number of vested but unexercised share options was 780,763 (as of December 31, 2013, the number of vested but unexercised share options was 1,763,618). The exercise prices for these options range from CHF 198.10 to CHF 336.50. If all vested options were to be exercised in the future, the number of shares required represents 0.52 percent of the share capital which is based on 149,636,836 registered shares eligible for dividends as of December 31, 2014. If the options, which were in the money at December 31, 2014 (share price CHF 311.70) were exercised the number of shares required would be 478,593 or 0.32 percent of the share capital based on 149,636,836 registered shares eligible for dividends as of December 31, 2014.
Q4_2014_05_AR14_Remuneration_report_part1_en.indd 70 23.02.2015 16:21:06
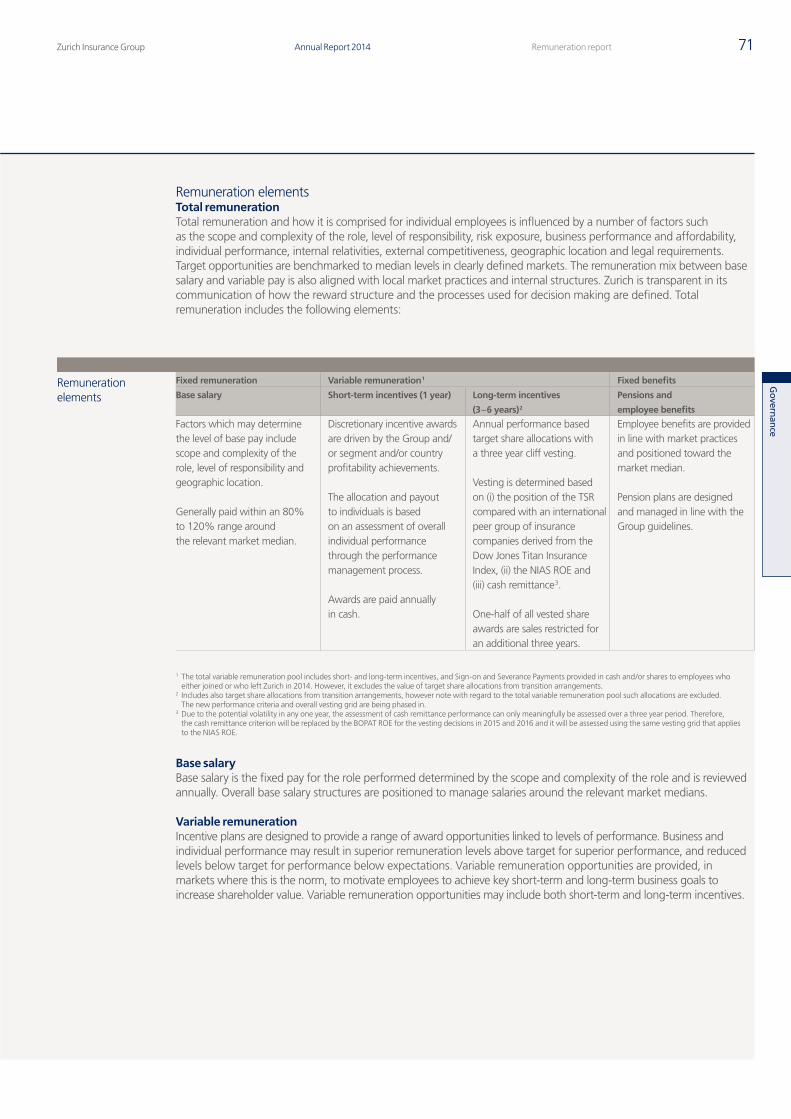
Zurich Insurance Group Annual Report 2014 71Remuneration report
Govern
ance
Remuneration elementsTotal remunerationTotal remuneration and how it is comprised for individual employees is influenced by a number of factors such as the scope and complexity of the role, level of responsibility, risk exposure, business performance and affordability, individual performance, internal relativities, external competitiveness, geographic location and legal requirements. Target opportunities are benchmarked to median levels in clearly defined markets. The remuneration mix between base salary and variable pay is also aligned with local market practices and internal structures. Zurich is transparent in its communication of how the reward structure and the processes used for decision making are defined. Total remuneration includes the following elements:
Remuneration elements
Fixed remuneration Variable remuneration 1 Fixed benefits
Base salary Short-term incentives (1 year) Long-term incentives
(3 – 6 years) 2
Pensions and
employee benefits
Factors which may determine the level of base pay include scope and complexity of the role, level of responsibility and geographic location. Generally paid within an 80% to 120% range around the relevant market median.
Discretionary incentive awards are driven by the Group and/or segment and/or country profitability achievements. The allocation and payout to individuals is based on an assessment of overall individual performance through the performance management process. Awards are paid annually in cash.
Annual performance based target share allocations with a three year cliff vesting. Vesting is determined based on (i) the position of the TSR compared with an international peer group of insurance companies derived from the Dow Jones Titan Insurance Index, (ii) the NIAS ROE and (iii) cash remittance 3. One-half of all vested share awards are sales restricted for an additional three years.
Employee benefits are provided in line with market practices and positioned toward the market median. Pension plans are designed and managed in line with the Group guidelines.
1 The total variable remuneration pool includes short- and long-term incentives, and Sign-on and Severance Payments provided in cash and/or shares to employees who either joined or who left Zurich in 2014. However, it excludes the value of target share allocations from transition arrangements.
2 Includes also target share allocations from transition arrangements, however note with regard to the total variable remuneration pool such allocations are excluded. The new performance criteria and overall vesting grid are being phased in.
3 Due to the potential volatility in any one year, the assessment of cash remittance performance can only meaningfully be assessed over a three year period. Therefore, the cash remittance criterion will be replaced by the BOPAT ROE for the vesting decisions in 2015 and 2016 and it will be assessed using the same vesting grid that applies to the NIAS ROE.
Base salaryBase salary is the fixed pay for the role performed determined by the scope and complexity of the role and is reviewed annually. Overall base salary structures are positioned to manage salaries around the relevant market medians.
Variable remuneration Incentive plans are designed to provide a range of award opportunities linked to levels of performance. Business and individual performance may result in superior remuneration levels above target for superior performance, and reduced levels below target for performance below expectations. Variable remuneration opportunities are provided, in markets where this is the norm, to motivate employees to achieve key short-term and long-term business goals to increase shareholder value. Variable remuneration opportunities may include both short-term and long-term incentives.
Q4_2014_05_AR14_Remuneration_report_part1_en.indd 71 23.02.2015 16:21:06
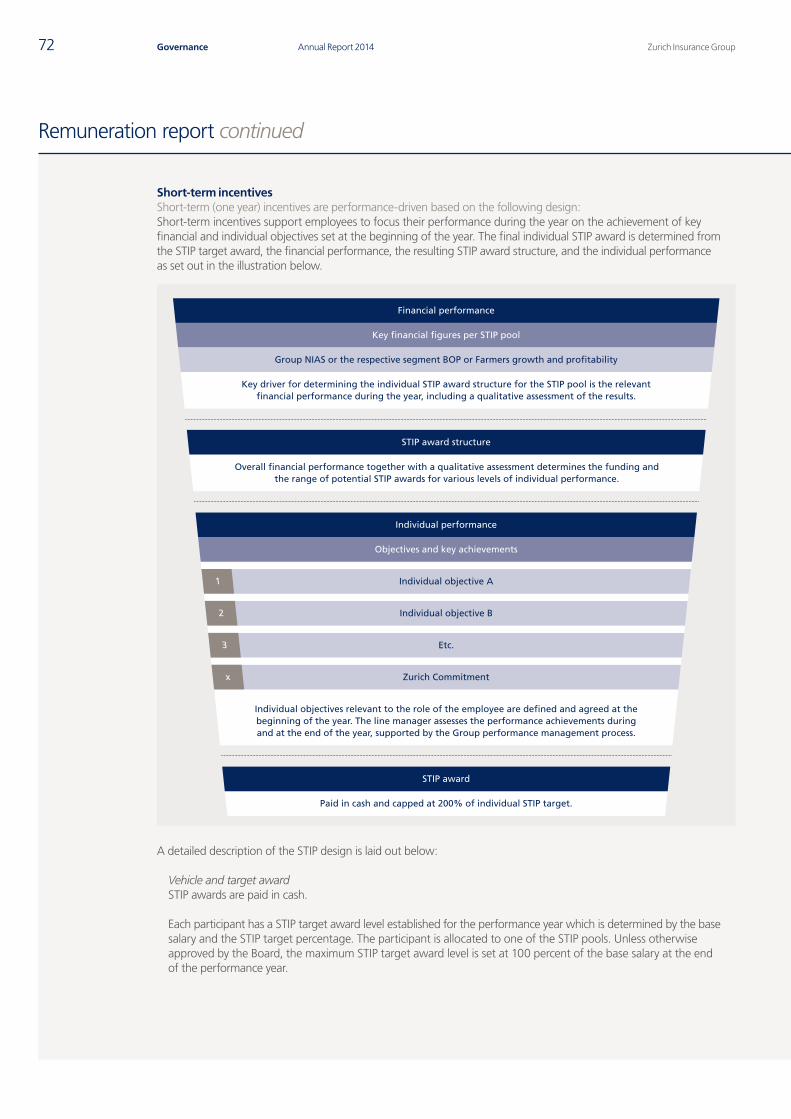
Zurich Insurance GroupAnnual Report 201472 Governance
Remuneration report continued
Short-term incentivesShort-term (one year) incentives are performance-driven based on the following design: Short-term incentives support employees to focus their performance during the year on the achievement of key financial and individual objectives set at the beginning of the year. The final individual STIP award is determined from the STIP target award, the financial performance, the resulting STIP award structure, and the individual performance as set out in the illustration below.
A detailed description of the STIP design is laid out below:
Vehicle and target awardSTIP awards are paid in cash.
Each participant has a STIP target award level established for the performance year which is determined by the base salary and the STIP target percentage. The participant is allocated to one of the STIP pools. Unless otherwise approved by the Board, the maximum STIP target award level is set at 100 percent of the base salary at the end of the performance year.
Key financial figures per STIP pool
Group NIAS or the respective segment BOP or Farmers growth and profitability
Key driver for determining the individual STIP award structure for the STIP pool is the relevantfinancial performance during the year, including a qualitative assessment of the results.
Paid in cash and capped at 200% of individual STIP target.
Overall financial performance together with a qualitative assessment determines the funding and the range of potential STIP awards for various levels of individual performance.
Individual objectives relevant to the role of the employee are defined and agreed at the beginning of the year. The line manager assesses the performance achievements during and at the end of the year, supported by the Group performance management process.
Financial performance
Objectives and key achievements
Individual performance
STIP award
STIP award structure
Individual objective A1
Individual objective B2
Zurich Commitmentx
Etc.3
Q4_2014_05_AR14_Remuneration_report_part1_en.indd 72 23.02.2015 16:21:06
Zurich Insurance Group Annual Report 2014 73Remuneration report
Govern
ance
Financial performanceThe STIP pool architecture which is reviewed and approved by the Board annually, is aligned with the organizational structure of Zurich. There are a number of STIP pools based on the NIAS result for members of the leadership team, the control functions, investment management, support functions and Group Operations and Technology. In addition, there are segment pools based on the overall BOP results of General Insurance and Global Life and based on specific growth and profitability measures of the Farmers Exchanges for employees in Farmers Group, Inc..
At the year-end the key financial figures are evaluated in relation to the business plan which has been approved by the Board in the December prior to the relevant performance year. A qualitative assessment of the financial performance takes place to ensure a holistic evaluation of the performance including the remuneration review by the Chief Risk Officer. The ultimate size of the STIP pools can vary between 0 percent and 175 percent of target, but typically the STIP pools vary in size in the range of 80 percent to 120 percent of target.
The CEO makes recommendations on the proposed size of the various STIP pools and on the aggregate amount required for STIP award payments across the organization to the Remuneration Committee. Following review and analysis, the Committee discusses their final recommendations with the Board and seeks their approval.
STIP award structureThe financial performance defines the funding available for each STIP pool and the resulting range of potential STIP awards for various levels of individual performance. As an illustration, if the financial performance meets expectations then the award structure for an individual that also meets expectations with regard to his or her objectives is set at the target level. However, if the financial performance only partially meets expectations, then the STIP award for an individual who meets expectations under his or her individual objectives will be set at a level lower than target and can be zero. Within General Insurance and Global Life, there are a number of sub-pools, for example at the country level, where the award structure is specifically defined to reflect the overall results of the segment and also the sub-pool.
Individual performanceAt the beginning of the year each individual jointly with his or her line manager defines and agrees the annual objectives. The individual performance achievements are then assessed during and at the end of the year through the Group performance management process. This process utilizes a rating scale between 1 and 5, with 5 being the highest rating. There is a target distribution and payout guideline for each of the ratings. Any violations of internal or external rules or requirements by an individual are taken into account in the individual performance rating.
STIP awardThe financial performance, the resulting STIP award structure together with the individual performance are then utilized to determine the final individual STIP award for the year which can vary between 0 percent and 200 percent of the target award level. In this way, STIP awards are differentiated based on the financial performance and on the individual performance. The funding and potential award structure of the STIP pool is based fully on the financial performance and given the award structure the final STIP award is based on the individual performance.
Short-term incentives are delivered primarily through STIP although there are additionally some local country plans. The Group plan is utilized across the organization and, in many countries covers all employees in the respective country who are selected to participate. In other countries only the most senior individuals participate in the STIP. Local country plans, following broadly the same principles as STIP, may be utilized for other employees.
In recent years, more than 12,000 employees have been transferred from local incentive plans to STIP. In 2015 and 2016, Zurich aims to transfer approximately a further 1,000 employees from local incentive plans to STIP taking into account the legal and market environment.
Q4_2014_05_AR14_Remuneration_report_part1_en.indd 73 23.02.2015 16:21:06
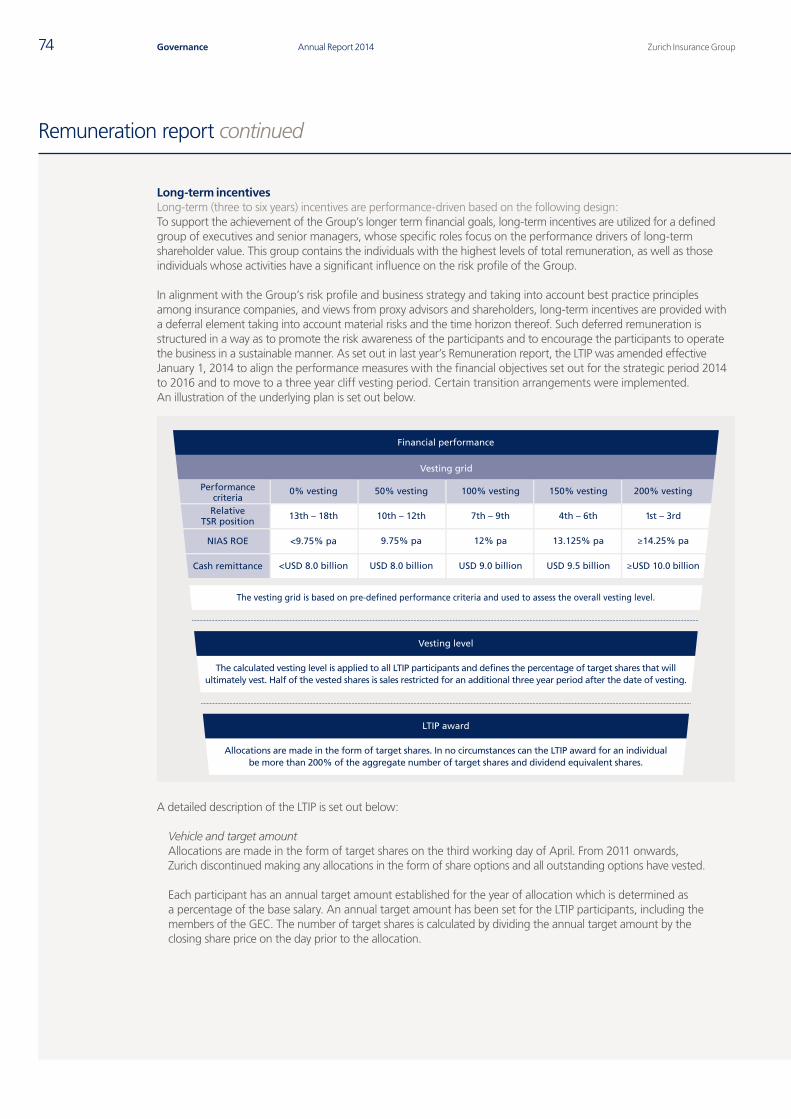
Zurich Insurance GroupAnnual Report 201474 Governance
Remuneration report continued
Long-term incentivesLong-term (three to six years) incentives are performance-driven based on the following design:To support the achievement of the Group’s longer term financial goals, long-term incentives are utilized for a defined group of executives and senior managers, whose specific roles focus on the performance drivers of long-term shareholder value. This group contains the individuals with the highest levels of total remuneration, as well as those individuals whose activities have a significant influence on the risk profile of the Group.
In alignment with the Group’s risk profile and business strategy and taking into account best practice principles among insurance companies, and views from proxy advisors and shareholders, long-term incentives are provided with a deferral element taking into account material risks and the time horizon thereof. Such deferred remuneration is structured in a way as to promote the risk awareness of the participants and to encourage the participants to operate the business in a sustainable manner. As set out in last year’s Remuneration report, the LTIP was amended effective January 1, 2014 to align the performance measures with the financial objectives set out for the strategic period 2014 to 2016 and to move to a three year cliff vesting period. Certain transition arrangements were implemented. An illustration of the underlying plan is set out below.
Vesting grid
The vesting grid is based on pre-defined performance criteria and used to assess the overall vesting level.
Allocations are made in the form of target shares. In no circumstances can the LTIP award for an individual be more than 200% of the aggregate number of target shares and dividend equivalent shares.
Financial performance
LTIP award
The calculated vesting level is applied to all LTIP participants and defines the percentage of target shares that will ultimately vest. Half of the vested shares is sales restricted for an additional three year period after the date of vesting.
Vesting level
Performancecriteria
0% vesting
≥USD 10.0 billionUSD 9.5 billionUSD 9.0 billionUSD 8.0 billion<USD 8.0 billion
<9.75% pa
13th – 18th
9.75% pa
10th – 12th
12% pa
7th – 9th
13.125% pa
4th – 6th
≥14.25% pa
1st – 3rd
50% vesting 100% vesting 150% vesting 200% vesting
RelativeTSR position
NIAS ROE
Cash remittance
A detailed description of the LTIP is set out below:
Vehicle and target amount Allocations are made in the form of target shares on the third working day of April. From 2011 onwards, Zurich discontinued making any allocations in the form of share options and all outstanding options have vested.
Each participant has an annual target amount established for the year of allocation which is determined as a percentage of the base salary. An annual target amount has been set for the LTIP participants, including the members of the GEC. The number of target shares is calculated by dividing the annual target amount by the closing share price on the day prior to the allocation.
Q4_2014_05_AR14_Remuneration_report_part1_en.indd 74 23.02.2015 16:21:07
Zurich Insurance Group Annual Report 2014 75Remuneration report
Govern
ance
Financial performanceThe financial performance is determined by the assessment of the performance criteria as per the vesting grid which are set and reviewed by the Board annually in order to ensure alignment with the strategy.
The performance criteria for the period 2014 to 2016 comprise:
(i) The position of the TSR compared with an international peer group of insurance companies derived from the Dow Jones Titan Insurance Index. The Remuneration Committee reviews the peer companies to be included in the relative TSR assessment regularly to ensure that the peer group exhibits a strong TSR correlation and reflects the Group’s business profile and geographic spread. The resulting industry peer group includes the following companies: Ace, AIG, Allianz, Allstate, Aviva, AXA, Chubb, Generali, Legal & General, Manulife Financial Corp., Met Life, Munich Re, Progressive Ohio, Prudential Plc, QBE, Swiss Re and Travelers Cos. Inc.
(ii) NIAS ROE3.
(iii) Cash remittance4.
Each performance measure is assessed independently over a three year period starting at the beginning of a calendar year when the target shares are allocated and each have a one third equal weighting. This then defines the vesting level according to the vesting grid.
Vesting levelThe vesting level defines the percentage of target shares that will vest. The target shares will not vest if all three performance criteria do not meet their respective minimum thresholds.
The vesting level is proposed by the CEO to the Remuneration Committee and finally approved by the Board. The Board may exercise discretion in order to take the financial and operating environment into account when assessing the final vesting level. Adjustments of +/–25 percent to the proposed vesting level may be applied and can be positive or negative depending on extraordinary market circumstances for example with regard to interest rates, exchange rates, etc.
Exceptional individual adjustmentsThe right to modify individual LTIP awards to reflect specific circumstances is reserved for the CEO except for modifications regarding members of the GEC where such right is reserved for the Remuneration Committee and the Board. An individual adjustment of +/–25 percent to the final vesting level may be applied before vesting.
However, if performance under exceptional or unusual circumstances warrants it exceptions to the +/–25 percent individual adjustment may be made. In this respect Zurich reserves the right to adjust and even set the vesting level to zero for an individual to reflect specific circumstances (e.g. in connection with a breach of internal or external rules) during the period prior to vesting. Any such adjustment is reserved exclusively for the Remuneration Committee and the Board.
The final vesting level which may include exceptional individual adjustments, is then used to assess the number of target shares for vesting.
LTIP awardThe LTIP award is then distributed to participants on the third of April three years after the target shares were allocated to the participant. In no circumstances can the LTIP award for an individual be more than 200 percent of the aggregate number of target shares and dividend equivalent target shares noted below.
One half of any vested shares is sales restricted for a further three year period following the date of vesting. This takes the overall vesting and sales restriction period to six years holding period for this part of the award.
3 In line with the methodology used to calculate the ROE with effect from January 1, 2014, the calculation of equity will exclude unrealized investment gains or losses.4 Due to the potential volatility in any one year, the assessment of cash remittance performance can only meaningfully be assessed over a three-year period. Therefore,
the cash remittance measure is being replaced by the BOPAT ROE for the vesting decisions in 2015 and 2016. The BOPAT ROE measure increases the focus on profitability in line with the Group strategy and it will be assessed using the same vesting grid that applies to the NIAS ROE as set out in the table.
Q4_2014_05_AR14_Remuneration_report_part1_en.indd 75 23.02.2015 16:21:07
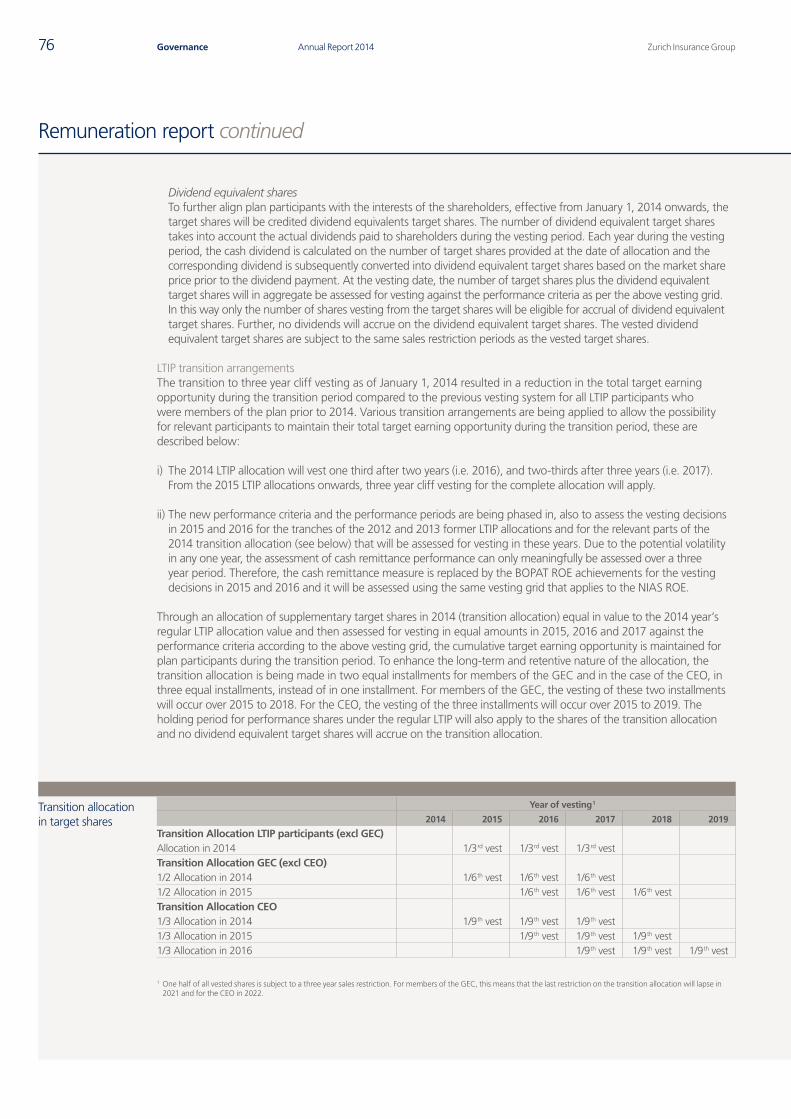
Zurich Insurance GroupAnnual Report 201476 Governance
Remuneration report continued
Dividend equivalent sharesTo further align plan participants with the interests of the shareholders, effective from January 1, 2014 onwards, the target shares will be credited dividend equivalents target shares. The number of dividend equivalent target shares takes into account the actual dividends paid to shareholders during the vesting period. Each year during the vesting period, the cash dividend is calculated on the number of target shares provided at the date of allocation and the corresponding dividend is subsequently converted into dividend equivalent target shares based on the market share price prior to the dividend payment. At the vesting date, the number of target shares plus the dividend equivalent target shares will in aggregate be assessed for vesting against the performance criteria as per the above vesting grid. In this way only the number of shares vesting from the target shares will be eligible for accrual of dividend equivalent target shares. Further, no dividends will accrue on the dividend equivalent target shares. The vested dividend equivalent target shares are subject to the same sales restriction periods as the vested target shares.
LTIP transition arrangementsThe transition to three year cliff vesting as of January 1, 2014 resulted in a reduction in the total target earning opportunity during the transition period compared to the previous vesting system for all LTIP participants who were members of the plan prior to 2014. Various transition arrangements are being applied to allow the possibility for relevant participants to maintain their total target earning opportunity during the transition period, these are described below:
i) The 2014 LTIP allocation will vest one third after two years (i.e. 2016), and two-thirds after three years (i.e. 2017). From the 2015 LTIP allocations onwards, three year cliff vesting for the complete allocation will apply.
ii) The new performance criteria and the performance periods are being phased in, also to assess the vesting decisions in 2015 and 2016 for the tranches of the 2012 and 2013 former LTIP allocations and for the relevant parts of the 2014 transition allocation (see below) that will be assessed for vesting in these years. Due to the potential volatility in any one year, the assessment of cash remittance performance can only meaningfully be assessed over a three year period. Therefore, the cash remittance measure is replaced by the BOPAT ROE achievements for the vesting decisions in 2015 and 2016 and it will be assessed using the same vesting grid that applies to the NIAS ROE.
Through an allocation of supplementary target shares in 2014 (transition allocation) equal in value to the 2014 year’s regular LTIP allocation value and then assessed for vesting in equal amounts in 2015, 2016 and 2017 against the performance criteria according to the above vesting grid, the cumulative target earning opportunity is maintained for plan participants during the transition period. To enhance the long-term and retentive nature of the allocation, the transition allocation is being made in two equal installments for members of the GEC and in the case of the CEO, in three equal installments, instead of in one installment. For members of the GEC, the vesting of these two installments will occur over 2015 to 2018. For the CEO, the vesting of the three installments will occur over 2015 to 2019. The holding period for performance shares under the regular LTIP will also apply to the shares of the transition allocation and no dividend equivalent target shares will accrue on the transition allocation.
Transition allocation in target shares
Year of vesting 1
2014 2015 2016 2017 2018 2019
Transition Allocation LTIP participants (excl GEC) Allocation in 2014 1/3 rd vest 1/3 rd vest 1/3 rd vestTransition Allocation GEC (excl CEO) 1/2 Allocation in 2014 1/6 th vest 1/6 th vest 1/6 th vest1/2 Allocation in 2015 1/6 th vest 1/6 th vest 1/6 th vestTransition Allocation CEO 1/3 Allocation in 2014 1/9 th vest 1/9 th vest 1/9 th vest1/3 Allocation in 2015 1/9 th vest 1/9 th vest 1/9 th vest1/3 Allocation in 2016 1/9 th vest 1/9 th vest 1/9 th vest
1 One half of all vested shares is subject to a three year sales restriction. For members of the GEC, this means that the last restriction on the transition allocation will lapse in 2021 and for the CEO in 2022.
Q4_2014_05_AR14_Remuneration_report_part1_en.indd 76 23.02.2015 16:21:07
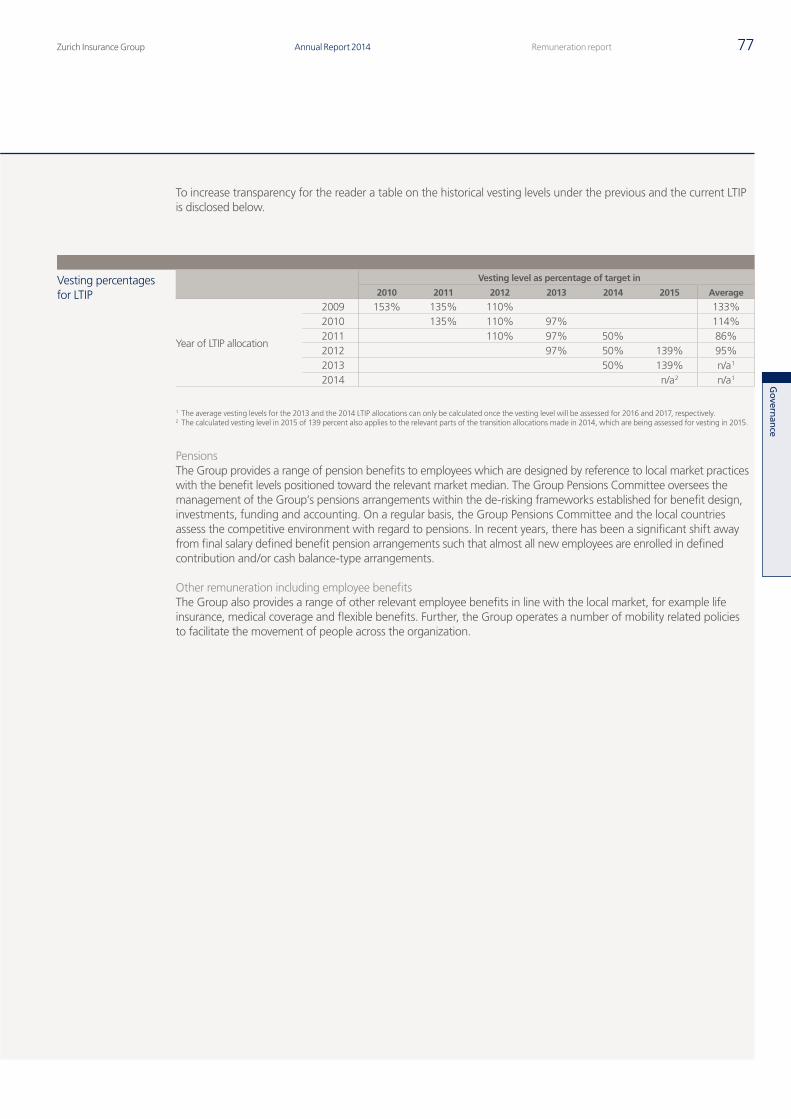
Zurich Insurance Group Annual Report 2014 77Remuneration report
Govern
ance
To increase transparency for the reader a table on the historical vesting levels under the previous and the current LTIP is disclosed below.
Vesting percentages for LTIP
Vesting level as percentage of target in
2010 2011 2012 2013 2014 2015 Average
Year of LTIP allocation
2009 153% 135% 110% 133%2010 135% 110% 97% 114%2011 110% 97% 50% 86%2012 97% 50% 139% 95%2013 50% 139% n/a 1
2014 n/a 2 n/a 1
1 The average vesting levels for the 2013 and the 2014 LTIP allocations can only be calculated once the vesting level will be assessed for 2016 and 2017, respectively. 2 The calculated vesting level in 2015 of 139 percent also applies to the relevant parts of the transition allocations made in 2014, which are being assessed for vesting in 2015.
PensionsThe Group provides a range of pension benefits to employees which are designed by reference to local market practices with the benefit levels positioned toward the relevant market median. The Group Pensions Committee oversees the management of the Group’s pensions arrangements within the de-risking frameworks established for benefit design, investments, funding and accounting. On a regular basis, the Group Pensions Committee and the local countries assess the competitive environment with regard to pensions. In recent years, there has been a significant shift away from final salary defined benefit pension arrangements such that almost all new employees are enrolled in defined contribution and/or cash balance-type arrangements.
Other remuneration including employee benefitsThe Group also provides a range of other relevant employee benefits in line with the local market, for example life insurance, medical coverage and flexible benefits. Further, the Group operates a number of mobility related policies to facilitate the movement of people across the organization.
Q4_2014_05_AR14_Remuneration_report_part1_en.indd 77 23.02.2015 16:21:08
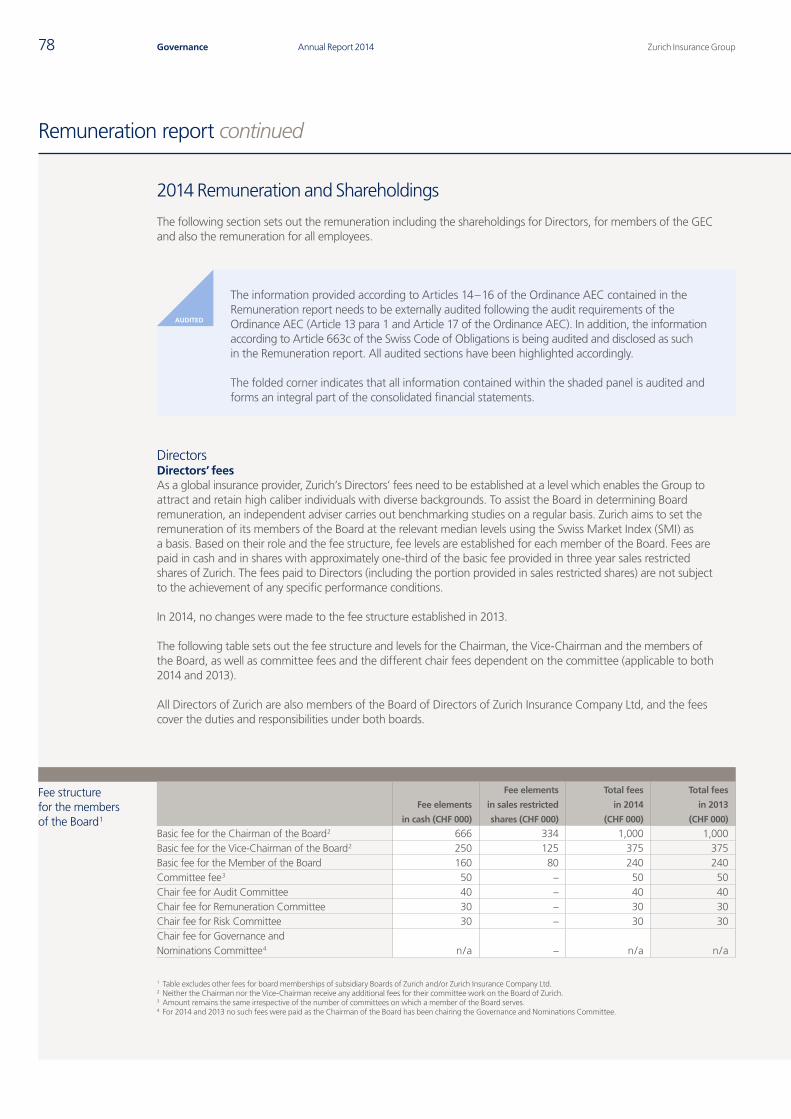
AUDITED
Zurich Insurance GroupAnnual Report 201478 Governance
Remuneration report continued
2014 Remuneration and Shareholdings
The following section sets out the remuneration including the shareholdings for Directors, for members of the GEC and also the remuneration for all employees.
The information provided according to Articles 14 – 16 of the Ordinance AEC contained in the Remuneration report needs to be externally audited following the audit requirements of the Ordinance AEC (Article 13 para 1 and Article 17 of the Ordinance AEC). In addition, the information according to Article 663c of the Swiss Code of Obligations is being audited and disclosed as such in the Remuneration report. All audited sections have been highlighted accordingly.
The folded corner indicates that all information contained within the shaded panel is audited and forms an integral part of the consolidated financial statements.
DirectorsDirectors’ feesAs a global insurance provider, Zurich’s Directors’ fees need to be established at a level which enables the Group to attract and retain high caliber individuals with diverse backgrounds. To assist the Board in determining Board remuneration, an independent adviser carries out benchmarking studies on a regular basis. Zurich aims to set the remuneration of its members of the Board at the relevant median levels using the Swiss Market Index (SMI) as a basis. Based on their role and the fee structure, fee levels are established for each member of the Board. Fees are paid in cash and in shares with approximately one-third of the basic fee provided in three year sales restricted shares of Zurich. The fees paid to Directors (including the portion provided in sales restricted shares) are not subject to the achievement of any specific performance conditions.
In 2014, no changes were made to the fee structure established in 2013.
The following table sets out the fee structure and levels for the Chairman, the Vice-Chairman and the members of the Board, as well as committee fees and the different chair fees dependent on the committee (applicable to both 2014 and 2013).
All Directors of Zurich are also members of the Board of Directors of Zurich Insurance Company Ltd, and the fees cover the duties and responsibilities under both boards.
Fee structure for the members of the Board 1
Fee elements
in cash (CHF 000)
Fee elements
in sales restricted
shares (CHF 000)
Total fees
in 2014
(CHF 000)
Total fees
in 2013
(CHF 000)
Basic fee for the Chairman of the Board 2 666 334 1,000 1,000Basic fee for the Vice-Chairman of the Board 2 250 125 375 375Basic fee for the Member of the Board 160 80 240 240Committee fee 3 50 – 50 50Chair fee for Audit Committee 40 – 40 40Chair fee for Remuneration Committee 30 – 30 30Chair fee for Risk Committee 30 – 30 30Chair fee for Governance and Nominations Committee 4 n / a – n / a n / a
1 Table excludes other fees for board memberships of subsidiary Boards of Zurich and/or Zurich Insurance Company Ltd.2 Neither the Chairman nor the Vice-Chairman receive any additional fees for their committee work on the Board of Zurich.3 Amount remains the same irrespective of the number of committees on which a member of the Board serves.4 For 2014 and 2013 no such fees were paid as the Chairman of the Board has been chairing the Governance and Nominations Committee.
Q4_2014_06_AR14_Remuneration_report_part2_en.indd 78 23.02.2015 16:23:21
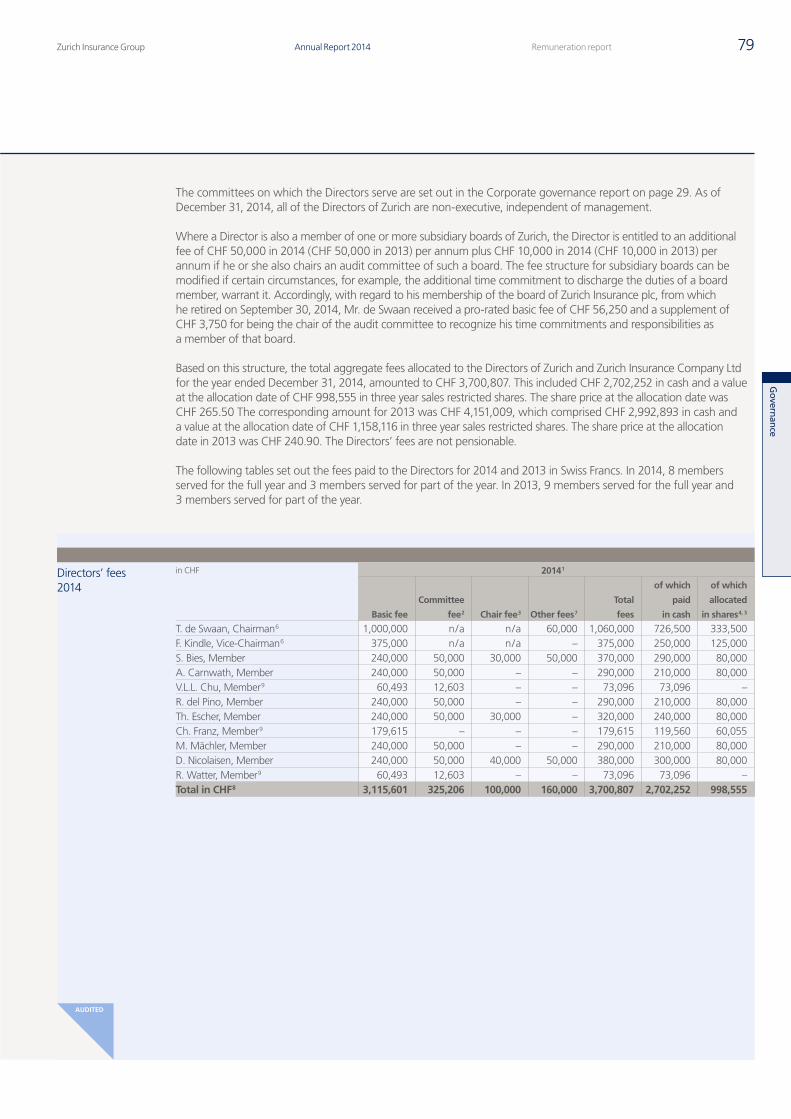
Govern
ance
Zurich Insurance Group Annual Report 2014 79Remuneration report
AUDITED
The committees on which the Directors serve are set out in the Corporate governance report on page 29. As of December 31, 2014, all of the Directors of Zurich are non-executive, independent of management.
Where a Director is also a member of one or more subsidiary boards of Zurich, the Director is entitled to an additional fee of CHF 50,000 in 2014 (CHF 50,000 in 2013) per annum plus CHF 10,000 in 2014 (CHF 10,000 in 2013) per annum if he or she also chairs an audit committee of such a board. The fee structure for subsidiary boards can be modified if certain circumstances, for example, the additional time commitment to discharge the duties of a board member, warrant it. Accordingly, with regard to his membership of the board of Zurich Insurance plc, from which he retired on September 30, 2014, Mr. de Swaan received a pro-rated basic fee of CHF 56,250 and a supplement of CHF 3,750 for being the chair of the audit committee to recognize his time commitments and responsibilities as a member of that board.
Based on this structure, the total aggregate fees allocated to the Directors of Zurich and Zurich Insurance Company Ltd for the year ended December 31, 2014, amounted to CHF 3,700,807. This included CHF 2,702,252 in cash and a value at the allocation date of CHF 998,555 in three year sales restricted shares. The share price at the allocation date was CHF 265.50 The corresponding amount for 2013 was CHF 4,151,009, which comprised CHF 2,992,893 in cash and a value at the allocation date of CHF 1,158,116 in three year sales restricted shares. The share price at the allocation date in 2013 was CHF 240.90. The Directors’ fees are not pensionable.
The following tables set out the fees paid to the Directors for 2014 and 2013 in Swiss Francs. In 2014, 8 members served for the full year and 3 members served for part of the year. In 2013, 9 members served for the full year and 3 members served for part of the year.
Directors’ fees 2014
in CHF 2014 1
Basic fee
Committee
fee 2 Chair fee 3 Other fees 7
Total
fees
of which
paid
in cash
of which
allocated
in shares 4, 5
T. de Swaan, Chairman 6 1,000,000 n / a n / a 60,000 1,060,000 726,500 333,500F. Kindle, Vice-Chairman 6 375,000 n / a n / a – 375,000 250,000 125,000S. Bies, Member 240,000 50,000 30,000 50,000 370,000 290,000 80,000A. Carnwath, Member 240,000 50,000 – – 290,000 210,000 80,000V.L.L. Chu, Member 9 60,493 12,603 – – 73,096 73,096 –R. del Pino, Member 240,000 50,000 – – 290,000 210,000 80,000Th. Escher, Member 240,000 50,000 30,000 – 320,000 240,000 80,000Ch. Franz, Member 9 179,615 – – – 179,615 119,560 60,055M. Mächler, Member 240,000 50,000 – – 290,000 210,000 80,000D. Nicolaisen, Member 240,000 50,000 40,000 50,000 380,000 300,000 80,000R. Watter, Member 9 60,493 12,603 – – 73,096 73,096 –Total in CHF 8 3,115,601 325,206 100,000 160,000 3,700,807 2,702,252 998,555
Q4_2014_06_AR14_Remuneration_report_part2_en.indd 79 23.02.2015 16:23:22
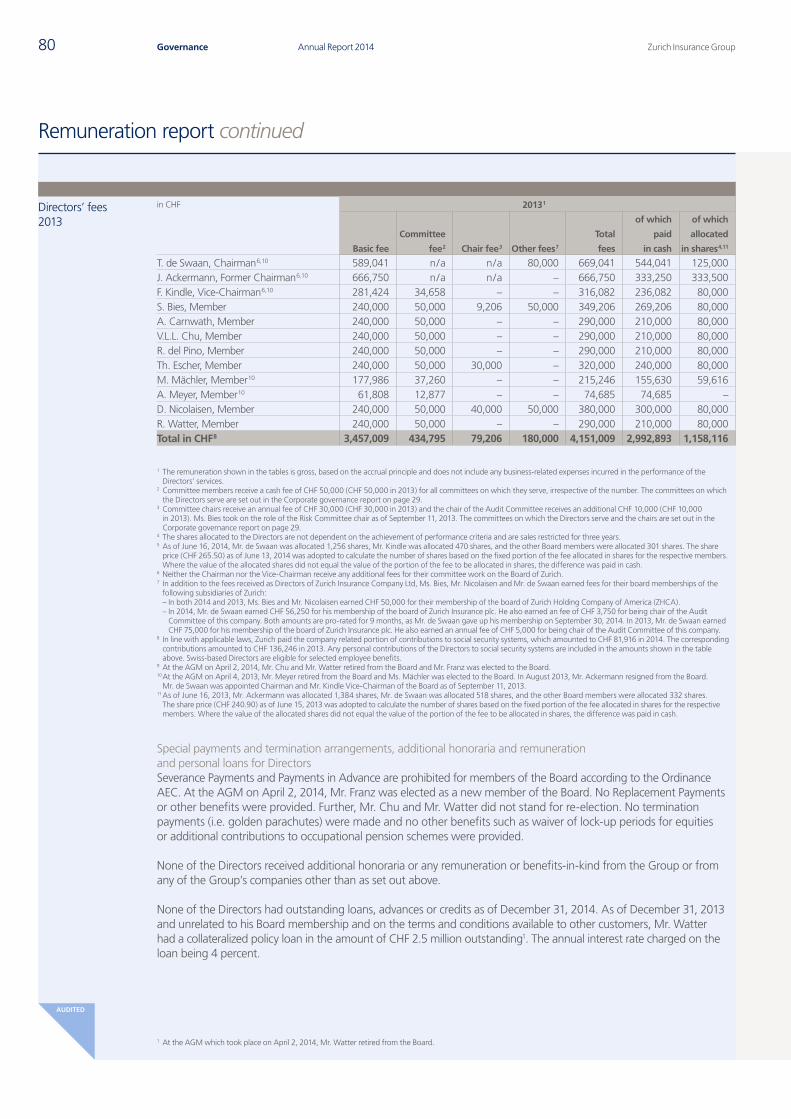
Zurich Insurance GroupAnnual Report 201480 Governance
AUDITEDAUDITED
Remuneration report continued
Directors’ fees 2013
in CHF 2013 1
Basic fee
Committee
fee 2 Chair fee 3 Other fees 7
Total
fees
of which
paid
in cash
of which
allocated
in shares 4,11
T. de Swaan, Chairman 6,10 589,041 n / a n / a 80,000 669,041 544,041 125,000J. Ackermann, Former Chairman 6,10 666,750 n / a n / a – 666,750 333,250 333,500F. Kindle, Vice-Chairman 6,10 281,424 34,658 – – 316,082 236,082 80,000S. Bies, Member 240,000 50,000 9,206 50,000 349,206 269,206 80,000A. Carnwath, Member 240,000 50,000 – – 290,000 210,000 80,000V.L.L. Chu, Member 240,000 50,000 – – 290,000 210,000 80,000R. del Pino, Member 240,000 50,000 – – 290,000 210,000 80,000Th. Escher, Member 240,000 50,000 30,000 – 320,000 240,000 80,000M. Mächler, Member 10 177,986 37,260 – – 215,246 155,630 59,616A. Meyer, Member 10 61,808 12,877 – – 74,685 74,685 –D. Nicolaisen, Member 240,000 50,000 40,000 50,000 380,000 300,000 80,000R. Watter, Member 240,000 50,000 – – 290,000 210,000 80,000Total in CHF 8 3,457,009 434,795 79,206 180,000 4,151,009 2,992,893 1,158,116
1 The remuneration shown in the tables is gross, based on the accrual principle and does not include any business-related expenses incurred in the performance of the Directors’ services.
2 Committee members receive a cash fee of CHF 50,000 (CHF 50,000 in 2013) for all committees on which they serve, irrespective of the number. The committees on which the Directors serve are set out in the Corporate governance report on page 29.
3 Committee chairs receive an annual fee of CHF 30,000 (CHF 30,000 in 2013) and the chair of the Audit Committee receives an additional CHF 10,000 (CHF 10,000 in 2013). Ms. Bies took on the role of the Risk Committee chair as of September 11, 2013. The committees on which the Directors serve and the chairs are set out in the Corporate governance report on page 29.
4 The shares allocated to the Directors are not dependent on the achievement of performance criteria and are sales restricted for three years.5 As of June 16, 2014, Mr. de Swaan was allocated 1,256 shares, Mr. Kindle was allocated 470 shares, and the other Board members were allocated 301 shares. The share
price (CHF 265.50) as of June 13, 2014 was adopted to calculate the number of shares based on the fixed portion of the fee allocated in shares for the respective members. Where the value of the allocated shares did not equal the value of the portion of the fee to be allocated in shares, the difference was paid in cash.
6 Neither the Chairman nor the Vice-Chairman receive any additional fees for their committee work on the Board of Zurich.7 In addition to the fees received as Directors of Zurich Insurance Company Ltd, Ms. Bies, Mr. Nicolaisen and Mr. de Swaan earned fees for their board memberships of the
following subsidiaries of Zurich: – In both 2014 and 2013, Ms. Bies and Mr. Nicolaisen earned CHF 50,000 for their membership of the board of Zurich Holding Company of America (ZHCA). – In 2014, Mr. de Swaan earned CHF 56,250 for his membership of the board of Zurich Insurance plc. He also earned an fee of CHF 3,750 for being chair of the Audit
Committee of this company. Both amounts are pro-rated for 9 months, as Mr. de Swaan gave up his membership on September 30, 2014. In 2013, Mr. de Swaan earned CHF 75,000 for his membership of the board of Zurich Insurance plc. He also earned an annual fee of CHF 5,000 for being chair of the Audit Committee of this company.
8 In line with applicable laws, Zurich paid the company related portion of contributions to social security systems, which amounted to CHF 81,916 in 2014. The corresponding contributions amounted to CHF 136,246 in 2013. Any personal contributions of the Directors to social security systems are included in the amounts shown in the table above. Swiss-based Directors are eligible for selected employee benefits.
9 At the AGM on April 2, 2014, Mr. Chu and Mr. Watter retired from the Board and Mr. Franz was elected to the Board.10 At the AGM on April 4, 2013, Mr. Meyer retired from the Board and Ms. Mächler was elected to the Board. In August 2013, Mr. Ackermann resigned from the Board.
Mr. de Swaan was appointed Chairman and Mr. Kindle Vice-Chairman of the Board as of September 11, 2013.11 As of June 16, 2013, Mr. Ackermann was allocated 1,384 shares, Mr. de Swaan was allocated 518 shares, and the other Board members were allocated 332 shares.
The share price (CHF 240.90) as of June 15, 2013 was adopted to calculate the number of shares based on the fixed portion of the fee allocated in shares for the respective members. Where the value of the allocated shares did not equal the value of the portion of the fee to be allocated in shares, the difference was paid in cash.
Special payments and termination arrangements, additional honoraria and remuneration and personal loans for DirectorsSeverance Payments and Payments in Advance are prohibited for members of the Board according to the Ordinance AEC. At the AGM on April 2, 2014, Mr. Franz was elected as a new member of the Board. No Replacement Payments or other benefits were provided. Further, Mr. Chu and Mr. Watter did not stand for re-election. No termination payments (i.e. golden parachutes) were made and no other benefits such as waiver of lock-up periods for equities or additional contributions to occupational pension schemes were provided.
None of the Directors received additional honoraria or any remuneration or benefits-in-kind from the Group or from any of the Group’s companies other than as set out above.
None of the Directors had outstanding loans, advances or credits as of December 31, 2014. As of December 31, 2013 and unrelated to his Board membership and on the terms and conditions available to other customers, Mr. Watter had a collateralized policy loan in the amount of CHF 2.5 million outstanding1. The annual interest rate charged on the loan being 4 percent.
1 At the AGM which took place on April 2, 2014, Mr. Watter retired from the Board.
Q4_2014_06_AR14_Remuneration_report_part2_en.indd 80 23.02.2015 16:23:23
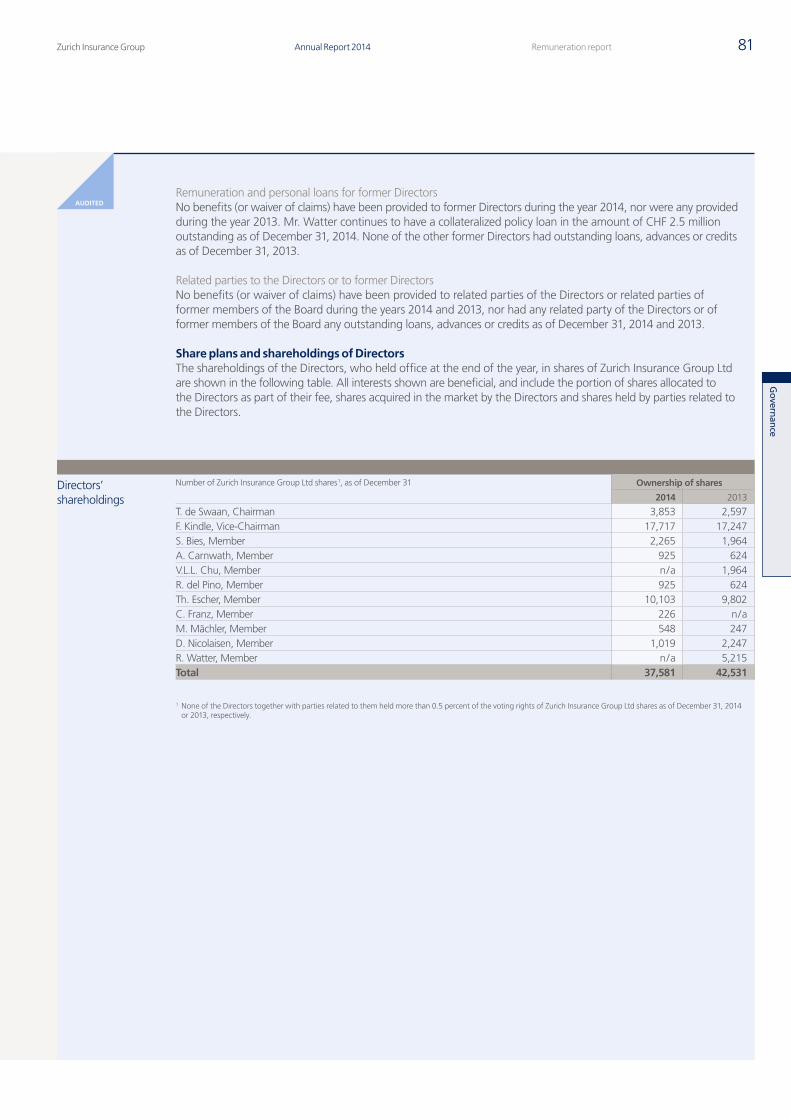
Govern
ance
AUDITED
Zurich Insurance Group Annual Report 2014 81Remuneration report
AUDITEDRemuneration and personal loans for former DirectorsNo benefits (or waiver of claims) have been provided to former Directors during the year 2014, nor were any provided during the year 2013. Mr. Watter continues to have a collateralized policy loan in the amount of CHF 2.5 million outstanding as of December 31, 2014. None of the other former Directors had outstanding loans, advances or credits as of December 31, 2013.
Related parties to the Directors or to former DirectorsNo benefits (or waiver of claims) have been provided to related parties of the Directors or related parties of former members of the Board during the years 2014 and 2013, nor had any related party of the Directors or of former members of the Board any outstanding loans, advances or credits as of December 31, 2014 and 2013.
Share plans and shareholdings of DirectorsThe shareholdings of the Directors, who held office at the end of the year, in shares of Zurich Insurance Group Ltd are shown in the following table. All interests shown are beneficial, and include the portion of shares allocated to the Directors as part of their fee, shares acquired in the market by the Directors and shares held by parties related to the Directors.
Directors’ shareholdings
Number of Zurich Insurance Group Ltd shares 1, as of December 31 Ownership of shares
2014 2013
T. de Swaan, Chairman 3,853 2,597F. Kindle, Vice-Chairman 17,717 17,247S. Bies, Member 2,265 1,964A. Carnwath, Member 925 624V.L.L. Chu, Member n / a 1,964R. del Pino, Member 925 624Th. Escher, Member 10,103 9,802C. Franz, Member 226 n / aM. Mächler, Member 548 247D. Nicolaisen, Member 1,019 2,247R. Watter, Member n / a 5,215Total 37,581 42,531
1 None of the Directors together with parties related to them held more than 0.5 percent of the voting rights of Zurich Insurance Group Ltd shares as of December 31, 2014 or 2013, respectively.
Q4_2014_06_AR14_Remuneration_report_part2_en.indd 81 23.02.2015 16:23:23
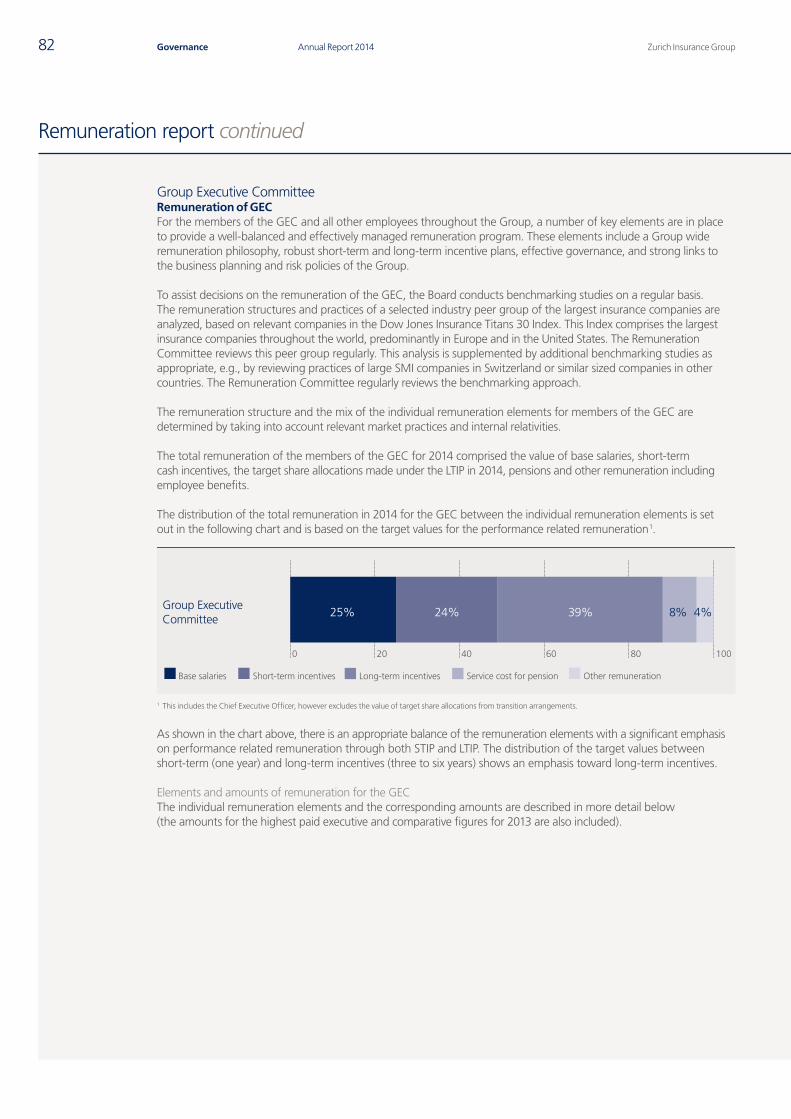
Zurich Insurance GroupAnnual Report 201482 Governance
Remuneration report continued
Group Executive CommitteeRemuneration of GECFor the members of the GEC and all other employees throughout the Group, a number of key elements are in place to provide a well-balanced and effectively managed remuneration program. These elements include a Group wide remuneration philosophy, robust short-term and long-term incentive plans, effective governance, and strong links to the business planning and risk policies of the Group.
To assist decisions on the remuneration of the GEC, the Board conducts benchmarking studies on a regular basis. The remuneration structures and practices of a selected industry peer group of the largest insurance companies are analyzed, based on relevant companies in the Dow Jones Insurance Titans 30 Index. This Index comprises the largest insurance companies throughout the world, predominantly in Europe and in the United States. The Remuneration Committee reviews this peer group regularly. This analysis is supplemented by additional benchmarking studies as appropriate, e.g., by reviewing practices of large SMI companies in Switzerland or similar sized companies in other countries. The Remuneration Committee regularly reviews the benchmarking approach.
The remuneration structure and the mix of the individual remuneration elements for members of the GEC are determined by taking into account relevant market practices and internal relativities.
The total remuneration of the members of the GEC for 2014 comprised the value of base salaries, short-term cash incentives, the target share allocations made under the LTIP in 2014, pensions and other remuneration including employee benefits.
The distribution of the total remuneration in 2014 for the GEC between the individual remuneration elements is set out in the following chart and is based on the target values for the performance related remuneration 1.
Group ExecutiveCommittee
Base salaries Short-term incentives Long-term incentives Service cost for pension Other remuneration
0 20 40 60 80 100
25% 39%24% 4%8%
1 This includes the Chief Executive Officer, however excludes the value of target share allocations from transition arrangements.
As shown in the chart above, there is an appropriate balance of the remuneration elements with a significant emphasis on performance related remuneration through both STIP and LTIP. The distribution of the target values between short-term (one year) and long-term incentives (three to six years) shows an emphasis toward long-term incentives.
Elements and amounts of remuneration for the GECThe individual remuneration elements and the corresponding amounts are described in more detail below (the amounts for the highest paid executive and comparative figures for 2013 are also included).
Q4_2014_06_AR14_Remuneration_report_part2_en.indd 82 23.02.2015 16:23:24
Govern
ance
Zurich Insurance Group Annual Report 2014 83Remuneration report
Elements and amounts of remuneration for the GEC
Description Amount
Base salaries paid during the year
See remuneration elements, page 71.
The total amount of base salaries for all members of the GEC paid in 2014 was USD 12.0m compared to USD 11.6m in 2013.
Cash incentive awards earned for the year (STIP)
For members of the GEC the STIP target percentages for 2014 vary between 75 percent and 100 percent of the base salary. The maximum STIP award for all members of the GEC is 200 percent of the individual target amount. Further information regarding STIP is set out below.
The total amount of annual cash incentive awards to be paid in 2015 for the 2014 performance year for all members of the GEC was USD 11.9m compared to USD 12.1m for 2013. As set out on page 72 the annual cash incentive awards are determined individually and are performance based.
Value of target share allocations made during the year
In 2014, each member of the GEC received an annual allocation of target shares under the LTIP. For members of the GEC the LTIP target percentages in 2014 vary between 100 percent and 225 percent of the base salary. As in previous years, the allocations of target shares for 2014 were made on the third working day in April, i.e. on April 3, 2014. The maximum vesting level is 200% of the target number of shares allocated.
The total number of target target shares allocated on April 3, 2014 to members of the GEC during 2014 was 64,460 which reflects a value of USD 18.7m at the date of allocation. This is based on the assumption of a 100 percent vesting in 2016 and 2017, a share price of CHF 274.30 on the day prior to the allocation and an exchange rate of 1 CHF = 0.88695 USD. This compares with 57,374 target shares allocated in 2013 and a respective value of USD 16.2m at the date of allocation on April 3, 2013.
Service costs for pension benefits during the year
Members of the GEC participate in the pension plan arrangements of the entities where they are employed. The Group’s philosophy is to provide pension benefits through cash balance and/or defined contribution plans where funds are accumulated throughout a career to provide retirement benefits. The majority of GEC members participate in such plans and, over time, all future GEC members will participate in such plans. The remaining members of the GEC participate in defined benefit plans that provide retirement benefits based on final pensionable earnings and the number of years of service. Normal retirement ages vary from 60 to 65.
The total value of pension benefits accruing to members of the GEC during 2014, calculated on the basis of the service costs for the company as assessed under IAS 19 accounting principles, was USD 3.6m (compared to USD 3.2m in 2013). Service costs value the amount of the pension benefits accruing during the year and for defined contribution plans take the amount of the company contribution paid during the year.
Value of other remuneration including employee benefits during the year
Members of the GEC received other remuneration in 2014 in relation to employee benefits, expatriate allowances, perquisites, benefits-in-kind and any other payments due under each member’s employment contract.
The total value of other remuneration in 2014 was USD 1.9m (compared to USD 2.9m in 2013). Benefits-in-kind have been valued using market rates.
Q4_2014_06_AR14_Remuneration_report_part2_en.indd 83 23.02.2015 16:23:24
Zurich Insurance GroupAnnual Report 201484 Governance
Remuneration report continued
GEC STIP performance assessment This section provides further insights into the assessment of the individual STIP awards of the members of the GEC.
The individual STIP award is determined in a similar way to all employees by the financial performance, the resulting STIP award structure, and by the individual performance.
For the GEC, the key financial metric is the NIAS performance during the year. In evaluating the NIAS performance, an overall qualitative assessment of the results is carried out to determine the STIP award structure. NIAS for 2014 was slightly under USD 3.9 billion reflecting a 3% decrease compared to 2013. With regard to the individual performance, each member defines and agrees individual objectives relating to the execution of the strategy in the following key areas: positioning the business for long-term profitable growth, reducing complexity, improving profitability, investing in people, capabilities and brand, and implementing the Zurich Commitment. In a rigorous process the Remuneration Committee reviews the individual performance achievements of each of the GEC members considering a number of factors including the performance of the business segment or function being managed, and the achievement of the strategic objectives across the defined areas. The proposals for STIP awards are then reviewed and approved by the Board. The Remuneration Committee and the Board also reviews the performance of the CEO using a similar process at the year-end. As a result of this rigorous process individual STIP awards for each member of the GEC are determined and approved by the Board. Given the assessment of the overall financial and individual results for 2014, lower overall cash incentives have been allocated to the GEC for 2014 than in the previous year.
Replacement Payments for GEC members appointed in 2014In extraordinary circumstances payments may be made to new hires to replace forfeitures under the incentive plans of the previous employer. In these circumstances, the payments mirror the type and timing of the forfeited payments and can include cash payments and/or awards of restricted shares. Where payments are made in cash, there is typically a clawback period if the employee leaves the company voluntarily during the first two years of employment. Restricted share allocations typically vest over three to five years following the date of allocation and are forfeited if the holder of such share allocation leaves the company voluntarily before the vesting date and the employment relationship terminates (Replacement Payments).
Replacement Payments were made to the two newly hired members of the GEC who took up their employment with the Group in 2014. The payments comprised a cash payment of CHF 0.8 million and restricted shares vesting over the four year period 2015 to 2018 with a value of CHF 7.0 million. The overall value of the Replacement Payments was therefore CHF 7.8 million, or USD 8.8 million when translated into U.S. dollars at the exchange rates at the time they were made.
No Replacement Payments, or allocations in restricted shares, were made in 2013 to members of the GEC.
Value of target share allocations from transition arrangements for the GECAs set out on page 76, transition arrangements were put in place for all plan participants in connection with the move from annual tranche vesting to three year cliff vesting under the LTIP. For members of the GEC, the value of the transition allocations made in 2014 was USD 7.2 million with vesting of the allocations in equal tranches in 2015, 2016 and 2017.
Summary of total remuneration (excluding Replacement Payments and allocations from transition arrangements)The table below shows that the total remuneration of the members of the GEC, comprising base salaries, cash incentive awards earned for the year, the value of target share allocations for 2014, pensions and the value of other remuneration including employee benefits amounted to USD 48.1 million. In 2013, the corresponding figure was USD 46.0 million. In order to make a suitable comparison to 2013, the amount excludes the value of target share allocations from transition arrangements and the Replacement Payments for members of the GEC hired in, and appointed in 2014.
The difference between the total amounts in 2014 and 2013 can predominantly be explained by the increased membership in the GEC in 2014 and also by changes in the relevant fx-rate over the two years.
Q4_2014_06_AR14_Remuneration_report_part2_en.indd 84 23.02.2015 16:23:24
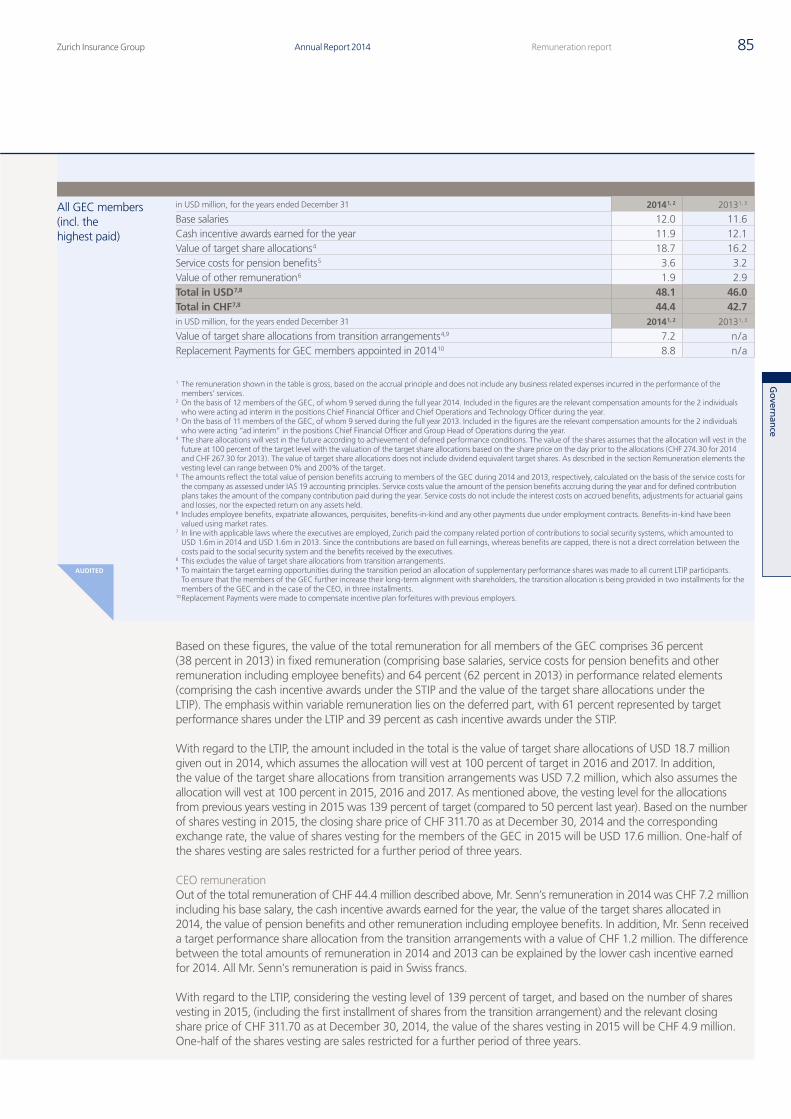
Govern
ance
Zurich Insurance Group Annual Report 2014 85Remuneration report
AUDITED
All GEC members (incl. the highest paid)
in USD million, for the years ended December 31 2014 1, 2 2013 1, 3
Base salaries 12.0 11.6Cash incentive awards earned for the year 11.9 12.1Value of target share allocations 4 18.7 16.2Service costs for pension benefits 5 3.6 3.2Value of other remuneration 6 1.9 2.9Total in USD 7,8 48.1 46.0Total in CHF 7,8 44.4 42.7in USD million, for the years ended December 31 2014 1, 2 2013 1, 3
Value of target share allocations from transition arrangements 4,9 7.2 n / aReplacement Payments for GEC members appointed in 2014 10 8.8 n / a
1 The remuneration shown in the table is gross, based on the accrual principle and does not include any business related expenses incurred in the performance of the members’ services.
2 On the basis of 12 members of the GEC, of whom 9 served during the full year 2014. Included in the figures are the relevant compensation amounts for the 2 individuals who were acting ad interim in the positions Chief Financial Officer and Chief Operations and Technology Officer during the year.
3 On the basis of 11 members of the GEC, of whom 9 served during the full year 2013. Included in the figures are the relevant compensation amounts for the 2 individuals who were acting “ad interim” in the positions Chief Financial Officer and Group Head of Operations during the year.
4 The share allocations will vest in the future according to achievement of defined performance conditions. The value of the shares assumes that the allocation will vest in the future at 100 percent of the target level with the valuation of the target share allocations based on the share price on the day prior to the allocations (CHF 274.30 for 2014 and CHF 267.30 for 2013). The value of target share allocations does not include dividend equivalent target shares. As described in the section Remuneration elements the vesting level can range between 0% and 200% of the target.
5 The amounts reflect the total value of pension benefits accruing to members of the GEC during 2014 and 2013, respectively, calculated on the basis of the service costs for the company as assessed under IAS 19 accounting principles. Service costs value the amount of the pension benefits accruing during the year and for defined contribution plans takes the amount of the company contribution paid during the year. Service costs do not include the interest costs on accrued benefits, adjustments for actuarial gains and losses, nor the expected return on any assets held.
6 Includes employee benefits, expatriate allowances, perquisites, benefits-in-kind and any other payments due under employment contracts. Benefits-in-kind have been valued using market rates.
7 In line with applicable laws where the executives are employed, Zurich paid the company related portion of contributions to social security systems, which amounted to USD 1.6m in 2014 and USD 1.6m in 2013. Since the contributions are based on full earnings, whereas benefits are capped, there is not a direct correlation between the costs paid to the social security system and the benefits received by the executives.
8 This excludes the value of target share allocations from transition arrangements.9 To maintain the target earning opportunities during the transition period an allocation of supplementary performance shares was made to all current LTIP participants.
To ensure that the members of the GEC further increase their long-term alignment with shareholders, the transition allocation is being provided in two installments for the members of the GEC and in the case of the CEO, in three installments.
10 Replacement Payments were made to compensate incentive plan forfeitures with previous employers.
Based on these figures, the value of the total remuneration for all members of the GEC comprises 36 percent (38 percent in 2013) in fixed remuneration (comprising base salaries, service costs for pension benefits and other remuneration including employee benefits) and 64 percent (62 percent in 2013) in performance related elements (comprising the cash incentive awards under the STIP and the value of the target share allocations under the LTIP). The emphasis within variable remuneration lies on the deferred part, with 61 percent represented by target performance shares under the LTIP and 39 percent as cash incentive awards under the STIP.
With regard to the LTIP, the amount included in the total is the value of target share allocations of USD 18.7 million given out in 2014, which assumes the allocation will vest at 100 percent of target in 2016 and 2017. In addition, the value of the target share allocations from transition arrangements was USD 7.2 million, which also assumes the allocation will vest at 100 percent in 2015, 2016 and 2017. As mentioned above, the vesting level for the allocations from previous years vesting in 2015 was 139 percent of target (compared to 50 percent last year). Based on the number of shares vesting in 2015, the closing share price of CHF 311.70 as at December 30, 2014 and the corresponding exchange rate, the value of shares vesting for the members of the GEC in 2015 will be USD 17.6 million. One-half of the shares vesting are sales restricted for a further period of three years.
CEO remunerationOut of the total remuneration of CHF 44.4 million described above, Mr. Senn’s remuneration in 2014 was CHF 7.2 million including his base salary, the cash incentive awards earned for the year, the value of the target shares allocated in 2014, the value of pension benefits and other remuneration including employee benefits. In addition, Mr. Senn received a target performance share allocation from the transition arrangements with a value of CHF 1.2 million. The difference between the total amounts of remuneration in 2014 and 2013 can be explained by the lower cash incentive earned for 2014. All Mr. Senn’s remuneration is paid in Swiss francs.
With regard to the LTIP, considering the vesting level of 139 percent of target, and based on the number of shares vesting in 2015, (including the first installment of shares from the transition arrangement) and the relevant closing share price of CHF 311.70 as at December 30, 2014, the value of the shares vesting in 2015 will be CHF 4.9 million. One-half of the shares vesting are sales restricted for a further period of three years.
Q4_2014_06_AR14_Remuneration_report_part2_en.indd 85 23.02.2015 16:23:25
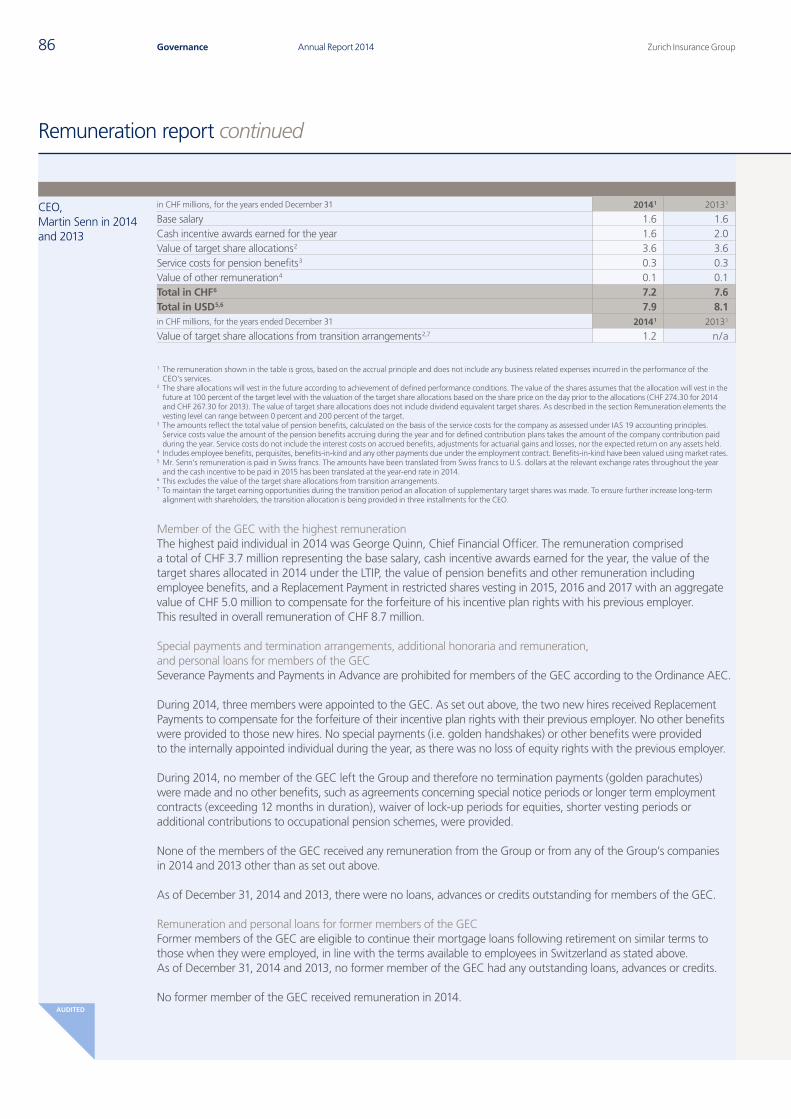
Zurich Insurance GroupAnnual Report 201486 Governance
AUDITEDAUDITED
Remuneration report continued
CEO, Martin Senn in 2014 and 2013
in CHF millions, for the years ended December 31 2014 1 2013 1
Base salary 1.6 1.6Cash incentive awards earned for the year 1.6 2.0Value of target share allocations 2 3.6 3.6Service costs for pension benefits 3 0.3 0.3Value of other remuneration 4 0.1 0.1Total in CHF 6 7.2 7.6Total in USD 5,6 7.9 8.1in CHF millions, for the years ended December 31 2014 1 2013 1
Value of target share allocations from transition arrangements 2,7 1.2 n / a
1 The remuneration shown in the table is gross, based on the accrual principle and does not include any business related expenses incurred in the performance of the CEO’s services.
2 The share allocations will vest in the future according to achievement of defined performance conditions. The value of the shares assumes that the allocation will vest in the future at 100 percent of the target level with the valuation of the target share allocations based on the share price on the day prior to the allocations (CHF 274.30 for 2014 and CHF 267.30 for 2013). The value of target share allocations does not include dividend equivalent target shares. As described in the section Remuneration elements the vesting level can range between 0 percent and 200 percent of the target.
3 The amounts reflect the total value of pension benefits, calculated on the basis of the service costs for the company as assessed under IAS 19 accounting principles. Service costs value the amount of the pension benefits accruing during the year and for defined contribution plans takes the amount of the company contribution paid during the year. Service costs do not include the interest costs on accrued benefits, adjustments for actuarial gains and losses, nor the expected return on any assets held.
4 Includes employee benefits, perquisites, benefits-in-kind and any other payments due under the employment contract. Benefits-in-kind have been valued using market rates.5 Mr. Senn’s remuneration is paid in Swiss francs. The amounts have been translated from Swiss francs to U.S. dollars at the relevant exchange rates throughout the year
and the cash incentive to be paid in 2015 has been translated at the year-end rate in 2014.6 This excludes the value of the target share allocations from transition arrangements.7 To maintain the target earning opportunities during the transition period an allocation of supplementary target shares was made. To ensure further increase long-term
alignment with shareholders, the transition allocation is being provided in three installments for the CEO.
Member of the GEC with the highest remunerationThe highest paid individual in 2014 was George Quinn, Chief Financial Officer. The remuneration comprised a total of CHF 3.7 million representing the base salary, cash incentive awards earned for the year, the value of the target shares allocated in 2014 under the LTIP, the value of pension benefits and other remuneration including employee benefits, and a Replacement Payment in restricted shares vesting in 2015, 2016 and 2017 with an aggregate value of CHF 5.0 million to compensate for the forfeiture of his incentive plan rights with his previous employer. This resulted in overall remuneration of CHF 8.7 million.
Special payments and termination arrangements, additional honoraria and remuneration, and personal loans for members of the GECSeverance Payments and Payments in Advance are prohibited for members of the GEC according to the Ordinance AEC.
During 2014, three members were appointed to the GEC. As set out above, the two new hires received Replacement Payments to compensate for the forfeiture of their incentive plan rights with their previous employer. No other benefits were provided to those new hires. No special payments (i.e. golden handshakes) or other benefits were provided to the internally appointed individual during the year, as there was no loss of equity rights with the previous employer.
During 2014, no member of the GEC left the Group and therefore no termination payments (golden parachutes) were made and no other benefits, such as agreements concerning special notice periods or longer term employment contracts (exceeding 12 months in duration), waiver of lock-up periods for equities, shorter vesting periods or additional contributions to occupational pension schemes, were provided.
None of the members of the GEC received any remuneration from the Group or from any of the Group’s companies in 2014 and 2013 other than as set out above.
As of December 31, 2014 and 2013, there were no loans, advances or credits outstanding for members of the GEC.
Remuneration and personal loans for former members of the GECFormer members of the GEC are eligible to continue their mortgage loans following retirement on similar terms to those when they were employed, in line with the terms available to employees in Switzerland as stated above. As of December 31, 2014 and 2013, no former member of the GEC had any outstanding loans, advances or credits.
No former member of the GEC received remuneration in 2014.
Q4_2014_06_AR14_Remuneration_report_part2_en.indd 86 23.02.2015 16:23:25
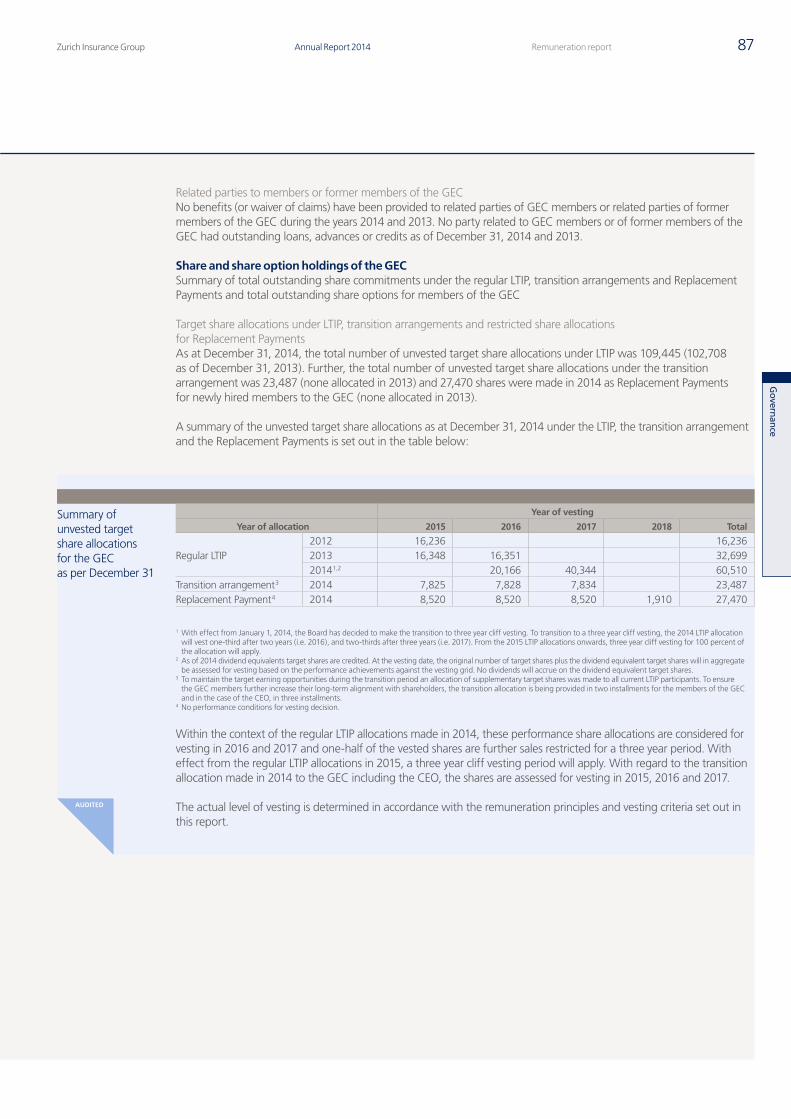
AUDITED
Govern
ance
Zurich Insurance Group Annual Report 2014 87Remuneration report
Related parties to members or former members of the GECNo benefits (or waiver of claims) have been provided to related parties of GEC members or related parties of former members of the GEC during the years 2014 and 2013. No party related to GEC members or of former members of the GEC had outstanding loans, advances or credits as of December 31, 2014 and 2013.
Share and share option holdings of the GECSummary of total outstanding share commitments under the regular LTIP, transition arrangements and Replacement Payments and total outstanding share options for members of the GEC
Target share allocations under LTIP, transition arrangements and restricted share allocations for Replacement PaymentsAs at December 31, 2014, the total number of unvested target share allocations under LTIP was 109,445 (102,708 as of December 31, 2013). Further, the total number of unvested target share allocations under the transition arrangement was 23,487 (none allocated in 2013) and 27,470 shares were made in 2014 as Replacement Payments for newly hired members to the GEC (none allocated in 2013).
A summary of the unvested target share allocations as at December 31, 2014 under the LTIP, the transition arrangement and the Replacement Payments is set out in the table below:
Summary of unvested target share allocations for the GEC as per December 31
Year of vesting
Year of allocation 2015 2016 2017 2018 Total
Regular LTIP 2012 16,236 16,2362013 16,348 16,351 32,6992014 1,2 20,166 40,344 60,510
Transition arrangement 3 2014 7,825 7,828 7,834 23,487Replacement Payment 4 2014 8,520 8,520 8,520 1,910 27,470
1 With effect from January 1, 2014, the Board has decided to make the transition to three year cliff vesting. To transition to a three year cliff vesting, the 2014 LTIP allocation will vest one-third after two years (i.e. 2016), and two-thirds after three years (i.e. 2017). From the 2015 LTIP allocations onwards, three year cliff vesting for 100 percent of the allocation will apply.
2 As of 2014 dividend equivalents target shares are credited. At the vesting date, the original number of target shares plus the dividend equivalent target shares will in aggregate be assessed for vesting based on the performance achievements against the vesting grid. No dividends will accrue on the dividend equivalent target shares.
3 To maintain the target earning opportunities during the transition period an allocation of supplementary target shares was made to all current LTIP participants. To ensure the GEC members further increase their long-term alignment with shareholders, the transition allocation is being provided in two installments for the members of the GEC and in the case of the CEO, in three installments.
4 No performance conditions for vesting decision.
Within the context of the regular LTIP allocations made in 2014, these performance share allocations are considered for vesting in 2016 and 2017 and one-half of the vested shares are further sales restricted for a three year period. With effect from the regular LTIP allocations in 2015, a three year cliff vesting period will apply. With regard to the transition allocation made in 2014 to the GEC including the CEO, the shares are assessed for vesting in 2015, 2016 and 2017.
The actual level of vesting is determined in accordance with the remuneration principles and vesting criteria set out in this report.
Q4_2014_06_AR14_Remuneration_report_part2_en.indd 87 23.02.2015 16:23:25
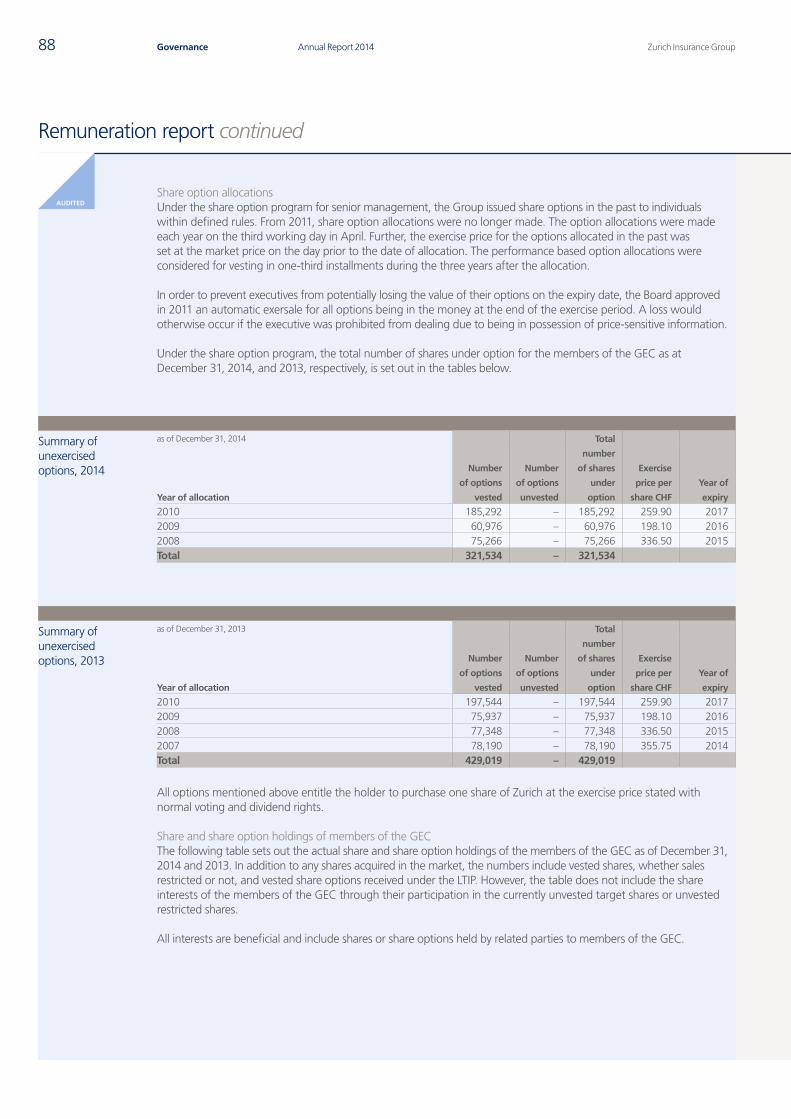
Zurich Insurance GroupAnnual Report 201488 Governance
AUDITED
Remuneration report continued
Share option allocationsUnder the share option program for senior management, the Group issued share options in the past to individuals within defined rules. From 2011, share option allocations were no longer made. The option allocations were made each year on the third working day in April. Further, the exercise price for the options allocated in the past was set at the market price on the day prior to the date of allocation. The performance based option allocations were considered for vesting in one-third installments during the three years after the allocation.
In order to prevent executives from potentially losing the value of their options on the expiry date, the Board approved in 2011 an automatic exersale for all options being in the money at the end of the exercise period. A loss would otherwise occur if the executive was prohibited from dealing due to being in possession of price-sensitive information.
Under the share option program, the total number of shares under option for the members of the GEC as at December 31, 2014, and 2013, respectively, is set out in the tables below.
Summary of unexercised options, 2014
as of December 31, 2014
Number
of options
vested
Number
of options
unvested
Total
number
of shares
under
option
Exercise
price per
share CHF
Year of
expiryYear of allocation
2010 185,292 – 185,292 259.90 20172009 60,976 – 60,976 198.10 20162008 75,266 – 75,266 336.50 2015Total 321,534 – 321,534
Summary of unexercised options, 2013
as of December 31, 2013
Number
of options
vested
Number
of options
unvested
Total
number
of shares
under
option
Exercise
price per
share CHF
Year of
expiryYear of allocation
2010 197,544 – 197,544 259.90 20172009 75,937 – 75,937 198.10 20162008 77,348 – 77,348 336.50 20152007 78,190 – 78,190 355.75 2014Total 429,019 – 429,019
All options mentioned above entitle the holder to purchase one share of Zurich at the exercise price stated with normal voting and dividend rights.
Share and share option holdings of members of the GECThe following table sets out the actual share and share option holdings of the members of the GEC as of December 31, 2014 and 2013. In addition to any shares acquired in the market, the numbers include vested shares, whether sales restricted or not, and vested share options received under the LTIP. However, the table does not include the share interests of the members of the GEC through their participation in the currently unvested target shares or unvested restricted shares.
All interests are beneficial and include shares or share options held by related parties to members of the GEC.
Q4_2014_06_AR14_Remuneration_report_part2_en.indd 88 23.02.2015 16:23:26
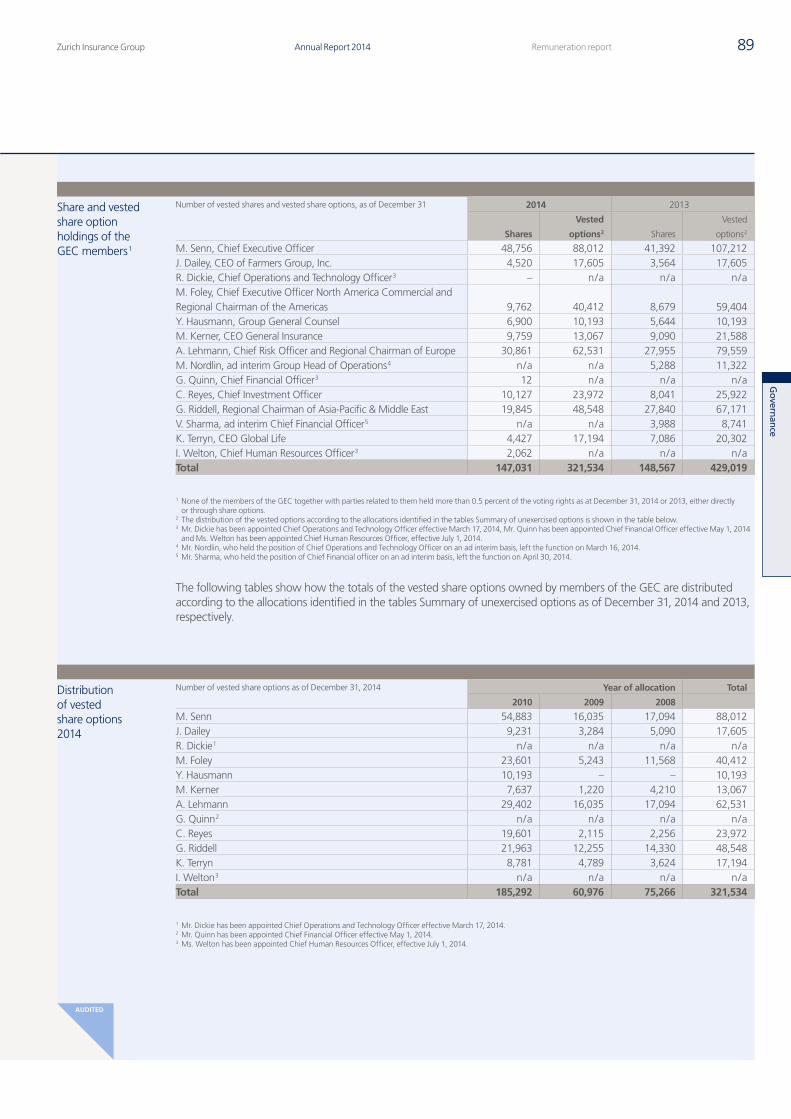
Govern
ance
Zurich Insurance Group Annual Report 2014 89Remuneration report
AUDITED
Share and vested share option holdings of the GEC members 1
Number of vested shares and vested share options, as of December 31 2014 2013
Shares
Vested
options 2 Shares
Vested
options 2
M. Senn, Chief Executive Officer 48,756 88,012 41,392 107,212J. Dailey, CEO of Farmers Group, Inc. 4,520 17,605 3,564 17,605R. Dickie, Chief Operations and Technology Officer 3 – n / a n / a n / aM. Foley, Chief Executive Officer North America Commercial and Regional Chairman of the Americas 9,762 40,412 8,679 59,404Y. Hausmann, Group General Counsel 6,900 10,193 5,644 10,193M. Kerner, CEO General Insurance 9,759 13,067 9,090 21,588A. Lehmann, Chief Risk Officer and Regional Chairman of Europe 30,861 62,531 27,955 79,559M. Nordlin, ad interim Group Head of Operations 4 n / a n / a 5,288 11,322G. Quinn, Chief Financial Officer 3 12 n / a n / a n / aC. Reyes, Chief Investment Officer 10,127 23,972 8,041 25,922G. Riddell, Regional Chairman of Asia-Pacific & Middle East 19,845 48,548 27,840 67,171V. Sharma, ad interim Chief Financial Officer 5 n / a n / a 3,988 8,741K. Terryn, CEO Global Life 4,427 17,194 7,086 20,302I. Welton, Chief Human Resources Officer 3 2,062 n / a n / a n / aTotal 147,031 321,534 148,567 429,019
1 None of the members of the GEC together with parties related to them held more than 0.5 percent of the voting rights as at December 31, 2014 or 2013, either directly or through share options.
2 The distribution of the vested options according to the allocations identified in the tables Summary of unexercised options is shown in the table below.3 Mr. Dickie has been appointed Chief Operations and Technology Officer effective March 17, 2014, Mr. Quinn has been appointed Chief Financial Officer effective May 1, 2014
and Ms. Welton has been appointed Chief Human Resources Officer, effective July 1, 2014.4 Mr. Nordlin, who held the position of Chief Operations and Technology Officer on an ad interim basis, left the function on March 16, 2014.5 Mr. Sharma, who held the position of Chief Financial officer on an ad interim basis, left the function on April 30, 2014.
The following tables show how the totals of the vested share options owned by members of the GEC are distributed according to the allocations identified in the tables Summary of unexercised options as of December 31, 2014 and 2013, respectively.
Distribution of vested share options 2014
Number of vested share options as of December 31, 2014 Year of allocation Total
2010 2009 2008
M. Senn 54,883 16,035 17,094 88,012J. Dailey 9,231 3,284 5,090 17,605R. Dickie 1 n / a n / a n / a n / aM. Foley 23,601 5,243 11,568 40,412Y. Hausmann 10,193 – – 10,193M. Kerner 7,637 1,220 4,210 13,067A. Lehmann 29,402 16,035 17,094 62,531G. Quinn 2 n / a n / a n / a n / aC. Reyes 19,601 2,115 2,256 23,972G. Riddell 21,963 12,255 14,330 48,548K. Terryn 8,781 4,789 3,624 17,194I. Welton 3 n / a n / a n / a n / aTotal 185,292 60,976 75,266 321,534
1 Mr. Dickie has been appointed Chief Operations and Technology Officer effective March 17, 2014.2 Mr. Quinn has been appointed Chief Financial Officer effective May 1, 2014.3 Ms. Welton has been appointed Chief Human Resources Officer, effective July 1, 2014.
Q4_2014_06_AR14_Remuneration_report_part2_en.indd 89 23.02.2015 16:23:26
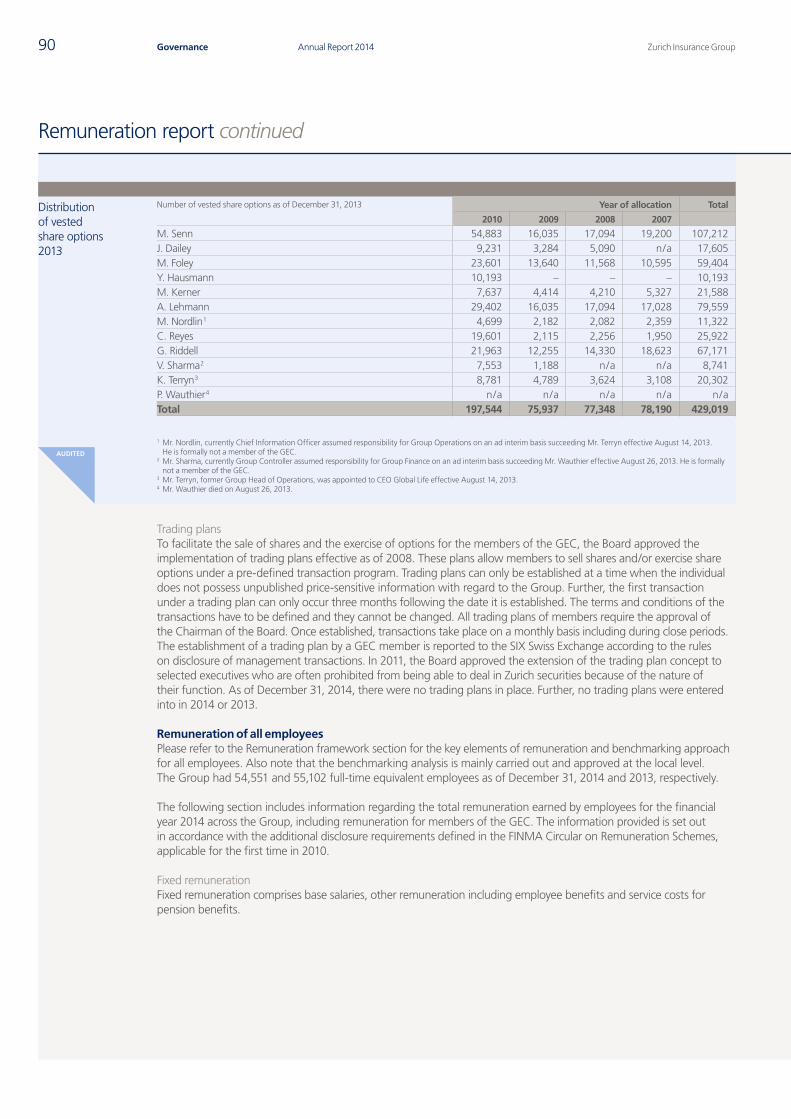
AUDITED
Zurich Insurance GroupAnnual Report 201490 Governance
Remuneration report continued
Distribution of vested share options 2013
Number of vested share options as of December 31, 2013 Year of allocation Total
2010 2009 2008 2007
M. Senn 54,883 16,035 17,094 19,200 107,212J. Dailey 9,231 3,284 5,090 n / a 17,605M. Foley 23,601 13,640 11,568 10,595 59,404Y. Hausmann 10,193 – – – 10,193M. Kerner 7,637 4,414 4,210 5,327 21,588A. Lehmann 29,402 16,035 17,094 17,028 79,559M. Nordlin 1 4,699 2,182 2,082 2,359 11,322C. Reyes 19,601 2,115 2,256 1,950 25,922G. Riddell 21,963 12,255 14,330 18,623 67,171V. Sharma 2 7,553 1,188 n / a n / a 8,741K. Terryn 3 8,781 4,789 3,624 3,108 20,302P. Wauthier 4 n / a n / a n / a n / a n / aTotal 197,544 75,937 77,348 78,190 429,019
1 Mr. Nordlin, currently Chief Information Officer assumed responsibility for Group Operations on an ad interim basis succeeding Mr. Terryn effective August 14, 2013. He is formally not a member of the GEC.
2 Mr. Sharma, currently Group Controller assumed responsibility for Group Finance on an ad interim basis succeeding Mr. Wauthier effective August 26, 2013. He is formally not a member of the GEC.
3 Mr. Terryn, former Group Head of Operations, was appointed to CEO Global Life effective August 14, 2013.4 Mr. Wauthier died on August 26, 2013.
Trading plansTo facilitate the sale of shares and the exercise of options for the members of the GEC, the Board approved the implementation of trading plans effective as of 2008. These plans allow members to sell shares and/or exercise share options under a pre-defined transaction program. Trading plans can only be established at a time when the individual does not possess unpublished price-sensitive information with regard to the Group. Further, the first transaction under a trading plan can only occur three months following the date it is established. The terms and conditions of the transactions have to be defined and they cannot be changed. All trading plans of members require the approval of the Chairman of the Board. Once established, transactions take place on a monthly basis including during close periods. The establishment of a trading plan by a GEC member is reported to the SIX Swiss Exchange according to the rules on disclosure of management transactions. In 2011, the Board approved the extension of the trading plan concept to selected executives who are often prohibited from being able to deal in Zurich securities because of the nature of their function. As of December 31, 2014, there were no trading plans in place. Further, no trading plans were entered into in 2014 or 2013.
Remuneration of all employeesPlease refer to the Remuneration framework section for the key elements of remuneration and benchmarking approach for all employees. Also note that the benchmarking analysis is mainly carried out and approved at the local level. The Group had 54,551 and 55,102 full-time equivalent employees as of December 31, 2014 and 2013, respectively.
The following section includes information regarding the total remuneration earned by employees for the financial year 2014 across the Group, including remuneration for members of the GEC. The information provided is set out in accordance with the additional disclosure requirements defined in the FINMA Circular on Remuneration Schemes, applicable for the first time in 2010.
Fixed remunerationFixed remuneration comprises base salaries, other remuneration including employee benefits and service costs for pension benefits.
Q4_2014_06_AR14_Remuneration_report_part2_en.indd 90 23.02.2015 16:23:27
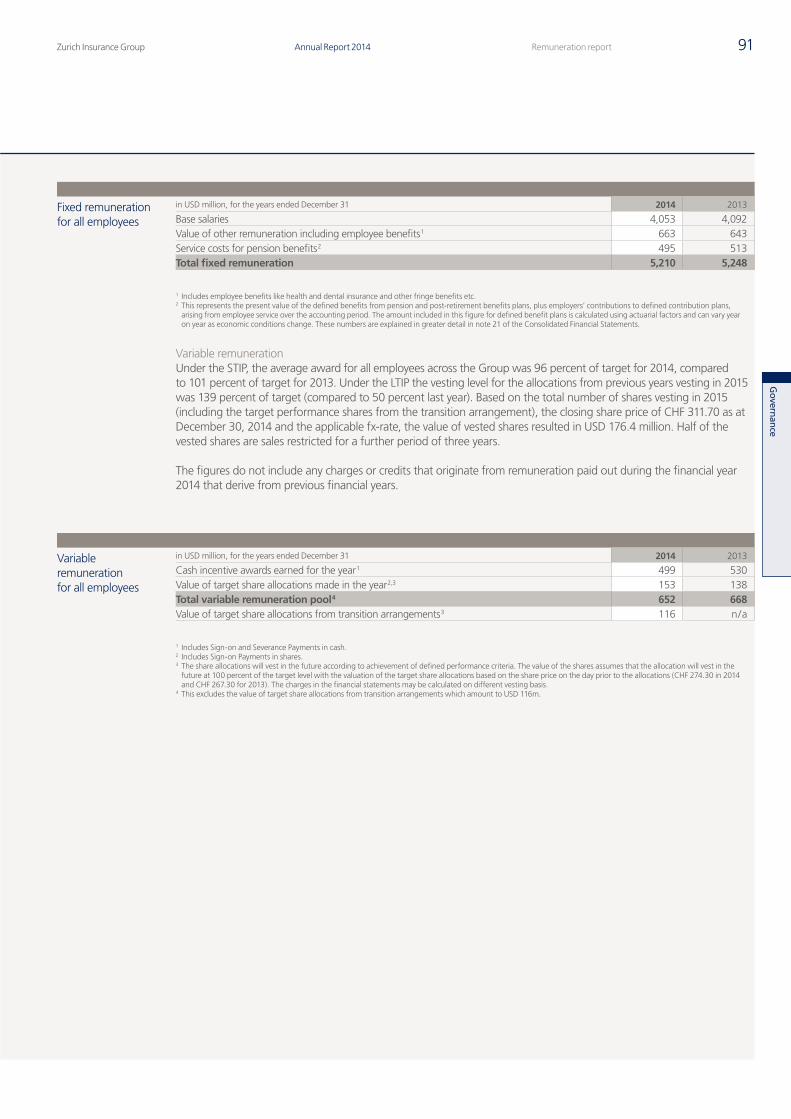
Govern
ance
Zurich Insurance Group Annual Report 2014 91Remuneration report
Fixed remuneration for all employees
in USD million, for the years ended December 31 2014 2013
Base salaries 4,053 4,092Value of other remuneration including employee benefits 1 663 643Service costs for pension benefits 2 495 513Total fixed remuneration 5,210 5,248
1 Includes employee benefits like health and dental insurance and other fringe benefits etc.2 This represents the present value of the defined benefits from pension and post-retirement benefits plans, plus employers’ contributions to defined contribution plans,
arising from employee service over the accounting period. The amount included in this figure for defined benefit plans is calculated using actuarial factors and can vary year on year as economic conditions change. These numbers are explained in greater detail in note 21 of the Consolidated Financial Statements.
Variable remunerationUnder the STIP, the average award for all employees across the Group was 96 percent of target for 2014, compared to 101 percent of target for 2013. Under the LTIP the vesting level for the allocations from previous years vesting in 2015 was 139 percent of target (compared to 50 percent last year). Based on the total number of shares vesting in 2015 (including the target performance shares from the transition arrangement), the closing share price of CHF 311.70 as at December 30, 2014 and the applicable fx-rate, the value of vested shares resulted in USD 176.4 million. Half of the vested shares are sales restricted for a further period of three years.
The figures do not include any charges or credits that originate from remuneration paid out during the financial year 2014 that derive from previous financial years.
Variable remuneration for all employees
in USD million, for the years ended December 31 2014 2013
Cash incentive awards earned for the year 1 499 530Value of target share allocations made in the year 2,3 153 138Total variable remuneration pool 4 652 668Value of target share allocations from transition arrangements 3 116 n / a
1 Includes Sign-on and Severance Payments in cash.2 Includes Sign-on Payments in shares.3 The share allocations will vest in the future according to achievement of defined performance criteria. The value of the shares assumes that the allocation will vest in the
future at 100 percent of the target level with the valuation of the target share allocations based on the share price on the day prior to the allocations (CHF 274.30 in 2014 and CHF 267.30 for 2013). The charges in the financial statements may be calculated on different vesting basis.
4 This excludes the value of target share allocations from transition arrangements which amount to USD 116m.
Q4_2014_06_AR14_Remuneration_report_part2_en.indd 91 23.02.2015 16:23:27
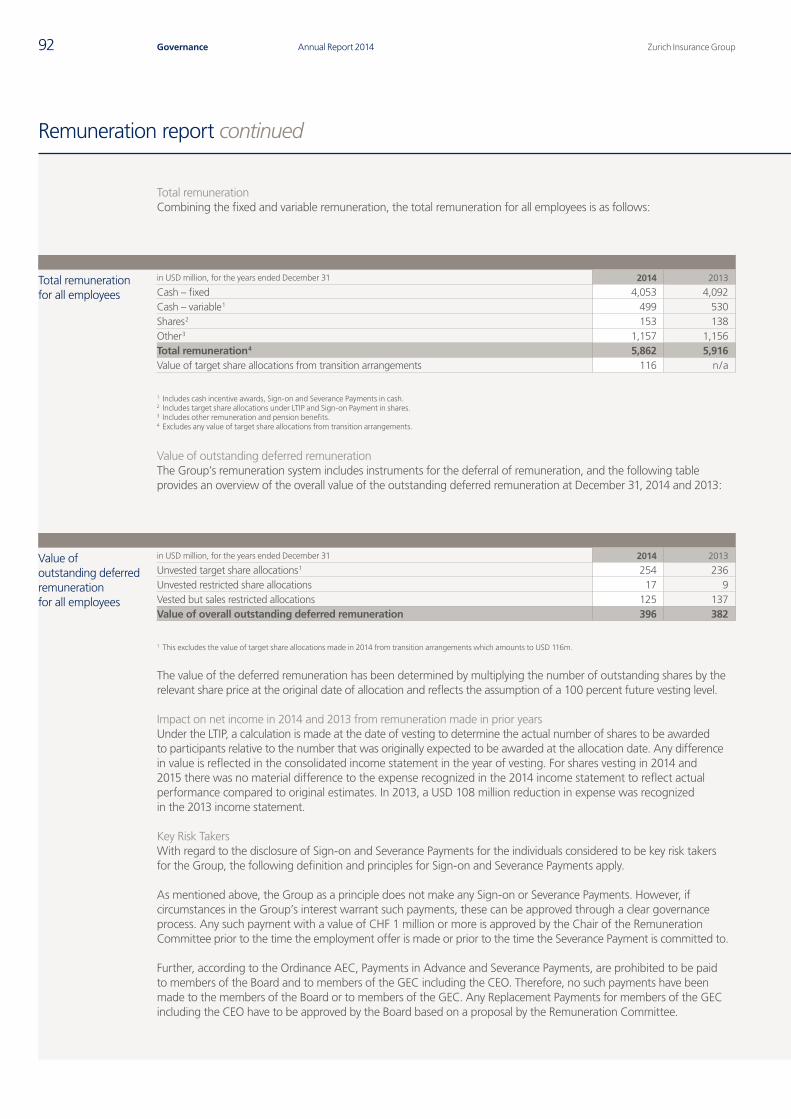
Zurich Insurance GroupAnnual Report 201492 Governance
Remuneration report continued
Total remunerationCombining the fixed and variable remuneration, the total remuneration for all employees is as follows:
Total remuneration for all employees
in USD million, for the years ended December 31 2014 2013
Cash – fixed 4,053 4,092Cash – variable 1 499 530Shares 2 153 138Other 3 1,157 1,156Total remuneration 4 5,862 5,916Value of target share allocations from transition arrangements 116 n / a
1 Includes cash incentive awards, Sign-on and Severance Payments in cash.2 Includes target share allocations under LTIP and Sign-on Payment in shares.3 Includes other remuneration and pension benefits.4 Excludes any value of target share allocations from transition arrangements.
Value of outstanding deferred remunerationThe Group’s remuneration system includes instruments for the deferral of remuneration, and the following table provides an overview of the overall value of the outstanding deferred remuneration at December 31, 2014 and 2013:
Value of outstanding deferred remuneration for all employees
in USD million, for the years ended December 31 2014 2013
Unvested target share allocations 1 254 236Unvested restricted share allocations 17 9Vested but sales restricted allocations 125 137Value of overall outstanding deferred remuneration 396 382
1 This excludes the value of target share allocations made in 2014 from transition arrangements which amounts to USD 116m.
The value of the deferred remuneration has been determined by multiplying the number of outstanding shares by the relevant share price at the original date of allocation and reflects the assumption of a 100 percent future vesting level.
Impact on net income in 2014 and 2013 from remuneration made in prior yearsUnder the LTIP, a calculation is made at the date of vesting to determine the actual number of shares to be awarded to participants relative to the number that was originally expected to be awarded at the allocation date. Any difference in value is reflected in the consolidated income statement in the year of vesting. For shares vesting in 2014 and 2015 there was no material difference to the expense recognized in the 2014 income statement to reflect actual performance compared to original estimates. In 2013, a USD 108 million reduction in expense was recognized in the 2013 income statement.
Key Risk TakersWith regard to the disclosure of Sign-on and Severance Payments for the individuals considered to be key risk takers for the Group, the following definition and principles for Sign-on and Severance Payments apply.
As mentioned above, the Group as a principle does not make any Sign-on or Severance Payments. However, if circumstances in the Group’s interest warrant such payments, these can be approved through a clear governance process. Any such payment with a value of CHF 1 million or more is approved by the Chair of the Remuneration Committee prior to the time the employment offer is made or prior to the time the Severance Payment is committed to.
Further, according to the Ordinance AEC, Payments in Advance and Severance Payments, are prohibited to be paid to members of the Board and to members of the GEC including the CEO. Therefore, no such payments have been made to the members of the Board or to members of the GEC. Any Replacement Payments for members of the GEC including the CEO have to be approved by the Board based on a proposal by the Remuneration Committee.
Q4_2014_06_AR14_Remuneration_report_part2_en.indd 92 23.02.2015 16:23:27
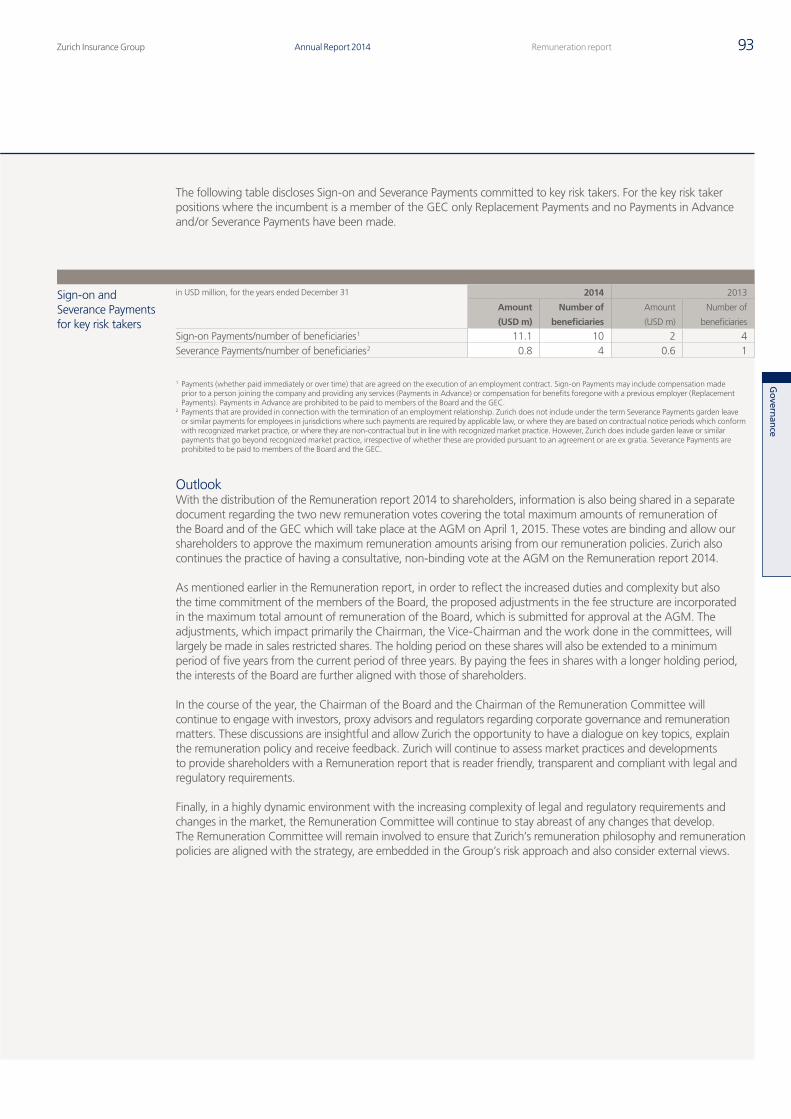
Govern
ance
Zurich Insurance Group Annual Report 2014 93Remuneration report
The following table discloses Sign-on and Severance Payments committed to key risk takers. For the key risk taker positions where the incumbent is a member of the GEC only Replacement Payments and no Payments in Advance and/or Severance Payments have been made.
Sign-on and Severance Payments for key risk takers
in USD million, for the years ended December 31 2014 2013
Amount
(USD m)
Number of
beneficiaries
Amount
(USD m)
Number of
beneficiaries
Sign-on Payments/number of beneficiaries 1 11.1 10 2 4Severance Payments/number of beneficiaries 2 0.8 4 0.6 1
1 Payments (whether paid immediately or over time) that are agreed on the execution of an employment contract. Sign-on Payments may include compensation made prior to a person joining the company and providing any services (Payments in Advance) or compensation for benefits foregone with a previous employer (Replacement Payments). Payments in Advance are prohibited to be paid to members of the Board and the GEC.
2 Payments that are provided in connection with the termination of an employment relationship. Zurich does not include under the term Severance Payments garden leave or similar payments for employees in jurisdictions where such payments are required by applicable law, or where they are based on contractual notice periods which conform with recognized market practice, or where they are non-contractual but in line with recognized market practice. However, Zurich does include garden leave or similar payments that go beyond recognized market practice, irrespective of whether these are provided pursuant to an agreement or are ex gratia. Severance Payments are prohibited to be paid to members of the Board and the GEC.
OutlookWith the distribution of the Remuneration report 2014 to shareholders, information is also being shared in a separate document regarding the two new remuneration votes covering the total maximum amounts of remuneration of the Board and of the GEC which will take place at the AGM on April 1, 2015. These votes are binding and allow our shareholders to approve the maximum remuneration amounts arising from our remuneration policies. Zurich also continues the practice of having a consultative, non-binding vote at the AGM on the Remuneration report 2014.
As mentioned earlier in the Remuneration report, in order to reflect the increased duties and complexity but also the time commitment of the members of the Board, the proposed adjustments in the fee structure are incorporated in the maximum total amount of remuneration of the Board, which is submitted for approval at the AGM. The adjustments, which impact primarily the Chairman, the Vice-Chairman and the work done in the committees, will largely be made in sales restricted shares. The holding period on these shares will also be extended to a minimum period of five years from the current period of three years. By paying the fees in shares with a longer holding period, the interests of the Board are further aligned with those of shareholders.
In the course of the year, the Chairman of the Board and the Chairman of the Remuneration Committee will continue to engage with investors, proxy advisors and regulators regarding corporate governance and remuneration matters. These discussions are insightful and allow Zurich the opportunity to have a dialogue on key topics, explain the remuneration policy and receive feedback. Zurich will continue to assess market practices and developments to provide shareholders with a Remuneration report that is reader friendly, transparent and compliant with legal and regulatory requirements.
Finally, in a highly dynamic environment with the increasing complexity of legal and regulatory requirements and changes in the market, the Remuneration Committee will continue to stay abreast of any changes that develop. The Remuneration Committee will remain involved to ensure that Zurich’s remuneration philosophy and remuneration policies are aligned with the strategy, are embedded in the Group’s risk approach and also consider external views.
Q4_2014_06_AR14_Remuneration_report_part2_en.indd 93 23.02.2015 16:23:28
Zurich Insurance GroupAnnual Report 201494 Governance
Report of the Statutory Auditor
Report of the Statutory Auditor
To the Annual General Meeting 2015 of Zurich Insurance Group Ltd
Report of the statutory auditor on the audit of the Remuneration report
We have audited the sections on pages 79 to 81 and pages 85 to 90 of the accompanying Remuneration report of Zurich Insurance Group Ltd for the year ended December 31, 2014.
Responsibility of the Board of DirectorsThe Board of Directors is responsible for the preparation and overall fair presentation of the remuneration report in accordance with Swiss law and the Ordinance against Excessive Compensation in Stock Exchange Listed Companies (Ordinance AEC). The Board of Directors is also responsible for designing the remuneration system and defining individual remuneration packages.
Auditor’s ResponsibilityOur responsibility is to express an opinion on the accompanying Remuneration report. We conducted our audit in accordance with Swiss Auditing Standards. Those standards require that we comply with ethical requirements and plan and perform the audit to obtain reasonable assurance about whether the Remuneration report complies with Swiss law and articles 14 – 16 of the Ordinance AEC.
An audit involves performing procedures to obtain audit evidence on the disclosures made in the Remuneration report with regard to compensation, loans and credits in accordance with articles 14 – 16 of the Ordinance. The procedures selected depend on the auditor’s judgment, including the assessment of the risks of material misstatements in the Remuneration report, whether due to fraud or error. This audit also includes evaluating the reasonableness of the methods applied to value components of remuneration, as well as assessing the overall presentation of the Remuneration report.
We believe that the audit evidence we have obtained is sufficient and appropriate to provide a basis for our opinion.
OpinionIn our opinion, the Remuneration report of Zurich Insurance Group Ltd for the year ended December 31, 2014 complies with Swiss law and articles 14 – 16 of the Ordinance AEC.
PricewaterhouseCoopers AG
Mark Humphreys Peter BieriAudit expert Audit expertAuditor in charge
Zurich, February 11, 2015
Q4_2014_06_AR14_Remuneration_report_part2_en.indd 94 23.02.2015 16:23:28

Govern
ance
Zurich Insurance Group Annual Report 2014 95Remuneration report
THIS PAGE HAS INTENTIONALLY BEEN LEFT BLANK
Q4_2014_06_AR14_Remuneration_report_part2_en.indd 95 23.02.2015 16:23:28

Zurich Insurance GroupAnnual Report 201496 Group performance review
Q4_2014_07_AR14_Divider_Group_performance_overview_en.indd 96 23.02.2015 16:24:01
97Annual Report 2014Zurich Insurance Group
In this sectionOperating and financial review 98Risk review 114
Group performance review
Q4_2014_07_AR14_Divider_Group_performance_overview_en.indd 97 23.02.2015 16:24:01
Zurich Insurance GroupAnnual Report 201498 Group performance review
Operating and financial review
The information contained within the Operating and financial review is unaudited and is based on the consolidated results of the Group for the years ended December 31, 2014 and 2013. All amounts are shown in U.S. dollars and rounded to the nearest million unless otherwise stated, with the consequence that the rounded amounts may not add up to the rounded total in all cases. All ratios and variances are calculated using the underlying amounts rather than the rounded amounts. This document should be read in conjunction with the Annual Report 2014 of the Group and, in particular, with its Consolidated financial statements for the year ended December 31, 2014.
In addition to the figures stated in accordance with International Financial Reporting Standards (IFRS), the Group uses business operating profit (BOP), new business measures and other performance indicators to enhance the understanding of its results. Details of these additional measures are set out in the separately published Glossary. These should be viewed as complementary to, and not as substitutes for the IFRS figures. For a reconciliation of BOP to net income attributable to shareholders, see table 27.2 in note 27 of the Consolidated financial statements.
From January 1, 2014, the General Insurance business has managed Middle East and Africa together with Europe to form a single market-facing business called Europe, Middle East & Africa (EMEA). This change had no impact on total General Insurance or the Group. Comparative figures have been re-presented to reflect this change.
The Group has reviewed the definition of net technical expenses within the General Insurance segment resulting in the reclassification of certain income and expenses between the net non-technical result and net technical expenses. As a result, comparative figures for total net technical expenses, net underwriting result, net non-technical result (excl. items not included in BOP), expense ratio and combined ratio have been restated to reflect this change.
Financial highlights 99Performance overview 100General Insurance 102Global Life 107Farmers 111Other Operating Businesses 113Non-Core Businesses 113
The Operating and financial review is the management analysis of the business performance of Zurich Insurance Group Ltd and its subsidiaries (collectively the Group) for the year ended December 31, 2014, compared with 2013.
Contents
Q4_2014_08_AR14_56_Operating_financial_review_en.indd 98 23.02.2015 16:25:12
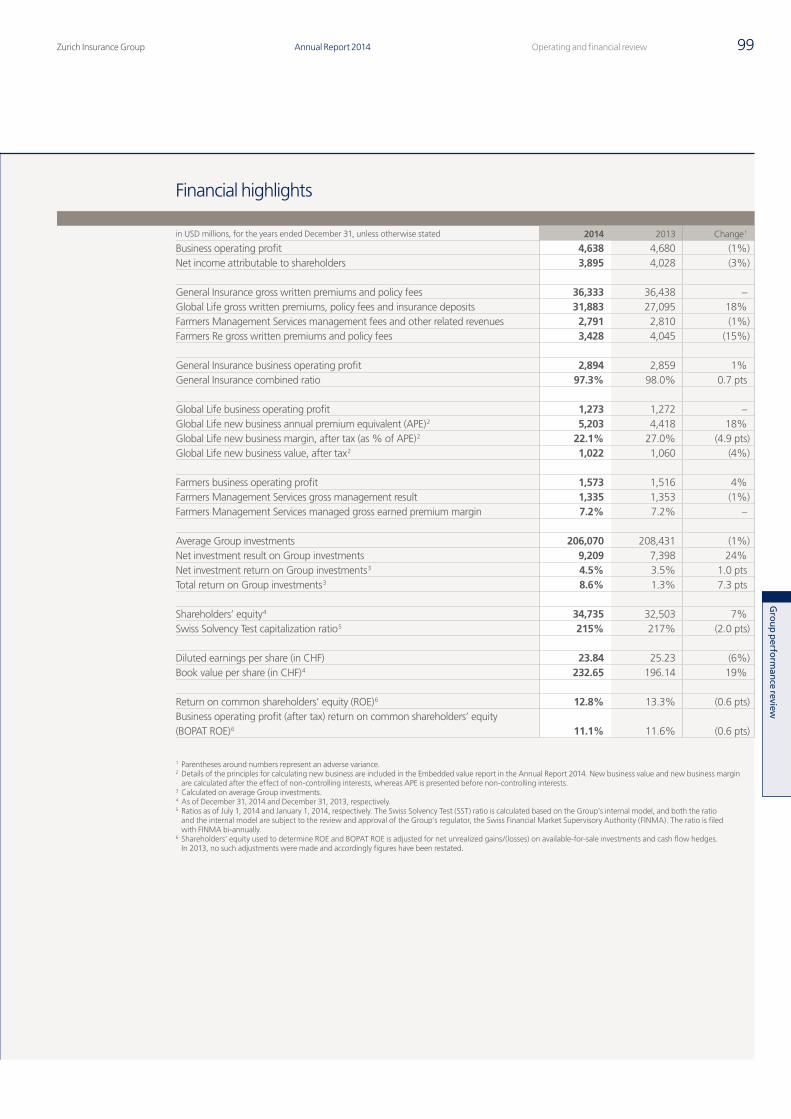
Zurich Insurance Group Annual Report 2014 99Operating and financial review
Gro
up p
erform
ance review
Financial highlights
in USD millions, for the years ended December 31, unless otherwise stated 2014 2013 Change 1
Business operating profit 4,638 4,680 (1%)Net income attributable to shareholders 3,895 4,028 (3%)
General Insurance gross written premiums and policy fees 36,333 36,438 –Global Life gross written premiums, policy fees and insurance deposits 31,883 27,095 18%Farmers Management Services management fees and other related revenues 2,791 2,810 (1%)Farmers Re gross written premiums and policy fees 3,428 4,045 (15%)
General Insurance business operating profit 2,894 2,859 1%General Insurance combined ratio 97.3% 98.0% 0.7 pts
Global Life business operating profit 1,273 1,272 –Global Life new business annual premium equivalent (APE) 2 5,203 4,418 18%Global Life new business margin, after tax (as % of APE) 2 22.1% 27.0% (4.9 pts)Global Life new business value, after tax 2 1,022 1,060 (4%)
Farmers business operating profit 1,573 1,516 4%Farmers Management Services gross management result 1,335 1,353 (1%)Farmers Management Services managed gross earned premium margin 7.2% 7.2% –
Average Group investments 206,070 208,431 (1%)Net investment result on Group investments 9,209 7,398 24%Net investment return on Group investments 3 4.5% 3.5% 1.0 ptsTotal return on Group investments 3 8.6% 1.3% 7.3 pts
Shareholders’ equity 4 34,735 32,503 7%Swiss Solvency Test capitalization ratio 5 215% 217% (2.0 pts)
Diluted earnings per share (in CHF) 23.84 25.23 (6%)Book value per share (in CHF) 4 232.65 196.14 19%
Return on common shareholders’ equity (ROE) 6 12.8% 13.3% (0.6 pts)Business operating profit (after tax) return on common shareholders’ equity (BOPAT ROE) 6 11.1% 11.6% (0.6 pts)
1 Parentheses around numbers represent an adverse variance.2 Details of the principles for calculating new business are included in the Embedded value report in the Annual Report 2014. New business value and new business margin
are calculated after the effect of non-controlling interests, whereas APE is presented before non-controlling interests.3 Calculated on average Group investments.4 As of December 31, 2014 and December 31, 2013, respectively.5 Ratios as of July 1, 2014 and January 1, 2014, respectively. The Swiss Solvency Test (SST) ratio is calculated based on the Group’s internal model, and both the ratio
and the internal model are subject to the review and approval of the Group’s regulator, the Swiss Financial Market Supervisory Authority (FINMA). The ratio is filed with FINMA bi-annually.
6 Shareholders’ equity used to determine ROE and BOPAT ROE is adjusted for net unrealized gains/(losses) on available-for-sale investments and cash flow hedges. In 2013, no such adjustments were made and accordingly figures have been restated.
Q4_2014_08_AR14_56_Operating_financial_review_en.indd 99 23.02.2015 16:25:13
Zurich Insurance GroupAnnual Report 2014100 Group performance review
Operating and financial review continued
Performance overview
The Group delivered overall business operating profit of USD 4.6 billion, a decrease of USD 42 million or 1 percent compared with 2013. All three core businesses increased business operating profits by focusing on their primary markets and maintaining their disciplined approach to products, underwriting and pricing. Both General Insurance and Farmers benefited from an improvement in underlying loss experience as well as from a lower level of catastrophe and weather-related losses. Global Life focused on its priority markets, as well as improving management of its in-force business. Overall development of loss reserves established in prior years was lower than in 2013 and impacted both the General Insurance business and Non-Core Businesses.
The Group’s capital and solvency positions remain strong, and together with the results for the year, have enabled the Board of Directors to propose a dividend of CHF 17 per share. Solvency measured on an economic basis as determined under the Swiss Solvency Test decreased slightly by 2 percentage points since January 1, 2014 to 215 percent as of July 1, 2014. Shareholders’ equity has increased since December 31, 2013 by USD 2.2 billion to USD 34.7 billion. This was driven by the positive effects of net income and net unrealized gains on investments, partly offset by the currency translation effect of the strong U.S. dollar as of December 31, 2014, and after deducting the total cost of USD 2.8 billion for the dividend paid in April 2014.
Business operating profit decreased by USD 42 million to USD 4.6 billion, or by 1 percent in U.S. dollar terms, but remained flat on a local currency basis.
• General Insurance business operating profit increased by USD 34 million to USD 2.9 billion, or by 1 percent in U.S. dollar terms and on a local currency basis, driven by an improved net underwriting result. This was partly offset by higher non-technical expenses as well as a lower investment result. The net underwriting result reflected an improvement in the underlying loss experience and the absence of major catastrophe and weather-related losses, partly offset by lower levels of favorable loss development on reserves established in prior years, as well as the cost of ongoing growth initiatives included in increased technical expenses.
• Global Life business operating profit of USD 1.3 billion was broadly flat, increasing by USD 1 million, but increased by 2 percent on a local currency basis, mainly reflecting the weakening of currencies in Latin America against the U.S. dollar, with improvements on a local currency basis arising in most regions. The ongoing focus on fee-based and protection business has resulted in overall improvements in loadings and fees and in the underlying technical margin, excluding the effect of management actions. These improvements were largely offset by the negative effect of a portfolio transfer in North America and an increase in operating costs, mainly driven by investments in Global Life’s priority markets and impairment of software intangible assets.
• Farmers business operating profit increased by USD 58 million to USD 1.6 billion, or by 4 percent. This was due to improved underwriting results in Farmers Re, which benefited from improved results on its assumed reinsurance business from the Farmers Exchanges. The Farmers Exchanges are owned by their policyholders. Farmers Group Inc., a wholly owned subsidiary of the Group, provides certain non-claims administrative and management services to the Farmers Exchanges as attorney-in-fact and receives fees for its services. Farmers Management Services business operating profit slightly reduced by USD 7 million to USD 1.4 billion, as lower management fees and other related revenues as well as decreased investment income were partly offset by gains in other income.
• Other Operating Businesses reported a business operating loss of USD 960 million, compared with a loss of USD 1.0 billion in 2013. Lower interest expenses on debt and an increase in investment income in Holding and Financing were offset by higher Headquarters costs with 2013 Headquarters costs benefiting from one-off positive effects.
• Non-Core Businesses reported a business operating loss of USD 142 million compared with a profit of USD 73 million in 2013, mainly as a result of increased loss reserves for future liabilities established in prior years.
Q4_2014_08_AR14_56_Operating_financial_review_en.indd 100 23.02.2015 16:25:13
Zurich Insurance Group Annual Report 2014 101Operating and financial review
Gro
up p
erform
ance review
Business volumes for the core business segments, comprising gross written premiums, policy fees, insurance deposits and management fees, increased by USD 4.0 billion to USD 74.4 billion, or by 6 percent in U.S. dollar terms and 7 percent on a local currency basis.
• General Insurance gross written premiums and policy fees decreased by USD 106 million to USD 36.3 billion, but increased by 2 percent on a local currency basis led by underlying growth in the Group’s priority markets, partly offset by a non-renewal of a fronted portfolio in North America.
• Global Life gross written premiums, policy fees and insurance deposits increased by USD 4.8 billion to USD 31.9 billion, or by 18 percent in both U.S. dollar terms and on a local currency basis. Improvements occurred predominantly in Europe, driven by growth in Corporate Life and Pensions and individual savings business within Bank Distribution.
• Farmers Management Services management fees and other related revenues decreased by USD 19 million to USD 2.8 billion, or by 1 percent, due to lower premiums earned in the Farmers Exchanges. Farmers Re gross written premiums and policy fees decreased by USD 617 million to USD 3.4 billion, or by 15 percent, due to the reductions in reinsurance assumed from the Farmers Exchanges.
The net investment result on Group investments of USD 9.2 billion increased by USD 1.8 billion or by 24 percent and represents a net investment return on average Group investments of 4.5 percent compared with 3.5 percent in 2013. Net investment income, predominantly included in the core business results, was marginally lower in U.S. dollar terms, but marginally higher on a local currency basis. Net capital gains on investments and impairments included in the net investment result increased by USD 1.8 billion to USD 3.0 billion. The increase primarily resulted from re-balancing activities due to the deployment of additional risk capital, as well as an increase in the valuation of debt securities booked at fair value through profit or loss and a gain compared with a loss in 2013 from the valuation of derivative financial instruments used for hedging underlying business or investment risks. Total return on average Group investments improved to 8.6 percent from 1.3 percent in 2013, benefiting from the increase in the net investment result, as well as from an increase of USD 8.5 billion in gross unrealized gains not flowing through net income compared with losses of USD 4.7 billion in 2013.
Overall, the net effect of currency fluctuations on the results in 2014 was relatively small with the British pound and the Swiss franc on average stronger against the U.S. dollar compared with 2013 broadly offset by the weakening of Latin American currencies, partly reflecting high inflation rates in that region. Exchange rates as of December 31, 2014 were weaker against the U.S. dollar, which resulted in a reduction in most balance sheet positions.
Net income attributable to shareholders decreased by USD 133 million to USD 3.9 billion primarily due to several non-recurring costs relating to the restructuring or disposal of business operations as well as an increase in income tax expense attributable to shareholders, which more than offset the increase in net capital gains on investments. The shareholders’ effective tax rate increased to 27.3 percent for the year ended December 31, 2014 compared with 24.9 percent for 2013. The increase of 2.4 percentage points reflects changes in the relative levels of profit by country and several one-off costs, including the loss related to the sale of the Group’s retail business in Russia, which do not attract tax relief.
ROE decreased by 0.6 percentage points to 12.8 percent, mainly due to the reduction in net income attributable to shareholders. BOPAT ROE decreased by 0.6 percentage points to 11.1 percent, as a result of the decrease in business operating profit and the increase in the shareholders’ effective tax rate. Diluted earnings per share decreased by 6 percent to CHF 23.84 compared with CHF 25.23 in 2013.
Q4_2014_08_AR14_56_Operating_financial_review_en.indd 101 23.02.2015 16:25:13
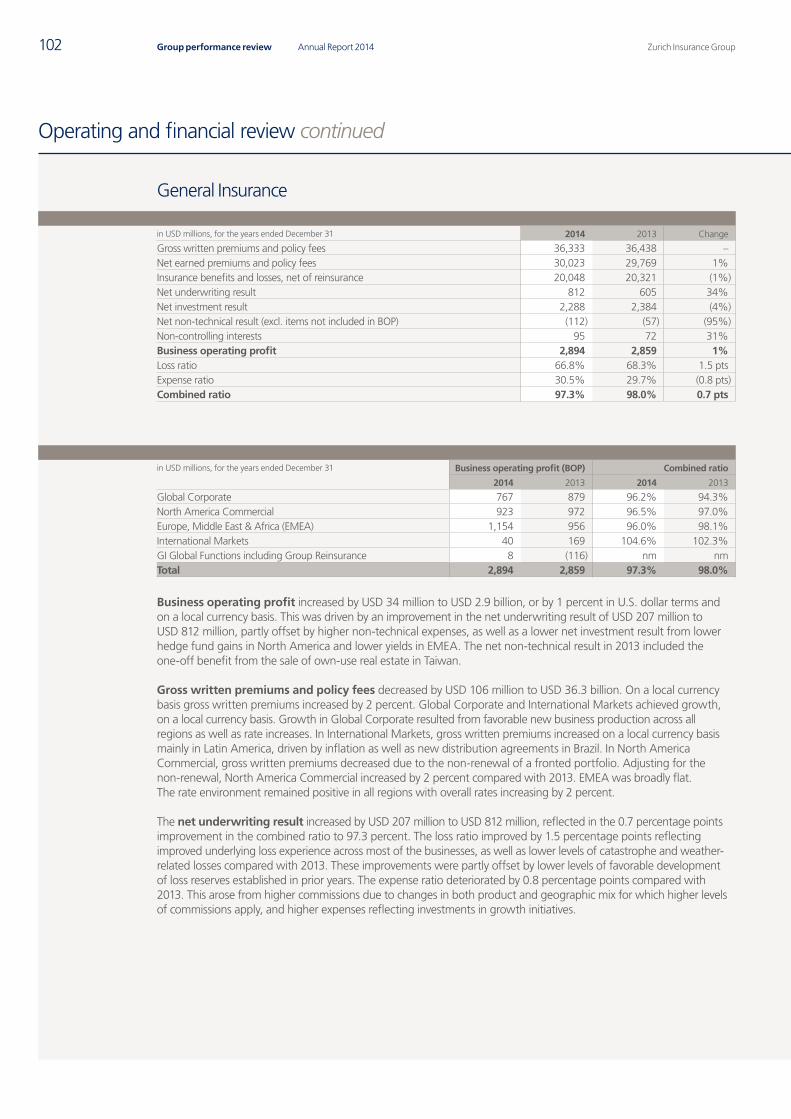
Zurich Insurance GroupAnnual Report 2014102 Group performance review
Operating and financial review continued
General Insurance
in USD millions, for the years ended December 31 2014 2013 Change
Gross written premiums and policy fees 36,333 36,438 –Net earned premiums and policy fees 30,023 29,769 1%Insurance benefits and losses, net of reinsurance 20,048 20,321 (1%)Net underwriting result 812 605 34%Net investment result 2,288 2,384 (4%)Net non-technical result (excl. items not included in BOP) (112) (57) (95%)Non-controlling interests 95 72 31%Business operating profit 2,894 2,859 1%Loss ratio 66.8% 68.3% 1.5 ptsExpense ratio 30.5% 29.7% (0.8 pts)Combined ratio 97.3% 98.0% 0.7 pts
in USD millions, for the years ended December 31 Business operating profit (BOP) Combined ratio
2014 2013 2014 2013
Global Corporate 767 879 96.2% 94.3%North America Commercial 923 972 96.5% 97.0%Europe, Middle East & Africa (EMEA) 1,154 956 96.0% 98.1%International Markets 40 169 104.6% 102.3%GI Global Functions including Group Reinsurance 8 (116) nm nm Total 2,894 2,859 97.3% 98.0%
Business operating profit increased by USD 34 million to USD 2.9 billion, or by 1 percent in U.S. dollar terms and on a local currency basis. This was driven by an improvement in the net underwriting result of USD 207 million to USD 812 million, partly offset by higher non-technical expenses, as well as a lower net investment result from lower hedge fund gains in North America and lower yields in EMEA. The net non-technical result in 2013 included the one-off benefit from the sale of own-use real estate in Taiwan.
Gross written premiums and policy fees decreased by USD 106 million to USD 36.3 billion. On a local currency basis gross written premiums increased by 2 percent. Global Corporate and International Markets achieved growth, on a local currency basis. Growth in Global Corporate resulted from favorable new business production across all regions as well as rate increases. In International Markets, gross written premiums increased on a local currency basis mainly in Latin America, driven by inflation as well as new distribution agreements in Brazil. In North America Commercial, gross written premiums decreased due to the non-renewal of a fronted portfolio. Adjusting for the non-renewal, North America Commercial increased by 2 percent compared with 2013. EMEA was broadly flat. The rate environment remained positive in all regions with overall rates increasing by 2 percent.
The net underwriting result increased by USD 207 million to USD 812 million, reflected in the 0.7 percentage points improvement in the combined ratio to 97.3 percent. The loss ratio improved by 1.5 percentage points reflecting improved underlying loss experience across most of the businesses, as well as lower levels of catastrophe and weather-related losses compared with 2013. These improvements were partly offset by lower levels of favorable development of loss reserves established in prior years. The expense ratio deteriorated by 0.8 percentage points compared with 2013. This arose from higher commissions due to changes in both product and geographic mix for which higher levels of commissions apply, and higher expenses reflecting investments in growth initiatives.
Q4_2014_08_AR14_56_Operating_financial_review_en.indd 102 23.02.2015 16:25:14
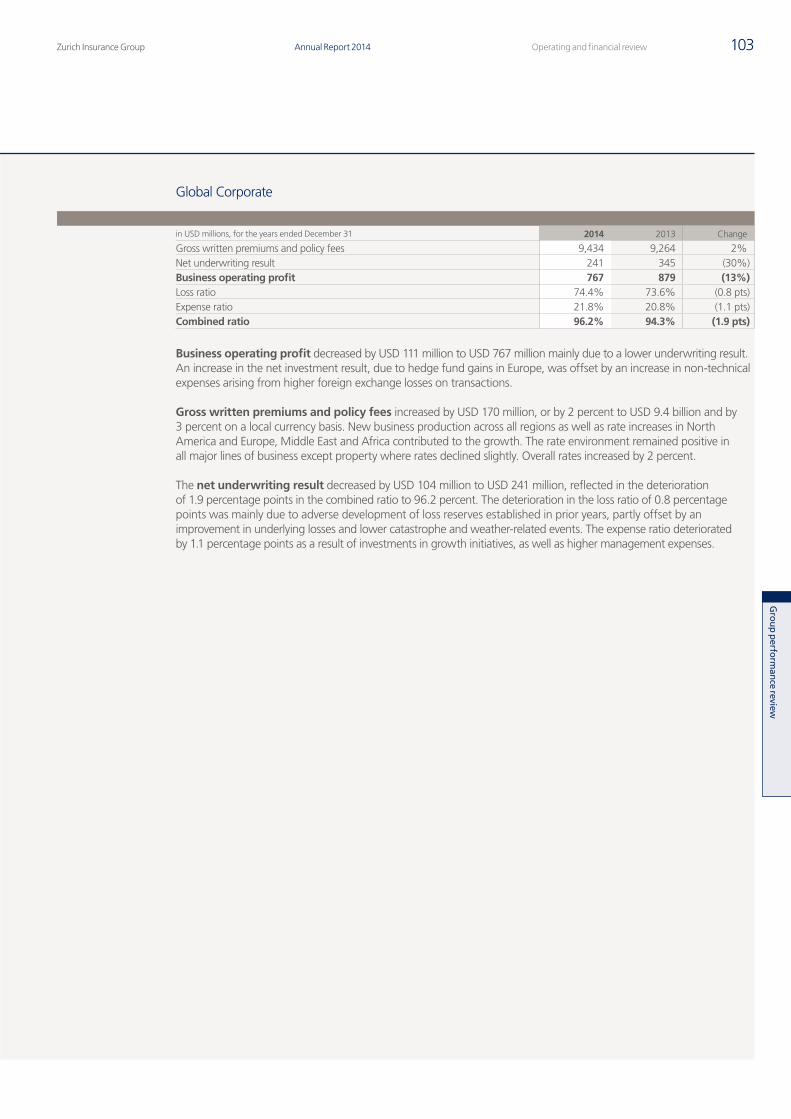
Zurich Insurance Group Annual Report 2014 103Operating and financial review
Gro
up p
erform
ance review
Global Corporate
in USD millions, for the years ended December 31 2014 2013 Change
Gross written premiums and policy fees 9,434 9,264 2%Net underwriting result 241 345 (30%)Business operating profit 767 879 (13%)Loss ratio 74.4% 73.6% (0.8 pts)Expense ratio 21.8% 20.8% (1.1 pts)Combined ratio 96.2% 94.3% (1.9 pts)
Business operating profit decreased by USD 111 million to USD 767 million mainly due to a lower underwriting result. An increase in the net investment result, due to hedge fund gains in Europe, was offset by an increase in non-technical expenses arising from higher foreign exchange losses on transactions.
Gross written premiums and policy fees increased by USD 170 million, or by 2 percent to USD 9.4 billion and by 3 percent on a local currency basis. New business production across all regions as well as rate increases in North America and Europe, Middle East and Africa contributed to the growth. The rate environment remained positive in all major lines of business except property where rates declined slightly. Overall rates increased by 2 percent.
The net underwriting result decreased by USD 104 million to USD 241 million, reflected in the deterioration of 1.9 percentage points in the combined ratio to 96.2 percent. The deterioration in the loss ratio of 0.8 percentage points was mainly due to adverse development of loss reserves established in prior years, partly offset by an improvement in underlying losses and lower catastrophe and weather-related events. The expense ratio deteriorated by 1.1 percentage points as a result of investments in growth initiatives, as well as higher management expenses.
Q4_2014_08_AR14_56_Operating_financial_review_en.indd 103 23.02.2015 16:25:14
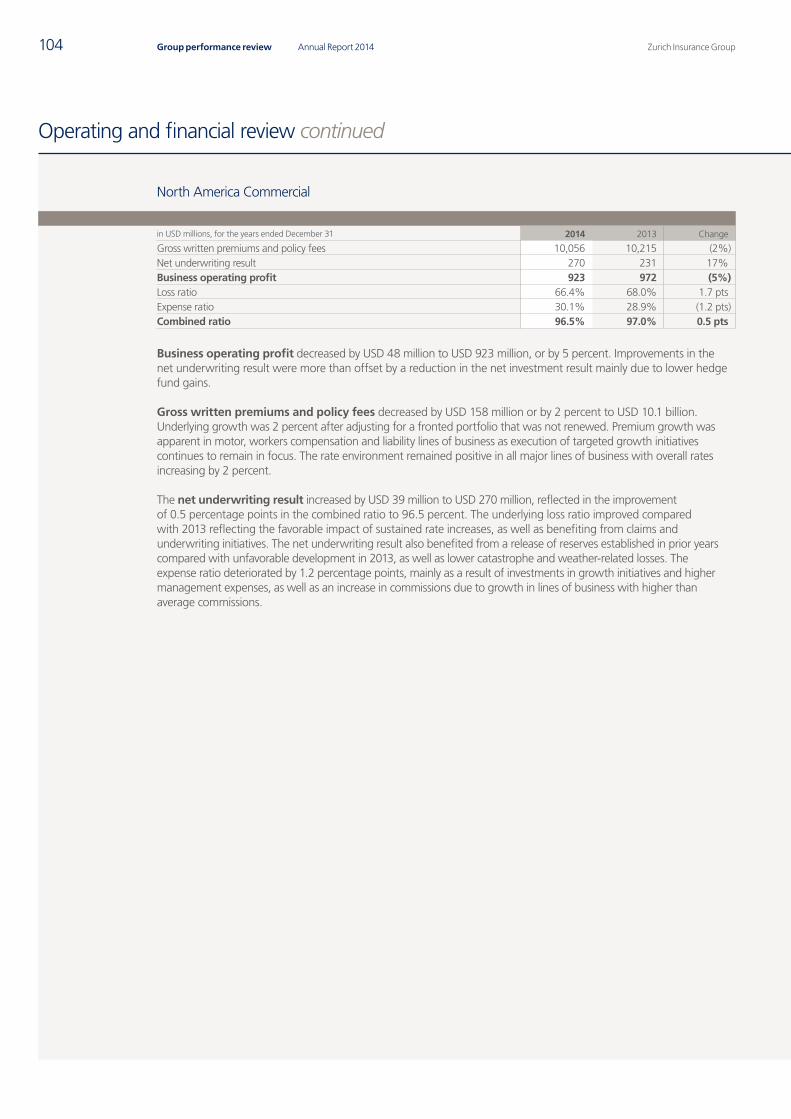
Zurich Insurance GroupAnnual Report 2014104 Group performance review
Operating and financial review continued
North America Commercial
in USD millions, for the years ended December 31 2014 2013 Change
Gross written premiums and policy fees 10,056 10,215 (2%)Net underwriting result 270 231 17%Business operating profit 923 972 (5%)Loss ratio 66.4% 68.0% 1.7 ptsExpense ratio 30.1% 28.9% (1.2 pts)Combined ratio 96.5% 97.0% 0.5 pts
Business operating profit decreased by USD 48 million to USD 923 million, or by 5 percent. Improvements in the net underwriting result were more than offset by a reduction in the net investment result mainly due to lower hedge fund gains.
Gross written premiums and policy fees decreased by USD 158 million or by 2 percent to USD 10.1 billion. Underlying growth was 2 percent after adjusting for a fronted portfolio that was not renewed. Premium growth was apparent in motor, workers compensation and liability lines of business as execution of targeted growth initiatives continues to remain in focus. The rate environment remained positive in all major lines of business with overall rates increasing by 2 percent.
The net underwriting result increased by USD 39 million to USD 270 million, reflected in the improvement of 0.5 percentage points in the combined ratio to 96.5 percent. The underlying loss ratio improved compared with 2013 reflecting the favorable impact of sustained rate increases, as well as benefiting from claims and underwriting initiatives. The net underwriting result also benefited from a release of reserves established in prior years compared with unfavorable development in 2013, as well as lower catastrophe and weather-related losses. The expense ratio deteriorated by 1.2 percentage points, mainly as a result of investments in growth initiatives and higher management expenses, as well as an increase in commissions due to growth in lines of business with higher than average commissions.
Q4_2014_08_AR14_56_Operating_financial_review_en.indd 104 23.02.2015 16:25:14
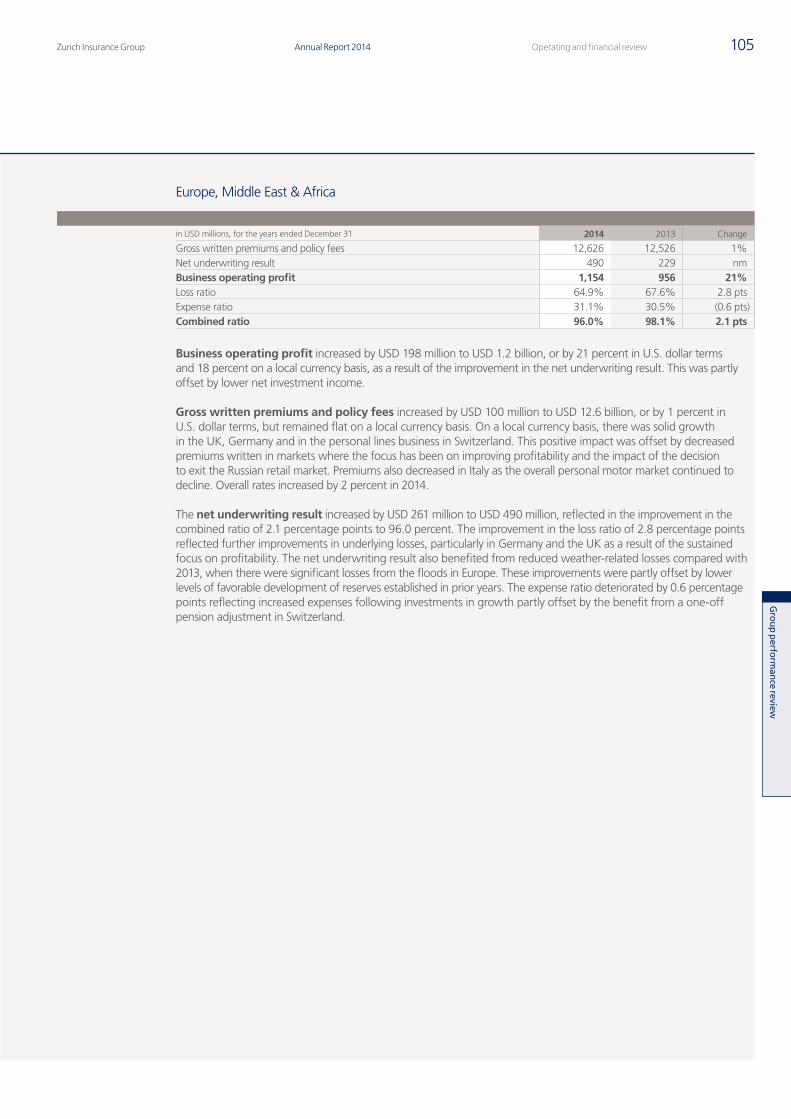
Zurich Insurance Group Annual Report 2014 105Operating and financial review
Gro
up p
erform
ance review
Europe, Middle East & Africa
in USD millions, for the years ended December 31 2014 2013 Change
Gross written premiums and policy fees 12,626 12,526 1%Net underwriting result 490 229 nm Business operating profit 1,154 956 21%Loss ratio 64.9% 67.6% 2.8 ptsExpense ratio 31.1% 30.5% (0.6 pts)Combined ratio 96.0% 98.1% 2.1 pts
Business operating profit increased by USD 198 million to USD 1.2 billion, or by 21 percent in U.S. dollar terms and 18 percent on a local currency basis, as a result of the improvement in the net underwriting result. This was partly offset by lower net investment income.
Gross written premiums and policy fees increased by USD 100 million to USD 12.6 billion, or by 1 percent in U.S. dollar terms, but remained flat on a local currency basis. On a local currency basis, there was solid growth in the UK, Germany and in the personal lines business in Switzerland. This positive impact was offset by decreased premiums written in markets where the focus has been on improving profitability and the impact of the decision to exit the Russian retail market. Premiums also decreased in Italy as the overall personal motor market continued to decline. Overall rates increased by 2 percent in 2014.
The net underwriting result increased by USD 261 million to USD 490 million, reflected in the improvement in the combined ratio of 2.1 percentage points to 96.0 percent. The improvement in the loss ratio of 2.8 percentage points reflected further improvements in underlying losses, particularly in Germany and the UK as a result of the sustained focus on profitability. The net underwriting result also benefited from reduced weather-related losses compared with 2013, when there were significant losses from the floods in Europe. These improvements were partly offset by lower levels of favorable development of reserves established in prior years. The expense ratio deteriorated by 0.6 percentage points reflecting increased expenses following investments in growth partly offset by the benefit from a one-off pension adjustment in Switzerland.
Q4_2014_08_AR14_56_Operating_financial_review_en.indd 105 23.02.2015 16:25:14
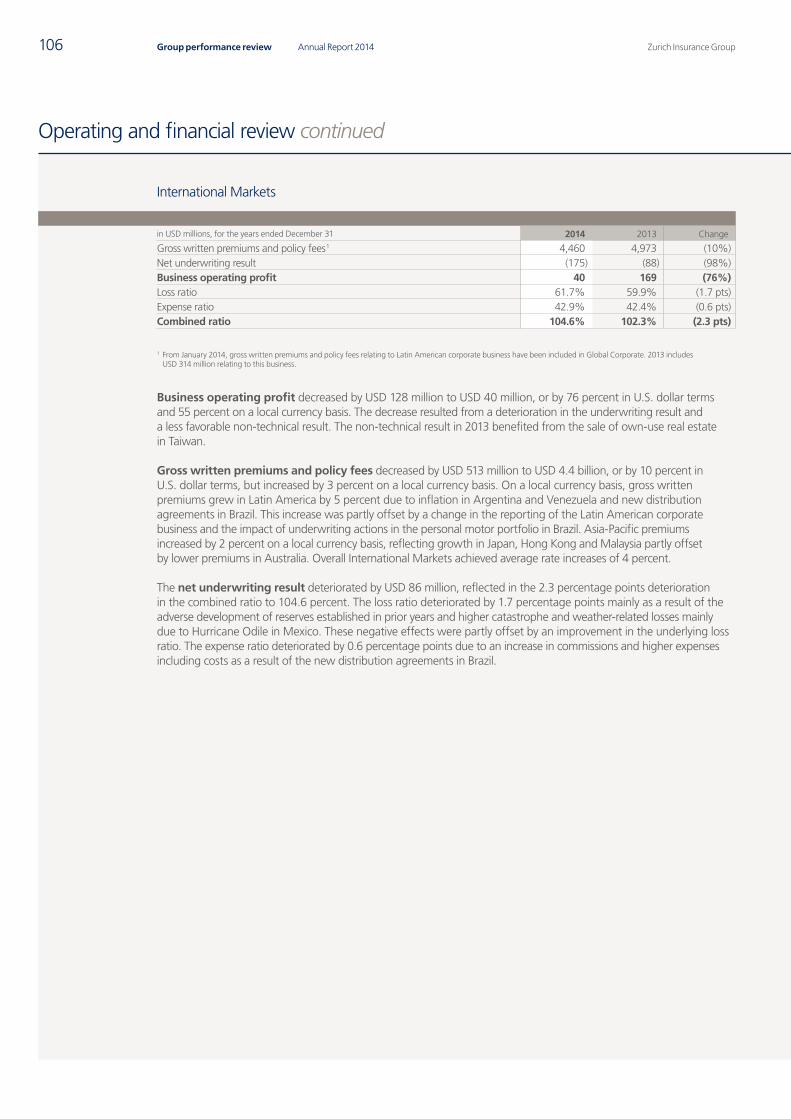
Zurich Insurance GroupAnnual Report 2014106 Group performance review
Operating and financial review continued
International Markets
in USD millions, for the years ended December 31 2014 2013 Change
Gross written premiums and policy fees 1 4,460 4,973 (10%)Net underwriting result (175) (88) (98%)Business operating profit 40 169 (76%)Loss ratio 61.7% 59.9% (1.7 pts)Expense ratio 42.9% 42.4% (0.6 pts)Combined ratio 104.6% 102.3% (2.3 pts)
1 From January 2014, gross written premiums and policy fees relating to Latin American corporate business have been included in Global Corporate. 2013 includes USD 314 million relating to this business.
Business operating profit decreased by USD 128 million to USD 40 million, or by 76 percent in U.S. dollar terms and 55 percent on a local currency basis. The decrease resulted from a deterioration in the underwriting result and a less favorable non-technical result. The non-technical result in 2013 benefited from the sale of own-use real estate in Taiwan.
Gross written premiums and policy fees decreased by USD 513 million to USD 4.4 billion, or by 10 percent in U.S. dollar terms, but increased by 3 percent on a local currency basis. On a local currency basis, gross written premiums grew in Latin America by 5 percent due to inflation in Argentina and Venezuela and new distribution agreements in Brazil. This increase was partly offset by a change in the reporting of the Latin American corporate business and the impact of underwriting actions in the personal motor portfolio in Brazil. Asia-Pacific premiums increased by 2 percent on a local currency basis, reflecting growth in Japan, Hong Kong and Malaysia partly offset by lower premiums in Australia. Overall International Markets achieved average rate increases of 4 percent.
The net underwriting result deteriorated by USD 86 million, reflected in the 2.3 percentage points deterioration in the combined ratio to 104.6 percent. The loss ratio deteriorated by 1.7 percentage points mainly as a result of the adverse development of reserves established in prior years and higher catastrophe and weather-related losses mainly due to Hurricane Odile in Mexico. These negative effects were partly offset by an improvement in the underlying loss ratio. The expense ratio deteriorated by 0.6 percentage points due to an increase in commissions and higher expenses including costs as a result of the new distribution agreements in Brazil.
Q4_2014_08_AR14_56_Operating_financial_review_en.indd 106 23.02.2015 16:25:14
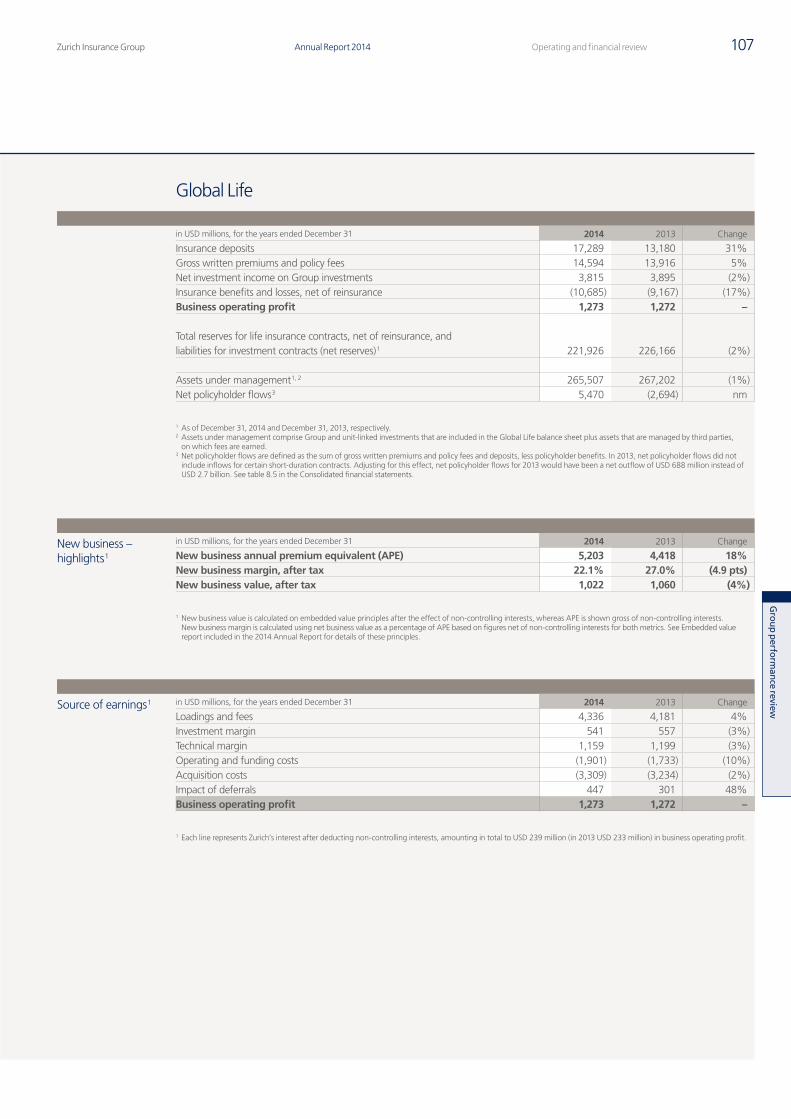
Zurich Insurance Group Annual Report 2014 107Operating and financial review
Gro
up p
erform
ance review
Global Life
in USD millions, for the years ended December 31 2014 2013 Change
Insurance deposits 17,289 13,180 31%Gross written premiums and policy fees 14,594 13,916 5%Net investment income on Group investments 3,815 3,895 (2%)Insurance benefits and losses, net of reinsurance (10,685) (9,167) (17%)Business operating profit 1,273 1,272 –
Total reserves for life insurance contracts, net of reinsurance, and liabilities for investment contracts (net reserves) 1 221,926 226,166 (2%)
Assets under management 1, 2 265,507 267,202 (1%)Net policyholder flows 3 5,470 (2,694) nm
1 As of December 31, 2014 and December 31, 2013, respectively.2 Assets under management comprise Group and unit-linked investments that are included in the Global Life balance sheet plus assets that are managed by third parties,
on which fees are earned.3 Net policyholder flows are defined as the sum of gross written premiums and policy fees and deposits, less policyholder benefits. In 2013, net policyholder flows did not
include inflows for certain short-duration contracts. Adjusting for this effect, net policyholder flows for 2013 would have been a net outflow of USD 688 million instead of USD 2.7 billion. See table 8.5 in the Consolidated financial statements.
New business – highlights 1
in USD millions, for the years ended December 31 2014 2013 Change
New business annual premium equivalent (APE) 5,203 4,418 18%New business margin, after tax 22.1% 27.0% (4.9 pts) New business value, after tax 1,022 1,060 (4%)
1 New business value is calculated on embedded value principles after the effect of non-controlling interests, whereas APE is shown gross of non-controlling interests. New business margin is calculated using net business value as a percentage of APE based on figures net of non-controlling interests for both metrics. See Embedded value report included in the 2014 Annual Report for details of these principles.
Source of earnings 1 in USD millions, for the years ended December 31 2014 2013 Change
Loadings and fees 4,336 4,181 4%Investment margin 541 557 (3%)Technical margin 1,159 1,199 (3%)Operating and funding costs (1,901) (1,733) (10%)Acquisition costs (3,309) (3,234) (2%)Impact of deferrals 447 301 48%Business operating profit 1,273 1,272 –
1 Each line represents Zurich’s interest after deducting non-controlling interests, amounting in total to USD 239 million (in 2013 USD 233 million) in business operating profit.
Q4_2014_08_AR14_56_Operating_financial_review_en.indd 107 23.02.2015 16:25:15
Zurich Insurance GroupAnnual Report 2014108 Group performance review
Operating and financial review continued
Business operating profit was broadly flat in U.S. dollar terms increasing by USD 1 million to USD 1.3 billion, but increased 2 percent on a local currency basis reflecting the weakening of currencies in Latin America against the U.S. dollar. Improvements on a local currency basis in most regions were offset by the negative effects in North America of both the transfer of an annuity portfolio to Non-Core Businesses associated with Global Life’s in-force management strategy and impairments of software intangible assets.
Ongoing focus on fee-based and protection business has resulted in improvements in loadings and fees and in the underlying technical margin. Loadings and fees increased by USD 154 million. The majority of the increase was driven by higher volumes in North America and Zurich Santander and higher fees in Asia-Pacific and Middle East (APME), predominantly driven by an increase in unit-linked assets under management. The investment margin decreased by USD 16 million, but with the positive effect of increased investment yields in Latin America, albeit reduced by the effects of foreign currency translation, offset by the impact of persistently low yields in other regions. The underlying technical margin improved by USD 56 million largely driven by North America, Zurich Santander and Europe. This improvement was more than offset by one-off impacts of USD 56 million from the reassessment of reserves prior to the transfer of an annuity portfolio in North America and USD 40 million from a change in the law in Germany affecting policyholders’ participations in the technical margin.
Operating and funding costs increased by USD 168 million, including the effect of investments in Global Life’s priority markets, impairment of software intangible assets and policyholder tax impacts. Acquisition costs increased by USD 75 million, reflecting higher volumes of business primarily in Europe and North America. In addition, a change in the expense allocation methodology between operating and acquisition costs resulted in an increase in operating costs and a decrease in acquisition costs by USD 30 million compared with 2013. The impact of deferrals improved the result by USD 145 million mainly due to the negative effect of one-off items in 2013.
Insurance deposits increased by USD 4.1 billion to USD 17.3 billion, or by 31 percent in U.S. dollar terms and 30 percent on a local currency basis. Europe experienced strong growth predominantly driven by higher sales of Corporate Life and Pensions products in the UK and Ireland. This growth was partly offset by the reduction in insurance deposits included in Bank Distribution following the withdrawal from new business for certain private banking products in Luxembourg and the UK.
Gross written premiums and policy fees increased by USD 678 million to USD 14.6 billion, or by 5 percent in U.S. dollar terms and 7 percent on a local currency basis. Growth in Europe, predominantly driven by sales of individual savings products in Spain and Germany, was partly offset by a reduction in Latin America, where 2013 included the effect of a large corporate contract in Chile.
Net reserves decreased by 2 percent in U.S. dollar terms, but increased 8 percent on a local currency basis compared with 2013, primarily reflecting favorable market movements on the underlying assets and positive net inflows, partly offset by the effect of the weakening of currencies against the U.S. dollar. Assets under management decreased by 1 percent in the U.S. dollar terms, but increased 10 percent on a local currency basis compared with 2013 driven by favorable market movements and positive net inflows, partly offset by the effect of the weakening of currencies against the U.S. dollar. Net policyholder flows were positive with a net inflow of USD 5.5 billion, with North America, Latin America and Europe all experiencing improved net inflows. This compared with a net outflow of USD 2.7 billion in 2013, which was mainly due to net outflows from private banking products in the UK.
Q4_2014_08_AR14_56_Operating_financial_review_en.indd 108 23.02.2015 16:25:15
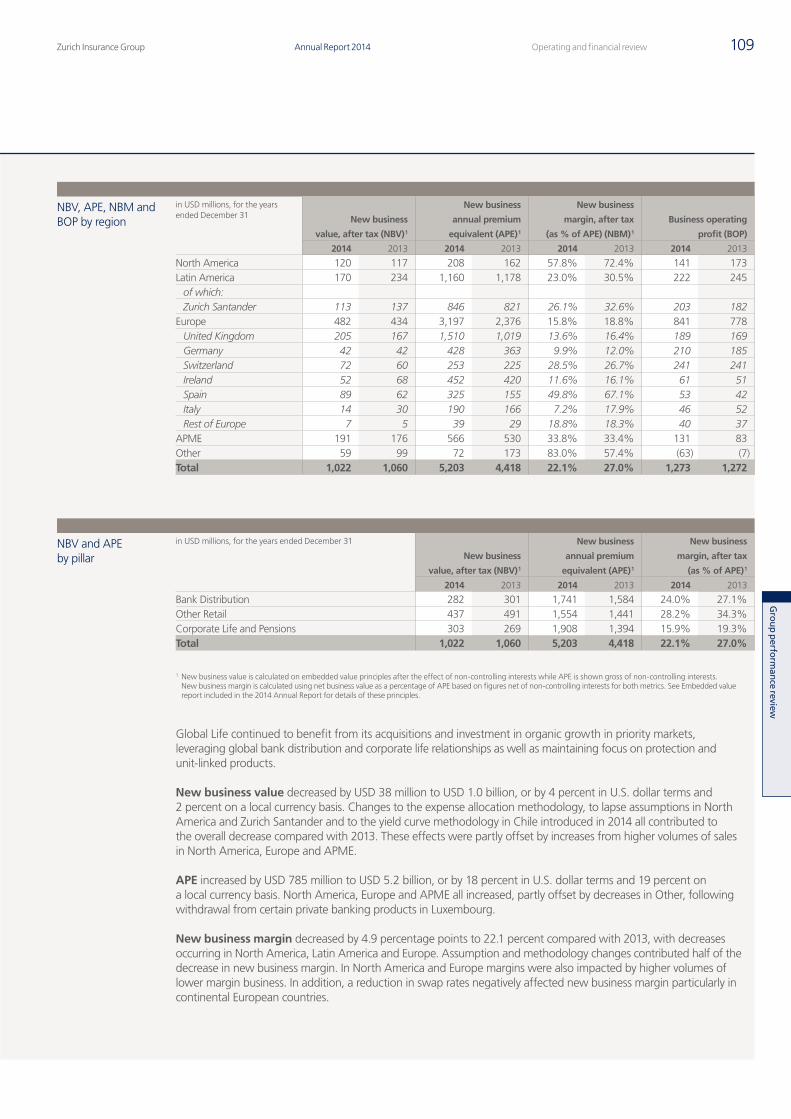
Zurich Insurance Group Annual Report 2014 109Operating and financial review
Gro
up p
erform
ance review
NBV, APE, NBM and BOP by region
in USD millions, for the years ended December 31 New business
value, after tax (NBV) 1
New business
annual premium
equivalent (APE) 1
New business
margin, after tax
(as % of APE) (NBM) 1
Business operating
profit (BOP)
2014 2013 2014 2013 2014 2013 2014 2013
North America 120 117 208 162 57.8% 72.4% 141 173Latin America 170 234 1,160 1,178 23.0% 30.5% 222 245
of which:Zurich Santander 113 137 846 821 26.1% 32.6% 203 182
Europe 482 434 3,197 2,376 15.8% 18.8% 841 778United Kingdom 205 167 1,510 1,019 13.6% 16.4% 189 169Germany 42 42 428 363 9.9% 12.0% 210 185Switzerland 72 60 253 225 28.5% 26.7% 241 241Ireland 52 68 452 420 11.6% 16.1% 61 51Spain 89 62 325 155 49.8% 67.1% 53 42Italy 14 30 190 166 7.2% 17.9% 46 52Rest of Europe 7 5 39 29 18.8% 18.3% 40 37
APME 191 176 566 530 33.8% 33.4% 131 83Other 59 99 72 173 83.0% 57.4% (63) (7)Total 1,022 1,060 5,203 4,418 22.1% 27.0% 1,273 1,272
NBV and APE by pillar
in USD millions, for the years ended December 31
New business
value, after tax (NBV) 1
New business
annual premium
equivalent (APE) 1
New business
margin, after tax
(as % of APE) 1
2014 2013 2014 2013 2014 2013
Bank Distribution 282 301 1,741 1,584 24.0% 27.1%Other Retail 437 491 1,554 1,441 28.2% 34.3%Corporate Life and Pensions 303 269 1,908 1,394 15.9% 19.3%Total 1,022 1,060 5,203 4,418 22.1% 27.0%
1 New business value is calculated on embedded value principles after the effect of non-controlling interests while APE is shown gross of non-controlling interests. New business margin is calculated using net business value as a percentage of APE based on figures net of non-controlling interests for both metrics. See Embedded value report included in the 2014 Annual Report for details of these principles.
Global Life continued to benefit from its acquisitions and investment in organic growth in priority markets, leveraging global bank distribution and corporate life relationships as well as maintaining focus on protection and unit-linked products.
New business value decreased by USD 38 million to USD 1.0 billion, or by 4 percent in U.S. dollar terms and 2 percent on a local currency basis. Changes to the expense allocation methodology, to lapse assumptions in North America and Zurich Santander and to the yield curve methodology in Chile introduced in 2014 all contributed to the overall decrease compared with 2013. These effects were partly offset by increases from higher volumes of sales in North America, Europe and APME.
APE increased by USD 785 million to USD 5.2 billion, or by 18 percent in U.S. dollar terms and 19 percent on a local currency basis. North America, Europe and APME all increased, partly offset by decreases in Other, following withdrawal from certain private banking products in Luxembourg.
New business margin decreased by 4.9 percentage points to 22.1 percent compared with 2013, with decreases occurring in North America, Latin America and Europe. Assumption and methodology changes contributed half of the decrease in new business margin. In North America and Europe margins were also impacted by higher volumes of lower margin business. In addition, a reduction in swap rates negatively affected new business margin particularly in continental European countries.
Q4_2014_08_AR14_56_Operating_financial_review_en.indd 109 23.02.2015 16:25:16
Zurich Insurance GroupAnnual Report 2014110 Group performance review
Operating and financial review continued
In North America, IFA/Brokers continued to gain momentum leading to growth in APE of 48 percent and an increase in new business value of 79 percent. Overall, this resulted in a lower, but still very strong, new business margin of 57.8 percent.
In Latin America, APE decreased by 1 percent in U.S. dollar terms, largely driven by the weakening of currencies in Latin America against the U.S. dollar, which also affected new business value. In addition, new business value was impacted by assumption changes, particularly in Zurich Santander, and a change in the expense allocation methodology.
In Europe, the overall increase of USD 48 million in new business value was primarily driven by the UK, Spain and Switzerland. In the UK, new business value improved by USD 38 million, benefiting from continued strong growth of lower margin Corporate Life and Pensions business, driving the overall reduction in new business margin. In Spain, increases in new business value continued to be driven by protection business, while APE growth was largely due to an increase in sales of individual savings products, resulting overall in a lower new business margin. In Switzerland, the increase in new business value resulted from both volume and margin improvements.
In APME, the increase in new business value occurred predominantly in Australia, which experienced both volume and margin improvements in protection business.
In Other, the decrease in new business value was driven by unusual volumes of Corporate Life and Pensions business in 2013, as well as the withdrawal in 2014 from certain private banking products in Luxembourg which resulted in the increase in new business margin.
In Bank Distribution, new business value decreased by USD 19 million to USD 282 million, or by 6 percent in U.S. dollar terms and 1 percent on a local currency basis. Strong volume growth in Zurich Santander and Spain was more than offset by the impact on new business value in Zurich Santander from changed assumptions and the weakening of currencies in Latin America against the U.S. dollar.
In Other Retail, new business value overall decreased by USD 54 million to USD 437 million, or by 11 percent in U.S. dollar terms and 10 percent on a local currency basis. The decrease arose mainly in Latin America, impacted by lower volumes, and Europe, which experienced lower margins, compared with 2013.
In Corporate Life and Pensions, new business value increased by USD 34 million to USD 303 million, or by 13 percent in U.S. dollar terms and 10 percent on a local currency basis, benefiting from higher volumes particularly in Europe, partly offset by a decrease in Other.
Q4_2014_08_AR14_56_Operating_financial_review_en.indd 110 23.02.2015 16:25:16
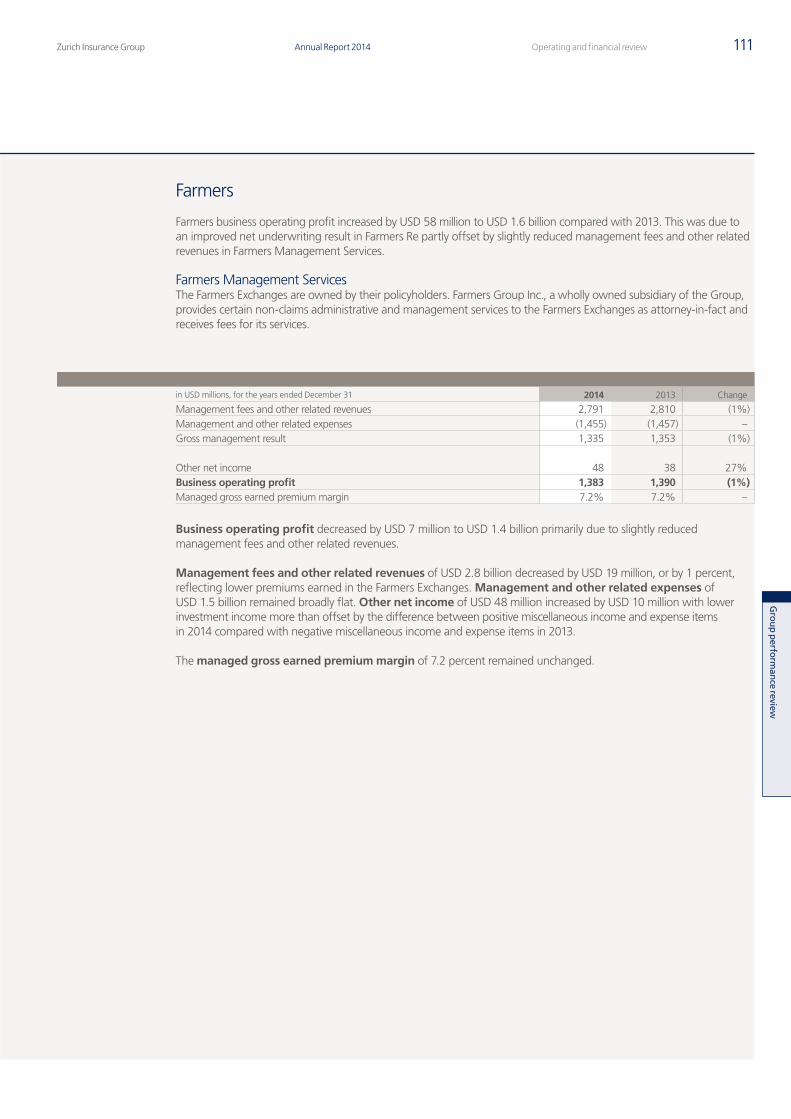
Zurich Insurance Group Annual Report 2014 111Operating and financial review
Gro
up p
erform
ance review
Farmers
Farmers business operating profit increased by USD 58 million to USD 1.6 billion compared with 2013. This was due to an improved net underwriting result in Farmers Re partly offset by slightly reduced management fees and other related revenues in Farmers Management Services.
Farmers Management ServicesThe Farmers Exchanges are owned by their policyholders. Farmers Group Inc., a wholly owned subsidiary of the Group, provides certain non-claims administrative and management services to the Farmers Exchanges as attorney-in-fact and receives fees for its services.
in USD millions, for the years ended December 31 2014 2013 Change
Management fees and other related revenues 2,791 2,810 (1%)Management and other related expenses (1,455) (1,457) –Gross management result 1,335 1,353 (1%)
Other net income 48 38 27%Business operating profit 1,383 1,390 (1%)Managed gross earned premium margin 7.2% 7.2% –
Business operating profit decreased by USD 7 million to USD 1.4 billion primarily due to slightly reduced management fees and other related revenues.
Management fees and other related revenues of USD 2.8 billion decreased by USD 19 million, or by 1 percent, reflecting lower premiums earned in the Farmers Exchanges. Management and other related expenses of USD 1.5 billion remained broadly flat. Other net income of USD 48 million increased by USD 10 million with lower investment income more than offset by the difference between positive miscellaneous income and expense items in 2014 compared with negative miscellaneous income and expense items in 2013.
The managed gross earned premium margin of 7.2 percent remained unchanged.
Q4_2014_08_AR14_56_Operating_financial_review_en.indd 111 23.02.2015 16:25:16
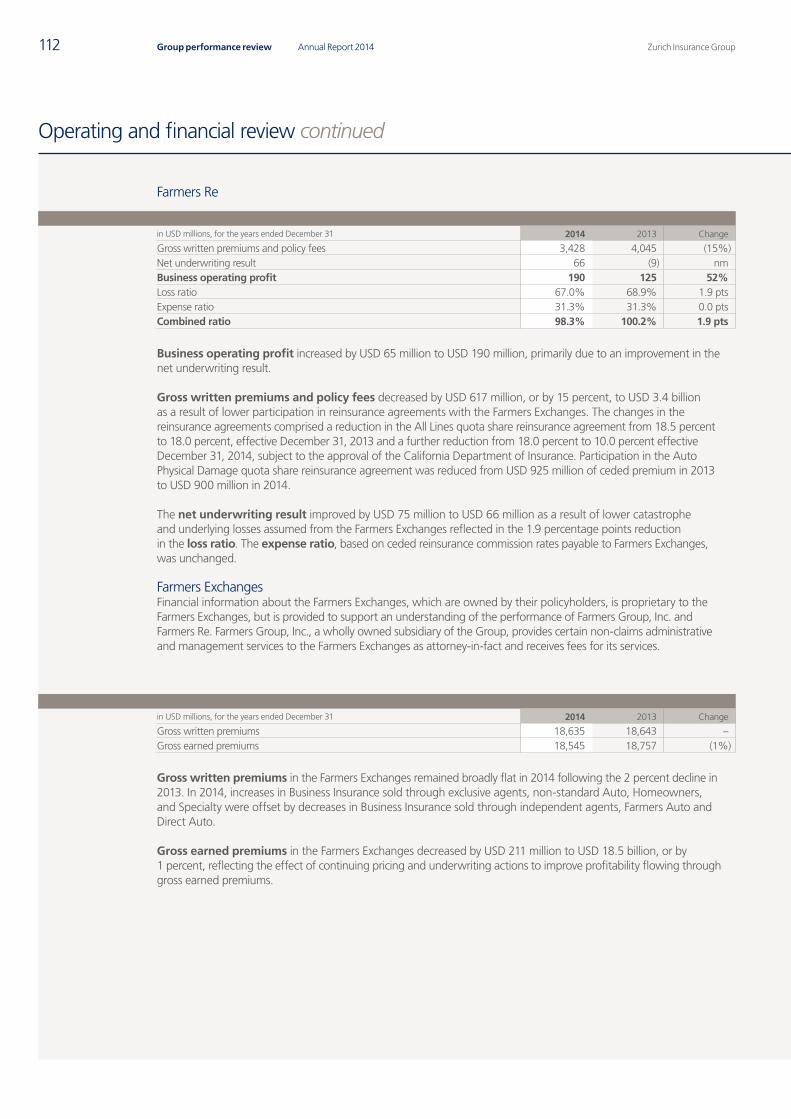
Zurich Insurance GroupAnnual Report 2014112 Group performance review
Operating and financial review continued
Farmers Re
in USD millions, for the years ended December 31 2014 2013 Change
Gross written premiums and policy fees 3,428 4,045 (15%)Net underwriting result 66 (9) nm Business operating profit 190 125 52%Loss ratio 67.0% 68.9% 1.9 ptsExpense ratio 31.3% 31.3% 0.0 ptsCombined ratio 98.3% 100.2% 1.9 pts
Business operating profit increased by USD 65 million to USD 190 million, primarily due to an improvement in the net underwriting result.
Gross written premiums and policy fees decreased by USD 617 million, or by 15 percent, to USD 3.4 billion as a result of lower participation in reinsurance agreements with the Farmers Exchanges. The changes in the reinsurance agreements comprised a reduction in the All Lines quota share reinsurance agreement from 18.5 percent to 18.0 percent, effective December 31, 2013 and a further reduction from 18.0 percent to 10.0 percent effective December 31, 2014, subject to the approval of the California Department of Insurance. Participation in the Auto Physical Damage quota share reinsurance agreement was reduced from USD 925 million of ceded premium in 2013 to USD 900 million in 2014.
The net underwriting result improved by USD 75 million to USD 66 million as a result of lower catastrophe and underlying losses assumed from the Farmers Exchanges reflected in the 1.9 percentage points reduction in the loss ratio. The expense ratio, based on ceded reinsurance commission rates payable to Farmers Exchanges, was unchanged.
Farmers ExchangesFinancial information about the Farmers Exchanges, which are owned by their policyholders, is proprietary to the Farmers Exchanges, but is provided to support an understanding of the performance of Farmers Group, Inc. and Farmers Re. Farmers Group, Inc., a wholly owned subsidiary of the Group, provides certain non-claims administrative and management services to the Farmers Exchanges as attorney-in-fact and receives fees for its services.
in USD millions, for the years ended December 31 2014 2013 Change
Gross written premiums 18,635 18,643 –Gross earned premiums 18,545 18,757 (1%)
Gross written premiums in the Farmers Exchanges remained broadly flat in 2014 following the 2 percent decline in 2013. In 2014, increases in Business Insurance sold through exclusive agents, non-standard Auto, Homeowners, and Specialty were offset by decreases in Business Insurance sold through independent agents, Farmers Auto and Direct Auto.
Gross earned premiums in the Farmers Exchanges decreased by USD 211 million to USD 18.5 billion, or by 1 percent, reflecting the effect of continuing pricing and underwriting actions to improve profitability flowing through gross earned premiums.
Q4_2014_08_AR14_56_Operating_financial_review_en.indd 112 23.02.2015 16:25:16
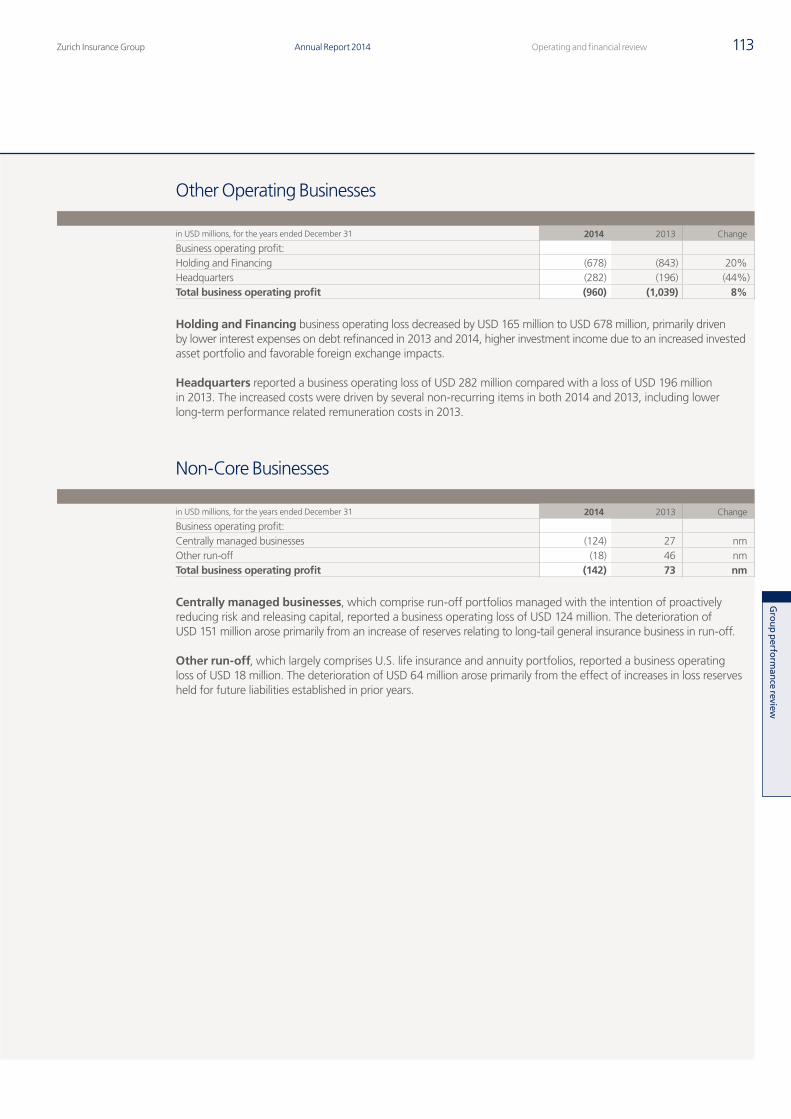
Zurich Insurance Group Annual Report 2014 113Operating and financial review
Gro
up p
erform
ance review
Other Operating Businesses
in USD millions, for the years ended December 31 2014 2013 Change
Business operating profit:Holding and Financing (678) (843) 20%Headquarters (282) (196) (44%)Total business operating profit (960) (1,039) 8%
Holding and Financing business operating loss decreased by USD 165 million to USD 678 million, primarily driven by lower interest expenses on debt refinanced in 2013 and 2014, higher investment income due to an increased invested asset portfolio and favorable foreign exchange impacts.
Headquarters reported a business operating loss of USD 282 million compared with a loss of USD 196 million in 2013. The increased costs were driven by several non-recurring items in both 2014 and 2013, including lower long-term performance related remuneration costs in 2013.
Non-Core Businesses
in USD millions, for the years ended December 31 2014 2013 Change
Business operating profit:Centrally managed businesses (124) 27 nm Other run-off (18) 46 nm Total business operating profit (142) 73 nm
Centrally managed businesses, which comprise run-off portfolios managed with the intention of proactively reducing risk and releasing capital, reported a business operating loss of USD 124 million. The deterioration of USD 151 million arose primarily from an increase of reserves relating to long-tail general insurance business in run-off.
Other run-off, which largely comprises U.S. life insurance and annuity portfolios, reported a business operating loss of USD 18 million. The deterioration of USD 64 million arose primarily from the effect of increases in loss reserves held for future liabilities established in prior years.
Q4_2014_08_AR14_56_Operating_financial_review_en.indd 113 23.02.2015 16:25:17
Zurich Insurance GroupAnnual Report 2014114 Group performance review
Risk review
Zurich’s approach to risk management aims to protect the Group’s capital, enhance value creation, optimize its risk-return profile, support decision making and protect Zurich’s reputation and brand. The risk review describes the Group’s risk management framework and risk governance, reports on capital management and capital adequacy, and presents an analysis of its main risks.
Contents
Executive summary 115
Risk and capital management 116Mission and objectives of risk management 116Risk management framework 116Risk governance and risk management organization 117Objectives of capital management 117Capital management framework 118Capital management program 118
Analysis of capital adequacy 119Insurance financial strength rating 119Regulatory capital adequacy 119Economic capital adequacy 122
Analysis by risk type 127Insurance risk 127Market risk 134Credit risk 140Operational risk 147Liquidity risk 149Strategic risk and risks to the Group’s reputation 152
The Risk review is an integral part of the consolidated financial statements (only the information marked “audited”).
Q4_2014_09_AR14_Risk review part1_en.indd 114 23.02.2015 16:31:39
AUDITED
Zurich Insurance Group Annual Report 2014 115Risk review
Gro
up p
erform
ance review
The risk review is structured differently this year in order to discuss a particular risk alongside important contextual information, such as Z-ECM capital required. As a consequence, audited and unaudited information is presented together. To address this, audited information is highlighted. The folded corner indicates that the information contained within the shaded panel is audited and forms an integral part of the consolidated financial statements.
Executive summary
Enterprise risk management
Zurich uses a comprehensive risk management framework throughout the Group. In 2014, the Group focused on significant financial reporting controls, and operational key controls for underwriting and claims.
Internal reporting was enriched by including in-depth risk insights into topics such as operational risk and corporate responsibility.
We expanded our training program to support local risk management teams, especially in the areas of quantifying operational risk, implementing controls, and complying with developing regulatory requirements.
Financial condition
The Group is well within its target capital level, which is calibrated to a ‘AA’ financial strength. As of July 1, 2014, the Group had a Zurich Economic Capital Model (Z-ECM) ratio of 126%, and was well above the Swiss Solvency Test requirements with a ratio of 215%. As of December 31, 2014, the Group’s Solvency I ratio was 307%. See note 29 for an update on the January 15, 2015 SNB action on the Swiss franc.
126%Z-ECM ratio (as of July 1, 2014)
AA–/positiveStandard & Poor’s financial strength rating of Zurich Insurance Company Ltd (as of December 31, 2014)
Economic risk profile
Insurance-related and business risks are the main drivers of the Group’s required capital.
As of July 1, 2014, insurance-related and business risks contribute 44% of the Z-ECM capital required. 52% of the total capital allocated to the segments goes to General Insurance, 33% to Global Life and 7% to Farmers.
44%
39%
14%
3%
Insurance-related and business risksCredit risk
Market riskOperational risk
Financial condition under stressed perspective
Zurich uses scenario analyses to assess the potential impact of conditions under stress. The Group identifies plausible threat scenarios, and quantifies their potential impact on financial resources. Depending on the outcome, the Group then develops, implements and monitors appropriate actions.
In 2014, the Z-ECM ratio was analyzed for sensitivity to three new scenarios: two related to monetary policy errors by central banks that trigger market corrections, and the third a macro-economic crisis. While under two of the scenarios the Z-ECM ratio would remain within the “AA” range, one of the potential policy error scenarios would cause the Z-ECM ratio to exceed our target range.
Q4_2014_09_AR14_Risk review part1_en.indd 115 23.02.2015 16:31:40
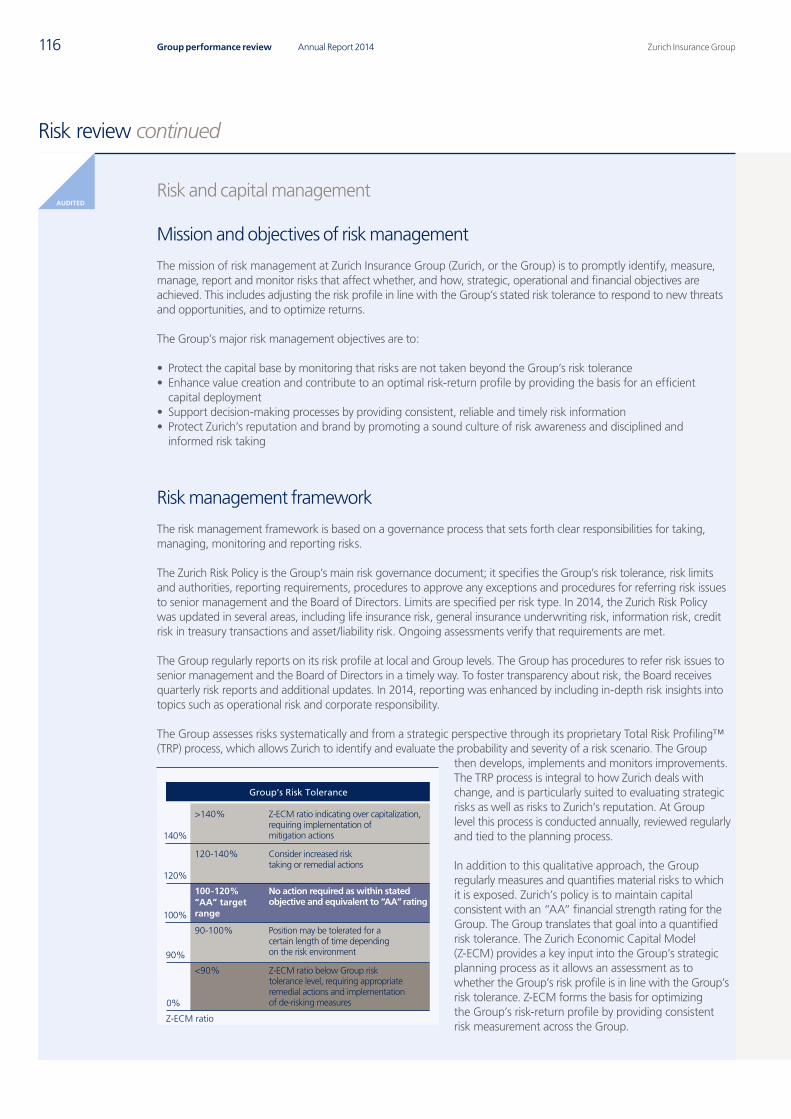
116
AUDITED
Zurich Insurance GroupAnnual Report 2014Group performance review
AUDITED
Risk review continued
Risk and capital management
Mission and objectives of risk management
The mission of risk management at Zurich Insurance Group (Zurich, or the Group) is to promptly identify, measure, manage, report and monitor risks that affect whether, and how, strategic, operational and financial objectives are achieved. This includes adjusting the risk profile in line with the Group’s stated risk tolerance to respond to new threats and opportunities, and to optimize returns.
The Group’s major risk management objectives are to:
• Protect the capital base by monitoring that risks are not taken beyond the Group’s risk tolerance• Enhance value creation and contribute to an optimal risk-return profile by providing the basis for an efficient
capital deployment• Support decision-making processes by providing consistent, reliable and timely risk information• Protect Zurich’s reputation and brand by promoting a sound culture of risk awareness and disciplined and
informed risk taking
Risk management framework
The risk management framework is based on a governance process that sets forth clear responsibilities for taking, managing, monitoring and reporting risks.
The Zurich Risk Policy is the Group’s main risk governance document; it specifies the Group’s risk tolerance, risk limits and authorities, reporting requirements, procedures to approve any exceptions and procedures for referring risk issues to senior management and the Board of Directors. Limits are specified per risk type. In 2014, the Zurich Risk Policy was updated in several areas, including life insurance risk, general insurance underwriting risk, information risk, credit risk in treasury transactions and asset/liability risk. Ongoing assessments verify that requirements are met.
The Group regularly reports on its risk profile at local and Group levels. The Group has procedures to refer risk issues to senior management and the Board of Directors in a timely way. To foster transparency about risk, the Board receives quarterly risk reports and additional updates. In 2014, reporting was enhanced by including in-depth risk insights into topics such as operational risk and corporate responsibility.
The Group assesses risks systematically and from a strategic perspective through its proprietary Total Risk Profiling™ (TRP) process, which allows Zurich to identify and evaluate the probability and severity of a risk scenario. The Group
then develops, implements and monitors improvements. The TRP process is integral to how Zurich deals with change, and is particularly suited to evaluating strategic risks as well as risks to Zurich’s reputation. At Group level this process is conducted annually, reviewed regularly and tied to the planning process.
In addition to this qualitative approach, the Group regularly measures and quantifies material risks to which it is exposed. Zurich’s policy is to maintain capital consistent with an “AA“ financial strength rating for the Group. The Group translates that goal into a quantified risk tolerance. The Zurich Economic Capital Model (Z-ECM) provides a key input into the Group’s strategic planning process as it allows an assessment as to whether the Group’s risk profile is in line with the Group’s risk tolerance. Z-ECM forms the basis for optimizing the Group’s risk-return profile by providing consistent risk measurement across the Group.
Group’s Risk Tolerance
120-140% Consider increased risk taking or remedial actions
100-120%“AA” target range
No action required as within stated objective and equivalent to “AA” rating
90-100% Position may be tolerated for a certain length of time depending on the risk environment
<90% Z-ECM ratio below Group risk tolerance level, requiring appropriate remedial actions and implementation of de-risking measures
120%
>140% Z-ECM ratio indicating over capitalization, requiring implementation of mitigation actions140%
100%
0%
90%
Z-ECM ratio
Q4_2014_09_AR14_Risk review part1_en.indd 116 23.02.2015 16:31:40
117
Gro
up p
erform
ance review
Zurich Insurance Group Annual Report 2014 Risk review
AUDITEDBased on the Group’s remuneration rules, the Board of Directors designs and structures remuneration arrangements to ensure they do not encourage inappropriate risk taking. The Group Chief Risk Officer (Group CRO) consults with the other assurance, control and governance functions to provide the CEO with a review of risk factors to consider in the annual variable-compensation process. In consultation with these functions, the Group CRO provides an individual assessment of Group key risk takers as part of their annual individual performance assessment. For more information on Zurich’s remuneration system, see the ‘remuneration report.’
Risk governance and risk management organization
For information on the Group’s overall governance, including the Board of Directors and Group executive level, see the ‘corporate governance report (unaudited).’
Group Risk Management organizationThe Group Chief Risk Officer leads the Group Risk Management function, which develops methods and processes for identifying, measuring, managing, monitoring and reporting risks throughout the Group. The Group Chief Risk Officer is responsible for oversight of risks across the Group, regularly reporting risk matters to the Chief Executive Officer, senior management committees and the Risk Committee of the Board.
The Group Risk Management organization consists of central functions at Group level and a decentralized risk management network at segment, regional, business unit and functional levels.
At Group level, the risk analytics department and risk and control department comprise the two centers of expertise. The risk analytics department makes quantitative assessments of insurance, financial market and asset/liability, credit and operational risks and is the Group’s center of excellence for risk quantification, modeling and model validation. The risk and control department includes operational risk management, risk reporting, risk governance and tools and methodologies. The risk management network consists of the Chief Risk Officers (CROs) of the Group’s segments and regions, and the Local Risk Officers (LROs) of the business units and functions and their staff. The risk officers are part of the management teams in their respective businesses and are thus embedded in the business. The LROs also report to the segment or regional CROs, who in turn report to the Group’s Chief Risk Officer.
The Group also has audit committees at the major business level. The committees are responsible for overseeing risk management and control functions including monitoring adherence to policies and periodic risk reporting. At the local level, these oversight activities are conducted through risk and control committees or quarterly meetings between senior executives and the local heads of governance functions.
Objectives of capital management
The Group manages its capital to maximize long term shareholder value while maintaining financial strength within its ‘AA’ target range and meeting regulatory, solvency and rating agency requirements. In particular, the Group endeavors to manage its capital so that the Group and all its regulated entities meet relevant regulatory capital adequacy requirements.
Zurich strives to simplify the Group’s legal entity structure to reduce complexity and increase fungibility of capital. The Group pools risk, capital and liquidity centrally as much as possible.
Q4_2014_09_AR14_Risk review part1_en.indd 117 23.02.2015 16:31:40
118
AUDITED
Zurich Insurance GroupAnnual Report 2014Group performance review
AUDITED
Risk review continued
Capital management framework
The Group’s capital management framework forms the basis for actively managing capital within Zurich. The Group uses a number of different capital models, taking into account economic, regulatory, and rating agency constraints. The Group’s capital and solvency position is monitored and regularly reported.
Zurich’s policy is to allocate capital to businesses earning the highest risk-adjusted returns and pools risks and capital as much as possible to operationalize its risk diversification.
The Group’s executive management determines the capital management strategy and sets the principles, standards and policies to execute the strategy. Group Treasury and Capital Management executes the strategy.
Capital management program
The Group’s capital management program comprises various actions to optimize shareholders’ total return and to meet capital needs, while enabling Zurich to take advantage of growth opportunities. Such actions include dividends, capital repayments, share buy-backs, issuances of shares, issuance of senior and hybrid debt, securitization and purchase of reinsurance.
The Group seeks to maintain a balance between higher returns for shareholders on equity held, and the security a sound capital position provides. Dividends, share buy-backs, and issuances and redemption of debt have a significant influence on capital levels. In 2014, the Group paid a dividend out of the capital contribution reserve, and replaced maturing senior debt and callable hybrid debt with new senior and hybrid debt.
The Swiss Code of Obligations stipulates the dividends may only be paid out of freely distributable reserves or retained earnings. Apart from what is specified by the Code, Zurich Insurance Group Ltd faces no legal restrictions on dividends it may pay to its shareholders. As of December 31, 2014, the amount of the general legal reserve exceeded 20 percent of the paid-in share capital.
The ability of the Group’s subsidiaries to pay dividends may be restricted or – while dividend payments as such may be legally permitted – may be indirectly influenced by minimum capital and solvency requirements imposed by insurance and other regulators in the countries in which the subsidiaries operate. Other limitations, such as foreign exchange control restrictions, exist in some countries.
For details on issuances and redemptions of debt, see note 19 and 20 of the consolidated financial statements.
Q4_2014_09_AR14_Risk review part1_en.indd 118 23.02.2015 16:31:40
119
Gro
up p
erform
ance review
Zurich Insurance Group Annual Report 2014 Risk review
AUDITEDAnalysis of capital adequacy
Insurance financial strength rating
The Group has active relationships with three global rating agencies: Standard & Poor’s, Moody’s and A.M. Best. The Insurance Financial Strength Rating (IFSR) of the Group’s main operating entity is an important element of Zurich’s competitive position. The Group’s credit ratings derived from the financial strength ratings also affect the cost of capital.
The Group maintained its strong rating level in 2014. As of December 31, 2014 the IFSR of Zurich Insurance Company Ltd (ZIC), the main operating entity of the Group, was ‘AA–’ by Standard and Poor’s, ‘Aa3’ by Moody’s and ‘A+ (superior)’ by A.M. Best. While Moody’s and AM Best have their rating outlooks as “stable,“ S&P revised its outlook for Zurich Insurance Group and all its core entities to “positive“ on October 1, 2014. The outlook revision reflects S&P’s growing confidence in the relative credit strength of ZIC compared with similarly rated peers. This follows S&P’s review of the Group’s non-life reserves and internal economic capital model.
Regulatory capital adequacy
The Group endeavors to manage its capital so that all of its regulated entities meet local regulatory capital requirements at all times.
In each country in which the Group operates, the local regulator specifies the minimum amount and type of capital that each of the regulated entities must hold in addition to their liabilities. Besides the minimum capital required to comply with the solvency requirements, the Group aims to hold an adequate buffer to ensure regulated subsidiaries meet local capital requirements. The Group is subject to different capital requirements depending on the countries in which it operates.
Zurich pools risk and capital as much as possible at a Group level, creating diversification benefits for the Group. This also allows the Group to take into account the benefits that arise in regions where these benefits are recognized under the capital adequacy regime, e.g., in the U.S., Ireland, and Switzerland.
Regulatory requirements in SwitzerlandInsurance entities operating in Switzerland are required to maintain minimum solvency margins according to the existing Solvency I legislation. Under the Swiss Solvency Test (SST), groups, conglomerates and reinsurers are required to use company-specific internal models to calculate risk-bearing and target capital. Internal models must be approved by the Swiss Financial Market Supervisory Authority (FINMA). The model approval process continues with FINMA, which approved the use of Zurich’s internal model for 2014 on a provisional basis, without prejudicing the final approval. Zurich has filed an SST ratio with FINMA in excess of the regulatory requirements, both as of January 1, 2014 and as of July 1, 2014 (subject to FINMA approval). For more details, see the ‘Swiss Solvency Test requirement (unaudited)’ section.
Q4_2014_09_AR14_Risk review part1_en.indd 119 23.02.2015 16:31:41
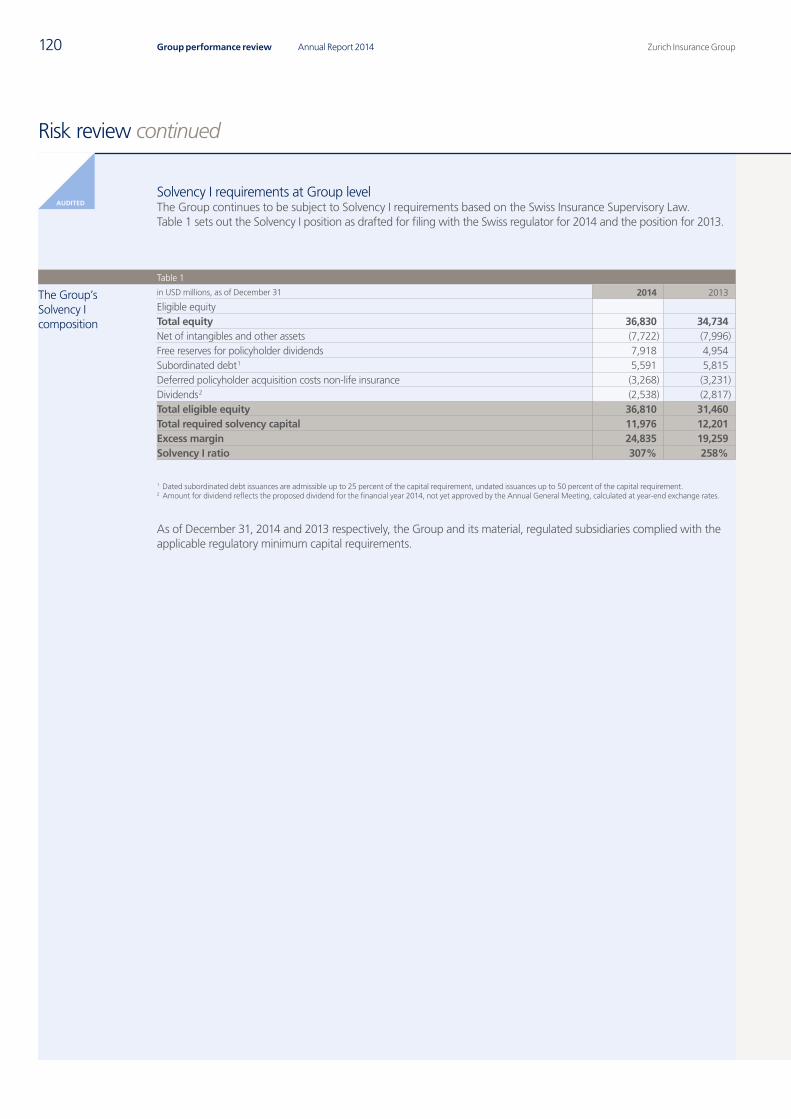
120 Zurich Insurance GroupAnnual Report 2014Group performance review
AUDITED
Risk review continued
Solvency I requirements at Group levelThe Group continues to be subject to Solvency I requirements based on the Swiss Insurance Supervisory Law. Table 1 sets out the Solvency I position as drafted for filing with the Swiss regulator for 2014 and the position for 2013.
Table 1
The Group’s Solvency I composition
in USD millions, as of December 31 2014 2013
Eligible equityTotal equity 36,830 34,734Net of intangibles and other assets (7,722) (7,996)Free reserves for policyholder dividends 7,918 4,954Subordinated debt 1 5,591 5,815Deferred policyholder acquisition costs non-life insurance (3,268) (3,231)Dividends 2 (2,538) (2,817)Total eligible equity 36,810 31,460Total required solvency capital 11,976 12,201Excess margin 24,835 19,259Solvency I ratio 307% 258%
1 Dated subordinated debt issuances are admissible up to 25 percent of the capital requirement, undated issuances up to 50 percent of the capital requirement.2 Amount for dividend reflects the proposed dividend for the financial year 2014, not yet approved by the Annual General Meeting, calculated at year-end exchange rates.
As of December 31, 2014 and 2013 respectively, the Group and its material, regulated subsidiaries complied with the applicable regulatory minimum capital requirements.
Q4_2014_09_AR14_Risk review part1_en.indd 120 23.02.2015 16:31:41
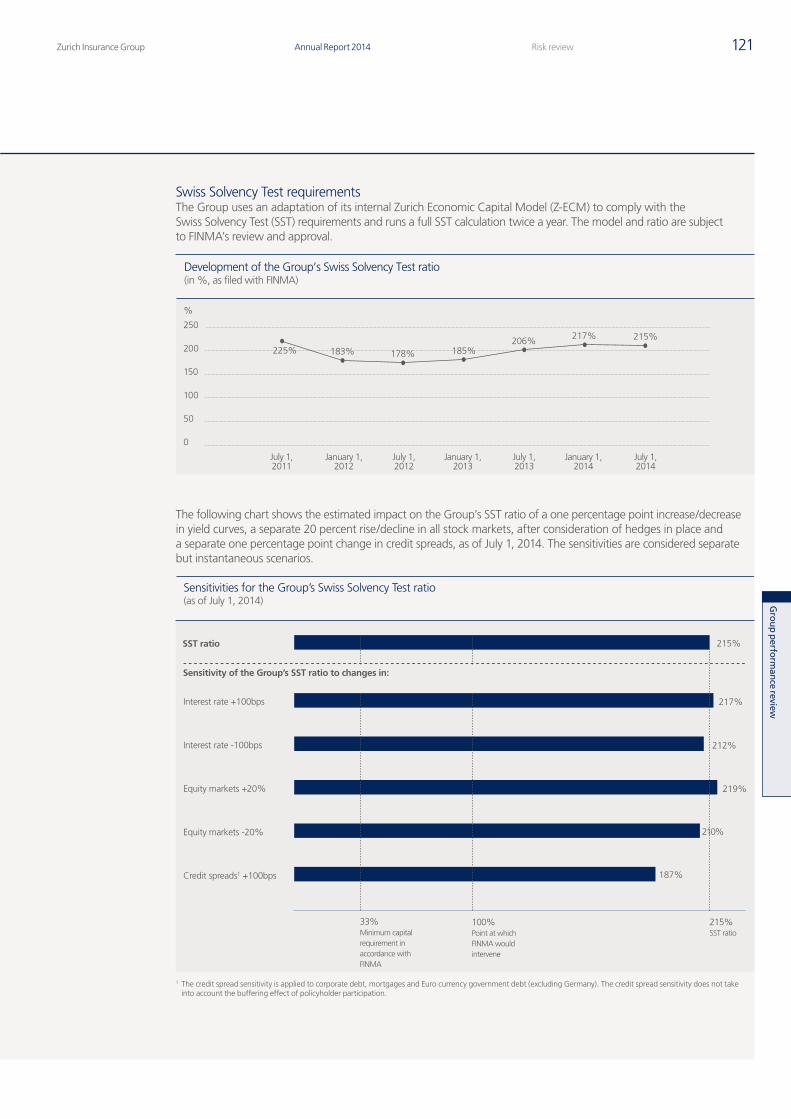
Zurich Insurance Group Annual Report 2014 121Risk review
Gro
up p
erform
ance review
Swiss Solvency Test requirementsThe Group uses an adaptation of its internal Zurich Economic Capital Model (Z-ECM) to comply with the Swiss Solvency Test (SST) requirements and runs a full SST calculation twice a year. The model and ratio are subject to FINMA’s review and approval.
The following chart shows the estimated impact on the Group’s SST ratio of a one percentage point increase/decrease in yield curves, a separate 20 percent rise/decline in all stock markets, after consideration of hedges in place and a separate one percentage point change in credit spreads, as of July 1, 2014. The sensitivities are considered separate but instantaneous scenarios.
1 The credit spread sensitivity is applied to corporate debt, mortgages and Euro currency government debt (excluding Germany). The credit spread sensitivity does not take into account the buffering effect of policyholder participation.
Development of the Group’s Swiss Solvency Test ratio(in %, as filed with FINMA)
250
200
150
100
50
0
%
225%
July 1,2011
January 1,2012
July 1,2012
183% 178% 185%206% 217% 215%
January 1,2013
July 1,2013
January 1,2014
July 1,2014
Sensitivity of the Group’s SST ratio to changes in:
SST ratio
Interest rate +100bps
Interest rate -100bps
Equity markets +20%
Equity markets -20%
Credit spreads1 +100bps
215%SST ratio
Sensitivities for the Group’s Swiss Solvency Test ratio(as of July 1, 2014)
215%
217%
212%
219%
187%
210%
100% Point at which FINMA would intervene
33%Minimum capital requirement in accordance with FINMA
Q4_2014_09_AR14_Risk review part1_en.indd 121 23.02.2015 16:31:41
Zurich Insurance GroupAnnual Report 2014122 Group performance review
AUDITED
Risk review continued
Regulatory requirements in other countries
Regulatory requirements in the European Economic AreaIn countries of the EEA, insurance entities are required to maintain minimum solvency margins according to the existing Solvency I legislation. Solvency I capital is calculated as a fixed percentage of premiums, claims, reserves and net amounts at risk. The same minimum capital requirements are applicable for insurance entities operating in Switzerland. In certain European countries, both EU and non-EU, further requirements have been imposed by regulators.
The directive on Solvency II was adopted on November 25, 2009. The complete framework will be introduced on January 1, 2016. Solvency II is designed to be more risk-sensitive and sophisticated in its approach than Solvency I. Solvency II capital requirements also take into account all material risks and how these interact. Under Solvency II, every insurance and reinsurance entity will be required to conduct its own risk and solvency assessment, including taking into account specific risk profiles. Under disclosure provisions, companies will have to publicly report their solvency and financial condition.
Zurich is fully engaged in order to meet Solvency II requirements when they enter into force. The Group intends to use its internal model, which aligns the Solvency II approach with that used for Z-ECM, for Zurich Insurance plc (Ireland) while other subsidiaries will use the Solvency II standard formula. The Group is in the pre-application process to gain regulatory approval for the internal model from the Central Bank of Ireland.
Regulatory requirements in the U.S.In the U.S., required capital is determined to be ‘company action level risk-based capital’ calculated using the National Association of Insurance Commissioners’ risk-based capital model. This method, which builds on regulatory accounts, measures the minimum amount of capital for an insurance company to support its overall business operations by taking into account its size and risk profile.
Regulatory requirements in Asia-Pacific, Latin America and Middle East and AfricaEvery country has a capital standard for insurance companies. Some jurisdictions, including Japan, Mexico and South Africa, are reviewing their economic capital requirements, considering similar approaches to Solvency II.
Economic capital adequacy
Internally, the Group uses its Zurich Economic Capital Model (Z-ECM), which also forms the basis of the SST model. The Z-ECM targets a total capital level that is calibrated to an “AA” financial strength. Zurich defines the Z-ECM capital required as being the capital required to protect the Group’s policyholders in order to meet all of their claims with a confidence level of 99.95 percent over a one-year time horizon.
The Group uses Z-ECM to assess the economic capital consumption of its business on a one-balance-sheet approach. Z-ECM is an integral part of how the Group is managed. It is embedded in the Group’s organization and decision-making processes, and is used in capital allocation, business performance management, pricing, reinsurance purchasing, transaction evaluation, risk optimization, and regulatory, investor, and rating agency communication. Z-ECM quantifies the capital required for insurance-related risk (including premium and reserve, natural catastrophe, business and life insurance), market risk (market/ALM), credit risk (including reinsurance credit and investment credit) and operational risks. In 2014, Zurich strengthened the validation of Z-ECM.
At the Group level, Zurich compares Z-ECM capital required to the Z-ECM available financial resources (Z-ECM AFR) to derive an Economic Solvency Ratio (Z-ECM ratio). Z-ECM AFR reflects financial resources available to cover policyholder liabilities in excess of their expected value. It is derived by adjusting the IFRS shareholders’ equity to reflect the full economic capital base available to absorb any unexpected volatility in the Group’s business activities.
Q4_2014_09_AR14_Risk review part1_en.indd 122 23.02.2015 16:31:42
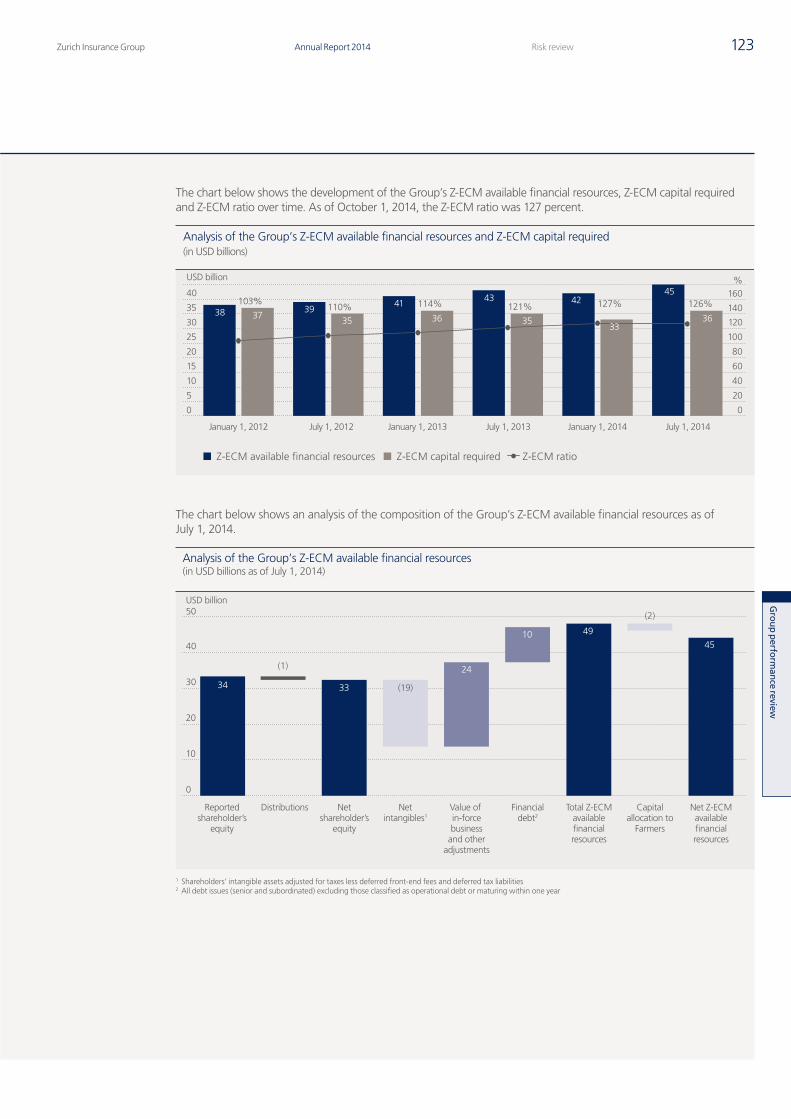
Zurich Insurance Group Annual Report 2014 123Risk review
Gro
up p
erform
ance review
The chart below shows the development of the Group’s Z-ECM available financial resources, Z-ECM capital required and Z-ECM ratio over time. As of October 1, 2014, the Z-ECM ratio was 127 percent.
Z-ECM available financial resources Z-ECM capital required Z-ECM ratio
40
USD billion
35
30
25
20
15
10
5
0
%
120
140
160
100
80
60
40
20
0
38 37
103%
January 1, 2012 July 1, 2012 January 1, 2013
3935
41
36110% 114%
43
35
121%42
33
127%45
36
126%
July 1, 2013 January 1, 2014 July 1, 2014
Analysis of the Group’s Z-ECM available financial resources and Z-ECM capital required(in USD billions)
The chart below shows an analysis of the composition of the Group’s Z-ECM available financial resources as of July 1, 2014.
1 Shareholders’ intangible assets adjusted for taxes less deferred front-end fees and deferred tax liabilities2 All debt issues (senior and subordinated) excluding those classified as operational debt or maturing within one year
Reportedshareholder’s
equity
Distributions Netshareholder’s
equity
Netintangibles1
Value of in-forcebusiness
and otheradjustments
Financialdebt2
Total Z-ECMavailablefinancialresources
Capitalallocation to
Farmers
Net Z-ECMavailablefinancialresources
34
(1)
(19)33
10
24
49
(2)
45
USD billion50
40
30
20
10
0
Analysis of the Group’s Z-ECM available financial resources(in USD billions as of July 1, 2014)
Q4_2014_09_AR14_Risk review part1_en.indd 123 23.02.2015 16:31:42
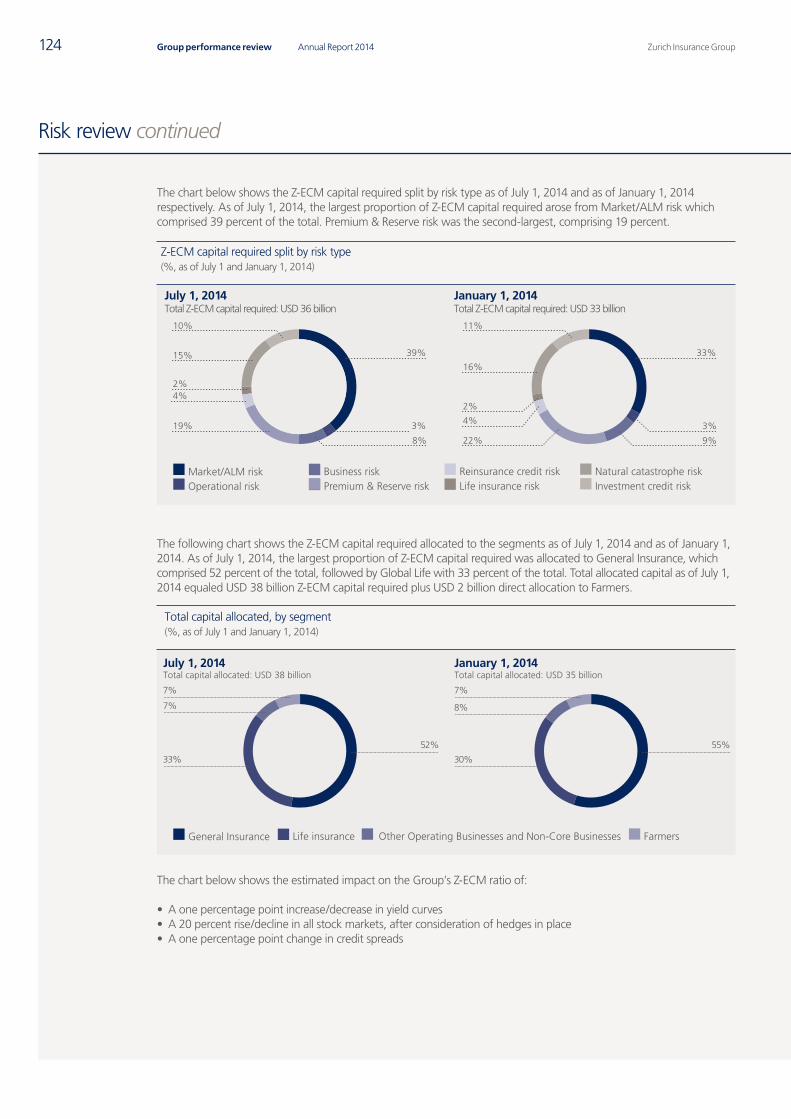
Zurich Insurance GroupAnnual Report 2014124 Group performance review
Risk review continued
The chart below shows the Z-ECM capital required split by risk type as of July 1, 2014 and as of January 1, 2014 respectively. As of July 1, 2014, the largest proportion of Z-ECM capital required arose from Market/ALM risk which comprised 39 percent of the total. Premium & Reserve risk was the second-largest, comprising 19 percent.
July 1, 2014Total Z-ECM capital required: USD 36 billion
Z-ECM capital required split by risk type(%, as of July 1 and January 1, 2014)
January 1, 2014Total Z-ECM capital required: USD 33 billion
Market/ALM risk Operational risk
Reinsurance credit risk Life insurance risk
Business riskPremium & Reserve risk
Natural catastrophe risk Investment credit risk
10%
15%
2%
19%
4%
8%
3%
39%
11%
16%
2%
4%
22% 9%
3%
33%
The following chart shows the Z-ECM capital required allocated to the segments as of July 1, 2014 and as of January 1, 2014. As of July 1, 2014, the largest proportion of Z-ECM capital required was allocated to General Insurance, which comprised 52 percent of the total, followed by Global Life with 33 percent of the total. Total allocated capital as of July 1, 2014 equaled USD 38 billion Z-ECM capital required plus USD 2 billion direct allocation to Farmers.
The chart below shows the estimated impact on the Group’s Z-ECM ratio of:
• A one percentage point increase/decrease in yield curves• A 20 percent rise/decline in all stock markets, after consideration of hedges in place• A one percentage point change in credit spreads
January 1, 2014Total capital allocated: USD 35 billion
Total capital allocated, by segment(%, as of July 1 and January 1, 2014)
7%
8%
30%
55%
July 1, 2014Total capital allocated: USD 38 billion
7%
7%
33%
52%
General Insurance Other Operating Businesses and Non-Core BusinessesLife insurance Farmers
Q4_2014_09_AR14_Risk review part1_en.indd 124 23.02.2015 16:31:43
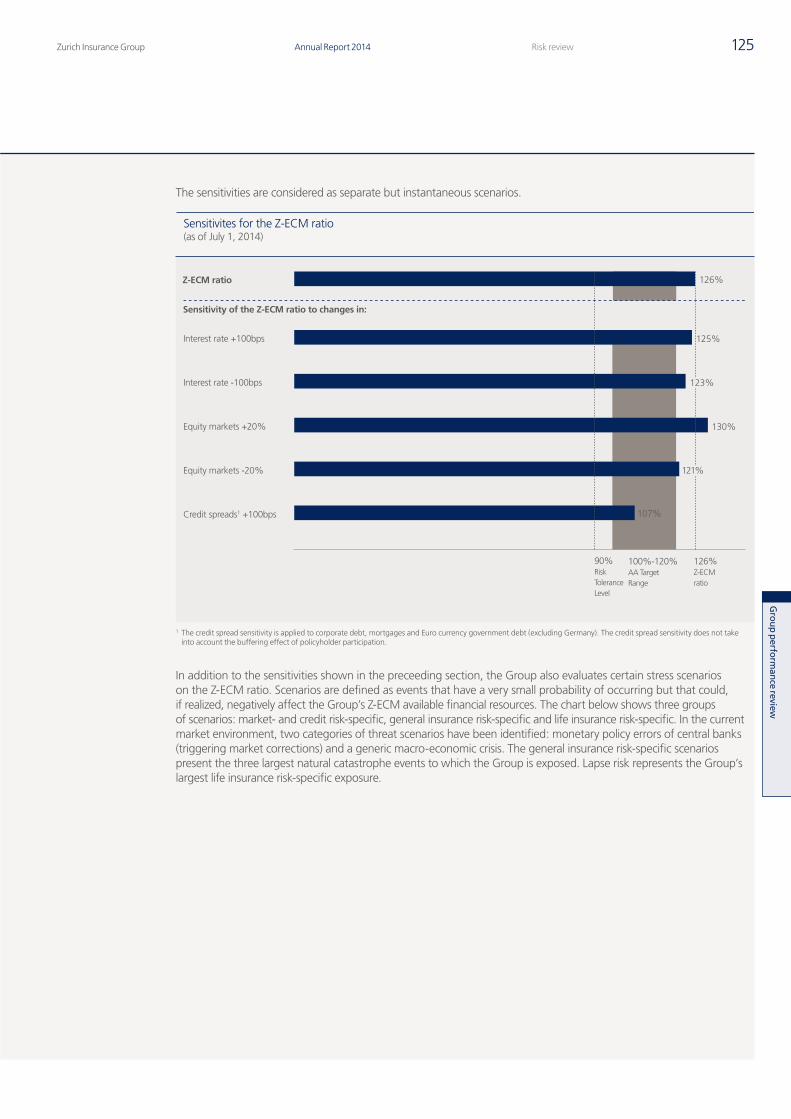
Zurich Insurance Group Annual Report 2014 125Risk review
Gro
up p
erform
ance review
The sensitivities are considered as separate but instantaneous scenarios.
1 The credit spread sensitivity is applied to corporate debt, mortgages and Euro currency government debt (excluding Germany). The credit spread sensitivity does not take into account the buffering effect of policyholder participation.
In addition to the sensitivities shown in the preceeding section, the Group also evaluates certain stress scenarios on the Z-ECM ratio. Scenarios are defined as events that have a very small probability of occurring but that could, if realized, negatively affect the Group’s Z-ECM available financial resources. The chart below shows three groups of scenarios: market- and credit risk-specific, general insurance risk-specific and life insurance risk-specific. In the current market environment, two categories of threat scenarios have been identified: monetary policy errors of central banks (triggering market corrections) and a generic macro-economic crisis. The general insurance risk-specific scenarios present the three largest natural catastrophe events to which the Group is exposed. Lapse risk represents the Group’s largest life insurance risk-specific exposure.
Sensitivity of the Z-ECM ratio to changes in:
Z-ECM ratio
Interest rate +100bps
Interest rate -100bps
Equity markets +20%
Equity markets -20%
Credit spreads1 +100bps
126%Z-ECMratio
Sensitivites for the Z-ECM ratio(as of July 1, 2014)
126%
125%
123%
130%
107%
121%
100%-120%AA Target Range
90%Risk Tolerance Level
Q4_2014_09_AR14_Risk review part1_en.indd 125 23.02.2015 16:31:43
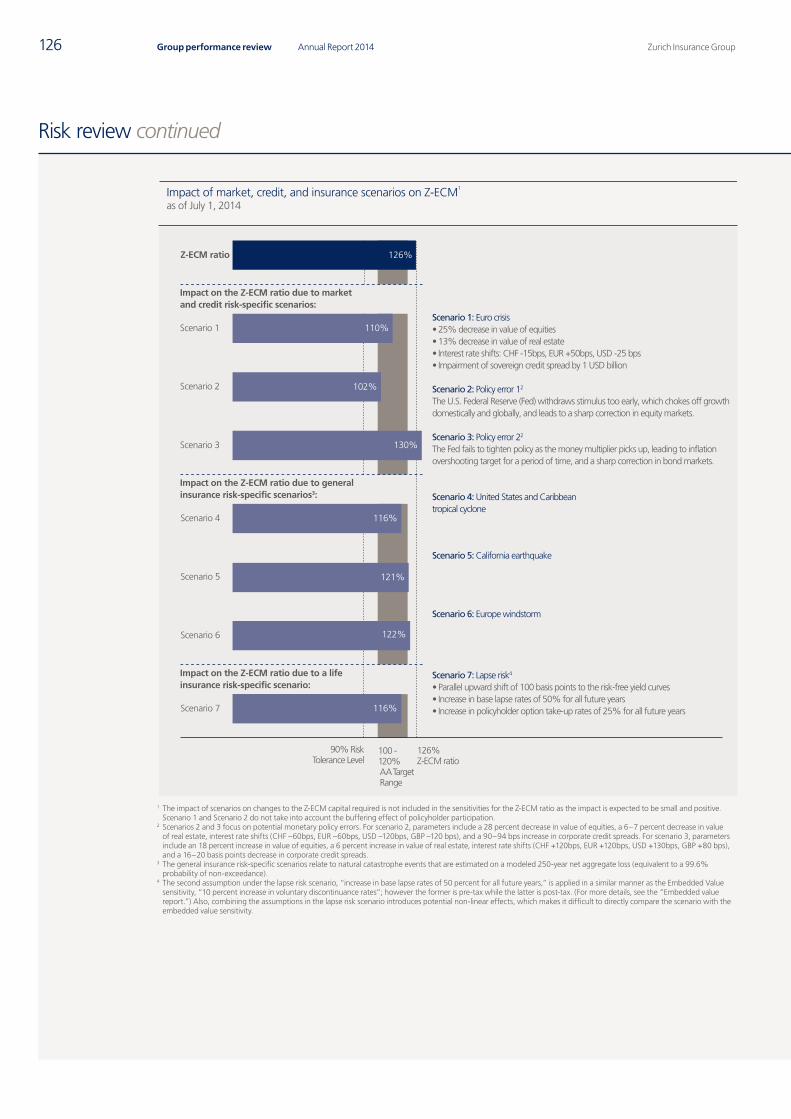
Zurich Insurance GroupAnnual Report 2014126 Group performance review
Risk review continued
Scenario 1: Euro crisis • 25% decrease in value of equities• 13% decrease in value of real estate • Interest rate shifts: CHF -15bps, EUR +50bps, USD -25 bps• Impairment of sovereign credit spread by 1 USD billion
Scenario 2: Policy error 12
The U.S. Federal Reserve (Fed) withdraws stimulus too early, which chokes off growth domestically and globally, and leads to a sharp correction in equity markets.
Scenario 3: Policy error 22
The Fed fails to tighten policy as the money multiplier picks up, leading to inflation overshooting target for a period of time, and a sharp correction in bond markets.
Scenario 4: United States and Caribbean tropical cyclone
Scenario 5: California earthquake
Scenario 6: Europe windstorm
Scenario 7: Lapse risk4
• Parallel upward shift of 100 basis points to the risk-free yield curves• Increase in base lapse rates of 50% for all future years• Increase in policyholder option take-up rates of 25% for all future years
Z-ECM ratio
Scenario 1
Scenario 2
Scenario 3
Scenario 4
Scenario 5
Scenario 6
Scenario 7
Impact of market, credit, and insurance scenarios on Z-ECM1
as of July 1, 2014
90% RiskTolerance Level
126% Z-ECM ratio
100 -120% AA Target Range
Impact on the Z-ECM ratio due to market and credit risk-specific scenarios:
Impact on the Z-ECM ratio due to general insurance risk-specific scenarios3:
Impact on the Z-ECM ratio due to a life insurance risk-specific scenario:
126%
110%
102%
116%
130%
121%
122%
116%
1 The impact of scenarios on changes to the Z-ECM capital required is not included in the sensitivities for the Z-ECM ratio as the impact is expected to be small and positive. Scenario 1 and Scenario 2 do not take into account the buffering effect of policyholder participation.
2 Scenarios 2 and 3 focus on potential monetary policy errors. For scenario 2, parameters include a 28 percent decrease in value of equities, a 6 – 7 percent decrease in value of real estate, interest rate shifts (CHF –60bps, EUR –60bps, USD –120bps, GBP –120 bps), and a 90 – 94 bps increase in corporate credit spreads. For scenario 3, parameters include an 18 percent increase in value of equities, a 6 percent increase in value of real estate, interest rate shifts (CHF +120bps, EUR +120bps, USD +130bps, GBP +80 bps), and a 16 – 20 basis points decrease in corporate credit spreads.
3 The general insurance risk-specific scenarios relate to natural catastrophe events that are estimated on a modeled 250-year net aggregate loss (equivalent to a 99.6% probability of non-exceedance).
4 The second assumption under the lapse risk scenario, “increase in base lapse rates of 50 percent for all future years,” is applied in a similar manner as the Embedded Value sensitivity, “10 percent increase in voluntary discontinuance rates”; however the former is pre-tax while the latter is post-tax. (For more details, see the “Embedded value report.”) Also, combining the assumptions in the lapse risk scenario introduces potential non-linear effects, which makes it difficult to directly compare the scenario with the embedded value sensitivity.
Q4_2014_09_AR14_Risk review part1_en.indd 126 23.02.2015 16:31:43
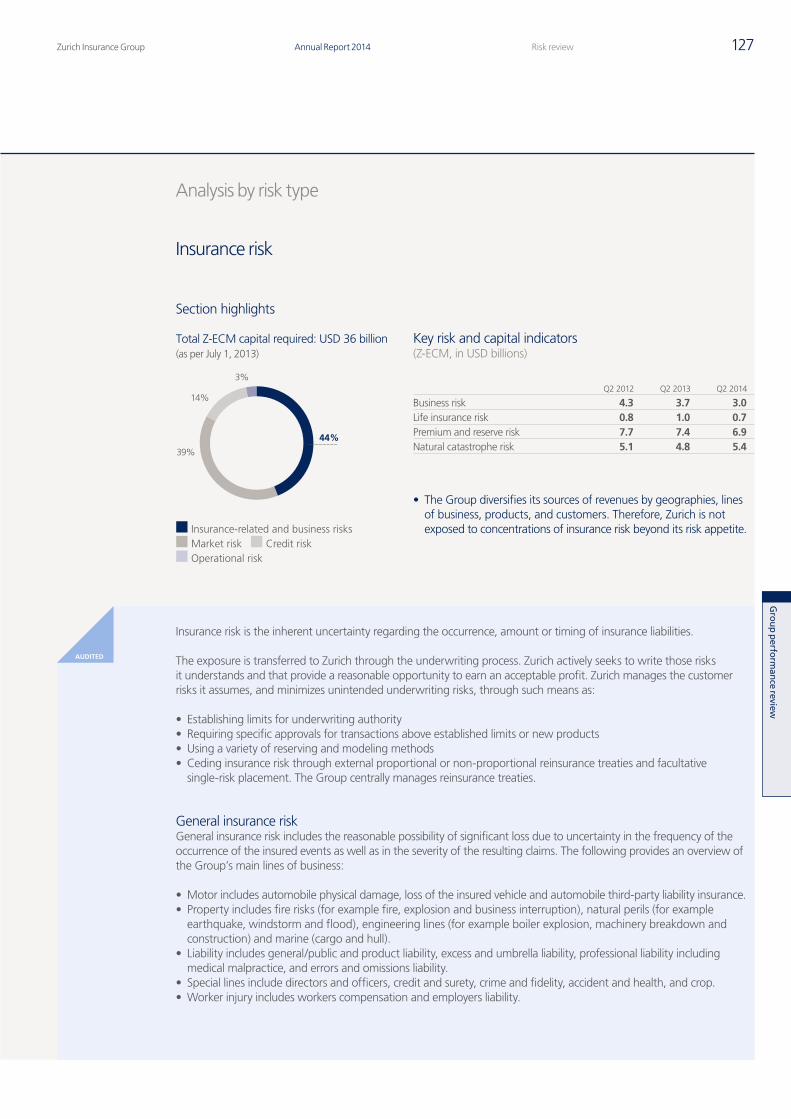
Zurich Insurance Group Annual Report 2014 127Risk review
Gro
up p
erform
ance review
AUDITED
Analysis by risk type
Insurance risk
Section highlights
Insurance risk is the inherent uncertainty regarding the occurrence, amount or timing of insurance liabilities.
The exposure is transferred to Zurich through the underwriting process. Zurich actively seeks to write those risks it understands and that provide a reasonable opportunity to earn an acceptable profit. Zurich manages the customer risks it assumes, and minimizes unintended underwriting risks, through such means as:
• Establishing limits for underwriting authority• Requiring specific approvals for transactions above established limits or new products• Using a variety of reserving and modeling methods• Ceding insurance risk through external proportional or non-proportional reinsurance treaties and facultative
single-risk placement. The Group centrally manages reinsurance treaties.
General insurance riskGeneral insurance risk includes the reasonable possibility of significant loss due to uncertainty in the frequency of the occurrence of the insured events as well as in the severity of the resulting claims. The following provides an overview of the Group’s main lines of business:
• Motor includes automobile physical damage, loss of the insured vehicle and automobile third-party liability insurance.• Property includes fire risks (for example fire, explosion and business interruption), natural perils (for example
earthquake, windstorm and flood), engineering lines (for example boiler explosion, machinery breakdown and construction) and marine (cargo and hull).
• Liability includes general/public and product liability, excess and umbrella liability, professional liability including medical malpractice, and errors and omissions liability.
• Special lines include directors and officers, credit and surety, crime and fidelity, accident and health, and crop.• Worker injury includes workers compensation and employers liability.
Key risk and capital indicators(Z-ECM, in USD billions)
Q2 2012 Q2 2013 Q2 2014
Business risk 4.3 3.7 3.0Life insurance risk 0.8 1.0 0.7Premium and reserve risk 7.7 7.4 6.9Natural catastrophe risk 5.1 4.8 5.4
• The Group diversifies its sources of revenues by geographies, lines of business, products, and customers. Therefore, Zurich is not exposed to concentrations of insurance risk beyond its risk appetite.
Total Z-ECM capital required: USD 36 billion(as per July 1, 2013)
44%
14%
39%
3%
Insurance-related and business risksCredit riskMarket risk
Operational risk
Q4_2014_10_AR14_Risk review part2_en.indd 127 23.02.2015 16:33:53
128 Zurich Insurance GroupAnnual Report 2014Group performance review
AUDITED
Risk review continued
The Group’s underwriting strategy aims to take advantage of the diversification of general insurance risks across lines of business and geographic regions. The Group seeks to optimize shareholder value by achieving its mid-term return on equity target. The Group’s major processes for underwriting governance – underwriting strategy, authorities, referrals and reviews – are implemented at Group and local levels.
Underwriting discipline is a fundamental part of managing insurance risk. The Group sets limits on underwriting capacity, and delegates authority to individuals based on their specific expertise. The Group sets appropriate pricing guidelines. These guidelines generally include a technical price set in line with common standards to allow a return on risk-based capital in line with the Group’s target. The ratio of actual premium to technical price is a key performance metric, which is monitored regularly. Technical reviews confirm whether underwriters perform within authorities and adhere to underwriting philosophies and policies. The Group has governance procedures to review and approve potential new products to evaluate whether the risks are well understood and justified by the potential rewards.
Actual losses on claims provisions may be higher or lower than anticipated. General insurance reserves are therefore regularly measured, reviewed and monitored. The total loss and loss adjustment expense reserves are based on work performed by qualified and experienced actuaries at local, regional and Group levels.
To arrive at their reserve estimates, the actuaries take into consideration, among other things, the latest available facts, historical trends and patterns of loss payments, exposure growth, court decisions, economic conditions, in particular inflation, and public attitudes that may affect the ultimate cost of claim settlement. Inflation is monitored on a country basis; the monitoring process relies on both Zurich’s economic view on inflation and specific claims activity, and feeds into actuarial models and Zurich’s underwriting processes such as technical price reviews.
In most cases, these actuarial analyses are conducted at least twice a year for on-going business according to agreed timetables. Analyses are performed by product line, type and extent of coverage and year of occurrence. As with any projection, claim reserve estimates are inherently uncertain due to the fact that the ultimate liability for claims will be affected by trends as yet unknown, including future changes in the likelihood of claimants bringing suit, the size of court awards, and claimants’ attitudes toward settlement of their claims.
The Group closely monitors potential new emerging risk exposures. Zurich has an Emerging Risk Group, with cross-functional expertise from core insurance functions such as underwriting, claims and risk to identify, assess and recommend actions for such risks.
In addition to the specific risks insured, each line of business could expose the Group to losses that could arise from natural and man-made catastrophes. The main concentrations of risks arising from such potential catastrophes are regularly reported to senior management. The most important peril regions and risks are U.S. and Caribbean tropical cyclone, Europe windstorm and California earthquake, as well as potential terrorism exposures.
Tables 2.a and 2.b show the Group’s concentration of risk within the General Insurance business by region and line of business based on direct written premiums before reinsurance. General insurance premiums ceded to reinsurers (including retrocessions) amounted to USD 5.5 billion and USD 6.0 billion for the years ended December 31, 2014 and 2013, respectively. Reinsurance programs are managed on a global basis, and therefore, net premium after reinsurance is monitored on an aggregated basis.
Table 2.a
General Insurance – Direct written premiums and policy fees by line of business – current period
in USD millions, for the year ended December 31, 2014 Motor Property Liability
Special
lines
Worker
injury Total
North America 1,492 3,310 3,529 1,790 2,613 12,734Europe, Middle East & Africa 6,077 5,026 2,554 2,208 522 16,387Other regions 2,018 1,477 431 1,148 157 5,230Total 9,587 9,813 6,515 5,146 3,291 34,351
Q4_2014_10_AR14_Risk review part2_en.indd 128 23.02.2015 16:33:53
129
Gro
up p
erform
ance review
Zurich Insurance Group Annual Report 2014 Risk review
AUDITED
Table 2.b
General Insurance – Direct written premiums and policy fees by line of business – prior period
in USD millions, for the year ended December 31, 2013 Motor Property Liability
Special
lines
Worker
injury Total
North America 1,414 3,501 3,454 1,695 2,558 12,621Europe, Middle East & Africa 6,163 5,003 2,480 2,154 485 16,286Other regions 2,168 1,591 442 958 174 5,333Total 9,746 10,095 6,376 4,806 3,217 34,240
Analysis of sensitivities for general insurance riskTables 3.a and 3.b show the sensitivity of net income before tax and the sensitivity of net assets, using the Group effective income tax rate, as a result of adverse development in the net loss ratio by one percentage point. Such an increase could develop either due to the insured events happening more frequently or due to resulting claims becoming more severe, or from a combination of frequency and severity. The sensitivities do not indicate a probability of such an event and do not consider any non-linear effects of reinsurance. Based on the assumptions applied in the sensitivity analysis in tables 3.a and 3.b, each additional percentage point increase in the loss ratio would have a linear impact on net income before tax and net assets. The Group also monitors insurance risk by evaluating extreme scenarios, taking into account non-linear effects of reinsurance contracts.
Table 3.a
Insurance risk sensitivity for the General Insurance business – current period
in USD millions, for the year ended December 31, 2014
Global
Corporate
North
America
Commercial
Europe,
Middle East &
Africa
International
Markets
+1% in net loss ratioNet income before tax (63) (77) (122) (38)Net assets (46) (56) (89) (28)
Table 3.b
Insurance risk sensitivity for the General Insurance business – prior period
in USD millions, for the year ended December 31, 2013
Global
Corporate
North
America
Commercial
Europe,
Middle East &
Africa
International
Markets
+1% in net loss ratioNet income before tax (61) (76) (122) (38)Net assets (46) (57) (92) (29)
Modeling natural catastrophesWhile specific catastrophes are unpredictable, modeling helps to determine potential losses should catastrophes occur. The Group uses adjusted third-party models to manage its underwriting and accumulations to stay within intended exposure limits and to guide how much reinsurance Zurich buys.
To have a consistent approach and form a global perspective on accumulations, the Group models exposures in a center of excellence, which works with local businesses to help improve the overall quality of data. The Group models potential losses from property policies in hazard-prone areas with material exposure and from workers’ compensation policies covering earthquakes in California. Other non-property-related losses are estimated based on adjustments. Risk modeling mainly addresses climate-induced perils such as windstorms, river floods, tornadoes and hail, and geologically-induced perils such as earthquakes. The Group constantly seeks to improve its modeling, fill in gaps in models with additional assessments, and increase the granularity of data collection. It uses internal and external knowledge in modeling accumulations. One such source of external knowledge is the Natural Catastrophe Advisory Council, a group of scientists associated with research organizations such as the U.S. National Center for Atmospheric Research, the U. S. Geological Survey and the Intergovernmental Panel on Climate Change. Zurich further validates modeling results by comparing them with claims experience.
Q4_2014_10_AR14_Risk review part2_en.indd 129 23.02.2015 16:33:54
130 Zurich Insurance GroupAnnual Report 2014Group performance review
AUDITED
Risk review continued
Risks from man-made catastrophesMan-made catastrophes include such risks as industrial accidents and terrorism attacks. Zurich’s experience in monitoring potential exposures to natural catastrophes is also applicable to threats posed by man-made catastrophes, particularly terrorism.
The Group reviews and aggregates worker injury and property exposures to identify areas of significant concentration and assesses other lines of business, such as liability and auto, although the potential exposure is not as significant. The data allows underwriters to evaluate how insuring a particular customer’s risk might affect Zurich’s overall exposure. In North America, Zurich uses a vendor-provided catastrophe model to evaluate potential exposures in every major U.S. city. The Group undertakes more detailed and frequent analyses for cities in which Zurich has greater exposure.
The Group’s analysis has shown that its exposures outside North America are lower, in large part due to government-provided pools; even so, the Group assesses the risk for countries with the next-greatest potential net exposure. The Group periodically monitors accumulation limits for these and other areas.
Life insurance riskThe risks associated with life insurance include:
• Mortality risk – actual policyholder death experience on life insurance policies is higher than expected.• Longevity risk – annuitants live longer than expected.• Morbidity risk – policyholder health-related claims are higher than expected.• Policyholder behavior risk – policyholders’ behavior in discontinuing and reducing contributions or withdrawing
benefits prior to the maturity of contracts is worse than expected. Poor persistency rates may lead to fewer policies remaining on the books to defray future fixed expenses and therefore reduce the future positive cash flows from the business written, potentially affecting Zurich’s ability to recover deferred acquisition expenses.
• Expense risk – expenses incurred in acquiring and administering policies are higher than expected.• Market risk – the risk associated with the Group’s balance sheet positions where the value or cash flow depends
on financial markets, which is analyzed in the ‘market risk’ section.• Credit risk – the risk associated with a loss or potential loss from counterparties failing to fulfill their financial
obligations, which is analyzed in the ‘credit risk’ section.
A more diversified portfolio of risks is less likely to be affected across the board by a change in any subset of the risks. As a result, the offsetting effects between unit-linked and traditional business reduce some of the risk associated with the Global Life business.
The Group has local product development committees and a Group-level product approval committee to analyze potential new life products that could significantly increase or change the nature of its risks. The Group regularly reviews the continued suitability and the potential risks of existing life products.
The Group uses market-consistent embedded value reporting principles, which allow Zurich to increase understanding, and report on, the risk profile of its life products, and how these risks would change under different market conditions. Embedded value is the measure that markets use to value life businesses. For more information, see the ‘embedded value report.’
From a risk-management perspective, unit-linked products are designed to reduce much of the market and credit risk associated with the Group’s traditional business. Risks that are inherent in these products are largely passed on to the policyholder, although a portion of the Group’s management fees are linked to the value of funds under management, and hence are at risk if fund values decrease. To the extent that there are guarantees built into the product design, unit-linked products carry mortality/morbidity risk and market risk. Contracts may have minimum guaranteed death benefits where the sum at risk depends on the fair value of the underlying investments. For certain contracts these risks are mitigated by explicit mortality and morbidity charges.
Other life insurance liabilities include traditional life insurance products, such as protection and life annuity products. Protection products carry mortality, longevity and morbidity risk, as well as market and credit risk. Epidemics and lifestyle changes are among the most significant factors that could result in earlier or more claims than expected. Disability, defined in terms of the ability to perform an occupation, could be affected by economic conditions. To reduce pricing cross-subsidies, where permitted, premiums are adjusted for factors such as age, gender and smoker status. Policy terms and conditions and disclosure requirements in insurance applications are designed to mitigate the risk arising from non-standard and unpredictable risks that could result in severe financial loss.
Q4_2014_10_AR14_Risk review part2_en.indd 130 23.02.2015 16:33:54
131
Gro
up p
erform
ance review
Zurich Insurance Group Annual Report 2014 Risk review
AUDITEDIn the life annuity business, medical advances and improved social conditions that lead to increased longevity are the most significant insurance risk. Annuitant (beneficiary) mortality assumptions include allowance for future mortality improvements.
The Group is also exposed to risks posed by policyholder behavior, and expenses. Policyholder behavior risk is mitigated by designing products that, as closely as possible, match revenue and expenses associated with the contract. Expense risk is reduced by carefully controlling expenses, and through regular expense analysis and allocation exercises.
Liabilities have been recorded for some life insurance contracts that contain guarantees for additional benefits and minimum guarantees; these are primarily in the subsidiary Zurich American Life Insurance Company (ZALICO), which in the past wrote variable annuity contracts that provide policyholders with certain guarantees related to minimum death and income benefits. After 2001, ZALICO stopped issuing new policies with such features. The Group has a dynamic hedging strategy to manage its economic exposure and reduce the volatility associated with its closed book of variable annuities products within its U.S. life business. New life products developed with financial guarantees are subject to review and approval by the Group-level product approval committee. The Group is also exposed to risks arising out of bank-owned life insurance contracts sold in the U.S. See heading ‘other contracts’ in note 7 of the consolidated financial statements for additional information.
The Group defines concentration risk in the Global Life business as the risk of exposure to increased losses associated with inadequately diversified portfolios of assets or obligations. Concentration risk for a life insurer may arise with respect to investments in a geographical area, economic sector, or individual issuers, or due to a concentration of business written within a geographical area, of a policy type, or of underlying risks covered.
Zurich is exposed to two main types of concentration risk in its Global Life business:
• From a market risk perspective, interest rate guarantees in Germany and Switzerland expose Zurich to financial losses that may arise as a result of adverse movements in interest rates. The Group also wrote a small book of variable annuity business in the U.S. with minimum guaranteed death benefits, but ceased writing new business in 2012. The management of these guarantees is a combination of asset-liability matching and hedging; see the ‘market risk’ section.
• From an insurance risk perspective, the main factors that would affect concentration risk include mortality risk, morbidity risk, longevity risk, policyholder behavior risk (lapse, anti-selection) and expense risk. Due to diversification across geographical regions, lines of business and even across different insurance risk factors, Zurich is not exposed to significant concentrations of insurance risk.
Table 4 shows the Group’s concentration of risk within the life business by region and line of business based on reserves for life insurance on a net basis. The Group’s exposure to life insurance risks varies significantly by geographic region and line of business and may change over time. See note 8 of the consolidated financial statements for additional information on reserves for insurance contracts.
Q4_2014_10_AR14_Risk review part2_en.indd 131 23.02.2015 16:33:54
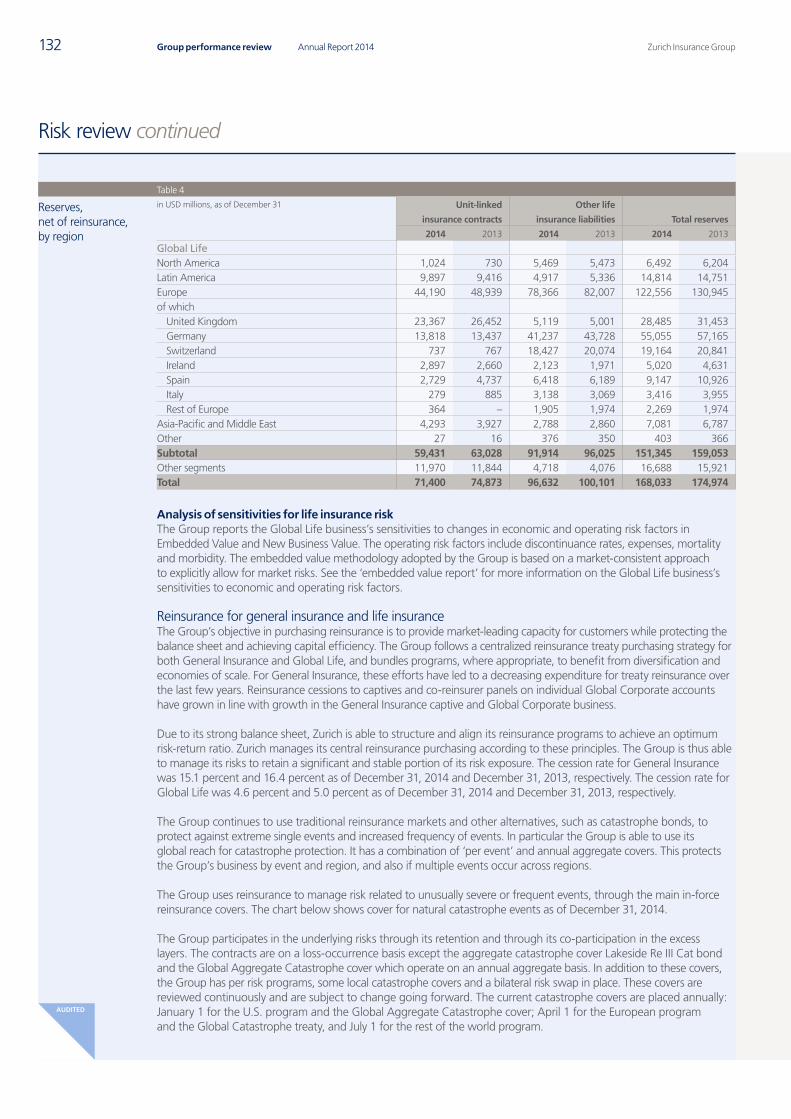
132
AUDITED
Zurich Insurance GroupAnnual Report 2014Group performance review
AUDITED
Risk review continued
Table 4
Reserves, net of reinsurance, by region
in USD millions, as of December 31 Unit-linked
insurance contracts
Other life
insurance liabilities Total reserves
2014 2013 2014 2013 2014 2013
Global LifeNorth America 1,024 730 5,469 5,473 6,492 6,204Latin America 9,897 9,416 4,917 5,336 14,814 14,751Europe 44,190 48,939 78,366 82,007 122,556 130,945of which
United Kingdom 23,367 26,452 5,119 5,001 28,485 31,453Germany 13,818 13,437 41,237 43,728 55,055 57,165Switzerland 737 767 18,427 20,074 19,164 20,841Ireland 2,897 2,660 2,123 1,971 5,020 4,631Spain 2,729 4,737 6,418 6,189 9,147 10,926Italy 279 885 3,138 3,069 3,416 3,955Rest of Europe 364 – 1,905 1,974 2,269 1,974
Asia-Pacific and Middle East 4,293 3,927 2,788 2,860 7,081 6,787Other 27 16 376 350 403 366Subtotal 59,431 63,028 91,914 96,025 151,345 159,053Other segments 11,970 11,844 4,718 4,076 16,688 15,921Total 71,400 74,873 96,632 100,101 168,033 174,974
Analysis of sensitivities for life insurance riskThe Group reports the Global Life business’s sensitivities to changes in economic and operating risk factors in Embedded Value and New Business Value. The operating risk factors include discontinuance rates, expenses, mortality and morbidity. The embedded value methodology adopted by the Group is based on a market-consistent approach to explicitly allow for market risks. See the ‘embedded value report’ for more information on the Global Life business’s sensitivities to economic and operating risk factors.
Reinsurance for general insurance and life insuranceThe Group’s objective in purchasing reinsurance is to provide market-leading capacity for customers while protecting the balance sheet and achieving capital efficiency. The Group follows a centralized reinsurance treaty purchasing strategy for both General Insurance and Global Life, and bundles programs, where appropriate, to benefit from diversification and economies of scale. For General Insurance, these efforts have led to a decreasing expenditure for treaty reinsurance over the last few years. Reinsurance cessions to captives and co-reinsurer panels on individual Global Corporate accounts have grown in line with growth in the General Insurance captive and Global Corporate business.
Due to its strong balance sheet, Zurich is able to structure and align its reinsurance programs to achieve an optimum risk-return ratio. Zurich manages its central reinsurance purchasing according to these principles. The Group is thus able to manage its risks to retain a significant and stable portion of its risk exposure. The cession rate for General Insurance was 15.1 percent and 16.4 percent as of December 31, 2014 and December 31, 2013, respectively. The cession rate for Global Life was 4.6 percent and 5.0 percent as of December 31, 2014 and December 31, 2013, respectively.
The Group continues to use traditional reinsurance markets and other alternatives, such as catastrophe bonds, to protect against extreme single events and increased frequency of events. In particular the Group is able to use its global reach for catastrophe protection. It has a combination of ‘per event’ and annual aggregate covers. This protects the Group’s business by event and region, and also if multiple events occur across regions.
The Group uses reinsurance to manage risk related to unusually severe or frequent events, through the main in-force reinsurance covers. The chart below shows cover for natural catastrophe events as of December 31, 2014.
The Group participates in the underlying risks through its retention and through its co-participation in the excess layers. The contracts are on a loss-occurrence basis except the aggregate catastrophe cover Lakeside Re III Cat bond and the Global Aggregate Catastrophe cover which operate on an annual aggregate basis. In addition to these covers, the Group has per risk programs, some local catastrophe covers and a bilateral risk swap in place. These covers are reviewed continuously and are subject to change going forward. The current catastrophe covers are placed annually: January 1 for the U.S. program and the Global Aggregate Catastrophe cover; April 1 for the European program and the Global Catastrophe treaty, and July 1 for the rest of the world program.
Q4_2014_10_AR14_Risk review part2_en.indd 132 23.02.2015 16:33:55
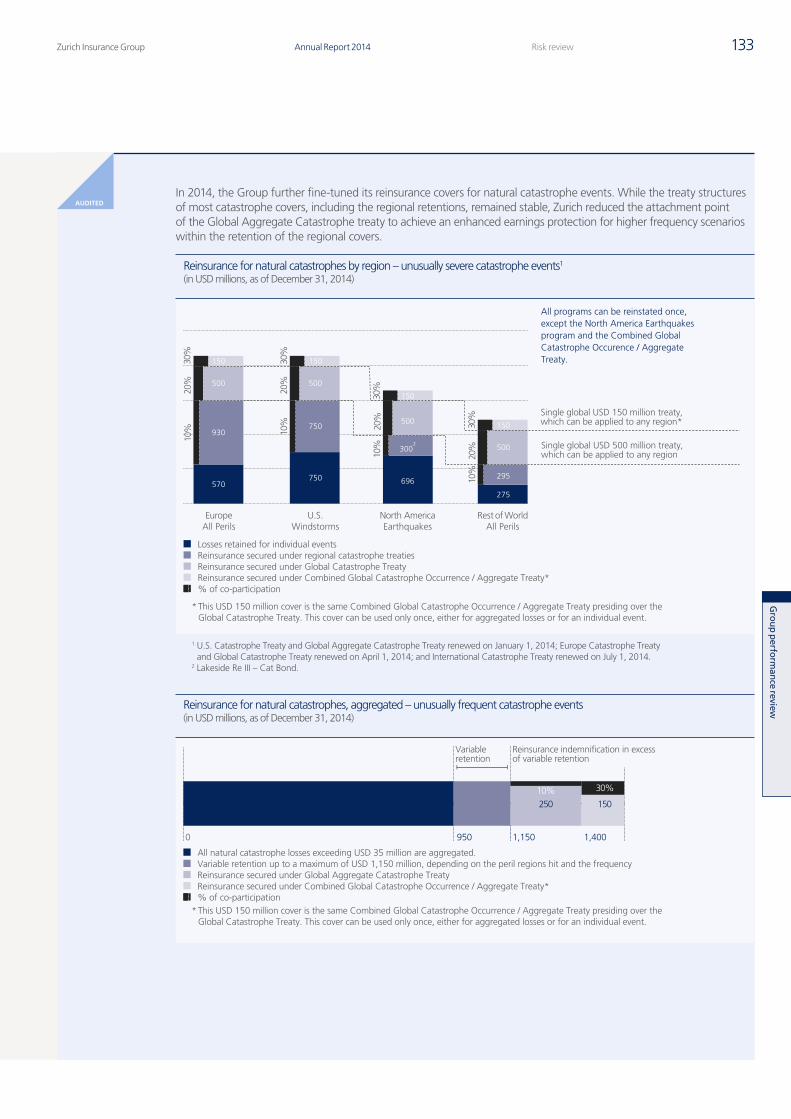
133
Gro
up p
erform
ance review
Zurich Insurance Group Annual Report 2014 Risk review
AUDITEDIn 2014, the Group further fine-tuned its reinsurance covers for natural catastrophe events. While the treaty structures of most catastrophe covers, including the regional retentions, remained stable, Zurich reduced the attachment point of the Global Aggregate Catastrophe treaty to achieve an enhanced earnings protection for higher frequency scenarios within the retention of the regional covers.
0
Reinsurance for natural catastrophes, aggregated – unusually frequent catastrophe events(in USD millions, as of December 31, 2014)
Reinsurance indemnification in excessof variable retention
Variable retention
0 950 1,4001,150
All natural catastrophe losses exceeding USD 35 million are aggregated.Variable retention up to a maximum of USD 1,150 million, depending on the peril regions hit and the frequencyReinsurance secured under Global Aggregate Catastrophe TreatyReinsurance secured under Combined Global Catastrophe Occurrence / Aggregate Treaty*% of co-participation
30%10%
250 150
* This USD 150 million cover is the same Combined Global Catastrophe Occurrence / Aggregate Treaty presiding over the Global Catastrophe Treaty. This cover can be used only once, either for aggregated losses or for an individual event.
Reinsurance for natural catastrophes by region – unusually severe catastrophe events1
(in USD millions, as of December 31, 2014)
750
750
500
150
696
3002
500
150
570
930
500
150
275
295
500
150
Single global USD 150 million treaty, which can be applied to any region*
* This USD 150 million cover is the same Combined Global Catastrophe Occurrence / Aggregate Treaty presiding over the Global Catastrophe Treaty. This cover can be used only once, either for aggregated losses or for an individual event.
Single global USD 500 million treaty, which can be applied to any region
Losses retained for individual eventsReinsurance secured under regional catastrophe treatiesReinsurance secured under Global Catastrophe TreatyReinsurance secured under Combined Global Catastrophe Occurrence / Aggregate Treaty*% of co-participation
EuropeAll Perils
U.S.Windstorms
North AmericaEarthquakes
Rest of WorldAll Perils
10%
20%
30%
10%
20%
30%
10%
20%
30%
10%
20%
30%
All programs can be reinstated once, except the North America Earthquakes program and the Combined Global Catastrophe Occurence / Aggregate Treaty.
1 U.S. Catastrophe Treaty and Global Aggregate Catastrophe Treaty renewed on January 1, 2014; Europe Catastrophe Treaty and Global Catastrophe Treaty renewed on April 1, 2014; and International Catastrophe Treaty renewed on July 1, 2014.2 Lakeside Re III – Cat Bond.
Q4_2014_10_AR14_Risk review part2_en.indd 133 23.02.2015 16:33:55
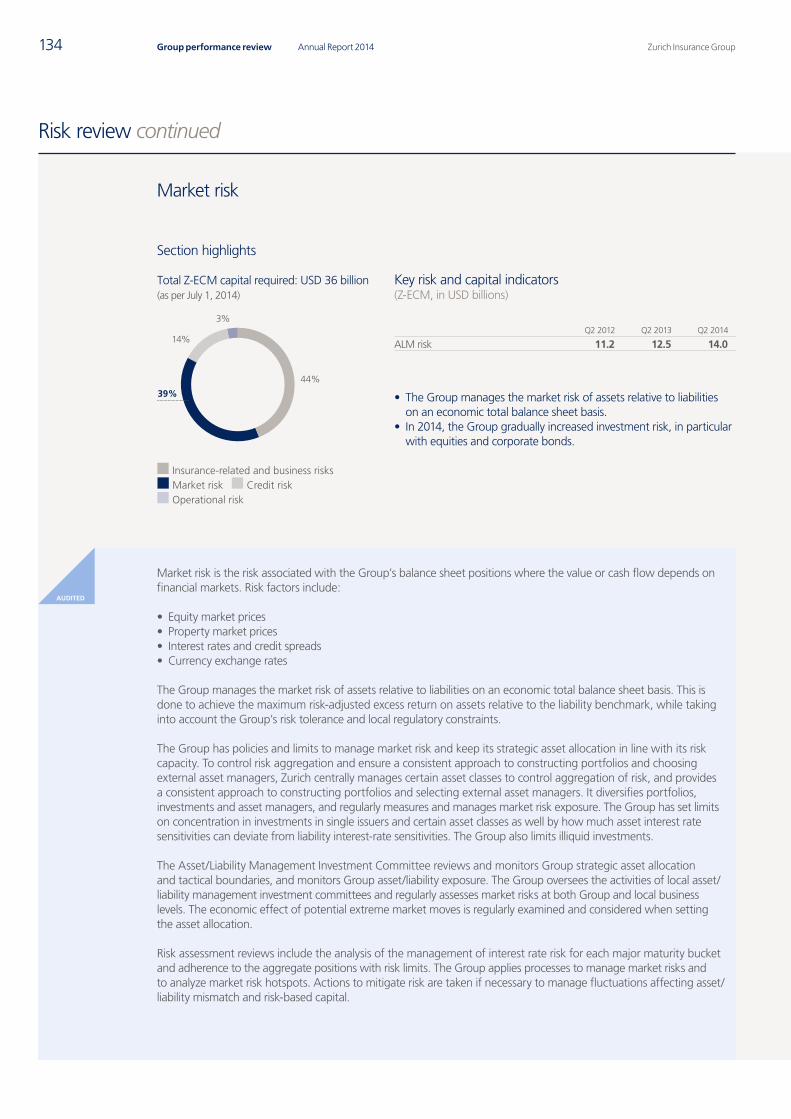
Zurich Insurance GroupAnnual Report 2014134 Group performance review
AUDITED
Risk review continued
Market risk
Section highlights
Market risk is the risk associated with the Group’s balance sheet positions where the value or cash flow depends on financial markets. Risk factors include:
• Equity market prices• Property market prices• Interest rates and credit spreads• Currency exchange rates
The Group manages the market risk of assets relative to liabilities on an economic total balance sheet basis. This is done to achieve the maximum risk-adjusted excess return on assets relative to the liability benchmark, while taking into account the Group’s risk tolerance and local regulatory constraints.
The Group has policies and limits to manage market risk and keep its strategic asset allocation in line with its risk capacity. To control risk aggregation and ensure a consistent approach to constructing portfolios and choosing external asset managers, Zurich centrally manages certain asset classes to control aggregation of risk, and provides a consistent approach to constructing portfolios and selecting external asset managers. It diversifies portfolios, investments and asset managers, and regularly measures and manages market risk exposure. The Group has set limits on concentration in investments in single issuers and certain asset classes as well by how much asset interest rate sensitivities can deviate from liability interest-rate sensitivities. The Group also limits illiquid investments.
The Asset/Liability Management Investment Committee reviews and monitors Group strategic asset allocation and tactical boundaries, and monitors Group asset/liability exposure. The Group oversees the activities of local asset/liability management investment committees and regularly assesses market risks at both Group and local business levels. The economic effect of potential extreme market moves is regularly examined and considered when setting the asset allocation.
Risk assessment reviews include the analysis of the management of interest rate risk for each major maturity bucket and adherence to the aggregate positions with risk limits. The Group applies processes to manage market risks and to analyze market risk hotspots. Actions to mitigate risk are taken if necessary to manage fluctuations affecting asset/liability mismatch and risk-based capital.
Key risk and capital indicators(Z-ECM, in USD billions)
Q2 2012 Q2 2013 Q2 2014
ALM risk 11.2 12.5 14.0
• The Group manages the market risk of assets relative to liabilities on an economic total balance sheet basis.
• In 2014, the Group gradually increased investment risk, in particular with equities and corporate bonds.
Total Z-ECM capital required: USD 36 billion(as per July 1, 2014)
44%
14%
39%
3%
Insurance-related and business risksCredit riskMarket risk
Operational risk
Q4_2014_10_AR14_Risk review part2_en.indd 134 23.02.2015 16:33:56
135
Gro
up p
erform
ance review
Zurich Insurance Group Annual Report 2014 Risk review
AUDITEDThe Group uses derivative financial instruments to limit market risks arising from changes in currency exchange rates, interest rates and equity prices, from credit quality of assets and liabilities and commitments to third parties. The Group enters into derivative financial instruments mostly for economic hedging purposes and, in limited circumstances, the instruments may also meet the definition of an effective hedge for accounting purposes. The latter include cross- currency interest rate swaps in fair value hedges and cross-currency swaps in cash flow hedges of Zurich’s borrowings, in order to mitigate exposure to foreign currency and interest rate risk. In compliance with Swiss insurance regulation, the Group’s policy prohibits speculative trading in derivatives, meaning a pattern of “in and out” activity without reference to an underlying position. Derivatives are complex financial transactions; therefore, the Group addresses the risks arising from derivatives through a stringent policy that requires approval of a derivative program before transactions are initiated, and by subsequent regular monitoring by Group Risk Management of open positions and annual reviews of derivative programs.
For more information on the Group’s investment result, including impairments and the treatment of selected financial instruments, see note 6 of the consolidated financial statements. For more information on derivative financial instruments and hedge accounting, see note 7 of the consolidated financial statements.
Risk from equity securities and propertyThe Group is exposed to risks from price fluctuations on equity securities and property which could affect the Group’s liquidity, reported income, surplus and regulatory capital position. Equity risk exposure includes common stocks, including equity unit trusts, common stock portfolios backing participating-with-profit policyholder contracts, and equities held for employee benefit plans. Exposure to property risk includes direct holdings in property, listed property company shares and funds, as well as property debt securities such as commercial and residential mortgages, commercial and residential mortgage-backed securities and mezzanine debt. Returns on unit-linked contracts, whether classified as insurance or investment contracts, may be exposed to risks from equity and property, but these risks are borne by policyholders. However, the Group is indirectly exposed to market movements from unit-linked contracts with respect to both earnings and economic capital. Market movements affect the amount of fee income earned when the fee income level is dependent on the valuation of the asset base. Therefore, the value of in-force business for unit-linked business can be negatively affected by adverse movements in equity and property markets.
The Group manages its risks from equity securities and property as part of the overall investment risk management process, and applies limits as expressed in policies and guidelines. Specifically, Zurich limits holdings in equities, real estate and alternative investments.
For additional information on equity securities and investment property, see note 6 of the consolidated financial statements.
Risk from interest rate and credit spreadInterest rate risk is the risk of loss resulting from changes in interest rates, including changes in the shape of yield curves. The Group is exposed to interest rate risk including from debt securities, reserves for insurance contracts, liabilities for investment contracts, employee benefit plans and loans and receivables.
Zurich has limits on holdings in real assets and limits on deviations of asset interest rate sensitivities from liability interest rate sensitivities. The Group also manages credit spread risk, which describes the sensitivity of the values of assets and liabilities due to changes in the level or the volatility of credit spreads over the risk-free interest rate yield curves.
Returns on unit-linked contracts, whether classified as insurance or investment contracts, are at the risk of the policyholder; however, the Group is exposed to fluctuations in interest rates in so far as they affect the amount of fee income earned if the fee income level is dependent on the valuation of the asset base.
During 2014, the Group gradually increased investment risk, in particular with equities and corporate bonds.
Q4_2014_10_AR14_Risk review part2_en.indd 135 23.02.2015 16:33:56
136 Zurich Insurance GroupAnnual Report 2014Group performance review
AUDITED
Risk review continued
Analysis of market risk sensitivities
Basis of presentation – General Insurance and rest of the businessThe basis of the presentation for tables 5, 6 and 7 is an economic valuation represented by the fair value for Group investments, IFRS insurance liabilities discounted at risk-free market rates (the Group describes risk-free market rates as swap rates) to reflect the present value of insurance liability cash flows and other liabilities, for example own debt. In the sensitivities, own debt does not include subordinated debt, which Zurich considers available to protect policyholders in a worst-case scenario.
Table 5, 6 and 7 shows the estimated economic market risk sensitivities of Group investments, including investment property, liabilities, including insurance and financial liabilities, and the net impact for General Insurance and the rest of the business. Positive values represent an increase in the balance, and values in parentheses represent a decrease. Mismatches in changes in value of assets relative to liabilities represent an economic risk to the Group. The net impact – the difference between the impact on Group investments and liabilities – represents the economic risk related to changes in market risk factors that the Group faces.
In determining the sensitivities, investments and liabilities are fully re-valued in the given scenarios. Each instrument is re-valued separately taking the relevant product features into account. Non-linear effects, where they exist, are reflected in the model. The sensitivities are shown after tax. They do not include the impact of transactions within the Group.
Sensitivities for the rest of the business include Farmers, Other Operating Businesses and Non-Core Businesses. In 2013, the analysis for Non-Core Businesess that included business with life insurance characteristics was based on market-consistent embedded value market-risk sensitivities. In 2014, the basis of presentation for this business is the same as for General Insurance and the rest of the business.
Basis of presentation – Global LifeTables 5, 6 and 7 show the estimated economic sensitivity of the embedded value of the Global Life business to financial market movements. Actions that would be taken by management or policyholders are considered. For contracts with financial options and guarantees, such as some participating business, movements in financial markets can change the nature and value of these benefits. The dynamics of these liabilities are captured so that this exposure is quantified, monitored, managed and where appropriate, mitigated.
For more information, see the ‘embedded value report’.
Q4_2014_10_AR14_Risk review part2_en.indd 136 23.02.2015 16:33:56
137
Gro
up p
erform
ance review
Zurich Insurance Group Annual Report 2014 Risk review
AUDITEDAnalysis of economic sensitivities for interest rate riskTable 5 shows the estimated impacts of a 100 basis point increase/decrease in yield curves after consideration of hedges in place, as of December 31, 2014 and 2013, respectively.
Table 5
Economic interest rate sensitivities
In USD millions, as of December 31 2014 2013
100 basis points increase in the interest rate yield curvesGeneral Insurance business Net impact after tax (220) (509)Global Life business Total impact on Embedded Value (65) (425)Rest of the business Net impact after tax (47) (172)100 basis points decrease in the interest rate yield curvesGeneral Insurance business Net impact after tax (17) 434Global Life business Total impact on Embedded Value (222) 437Rest of the business Net impact after tax 143 234
Analysis of economic sensitivities for equity riskTable 6 shows the estimated impacts from a 10 percent decline in stock markets, after consideration of hedges in place, as of December 31, 2014 and 2013, respectively.
Table 6
Economic equity price sensitivities
In USD millions, as of December 31 2014 2013
10% decline in stock marketsGeneral Insurance business Net impact after tax (541) (394)Global Life business Total impact on Embedded Value (301) (279)Rest of the business Net impact after tax (61) (85)
Q4_2014_10_AR14_Risk review part2_en.indd 137 23.02.2015 16:33:57
138
AUDITED
Zurich Insurance GroupAnnual Report 2014Group performance review
AUDITED
Risk review continued
Analysis of economic sensitivities for credit spread riskTable 7 shows the estimated impacts from a 100 basis points increase in corporate credit spreads, as of December 31, 2014 and 2013, respectively. The sensitivities apply to all fixed income instruments, excluding government, supranational and similar debt securities.
Table 7
Economic credit spread sensitivities
In USD millions, as of December 31 2014 2013
100 basis points increase in credit spreadsGeneral Insurance business Net impact after tax (1,383) (1,310)Global Life business Total impact on Embedded Value (884) (901)Rest of the business Net impact after tax (421) (285)
Limitations of the analysis for General Insurance and rest of the business: – The sensitivities show the effects of a change of certain risk factors, while other assumptions remain unchanged. – The interest rate scenarios assume a parallel shift of all interest rates in the respective currencies. They do not take into account the possibility that interest rate changes
might differ by rating class; these are disclosed separately as credit spread risk sensitivities. – The sensitivity analysis is based on economic net assets, and not on shareholders’ equity or net income as set out in the consolidated financial statements. – The sensitivity analysis is calculated after tax; the Group effective tax rate is 27.3 percent for 2014 and 24.9 percent for 2013. – The equity market scenarios assume a concurrent movement of all stock markets. – The sensitivity analysis does not take into account actions that might be taken to mitigate losses. Actions may involve changing the asset allocation, for example through
selling and buying assets. – The sensitivities do not indicate a probability of such events occurring in the future. They do not necessarily represent the Group’s view of expected future market
changes. In addition to the sensitivities, management uses stress scenarios to assess the impact of more severe market movements on the Group’s financial condition. For more information on stress scenarios, see table ‘impact of market, credit, and insurance scenarios on Z-ECM (unaudited)’.
Limitations of the analysis for Global Life: – The sensitivities show the effects of a change in certain risk factors, while other assumptions remain unchanged, except where they are directly affected by the
revised conditions. – The market risk scenarios assume a concurrent movement of all stock markets and an unrelated parallel shift of all interest rates in different currencies. – The assumptions on policyholder behavior, such as lapsing of policies, included in the sensitivity analysis for Global Life may be different from actual behavior.
Therefore, the actual impact may deviate from the analysis.
Currency riskCurrency risk is the risk of loss resulting from changes in exchange rates. The Group operates internationally and therefore is exposed to the financial impact arising from changes in the exchange rates of various currencies. The Group’s presentation currency is the U.S. dollar, but its assets, liabilities, income and expenses are denominated in many currencies, with significant amounts in the euro, Swiss franc and British pound, as well as the U.S. dollar.
On local balance sheets a currency mismatch may cause a balance sheet’s net asset value to fluctuate, through either income or directly through equity. The Group manages this risk by matching foreign currency positions on local balance sheets within prescribed limits. Residual local mismatches are reported centrally to make use of the netting effect across the Group. Zurich hedges these residual local mismatches within an established limit through a central balance sheet. The monetary currency risk exposure on local balance sheets is considered immaterial.
Differences arise when functional currencies are translated into the Group’s presentation currency, the U.S. dollar. The Group applies net investment hedge accounting to protect against the impact that changes in certain exchange rates might have on selected net investments. The Group takes no speculative positions on foreign currency market movements. Using constant exchange rates from one year to the next, the Group’s 2014 net income attributable to shareholders would have been higher by USD 22 million (applying 2013 exchange rates to the 2014 result). In 2013, the result would have been lower by USD 6 million (applying 2012 exchange rates to the 2013 results).
Table 8 shows the total IFRS equity’s sensitivity to changes in exchange rates for the main functional currencies to which the Group is exposed. Positive values represent an increase in the value of the Group’s total equity.
Q4_2014_10_AR14_Risk review part2_en.indd 138 23.02.2015 16:33:57
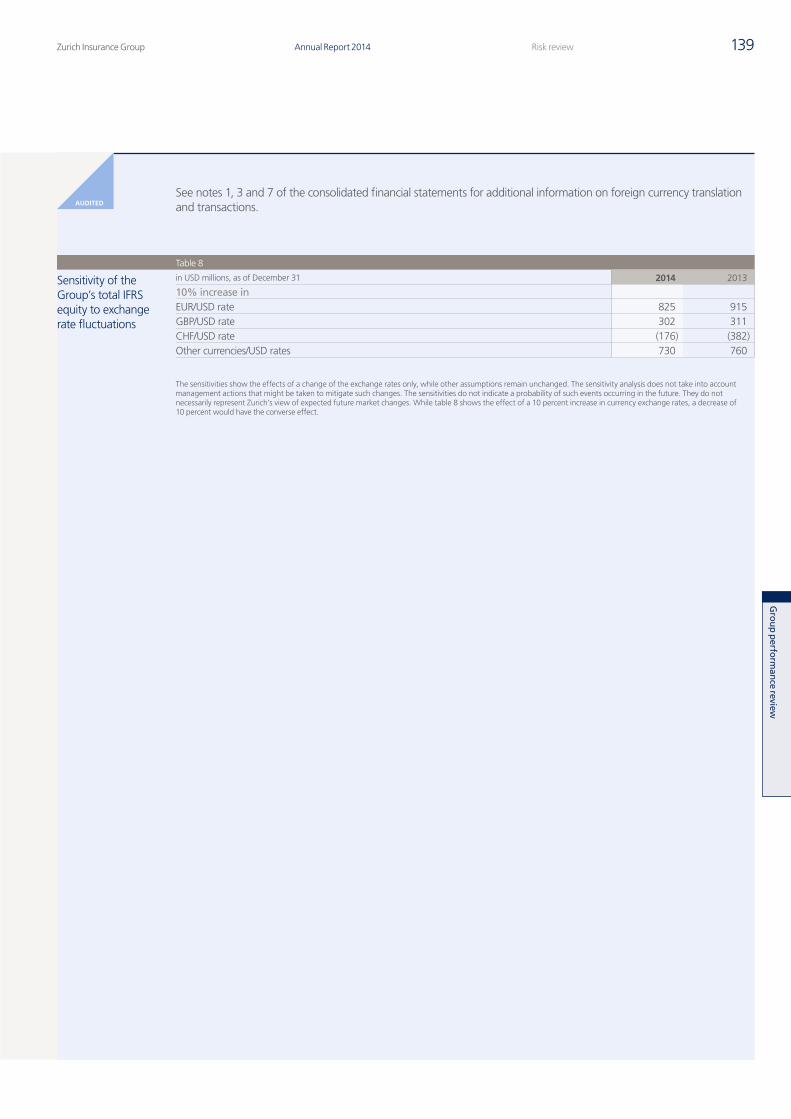
139
Gro
up p
erform
ance review
Zurich Insurance Group Annual Report 2014 Risk review
AUDITEDSee notes 1, 3 and 7 of the consolidated financial statements for additional information on foreign currency translation and transactions.
Table 8
Sensitivity of the Group’s total IFRS equity to exchange rate fluctuations
in USD millions, as of December 31 2014 2013
10% increase inEUR/USD rate 825 915GBP/USD rate 302 311CHF/USD rate (176) (382)Other currencies/USD rates 730 760
The sensitivities show the effects of a change of the exchange rates only, while other assumptions remain unchanged. The sensitivity analysis does not take into account management actions that might be taken to mitigate such changes. The sensitivities do not indicate a probability of such events occurring in the future. They do not necessarily represent Zurich’s view of expected future market changes. While table 8 shows the effect of a 10 percent increase in currency exchange rates, a decrease of 10 percent would have the converse effect.
Q4_2014_10_AR14_Risk review part2_en.indd 139 23.02.2015 16:33:57
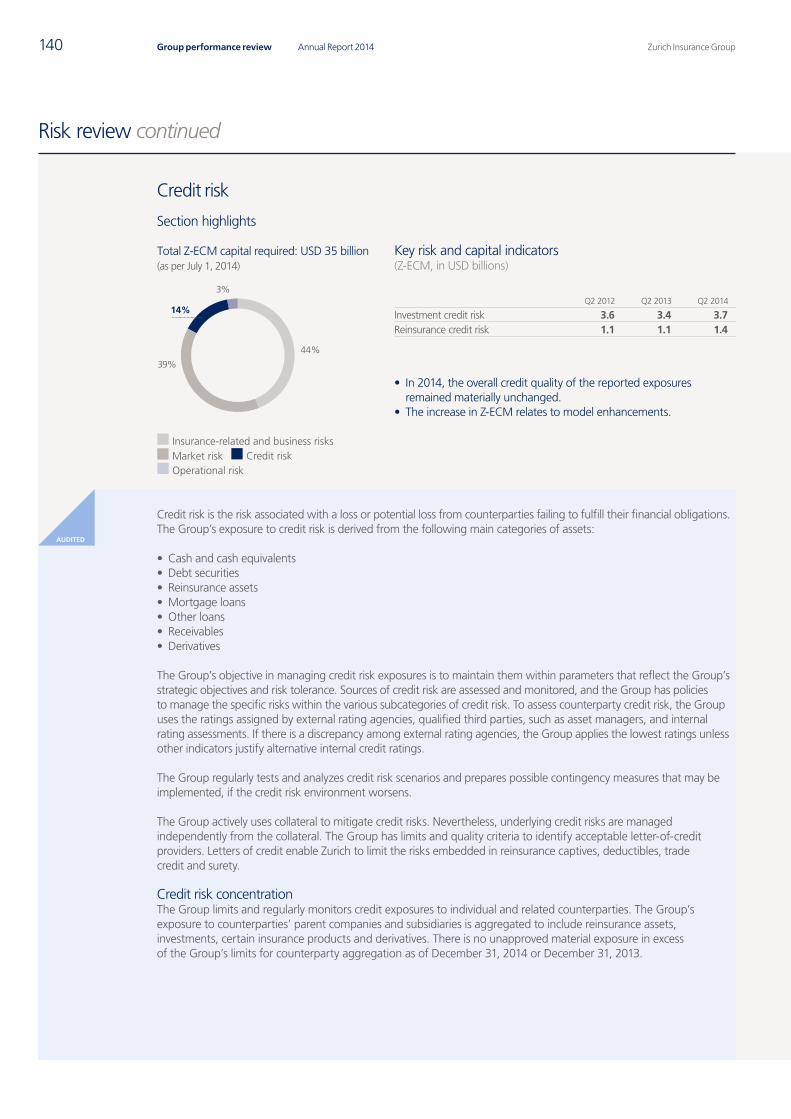
Zurich Insurance GroupAnnual Report 2014140 Group performance review
AUDITED
Risk review continued
Credit risk
Section highlights
Credit risk is the risk associated with a loss or potential loss from counterparties failing to fulfill their financial obligations. The Group’s exposure to credit risk is derived from the following main categories of assets:
• Cash and cash equivalents• Debt securities• Reinsurance assets• Mortgage loans• Other loans• Receivables• Derivatives
The Group’s objective in managing credit risk exposures is to maintain them within parameters that reflect the Group’s strategic objectives and risk tolerance. Sources of credit risk are assessed and monitored, and the Group has policies to manage the specific risks within the various subcategories of credit risk. To assess counterparty credit risk, the Group uses the ratings assigned by external rating agencies, qualified third parties, such as asset managers, and internal rating assessments. If there is a discrepancy among external rating agencies, the Group applies the lowest ratings unless other indicators justify alternative internal credit ratings.
The Group regularly tests and analyzes credit risk scenarios and prepares possible contingency measures that may be implemented, if the credit risk environment worsens.
The Group actively uses collateral to mitigate credit risks. Nevertheless, underlying credit risks are managed independently from the collateral. The Group has limits and quality criteria to identify acceptable letter-of-credit providers. Letters of credit enable Zurich to limit the risks embedded in reinsurance captives, deductibles, trade credit and surety.
Credit risk concentrationThe Group limits and regularly monitors credit exposures to individual and related counterparties. The Group’s exposure to counterparties’ parent companies and subsidiaries is aggregated to include reinsurance assets, investments, certain insurance products and derivatives. There is no unapproved material exposure in excess of the Group’s limits for counterparty aggregation as of December 31, 2014 or December 31, 2013.
Key risk and capital indicators(Z-ECM, in USD billions)
Q2 2012 Q2 2013 Q2 2014
Investment credit risk 3.6 3.4 3.7Reinsurance credit risk 1.1 1.1 1.4
• In 2014, the overall credit quality of the reported exposures remained materially unchanged.
• The increase in Z-ECM relates to model enhancements.
Total Z-ECM capital required: USD 35 billion(as per July 1, 2014)
44%
14%
39%
3%
Insurance-related and business risksCredit riskMarket risk
Operational risk
Q4_2014_10_AR14_Risk review part2_en.indd 140 23.02.2015 16:33:57
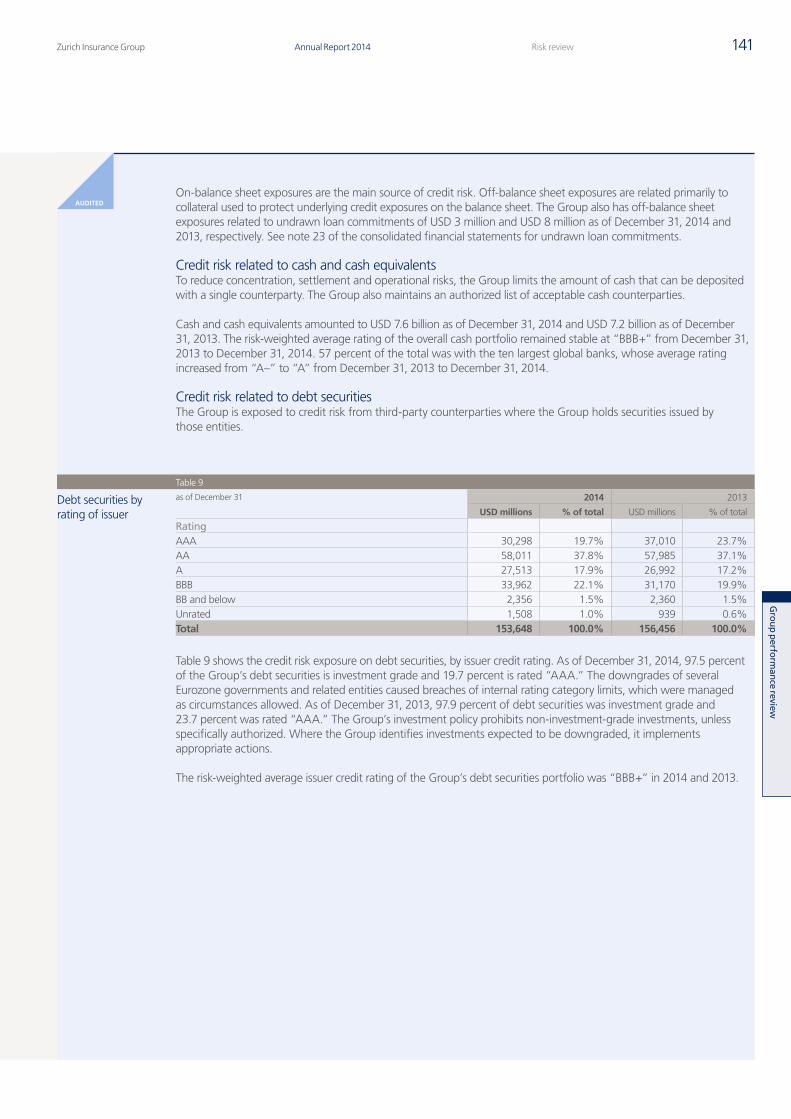
141
Gro
up p
erform
ance review
Zurich Insurance Group Annual Report 2014 Risk review
AUDITEDOn-balance sheet exposures are the main source of credit risk. Off-balance sheet exposures are related primarily to collateral used to protect underlying credit exposures on the balance sheet. The Group also has off-balance sheet exposures related to undrawn loan commitments of USD 3 million and USD 8 million as of December 31, 2014 and 2013, respectively. See note 23 of the consolidated financial statements for undrawn loan commitments.
Credit risk related to cash and cash equivalentsTo reduce concentration, settlement and operational risks, the Group limits the amount of cash that can be deposited with a single counterparty. The Group also maintains an authorized list of acceptable cash counterparties.
Cash and cash equivalents amounted to USD 7.6 billion as of December 31, 2014 and USD 7.2 billion as of December 31, 2013. The risk-weighted average rating of the overall cash portfolio remained stable at “BBB+” from December 31, 2013 to December 31, 2014. 57 percent of the total was with the ten largest global banks, whose average rating increased from “A–” to “A” from December 31, 2013 to December 31, 2014.
Credit risk related to debt securitiesThe Group is exposed to credit risk from third-party counterparties where the Group holds securities issued by those entities.
Table 9
Debt securities by rating of issuer
as of December 31 2014 2013
USD millions % of total USD millions % of total
RatingAAA 30,298 19.7% 37,010 23.7%AA 58,011 37.8% 57,985 37.1%A 27,513 17.9% 26,992 17.2%BBB 33,962 22.1% 31,170 19.9%BB and below 2,356 1.5% 2,360 1.5%Unrated 1,508 1.0% 939 0.6%Total 153,648 100.0% 156,456 100.0%
Table 9 shows the credit risk exposure on debt securities, by issuer credit rating. As of December 31, 2014, 97.5 percent of the Group’s debt securities is investment grade and 19.7 percent is rated “AAA.” The downgrades of several Eurozone governments and related entities caused breaches of internal rating category limits, which were managed as circumstances allowed. As of December 31, 2013, 97.9 percent of debt securities was investment grade and 23.7 percent was rated “AAA.” The Group’s investment policy prohibits non-investment-grade investments, unless specifically authorized. Where the Group identifies investments expected to be downgraded, it implements appropriate actions.
The risk-weighted average issuer credit rating of the Group’s debt securities portfolio was “BBB+” in 2014 and 2013.
Q4_2014_10_AR14_Risk review part2_en.indd 141 23.02.2015 16:33:58
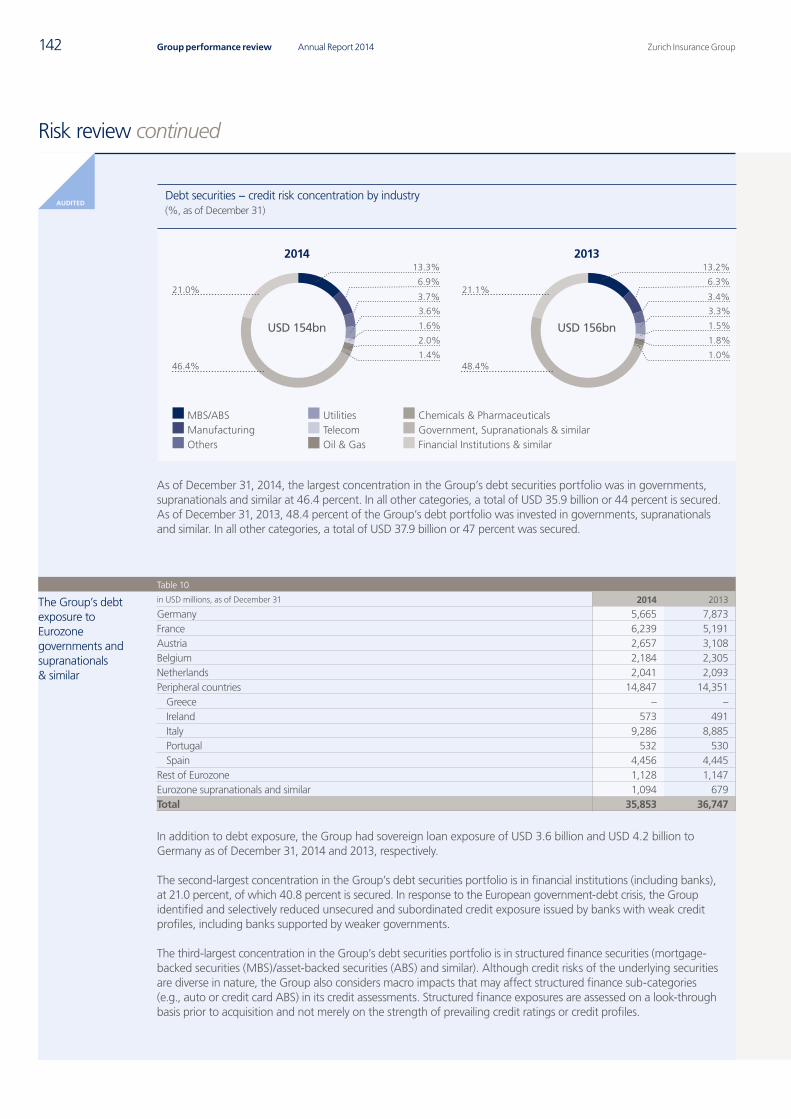
142
AUDITED
Zurich Insurance GroupAnnual Report 2014Group performance review
AUDITED
Risk review continued
Debt securities − credit risk concentration by industry(%, as of December 31)
UtilitiesTelecomOil & Gas
MBS/ABSManufacturingOthers
Chemicals & PharmaceuticalsGovernment, Supranationals & similarFinancial Institutions & similar
21.0%6.9%
3.7%
3.6%
46.4%
1.6%
2.0%
1.4%
13.3%2014
USD 154bn
21.1%6.3%
3.4%
3.3%
48.4%
1.5%
1.8%
1.0%
13.2%2013
USD 156bn
As of December 31, 2014, the largest concentration in the Group’s debt securities portfolio was in governments, supranationals and similar at 46.4 percent. In all other categories, a total of USD 35.9 billion or 44 percent is secured. As of December 31, 2013, 48.4 percent of the Group’s debt portfolio was invested in governments, supranationals and similar. In all other categories, a total of USD 37.9 billion or 47 percent was secured.
Table 10
The Group’s debt exposure to Eurozone governments and supranationals & similar
in USD millions, as of December 31 2014 2013
Germany 5,665 7,873France 6,239 5,191Austria 2,657 3,108Belgium 2,184 2,305Netherlands 2,041 2,093Peripheral countries 14,847 14,351
Greece – – Ireland 573 491Italy 9,286 8,885Portugal 532 530Spain 4,456 4,445
Rest of Eurozone 1,128 1,147Eurozone supranationals and similar 1,094 679Total 35,853 36,747
In addition to debt exposure, the Group had sovereign loan exposure of USD 3.6 billion and USD 4.2 billion to Germany as of December 31, 2014 and 2013, respectively.
The second-largest concentration in the Group’s debt securities portfolio is in financial institutions (including banks), at 21.0 percent, of which 40.8 percent is secured. In response to the European government-debt crisis, the Group identified and selectively reduced unsecured and subordinated credit exposure issued by banks with weak credit profiles, including banks supported by weaker governments.
The third-largest concentration in the Group’s debt securities portfolio is in structured finance securities (mortgage- backed securities (MBS)/asset-backed securities (ABS) and similar). Although credit risks of the underlying securities are diverse in nature, the Group also considers macro impacts that may affect structured finance sub-categories (e.g., auto or credit card ABS) in its credit assessments. Structured finance exposures are assessed on a look-through basis prior to acquisition and not merely on the strength of prevailing credit ratings or credit profiles.
Q4_2014_10_AR14_Risk review part2_en.indd 142 23.02.2015 16:33:58
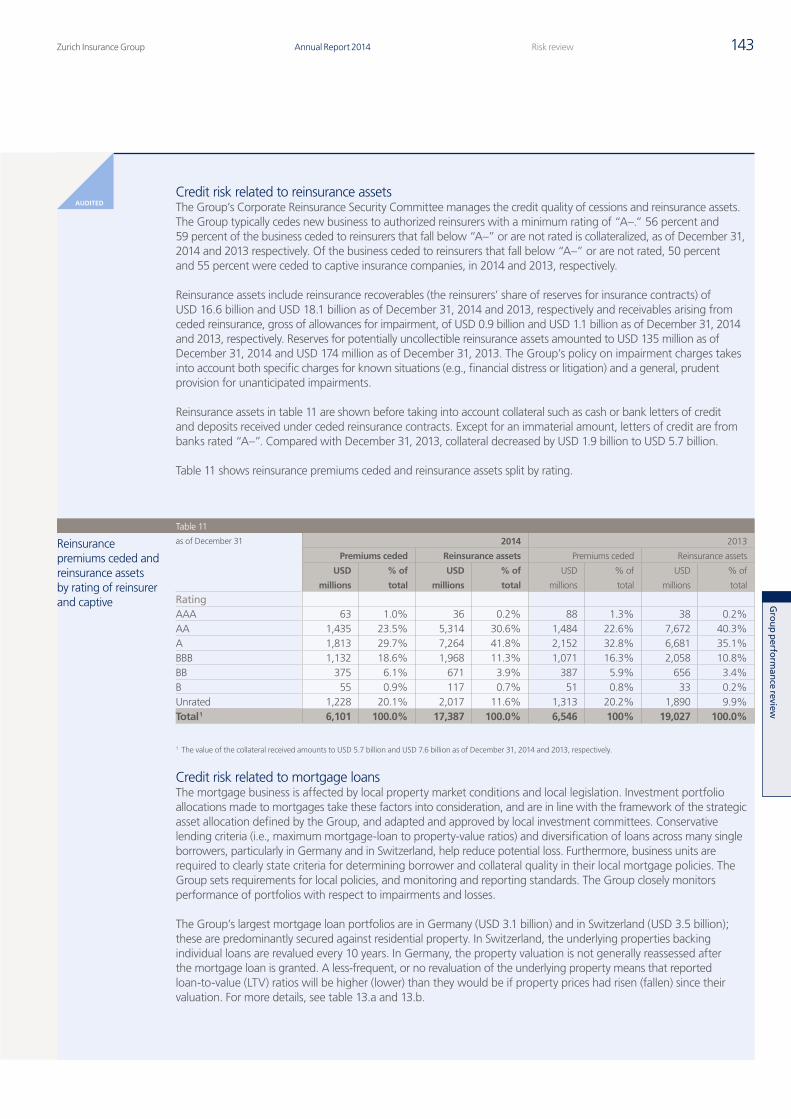
143
Gro
up p
erform
ance review
Zurich Insurance Group Annual Report 2014 Risk review
AUDITEDCredit risk related to reinsurance assetsThe Group’s Corporate Reinsurance Security Committee manages the credit quality of cessions and reinsurance assets. The Group typically cedes new business to authorized reinsurers with a minimum rating of “A–.” 56 percent and 59 percent of the business ceded to reinsurers that fall below “A–” or are not rated is collateralized, as of December 31, 2014 and 2013 respectively. Of the business ceded to reinsurers that fall below “A–” or are not rated, 50 percent and 55 percent were ceded to captive insurance companies, in 2014 and 2013, respectively.
Reinsurance assets include reinsurance recoverables (the reinsurers’ share of reserves for insurance contracts) of USD 16.6 billion and USD 18.1 billion as of December 31, 2014 and 2013, respectively and receivables arising from ceded reinsurance, gross of allowances for impairment, of USD 0.9 billion and USD 1.1 billion as of December 31, 2014 and 2013, respectively. Reserves for potentially uncollectible reinsurance assets amounted to USD 135 million as of December 31, 2014 and USD 174 million as of December 31, 2013. The Group’s policy on impairment charges takes into account both specific charges for known situations (e.g., financial distress or litigation) and a general, prudent provision for unanticipated impairments.
Reinsurance assets in table 11 are shown before taking into account collateral such as cash or bank letters of credit and deposits received under ceded reinsurance contracts. Except for an immaterial amount, letters of credit are from banks rated “A–”. Compared with December 31, 2013, collateral decreased by USD 1.9 billion to USD 5.7 billion.
Table 11 shows reinsurance premiums ceded and reinsurance assets split by rating.
Table 11
Reinsurance premiums ceded and reinsurance assets by rating of reinsurer and captive
as of December 31 2014 2013
Premiums ceded Reinsurance assets Premiums ceded Reinsurance assets
USD
millions
% of
total
USD
millions
% of
total
USD
millions
% of
total
USD
millions
% of
total
RatingAAA 63 1.0% 36 0.2% 88 1.3% 38 0.2%AA 1,435 23.5% 5,314 30.6% 1,484 22.6% 7,672 40.3%A 1,813 29.7% 7,264 41.8% 2,152 32.8% 6,681 35.1%BBB 1,132 18.6% 1,968 11.3% 1,071 16.3% 2,058 10.8%BB 375 6.1% 671 3.9% 387 5.9% 656 3.4%B 55 0.9% 117 0.7% 51 0.8% 33 0.2%Unrated 1,228 20.1% 2,017 11.6% 1,313 20.2% 1,890 9.9%Total 1 6,101 100.0% 17,387 100.0% 6,546 100% 19,027 100.0%
1 The value of the collateral received amounts to USD 5.7 billion and USD 7.6 billion as of December 31, 2014 and 2013, respectively.
Credit risk related to mortgage loansThe mortgage business is affected by local property market conditions and local legislation. Investment portfolio allocations made to mortgages take these factors into consideration, and are in line with the framework of the strategic asset allocation defined by the Group, and adapted and approved by local investment committees. Conservative lending criteria (i.e., maximum mortgage-loan to property-value ratios) and diversification of loans across many single borrowers, particularly in Germany and in Switzerland, help reduce potential loss. Furthermore, business units are required to clearly state criteria for determining borrower and collateral quality in their local mortgage policies. The Group sets requirements for local policies, and monitoring and reporting standards. The Group closely monitors performance of portfolios with respect to impairments and losses.
The Group’s largest mortgage loan portfolios are in Germany (USD 3.1 billion) and in Switzerland (USD 3.5 billion); these are predominantly secured against residential property. In Switzerland, the underlying properties backing individual loans are revalued every 10 years. In Germany, the property valuation is not generally reassessed after the mortgage loan is granted. A less-frequent, or no revaluation of the underlying property means that reported loan-to-value (LTV) ratios will be higher (lower) than they would be if property prices had risen (fallen) since their valuation. For more details, see table 13.a and 13.b.
Q4_2014_10_AR14_Risk review part2_en.indd 143 23.02.2015 16:33:59
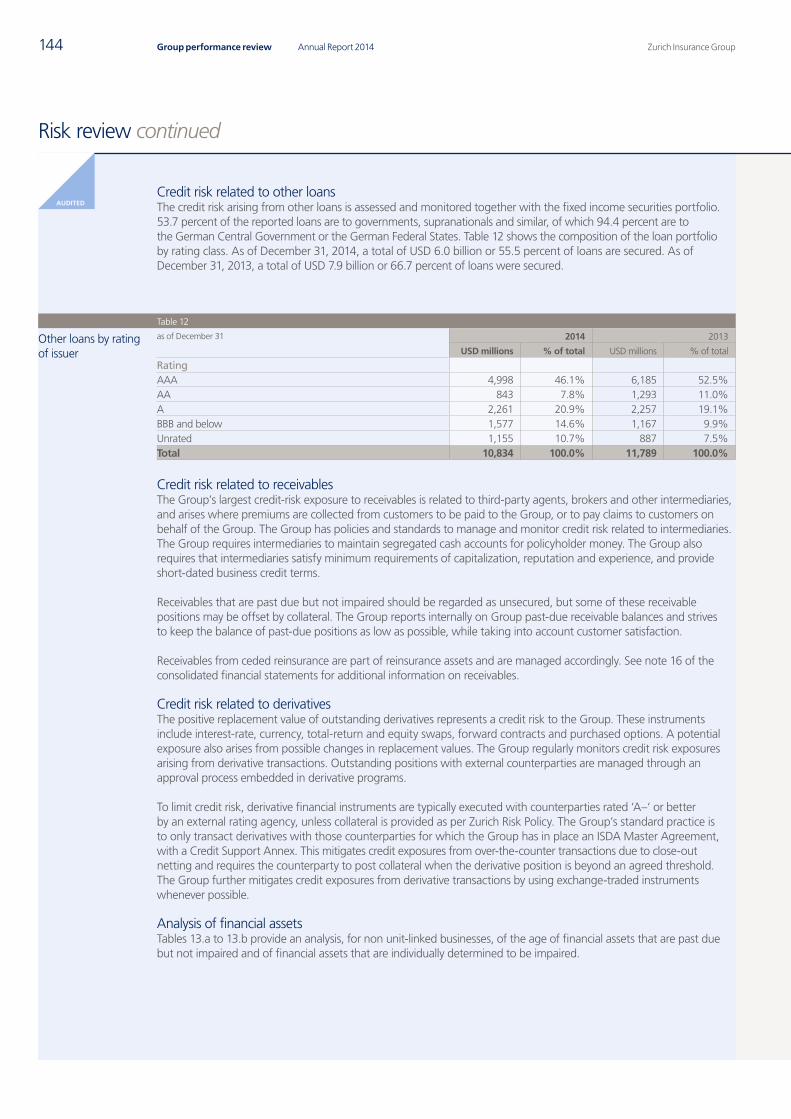
144 Zurich Insurance GroupAnnual Report 2014Group performance review
AUDITED
Risk review continued
Credit risk related to other loansThe credit risk arising from other loans is assessed and monitored together with the fixed income securities portfolio. 53.7 percent of the reported loans are to governments, supranationals and similar, of which 94.4 percent are to the German Central Government or the German Federal States. Table 12 shows the composition of the loan portfolio by rating class. As of December 31, 2014, a total of USD 6.0 billion or 55.5 percent of loans are secured. As of December 31, 2013, a total of USD 7.9 billion or 66.7 percent of loans were secured.
Table 12
Other loans by rating of issuer
as of December 31 2014 2013
USD millions % of total USD millions % of total
RatingAAA 4,998 46.1% 6,185 52.5%AA 843 7.8% 1,293 11.0%A 2,261 20.9% 2,257 19.1%BBB and below 1,577 14.6% 1,167 9.9%Unrated 1,155 10.7% 887 7.5%Total 10,834 100.0% 11,789 100.0%
Credit risk related to receivablesThe Group’s largest credit-risk exposure to receivables is related to third-party agents, brokers and other intermediaries, and arises where premiums are collected from customers to be paid to the Group, or to pay claims to customers on behalf of the Group. The Group has policies and standards to manage and monitor credit risk related to intermediaries. The Group requires intermediaries to maintain segregated cash accounts for policyholder money. The Group also requires that intermediaries satisfy minimum requirements of capitalization, reputation and experience, and provide short-dated business credit terms.
Receivables that are past due but not impaired should be regarded as unsecured, but some of these receivable positions may be offset by collateral. The Group reports internally on Group past-due receivable balances and strives to keep the balance of past-due positions as low as possible, while taking into account customer satisfaction.
Receivables from ceded reinsurance are part of reinsurance assets and are managed accordingly. See note 16 of the consolidated financial statements for additional information on receivables.
Credit risk related to derivativesThe positive replacement value of outstanding derivatives represents a credit risk to the Group. These instruments include interest-rate, currency, total-return and equity swaps, forward contracts and purchased options. A potential exposure also arises from possible changes in replacement values. The Group regularly monitors credit risk exposures arising from derivative transactions. Outstanding positions with external counterparties are managed through an approval process embedded in derivative programs.
To limit credit risk, derivative financial instruments are typically executed with counterparties rated ‘A–‘ or better by an external rating agency, unless collateral is provided as per Zurich Risk Policy. The Group’s standard practice is to only transact derivatives with those counterparties for which the Group has in place an ISDA Master Agreement, with a Credit Support Annex. This mitigates credit exposures from over-the-counter transactions due to close-out netting and requires the counterparty to post collateral when the derivative position is beyond an agreed threshold. The Group further mitigates credit exposures from derivative transactions by using exchange-traded instruments whenever possible.
Analysis of financial assetsTables 13.a to 13.b provide an analysis, for non unit-linked businesses, of the age of financial assets that are past due but not impaired and of financial assets that are individually determined to be impaired.
Q4_2014_10_AR14_Risk review part2_en.indd 144 23.02.2015 16:33:59
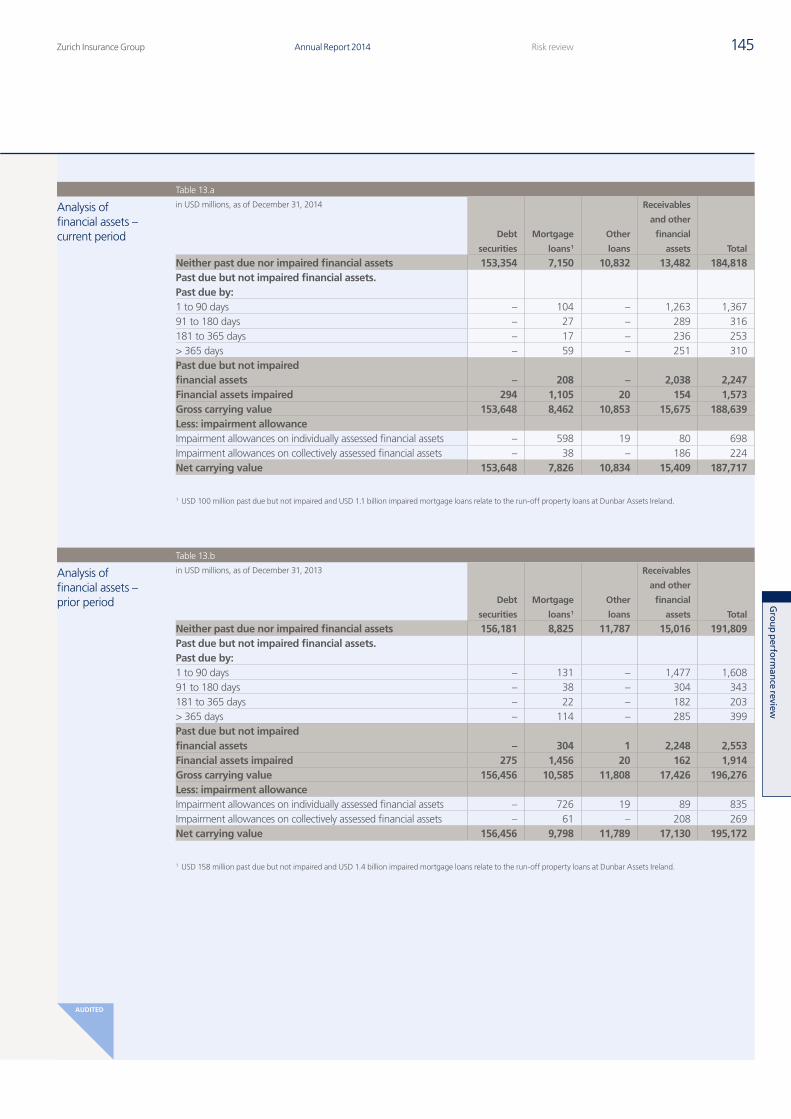
145
Gro
up p
erform
ance review
Zurich Insurance Group Annual Report 2014 Risk review
AUDITED
Table 13.a
Analysis of financial assets – current period
in USD millions, as of December 31, 2014
Debt
securities
Mortgage
loans 1
Other
loans
Receivables
and other
financial
assets Total
Neither past due nor impaired financial assets 153,354 7,150 10,832 13,482 184,818Past due but not impaired financial assets. Past due by:1 to 90 days – 104 – 1,263 1,36791 to 180 days – 27 – 289 316181 to 365 days – 17 – 236 253> 365 days – 59 – 251 310Past due but not impaired financial assets – 208 – 2,038 2,247Financial assets impaired 294 1,105 20 154 1,573Gross carrying value 153,648 8,462 10,853 15,675 188,639Less: impairment allowanceImpairment allowances on individually assessed financial assets – 598 19 80 698Impairment allowances on collectively assessed financial assets – 38 – 186 224Net carrying value 153,648 7,826 10,834 15,409 187,717
1 USD 100 million past due but not impaired and USD 1.1 billion impaired mortgage loans relate to the run-off property loans at Dunbar Assets Ireland.
Table 13.b
Analysis of financial assets – prior period
in USD millions, as of December 31, 2013
Debt
securities
Mortgage
loans 1
Other
loans
Receivables
and other
financial
assets Total
Neither past due nor impaired financial assets 156,181 8,825 11,787 15,016 191,809Past due but not impaired financial assets. Past due by:1 to 90 days – 131 – 1,477 1,60891 to 180 days – 38 – 304 343181 to 365 days – 22 – 182 203> 365 days – 114 – 285 399Past due but not impaired financial assets – 304 1 2,248 2,553Financial assets impaired 275 1,456 20 162 1,914Gross carrying value 156,456 10,585 11,808 17,426 196,276Less: impairment allowanceImpairment allowances on individually assessed financial assets – 726 19 89 835Impairment allowances on collectively assessed financial assets – 61 – 208 269Net carrying value 156,456 9,798 11,789 17,130 195,172
1 USD 158 million past due but not impaired and USD 1.4 billion impaired mortgage loans relate to the run-off property loans at Dunbar Assets Ireland.
Q4_2014_10_AR14_Risk review part2_en.indd 145 23.02.2015 16:34:00
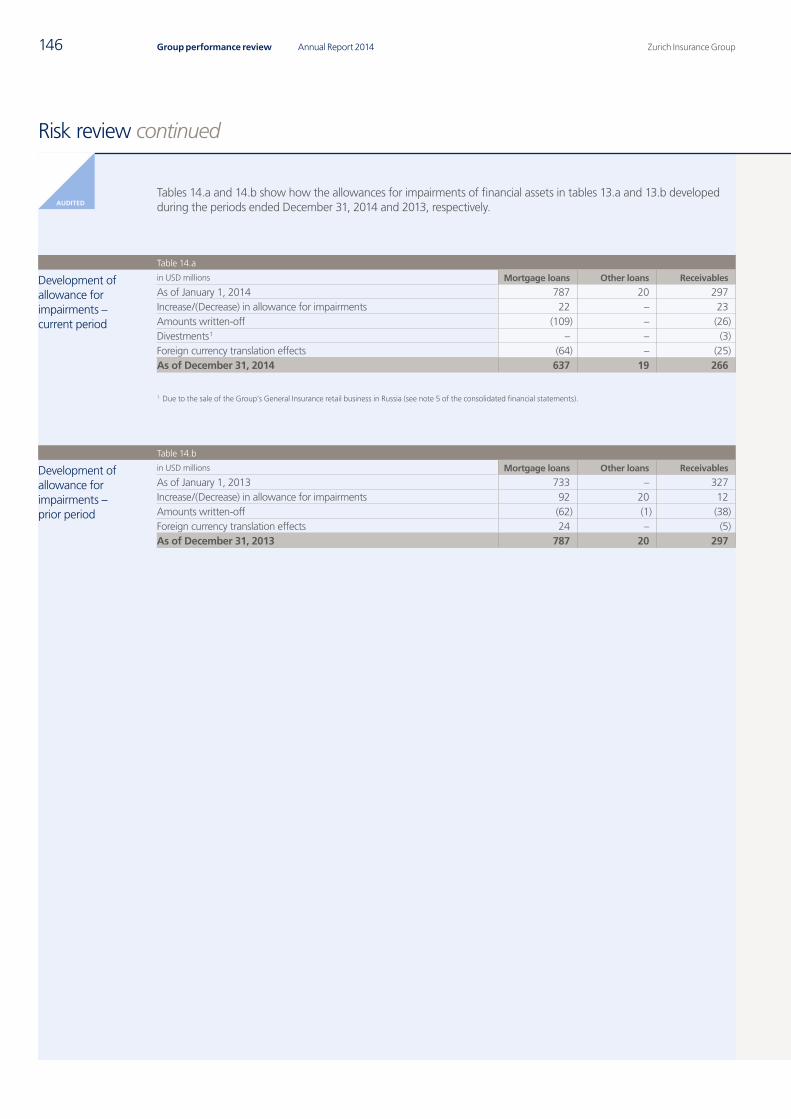
146 Zurich Insurance GroupAnnual Report 2014Group performance review
AUDITED
Risk review continued
Tables 14.a and 14.b show how the allowances for impairments of financial assets in tables 13.a and 13.b developed during the periods ended December 31, 2014 and 2013, respectively.
Table 14.a
Development of allowance for impairments – current period
in USD millions Mortgage loans Other loans Receivables
As of January 1, 2014 787 20 297Increase/(Decrease) in allowance for impairments 22 – 23Amounts written-off (109) – (26)Divestments 1 – – (3)Foreign currency translation effects (64) – (25)As of December 31, 2014 637 19 266
1 Due to the sale of the Group’s General Insurance retail business in Russia (see note 5 of the consolidated financial statements).
Table 14.b
Development of allowance for impairments – prior period
in USD millions Mortgage loans Other loans Receivables
As of January 1, 2013 733 – 327Increase/(Decrease) in allowance for impairments 92 20 12Amounts written-off (62) (1) (38)Foreign currency translation effects 24 – (5)As of December 31, 2013 787 20 297
Q4_2014_10_AR14_Risk review part2_en.indd 146 23.02.2015 16:34:00
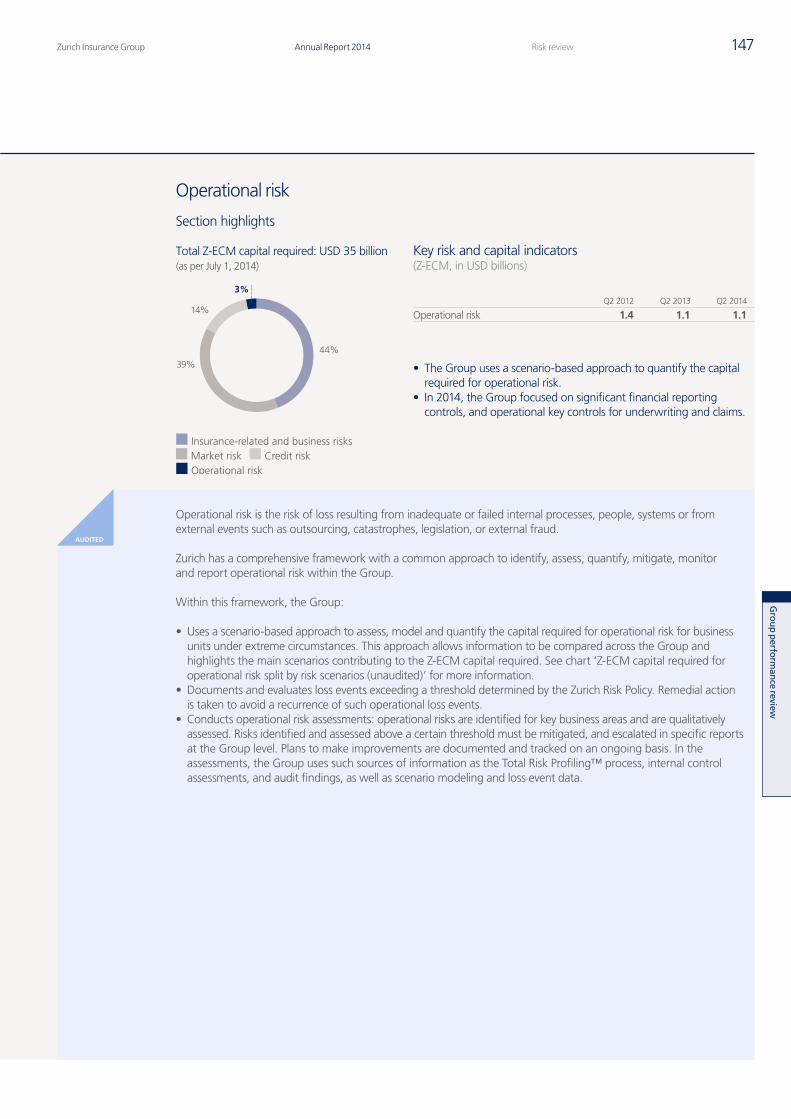
Zurich Insurance Group Annual Report 2014 147Risk review
Gro
up p
erform
ance review
AUDITED
Operational risk
Section highlights
Operational risk is the risk of loss resulting from inadequate or failed internal processes, people, systems or from external events such as outsourcing, catastrophes, legislation, or external fraud.
Zurich has a comprehensive framework with a common approach to identify, assess, quantify, mitigate, monitor and report operational risk within the Group.
Within this framework, the Group:
• Uses a scenario-based approach to assess, model and quantify the capital required for operational risk for business units under extreme circumstances. This approach allows information to be compared across the Group and highlights the main scenarios contributing to the Z-ECM capital required. See chart ‘Z-ECM capital required for operational risk split by risk scenarios (unaudited)’ for more information.
• Documents and evaluates loss events exceeding a threshold determined by the Zurich Risk Policy. Remedial action is taken to avoid a recurrence of such operational loss events.
• Conducts operational risk assessments: operational risks are identified for key business areas and are qualitatively assessed. Risks identified and assessed above a certain threshold must be mitigated, and escalated in specific reports at the Group level. Plans to make improvements are documented and tracked on an ongoing basis. In the assessments, the Group uses such sources of information as the Total Risk Profiling™ process, internal control assessments, and audit findings, as well as scenario modeling and loss event data.
Key risk and capital indicators(Z-ECM, in USD billions)
Q2 2012 Q2 2013 Q2 2014
Operational risk 1.4 1.1 1.1
• The Group uses a scenario-based approach to quantify the capital required for operational risk.
• In 2014, the Group focused on significant financial reporting controls, and operational key controls for underwriting and claims.
Total Z-ECM capital required: USD 35 billion(as per July 1, 2014)
44%
14%
39%
3%
Insurance-related and business risksCredit riskMarket risk
Operational risk
Q4_2014_10_AR14_Risk review part2_en.indd 147 23.02.2015 16:34:00

148 Zurich Insurance GroupAnnual Report 2014Group performance review
AUDITED
Risk review continued
The Group has specific processes and systems in place to focus on high priority operational matters such as managing information security and third party suppliers, as well as combating fraud.
Zurich makes sure that cyber risks and threats to data security are mitigated and responded to. Data held by Zurich’s business partners is protected through controls that are built into “cloud governance” procedures designed to secure Zurich’s data in accordance with regulatory requirements and the Group’s information security policies.
The Group regularly assesses risks associated with strategic suppliers to verify that suppliers remain financially viable and able to deliver services, and that the Group is not exposed to geographic and supplier concentration risks.
Preventing, detecting and responding to fraud is embedded in Zurich’s business. Both claims and non-claims fraud are included in the common framework for assessing and managing operational risks. For Z-ECM calculations, claims fraud is part of insurance risk and non-claims fraud is part of operational risk.
As part of Z-ECM, the Group uses a scenario-based approach to assess, model and quantify the capital required for operational risk for business units under extreme circumstances and a very slight probability of occurrence. The chart below shows the operational risk scenarios that have the highest impact on Z-ECM capital required.
49% 10%
7%
15%
19%
Regulatory and Tax Compliance: This risk cluster relates to possible non-compliance with applicable laws and regulations, leading to a range of consequences. It includes fines and penalties, litigation, compensation to policyholders,increased regulatory scrutiny, financial losses and increased cost of compliance, as well as consequences from a possible failure to comply with tax requirements.
M&A – Due Diligence and Integration: This risk cluster relates to poor execution of both the due diligence and the post-M&A integration processes. It includes theunderstatement of liabilities and required investments, operational or legal risks in theacquired business, inadequate transaction decisions, loss of key staff, inability to realize synergies or deliver benefits.
Outsourcing: This risk cluster relates to poor quality or disruption in services provided by third parties as a result of failure to manage global or local outsourcingagreements effectively or financial failure (e.g. insolvency) of a major supplier.
Market Abuse, Mis-selling and Conduct of Business: This risk cluster relates to the possibility that staff, processes or systems may operate in ways that lead to inappropriate conduct of business in relation to the customer. It includes the possibilityof investigations, sanctions and fines imposed on Zurich as a company or any member of staff as a result of market abuse, mis-selling practices leading to regulatory breach or increased compensation.
Other scenarios, e.g. project management, employment malpractice, record retention, licensing.
Z-ECM capital required for operational risk, split by risk scenario clusters(as of July 1, 2014)
Risk scenario clusters contributing to the Z-ECM capital required for operational risk
Risk management and internal controlsThe Group considers controls to be key instruments for monitoring and managing operational risk. The Board has overall responsibility for the Group’s risk management and internal controls, in particular for their adequacy and integrity. The Group’s internal control system increases the reliability of Zurich’s financial reporting, makes operations more effective, and aims to ensure legal and regulatory compliance. The internal controls system is designed to manage rather than eliminate the material risk that business objectives will not be achieved. It can provide only reasonable, not absolute, assurance against material financial misstatement or loss.
The Group encourages risk awareness and understanding of controls with communication and training. Primary risk management and internal control systems are established at Group level and implemented Group-wide.
Q4_2014_10_AR14_Risk review part2_en.indd 148 23.02.2015 16:34:01
149
Gro
up p
erform
ance review
Zurich Insurance Group Annual Report 2014 Risk review
AUDITED
Management is responsible for identifying, evaluating and addressing significant risks, and designing and maintaining internal controls. Key processes and controls in the organization are subject to reviews by management, Group Audit, Group Compliance and Group Risk Management. Significant risks and the mitigation actions are reported regularly to the Risk and Audit Committees of the Board.
In 2014, the Group enhanced the internal control environment focusing on significant financial reporting controls as well as operational key controls in the areas of underwriting and claims. An internal control certification process is conducted regularly by local business units throughout the Group.
Significant financial reporting controls are independently assessed for their design and operating effectiveness. Significant control issues or issues affecting more than one business unit may be categorized as having Group-level significance. The Board’s Risk and Audit Committees monitor resolution of such issues.
In a disclosure meeting led by the Group Controller, the content, accuracy and integrity of the disclosures are considered and the effectiveness of the internal controls over financial reporting is assessed. The conclusions are reported to the Group Executive Committee and the Board Audit Committee, which may provide further challenge. The Board reviews and approves results announcements and the annual report. This ensures that both the Board and management have sufficient opportunity to review and challenge the Group’s financial statements and other significant disclosures before they are made public.
The Board Risk Committee has reviewed the effectiveness of the Group’s risk management system, including the Group’s risk tolerance and the enterprise-wide risk governance framework, and the Board Audit Committee has reviewed the effectiveness of the system of control over financial reporting for the calendar year 2014 and have reported to the Board accordingly. Issues identified have been communicated to the Board and either have been or are being addressed by the Group.
The internal and external auditors also regularly report conclusions, observations and recommendations that arise as a result of their independent reviews and testing of internal controls over financial reporting.
Liquidity risk
Liquidity risk is the risk that the Group may not have sufficient liquid financial resources to meet its obligations when they fall due, or would have to incur excessive costs to do so. Zurich’s policy is to maintain adequate liquidity and contingent liquidity to meet its liquidity needs under normal conditions and in times of stress. To achieve this, the Group assesses, monitors and manages its liquidity needs on an ongoing basis.
Group-wide liquidity management policies and specific guidelines governing how local businesses plan, manage and report their local liquidity and include regular stress tests for all major carriers within the Group. The stress tests use a standardized set of internally defined stress events, and are designed to provide an overview of the potential drain on liquidity if the Group had to recapitalize local balance sheets.
Similar guidelines apply at the Group level, and detailed liquidity forecasts are regularly conducted, based on local businesses’ input and the Group’s forecasts. As part of its liquidity management, the Group maintains sufficient cash and cash equivalents and high-quality, liquid investment portfolios to meet outflows under expected and stressed conditions. The Group also maintains internal liquidity sources that cover the Group’s potential liquidity needs, including those that might arise in times of stress. The Group takes into account the amount, availability and speed at which these sources can be accessed. The Group has access to diverse funding sources to cover contingencies, including asset sales, external debt issuance and making use of committed borrowing facilities or letters of credit. The Group maintains a range of maturities for external debt securities. A potential source of liquidity risk is actions that could occur as a result of a downgrade of the Group’s credit rating. This could affect the Group’s commitments and guarantees, potentially increasing liquidity needs. This risk, and mitigating actions that might be employed, are assessed on an ongoing basis within the Group’s liquidity framework.
Q4_2014_10_AR14_Risk review part2_en.indd 149 23.02.2015 16:34:01
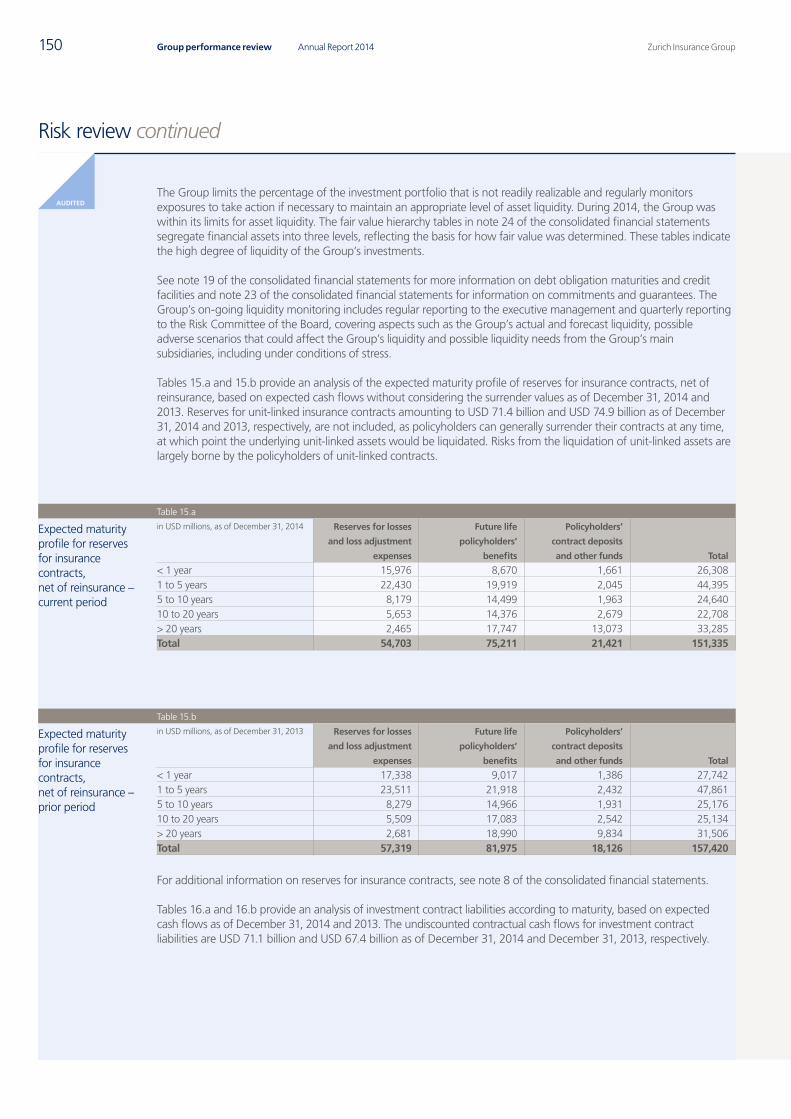
150 Zurich Insurance GroupAnnual Report 2014Group performance review
AUDITED
Risk review continued
The Group limits the percentage of the investment portfolio that is not readily realizable and regularly monitors exposures to take action if necessary to maintain an appropriate level of asset liquidity. During 2014, the Group was within its limits for asset liquidity. The fair value hierarchy tables in note 24 of the consolidated financial statements segregate financial assets into three levels, reflecting the basis for how fair value was determined. These tables indicate the high degree of liquidity of the Group’s investments.
See note 19 of the consolidated financial statements for more information on debt obligation maturities and credit facilities and note 23 of the consolidated financial statements for information on commitments and guarantees. The Group’s on-going liquidity monitoring includes regular reporting to the executive management and quarterly reporting to the Risk Committee of the Board, covering aspects such as the Group’s actual and forecast liquidity, possible adverse scenarios that could affect the Group’s liquidity and possible liquidity needs from the Group’s main subsidiaries, including under conditions of stress.
Tables 15.a and 15.b provide an analysis of the expected maturity profile of reserves for insurance contracts, net of reinsurance, based on expected cash flows without considering the surrender values as of December 31, 2014 and 2013. Reserves for unit-linked insurance contracts amounting to USD 71.4 billion and USD 74.9 billion as of December 31, 2014 and 2013, respectively, are not included, as policyholders can generally surrender their contracts at any time, at which point the underlying unit-linked assets would be liquidated. Risks from the liquidation of unit-linked assets are largely borne by the policyholders of unit-linked contracts.
Table 15.a
Expected maturity profile for reserves for insurance contracts, net of reinsurance – current period
in USD millions, as of December 31, 2014 Reserves for losses
and loss adjustment
expenses
Future life
policyholders’
benefits
Policyholders’
contract deposits
and other funds Total
< 1 year 15,976 8,670 1,661 26,3081 to 5 years 22,430 19,919 2,045 44,3955 to 10 years 8,179 14,499 1,963 24,64010 to 20 years 5,653 14,376 2,679 22,708> 20 years 2,465 17,747 13,073 33,285Total 54,703 75,211 21,421 151,335
Table 15.b
Expected maturity profile for reserves for insurance contracts, net of reinsurance – prior period
in USD millions, as of December 31, 2013 Reserves for losses
and loss adjustment
expenses
Future life
policyholders’
benefits
Policyholders’
contract deposits
and other funds Total
< 1 year 17,338 9,017 1,386 27,7421 to 5 years 23,511 21,918 2,432 47,8615 to 10 years 8,279 14,966 1,931 25,17610 to 20 years 5,509 17,083 2,542 25,134> 20 years 2,681 18,990 9,834 31,506Total 57,319 81,975 18,126 157,420
For additional information on reserves for insurance contracts, see note 8 of the consolidated financial statements.
Tables 16.a and 16.b provide an analysis of investment contract liabilities according to maturity, based on expected cash flows as of December 31, 2014 and 2013. The undiscounted contractual cash flows for investment contract liabilities are USD 71.1 billion and USD 67.4 billion as of December 31, 2014 and December 31, 2013, respectively.
Q4_2014_10_AR14_Risk review part2_en.indd 150 23.02.2015 16:34:01
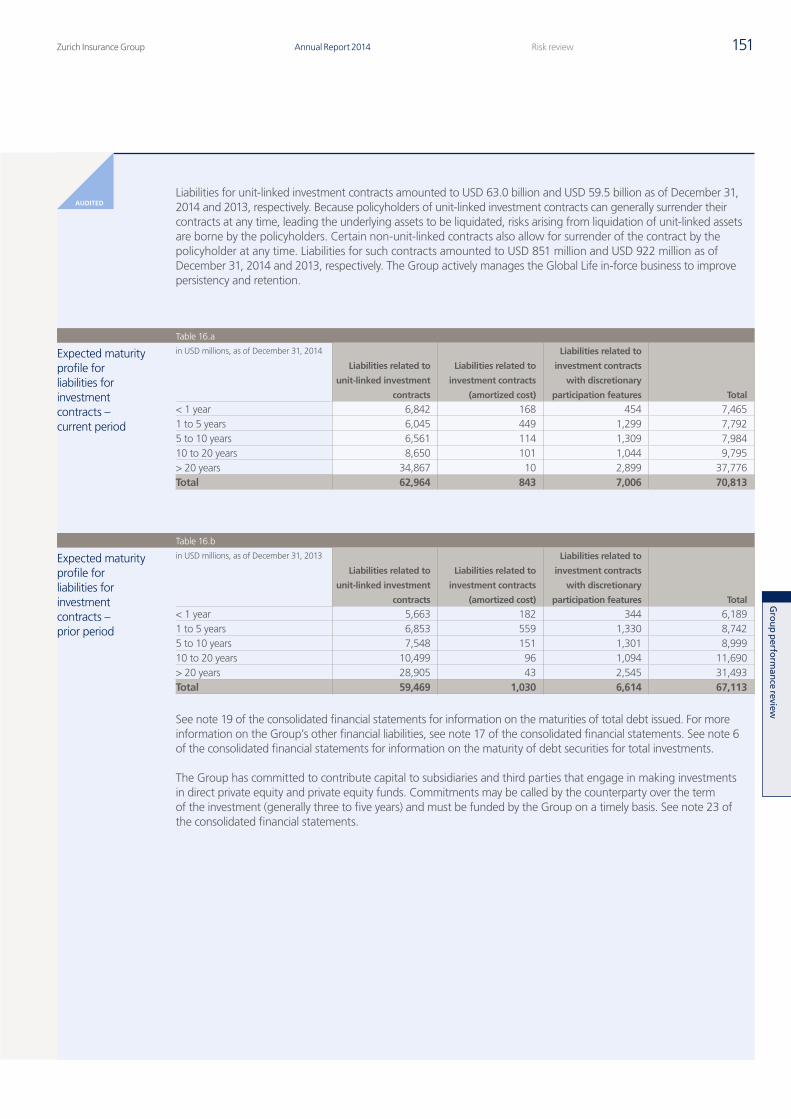
151
Gro
up p
erform
ance review
Zurich Insurance Group Annual Report 2014 Risk review
AUDITEDLiabilities for unit-linked investment contracts amounted to USD 63.0 billion and USD 59.5 billion as of December 31, 2014 and 2013, respectively. Because policyholders of unit-linked investment contracts can generally surrender their contracts at any time, leading the underlying assets to be liquidated, risks arising from liquidation of unit-linked assets are borne by the policyholders. Certain non-unit-linked contracts also allow for surrender of the contract by the policyholder at any time. Liabilities for such contracts amounted to USD 851 million and USD 922 million as of December 31, 2014 and 2013, respectively. The Group actively manages the Global Life in-force business to improve persistency and retention.
Table 16.a
Expected maturity profile for liabilities for investment contracts – current period
in USD millions, as of December 31, 2014
Liabilities related to
unit-linked investment
contracts
Liabilities related to
investment contracts
(amortized cost)
Liabilities related to
investment contracts
with discretionary
participation features Total
< 1 year 6,842 168 454 7,4651 to 5 years 6,045 449 1,299 7,7925 to 10 years 6,561 114 1,309 7,98410 to 20 years 8,650 101 1,044 9,795> 20 years 34,867 10 2,899 37,776Total 62,964 843 7,006 70,813
Table 16.b
Expected maturity profile for liabilities for investment contracts – prior period
in USD millions, as of December 31, 2013
Liabilities related to
unit-linked investment
contracts
Liabilities related to
investment contracts
(amortized cost)
Liabilities related to
investment contracts
with discretionary
participation features Total
< 1 year 5,663 182 344 6,1891 to 5 years 6,853 559 1,330 8,7425 to 10 years 7,548 151 1,301 8,99910 to 20 years 10,499 96 1,094 11,690> 20 years 28,905 43 2,545 31,493Total 59,469 1,030 6,614 67,113
See note 19 of the consolidated financial statements for information on the maturities of total debt issued. For more information on the Group’s other financial liabilities, see note 17 of the consolidated financial statements. See note 6 of the consolidated financial statements for information on the maturity of debt securities for total investments.
The Group has committed to contribute capital to subsidiaries and third parties that engage in making investments in direct private equity and private equity funds. Commitments may be called by the counterparty over the term of the investment (generally three to five years) and must be funded by the Group on a timely basis. See note 23 of the consolidated financial statements.
Q4_2014_10_AR14_Risk review part2_en.indd 151 23.02.2015 16:34:02
152 Zurich Insurance GroupAnnual Report 2014Group performance review
AUDITED
Risk review continued
Strategic risk and risks to the Group’s reputation
Strategic riskStrategic risk corresponds to the unintended risk that can result as a by-product of planning or executing the strategy.
A strategy is a long term plan of action designed to allow the Group to achieve its goals and aspirations. Strategic risks can arise from:
• Inadequate assessment of strategic plans• Ineffective implementation of strategic plans• Unexpected changes to assumptions underlying strategic plans Risk considerations are a key element in the strategic decision-making process. The Group assesses the implications of strategic decisions on risk-based return measures and risk-based capital to achieve an optimal risk-return profile and take advantage of economically profitable growth opportunities as they arise.
The Group works to reduce unintended risks of strategic business decisions through its risk assessment processes and tools, including the Total Risk Profiling™ process. The Group Executive Committee regularly assesses key strategic risk scenarios for the Group as a whole, including scenarios for emerging risks and their strategic implications.
The Group evaluates the risks of M&A transactions both from a quantitative and a qualitative perspective. The Group conducts risk assessments of M&A transactions to evaluate risks specifically related to integrating acquired businesses.
Risks to the Group’s reputationRisks include acts or omissions by the Group or any of its employees that could damage the Group’s reputation or lead to a loss of trust among its stakeholders. Every risk type has potential consequences for Zurich’s reputation. Effectively managing each type of risk helps reduce threats to Zurich’s reputation.
The Group aims to preserve its reputation by adhering to applicable laws and regulations, and by following the core values and principles of Zurich Basics, the Group’s code of conduct, which promotes integrity and good business practice. The Group centrally manages certain aspects of reputation risk, for example, communications, through functions with the appropriate expertise.
Q4_2014_10_AR14_Risk review part2_en.indd 152 23.02.2015 16:34:02

Zurich Insurance Group Annual Report 2014 153Risk review
Gro
up p
erform
ance review
THIS PAGE HAS INTENTIONALLY BEEN LEFT BLANK
Q4_2014_10_AR14_Risk review part2_en.indd 153 23.02.2015 16:34:02

Zurich Insurance GroupAnnual Report 2014154 Financial information
Q4_2014_11_AR14_Divider_Financial_information_en.indd 154 23.02.2015 16:34:47
155Annual Report 2014Zurich Insurance Group
In this sectionConsolidated financial statements 156Embedded value report 258Holding company 292Shareholder information 308Contact information 311Glossary 312
Financial information
Q4_2014_11_AR14_Divider_Financial_information_en.indd 155 23.02.2015 16:34:47
Zurich Insurance GroupAnnual Report 2014156 Financial information
Consolidated financial statements
Contents
Consolidated income statements 157Consolidated statements of comprehensive income 158Consolidated balance sheets 160Consolidated statements of cash flows 162Consolidated statements of changes in equity 1641. Basis of presentation 1662. New accounting standards and amendments to published accounting standards 1683. Summary of significant accounting policies 1694. Critical accounting judgments and estimates 1795. Acquisitions and divestments 1846. Group investments 1857. Group derivative financial instruments and hedge accounting 1888. Reserves for insurance contracts and reinsurers’ share of reserves for insurance contracts 1929. Liabilities for investment contracts 19810. Equity component relating to contracts with DPF 19811. Gross and ceded insurance revenues and expenses 19912. Deferred policy acquisition costs and deferred origination costs 20013. Expenses 20114. Property and equipment 20215. Goodwill and other intangible assets 20316. Receivables and other assets 20517. Other liabilities 20618. Income taxes 20819. Senior and subordinated debt 21120. Shareholders’ equity 21321. Employee benefits 21522. Share-based compensation and cash incentive plans 22223. Commitments and contingencies, legal proceedings and regulatory investigations 22424. Fair value measurement 22725. Related party transactions 23726. Relationship with the Farmers Exchanges 23827. Segment information 24028. Interest in subsidiaries 25029. Events after the balance sheet date 254Report of the statutory auditor 256
Q4_2014_12_AR14_104_Consolidated_financial_statements_en.indd 156 23.02.2015 16:37:21
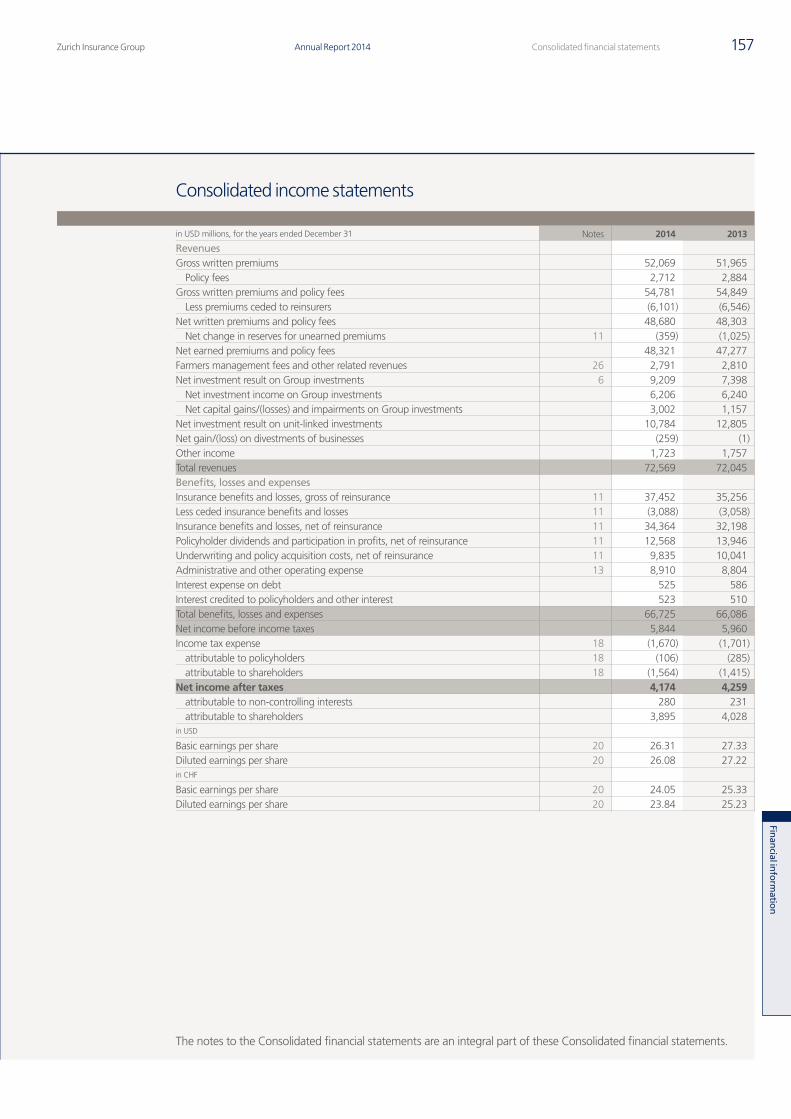
Zurich Insurance Group Annual Report 2014 157Consolidated financial statements
Finan
cial inform
ation
Consolidated income statements
in USD millions, for the years ended December 31 Notes 2014 2013
RevenuesGross written premiums 52,069 51,965
Policy fees 2,712 2,884Gross written premiums and policy fees 54,781 54,849
Less premiums ceded to reinsurers (6,101) (6,546)Net written premiums and policy fees 48,680 48,303
Net change in reserves for unearned premiums 11 (359) (1,025)Net earned premiums and policy fees 48,321 47,277Farmers management fees and other related revenues 26 2,791 2,810Net investment result on Group investments 6 9,209 7,398
Net investment income on Group investments 6,206 6,240Net capital gains/(losses) and impairments on Group investments 3,002 1,157
Net investment result on unit-linked investments 10,784 12,805Net gain/(loss) on divestments of businesses (259) (1)Other income 1,723 1,757Total revenues 72,569 72,045Benefits, losses and expensesInsurance benefits and losses, gross of reinsurance 11 37,452 35,256Less ceded insurance benefits and losses 11 (3,088) (3,058)Insurance benefits and losses, net of reinsurance 11 34,364 32,198Policyholder dividends and participation in profits, net of reinsurance 11 12,568 13,946Underwriting and policy acquisition costs, net of reinsurance 11 9,835 10,041Administrative and other operating expense 13 8,910 8,804Interest expense on debt 525 586Interest credited to policyholders and other interest 523 510Total benefits, losses and expenses 66,725 66,086Net income before income taxes 5,844 5,960Income tax expense 18 (1,670) (1,701)
attributable to policyholders 18 (106) (285)attributable to shareholders 18 (1,564) (1,415)
Net income after taxes 4,174 4,259attributable to non-controlling interests 280 231attributable to shareholders 3,895 4,028
in USD
Basic earnings per share 20 26.31 27.33Diluted earnings per share 20 26.08 27.22in CHF
Basic earnings per share 20 24.05 25.33Diluted earnings per share 20 23.84 25.23
The notes to the Consolidated financial statements are an integral part of these Consolidated financial statements.
Q4_2014_12_AR14_104_Consolidated_financial_statements_en.indd 157 23.02.2015 16:37:21
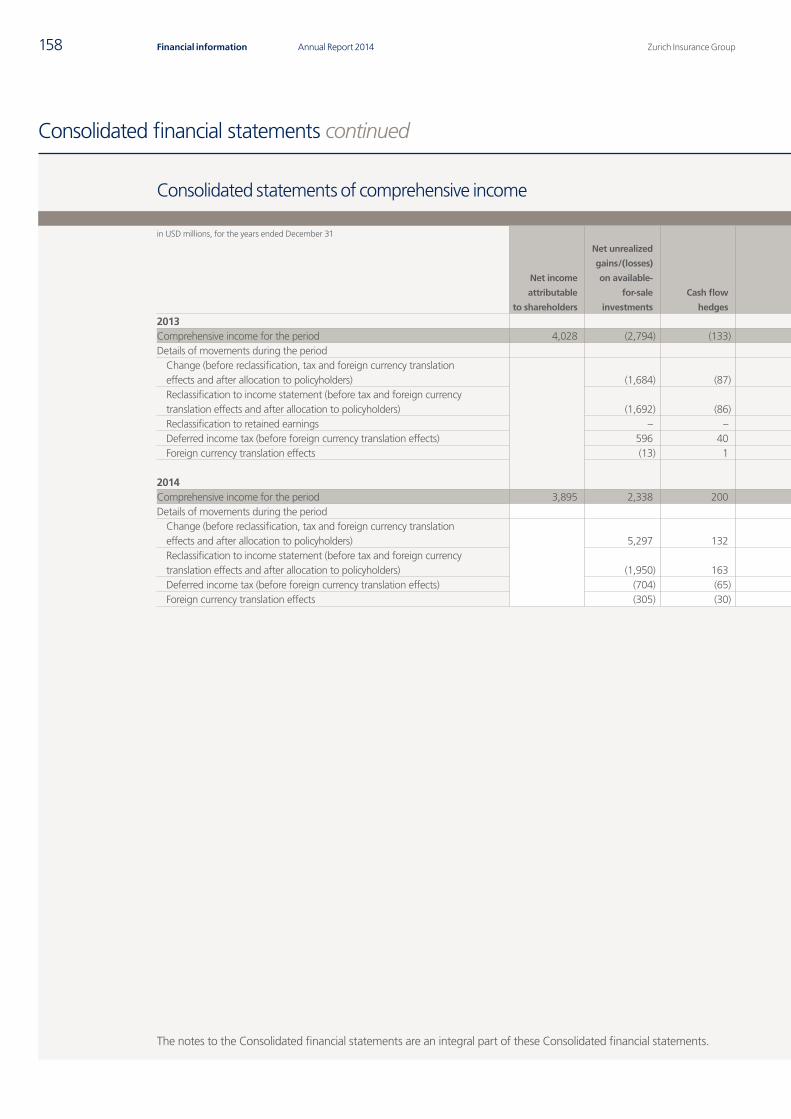
Zurich Insurance GroupAnnual Report 2014158 Financial information
Consolidated financial statements continued
The notes to the Consolidated financial statements are an integral part of these Consolidated financial statements.
Consolidated statements of comprehensive income
in USD millions, for the years ended December 31
Net income
attributable
to shareholders
Net unrealized
gains/(losses)
on available-
for-sale
investments
Cash flow
hedges
Cumulative
foreign
currency
translation
adjustment
Total other
comprehensive
income
recycled
through
profit or loss
Revaluation
reserve
Net actuarial
gains/(losses)
on pension
plans
Total other
comprehensive
income
not recycled
through
profit or loss
Total other
comprehensive
income
attributable
to shareholders
Total
comprehensive
income
attributable
to shareholders
Total
comprehensive
income
attributable to
non-controlling
interests
Total
comprehensive
income
2013Comprehensive income for the period 4,028 (2,794) (133) (986) (3,912) 15 (367) (352) (4,265) (237) 122 (115)Details of movements during the period
Change (before reclassification, tax and foreign currency translation effects and after allocation to policyholders) (1,684) (87) (1,065) (2,836) 24 (205) (181) (3,017) Reclassification to income statement (before tax and foreign currency translation effects and after allocation to policyholders) (1,692) (86) 79 (1,699) – – – (1,699) Reclassification to retained earnings – – – – (6) – (6) (6) Deferred income tax (before foreign currency translation effects) 596 40 – 635 (4) (76) (80) 555 Foreign currency translation effects (13) 1 – (12) – (86) (86) (98)
2014Comprehensive income for the period 3,895 2,338 200 (2,251) 288 24 (407) (383) (95) 3,799 43 3,842Details of movements during the period
Change (before reclassification, tax and foreign currency translation effects and after allocation to policyholders) 5,297 132 (2,507) 2,922 32 (855) (823) 2,099 Reclassification to income statement (before tax and foreign currency translation effects and after allocation to policyholders) (1,950) 163 256 (1,531) – – – (1,531) Deferred income tax (before foreign currency translation effects) (704) (65) – (769) (8) 190 183 (586) Foreign currency translation effects (305) (30) – (335) – 257 257 (78)
Q4_2014_12_AR14_104_Consolidated_financial_statements_en.indd 158 23.02.2015 16:37:22
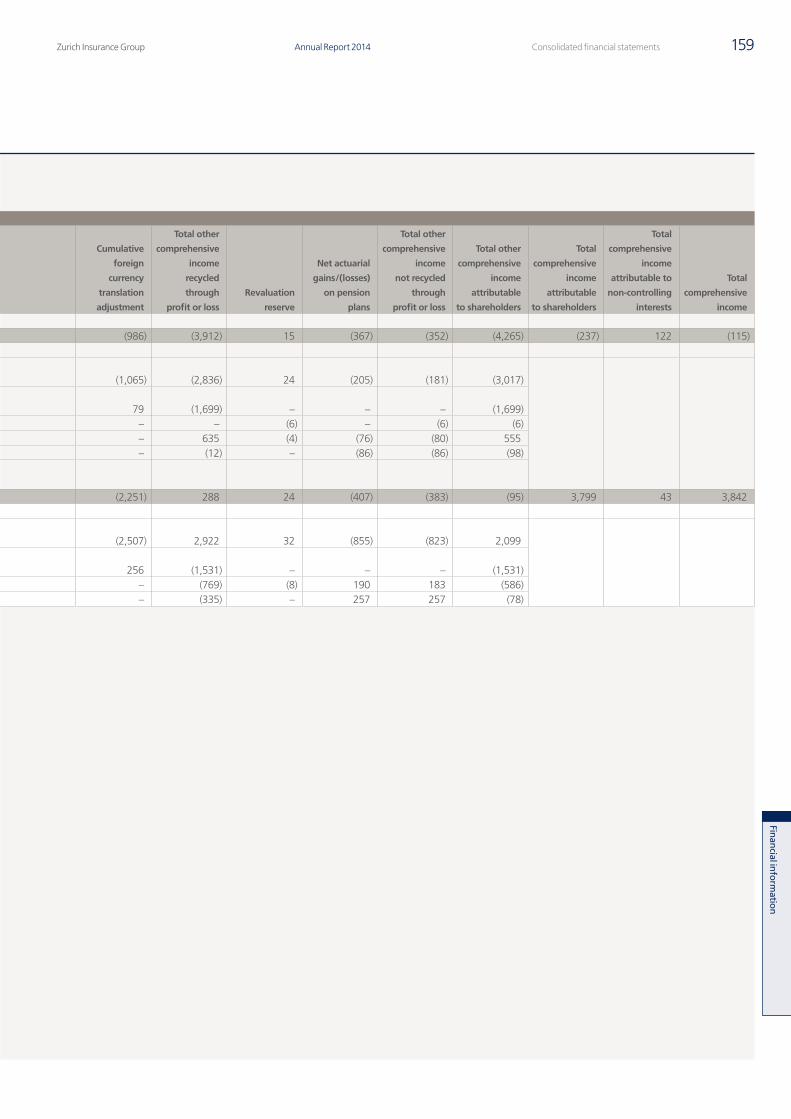
Zurich Insurance Group Annual Report 2014 159Consolidated financial statements
Finan
cial inform
ation
Consolidated statements of comprehensive income
in USD millions, for the years ended December 31
Net income
attributable
to shareholders
Net unrealized
gains/(losses)
on available-
for-sale
investments
Cash flow
hedges
Cumulative
foreign
currency
translation
adjustment
Total other
comprehensive
income
recycled
through
profit or loss
Revaluation
reserve
Net actuarial
gains/(losses)
on pension
plans
Total other
comprehensive
income
not recycled
through
profit or loss
Total other
comprehensive
income
attributable
to shareholders
Total
comprehensive
income
attributable
to shareholders
Total
comprehensive
income
attributable to
non-controlling
interests
Total
comprehensive
income
2013Comprehensive income for the period 4,028 (2,794) (133) (986) (3,912) 15 (367) (352) (4,265) (237) 122 (115)Details of movements during the period
Change (before reclassification, tax and foreign currency translation effects and after allocation to policyholders) (1,684) (87) (1,065) (2,836) 24 (205) (181) (3,017) Reclassification to income statement (before tax and foreign currency translation effects and after allocation to policyholders) (1,692) (86) 79 (1,699) – – – (1,699) Reclassification to retained earnings – – – – (6) – (6) (6) Deferred income tax (before foreign currency translation effects) 596 40 – 635 (4) (76) (80) 555 Foreign currency translation effects (13) 1 – (12) – (86) (86) (98)
2014Comprehensive income for the period 3,895 2,338 200 (2,251) 288 24 (407) (383) (95) 3,799 43 3,842Details of movements during the period
Change (before reclassification, tax and foreign currency translation effects and after allocation to policyholders) 5,297 132 (2,507) 2,922 32 (855) (823) 2,099 Reclassification to income statement (before tax and foreign currency translation effects and after allocation to policyholders) (1,950) 163 256 (1,531) – – – (1,531) Deferred income tax (before foreign currency translation effects) (704) (65) – (769) (8) 190 183 (586) Foreign currency translation effects (305) (30) – (335) – 257 257 (78)
Q4_2014_12_AR14_104_Consolidated_financial_statements_en.indd 159 23.02.2015 16:37:22
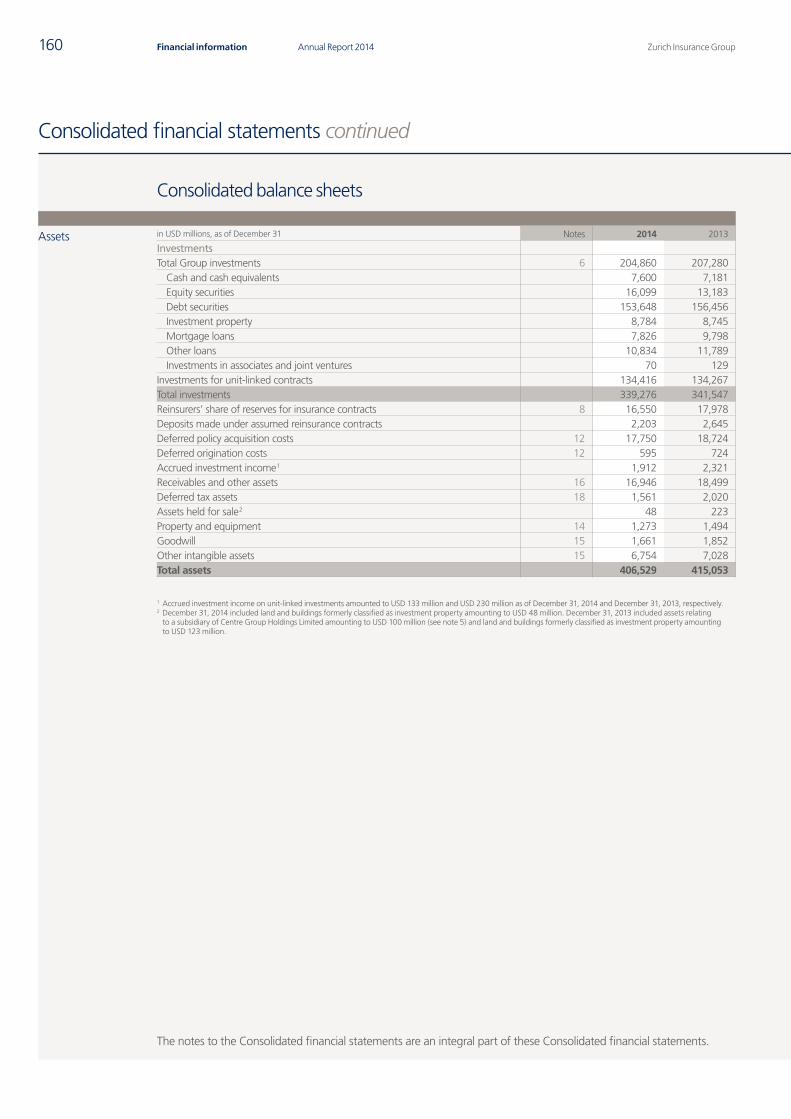
Zurich Insurance GroupAnnual Report 2014160 Financial information
Consolidated financial statements continued
Consolidated balance sheets
Assets in USD millions, as of December 31 Notes 2014 2013
InvestmentsTotal Group investments 6 204,860 207,280
Cash and cash equivalents 7,600 7,181Equity securities 16,099 13,183Debt securities 153,648 156,456Investment property 8,784 8,745Mortgage loans 7,826 9,798Other loans 10,834 11,789Investments in associates and joint ventures 70 129
Investments for unit-linked contracts 134,416 134,267Total investments 339,276 341,547Reinsurers’ share of reserves for insurance contracts 8 16,550 17,978Deposits made under assumed reinsurance contracts 2,203 2,645Deferred policy acquisition costs 12 17,750 18,724Deferred origination costs 12 595 724Accrued investment income 1 1,912 2,321Receivables and other assets 16 16,946 18,499Deferred tax assets 18 1,561 2,020Assets held for sale 2 48 223Property and equipment 14 1,273 1,494Goodwill 15 1,661 1,852Other intangible assets 15 6,754 7,028Total assets 406,529 415,053
1 Accrued investment income on unit-linked investments amounted to USD 133 million and USD 230 million as of December 31, 2014 and December 31, 2013, respectively.2 December 31, 2014 included land and buildings formerly classified as investment property amounting to USD 48 million. December 31, 2013 included assets relating
to a subsidiary of Centre Group Holdings Limited amounting to USD 100 million (see note 5) and land and buildings formerly classified as investment property amounting to USD 123 million.
The notes to the Consolidated financial statements are an integral part of these Consolidated financial statements.
Q4_2014_12_AR14_104_Consolidated_financial_statements_en.indd 160 23.02.2015 16:37:23
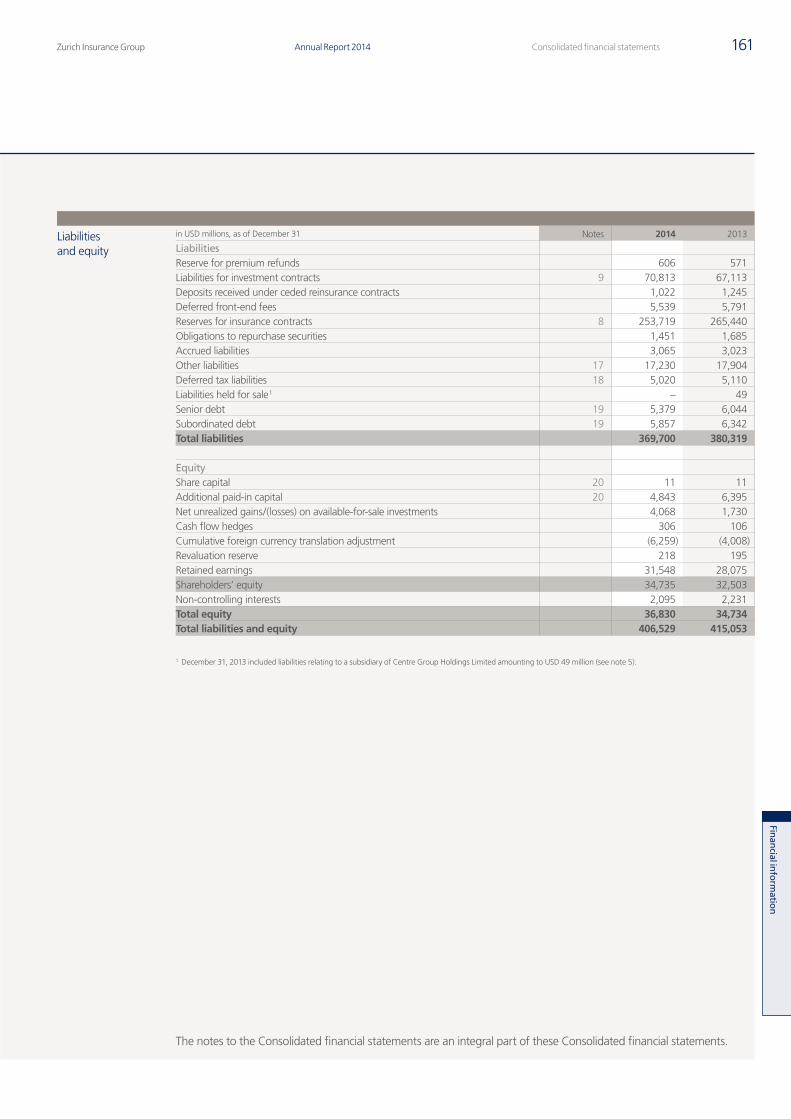
Zurich Insurance Group Annual Report 2014 161Consolidated financial statements
Finan
cial inform
ation
Liabilities and equity
in USD millions, as of December 31 Notes 2014 2013
LiabilitiesReserve for premium refunds 606 571Liabilities for investment contracts 9 70,813 67,113Deposits received under ceded reinsurance contracts 1,022 1,245Deferred front-end fees 5,539 5,791Reserves for insurance contracts 8 253,719 265,440Obligations to repurchase securities 1,451 1,685Accrued liabilities 3,065 3,023Other liabilities 17 17,230 17,904Deferred tax liabilities 18 5,020 5,110Liabilities held for sale 1 – 49Senior debt 19 5,379 6,044Subordinated debt 19 5,857 6,342Total liabilities 369,700 380,319
EquityShare capital 20 11 11Additional paid-in capital 20 4,843 6,395Net unrealized gains/(losses) on available-for-sale investments 4,068 1,730Cash flow hedges 306 106Cumulative foreign currency translation adjustment (6,259) (4,008)Revaluation reserve 218 195Retained earnings 31,548 28,075Shareholders’ equity 34,735 32,503Non-controlling interests 2,095 2,231Total equity 36,830 34,734Total liabilities and equity 406,529 415,053
1 December 31, 2013 included liabilities relating to a subsidiary of Centre Group Holdings Limited amounting to USD 49 million (see note 5).
The notes to the Consolidated financial statements are an integral part of these Consolidated financial statements.
Q4_2014_12_AR14_104_Consolidated_financial_statements_en.indd 161 23.02.2015 16:37:23
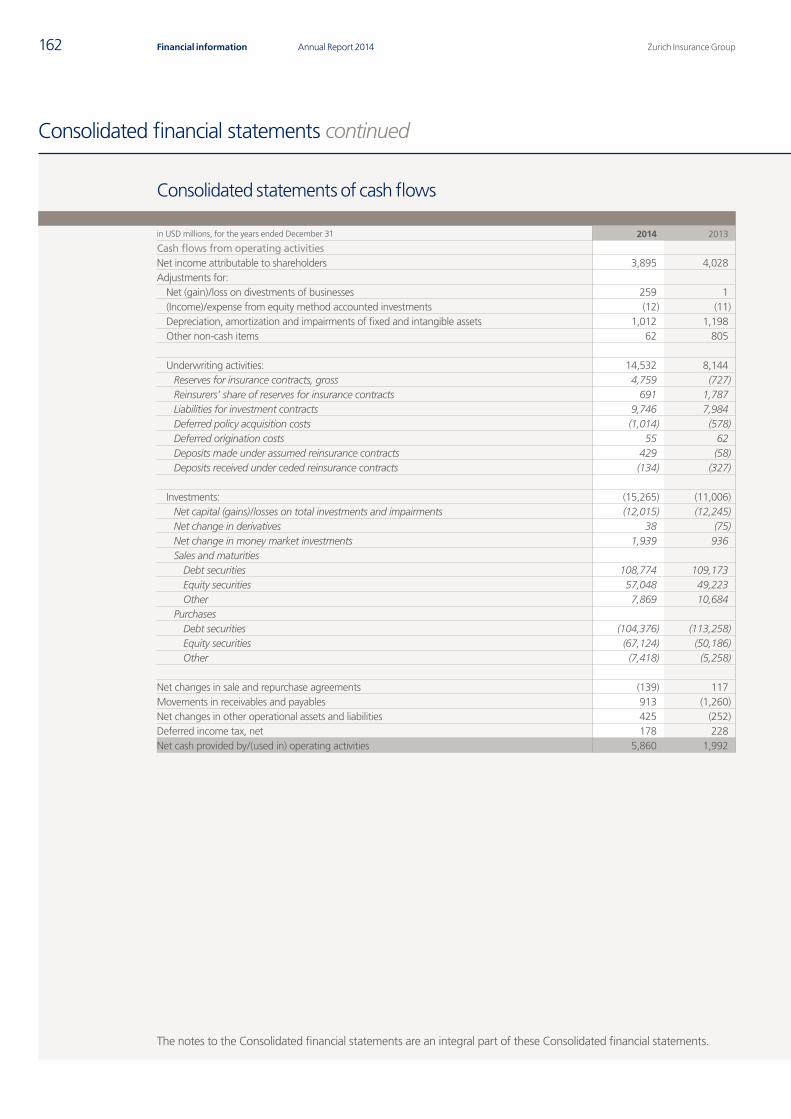
Zurich Insurance GroupAnnual Report 2014162 Financial information
Consolidated financial statements continued
Consolidated statements of cash flows
in USD millions, for the years ended December 31 2014 2013
Cash flows from operating activitiesNet income attributable to shareholders 3,895 4,028Adjustments for:
Net (gain)/loss on divestments of businesses 259 1(Income)/expense from equity method accounted investments (12) (11)Depreciation, amortization and impairments of fixed and intangible assets 1,012 1,198Other non-cash items 62 805
Underwriting activities: 14,532 8,144Reserves for insurance contracts, gross 4,759 (727)Reinsurers’ share of reserves for insurance contracts 691 1,787Liabilities for investment contracts 9,746 7,984Deferred policy acquisition costs (1,014) (578)Deferred origination costs 55 62Deposits made under assumed reinsurance contracts 429 (58)Deposits received under ceded reinsurance contracts (134) (327)
Investments: (15,265) (11,006)Net capital (gains)/losses on total investments and impairments (12,015) (12,245)Net change in derivatives 38 (75)Net change in money market investments 1,939 936Sales and maturities
Debt securities 108,774 109,173Equity securities 57,048 49,223Other 7,869 10,684
PurchasesDebt securities (104,376) (113,258)Equity securities (67,124) (50,186)Other (7,418) (5,258)
Net changes in sale and repurchase agreements (139) 117Movements in receivables and payables 913 (1,260)Net changes in other operational assets and liabilities 425 (252)Deferred income tax, net 178 228Net cash provided by/(used in) operating activities 5,860 1,992
The notes to the Consolidated financial statements are an integral part of these Consolidated financial statements.
Q4_2014_12_AR14_104_Consolidated_financial_statements_en.indd 162 23.02.2015 16:37:23
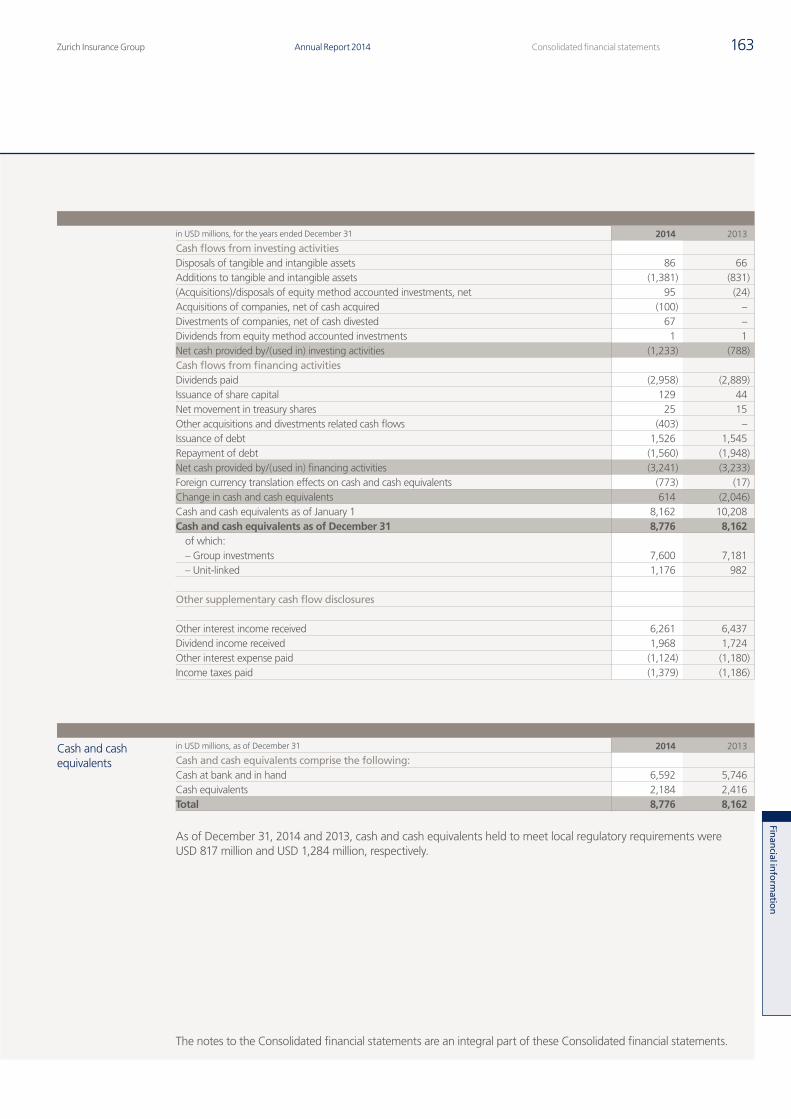
Zurich Insurance Group Annual Report 2014 163Consolidated financial statements
Finan
cial inform
ation
in USD millions, for the years ended December 31 2014 2013
Cash flows from investing activitiesDisposals of tangible and intangible assets 86 66Additions to tangible and intangible assets (1,381) (831)(Acquisitions)/disposals of equity method accounted investments, net 95 (24)Acquisitions of companies, net of cash acquired (100) –Divestments of companies, net of cash divested 67 –Dividends from equity method accounted investments 1 1Net cash provided by/(used in) investing activities (1,233) (788)Cash flows from financing activitiesDividends paid (2,958) (2,889)Issuance of share capital 129 44Net movement in treasury shares 25 15Other acquisitions and divestments related cash flows (403) –Issuance of debt 1,526 1,545Repayment of debt (1,560) (1,948)Net cash provided by/(used in) financing activities (3,241) (3,233)Foreign currency translation effects on cash and cash equivalents (773) (17)Change in cash and cash equivalents 614 (2,046)Cash and cash equivalents as of January 1 8,162 10,208Cash and cash equivalents as of December 31 8,776 8,162
of which: – Group investments 7,600 7,181– Unit-linked 1,176 982
Other supplementary cash flow disclosures
Other interest income received 6,261 6,437Dividend income received 1,968 1,724Other interest expense paid (1,124) (1,180)Income taxes paid (1,379) (1,186)
Cash and cash equivalents
in USD millions, as of December 31 2014 2013
Cash and cash equivalents comprise the following:Cash at bank and in hand 6,592 5,746Cash equivalents 2,184 2,416Total 8,776 8,162
As of December 31, 2014 and 2013, cash and cash equivalents held to meet local regulatory requirements were USD 817 million and USD 1,284 million, respectively.
The notes to the Consolidated financial statements are an integral part of these Consolidated financial statements.
Q4_2014_12_AR14_104_Consolidated_financial_statements_en.indd 163 23.02.2015 16:37:23
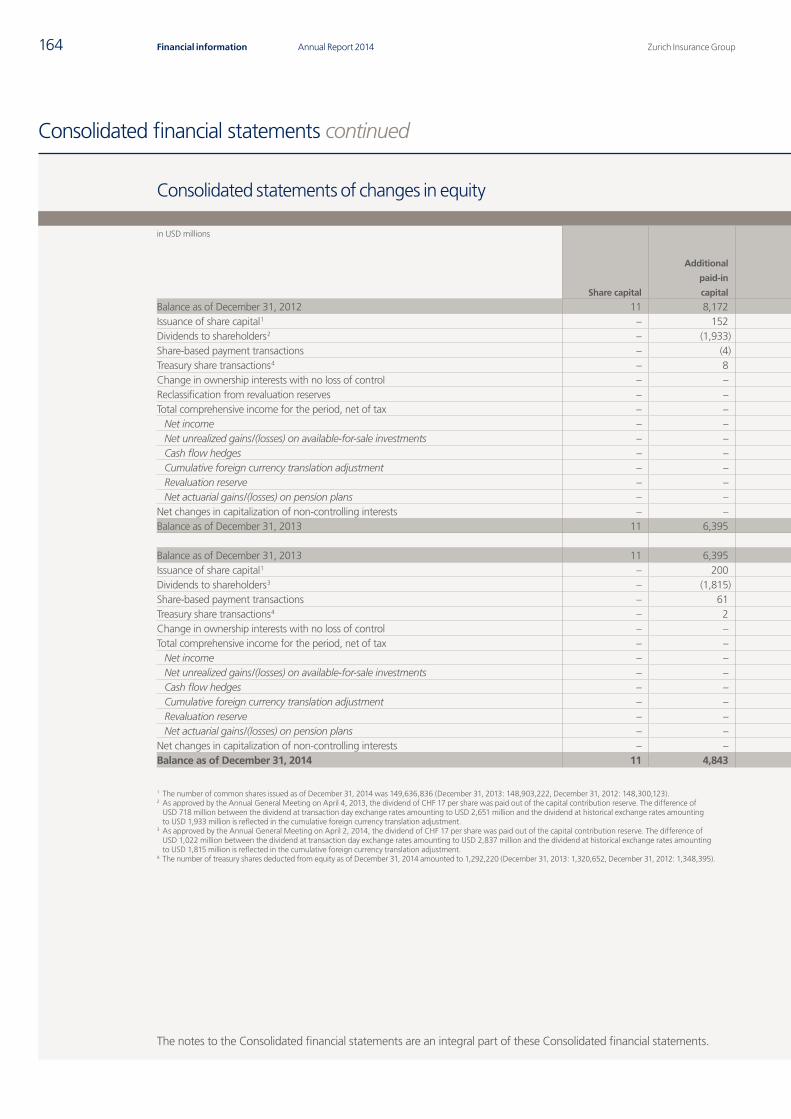
Zurich Insurance GroupAnnual Report 2014164 Financial information
Consolidated financial statements continued
Consolidated statements of changes in equity
in USD millions
Share capital
Additional
paid-in
capital
Net unrealized
gains/(losses)
on available-
for-sale
investments
Cash flow
hedges
Cumulative
foreign
currency
translation
adjustment
Revaluation
reserve
Retained
earnings
Shareholders’
equity
Non-
controlling
interests
Total
equity
Balance as of December 31, 2012 11 8,172 4,523 238 (3,022) 180 24,403 34,505 2,369 36,874Issuance of share capital 1 – 152 – – – – – 152 – 152Dividends to shareholders 2 – (1,933) – – – – – (1,933) (238) (2,171)Share-based payment transactions – (4) – – – – – (4) – (4)Treasury share transactions 4 – 8 – – – – 7 15 – 15Change in ownership interests with no loss of control – – – – – – (1) (1) – (1)Reclassification from revaluation reserves – – – – – – 6 6 – 6Total comprehensive income for the period, net of tax – – (2,794) (133) (986) 15 3,661 (237) 122 (115)
Net income – – – – – – 4,028 4,028 Net unrealized gains/(losses) on available-for-sale investments – – (2,794) – – – – (2,794) Cash flow hedges – – – (133) – – – (133) Cumulative foreign currency translation adjustment – – – – (986) – – (986) Revaluation reserve – – – – – 15 – 15 Net actuarial gains/(losses) on pension plans – – – – – – (367) (367)
Net changes in capitalization of non-controlling interests – – – – – – – – (22) (22)Balance as of December 31, 2013 11 6,395 1,730 106 (4,008) 195 28,075 32,503 2,231 34,734
Balance as of December 31, 2013 11 6,395 1,730 106 (4,008) 195 28,075 32,503 2,231 34,734Issuance of share capital 1 – 200 – – – – – 200 – 200Dividends to shareholders 3 – (1,815) – – – – – (1,815) (121) (1,936)Share-based payment transactions – 61 – – – – – 61 – 61Treasury share transactions 4 – 2 – – – – 23 25 – 25Change in ownership interests with no loss of control – – – – – – (38) (38) – (38)Total comprehensive income for the period, net of tax – – 2,338 200 (2,251) 24 3,488 3,799 43 3,842
Net income – – – – – – 3,895 3,895 Net unrealized gains/(losses) on available-for-sale investments – – 2,338 – – – – 2,338 Cash flow hedges – – – 200 – – – 200 Cumulative foreign currency translation adjustment – – – – (2,251) – – (2,251) Revaluation reserve – – – – – 24 – 24 Net actuarial gains/(losses) on pension plans – – – – – – (407) (407)
Net changes in capitalization of non-controlling interests – – – – – – – – (59) (59)Balance as of December 31, 2014 11 4,843 4,068 306 (6,259) 218 31,548 34,735 2,095 36,830
1 The number of common shares issued as of December 31, 2014 was 149,636,836 (December 31, 2013: 148,903,222, December 31, 2012: 148,300,123).2 As approved by the Annual General Meeting on April 4, 2013, the dividend of CHF 17 per share was paid out of the capital contribution reserve. The difference of
USD 718 million between the dividend at transaction day exchange rates amounting to USD 2,651 million and the dividend at historical exchange rates amounting to USD 1,933 million is reflected in the cumulative foreign currency translation adjustment.
3 As approved by the Annual General Meeting on April 2, 2014, the dividend of CHF 17 per share was paid out of the capital contribution reserve. The difference of USD 1,022 million between the dividend at transaction day exchange rates amounting to USD 2,837 million and the dividend at historical exchange rates amounting to USD 1,815 million is reflected in the cumulative foreign currency translation adjustment.
4 The number of treasury shares deducted from equity as of December 31, 2014 amounted to 1,292,220 (December 31, 2013: 1,320,652, December 31, 2012: 1,348,395).
The notes to the Consolidated financial statements are an integral part of these Consolidated financial statements.
Q4_2014_12_AR14_104_Consolidated_financial_statements_en.indd 164 23.02.2015 16:37:25
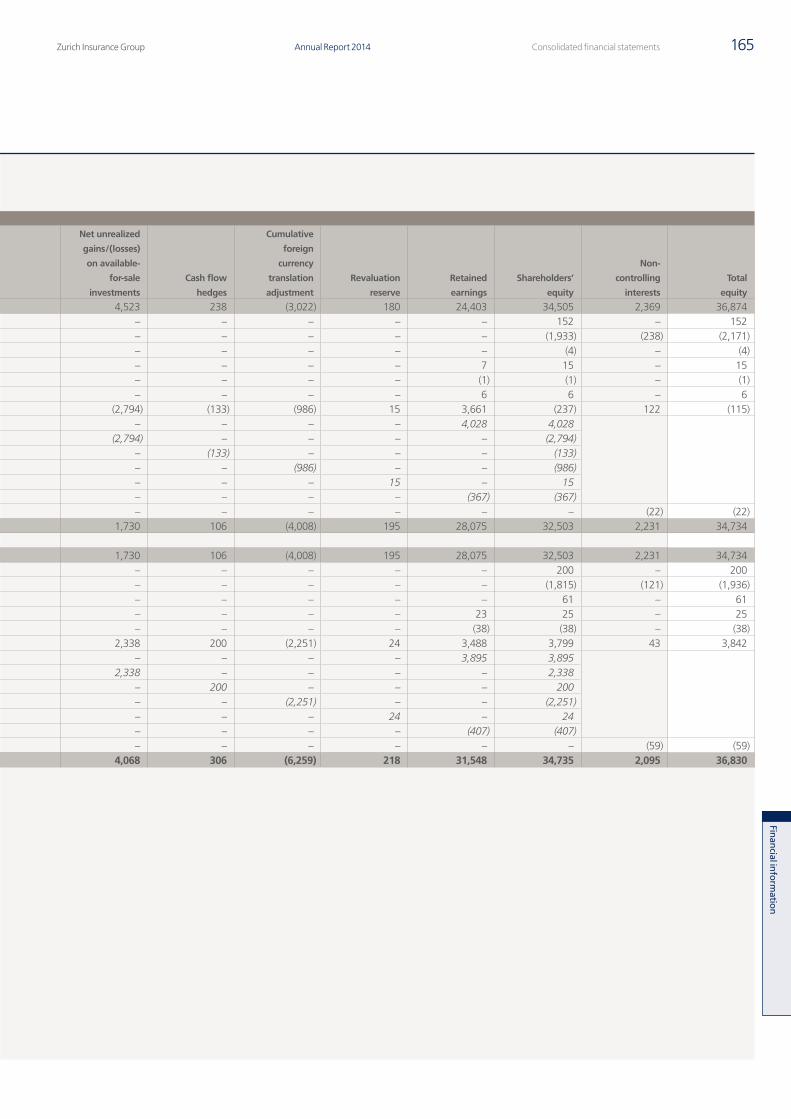
Zurich Insurance Group Annual Report 2014 165Consolidated financial statements
Finan
cial inform
ation
Consolidated statements of changes in equity
in USD millions
Share capital
Additional
paid-in
capital
Net unrealized
gains/(losses)
on available-
for-sale
investments
Cash flow
hedges
Cumulative
foreign
currency
translation
adjustment
Revaluation
reserve
Retained
earnings
Shareholders’
equity
Non-
controlling
interests
Total
equity
Balance as of December 31, 2012 11 8,172 4,523 238 (3,022) 180 24,403 34,505 2,369 36,874Issuance of share capital 1 – 152 – – – – – 152 – 152Dividends to shareholders 2 – (1,933) – – – – – (1,933) (238) (2,171)Share-based payment transactions – (4) – – – – – (4) – (4)Treasury share transactions 4 – 8 – – – – 7 15 – 15Change in ownership interests with no loss of control – – – – – – (1) (1) – (1)Reclassification from revaluation reserves – – – – – – 6 6 – 6Total comprehensive income for the period, net of tax – – (2,794) (133) (986) 15 3,661 (237) 122 (115)
Net income – – – – – – 4,028 4,028 Net unrealized gains/(losses) on available-for-sale investments – – (2,794) – – – – (2,794) Cash flow hedges – – – (133) – – – (133) Cumulative foreign currency translation adjustment – – – – (986) – – (986) Revaluation reserve – – – – – 15 – 15 Net actuarial gains/(losses) on pension plans – – – – – – (367) (367)
Net changes in capitalization of non-controlling interests – – – – – – – – (22) (22)Balance as of December 31, 2013 11 6,395 1,730 106 (4,008) 195 28,075 32,503 2,231 34,734
Balance as of December 31, 2013 11 6,395 1,730 106 (4,008) 195 28,075 32,503 2,231 34,734Issuance of share capital 1 – 200 – – – – – 200 – 200Dividends to shareholders 3 – (1,815) – – – – – (1,815) (121) (1,936)Share-based payment transactions – 61 – – – – – 61 – 61Treasury share transactions 4 – 2 – – – – 23 25 – 25Change in ownership interests with no loss of control – – – – – – (38) (38) – (38)Total comprehensive income for the period, net of tax – – 2,338 200 (2,251) 24 3,488 3,799 43 3,842
Net income – – – – – – 3,895 3,895 Net unrealized gains/(losses) on available-for-sale investments – – 2,338 – – – – 2,338 Cash flow hedges – – – 200 – – – 200 Cumulative foreign currency translation adjustment – – – – (2,251) – – (2,251) Revaluation reserve – – – – – 24 – 24 Net actuarial gains/(losses) on pension plans – – – – – – (407) (407)
Net changes in capitalization of non-controlling interests – – – – – – – – (59) (59)Balance as of December 31, 2014 11 4,843 4,068 306 (6,259) 218 31,548 34,735 2,095 36,830
1 The number of common shares issued as of December 31, 2014 was 149,636,836 (December 31, 2013: 148,903,222, December 31, 2012: 148,300,123).2 As approved by the Annual General Meeting on April 4, 2013, the dividend of CHF 17 per share was paid out of the capital contribution reserve. The difference of
USD 718 million between the dividend at transaction day exchange rates amounting to USD 2,651 million and the dividend at historical exchange rates amounting to USD 1,933 million is reflected in the cumulative foreign currency translation adjustment.
3 As approved by the Annual General Meeting on April 2, 2014, the dividend of CHF 17 per share was paid out of the capital contribution reserve. The difference of USD 1,022 million between the dividend at transaction day exchange rates amounting to USD 2,837 million and the dividend at historical exchange rates amounting to USD 1,815 million is reflected in the cumulative foreign currency translation adjustment.
4 The number of treasury shares deducted from equity as of December 31, 2014 amounted to 1,292,220 (December 31, 2013: 1,320,652, December 31, 2012: 1,348,395).
Q4_2014_12_AR14_104_Consolidated_financial_statements_en.indd 165 23.02.2015 16:37:25
Zurich Insurance GroupAnnual Report 2014166 Financial information
Consolidated financial statements continued
Zurich Insurance Group Ltd and its subsidiaries (collectively the Group) is a provider of insurance products and related services. The Group mainly operates in Europe, North America, Latin America and Asia Pacific through subsidiaries, as well as branch and representative offices.
Zurich Insurance Group Ltd, a Swiss corporation, is the holding company of the Group and is listed on the SIX Swiss Exchange. Zurich Insurance Group Ltd was incorporated on April 26, 2000, in Zurich, Switzerland. It is recorded in the Commercial Register of the Canton of Zurich under its registered address at Mythenquai 2, 8002 Zurich.
On February 11, 2015 the Board of Directors of Zurich Insurance Group Ltd authorized these Consolidated financial statements for issue. These financial statements will be submitted for approval to the Annual General Meeting of Shareholders to be held on April 1, 2015.
1. Basis of presentation
General informationThe Consolidated financial statements of the Group have been prepared in accordance with International Financial Reporting Standards (IFRS) and comply with Swiss law. Where IFRS does not contain clear guidance governing the accounting treatment of certain transactions, including those that are specific to insurance and reinsurance products, IFRS permits reference to another comprehensive body of accounting principles that uses a similar conceptual framework. The Group’s accounting policies for insurance and reinsurance contracts are therefore based on those developed by the Group before the adoption of IFRS 4 in areas where IFRS 4 did not include specific requirements. Before the time of adoption, the Group typically applied U.S. GAAP pronouncements issued by the Financial Accounting Standards Board (FASB) on insurance and reinsurance contracts. Any subsequent changes to such pronouncements are not reflected in the Group’s accounting policies. In case of business combinations, the Group may decide to maintain the local statutory treatment if this does not distort the fair presentation of the financial position of the Group. If significant, the impact of such cases is described elsewhere in the notes to these Consolidated financial statements.
The accounting policies applied by the reportable segments are the same as those applied by the Group. The Group accounts for inter-segment revenues and transfers as if the transactions were with third parties at current market prices. Dividends, realized capital gains and losses as well as gains and losses on the transfer of net assets, are eliminated within the segment, whereas all other intercompany gains and losses are eliminated at Group level. In the Consolidated financial statements, inter-segment revenues and transfers are eliminated.
Disclosures under IFRS 4 “Insurance Contracts” and IFRS 7 “Financial Instruments: Disclosures” relating to the nature and extent of risks, and capital disclosures under IAS 1 “Presentation of Financial Statements” have been included in the audited sections of the Risk review on pages 115 to 152, and they form an integral part of the Consolidated financial statements.
The Group’s consolidated balance sheets are not presented using a current/non-current classification. The following balances are generally considered to be current: cash and cash equivalents, deferred policy acquisition costs on general insurance contracts, accrued investment income, receivables, reserve for premium refunds, obligations to repurchase securities and accrued liabilities.
The following balances are generally considered to be non-current: equity securities, investment property, investments in associates and joint ventures, deferred policy acquisition costs on life insurance contracts, deferred tax assets, property and equipment, goodwill, other intangible assets and deferred tax liabilities.
The following balances are mixed in nature (including both current and non-current portions): debt securities, mortgage loans, other loans, reinsurers’ share of reserves for insurance contracts, deposits made under assumed reinsurance contracts, deferred origination costs, other assets, reserves and investments for unit-linked contracts, liabilities for investment contracts, deposits received under ceded reinsurance contracts, deferred front-end fees, reserves for losses and loss adjustment expenses, reserves for unearned premiums, future life policyholders’ benefits, policyholders’ contract deposits and other funds, other liabilities, senior and subordinated debt, and assets and liabilities held for sale.
Q4_2014_12_AR14_104_Consolidated_financial_statements_en.indd 166 23.02.2015 16:37:25
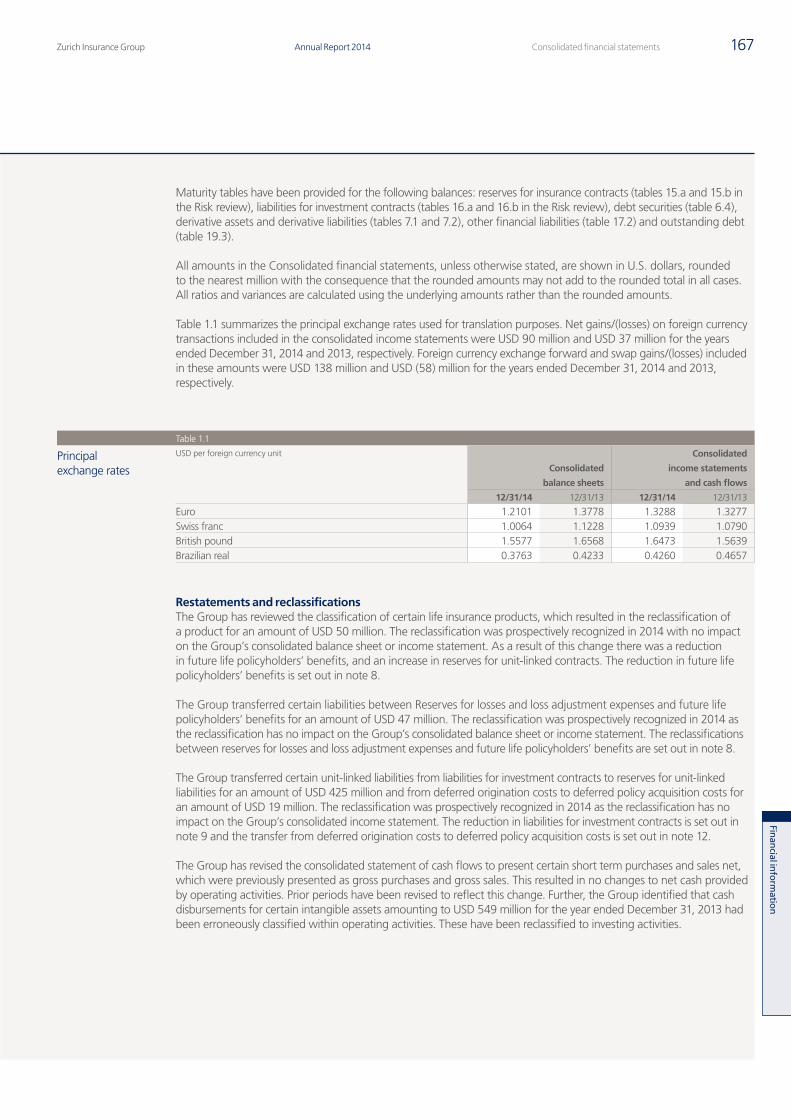
Zurich Insurance Group Annual Report 2014 167Consolidated financial statements
Finan
cial inform
ation
Maturity tables have been provided for the following balances: reserves for insurance contracts (tables 15.a and 15.b in the Risk review), liabilities for investment contracts (tables 16.a and 16.b in the Risk review), debt securities (table 6.4), derivative assets and derivative liabilities (tables 7.1 and 7.2), other financial liabilities (table 17.2) and outstanding debt (table 19.3).
All amounts in the Consolidated financial statements, unless otherwise stated, are shown in U.S. dollars, rounded to the nearest million with the consequence that the rounded amounts may not add to the rounded total in all cases. All ratios and variances are calculated using the underlying amounts rather than the rounded amounts.
Table 1.1 summarizes the principal exchange rates used for translation purposes. Net gains/(losses) on foreign currency transactions included in the consolidated income statements were USD 90 million and USD 37 million for the years ended December 31, 2014 and 2013, respectively. Foreign currency exchange forward and swap gains/(losses) included in these amounts were USD 138 million and USD (58) million for the years ended December 31, 2014 and 2013, respectively.
Table 1.1
Principal exchange rates
USD per foreign currency unit
Consolidated
balance sheets
Consolidated
income statements
and cash flows
12/31/14 12/31/13 12/31/14 12/31/13
Euro 1.2101 1.3778 1.3288 1.3277Swiss franc 1.0064 1.1228 1.0939 1.0790British pound 1.5577 1.6568 1.6473 1.5639Brazilian real 0.3763 0.4233 0.4260 0.4657
Restatements and reclassificationsThe Group has reviewed the classification of certain life insurance products, which resulted in the reclassification of a product for an amount of USD 50 million. The reclassification was prospectively recognized in 2014 with no impact on the Group’s consolidated balance sheet or income statement. As a result of this change there was a reduction in future life policyholders’ benefits, and an increase in reserves for unit-linked contracts. The reduction in future life policyholders’ benefits is set out in note 8.
The Group transferred certain liabilities between Reserves for losses and loss adjustment expenses and future life policyholders’ benefits for an amount of USD 47 million. The reclassification was prospectively recognized in 2014 as the reclassification has no impact on the Group’s consolidated balance sheet or income statement. The reclassifications between reserves for losses and loss adjustment expenses and future life policyholders’ benefits are set out in note 8.
The Group transferred certain unit-linked liabilities from liabilities for investment contracts to reserves for unit-linked liabilities for an amount of USD 425 million and from deferred origination costs to deferred policy acquisition costs for an amount of USD 19 million. The reclassification was prospectively recognized in 2014 as the reclassification has no impact on the Group’s consolidated income statement. The reduction in liabilities for investment contracts is set out in note 9 and the transfer from deferred origination costs to deferred policy acquisition costs is set out in note 12.
The Group has revised the consolidated statement of cash flows to present certain short term purchases and sales net, which were previously presented as gross purchases and gross sales. This resulted in no changes to net cash provided by operating activities. Prior periods have been revised to reflect this change. Further, the Group identified that cash disbursements for certain intangible assets amounting to USD 549 million for the year ended December 31, 2013 had been erroneously classified within operating activities. These have been reclassified to investing activities.
Q4_2014_12_AR14_104_Consolidated_financial_statements_en.indd 167 23.02.2015 16:37:26
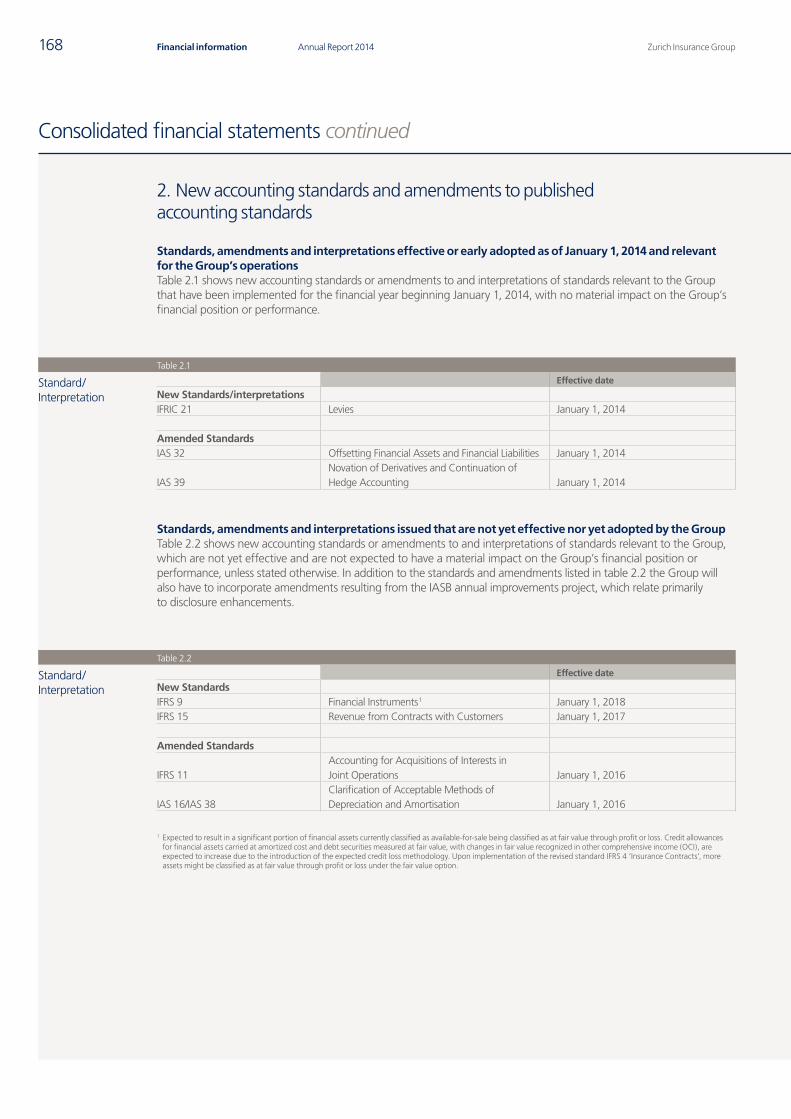
Zurich Insurance GroupAnnual Report 2014168 Financial information
Consolidated financial statements continued
2. New accounting standards and amendments to published accounting standards
Standards, amendments and interpretations effective or early adopted as of January 1, 2014 and relevant for the Group’s operationsTable 2.1 shows new accounting standards or amendments to and interpretations of standards relevant to the Group that have been implemented for the financial year beginning January 1, 2014, with no material impact on the Group’s financial position or performance.
Table 2.1
Standard/ Interpretation
Effective date
New Standards/interpretationsIFRIC 21 Levies January 1, 2014
Amended StandardsIAS 32 Offsetting Financial Assets and Financial Liabilities January 1, 2014
IAS 39Novation of Derivatives and Continuation of Hedge Accounting January 1, 2014
Standards, amendments and interpretations issued that are not yet effective nor yet adopted by the GroupTable 2.2 shows new accounting standards or amendments to and interpretations of standards relevant to the Group, which are not yet effective and are not expected to have a material impact on the Group’s financial position or performance, unless stated otherwise. In addition to the standards and amendments listed in table 2.2 the Group will also have to incorporate amendments resulting from the IASB annual improvements project, which relate primarily to disclosure enhancements.
Table 2.2
Standard/ Interpretation
Effective date
New StandardsIFRS 9 Financial Instruments 1 January 1, 2018IFRS 15 Revenue from Contracts with Customers January 1, 2017
Amended Standards
IFRS 11Accounting for Acquisitions of Interests in Joint Operations January 1, 2016
IAS 16/IAS 38Clarification of Acceptable Methods of Depreciation and Amortisation January 1, 2016
1 Expected to result in a significant portion of financial assets currently classified as available-for-sale being classified as at fair value through profit or loss. Credit allowances for financial assets carried at amortized cost and debt securities measured at fair value, with changes in fair value recognized in other comprehensive income (OCI), are expected to increase due to the introduction of the expected credit loss methodology. Upon implementation of the revised standard IFRS 4 ‘Insurance Contracts’, more assets might be classified as at fair value through profit or loss under the fair value option.
Q4_2014_12_AR14_104_Consolidated_financial_statements_en.indd 168 23.02.2015 16:37:26
Zurich Insurance Group Annual Report 2014 169Consolidated financial statements
Finan
cial inform
ation
3. Summary of significant accounting policies
The principal accounting policies applied in these Consolidated financial statements are set out below. These policies have been consistently applied to all years presented unless otherwise stated.
a) Consolidation principlesThe Group’s Consolidated financial statements include the assets, liabilities, equity, revenues, expenses and cash flows of Zurich Insurance Group Ltd and its subsidiaries. A subsidiary is an entity that Zurich Insurance Group Ltd either directly or indirectly controls. The results of subsidiaries acquired are included in the Consolidated financial statements from the date of acquisition. The results of subsidiaries that have been divested during the year are included up to the date control ceased. All significant intercompany balances, profits and transactions are eliminated in full.
Acquisition transactions with non-controlling interests are recorded within equity if there is no change in control.
The Consolidated financial statements are prepared as of December 31 based on individual company financial statements at the same date. In some cases information is included with a time lag of up to three months. The consequent effect on the Group’s Consolidated financial statements is not material.
b) Foreign currency translation and transactionsForeign currency translationDue to the Group’s economic exposure to the U.S. dollar (USD), the presentation currency of the Group’s Consolidated financial statements is USD. Many Group companies use a different functional currency, being that of the respective primary economic environment in which these companies operate. Assets and liabilities are translated into the presentation currency at end-of-period exchange rates, while income statements and statements of cash flows are translated at average exchange rates for the period. The resulting foreign currency translation differences are recorded directly in other comprehensive income (OCI) as cumulative foreign currency translation adjustment.
Foreign currency transactions and balancesForeign currency transactions are translated into the functional currency using the spot exchange rate at the date of the transaction or, for practical reasons, a weighted average rate, if exchange rates do not fluctuate significantly. Foreign currency monetary items and foreign currency non-monetary items that are carried at fair value, are translated at end-of-period exchange rates. The resulting foreign currency translation differences are recorded in income, except for the following:
• Foreign currency translation differences that are recognized in OCI in conjunction with the recognition of unrealized gains or losses on available-for-sale investments; and
• Foreign currency translation differences arising on monetary items that form part of net investments in foreign operations are included directly in OCI as cumulative foreign currency translation adjustment.
c) Insurance contracts and investment contracts with discretionary participating features (DPF)ClassificationContracts issued under which the Group accepts significant insurance risk and obligations arising from investment contracts with DPF are accounted for as insurance contracts.
The Group also issues products containing embedded options that entitle the policyholder to switch all or part of the current and future invested funds into another product issued by the Group. Where this results in the reclassification of an investment product to a product that meets the definition of an insurance contract, the previously held reserve and the related deferred origination costs are also reclassified and are accounted for in accordance with the accounting policy to be applied to the new product on a prospective basis. As a consequence, no gain or loss is recognized as a result of the reclassification of a contract from investment to insurance.
Once a contract has been classified as an insurance contract, no reclassification can subsequently be made.
PremiumsGeneral insurancePremiums from the sale of short-duration general insurance products are recorded when written and are normally recognized as revenue in relation to the insurance coverage provided. The unearned premium reserve represents the portion of the premiums written relating to the unexpired coverage period.
Q4_2014_12_AR14_104_Consolidated_financial_statements_en.indd 169 23.02.2015 16:37:26
Zurich Insurance GroupAnnual Report 2014170 Financial information
Consolidated financial statements continued
Life insurancePremiums from traditional life insurance contracts, including participating contracts and annuity policies with life contingencies, are recognized as revenue when due from the policyholder. For single premium and limited pay contracts, premiums are recognized as revenue when due, with any excess profit deferred and recognized in income in a constant relationship to the insurance in-force or, for annuities, the amount of expected benefit payments.
Amounts collected as premiums from investment type insurance contracts such as universal life, unit-linked and unitized with-profits contracts are reported as deposits. Revenue from these contracts consists of policy fees for the cost of insurance, administration and surrenders during the period. Front-end fees are deferred and recognized over the estimated life of the contracts.
Cash flows from certain universal life-type contracts in the Group‘s Spanish operations are recognized as gross written premiums and insurance benefits and losses and not as deposits.
Reserves for losses and loss adjustment expensesLosses and loss adjustment expenses are charged to income as incurred. Reserves for losses and loss adjustment expenses represent estimates of future payments of reported and unreported claims for losses and related expenses, with respect to insured events that have occurred. Any changes in estimates are reflected in the results of operations in the period in which estimates are changed. The Group does not discount its loss reserves, other than for settled claims with fixed payment terms.
Reserves for life benefitsFuture life policyholders’ benefits represent the estimated future benefit liability for traditional life insurance policies and include the value of accumulated declared bonuses or dividends that have vested to policyholders.
The reserves for life benefits for participating traditional life insurance policies are calculated using a net level premium valuation method based on actuarial assumptions taking into account guaranteed mortality benefits and interest rates.
The reserves for life benefits for other traditional life insurance policies are calculated using a net level premium valuation method based on actuarial assumptions including mortality, persistency, expenses and investment return, plus a margin for adverse deviations. These assumptions are locked-in at inception and are regularly assessed as part of the liability adequacy testing over the period of the contract.
Policyholders’ contract deposits represent the estimated policy benefits for investment type insurance contracts invested in non unit-linked funds. This liability comprises the accumulation of premiums received, less charges, plus declared policyholder dividends.
Unrealized gains or losses arising on the revaluation of available-for-sale assets are recorded directly in OCI in accordance with the Group’s accounting policy for such assets. Where these assets are related to life insurance, corresponding adjustments to the reserves for life benefits and related assets are also recognized directly in OCI.
Reserves for unit-linked contracts are based on the fair value of the financial instruments backing those contracts less any fees and assessments charged to the policyholders.
For products containing guarantees in respect of minimum death benefits (GMDB), retirement income benefits (GRIB) and/or annuitization options (GAO), additional liabilities are recorded in proportion to the receipt of the contracted revenues which are subject to a loss adequacy test taking into account policyholder behavior and current market conditions.
For products managed on a dynamic basis, an option in IFRS 4 is used to measure the insurance liabilities using current financial and non-financial assumptions, to better reflect the way that these products are managed. Financial assets relating to these liabilities are designated at fair value through profit or loss.
Deferred acquisition costs (DAC)Costs that vary with and are directly related to the acquisition of new and renewal business, including for example commissions and certain underwriting and policy issue expenses, are deferred and subsequently amortized over a defined period.
Q4_2014_12_AR14_104_Consolidated_financial_statements_en.indd 170 23.02.2015 16:37:26
Zurich Insurance Group Annual Report 2014 171Consolidated financial statements
Finan
cial inform
ation
General insuranceDAC for general insurance contracts is amortized over the period in which the related premiums written are earned.
Life insuranceDAC for traditional participating life insurance contracts is amortized based on estimated gross margins expected to be realized over the life of the contract. Estimated gross margins are updated for actual and anticipated future experience and discounted using the latest revised interest rate for the remaining benefit period. Resultant deviations are reflected in income.
DAC for other traditional life insurance and annuity contracts is amortized over the life of the contracts based on expected premiums. Expected premiums are estimated at the date of policy issue for application throughout the life of the contract, unless a premium deficiency subsequently occurs.
DAC for investment type insurance contracts such as universal life, unit-linked and unitized with-profits contracts is amortized based on estimated gross profits expected to be realized over the life of the contract. Estimated gross profits are updated for actual and anticipated future experience and discounted using either the interest rate in effect at the inception of the contracts or the latest revised interest rate for the remaining benefit period, depending on whether crediting is based on the policyholder’s or on the reporting entity’s investment performance. Resultant deviations are reflected in income.
Unamortized DAC for life insurance contracts accrues interest at a rate consistent with the related assumptions for reserves.
For traditional participating and investment type life insurance contracts, DAC is adjusted for the impact of unrealized gains/(losses) on allocated investments that are recorded in OCI.
Liability adequacy testsLiability adequacy tests are performed annually for groupings of contracts determined in accordance with the Group’s manner of acquiring, servicing and measuring the profitability of its insurance contracts.
General insuranceFor general insurance contracts, unearned premiums are tested to determine whether they are sufficient to cover related expected losses, loss adjustment expenses, policyholder dividends, unamortized DAC and maintenance expenses, using current assumptions and considering anticipated investment returns. If a premium deficiency is identified, the DAC asset for the respective grouping of contracts is written down by the amount of the deficiency. If, after writing down the DAC asset to nil, a premium deficiency still exists for the respective grouping of contracts, then a premium deficiency reserve is established for the amount of the remaining deficiency.
Life insuranceFor life insurance contracts, the carrying amount of the existing reserve for life benefits, including any deferred front-end fees, reduced by the unamortized balance of DAC or present value of future profits of acquired insurance contracts (PVFP), is compared with the reserve for life benefits, calculated using revised assumptions for actual and anticipated experience as of the valuation date. If a deficiency is identified, the DAC or PVFP for the respective grouping of contracts is written down by the amount of the deficiency. If, after writing down the DAC or PVFP to nil, a deficiency still exists for the respective grouping of contracts, the reserve for life benefits is increased by the amount of the remaining deficiency.
ReinsuranceThe Group’s insurance subsidiaries cede risk in the normal course of business in order to limit the potential for losses arising from certain exposures. Reinsurance does not relieve the originating insurer of its liability. Certain Group insurance companies assume reinsurance business incidental to their normal business.
Reinsurance contracts that do not transfer significant insurance risk are accounted for using the deposit method.
Q4_2014_12_AR14_104_Consolidated_financial_statements_en.indd 171 23.02.2015 16:37:26
Zurich Insurance GroupAnnual Report 2014172 Financial information
Consolidated financial statements continued
A deposit asset or liability is recognized based on the premium paid or received less any explicitly identified premiums or fees to be retained by the ceding company. Interest on deposits is accounted for using the effective interest rate method. Future cash flows are estimated to calculate the effective yield, and revenue and expense are recorded as interest income or expense. Reinsurance deposit assets or liabilities also include funds deposited or held by the Group, under assumed or ceded reinsurance contracts, respectively, when funds are retained by the reinsured under the terms of the contract.
Reinsurance is recorded gross in the consolidated balance sheet. Reinsurance assets include balances expected to be recovered from reinsurance companies for ceded paid and unpaid losses and loss adjustment expenses, ceded unearned premiums and ceded future life policy benefits. Amounts recoverable from reinsurers are estimated in a manner consistent with the liability associated with the reinsured policy.
Reinsurance assets are assessed for impairment on a regular basis and impairment losses, if any, are recorded in the same manner as for loans and receivables.
d) Liabilities for investment contracts (without DPF)Investment contracts are those contracts that do not transfer significant insurance risk. The Group issues investment contracts without fixed terms (unit-linked) and investment contracts with fixed and guaranteed terms (fixed interest rate).
Unit-linked investment contractsThese represent portfolios maintained to meet the specific investment objectives of policyholders who bear the credit, market and liquidity risks related to the investments. The liabilities are carried at fair value, which is determined by reference to the underlying financial assets. Changes in fair value are recorded in income. The related assets for unit-linked investment contracts are designated at fair value through profit or loss in order to reduce measurement inconsistencies.
The costs of policy administration, investment management, surrender charges and certain policyholder taxes assessed against the policyholders’ account balances are included in policy fee revenue.
Investment contracts at amortized costLiabilities for investment contracts with fixed and guaranteed terms are measured at amortized cost, using the effective interest rate method. Transaction costs are included in the calculation of the effective yield. As of each reporting date, the Group re-estimates the expected future cash flows and re-calculates the carrying amount of the financial liability by computing the present value of estimated future cash flows using the original effective interest rate for the financial liability. Any adjustment is immediately recognized in income.
Deferred origination costs (DOC)The costs of acquiring new investment contracts with investment management services, such as commissions and other incremental expenses directly related to the issuance of each new contract, are capitalized and amortized in line with the revenue generated by providing investment management services. DOC is tested for recoverability annually.
e) Investments excluding derivative financial instrumentsInvestments include financial assets (excluding derivative financial instruments), investments in associates and joint ventures and investment property.
Categories and measurement of investments (excluding derivative financial instruments)Financial assets are classified as available-for-sale, financial assets at fair value through profit or loss, held-to-maturity investments, or loans and receivables.
The Group recognizes regular purchases and sales of financial assets on the trade date, which is the date on which the Group commits to purchase or sell the asset. Financial assets are recognized initially at fair value plus, in the case of a financial asset not measured at fair value through profit or loss, transaction costs that are directly attributable to the acquisition of the financial asset. Subsequently, financial assets are measured in accordance with the classification category.
Q4_2014_12_AR14_104_Consolidated_financial_statements_en.indd 172 23.02.2015 16:37:27
Zurich Insurance Group Annual Report 2014 173Consolidated financial statements
Finan
cial inform
ation
Available-for-sale financial assetsAvailable-for-sale financial assets are carried at fair value, with changes in fair value recognized in OCI, until the securities are either sold or impaired. The cumulative unrealized gains or losses recorded in OCI are net of cumulative deferred income taxes, certain related life policyholder liabilities and deferred acquisition costs. When available-for-sale financial assets are sold, impaired or otherwise disposed of, the cumulative gains or losses are reclassified from OCI to income as net capital gains/(losses) on investments and impairments.
Financial assets at fair value through profit or lossFinancial assets at fair value through profit or loss are mainly financial assets backing unit-linked insurance contracts, unit-linked investment contracts and certain life insurance contracts with participation features. The designation of these assets at fair value through profit or loss eliminates or significantly reduces a measurement inconsistency that would otherwise arise from measuring assets or recognizing the gains and losses on them on a different basis compared to the liabilities.
Financial assets at fair value through profit or loss are carried at fair value. Realized and unrealized gains and losses arising from changes in the fair value are recognized in income within net capital gains/(losses) on investments and impairments, in the period in which they arise.
Held-to-maturity investmentsHeld-to-maturity investments are financial assets with fixed or determinable payments and fixed maturities other than those that meet the definition of loans and receivables, and for which the Group has the positive intention and ability to hold to maturity. Held-to-maturity investments are carried at amortized cost using the effective interest rate method, less any charges for impairment.
Loans and receivablesLoans and receivables are financial assets with fixed or determinable payments that are neither quoted in an active market nor classified in any of the other categories. They are carried at amortized cost using the effective interest rate method, less any charges for impairment.
Other itemsCash and cash equivalents comprise cash on hand, deposits held at call with banks and other short-term highly liquid investments that are readily convertible into cash and are subject to an insignificant risk of change in fair value, for example, short-term investments with maturities of three months or less from the date of acquisition. Cash and cash equivalents also include cash received as collateral for securities lending. Cash and cash equivalents are stated at face value.
Investments in associates where the Group has the ability to exercise significant influence but not control, as well as joint ventures where there is joint control, are accounted for using the equity method. Significant influence is presumed to exist when the Group owns, directly or indirectly, between 20 percent and 50 percent of the voting rights. Under the equity method of accounting, these investments are initially recognized at cost, including attributable goodwill, and adjusted thereafter for post-acquisition changes in the Group’s share of the net assets of the investment and impairment charges.
Investment property is initially recorded at cost (including transaction costs) and subsequently measured at fair value with changes in fair value, as well as any realized gain or loss upon disposal, recognized in income.
Impairment of financial assetsGeneralThe Group assesses at each reporting date whether there is objective evidence that loss events have occurred that negatively affect the estimated future cash flows of a financial asset or a group of financial assets.
Available-for-sale financial assets When there is objective evidence that an available-for-sale debt security is impaired, the cumulative loss that had been recognized in OCI is reclassified to income as an impairment loss. If the fair value of a debt security increases in a subsequent period, and the increase can be objectively related to an event occurring after the impairment loss was recognized, the impairment loss is reversed through income. The amount of reversal is limited so that it does not result in a carrying amount exceeding the amortized cost that would have been calculated at the date of reversal had an impairment loss not been previously recognized. Any further gains are recognized in OCI. Any subsequent losses, to the extent that they do not represent further impairment losses, are also recognized in OCI.
Q4_2014_12_AR14_104_Consolidated_financial_statements_en.indd 173 23.02.2015 16:37:27
Zurich Insurance GroupAnnual Report 2014174 Financial information
Consolidated financial statements continued
When there is objective evidence that an available-for-sale equity security is impaired, the cumulative loss that had been recognized in OCI, including any portion attributable to foreign currency changes, is reclassified to income as an impairment loss. The impairment loss is the difference between the weighted-average acquisition cost (less any impairment loss on that security previously recognized in income) and the current fair value. Impairment losses on equity securities are not reversed through income, instead, when the fair value of a previously impaired equity security increases, the resulting unrealized gains are recognized in OCI. Any further decrease in fair value subsequent to recognition of an impairment loss is also recognized in income as an impairment loss, together with any portion attributable to foreign currency changes, until the equity security is derecognized.
Held-to-maturity investments and loans and receivablesGenerally, significant financial assets are individually assessed to determine whether objective evidence of impairment exists. If no objective evidence of impairment exists, the asset is included in a group of financial assets with similar credit risk characteristics that are collectively assessed for impairment.
Objective evidence of impairment exists if it is probable that the Group will not be able to collect principal and/or interest due according to the contractual terms of the instrument. When impairment is determined to have occurred, the carrying amount of held-to-maturity investments and loans and receivables is reduced through the use of an allowance account, and the movement in the impairment allowance is recognized in income as an impairment loss. The impairment allowance is measured as the difference between the carrying amount of the assets and the present value of estimated future cash flows, calculated using the original effective interest rate, for fixed rate financial assets, or current effective interest rate, for variable rate financial assets. If the amount of the impairment loss decreases and the decrease relates objectively to an event occurring after the impairment loss was recognized, the impairment loss is reversed through income. The amount of reversal is limited so that it does not result in a carrying amount exceeding the amortized cost that would have been calculated at the date of reversal had an impairment loss not been previously recognized.
f) Derivative financial instruments and hedge accountingDerivative financial instruments, except those designated under a qualifying hedge relationship, are classified as held for trading assets or liabilities and carried at fair value on the balance sheet with changes in fair value recognized in income.
Derivative financial instruments that qualify for hedge accountingDerivative financial instruments are used by the Group to economically hedge risks. In limited circumstances derivative financial instruments are designated as hedging instruments for accounting purposes in:
• Fair value hedges which are hedges of the exposure to changes in the fair value of a recognized asset or liability;• Cash flow hedges, which are hedges of the exposure to variability in cash flows attributable to a particular risk as
associated with a recognized asset or liability or a highly probable forecast transaction and could affect profit or loss; or • Net investment hedges, which are hedges of a net investment in a foreign operation.
All hedge relationships are formally documented, including the risk management objectives and strategy for undertaking the hedge. At inception of a hedge and on an ongoing basis, the hedge relationship is formally assessed in order to determine whether the hedging instruments are expected (prospective assessment) and have been (retrospective assessment) highly effective in offsetting changes in fair values or cash flows of hedged items attributable to the hedged risk. Where the hedge accounting criteria are fulfilled, the accounting treatment is as follows:
Fair value hedgesThe hedged item is remeasured for fair value changes attributable to the risk being hedged and such fair value changes are recognized in the same line item of the consolidated income statement as the offsetting gains or losses from remeasuring the hedging derivatives at fair value through profit or loss.
Cash flow hedgesThe effective portion of the gain or loss on the remeasurement of the cash flow hedging instrument is recognized in OCI. The ineffective portion is recognized immediately in income. The accumulated gains and losses on the hedged instrument in OCI are reclassified to income in the same period in which gains or losses on the hedged item are recognized in income.
Q4_2014_12_AR14_104_Consolidated_financial_statements_en.indd 174 23.02.2015 16:37:27
Zurich Insurance Group Annual Report 2014 175Consolidated financial statements
Finan
cial inform
ation
Net investment hedgesMeasurement of hedge effectiveness is based on changes in forward rates. Gains and losses on the designated hedging derivative relating to the effective portion of the hedge are recognized in OCI, whereas the ineffective portion is immediately recognized in income. The Group also designates non-derivative financial instruments as hedging instruments in hedges of certain net investments in foreign operations. Foreign currency re-measurement gains and losses on the designated non-derivative financial instruments are reported in OCI together with the translation gains and losses on the hedged net investment. The accumulated gains and losses in OCI on the hedging instrument are reclassified to income on disposal or partial disposal of the foreign operation.
If the qualifying criteria for the application of hedge accounting are no longer met, the hedge relationship is discontinued prospectively, in which case the hedging instrument and the hedged item are reported independently in accordance with the respective accounting policy.
g) Borrowings Borrowings (debt issued) are recognized initially at fair value of the consideration received, net of transaction costs incurred. Borrowings are subsequently carried at amortized cost; any difference between the proceeds (net of transaction costs) and the redemption value is recognized in income over the period of the borrowing using the effective interest rate method.
h) Derecognition of financial assets and liabilitiesFinancial assets are derecognized when the right to receive cash flows from the assets has expired, or when the Group has transferred the financial asset and substantially all the risks and rewards of ownership.
Financial liabilities are derecognized when they are extinguished, which is when the obligation is discharged, cancelled or has expired.
Securities lending, repurchase and reverse repurchase transactionsCertain entities within the Group participate in securities lending or repurchase arrangements whereby specific securities are transferred to other institutions, primarily banks and brokerage firms, for short periods of time. Under the terms of these agreements, the Group retains substantially all the risks and rewards of ownership of the transferred securities, and also retains contractual rights to the cash flows therefrom. These securities are therefore not derecognized from the Group’s balance sheet. Cash received as collateral is recorded as an asset, and a corresponding liability is established. Interest expense is charged to income using the effective interest rate method over the life of the agreement.
Under a reverse repurchase agreement, the securities received are not recognized on the balance sheet, as long as the risk and rewards of ownership have not been transferred to the Group. The cash delivered by the Group is derecognized and a corresponding receivable is recorded within receivables and other assets. Interest income is recognized in income using the effective interest rate method over the life of the agreement.
i) Property and equipmentBuildings held for own use and equipment are carried at cost less accumulated depreciation and any accumulated impairment loss. These assets are depreciated usually on a straight-line basis to income over the following estimated useful lives:
• Buildings 25 to 50 years;• Furniture and fixtures five to ten years; and• Computer equipment three to six years.
Land held for own use is carried at cost less any accumulated impairment loss.
j) GoodwillGoodwill arises on the acquisition of subsidiaries, associates and joint ventures and represents the excess of the cost of acquisition over the fair value of the Group’s share of the net identifiable assets of the acquired entity at the acquisition date.
Q4_2014_12_AR14_104_Consolidated_financial_statements_en.indd 175 23.02.2015 16:37:27
Zurich Insurance GroupAnnual Report 2014176 Financial information
Consolidated financial statements continued
Goodwill on the acquisition of subsidiaries is capitalized as a separate line and tested for impairment annually, or more frequently if impairment indicators are observed. For the purpose of impairment testing, goodwill is allocated to cash generating units (CGUs) based on the level at which management monitors operations and makes decisions relating to the continuation or disposal of assets and operations. If goodwill has been allocated to a CGU and an operation within that unit is disposed of, the carrying amount of the operation includes attributable goodwill when determining the gain or loss on disposal.
k) Intangible assetsIntangible assets with finite lives are carried at cost less accumulated amortization and impairments. Such assets are generally amortized using the straight-line method over their useful lives and reviewed for impairment at least annually or whenever events or changes in circumstances indicate that the carrying amount may not be recoverable.
Intangible assets with indefinite lives are not subject to amortization but are tested for impairment annually and whenever events or changes in circumstances indicate that the carrying amount may not be recoverable.
Present value of future profits from acquired insurance contracts (PVFP)An intangible asset representing the PVFP arises from the acquisition of life insurance businesses. Such an asset has a finite life and is amortized over the expected life of the acquired contracts, following the same rules as outlined for deferred acquisition costs. The carrying value of the PVFP asset is tested periodically for impairment as part of the liability adequacy test for insurance contracts.
Attorney-in-fact relationships (AIF)The AIF reflects the ability of the Group to generate future revenues based on the Group’s relationship with the Farmers Exchanges, which are managed but not owned by Farmers Group, Inc. (FGI), a wholly owned subsidiary of the Group. In determining that these relationships have an indefinite useful life, the Group considered the organizational structure of inter-insurance exchanges, under which subscribers exchange contracts with each other and appoint an attorney-in-fact to provide non-claims management services, and the historical AIF between FGI and the Farmers Exchanges. The AIF is tested for impairment at least annually.
Distribution agreements Distribution agreements may have useful lives extending up to 30 years which are estimated based on the period of time over which they are expected to provide economic benefits, but no longer than the contractual term, after taking into account all economic and legal factors such as stability of the industry, competitive position and the period of control over the assets.
SoftwareCosts associated with research and maintenance of internally developed computer software are expensed as incurred. Costs incurred during the development phase are capitalized. Software under development is tested for impairment annually.
Acquired computer software licenses are capitalized on the basis of the costs incurred to acquire and bring the specific software into use.
The useful lives of computer software licenses and capitalized internal software development costs generally do not exceed five years. In limited circumstances, capitalized software development costs may be amortized over a period of up to ten years, taking into account the effects of obsolescence, technology, competition and other economic and legal factors.
l) Provisions, contingent liabilities, commitments and financial guaranteesProvisions, contingent liabilities, commitments and financial guarantees are recognized when the Group has a present obligation (legal or constructive) as a result of a past event, it is probable that an outflow of resources embodying economic benefits will be required to settle the obligation and a reliable estimate can be made of the amount of such an obligation. Provisions are discounted when the effect of the time value of money is considered material.
Restructuring provisions for employee termination costs are recognized when the Group has a present obligation as a result of a detailed formal plan, which has been announced to those affected, and the amount can be reasonably estimated.
Q4_2014_12_AR14_104_Consolidated_financial_statements_en.indd 176 23.02.2015 16:37:27
Zurich Insurance Group Annual Report 2014 177Consolidated financial statements
Finan
cial inform
ation
m) Treasury sharesZurich Insurance Group Ltd shares held by the Group are classified as treasury shares and are deducted from shareholders’ equity, net of transaction costs and tax. The nominal value of treasury shares is deducted from share capital. The difference between the nominal value and the amount paid to acquire the treasury shares, is allocated between additional paid-in capital and retained earnings. No gain or loss is recognized in income on purchase, sale, issue or cancellation of treasury shares.
n) Other revenue recognitionFarmers management feesFGI provides certain non-claims administrative and management services to the Farmers Exchanges, including risk selection, preparation and mailing of policy documents and invoices, premium collection, management of the investment portfolios and certain other administrative and managerial functions. Fees for these management services are primarily determined as a percentage of gross premiums earned by the Farmers Exchanges.
Other fees and commission incomeRevenues from investment management and distribution fees are based on contractual fee arrangements applied to assets under management and recognized as earned when the service has been provided. For practical purposes, the Group recognizes these fees on a straight-line basis over the estimated life of the contract.
The Group charges its customers for asset management and other related services using the following approaches:
• Front-end fees charged to the customer at inception are used particularly for single premium contracts. The consideration received is deferred as a liability and recognized over the life of the contract on a straight-line basis.
• Regular fees charged to the customer periodically (monthly, quarterly or annually) either directly or by making a deduction from invested funds are billed in advance and recognized on a straight-line basis over the period in which the service is rendered. Fees charged at the end of the period are accrued as a receivable and are offset against the financial liability when charged to the customer.
o) Net investment income Net investment income includes investment income earned net of investment expenses incurred.
Investment incomeInvestment income primarily consists of interest income on debt securities, loans and receivables, dividend income on equity securities, rental income from investment property and income earned on equity method accounted investments.
For Group investments, interest income is recognized using the effective interest method. Dividend income is recognized when the right to receive payment is established, which is usually the ex-dividend date. Rental income from investment property is recognized on a straight-line basis over the lease term.
Investment expensesInvestment expenses consist of costs relating to investment management services and operating expenses for investment property. These expenses are recognized on an accrual basis.
p) Employee benefitsShare-based compensation and cash incentive plansThe Group operates long-term incentive plans that are accounted for as equity-settled share-based compensation plans. The fair value of these incentive plans is determined at the grant date and is recognized as an expense in income over the vesting period, with a corresponding increase recorded in additional paid-in capital.
Subsequently, depending on the underlying performance metrics, the Group revises its estimates of the number of shares that are expected to be issued and recognizes the impact of the revision, if any, in income with a corresponding adjustment to additional paid-in capital. However, no subsequent adjustment to additional paid-in capital is made after the vesting date.
Retirement benefitsContributions to defined contribution plans are recorded as an expense in the period in which the economic benefit from the employees’ service was received.
Q4_2014_12_AR14_104_Consolidated_financial_statements_en.indd 177 23.02.2015 16:37:28
Zurich Insurance GroupAnnual Report 2014178 Financial information
Consolidated financial statements continued
Defined benefit plan obligations and contributions are determined annually by qualified actuaries using the projected unit credit method. The Group’s expense relating to these plans is accrued over the employees’ service periods based on the actuarially determined cost for the period. Actuarial gains and losses are recognized, in full in the period in which they occur, in OCI. Past service costs, which result from plan amendments and curtailments, are recognized in income on the earlier of the date on which the plan amendment or curtailment occurs (which is the date from which the plan change is effective) and the date on which a constructive obligation arises. Settlement gains or losses are recognized in income when the settlement occurs.
Other post-employment benefitsOther post-employment benefits, such as medical care and life insurance, are also provided for certain employees and are primarily funded internally. Similar to retirement benefits, the cost of such benefits is accrued over the service period of the employees based on the actuarially determined cost for the period.
q) LeasesPayments made under operating leases (net of any incentives received from the lessor) are charged to income on a straight-line basis over the period of the lease. A termination penalty, if any, is recognized immediately as expense at the time the termination is made.
r) Income taxesThe Group provides current tax expense according to the tax laws of each jurisdiction in which it operates. Deferred income taxes are recorded for temporary differences, which are based on the difference between financial statement carrying amounts and income tax bases of assets and liabilities using enacted or substantively enacted tax rates applicable in the respective tax jurisdiction. Deferred tax assets on taxable losses carried forward are recognized to the extent it is probable that they can be utilized against future taxable profits in the respective jurisdictions.
Taxes payable by either the holding company or its subsidiaries on expected distributions to the holding company of the profits of subsidiaries are not recognized as deferred income taxes unless a distribution of those profits is intended in the foreseeable future.
Taxes paid by certain of the Group’s life insurance businesses are based on the investment result less allowable expenses. To the extent these taxes exceed the amount that would have been payable in relation to the shareholders’ share of taxable profits, it is normal practice for certain of the Group’s businesses to recover this portion from policyholders. While the relevant company has the contractual right to charge policyholders for the taxes attributable to their share of the investment result less expenses, the obligation to pay the tax authority rests with the company and therefore, the full amount of tax including the portion attributable to policyholders is accounted for as income tax. Income tax expense therefore includes an element attributable to policyholders. In addition, deferred tax on unrealized gains related to certain investment contracts with DPF is included as income tax expense recognized in OCI and an accrual for future policy fees to recover the tax charge is included in policy fee revenue.
Q4_2014_12_AR14_104_Consolidated_financial_statements_en.indd 178 23.02.2015 16:37:28
Zurich Insurance Group Annual Report 2014 179Consolidated financial statements
Finan
cial inform
ation
4. Critical accounting judgments and estimates
The application of certain accounting policies necessitates critical accounting estimates that involve discretionary judgments and the use of assumptions which are susceptible to change due to inherent uncertainties. Because of the uncertainties involved, actual results could differ significantly from the assumptions and estimates made by management. Such critical accounting estimates are of significance to insurance reserves and deferred acquisition costs, the determination of fair value for financial assets and liabilities, impairment charges, deferred taxes and employee benefits.
a) Reserves for insurance contracts and deferred acquisition costsGeneral InsuranceThe Group is required to establish reserves for payment of losses and loss adjustment expenses that arise from the Group’s general insurance products and the run-off of its former third party reinsurance operations. These reserves represent the expected ultimate cost to settle claims occurring prior to, but still outstanding as of, the balance sheet date. The Group establishes its reserves by product line, type and extent of coverage and year of occurrence. There are two categories of loss reserve: reserves for reported losses and reserves for incurred but not reported (IBNR) losses. Additionally, reserves are held for loss adjustment expenses, which contain the estimated legal and other expenses expected to be incurred to finalize the settlement of the losses.
The Group’s reserves for reported losses and loss adjustment expenses are based on estimates of future payments to settle reported claims. The Group bases such estimates on the facts available at the time the reserves are established. These reserves are generally established on an undiscounted basis to recognize the estimated costs of bringing pending claims to final settlement. The reserve calculation takes into account inflation, as well as other factors that can influence the amount of reserves required, some of which are subjective and some of which are dependent on future events. In determining the level of reserves, the Group considers historical trends and patterns of loss payments, pending levels of unpaid claims and types of coverage. In addition, court decisions, economic conditions and public attitudes may affect the ultimate cost of settlement and, as a result, the Group’s estimation of reserves. Between the reporting and final settlement of a claim circumstances may change, which may result in changes to established reserves. Items such as changes in law and interpretations of relevant case law, results of litigation, changes in medical costs, as well as costs of vehicle and home repair materials and labor rates can substantially impact ultimate settlement costs. Accordingly, the Group reviews and re-evaluates claims and reserves on a regular basis. Amounts ultimately paid for losses and loss adjustment expenses can vary significantly from the level of reserves originally set.
The Group establishes IBNR reserves, to recognize the estimated cost of losses for events which have already occurred but which have not yet been notified. These reserves are established to recognize the estimated costs required to bring such claims to final settlement. As these losses have not yet been reported, the Group relies upon historical information and statistical models, based on product line, type and extent of coverage, to estimate its IBNR liability. The Group also uses reported claim trends, claim severities, exposure growth, and other factors in estimating its IBNR reserves. These reserves are revised as additional information becomes available and as claims are actually reported.
The time required to learn of and settle claims is an important consideration in establishing the Group’s reserves. Short-tail claims, such as those for automobile and property damage, are normally reported soon after the incident and are generally settled within months of the incident. Long-tail claims, such as bodily injury, pollution, asbestos and product liability, can take years to develop and additional time to settle. For these claims, information concerning the event, such as the required medical treatment for bodily injury claims and the required measures to clean up pollution, may not be readily available. Accordingly, the reserving analysis of long-tail lines of business is generally more difficult and subject to greater uncertainties than for short-tail claims.
Since the Group does not establish reserves for catastrophes in advance of the occurrence of such events, these events may cause volatility in the levels of its incurred losses and reserves, subject to the effects of reinsurance recoveries. This volatility may also be contingent upon political and legal developments after the occurrence of the event.
The Group uses a number of accepted actuarial methods to estimate and evaluate the amount of reserves recorded. The nature of the claim being reserved for and the geographic location of the claim influence the techniques used by the Group’s actuaries. Additionally, the Group’s Corporate Center actuaries perform periodic reserve reviews of the Group’s businesses throughout the world. Management considers the results of these reviews and adjusts its reserves for losses and loss adjustment expenses, where necessary.
Q4_2014_12_AR14_104_Consolidated_financial_statements_en.indd 179 23.02.2015 16:37:28
Zurich Insurance GroupAnnual Report 2014180 Financial information
Consolidated financial statements continued
Life insuranceThe reserves for future life policyholders’ benefits and policyholders’ contract deposits and other funds contain a number of assumptions regarding mortality or longevity, lapses, surrenders, expenses, discount rates and investment returns. These assumptions can vary by country, year of policy issuance and product type and are determined with reference to past experience adjusted for new trends, current market conditions and future expectations. As such the liabilities for future life policyholders’ benefits and policyholders’ contract deposits may not represent the ultimate amounts paid out to policyholders. For example:
• The estimated number of deaths determines the value of the benefit payments. The main source of uncertainty arises because of the potential for pandemics and wide-ranging lifestyle changes, such as changes in eating, smoking and exercise habits, which could result in earlier deaths for age groups in which the Group has significant exposure to mortality risk.
• For contracts that insure the risk of longevity, such as annuity contracts, an appropriate allowance is made for people living longer. Continuing improvements in medical care and social conditions could result in further improvements in longevity in excess of those allowed for in the estimates used to determine the liability for contracts where the Group is exposed to longevity risk.
• Under certain contracts, the Group has offered product guarantees (or options to take up product guarantees), including fixed minimum interest rate or mortality rate returns. In determining the value of these options and/or benefits, estimates have been made as to the percentage of contract holders that may exercise them. Changes in investment conditions could result in significantly more contract holders exercising their options and/or benefits than has been assumed.
• Estimates are also made as to future investment income arising from the assets backing long-term insurance contracts. These estimates are based on current market returns as well as expectations about future economic and financial developments.
• Assumptions are determined with reference to current and historical client data, as well as industry data. Interest rate assumptions reflect expected earnings on the assets supporting the future policyholder benefits. The information used by the Group’s qualified actuaries in setting such assumptions includes, but is not limited to, pricing assumptions, available experience studies and profitability analysis.
Deferred policy acquisition costs and PVFP are deferred only to the extent that they are recoverable from future policy income which also depends on the above assumptions. Recoverability is tested at contract inception and subsequently on a regular basis with reference to current expectations of future profits or margins.
See note 8 for further information on reserves for insurance contracts and note 12 for deferred policy acquisition costs. Also refer to the insurance risk section of the Risk review.
b) Fair value measurementIn determining the fair values of financial debt instruments and equity instruments traded in exchange and OTC markets, the Group makes extensive use of independent, reliable and reputable third party pricing providers and only in rare cases places reliance on prices that are derived from internal models.
In addition, the Group’s policy is to ensure that independently sourced prices are developed by making maximum use of current observable market inputs derived from orderly transactions and by employing widely accepted valuation techniques and models. When third party pricing providers are unable to obtain adequate observable information for a particular financial instrument, the fair value is determined either by requesting selective non-binding broker quotes or by using internal valuation models.
Valuations can be subject to significant judgment especially when the fair value is determined based on at least one significant unobservable input parameter; such items are classified within Level 3 of the fair value hierarchy. See notes 6, 7 and 24 for further information regarding the estimate of fair value.
Q4_2014_12_AR14_104_Consolidated_financial_statements_en.indd 180 23.02.2015 16:37:28
Zurich Insurance Group Annual Report 2014 181Consolidated financial statements
Finan
cial inform
ation
c) Impairment of assets Financial assets A financial asset is considered impaired if there is objective evidence of impairment as a result of one or more occurred loss events that have an impact on the estimated future cash flows of the financial asset.
The evaluation of whether an available-for-sale debt security is impaired requires analysis of the credit standing of a particular issuer and involves management judgment. When assessing impairment of available-for-sale debt securities, the Group places emphasis on issuer specific factors, such as significant financial difficulty, default or delinquency on interest or principal payments. A credit rating downgrade, worsened liquidity or decline in fair value is not by itself considered a loss event, but rather incorporated in the impairment analysis along with other available information.
The Group determines that there is objective evidence of impairment of an available-for-sale equity security, if at the reporting date:
• Its fair value is below the weighted-average cost by an amount significantly exceeding the volatility threshold determined quarterly for the respective equity market (such as North America, UK, Switzerland, other European countries and Asia-Pacific), or
• Its fair value has been below the weighted-average cost for a prolonged period of 24 consecutive months or longer.
Goodwill and Attorney-in-fact relationships (AIF)Goodwill is allocated to the cash generating units (CGUs) as outlined in note 3. For the General Insurance segment, CGUs are aggregated predominantly at the segment level. Within the Global Life and Farmers segments, CGUs are identified at either business unit level or individual reporting entity level.
For goodwill impairment testing, the recoverable amount is the higher of its fair value less costs to sell and its value-in-use.
Fair value is determined, considering quoted market prices, current share values in the market place for similar publicly traded entities, and recent sale transactions of similar businesses.
Value-in-use is determined using the present value of estimated future cash flows expected to be generated from the CGU. Cash flow projections are based on financial budgets, which are approved by management, typically covering a three-year period or, if appropriate and adequately justified, a longer period, which may be necessary to more accurately represent the nature of the cash flows used to test the goodwill. Cash flows beyond this period are extrapolated using, amongst others, estimated perpetual growth rates, which reflect the expected inflation of the geographical areas in which the cash flows supporting the goodwill are generated. If cash flows are generated in different geographical areas with different expected inflation rates, weighted averages are used. The discount rates applied reflect the respective risk free interest rate adjusted for the relevant risk factors to the extent they have not already been considered in the underlying cash flows.
The discount rates used in the recoverable amount calculations for developed markets are based on the capital asset pricing model and consider government bond rates which are further adjusted for equity risk premium, appropriate beta and leverage ratio. In emerging markets, discount rates are based on the U.S. dollar discount rate taking into account inflation differential expectations and country risks. All input factors to the discount rates are based on observable market data.
The recoverable amount of the intangible assets with an indefinite life related to the Farmers segment (i.e., attorney- in-fact (AIF) relationships and goodwill) is determined on the basis of value-in-use calculations. These calculations use cash flow projections based on business plans which are approved by management and typically cover a three-year period. The basis for determining the values assigned to the key assumptions are current market trends and earnings projections.
Table 4.1 sets out, as of the date of valuation, the value of goodwill and AIF for the major CGUs, applied discount rates and the perpetual nominal growth rates beyond the projection period which are dependent on country specific growth rate and inflation expectations.
Q4_2014_12_AR14_104_Consolidated_financial_statements_en.indd 181 23.02.2015 16:37:28
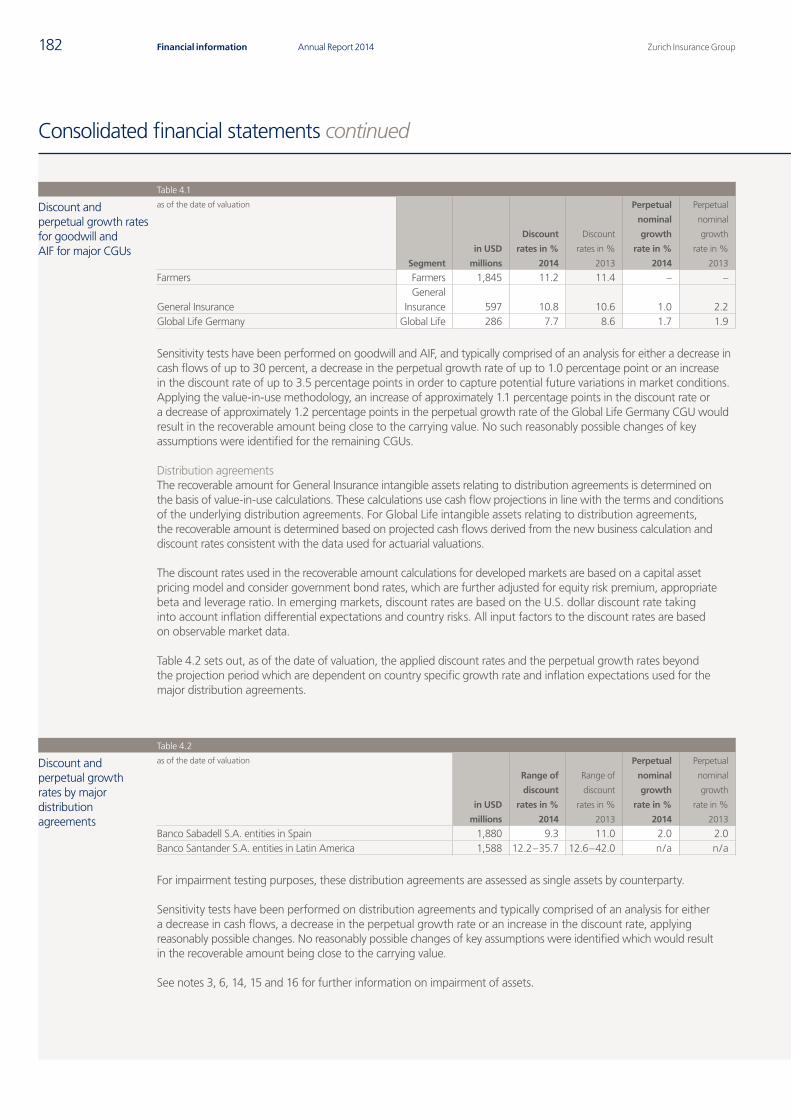
Zurich Insurance GroupAnnual Report 2014182 Financial information
Consolidated financial statements continued
Table 4.1
Discount and perpetual growth rates for goodwill and AIF for major CGUs
as of the date of valuation
Segment
in USD
millions
Discount
rates in %
2014
Discount
rates in %
2013
Perpetual
nominal
growth
rate in %
2014
Perpetual
nominal
growth
rate in %
2013
Farmers Farmers 1,845 11.2 11.4 – –
General InsuranceGeneral
Insurance 597 10.8 10.6 1.0 2.2Global Life Germany Global Life 286 7.7 8.6 1.7 1.9
Sensitivity tests have been performed on goodwill and AIF, and typically comprised of an analysis for either a decrease in cash flows of up to 30 percent, a decrease in the perpetual growth rate of up to 1.0 percentage point or an increase in the discount rate of up to 3.5 percentage points in order to capture potential future variations in market conditions. Applying the value-in-use methodology, an increase of approximately 1.1 percentage points in the discount rate or a decrease of approximately 1.2 percentage points in the perpetual growth rate of the Global Life Germany CGU would result in the recoverable amount being close to the carrying value. No such reasonably possible changes of key assumptions were identified for the remaining CGUs.
Distribution agreementsThe recoverable amount for General Insurance intangible assets relating to distribution agreements is determined on the basis of value-in-use calculations. These calculations use cash flow projections in line with the terms and conditions of the underlying distribution agreements. For Global Life intangible assets relating to distribution agreements, the recoverable amount is determined based on projected cash flows derived from the new business calculation and discount rates consistent with the data used for actuarial valuations.
The discount rates used in the recoverable amount calculations for developed markets are based on a capital asset pricing model and consider government bond rates, which are further adjusted for equity risk premium, appropriate beta and leverage ratio. In emerging markets, discount rates are based on the U.S. dollar discount rate taking into account inflation differential expectations and country risks. All input factors to the discount rates are based on observable market data.
Table 4.2 sets out, as of the date of valuation, the applied discount rates and the perpetual growth rates beyond the projection period which are dependent on country specific growth rate and inflation expectations used for the major distribution agreements.
Table 4.2
Discount and perpetual growth rates by major distribution agreements
as of the date of valuation
in USD
millions
Range of
discount
rates in %
2014
Range of
discount
rates in %
2013
Perpetual
nominal
growth
rate in %
2014
Perpetual
nominal
growth
rate in %
2013
Banco Sabadell S.A. entities in Spain 1,880 9.3 11.0 2.0 2.0Banco Santander S.A. entities in Latin America 1,588 12.2 – 35.7 12.6 – 42.0 n / a n / a
For impairment testing purposes, these distribution agreements are assessed as single assets by counterparty.
Sensitivity tests have been performed on distribution agreements and typically comprised of an analysis for either a decrease in cash flows, a decrease in the perpetual growth rate or an increase in the discount rate, applying reasonably possible changes. No reasonably possible changes of key assumptions were identified which would result in the recoverable amount being close to the carrying value.
See notes 3, 6, 14, 15 and 16 for further information on impairment of assets.
Q4_2014_12_AR14_104_Consolidated_financial_statements_en.indd 182 23.02.2015 16:37:29
Zurich Insurance Group Annual Report 2014 183Consolidated financial statements
Finan
cial inform
ation
d) Deferred taxesDeferred tax assets are recognized if sufficient future taxable income, including income from the reversal of existing taxable temporary differences and available tax planning strategies, is available for realization. The utilization of deferred tax assets arising from temporary differences depends on the generation of sufficient taxable profits in the period in which the underlying asset or liability is recovered or settled. The utilization of deferred tax assets arising from unused tax losses or tax credits depends on the generation of sufficient taxable profits before the unused tax losses or tax credits expire. As of each balance sheet date, management evaluates the recoverability of deferred tax assets and if it is considered probable, that all or a portion of the deferred tax asset will not be utilized, then a valuation allowance is recognized.
See note 18 for further information on deferred taxes.
e) Employee benefitsThe Group provides defined benefit plans and other post-employment plans. In assessing the Group’s liability for these plans, critical judgments include estimates of mortality rates, rates of employment turnover, disability, early retirement, discount rates, future salary and pension increases and increases in long-term healthcare costs. Discount rates for significant plans are based on a yield curve approach. The Group sets the discount rate by creating a hypothetical portfolio of high quality corporate bonds for which the timing and amount of cash outflows approximate the estimated payouts of the defined benefit plan. These assumptions may differ from actual results due to changing economic conditions, higher or lower withdrawal rates or longer or shorter life spans of participants. These differences may result in variability of pension income or expense recorded in future years.
See note 21 for further information on employee benefits.
Q4_2014_12_AR14_104_Consolidated_financial_statements_en.indd 183 23.02.2015 16:37:29
Zurich Insurance GroupAnnual Report 2014184 Financial information
Consolidated financial statements continued
5. Acquisitions and divestments
Transactions in 2014AcquisitionsOn October 31, 2014, the Group completed the acquisition of an effective 50.0 percent stake in Mediterráneo Seguros Diversos, S.A. (MSD), a general insurance company incorporated in Spain and thus extended the existing cooperation with Banco Sabadell S.A. (Banco Sabadell) entered into during 2008. The Group obtained control over MSD by virtue of the existing shareholders’ agreement between the Group and Banco Sabadell.
The initial consideration on a 50.0 percent basis amounted to approximately USD 50 million, subject to a purchase price adjustment. The Group is still in the process of finalizing the purchase price adjustment. In addition to the initial consideration, an uncapped contingent liability based on the future profitability over the term of the distribution agreement was agreed, for which the fair value was estimated to amount to USD 4 million on a 50.0 percent basis. Based on the preliminary purchase accounting, the fair value of net tangible assets acquired amounted to USD 33 million, identifiable intangible assets relating to the distribution agreement amounted to USD 76 million, net of deferred tax and the non-controlling interest amounted to USD 54 million.
On May 28, 2014, the Group increased its shareholding in Deutscher Herold AG to 100 percent. This increase was the result of the non-controlling shareholder exercising its put option right over 15.17 percent of the shares and the Group exercising its call option right over 5.0 percent. The total consideration amounted to USD 366 million, of which USD 275 million for 15.17 percent was previously recorded on the balance sheet as a put option liability.
DivestmentsOn October 30, 2014, the Group closed the sale of its General Insurance retail business in Russia to OLMA Group. The contractually agreed sales price amounted to RUB 1 billion (approximately USD 23 million), subject to a purchase price adjustment. The Group is still in the process of finalizing any purchase price adjustment. A pre-tax loss of USD 247 million has been recorded within net gain/(loss) on divestments of businesses.
Transactions in 2013Assets/liabilities held for saleAs of December 31, 2013, a subsidiary of Centre Group Holdings Limited, Centre Insurance Company, which is a general insurance and reinsurance company based in the United States of America, with total assets of USD 100 million and total liabilities of USD 49 million, was classified as held for sale. As of September 30 2014, Centre Insurance Company was no longer classified as held for sale as the sale was not completed.
Q4_2014_12_AR14_104_Consolidated_financial_statements_en.indd 184 23.02.2015 16:37:29
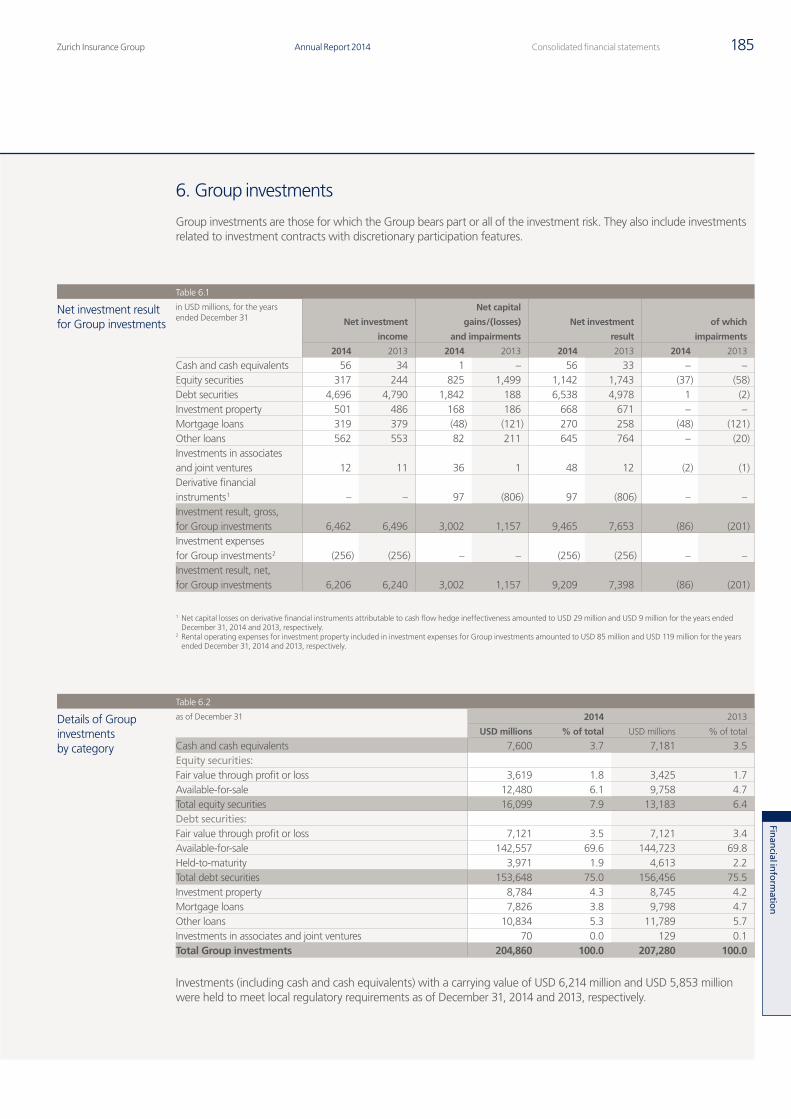
Zurich Insurance Group Annual Report 2014 185Consolidated financial statements
Finan
cial inform
ation
6. Group investments
Group investments are those for which the Group bears part or all of the investment risk. They also include investments related to investment contracts with discretionary participation features.
Table 6.1
Net investment result for Group investments
in USD millions, for the years ended December 31 Net investment
income
Net capital
gains/(losses)
and impairments
Net investment
result
of which
impairments
2014 2013 2014 2013 2014 2013 2014 2013
Cash and cash equivalents 56 34 1 – 56 33 – –Equity securities 317 244 825 1,499 1,142 1,743 (37) (58)Debt securities 4,696 4,790 1,842 188 6,538 4,978 1 (2)Investment property 501 486 168 186 668 671 – –Mortgage loans 319 379 (48) (121) 270 258 (48) (121)Other loans 562 553 82 211 645 764 – (20)Investments in associates and joint ventures 12 11 36 1 48 12 (2) (1)Derivative financial instruments 1 – – 97 (806) 97 (806) – –Investment result, gross, for Group investments 6,462 6,496 3,002 1,157 9,465 7,653 (86) (201)Investment expenses for Group investments 2 (256) (256) – – (256) (256) – –Investment result, net, for Group investments 6,206 6,240 3,002 1,157 9,209 7,398 (86) (201)
1 Net capital losses on derivative financial instruments attributable to cash flow hedge ineffectiveness amounted to USD 29 million and USD 9 million for the years ended December 31, 2014 and 2013, respectively.
2 Rental operating expenses for investment property included in investment expenses for Group investments amounted to USD 85 million and USD 119 million for the years ended December 31, 2014 and 2013, respectively.
Table 6.2
Details of Group investments by category
as of December 31 2014 2013
USD millions % of total USD millions % of total
Cash and cash equivalents 7,600 3.7 7,181 3.5Equity securities:Fair value through profit or loss 3,619 1.8 3,425 1.7Available-for-sale 12,480 6.1 9,758 4.7Total equity securities 16,099 7.9 13,183 6.4Debt securities:Fair value through profit or loss 7,121 3.5 7,121 3.4Available-for-sale 142,557 69.6 144,723 69.8Held-to-maturity 3,971 1.9 4,613 2.2Total debt securities 153,648 75.0 156,456 75.5Investment property 8,784 4.3 8,745 4.2Mortgage loans 7,826 3.8 9,798 4.7Other loans 10,834 5.3 11,789 5.7Investments in associates and joint ventures 70 0.0 129 0.1Total Group investments 204,860 100.0 207,280 100.0
Investments (including cash and cash equivalents) with a carrying value of USD 6,214 million and USD 5,853 million were held to meet local regulatory requirements as of December 31, 2014 and 2013, respectively.
Q4_2014_12_AR14_104_Consolidated_financial_statements_en.indd 185 23.02.2015 16:37:29
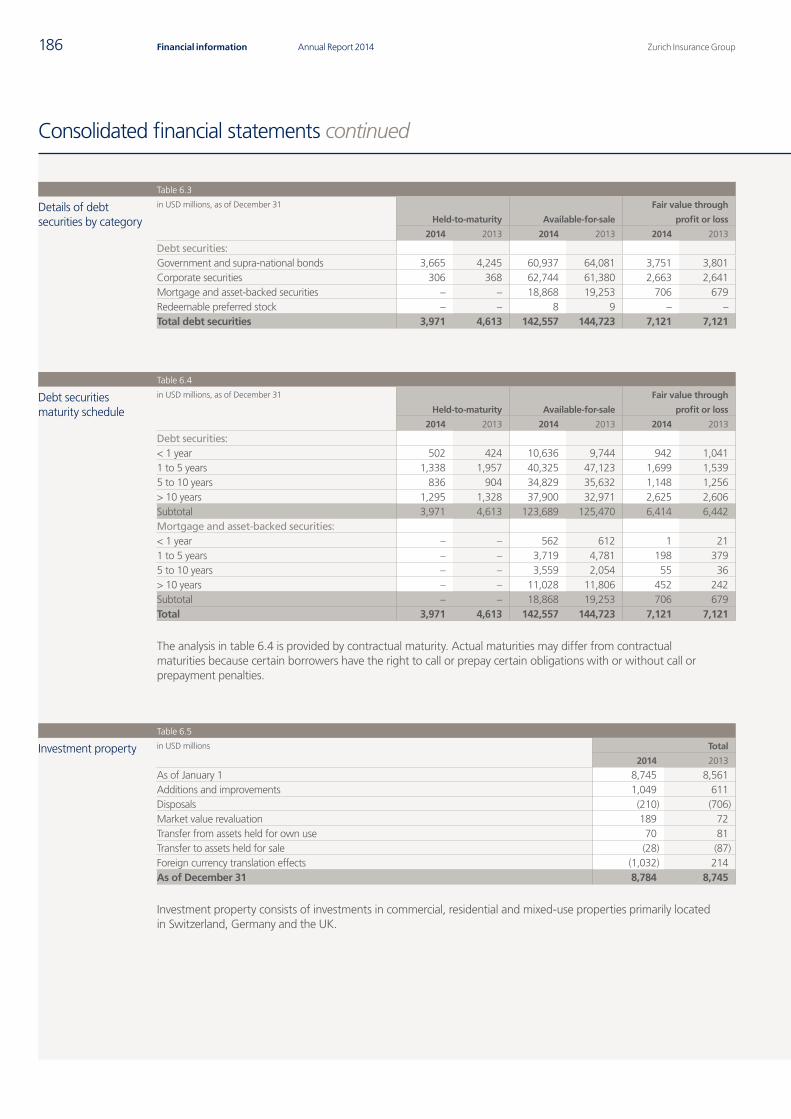
Zurich Insurance GroupAnnual Report 2014186 Financial information
Consolidated financial statements continued
Table 6.3
Details of debt securities by category
in USD millions, as of December 31
Held-to-maturity Available-for-sale
Fair value through
profit or loss
2014 2013 2014 2013 2014 2013
Debt securities:Government and supra-national bonds 3,665 4,245 60,937 64,081 3,751 3,801Corporate securities 306 368 62,744 61,380 2,663 2,641Mortgage and asset-backed securities – – 18,868 19,253 706 679Redeemable preferred stock – – 8 9 – –Total debt securities 3,971 4,613 142,557 144,723 7,121 7,121
Table 6.4
Debt securities maturity schedule
in USD millions, as of December 31
Held-to-maturity Available-for-sale
Fair value through
profit or loss
2014 2013 2014 2013 2014 2013
Debt securities:< 1 year 502 424 10,636 9,744 942 1,0411 to 5 years 1,338 1,957 40,325 47,123 1,699 1,5395 to 10 years 836 904 34,829 35,632 1,148 1,256> 10 years 1,295 1,328 37,900 32,971 2,625 2,606Subtotal 3,971 4,613 123,689 125,470 6,414 6,442Mortgage and asset-backed securities:< 1 year – – 562 612 1 211 to 5 years – – 3,719 4,781 198 3795 to 10 years – – 3,559 2,054 55 36> 10 years – – 11,028 11,806 452 242Subtotal – – 18,868 19,253 706 679Total 3,971 4,613 142,557 144,723 7,121 7,121
The analysis in table 6.4 is provided by contractual maturity. Actual maturities may differ from contractual maturities because certain borrowers have the right to call or prepay certain obligations with or without call or prepayment penalties.
Table 6.5
Investment property in USD millions Total
2014 2013
As of January 1 8,745 8,561Additions and improvements 1,049 611Disposals (210) (706)Market value revaluation 189 72Transfer from assets held for own use 70 81Transfer to assets held for sale (28) (87)Foreign currency translation effects (1,032) 214As of December 31 8,784 8,745
Investment property consists of investments in commercial, residential and mixed-use properties primarily located in Switzerland, Germany and the UK.
Q4_2014_12_AR14_104_Consolidated_financial_statements_en.indd 186 23.02.2015 16:37:30
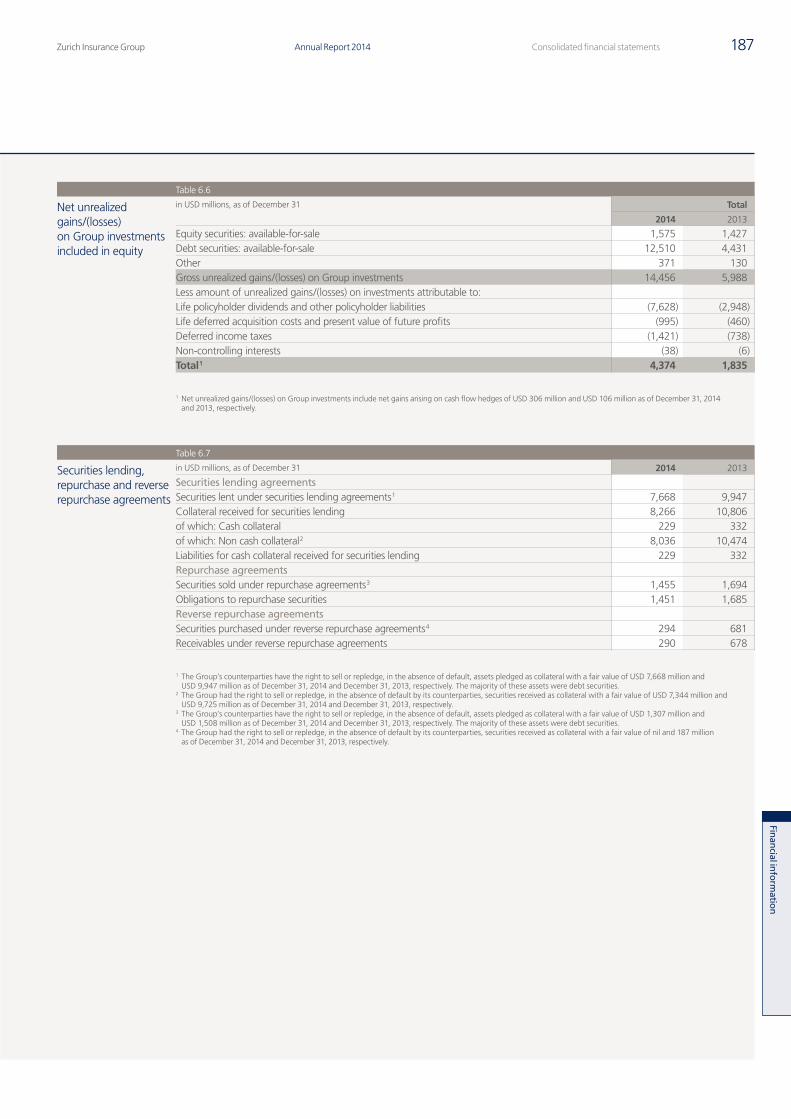
Zurich Insurance Group Annual Report 2014 187Consolidated financial statements
Finan
cial inform
ation
Table 6.6
Net unrealized gains/(losses) on Group investments included in equity
in USD millions, as of December 31 Total
2014 2013
Equity securities: available-for-sale 1,575 1,427Debt securities: available-for-sale 12,510 4,431Other 371 130Gross unrealized gains/(losses) on Group investments 14,456 5,988Less amount of unrealized gains/(losses) on investments attributable to:Life policyholder dividends and other policyholder liabilities (7,628) (2,948)Life deferred acquisition costs and present value of future profits (995) (460)Deferred income taxes (1,421) (738)Non-controlling interests (38) (6)Total 1 4,374 1,835
1 Net unrealized gains/(losses) on Group investments include net gains arising on cash flow hedges of USD 306 million and USD 106 million as of December 31, 2014 and 2013, respectively.
Table 6.7
Securities lending, repurchase and reverse repurchase agreements
in USD millions, as of December 31 2014 2013
Securities lending agreementsSecurities lent under securities lending agreements 1 7,668 9,947Collateral received for securities lending 8,266 10,806of which: Cash collateral 229 332of which: Non cash collateral 2 8,036 10,474Liabilities for cash collateral received for securities lending 229 332Repurchase agreements Securities sold under repurchase agreements 3 1,455 1,694Obligations to repurchase securities 1,451 1,685Reverse repurchase agreementsSecurities purchased under reverse repurchase agreements 4 294 681Receivables under reverse repurchase agreements 290 678
1 The Group’s counterparties have the right to sell or repledge, in the absence of default, assets pledged as collateral with a fair value of USD 7,668 million and USD 9,947 million as of December 31, 2014 and December 31, 2013, respectively. The majority of these assets were debt securities.
2 The Group had the right to sell or repledge, in the absence of default by its counterparties, securities received as collateral with a fair value of USD 7,344 million and USD 9,725 million as of December 31, 2014 and December 31, 2013, respectively.
3 The Group’s counterparties have the right to sell or repledge, in the absence of default, assets pledged as collateral with a fair value of USD 1,307 million and USD 1,508 million as of December 31, 2014 and December 31, 2013, respectively. The majority of these assets were debt securities.
4 The Group had the right to sell or repledge, in the absence of default by its counterparties, securities received as collateral with a fair value of nil and 187 million as of December 31, 2014 and December 31, 2013, respectively.
Q4_2014_12_AR14_104_Consolidated_financial_statements_en.indd 187 23.02.2015 16:37:30
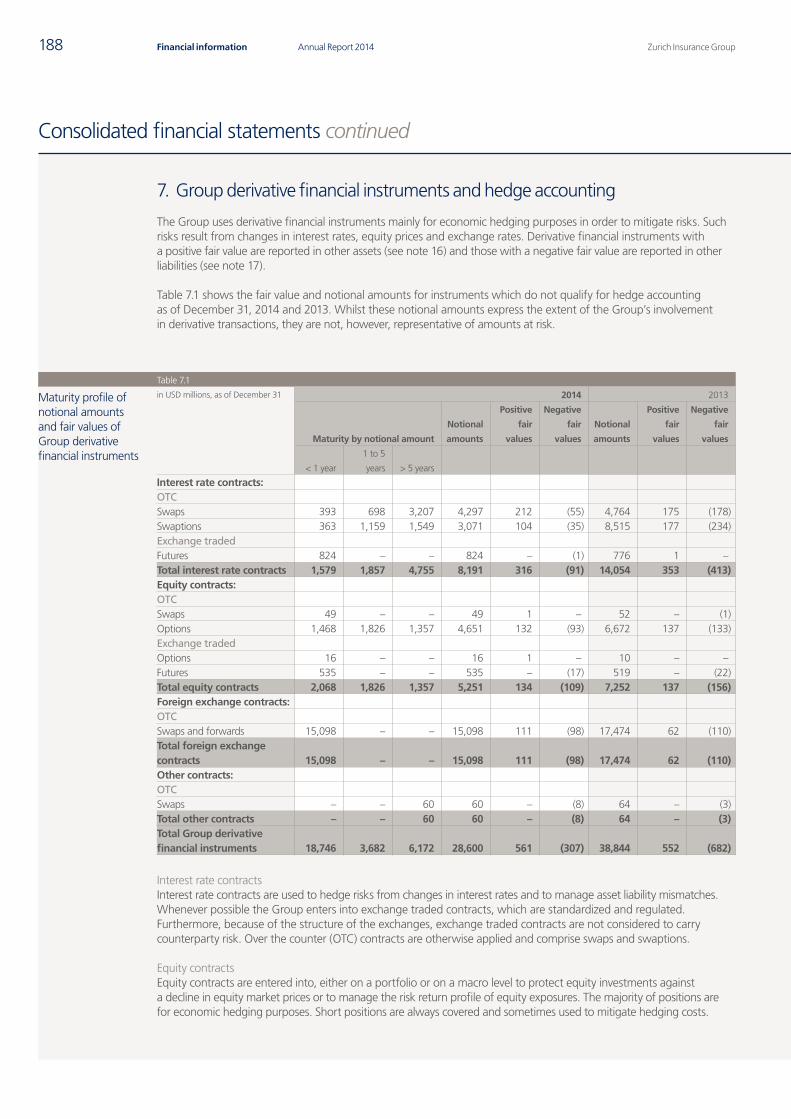
Zurich Insurance GroupAnnual Report 2014188 Financial information
Consolidated financial statements continued
7. Group derivative financial instruments and hedge accounting
The Group uses derivative financial instruments mainly for economic hedging purposes in order to mitigate risks. Such risks result from changes in interest rates, equity prices and exchange rates. Derivative financial instruments with a positive fair value are reported in other assets (see note 16) and those with a negative fair value are reported in other liabilities (see note 17).
Table 7.1 shows the fair value and notional amounts for instruments which do not qualify for hedge accounting as of December 31, 2014 and 2013. Whilst these notional amounts express the extent of the Group’s involvement in derivative transactions, they are not, however, representative of amounts at risk.
Table 7.1
Maturity profile of notional amounts and fair values of Group derivative financial instruments
in USD millions, as of December 31 2014 2013
Maturity by notional amount
Notional
amounts
Positive
fair
values
Negative
fair
values
Notional
amounts
Positive
fair
values
Negative
fair
values
< 1 year
1 to 5
years > 5 years
Interest rate contracts:OTCSwaps 393 698 3,207 4,297 212 (55) 4,764 175 (178)Swaptions 363 1,159 1,549 3,071 104 (35) 8,515 177 (234)Exchange tradedFutures 824 – – 824 – (1) 776 1 –Total interest rate contracts 1,579 1,857 4,755 8,191 316 (91) 14,054 353 (413)Equity contracts:OTCSwaps 49 – – 49 1 – 52 – (1)Options 1,468 1,826 1,357 4,651 132 (93) 6,672 137 (133)Exchange tradedOptions 16 – – 16 1 – 10 – –Futures 535 – – 535 – (17) 519 – (22)Total equity contracts 2,068 1,826 1,357 5,251 134 (109) 7,252 137 (156)Foreign exchange contracts:OTCSwaps and forwards 15,098 – – 15,098 111 (98) 17,474 62 (110)Total foreign exchange contracts 15,098 – – 15,098 111 (98) 17,474 62 (110)Other contracts:OTCSwaps – – 60 60 – (8) 64 – (3)Total other contracts – – 60 60 – (8) 64 – (3)Total Group derivative financial instruments 18,746 3,682 6,172 28,600 561 (307) 38,844 552 (682)
Interest rate contractsInterest rate contracts are used to hedge risks from changes in interest rates and to manage asset liability mismatches. Whenever possible the Group enters into exchange traded contracts, which are standardized and regulated. Furthermore, because of the structure of the exchanges, exchange traded contracts are not considered to carry counterparty risk. Over the counter (OTC) contracts are otherwise applied and comprise swaps and swaptions.
Equity contractsEquity contracts are entered into, either on a portfolio or on a macro level to protect equity investments against a decline in equity market prices or to manage the risk return profile of equity exposures. The majority of positions are for economic hedging purposes. Short positions are always covered and sometimes used to mitigate hedging costs.
Q4_2014_12_AR14_104_Consolidated_financial_statements_en.indd 188 23.02.2015 16:37:31
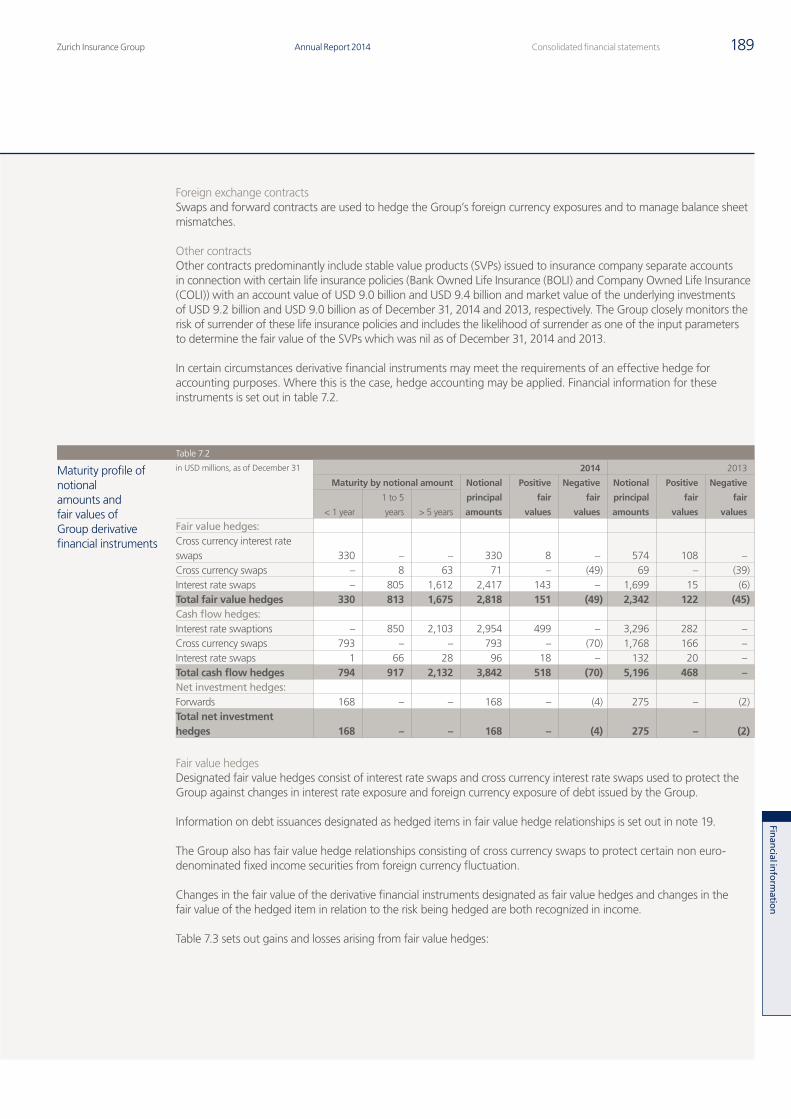
Zurich Insurance Group Annual Report 2014 189Consolidated financial statements
Finan
cial inform
ation
Foreign exchange contractsSwaps and forward contracts are used to hedge the Group’s foreign currency exposures and to manage balance sheet mismatches.
Other contractsOther contracts predominantly include stable value products (SVPs) issued to insurance company separate accounts in connection with certain life insurance policies (Bank Owned Life Insurance (BOLI) and Company Owned Life Insurance (COLI)) with an account value of USD 9.0 billion and USD 9.4 billion and market value of the underlying investments of USD 9.2 billion and USD 9.0 billion as of December 31, 2014 and 2013, respectively. The Group closely monitors the risk of surrender of these life insurance policies and includes the likelihood of surrender as one of the input parameters to determine the fair value of the SVPs which was nil as of December 31, 2014 and 2013.
In certain circumstances derivative financial instruments may meet the requirements of an effective hedge for accounting purposes. Where this is the case, hedge accounting may be applied. Financial information for these instruments is set out in table 7.2.
Table 7.2
Maturity profile of notional amounts and fair values of Group derivative financial instruments
in USD millions, as of December 31 2014 2013
Maturity by notional amount Notional
principal
amounts
Positive
fair
values
Negative
fair
values
Notional
principal
amounts
Positive
fair
values
Negative
fair
values< 1 year
1 to 5
years > 5 years
Fair value hedges:Cross currency interest rate swaps 330 – – 330 8 – 574 108 –Cross currency swaps – 8 63 71 – (49) 69 – (39)Interest rate swaps – 805 1,612 2,417 143 – 1,699 15 (6)Total fair value hedges 330 813 1,675 2,818 151 (49) 2,342 122 (45)Cash flow hedges:Interest rate swaptions – 850 2,103 2,954 499 – 3,296 282 –Cross currency swaps 793 – – 793 – (70) 1,768 166 –Interest rate swaps 1 66 28 96 18 – 132 20 –Total cash flow hedges 794 917 2,132 3,842 518 (70) 5,196 468 –Net investment hedges:Forwards 168 – – 168 – (4) 275 – (2)Total net investment hedges 168 – – 168 – (4) 275 – (2)
Fair value hedgesDesignated fair value hedges consist of interest rate swaps and cross currency interest rate swaps used to protect the Group against changes in interest rate exposure and foreign currency exposure of debt issued by the Group.
Information on debt issuances designated as hedged items in fair value hedge relationships is set out in note 19.
The Group also has fair value hedge relationships consisting of cross currency swaps to protect certain non euro-denominated fixed income securities from foreign currency fluctuation.
Changes in the fair value of the derivative financial instruments designated as fair value hedges and changes in the fair value of the hedged item in relation to the risk being hedged are both recognized in income.
Table 7.3 sets out gains and losses arising from fair value hedges:
Q4_2014_12_AR14_104_Consolidated_financial_statements_en.indd 189 23.02.2015 16:37:31
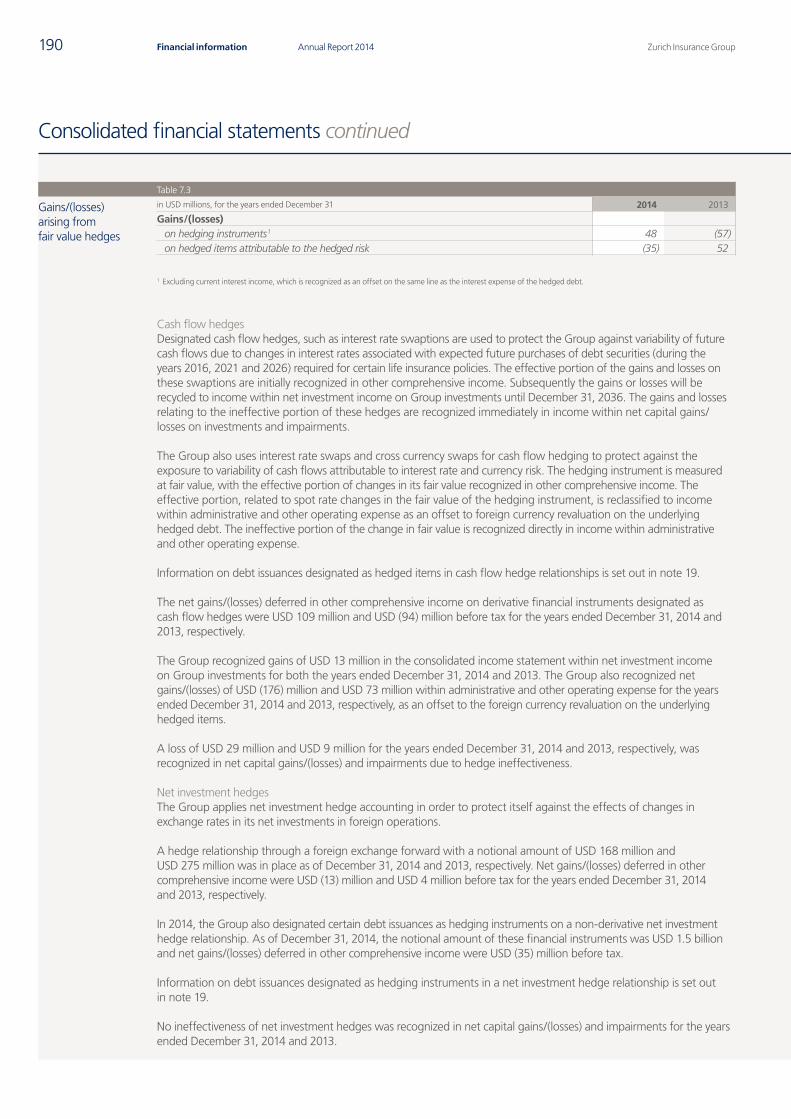
Zurich Insurance GroupAnnual Report 2014190 Financial information
Consolidated financial statements continued
Table 7.3
Gains/(losses) arising from fair value hedges
in USD millions, for the years ended December 31 2014 2013
Gains/(losses)on hedging instruments 1 48 (57)on hedged items attributable to the hedged risk (35) 52
1 Excluding current interest income, which is recognized as an offset on the same line as the interest expense of the hedged debt.
Cash flow hedgesDesignated cash flow hedges, such as interest rate swaptions are used to protect the Group against variability of future cash flows due to changes in interest rates associated with expected future purchases of debt securities (during the years 2016, 2021 and 2026) required for certain life insurance policies. The effective portion of the gains and losses on these swaptions are initially recognized in other comprehensive income. Subsequently the gains or losses will be recycled to income within net investment income on Group investments until December 31, 2036. The gains and losses relating to the ineffective portion of these hedges are recognized immediately in income within net capital gains/losses on investments and impairments.
The Group also uses interest rate swaps and cross currency swaps for cash flow hedging to protect against the exposure to variability of cash flows attributable to interest rate and currency risk. The hedging instrument is measured at fair value, with the effective portion of changes in its fair value recognized in other comprehensive income. The effective portion, related to spot rate changes in the fair value of the hedging instrument, is reclassified to income within administrative and other operating expense as an offset to foreign currency revaluation on the underlying hedged debt. The ineffective portion of the change in fair value is recognized directly in income within administrative and other operating expense.
Information on debt issuances designated as hedged items in cash flow hedge relationships is set out in note 19.
The net gains/(losses) deferred in other comprehensive income on derivative financial instruments designated as cash flow hedges were USD 109 million and USD (94) million before tax for the years ended December 31, 2014 and 2013, respectively.
The Group recognized gains of USD 13 million in the consolidated income statement within net investment income on Group investments for both the years ended December 31, 2014 and 2013. The Group also recognized net gains/(losses) of USD (176) million and USD 73 million within administrative and other operating expense for the years ended December 31, 2014 and 2013, respectively, as an offset to the foreign currency revaluation on the underlying hedged items.
A loss of USD 29 million and USD 9 million for the years ended December 31, 2014 and 2013, respectively, was recognized in net capital gains/(losses) and impairments due to hedge ineffectiveness.
Net investment hedgesThe Group applies net investment hedge accounting in order to protect itself against the effects of changes in exchange rates in its net investments in foreign operations.
A hedge relationship through a foreign exchange forward with a notional amount of USD 168 million and USD 275 million was in place as of December 31, 2014 and 2013, respectively. Net gains/(losses) deferred in other comprehensive income were USD (13) million and USD 4 million before tax for the years ended December 31, 2014 and 2013, respectively.
In 2014, the Group also designated certain debt issuances as hedging instruments on a non-derivative net investment hedge relationship. As of December 31, 2014, the notional amount of these financial instruments was USD 1.5 billion and net gains/(losses) deferred in other comprehensive income were USD (35) million before tax.
Information on debt issuances designated as hedging instruments in a net investment hedge relationship is set out in note 19.
No ineffectiveness of net investment hedges was recognized in net capital gains/(losses) and impairments for the years ended December 31, 2014 and 2013.
Q4_2014_12_AR14_104_Consolidated_financial_statements_en.indd 190 23.02.2015 16:37:32
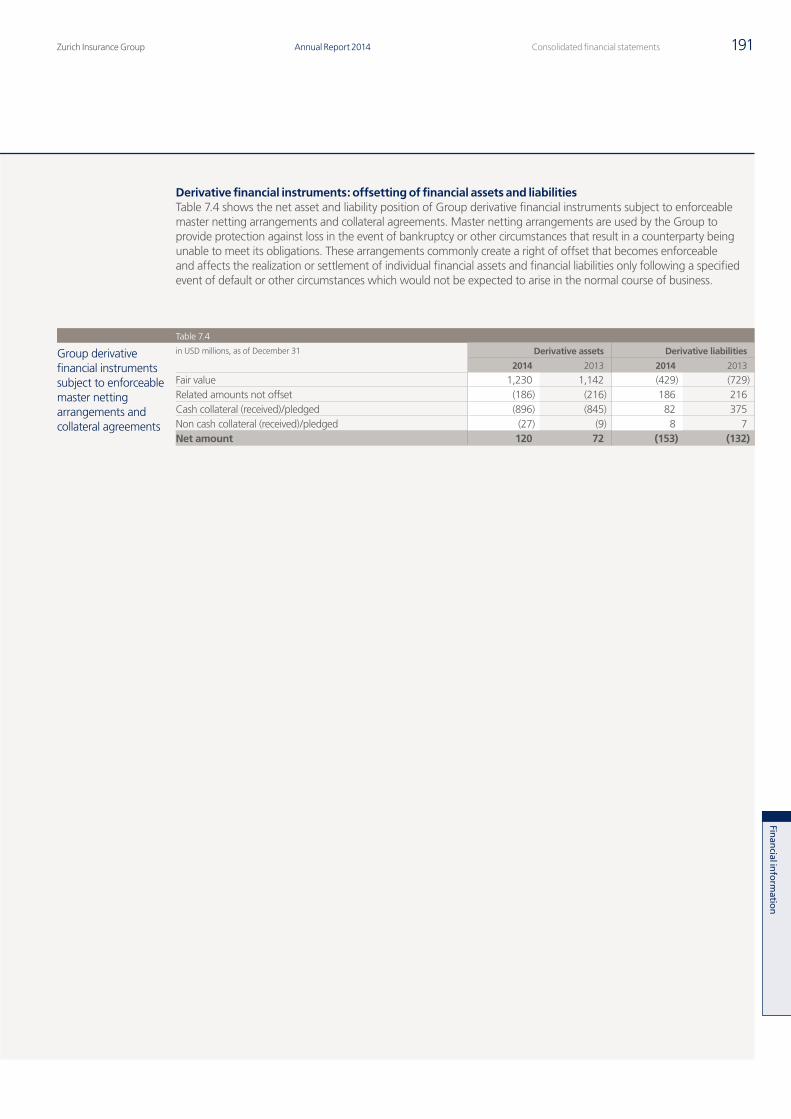
Zurich Insurance Group Annual Report 2014 191Consolidated financial statements
Finan
cial inform
ation
Derivative financial instruments: offsetting of financial assets and liabilitiesTable 7.4 shows the net asset and liability position of Group derivative financial instruments subject to enforceable master netting arrangements and collateral agreements. Master netting arrangements are used by the Group to provide protection against loss in the event of bankruptcy or other circumstances that result in a counterparty being unable to meet its obligations. These arrangements commonly create a right of offset that becomes enforceable and affects the realization or settlement of individual financial assets and financial liabilities only following a specified event of default or other circumstances which would not be expected to arise in the normal course of business.
Table 7.4
Group derivative financial instruments subject to enforceable master netting arrangements and collateral agreements
in USD millions, as of December 31 Derivative assets Derivative liabilities
2014 2013 2014 2013
Fair value 1,230 1,142 (429) (729)Related amounts not offset (186) (216) 186 216Cash collateral (received)/pledged (896) (845) 82 375Non cash collateral (received)/pledged (27) (9) 8 7Net amount 120 72 (153) (132)
Q4_2014_12_AR14_104_Consolidated_financial_statements_en.indd 191 23.02.2015 16:37:32
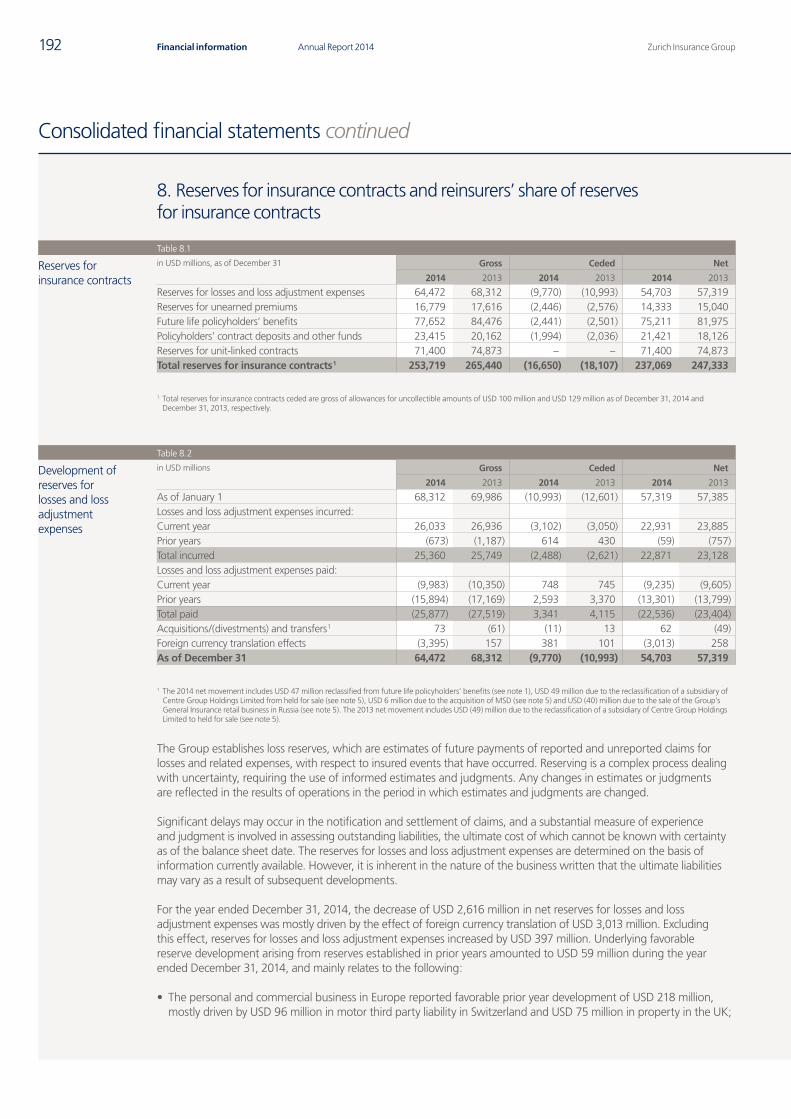
Zurich Insurance GroupAnnual Report 2014192 Financial information
Consolidated financial statements continued
8. Reserves for insurance contracts and reinsurers’ share of reserves for insurance contracts
Table 8.1
Reserves for insurance contracts
in USD millions, as of December 31 Gross Ceded Net
2014 2013 2014 2013 2014 2013
Reserves for losses and loss adjustment expenses 64,472 68,312 (9,770) (10,993) 54,703 57,319Reserves for unearned premiums 16,779 17,616 (2,446) (2,576) 14,333 15,040Future life policyholders’ benefits 77,652 84,476 (2,441) (2,501) 75,211 81,975Policyholders’ contract deposits and other funds 23,415 20,162 (1,994) (2,036) 21,421 18,126Reserves for unit-linked contracts 71,400 74,873 – – 71,400 74,873Total reserves for insurance contracts 1 253,719 265,440 (16,650) (18,107) 237,069 247,333
1 Total reserves for insurance contracts ceded are gross of allowances for uncollectible amounts of USD 100 million and USD 129 million as of December 31, 2014 and December 31, 2013, respectively.
Table 8.2
Development of reserves for losses and loss adjustment expenses
in USD millions Gross Ceded Net
2014 2013 2014 2013 2014 2013
As of January 1 68,312 69,986 (10,993) (12,601) 57,319 57,385Losses and loss adjustment expenses incurred:Current year 26,033 26,936 (3,102) (3,050) 22,931 23,885Prior years (673) (1,187) 614 430 (59) (757)Total incurred 25,360 25,749 (2,488) (2,621) 22,871 23,128Losses and loss adjustment expenses paid:Current year (9,983) (10,350) 748 745 (9,235) (9,605)Prior years (15,894) (17,169) 2,593 3,370 (13,301) (13,799)Total paid (25,877) (27,519) 3,341 4,115 (22,536) (23,404)Acquisitions/(divestments) and transfers 1 73 (61) (11) 13 62 (49)Foreign currency translation effects (3,395) 157 381 101 (3,013) 258As of December 31 64,472 68,312 (9,770) (10,993) 54,703 57,319
1 The 2014 net movement includes USD 47 million reclassified from future life policyholders’ benefits (see note 1), USD 49 million due to the reclassification of a subsidiary of Centre Group Holdings Limited from held for sale (see note 5), USD 6 million due to the acquisition of MSD (see note 5) and USD (40) million due to the sale of the Group’s General Insurance retail business in Russia (see note 5). The 2013 net movement includes USD (49) million due to the reclassification of a subsidiary of Centre Group Holdings Limited to held for sale (see note 5).
The Group establishes loss reserves, which are estimates of future payments of reported and unreported claims for losses and related expenses, with respect to insured events that have occurred. Reserving is a complex process dealing with uncertainty, requiring the use of informed estimates and judgments. Any changes in estimates or judgments are reflected in the results of operations in the period in which estimates and judgments are changed.
Significant delays may occur in the notification and settlement of claims, and a substantial measure of experience and judgment is involved in assessing outstanding liabilities, the ultimate cost of which cannot be known with certainty as of the balance sheet date. The reserves for losses and loss adjustment expenses are determined on the basis of information currently available. However, it is inherent in the nature of the business written that the ultimate liabilities may vary as a result of subsequent developments.
For the year ended December 31, 2014, the decrease of USD 2,616 million in net reserves for losses and loss adjustment expenses was mostly driven by the effect of foreign currency translation of USD 3,013 million. Excluding this effect, reserves for losses and loss adjustment expenses increased by USD 397 million. Underlying favorable reserve development arising from reserves established in prior years amounted to USD 59 million during the year ended December 31, 2014, and mainly relates to the following:
• The personal and commercial business in Europe reported favorable prior year development of USD 218 million, mostly driven by USD 96 million in motor third party liability in Switzerland and USD 75 million in property in the UK;
Q4_2014_12_AR14_104_Consolidated_financial_statements_en.indd 192 23.02.2015 16:37:32
Zurich Insurance Group Annual Report 2014 193Consolidated financial statements
Finan
cial inform
ation
• In Global Corporate, adverse prior year development of USD 56 million arising in North America, partially offset by favorable development in Europe;
• Adverse prior year development of USD 198 million relating to asbestos and other run-off businesses.
For the year ended December 31, 2013, the decrease of USD 66 million (USD 324 million before the foreign currency translation impact) in net reserves for losses and loss adjustment expenses was mostly driven by payments on crop and storm Sandy losses in North America. Favorable reserve development arising from reserves established in prior years amounted to USD 757 million, and mainly related to the following movements by market-facing business, country and line of business:
• The personal and commercial business in Europe reported favorable prior year development of USD 412 million, mostly driven by USD 326 million in motor liability in Switzerland and a reduction of large property claims of USD 46 million in the UK;
• In Global Corporate, favorable development of USD 355 million was driven by lower estimates of large property claims in Switzerland, the UK and Global Energy and lower estimates for the Thai floods, which occurred in 2012.
Q4_2014_12_AR14_104_Consolidated_financial_statements_en.indd 193 23.02.2015 16:37:33
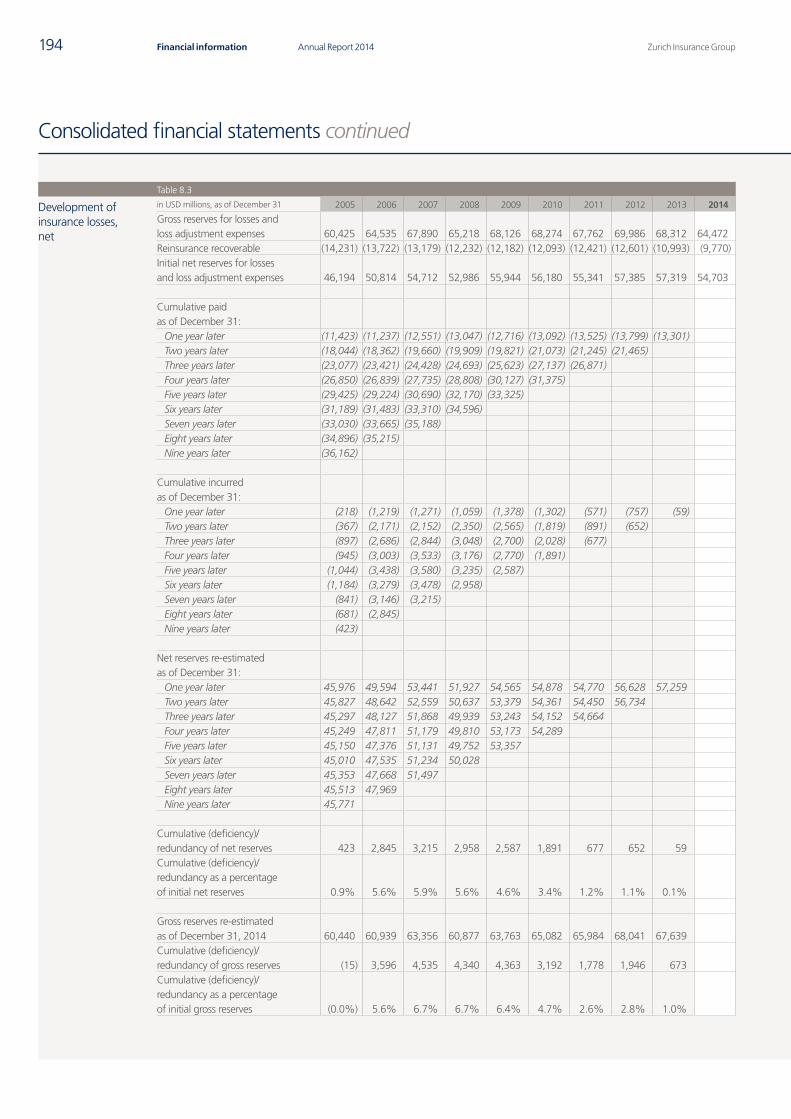
Zurich Insurance GroupAnnual Report 2014194 Financial information
Consolidated financial statements continued
Table 8.3
Development of insurance losses, net
in USD millions, as of December 31 2005 2006 2007 2008 2009 2010 2011 2012 2013 2014
Gross reserves for losses and loss adjustment expenses 60,425 64,535 67,890 65,218 68,126 68,274 67,762 69,986 68,312 64,472Reinsurance recoverable (14,231) (13,722) (13,179) (12,232) (12,182) (12,093) (12,421) (12,601) (10,993) (9,770)Initial net reserves for losses and loss adjustment expenses 46,194 50,814 54,712 52,986 55,944 56,180 55,341 57,385 57,319 54,703
Cumulative paid as of December 31:
One year later (11,423) (11,237) (12,551) (13,047) (12,716) (13,092) (13,525) (13,799) (13,301)Two years later (18,044) (18,362) (19,660) (19,909) (19,821) (21,073) (21,245) (21,465)Three years later (23,077) (23,421) (24,428) (24,693) (25,623) (27,137) (26,871)Four years later (26,850) (26,839) (27,735) (28,808) (30,127) (31,375)Five years later (29,425) (29,224) (30,690) (32,170) (33,325)Six years later (31,189) (31,483) (33,310) (34,596)Seven years later (33,030) (33,665) (35,188)Eight years later (34,896) (35,215)Nine years later (36,162)
Cumulative incurred as of December 31:
One year later (218) (1,219) (1,271) (1,059) (1,378) (1,302) (571) (757) (59)Two years later (367) (2,171) (2,152) (2,350) (2,565) (1,819) (891) (652)Three years later (897) (2,686) (2,844) (3,048) (2,700) (2,028) (677)Four years later (945) (3,003) (3,533) (3,176) (2,770) (1,891)Five years later (1,044) (3,438) (3,580) (3,235) (2,587)Six years later (1,184) (3,279) (3,478) (2,958)Seven years later (841) (3,146) (3,215)Eight years later (681) (2,845)Nine years later (423)
Net reserves re-estimated as of December 31:
One year later 45,976 49,594 53,441 51,927 54,565 54,878 54,770 56,628 57,259Two years later 45,827 48,642 52,559 50,637 53,379 54,361 54,450 56,734Three years later 45,297 48,127 51,868 49,939 53,243 54,152 54,664Four years later 45,249 47,811 51,179 49,810 53,173 54,289Five years later 45,150 47,376 51,131 49,752 53,357Six years later 45,010 47,535 51,234 50,028Seven years later 45,353 47,668 51,497Eight years later 45,513 47,969Nine years later 45,771
Cumulative (deficiency)/ redundancy of net reserves 423 2,845 3,215 2,958 2,587 1,891 677 652 59Cumulative (deficiency)/ redundancy as a percentage of initial net reserves 0.9% 5.6% 5.9% 5.6% 4.6% 3.4% 1.2% 1.1% 0.1%
Gross reserves re-estimated as of December 31, 2014 60,440 60,939 63,356 60,877 63,763 65,082 65,984 68,041 67,639Cumulative (deficiency)/ redundancy of gross reserves (15) 3,596 4,535 4,340 4,363 3,192 1,778 1,946 673Cumulative (deficiency)/ redundancy as a percentage of initial gross reserves (0.0%) 5.6% 6.7% 6.7% 6.4% 4.7% 2.6% 2.8% 1.0%
Q4_2014_12_AR14_104_Consolidated_financial_statements_en.indd 194 23.02.2015 16:37:33
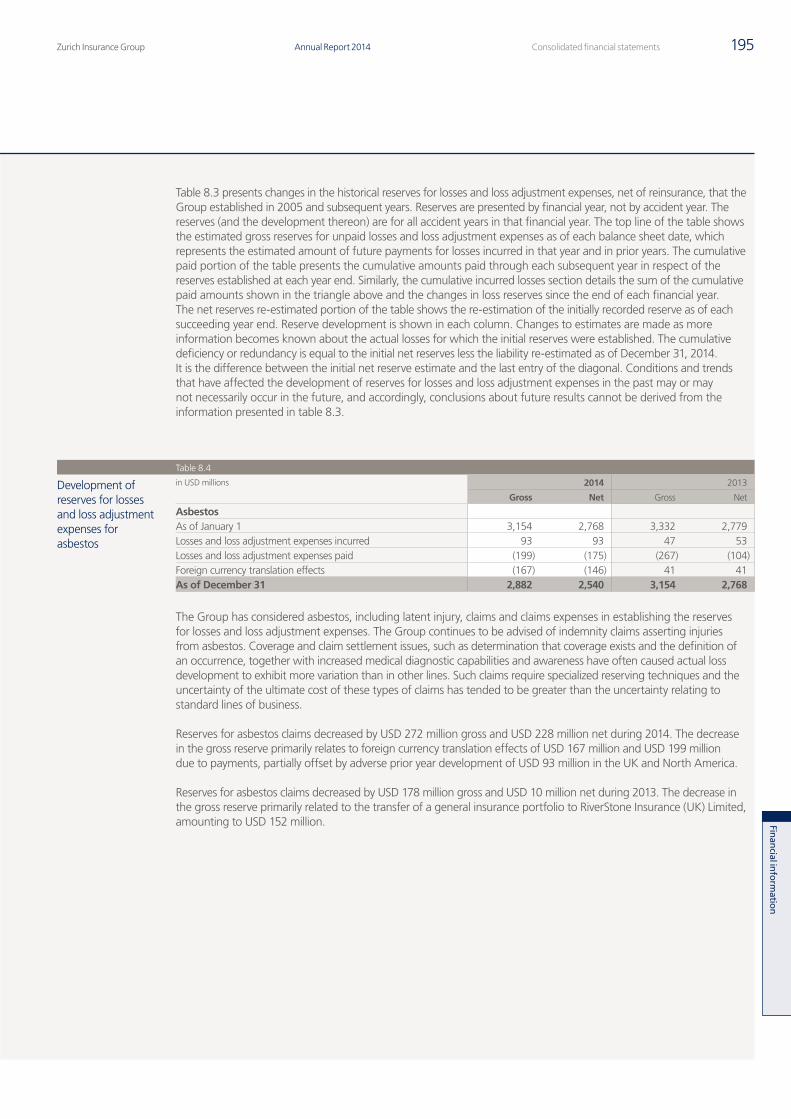
Zurich Insurance Group Annual Report 2014 195Consolidated financial statements
Finan
cial inform
ation
Table 8.3 presents changes in the historical reserves for losses and loss adjustment expenses, net of reinsurance, that the Group established in 2005 and subsequent years. Reserves are presented by financial year, not by accident year. The reserves (and the development thereon) are for all accident years in that financial year. The top line of the table shows the estimated gross reserves for unpaid losses and loss adjustment expenses as of each balance sheet date, which represents the estimated amount of future payments for losses incurred in that year and in prior years. The cumulative paid portion of the table presents the cumulative amounts paid through each subsequent year in respect of the reserves established at each year end. Similarly, the cumulative incurred losses section details the sum of the cumulative paid amounts shown in the triangle above and the changes in loss reserves since the end of each financial year. The net reserves re-estimated portion of the table shows the re-estimation of the initially recorded reserve as of each succeeding year end. Reserve development is shown in each column. Changes to estimates are made as more information becomes known about the actual losses for which the initial reserves were established. The cumulative deficiency or redundancy is equal to the initial net reserves less the liability re-estimated as of December 31, 2014. It is the difference between the initial net reserve estimate and the last entry of the diagonal. Conditions and trends that have affected the development of reserves for losses and loss adjustment expenses in the past may or may not necessarily occur in the future, and accordingly, conclusions about future results cannot be derived from the information presented in table 8.3.
Table 8.4
Development of reserves for losses and loss adjustment expenses for asbestos
in USD millions 2014 2013
Gross Net Gross Net
AsbestosAs of January 1 3,154 2,768 3,332 2,779Losses and loss adjustment expenses incurred 93 93 47 53Losses and loss adjustment expenses paid (199) (175) (267) (104)Foreign currency translation effects (167) (146) 41 41As of December 31 2,882 2,540 3,154 2,768
The Group has considered asbestos, including latent injury, claims and claims expenses in establishing the reserves for losses and loss adjustment expenses. The Group continues to be advised of indemnity claims asserting injuries from asbestos. Coverage and claim settlement issues, such as determination that coverage exists and the definition of an occurrence, together with increased medical diagnostic capabilities and awareness have often caused actual loss development to exhibit more variation than in other lines. Such claims require specialized reserving techniques and the uncertainty of the ultimate cost of these types of claims has tended to be greater than the uncertainty relating to standard lines of business.
Reserves for asbestos claims decreased by USD 272 million gross and USD 228 million net during 2014. The decrease in the gross reserve primarily relates to foreign currency translation effects of USD 167 million and USD 199 million due to payments, partially offset by adverse prior year development of USD 93 million in the UK and North America.
Reserves for asbestos claims decreased by USD 178 million gross and USD 10 million net during 2013. The decrease in the gross reserve primarily related to the transfer of a general insurance portfolio to RiverStone Insurance (UK) Limited, amounting to USD 152 million.
Q4_2014_12_AR14_104_Consolidated_financial_statements_en.indd 195 23.02.2015 16:37:34
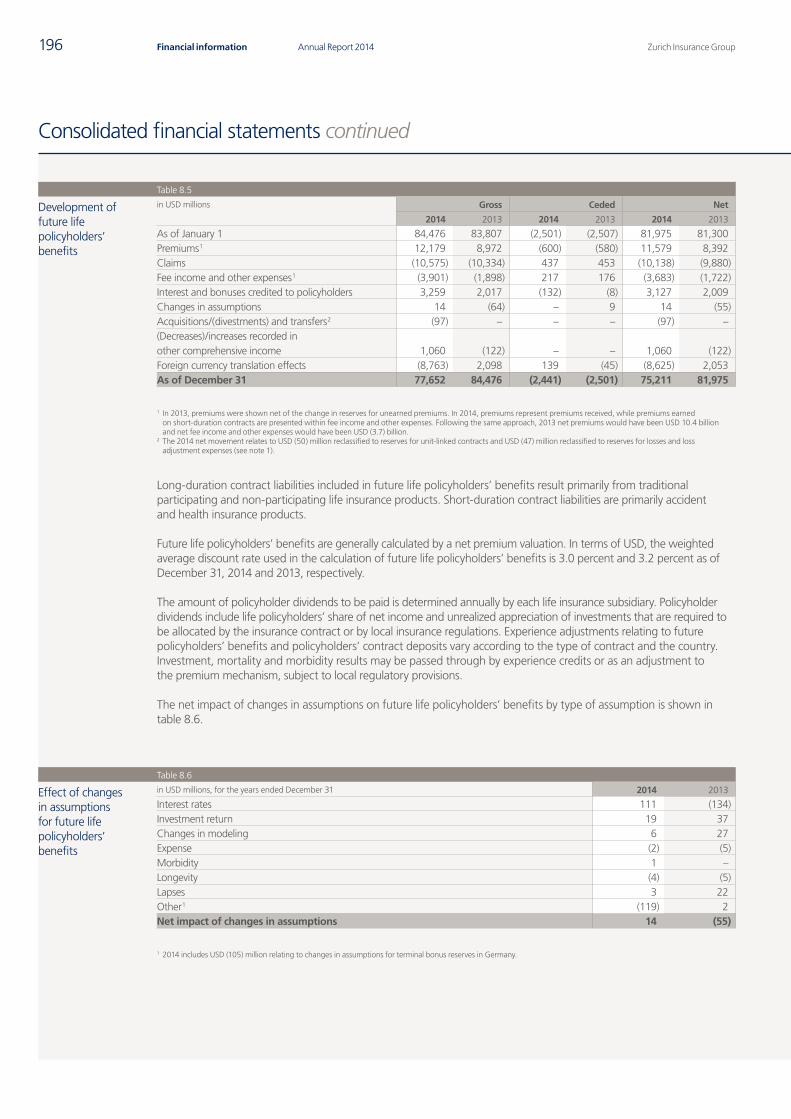
Zurich Insurance GroupAnnual Report 2014196 Financial information
Consolidated financial statements continued
Table 8.5
Development of future life policyholders’ benefits
in USD millions Gross Ceded Net
2014 2013 2014 2013 2014 2013
As of January 1 84,476 83,807 (2,501) (2,507) 81,975 81,300Premiums 1 12,179 8,972 (600) (580) 11,579 8,392Claims (10,575) (10,334) 437 453 (10,138) (9,880)Fee income and other expenses 1 (3,901) (1,898) 217 176 (3,683) (1,722)Interest and bonuses credited to policyholders 3,259 2,017 (132) (8) 3,127 2,009Changes in assumptions 14 (64) – 9 14 (55)Acquisitions/(divestments) and transfers 2 (97) – – – (97) –(Decreases)/increases recorded in other comprehensive income 1,060 (122) – – 1,060 (122)Foreign currency translation effects (8,763) 2,098 139 (45) (8,625) 2,053As of December 31 77,652 84,476 (2,441) (2,501) 75,211 81,975
1 In 2013, premiums were shown net of the change in reserves for unearned premiums. In 2014, premiums represent premiums received, while premiums earned on short-duration contracts are presented within fee income and other expenses. Following the same approach, 2013 net premiums would have been USD 10.4 billion and net fee income and other expenses would have been USD (3.7) billion.
2 The 2014 net movement relates to USD (50) million reclassified to reserves for unit-linked contracts and USD (47) million reclassified to reserves for losses and loss adjustment expenses (see note 1).
Long-duration contract liabilities included in future life policyholders’ benefits result primarily from traditional participating and non-participating life insurance products. Short-duration contract liabilities are primarily accident and health insurance products.
Future life policyholders’ benefits are generally calculated by a net premium valuation. In terms of USD, the weighted average discount rate used in the calculation of future life policyholders’ benefits is 3.0 percent and 3.2 percent as of December 31, 2014 and 2013, respectively.
The amount of policyholder dividends to be paid is determined annually by each life insurance subsidiary. Policyholder dividends include life policyholders’ share of net income and unrealized appreciation of investments that are required to be allocated by the insurance contract or by local insurance regulations. Experience adjustments relating to future policyholders’ benefits and policyholders’ contract deposits vary according to the type of contract and the country. Investment, mortality and morbidity results may be passed through by experience credits or as an adjustment to the premium mechanism, subject to local regulatory provisions.
The net impact of changes in assumptions on future life policyholders’ benefits by type of assumption is shown in table 8.6.
Table 8.6
Effect of changes in assumptions for future life policyholders’ benefits
in USD millions, for the years ended December 31 2014 2013
Interest rates 111 (134)Investment return 19 37Changes in modeling 6 27Expense (2) (5)Morbidity 1 –Longevity (4) (5)Lapses 3 22Other 1 (119) 2Net impact of changes in assumptions 14 (55)
1 2014 includes USD (105) million relating to changes in assumptions for terminal bonus reserves in Germany.
Q4_2014_12_AR14_104_Consolidated_financial_statements_en.indd 196 23.02.2015 16:37:34
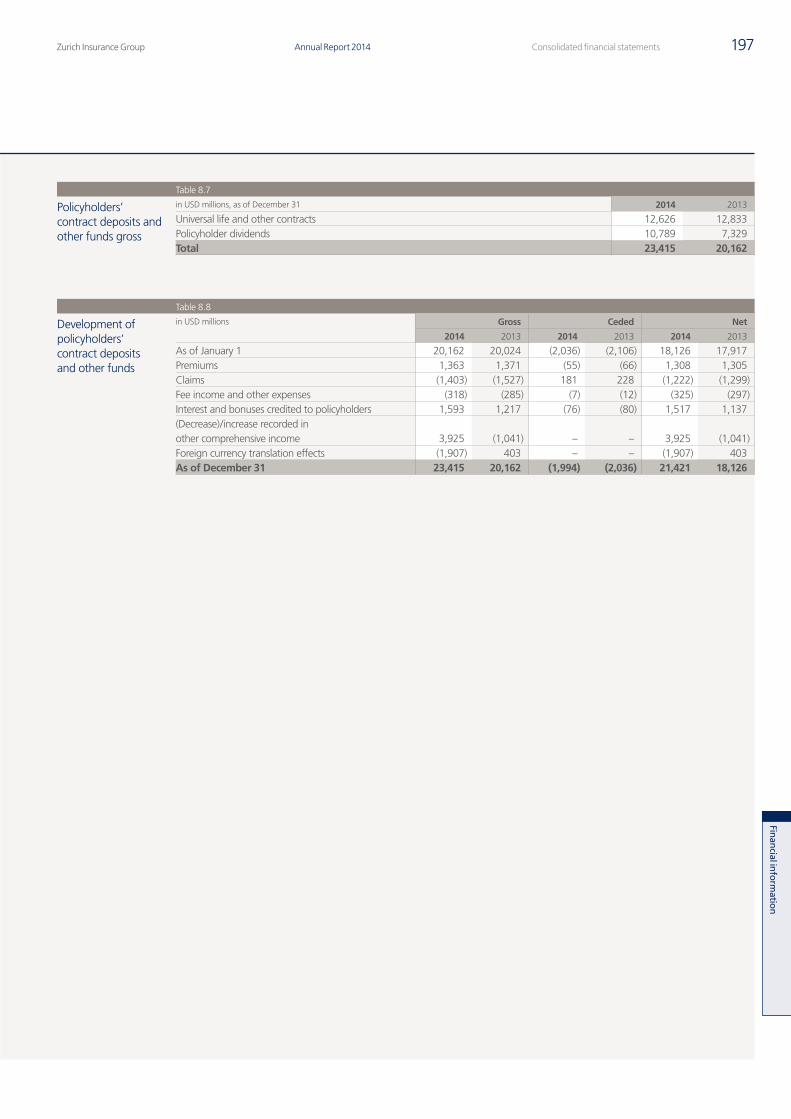
Zurich Insurance Group Annual Report 2014 197Consolidated financial statements
Finan
cial inform
ation
Table 8.7
Policyholders’ contract deposits and other funds gross
in USD millions, as of December 31 2014 2013
Universal life and other contracts 12,626 12,833Policyholder dividends 10,789 7,329Total 23,415 20,162
Table 8.8
Development of policyholders’ contract deposits and other funds
in USD millions Gross Ceded Net
2014 2013 2014 2013 2014 2013
As of January 1 20,162 20,024 (2,036) (2,106) 18,126 17,917Premiums 1,363 1,371 (55) (66) 1,308 1,305Claims (1,403) (1,527) 181 228 (1,222) (1,299)Fee income and other expenses (318) (285) (7) (12) (325) (297)Interest and bonuses credited to policyholders 1,593 1,217 (76) (80) 1,517 1,137(Decrease)/increase recorded in other comprehensive income 3,925 (1,041) – – 3,925 (1,041)Foreign currency translation effects (1,907) 403 – – (1,907) 403As of December 31 23,415 20,162 (1,994) (2,036) 21,421 18,126
Q4_2014_12_AR14_104_Consolidated_financial_statements_en.indd 197 23.02.2015 16:37:34
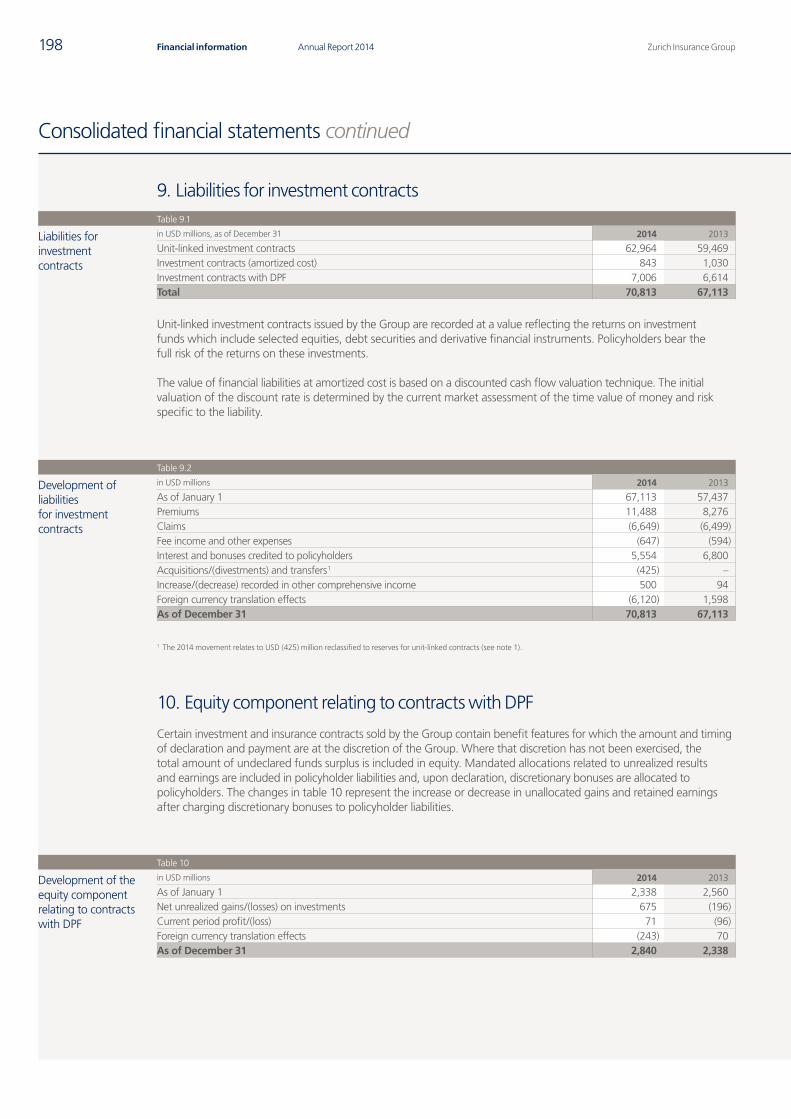
Zurich Insurance GroupAnnual Report 2014198 Financial information
Consolidated financial statements continued
9. Liabilities for investment contractsTable 9.1
Liabilities for investment contracts
in USD millions, as of December 31 2014 2013
Unit-linked investment contracts 62,964 59,469Investment contracts (amortized cost) 843 1,030Investment contracts with DPF 7,006 6,614Total 70,813 67,113
Unit-linked investment contracts issued by the Group are recorded at a value reflecting the returns on investment funds which include selected equities, debt securities and derivative financial instruments. Policyholders bear the full risk of the returns on these investments.
The value of financial liabilities at amortized cost is based on a discounted cash flow valuation technique. The initial valuation of the discount rate is determined by the current market assessment of the time value of money and risk specific to the liability.
Table 9.2
Development of liabilities for investment contracts
in USD millions 2014 2013
As of January 1 67,113 57,437Premiums 11,488 8,276Claims (6,649) (6,499)Fee income and other expenses (647) (594)Interest and bonuses credited to policyholders 5,554 6,800Acquisitions/(divestments) and transfers 1 (425) –Increase/(decrease) recorded in other comprehensive income 500 94Foreign currency translation effects (6,120) 1,598As of December 31 70,813 67,113
1 The 2014 movement relates to USD (425) million reclassified to reserves for unit-linked contracts (see note 1).
10. Equity component relating to contracts with DPF
Certain investment and insurance contracts sold by the Group contain benefit features for which the amount and timing of declaration and payment are at the discretion of the Group. Where that discretion has not been exercised, the total amount of undeclared funds surplus is included in equity. Mandated allocations related to unrealized results and earnings are included in policyholder liabilities and, upon declaration, discretionary bonuses are allocated to policyholders. The changes in table 10 represent the increase or decrease in unallocated gains and retained earnings after charging discretionary bonuses to policyholder liabilities.
Table 10
Development of the equity component relating to contracts with DPF
in USD millions 2014 2013
As of January 1 2,338 2,560Net unrealized gains/(losses) on investments 675 (196)Current period profit/(loss) 71 (96)Foreign currency translation effects (243) 70As of December 31 2,840 2,338
Q4_2014_12_AR14_104_Consolidated_financial_statements_en.indd 198 23.02.2015 16:37:35
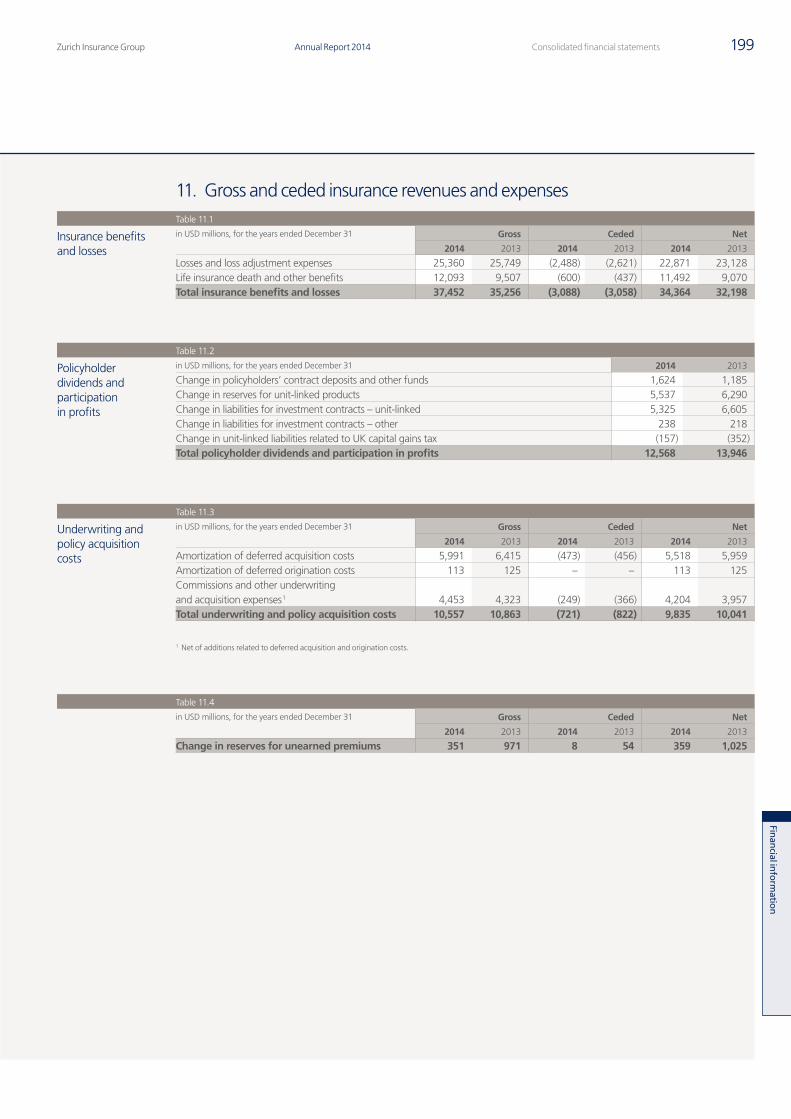
Zurich Insurance Group Annual Report 2014 199Consolidated financial statements
Finan
cial inform
ation
11. Gross and ceded insurance revenues and expensesTable 11.1
Insurance benefits and losses
in USD millions, for the years ended December 31 Gross Ceded Net
2014 2013 2014 2013 2014 2013
Losses and loss adjustment expenses 25,360 25,749 (2,488) (2,621) 22,871 23,128Life insurance death and other benefits 12,093 9,507 (600) (437) 11,492 9,070Total insurance benefits and losses 37,452 35,256 (3,088) (3,058) 34,364 32,198
Table 11.2
Policyholder dividends and participation in profits
in USD millions, for the years ended December 31 2014 2013
Change in policyholders’ contract deposits and other funds 1,624 1,185Change in reserves for unit-linked products 5,537 6,290Change in liabilities for investment contracts – unit-linked 5,325 6,605Change in liabilities for investment contracts – other 238 218Change in unit-linked liabilities related to UK capital gains tax (157) (352)Total policyholder dividends and participation in profits 12,568 13,946
Table 11.3
Underwriting and policy acquisition costs
in USD millions, for the years ended December 31 Gross Ceded Net
2014 2013 2014 2013 2014 2013
Amortization of deferred acquisition costs 5,991 6,415 (473) (456) 5,518 5,959Amortization of deferred origination costs 113 125 – – 113 125Commissions and other underwriting and acquisition expenses 1 4,453 4,323 (249) (366) 4,204 3,957Total underwriting and policy acquisition costs 10,557 10,863 (721) (822) 9,835 10,041
1 Net of additions related to deferred acquisition and origination costs.
Table 11.4
in USD millions, for the years ended December 31 Gross Ceded Net
2014 2013 2014 2013 2014 2013
Change in reserves for unearned premiums 351 971 8 54 359 1,025
Q4_2014_12_AR14_104_Consolidated_financial_statements_en.indd 199 23.02.2015 16:37:35
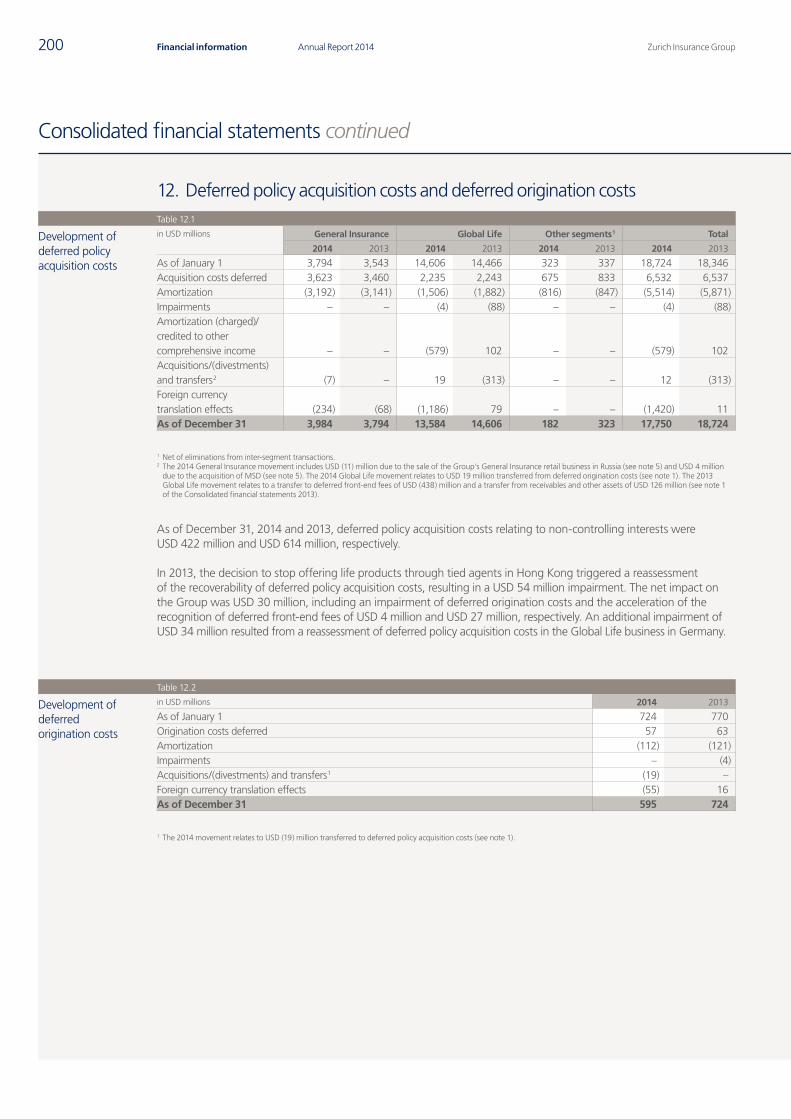
Zurich Insurance GroupAnnual Report 2014200 Financial information
Consolidated financial statements continued
12. Deferred policy acquisition costs and deferred origination costsTable 12.1
Development of deferred policy acquisition costs
in USD millions General Insurance Global Life Other segments 1 Total
2014 2013 2014 2013 2014 2013 2014 2013
As of January 1 3,794 3,543 14,606 14,466 323 337 18,724 18,346Acquisition costs deferred 3,623 3,460 2,235 2,243 675 833 6,532 6,537Amortization (3,192) (3,141) (1,506) (1,882) (816) (847) (5,514) (5,871)Impairments – – (4) (88) – – (4) (88)Amortization (charged)/ credited to other comprehensive income – – (579) 102 – – (579) 102Acquisitions/(divestments) and transfers 2 (7) – 19 (313) – – 12 (313)Foreign currency translation effects (234) (68) (1,186) 79 – – (1,420) 11As of December 31 3,984 3,794 13,584 14,606 182 323 17,750 18,724
1 Net of eliminations from inter-segment transactions.2 The 2014 General Insurance movement includes USD (11) million due to the sale of the Group’s General Insurance retail business in Russia (see note 5) and USD 4 million
due to the acquisition of MSD (see note 5). The 2014 Global Life movement relates to USD 19 million transferred from deferred origination costs (see note 1). The 2013 Global Life movement relates to a transfer to deferred front-end fees of USD (438) million and a transfer from receivables and other assets of USD 126 million (see note 1 of the Consolidated financial statements 2013).
As of December 31, 2014 and 2013, deferred policy acquisition costs relating to non-controlling interests were USD 422 million and USD 614 million, respectively.
In 2013, the decision to stop offering life products through tied agents in Hong Kong triggered a reassessment of the recoverability of deferred policy acquisition costs, resulting in a USD 54 million impairment. The net impact on the Group was USD 30 million, including an impairment of deferred origination costs and the acceleration of the recognition of deferred front-end fees of USD 4 million and USD 27 million, respectively. An additional impairment of USD 34 million resulted from a reassessment of deferred policy acquisition costs in the Global Life business in Germany.
Table 12.2
Development of deferred origination costs
in USD millions 2014 2013
As of January 1 724 770Origination costs deferred 57 63Amortization (112) (121)Impairments – (4)Acquisitions/(divestments) and transfers 1 (19) –Foreign currency translation effects (55) 16As of December 31 595 724
1 The 2014 movement relates to USD (19) million transferred to deferred policy acquisition costs (see note 1).
Q4_2014_12_AR14_104_Consolidated_financial_statements_en.indd 200 23.02.2015 16:37:36
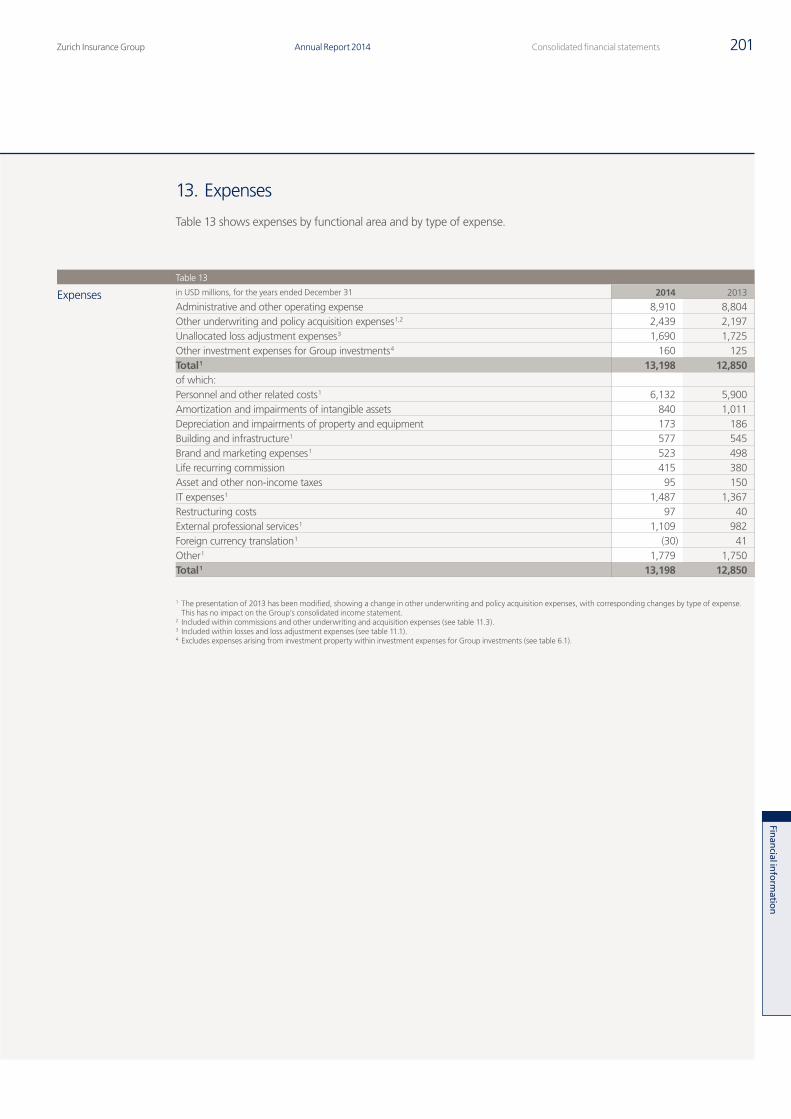
Zurich Insurance Group Annual Report 2014 201Consolidated financial statements
Finan
cial inform
ation
13. Expenses
Table 13 shows expenses by functional area and by type of expense.
Table 13
Expenses in USD millions, for the years ended December 31 2014 2013
Administrative and other operating expense 8,910 8,804Other underwriting and policy acquisition expenses 1,2 2,439 2,197Unallocated loss adjustment expenses 3 1,690 1,725Other investment expenses for Group investments 4 160 125Total 1 13,198 12,850of which:Personnel and other related costs 1 6,132 5,900Amortization and impairments of intangible assets 840 1,011Depreciation and impairments of property and equipment 173 186Building and infrastructure 1 577 545Brand and marketing expenses 1 523 498Life recurring commission 415 380Asset and other non-income taxes 95 150IT expenses 1 1,487 1,367Restructuring costs 97 40External professional services 1 1,109 982Foreign currency translation 1 (30) 41Other 1 1,779 1,750Total 1 13,198 12,850
1 The presentation of 2013 has been modified, showing a change in other underwriting and policy acquisition expenses, with corresponding changes by type of expense. This has no impact on the Group’s consolidated income statement.
2 Included within commissions and other underwriting and acquisition expenses (see table 11.3).3 Included within losses and loss adjustment expenses (see table 11.1).4 Excludes expenses arising from investment property within investment expenses for Group investments (see table 6.1).
Q4_2014_12_AR14_104_Consolidated_financial_statements_en.indd 201 23.02.2015 16:37:36
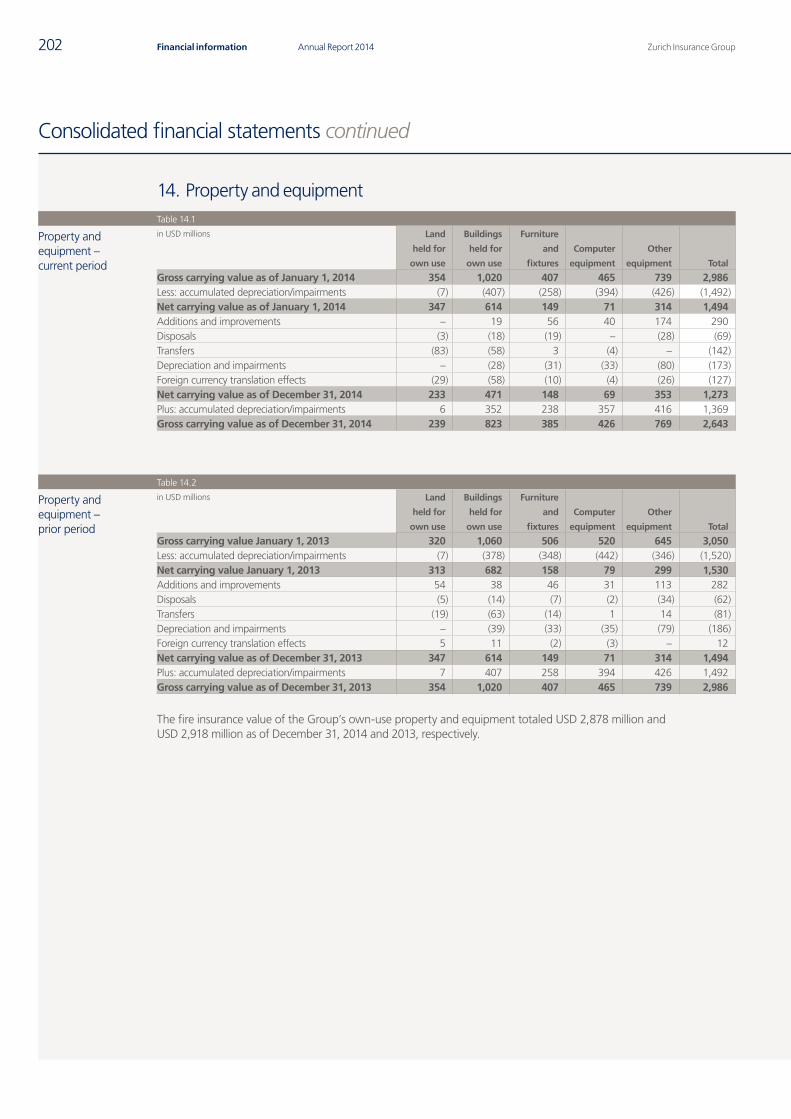
Zurich Insurance GroupAnnual Report 2014202 Financial information
Consolidated financial statements continued
14. Property and equipmentTable 14.1
Property and equipment – current period
in USD millions Land
held for
own use
Buildings
held for
own use
Furniture
and
fixtures
Computer
equipment
Other
equipment Total
Gross carrying value as of January 1, 2014 354 1,020 407 465 739 2,986Less: accumulated depreciation/impairments (7) (407) (258) (394) (426) (1,492)Net carrying value as of January 1, 2014 347 614 149 71 314 1,494Additions and improvements – 19 56 40 174 290Disposals (3) (18) (19) – (28) (69)Transfers (83) (58) 3 (4) – (142)Depreciation and impairments – (28) (31) (33) (80) (173)Foreign currency translation effects (29) (58) (10) (4) (26) (127)Net carrying value as of December 31, 2014 233 471 148 69 353 1,273Plus: accumulated depreciation/impairments 6 352 238 357 416 1,369Gross carrying value as of December 31, 2014 239 823 385 426 769 2,643
Table 14.2
Property and equipment – prior period
in USD millions Land
held for
own use
Buildings
held for
own use
Furniture
and
fixtures
Computer
equipment
Other
equipment Total
Gross carrying value January 1, 2013 320 1,060 506 520 645 3,050Less: accumulated depreciation/impairments (7) (378) (348) (442) (346) (1,520)Net carrying value January 1, 2013 313 682 158 79 299 1,530Additions and improvements 54 38 46 31 113 282Disposals (5) (14) (7) (2) (34) (62)Transfers (19) (63) (14) 1 14 (81)Depreciation and impairments – (39) (33) (35) (79) (186)Foreign currency translation effects 5 11 (2) (3) – 12Net carrying value as of December 31, 2013 347 614 149 71 314 1,494Plus: accumulated depreciation/impairments 7 407 258 394 426 1,492Gross carrying value as of December 31, 2013 354 1,020 407 465 739 2,986
The fire insurance value of the Group’s own-use property and equipment totaled USD 2,878 million and USD 2,918 million as of December 31, 2014 and 2013, respectively.
Q4_2014_12_AR14_104_Consolidated_financial_statements_en.indd 202 23.02.2015 16:37:37
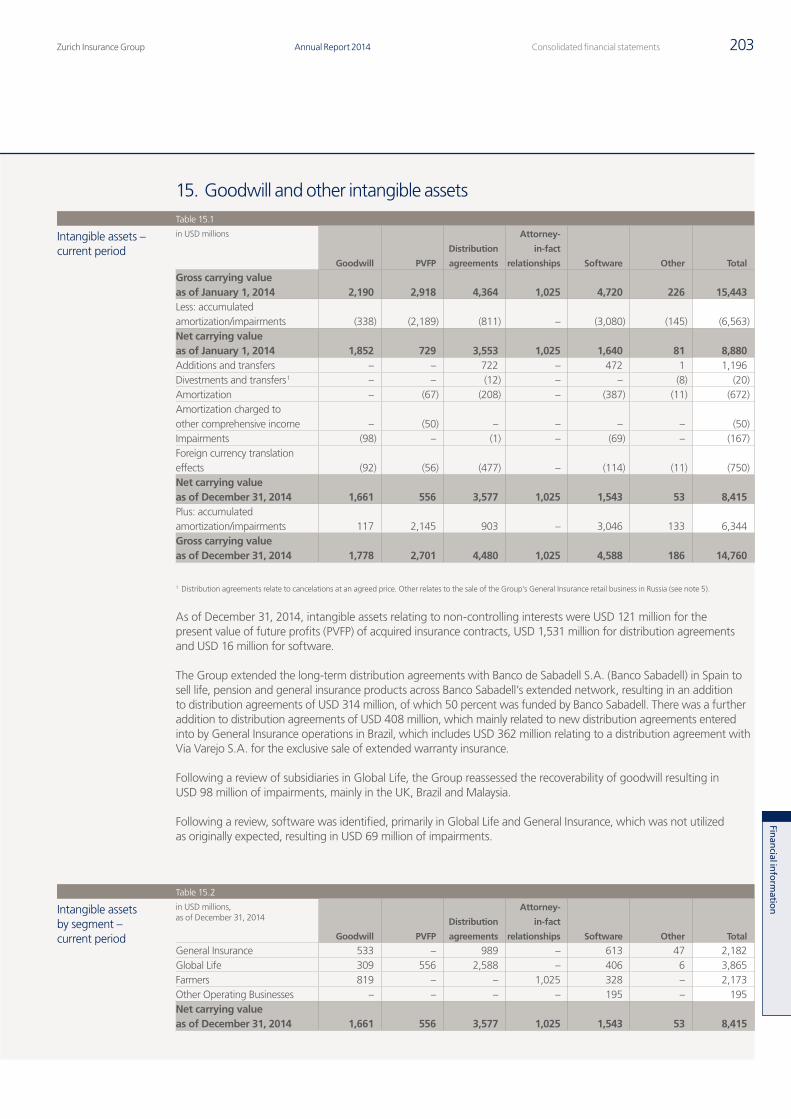
Zurich Insurance Group Annual Report 2014 203Consolidated financial statements
Finan
cial inform
ation
15. Goodwill and other intangible assetsTable 15.1
Intangible assets – current period
in USD millions
Goodwill PVFP
Distribution
agreements
Attorney-
in-fact
relationships Software Other Total
Gross carrying value as of January 1, 2014 2,190 2,918 4,364 1,025 4,720 226 15,443Less: accumulated amortization/impairments (338) (2,189) (811) – (3,080) (145) (6,563)Net carrying value as of January 1, 2014 1,852 729 3,553 1,025 1,640 81 8,880Additions and transfers – – 722 – 472 1 1,196Divestments and transfers 1 – – (12) – – (8) (20)Amortization – (67) (208) – (387) (11) (672)Amortization charged to other comprehensive income – (50) – – – – (50)Impairments (98) – (1) – (69) – (167)Foreign currency translation effects (92) (56) (477) – (114) (11) (750)Net carrying value as of December 31, 2014 1,661 556 3,577 1,025 1,543 53 8,415Plus: accumulated amortization/impairments 117 2,145 903 – 3,046 133 6,344Gross carrying value as of December 31, 2014 1,778 2,701 4,480 1,025 4,588 186 14,760
1 Distribution agreements relate to cancelations at an agreed price. Other relates to the sale of the Group’s General Insurance retail business in Russia (see note 5).
As of December 31, 2014, intangible assets relating to non-controlling interests were USD 121 million for the present value of future profits (PVFP) of acquired insurance contracts, USD 1,531 million for distribution agreements and USD 16 million for software.
The Group extended the long-term distribution agreements with Banco de Sabadell S.A. (Banco Sabadell) in Spain to sell life, pension and general insurance products across Banco Sabadell’s extended network, resulting in an addition to distribution agreements of USD 314 million, of which 50 percent was funded by Banco Sabadell. There was a further addition to distribution agreements of USD 408 million, which mainly related to new distribution agreements entered into by General Insurance operations in Brazil, which includes USD 362 million relating to a distribution agreement with Via Varejo S.A. for the exclusive sale of extended warranty insurance.
Following a review of subsidiaries in Global Life, the Group reassessed the recoverability of goodwill resulting in USD 98 million of impairments, mainly in the UK, Brazil and Malaysia.
Following a review, software was identified, primarily in Global Life and General Insurance, which was not utilized as originally expected, resulting in USD 69 million of impairments.
Table 15.2
Intangible assets by segment – current period
in USD millions, as of December 31, 2014
Goodwill PVFP
Distribution
agreements
Attorney-
in-fact
relationships Software Other Total
General Insurance 533 – 989 – 613 47 2,182Global Life 309 556 2,588 – 406 6 3,865Farmers 819 – – 1,025 328 – 2,173Other Operating Businesses – – – – 195 – 195Net carrying value as of December 31, 2014 1,661 556 3,577 1,025 1,543 53 8,415
Q4_2014_12_AR14_104_Consolidated_financial_statements_en.indd 203 23.02.2015 16:37:37
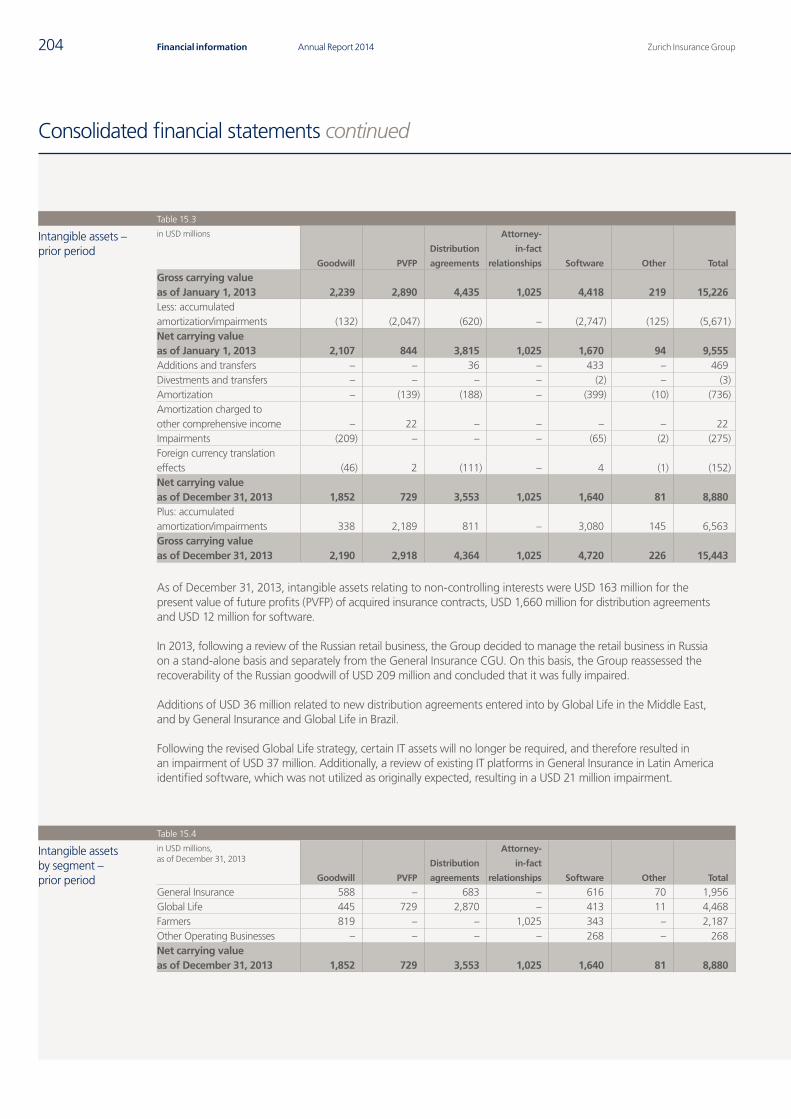
Zurich Insurance GroupAnnual Report 2014204 Financial information
Consolidated financial statements continued
Table 15.3
Intangible assets – prior period
in USD millions
Goodwill PVFP
Distribution
agreements
Attorney-
in-fact
relationships Software Other Total
Gross carrying value as of January 1, 2013 2,239 2,890 4,435 1,025 4,418 219 15,226Less: accumulated amortization/impairments (132) (2,047) (620) – (2,747) (125) (5,671)Net carrying value as of January 1, 2013 2,107 844 3,815 1,025 1,670 94 9,555Additions and transfers – – 36 – 433 – 469Divestments and transfers – – – – (2) – (3)Amortization – (139) (188) – (399) (10) (736)Amortization charged to other comprehensive income – 22 – – – – 22Impairments (209) – – – (65) (2) (275)Foreign currency translation effects (46) 2 (111) – 4 (1) (152)Net carrying value as of December 31, 2013 1,852 729 3,553 1,025 1,640 81 8,880Plus: accumulated amortization/impairments 338 2,189 811 – 3,080 145 6,563Gross carrying value as of December 31, 2013 2,190 2,918 4,364 1,025 4,720 226 15,443
As of December 31, 2013, intangible assets relating to non-controlling interests were USD 163 million for the present value of future profits (PVFP) of acquired insurance contracts, USD 1,660 million for distribution agreements and USD 12 million for software.
In 2013, following a review of the Russian retail business, the Group decided to manage the retail business in Russia on a stand-alone basis and separately from the General Insurance CGU. On this basis, the Group reassessed the recoverability of the Russian goodwill of USD 209 million and concluded that it was fully impaired.
Additions of USD 36 million related to new distribution agreements entered into by Global Life in the Middle East, and by General Insurance and Global Life in Brazil.
Following the revised Global Life strategy, certain IT assets will no longer be required, and therefore resulted in an impairment of USD 37 million. Additionally, a review of existing IT platforms in General Insurance in Latin America identified software, which was not utilized as originally expected, resulting in a USD 21 million impairment.
Table 15.4
Intangible assets by segment – prior period
in USD millions, as of December 31, 2013
Goodwill PVFP
Distribution
agreements
Attorney-
in-fact
relationships Software Other Total
General Insurance 588 – 683 – 616 70 1,956Global Life 445 729 2,870 – 413 11 4,468Farmers 819 – – 1,025 343 – 2,187Other Operating Businesses – – – – 268 – 268Net carrying value as of December 31, 2013 1,852 729 3,553 1,025 1,640 81 8,880
Q4_2014_12_AR14_104_Consolidated_financial_statements_en.indd 204 23.02.2015 16:37:38
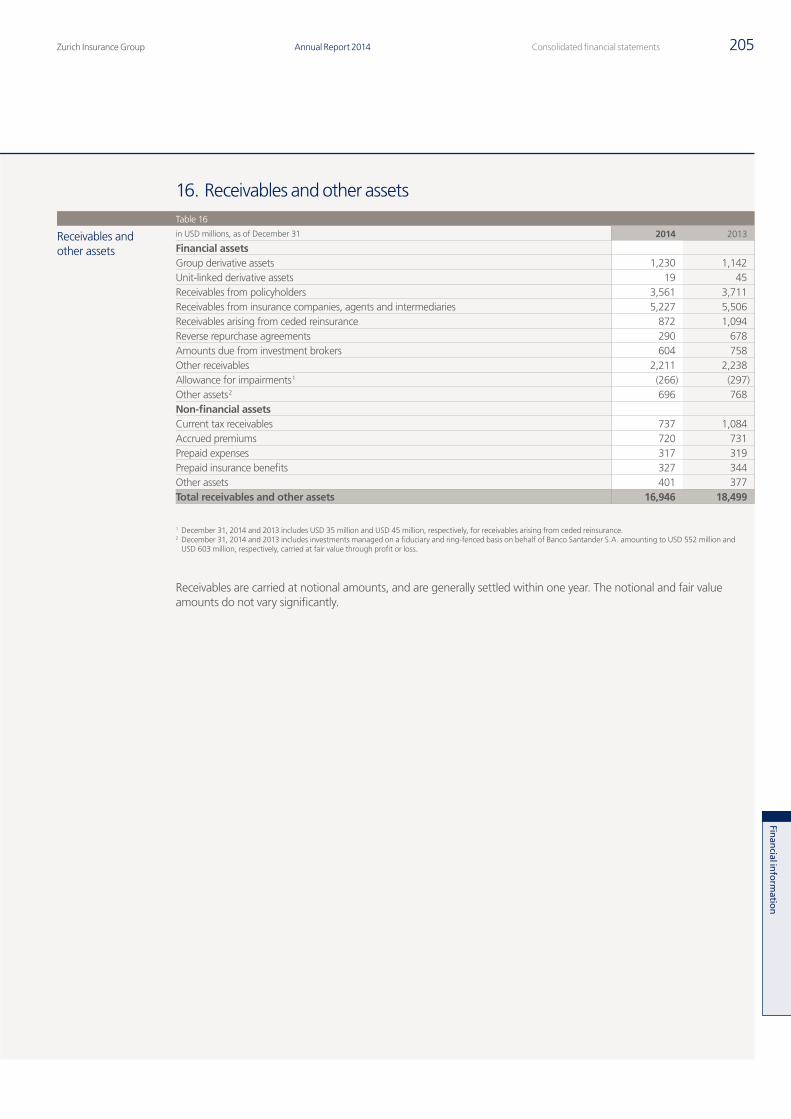
Zurich Insurance Group Annual Report 2014 205Consolidated financial statements
Finan
cial inform
ation
16. Receivables and other assetsTable 16
Receivables and other assets
in USD millions, as of December 31 2014 2013
Financial assetsGroup derivative assets 1,230 1,142Unit-linked derivative assets 19 45Receivables from policyholders 3,561 3,711Receivables from insurance companies, agents and intermediaries 5,227 5,506Receivables arising from ceded reinsurance 872 1,094Reverse repurchase agreements 290 678Amounts due from investment brokers 604 758Other receivables 2,211 2,238Allowance for impairments 1 (266) (297)Other assets 2 696 768Non-financial assetsCurrent tax receivables 737 1,084Accrued premiums 720 731Prepaid expenses 317 319Prepaid insurance benefits 327 344Other assets 401 377Total receivables and other assets 16,946 18,499
1 December 31, 2014 and 2013 includes USD 35 million and USD 45 million, respectively, for receivables arising from ceded reinsurance.2 December 31, 2014 and 2013 includes investments managed on a fiduciary and ring-fenced basis on behalf of Banco Santander S.A. amounting to USD 552 million and
USD 603 million, respectively, carried at fair value through profit or loss.
Receivables are carried at notional amounts, and are generally settled within one year. The notional and fair value amounts do not vary significantly.
Q4_2014_12_AR14_104_Consolidated_financial_statements_en.indd 205 23.02.2015 16:37:38
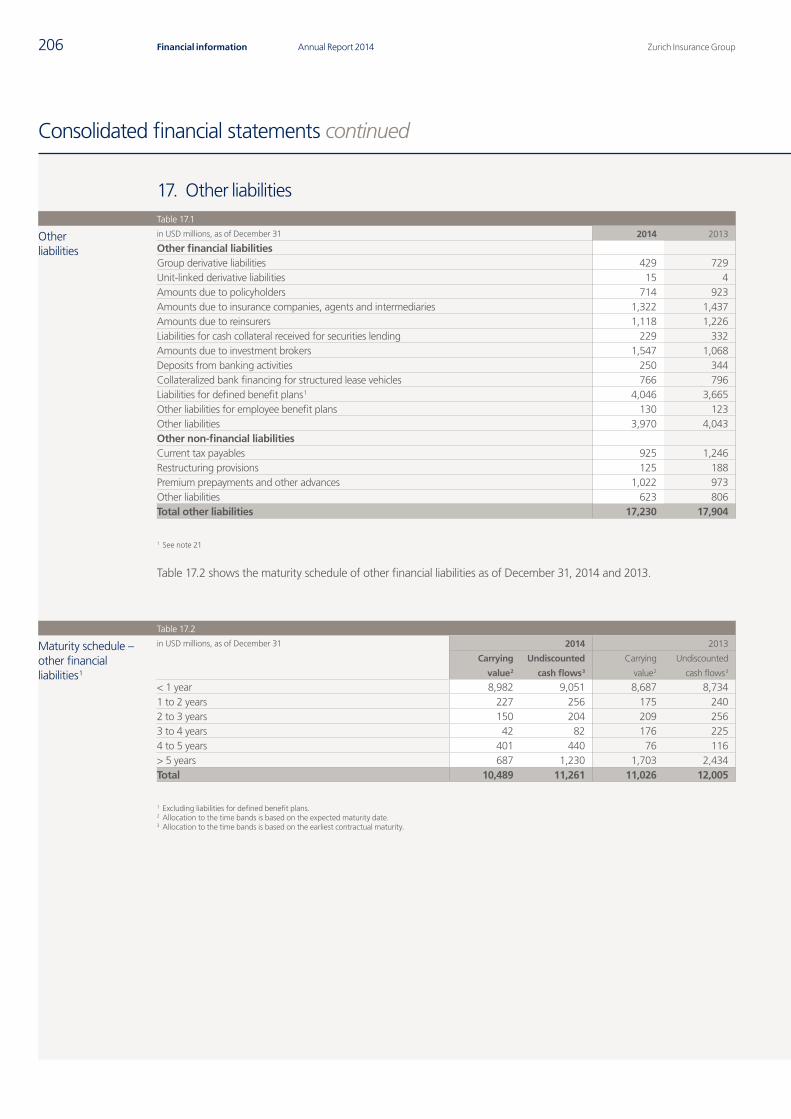
Zurich Insurance GroupAnnual Report 2014206 Financial information
Consolidated financial statements continued
17. Other liabilitiesTable 17.1
Other liabilities
in USD millions, as of December 31 2014 2013
Other financial liabilitiesGroup derivative liabilities 429 729Unit-linked derivative liabilities 15 4Amounts due to policyholders 714 923Amounts due to insurance companies, agents and intermediaries 1,322 1,437Amounts due to reinsurers 1,118 1,226Liabilities for cash collateral received for securities lending 229 332Amounts due to investment brokers 1,547 1,068Deposits from banking activities 250 344Collateralized bank financing for structured lease vehicles 766 796Liabilities for defined benefit plans 1 4,046 3,665Other liabilities for employee benefit plans 130 123Other liabilities 3,970 4,043Other non-financial liabilitiesCurrent tax payables 925 1,246Restructuring provisions 125 188Premium prepayments and other advances 1,022 973Other liabilities 623 806Total other liabilities 17,230 17,904
1 See note 21
Table 17.2 shows the maturity schedule of other financial liabilities as of December 31, 2014 and 2013.
Table 17.2
Maturity schedule – other financial liabilities 1
in USD millions, as of December 31 2014 2013
Carrying
value 2
Undiscounted
cash flows 3
Carrying
value 2
Undiscounted
cash flows 3
< 1 year 8,982 9,051 8,687 8,7341 to 2 years 227 256 175 2402 to 3 years 150 204 209 2563 to 4 years 42 82 176 2254 to 5 years 401 440 76 116> 5 years 687 1,230 1,703 2,434Total 10,489 11,261 11,026 12,005
1 Excluding liabilities for defined benefit plans.2 Allocation to the time bands is based on the expected maturity date.3 Allocation to the time bands is based on the earliest contractual maturity.
Q4_2014_12_AR14_104_Consolidated_financial_statements_en.indd 206 23.02.2015 16:37:38
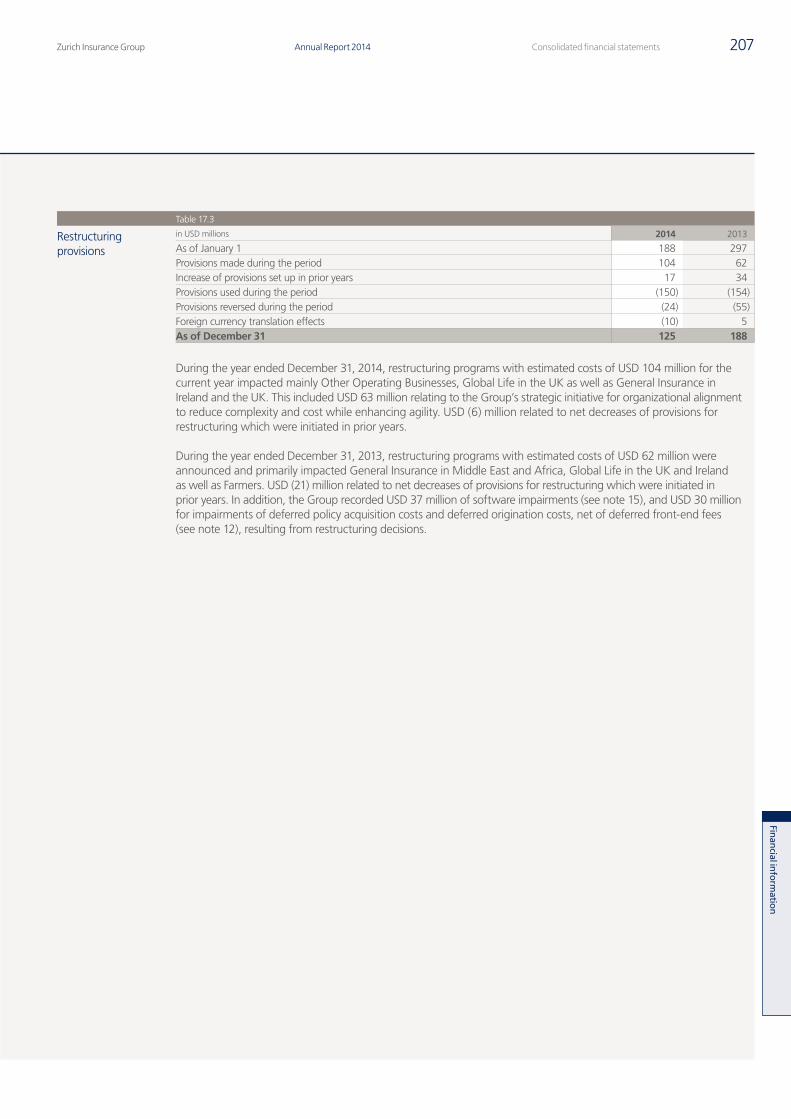
Zurich Insurance Group Annual Report 2014 207Consolidated financial statements
Finan
cial inform
ation
Table 17.3
Restructuring provisions
in USD millions 2014 2013
As of January 1 188 297Provisions made during the period 104 62Increase of provisions set up in prior years 17 34Provisions used during the period (150) (154)Provisions reversed during the period (24) (55)Foreign currency translation effects (10) 5As of December 31 125 188
During the year ended December 31, 2014, restructuring programs with estimated costs of USD 104 million for the current year impacted mainly Other Operating Businesses, Global Life in the UK as well as General Insurance in Ireland and the UK. This included USD 63 million relating to the Group’s strategic initiative for organizational alignment to reduce complexity and cost while enhancing agility. USD (6) million related to net decreases of provisions for restructuring which were initiated in prior years.
During the year ended December 31, 2013, restructuring programs with estimated costs of USD 62 million were announced and primarily impacted General Insurance in Middle East and Africa, Global Life in the UK and Ireland as well as Farmers. USD (21) million related to net decreases of provisions for restructuring which were initiated in prior years. In addition, the Group recorded USD 37 million of software impairments (see note 15), and USD 30 million for impairments of deferred policy acquisition costs and deferred origination costs, net of deferred front-end fees (see note 12), resulting from restructuring decisions.
Q4_2014_12_AR14_104_Consolidated_financial_statements_en.indd 207 23.02.2015 16:37:38
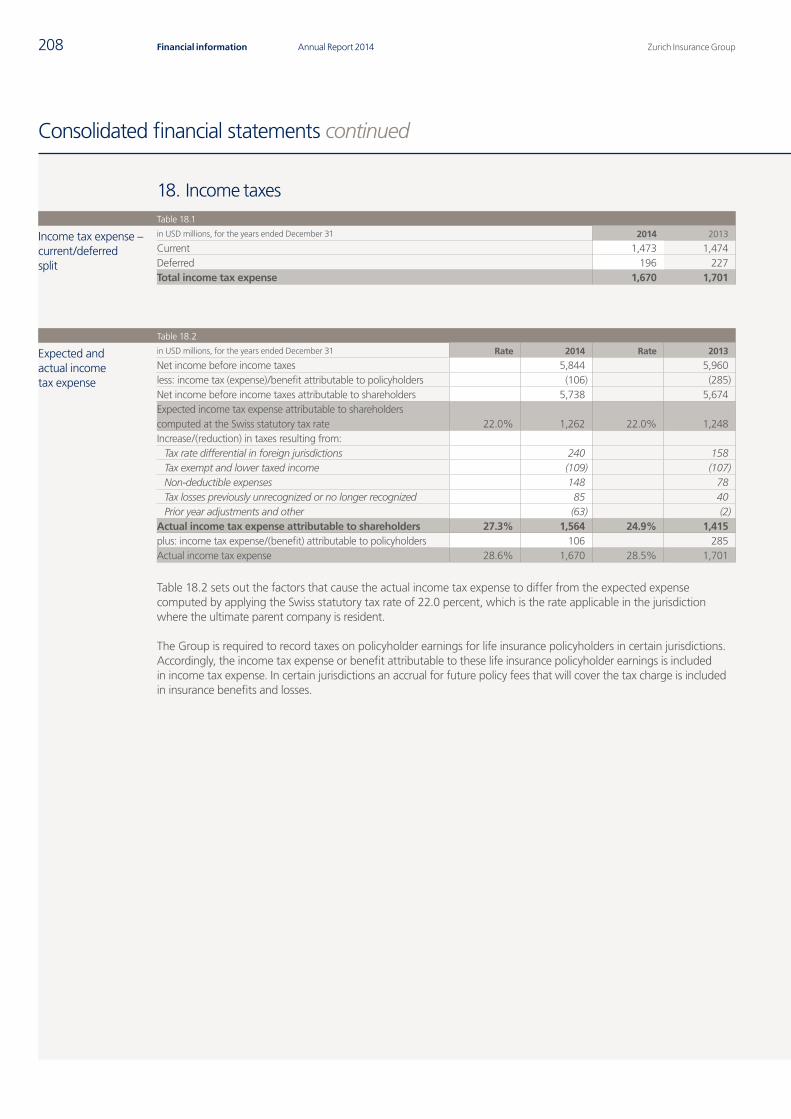
Zurich Insurance GroupAnnual Report 2014208 Financial information
Consolidated financial statements continued
18. Income taxesTable 18.1
Income tax expense – current/deferred split
in USD millions, for the years ended December 31 2014 2013
Current 1,473 1,474Deferred 196 227Total income tax expense 1,670 1,701
Table 18.2
Expected and actual income tax expense
in USD millions, for the years ended December 31 Rate 2014 Rate 2013
Net income before income taxes 5,844 5,960less: income tax (expense)/benefit attributable to policyholders (106) (285)Net income before income taxes attributable to shareholders 5,738 5,674Expected income tax expense attributable to shareholders computed at the Swiss statutory tax rate 22.0% 1,262 22.0% 1,248Increase/(reduction) in taxes resulting from:
Tax rate differential in foreign jurisdictions 240 158Tax exempt and lower taxed income (109) (107)Non-deductible expenses 148 78Tax losses previously unrecognized or no longer recognized 85 40Prior year adjustments and other (63) (2)
Actual income tax expense attributable to shareholders 27.3% 1,564 24.9% 1,415plus: income tax expense/(benefit) attributable to policyholders 106 285Actual income tax expense 28.6% 1,670 28.5% 1,701
Table 18.2 sets out the factors that cause the actual income tax expense to differ from the expected expense computed by applying the Swiss statutory tax rate of 22.0 percent, which is the rate applicable in the jurisdiction where the ultimate parent company is resident.
The Group is required to record taxes on policyholder earnings for life insurance policyholders in certain jurisdictions. Accordingly, the income tax expense or benefit attributable to these life insurance policyholder earnings is included in income tax expense. In certain jurisdictions an accrual for future policy fees that will cover the tax charge is included in insurance benefits and losses.
Q4_2014_12_AR14_104_Consolidated_financial_statements_en.indd 208 23.02.2015 16:37:39
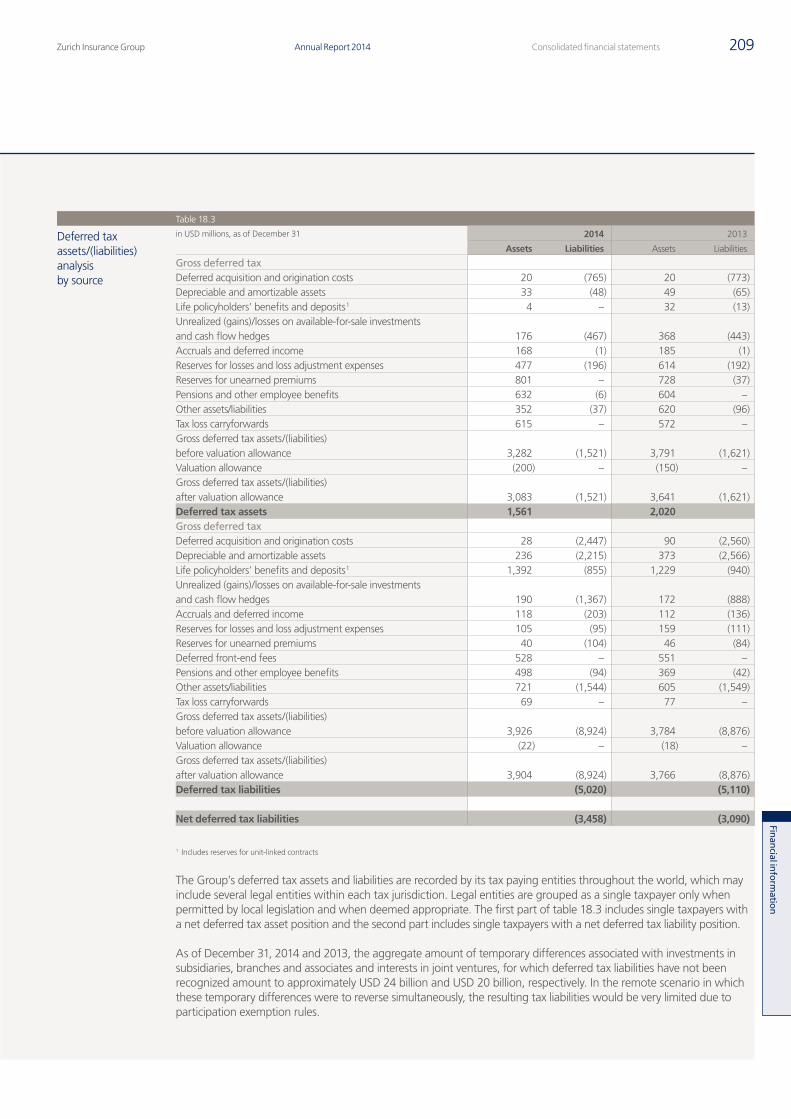
Zurich Insurance Group Annual Report 2014 209Consolidated financial statements
Finan
cial inform
ation
Table 18.3
Deferred tax assets/(liabilities) analysis by source
in USD millions, as of December 31 2014 2013
Assets Liabilities Assets Liabilities
Gross deferred taxDeferred acquisition and origination costs 20 (765) 20 (773)Depreciable and amortizable assets 33 (48) 49 (65)Life policyholders’ benefits and deposits 1 4 – 32 (13)Unrealized (gains)/losses on available-for-sale investments and cash flow hedges 176 (467) 368 (443)Accruals and deferred income 168 (1) 185 (1)Reserves for losses and loss adjustment expenses 477 (196) 614 (192)Reserves for unearned premiums 801 – 728 (37)Pensions and other employee benefits 632 (6) 604 –Other assets/liabilities 352 (37) 620 (96)Tax loss carryforwards 615 – 572 –Gross deferred tax assets/(liabilities) before valuation allowance 3,282 (1,521) 3,791 (1,621)Valuation allowance (200) – (150) –Gross deferred tax assets/(liabilities) after valuation allowance 3,083 (1,521) 3,641 (1,621)Deferred tax assets 1,561 2,020Gross deferred taxDeferred acquisition and origination costs 28 (2,447) 90 (2,560)Depreciable and amortizable assets 236 (2,215) 373 (2,566)Life policyholders’ benefits and deposits 1 1,392 (855) 1,229 (940)Unrealized (gains)/losses on available-for-sale investments and cash flow hedges 190 (1,367) 172 (888)Accruals and deferred income 118 (203) 112 (136)Reserves for losses and loss adjustment expenses 105 (95) 159 (111)Reserves for unearned premiums 40 (104) 46 (84)Deferred front-end fees 528 – 551 –Pensions and other employee benefits 498 (94) 369 (42)Other assets/liabilities 721 (1,544) 605 (1,549)Tax loss carryforwards 69 – 77 –Gross deferred tax assets/(liabilities) before valuation allowance 3,926 (8,924) 3,784 (8,876)Valuation allowance (22) – (18) –Gross deferred tax assets/(liabilities) after valuation allowance 3,904 (8,924) 3,766 (8,876)Deferred tax liabilities (5,020) (5,110)
Net deferred tax liabilities (3,458) (3,090)
1 Includes reserves for unit-linked contracts
The Group’s deferred tax assets and liabilities are recorded by its tax paying entities throughout the world, which may include several legal entities within each tax jurisdiction. Legal entities are grouped as a single taxpayer only when permitted by local legislation and when deemed appropriate. The first part of table 18.3 includes single taxpayers with a net deferred tax asset position and the second part includes single taxpayers with a net deferred tax liability position.
As of December 31, 2014 and 2013, the aggregate amount of temporary differences associated with investments in subsidiaries, branches and associates and interests in joint ventures, for which deferred tax liabilities have not been recognized amount to approximately USD 24 billion and USD 20 billion, respectively. In the remote scenario in which these temporary differences were to reverse simultaneously, the resulting tax liabilities would be very limited due to participation exemption rules.
Q4_2014_12_AR14_104_Consolidated_financial_statements_en.indd 209 23.02.2015 16:37:39
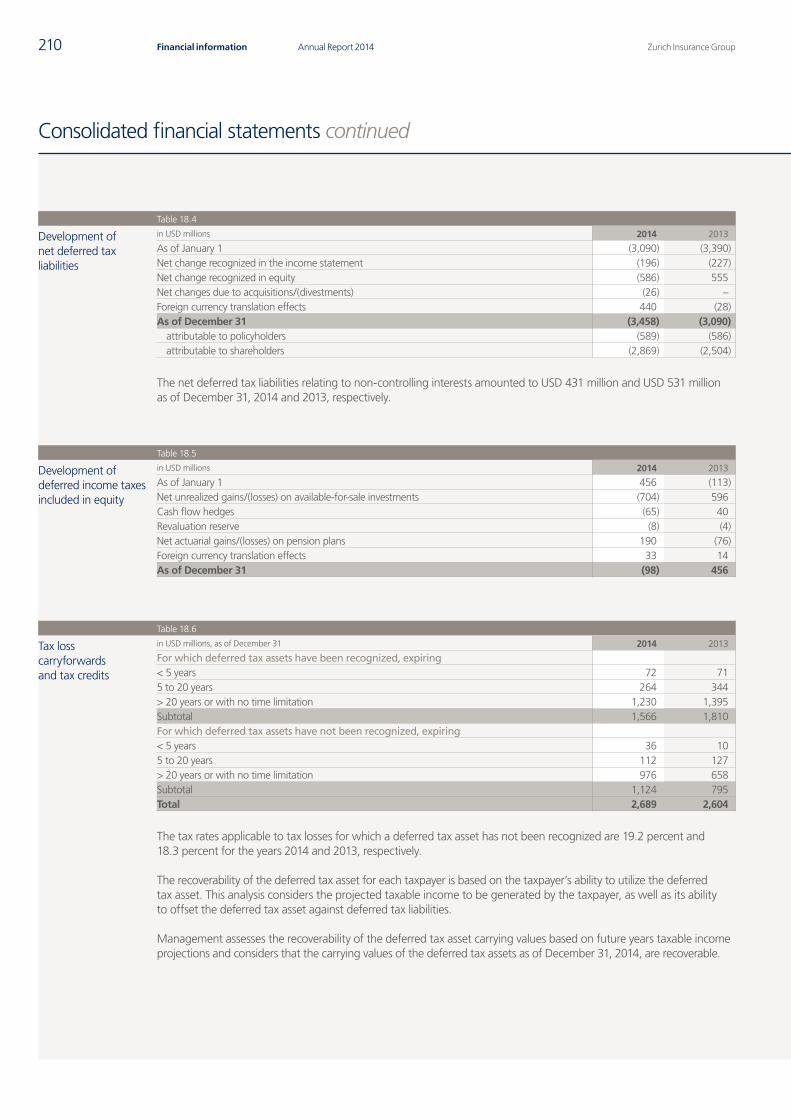
Zurich Insurance GroupAnnual Report 2014210 Financial information
Consolidated financial statements continued
Table 18.4
Development of net deferred tax liabilities
in USD millions 2014 2013
As of January 1 (3,090) (3,390)Net change recognized in the income statement (196) (227)Net change recognized in equity (586) 555Net changes due to acquisitions/(divestments) (26) –Foreign currency translation effects 440 (28)As of December 31 (3,458) (3,090)
attributable to policyholders (589) (586)attributable to shareholders (2,869) (2,504)
The net deferred tax liabilities relating to non-controlling interests amounted to USD 431 million and USD 531 million as of December 31, 2014 and 2013, respectively.
Table 18.5
Development of deferred income taxes included in equity
in USD millions 2014 2013
As of January 1 456 (113)Net unrealized gains/(losses) on available-for-sale investments (704) 596Cash flow hedges (65) 40Revaluation reserve (8) (4)Net actuarial gains/(losses) on pension plans 190 (76)Foreign currency translation effects 33 14As of December 31 (98) 456
Table 18.6
Tax loss carryforwards and tax credits
in USD millions, as of December 31 2014 2013
For which deferred tax assets have been recognized, expiring< 5 years 72 715 to 20 years 264 344> 20 years or with no time limitation 1,230 1,395Subtotal 1,566 1,810For which deferred tax assets have not been recognized, expiring< 5 years 36 105 to 20 years 112 127> 20 years or with no time limitation 976 658Subtotal 1,124 795Total 2,689 2,604
The tax rates applicable to tax losses for which a deferred tax asset has not been recognized are 19.2 percent and 18.3 percent for the years 2014 and 2013, respectively.
The recoverability of the deferred tax asset for each taxpayer is based on the taxpayer’s ability to utilize the deferred tax asset. This analysis considers the projected taxable income to be generated by the taxpayer, as well as its ability to offset the deferred tax asset against deferred tax liabilities.
Management assesses the recoverability of the deferred tax asset carrying values based on future years taxable income projections and considers that the carrying values of the deferred tax assets as of December 31, 2014, are recoverable.
Q4_2014_12_AR14_104_Consolidated_financial_statements_en.indd 210 23.02.2015 16:37:40
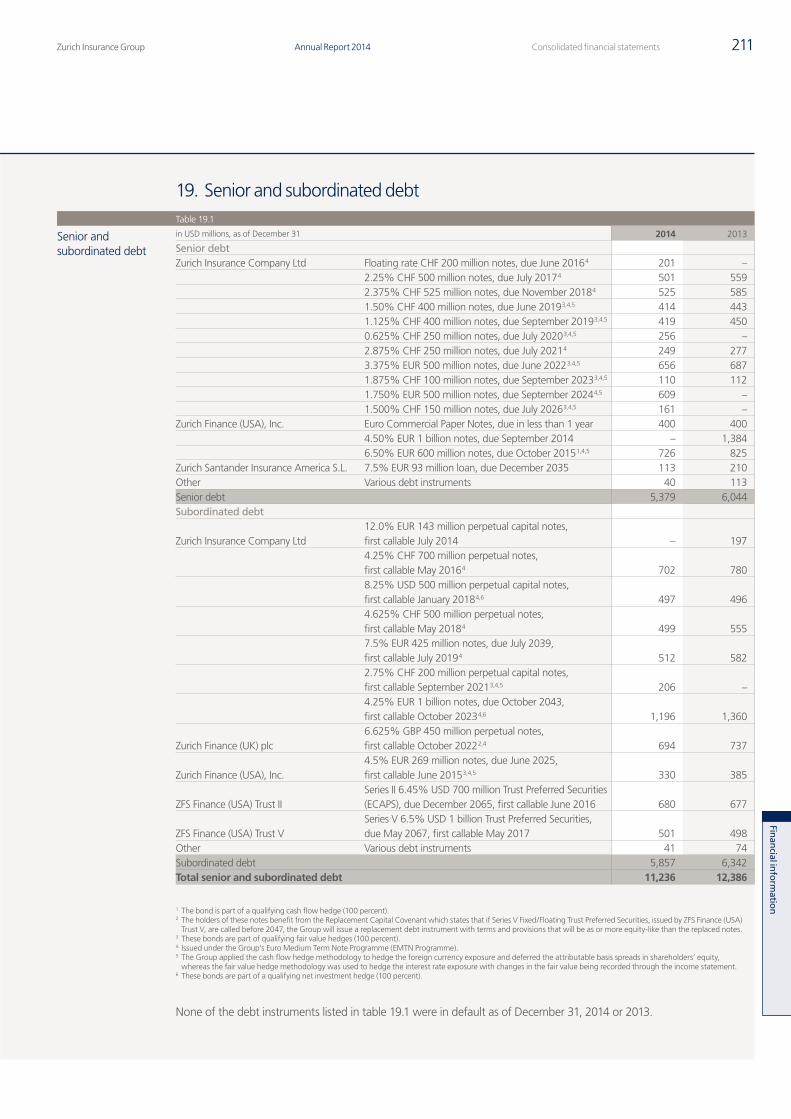
Zurich Insurance Group Annual Report 2014 211Consolidated financial statements
Finan
cial inform
ation
19. Senior and subordinated debtTable 19.1
Senior and subordinated debt
in USD millions, as of December 31 2014 2013
Senior debtZurich Insurance Company Ltd Floating rate CHF 200 million notes, due June 2016 4 201 –
2.25% CHF 500 million notes, due July 2017 4 501 5592.375% CHF 525 million notes, due November 2018 4 525 5851.50% CHF 400 million notes, due June 2019 3,4,5 414 4431.125% CHF 400 million notes, due September 2019 3,4,5 419 4500.625% CHF 250 million notes, due July 2020 3,4,5 256 –2.875% CHF 250 million notes, due July 2021 4 249 2773.375% EUR 500 million notes, due June 2022 3,4,5 656 6871.875% CHF 100 million notes, due September 2023 3,4,5 110 1121.750% EUR 500 million notes, due September 2024 4,5 609 –1.500% CHF 150 million notes, due July 2026 3,4,5 161 –
Zurich Finance (USA), Inc. Euro Commercial Paper Notes, due in less than 1 year 400 4004.50% EUR 1 billion notes, due September 2014 – 1,3846.50% EUR 600 million notes, due October 2015 1,4,5 726 825
Zurich Santander Insurance America S.L. 7.5% EUR 93 million loan, due December 2035 113 210Other Various debt instruments 40 113Senior debt 5,379 6,044Subordinated debt
Zurich Insurance Company Ltd12.0% EUR 143 million perpetual capital notes, first callable July 2014 – 1974.25% CHF 700 million perpetual notes, first callable May 2016 4 702 7808.25% USD 500 million perpetual capital notes, first callable January 2018 4,6 497 4964.625% CHF 500 million perpetual notes, first callable May 2018 4 499 5557.5% EUR 425 million notes, due July 2039, first callable July 2019 4 512 5822.75% CHF 200 million perpetual capital notes, first callable September 2021 3,4,5 206 –4.25% EUR 1 billion notes, due October 2043, first callable October 2023 4,6 1,196 1,360
Zurich Finance (UK) plc6.625% GBP 450 million perpetual notes, first callable October 2022 2,4 694 737
Zurich Finance (USA), Inc. 4.5% EUR 269 million notes, due June 2025, first callable June 2015 3,4,5 330 385
ZFS Finance (USA) Trust IISeries II 6.45% USD 700 million Trust Preferred Securities (ECAPS), due December 2065, first callable June 2016 680 677
ZFS Finance (USA) Trust VSeries V 6.5% USD 1 billion Trust Preferred Securities, due May 2067, first callable May 2017 501 498
Other Various debt instruments 41 74Subordinated debt 5,857 6,342Total senior and subordinated debt 11,236 12,386
1 The bond is part of a qualifying cash flow hedge (100 percent).2 The holders of these notes benefit from the Replacement Capital Covenant which states that if Series V Fixed/Floating Trust Preferred Securities, issued by ZFS Finance (USA)
Trust V, are called before 2047, the Group will issue a replacement debt instrument with terms and provisions that will be as or more equity-like than the replaced notes.3 These bonds are part of qualifying fair value hedges (100 percent). 4 Issued under the Group’s Euro Medium Term Note Programme (EMTN Programme).5 The Group applied the cash flow hedge methodology to hedge the foreign currency exposure and deferred the attributable basis spreads in shareholders’ equity,
whereas the fair value hedge methodology was used to hedge the interest rate exposure with changes in the fair value being recorded through the income statement.6 These bonds are part of a qualifying net investment hedge (100 percent).
None of the debt instruments listed in table 19.1 were in default as of December 31, 2014 or 2013.
Q4_2014_12_AR14_104_Consolidated_financial_statements_en.indd 211 23.02.2015 16:37:40
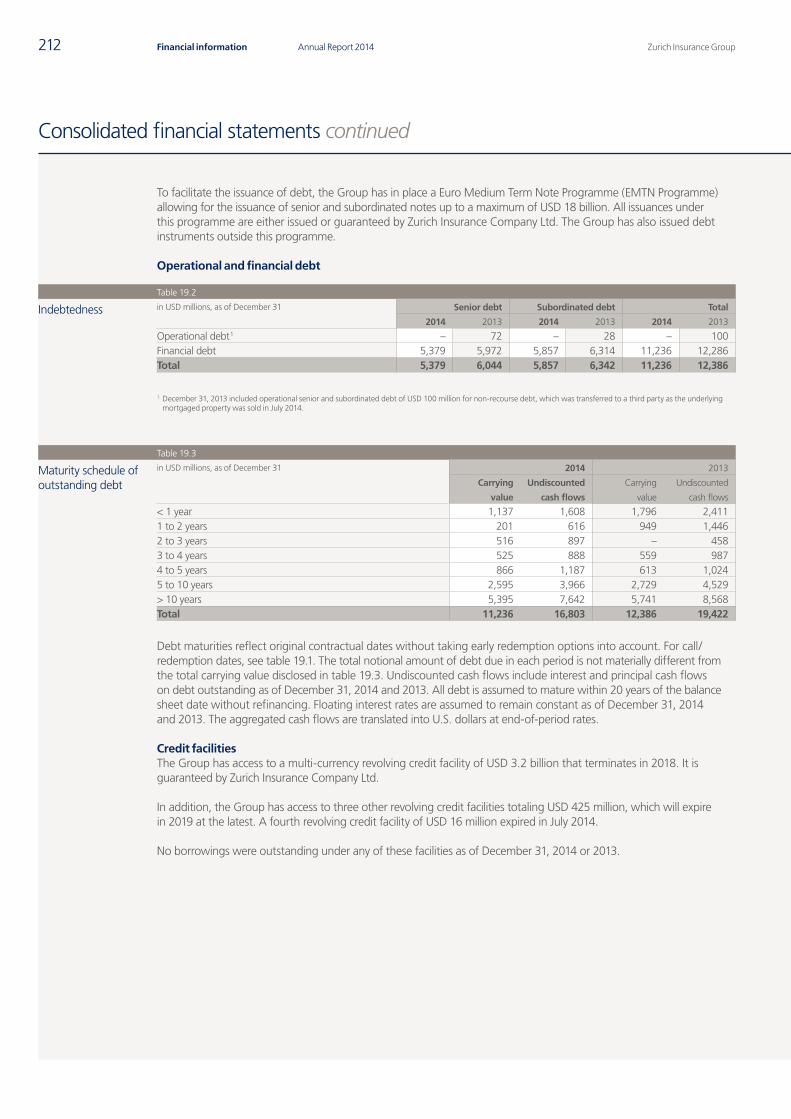
Zurich Insurance GroupAnnual Report 2014212 Financial information
Consolidated financial statements continued
To facilitate the issuance of debt, the Group has in place a Euro Medium Term Note Programme (EMTN Programme) allowing for the issuance of senior and subordinated notes up to a maximum of USD 18 billion. All issuances under this programme are either issued or guaranteed by Zurich Insurance Company Ltd. The Group has also issued debt instruments outside this programme.
Operational and financial debt
Table 19.2
Indebtedness in USD millions, as of December 31 Senior debt Subordinated debt Total
2014 2013 2014 2013 2014 2013
Operational debt 1 – 72 – 28 – 100Financial debt 5,379 5,972 5,857 6,314 11,236 12,286Total 5,379 6,044 5,857 6,342 11,236 12,386
1 December 31, 2013 included operational senior and subordinated debt of USD 100 million for non-recourse debt, which was transferred to a third party as the underlying mortgaged property was sold in July 2014.
Table 19.3
Maturity schedule of outstanding debt
in USD millions, as of December 31 2014 2013
Carrying
value
Undiscounted
cash flows
Carrying
value
Undiscounted
cash flows
< 1 year 1,137 1,608 1,796 2,4111 to 2 years 201 616 949 1,4462 to 3 years 516 897 – 4583 to 4 years 525 888 559 9874 to 5 years 866 1,187 613 1,0245 to 10 years 2,595 3,966 2,729 4,529> 10 years 5,395 7,642 5,741 8,568Total 11,236 16,803 12,386 19,422
Debt maturities reflect original contractual dates without taking early redemption options into account. For call/redemption dates, see table 19.1. The total notional amount of debt due in each period is not materially different from the total carrying value disclosed in table 19.3. Undiscounted cash flows include interest and principal cash flows on debt outstanding as of December 31, 2014 and 2013. All debt is assumed to mature within 20 years of the balance sheet date without refinancing. Floating interest rates are assumed to remain constant as of December 31, 2014 and 2013. The aggregated cash flows are translated into U.S. dollars at end-of-period rates.
Credit facilitiesThe Group has access to a multi-currency revolving credit facility of USD 3.2 billion that terminates in 2018. It is guaranteed by Zurich Insurance Company Ltd.
In addition, the Group has access to three other revolving credit facilities totaling USD 425 million, which will expire in 2019 at the latest. A fourth revolving credit facility of USD 16 million expired in July 2014.
No borrowings were outstanding under any of these facilities as of December 31, 2014 or 2013.
Q4_2014_12_AR14_104_Consolidated_financial_statements_en.indd 212 23.02.2015 16:37:41
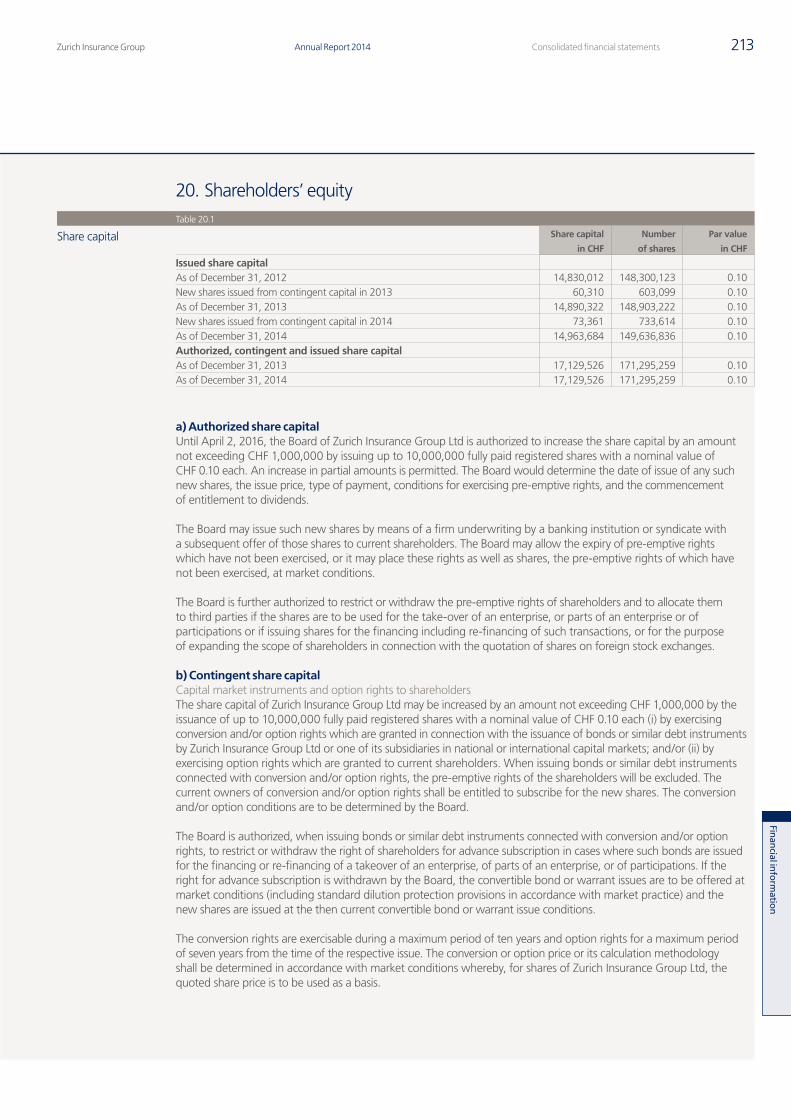
Zurich Insurance Group Annual Report 2014 213Consolidated financial statements
Finan
cial inform
ation
20. Shareholders’ equityTable 20.1
Share capital Share capital
in CHF
Number
of shares
Par value
in CHF
Issued share capitalAs of December 31, 2012 14,830,012 148,300,123 0.10New shares issued from contingent capital in 2013 60,310 603,099 0.10As of December 31, 2013 14,890,322 148,903,222 0.10New shares issued from contingent capital in 2014 73,361 733,614 0.10As of December 31, 2014 14,963,684 149,636,836 0.10Authorized, contingent and issued share capitalAs of December 31, 2013 17,129,526 171,295,259 0.10As of December 31, 2014 17,129,526 171,295,259 0.10
a) Authorized share capitalUntil April 2, 2016, the Board of Zurich Insurance Group Ltd is authorized to increase the share capital by an amount not exceeding CHF 1,000,000 by issuing up to 10,000,000 fully paid registered shares with a nominal value of CHF 0.10 each. An increase in partial amounts is permitted. The Board would determine the date of issue of any such new shares, the issue price, type of payment, conditions for exercising pre-emptive rights, and the commencement of entitlement to dividends.
The Board may issue such new shares by means of a firm underwriting by a banking institution or syndicate with a subsequent offer of those shares to current shareholders. The Board may allow the expiry of pre-emptive rights which have not been exercised, or it may place these rights as well as shares, the pre-emptive rights of which have not been exercised, at market conditions.
The Board is further authorized to restrict or withdraw the pre-emptive rights of shareholders and to allocate them to third parties if the shares are to be used for the take-over of an enterprise, or parts of an enterprise or of participations or if issuing shares for the financing including re-financing of such transactions, or for the purpose of expanding the scope of shareholders in connection with the quotation of shares on foreign stock exchanges.
b) Contingent share capitalCapital market instruments and option rights to shareholdersThe share capital of Zurich Insurance Group Ltd may be increased by an amount not exceeding CHF 1,000,000 by the issuance of up to 10,000,000 fully paid registered shares with a nominal value of CHF 0.10 each (i) by exercising conversion and/or option rights which are granted in connection with the issuance of bonds or similar debt instruments by Zurich Insurance Group Ltd or one of its subsidiaries in national or international capital markets; and/or (ii) by exercising option rights which are granted to current shareholders. When issuing bonds or similar debt instruments connected with conversion and/or option rights, the pre-emptive rights of the shareholders will be excluded. The current owners of conversion and/or option rights shall be entitled to subscribe for the new shares. The conversion and/or option conditions are to be determined by the Board.
The Board is authorized, when issuing bonds or similar debt instruments connected with conversion and/or option rights, to restrict or withdraw the right of shareholders for advance subscription in cases where such bonds are issued for the financing or re-financing of a takeover of an enterprise, of parts of an enterprise, or of participations. If the right for advance subscription is withdrawn by the Board, the convertible bond or warrant issues are to be offered at market conditions (including standard dilution protection provisions in accordance with market practice) and the new shares are issued at the then current convertible bond or warrant issue conditions.
The conversion rights are exercisable during a maximum period of ten years and option rights for a maximum period of seven years from the time of the respective issue. The conversion or option price or its calculation methodology shall be determined in accordance with market conditions whereby, for shares of Zurich Insurance Group Ltd, the quoted share price is to be used as a basis.
Q4_2014_12_AR14_104_Consolidated_financial_statements_en.indd 213 23.02.2015 16:37:41
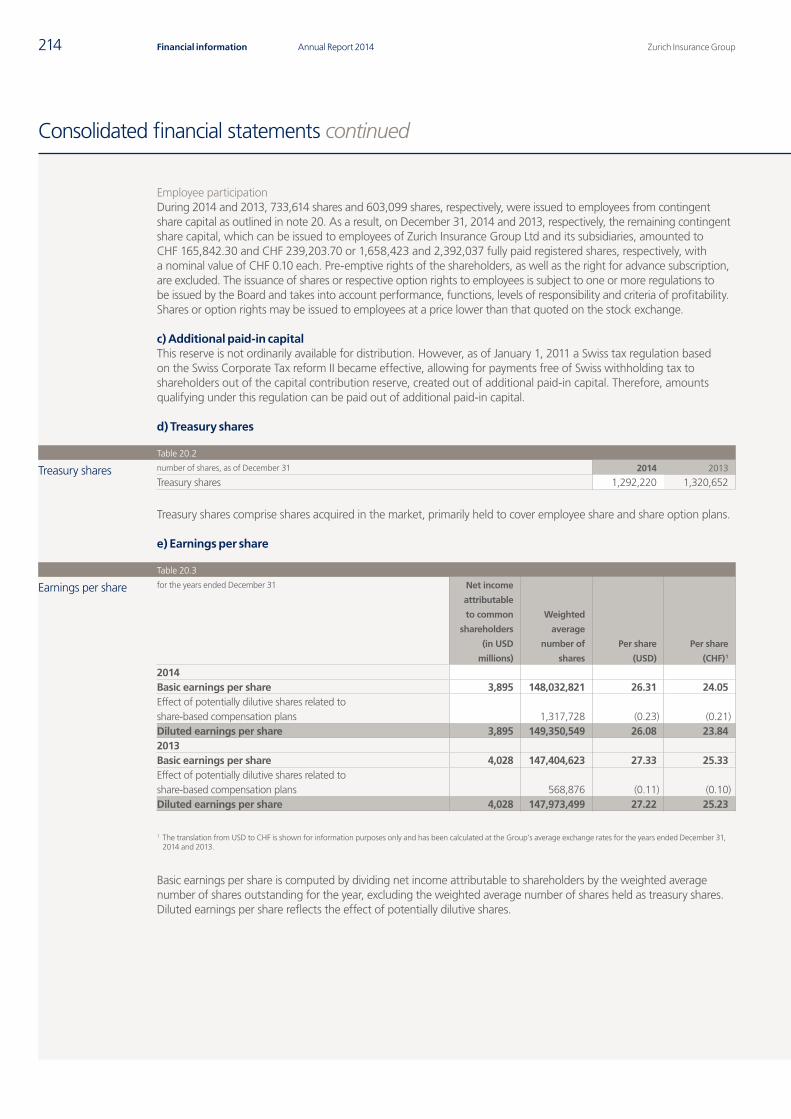
Zurich Insurance GroupAnnual Report 2014214 Financial information
Consolidated financial statements continued
Employee participationDuring 2014 and 2013, 733,614 shares and 603,099 shares, respectively, were issued to employees from contingent share capital as outlined in note 20. As a result, on December 31, 2014 and 2013, respectively, the remaining contingent share capital, which can be issued to employees of Zurich Insurance Group Ltd and its subsidiaries, amounted to CHF 165,842.30 and CHF 239,203.70 or 1,658,423 and 2,392,037 fully paid registered shares, respectively, with a nominal value of CHF 0.10 each. Pre-emptive rights of the shareholders, as well as the right for advance subscription, are excluded. The issuance of shares or respective option rights to employees is subject to one or more regulations to be issued by the Board and takes into account performance, functions, levels of responsibility and criteria of profitability. Shares or option rights may be issued to employees at a price lower than that quoted on the stock exchange.
c) Additional paid-in capitalThis reserve is not ordinarily available for distribution. However, as of January 1, 2011 a Swiss tax regulation based on the Swiss Corporate Tax reform II became effective, allowing for payments free of Swiss withholding tax to shareholders out of the capital contribution reserve, created out of additional paid-in capital. Therefore, amounts qualifying under this regulation can be paid out of additional paid-in capital.
d) Treasury shares
Table 20.2
Treasury shares number of shares, as of December 31 2014 2013
Treasury shares 1,292,220 1,320,652
Treasury shares comprise shares acquired in the market, primarily held to cover employee share and share option plans.
e) Earnings per share
Table 20.3
Earnings per share for the years ended December 31 Net income
attributable
to common
shareholders
(in USD
millions)
Weighted
average
number of
shares
Per share
(USD)
Per share
(CHF) 1
2014Basic earnings per share 3,895 148,032,821 26.31 24.05Effect of potentially dilutive shares related to share-based compensation plans 1,317,728 (0.23) (0.21)Diluted earnings per share 3,895 149,350,549 26.08 23.842013Basic earnings per share 4,028 147,404,623 27.33 25.33Effect of potentially dilutive shares related to share-based compensation plans 568,876 (0.11) (0.10)Diluted earnings per share 4,028 147,973,499 27.22 25.23
1 The translation from USD to CHF is shown for information purposes only and has been calculated at the Group’s average exchange rates for the years ended December 31, 2014 and 2013.
Basic earnings per share is computed by dividing net income attributable to shareholders by the weighted average number of shares outstanding for the year, excluding the weighted average number of shares held as treasury shares. Diluted earnings per share reflects the effect of potentially dilutive shares.
Q4_2014_12_AR14_104_Consolidated_financial_statements_en.indd 214 23.02.2015 16:37:41
Zurich Insurance Group Annual Report 2014 215Consolidated financial statements
Finan
cial inform
ation
21. Employee benefits
The Group had 54,551 and 55,102 employees (full-time equivalents) as of December 31, 2014 and 2013, respectively. Personnel and other related costs incurred for the years ended December 31, 2014 and 2013, were USD 6,241 million and USD 5,937 million, including wages and salaries of USD 5,096 million and USD 4,686 million, respectively.
The Group operates a number of retirement benefit arrangements for employees, with the majority of employees belonging to defined benefit pension plans. Other employees participate in defined contribution plans, which provide benefits equal to the amounts contributed by both the employer and the employee plus investment returns.
Certain of the Group’s operating companies also provide post-employment benefit plans covering medical care and life insurance, mainly in the U.S. Eligibility for these plans is generally based on completion of a specified period of eligible service and reaching a specified age. The plans typically pay a stated percentage of medical expenses subject to deductibles and other factors. The cost of post-employment benefits is accrued during the employees’ service periods.
Governance of the Group’s pension and post-employment benefit plans is the responsibility of the Group Pensions Committee. This committee is responsible for developing, reviewing and advising on the Group governance framework for matters relating to pension and benefit plans, including the relevant policies and processes. The committee provides oversight and guidance over the Group’s principal pension and post-retirement benefit plans for benefit design, funding, investment purposes and accounting. This includes, but is not limited to:
• Oversight of the impact of the Group’s principal defined benefit pension and post retirement benefit plans in terms of cash, expense, and balance sheet accounting impact and capital implications
• Development and maintenance of policies on funding, asset allocation and assumption setting.
The Group Pensions Committee provides a point of focus and co-ordination on the topic of pensions and benefits at Group level for the supervision and exercise of company powers and obligations in relation to pension and benefit plans.
The Group’s policy on funding and asset allocation is subject to local legal and regulatory requirements and tax efficiency.
a) Defined benefit pension plansEmployees of the Group’s companies are covered by various pension plans, the largest of which are in Switzerland, the UK, the U.S. and Germany, which together comprise over 90 percent of the Group’s total defined benefit obligation. The remaining plans in other countries are not individually significant, therefore no separate disclosure is provided.
Certain Group companies provide defined benefit pension plans, some of which provide benefits on retirement, death or disability related to employees’ service periods and pensionable earnings. Others provide cash balance plans where the participants receive the benefit of the accumulated employer and employee contributions (where paid) together with additional cash credits in line with the rules of the plan. Eligibility for participation in the various plans is either immediate on commencement of employment or based on completion of a specified period of continuous service.
Most of the Group’s defined benefit pension plans are funded through contributions by the Group and, in some cases also by employees, to investment vehicles managed by trusts or foundations independent of the Group’s finances, or by management committees with fiduciary responsibilities. Where a trust or foundation exists, it is required by law or by articles of association to act in the interests of the fund and of all relevant beneficiaries to the plan, which can also include the sponsoring company, and is responsible for the investment policy with regard to the assets of the fund. The trust/foundation board or committee is usually composed of representatives from both employers and plan members. In these cases, the annual funding requirements are determined in accordance with the Group’s overall funding policy and local regulation. Independent actuarial valuations for the plans are performed as required. It is the Group’s general principle to ensure that the plans are appropriately funded in accordance with local pension regulations in each country.
The pension plans typically expose the company to risks such as interest rate, price inflation, longevity and salary risks. To the extent the pension plans are funded, the assets held mitigate some of the liability risk but introduce investment risk.
Q4_2014_12_AR14_104_Consolidated_financial_statements_en.indd 215 23.02.2015 16:37:42
Zurich Insurance GroupAnnual Report 2014216 Financial information
Consolidated financial statements continued
The overall investment policy and strategy for the Group’s defined benefit pension plans is to achieve an investment return which, together with contributions, targets having sufficient assets to pay pension benefits as they fall due while also mitigating the various risks of the plans. The actual asset allocation is determined by reference to current and expected economic and market conditions and in consideration of specific asset class risk in the risk profile. The Group has a governance framework to ensure the trust/foundation board or committee considers how the asset investment strategy correlates with the maturity profile of the plan liabilities and the potential impact on the funding status of the plans, including short-term liquidity requirements. The investment strategies for each pension plan are independently determined by the governance body in each country, with oversight by the Group Pensions Committee. The pension assets are invested in diversified portfolios across geographical regions and asset classes to ensure diversified returns, also taking into account local pension laws. The investment strategies aim to mitigate asset-liability mismatches in the long run.
For post-employment defined benefit plans, total contributions to funded plans and benefits paid directly by the Group were USD 572 million for 2014 compared with USD 491 million for 2013. The estimated total for 2015 is USD 540 million (actual amount may differ).
Swiss pension plansThe Group has two major pension plans in Switzerland both of which provide benefits that exceed the minimum benefit requirements under Swiss pension law. The plans provide a lifetime pension to members at the normal retirement age of 65 (age 62 for Executive Staff). Participants can draw retirement benefits early from age 60 (age 58 for Executive Staff). Alternatively, the benefit can be taken as a lump sum payment at retirement. Contributions to the plan are paid by the employees and the employer, both for retirement savings and to finance risk benefits paid out in the event of death and disability. The accumulated balance on the pension account is based on the employee and employer pension contributions and interest accrued. The interest rate credited is defined annually by the plans’ Board of Trustees which is responsible for the governance of the plans. The amount of pension payable on retirement is a result of the conversion rate applied on the accumulated balance of the individual participant’s pension account at the retirement date. Although the Swiss plans operate like defined contribution plans under local regulations, they are accounted for as defined benefit pension plans under IAS 19 “Employee Benefits”, because of the need to accrue interest on the pension accounts and the payment of a lifetime pension at a fixed conversion rate under the plan rules.
Actuarial valuations are completed regularly and if the plans become underfunded under local regulations, options for dealing with this include the Group paying additional contributions into the plan and/or reducing future benefits. At present, the plans are sufficiently funded, meaning that no additional contributions into the plans are expected to be required in the next year. The investment strategy of the Swiss plans is constrained by Swiss pension law including regulations relating to diversification of plan assets. Under IAS 19, volatility arises in the Swiss pension plan net liability because the fair value of the plan assets is not directly correlated to movements in the value of the plan’s defined benefit obligation in the short-term.
Effective January 1, 2014, following plan amendments, the fixed annuity conversion rates have been revised downwards to reflect the migration of the plans’ technical basis to a revised interest rate expectation and new mortality tables resulting in a one-off curtailment gain of USD 130 million which has been reflected as a reduction in expenses. This amendment results in a lower defined benefit obligation and therefore future service costs will be affected. This change will be phased in over a period of four years. It is also intended that the plans will be combined into a single legal entity in order to reduce complexity.
UK pension planThe major UK pension plan is a final salary plan and accrued benefits increase in line with salary increases. Normal retirement age for the plan is 60. The plan is split into distinct sections and the two defined benefit sections are closed to new entrants, who instead can participate in a defined contribution section within the same trust. The notes that follow consider only the defined benefit sections. There is a UK Pension Trustee Board, which is responsible for the governance of the plan. The employer contributions are determined based on regular triennial actuarial valuations which are conducted using assumptions agreed by the Trustee Board and the sponsoring company. A valuation was carried out during 2013 and the results were finalized on August 28, 2014. The local statutory valuation revealed a funding deficit and an asset backed funding arrangement was agreed with the Trustee Board.
Q4_2014_12_AR14_104_Consolidated_financial_statements_en.indd 216 23.02.2015 16:37:42
Zurich Insurance Group Annual Report 2014 217Consolidated financial statements
Finan
cial inform
ation
The ongoing funding of the plan is closely monitored by the Trustee Board and a dedicated funding committee is made up of representatives from the Trustee Board and the Group. The plan rules and UK pension legislation set out maximum levels of inflationary increases applied to plan benefits. The plan assets are invested in diversified classes of assets and a portion are invested in inflation-linked debt securities, to provide a partial hedge against inflation. The Trustees have also implemented an interest rate swap contract which will provide partial protection against volatility in interest rates.
U.S. pension plansThere are two major pension plans in the U.S., the Zurich North America (ZNA) plan and the Farmers Group, Inc. (FGI) pension plan. These are both cash balance pension plans funded entirely by the participating employers. The ZNA plan is entirely cash balance and the FGI pension plan provides benefits on a cash balance pension formula for benefits accruing after January 1, 2009, except with respect to certain grandfathered participants. A final average pay defined benefit formula applied for benefits accrued before 2009, and for the grandfathered participants. For both cash balance plans, an amount is credited to the cash balance plan each quarter, determined by an employee’s age, service and their level of earnings up to and above the social security taxable wage base. The minimum annual interest earned on the account balance is 5 percent. The retirement account is available from age 65, or age 55 with five years’ service. The benefit can be taken as a monthly annuity or as a lump sum. Both the ZNA plan and the FGI pension plan have fiduciaries as required under local pension laws. The fiduciaries are responsible for the governance of the plans. Actuarial valuations are completed regularly and the Group has historically elected to make contributions to the plans to maintain a funding ratio of at least 90 percent as valued under local pension regulations. The annual employer contributions are equal to the present value of benefits accrued each year, plus a rolling amortization of any prior underfunding.
German pension plansThere are a number of legacy defined benefit plans in Germany, most of which were set up under works council agreements. In 2007, a contractual trust arrangement was set up to support all pension commitments of the employing companies in Germany. From this time, new contributions to the contractual trust arrangement relate to the pension payment refund of the employer companies. A separate arrangement was also established in 2010 to provide for retirement obligations that were in payment at that time. Consideration is given from time to time based on the fiscal efficiency of adding recent retirees to this arrangement and to adding assets to the contractual trust. There is currently no formal plan to pay any further contributions to the contractual trust arrangement or to transfer recent retirees. These defined benefit plans provide benefits on either a final salary, career average salary or a cash balance basis. These plans are now closed to new entrants, who instead participate in a new cash balance arrangement, which has the characteristics of a defined contribution arrangement with a capital guarantee on members’ balances, which mirrors the capital guarantee given in a conventional life insurance arrangement in Germany.
Tables 21.1a and 21.1b set out the reconciliation of the defined benefit obligation and plan assets for the Group’s post-employment defined benefit plans.
Q4_2014_12_AR14_104_Consolidated_financial_statements_en.indd 217 23.02.2015 16:37:42
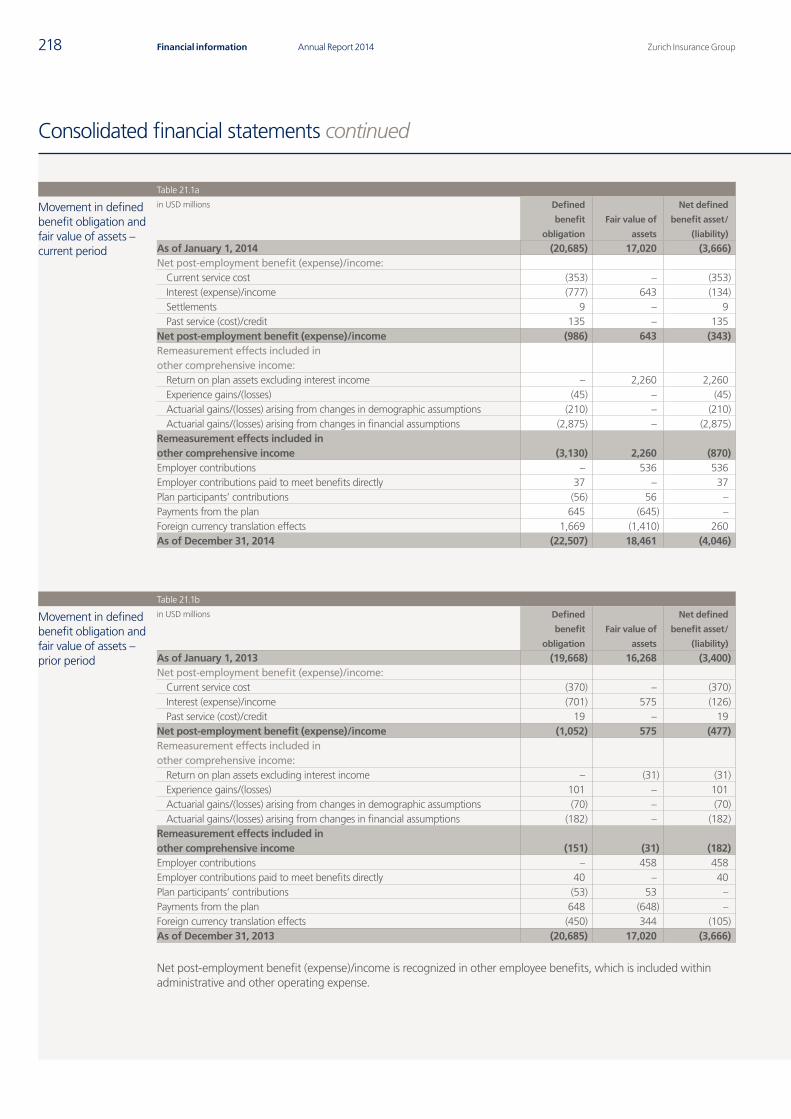
Zurich Insurance GroupAnnual Report 2014218 Financial information
Consolidated financial statements continued
Table 21.1a
Movement in defined benefit obligation and fair value of assets – current period
in USD millions Defined
benefit
obligation
Fair value of
assets
Net defined
benefit asset/
(liability)
As of January 1, 2014 (20,685) 17,020 (3,666)Net post-employment benefit (expense)/income:
Current service cost (353) – (353)Interest (expense)/income (777) 643 (134)Settlements 9 – 9Past service (cost)/credit 135 – 135
Net post-employment benefit (expense)/income (986) 643 (343)Remeasurement effects included in other comprehensive income:
Return on plan assets excluding interest income – 2,260 2,260Experience gains/(losses) (45) – (45)Actuarial gains/(losses) arising from changes in demographic assumptions (210) – (210)Actuarial gains/(losses) arising from changes in financial assumptions (2,875) – (2,875)
Remeasurement effects included in other comprehensive income (3,130) 2,260 (870)Employer contributions – 536 536Employer contributions paid to meet benefits directly 37 – 37Plan participants’ contributions (56) 56 –Payments from the plan 645 (645) –Foreign currency translation effects 1,669 (1,410) 260As of December 31, 2014 (22,507) 18,461 (4,046)
Table 21.1b
Movement in defined benefit obligation and fair value of assets – prior period
in USD millions Defined
benefit
obligation
Fair value of
assets
Net defined
benefit asset/
(liability)
As of January 1, 2013 (19,668) 16,268 (3,400)Net post-employment benefit (expense)/income:
Current service cost (370) – (370)Interest (expense)/income (701) 575 (126)Past service (cost)/credit 19 – 19
Net post-employment benefit (expense)/income (1,052) 575 (477)Remeasurement effects included in other comprehensive income:
Return on plan assets excluding interest income – (31) (31)Experience gains/(losses) 101 – 101Actuarial gains/(losses) arising from changes in demographic assumptions (70) – (70)Actuarial gains/(losses) arising from changes in financial assumptions (182) – (182)
Remeasurement effects included in other comprehensive income (151) (31) (182)Employer contributions – 458 458Employer contributions paid to meet benefits directly 40 – 40Plan participants’ contributions (53) 53 –Payments from the plan 648 (648) –Foreign currency translation effects (450) 344 (105)As of December 31, 2013 (20,685) 17,020 (3,666)
Net post-employment benefit (expense)/income is recognized in other employee benefits, which is included within administrative and other operating expense.
Q4_2014_12_AR14_104_Consolidated_financial_statements_en.indd 218 23.02.2015 16:37:42
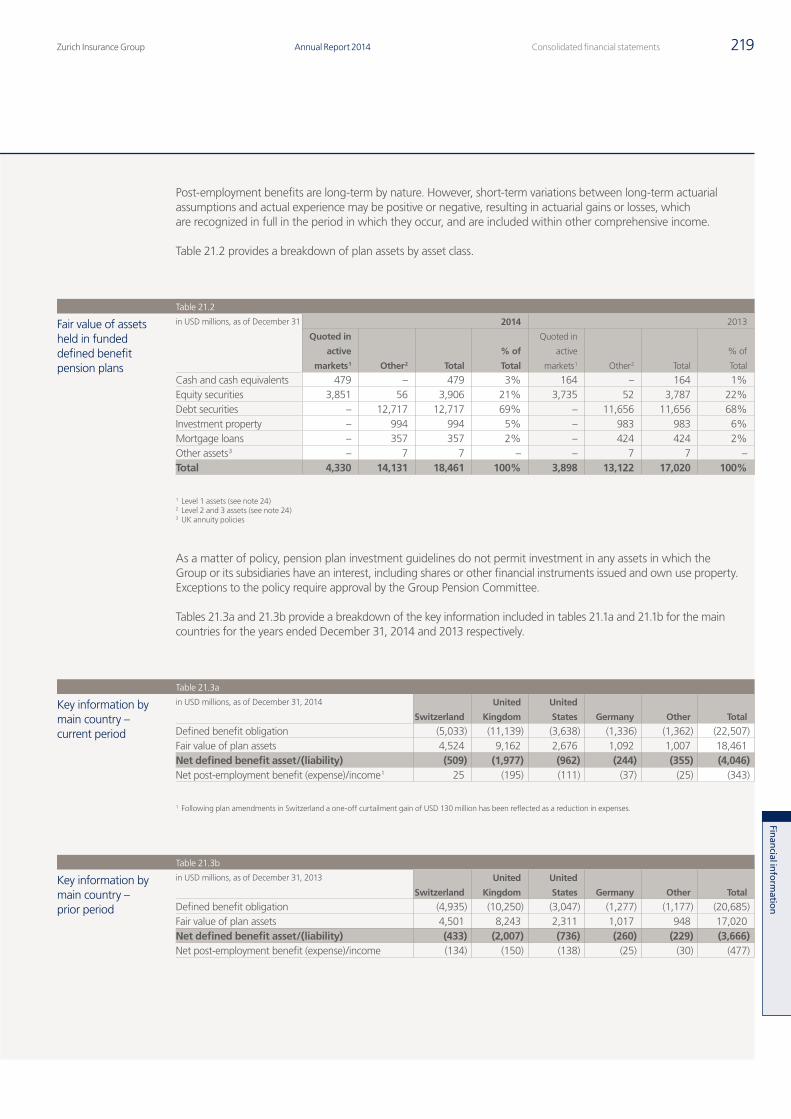
Zurich Insurance Group Annual Report 2014 219Consolidated financial statements
Finan
cial inform
ation
Post-employment benefits are long-term by nature. However, short-term variations between long-term actuarial assumptions and actual experience may be positive or negative, resulting in actuarial gains or losses, which are recognized in full in the period in which they occur, and are included within other comprehensive income.
Table 21.2 provides a breakdown of plan assets by asset class.
Table 21.2
Fair value of assets held in funded defined benefit pension plans
in USD millions, as of December 31 2014 2013
Quoted in
active
markets 1 Other 2 Total
% of
Total
Quoted in
active
markets 1 Other 2 Total
% of
Total
Cash and cash equivalents 479 – 479 3% 164 – 164 1%Equity securities 3,851 56 3,906 21% 3,735 52 3,787 22%Debt securities – 12,717 12,717 69% – 11,656 11,656 68%Investment property – 994 994 5% – 983 983 6%Mortgage loans – 357 357 2% – 424 424 2%Other assets 3 – 7 7 – – 7 7 –Total 4,330 14,131 18,461 100% 3,898 13,122 17,020 100%
1 Level 1 assets (see note 24)2 Level 2 and 3 assets (see note 24)3 UK annuity policies
As a matter of policy, pension plan investment guidelines do not permit investment in any assets in which the Group or its subsidiaries have an interest, including shares or other financial instruments issued and own use property. Exceptions to the policy require approval by the Group Pension Committee.
Tables 21.3a and 21.3b provide a breakdown of the key information included in tables 21.1a and 21.1b for the main countries for the years ended December 31, 2014 and 2013 respectively.
Table 21.3a
Key information by main country – current period
in USD millions, as of December 31, 2014
Switzerland
United
Kingdom
United
States Germany Other Total
Defined benefit obligation (5,033) (11,139) (3,638) (1,336) (1,362) (22,507)Fair value of plan assets 4,524 9,162 2,676 1,092 1,007 18,461Net defined benefit asset/(liability) (509) (1,977) (962) (244) (355) (4,046)Net post-employment benefit (expense)/income 1 25 (195) (111) (37) (25) (343)
1 Following plan amendments in Switzerland a one-off curtailment gain of USD 130 million has been reflected as a reduction in expenses.
Table 21.3b
Key information by main country – prior period
in USD millions, as of December 31, 2013
Switzerland
United
Kingdom
United
States Germany Other Total
Defined benefit obligation (4,935) (10,250) (3,047) (1,277) (1,177) (20,685)Fair value of plan assets 4,501 8,243 2,311 1,017 948 17,020Net defined benefit asset/(liability) (433) (2,007) (736) (260) (229) (3,666)Net post-employment benefit (expense)/income (134) (150) (138) (25) (30) (477)
Q4_2014_12_AR14_104_Consolidated_financial_statements_en.indd 219 23.02.2015 16:37:43
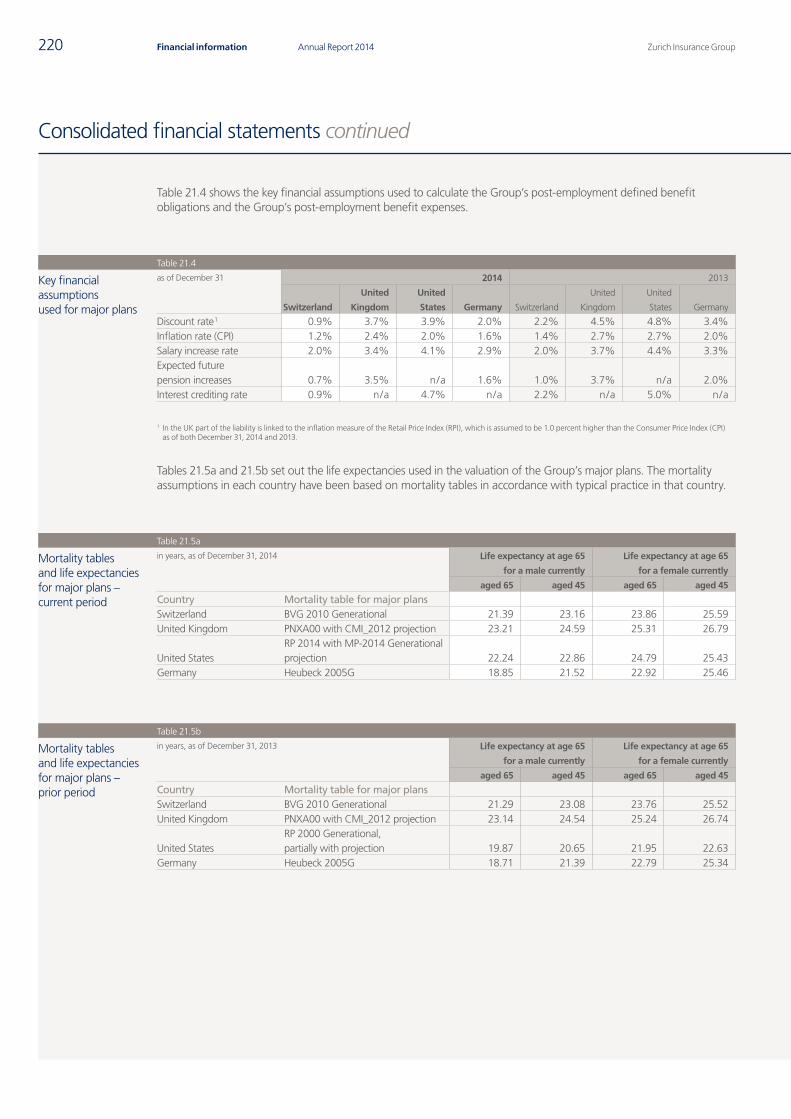
Zurich Insurance GroupAnnual Report 2014220 Financial information
Consolidated financial statements continued
Table 21.4 shows the key financial assumptions used to calculate the Group’s post-employment defined benefit obligations and the Group’s post-employment benefit expenses.
Table 21.4
Key financial assumptions used for major plans
as of December 31 2014 2013
Switzerland
United
Kingdom
United
States Germany Switzerland
United
Kingdom
United
States Germany
Discount rate 1 0.9% 3.7% 3.9% 2.0% 2.2% 4.5% 4.8% 3.4%Inflation rate (CPI) 1.2% 2.4% 2.0% 1.6% 1.4% 2.7% 2.7% 2.0%Salary increase rate 2.0% 3.4% 4.1% 2.9% 2.0% 3.7% 4.4% 3.3%Expected future pension increases 0.7% 3.5% n / a 1.6% 1.0% 3.7% n / a 2.0%Interest crediting rate 0.9% n / a 4.7% n / a 2.2% n / a 5.0% n / a
1 In the UK part of the liability is linked to the inflation measure of the Retail Price Index (RPI), which is assumed to be 1.0 percent higher than the Consumer Price Index (CPI) as of both December 31, 2014 and 2013.
Tables 21.5a and 21.5b set out the life expectancies used in the valuation of the Group’s major plans. The mortality assumptions in each country have been based on mortality tables in accordance with typical practice in that country.
Table 21.5a
Mortality tables and life expectancies for major plans – current period
in years, as of December 31, 2014 Life expectancy at age 65
for a male currently
Life expectancy at age 65
for a female currently
aged 65 aged 45 aged 65 aged 45
Country Mortality table for major plansSwitzerland BVG 2010 Generational 21.39 23.16 23.86 25.59 United Kingdom PNXA00 with CMI_2012 projection 23.21 24.59 25.31 26.79
United StatesRP 2014 with MP-2014 Generational projection 22.24 22.86 24.79 25.43
Germany Heubeck 2005G 18.85 21.52 22.92 25.46
Table 21.5b
Mortality tables and life expectancies for major plans – prior period
in years, as of December 31, 2013 Life expectancy at age 65
for a male currently
Life expectancy at age 65
for a female currently
aged 65 aged 45 aged 65 aged 45
Country Mortality table for major plansSwitzerland BVG 2010 Generational 21.29 23.08 23.76 25.52 United Kingdom PNXA00 with CMI_2012 projection 23.14 24.54 25.24 26.74
United StatesRP 2000 Generational, partially with projection 19.87 20.65 21.95 22.63
Germany Heubeck 2005G 18.71 21.39 22.79 25.34
Q4_2014_12_AR14_104_Consolidated_financial_statements_en.indd 220 23.02.2015 16:37:43
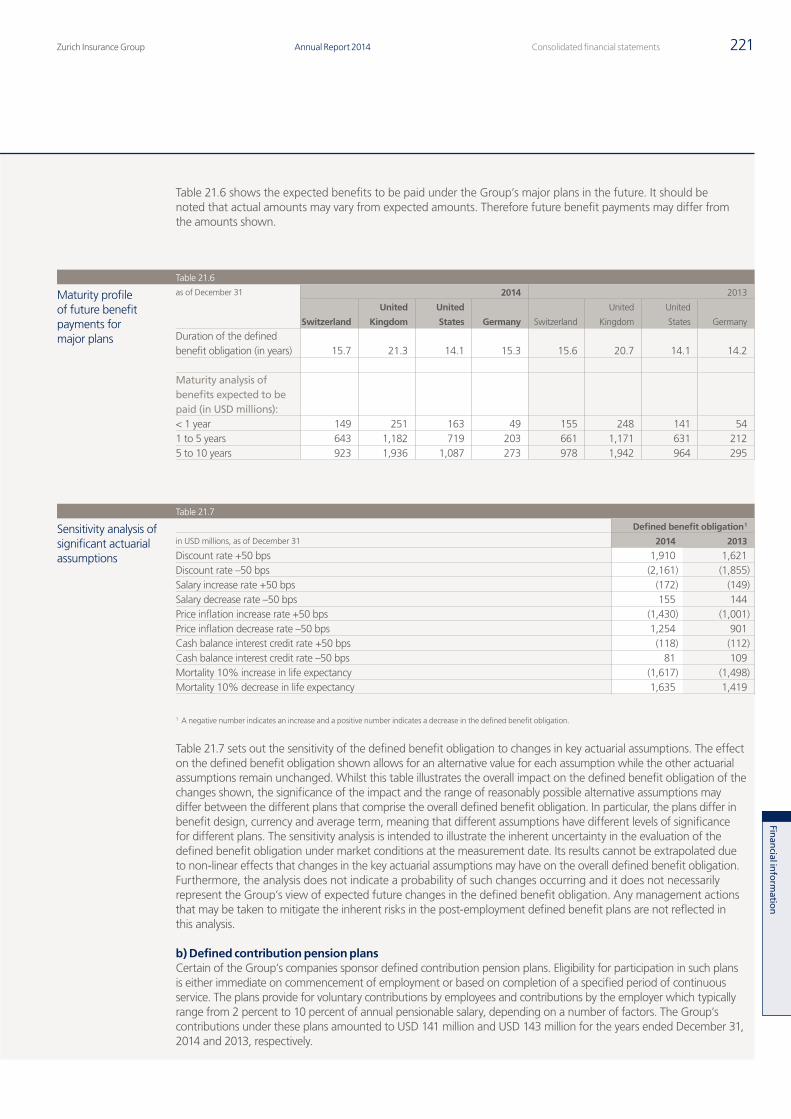
Zurich Insurance Group Annual Report 2014 221Consolidated financial statements
Finan
cial inform
ation
Table 21.6 shows the expected benefits to be paid under the Group’s major plans in the future. It should be noted that actual amounts may vary from expected amounts. Therefore future benefit payments may differ from the amounts shown.
Table 21.6
Maturity profile of future benefit payments for major plans
as of December 31 2014 2013
Switzerland
United
Kingdom
United
States Germany Switzerland
United
Kingdom
United
States Germany
Duration of the defined benefit obligation (in years) 15.7 21.3 14.1 15.3 15.6 20.7 14.1 14.2
Maturity analysis of benefits expected to be paid (in USD millions):< 1 year 149 251 163 49 155 248 141 54 1 to 5 years 643 1,182 719 203 661 1,171 631 212 5 to 10 years 923 1,936 1,087 273 978 1,942 964 295
Table 21.7
Sensitivity analysis of significant actuarial assumptions
Defined benefit obligation 1
in USD millions, as of December 31 2014 2013
Discount rate +50 bps 1,910 1,621 Discount rate –50 bps (2,161) (1,855)Salary increase rate +50 bps (172) (149)Salary decrease rate –50 bps 155 144 Price inflation increase rate +50 bps (1,430) (1,001)Price inflation decrease rate –50 bps 1,254 901 Cash balance interest credit rate +50 bps (118) (112)Cash balance interest credit rate –50 bps 81 109 Mortality 10% increase in life expectancy (1,617) (1,498)Mortality 10% decrease in life expectancy 1,635 1,419
1 A negative number indicates an increase and a positive number indicates a decrease in the defined benefit obligation.
Table 21.7 sets out the sensitivity of the defined benefit obligation to changes in key actuarial assumptions. The effect on the defined benefit obligation shown allows for an alternative value for each assumption while the other actuarial assumptions remain unchanged. Whilst this table illustrates the overall impact on the defined benefit obligation of the changes shown, the significance of the impact and the range of reasonably possible alternative assumptions may differ between the different plans that comprise the overall defined benefit obligation. In particular, the plans differ in benefit design, currency and average term, meaning that different assumptions have different levels of significance for different plans. The sensitivity analysis is intended to illustrate the inherent uncertainty in the evaluation of the defined benefit obligation under market conditions at the measurement date. Its results cannot be extrapolated due to non-linear effects that changes in the key actuarial assumptions may have on the overall defined benefit obligation. Furthermore, the analysis does not indicate a probability of such changes occurring and it does not necessarily represent the Group’s view of expected future changes in the defined benefit obligation. Any management actions that may be taken to mitigate the inherent risks in the post-employment defined benefit plans are not reflected in this analysis.
b) Defined contribution pension plansCertain of the Group’s companies sponsor defined contribution pension plans. Eligibility for participation in such plans is either immediate on commencement of employment or based on completion of a specified period of continuous service. The plans provide for voluntary contributions by employees and contributions by the employer which typically range from 2 percent to 10 percent of annual pensionable salary, depending on a number of factors. The Group’s contributions under these plans amounted to USD 141 million and USD 143 million for the years ended December 31, 2014 and 2013, respectively.
Q4_2014_12_AR14_104_Consolidated_financial_statements_en.indd 221 23.02.2015 16:37:44
Zurich Insurance GroupAnnual Report 2014222 Financial information
Consolidated financial statements continued
22. Share-based compensation and cash incentive plans
The Group has adopted various share-based compensation and cash incentive plans to attract, retain and motivate executives and employees. The plans are designed to reward employees for their contribution to the performance of the Group and to encourage employee share ownership. Share-based compensation plans include plans under which shares and options to purchase shares, based on the performance of the businesses, are awarded. Share-based compensation plans are based on the provision of the Zurich Insurance Group Ltd shares.
a) Cash incentive plansVarious businesses throughout the Group operate short-term incentive programs for executives, management and, in some cases, for employees of that business. Awards are made in cash, based on the accomplishment of both organizational and individual performance objectives. The expense recognized for these cash incentive plans amounted to USD 525 million and USD 472 million for the years ended December 31, 2014 and 2013, respectively.
b) Share-based compensation plans for employees and executivesThe Group encourages employees to own shares in Zurich Insurance Group Ltd and has set up a framework based on the implementation of performance share programs. Actual plans are tailored to meet local market requirements.
Expenses for share-based payments depend on various factors, including achievement of targets, and are subject to the discretion of the Remuneration Committee. The expenses may therefore vary significantly from year to year. The net amount of USD 202 million and USD 50 million for the years ended December 31, 2014 and 2013, respectively, reflects all aspects of share-based compensation, including adjustments made during the year.
The explanations below provide a more detailed overview of the main plans of the Group.
Employee share plansShare Incentive Plan for employees in the UKThe Group established an Inland Revenue approved Share Incentive Plan and launched the Partnership Shares element of this plan in 2003, which enabled participating employees to make monthly purchases of Zurich Insurance Group Ltd shares at the prevailing market price out of their gross earnings. This plan was terminated in 2007. There were 112 and 138 participants in the plan as of December 31, 2014 and 2013, respectively.
The Partnership Share Scheme was launched in March 2013. Participants benefit from making deductions from their gross salary up to a maximum of GBP 1,500 or 10 percent of their year to date earnings. There were 905 and 782 active participants in the plan as of December 31, 2014 and 2013, respectively.
The Group also operates the profit-sharing element of the Share Incentive Plan (Reward Shares) which was launched in 2004 with annual share allocations being made in May each year subject to business performance. The awards are based on the business operating profit (BOP) after tax for the year, for the business unit of each participating employee. Individual awards are subject to a maximum of 5 percent of a participant’s base salary (before any flexible benefit adjustments) with an overall maximum of GBP 3,000. The total number of participating employees in the Reward Share element of the plan as of December 31, 2014 and 2013 was 5,463 and 5,201, respectively.
Share Incentive Plan for employees in SwitzerlandUnder this plan, employees have the option to acquire sales-restricted shares at a 30 percent discount to the market value. The maximum permitted investment in shares is equivalent to CHF 3,500 per employee per annum. During 2014, 4,764 employees were eligible to participate in the share incentive plan, compared with 4,533 in 2013. For the years ended December 31, 2014 and 2013, 1,574 and 1,506 employees, respectively, purchased shares under the 2013 and 2012 share plans.
The Group Long-Term Incentive Plan (LTIP)Participants in this plan are allocated a target number of performance shares as notional shares of Zurich Insurance Group Ltd in April each year (Target Shares). The number of Target Shares is calculated as a percentage of the annual base salary.
Q4_2014_12_AR14_104_Consolidated_financial_statements_en.indd 222 23.02.2015 16:37:44
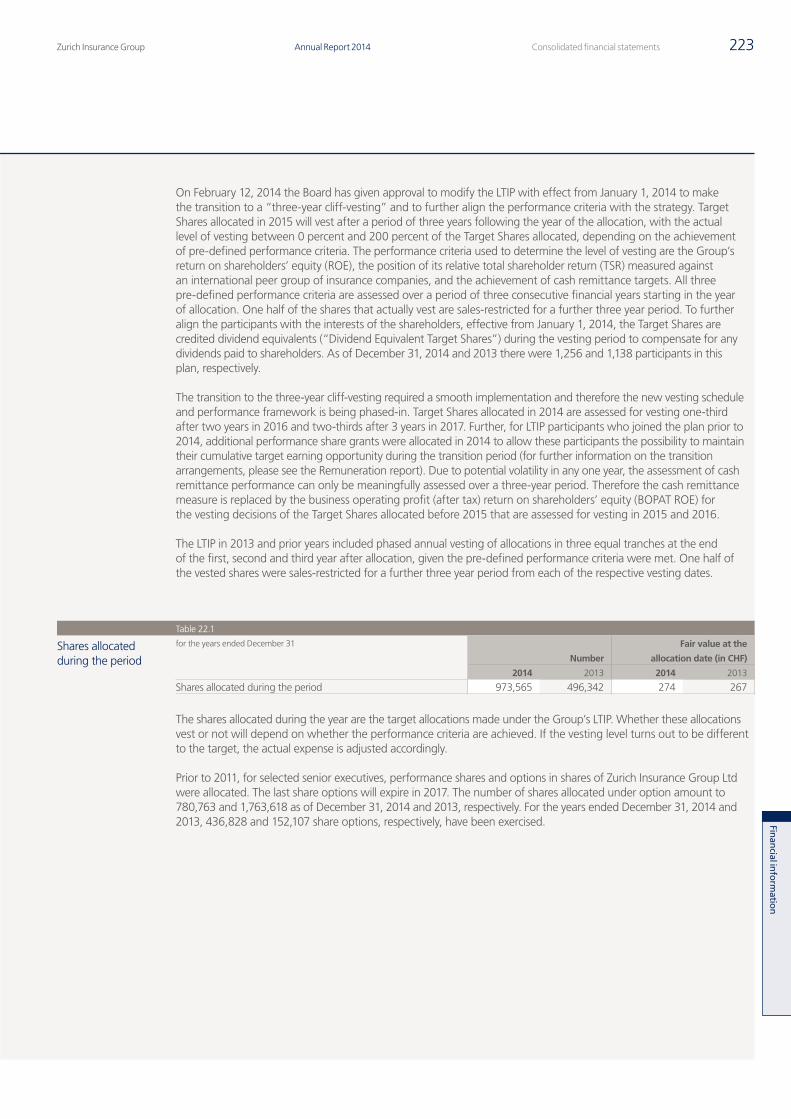
Zurich Insurance Group Annual Report 2014 223Consolidated financial statements
Finan
cial inform
ation
On February 12, 2014 the Board has given approval to modify the LTIP with effect from January 1, 2014 to make the transition to a “three-year cliff-vesting” and to further align the performance criteria with the strategy. Target Shares allocated in 2015 will vest after a period of three years following the year of the allocation, with the actual level of vesting between 0 percent and 200 percent of the Target Shares allocated, depending on the achievement of pre-defined performance criteria. The performance criteria used to determine the level of vesting are the Group’s return on shareholders’ equity (ROE), the position of its relative total shareholder return (TSR) measured against an international peer group of insurance companies, and the achievement of cash remittance targets. All three pre-defined performance criteria are assessed over a period of three consecutive financial years starting in the year of allocation. One half of the shares that actually vest are sales-restricted for a further three year period. To further align the participants with the interests of the shareholders, effective from January 1, 2014, the Target Shares are credited dividend equivalents (“Dividend Equivalent Target Shares”) during the vesting period to compensate for any dividends paid to shareholders. As of December 31, 2014 and 2013 there were 1,256 and 1,138 participants in this plan, respectively.
The transition to the three-year cliff-vesting required a smooth implementation and therefore the new vesting schedule and performance framework is being phased-in. Target Shares allocated in 2014 are assessed for vesting one-third after two years in 2016 and two-thirds after 3 years in 2017. Further, for LTIP participants who joined the plan prior to 2014, additional performance share grants were allocated in 2014 to allow these participants the possibility to maintain their cumulative target earning opportunity during the transition period (for further information on the transition arrangements, please see the Remuneration report). Due to potential volatility in any one year, the assessment of cash remittance performance can only be meaningfully assessed over a three-year period. Therefore the cash remittance measure is replaced by the business operating profit (after tax) return on shareholders’ equity (BOPAT ROE) for the vesting decisions of the Target Shares allocated before 2015 that are assessed for vesting in 2015 and 2016.
The LTIP in 2013 and prior years included phased annual vesting of allocations in three equal tranches at the end of the first, second and third year after allocation, given the pre-defined performance criteria were met. One half of the vested shares were sales-restricted for a further three year period from each of the respective vesting dates.
Table 22.1
Shares allocated during the period
for the years ended December 31
Number
Fair value at the
allocation date (in CHF)
2014 2013 2014 2013
Shares allocated during the period 973,565 496,342 274 267
The shares allocated during the year are the target allocations made under the Group’s LTIP. Whether these allocations vest or not will depend on whether the performance criteria are achieved. If the vesting level turns out to be different to the target, the actual expense is adjusted accordingly.
Prior to 2011, for selected senior executives, performance shares and options in shares of Zurich Insurance Group Ltd were allocated. The last share options will expire in 2017. The number of shares allocated under option amount to 780,763 and 1,763,618 as of December 31, 2014 and 2013, respectively. For the years ended December 31, 2014 and 2013, 436,828 and 152,107 share options, respectively, have been exercised.
Q4_2014_12_AR14_104_Consolidated_financial_statements_en.indd 223 23.02.2015 16:37:44
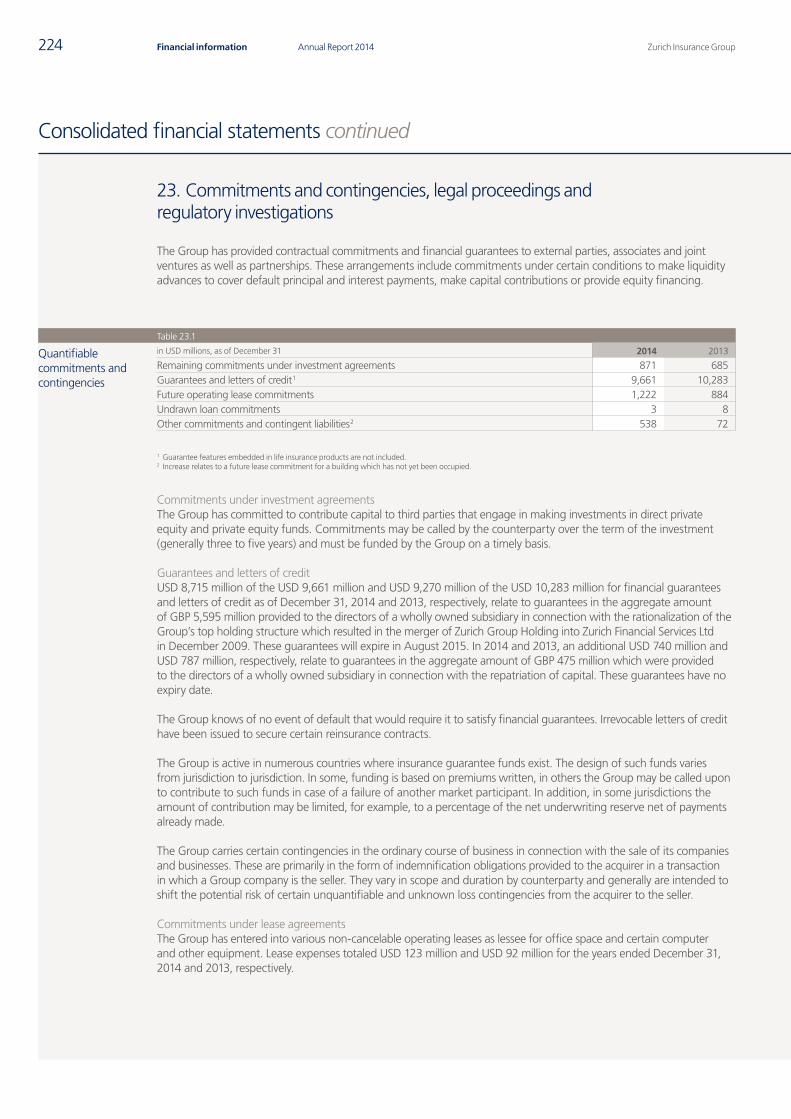
Zurich Insurance GroupAnnual Report 2014224 Financial information
Consolidated financial statements continued
23. Commitments and contingencies, legal proceedings and regulatory investigations
The Group has provided contractual commitments and financial guarantees to external parties, associates and joint ventures as well as partnerships. These arrangements include commitments under certain conditions to make liquidity advances to cover default principal and interest payments, make capital contributions or provide equity financing.
Table 23.1
Quantifiable commitments and contingencies
in USD millions, as of December 31 2014 2013
Remaining commitments under investment agreements 871 685Guarantees and letters of credit 1 9,661 10,283Future operating lease commitments 1,222 884Undrawn loan commitments 3 8Other commitments and contingent liabilities 2 538 72
1 Guarantee features embedded in life insurance products are not included.2 Increase relates to a future lease commitment for a building which has not yet been occupied.
Commitments under investment agreementsThe Group has committed to contribute capital to third parties that engage in making investments in direct private equity and private equity funds. Commitments may be called by the counterparty over the term of the investment (generally three to five years) and must be funded by the Group on a timely basis.
Guarantees and letters of creditUSD 8,715 million of the USD 9,661 million and USD 9,270 million of the USD 10,283 million for financial guarantees and letters of credit as of December 31, 2014 and 2013, respectively, relate to guarantees in the aggregate amount of GBP 5,595 million provided to the directors of a wholly owned subsidiary in connection with the rationalization of the Group’s top holding structure which resulted in the merger of Zurich Group Holding into Zurich Financial Services Ltd in December 2009. These guarantees will expire in August 2015. In 2014 and 2013, an additional USD 740 million and USD 787 million, respectively, relate to guarantees in the aggregate amount of GBP 475 million which were provided to the directors of a wholly owned subsidiary in connection with the repatriation of capital. These guarantees have no expiry date.
The Group knows of no event of default that would require it to satisfy financial guarantees. Irrevocable letters of credit have been issued to secure certain reinsurance contracts.
The Group is active in numerous countries where insurance guarantee funds exist. The design of such funds varies from jurisdiction to jurisdiction. In some, funding is based on premiums written, in others the Group may be called upon to contribute to such funds in case of a failure of another market participant. In addition, in some jurisdictions the amount of contribution may be limited, for example, to a percentage of the net underwriting reserve net of payments already made.
The Group carries certain contingencies in the ordinary course of business in connection with the sale of its companies and businesses. These are primarily in the form of indemnification obligations provided to the acquirer in a transaction in which a Group company is the seller. They vary in scope and duration by counterparty and generally are intended to shift the potential risk of certain unquantifiable and unknown loss contingencies from the acquirer to the seller.
Commitments under lease agreementsThe Group has entered into various non-cancelable operating leases as lessee for office space and certain computer and other equipment. Lease expenses totaled USD 123 million and USD 92 million for the years ended December 31, 2014 and 2013, respectively.
Q4_2014_12_AR14_104_Consolidated_financial_statements_en.indd 224 23.02.2015 16:37:45
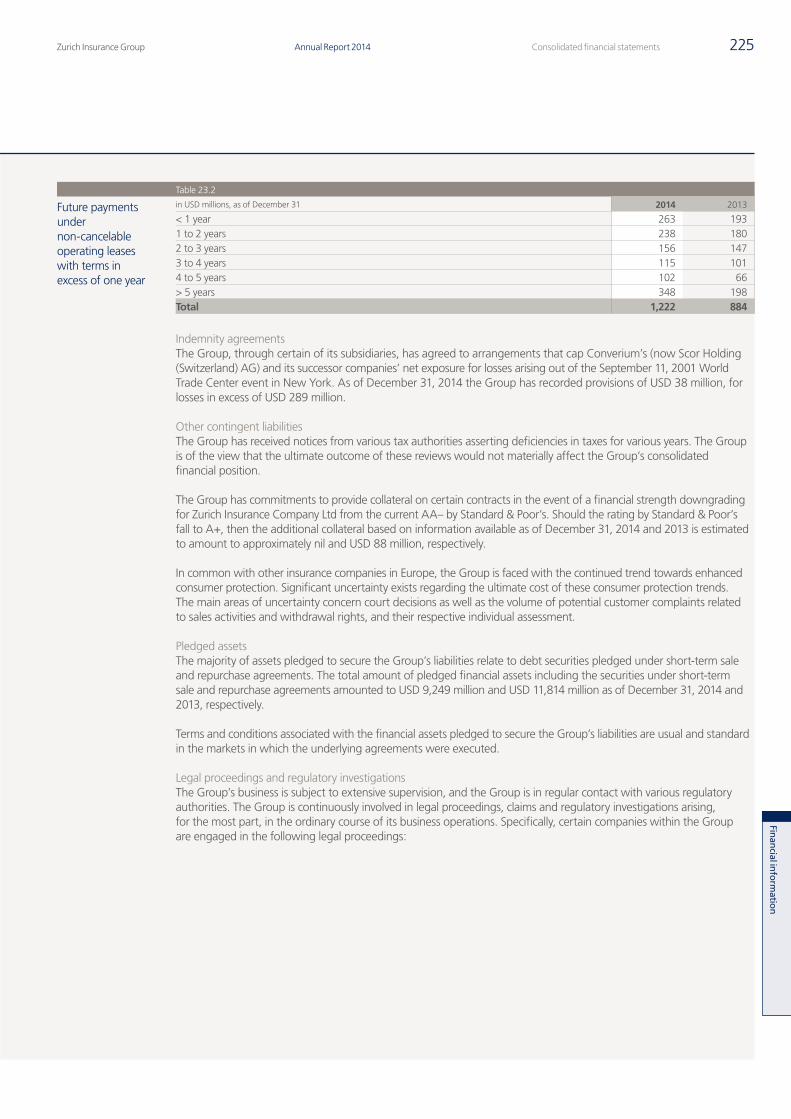
Zurich Insurance Group Annual Report 2014 225Consolidated financial statements
Finan
cial inform
ation
Table 23.2
Future payments under non-cancelable operating leases with terms in excess of one year
in USD millions, as of December 31 2014 2013
< 1 year 263 1931 to 2 years 238 1802 to 3 years 156 1473 to 4 years 115 1014 to 5 years 102 66> 5 years 348 198Total 1,222 884
Indemnity agreementsThe Group, through certain of its subsidiaries, has agreed to arrangements that cap Converium’s (now Scor Holding (Switzerland) AG) and its successor companies’ net exposure for losses arising out of the September 11, 2001 World Trade Center event in New York. As of December 31, 2014 the Group has recorded provisions of USD 38 million, for losses in excess of USD 289 million.
Other contingent liabilitiesThe Group has received notices from various tax authorities asserting deficiencies in taxes for various years. The Group is of the view that the ultimate outcome of these reviews would not materially affect the Group’s consolidated financial position.
The Group has commitments to provide collateral on certain contracts in the event of a financial strength downgrading for Zurich Insurance Company Ltd from the current AA– by Standard & Poor’s. Should the rating by Standard & Poor’s fall to A+, then the additional collateral based on information available as of December 31, 2014 and 2013 is estimated to amount to approximately nil and USD 88 million, respectively.
In common with other insurance companies in Europe, the Group is faced with the continued trend towards enhanced consumer protection. Significant uncertainty exists regarding the ultimate cost of these consumer protection trends. The main areas of uncertainty concern court decisions as well as the volume of potential customer complaints related to sales activities and withdrawal rights, and their respective individual assessment.
Pledged assetsThe majority of assets pledged to secure the Group’s liabilities relate to debt securities pledged under short-term sale and repurchase agreements. The total amount of pledged financial assets including the securities under short-term sale and repurchase agreements amounted to USD 9,249 million and USD 11,814 million as of December 31, 2014 and 2013, respectively.
Terms and conditions associated with the financial assets pledged to secure the Group’s liabilities are usual and standard in the markets in which the underlying agreements were executed.
Legal proceedings and regulatory investigations The Group’s business is subject to extensive supervision, and the Group is in regular contact with various regulatory authorities. The Group is continuously involved in legal proceedings, claims and regulatory investigations arising, for the most part, in the ordinary course of its business operations. Specifically, certain companies within the Group are engaged in the following legal proceedings:
Q4_2014_12_AR14_104_Consolidated_financial_statements_en.indd 225 23.02.2015 16:37:45
Zurich Insurance GroupAnnual Report 2014226 Financial information
Consolidated financial statements continued
An action entitled Fuller-Austin Asbestos Settlement Trust, et al. v. Zurich American Insurance Company (ZAIC), et al., was filed in May 2004 in the Superior Court for San Francisco County, California. Three other similar actions were filed in 2004 and 2005 and have been coordinated with the Fuller-Austin action (collectively, the Fuller-Austin Case). In addition to ZAIC and four of its insurance company subsidiaries, Zurich Insurance Company Ltd and Orange Stone Reinsurance Dublin (Orange Stone) are named as defendants. The plaintiffs, who are historical policyholders of the Home Insurance Company (Home), plead claims for, inter alia, fraudulent transfer, tortious interference, unfair competition, alter ego and agency liability relating to the recapitalization of Home, which occurred in 1995 following regulatory review and approval. The plaintiffs allege that pursuant to the recapitalization and subsequent transactions, various Zurich entities took assets of Home without giving adequate consideration in return, and contend that this forced Home into liquidation. The plaintiffs further allege that the defendants should be held responsible for Home’s alleged obligations under their Home policies. The trial judge designated the plaintiffs’ claims for constructive fraudulent transfer for adjudication before all other claims; he subsequently ordered an initial bench trial on certain threshold elements of those fraudulent transfer claims and on certain of defendants’ affirmative defenses (Phase 1). The Phase 1 trial commenced on November 1, 2010. Closing arguments were heard on February 22 and 23, 2012.
The court issued its Statement of Decision for Phase 1 on December 27, 2013. While the court found that the plaintiffs had established that Home transferred certain assets to one of the defendants in connection with the 1995 recapitalization transaction, it held that the plaintiffs’ fraudulent transfer claims, which all related to transfers allegedly made as part of the 1995 recapitalization, were time-barred. The court further held that Home’s liquidator had exclusive standing to bring fraudulent transfer claims involving Home’s assets. The effect of these holdings should be the dismissal of the plaintiffs’ fraudulent transfer claims. In addition, the court accepted the defendants’ arguments that the findings made by the regulators in approving the recapitalization transaction are binding on the plaintiffs in the Fuller-Austin Case.
On March 6, 2014, the court held a hearing to consider the effect of the initial decision on the plaintiffs’ remaining claims. On July 21, 2014, the court issued a Tentative Statement of Decision for Phase 1A. The court ruled that all of the plaintiffs’ fraudulent transfer causes of action were barred, and asked the plaintiffs to confirm on the record their concession that their unfair competition claims were also barred. The court allowed the plaintiffs’ remaining claims to proceed, but held that the plaintiffs are bound by the insurance regulators’ determinations that the 1995 recapitalization was fair and in the best interests of Home’s policyholders, including the plaintiffs. In early 2015, certain plaintiffs committed to voluntarily dismiss their claims with prejudice in exchange for an agreement that the defendants will not pursue them for litigation costs. The remaining parties have exchanged information concerning possible next steps in the litigation and will next appear before the court on February 26, 2015. The Group maintains that the Fuller-Austin Case is without merit and intends to continue to defend itself vigorously.
While the Group believes that it is not a party to, nor are any of its subsidiaries the subject of, any unresolved current legal proceedings, claims, litigation and investigations that will have a material adverse effect on the Group’s consolidated financial condition, proceedings are inherently unpredictable, and it is possible that the outcome of any proceeding could have a material impact on results of operations in the particular reporting period in which it is resolved.
Q4_2014_12_AR14_104_Consolidated_financial_statements_en.indd 226 23.02.2015 16:37:45
Zurich Insurance Group Annual Report 2014 227Consolidated financial statements
Finan
cial inform
ation
24. Fair value measurement
To measure fair value, the Group gives the highest priority to quoted and unadjusted prices in active markets. In the absence of quoted prices, fair values are calculated through valuation techniques, making the maximum use of relevant observable market data inputs. Whenever observable parameters are not available, the inputs used to derive the fair value are based on common market assumptions that market participants would use when pricing assets and liabilities. Depending on the observability of prices and inputs to valuation techniques, the Group classifies instruments measured at fair value within the following three levels (the fair value hierarchy):
Level 1 – includes assets and liabilities for which fair values are determined directly from unadjusted current quoted prices resulting from orderly transactions in active markets for identical assets/liabilities.
Level 2 – includes assets and liabilities for which fair values are determined using significant inputs other than quoted prices included in level 1 that are observable for the asset or liability, either directly or indirectly. These inputs include quoted prices for similar assets or liabilities in active markets, quoted prices for identical or similar assets or liabilities in markets that are not active, and other observable market inputs.
Level 3 – includes assets and liabilities for which fair values are determined using valuation techniques with at least one significant input not being based on observable market data. This approach is used only in circumstances when there is little, if any, market activity for a certain instrument, and the Group is required to develop internal valuation inputs based on the best information available about the assumptions that market participants would use when pricing the asset or liability.
The governance framework and oversight of the Group standards and procedures regarding the valuation of financial instruments measured at fair value is the responsibility of the Valuation Forum, an independent committee composed of representatives from Group Risk Management, Investment Management and Group Finance. The Valuation Forum ensures the adequacy of valuation models, approves methodologies and sources to derive model input parameters, provides oversight over the selection of third party pricing providers, and on a quarterly basis reviews the classification within the fair value hierarchy of the financial instruments in scope.
The Group makes extensive use of third party pricing providers to determine the fair values of its available-for-sale and fair value through profit or loss financial instruments, and only in rare cases places reliance on prices that are derived from internal models. Investment accounting, operations and process functions, are independent from those responsible for buying and selling the assets, and are responsible for receiving, challenging and verifying values provided by third party pricing providers to ensure that fair values are reliable, as well as ensuring compliance with applicable accounting and valuation policies. The quality control procedures used depend on the nature and complexity of the invested assets. They include regular reviews of valuation techniques and inputs used by pricing providers (for example, default rates of collateral for asset-backed securities), variance and stale price analysis, and comparisons with fair values of similar instruments and with alternative values obtained from asset managers and brokers.
Q4_2014_12_AR14_104_Consolidated_financial_statements_en.indd 227 23.02.2015 16:37:45
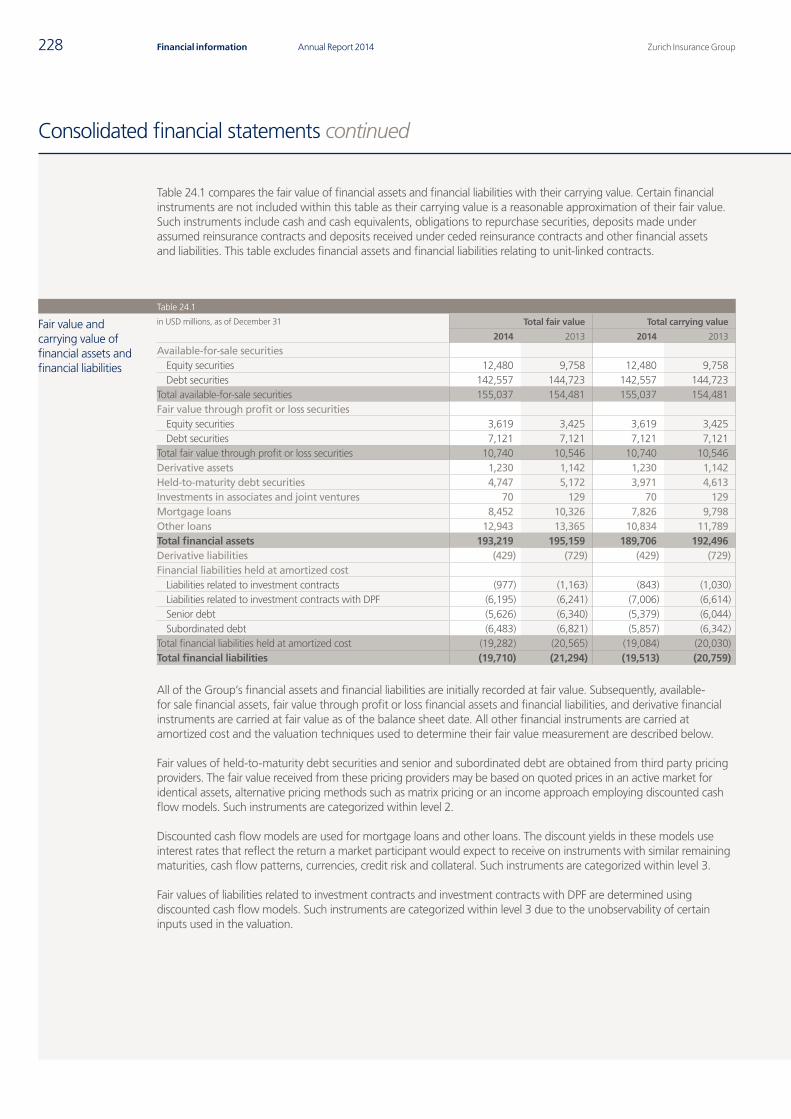
Zurich Insurance GroupAnnual Report 2014228 Financial information
Consolidated financial statements continued
Table 24.1 compares the fair value of financial assets and financial liabilities with their carrying value. Certain financial instruments are not included within this table as their carrying value is a reasonable approximation of their fair value. Such instruments include cash and cash equivalents, obligations to repurchase securities, deposits made under assumed reinsurance contracts and deposits received under ceded reinsurance contracts and other financial assets and liabilities. This table excludes financial assets and financial liabilities relating to unit-linked contracts.
Table 24.1
Fair value and carrying value of financial assets and financial liabilities
in USD millions, as of December 31 Total fair value Total carrying value
2014 2013 2014 2013
Available-for-sale securitiesEquity securities 12,480 9,758 12,480 9,758Debt securities 142,557 144,723 142,557 144,723
Total available-for-sale securities 155,037 154,481 155,037 154,481Fair value through profit or loss securities
Equity securities 3,619 3,425 3,619 3,425Debt securities 7,121 7,121 7,121 7,121
Total fair value through profit or loss securities 10,740 10,546 10,740 10,546Derivative assets 1,230 1,142 1,230 1,142Held-to-maturity debt securities 4,747 5,172 3,971 4,613Investments in associates and joint ventures 70 129 70 129Mortgage loans 8,452 10,326 7,826 9,798Other loans 12,943 13,365 10,834 11,789Total financial assets 193,219 195,159 189,706 192,496Derivative liabilities (429) (729) (429) (729)Financial liabilities held at amortized cost
Liabilities related to investment contracts (977) (1,163) (843) (1,030)Liabilities related to investment contracts with DPF (6,195) (6,241) (7,006) (6,614)Senior debt (5,626) (6,340) (5,379) (6,044)Subordinated debt (6,483) (6,821) (5,857) (6,342)
Total financial liabilities held at amortized cost (19,282) (20,565) (19,084) (20,030)Total financial liabilities (19,710) (21,294) (19,513) (20,759)
All of the Group’s financial assets and financial liabilities are initially recorded at fair value. Subsequently, available- for sale financial assets, fair value through profit or loss financial assets and financial liabilities, and derivative financial instruments are carried at fair value as of the balance sheet date. All other financial instruments are carried at amortized cost and the valuation techniques used to determine their fair value measurement are described below.
Fair values of held-to-maturity debt securities and senior and subordinated debt are obtained from third party pricing providers. The fair value received from these pricing providers may be based on quoted prices in an active market for identical assets, alternative pricing methods such as matrix pricing or an income approach employing discounted cash flow models. Such instruments are categorized within level 2.
Discounted cash flow models are used for mortgage loans and other loans. The discount yields in these models use interest rates that reflect the return a market participant would expect to receive on instruments with similar remaining maturities, cash flow patterns, currencies, credit risk and collateral. Such instruments are categorized within level 3.
Fair values of liabilities related to investment contracts and investment contracts with DPF are determined using discounted cash flow models. Such instruments are categorized within level 3 due to the unobservability of certain inputs used in the valuation.
Q4_2014_12_AR14_104_Consolidated_financial_statements_en.indd 228 23.02.2015 16:37:46
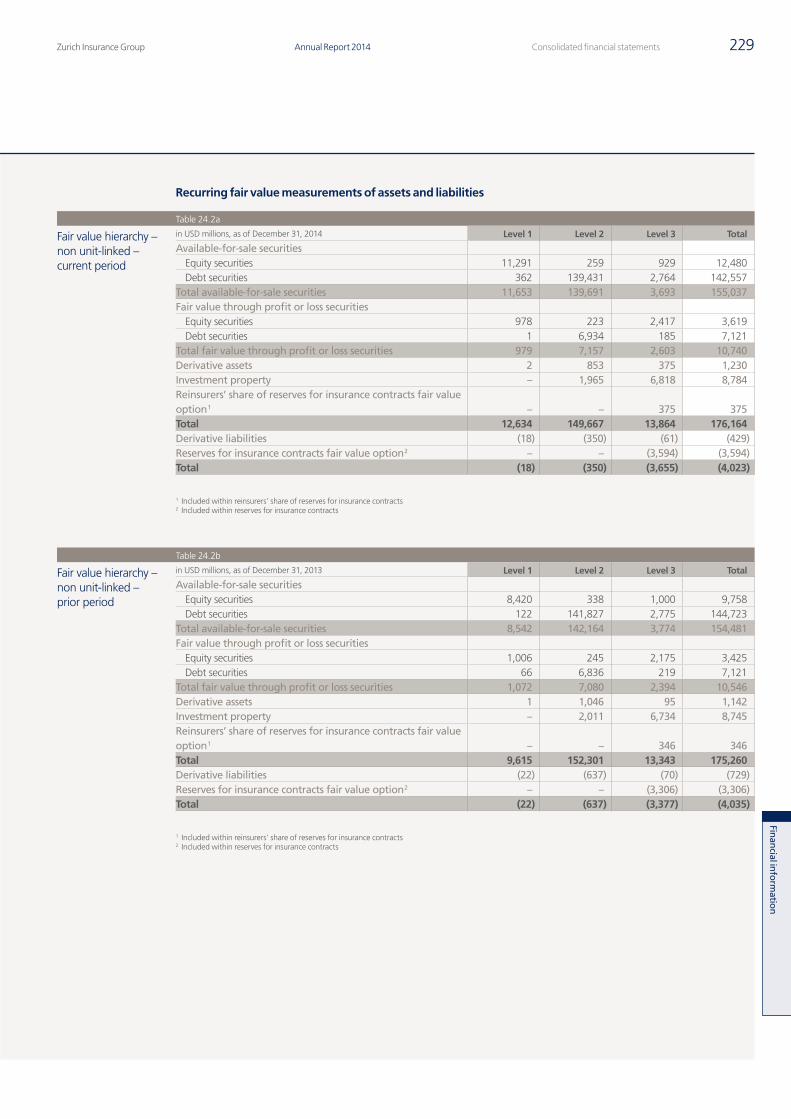
Zurich Insurance Group Annual Report 2014 229Consolidated financial statements
Finan
cial inform
ation
Recurring fair value measurements of assets and liabilities
Table 24.2a
Fair value hierarchy – non unit-linked – current period
in USD millions, as of December 31, 2014 Level 1 Level 2 Level 3 Total
Available-for-sale securitiesEquity securities 11,291 259 929 12,480Debt securities 362 139,431 2,764 142,557
Total available-for-sale securities 11,653 139,691 3,693 155,037Fair value through profit or loss securities
Equity securities 978 223 2,417 3,619Debt securities 1 6,934 185 7,121
Total fair value through profit or loss securities 979 7,157 2,603 10,740Derivative assets 2 853 375 1,230Investment property – 1,965 6,818 8,784Reinsurers’ share of reserves for insurance contracts fair value option 1 – – 375 375Total 12,634 149,667 13,864 176,164Derivative liabilities (18) (350) (61) (429)Reserves for insurance contracts fair value option 2 – – (3,594) (3,594)Total (18) (350) (3,655) (4,023)
1 Included within reinsurers’ share of reserves for insurance contracts2 Included within reserves for insurance contracts
Table 24.2b
Fair value hierarchy – non unit-linked – prior period
in USD millions, as of December 31, 2013 Level 1 Level 2 Level 3 Total
Available-for-sale securitiesEquity securities 8,420 338 1,000 9,758Debt securities 122 141,827 2,775 144,723
Total available-for-sale securities 8,542 142,164 3,774 154,481Fair value through profit or loss securities
Equity securities 1,006 245 2,175 3,425Debt securities 66 6,836 219 7,121
Total fair value through profit or loss securities 1,072 7,080 2,394 10,546Derivative assets 1 1,046 95 1,142Investment property – 2,011 6,734 8,745Reinsurers’ share of reserves for insurance contracts fair value option 1 – – 346 346Total 9,615 152,301 13,343 175,260Derivative liabilities (22) (637) (70) (729)Reserves for insurance contracts fair value option 2 – – (3,306) (3,306)Total (22) (637) (3,377) (4,035)
1 Included within reinsurers’ share of reserves for insurance contracts2 Included within reserves for insurance contracts
Q4_2014_12_AR14_104_Consolidated_financial_statements_en.indd 229 23.02.2015 16:37:46
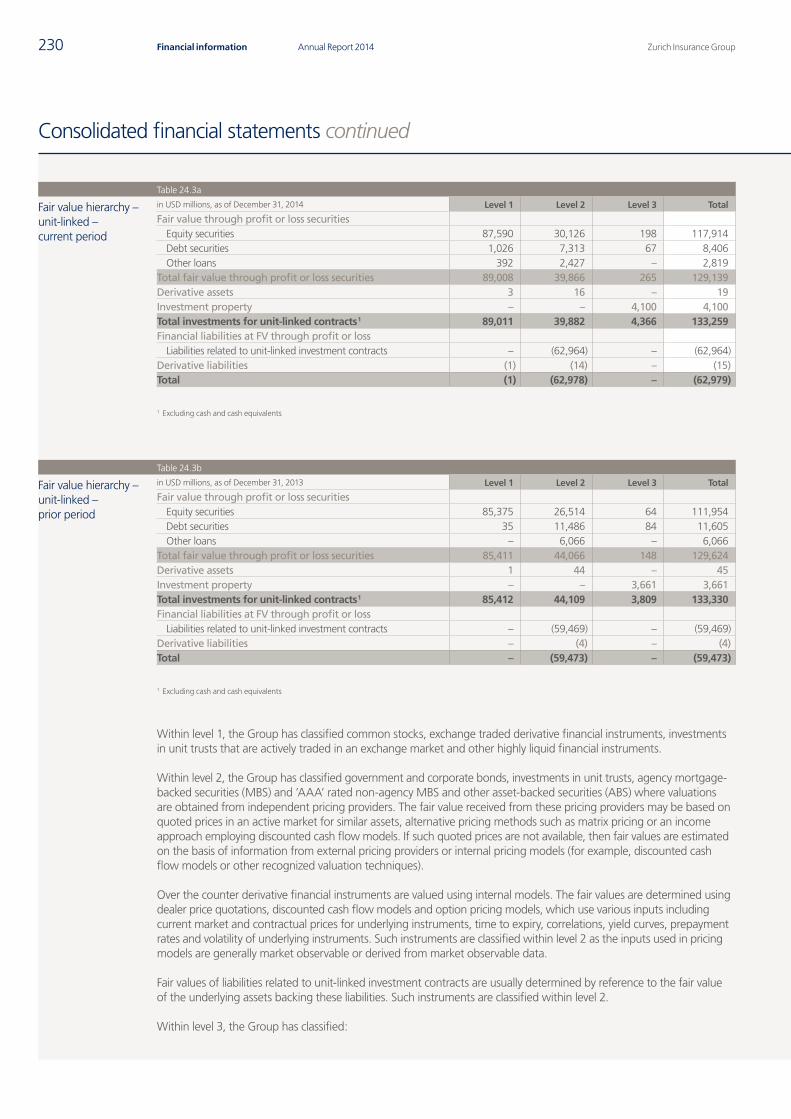
Zurich Insurance GroupAnnual Report 2014230 Financial information
Consolidated financial statements continued
Table 24.3a
Fair value hierarchy – unit-linked – current period
in USD millions, as of December 31, 2014 Level 1 Level 2 Level 3 Total
Fair value through profit or loss securitiesEquity securities 87,590 30,126 198 117,914Debt securities 1,026 7,313 67 8,406Other loans 392 2,427 – 2,819
Total fair value through profit or loss securities 89,008 39,866 265 129,139Derivative assets 3 16 – 19Investment property – – 4,100 4,100Total investments for unit-linked contracts 1 89,011 39,882 4,366 133,259Financial liabilities at FV through profit or loss
Liabilities related to unit-linked investment contracts – (62,964) – (62,964)Derivative liabilities (1) (14) – (15)Total (1) (62,978) – (62,979)
1 Excluding cash and cash equivalents
Table 24.3b
Fair value hierarchy – unit-linked – prior period
in USD millions, as of December 31, 2013 Level 1 Level 2 Level 3 Total
Fair value through profit or loss securitiesEquity securities 85,375 26,514 64 111,954Debt securities 35 11,486 84 11,605Other loans – 6,066 – 6,066
Total fair value through profit or loss securities 85,411 44,066 148 129,624Derivative assets 1 44 – 45Investment property – – 3,661 3,661Total investments for unit-linked contracts 1 85,412 44,109 3,809 133,330Financial liabilities at FV through profit or loss
Liabilities related to unit-linked investment contracts – (59,469) – (59,469)Derivative liabilities – (4) – (4)Total – (59,473) – (59,473)
1 Excluding cash and cash equivalents
Within level 1, the Group has classified common stocks, exchange traded derivative financial instruments, investments in unit trusts that are actively traded in an exchange market and other highly liquid financial instruments.
Within level 2, the Group has classified government and corporate bonds, investments in unit trusts, agency mortgage-backed securities (MBS) and ’AAA’ rated non-agency MBS and other asset-backed securities (ABS) where valuations are obtained from independent pricing providers. The fair value received from these pricing providers may be based on quoted prices in an active market for similar assets, alternative pricing methods such as matrix pricing or an income approach employing discounted cash flow models. If such quoted prices are not available, then fair values are estimated on the basis of information from external pricing providers or internal pricing models (for example, discounted cash flow models or other recognized valuation techniques).
Over the counter derivative financial instruments are valued using internal models. The fair values are determined using dealer price quotations, discounted cash flow models and option pricing models, which use various inputs including current market and contractual prices for underlying instruments, time to expiry, correlations, yield curves, prepayment rates and volatility of underlying instruments. Such instruments are classified within level 2 as the inputs used in pricing models are generally market observable or derived from market observable data.
Fair values of liabilities related to unit-linked investment contracts are usually determined by reference to the fair value of the underlying assets backing these liabilities. Such instruments are classified within level 2.
Within level 3, the Group has classified:
Q4_2014_12_AR14_104_Consolidated_financial_statements_en.indd 230 23.02.2015 16:37:47
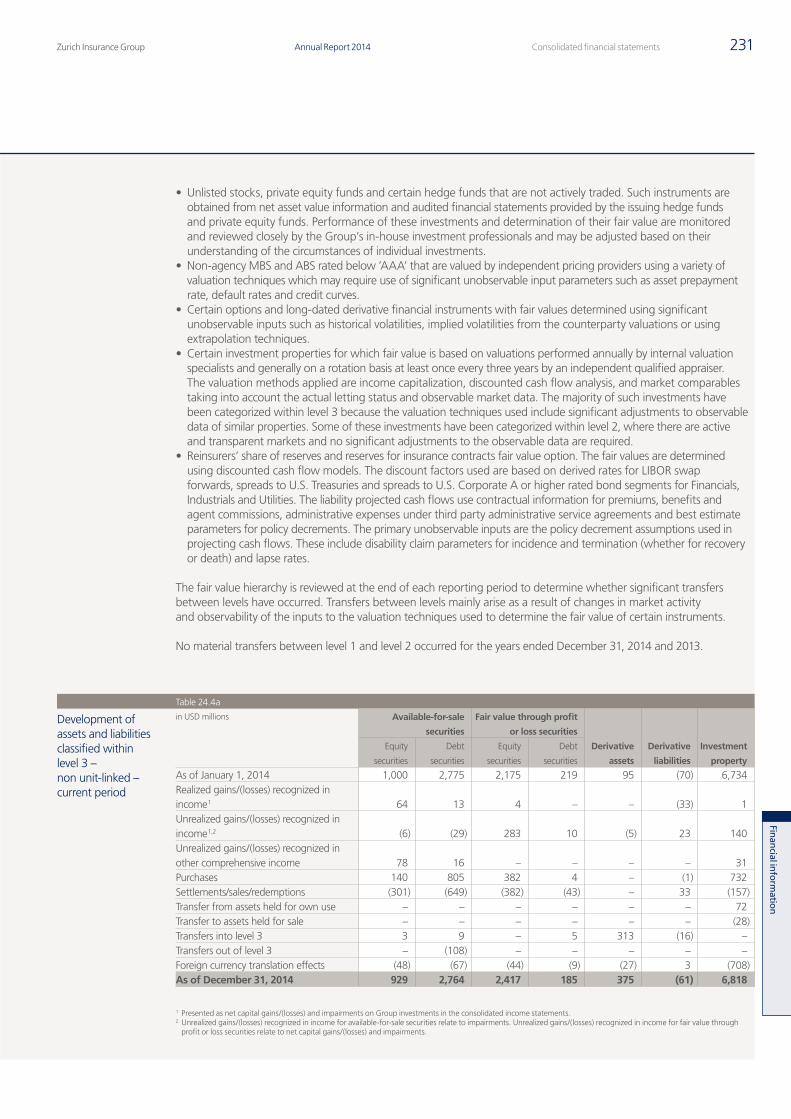
Zurich Insurance Group Annual Report 2014 231Consolidated financial statements
Finan
cial inform
ation
• Unlisted stocks, private equity funds and certain hedge funds that are not actively traded. Such instruments are obtained from net asset value information and audited financial statements provided by the issuing hedge funds and private equity funds. Performance of these investments and determination of their fair value are monitored and reviewed closely by the Group’s in-house investment professionals and may be adjusted based on their understanding of the circumstances of individual investments.
• Non-agency MBS and ABS rated below ’AAA’ that are valued by independent pricing providers using a variety of valuation techniques which may require use of significant unobservable input parameters such as asset prepayment rate, default rates and credit curves.
• Certain options and long-dated derivative financial instruments with fair values determined using significant unobservable inputs such as historical volatilities, implied volatilities from the counterparty valuations or using extrapolation techniques.
• Certain investment properties for which fair value is based on valuations performed annually by internal valuation specialists and generally on a rotation basis at least once every three years by an independent qualified appraiser. The valuation methods applied are income capitalization, discounted cash flow analysis, and market comparables taking into account the actual letting status and observable market data. The majority of such investments have been categorized within level 3 because the valuation techniques used include significant adjustments to observable data of similar properties. Some of these investments have been categorized within level 2, where there are active and transparent markets and no significant adjustments to the observable data are required.
• Reinsurers’ share of reserves and reserves for insurance contracts fair value option. The fair values are determined using discounted cash flow models. The discount factors used are based on derived rates for LIBOR swap forwards, spreads to U.S. Treasuries and spreads to U.S. Corporate A or higher rated bond segments for Financials, Industrials and Utilities. The liability projected cash flows use contractual information for premiums, benefits and agent commissions, administrative expenses under third party administrative service agreements and best estimate parameters for policy decrements. The primary unobservable inputs are the policy decrement assumptions used in projecting cash flows. These include disability claim parameters for incidence and termination (whether for recovery or death) and lapse rates.
The fair value hierarchy is reviewed at the end of each reporting period to determine whether significant transfers between levels have occurred. Transfers between levels mainly arise as a result of changes in market activity and observability of the inputs to the valuation techniques used to determine the fair value of certain instruments.
No material transfers between level 1 and level 2 occurred for the years ended December 31, 2014 and 2013.
Table 24.4a
Development of assets and liabilities classified within level 3 – non unit-linked – current period
in USD millions Available-for-sale
securities
Fair value through profit
or loss securities
Derivative
assets
Derivative
liabilities
Investment
property
Equity
securities
Debt
securities
Equity
securities
Debt
securities
As of January 1, 2014 1,000 2,775 2,175 219 95 (70) 6,734Realized gains/(losses) recognized in income 1 64 13 4 – – (33) 1Unrealized gains/(losses) recognized in income 1,2 (6) (29) 283 10 (5) 23 140Unrealized gains/(losses) recognized in other comprehensive income 78 16 – – – – 31Purchases 140 805 382 4 – (1) 732Settlements/sales/redemptions (301) (649) (382) (43) – 33 (157)Transfer from assets held for own use – – – – – – 72Transfer to assets held for sale – – – – – – (28)Transfers into level 3 3 9 – 5 313 (16) –Transfers out of level 3 – (108) – – – – –Foreign currency translation effects (48) (67) (44) (9) (27) 3 (708)As of December 31, 2014 929 2,764 2,417 185 375 (61) 6,818
1 Presented as net capital gains/(losses) and impairments on Group investments in the consolidated income statements.2 Unrealized gains/(losses) recognized in income for available-for-sale securities relate to impairments. Unrealized gains/(losses) recognized in income for fair value through
profit or loss securities relate to net capital gains/(losses) and impairments.
Q4_2014_12_AR14_104_Consolidated_financial_statements_en.indd 231 23.02.2015 16:37:47
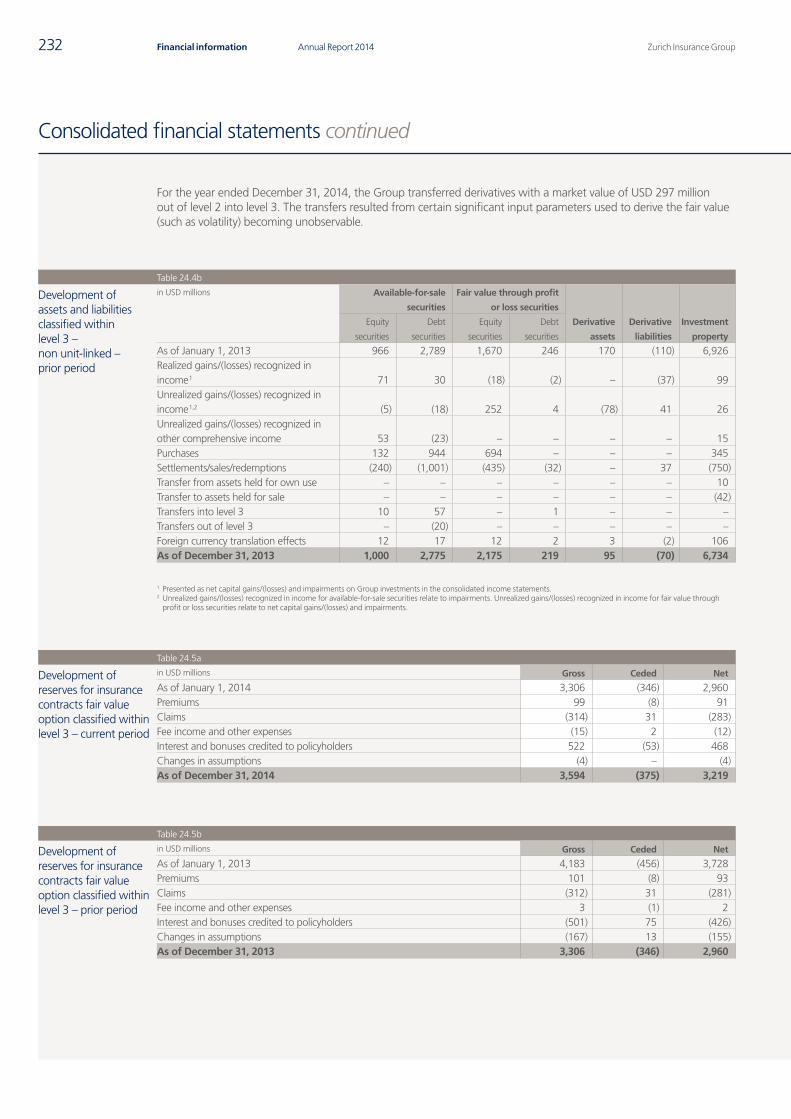
Zurich Insurance GroupAnnual Report 2014232 Financial information
Consolidated financial statements continued
For the year ended December 31, 2014, the Group transferred derivatives with a market value of USD 297 million out of level 2 into level 3. The transfers resulted from certain significant input parameters used to derive the fair value (such as volatility) becoming unobservable.
Table 24.4b
Development of assets and liabilities classified within level 3 – non unit-linked – prior period
in USD millions Available-for-sale
securities
Fair value through profit
or loss securities
Derivative
assets
Derivative
liabilities
Equity
securities
Debt
securities
Equity
securities
Debt
securities
Investment
property
As of January 1, 2013 966 2,789 1,670 246 170 (110) 6,926Realized gains/(losses) recognized in income 1 71 30 (18) (2) – (37) 99Unrealized gains/(losses) recognized in income 1,2 (5) (18) 252 4 (78) 41 26Unrealized gains/(losses) recognized in other comprehensive income 53 (23) – – – – 15Purchases 132 944 694 – – – 345Settlements/sales/redemptions (240) (1,001) (435) (32) – 37 (750)Transfer from assets held for own use – – – – – – 10Transfer to assets held for sale – – – – – – (42)Transfers into level 3 10 57 – 1 – – –Transfers out of level 3 – (20) – – – – –Foreign currency translation effects 12 17 12 2 3 (2) 106As of December 31, 2013 1,000 2,775 2,175 219 95 (70) 6,734
1 Presented as net capital gains/(losses) and impairments on Group investments in the consolidated income statements.2 Unrealized gains/(losses) recognized in income for available-for-sale securities relate to impairments. Unrealized gains/(losses) recognized in income for fair value through
profit or loss securities relate to net capital gains/(losses) and impairments.
Table 24.5a
Development of reserves for insurance contracts fair value option classified within level 3 – current period
in USD millions Gross Ceded Net
As of January 1, 2014 3,306 (346) 2,960Premiums 99 (8) 91Claims (314) 31 (283)Fee income and other expenses (15) 2 (12)Interest and bonuses credited to policyholders 522 (53) 468Changes in assumptions (4) – (4)As of December 31, 2014 3,594 (375) 3,219
Table 24.5b
Development of reserves for insurance contracts fair value option classified within level 3 – prior period
in USD millions Gross Ceded Net
As of January 1, 2013 4,183 (456) 3,728Premiums 101 (8) 93Claims (312) 31 (281)Fee income and other expenses 3 (1) 2Interest and bonuses credited to policyholders (501) 75 (426)Changes in assumptions (167) 13 (155)As of December 31, 2013 3,306 (346) 2,960
Q4_2014_12_AR14_104_Consolidated_financial_statements_en.indd 232 23.02.2015 16:37:48
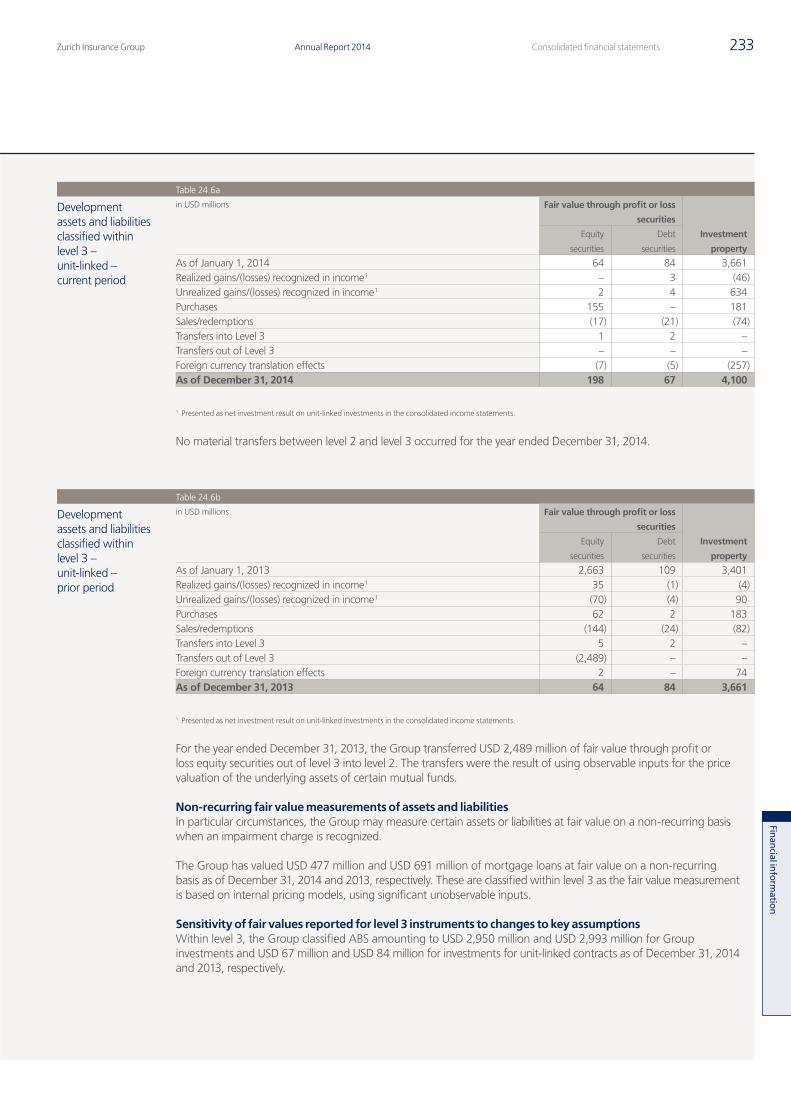
Zurich Insurance Group Annual Report 2014 233Consolidated financial statements
Finan
cial inform
ation
Table 24.6a
Development assets and liabilities classified within level 3 – unit-linked – current period
in USD millions Fair value through profit or loss
securities
Investment
property
Equity
securities
Debt
securities
As of January 1, 2014 64 84 3,661Realized gains/(losses) recognized in income 1 – 3 (46)Unrealized gains/(losses) recognized in income 1 2 4 634Purchases 155 – 181Sales/redemptions (17) (21) (74)Transfers into Level 3 1 2 –Transfers out of Level 3 – – –Foreign currency translation effects (7) (5) (257)As of December 31, 2014 198 67 4,100
1 Presented as net investment result on unit-linked investments in the consolidated income statements.
No material transfers between level 2 and level 3 occurred for the year ended December 31, 2014.
Table 24.6b
Development assets and liabilities classified within level 3 – unit-linked – prior period
in USD millions Fair value through profit or loss
securities
Investment
property
Equity
securities
Debt
securities
As of January 1, 2013 2,663 109 3,401Realized gains/(losses) recognized in income 1 35 (1) (4)Unrealized gains/(losses) recognized in income 1 (70) (4) 90Purchases 62 2 183Sales/redemptions (144) (24) (82)Transfers into Level 3 5 2 –Transfers out of Level 3 (2,489) – –Foreign currency translation effects 2 – 74As of December 31, 2013 64 84 3,661
1 Presented as net investment result on unit-linked investments in the consolidated income statements.
For the year ended December 31, 2013, the Group transferred USD 2,489 million of fair value through profit or loss equity securities out of level 3 into level 2. The transfers were the result of using observable inputs for the price valuation of the underlying assets of certain mutual funds.
Non-recurring fair value measurements of assets and liabilitiesIn particular circumstances, the Group may measure certain assets or liabilities at fair value on a non-recurring basis when an impairment charge is recognized.
The Group has valued USD 477 million and USD 691 million of mortgage loans at fair value on a non-recurring basis as of December 31, 2014 and 2013, respectively. These are classified within level 3 as the fair value measurement is based on internal pricing models, using significant unobservable inputs.
Sensitivity of fair values reported for level 3 instruments to changes to key assumptionsWithin level 3, the Group classified ABS amounting to USD 2,950 million and USD 2,993 million for Group investments and USD 67 million and USD 84 million for investments for unit-linked contracts as of December 31, 2014 and 2013, respectively.
Q4_2014_12_AR14_104_Consolidated_financial_statements_en.indd 233 23.02.2015 16:37:48
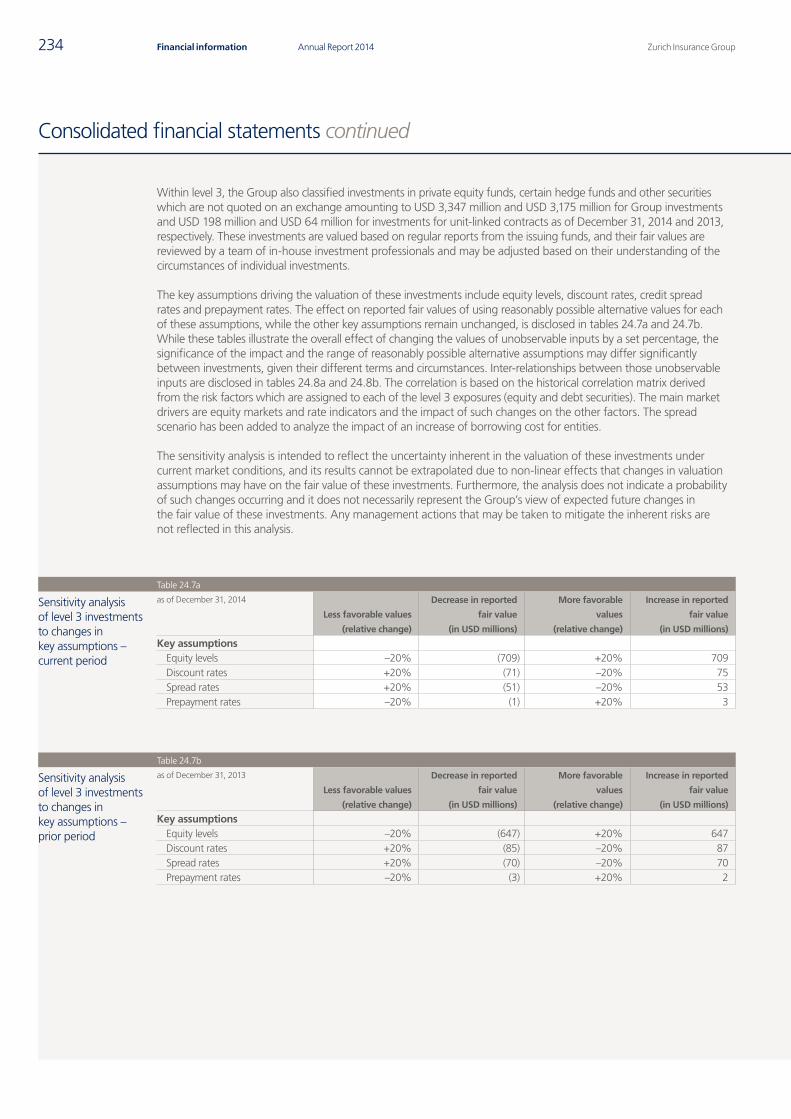
Zurich Insurance GroupAnnual Report 2014234 Financial information
Consolidated financial statements continued
Within level 3, the Group also classified investments in private equity funds, certain hedge funds and other securities which are not quoted on an exchange amounting to USD 3,347 million and USD 3,175 million for Group investments and USD 198 million and USD 64 million for investments for unit-linked contracts as of December 31, 2014 and 2013, respectively. These investments are valued based on regular reports from the issuing funds, and their fair values are reviewed by a team of in-house investment professionals and may be adjusted based on their understanding of the circumstances of individual investments.
The key assumptions driving the valuation of these investments include equity levels, discount rates, credit spread rates and prepayment rates. The effect on reported fair values of using reasonably possible alternative values for each of these assumptions, while the other key assumptions remain unchanged, is disclosed in tables 24.7a and 24.7b. While these tables illustrate the overall effect of changing the values of unobservable inputs by a set percentage, the significance of the impact and the range of reasonably possible alternative assumptions may differ significantly between investments, given their different terms and circumstances. Inter-relationships between those unobservable inputs are disclosed in tables 24.8a and 24.8b. The correlation is based on the historical correlation matrix derived from the risk factors which are assigned to each of the level 3 exposures (equity and debt securities). The main market drivers are equity markets and rate indicators and the impact of such changes on the other factors. The spread scenario has been added to analyze the impact of an increase of borrowing cost for entities.
The sensitivity analysis is intended to reflect the uncertainty inherent in the valuation of these investments under current market conditions, and its results cannot be extrapolated due to non-linear effects that changes in valuation assumptions may have on the fair value of these investments. Furthermore, the analysis does not indicate a probability of such changes occurring and it does not necessarily represent the Group’s view of expected future changes in the fair value of these investments. Any management actions that may be taken to mitigate the inherent risks are not reflected in this analysis.
Table 24.7a
Sensitivity analysis of level 3 investments to changes in key assumptions – current period
as of December 31, 2014
Less favorable values
(relative change)
Decrease in reported
fair value
(in USD millions)
More favorable
values
(relative change)
Increase in reported
fair value
(in USD millions)
Key assumptionsEquity levels –20% (709) +20% 709Discount rates +20% (71) –20% 75Spread rates +20% (51) –20% 53Prepayment rates –20% (1) +20% 3
Table 24.7b
Sensitivity analysis of level 3 investments to changes in key assumptions – prior period
as of December 31, 2013
Less favorable values
(relative change)
Decrease in reported
fair value
(in USD millions)
More favorable
values
(relative change)
Increase in reported
fair value
(in USD millions)
Key assumptionsEquity levels –20% (647) +20% 647Discount rates +20% (85) –20% 87Spread rates +20% (70) –20% 70Prepayment rates –20% (3) +20% 2
Q4_2014_12_AR14_104_Consolidated_financial_statements_en.indd 234 23.02.2015 16:37:48
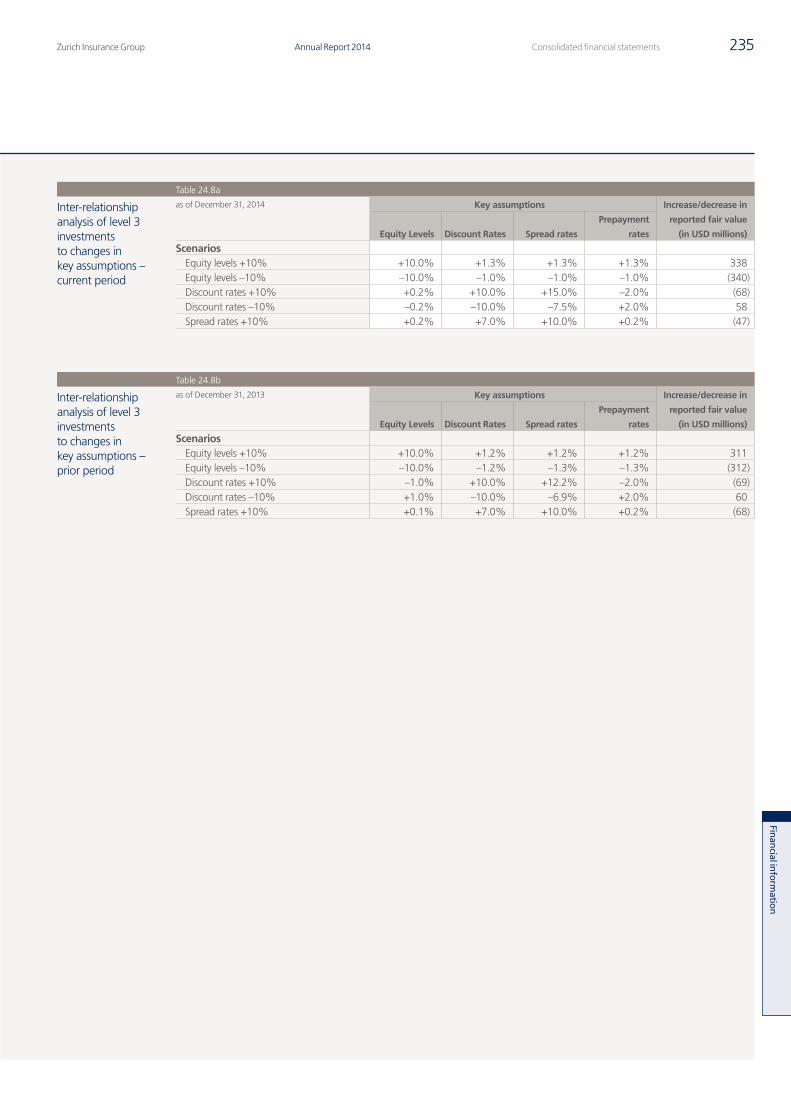
Zurich Insurance Group Annual Report 2014 235Consolidated financial statements
Finan
cial inform
ation
Table 24.8a
Inter-relationship analysis of level 3 investments to changes in key assumptions – current period
as of December 31, 2014 Key assumptions Increase/decrease in
reported fair value
(in USD millions)Equity Levels Discount Rates Spread rates
Prepayment
rates
ScenariosEquity levels +10% +10.0% +1.3% +1.3% +1.3% 338Equity levels –10% –10.0% –1.0% –1.0% –1.0% (340)Discount rates +10% +0.2% +10.0% +15.0% –2.0% (68)Discount rates –10% –0.2% –10.0% –7.5% +2.0% 58Spread rates +10% +0.2% +7.0% +10.0% +0.2% (47)
Table 24.8b
Inter-relationship analysis of level 3 investments to changes in key assumptions – prior period
as of December 31, 2013 Key assumptions Increase/decrease in
reported fair value
(in USD millions)Equity Levels Discount Rates Spread rates
Prepayment
rates
ScenariosEquity levels +10% +10.0% +1.2% +1.2% +1.2% 311Equity levels –10% –10.0% –1.2% –1.3% –1.3% (312)Discount rates +10% –1.0% +10.0% +12.2% –2.0% (69)Discount rates –10% +1.0% –10.0% –6.9% +2.0% 60Spread rates +10% +0.1% +7.0% +10.0% +0.2% (68)
Q4_2014_12_AR14_104_Consolidated_financial_statements_en.indd 235 23.02.2015 16:37:49
Zurich Insurance GroupAnnual Report 2014236 Financial information
Consolidated financial statements continued
Within level 3, the Group also classified:
• Investment property amounting to USD 6,818 million and 6,734 million for Group investments and USD 4,100 million and USD 3,661 million for investments for unit-linked contracts as of December 31, 2014 and 2013, respectively. A large portion of this portfolio is valued using an internal income capitalization model. The model is asset specific and capitalizes the sustainable investment income of a property with its risk specific cap rate. This cap rate is an “all risk yield” with components such as asset class yield for core assets (lowest risk) plus additional premiums for additional risks, for example second tier location or deterioration risk. All cap rate components (risk premiums) are reviewed and, if necessary, adjusted annually before revaluations are performed. The model takes into consideration external factors such as interest rate, market rent and vacancy rate. The significant unobservable inputs which are outside this model, are estimated rental value, rental growth, long term vacancy rate and discount rate. Significant increases/(decreases) in rental value and rental growth, in isolation, would result in a significantly higher/(lower) fair value measurement. Significant increases/(decreases) in the long term vacancy rate and discount rate, in isolation, would result in a significantly lower/(higher) fair value measurement.
• USD 375 million and USD 346 million for reinsurers’ share of reserves fair value option and, USD 3,594 million and USD 3,306 million reserves for insurance contracts fair value option as of December 31, 2014 and 2013, respectively. The significant unobservable inputs used in the fair value measurement are the policy decrement assumptions used in projecting cash flows. Significant increases/(decreases) in claim incidence rates and significant decreases/(increases) in claim termination rates would result in a significantly higher(lower) fair value measurement.
Q4_2014_12_AR14_104_Consolidated_financial_statements_en.indd 236 23.02.2015 16:37:49
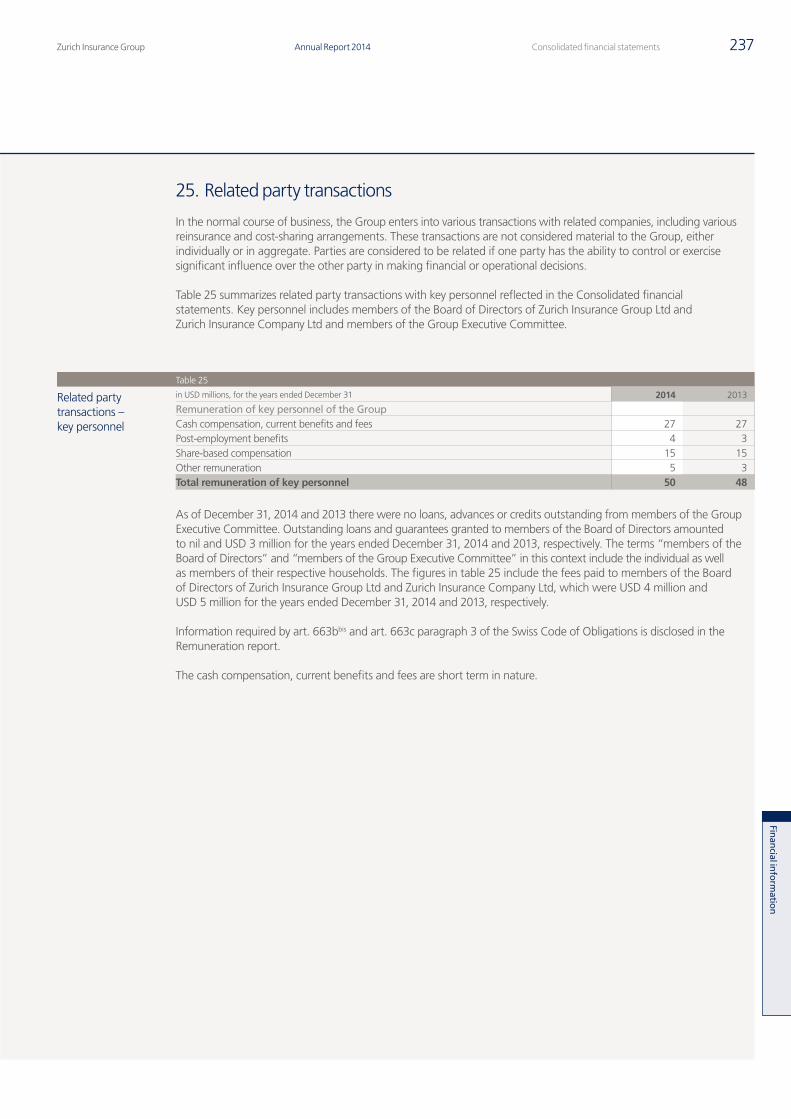
Zurich Insurance Group Annual Report 2014 237Consolidated financial statements
Finan
cial inform
ation
25. Related party transactions
In the normal course of business, the Group enters into various transactions with related companies, including various reinsurance and cost-sharing arrangements. These transactions are not considered material to the Group, either individually or in aggregate. Parties are considered to be related if one party has the ability to control or exercise significant influence over the other party in making financial or operational decisions.
Table 25 summarizes related party transactions with key personnel reflected in the Consolidated financial statements. Key personnel includes members of the Board of Directors of Zurich Insurance Group Ltd and Zurich Insurance Company Ltd and members of the Group Executive Committee.
Table 25
Related party transactions – key personnel
in USD millions, for the years ended December 31 2014 2013
Remuneration of key personnel of the GroupCash compensation, current benefits and fees 27 27Post-employment benefits 4 3Share-based compensation 15 15Other remuneration 5 3Total remuneration of key personnel 50 48
As of December 31, 2014 and 2013 there were no loans, advances or credits outstanding from members of the Group Executive Committee. Outstanding loans and guarantees granted to members of the Board of Directors amounted to nil and USD 3 million for the years ended December 31, 2014 and 2013, respectively. The terms “members of the Board of Directors” and “members of the Group Executive Committee” in this context include the individual as well as members of their respective households. The figures in table 25 include the fees paid to members of the Board of Directors of Zurich Insurance Group Ltd and Zurich Insurance Company Ltd, which were USD 4 million and USD 5 million for the years ended December 31, 2014 and 2013, respectively.
Information required by art. 663bbis and art. 663c paragraph 3 of the Swiss Code of Obligations is disclosed in the Remuneration report.
The cash compensation, current benefits and fees are short term in nature.
Q4_2014_12_AR14_104_Consolidated_financial_statements_en.indd 237 23.02.2015 16:37:49
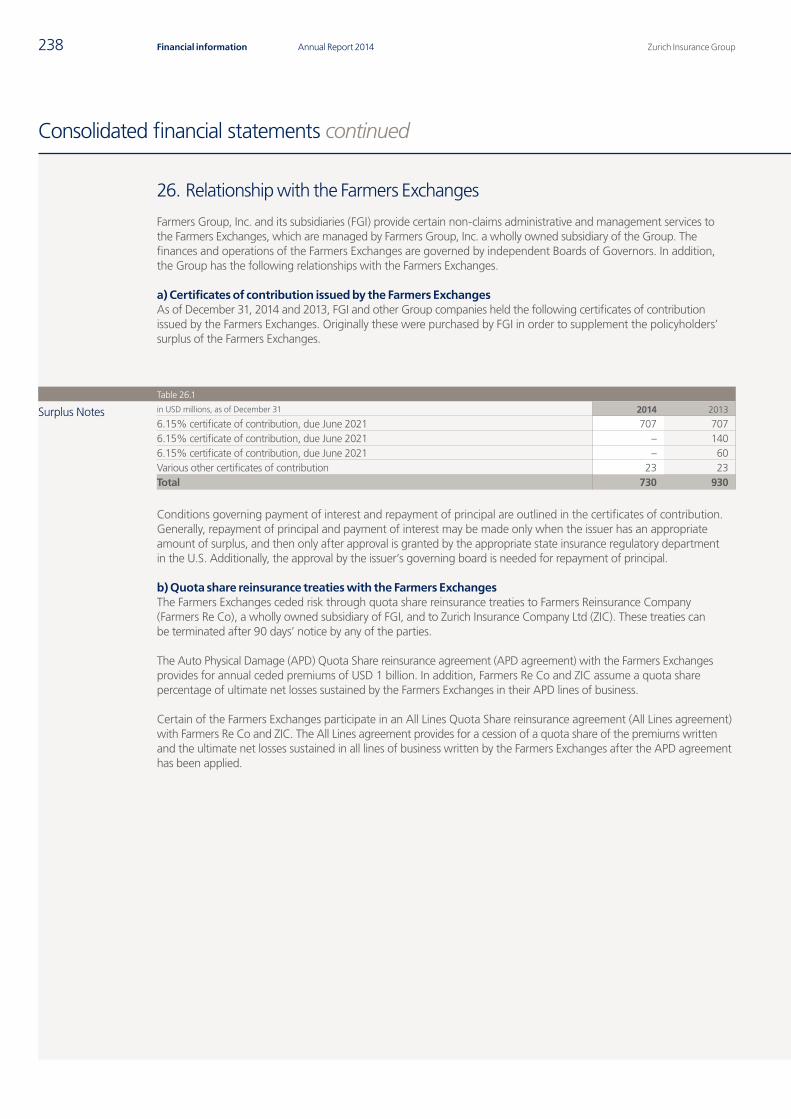
Zurich Insurance GroupAnnual Report 2014238 Financial information
Consolidated financial statements continued
26. Relationship with the Farmers Exchanges
Farmers Group, Inc. and its subsidiaries (FGI) provide certain non-claims administrative and management services to the Farmers Exchanges, which are managed by Farmers Group, Inc. a wholly owned subsidiary of the Group. The finances and operations of the Farmers Exchanges are governed by independent Boards of Governors. In addition, the Group has the following relationships with the Farmers Exchanges.
a) Certificates of contribution issued by the Farmers ExchangesAs of December 31, 2014 and 2013, FGI and other Group companies held the following certificates of contribution issued by the Farmers Exchanges. Originally these were purchased by FGI in order to supplement the policyholders’ surplus of the Farmers Exchanges.
Table 26.1
Surplus Notes in USD millions, as of December 31 2014 2013
6.15% certificate of contribution, due June 2021 707 7076.15% certificate of contribution, due June 2021 – 1406.15% certificate of contribution, due June 2021 – 60Various other certificates of contribution 23 23Total 730 930
Conditions governing payment of interest and repayment of principal are outlined in the certificates of contribution. Generally, repayment of principal and payment of interest may be made only when the issuer has an appropriate amount of surplus, and then only after approval is granted by the appropriate state insurance regulatory department in the U.S. Additionally, the approval by the issuer’s governing board is needed for repayment of principal.
b) Quota share reinsurance treaties with the Farmers ExchangesThe Farmers Exchanges ceded risk through quota share reinsurance treaties to Farmers Reinsurance Company (Farmers Re Co), a wholly owned subsidiary of FGI, and to Zurich Insurance Company Ltd (ZIC). These treaties can be terminated after 90 days’ notice by any of the parties.
The Auto Physical Damage (APD) Quota Share reinsurance agreement (APD agreement) with the Farmers Exchanges provides for annual ceded premiums of USD 1 billion. In addition, Farmers Re Co and ZIC assume a quota share percentage of ultimate net losses sustained by the Farmers Exchanges in their APD lines of business.
Certain of the Farmers Exchanges participate in an All Lines Quota Share reinsurance agreement (All Lines agreement) with Farmers Re Co and ZIC. The All Lines agreement provides for a cession of a quota share of the premiums written and the ultimate net losses sustained in all lines of business written by the Farmers Exchanges after the APD agreement has been applied.
Q4_2014_12_AR14_104_Consolidated_financial_statements_en.indd 238 23.02.2015 16:37:49
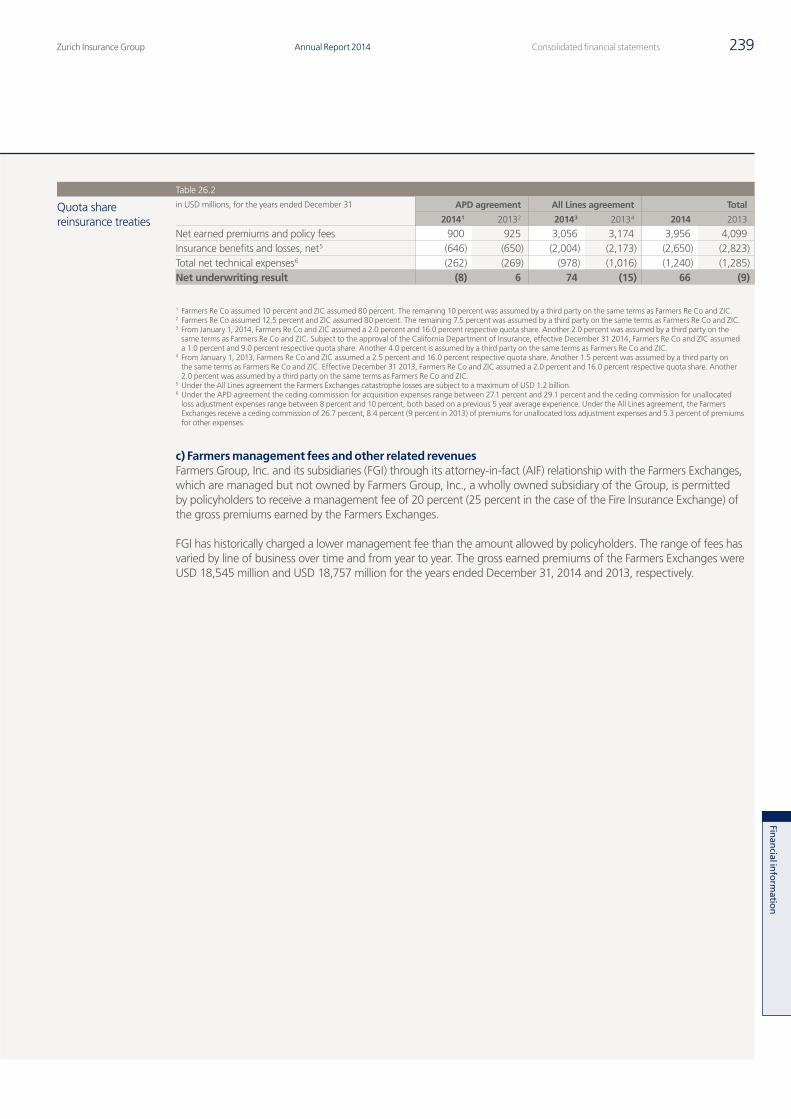
Zurich Insurance Group Annual Report 2014 239Consolidated financial statements
Finan
cial inform
ation
Table 26.2
Quota share reinsurance treaties
in USD millions, for the years ended December 31 APD agreement All Lines agreement Total
2014 1 2013 2 2014 3 2013 4 2014 2013
Net earned premiums and policy fees 900 925 3,056 3,174 3,956 4,099Insurance benefits and losses, net 5 (646) (650) (2,004) (2,173) (2,650) (2,823)Total net technical expenses 6 (262) (269) (978) (1,016) (1,240) (1,285)Net underwriting result (8) 6 74 (15) 66 (9)
1 Farmers Re Co assumed 10 percent and ZIC assumed 80 percent. The remaining 10 percent was assumed by a third party on the same terms as Farmers Re Co and ZIC.2 Farmers Re Co assumed 12.5 percent and ZIC assumed 80 percent. The remaining 7.5 percent was assumed by a third party on the same terms as Farmers Re Co and ZIC.3 From January 1, 2014, Farmers Re Co and ZIC assumed a 2.0 percent and 16.0 percent respective quota share. Another 2.0 percent was assumed by a third party on the
same terms as Farmers Re Co and ZIC. Subject to the approval of the California Department of Insurance, effective December 31 2014, Farmers Re Co and ZIC assumed a 1.0 percent and 9.0 percent respective quota share. Another 4.0 percent is assumed by a third party on the same terms as Farmers Re Co and ZIC.
4 From January 1, 2013, Farmers Re Co and ZIC assumed a 2.5 percent and 16.0 percent respective quota share. Another 1.5 percent was assumed by a third party on the same terms as Farmers Re Co and ZIC. Effective December 31 2013, Farmers Re Co and ZIC assumed a 2.0 percent and 16.0 percent respective quota share. Another 2.0 percent was assumed by a third party on the same terms as Farmers Re Co and ZIC.
5 Under the All Lines agreement the Farmers Exchanges catastrophe losses are subject to a maximum of USD 1.2 billion.6 Under the APD agreement the ceding commission for acquisition expenses range between 27.1 percent and 29.1 percent and the ceding commission for unallocated
loss adjustment expenses range between 8 percent and 10 percent, both based on a previous 5 year average experience. Under the All Lines agreement, the Farmers Exchanges receive a ceding commission of 26.7 percent, 8.4 percent (9 percent in 2013) of premiums for unallocated loss adjustment expenses and 5.3 percent of premiums for other expenses.
c) Farmers management fees and other related revenuesFarmers Group, Inc. and its subsidiaries (FGI) through its attorney-in-fact (AIF) relationship with the Farmers Exchanges, which are managed but not owned by Farmers Group, Inc., a wholly owned subsidiary of the Group, is permitted by policyholders to receive a management fee of 20 percent (25 percent in the case of the Fire Insurance Exchange) of the gross premiums earned by the Farmers Exchanges.
FGI has historically charged a lower management fee than the amount allowed by policyholders. The range of fees has varied by line of business over time and from year to year. The gross earned premiums of the Farmers Exchanges were USD 18,545 million and USD 18,757 million for the years ended December 31, 2014 and 2013, respectively.
Q4_2014_12_AR14_104_Consolidated_financial_statements_en.indd 239 23.02.2015 16:37:50
Zurich Insurance GroupAnnual Report 2014240 Financial information
Consolidated financial statements continued
27. Segment information
The Group pursues a customer-centric strategy and is managed on a matrix basis, reflecting both businesses and geography. The Group’s operating segments have been identified on the basis of the businesses operated by the Group and how these are strategically managed to offer different products and services to specific customer groups. Segment information is presented accordingly. The Group’s segments are as follows:
General Insurance provides a variety of motor, home and commercial products and services for individuals, as well as small and large businesses.
Global Life pursues a strategy of providing market-leading unit-linked, protection and corporate propositions through global distribution and proposition pillars to develop leadership positions in its chosen segments.
Farmers, through Farmers Group, Inc. and its subsidiaries (FGI), provides certain non-claims administrative and management services to the Farmers Exchanges. FGI receives fee income for the provision of services to the Farmers Exchanges, which are owned by their policyholders and managed by Farmers Group, Inc., a wholly owned subsidiary of the Group. This segment also includes all reinsurance assumed from the Farmers Exchanges by the Group. Farmers Exchanges are prominent writers of personal and small commercial lines of business in the U.S..
For the purpose of discussing financial performance the Group considers General Insurance, Global Life and Farmers to be its core business segments.
Other Operating Businesses predominantly consist of the Group´s Holding and Financing and Headquarters activities. Certain alternative investment positions not allocated to business operating segments are included within Holding and Financing.
Non-Core Businesses include insurance and reinsurance businesses that the Group does not consider core to its operations and that are therefore mostly managed to achieve a beneficial run-off. In addition, Non-Core Businesses includes the Group’s management of property loans and banking activities. Non-core businesses are mainly situated in the U.S., Bermuda, the UK and Ireland.
The Group also manages two of the three core segments on a secondary level.
General Insurance is managed based on market-facing businesses, including:
• Global Corporate• North America Commercial• Europe, Middle East & Africa (EMEA)• Latin America• Asia-Pacific
For external reporting purposes Latin America and Asia-Pacific are aggregated into International Markets.
From January 1, 2014, the General Insurance business manages Middle East and Africa together with Europe to form a single market-facing business called Europe, Middle East & Africa (EMEA). This change had no impact on total General Insurance or the Group.
Global Life is managed on a regional-based structure within a global framework, including:
• North America• Latin America• Europe• Asia-Pacific and Middle East
From January 1, 2015, the Global Life business will change its regional structure by establishing the regions Europe, Middle East & Africa (EMEA) and Asia Pacific. EMEA will include the current European business units, Zurich International Life and Luxembourg. This change has no impact on total Global Life or the Group.
Q4_2014_12_AR14_104_Consolidated_financial_statements_en.indd 240 23.02.2015 16:37:50
Zurich Insurance Group Annual Report 2014 241Consolidated financial statements
Finan
cial inform
ation
Business operating profitThe segment information includes the Group’s internal performance measure, business operating profit (BOP). This measure is the basis on which the Group manages all of its business units. It indicates the underlying performance of the Group’s business units, after non-controlling interests, by eliminating the impact of financial market volatility and other non-operational variables. BOP reflects adjustments for shareholders’ taxes, net capital gains/(losses) and impairments on investments (except for the capital markets and property lending/banking operations included in Non-Core Businesses, investments in hedge funds, certain securities held for specific economic hedging purposes and policyholders’ share of investment results for the life businesses) and non-operational foreign exchange movements. Significant items arising from special circumstances, including restructuring charges, charges for litigation outside the ordinary course of business, gains and losses on divestments of businesses, impairments of goodwill and the change n estimates of earn-out liabilities (with the exception of experience adjustments, which remain in BOP) are also excluded from BOP.
Q4_2014_12_AR14_104_Consolidated_financial_statements_en.indd 241 23.02.2015 16:37:50
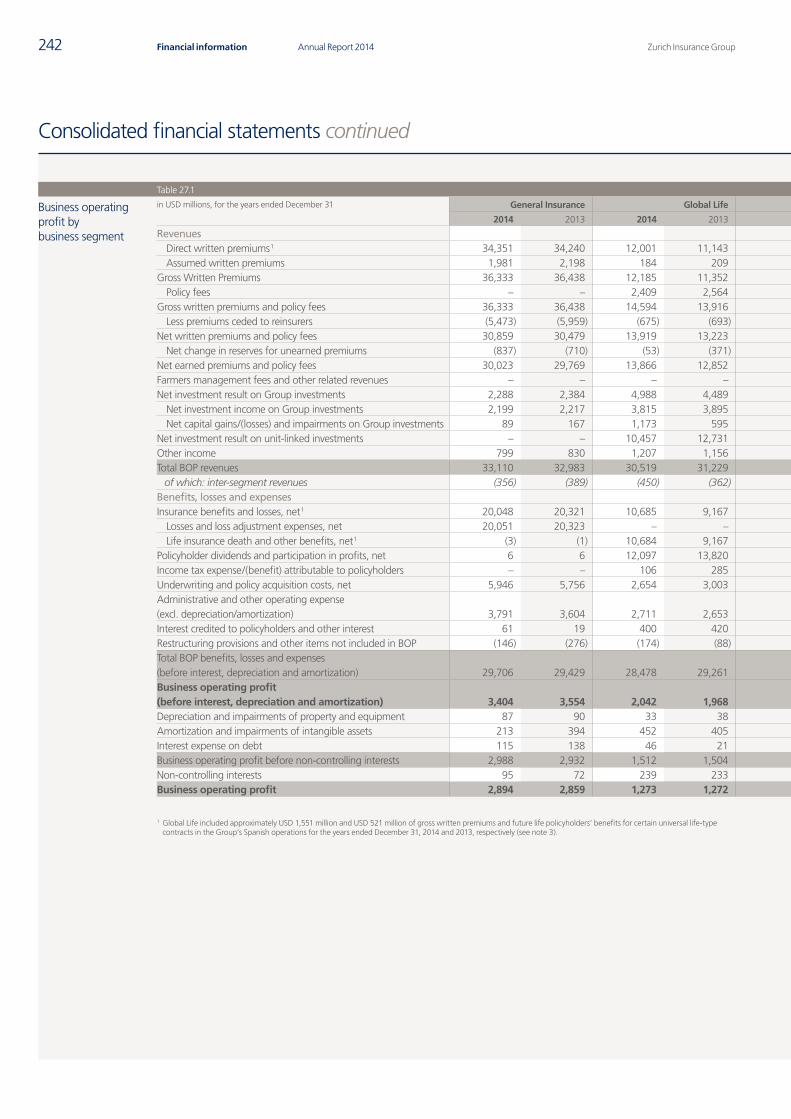
Zurich Insurance GroupAnnual Report 2014242 Financial information
Consolidated financial statements continued
Table 27.1
Business operating profit by business segment
in USD millions, for the years ended December 31 General Insurance Global Life Farmers Other Operating Businesses Non-Core Businesses Eliminations Total
2014 2013 2014 2013 2014 2013 2014 2013 2014 2013 2014 2013 2014 2013
RevenuesDirect written premiums 1 34,351 34,240 12,001 11,143 – – – – 95 113 – – 46,448 45,496Assumed written premiums 1,981 2,198 184 209 3,428 4,045 45 109 92 102 (110) (194) 5,621 6,469
Gross Written Premiums 36,333 36,438 12,185 11,352 3,428 4,045 45 109 188 215 (110) (194) 52,069 51,965Policy fees – – 2,409 2,564 – – – – 303 320 – – 2,712 2,884
Gross written premiums and policy fees 36,333 36,438 14,594 13,916 3,428 4,045 45 109 491 535 (110) (194) 54,781 54,849Less premiums ceded to reinsurers (5,473) (5,959) (675) (693) – – (47) (55) (16) (33) 110 194 (6,101) (6,546)
Net written premiums and policy fees 30,859 30,479 13,919 13,223 3,428 4,045 (2) 54 475 502 – – 48,680 48,303Net change in reserves for unearned premiums (837) (710) (53) (371) 528 54 – – 3 1 – – (359) (1,025)
Net earned premiums and policy fees 30,023 29,769 13,866 12,852 3,956 4,099 (2) 54 478 504 – – 48,321 47,277Farmers management fees and other related revenues – – – – 2,791 2,810 – – – – – – 2,791 2,810Net investment result on Group investments 2,288 2,384 4,988 4,489 68 107 387 315 712 (439) (628) (602) 7,816 6,254
Net investment income on Group investments 2,199 2,217 3,815 3,895 68 107 387 315 365 309 (628) (602) 6,206 6,240Net capital gains/(losses) and impairments on Group investments 89 167 1,173 595 – – – – 347 (748) – – 1,610 14
Net investment result on unit-linked investments – – 10,457 12,731 – – – – 327 73 – – 10,784 12,805Other income 799 830 1,207 1,156 99 80 847 730 47 144 (1,276) (1,183) 1,723 1,757Total BOP revenues 33,110 32,983 30,519 31,229 6,914 7,095 1,233 1,099 1,563 282 (1,904) (1,785) 71,435 70,903
of which: inter-segment revenues (356) (389) (450) (362) (30) (64) (1,022) (919) (46) (51) 1,904 1,785 – –Benefits, losses and expensesInsurance benefits and losses, net 1 20,048 20,321 10,685 9,167 2,650 2,823 (7) 49 988 (162) – – 34,364 32,198
Losses and loss adjustment expenses, net 20,051 20,323 – – 2,650 2,823 (1) – 171 (18) – – 22,871 23,128Life insurance death and other benefits, net 1 (3) (1) 10,684 9,167 – – (6) 49 817 (144) – – 11,492 9,070
Policyholder dividends and participation in profits, net 6 6 12,097 13,820 – – – – 465 121 – – 12,568 13,946Income tax expense/(benefit) attributable to policyholders – – 106 285 – – – – – – – – 106 285Underwriting and policy acquisition costs, net 5,946 5,756 2,654 3,003 1,240 1,285 – – 6 6 (10) (10) 9,835 10,041Administrative and other operating expense (excl. depreciation/amortization) 3,791 3,604 2,711 2,653 1,315 1,343 1,169 993 108 132 (1,198) (1,119) 7,897 7,607Interest credited to policyholders and other interest 61 19 400 420 – – 3 4 126 91 (68) (23) 523 510Restructuring provisions and other items not included in BOP (146) (276) (174) (88) 3 (12) (38) (63) – 2 – – (355) (437)Total BOP benefits, losses and expenses (before interest, depreciation and amortization) 29,706 29,429 28,478 29,261 5,208 5,440 1,128 984 1,693 189 (1,275) (1,151) 64,938 64,151Business operating profit (before interest, depreciation and amortization) 3,404 3,554 2,042 1,968 1,706 1,655 105 115 (130) 93 (629) (634) 6,497 6,752Depreciation and impairments of property and equipment 87 90 33 38 46 48 7 10 – 1 – – 173 186Amortization and impairments of intangible assets 213 394 452 405 86 91 89 121 – – – – 840 1,011Interest expense on debt 115 138 46 21 – 1 982 1,040 11 20 (629) (634) 525 586Business operating profit before non-controlling interests 2,988 2,932 1,512 1,504 1,573 1,516 (973) (1,056) (141) 72 – – 4,959 4,968Non-controlling interests 95 72 239 233 – – (13) (16) 1 – – – 322 288Business operating profit 2,894 2,859 1,273 1,272 1,573 1,516 (960) (1,039) (142) 73 – – 4,638 4,680
1 Global Life included approximately USD 1,551 million and USD 521 million of gross written premiums and future life policyholders‘ benefits for certain universal life-type contracts in the Group’s Spanish operations for the years ended December 31, 2014 and 2013, respectively (see note 3).
Q4_2014_12_AR14_104_Consolidated_financial_statements_en.indd 242 23.02.2015 16:37:51
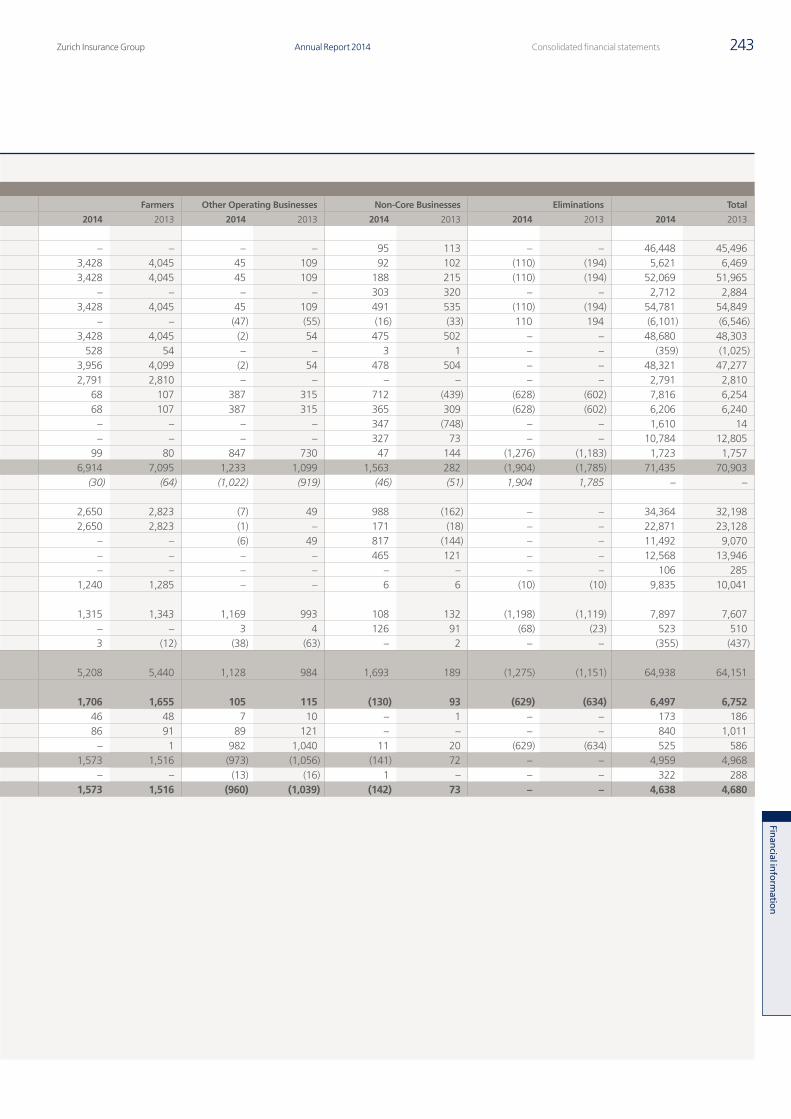
Zurich Insurance Group Annual Report 2014 243Consolidated financial statements
Finan
cial inform
ation
Table 27.1
Business operating profit by business segment
in USD millions, for the years ended December 31 General Insurance Global Life Farmers Other Operating Businesses Non-Core Businesses Eliminations Total
2014 2013 2014 2013 2014 2013 2014 2013 2014 2013 2014 2013 2014 2013
RevenuesDirect written premiums 1 34,351 34,240 12,001 11,143 – – – – 95 113 – – 46,448 45,496Assumed written premiums 1,981 2,198 184 209 3,428 4,045 45 109 92 102 (110) (194) 5,621 6,469
Gross Written Premiums 36,333 36,438 12,185 11,352 3,428 4,045 45 109 188 215 (110) (194) 52,069 51,965Policy fees – – 2,409 2,564 – – – – 303 320 – – 2,712 2,884
Gross written premiums and policy fees 36,333 36,438 14,594 13,916 3,428 4,045 45 109 491 535 (110) (194) 54,781 54,849Less premiums ceded to reinsurers (5,473) (5,959) (675) (693) – – (47) (55) (16) (33) 110 194 (6,101) (6,546)
Net written premiums and policy fees 30,859 30,479 13,919 13,223 3,428 4,045 (2) 54 475 502 – – 48,680 48,303Net change in reserves for unearned premiums (837) (710) (53) (371) 528 54 – – 3 1 – – (359) (1,025)
Net earned premiums and policy fees 30,023 29,769 13,866 12,852 3,956 4,099 (2) 54 478 504 – – 48,321 47,277Farmers management fees and other related revenues – – – – 2,791 2,810 – – – – – – 2,791 2,810Net investment result on Group investments 2,288 2,384 4,988 4,489 68 107 387 315 712 (439) (628) (602) 7,816 6,254
Net investment income on Group investments 2,199 2,217 3,815 3,895 68 107 387 315 365 309 (628) (602) 6,206 6,240Net capital gains/(losses) and impairments on Group investments 89 167 1,173 595 – – – – 347 (748) – – 1,610 14
Net investment result on unit-linked investments – – 10,457 12,731 – – – – 327 73 – – 10,784 12,805Other income 799 830 1,207 1,156 99 80 847 730 47 144 (1,276) (1,183) 1,723 1,757Total BOP revenues 33,110 32,983 30,519 31,229 6,914 7,095 1,233 1,099 1,563 282 (1,904) (1,785) 71,435 70,903
of which: inter-segment revenues (356) (389) (450) (362) (30) (64) (1,022) (919) (46) (51) 1,904 1,785 – –Benefits, losses and expensesInsurance benefits and losses, net 1 20,048 20,321 10,685 9,167 2,650 2,823 (7) 49 988 (162) – – 34,364 32,198
Losses and loss adjustment expenses, net 20,051 20,323 – – 2,650 2,823 (1) – 171 (18) – – 22,871 23,128Life insurance death and other benefits, net 1 (3) (1) 10,684 9,167 – – (6) 49 817 (144) – – 11,492 9,070
Policyholder dividends and participation in profits, net 6 6 12,097 13,820 – – – – 465 121 – – 12,568 13,946Income tax expense/(benefit) attributable to policyholders – – 106 285 – – – – – – – – 106 285Underwriting and policy acquisition costs, net 5,946 5,756 2,654 3,003 1,240 1,285 – – 6 6 (10) (10) 9,835 10,041Administrative and other operating expense (excl. depreciation/amortization) 3,791 3,604 2,711 2,653 1,315 1,343 1,169 993 108 132 (1,198) (1,119) 7,897 7,607Interest credited to policyholders and other interest 61 19 400 420 – – 3 4 126 91 (68) (23) 523 510Restructuring provisions and other items not included in BOP (146) (276) (174) (88) 3 (12) (38) (63) – 2 – – (355) (437)Total BOP benefits, losses and expenses (before interest, depreciation and amortization) 29,706 29,429 28,478 29,261 5,208 5,440 1,128 984 1,693 189 (1,275) (1,151) 64,938 64,151Business operating profit (before interest, depreciation and amortization) 3,404 3,554 2,042 1,968 1,706 1,655 105 115 (130) 93 (629) (634) 6,497 6,752Depreciation and impairments of property and equipment 87 90 33 38 46 48 7 10 – 1 – – 173 186Amortization and impairments of intangible assets 213 394 452 405 86 91 89 121 – – – – 840 1,011Interest expense on debt 115 138 46 21 – 1 982 1,040 11 20 (629) (634) 525 586Business operating profit before non-controlling interests 2,988 2,932 1,512 1,504 1,573 1,516 (973) (1,056) (141) 72 – – 4,959 4,968Non-controlling interests 95 72 239 233 – – (13) (16) 1 – – – 322 288Business operating profit 2,894 2,859 1,273 1,272 1,573 1,516 (960) (1,039) (142) 73 – – 4,638 4,680
1 Global Life included approximately USD 1,551 million and USD 521 million of gross written premiums and future life policyholders‘ benefits for certain universal life-type contracts in the Group’s Spanish operations for the years ended December 31, 2014 and 2013, respectively (see note 3).
Q4_2014_12_AR14_104_Consolidated_financial_statements_en.indd 243 23.02.2015 16:37:52
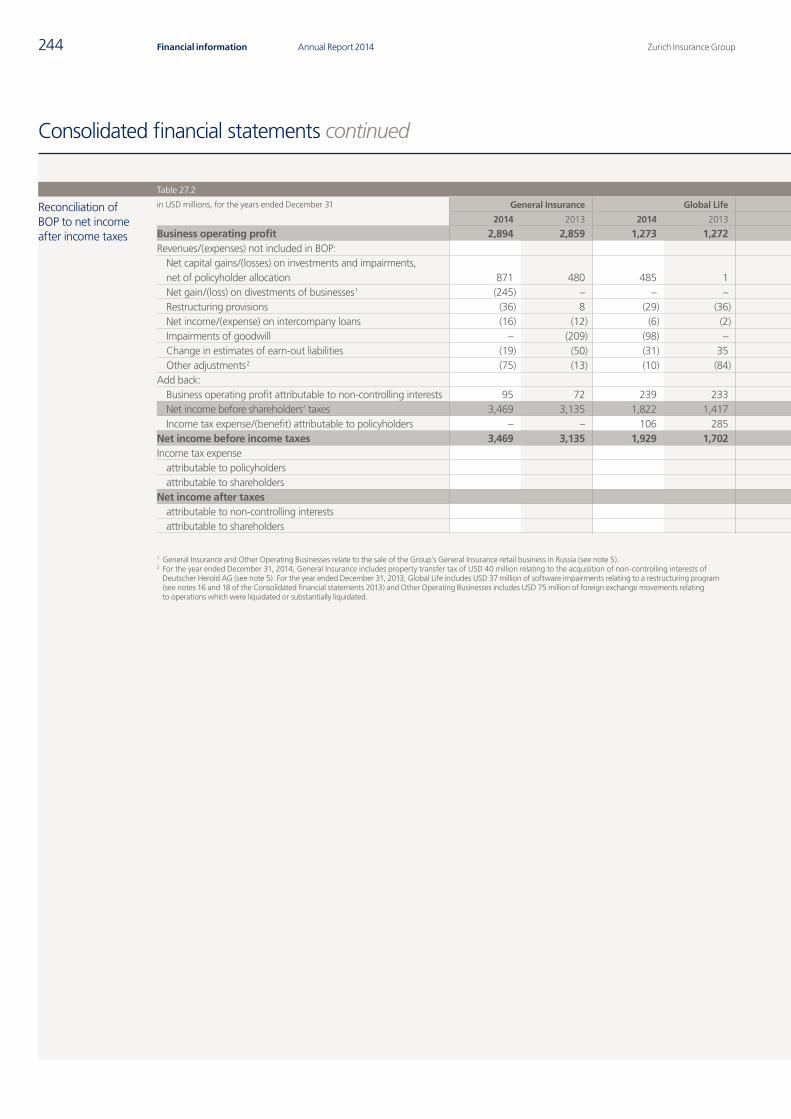
Zurich Insurance GroupAnnual Report 2014244 Financial information
Consolidated financial statements continued
Table 27.2
Reconciliation of BOP to net income after income taxes
in USD millions, for the years ended December 31 General Insurance Global Life Farmers Other Operating Businesses Non-Core Businesses Total
2014 2013 2014 2013 2014 2013 2014 2013 2014 2013 2014 2013
Business operating profit 2,894 2,859 1,273 1,272 1,573 1,516 (960) (1,039) (142) 73 4,638 4,680Revenues/(expenses) not included in BOP:
Net capital gains/(losses) on investments and impairments, net of policyholder allocation 871 480 485 1 34 6 (1) 645 4 12 1,393 1,144Net gain/(loss) on divestments of businesses 1 (245) – – – – – (2) (1) (13) – (259) (1)Restructuring provisions (36) 8 (29) (36) 2 (12) (34) (2) – 1 (97) (41)Net income/(expense) on intercompany loans (16) (12) (6) (2) – – 22 14 – – – –Impairments of goodwill – (209) (98) – – – – – – – (98) (209)Change in estimates of earn-out liabilities (19) (50) (31) 35 – – – – – – (50) (16)Other adjustments 2 (75) (13) (10) (84) 1 – (26) (74) – – (110) (172)
Add back:Business operating profit attributable to non-controlling interests 95 72 239 233 – – (13) (16) 1 – 322 288Net income before shareholders’ taxes 3,469 3,135 1,822 1,417 1,611 1,510 (1,015) (474) (150) 86 5,738 5,674Income tax expense/(benefit) attributable to policyholders – – 106 285 – – – – – – 106 285
Net income before income taxes 3,469 3,135 1,929 1,702 1,611 1,510 (1,015) (474) (150) 86 5,844 5,960Income tax expense (1,670) (1,701)
attributable to policyholders (106) (285)attributable to shareholders (1,564) (1,415)
Net income after taxes 4,174 4,259attributable to non-controlling interests 280 231attributable to shareholders 3,895 4,028
1 General Insurance and Other Operating Businesses relate to the sale of the Group’s General Insurance retail business in Russia (see note 5).2 For the year ended December 31, 2014, General Insurance includes property transfer tax of USD 40 million relating to the acquisition of non-controlling interests of
Deutscher Herold AG (see note 5). For the year ended December 31, 2013, Global Life includes USD 37 million of software impairments relating to a restructuring program (see notes 16 and 18 of the Consolidated financial statements 2013) and Other Operating Businesses includes USD 75 million of foreign exchange movements relating to operations which were liquidated or substantially liquidated.
Q4_2014_12_AR14_104_Consolidated_financial_statements_en.indd 244 23.02.2015 16:37:53
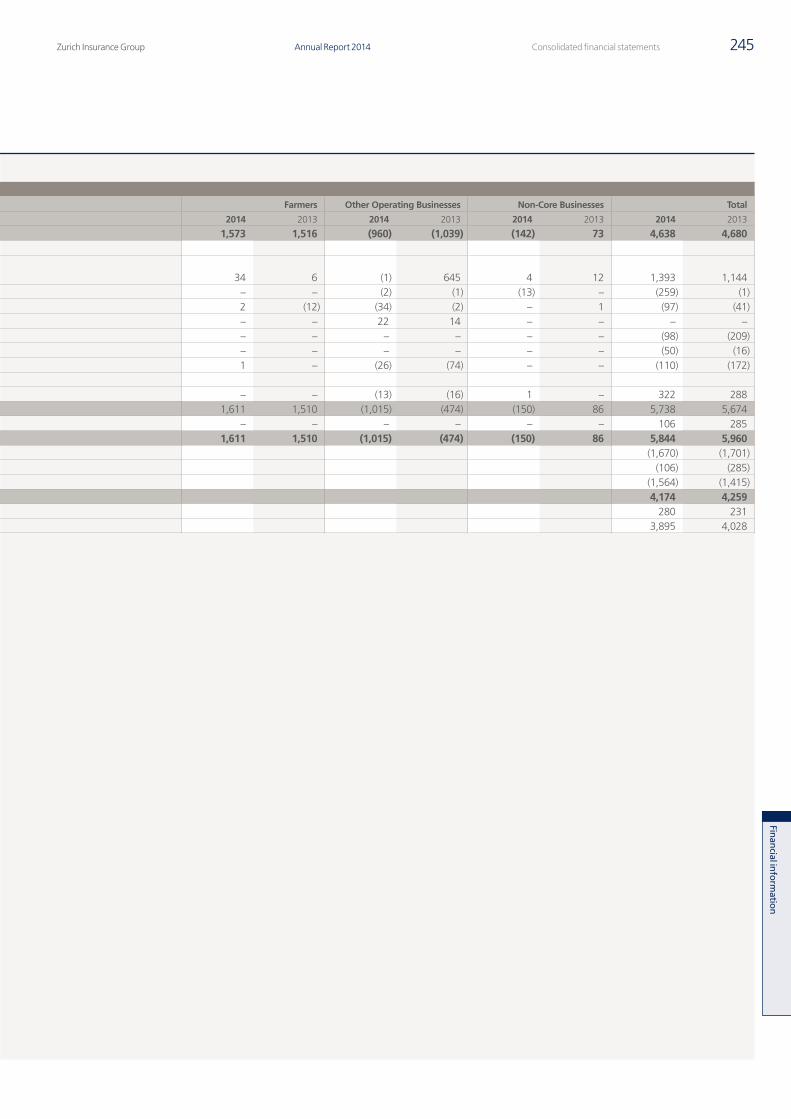
Zurich Insurance Group Annual Report 2014 245Consolidated financial statements
Finan
cial inform
ation
Table 27.2
Reconciliation of BOP to net income after income taxes
in USD millions, for the years ended December 31 General Insurance Global Life Farmers Other Operating Businesses Non-Core Businesses Total
2014 2013 2014 2013 2014 2013 2014 2013 2014 2013 2014 2013
Business operating profit 2,894 2,859 1,273 1,272 1,573 1,516 (960) (1,039) (142) 73 4,638 4,680Revenues/(expenses) not included in BOP:
Net capital gains/(losses) on investments and impairments, net of policyholder allocation 871 480 485 1 34 6 (1) 645 4 12 1,393 1,144Net gain/(loss) on divestments of businesses 1 (245) – – – – – (2) (1) (13) – (259) (1)Restructuring provisions (36) 8 (29) (36) 2 (12) (34) (2) – 1 (97) (41)Net income/(expense) on intercompany loans (16) (12) (6) (2) – – 22 14 – – – –Impairments of goodwill – (209) (98) – – – – – – – (98) (209)Change in estimates of earn-out liabilities (19) (50) (31) 35 – – – – – – (50) (16)Other adjustments 2 (75) (13) (10) (84) 1 – (26) (74) – – (110) (172)
Add back:Business operating profit attributable to non-controlling interests 95 72 239 233 – – (13) (16) 1 – 322 288Net income before shareholders’ taxes 3,469 3,135 1,822 1,417 1,611 1,510 (1,015) (474) (150) 86 5,738 5,674Income tax expense/(benefit) attributable to policyholders – – 106 285 – – – – – – 106 285
Net income before income taxes 3,469 3,135 1,929 1,702 1,611 1,510 (1,015) (474) (150) 86 5,844 5,960Income tax expense (1,670) (1,701)
attributable to policyholders (106) (285)attributable to shareholders (1,564) (1,415)
Net income after taxes 4,174 4,259attributable to non-controlling interests 280 231attributable to shareholders 3,895 4,028
1 General Insurance and Other Operating Businesses relate to the sale of the Group’s General Insurance retail business in Russia (see note 5).2 For the year ended December 31, 2014, General Insurance includes property transfer tax of USD 40 million relating to the acquisition of non-controlling interests of
Deutscher Herold AG (see note 5). For the year ended December 31, 2013, Global Life includes USD 37 million of software impairments relating to a restructuring program (see notes 16 and 18 of the Consolidated financial statements 2013) and Other Operating Businesses includes USD 75 million of foreign exchange movements relating to operations which were liquidated or substantially liquidated.
Q4_2014_12_AR14_104_Consolidated_financial_statements_en.indd 245 23.02.2015 16:37:53
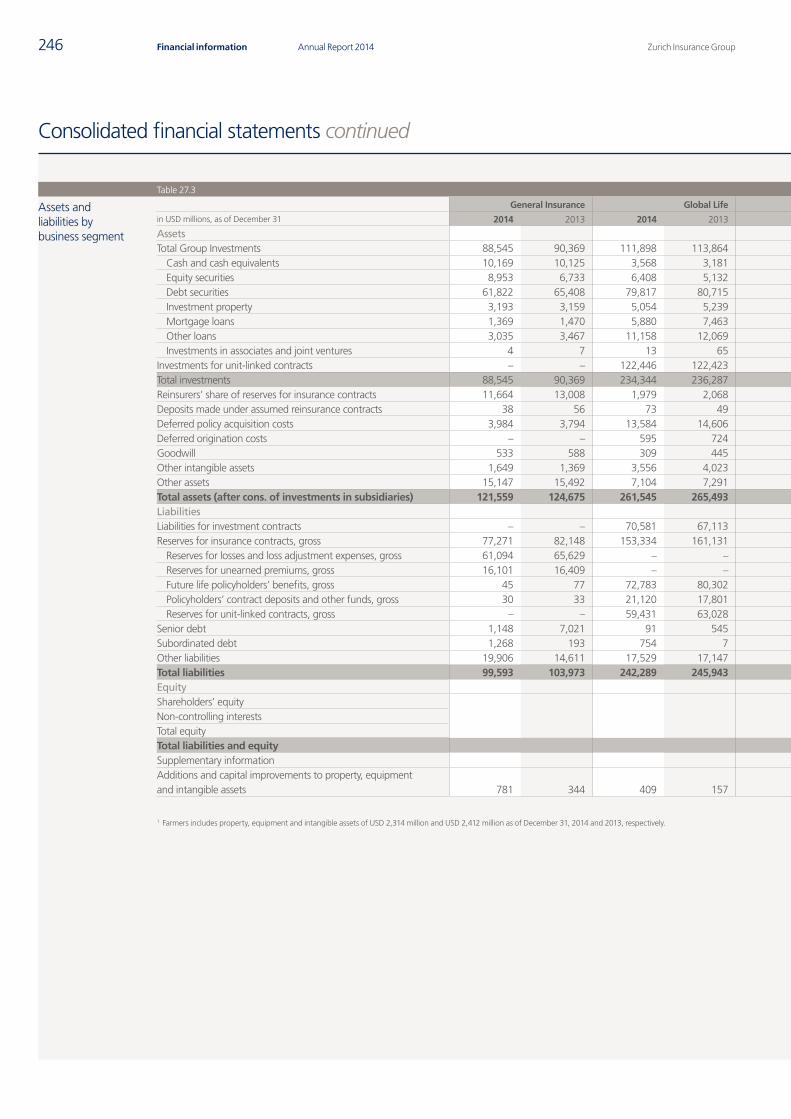
Zurich Insurance GroupAnnual Report 2014246 Financial information
Consolidated financial statements continued
Table 27.3
Assets and liabilities by business segment
General Insurance Global Life Farmers 1 Other Operating Businesses Non-Core Businesses Eliminations Total
in USD millions, as of December 31 2014 2013 2014 2013 2014 2013 2014 2013 2014 2013 2014 2013 2014 2013
AssetsTotal Group Investments 88,545 90,369 111,898 113,864 4,096 3,769 19,510 17,834 10,297 9,856 (29,486) (28,412) 204,860 207,280
Cash and cash equivalents 10,169 10,125 3,568 3,181 481 418 8,525 9,023 1,613 1,676 (16,755) (17,242) 7,600 7,181Equity securities 8,953 6,733 6,408 5,132 62 91 577 1,098 99 130 – – 16,099 13,183Debt securities 61,822 65,408 79,817 80,715 1,163 1,190 6,261 5,925 5,810 5,012 (1,224) (1,794) 153,648 156,456Investment property 3,193 3,159 5,054 5,239 74 76 209 – 254 272 – – 8,784 8,745Mortgage loans 1,369 1,470 5,880 7,463 – – – – 576 864 – – 7,826 9,798Other loans 3,035 3,467 11,158 12,069 2,317 1,995 3,887 1,733 1,943 1,901 (11,507) (9,376) 10,834 11,789Investments in associates and joint ventures 4 7 13 65 – – 51 55 2 2 – – 70 129
Investments for unit-linked contracts – – 122,446 122,423 – – – – 11,970 11,844 – – 134,416 134,267Total investments 88,545 90,369 234,344 236,287 4,096 3,769 19,510 17,834 22,267 21,701 (29,486) (28,412) 339,276 341,547Reinsurers’ share of reserves for insurance contracts 11,664 13,008 1,979 2,068 – – – – 3,011 3,013 (103) (111) 16,550 17,978Deposits made under assumed reinsurance contracts 38 56 73 49 1,952 2,376 – – 142 165 (2) (2) 2,203 2,645Deferred policy acquisition costs 3,984 3,794 13,584 14,606 182 323 – – – – – – 17,750 18,724Deferred origination costs – – 595 724 – – – – – – – – 595 724Goodwill 533 588 309 445 819 819 – – – – – – 1,661 1,852Other intangible assets 1,649 1,369 3,556 4,023 1,354 1,368 195 268 – – – – 6,754 7,028Other assets 15,147 15,492 7,104 7,291 599 985 1,021 1,662 1,864 1,324 (3,995) (2,198) 21,740 24,556Total assets (after cons. of investments in subsidiaries) 121,559 124,675 261,545 265,493 9,002 9,640 20,726 19,765 27,284 26,203 (33,586) (30,723) 406,529 415,053LiabilitiesLiabilities for investment contracts – – 70,581 67,113 – – – – 232 – – – 70,813 67,113Reserves for insurance contracts, gross 77,271 82,148 153,334 161,131 2,231 2,820 31 35 20,957 19,416 (104) (111) 253,719 265,440
Reserves for losses and loss adjustment expenses, gross 61,094 65,629 – – 1,551 1,612 26 27 1,886 1,119 (84) (75) 64,472 68,312Reserves for unearned premiums, gross 16,101 16,409 – – 680 1,208 3 3 14 17 (19) (21) 16,779 17,616Future life policyholders’ benefits, gross 45 77 72,783 80,302 – – 2 5 4,823 4,107 – (14) 77,652 84,476Policyholders’ contract deposits and other funds, gross 30 33 21,120 17,801 – – – – 2,265 2,328 (1) – 23,415 20,162Reserves for unit-linked contracts, gross – – 59,431 63,028 – – – – 11,970 11,844 – – 71,400 74,873
Senior debt 1,148 7,021 91 545 – 172 13,257 24,251 514 1,668 (9,631) (27,612) 5,379 6,044Subordinated debt 1,268 193 754 7 – – 6,615 6,268 23 23 (2,803) (149) 5,857 6,342Other liabilities 19,906 14,611 17,529 17,147 1,427 1,175 11,998 1,830 4,120 3,467 (21,048) (2,850) 33,932 35,380Total liabilities 99,593 103,973 242,289 245,943 3,658 4,167 31,900 32,385 25,846 24,574 (33,586) (30,723) 369,700 380,319EquityShareholders’ equity 34,735 32,503Non-controlling interests 2,095 2,231Total equity 36,830 34,734Total liabilities and equity 406,529 415,053Supplementary informationAdditions and capital improvements to property, equipment and intangible assets 781 344 409 157 144 169 51 81 – – – – 1,384 752
1 Farmers includes property, equipment and intangible assets of USD 2,314 million and USD 2,412 million as of December 31, 2014 and 2013, respectively.
Q4_2014_12_AR14_104_Consolidated_financial_statements_en.indd 246 23.02.2015 16:37:55
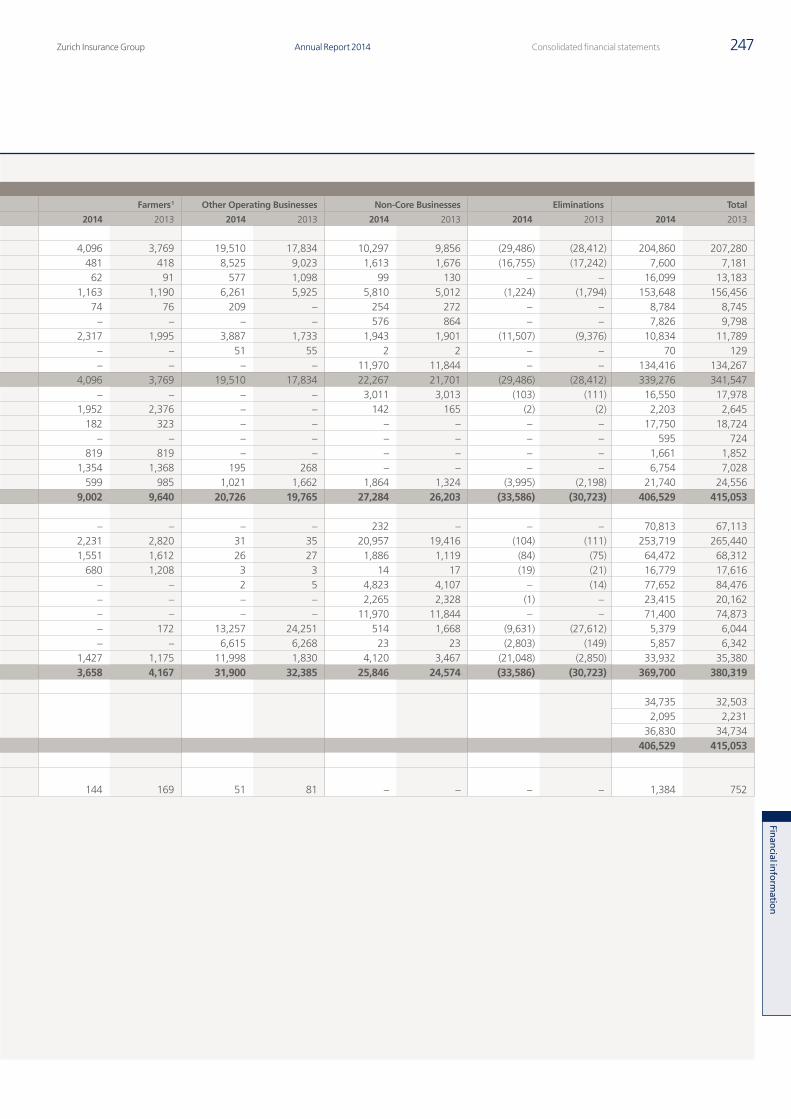
Zurich Insurance Group Annual Report 2014 247Consolidated financial statements
Finan
cial inform
ation
Table 27.3
Assets and liabilities by business segment
General Insurance Global Life Farmers 1 Other Operating Businesses Non-Core Businesses Eliminations Total
in USD millions, as of December 31 2014 2013 2014 2013 2014 2013 2014 2013 2014 2013 2014 2013 2014 2013
AssetsTotal Group Investments 88,545 90,369 111,898 113,864 4,096 3,769 19,510 17,834 10,297 9,856 (29,486) (28,412) 204,860 207,280
Cash and cash equivalents 10,169 10,125 3,568 3,181 481 418 8,525 9,023 1,613 1,676 (16,755) (17,242) 7,600 7,181Equity securities 8,953 6,733 6,408 5,132 62 91 577 1,098 99 130 – – 16,099 13,183Debt securities 61,822 65,408 79,817 80,715 1,163 1,190 6,261 5,925 5,810 5,012 (1,224) (1,794) 153,648 156,456Investment property 3,193 3,159 5,054 5,239 74 76 209 – 254 272 – – 8,784 8,745Mortgage loans 1,369 1,470 5,880 7,463 – – – – 576 864 – – 7,826 9,798Other loans 3,035 3,467 11,158 12,069 2,317 1,995 3,887 1,733 1,943 1,901 (11,507) (9,376) 10,834 11,789Investments in associates and joint ventures 4 7 13 65 – – 51 55 2 2 – – 70 129
Investments for unit-linked contracts – – 122,446 122,423 – – – – 11,970 11,844 – – 134,416 134,267Total investments 88,545 90,369 234,344 236,287 4,096 3,769 19,510 17,834 22,267 21,701 (29,486) (28,412) 339,276 341,547Reinsurers’ share of reserves for insurance contracts 11,664 13,008 1,979 2,068 – – – – 3,011 3,013 (103) (111) 16,550 17,978Deposits made under assumed reinsurance contracts 38 56 73 49 1,952 2,376 – – 142 165 (2) (2) 2,203 2,645Deferred policy acquisition costs 3,984 3,794 13,584 14,606 182 323 – – – – – – 17,750 18,724Deferred origination costs – – 595 724 – – – – – – – – 595 724Goodwill 533 588 309 445 819 819 – – – – – – 1,661 1,852Other intangible assets 1,649 1,369 3,556 4,023 1,354 1,368 195 268 – – – – 6,754 7,028Other assets 15,147 15,492 7,104 7,291 599 985 1,021 1,662 1,864 1,324 (3,995) (2,198) 21,740 24,556Total assets (after cons. of investments in subsidiaries) 121,559 124,675 261,545 265,493 9,002 9,640 20,726 19,765 27,284 26,203 (33,586) (30,723) 406,529 415,053LiabilitiesLiabilities for investment contracts – – 70,581 67,113 – – – – 232 – – – 70,813 67,113Reserves for insurance contracts, gross 77,271 82,148 153,334 161,131 2,231 2,820 31 35 20,957 19,416 (104) (111) 253,719 265,440
Reserves for losses and loss adjustment expenses, gross 61,094 65,629 – – 1,551 1,612 26 27 1,886 1,119 (84) (75) 64,472 68,312Reserves for unearned premiums, gross 16,101 16,409 – – 680 1,208 3 3 14 17 (19) (21) 16,779 17,616Future life policyholders’ benefits, gross 45 77 72,783 80,302 – – 2 5 4,823 4,107 – (14) 77,652 84,476Policyholders’ contract deposits and other funds, gross 30 33 21,120 17,801 – – – – 2,265 2,328 (1) – 23,415 20,162Reserves for unit-linked contracts, gross – – 59,431 63,028 – – – – 11,970 11,844 – – 71,400 74,873
Senior debt 1,148 7,021 91 545 – 172 13,257 24,251 514 1,668 (9,631) (27,612) 5,379 6,044Subordinated debt 1,268 193 754 7 – – 6,615 6,268 23 23 (2,803) (149) 5,857 6,342Other liabilities 19,906 14,611 17,529 17,147 1,427 1,175 11,998 1,830 4,120 3,467 (21,048) (2,850) 33,932 35,380Total liabilities 99,593 103,973 242,289 245,943 3,658 4,167 31,900 32,385 25,846 24,574 (33,586) (30,723) 369,700 380,319EquityShareholders’ equity 34,735 32,503Non-controlling interests 2,095 2,231Total equity 36,830 34,734Total liabilities and equity 406,529 415,053Supplementary informationAdditions and capital improvements to property, equipment and intangible assets 781 344 409 157 144 169 51 81 – – – – 1,384 752
1 Farmers includes property, equipment and intangible assets of USD 2,314 million and USD 2,412 million as of December 31, 2014 and 2013, respectively.
Q4_2014_12_AR14_104_Consolidated_financial_statements_en.indd 247 23.02.2015 16:37:56
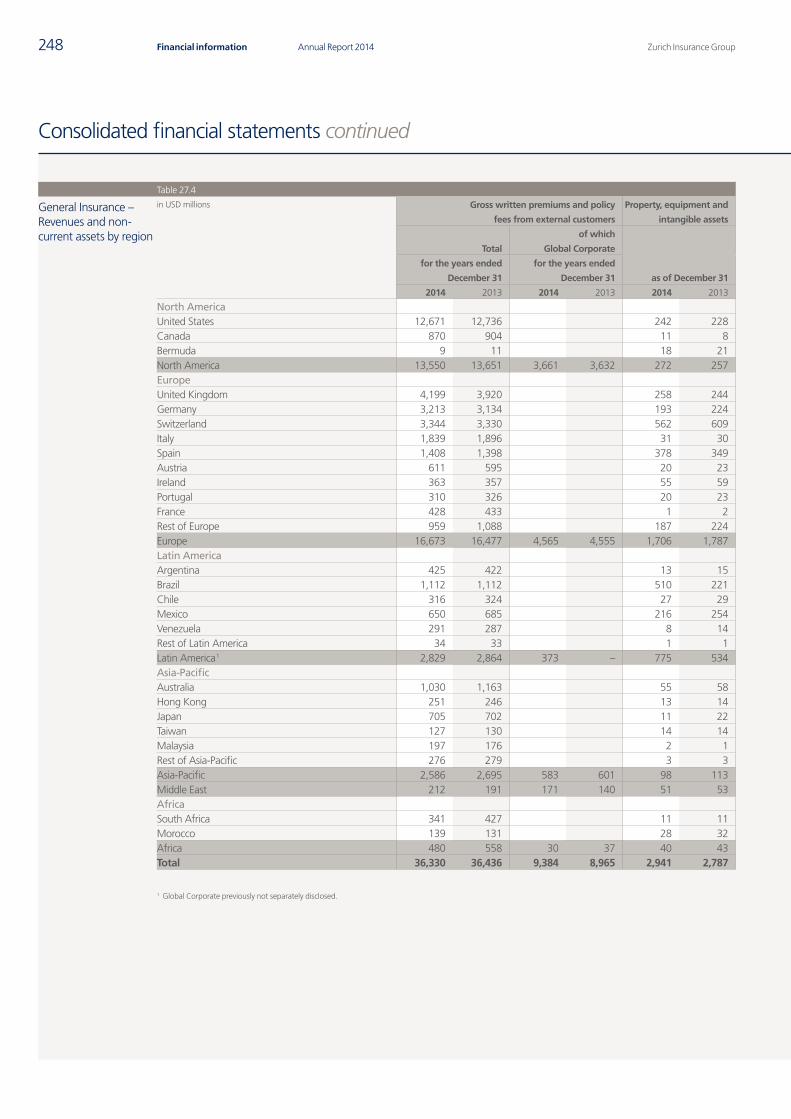
Zurich Insurance GroupAnnual Report 2014248 Financial information
Consolidated financial statements continued
Table 27.4
General Insurance – Revenues and non-current assets by region
in USD millions Gross written premiums and policy
fees from external customers
Property, equipment and
intangible assets
Total
of which
Global Corporate
for the years ended
December 31
for the years ended
December 31 as of December 31
2014 2013 2014 2013 2014 2013
North America United States 12,671 12,736 242 228Canada 870 904 11 8Bermuda 9 11 18 21North America 13,550 13,651 3,661 3,632 272 257EuropeUnited Kingdom 4,199 3,920 258 244Germany 3,213 3,134 193 224Switzerland 3,344 3,330 562 609Italy 1,839 1,896 31 30Spain 1,408 1,398 378 349Austria 611 595 20 23Ireland 363 357 55 59Portugal 310 326 20 23France 428 433 1 2Rest of Europe 959 1,088 187 224Europe 16,673 16,477 4,565 4,555 1,706 1,787Latin AmericaArgentina 425 422 13 15Brazil 1,112 1,112 510 221Chile 316 324 27 29Mexico 650 685 216 254Venezuela 291 287 8 14Rest of Latin America 34 33 1 1Latin America 1 2,829 2,864 373 – 775 534Asia-PacificAustralia 1,030 1,163 55 58Hong Kong 251 246 13 14Japan 705 702 11 22Taiwan 127 130 14 14Malaysia 197 176 2 1Rest of Asia-Pacific 276 279 3 3Asia-Pacific 2,586 2,695 583 601 98 113Middle East 212 191 171 140 51 53AfricaSouth Africa 341 427 11 11Morocco 139 131 28 32Africa 480 558 30 37 40 43Total 36,330 36,436 9,384 8,965 2,941 2,787
1 Global Corporate previously not separately disclosed.
Q4_2014_12_AR14_104_Consolidated_financial_statements_en.indd 248 23.02.2015 16:37:57
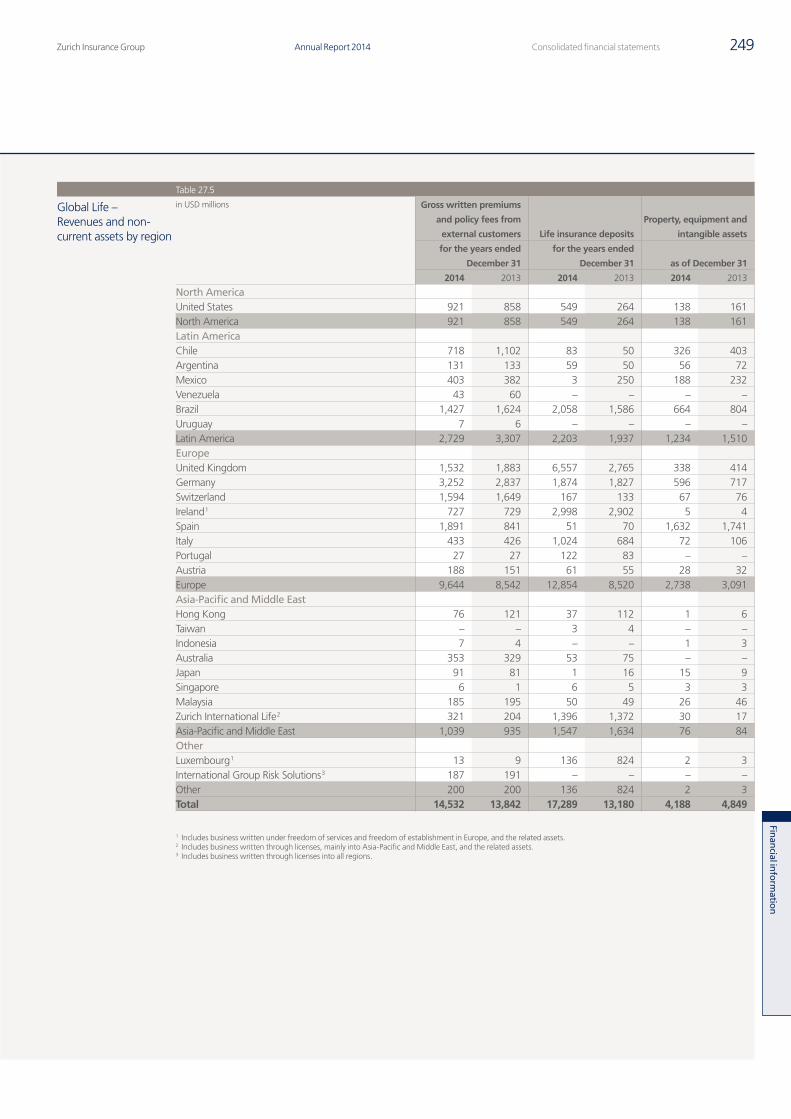
Zurich Insurance Group Annual Report 2014 249Consolidated financial statements
Finan
cial inform
ation
Table 27.5
Global Life – Revenues and non-current assets by region
in USD millions Gross written premiums
and policy fees from
external customers Life insurance deposits
Property, equipment and
intangible assets
for the years ended
December 31
for the years ended
December 31 as of December 31
2014 2013 2014 2013 2014 2013
North AmericaUnited States 921 858 549 264 138 161North America 921 858 549 264 138 161Latin AmericaChile 718 1,102 83 50 326 403Argentina 131 133 59 50 56 72Mexico 403 382 3 250 188 232Venezuela 43 60 – – – –Brazil 1,427 1,624 2,058 1,586 664 804Uruguay 7 6 – – – –Latin America 2,729 3,307 2,203 1,937 1,234 1,510EuropeUnited Kingdom 1,532 1,883 6,557 2,765 338 414Germany 3,252 2,837 1,874 1,827 596 717Switzerland 1,594 1,649 167 133 67 76Ireland 1 727 729 2,998 2,902 5 4Spain 1,891 841 51 70 1,632 1,741Italy 433 426 1,024 684 72 106Portugal 27 27 122 83 – –Austria 188 151 61 55 28 32Europe 9,644 8,542 12,854 8,520 2,738 3,091Asia-Pacific and Middle EastHong Kong 76 121 37 112 1 6Taiwan – – 3 4 – –Indonesia 7 4 – – 1 3Australia 353 329 53 75 – –Japan 91 81 1 16 15 9Singapore 6 1 6 5 3 3Malaysia 185 195 50 49 26 46Zurich International Life 2 321 204 1,396 1,372 30 17Asia-Pacific and Middle East 1,039 935 1,547 1,634 76 84OtherLuxembourg 1 13 9 136 824 2 3International Group Risk Solutions 3 187 191 – – – –Other 200 200 136 824 2 3Total 14,532 13,842 17,289 13,180 4,188 4,849
1 Includes business written under freedom of services and freedom of establishment in Europe, and the related assets.2 Includes business written through licenses, mainly into Asia-Pacific and Middle East, and the related assets.3 Includes business written through licenses into all regions.
Q4_2014_12_AR14_104_Consolidated_financial_statements_en.indd 249 23.02.2015 16:37:58
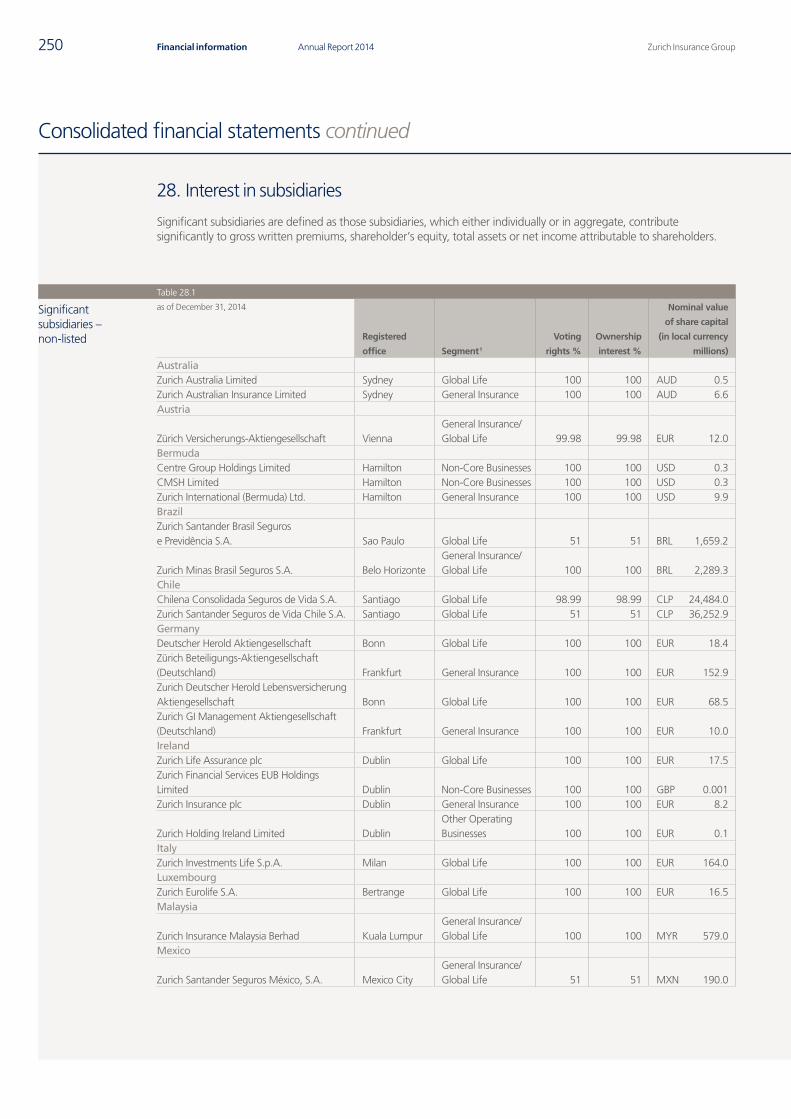
Zurich Insurance GroupAnnual Report 2014250 Financial information
Consolidated financial statements continued
28. Interest in subsidiaries
Significant subsidiaries are defined as those subsidiaries, which either individually or in aggregate, contribute significantly to gross written premiums, shareholder’s equity, total assets or net income attributable to shareholders.
Table 28.1
Significant subsidiaries – non-listed
as of December 31, 2014
Registered
office Segment 1
Voting
rights %
Ownership
interest %
Nominal value
of share capital
(in local currency
millions)
AustraliaZurich Australia Limited Sydney Global Life 100 100 AUD 0.5Zurich Australian Insurance Limited Sydney General Insurance 100 100 AUD 6.6Austria
Zürich Versicherungs-Aktiengesellschaft ViennaGeneral Insurance/Global Life 99.98 99.98 EUR 12.0
BermudaCentre Group Holdings Limited Hamilton Non-Core Businesses 100 100 USD 0.3CMSH Limited Hamilton Non-Core Businesses 100 100 USD 0.3Zurich International (Bermuda) Ltd. Hamilton General Insurance 100 100 USD 9.9BrazilZurich Santander Brasil Seguros e Previdência S.A. Sao Paulo Global Life 51 51 BRL 1,659.2
Zurich Minas Brasil Seguros S.A. Belo HorizonteGeneral Insurance/Global Life 100 100 BRL 2,289.3
ChileChilena Consolidada Seguros de Vida S.A. Santiago Global Life 98.99 98.99 CLP 24,484.0Zurich Santander Seguros de Vida Chile S.A. Santiago Global Life 51 51 CLP 36,252.9GermanyDeutscher Herold Aktiengesellschaft Bonn Global Life 100 100 EUR 18.4Zürich Beteiligungs-Aktiengesellschaft (Deutschland) Frankfurt General Insurance 100 100 EUR 152.9Zurich Deutscher Herold Lebensversicherung Aktiengesellschaft Bonn Global Life 100 100 EUR 68.5Zurich GI Management Aktiengesellschaft (Deutschland) Frankfurt General Insurance 100 100 EUR 10.0IrelandZurich Life Assurance plc Dublin Global Life 100 100 EUR 17.5Zurich Financial Services EUB Holdings Limited Dublin Non-Core Businesses 100 100 GBP 0.001Zurich Insurance plc Dublin General Insurance 100 100 EUR 8.2
Zurich Holding Ireland Limited DublinOther Operating Businesses 100 100 EUR 0.1
ItalyZurich Investments Life S.p.A. Milan Global Life 100 100 EUR 164.0LuxembourgZurich Eurolife S.A. Bertrange Global Life 100 100 EUR 16.5Malaysia
Zurich Insurance Malaysia Berhad Kuala LumpurGeneral Insurance/Global Life 100 100 MYR 579.0
Mexico
Zurich Santander Seguros México, S.A. Mexico CityGeneral Insurance/Global Life 51 51 MXN 190.0
Q4_2014_12_AR14_104_Consolidated_financial_statements_en.indd 250 23.02.2015 16:37:58
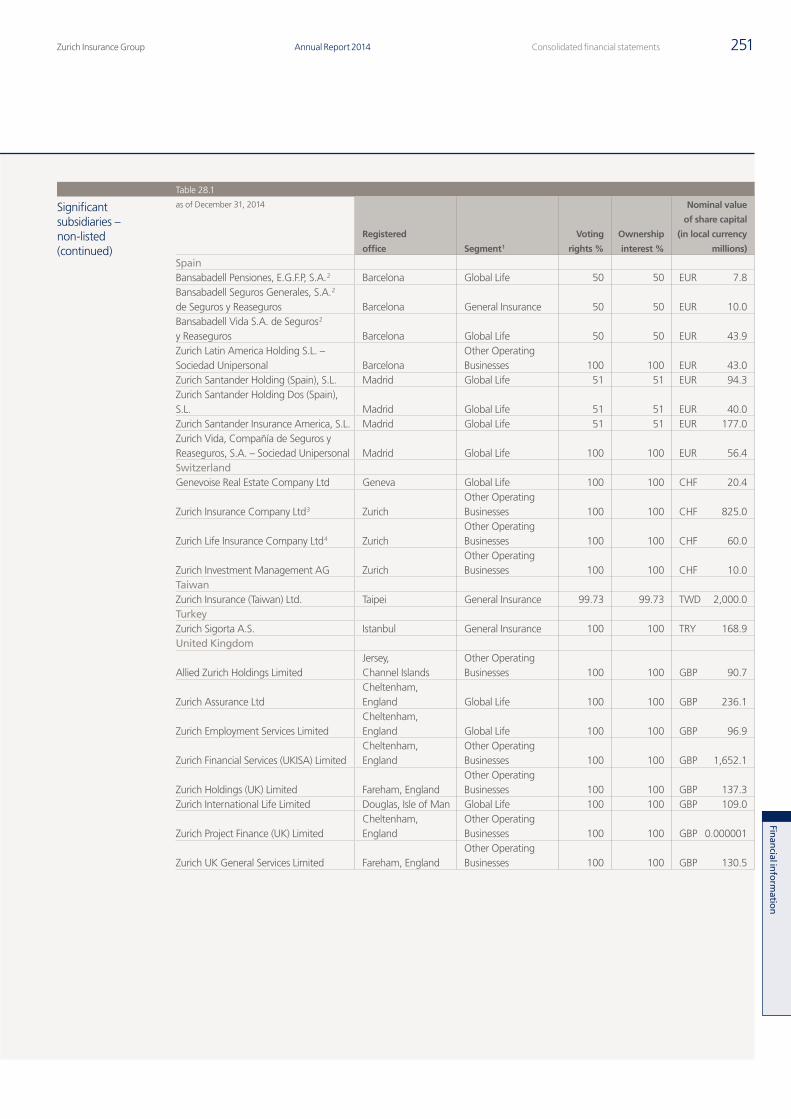
Zurich Insurance Group Annual Report 2014 251Consolidated financial statements
Finan
cial inform
ation
Table 28.1
Significant subsidiaries – non-listed (continued)
as of December 31, 2014
Registered
office Segment 1
Voting
rights %
Ownership
interest %
Nominal value
of share capital
(in local currency
millions)
SpainBansabadell Pensiones, E.G.F.P, S.A. 2 Barcelona Global Life 50 50 EUR 7.8Bansabadell Seguros Generales, S.A. 2 de Seguros y Reaseguros Barcelona General Insurance 50 50 EUR 10.0Bansabadell Vida S.A. de Seguros 2 y Reaseguros Barcelona Global Life 50 50 EUR 43.9Zurich Latin America Holding S.L. – Sociedad Unipersonal Barcelona
Other Operating Businesses 100 100 EUR 43.0
Zurich Santander Holding (Spain), S.L. Madrid Global Life 51 51 EUR 94.3Zurich Santander Holding Dos (Spain), S.L. Madrid Global Life 51 51 EUR 40.0Zurich Santander Insurance America, S.L. Madrid Global Life 51 51 EUR 177.0Zurich Vida, Compañía de Seguros y Reaseguros, S.A. – Sociedad Unipersonal Madrid Global Life 100 100 EUR 56.4SwitzerlandGenevoise Real Estate Company Ltd Geneva Global Life 100 100 CHF 20.4
Zurich Insurance Company Ltd 3 ZurichOther Operating Businesses 100 100 CHF 825.0
Zurich Life Insurance Company Ltd 4 ZurichOther Operating Businesses 100 100 CHF 60.0
Zurich Investment Management AG ZurichOther Operating Businesses 100 100 CHF 10.0
TaiwanZurich Insurance (Taiwan) Ltd. Taipei General Insurance 99.73 99.73 TWD 2,000.0TurkeyZurich Sigorta A.S. Istanbul General Insurance 100 100 TRY 168.9United Kingdom
Allied Zurich Holdings LimitedJersey, Channel Islands
Other Operating Businesses 100 100 GBP 90.7
Zurich Assurance LtdCheltenham, England Global Life 100 100 GBP 236.1
Zurich Employment Services LimitedCheltenham, England Global Life 100 100 GBP 96.9
Zurich Financial Services (UKISA) LimitedCheltenham, England
Other Operating Businesses 100 100 GBP 1,652.1
Zurich Holdings (UK) Limited Fareham, EnglandOther Operating Businesses 100 100 GBP 137.3
Zurich International Life Limited Douglas, Isle of Man Global Life 100 100 GBP 109.0
Zurich Project Finance (UK) LimitedCheltenham, England
Other Operating Businesses 100 100 GBP 0.000001
Zurich UK General Services Limited Fareham, EnglandOther Operating Businesses 100 100 GBP 130.5
Q4_2014_12_AR14_104_Consolidated_financial_statements_en.indd 251 23.02.2015 16:37:59
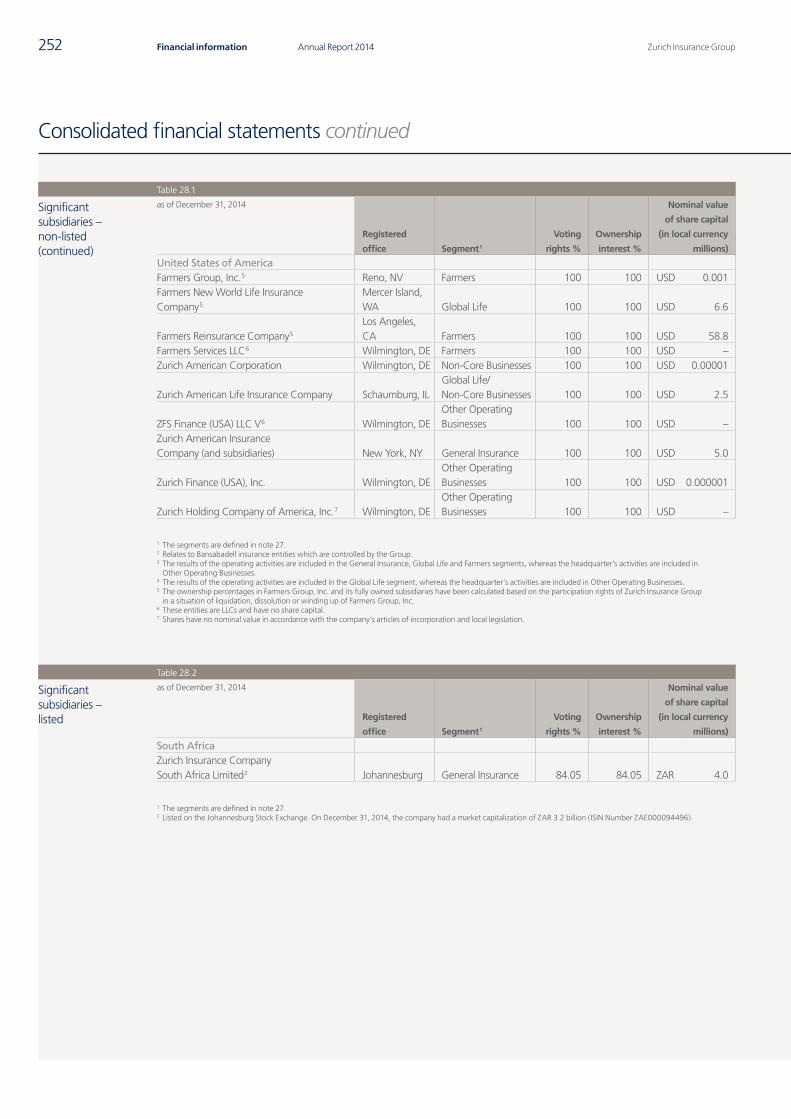
Zurich Insurance GroupAnnual Report 2014252 Financial information
Consolidated financial statements continued
Table 28.1
Significant subsidiaries – non-listed (continued)
as of December 31, 2014
Registered
office Segment 1
Voting
rights %
Ownership
interest %
Nominal value
of share capital
(in local currency
millions)
United States of AmericaFarmers Group, Inc. 5 Reno, NV Farmers 100 100 USD 0.001Farmers New World Life Insurance Company 5
Mercer Island, WA Global Life 100 100 USD 6.6
Farmers Reinsurance Company 5
Los Angeles, CA Farmers 100 100 USD 58.8
Farmers Services LLC 6 Wilmington, DE Farmers 100 100 USD – Zurich American Corporation Wilmington, DE Non-Core Businesses 100 100 USD 0.00001
Zurich American Life Insurance Company Schaumburg, ILGlobal Life/ Non-Core Businesses 100 100 USD 2.5
ZFS Finance (USA) LLC V 6 Wilmington, DEOther Operating Businesses 100 100 USD –
Zurich American Insurance Company (and subsidiaries) New York, NY General Insurance 100 100 USD 5.0
Zurich Finance (USA), Inc. Wilmington, DEOther Operating Businesses 100 100 USD 0.000001
Zurich Holding Company of America, Inc. 7 Wilmington, DEOther Operating Businesses 100 100 USD –
1 The segments are defined in note 27.2 Relates to Bansabadell insurance entities which are controlled by the Group.3 The results of the operating activities are included in the General Insurance, Global Life and Farmers segments, whereas the headquarter’s activities are included in
Other Operating Businesses.4 The results of the operating activities are included in the Global Life segment, whereas the headquarter’s activities are included in Other Operating Businesses.5 The ownership percentages in Farmers Group, Inc. and its fully owned subsidiaries have been calculated based on the participation rights of Zurich Insurance Group
in a situation of liquidation, dissolution or winding up of Farmers Group, Inc.6 These entities are LLCs and have no share capital.7 Shares have no nominal value in accordance with the company’s articles of incorporation and local legislation.
Table 28.2
Significant subsidiaries – listed
as of December 31, 2014
Registered
office Segment 1
Voting
rights %
Ownership
interest %
Nominal value
of share capital
(in local currency
millions)
South AfricaZurich Insurance Company South Africa Limited 2 Johannesburg General Insurance 84.05 84.05 ZAR 4.0
1 The segments are defined in note 27.2 Listed on the Johannesburg Stock Exchange. On December 31, 2014, the company had a market capitalization of ZAR 3.2 billion (ISIN Number ZAE000094496).
Q4_2014_12_AR14_104_Consolidated_financial_statements_en.indd 252 23.02.2015 16:37:59
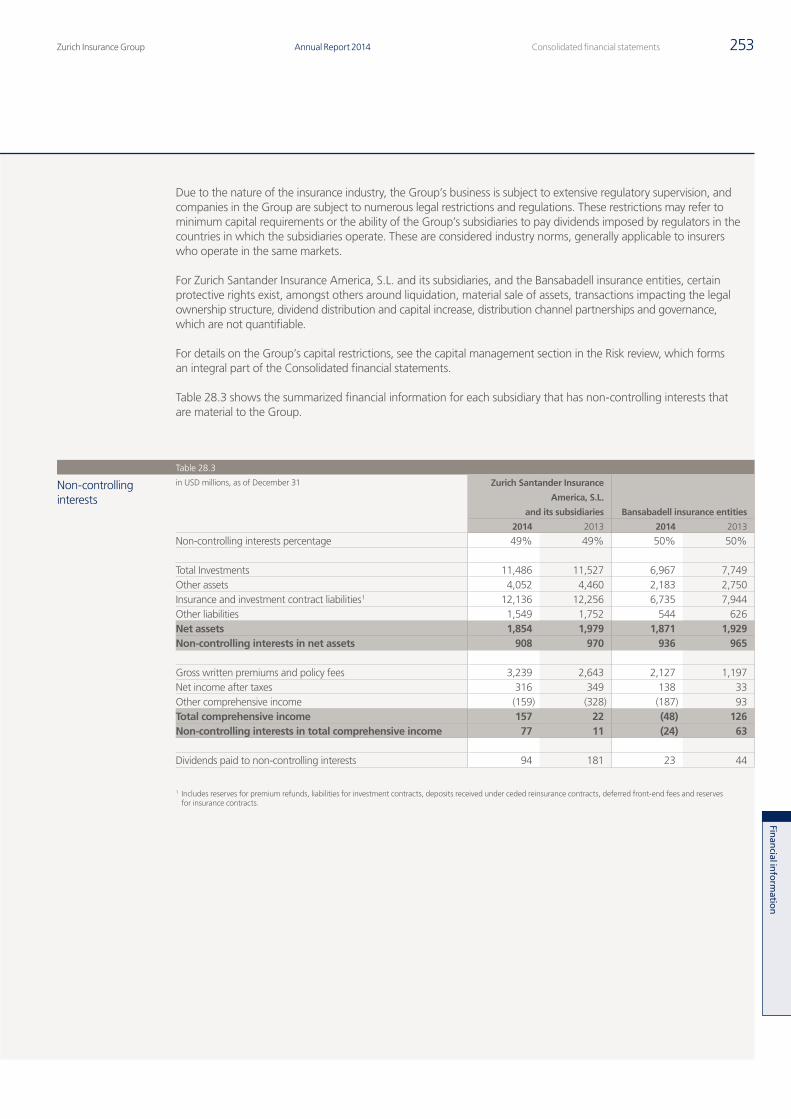
Zurich Insurance Group Annual Report 2014 253Consolidated financial statements
Finan
cial inform
ation
Due to the nature of the insurance industry, the Group’s business is subject to extensive regulatory supervision, and companies in the Group are subject to numerous legal restrictions and regulations. These restrictions may refer to minimum capital requirements or the ability of the Group’s subsidiaries to pay dividends imposed by regulators in the countries in which the subsidiaries operate. These are considered industry norms, generally applicable to insurers who operate in the same markets.
For Zurich Santander Insurance America, S.L. and its subsidiaries, and the Bansabadell insurance entities, certain protective rights exist, amongst others around liquidation, material sale of assets, transactions impacting the legal ownership structure, dividend distribution and capital increase, distribution channel partnerships and governance, which are not quantifiable.
For details on the Group’s capital restrictions, see the capital management section in the Risk review, which forms an integral part of the Consolidated financial statements.
Table 28.3 shows the summarized financial information for each subsidiary that has non-controlling interests that are material to the Group.
Table 28.3
Non-controlling interests
in USD millions, as of December 31 Zurich Santander Insurance
America, S.L.
and its subsidiaries Bansabadell insurance entities
2014 2013 2014 2013
Non-controlling interests percentage 49% 49% 50% 50%
Total Investments 11,486 11,527 6,967 7,749Other assets 4,052 4,460 2,183 2,750Insurance and investment contract liabilities 1 12,136 12,256 6,735 7,944Other liabilities 1,549 1,752 544 626Net assets 1,854 1,979 1,871 1,929Non-controlling interests in net assets 908 970 936 965
Gross written premiums and policy fees 3,239 2,643 2,127 1,197Net income after taxes 316 349 138 33Other comprehensive income (159) (328) (187) 93Total comprehensive income 157 22 (48) 126Non-controlling interests in total comprehensive income 77 11 (24) 63
Dividends paid to non-controlling interests 94 181 23 44
1 Includes reserves for premium refunds, liabilities for investment contracts, deposits received under ceded reinsurance contracts, deferred front-end fees and reserves for insurance contracts.
Q4_2014_12_AR14_104_Consolidated_financial_statements_en.indd 253 23.02.2015 16:38:00

Zurich Insurance GroupAnnual Report 2014254 Financial information
Consolidated financial statements continued
29. Events after the balance sheet date
On January 15, 2015, the Swiss National Bank ceased to enforce its temporary commitment to maintain the EUR/CHF exchange rate at or above CHF 1.20 to the EUR. As a result, the CHF appreciated against the EUR and other currencies. The Group presents its Consolidated financial statements and related footnotes in USD. The impacts of the currency movements on shareholders’ equity were not material.
Q4_2014_12_AR14_104_Consolidated_financial_statements_en.indd 254 23.02.2015 16:38:00

Zurich Insurance Group Annual Report 2014 255Consolidated financial statements
Finan
cial inform
ation
THIS PAGE HAS INTENTIONALLY BEEN LEFT BLANK
Q4_2014_12_AR14_104_Consolidated_financial_statements_en.indd 255 23.02.2015 16:38:00
Zurich Insurance GroupAnnual Report 2014256 Financial information
Report of the statutory auditor
Report of the statutory auditor
To the General Meeting of Zurich Insurance Group Ltd
Report of the statutory auditor on the Consolidated financial statements
As statutory auditor, we have audited the Consolidated financial statements of Zurich Insurance Group Ltd, which comprise the consolidated income statement, consolidated statement of comprehensive income, consolidated balance sheet, consolidated statement of cash flows, consolidated statement of changes in equity, and notes (pages 157 to 255 and the audited sections of the Risk review on pages 115 to 152), for the year ended December 31, 2014.
Board of Directors’ responsibilityThe Board of Directors is responsible for the preparation and fair presentation of the Consolidated financial statements in accordance with the International Financial Reporting Standards (IFRS) and the requirements of Swiss law. This responsibility includes designing, implementing and maintaining an internal control system relevant to the preparation and fair presentation of Consolidated financial statements that are free from material misstatement, whether due to fraud or error. The Board of Directors is further responsible for selecting and applying appropriate accounting policies and making accounting estimates that are reasonable in the circumstances.
Auditor’s responsibilityOur responsibility is to express an opinion on these Consolidated financial statements based on our audit. We conducted our audit in accordance with Swiss law and Swiss Auditing Standards as well as the International Standards on Auditing. Those standards require that we plan and perform the audit to obtain reasonable assurance whether the Consolidated financial statements are free from material misstatement.
An audit involves performing procedures to obtain audit evidence about the amounts and disclosures in the Consolidated financial statements. The procedures selected depend on the auditor’s judgment, including the assessment of the risks of material misstatement of the Consolidated financial statements, whether due to fraud or error. In making those risk assessments, the auditor considers the internal control system relevant to the entity’s preparation and fair presentation of the Consolidated financial statements in order to design audit procedures that are appropriate in the circumstances, but not for the purpose of expressing an opinion on the effectiveness of the entity’s internal control system. An audit also includes evaluating the appropriateness of the accounting policies used and the reasonableness of accounting estimates made, as well as evaluating the overall presentation of the Consolidated financial statements. We believe that the audit evidence we have obtained is sufficient and appropriate to provide a basis for our audit opinion.
OpinionIn our opinion, the Consolidated financial statements for the year ended December 31, 2014 give a true and fair view of the financial position, the results of operations and the cash flows in accordance with the International Financial Reporting Standards (IFRS) and comply with Swiss law.
Q4_2014_12_AR14_104_Consolidated_financial_statements_en.indd 256 23.02.2015 16:38:00
Zurich Insurance Group Annual Report 2014 257Consolidated financial statements
Finan
cial inform
ation
Report on other legal requirements
We confirm that we meet the legal requirements on licensing according to the Auditor Oversight Act (AOA) and independence (article 728 CO and article 11 AOA) and that there are no circumstances incompatible with our independence.
In accordance with article 728a paragraph 1 item 3 CO and Swiss Auditing Standard 890, we confirm that an internal control system exists which has been designed for the preparation of Consolidated financial statements according to the instructions of the Board of Directors.
We recommend that the Consolidated financial statements submitted to you be approved.
PricewaterhouseCoopers AG
Mark Humphreys Stephen O’HearnAudit expert Global relationship partnerAuditor in charge
Zurich, February 11, 2015
Q4_2014_12_AR14_104_Consolidated_financial_statements_en.indd 257 23.02.2015 16:38:00
Zurich Insurance GroupAnnual Report 2014258 Financial information
Embedded value report
Zurich produces and reports embedded value in accordance with the Market Consistent Embedded Value (MCEV) Principles and Guidance issued by the European Insurance CFO Forum (CFO Forum) in October 2009 to provide an economic view of the value of the life business to shareholders and to support financial management and strategic decision making. This report provides an overview of the movement in the MCEV over the calendar year 2014 and new business value added from new sales during the year, including further splits into constituent parts and geographical regions.
Contents
Embedded value report – executive summary 2591. Analysis of embedded value earnings 2602. New business 2623. Free surplus 2664. Analysis of free surplus generation 2675. Expected contribution and expected transfer to shareholders’ net assets 2686. Operating, economic and other non-operating variances 2697. Dividends, injections and other movements 2738. Value of business in-force 2749. Reconciliation of shareholders’ equity to embedded value 27510. Sensitivities 27611. Group MCEV 27712. Embedded value methodology 27813. Embedded value assumptions 283Appendix: Embedded value tables 286Statement by Directors 290Auditor’s report on embedded value 291
This report describes the development of embedded value of the Zurich Insurance Group (the Group) for the year ended December 31, 2014.
The majority of this report, sections 1 to 10, relates to Global Life, but summary information relating to total Group MCEV is given in section 11.
Q4_2014_13_AR14_Embedded_Value_Report_part1_en.indd 258 23.02.2015 16:39:47
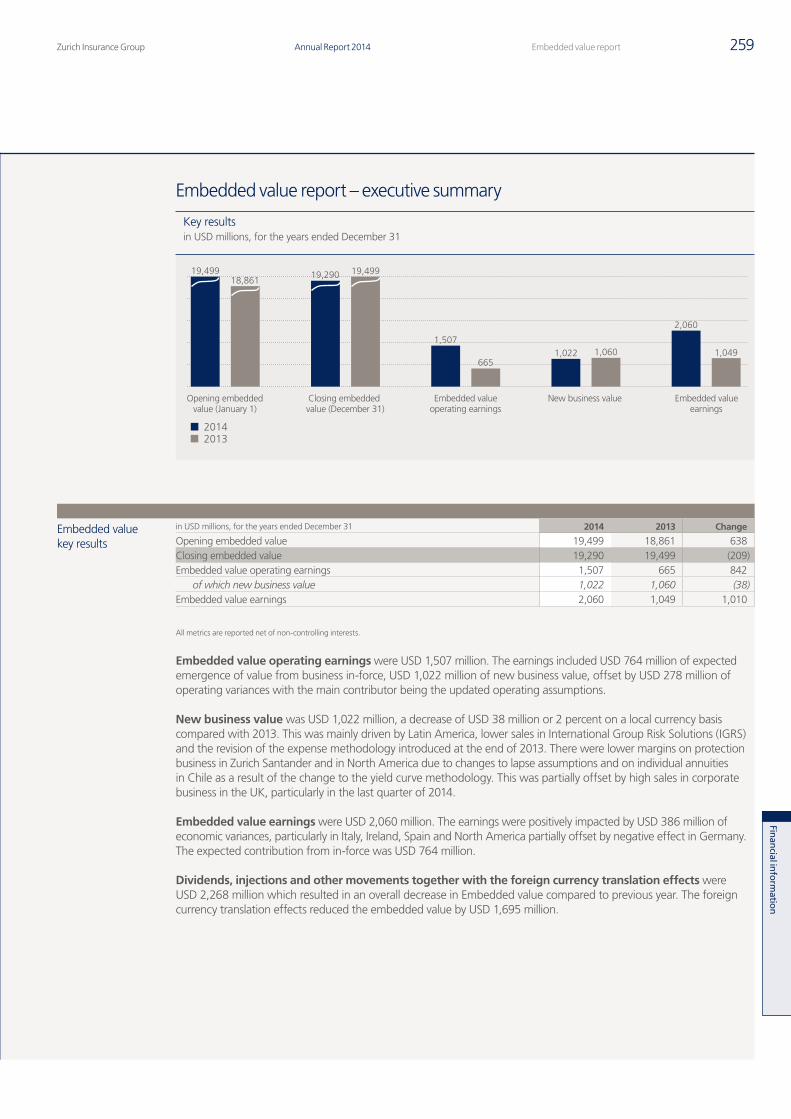
Zurich Insurance Group Annual Report 2014 259Embedded value report
Finan
cial inform
ation
Embedded value report – executive summary
Embedded value key results
in USD millions, for the years ended December 31 2014 2013 Change
Opening embedded value 19,499 18,861 638Closing embedded value 19,290 19,499 (209)Embedded value operating earnings 1,507 665 842
of which new business value 1,022 1,060 (38)Embedded value earnings 2,060 1,049 1,010
All metrics are reported net of non-controlling interests.
Embedded value operating earnings were USD 1,507 million. The earnings included USD 764 million of expected emergence of value from business in-force, USD 1,022 million of new business value, offset by USD 278 million of operating variances with the main contributor being the updated operating assumptions.
New business value was USD 1,022 million, a decrease of USD 38 million or 2 percent on a local currency basis compared with 2013. This was mainly driven by Latin America, lower sales in International Group Risk Solutions (IGRS) and the revision of the expense methodology introduced at the end of 2013. There were lower margins on protection business in Zurich Santander and in North America due to changes to lapse assumptions and on individual annuities in Chile as a result of the change to the yield curve methodology. This was partially offset by high sales in corporate business in the UK, particularly in the last quarter of 2014.
Embedded value earnings were USD 2,060 million. The earnings were positively impacted by USD 386 million of economic variances, particularly in Italy, Ireland, Spain and North America partially offset by negative effect in Germany. The expected contribution from in-force was USD 764 million.
Dividends, injections and other movements together with the foreign currency translation effects were USD 2,268 million which resulted in an overall decrease in Embedded value compared to previous year. The foreign currency translation effects reduced the embedded value by USD 1,695 million.
20142013
665
18,861
1,060 1,049
Closing embedded value (December 31)
Opening embeddedvalue (January 1)
Embedded valueoperating earnings
New business value Embedded valueearnings
19,49919,499 19,290
1,5071,022
2,060
Key resultsin USD millions, for the years ended December 31
Q4_2014_13_AR14_Embedded_Value_Report_part1_en.indd 259 23.02.2015 16:39:48
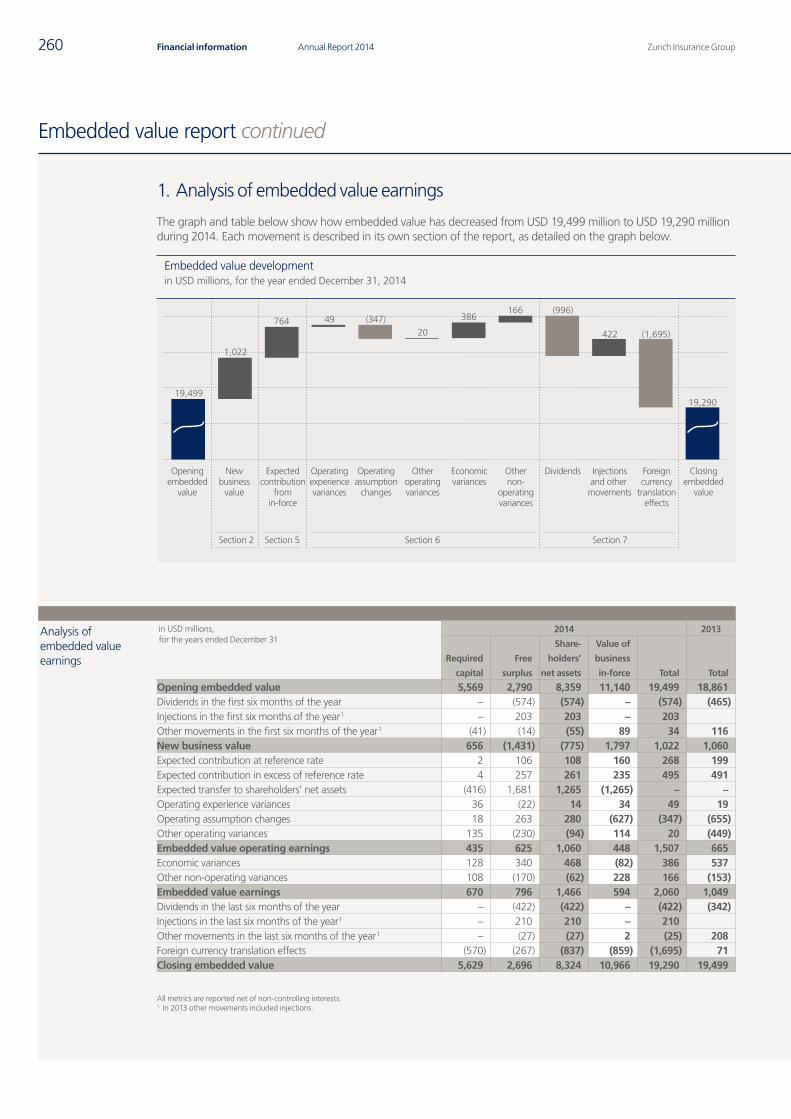
Zurich Insurance GroupAnnual Report 2014260 Financial information
Embedded value report continued
1. Analysis of embedded value earnings
The graph and table below show how embedded value has decreased from USD 19,499 million to USD 19,290 million during 2014. Each movement is described in its own section of the report, as detailed on the graph below.
Analysis of embedded value earnings
in USD millions, for the years ended December 31
2014 2013
Required
capital
Free
surplus
Share-
holders’
net assets
Value of
business
in-force Total Total
Opening embedded value 5,569 2,790 8,359 11,140 19,499 18,861Dividends in the first six months of the year – (574) (574) – (574) (465)Injections in the first six months of the year 1 – 203 203 – 203Other movements in the first six months of the year 1 (41) (14) (55) 89 34 116New business value 656 (1,431) (775) 1,797 1,022 1,060Expected contribution at reference rate 2 106 108 160 268 199Expected contribution in excess of reference rate 4 257 261 235 495 491Expected transfer to shareholders’ net assets (416) 1,681 1,265 (1,265) – –Operating experience variances 36 (22) 14 34 49 19Operating assumption changes 18 263 280 (627) (347) (655)Other operating variances 135 (230) (94) 114 20 (449)Embedded value operating earnings 435 625 1,060 448 1,507 665Economic variances 128 340 468 (82) 386 537Other non-operating variances 108 (170) (62) 228 166 (153)Embedded value earnings 670 796 1,466 594 2,060 1,049Dividends in the last six months of the year – (422) (422) – (422) (342)Injections in the last six months of the year 1 – 210 210 – 210Other movements in the last six months of the year 1 – (27) (27) 2 (25) 208Foreign currency translation effects (570) (267) (837) (859) (1,695) 71Closing embedded value 5,629 2,696 8,324 10,966 19,290 19,499
All metrics are reported net of non-controlling interests.1 In 2013 other movements included injections.
Openingembedded
value
Newbusiness
value
Expectedcontribution
fromin-force
Operatingexperiencevariances
Operatingassumption
changes
Otheroperatingvariances
Economicvariances
Othernon-
operatingvariances
Dividends Injectionsand other movements
Closingembedded
value
Foreigncurrency
translationeffects
19,499
1,022
764 (347)4920
386166 (996)
422 (1,695)
19,290
Section 2 Section 5 Section 6 Section 7
Embedded value developmentin USD millions, for the year ended December 31, 2014
Q4_2014_13_AR14_Embedded_Value_Report_part1_en.indd 260 23.02.2015 16:39:48
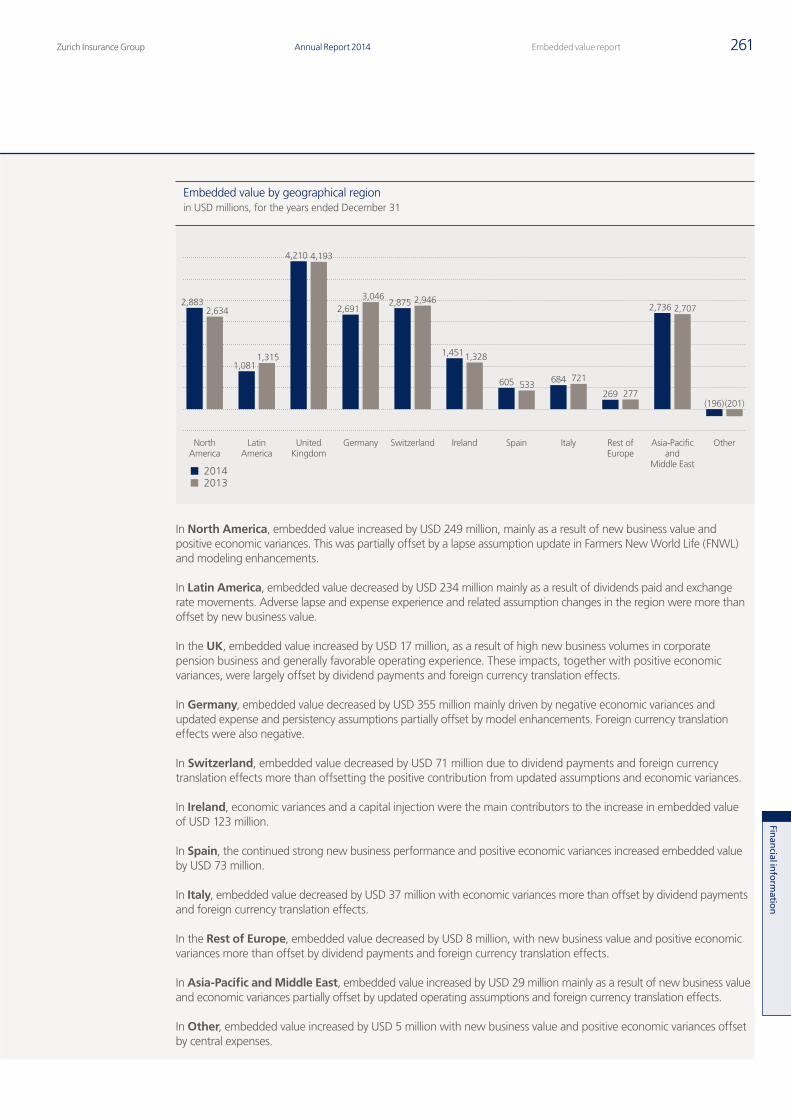
Zurich Insurance Group Annual Report 2014 261Embedded value report
Finan
cial inform
ation
In North America, embedded value increased by USD 249 million, mainly as a result of new business value and positive economic variances. This was partially offset by a lapse assumption update in Farmers New World Life (FNWL) and modeling enhancements.
In Latin America, embedded value decreased by USD 234 million mainly as a result of dividends paid and exchange rate movements. Adverse lapse and expense experience and related assumption changes in the region were more than offset by new business value.
In the UK, embedded value increased by USD 17 million, as a result of high new business volumes in corporate pension business and generally favorable operating experience. These impacts, together with positive economic variances, were largely offset by dividend payments and foreign currency translation effects.
In Germany, embedded value decreased by USD 355 million mainly driven by negative economic variances and updated expense and persistency assumptions partially offset by model enhancements. Foreign currency translation effects were also negative.
In Switzerland, embedded value decreased by USD 71 million due to dividend payments and foreign currency translation effects more than offsetting the positive contribution from updated assumptions and economic variances.
In Ireland, economic variances and a capital injection were the main contributors to the increase in embedded value of USD 123 million.
In Spain, the continued strong new business performance and positive economic variances increased embedded value by USD 73 million.
In Italy, embedded value decreased by USD 37 million with economic variances more than offset by dividend payments and foreign currency translation effects.
In the Rest of Europe, embedded value decreased by USD 8 million, with new business value and positive economic variances more than offset by dividend payments and foreign currency translation effects.
In Asia-Pacific and Middle East, embedded value increased by USD 29 million mainly as a result of new business value and economic variances partially offset by updated operating assumptions and foreign currency translation effects.
In Other, embedded value increased by USD 5 million with new business value and positive economic variances offset by central expenses.
20142013
NorthAmerica
LatinAmerica
UnitedKingdom
Germany Switzerland Ireland Spain Italy Rest ofEurope
Asia-Pacificand
Middle East
Other
2,6342,883
1,3151,081
4,1934,210
3,0462,691
2,9462,875
1,3281,451
533605 721684
277269
2,7072,736
(201)(196)
Embedded value by geographical regionin USD millions, for the years ended December 31
Q4_2014_13_AR14_Embedded_Value_Report_part1_en.indd 261 23.02.2015 16:39:49
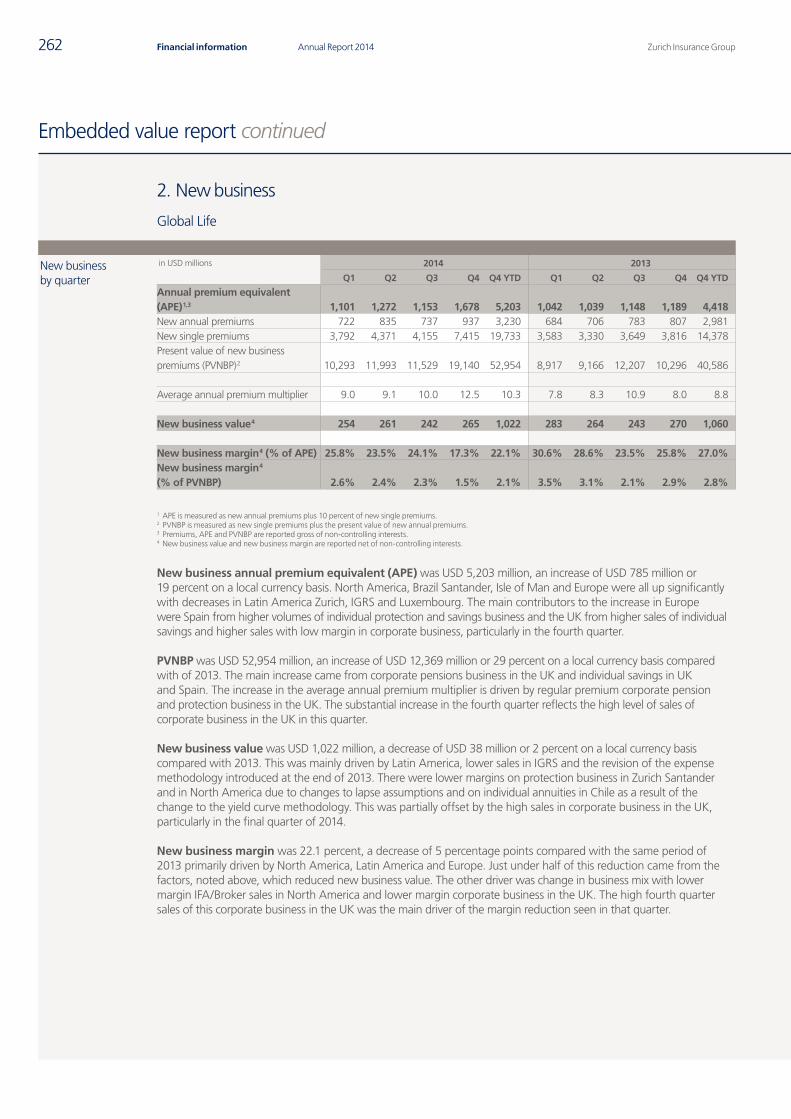
Zurich Insurance GroupAnnual Report 2014262 Financial information
Embedded value report continued
2. New business
Global Life
New business by quarter
in USD millions 2014 2013
Q1 Q2 Q3 Q4 Q4 YTD Q1 Q2 Q3 Q4 Q4 YTD
Annual premium equivalent (APE) 1,3 1,101 1,272 1,153 1,678 5,203 1,042 1,039 1,148 1,189 4,418New annual premiums 722 835 737 937 3,230 684 706 783 807 2,981New single premiums 3,792 4,371 4,155 7,415 19,733 3,583 3,330 3,649 3,816 14,378Present value of new business premiums (PVNBP) 2 10,293 11,993 11,529 19,140 52,954 8,917 9,166 12,207 10,296 40,586
Average annual premium multiplier 9.0 9.1 10.0 12.5 10.3 7.8 8.3 10.9 8.0 8.8
New business value 4 254 261 242 265 1,022 283 264 243 270 1,060
New business margin 4 (% of APE) 25.8% 23.5% 24.1% 17.3% 22.1% 30.6% 28.6% 23.5% 25.8% 27.0%New business margin 4 (% of PVNBP) 2.6% 2.4% 2.3% 1.5% 2.1% 3.5% 3.1% 2.1% 2.9% 2.8%
1 APE is measured as new annual premiums plus 10 percent of new single premiums.2 PVNBP is measured as new single premiums plus the present value of new annual premiums.3 Premiums, APE and PVNBP are reported gross of non-controlling interests.4 New business value and new business margin are reported net of non-controlling interests.
New business annual premium equivalent (APE) was USD 5,203 million, an increase of USD 785 million or 19 percent on a local currency basis. North America, Brazil Santander, Isle of Man and Europe were all up significantly with decreases in Latin America Zurich, IGRS and Luxembourg. The main contributors to the increase in Europe were Spain from higher volumes of individual protection and savings business and the UK from higher sales of individual savings and higher sales with low margin in corporate business, particularly in the fourth quarter.
PVNBP was USD 52,954 million, an increase of USD 12,369 million or 29 percent on a local currency basis compared with of 2013. The main increase came from corporate pensions business in the UK and individual savings in UK and Spain. The increase in the average annual premium multiplier is driven by regular premium corporate pension and protection business in the UK. The substantial increase in the fourth quarter reflects the high level of sales of corporate business in the UK in this quarter.
New business value was USD 1,022 million, a decrease of USD 38 million or 2 percent on a local currency basis compared with 2013. This was mainly driven by Latin America, lower sales in IGRS and the revision of the expense methodology introduced at the end of 2013. There were lower margins on protection business in Zurich Santander and in North America due to changes to lapse assumptions and on individual annuities in Chile as a result of the change to the yield curve methodology. This was partially offset by the high sales in corporate business in the UK, particularly in the final quarter of 2014.
New business margin was 22.1 percent, a decrease of 5 percentage points compared with the same period of 2013 primarily driven by North America, Latin America and Europe. Just under half of this reduction came from the factors, noted above, which reduced new business value. The other driver was change in business mix with lower margin IFA/Broker sales in North America and lower margin corporate business in the UK. The high fourth quarter sales of this corporate business in the UK was the main driver of the margin reduction seen in that quarter.
Q4_2014_13_AR14_Embedded_Value_Report_part1_en.indd 262 23.02.2015 16:39:49
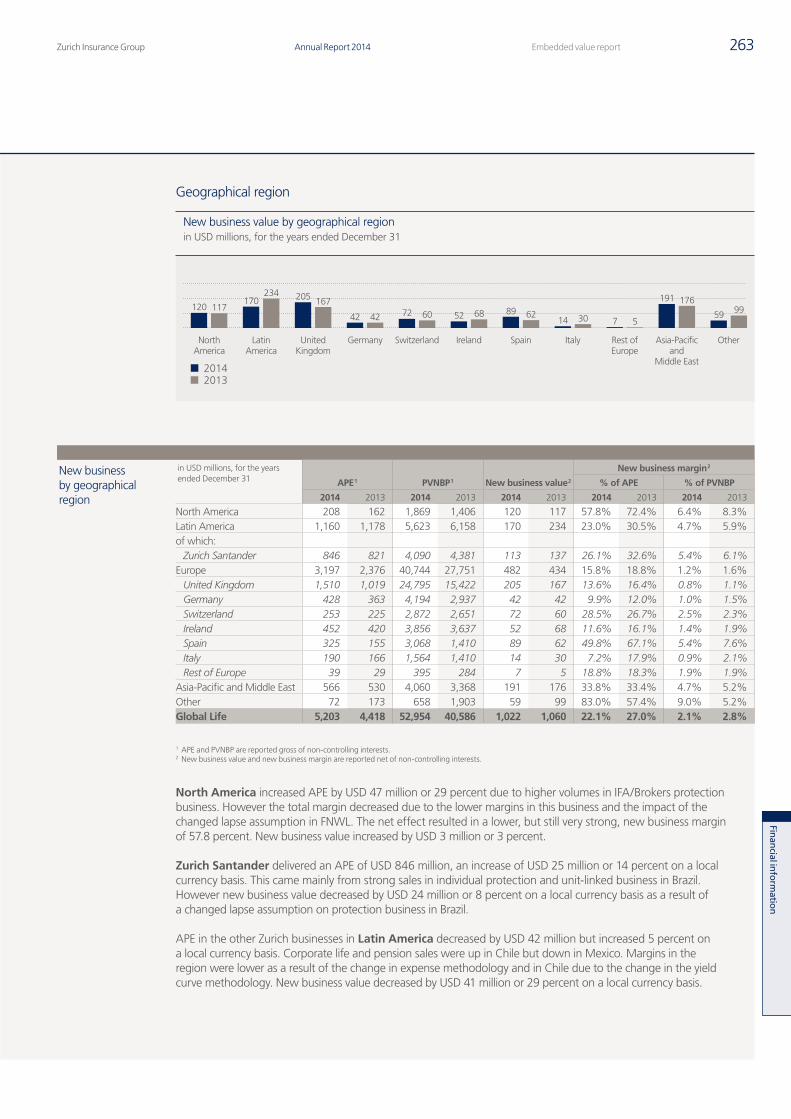
Zurich Insurance Group Annual Report 2014 263Embedded value report
Finan
cial inform
ation
Geographical region
New business by geographical region
in USD millions, for the years ended December 31 APE 1 PVNBP 1 New business value 2
New business margin 2
% of APE % of PVNBP
2014 2013 2014 2013 2014 2013 2014 2013 2014 2013
North America 208 162 1,869 1,406 120 117 57.8% 72.4% 6.4% 8.3%Latin America 1,160 1,178 5,623 6,158 170 234 23.0% 30.5% 4.7% 5.9%of which:
Zurich Santander 846 821 4,090 4,381 113 137 26.1% 32.6% 5.4% 6.1%Europe 3,197 2,376 40,744 27,751 482 434 15.8% 18.8% 1.2% 1.6%
United Kingdom 1,510 1,019 24,795 15,422 205 167 13.6% 16.4% 0.8% 1.1%Germany 428 363 4,194 2,937 42 42 9.9% 12.0% 1.0% 1.5%Switzerland 253 225 2,872 2,651 72 60 28.5% 26.7% 2.5% 2.3%Ireland 452 420 3,856 3,637 52 68 11.6% 16.1% 1.4% 1.9%Spain 325 155 3,068 1,410 89 62 49.8% 67.1% 5.4% 7.6%Italy 190 166 1,564 1,410 14 30 7.2% 17.9% 0.9% 2.1%Rest of Europe 39 29 395 284 7 5 18.8% 18.3% 1.9% 1.9%
Asia-Pacific and Middle East 566 530 4,060 3,368 191 176 33.8% 33.4% 4.7% 5.2%Other 72 173 658 1,903 59 99 83.0% 57.4% 9.0% 5.2%Global Life 5,203 4,418 52,954 40,586 1,022 1,060 22.1% 27.0% 2.1% 2.8%
1 APE and PVNBP are reported gross of non-controlling interests.2 New business value and new business margin are reported net of non-controlling interests.
North America increased APE by USD 47 million or 29 percent due to higher volumes in IFA/Brokers protection business. However the total margin decreased due to the lower margins in this business and the impact of the changed lapse assumption in FNWL. The net effect resulted in a lower, but still very strong, new business margin of 57.8 percent. New business value increased by USD 3 million or 3 percent.
Zurich Santander delivered an APE of USD 846 million, an increase of USD 25 million or 14 percent on a local currency basis. This came mainly from strong sales in individual protection and unit-linked business in Brazil. However new business value decreased by USD 24 million or 8 percent on a local currency basis as a result of a changed lapse assumption on protection business in Brazil.
APE in the other Zurich businesses in Latin America decreased by USD 42 million but increased 5 percent on a local currency basis. Corporate life and pension sales were up in Chile but down in Mexico. Margins in the region were lower as a result of the change in expense methodology and in Chile due to the change in the yield curve methodology. New business value decreased by USD 41 million or 29 percent on a local currency basis.
20142013
NorthAmerica
LatinAmerica
UnitedKingdom
Germany Switzerland Ireland Spain Italy Rest ofEurope
Asia-Pacificand
Middle East
Other
120 117170
234 205 167
42 42 72 60 52 68 89 6214 30 7 5
191 176
59 99
New business value by geographical regionin USD millions, for the years ended December 31
Q4_2014_13_AR14_Embedded_Value_Report_part1_en.indd 263 23.02.2015 16:39:50
Zurich Insurance GroupAnnual Report 2014264 Financial information
Embedded value report continued
Overall in Europe, APE increased by USD 821 million or 31 percent on a local currency basis. The main increases were in the UK and Spain followed by Germany. In the UK, higher volumes of corporate business and individual saving business were partially offset by lower volumes of unit-linked business. In Spain, volumes increased mainly for individual saving products boosted by the current economic environment and the wider bank distribution network. Germany also experienced higher sales in saving products through the bank distribution channel. New business value increased by USD 48 million or 9 percent on a local currency basis, with lower margins reflecting the change in product mix.
In the UK, APE increased by USD 491 million or 41 per cent on a local currency basis, as a result of higher volumes of corporate business sold during the last quarter of the year, increased volumes in the retail wealth business offset by a drop in single premium unit linked. Higher profitability in corporate protection business was more than offset by reductions in margins for individual protection business. Despite the lower margins associated with changes in the mix of business, new business value increased by USD 38 million or 17 per cent on local currency basis.
In Germany, APE increased by USD 65 million or 18 percent on a local currency basis, mainly as a result of a special sales campaign in the Bank Distribution channel of a traditional single premium product. The less favorable economic conditions decreased margins and as a result new business value remained stable at USD 42 million.
In Switzerland, APE increased by USD 29 million or 11 percent on a local currency basis, mainly from higher sales of corporate protection business which also increased the overall margins. As a result new business value increased by USD 12 million or 18 percent on a local currency basis.
In Ireland, APE increased by USD 32 million or 7 percent on a local currency basis, benefitting from increased sales of corporate products, including bulk annuities and corporate life and pensions. However the lower volumes of cross-border Italian business and the reductions in margins for unit-linked business reduced overall margins. As a result new business value decreased by USD 16 million or 23 percent on a local currency basis.
In Spain, APE increased by USD 171 million or 110 percent on a local currency basis, mainly due to higher sales of individual saving products. This increased sales of products with lower margins resulted in a lower increase in new business value of USD 27 million or 43 percent on a local currency basis.
In Italy, APE increased by USD 24 million or 14 percent on a local currency basis, arising mainly from individual savings business. However margins reduced as a result of lower interest rates and as a result new business value decreased by USD 16 million or 54 percent on a local currency basis.
In Rest of Europe, APE increased by USD 10 million or 34 percent on a local currency basis. New business value increased of USD 2 million or 38 percent on a local currency basis, mainly from unit-linked business in Austria.
In Asia-Pacific and Middle East, APE increased by USD 36 million or 4 percent on a local currency basis. This arose mainly from the Isle of Man which experienced higher volume in corporate and unit linked business, although assumption changes resulted in lower margins. New business value also increased by USD 14 million, or 8 percent on a local currency basis, with the main contributions from Australia and Japan. Both countries experienced strong growth in new business value with both volume and margin improvements in protection business. The lower volumes in the Middle East and the decision to close the agency channel in Hong Kong partially offset the other positive impacts in the region.
In Other, APE decreased by USD 101 million or 59 percent on a local currency basis as a result of lower sales of unit-linked products in Luxembourg and lower sales of corporate protection business in IGRS. As a result new business value decreased by USD 40 million or 41 percent on a local currency basis.
Q4_2014_13_AR14_Embedded_Value_Report_part1_en.indd 264 23.02.2015 16:39:50
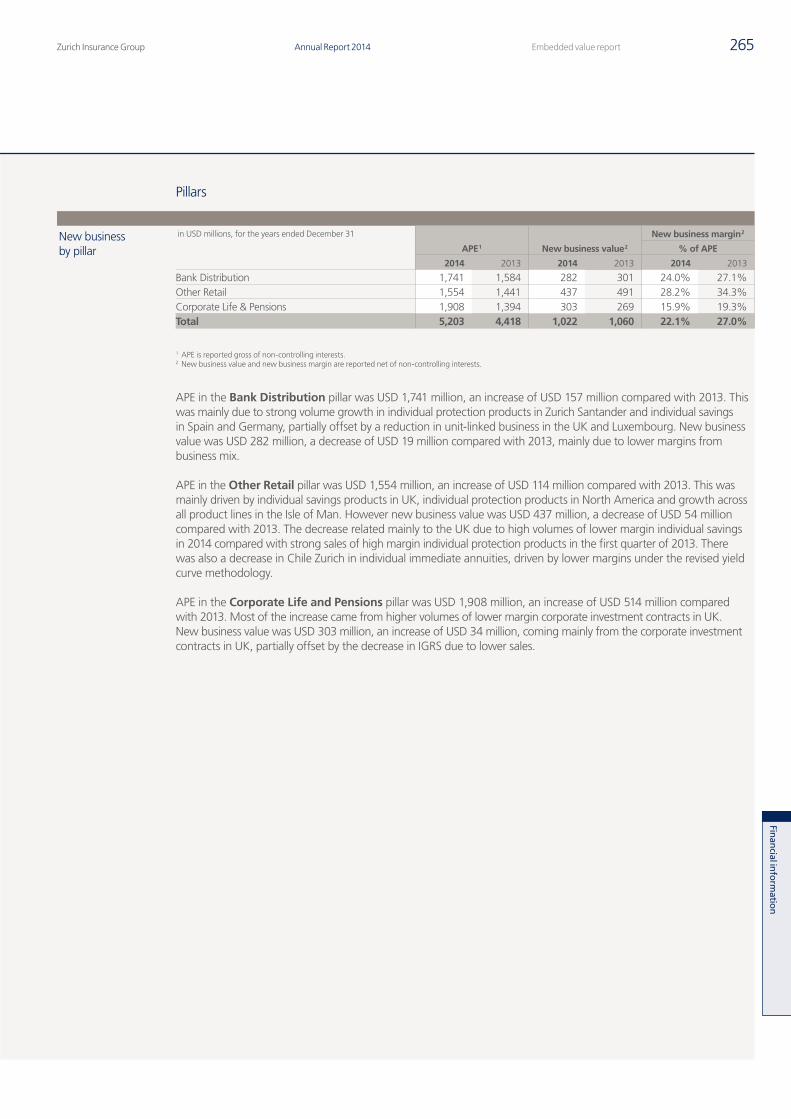
Zurich Insurance Group Annual Report 2014 265Embedded value report
Finan
cial inform
ation
Pillars
New business by pillar
in USD millions, for the years ended December 31
APE 1 New business value 2
New business margin 2
% of APE
2014 2013 2014 2013 2014 2013
Bank Distribution 1,741 1,584 282 301 24.0% 27.1%Other Retail 1,554 1,441 437 491 28.2% 34.3%Corporate Life & Pensions 1,908 1,394 303 269 15.9% 19.3%Total 5,203 4,418 1,022 1,060 22.1% 27.0%
1 APE is reported gross of non-controlling interests.2 New business value and new business margin are reported net of non-controlling interests.
APE in the Bank Distribution pillar was USD 1,741 million, an increase of USD 157 million compared with 2013. This was mainly due to strong volume growth in individual protection products in Zurich Santander and individual savings in Spain and Germany, partially offset by a reduction in unit-linked business in the UK and Luxembourg. New business value was USD 282 million, a decrease of USD 19 million compared with 2013, mainly due to lower margins from business mix.
APE in the Other Retail pillar was USD 1,554 million, an increase of USD 114 million compared with 2013. This was mainly driven by individual savings products in UK, individual protection products in North America and growth across all product lines in the Isle of Man. However new business value was USD 437 million, a decrease of USD 54 million compared with 2013. The decrease related mainly to the UK due to high volumes of lower margin individual savings in 2014 compared with strong sales of high margin individual protection products in the first quarter of 2013. There was also a decrease in Chile Zurich in individual immediate annuities, driven by lower margins under the revised yield curve methodology.
APE in the Corporate Life and Pensions pillar was USD 1,908 million, an increase of USD 514 million compared with 2013. Most of the increase came from higher volumes of lower margin corporate investment contracts in UK. New business value was USD 303 million, an increase of USD 34 million, coming mainly from the corporate investment contracts in UK, partially offset by the decrease in IGRS due to lower sales.
Q4_2014_13_AR14_Embedded_Value_Report_part1_en.indd 265 23.02.2015 16:39:50
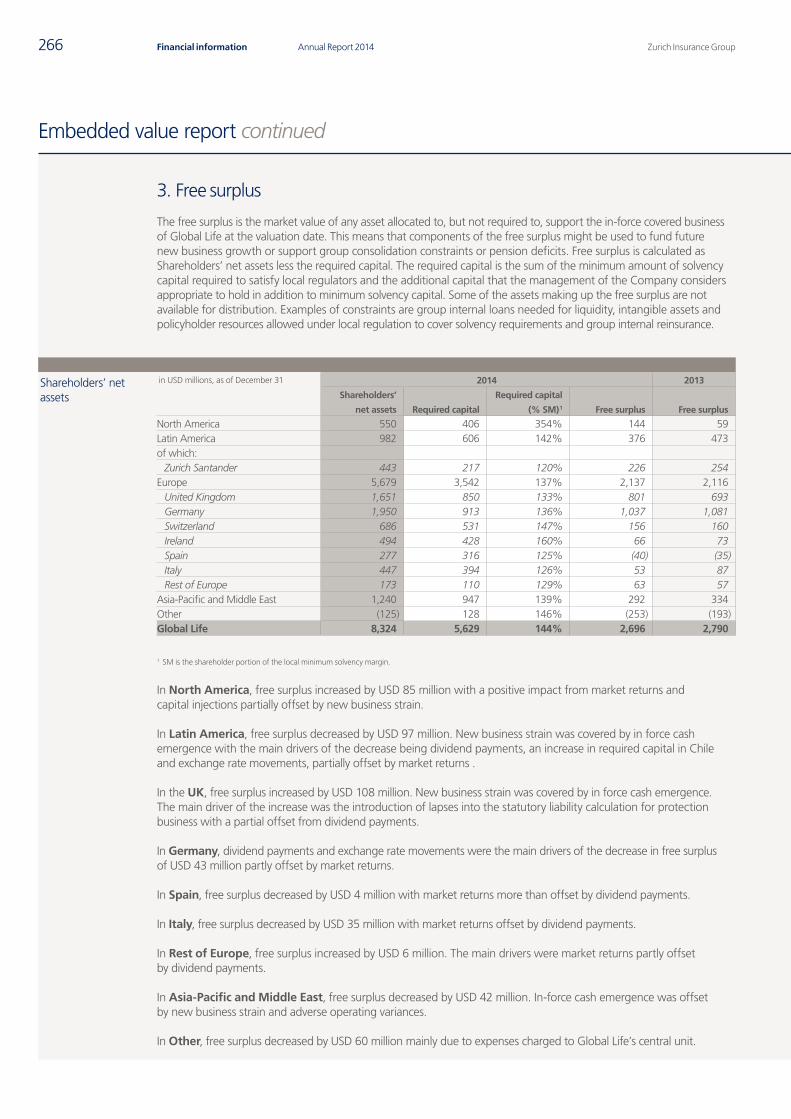
Zurich Insurance GroupAnnual Report 2014266 Financial information
Embedded value report continued
3. Free surplus
The free surplus is the market value of any asset allocated to, but not required to, support the in-force covered business of Global Life at the valuation date. This means that components of the free surplus might be used to fund future new business growth or support group consolidation constraints or pension deficits. Free surplus is calculated as Shareholders’ net assets less the required capital. The required capital is the sum of the minimum amount of solvency capital required to satisfy local regulators and the additional capital that the management of the Company considers appropriate to hold in addition to minimum solvency capital. Some of the assets making up the free surplus are not available for distribution. Examples of constraints are group internal loans needed for liquidity, intangible assets and policyholder resources allowed under local regulation to cover solvency requirements and group internal reinsurance.
Shareholders’ net assets
in USD millions, as of December 31 2014 2013
Shareholders’
net assets Required capital
Required capital
(% SM) 1 Free surplus Free surplus
North America 550 406 354% 144 59Latin America 982 606 142% 376 473of which:
Zurich Santander 443 217 120% 226 254Europe 5,679 3,542 137% 2,137 2,116
United Kingdom 1,651 850 133% 801 693Germany 1,950 913 136% 1,037 1,081Switzerland 686 531 147% 156 160Ireland 494 428 160% 66 73Spain 277 316 125% (40) (35)Italy 447 394 126% 53 87Rest of Europe 173 110 129% 63 57
Asia-Pacific and Middle East 1,240 947 139% 292 334Other (125) 128 146% (253) (193)Global Life 8,324 5,629 144% 2,696 2,790
1 SM is the shareholder portion of the local minimum solvency margin.
In North America, free surplus increased by USD 85 million with a positive impact from market returns and capital injections partially offset by new business strain.
In Latin America, free surplus decreased by USD 97 million. New business strain was covered by in force cash emergence with the main drivers of the decrease being dividend payments, an increase in required capital in Chile and exchange rate movements, partially offset by market returns .
In the UK, free surplus increased by USD 108 million. New business strain was covered by in force cash emergence. The main driver of the increase was the introduction of lapses into the statutory liability calculation for protection business with a partial offset from dividend payments.
In Germany, dividend payments and exchange rate movements were the main drivers of the decrease in free surplus of USD 43 million partly offset by market returns.
In Spain, free surplus decreased by USD 4 million with market returns more than offset by dividend payments.
In Italy, free surplus decreased by USD 35 million with market returns offset by dividend payments.
In Rest of Europe, free surplus increased by USD 6 million. The main drivers were market returns partly offset by dividend payments.
In Asia-Pacific and Middle East, free surplus decreased by USD 42 million. In-force cash emergence was offset by new business strain and adverse operating variances.
In Other, free surplus decreased by USD 60 million mainly due to expenses charged to Global Life’s central unit.
Q4_2014_13_AR14_Embedded_Value_Report_part1_en.indd 266 23.02.2015 16:39:51
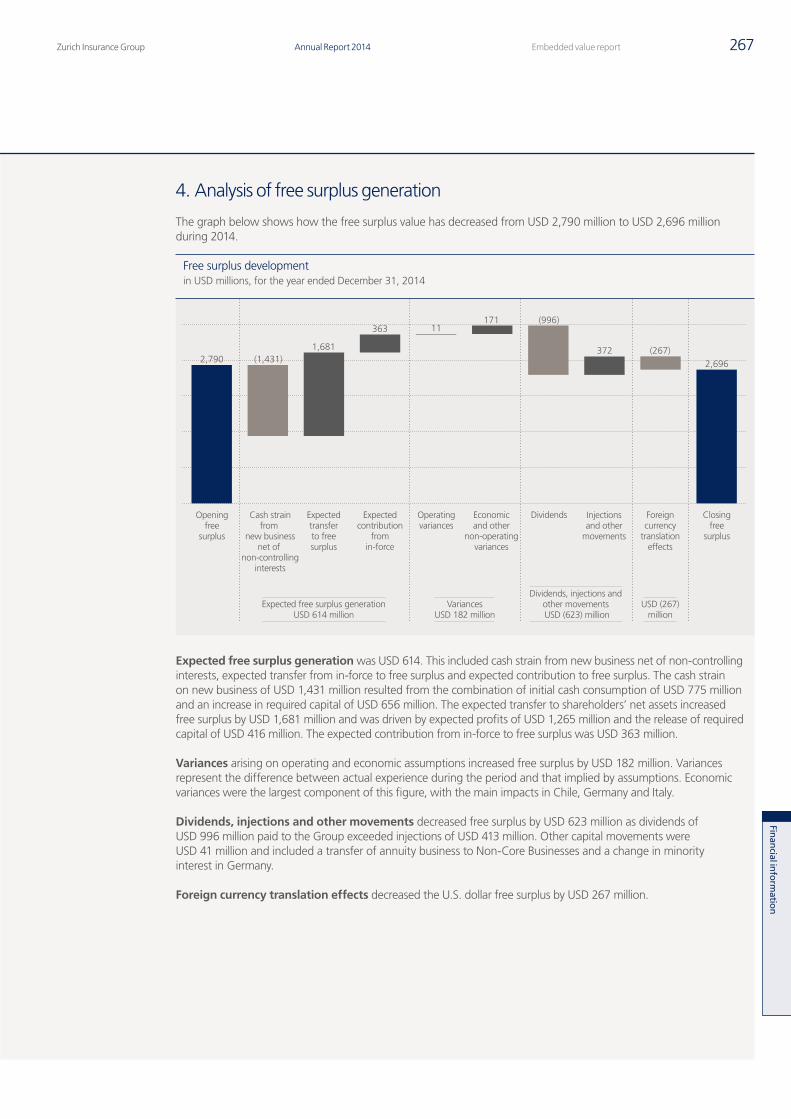
Zurich Insurance Group Annual Report 2014 267Embedded value report
Finan
cial inform
ation
4. Analysis of free surplus generation
The graph below shows how the free surplus value has decreased from USD 2,790 million to USD 2,696 million during 2014.
Expected free surplus generation was USD 614. This included cash strain from new business net of non-controlling interests, expected transfer from in-force to free surplus and expected contribution to free surplus. The cash strain on new business of USD 1,431 million resulted from the combination of initial cash consumption of USD 775 million and an increase in required capital of USD 656 million. The expected transfer to shareholders’ net assets increased free surplus by USD 1,681 million and was driven by expected profits of USD 1,265 million and the release of required capital of USD 416 million. The expected contribution from in-force to free surplus was USD 363 million.
Variances arising on operating and economic assumptions increased free surplus by USD 182 million. Variances represent the difference between actual experience during the period and that implied by assumptions. Economic variances were the largest component of this figure, with the main impacts in Chile, Germany and Italy.
Dividends, injections and other movements decreased free surplus by USD 623 million as dividends of USD 996 million paid to the Group exceeded injections of USD 413 million. Other capital movements were USD 41 million and included a transfer of annuity business to Non-Core Businesses and a change in minority interest in Germany.
Foreign currency translation effects decreased the U.S. dollar free surplus by USD 267 million.
Openingfree
surplus
Cash strainfrom
new businessnet of
non-controllinginterests
Expectedtransferto freesurplus
Expectedcontribution
fromin-force
Operatingvariances
Economicand other
non-operatingvariances
Dividends Foreigncurrency
translationeffects
Closingfree
surplus
2,790 (1,431)1,681
17111363
(996)
(267)2,696
Injectionsand other
movements
372
Free surplus developmentin USD millions, for the year ended December 31, 2014
Expected free surplus generationUSD 614 million
VariancesUSD 182 million
USD (267)million
Dividends, injections and other movements USD (623) million
Q4_2014_13_AR14_Embedded_Value_Report_part1_en.indd 267 23.02.2015 16:39:51
Zurich Insurance GroupAnnual Report 2014268 Financial information
Embedded value report continued
5. Expected contribution and expected transfer to shareholders’ net assets
Expected contribution at reference rateThe expected contribution at reference rate is the projected change in embedded value over the year using risk free investment returns applicable at the start of the year. The expected contribution at reference rate was USD 268 million.
Expected contribution in excess of reference rateThe expected contribution in excess of reference rate is the additional embedded value expected to be created if “real world” expected investment returns applicable at the start of the year were to emerge. The expected contribution in excess of reference rate was USD 495 million.
Expected transfer to shareholders’ net assetsThe expected transfer to shareholders’ net assets shows the profits expected to emerge during the year in respect of business in-force at the start of the year. The net effect on embedded value is zero, because the change in the value of business in-force is offset by an equal and opposite change in shareholders’ net assets.
Q4_2014_13_AR14_Embedded_Value_Report_part1_en.indd 268 23.02.2015 16:39:51
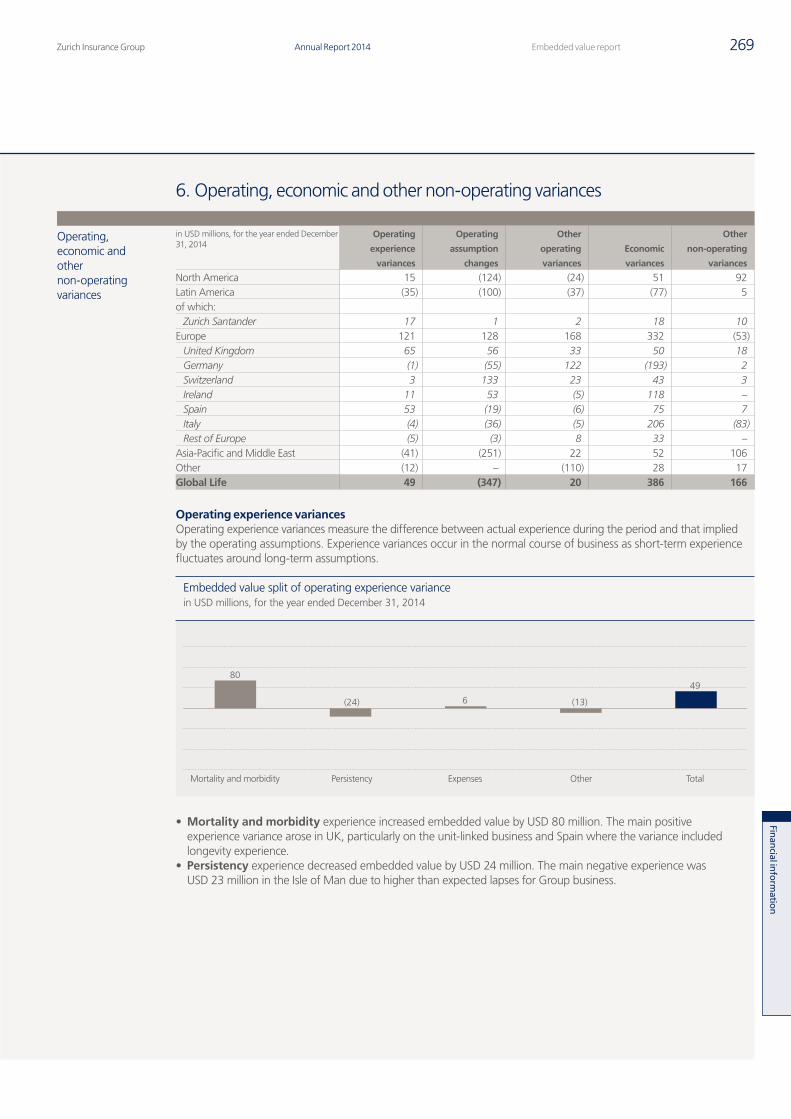
Zurich Insurance Group Annual Report 2014 269Embedded value report
Finan
cial inform
ation
6. Operating, economic and other non-operating variances
Operating, economic and other non-operating variances
in USD millions, for the year ended December 31, 2014
Operating
experience
variances
Operating
assumption
changes
Other
operating
variances
Economic
variances
Other
non-operating
variances
North America 15 (124) (24) 51 92Latin America (35) (100) (37) (77) 5of which:
Zurich Santander 17 1 2 18 10Europe 121 128 168 332 (53)
United Kingdom 65 56 33 50 18Germany (1) (55) 122 (193) 2Switzerland 3 133 23 43 3Ireland 11 53 (5) 118 –Spain 53 (19) (6) 75 7Italy (4) (36) (5) 206 (83)Rest of Europe (5) (3) 8 33 –
Asia-Pacific and Middle East (41) (251) 22 52 106Other (12) – (110) 28 17Global Life 49 (347) 20 386 166
Operating experience variancesOperating experience variances measure the difference between actual experience during the period and that implied by the operating assumptions. Experience variances occur in the normal course of business as short-term experience fluctuates around long-term assumptions.
• Mortality and morbidity experience increased embedded value by USD 80 million. The main positive experience variance arose in UK, particularly on the unit-linked business and Spain where the variance included longevity experience.
• Persistency experience decreased embedded value by USD 24 million. The main negative experience was USD 23 million in the Isle of Man due to higher than expected lapses for Group business.
Mortality and morbidity Persistency Expenses Other Total
(24)
80
6 (13)
49
Embedded value split of operating experience variance in USD millions, for the year ended December 31, 2014
Q4_2014_13_AR14_Embedded_Value_Report_part1_en.indd 269 23.02.2015 16:39:52
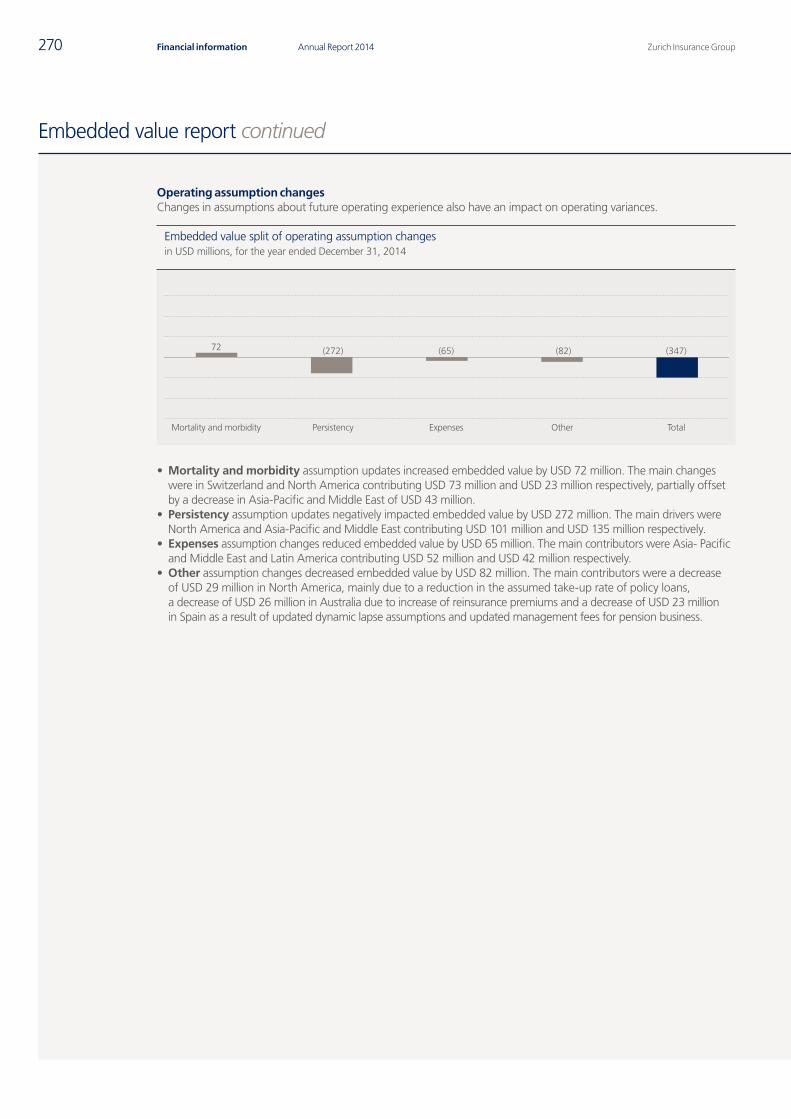
Zurich Insurance GroupAnnual Report 2014270 Financial information
Embedded value report continued
Operating assumption changes Changes in assumptions about future operating experience also have an impact on operating variances.
• Mortality and morbidity assumption updates increased embedded value by USD 72 million. The main changes were in Switzerland and North America contributing USD 73 million and USD 23 million respectively, partially offset by a decrease in Asia-Pacific and Middle East of USD 43 million.
• Persistency assumption updates negatively impacted embedded value by USD 272 million. The main drivers were North America and Asia-Pacific and Middle East contributing USD 101 million and USD 135 million respectively.
• Expenses assumption changes reduced embedded value by USD 65 million. The main contributors were Asia- Pacific and Middle East and Latin America contributing USD 52 million and USD 42 million respectively.
• Other assumption changes decreased embedded value by USD 82 million. The main contributors were a decrease of USD 29 million in North America, mainly due to a reduction in the assumed take-up rate of policy loans, a decrease of USD 26 million in Australia due to increase of reinsurance premiums and a decrease of USD 23 million in Spain as a result of updated dynamic lapse assumptions and updated management fees for pension business.
Mortality and morbidity Persistency Expenses Other Total
(272)72 (65) (82) (347)
Embedded value split of operating assumption changes in USD millions, for the year ended December 31, 2014
Q4_2014_13_AR14_Embedded_Value_Report_part1_en.indd 270 23.02.2015 16:39:52
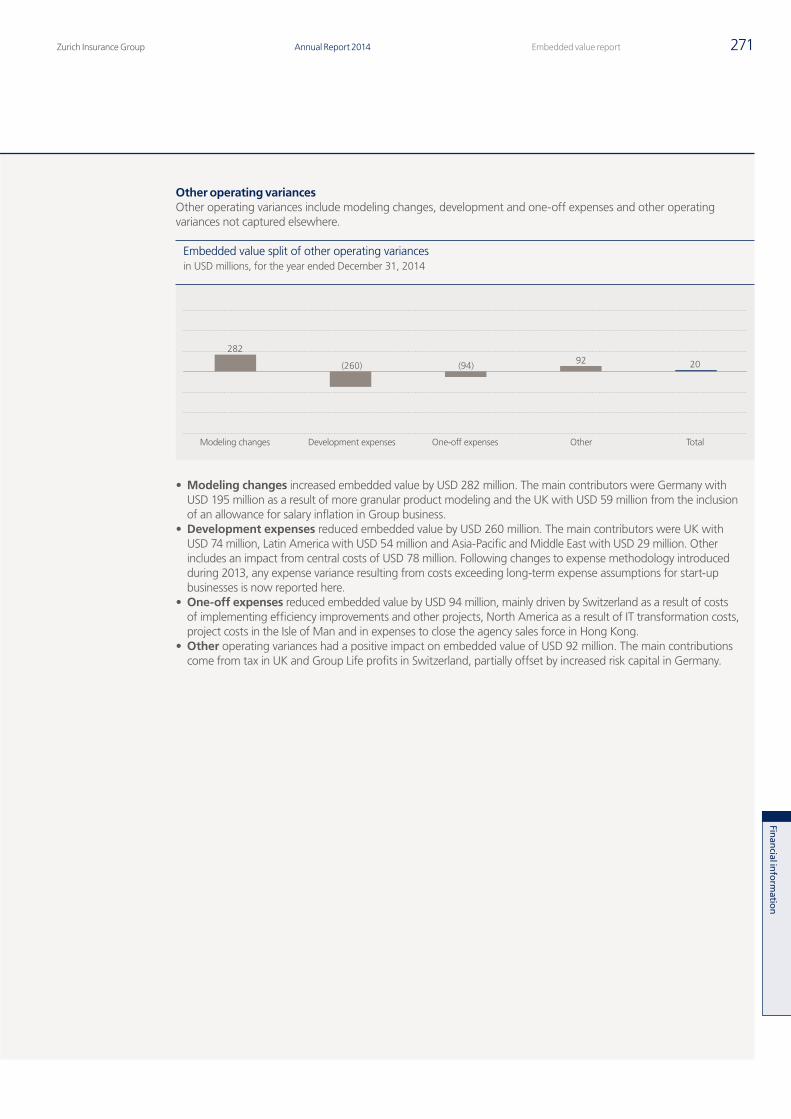
Zurich Insurance Group Annual Report 2014 271Embedded value report
Finan
cial inform
ation
Other operating variances Other operating variances include modeling changes, development and one-off expenses and other operating variances not captured elsewhere.
• Modeling changes increased embedded value by USD 282 million. The main contributors were Germany with USD 195 million as a result of more granular product modeling and the UK with USD 59 million from the inclusion of an allowance for salary inflation in Group business.
• Development expenses reduced embedded value by USD 260 million. The main contributors were UK with USD 74 million, Latin America with USD 54 million and Asia-Pacific and Middle East with USD 29 million. Other includes an impact from central costs of USD 78 million. Following changes to expense methodology introduced during 2013, any expense variance resulting from costs exceeding long-term expense assumptions for start-up businesses is now reported here.
• One-off expenses reduced embedded value by USD 94 million, mainly driven by Switzerland as a result of costs of implementing efficiency improvements and other projects, North America as a result of IT transformation costs, project costs in the Isle of Man and in expenses to close the agency sales force in Hong Kong.
• Other operating variances had a positive impact on embedded value of USD 92 million. The main contributions come from tax in UK and Group Life profits in Switzerland, partially offset by increased risk capital in Germany.
Modeling changes Development expenses One-off expenses Other Total
(260)
282
(94) 92 20
Embedded value split of other operating variances in USD millions, for the year ended December 31, 2014
Q4_2014_13_AR14_Embedded_Value_Report_part1_en.indd 271 23.02.2015 16:39:52
Zurich Insurance GroupAnnual Report 2014272 Financial information
Embedded value report continued
Economic variancesEconomic variances arise from the difference between actual economic experience during the year and the expected experience implied by the economic assumptions at the start of the year. Economic variances also include the impact of changes in assumptions in respect of future economic experience at the end of the year. In total, economic variances increased embedded value by USD 386 million in 2014.
In 2014, both the risk free rates and the liquidity premium spread reduced for the major currencies and in particular for the euro and the Swiss franc. Yields on sovereign debt were volatile across Europe, but spreads have reduced during the year. These movements are most significant for spread business and traditional participating business and as a result investment performance was positive in Italy, Ireland and Spain. In Germany the negative impact from the updated economic assumptions more than offset the positive investment variance.
Outside Europe, decreased interest rates positively affected the economic variance on protection business in Asia-Pacific and Middle East and North America.
Other non-operating variancesOther non-operating variances include the impact of legal, tax and regulatory changes implemented during the year as well as other one-off items.
Other non-operating variances increased embedded value by USD 166 million, mainly driven by positive impacts in North America as a result of an updated change to the internal capital model, and from FX in the Isle of Man, partially offset in Italy by the impact on guaranteed costs of higher equities.
Q4_2014_13_AR14_Embedded_Value_Report_part1_en.indd 272 23.02.2015 16:39:52
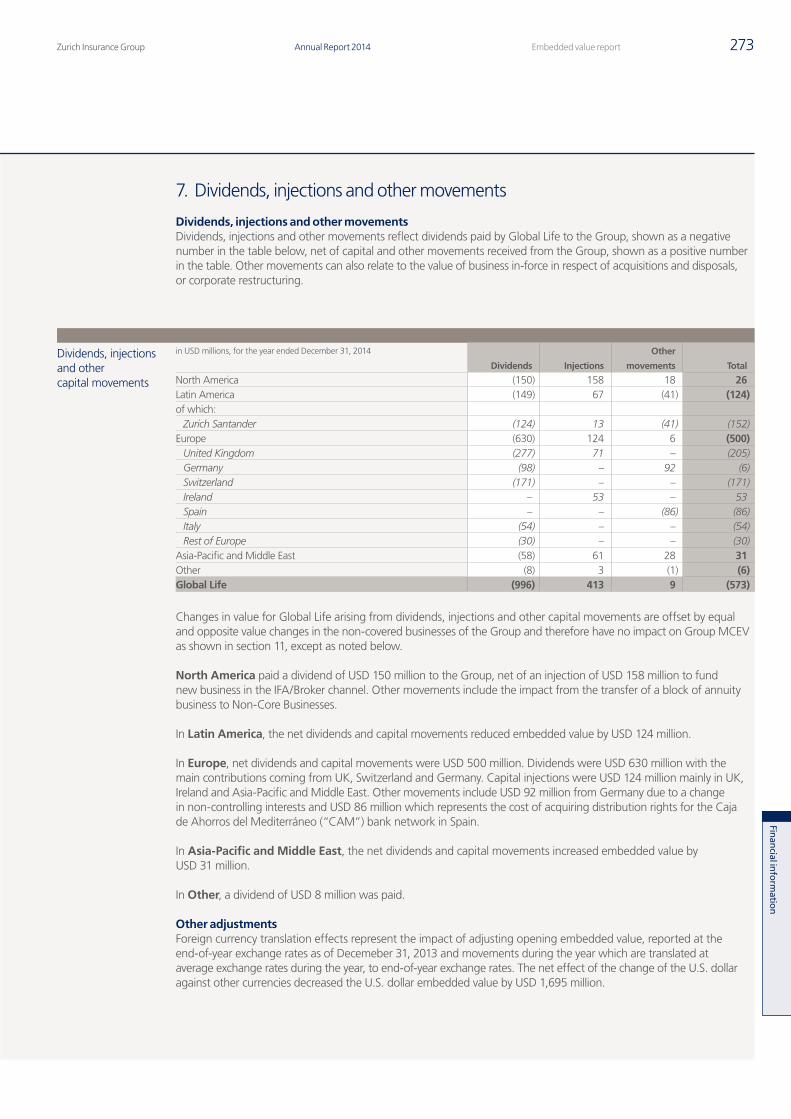
Zurich Insurance Group Annual Report 2014 273Embedded value report
Finan
cial inform
ation
7. Dividends, injections and other movements
Dividends, injections and other movementsDividends, injections and other movements reflect dividends paid by Global Life to the Group, shown as a negative number in the table below, net of capital and other movements received from the Group, shown as a positive number in the table. Other movements can also relate to the value of business in-force in respect of acquisitions and disposals, or corporate restructuring.
Dividends, injections and other capital movements
in USD millions, for the year ended December 31, 2014
Dividends Injections
Other
movements Total
North America (150) 158 18 26Latin America (149) 67 (41) (124)of which:
Zurich Santander (124) 13 (41) (152)Europe (630) 124 6 (500)
United Kingdom (277) 71 – (205)Germany (98) – 92 (6)Switzerland (171) – – (171)Ireland – 53 – 53Spain – – (86) (86)Italy (54) – – (54)Rest of Europe (30) – – (30)
Asia-Pacific and Middle East (58) 61 28 31Other (8) 3 (1) (6)Global Life (996) 413 9 (573)
Changes in value for Global Life arising from dividends, injections and other capital movements are offset by equal and opposite value changes in the non-covered businesses of the Group and therefore have no impact on Group MCEV as shown in section 11, except as noted below.
North America paid a dividend of USD 150 million to the Group, net of an injection of USD 158 million to fund new business in the IFA/Broker channel. Other movements include the impact from the transfer of a block of annuity business to Non-Core Businesses.
In Latin America, the net dividends and capital movements reduced embedded value by USD 124 million.
In Europe, net dividends and capital movements were USD 500 million. Dividends were USD 630 million with the main contributions coming from UK, Switzerland and Germany. Capital injections were USD 124 million mainly in UK, Ireland and Asia-Pacific and Middle East. Other movements include USD 92 million from Germany due to a change in non-controlling interests and USD 86 million which represents the cost of acquiring distribution rights for the Caja de Ahorros del Mediterráneo (“CAM”) bank network in Spain.
In Asia-Pacific and Middle East, the net dividends and capital movements increased embedded value by USD 31 million.
In Other, a dividend of USD 8 million was paid.
Other adjustmentsForeign currency translation effects represent the impact of adjusting opening embedded value, reported at the end-of-year exchange rates as of Decemeber 31, 2013 and movements during the year which are translated at average exchange rates during the year, to end-of-year exchange rates. The net effect of the change of the U.S. dollar against other currencies decreased the U.S. dollar embedded value by USD 1,695 million.
Q4_2014_13_AR14_Embedded_Value_Report_part1_en.indd 273 23.02.2015 16:39:53
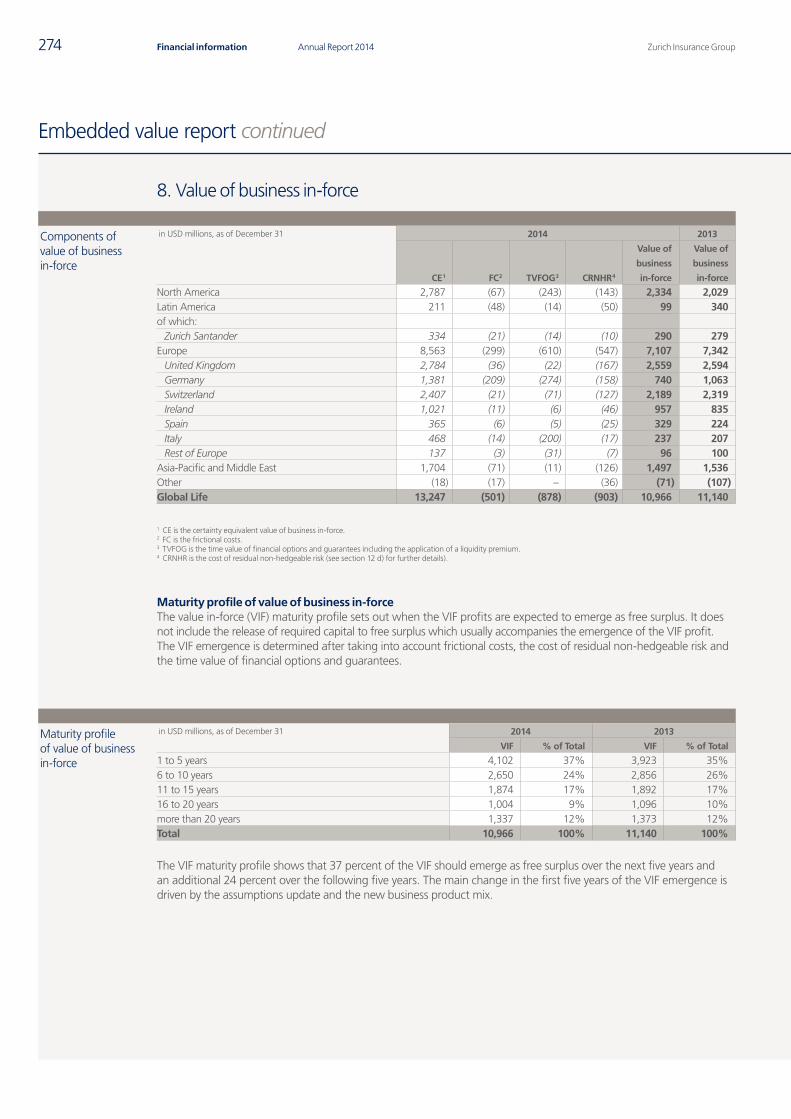
Zurich Insurance GroupAnnual Report 2014274 Financial information
Embedded value report continued
8. Value of business in-force
Components of value of business in-force
in USD millions, as of December 31 2014 2013
CE 1 FC 2 TVFOG 3 CRNHR 4
Value of
business
in-force
Value of
business
in-force
North America 2,787 (67) (243) (143) 2,334 2,029Latin America 211 (48) (14) (50) 99 340of which:
Zurich Santander 334 (21) (14) (10) 290 279Europe 8,563 (299) (610) (547) 7,107 7,342
United Kingdom 2,784 (36) (22) (167) 2,559 2,594Germany 1,381 (209) (274) (158) 740 1,063Switzerland 2,407 (21) (71) (127) 2,189 2,319Ireland 1,021 (11) (6) (46) 957 835Spain 365 (6) (5) (25) 329 224Italy 468 (14) (200) (17) 237 207Rest of Europe 137 (3) (31) (7) 96 100
Asia-Pacific and Middle East 1,704 (71) (11) (126) 1,497 1,536Other (18) (17) – (36) (71) (107)Global Life 13,247 (501) (878) (903) 10,966 11,140
1 CE is the certainty equivalent value of business in-force.2 FC is the frictional costs.3 TVFOG is the time value of financial options and guarantees including the application of a liquidity premium.4 CRNHR is the cost of residual non-hedgeable risk (see section 12 d) for further details).
Maturity profile of value of business in-forceThe value in-force (VIF) maturity profile sets out when the VIF profits are expected to emerge as free surplus. It does not include the release of required capital to free surplus which usually accompanies the emergence of the VIF profit. The VIF emergence is determined after taking into account frictional costs, the cost of residual non-hedgeable risk and the time value of financial options and guarantees.
Maturity profile of value of business in-force
in USD millions, as of December 31 2014 2013
VIF % of Total VIF % of Total
1 to 5 years 4,102 37% 3,923 35%6 to 10 years 2,650 24% 2,856 26%11 to 15 years 1,874 17% 1,892 17%16 to 20 years 1,004 9% 1,096 10%more than 20 years 1,337 12% 1,373 12%Total 10,966 100% 11,140 100%
The VIF maturity profile shows that 37 percent of the VIF should emerge as free surplus over the next five years and an additional 24 percent over the following five years. The main change in the first five years of the VIF emergence is driven by the assumptions update and the new business product mix.
Q4_2014_13_AR14_Embedded_Value_Report_part1_en.indd 274 23.02.2015 16:39:53
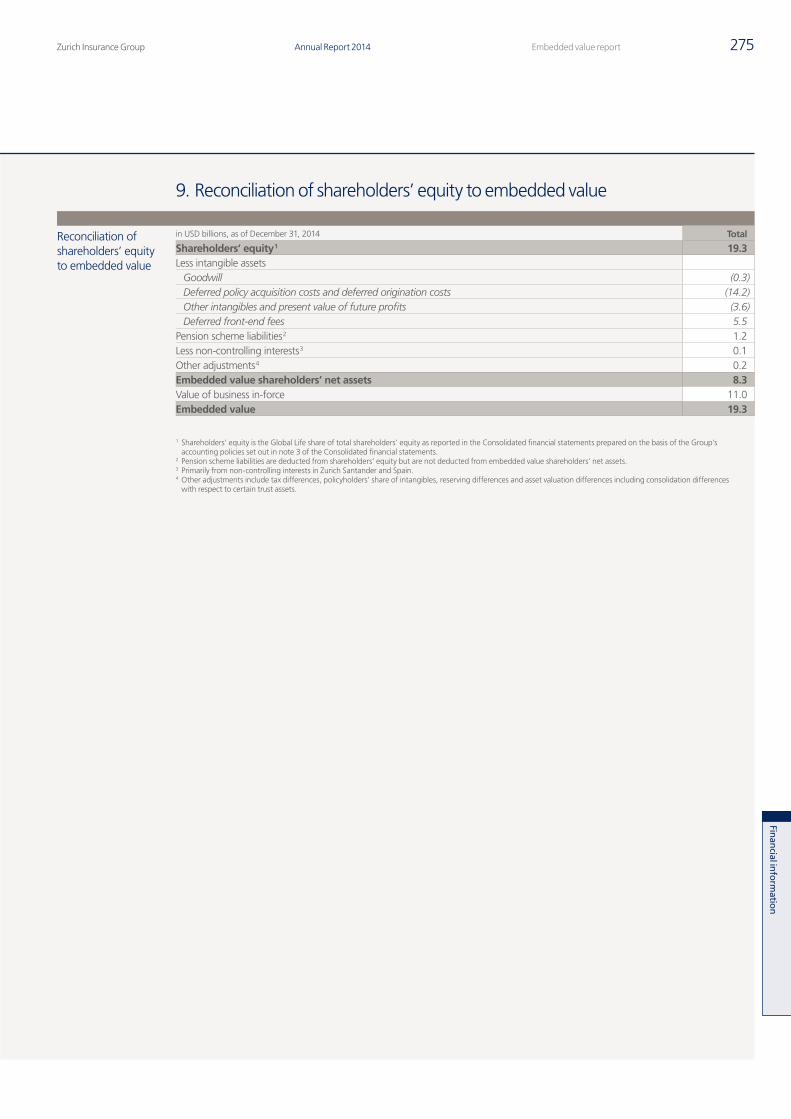
Zurich Insurance Group Annual Report 2014 275Embedded value report
Finan
cial inform
ation
9. Reconciliation of shareholders’ equity to embedded value
Reconciliation of shareholders’ equity to embedded value
in USD billions, as of December 31, 2014 Total
Shareholders’ equity 1 19.3Less intangible assets
Goodwill (0.3)Deferred policy acquisition costs and deferred origination costs (14.2)Other intangibles and present value of future profits (3.6)Deferred front-end fees 5.5
Pension scheme liabilities 2 1.2Less non-controlling interests 3 0.1Other adjustments 4 0.2Embedded value shareholders’ net assets 8.3Value of business in-force 11.0Embedded value 19.3
1 Shareholders’ equity is the Global Life share of total shareholders’ equity as reported in the Consolidated financial statements prepared on the basis of the Group’s accounting policies set out in note 3 of the Consolidated financial statements.
2 Pension scheme liabilities are deducted from shareholders’ equity but are not deducted from embedded value shareholders’ net assets.3 Primarily from non-controlling interests in Zurich Santander and Spain.4 Other adjustments include tax differences, policyholders’ share of intangibles, reserving differences and asset valuation differences including consolidation differences
with respect to certain trust assets.
Q4_2014_13_AR14_Embedded_Value_Report_part1_en.indd 275 23.02.2015 16:39:54
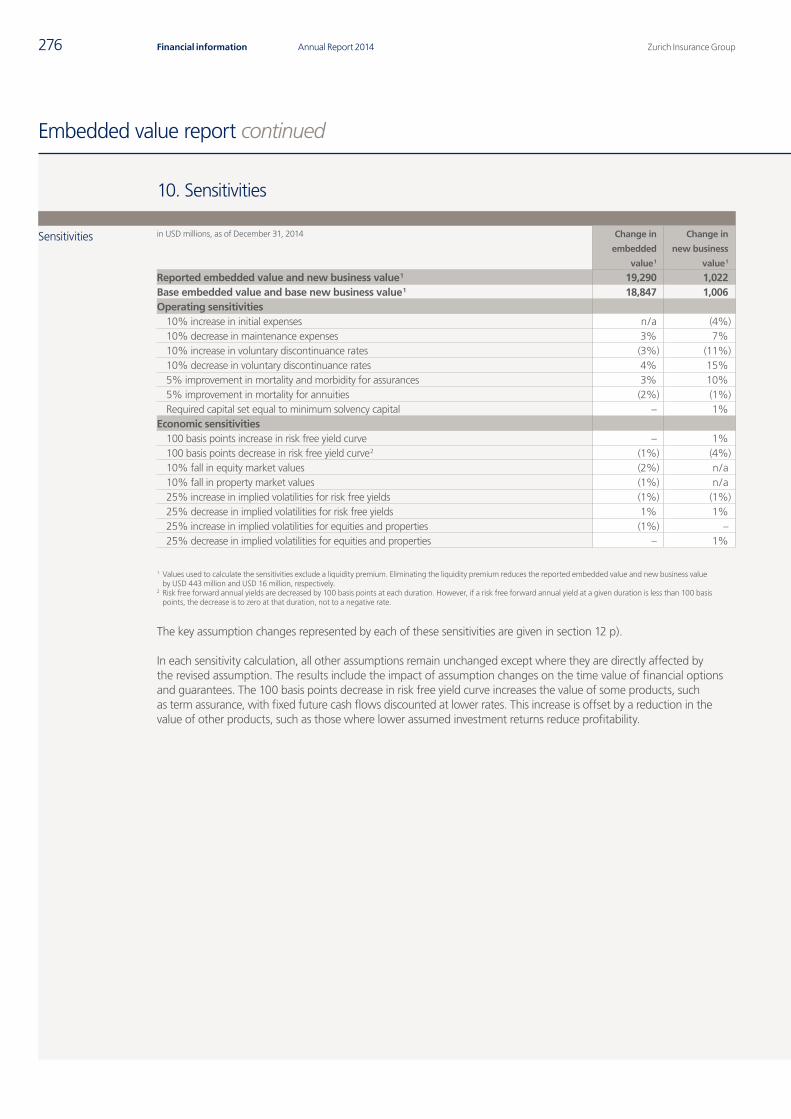
Zurich Insurance GroupAnnual Report 2014276 Financial information
Embedded value report continued
10. Sensitivities
Sensitivities in USD millions, as of December 31, 2014 Change in
embedded
value 1
Change in
new business
value 1
Reported embedded value and new business value 1 19,290 1,022Base embedded value and base new business value 1 18,847 1,006Operating sensitivities
10% increase in initial expenses n / a (4%)10% decrease in maintenance expenses 3% 7%10% increase in voluntary discontinuance rates (3%) (11%)10% decrease in voluntary discontinuance rates 4% 15%5% improvement in mortality and morbidity for assurances 3% 10%5% improvement in mortality for annuities (2%) (1%)Required capital set equal to minimum solvency capital – 1%
Economic sensitivities100 basis points increase in risk free yield curve – 1%100 basis points decrease in risk free yield curve 2 (1%) (4%)10% fall in equity market values (2%) n / a10% fall in property market values (1%) n / a25% increase in implied volatilities for risk free yields (1%) (1%)25% decrease in implied volatilities for risk free yields 1% 1%25% increase in implied volatilities for equities and properties (1%) –25% decrease in implied volatilities for equities and properties – 1%
1 Values used to calculate the sensitivities exclude a liquidity premium. Eliminating the liquidity premium reduces the reported embedded value and new business value by USD 443 million and USD 16 million, respectively.
2 Risk free forward annual yields are decreased by 100 basis points at each duration. However, if a risk free forward annual yield at a given duration is less than 100 basis points, the decrease is to zero at that duration, not to a negative rate.
The key assumption changes represented by each of these sensitivities are given in section 12 p).
In each sensitivity calculation, all other assumptions remain unchanged except where they are directly affected by the revised assumption. The results include the impact of assumption changes on the time value of financial options and guarantees. The 100 basis points decrease in risk free yield curve increases the value of some products, such as term assurance, with fixed future cash flows discounted at lower rates. This increase is offset by a reduction in the value of other products, such as those where lower assumed investment returns reduce profitability.
Q4_2014_13_AR14_Embedded_Value_Report_part1_en.indd 276 23.02.2015 16:39:54
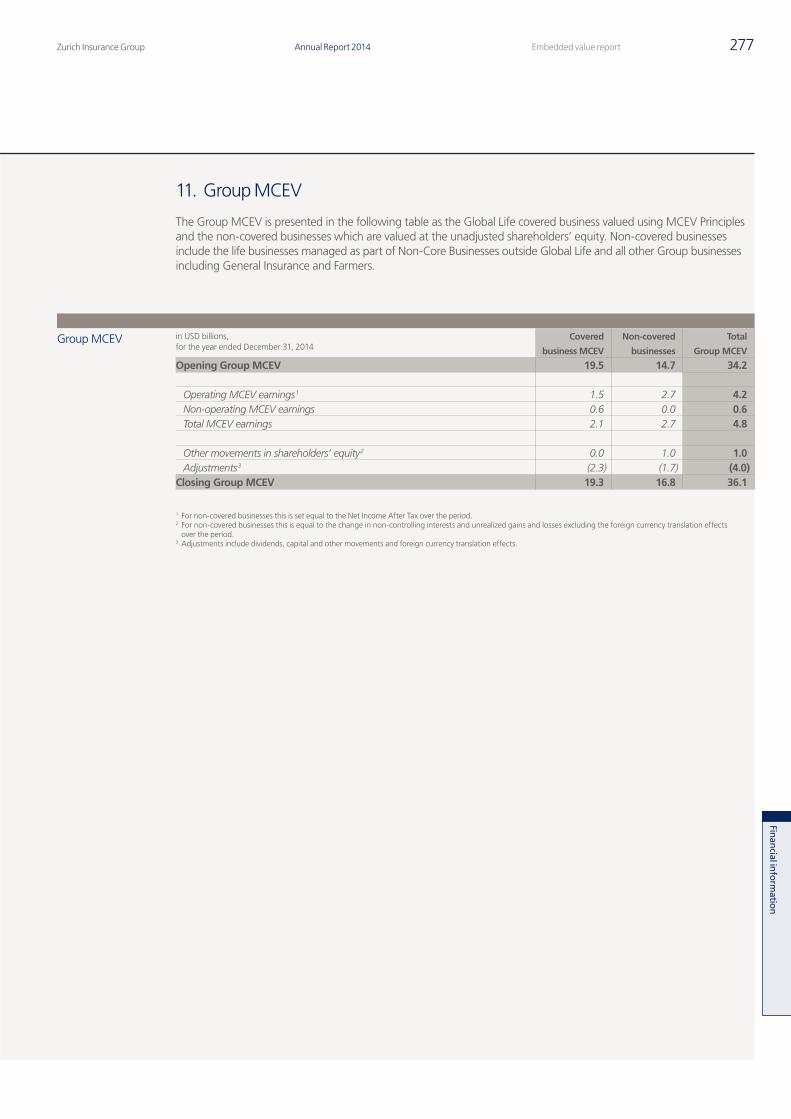
Zurich Insurance Group Annual Report 2014 277Embedded value report
Finan
cial inform
ation
11. Group MCEV
The Group MCEV is presented in the following table as the Global Life covered business valued using MCEV Principles and the non-covered businesses which are valued at the unadjusted shareholders’ equity. Non-covered businesses include the life businesses managed as part of Non-Core Businesses outside Global Life and all other Group businesses including General Insurance and Farmers.
Group MCEV in USD billions, for the year ended December 31, 2014
Covered
business MCEV
Non-covered
businesses
Total
Group MCEV
Opening Group MCEV 19.5 14.7 34.2
Operating MCEV earnings 1 1.5 2.7 4.2Non-operating MCEV earnings 0.6 0.0 0.6Total MCEV earnings 2.1 2.7 4.8
Other movements in shareholders’ equity 2 0.0 1.0 1.0Adjustments 3 (2.3) (1.7) (4.0)
Closing Group MCEV 19.3 16.8 36.1
1 For non-covered businesses this is set equal to the Net Income After Tax over the period.2 For non-covered businesses this is equal to the change in non-controlling interests and unrealized gains and losses excluding the foreign currency translation effects
over the period.3 Adjustments include dividends, capital and other movements and foreign currency translation effects.
Q4_2014_13_AR14_Embedded_Value_Report_part1_en.indd 277 23.02.2015 16:39:54
Zurich Insurance GroupAnnual Report 2014278 Financial information
Embedded value report continued
12. Embedded value methodology
The Group has applied Market Consistent Embedded Value (MCEV) Principles and Guidance issued by the European Insurance CFO Forum in October 2009, for its Embedded value report for the companies and businesses in its Global Life segment (the covered business). The Embedded value report primarily relates to Global Life. Total Group MCEV is shown in section 11. The embedded value methodology adopted by the Group is based on a “bottom-up” market consistent approach to allow explicitly for market risk. In particular, asset and liability cash flows are valued using risk discount rates consistent with those applied to similar cash flows in capital markets, and options and guarantees are valued using market consistent models calibrated to observable market prices. Where markets exhibit a limited capacity, the valuation is based on historical averages. Embedded value excludes any value from future new business.
All amounts shown in U.S. dollars are rounded. All ratios and variances are calculated using the underlying amounts rather than the rounded amounts.
a) Covered businessCovered business includes all business written by companies that are included in Global Life, unless otherwise stated. In particular:
• life and critical illness;• savings (with profit, non-profit and unit-linked);• pensions and annuity; and• long-term health and accident.
For certain smaller companies in Global Life, no embedded value has been calculated but these companies have been included in embedded value at shareholders’ equity, as calculated in accordance with the Group’s accounting policies. The contribution from these companies to embedded value is less than 5 percent.
b) Reporting of embedded valueIn line with MCEV Principles, embedded value is split between shareholders’ net assets, including free surplus and required capital, and the value of business in-force.
The results are disclosed in a format that the Group considers to be appropriate for the market consistent methodology adopted.
c) Shareholders’ net assetsShareholders’ net assets represent the market value of net assets held in respect of the covered business, and consist of the required capital and free surplus. The level of required capital reflects the amount of capital considered by the directors of each legal entity to be appropriate to manage the business. This is set at least at the level equal to the regulatory required capital of each legal entity, at which the regulator would intervene to request a capital injection and in addition, for the main companies, an adequate buffer to cover short-term volatilities in solvency due to financial and non-financial risks or to achieve the capital required to maintain the desired credit rating.
The free surplus comprises the market value of shareholders’ net assets allocated to the covered business of the Global Life Segment in excess of the assets backing the required capital.
The Free surplus does not consider any allowance, for example, for capital required to fund future new business growth, group consolidation constraints or pension deficits.
In the UK, insurers are required to assess capital requirements on two separate bases, Pillar 1 and Pillar 2. For Zurich Assurance Ltd, Pillar 1 was more onerous both at December 31, 2013 and at December 31, 2014. The amounts of required capital and free surplus shown in this report applicable to Zurich Assurance Ltd reflect those positions. The required capital modeled for embedded value is based on 125 percent of the Group’s target Pillar 1 required capital, and the analysis of change is performed on a Pillar 1 basis.
Shareholders’ net assets are based on local statutory and regulatory accounting. Adjustments are made to embedded value where appropriate, for example in respect of any unrealized gains attributable to shareholders. Any such adjustments are made consistently with the calculation of the value of business in-force.
Q4_2014_14_AR14_Embedded_Value_Report_part2_en.indd 278 23.02.2015 16:41:30
Zurich Insurance Group Annual Report 2014 279Embedded value report
Finan
cial inform
ation
d) Value of business in-forceThe value of business in-force is the present value of future projected profits, distributable after tax to shareholders from the covered business. It is defined as the certainty equivalent value of business in-force less frictional costs, the time value of financial options and guarantees, and the cost of residual non-hedgeable risk. These components are explained below.
Certainty equivalent (CE) value is the value calculated using discount rates consistent with those applied to the underlying cash flows in the capital markets. It includes the intrinsic value but excludes the time value of financial options and guarantees which is allowed for separately, as described below.
Frictional costs (FC) reflect a deduction for the cost of holding the required capital. Under the market consistent framework, the FC represents tax in respect of the future investment return on required capital together with the cost of future investment management expenses on required capital. In Germany, the policyholders’ share of investment income on the required capital is also included.
For the purpose of these calculations, required capital is assumed to run off in line with existing business.
The allowance for FC is included both in the value of business in-force and in new business value. For new business value, FC is applied to the required capital to be held in respect of that business.
Time value of financial options and guarantees (TVFOG) represents additional costs in excess of the intrinsic value of options and guarantees which are already allowed for in the CE value. These are based on the variability of investment returns which need to be allowed for explicitly under MCEV Principles. The time value is calculated on a market consistent basis using stochastic modeling techniques, and after making allowance for expected management and policyholder behavior.
For products with significant guarantees, the time value has been calculated on a market consistent basis by deducting the average present value of shareholder cash flows using 1,000 stochastic economic simulations from the CE value (both for the value of business in-force and separately for new business value).
For most products, the average value has been calculated using Monte Carlo simulations. For a small number of products, the TVFOG has been derived using closed form solutions.
Where appropriate, the calculation of the TVFOG makes allowance for:
• dynamic actions that would be taken by management under different economic simulations, for example to implement a life business’ investment strategy; and
• dynamic policyholder behavior, for example changes in surrender behavior as interest rates rise or fall, or take-up rates of guaranteed annuity options.
The cost of residual non-hedgeable risk (CRNHR) is an explicit deduction for non-hedgeable financial risks (non-hedgeable asset/liability management risks and reinsurance credit risk), and non-financial risks (mortality, persistency, expenses and operational risk). The CE value allows for best estimate shareholder cashflows. The CRNHR is largely an allowance for uncertainty in shareholder cashflows, and for risks which are not already considered in the CE value or the TVFOG, such as operational risk. Most residual non-hedgeable risks have a symmetric impact on embedded value apart from operational risk.
CRNHR is calculated as a charge on the capital held for residual non-hedgeable risks. This is calculated according to Zurich’s internal risk based capital model by applying 2,000 shocks to the embedded value assumptions. To align with the MCEV Principles the risk based capital is scaled to a 99.5 percent confidence level by using empirical distributions where available, or by assuming probability distributions as appropriate.
Q4_2014_14_AR14_Embedded_Value_Report_part2_en.indd 279 23.02.2015 16:41:30
Zurich Insurance GroupAnnual Report 2014280 Financial information
Embedded value report continued
The capital is projected over the lifetime of the business using appropriate risk drivers for each risk type. The present value of the risk capital is calculated by applying the swap curve as of the valuation date. The CRNHR allows for diversification across risk types and across geographical segments. This approach complies with MCEV Principles except Guidance 9.7 which does not allow for diversification benefits between covered and non-covered business. The Embedded value report does allow for diversification benefits between covered and non-covered business, which is consistent with the management view of the business and adds an estimated USD 501 million to embedded value and an estimated USD 57 million to new business value. Starting from January 1, 2015 these diversification benefits will be excluded in order to bring the presentation of MCEV results in line with the MCEV principles and guidance set by the CFO Forum.
A 4 percent cost of capital charge has been applied to the diversified present value of non-hedgeable risk based capital.
e) New businessNew business covers new contracts sold during the reporting period and includes recurring single premiums, new premiums written during the period on existing contracts and variations to premiums on existing contracts where these premiums and variations have not previously been assumed to be part of business in-force. Where recurring single premiums are projected over time to derive the corresponding new business value, they are treated as annual premium for the volume definition. Group Life business valued with a contract renewal assumption is treated as annual premium.
New business is valued at the point of sale. Explicit allowance is made for FC, TVFOG, and CRNHR. New business value is valued using actual new business volumes.
The value generated by new business written during the period is the present value of the projected stream of after tax distributable profits from that business.
In certain profit sharing funds, the new business written can affect the TVFOG for business written in prior years. This effect is taken into account in the new business value by valuing the new business on a marginal approach, the difference between embedded value with and without the new business. This captures the effect of cross-subsidies between business in-force and new business due to, for example, different interest rate guarantees operating in a shared common pool of assets.
New business is valued on a discrete quarter basis. Once calculated and reported, new business value for a quarter will not change in subsequent quarters in local currency terms. For details on the assumptions used for new business see section 13.
New business amounts in the Embedded value report are reported after the effects of non-controlling interests.
f) Asset and liability dataThe majority of the Group’s embedded value has been calculated using a “hard close” approach, such that all asset and liability data reflect the actual position as of the valuation date.
Germany has followed an approach where liability model points are set up in advance, using the structure of a previous run, and then projected to the valuation date by scaling to match the expected balance sheet figures.
g) Market consistent discountingThe Group has adopted a “bottom-up” market consistent approach for the projection and discounting of future cash flows in the calculation of embedded value. As a result, the risks inherent in the cash flows are allowed for in a way that is consistent with the way the market is expected to allow for such risks.
In principle, this method values each cash flow using a discount rate consistent with that applied to such a cash flow in the capital markets. For example, an equity cash flow is valued using an equity risk discount rate, and a debt security cash flow is valued using a debt security discount rate. If a higher return is assumed for equities, the equity cash flow is discounted at this higher rate.
In practice, the Group has applied a computational method known as a “risk neutral” approach. This involves projecting the assets and liabilities using a distribution of asset returns where all asset types, on average, earn the same risk free rate.
Q4_2014_14_AR14_Embedded_Value_Report_part2_en.indd 280 23.02.2015 16:41:30
Zurich Insurance Group Annual Report 2014 281Embedded value report
Finan
cial inform
ation
The risk free yield curve assumptions are based on the swap curve in each major currency (U.S. dollars, euro, British pounds and Swiss francs). For liabilities where payouts are either independent or move linearly with markets, deterministic techniques (referred to as “certainty equivalent”) have been used. In such cases, the projection and discounting are based on the same risk free yield curve. Further details are set out under “Economic assumptions” in section 13.
h) Economic scenario generatorAll operations use actual yield curves observable as of the valuation date for the calculation of the certainty equivalent value of business in-force.
The calculations of the TVFOG are based on stochastic simulations using an economic scenario generator provided by Barrie & Hibbert. The outputs (“simulations”) have been calibrated to conform to the economic parameters specified by the Group.
The simulations used for calculation of TVFOG reflect the actual yield curves and implied volatilities observable as of the valuation date.
Simulations are produced for the economies in the U.S., the UK, Switzerland and the eurozone. In each economic area, risk free nominal interest rates are modeled using a LIBOR market model. The excess return on other asset classes relative to the total returns on risk free assets are then modeled using a multi-factor lognormal model. Hong Kong uses U.S. dollar simulations because their principal liabilities are U.S. dollar-denominated. Chile uses closed form solutions rather than simulations. Other operations, not mentioned above, have no significant options and guarantees. Further details are set out under “Economic assumptions” in section 13.
i) Holding companiesHolding companies allocated to Global Life have been consolidated in embedded value at their shareholders’ equity. Related expenses have been included in the projection assumptions. Holding companies outside Global Life are not included in embedded value of the covered business.
j) Consolidation adjustmentsWhere a reinsurance arrangement exists between two life companies within Global Life, the value of the reinsurance is shown in embedded value of the region to which the ceding company belongs.
k) DebtWhere a loan exists between a company in Global Life and a Group company outside Global Life, the loan is included in embedded value at the same value included in the balance sheet of the other Group company.
l) “Look through” principle – service companiesThere are some companies within Global Life that provide administration and distribution services. These are valued on a “look through” basis. The results do not include any Group service companies outside Global Life.
In Germany, the majority of distribution and administration is provided by service companies. These are valued on a “look through” basis. These companies also provide limited services to companies outside Global Life. The value of business in-force and new business value reflect the services provided to companies within Global Life. The shareholders’ net assets of Global Life include, however, the full shareholders’ net assets of these service companies.
In Switzerland, an investment management company provides asset management services to pension schemes written in foundations and other pension funds. The present value of the net asset management fees, after tax, is included in embedded value and new business value.
m) Employee pension schemesIn the Group’s Consolidated financial statements, actuarial gains and losses arising from defined benefit pension and other defined benefit post-retirement plans are recognized in full in the period in which they occur and are presented on a separate line in the statement of comprehensive income, with a liability recognized for employee benefit deficits under IAS 19. This adjustment has not been made in the detailed embedded value described in this Embedded value report. If the adjustment had been made embedded value as of the valuation date would have been lower by USD 1,192 million. The actuarial and economic assumptions used for this adjustment are consistent with those used for the equivalent allowance made in the Group’s Consolidated financial statements.
Q4_2014_14_AR14_Embedded_Value_Report_part2_en.indd 281 23.02.2015 16:41:30
Zurich Insurance GroupAnnual Report 2014282 Financial information
Embedded value report continued
Expense assumptions for each life business include expected pension scheme costs in respect of future service entitlements.
n) Change in legislation or solvency regimeThe impacts of changes in legislation or solvency regimes are included in economic variance for the analysis of movement when they occur.
o) Translation to Group presentation currencyTo align embedded value reporting with the Group’s Consolidated financial statements, relevant results have been translated to the Group presentation currency, U.S. dollar, using average exchange rates for the period. This applies to new business value and new business volumes (APE and PVNBP) for the current period and comparative figures. This approach has also been applied to the analysis of movement. Valuations as at a specified date are translated at end-of-period exchange rates.
The rates can be found in note 1 of the audited Consolidated financial statements as of December 31, 2014.
p) SensitivitiesThe key assumption changes represented by each of the sensitivities in section 10 are as follows:
Operating sensitivities
A 10 percent increase in initial expenses was considered for new business value only.
A 10 percent decrease in maintenance expenses means that, for example, a base assumption of USD 30 per annum would decrease to USD 27 per annum.
A 10 percent decrease in voluntary discontinuance rates means that, for example, a base assumption of 5 percent per annum would decrease to 4.5 percent per annum.
A 5 percent improvement in mortality and morbidity assumptions for assurances means that, for example, if the actuarial mortality assumption for assurances was 90 percent of a particular table, this would decrease to 85.5 percent.
A 5 percent improvement in mortality assumptions for annuities means that, for example, if the actuarial mortality assumption for annuities was 90 percent of a particular table, this would decrease to 85.5 percent.
Required Capital set to Minimum Solvency Capital means that frictional costs are applied to minimum solvency capital only and frictional costs on excess solvency capital are released.
Economic sensitivities
A 100 basis points increase and decrease was applied to the risk free forward yield curve across all durations. For the 100 basis points decrease sensitivity, if a risk free forward annual yield at a given duration is less than 100 basis points, the decrease is to zero at that duration, not to a negative rate.
A 10 percent fall in equity and property market values was assessed for embedded value only.
A 25 percent increase in implied risk free volatilities means that, for example, a volatility of 20 percent per annum would increase to 25 percent per annum.
A 25 percent increase in implied equity and property volatilities means that, for example, a volatility of 20 percent per annum would increase to 25 percent per annum.
In each sensitivity calculation, all other assumptions remain unchanged except where they are directly affected by the revised conditions. The results include any impact of the assumption changes on the time value of financial options and guarantees.
Q4_2014_14_AR14_Embedded_Value_Report_part2_en.indd 282 23.02.2015 16:41:30
Zurich Insurance Group Annual Report 2014 283Embedded value report
Finan
cial inform
ation
13. Embedded value assumptions
Projections of future shareholder cash flows expected to emerge from covered business and for new business are determined using best estimate operating assumptions. These assumptions, including mortality, morbidity, persistency and expenses, reflect recent experience and are reviewed annually and updated as appropriate. Allowance is made for future improvements in annuitant mortality based on experience and externally published data. Favorable changes in future operating efficiency are not anticipated in the assumptions – in particular for expenses and persistency.
For the purposes of calculating the value of business in-force, future economic assumptions, for example, investment returns and inflation, are based on period end conditions and assumed risk discount rates are consistent with these conditions.
For the purposes of calculating new business value, for each discrete quarter of new business, economic assumptions are based on market conditions at the start of the quarter. New business operating assumptions are reviewed annually and updated as appropriate with effect from the first quarter of the next calendar year. In general the operating assumptions remain unchanged throughout the year.
a) Economic assumptionsMarket consistent frameworkThe Group has adopted a computational method known as “risk neutral.” With this method the key economic assumptions are:
• risk free rates;• implied volatilities of different assets; and,• correlations between different asset returns.
Expected asset returns in excess of the risk free rate have no bearing on the calculated embedded value other than in the expected contribution used for the analysis of embedded value earnings. The expected return for equities comprises an equity risk premium added to the start of period one year swap rate. The expected return on corporate bonds is equal to the start of period one year swap rate plus a risk premium estimated by comparing the market yield on corporate bonds with the swap rates for equivalent durations. In addition, a reduction must be made to the yield to allow for the expected level of defaults.
Choice of “risk free yield curve”The risk free yield curve is derived from mid-market swap rates applicable to each economy as of the valuation date. These curves were used to extract forward reinvestment yields that are used for all asset classes. The yield curves are consistent with the assumptions used by investment banks to derive their option prices and their use ensures consistency with the derivation of implied volatilities. They also have the advantage of being available for most of the markets in which the Group operates. Domestic yield curves are used by businesses in other countries, except Hong Kong and Argentina which use the U.S. dollar, as their liabilities are principally U.S. dollar-denominated.
Implied asset volatility and correlationsThe Group’s embedded value model is based on market consistent assumptions. Interest volatility is derived from the implied volatility of interest rate swaptions. Swaption implied volatilities vary both by the term of the option and also the term of the underlying swap contract, a fact that is reflected in the economic scenarios. The equity volatilities are based on at-the-money forward European options on capital indices, consistent with traded options in the market. Volatility of property investments is derived from relevant historical return data for each modeled economy. Assumptions for long-term equity volatility and long-term correlations between equity, property and bond indices are prepared with reference to historical analysis.
InflationInflation assumptions have been derived from the yields on index linked government bonds relative to the corresponding nominal government yield curve, where such index linked government bonds exist. Where appropriate, allowance has been made for expense inflation to exceed the assumed level of price inflation reflecting the contribution of salary related expenses to life company expenses. In Switzerland, reference was made to Swiss Financial Market Supervisory Authority (FINMA) published rate.
Q4_2014_14_AR14_Embedded_Value_Report_part2_en.indd 283 23.02.2015 16:41:31
Zurich Insurance GroupAnnual Report 2014284 Financial information
Embedded value report continued
Risk discount rateUnder the “risk neutral” approach, risk discount rates are based on the same risk free yield curves as those used to project the investment return.
For stochastic modeling, the risk discount rates are simulation specific and also vary by calendar year consistently with the projected risk free yields in each simulation.
Liquidity premiumsThe CFO Forum engaged Barrie & Hibbert who estimated a liquidity premium proxy to be equal to 50 percent times the credit spread over swaps less 40 basis points where credit spreads over swaps are equal to the credit spread on a representative corporate bond index less the swap rate for each particular currency.
The Group applies liquidity premium in the operating currencies of U.S. dollar, euro, British pound and Swiss franc in its embedded value.
The liquidity premium is applied to the following lines of business:
• 100 percent for annuities;• 75 percent for contracts with participating features, universal life contracts and fixed interest annuities in the U.S.;• 0 percent for all other lines of business.
All sensitivities in the report relate to the base yield curve with no liquidity premium.
Expected contributionThe expected contribution for the analysis of embedded value earnings is based on a projection from the start of period to the end of period. This requires assumptions regarding the investment returns expected to be achieved over the period on different asset classes. The investment return assumptions (for this purpose only) are based on the “real world” returns expected by the Group. The use of “real world” investment assumptions gives a more realistic basis for the expected contribution calculation and allows for the risk underlying each asset. Any under or over performance will be reported through economic variance.
For fixed interest assets, the “real world” investment return assumptions are based on the gross redemption yield on the assets, less an allowance for defaults where appropriate, together with an adjustment to reflect the change over the period implied in the yield curve assumptions.
For equity assets for units where there is a substantial equity allocation, the investment return assumption is based on the long-term “real world” expected return. For equity assets for units without a material equity allocation the investment return assumption is based on the one year swap rate at the start of period plus a margin to reflect the additional risk associated with investment in this asset class.
For property assets, the investment return assumptions are based on the one year swap rate at the start of period plus a margin to reflect the additional risk associated with investment in this asset class.
These assumptions have been set by asset class and separately for each sub-fund in each life business in order to best reflect the actual assets held.
Participating businessRates of future bonus or crediting rates have been set at levels consistent with the “risk neutral” investment return assumptions and current bonus plans. In the UK, bonus rates have been set so as to exhaust any remaining assets in the relevant long-term funds. In certain scenarios shareholder injections may be required to meet existing guaranteed benefits and this additional cost is included in the TVFOG.
In other European life businesses and in the U.S., bonuses have been set to be consistent with the investment return assumptions and with the book value approach used by these life businesses in practice. Existing practice, contractual and regulatory requirements as well as the reasonable expectations of policyholders are considered in setting bonuses.
Q4_2014_14_AR14_Embedded_Value_Report_part2_en.indd 284 23.02.2015 16:41:31
Zurich Insurance Group Annual Report 2014 285Embedded value report
Finan
cial inform
ation
TaxationCurrent income tax legislation and rates have been assumed to continue unaltered, except where changes in future such tax rates or practices have been announced.
b) Operating assumptionsDemographic assumptionsThe assumed future mortality, morbidity and lapse rates have been derived from recent operating experience and relevant industry statistics. Where operating experience or industry statistics are limited, the assumptions are derived from a best estimate of future developments and are subject to regular review as more experience emerges. Where appropriate, surrender and option take-up rate assumptions that vary according to the investment simulation under consideration have been used, based on an assessment of likely policyholder behavior.
Expense assumptionsManagement expenses have been analyzed between expenses related to acquisition of new business, the maintenance of business in-force and, where appropriate, development expenses and one-off expenses. Future expense assumptions allow for expected levels of maintenance expenses. Headquarters’ expenses relating to covered business have been allocated to business units, or to Global Life’s central unit which is in region Other, and are reflected in assumed future expenses.
The maintenance expense assumptions allow for the expected cost of providing future service benefits in respect of the Group staff pension schemes. An adjustment to embedded value is noted in section 12 m) for pension scheme liabilities and no allowance is made in the expense assumptions for any contributions as a result of past service benefits.
No allowance has been made for future productivity improvements in the expense assumptions.
Where service companies have been valued on a “look through” basis, the value of profits or losses arising from these services have been included in embedded value and new business value.
The Group is liable for payments to be made to various distributors, each payment being dependent on preceding sales volumes or profits or other factors, in accordance with distribution agreements. As part of the economic valuation, for each such agreement, a liability is included in embedded value shareholders’ net assets for the best estimate of the next potential payment attributable to the business issued to date.
In countries where significant development work is performed these are shown under “development expenses”.
Any expense excluded from the unit cost base used for assumption setting requires approval from the Global Life Chief Financial Officer.
Expenses excluded from the unit cost base for embedded value reporting are split into development expenses and one-off expenses. Development expenses relate to expenses incurred to improve the long-term capacity of the business or to reduce its future unit costs, and include certain expenses for start-up operations, certain expenses for regional offices, and certain central overhead expenses not reflected in the long-term assumptions of the business units. They also include certain project-based costs and certain distribution expenses. One-off expenses are those that are not expected to recur and are short-term in nature.
All expenses in embedded value are net of tax appropriate to the business unit to which the expense is charged.
c) Dynamic decisionsTo reflect more realistically the outcome of stochastic simulations, the assumptions for each simulation make allowance for the behavior of policyholders and management actions in response to the investment conditions modeled.
In many life businesses, policyholders can exercise an option against the life company in certain circumstances, such as to surrender a policy. This leads to an increase in the assumed lapse rates when interest rates rise (or a corresponding reduction when interest rates fall). This dynamic effect in relation to lapse rates has been allowed for in the stochastic models.
The stochastic models allow, where appropriate, for management actions to change investment strategy in response to market conditions.
Q4_2014_14_AR14_Embedded_Value_Report_part2_en.indd 285 23.02.2015 16:41:31
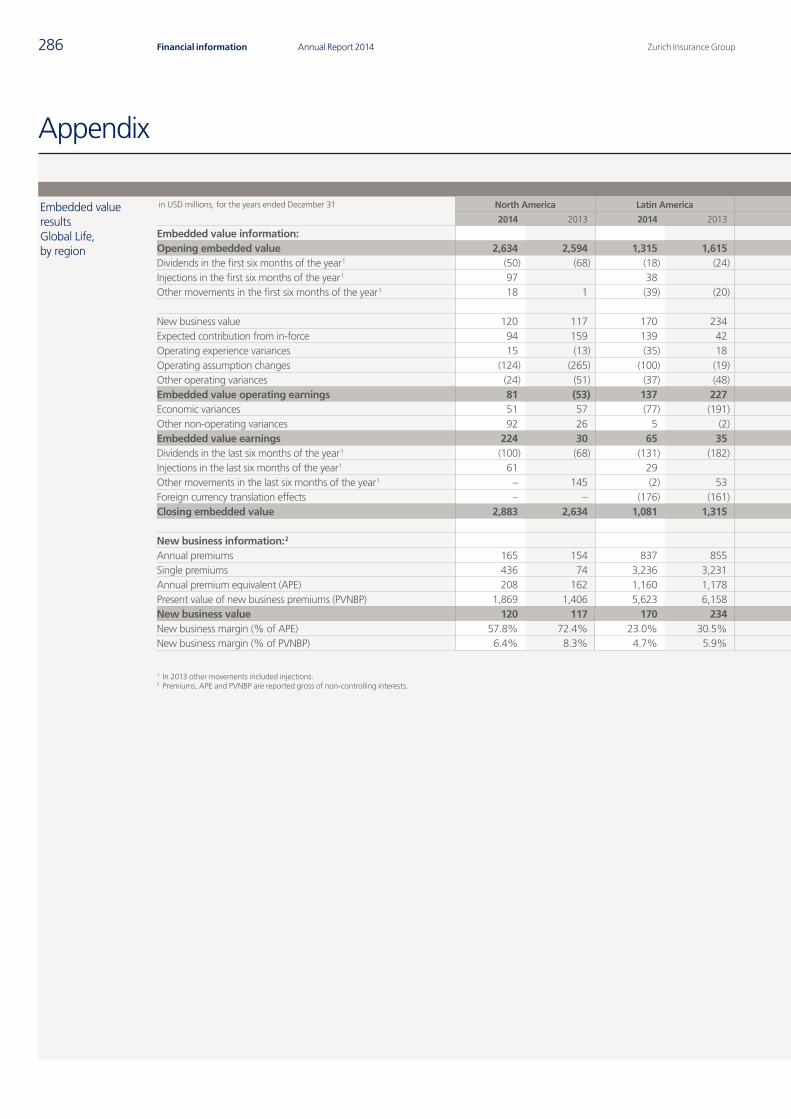
Zurich Insurance GroupAnnual Report 2014286 Financial information
Appendix
Embedded value results Global Life, by region
in USD millions, for the years ended December 31 North America Latin America of which Zurich Santander Europe Asia-Pacific and Middle East Other Global Life
2014 2013 2014 2013 2014 2013 2014 2013 2014 2013 2014 2013 2014 2013
Embedded value information:Opening embedded value 2,634 2,594 1,315 1,615 776 820 13,044 11,298 2,707 3,043 (201) 312 19,499 18,861Dividends in the first six months of the year 1 (50) (68) (18) (24) (2) (22) (497) (347) – – (8) (26) (574) (465)Injections in the first six months of the year 1 97 38 6 32 37 – 203Other movements in the first six months of the year 1 18 1 (39) (20) (39) (35) 24 43 33 93 (1) (1) 34 116
New business value 120 117 170 234 113 137 482 434 191 176 59 99 1,022 1,060Expected contribution from in-force 94 159 139 42 52 32 425 392 104 94 3 2 764 689Operating experience variances 15 (13) (35) 18 17 7 121 22 (41) – (12) (8) 49 19Operating assumption changes (124) (265) (100) (19) 1 22 128 (95) (251) (226) – (50) (347) (655)Other operating variances (24) (51) (37) (48) 2 4 168 390 22 (225) (110) (515) 20 (449)Embedded value operating earnings 81 (53) 137 227 184 201 1,325 1,142 25 (180) (60) (472) 1,507 665Economic variances 51 57 (77) (191) 18 37 332 706 52 (28) 28 (6) 386 537Other non-operating variances 92 26 5 (2) 10 (5) (53) (121) 106 (54) 17 (2) 166 (153)Embedded value earnings 224 30 65 35 211 234 1,604 1,726 182 (262) (15) (480) 2,060 1,049Dividends in the last six months of the year 1 (100) (68) (131) (182) (123) (146) (133) (77) (58) (15) – – (422) (342)Injections in the last six months of the year 1 61 29 7 93 24 3 210Other movements in the last six months of the year 1 – 145 (2) 53 (2) – (18) (7) (5) 11 – 6 (25) 208Foreign currency translation effects – – (176) (161) (102) (75) (1,361) 408 (184) (163) 26 (12) (1,695) 71Closing embedded value 2,883 2,634 1,081 1,315 733 776 12,786 13,044 2,736 2,707 (196) (201) 19,290 19,499
New business information: 2
Annual premiums 165 154 837 855 584 561 1,645 1,398 526 483 57 90 3,230 2,981Single premiums 436 74 3,236 3,231 2,625 2,603 15,519 9,782 396 466 146 824 19,733 14,378Annual premium equivalent (APE) 208 162 1,160 1,178 846 821 3,197 2,376 566 530 72 173 5,203 4,418Present value of new business premiums (PVNBP) 1,869 1,406 5,623 6,158 4,090 4,381 40,744 27,751 4,060 3,368 658 1,903 52,954 40,586New business value 120 117 170 234 113 137 482 434 191 176 59 99 1,022 1,060New business margin (% of APE) 57.8% 72.4% 23.0% 30.5% 26.1% 32.6% 15.8% 18.8% 33.8% 33.4% 83.0% 57.4% 22.1% 27.0%New business margin (% of PVNBP) 6.4% 8.3% 4.7% 5.9% 5.4% 6.1% 1.2% 1.6% 4.7% 5.2% 9.0% 5.2% 2.1% 2.8%
1 In 2013 other movements included injections.2 Premiums, APE and PVNBP are reported gross of non-controlling interests.
Q4_2014_14_AR14_Embedded_Value_Report_part2_en.indd 286 23.02.2015 16:41:32
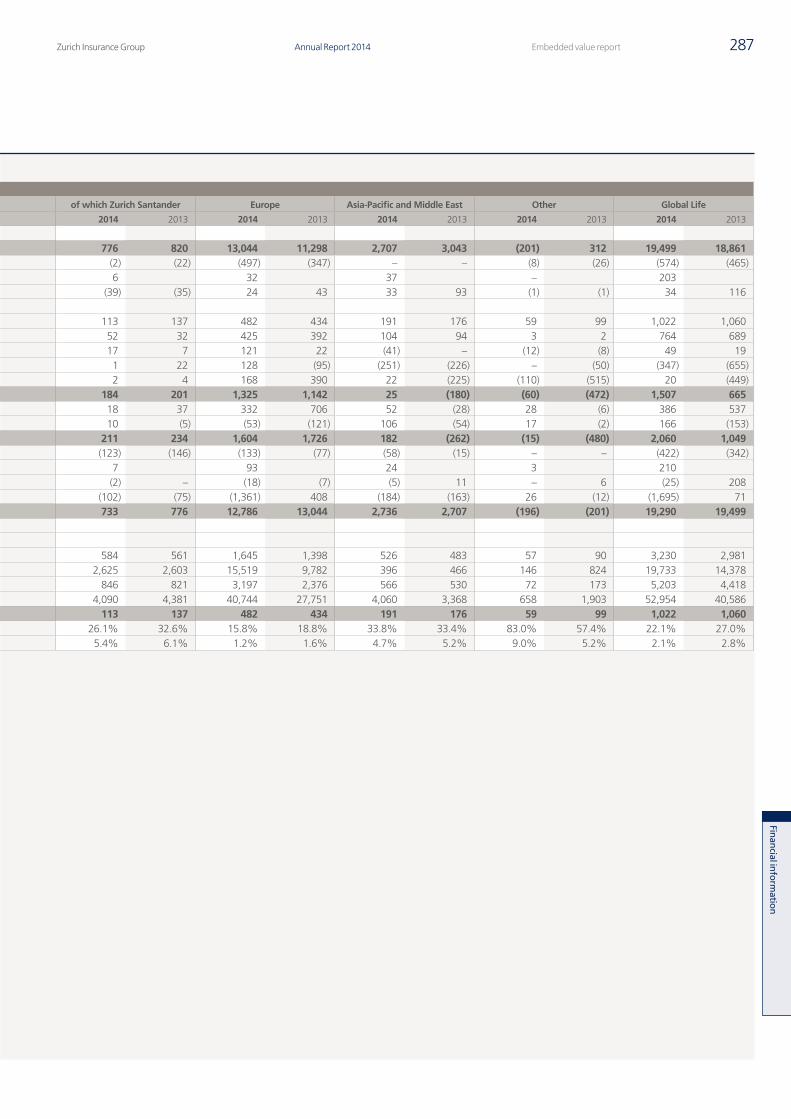
Zurich Insurance Group Annual Report 2014 287Embedded value report
Finan
cial inform
ation
Embedded value results Global Life, by region
in USD millions, for the years ended December 31 North America Latin America of which Zurich Santander Europe Asia-Pacific and Middle East Other Global Life
2014 2013 2014 2013 2014 2013 2014 2013 2014 2013 2014 2013 2014 2013
Embedded value information:Opening embedded value 2,634 2,594 1,315 1,615 776 820 13,044 11,298 2,707 3,043 (201) 312 19,499 18,861Dividends in the first six months of the year 1 (50) (68) (18) (24) (2) (22) (497) (347) – – (8) (26) (574) (465)Injections in the first six months of the year 1 97 38 6 32 37 – 203Other movements in the first six months of the year 1 18 1 (39) (20) (39) (35) 24 43 33 93 (1) (1) 34 116
New business value 120 117 170 234 113 137 482 434 191 176 59 99 1,022 1,060Expected contribution from in-force 94 159 139 42 52 32 425 392 104 94 3 2 764 689Operating experience variances 15 (13) (35) 18 17 7 121 22 (41) – (12) (8) 49 19Operating assumption changes (124) (265) (100) (19) 1 22 128 (95) (251) (226) – (50) (347) (655)Other operating variances (24) (51) (37) (48) 2 4 168 390 22 (225) (110) (515) 20 (449)Embedded value operating earnings 81 (53) 137 227 184 201 1,325 1,142 25 (180) (60) (472) 1,507 665Economic variances 51 57 (77) (191) 18 37 332 706 52 (28) 28 (6) 386 537Other non-operating variances 92 26 5 (2) 10 (5) (53) (121) 106 (54) 17 (2) 166 (153)Embedded value earnings 224 30 65 35 211 234 1,604 1,726 182 (262) (15) (480) 2,060 1,049Dividends in the last six months of the year 1 (100) (68) (131) (182) (123) (146) (133) (77) (58) (15) – – (422) (342)Injections in the last six months of the year 1 61 29 7 93 24 3 210Other movements in the last six months of the year 1 – 145 (2) 53 (2) – (18) (7) (5) 11 – 6 (25) 208Foreign currency translation effects – – (176) (161) (102) (75) (1,361) 408 (184) (163) 26 (12) (1,695) 71Closing embedded value 2,883 2,634 1,081 1,315 733 776 12,786 13,044 2,736 2,707 (196) (201) 19,290 19,499
New business information: 2
Annual premiums 165 154 837 855 584 561 1,645 1,398 526 483 57 90 3,230 2,981Single premiums 436 74 3,236 3,231 2,625 2,603 15,519 9,782 396 466 146 824 19,733 14,378Annual premium equivalent (APE) 208 162 1,160 1,178 846 821 3,197 2,376 566 530 72 173 5,203 4,418Present value of new business premiums (PVNBP) 1,869 1,406 5,623 6,158 4,090 4,381 40,744 27,751 4,060 3,368 658 1,903 52,954 40,586New business value 120 117 170 234 113 137 482 434 191 176 59 99 1,022 1,060New business margin (% of APE) 57.8% 72.4% 23.0% 30.5% 26.1% 32.6% 15.8% 18.8% 33.8% 33.4% 83.0% 57.4% 22.1% 27.0%New business margin (% of PVNBP) 6.4% 8.3% 4.7% 5.9% 5.4% 6.1% 1.2% 1.6% 4.7% 5.2% 9.0% 5.2% 2.1% 2.8%
1 In 2013 other movements included injections.2 Premiums, APE and PVNBP are reported gross of non-controlling interests.
Q4_2014_14_AR14_Embedded_Value_Report_part2_en.indd 287 23.02.2015 16:41:33
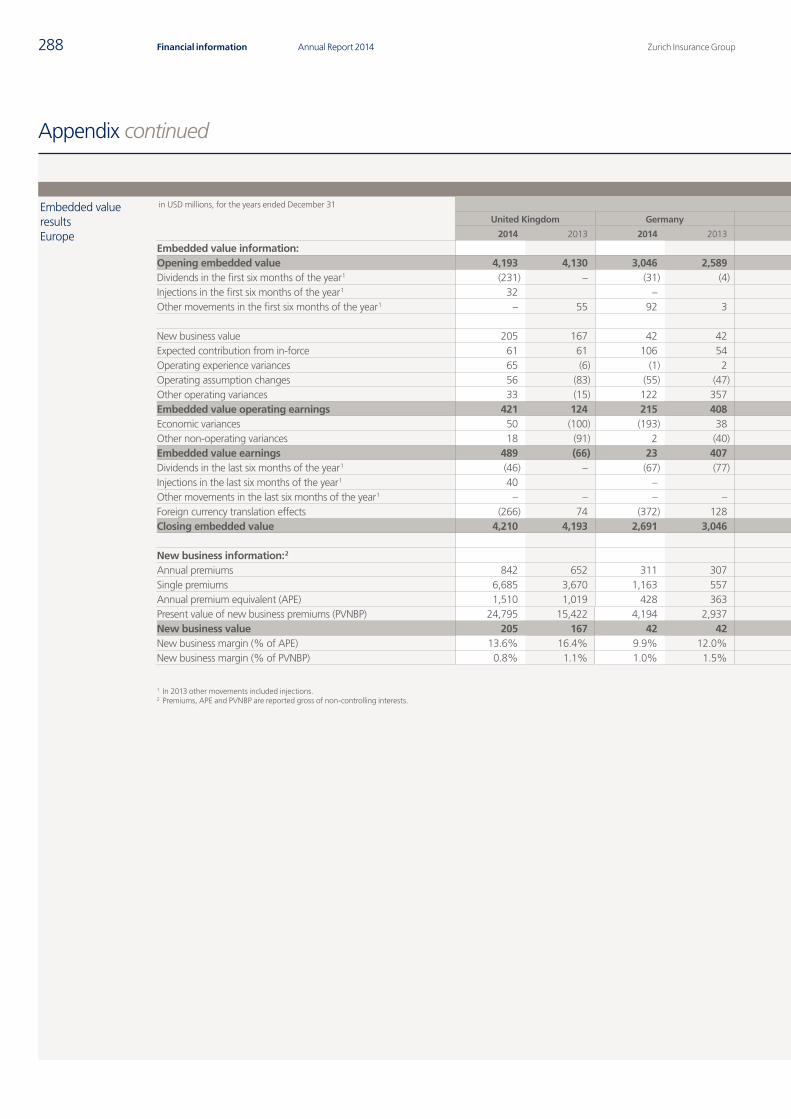
Zurich Insurance GroupAnnual Report 2014288 Financial information
Appendix continued
Embedded value results Europe
in USD millions, for the years ended December 31 Europe
United Kingdom Germany Switzerland Ireland Spain Italy Rest of Europe
2014 2013 2014 2013 2014 2013 2014 2013 2014 2013 2014 2013 2014 2013
Embedded value information:Opening embedded value 4,193 4,130 3,046 2,589 2,946 2,286 1,328 1,204 533 281 721 533 277 275Dividends in the first six months of the year 1 (231) – (31) (4) (151) (163) – – – (27) (54) (133) (30) (21)Injections in the first six months of the year 1 32 – – – – –Other movements in the first six months of the year 1 – 55 92 3 – 4 – 13 (68) (6) – – – (27)
New business value 205 167 42 42 72 60 52 68 89 62 14 30 7 5Expected contribution from in-force 61 61 106 54 149 139 31 19 39 66 19 20 19 32Operating experience variances 65 (6) (1) 2 3 12 11 9 53 14 (4) (3) (5) (6)Operating assumption changes 56 (83) (55) (47) 133 103 53 (47) (19) (24) (36) – (3) 1Other operating variances 33 (15) 122 357 23 111 (5) (68) (6) (5) (5) 4 8 4Embedded value operating earnings 421 124 215 408 379 426 142 (19) 155 114 (12) 51 26 37Economic variances 50 (100) (193) 38 43 302 118 73 75 153 206 238 33 –Other non-operating variances 18 (91) 2 (40) 3 8 – – 7 – (83) 2 – –Embedded value earnings 489 (66) 23 407 426 735 260 54 237 267 110 292 58 37Dividends in the last six months of the year 1 (46) – (67) (77) (20) – – – – – – – – –Injections in the last six months of the year 1 40 – – 53 – –Other movements in the last six months of the year 1 – – – – – (2) – – (18) (4) – – – –Foreign currency translation effects (266) 74 (372) 128 (326) 86 (190) 56 (78) 21 (93) 30 (36) 12Closing embedded value 4,210 4,193 2,691 3,046 2,875 2,946 1,451 1,328 605 533 684 721 269 277
New business information: 2
Annual premiums 842 652 311 307 108 111 142 117 123 84 98 107 22 20Single premiums 6,685 3,670 1,163 557 1,458 1,141 3,098 3,037 2,029 703 918 591 170 84Annual premium equivalent (APE) 1,510 1,019 428 363 253 225 452 420 325 155 190 166 39 29Present value of new business premiums (PVNBP) 24,795 15,422 4,194 2,937 2,872 2,651 3,856 3,637 3,068 1,410 1,564 1,410 395 284New business value 205 167 42 42 72 60 52 68 89 62 14 30 7 5New business margin (% of APE) 13.6% 16.4% 9.9% 12.0% 28.5% 26.7% 11.6% 16.1% 49.8% 67.1% 7.2% 17.9% 18.8% 18.3%New business margin (% of PVNBP) 0.8% 1.1% 1.0% 1.5% 2.5% 2.3% 1.4% 1.9% 5.4% 7.6% 0.9% 2.1% 1.9% 1.9%
1 In 2013 other movements included injections.2 Premiums, APE and PVNBP are reported gross of non-controlling interests.
Q4_2014_14_AR14_Embedded_Value_Report_part2_en.indd 288 23.02.2015 16:41:34
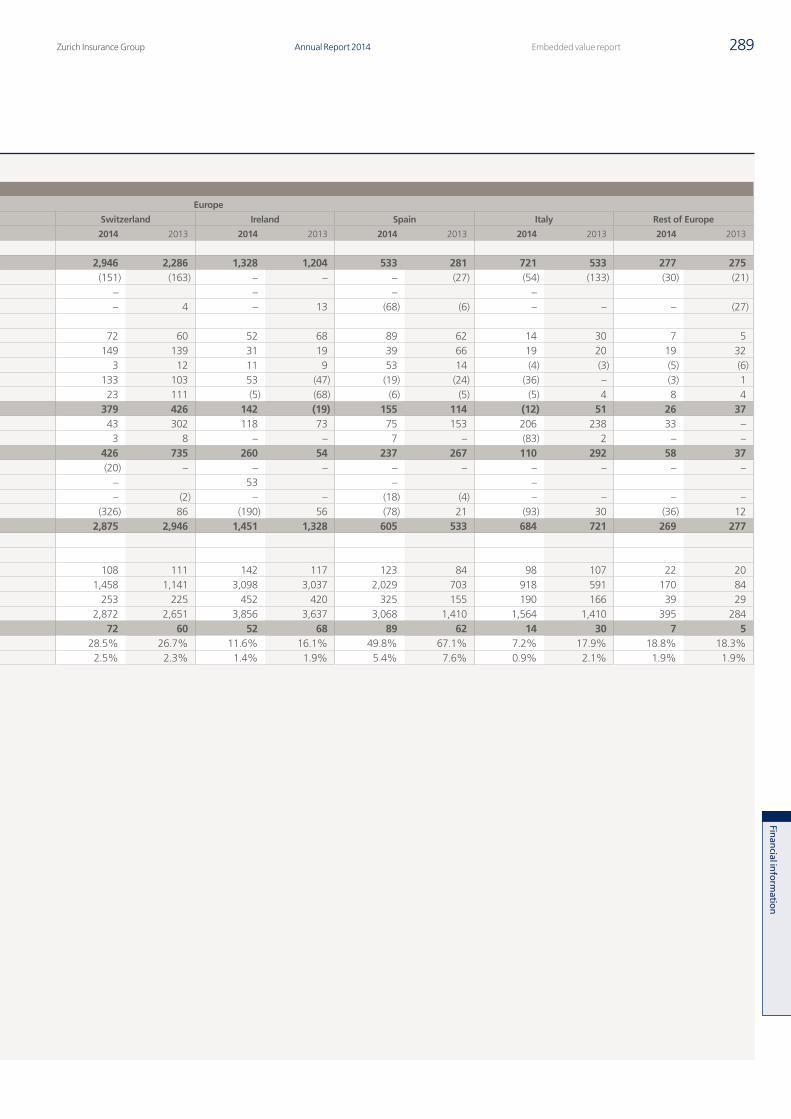
Zurich Insurance Group Annual Report 2014 289Embedded value report
Finan
cial inform
ation
Embedded value results Europe
in USD millions, for the years ended December 31 Europe
United Kingdom Germany Switzerland Ireland Spain Italy Rest of Europe
2014 2013 2014 2013 2014 2013 2014 2013 2014 2013 2014 2013 2014 2013
Embedded value information:Opening embedded value 4,193 4,130 3,046 2,589 2,946 2,286 1,328 1,204 533 281 721 533 277 275Dividends in the first six months of the year 1 (231) – (31) (4) (151) (163) – – – (27) (54) (133) (30) (21)Injections in the first six months of the year 1 32 – – – – –Other movements in the first six months of the year 1 – 55 92 3 – 4 – 13 (68) (6) – – – (27)
New business value 205 167 42 42 72 60 52 68 89 62 14 30 7 5Expected contribution from in-force 61 61 106 54 149 139 31 19 39 66 19 20 19 32Operating experience variances 65 (6) (1) 2 3 12 11 9 53 14 (4) (3) (5) (6)Operating assumption changes 56 (83) (55) (47) 133 103 53 (47) (19) (24) (36) – (3) 1Other operating variances 33 (15) 122 357 23 111 (5) (68) (6) (5) (5) 4 8 4Embedded value operating earnings 421 124 215 408 379 426 142 (19) 155 114 (12) 51 26 37Economic variances 50 (100) (193) 38 43 302 118 73 75 153 206 238 33 –Other non-operating variances 18 (91) 2 (40) 3 8 – – 7 – (83) 2 – –Embedded value earnings 489 (66) 23 407 426 735 260 54 237 267 110 292 58 37Dividends in the last six months of the year 1 (46) – (67) (77) (20) – – – – – – – – –Injections in the last six months of the year 1 40 – – 53 – –Other movements in the last six months of the year 1 – – – – – (2) – – (18) (4) – – – –Foreign currency translation effects (266) 74 (372) 128 (326) 86 (190) 56 (78) 21 (93) 30 (36) 12Closing embedded value 4,210 4,193 2,691 3,046 2,875 2,946 1,451 1,328 605 533 684 721 269 277
New business information: 2
Annual premiums 842 652 311 307 108 111 142 117 123 84 98 107 22 20Single premiums 6,685 3,670 1,163 557 1,458 1,141 3,098 3,037 2,029 703 918 591 170 84Annual premium equivalent (APE) 1,510 1,019 428 363 253 225 452 420 325 155 190 166 39 29Present value of new business premiums (PVNBP) 24,795 15,422 4,194 2,937 2,872 2,651 3,856 3,637 3,068 1,410 1,564 1,410 395 284New business value 205 167 42 42 72 60 52 68 89 62 14 30 7 5New business margin (% of APE) 13.6% 16.4% 9.9% 12.0% 28.5% 26.7% 11.6% 16.1% 49.8% 67.1% 7.2% 17.9% 18.8% 18.3%New business margin (% of PVNBP) 0.8% 1.1% 1.0% 1.5% 2.5% 2.3% 1.4% 1.9% 5.4% 7.6% 0.9% 2.1% 1.9% 1.9%
1 In 2013 other movements included injections.2 Premiums, APE and PVNBP are reported gross of non-controlling interests.
Q4_2014_14_AR14_Embedded_Value_Report_part2_en.indd 289 23.02.2015 16:41:35

Zurich Insurance GroupAnnual Report 2014290 Financial information
Statement by Directors
Statement by Directors
This Embedded value report has been prepared in all material respects in accordance with the Market Consistent Embedded Value Principles and Guidance issued by the European Insurance CFO Forum in October 2009.
The methodology and assumptions underlying the report are described in sections 12 and 13.
Q4_2014_14_AR14_Embedded_Value_Report_part2_en.indd 290 23.02.2015 16:41:35
Zurich Insurance Group Annual Report 2014 291Embedded value report
Finan
cial inform
ation
Auditor’s report on embedded value
Auditor’s report on embedded value
To the Board of Directors of Zurich Insurance Group Ltd
We have audited the Embedded value report of Zurich Insurance Group Ltd (“the Company”) included on pages 259 to 290 of the Annual Report 2014 for the year ended December 31, 2014. The embedded value information included in the Embedded value report has been prepared in accordance with the Market Consistent Embedded Value (“MCEV”) Principles and Guidance issued by the European Insurance CFO Forum, as described on pages 278 to 282.
Board of Directors’ responsibilityThe Board of Directors is responsible for the preparation of the Embedded value report in accordance with the MCEV Principles and Guidance, including consistency of the applied methodology and the assumptions used and for an internal control system as determined necessary to enable the preparation of the Embedded value report that is free from material misstatement, whether due to fraud or error.
Auditor’s responsibilityOur responsibility is to express an opinion on whether the Embedded value report has been properly prepared in accordance with the MCEV Principles and Guidance. We conducted our audit in accordance with International Standards on Auditing. Those standards require that we comply with ethical requirements and plan and perform the audit to obtain reasonable assurance whether the Embedded value report is free from material misstatement.
An audit involves performing procedures to obtain audit evidence about the amounts and disclosures in the Embedded value report. The procedures selected depend on the auditor’s judgment, including the assessment of the risks of material misstatement of the Embedded value report, whether due to fraud or error. In making those risk assessments, the auditor considers the internal control system relevant to the entity’s preparation of the Embedded value report in order to design audit procedures that are appropriate in the circumstances, but not for the purpose of expressing an opinion on the effectiveness of the entity’s internal control system. An audit also includes evaluating the appropriateness of the principles used and the reasonableness of significant estimates made, as well as evaluating the adequacy of the overall presentation of the Embedded value report.
We believe that the audit evidence we have obtained is sufficient and appropriate to provide a basis for our audit opinion.
OpinionIn our opinion, the Embedded value report of the Company for the year ended December 31, 2014 is prepared, in all material respects, in accordance with the MCEV Principles and Guidance.
Basis of preparationWithout modifying our opinion, we draw attention to sections 12 and 13 of the Embedded value report, which describe the basis of embedded value methodology and embedded value assumptions. The Embedded value report is prepared in compliance with the MCEV Principles and Guidance referred to above and as a result, may not be suitable for another purpose. This report does not extend to any financial statements of Zurich Insurance Group Ltd.
PricewaterhouseCoopers AG
Peter Eberli Stephen O’Hearn Audit expert Global relationship partner
Zurich, February 11, 2015
Q4_2014_14_AR14_Embedded_Value_Report_part2_en.indd 291 23.02.2015 16:41:35
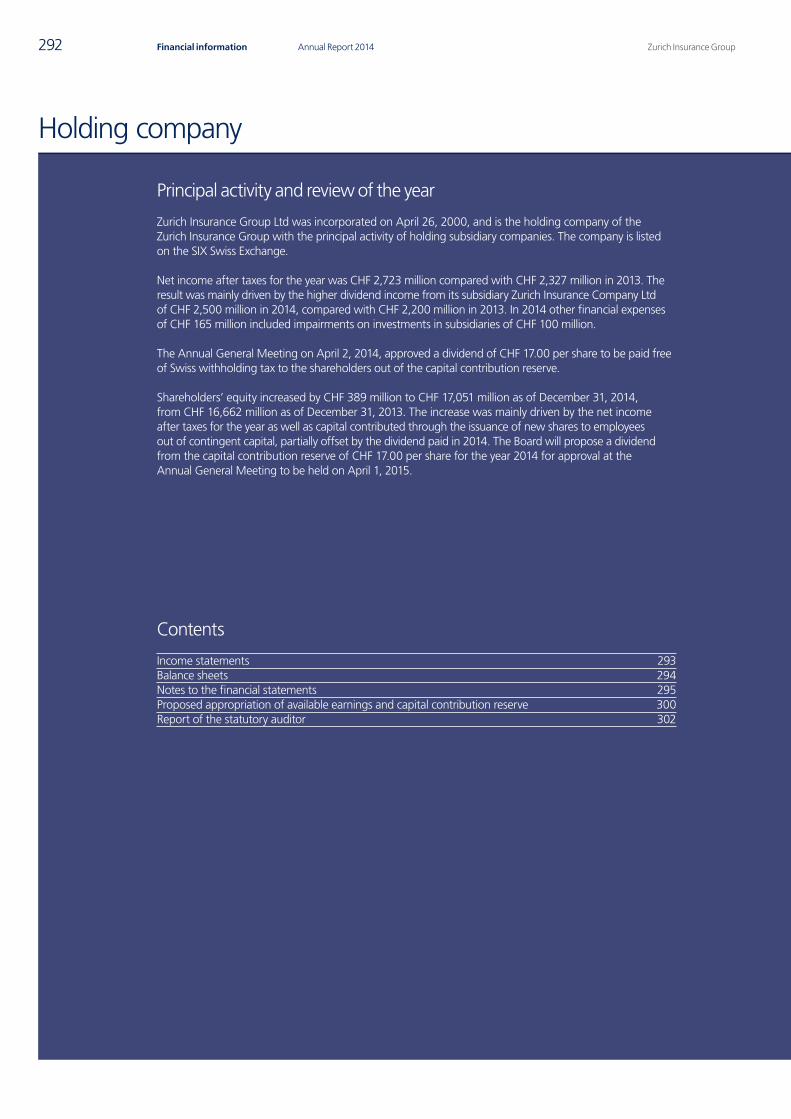
Zurich Insurance GroupAnnual Report 2014292 Financial information
Holding company
Principal activity and review of the year
Zurich Insurance Group Ltd was incorporated on April 26, 2000, and is the holding company of the Zurich Insurance Group with the principal activity of holding subsidiary companies. The company is listed on the SIX Swiss Exchange.
Net income after taxes for the year was CHF 2,723 million compared with CHF 2,327 million in 2013. The result was mainly driven by the higher dividend income from its subsidiary Zurich Insurance Company Ltd of CHF 2,500 million in 2014, compared with CHF 2,200 million in 2013. In 2014 other financial expenses of CHF 165 million included impairments on investments in subsidiaries of CHF 100 million.
The Annual General Meeting on April 2, 2014, approved a dividend of CHF 17.00 per share to be paid free of Swiss withholding tax to the shareholders out of the capital contribution reserve.
Shareholders’ equity increased by CHF 389 million to CHF 17,051 million as of December 31, 2014, from CHF 16,662 million as of December 31, 2013. The increase was mainly driven by the net income after taxes for the year as well as capital contributed through the issuance of new shares to employees out of contingent capital, partially offset by the dividend paid in 2014. The Board will propose a dividend from the capital contribution reserve of CHF 17.00 per share for the year 2014 for approval at the Annual General Meeting to be held on April 1, 2015.
Contents
Income statements 293Balance sheets 294Notes to the financial statements 295Proposed appropriation of available earnings and capital contribution reserve 300Report of the statutory auditor 302
Q4_2014_15_AR14_Holding_Company_en.indd 292 23.02.2015 16:43:12
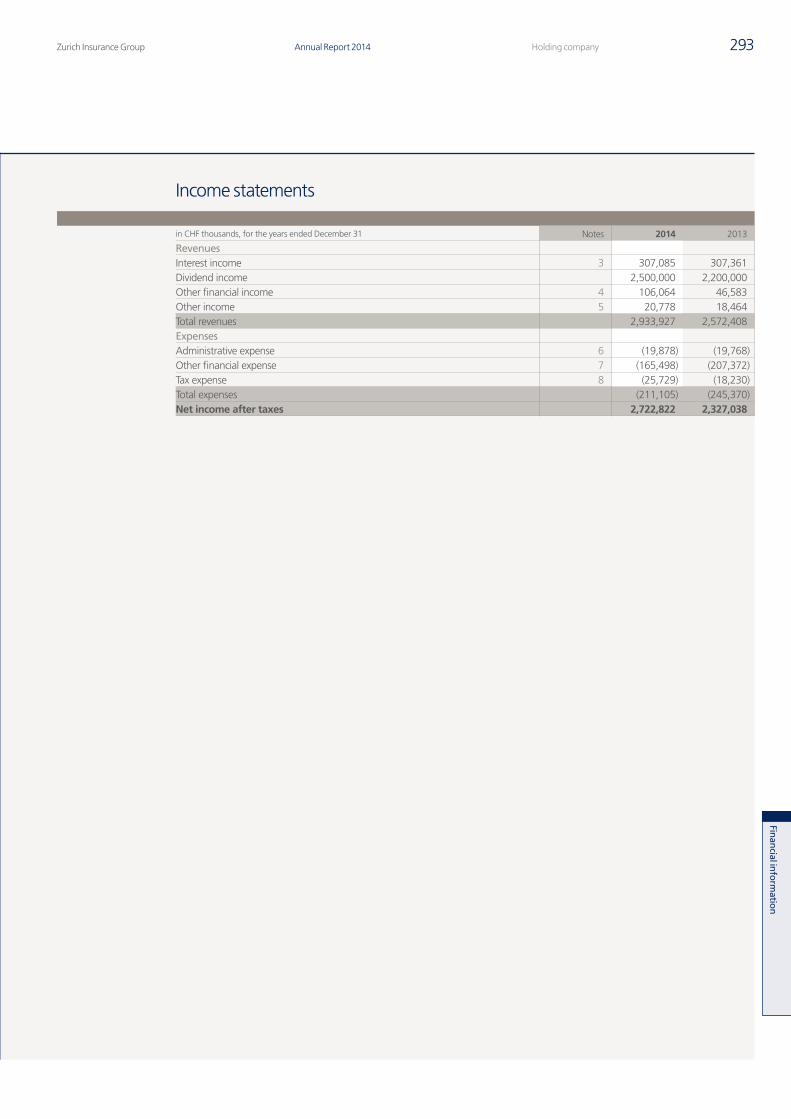
Zurich Insurance Group Annual Report 2014 293Holding company
Finan
cial inform
ation
Income statements
in CHF thousands, for the years ended December 31 Notes 2014 2013
RevenuesInterest income 3 307,085 307,361Dividend income 2,500,000 2,200,000Other financial income 4 106,064 46,583Other income 5 20,778 18,464Total revenues 2,933,927 2,572,408ExpensesAdministrative expense 6 (19,878) (19,768)Other financial expense 7 (165,498) (207,372)Tax expense 8 (25,729) (18,230)Total expenses (211,105) (245,370)Net income after taxes 2,722,822 2,327,038
Q4_2014_15_AR14_Holding_Company_en.indd 293 23.02.2015 16:43:13
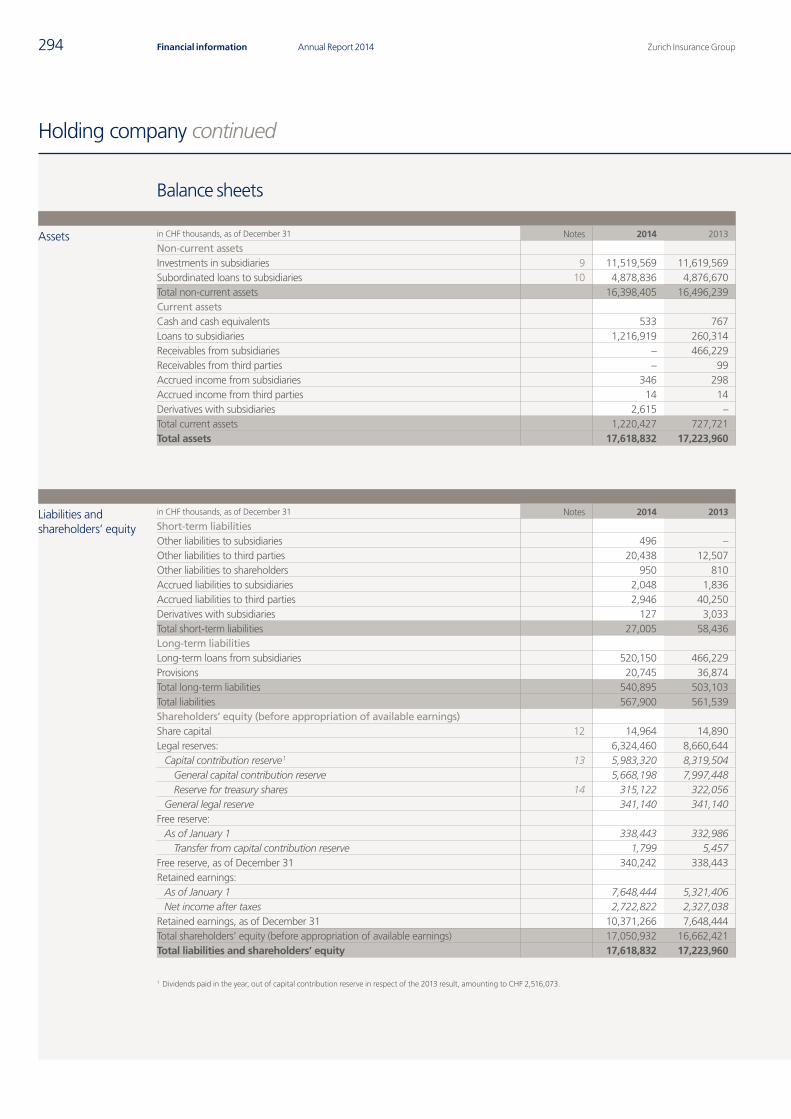
Zurich Insurance GroupAnnual Report 2014294 Financial information
Holding company continued
Balance sheets
Assets in CHF thousands, as of December 31 Notes 2014 2013
Non-current assetsInvestments in subsidiaries 9 11,519,569 11,619,569Subordinated loans to subsidiaries 10 4,878,836 4,876,670Total non-current assets 16,398,405 16,496,239Current assetsCash and cash equivalents 533 767Loans to subsidiaries 1,216,919 260,314Receivables from subsidiaries – 466,229Receivables from third parties – 99Accrued income from subsidiaries 346 298Accrued income from third parties 14 14Derivatives with subsidiaries 2,615 –Total current assets 1,220,427 727,721Total assets 17,618,832 17,223,960
Liabilities and shareholders’ equity
in CHF thousands, as of December 31 Notes 2014 2013
Short-term liabilitiesOther liabilities to subsidiaries 496 –Other liabilities to third parties 20,438 12,507Other liabilities to shareholders 950 810Accrued liabilities to subsidiaries 2,048 1,836Accrued liabilities to third parties 2,946 40,250Derivatives with subsidiaries 127 3,033Total short-term liabilities 27,005 58,436Long-term liabilitiesLong-term loans from subsidiaries 520,150 466,229Provisions 20,745 36,874Total long-term liabilities 540,895 503,103Total liabilities 567,900 561,539Shareholders’ equity (before appropriation of available earnings)Share capital 12 14,964 14,890Legal reserves: 6,324,460 8,660,644
Capital contribution reserve 1 13 5,983,320 8,319,504General capital contribution reserve 5,668,198 7,997,448Reserve for treasury shares 14 315,122 322,056
General legal reserve 341,140 341,140Free reserve:
As of January 1 338,443 332,986Transfer from capital contribution reserve 1,799 5,457
Free reserve, as of December 31 340,242 338,443Retained earnings:
As of January 1 7,648,444 5,321,406Net income after taxes 2,722,822 2,327,038
Retained earnings, as of December 31 10,371,266 7,648,444Total shareholders’ equity (before appropriation of available earnings) 17,050,932 16,662,421Total liabilities and shareholders’ equity 17,618,832 17,223,960
1 Dividends paid in the year, out of capital contribution reserve in respect of the 2013 result, amounting to CHF 2,516,073.
Q4_2014_15_AR14_Holding_Company_en.indd 294 23.02.2015 16:43:13
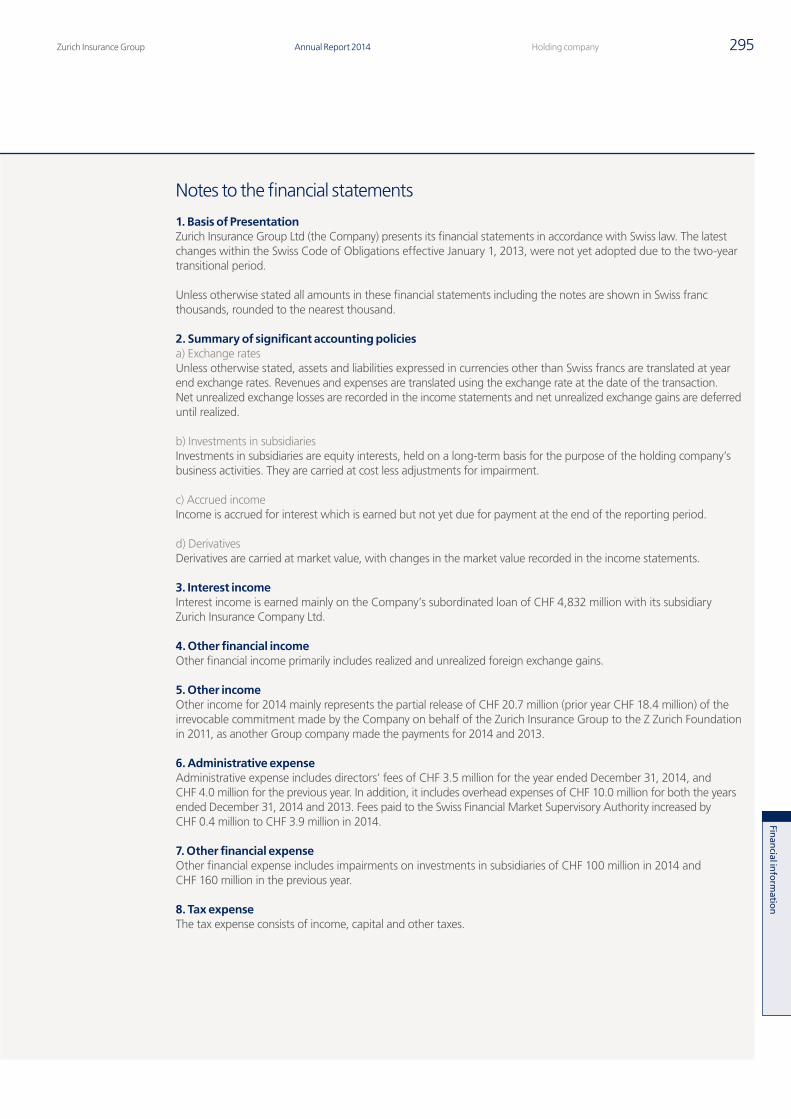
Zurich Insurance Group Annual Report 2014 295Holding company
Finan
cial inform
ation
Notes to the financial statements
1. Basis of PresentationZurich Insurance Group Ltd (the Company) presents its financial statements in accordance with Swiss law. The latest changes within the Swiss Code of Obligations effective January 1, 2013, were not yet adopted due to the two-year transitional period.
Unless otherwise stated all amounts in these financial statements including the notes are shown in Swiss franc thousands, rounded to the nearest thousand.
2. Summary of significant accounting policiesa) Exchange ratesUnless otherwise stated, assets and liabilities expressed in currencies other than Swiss francs are translated at year end exchange rates. Revenues and expenses are translated using the exchange rate at the date of the transaction. Net unrealized exchange losses are recorded in the income statements and net unrealized exchange gains are deferred until realized.
b) Investments in subsidiariesInvestments in subsidiaries are equity interests, held on a long-term basis for the purpose of the holding company’s business activities. They are carried at cost less adjustments for impairment.
c) Accrued incomeIncome is accrued for interest which is earned but not yet due for payment at the end of the reporting period.
d) DerivativesDerivatives are carried at market value, with changes in the market value recorded in the income statements.
3. Interest incomeInterest income is earned mainly on the Company’s subordinated loan of CHF 4,832 million with its subsidiary Zurich Insurance Company Ltd.
4. Other financial incomeOther financial income primarily includes realized and unrealized foreign exchange gains.
5. Other incomeOther income for 2014 mainly represents the partial release of CHF 20.7 million (prior year CHF 18.4 million) of the irrevocable commitment made by the Company on behalf of the Zurich Insurance Group to the Z Zurich Foundation in 2011, as another Group company made the payments for 2014 and 2013.
6. Administrative expenseAdministrative expense includes directors’ fees of CHF 3.5 million for the year ended December 31, 2014, and CHF 4.0 million for the previous year. In addition, it includes overhead expenses of CHF 10.0 million for both the years ended December 31, 2014 and 2013. Fees paid to the Swiss Financial Market Supervisory Authority increased by CHF 0.4 million to CHF 3.9 million in 2014.
7. Other financial expenseOther financial expense includes impairments on investments in subsidiaries of CHF 100 million in 2014 and CHF 160 million in the previous year.
8. Tax expenseThe tax expense consists of income, capital and other taxes.
Q4_2014_15_AR14_Holding_Company_en.indd 295 23.02.2015 16:43:13
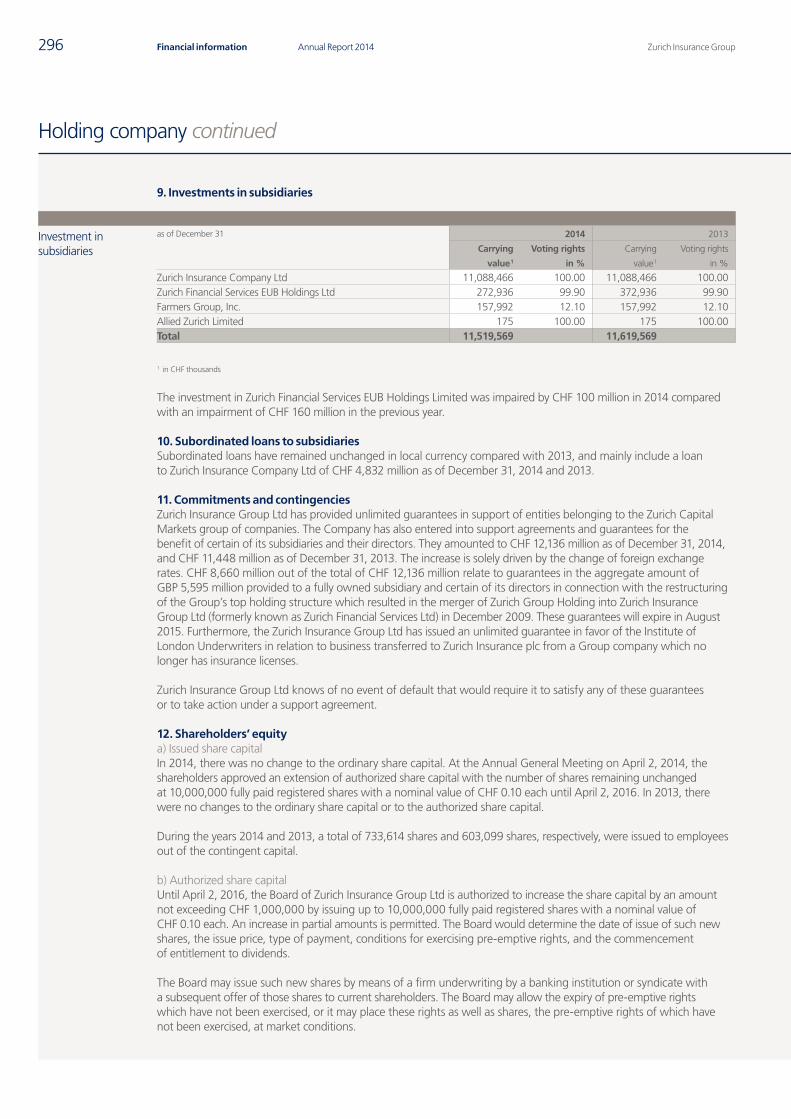
Zurich Insurance GroupAnnual Report 2014296 Financial information
Holding company continued
9. Investments in subsidiaries
Investment in subsidiaries
as of December 31 2014 2013
Carrying
value 1
Voting rights
in %
Carrying
value 1
Voting rights
in %
Zurich Insurance Company Ltd 11,088,466 100.00 11,088,466 100.00Zurich Financial Services EUB Holdings Ltd 272,936 99.90 372,936 99.90Farmers Group, Inc. 157,992 12.10 157,992 12.10Allied Zurich Limited 175 100.00 175 100.00Total 11,519,569 11,619,569
1 in CHF thousands
The investment in Zurich Financial Services EUB Holdings Limited was impaired by CHF 100 million in 2014 compared with an impairment of CHF 160 million in the previous year.
10. Subordinated loans to subsidiariesSubordinated loans have remained unchanged in local currency compared with 2013, and mainly include a loan to Zurich Insurance Company Ltd of CHF 4,832 million as of December 31, 2014 and 2013.
11. Commitments and contingenciesZurich Insurance Group Ltd has provided unlimited guarantees in support of entities belonging to the Zurich Capital Markets group of companies. The Company has also entered into support agreements and guarantees for the benefit of certain of its subsidiaries and their directors. They amounted to CHF 12,136 million as of December 31, 2014, and CHF 11,448 million as of December 31, 2013. The increase is solely driven by the change of foreign exchange rates. CHF 8,660 million out of the total of CHF 12,136 million relate to guarantees in the aggregate amount of GBP 5,595 million provided to a fully owned subsidiary and certain of its directors in connection with the restructuring of the Group’s top holding structure which resulted in the merger of Zurich Group Holding into Zurich Insurance Group Ltd (formerly known as Zurich Financial Services Ltd) in December 2009. These guarantees will expire in August 2015. Furthermore, the Zurich Insurance Group Ltd has issued an unlimited guarantee in favor of the Institute of London Underwriters in relation to business transferred to Zurich Insurance plc from a Group company which no longer has insurance licenses.
Zurich Insurance Group Ltd knows of no event of default that would require it to satisfy any of these guarantees or to take action under a support agreement.
12. Shareholders’ equity a) Issued share capitalIn 2014, there was no change to the ordinary share capital. At the Annual General Meeting on April 2, 2014, the shareholders approved an extension of authorized share capital with the number of shares remaining unchanged at 10,000,000 fully paid registered shares with a nominal value of CHF 0.10 each until April 2, 2016. In 2013, there were no changes to the ordinary share capital or to the authorized share capital.
During the years 2014 and 2013, a total of 733,614 shares and 603,099 shares, respectively, were issued to employees out of the contingent capital.
b) Authorized share capitalUntil April 2, 2016, the Board of Zurich Insurance Group Ltd is authorized to increase the share capital by an amount not exceeding CHF 1,000,000 by issuing up to 10,000,000 fully paid registered shares with a nominal value of CHF 0.10 each. An increase in partial amounts is permitted. The Board would determine the date of issue of such new shares, the issue price, type of payment, conditions for exercising pre-emptive rights, and the commencement of entitlement to dividends.
The Board may issue such new shares by means of a firm underwriting by a banking institution or syndicate with a subsequent offer of those shares to current shareholders. The Board may allow the expiry of pre-emptive rights which have not been exercised, or it may place these rights as well as shares, the pre-emptive rights of which have not been exercised, at market conditions.
Q4_2014_15_AR14_Holding_Company_en.indd 296 23.02.2015 16:43:14
Zurich Insurance Group Annual Report 2014 297Holding company
Finan
cial inform
ation
The Board is further authorized to restrict or withdraw the pre-emptive rights of shareholders and to allocate them to third parties if the shares are to be used for the take-over of an enterprise, or parts of an enterprise or of participations or if issuing shares for the financing including re-financing of such transactions, or for the purpose of expanding the scope of shareholders in connection with the quotation of shares on foreign stock exchanges.
c) Contingent share capitalCapital market instruments and option rights to shareholdersThe share capital of Zurich Insurance Group Ltd may be increased by an amount not exceeding CHF 1,000,000 by the issuance of up to 10,000,000 fully paid registered shares with a nominal value of CHF 0.10 each (i) by exercising of conversion and/or option rights which are granted in connection with the issuance of bonds or similar debt instruments by Zurich Insurance Group Ltd or one of its subsidiaries in national or international capital markets; and/or (ii) by exercising option rights which are granted to current shareholders. When issuing bonds or similar debt instruments connected with conversion and/or option rights, the pre-emptive rights of the shareholders will be excluded. The current owners of conversion and/or option rights shall be entitled to subscribe for the new shares. The conversion and/or option conditions are to be determined by the Board.
The Board is authorized, when issuing bonds or similar debt instruments connected with conversion and/or option rights, to restrict or withdraw the right of shareholders for advance subscription in cases where such bonds are issued for the financing or re-financing of a takeover of an enterprise, of parts of an enterprise, or of participations. If the right for advance subscription is withdrawn by the Board, the convertible bond or warrant issues are to be offered at market conditions (including standard dilution protection provisions in accordance with market practice) and the new shares are issued at the current convertible bond or warrant issue conditions.
The conversion rights may be exercisable during a maximum of ten years and option rights for a maximum of seven years from the time of the respective issue. The conversion or option price or its calculation methodology shall be determined in accordance with market conditions whereby, for shares of Zurich Insurance Group Ltd, the quoted share price is to be used as a basis.
Employee participationOn January 1, 2013, the contingent share capital, to be issued to employees of Zurich Insurance Group Ltd and its subsidiaries, amounted to CHF 299,513.60 or 2,995,136 fully paid registered shares with a nominal value of CHF 0.10 each. On January 1, 2014, the contingent share capital, to be issued to employees of Zurich Insurance Group Ltd and its subsidiaries, amounted to 239,203.70 or 2,392,037 fully paid registered shares with a nominal value of CHF 0.10 each.
During 2014 and 2013, 733,614 and 603,099 shares, respectively, were issued to employees out of the contingent share capital. Of the total 733,614 registered shares issued to employees during the year 2014, 364,947 shares were issued in the period from January 1, 2014, to March 31, 2014, and 368,667 registered shares were issued as from April 1, 2014, to December 31, 2014. As a result, on December 31, 2014 and 2013, respectively, the remaining contingent share capital, which can be issued to employees of Zurich Insurance Group Ltd and its subsidiaries, amounted to CHF 165,842.30 and 239,203.70 or 1,658,423 and 2,392,037 fully paid registered shares, respectively, with a nominal value of CHF 0.10 each. The pre-emptive rights of the shareholders, as well as the right for advance subscription, are excluded. The issuance of shares to employees is subject to one or more regulations to be issued by the Board and take into account performance, functions, levels of responsibility and criteria of profitability. Shares or option rights may be issued to the employees at a price lower than that quoted on the stock exchange.
Q4_2014_15_AR14_Holding_Company_en.indd 297 23.02.2015 16:43:14
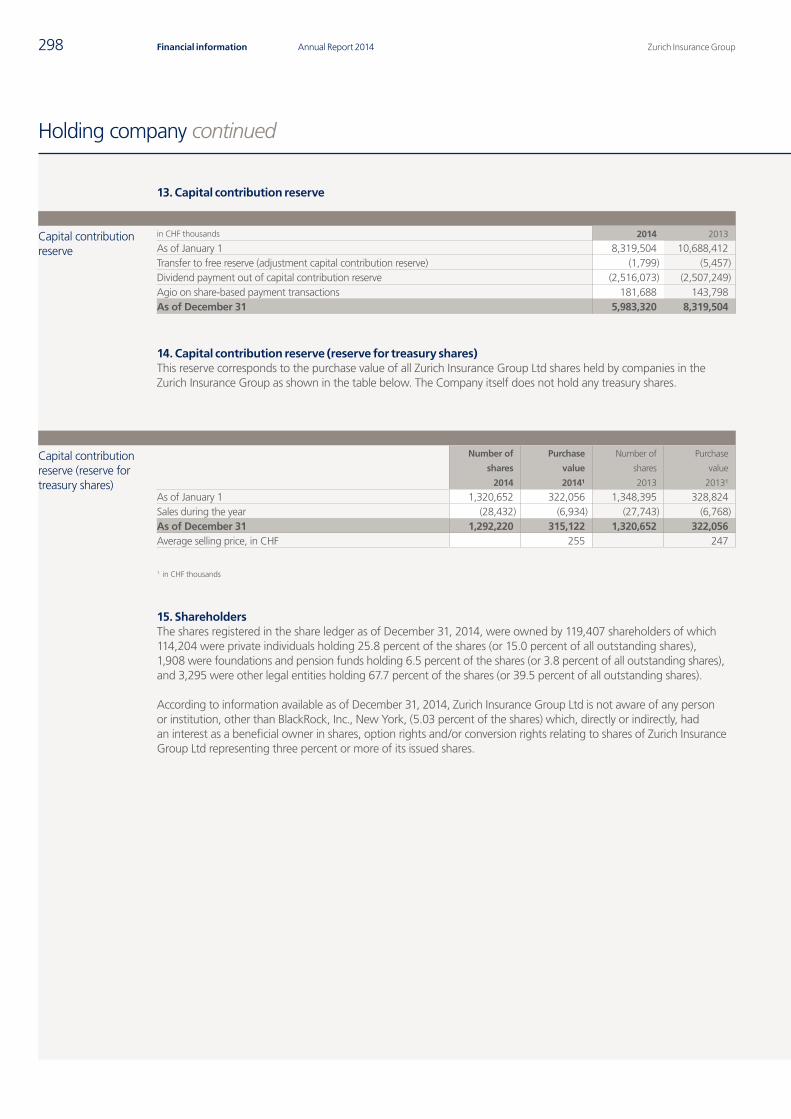
Zurich Insurance GroupAnnual Report 2014298 Financial information
Holding company continued
13. Capital contribution reserve
Capital contribution reserve
in CHF thousands 2014 2013
As of January 1 8,319,504 10,688,412Transfer to free reserve (adjustment capital contribution reserve) (1,799) (5,457)Dividend payment out of capital contribution reserve (2,516,073) (2,507,249)Agio on share-based payment transactions 181,688 143,798As of December 31 5,983,320 8,319,504
14. Capital contribution reserve (reserve for treasury shares)This reserve corresponds to the purchase value of all Zurich Insurance Group Ltd shares held by companies in the Zurich Insurance Group as shown in the table below. The Company itself does not hold any treasury shares.
Capital contribution reserve (reserve for treasury shares)
Number of
shares
2014
Purchase
value
2014¹
Number of
shares
2013
Purchase
value
2013¹
As of January 1 1,320,652 322,056 1,348,395 328,824Sales during the year (28,432) (6,934) (27,743) (6,768)As of December 31 1,292,220 315,122 1,320,652 322,056Average selling price, in CHF 255 247
1 in CHF thousands
15. ShareholdersThe shares registered in the share ledger as of December 31, 2014, were owned by 119,407 shareholders of which 114,204 were private individuals holding 25.8 percent of the shares (or 15.0 percent of all outstanding shares), 1,908 were foundations and pension funds holding 6.5 percent of the shares (or 3.8 percent of all outstanding shares), and 3,295 were other legal entities holding 67.7 percent of the shares (or 39.5 percent of all outstanding shares).
According to information available as of December 31, 2014, Zurich Insurance Group Ltd is not aware of any person or institution, other than BlackRock, Inc., New York, (5.03 percent of the shares) which, directly or indirectly, had an interest as a beneficial owner in shares, option rights and/or conversion rights relating to shares of Zurich Insurance Group Ltd representing three percent or more of its issued shares.
Q4_2014_15_AR14_Holding_Company_en.indd 298 23.02.2015 16:43:14
Zurich Insurance Group Annual Report 2014 299Holding company
Finan
cial inform
ation
16. Information on the risk assessment processRefer to the disclosures in the Risk review on pages 114 to 152 of this Annual Report.
17. Remuneration of the Board of Directors and the Group Executive CommitteeThe Ordinance Against Excessive Compensation in articles 14 –16 prevails over article 663bbis of the Swiss Code of Obligations. The information required by article 663bbis of the Swiss Code of Obligations is therefore now disclosed and audited in the Remuneration report on pages 62 to 93 of this Annual Report.
18. Shareholdings of the Board of Directors and the Group Executive CommitteeThe information on share and share option holdings of Directors and of the members of the GEC, who held office as of December 31, 2014, as required by article 663c paragraph 3 of the Swiss Code of Obligations is included and audited in the Remuneration report on pages 62 to 93 of this Annual Report.
19. Supplementary informationCash and cash equivalents of CHF 0.5 million include restricted cash of CHF 0.4 million in 2014. There was no restricted cash in the previous year.
Q4_2014_15_AR14_Holding_Company_en.indd 299 23.02.2015 16:43:14
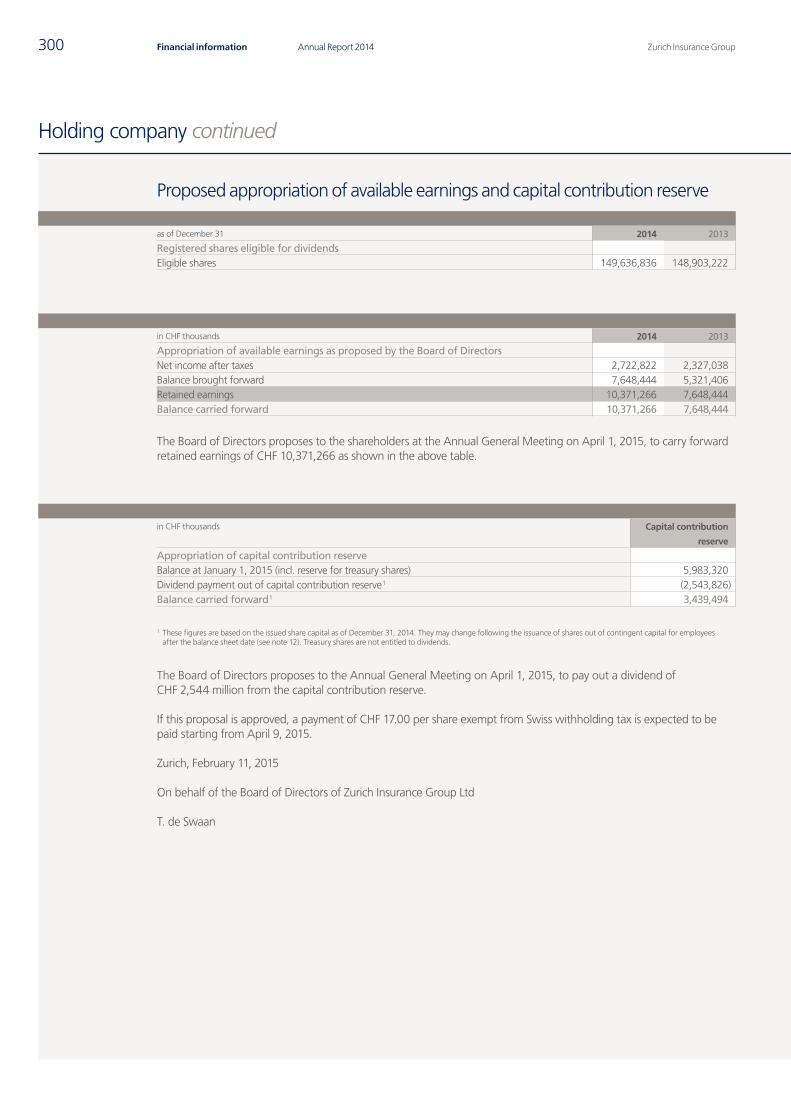
Zurich Insurance GroupAnnual Report 2014300 Financial information
Holding company continued
Proposed appropriation of available earnings and capital contribution reserve
as of December 31 2014 2013
Registered shares eligible for dividendsEligible shares 149,636,836 148,903,222
in CHF thousands 2014 2013
Appropriation of available earnings as proposed by the Board of DirectorsNet income after taxes 2,722,822 2,327,038Balance brought forward 7,648,444 5,321,406Retained earnings 10,371,266 7,648,444Balance carried forward 10,371,266 7,648,444
The Board of Directors proposes to the shareholders at the Annual General Meeting on April 1, 2015, to carry forward retained earnings of CHF 10,371,266 as shown in the above table.
in CHF thousands Capital contribution
reserve
Appropriation of capital contribution reserveBalance at January 1, 2015 (incl. reserve for treasury shares) 5,983,320Dividend payment out of capital contribution reserve 1 (2,543,826)Balance carried forward 1 3,439,494
1 These figures are based on the issued share capital as of December 31, 2014. They may change following the issuance of shares out of contingent capital for employees after the balance sheet date (see note 12). Treasury shares are not entitled to dividends.
The Board of Directors proposes to the Annual General Meeting on April 1, 2015, to pay out a dividend of CHF 2,544 million from the capital contribution reserve.
If this proposal is approved, a payment of CHF 17.00 per share exempt from Swiss withholding tax is expected to be paid starting from April 9, 2015.
Zurich, February 11, 2015
On behalf of the Board of Directors of Zurich Insurance Group Ltd
T. de Swaan
Q4_2014_15_AR14_Holding_Company_en.indd 300 23.02.2015 16:43:14

Zurich Insurance Group Annual Report 2014 301Holding company
Finan
cial inform
ation
THIS PAGE HAS INTENTIONALLY BEEN LEFT BLANK
Q4_2014_15_AR14_Holding_Company_en.indd 301 23.02.2015 16:43:14
Zurich Insurance GroupAnnual Report 2014302 Financial information
Report of the Statutory Auditor
Report of the statutory auditor
To the General Meeting of Zurich Insurance Group Ltd
Report of the statutory auditor on the financial statements
As statutory auditor, we have audited the accompanying financial statements of Zurich Insurance Group Ltd, which comprise the balance sheet, income statement and notes (pages 293 to 299), for the year ended December 31, 2014.
Board of Directors’ responsibilityThe Board of Directors is responsible for the preparation of the financial statements in accordance with the requirements of Swiss law and the Company’s articles of incorporation. This responsibility includes designing, implementing and maintaining an internal control system relevant to the preparation of financial statements that are free from material misstatement, whether due to fraud or error. The Board of Directors is further responsible for selecting and applying appropriate accounting policies and making accounting estimates that are reasonable in the circumstances.
Auditor’s responsibilityOur responsibility is to express an opinion on these financial statements based on our audit. We conducted our audit in accordance with Swiss law and Swiss Auditing Standards. Those standards require that we plan and perform the audit to obtain reasonable assurance whether the financial statements are free from material misstatement.
An audit involves performing procedures to obtain audit evidence about the amounts and disclosures in the financial statements. The procedures selected depend on the auditor’s judgment, including the assessment of the risks of material misstatement of the financial statements, whether due to fraud or error. In making those risk assessments, the auditor considers the internal control system relevant to the entity’s preparation of the financial statements in order to design audit procedures that are appropriate in the circumstances, but not for the purpose of expressing an opinion on the effectiveness of the entity’s internal control system. An audit also includes evaluating the appropriateness of the accounting policies used and the reasonableness of accounting estimates made, as well as evaluating the overall presentation of the financial statements. We believe that the audit evidence we have obtained is sufficient and appropriate to provide a basis for our audit opinion.
OpinionIn our opinion, the financial statements for the period from January 1, 2014, to December 31, 2014, comply with Swiss law and the Company’s articles of incorporation.
Q4_2014_15_AR14_Holding_Company_en.indd 302 23.02.2015 16:43:15
Zurich Insurance Group Annual Report 2014 303Holding company
Finan
cial inform
ation
Report on other legal requirements
We confirm that we meet the legal requirements on licensing according to the Auditor Oversight Act (AOA) and independence (article 728 CO and article 11 AOA) and that there are no circumstances incompatible with our independence.
In accordance with article 728a paragraph 1 item 3 CO and Swiss Auditing Standard 890, we confirm that an internal control system exists which has been designed for the preparation of financial statements according to the instructions of the Board of Directors.
We further confirm that the proposed appropriation of available earnings complies with Swiss law and the Company’s articles of incorporation. We recommend that the financial statements submitted to you be approved.
PricewaterhouseCoopers AG
Mark Humphreys Peter Bieri Audit expert Audit expert Auditor in charge
Zurich, February 11, 2015
Q4_2014_15_AR14_Holding_Company_en.indd 303 23.02.2015 16:43:15
Zurich Insurance GroupAnnual Report 2014304 Financial information
Report in relation to the conditional capital increase
Report in relation to the conditional capital increase
To the Board of Directors of Zurich Insurance Group Ltd
On your instructions, we have audited in accordance with Art. 653f, paragraph 1 Swiss Code of Obligations the issuance of new shares, which took place during the period of January 1, 2014, to December 31, 2014, according to the resolution of the general meeting of March 30, 2010.
It is the duty of the Board of Directors to perform the issuance of new shares in accordance with the requirements of the Company’s statutes. Our responsibility is to perform audit procedures designed to test whether the issuance was performed in accordance with the law and requirements of the Company’s statutes. We confirm that we meet the licensing and independence requirements as stipulated by Swiss law.
Our audit was conducted in accordance with Swiss Auditing Standards, which require that an audit be planned and performed to obtain reasonable assurance about whether material violations against legal and statutory requirements are detected. We have performed audit procedures appropriate to the circumstances and we believe that our audit provides a reasonable basis for our opinion.
In our opinion, the issuance of 733,614 registered shares with a par value of CHF 0.10 complies with Swiss law and the Company’s articles of incorporation.
PricewaterhouseCoopers AG
Mark Humphreys Peter Bieri Audit expert Audit expert Auditor in charge
Zurich, January 9, 2015
Q4_2014_15_AR14_Holding_Company_en.indd 304 23.02.2015 16:43:15

Zurich Insurance Group Annual Report 2014 305Holding company
Finan
cial inform
ation
THIS PAGE HAS INTENTIONALLY BEEN LEFT BLANK
Q4_2014_15_AR14_Holding_Company_en.indd 305 23.02.2015 16:43:15

Zurich Insurance GroupAnnual Report 2014306 Financial information
Q4_2014_17_AR14_Divider_Shareholder_Information_en.indd 306 23.02.2015 16:44:07
307Annual Report 2014Zurich Insurance Group
In this sectionRegistered share data 308Financial calendar 310Contact information 311Glossary 312
Shareholder information
Q4_2014_17_AR14_Divider_Shareholder_Information_en.indd 307 23.02.2015 16:44:07
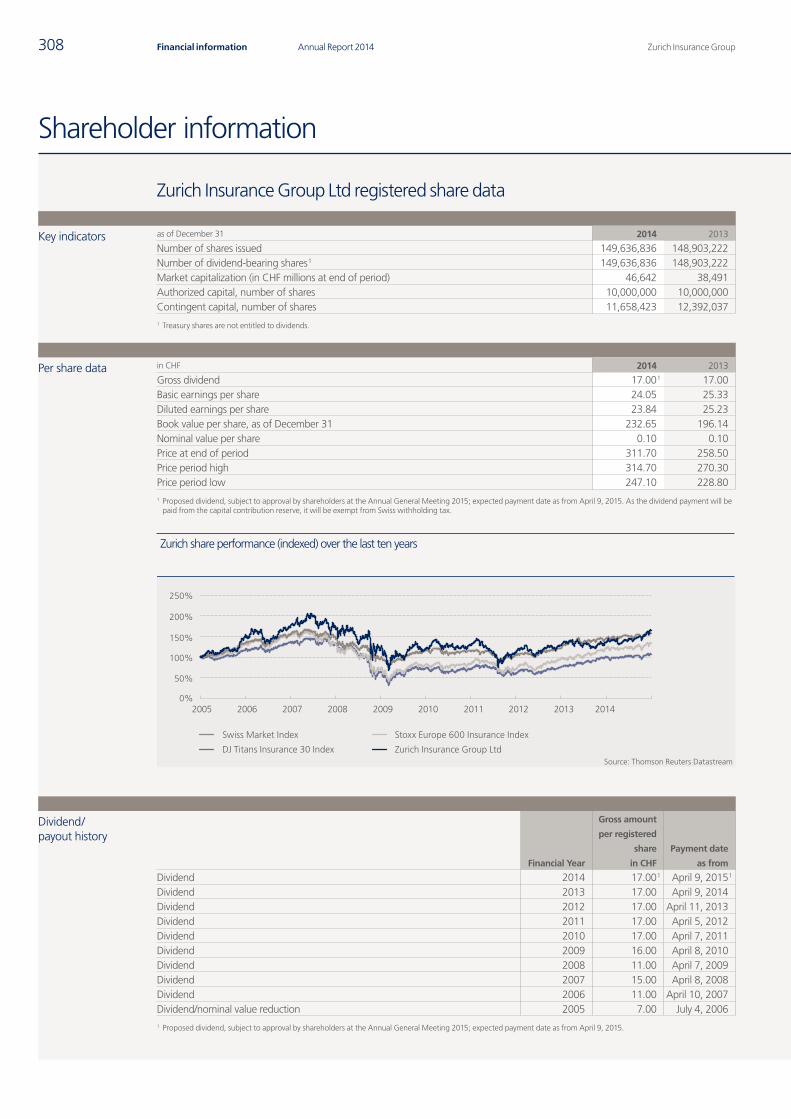
Zurich Insurance GroupAnnual Report 2014308 Financial information
Shareholder information
Zurich Insurance Group Ltd registered share data
Key indicators as of December 31 2014 2013
Number of shares issued 149,636,836 148,903,222Number of dividend-bearing shares 1 149,636,836 148,903,222Market capitalization (in CHF millions at end of period) 46,642 38,491Authorized capital, number of shares 10,000,000 10,000,000Contingent capital, number of shares 11,658,423 12,392,0371 Treasury shares are not entitled to dividends.
Per share data in CHF 2014 2013
Gross dividend 17.00 1 17.00Basic earnings per share 24.05 25.33Diluted earnings per share 23.84 25.23Book value per share, as of December 31 232.65 196.14Nominal value per share 0.10 0.10Price at end of period 311.70 258.50Price period high 314.70 270.30Price period low 247.10 228.801 Proposed dividend, subject to approval by shareholders at the Annual General Meeting 2015; expected payment date as from April 9, 2015. As the dividend payment will be
paid from the capital contribution reserve, it will be exempt from Swiss withholding tax.
Dividend/ payout history
Financial Year
Gross amount
per registered
share
in CHF
Payment date
as from
Dividend 2014 17.00 1 April 9, 2015 1
Dividend 2013 17.00 April 9, 2014Dividend 2012 17.00 April 11, 2013Dividend 2011 17.00 April 5, 2012Dividend 2010 17.00 April 7, 2011Dividend 2009 16.00 April 8, 2010Dividend 2008 11.00 April 7, 2009Dividend 2007 15.00 April 8, 2008Dividend 2006 11.00 April 10, 2007Dividend/nominal value reduction 2005 7.00 July 4, 20061 Proposed dividend, subject to approval by shareholders at the Annual General Meeting 2015; expected payment date as from April 9, 2015.
Swiss Market Index Stoxx Europe 600 Insurance Index
Zurich Insurance Group LtdDJ Titans Insurance 30 IndexSource: Thomson Reuters Datastream
250%
200%
150%
100%
50%
0%2005 2006 2007 2008 2009 2010 2011 2012 2013 2014
Zurich share performance (indexed) over the last ten years
Q4_2014_18_AR14_Shareholder_Info_Glossary_Disclaimer_en.indd 308 23.02.2015 17:10:01
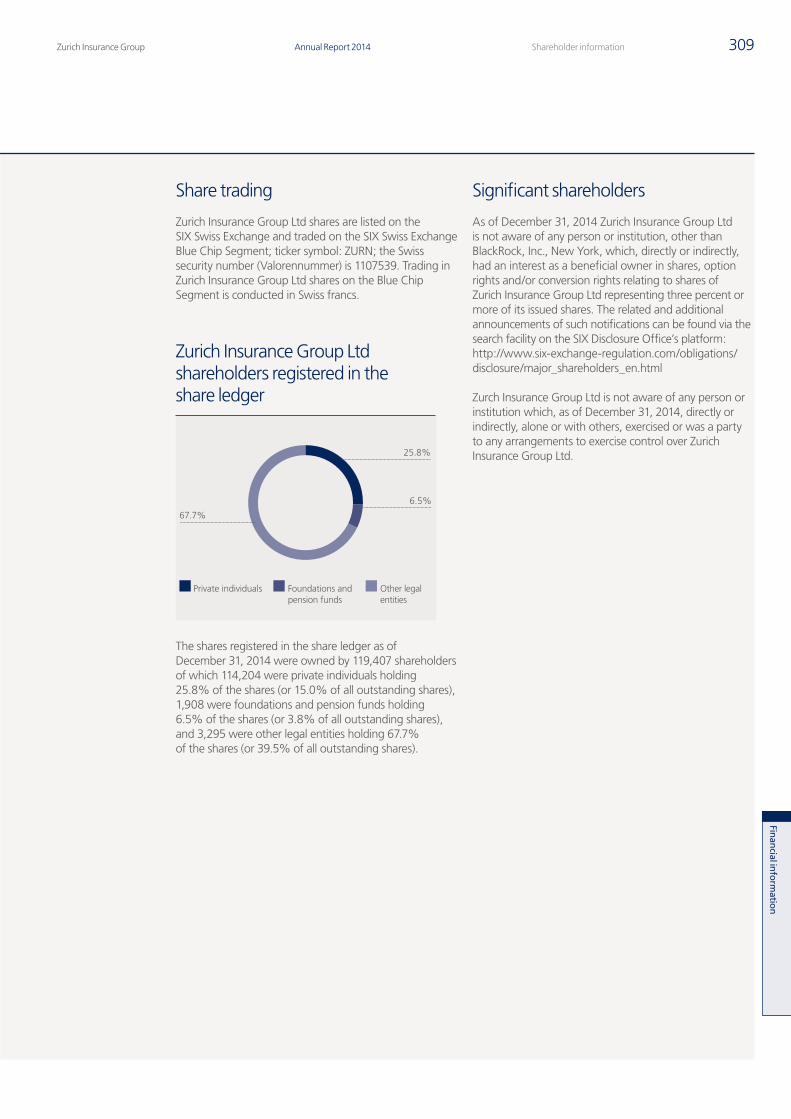
Finan
cial inform
ation
Zurich Insurance Group Annual Report 2014 309Shareholder information
Share trading
Zurich Insurance Group Ltd shares are listed on the SIX Swiss Exchange and traded on the SIX Swiss Exchange Blue Chip Segment; ticker symbol: ZURN; the Swiss security number (Valorennummer) is 1107539. Trading in Zurich Insurance Group Ltd shares on the Blue Chip Segment is conducted in Swiss francs.
Zurich Insurance Group Ltd shareholders registered in the share ledger
67.7%
6.5%
25.8%
Private individuals Foundations and pension funds
Other legal entities
The shares registered in the share ledger as of December 31, 2014 were owned by 119,407 shareholders of which 114,204 were private individuals holding 25.8% of the shares (or 15.0% of all outstanding shares), 1,908 were foundations and pension funds holding 6.5% of the shares (or 3.8% of all outstanding shares), and 3,295 were other legal entities holding 67.7% of the shares (or 39.5% of all outstanding shares).
Significant shareholders
As of December 31, 2014 Zurich Insurance Group Ltd is not aware of any person or institution, other than BlackRock, Inc., New York, which, directly or indirectly, had an interest as a beneficial owner in shares, option rights and/or conversion rights relating to shares of Zurich Insurance Group Ltd representing three percent or more of its issued shares. The related and additional announcements of such notifications can be found via the search facility on the SIX Disclosure Office’s platform: http://www.six-exchange-regulation.com/obligations/disclosure/major_shareholders_en.html
Zurch Insurance Group Ltd is not aware of any person or institution which, as of December 31, 2014, directly or indirectly, alone or with others, exercised or was a party to any arrangements to exercise control over Zurich Insurance Group Ltd.
Q4_2014_18_AR14_Shareholder_Info_Glossary_Disclaimer_en.indd 309 23.02.2015 17:10:01
Zurich Insurance GroupAnnual Report 2014310 Financial information
Annual Report 2014
Zurich Insurance Group
Q4_2014_01_AR14_Group_Overview_en.indd 1 23.02.2015 16:10:31
Zurich Insurance Group
Annual Review 2014
Intelligent protection for customers and communities
01_Q4_2014_Annual_Review_en.indd 1 23.02.2015 16:58:26
Shareholder information continued
Financial calendar
Annual General Meeting 2015April 1, 2015
Ex-dividend dateApril 7, 2015
Dividend payable as from April 9, 2015
Results for the three months to March 31, 2015May 7, 2015
Investor dayMay 21, 2015
Half year results 2015August 6, 2015
Results for the nine months to September 30, 2015November 5, 2015
Annual Review 2014 The Annual Review provides an overview of Zurich’s business and strategy, and its financial and operating performance in 2014. It is available in English and German.
Annual Report 2014 The Annual Report contains detailed information about Zurich’s financial performance, structure, executive bodies, risk management, corporate governance and remuneration practices in 2014. It is available in English and German, with the financial statements in English only.
If you are an iPad user, try our Investors and Media App, available on www.zurich.com
Q4_2014_18_AR14_Shareholder_Info_Glossary_Disclaimer_en.indd 310 23.02.2015 17:10:09
Finan
cial inform
ation
Zurich Insurance Group Annual Report 2014 311Shareholder information
Registered OfficeZurich Insurance Group Ltd Mythenquai 2 8002 Zurich, Switzerland
Media RelationsZurich Insurance Group Ltd, Switzerland Telephone: +41 (0)44 625 21 00 E-mail: [email protected]
Investor RelationsZurich Insurance Group Ltd, Switzerland Telephone: +41 (0)44 625 22 99 E-mail: [email protected]
Share Register ServicesZurich Insurance Group Ltd, Switzerland Telephone: +41 (0)44 625 22 55 E-mail: [email protected] Website: www.zurich.com/shareholder-information
Corporate ResponsibilityZurich Insurance Group Ltd, Switzerland E-mail: [email protected]
American Depositary Receipts Zurich Insurance Group Ltd has an American Depositary Receipt program with The Bank of New York Mellon (BNYM). For information relating to an ADR account, please contact BNY Mellon’s Shareowner Services at www.mybnymdr.com. In the U.S. call +1 888 BNY ADRS or outside the U.S. +1 201 680 6825, or email [email protected] General information on the company’s ADR program can be obtained from The Bank of New York Mellon at www.adrbnymellon.com
For more information please contact the appropriate office below, or visit our website at www.zurich.com
Contact information
Q4_2014_18_AR14_Shareholder_Info_Glossary_Disclaimer_en.indd 311 23.02.2015 17:10:09
Zurich Insurance GroupAnnual Report 2014312 Financial informationG
lossary
1Annual results 2014Zurich Insurance Group Glossary
Group
Book value per shareis a measure that is calculated by dividing shareholders’ equity by the number of shares issued less the number of treasury shares as of the period end.
Business operating profit (BOP)is a measure that is the basis on which the Group manages all of its business units. It indicates the underlying performance of the Group’s business units, after non-controlling interests, by eliminating the impact of financial market volatility and other non-operational variables. BOP reflects adjustments for shareholders’ taxes, net capital gains/(losses) and impairments on investments (except for the capital markets and property lending/banking operations included in Non-Core Businesses, investments in hedge funds, certain securities held for specific economic hedging purposes and policyholders’ share of investment results for the life businesses) and non-operational foreign exchange movements. Significant items arising from special circumstances, including restructuring charges, charges for litigation outside the ordinary course of business, gains and losses on divestments of businesses, impairments of goodwill and the change in estimates of earn-out liabilities (with the exception of experience adjustments, which remain within BOP) are also excluded from BOP. Business operating profit before interest, depreciation and amortization (BOPBIDA) is BOP before interest expense on debt, depreciation and impairments of property and equipment and amortization and impairments of intangible assets, but including amortization of deferred policy acquisition costs and deferred origination costs.
Business operating profit (after-tax) return on shareholders’ equity (BOPAT ROE)indicates the level of BOP relative to resources provided by shareholders. It is calculated as BOP, annualized on a linear basis and adjusted for taxes, divided by the average value of shareholders’ equity, adjusted for net unrealized gains/(losses) on available-for-sale investments and cash flow hedges, on a simple basis using the value at the beginning and end of the period.
InvestmentsTotal investments in the consolidated balance sheets includes Group investments and investments for unit-linked contracts. Group investments are those for which the Group bears part or all of the investment risk. They also include investments related to investment contracts with discretionary participation features. Average invested assets exclude cash collateral received for securities lending. The Group manages its diversified investment portfolio to optimize benefits for both shareholders and policyholders while ensuring compliance with local regulatory and business requirements under the guidance of the Group’s Asset/Liability Management and Investment Committee. Investments for unit-linked contracts include such investments where the policyholder bears the investment risk, and are held for liabilities related to unit-linked investment contracts and reserves for unit-linked contracts. They are managed in accordance with the investment objectives of each unit-linked fund. The investment result for unit-linked products is passed to policyholders through a charge to policyholder dividends and participation in profits.
Return on shareholders’ equity (ROE)is a measure that indicates the level of profit or loss relative to resources provided by shareholders. It is calculated as net income after taxes attributable to shareholders, annualized on a linear basis, divided by the average value of shareholders’ equity, adjusted for net unrealized gains/(losses) on available-for-sale investments and cash flow hedges, on a simple basis using the value at the beginning and end of the period.
General Insurance
The following General Insurance measures are net of reinsurance.
Net underwriting resultis calculated as the difference between earned premiums and policy fees and the sum of insurance benefits and losses and net technical expenses.
Total net technical expensesincludes underwriting and policy acquisition costs, as well as the technical elements of administrative and other operating expenses, amortization of intangible assets, interest credited to policyholders and other interest, and other income.
Combined ratiois a performance measure that indicates the level of claims and net technical expenses during the period relative to earned premiums and policy fees. It is calculated as the sum of the loss ratio and the expense ratio.
Q4_2014_Glossary_online_en.indd 1 23.02.2015 12:03:56
Glossary
Q4_2014_18_AR14_Shareholder_Info_Glossary_Disclaimer_en.indd 312 23.02.2015 17:10:10
Finan
cial inform
ation
Zurich Insurance Group Annual Report 2014 313Glossary Zurich Insurance GroupAnnual results 2014Glossary2
Glossary continued
Loss ratiois a performance measure that indicates the level of claims during the period relative to earned premiums and policy fees. It is calculated as insurance benefits and losses, which include paid claims, claims incurred but not reported (IBNR) and claims handling costs, divided by earned premiums and policy fees.
Expense ratiois a performance measure that indicates the level of technical expenses during the period relative to earned premiums and policy fees. It is calculated as the sum of net technical expenses and policyholder dividends and participation in profits, divided by earned premiums and policy fees.
Net non-technical resultincludes expenses or income not directly linked to the insurance operating performance, such as gains/losses on foreign currency translation and interest expense on debt. It includes the impact of financial market volatility and other non-operational variables that distort the ongoing business performance.
Global Life
Embedded value (EV) principlesis a methodology using a “bottom-up” market consistent approach, which explicitly allows for market risk. In particular, asset and liability cash flows are valued using risk discount rates consistent with those applied to similar cash flows in the capital markets. A liquidity premium, which increases risk discount rates, has been applied to certain lines of business consistent with the CFO Forum principles. Options and guarantees are valued using market consistent models calibrated to observable market prices.
Insurance depositsare deposits, similar to customer account balances, not recorded as revenues. However, the fees charged on insurance deposits are recorded as revenue within gross written premiums and policy fees within the consolidated income statement. These deposits arise from investment contracts and insurance contracts that are accounted for under deposit accounting. They represent the pure savings part, which is invested.
New business annual premium equivalent (APE)is calculated as new business annual premiums plus 10 percent of single premiums, before the effect of non-controlling interests. Present value of new business premiums (PVNBP) is calculated as the value of new business premiums discounted at the risk-free rate, before the effect of non-controlling interests.
New business value, after taxis a measure that reflects the value added by new business written during the period, including allowance for frictional costs, time value of options and guarantees, and the cost of non-market risk, and is valued at the point of sale. It is calculated as the present value of the projected after-tax profit from life insurance contracts sold during the period using a valuation methodology consistent with the EV principles, after the effect of non-controlling interests.
Source of earnings (SOE)reporting presents the key drivers of Global Life BOP identifying specific profit sources. This information provides a shareholder’s view of earnings, thereby the components attributable to policyholders and non-controlling interests are included in each line item and not separately identified.
Loadings and fees include fund and non-fund based fees. The investment margin is the spread between the investment result and interest credited to policyholders, plus the return on free surplus. The technical margin shows the mortality, morbidity, and longevity premiums less benefits to the policyholders together with the reinsurance result.
Operating and funding costs include administrative and operating expenses, interest expense on debt, depreciation and amortization of fixed assets and non-acquisition related intangible assets. Acquisition expenses include commissions and other new business expenses, as well as costs related to business combinations, including amortization of acquisition related intangible assets. The impact of deferrals is the net effect of deferral and amortization of policy acquisition costs and front-end fees, which may be affected by movements in financial markets and changes in assumptions.
Farmers
Gross management resultis a performance measure of Farmers Management Services calculated as management fees and other related revenues minus management and other related expenses, which include amortization and impairments of intangible assets.
Managed gross earned premium marginis a performance measure calculated as the gross operating profit of Farmers Management Services divided by the gross earned premiums of the Farmers Exchanges, which are owned by their policyholders. Farmers Group, Inc, a wholly owned subsidiary of the Group, provides certain non-claims administrative and management services as attorney-in-fact and receives fees for its services.
Q4_2014_Glossary_online_en.indd 2 23.02.2015 12:03:56Q4_2014_18_AR14_Shareholder_Info_Glossary_Disclaimer_en.indd 313 23.02.2015 17:10:10
Zurich Insurance GroupAnnual Report 2014314
Disclaimer and cautionary statementCertain statements in this document are forward-looking statements, including, but not limited to, statements that are predictions of or indicate future events, trends, plans or objectives of Zurich Insurance Group Ltd or the Zurich Insurance Group (the Group). Forward-looking statements include statements regarding the Group’s targeted profit, return on equity targets, expenses, pricing conditions, dividend policy and underwriting and claims results, as well as statements regarding the Group’s understanding of general economic, financial and insurance market conditions and expected developments. Undue reliance should not be placed on such statements because, by their nature, they are subject to known and unknown risks and uncertainties and can be affected by other factors that could cause actual results and plans and objectives of Zurich Insurance Group Ltd or the Group to differ materially from those expressed or implied in the forward-looking statements (or from past results). Factors such as (i) general economic conditions and competitive factors, particularly in key markets; (ii) the risk of a global economic downturn; (iii) performance of financial markets; (iv) levels of interest rates and currency exchange rates; (v) frequency, severity and development of insured claims events; (vi) mortality and morbidity experience; (vii) policy renewal and lapse rates; and (viii) changes in laws and regulations and in the policies of regulators may have a direct bearing on the results of operations of Zurich Insurance Group Ltd and its Group and on whether the targets will be achieved. Zurich Insurance Group Ltd undertakes no obligation to publicly update or revise any of these forward-looking statements, whether to reflect new information, future events or circumstances or otherwise.
All references to ‘Farmers Exchanges’ mean Farmers Insurance Exchange, Fire Insurance Exchange, Truck Insurance Exchange and their subsidiaries and affiliates. The three Exchanges are California domiciled interinsurance exchanges owned by their policyholders with governance oversight by their Boards of Governors. Farmers Group, Inc. and its subsidiaries are appointed as the attorneys-in-fact for the Farmers Exchanges and in that capacity provide certain non-claims administrative and management services to the Farmers Exchanges. Neither Farmers Group, Inc., nor its parent companies, Zurich Insurance Company Ltd and Zurich Insurance Group Ltd, have any ownership interest in the Farmers Exchanges. Financial information about the Farmers Exchanges is proprietary to the Farmers Exchanges, but is provided to support an understanding of the performance of Farmers Group, Inc. and Farmers Reinsurance Company.
It should be noted that past performance is not a guide to future performance.
Persons requiring advice should consult an independent advisor.
This communication does not constitute an offer or an invitation for the sale or purchase of securities in any jurisdiction.
THIS COMMUNICATION DOES NOT CONTAIN AN OFFER OF SECURITIES FOR SALE IN THE UNITED STATES; SECURITIES MAY NOT BE OFFERED OR SOLD IN THE UNITED STATES ABSENT REGISTRATION OR EXEMPTION FROM REGISTRATION, AND ANY PUBLIC OFFERING OF SECURITIES TO BE MADE IN THE UNITED STATES WILL BE MADE BY MEANS OF A PROSPECTUS THAT MAY BE OBTAINED FROM THE ISSUER AND THAT WILL CONTAIN DETAILED INFORMATION ABOUT THE COMPANY AND MANAGEMENT, AS WELL AS FINANCIAL STATEMENTS.
Q4_2014_18_AR14_Shareholder_Info_Glossary_Disclaimer_en.indd 314 23.02.2015 17:10:11
13
2
45
1 2 3
4 5
About Zurich
Zurich is a leading multi-line insurer that serves its customers in global and local markets. With about 55,000 employees, we provide a wide range of general insurance and life insurance products and services. We serve individuals, small businesses, and mid-sized and large companies, including multinational corporations, in more than 170 countries.
A global presence
Zurich operates globally and locally, according to our customers’ needs.
North AmericaIn North America, Zurich is a leading commercial property-casualty insurance provider serving the global corporate, large corporate, middle market, specialties and programs sectors. It also serves life customers in the retail, affluent and corporate markets.
Latin AmericaZurich operates in Argentina, Brazil, Chile, Colombia, Mexico and Venezuela.
EuropeZurich has major operations in Germany, Italy, Spain, Switzerland, and the UK and a significant presence in other countries.
AA–/positiveStandard & Poor’s financial strength rating on Zurich Insurance Company Ltd(December 31, 2014)
55,000Employees (approximately)(December 31, 2014)
170+Countries(December 31, 2014)
Middle East & AfricaOur business spans the region with key operations in the Middle East, South Africa, Morocco and Turkey.
Asia PacificZurich has operations in Australia, China, Hong Kong, Indonesia, Japan, Malaysia, New Zealand, Singapore and Taiwan.
Our coverOur customers want the best possible protection for the people and things they truly love – from personal accident and life insurance to global risk coverage for corporations.
Q4_2014_01_AR14_Group_Overview_en.indd 2 23.02.2015 16:10:32
Zurich Insurance Group Annual Report 2014
The Annual Report is published in English and German. In the event of inconsistencies in the German translation, the English original version shall prevail.
Design by Addison Group, www.addison-group.net
Photography by Anne Morgenstern except for cover image.
Publishing system: ns.publish by Multimedia Solutions AG, www.mmsag.ch
Cover printed on Heaven 42, an environmentally friendly paper sourced from well-managed forests independently certified according to the rules of the Forest Stewardship Council ® (FSC).
Content printed on MultiOffset, an environmentally friendly paper made from totally chlorine-free pulp also sourced from well-managed forests independently certified according to the rules of the Forest Stewardship Council ® (FSC).
Printed climate neutrally with ClimatePartner using green electricity end of February 2015 by Neidhart + Schön AG, www.nsgroup.ch. ISO 14001 certified.
Q4_2014_18_AR14_Shareholder_Info_Glossary_Disclaimer_en.indd 3 23.02.2015 16:48:46Q4_2014_00_AR14_Cover_en.indd 2 23.02.2015 17:10:59

Annual Report 2014
Zurich Insurance Group
Q4_2014_01_AR14_Group_Overview_en.indd 1 23.02.2015 16:10:31
Zurich Insurance Group Mythenquai 2 8002 Zurich, Switzerland Phone +41 (0) 44 625 25 25 www.zurich.com
48559–1502
Q4_2014_18_AR14_Shareholder_Info_Glossary_Disclaimer_en.indd 4 23.02.2015 16:48:46
Zurich Insurance Group A
nnu
al Repo
rt 2014w
ww
.zurich.com
Q4_2014_00_AR14_Cover_en.indd 1 23.02.2015 17:10:58